efficient contrast enhancement through log-power histogram modification
TRANSCRIPT

Efficient contrast enhancementthrough log-power histogrammodification
Alexander ToetTirui Wu

Efficient contrast enhancement through log-powerhistogram modification
Alexander Toeta,* and Tirui Wub
aTNO, Kampweg 5, 3769 DE, Soesterberg, The NetherlandsbFord Motor Research & Engineering (Nanjing) Co., Ltd., No. 118 General Road, Nanjing Development Zone, Nanjing 211100, China
Abstract. A simple power-logarithm histogram modification operator is proposed to enhance digital image con-trast. First, a logarithm operator reduces the effect of spikes and transforms the image histogram into a smoothedone that approximates a uniform histogram while retaining the relative size ordering of the original bins. Then, apower operator transforms this smoothed histogram into one that approximates the original input histogram.Contrast enhancement is then achieved by using the cumulative distribution function of the resulting histogramin a standard lookup table-based histogram equalization procedure. The method is computationally efficient,independent of image content, and (unlike most existing contrast enhancement algorithms) does not sufferfrom the occurrence of artifacts, overenhancement and unnatural effects in the processed images. Performancecomparisons with several state-of-the-art contrast enhancement algorithms show that the proposed methodachieves appreciable contrast enhancement under diverse conditions. © 2014 SPIE and IS&T [DOI: 10.1117/1.JEI.23.6.063017]
Keywords: contrast enhancement; histogram modification; log-pow operation.
Paper 14443P received Jul. 30, 2014; accepted for publication Nov. 13, 2014; published online Dec. 16, 2014.
1 IntroductionContrast enhancement is an important preprocessing opera-tion in digital image processing for both human and com-puter visions. Poor image contrast can have several causes,such as unfavorable environmental conditions in the cap-tured scene (e.g., poor visibility due to fog, smoke or rain,low-light levels, scenes that are backlit, etc.) or inadequacyof the image capture device (e.g., low sensitivity).
Especially for real-time imaging applications like surveil-lance and navigation, video signal enhancement should pro-vide a great accommodate for varying light conditions andversatility of scenes with less than ideal luminance distribu-tions. Effective image and video contrast enhancement algo-rithms should make image details in all parts of the scenemore distinct by boosting their sharpness and contrast. Inaddition, processing should be largely autonomous sincemany real-time applications do not allow human interaction.Thus, to enable effective real-time applications in varyingconditions, contrast enhancement algorithms should prefer-ably require a minimal amount of user interaction (have aminimal number of free parameters) to achieve optimal per-formance and should be computationally efficient.
Many different contrast enhancement algorithms havebeen proposed such as graylevel transformation-basedtechniques (e.g., logarithm, power law, and piecewise lineartransformations1–3) and histogram processing techniques(e.g., histogram equalization and histogram specification).3
This section only presents a brief overview of the existingapproaches to contrast enhancement. Recent and more exten-sive reviews of the state of the art of contrast enhancementtechniques can be found elsewhere.4–7
Traditional gamma correction (TGC) techniques usea constant power function with exponent γ to enhanceimage contrast:
TðrÞ ¼ rmaxðr∕rmaxÞγ; (1)
where rmax is the maximum of the input intensity r. Adaptivepower law1 and hybrid methods that combine TGC withtechniques that modify the image histogram have been pro-posed to avoid the over and underenhancement effects thatare typical for TGC.
A histogram of the graylevel content of an image providesa global description of its appearance. Contrast enhancementcan also be achieved through modification of the imagehistogram in a specified manner. One of the most popularcontrast enhancement techniques is traditional histogramequalization (THE), which tries to fully exploit the dynamicrange by creating a uniformly distributed output histo-gram.3,8 The method is simple and efficient [O(N) complex-ity, where N is the number of image pixels] and works asmentioned.
Let r represents the graylevel of the pixels in the image tobe enhanced. For simplicity, we assume that the pixel valueshave been normalized: 0 ≤ r ≤ 1. A contrast enhancementoperation can be defined as a graylevel transformation
s ¼ TðrÞ; (2)
that maps every pixel value r to a new value s in theenhanced image. It is assumed that (i) TðrÞ is monotonicallyincreasing in the interval 0 ≤ r ≤ 1 and (ii) 0 ≤ TðrÞ ≤ 1 for0 ≤ r ≤ 1. The first condition preserves the grayscale order-ing and the second condition guarantees that the mapping is
*Address all correspondence to: Alexander Toet, E-mail [email protected] 0091-3286/2014/$25.00 © 2014 SPIE and IS&T
Journal of Electronic Imaging 063017-1 Nov∕Dec 2014 • Vol. 23(6)
Journal of Electronic Imaging 23(6), 063017 (Nov∕Dec 2014)

restricted to the allowed range of grayscale values. In histo-gram equalization (HE), the transformation function TðrÞ isgiven by
sk ¼ TðrkÞ ¼Xkj¼0
prðrjÞ ¼Xkj¼0
njN
; 0 ≤ rk ≤ 1 and
k ¼ 0;1; : : : ; L − 1; (3)
where prðrjÞ ¼ nj∕N is the probability density function ofthe input image level rj; nj is the number of pixels in theinput image that have grayscale level rj; N is the total num-ber of pixels in the input image.
Thus, the transformation function TðrÞ represents thecumulative distribution function (CDF) of the input imagelevels. Using this CDF as the transformation function, gray-levels in densely populated histogram regions are spreadout while values in sparsely populated regions becomeconcentrated.
THE uses the histogram of the entire input image as itstransformation function.3 Global HE is simple and effective,but its effect is too severe for many applications since it can-not adapt to local brightness features of the input image. Thistypically results in a contrast deterioration of the backgroundand small objects. Figure 1 shows an example of a low-con-trast image with a graylevel distribution that is concentratedin a small part of the available graylevel range. After THE,the output image has higher contrast and a more uniformgraylevel distribution. However, some image regions areoverenhanced (such as the bright regions on the jacket) andappear unnatural. Also, noise is enhanced in some regions(such as the fence).
Figure 2(a) shows a medical image with a large darkbackground. HE fails to improve contrast for this image[Fig. 2(c)] since its graylevel distribution [Fig. 2(b)] isextremely peaked (i.e., a single histogram component—representing the dark image background—accounts for alarge percentage of the total distribution). The spike in the
Fig. 1 Example of histogram equalization. (a) The input image and (b) its graylevel histogram, whichshows that the graylevel distribution is concentrated in a small range. Although histogram equalization(HE) improves the overall contrast of the image (c) by distributing the pixel values more uniformly overthe available graylevel range (d) some image regions are clearly overenhanced.
Journal of Electronic Imaging 063017-2 Nov∕Dec 2014 • Vol. 23(6)
Toet and Wu: Efficient contrast enhancement through log-power histogram modification
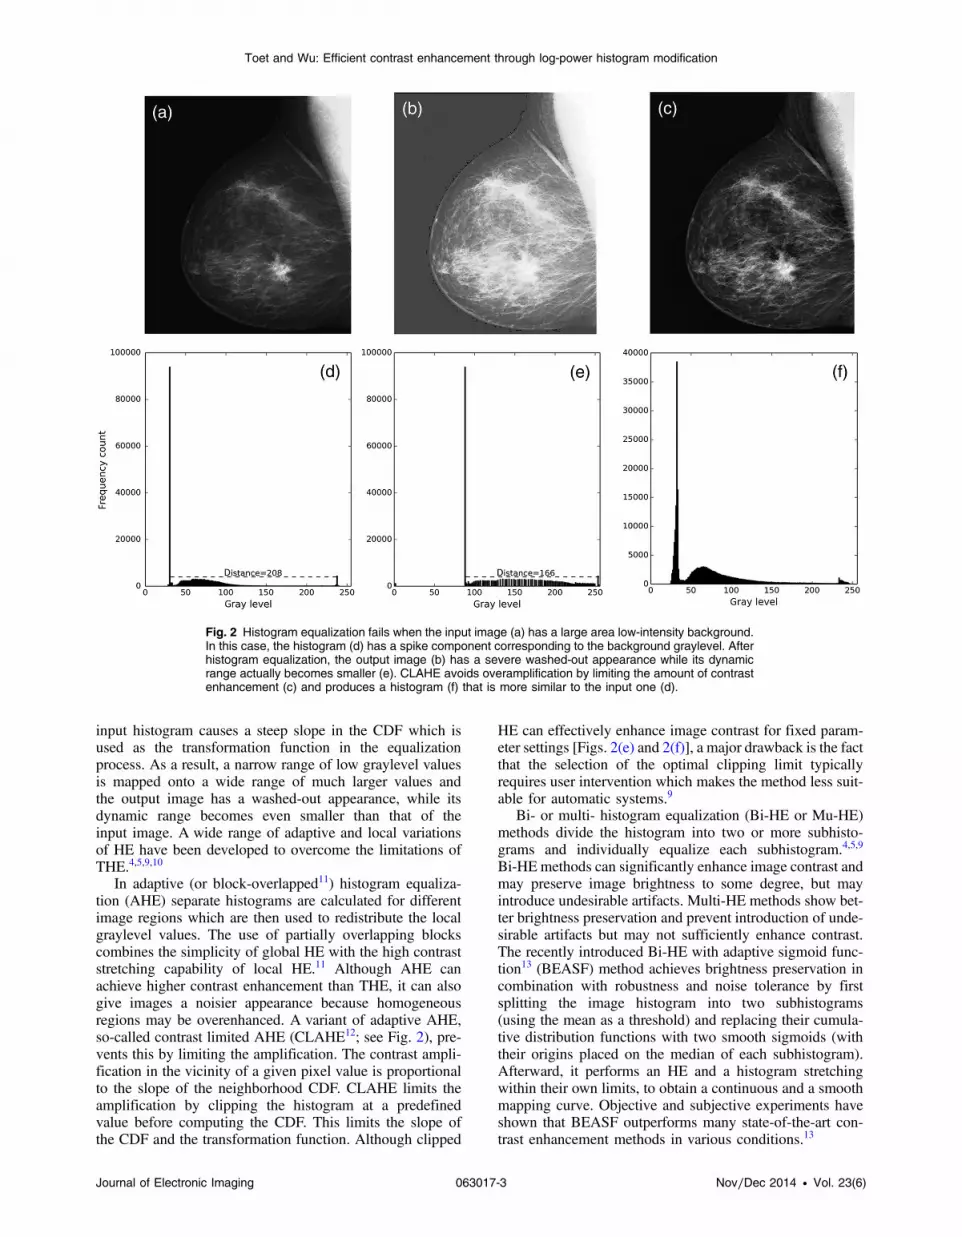
input histogram causes a steep slope in the CDF which isused as the transformation function in the equalizationprocess. As a result, a narrow range of low graylevel valuesis mapped onto a wide range of much larger values andthe output image has a washed-out appearance, while itsdynamic range becomes even smaller than that of theinput image. A wide range of adaptive and local variationsof HE have been developed to overcome the limitations ofTHE.4,5,9,10
In adaptive (or block-overlapped11) histogram equaliza-tion (AHE) separate histograms are calculated for differentimage regions which are then used to redistribute the localgraylevel values. The use of partially overlapping blockscombines the simplicity of global HE with the high contraststretching capability of local HE.11 Although AHE canachieve higher contrast enhancement than THE, it can alsogive images a noisier appearance because homogeneousregions may be overenhanced. A variant of adaptive AHE,so-called contrast limited AHE (CLAHE12; see Fig. 2), pre-vents this by limiting the amplification. The contrast ampli-fication in the vicinity of a given pixel value is proportionalto the slope of the neighborhood CDF. CLAHE limits theamplification by clipping the histogram at a predefinedvalue before computing the CDF. This limits the slope ofthe CDF and the transformation function. Although clipped
HE can effectively enhance image contrast for fixed param-eter settings [Figs. 2(e) and 2(f)], a major drawback is the factthat the selection of the optimal clipping limit typicallyrequires user intervention which makes the method less suit-able for automatic systems.9
Bi- or multi- histogram equalization (Bi-HE or Mu-HE)methods divide the histogram into two or more subhisto-grams and individually equalize each subhistogram.4,5,9
Bi-HE methods can significantly enhance image contrast andmay preserve image brightness to some degree, but mayintroduce undesirable artifacts. Multi-HE methods show bet-ter brightness preservation and prevent introduction of unde-sirable artifacts but may not sufficiently enhance contrast.The recently introduced Bi-HE with adaptive sigmoid func-tion13 (BEASF) method achieves brightness preservation incombination with robustness and noise tolerance by firstsplitting the image histogram into two subhistograms(using the mean as a threshold) and replacing their cumula-tive distribution functions with two smooth sigmoids (withtheir origins placed on the median of each subhistogram).Afterward, it performs an HE and a histogram stretchingwithin their own limits, to obtain a continuous and a smoothmapping curve. Objective and subjective experiments haveshown that BEASF outperforms many state-of-the-art con-trast enhancement methods in various conditions.13
Fig. 2 Histogram equalization fails when the input image (a) has a large area low-intensity background.In this case, the histogram (d) has a spike component corresponding to the background graylevel. Afterhistogram equalization, the output image (b) has a severe washed-out appearance while its dynamicrange actually becomes smaller (e). CLAHE avoids overamplification by limiting the amount of contrastenhancement (c) and produces a histogram (f) that is more similar to the input one (d).
Journal of Electronic Imaging 063017-3 Nov∕Dec 2014 • Vol. 23(6)
Toet and Wu: Efficient contrast enhancement through log-power histogram modification

Dynamic histogram equalization14 (DHE) partitions theglobal image histogram into multiple segments using localminima, and then independently equalizes them. Althoughthis technique is designed to preserve mean image bright-ness, it remaps peaks which still leads to perceivable bright-ness changes. Brightness preserving dynamic histogramequalization15 (BPDHE) alleviates this problem by smooth-ing the global image histogram using a Gaussian kernel.Brightness preserving dynamic fuzzy histogram equaliza-tion15 (BPDFHE) uses fuzzy statistics to represent andprocesses images. This eliminates the need for histogramsmoothing (a fuzzy representation is inherently smooth)while no remapping of the histogram peaks takes place:only graylevel values in the valley portions between twoconsecutive peaks are redistributed.16 Evaluation studies onmedical images have shown that BPDFHE outperformsboth CLAHE and BPDHE.17
Several methods have been proposed to perform histo-gram modification (HM) prior to HE. Weighting andthresholding the image histogram prior to equalization canprevent overenhancement and level saturation effects inimages with very dark and bright regions.18 Graylevel group-ing (GLG) first groups the histogram components of a low-contrast image into a proper number of bins according toa selected criterion, then uniformly redistributes these binsover the grayscale, and finally ungroups the previouslygrouped graylevels.19 Selective GLG can be used to selec-tively control the grouping of histogram components.20 Sincethe resulting histogram is more uniform, it is also more suit-able as input for HE. Although GLG can effectively preventover and underenhancements, it is computationally complexand may cause flicker when applied to video sequences.
Arici et al.21 formulated HM in an optimization frame-work that minimizes a cost function to compute a modifiedtarget histogram. The cost function is composed of penaltyterms representing (i) minimum histogram deviation fromboth the original and uniform histograms and (ii) histogramsmoothness. Furthermore, edge information is embeddedinto the cost function to weigh pixels around region bounda-ries to address noise and black/white stretching. This approachcan achieve different levels of contrast enhancements throughthe use of different adaptive parameters. This allows contrastenhancement of an image without introducing visual artifactsthat decrease its visual quality or cause it to have an unnaturalappearance. These parameters can manually be tuned accord-ing to the image content to achieve optimal contrast. However,the use of local variance information may cause a loss ofinformation in homogeneous image regions.
Nonparametric modified histogram equalization22
(NMHE) first removes any spikes from the input histogram,clips and normalizes the result, computes the summeddeviation of this intermediate modified histogram from theuniform histogram and uses this as a weighting factor toconstruct a final modified histogram that is a weightedmean of the modified histogram and the uniform histogram.Contrast enhancement is then achieved by using the CDF ofthis modified histogram as the transformation function.Extensive experiments have shown that this method produ-ces results that are comparable or even superior to severalstate-of-the-art contrast enhancement algorithms.22
Other techniques perform contrast enhancement in atransformed domain such as the Fourier transform,3 the
DCT23 or the pyramid, and wavelet transforms.24 Althoughthese methods may achieve better results than THE, they areusually complex and time consuming.
Content aware algorithms can effectively enhance con-trast while preserving overall image brightness.25 They cansimultaneously enhance contrast in both light and darkregions without causing overenhancement.25,26 As a result,they are better able to retain the mood of scenes with lowillumination (night shots) that presents important or largeunderexposed regions.27 Image independent algorithmsoften introduce noise and overenhance these types of scenes.
Recently, a content-aware algorithm was introduced thatenhances dark images, sharpens edges, and reveals details intextured regions while preserving the smoothness of flatregions.28 The algorithm achieves maximum contrastenhancement by producing a content aware “channel divi-sion” (CD) transformation for each image that spreadsthe dynamic range of dark regions while maintaining theshape of their distributions. This algorithm can automaticallyenhance a wide range of images without introducing artifactsand has been shown to outperform many state-of-the-artalgorithms.28
This paper is structured as follows. In Sec. 2, we present asimple power-logarithm operator to modify the image histo-gram prior to HE. The proposed method is simple and inde-pendent of image content, can be applied in both a directand an iterative mode, and (unlike most existing contrastenhancement algorithms) does not suffer from the occur-rence of artifacts, overenhancement, and unnatural effectsin the processed images. Section 3 describes the differentmethods that were used to quantify the effectiveness ofthe proposed method by comparing its performance tothat of, respectively, THE and four state-of-the-art contrastenhancement techniques (respectively BEASF, BPDFHE,NMHE, and CD). Section 4 presents the results of boththe subjective and objective evaluation studies. Finally, wepresent the conclusions of this study in Sec. 5.
2 Pow-Log Contrast EnhancementThe algorithms presented in this section operate on the inten-sity component of an image. Therefore, the input imagesare first transformed into the hue-saturation-value (HSV)color space. The proposed algorithms are then applied tothe image intensity (V component). The enhanced V com-ponent of the input image is then merged with the hue(H) and saturation (S) components from the original inputimage to create the final image. This procedure maintainsthe color (HS) of the input image while improving itsintensity contrast (V). Note that the visual appearance ofthe results may depend on the actual color space used.Therefore, we also perceptually investigated the more uni-form CIELAB L � a � b� color space, but observed no sig-nificant differences in the results.
2.1 Pow-Log OperatorAs discussed above, standard HE fails to increase contrastwhen the image histogram contains large spikes. Hence,we need a monotonously increasing function (i.e., a functionthat retains the relative size ordering of the histogram bins)that effectively reduces the effects of spikes. A simplecombination of a power and logarithm (pow-log) operatorsatisfies the requirement
Journal of Electronic Imaging 063017-4 Nov∕Dec 2014 • Vol. 23(6)
Toet and Wu: Efficient contrast enhancement through log-power histogram modification

h 0½i� ¼ pow½logðh½i� þ αÞ;β�; 0 ≤ i ≤ L− 1; α > 1; (4)
where h and h 0 represent, respectively, the original andmodified histograms, α is a number larger than or equalto 1 introduced to avoid taking the logarithm of zero forempty histogram bins, β is the exponent of the power func-tion, and L is the number of available graylevels.
The log transformation serves to compress the dynamicrange of the input histogram by compressing large valuesand expanding small values, and effectively reduces therelative contribution of spikes in the histogram. The powertransform has the inverse effect: it expands larger values rel-ative to smaller ones. The power transform partly restores thehistogram to its original shape. The overall pow–log functionyields a smoothed version of the original histogram in whichthe relative contribution of spikes has been diminished.Figure 3 illustrates the effect of this operator on the medicalimage from Fig. 2(a), for α ¼ 1 and β ¼ 3. The value of α isset to a default value of 1 in the rest of this study.
2.2 Direct ModeWhen directly applied the pow-log operator (direct pow-logor DPL) redistributes the original image histogram and
image contrast is enhanced by using the cumulative distri-bution function of the resulting histogram in a standardlookup table-based HE procedure. This approach requiresthe selection of a value for β: if β is too small there willbe no appreciable contrast enhancement; if β is too largethe transformation will suffer from the same problems asTHE (washout; see Fig. 4).
Arici et al.29 showed that the optimally enhanced (optimalin the sense that contrast is enhanced while mean brightnessis largely preserved and the introduction of visual artifacts isprevented) distribution is a linear combination of the originaland the uniform distributions:
ho ¼1
1þ λhi þ
λ
1þ λhu; (5)
where hi, ho, and hu are respectively the input, output, anduniform histograms, and λ is used to control the degree ofenhancement. When λ is small, the output histogram isnearly equal to the input histogram; as it approaches the uni-form histogram λ is large. Therefore, the optimal outputhistogram should resemble both the uniform histogram(for optimal contrast enhancement) and the original input
Fig. 3 Effect of the pow-log contrast operator (with α ¼ 1 and β ¼ 3) on Fig. 2(a). (a) The original dis-tribution has a large peak representing the dark background. (b) The logarithm operator reduces thislarge spike and makes the distribution more uniform. (c) The power operator restores the distributionto one that is similar to the original. (d) The cumulative distribution functions (CDF) of the histogramsshown in (a–c) The CDF of the pow-log enhanced distribution is in between the CDF’s of respectivelythe original distribution and the uniform distribution (approximated by the logarithm of the originaldistribution).
Journal of Electronic Imaging 063017-5 Nov∕Dec 2014 • Vol. 23(6)
Toet and Wu: Efficient contrast enhancement through log-power histogram modification

histogram (to minimize artifacts). Hence, the optimal outputhistogram should maximally correlate with both the inputand uniform histograms. Therefore, the optimal value of βcan automatically be obtained by means of a simple heuristicsearch process: find the value of β that satisfies
β ¼ argmax½crosscorrelationðho; hiÞþ crosscorrelationðho; h 0
u�; (6)
where the uniform histogram hu is approximated by h 0u
which represents the logarithm of the input histogram.Figure 5 shows that the optimal value of β for the imagefrom Fig. 2(a) is about 5.
2.3 Iterative ModeThe pow-log contrast enhancement operator can also beapplied in an iterative mode (iterative pow-log or IPL). Inthat case, β is initially set to a relative small value (e.g.,3) to guarantee a conservative contrast enhancement, andthe operator is repeatedly applied. This results in a moderatestepwise contrast enhancement. The root mean square error(RMSE) is used to quantify the degree of contrast enhance-ment between two successive iteration steps:
RMSE ¼ffiffiffiffiffiffiffiffiffiffiffiffiffiffiffiffiffiffiffiffiffiffiffiffiffiffiffiffiffiffiffiffiffiffiffiffiffiffiffiffiffiffiffiffiffiffiffiffiffiffiffiffiffiffiffiffiffiffiffiffiffiffiffiffiffiffiffiffiffi1
m × n
Xmi¼1
Xnj¼1
jIkði; jÞ − Ikþ1ði; jÞj2vuut ; (7)
where Ik represents the image I of size m × n pixels after kapplications of the pow-log operator (i.e., the image after thek’th iteration step). The iteration ends when the value ofRMSE drops below a small predefined threshold value(set at 0.001 in this study) or after a predetermined maximalnumber of iterations (limited to 10 in this study). Figure 6shows the effect of IPL on the image from Fig. 2(a). Thisexample shows that IPL only enhances the regions of inter-est, while the background remains nearly unaffected. Thecorresponding histograms [Figs. 6(d)–6(f)] show that thehistogram is slowly spread over the range of available gray-scales during the iteration process, while the spike remains in
Fig. 4 Example of the pow-log contrast operator effect on the image of Fig. 2(a). (a–c): Results for βequal to 3, 6, and 9 respectively. (d–f): Histograms corresponding to (a–c).
Fig. 5 Example of the heuristic search process to obtain the optimalvalue of β for Fig. 2a. The value of β is set to 1 at the start of theiteration and increases by 0.1 at each next iteration step.
Journal of Electronic Imaging 063017-6 Nov∕Dec 2014 • Vol. 23(6)
Toet and Wu: Efficient contrast enhancement through log-power histogram modification

place. Figure 7 shows that the RMSE quickly decreases afteronly a few iteration steps.
Note that β can also be optimized at each iteration step ofIPL. However, pilot studies have shown that this approachdoes not significantly yield different results although it doesnot increase the computational complexity of the algorithm.
3 Evaluation MethodsTo evaluate the performance of the proposed IPL and DPLcontrast enhancement methods, we applied them to a set of13 different test images that have been used in earlier studieson contrast enhancement28 and that are available from the
authors at their website (see Fig. 8).30 The images are eitherdark or have dark shadows and include buildings and people,outdoor and indoor scenes, scenes in total darkness or inmixed light conditions (i.e., light parts with dark shadows),and close-up and wide depth-of-field images (see Fig. 3). Asa result, these test images show wide variations in terms ofaverage image intensity and contrast. Thus, they are highlysuitable for measuring the strength of a contrast enhancementalgorithm under different circumstances.
The application of DPL to the set of test images (see Fig. 8)showed that the optimal value of β varied between 2.9 and 4.9,with a mean value of 4.0 (SD ¼ 0.7). For IPL, we adoptedβ ¼ 4 since this value yields near-optimal results.
Since there is currently no universally accepted imageenhancement evaluation procedure, we evaluated the enhance-ment capability of the proposed DPL and IPL procedures both(a) through a subjective observer test and (b) by means of fivewidely used computational metrics. In addition, we investi-gated the time complexity of the algorithms. The results ofthe DPL and IPL are compared with the results of bothTHE and with the results of four recently introduced state-of-the-art image contrast enhancement procedures (BEASF,13
BPDFHE,16 NMHE22 and CD28), each of which has beenshown to outperform many existing methods.
3.1 Subjective AssessmentSince the proposed contrast enhancement methods are pri-marily intended for human visual perception, we performed
Fig. 6 Example of iterative contrast enhancement (IPL) of Fig. 2(a) (β ¼ 3). (a–c): results of steps 1, 5,and 10. (d–f): histograms of (a–c).
Fig. 7 The RMSE between two successively enhanced versions ofthe input image at each iteration step of the IPL algorithm (β ¼ 3).
Journal of Electronic Imaging 063017-7 Nov∕Dec 2014 • Vol. 23(6)
Toet and Wu: Efficient contrast enhancement through log-power histogram modification

a subjective evaluation study with 10 human interpreters(three of whom were image processing experts) to assessthe perceived quality of the results produced by the proposedimage enhancement algorithms (DPL and IPL), and to com-pare their performance to both THE and the four state-of-the-art methods BEASF, BPDFHE, NMHE, and CD.
We printed color hardcopies of the original test imagesand their seven enhanced representations on high fidelityphotographic paper, using a calibrated 600 dpi laser printer.The printed images were 8.2 × 11.7 cm2 in size. The printswere presented to the interpreters in a Macbetch Spectra-Light II booth, and viewed under homogeneous lighting.The luminance reflected from the print was maximally450 cd∕m2 (white paper). The color temperature of the illu-minant is approximately 6430 K.
On each trial, a participant was handed one of the originaltest images plus its seven enhanced versions. The originaltest image merely served as a reference and was placedon top in the center of view. The participant was thenasked to order the seven enhanced versions from best toworst below the original image, with no ties allowed. Weasked the subjects to keep the images on a viewing standwhile sorting them and to keep their viewing distancefixed at approximately 30 cm. There was no time constraint.
The participants were not informed about the methodsthat produced each result, and the test images and theirenhanced versions were presented in random order. The par-ticipants were instructed to rank the images with respect toboth contrast (the number of details that could be distin-guished) and naturalness (the absence of noise artifacts,color distortions, and washout).
3.2 Objective AssessmentThere is currently no universally accepted computationalmetric to quantify the objective validity of an image enhance-ment method. We therefore use five objective metrics that arefrequently used in the literature to assess the effectiveness ofimage enhancement algorithms: the absolute mean brightnesserror or absolute mean brightness error (AMBE),9,31–34 thediscrete entropy H,2,32 the measure of enhancement orEME,35 the image enhancement metric or IEM,36 and themean structural similarity metric or MSSIM.37,38
3.2.1 Absolute mean brightness error
The AMBE is defined as the absolute difference betweenthe mean of the input and the output images:33
AMBEðIin; IoutÞ ¼ jEðIinÞ − EðIoutÞj; (8)
where Iin and Iout denote, respectively, the input and outputimages, and Eð·Þ denotes the expected image value (i.e., thestatistical mean). AMBE rates the degree to which a trans-formation preserves the original image brightness. LowerAMBE values indicate that image brightness is better pre-served. Brightness preservation is especially important foruse in electronic consumer products. AMBE is frequentlyused to quantify the effectiveness of image enhancementmethods.7,9,32,33,39,40
Fig. 8 Original images (column 2) and the results of respectivelyTHE, CD, BEASF, BPDHFE, NMHE, DPL, and IPL contrast enhance-ment (columns 3–9). The corresponding intensity histogram is shownunderneath each image.
Journal of Electronic Imaging 063017-8 Nov∕Dec 2014 • Vol. 23(6)
Toet and Wu: Efficient contrast enhancement through log-power histogram modification

3.2.2 Discrete entropy H
The discrete entropy H of a given image I is defined as41
HðIÞ ¼ −X255k¼0
pðkÞ log pðkÞ; (9)
where pðkÞ is the discrete probability of grayscale level k,which is estimated from the normalized histogram of I(i.e., pðkÞ ¼ nk∕N, where nk is the number of pixels in Iwith graylevel k and N is the total number of graylevels).H measures the information content of an image: ahigher value of H indicates an image with more details.Therefore, discrete entropy can be used to quantify the effec-tiveness of image enhancement methods to enhance imagestructure.2,32
3.2.3 Measure of enhancement
The measure of enhancement (EME) approximates averageimage contrast by dividing the image into nonoverlappingblocks, finding a measure based on minimum and maximumintensity values in each block, and averaging them.35 Let theimage Iðn;mÞ be partitioned into k1 × k2 blocks wk;l ði; jÞ ofsize l1 × l2. EMEðIÞ is then defined as
EMEðIÞ ¼ 1
k1k2
Xk1l¼1
Xk2k¼1
20 logIwmax;k;l
Iwmin;k;l; (10)
where Iwmin;k;l and Iwmax;k;l are, respectively, the maximum and
minimum values of the image I in the block wk;l. Since thelogarithm of the ratio of the intensity values can be written asa logarithmic difference, the EME effectively representslocal edge strength. The EME metric has been used to quan-tify the effectiveness of contrast enhancement methods.42
3.2.4 Image enhancement metric
The image enhancement metric (IEM) approximates averageimage contrast by dividing the image into nonoverlappingblocks. The average value of the absolute difference betweenthe center pixel and its eight neighbors for all local windowscorresponding to the reference and enhanced image givesan indication of the change in contrast and sharpness. Thefull-reference IEM metric is defined as the ratio of sum ofabsolute values of the difference of each pixel from its eight-neighbors of the enhanced image to the reference image:36
IEM8n ¼Pk1
m¼1
Pk2l¼1
P8n¼1 jIl;me;c − Il;me;n jPk1
m¼1
Pk2l¼1
P8n¼1 jIl;mr;c − Il;mr;n j
; (11)
where the images are divided into blocks of size 3 × 3 andIl;me;c and Il;mr;c represent the intensity of the center pixel in,respectively, the enhanced and reference (input) image.Il;mn , n ¼ 1;2; : : : ; 8 represent the eight neighbor pixels ofthe center pixel. When the reference and enhanced imagesare identical, IEM ¼ 1. IEM > 1 indicates that the imagecontrast is enhanced, whereas there is contrast reduction oth-erwise. Higher IEM values indicate a larger improvement inimage contrast and sharpness. Similar to the EME contrastmetric, the IEM metric effectively represents local edgestrength. The IEM metric strongly correlates with human
subjective perception of image contrast and sharpness ofnatural and medical images.36
3.2.5 Mean structural similarity metric
The H, EME, and IEMmetrics by their own are not sufficientto characterize the effectiveness of a contrast enhancementalgorithm, since their value also increases when undesirableartifacts are introduced and noise is enhanced. Hence, largerH, EME, or IEM values do not necessarily indicate visualenhancement but may also signal visual degradation. To reli-ably evaluate the quality of the contrast enhancement algo-rithms, the visual appearance of the enhanced images shouldbe taken into account. This can be achieved by using themean structural similarity metric (MSSIM37,38), which quan-tifies the visual similarity between the original image and itsenhanced version.
The MSSIM for two images Iin and Iout of size M × N iscomputed as the mean of the structural similarity index SSIMover the image support:
MSSIM ¼XMi¼1
XNj¼1
SSIMði; jÞ; (12)
with
SSIMði; jÞ ¼ 2IinIoutðIinÞ2 þ ðIoutÞ2
·2σIin · σIoutσ2Iin þ σ2Iout
·σIin;Iout
σIin · σIout
¼ lðIin; IoutÞ · cðIin; IoutÞ · sðIin; IoutÞ; (13)
where the mean and variances are computed over a shiftinglocal window of size K × L and
Iin ¼1
K · L
XKk¼1
XLl¼1
Iinðk; lÞ;
Iout ¼1
K · L
XKk¼1
XLl¼1
Ioutðk; lÞ;
σ2Iin ¼1
K · L − 1
XKk¼1
XLl¼1
½Iinðk; lÞ − Iin�2;
σ2Iout ¼1
K · L − 1
XKk¼1
XLl¼1
½Ioutðk; lÞ − Iout�2; and
σIin;Iout ¼1
K · L − 1
XKk¼1
XLl¼1
½Iinðk; lÞ − Iin� · ½Ioutðk; lÞ − Iout�:
The three components l, c, and s of Eq. (13) measure howclosely both images resemble each other in, respectively,mean luminance, contrast, and spatial structure.
Equation (13) can be reduced to
SSIMði; jÞ ¼ 4 · σIin;Iout · Iin · Ioutðσ2Iin þ σ2IoutÞ½ðIinÞ2 þ ðIoutÞ2�
: (14)
The value of MSSIM varies between 0 and 1. A highervalue of MSSIM indicates a higher degree of retaining theoverall appearance of an image including its structural infor-mation. Therefore, this index is an effective measure of the
Journal of Electronic Imaging 063017-9 Nov∕Dec 2014 • Vol. 23(6)
Toet and Wu: Efficient contrast enhancement through log-power histogram modification

distortions and noise induced in an image as a result of anytransformation.
To investigate in more detail how the different algorithmstested in this study affect image luminance, contrast, and spa-tial structure, we also analyzed the individual components l,c, and s of the SSIM. The ranges of l, c, and s of are respec-tively [0,1], [0,1], and [−1,1], where the upper bound 1 rep-resents the optimal agreement with the original input image.The luminance, contrast, and structural components of theMSSIM are, respectively, given by
MSSIM−L ¼XMi¼1
XNj¼1
lIin;Ioutði; jÞ; (15)
MSSIM−C ¼XMi¼1
XNj¼1
cIin;Ioutði; jÞ; (16)
MSSIM−S ¼XMi¼1
XNj¼1
sIin;Ioutði; jÞ: (17)
3.3 Computational ComplexityAll computations were performed in MATLAB® 2012arunning on a PC with an Intel I5-3340M processor and8GB RAM memory. THE was performed with the standardMATLAB histeq function. CD,28,43 and BEASF,13 BPDFHE,16
NMHE22,44 were performed using the MATLAB code pro-vided by the authors of these respective methods. The DPLand IPL algorithms were straightforwardly implemented inMATLAB without optimization.
The computational complexities of the different contrastenhancement algorithms (THE, BEASF, BPDFHE, CD,NMHE, DPL, and IPL) are analyzed for an input image ofsize W ×H with G distinct graylevels. The analysis is per-formed only for grayscale images, since the methods are typ-ically only applied to the intensity channel of a color image.The complexity of THE is Oð2 · W · H þ GÞ.45 The com-plexity of BEASF is Oð3 · W · H þ 4 · GÞ.13 The complex-ity of NMHE has an upper limit of Oð4 · W · H þ 8 · GÞ butmay approach Oð2 · W · H þ 2 · GÞ in practice since itdepends on the image structure.22 The complexity of DPLis Oð2 · W · H þ 4 · GÞ when a fixed value of β is adoptedand Oð2 · W · H þ 3 · K þ 4 · N · GÞ when β is optimizedthrough a heuristic search process involving N iterationsteps. The complexity of IPL is Oð2 · N · W · H þ 6 · GÞfor N iteration steps. Hence, it follows that the time com-plexities of THE, BEASF, NMHE, DPL, and IPL are com-parable (Oð2 · W · HÞ) for W;H ≫ G;N. The complexityof BPDFHE depends on the image size and the nature ofthe histogram.16,17 For CD, it is difficult to perform a com-plexity analysis since the exact code is not available (thealgorithm is only available in MATLAB p code). However,it was empirically observed that the CD method significantlydemanded longer computing times for all test images used in
Fig. 9 (a) Original advertisement image and the contrast enhanced versions produced with respectively(b) THE, (c) CD, (d) BEASF, (e) BPDFHE, (f) NMHE, (g) DPL and (h) IPL.
Journal of Electronic Imaging 063017-10 Nov∕Dec 2014 • Vol. 23(6)
Toet and Wu: Efficient contrast enhancement through log-power histogram modification

this study (several orders of magnitude larger than the othermethods).
4 Results
4.1 Subjective AssessmentFigure 8 shows the original test images together with theirintensity histograms (i.e., the histograms of their V compo-nent) and the results of the seven contrast enhancementmethods investigated in this study. Figure 9 shows anenlarged version of the results for the advertisement image.Since this scene is captured in a backlight condition, it con-tains both dark and bright regions and its histogram issharply peaked for these two zones. Figure 9 shows thatall seven algorithms enhance the contrast of the originalscene. THE produces the highest contrast stretching, butalso enhances noise and results in a washed out appearance.CD overenhances the bright regions (e.g., the details in thesky completely disappear) and underenhances dark regions(details in the shadows of the street are very difficult to per-ceive). BEASF enhances details in the bright regions (e.g.,details in the sky are well defined), but underenhances darkerregions. BPDHFE enhances image contrast in both light anddark regions, but appears to reduce the luminance of thebrighter areas (e.g., the luminance of the sky is significantlyreduced). NMHE enhances image contrast in all parts ofthe scene, although the thin wires are somewhat difficult toperceive against the sky. DPL and IPL perform similar toNMHE, but easily represent the thin wires at higher contrastmaking them more visible. Figure 10 shows the results of allseven contrast enhancement methods for the dark_oceanimage. In this case, HE clearly overenhances the sky sothat the sunbeams breaking through the clouds are largelylost after enhancement. CD, BEASF, and BPDHFE all nicelyrepresent the details in the sky, but render the dark sea sur-face at very low contrast. NMHE increases the overall scenebrightness which degrades the representation of the sun-beams and which changes the atmosphere of the scene (itno longer has a sunset appearance). DPL and IPL clearly re-present all details in both the sky and the sea while preserv-ing the overall brightness to the extent that the atmosphere ofthe scene is retained.
Figure 11 shows the mean subjective rank order (overall 10 participants and all 13 test images) of the seven
contrast enhancement methods (THE, BEASF, BPDFHE,CD, NMHE, DPL, and IPL) investigated in this study.These results show that the proposed methods DPL andIPL received the highest overall mean rankings, meaningthat the enhanced images produced by these methods weresubjectively rated as looking the most natural and having agood overall contrast. THE and NMHE received intermedi-ate ranking values, while CD, BEASF, and BPDFHEreceived the lowest rankings. The relatively high rating ofTHE is probably because the participants appreciated the sig-nificant enhancement of the dark regions in several images ofthe test set (see Fig. 8), although the method clearly givessome images an unnatural appearance as a result of over-enhancement (e.g., advertisement, fountain, girl; see Fig. 8).CD, BEASF, and BPDFHE do not enhance the dark imageregions very well and were probably judged less effective.
4.2 Objective AssessmentFigure 12 shows the performance of the proposed contrastenhancement methods (DPL and IPL), THE, and four
Fig. 10 (a) Original dark_ocean image and the contrast enhanced versions produced with respectively(b) THE, (c) CD, (d) BEASF, (e) BPDFHE, (f) NMHE, (g) DPL and (h) IPL.
Fig. 11 Mean subjective rank order (over all 10 participants) of theseven contrast enhancement methods (THE, BEASF, BPDFHE,CD, NMHE, DPL, and IPL) investigated in this study. The contrastenhancement methods are arranged from left to right in order ofincreasing rank order (increasing subjective quality). The proposedmethods (DPL and IPL) are represented with filled symbols to enableeasy comparison. The error bars represent the standard error of themean.
Journal of Electronic Imaging 063017-11 Nov∕Dec 2014 • Vol. 23(6)
Toet and Wu: Efficient contrast enhancement through log-power histogram modification

Fig. 12 Mean value (over all 13 test images) of eight different contrast enhancement metrics (AMBE, H,EME, IEM, MSSIM and its luminance, contrast, and structural subcomponents MSSIM_L, MSSIM_C andMSSIM_S) for each of the seven contrast enhancement methods (THE, BEASF, BPDFHE, CD, NMHE,DPL, and IPL) investigated in this study. In each subplot, the contrast enhancement methods arearranged from left to right in order of increasing performance (the rightmost method has best perfor-mance). The graph forH also shows the mean value for the original input images. The proposedmethods(DPL and IPL) are represented with filled symbols to enable easy comparison. The error bars representthe standard error of the mean.
Journal of Electronic Imaging 063017-12 Nov∕Dec 2014 • Vol. 23(6)
Toet and Wu: Efficient contrast enhancement through log-power histogram modification

other state-of-the-art contrast enhancement methods (BEASF,BPDFHE, CD, and NMHE) quantified by eight differentobjective image contrast enhancement quality metrics(AMBE, H, EME, IEM, MSSIM, and its luminance, con-trast, and structural subcomponents MSSIM_L, MSSIM_C,and MSSIM_S) for the set of 13 test images shown in Fig. 8.To facilitate comparison, the different contrast enhancementmethods are arranged from left to right in order of increasingperformance, while the proposed methods DPL and IPL arerepresented with filled symbols.
The AMBE metric shows that DPL and IPL preserveimage brightness to a similar extent as CD, while NMHEslightly performs better than the proposed methods. BPDFHEshows the overall best brightness preservation, closely fol-lowed by BEASF. THE shows the overall largest meanAMBE value, meaning that it causes the largest changes inimage brightness. Visual inspection of the enhanced images(Fig. 8) shows that the large AMBE values of THE correspondto overenhancement and washout (especially noticeable inthe bright areas of the advertisement, dark_ocean, fountain,street_05 and street_07 images). The small AMBE values ofBPDHFE correspond to only a small degree of contrastenhancement, which is especially noticeable in the overalldarker scenes (e.g., advertisement, dark_ocean, girl, andsubway) where the dark regions largely remain illegible.Although DPL, IPL, and CD are in the same range of AMBEvalues, CD appears to enhance the lighter areas more andthe dark areas less than both DPL and IPL (Fig. 8), resultingin less overall visual contrast. The appearance of NMHEenhanced images is highly similar to that of both DPLand IPL enhanced images (Fig. 8).
The discrete entropy H shows that the proposed DPL andIPL methods enhance image structure somewhat less effec-tively than THE, but comparable to NMHE and somewhatmore effectively than the other methods tested (CD,BPDFHE, BEASF, and NMHE). Note that CD appears tocause a slight overall reduction of the discrete entropy ofthe original images, suggesting a loss of detail. On closerinspection, it was observed that this occurs due to overen-hancement (washout) of detail in bright image regions (e.g.,in the advertisement, boat, empire_state2, guy5, street01,street02, and street05 images).
In terms of the EME contrast enhancement metric, theproposed DPL and IPL methods appear to be in the middleof the performance range, while THE and NMHE appear tobe, respectively, the worst and best performing methods.However, since the differences between the individual EMEvalues are not significant, no further conclusions can bedrawn from these results.
The results for the IEM metric show that all contrastenhancement methods have an overall mean IEM valuelarger than 1, meaning that all methods tested effectivelyenhance image contrast. DPL and IPL show the largestmean IEM values meaning that these methods induce thelargest improvement in image contrast and edge sharpness.Note that the objective order induced by the IEM metricagrees to a large extent with the subjective ranking ordershown in Fig. 11: BEASF, NMHE, THE, DPL, and IPLare all in the same order. The subjective order of BEASFand BPDFHE is the reverse of the objective order inducedby IEM, but no conclusions can be drawn from this obser-vation since the difference between the subjective rankings
of these two methods is not significant. While CD hasan intermediate performance as rated objectively by IEM(Fig. 12), it has the lowest subjective ranking (Fig. 11).This is probably because CD preserves the brightness ofthe dark image regions, resulting in images with a dark over-all appearance.
The MSSIM metric shows that THE enhanced imageshave the overall lowest structural similarity to the originalinput images, while BEASF enhanced images are most sim-ilar to the input images. The mean MSSIM value for the pro-posed DPL and IPL methods is larger than that for THE andsmaller than the mean MSSIM values for the other methods.To analyze these results in more detail, we also computedthe mean values of the individual luminance [MSSIM_L;Eq. (15)], contrast [MSSIM_C; Eq. (16)], and structuralsimilarity [MSSIM_S; Eq. (17)] components of the SSIMmetric. The results of this analysis are also shown inFig. 12. Higher scores on the luminance (MSSIM_L), con-trast (MSSIM_C), and structural (MSSIM_S) components ofthe SSIM respectively correspond to a larger degree of lumi-nance, contrast, and structural preservation. The results showthat THE scores the lowest mean values for all three of theSSIM components, meaning that it preserves image lumi-nance, contrast, and structure less than all other methodstested. This reflects the effects of overenhancement andwashout which are typical for THE. Since both DPL andIPL effectively enhance image luminance and contrast,both methods score low on MSSIM_L and MSSIM_C.This finding agrees with the results from the AMBE metric(showing that both DPL and IPL change image brightness)and with the results from both the EME and IEM metrics(showing that both DPL and IPL enhance image contrast).However, both DPL and IPL score high on MSSIM_S,meaning that both methods preserve image structure to alarge extent and do not introduce spurious detail or removeoriginal detail through washout. Note that this structuralpreservation capability of DPL and IPL is comparable tothat of several (BEASF, CD, and NMHE) recent state-of-the-art contrast enhancement methods.
In summary these results demonstrate that the proposedmethods DPL and IPL effectively enhance image structurewhile preserving the characteristics of the original inputimage to a large extent. Both methods are also comparableto several state-of-the-art contrast enhancement methodswith respect to contrast enhancement (as shown by theEME and IEM metrics) and the preservation of image struc-ture (as shown by the MSSIM_S metric).
4.3 Run-Time AnalysisIn this section, we analyze the run-time behavior of the imageenhancement methods tested in this study, in order to confirmthe computational complexity analysis performed in Sec. 3.3.Figure 13 shows the average computing time over all 13 testimages for each of the seven contrast enhancement methodsinvestigated. These results show that the overall order appearsto agree with the complexity analysis reported in Sec. 3.3(which suggests the following order: THE, DPL, IPL,BEASF, and NMHE). The proposed methods DPL and IPLare somewhat less efficient than THE, but appear to be slightlymore efficient than the state-of-the-art methods BEASF,BPDFHE, and NMHE. The average computing time of CD
Journal of Electronic Imaging 063017-13 Nov∕Dec 2014 • Vol. 23(6)
Toet and Wu: Efficient contrast enhancement through log-power histogram modification
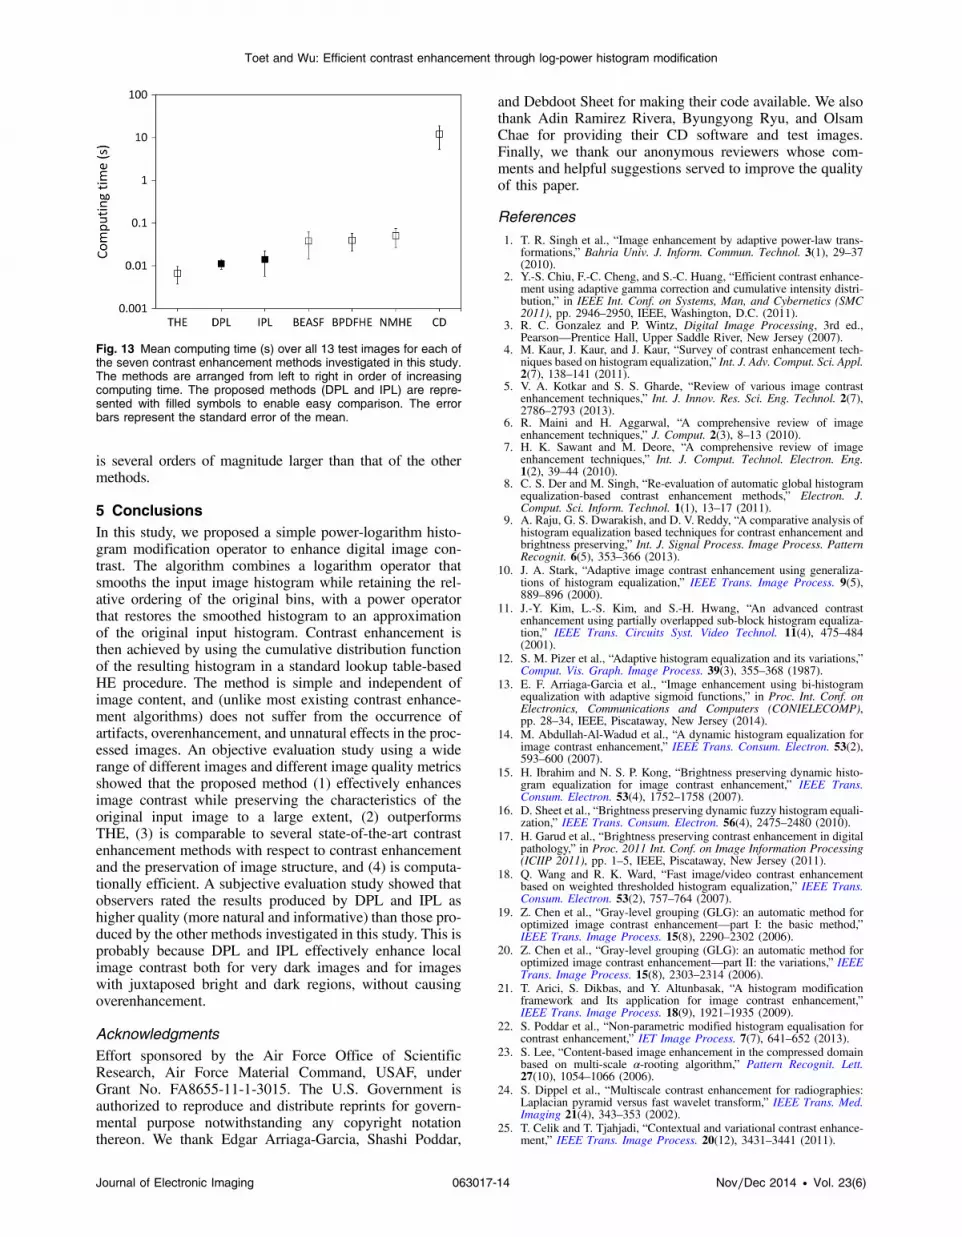
is several orders of magnitude larger than that of the othermethods.
5 ConclusionsIn this study, we proposed a simple power-logarithm histo-gram modification operator to enhance digital image con-trast. The algorithm combines a logarithm operator thatsmooths the input image histogram while retaining the rel-ative ordering of the original bins, with a power operatorthat restores the smoothed histogram to an approximationof the original input histogram. Contrast enhancement isthen achieved by using the cumulative distribution functionof the resulting histogram in a standard lookup table-basedHE procedure. The method is simple and independent ofimage content, and (unlike most existing contrast enhance-ment algorithms) does not suffer from the occurrence ofartifacts, overenhancement, and unnatural effects in the proc-essed images. An objective evaluation study using a widerange of different images and different image quality metricsshowed that the proposed method (1) effectively enhancesimage contrast while preserving the characteristics of theoriginal input image to a large extent, (2) outperformsTHE, (3) is comparable to several state-of-the-art contrastenhancement methods with respect to contrast enhancementand the preservation of image structure, and (4) is computa-tionally efficient. A subjective evaluation study showed thatobservers rated the results produced by DPL and IPL ashigher quality (more natural and informative) than those pro-duced by the other methods investigated in this study. This isprobably because DPL and IPL effectively enhance localimage contrast both for very dark images and for imageswith juxtaposed bright and dark regions, without causingoverenhancement.
AcknowledgmentsEffort sponsored by the Air Force Office of ScientificResearch, Air Force Material Command, USAF, underGrant No. FA8655-11-1-3015. The U.S. Government isauthorized to reproduce and distribute reprints for govern-mental purpose notwithstanding any copyright notationthereon. We thank Edgar Arriaga-Garcia, Shashi Poddar,
and Debdoot Sheet for making their code available. We alsothank Adin Ramirez Rivera, Byungyong Ryu, and OlsamChae for providing their CD software and test images.Finally, we thank our anonymous reviewers whose com-ments and helpful suggestions served to improve the qualityof this paper.
References
1. T. R. Singh et al., “Image enhancement by adaptive power-law trans-formations,” Bahria Univ. J. Inform. Commun. Technol. 3(1), 29–37(2010).
2. Y.-S. Chiu, F.-C. Cheng, and S.-C. Huang, “Efficient contrast enhance-ment using adaptive gamma correction and cumulative intensity distri-bution,” in IEEE Int. Conf. on Systems, Man, and Cybernetics (SMC2011), pp. 2946–2950, IEEE, Washington, D.C. (2011).
3. R. C. Gonzalez and P. Wintz, Digital Image Processing, 3rd ed.,Pearson—Prentice Hall, Upper Saddle River, New Jersey (2007).
4. M. Kaur, J. Kaur, and J. Kaur, “Survey of contrast enhancement tech-niques based on histogram equalization,” Int. J. Adv. Comput. Sci. Appl.2(7), 138–141 (2011).
5. V. A. Kotkar and S. S. Gharde, “Review of various image contrastenhancement techniques,” Int. J. Innov. Res. Sci. Eng. Technol. 2(7),2786–2793 (2013).
6. R. Maini and H. Aggarwal, “A comprehensive review of imageenhancement techniques,” J. Comput. 2(3), 8–13 (2010).
7. H. K. Sawant and M. Deore, “A comprehensive review of imageenhancement techniques,” Int. J. Comput. Technol. Electron. Eng.1(2), 39–44 (2010).
8. C. S. Der and M. Singh, “Re-evaluation of automatic global histogramequalization-based contrast enhancement methods,” Electron. J.Comput. Sci. Inform. Technol. 1(1), 13–17 (2011).
9. A. Raju, G. S. Dwarakish, and D. V. Reddy, “A comparative analysis ofhistogram equalization based techniques for contrast enhancement andbrightness preserving,” Int. J. Signal Process. Image Process. PatternRecognit. 6(5), 353–366 (2013).
10. J. A. Stark, “Adaptive image contrast enhancement using generaliza-tions of histogram equalization,” IEEE Trans. Image Process. 9(5),889–896 (2000).
11. J.-Y. Kim, L.-S. Kim, and S.-H. Hwang, “An advanced contrastenhancement using partially overlapped sub-block histogram equaliza-tion,” IEEE Trans. Circuits Syst. Video Technol. 11(4), 475–484(2001).
12. S. M. Pizer et al., “Adaptive histogram equalization and its variations,”Comput. Vis. Graph. Image Process. 39(3), 355–368 (1987).
13. E. F. Arriaga-Garcia et al., “Image enhancement using bi-histogramequalization with adaptive sigmoid functions,” in Proc. Int. Conf. onElectronics, Communications and Computers (CONIELECOMP),pp. 28–34, IEEE, Piscataway, New Jersey (2014).
14. M. Abdullah-Al-Wadud et al., “A dynamic histogram equalization forimage contrast enhancement,” IEEE Trans. Consum. Electron. 53(2),593–600 (2007).
15. H. Ibrahim and N. S. P. Kong, “Brightness preserving dynamic histo-gram equalization for image contrast enhancement,” IEEE Trans.Consum. Electron. 53(4), 1752–1758 (2007).
16. D. Sheet et al., “Brightness preserving dynamic fuzzy histogram equali-zation,” IEEE Trans. Consum. Electron. 56(4), 2475–2480 (2010).
17. H. Garud et al., “Brightness preserving contrast enhancement in digitalpathology,” in Proc. 2011 Int. Conf. on Image Information Processing(ICIIP 2011), pp. 1–5, IEEE, Piscataway, New Jersey (2011).
18. Q. Wang and R. K. Ward, “Fast image/video contrast enhancementbased on weighted thresholded histogram equalization,” IEEE Trans.Consum. Electron. 53(2), 757–764 (2007).
19. Z. Chen et al., “Gray-level grouping (GLG): an automatic method foroptimized image contrast enhancement—part I: the basic method,”IEEE Trans. Image Process. 15(8), 2290–2302 (2006).
20. Z. Chen et al., “Gray-level grouping (GLG): an automatic method foroptimized image contrast enhancement—part II: the variations,” IEEETrans. Image Process. 15(8), 2303–2314 (2006).
21. T. Arici, S. Dikbas, and Y. Altunbasak, “A histogram modificationframework and Its application for image contrast enhancement,”IEEE Trans. Image Process. 18(9), 1921–1935 (2009).
22. S. Poddar et al., “Non-parametric modified histogram equalisation forcontrast enhancement,” IET Image Process. 7(7), 641–652 (2013).
23. S. Lee, “Content-based image enhancement in the compressed domainbased on multi-scale α-rooting algorithm,” Pattern Recognit. Lett.27(10), 1054–1066 (2006).
24. S. Dippel et al., “Multiscale contrast enhancement for radiographies:Laplacian pyramid versus fast wavelet transform,” IEEE Trans. Med.Imaging 21(4), 343–353 (2002).
25. T. Celik and T. Tjahjadi, “Contextual and variational contrast enhance-ment,” IEEE Trans. Image Process. 20(12), 3431–3441 (2011).
Fig. 13 Mean computing time (s) over all 13 test images for each ofthe seven contrast enhancement methods investigated in this study.The methods are arranged from left to right in order of increasingcomputing time. The proposed methods (DPL and IPL) are repre-sented with filled symbols to enable easy comparison. The errorbars represent the standard error of the mean.
Journal of Electronic Imaging 063017-14 Nov∕Dec 2014 • Vol. 23(6)
Toet and Wu: Efficient contrast enhancement through log-power histogram modification
26. C. Lee, C. Lee, and C.-S. Kim “Contrast enhancement based on layereddifference representation of 2D histograms,” IEEE Trans. ImageProcess. 22(12), 5372–5384 (2013).
27. S. Corchs and F. Gasparini, “Enhancing underexposed images preserv-ing the original mood,” in Computational Color Imaging, R. Schettini,S. Tominaga, and A. Trémeau, Eds., pp. 125–136, Springer, Berlin-Heidelberg, Germany (2011).
28. A. Ramirez Rivera, R. Byungyong, and C. Oksam, “Content-awaredark image enhancement through channel division,” IEEE Trans.Image Process. 21(9), 3967–3980 (2012).
29. T. Arici, S. Dikbas, and Y. Altunbasak, “A histogram modificationframework and its application for image contrast enhancement,”IEEE Trans. Image Process. 18(9), 1921–1935 (2009).
30. Channel division code, Image Processing Lab, Kyung Hee University,South Korea http://vision.khu.ac.kr/?mid=Downloads.
31. T. Arici, S. Dikbas, and Y. Altunbasak, “A histogram modificationframework and its application for image contrast enhancement,”IEEE Trans. Image Process. 18(9), 1921–1935 (2009).
32. T. Celik and T. Tjahjadi “Automatic image equalization and contrastenhancement using Gaussian mixture modeling,” IEEE Trans. ImageProcess. 21(1), 145–156 (2012).
33. C. Soong-Der and A. R. Ramli, “Minimum mean brightness errorbi-histogram equalization in contrast enhancement,” IEEE Trans.Consum. Electron. 49(4), 1310–1319 (2003).
34. C. Wang and Z. Ye, “Brightness preserving histogram equalization withmaximum entropy: a variational perspective,” IEEE Trans. Consum.Electron. 51(4), 1326–1334 (2005).
35. S. S. Agaian, K. Panetta, and A. M. Grigoryan, “Transform-basedimage enhancement algorithms with performance measure,” IEEETrans. Image Process. 10(3), 367–382 (2001).
36. V. L. Jaya and R. Gopikakumari, “IEM: a new image enhancementmetric for contrast and sharpness measurements,” Int. J. Comput.Appl. 79(9), 1–9 (2013).
37. Z. Wang and A. C. Bovik, “A universal image quality index,” IEEESignal Process. Lett. 9(3), 81–84 (2002).
38. Z. Wang et al., “Image quality assessment: from error visibility to struc-tural similarity,” IEEE Trans. Image Process. 13(4), 600–612 (2004).
39. T. Arici, S. Dikbas, and Y. Altunbasak, “A histogram modificationframework and its application for image contrast enhancement,”IEEE Trans. Image Process. 18(9), 1921–1935 (2009).
40. S.-C. Huang, F.-C. Cheng, and Y.-S. Chiu, “Efficient contrast enhance-ment using adaptive gamma correction with weighting distribution,”IEEE Trans. Image Process. 22(3), 1032–1041 (2013).
41. C. E. Shannon, “A mathematical theory of communication,” Bell Syst.Tech. J. 27, 379–423 (1948).
42. T. Arici, S. Dikbas, and Y. Altunbasak, “A histogram modificationframework and its application for image contrast enhancement,”IEEE Trans. Image Process. 18(9), 1921–1935 (2009).
43. MTES Image Processing Software, Image Processing Lab, Kyung HeeUniversity, South Korea http://vision.khu.ac.kr/mtes.
44. MATLAB Central, The MathWorks http://www.mathworks.nl/matlabcentral/fileexchange.
45. S. C. Huang and C. H. Yeh, “Image contrast enhancement for preserv-ing mean brightness without losing image features,” Eng. Appl. Artif.Intell. 26(5–6), 1487–1492 (2013).
Alexander Toet is a senior research scientist at TNO (Soesterberg,the Netherlands), where he investigates multimodal image fusion,image quality, computational models of human visual search anddetection, visual target distinctness and cross-modal perceptualinteractions among the visual, auditory, olfactory, and tactile senses.He is a fellow of SPIE and a senior member of the Institute of Electricaland Electronics Engineers (IEEE).
Tirui Wu is currently a research engineer at Ford REC (China), wherehe investigates vision-based active safety technologies, machinelearning, image fusion, face recognition, motion magnification, andimplemented on FPGA-based vision computing platforms.
Journal of Electronic Imaging 063017-15 Nov∕Dec 2014 • Vol. 23(6)
Toet and Wu: Efficient contrast enhancement through log-power histogram modification