efficiency of islamic banks during the financial crisis: an analysis of middle eastern and asian...
TRANSCRIPT

Pacific-Basin Finance Journal 28 (2014) 76–90
Contents lists available at ScienceDirect
Pacific-Basin Finance Journal
j ourna l homepage: www.e lsev ie r .com/ locate /pacf in
Efficiency of Islamic banks during the financial
crisis: An analysis of Middle Eastern andAsian countriesRomzie Rosman a, Norazlina Abd Wahab b,⁎, Zairy Zainol b
a 5R Strategic Consultancy, No. 22, Jalan PJU 3/38A, Sunway Damansara, 47810 Petaling Jaya, Selangor, Malaysiab Islamic Business School, College of Business, Universiti Utara Malaysia, 06010 Sintok, Kedah, Malaysia
a r t i c l e i n f o
⁎ Corresponding author. Tel.: +60 4 9286669; faxE-mail address: [email protected] (N.A.
0927-538X/$ – see front matter © 2013 Elsevier B.V.http://dx.doi.org/10.1016/j.pacfin.2013.11.001
a b s t r a c t
Article history:Received 18 August 2013Accepted 15 November 2013Available online 26 November 2013
The world economy is still suffering from the severe global financialcrisis that caused the failure of several banks. This has encouragedeconomists worldwide to consider alternative financial solutions andattention has been focused on Islamic banking and finance as analternative model. Hence, this study examines the efficiency level ofIslamic banks during the financial crisis specifically in Middle Easternand Asian countries from 2007 to 2010. Moreover, bank-specific andrisk factors were examined to understand the determinants ofefficiency. The efficiency of Islamic banks is measured using dataenvelopment analysis by adopting the intermediation approach. Thefinancial information is extracted from BankScope database for a fouryear period (2007–2010) which includes 79 Islamic banks across anumber of countries. The study also critically analyses pure technicalefficiency and scale efficiency of the Islamic banks in Middle Easternand Asian countries and estimates their return to scale. The findingsexplain that Islamic banks were able to sustain operations throughthe crisis. However, the study also shows that the majority of theseIslamic banks were scale inefficient. Most of the scale inefficientbanks were operating at decreasing returns to scale. This study alsofound that both profitability and capitalisation were the maindeterminants of Islamic banking efficiency. Hence, the findings ofthis study have policy implications and make a contribution topolicy-making by providing empirical evidence on the performanceof the Islamic banks and their efficiency levels.
© 2013 Elsevier B.V. All rights reserved.
JEL classification:G21C14L29
Keywords:EfficiencyIslamic banksFinancial crisisData envelopment analysis
: +60 4 9286653.Wahab).
All rights reserved.

77R. Rosman et al. / Pacific-Basin Finance Journal 28 (2014) 76–90
1. Introduction
The salient features of Islamic banking are prohibition of interest payments in all transactions, andprohibition of undertaking or financing anti-social and unethical behaviour such as gambling, pornographyand alcohol (Abdul-Majid et al., 2010). Specifically, Shari'ah-compliant finance does not allow the charging ofinterest payments (i.e., riba), as only goods and services are allowed to carry a price; further, it does not allowspeculation, and prohibits the financing of specific illicit activities (Beck et al., 2013).
A severe financial crisis, traced back to mid-2007 till the end of 2009, caused the collapse of investmentbanks largely due to loss of confidence in mortgage credit market in the United States. This financial crisishas focused attention on weaknesses of conventional financial systems which in turn has led toidentification of Islamic finance as an alternative. It has been contended that Islamic finance is resilient toshocks due to its inherent stability (Mirakhor, 2008) and that the world of banking and finance withoutriba (usury) andmaysir (gambling) is a better alternative to the current scenario (Siddiqi, 2008). Iqbal andLlewellyn (2002) emphasised that by, various means, international financial systems can benefit fromdiversified financial products and operations, such as those available in Islamic banks which arecharacterised by distinct risk-sharing features for each type of contract. Moreover, academics andpolicymakers alike point to advantages of Shari'ah-compliant financial products, such as mismatch ofshort-term, on-sight demandable deposit contracts with long-term uncertain loan contracts beingmitigated with equity and risk-sharing elements (Beck et al., 2013) and some observers have pointed totheir superior performance during the crisis (Hasan and Dridi, 2010). However, Kuran (2004) stated thatIslamic banks do not have any advantage in efficiency as compared to conventional banks. Hence, thisstudy aims to shed light on this issue by examining pure technical efficiency (PTE) and scale efficiency (SE)of Islamic banks in the Middle Eastern and Asian countries during the financial crisis. Fundamentally, thisstudy estimates the relative efficiency of both groups of Islamic banks in Middle Eastern and Asiancountries as Islamic financial institutions have a relatively high market share in several emerging markets,such as Malaysia and several Middle Eastern countries (Beck et al., 2013) and is currently practised inmore than 50 countries worldwide (Chong and Liu, 2009) majority of which are in Middle East and Asia.
Consequently, it is crucial to understand how Islamic banks in both Middle Eastern and Asian countriesperform during the financial crisis due to the fact that majority of Islamic banks are operating in these tworegions. The operations and performance of these Islamic banks show the importance of Islamic bankingand finance in the global financial markets. Additionally, very limited cross national comparison studieswere undertaken on the efficiency of Islamic banking especially during the recent financial crisis to explainits determinants.]
The aim of this study is to fill the significant gap in the literature by providing up-to-date empiricalevidence on the efficiency of Islamic banks in twelve Middle Eastern countries and seven Asian countriesduring 2007–2010 that includes the period of the 2007/2008 financial crisis. The efficiency estimate ofeach Islamic bank is computed by using the non-parametric data envelopment analysis (DEA) method.This method allows us to estimate three different types of efficiency measures, namely, overall technical,pure technical, and scale efficiency. In addition, this method enables us to distinguish between three typesof return to scale (RTS), namely: the constant return to scale (CRS), decreasing return to scale (DRS) andincreasing return to scale (IRS).
The remainder of this paper is organised as follows. Section 2 provides a brief literature review focusedon the efficiency of Islamic banks across countries; followed by a description of the methodology inSection 3. Section 4 reports the results of the analysis, comprised of the pure technical efficiency and scaleefficiency estimates for both specific frontiers as well as the return to scale estimates. Finally, Section 5offers some conclusions.
2. Review of the literature
Despite the rapid growth of the Islamic banking and finance industry, analysis of Islamic banking at across-country level is still in its infancy (Sufian and Noor, 2009). Existing studies in this area are classifiedin two groups. The first group includes the studies that evaluate the efficiency of Islamic banksgeographically (see, for example: Yudistira, 2004; Sufian, 2006, 2007; Sufian and Noor, 2009). While thesecond group includes the comparative analysis of the efficiency of the Islamic banks and conventional

78 R. Rosman et al. / Pacific-Basin Finance Journal 28 (2014) 76–90
banks (see, for example: Hassan et al., 2009; Ahmad and Abdul-Rahman, 2012; Al-Khasawneh et al., 2012;Gishkori and Ullah, 2013). Some of these studies also explain the determinants of efficiency (see, forexample: Yudistira, 2004; Sufian, 2006, 2007; Sufian and Noor, 2009) which influence its level includingprofitability, size, capitalization and risk.
For the first group, a cross-country analysis of the Islamic banks made by Yudistira (2004) explainedthe performance of 18 Islamic banks from the Gulf Cooperation Countries (GCC), East Asian, MiddleEastern and African countries for the period 1997 to 2000 using a non-parametric approach. In that study,DEA was utilised to analyse the technical and scale efficiencies of the Islamic banks. The results suggestedthat the Islamic banks experienced slight inefficiencies during the global crisis of 1998/1999. Theinefficiencies were related to pure technical inefficiency rather than scale inefficiency. According toYudistira (2004) the contributing factor to scale inefficiency was bank size. The study also found thatprofitability and risk taking did not have significant effect on the overall technical efficiency of theseIslamic banks.
Sufian (2006 and 2007) examined the efficiency of the Malaysia Islamic banking sector during theperiod 2001 to 2005 by utilising DEA. The findings suggested that the scale inefficiency dominated puretechnical inefficiency in the Malaysia Islamic banking industry. Also, domestic Islamic banks weremarginally more efficient compared to foreign Islamic banks. This study found that bank size has anegative relationship with technical efficiency of Malaysia Islamic banks and further investigationrevealed that the negative relationship is more prevalent on scale efficiency. The research also establishedthat better capitalised banks are more efficient, and, that risk has positive relationship with both overalland pure technical efficiency.
Sufian and Noor (2009) provided a comparative analysis of the efficiency of Islamic banking sectors inthe Middle Eastern and African (MENA) and Asian countries by utilising DEA to estimate the technical,pure technical, and scale efficiency for each bank during the period 2001 to 2006. The findings showedthat the Islamic banks in MENA exhibited higher mean technical efficiency relative to the Islamic banks inAsian countries. In addition, the pure technical inefficiency outweighed the scale inefficiency in bothMENA and Asia banking sectors, and the banks from MENA countries were found to be global leaders bydominating the efficiency ratings during the period of study. They also found there are positive effects ofsize, capitalization and profitability on the efficiency of Islamic banks. The risk factor proxy of loan lossprovision to total loan was found to have a negative effect on efficiency.
For the second group, Hassan et al. (2009) investigated the difference in mean cost, revenue and profitefficiency estimates of Islamic versus conventional banks. The study evaluated cross-country level data of40 banks in eleven Organisation of Islamic Conference (OIC) countries from 1990 to 2005. The findingsshowed that there was no significant difference between the overall efficiency of the Islamic banks and theconventional banks.
Ahmad and Abdul-Rahman (2012) examined the relative efficiency of the Islamic commercial banksand conventional commercial banks in Malaysia using DEA for the period of 2003 to 2007. Their studyfound that the conventional commercial banks outperformed the Islamic commercial banks in allefficiency measures and indicated that the conventional commercial banks may have been more efficientthan the Islamic commercial banks due to managerial efficiency and technological advancement.
Al-Khasawneh et al. (2012) examined the efficiency of Islamic banks relative to conventional banksoperating in the North African Arab countries from 2003 to 2006 in terms of cost and revenue efficiency byemploying DEA. The sample consisted of nine Islamic banks and eleven conventional banks. The findingsindicated that the Islamic banks achieved higher average revenue efficiency scores compared to theconventional banks in the region. However, it was found that the growth rate of the revenue efficiencyscores for the Islamic banks was less than the rate for the conventional banks.
Finally, Gishkori and Ullah (2013) employed DEA to investigate the technical efficiency of Islamic banksand conventional banks operating in Pakistan for the period of 2007 to 2011. The sample included Islamic,conventional and foreign banks and the study found that the source of technical inefficiency was due topure technical inefficiency. However, the technical inefficiency – particularly for the Islamic banks – wasdue to scale inefficiency instead of pure technical inefficiency.
This study is an extension of the previous literature by providing recent empirical evidence on theperformance of the banks especially during the period of the 2007/2008 financial crisis. Moreover, thisstudy explores the differences in the efficiency scores between the Islamic banks in the Middle Eastern and
79R. Rosman et al. / Pacific-Basin Finance Journal 28 (2014) 76–90
Asian countries as these two regions are vital in the development of Islamic banking and financethroughout the world. We provide empirical evidence on how these Islamic banks sustain operationsduring the financial crisis which subsequently explain the main determinants of their efficiency. Ourfindings will facilitate managers of Islamic banks, policymakers and regulators in furthering theirunderstanding of the performance of these Islamic banks during the period of financial crisis.
3. Data and methodology
This study employed Data Envelopment Analysis (DEA) and Tobit model. This section starts bydescribing the DEA and its input–output specification and then explaining the determinants used in theTobit model.
3.1. Data envelopment analysis
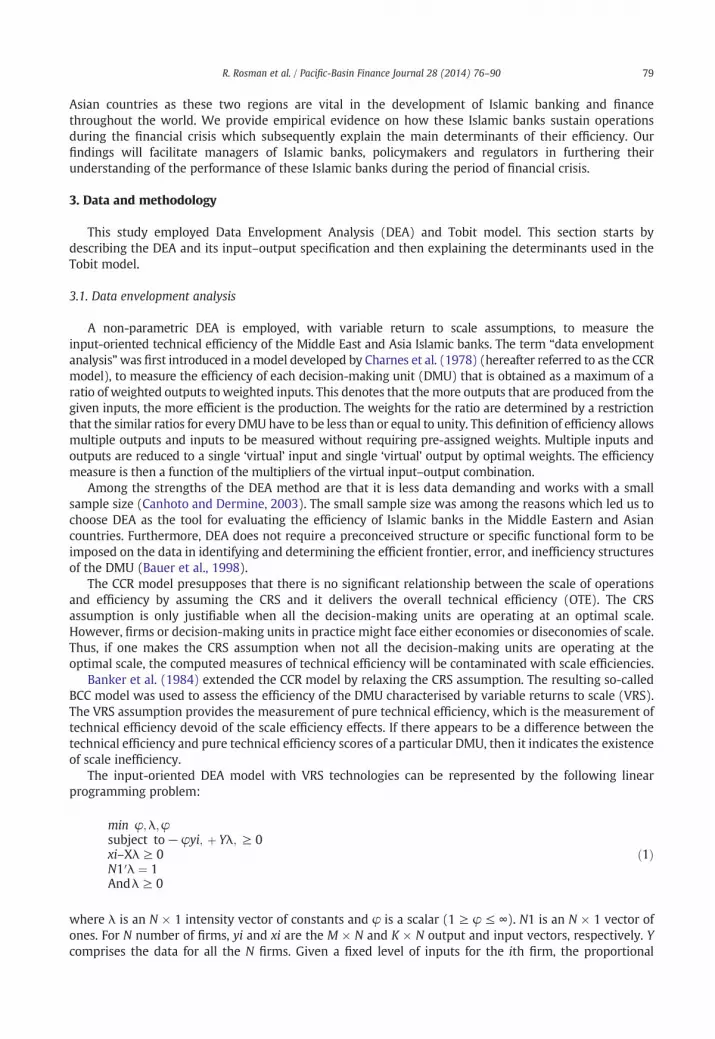
A non-parametric DEA is employed, with variable return to scale assumptions, to measure theinput-oriented technical efficiency of the Middle East and Asia Islamic banks. The term “data envelopmentanalysis”was first introduced in a model developed by Charnes et al. (1978) (hereafter referred to as the CCRmodel), to measure the efficiency of each decision-making unit (DMU) that is obtained as a maximum of aratio of weighted outputs to weighted inputs. This denotes that the more outputs that are produced from thegiven inputs, the more efficient is the production. The weights for the ratio are determined by a restrictionthat the similar ratios for every DMU have to be less than or equal to unity. This definition of efficiency allowsmultiple outputs and inputs to be measured without requiring pre-assigned weights. Multiple inputs andoutputs are reduced to a single ‘virtual’ input and single ‘virtual’ output by optimal weights. The efficiencymeasure is then a function of the multipliers of the virtual input–output combination.
Among the strengths of the DEA method are that it is less data demanding and works with a smallsample size (Canhoto and Dermine, 2003). The small sample size was among the reasons which led us tochoose DEA as the tool for evaluating the efficiency of Islamic banks in the Middle Eastern and Asiancountries. Furthermore, DEA does not require a preconceived structure or specific functional form to beimposed on the data in identifying and determining the efficient frontier, error, and inefficiency structuresof the DMU (Bauer et al., 1998).
The CCR model presupposes that there is no significant relationship between the scale of operationsand efficiency by assuming the CRS and it delivers the overall technical efficiency (OTE). The CRSassumption is only justifiable when all the decision-making units are operating at an optimal scale.However, firms or decision-making units in practice might face either economies or diseconomies of scale.Thus, if one makes the CRS assumption when not all the decision-making units are operating at theoptimal scale, the computed measures of technical efficiency will be contaminated with scale efficiencies.
Banker et al. (1984) extended the CCR model by relaxing the CRS assumption. The resulting so-calledBCC model was used to assess the efficiency of the DMU characterised by variable returns to scale (VRS).The VRS assumption provides the measurement of pure technical efficiency, which is the measurement oftechnical efficiency devoid of the scale efficiency effects. If there appears to be a difference between thetechnical efficiency and pure technical efficiency scores of a particular DMU, then it indicates the existenceof scale inefficiency.
The input-oriented DEA model with VRS technologies can be represented by the following linearprogramming problem:
min φ;λ;φsubject to−φyi; þ Yλ; ≥ 0xi–Xλ ≥ 0N1′λ ¼ 1Andλ ≥ 0
ð1Þ
λ is an N × 1 intensity vector of constants and φ is a scalar (1 ≥ φ ≤ ∞). N1 is an N × 1 vector of
whereones. For N number of firms, yi and xi are the M × N and K × N output and input vectors, respectively. Ycomprises the data for all the N firms. Given a fixed level of inputs for the ith firm, the proportional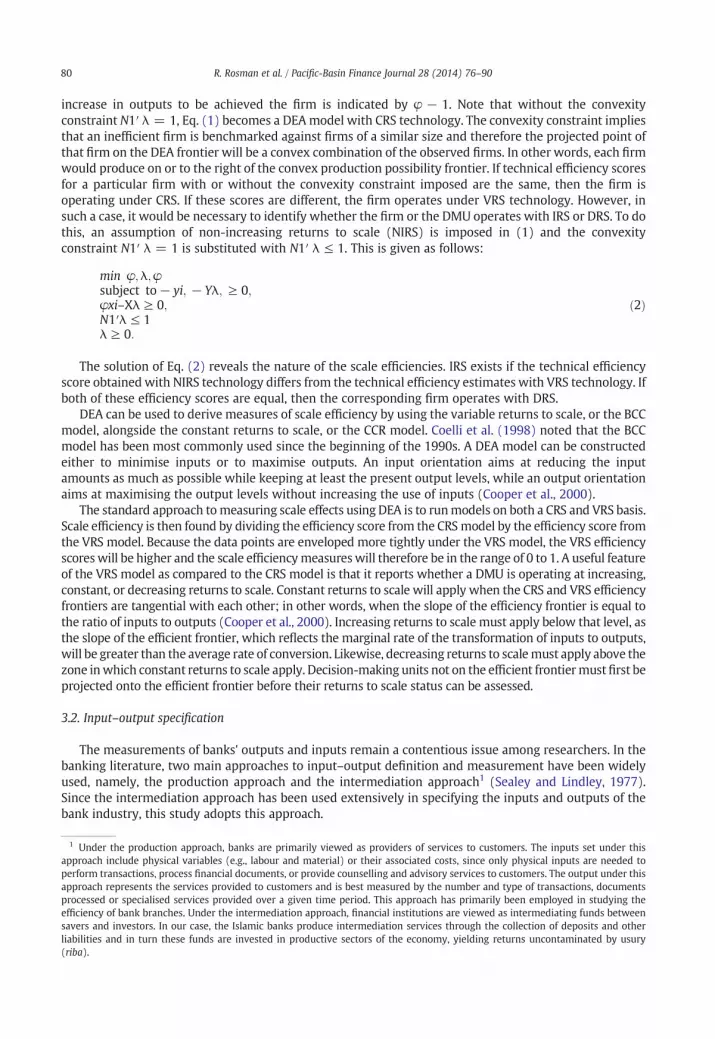
80 R. Rosman et al. / Pacific-Basin Finance Journal 28 (2014) 76–90
increase in outputs to be achieved the firm is indicated by φ − 1. Note that without the convexityconstraint N1′ λ = 1, Eq. (1) becomes a DEAmodel with CRS technology. The convexity constraint impliesthat an inefficient firm is benchmarked against firms of a similar size and therefore the projected point ofthat firm on the DEA frontier will be a convex combination of the observed firms. In other words, each firmwould produce on or to the right of the convex production possibility frontier. If technical efficiency scoresfor a particular firm with or without the convexity constraint imposed are the same, then the firm isoperating under CRS. If these scores are different, the firm operates under VRS technology. However, insuch a case, it would be necessary to identify whether the firm or the DMU operates with IRS or DRS. To dothis, an assumption of non-increasing returns to scale (NIRS) is imposed in (1) and the convexityconstraint N1′ λ = 1 is substituted with N1′ λ ≤ 1. This is given as follows:
1 Undapproacperformapproacprocessefficiensavers aliabilitie(riba).
min φ;λ;φsubject to− yi; − Yλ; ≥ 0;φxi–Xλ ≥ 0;N1′λ ≤ 1λ ≥ 0:
ð2Þ
The solution of Eq. (2) reveals the nature of the scale efficiencies. IRS exists if the technical efficiencyscore obtained with NIRS technology differs from the technical efficiency estimates with VRS technology. Ifboth of these efficiency scores are equal, then the corresponding firm operates with DRS.
DEA can be used to derive measures of scale efficiency by using the variable returns to scale, or the BCCmodel, alongside the constant returns to scale, or the CCR model. Coelli et al. (1998) noted that the BCCmodel has been most commonly used since the beginning of the 1990s. A DEA model can be constructedeither to minimise inputs or to maximise outputs. An input orientation aims at reducing the inputamounts as much as possible while keeping at least the present output levels, while an output orientationaims at maximising the output levels without increasing the use of inputs (Cooper et al., 2000).
The standard approach tomeasuring scale effects using DEA is to runmodels on both a CRS and VRS basis.Scale efficiency is then found by dividing the efficiency score from the CRSmodel by the efficiency score fromthe VRS model. Because the data points are enveloped more tightly under the VRS model, the VRS efficiencyscoreswill be higher and the scale efficiencymeasureswill therefore be in the range of 0 to 1. A useful featureof the VRS model as compared to the CRS model is that it reports whether a DMU is operating at increasing,constant, or decreasing returns to scale. Constant returns to scale will apply when the CRS and VRS efficiencyfrontiers are tangential with each other; in other words, when the slope of the efficiency frontier is equal tothe ratio of inputs to outputs (Cooper et al., 2000). Increasing returns to scale must apply below that level, asthe slope of the efficient frontier, which reflects the marginal rate of the transformation of inputs to outputs,will be greater than the average rate of conversion. Likewise, decreasing returns to scalemust apply above thezone inwhich constant returns to scale apply. Decision-making units not on the efficient frontiermustfirst beprojected onto the efficient frontier before their returns to scale status can be assessed.
3.2. Input–output specification
The measurements of banks' outputs and inputs remain a contentious issue among researchers. In thebanking literature, two main approaches to input–output definition and measurement have been widelyused, namely, the production approach and the intermediation approach1 (Sealey and Lindley, 1977).Since the intermediation approach has been used extensively in specifying the inputs and outputs of thebank industry, this study adopts this approach.
er the production approach, banks are primarily viewed as providers of services to customers. The inputs set under thish include physical variables (e.g., labour and material) or their associated costs, since only physical inputs are needed totransactions, process financial documents, or provide counselling and advisory services to customers. The output under thish represents the services provided to customers and is best measured by the number and type of transactions, documentsed or specialised services provided over a given time period. This approach has primarily been employed in studying thecy of bank branches. Under the intermediation approach, financial institutions are viewed as intermediating funds betweennd investors. In our case, the Islamic banks produce intermediation services through the collection of deposits and others and in turn these funds are invested in productive sectors of the economy, yielding returns uncontaminated by usury
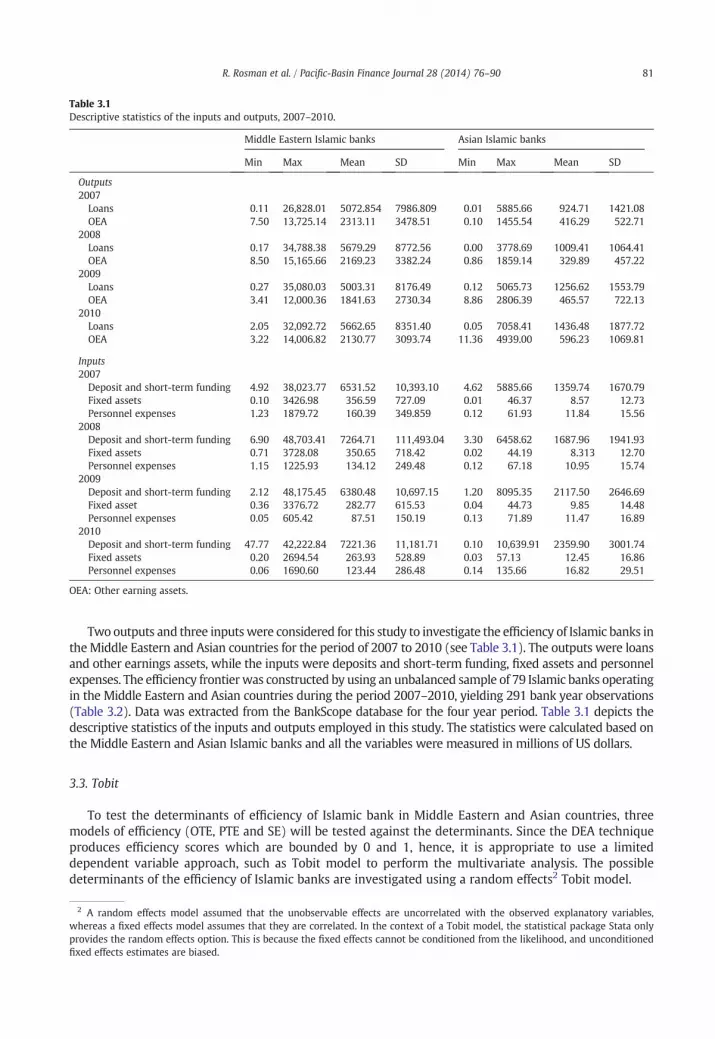
Table 3.1Descriptive statistics of the inputs and outputs, 2007–2010.
Middle Eastern Islamic banks Asian Islamic banks
Min Max Mean SD Min Max Mean SD
Outputs2007
Loans 0.11 26,828.01 5072.854 7986.809 0.01 5885.66 924.71 1421.08OEA 7.50 13,725.14 2313.11 3478.51 0.10 1455.54 416.29 522.71
2008Loans 0.17 34,788.38 5679.29 8772.56 0.00 3778.69 1009.41 1064.41OEA 8.50 15,165.66 2169.23 3382.24 0.86 1859.14 329.89 457.22
2009Loans 0.27 35,080.03 5003.31 8176.49 0.12 5065.73 1256.62 1553.79OEA 3.41 12,000.36 1841.63 2730.34 8.86 2806.39 465.57 722.13
2010Loans 2.05 32,092.72 5662.65 8351.40 0.05 7058.41 1436.48 1877.72OEA 3.22 14,006.82 2130.77 3093.74 11.36 4939.00 596.23 1069.81
Inputs2007
Deposit and short-term funding 4.92 38,023.77 6531.52 10,393.10 4.62 5885.66 1359.74 1670.79Fixed assets 0.10 3426.98 356.59 727.09 0.01 46.37 8.57 12.73Personnel expenses 1.23 1879.72 160.39 349.859 0.12 61.93 11.84 15.56
2008Deposit and short-term funding 6.90 48,703.41 7264.71 111,493.04 3.30 6458.62 1687.96 1941.93Fixed assets 0.71 3728.08 350.65 718.42 0.02 44.19 8.313 12.70Personnel expenses 1.15 1225.93 134.12 249.48 0.12 67.18 10.95 15.74
2009Deposit and short-term funding 2.12 48,175.45 6380.48 10,697.15 1.20 8095.35 2117.50 2646.69Fixed asset 0.36 3376.72 282.77 615.53 0.04 44.73 9.85 14.48Personnel expenses 0.05 605.42 87.51 150.19 0.13 71.89 11.47 16.89
2010Deposit and short-term funding 47.77 42,222.84 7221.36 11,181.71 0.10 10,639.91 2359.90 3001.74Fixed assets 0.20 2694.54 263.93 528.89 0.03 57.13 12.45 16.86Personnel expenses 0.06 1690.60 123.44 286.48 0.14 135.66 16.82 29.51
OEA: Other earning assets.
81R. Rosman et al. / Pacific-Basin Finance Journal 28 (2014) 76–90
Two outputs and three inputswere considered for this study to investigate the efficiency of Islamic banks intheMiddle Eastern and Asian countries for the period of 2007 to 2010 (see Table 3.1). The outputs were loansand other earnings assets, while the inputs were deposits and short-term funding, fixed assets and personnelexpenses. The efficiency frontierwas constructed by using an unbalanced sample of 79 Islamic banks operatingin the Middle Eastern and Asian countries during the period 2007–2010, yielding 291 bank year observations(Table 3.2). Data was extracted from the BankScope database for the four year period. Table 3.1 depicts thedescriptive statistics of the inputs and outputs employed in this study. The statistics were calculated based onthe Middle Eastern and Asian Islamic banks and all the variables were measured in millions of US dollars.
3.3. Tobit
To test the determinants of efficiency of Islamic bank in Middle Eastern and Asian countries, threemodels of efficiency (OTE, PTE and SE) will be tested against the determinants. Since the DEA techniqueproduces efficiency scores which are bounded by 0 and 1, hence, it is appropriate to use a limiteddependent variable approach, such as Tobit model to perform the multivariate analysis. The possibledeterminants of the efficiency of Islamic banks are investigated using a random effects2 Tobit model.
2 A random effects model assumed that the unobservable effects are uncorrelated with the observed explanatory variables,whereas a fixed effects model assumes that they are correlated. In the context of a Tobit model, the statistical package Stata onlyprovides the random effects option. This is because the fixed effects cannot be conditioned from the likelihood, and unconditionedfixed effects estimates are biased.

Table 3.2Islamic banks operating in the Middle Eastern and Asian countries during the period 2007–2010.
Year
Country 2007 2008 2009 2010
Bahrain 9 6 7 7Bangladesh 2 2 1 2Brunei 1 1 1 1Indonesia 1 1 0 0Iran 12 13 11 11Iraq 1 2 4 4Jordan 3 3 3 3Kuwait 6 7 8 6Lebanon 1 1 1 1Malaysia 7 11 10 11Pakistan 5 5 6 6Palestine 1 1 1 1Philippines 1 1 0 1Qatar 3 3 3 3Saudi Arabia 2 2 3 3Singapore 1 1 1 1Syria 1 1 1 1UAE 7 9 10 9Yemen 3 4 5 3
67 74 76 74
82 R. Rosman et al. / Pacific-Basin Finance Journal 28 (2014) 76–90
The model is written as:
Table 3Descrip
Varia
OTE, PROAInTAEQTALLP
OTEit ¼ β0 þ β1ROAit þ β2InTAit þ β3EQTAit þ β4LLPit þ μ itPTEit ¼ β0 þ β1ROAit þ β2InTAit þ β3EQTAit þ β4LLPit þ μ itSEit ¼ β0 þ β1ROAit þ β2InTAit þ β3EQTAit þ β4LLPit þ μ it
OTE, PTE, and SE denote the banks' technical efficiency, pure technical efficiency and scale efficiency
wherecomputed from the DEA model respectively, i denotes the bank, t the examined time period, ROA denotesthe return on asset, InTA denotes the natural logarithm of total assets, EQTA denotes equity/total asset, LLPdenotes loan loss provision/net interest revenue and μ the disturbance term. The explanatory variablesand their hypothesised relationship with efficiency are shown in Table 3.3.Four independent variables are examined in determining efficiency of the Middle East and Asia Islamicbanks. The ROA variable is included in the regression model as a proxy of profitability. Banks reportinghigher profitability ratios are usually preferred by clients and therefore attract the biggest share ofdeposits and the best potential creditworthy borrowers, which in turn create a favourable environment forthe profitable banks to be more efficient (Sufian, 2009).
Further, the lnTA variable is included in the regression model as a proxy measure of size. Even thoughbigger sizemay be demonstrated to be important in explaining ability of a bank to performwell, its impact onbank performance has been ambiguous. Larger banks should pay less for their inputs due to their perceivedmarket power. There may also be an increasing return to scale through allocation of fixed costs over a higher
.3tive of the variables used in the Tobit model.
bles Description Expectedsign
TE, SE Banks' technical efficiency, pure technical efficiency and scale efficiency derived from the DEA method NAReturn on asset indicating profitability +Natural logarithm of total assets, measuring size ±Equity/total asset, measuring capitalization ±Loan loss provision/net interest revenue, measuring credit risk −

83R. Rosman et al. / Pacific-Basin Finance Journal 28 (2014) 76–90
volume of services or from efficiency gains from a specialized workforce (Hauner, 2005). Conversely, largerbanks may tend to be less efficient due to their management seeking a quiet life by pursuing other objectivesor by maintaining the advantages their market power produces (Berger and Hannan, 1994).
EQTA is included in the regression model to examine the relationship between efficiency and bankcapitalisation. It is widely recognized that bank capitalisation is important in explaining the performanceof financial institutions. However, previous studies have shown ambiguous relationship betweencapitalisation and performance. As lower capital ratios suggest a relatively risky position, one mightexpect a negative coefficient (Berger, 1995) but it could be the case that higher levels of equity wouldlower the cost of capital (Molyneux, 1993).
Risk management is another important event undertaken by financial institutions to ensure that theyare performing well. Credit risk is one of the important factors influencing the performance of a bank. Thevariable LLP is included in the regression model to examine the relationship between efficiency and creditrisk. Problem loans may be caused by exogenous events and may bring along some extra expenses thatlead to deterioration in efficiency. To some extent, banks may incur both extra costs and non-performingloans simply because they are poorly managed which in turn decrease efficiency (Resti, 1997).
4. Findings and discussion
In this section, the results of the analysis of technical change in the Middle East and Asia Islamicbanking are discussed. The efficiency was measured by the DEA method which can be decomposed intopure technical efficiency and scale efficiency components. Moreover, in the event of the existence of scaleinefficiency, the nature of the returns to scale of Islamic banks can be explained. The efficiency of theIslamic banks in the Middle Eastern countries and Asian countries was examined separately due to thedifferent environments in these two regions.
By referencing to the guidelines proposed by Isik and Hassan (2002) and Sufian and Noor (2009),constructing an annual frontier specific to each year is more flexible and thus more appropriate thanestimating a single multi-year frontier for the banks in the sample. Hence, there are separate annualfrontiers for each year for both the Middle East and Asia banks separately. The principal advantage of usingpanel data is the ability to observe each bankmore than once over a period of time (Isik and Hassan, 2002).This advantage is critical in a continuously changing business environment because the technology of abank that is efficient in one period may not be efficient in another (Sufian and Noor, 2009).
4.1. Efficiency of the Middle East Islamic banking sector
Figure 4.1 shows the efficiency trends for the Islamic banks in the Middle Eastern countries. The overalltechnical efficiency reached its peak in 2008 and declined in 2009 and 2010. In addition, it is clear from the
Figure 4.1. Overall technical efficiency, pure technical efficiency and scale efficiency of Middle Eastern Islamic banks, 2007–2010.
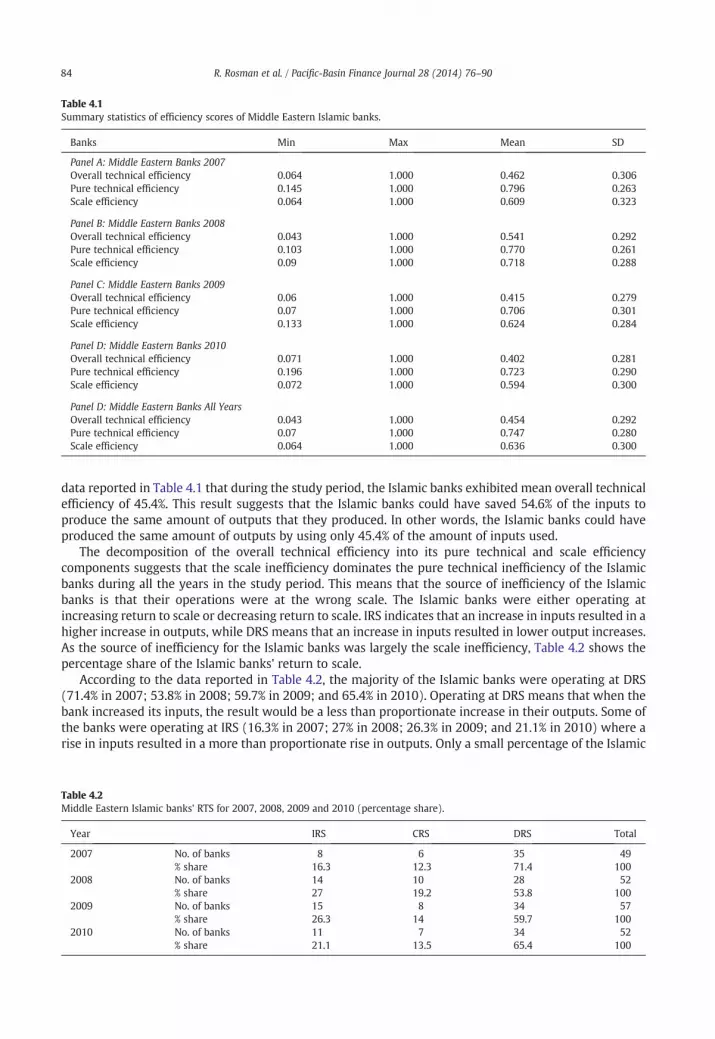
Table 4.1Summary statistics of efficiency scores of Middle Eastern Islamic banks.
Banks Min Max Mean SD
Panel A: Middle Eastern Banks 2007Overall technical efficiency 0.064 1.000 0.462 0.306Pure technical efficiency 0.145 1.000 0.796 0.263Scale efficiency 0.064 1.000 0.609 0.323
Panel B: Middle Eastern Banks 2008Overall technical efficiency 0.043 1.000 0.541 0.292Pure technical efficiency 0.103 1.000 0.770 0.261Scale efficiency 0.09 1.000 0.718 0.288
Panel C: Middle Eastern Banks 2009Overall technical efficiency 0.06 1.000 0.415 0.279Pure technical efficiency 0.07 1.000 0.706 0.301Scale efficiency 0.133 1.000 0.624 0.284
Panel D: Middle Eastern Banks 2010Overall technical efficiency 0.071 1.000 0.402 0.281Pure technical efficiency 0.196 1.000 0.723 0.290Scale efficiency 0.072 1.000 0.594 0.300
Panel D: Middle Eastern Banks All YearsOverall technical efficiency 0.043 1.000 0.454 0.292Pure technical efficiency 0.07 1.000 0.747 0.280Scale efficiency 0.064 1.000 0.636 0.300
84 R. Rosman et al. / Pacific-Basin Finance Journal 28 (2014) 76–90
data reported in Table 4.1 that during the study period, the Islamic banks exhibited mean overall technicalefficiency of 45.4%. This result suggests that the Islamic banks could have saved 54.6% of the inputs toproduce the same amount of outputs that they produced. In other words, the Islamic banks could haveproduced the same amount of outputs by using only 45.4% of the amount of inputs used.
The decomposition of the overall technical efficiency into its pure technical and scale efficiencycomponents suggests that the scale inefficiency dominates the pure technical inefficiency of the Islamicbanks during all the years in the study period. This means that the source of inefficiency of the Islamicbanks is that their operations were at the wrong scale. The Islamic banks were either operating atincreasing return to scale or decreasing return to scale. IRS indicates that an increase in inputs resulted in ahigher increase in outputs, while DRS means that an increase in inputs resulted in lower output increases.As the source of inefficiency for the Islamic banks was largely the scale inefficiency, Table 4.2 shows thepercentage share of the Islamic banks' return to scale.
According to the data reported in Table 4.2, the majority of the Islamic banks were operating at DRS(71.4% in 2007; 53.8% in 2008; 59.7% in 2009; and 65.4% in 2010). Operating at DRS means that when thebank increased its inputs, the result would be a less than proportionate increase in their outputs. Some ofthe banks were operating at IRS (16.3% in 2007; 27% in 2008; 26.3% in 2009; and 21.1% in 2010) where arise in inputs resulted in a more than proportionate rise in outputs. Only a small percentage of the Islamic
Table 4.2Middle Eastern Islamic banks' RTS for 2007, 2008, 2009 and 2010 (percentage share).
Year IRS CRS DRS Total
2007 No. of banks 8 6 35 49% share 16.3 12.3 71.4 100
2008 No. of banks 14 10 28 52% share 27 19.2 53.8 100
2009 No. of banks 15 8 34 57% share 26.3 14 59.7 100
2010 No. of banks 11 7 34 52% share 21.1 13.5 65.4 100

85R. Rosman et al. / Pacific-Basin Finance Journal 28 (2014) 76–90
banks were operating at the optimum scale, that is, constant return to scale (12.3% in 2007; 19.2% in 2008;14% in 2009; and 13.5% in 2010). These were the only banks operating at the right scale.
The result is not surprising since many studies have found that the source of technical inefficiency ismainly scale inefficiency (see, for example: Miller and Noulas, 1996; Isik and Hassan, 2002; Maghyereh,2004; Hassan, 2006; Sufian, 2006, 2007; Mohd Tahir et al., 2009). Hence, the Islamic banks thatexperienced IRS in their operations could achieve significant cost savings and efficiency gains byincreasing their scale of operations. In this case, the substantial gains can be obtained by altering the scalevia internal growth or further consolidation in the sector (Sufian and Noor, 2009). In contrast, the Islamicbanks that were operating at DRS should consider downsizing because those banks have already grownbeyond their most productive scale size. However, it is more time-consuming to rectify scale inefficiencyas compared to pure technical inefficiency (Avkiran, 2006).
4.2. Efficiency of the Asia Islamic banking sector
Figure 4.2 illustrates the trends in the efficiency of the Asian Islamic banks. The overall technicalefficiency reached its peak in 2009 from the lowest score in 2007. However, it dropped again in 2010.Table 4.3 shows that during the study period, the Islamic banks exhibited a mean overall technicalefficiency of 67.1%. This result suggests that the Islamic banks could have saved 32.9% of the inputs toproduce the same amount of outputs that they produced. In other words, by using 67.1% of the inputsused, the Islamic banks could have produced the same amount of outputs.
Furthermore, by examining both the pure technical efficiency and scale efficiency, it is found that thescale inefficiency outweighed the pure technical efficiency in each year except in 2007. However,interestingly, the difference between the scale efficiency and pure technical efficiency was minimal. Thismight be due to the higher overall technical efficiency score achieved by the Islamic banks in the Asiancountries. Similarly, the decomposition of overall technical efficiency into its pure technical and scaleefficiency components suggests that the scale inefficiency dominated the pure technical inefficiency of theIslamic banks for every year in the study period except 2007. This means that the source of inefficiency ofthe Islamic banks is that their operations were at the wrong scale (i.e., either producing at IRS and DRS).Table 4.4 shows the percentage share of the Islamic banks' return to scale.
In the Asian countries, the majority of the Islamic banks were operating at DRS for the four year periodexcept in 2008 (44.4% in 2007; 36.4% in 2008; 47.4% in 2009; and 64% in 2010). Operating at DRS meansthat when the bank increased its inputs, the result was a less than proportionate increase in their outputs.A higher percentage of the Islamic banks can be found operating at the optimum scale, that is, the constantreturn to scale (27.8% in 2007; 40.9% in 2008; 42.1% in 2009; and 18% in 2010). These were the only banksoperating at the right scale. Finally, a smaller percentage of the banks were operating at IRS (27.8% in
Figure 4.2. Overall technical efficiency, pure technical efficiency and scale efficiency of Asian Islamic banks, 2007–2010.
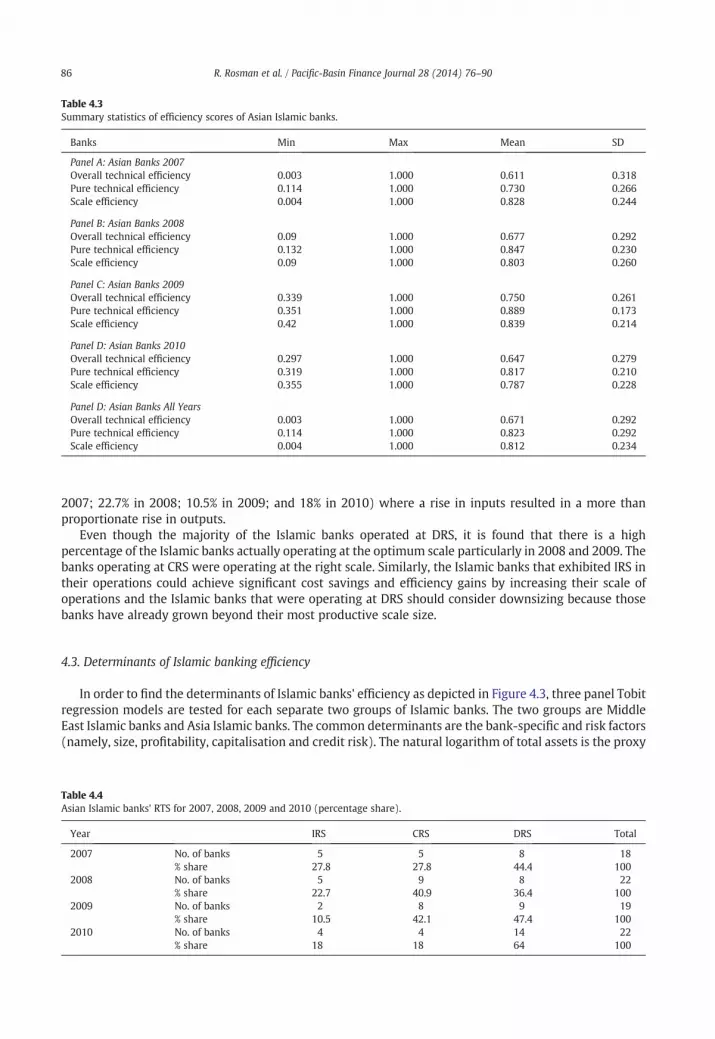
Table 4.3Summary statistics of efficiency scores of Asian Islamic banks.
Banks Min Max Mean SD
Panel A: Asian Banks 2007Overall technical efficiency 0.003 1.000 0.611 0.318Pure technical efficiency 0.114 1.000 0.730 0.266Scale efficiency 0.004 1.000 0.828 0.244
Panel B: Asian Banks 2008Overall technical efficiency 0.09 1.000 0.677 0.292Pure technical efficiency 0.132 1.000 0.847 0.230Scale efficiency 0.09 1.000 0.803 0.260
Panel C: Asian Banks 2009Overall technical efficiency 0.339 1.000 0.750 0.261Pure technical efficiency 0.351 1.000 0.889 0.173Scale efficiency 0.42 1.000 0.839 0.214
Panel D: Asian Banks 2010Overall technical efficiency 0.297 1.000 0.647 0.279Pure technical efficiency 0.319 1.000 0.817 0.210Scale efficiency 0.355 1.000 0.787 0.228
Panel D: Asian Banks All YearsOverall technical efficiency 0.003 1.000 0.671 0.292Pure technical efficiency 0.114 1.000 0.823 0.292Scale efficiency 0.004 1.000 0.812 0.234
86 R. Rosman et al. / Pacific-Basin Finance Journal 28 (2014) 76–90
2007; 22.7% in 2008; 10.5% in 2009; and 18% in 2010) where a rise in inputs resulted in a more thanproportionate rise in outputs.
Even though the majority of the Islamic banks operated at DRS, it is found that there is a highpercentage of the Islamic banks actually operating at the optimum scale particularly in 2008 and 2009. Thebanks operating at CRS were operating at the right scale. Similarly, the Islamic banks that exhibited IRS intheir operations could achieve significant cost savings and efficiency gains by increasing their scale ofoperations and the Islamic banks that were operating at DRS should consider downsizing because thosebanks have already grown beyond their most productive scale size.
4.3. Determinants of Islamic banking efficiency
In order to find the determinants of Islamic banks' efficiency as depicted in Figure 4.3, three panel Tobitregression models are tested for each separate two groups of Islamic banks. The two groups are MiddleEast Islamic banks and Asia Islamic banks. The common determinants are the bank-specific and risk factors(namely, size, profitability, capitalisation and credit risk). The natural logarithm of total assets is the proxy
Table 4.4Asian Islamic banks' RTS for 2007, 2008, 2009 and 2010 (percentage share).
Year IRS CRS DRS Total
2007 No. of banks 5 5 8 18% share 27.8 27.8 44.4 100
2008 No. of banks 5 9 8 22% share 22.7 40.9 36.4 100
2009 No. of banks 2 8 9 19% share 10.5 42.1 47.4 100
2010 No. of banks 4 4 14 22% share 18 18 64 100

Table 4.5Summary of Model 1, Model 2 and Model 3 results — Middle Eastern Islamic banks.
Model 1 Model 2 Model 3
OTE PTE SE
Coef. P N (t) Coef. P N (t) Coef. P N (t)
ROA 0.012⁎⁎ 0.029 0.021⁎⁎ 0.018 0.001 0.875lnTA −0.017⁎⁎ 0.056 0.002 0.893 −0.013 0.195EQTA 0.006⁎⁎⁎ 0.002 0.001 0.648 0.007⁎⁎⁎ 0.001LLP 0.000 0.465 −0.000 0.424 0.000 0.381Constant 0.438 0.000 0.808 0.000 0.583 0.000Sigma 0.2793 0.0181 0.4375 0.0376 0.2987 0.0191
⁎ Significant at 10 percent levels.⁎⁎ Significant at 5 percent levels.
⁎⁎⁎ Significant at 1 percent levels.
Efficiency
Overall Technical
Efficiency
Pure Technical
Efficiency
Scale Efficiency
Determinants
Bank-specific and risk:
Profitability
Size
Capitalization
Credit risk
Figure 4.3. Determinants of Islamic banking efficiency.
87R. Rosman et al. / Pacific-Basin Finance Journal 28 (2014) 76–90
for size; return on assets is the proxy for profitability; total equity per total assets is the proxy forcapitalisation; and the loan loss provision by net interest revenue3 is the proxy of credit risk.
There are six models to examine the determinants of overall technical efficiency, pure technicalefficiency and scale efficiency, respectively. Table 4.5 summarises the results of Models 1, 2 and 3 for theMiddle East Islamic banks; and Table 4.6 summarises the results of Model 4, 5 and 6 for the Asia Islamicbanks.
Firstly, the results showed that profitability had significant positive effect on efficiency for both MiddleEast Islamic banks and Asia Islamic banks. For the Middle East Islamic banks, profitability had significantpositive effect on both overall technical efficiency and pure technical efficiency at 5% level. Meanwhile,profitability had a significant positive effect on all the efficiency measures for Asia Islamic banks at 1%level. This is well explained as previous studies (see, for example: Pasiouras, 2008; Sufian, 2009) found asignificant positive relationship between profitability and efficiency. This supports the notion that banksbecomemore efficient as a by-product of enhancing their profitability. As indicated by Sufian (2009), fromthe point of view of intermediation activities, the profitable banks tend to be more efficient.
Secondly, it is found that size had a significant negative effect on overall technical efficiency for MiddleEast Islamic banks at 10% level. This finding supports earlier studies (see, for example: Isik and Hassan,2002, 2003) that found a negative relationship. In the case of this study, the negative relationship might bedue to the findings that the majority of the Middle East Islamic banks were operating at decreasing to
3 BankScope standardised the use of net interest revenue for both conventional banks and Islamic banks where it equates the netprofit from financing of Islamic banks. For Islamic banks, the net interest revenue is defined as the sum of the positive and negativeincome flows associated with the PLS arrangements (Cihak and Hesse, 2008).

Table 4.6Summary of Model 4, Model 5 and Model 6 results — Asian Islamic banks.
Model 4 Model 5 Model 6
OTE PTE SE
Coef. P N (t) Coef. P N (t) Coef. P N (t)
ROA 0.166⁎⁎⁎ 0.000 0.115⁎⁎⁎ 0.005 0.115⁎⁎⁎ 0.000lnTA 0.026 0.453 0.085⁎⁎ 0.018 −0.018 0.521EQTA 0.006⁎ 0.069 0.005⁎ 0.089 0.005⁎ 0.086LLP 0.005⁎⁎⁎ 0.002 0.003⁎⁎ 0.017 0.005⁎⁎⁎ 0.001Constant 0.191 0.521 0.069 0.806 0.733 0.004sigma 0.3165 0.0352 0.3169 0.0407 0.2325 0.0252
⁎ Significant at 10 percent levels.⁎⁎ Significant at 5 percent levels.
⁎⁎⁎ Significant at 1 percent levels.
88 R. Rosman et al. / Pacific-Basin Finance Journal 28 (2014) 76–90
scale. In contrast, size had a significant positive effect on pure technical efficiency for Asia Islamic banks at5% level. This finding is also supported by previous studies (see, for example: Hauner, 2005; Hassan, 2006).In these cases, the management of the bigger banks was more efficient in converting their inputs intooutputs regardless of their scale.
Thirdly, capitalisation had a significant positive effect on overall technical efficiency and scale efficiencyof Middle East Islamic banks at 1% level. Also, it is found that capitalisation had a significant positive effecton all the efficiency measures of Asia Islamic banks at 10% level. This positive relationship with bankefficiency is expected as studies (see, for example: Isik and Hassan, 2003; Casu and Girardone, 2004;Sufian and Noor, 2009) viewed the higher level of equity as a cushion for future losses. As suggested bySufian and Noor (2009), the more efficient banks, ceteris paribus, use less leverage (i.e. more equity)compared to their peers.
Finally, credit risk as represented by the loan loss provision per net interest revenue is the relationshipbetween provisions in the profit and loss account and their interest income over the same period.Surprisingly, it is found that the credit risk had a significant positive effect on both overall technicalefficiency and scale efficiency at 1%; and on pure technical efficiency at 5% for Asia Islamic banks. Thisfinding is in contradiction to previous studies (see, for example: Kwan and Eisenbeis, 1997; Resti, 1997)which found negative relationship between problem loans and bank efficiency. Furthermore Ahmad andHassan (2007) proposed that this ratio should be as low as possible. The possible reason of this positiverelationship might be because the efficient banks may provide higher provision on their financing to bemore prudent in managing their financing activities during the study period. Hence, higher ratio of loanloss provision per net interest revenue.
5. Conclusion
In conclusion, the Islamic banks in both Middle Eastern and Asian countries on average can becharacterised as purely technically efficient throughout the periods. This indicates that the banks'managementwas able to efficiently control the costs and use themix of inputs to produce outputs regardlessof the scale effects. Comparatively, on average, the overall technical efficiency scores of the Islamic banks inthe Asian countries were higher than in theMiddle Eastern countries. The average overall technical efficiencyscores for the Asia Islamic banks were between 61% and 75%, whereby for the Middle East banks the scoreswere between 40% and 54%. This gap may be due to the variation of Islamic banks that represent the MiddleEastern countries (57 banks from 12 countries), whichmay have caused the average score to be quite low fortheir region. In contrast, the variation of the Islamic banks in the Asian countries was smaller (22 banks fromseven countries) with the majority of the Islamic banks from Malaysia.
In terms of the source of technical inefficiency, it is found that the main source of technical inefficiencywas due to the Islamic banks operating at the wrong scale, particularly as the majority of Islamic bankswere operating at DRS in the Middle Eastern countries. Hence, they needed to reduce their inputs toachieve optimum scales. In the case of the Islamic banks in the Asian countries, even though the source of

89R. Rosman et al. / Pacific-Basin Finance Journal 28 (2014) 76–90
technical inefficiency was still the scale inefficiency, the difference between the average scores of puretechnical efficiency and scale inefficiency was minimal. In addition, both profitability and capitalisation arethe common determinants that have a significant positive effect on efficiency for both Middle East andAsia Islamic banks during the financial crisis.
This study provides a significant contribution as its findings can give policymakers, regulators, bankmanagement, and international bodies such as the Islamic Financial Services Board better insight into theperformance of Islamic banks during the financial crisis. The issues related to the scale inefficiency of themajority of the Islamic banks may need to be addressed. The policymakers and bank management shouldconsider downsizing because these Islamic banks have already grown beyond their most productive scale.
Finally, due to its limitations, this study could be extended in a number ofways. The scope of this study canbe extended to explain the comparative efficiency of both Islamic banks and conventional banks. In addition,further investigation of changes in productivity over time as a result of technical change can be explored byemploying the Malmquist Productivity Index to supplement the DEA approach taken in this study.
References
Abdul-Majid, M., Saal, D.S., Battisti, G., 2010. Efficiency in Islamic and conventional banking: an international comparison. J. Prod.Anal. 34, 25–43.
Ahmad, S., Abdul-Rahman, A.R., 2012. The efficiency of Islamic and conventional commercial banks in Malaysia. Int. J. Islam. MiddleEast. Finance Manage. 5 (3), 241–263.
Ahmad, A.U.F., Hassan, M.K., 2007. Regulation and performance of Islamic banking in Bangladesh. Thunderbird Int. Bus. Rev. 49 (2),251–277.
Al-Khasawneh, J.A., Bassedat, K., Aktan, B., Thapa, P.D.P., 2012. Efficiency of Islamic banks: case of North African Arab countries. Qual.Res. Financ. Mark. 4 (2/3), 228–239.
Avkiran, N.K., 2006. Productivity Analysis in the Service Sector with Data Envelopment Analysis. Avkiran NK, Brisbane.Banker, R.D., Charnes, A., Cooper, W.W., 1984. Some models for estimating technical and scale inefficiencies in data envelopment
analysis. Manag. Sci. 30 (9), 1078–1092.Bauer, P.W., Berger, A.N., Ferrier, G.D., Humphrey, D.B., 1998. Consistency conditions for regulatory analysis of financial institutions:
A comparison of efficiency frontier methods. J. Econ. Bus. 50 (2), 85–114.Beck, T., Demirguc-Kunt, A., Merrouche, O., 2013. Islamic vs. conventional banking: business model, efficiency and stability. J. Bank.
Financ. 37, 433–447.Berger, A.N., 1995. The relationship between capital and earnings in banking. J. Money Credit Bank. 27, 432–456.Berger, A.N., Hannan, T., 1994. The efficiency cost of market power in the banking industry: a test of the ‘Quiet Life’ and related
hypotheses. Working Paper 94–29, Vol. 2006: Financial Institutions Center. The What School, University of Pennsylvania.Canhoto, A., Dermine, J., 2003. A note on banking efficiency in Portugal: new vs. old banks. J. Bank. Finance 27 (11), 2087–2098.Casu, B., Girardone, C., 2004. Financial conglomeration: efficiency, productivity and strategic drive. Appl. Financ. Econ. 14, 687–696.Charnes, A., Cooper, W.W., Rhodes, E., 1978. Measuring efficiency of decision making units. Eur. J. Oper. Res. 2, 429–444.Chong, B.S., Liu, M., 2009. Islamic banking: interest-free or interest-based? Pac. Basin Financ. J. 17, 125–144.Cihak, N.K., Hesse, H., 2008. Islamic banks and financial stability: An empirical analysis. In: IMF Working Paper. IMF.Coelli, T., Prasada Rao, D., Battese, G.E., 1998. An Introduction to Efficiency and Productivity Analysis. Kluwer Academic Publishers,
Norwall, MA.Cooper, W.W., Seiford, L.M., Tone, K., 2000. Data Envelopment Analysis. Kluwer Academic Publishers, Boston.Gishkori, M.A., Ullah, N., 2013. Technical efficiency of Islamic and commercial banks: evidence from Pakistan using DEA Model
(2007–2011). IOSR J. Bus. Manag. 7 (4), 68–76.Hasan, M., Dridi, J., 2010. The effects of the global crisis on Islamic and conventional banks: a comparative study. IMF Working Paper.
IMF.Hassan, M.K., 2006. The X-efficiency in Islamic banks. Islam. Econ. Stud. 13 (2), 49–78.Hassan, T., Mohamad, S., Bader, M.K.I., 2009. Efficiency of conventional versus Islamic banks: evidence from the Middle East. Int.
J. Islam. Middle East. Finance Manage. 2 (1), 46–65.Hauner, D., 2005. Explaining efficiency differences among large German and Austrian bank. Appl. Econ. 37 (9), 969–980.Iqbal, M., Llewellyn, D.T., 2002. Islamic Banking and Finance: New Perspectives on Profit Sharing and Risk. Edward Elgar Publishing,
Inc., UK.Isik, I., Hassan, M.K., 2002. Technical, scale and cost efficiencies of Turkish banking industry. J. Bank. Finance 26, 719–766.Isik, I., Hassan, M.K., 2003. Efficiency, ownership and market structure, corporate control and governance in Turkish banking
industry. J. Bus. Finance Acc. 30 (9 & 10), 1363–1421.Kuran, T., 2004. Islam & Mammon: The Economic Predicaments of Islamism. Princeton University Press, Princeton.Kwan, S., Eisenbeis, R.A., 1997. Bank risk, capitalization, and operating efficiency. J. Financ. Res. 12 (2–3), 117–131.Maghyereh, A., 2004. The effect of financial liberalization on the efficiency of financial institutions: the case of Jordanian commercial
banks. J. Transl. Manag. Dev. 9 (2–3), 71–106.Miller, S.M., Noulas, A.G., 1996. The technical efficiency of large bank production. J. Bank. Finance 20, 495–509.Mirakhor, A., 2008. Lesson of the recent crisis for Islamic finance. IIUM J. Econ. Manag. 16 (2), 132–138.Mohd Tahir, I., Abu Bakar, N.M., Haron, S., 2009. Estimating technical and scale efficiency of Malaysian commercial banks: a non-
parametric approach. Int. Rev. Bus. Res. Pap. 5 (1), 113–123.Molyneux, P., 1993. Structure and performance in European banking. Unpublished working paper, University of Wales Bangor.

90 R. Rosman et al. / Pacific-Basin Finance Journal 28 (2014) 76–90
Pasiouras, F., 2008. Estimating the technical and scale efficiency of Greek commercial banks: the impact of credit risk, off-balancesheet activities, and international operations. Res. Int. Bus. Finance 22, 301–318.
Resti, A., 1997. Evaluating the cost efficiency of the Italian banking system: what can we learn from the joint application ofparametric and non-parametric techniques. J. Bank. Finance 21, 221–250.
Sealey, C., Lindley, J.T., 1977. Inputs, outputs and a theory of production and cost at depository financial institutions. J. Finance 32 (4),1251–1266.
Siddiqi, M.N., 2008. The current financial crisis and Islamic economics. IIUM J. Econ. Manag. 16 (2), 125–132.Sufian, F., 2006 and 2007. The efficiency of Islamic banking industry: a non-parametric analysis with non-discretionary input
variable. Islam. Econ. Stud. 14 (1&2), 53–86.Sufian, F., 2009. Determinants of bank efficiency during unstable macroeconomic environment: empirical evidence from Malaysia.
Res. Int. Bus. Finance 23, 54–77.Sufian, F., Noor, M.A.N.M., 2009. The determinants of Islamic bank's efficiency changes: empirical evidence from MENA and Asian
banking sectors. Int. J. Islam. Middle East. Finance Manage. 2 (1), 120–138.Yudistira, D., 2004. Efficiency in Islamic banking: an empirical analysis of eighteen banks. Islam. Econ. Stud. 12 (1), 1–19.
Romzie Rosman graduated with BA (Hons) Accounting and Finance from Lancaster University, United Kingdom in 2000. He wasawarded Masters of Business Administration (Islamic Banking and Finance) in 2005 and Ph.D. (Islamic Banking and Finance) in 2012from International Islamic University Malaysia (IIUM). Currently, he works as a researcher in a private consulting firm in Malaysia.He also has presented papers at national and international conference, and published in international referred academic journals.
Norazlina Abd Wahab is a lecturer at the Islamic Business School, Universiti Utara Malaysia. She graduated with BA (Syariah)(Hons.)from University of Malaya. She was awarded her Master Degree from Universiti Kebangsaan Malaysia and received her PhD Degree in2013 from International Islamic University Malaysia (IIUM). Norazlina has published her research in several refereed journals namely,Journal of Islamic Accounting and Business Research, Studies in Economics and Finance and Journal of Economic Cooperation andDevelopment. She has also presented papers in international and local conferences. Her research interests include Islamic economics(zakat) and Islamic banking.
Zairy Zainol was educated at University of Malaya where he obtained a Bachelor in Syariah (Hons.) in 1999. He holds a Master inEconomics from Universiti Kebangsaan Malaysia in 2001 and currently pursuing his PhD at International Islamic Universiti Malaysia(IIUM). Zairy Zainol is currently a lecturer at the Islamic Business School, Universiti Utara Malaysia. He has published his research inseveral refereed journals namely, Journal of Islamic Accounting and Business Research and Journal of Economic Cooperation andDevelopment. His research interests include Risk Management of Islamic banks and Islamic economic analysis.