effects of probiotic or prebiotic supplemented milk formulas on fecal microbiota composition of...
TRANSCRIPT
APJCN 2006: 15, Number 3: 287 - 442 ISSN 0964-7058
2006 Volume 15 Number 3
APCNS • IUNS • NSNZ
Asia Pacific
Journal of
Clinical Nutrition
Editor-in-Chief Mark Wahlqvist, Melbourne
Co-Editors Akira Okada, Osaka Duo Li, Hangzhou
HEC PRESS
www.healthyeatingclub.org/APJCN/
APJCN 2006: 15, Number 3: 287 - 442 ISSN 0964-7058
2006 Volume 15 Number 3
APCNS • IUNS • NSNZ
Asia Pacific Journal of Clinical Nutrition
ANNOUNCEMENT
SUPPLEMENTAL RESEARCH AWARD FOR PHYSIOLOGICAL
EFFECTS OF CARBOHYDRATES
The ILSI Research Foundation is soliciting applications from junior investigators (no more than 5 years since most recent post-doctoral fellowship) for innovative supplemental studies aimed at identifying in vivo endpoints that link dietary carbohydrate intake to a physiological or health-related outcome. Research topics of interest include the impact of dietary carbohydrates on: 1) appetite control in the content of energy balance 2) glycemic response at it relates to risk for overweight/obesity and chronic disease 3) food intake behavior, physical activity patterns, and performance, and 4) gut health. Each award will not exceed US$ 30,000 per year for a maximum of 2 years. Application deadline is October 27, 2006. To obtain an application package, please contact the ILSI Research Foundation, One Thomas Circle, NW, 9th Floor, Washington, DC 20005-5802. Telephone: 202-659-0789; fax: 202-659-3617; or email: [email protected]. Additional information is available at www.ilsi.org.
Visit the journal website at: http://www.healthyeatingclub.org/APJCN
Asia Pacific
Journal of
Clinical Nutrition
THE JOURNAL OF THE ASIA PACIFIC CLINICAL NUTRITION SOCIETY
APJCN 2006: Volume 15 (Number 3): 287-442 ISSN 0964-7058
EDITORS: Professor Mark Wahlqvist MD, Asia Pacific Health and Nutrition Centre, Monash Asia Institute, 8th Floor, Menzies Building, Monash University, Wellington Road, Clayton, Melbourne, Victoria 3800, AUSTRALIA . Fax: (+61) 3 9905 8146; Email: [email protected]. Professor Akira Okada MD, President, Osaka Medical Center and Research Institute for Maternal and Child Health, 840 Murodo-cho, Izumi City, Osaka, 594-1101, JAPAN. Fax: (+81) 725 56 5682; Email: [email protected]. Professor Duo Li MD, Professor of Nutrition & Food Safety, Dept of Food Science & Nutrition, Zhejiang University, 268 Kaixuan Road, Hangzhou 310029, CHINA. Fax: (+86) 571 86971024; Email: [email protected] Managing Editor: Dr Antigone Kouris-Blazos, HEC PRESS, PO Box 4121, McKinnon, Melbourne, Victoria 3204, AUSTRALIA; Fax: (+61) 3 95154544. Email: [email protected] Manuscript Submission: Asia Pacific Journal of Clinical Nutrition, Email: [email protected] or P.O. Box 90048-509, Neihu, Taiwan, ROC, Tel/Fax: +886-2-87910704 Administrative officer: Yi-Chen Huang, MPH
Asia Pacific Journal of Clinical Nutrition (APJCN) is a peer-reviewed journal published for the Asia Pacific Clinical Nutrition Society (APCNS). The journal publishes original research reports, short communications, reviews, and letters to the editors. Letters to the editors may be either very short articles (500 words) containing new material, case reports, or comments on previous papers or on other topics of current interest. News, book reviews and other items may also be included. All articles are peer-reviewed by at least two researchers expert in the field of the submitted paper. For detailed instructions concerning the submission of manuscripts, please refer to the Instructions to Authors at the back of this issue or visit the journal web page, listed below.
The aims of the Asia Pacific Clinical Nutrition Society (APCNS) are to promote the education and training of clinical nutritionists in the region and to enhance the practice of human nutrition and related disciplines in their application to health and the prevention of disease.
The journal is also an organ of The Nutrition Society of New Zealand and of The Nutrition Society of Australia, whose members receive APJCN as part of their society membership. The International Union of Nutritional Sciences (IUNS) is acknowledged as a non-financial co-sponsor of the journal.
Abstracting and Indexing Services: The Journal is indexed by Australasian Medical Index, CAB Abstracts, Chemical Abstracts Service, Current Contents/Clinical Medicine, Current Opinion, Index Medicus/MEDLINE, ISI Alerting Services, Science Citation Index, SciSearch and SUBIS Current Awareness in Biomedicine. The Journal is also indexed selectively in APAIS. Business Correspondence and Advertisement Booking: All matters relating to orders, subscriptions, back issues, offprints, advertisement booking and general enquiries should be addressed to: HEC PRESS, PO Box 4121, McKinnon, Mel-bourne, Victoria 3204, Australia; Mobile: +61 0408551702; Fax:+61(0)395154544;[email protected]; http://www.healthyeatingclub.org
Subscription Rates (1/7/2006): The journal is published four times per year and the prices per annum for 2006 are as follows:
Personal: Hard copy (including on-line access) AU$195; On-line access only AU$150. Institution: Hard copy (including on-line access) AU$400; On-line access only AU$250.
The journal is despatched to subscribers outside Australia by surface air-lifted delivery.
Copyright and Photocopying: © 2006 HEC PRESS, Healthy Eating Club Pty Ltd. Authorization to photocopy items for internal or personal use, or the internal or personal use of specific clients, is granted by HEC PRESS, Healthy Eating Club Pty Ltd for libraries and other users registered with the Copyright Clearance Center (CCC) Transactional Reporting Service, provided that the base fee of US$15 per copy is paid directly to: CCC, 222 Rosewood Drive, Danvers, MA 01923, USA. This consent does not extend to other kinds of copying, such as copying for general distribution, for advertising or promotional purposes, for creating new collective works or for resale. Special requests should be addressed to the Publisher.
APJCN online & CD-ROM Issues prior to 2004: Full papers are available free-of-charge via the website http://www.healthyeatingclub.org. Volumes 1-13 can also be purchased on CD-ROM for AU$190 (to order CD-ROM use APJCN subscription form on last page of this issue). Issues after 2003: subscribers have on-line access to full papers on the website www.healthyeatingclub.org (password access).
Disclaimer: The Publisher, the Society and the Editors cannot be held responsible for errors or any consequences arising from the use of information contained in this journal; the views and opinions expressed do not necessarily reflect those of the Publisher, the Society or the Editors, neither does the publi-cation of advertisements constitute any endorsement by the Publisher, the Society or the Editors of the products advertised.
APJCN Editorial Advisory Board
Australia Professor Paul J Nestel
Baker Institute, Alfred Hospital, Commercial Rd, Prahran, VIC 3181 Tel: +61-3-9522-4333 Fax: +61-3-9521-1362 Email: [email protected]
Professor Boyd Swinburn Physical Activity and Nutrition Research Unit, School of Health Sciences, Deakin University, 221 Burwood Highway, Burwood, VIC 3125 Tel: +61-3-9251-7096 Fax: +61-3-9244-6017 Email: [email protected]
Professor A Stewart Truswell Human Nutrition Unit, Biochemistry Dept, University of Sydney, Sydney, NSW 2006 Tel: +61-2-9351-3726 Fax: +61-2-9351-6022 Email: [email protected]
China Professor Gu Jing-Fan
Professor of Nutrition, Institute of Hygiene and Environment Medicine, 1 Da Li Dao, Tianjin, 300050 Tel: +86-22-846-55402 Fax: +86-22-846-55402 Email: [email protected]
Fiji Professor Sitaleki Finau
Head, School of Public Health & Primary Care, Fiji School of Medicine, Private Mail Bag Suva, Fiji Islands Tel: +679-311-700 Fax: +679-303-469
Dr Jimaima Veisikiaki Lako c/o Professor Subramaniam Sotheeswaran, Department of Chemistry, University of the South Pacific, Suva, Fiji Email:[email protected]
Guatemala Dr Noel W Solomons
Centre for Studies of Sensory Impairment, Aging and Metabolism, PO Box 02-5339 Section 3162/Guatemala Miami, FL 33102-5339 Tel: +502-473-3942 Fax: +502-473-3942 Email: [email protected]
Indonesia Assoc. Professor Widjaja Lukito
SEAMEO-TROPMED* National Centre Indonesia, Regional Center of Community Nutrition, University of Indonesia, Jalan Salemba Raya 6, Jakarta 10430, Indonesia Tel: +62-21-330-205 Fax: +62-21-390-7695
Email: [email protected] Professor Soemilah Sastroamidjojo
(for SEAMEO-TROPMED Nutrition Centre) Faculty of Medicine, University of Indonesia, 6 Salemba Raya, Jakarta 10430
Japan Professor Kazuo Kondo
Institute of Environmental Science for Human Life, Ochanomizu University, 2-1-1 Ohtsuka, Bunkyo-ku, Tokyo 112-8610 Tel: +81-3-5978-5812 Fax: +81-3-5978-2694 Email: [email protected]
Korea Professor Sook He Kim
Department of Foods and Nutrition, Ewha Women’s University,
11-1 Dae-hyun Dong, Seo-dae moon Ku, Seoul 120-750 Tel: +82-2-393-0051 Fax: +82-2-393-5903 Email: [email protected]
Malaysia
Professor B Abdul K Khalid Professor of Medicine, Universiti Kebangsaan Malaysia, Jalan Raja Muda Abdul Aziz, 50300 Kuala Lumpur Tel: +60-3-440-5000 Fax: +60-3-291-2659 Email: [email protected]
New Zealand Professor Jim Mann Department of Nutrition, University of Otago, PO Box 56, Dunedin Tel: +64-9-795-780 Fax: +64-9-770-956 Email: [email protected] Philippines Dr Rodolfo Florentino
Food & Nutrition Research Institute, Pedro Gil Street, PO Box EA-467, Emita, Manila 1000 Tel: +63-2-823-8071 Fax: +63-2-823-8934
Email: [email protected] Singapore Dr Paul Deurenberg
135, Serangoon Avenue 3, #10–01, Chiltern Park, Singapore 556114 Tel: +65- 91251425 Fax: +65-68585985 Email: [email protected]
Taiwan Professor Wei-Jao Chen
National Taiwan University 1 Section 4, Roosevelt Road Taipei, Taiwan, ROC 106 Tel: +886-2-23634090 Fax: +886-2-23621877 Email: [email protected]
Thailand Professor Prasong Tienboon
Division of Nutrition, Dept of Paediatrics, Faculty of Medicine, Chiang Mai University, Chiang Mai 50002 Tel: + 66-53-895269 Fax: + +66-53-214437 Email: [email protected]
Vietnam Professor Ha Huy Khoi
National Institute of Nutrition, 48 Tang Bat Ho, Hanoi Tel: +84-4971-7090 Fax: +84-4971-7885
Email: [email protected]
* SEAMO-TROPMED = South East Asia Ministry of Education, Tropical Medicine
APCNS Editorial Advisory Board
Asia Pacific Clinical Nutrition Society www.apcns.org
President: Professor Prasong Tienboon, Thailand
Immediate Past President: Professor Widjaja Lukito, Indonesia
Vice President: Professor Zhu-Ming Jiang, China
Secretary: Dr Irene Darmadi, Australia
Treasurer: Professor Mark Wahlqvist, Australia
Councillor: Professor Kazuo Kondo, Japan
Webmaster: Dr Antigone Kouris-Blazos, Australia
Asia Pacific Clinical Nutrition Society is established to create links between clinical nutritionists in the Asia Pacific region. The Society seeks thereby to promote the contribution of nutritionists to the health of the populations in Asia Pacific countries. Asia Pacific Clinical Nutrition Society will encourage continuing nutrition and training in the region so as to promote the highest possible level of research and practical innovation. Asia Pacific Journal of Clinical Nutrition, along with the sponsorship by Asia Pacific Clinical Nutrition Society of regional and local clinical nutrition meetings, is expected to assist greatly in the achievement of these aims. Membership of Asia Pacific Clinical Nutrition Society, for which there is a modest annual fee and which includes on-line access to Asia Pacific Journal of Clinical Nutrition, is open to all clinical nutritionists in the region. The Society will consider application for membership based on submission of a curriculum vitae and a statement of support from one of the officers and the individuals listed below. The Asia Pacific Clinical Nutrition Society representatives should state: 'On behalf of Asia Pacific Clinical Nutrition Society I support the application of [Name and address] for membership in the Society'. After the applicant has obtained this endorsement from the representative it should be forwarded with the applicant's curriculum vitae for consideration and acknowledgement to: The Secretary, Asia Pacific Clinical Nutrition Society, Asia Pacific Health and Nutrition Centre, Monash Asia Institute, 8th Floor, Menzies Building, Monash University, Wellington Road, Clayton, Victoria 3168, Australia.

ASIA PACIFIC CLINICAL NUTRITION SOCIETY (APCNS)
Society Membership
AU$100 per annum
Asia Pacific Clinical Nutrition Society (APCNS) was established to create links between clinical nutritionists in the Asia Pacific region and to promote their contribution to the health of the populations of Asia Pacific countries. APCNS encourages continuing nutrition education and training in the region in order to support the highest possible levels of research and practical innovation. APCNS sponsorship of local and regional meetings along with the publication of Asia Pacific Journal of Clinical Nutrition, is expected to assist greatly in the achievement of these aims. President: Professor Prasong Tienboon, Thailand Immediate Past President: Professor Widjaja Lukito, Indonesia Vice President: Professor Zhu-Ming Jiang, China
Membership Application You will need your membership application endorsed by one of the members of the Advisory Board listed at the front of the journal. Please use the Endorsement Form below. Send the completed endorsement form, your curriculum vitae and bankdraft for AU$100 (made payable to APCNS) or credit card details (use the form below) to the society. Membership Application & Endorsement I wish to apply for membership of the Asia Pacific Clinical Nutrition Society Title ………………. Name……………………………………………………………………………………………………
Mailing Address……………..…………………………………………………………………………………………………
……………………………………………………………………………………………Postcode…………………………..
Tel: ………………………………………………………..Fax………………………………………………………………..
Email ……………………………………………………………………………………………………………………………
I support the application of ………………………………………………………………for membership of the Asia Pacific Clinical Nutrition Society.
Name of Endorser…………………………………………Signature of Endorser……………………………………... CREDIT CARD PAYMENT I wish to pay by Visa MasterCard (Other cards are not accepted) Amount $ …………….. Expiry Date ……./……….Signature …………………………………………………………. Name on Card ………………………………………………………………………………………………………………. On-line access: Please provide preferred Username..................................................…………......Password...........................................……………………. Send your membership application to: The Secretary, Asia Pacific Clinical Nutrition Society, Asia Pacific Health and Nutrition Centre, Monash Asia Institute, 8th Floor, Menzies Building, Monash University, Wellington Road, Clayton, Melbourne, Victoria 3800, AUSTRALIA Fax: (+61) 3 9905 8146. Email: [email protected].
receive ON-LINE ACCESS
to Asia Pacific Journal of Clinical Nutrition as part of your membership
Asia Pac J Clin Nutr 2006;15 (3):287-292 287
Original Article Central obesity and risk of cardiovascular disease in the Asia Pacific Region
Asia Pacific Cohort Studies Collaboration1
This paper compares body mass index, waist circumference, hip circumference, and waist-hip ratio as risk factors for ischaemic heart disease and stroke in Asia Pacific populations. We undertook a pooled analysis involving six cohort studies (45 988 participants) and used Cox proportional hazards regression to assess the associations of the four anthropometric indices with stroke and ischaemic heart disease by age, sex and region. During a mean follow-up of six years, 346 stroke and 601 ischaemic heart disease events (fatal and non-fatal) were documented. Overall, a one-standard deviation increase in index was associated with an increase in risk of ischaemic heart disease of 17% (95% CI 7-27%) for body mass index, 27% (95% CI 14-40%) for waist circumference, 10% (95% CI 1-20%) for hip circumference, and 36% (95% CI 21-52%) for waist-hip ratio. There were no significant differences between age groups, sex, and region. None of the four anthropometric indices had a strong association with risk of stroke. These data indicate that measures of central obesity such as waist circumference and waist-hip ratio are strongly associated with risk of ischaemic heart disease in this region. Therefore, we suggest that, along with calculation of body mass index, measures of central obesity such as waist circumference and waist-hip ratio should be undertaken routinely.
Key Words: abdominal obesity, waist circumference, waist hip ratio, cardiovascular diseases, cohort studies, Asia Introduction The risk of heart disease and stroke increases continuously with increasing body mass index (BMI)1,2 but the relative importance of total and central obesity is still debated. There are uncertainties over what anthropometric index, BMI, waist circumference (WC), hip circumference (HC), or waist-hip ratio (WHR), is the most important risk factor for cardiovascular events. Previous prospective studies comparing the importance of various anthropometric indi-ces in determining risk of CVD have been mainly con-ducted in North America,3,4 Europe,5-7 and more recently Australia.8 There is a lack of similar prospective data from the greater Asia Pacific region, despite frequent assertions that lower cut-offs should be used to define overweight and obesity in Asian populations.9,10 Data collected with the Asia Pacific Cohort Studies Collabora-tion allow com-parison of four anthropometric indices as risk factors for both stroke and ischaemic heart disease (IHD) in the Asia Pacific region. Methods Identification of studies and collection of data The Asia Pacific Cohort Studies Collaboration (APCSC) is an individual participant data overview (meta-analysis) involving prospective cohort studies in the Asia Pacific region. As reported elsewhere,11 studies are eligible for inclusion in the collaboration if they satisfied the following criteria; 1) a study population from the Asia Pacific region: 2) prospective cohort design; 3) at least 5 000 person-years of follow-up recorded; 4) date of birth or age, sex, and blood pressure recorded at baseline; 5) date of death or age at death recorded during follow-up. Studies are identified by literature searches (Medline and EMBASE), scrutiny of abstracts from proceedings of meetings, and enquiry
among collaborators and colleagues. There are no language restrictions. In addition to these inclusion criteria, data sought on individual participants include date of baseline survey, height, weight, WC, HC, and smoking habit. As height, weight, WC, and HC were not essential for inclusion in the collaboration not all studies could contribute to the analyses reported here. Measurements of indices were variably stan-dardized and not uniform in the different studies. Outcome data for these analyses included fatal and non-fatal stroke and IHD events, where fatal events were defined as death occurring within 28 days of the event. All data provided to the secretariat were checked for completeness and con-sistency and were recoded where necessary to maximize comparability across cohorts. Summary reports were re-ferred back to principal investigators of each collaborating study for review and confirmation.
Statistical methods In eligible cohorts, analyses were restricted to participants aged 20 years or older who had data on baseline height, weight, WC and HC. BMI was calculated as weight (kg) divided by the square of height (m), and WHR was cal-culated as WC (cm) divided by HC (cm). Participants with values outside the following ranges were excluded since it was assumed that they were due to recording errors: 12 ≤ BMI ≤ 59, 50 ≤ WC ≤ 150 and 50 ≤ HC ≤ 200 (N = 17). Analyses were undertaken for total (fatal and non fatal Correspondence address: Asia Pacific Cohort Studies Colla-boration, Clinical Trials Research Unit, University of Auckland, Private Bag 92019, Auckland, New Zealand Tel: + 64 9 373 7599 Ext. 84494; Fax: + 64 9 373 7599 Email: [email protected] Accepted 9th January 2006 1 Writing committee and members listed in appendix
288 Asia Pacific Cohort Studies Collaboration
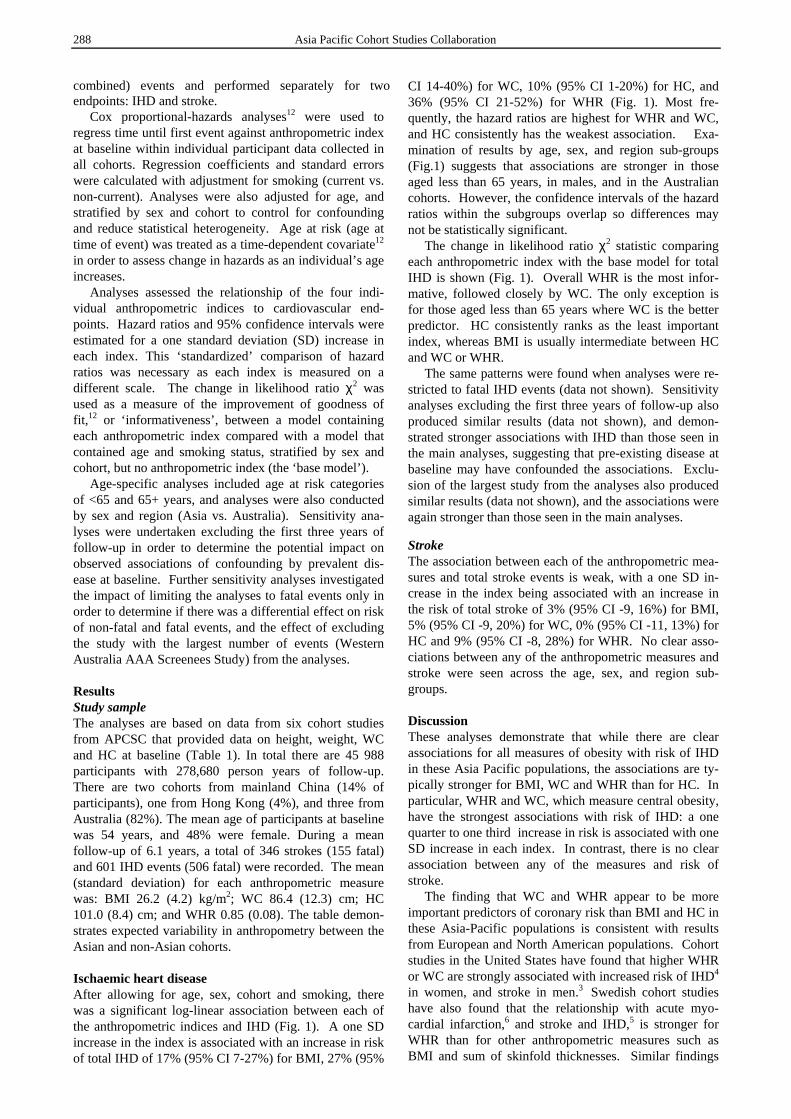
combined) events and performed separately for two endpoints: IHD and stroke. Cox proportional-hazards analyses12 were used to regress time until first event against anthropometric index at baseline within individual participant data collected in all cohorts. Regression coefficients and standard errors were calculated with adjustment for smoking (current vs. non-current). Analyses were also adjusted for age, and stratified by sex and cohort to control for confounding and reduce statistical heterogeneity. Age at risk (age at time of event) was treated as a time-dependent covariate12 in order to assess change in hazards as an individual’s age increases. Analyses assessed the relationship of the four indi-vidual anthropometric indices to cardiovascular end-points. Hazard ratios and 95% confidence intervals were estimated for a one standard deviation (SD) increase in each index. This ‘standardized’ comparison of hazard ratios was necessary as each index is measured on a different scale. The change in likelihood ratio χ2 was used as a measure of the improvement of goodness of fit,12 or ‘informativeness’, between a model containing each anthropometric index compared with a model that contained age and smoking status, stratified by sex and cohort, but no anthropometric index (the ‘base model’). Age-specific analyses included age at risk categories of <65 and 65+ years, and analyses were also conducted by sex and region (Asia vs. Australia). Sensitivity ana-lyses were undertaken excluding the first three years of follow-up in order to determine the potential impact on observed associations of confounding by prevalent dis-ease at baseline. Further sensitivity analyses investigated the impact of limiting the analyses to fatal events only in order to determine if there was a differential effect on risk of non-fatal and fatal events, and the effect of excluding the study with the largest number of events (Western Australia AAA Screenees Study) from the analyses. Results Study sample The analyses are based on data from six cohort studies from APCSC that provided data on height, weight, WC and HC at baseline (Table 1). In total there are 45 988 participants with 278,680 person years of follow-up. There are two cohorts from mainland China (14% of participants), one from Hong Kong (4%), and three from Australia (82%). The mean age of participants at baseline was 54 years, and 48% were female. During a mean follow-up of 6.1 years, a total of 346 strokes (155 fatal) and 601 IHD events (506 fatal) were recorded. The mean (standard deviation) for each anthropometric measure was: BMI 26.2 (4.2) kg/m2; WC 86.4 (12.3) cm; HC 101.0 (8.4) cm; and WHR 0.85 (0.08). The table demon-strates expected variability in anthropometry between the Asian and non-Asian cohorts. Ischaemic heart disease After allowing for age, sex, cohort and smoking, there was a significant log-linear association between each of the anthropometric indices and IHD (Fig. 1). A one SD increase in the index is associated with an increase in risk of total IHD of 17% (95% CI 7-27%) for BMI, 27% (95%
CI 14-40%) for WC, 10% (95% CI 1-20%) for HC, and 36% (95% CI 21-52%) for WHR (Fig. 1). Most fre-quently, the hazard ratios are highest for WHR and WC, and HC consistently has the weakest association. Exa-mination of results by age, sex, and region sub-groups (Fig.1) suggests that associations are stronger in those aged less than 65 years, in males, and in the Australian cohorts. However, the confidence intervals of the hazard ratios within the subgroups overlap so differences may not be statistically significant. The change in likelihood ratio χ2 statistic comparing each anthropometric index with the base model for total IHD is shown (Fig. 1). Overall WHR is the most infor-mative, followed closely by WC. The only exception is for those aged less than 65 years where WC is the better predictor. HC consistently ranks as the least important index, whereas BMI is usually intermediate between HC and WC or WHR. The same patterns were found when analyses were re-stricted to fatal IHD events (data not shown). Sensitivity analyses excluding the first three years of follow-up also produced similar results (data not shown), and demon-strated stronger associations with IHD than those seen in the main analyses, suggesting that pre-existing disease at baseline may have confounded the associations. Exclu-sion of the largest study from the analyses also produced similar results (data not shown), and the associations were again stronger than those seen in the main analyses.
Stroke The association between each of the anthropometric mea-sures and total stroke events is weak, with a one SD in-crease in the index being associated with an increase in the risk of total stroke of 3% (95% CI -9, 16%) for BMI, 5% (95% CI -9, 20%) for WC, 0% (95% CI -11, 13%) for HC and 9% (95% CI -8, 28%) for WHR. No clear asso-ciations between any of the anthropometric measures and stroke were seen across the age, sex, and region sub-groups.
Discussion These analyses demonstrate that while there are clear associations for all measures of obesity with risk of IHD in these Asia Pacific populations, the associations are ty-pically stronger for BMI, WC and WHR than for HC. In particular, WHR and WC, which measure central obesity, have the strongest associations with risk of IHD: a one quarter to one third increase in risk is associated with one SD increase in each index. In contrast, there is no clear association between any of the measures and risk of stroke. The finding that WC and WHR appear to be more important predictors of coronary risk than BMI and HC in these Asia-Pacific populations is consistent with results from European and North American populations. Cohort studies in the United States have found that higher WHR or WC are strongly associated with increased risk of IHD4 in women, and stroke in men.3 Swedish cohort studies have also found that the relationship with acute myo-cardial infarction,6 and stroke and IHD,5 is stronger for WHR than for other anthropometric measures such as BMI and sum of skinfold thicknesses. Similar findings
Asia Pacific Cohort Studies Collaboration 289
Table 1. Characteristics of the study cohorts
Sample Start Mean % Age BMI Size Year Follow-up Females (Years) (kg/m2)
WC (cm) HC (cm) WHR Study name Country
(years) mean SD mean SD mean SD mean SD mean SD
Total Stroke
Total IHD
Anzhen02 China 4 153 1992 2.8 51 47 8 24.0 3.3 80.1 9.3 96.7 6.5 0.83 0.07 16 1
CISCH China 2 163 1992 3.3 51 44 7 24.7 3.5 80.8 9.6 97.0 7.0 0.83 0.09 9 14
Hong Kong Hong Kong 1 872 1991 2.0 50 79 7 22.0 3.8 83.3 10.6 92.7 8.5 0.90 0.07 40 57
Western Australia AAA Screenees Australia 12 192 1996 3.2 0 72 4 26.9 3.7 99.1 10.4 103.2 7.2 0.96 0.06 227 321
Australian National Heart Foundation Australia 9 243 1989 8.2 51 43 13 25.4 4.3 83.3 12.9 100.5 8.7 0.83 0.09 17 76
Melbourne Australia 16 365 1990 8.6 60 55 9 26.8 4.4 85.5 12.9 101.5 8.9 0.84 0.09 37 132
Total or average† 45 988 6.1 48 54 9 26.2 4.2 86.4 12.3 101.0 8.4 0.85 0.08 346 601 BMI=Body mass index, WC=Waist circumference, HC= Hip circumference, WHR=Waist-hip ratio † Weighted by person years of follow-up; Total person years of follow-up=278,680
0.75 1.00 2.00
HCBMIWCWHRAustralia
HCBMIWCWHRAsia
HCBMIWCWHRFemales
HCBMIWCWHRMales
HCBMIWCWHR65+ years
HCBMIWCWHR<65 years
HCBMIWCWHROverall 1.4 (1.2-1.5) 276.0
1.3 (1.1-1.4) 271.31.2 (1.1-1.3) 263.01.1 (1.0-1.2) 255.4
1.6 (1.4-1.8) 36.31.9 (1.6-2.3) 48.91.6 (1.3-1.8) 29.61.4 (1.2-1.6) 18.3
1.2 (1.1-1.3) 8.11.1 (1.0-1.2) 4.21.1 (1.0-1.2) 1.81.0 (0.9-1.1) 0.2
1.2 (1.1-1.3) 196.11.2 (1.1-1.3) 194.21.2 (1.1-1.3) 188.41.1 (1.0-1.2) 182.8
1.3 (1.1-1.5) 87.11.2 (1.0-1.5) 84.31.2 (0.9-1.4) 82.11.1 (0.9-1.3) 80.3
1.2 (1.0-1.5) 2.91.2 (0.9-1.4) 2.01.2 (0.9-1.4) 2.01.0 (0.8-1.2) 0.4
1.4 (1.2-1.6) 275.31.3 (1.1-1.4) 271.01.2 (1.1-1.3) 262.81.1 (1.0-1.2) 257.1
H a z a r d R a t i o s
H a z a r d R a t i o sa n d 9 5 % C I
C h a n g e i nL i k e l i h o o d
R a t i o χ 2
Figure 1. Relationship between anthropometric indices and total ischaemic heart disease events. The hazard ratios for total ischaemic heart disease events are plotted on a log scale, overall and for age (<65 years, 65+years), sex and region (Asia & Australia) subgroups, for each of the following anthropometric indices: body mass index (BMI), waist circumference (WC), hip circumference (HC) and waist-hip ratio (WHR). The hazard ratios are adjusted for age, sex, cohort and smoking, and have been calculated for a one standard deviation increase in each index. The solid squares are larger where there are more events, as their size is proportional to the inverse of the variance, and the horizontal lines represent 95% confidence intervals. The change in likelihood ratio χ2 statistic has been calculated by comparing a model containing each anthropometric index with a model that contained age at risk and smoking, stratified by sex and cohort, but no anthropometric index (the ‘base model’). The greater the change in likelihood ratio χ2 statistic, the greater the increase in goodness of fit or “informativeness” of the index.
290 Central obesity and the risk of cardiovascular disease in the Asia Pacific Region
have been observed in cohort studies that have examined the relationship between various anthropometric measures and risk of diabetes mellitus.13-15 As larger studies have found associations between BMI and risk of stroke,16 and other measures of central obesity and stroke,3,5 the lack of association with risk of stroke seen in these analyses may be due to the small number of stroke events (346) inclu-ded. The higher hazard ratios observed for IHD in Austra-lian versus Asian cohorts was statistically non-significant and is likely to be due to the longer mean follow-up pe-riods (3.2–8.6 years) of the Australian studies. Sensitivity analyses demonstrated that exclusion of the first three years of follow-up strengthened associations between the various anthropometric measures and IHD. The Asian cohorts all had mean follow-up periods of 3.3 years or less, and the attenuated associations seen in these studies may be due to confounding by pre-existing disease at baseline. These analyses have several strengths: they involve a large number of participants, utilize individual participant data, and the anthropometric measures were largely mea-sured rather than self-reported. Most importantly they are based on prospective cohort data rather than cross-sectional data. However, provision of data on anthro-pometric measures was not a requirement for participation in the Collaboration and many cohorts did not collect or provide data on these risk factors. Our analyses were therefore limited to six of the 44 cohorts in the APCSC. As a result, there were a relatively small number of events available for analysis, and it is possible that despite the apparent lack of significant effects by age, sex or region, some important subgroup effect might have been ob-scured. In addition, the current analyses are largely domi-nated by data from the Australian cohorts, which had the larger number of participants, person years of follow-up, and events. Additional data on measures of obesity have been requested from all members of the Collaboration with a view to further analyses. Several risk factors associated with central obesity may account for the increased risk of IHD. These include changes in lipoprotein levels and lipid transport,17 insulin resistance,18 and glucose intolerance and type 2 dia-betes.19 Cross-sectional studies conducted in the Asia Pacific region20,21 have found a continuous relationship between central obesity and cardiovascular risk factors including blood pressure, plasma glucose, plasma lipids, and insulin levels. However, no prospective data from the region have been available until now. Our analyses demonstrate that a one SD increase in BMI, WC or WHR is associated with an increased risk of IHD ranging from 17 to 36%. In practical terms, this equates to a 4.2 kg/m2 increase in BMI, a 12.3 cm in-crease in WC, or an increase in WHR of 0.08. These are substantial increases of the kind that might be expected to take place within a population only over several years. For example, in New Zealand, mean BMI increased by 1.4 kg/m2 in men and 1.9 kg/m2 in women over a period of 26 years (1977 to 2003).22 Based upon our analyses these changes would equate to a subsequent 5% and 7% increase in risk of IHD.
These analyses demonstrate that BMI, WHR, and WC are important measures in predicting risk of IHD in Asia-Pacific populations. In particular, WHR and WC are the strongest anthropometric predictors of IHD, suggesting that central obesity is an important risk factor for IHD in this region. Measures of central obesity should therefore be undertaken routinely along with measurements of ge-neral obesity such as BMI. In situations where time or resources are scarce WHR may be the most appropriate single anthropometric measure of cardiovascular risk. Acknowledgement s The Asia Pacific cohort Studies Collaboration has been supported by grants from the Health Research Council of New Zealand, the National Health and the Medical Research Council of Australia, the US National Institute of Aging (Grant 1-PO1-AG17625), and an unrestricted educational grant from Pfizer Inc. We thank Gary Whitlock, Rachel Huxley, Valery Feigin, Tim Welborn, Konrad Jamrozik and Carlene Lawes for helpful comments on earlier versions of this manuscript. Appendix Asia Pacific Cohort Studies Collaboration Writing Committee: C Ni Mhurchu, V Parag, J Woo, TH Lam, M Woodward, and DA Bennett Statistical analyses: V Parag, RB Lin, S Vander Hoorn, DA Bennett, F Barzi, M Woodward Executive Committee: DF Gu, TH Lam, CMM Lawes, S MacMahon, WH Pan, A Rodgers, I Suh, H Ueshima, M Woodward Participating studies and principal collaborators: Aito Town: A Okayama, H Ueshima; H Maegawa, Akabane: N Aoki, M Nakamura, N Kubo, T Yamada; Anzhen02: ZS Wu; Anzhen: CH Yao, ZS Wu; Australian Longitudinal Study of Ageing: G Andrews; Australian National Heart Foundation: TA Welborn; Beijing Ageing: Z Tang; Beijing Steelworkers: LS Liu, JX Xie; Blood Donors’ Health: R Norton, S Ameratunga, S MacMahon, G Whitlock; Busselton: MW Knuiman; Canberra-Queanbeyan: H. Christensen; Capital Iron and Steel Company: XG Wu; CISCH: J Zhou, XH Yu; Civil Service Workers: A Tamakoshi; CVDFACTS: WH Pan; East Beijing: ZL Wu, LQ Chen, GL Shan; Electricity Generating Authority of Thailand: P Sritara; Fangshan: DF Gu, XF Duan; Fletcher Challenge: S MacMahon, R Norton, G Whitlock, R Jackson; Guangzhou: YH Li; Guangzhou Occupational: TH Lam, CQ Jiang; Hisayama: M Fujishima, Y Kiyohara, H Iwamoto; Hong Kong: J Woo, SC Ho; Huashan: Z Hong, MS Huang, B Zhou; Kinmen: JL Fuh; Konan: H Ueshima, Y Kita, SR Choudhury; KMIC: I Suh, SH Jee, IS Kim; Melbourne: G Giles; Miyama: T Hashimoto, K Sakata; Newcastle: A Dobson; Ohasama: Y Imai, T Ohkubo, A Hozawa; Perth: K Jamrozik, M Hobbs, R Broadhurst; Saitama: K Nakachi; Seven Cities: XH Fang, SC Li, QD Yang; Shanghai Factory Workers: ZM Chen; Shibata: H Tanaka; Shigaraki Town: Y Kita, A Nozaki, H Ueshima; Shirakawa: H Horibe, Y Matsutani, M Kagaya; Singapore Heart: K Hughes, J Lee; Singapore NHS92: D Heng, SK Chew; Six Cohorts: BF Zhou, HY Zhang; Tanno/Soubetsu: K Shimamoto, S Saitoh; Tianjin: ZZ Li, HY Zhang; Western Australia AAA Screenees: P Norman, K Jamrozik; Xi'an: Y He, TH Lam; Yunnan: SX Yao. (The underlined studies provided data used in this paper).
Asia Pacific Cohort Studies Collaboration 291
References 1. Field AE, Coakley EH, Must A, Spadano JL, Laird N,
Dietz WH, Rimm E, Colditz, GA. Impact of overweight on the risk of developing common chronic diseases during a 10-year period. Archives Int Med 2001;161:1581-1586.
2. Willett WC, Manson JE, Stampfer MJ, Colditz GA, Rosner B, Speizer FE, Hennekens, CH. Weight, weight change, and coronary heart disease in women. Risk within the 'normal' weight range. J Am Med Assoc 1995; 273 (6): 461-5.
3. Walker SP, Rimm EB, Ascherio A, Kawachi I, Stampfer MJ, Willett WC. Body size and fat distribution as predictors of stroke among US men. Am J Epidem 1996; 144 (12): 1143-50.
4. Rexrode KM, Carey VJ, Hennekens CH, Walters EE, Colditz GA, Stampfer MJ, Willett WC, Manson JE. Abdo-minal obesity and coronary heart disease in women. J Am Med Assoc 1998; 280 (21): 1843-8.
5. Larsson B, Svardsudd K, Welin L, Wilhelmsen L, Bjorntorp P, Tibblin G. Abdominal tissue distribution, obesity, and risk of cardiovascular disease and death: 13 year follow up of participants in the study of men born in 1913. Br Med J 1984; 288: 1401-4.
6. Lapidus L, Bengtsson C, Larsson B, Pennert K, Rybo E, Sjostrom L. Distribution of adipose tissue and risk of cardiovascular disease and death: a 12 year follow up of participants in the population study of women in Gothen-burg, Sweden. Br Med J 1984; 289:1257-61.
7. Lissner L, Bjorkelund C, Heitmann BL, Seidell JC, Bengtsson C. Larger hip circumference independently pre-dicts health and longevity in a Swedish female cohort. Obesity Research 2001; 9 (10): 644-6.
8. Welborn TA, Dhaliwal SS, Bennett SA. Waist-hip ratio is the dominant risk factor predicting cardiovascular death in Australia. Med J Aust 2003; 179 (11/12): 580-5.
9. Deurenberg-Yap M, Yian TB, Kai CS, Deurenberg P, van Staveren WA. Manifestation of cardiovascular risk factors at low levels of body mass index and waist-to-hip ratio in Singaporean Chinese. Asia Pac J Clin Nutr 1999; 8 (3): 177-83.
10. Ko GTC, Chan JCN, Cockram CS, Woo J. Prediction of hypertension, diabetes, dyslipidaemia or albuminuria using simple anthropometric indexes in Hong Kong Chinese. Int J Obesity 1999; 23 (11): 1136-1142.
11. Asia Pacific Cohort Studies Collaboration. Determinants of cardiovascular disease in the Asian Pacific region: protocol for a collaborative overview of cohort studies. Cardio-vascular Disease Prevention 1999; 2 (4):281-289.
12. Woodward M. Epidemiology: Study Design and Data Analysis. Second ed. Boca Raton: Chapman and Hall/CRC, 2004.
13. Carey VJ, Walters EE, Colditz GA, Solomon CG, Willett
WC, Rosner BA, et al. Body fat distribution and risk of non-insulin-dependent diabetes mellitus in women. Am J Epidem 1997; 145:614-9.
14. Wei M, Gaskill SP, Haffner SM, Stern MP. Waist circumference as the best predictor of noninsulin dependent diabetes mellitus (NIDDM) compared to body mass index, waist/hip ratio and other anthropometric measurements in Mexican Americans - a 7-year prospective study. Obesity Research 1997; 5 (1):16-23.
15. Lundgrun H, Bengtsson C, Blohme G, Lapidus L, Sjostrom L. Adiposity and adipose tissue distributions in relation to incidence of diabetes in women: results from a prospective population study in Gothenburg, Sweden. Int J Obesity 1989; 13:413-23.
16. Asia Pacific Cohort Studies Collaboration (Writing Committee: Ni Mhurchu C, Rodgers A, Pan WH, Gu DF, Woodward M). Body mass index and cardiovascular disease in the Asia-Pacific region: an overview of 33 cohorts involving 310,000 participants. Int J Epidem 2004; 33 (4): 751-758.
17. Despres JP, Moorjani S, Lupien P, Tremblay A, Nadeau A, Bouchard C. Regional distribution of body fat, plasma lipoproteins, and cardiovascular disease. Arteriosclerosis Thrombosis and Vascular Biology 1990; 10 (4): 497-511.
18. Ross R, Freeman J, Hudson R, Janssen I. Abdominal obesity, muscle composition, and insulin resistance in premenopausal women. J Clin Endocrin Metab 2002; 87 (11): 5044-51.
19. Brochu M, Starling RD, Tchernof A, Matthews DE, Garcia-Rubi E, Poehlman ET. Visceral adipose tissue is an independent correlate of glucose disposal in older obese postmenopausal women. J Clin Endocrin Metab 2000; 85 (7): 2378-84.
20. Thomas GN, Ho SY, Lam KSL, Janus ED, Hedley AJ, Lam TH. Impact of obesity and body fat distribution on cardiovascular risk factors in Hong Kong Chinese. Obesity Research 2004; 12 (11): 1805-13.
21. Lin W-Y, Lee L-T, Chen C-Y, Lo H, Hsia H-H, Liu I-L, et al. Optimal cut-off values for obesity: using simple anthro-pometric indices to predict cardiovascular risk factors in Taiwan. Int J Obesity 2002; 26: 1232-8.
22. Ministry of Health. Tracking the obesity epidemic: New Zealand 1997 - 2003. Wellington: Ministry of Health, 2004.
292 Central obesity and the risk of cardiovascular disease in the Asia Pacific Region
Original Article Central obesity and risk of cardiovascular disease in the Asia Pacific Region
Asia Pacific Cohort Studies Collaboration1 亚太地区向心性肥胖与心血管疾病的风险亚太地区向心性肥胖与心血管疾病的风险亚太地区向心性肥胖与心血管疾病的风险亚太地区向心性肥胖与心血管疾病的风险
本论文比较作为亚太地区人口缺血性心脏病和脑卒中危险因子的四项指标:身体质量指数,
腰围,臀围和腰臀比。我们的合并分析包括对 6组人群研究(45988名参与者),使用 Cox比例危险回归法,通过年龄、性别与地域评估以上四项人体测量指标与缺血性心脏病和脑卒
中的相关性。6年中,诊断出 346例脑卒中和 601例缺血性心脏病,其中有致命的也有不致命的。结果显示身体质量指数、腰围,臀围和腰臀比每增加一个标准差,缺血性心脏病危险
度分别增加 17% (95% CI 7-27%)、27% (95% CI 14-40%)、10% (95% CI 1-20%)和 36% (95% CI 21-52%)。而年龄、性别和地区组间没有显著性差异。这四项指标与脑卒中也没有显著相关性。数据显示该地区向心性肥胖的测量如腰围和腰臀比与缺血性心脏病危险度显著相关。
因此我们建议,在计算身体质量指数的同时,腰围和腰臀比要作为向心性肥胖的常规测量指
标。 关键词关键词关键词关键词:肥胖、人体测量学、心血管疾病、亚洲、人群研究。
Asia Pac J Clin Nutr 2006;15 (3):293-299 293
Original Article Defining obesity by body mass index in the Thai population: an epidemiologic study Chatlert Pongchaiyakul MD
1, Tuan V Nguyen PhD2,3, Vongsvat Kosulwat PhD
4, Nipa Rojroongwasinkul MSc
4, Somsri Charoenkiatkul DSc4, Choowong Pongchaiyakul
BSc5, Patara Sanchaisuriya PhD
6 and Rajata Rajatanavin MD7
1Division of Endocrinology and Metabolism, Dept of Medicine, Faculty of Medicine, Khon Kaen University, Khon Kaen, Thailand; 2Garvan Institute of Medical Research; 3University of New South Wales, Sydney, Australia; 4Institute of Nutrition, Salaya Campus, Mahidol University, Bangkok, Thailand; 5Division of Nursing, Srinagarind Hospital, Faculty of Medicine, Khon Kaen University, Khon Kaen, Thailand; 6Department of Nutrition, Faculty of Public Health, Khon Kaen University; 7Division of Endocrinology, Dept of Medicine, Ramathibodi Hospital, Mahidol University, Bangkok, Thailand
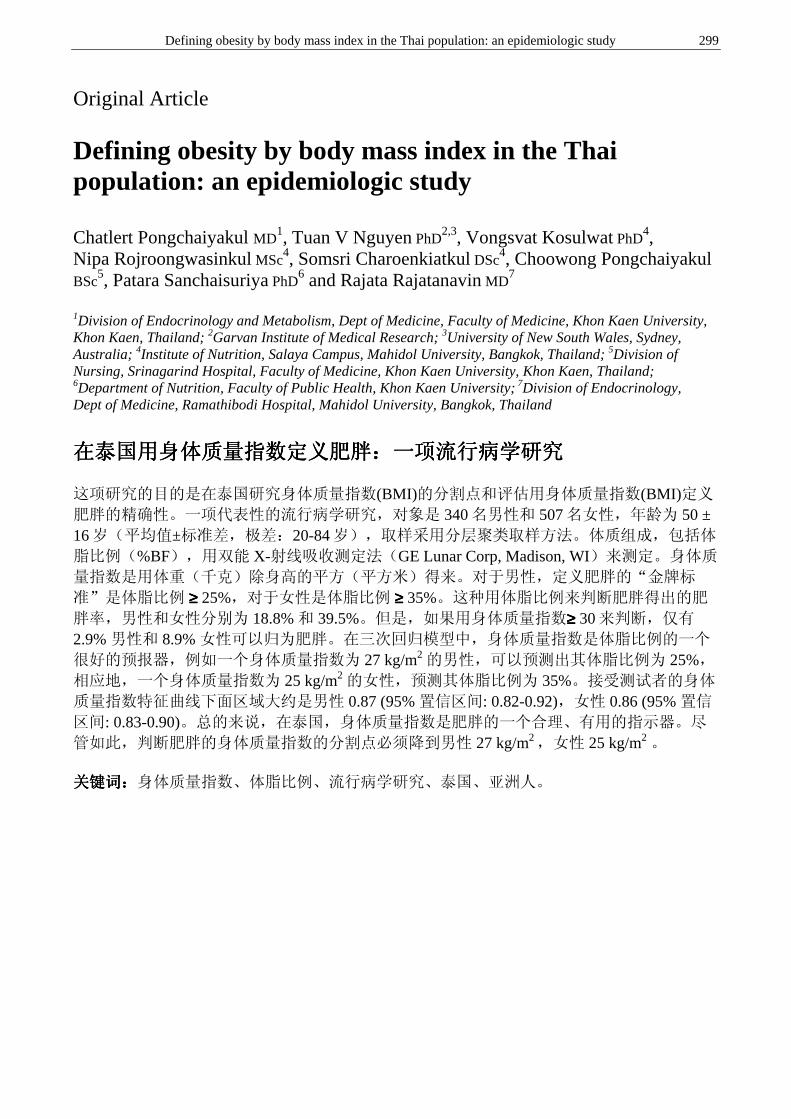
The objective of this study was to develop cut-off values and evaluate the accuracy of body mass index (BMI) in the definition of obesity in the Thai population. A cross-sectional, epidemiologic study in 340 men and 507 women aged 50 ± 16 yr (mean ± SD; range: 20-84 yr), were sampled by stratified clustering sampling method. Body composition, including percentage body fat (%BF), was measured by dual energy X-ray absorptiometry (GE Lunar Corp, Madison, WI). BMI was obtained by dividing weight (in kg) by height (in m2). The “golden standard” for defining obesity was %BF ≥≥≥≥ 25% in men and %BF ≥≥≥≥ 35% in women. The %BF-based prevalence of obesity in men and women was 18.8% and 39.5%, respectively. However, using the BMI cut-off of ≥≥≥≥ 30, only 2.9% of men and 8.9% of women were classified as obese. In the cubic regression model, BMI was a significant predictor of %BF, such that in men a BMI of 27 kg/m2 would predict a %BF of 25%, and in women a BMI of 25 kg/m2 would correspond to a %BF of 35%. The area under the receiver operating characteristic curve for BMI was approximately 0.87 (95% CI: 0.82-0.92) and 0.86 (95% CI: 0.83-0.90) in men and women, respectively. In conclusion, for the Thai population, BMI is a reasonably useful indicator of obesity; however, the cut-off values of BMI for diagnosing obesity should be lowered to 27 kg/m2 in men and 25 kg/m2 in women.
Key Words: BMI, percentage body fat, epidemiology, Thailand, Asian
Introduction Obesity is a complex disorder characterized by an ex-cessively high amount of fat or adipose tissue in the body to the degree that health and well-being are adversely affected.1-5 The disorder is considered one of the most im-portant global threats to human health, because its pre-valence is rapidly increasing in developed as well as in developing countries,6-9 and because it is associated with a range of medical, psychosocial and economic conse-quences.9-11 While anthropometry-based diagnostic cri-teria of obesity have been developed for Caucasian popu-lations, there is currently a lack of accepted and validated diagnostic criteria for the Thai population. Because an excess of body fat is the main charac-teristic of obesity, the “golden standard” for defining the disorder is based on percentage body fat (%BF). In Caucasian populations, the cut-off value of body mass index (BMI) for defining obesity is 30 kg/m2 which corresponds with a percentage body fat (%BF) of over 25% in men and 35% in women.12-14 These criteria were defined on the basis of consideration that higher %BF
increased the risk of mortality, cardiovascular diseases, in-creased blood pressure, and unfavourable lipoprotein pro-file. However, it seems that the Caucasian-based cut-off value is not necessarily applicable to Asian populations, because the relationships between BMI and %BF in Cau-casian and Asian populations are not necessarily identical. For example, Asians are known to have lower BMI but higher %BF than Caucasians.15 Furthermore, measurement of %BF is expensive, requiring sophisticated instruments such as dual-energy X-ray absorptiometry (DXA) densi-tometer, which is scarcely available in developing coun-tries, particularly in primary care setting. Therefore, the development of alternative non-invasive and inexpensive measures of obesity in developing Correspondence address: Dr. Chatlert Pongchaiyakul, Division of Endocrinology and Metabolism, Dept Medicine, Faculty of Medicine, Khon Kaen University, Khon Kaen, Thailand 40002. Tel: 66-43-363664 Fax: 66-43-347542, 66-43-202484 Email: [email protected] Accepted 3rd November 2005
C Pongchaiyakul, TV Nguyen,V Kosulwat, N Rojroongwasinkul,S Charoenkiatkul, C Pongchaiyakul, P Sanchaisuriya, R Rajatanavin
countries is an important research endeavour. Indeed, a recent WHO recent WHO Expert Consultation could not arrive at a specific cut-off value for defining obesity in Asian populations, primarily because of lack of empirical data, and they call for “[F]urther body composition stu-dies are needed”.16 The present study was designed to address this question by (i) first validating the WHO recommended criteria; and (ii) developing new optimal anthropometric criteria for defining obesity in Thai men and women. Subjects and Methods The study was designed as a cross-sectional community-based investigation. The settings were Bangkok city and Khon Kaen province. Bangkok is predominantly an urban centre of Thailand with a population of 5.7 million and lifestyle similar to that in Western cities. Khon Kaen is a rural province with a population of 1.8 million, located 445 km northeast of Bangkok. The sampling technique has been described pre-viously.17 Briefly, subjects were recruited from 14 ham-lets within 2 villages in Muang district of the Khon Kaen province. In each hamlet, a full list of subjects was ob-tained, from which 10 subjects were randomly selected by the village’s administrator. We excluded participants with a history of recent acute illness (e.g. myocardial infarction or pneumonia), chronic conditions (e.g. cancer, chronic infection, collagen vascular disease, hepatic or renal im-pairment, diabetes), history taking of medication affecting body weight (e.g. thyroid hormone, prednisolone, diu-retics) or involvement in weight training. In Bangkok, subjects were recruited via a media campaign, and the sampling technique was similar to the scheme used in Khon Kaen, where subjects were randomly selected from 5 districts within the City of Bangkok. The study was formally approved by the Ethics Committee of Khon Kaen University, and written informed consent was ob-tained from each subject. The study was performed in accordance with the Helsinki Declaration of 1975 as revised in Edinburgh 2000. Anthropometric measurements Body weight (including light indoor clothing) was mea-sured using an electronic balance (accuracy 0.1 kg) and standing height (without shoes) with a stadiometer (nearest 0.1 cm). Body mass index (BMI) was calculated as the ratio of weight (in kg) over height (in m2).
Measures of body composition Body composition, including lean tissue mass and fat mass, was measured by DXA scanner (model DPX-IQ, Lunar Radiation Corp, Madison, WI, USA). The onboard software estimated fat mass, lean tissue mass and %BF based on an extrapolation of fatness from the ratio of soft tissue attenuation of two x-ray energies in pixels not containing bone. Fat mass and lean tissue mass were ex-pressed in kg. Percentage body fat (%BF) was calculated as the percent of fat mass relative to body weight. The coefficient of variation for DXA measures of body com-position was between 3 and 4%.18,19 Statistical analyses Data analysis was performed separately for men and women. By using the WHO recommended criteria, a man was classified as obese if his %BF was equal to or more than 25, while the criterion for women was 35. The pre-valence of obesity was then estimated for each sex. In order to derive an optimal cut-off value of BMI for the diagnosis of obesity in the absence of %BF, a series of re-gression analyses were carried out. In this analysis, % BF was considered the primary outcome variable, while BMI was treated as predictor variable. In each sex, a poly-nomial regression equation for predicting %BF as a linear function of BMI was developed, e.g., %BF = β0+ β1BMI + β2BMI2 + β3BMI3 + … + e, where β0, β1, β2, β3, … are unknown parameters, the random error e is assumed to be normally distributed with mean 0 and a constant variance. The unknown parameters of the polynomial regression equation were estimated by the method of least squares. Because there are several possible polynomial equations, the selection of a “final” equation was based on measures of goodness-of-fit of the equation, such as coefficient of determination (which reflects the amount of variation in %BF that could be explained by BMI), residual mean square error, and residual analyses (to make sure the assumptions of normality, homogeneity and independence were satisfied). Based on the parameter estimates of the final polynomial equation, a BMI value was derived so that the predicted value of %BF is 25% for men and 35% for women. In considering the use of BMI as a surrogate measure of obesity, a number of receiver operating characteristic (ROC) curves were constructed. ROC curve is a gra-phical representation of the trade-off between true po-sitive rate (e.g., sensitivity) and false positive rate (e.g., 1
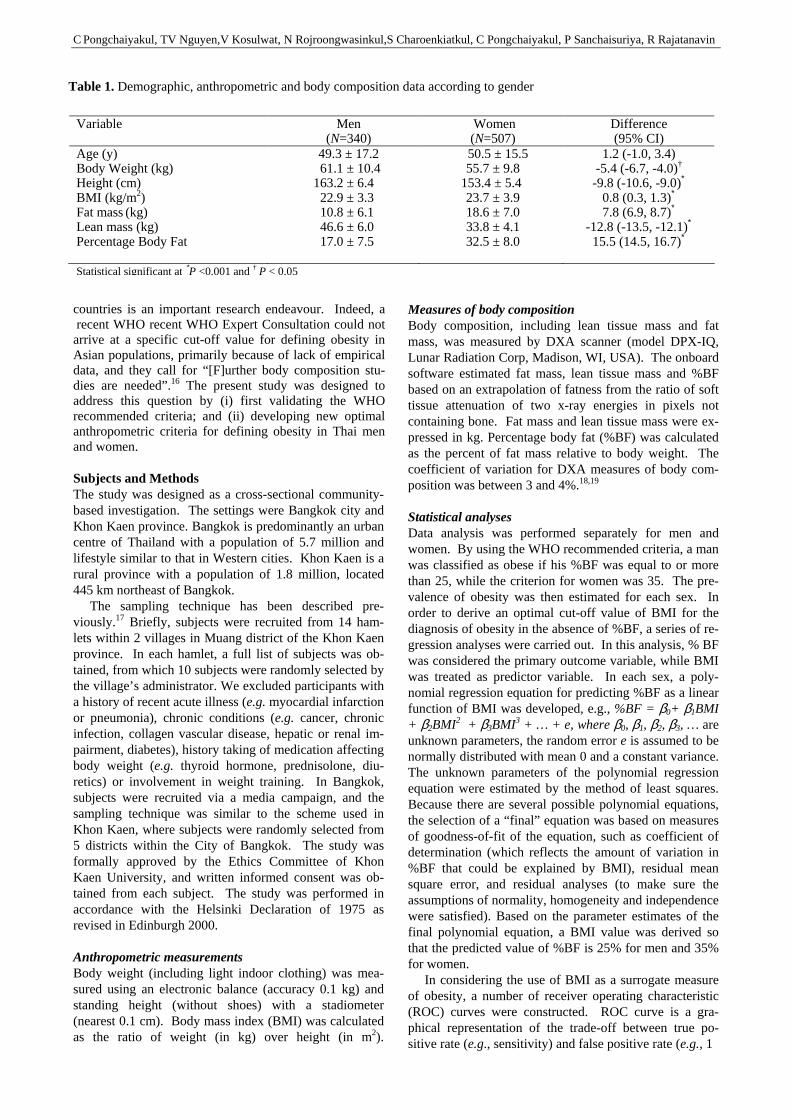
Table 1. Demographic, anthropometric and body composition data according to gender
Variable Men (N=340)
Women (N=507)
Difference (95% CI)
Age (y) Body Weight (kg) Height (cm) BMI (kg/m2) Fat mass (kg) Lean mass (kg) Percentage Body Fat
49.3 ± 17.2 61.1 ± 10.4 163.2 ± 6.4 22.9 ± 3.3 10.8 ± 6.1 46.6 ± 6.0 17.0 ± 7.5
50.5 ± 15.5 55.7 ± 9.8 153.4 ± 5.4 23.7 ± 3.9 18.6 ± 7.0 33.8 ± 4.1 32.5 ± 8.0
1.2 (-1.0, 3.4) -5.4 (-6.7, -4.0)† -9.8 (-10.6, -9.0)∗
0.8 (0.3, 1.3)∗ 7.8 (6.9, 8.7)∗
-12.8 (-13.5, -12.1)∗ 15.5 (14.5, 16.7)∗
Statistical significant at ∗P <0.001 and † P < 0.05
Defining obesity by body mass index in the Thai population: an epidemiologic study 295
minus specificity) of a prediction model. The area under the ROC curve (denoted by AUC) is a measure of accu-racy of a diagnostic test which is, in this case, BMI. Prac-tically, AUC is the probability that a randomly drawn individual from the obese group (defined by %BF) has a greater BMI value than a randomly drawn individual from the non-obese group. This probability is not affected by the prevalence of obesity in the population. Results Characteristics of study sample A total of 340 men and 507 women aged 50 ± 16 yr (mean ± SD; range: 20-84 yr) were included in this study. While the two sexes were comparable in terms of age, men had significantly greater stature, heavier weight, higher percentage of lean mass tissue, but lower BMI, lower %BF, than women (Table 1). There was no evi-dence of skewness in the distribution of %BF or anthro-pometric variables. There was no statistically significant correlation be-tween age and BMI in either men (r = 0.08; P = 0.12) or women (r = 0.07; P = 0.08). However, age was positively correlated with %BF in men (r = 0.30; P < 0.001) and in women (r = 0.14; P = 0.001). As expected, for the same BMI category, women had consistently higher %BF than men. For example, among those with BMI ≥≥≥≥ 25 kg/m2, %BF in women was approximately 16% higher than that in men. The difference was somewhat lower among those with BMI ≥≥≥≥ 30 kg/m2 (Table 2). Prevalence of obesity Using the “golden criteria” (e.g. %BF ≥ 25% for men and %BF ≥ 35% for women), 18.8% of men and 39.5% of
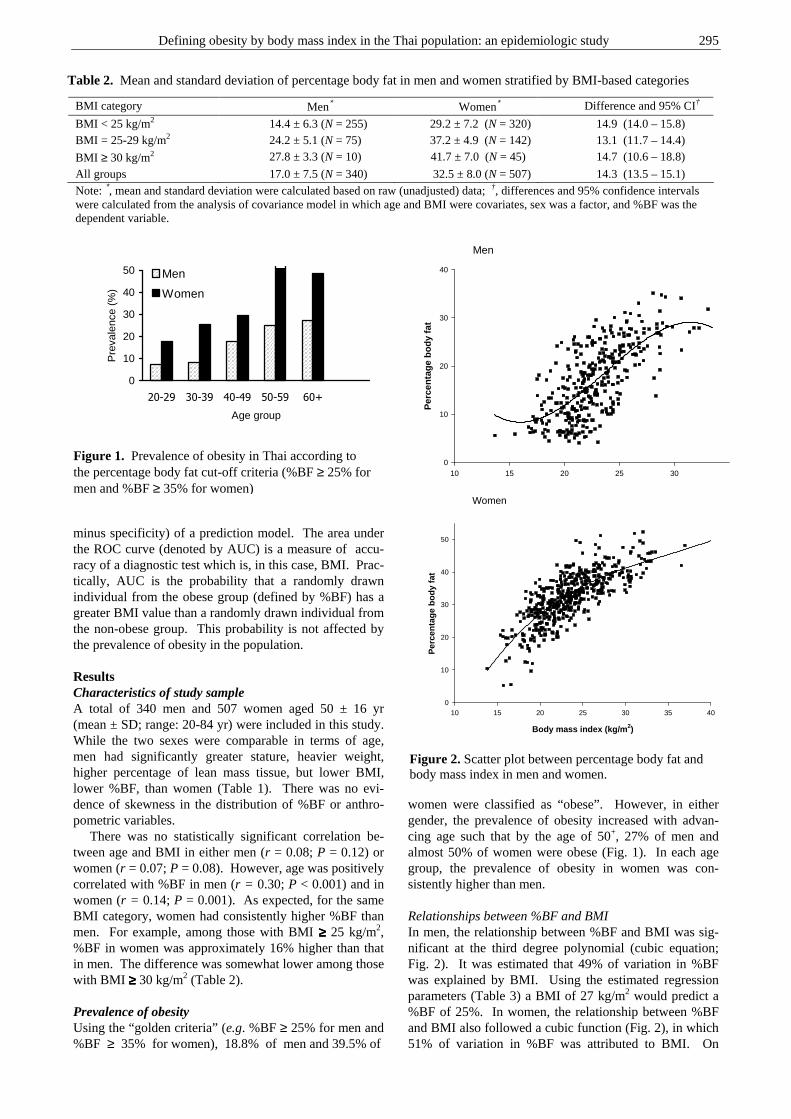
women were classified as “obese”. However, in either gender, the prevalence of obesity increased with advan-cing age such that by the age of 50+, 27% of men and almost 50% of women were obese (Fig. 1). In each age group, the prevalence of obesity in women was con-sistently higher than men. Relationships between %BF and BMI In men, the relationship between %BF and BMI was sig-nificant at the third degree polynomial (cubic equation; Fig. 2). It was estimated that 49% of variation in %BF was explained by BMI. Using the estimated regression parameters (Table 3) a BMI of 27 kg/m2 would predict a %BF of 25%. In women, the relationship between %BF and BMI also followed a cubic function (Fig. 2), in which 51% of variation in %BF was attributed to BMI. On
Table 2. Mean and standard deviation of percentage body fat in men and women stratified by BMI-based categories
BMI category Men∗ Women∗ Difference and 95% CI†
BMI < 25 kg/m2 14.4 ± 6.3 (N = 255) 29.2 ± 7.2 (N = 320) 14.9 (14.0 – 15.8) BMI = 25-29 kg/m2 24.2 ± 5.1 (N = 75) 37.2 ± 4.9 (N = 142) 13.1 (11.7 – 14.4)
BMI ≥ 30 kg/m2 27.8 ± 3.3 (N = 10) 41.7 ± 7.0 (N = 45) 14.7 (10.6 – 18.8)
All groups 17.0 ± 7.5 (N = 340) 32.5 ± 8.0 (N = 507) 14.3 (13.5 – 15.1) Note: ∗, mean and standard deviation were calculated based on raw (unadjusted) data; †, differences and 95% confidence intervals were calculated from the analysis of covariance model in which age and BMI were covariates, sex was a factor, and %BF was the dependent variable.
0
10
20
30
40
50
20-29 30-39 40-49 50-59 60+
Age group
Pre
vale
nce
(%)
Men
Women
Figure 1. Prevalence of obesity in Thai according to the percentage body fat cut-off criteria (%BF ≥ 25% for men and %BF ≥ 35% for women)
Men
10 15 20 25 30
Per
cen
tag
e b
od
y fa
t
0
10
20
30
40
Women
Body mass index (kg/m2)
10 15 20 25 30 35 40
Per
cen
tag
e b
od
y fa
t
0
10
20
30
40
50
Figure 2. Scatter plot between percentage body fat and body mass index in men and women.
C Pongchaiyakul, TV Nguyen,V Kosulwat, N Rojroongwasinkul,S Charoenkiatkul, C Pongchaiyakul, P Sanchaisuriya, R Rajatanavin
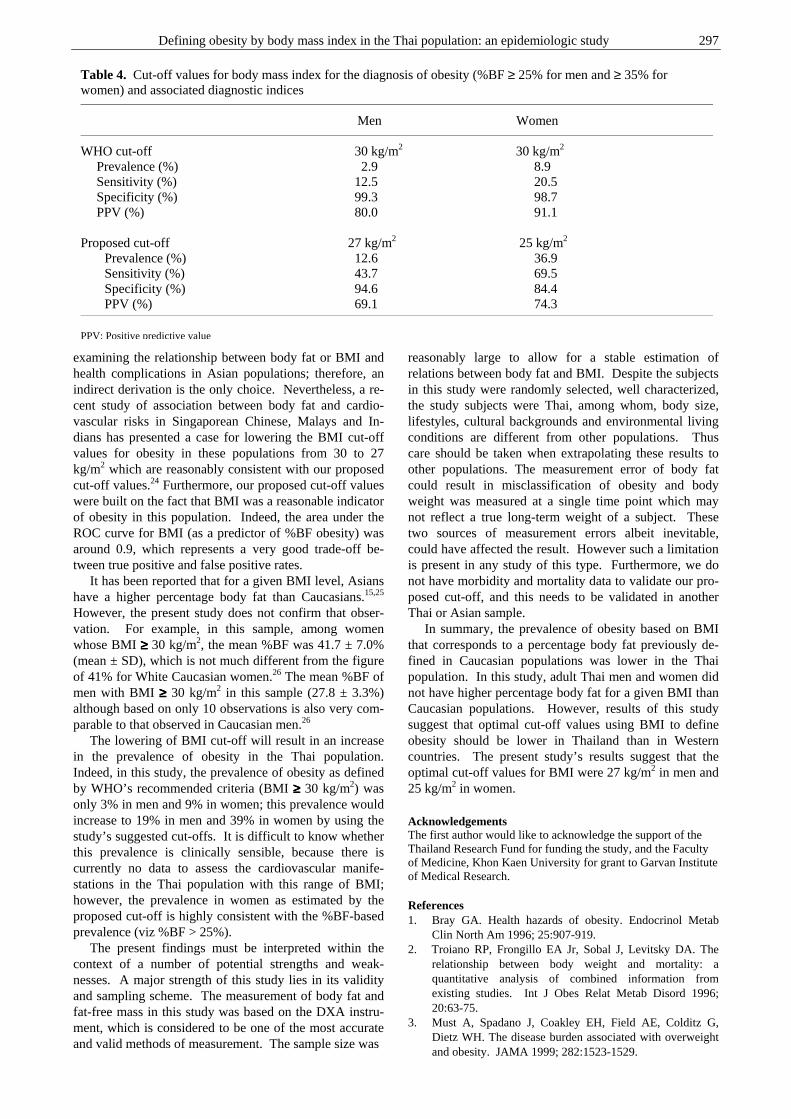
solving the cubic equation, it was estimated that a BMI of 25 kg/m2 would predict a %BF of 35% in women (Table 3). Sensitivity and specificity of BMI In men, using the %BF-based criteria of ≥≥≥≥ 25% the pre-valence of obesity was estimated to be 18.8% (64/340). On the other hand, if BMI levels of ≥≥≥≥ 30 kg /m2 were used, the prevalence of obesity was only 2.9% (or 10/ 340). Therefore, the sensitivity of the BMI criteria was low (12.5%), even with a high specificity of 99.3%.
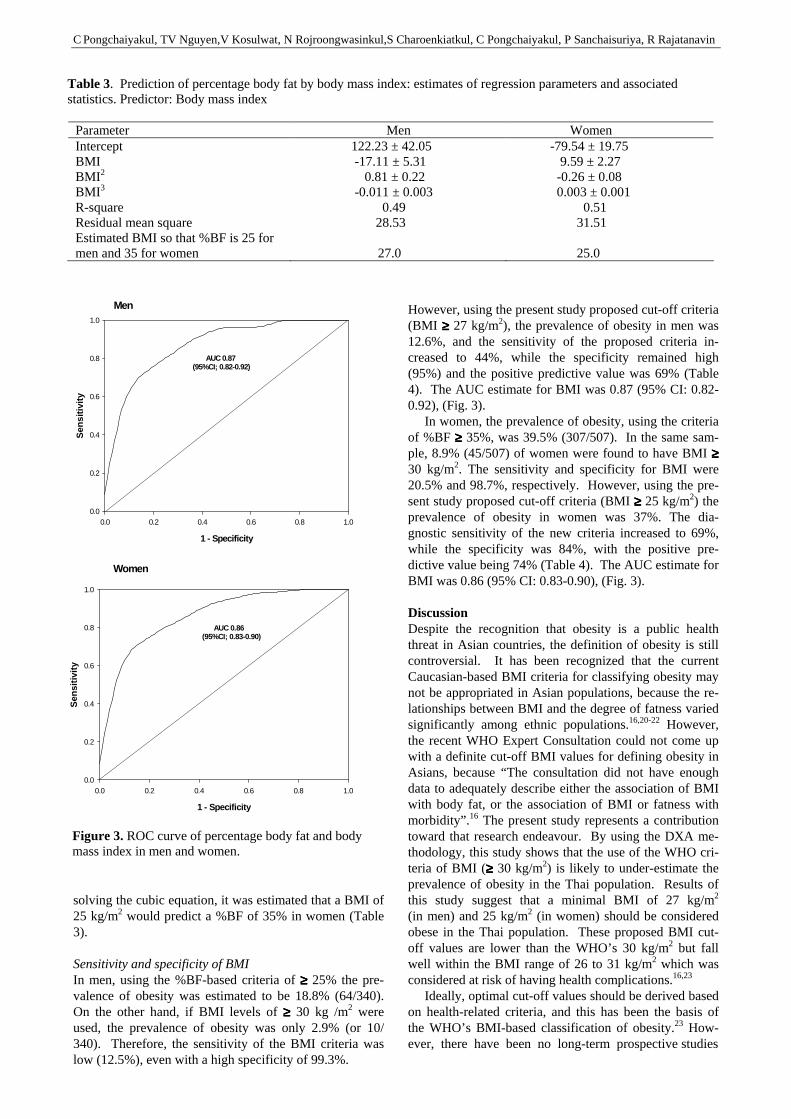
However, using the present study proposed cut-off criteria (BMI ≥≥≥≥ 27 kg/m2), the prevalence of obesity in men was 12.6%, and the sensitivity of the proposed criteria in-creased to 44%, while the specificity remained high (95%) and the positive predictive value was 69% (Table 4). The AUC estimate for BMI was 0.87 (95% CI: 0.82-0.92), (Fig. 3). In women, the prevalence of obesity, using the criteria of %BF ≥≥≥≥ 35%, was 39.5% (307/507). In the same sam-ple, 8.9% (45/507) of women were found to have BMI ≥≥≥≥ 30 kg/m2. The sensitivity and specificity for BMI were 20.5% and 98.7%, respectively. However, using the pre-sent study proposed cut-off criteria (BMI ≥≥≥≥ 25 kg/m2) the prevalence of obesity in women was 37%. The dia-gnostic sensitivity of the new criteria increased to 69%, while the specificity was 84%, with the positive pre-dictive value being 74% (Table 4). The AUC estimate for BMI was 0.86 (95% CI: 0.83-0.90), (Fig. 3). Discussion Despite the recognition that obesity is a public health threat in Asian countries, the definition of obesity is still controversial. It has been recognized that the current Caucasian-based BMI criteria for classifying obesity may not be appropriated in Asian populations, because the re-lationships between BMI and the degree of fatness varied significantly among ethnic populations.16,20-22 However, the recent WHO Expert Consultation could not come up with a definite cut-off BMI values for defining obesity in Asians, because “The consultation did not have enough data to adequately describe either the association of BMI with body fat, or the association of BMI or fatness with morbidity”.16 The present study represents a contribution toward that research endeavour. By using the DXA me-thodology, this study shows that the use of the WHO cri-teria of BMI (≥≥≥≥ 30 kg/m2) is likely to under-estimate the prevalence of obesity in the Thai population. Results of this study suggest that a minimal BMI of 27 kg/m2 (in men) and 25 kg/m2 (in women) should be considered obese in the Thai population. These proposed BMI cut-off values are lower than the WHO’s 30 kg/m2 but fall well within the BMI range of 26 to 31 kg/m2 which was considered at risk of having health complications.16,23 Ideally, optimal cut-off values should be derived based on health-related criteria, and this has been the basis of the WHO’s BMI-based classification of obesity.23 How-ever, there have been no long-term prospective studies
Table 3. Prediction of percentage body fat by body mass index: estimates of regression parameters and associated statistics. Predictor: Body mass index
Parameter Men Women Intercept 122.23 ± 42.05 -79.54 ± 19.75 BMI -17.11 ± 5.31 9.59 ± 2.27 BMI 2 0.81 ± 0.22 -0.26 ± 0.08 BMI 3 -0.011 ± 0.003 0.003 ± 0.001 R-square 0.49 0.51 Residual mean square 28.53 31.51 Estimated BMI so that %BF is 25 for men and 35 for women
27.0
25.0
Men
1 - Specificity
0.0 0.2 0.4 0.6 0.8 1.0
Sen
siti
vity
0.0
0.2
0.4
0.6
0.8
1.0
AUC 0.87(95%CI; 0.82-0.92)
Women
1 - Specificity
0.0 0.2 0.4 0.6 0.8 1.0
Sen
siti
vity
0.0
0.2
0.4
0.6
0.8
1.0
AUC 0.86(95%CI; 0.83-0.90)
Figure 3. ROC curve of percentage body fat and body mass index in men and women.
Defining obesity by body mass index in the Thai population: an epidemiologic study 297
examining the relationship between body fat or BMI and health complications in Asian populations; therefore, an indirect derivation is the only choice. Nevertheless, a re-cent study of association between body fat and cardio-vascular risks in Singaporean Chinese, Malays and In-dians has presented a case for lowering the BMI cut-off values for obesity in these populations from 30 to 27 kg/m2 which are reasonably consistent with our proposed cut-off values.24 Furthermore, our proposed cut-off values were built on the fact that BMI was a reasonable indicator of obesity in this population. Indeed, the area under the ROC curve for BMI (as a predictor of %BF obesity) was around 0.9, which represents a very good trade-off be-tween true positive and false positive rates. It has been reported that for a given BMI level, Asians have a higher percentage body fat than Caucasians.15,25 However, the present study does not confirm that obser-vation. For example, in this sample, among women whose BMI ≥≥≥≥ 30 kg/m2, the mean %BF was 41.7 ± 7.0% (mean ± SD), which is not much different from the figure of 41% for White Caucasian women.26 The mean %BF of men with BMI ≥≥≥≥ 30 kg/m2 in this sample (27.8 ± 3.3%) although based on only 10 observations is also very com-parable to that observed in Caucasian men.26 The lowering of BMI cut-off will result in an increase in the prevalence of obesity in the Thai population. Indeed, in this study, the prevalence of obesity as defined by WHO’s recommended criteria (BMI ≥≥≥≥ 30 kg/m2) was only 3% in men and 9% in women; this prevalence would increase to 19% in men and 39% in women by using the study’s suggested cut-offs. It is difficult to know whether this prevalence is clinically sensible, because there is currently no data to assess the cardiovascular manife-stations in the Thai population with this range of BMI; however, the prevalence in women as estimated by the proposed cut-off is highly consistent with the %BF-based prevalence (viz %BF > 25%). The present findings must be interpreted within the context of a number of potential strengths and weak-nesses. A major strength of this study lies in its validity and sampling scheme. The measurement of body fat and fat-free mass in this study was based on the DXA instru-ment, which is considered to be one of the most accurate and valid methods of measurement. The sample size was
reasonably large to allow for a stable estimation of relations between body fat and BMI. Despite the subjects in this study were randomly selected, well characterized, the study subjects were Thai, among whom, body size, lifestyles, cultural backgrounds and environmental living conditions are different from other populations. Thus care should be taken when extrapolating these results to other populations. The measurement error of body fat could result in misclassification of obesity and body weight was measured at a single time point which may not reflect a true long-term weight of a subject. These two sources of measurement errors albeit inevitable, could have affected the result. However such a limitation is present in any study of this type. Furthermore, we do not have morbidity and mortality data to validate our pro-posed cut-off, and this needs to be validated in another Thai or Asian sample. In summary, the prevalence of obesity based on BMI that corresponds to a percentage body fat previously de-fined in Caucasian populations was lower in the Thai population. In this study, adult Thai men and women did not have higher percentage body fat for a given BMI than Caucasian populations. However, results of this study suggest that optimal cut-off values using BMI to define obesity should be lower in Thailand than in Western countries. The present study’s results suggest that the optimal cut-off values for BMI were 27 kg/m2 in men and 25 kg/m2 in women.
Acknowledgements The first author would like to acknowledge the support of the Thailand Research Fund for funding the study, and the Faculty of Medicine, Khon Kaen University for grant to Garvan Institute of Medical Research. References 1. Bray GA. Health hazards of obesity. Endocrinol Metab
Clin North Am 1996; 25:907-919. 2. Troiano RP, Frongillo EA Jr, Sobal J, Levitsky DA. The
relationship between body weight and mortality: a quantitative analysis of combined information from existing studies. Int J Obes Relat Metab Disord 1996; 20:63-75.
3. Must A, Spadano J, Coakley EH, Field AE, Colditz G, Dietz WH. The disease burden associated with overweight and obesity. JAMA 1999; 282:1523-1529.
Table 4. Cut-off values for body mass index for the diagnosis of obesity (%BF ≥ 25% for men and ≥ 35% for women) and associated diagnostic indices
Men Women
WHO cut-off 30 kg/m2 30 kg/m2 Prevalence (%) 2.9 8.9 Sensitivity (%) 12.5 20.5 Specificity (%) 99.3 98.7 PPV (%) 80.0 91.1
Proposed cut-off 27 kg/m2 25 kg/m2
Prevalence (%) 12.6 36.9 Sensitivity (%) 43.7 69.5 Specificity (%) 94.6 84.4 PPV (%) 69.1 74.3
PPV: Positive predictive value
C Pongchaiyakul, TV Nguyen,V Kosulwat, N Rojroongwasinkul,S Charoenkiatkul, C Pongchaiyakul, P Sanchaisuriya, R Rajatanavin
4. Allison DB, Frontaine KR, Manson JE, Stevens J, VanItallie TB. Annual deaths attributable to obesity in the United States. JAMA 1999; 282:1530-1538.
5. Manson JE, Willet WC, Stampfer MI. Body weight and mortality among women. N Eng J Med 1995; 333:677-685.
6. Flegal KM, Carroll MD, Ogden CL, Johnson CL. Prevalence and trends in obesity among US adults, 1999-2000. JAMA 2002; 288:1723-1727.
7. Hodge AM, Zimmet PZ. The epidemiology of obesiity. Baillieres Clin Endocrinol Metab 1994; 8:577-599.
8. Deitel M. Overweight and obesity worldwide now estimated to involve 1.7 billion people. Obes Surg 2003; 13:329-330.
9. WHO/IASO/IOTF. The Asia-Pacifiic perspective: redefining obesity and its treatment. Health Communications Australia: Melbourne. ISBN 0-9577082-1-1. 2000.
10. Sarlio-Lahteenkorva S, Stunkard A, Rissanen A. Psychosocial factors and quality of life in obesity. Int J Obes Relat Metab Disord 1995; 19(Suppl 6):S1-S5.
11. Colditz GA. Economic costs of obesity. Am J Clin Nutr 1992; 55(Suppl 2):S503-S507.
12. World Health Organization. Obesity. Preventing and managing the global epidemic. Report on a WHO consultant on Obesity, Geneva, 3-5 June, 1997.
13. AACE/ACE Obesity Task Force. AACE/ACE position statement on the prevention, diagnosis, and treatment of obesity. Endocr Pract 1998; 4:297-330.
14. Deurenberg P, Deurenberg-Yap M, van Staveren WA. Body mass index and percent body fat: a meta analysis among different ethnic groups. Int J Obes Relat Metab Disord 1998; 22:1164-1171.
15. Wang J, Thorton JC, Russell M, Burastero S, Heymsfield SB, Pierson RN Jr. Asians have lower body mass index (BMI) but higher percent body fat than do whites: comparisons of anthropometric measurements. Am J Clin Nutr 1994; 60:23-28.
16. WHO Expert Consultation. Appropriate body-mass index for Asian populations and its implications for policy and intervention strategies. Lancet 2004; 363:157-163.
17. Pongchaiyakul C, Kosulwat V, Charoenkiatkul S, Rojroongwasinkul N, Chotmongkol R, , Rajatanavin R. Bone mineral density in rural Thai adults living in Khon Kaen province. J Med Assoc Thai 2002; 85:235-244.
18. Mazess RB, Barden HS, Bisek JP, Hanson J. Dual-energy x-ray absorptiometry for total-body and regional bone-mineral and soft tissue composition. Am J Clin Nutr 1990; 51:1106-1112.
19. Russell-Aulet M, Wang J, Thornton J, Pierson RN Jr. Comparison of dual-photon absorptiometry systems for total-body bone and soft tissue measurements: dual-energy X-rays versus gadolinium 153. J Bone Miner Res 1991; 6:411-415.
20. James WP, Chunming C, Inoue S. Appropriate Asian body mass indices? Obes Rev 2002; 3:139.
21. Deurenberg P, Deurenberg-Yap M, Guricci S. Asians are different from Caucasians and from each other in their body mass index/body fat per cent relationship. Obes Rev 2002; 3:141-146.
22. Gallagher D, Visser M, Sepulveda D, Pierson RN, Harris T, Heymsfield SB. How useful is body mass index for comparison of body fatness across age, sex, and ethnic groups? Am J Epidemiol 1996; 143:228-239.
23. World Health Organization. Physical status: the use and interpretation of anthropometry. Report of a WHO Expert Consultation. Technical Report Series Number 854. Geneva: World Health Organization, 1995.
24. Deurenberg-Yap M, Chew SK, Deurenberg P. Elevated body fat percentage and cardiovascular risks at low body mass index levels among Singaporean Chinese, Malays and Indians. Obes Rev 2002; 3:209-215.
25. Deurenberg P, Yap M, van Staveren WA. Body mass index and percent body fat: a meta analysis among different ethnic groups. Int J Obes Relat Metab Disord 1998; 22:1164-1171.
26. Gallagher D, Heymsfield SB, Heo M, Jebb SA, Murgatroyd PR, Sakamoto Y. Healthy percentage body fat ranges: an approach for developing guidelines based on body mass index. Am J Clin Nutr 2000; 72:694-701.
Defining obesity by body mass index in the Thai population: an epidemiologic study 299
Original Article Defining obesity by body mass index in the Thai population: an epidemiologic study Chatlert Pongchaiyakul MD
1, Tuan V Nguyen PhD2,3, Vongsvat Kosulwat PhD
4, Nipa Rojroongwasinkul MSc
4, Somsri Charoenkiatkul DSc4, Choowong Pongchaiyakul
BSc5, Patara Sanchaisuriya PhD
6 and Rajata Rajatanavin MD7
1Division of Endocrinology and Metabolism, Dept of Medicine, Faculty of Medicine, Khon Kaen University, Khon Kaen, Thailand; 2Garvan Institute of Medical Research; 3University of New South Wales, Sydney, Australia; 4Institute of Nutrition, Salaya Campus, Mahidol University, Bangkok, Thailand; 5Division of Nursing, Srinagarind Hospital, Faculty of Medicine, Khon Kaen University, Khon Kaen, Thailand; 6Department of Nutrition, Faculty of Public Health, Khon Kaen University; 7Division of Endocrinology, Dept of Medicine, Ramathibodi Hospital, Mahidol University, Bangkok, Thailand
在泰国用身体质量指数定义肥胖:一项流行病学研究在泰国用身体质量指数定义肥胖:一项流行病学研究在泰国用身体质量指数定义肥胖:一项流行病学研究在泰国用身体质量指数定义肥胖:一项流行病学研究 这项研究的目的是在泰国研究身体质量指数(BMI)的分割点和评估用身体质量指数(BMI)定义肥胖的精确性。一项代表性的流行病学研究,对象是 340名男性和 507名女性,年龄为 50 ± 16岁(平均值±标准差,极差:20-84岁),取样采用分层聚类取样方法。体质组成,包括体脂比例(%BF),用双能 X-射线吸收测定法(GE Lunar Corp, Madison, WI)来测定。身体质量指数是用体重(千克)除身高的平方(平方米)得来。对于男性,定义肥胖的“金牌标
准”是体脂比例 ≥≥≥≥ 25%,对于女性是体脂比例 ≥≥≥≥ 35%。这种用体脂比例来判断肥胖得出的肥胖率,男性和女性分别为 18.8% 和 39.5%。但是,如果用身体质量指数≥≥≥≥ 30来判断,仅有2.9% 男性和 8.9% 女性可以归为肥胖。在三次回归模型中,身体质量指数是体脂比例的一个很好的预报器,例如一个身体质量指数为 27 kg/m2 的男性,可以预测出其体脂比例为 25%,相应地,一个身体质量指数为 25 kg/m2 的女性,预测其体脂比例为 35%。接受测试者的身体质量指数特征曲线下面区域大约是男性 0.87 (95% 置信区间: 0.82-0.92),女性 0.86 (95% 置信区间: 0.83-0.90)。总的来说,在泰国,身体质量指数是肥胖的一个合理、有用的指示器。尽管如此,判断肥胖的身体质量指数的分割点必须降到男性 27 kg/m2 ,女性 25 kg/m2 。 关键词:关键词:关键词:关键词:身体质量指数、体脂比例、流行病学研究、泰国、亚洲人。

300 Asia Pac J Clin Nutr 2006;15:300-306
Original Article Relation of anthropometric parameters to the functional assessment of HDL particle size in three ethnic cohorts Hamidreza Zakeri MD,1 Jiri J Frohlich MD, 2,3 and Scott A Lear PhD
3,4
1 St. Paul’s Hospital and University of British Columbia, Vancouver, B.C., Canada and Mazandaran Medical Science University, Iran 2 Department of Pathology and Laboratory Medicine, University of British Columbia, Vancouver, Canada 3 Healthy Heart Program, St. Paul's Hospital, Canada 4 School of Kinesiology, Simon Fraser University, Canada
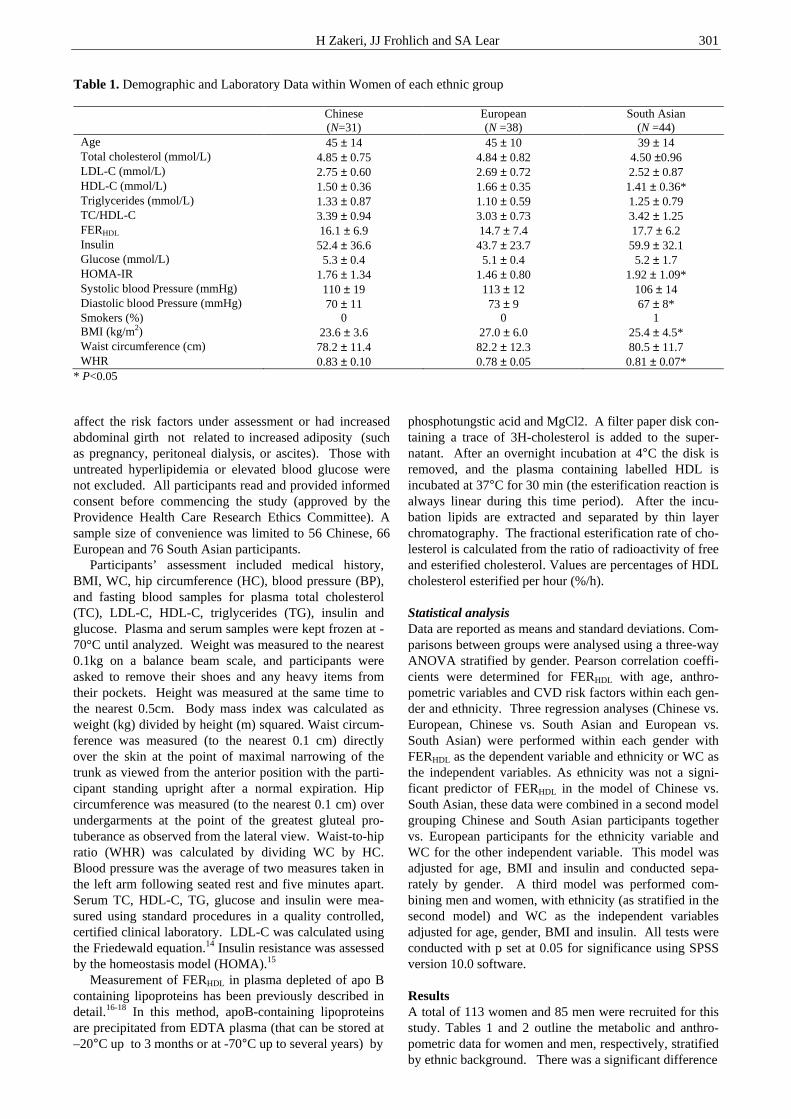
The purpose of this study was to characterize the association between HDL particle size (assessed by fractional esterification rate in apo B depleted plasma (FERHDL)), and anthropometric measures in men and women of Chinese, European and South Asian origin and to determine if ethnic background is a modifier of this relationship. A convenience sample of apparently healthy men and women of Chinese (n=56), European (n=66) or South Asian (n=76) descent were recruited and assessed for body mass index, waist circumference, blood pressure, lipids, insulin, glucose and FERHDL. Univariate correlations with FERHDL were determined within each ethnic–gender group. Regression analysis was used to determine if ethnicity was a significant modifier of the relationship between FERHDL and waist circumference. FERHDL was significantly correlated with various anthropometric measures within the ethnic and gender groups. The relationship between waist circumference and FERHDL was significantly different between the European, and Chinese and South Asian groups combined in women, but not in men. After adjustment for age, body mass index and insulin, ethnicity was no longer a significant predictor. However, ethnic background (European vs. Chinese/South Asian) was a significant predictor (P=0.034) of the relationship between FERHDL and waist circumference adjusted for age, gender, body mass index and insulin in the entire cohort. Increasing adiposity in Chinese and South Asian men and women is associated with a less protective HDL particle profile. Ethnic background (Asian compared to European) is a significant modifier of the relationship between FERHDL and waist circumference.
Key Words: anthropometry; lipoproteins, HDL; Asians
Introduction Obesity, particularly an increase in abdominal fat, is asso-ciated with dyslipidemia, insulin resistance, the metabolic syndrome, diabetes mellitus and an increase in cardio-vascular disease (CVD) risk.1-3 Previous reports have suggested a relationship between the degree of adiosity, insulin resistance and qualitative changes in plasma lipo-proteins, specifically decreased lipoprotein particle size as assessed by gel electrophoresis or nuclear magnetic re-sonance methods.4-8 Of the lipoprotein particles, high den-sity lipoproteins (HDL) are inversely associated with ab-dominal fat and CVD risk.4 However, subclasses of the HDL particles have differing effects with HDL2 having a greater protective effect than does HDL3.9 Our group and others have previously identified that the association between abdominal fat and CVD risk fac-tors differs along ethnic lines, such that individuals of Chi-nese and South Asian origin tend to present with more CVD risk factors at a similar waist circumference (WC) and body mass index (BMI) than those of European origin.10-13 Whether this finding extends to HDL particle size is unknown. The purpose of this study was to charac-erize the association between HDL particle size (using a functional assay of the fractional esterification rate in apo
B depleted plasma (FERHDL)), and BMI and WC in men and women of Chinese, European and South Asian origin and to determine if ethnic background is a modifier of this relationship.
Materials and methods
The participants were recruited from staff, students, volun-teers and their friends of three local hospitals and the surrounding communities. Apparently healthy subjects were eligible if they were over 18 years of age and either of Chinese, European or South Asian descent. Ethnicity was determined by interview; only those individuals who re-ported having all known ancestors exclusively of either European, Chinese or South Asian descent were invited to participate. Participants were excluded if they had a history of either diabetes, CVD, taking medications that would Correspondence address: Dr Scott A. Lear, Healthy Heart Program, St. Paul's Hospital 180 – 1081 Burrard St, Vancouver, BC, CanadaV6Z 1Y6 Tel: (604) 682-2344 ext. 62778; Fax: (604) 806-8590 [email protected]
Accepted 12th December 2005
H Zakeri, JJ Frohlich and SA Lear 301
affect the risk factors under assessment or had increased abdominal girth not related to increased adiposity (such as pregnancy, peritoneal dialysis, or ascites). Those with untreated hyperlipidemia or elevated blood glucose were not excluded. All participants read and provided informed consent before commencing the study (approved by the Providence Health Care Research Ethics Committee). A sample size of convenience was limited to 56 Chinese, 66 European and 76 South Asian participants. Participants’ assessment included medical history, BMI, WC, hip circumference (HC), blood pressure (BP), and fasting blood samples for plasma total cholesterol (TC), LDL-C, HDL-C, triglycerides (TG), insulin and glucose. Plasma and serum samples were kept frozen at -70°C until analyzed. Weight was measured to the nearest 0.1kg on a balance beam scale, and participants were asked to remove their shoes and any heavy items from their pockets. Height was measured at the same time to the nearest 0.5cm. Body mass index was calculated as weight (kg) divided by height (m) squared. Waist circum-ference was measured (to the nearest 0.1 cm) directly over the skin at the point of maximal narrowing of the trunk as viewed from the anterior position with the parti-cipant standing upright after a normal expiration. Hip circumference was measured (to the nearest 0.1 cm) over undergarments at the point of the greatest gluteal pro-tuberance as observed from the lateral view. Waist-to-hip ratio (WHR) was calculated by dividing WC by HC. Blood pressure was the average of two measures taken in the left arm following seated rest and five minutes apart. Serum TC, HDL-C, TG, glucose and insulin were mea-sured using standard procedures in a quality controlled, certified clinical laboratory. LDL-C was calculated using the Friedewald equation.14 Insulin resistance was assessed by the homeostasis model (HOMA).15 Measurement of FERHDL in plasma depleted of apo B containing lipoproteins has been previously described in detail.16-18 In this method, apoB-containing lipoproteins are precipitated from EDTA plasma (that can be stored at –20°C up to 3 months or at -70°C up to several years) by
phosphotungstic acid and MgCl2. A filter paper disk con-taining a trace of 3H-cholesterol is added to the super-natant. After an overnight incubation at 4°C the disk is removed, and the plasma containing labelled HDL is incubated at 37°C for 30 min (the esterification reaction is always linear during this time period). After the incu-bation lipids are extracted and separated by thin layer chromatography. The fractional esterification rate of cho-lesterol is calculated from the ratio of radioactivity of free and esterified cholesterol. Values are percentages of HDL cholesterol esterified per hour (%/h). Statistical analysis Data are reported as means and standard deviations. Com-parisons between groups were analysed using a three-way ANOVA stratified by gender. Pearson correlation coeffi-cients were determined for FERHDL with age, anthro-pometric variables and CVD risk factors within each gen-der and ethnicity. Three regression analyses (Chinese vs. European, Chinese vs. South Asian and European vs. South Asian) were performed within each gender with FERHDL as the dependent variable and ethnicity or WC as the independent variables. As ethnicity was not a signi-ficant predictor of FERHDL in the model of Chinese vs. South Asian, these data were combined in a second model grouping Chinese and South Asian participants together vs. European participants for the ethnicity variable and WC for the other independent variable. This model was adjusted for age, BMI and insulin and conducted sepa-rately by gender. A third model was performed com-bining men and women, with ethnicity (as stratified in the second model) and WC as the independent variables adjusted for age, gender, BMI and insulin. All tests were conducted with p set at 0.05 for significance using SPSS version 10.0 software. Results A total of 113 women and 85 men were recruited for this study. Tables 1 and 2 outline the metabolic and anthro-pometric data for women and men, respectively, stratified by ethnic background. There was a significant difference
Table 1. Demographic and Laboratory Data within Women of each ethnic group
Chinese (N=31)
European (N =38)
South Asian (N =44)
Age 45 ± 14 45 ± 10 39 ± 14 Total cholesterol (mmol/L) 4.85 ± 0.75 4.84 ± 0.82 4.50 ±0.96 LDL-C (mmol/L) 2.75 ± 0.60 2.69 ± 0.72 2.52 ± 0.87 HDL-C (mmol/L) 1.50 ± 0.36 1.66 ± 0.35 1.41 ± 0.36* Triglycerides (mmol/L) 1.33 ± 0.87 1.10 ± 0.59 1.25 ± 0.79 TC/HDL-C 3.39 ± 0.94 3.03 ± 0.73 3.42 ± 1.25 FERHDL 16.1 ± 6.9 14.7 ± 7.4 17.7 ± 6.2 Insulin 52.4 ± 36.6 43.7 ± 23.7 59.9 ± 32.1 Glucose (mmol/L) 5.3 ± 0.4 5.1 ± 0.4 5.2 ± 1.7 HOMA-IR 1.76 ± 1.34 1.46 ± 0.80 1.92 ± 1.09* Systolic blood Pressure (mmHg) 110 ± 19 113 ± 12 106 ± 14 Diastolic blood Pressure (mmHg) 70 ± 11 73 ± 9 67 ± 8* Smokers (%) 0 0 1 BMI (kg/m2) 23.6 ± 3.6 27.0 ± 6.0 25.4 ± 4.5* Waist circumference (cm) 78.2 ± 11.4 82.2 ± 12.3 80.5 ± 11.7 WHR 0.83 ± 0.10 0.78 ± 0.05 0.81 ± 0.07*
* P<0.05
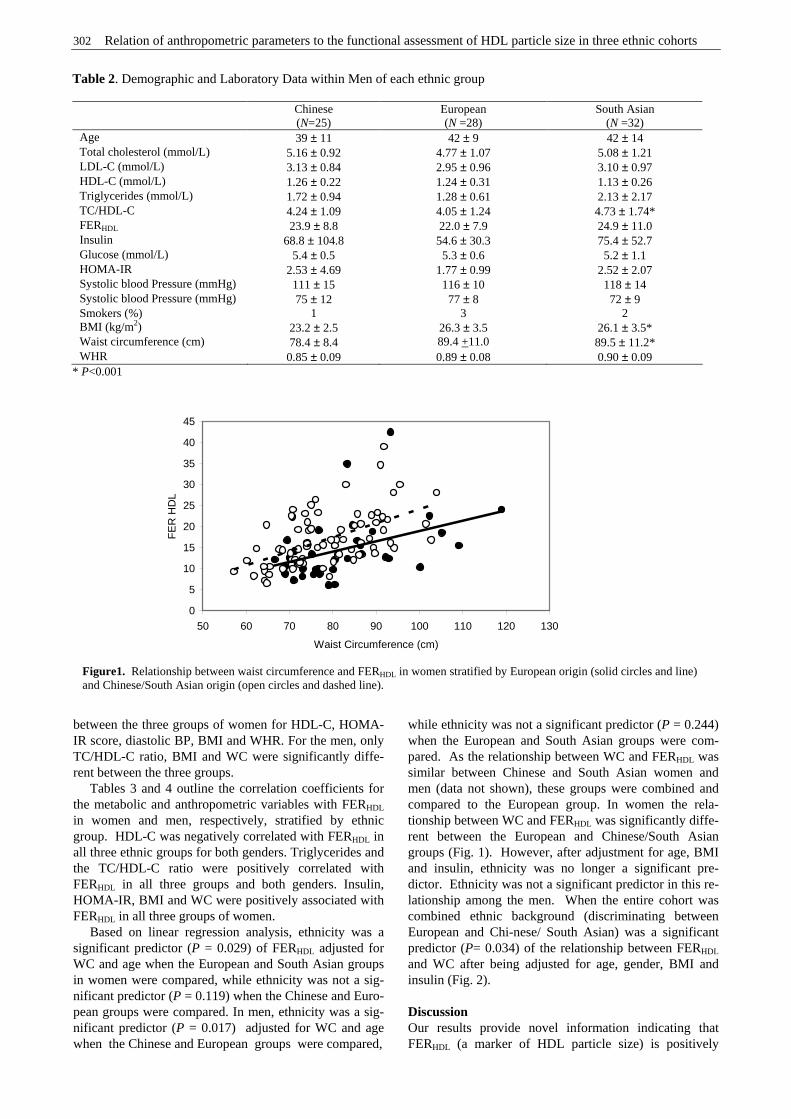
302 Relation of anthropometric parameters to the functional assessment of HDL particle size in three ethnic cohorts
between the three groups of women for HDL-C, HOMA-IR score, diastolic BP, BMI and WHR. For the men, only TC/HDL-C ratio, BMI and WC were significantly diffe-rent between the three groups. Tables 3 and 4 outline the correlation coefficients for the metabolic and anthropometric variables with FERHDL in women and men, respectively, stratified by ethnic group. HDL-C was negatively correlated with FERHDL in all three ethnic groups for both genders. Triglycerides and the TC/HDL-C ratio were positively correlated with FERHDL in all three groups and both genders. Insulin, HOMA-IR, BMI and WC were positively associated with FERHDL in all three groups of women. Based on linear regression analysis, ethnicity was a significant predictor (P = 0.029) of FERHDL adjusted for WC and age when the European and South Asian groups in women were compared, while ethnicity was not a sig-nificant predictor (P = 0.119) when the Chinese and Euro-pean groups were compared. In men, ethnicity was a sig-nificant predictor (P = 0.017) adjusted for WC and age when the Chinese and European groups were compared,
while ethnicity was not a significant predictor (P = 0.244) when the European and South Asian groups were com-pared. As the relationship between WC and FERHDL was similar between Chinese and South Asian women and men (data not shown), these groups were combined and compared to the European group. In women the rela-tionship between WC and FERHDL was significantly diffe-rent between the European and Chinese/South Asian groups (Fig. 1). However, after adjustment for age, BMI and insulin, ethnicity was no longer a significant pre-dictor. Ethnicity was not a significant predictor in this re-lationship among the men. When the entire cohort was combined ethnic background (discriminating between European and Chi-nese/ South Asian) was a significant predictor (P= 0.034) of the relationship between FERHDL and WC after being adjusted for age, gender, BMI and insulin (Fig. 2). Discussion Our results provide novel information indicating that FERHDL (a marker of HDL particle size) is positively
Table 2. Demographic and Laboratory Data within Men of each ethnic group
Chinese (N=25)
European (N =28)
South Asian (N =32)
Age 39 ± 11 42 ± 9 42 ± 14 Total cholesterol (mmol/L) 5.16 ± 0.92 4.77 ± 1.07 5.08 ± 1.21 LDL-C (mmol/L) 3.13 ± 0.84 2.95 ± 0.96 3.10 ± 0.97 HDL-C (mmol/L) 1.26 ± 0.22 1.24 ± 0.31 1.13 ± 0.26 Triglycerides (mmol/L) 1.72 ± 0.94 1.28 ± 0.61 2.13 ± 2.17 TC/HDL-C 4.24 ± 1.09 4.05 ± 1.24 4.73 ± 1.74* FERHDL 23.9 ± 8.8 22.0 ± 7.9 24.9 ± 11.0 Insulin 68.8 ± 104.8 54.6 ± 30.3 75.4 ± 52.7 Glucose (mmol/L) 5.4 ± 0.5 5.3 ± 0.6 5.2 ± 1.1 HOMA-IR 2.53 ± 4.69 1.77 ± 0.99 2.52 ± 2.07 Systolic blood Pressure (mmHg) 111 ± 15 116 ± 10 118 ± 14 Systolic blood Pressure (mmHg) 75 ± 12 77 ± 8 72 ± 9 Smokers (%) 1 3 2 BMI (kg/m2) 23.2 ± 2.5 26.3 ± 3.5 26.1 ± 3.5* Waist circumference (cm) 78.4 ± 8.4 89.4 +11.0 89.5 ± 11.2* WHR 0.85 ± 0.09 0.89 ± 0.08 0.90 ± 0.09
* P<0.001
0
5
10
15
20
25
30
35
40
45
50 60 70 80 90 100 110 120 130
Waist Circumference (cm)
FE
R H
DL
Figure1. Relationship between waist circumference and FERHDL in women stratified by European origin (solid circles and line) and Chinese/South Asian origin (open circles and dashed line).
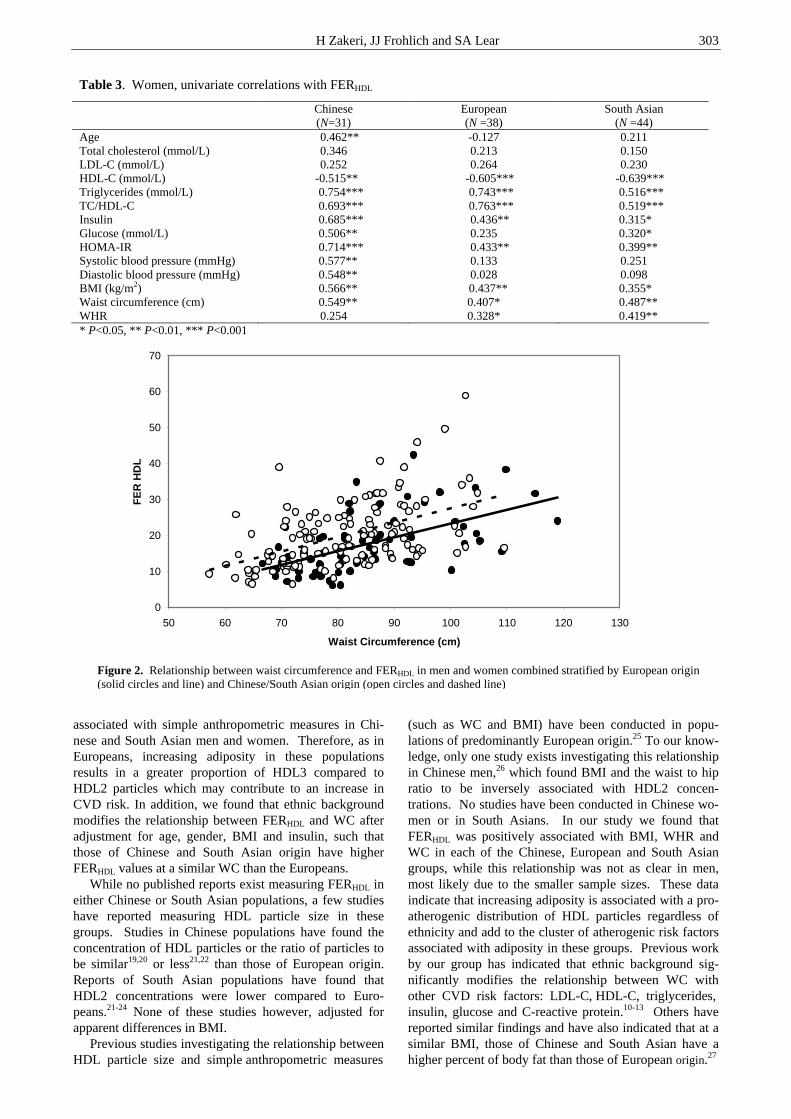
H Zakeri, JJ Frohlich and SA Lear 303
associated with simple anthropometric measures in Chi-nese and South Asian men and women. Therefore, as in Europeans, increasing adiposity in these populations results in a greater proportion of HDL3 compared to HDL2 particles which may contribute to an increase in CVD risk. In addition, we found that ethnic background modifies the relationship between FERHDL and WC after adjustment for age, gender, BMI and insulin, such that those of Chinese and South Asian origin have higher FERHDL values at a similar WC than the Europeans. While no published reports exist measuring FERHDL in either Chinese or South Asian populations, a few studies have reported measuring HDL particle size in these groups. Studies in Chinese populations have found the concentration of HDL particles or the ratio of particles to be similar19,20 or less21,22 than those of European origin. Reports of South Asian populations have found that HDL2 concentrations were lower compared to Euro-peans.21-24 None of these studies however, adjusted for apparent differences in BMI. Previous studies investigating the relationship between HDL particle size and simple anthropometric measures
(such as WC and BMI) have been conducted in popu-lations of predominantly European origin.25 To our know-ledge, only one study exists investigating this relationship in Chinese men,26 which found BMI and the waist to hip ratio to be inversely associated with HDL2 concen-trations. No studies have been conducted in Chinese wo-men or in South Asians. In our study we found that FERHDL was positively associated with BMI, WHR and WC in each of the Chinese, European and South Asian groups, while this relationship was not as clear in men, most likely due to the smaller sample sizes. These data indicate that increasing adiposity is associated with a pro-atherogenic distribution of HDL particles regardless of ethnicity and add to the cluster of atherogenic risk factors associated with adiposity in these groups. Previous work by our group has indicated that ethnic background sig-nificantly modifies the relationship between WC with other CVD risk factors: LDL-C, HDL-C, triglycerides, insulin, glucose and C-reactive protein.10-13 Others have reported similar findings and have also indicated that at a similar BMI, those of Chinese and South Asian have a higher percent of body fat than those of European origin.27
Table 3. Women, univariate correlations with FERHDL
Chinese (N=31)
European (N =38)
South Asian (N =44)
Age 0.462** -0.127 0.211 Total cholesterol (mmol/L) 0.346 0.213 0.150 LDL-C (mmol/L) 0.252 0.264 0.230 HDL-C (mmol/L) -0.515** -0.605*** -0.639*** Triglycerides (mmol/L) 0.754*** 0.743*** 0.516*** TC/HDL-C 0.693*** 0.763*** 0.519*** Insulin 0.685*** 0.436** 0.315* Glucose (mmol/L) 0.506** 0.235 0.320* HOMA-IR 0.714*** 0.433** 0.399** Systolic blood pressure (mmHg) 0.577** 0.133 0.251 Diastolic blood pressure (mmHg) 0.548** 0.028 0.098 BMI (kg/m2) 0.566** 0.437** 0.355* Waist circumference (cm) 0.549** 0.407* 0.487** WHR 0.254 0.328* 0.419** * P<0.05, ** P<0.01, *** P<0.001
0
10
20
30
40
50
60
70
50 60 70 80 90 100 110 120 130
Waist Circumference (cm)
FE
R H
DL
Figure 2. Relationship between waist circumference and FERHDL in men and women combined stratified by European origin (solid circles and line) and Chinese/South Asian origin (open circles and dashed line)
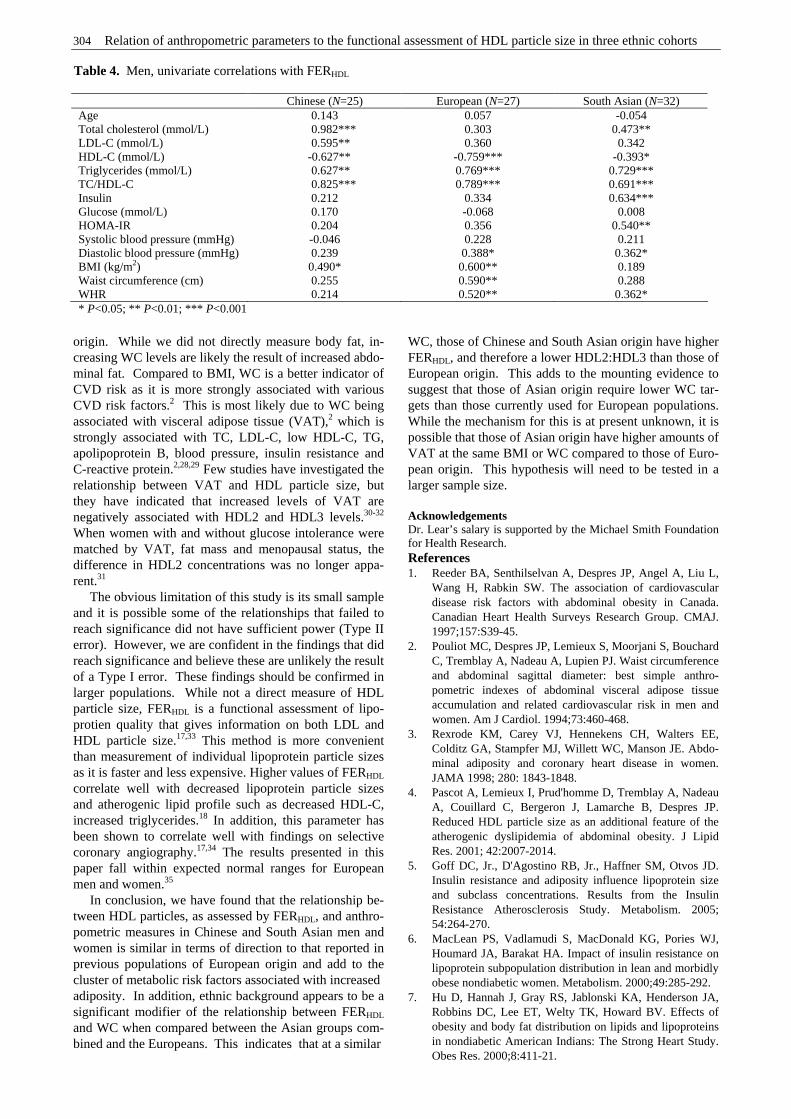
304 Relation of anthropometric parameters to the functional assessment of HDL particle size in three ethnic cohorts
origin. While we did not directly measure body fat, in-creasing WC levels are likely the result of increased abdo-minal fat. Compared to BMI, WC is a better indicator of CVD risk as it is more strongly associated with various CVD risk factors.2 This is most likely due to WC being associated with visceral adipose tissue (VAT),2 which is strongly associated with TC, LDL-C, low HDL-C, TG, apolipoprotein B, blood pressure, insulin resistance and C-reactive protein.2,28,29 Few studies have investigated the relationship between VAT and HDL particle size, but they have indicated that increased levels of VAT are negatively associated with HDL2 and HDL3 levels.30-32 When women with and without glucose intolerance were matched by VAT, fat mass and menopausal status, the difference in HDL2 concentrations was no longer appa-rent.31 The obvious limitation of this study is its small sample and it is possible some of the relationships that failed to reach significance did not have sufficient power (Type II error). However, we are confident in the findings that did reach significance and believe these are unlikely the result of a Type I error. These findings should be confirmed in larger populations. While not a direct measure of HDL particle size, FERHDL is a functional assessment of lipo-protien quality that gives information on both LDL and HDL particle size.17,33 This method is more convenient than measurement of individual lipoprotein particle sizes as it is faster and less expensive. Higher values of FERHDL correlate well with decreased lipoprotein particle sizes and atherogenic lipid profile such as decreased HDL-C, increased triglycerides.18 In addition, this parameter has been shown to correlate well with findings on selective coronary angiography.17,34 The results presented in this paper fall within expected normal ranges for European men and women.35 In conclusion, we have found that the relationship be-tween HDL particles, as assessed by FERHDL, and anthro-pometric measures in Chinese and South Asian men and women is similar in terms of direction to that reported in previous populations of European origin and add to the cluster of metabolic risk factors associated with increased adiposity. In addition, ethnic background appears to be a significant modifier of the relationship between FERHDL and WC when compared between the Asian groups com-bined and the Europeans. This indicates that at a similar
WC, those of Chinese and South Asian origin have higher FERHDL, and therefore a lower HDL2:HDL3 than those of European origin. This adds to the mounting evidence to suggest that those of Asian origin require lower WC tar-gets than those currently used for European populations. While the mechanism for this is at present unknown, it is possible that those of Asian origin have higher amounts of VAT at the same BMI or WC compared to those of Euro-pean origin. This hypothesis will need to be tested in a larger sample size. Acknowledgements Dr. Lear’s salary is supported by the Michael Smith Foundation for Health Research. References 1. Reeder BA, Senthilselvan A, Despres JP, Angel A, Liu L,
Wang H, Rabkin SW. The association of cardiovascular disease risk factors with abdominal obesity in Canada. Canadian Heart Health Surveys Research Group. CMAJ. 1997;157:S39-45.
2. Pouliot MC, Despres JP, Lemieux S, Moorjani S, Bouchard C, Tremblay A, Nadeau A, Lupien PJ. Waist circumference and abdominal sagittal diameter: best simple anthro-pometric indexes of abdominal visceral adipose tissue accumulation and related cardiovascular risk in men and women. Am J Cardiol. 1994;73:460-468.
3. Rexrode KM, Carey VJ, Hennekens CH, Walters EE, Colditz GA, Stampfer MJ, Willett WC, Manson JE. Abdo-minal adiposity and coronary heart disease in women. JAMA 1998; 280: 1843-1848.
4. Pascot A, Lemieux I, Prud'homme D, Tremblay A, Nadeau A, Couillard C, Bergeron J, Lamarche B, Despres JP. Reduced HDL particle size as an additional feature of the atherogenic dyslipidemia of abdominal obesity. J Lipid Res. 2001; 42:2007-2014.
5. Goff DC, Jr., D'Agostino RB, Jr., Haffner SM, Otvos JD. Insulin resistance and adiposity influence lipoprotein size and subclass concentrations. Results from the Insulin Resistance Atherosclerosis Study. Metabolism. 2005; 54:264-270.
6. MacLean PS, Vadlamudi S, MacDonald KG, Pories WJ, Houmard JA, Barakat HA. Impact of insulin resistance on lipoprotein subpopulation distribution in lean and morbidly obese nondiabetic women. Metabolism. 2000;49:285-292.
7. Hu D, Hannah J, Gray RS, Jablonski KA, Henderson JA, Robbins DC, Lee ET, Welty TK, Howard BV. Effects of obesity and body fat distribution on lipids and lipoproteins in nondiabetic American Indians: The Strong Heart Study. Obes Res. 2000;8:411-21.
Table 4. Men, univariate correlations with FERHDL
Chinese (N=25) European (N=27) South Asian (N=32) Age 0.143 0.057 -0.054 Total cholesterol (mmol/L) 0.982*** 0.303 0.473** LDL-C (mmol/L) 0.595** 0.360 0.342 HDL-C (mmol/L) -0.627** -0.759*** -0.393* Triglycerides (mmol/L) 0.627** 0.769*** 0.729*** TC/HDL-C 0.825*** 0.789*** 0.691*** Insulin 0.212 0.334 0.634*** Glucose (mmol/L) 0.170 -0.068 0.008 HOMA-IR 0.204 0.356 0.540** Systolic blood pressure (mmHg) -0.046 0.228 0.211 Diastolic blood pressure (mmHg) 0.239 0.388* 0.362* BMI (kg/m2) 0.490* 0.600** 0.189 Waist circumference (cm) 0.255 0.590** 0.288 WHR 0.214 0.520** 0.362* * P<0.05; ** P<0.01; *** P<0.001
H Zakeri, JJ Frohlich and SA Lear 305
8. Sattar N, Tan CE, Han TS, Forster L, Lean ME, Shepherd J, Packard CJ. Associations of indices of adiposity with atherogenic lipoprotein subfractions. Int J Obes Relat Metab Disord. 1998;22:432-439.
9. Lamarche B, Moorjani S, Cantin B, Dagenais GR, Lupien PJ, Despres JP. Associations of HDL2 and HDL3 subfractions with ischemic heart disease in men. Prospective results from the Quebec Cardiovascular Study. Arterioscler Thromb Vasc Biol. 1997;17:1098-1105.
10. Lear SA, Chen MM, Frohlich JJ, Birmingham CL. The relationship between waist circumference and metabolic risk factors: Cohorts of European and Chinese descent. Metabolism. 2002;51:1427-1432.
11. Lear SA, Toma M, Birmingham CL, Frohlich JJ. Modification of the relationship between simple anthropometric indices and risk factors by ethnic background. Metabolism. 2003;52:1295-1301.
12. Patel S, Unwin N, Bhopal R, White M, Harland J, Ayis SA, Watson W, Alberti KG. A comparison of proxy measures of abdominal obesity in Chinese, European and South Asian adults. Diabet Med. 1999;16:853-860.
13. Razak F, Anand S, Vuksan V, Davis B, Jacobs R, Teo KK, Yusuf S. Ethnic differences in the relationships between obesity and glucose-metabolic abnormalities: a cross-sectional population-based study. Int J Obes Relat Metab Disord. 2005;29:656-667.
14. Friedewald WT, Levy RI, Fredrickson DS. Estimation of the concentration of low-density lipoprotein cholesterol in plasma, without use of the preparative ultracentrifuge. Clin Chem. 1972;18:499-502.
15. Matthews DR, Hosker JP, Rudenski AS, Naylor BA, Treacher DF, Turner RC. Homeostasis model assessment: insulin resistance and beta-cell function from fasting plasma glucose and insulin concentrations in man. Diabetologia. 1985;28:412-419.
16. Dobiasova M, Frohlich J. The plasma parameter log (TG/HDL-C) as an atherogenic index: correlation with lipoprotein particle size and esterification rate in apoB-lipoprotein-depleted plasma (FER(HDL)). Clin Biochem. 2001;34:583-8.
17. Frohlich J, Dobiasova M. Fractional esterification rate of cholesterol and ratio of triglycerides to HDL-cholesterol are powerful predictors of positive findings on coronary angiography. Clin Chem. 2003;49:1873-1880.
18. Dobiasova M, Stribrna J, Sparks DL, Pritchard PH, Frohlich JJ. Cholesterol esterification rates in very low density lipoprotein- and low density lipoprotein-depleted plasma. Relation to high density lipoprotein subspecies, sex, hyperlipidemia, and coronary artery disease. Arterioscler Thromb. 1991;11:64-70.
19. Howard BV, Criqui MH, Curb JD, Rodabough R, Safford MM, Santoro N, Wilson AC, Wylie-Rosett J. Risk factor clustering in the insulin resistance syndrome and its relationship to cardiovascular disease in postmenopausal white, black, hispanic, and Asian/Pacific Islander women. Metabolism. 2003;52:362-371.
20. Pacy PJ, Dodson PM, Kubicki AJ, Fletcher RF. Differences in lipid and lipoprotein levels in white, black and Asian non-insulin dependent (type 2) diabetics with hypertension. Diabetes Res. 1987;4:187-193.
21. Proudler AJ, Godsland IF, Bruce R, Seed M, Wynn V. Lipid and carbohydrate metabolic risk markers for coronary heart disease and blood pressure in healthy non-obese premenopausal women of different racial origins in the United Kingdom. Metabolism. 1996;45:328-333.
22. Ko GT, Chan JC, Lau E, Woo J, Cockram CS. Fasting plasma glucose as a screening test for diabetes and its relationship with cardiovascular risk factors in Hong Kong Chinese. Diabetes Care. 1997;20:170-172.
23. Zoratti R, Godsland IF, Chaturvedi N, Crook D, Stevenson JC, McKeigue PM. Relation of plasma lipids to insulin resistance, nonesterified fatty acid levels, and body fat in men from three ethnic groups: relevance to variation in risk of diabetes and coronary disease. Metabolism. 2000;49:245-252.
24. Knight TM, Smith Z, Whittles A, Sahota P, Lockton JA, Hogg G, Bedford A, Toop M, Kernohan EE, Baker MR. Insulin resistance, diabetes, and risk markers for ischaemic heart disease in Asian men and non-Asian in Bradford. Br Heart J. 1992;67:343-350.
25. Ostlund RE, Jr., Staten M, Kohrt WM, Schultz J, Malley M. The ratio of waist-to-hip circumference, plasma insulin level, and glucose intolerance as independent predictors of the HDL2 cholesterol level in older adults. N Engl J Med. 1990;322:229-234.
26. Ko GT, Chan JC, Cockram CS. The association between dyslipidaemia and obesity in Chinese men after adjustment for insulin resistance. Atherosclerosis. 1998;138:153-161.
27. Deurenberg-Yap M, Schmidt G, van Staveren WA, Deurenberg P. The paradox of low body mass index and high body fat percentage among Chinese, Malays and Indians in Singapore. Int J Obes Relat Metab Disord. 2000;24:1011-1017.
28. Johnson D, Prud'homme D, Despres JP, Nadeau A, Tremblay A, Bouchard C. Relation of abdominal obesity to hyperinsulinemia and high blood pressure in men. Int J Obes Relat Metab Disord. 1992;16:881-890.
29. Lemieux I, Pascot A, Prud'homme D, Almeras N, Bogaty P, Nadeau A, Bergeron J, Despres JP. Elevated C-reactive protein: another component of the atherothrombotic profile of abdominal obesity. Arterioscler Thromb Vasc Biol. 2001;21:961-967.
30. Sibley SD, Palmer JP, Hirsch IB, Brunzell JD. Visceral obesity, hepatic lipase activity, and dyslipidemia in type 1 diabetes. J Clin Endocrinol Metab. 2003;88:3379-3384.
31. Pascot A, Despres JP, Lemieux I, Almeras N, Bergeron J, Nadeau A, Prud'homme D, Tremblay A, Lemieux S. Deterioration of the metabolic risk profile in women. Respective contributions of impaired glucose tolerance and visceral fat accumulation. Diabetes Care. 2001;24:902-908.
32. Vohl MC, Lamarche B, Pascot A, Leroux G, Prud'homme D, Bouchard C, Nadeau A, Despres JP. Contribution of the cholesteryl ester transfer protein gene TaqIB polymorphism to the reduced plasma HDL-cholesterol levels found in abdominal obese men with the features of the insulin resistance syndrome. Int J Obes Relat Metab Disord. 1999;23:918-925.
33. Dobiasova M, Urbanova Z, Samanek M. Relations between particle size of HDL and LDL lipoproteins and cholesterol esterification rate. Physiol Res. 2005;54:159-65.
34. Brown BG, Zhao X, Chait A, Fisher LD, Cheung MC, Morse JS, Dowdy AA, Marino EK, Bolson EL, Alaupovic P, Frohlich J, Serafini L, Huss-Frechette E, Wang S, DeAngelis D, Dodek A, Albers JJ. Simvastatin and Niacin, Antioxidant Vitamins, or the Combination for the Prevention of Coronary Disease. N Engl J Med. 2001;345:1583-1592.
35. Dobiasova M, Frohlich J. Measurement of fractional esterification rate of cholesterol in plasma depleted of apoprotein B containing lipoprotein: methods and normal values. Physiol Res. 1996;45:65-73.
306 Relation of anthropometric parameters to the functional assessment of HDL particle size in three ethnic cohorts
Original Article Relation of anthropometric parameters to the functional assessment of HDL particle size in three ethnic cohorts Hamidreza Zakeri MD,1 Jiri J Frohlich MD,2,3 and Scott A Lear PhD
3,4
1 St. Paul’s Hospital and University of British Columbia, Vancouver, B.C., Canada and Mazandaran Medical Science University, Iran 2 Department of Pathology and Laboratory Medicine, University of British Columbia, Vancouver, Canada 3 Healthy Heart Program, St. Paul's Hospital, Canada 4 School of Kinesiology, Simon Fraser University, Canada
三个种族队列人体测量学参数与三个种族队列人体测量学参数与三个种族队列人体测量学参数与三个种族队列人体测量学参数与 HDLHDLHDLHDL 脂蛋白颗粒大小功能评价的关系脂蛋白颗粒大小功能评价的关系脂蛋白颗粒大小功能评价的关系脂蛋白颗粒大小功能评价的关系 本科题的目的是阐明华人、欧洲人、南亚后裔高密度脂蛋白(HDL)颗粒大小(以去除 apo B 后的高密度脂蛋白酯化速率来评价(FERHDL)和人体测量学参数之间的相关性,种族背景是
否是这种相关性的预测指标。招募明显健康华人(n=56) 、欧洲人(n=66)和南亚后裔 (n=76)(包括男性和女性)作为受试者,测定受试者的体重指数、腰围、血压、脂类、胰岛素、葡
萄糖和 FERHDL。以 FERHDL在每一种族-性别组内进行单变量相关性分析。采用回归分析来决
定种族背景是否是 FERHDL 和腰围相关性的重要预测指标。每一种族组内和性别组内,
FERHDL 显著地与各种人体测量学参数相关。腰围和 FERHDL 的相关性在欧洲人、华人、南亚
后裔女性组间显著的不同,校正年龄、体重指数和胰岛素等因素后,种族性不再是腰围和
FERHDL 相关性的重要预测指标。然而在整个队列中,校正年龄、性别、体重指数和胰岛素等
因素后,种族背景 (欧洲比较华人 /南亚后裔 )是 FERHDL 和腰围相关性的重要预测指标
(p=0.034)。中国和南亚人日益增加的肥胖与低的保护性 HDL 脂蛋白颗粒组成相关。种族背景
( 亚洲人与欧洲人比较)是 FERHDL和腰围相关性的显著指标。
关键字:关键字:关键字:关键字:人体测量学、脂蛋白、HDL、亚洲人。
Asia Pac J Clin Nutr 2006;15 (3): 307-316 307
Original Article Use Of [14C]-sodium bicarbonate/urea to measure total energy expenditure in overweight men and women before and after low calorie diet induced weight loss Natalie D Luscombe PhD
1,4, Christopher Tsopelas PhD2, Max Bellon DipMedTech,
ADNucMed 2, Peter M Clifton MBBS, PhD,FRACP,3, Ian Kirkwood MBBS, FRACP
2 and Gary A Wittert MBBch, MD, FRACP
4
1 University of Adelaide, Department of Physiology, South Australia, 5000 2 Royal Adelaide Hospital, Department of Nuclear Medicine, South Australia, 5000 3 CSIRO Health Science and Nutrition, Adelaide, South Australia, 5000 4 University of Adelaide, Department of Medicine, South Australia, 5000
The aim of this study was to evaluate the use of the [
14C]-sodium bicarbonate/urea technique to measure the
change in total energy expenditure after weight loss and a period of weight maintenance. Eleven healthy subjects (6 men and 5 women aged 50 ± 3 yrs, BMI 34.1 ± 2.1 kg/m2, body fat 38.7 ± 3%) underwent 8 weeks of energy restriction using a combination of ‘Modifast™’ formula and one small meal per day (≈3.3 MJ/day). For an additional 2-weeks, subjects resumed a solid food diet that contained enough energy to stabilize body weight at the newly reduced level. Body composition, total energy expenditure (TEE), resting energy expenditure (REE) and the thermic effect of a 2.7 MJ test meal (TEF) were measured at both weeks 0 and 10. At week 10 as compared to week 0, body weight decreased by 12.2 ± 1.6 kg (12.5%) (P < 0.001). Total fat and lean mass decreased by 8.4 ± 1.0 kg (20.4%) and 3.8 ± 0.7 kg (6.7%), respectively (P < 0.001). REE decreased by 500 ± 128 kJ/day (5.6 ± 1.3%) (P < 0.002). Decreases in the TEE (0.18 ± 3.7%) and TEF (1.4 ± 0.9%) were not significant. In conclusion, although [
14C]-sodium bicarbonate/urea was well tolerated and did not interfere
with normal daily activities, it did not have sufficient sensitivity to accurately measure weight loss induced changes in TEE in the range of 0.1-10%.
Key Words: energy expenditure, thermic effect of feeding, weight loss, low calorie diet, clinical intervention. Introduction Most obesity treatments involve energy restriction to induce a negative energy balance and promote weight loss. Diet-induced weight loss is often,1-5 but not always6-8 accom-panied by a decrease in total energy expenditure (TEE) that can predispose to weight regain over time if not compen-sated by a proportional reduction in habitual energy intake, or an increase in voluntary energy expenditure. TEE is com-prised of three components: resting energy expenditure (REE) accounts for 60-75% of TEE,9-11 the thermic effect of feeding (TEF) accounts for 6-15%,12-13 and energy expen-diture due to physical activity (includes voluntary and in-voluntary activity) accounts for the remaining proportion. Previous studies have suggested that the majority, if not all, of the reduction in TEE following weight loss is accounted for by the cumulative reduction in one or more of its com-ponents.5,11 As REE is the major determinant of TEE in sedentary people, it is likely that a persistent decrease in REE following an energy-restricted diet, is largely respon-sible for the positive energy balance and weight regain that is often seen when energy intake returns to its’ pre-restricted levels.4,11,14,15 There is also evidence that the reduction in TEE involves decreases in the TEF,5,14,15 and decreases in the energy cost of physical activity because of a smaller
body size.4,16 At present few studies have simultaneously assessed the impact of diet-induced weight loss on free-living TEE as well as REE, TEF and physical activity.4,7 A relatively new alternative to doubly labeled water and whole-body indirect calorimetry for the measurement of TEE is the [14C]-sodium bicarbonate/urea method. It is an isotopic dilution technique that involves subcutaneous infusion of [14C]-sodium bicarbonate/urea and collection of urine. The specific activity of CO2 incorporated into uri-nary urea is measured, from which TEE can be indirectly calculated. The method is unique because it allows the assessment of CO2 turnover and TEE under free-living conditions over a period of 24 hours (or multiples thereof).17 In addition, it is considerably cheaper (≈10-fold) than doubly labelled water, it uses simple laboratory equipment and results can be ob-tained within several hours of the urine collection. More-over, [14C]-bicarbonate/urea can provide information about Correspondence address: Professor Gary Wittert, University of Adelaide, Department of Medicine, Royal Adelaide Hospital, Adelaide SA 5000 Tel: +61-08-8222 5502; Fax: +61-08-8223 3870 Email: [email protected] Accepted 10th October 2005
308 ND Luscombe, C Tsopelas, M Bellon, PM Clifton, I Kirkwood and GA Wittert
physical activity when used in conjunction with indirect calorimetry for measuring REE and TEF.18-20 Two studies in healthy men17,21 and a third in men with small-cell lung cancer,19 have shown that the values of CO2 production and TEE measured using [14C]-bicarbonate/urea are within 2 to 5% of those obtained using whole-body indi-rect calorimetry over a 1-day or 4-day period. In addition, Gibney and colleagues18 found in six grossly obese wo-men that free-living TEE, measured using [14C]-bicarbonate/urea as compared to doubly labeled water, was similar (mean difference of 3.6%). Accordingly, these previous studies have shown that [14C]-bicarbonate/ urea may be a reasonable alternative to whole body calo-rimetry and doubly labeled water, for measuring TEE. The aim of this study was to examine the use of the [14
C]-sodium bicarbonate/urea technique for measuring a decrease in total energy expenditure after weight loss and a period of weight maintenance. We hypothesized that a reduction in TEE may be accounted for by a cumulative reduction in REE and TEF. Research Design and Methods Subjects Fifteen subjects (6 men/ 9 women) with a BMI of greater than 27 kg/m2 were recruited by public advertisement for a weight loss trial at the Royal Adelaide Hospital. Men were included if they were over 35 years of age and women had to be postmenopausal or sterile. Exclusion criteria included malignancy; type 1 or 2 diabetes melli-tus; renal, liver or thyroid disease; unstable cardio-vascular, respiratory or gastrointestinal disorders; and sig-nificant weight loss in the month prior to commencing the study. Subjects on anti-hypertensive, lipid lowering, respiratory or gastrointestinal medication were asked to maintain them at pre-study doses. A detailed information session attended by all subjects stressed the importance that they be motivated to lose approximately 10% of their initial body weight. All subjects gave informed written consent to participate in the study, which was approved by the Human Ethics Research Committee of the Royal Adelaide Hospital. Experimental protocol The study was conducted on an outpatient basis over 10 weeks. It consisted of 8 weeks of energy restriction (i.e. week 0 to week 8) and 2 weeks of energy balance (i.e. week 8 to week 10). Measurements of body weight and composition, TEE, REE, TEF and respiratory quotient (RQ) were made at week 0 (before energy restriction) and at week 10 (after 2 weeks of prescribed energy balance for maintenance of the reduced body weight as assessed at week 8). In addition, body weight was recorded every 2-weeks while subjects were at the research unit for dietary counselling. For each subject, all measurements were per-formed in the morning, on the same day of the week and at the same time of day. Following TEE measure-ments on the two separate occasions, subjects completed a questionnaire evaluating the intrusiveness of the [14C]-sodium bicarbonate/urea method on their daily lifestyle. Throughout the study all subjects were asked to continue their usual physical activity routine.
Dietary prescription Over the period from week 0 to week 8 all subjects followed a fixed energy restricted diet to induce a mini-mum weight loss of 10%. The daily energy provided was 3,300 kJ/day and it reflected a mean restriction of 60% of daily energy requirements. Energy was predominately de-rived from a liquid dietary formula (Modifast™, No-vartis, Australia) that contained 50% of the total energy as protein, 40% as carbohydrate and 10% as fat; all essential micronutrients were incorporated in the formula. The majority of subjects had 5 sachets of the Modifast™ for-mula per day. Several subjects, however, replaced two sachets of Modifast™ with one low calorie meal (≈ 1470 kJ) at night. The low calorie meal consisted of 120g of lean meat, chicken or fish plus green vegetables or salad. Following the 8-week energy-restrictive phase, subjects resumed a solid food, low-fat diet for an additional two weeks. Subjects were instructed to consume enough energy to maintain body weight at the newly reduced level. The energy level of the weight maintenance period was calculated from each subject’s resting metabolic rate multiplied by a physical activity index. Resting metabolic rate was not directly measured at the end of the energy-restricted period. Instead, it was calculated using the Schofield formula22 that incorporates the measured value of body weight after weight loss. A suitable physical activity index was derived from physical activity inform-ation collected by the dietitian at week 8 and a table that specified indexes (multiples of REE) for eight different levels of activity.23,24 Prior to commencing the study, subjects received detailed dietary guidelines and a meal plan from a dietitian experienced in the use of Modi-fast™. Subjects were asked to refrain from drinking alco-hol throughout the 10-week study. Once a week for the first two weeks of the energy-restrictive phase, subjects visited the same dietitian to receive the formula and dietary counseling. Thereafter, they received fortnightly counseling until the commencement of the weight main-tenance phase where they resumed counseling once a week. A three-day food diary (commenced the day prior to the energy expenditure measurements being made and continued until the end of the TEE measurement) was collected at weeks 0 and 10. For each dietary phase, energy intake (EI) and macronutrient composition was determined from food diaries using Diet 1 Nutritional software (Xyris Software, Highgate Hill, Queensland, Australia). This program is based on Australian food composition tables and food manufacturer’s data. In addition, the ratio of RQ-to-FQ (FQ represents food quotient) was determined. RQ/FQ is an additional index to the equation of TEE-EI that is used to reflect the state of energy balance of an individual; a RQ/FQ of 1 indicates that energy intake matches energy expenditure. The FQ of the subjects’ diet was calculated using the equation cited by Toubro and colleagues.25 The cal-culation was based on the average macronutrient com-position of the diet that the subjects consumed over the 3-days of the energy expenditure measurements. Fasting RQ, instead of mean 24-hour RQ was used in the cal-culation of the RQ/FQ ratio.
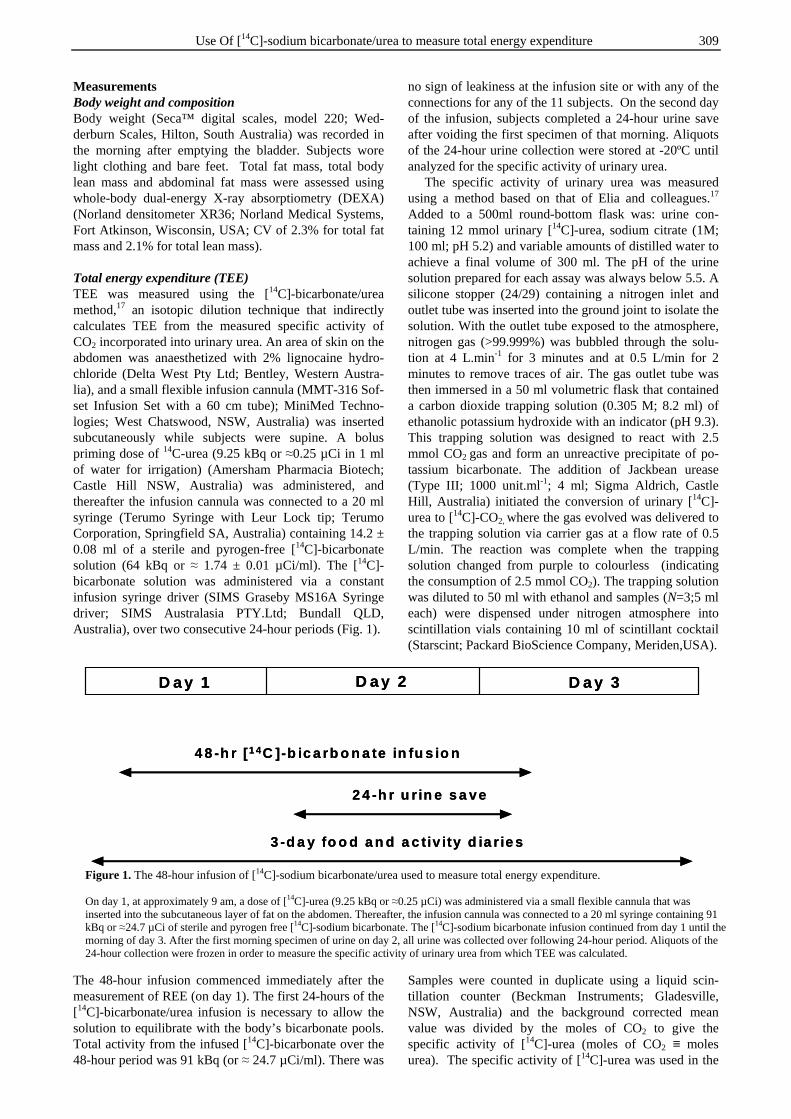
Use Of [14C]-sodium bicarbonate/urea to measure total energy expenditure 309
Measurements Body weight and composition Body weight (Seca™ digital scales, model 220; Wed-derburn Scales, Hilton, South Australia) was recorded in the morning after emptying the bladder. Subjects wore light clothing and bare feet. Total fat mass, total body lean mass and abdominal fat mass were assessed using whole-body dual-energy X-ray absorptiometry (DEXA) (Norland densitometer XR36; Norland Medical Systems, Fort Atkinson, Wisconsin, USA; CV of 2.3% for total fat mass and 2.1% for total lean mass). Total energy expenditure (TEE) TEE was measured using the [14C]-bicarbonate/urea method,17 an isotopic dilution technique that indirectly calculates TEE from the measured specific activity of CO2 incorporated into urinary urea. An area of skin on the abdomen was anaesthetized with 2% lignocaine hydro-chloride (Delta West Pty Ltd; Bentley, Western Austra-lia), and a small flexible infusion cannula (MMT-316 Sof-set Infusion Set with a 60 cm tube); MiniMed Techno-logies; West Chatswood, NSW, Australia) was inserted subcutaneously while subjects were supine. A bolus priming dose of 14C-urea (9.25 kBq or ≈0.25 µCi in 1 ml of water for irrigation) (Amersham Pharmacia Biotech; Castle Hill NSW, Australia) was administered, and thereafter the infusion cannula was connected to a 20 ml syringe (Terumo Syringe with Leur Lock tip; Terumo Corporation, Springfield SA, Australia) containing 14.2 ± 0.08 ml of a sterile and pyrogen-free [14C]-bicarbonate solution (64 kBq or ≈ 1.74 ± 0.01 µCi/ml). The [14C]-bicarbonate solution was administered via a constant infusion syringe driver (SIMS Graseby MS16A Syringe driver; SIMS Australasia PTY.Ltd; Bundall QLD, Australia), over two consecutive 24-hour periods (Fig. 1). The 48-hour infusion commenced immediately after the measurement of REE (on day 1). The first 24-hours of the [14C]-bicarbonate/urea infusion is necessary to allow the solution to equilibrate with the body’s bicarbonate pools. Total activity from the infused [14C]-bicarbonate over the 48-hour period was 91 kBq (or ≈ 24.7 µCi/ml). There was
no sign of leakiness at the infusion site or with any of the connections for any of the 11 subjects. On the second day of the infusion, subjects completed a 24-hour urine save after voiding the first specimen of that morning. Aliquots of the 24-hour urine collection were stored at -20ºC until analyzed for the specific activity of urinary urea. The specific activity of urinary urea was measured using a method based on that of Elia and colleagues.17 Added to a 500ml round-bottom flask was: urine con-taining 12 mmol urinary [14C]-urea, sodium citrate (1M; 100 ml; pH 5.2) and variable amounts of distilled water to achieve a final volume of 300 ml. The pH of the urine solution prepared for each assay was always below 5.5. A silicone stopper (24/29) containing a nitrogen inlet and outlet tube was inserted into the ground joint to isolate the solution. With the outlet tube exposed to the atmosphere, nitrogen gas (>99.999%) was bubbled through the solu-tion at 4 L.min-1 for 3 minutes and at 0.5 L/min for 2 minutes to remove traces of air. The gas outlet tube was then immersed in a 50 ml volumetric flask that contained a carbon dioxide trapping solution (0.305 M; 8.2 ml) of ethanolic potassium hydroxide with an indicator (pH 9.3). This trapping solution was designed to react with 2.5 mmol CO2 gas and form an unreactive precipitate of po-tassium bicarbonate. The addition of Jackbean urease (Type III; 1000 unit.ml-1; 4 ml; Sigma Aldrich, Castle Hill, Australia) initiated the conversion of urinary [14C]-urea to [14C]-CO2, where the gas evolved was delivered to the trapping solution via carrier gas at a flow rate of 0.5 L/min. The reaction was complete when the trapping solution changed from purple to colourless (indicating the consumption of 2.5 mmol CO2). The trapping solution was diluted to 50 ml with ethanol and samples (N=3;5 ml each) were dispensed under nitrogen atmosphere into scintillation vials containing 10 ml of scintillant cocktail (Starscint; Packard BioScience Company, Meriden,USA). Samples were counted in duplicate using a liquid scin-tillation counter (Beckman Instruments; Gladesville, NSW, Australia) and the background corrected mean value was divided by the moles of CO2 to give the specific activity of [14C]-urea (moles of CO2 ≡ moles urea). The specific activity of [14C]-urea was used in the
4 8 -h r [1 4C ]-b ic a rb o n a te in fu s io n
3 -d a y fo o d a n d a c tiv ity d ia r ie s
2 4 -h r u r in e s a ve
D a y 1 D a y 2 D a y 3
4 8 -h r [1 4C ]-b ic a rb o n a te in fu s io n
3 -d a y fo o d a n d a c tiv ity d ia r ie s
2 4 -h r u r in e s a ve
D a y 1 D a y 2 D a y 3
Figure 1. The 48-hour infusion of [14C]-sodium bicarbonate/urea used to measure total energy expenditure. On day 1, at approximately 9 am, a dose of [14C]-urea (9.25 kBq or ≈0.25 µCi) was administered via a small flexible cannula that was inserted into the subcutaneous layer of fat on the abdomen. Thereafter, the infusion cannula was connected to a 20 ml syringe containing 91 kBq or ≈24.7 µCi of sterile and pyrogen free [14C]-sodium bicarbonate. The [14C]-sodium bicarbonate infusion continued from day 1 until the morning of day 3. After the first morning specimen of urine on day 2, all urine was collected over following 24-hour period. Aliquots of the 24-hour collection were frozen in order to measure the specific activity of urinary urea from which TEE was calculated.
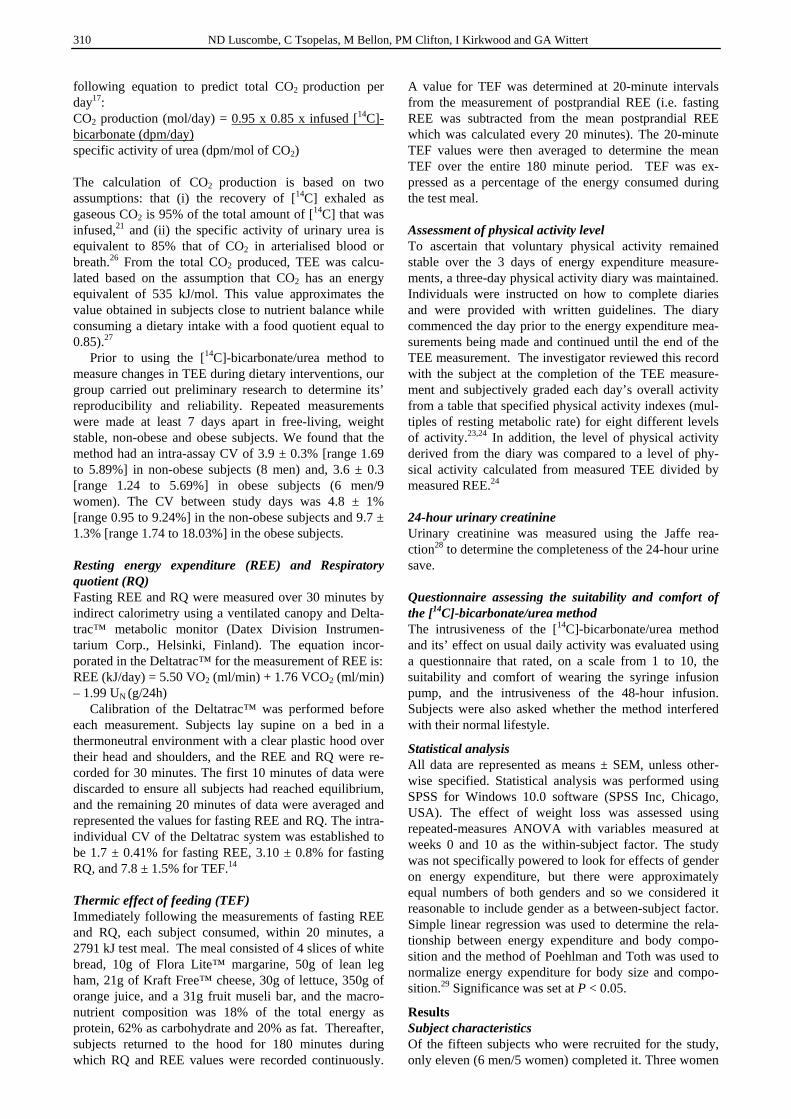
310 ND Luscombe, C Tsopelas, M Bellon, PM Clifton, I Kirkwood and GA Wittert
following equation to predict total CO2 production per day17: CO2 production (mol/day) = 0.95 x 0.85 x infused [14C]-bicarbonate (dpm/day) specific activity of urea (dpm/mol of CO2) The calculation of CO2 production is based on two assumptions: that (i) the recovery of [14C] exhaled as gaseous CO2 is 95% of the total amount of [14C] that was infused,21 and (ii) the specific activity of urinary urea is equivalent to 85% that of CO2 in arterialised blood or breath.26 From the total CO2 produced, TEE was calcu-lated based on the assumption that CO2 has an energy equivalent of 535 kJ/mol. This value approximates the value obtained in subjects close to nutrient balance while consuming a dietary intake with a food quotient equal to 0.85).27 Prior to using the [14C]-bicarbonate/urea method to measure changes in TEE during dietary interventions, our group carried out preliminary research to determine its’ reproducibility and reliability. Repeated measurements were made at least 7 days apart in free-living, weight stable, non-obese and obese subjects. We found that the method had an intra-assay CV of 3.9 ± 0.3% [range 1.69 to 5.89%] in non-obese subjects (8 men) and, 3.6 ± 0.3 [range 1.24 to 5.69%] in obese subjects (6 men/9 women). The CV between study days was 4.8 ± 1% [range 0.95 to 9.24%] in the non-obese subjects and 9.7 ± 1.3% [range 1.74 to 18.03%] in the obese subjects. Resting energy expenditure (REE) and Respiratory quotient (RQ) Fasting REE and RQ were measured over 30 minutes by indirect calorimetry using a ventilated canopy and Delta-trac™ metabolic monitor (Datex Division Instrumen-tarium Corp., Helsinki, Finland). The equation incor-porated in the Deltatrac™ for the measurement of REE is: REE (kJ/day) = 5.50 VO2 (ml/min) + 1.76 VCO2 (ml/min) – 1.99 UN (g/24h) Calibration of the Deltatrac™ was performed before each measurement. Subjects lay supine on a bed in a thermoneutral environment with a clear plastic hood over their head and shoulders, and the REE and RQ were re-corded for 30 minutes. The first 10 minutes of data were discarded to ensure all subjects had reached equilibrium, and the remaining 20 minutes of data were averaged and represented the values for fasting REE and RQ. The intra-individual CV of the Deltatrac system was established to be 1.7 ± 0.41% for fasting REE, 3.10 ± 0.8% for fasting RQ, and 7.8 ± 1.5% for TEF.14 Thermic effect of feeding (TEF) Immediately following the measurements of fasting REE and RQ, each subject consumed, within 20 minutes, a 2791 kJ test meal. The meal consisted of 4 slices of white bread, 10g of Flora Lite™ margarine, 50g of lean leg ham, 21g of Kraft Free™ cheese, 30g of lettuce, 350g of orange juice, and a 31g fruit museli bar, and the macro-nutrient composition was 18% of the total energy as protein, 62% as carbohydrate and 20% as fat. Thereafter, subjects returned to the hood for 180 minutes during which RQ and REE values were recorded continuously.
A value for TEF was determined at 20-minute intervals from the measurement of postprandial REE (i.e. fasting REE was subtracted from the mean postprandial REE which was calculated every 20 minutes). The 20-minute TEF values were then averaged to determine the mean TEF over the entire 180 minute period. TEF was ex-pressed as a percentage of the energy consumed during the test meal. Assessment of physical activity level To ascertain that voluntary physical activity remained stable over the 3 days of energy expenditure measure-ments, a three-day physical activity diary was maintained. Individuals were instructed on how to complete diaries and were provided with written guidelines. The diary commenced the day prior to the energy expenditure mea-surements being made and continued until the end of the TEE measurement. The investigator reviewed this record with the subject at the completion of the TEE measure-ment and subjectively graded each day’s overall activity from a table that specified physical activity indexes (mul-tiples of resting metabolic rate) for eight different levels of activity.23,24 In addition, the level of physical activity derived from the diary was compared to a level of phy-sical activity calculated from measured TEE divided by measured REE.24
24-hour urinary creatinine Urinary creatinine was measured using the Jaffe rea-ction28 to determine the completeness of the 24-hour urine save. Questionnaire assessing the suitability and comfort of the [14C]-bicarbonate/urea method The intrusiveness of the [14C]-bicarbonate/urea method and its’ effect on usual daily activity was evaluated using a questionnaire that rated, on a scale from 1 to 10, the suitability and comfort of wearing the syringe infusion pump, and the intrusiveness of the 48-hour infusion. Subjects were also asked whether the method interfered with their normal lifestyle.
Statistical analysis All data are represented as means ± SEM, unless other-wise specified. Statistical analysis was performed using SPSS for Windows 10.0 software (SPSS Inc, Chicago, USA). The effect of weight loss was assessed using repeated-measures ANOVA with variables measured at weeks 0 and 10 as the within-subject factor. The study was not specifically powered to look for effects of gender on energy expenditure, but there were approximately equal numbers of both genders and so we considered it reasonable to include gender as a between-subject factor. Simple linear regression was used to determine the rela-tionship between energy expenditure and body compo-sition and the method of Poehlman and Toth was used to normalize energy expenditure for body size and compo-sition.29 Significance was set at P < 0.05.
Results Subject characteristics Of the fifteen subjects who were recruited for the study, only eleven (6 men/5 women) completed it. Three women

Use Of [14C]-sodium bicarbonate/urea to measure total energy expenditure 311
withdrew due to family and work commitments during the course of the study. Data from another subject was excluded from the analysis because she declined, for personal reasons, to have the final [14C]-bicarbonate/urea measurement of TEE made. The physical characteristics of subjects at baseline are shown in Table 1. Energy intake and urinary creatinine during the 3 days of energy expenditure measurements The mean energy intake over the 3 days of the energy expenditure measurements was 8022 ± 682 kJ/day (range 5110 to 12619 kJ/day) at week 0 as compared to 5700 ± 317 kJ/day (range 3871 to 6992 kJ/day) at week 10 (P< 0.001); the mean change was 2326 ± 556 kJ/day (range –5627 to 790 kJ/day). The percentage of energy derived from carbohydrate (42 ± 2 vs 43 ± 2%, P = 0.8), fat (32 ± 2 vs 29 ± 1.2%, P = 0.1), and protein (20 ± 1.1 vs 22 ± 1.6%, P=0.2) were similar at week 0 and week 10. Al-though subjects were asked to refrain from alcohol seve-ral subjects had reported having a social drink and the mean energy derived from alcohol was 3.0 ± 1.4 at week 0 vs 3.0 ± 1.4%. At week 0 as compared to week 10, fasting RQ (0.80 ± 0.01 vs 0.78 ± 0.02), FQ (0.85 vs 0.84), and the RQ-to-FQ ratio of the diet (0.91 vs 0.95) were not different (P>0.1). Twenty-four hour urinary creatinine (Table 2) was similar at weeks 0 (P =0.23) indicating that the subjects’ 24-hour urine collections were likely to be complete. Body weight and composition The change in body weight over the course of the 8-week period of energy restriction and the 2-week period of energy balance is shown in Figure 2. After 8 weeks of energy restriction, mean body weight decreased by 11.7 ± 1.8 kg (range -6 to -27 kg) (P<0.001). After a further 2 weeks at prescribed energy balance, body weight had decreased an additional 0.51 ± 0.3 kg (range -2.16 to +1.4 kg) (P = 0.04). There was, however, an effect of gender on weight loss from week 0 to week 8. From week 8 to the end of week 10, women lost an additional 1.2 ± 0.2 kg (P = 0.004) of weight, whereas body weight remained stable for the men. When female number 5 (Table 1), who
lost a further 2.2 kg during the prescribed weight mainte-nance phase was removed from the analysis, the overall weight loss for the remaining 10 individuals was not significant (P = 0.08). Total fat mass and total lean mass at week 0 and week 10 are shown for all subjects in Table 1. Total fat mass decreased 8.4 ± 1.0 kg (20.4 ± 1.6%; range –13.2 to –27.2%) from week 0 to week 10 (P< 0.001) and this represented 68% of the total weight loss. Abdominal fat mass decreased 2.3 ± 0.4 kg (22.5 ± 2.3 %, range -12.2 to –34.8%) (P<0.001). After 10 weeks, total lean mass was reduced 3.8 ± 0.7 kg (6.7 ± 0.9%, range -0.8 to –8.5%) (P <0.001) which represented 31% of total weight loss. There was no affect of gender on the re-duction in fat mass, but abdominal fat mass was reduced approximately 59% more in the men than in the women (-3.2 ± 0.3 vs -1.3 ± 0.2 kg, P = 0.003). There was a greater reduction in lean mass (by 51%) in the men than in the women (-4.9 ± 1.0 vs -2.4 ± 0.6 kg, P = 0.056). Total and resting energy expenditure, and the thermic effect of feeding Individual values and the means of the group for TEE, REE, and TEF at weeks 0 and 10 are shown in Table 2. After a mean weight loss of 11.8%, TEE expressed as an absolute value was not statistically reduced (mean de-crease in TEE was 181 ± 454 kJ/day; or 0.18 ± 3.7%, range –24% to 22%). This finding remained consistent after the removal of subject number 5, who was not weight stable at week 10. TEE was associated with lean mass and fat mass at week 0 (r = 0.88 for lean mass and r = 0.62 for fat mass, P < 0.05) and at week 10 (r = 0.88 for lean mass and r = 0.62 for fat mass, P < 0.05). From week 0 to week 10, the change in TEE nor-malized for lean mass, was 11 ± 1.2% (from 9912.3 ± 1020 at week 0 to 8784 ± 928 kJ/day at week 10, P = 0.07). TEE was greater (by ≈30%, P= 0.06) in the men than in the women, at both week 0 (13751 ± 1774 vs 9440 ± 460 kJ/day) and week 10 (13320 ± 1622 vs 9560 ± 651 kJ/day). Resting energy expenditure (expressed as an absolute) decreased by 507 ± 125 kJ/day (or 5.6 ± 1.3%, range -12 to + 2.8%) after 10 weeks (P = 0.002). REE was
7 0
7 5
8 0
8 5
9 0
9 5
1 0 0
1 0 5
1 1 0
0 2 4 6 8 1 0
W e e k
Bod
y W
eigh
t (k
g)
‡ †
ER phase EB phase
Figure 2. Change in body weight following 8 weeks of energy restriction (ER phase, weeks 0 to 8) and 2 weeks of weight maintenance at energy balance (EB phase, weeks 8 to 10) in the 11 subjects who completed the study. Data are expressed as means ± SEM. Weeks 0, 2, 4, 6, 8 and 10 were compared using repeated-measures ANOVA with gender as the between subject factor. †Significant reduction in weight from week 0 to week 8, P < 0.001. ‡Significant reduction in weight, P = 0.04.
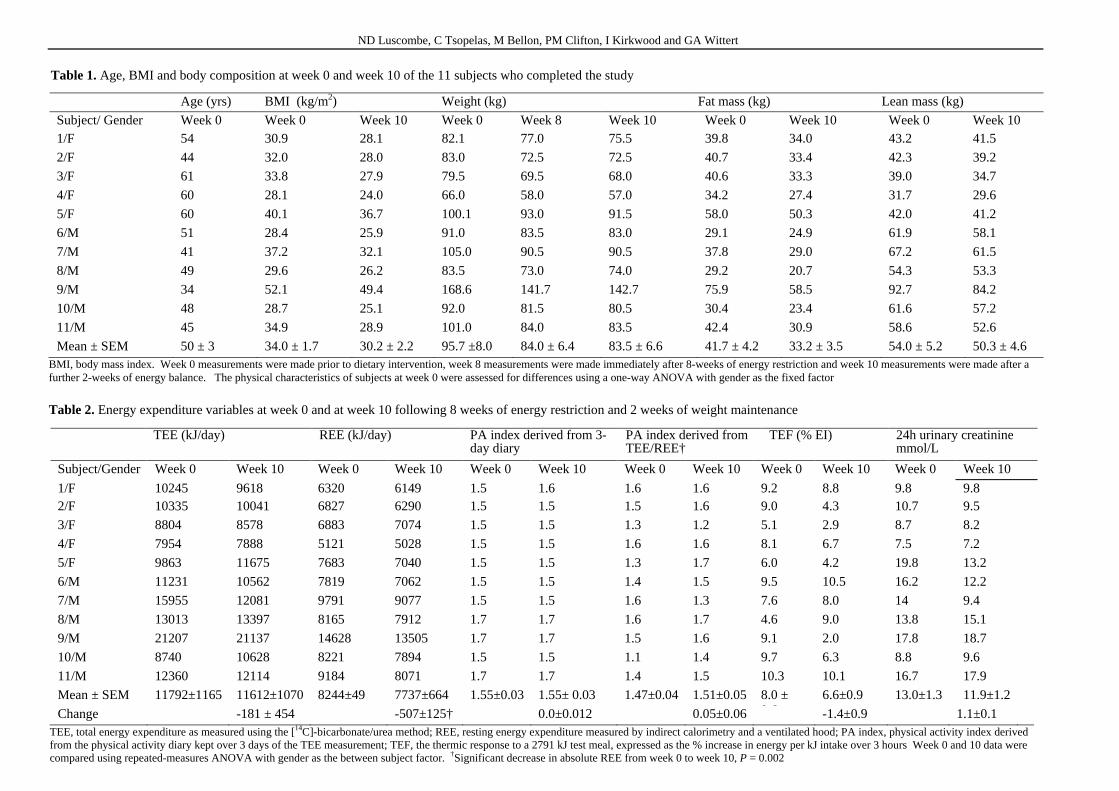
ND Luscombe, C Tsopelas, M Bellon, PM Clifton, I Kirkwood and GA Wittert
Table 1. Age, BMI and body composition at week 0 and week 10 of the 11 subjects who completed the study
Age (yrs) BMI (kg/m2) Weight (kg) Fat mass (kg) Lean mass (kg)
Subject/ Gender Week 0 Week 0 Week 10 Week 0 Week 8 Week 10 Week 0 Week 10 Week 0 Week 10 1/F 54 30.9 28.1 82.1 77.0 75.5 39.8 34.0 43.2 41.5
2/F 44 32.0 28.0 83.0 72.5 72.5 40.7 33.4 42.3 39.2
3/F 61 33.8 27.9 79.5 69.5 68.0 40.6 33.3 39.0 34.7
4/F 60 28.1 24.0 66.0 58.0 57.0 34.2 27.4 31.7 29.6
5/F 60 40.1 36.7 100.1 93.0 91.5 58.0 50.3 42.0 41.2
6/M 51 28.4 25.9 91.0 83.5 83.0 29.1 24.9 61.9 58.1
7/M 41 37.2 32.1 105.0 90.5 90.5 37.8 29.0 67.2 61.5
8/M 49 29.6 26.2 83.5 73.0 74.0 29.2 20.7 54.3 53.3
9/M 34 52.1 49.4 168.6 141.7 142.7 75.9 58.5 92.7 84.2
10/M 48 28.7 25.1 92.0 81.5 80.5 30.4 23.4 61.6 57.2
11/M 45 34.9 28.9 101.0 84.0 83.5 42.4 30.9 58.6 52.6
Mean ± SEM 50 ± 3 34.0 ± 1.7 30.2 ± 2.2 95.7 ±8.0 84.0 ± 6.4 83.5 ± 6.6 41.7 ± 4.2 33.2 ± 3.5 54.0 ± 5.2 50.3 ± 4.6 BMI, body mass index. Week 0 measurements were made prior to dietary intervention, week 8 measurements were made immediately after 8-weeks of energy restriction and week 10 measurements were made after a further 2-weeks of energy balance. The physical characteristics of subjects at week 0 were assessed for differences using a one-way ANOVA with gender as the fixed factor
Table 2. Energy expenditure variables at week 0 and at week 10 following 8 weeks of energy restriction and 2 weeks of weight maintenance
TEE (kJ/day) REE (kJ/day) PA index derived from 3-day diary
PA index derived from TEE/REE†
TEF (% EI) 24h urinary creatinine mmol/L
Subject/Gender Week 0 Week 10 Week 0 Week 10 Week 0 Week 10 Week 0 Week 10 Week 0 Week 10 Week 0 Week 10
1/F 10245 9618 6320 6149 1.5 1.6 1.6 1.6 9.2 8.8 9.8 9.8 2/F 10335 10041 6827 6290 1.5 1.5 1.5 1.6 9.0 4.3 10.7 9.5
3/F 8804 8578 6883 7074 1.5 1.5 1.3 1.2 5.1 2.9 8.7 8.2
4/F 7954 7888 5121 5028 1.5 1.5 1.6 1.6 8.1 6.7 7.5 7.2
5/F 9863 11675 7683 7040 1.5 1.5 1.3 1.7 6.0 4.2 19.8 13.2
6/M 11231 10562 7819 7062 1.5 1.5 1.4 1.5 9.5 10.5 16.2 12.2
7/M 15955 12081 9791 9077 1.5 1.5 1.6 1.3 7.6 8.0 14 9.4
8/M 13013 13397 8165 7912 1.7 1.7 1.6 1.7 4.6 9.0 13.8 15.1
9/M 21207 21137 14628 13505 1.7 1.7 1.5 1.6 9.1 2.0 17.8 18.7
10/M 8740 10628 8221 7894 1.5 1.5 1.1 1.4 9.7 6.3 8.8 9.6
11/M 12360 12114 9184 8071 1.7 1.7 1.4 1.5 10.3 10.1 16.7 17.9
Mean ± SEM 11792±1165 11612±1070 8244±49 7737±664 1.55±0.03 1.55± 0.03 1.47±0.04 1.51±0.05 8.0 ± 0.6
6.6±0.9 13.0±1.3 11.9±1.2
Change -181 ± 454 -507±125† 0.0±0.012 0.05±0.06 -1.4±0.9 1.1±0.1 TEE, total energy expenditure as measured using the [14C]-bicarbonate/urea method; REE, resting energy expenditure measured by indirect calorimetry and a ventilated hood; PA index, physical activity index derived from the physical activity diary kept over 3 days of the TEE measurement; TEF, the thermic response to a 2791 kJ test meal, expressed as the % increase in energy per kJ intake over 3 hours Week 0 and 10 data were compared using repeated-measures ANOVA with gender as the between subject factor. †Significant decrease in absolute REE from week 0 to week 10, P = 0.002
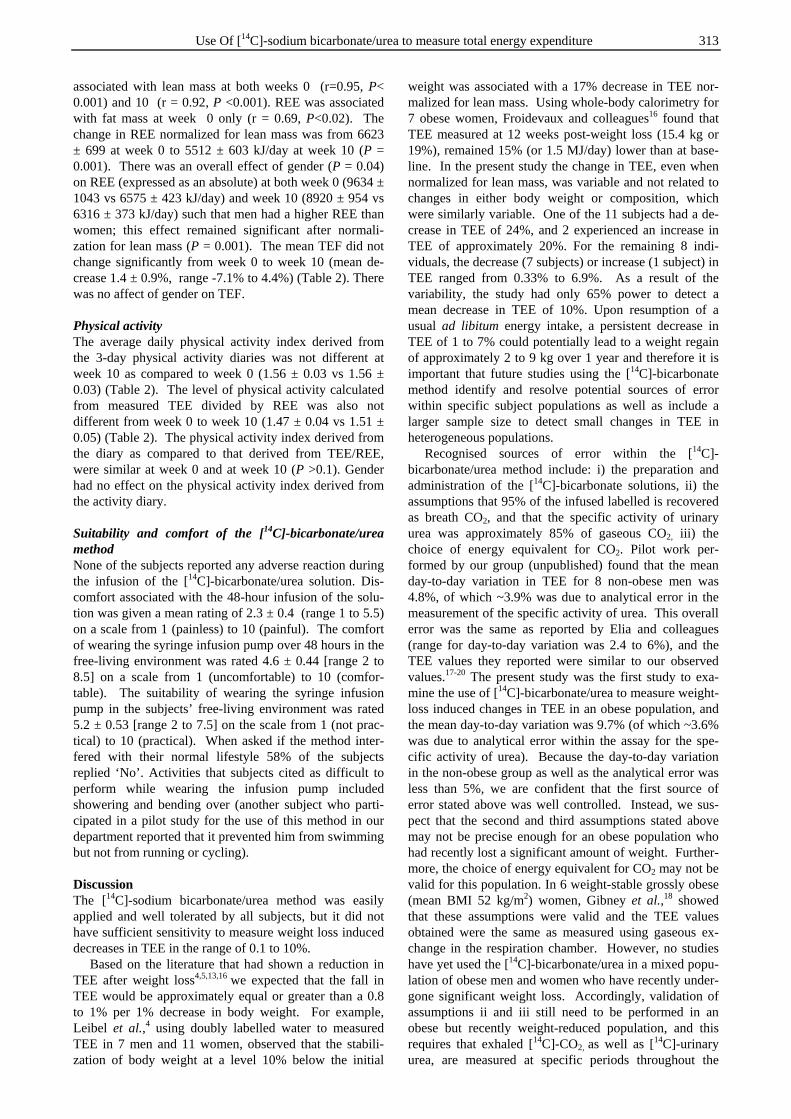
Use Of [14C]-sodium bicarbonate/urea to measure total energy expenditure 313
associated with lean mass at both weeks 0 (r=0.95, P< 0.001) and 10 (r = 0.92, P <0.001). REE was associated with fat mass at week 0 only (r = 0.69, P<0.02). The change in REE normalized for lean mass was from 6623 ± 699 at week 0 to 5512 ± 603 kJ/day at week 10 (P = 0.001). There was an overall effect of gender (P = 0.04) on REE (expressed as an absolute) at both week 0 (9634 ± 1043 vs 6575 ± 423 kJ/day) and week 10 (8920 ± 954 vs 6316 ± 373 kJ/day) such that men had a higher REE than women; this effect remained significant after normali-zation for lean mass (P = 0.001). The mean TEF did not change significantly from week 0 to week 10 (mean de-crease 1.4 ± 0.9%, range -7.1% to 4.4%) (Table 2). There was no affect of gender on TEF. Physical activity The average daily physical activity index derived from the 3-day physical activity diaries was not different at week 10 as compared to week 0 (1.56 ± 0.03 vs 1.56 ± 0.03) (Table 2). The level of physical activity calculated from measured TEE divided by REE was also not different from week 0 to week 10 (1.47 ± 0.04 vs 1.51 ± 0.05) (Table 2). The physical activity index derived from the diary as compared to that derived from TEE/REE, were similar at week 0 and at week 10 (P >0.1). Gender had no effect on the physical activity index derived from the activity diary. Suitability and comfort of the [14C]-bicarbonate/urea method None of the subjects reported any adverse reaction during the infusion of the [14C]-bicarbonate/urea solution. Dis-comfort associated with the 48-hour infusion of the solu-tion was given a mean rating of 2.3 ± 0.4 (range 1 to 5.5) on a scale from 1 (painless) to 10 (painful). The comfort of wearing the syringe infusion pump over 48 hours in the free-living environment was rated 4.6 ± 0.44 [range 2 to 8.5] on a scale from 1 (uncomfortable) to 10 (comfor-table). The suitability of wearing the syringe infusion pump in the subjects’ free-living environment was rated 5.2 ± 0.53 [range 2 to 7.5] on the scale from 1 (not prac-tical) to 10 (practical). When asked if the method inter-fered with their normal lifestyle 58% of the subjects replied ‘No’. Activities that subjects cited as difficult to perform while wearing the infusion pump included showering and bending over (another subject who parti-cipated in a pilot study for the use of this method in our department reported that it prevented him from swimming but not from running or cycling). Discussion The [14C]-sodium bicarbonate/urea method was easily applied and well tolerated by all subjects, but it did not have sufficient sensitivity to measure weight loss induced decreases in TEE in the range of 0.1 to 10%. Based on the literature that had shown a reduction in TEE after weight loss4,5,13,16 we expected that the fall in TEE would be approximately equal or greater than a 0.8 to 1% per 1% decrease in body weight. For example, Leibel et al.,4 using doubly labelled water to measured TEE in 7 men and 11 women, observed that the stabili-zation of body weight at a level 10% below the initial
weight was associated with a 17% decrease in TEE nor-malized for lean mass. Using whole-body calorimetry for 7 obese women, Froidevaux and colleagues16 found that TEE measured at 12 weeks post-weight loss (15.4 kg or 19%), remained 15% (or 1.5 MJ/day) lower than at base-line. In the present study the change in TEE, even when normalized for lean mass, was variable and not related to changes in either body weight or composition, which were similarly variable. One of the 11 subjects had a de-crease in TEE of 24%, and 2 experienced an increase in TEE of approximately 20%. For the remaining 8 indi-viduals, the decrease (7 subjects) or increase (1 subject) in TEE ranged from 0.33% to 6.9%. As a result of the variability, the study had only 65% power to detect a mean decrease in TEE of 10%. Upon resumption of a usual ad libitum energy intake, a persistent decrease in TEE of 1 to 7% could potentially lead to a weight regain of approximately 2 to 9 kg over 1 year and therefore it is important that future studies using the [14C]-bicarbonate method identify and resolve potential sources of error within specific subject populations as well as include a larger sample size to detect small changes in TEE in heterogeneous populations. Recognised sources of error within the [14C]-bicarbonate/urea method include: i) the preparation and administration of the [14C]-bicarbonate solutions, ii) the assumptions that 95% of the infused labelled is recovered as breath CO2, and that the specific activity of urinary urea was approximately 85% of gaseous CO2, iii) the choice of energy equivalent for CO2. Pilot work per-formed by our group (unpublished) found that the mean day-to-day variation in TEE for 8 non-obese men was 4.8%, of which ~3.9% was due to analytical error in the measurement of the specific activity of urea. This overall error was the same as reported by Elia and colleagues (range for day-to-day variation was 2.4 to 6%), and the TEE values they reported were similar to our observed values.17-20 The present study was the first study to exa-mine the use of [14C]-bicarbonate/urea to measure weight-loss induced changes in TEE in an obese population, and the mean day-to-day variation was 9.7% (of which ~3.6% was due to analytical error within the assay for the spe-cific activity of urea). Because the day-to-day variation in the non-obese group as well as the analytical error was less than 5%, we are confident that the first source of error stated above was well controlled. Instead, we sus-pect that the second and third assumptions stated above may not be precise enough for an obese population who had recently lost a significant amount of weight. Further-more, the choice of energy equivalent for CO2 may not be valid for this population. In 6 weight-stable grossly obese (mean BMI 52 kg/m2) women, Gibney et al.,18 showed that these assumptions were valid and the TEE values obtained were the same as measured using gaseous ex-change in the respiration chamber. However, no studies have yet used the [14C]-bicarbonate/urea in a mixed popu-lation of obese men and women who have recently under-gone significant weight loss. Accordingly, validation of assumptions ii and iii still need to be performed in an obese but recently weight-reduced population, and this requires that exhaled [14C]-CO2, as well as [14C]-urinary urea, are measured at specific periods throughout the
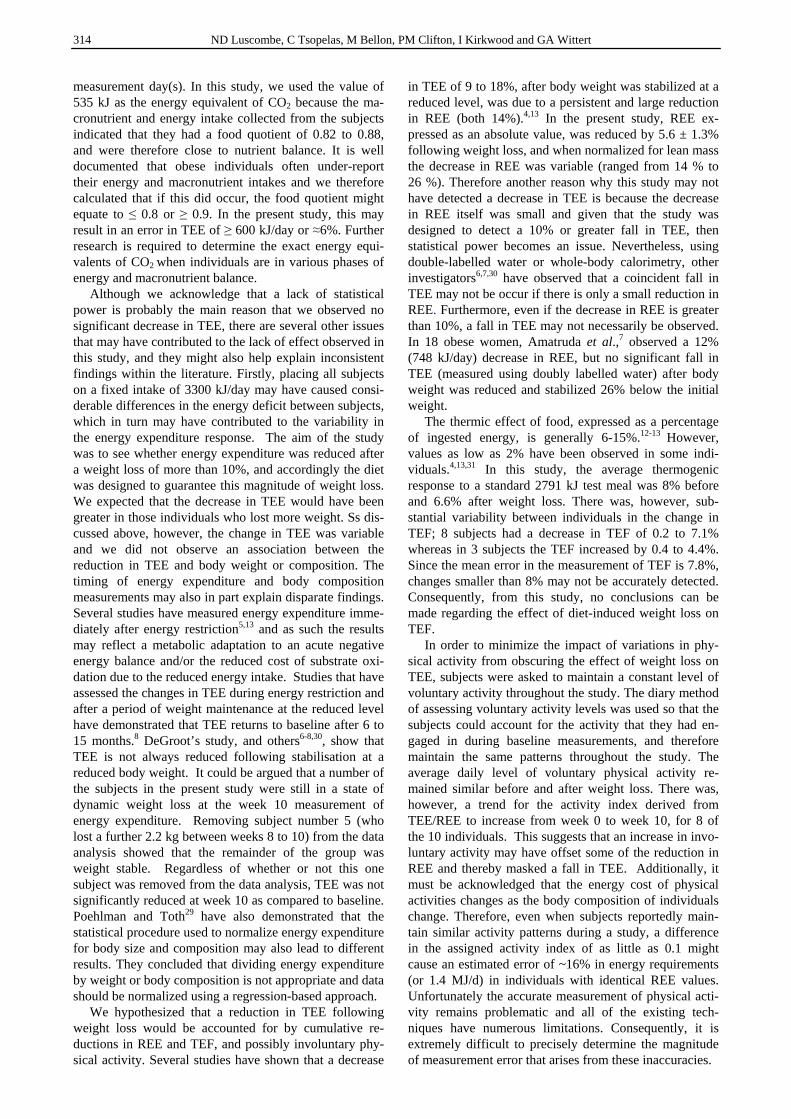
314 ND Luscombe, C Tsopelas, M Bellon, PM Clifton, I Kirkwood and GA Wittert
measurement day(s). In this study, we used the value of 535 kJ as the energy equivalent of CO2 because the ma-cronutrient and energy intake collected from the subjects indicated that they had a food quotient of 0.82 to 0.88, and were therefore close to nutrient balance. It is well documented that obese individuals often under-report their energy and macronutrient intakes and we therefore calculated that if this did occur, the food quotient might equate to ≤ 0.8 or ≥ 0.9. In the present study, this may result in an error in TEE of ≥ 600 kJ/day or ≈6%. Further research is required to determine the exact energy equi-valents of CO2 when individuals are in various phases of energy and macronutrient balance. Although we acknowledge that a lack of statistical power is probably the main reason that we observed no significant decrease in TEE, there are several other issues that may have contributed to the lack of effect observed in this study, and they might also help explain inconsistent findings within the literature. Firstly, placing all subjects on a fixed intake of 3300 kJ/day may have caused consi-derable differences in the energy deficit between subjects, which in turn may have contributed to the variability in the energy expenditure response. The aim of the study was to see whether energy expenditure was reduced after a weight loss of more than 10%, and accordingly the diet was designed to guarantee this magnitude of weight loss. We expected that the decrease in TEE would have been greater in those individuals who lost more weight. Ss dis-cussed above, however, the change in TEE was variable and we did not observe an association between the reduction in TEE and body weight or composition. The timing of energy expenditure and body composition measurements may also in part explain disparate findings. Several studies have measured energy expenditure imme-diately after energy restriction5,13 and as such the results may reflect a metabolic adaptation to an acute negative energy balance and/or the reduced cost of substrate oxi-dation due to the reduced energy intake. Studies that have assessed the changes in TEE during energy restriction and after a period of weight maintenance at the reduced level have demonstrated that TEE returns to baseline after 6 to 15 months.8 DeGroot’s study, and others6-8,30, show that TEE is not always reduced following stabilisation at a reduced body weight. It could be argued that a number of the subjects in the present study were still in a state of dynamic weight loss at the week 10 measurement of energy expenditure. Removing subject number 5 (who lost a further 2.2 kg between weeks 8 to 10) from the data analysis showed that the remainder of the group was weight stable. Regardless of whether or not this one subject was removed from the data analysis, TEE was not significantly reduced at week 10 as compared to baseline. Poehlman and Toth29 have also demonstrated that the statistical procedure used to normalize energy expenditure for body size and composition may also lead to different results. They concluded that dividing energy expenditure by weight or body composition is not appropriate and data should be normalized using a regression-based approach. We hypothesized that a reduction in TEE following weight loss would be accounted for by cumulative re-ductions in REE and TEF, and possibly involuntary phy-sical activity. Several studies have shown that a decrease
in TEE of 9 to 18%, after body weight was stabilized at a reduced level, was due to a persistent and large reduction in REE (both 14%).4,13 In the present study, REE ex-pressed as an absolute value, was reduced by 5.6 ± 1.3% following weight loss, and when normalized for lean mass the decrease in REE was variable (ranged from 14 % to 26 %). Therefore another reason why this study may not have detected a decrease in TEE is because the decrease in REE itself was small and given that the study was designed to detect a 10% or greater fall in TEE, then statistical power becomes an issue. Nevertheless, using double-labelled water or whole-body calorimetry, other investigators6,7,30 have observed that a coincident fall in TEE may not be occur if there is only a small reduction in REE. Furthermore, even if the decrease in REE is greater than 10%, a fall in TEE may not necessarily be observed. In 18 obese women, Amatruda et al.,7 observed a 12% (748 kJ/day) decrease in REE, but no significant fall in TEE (measured using doubly labelled water) after body weight was reduced and stabilized 26% below the initial weight. The thermic effect of food, expressed as a percentage of ingested energy, is generally 6-15%.12-13 However, values as low as 2% have been observed in some indi-viduals.4,13,31 In this study, the average thermogenic response to a standard 2791 kJ test meal was 8% before and 6.6% after weight loss. There was, however, sub-stantial variability between individuals in the change in TEF; 8 subjects had a decrease in TEF of 0.2 to 7.1% whereas in 3 subjects the TEF increased by 0.4 to 4.4%. Since the mean error in the measurement of TEF is 7.8%, changes smaller than 8% may not be accurately detected. Consequently, from this study, no conclusions can be made regarding the effect of diet-induced weight loss on TEF. In order to minimize the impact of variations in phy-sical activity from obscuring the effect of weight loss on TEE, subjects were asked to maintain a constant level of voluntary activity throughout the study. The diary method of assessing voluntary activity levels was used so that the subjects could account for the activity that they had en-gaged in during baseline measurements, and therefore maintain the same patterns throughout the study. The average daily level of voluntary physical activity re-mained similar before and after weight loss. There was, however, a trend for the activity index derived from TEE/REE to increase from week 0 to week 10, for 8 of the 10 individuals. This suggests that an increase in invo-luntary activity may have offset some of the reduction in REE and thereby masked a fall in TEE. Additionally, it must be acknowledged that the energy cost of physical activities changes as the body composition of individuals change. Therefore, even when subjects reportedly main-tain similar activity patterns during a study, a difference in the assigned activity index of as little as 0.1 might cause an estimated error of ~16% in energy requirements (or 1.4 MJ/d) in individuals with identical REE values. Unfortunately the accurate measurement of physical acti-vity remains problematic and all of the existing tech-niques have numerous limitations. Consequently, it is extremely difficult to precisely determine the magnitude of measurement error that arises from these inaccuracies.
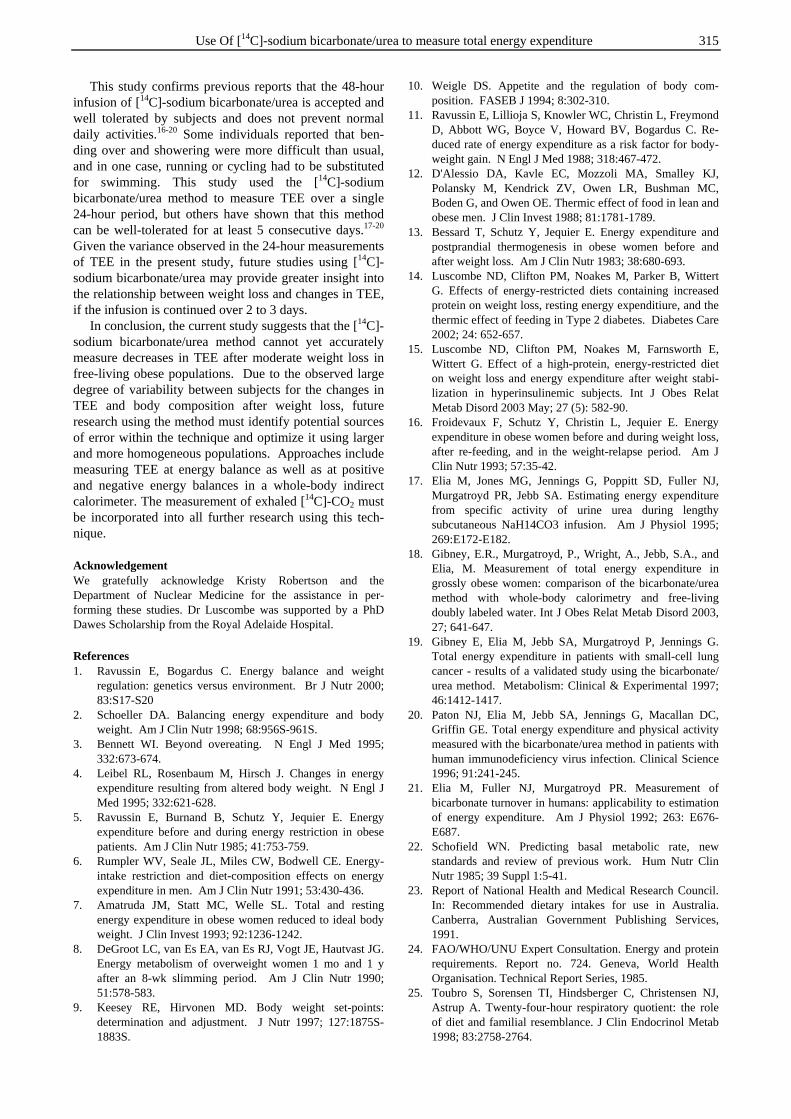
Use Of [14C]-sodium bicarbonate/urea to measure total energy expenditure 315
This study confirms previous reports that the 48-hour infusion of [14C]-sodium bicarbonate/urea is accepted and well tolerated by subjects and does not prevent normal daily activities.16-20 Some individuals reported that ben-ding over and showering were more difficult than usual, and in one case, running or cycling had to be substituted for swimming. This study used the [14C]-sodium bicarbonate/urea method to measure TEE over a single 24-hour period, but others have shown that this method can be well-tolerated for at least 5 consecutive days.17-20 Given the variance observed in the 24-hour measurements of TEE in the present study, future studies using [14C]-sodium bicarbonate/urea may provide greater insight into the relationship between weight loss and changes in TEE, if the infusion is continued over 2 to 3 days. In conclusion, the current study suggests that the [14C]-sodium bicarbonate/urea method cannot yet accurately measure decreases in TEE after moderate weight loss in free-living obese populations. Due to the observed large degree of variability between subjects for the changes in TEE and body composition after weight loss, future research using the method must identify potential sources of error within the technique and optimize it using larger and more homogeneous populations. Approaches include measuring TEE at energy balance as well as at positive and negative energy balances in a whole-body indirect calorimeter. The measurement of exhaled [14C]-CO2 must be incorporated into all further research using this tech-nique. Acknowledgement We gratefully acknowledge Kristy Robertson and the Department of Nuclear Medicine for the assistance in per-forming these studies. Dr Luscombe was supported by a PhD Dawes Scholarship from the Royal Adelaide Hospital. References 1. Ravussin E, Bogardus C. Energy balance and weight
regulation: genetics versus environment. Br J Nutr 2000; 83:S17-S20
2. Schoeller DA. Balancing energy expenditure and body weight. Am J Clin Nutr 1998; 68:956S-961S.
3. Bennett WI. Beyond overeating. N Engl J Med 1995; 332:673-674.
4. Leibel RL, Rosenbaum M, Hirsch J. Changes in energy expenditure resulting from altered body weight. N Engl J Med 1995; 332:621-628.
5. Ravussin E, Burnand B, Schutz Y, Jequier E. Energy expenditure before and during energy restriction in obese patients. Am J Clin Nutr 1985; 41:753-759.
6. Rumpler WV, Seale JL, Miles CW, Bodwell CE. Energy-intake restriction and diet-composition effects on energy expenditure in men. Am J Clin Nutr 1991; 53:430-436.
7. Amatruda JM, Statt MC, Welle SL. Total and resting energy expenditure in obese women reduced to ideal body weight. J Clin Invest 1993; 92:1236-1242.
8. DeGroot LC, van Es EA, van Es RJ, Vogt JE, Hautvast JG. Energy metabolism of overweight women 1 mo and 1 y after an 8-wk slimming period. Am J Clin Nutr 1990; 51:578-583.
9. Keesey RE, Hirvonen MD. Body weight set-points: determination and adjustment. J Nutr 1997; 127:1875S-1883S.
10. Weigle DS. Appetite and the regulation of body com-position. FASEB J 1994; 8:302-310.
11. Ravussin E, Lillioja S, Knowler WC, Christin L, Freymond D, Abbott WG, Boyce V, Howard BV, Bogardus C. Re-duced rate of energy expenditure as a risk factor for body-weight gain. N Engl J Med 1988; 318:467-472.
12. D'Alessio DA, Kavle EC, Mozzoli MA, Smalley KJ, Polansky M, Kendrick ZV, Owen LR, Bushman MC, Boden G, and Owen OE. Thermic effect of food in lean and obese men. J Clin Invest 1988; 81:1781-1789.
13. Bessard T, Schutz Y, Jequier E. Energy expenditure and postprandial thermogenesis in obese women before and after weight loss. Am J Clin Nutr 1983; 38:680-693.
14. Luscombe ND, Clifton PM, Noakes M, Parker B, Wittert G. Effects of energy-restricted diets containing increased protein on weight loss, resting energy expenditiure, and the thermic effect of feeding in Type 2 diabetes. Diabetes Care 2002; 24: 652-657.
15. Luscombe ND, Clifton PM, Noakes M, Farnsworth E, Wittert G. Effect of a high-protein, energy-restricted diet on weight loss and energy expenditure after weight stabi-lization in hyperinsulinemic subjects. Int J Obes Relat Metab Disord 2003 May; 27 (5): 582-90.
16. Froidevaux F, Schutz Y, Christin L, Jequier E. Energy expenditure in obese women before and during weight loss, after re-feeding, and in the weight-relapse period. Am J Clin Nutr 1993; 57:35-42.
17. Elia M, Jones MG, Jennings G, Poppitt SD, Fuller NJ, Murgatroyd PR, Jebb SA. Estimating energy expenditure from specific activity of urine urea during lengthy subcutaneous NaH14CO3 infusion. Am J Physiol 1995; 269:E172-E182.
18. Gibney, E.R., Murgatroyd, P., Wright, A., Jebb, S.A., and Elia, M. Measurement of total energy expenditure in grossly obese women: comparison of the bicarbonate/urea method with whole-body calorimetry and free-living doubly labeled water. Int J Obes Relat Metab Disord 2003, 27; 641-647.
19. Gibney E, Elia M, Jebb SA, Murgatroyd P, Jennings G. Total energy expenditure in patients with small-cell lung cancer - results of a validated study using the bicarbonate/ urea method. Metabolism: Clinical & Experimental 1997; 46:1412-1417.
20. Paton NJ, Elia M, Jebb SA, Jennings G, Macallan DC, Griffin GE. Total energy expenditure and physical activity measured with the bicarbonate/urea method in patients with human immunodeficiency virus infection. Clinical Science 1996; 91:241-245.
21. Elia M, Fuller NJ, Murgatroyd PR. Measurement of bicarbonate turnover in humans: applicability to estimation of energy expenditure. Am J Physiol 1992; 263: E676-E687.
22. Schofield WN. Predicting basal metabolic rate, new standards and review of previous work. Hum Nutr Clin Nutr 1985; 39 Suppl 1:5-41.
23. Report of National Health and Medical Research Council. In: Recommended dietary intakes for use in Australia. Canberra, Australian Government Publishing Services, 1991.
24. FAO/WHO/UNU Expert Consultation. Energy and protein requirements. Report no. 724. Geneva, World Health Organisation. Technical Report Series, 1985.
25. Toubro S, Sorensen TI, Hindsberger C, Christensen NJ, Astrup A. Twenty-four-hour respiratory quotient: the role of diet and familial resemblance. J Clin Endocrinol Metab 1998; 83:2758-2764.
316 ND Luscombe, C Tsopelas, M Bellon, PM Clifton, I Kirkwood and GA Wittert
26. Fuller NJ and Elia M. Does mitochondrial compart-mentation of CO2 exist in man? Clin Physiol 1989 Aug; 9 (4): 345-52.
27. Elia M. Energy equivalents of CO2 and their importance in assessing energy expenditure when using tracer techniques. Am J Physiol 1991; 260: E75-E88.
28. Narayanan S, Appleton HD. Creatinine: a review. Clin Chem 1980; 26: 1119-1126.
29. Poehlman ET, Toth MJ. Mathematical ratios lead to spurious conclusions regarding age- and sex-related differences in resting metabolic rate. Am J Clin Nutr 1995; 61:482-485.
30. Racette SB, Schoeller DA, Kushner RF, Neil KM, Herling-Iaffaldano K. Effects of aerobic exercise and dietary carbo-hydrate on energy expenditure and body composition during weight reduction in obese women. Am J Clin Nutr 1995; 61:486-494.
31. Weststrate JA. Resting metabolic rate and diet-induced thermogenesis: a methodological reappraisal. Am J Clin Nutr 1993; 58:592-601
Original Article Use Of [14C]-sodium bicarbonate/urea to measure total energy expenditure in overweight men and women before and after low calorie diet induced weight loss Natalie D Luscombe PhD
1,4, Christopher Tsopelas PhD2, Max Bellon DipMedTech,
ADNucMed 2, Peter M Clifton MBBS, PhD,FRACP,3, Ian Kirkwood MBBS, FRACP
2 and Gary A Wittert MBBch, MD, FRACP
4
1 University of Adelaide, Department of Physiology, South Australia, 5000 2 Royal Adelaide Hospital, Department of Nuclear Medicine, South Australia, 5000 3 CSIRO Health Science and Nutrition, Adelaide, South Australia, 5000 4 University of Adelaide, Department of Medicine, South Australia, 5000
利用利用利用利用 C14重碳酸钠重碳酸钠重碳酸钠重碳酸钠////尿素测低卡路里饮食导致男人和女人体重降低前后尿素测低卡路里饮食导致男人和女人体重降低前后尿素测低卡路里饮食导致男人和女人体重降低前后尿素测低卡路里饮食导致男人和女人体重降低前后
总能支出总能支出总能支出总能支出
目的:评价14
C 重碳酸钠/尿素技术在测定体重降低和一段时间的体重保持后总能支出的改变
中的应用。方法:通过结合运用 Modifast™ 配方和每日少量一餐的方法,11 个健康人(6 男
5 女,50±3 岁,BMI 34.1 ± 2.1 kg/m2,体脂含量 38.7 ± 3%)经历 8 周的能量摄入限制
(≈3.3 MJ/day)后,所有研究对象摄入两周足够能量的固体食物,使体重保持在降低后的
新水平。第 0 周和第 10 周分别测身体组成、总能支出(TEE)、静息状态能量支出(REE)
和摄食测试餐(能量含量 2.7MJ)后的生热作用。结果:与第 0 周相比,第 10 周时体重降低
了 12.2 ± 1.6 kg (12.5%) (P < 0.001);总脂肪和瘦体质分别降低了 8.4 ± 1.0 kg (20.4%)和 3.8 ± 0.7 kg (6.7%) (P < 0.001);REE 降低了 500 ± 128 kJ/day (5.6 ± 1.3%) (P < 0.002);;TEE 和 TEF 有所降低(0.18 ± 3.7%和 1.4 ± 0.9%),但差异不显
著。结论:虽然14
C 重碳酸钠/尿素技术具有较好的耐受度且与每日正常活动互不干扰,但并
不能灵敏地反映由体重减轻引起的 TEE 在 0.1-1.0%范围内的精确变化。
关键词:关键词:关键词:关键词:能量支出,摄食的生热作用,体重降低,低卡路里饮食,临床干扰
Asia Pac J Clin Nutr 2006;15 (3): 317-322 317
Original Article Validity and reliability of BodyGem for measuring resting metabolic rate on Taiwanese women
Tsan-Hon Liou MD1,2, Ching-Min Chen RN DNS
3, Wan-Yu Chung RD4 and
Nain-Feng Chu MD Dr.PH5
1 Community Medicine Research Center and Institute of Public Health, National Yang-Ming University 2 Department of Rehabilitation, Taipei Medical University-Wan Fan Hospital 3 College of Nursing, Taipei Medical University 4 Department of Clinical Nutrition, Tri-Service General Hospital, NDMC 5 Department of Community Medicine, Tri-Service General Hospital, NDMC
Resting metabolic rate (RMR) accounts for about two thirds of total energy expenditure. The widely used Harris-Benedict equations systematically overestimate RMR. This study assessed overall reliability and validity of a handheld indirect calorimeter, BodyGem, on a sample of women. Thirty healthy nurses participated in this study with an age of 41.9 ± 9.0 years old and a body mass index of 24.0 ± 2.8 kg/m2. The Deltatrac Metabolic Monitor was used as the criterion method to validate BodyGem. Reliability was estimated by repeated measures of BodyGem to test internal consistency and stability. Analysis indicated that measurements of Deltatrac and BodyGem are well correlated (r = 0.76, P < 0.001). The correlation coefficients of two BodyGem RMR measurements were of large statistical significance (r = 0.96, P <0.001, mean difference = 15.8±55.8 Kcal/d). A significant difference (F = 3.81, P = 0.04) in repeated measures ANOVA and post hoc revealed a difference between BodyGem and Deltatrac. There was a systematic difference between both methods (mean difference between BodyGem and Deltatrac = 36.4~52.2 Kcal/d). After adjustment of additional energy demand by holding BodyGem in position, the difference became non-significant (F = 1.62, P = 0.22). Bland-Altman plots revealed that there was no significant trend in both methods, and repeated measurements of Bodygem. In conclusion, RMR obtained using the BodyGem has a high degree of reproducibility and an acceptable validity compared to the Deltatrac. Further validity research is needed in Taiwanese women.
Key Words: women, reliability, validity, resting metabolic rate, indirect calorimeter, Harris-Benedict equations, Taiwan
Introduction Daily energy expenditure is usually divided into the following three components: resting metabolic rate (RMR), the thermic effect of food, and energy expended in exercise and physical activity.1 Among these, RMR accounts for 60 to 75% of total daily expenditure in sedentary individuals, and shows little day-to-day variation. RMR is an important factor of energy metabolism in humans.2 The principle of treatment of obesity is to keep calorie intake below calorie expenditure. To achieve the desired weight loss requires accurate measurement of energy expenditure.3-5 Hence, it is important to assess RMR accurately in order to achieve a negative balance of energy.6, 7 For clinical convenience, RMR is often estimated using predictive equations, such as Harris-Benedict (H-B),8 Bern-stein,9 Mifflin, 10 and World Health Organization (WHO)11 equations, which involve variables such as height, weight, age, gender, and fat-free mass. However, only 50-70% of the variability in RMR is explained by these prediction equations.12-14 Indirect calorimetry is also used clinically to determine RMR.2,7 However, not only does the current indirect calorimetry measure require highly skilled tech-nicians, it is also costly and impractical for most clinical
and community settings. Therefore, there has been a strong interest in the development of a more sensitive, easy-to-use, portable and accurate device to measure RMR, which can be used in non-laboratory settings. BodyGem ( Health Tech Inc., Golden, CO), a small, hand-held device, is an example of such technology. Melanson15 and Nieman16 tested Body-Gem by comparing it with metabolic cart and Douglas bag measurements and both showed that BodyGem provided valid and reliable measurements of RMR. However, there are few studies on the Asian population. At present, H-B equations that were derived in 1910 and based on the Caucasians are still widely used in clinical and experi-mental studies in Asia. HB equations overestimate RMR by 10-15% in the United States4, 10, 12 and 15~20% in Asians.17 In addition, H-B equations give the same RMR in people of the same gender, age, body height and weight. However, it is known that individuals differ in RMR. Correspondence address: Dr Nain-Feng Chu, MD, Department of Community Medicine, Tri-Service General Hospital, NDMC, No.325, Sec. 2, Cheng-Gong Rd, Nei-Hu, Taipei, Taiwan, ROC Tel: 886-2-8791-0506; Fax: 886-2-8791-0590 E-mail: [email protected] Accepted 29th November 2005
318 T-H Liou, C-M Chen, W-Y Chung and N- Chu
Accurate estimation of RMR is crucial to achieve an energy metabolism balance. It is especially important for the Asians to develop a reliable and individualized me-thod for measuring RMR. Therefore, the purpose of this study was to evaluate the validity and reliability of BodyGem on a sample of Taiwanese women. Materials and Methods Subjects Thirty volunteer nurses were recruited in the Wan Fang hospitals and stratified into one of three body mass index (BMI) categories: normal, 19-22.9; overweight, 23-24.9; and obese, >25 according to the World Health Organi-zation definition of obesity for the Asia-Pacific coun-tries.18 Selection eligibility criteria included the follow-ing: apparently healthy women, age of 18 or above, non-smoking, non-alcohol drinking, and not having been on any recent weight reduction program (weight stable for the previous 4 months). Women who had been previously diagnosed as having diabetes mellitus, thyroid disease, renal insufficiency, cardiovascular disease, pulmonary dysfunction, severe hypertension, or taking medications that could affect RMR were excluded. T3, T4, and TSH were also checked to rule out thyroid disease. This study was approved by the Institutional Human Subject Review Board of Tri-Service General Hospital, Taiwan. All sub-jects gave written informed consent before participa-ting. Protocol Subjects fasted, avoided caffeine beverages for at least 8 hours, and abstained from strenuous exercise for 24 hours prior to the test. After arriving in the lab, subjects were measured for their body height, body weight, and per-centage of body fat and then rested quietly in a semi-recumbent position for approximately 30 min in an iso-lated room with the temperature maintained around 24�. RMR was measured by the same technician using both the BodyGem and an indirect caloriometry method (Deltatrac Metabolic Monitor, Datex Inc., Helsinki, Finland) on the same morning (8:30 ~ 10: 30) to reduce the effect of diurnal variation. Two trials of BodyGem and one of Deltatrac were made in a random order. Sub-jects were given a break of 20-30 minutes between tests. During the break, subjects remained seated and were asked to remain awake and relaxed. Resting metabolic rate measurements BodyGem
BodyGem is designed to measure the human RMR. The principle of BodyGem has been described elsewhere.15, 16 Each subject is asked to breathe through the device with a disposable mouthpiece and a nose clip for a period of 5-12 minutes, during which the device measures the volume and content of the breaths, flow rate, oxygen concen-tration, temperature, pressure, and humidity. The RMR is calculated from oxygen consumption and a fixed respi-ratory quotient (RQ) of 0.85 using a modified Weir equa-tion.19 Deltatrac metabolic monitor Deltatrac Metabolic Monitor is a continuous open-circuit indirect calorimetry for measuring energy expenditure
using a ventilated hood system. This device collects con-tinuously the subjects’ O2 and CO2 concentrations in in-spired and expired air diluted in a constant airflow (40L air/min) generated by the analyzer. One-minute data were taken for half an hour. For each set of data, the first 10 minutes were discarded and the mean value of the data for the remaining 20 minutes was used in the calculations. Anthropometry Height and weight measurements were taken with parti-cipant’s clothes and without shoes. Body weight was measured to the nearest 0.1kg on a calibrated clinical balance scale. Body height was measured to the nearest 0.1cm using a standard stadiometer. Body mass index (BMI; kg/m2) was calculated from the weight in kilo-grams divided by the height in meters squared. Body composition was determined using a multiple frequency bio-impedance analysis (Inbody 3.0 Biospace Co, Ko-rea).20 Fat mass (FM) was calculated by multiplying per-centage of body fat times body mass (kg). Fat-free mass (FFM) was determined by subtracting FM (kg) from total body mass (kg). Statistical analyses Data were analyzed using the SPSS for Windows sta-tistics program, version 11.0 (SPSS, Chicago, USA). Pearson correlation coefficients were used to evaluate the relationship between the measurements obtained by the two methods. A repeated measures ANOVA was em-ployed to test the dependability of BodyGem in mea-suring RMR. A significant overall F-statistic was followed by post hoc pairwise comparisons to determine which means differed significantly from the others. The homoskedasticity was explored by inspection of Bland-Altman plots21 and quantified with Pearson’s correlations. The results are expressed as mean + SD. A two-tailed P-value of less than 0.05 was considered statistically sig-nificant. Results The volunteer women had a mean age of 42.0 ± 9.0 (21.3~54.8) years old and a mean BMI of 24.0 ± 2.8 (19.2~31.9) kg/m2. Ten had a BMI less than 23, ten had a BMI between 23 and 25, whereas ten had a BMI greater than 25. The characteristics of subjects and the different methods of predicting RMR among study subjects are summarized in Table 1. Based on the RMR measurement of Deltatrac, there was a mean 20.0% overestimation (19.6% in the normal group, 18.4% in the overweight group, and 22.1% in the obese group, F=0.34, P = 0.72) of RMR predicted by the H-B equations among subjects. These results indicate that the commonly used H-B equations overestimate RMR of the Asians in all three BMI categories. It would be proble-matic if a weight loss program was based on such in-accurate RMR predictions. Concurrent validity is the degree to which the scores on an instrument correlate with some external criterion.22 In this study, Pearson correlation analysis indicated that the RMR measures from BodyGem (mean of two trials) and Deltatrac are well related (r = 0.76, P < 0.001).
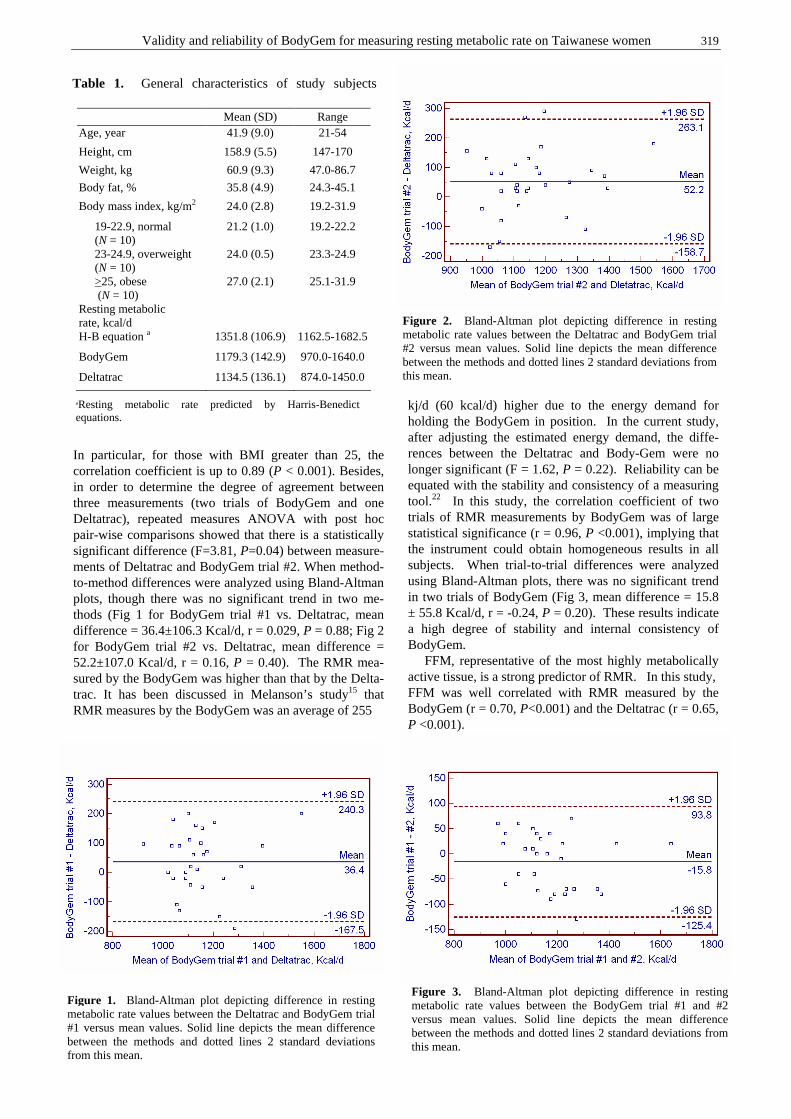
Validity and reliability of BodyGem for measuring resting metabolic rate on Taiwanese women 319
In particular, for those with BMI greater than 25, the correlation coefficient is up to 0.89 (P < 0.001). Besides, in order to determine the degree of agreement between three measurements (two trials of BodyGem and one Deltatrac), repeated measures ANOVA with post hoc pair-wise comparisons showed that there is a statistically significant difference (F=3.81, P=0.04) between measure-ments of Deltatrac and BodyGem trial #2. When method-to-method differences were analyzed using Bland-Altman plots, though there was no significant trend in two me-thods (Fig 1 for BodyGem trial #1 vs. Deltatrac, mean difference = 36.4±106.3 Kcal/d, r = 0.029, P = 0.88; Fig 2 for BodyGem trial #2 vs. Deltatrac, mean difference = 52.2±107.0 Kcal/d, r = 0.16, P = 0.40). The RMR mea-sured by the BodyGem was higher than that by the Delta-trac. It has been discussed in Melanson’s study15 that RMR measures by the BodyGem was an average of 255
kj/d (60 kcal/d) higher due to the energy demand for holding the BodyGem in position. In the current study, after adjusting the estimated energy demand, the diffe-rences between the Deltatrac and Body-Gem were no longer significant (F = 1.62, P = 0.22). Reliability can be equated with the stability and consistency of a measuring tool.22 In this study, the correlation coefficient of two trials of RMR measurements by BodyGem was of large statistical significance (r = 0.96, P <0.001), implying that the instrument could obtain homogeneous results in all subjects. When trial-to-trial differences were analyzed using Bland-Altman plots, there was no significant trend in two trials of BodyGem (Fig 3, mean difference = 15.8 ± 55.8 Kcal/d, r = -0.24, P = 0.20). These results indicate a high degree of stability and internal consistency of BodyGem. FFM, representative of the most highly metabolically active tissue, is a strong predictor of RMR. In this study, FFM was well correlated with RMR measured by the BodyGem (r = 0.70, P<0.001) and the Deltatrac (r = 0.65, P <0.001).
Table 1. General characteristics of study subjects
Mean (SD) Range Age, year 41.9 (9.0) 21-54
Height, cm 158.9 (5.5) 147-170
Weight, kg 60.9 (9.3) 47.0-86.7
Body fat, % 35.8 (4.9) 24.3-45.1
Body mass index, kg/m2 24.0 (2.8) 19.2-31.9
19-22.9, normal (N = 10)
21.2 (1.0) 19.2-22.2
23-24.9, overweight (N = 10)
24.0 (0.5) 23.3-24.9
>25, obese (N = 10)
27.0 (2.1) 25.1-31.9
Resting metabolic rate, kcal/d
H-B equation a 1351.8 (106.9) 1162.5-1682.5
BodyGem 1179.3 (142.9) 970.0-1640.0
Deltatrac 1134.5 (136.1) 874.0-1450.0
aResting metabolic rate predicted by Harris-Benedict equations.
Figure 1. Bland-Altman plot depicting difference in resting metabolic rate values between the Deltatrac and BodyGem trial #1 versus mean values. Solid line depicts the mean difference between the methods and dotted lines 2 standard deviations from this mean.
Figure 2. Bland-Altman plot depicting difference in resting metabolic rate values between the Deltatrac and BodyGem trial #2 versus mean values. Solid line depicts the mean difference between the methods and dotted lines 2 standard deviations from this mean.
Figure 3. Bland-Altman plot depicting difference in resting metabolic rate values between the BodyGem trial #1 and #2 versus mean values. Solid line depicts the mean difference between the methods and dotted lines 2 standard deviations from this mean.
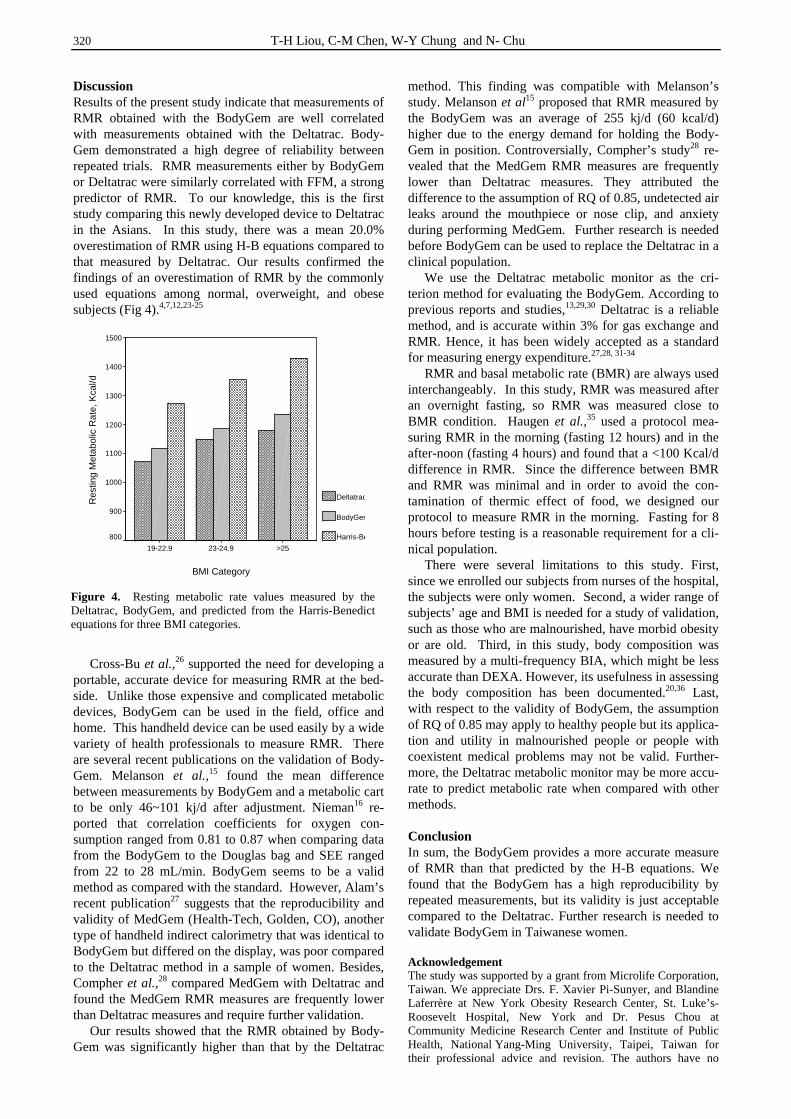
320 T-H Liou, C-M Chen, W-Y Chung and N- Chu
Discussion Results of the present study indicate that measurements of RMR obtained with the BodyGem are well correlated with measurements obtained with the Deltatrac. Body-Gem demonstrated a high degree of reliability between repeated trials. RMR measurements either by BodyGem or Deltatrac were similarly correlated with FFM, a strong predictor of RMR. To our knowledge, this is the first study comparing this newly developed device to Deltatrac in the Asians. In this study, there was a mean 20.0% overestimation of RMR using H-B equations compared to that measured by Deltatrac. Our results confirmed the findings of an overestimation of RMR by the commonly used equations among normal, overweight, and obese subjects (Fig 4).4,7,12,23-25 Cross-Bu et al.,26 supported the need for developing a portable, accurate device for measuring RMR at the bed-side. Unlike those expensive and complicated metabolic devices, BodyGem can be used in the field, office and home. This handheld device can be used easily by a wide variety of health professionals to measure RMR. There are several recent publications on the validation of Body-Gem. Melanson et al.,15 found the mean difference between measurements by BodyGem and a metabolic cart to be only 46~101 kj/d after adjustment. Nieman16 re-ported that correlation coefficients for oxygen con-sumption ranged from 0.81 to 0.87 when comparing data from the BodyGem to the Douglas bag and SEE ranged from 22 to 28 mL/min. BodyGem seems to be a valid method as compared with the standard. However, Alam’s recent publication27 suggests that the reproducibility and validity of MedGem (Health-Tech, Golden, CO), another type of handheld indirect calorimetry that was identical to BodyGem but differed on the display, was poor compared to the Deltatrac method in a sample of women. Besides, Compher et al.,28 compared MedGem with Deltatrac and found the MedGem RMR measures are frequently lower than Deltatrac measures and require further validation. Our results showed that the RMR obtained by Body-Gem was significantly higher than that by the Deltatrac
method. This finding was compatible with Melanson’s study. Melanson et al15 proposed that RMR measured by the BodyGem was an average of 255 kj/d (60 kcal/d) higher due to the energy demand for holding the Body-Gem in position. Controversially, Compher’s study28 re-vealed that the MedGem RMR measures are frequently lower than Deltatrac measures. They attributed the difference to the assumption of RQ of 0.85, undetected air leaks around the mouthpiece or nose clip, and anxiety during performing MedGem. Further research is needed before BodyGem can be used to replace the Deltatrac in a clinical population. We use the Deltatrac metabolic monitor as the cri-terion method for evaluating the BodyGem. According to previous reports and studies,13,29,30 Deltatrac is a reliable method, and is accurate within 3% for gas exchange and RMR. Hence, it has been widely accepted as a standard for measuring energy expenditure.27,28, 31-34 RMR and basal metabolic rate (BMR) are always used interchangeably. In this study, RMR was measured after an overnight fasting, so RMR was measured close to BMR condition. Haugen et al.,35 used a protocol mea-suring RMR in the morning (fasting 12 hours) and in the after-noon (fasting 4 hours) and found that a <100 Kcal/d difference in RMR. Since the difference between BMR and RMR was minimal and in order to avoid the con-tamination of thermic effect of food, we designed our protocol to measure RMR in the morning. Fasting for 8 hours before testing is a reasonable requirement for a cli-nical population. There were several limitations to this study. First, since we enrolled our subjects from nurses of the hospital, the subjects were only women. Second, a wider range of subjects’ age and BMI is needed for a study of validation, such as those who are malnourished, have morbid obesity or are old. Third, in this study, body composition was measured by a multi-frequency BIA, which might be less accurate than DEXA. However, its usefulness in assessing the body composition has been documented.20,36 Last, with respect to the validity of BodyGem, the assumption of RQ of 0.85 may apply to healthy people but its applica-tion and utility in malnourished people or people with coexistent medical problems may not be valid. Further-more, the Deltatrac metabolic monitor may be more accu-rate to predict metabolic rate when compared with other methods. Conclusion In sum, the BodyGem provides a more accurate measure of RMR than that predicted by the H-B equations. We found that the BodyGem has a high reproducibility by repeated measurements, but its validity is just acceptable compared to the Deltatrac. Further research is needed to validate BodyGem in Taiwanese women. Acknowledgement The study was supported by a grant from Microlife Corporation, Taiwan. We appreciate Drs. F. Xavier Pi-Sunyer, and Blandine Laferrère at New York Obesity Research Center, St. Luke’s-Roosevelt Hospital, New York and Dr. Pesus Chou at Community Medicine Research Center and Institute of Public Health, National Yang-Ming University, Taipei, Taiwan for their professional advice and revision. The authors have no
Figure 4. Resting metabolic rate values measured by the Deltatrac, BodyGem, and predicted from the Harris-Benedict equations for three BMI categories.
BMI Category
>2523-24.919-22.9
Res
ting
Met
abol
ic R
ate,
Kca
l/d
1500
1400
1300
1200
1100
1000
900
800
Deltatrac
BodyGem
Harris-Benedict
Validity and reliability of BodyGem for measuring resting metabolic rate on Taiwanese women 321
known conflicts of interest, financial or otherwise, with any of the products mentioned in this manuscript. References 1. Garrow JS. Energy balance in man--an overview. Am J
Clin Nutr 1987;45(5 Suppl):1114-1119. 2. De Lorenzo A, Sorge RP, Bertini I, et al. Validation and
reliability of a new portable telemetric calorimeter designed to measure oxygen consumption and carbon dioxide production. Diabetes Nutr Metab 2001;14:268-276.
3. Garrow JS, Durrant ML, Mann S, Stalley SF, Warwick PM. Factors determining weight loss in obese patients in a metabolic ward. Int J Obes 1978;2:441-447.
4. Owen OE, Kavle E, S OR, et al. A reappraisal of caloric requirements in healthy women. Am J Clin Nutr 1986;44:1-19.
5. Owen OE, Holup JL, D'Alessio DA, et al. A reappraisal of the caloric requirements of men. Am J Clin Nutr 1987;46:875-885.
6. Wang Z, Heshka S, Gallagher D, Boozer CN, Kotler DP, Heymsfield SB. Resting energy expenditure-fat-free mass relationship: New insights provided by body composition modeling. Am J Physiol Endocrinol Metab 2000;279:E539-545.
7. Foster GD, Wadden TA, Mullen JL, et al. Resting energy expenditure, body composition, and excess weight in the obese. Metabolism 1988;37:467-472.
8. Harris J, Benedict F. A biometric study of the basal metabolism in man: Carnegie Institution of Washington: Washington, DC; 1919.
9. Bernstein RS, Thornton JC, Yang MU, et al. Prediction of the resting metabolic rate in obese patients. Am J Clin Nutr 1983;37:595-602.
10. Mifflin MD, St Jeor ST, Hill LA, Scott BJ, Daugherty SA, Koh YO. A new predictive equation for resting energy expenditure in healthy individuals. Am J Clin Nutr 1990;51:241-247.
11. Energy and protein requirements. Report of a joint FAO/WHO/UNU Expert Consultation. World Health Organ Tech Rep Ser 1985;724:1-206.
12. Daly JM, Heymsfield SB, Head CA, et al. Human energy requirements: overestimation by widely used prediction equation. Am J Clin Nutr 1985;42:1170-1174.
13. Frankenfield DC, Muth ER, Rowe WA. The Harris-Benedict studies of human basal metabolism: history and limitations. J Am Diet Assoc 1998;98:439-445.
14. Garrel DR, Jobin N, DeJonge LHM. Should we still use the Harris and Benedict Equations? Nutr Clin Pract 1996;11:99-103.
15. Melanson EL, Coelho LB, Tran ZV, Haugen HA, Kearney JT, Hill JO. Validation of the BodyGem hand-held calorimeter. Int J Obes 2004;28:1479-1484.
16. Nieman DC, Trone GA, Austin MD. A new handheld device for measuring resting metabolic rate and oxygen consumption. J Am Diet Assoc 2003;103:588-592.
17. Liu H, Lu Y, Chen W. Validity of predictive equations for the calculaiton of basal metabolic rate in healthy Chinese adults. J Chinese Nutr Soc 1994;19:141-150.
18. Steering Committee. The Asia-Pacific perspective: Redefining obesity and its treatment. Melbourne: International Diabetes Institute; 2000.
19. Weir JB. New methods for calculating metabolic rate with special reference to protein metabolism. Nutrition 1990;6:213-221.
20. Bedogni G, Malavolti M, Severi S, et al. Accuracy of an eight-point tactile-electrode impedance method in the assessment of total body water. Eur J Clin Nutr 2002;56:1143-1148.
21. Bland J, Altman D. Statistical methods for assessing agreement between two methods of clinical measurement. Lancet 1986;327:307-310.
22. Polit DF, Hungler BP. Nursing research: Principles and methods. New York, Lippincott, 1995.
23. Liu HY, Lu YE, Chen YJ. Predictive equation for basal metabolic rate in Chinese adults: a cross-validation study. J Am Diet Assoc 1995;95:1403-1408.
24. James WPT, Bailes J, Davies HL, Dauncey MJ. Elevated metabolic rates in obesity. Lancet 1978;1:1122-1125.
25. Bray GA, Schwartz M, Rozin R, Lister J. Relationships between oxygen consumption and body composition of obese patients. Metabolism 1970;19:418-429.
26. Cross-Bu JA, Jefferson LS, Walding D, David Y, Smith EO, Klish WJ. Resting energy expenditure in children in a pediatric intensive care unit: Comparison of Harris-Benedict and Talbot predictions with indirect calorimetry values. Am J Clin Nutr 1998;67:74-80.
27. Alam DS, Hulshof PJM, Roordink D, et al. Validity and reproducibility of resting metabolic rate measurements in rural Bangladeshi women: comparison of measurements obtained by MedGem and by Deltatrac device. Eur J Clin Nutr 2005;59:651-657.
28. Compher C, Hise M, Sternberg A, Kinosian BP. Comparison between MedGem and Deltatrac resting metabolic rate measurements. Eur J Clin Nutr[Epub ahead of print] 2005.
29. Karhunen L, Franssila-Kallunki A, Rissanen P, et al. Effect of orlistat treatment on body composition and resting energy expenditure during a two-year weight-reduction programme in obese Finns. Int J Obes 2000;24:1567-1572.
30. Wells JC, Fuller NJ. Precision and accuracy in a metabolic monitor for indirect calorimetry. Eur J Clin Nutr 1998;52:536-540.
31. Stewart CL, Goody CM, Branson R. Comparison of two systems of measuring energy expenditure. J Parenter Enteral Nutr 2005;29:212-217.
32. Takala J, Keinanen O, Vaisanen P, Kari A. Measurement of gas exchange in intensive care: laboratory and clinical validation of a new device. Crit Care Med 1989;17:1041-1047.
33. Tissot S, Delafosse B, Bertrand O, Bouffard Y, Viale JP, Annat G. Clinical validation of the Deltatrac monitoring system in mechanically ventilated patients. Intensive Care Med 1995;21:149-153.
34. Weissman C, Sardar A, Kemper M. In vitro evaluation of a compact metabolic measurement instrument. J Parenter Enteral Nutr 1990;14:216-221.
35. Haugen A, Melanson EL, Tran ZU, Kearney JT, Hill JO. Variability of measured resting metabolic rate. Am J Clin Nutr 2003;78:1141-1144.
36. Segal NA, Hein J, Basford JR. The effects of Pilates training on flexibility and body composition: An observational study. Arch Phys Med Rehabil 2004;85:1977-1981.
322 T-H Liou, C-M Chen, W-Y Chung and N- Chu
Original Article Validity and reliability of BodyGem for measuring resting metabolic rate on Taiwanese women
Tsan-Hon Liou MD1,2, Ching-Min Chen RN DNS
3, Wan-Yu Chung RD4 and
Nain-Feng Chu MD Dr.PH5
1 Community Medicine Research Center and Institute of Public Health, National Yang-Ming University 2 Department of Rehabilitation, Taipei Medical University-Wan Fan Hospital 3 College of Nursing, Taipei Medical University 4 Department of Clinical Nutrition, Tri-Service General Hospital, NDMC 5 Department of Community Medicine, Tri-Service General Hospital, NDMC
BodyGem用于测定台湾妇女休息代谢率的有效性和可靠性
休息代谢率(RMR)约占总能量消耗率的三分之二。目前广泛使用的 Harris-Benedict 方程
计算 RMR 值结果偏高。本次研究评价了身握式间接热量计,BodyGemBodyGemBodyGemBodyGem 用于测定一组妇女样本
RMR 的可靠性和有效性。共 30 名健康护士参与了此项研究,她们平均年龄 41.9±9 岁,身体
质量指数为 24.0 + 2.8 kg/m2。Deltatrac 代谢监测器用来确认身体珍宝测定的结果。用身
体珍宝重复测定以估算出结果的一致性和稳定性。分析结果表明,Deltatrac 方法和
BodyGemBodyGemBodyGemBodyGem 方法相关性良好(r = 0.76, P< 0.001),两次 BodyGemBodyGemBodyGemBodyGem 测定 RMR 的结果间相关系数
在统计上有极显著相关(r = 0.96, P <0.001,均差 15.8±55.8 Kcal/d)。用 ANOVA 重复测
定结果的显著差异性(F = 3.81, P = 0.04)反应了用 BodyGemBodyGemBodyGemBodyGem 和 Deltatrac 方法间的差异
性。在两种方法间存在系统差异(二者平均差 36.4~52.2 Kcal/d),在通过正确的手握
BodyGemBodyGemBodyGemBodyGem 后可以调整额外的能量需要,二者间的差异变得不显著(F = 1.62, P = 0.22)。
Bland-Altman 图表显示两种方法间以及用 BodyGemBodyGemBodyGemBodyGem 重复测定结果间无显著性差异。总之,用
BodyGemBodyGemBodyGemBodyGem 测得的 RMR 值与 Deltatrac 方法相比有高的重复性和可被接受的有效性,对该方法
进一步的有效性研究有必要在台湾妇女中继续开展。
关键词:关键词:关键词:关键词:妇女、可靠度、有效性、休息代谢率、间接热量计、Harris-Benedict 方程、台
湾。
Asia Pac J Clin Nutr 2006;15 (3): 323-328 323
Original Article Nutrition education in medical schools in Japan: results from a questionnaire survey Hideo Orimo MD, PhD
1, Toshiro Shimura MD, PhD2 and Takashi Shimada MD, PhD1
1Department of Biochemistry and Molecular Biology, Nippon Medical School 2Center for Educational Development, Nippon Medical School
Diet is known to play a critical role in the pathogenesis of major age-related chronic diseases, which are rapidly becoming more common in Japan and other industrialized countries. However, traditional medical education has not provided adequate knowledge of nutrition. To understand the current status of nutrition education in Japan, we sent a questionnaire to all Japanese medical schools to survey their nutrition curricula. The questionnaire was sent to 79 medical schools in Japan, which includes all medical schools except for that of the authors. We also used a questionnaire to survey second year medical students just after they received a short nutrition course at Nippon Medical School. Fifty-seven medical schools (72.2%) responded to the questionnaire: 12 (21.1% of the responding schools) offered a “nutrition” course and 3 (5.4%) offered a “clinical nutrition” course. Including “nutrition” and “clinical nutrition” courses, 14 of the responding medical schools (24. 6 %) offered stand-alone nutrition courses in their undergraduate education. Although a total of 48 of the responding medical schools (84.2%) offered some nutrition topics, only 8 of the responding schools (14.0%) may have offered substantial nutrition education. No special postgraduate course in medical or clinical nutrition was offered by any of the schools. Despite this, more than 80% of the students that appeared to be interested in a nutrition course recognized the importance of nutrition education in medical school. This survey showed that nutrition education in Japanese medical schools remains inadequate and changes are necessary.
Key Words: nutrition education, medical schools, Japan, questionnaire, curriculum Introduction Diet is known to play a critical role in the pathogenesis of major age-related chronic diseases, which are rapidly becoming more common in Japan and other industrialized countries. To prevent and care for these chronic diseases, nutritional knowledge is essential for health professionals including physicians. However, traditional medical edu-cation has not provided adequate knowledge of nutrition. Even in the “model core-curriculum for medical edu-cation”,1 which provides a national standard curriculum guideline for Japanese medical schools, nutrition is not treated as an essential course. According to a survey performed in 1997, only 12.9 % of the medical schools in Japan offered stand-alone nutrition courses during under-graduate education.2 In contrast, during the last few years, new educational programs such as the “Nutrition Academic Award Program”, have been conducted in the United States.3 We therefore carried out a new survey to deter-mine the current status of nutrition education in Japanese medical schools. Subjects and methods A questionnaire (Table 1) was sent to the deans of 79 medical schools in Japan in March 2004. This includes all medical schools except for Nippon Medical School to which the authors belong. The questionnaire was designed to compare with the former questionnaire survey by Wata-nabe and Saito.2 By May 13, 45 of the medical schools
responded. We sent a letter of reminder to 34 of the me-dical schools, and 23 of them responded by the end of June. Together, 57 of the medical schools (72.2%) re-sponded. We also used a questionnaire (Table 2) in Febru-ary 2004 and February 2005 to survey second year students who had just received a 4-h (2004) and 3-h (2005; because of a national holiday) nutrition course at Nippon Medical School. Results The survey was performed in 79 medical schools in Japan, 57 of which responded. Of these 57 responding schools, 30 were national schools (69.8% of a total of 43 national schools), 4 were municipal schools (50% of 8 municipal schools), and 23 were private schools (82.1% of 28 private schools except for Nippon Medical School). Of the 57 re-sponding schools, 12 (21.1%) indicated that they offered a nutrition course and 3 (5.4%) offered a clinical nutrition course. These “nutrition” courses included a “biochemistry and nutrition” course, a “nutrition and gene therapy” course, and a “biochemistry” course. The answers for the questions A-1 and B-1 were self-declaration. Correspondence address: Dr Hideo Orimo, Department of Biochemistry and Molecular Biology, Nippon Medical School, 1-1-5 Sendagi, Bunkyo-ku, Tokyo 113-8602, Japan Tel: +81-3-3822-2131; Fax: +81-3-5814-8156 Email: [email protected] Accepted 12th December 2005
324 H Orimo, T Shimura and T Shimada
Because one school offered both a “nutrition” course and a “clinical nutrition” course, a total of 14 schools (24.6% of the responding schools) offered some form of a nutrition course. Among the 45 schools that did not offer stand-alone “nutrition” courses, 25 answered that they offered nutrition-related curriculum in biochemistry or a related course. Ten schools offered it in a clinical course (i.e., in the introduction to clinical medicine, internal me-dicine, or paediatrics courses), and 5 schools offered it in a social medicine or a public health course. Because nu-trition was taught within several overlapping courses in some schools, a total of 36 schools (63.2% of the re-sponding schools) offered at least some topics in nutri-tion. Together with the schools that offered a stand-alone “nutrition” course, 48 schools (84.2% of the responding schools) offered some nutrition education. Nine schools (15.8% of the responding schools) did not offer any nutrition course or did not respond to this particular question. One school planned to offer a stand-alone nutri-tion course, and 3 schools answered that such a course was under consideration. With regard to an academic year, 1 school offered it in the first year, 5 schools offered it in the second year, 2 schools in the third year, 2 schools in the fourth year, 1 school in the third and fourth years, and 1 school in the sixth year. Of the 53 schools that did not offer a stand-alone clinical nutrition course, 28 (52.8%) offered clinical nutrition topics in clinical
courses, including endocrinology and metabolic disease, gastroenterology, paediatrics and surgery; however, 25 schools did not offer any clinical nutrition education or did not specify the course in which clinical nutrition was taught. One school (the same school as will offer a nu-trition course) planned to offer a stand-alone clinical nu-trition course, and such a course was under consideration in 2 schools. A “clinical nutrition” course was offered in the third year in 1 school and in the fourth year in 2 schools. The length of the course varied from 1 to 50 h (Table 3). However, the courses that offered 25 to 50h of nutrition education were “biochemistry and nutrition” courses, and the syllabi indicated that the content of the courses dedicated almost basic biochemistry without nutritional topics. In the 7 schools (12.3% of the re-sponding schools) that offered a stand-alone nutrition courses, 5 to 17 h (mean = 9.3 h) were dedicated to proper nutrition content according to their syllabi. Although 1 school answered that they did not offer a stand-alone “nutrition” course, substantial nutrition content (15 h) was offered in the introduction to medicine course. When this school was added to those offering proper nutrition con-tent, only 8 schools (14.0% of the responding schools) offered substantial nutrition education, and mean length of the courses was 10h. Ten schools required a “nutrition” course, while such a course was an elective in 2 schools. All “clinical nutrition” courses were required.
Table 1. Questionnaire sent to medical schools (in Japanese)
A. IN UNDERGRADUATE EDUCATION OF YOUR MEDICAL SCHOOL 1. Do you offer a “nutrition” course? (yes, no)
1.1 If a course is offered, please answer the following questions: a. During which academic year students do you offer the course? ( ) year b. How many hours do you offer? ( ) times of ( ) minutes lecture c. What is the name of department that offers the course? ( ) d. Is the course required or elective? (required, elective, other) e. Do you offer experiments or practice in the course? (yes, no) f. Describe the topics of the curriculum.
1.2. If a course is not offered, please answer the following questions: a. In what course do you provide nutrition education? ( )
b. Do you plan to offer a stand-alone nutrition course? (yes, under consideration, no) 2. Do you offer a “clinical nutrition” course? (yes, no)
2.1 If a course is offered, please answer the following questions: a. During which academic year students do you offer the course? ( ) year b. How many hours do you offer? ( ) times of ( ) minutes lecture c. What is the name of department that offers the course? ( ) d. Is the course required or elective? (required, elective, other) e. Do you offer experiments or practice in the course? (yes, no) f. Describe the topics of the curriculum.
2.2 If a course is not offered, please answer the following questions: a. In what course do you provide clinical nutrition education? ( ) b. Do you plan to offer a stand-alone course? (yes, under consideration, no)
3. Do you offer practice on nutrition in clinical practice? (yes, no) 4. Are registered dietitians in the hospital involved in clinical practice? (yes, no) B. IN POSTGRADUATE EDUCATION IN YOUR MEDICAL SCHOOL 1. Do you offer a medical or clinical nutrition course? (yes, no) 2. If a course is not offered, do you plan to offer a course? (yes, no) 3. If a course is not offered, how do you provide nutrition education during postgraduate education?
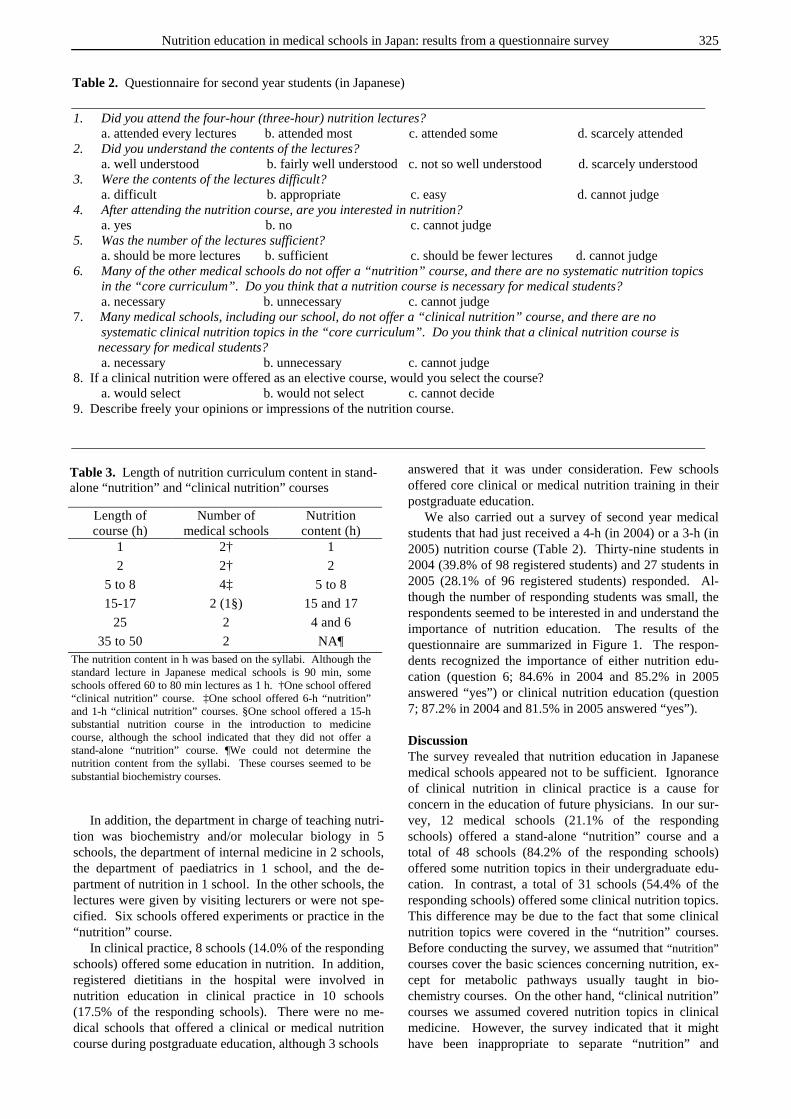
Nutrition education in medical schools in Japan: results from a questionnaire survey 325
In addition, the department in charge of teaching nutri-tion was biochemistry and/or molecular biology in 5 schools, the department of internal medicine in 2 schools, the department of paediatrics in 1 school, and the de-partment of nutrition in 1 school. In the other schools, the lectures were given by visiting lecturers or were not spe-cified. Six schools offered experiments or practice in the “nutrition” course. In clinical practice, 8 schools (14.0% of the responding schools) offered some education in nutrition. In addition, registered dietitians in the hospital were involved in nutrition education in clinical practice in 10 schools (17.5% of the responding schools). There were no me-dical schools that offered a clinical or medical nutrition course during postgraduate education, although 3 schools
answered that it was under consideration. Few schools offered core clinical or medical nutrition training in their postgraduate education. We also carried out a survey of second year medical students that had just received a 4-h (in 2004) or a 3-h (in 2005) nutrition course (Table 2). Thirty-nine students in 2004 (39.8% of 98 registered students) and 27 students in 2005 (28.1% of 96 registered students) responded. Al-though the number of responding students was small, the respondents seemed to be interested in and understand the importance of nutrition education. The results of the questionnaire are summarized in Figure 1. The respon-dents recognized the importance of either nutrition edu-cation (question 6; 84.6% in 2004 and 85.2% in 2005 answered “yes”) or clinical nutrition education (question 7; 87.2% in 2004 and 81.5% in 2005 answered “yes”). Discussion The survey revealed that nutrition education in Japanese medical schools appeared not to be sufficient. Ignorance of clinical nutrition in clinical practice is a cause for concern in the education of future physicians. In our sur-vey, 12 medical schools (21.1% of the responding schools) offered a stand-alone “nutrition” course and a total of 48 schools (84.2% of the responding schools) offered some nutrition topics in their undergraduate edu-cation. In contrast, a total of 31 schools (54.4% of the responding schools) offered some clinical nutrition topics. This difference may be due to the fact that some clinical nutrition topics were covered in the “nutrition” courses. Before conducting the survey, we assumed that “nutrition” courses cover the basic sciences concerning nutrition, ex-cept for metabolic pathways usually taught in bio-chemistry courses. On the other hand, “clinical nutrition” courses we assumed covered nutrition topics in clinical medicine. However, the survey indicated that it might have been inappropriate to separate “nutrition” and
1. Did you attend the four-hour (three-hour) nutrition lectures? a. attended every lectures b. attended most c. attended some d. scarcely attended
2. Did you understand the contents of the lectures? a. well understood b. fairly well understood c. not so well understood d. scarcely understood
3. Were the contents of the lectures difficult? a. difficult b. appropriate c. easy d. cannot judge
4. After attending the nutrition course, are you interested in nutrition? a. yes b. no c. cannot judge
5. Was the number of the lectures sufficient? a. should be more lectures b. sufficient c. should be fewer lectures d. cannot judge
6. Many of the other medical schools do not offer a “nutrition” course, and there are no systematic nutrition topics in the “core curriculum”. Do you think that a nutrition course is necessary for medical students? a. necessary b. unnecessary c. cannot judge
7. Many medical schools, including our school, do not offer a “clinical nutrition” course, and there are no systematic clinical nutrition topics in the “core curriculum”. Do you think that a clinical nutrition course is necessary for medical students? a. necessary b. unnecessary c. cannot judge
8. If a clinical nutrition were offered as an elective course, would you select the course? a. would select b. would not select c. cannot decide
9. Describe freely your opinions or impressions of the nutrition course.
Table 2. Questionnaire for second year students (in Japanese)
Table 3. Length of nutrition curriculum content in stand-alone “nutrition” and “clinical nutrition” courses
Length of course (h)
Number of medical schools
Nutrition content (h)
1 2† 1
2 2† 2
5 to 8 4‡ 5 to 8
15-17 2 (1§) 15 and 17
25 2 4 and 6
35 to 50 2 NA¶ The nutrition content in h was based on the syllabi. Although the standard lecture in Japanese medical schools is 90 min, some schools offered 60 to 80 min lectures as 1 h. †One school offered “clinical nutrition” course. ‡One school offered 6-h “nutrition” and 1-h “clinical nutrition” courses. §One school offered a 15-h substantial nutrition course in the introduction to medicine course, although the school indicated that they did not offer a stand-alone “nutrition” course. ¶We could not determine the nutrition content from the syllabi. These courses seemed to be substantial biochemistry courses.

326 H Orimo, T Shimura and T Shimada
“clinical nutrition” in the questions. When “nutrition” and “clinical nutrition” courses were combined, 14 of the medical schools (24.6% of the responding schools) offered a stand-alone nutrition course and a total of 48 schools (84.2% of the responding schools) offered some form of nutrition education. However, we estimated that only 8 schools (14.0% of the responding schools) offer substantial nutrition education. In addition, several schools offered only one to several hours for the stand-alone “nutrition” course (Table 3), suggesting that these courses were not sufficient to allow understanding of nu-tritional principles for medicine. The questionnaire survey had some limitations. We sent the questionnaire to the deans of the medical schools, but 22 schools (27.8%) did not respond. In contrast, in the survey carried out by Torti et al.,4 in the United States, individuals responsible for teaching nutrition were contacted directly. Although their method would achieve more reliable results, a list of teaching staff was not available when we performed the survey. With regard to the student surveys, a poor response rate made them less valid resulting in difficulty interpreting the findings. Because the nutrition course in Nippon Medical School was offered within a biochemistry and molecular biology course and its examination was also given with bio-chemistry, students had a tendency to be more interested in molecular biology and the percentage of attendance in the nutrition course was low. Nevertheless, responding students appeared to be inte-rested in nutritional topics and recognized the importance
of the course. In 1997, Watanabe and Saito2 surveyed nu-trition education in Japanese medical schools. They re-ported that 9 schools (12.9% of the responding schools) offered a stand-alone nutrition or clinical nutrition course that was 6 to 16 h in length. The current survey of nutri-tion education in Japanese medical schools indicates slight improvement, but a lack of systematic nutrition education is a problem that still needs to be solved. There are many barriers to the incorporation of nutrition into medical education. Similar to the finding of Winick,5 who reviewed medical education in the United States, some of these problems are the limitation of the curri-culum in medical schools, a lack of teaching staff, and uncertainty in the topics to teach. To overcome the limi-tation of the curriculum, nutrition education can be inte-grated into established basic science and clinical courses, which has been successful in the United States.6,7 In our survey, only one school answered that the Department of Nutrition was in charge of nutrition education, suggesting that a faculty for teaching nutrition was lacking at many schools. In addition to these problems, we do not have a Ja-panese textbook of nutrition for medical students such as that edited by Hark and Morrison,8 although students of dietetics have many available textbooks. A different type of textbook written by Truswell for general practitioners who had been taught almost no nutrition at medical school might also be useful.9 Even though a text-book in English would be useful, there is a difference in food culture between Western countries and Japan so that a textbook based on Japanese food traditions may be
0
5
10
15
20
25
30
35
40
A B A B A B A B A B A B A B A B
1 2 3 4 5 6 7 8
Question #
Ans
wer
s d
c
b
a
26(66.7%)
8(20.5%)
5(12.8%)
7(17.9%)
22(56.4%)
10(25.6%)
6(15.4%)
27(69.2%)
2(5.1%)
4(10.3%)
30(76.9%)
5(12.8%)
4(10.3%)
18(46.2%)
17(43.6%)
1(2.6%)
3(7.7%)
33(84.6%)
2(5.1%)
4(10.3%)
34(87.2%)
1(2.6%)
4(10.3%)
29(74.4%)
2(5.1%)
8(20.5%)
16(59.3%)
6(22.2%)
5(18.5%)
6(22.2%)
9(33.3%)
11(40.7%)
7(25.9%)
17(63.0%)
3(11.1%)
19(70.4%)
4(14.8%)
4(14.8%)
11(40.7%)
14(51.9%)
2(7.4%)
23(85.2%)
4(14.8%)
22(81.5%)
5(18.5%)
24(88.9%)
3(11.1%)
Figure 1
Figure 1. Summary of answers of a questionnaire for second-year students. Question # corresponds to each question number in Table 2. A indicates answers in 2004 and B indicates those in 2005. Small letters (a to d) correspond to the answers in Table 2. Numerals indicate number of answers and numerals in parentheses indicate percentage of the answers.
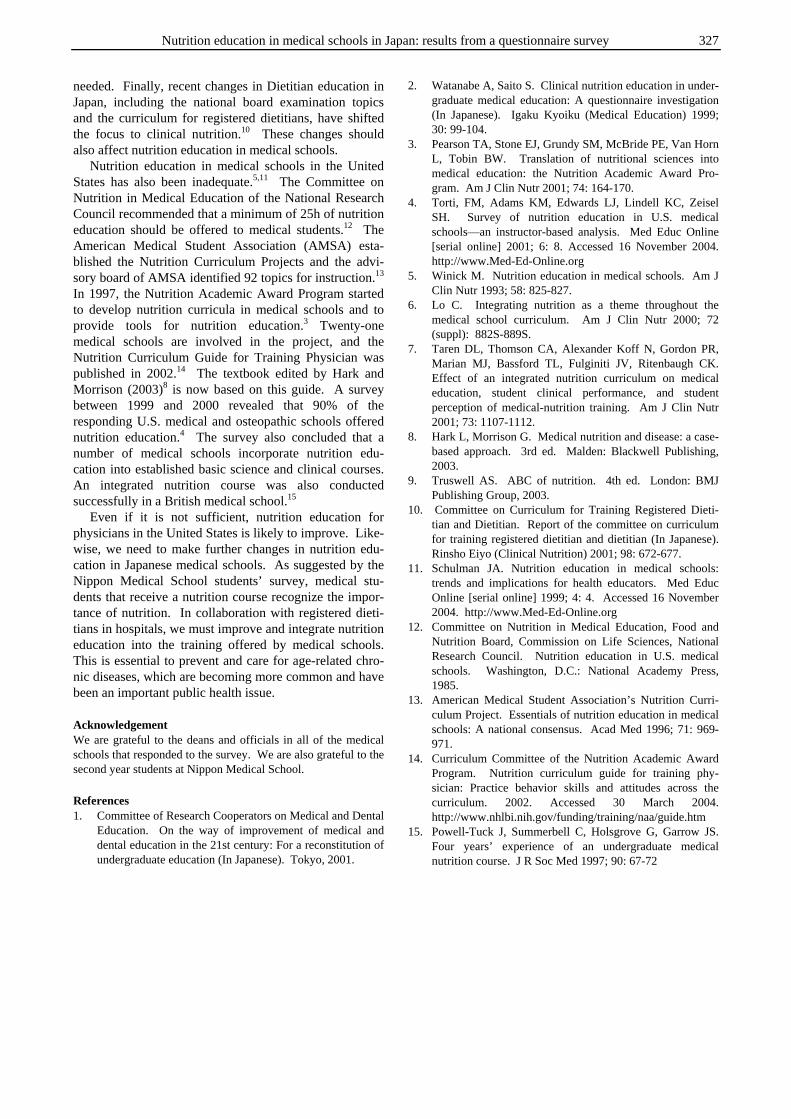
Nutrition education in medical schools in Japan: results from a questionnaire survey 327
needed. Finally, recent changes in Dietitian education in Japan, including the national board examination topics and the curriculum for registered dietitians, have shifted the focus to clinical nutrition.10 These changes should also affect nutrition education in medical schools. Nutrition education in medical schools in the United States has also been inadequate.5,11 The Committee on Nutrition in Medical Education of the National Research Council recommended that a minimum of 25h of nutrition education should be offered to medical students.12 The American Medical Student Association (AMSA) esta-blished the Nutrition Curriculum Projects and the advi-sory board of AMSA identified 92 topics for instruction.13 In 1997, the Nutrition Academic Award Program started to develop nutrition curricula in medical schools and to provide tools for nutrition education.3 Twenty-one medical schools are involved in the project, and the Nutrition Curriculum Guide for Training Physician was published in 2002.14 The textbook edited by Hark and Morrison (2003)8 is now based on this guide. A survey between 1999 and 2000 revealed that 90% of the responding U.S. medical and osteopathic schools offered nutrition education.4 The survey also concluded that a number of medical schools incorporate nutrition edu-cation into established basic science and clinical courses. An integrated nutrition course was also conducted successfully in a British medical school.15 Even if it is not sufficient, nutrition education for physicians in the United States is likely to improve. Like-wise, we need to make further changes in nutrition edu-cation in Japanese medical schools. As suggested by the Nippon Medical School students’ survey, medical stu-dents that receive a nutrition course recognize the impor-tance of nutrition. In collaboration with registered dieti-tians in hospitals, we must improve and integrate nutrition education into the training offered by medical schools. This is essential to prevent and care for age-related chro-nic diseases, which are becoming more common and have been an important public health issue. Acknowledgement We are grateful to the deans and officials in all of the medical schools that responded to the survey. We are also grateful to the second year students at Nippon Medical School. References 1. Committee of Research Cooperators on Medical and Dental
Education. On the way of improvement of medical and dental education in the 21st century: For a reconstitution of undergraduate education (In Japanese). Tokyo, 2001.
2. Watanabe A, Saito S. Clinical nutrition education in under-graduate medical education: A questionnaire investigation (In Japanese). Igaku Kyoiku (Medical Education) 1999; 30: 99-104.
3. Pearson TA, Stone EJ, Grundy SM, McBride PE, Van Horn L, Tobin BW. Translation of nutritional sciences into medical education: the Nutrition Academic Award Pro-gram. Am J Clin Nutr 2001; 74: 164-170.
4. Torti, FM, Adams KM, Edwards LJ, Lindell KC, Zeisel SH. Survey of nutrition education in U.S. medical schools—an instructor-based analysis. Med Educ Online [serial online] 2001; 6: 8. Accessed 16 November 2004. http://www.Med-Ed-Online.org
5. Winick M. Nutrition education in medical schools. Am J Clin Nutr 1993; 58: 825-827.
6. Lo C. Integrating nutrition as a theme throughout the medical school curriculum. Am J Clin Nutr 2000; 72 (suppl): 882S-889S.
7. Taren DL, Thomson CA, Alexander Koff N, Gordon PR, Marian MJ, Bassford TL, Fulginiti JV, Ritenbaugh CK. Effect of an integrated nutrition curriculum on medical education, student clinical performance, and student perception of medical-nutrition training. Am J Clin Nutr 2001; 73: 1107-1112.
8. Hark L, Morrison G. Medical nutrition and disease: a case-based approach. 3rd ed. Malden: Blackwell Publishing, 2003.
9. Truswell AS. ABC of nutrition. 4th ed. London: BMJ Publishing Group, 2003.
10. Committee on Curriculum for Training Registered Dieti-tian and Dietitian. Report of the committee on curriculum for training registered dietitian and dietitian (In Japanese). Rinsho Eiyo (Clinical Nutrition) 2001; 98: 672-677.
11. Schulman JA. Nutrition education in medical schools: trends and implications for health educators. Med Educ Online [serial online] 1999; 4: 4. Accessed 16 November 2004. http://www.Med-Ed-Online.org
12. Committee on Nutrition in Medical Education, Food and Nutrition Board, Commission on Life Sciences, National Research Council. Nutrition education in U.S. medical schools. Washington, D.C.: National Academy Press, 1985.
13. American Medical Student Association’s Nutrition Curri-culum Project. Essentials of nutrition education in medical schools: A national consensus. Acad Med 1996; 71: 969-971.
14. Curriculum Committee of the Nutrition Academic Award Program. Nutrition curriculum guide for training phy-sician: Practice behavior skills and attitudes across the curriculum. 2002. Accessed 30 March 2004. http://www.nhlbi.nih.gov/funding/training/naa/guide.htm
15. Powell-Tuck J, Summerbell C, Holsgrove G, Garrow JS. Four years’ experience of an undergraduate medical nutrition course. J R Soc Med 1997; 90: 67-72
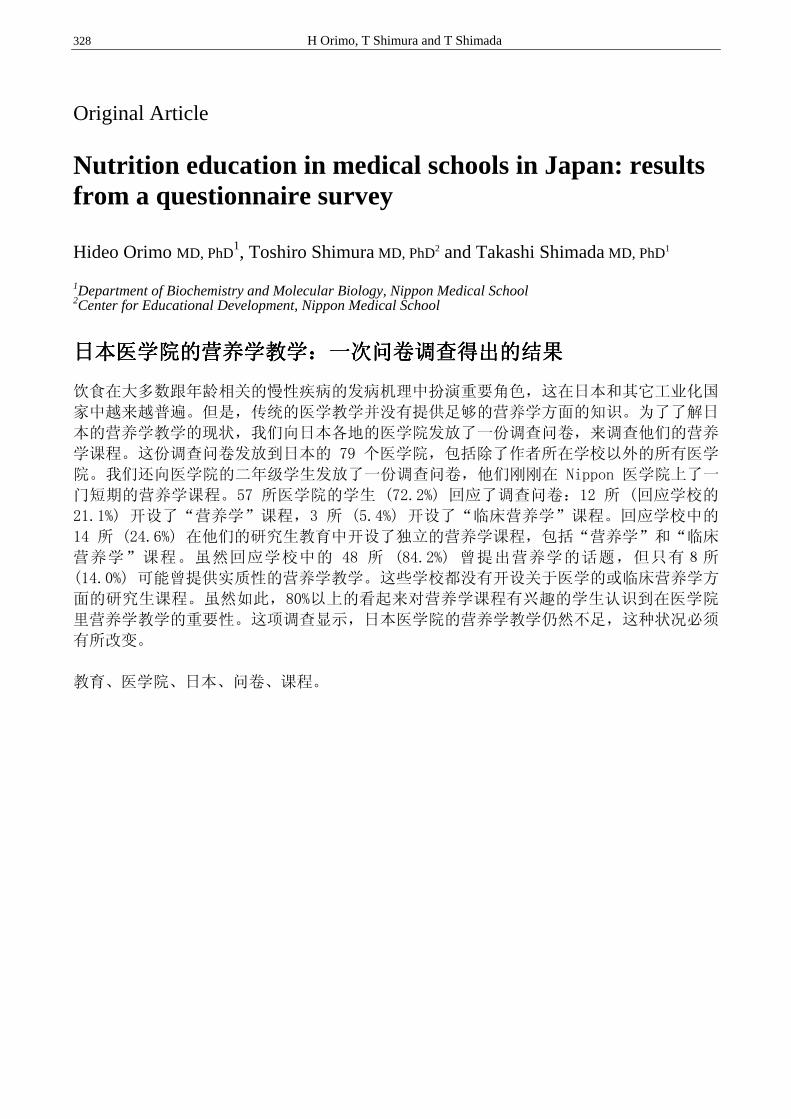
328 H Orimo, T Shimura and T Shimada
Original Article Nutrition education in medical schools in Japan: results from a questionnaire survey Hideo Orimo MD, PhD
1, Toshiro Shimura MD, PhD2 and Takashi Shimada MD, PhD1
1Department of Biochemistry and Molecular Biology, Nippon Medical School 2Center for Educational Development, Nippon Medical School
日本医学院的营养学教学:一次问卷调查得出的结果日本医学院的营养学教学:一次问卷调查得出的结果日本医学院的营养学教学:一次问卷调查得出的结果日本医学院的营养学教学:一次问卷调查得出的结果
饮食在大多数跟年龄相关的慢性疾病的发病机理中扮演重要角色,这在日本和其它工业化国
家中越来越普遍。但是,传统的医学教学并没有提供足够的营养学方面的知识。为了了解日
本的营养学教学的现状,我们向日本各地的医学院发放了一份调查问卷,来调查他们的营养
学课程。这份调查问卷发放到日本的 79 个医学院,包括除了作者所在学校以外的所有医学
院。我们还向医学院的二年级学生发放了一份调查问卷,他们刚刚在 Nippon 医学院上了一
门短期的营养学课程。57 所医学院的学生 (72.2%) 回应了调查问卷:12 所 (回应学校的
21.1%) 开设了“营养学”课程,3 所 (5.4%) 开设了“临床营养学”课程。回应学校中的
14 所 (24.6%) 在他们的研究生教育中开设了独立的营养学课程,包括“营养学”和“临床
营养学”课程。虽然回应学校中的 48 所 (84.2%) 曾提出营养学的话题,但只有8所
(14.0%) 可能曾提供实质性的营养学教学。这些学校都没有开设关于医学的或临床营养学方
面的研究生课程。虽然如此,80%以上的看起来对营养学课程有兴趣的学生认识到在医学院
里营养学教学的重要性。这项调查显示,日本医学院的营养学教学仍然不足,这种状况必须
有所改变。
教育、医学院、日本、问卷、课程。
Asia Pac J Clin Nutr 2006;15 (3): 329-334 329
Original Article
Nutritional status of pregnant women in Northeast Thailand Christoph U Andert 1, Pattara Sanchaisuriya PhD
2, Kanokwan Sanchaisuriya PhD 3,
Frank P Schelp PhD 4 and Florian J Schweigert PhD
1
1 Institute of Nutritional Science, Department of Physiology and Pathophysiology of Nutrition, University of Potsdam, Germany 2 Faculty of Public Health, Department of Nutrition, Khon Kaen University, Thailand 3 Faculty of Associated Medical Sciences, Department of Clinical Microscopy, Khon Kaen University, Khon Kaen, Thailand 4 Institute for Social Medicine, Joint Center for Humanities and Health Sciences, Free University Berlin and
Humboldt University at Berlin, Germany
A comparative study on the nutritional status of primiparous and multiparous women in the first trimester of pregnancy was conducted in the northeastern province of Thailand, Khon Kaen, to investigate differences in protein-energy-malnutrition, iron deficiency anaemia, vitamin A deficiency and carotenoid status between both parity groups. 94 subjects were recruited at first attendance of antenatal clinic. Data about weight, height, haemoglobin and haematocrit were obtained from hospital records. Anthropometric measurements of mid-upper arm circumference and triceps skinfold were done on a sub sample. Retinol, carotenoids and α-tocopherol were analysed using a reversed-phase high-performance liquid chromatography method. Ferritin, transthyretin and retinol-binding protein were determined by enzyme–linked immunosorbent assay. Primi-parous women showed lower body mass index, mid-upper arm circumference, corrected arm muscle area (P <0.001) as well as lower retinol, cholesterol and triceps skinfold (P <0.05). After adjusting for age and socio-economical status the significant difference persisted for all parameters but triceps skinfold. No significant differences of α-tocopherol, serum proteins, carotenoids and iron indices could be observed, even though a tendency to higher values for ferritin, haemoglobin and haematocrit was shown in multiparous women. Prevalence of protein-energy-malnutrition (body mass index <18.5 kg/m2) in the primiparous group was significantly higher compared to the multiparous group (P<0.05). Prevalence of protein-energy-malnutrition, iron deficiency anaemia and vitamin A deficiency were 15.1%, 6.3 % and 3.3%, respectively, in the total study population. No differences between parity groups could be observed for prevalence of iron deficiency anaemia and vitamin A deficiency.
Key Words: nutritional status, pregnancy, vitamin A, iron, carotenoids.
Introduction Adequate nutritional status of expectant mothers is essential for their health and pregnancy outcomes. Due to increased nutritional requirements pregnancy is a critical period for meeting the body’s demand for macro- and micronutrients. Thus, anaemia and vitamin A deficiency (VAD) are highly prevalent nutrient deficiencies encountered in pregnant women, affecting 53.8 million (55.8 %) and 7.2 million (6.8 %) on a global scale, respectively.1,2 Both deficiencies have been shown to result in serious health consequences including increased morbidity and mortality of both mother and child.3 In addition, the prevalence of teenage pregnancy is still high in most developing countries, 33% on average, reaching from 8% in East Asia to 55% in West Africa.4 These approximately 15 million women worldwide, who are physically immature and still in a state of growth, face even more difficulties in meeting their nutritional require-ments. Among them malnutrition, maternal morbidity and adverse effects on pregnancy outcomes, e.g. low birth
weight babies, were shown to be more prevalent.5,6 Re- ported prevalence of teenage pregnancy in Thailand de- creased from 28.7% in 19967 to 12.9% in 2001.8 Con- sidering the high percentage of young pregnant women in Southeast Asia, this study was undertaken to compare the nutritional status of first trimester primiparous and multi- parous pregnant women in a poor settings in Northeast- Thailand and to describe the extent of protein-energy- malnutrition (PEM), iron deficiency anaemia (IDA) and vitamin A deficiency (VAD) as well as the carotenoid status.
Subjects and Methods Study population The study was conducted in Khon Kaen Province in the
Correspondence address: Christoph U. Andert, University of Potsdam, Institute of Nutritional Science, Arthur-Scheunert-Allee 114-116, D-14558 Nuthetal, Germany Phone: +49 33200 88 540, Fax: +49 33200 88 573 E-Mail: [email protected]
Accepted 9th August 2005

330 CU Andert, P Sanchaisuriya, K Sanchaisuriya, FP Schelp and FJ Schweigert
north-eastern part of Thailand. 94 pregnant women in the first trimester, primiparous (pregnant for the first time) and multiparous, were recruited from three district hospitals and four health centres from February to June 2003 following the first attendance of antenatal clinics. Pregnant women exceeding the 12th week of pregnancy, women receiving vitamin and/or iron supplements and women suffering from infections within the last two weeks before attending were excluded from the study. All women signed informed consent forms before partici-pating in the study. Ethics committee approval was obtained from the ethical committee of the Faculty of Associated Medical Sciences, Khon Kaen University, Thailand. Questionnaire and sample collection After obtaining informed consent, subjects were inter-viewed about socio-economic characteristics and personal and pregnancy history. Data about weight, height, gesta-tion age, haemoglobin and haematocrit were obtained from hospital records. Subsequently, anthropometric data and blood samples were collected. Blood were drawn from the subjects arm. One part was placed in Eppendorf cups prepared with the anticoagulant EDTA, transported on ice to the Khon Kaen University campus and stored at –80°C until analysis. The other part was centrifuged to obtain serum samples, placed in opaque Eppendorf cups to protect from light and transported on ice to be stored at –80°C at Khon Kaen University campus. Samples were transferred to Germany by air on dry ice and stored at –80°C until further analysis, which was performed within six months after blood collection. This is a time span and storage temperature at which analytes have been reported to remain stable.9 Anthropometrics and sample analysis Measurement of triceps skinfold (TSF) and mid-upper arm circumference (MUAC) were performed on a sub sample using Harpenden skinfold calliper (Holtain Ltd. Crymych, UK) and commercially available tape measure. Both measurements were done in triplicate to the nearest 0,1 mm and 0,1 cm for TSF and MUAC, respectively. Body mass index (BMI) and corrected arm muscle area (cAMA) were calculated. 10 Blood samples were analysed for ferritin, retinol-binding protein and transthyretin (TTR) using enzyme–linked immunosorbent assay (ELISA) according to the standard procedures in our laboratory.11 Retinol, carote-noids (lutein, zeaxanthin, α-carotene, β-carotene, β-cryptoxanthin, lycopene) and α-tocopherol were deter-mined by a reversed-phase high-performance liquid chro-matography method as described previously.11 Total pro-tein and cholesterol were analysed using BCA method12 and cholesterol oxidase assay method (Infinity™ Chole-sterol, Thermo Trace, Australia). Statistics Data was analysed by statistical program SPSS 10.0 for Windows (SPSS Inc., Chicago, USA). Statistical com-parison between the results for primiparous and multi-parous women was carried out with a parametric method (t-test) and nonparametric method (Mann-Whitney U-test). Probability values below 0.05 were considered significant.
Results 94 pregnant participants, ranging in age from 15 to 41 years, 51 of whom were primiparous and 43 multiparous (38 second pregnancy, three third pregnancy, two fourth pregnancy) were enrolled in the study. General charac-teristics of the study population are shown in Table 1. 19.4% of the study population were below 20 years of age. All of them were in the primiparous group. Most of the study population were house wives or engaged in farming activities. 43.8% of the women lived below the official poverty line of Khon Kaen Province (885 Baht/month, 1 US$ = 42 Baht).13
Table 2 shows the means of age, height, weight, BMI, MUAC, TSF and cAMA for primiparous and multiparous women. All parameters except height showed a signi-ficant difference between parity groups. Primiparous wo-men were found to have lower values compared to multi-parous. BMI and MUAC in multiparous women were on average 3.4 kg/m2 and 2.6 cm higher, respectively. After adjusting for age and socio-economic status the signi-ficant difference persisted for all parameters but TSF. The analysis of blood samples revealed no significant differences in blood parameters between the primiparous and multiparous group, except for serum retinol (Table 3). However, a tendency for higher values for multiparous women was observed. The prevalence for PEM by BMI, MUAC and cAMA in primiparous women was significantly higher compared to multiparous ones (Table 4). None of the women in the multiparous group showed a BMI below 18.5 kg/m2. No differences in prevalence of IDA and VAD were found between both study groups, although a slightly lower
Table 1. General characteristics of the study population, means ± standard deviation.
Variable Study population N = 94
Age < 20 years (%) 19.4 Gestational age (month) 10.2 ± 1.8 Income per capita (Baht) 1435 ± 1329 Below poverty line (%) † 43.8
† Income < 885 Baht per month/capita
Primipara N = 51
Multipara N = 43
P-value
Age (years) 23.1 ± 5.2 29.3 ± 4.9 0,000
Weight (kg) 48.8 ± 6.9 57.2 ± 11.1 0.006
Height (cm) 154.2 ± 0.5 154.7 ± 0.6 0.684
BMI (kg/m2) 20.5 ± 2.6 23.9 ± 4.6 0.000
MUAC (cm) † 24.1 ± 2.4 26.7 ± 2.9 0.000
TSF (mm) † 13.9 ± 4.4 16.3 ± 4.2 0.016
cAMA (cm2) † 24.6 ± 4.9 30.9 ± 7.7 0.000
Table 2. Anthropometrical characteristics of pregnant women according to parity, means ± standard deviation.
† Sub sample: N = 37 for Primipara, N = 37 for Multipara
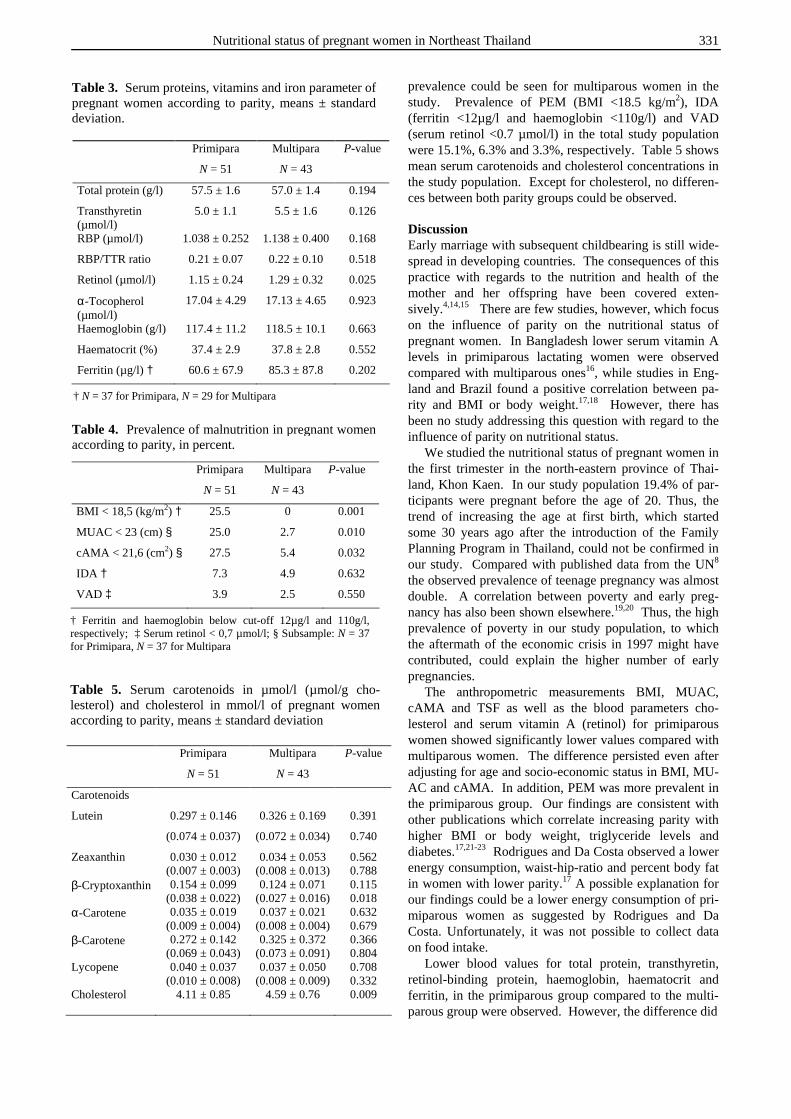
Nutritional status of pregnant women in Northeast Thailand 331
prevalence could be seen for multiparous women in the study. Prevalence of PEM (BMI <18.5 kg/m2), IDA (ferritin <12µg/l and haemoglobin <110g/l) and VAD (serum retinol <0.7 µmol/l) in the total study population were 15.1%, 6.3% and 3.3%, respectively. Table 5 shows mean serum carotenoids and cholesterol concentrations in the study population. Except for cholesterol, no differen-ces between both parity groups could be observed. Discussion Early marriage with subsequent childbearing is still wide-spread in developing countries. The consequences of this practice with regards to the nutrition and health of the mother and her offspring have been covered exten- sively.4,14,15 There are few studies, however, which focus on the influence of parity on the nutritional status of pregnant women. In Bangladesh lower serum vitamin A levels in primiparous lactating women were observed compared with multiparous ones16, while studies in Eng-land and Brazil found a positive correlation between pa-rity and BMI or body weight.17,18 However, there has been no study addressing this question with regard to the influence of parity on nutritional status. We studied the nutritional status of pregnant women in the first trimester in the north-eastern province of Thai-land, Khon Kaen. In our study population 19.4% of par-ticipants were pregnant before the age of 20. Thus, the trend of increasing the age at first birth, which started some 30 years ago after the introduction of the Family Planning Program in Thailand, could not be confirmed in our study. Compared with published data from the UN8 the observed prevalence of teenage pregnancy was almost double. A correlation between poverty and early preg-nancy has also been shown elsewhere.19,20 Thus, the high prevalence of poverty in our study population, to which the aftermath of the economic crisis in 1997 might have contributed, could explain the higher number of early pregnancies. The anthropometric measurements BMI, MUAC, cAMA and TSF as well as the blood parameters cho-lesterol and serum vitamin A (retinol) for primiparous women showed significantly lower values compared with multiparous women. The difference persisted even after adjusting for age and socio-economic status in BMI, MU-AC and cAMA. In addition, PEM was more prevalent in the primiparous group. Our findings are consistent with other publications which correlate increasing parity with higher BMI or body weight, triglyceride levels and diabetes.17,21-23 Rodrigues and Da Costa observed a lower energy consumption, waist-hip-ratio and percent body fat in women with lower parity.17 A possible explanation for our findings could be a lower energy consumption of pri-miparous women as suggested by Rodrigues and Da Costa. Unfortunately, it was not possible to collect data on food intake. Lower blood values for total protein, transthyretin, retinol-binding protein, haemoglobin, haematocrit and ferritin, in the primiparous group compared to the multi-parous group were observed. However, the difference did
Table 3. Serum proteins, vitamins and iron parameter of pregnant women according to parity, means ± standard deviation.
Primipara Multipara P-value
N = 51 N = 43
Total protein (g/l) 57.5 ± 1.6 57.0 ± 1.4 0.194
Transthyretin (µmol/l)
5.0 ± 1.1 5.5 ± 1.6 0.126
RBP (µmol/l) 1.038 ± 0.252 1.138 ± 0.400 0.168
RBP/TTR ratio 0.21 ± 0.07 0.22 ± 0.10 0.518
Retinol (µmol/l) 1.15 ± 0.24 1.29 ± 0.32 0.025
α-Tocopherol (µmol/l)
17.04 ± 4.29 17.13 ± 4.65 0.923
Haemoglobin (g/l) 117.4 ± 11.2 118.5 ± 10.1 0.663
Haematocrit (%) 37.4 ± 2.9 37.8 ± 2.8 0.552
Ferritin (µg/l) † 60.6 ± 67.9 85.3 ± 87.8 0.202
† N = 37 for Primipara, N = 29 for Multipara
Table 4. Prevalence of malnutrition in pregnant women according to parity, in percent.
Primipara Multipara P-value
N = 51 N = 43
BMI < 18,5 (kg/m2) † 25.5 0 0.001
MUAC < 23 (cm) § 25.0 2.7 0.010
cAMA < 21,6 (cm2) § 27.5 5.4 0.032
IDA † 7.3 4.9 0.632
VAD ‡ 3.9 2.5 0.550
† Ferritin and haemoglobin below cut-off 12µg/l and 110g/l, respectively; ‡ Serum retinol < 0,7 µmol/l; § Subsample: N = 37 for Primipara, N = 37 for Multipara
Primipara Multipara P-value
N = 51 N = 43
Carotenoids
Lutein 0.297 ± 0.146
(0.074 ± 0.037)
0.326 ± 0.169
(0.072 ± 0.034)
0.391
0.740
Zeaxanthin 0.030 ± 0.012 (0.007 ± 0.003)
0.034 ± 0.053 (0.008 ± 0.013)
0.562 0.788
β-Cryptoxanthin 0.154 ± 0.099 (0.038 ± 0.022)
0.124 ± 0.071 (0.027 ± 0.016)
0.115 0.018
α-Carotene 0.035 ± 0.019 (0.009 ± 0.004)
0.037 ± 0.021 (0.008 ± 0.004)
0.632 0.679
β-Carotene 0.272 ± 0.142 (0.069 ± 0.043)
0.325 ± 0.372 (0.073 ± 0.091)
0.366 0.804
Lycopene 0.040 ± 0.037 (0.010 ± 0.008)
0.037 ± 0.050 (0.008 ± 0.009)
0.708 0.332
Cholesterol 4.11 ± 0.85 4.59 ± 0.76 0.009
Table 5. Serum carotenoids in µmol/l (µmol/g cho-lesterol) and cholesterol in mmol/l of pregnant women according to parity, means ± standard deviation
332 CU Andert, P Sanchaisuriya, K Sanchaisuriya, FP Schelp and FJ Schweigert
not reach the level of significance (P>0.05). Also, IDA and VAD tended to be more prevalent in primiparous women though not significantly. These slightly lower values might be explained by the high number of women younger than 20 years in the primiparous group. As re-ported by Dreyfuss et al., (2000) parity seems to have no effect on the prevalence of anaemia.24 However, we suggest a connection between age and the occurrence of anaemia since other studies have reported that young wo-men (<18 or <20 years) showed a higher tendency to be anaemic.25, 26 Primiparous women showed significantly lower serum vitamin A concentrations than multiparous women. The same association was shown by Ahmed et al., (2002) in lactating women in a poor urban setting.16 However, the authors conclude that the age rather than the parity was the causative factor for this finding. Another report re-vealed a 1.7 times higher risk for VAD in younger women compared to older ones.27 Also, no correlation between parity and serum vitamin A levels could be found by Panpanich et al., (2003) in women during lactation in rural Thailand. Thus, as the parity effect disappeared after adjusting for age we assume our findings were due to the age difference between the two groups. The prevalence of PEM in the total study population ranged from 14.3 to 16.9% depending on the indicator, which is in agreement with data released from the WHO.28 Prevalence data for VAD in pregnant women in Thailand is scarce. However, the mean serum vitamin A level in our study showed to be slightly lower com-pared with two studies undertaken in Bangkok by Phuapradit et al., with 1.21 µmol/l versus 1.31 µmol/l and 1.56 µmol/l.29,30 Unpublished data from these studies ob-served 1.5% VAD in pregnant Thai women. These diffe-rences between our observation on VAD (3.3%) and the ones of Phuaradit et al., are possibly due to the different study areas and income groups which were examined. IDA was prevalent with 6.3% among all study parti-cipants which is a much lower value than the national average for Thailand (11.9%). This is probably due to de-fining IDA only as a haematocrit below 33% so there is a difficulty in comparing with our findings. Sethawanich et al., (1998) however, described a similar low prevalence of IDA in pregnant Thai women.31 Serum carotenoid con-centrations between parity groups showed no differences. There is a great variability in serum carotenoid con-centrations between different populations worldwide mainly depending on the carotenoid availability and thus the dietary intake. As a consequence, values for lutein for example vary from 0.27 µmol/l in US-American women to 0.69 µmol/l in Japanese women.32 In addition, a vary-ing seasonal food supply has been shown to alter serum carotenoid concentrations within the same population.33 Lutein and β-carotene were the most prevalent caro-tenoids in the serum of study participants. Compared to a German reference group of non-pregnant women (data unpublished), Thai women showed two times higher serum lutein values. On the other hand, lycopene, cantha-xanthin and β-carotene reached just 27%, 38% and 41% of the German reference group. These variations in caro-tenoid supply among Western and Asian populations had been already described by us and others.34,35 The high in-
take of green leafy vegetable rich in lutein and zeaxan-thin in Asian communities might be cause for this finding.34 Conclusion In our study we showed that the nutritional status of pri-miparous pregnant women was suboptimal with regard to BMI, MUAC and cAMA compared to multiparous wo-men. All these indicators however, were shown to be age-independent. No significant differences could be ob-served in micronutrient status between both study groups, except for serum vitamin A. However, a tendency for a marginally better micronutrient status in multiparous wo-men could be seen, although again due to the effect of age than parity. The mild to moderate prevalence of mal-nutrition found in this study population points to the need for nutritional interventions to reduce these deficiencies.
Acknowledgement
The authors express their sincere thanks to the participants of this study. References 1. West KP, Jr. Extent of vitamin A deficiency among
preschool children and women of reproductive age. J Nutr 2002; 132 (9 Suppl): 2857S-2866S.
2. Mason JB, Lotfi M, Dalmiya N, Sethuraman K, Deitchler M, Geibel S, Gillenwater K, Gilman A, Mason K, Mock N. The micronutrient report: current progress in the control of vitamin A, iodine, and iron deficiencies. Ottowa, Micronutrient Initiative/ International Develop-ment Research Center. 2001.
3. Kennedy G, Nantel G, Shetty P. The scourge of "hidden hunger":global dimensions of micronutrient deficiencies, FAO: Food, Nutrition & Agriculture, accessed end April 2004 ftp://ftp.fao.org/docrep/fao/005/y8346m/y8346m00.pdf
4. Boyd A. The World's Youth 2000. Washington, DC: Population Reference Bureau. 2000.
5. Mehra S, Agrawal D. Adolescent health determinants for pregnancy and child health outcomes among the urban poor. Indian Pediatr 2004; 41 (2): 137-45.
6. Baron MA, Solano L, Pena E, Moron A. [Nutritional status of folate, vitamin B12 and iron in pregnant adolescents]. Arch Latinoam Nutr 2003; 53 (2): 150-6.
7. NSO. National Statistical Office: Report of the 1996 Survey of Ferility in Thailand; 1996.
8. UN. World Population Prospects, The 2000 Revision, Volume 1: Comprehensive Tables (United Nations publication, Sales No. E. 01.XIII.8). 2001.
9. Comstock GW, Alberg AJ, Helzlsouer KJ. Reported effects of long-term freezer storage on concentrations of retinol, beta-carotene, and alpha-tocopherol in serum or plasma summarized. Clin Chem 1993; 39 (6): 1075-8.
10. Heymsfield SB, McManus C, Smith J, Stevens V, Nixon DW. Anthropometric measurement of muscle mass: revised equations for calculating bone-free arm muscle area. Am J Clin Nutr. 1982 Oct; 36 (4): 680-90.
11. Schweigert FJ, Steinhagen B, Raila J, Siemann A, Peet D, Buscher U. Concentrations of carotenoids, retinol and alpha-tocopherol in plasma and follicular fluid of women undergoing IVF. Hum Reprod 2003; 18 (6): 1259-64.
12. Walker JM. The Protein Protocols Handbook. Humana Press N.J. 1996.
Nutritional status of pregnant women in Northeast Thailand 333
13. UNDP. Thailand Human Development Report 2003 on Community Empowerment and Human Development. 2003. UNDP Thailand, Bangkok, Thailand
14. Pena E, Sanchez A, Portillo Z, Solano L. [Dietary evaluation of pregnant adolescents during first, second and third trimester]. Arch Latinoam Nutr 2003; 53 (2):133-40.
15. Pratinidhi A, Shrotri A, Shah U. Risk of teen-age pregnancy in a rural community of India. Indian J Matern Child Health 1990; 1 (4):134-8.
16. Ahmed F, Azim A, Akhtaruzzaman M. Vitamin A deficiency in poor, urban, lactating women in Bangladesh: factors influencing vitamin A status. Public Health Nutr 2003; 6 (5): 447-52.
17. Rodrigues ML, Da Costa TH. Association of the maternal experience and changes in adiposity measured by BMI, waist:hip ratio and percentage body fat in urban Brazilian women. Br J Nutr 2001; 85 (1): 107-14.
18. Harris HE, Ellison GT, Holliday M. Is there an independent association between parity and maternal weight gain? Ann Hum Biol 1997; 24 (6): 507-19.
19. Sharma AK, Verma K, Khatri S, Kannan AT. Determinants of pregnancy in adolescents in Nepal. Indian J Pediatr 2002; 69 (1): 19-22.
20. Wang RH, Wang HH, Hsu MT. Factors associated with adolescent pregnancy - a sample of Taiwanese female adolescents. Public Health Nurs 2003; 20 (1): 33-41.
21. Lawlor DA, Emberson JR, Ebrahim S, Whincup PH, Wannamethee SG, Walker M, Davey Smith G. Is the association between parity and coronary heart disease due to biological effects of pregnancy or adverse lifestyle risk factors associated with child-rearing? Findings from the British Women's Heart and Health Study and the British Regional Heart Study. Circulation 2003; 107 (9): 1260-4.
22. Wen W, Gao YT, Shu XO, Yang G, Li HL, Jin F, et al. Sociodemographic, behavioral, and reproductive factors associated with weight gain in Chinese women. Int J Obes Relat Metab Disord 2003; 27 (8): 933-40.
23. Szklarska A, Jankowska EA. Independent effects of social position and parity on body mass index among Polish adult women. J Biosoc Sci 2003; 35 (4): 575-83.
24. Dreyfuss ML, Stoltzfus RJ, Shrestha JB, Pradhan EK, LeClerq SC, Khatry SK, et al. Hookworms, malaria and vitamin A deficiency contribute to anemia and iron deficiency among pregnant women in the plains of Nepal. J Nutr 2000; 130 (10): 2527-36.
25. Malviya MK, Bhardwaj VK, Chansoria M, Khare S. Anthropometric profile and perinatal outcome of babies born to young women (< 18 years). Indian Pediatr 2003; 40 (10): 971-6.
26. Singh K, Fong YF, Arulkumaran S. Anaemia in pregnancy - a cross-sectional study in Singapore. Eur J Clin Nutr 1998; 52 (1): 65-70.
27. HKI. Helen Keller International (HKI)/Institute of Public Health Nutriton (IPHN)/Institute of Nutrition and Food Science (INFS). Vitamin A status throughout the lifecycle in rural Bangladesh. National Vitamin A Survey, 1997-98. Helen Keller International, Dhaka, Bangladesh 1999.
28. WHO. Nutrition in South-East Asia, WHO, Regional Office for South-East Asia New Delhi. 2000.
29. Phuapradit W, Chaturachinda K, Taneepanichskul S, Sirivarasry J, Khupulsup K, Lerdvuthisopon N. Serum vitamin A and beta-carotene levels in pregnant women infected with human immunodeficiency virus-1. Obstet Gynecol 1996; 87 (4): 564-7.
30. Phuapradit W, Panburana P, Jaovisidha A, Chanrachakul B, Bunyaratvej A, Puchaiwatananon O. Serum vitamin A and E in pregnant women with hemoglobinopathies. J Obstet Gynaecol Res 1999; 25 (3): 173-6.
31. Sethawanich S, Koosmith S, Kamolratanakul P, Hawanon P, Hutheerat P. Anemia in pregnant women in 1997: Trend of decreasing magnitude of problem in Thailand. Thai Med Council Bull 1998; 27: 303-314.
32. Olmedilla B, Granado F, Gil-Martinez E, Blanco I, Rojas-Hidalgo E. Reference values for retinol, tocopherol, and main carotenoids in serum of control and insulin-dependent diabetic Spanish subjects. Clin Chem 1997; 43 (6 Pt 1): 1066-71.
33. Arnaud J, Fleites P, Chassagne M, Verdura T, Barnouin J, Richard MJ, et al. Seasonal variations of antioxidant imbalance in Cuban healthy men. Eur J Clin Nutr 2001; 55 (1): 29-38.
34. Schweigert FJ, Klinger J, Hurtinne A, Zunft H-J. Vitamin A, carotenoids and vitamin E plasma concentrations in children from Laos in relation to sex and growth failure. Nutr J 2003; 2: 17 www.nutritionj.com/content/2/1/17.
35. Lo C, Wahlqvist M, Horie Y, Horie K, Bainbridge R. Serum carotenoid status in Caucasian Australians (with and without Pritikin diet), and Japanese. Asia Pac J Clin Nutr 1996; 5: 2:124.
334 CU Andert, P Sanchaisuriya, K Sanchaisuriya, FP Schelp and FJ Schweigert
Original Article Nutritional status of pregnant women in Northeast Thailand Christoph U Andert 1, Pattara Sanchaisuriya PhD
2, Kanokwan Sanchaisuriya PhD 3,
Frank P Schelp PhD 4 and Florian J Schweigert PhD
1
1 Institute of Nutritional Science, Department of Physiology and Pathophysiology of Nutrition, University of Potsdam, Germany 2 Faculty of Public Health, Department of Nutrition, Khon Kaen University, Thailand 3Faculty of Associated Medical Sciences, Department of Clinical Microscopy, Khon Kaen University, Khon Kaen, Thailand 4Institute for Social Medicine, Joint Center for Humanities and Health Sciences, Free University Berlin and
Humboldt University at Berlin, Germany
泰国东北部孕妇的营养状况泰国东北部孕妇的营养状况泰国东北部孕妇的营养状况泰国东北部孕妇的营养状况 本研究是对泰国东北部 Khon Kaen的初产妇和经产妇怀孕前三个月的营养状况进行对比研究,调查两组人群的蛋白能量型营养失调,缺铁性贫血,维生素 A 缺乏和类胡萝卜素状况的差别。94 个试验者在第一次产前门诊时就参加本实验。从医院病例卡中获得了试验者的体重,身高,血红蛋白和红细胞比容的数据。人体测量法测量试验人员上臂围和三头肌皮褶厚
度。维生素 A,类胡萝卜素,维生素 E用反相高效液相色谱分析。铁蛋白、前清蛋白和视黄醇结合蛋白由酶联免疫分析。结果显示初产妇组身体质量指数、上臂围、校正的臂肌面积显
著降低(P <0.001),维生素 A,胆固醇和三头肌皮褶厚度也显著降低(P <0.05)。在校正年龄和社会经济条件后,除了三头肌皮褶厚度,上述其他参数仍旧有显著差别。尽管经产妇组铁蛋
白、血红蛋白和红细胞比容有升高趋势,但是维生素 E,血清蛋白,类胡萝卜素和铁指标却没有显著差别。初产妇组蛋白能量型营养失调(身体质量指数小于<18.5 kg/m2)显著高于经
产妇组(P<0.05)。总试验者中蛋白能量型营养失调,缺铁性贫血和维生素 A 缺乏者分别15.1%, 6.3 % and 3.3%。两组之间的缺铁性缺血和维生素 A缺乏无差别。 关键词关键词关键词关键词:营养状况、怀孕、维生素A、铁、类胡萝卜素。
Asia Pac J Clin Nutr 2006;15 (3):335-340 335
Original Article Which mothers take folic acid and folate containing foods?
Colin Binns MBBS MPH PhD1, Jane Scott MPH PhD 1,2, Nkeonyelu Nwafor MBBS MSc
2, Kathleen Graham BSc
1, Wendy Oddy PhD1 and Andy Lee PhD
1 1School of Public Health, Curtin University of Technology, Perth, Western Australia 2Division of Developmental Medicine, University of Glasgow
This study documented the prevalence (proportion) of mothers taking folic as supplements or as fortified foods and explored the factors that determined whether folic acid was taken. A cross sectional analysis of the baseline data of mothers who participated in the Perth Infant Feeding Study was performed. A total of 587 mothers who delivered at the two hospitals in the study completed baseline questionnaires. The factors associated with the decision to take folic acid supplements or fortified foods were investigated using multivariate logistic regression. Main outcome measures were the percentage of mothers taking folic acid or folic acid fortified foods. A total of 455 (78%) mothers stated that they took folic acid supplements before or during the first three months of their pregnancy. Of the 132 who did not take folate supplements only 35 (6% of all participating mothers) claimed to have taken folate fortified food or beverages. In the highest income group, 87% of mothers took folic acid supplements compared to 64% in the poorest group. The significant factors independently associated with not taking folic acid supplements or fortified food were “years of education” (OR ‘10 years or less’ 0.45 (0.23-0.88)), “family income” (OR <$25000 0.40(0.20-0.80)), and for taking folic acid “the timing of the pregnancy.” (OR ‘actively trying’ 2.01 (0.1.04-0.3.87)). There was a significant proportion of mothers who did not take folic acid periconceptually. The mothers who were not taking folic were less educated, from lower socio-economic groups and were not actively trying to fall pregnant at the time they became pregnant. The results suggest that in order to reach all Australian mothers, mandatory fortification of foods with folic acid should be required.
Key Words: folic acid, folate, pregnancy, Australia, socio-economic group
Introduction Folic acid or folate is a vitamin, classified as a member of the B group of vitamins and was established as an essential nutrient for man and animals in 1946. The active form, pteryl monoglutamic acid, is referred to as folic acid, but many different forms are present in foods, where it is usually conjugated into a polyglutamate. A major problem with assessing dietary intakes of folate is the variation in bioavailability of many of the naturally occurring com-pounds. For this reason where there is a public health reason for taking additional folate it is usually given as folic acid, which has known bioavailability and activity. The function of folate is essential to one carbon transfers in the body and particularly in the synthesis of purines used in the formation of DNA and RNA and it also serves as a carbon carrier in the formation of haem. Folate deficiency is common on a world wide basis, particularly affecting indigent populations.1, 2 There has been increasing interest in the role of folic acid in the prevention of neural tube defects in recent years. Several major reviews summarised the evidence of the effectiveness of the use of folic acid as a public health intervention, either as a supplement or in the fortification of the food supply.3-6 Two Cochrane reviews have confirmed the efficacy of folate in pregnancy for the prevention of anaemia and
neural tube defects (NTDs).3,7 The Cochrane review on folate and NTDs concluded that “Periconceptional folate supplementation has a strong protective effect against neural tube defects.” Other studies have shown a decline in acute lymphoblastic leukaemia and neuroblastoma in the children of mothers who have taken additional folic acid during their pregnancies.8 In 1992 the United States De-partment of Health and Human Services recommended that all mothers take folic acid before becoming pregnant and in 1993 the National Health and Medical Research Council in Australia made a similar recommendation that all mothers take 0.5mg of folic acid daily prior to becoming pregnant.9 The recognition of the importance of folic acid supple-mentation during pregnancy saw a number of countries take action to fortify their food supply with folic acid. In Austra-lia a need to develop an overall policy to reduce the inci-dence of NTDs became a priority. While NTDs are a pub-lic health problem that is not numerically large, they cause Correspondence address: Prof. Colin Binns, School of Public Health, Curtin University of Technology, GPO Box U1987, Perth 6845, Western Australia E-mail: [email protected] Accepted 20th September 2005
336 C Binns, J Scott, N Nwafor, K Graham, W Oddy and A Lee
considerable stress to families, a diminution in quality of life to the individual and a large cost burden to the community. Early in 1994 a Working Party of the National Health and Medical Research Council was formed to consider the issues and to make recommen-dations.10 This working party recommended that volun-tary fortification of flour, bread, breakfast cereals and juices be allowed up to 50% of the folic acid RDI per serving size. As a result of this recommendation Austra-lian and New Zealand Food Standards (now Food Stan-dards Australia New Zealand, FSANZ) authorised a trial of voluntary fortification of the Australian food supply with folic acid.11 Those companies who fortified their foods were permitted to use a health claim on their pro-ducts. Following voluntary fortification and associated health promotion campaigns, awareness of the role of folate and its food sources was found to have increased in a telephone survey.12 However the authors noted a lower level of awareness about folate in lower income and rural groups. The program of voluntary fortification of food with folate resulted in an improved folate status in a study of 69 South Australian adolescents, but the authors con-cluded that “current levels of fortification may not be sufficient to provide maximal protection against neural tube defects at a population level.”13 Metz also docu-mented an increase in blood folate levels, but of only 19% after voluntary fortification in Australia, compared to the 250% that occurred in the USA after mandatory forti-fication.14 A review by Bower and colleagues of data from the WA Birth Defects Registry found that following folate fortification the difference in the prevalence between indigenous and non-indigenous infants increased; the rate ratio increasing from 1.43 to almost 2.0.15 This suggested that the indigenous population is not benefiting as much from voluntary fortification or is not taking folic acid supplements periconceptually. Objectives The objectives of this study were to document the pre-valence (proportion) of new mothers taking folic acid as supplements or as fortified foods during their pregnancy and to study the factors that determined whether folic acid was taken.
Methods The second Perth Infant Feeding Study (PIFS) II was undertaken between mid-September 2002 and mid-July 2003 using the same hospitals, survey tools and me-thodology as had been used in the first PIFS (PIFS I) ten years previously.16-18 In the PIFS II additional questions were included about the use of folic acid supplements and foods and beverages containing added folic acid. These questions were identical to those used in the National Health Survey.19 New mothers were visited by the re-search officer within the first three days following the birth of their infant and invited to participate in an infant feeding study. Attempts were made to contact all women delivering during the study period. Women were eligible for the study if they had delivered a live infant free of serious health problems requiring transfer to Perth’s
major maternity hospital for critical care. Mothers whose infants were admitted to the Special Care Units of the participating hospitals were eligible for recruitment. Par-ticipants completed the self-administered baseline que-stionnaire while in hospital or shortly after discharge from hospital. All participants were then followed up by tele-phone to ascertain how they were feeding their infants at home. The study instruments used in the two studies were essentially the same, with only minor improvements and additions being made to the instrument used in the PIFS II. As the baseline questionnaire was to be self-administered, a number of steps had been taken to ensure that it was easy to read, comprehend, and complete. The original questionnaire had been reviewed by literacy experts and pre-tested by a group of 20 new mothers prior to its use in the PIFS I. Statistical analysis Data were entered and analysed using the Statistical Pack-age for the Social Sciences, Version 11.5 (SPSS for Win-dows, SPSS Inc., Chicago, IL, USA). Descriptive ana-lysis of relevant variables was followed by univariate ana-lysis, using the Chi square test, of variables that were possibly related to folic acid intake. Multivariate logistic regression analysis was used to investigate the factors in determining whether folic acid supplements or fortified food or beverages was taken. Ethical considerations The Human Ethics Committee of the Curtin University of Technology and the ethics committees of the two parti-cipating hospitals approved the study. Signed informed consent was obtained from participants. Confidentiality was assured and mothers were advised that their parti-cipation was voluntary and that they could withdraw at any time without prejudice.
Results During the period of the study a total of 1068 women were eligible to participate and of these, 870 were con-tacted and 587 completed baseline questionnaires, repre-senting 68% of women contacted. Demographic and delivery details are available on 233 of the women who were contacted but who declined to participate. There were no significant differences in the age (χ2 = 4.574 df 4 P = 0.334) or level of education (χ2 = 5.4834 df 2 P = 0.064) of participants in the PIFS II compared to non-participants, indicating they were representative of the population from which they were drawn with respect to these two characteristics. The basic demographic charac-teristics of the sample are shown in Table 1. The average age of the participants was 28.4 years; with 80% being in the 20-35 year age range. The youngest mother was 14 years and the oldest 45 years. A total of 455 (78%) mothers stated that they took folic acid supplements. Of the 132 who did not take folate supplements only 35 (6% of all participating mothers) claimed to have taken folate fortified food or beverages. (see Table 2) This left 97 (16%) of the sample who did not take folate supplements or did not con-sciously consume foods or drinks that contained addi-tional folate.
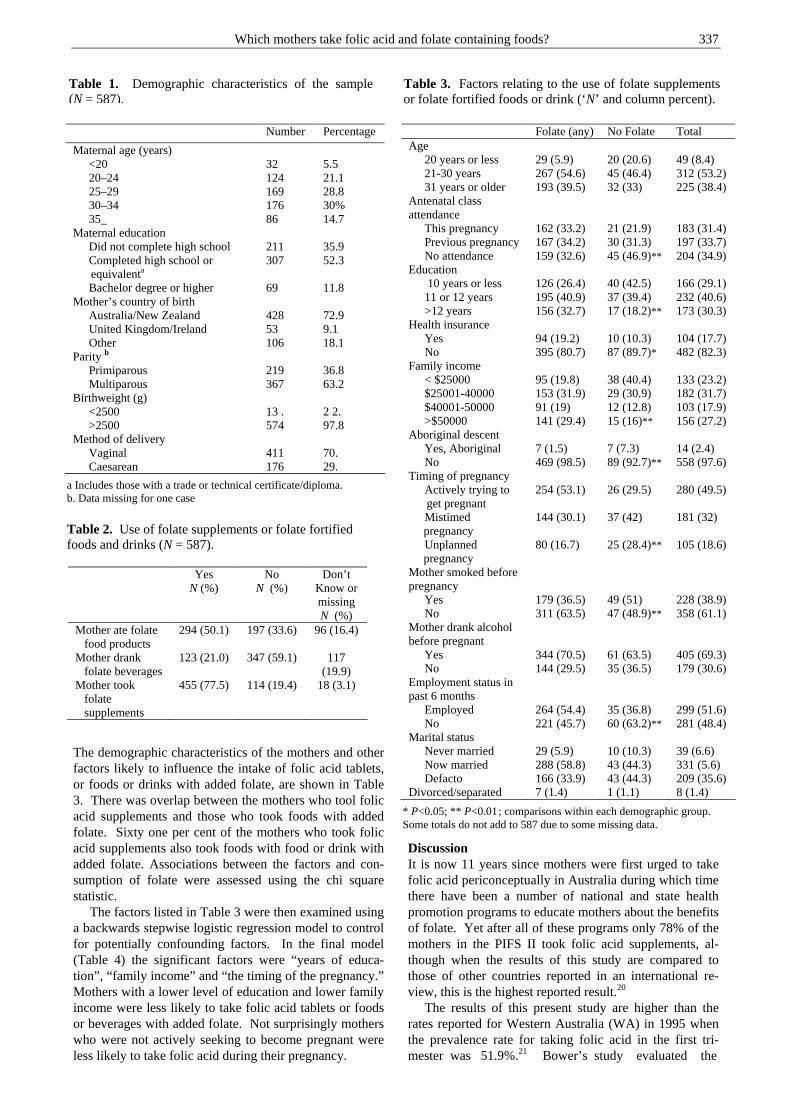
Which mothers take folic acid and folate containing foods? 337
The demographic characteristics of the mothers and other factors likely to influence the intake of folic acid tablets, or foods or drinks with added folate, are shown in Table 3. There was overlap between the mothers who tool folic acid supplements and those who took foods with added folate. Sixty one per cent of the mothers who took folic acid supplements also took foods with food or drink with added folate. Associations between the factors and con-sumption of folate were assessed using the chi square statistic. The factors listed in Table 3 were then examined using a backwards stepwise logistic regression model to control for potentially confounding factors. In the final model (Table 4) the significant factors were “years of educa-tion”, “family income” and “the timing of the pregnancy.” Mothers with a lower level of education and lower family income were less likely to take folic acid tablets or foods or beverages with added folate. Not surprisingly mothers who were not actively seeking to become pregnant were less likely to take folic acid during their pregnancy.
Discussion It is now 11 years since mothers were first urged to take folic acid periconceptually in Australia during which time there have been a number of national and state health promotion programs to educate mothers about the benefits of folate. Yet after all of these programs only 78% of the mothers in the PIFS II took folic acid supplements, al-though when the results of this study are compared to those of other countries reported in an international re-view, this is the highest reported result.20
The results of this present study are higher than the rates reported for Western Australia (WA) in 1995 when the prevalence rate for taking folic acid in the first tri-mester was 51.9%.21 Bower’s study evaluated the
Number Percentage
Maternal age (years) <20 32 5.5 20–24 124 21.1 25–29 169 28.8 30–34 176 30% 35_ 86 14.7
Maternal education Did not complete high school 211 35.9 Completed high school or
equivalenta 307 52.3
Bachelor degree or higher 69 11.8 Mother’s country of birth
Australia/New Zealand 428 72.9 United Kingdom/Ireland 53 9.1 Other 106 18.1
Parity b Primiparous 219 36.8 Multiparous 367 63.2
Birthweight (g) <2500 13 . 2 2. >2500 574 97.8
Method of delivery Vaginal 411 70. Caesarean 176 29.
Folate (any) No Folate Total Age
20 years or less 29 (5.9) 20 (20.6) 49 (8.4) 21-30 years 267 (54.6) 45 (46.4) 312 (53.2) 31 years or older 193 (39.5) 32 (33) 225 (38.4)
Antenatal class attendance
This pregnancy 162 (33.2) 21 (21.9) 183 (31.4) Previous pregnancy 167 (34.2) 30 (31.3) 197 (33.7) No attendance 159 (32.6) 45 (46.9)** 204 (34.9)
Education 10 years or less 126 (26.4) 40 (42.5) 166 (29.1) 11 or 12 years 195 (40.9) 37 (39.4) 232 (40.6) >12 years 156 (32.7) 17 (18.2)** 173 (30.3)
Health insurance Yes 94 (19.2) 10 (10.3) 104 (17.7) No 395 (80.7) 87 (89.7)* 482 (82.3)
Family income < $25000 95 (19.8) 38 (40.4) 133 (23.2) $25001-40000 153 (31.9) 29 (30.9) 182 (31.7) $40001-50000 91 (19) 12 (12.8) 103 (17.9) >$50000 141 (29.4) 15 (16)** 156 (27.2)
Aboriginal descent Yes, Aboriginal 7 (1.5) 7 (7.3) 14 (2.4) No 469 (98.5) 89 (92.7)** 558 (97.6)
Timing of pregnancy Actively trying to
get pregnant 254 (53.1) 26 (29.5) 280 (49.5)
Mistimed pregnancy
144 (30.1) 37 (42) 181 (32)
Unplanned pregnancy
80 (16.7) 25 (28.4)** 105 (18.6)
Mother smoked before pregnancy
Yes 179 (36.5) 49 (51) 228 (38.9) No 311 (63.5) 47 (48.9)** 358 (61.1)
Mother drank alcohol before pregnant
Yes 344 (70.5) 61 (63.5) 405 (69.3) No 144 (29.5) 35 (36.5) 179 (30.6)
Employment status in past 6 months
Employed 264 (54.4) 35 (36.8) 299 (51.6) No 221 (45.7) 60 (63.2)** 281 (48.4)
Marital status Never married 29 (5.9) 10 (10.3) 39 (6.6) Now married 288 (58.8) 43 (44.3) 331 (5.6) Defacto 166 (33.9) 43 (44.3) 209 (35.6)
Divorced/separated 7 (1.4) 1 (1.1) 8 (1.4)
Table 1. Demographic characteristics of the sample (N = 587).
a Includes those with a trade or technical certificate/diploma. b. Data missing for one case
Yes N (%)
No N (%)
Don’t Know or missing N (%)
Mother ate folate food products
294 (50.1) 197 (33.6) 96 (16.4)
Mother drank folate beverages
123 (21.0) 347 (59.1) 117 (19.9)
Mother took folate supplements
455 (77.5) 114 (19.4) 18 (3.1)
Table 2. Use of folate supplements or folate fortified foods and drinks (N = 587).
Table 3. Factors relating to the use of folate supplements or folate fortified foods or drink (‘N’ and column percent).
* P<0.05; ** P<0.01 ; comparisons within each demographic group. Some totals do not add to 587 due to some missing data.
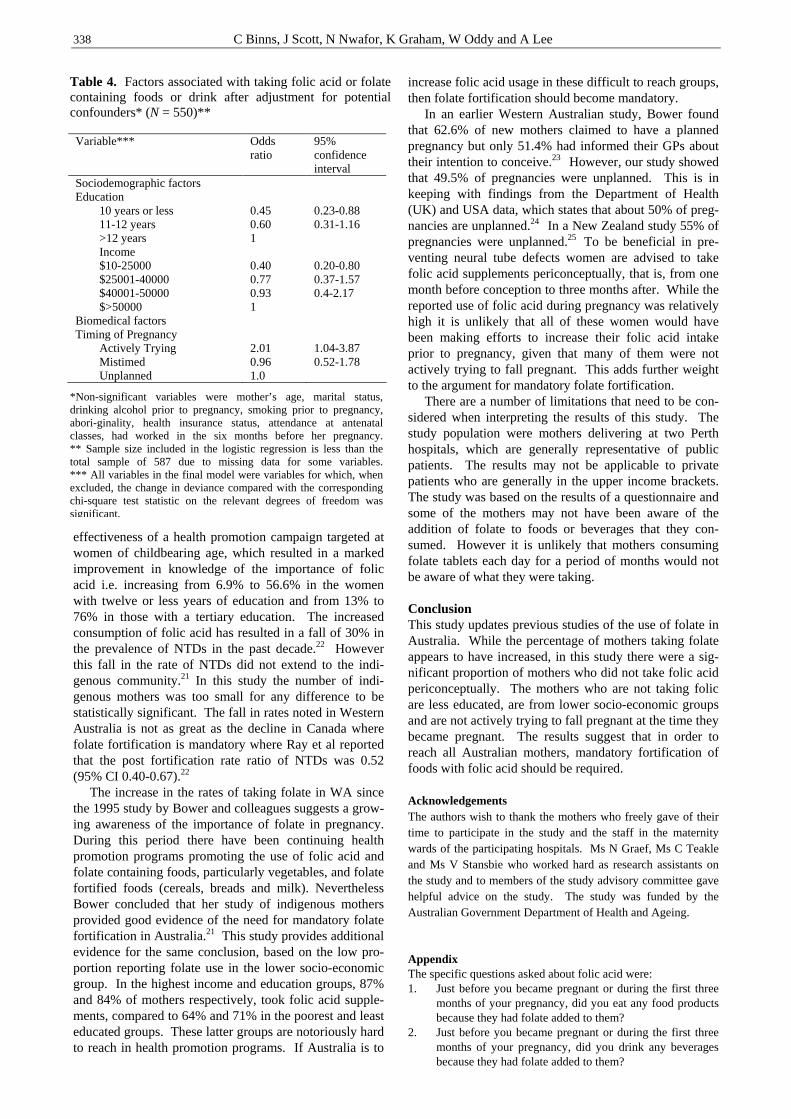
338 C Binns, J Scott, N Nwafor, K Graham, W Oddy and A Lee
effectiveness of a health promotion campaign targeted at women of childbearing age, which resulted in a marked improvement in knowledge of the importance of folic acid i.e. increasing from 6.9% to 56.6% in the women with twelve or less years of education and from 13% to 76% in those with a tertiary education. The increased consumption of folic acid has resulted in a fall of 30% in the prevalence of NTDs in the past decade.22 However this fall in the rate of NTDs did not extend to the indi-genous community.21 In this study the number of indi-genous mothers was too small for any difference to be statistically significant. The fall in rates noted in Western Australia is not as great as the decline in Canada where folate fortification is mandatory where Ray et al reported that the post fortification rate ratio of NTDs was 0.52 (95% CI 0.40-0.67).22 The increase in the rates of taking folate in WA since the 1995 study by Bower and colleagues suggests a grow-ing awareness of the importance of folate in pregnancy. During this period there have been continuing health promotion programs promoting the use of folic acid and folate containing foods, particularly vegetables, and folate fortified foods (cereals, breads and milk). Nevertheless Bower concluded that her study of indigenous mothers provided good evidence of the need for mandatory folate fortification in Australia.21 This study provides additional evidence for the same conclusion, based on the low pro-portion reporting folate use in the lower socio-economic group. In the highest income and education groups, 87% and 84% of mothers respectively, took folic acid supple-ments, compared to 64% and 71% in the poorest and least educated groups. These latter groups are notoriously hard to reach in health promotion programs. If Australia is to
increase folic acid usage in these difficult to reach groups, then folate fortification should become mandatory. In an earlier Western Australian study, Bower found that 62.6% of new mothers claimed to have a planned pregnancy but only 51.4% had informed their GPs about their intention to conceive.23 However, our study showed that 49.5% of pregnancies were unplanned. This is in keeping with findings from the Department of Health (UK) and USA data, which states that about 50% of preg-nancies are unplanned.24 In a New Zealand study 55% of pregnancies were unplanned.25 To be beneficial in pre-venting neural tube defects women are advised to take folic acid supplements periconceptually, that is, from one month before conception to three months after. While the reported use of folic acid during pregnancy was relatively high it is unlikely that all of these women would have been making efforts to increase their folic acid intake prior to pregnancy, given that many of them were not actively trying to fall pregnant. This adds further weight to the argument for mandatory folate fortification. There are a number of limitations that need to be con-sidered when interpreting the results of this study. The study population were mothers delivering at two Perth hospitals, which are generally representative of public patients. The results may not be applicable to private patients who are generally in the upper income brackets. The study was based on the results of a questionnaire and some of the mothers may not have been aware of the addition of folate to foods or beverages that they con-sumed. However it is unlikely that mothers consuming folate tablets each day for a period of months would not be aware of what they were taking.
Conclusion This study updates previous studies of the use of folate in Australia. While the percentage of mothers taking folate appears to have increased, in this study there were a sig-nificant proportion of mothers who did not take folic acid periconceptually. The mothers who are not taking folic are less educated, are from lower socio-economic groups and are not actively trying to fall pregnant at the time they became pregnant. The results suggest that in order to reach all Australian mothers, mandatory fortification of foods with folic acid should be required. Acknowledgements The authors wish to thank the mothers who freely gave of their time to participate in the study and the staff in the maternity wards of the participating hospitals. Ms N Graef, Ms C Teakle and Ms V Stansbie who worked hard as research assistants on the study and to members of the study advisory committee gave helpful advice on the study. The study was funded by the Australian Government Department of Health and Ageing. Appendix The specific questions asked about folic acid were: 1. Just before you became pregnant or during the first three
months of your pregnancy, did you eat any food products because they had folate added to them?
2. Just before you became pregnant or during the first three months of your pregnancy, did you drink any beverages because they had folate added to them?
Table 4. Factors associated with taking folic acid or folate containing foods or drink after adjustment for potential confounders* (N = 550)**
*Non-significant variables were mother’s age, marital status, drinking alcohol prior to pregnancy, smoking prior to pregnancy, abori-ginality, health insurance status, attendance at antenatal classes, had worked in the six months before her pregnancy. ** Sample size included in the logistic regression is less than the total sample of 587 due to missing data for some variables. *** All variables in the final model were variables for which, when excluded, the change in deviance compared with the corresponding chi-square test statistic on the relevant degrees of freedom was significant.
Variable*** Odds ratio
95% confidence interval
Sociodemographic factors Education
10 years or less 0.45 0.23-0.88 11-12 years 0.60 0.31-1.16 >12 years 1 Income $10-25000 0.40 0.20-0.80 $25001-40000 0.77 0.37-1.57 $40001-50000 0.93 0.4-2.17 $>50000 1
Biomedical factors Timing of Pregnancy
Actively Trying 2.01 1.04-3.87 Mistimed 0.96 0.52-1.78 Unplanned 1.0
Which mothers take folic acid and folate containing foods? 339
3. Just before you became pregnant or during the first three months of your pregnancy, did you take any vitamin or mineral supplements because they had folate added to them?
References 1. Anonymous. Editorial: Iron and folate deficiency in
pregnancy. Med J Aust 1974;2(13):470-1. 2. Micronutrient-Initiative. Vitamin and Mineral Deficiency :
a global progress report. In. Ottawa: Mironutrient Initiative and UNICEF; 2004.
3. Lumley J, Watson L, Watson M, Bower C. Periconceptional supplementation with folate and/or multivitamins for preventing neural tube defects (Cochrane Review). Chichester, UK:; 2004.
4. Fletcher RJ, Bell IP, Lambert JP. Public health aspects of food fortification: a question of balance. Proc Nutr Soc 2004;63(4):605-14.
5. Mills JL, Signore C. Neural tube defect rates before and after food fortification with folic acid. Birth Defects Res A Clin Mol Teratol 2004;70(11):844-5.
6. Liu S, West R, Randell E, Longerich L, O'Connor K S, Scott H, et al. A comprehensive evaluation of food fortification with folic acid for the primary prevention of neural tube defects. BMC Pregnancy Childbirth 2004;4(1):20.
7. Mahomed K. Folate supplementation in pregnancy (Cochrane Review). Chichester, UK: John Wiley & Sons, Ltd.; 2004.
8. Thompson JR, Gerald PF, Willoughby ML, Armstrong BK. Maternal folate supplementation in pregnancy and protection against acute lymphoblastic leukaemia in childhood: a case-control study. Lancet 2001;358(9297):1935-40.
9. Adams T, Jeffreson S. Australia implements voluntary folate fortification. Am J Public Health 1996;86(4):593-4.
10. NHMRC. Report of the Working Party on Folate Fortification and Neural Tube Defects. Canberra: NHMRC; 1994.
11. ANZFA. Evaluating the Folate - Neural Tube Defect Health Claim Pilot. In. Canberra: Australia New Zealand Food Authority; 2000.
12. Williams P, McHenery J, McMahon A, Anderson H. Impact evaluation of a folate education campaign with and without the use of a health claim. Aust N Z J Public Health 2001;25(5):396-404.
13. Wiltshire EJ, Couper JJ. Improved folate status in children and adolescents during voluntary fortification of food with folate. J Paediatr Child Health 2004;40(1-2):44-7.
14. Metz J, Sikaris KA, Maxwell EL, Levin MD. Changes in serum folate concentrations following voluntary food fortification in Australia. Med J Aust 2002;176(2):90-1.
15. Bower C, Knowles S, Nicol D. Changes in folate supplementation, and in serum and red cell folate levels in antenatal patients over the course of a health promotion project for the prevention of neural tube defects. Aust N Z J Obstet Gynaecol 1997;37(3):267-71.
16. Scott JA, Aitkin I, Binns CW, Aroni RA. Factors associated with the duration of breastfeeding amongst women in Perth, Australia. Acta Paediatr 1999;88(4):416-21.
17. Scott JA, Landers MC, Hughes RM, Binns CW. Factors associated with breastfeeding at discharge and duration of breastfeeding. J Paediatr Child Health 2001;37(3):254-61.
18. Binns C, Scott J. Breastfeeding: reasons for starting, reasons for stopping and problems along the way. Breastfeeding Review 2002;10(2):13-19.
19. ABS. Information Paper: National Health Survey Publication number 4324.0. Canberra: Australian Bureau of Statistics; 2003.
20. Ray JG, Singh G, Burrows RF. Evidence for suboptimal use of periconceptional folic acid supplements globally. BJOG 2004;111(5):399-408.
21. Bower C, Eades S, Payne J, D'Antoine H, Stanley F. Trends in neural tube defects in Western Australia in Indigenous and non-Indigenous populations. Paediatr Perinat Epidemiol 2004;18(4):277-80.
22. Ray JG, Meier C, Vermeulen MJ, Boss S, Wyatt PR, Cole DE. Association of neural tube defects and folic acid food fortification in Canada. Lancet 2002;360(9350):2047-8.
23. Bower C, Blum L, O'Daly K, Higgins C, Loutsky F, Kosky C. Promotion of folate for the prevention of neural tube defects: knowledge and use of periconceptional folic acid supplements in Western Australia, 1992 to 1995. Aust N Z J Public Health 1997;21(7):716-21.
24. Department of Health. Health of the Nation. London,: HMSO; 1992.
25. Schader I, Corwin P. How many pregnant women in Christchurch are using folic acid supplements in early pregnancy? N Z Med J 1999;112(1101):463-5.
340 C Binns, J Scott, N Nwafor, K Graham, W Oddy and A Lee
Original Article Which mothers take folic acid and folate containing foods?
Colin Binns MBBS MPH PhD1, Jane Scott MPH PhD 1,2, Nkeonyelu Nwafor MBBS MSc
2, Kathleen Graham BSc
1, Wendy Oddy PhD1 and Andy Lee PhD
1 1School of Public Health, Curtin University of Technology, Perth, Western Australia 2Division of Developmental Medicine, University of Glasgow
哪类母亲摄入叶酸增补剂和富含叶酸的食物哪类母亲摄入叶酸增补剂和富含叶酸的食物哪类母亲摄入叶酸增补剂和富含叶酸的食物哪类母亲摄入叶酸增补剂和富含叶酸的食物 本研究证实了母亲摄入叶酸作为增补剂或强化食品现象的流行,并探究了决定母亲是否摄入
叶酸的因素。对参与佩斯婴儿哺育研究的母亲的基础数据进行代表性研究。参与此项研究并
在这两个医院生产的 587 名母亲完成了基础数据的问卷调查。采用多元逻辑回归对决定母亲
是否摄入叶酸的因素进行检验。主要测定指标为摄入叶酸或富含叶酸食物的母亲占总体的比
例。共有 455(78%)名母亲声称在怀孕前或怀孕的前三个月中曾摄入叶酸增补剂。在剩余的
未摄入叶酸增补剂的 132 名母亲中,有 35 名(占总体 6%)母亲声称食用过富含叶酸的食物
或饮料。在最高收入实验组中,有 87%的母亲摄入过叶酸增补剂,而在最低收入实验组中,
仅有 64%的母亲摄入过叶酸增补剂。与未摄入叶酸增补剂或富含叶酸食物独立相关的显著因
素为接受教育的时间(优势比(10 年或更少的时间)为 0.45,致信区间为 0.23-0.88)和家
庭收入(优势比(少于 25000 美元)为 0.40,致信区间为 0.20-0.80)。而与摄入叶酸独立
相关的显著因素为怀孕的时间(优势比(积极尝试)为 2.01,致信区间为 1.04-3.87)。有
相当一部分母亲并未预先摄入叶酸。这些未摄入叶酸的母亲所受教育较少,来自于较低的社
会经济阶层,而且在她们怀孕之前,并没有积极地去尝试怀孕。本研究说明:要使所有的澳
大利亚母亲补充叶酸,富含叶酸食物的强制性推荐是必须的。 关键词关键词关键词关键词:叶酸、怀孕、澳大利亚、社会经济阶层。

Asia Pac J Clin Nutr 2006;15 (3): 341-349 341
Original Article Dietary and blood folate status of Malaysian women of childbearing age Geok Lin Khor PhD
1, G Duraisamy MBBS2, Su Peng Loh PhD
1, Timothy J Green PhD3
and C Murray Skeaff PhD3
1Department of Nutrition and Health Sciences 2Department of Clinical Laboratory Sciences, Faculty of Medicine and Health Sciences, Universiti Putra Malaysia, Serdang, Malaysia 3Department of Human Nutrition, University of Otago, Dunedin, New Zealand
The protective role of folic acid taken during the periconceptual period in reducing the occurrence of neural tube defects (NTD) has been well documented by epidemiological evidence, randomized controlled trials and intervention studies. Much of the evidence is derived from western populations while similar data on Asian subjects is relatively nascent. Baseline data on folate status of Malaysian women is lacking, while NTD prevalence is estimated as 10 per 10,000 births. This study was conducted with the objective of determining the dietary and blood folate status of Malaysian women of childbearing age. A total of 399 women comprising 140 Malay, 131 Chinese and 128 Indian subjects were recruited from universities and worksites in the suburbs of Kuala Lumpur. Inclusion criteria were that the subjects were not pregnant or breastfeeding, not taking folic acid supplements, not habitual drinkers or smokers. Based on a 24-hour recall, the median intake level for folate was 202.4µg (59.4-491.8 µg), which amounts to 50.6% of the Malaysian Recommended Nutrient Intakes level. The median (5-95th percentiles) values for plasma and red cell folate (RBC) concentrations were 11 (4-33) nmol/L and 633 (303-1209) nmol/L respectively. Overall, nearly 15.1% showed plasma folate deficiency (< 6.8 nmol/L), with Indian subjects having the highest prevalence (21.5%). Overall prevalence of RBC folate deficiency (< 363 nmol/L) was 9.3%, and an almost similar level prevailed for each ethnic group. Only 15.2% had RBC concentration exceeding 906 nmol/L, which is associated with a very low risk of NTD. The result of this study point to the need for intervention strategies to improve the blood folate status of women of childbearing age, so that they have adequate protection against the occurrence of NTD at birth.
Key Words: blood folate, neural tube defects, dietary intake, women, Malaysia Introduction Folic acid or pteroylglutamic acid was synthesized in 1945 at the Lederle Laboratories in United Sates two years after pteroyl-triglutamate was isolated in the same laboratory.1 While folic acid is in the form of a monoglutamate, most naturally occurring folates including those in food are a mixture of mono- and polyglutamates. Good food sources of folate include legumes, green leafy vegetables, peanuts and broccoli. It is recognized that the bioavailability of food folate is less than that of folic acid when consumed as part of a mixed diet.2 Folate functions as a co-enzyme in several biochemical reactions and is essential for growth and reproduction. Deficiency of folate leads to inability to synthesize thy-midine, resulting in decreased DNA synthesis and reduced production of rapidly dividing cells such as erythrocytes. A serious consequence of severe folate deficiency is break-down in central nervous system maturation producing neural tube defects (NTDs).3 NTDs are a group of birth defects presumed to have a common origin in failure of the neural tube to develop properly during the embryonic stage. Spina bifida is a form of NTD that has a defective closure of the bony encasement of the spinal cord. The neural tube
closes by approximately the 28th day of gestation, and so any potential exposures suspected to have caused an NTD would have to have occurred within the first month of gestation. Since the 1980s, definitive evidence from ran-domized controlled trials and intervention studies have demonstrated that folic acid taken during the periconceptual period substantially reduces the risk of neural tube defects (NTD) at birth.4 In the latter study in United Kingdom, 1817 women who had a history of NTD pregnancy, consumed 4 mg folic acid daily during the periconceptual period resulting in over 70% reduction in the recurrence of NTDs. In China, con-sumption of 400 µg of folic acid daily reduced the risk of NTD-affected pregnancy by 79% in Hebei province, where the incidence of NTD was high at 50-60 per 10,000.5
Correspondence address: : Professor GL Khor, Department of Nutrition and Health Sciences, Faculty of Medicine and Health Sciences, Universiti Putra Malaysia, 43400 Serdang, Malaysia Tel: 603-89468487; Fax: 603-89455075 E-mail: [email protected] Accepted 20th September 2005
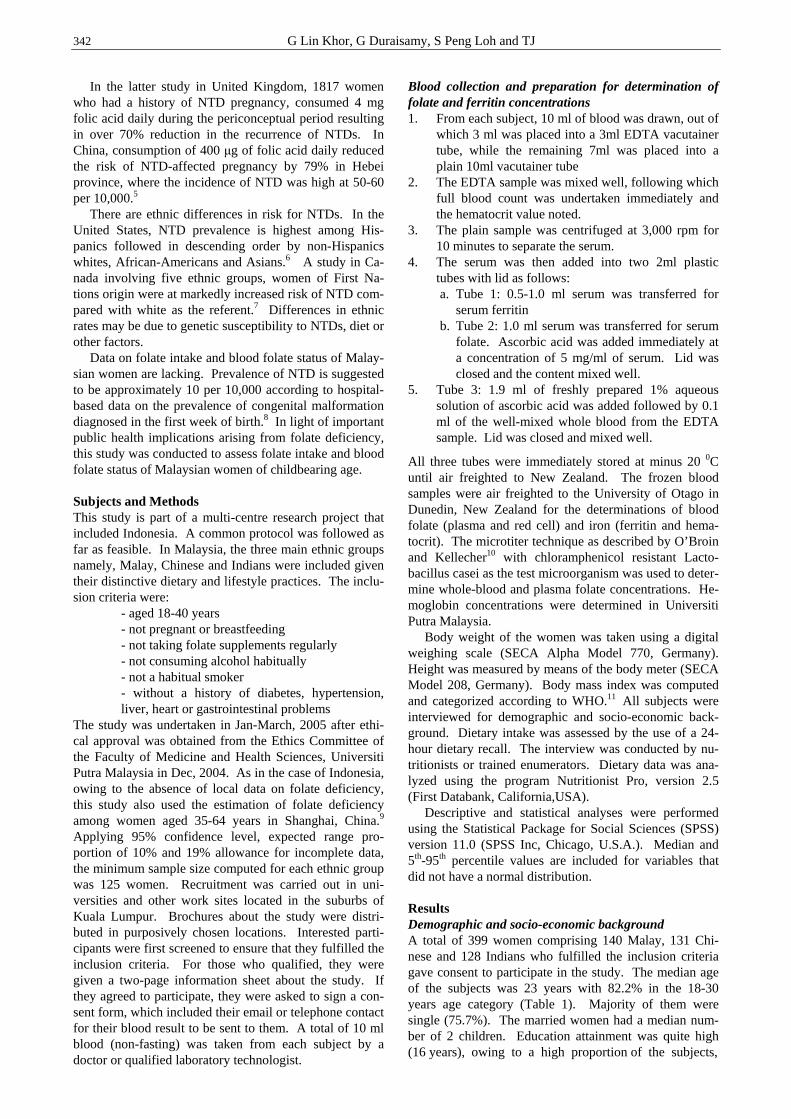
342 G Lin Khor, G Duraisamy, S Peng Loh and TJ
In the latter study in United Kingdom, 1817 women who had a history of NTD pregnancy, consumed 4 mg folic acid daily during the periconceptual period resulting in over 70% reduction in the recurrence of NTDs. In China, consumption of 400 µg of folic acid daily reduced the risk of NTD-affected pregnancy by 79% in Hebei province, where the incidence of NTD was high at 50-60 per 10,000.5 There are ethnic differences in risk for NTDs. In the United States, NTD prevalence is highest among His-panics followed in descending order by non-Hispanics whites, African-Americans and Asians.6 A study in Ca-nada involving five ethnic groups, women of First Na-tions origin were at markedly increased risk of NTD com-pared with white as the referent.7 Differences in ethnic rates may be due to genetic susceptibility to NTDs, diet or other factors. Data on folate intake and blood folate status of Malay-sian women are lacking. Prevalence of NTD is suggested to be approximately 10 per 10,000 according to hospital-based data on the prevalence of congenital malformation diagnosed in the first week of birth.8 In light of important public health implications arising from folate deficiency, this study was conducted to assess folate intake and blood folate status of Malaysian women of childbearing age. Subjects and Methods This study is part of a multi-centre research project that included Indonesia. A common protocol was followed as far as feasible. In Malaysia, the three main ethnic groups namely, Malay, Chinese and Indians were included given their distinctive dietary and lifestyle practices. The inclu-sion criteria were:
- aged 18-40 years - not pregnant or breastfeeding - not taking folate supplements regularly - not consuming alcohol habitually - not a habitual smoker - without a history of diabetes, hypertension, liver, heart or gastrointestinal problems
The study was undertaken in Jan-March, 2005 after ethi-cal approval was obtained from the Ethics Committee of the Faculty of Medicine and Health Sciences, Universiti Putra Malaysia in Dec, 2004. As in the case of Indonesia, owing to the absence of local data on folate deficiency, this study also used the estimation of folate deficiency among women aged 35-64 years in Shanghai, China.9 Applying 95% confidence level, expected range pro-portion of 10% and 19% allowance for incomplete data, the minimum sample size computed for each ethnic group was 125 women. Recruitment was carried out in uni-versities and other work sites located in the suburbs of Kuala Lumpur. Brochures about the study were distri-buted in purposively chosen locations. Interested parti-cipants were first screened to ensure that they fulfilled the inclusion criteria. For those who qualified, they were given a two-page information sheet about the study. If they agreed to participate, they were asked to sign a con-sent form, which included their email or telephone contact for their blood result to be sent to them. A total of 10 ml blood (non-fasting) was taken from each subject by a doctor or qualified laboratory technologist.
Blood collection and preparation for determination of folate and ferritin concentrations 1. From each subject, 10 ml of blood was drawn, out of
which 3 ml was placed into a 3ml EDTA vacutainer tube, while the remaining 7ml was placed into a plain 10ml vacutainer tube
2. The EDTA sample was mixed well, following which full blood count was undertaken immediately and the hematocrit value noted.
3. The plain sample was centrifuged at 3,000 rpm for 10 minutes to separate the serum.
4. The serum was then added into two 2ml plastic tubes with lid as follows: a. Tube 1: 0.5-1.0 ml serum was transferred for
serum ferritin b. Tube 2: 1.0 ml serum was transferred for serum
folate. Ascorbic acid was added immediately at a concentration of 5 mg/ml of serum. Lid was closed and the content mixed well.
5. Tube 3: 1.9 ml of freshly prepared 1% aqueous solution of ascorbic acid was added followed by 0.1 ml of the well-mixed whole blood from the EDTA sample. Lid was closed and mixed well.
All three tubes were immediately stored at minus 20 0C until air freighted to New Zealand. The frozen blood samples were air freighted to the University of Otago in Dunedin, New Zealand for the determinations of blood folate (plasma and red cell) and iron (ferritin and hema-tocrit). The microtiter technique as described by O’Broin and Kellecher10 with chloramphenicol resistant Lacto-bacillus casei as the test microorganism was used to deter-mine whole-blood and plasma folate concentrations. He-moglobin concentrations were determined in Universiti Putra Malaysia. Body weight of the women was taken using a digital weighing scale (SECA Alpha Model 770, Germany). Height was measured by means of the body meter (SECA Model 208, Germany). Body mass index was computed and categorized according to WHO.11 All subjects were interviewed for demographic and socio-economic back-ground. Dietary intake was assessed by the use of a 24-hour dietary recall. The interview was conducted by nu-tritionists or trained enumerators. Dietary data was ana-lyzed using the program Nutritionist Pro, version 2.5 (First Databank, California,USA). Descriptive and statistical analyses were performed using the Statistical Package for Social Sciences (SPSS) version 11.0 (SPSS Inc, Chicago, U.S.A.). Median and 5th-95th percentile values are included for variables that did not have a normal distribution. Results Demographic and socio-economic background A total of 399 women comprising 140 Malay, 131 Chi-nese and 128 Indians who fulfilled the inclusion criteria gave consent to participate in the study. The median age of the subjects was 23 years with 82.2% in the 18-30 years age category (Table 1). Majority of them were single (75.7%). The married women had a median num-ber of 2 children. Education attainment was quite high (16 years), owing to a high proportion of the subjects,
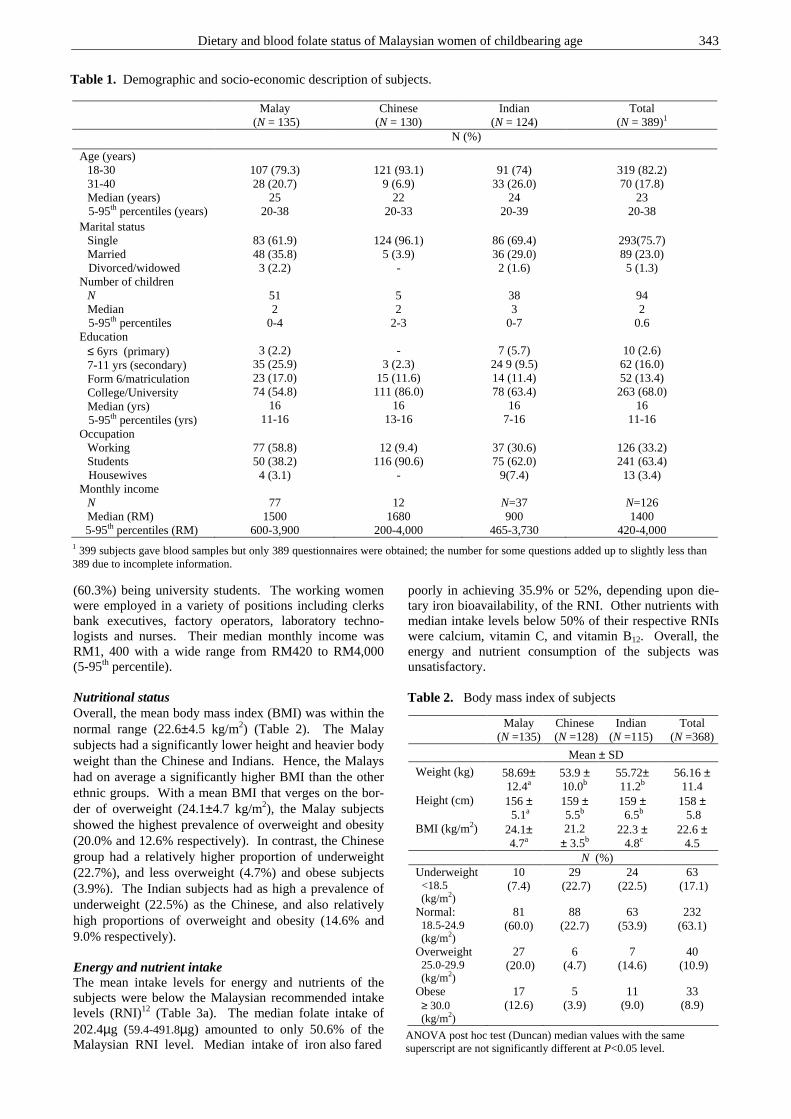
Dietary and blood folate status of Malaysian women of childbearing age 343
(60.3%) being university students. The working women were employed in a variety of positions including clerks bank executives, factory operators, laboratory techno-logists and nurses. Their median monthly income was RM1, 400 with a wide range from RM420 to RM4,000 (5-95th percentile). Nutritional status Overall, the mean body mass index (BMI) was within the normal range (22.6±4.5 kg/m2) (Table 2). The Malay subjects had a significantly lower height and heavier body weight than the Chinese and Indians. Hence, the Malays had on average a significantly higher BMI than the other ethnic groups. With a mean BMI that verges on the bor-der of overweight (24.1±4.7 kg/m2), the Malay subjects showed the highest prevalence of overweight and obesity (20.0% and 12.6% respectively). In contrast, the Chinese group had a relatively higher proportion of underweight (22.7%), and less overweight (4.7%) and obese subjects (3.9%). The Indian subjects had as high a prevalence of underweight (22.5%) as the Chinese, and also relatively high proportions of overweight and obesity (14.6% and 9.0% respectively). Energy and nutrient intake The mean intake levels for energy and nutrients of the subjects were below the Malaysian recommended intake levels (RNI)12 (Table 3a). The median folate intake of 202.4µg (59.4-491.8µg) amounted to only 50.6% of the Malaysian RNI level. Median intake of iron also fared
poorly in achieving 35.9% or 52%, depending upon die-tary iron bioavailability, of the RNI. Other nutrients with median intake levels below 50% of their respective RNIs were calcium, vitamin C, and vitamin B12. Overall, the energy and nutrient consumption of the subjects was unsatisfactory.
Table 1. Demographic and socio-economic description of subjects.
Malay (N = 135)
Chinese (N = 130)
Indian (N = 124)
Total (N = 389)1
N (%)
Age (years) 18-30 31-40 Median (years)
5-95th percentiles (years)
107 (79.3) 28 (20.7)
25 20-38
121 (93.1)
9 (6.9) 22
20-33
91 (74)
33 (26.0) 24
20-39
319 (82.2) 70 (17.8)
23 20-38
Marital status Single Married
Divorced/widowed
83 (61.9) 48 (35.8) 3 (2.2)
124 (96.1)
5 (3.9) -
86 (69.4) 36 (29.0) 2 (1.6)
293(75.7) 89 (23.0) 5 (1.3)
Number of children N Median
5-95th percentiles
51 2
0-4
5 2
2-3
38 3
0-7
94 2
0.6 Education
≤ 6yrs (primary) 7-11 yrs (secondary) Form 6/matriculation College/University Median (yrs)
5-95th percentiles (yrs)
3 (2.2)
35 (25.9) 23 (17.0) 74 (54.8)
16 11-16
-
3 (2.3) 15 (11.6) 111 (86.0)
16 13-16
7 (5.7)
24 9 (9.5) 14 (11.4) 78 (63.4)
16 7-16
10 (2.6) 62 (16.0) 52 (13.4) 263 (68.0)
16 11-16
Occupation Working Students
Housewives
77 (58.8) 50 (38.2) 4 (3.1)
12 (9.4)
116 (90.6) -
37 (30.6) 75 (62.0)
9(7.4)
126 (33.2) 241 (63.4) 13 (3.4)
Monthly income N Median (RM)
5-95th percentiles (RM)
77
1500 600-3,900
12
1680 200-4,000
N=37 900
465-3,730
N=126 1400
420-4,000 1 399 subjects gave blood samples but only 389 questionnaires were obtained; the number for some questions added up to slightly less than
389 due to incomplete information.
Malay (N =135)
Chinese (N =128)
Indian (N =115)
Total (N =368)
Mean ± SD
Weight (kg)
58.69± 12.4a
53.9 ± 10.0b
55.72± 11.2b
56.16 ± 11.4
Height (cm)
156 ± 5.1a
159 ± 5.5b
159 ± 6.5b
158 ± 5.8
BMI (kg/m2)
24.1± 4.7a
21.2 ± 3.5b
22.3 ± 4.8c
22.6 ± 4.5
N (%) Underweight <18.5 (kg/m2)
10 (7.4)
29 (22.7)
24 (22.5)
63 (17.1)
Normal: 18.5-24.9 (kg/m2)
81 (60.0)
88 (22.7)
63 (53.9)
232 (63.1)
Overweight 25.0-29.9 (kg/m2)
27 (20.0)
6 (4.7)
7 (14.6)
40 (10.9)
Obese ≥ 30.0 (kg/m2)
17 (12.6)
5 (3.9)
11 (9.0)
33 (8.9)
ANOVA post hoc test (Duncan) median values with the same superscript are not significantly different at P<0.05 level.
Table 2. Body mass index of subjects
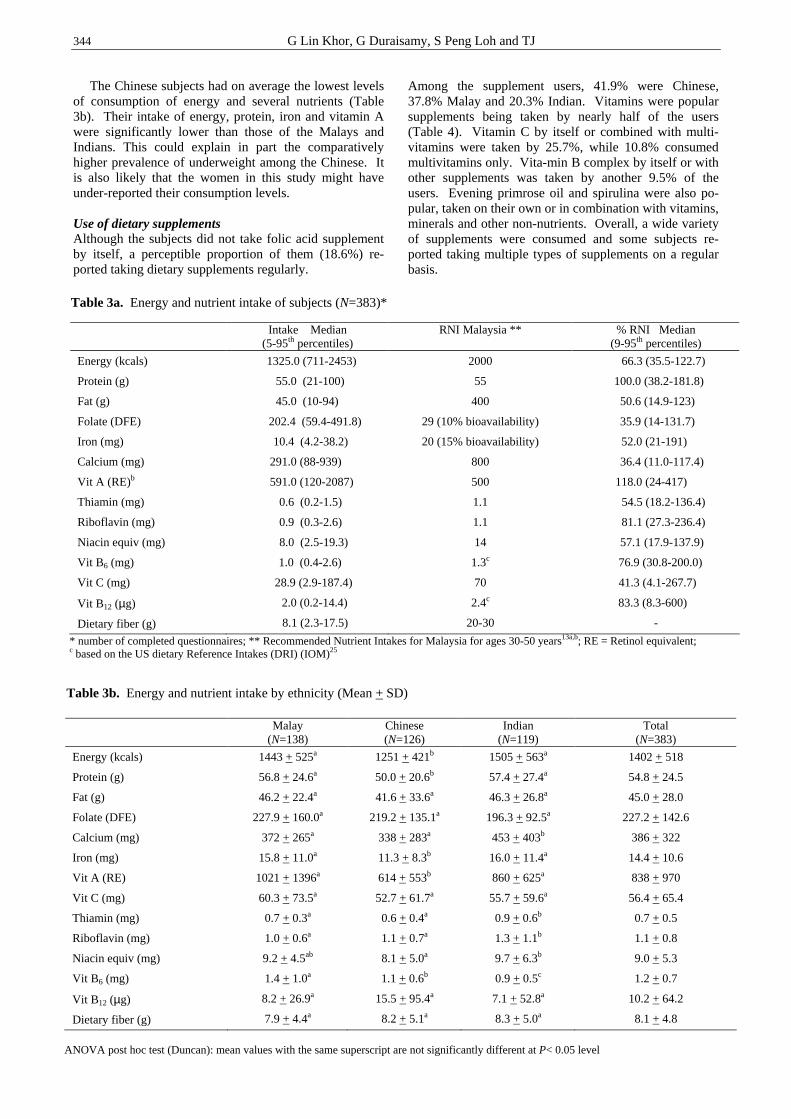
344 G Lin Khor, G Duraisamy, S Peng Loh and TJ
The Chinese subjects had on average the lowest levels of consumption of energy and several nutrients (Table 3b). Their intake of energy, protein, iron and vitamin A were significantly lower than those of the Malays and Indians. This could explain in part the comparatively higher prevalence of underweight among the Chinese. It is also likely that the women in this study might have under-reported their consumption levels. Use of dietary supplements Although the subjects did not take folic acid supplement by itself, a perceptible proportion of them (18.6%) re-ported taking dietary supplements regularly.
Among the supplement users, 41.9% were Chinese, 37.8% Malay and 20.3% Indian. Vitamins were popular supplements being taken by nearly half of the users (Table 4). Vitamin C by itself or combined with multi-vitamins were taken by 25.7%, while 10.8% consumed multivitamins only. Vita-min B complex by itself or with other supplements was taken by another 9.5% of the users. Evening primrose oil and spirulina were also po-pular, taken on their own or in combination with vitamins, minerals and other non-nutrients. Overall, a wide variety of supplements were consumed and some subjects re-ported taking multiple types of supplements on a regular basis.
Table 3a. Energy and nutrient intake of subjects (N=383)*
Intake Median (5-95th percentiles)
RNI Malaysia ** % RNI Median (9-95th percentiles)
Energy (kcals)
Protein (g)
Fat (g)
Folate (DFE)
Iron (mg)
Calcium (mg)
Vit A (RE)b
Thiamin (mg)
Riboflavin (mg)
Niacin equiv (mg)
Vit B6 (mg)
Vit C (mg)
Vit B12 (µg)
Dietary fiber (g)
1325.0 (711-2453)
55.0 (21-100)
45.0 (10-94)
202.4 (59.4-491.8)
10.4 (4.2-38.2)
291.0 (88-939)
591.0 (120-2087)
0.6 (0.2-1.5)
0.9 (0.3-2.6)
8.0 (2.5-19.3)
1.0 (0.4-2.6)
28.9 (2.9-187.4)
2.0 (0.2-14.4)
8.1 (2.3-17.5)
2000
55
400
29 (10% bioavailability)
20 (15% bioavailability)
800
500
1.1
1.1
14
1.3c
70
2.4c
20-30
66.3 (35.5-122.7)
100.0 (38.2-181.8)
50.6 (14.9-123)
35.9 (14-131.7)
52.0 (21-191)
36.4 (11.0-117.4)
118.0 (24-417)
54.5 (18.2-136.4)
81.1 (27.3-236.4)
57.1 (17.9-137.9)
76.9 (30.8-200.0)
41.3 (4.1-267.7)
83.3 (8.3-600)
-
* number of completed questionnaires; ** Recommended Nutrient Intakes for Malaysia for ages 30-50 years13a,b; RE = Retinol equivalent; c based on the US dietary Reference Intakes (DRI) (IOM)25
Malay (N=138)
Chinese (N=126)
Indian (N=119)
Total (N=383)
Energy (kcals)
Protein (g)
Fat (g)
Folate (DFE)
Calcium (mg)
Iron (mg)
Vit A (RE)
Vit C (mg)
Thiamin (mg)
Riboflavin (mg)
Niacin equiv (mg)
Vit B6 (mg)
Vit B12 (µg)
Dietary fiber (g)
1443 + 525a
56.8 + 24.6a
46.2 + 22.4a
227.9 + 160.0a
372 + 265a
15.8 + 11.0a
1021 + 1396a
60.3 + 73.5a
0.7 + 0.3a
1.0 + 0.6a
9.2 + 4.5ab
1.4 + 1.0a
8.2 + 26.9a
7.9 + 4.4a
1251 + 421b
50.0 + 20.6b
41.6 + 33.6a
219.2 + 135.1a
338 + 283a
11.3 + 8.3b
614 + 553b
52.7 + 61.7a
0.6 + 0.4a
1.1 + 0.7a
8.1 + 5.0a
1.1 + 0.6b
15.5 + 95.4a
8.2 + 5.1a
1505 + 563a
57.4 + 27.4a
46.3 + 26.8a
196.3 + 92.5a
453 + 403b
16.0 + 11.4a
860 + 625a
55.7 + 59.6a
0.9 + 0.6b
1.3 + 1.1b
9.7 + 6.3b
0.9 + 0.5c
7.1 + 52.8a
8.3 + 5.0a
1402 + 518
54.8 + 24.5
45.0 + 28.0
227.2 + 142.6
386 + 322
14.4 + 10.6
838 + 970
56.4 + 65.4
0.7 + 0.5
1.1 + 0.8
9.0 + 5.3
1.2 + 0.7
10.2 + 64.2
8.1 + 4.8
ANOVA post hoc test (Duncan): mean values with the same superscript are not significantly different at P< 0.05 level
Table 3b. Energy and nutrient intake by ethnicity (Mean + SD)
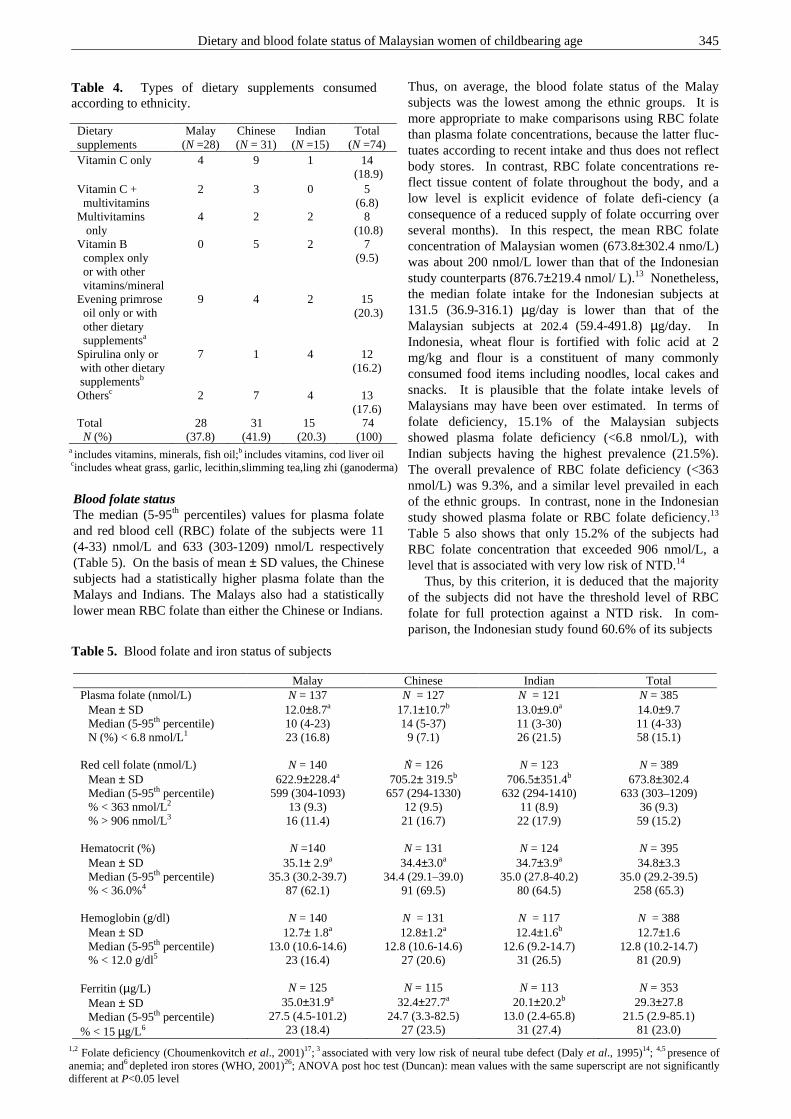
Dietary and blood folate status of Malaysian women of childbearing age 345
Blood folate status The median (5-95th percentiles) values for plasma folate and red blood cell (RBC) folate of the subjects were 11 (4-33) nmol/L and 633 (303-1209) nmol/L respectively (Table 5). On the basis of mean ± SD values, the Chinese subjects had a statistically higher plasma folate than the Malays and Indians. The Malays also had a statistically lower mean RBC folate than either the Chinese or Indians.
Thus, on average, the blood folate status of the Malay subjects was the lowest among the ethnic groups. It is more appropriate to make comparisons using RBC folate than plasma folate concentrations, because the latter fluc-tuates according to recent intake and thus does not reflect body stores. In contrast, RBC folate concentrations re-flect tissue content of folate throughout the body, and a low level is explicit evidence of folate defi-ciency (a consequence of a reduced supply of folate occurring over several months). In this respect, the mean RBC folate concentration of Malaysian women (673.8±302.4 nmo/L) was about 200 nmol/L lower than that of the Indonesian study counterparts (876.7±219.4 nmol/ L).13 Nonetheless, the median folate intake for the Indonesian subjects at 131.5 (36.9-316.1) µg/day is lower than that of the Malaysian subjects at 202.4 (59.4-491.8) µg/day. In Indonesia, wheat flour is fortified with folic acid at 2 mg/kg and flour is a constituent of many commonly consumed food items including noodles, local cakes and snacks. It is plausible that the folate intake levels of Malaysians may have been over estimated. In terms of folate deficiency, 15.1% of the Malaysian subjects showed plasma folate deficiency (<6.8 nmol/L), with Indian subjects having the highest prevalence (21.5%). The overall prevalence of RBC folate deficiency (<363 nmol/L) was 9.3%, and a similar level prevailed in each of the ethnic groups. In contrast, none in the Indonesian study showed plasma folate or RBC folate deficiency.13 Table 5 also shows that only 15.2% of the subjects had RBC folate concentration that exceeded 906 nmol/L, a level that is associated with very low risk of NTD.14 Thus, by this criterion, it is deduced that the majority of the subjects did not have the threshold level of RBC folate for full protection against a NTD risk. In com-parison, the Indonesian study found 60.6% of its subjects .
Table 5. Blood folate and iron status of subjects
Malay Chinese Indian Total Plasma folate (nmol/L)
Mean ± SD Median (5-95th percentile) N (%) < 6.8 nmol/L1
N = 137 12.0±8.7a 10 (4-23) 23 (16.8)
N = 127 17.1±10.7b 14 (5-37) 9 (7.1)
N = 121 13.0±9.0a 11 (3-30) 26 (21.5)
N = 385 14.0±9.7 11 (4-33) 58 (15.1)
Red cell folate (nmol/L)
Mean ± SD Median (5-95th percentile) % < 363 nmol/L2 % > 906 nmol/L3
N = 140 622.9±228.4a
599 (304-1093) 13 (9.3) 16 (11.4)
N = 126 705.2± 319.5b
657 (294-1330) 12 (9.5) 21 (16.7)
N = 123 706.5±351.4b
632 (294-1410) 11 (8.9) 22 (17.9)
N = 389 673.8±302.4
633 (303–1209) 36 (9.3) 59 (15.2)
Hematocrit (%) Mean ± SD Median (5-95th percentile) % < 36.0%4
N =140 35.1± 2.9a
35.3 (30.2-39.7) 87 (62.1)
N = 131 34.4±3.0a
34.4 (29.1–39.0) 91 (69.5)
N = 124 34.7±3.9a
35.0 (27.8-40.2) 80 (64.5)
N = 395 34.8±3.3
35.0 (29.2-39.5) 258 (65.3)
Hemoglobin (g/dl) Mean ± SD Median (5-95th percentile) % < 12.0 g/dl5
N = 140 12.7± 1.8a
13.0 (10.6-14.6) 23 (16.4)
N = 131 12.8±1.2a
12.8 (10.6-14.6) 27 (20.6)
N = 117 12.4±1.6b
12.6 (9.2-14.7) 31 (26.5)
N = 388 12.7±1.6
12.8 (10.2-14.7) 81 (20.9)
Ferritin (µg/L) Mean ± SD Median (5-95th percentile)
% < 15 µg/L6
N = 125 35.0±31.9a
27.5 (4.5-101.2) 23 (18.4)
N = 115 32.4±27.7a
24.7 (3.3-82.5) 27 (23.5)
N = 113 20.1±20.2b
13.0 (2.4-65.8) 31 (27.4)
N = 353 29.3±27.8
21.5 (2.9-85.1) 81 (23.0)
Dietary supplements
Malay (N =28)
Chinese (N = 31)
Indian (N =15)
Total (N =74)
Vitamin C only 4 9 1 14 (18.9)
Vitamin C + multivitamins
2 3 0 5 (6.8)
Multivitamins only
4 2 2 8 (10.8)
Vitamin B complex only or with other vitamins/mineral
0 5 2 7 (9.5)
Evening primrose oil only or with other dietary supplementsa
9 4 2 15 (20.3)
Spirulina only or with other dietary supplementsb
7 1 4 12 (16.2)
Othersc 2 7 4 13 (17.6)
Total N (%)
28 (37.8)
31 (41.9)
15 (20.3)
74 (100)
Table 4. Types of dietary supplements consumed according to ethnicity.
a includes vitamins, minerals, fish oil;b includes vitamins, cod liver oil
cincludes wheat grass, garlic, lecithin,slimming tea,ling zhi (ganoderma)
1,2 Folate deficiency (Choumenkovitch et al., 2001)17; 3 associated with very low risk of neural tube defect (Daly et al., 1995)14; 4,5 presence of anemia; and6 depleted iron stores (WHO, 2001)26; ANOVA post hoc test (Duncan): mean values with the same superscript are not significantly different at P<0.05 level
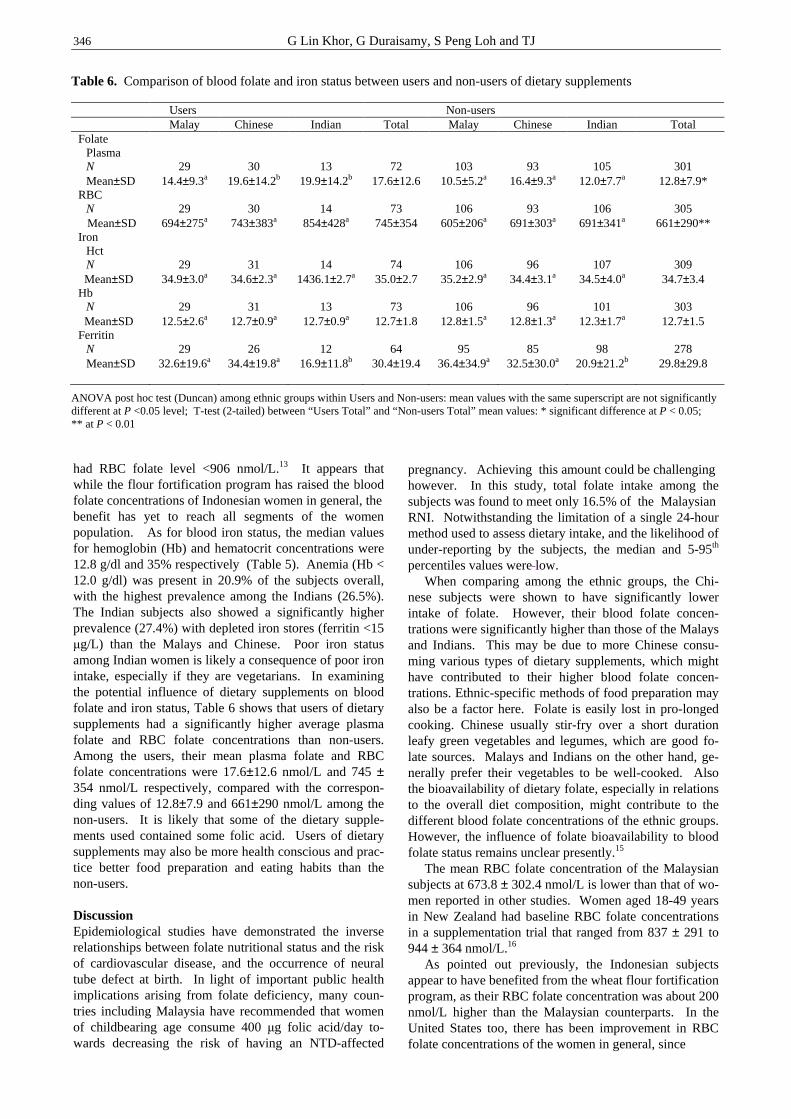
346 G Lin Khor, G Duraisamy, S Peng Loh and TJ
had RBC folate level <906 nmol/L.13 It appears that while the flour fortification program has raised the blood folate concentrations of Indonesian women in general, the benefit has yet to reach all segments of the women population. As for blood iron status, the median values for hemoglobin (Hb) and hematocrit concentrations were 12.8 g/dl and 35% respectively (Table 5). Anemia (Hb < 12.0 g/dl) was present in 20.9% of the subjects overall, with the highest prevalence among the Indians (26.5%). The Indian subjects also showed a significantly higher prevalence (27.4%) with depleted iron stores (ferritin <15 µg/L) than the Malays and Chinese. Poor iron status among Indian women is likely a consequence of poor iron intake, especially if they are vegetarians. In examining the potential influence of dietary supplements on blood folate and iron status, Table 6 shows that users of dietary supplements had a significantly higher average plasma folate and RBC folate concentrations than non-users. Among the users, their mean plasma folate and RBC folate concentrations were 17.6±12.6 nmol/L and 745 ± 354 nmol/L respectively, compared with the correspon-ding values of 12.8±7.9 and 661±290 nmol/L among the non-users. It is likely that some of the dietary supple-ments used contained some folic acid. Users of dietary supplements may also be more health conscious and prac-tice better food preparation and eating habits than the non-users. Discussion Epidemiological studies have demonstrated the inverse relationships between folate nutritional status and the risk of cardiovascular disease, and the occurrence of neural tube defect at birth. In light of important public health implications arising from folate deficiency, many coun-tries including Malaysia have recommended that women of childbearing age consume 400 µg folic acid/day to-wards decreasing the risk of having an NTD-affected
pregnancy. Achieving this amount could be challenging however. In this study, total folate intake among the subjects was found to meet only 16.5% of the Malaysian RNI. Notwithstanding the limitation of a single 24-hour method used to assess dietary intake, and the likelihood of under-reporting by the subjects, the median and 5-95th percentiles values were low. When comparing among the ethnic groups, the Chi-nese subjects were shown to have significantly lower intake of folate. However, their blood folate concen-trations were significantly higher than those of the Malays and Indians. This may be due to more Chinese consu-ming various types of dietary supplements, which might have contributed to their higher blood folate concen-trations. Ethnic-specific methods of food preparation may also be a factor here. Folate is easily lost in pro-longed cooking. Chinese usually stir-fry over a short duration leafy green vegetables and legumes, which are good fo-late sources. Malays and Indians on the other hand, ge-nerally prefer their vegetables to be well-cooked. Also the bioavailability of dietary folate, especially in relations to the overall diet composition, might contribute to the different blood folate concentrations of the ethnic groups. However, the influence of folate bioavailability to blood folate status remains unclear presently.15 The mean RBC folate concentration of the Malaysian subjects at 673.8 ± 302.4 nmol/L is lower than that of wo-men reported in other studies. Women aged 18-49 years in New Zealand had baseline RBC folate concentrations in a supplementation trial that ranged from 837 ± 291 to 944 ± 364 nmol/L.16 As pointed out previously, the Indonesian subjects appear to have benefited from the wheat flour fortification program, as their RBC folate concentration was about 200 nmol/L higher than the Malaysian counterparts. In the United States too, there has been improvement in RBC folate concentrations of the women in general, since
Users Non-users Malay Chinese Indian Total Malay Chinese Indian Total Folate
Plasma N Mean±SD
29 14.4±9.3a
30 19.6±14.2b
13 19.9±14.2b
72 17.6±12.6
103 10.5±5.2a
93 16.4±9.3a
105 12.0±7.7a
301 12.8±7.9*
RBC N
Mean±SD
29
694±275a
30
743±383a
14
854±428a
73
745±354
106
605±206a
93
691±303a
106
691±341a
305
661±290** Iron
Hct N
Mean±SD
29
34.9±3.0a
31
34.6±2.3a
14
1436.1±2.7a
74
35.0±2.7
106
35.2±2.9a
96
34.4±3.1a
107
34.5±4.0a
309
34.7±3.4 Hb
N Mean±SD
29
12.5±2.6a
31
12.7±0.9a
13
12.7±0.9a
73
12.7±1.8
106
12.8±1.5a
96
12.8±1.3a
101
12.3±1.7a
303
12.7±1.5 Ferritin
N Mean±SD
29
32.6±19.6a
26
34.4±19.8a
12
16.9±11.8b
64
30.4±19.4
95
36.4±34.9a
85
32.5±30.0a
98
20.9±21.2b
278
29.8±29.8
ANOVA post hoc test (Duncan) among ethnic groups within Users and Non-users: mean values with the same superscript are not significantly different at P <0.05 level; T-test (2-tailed) between “Users Total” and “Non-users Total” mean values: * significant difference at P < 0.05; ** at P < 0.01
Table 6. Comparison of blood folate and iron status between users and non-users of dietary supplements
Dietary and blood folate status of Malaysian women of childbearing age 347
cereal-grain products were fortified with folic acid in early 1998. The amount of folic acid added to different cereal-grain products ranges form 95 to 309 µg/100 g of product. At this range of fortification, it was projected that folic acid intake in the general population attributable to fortification would be approximately 100 µg/day.17 Caudill et al.,18 reported that Californian women of child-bearing age from socio-economically-advantaged back-ground had a mean RBC folate concentration of 1307 nmol/L, four times higher than the level deemed accep-table (≥362 nmol/L). Asian women in this study had RBC folate level of 1269 ± 274 nmol/L and the Hispanics 1586±417 nmol/L. These folate concentrations were 2-3 times higher than pre-fortification red cell levels. The NHANES III data collected in 1988-91 reported mean RBC folate concentration of 515.9 nmol/L for whites, 455.7 nmol/L in Mexican Americans, and 415.4 nmol/L among African Americans.19 It appears that the subjects in this study had RBC folate concentrations at about the pre-fortification levels of US women or slightly higher. More importantly, is the finding that the majority of the Malaysian subjects had RBC folate concentration below the concentration of 906 nmol/L, which is deemed to confer maximum protection against the occurrence of NTD at birth. There is therefore a need to improve the blood folate status of Malaysian women of childbearing age. One strategy is fortifying selected foods or food ingre-dients with folic acid as practiced in countries like Indo-nesia, Untied States and Canada. In United States, the birth prevalence of NTDs is estimated to have decreased from pre-fortification level of 37.8 per 100,000 live births to 30.5 per 100,000 conceived after mandatory folic fortification.20 A similar fortification program in Canada begun in late 1998 has also led to a decline (38%) in the prevalence of NTD in Ontario.21 A study in New Zealand in which women of childbearing age were given milk fortified with 375µg folic acid daily over 12 weeks had folate status raised by 51% compared to baseline. The mean RBC folate of the fortified group was 1262 nmol/L, which is well above 906 nmol/L associated with the greatest reduction of NTD.22 Another strategy is to encourage all women capable of becoming pregnant to take folic acid supplements. The daily use of 400 µg of folic acid remains the most effec-tive practice to prevent NTD defects. Norsworthy et al.,23
demonstrated that, while once-a-week 2800µg of folic acid supplement resulted in 50% of the women achieving a RBC folate concentration exceeding 905nmol/L, this was significantly lower that the daily 400µg supplement group, where 74% exceeded 905 nmol/L. The authors also highlighted their finding of only 23% of women taking the daily folic acid supplement showed a RBC folate concentration that exceeded 905 nmol/L after 6 weeks. This is noteworthy because many countries re-commend women to take folic acid for only 4 weeks be-fore pregnancy. Thus, the authors recommended a longer period to achieve blood folate concentration associated with the lowest risk of NTD risk. This study also found the persistence of poor iron status among the women particularly among the Indians. Iron-folate supplementation is a feasible strategy to
improve ferritin-Hb status of Malaysian adolescents.24 Health promotion on good nutritional practice and less reliance on costly dietary supplements is desirable among young female adults at work sites and the universities. There was also a noticeable prevalence of overweight and obese subjects in this sample, ranging from 8.8% in the Chinese to 32.6% among the Malays. A study in China found that being too thin (BMI <21 kg/m2) increases the odds of blood folate deficiency two folds, and being overweight (BMI ≥27 kg/m2) also has a 1.3 times higher chance of having folate deficiency.9 The relationship between nutritional status and folate deficiency needs further investigation. In Malaysia, the leading cause of mortality of adults is cardiovascular disease, and this is often attributed to lifestyle-related conditions such as diabetes, hypercholesterolemia and obesity. The implica-tions of low folate and high homocysteine as cardio-vascular risk in Malaysians should be studied. In conclusion, there is a definite need to improve the consumption of folate and blood folate status of Malay-sian women of childbearing age. The public health autho-rity has to weigh the costs and benefits of various stra-tegic interventions. Research is also needed to generate data on (a) the folate content of Malaysian foods, (b) the bioavailability of folate in commonly consumed foods, (c) dietary intake of folate and other B vitamins of adolescents and adults, and (d) dietary intake and blood folate of pregnant women and birth outcomes. Acknowledgement The Clinical Laboratory Sciences Department (Haematology Unit), Universiti Putra Malaysia, and the Department of Nutrition, University of Otago for their technical support. Fonterra Brands Limited funded the study. References 1. Rosenberg IH. Virtual folate: virtual success? Am J Clin
Nutr 1999; 70:177-8. 2. Gregory JF. Dietary folate in a changing environment:
bioavailability, fortification and requirements. F Food Sci 2004; 69: SNQ59-SNQ60.
3. Czeizel AE, Dudas I. Prevention of the first occurrence of neural tube defects by periconceptional vitamin supple-mentation. N Engl J Med 1992; 327: 1832-5.
4. MRC Vitamin Study Research Group. Prevention of NTDs: results of the Medical Research Council Vitamin Study. Lancet 1991; 338:131-137.
5. Berry RJ, Li Z, Erikson JD, Li S, Moore CA, Wang H, Mulinare J, Zhao P, Wong L-Y C, Gindler J, Hong SX, Correa A. Prevention of neural-tube defects with folic acid in China. N Engl J Med 1999; 341:1485-90.
6. Centre for Disease Control (CDC). Spina bifida incidence at birth – United States 1983-1990. MMMR Morb Mortal Wkly Rep1992; 19:399-404.
7. Ray JG, Vermeulen MJ, Meier C, Cole DEC, Wyatt PR. Maternal ethnicity and risk of neural tube defects: a population-based study. Canadian Med Assoc J 2004; 171:343-5.
8. Ho J. Folic acid in the prevention of neural tube defect – a programme for Malaysia? Med J Malaysia 2004; 59:94-9.
9. Hao L, Ma J, Stanpfer MJ, Ren A, Tian Y, Tang Y, Willet WC, Li Z. Geographical, seasonal and gender differences in folate status among Chinese adults. J Nutr 2003; 133: 3630-35.
348 G Lin Khor, G Duraisamy, S Peng Loh and TJ
10. O’Broin S, Kellecher B. Microbiological assay on micro-titre plates of foalte in serum and red cells. J Clin Pathol 1992; 45:344-7.
11. WHO Obesity. Preventing and Managing the Global Epidemic. Report of a WHO Consultation on Obesity. Geneva, WHO; 1998.
12. National Coordinating Committee on Food and Nutrition (NCCFN), Ministry of Health Malaysia. Recommended Nutrient Intakes for Malaysia. Putrajaya, Ministry of Health Malaysia; 2005.
13. Muslimatun S, Augustina R, Wiradnyani RAR. Folate status among selected child bearing-age and pregnant women in Jakarta, Indonesia. Unpublished Research Report. SEAMEO-TROPMED Regional Centre for Community Nutrition, Jakarta; 2005.
14. Daly LE, Kirke PN, Molloy A, Weir DG, Scott JM. Folate levels and neural tube defects: implications for prevention. J Am Med Assoc 1995; 274: 1698-1702.
15. Gregory JF. Case study: folate bioavailability. J Nutr 2001; 131:1376S-82S
16. Venn BJ, Green TJ, Moser R, Mckenzie JE, Skeaff CM, Mann J. Increases in blood folate indices are similar in women of childbearing age supplemented with (6S)-5-methytetrahydrofolate and folic acid. J Nutr 2002; 132: 3353-3355.
17. Choumenkovitch SF, Jacques PF, Nadeau MR, Wilson PWF, Rosenberh IH, Selhub J. Folic acid fortification increases red blood cell folate concentrations in the Framingham Study. J Nutr 2001; 131:3277-80.
18. Caudill MA, Le T, Moonie SA, Esfani ST, Cogger EA. Folate status in women of childbearing age residing in Southern California after folic acid fortification. J Am Coll Nutr 2001; 20:129-34.
19. Ford ES, Bowman BA. Serum and red blood cell folate concentrations, race, and education: findings from the third National Health and Nutrition Examination Survey. Am J Clin Nutr 1999; 69:476-81.
20. Choumenkovitch SF, Selhub J, Wilson PWF, Rader JI, Rosenberg IH, Jacques PF. Folic acid intake from fortification in United States exceeds predictions. J Nutr 2002; 132: 2792-98.
21. Ray JG, Meier C, Vermeulen MJ, Boss S, Wyatt PR, Cole DEC. Association of neural tube defects and folic acid fortification. Lancet 2002; 360: 2047-48.
22. Green TJ, Skeaff CM, Rockell JEP, Venn BJ. Folic acid fortified milk increases blood folate and lowers homo-cysteine concentration in women of childbearing age. Asia Pac J Clin Nutr 2005; 14:173-8.
23. Norsworthy B, Skeaff CM, Adank C, TJ Green. Effects of once-a-week or daily folic acid supplementation on red blood cell folate concentrations in women. Eur J Clin Nutr 2004; 58:548-54.
24. Tee ES, Kandiah M. Awin N, Chong SM, Satgunasingam N, Kamarudin I, Milano S, Dugdale AE, Viteri FE. School-administered weekly iron-folate supplements improve hemoglobin and ferritin concentrations in Malaysian adolescent girls. Am J Clin Nutr 1999; 69: 1249-56.
25. Institute of Medicine, National Research Council. Dietary Reference Intakes for Thiamine, Riboflavin, Niacin, Vitamin B6, Folate, Vitamin B12, Pantothenic Acid, Biotin, and Choline. Washington DC: National Academy Press, 2000.
26. WHO. Iron Deficiency Anaemia. Assessment, Prevention and Control. A guide for programme managers. Geneva, WHO; 2001
Dietary and blood folate status of Malaysian women of childbearing age 349
Original Article Dietary and blood folate status of Malaysian women of childbearing age Geok Lin Khor PhD
1, G Duraisamy MBBS2, Su Peng Loh PhD
1, Timothy J Green PhD3
and C Murray Skeaff PhD3
1Department of Nutrition and Health Sciences 2Department of Clinical Laboratory Sciences, Faculty of Medicine and Health Sciences, Universiti Putra Malaysia, Serdang, Malaysia 3Department of Human Nutrition, University of Otago, Dunedin, New Zealand
马来群岛育龄妇女的饮食和体内叶酸水平的研究马来群岛育龄妇女的饮食和体内叶酸水平的研究马来群岛育龄妇女的饮食和体内叶酸水平的研究马来群岛育龄妇女的饮食和体内叶酸水平的研究
流行病学证据、随机对照试验以及干预性研究都证明妇女在怀孕期间服用叶酸对胎儿具有保
护作用,能够降低胎儿神经管缺乏(NTD)发生率的作用。这些证据主要来自西方人群,而
在亚洲类似的研究相对来说还是比较缺少的。在马来群岛,每 10000 个新生婴儿中就有 10
个患有 NTD 疾病,然而却缺少关于其育龄妇女的叶酸水平的基线数据。本项研究的目的是测
定马来群岛育龄妇女的饮食和体内叶酸水平。共有 399 个妇女参加本次研究,其中包括 140
个马来人,131 个华人以及 128 个印第安人,这些人来自吉隆坡的大学和工厂。选择志愿者
的标准是这些妇女没有怀孕或者未处于哺乳期,不服用叶酸,没有酗酒和吸烟的习惯。根据
这些志愿者 24 小时的饮食回忆,叶酸摄入中值量为 66µg (15.7-207.8 µg), 占了马来群岛
人推荐营养素摄入量的 16.5%。血浆和红细胞叶酸(RBC)中值(5-95 百分点)分别为 11
(4-33) nmol/L and 633 (303-1209) nmol/L。总的来讲,将近 15.1%的被调查人员的叶酸摄
入量缺乏(< 6.8 nmol/L),而叶酸缺乏人数最高的是印第安人为 21.5%。总的红细胞叶酸缺
乏是 9.3 %,一个对每个同种同文化之民族最相似的流行水平。只有 15.2%的人的红细胞叶
酸浓度大于 906 nmol/L,这个浓度与 NTD 低发生率相关。本项研究结果说明处于育龄期妇女
应采取一定的干扰措施来改善她们体内叶酸缺乏的状况,以便她们防御孩子出生时患 NTD 的
几率。
关键词关键词关键词关键词:血液叶酸浓度、饮食摄入、妇女。
350 Asia Pac J Clin Nutr 2006;15 (3): 350-356
Original Article Anaemia and iron deficiency anaemia among young adolescent girls from peri urban coastal area of Indonesia Yustina Anie Indriastuti Kurniawan MD, MSc, PhD
1,2, Siti Muslimatun MSc, PhD 2,
Endang L Achadi MD, PhD 3 and Soemilah Sastroamidjojo MD
2
1Directorate of Community Nutrition, Ministry of Health Republic of Indonesia. 2Southeast Asian Ministers of Education Organization (SEAMEO) Tropical Medicine (TROPMED) and Public Health Network Regional Center for Community Nutrition (RCCN), University of Indonesia. 3Faculty of Public Health, University of Indonesia.
Anaemia due to iron deficiency is still a widespread problem. Among adolescent girls, it will bring negative consequences on growth, school performance, morbidity and reproductive performance. This cross sectional study aimed to identify the different nutritional and iron status characteristics of young adolescent girls 10 – 12 years old with iron deficiency anaemia and anaemia without iron deficiency in the rural coastal area of Indonesia. Anaemic girls (N = 133) were recruited out of 1358 girls from 34 elementary schools. Haemo-globin, serum ferritin, serum transferrin receptor and zinc protophorphyrin were determined for iron status, whilst weight and height were measured for their nutritional status. General characteristics and dietary intake were assessed through interview. Out of 133 anaemic subjects, 29 (21.8%) suffered from iron deficiency anaemia, which was not significantly related to age and menarche. About 50% were underweight and stunted indicating the presence of acute and chronic malnutrition. The proportion of thinness was significantly higher (P <0.05) among subjects who suffered from iron deficiency anaemia (51.7% vs. 29.8%). Furthermore, thin subjects had a 5 fold higher risk of suffering from iron deficiency anaemia (P < 0.05) than non-thin subjects (OR: 5.1; 95%CI 1.34 -19.00). Further study was recommended to explore other factors associated with anaemia and iron deficiency anaemia, such as the thalassemia trait and vitamin A deficiency. The current iron-folate supplementation program for pregnant women should be expanded to adolescent girls.
Key Words: iron, deficiency, anaemia, adolescent, girls, urban, Indonesia. Introduction Despite more than 30 years of iron supplementation pro-gram, anaemia is still a widespread problem among preg-nant women and under-five children in Indonesia. Inter-vention through iron supplementation during pregnancy might be too late for improving pregnancy outcomes as many women are already anaemic or iron deficient when they enter pregnancy. Many adolescent girls from rural areas usually drop out from school and enter marriage during adolescent period or at around 17 years.1 There-fore, anaemia prevention has to start prior to pregnancy, or even earlier, during adolescence period, considering that anaemia among adolescent girls will bring negative con-sequences on growth, school performances2-4, morbidity status5 and future reproductive performance.6,7 The definition for anaemia refers to an abnormally low haemoglobin level due to pathological conditions related to nutritional and non-nutritional factors. Iron deficiency is one of the most common causes of nutritional anaemia.8 Iron deficiency anaemia (IDA) is a condition in which se-vere iron deficiency causes anaemia. Some functional con-sequences such as cognitive impairment, decreased phy-sical activity and reduced immunity are commonly
associated with iron deficiency anaemia. Iron is needed for haemoglobin formation. Approximately 73 percent of the body’s iron is normally incorporated into haemoglobin, 12 percent in the storage complexes of ferritin and hemo-siderin, and 15 percent is incorporated into other iron–containing compounds such as enzymes. When iron intake does not meet the requirement for normal iron turn over, iron stores can become exhausted.10,11 Low dietary iron in-take (below 2/3 of RDA9), is the major cause of anaemia in Indonesia. In addition, iron in a rice-based diet has poor bioavailability, which leads to poor iron absorption. Other nutrition factors causing anaemia are deficiencies of pro-tein, folic acid, vitamin B12, vitamin A and copper.7,10,11 Non-nutritional causes of anaemia include chronic in-fections such as malaria, worm infestation and hereditary haemoglobinophathies such as thalassemia and sickle cell diseases.7,10
Correspondence address: Directorate of Community Nutrition, Ministry of Health, Republic of Indonesia. H.R. Rasuna Said, Block X-5, Kav 4 – 9, Jakarta 12950 Tel: +62 21 5277153; Fax: +62 21 5210176. Website: www.gizi.net Email:[email protected], [email protected] Accepted 8th November 2005
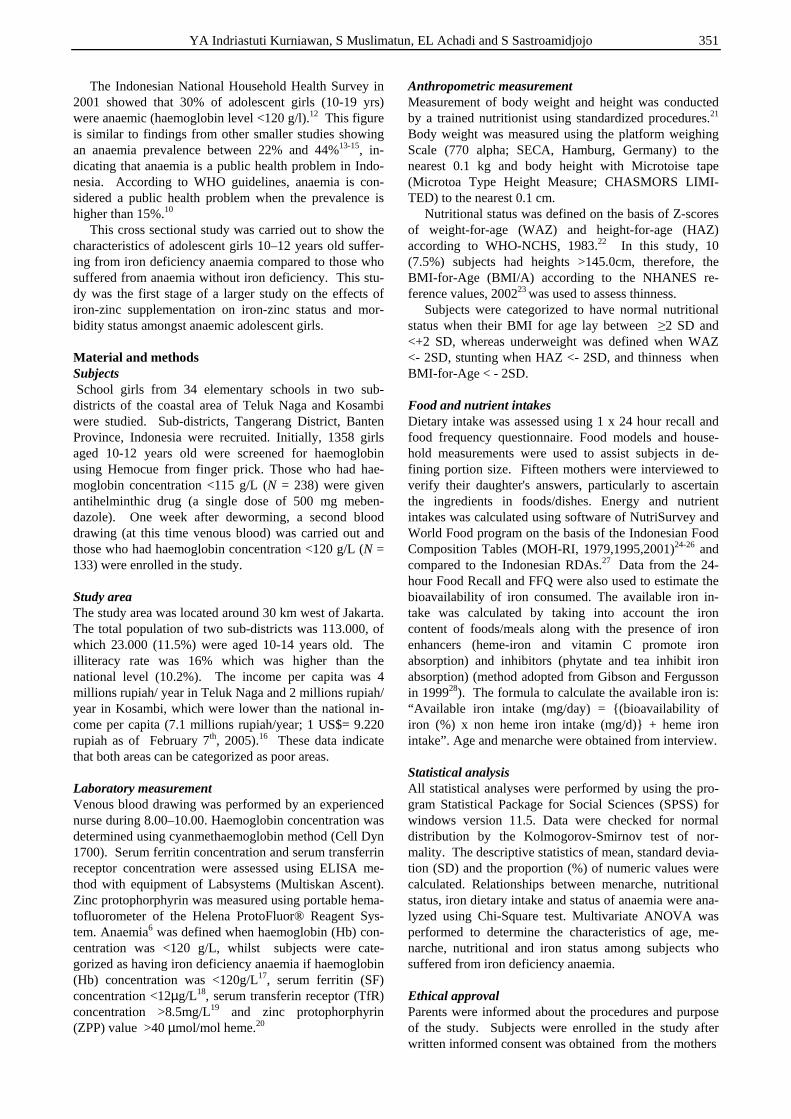
YA Indriastuti Kurniawan, S Muslimatun, EL Achadi and S Sastroamidjojo 351
The Indonesian National Household Health Survey in 2001 showed that 30% of adolescent girls (10-19 yrs) were anaemic (haemoglobin level <120 g/l).12 This figure is similar to findings from other smaller studies showing an anaemia prevalence between 22% and 44%13-15, in-dicating that anaemia is a public health problem in Indo-nesia. According to WHO guidelines, anaemia is con-sidered a public health problem when the prevalence is higher than 15%.10 This cross sectional study was carried out to show the characteristics of adolescent girls 10–12 years old suffer-ing from iron deficiency anaemia compared to those who suffered from anaemia without iron deficiency. This stu-dy was the first stage of a larger study on the effects of iron-zinc supplementation on iron-zinc status and mor-bidity status amongst anaemic adolescent girls. Material and methods Subjects School girls from 34 elementary schools in two sub-districts of the coastal area of Teluk Naga and Kosambi were studied. Sub-districts, Tangerang District, Banten Province, Indonesia were recruited. Initially, 1358 girls aged 10-12 years old were screened for haemoglobin using Hemocue from finger prick. Those who had hae-moglobin concentration <115 g/L (N = 238) were given antihelminthic drug (a single dose of 500 mg meben-dazole). One week after deworming, a second blood drawing (at this time venous blood) was carried out and those who had haemoglobin concentration <120 g/L (N = 133) were enrolled in the study. Study area The study area was located around 30 km west of Jakarta. The total population of two sub-districts was 113.000, of which 23.000 (11.5%) were aged 10-14 years old. The illiteracy rate was 16% which was higher than the national level (10.2%). The income per capita was 4 millions rupiah/ year in Teluk Naga and 2 millions rupiah/ year in Kosambi, which were lower than the national in-come per capita (7.1 millions rupiah/year; 1 US$= 9.220 rupiah as of February 7th, 2005).16 These data indicate that both areas can be categorized as poor areas. Laboratory measurement Venous blood drawing was performed by an experienced nurse during 8.00–10.00. Haemoglobin concentration was determined using cyanmethaemoglobin method (Cell Dyn 1700). Serum ferritin concentration and serum transferrin receptor concentration were assessed using ELISA me-thod with equipment of Labsystems (Multiskan Ascent). Zinc protophorphyrin was measured using portable hema-tofluorometer of the Helena ProtoFluor® Reagent Sys-tem. Anaemia6 was defined when haemoglobin (Hb) con-centration was <120 g/L, whilst subjects were cate-gorized as having iron deficiency anaemia if haemoglobin (Hb) concentration was <120g/L17, serum ferritin (SF) concentration <12µg/L18, serum transferin receptor (TfR) concentration >8.5mg/L19 and zinc protophorphyrin (ZPP) value >40 µmol/mol heme.20
Anthropometric measurement Measurement of body weight and height was conducted by a trained nutritionist using standardized procedures.21 Body weight was measured using the platform weighing Scale (770 alpha; SECA, Hamburg, Germany) to the nearest 0.1 kg and body height with Microtoise tape (Microtoa Type Height Measure; CHASMORS LIMI-TED) to the nearest 0.1 cm. Nutritional status was defined on the basis of Z-scores of weight-for-age (WAZ) and height-for-age (HAZ) according to WHO-NCHS, 1983.22 In this study, 10 (7.5%) subjects had heights >145.0cm, therefore, the BMI-for-Age (BMI/A) according to the NHANES re-ference values, 200223 was used to assess thinness. Subjects were categorized to have normal nutritional status when their BMI for age lay between ≥2 SD and <+2 SD, whereas underweight was defined when WAZ <- 2SD, stunting when HAZ <- 2SD, and thinness when BMI-for-Age < - 2SD. Food and nutrient intakes Dietary intake was assessed using 1 x 24 hour recall and food frequency questionnaire. Food models and house-hold measurements were used to assist subjects in de-fining portion size. Fifteen mothers were interviewed to verify their daughter's answers, particularly to ascertain the ingredients in foods/dishes. Energy and nutrient intakes was calculated using software of NutriSurvey and World Food program on the basis of the Indonesian Food Composition Tables (MOH-RI, 1979,1995,2001)24-26 and compared to the Indonesian RDAs.27 Data from the 24-hour Food Recall and FFQ were also used to estimate the bioavailability of iron consumed. The available iron in-take was calculated by taking into account the iron content of foods/meals along with the presence of iron enhancers (heme-iron and vitamin C promote iron absorption) and inhibitors (phytate and tea inhibit iron absorption) (method adopted from Gibson and Fergusson in 199928). The formula to calculate the available iron is: “Available iron intake (mg/day) = {(bioavailability of iron (%) x non heme iron intake (mg/d)} + heme iron intake”. Age and menarche were obtained from interview. Statistical analysis All statistical analyses were performed by using the pro-gram Statistical Package for Social Sciences (SPSS) for windows version 11.5. Data were checked for normal distribution by the Kolmogorov-Smirnov test of nor-mality. The descriptive statistics of mean, standard devia-tion (SD) and the proportion (%) of numeric values were calculated. Relationships between menarche, nutritional status, iron dietary intake and status of anaemia were ana-lyzed using Chi-Square test. Multivariate ANOVA was performed to determine the characteristics of age, me-narche, nutritional and iron status among subjects who suffered from iron deficiency anaemia. Ethical approval Parents were informed about the procedures and purpose of the study. Subjects were enrolled in the study after written informed consent was obtained from the mothers
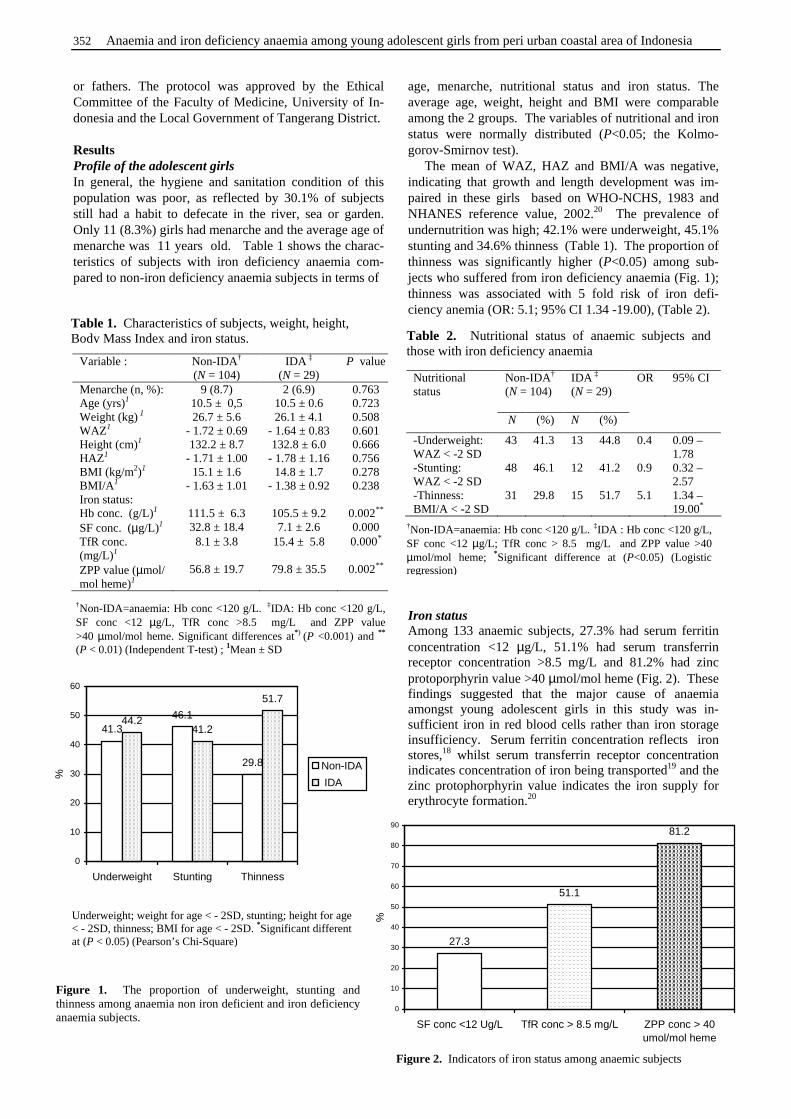
352 Anaemia and iron deficiency anaemia among young adolescent girls from peri urban coastal area of Indonesia
or fathers. The protocol was approved by the Ethical Committee of the Faculty of Medicine, University of In-donesia and the Local Government of Tangerang District. Results Profile of the adolescent girls In general, the hygiene and sanitation condition of this population was poor, as reflected by 30.1% of subjects still had a habit to defecate in the river, sea or garden. Only 11 (8.3%) girls had menarche and the average age of menarche was 11 years old. Table 1 shows the charac- teristics of subjects with iron deficiency anaemia com-pared to non-iron deficiency anaemia subjects in terms of
age, menarche, nutritional status and iron status. The average age, weight, height and BMI were comparable among the 2 groups. The variables of nutritional and iron status were normally distributed (P<0.05; the Kolmo-gorov-Smirnov test). The mean of WAZ, HAZ and BMI/A was negative, indicating that growth and length development was im-paired in these girls based on WHO-NCHS, 1983 and NHANES reference value, 2002.20 The prevalence of undernutrition was high; 42.1% were underweight, 45.1% stunting and 34.6% thinness (Table 1). The proportion of thinness was significantly higher (P<0.05) among sub-jects who suffered from iron deficiency anaemia (Fig. 1); thinness was associated with 5 fold risk of iron defi-ciency anemia (OR: 5.1; 95% CI 1.34 -19.00), (Table 2). Iron status Among 133 anaemic subjects, 27.3% had serum ferritin concentration <12 µg/L, 51.1% had serum transferrin receptor concentration >8.5 mg/L and 81.2% had zinc protoporphyrin value >40 µmol/mol heme (Fig. 2). These findings suggested that the major cause of anaemia amongst young adolescent girls in this study was in-sufficient iron in red blood cells rather than iron storage insufficiency. Serum ferritin concentration reflects iron stores,18 whilst serum transferrin receptor concentration indicates concentration of iron being transported19 and the zinc protophorphyrin value indicates the iron supply for erythrocyte formation.20
Table 1. Characteristics of subjects, weight, height, Body Mass Index and iron status.
Variable : Non-IDA† (N = 104)
IDA ‡ (N = 29)
P value
Menarche (n, %): 9 (8.7) 2 (6.9) 0.763 Age (yrs)1 10.5 ± 0,5 10.5 ± 0.6 0.723 Weight (kg) 1 26.7 ± 5.6 26.1 ± 4.1 0.508 WAZ1 - 1.72 ± 0.69 - 1.64 ± 0.83 0.601 Height (cm)1 132.2 ± 8.7 132.8 ± 6.0 0.666 HAZ1 - 1.71 ± 1.00 - 1.78 ± 1.16 0.756 BMI (kg/m2)1 15.1 ± 1.6 14.8 ± 1.7 0.278 BMI/A 1 - 1.63 ± 1.01 - 1.38 ± 0.92 0.238 Iron status: Hb conc. (g/L)1 111.5 ± 6.3 105.5 ± 9.2 0.002** SF conc. (µg/L)1 32.8 ± 18.4 7.1 ± 2.6 0.000 TfR conc. (mg/L)1
8.1 ± 3.8 15.4 ± 5.8 0.000*
ZPP value (µmol/ mol heme)1
56.8 ± 19.7 79.8 ± 35.5 0.002**
†Non-IDA=anaemia: Hb conc <120 g/L. ‡IDA: Hb conc <120 g/L, SF conc <12 µg/L, TfR conc >8.5 mg/L and ZPP value >40 µmol/mol heme. Significant differences at*) (P <0.001) and **
(P < 0.01) (Independent T-test) ; 1Mean ± SD
46.1
29.8
44.241.2
51.7
41.3
0
10
20
30
40
50
60
Underweight Stunting Thinness
%
Non-IDA
IDA
Figure 1. The proportion of underweight, stunting and thinness among anaemia non iron deficient and iron deficiency anaemia subjects.
Underweight; weight for age < - 2SD, stunting; height for age < - 2SD, thinness; BMI for age < - 2SD. *Significant different at (P < 0.05) (Pearson’s Chi-Square)
Table 2. Nutritional status of anaemic subjects and those with iron deficiency anaemia
Non-IDA† (N = 104)
IDA ‡ (N = 29)
Nutritional status
N (%) N (%)
OR 95% CI
-Underweight: WAZ < -2 SD
43 41.3 13 44.8 0.4 0.09 – 1.78
-Stunting: WAZ < -2 SD
48 46.1 12 41.2 0.9 0.32 – 2.57
-Thinness: BMI/A < -2 SD
31 29.8 15 51.7 5.1 1.34 – 19.00*
†Non-IDA=anaemia: Hb conc <120 g/L. ‡IDA : Hb conc <120 g/L, SF conc <12 µg/L; TfR conc > 8.5 mg/L and ZPP value >40 µmol/mol heme; *Significant difference at (P<0.05) (Logistic regression)
81.2
51.1
27.3
0
10
20
30
40
50
60
70
80
90
SF conc <12 Ug/L TfR conc > 8.5 mg/L ZPP conc > 40umol/mol heme
%
Figure 2. Indicators of iron status among anaemic subjects
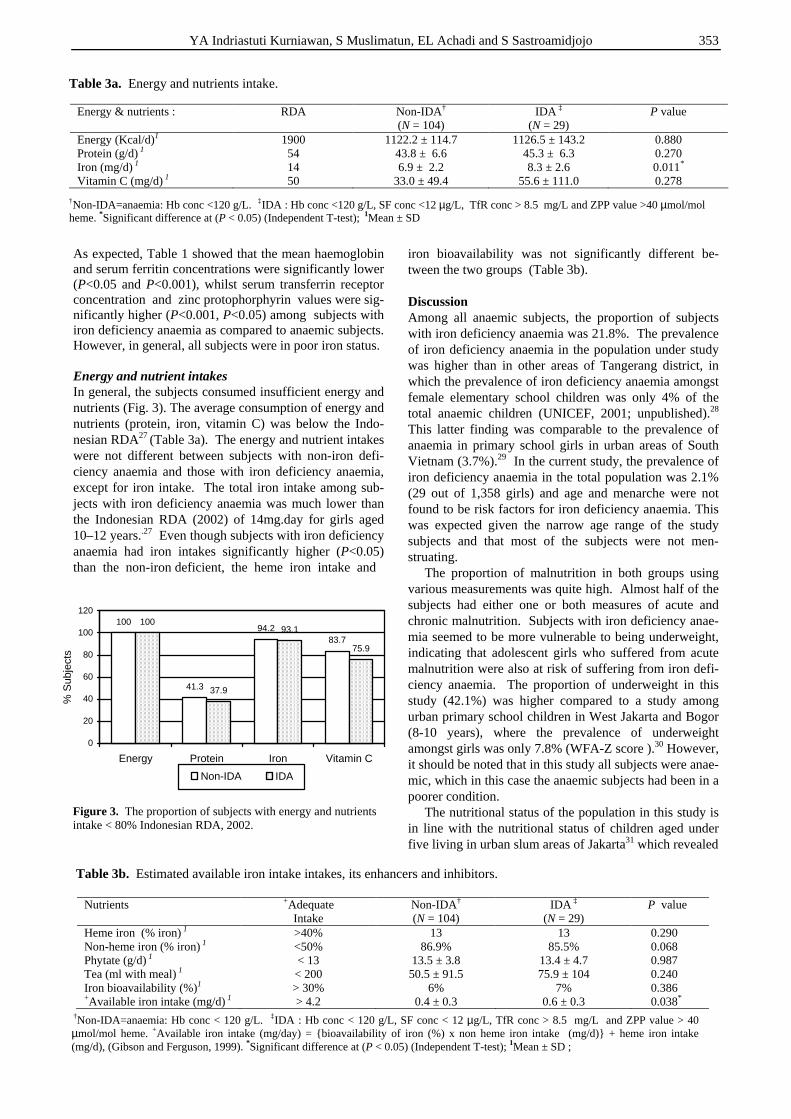
YA Indriastuti Kurniawan, S Muslimatun, EL Achadi and S Sastroamidjojo 353
As expected, Table 1 showed that the mean haemoglobin and serum ferritin concentrations were significantly lower (P<0.05 and P<0.001), whilst serum transferrin receptor concentration and zinc protophorphyrin values were sig-nificantly higher (P<0.001, P<0.05) among subjects with iron deficiency anaemia as compared to anaemic subjects. However, in general, all subjects were in poor iron status. Energy and nutrient intakes In general, the subjects consumed insufficient energy and nutrients (Fig. 3). The average consumption of energy and nutrients (protein, iron, vitamin C) was below the Indo-nesian RDA27 (Table 3a). The energy and nutrient intakes were not different between subjects with non-iron defi-ciency anaemia and those with iron deficiency anaemia, except for iron intake. The total iron intake among sub-jects with iron deficiency anaemia was much lower than the Indonesian RDA (2002) of 14mg.day for girls aged 10–12 years..27 Even though subjects with iron deficiency anaemia had iron intakes significantly higher (P<0.05) than the non-iron deficient, the heme iron intake and
iron bioavailability was not significantly different be-tween the two groups (Table 3b). Discussion Among all anaemic subjects, the proportion of subjects with iron deficiency anaemia was 21.8%. The prevalence of iron deficiency anaemia in the population under study was higher than in other areas of Tangerang district, in which the prevalence of iron deficiency anaemia amongst female elementary school children was only 4% of the total anaemic children (UNICEF, 2001; unpublished).28 This latter finding was comparable to the prevalence of anaemia in primary school girls in urban areas of South Vietnam (3.7%).29 In the current study, the prevalence of iron deficiency anaemia in the total population was 2.1% (29 out of 1,358 girls) and age and menarche were not found to be risk factors for iron deficiency anaemia. This was expected given the narrow age range of the study subjects and that most of the subjects were not men-struating. The proportion of malnutrition in both groups using various measurements was quite high. Almost half of the subjects had either one or both measures of acute and chronic malnutrition. Subjects with iron deficiency anae-mia seemed to be more vulnerable to being underweight, indicating that adolescent girls who suffered from acute malnutrition were also at risk of suffering from iron defi-ciency anaemia. The proportion of underweight in this study (42.1%) was higher compared to a study among urban primary school children in West Jakarta and Bogor (8-10 years), where the prevalence of underweight amongst girls was only 7.8% (WFA-Z score ).30 However, it should be noted that in this study all subjects were anae-mic, which in this case the anaemic subjects had been in a poorer condition. The nutritional status of the population in this study is in line with the nutritional status of children aged under five living in urban slum areas of Jakarta31 which revealed
100
41.3
94.283.7
100
37.9
93.1
75.9
0
20
40
60
80
100
120
Energy Protein Iron Vitamin C
% S
ubje
cts
Non-IDA IDA
Figure 3. The proportion of subjects with energy and nutrients intake < 80% Indonesian RDA, 2002.
Table 3a. Energy and nutrients intake.
†Non-IDA=anaemia: Hb conc <120 g/L. ‡IDA : Hb conc <120 g/L, SF conc <12 µg/L, TfR conc > 8.5 mg/L and ZPP value >40 µmol/mol heme. *Significant difference at (P < 0.05) (Independent T-test); 1Mean ± SD
Table 3b. Estimated available iron intake intakes, its enhancers and inhibitors.
Nutrients
+Adequate Intake
Non-IDA† (N = 104)
IDA ‡ (N = 29)
P value
Heme iron (% iron) 1 >40% 13 13 0.290 Non-heme iron (% iron) 1 <50% 86.9% 85.5% 0.068 Phytate (g/d) 1 < 13 13.5 ± 3.8 13.4 ± 4.7 0.987 Tea (ml with meal) 1 < 200 50.5 ± 91.5 75.9 ± 104 0.240 Iron bioavailability (%)1 > 30% 6% 7% 0.386 +Available iron intake (mg/d) 1 > 4.2 0.4 ± 0.3 0.6 ± 0.3 0.038*
†Non-IDA=anaemia: Hb conc < 120 g/L. ‡IDA : Hb conc < 120 g/L, SF conc < 12 µg/L, TfR conc > 8.5 mg/L and ZPP value > 40 µmol/mol heme. +Available iron intake (mg/day) = {bioavailability of iron (%) x non heme iron intake (mg/d)} + heme iron intake (mg/d), (Gibson and Ferguson, 1999). *Significant difference at (P < 0.05) (Independent T-test); 1Mean ± SD ;
Energy & nutrients :
RDA
Non-IDA† (N = 104)
IDA ‡ (N = 29)
P value
Energy (Kcal/d)1 1900 1122.2 ± 114.7 1126.5 ± 143.2 0.880 Protein (g/d) 1 54 43.8 ± 6.6 45.3 ± 6.3 0.270 Iron (mg/d) 1 14 6.9 ± 2.2 8.3 ± 2.6 0.011* Vitamin C (mg/d) 1 50 33.0 ± 49.4 55.6 ± 111.0 0.278
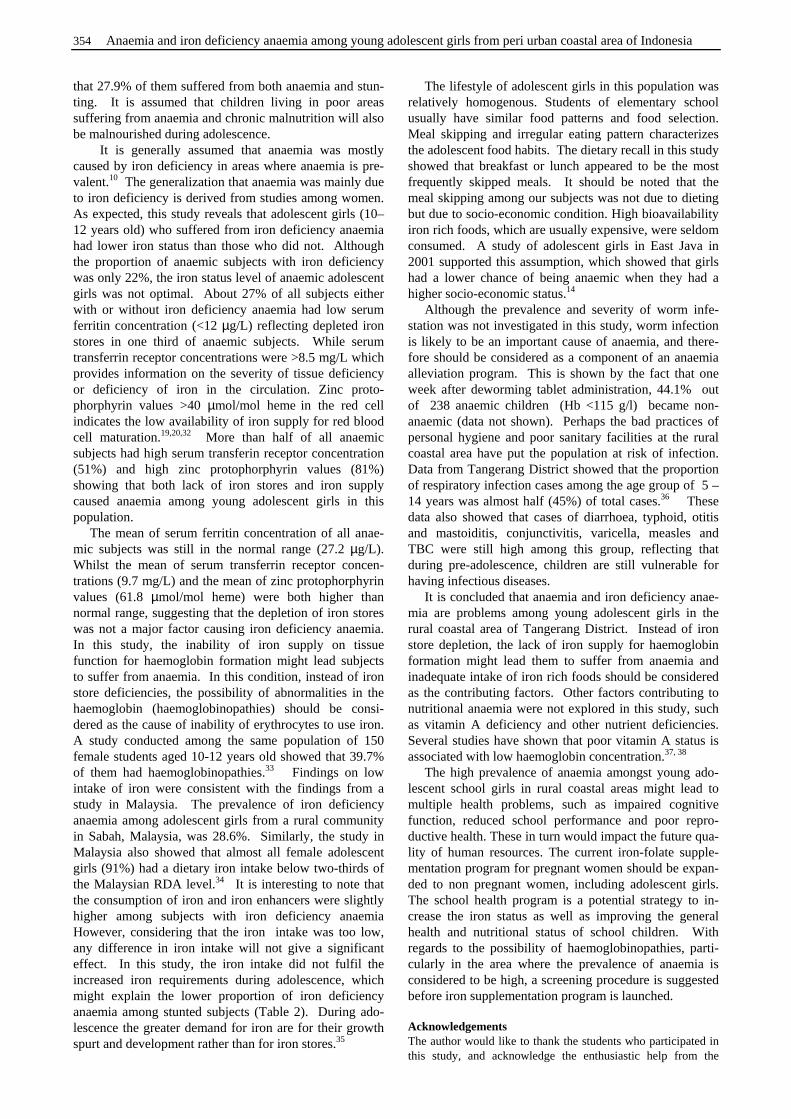
354 Anaemia and iron deficiency anaemia among young adolescent girls from peri urban coastal area of Indonesia
that 27.9% of them suffered from both anaemia and stun-ting. It is assumed that children living in poor areas suffering from anaemia and chronic malnutrition will also be malnourished during adolescence. It is generally assumed that anaemia was mostly caused by iron deficiency in areas where anaemia is pre-valent.10 The generalization that anaemia was mainly due to iron deficiency is derived from studies among women. As expected, this study reveals that adolescent girls (10–12 years old) who suffered from iron deficiency anaemia had lower iron status than those who did not. Although the proportion of anaemic subjects with iron deficiency was only 22%, the iron status level of anaemic adolescent girls was not optimal. About 27% of all subjects either with or without iron deficiency anaemia had low serum ferritin concentration (<12 µg/L) reflecting depleted iron stores in one third of anaemic subjects. While serum transferrin receptor concentrations were >8.5 mg/L which provides information on the severity of tissue deficiency or deficiency of iron in the circulation. Zinc proto-phorphyrin values >40 µmol/mol heme in the red cell indicates the low availability of iron supply for red blood cell maturation.19,20,32 More than half of all anaemic subjects had high serum transferin receptor concentration (51%) and high zinc protophorphyrin values (81%) showing that both lack of iron stores and iron supply caused anaemia among young adolescent girls in this population. The mean of serum ferritin concentration of all anae-mic subjects was still in the normal range (27.2 µg/L). Whilst the mean of serum transferrin receptor concen-trations (9.7 mg/L) and the mean of zinc protophorphyrin values (61.8 µmol/mol heme) were both higher than normal range, suggesting that the depletion of iron stores was not a major factor causing iron deficiency anaemia. In this study, the inability of iron supply on tissue function for haemoglobin formation might lead subjects to suffer from anaemia. In this condition, instead of iron store deficiencies, the possibility of abnormalities in the haemoglobin (haemoglobinopathies) should be consi-dered as the cause of inability of erythrocytes to use iron. A study conducted among the same population of 150 female students aged 10-12 years old showed that 39.7% of them had haemoglobinopathies.33 Findings on low intake of iron were consistent with the findings from a study in Malaysia. The prevalence of iron deficiency anaemia among adolescent girls from a rural community in Sabah, Malaysia, was 28.6%. Similarly, the study in Malaysia also showed that almost all female adolescent girls (91%) had a dietary iron intake below two-thirds of the Malaysian RDA level.34 It is interesting to note that the consumption of iron and iron enhancers were slightly higher among subjects with iron deficiency anaemia However, considering that the iron intake was too low, any difference in iron intake will not give a significant effect. In this study, the iron intake did not fulfil the increased iron requirements during adolescence, which might explain the lower proportion of iron deficiency anaemia among stunted subjects (Table 2). During ado-lescence the greater demand for iron are for their growth spurt and development rather than for iron stores.35
The lifestyle of adolescent girls in this population was relatively homogenous. Students of elementary school usually have similar food patterns and food selection. Meal skipping and irregular eating pattern characterizes the adolescent food habits. The dietary recall in this study showed that breakfast or lunch appeared to be the most frequently skipped meals. It should be noted that the meal skipping among our subjects was not due to dieting but due to socio-economic condition. High bioavailability iron rich foods, which are usually expensive, were seldom consumed. A study of adolescent girls in East Java in 2001 supported this assumption, which showed that girls had a lower chance of being anaemic when they had a higher socio-economic status.14 Although the prevalence and severity of worm infe-station was not investigated in this study, worm infection is likely to be an important cause of anaemia, and there-fore should be considered as a component of an anaemia alleviation program. This is shown by the fact that one week after deworming tablet administration, 44.1% out of 238 anaemic children (Hb <115 g/l) became non- anaemic (data not shown). Perhaps the bad practices of personal hygiene and poor sanitary facilities at the rural coastal area have put the population at risk of infection. Data from Tangerang District showed that the proportion of respiratory infection cases among the age group of 5 – 14 years was almost half (45%) of total cases.36 These data also showed that cases of diarrhoea, typhoid, otitis and mastoiditis, conjunctivitis, varicella, measles and TBC were still high among this group, reflecting that during pre-adolescence, children are still vulnerable for having infectious diseases. It is concluded that anaemia and iron deficiency anae-mia are problems among young adolescent girls in the rural coastal area of Tangerang District. Instead of iron store depletion, the lack of iron supply for haemoglobin formation might lead them to suffer from anaemia and inadequate intake of iron rich foods should be considered as the contributing factors. Other factors contributing to nutritional anaemia were not explored in this study, such as vitamin A deficiency and other nutrient deficiencies. Several studies have shown that poor vitamin A status is associated with low haemoglobin concentration.37, 38 The high prevalence of anaemia amongst young ado-lescent school girls in rural coastal areas might lead to multiple health problems, such as impaired cognitive function, reduced school performance and poor repro-ductive health. These in turn would impact the future qua-lity of human resources. The current iron-folate supple-mentation program for pregnant women should be expan-ded to non pregnant women, including adolescent girls. The school health program is a potential strategy to in-crease the iron status as well as improving the general health and nutritional status of school children. With regards to the possibility of haemoglobinopathies, parti-cularly in the area where the prevalence of anaemia is considered to be high, a screening procedure is suggested before iron supplementation program is launched. Acknowledgements The author would like to thank the students who participated in this study, and acknowledge the enthusiastic help from the
YA Indriastuti Kurniawan, S Muslimatun, EL Achadi and S Sastroamidjojo 355
school principles, teachers and staff of Teluk Naga and Kosambi Health Centers. The author is grateful to UNICEF Indonesia and the Ministry of Health for financially supporting this study and to DR. Abas B Jahari for his valuable statistical analysis input. Finally, the authors appreciate the cooperation and efforts of the staff of the Directorate of Community Nutrition, Ministry of Health, Republic of Indonesia and SEAMEO-TROPMED, RCCN-University of Indonesia. References 1. Departemen Kesehatan RI. Program penanggulangan
anemia gizi pada Wanita Usia Subur (WUS), 2001. 2. Soemantri AG. Hubungan anemi kekurangan zat besi
dengan konsentrasi dan prestasi belajar. Universitas Diponegoro, 1978. Disertasi.
3. Sandstead HH. Causes of iron and zinc deficiencies and their effects on brain. J Nutr 2000; 130: 347S-349S.
4. Halterman JS, Kaczorowski JM, Aligne CA Auinger P, Szilagyi PG. Iron deficiency and cognitive achievement among school-aged children and adolescents in the United States. Pediatrics 2001; 107: 1381-1386.
5. Agarwal KN. Iron and the brain: neurotransmitter receptors and magnetic resonance spectroscopy. British J of Nutr 2001; 85: suppl.2, S147-S150.
6. Bhaskaram P. Immunology of iron deficient subjects in contemporary issues in clinical nutrition. In: RK Chandra, ed. Nutrition and immunology. NY: Alan R Liss inc, 1988; 149-68.
7. Yip R, Parvanta I, Cogswell ME, McDonnell SM, Bowman BA, Grummer-Strawn LM Trowbridge FL. Recommendations to prevent and control Iron Deficiency in the United stated. CDC, Atlanta, Georgia 30333, 1998.
8. Elder LK. Issues in programming for maternal anemia. MotherCare, 2001.
9. Husaini MA Suharno D, Husaini YK, Siagian UL. Study nutritional anemia an assessment of information compilation for supporting and formulating national policy program. Collaboration between Ministry of Health and WHO, and 1989.
10. A UNICEF/UNU/WHO/MI Technical Workshop. Preventing Iron Deficiency in Women and children, Tech-nical Consensus on Key Issues, New York, 1998.
11. Richard Lee G, Herbert V. Nutritional factors in the production and function of erythrocytes. In: Richard Lee G, Foerster J, Lukens J, Paraskevas F, Greer JP, Rodgers GM, edis. Wintrobe’s Clinical Hematology. 10th ed. 1998; 29: 239-254.
12. Permaesih D. Pambudi D, Ridwan E. Laporan status gizi remaja dan faktor yang mempengaruhinya. Pusat Penelitian dan Pengembangan Gizi dan Makanan, Badan Penelitian dan Pengembangan Kesehatan, Departemen Kesehatan, 2003.
13. Angeles-Agdeppa I, Schulthink W, Sastroamidjojo S, Gross R, Karyadi D. Weekly micronutrient supple-mentation to build iron stores in female Indonesia ado-lescents. Am J Nutr 1997; 66: 177-183.
14. Soekarjo DD, Pee SD, Bloem MW, Tjiong R, Yip R, Schreurs, Muhilal. Socio-economic status and puberty are the main factors are determining anemia in adolescent girls and boy in East Java, Indonesia. Eur J of Clin Nutr 2001; 55: 32-39.
15. Dinas Kesehatan Kabupaten Tangerang. Laporan pelaksanaan kegiatan penanggulangan anemia di sekolah dasar Kabupaten Tangerang, 2001.
16. Badan Pusat Statistik, Jakarta, Indonesia. Statistik Indonesia, Statistical pocket book of Indonesia, 2003.
17. Stoltzfus RJ, Dreyfuss M. Guidelines for the use of iron supplements to prevent and treat iron deficiency Anemia. INACG/WHO/UNICEF. ILSI Press: 1999. p.14-17, 29.
18. Dallman PR, Locker AC, Johnson CL, Carroll M. Influence of age on laboratory criteria for the diagnosis of iron deficiency anemia and Iron deficiency in infants and children. In: Halberg L, Asp NG, eds. Iron nutrition in health and disease. The Swedish Nutrition Foundation 20th International Symposium. John Libby and Co. Ltd: London, England, 1996; 65-74.
19. Sauberlich HE. Laboratory test for the assessment of nutritional status. 2nd Ed. CRC Press: Florida, 1999.
20. Hastka J, Lassere JJ, Schwarabeck A, Strauch M, Hchlmann R. Washing erythrocytes to remove interferents in measurements of the zinc protophorphyrin by front-face hematofluorometry. Clin Chem 1992; 38: 2184-2189.
21. Gibson RS. Principles of nutritional assessment, Oxford University Press, 1990; 172-181
22. World Health Organization. Measuring change in nutritional status. Guidelines for assessing the nutritional impact of supplementary feeding programmers for vulnerable groups, Geneva, 1983.
23. Department of Health and Human Services CCDC-P-NCHS. Vital and Health Statistics, 2000. CDC Growth chart for the United States: Methods and development, data from the National Health and Nutrition Examination Surveys (NHANES), 2002.
24. Departemen Kesehatan Republik Indonesia (MOH-RI). Daftar komposisi zat gizi pangan Indonesia, 1979
25. Departemen Kesehatan Republik Indonesia (MOH-RI). Daftar komposisi zat gizi pangan Indonesia, 1995.
26. Departemen Kesehatan Republik Indonesia (MOH-RI). Komposisi zat gizi makananan Indonesia, 2001.
27. Keputusan Menteri Kesehatan Republik Indonesia, No. 913/MENKES/SK/VII/2002 tentang Angka Kecukupan Gizi yang dianjurkan bagi bangsa Indonesia, 2002.
28. Gibson RS, Ferguson EL. An interactive 24-hour Recall for assessing the adequacy of iron and zinc intakes in developing countries. ILSI Press: USA, 1999.
29. Ta thi Tuyet Mai, Nguyen thi Kim Hung, Masanobu Kawakami, Mari Kawase and Nguyen van Chuyen. Micronutrient status of primary school girls in rural and urban areas of South Vietnam. Asia Pac J Clin Nutr 2003; 12(2): 178-185.
30. Soekirman, Hardinsyah, Jus’at I, Jahari AB. Regional study of nutritional status of urban primary school children. West Jakarta and Bogor, Indonesia. Food and Nutr Bull 2002; 23: 1: 31-40.
31. Bardosono S. Determinant of child malnutrition during the economic crisis in selected poor areas of Indonesia. Post-graduate program-Study program in Nutrition, Faculty of Medicine-University of Indonesia, 2003. Dissertation.
32. Zimmermann, 2005, Molinari L, Staubli-Asobayire F, Hess SY, Chaouki N.Serum transferrin receptor and zinc protoporphyrin as indicarors of iron status in African children. Am J Clin Nutr 2005; 81: 615-623.
33. Pattiperlony ER Enny. Gambaran kelainan metabolisme besi pada anak wanita usia 10-12 tahun di kecamatan Teluk Naga dan Kosambi Kabupaten Tangerang. Tesis. 2005. Departemen Patologi Klinik FKUI, Jakarta.
34. Foo LH, Khor GL, Tee E-S and Prabakaran D. Iron status and dietary iron intake of adolescent from a rural community in Sabah, Malaysia. Asia Pac J Clin Nutr 2004; 1 3 (1): 48-55.
356 Anaemia and iron deficiency anaemia among young adolescent girls from peri urban coastal area of Indonesia
35. Spear B. Adolescent growth and development. In Rickert V.I, eds. Adolescent nutrition, Assessment and Manage-ment. Chapman & Hall, Series in Clinical Nutrition, 1995; 3-20.
36. Dinas Kesehatan Kabupaten Tangerang. Laporan bulanan penyakit dari Puskesmas Kabupaten Tangerang, 2003.
37. Bloem MW, Wedel M, Egger RJ, Speek AJ, Schrijver J, Saowakontha S, Schreurs WH. Iron metabolism and vitamin A deficiency in children in northeast Thailand. Am J Clin Nutr 1989; 50: 332-328
38. Wolde-Gebriel Z, West CE, Gebru H, Tadesse AS, Fisseha T, Gabre P, Aboye C, Ayana G and Hautvast JGAJ. Interrelationship between vitamin A, iodine and iron status in schoolchildren in Shoa Region, Central Ethiopia. Br J Nutr 1993; 70: 593-607.
Original Article Anaemia and iron deficiency anaemia among young adolescent girls from peri urban coastal area of Indonesia Yustina Anie Indriastuti Kurniawan MD, MSc, PhD
1,2, Siti Muslimatun MSc, PhD 2,
Endang L Achadi MD, PhD 3 and Soemilah Sastroamidjojo MD
2
1Directorate of Community Nutrition, Ministry of Health Republic of Indonesia. 2Southeast Asian Ministers of Education Organization (SEAMEO) Tropical Medicine (TROPMED) and Public Health Network Regional Center for Community Nutrition (RCCN), University of Indonesia. 3Faculty of Public Health, University of Indonesia.
印度尼西亚沿海城市周边地区青春期早期女孩的贫血和缺铁性贫血状印度尼西亚沿海城市周边地区青春期早期女孩的贫血和缺铁性贫血状印度尼西亚沿海城市周边地区青春期早期女孩的贫血和缺铁性贫血状印度尼西亚沿海城市周边地区青春期早期女孩的贫血和缺铁性贫血状
况况况况
缺铁性贫血仍然是一个普遍问题。它会对青春期女孩的生长发育、学习成绩、发病率及生殖
能力产生负面影响。这项代表性研究的目的是搞清印度尼西亚沿海乡村地区年龄在 10-12
岁患缺铁性和非缺铁性贫血的处于青春期早期的女孩的营养状况和铁状况的差异。从来自于
34 所小学的 1358 名女孩中挑选了 133 名贫血女孩,测定了血红蛋白、血清铁蛋白、血清转
铁蛋白受体和原卟啉锌来反映铁状况,同时测量了身高、体重来反映营养状况。一般特征和
饮食摄入通过面谈来评估。在这 133 个贫血女孩中,有 29(21.8%)个患缺铁性贫血,这与
年龄和月经无显著相关。大约 50%的女孩体重偏轻、身材矮小,这显示存在急性和慢性的营
养不良。缺铁性贫血女孩中消瘦的比例显著高于非缺铁性女孩(P <0.05,51.7% vs.
29.8%)。而且,消瘦女孩患缺铁性贫血的危险性比非消瘦女孩高 5 倍(P < 0.05, OR: 5.1; 95%CI 1.34 -19.00)。建议进一步探索其它和贫血及缺铁性贫血相关的因素,如地中海贫血
特征和维生素 A 缺乏。目前流行的给孕妇补充铁和叶酸的措施应该应用于青春期女孩。
关关关关键词:键词:键词:键词:铁、缺乏、贫血、青春期的、女孩、城市的、印度尼西亚。
Asia Pac J Clin Nutr 2006;15 (3): 357-361 357
Original Article Goitre prevalence and the state of iodine nutrition in sundarban delta of north 24-parganas in West Benegal Amar K Chandra PhD, Smritiratan Tripathy MSc, Dishari Ghosh MSc, Arijit Debnath MSc and Sanjukta Mukhopadhyay MSc
Endocrinology and Reproductive Physiology Laboratory, Department of Physiology, University College of Science and Technology, University of Calcutta
The main objective of this study was to assess the iodine nutritional status among school children (6-12 yrs) of Sundarban delta in North 24- Parganas district of West Bengal in eastern India. A total of 2050 children were clinically examined for goiter and 240 urine samples were analyzed for iodine and thiocyanate respectively; iodine content in 48 water samples and 210 salt samples were also measured. Results indicate that the studied region is clinically severely goiter endemic having goiter prevalence 33.1 % (grade 1: 30.4 %; grade 2: 2.7%), median urinary iodine level 200 µg/l indicating no biochemical iodine deficiency, 65.2 % salt samples contain recommended level of iodine and the iodine content in drinking water is sufficient while mean urinary thiocyanate level was 0.708±0.38 mg/dl. In spite of the consumption of adequate iodine, the existing goiter prevalence may be for the consumption of dietary goitrogens/antithyroid substances that possibly come through food and water.
Key Words: endemic goiter, goitrogens, school children, urinary iodine, urinary thiocyanate, West Bengal Introduction Iodine deficiency disorders (IDD) are a major public health problem all over world including India. Its major manife-stations are endemic goiter, mental defects, deaf mutism, stillbirth and miscarriages, weakness and paralysis of muscles as well as lesser degree of physical and mental functions.1 It is not restricted in the hilly Himalayan moun-tain areas, it has been reported from the sub-Himalayan flat lands (Tarai), plains, riverine areas, deltas and even coastal regions.2 The Sundarban delta is the largest mangrove ecosystem of maximum bio-diversity in India. A random study in a rural village of Sundarban delta on a population of 3814 covering all age groups showed over all goiter prevalence 44.5%, along with associated disorders viz. feeble minded-ness (49%), hypothyroidism (29%), stunted growth (12%), deaf mute (6.6%), reproductive failure (18%), and stillbirth (4%).3 In another study on iodine nutritional status among school children conducted in an adjoining rural area of the Gangetic West Bengal showed that in spite of adequate iodine intake as evidenced by urinary iodine level, the total goitre prevalence was about 38%.4 Reports on the iodine nutrition of the population in the delta region are not available. The present investigation was therefore under-taken to study the prevalence of goiter and to assess the iodine nutritional status by measuring urinary iodine and consumption pattern of common dietary goitrogen available in the region measuring urinary thiocyanate, iodine content in edible salts and bio-availability of iodine by measuring iodine content in drinking water collected from the
Sundarban delta of North 24-Parganas district in West Bengal. Subjects and methods The Sundarban delta spreads itself amidst the two districts of North and South 24-Parganas in West Bengal. It has as its boundaries the Hooghly River in the west, Bangladesh in the east, Bay of Bengal in the south and Dampier Hodges line in north and covers an area of 9630 sq. Km. of land in West Bengal.5 It is an archipelago of 54 islands, full of unnumbered rivers and creeks. It has population of 31, 20, 986 (2001 Census Report) living under 19 Community Development Blocks (CD Blocks) of which 13 are in the district of South 24-Parganas and the rest 6 are in North 24-Parganas district. Each CD Block consists of about 100-120 localities or villages. Most of the villages have a primary school and a secondary school covers nearby 8-10 villages. To get the proper representation 6 areas/localities were selected from 6 CD Blocks of North 24-Parganas taking one from each by random purposive sampling.6
Correspondence address: Dr. Amar K Chandra, Endocrinology and Reproductive Physiology Laboratory, Department of Physiology, University College of Science and Technology, University of Calcutta, 92, Acharya Prafulla Chandra Road, Kolkata 700009, India E-mail address: [email protected] Accepted 10th October 2005
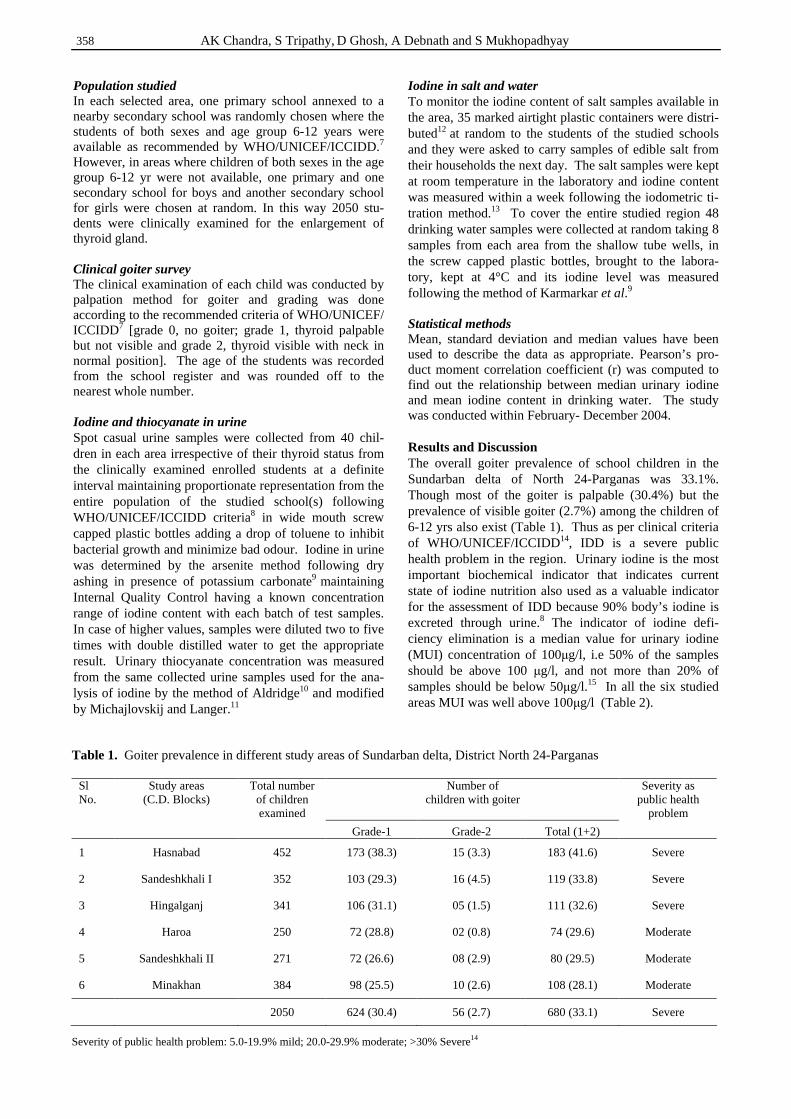
358 AK Chandra, S Tripathy, D Ghosh, A Debnath and S Mukhopadhyay
Population studied In each selected area, one primary school annexed to a nearby secondary school was randomly chosen where the students of both sexes and age group 6-12 years were available as recommended by WHO/UNICEF/ICCIDD.7 However, in areas where children of both sexes in the age group 6-12 yr were not available, one primary and one secondary school for boys and another secondary school for girls were chosen at random. In this way 2050 stu-dents were clinically examined for the enlargement of thyroid gland. Clinical goiter survey The clinical examination of each child was conducted by palpation method for goiter and grading was done according to the recommended criteria of WHO/UNICEF/ ICCIDD7 [grade 0, no goiter; grade 1, thyroid palpable but not visible and grade 2, thyroid visible with neck in normal position]. The age of the students was recorded from the school register and was rounded off to the nearest whole number. Iodine and thiocyanate in urine Spot casual urine samples were collected from 40 chil- dren in each area irrespective of their thyroid status from the clinically examined enrolled students at a definite interval maintaining proportionate representation from the entire population of the studied school(s) following WHO/UNICEF/ICCIDD criteria8 in wide mouth screw capped plastic bottles adding a drop of toluene to inhibit bacterial growth and minimize bad odour. Iodine in urine was determined by the arsenite method following dry ashing in presence of potassium carbonate9 maintaining Internal Quality Control having a known concentration range of iodine content with each batch of test samples. In case of higher values, samples were diluted two to five times with double distilled water to get the appropriate result. Urinary thiocyanate concentration was measured from the same collected urine samples used for the ana-lysis of iodine by the method of Aldridge10 and modified by Michajlovskij and Langer.11
Iodine in salt and water To monitor the iodine content of salt samples available in the area, 35 marked airtight plastic containers were distri-buted12 at random to the students of the studied schools and they were asked to carry samples of edible salt from their households the next day. The salt samples were kept at room temperature in the laboratory and iodine content was measured within a week following the iodometric ti-tration method.13 To cover the entire studied region 48 drinking water samples were collected at random taking 8 samples from each area from the shallow tube wells, in the screw capped plastic bottles, brought to the labora-tory, kept at 4°C and its iodine level was measured following the method of Karmarkar et al.9 Statistical methods Mean, standard deviation and median values have been used to describe the data as appropriate. Pearson’s pro-duct moment correlation coefficient (r) was computed to find out the relationship between median urinary iodine and mean iodine content in drinking water. The study was conducted within February- December 2004. Results and Discussion The overall goiter prevalence of school children in the Sundarban delta of North 24-Parganas was 33.1%. Though most of the goiter is palpable (30.4%) but the prevalence of visible goiter (2.7%) among the children of 6-12 yrs also exist (Table 1). Thus as per clinical criteria of WHO/UNICEF/ICCIDD14, IDD is a severe public health problem in the region. Urinary iodine is the most important biochemical indicator that indicates current state of iodine nutrition also used as a valuable indicator for the assessment of IDD because 90% body’s iodine is excreted through urine.8 The indicator of iodine defi-ciency elimination is a median value for urinary iodine (MUI) concentration of 100µg/l, i.e 50% of the samples should be above 100 µg/l, and not more than 20% of samples should be below 50µg/l.15 In all the six studied areas MUI was well above 100µg/l (Table 2).
Sl No.
Study areas (C.D. Blocks)
Total number of children examined
Number of children with goiter
Severity as public health
problem Grade-1 Grade-2 Total (1+2)
1 Hasnabad 452 173 (38.3) 15 (3.3) 183 (41.6) Severe
2 Sandeshkhali I 352 103 (29.3) 16 (4.5) 119 (33.8) Severe
3 Hingalganj 341 106 (31.1) 05 (1.5) 111 (32.6) Severe
4 Haroa 250 72 (28.8) 02 (0.8) 74 (29.6) Moderate
5 Sandeshkhali II 271 72 (26.6) 08 (2.9) 80 (29.5) Moderate
6 Minakhan 384 98 (25.5) 10 (2.6) 108 (28.1) Moderate
2050 624 (30.4) 56 (2.7) 680 (33.1) Severe
Table 1. Goiter prevalence in different study areas of Sundarban delta, District North 24-Parganas
Severity of public health problem: 5.0-19.9% mild; 20.0-29.9% moderate; >30% Severe14
Goitre prevalence and the state of iodine nutrition in sundarban delta of north 24-parganas in West Benegal 359
In addition urinary iodine values less than 50µg/l in more than 20% sample was not found in any of the areas suggesting that as per WHO/UNICEF/ICCIDD there is no biochemical iodine deficiency or no inadequacy in iodine intake of the overall population. WHO/UNICEF/ICCIDD further recommends, 90% of the house hold should get iodised salt at the level of 15 ppm15 but the study shows that in overall 65.2% of house holds are consuming salt at adequacy level (Table 2). In spite of that MUI of the studied population was more than 100 µg/l because of the bioavailability of iodine through food and water. Zeltser et al.,16 have categorised the iodine deficient zone having iodine less than 4 µg/l of water; moderate deficient zone with iodine level 4-10 µg/l of water and the relative defi-cient zone having iodine level 20 µg/l of water. Accor-ding to these criteria, the region should be considered as iodine sufficient zone as evidenced by iodine content in drinking water (Table 2). A positive correlation (r = 0.96; P=0.002) was found between the iodine content in drinking water and urinary iodine level further showed that consumption of iodine rich food and water was per-haps responsible for high MUI of the population and was enough to fulfil the inadequacy of iodine in salt available in the region. The consumption of cyanogenic plant foods (e.g cabbage, cauliflower, radish, mustard, turnip) was also evident from the urinary excretion of thiocyanate (SCN). In India, large numbers of cyanogenic plants (SCN pre-cursors) are used as common vegetables and IDD thus persists in many such regions in spite of recommended iodine intake.17-19 Indian cyanogenic plant foods that are used as common vegetables have potent anti-thyroid acti-vity and supplementation of extra iodine even fails to counteract their effect.20 In a recent country wide study conducted by Marwaha et al.,21 reported that thiocyanate appears to play an important role in goiter formation especially among poor children in India in post iodization phase. It has been mentioned that the mean value ob-tained from non-endemic population was 0.504 ± 0.197 mg/dl. In our present study, the mean urinary thiocyanate
value was 0.708 ± 0.38 mg/dl. So, the involvement of thiocyanate thiocyanate or thiocyanate precursors present in foods consumed by the people of the region may not be ruled out because the people of the region often consume those foods. Besides this, Sun-darban delta is made up of sedimentary rock because the deltas are the accumulation of sediments at the end of the channel where it discharges into standing body of water, the seas and the oceans i.e. Bay of Bengal.22 Presence of sedimentary rocks rich in organic matter are the main source of water borne goitro-gens because it contains resorcinol, phthalate esters, ali-phatic disulphides etc. are potent anti-thyroid com-pounds.23 The people use the drinking water from shallow tube well of 150-200 feet deep i.e. the water contaminated with sedimentary rock. Therefore, the present study indicates that goitrogenic and antithyroid substances possibly comes through food and water may have the role for the persistence of ende-mic goiter in spite of the consumption of adequate iodine in the studied region. More investigation is thus nece-ssary to arrive at certain definite cause of high goiter rates in the populations. Acknowledgement The financial assistance by the Department of Science & Technology and NES (Govt. of West Bengal) is gratefully acknowledged. The authors acknowledge the co-operation re-ceived from the staff and students of the schools studied. References 1. Hetzel BS. An overview of the prevention and control of
iodine deficiency disorders. In: Hetzel BS, Dunn JT, Stanbury JB, eds. The prevention and control of iodine deficiency disorders. Elsevier: Amsterdam, 1987; 7-31.
2. Clugston GA, Dulberg EM, Pandav CS, Tilden RL. Iodine Deficiency Disorders in South East Asia. In: Hetzel BS, Dunn JT, Stanbury JB, eds. The prevention and control of iodine deficiency disorders. Elsevier: Amsterdam, 1987; 273-308.
3. Chandra AK, Tripathy S, Mukhopadhyay S, Lahari D. Studies on endemic goiter and associated iodine defi-ciency disorders (IDD) in a rural area of the Gangetic West Bengal. Indian J Nutr Dietet 2003; 40: 53-8.
Urinary iodine levels (µg/l) Sl. No
Study areas (C.D. Blocks) Median % urine samples % urine samples
<100 µg/l <50 µg/l
Urinary thiocyanate
(USCN) level mg/dl
Mean ± SD
Percentage of salt samples con-taining iodine
>15 ppm
Iodine content
in drinking water µg/l
1 Hasnabad 225 7.5 - 0.857 ± 0.41 65.7 60.2 ± 2.1
2 Sandeshkhali I 220 12.5 2.5 0.746 ± 0.23 74.3 70.8 ± 3.4
3 Hingalganj 185 22.5 2.5 0.760 ± 0.41 60.0 55.4 ± 2.5
4 Haroa 110 40.0 15.0 0.685 ± 0.39 42.9 20.2 ± 2.9
5 Sandeshkhali II
165 32.5 15.0 0.569 ± 0.35 71.4 44.6 ± 1.9
6 Minakhan 190 12.5 7.5 0.846 ± 0.33 77.1 49.6 ± 2.8
200 21.3 7.1 0.708 ± 0.38 65.2 48.9 ± 30.7
Table 2. Urinary iodine and thiocyanate excretion of studied population and iodine content in salt and drinking water of Sundarban delta, North 24 Parganas
No. of urine samples from each area= 40; Total urine samples=240; No. of salt samples from each area- 35; Total salt samples=210; No. of drinking water samples from each area=8; Total water samples=48
360 AK Chandra, S Tripathy, D Ghosh, A Debnath and S Mukhopadhyay
4. Chandra AK, Tripathy S, Lahari D, Mukhopadhyay S. Iodine nutritional status of school children in a rural area of Howrah district in the Gangetic West Bengal. Indian J Physiol Pharmacol 2004; 48 (2): 219-24.
5. Banarjee U. Social forest in Sundarban: A tool for rural development. In: Bose AN, Dwivedi SN, Dhanda AK, Mukhopadhyay D, Bandyopadhyay KK, eds. Coast Zone Management of West Bengal, Sea Explorer’s Institute Calcutta, 1989; C12.
6. Cochran WG. Sampling techniques, Edition 3, Wiley Eastern Limited, Calcutta; 1977.
7. WHO/UNICEF/ICCIDD. Indicators for assessing Iodine Deficiency Disorders and their control through salt iodization. WHO/NUT/94.6, 1994.
8. Dunn JT, Van der Haar F. Detection of iodine deficiency. In: A practical guide to the correction of Iodine Defi-ciency. Technical Manual No.3. The Netherlands ICCIDD/UNICEF/WHO Publication; 1990: 13-20.
9. Karmarkar MG, Pandav CS, Krishnamachari KAVR. Principle and procedure for iodine estimation. A laboratory manual, New Delhi, Indian Council of Medical Research, 1986.
10. Aldridge WN. The estimation of micro quantities of cya-nide and thiocyanate. Analyst, London, 1945; 70: 474-5.
11. Michajlovskij N, Langer P. Studien uber Benziehungen Zwischen Rhodanbildung und Kropfbildender Eigenschaft Von Nahrungsmitteln. In: Gehalt einiger Nahrungs Mittel an praformierten Rhodanid. Z Physiol Chem 1958; 312: 26-30.
12. Hetzel BS. The story of iodine deficiency: an international challenge in nutrition. Oxford University Press, Delhi, 1989.
13. Titration methods for salt iodine analysis. In: Monitoring Universal salt iodization programme (Edition Sullivan KM, Houston E, Gorestein J, Cervinskas J). UNICEF/ ICCIDD/PAMM/WHO, 1995; 11.
14. Indicators for Trackling Progress in IDD Elimination. In: IDD Newsletter 1994; 10: 37-41.
15. ICCIDD/UNICEF/WHO. Assessment of iodine deficiency disorders and monitoring their elimination, A guide for programme managers, Second edition, WHO/ NHD/ 01.1,2001.
16. Zeltser ME, Aldarkhanov BA, Berezhnaya IM, Spernasky GG, Bazarbekova RB, Nurbekova AA, Levina SA, Mandrovnaya NV, Aripova AA. Iodine deficiency and its clinical manifestation in Kazakhastan. IDD Newsletter 1992; 8 (1): 5-6.
17. Delange F, Thilly C,Bourdoux P, Hennart P, Courtois P, Ermans AM. Influence of dietary goitrogens during pregnancy in humans on thyroid function of the newborn. In: Delange F, Iteke FB, Ermans AM, eds. Nutritional factors involved in the goitrogenic action of cassava. IDRC-184e, Int Dev Res Cent, Ottawa, 1982; 40-50.
18. Kochupillai N. Neonatal hypothyroidism in India. Mount Sinai J Med 1992; 59 (2): 111-5.
19. Chandra AK, Ray I. Evaluation of the effectiveness of salt iodization status in Tripura, northeast India. Indian J Med Res 2002; 115: 22-27.
20. Chandra AK, Mukhopadhyay S, Lahari D, Tripathy S. Goitrogenic content of cyanogenic plant foods of Indian origin and their anti-thyroidal activity in vitro. Indian J Med Res 2004; 119: 180-5.
21. Marwaha RK, Tandon N, Gupta N, Karak AK, Verma K and Kochupillai N. Residual goitre in the postiodization phase: iodine status, thiocyanate exposure and auto-immunity. Clin Endocrinol 2003; 59 (6): 672-81.
22. Bhattacharyay AK, Costal geomorphology, processes and hazards: A note on management measures. In: Bose AN, Dwivedi SN, Dhanda AK, Mukhopadhyay D, Bandyo-padhyay KK, eds. Coast zone management of West Bengal. Sea Explorer’s Institute, Calcutta,1989; D49-D61.
23. Gaitan E, Cooksey RC, Legan J, Cruse JM, Lindsay RH, Hill J. Antithyroid and goitrogenic effects of coal water extracts from iodine sufficient goiter areas, Thyroid 1993; 3 (1): 49-53.
Goitre prevalence and the state of iodine nutrition in sundarban delta of north 24-parganas in West Benegal 361
Original Article Goitre prevalence and the state of iodine nutrition in sundarban delta of north 24-parganas in West Benegal Amar K Chandra PhD, Smritiratan Tripathy MSc, Dishari Ghosh MSc, Arijit Debnath MSc and Sanjukta Mukhopadhyay MSc
Endocrinology and Reproductive Physiology Laboratory, Department of Physiology, University College of Science and Technology, University of Calcutta
甲状腺肿大流行和碘营养在西孟加拉北部甲状腺肿大流行和碘营养在西孟加拉北部甲状腺肿大流行和碘营养在西孟加拉北部甲状腺肿大流行和碘营养在西孟加拉北部 24----parganas 的的的的 sundarban 三角州的状况三角州的状况三角州的状况三角州的状况
本研究的主要目的在于评估印度东部西孟加拉北部 24-parganas 区的 sundarban 三角州的
学龄儿童(6-12 岁)碘营养的状况。2050 名儿童临床检查了甲状腺,240 份尿样分别分析
了碘和硫氰酸盐;还测量了 48 个水样和 210 个盐样中的碘含量。结果显示研究的区域有严
重的临床地方性甲状腺肿大流行达 33.1%(一级:30.4%,二级:2.7%),中值小便碘含
量为 200 μg/l,显示无生物化学上的碘缺乏,65.2 %的盐样含推荐量的碘含量和饮用水中
含足够量的碘,而平均的尿硫氰酸盐含量是 0.708±0.38 mg/dl。尽管摄入了足够量的碘,现
有的甲状腺肿流行可能是由于来自食物和水中的饮食致甲状腺肿因子/抗甲状腺的物质所引
起。
关键词关键词关键词关键词:地方性甲状腺肿大、致甲状腺肿因子、学龄儿童、尿碘含量、尿硫氰酸盐含量、西
孟加拉。
362 Asia Pac J Clin Nutr 2006;15 (3): 362-367
Original Article Determination of discretionary salt intake in an iodine deficient area of East Java-Indonesia using three different methods Annasari Mustafa SKM, MSc
1, Siti Muslimatun Ir MSc PhD2, Juliawati Untoro Ir MSc PhD
3, Maria CPJ Lan Ir MSc
4 and Yohanes Kristianto GradDipFoodSci MFT1
1 School of Nutrition, Ministry of Health of Indonesia, Malang 65112, East Java, Indonesia 2 SEAMEO TROPMED Regional Centre for Community Nutrition, University of Indonesia, Jakarta,Indonesia 3 Micronutrient Initiatives, Canada 4World Food Program, Jakarta, Indonesia
As salt is a potential vehicle for delivering iodine to a population, study on salt intake is important. Many methods have been used to measure iodised-salt intake, but the methods were suspected to be inaccurate. A new method, called a lithium-marker technique, has been considered as suitable and safe; hence it has been proposed as a gold standard for measuring the actual salt intake of an individual. We conducted a study to determine discretionary salt intake using the lithium marker technique. The study shows that the total salt intake for children (N =15) and mothers (N =15) were 5.4±2.1 g/d and 5.8±1.7 g/d respectively in which 48.5±17.1% and 50.5±17.3% were discretionary salt. The discretionary salt intake measured using lithium marker (2.53 ± 1.2 g/d for children and 2.99 ± 1.5 g/d for mother) were significantly lower than using 24-hour salt recall (7.01±2.44 g/cap/d) and salt weighing (6.00±1.8 g/cap/d) (P<0.001). In conclusion, the discretionary salt intake by 24-hour salt recall and salt weighing were over estimated as compared to the lithium-labelled salt measurement. It is recommended that the level of iodine fortification in salt be increased up to 80-100 ppm of KIO3 to provide iodine intake of 150µg/d.
Key Words: lithium marker technique, 24-hour salt recall, salt weighing, discretionary salt intake. Introduction The government of Indonesia has initiated an iodination program on salt with the level of fortification of > 30 ppm potassium Iodate (KIO3).
1 The fortification is based on surveys which show that the discretionary salt intake in Indonesia is 10 g/d.2 In spite of that, iodine deficiency is still prevalent in Indonesia3, this is probably a result of low iodine daily intake, which is mainly from iodised salt. Two methods, namely 24-hour salt recall and salt weighing, have been used to measure discretionary salt intake in different countries. The methods suggest that the discretionary salt intake ranges from 5-15 g/d for children and adults.4 Unfortunately, the methods lack in precision and accuracy. Current studies suggest that the lithium-marker technique can be used as a gold standard for mea-suring discretionary salt intake. The method is more precise and biologically safe. The lithium-marker technique has been employed to measure discretionary and total salt intake of European5-7, African and Latin American countries.8 There have been no salt consumption studies using the gold standard method in Asia. The current study was conducted in Indonesia to compare three methods of discretionary salt measurements, i.e. lithium-labelled, 24-hour recall, and salt weighing. More precise data of dis-cretionary salt intake amongst Indonesians would be ob-
tained, so that the fortification level of iodine in salt could be reformulated to combat iodine deficiency. Subjects and methods Fifteen schoolboys aged seven to ten years (from the same school) and their respective mothers participated volun-tarily. This study was carried out in an endemic, moun-tainous rural area in the district of Malang, East Java In-donesia. Malang is 1300m above sea level and has an average temperature of 22°C. The prevalence of TGR (Total Goitre Rate) in East Java is 15.31%.9 The TGR among school-children measured by palpation is 46% or 100% using USG technique.10 Ethical approval was ob-tained from the Faculty of Medicine, University of Indo-nesia by considering the guidelines of the Council for Inter-national Organisation of Medical Sciences.11 Participating mothers signed written informed consents. Correspondence address: Dr. Siti Muslimatun, Seameo Tropmed, Regional Center for Community Nutrition University of Indonesia, P.O. Box 3852 Jakarta 10038 Indonesia Tel./Fax: +62-21-3914017 E-mail: [email protected] Accepted 10th October 2005
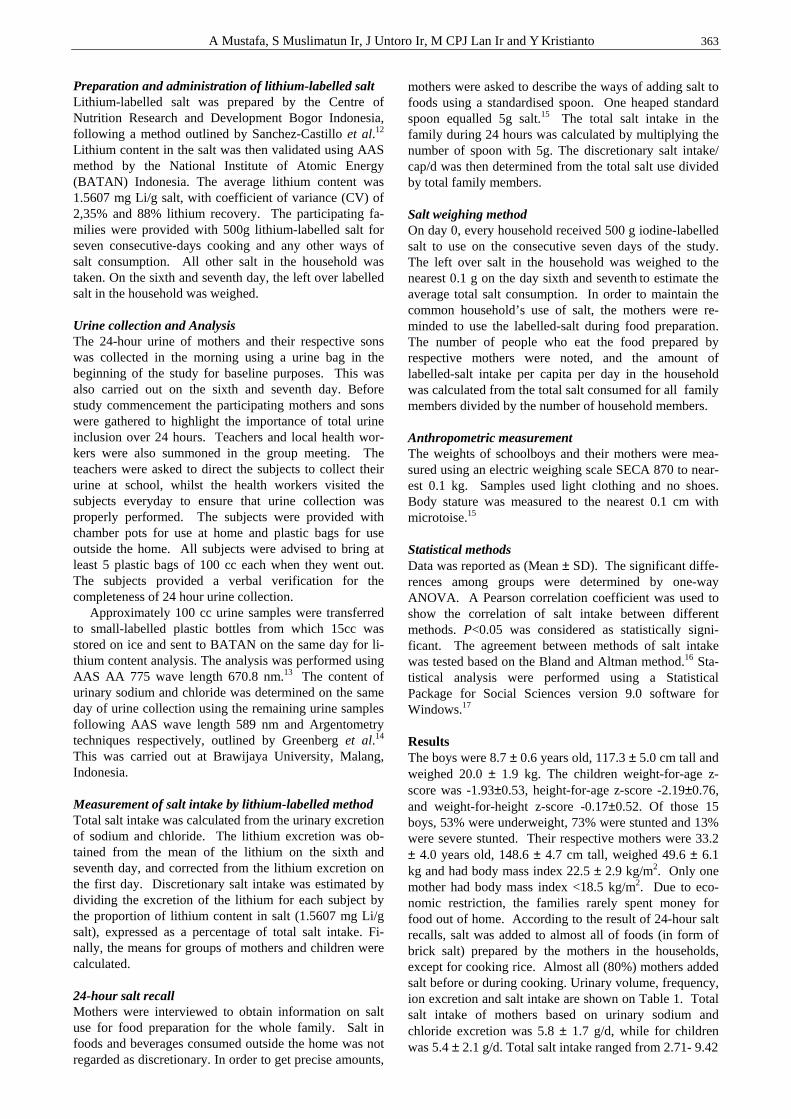
A Mustafa, S Muslimatun Ir, J Untoro Ir, M CPJ Lan Ir and Y Kristianto 363
Preparation and administration of lithium-labelled salt Lithium-labelled salt was prepared by the Centre of Nutrition Research and Development Bogor Indonesia, following a method outlined by Sanchez-Castillo et al.12 Lithium content in the salt was then validated using AAS method by the National Institute of Atomic Energy (BATAN) Indonesia. The average lithium content was 1.5607 mg Li/g salt, with coefficient of variance (CV) of 2,35% and 88% lithium recovery. The participating fa-milies were provided with 500g lithium-labelled salt for seven consecutive-days cooking and any other ways of salt consumption. All other salt in the household was taken. On the sixth and seventh day, the left over labelled salt in the household was weighed. Urine collection and Analysis The 24-hour urine of mothers and their respective sons was collected in the morning using a urine bag in the beginning of the study for baseline purposes. This was also carried out on the sixth and seventh day. Before study commencement the participating mothers and sons were gathered to highlight the importance of total urine inclusion over 24 hours. Teachers and local health wor-kers were also summoned in the group meeting. The teachers were asked to direct the subjects to collect their urine at school, whilst the health workers visited the subjects everyday to ensure that urine collection was properly performed. The subjects were provided with chamber pots for use at home and plastic bags for use outside the home. All subjects were advised to bring at least 5 plastic bags of 100 cc each when they went out. The subjects provided a verbal verification for the completeness of 24 hour urine collection. Approximately 100 cc urine samples were transferred to small-labelled plastic bottles from which 15cc was stored on ice and sent to BATAN on the same day for li-thium content analysis. The analysis was performed using AAS AA 775 wave length 670.8 nm.13 The content of urinary sodium and chloride was determined on the same day of urine collection using the remaining urine samples following AAS wave length 589 nm and Argentometry techniques respectively, outlined by Greenberg et al.14 This was carried out at Brawijaya University, Malang, Indonesia. Measurement of salt intake by lithium-labelled method Total salt intake was calculated from the urinary excretion of sodium and chloride. The lithium excretion was ob-tained from the mean of the lithium on the sixth and seventh day, and corrected from the lithium excretion on the first day. Discretionary salt intake was estimated by dividing the excretion of the lithium for each subject by the proportion of lithium content in salt (1.5607 mg Li/g salt), expressed as a percentage of total salt intake. Fi-nally, the means for groups of mothers and children were calculated. 24-hour salt recall Mothers were interviewed to obtain information on salt use for food preparation for the whole family. Salt in foods and beverages consumed outside the home was not regarded as discretionary. In order to get precise amounts,
mothers were asked to describe the ways of adding salt to foods using a standardised spoon. One heaped standard spoon equalled 5g salt.15 The total salt intake in the family during 24 hours was calculated by multiplying the number of spoon with 5g. The discretionary salt intake/ cap/d was then determined from the total salt use divided by total family members. Salt weighing method On day 0, every household received 500 g iodine-labelled salt to use on the consecutive seven days of the study. The left over salt in the household was weighed to the nearest 0.1 g on the day sixth and seventh to estimate the average total salt consumption. In order to maintain the common household’s use of salt, the mothers were re-minded to use the labelled-salt during food preparation. The number of people who eat the food prepared by respective mothers were noted, and the amount of labelled-salt intake per capita per day in the household was calculated from the total salt consumed for all family members divided by the number of household members. Anthropometric measurement The weights of schoolboys and their mothers were mea-sured using an electric weighing scale SECA 870 to near-est 0.1 kg. Samples used light clothing and no shoes. Body stature was measured to the nearest 0.1 cm with microtoise.15 Statistical methods Data was reported as (Mean ± SD). The significant diffe-rences among groups were determined by one-way ANOVA. A Pearson correlation coefficient was used to show the correlation of salt intake between different methods. P<0.05 was considered as statistically signi-ficant. The agreement between methods of salt intake was tested based on the Bland and Altman method.16 Sta-tistical analysis were performed using a Statistical Package for Social Sciences version 9.0 software for Windows.17 Results The boys were 8.7 ± 0.6 years old, 117.3 ± 5.0 cm tall and weighed 20.0 ± 1.9 kg. The children weight-for-age z-score was -1.93±0.53, height-for-age z-score -2.19±0.76, and weight-for-height z-score -0.17±0.52. Of those 15 boys, 53% were underweight, 73% were stunted and 13% were severe stunted. Their respective mothers were 33.2 ± 4.0 years old, 148.6 ± 4.7 cm tall, weighed 49.6 ± 6.1 kg and had body mass index 22.5 ± 2.9 kg/m2. Only one mother had body mass index <18.5 kg/m2. Due to eco-nomic restriction, the families rarely spent money for food out of home. According to the result of 24-hour salt recalls, salt was added to almost all of foods (in form of brick salt) prepared by the mothers in the households, except for cooking rice. Almost all (80%) mothers added salt before or during cooking. Urinary volume, frequency, ion excretion and salt intake are shown on Table 1. Total salt intake of mothers based on urinary sodium and chloride excretion was 5.8 ± 1.7 g/d, while for children was 5.4 ± 2.1 g/d. Total salt intake ranged from 2.71- 9.42
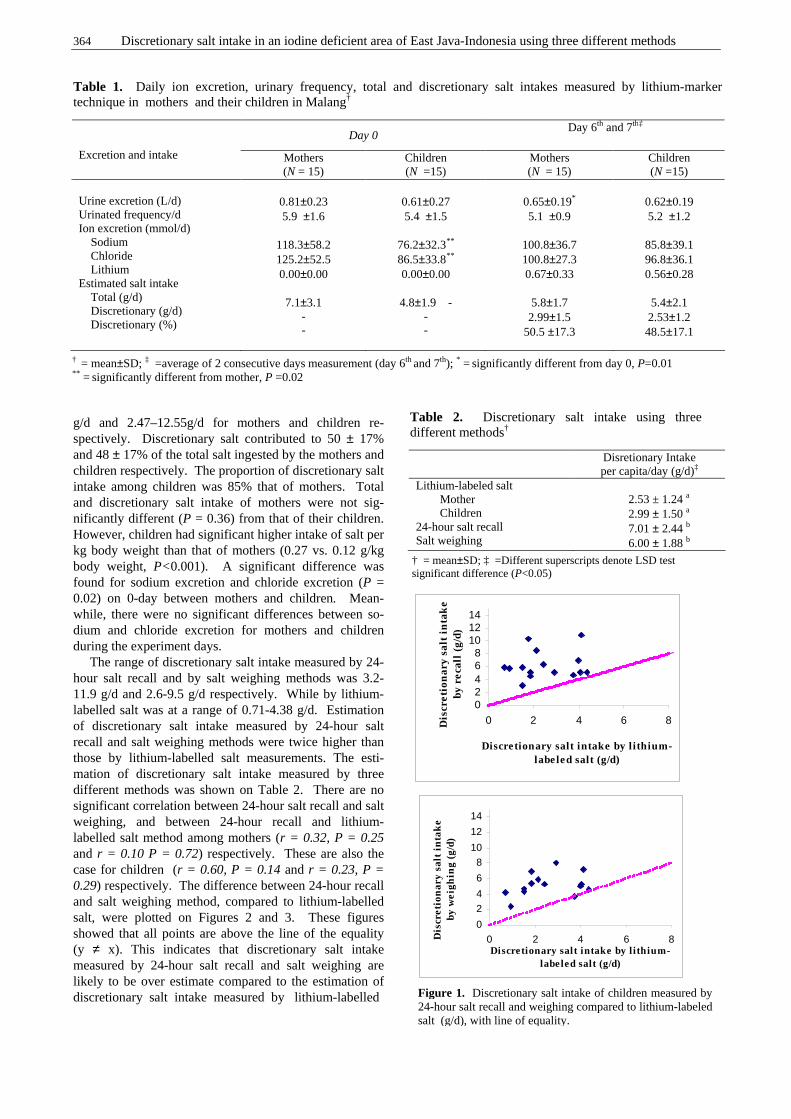
364 Discretionary salt intake in an iodine deficient area of East Java-Indonesia using three different methods
g/d and 2.47–12.55g/d for mothers and children re-spectively. Discretionary salt contributed to 50 ± 17% and 48 ± 17% of the total salt ingested by the mothers and children respectively. The proportion of discretionary salt intake among children was 85% that of mothers. Total and discretionary salt intake of mothers were not sig-nificantly different (P = 0.36) from that of their children. However, children had significant higher intake of salt per kg body weight than that of mothers (0.27 vs. 0.12 g/kg body weight, P<0.001). A significant difference was found for sodium excretion and chloride excretion (P = 0.02) on 0-day between mothers and children. Mean-while, there were no significant differences between so-dium and chloride excretion for mothers and children during the experiment days. The range of discretionary salt intake measured by 24-hour salt recall and by salt weighing methods was 3.2-11.9 g/d and 2.6-9.5 g/d respectively. While by lithium-labelled salt was at a range of 0.71-4.38 g/d. Estimation of discretionary salt intake measured by 24-hour salt recall and salt weighing methods were twice higher than those by lithium-labelled salt measurements. The esti-mation of discretionary salt intake measured by three different methods was shown on Table 2. There are no significant correlation between 24-hour salt recall and salt weighing, and between 24-hour recall and lithium-labelled salt method among mothers (r = 0.32, P = 0.25 and r = 0.10 P = 0.72) respectively. These are also the case for children (r = 0.60, P = 0.14 and r = 0.23, P = 0.29) respectively. The difference between 24-hour recall and salt weighing method, compared to lithium-labelled salt, were plotted on Figures 2 and 3. These figures showed that all points are above the line of the equality (y ≠ x). This indicates that discretionary salt intake measured by 24-hour salt recall and salt weighing are likely to be over estimate compared to the estimation of discretionary salt intake measured by lithium-labelled
Table 1. Daily ion excretion, urinary frequency, total and discretionary salt intakes measured by lithium-marker technique in mothers and their children in Malang†
Day 0 Day 6th and 7th‡
Excretion and intake Mothers (N = 15)
Children (N =15)
Mothers (N = 15)
Children (N =15)
Urine excretion (L/d) Urinated frequency/d Ion excretion (mmol/d) Sodium Chloride Lithium Estimated salt intake Total (g/d) Discretionary (g/d) Discretionary (%)
0.81±0.23 5.9 ±1.6
118.3±58.2 125.2±52.5 0.00±0.00
7.1±3.1
- -
0.61±0.27 5.4 ±1.5
76.2±32.3** 86.5±33.8** 0.00±0.00
4.8±1.9 -
- -
0.65±0.19*
5.1 ±0.9
100.8±36.7 100.8±27.3 0.67±0.33
5.8±1.7 2.99±1.5
50.5 ±17.3
0.62±0.19 5.2 ±1.2
85.8±39.1 96.8±36.1 0.56±0.28
5.4±2.1 2.53±1.2 48.5±17.1
† = mean±SD; ‡ =average of 2 consecutive days measurement (day 6th and 7th); * = significantly different from day 0, P=0.01 ** = significantly different from mother, P =0.02
Disretionary Intake per capita/day (g/d)‡
Lithium-labeled salt Mother Children
24-hour salt recall Salt weighing
2.53 ± 1.24 a 2.99 ± 1.50 a 7.01 ± 2.44 b 6.00 ± 1.88 b
Table 2. Discretionary salt intake using three different methods†
† = mean±SD; ‡ =Different superscripts denote LSD test significant difference (P<0.05)
02468
101214
0 2 4 6 8
Discretionary salt intake by l ithium-labe led salt (g/d)
Dis
cret
ion
ary
salt
in
tak
e by
rec
all
(g/d
)
0
2
4
6
8
10
12
14
0 2 4 6 8Discretionary salt intake by l ithium-
labeled salt (g/d)
Dis
cret
ion
ary
salt
in
tak
e by
wei
ghin
g (g
/d)
Figure 1. Discretionary salt intake of children measured by 24-hour salt recall and weighing compared to lithium-labeled salt (g/d), with line of equality.
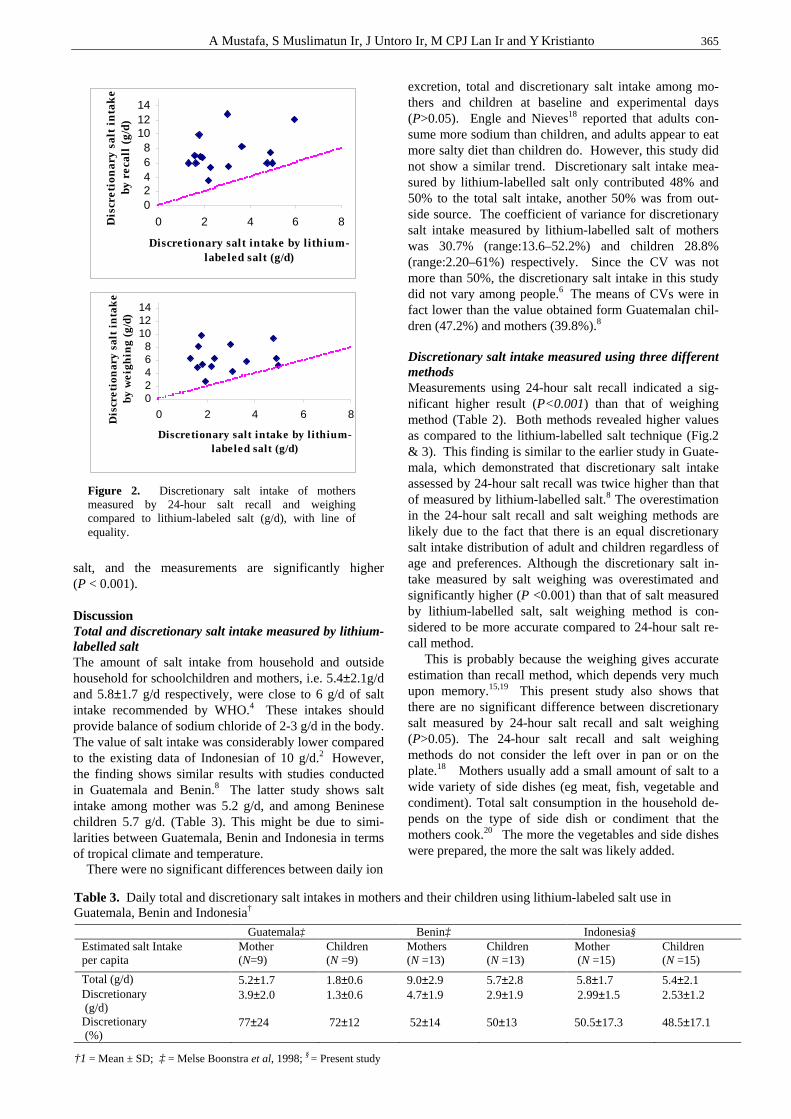
A Mustafa, S Muslimatun Ir, J Untoro Ir, M CPJ Lan Ir and Y Kristianto 365
salt, and the measurements are significantly higher (P < 0.001). Discussion Total and discretionary salt intake measured by lithium-labelled salt The amount of salt intake from household and outside household for schoolchildren and mothers, i.e. 5.4±2.1g/d and 5.8±1.7 g/d respectively, were close to 6 g/d of salt intake recommended by WHO.4 These intakes should provide balance of sodium chloride of 2-3 g/d in the body. The value of salt intake was considerably lower compared to the existing data of Indonesian of 10 g/d.2 However, the finding shows similar results with studies conducted in Guatemala and Benin.8 The latter study shows salt intake among mother was 5.2 g/d, and among Beninese children 5.7 g/d. (Table 3). This might be due to simi-larities between Guatemala, Benin and Indonesia in terms of tropical climate and temperature. There were no significant differences between daily ion
excretion, total and discretionary salt intake among mo-thers and children at baseline and experimental days (P>0.05). Engle and Nieves18 reported that adults con-sume more sodium than children, and adults appear to eat more salty diet than children do. However, this study did not show a similar trend. Discretionary salt intake mea-sured by lithium-labelled salt only contributed 48% and 50% to the total salt intake, another 50% was from out-side source. The coefficient of variance for discretionary salt intake measured by lithium-labelled salt of mothers was 30.7% (range:13.6–52.2%) and children 28.8% (range:2.20–61%) respectively. Since the CV was not more than 50%, the discretionary salt intake in this study did not vary among people.6 The means of CVs were in fact lower than the value obtained form Guatemalan chil-dren (47.2%) and mothers (39.8%).8 Discretionary salt intake measured using three different methods Measurements using 24-hour salt recall indicated a sig-nificant higher result (P<0.001) than that of weighing method (Table 2). Both methods revealed higher values as compared to the lithium-labelled salt technique (Fig.2 & 3). This finding is similar to the earlier study in Guate-mala, which demonstrated that discretionary salt intake assessed by 24-hour salt recall was twice higher than that of measured by lithium-labelled salt.8 The overestimation in the 24-hour salt recall and salt weighing methods are likely due to the fact that there is an equal discretionary salt intake distribution of adult and children regardless of age and preferences. Although the discretionary salt in-take measured by salt weighing was overestimated and significantly higher (P <0.001) than that of salt measured by lithium-labelled salt, salt weighing method is con-sidered to be more accurate compared to 24-hour salt re-call method. This is probably because the weighing gives accurate estimation than recall method, which depends very much upon memory.15,19 This present study also shows that there are no significant difference between discretionary salt measured by 24-hour salt recall and salt weighing (P>0.05). The 24-hour salt recall and salt weighing methods do not consider the left over in pan or on the plate.18 Mothers usually add a small amount of salt to a wide variety of side dishes (eg meat, fish, vegetable and condiment). Total salt consumption in the household de-pends on the type of side dish or condiment that the mothers cook.20 The more the vegetables and side dishes were prepared, the more the salt was likely added.
02468
101214
0 2 4 6 8
Discretionary salt intake by lithium-labeled salt (g/d)
Dis
cret
ion
ary
salt
in
tak
e by
rec
all
(g/d
)
02468
101214
0 2 4 6 8
Discretionary salt intake by lithium-labeled salt (g/d)
Dis
cret
ion
ary
salt
in
tak
e by
wei
ghin
g (g
/d)
Figure 2. Discretionary salt intake of mothers measured by 24-hour salt recall and weighing compared to lithium-labeled salt (g/d), with line of equality.
Guatemala‡ Benin‡ Indonesia§ Estimated salt Intake per capita
Mother (N=9)
Children (N =9)
Mothers (N =13)
Children (N =13)
Mother (N =15)
Children (N =15)
Total (g/d) 5.2±1.7 1.8±0.6 9.0±2.9 5.7±2.8 5.8±1.7 5.4±2.1 Discretionary (g/d)
3.9±2.0 1.3±0.6 4.7±1.9 2.9±1.9 2.99±1.5 2.53±1.2
Discretionary (%)
77±24 72±12 52±14 50±13 50.5±17.3 48.5±17.1
Table 3. Daily total and discretionary salt intakes in mothers and their children using lithium-labeled salt use in Guatemala, Benin and Indonesia†
†1 = Mean ± SD; ‡ = Melse Boonstra et al, 1998; § = Present study
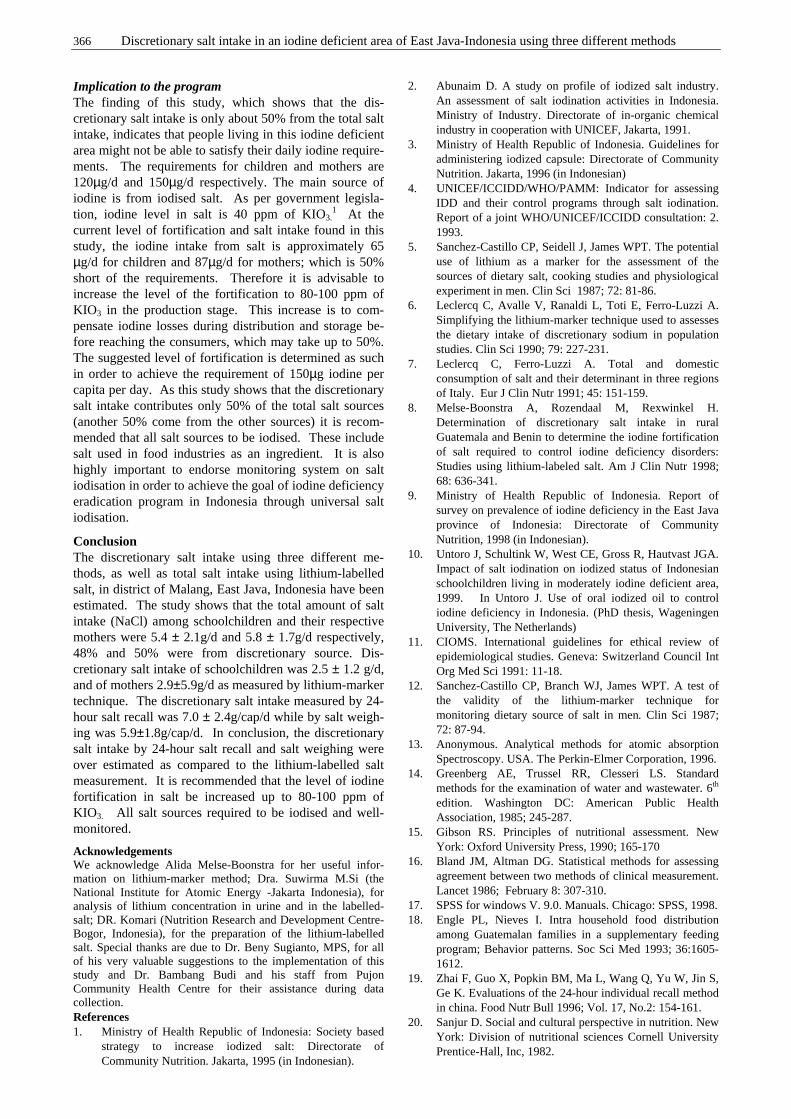
366 Discretionary salt intake in an iodine deficient area of East Java-Indonesia using three different methods
Implication to the program The finding of this study, which shows that the dis-cretionary salt intake is only about 50% from the total salt intake, indicates that people living in this iodine deficient area might not be able to satisfy their daily iodine require-ments. The requirements for children and mothers are 120µg/d and 150µg/d respectively. The main source of iodine is from iodised salt. As per government legisla-tion, iodine level in salt is 40 ppm of KIO3.
1 At the current level of fortification and salt intake found in this study, the iodine intake from salt is approximately 65 µg/d for children and 87µg/d for mothers; which is 50% short of the requirements. Therefore it is advisable to increase the level of the fortification to 80-100 ppm of KIO3 in the production stage. This increase is to com-pensate iodine losses during distribution and storage be-fore reaching the consumers, which may take up to 50%. The suggested level of fortification is determined as such in order to achieve the requirement of 150µg iodine per capita per day. As this study shows that the discretionary salt intake contributes only 50% of the total salt sources (another 50% come from the other sources) it is recom-mended that all salt sources to be iodised. These include salt used in food industries as an ingredient. It is also highly important to endorse monitoring system on salt iodisation in order to achieve the goal of iodine deficiency eradication program in Indonesia through universal salt iodisation.
Conclusion The discretionary salt intake using three different me-thods, as well as total salt intake using lithium-labelled salt, in district of Malang, East Java, Indonesia have been estimated. The study shows that the total amount of salt intake (NaCl) among schoolchildren and their respective mothers were 5.4 ± 2.1g/d and 5.8 ± 1.7g/d respectively, 48% and 50% were from discretionary source. Dis-cretionary salt intake of schoolchildren was 2.5 ± 1.2 g/d, and of mothers 2.9±5.9g/d as measured by lithium-marker technique. The discretionary salt intake measured by 24-hour salt recall was 7.0 ± 2.4g/cap/d while by salt weigh-ing was 5.9±1.8g/cap/d. In conclusion, the discretionary salt intake by 24-hour salt recall and salt weighing were over estimated as compared to the lithium-labelled salt measurement. It is recommended that the level of iodine fortification in salt be increased up to 80-100 ppm of KIO3. All salt sources required to be iodised and well-monitored.
Acknowledgements We acknowledge Alida Melse-Boonstra for her useful infor-mation on lithium-marker method; Dra. Suwirma M.Si (the National Institute for Atomic Energy -Jakarta Indonesia), for analysis of lithium concentration in urine and in the labelled-salt; DR. Komari (Nutrition Research and Development Centre-Bogor, Indonesia), for the preparation of the lithium-labelled salt. Special thanks are due to Dr. Beny Sugianto, MPS, for all of his very valuable suggestions to the implementation of this study and Dr. Bambang Budi and his staff from Pujon Community Health Centre for their assistance during data collection. References 1. Ministry of Health Republic of Indonesia: Society based
strategy to increase iodized salt: Directorate of Community Nutrition. Jakarta, 1995 (in Indonesian).
2. Abunaim D. A study on profile of iodized salt industry. An assessment of salt iodination activities in Indonesia. Ministry of Industry. Directorate of in-organic chemical industry in cooperation with UNICEF, Jakarta, 1991.
3. Ministry of Health Republic of Indonesia. Guidelines for administering iodized capsule: Directorate of Community Nutrition. Jakarta, 1996 (in Indonesian)
4. UNICEF/ICCIDD/WHO/PAMM: Indicator for assessing IDD and their control programs through salt iodination. Report of a joint WHO/UNICEF/ICCIDD consultation: 2. 1993.
5. Sanchez-Castillo CP, Seidell J, James WPT. The potential use of lithium as a marker for the assessment of the sources of dietary salt, cooking studies and physiological experiment in men. Clin Sci 1987; 72: 81-86.
6. Leclercq C, Avalle V, Ranaldi L, Toti E, Ferro-Luzzi A. Simplifying the lithium-marker technique used to assesses the dietary intake of discretionary sodium in population studies. Clin Sci 1990; 79: 227-231.
7. Leclercq C, Ferro-Luzzi A. Total and domestic consumption of salt and their determinant in three regions of Italy. Eur J Clin Nutr 1991; 45: 151-159.
8. Melse-Boonstra A, Rozendaal M, Rexwinkel H. Determination of discretionary salt intake in rural Guatemala and Benin to determine the iodine fortification of salt required to control iodine deficiency disorders: Studies using lithium-labeled salt. Am J Clin Nutr 1998; 68: 636-341.
9. Ministry of Health Republic of Indonesia. Report of survey on prevalence of iodine deficiency in the East Java province of Indonesia: Directorate of Community Nutrition, 1998 (in Indonesian).
10. Untoro J, Schultink W, West CE, Gross R, Hautvast JGA. Impact of salt iodination on iodized status of Indonesian schoolchildren living in moderately iodine deficient area, 1999. In Untoro J. Use of oral iodized oil to control iodine deficiency in Indonesia. (PhD thesis, Wageningen University, The Netherlands)
11. CIOMS. International guidelines for ethical review of epidemiological studies. Geneva: Switzerland Council Int Org Med Sci 1991: 11-18.
12. Sanchez-Castillo CP, Branch WJ, James WPT. A test of the validity of the lithium-marker technique for monitoring dietary source of salt in men. Clin Sci 1987; 72: 87-94.
13. Anonymous. Analytical methods for atomic absorption Spectroscopy. USA. The Perkin-Elmer Corporation, 1996.
14. Greenberg AE, Trussel RR, Clesseri LS. Standard methods for the examination of water and wastewater. 6th edition. Washington DC: American Public Health Association, 1985; 245-287.
15. Gibson RS. Principles of nutritional assessment. New York: Oxford University Press, 1990; 165-170
16. Bland JM, Altman DG. Statistical methods for assessing agreement between two methods of clinical measurement. Lancet 1986; February 8: 307-310.
17. SPSS for windows V. 9.0. Manuals. Chicago: SPSS, 1998. 18. Engle PL, Nieves I. Intra household food distribution
among Guatemalan families in a supplementary feeding program; Behavior patterns. Soc Sci Med 1993; 36:1605-1612.
19. Zhai F, Guo X, Popkin BM, Ma L, Wang Q, Yu W, Jin S, Ge K. Evaluations of the 24-hour individual recall method in china. Food Nutr Bull 1996; Vol. 17, No.2: 154-161.
20. Sanjur D. Social and cultural perspective in nutrition. New York: Division of nutritional sciences Cornell University Prentice-Hall, Inc, 1982.
A Mustafa, S Muslimatun Ir, J Untoro Ir, M CPJ Lan Ir and Y Kristianto 367
Original Article Determination of discretionary salt intake in an iodine deficient area of East Java-Indonesia using three different methods Annasari Mustafa SKM, MSc
1, Siti Muslimatun Ir MSc PhD2, Juliawati Untoro Ir MSc PhD
3, Maria CPJ Lan Ir MSc
4 and Yohanes Kristianto GradDipFoodSci MFT1
1 School of Nutrition, Ministry of Health of Indonesia, Malang 65112, East Java, Indonesia 2 SEAMEO TROPMED Regional Centre for Community Nutrition, University of Indonesia, Jakarta,Indonesia 3 Micronutrient Initiatives, Canada 4World Food Program, Jakarta, Indonesia
用三种不同方法检测印尼瓜哇岛东部碘缺乏地区的任意盐摄入量用三种不同方法检测印尼瓜哇岛东部碘缺乏地区的任意盐摄入量用三种不同方法检测印尼瓜哇岛东部碘缺乏地区的任意盐摄入量用三种不同方法检测印尼瓜哇岛东部碘缺乏地区的任意盐摄入量
由于盐是传递碘给人的一种潜在媒介物, 所以研究盐的摄入量是重要的。已经有很多方法
用来测量碘盐的摄入,但这些方法还是被怀疑不准确的。一种被称为锂标志技术的新方法,
已经被认为合适的和安全的;因此,这种技术已经提议作为测量个体真实盐摄入量的最佳标
准。我们引导了一个用锂标志技术检测任意盐摄入的研究。本研究显示孩子(N =15)和母亲
(N =15) 总的盐摄入量分别是 5.4±2.1 g/d 和 5.8±1.7 g/d ,其中 48.5±17.1% 和
50.5±17.3%是任意盐。任意盐的摄入量使用锂标志技术(孩子:2.53 ± 1.2 g/d,母亲:
2.99 ± 1.5 g/d )比使用 24 小时盐回忆(7.01±2.44 g/cap/d)和盐称重(6.00±1.8 g/cap/d)显著性偏低。结论,和锂标志盐测量作比较,24 小时盐回忆和盐称重对任意盐摄入量是高估
计的。我们推荐盐中的碘强化水平应增加到 KIO3 在 80-100 ppm 以提供碘的摄入量在
150µg/d。
关键词关键词关键词关键词:锂标志技术、24 小时盐回忆、盐称重、任意盐摄入。
368 Asia Pac J Clin Nutr 2006;15 (3):368-376
Original Article Effects of probiotic or prebiotic supplemented milk formulas on fecal microbiota composition of infants Oscar Brunser MD
1, Guillermo Figueroa R.Tech 2, Martin Gotteland PhD
2, Elizabeth Haschke-Becher MD PhD
3, Corine Magliola Pharm4, Florence Rochat PhD
5, Sylvia Cruchet MD
2, Richard Palframan PhD6, Glenn Gibson PhD
6, Françoise Chauffard Pharm5,
and Ferdinand Haschke MD4
1Ultrastructure Laboratory 2 Microbiology Laboratory, Institute of Nutrition and Food Technology (INTA), University of Chile, J.P. Alessandri 5540, Santiago, Chile. 3 Department of Clinical Chemistry, University of Lausanne, Lausanne, Switzerland. 4 Nestec Ltd., Vevey, Switzerland. 5 Nestlé Research Center, Vers-chez-les-Blanc, Switzerland. 6Food Microbial Sciences Unit, School of Food Biosciences, University of Reading, Whiteknights, UK.
The aim of the study was to evaluate whether supplementation of milk-formulas with prebiotic fructo-oligosaccharides or a probiotic, Lactobacillus johnsonii La1 (La1), could modulate the composition of the fecal microbiota of formula-fed infants, compared to breastfed (BF) infants. Ninety infants close to 4 months of age were randomized into one of three groups to be blindly assigned to receive for 13 weeks: a) an infant formula (Control), b) the same formula with fructo-oligosaccharides (Prebio), or c) with La1 (Probio). At the end of this period, all infants received the control formula for 2 additional weeks. Twenty-six infants, breastfed throughout the study, were recruited to form group BF. Fecal samples were obtained upon enrolment and after 7 and 15 weeks. Bacterial populations were assessed with classical culture techniques and fluorescent in situ hybridisation (FISH). Seventy-six infants completed the study. On enrolment, higher counts of Bifidobacterium and Lactobacillus and lower counts of enterobacteria were observed in BF compared to the formula-fed infants; these differences tended to disappear at weeks 7 and 15. No major differences for Clostridium, Bacteroides or Enterococcus were observed between the groups or along the follow up. Probio increased fecal Lactobacillus counts (P<0.001); 88% of the infants in this group excreted live La1 in their stools at week 7 but only 17% at week 15. Increased Bifidobacterium counts were observed at week 7 in the 3 formula groups, similar to BF infants. These results confirm the presence of higher counts of bifidobacteria and lactobacilli in the microbiota of BF infants compared to formula-fed infants before dietary diversification, and that La1 survives in the infant digestive tract.
Key Words: breastfeeding, milk formula, fructooligosaccharides, infants, intestinal microbiota, Lactobacillus johnsonii La1, prebiotic, probiotic.
Introduction The colonization of the newborn gastrointestinal tract by bacteria is a complex process which implicates competition for oxygen, nutrients and ecological niches, and is strongly influenced by infant diet, breast or formula feeding. Human milk contains secretory IgA, immune cells, lactoferrin, and lysozyme which hinder pathogen proliferation. It also contains high levels of oligosaccharides (∼ 10g/L) which stimulate selectively the growth of some bacterial species, resulting in higher counts of bifidobacteria and lower counts of enterobacteriaceae compared to the microbiota of formula-fed infants.1,2 Weaning changes the colonic micro-biota, decreasing bifidobacteria and lactobacilli and con-comitantly increasing Bacteroides, Enterobacter, Clostri-dium, Enterococcus; the resulting microbiota resembles to that of the adult.1 It is considered that the predominance of bifidobacteria and lactobacilli in the digestive tract gene-rates positive effects upon the host’s health and for this
reason efforts are being made to modulate the luminal envi-ronment with the aim of promoting bacterial populations that more closely imitate those of breastfed infants.1,3 Theoretically, this may be achieved through the admini-stration of probiotics or prebiotics. Probiotics are micro-organisms capable of resisting gastric acidity and bile salts and survive their transit along the gastrointestinal tract of the host where they may regulate the autochtonous micro-biota and exert health-promoting functions.4
Correspondence address: Dr. Oscar Brunser, Ultrastructure Laboratory, Institute of Nutrition and Food Technology (INTA), University of Chile, J.P. Alessandri 5540, Santiago, Chile. E-mail: [email protected] Accepted 9th August 2005

O Brunser,G Figueroa,M Gotteland,E Haschke-Becher,C Magliola,F Rochat,S Cruchet,R Palframan,G Gibson,F Chauffard,F Haschke
Lactobacillus johnsonii La1 (La1) is a well-described probiotic strain which has been shown to adhere to inte-stinal epithelial cells through its lipoteichoic acid, a major cell wall constituent.5 La1 is capable of modulating local and systemic immunity.6,7 and antagonizing the sCD14-mediated proinflammatory response induced by LPS in intestinal cell lines.8 Furthermore, La1 has been shown to exert inhibitory activities against a wide range of patho-gens both in adults and children.9-11 Prebiotics are non-digestible carbohydrates which are widely used by the food industry. Inulin and fructo-oligosaccharides (FOS) which are extracted from tubers such as chicory or Jerusalem artichoke are among the best described.12 These molecules cannot be digested by the host and are fermented by the colonic microbiota, selec-tively stimulating the growth of bifidobacteria.13 Regular intake of prebiotics has also been associated with health-promoting effects such as immune stimu-lation, improved calcium absorption and decreased trigly-ceridemia and cholesterolemia.14 In this study, we eva-luated the effects of a milk formula supplemented with La1 or FOS upon the colonic microbiota of bottle-fed in-fants compared to breast-fed infants, using culture me-thods and fluorescent in-situ hybridization (FISH). Subjects and methods Subjects The study was designed as a prospective, randomized and blinded clinical trial carried out in infants recruited at the “La Faena’ Health Care Center in the South Eastern Health District in Santiago, Chile. Parents of potential partici-pants were contacted at the regular Pediatric Clinic of the Health Care Center and, after careful explanation of the scope and aims of the project, those who agreed to the participation of their infants signed a written consent form. The project was approved by the Ethics Committee for Research in Humans of INTA, University of Chile. Healthy infants born at term, of either sex, 3.5 months old, with birth weight between 3,000 and 4,200 grams, who had not received antibiotic treatments in the month prior to enrolment were included in the study protocol. Exclusion criteria were multiple births, presence of any degree of malnutrition, or gastrointestinal, renal or other chronic diseases. Study design The study comprised four diet groups: a) a breastfed group (BF) consisting of infants whose mothers main-tained breastfeeding until the end of the observation period (at least 15 weeks after enrolment); b) a control group (Control) who received a standard infant formula available in the local market (Nan 2, Nestlé Chile, San-tiago, Chile); c) a prebiotic group (Prebio) who received the same formula but with FOS at a concentration of 2 grams per liter of prepared formula (Raftilose P95, Orafti, Tienen, Belgium) and, d) a probiotic group (Probio) who received the same formula but enriched with 108 living La1 per gram of powder. The formula groups included infants who had been spontaneously weaned at least 14 days before the beginning of the study; between their weaning and incorporation to the protocol, they were fed a milk formula provided nationwide by the
Ministry of Health. Each group received the study diet for 13 weeks following enrolment; in the two weeks following the end of the observation period, all formula-fed infants were given only the standard Nan 2 formula. The sample size was calculated as follows: experience with FISH counts for bifidobacteria gives a SD for log-counts of 0.6. In order to detect a difference in log-count of 0.5 at α=0.5 and a power of 80%, 24 subjects per diet group are required. To compensate for a 15% drop-out, 29 subjects per diet group had to be enrolled, i.e. a total of 116 infants for the four groups. Assignment of the infants to one of the three formula diets was carried out using a computer-generated randomization table. All formula products were letter-coded by the manufacturer such that neither the investigators, the field personnel nor the parents receiving the products were aware of its com-position. The code was broken after the data analysis ended. Formulae were placed into cold storage and deli-vered to the field station at “La Faena” as required, where they were also kept refrigerated. Formulae were perio-dically tested by Nestlé to ascertain that the probiotic concentrations remained constant during the time course of the study (analysis at release, and 15 and 24 months after production). A total of 3kg of powdered formula were delivered monthly for each child and mothers were carefully instructed on its appropriate preparation. Mo-thers were also informed that their infant should not receive yogurt or any other fermented foodstuffs through-out the duration of the study. Children who received antibiotics for any condition during the follow up period were excluded from the protocol. Data and sample collection Parents were advised to report with their infant every 15 days at the Pediatric Clinic established for this study for health status evaluation and for weight and body length measurements. On this occasion, mothers received a stan-dardized Diet Record Form designed to register pro-spectively information about food intake for a two week period; items registered were volumes of formula intake, possible intake of yogurt or other fermented food-stuffs, any non dairy products provided to the infants, and possible adverse reactions (including spitting up, vo-miting, diarrhea, skin rashes, nasal discharge, cough and difficulty breathing). One week after receiving the Form at the Health Center the child was visited at home by a Registered Nurse from the Project who reviewed in detail with the mother the information accumulated. The nurse took advantage of this visit to stress the importance of the proper preparation of the formula, the need to avoid pro-viding yogurt or similar products and underlined the need for a visit to the Field Station in a week’s time. If the mother failed to keep the appointment, the nurse would visit the home and drive the mother with her child to the Station for consultation with the pediatricians partici-pating in the project. In this way, each mother had a contact with the research team at least once weekly. If the infant became ill, mothers had free access to the Project pediatricians. The nurses also undertook unsche-duled visits to the homes to verify the compliance with the instructions provided. All children had to take at least 500 ml of the allocated formula daily. The protocol was

370 Effects of probiotic or prebiotic supplemented milk formulas on fecal microbiota composition of infants
inserted within the framework of the National Nutrition Program of the Ministry of Health and in consequence, around weeks 15-16 of the project, when infants were 6 months of age, a vegetable soup and some mashed fruits had to be introduced in the infant’s diet to comply with the governmental dispositions. Fecal samples were co-llected on the day of enrolment (sample 1), after 7 weeks of ingesting the study diets (sample 2), and 2 weeks after the study diet had been interrupted, when all the infants were fed the standard Nan 2 formula (sample 3). Bacterial cultures For culture studies, 5 to 10 grams of feces were collected with a sterile spatula immediately after emission, placed into a sterile glass container placed in an anaerobic jar with an Anaero Gen pack, and stored at 4ºC until trans-port to the laboratory. No more than 2 hours elapsed be-tween sampling and arrival at the laboratory for imme-diate processing. An aliquot of stool was homogenized, serially diluted, inoculated onto semi-selective media, and incubated under anaerobic conditions. Bifidobacterium species were cultured in Eugon Agar, Lactobacillus in MRS Agar with antibiotics, Clostridium in NN Agar and Bacteroides in Schaedler Agar with antibiotics. After incubation, the colonies were counted and further iden-tified. Lactobacilli and bifidobacteria strains were iden-tified by microscopy, and biochemically using the API gallery system (BioMérieux, Paris, France), API 50 CHL gallery for lactobacilli and API ID 32A gallery for bifidobacteria, respectively. Enterococcus and Entero-bacteria were cultured under aerobic conditions in Bile-Azide Esculin Agar and in Violet Red Agar, re-spectively.15 Bacterial counts are expressed as log10 colony-forming units (CFUs) per gram of fresh fecal sample, with detection limit at 3.30 cfu/g. Duplicate stool samples obtained on the same occasion were placed into cryotubes containing sterile glycerol, frozen in liquid nitrogen and kept at –70ºC. These samples were shipped periodically to the Nestlé Research Centre (Vers-chez-les-Blanc, Lausanne, Switzerland) for La1 determination and to the University of Reading for fluorescent in situ hybridization (FISH) study. Presence of La1 was moni-tored by random amplification of polymorphisms DNA (RAPD) fingerprint16,17 using the following oligos GGTT-GGGTGAGAATTGCACG and CGGCCAGCTGGTCA-GCC (Microsynth, Balgach, Switzerland); this technique identifies strain-specific fingerprints. For detection of enteropathogens, a rectal swab was obtained on the same occasion as the sample just de-scribed and conserved in transport medium. The swab was plated onto culture media for the isolation and iden-tification of Salmonella and Shigella (XLD Agar with previous inoculation in pre-enrichment and enrichment broths), Campylobacter (Skirrow Agar) and E. coli classical serotypes, invasive and enterohemorrhagic (EMB and MacConkey Agar). Strains biochemically considered as pathogens were confirmed by using the API gallery system or by PCR and confirmed by serological tests.
Fluorescent in situ hybridisation (FISH) The probes used in the study were Bif164 and Chis150, specific for Bifidobacterium and Clostridium histolyticum cluster including C. perfringens, respectively.18,19 These were commercially synthesized and 5’ labeled with the fluorescent dye Cy3 (MWG Biotech, Germany). The nucleic acid stain DAPI (4’, 6-diamidino-2-phenylindole) was used for total counts.20 Samples were diluted (1:3 v/v) and fixed overnight at 4°C with 4% (w/v) para-formaldehyde; the cells were washed with PBS, resus-pended in a mixture of PBS/ethanol (1:1 v/v) and stored at – 20°C.26 Sixteen microliters of the PBS/ethanol cell suspension were added to 200 µl of pre-warmed hybri-dization buffer (40mM Tris-HCl, 1.8M NaCl, pH 7.2) and 64µl of HPLC grade water (Fisher Scientific, Lough-borough, UK). Ninety micro-liters of the hybridization mixture were then added to 10µl of each probe (50ng/µl) and hybridized for 24h at 50°C. The cells were washed at their respective hybridization temperatures for 30 min in 5 ml of wash buffer (20mM Tris-HCl, 0.9M NaCl, and pH 7.2). The cells were then vacuum filtered onto a 0.2 µm Isopore membrane filter (Millipore Cor-poration, Watford, UK) which was then mounted on a microscope slide with SlowFade (Molecular Probes, Leiden, The Netherlands) and examined using a Nikon Eclipse E400 fluorescent microscope. The 455nm-excitation filter was used to illuminate DAPI stained cells and the 510nm filter was used to count the hybridized cells. At least fifteen random fields of view were counted on each slide and the average count used for analysis. The probes used in this study were Bif164 with a sequence of 5’-CATCCGGCA TTACCACCC-3’18 and Chis150 with a sequence of 5’-TTATGCGGTATTAATAT(C/T)CCTTT-3’19. Statistical analysis Results were expressed as means ± SD. Data were ana-lyzed as “Intention To Treat” (ITT) taking in account all available data, including those from drop-out subjects, and as “Per Protocol” (PP) including only those infants who completed the study. The number of observed ad-verse events per subject was compared by one-way ANO-VA. Fecal bacterial levels were log-transformed and com-pared between the three formulas using one way ANO-VA. In case of positive ANOVA results, formula groups were compared between them with the Tukey pair-wise multiple comparison test. The breast-fed group was com-pared to each of the formula group using the two sample t-test. Results Characteristics of the study groups A total of 116 infants were enrolled; because of drop outs, the number of infants under observation decreased, with 76 completing the entire protocol (34.0% drop out rate). Reasons for dropping out were intercurrent illness in 7 subjects (17.5%), antibiotic use in 15 (37.5%), and volun-tary withdrawal from the protocol or non-compliance with the diet in 18 (45%). None of the withdrawals was associated with adverse reactions to the formulas. No
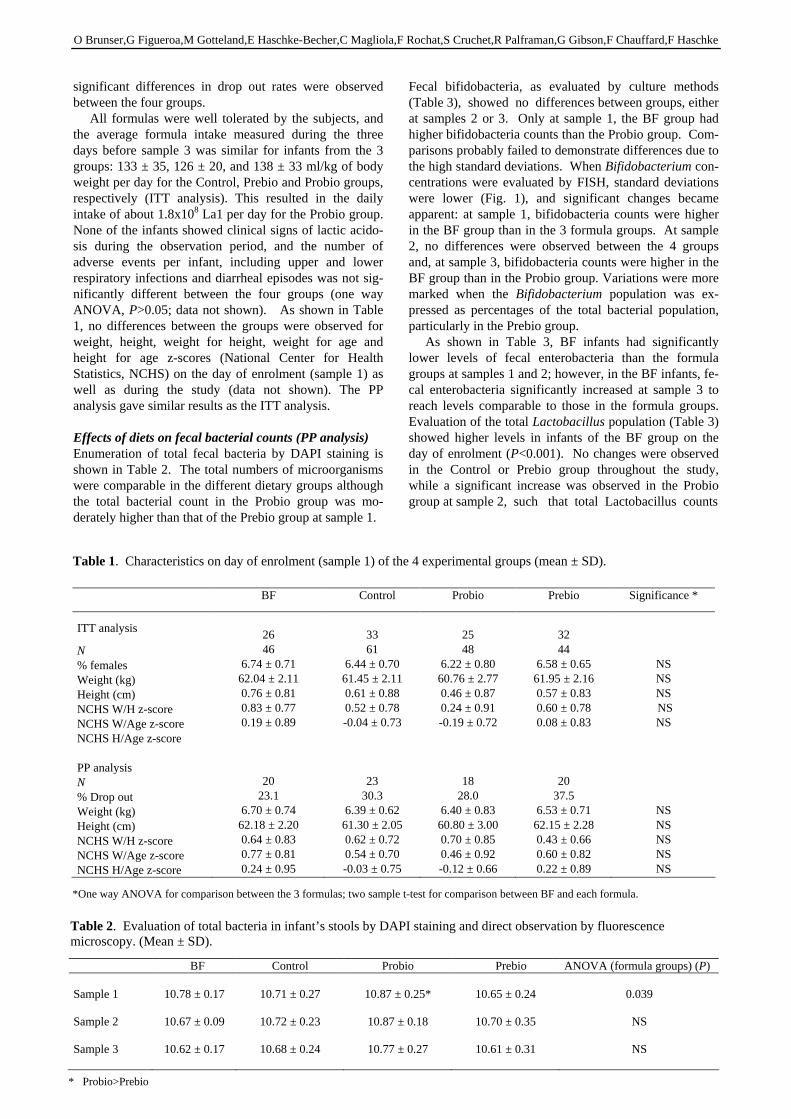
O Brunser,G Figueroa,M Gotteland,E Haschke-Becher,C Magliola,F Rochat,S Cruchet,R Palframan,G Gibson,F Chauffard,F Haschke
significant differences in drop out rates were observed between the four groups. All formulas were well tolerated by the subjects, and the average formula intake measured during the three days before sample 3 was similar for infants from the 3 groups: 133 ± 35, 126 ± 20, and 138 ± 33 ml/kg of body weight per day for the Control, Prebio and Probio groups, respectively (ITT analysis). This resulted in the daily intake of about 1.8x10⁸ La1 per day for the Probio group. None of the infants showed clinical signs of lactic acido-sis during the observation period, and the number of adverse events per infant, including upper and lower respiratory infections and diarrheal episodes was not sig-nificantly different between the four groups (one way ANOVA, P>0.05; data not shown). As shown in Table 1, no differences between the groups were observed for weight, height, weight for height, weight for age and height for age z-scores (National Center for Health Statistics, NCHS) on the day of enrolment (sample 1) as well as during the study (data not shown). The PP analysis gave similar results as the ITT analysis. Effects of diets on fecal bacterial counts (PP analysis) Enumeration of total fecal bacteria by DAPI staining is shown in Table 2. The total numbers of microorganisms were comparable in the different dietary groups although the total bacterial count in the Probio group was mo-derately higher than that of the Prebio group at sample 1.
Fecal bifidobacteria, as evaluated by culture methods (Table 3), showed no differences between groups, either at samples 2 or 3. Only at sample 1, the BF group had higher bifidobacteria counts than the Probio group. Com-parisons probably failed to demonstrate differences due to the high standard deviations. When Bifidobacterium con-centrations were evaluated by FISH, standard deviations were lower (Fig. 1), and significant changes became apparent: at sample 1, bifidobacteria counts were higher in the BF group than in the 3 formula groups. At sample 2, no differences were observed between the 4 groups and, at sample 3, bifidobacteria counts were higher in the BF group than in the Probio group. Variations were more marked when the Bifidobacterium population was ex-pressed as percentages of the total bacterial population, particularly in the Prebio group. As shown in Table 3, BF infants had significantly lower levels of fecal enterobacteria than the formula groups at samples 1 and 2; however, in the BF infants, fe-cal enterobacteria significantly increased at sample 3 to reach levels comparable to those in the formula groups. Evaluation of the total Lactobacillus population (Table 3) showed higher levels in infants of the BF group on the day of enrolment (P<0.001). No changes were observed in the Control or Prebio group throughout the study, while a significant increase was observed in the Probio group at sample 2, such that total Lactobacillus counts
BF Control Probio Prebio Significance *
ITT analysis
N % females Weight (kg) Height (cm) NCHS W/H z-score NCHS W/Age z-score NCHS H/Age z-score PP analysis N % Drop out Weight (kg) Height (cm) NCHS W/H z-score NCHS W/Age z-score NCHS H/Age z-score
26 46
6.74 ± 0.71 62.04 ± 2.11 0.76 ± 0.81 0.83 ± 0.77 0.19 ± 0.89
20 23.1
6.70 ± 0.74 62.18 ± 2.20 0.64 ± 0.83 0.77 ± 0.81 0.24 ± 0.95
33 61
6.44 ± 0.70 61.45 ± 2.11 0.61 ± 0.88 0.52 ± 0.78 -0.04 ± 0.73
23 30.3
6.39 ± 0.62 61.30 ± 2.05 0.62 ± 0.72 0.54 ± 0.70 -0.03 ± 0.75
25 48
6.22 ± 0.80 60.76 ± 2.77 0.46 ± 0.87 0.24 ± 0.91 -0.19 ± 0.72
18 28.0
6.40 ± 0.83 60.80 ± 3.00 0.70 ± 0.85 0.46 ± 0.92 -0.12 ± 0.66
32 44
6.58 ± 0.65 61.95 ± 2.16 0.57 ± 0.83 0.60 ± 0.78 0.08 ± 0.83
20 37.5
6.53 ± 0.71 62.15 ± 2.28 0.43 ± 0.66 0.60 ± 0.82 0.22 ± 0.89
NS NS NS NS NS
NS NS NS NS NS
Table 1. Characteristics on day of enrolment (sample 1) of the 4 experimental groups (mean ± SD).
*One way ANOVA for comparison between the 3 formulas; two sample t-test for comparison between BF and each formula.
BF Control Probio Prebio ANOVA (formula groups) (P) Sample 1 Sample 2 Sample 3
10.78 ± 0.17
10.67 ± 0.09
10.62 ± 0.17
10.71 ± 0.27
10.72 ± 0.23
10.68 ± 0.24
10.87 ± 0.25*
10.87 ± 0.18
10.77 ± 0.27
10.65 ± 0.24
10.70 ± 0.35
10.61 ± 0.31
0.039
NS
NS
Table 2. Evaluation of total bacteria in infant’s stools by DAPI staining and direct observation by fluorescence microscopy. (Mean ± SD).
* Probio>Prebio
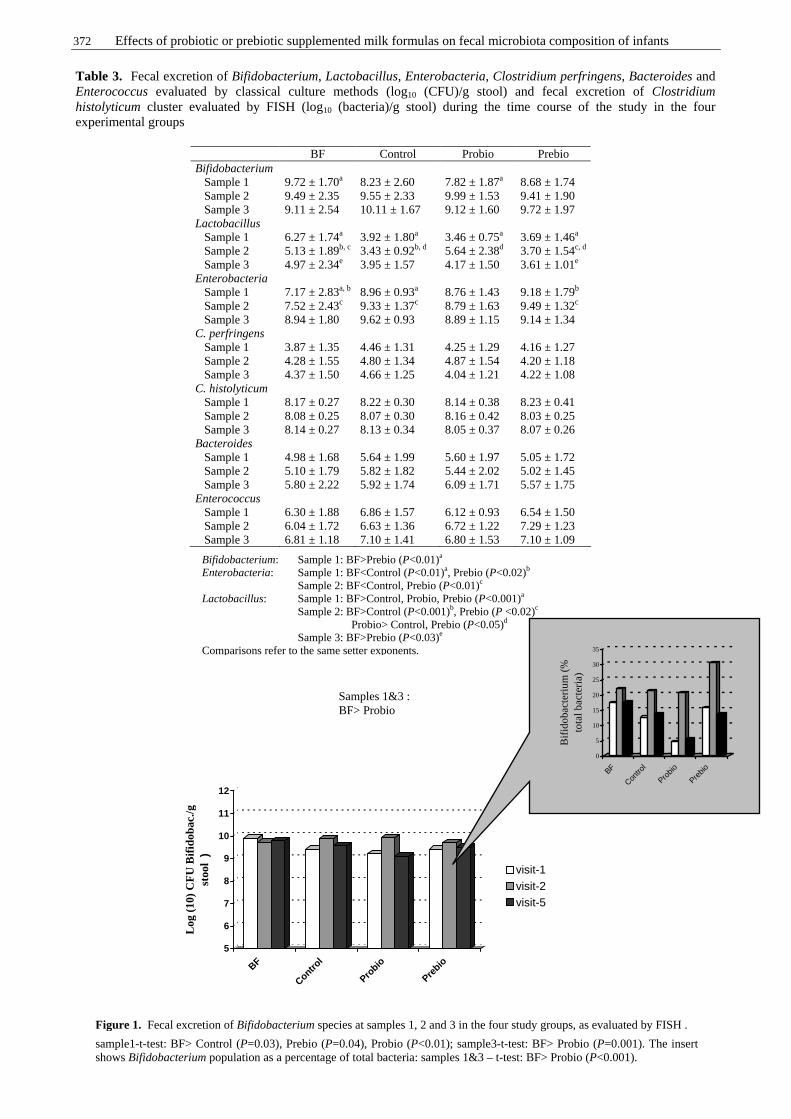
372 Effects of probiotic or prebiotic supplemented milk formulas on fecal microbiota composition of infants
BF Control Probio Prebio Bifidobacterium Sample 1 Sample 2 Sample 3
9.72 ± 1.70a
9.49 ± 2.35 9.11 ± 2.54
8.23 ± 2.60 9.55 ± 2.33 10.11 ± 1.67
7.82 ± 1.87a
9.99 ± 1.53 9.12 ± 1.60
8.68 ± 1.74 9.41 ± 1.90 9.72 ± 1.97
Lactobacillus Sample 1 Sample 2 Sample 3
6.27 ± 1.74a
5.13 ± 1.89b, c
4.97 ± 2.34e
3.92 ± 1.80a
3.43 ± 0.92b, d
3.95 ± 1.57
3.46 ± 0.75a
5.64 ± 2.38d
4.17 ± 1.50
3.69 ± 1.46a
3.70 ± 1.54c, d
3.61 ± 1.01e
Enterobacteria Sample 1 Sample 2 Sample 3
7.17 ± 2.83a, b
7.52 ± 2.43c
8.94 ± 1.80
8.96 ± 0.93a
9.33 ± 1.37c
9.62 ± 0.93
8.76 ± 1.43 8.79 ± 1.63 8.89 ± 1.15
9.18 ± 1.79b
9.49 ± 1.32c
9.14 ± 1.34 C. perfringens Sample 1 Sample 2 Sample 3
3.87 ± 1.35 4.28 ± 1.55 4.37 ± 1.50
4.46 ± 1.31 4.80 ± 1.34 4.66 ± 1.25
4.25 ± 1.29 4.87 ± 1.54 4.04 ± 1.21
4.16 ± 1.27 4.20 ± 1.18 4.22 ± 1.08
C. histolyticum Sample 1 Sample 2 Sample 3
8.17 ± 0.27 8.08 ± 0.25 8.14 ± 0.27
8.22 ± 0.30 8.07 ± 0.30 8.13 ± 0.34
8.14 ± 0.38 8.16 ± 0.42 8.05 ± 0.37
8.23 ± 0.41 8.03 ± 0.25 8.07 ± 0.26
Bacteroides Sample 1 Sample 2 Sample 3
4.98 ± 1.68 5.10 ± 1.79 5.80 ± 2.22
5.64 ± 1.99 5.82 ± 1.82 5.92 ± 1.74
5.60 ± 1.97 5.44 ± 2.02 6.09 ± 1.71
5.05 ± 1.72 5.02 ± 1.45 5.57 ± 1.75
Enterococcus Sample 1 Sample 2 Sample 3
6.30 ± 1.88 6.04 ± 1.72 6.81 ± 1.18
6.86 ± 1.57 6.63 ± 1.36 7.10 ± 1.41
6.12 ± 0.93 6.72 ± 1.22 6.80 ± 1.53
6.54 ± 1.50 7.29 ± 1.23 7.10 ± 1.09
Table 3. Fecal excretion of Bifidobacterium, Lactobacillus, Enterobacteria, Clostridium perfringens, Bacteroides and Enterococcus evaluated by classical culture methods (log10 (CFU)/g stool) and fecal excretion of Clostridium histolyticum cluster evaluated by FISH (log10 (bacteria)/g stool) during the time course of the study in the four experimental groups
Bifidobacterium: Sample 1: BF>Prebio (P<0.01)a Enterobacteria: Sample 1: BF<Control (P<0.01)a, Prebio (P<0.02)b
Sample 2: BF<Control, Prebio (P<0.01)c Lactobacillus: Sample 1: BF>Control, Probio, Prebio (P<0.001)a Sample 2: BF>Control (P<0.001)b, Prebio (P <0.02)c
Probio> Control, Prebio (P<0.05)d
Sample 3: BF>Prebio (P<0.03)e Comparisons refer to the same setter exponents.
5
6
7
8
9
10
11
12
Log
(10
) C
FU
Bif
idob
ac./g
st
ool
)
BF
Control
Probio
Prebio
visit-1visit-2visit-5
0
5
10
15
20
25
30
35
Bifi
do
bact
eriu
m (
%
tota
l ba
cte
ria)
BF
Contro
l
Probio
Prebio
Figure 1. Fecal excretion of Bifidobacterium species at samples 1, 2 and 3 in the four study groups, as evaluated by FISH .
sample1-t-test: BF> Control (P=0.03), Prebio (P=0.04), Probio (P<0.01); sample3-t-test: BF> Probio (P=0.001). The insert shows Bifidobacterium population as a percentage of total bacteria: samples 1&3 – t-test: BF> Probio (P<0.001).
Samples 1&3 : BF> Probio

O Brunser,G Figueroa,M Gotteland,E Haschke-Becher,C Magliola,F Rochat,S Cruchet,R Palframan,G Gibson,F Chauffard,F Haschke
were higher than in the other two formula groups at this time; after interruption of the Probio formula, Lacto-bacillus tended to return to their pretest levels. The presence of fecal La1 was also determined in all the infants (Table 4). At sample 1, before the beginning of formula administration, one child was La1-positive in the control and Probio groups. The infant who was La1-positive in the Control group remained positive through-out the study. Fifteen (88%) of the infants who ingested the La1-containing formula excreted the bacteria in their stools on sample 2; however, two weeks after they had interrupted the intake of the formula, only 3 children (17%) continued excreting La1, but with levels similar to those observed at sample 2. No differences between groups were observed in fecal C. perfringens counts evaluated by culture methods, neither in the counts of C. histolyticum cluster detected by FISH (Table 3). No changes in fecal Bacteroides or Entero-coccus (Table 3) populations were observed when com-paring the groups in the three stages of the study, nor were intra-group variations observed throughout its time course. Effects of treatments on fecal enteropathogens Search of enteropathogens in stool samples from the four groups showed absence of Salmonella, Shigella or entero-invasive E. coli (EHEC). Two major entero-pathogens were isolated in this study, enteropathogenic E. coli (EPEC) and Campylobacter jejuni, but no differences were found between the groups studied. EPEC were de-tected in 12%, 9%, 9% and 16% of stools from the BF, Control, Prebio and Probio groups, respectively and C. jejuni was detected in 4% and 3% of stools from the BF and Control groups, respectively, and was not detected in the other two groups.
Discussion The colonic microbiota is a complex ecosystem which plays an important role in the maintenance of health and in the pathogenesis of various diseases.3 During the last decade, efforts have been made to influence this micro-biota through the administration of substances and/or microorganisms such as prebiotics, probiotics or syn-biotics with the aim of selectively stimulating the growth of bacteria capable of health-promoting functions, spe-cially bifidobacteria or lactobacilli. In the present study, we examined whether supplementation of milk-formulas with a prebiotic or a probiotic strain modulates the fecal microbiota of bottle-fed infants; these results were com-pared with the fecal flora of BF infants. Although some studies have observed a predominance of coliforms or Bacteroides in the colonic microbiota21,22, Bifidobac-terium is usually the predominant genus in BF infants.23,24 Our results confirm these observations because on the day of enrolment, bifidobacteria accounted for almost 20% of the total fecal population of the BF infants, while per-centages as low as 4.6% were observed in the formula-fed infants. Moreover, in the first sampling, fecal counts of lactobacilli, another “beneficial” species, were also higher in the BF group. This may be explained by the presence of galacto-oligosaccharides in the human milk and also by the release in the intestine of bioactive peptides resulting from the digestion of human milk proteins, which are known to stimulate the growth of both Bifido-bacterium and Lactobacillus in the colon.25,26 Infants fed cow’s milk-formulas that do not contain such factors, develop a more complex microbiota with higher counts of facultative anaerobes, Bacteroides and clostridia.21,26-28 Our results at the time of enrolment confirm partially these observations because fecal enterobacteria counts were higher in formula-fed infants, with no differences for Clostridium, Bacteroides or Enterococcus, compared to the BF group. As previously discussed, Bifidobacterium counts at the beginning of the study were higher in BF compared to formula-fed groups, but this difference disappeared at the time of the second fecal sampling, maybe due to the beginning of food diversification at weaning. An increase of bifidobacteria was expected in the Prebio group, as fructo-oligosaccharides are a preferential substrate for these microorganisms.6 This increase of bifidobacteria in the Prebio group was not significant when expressed as absolute counts, but it became significant when expressed as percentage of the total bacteria population detected by FISH. In the case of Probio the increase of bifidobacteria may be explained as a response to La1 in the intestinal lumen; in effect, it has been recently shown that this microorganism synthesizes and releases fructans that sti-mulate Bifidobacterium growth.29 We recently observed a similar finding in adult volunteers consuming a La1-containing product.30 No differences in lactobacilli counts were observed between the 3 formula-groups. Throughout the study, a decrease in fecal lactobacilli was observed and a similar change was found for Bifidobacterium in the BF group; simultaneously with this decrease, a moderate increase in
BF Control Probio Prebio Sample 1
Nº of La1-positive subject
Log CFU La1/g stool
0 0
1/22 5.79
1/18 3.30
0 -
Sample 2
Nº of La1-positive subject
Log CFU La1/g stool
0 0
1/22 4.86
15/17 6.38±1.11
0 -
Sample 3
Nº of La1-positive subject
Log CFU La1/g stool
0 0
1/22 6.20
3/18 5.21±1.73
0 -
Table 4. Number of La1-positive infants and fecal excretion of La1 in the four experimental groups at the three steps of the study
374 Effects of probiotic or prebiotic supplemented milk formulas on fecal microbiota composition of infants
enterobacteria and Enterococcus was observed, suggesting that their colonic microbiota was gradually becoming more complex. As expected, our results showed a sig-nificant increase of fecal lactobacilli in the Probio group between the first and the second samples, their counts being higher than in the other formula-fed groups. Addition of La1 to the infant formula was interesting as this probiotic has been shown to stimulate local and systemic immune responses, to modulate mucosal in-flammatory processes,6,7 and to interfere with a wide range of pathogens.8-11 We observed fecal excretion levels of about 2.4x10⁶ CFU of living La1/g stool in 88% of the infants of the Probio group at the second fecal sampling, reflecting its survival during transit along the gastrointestinal tract. Although it is thought that ingested lactobacilli may compete with the autochthonous micro-biota, this was not observed in our study in the Probio group, probably because lactobacilli remained subdo-minant in the microbiota despite the intake of La1. Two infants from the Probio group did not excrete La1 and as only one stool sample was obtained during the period of formula intake, it is difficult to know whether this ab-sence was due to problems in sample processing or to host factors. Two weeks after completing administration of the formula, La1 was present in the feces of only 3 of the subjects (17%), but at lower fecal concentrations (1.6x10⁵ CFU/g). This confirms data obtained with other strains of Lactobacillus31 and Bifidobacterium32 indi-cating that probiotics do not colonize the gastrointestinal tract, but are eliminated after their administration ends. On the other hand, one infant from the control group appeared to be colonized with lactobacilli genetically close to La1; the molecular technique was unable to differentiate between the two bacteria. Similar findings occurred in a clinical trial carried out in Peruvian children with Lactobacillus GG.33 We cannot compare the culture and FISH techniques for the Clostridium because the former detects C. per-fringens, whereas FISH detects the C. histolyticum cluster which includes C. perfringens and other Clostridium spe-cies. Regarding bifidobacteria, again different results were obtained with the two techniques, which confirms Gibson’s former observations.34 However, the standard deviations of results obtained by FISH in our study were lower than those obtained by culture, allowing detection of differences in bifidobacteria counts between groups, which were not observed by culture methods. Finally, we were also interested in evaluating whether pre or probiotic supplementation decreased pathogens in the intestinal tract of the infants. We previously observed that an acidified milk with S. thermophilus and L. helveticus decreased asymptomatic fecal shedding of enteropathogens in children35, a possible cause of chronic environmental enteropathy.36, 37 In the present study we did not observe effects on the detection of entero-pathogens possibly associated with the prebiotic or the probiotic due to their low frequency in the fecal samples. This is probably related to the considerable decrease in microbiological contamination of the environment re-sulting from improved socioeconomic and hygienic con-ditions in Chile.
In conclusion, this study confirms a predominance of bifidobacteria and the presence of lactobacilli in higher counts in BF infants than in formula-fed infants. The concentration of fructo-oligosaccharides used in this study showed little effect on the host microbiota, whereas regular intake of a formula containing La1 leads to fecal lactobacilli counts similar to those in BF infants. References 1. Mountzouris KC, McCartney AL, Gibson GR. Intestinal
microflora of human infants and current trends for its nutritional modulation. Br J Nutr 2002; 87: 405-420.
2. Wold AE, Adlerberth I. Breast feeding and the intestinal microflora of the infant - implications for protection against infectious diseases. Adv Exp Med Biol 2000; 478: 77-93.
3. Hart AL, Stagg AJ, Frame M, Graffner H, Glise H, Falk P, Kamm MA. The role of the gut flora in health and disease, and its modification as therapy. Aliment Pharmacol Ther 2002; 16: 1383-1393.
4. Salminen SJ, Gueimonde M, Isolauri E. Probiotics that modify disease risk. J Nutr 2005; 135: 1294-8.
5. Granato D, Perotti F, Masserey I, et al. Cell surface-associated lipoteichoic acid acts as an adhesion factor for attachment of Lactobacillus johnsonii La1 to human enterocyte-like Caco-2 cells. Appl Environ Microbiol 1999 ; 65 : 1071-1077.
6. Link-Amster H, Rochat F, Saudan KY, Mignot O, Aeschliman JM. Modulation of a specific humoral immune response and changes in intestinal flora mediated through fermented milk intake. FEMS Immunol Med Microbiol 1994; 10: 55-63.
7. Schiffrin EJ, Rochat F, Link-Amster H, Aeschlimann JM, Donnet-Hughes A. Immunomodulation of human blood cells following the ingestion of lactic acid bacteria. J Dairy Sci 1995; 78: 491-497.
8. Vidal K, Donnet-Hughes A, Granato D. Lipoteichoic acids from Lactobacillus johnsonii strain La1 and Lactobacillus acidophilus strain La10 antagonize the responsiveness of human intestinal epithelial HT29 cells to lipopolysaccharide and gram-negative bacteria. Infect Immun 2002; 70: 2057-2064.
9. Bernet-Camard MF, Lievin V, Brassart D, Neeser JR, Servin AL, Hudault S. The human Lactobacillus acidophilus strain LA1 secretes a nonbacteriocin anti-bacterial substance(s) active in vitro and in vivo. Appl Environ Microbiol 1997 ; 63 : 2747-2753.
10. Michetti P, Dorta G, Wiesel PH, Brassart D, Verdu E, Herranz M, Felley C, Porta N, Rouvet M, Blum AL, Corthesy-Theulaz I. Effect of whey-based culture supernatant of Lactobacillus acidophilus (johnsonii) La1 on Helicobacter pylori infection in humans. Digestion 1999; 60: 203-209.
11. Cruchet S, Obregon MC, Salazar G, Díaz E, Gotteland M. Effect of the ingestion of a dietary product containing Lactobacillus johnsonni La1 on Helicobacter pylori colonization in children. Nutrition 2003; 19: 716-21.
12. Flamm Glinsmann W, Kritchevsky D, Prosky L, Roberfroid M. Inulin and oligofructose as dietary fiber: a review of the evidence. Crit Rev Food Sci Nutr 2001; 41: 353-362.
13. Gibson GR, Roberfroid MB. Dietary modulation of the human colonic microbiota: introducing the concept of prebiotics. J Nutr 1995; 125: 1401-1412.
14. Kolida S, Tuohy K, Gibson GR. Prebiotic effects of inulin and oligofructose. Br J Nutr 2002; 87 (Suppl 2):S193-197.
O Brunser,G Figueroa,M Gotteland,E Haschke-Becher,C Magliola,F Rochat,S Cruchet,R Palframan,G Gibson,F Chauffard,F Haschke
15. Manual of clinical microbiology. 7th edition. PR Murray, Editor. Washington DC: ASM Press 1999, 438-41.
16. Welsh J, McClelland M. Fingerprinting genomes using PCR with arbitrary primers. Nucleic Acids Research 1990; 18: 7213-7218.
17. Johansson ML, Quednau M, Molin G, Ahrne S. Random amplified polymorphic DNA (RAPD) for typing Lactobacillus plantarum strains. Lett Appl Microbiol 1995; 21: 155-159.
18. Langendijk PS, Schut F, Jabsen GJ, Raangs GC, Kamphuis GR, Wilkinson MH, Welling GW. Quan-titative fluorescence in situ hybridization of bifidobacteria spp with genus-specific 16S rRNA-targeted probes and its application in fecal samples. J Appl Microbiol 1995; 61: 3069-3075.
19. Franks AH, Harmsen HJM, Raangs GC, Jansen GJ, Schut F, Welling GW. Variations of bacterial populations in human faeces measured by fluorescent in situ hybri-disation with group specific 16S rRNA-targeted oligo-nucleotide probes. Appl Environ Microbiol 1998; 64: 3336-3345.
20. Porter KG, Feig YS. The use of DAPI for identifying and counting aquatic microflora. Am Soc Limnol Oceanog 1980; 25: 943-948.
21. Lundequist B, Nord CE, Winberg J. The composition of the faecal microflora in breastfed and bottle fed infants from birth to eight weeks. Acta Paediatr Scand 1985; 74: 45-51.
22. Simhon A, Douglas JR, Drasar BS, Soothill JF. Effect of feeding on infants' faecal flora. Arch Dis Child 1982; 57: 54-58.
23. Kelleher SL, Lönnerdal B. Immunological activities associated with milk. Adv Nutr Res 2001; 10: 39-65.
24. Kunz C, Rudloff S, Baier W, Klein N, Strobel S. Oligo-saccharides in human milk: structural, functional, and metabolic aspects. Annu Rev Nutr 2000 ; 20: 699-722.
25. Liepke C, Adermann K, Raida M, Magert HJ, Forsmann WG, Zucht HD. Human milk provides peptides highly stimulating the growth of bifidobacteria. Eur J Biochem 2002 ; 269 : 712-718.
26. Harmsen HJ, Wildeboer-Veloo AC, Raangs GC, Wagendorp AA, Klijn N, Bindels JG, Welling GW. Analysis of intestinal flora development in breast-fed and formula-fed infants by using molecular identification and detection methods. J Pediatr Gastroenterol Nutr 2000; 30: 61-67.
27. Mevissen-Verhage EA, Marcelis JH., de Vos MN, Harm-senvan Amerongen WC, Verhoef J. Bifidobacterium, Bacteroides, and Clostridium spp. in fecal samples from breast-fed and bottle-fed infants with and without iron supplement. J Clin Microbiol 1987 ; 25: 285-289.
28. Stark PL, Lee A. The microbial ecology of the large bowel of breast-fed and formula-fed infants during the first year of life. J Med Microbiol 1982; 15: 189-203.
29. Pridmore RD, Berger B, Desiere F, et al. The genome sequence of the probiotic intestinal bacterium Lacto-bacillus johnsonii NCC 533. Proc Natl Acad Sci USA 2004; 101: 2512-2517.
30. Garrido D, Suau A, Pochart P, Cruchet S, Gotteland M. Modulation of the fecal microbiota by the intake of a Lactobacillus johnsonii La1-containing product in human volunteers. FEMS Microbiol Lett 2005; 248: 249-256.
31. Goldin BR, Gorbach SL, Saxelin M, Barakat S, Gualtieri L, Salminen S. Survival of Lactobacillus species (strain GG) in human gastro-intestinal tract. Dig Dis Sci 1992; 37: 121-128.
32. Bouhnik Y, Pochart P, Marteau P, et al. Fecal recovery in humans of viable Bifidobacterium sp ingested in fermented milk. Gastroenterology 1992; 102: 875-878.
33. Oberhelman RA, Gilman RH, Sheen P, Taylor DN, Black RE, Cabrera L, Lescano AG, Meza R, Madico G. A placebo-controlled trial of Lactobacillus GG to prevent diarrhea in undernourished Peruvian children. J Pediatr 1999; 134: 15-20.
34. Harmsen HJM, Gibson GR, Elfferich P, Raang GC, Wildeboer-Veloo AC, Argaiz A, Roberfroid MB, Welling GW. Comparison of viable cell counts and fluorescence in situ hybridization using specific rRNA-based probes for the quantification of human fecal bacteria. FEMS Microbiology Letters 1999; 183:125-129.
35. Brunser O, Araya M, Espinoza J, Guesry PR, Secretin MC, Pacheco I. Effect of an acidified milk on diarrhoea and the carrier state in infants of low socio-economic stratum. Acta Paediatr Scand 1989; 78: 259-264.
36. Lutz M, Espinoza J, Arancibia A, Araya M, Pacheco I, Brunser I. Effect of structured dietary fiber on bioavailability of amoxicillin. Clin Pharmacol Ther 1987; 42: 220-224.
37. Brunser O, Araya M, Espinoza J, Figueroa G, Pacheco I, Lois I. Chronic environ-mental enteropathy in a tem-perate climate. Hum Nutr Clin Nutr 1987; 41: 251-261.
376 Effects of probiotic or prebiotic supplemented milk formulas on fecal microbiota composition of infants
Original Article Effects of probiotic or prebiotic supplemented milk formulas on fecal microbiota composition of infants Oscar Brunser MD
1, Guillermo Figueroa R.Tech 2, Martin Gotteland PhD
2, Elizabeth Haschke-Becher MD PhD
3, Corine Magliola Pharm4, Florence Rochat PhD
5, Sylvia Cruchet MD
2, Richard Palframan PhD6, Glenn Gibson PhD
6, Françoise Chauffard Pharm5,
and Ferdinand Haschke MD4
1Ultrastructure Laboratory 2 Microbiology Laboratory, Institute of Nutrition and Food Technology (INTA), University of Chile, J.P. Alessandri 5540, Santiago, Chile. 3 Department of Clinical Chemistry, University of Lausanne, Lausanne, Switzerland. 4 Nestec Ltd., Vevey, Switzerland. 5 Nestlé Research Center, Vers-chez-les-Blanc, Switzerland. 6Food Microbial Sciences Unit, School of Food Biosciences, University of Reading, Whiteknights, UK.
含有益生菌或益生元的婴儿配方奶的补充对婴儿的排泄物微生物组成含有益生菌或益生元的婴儿配方奶的补充对婴儿的排泄物微生物组成含有益生菌或益生元的婴儿配方奶的补充对婴儿的排泄物微生物组成含有益生菌或益生元的婴儿配方奶的补充对婴儿的排泄物微生物组成
的影响的影响的影响的影响
本研究的目的在于评价与母乳喂养(BF)的婴儿相比,用含益生元的左旋寡糖或者一种益
生菌的约氏乳酸菌 La1 (La1)是否能调节配方奶喂食的婴儿排泄物微生物的组成。90 名 4 个
月左右大的婴儿随机分成 3 组中的一组任意地接受 13 周:a)一个婴儿配方(对照),b) 婴
儿配方加了左旋寡糖的配方,或者 c) 婴儿配方加约氏乳酸菌(Probio)。在 13 周结束后,
所有的婴儿吃 2 周对照组配方。在这个课题中,26 个接受母乳喂养的婴儿形成 BF 组贯穿整
个课题。粪便样本分别在课题开始前、第 7 周和第 15 周采集。细菌群落数量用传统的培养
技术和荧光杂交法测定。76 名婴儿完成了本实验,在课题开始前,与配方喂食组相比、BF
组的婴儿粪便中双歧杆菌和乳酸菌数量比较多,肠杆菌数量比较少,在 7 和 15 周时这些差
别渐渐消失了。而梭菌属、似细菌或者肠球菌在这两组间课题开始前或者接下来的实验中均
没有差异。Probio 增加了粪便中乳酸菌数量;这组中 88%的婴儿在第 7 周时大便中排出活
的 La1,而在第 15 周时只有 17%的婴儿排出。在 3 个配方组中,在第 7 周双歧杆菌数量增
加,与 BF 相似。这些结果证明了与配方喂食组婴儿相比,在饮食多样化之前,母乳喂养婴
儿菌丛中大量的双歧杆菌属和乳酸菌属的存在,并且在婴儿消化道有存活的 La1。
关键词:关键词:关键词:关键词:母乳喂养、配方奶、左旋低聚糖、婴儿、肠道微生物、约氏乳酸菌 La1、益生元、
益生菌。
Asia Pac J Clin Nutr 2006;15 (3): 377-387 377
Original Article A population-based survey on infant feeding practice (0-2 years) in Hong Kong: breastfeeding rate and patterns among 3,161 infants below 6 months old Warren T K Lee, PhD, RD (UK)
1,2,3, Susan SH Lui, PhD, RD (USA) 1, Veronica Chan, MPH,
RD (USA) 1, Eric Wong MA
4 and Joseph Lau PhD
4
1Hong Kong Nutrition Association, PO Box 71290, Kowloon Central, Hong Kong SAR, 2Department of Orthopaedics & Traumatology, Faculty of Medicine, The Chinese University of Hong Kong, Prince of Wales Hospital, Shatin, Hong Kong SAR. 3Centre for Nutrition and Food Safety, School of Biomedical and Molecular Sciences, University of Surrey, Guildford, Surrey GU2 7XH, United Kingdom. 4Centre for Epidemiology and Biostatistics, School of Public Health, Faculty of Medicine, The Chinese University of Hong Kong, Prince of Wales Hospital, Shatin, Hong Kong SAR.
The prevalence of breastfeeding for the first 6 months in infants has been low in Hong Kong since the 1970s. In order to develop effective breastfeeding policies and promotion programs, an appraisal of feeding practices and factors related to initiation and early cessation of breastfeeding is necessary. A survey with a population-based representative sample was conducted to determine social-demographic, personal and cultural factors that influenced decision, duration and practice of infant feeding among infants 0-24 months old. This paper focuses on infants below 6 months old to study factors related to decision, duration and practice of breastfeeding. In 1993, 7,298 healthy infants were recruited from 46 Maternal-and-Child-Health-Clinics (MCHC) throughout Hong Kong, of whom 3161 were below 6 months old. The mother reported her feeding decision, duration and practice in a questionnaire. Breastfeeding rate was found to be very low (8.4%) for infants below 6 months old. Only 50.9% infants were breastfed. Infant formulae were widely given among partially breastfed infants. 45% mothers were full-time employed. Most mothers were aware of the benefits of breastfeeding to the infants and themselves. Husbands (43.3%) were regarded the most influential on initiation and duration on breastfeeding. Restricted food varieties (54%), sore nipple and breast engorgement (67%), perceived home confinement (41.5%) and perceived inadequate milk supply (31.7%) were major concerns upon breastfeeding. Furthermore, 76.9% mothers turned to MCHC staff for advice when they encountered difficulties during breastfeeding. In conclusion, the survey collected population-based representative data on factors determining initiation and early cessation of breastfeeding in Hong Kong in 1993. The findings will serve as a cornerstone in understanding the evolution of breastfeeding practice in Hong Kong. It merits further study to investigate how the confounders interplay to modulate initiation, duration and patterns of breastfeeding.
Key Words: breastfeeding, breastmilk, infant formulae, infants, Hong Kong. Introduction Breastmilk is an ideal natural food for infants. Exclusive breastfeeding up to 6 months is recommended by World Health Organization (WHO) and that breastfeeding can be extended to 2 years of age or beyond provided that there are appropriate complementary foods.1 Over the last 4 decades, both the initiation and duration of breastfeeding (BF) in Hong Kong has been low which coincides with rapid urbani-sation and economic development. According to the official figures, the rate of ever breastfeeding among newborns in Hong Kong was 68% in 1932 and this gradually declined to 45%, 11% and 5% in 1962, 1972 and 1977 respectively, the rate increased to 10% in 1982 and then plateaued off in 1984-1992 (~23-24%).2 Sporadic studies in the last three decades indicated that breastfeeding attempt was as high as 44% in 1967, and dropped to 5% by 1978,3 then increased
to 28% in 1983.4 Leung et al., 20025 compared ever breastfeeding rates of two large cohorts of infants born in 1987 and 1997 and found that the rate increased from 26.8% to 33.5% over a decade.
Correspondence address: Mr Eric Wong, Centre for Epidemiology and Biostatistics, School of Public Health, Faculty of Medicine, The Chinese University of Hong Kong, 5/F School of Public Health, Prince of Wales Hospital, Shatin, Hong Kong Fax: +852 2645 3098 Email: [email protected] Accepted 29th November, 2005
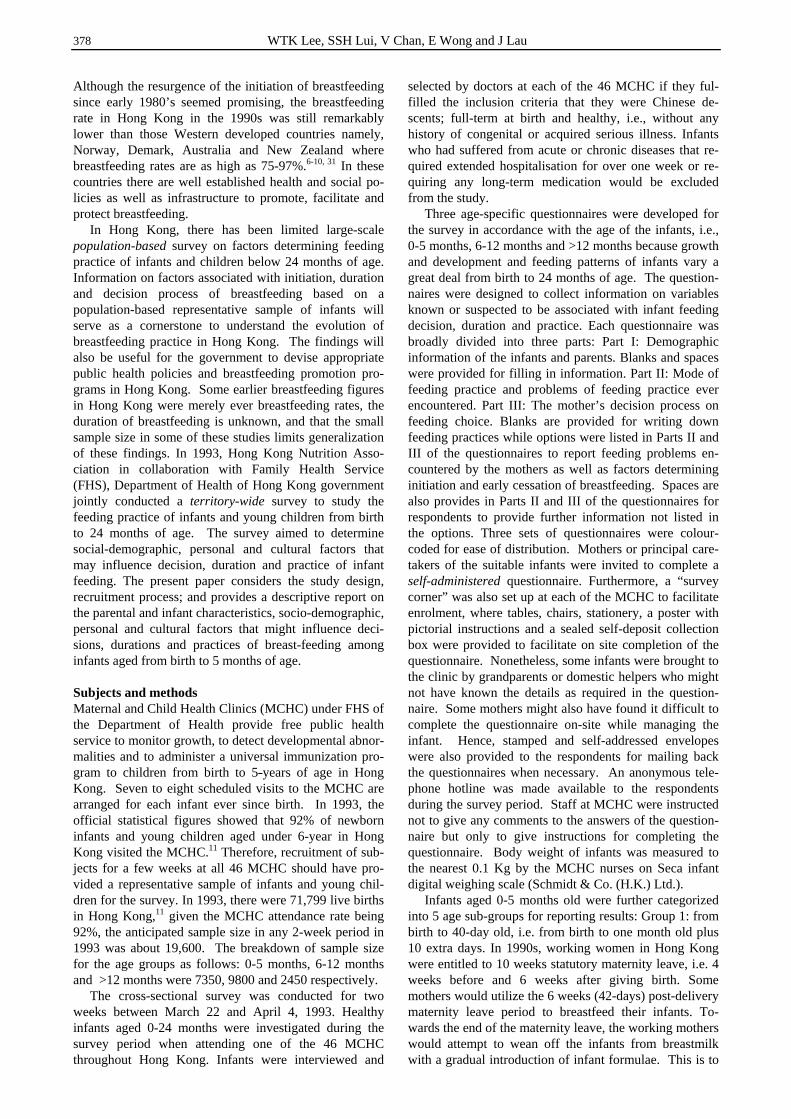
378 WTK Lee, SSH Lui, V Chan, E Wong and J Lau
Although the resurgence of the initiation of breastfeeding since early 1980’s seemed promising, the breastfeeding rate in Hong Kong in the 1990s was still remarkably lower than those Western developed countries namely, Norway, Demark, Australia and New Zealand where breastfeeding rates are as high as 75-97%.6-10, 31 In these countries there are well established health and social po-licies as well as infrastructure to promote, facilitate and protect breastfeeding. In Hong Kong, there has been limited large-scale population-based survey on factors determining feeding practice of infants and children below 24 months of age. Information on factors associated with initiation, duration and decision process of breastfeeding based on a population-based representative sample of infants will serve as a cornerstone to understand the evolution of breastfeeding practice in Hong Kong. The findings will also be useful for the government to devise appropriate public health policies and breastfeeding promotion pro-grams in Hong Kong. Some earlier breastfeeding figures in Hong Kong were merely ever breastfeeding rates, the duration of breastfeeding is unknown, and that the small sample size in some of these studies limits generalization of these findings. In 1993, Hong Kong Nutrition Asso-ciation in collaboration with Family Health Service (FHS), Department of Health of Hong Kong government jointly conducted a territory-wide survey to study the feeding practice of infants and young children from birth to 24 months of age. The survey aimed to determine social-demographic, personal and cultural factors that may influence decision, duration and practice of infant feeding. The present paper considers the study design, recruitment process; and provides a descriptive report on the parental and infant characteristics, socio-demographic, personal and cultural factors that might influence deci-sions, durations and practices of breast-feeding among infants aged from birth to 5 months of age. Subjects and methods Maternal and Child Health Clinics (MCHC) under FHS of the Department of Health provide free public health service to monitor growth, to detect developmental abnor-malities and to administer a universal immunization pro-gram to children from birth to 5-years of age in Hong Kong. Seven to eight scheduled visits to the MCHC are arranged for each infant ever since birth. In 1993, the official statistical figures showed that 92% of newborn infants and young children aged under 6-year in Hong Kong visited the MCHC.11 Therefore, recruitment of sub-jects for a few weeks at all 46 MCHC should have pro-vided a representative sample of infants and young chil-dren for the survey. In 1993, there were 71,799 live births in Hong Kong,11 given the MCHC attendance rate being 92%, the anticipated sample size in any 2-week period in 1993 was about 19,600. The breakdown of sample size for the age groups as follows: 0-5 months, 6-12 months and >12 months were 7350, 9800 and 2450 respectively. The cross-sectional survey was conducted for two weeks between March 22 and April 4, 1993. Healthy infants aged 0-24 months were investigated during the survey period when attending one of the 46 MCHC throughout Hong Kong. Infants were interviewed and
selected by doctors at each of the 46 MCHC if they ful-filled the inclusion criteria that they were Chinese de-scents; full-term at birth and healthy, i.e., without any history of congenital or acquired serious illness. Infants who had suffered from acute or chronic diseases that re-quired extended hospitalisation for over one week or re-quiring any long-term medication would be excluded from the study. Three age-specific questionnaires were developed for the survey in accordance with the age of the infants, i.e., 0-5 months, 6-12 months and >12 months because growth and development and feeding patterns of infants vary a great deal from birth to 24 months of age. The question-naires were designed to collect information on variables known or suspected to be associated with infant feeding decision, duration and practice. Each questionnaire was broadly divided into three parts: Part I: Demographic information of the infants and parents. Blanks and spaces were provided for filling in information. Part II: Mode of feeding practice and problems of feeding practice ever encountered. Part III: The mother’s decision process on feeding choice. Blanks are provided for writing down feeding practices while options were listed in Parts II and III of the questionnaires to report feeding problems en-countered by the mothers as well as factors determining initiation and early cessation of breastfeeding. Spaces are also provides in Parts II and III of the questionnaires for respondents to provide further information not listed in the options. Three sets of questionnaires were colour-coded for ease of distribution. Mothers or principal care-takers of the suitable infants were invited to complete a self-administered questionnaire. Furthermore, a “survey corner” was also set up at each of the MCHC to facilitate enrolment, where tables, chairs, stationery, a poster with pictorial instructions and a sealed self-deposit collection box were provided to facilitate on site completion of the questionnaire. Nonetheless, some infants were brought to the clinic by grandparents or domestic helpers who might not have known the details as required in the question-naire. Some mothers might also have found it difficult to complete the questionnaire on-site while managing the infant. Hence, stamped and self-addressed envelopes were also provided to the respondents for mailing back the questionnaires when necessary. An anonymous tele-phone hotline was made available to the respondents during the survey period. Staff at MCHC were instructed not to give any comments to the answers of the question-naire but only to give instructions for completing the questionnaire. Body weight of infants was measured to the nearest 0.1 Kg by the MCHC nurses on Seca infant digital weighing scale (Schmidt & Co. (H.K.) Ltd.). Infants aged 0-5 months old were further categorized into 5 age sub-groups for reporting results: Group 1: from birth to 40-day old, i.e. from birth to one month old plus 10 extra days. In 1990s, working women in Hong Kong were entitled to 10 weeks statutory maternity leave, i.e. 4 weeks before and 6 weeks after giving birth. Some mothers would utilize the 6 weeks (42-days) post-delivery maternity leave period to breastfeed their infants. To-wards the end of the maternity leave, the working mothers would attempt to wean off the infants from breastmilk with a gradual introduction of infant formulae. This is to

Infant feeding practices in Hong Kong 379
prepare for resumption of her full time job. Hence, ex-tending 10 more days following the first month (30 day) of age to a 40 day period would reveal more information relating to the duration and practice of breast-feeding at the peri-maternity leave period. As a result, infants below 5 month old were categorised into the following 5 age sub-groups for reporting results: Group 1:0-40 days (~ 1 month) old, Group 2: 41-70 days (~2 months) old, Group 3: 71-100 days (~3 months) old, Group 4: 101-130 days (~4 months ) old, Group 5: 131-160 days (~5 months ) old. Breastfeeding in the survey was defined as over 70% of the feeds given per day coming from breastmilk and the infant was thus regarded as breastfed. Clearance of ethical approval was obtained from the Ethics Committee, Department of Health, Hong Kong Government before subject recruitment. Statistics Descriptive statistics was used for data analysis. Group comparisons were tested by two-tailed student’s t test. Data were summarized as mean ± SD. The level of significance was set at P<0.05. SPSS Version 11 (SPSS, Chicago, IL, U.S.A.) was used for statistical analysis. Results 14,366 infants and young children aged 0-24 months fulfilling the selection criteria were invited to enter the survey. The number of subjects selected per age group were 7303, 3652 and 3411 for age 0-5 months, 6-12 months and age >12 months respectively. The response rate to the survey was slightly higher than 50%, i.e., 0-5 months age (50.9%, N = 3717), 6-12 months age (50.8%, N = 1855) and age >12 months (50.6%, N = 1726). Con-sequently, a total of 7,298 infants and young children were finally included for data analysis in the present survey. Data of 556 infants out of 3717 aged 0-5 months were subsequently rejected due to missing key infor-mation such as date of birth, sex or current mode of feeding. Hence, results of data analysis in the present study were based on 3161 infants under 6 months of age. Parental information Mean age of fathers and mothers were 33.2 ± 5.0 years and 29.6 ± 4.3 years respectively. Mean weight of fathers and mothers were 65.6 ± 9.5kg and 55.5 ± 8.3kg re-spectively. Height of fathers and mothers were 170 ± 6.8 cm and 158 ± 6.2 cm respectively. The length of stay in Hong Kong was 27.6 ± 9.2 years for fathers and 24.4 ± 10.2 years for mothers. All the parents were Chinese descents, and their places of origin in China were mainly from Guangdong Province (fathers 92% and mothers 88.2%) and provinces other than Guangdong (fathers: 4.6%, mothers: 7.9%), South China. The remaining parents came from other parts of China. Regarding paren-tal education level, over 80% parents had educational attainment at secondary school or above (Table 1). A higher proportion of fathers (20.9%) than mothers (12.8%) had vocational training or tertiary education, especially university education (10.2% vs. 4.9%). The figures are in line with the results of 1991 Population Census in Hong Kong.12 The unemployment rate was very low among the parents (Table 2), only 0.4% fathers
were unemployed, whereas over 50% of mothers were full-time housewives, 43.1% mothers had full time em-ployment. The figures are in comparable to the findings of the 1991 Population Census in Hong Kong.13 Parents were predominantly primary care-takers 62.2% (N = 1710), grandparents ranked second in providing primary care to the infants (21.2%). while domestic maids ranked third (7.4%) (Fig. 1). It was common that primary care takers sought for secondary support from grandparents, relatives or domestic maids to help look after their in-fants. However, the utility rate of baby-care service provided in the community was extremely low (Fig. 1). Characteristics of infants under 6 months old Mean birth weight for males and females were 3.25 ± 0.41 kg and 3.16 ± 0.42 kg respectively. The mean birth weight of the studied infants was similar to those of the full-term infants in the 1982-86 and 1998-2000 territory–wide cohort study in Hong Kong.14 The breakdown of body weight of males and females aged 0-5 months old as determined during clinic visits is depicted in Table 3. Mode of feeding Practice Figure 2 depicts the rates of breastfeeding and formula feeding among infants across the first 5 months of life. The average rate of breastfeeding and partial breast-feeding was extremely low among infants in the first 5 months of age (8.4%, N=265). In fact, formula feeding was the predominant mode of feeding (91.6%, N=2896). The rate of breastfeeding in the first 40-day of life, i.e. before the end of the maternity leave was only 18.4%. By
Table 1. Educational attainment of parents among infants at 0-5 months old
Father Mother 1991 Census
Category N % N % % No school 12 (0.4) 18 (0.6) 12.8 Primary school
423 (13.9) 475 (15.5) 25.2
Secondary school
1974 (64.8) 2173 (71.1) 50.7
Technical/vocational
327 (10.7) 243 (7.9) 5.4
University 312 (10.2) 149 (4.9) 5.9 Total 3048 (100) 3058 (100) 100
Table 2. Employment status of parents among infants at 0-5 months old
Father Mother Employment Status
N % N % 1991 Census
Own proprietor
521 (18.5) 90 (3.2)
Fully employed
1962 (70.0) 1215 (43.1) (78.3% for male)
Part-time employed
75 (2.7) 57 (2.0) (49.5% for female)
Causal worker
233 (8.3) 29 (1.0)
Unemployed/ housewife
10 (0.4) 1425 (50.6) (1.9% for male)
Total 2801 (100) 2816 (100)
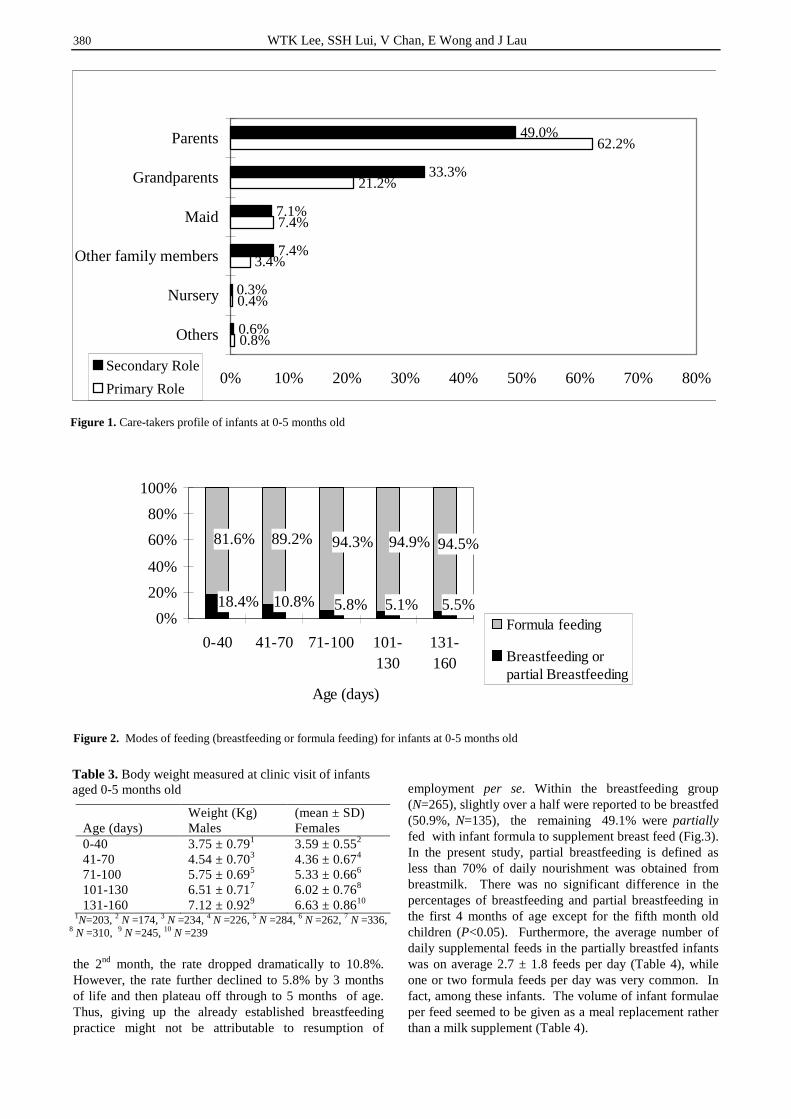
380 WTK Lee, SSH Lui, V Chan, E Wong and J Lau
the 2nd month, the rate dropped dramatically to 10.8%. However, the rate further declined to 5.8% by 3 months of life and then plateau off through to 5 months of age. Thus, giving up the already established breastfeeding practice might not be attributable to resumption of
employment per se. Within the breastfeeding group (N=265), slightly over a half were reported to be breastfed (50.9%, N=135), the remaining 49.1% were partially fed with infant formula to supplement breast feed (Fig.3). In the present study, partial breastfeeding is defined as less than 70% of daily nourishment was obtained from breastmilk. There was no significant difference in the percentages of breastfeeding and partial breastfeeding in the first 4 months of age except for the fifth month old children (P<0.05). Furthermore, the average number of daily supplemental feeds in the partially breastfed infants was on average 2.7 ± 1.8 feeds per day (Table 4), while one or two formula feeds per day was very common. In fact, among these infants. The volume of infant formulae per feed seemed to be given as a meal replacement rather than a milk supplement (Table 4).
0.8%
0.4%
3.4%
7.4%
21.2%
62.2%
0.6%
0.3%
7.4%
7.1%
33.3%
49.0%
0% 10% 20% 30% 40% 50% 60% 70% 80%
Others
Nursery
Other family members
Maid
Grandparents
Parents
Secondary Role
Primary Role
Figure 1. Care-takers profile of infants at 0-5 months old
18.4% 10.8% 5.8% 5.1% 5.5%
81.6% 89.2% 94.3% 94.9% 94.5%
0%
20%
40%
60%
80%
100%
0-40 41-70 71-100 101-130
131-160
Age (days)
Formula feeding
Breastfeeding orpartial Breastfeeding
Figure 2. Modes of feeding (breastfeeding or formula feeding) for infants at 0-5 months old
Table 3. Body weight measured at clinic visit of infants aged 0-5 months old
Weight (Kg) (mean ± SD) Age (days) Males Females 0-40 3.75 ± 0.791 3.59 ± 0.552 41-70 4.54 ± 0.703 4.36 ± 0.674 71-100 5.75 ± 0.695 5.33 ± 0.666 101-130 6.51 ± 0.717 6.02 ± 0.768 131-160 7.12 ± 0.929 6.63 ± 0.8610
1N=203, 2 N =174, 3 N =234, 4 N =226, 5 N =284, 6 N =262, 7 N =336, 8 N =310, 9 N =245, 10 N =239
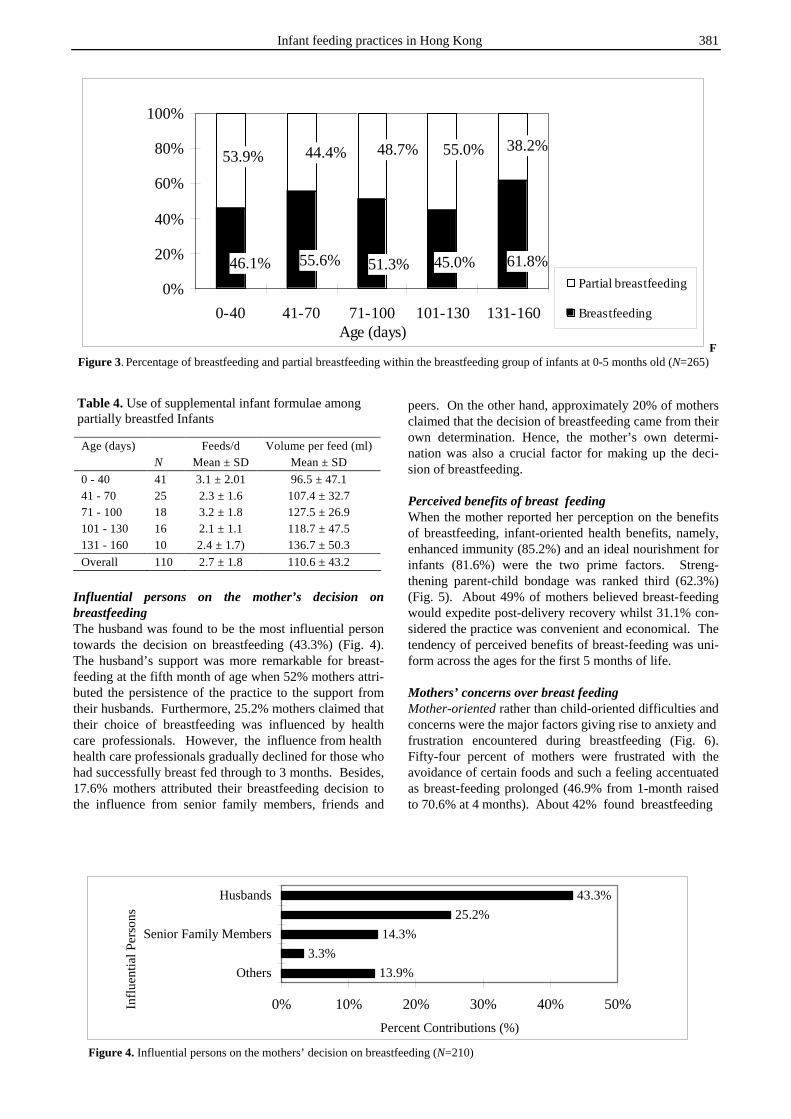
Infant feeding practices in Hong Kong 381
Influential persons on the mother’s decision on breastfeeding The husband was found to be the most influential person towards the decision on breastfeeding (43.3%) (Fig. 4). The husband’s support was more remarkable for breast-feeding at the fifth month of age when 52% mothers attri-buted the persistence of the practice to the support from their husbands. Furthermore, 25.2% mothers claimed that their choice of breastfeeding was influenced by health care professionals. However, the influence from health health care professionals gradually declined for those who had successfully breast fed through to 3 months. Besides, 17.6% mothers attributed their breastfeeding decision to the influence from senior family members, friends and
peers. On the other hand, approximately 20% of mothers claimed that the decision of breastfeeding came from their own determination. Hence, the mother’s own determi-nation was also a crucial factor for making up the deci-sion of breastfeeding. Perceived benefits of breast feeding When the mother reported her perception on the benefits of breastfeeding, infant-oriented health benefits, namely, enhanced immunity (85.2%) and an ideal nourishment for infants (81.6%) were the two prime factors. Streng-thening parent-child bondage was ranked third (62.3%) (Fig. 5). About 49% of mothers believed breast-feeding would expedite post-delivery recovery whilst 31.1% con-sidered the practice was convenient and economical. The tendency of perceived benefits of breast-feeding was uni-form across the ages for the first 5 months of life. Mothers’ concerns over breast feeding Mother-oriented rather than child-oriented difficulties and concerns were the major factors giving rise to anxiety and frustration encountered during breastfeeding (Fig. 6). Fifty-four percent of mothers were frustrated with the avoidance of certain foods and such a feeling accentuated as breast-feeding prolonged (46.9% from 1-month raised to 70.6% at 4 months). About 42% found breastfeeding
46.1% 55.6% 51.3% 45.0% 61.8%
53.9% 44.4% 48.7% 55.0% 38.2%
0%
20%
40%
60%
80%
100%
0-40 41-70 71-100 101-130 131-160Age (days)
Partial breastfeeding
Breastfeeding
FFigure 3. Percentage of breastfeeding and partial breastfeeding within the breastfeeding group of infants at 0-5 months old (N=265)
Table 4. Use of supplemental infant formulae among partially breastfed Infants
13.9%
3.3%
14.3%
25.2%
43.3%
0% 10% 20% 30% 40% 50%
Others
Senior Family Members
Husbands
Influ
en
tial P
ers
on
s
Percent Contributions (%)
Figure 4. Influential persons on the mothers’ decision on breastfeeding (N=210)
Age (days) Feeds/d Volume per feed (ml) N Mean ± SD Mean ± SD
0 - 40 41 3.1 ± 2.01 96.5 ± 47.1 41 - 70 25 2.3 ± 1.6 107.4 ± 32.7 71 - 100 18 3.2 ± 1.8 127.5 ± 26.9 101 - 130 16 2.1 ± 1.1 118.7 ± 47.5 131 - 160 10 2.4 ± 1.7) 136.7 ± 50.3
Overall 110 2.7 ± 1.8 110.6 ± 43.2
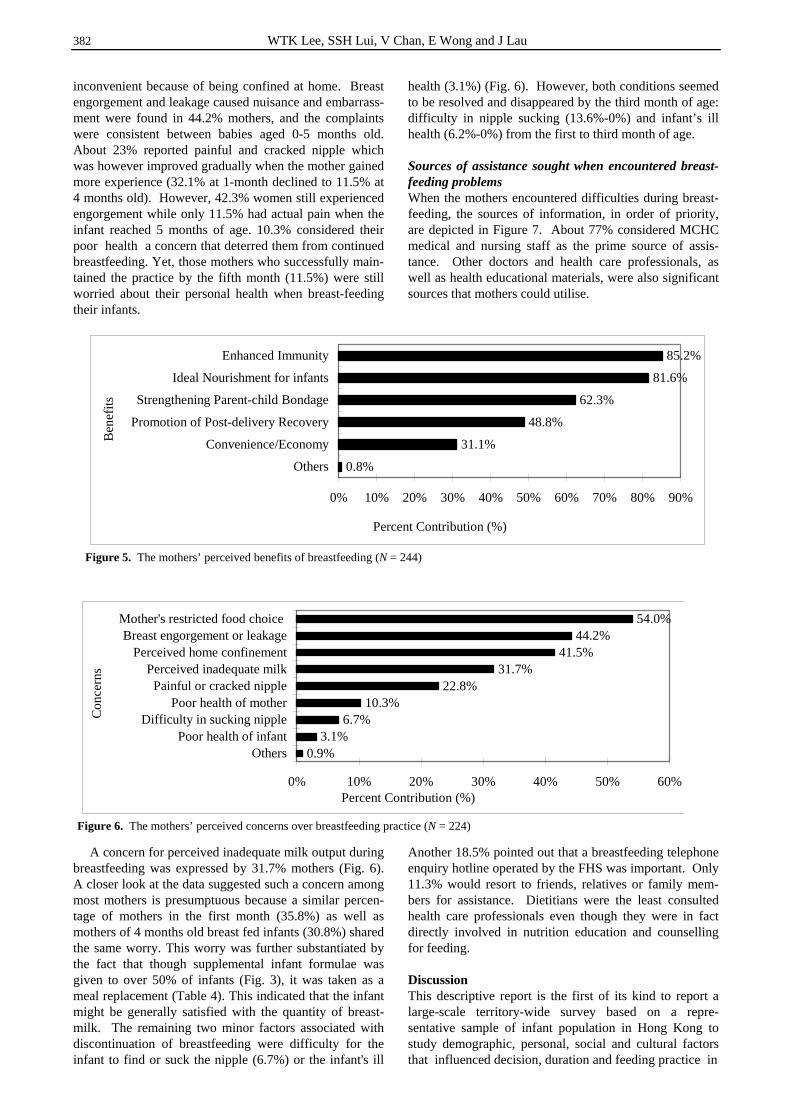
382 WTK Lee, SSH Lui, V Chan, E Wong and J Lau
inconvenient because of being confined at home. Breast engorgement and leakage caused nuisance and embarrass-ment were found in 44.2% mothers, and the complaints were consistent between babies aged 0-5 months old. About 23% reported painful and cracked nipple which was however improved gradually when the mother gained more experience (32.1% at 1-month declined to 11.5% at 4 months old). However, 42.3% women still experienced engorgement while only 11.5% had actual pain when the infant reached 5 months of age. 10.3% considered their poor health a concern that deterred them from continued breastfeeding. Yet, those mothers who successfully main-tained the practice by the fifth month (11.5%) were still worried about their personal health when breast-feeding their infants. A concern for perceived inadequate milk output during breastfeeding was expressed by 31.7% mothers (Fig. 6). A closer look at the data suggested such a concern among most mothers is presumptuous because a similar percen-tage of mothers in the first month (35.8%) as well as mothers of 4 months old breast fed infants (30.8%) shared the same worry. This worry was further substantiated by the fact that though supplemental infant formulae was given to over 50% of infants (Fig. 3), it was taken as a meal replacement (Table 4). This indicated that the infant might be generally satisfied with the quantity of breast-milk. The remaining two minor factors associated with discontinuation of breastfeeding were difficulty for the infant to find or suck the nipple (6.7%) or the infant's ill
health (3.1%) (Fig. 6). However, both conditions seemed to be resolved and disappeared by the third month of age: difficulty in nipple sucking (13.6%-0%) and infant’s ill health (6.2%-0%) from the first to third month of age. Sources of assistance sought when encountered breast-feeding problems When the mothers encountered difficulties during breast-feeding, the sources of information, in order of priority, are depicted in Figure 7. About 77% considered MCHC medical and nursing staff as the prime source of assis-tance. Other doctors and health care professionals, as well as health educational materials, were also significant sources that mothers could utilise. Another 18.5% pointed out that a breastfeeding telephone enquiry hotline operated by the FHS was important. Only 11.3% would resort to friends, relatives or family mem-bers for assistance. Dietitians were the least consulted health care professionals even though they were in fact directly involved in nutrition education and counselling for feeding. Discussion This descriptive report is the first of its kind to report a large-scale territory-wide survey based on a repre-sentative sample of infant population in Hong Kong to study demographic, personal, social and cultural factors that influenced decision, duration and feeding practice in
0.8%
31.1%
48.8%
62.3%
81.6%
85.2%
0% 10% 20% 30% 40% 50% 60% 70% 80% 90%
Others
Convenience/Economy
Promotion of Post-delivery Recovery
Strengthening Parent-child Bondage
Ideal Nourishment for infants
Enhanced Immunity
Be
ne
fits
Percent Contribution (%)
Figure 5. The mothers’ perceived benefits of breastfeeding (N = 244)
0.9%3.1%
6.7%10.3%
22.8%31.7%
41.5%44.2%
54.0%
0% 10% 20% 30% 40% 50% 60%
OthersPoor health of infant
Difficulty in sucking nipplePoor health of mother
Painful or cracked nipplePerceived inadequate milk
Perceived home confinementBreast engorgement or leakage
Mother's restricted food choice
Co
nce
rns
Percent Contribution (%)
Figure 6. The mothers’ perceived concerns over breastfeeding practice (N = 224)
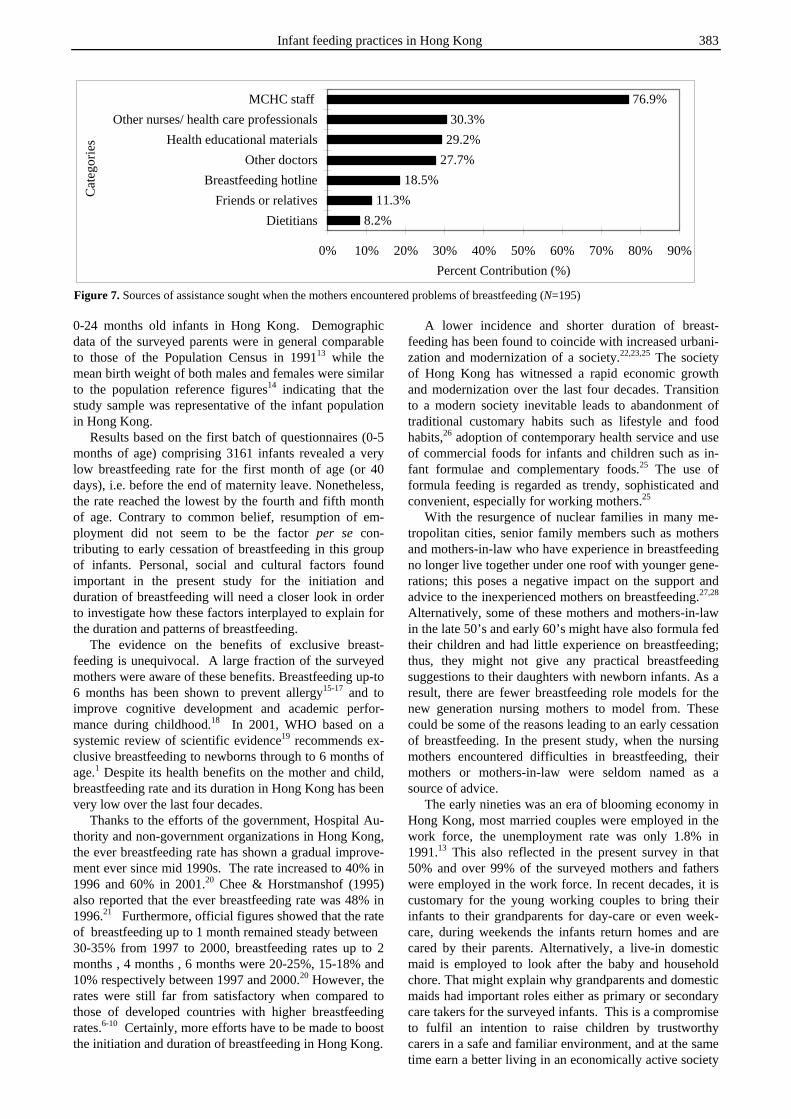
Infant feeding practices in Hong Kong 383
0-24 months old infants in Hong Kong. Demographic data of the surveyed parents were in general comparable to those of the Population Census in 199113 while the mean birth weight of both males and females were similar to the population reference figures14 indicating that the study sample was representative of the infant population in Hong Kong. Results based on the first batch of questionnaires (0-5 months of age) comprising 3161 infants revealed a very low breastfeeding rate for the first month of age (or 40 days), i.e. before the end of maternity leave. Nonetheless, the rate reached the lowest by the fourth and fifth month of age. Contrary to common belief, resumption of em-ployment did not seem to be the factor per se con-tributing to early cessation of breastfeeding in this group of infants. Personal, social and cultural factors found important in the present study for the initiation and duration of breastfeeding will need a closer look in order to investigate how these factors interplayed to explain for the duration and patterns of breastfeeding. The evidence on the benefits of exclusive breast-feeding is unequivocal. A large fraction of the surveyed mothers were aware of these benefits. Breastfeeding up-to 6 months has been shown to prevent allergy15-17 and to improve cognitive development and academic perfor-mance during childhood.18 In 2001, WHO based on a systemic review of scientific evidence19 recommends ex-clusive breastfeeding to newborns through to 6 months of age.1 Despite its health benefits on the mother and child, breastfeeding rate and its duration in Hong Kong has been very low over the last four decades. Thanks to the efforts of the government, Hospital Au-thority and non-government organizations in Hong Kong, the ever breastfeeding rate has shown a gradual improve-ment ever since mid 1990s. The rate increased to 40% in 1996 and 60% in 2001.20 Chee & Horstmanshof (1995) also reported that the ever breastfeeding rate was 48% in 1996.21 Furthermore, official figures showed that the rate of breastfeeding up to 1 month remained steady between 30-35% from 1997 to 2000, breastfeeding rates up to 2 months , 4 months , 6 months were 20-25%, 15-18% and 10% respectively between 1997 and 2000.20 However, the rates were still far from satisfactory when compared to those of developed countries with higher breastfeeding rates.6-10 Certainly, more efforts have to be made to boost the initiation and duration of breastfeeding in Hong Kong.
A lower incidence and shorter duration of breast-feeding has been found to coincide with increased urbani-zation and modernization of a society.22,23,25 The society of Hong Kong has witnessed a rapid economic growth and modernization over the last four decades. Transition to a modern society inevitable leads to abandonment of traditional customary habits such as lifestyle and food habits,26 adoption of contemporary health service and use of commercial foods for infants and children such as in-fant formulae and complementary foods.25 The use of formula feeding is regarded as trendy, sophisticated and convenient, especially for working mothers.25 With the resurgence of nuclear families in many me-tropolitan cities, senior family members such as mothers and mothers-in-law who have experience in breastfeeding no longer live together under one roof with younger gene-rations; this poses a negative impact on the support and advice to the inexperienced mothers on breastfeeding.27,28 Alternatively, some of these mothers and mothers-in-law in the late 50’s and early 60’s might have also formula fed their children and had little experience on breastfeeding; thus, they might not give any practical breastfeeding suggestions to their daughters with newborn infants. As a result, there are fewer breastfeeding role models for the new generation nursing mothers to model from. These could be some of the reasons leading to an early cessation of breastfeeding. In the present study, when the nursing mothers encountered difficulties in breastfeeding, their mothers or mothers-in-law were seldom named as a source of advice. The early nineties was an era of blooming economy in Hong Kong, most married couples were employed in the work force, the unemployment rate was only 1.8% in 1991.13 This also reflected in the present survey in that 50% and over 99% of the surveyed mothers and fathers were employed in the work force. In recent decades, it is customary for the young working couples to bring their infants to their grandparents for day-care or even week-care, during weekends the infants return homes and are cared by their parents. Alternatively, a live-in domestic maid is employed to look after the baby and household chore. That might explain why grandparents and domestic maids had important roles either as primary or secondary care takers for the surveyed infants. This is a compromise to fulfil an intention to raise children by trustworthy carers in a safe and familiar environment, and at the same time earn a better living in an economically active society
8.2%
11.3%
18.5%
27.7%
29.2%
30.3%
76.9%
0% 10% 20% 30% 40% 50% 60% 70% 80% 90%
Dietitians
Friends or relatives
Breastfeeding hotline
Other doctors
Health educational materials
Other nurses/ health care professionals
MCHC staff C
ate
go
rie
s
Percent Contribution (%)
Figure 7. Sources of assistance sought when the mothers encountered problems of breastfeeding (N=195)
384 WTK Lee, SSH Lui, V Chan, E Wong and J Lau
where the traditional supportive network from an ex-tended family has weakened. Among the breastfed infants in the present study, only half of them were in fact breastfed. Ironically, another half of the breastfed infants partially fed with infant formulae were a prevailing practice in the present study. The findings implied that the addition of formula feeds might not necessary reflect an inadequacy of breastmilk output as indicated by over 30% of mothers in relation to their concerns over breastfeeding. The reasons as to why infant formulae was added as a meal replacement merits further investigation. However, previous studies have shown that an early introduction of milk supplements was associated with early cessation of breastfeeding.25,29-31 Each month’s delay in introduction to infant formulae to the breastfed infants, the risk of early cessation of breast-feeding reduced by 3%.25 Risk factors that have been reported to be associated with lower rate and early cessa-tion of breastfeeding were returning to work,10,25,31 perceived insufficient milk supply,10,31,32 sore nipples and breast infection,10,31-32 being too tired32 and early intro-duction of food supplements.25, 29-31 In fact, most of these risk factors and concerns were also frequently encoun-tered by mothers in the present survey. If these diffi-culties and concerns were left unattended, it would lead to early stoppage of breastfeeding. In the present survey, although a majority of the mothers were aware of the be-nefits of breastfeeding, barriers such as social-demographic background, will-power, family and social support, resumption of employment and concerns over breastfeeding, etc. might have counterbalanced the aware-ness of breastfeeding benefits. Breastfeeding can be practiced anywhere in some other cultures. However, this practice may not be cul-turally acceptable to the Chinese in Hong Kong. Women wholly or partially expose their breasts for breastfeeding at work or public places have not been culturally acceptable in the 1990s and even today! A detailed survey in 2004 investigated this issue among 230 first-time mothers in Hong Kong.35 The authors found that even though breastfeeding was regarded as a natural human behavior by 80% women, 75% were embarrassed or con-sidered it unacceptable to breastfeed in public. 79% and 74% mothers viewed that the workplace and public facilities respectively were not supportive for breast-feeding. 55% of mothers reported that their overcrowded living environment in Hong Kong was a barrier for breastfeeding. Most importantly, they felt that a lack of privacy (64%) was also a barrier for breastfeeding their infants. Findings from this very recent study echoed our observations conducted more than 10 years back. Hence, if the mothers in the present study wish to breastfeed their infants, they were obliged to practise at home. This is why the women in the present study perceived ‘home confinement’ as one of their major concerns for breast-feeding. The practice of expressing breastmilk into a bottle was common among nursing mothers as a method to feed their infants, and this contributed to a higher success rate of breastfeeding in some Western countries in the early 1990s.6-10,31 However, such a practice was neither common nor even heard of by nursing mothers in Hong
Kong at the time of the survey. It was not until 2002, that the Department of Health had the first official written departmental breastfeeding policy in which the WHO Ten steps to successful breastfeeding and the International code of marketing of breastmilk substitutes were incor-porated. Furthermore, the guidelines on supporting wor-king employees to express breastmilk and to breastfeed at work places only appeared for the first time in this government policy statement.20 Hence, in early 1990s, most working mothers in Hong Kong would only think of using an infant formula as a substitute after weaning off their infants from breast milk. The decline in global breastfeeding rate has many causes, not the least of which is the aggressive marketing and promotion of infant formulae by multinational com-panies. The government of Hong Kong has been volun-tarily complying to the 1981 World health Assembly (WHA) and has adopted the “International Code of Marketing of Breastmilk Substitutes” but has not incor-porated the Code into its legislation. Infant formulae on a rotational basis have been freely supplied to all hospitals in Hong Kong. Complimentary samples of infant for-mulas or gifts have been directly or indirectly distributed by sales representatives to mothers or their relatives in hospitals and antenatal clinics. Although starting infant formulae for infants under 4 months old were prohibited by law to be advertised in the mass media, there have been aggressive marketing campaigns to push for follow-on infant formulae for infants aged 4 months to 3 years of age. Some infant formula companies even organised Mothers’ Clubs to run activities for mothers, expectant mothers and young children to promote their products directly or indirectly. These aggressive marketing stra-tegies had a significant impact on the decline in breast-feeding rate and early cessation of breastfeeding in Hong Kong over the last 3 decades. An increased effort played by the health care system and increased media promotion of breastfeeding is nece-ssary to balance and counteract the aggressive commer-cial programs for marketing infant formula in Hong Kong. In the late 1990s, the strength of breast-feeding promotion has increased. In 1994, United Nations Chil-dren Funds (UNICEF)’s Hong Kong Committee set up the Baby Friendly Hospital Initiative (BFHI) - Hong Kong Asso-ciation to promote breastfeeding in Hong Kong. BFHI organizes training for health care workers to facilitate mothers to breastfeed, a breastfeeding certificate course is also run by the BFHI. Furthermore, a Baby-friendly Hot-line has been set up and a survey on ever breastfeeding is being conducted every year. In conjunction with the ‘World Breastfeeding Week’ the BFHI organizes Breast-feeding promotional activities in the community during August every year. At the same time, the Department of Health also actively promoted breast-feeding in MCHC through educational activities and improvement of the MCHC environment to facilitate mothers to breastfeed. The Department of Health has also banned any direct or indirect marketing activities in all the clinics including distribution of complimentary infant formula samples to the staff and clients. Many hospitals in Hong Kong began to adopt the Ten Steps to Successful Breastfeeding as guidelines for breastfeeding promotion.39 Moving towards
Infant feeding practices in Hong Kong 385
the mid 2000s, The Hospital Authority in Hong Kong has decided not to receive free supply of infant formulae for hospitals and clinics. The Department of Health has incorporated the Ten Steps to Successful Breastfeeding and adopted the International Code of Marketing of Breastmilk Substitutes as guidelines for breastfeeding promotion.20 All these concerted efforts have been made to promote, support and protect breast-feeding to safe-guard the health of our children and mothers in the new millennium. The husbands in the present survey were rated the most important factor in influencing the decision of whether or not to breastfeed. Numerous studies have also indicated that the husband’s positive attitude, emotional and practical support towards breastfeeding was favorably associated with initiation and duration of breastfeeding.8,9,
33,34 Recently, in a survey comprising 230 first-time Hong Kong mothers, 73% also agreed that the husband’s support and encouragement was important towards breastfeeding.35 Therefore, public education on breast-feeding promotion should also target men in addition to women. Another study has shown that an infant feeding decision made before conception has been shown to be associated with initiation and longer duration of breast-feeding.9 Expectant fathers should also be invited to join prenatal classes to learn about breastfeeding and to consider their role in breastfeeding success in terms of initiation, facilitation and prolonged duration of breast-feeding. Furthermore, classes can be organized for working mothers and for those who have a concern of home confinement for breastfeeding. Classes may be structured to teach about different options to formula feeding when they return to work. For example breast-milk can be expressed into an infant bottle by using a pump and stored in the refrigerator. This could be an option for allowing the mother to leave the home with an appropriate caretaker to give the expressed breastmilk to the infant. On the other hand, knowledge and skills provided by the health care professionals seemed to be important in the initial 3 months of breastfeeding. There-after, mental determination with support from the hus-band, family members and friends was more important to sustain the practice. There might be a potential response bias in the present study because only 50% of eligible mothers participated in the survey. However, this seemed to be acceptable in a large-scale population based epidemiological study. The design of the survey has attempted to avoid potential bias as found in other studies that often rely on respondents mailing in questionnaires. The respondents in the present survey were first approached and invited by the medical doctors at the MCHC. The clinic nurses were responsible for weighing and recording down the infant’s current weight and a survey corner was set up to facilitate com-pletion of the questionnaires. In addition, a telephone hot line was also set up to entertain problems encountered by the respondents when filling out the questionnaire at home. A total of over 300 phone calls were received with enquiries mainly concentrated on conversion of measure-ment units and portion size information. All efforts were made to minimise the burdens on the nursing mothers in completing the questionnaire so as to achieve a higher
response rate. On the other hand, the present survey was a cross-sectional study; a longitudinal study may be a better design to monitor the duration and changes in breastfeeding practice with time, as well as the con-founding factors. Despite the limitations, results from the present study corroborate findings from subsequent stu-dies in the literature undertaken to investigate the low breastfeeding rate, factors predisposing to low breast-feeding rate and early termination of breastfeeding in Hong Kong.5,20,28,35-38 The results also contribute to the understanding of the determinants of the decision and duration of breastfeeding in early 1990s, and the history of evolution of infant feeding practice in Hong Kong. Acknowledging of the factors contributing to low breastfeeding rate and early cessation of breastfeeding is useful to formulate appropriate health and social policies and education programs to promote breastfeeding. This will pose a significant impact on the health and well being of the next generation. Conclusion A population-based survey with representative samples reported by 3161 respondents has successfully revealed a low breastfeeding rate among infants below 6 months old in Hong Kong in 1993. Social-demographic, personal and cultural factors that might have influenced the initiation, practice and early cessation of breastfeeding were eva-luated. A further study is merited to understand how these factors might lead to low initiation and early cessa-tion of breastfeeding. Findings from the survey serve as a cornerstone to understand the evolution of breastfeeding practice in Hong Kong. Acknowledgement We are grateful to Drs. Lai Yin Tse, Winnie Tang and Cindy Lai from of the Family Health Service, Department of Health for advice on the study design and co-ordination of field work at the 43 MCHC Clinics throughout Hong Kong. We thank Mr. Albert Cheung from the Centre for Epidemiology and Biostatistics, Faculty of Medicine, The Chinese University of Hong Kong for invaluable advice and assistance in statistics, Mr. John Chang and colleagues from the EDP Unit, Wyeth (HK) Ltd. for the design and management of the data capture program. We also appreciate members from Hong Kong Nutrition Association and staff from MCHC, Family Health Service, Department of Health for their assistance in field work. We are in debt to Wyeth (HK) Ltd. for the generous manpower and logistics supports on this project. References 1. World Health Organization. Global Strategy for Infant and
Young Child Feeding. 54th World Health Assembly (Report no. A54/INF.DOC./4). Geneva, WHO, 2001.
2. Tse LY. Breastfeeding in Hong Kong. Public Health and Epidemiology Bulletin. Department of Health, Hong Kong Government, Hong Kong 1993;2(3)19-21.
3. Baber FM. The current situation in Hong Kong. H.K. Practitioner 1981;3:132-7.
4. Koo LC, Wong VC, Ho CY. Factors affecting breast-feeding among Hong Kong Chinese. Asia Oceania J Obstet Gynaecol 1986; 12: 469-77.
5. Leung GM, Ho LM, Lam TH. Breastfeeding rates in Hong Kong: a comparison of the 1987 and 1997 birth cohorts. Birth 2002; 29: 162-8.
386 WTK Lee, SSH Lui, V Chan, E Wong and J Lau
6. Heiberg Endresen E, Helsing E. Changes in breastfeeding practices in Norwegian maternity wards: national surveys 1973, 1982 and 1991. Acta Paediatr 1995; 84: 719-24.
7. Michaelsen KF, Larsen PS, Thomsen BL, Samuelson G. The Copenhagen cohort study on infant nutrition and growth: duration of breast feeding and influencing factors. Acta Paediatr 1994; 83: 565-71.
8. Scott JA, Aitkin I, Binns CW, Aroni RA. Factors asso-ciated with the duration of breastfeeding amongst women in Perth, Australia. Acta Paediatr 1999; 88: 416-21.
9. Scott JA, Landers MC, Hughes RM, Binns CW. Factors associated with breastfeeding at discharge and duration of breastfeeding. J Paediatr Child Health 2001; 37: 254-61.
10. Essex C, Smale P, Geddis D. Breastfeeding rates in New Zealand in the first 6 months and the reasons for stopping. N Z Med J 1995; 8: 108:355-7.
11. Department of Health Annual Report (1993/94). Depart-ment of Health, Hong Kong Government, Hong Kong 1994.
12. Census & Statistics Department. 2001 Population Census - Summary Results. Census & Statistics Department, Hong Kong SAR Government, Hong Kong, 2002.
13. Census & Statistics Department. Hong Kong - Annual Digest of Statistics, 1992 Edition. Census & Statistics Department, Hong Kong Government , Hong Kong, 1992.
14. Fok TF, So HK, Wong E, Ng PC. Chang A, Lau J, Chow CB, Lee WH. Hong Kong Neonatal Measurements Working Group. Updated gestational age specific birth weight, crown-heel length, and head circumference of Chinese newborns. Arch Dis Child Fetal Neonatal Ed 2003; 88: F229-36.
15. Saarinen UM, Kajosaari M. Breastfeeding as prophylaxis against atopic disease: prospective follow-up study until 17 years old. Lancet 1995; 21: 1065-9.
16. Gdalevich M, Mimouni D, David M, Mimouni M. Breast-feeding and the onset of atopic dermatitis in childhood: a systematic review and meta-analysis of prospective studies. J Am Acad Dermatol 2001; 45: 520-7.
17. Gdalevich M, Mimouni D, Mimouni M. Breast-feeding and the risk of bronchial asthma in childhood: a systematic review with meta-analysis of prospective studies. J Pediatr 2001; 139: 261-6.
18. Horwood LJ, Fergusson DM. Breastfeeding and later cognitive and academic outcomes. Pediatrics 1998;101:1-7.
19. Kramer MS, Kakuma R. The Optimal Duration of Ex-clusive Breastfeeding. A Systematic Review. (Report No. WHO/NHD/01.08). Geneva, WHO, 2002.
20 Khin PP, Cheung SL, Loh T. Support and promotion of breastfeeding: where are we now? Department of Health, Hong Kong Government, Hong Kong 2002; 11 (3)25-32.
21 Chee YO. Horstmanshof L. A review of breastfeeding practices in Hong Kong. Breastfeeding Review 1986; 4: 7-12.
22 Castle MA, Solimano G, Winikoff B, Samper de Paredes B, Romero ME, Morales de Look A. Infant feeding in Bogota, Columbia. In: Winikoff MA, Castle MA and Laukaran VH, eds. Feeding infants in four societies: Causes and consequences of mother’s choices, New York: Greenwood Press, 1988; 43-66.
23 Akin JS, Bilsborrow RE, Guilkey DK, Popkin BM. Breast-feeding Patterns and Determinants in the Near East: An Analysis for Four Countries. Population Studies 1986; 40: 247-62.
24 Adair LS, Popkin BM, Guilkey DK. The duration of breast-feeding: how is it affected by biological, sociodemo-graphic, health sector, and food industry factors? Demography 1993; 30: 63-80.
25 Abada TS, Trovato F, Lalu N. Determinants of breast-feeding in the Philippines: a survival analysis. Soc Sci Med 2001; 52:71-81.
26 Lee WTK. Nutrition transition in China – a challenge in the new millennium. Nutr Diet 2002; 59: 74-75.
27 Stewart JF, Popkin BM, Guilkey DK, Akin JS, Adair L, Flieger W. Influences on the extent of breast-feeding: a prospective study in the Philippines. Demography 1991; 28: 181-99.
28 Tarrant M, Dodgson JE, Tsang Fei S. Initiating and sustaining breastfeeding in Hong Kong: contextual influences on new mothers' experiences. Nursing & Health Sciences 2002; 4:181-91.
29 Loughlin HH, Clapp-Channing NE, Gehlbach SH, Pollard JC, McCutchen TM. Early termination of breast-feeding; identifying those at risk. Pediatrics 1985; 75: 508-513.
30 Gray-Donald K, Kramer MS, Munday S, Leduc DG. Effect of formula supplementation in the hospital on the duration of breast-feeding, a controlled clinical trial. Pediatrics 1985; 75: 514-518.
31 Vogel A, Hutchison BL, Mitchell EA. Factors associated with the duration of breastfeeding. Acta Paediatr 1999; 88: 1320-6.
32 Chan SM, Nelson EA, Leung SS, Li CY. Breastfeeding failure in a longitudinal post-partum maternal nutrition study in Hong Kong. J Paediatr Child Health 2000; 36: 466-71.
33 Freed GL, Fraley JK, Schanler RJ. Attitudes of expectant fathers regarding breast-feeding. Pediatrics.1992; 90:224-7.
34 Littman H, Medendorp SV, Goldfarb J. The decision to breastfeed. The importance of father's approval. Clin Pediatr 1994; 33: 214-9.
35 Kong SK, Lee DT. Factors influencing decision to breast-feed. J Adv Nurs 2004; 46: 369-79.
36 Dodgson JE, Tarrant M, Fong DY, Peng XH, Hui WH. Breastfeeding patterns of primiparous mothers in Hong Kong Birth 2003; 30: 195-202.
37 Leung SSF, Lee WTK, Lui SSH, Ng MY, Peng XH, Luo HY, Lam CW, Davies DD. Fat intake in Hong Kong Chinese children. Am J Clin Nutr 2000; 72: 1373S-1378S.
38 Leung SSF, Chan SM, Lui SSH, Lee WTK, Davies DP. Growth and nutrition of Hong Kong children aged 0-7 years. J Paediatr Child Health 2000; 36: 56-65.
39 Ip P. Promotion and support of breastfeeding. Hong Kong Paediatric Society Education Bulletin, March 1999; 6 (2): 1-6.
Infant feeding practices in Hong Kong 387
Original Article A population-based survey on infant feeding practice (0-2 years) in Hong Kong: breastfeeding rate and patterns among 3,161 infants below 6 months old Warren T K Lee, PhD, RD (UK)
1,2,3, Susan SH Lui, PhD, RD (USA) 1, Veronica Chan, MPH,
RD (USA) 1, Eric Wong MA
4 and Joseph Lau PhD
4
1Hong Kong Nutrition Association, PO Box 71290, Kowloon Central, Hong Kong SAR, 2Department of Orthopaedics & Traumatology, Faculty of Medicine, The Chinese University of Hong Kong, Prince of Wales Hospital, Shatin, Hong Kong SAR. 3Centre for Nutrition and Food Safety, School of Biomedical and Molecular Sciences, University of Surrey, Guildford, Surrey GU2 7XH, United Kingdom. 4Centre for Epidemiology and Biostatistics, School of Public Health, Faculty of Medicine, The Chinese University of Hong Kong, Prince of Wales Hospital, Shatin, Hong Kong SAR.
对于选自人群的香港婴儿对于选自人群的香港婴儿对于选自人群的香港婴儿对于选自人群的香港婴儿(0(0(0(0----2222 岁岁岁岁))))的哺育方式调查的哺育方式调查的哺育方式调查的哺育方式调查:3161:3161:3161:3161 名名名名 6666 月龄以月龄以月龄以月龄以
下婴下婴下婴下婴儿的母乳喂养率及哺乳方式儿的母乳喂养率及哺乳方式儿的母乳喂养率及哺乳方式儿的母乳喂养率及哺乳方式 在香港,从 19 世纪 70 年代以来对于初生 6 月龄期间婴儿的母乳喂养的比率一直较低。为了
制定有效的人乳哺育政策和实施方案,对于开始母乳喂养及早期断奶相关的行为和因素进行
评估是很必要的。为此,进行了一项针对选自代表性人群的样本普查,旨在确定影响对 0-24
月龄婴儿的哺乳行为、哺乳期的社会人口因素、个人因素及文化因素。本次研究通过选取 6
月龄以下婴儿为研究对象,以研究与是否哺乳、哺乳期及哺乳行为相关的因素。1993 年,从
全香港 46 所妇幼保健诊所(MCHC)中召集 7298 名健康婴儿,其中 3161 名在 6 月龄以下。
婴儿母亲在问卷调查中填写了她们的哺乳决定、哺乳期及哺乳行为。结果发现 6 月龄以下婴
儿的哺乳率极低(8.4%),只有 50.9%的婴儿接受过哺乳行为。在接受部分母乳喂养的婴儿中,
婴儿处方被广泛使用。调查对象的母亲中 45%为全职工作人员,大多数母亲都意识到接受母
乳喂养对婴儿和她们自身的益处,43.3%的丈夫被看作是对于进行和持续母乳喂养的最主要
的决定因素。在母乳喂养过程中,主要的考虑因素为单调的食物种类(54%)、中心乳头和
乳房肿胀(67%)、可察觉的家庭限制(41.5%)和不充足的牛奶供应(31.7%)。而且,在哺乳过
程中遇到困难时,76.9%的母亲会咨询 MCHC 工作人员以获得建议。总之,此次调查收集了来
自人群的代表性数据,以反映 1993 年香港地区影响开始哺乳和早期断奶行为的各因素,这
一研究结果将作为更好分析香港地区哺乳行为的重要材料。今后研究中值得进一步探讨各因
素间如何相互作用以调整哺乳行为的开始、持续时间和哺乳方式。
关键词关键词关键词关键词:哺乳、母乳、婴儿处方、婴儿、香港。
388 Asia Pac J Clin Nutr 2006;15 (3): 388-399
Original Article Diet, nutritional knowledge and health status of urban middle-aged Malaysian women LW Pon MSc
1, MY Noor-Aini PhD2, FB Ong PhD
3, N Adeeb FRCOG3, SS Seri MOG
3, K Shamsuddin PhD
4, AL Mohamed PhD5, N Hapizah MRCPath
6, A Mokhtar MRCOG7,
and HWH Wan MOG8
1Malaysian Palm Oil Promotion Council, Kuala Lumpur; 2Dept of Nutrition and Dietetic, Faculty of Allied Sciences, Universiti Kebangsaan Malaysia, Kuala Lumpur; 3Dept of Obstetrics & Gynaecology, Medical Faculty, Universiti Kebangsaan Malaysia, Kuala Lumpur; 4Dept of Community Medicine, Medical Faculty, Universiti Kebangsaan Malaysia, Kuala Lumpur; 5Dept of Medicine, International Medical University, Kuala Lumpur; 6Dept of Chemical Pathology, Medical Faculty, Universiti Kebangsaan Malaysia, Kuala Lumpu; 7Dept of Obstetrics & Gynaecology, Hospital Tengku Ampuan Afzan, Kuantan, Pahang; 8Dept of Obstetrics & Gynaecology, Hospital Serdang, Selangor
The objective of the study was to assess nutritional and health status as well as nutritional knowledge in urban middle-aged Malaysian women. The impact of menopause on diet and health indices was also studied. The study included 360 disease free women, non users of HRT, aged ≥45 years with an intact uterus recruited from November 1999 to October 2001. Personal characteristics, anthropometric measurements and blood sample were acquired followed by clinical examination. Nutrient intake and nutritional knowledge was determined by a quantitative FFQ and KAP. The findings showed that urban middle-aged women, aged 51.65±5.40 years had energy intakes (EI) 11% below RDA, consisting of 53% carbohydrates, 15% protein and a 32% fat which declined with age. The sample which comprised of 42.5% postmenopausal women had a satisfactory diet and healthy lifestyle practices. Premenopausal women consumed more dietary fat (6%) with other aspects of diet comparable to the postmenopausal women. Iron intake was deficient in premenopausal women, amounting to 56% RDA contributing to a 26% prevalence of anaemia. Overall, calcium intake reached 440mg daily but dairy products were not the main source. The postmenopaused had a more artherogenic lipid profile with significantly higher total cholesterol (TC) and LDL-C, but more premenopausal women were overweight/obese (49% versus 35%). EI was the strongest predictor for BMI and waist circumference (WC), with WC itself an independent predictor of fasting blood sugar and TC with BMI strongly affecting glucose tolerance. High nutritional knowledge was seen in 39% whereas 20% had poor knowledge. Newspapers and magazines, followed by the subject's social circle, were the main sources of nutritional information. Nutritional knowledge was positively associated with education, household income, vitamin/mineral supplementation and regular physical activity but inversely related to TC. In conclusion, middle-aged urban women had an adequate diet with low iron and calcium intakes. Nutritional knowledge was positively associated to healthier lifestyle practices and lower TC. A comparable nutrient intake and lifestyle between pre and postmenopausal women suggested that health changes associated with menopause was largely independent of diet.
Key Words: food frequency, perimenopause, knowledge, health, middle-aged, women, urban, Malaysia
Introduction The Second National Health and Morbidity Survey in 1996 showed that 16.6% and 4.4% of Malaysia’s population was overweight and obese. In 2004, the obese population had risen to 12.2% and is estimated to reach 18.8% in 2010. By 2010, prevalence of diabetes is expected to double to 16.4%, hypertension 10.9%, hyperlipidaemia 22.8% following the increasing trend of obesity.1 Furthermore, mortality from all causes, including cancer, was shown to be more common in obese individuals compared to those of normal body mass index.2 Currently 23% of the female population was over-weight compared with 18% of the men; while 17% of urba-nites were overweight against 15% in rural areas. Ethnic
Indians had the highest number of overweight, followed by Malays and Chinese.3 In efforts to gain insight into the ‘obesity epidemic’, studies on nutritional and health status have been carried out among children, adults and the el-derly4-9 with insufficient emphasis on middle-aged adults.10
Correspondence: Dr. Ong Fee-Bee, Dept of Obstetrics & Gynaecology, Medical Faculty, Universiti Kebangsaan Malaysia. Jalan Yaacob Latiff, Bandar Tun Razak, 56000 Cheras, Kuala Lumpur, Malaysia Tel:603-9170 2294; Fax:603-9173 8946 Email:[email protected] Accepted 8th November 2005
LW Pon, MY Noor-Aini, FB Ong, N Adeeb, SS Seri, K Shamsuddin, AL Mohamed, N Hapizah, A Mokhtar, HWH Wan
Improved healthcare system and better nutrition had seen increased average lifespan for females from 64.7 years in 197011 to 75.2 years in 2001.12 Rapid industri-alization and socio-economic progress had wrought major lifestyle changes and shifts in disease patterns within three decades with concomitant social and economic implications for the older population.13 The study hoped to provide an insight into the nutritional and health status in urban middle-aged women as well as the relationship between nutritional knowledge and health indices. Com-parisons were made between pre and postmenopausal women to see whether changes in health status due to menopause were associated with differences in diet and lifestyle. Methodology The study design was prospective cross sectional, carried out in a referral hospital (HUKM) situated in a residential suburb of the capital city. Recruitment was via distri-bution of 2000 flyers to residential areas around the hospital over a period of two years, but subjects from other areas responded as well after being informed by friends. Participants of the study were part of first year recruitment (November 1999 to October 2001) whereby 519 women underwent initial screening by telephone and 360 disease free women, non users of HRT, aged 45 years and above with intact uterus were accepted. Exclusion criteria included those with chronic diseases, on phar-macological treatment, secondary causes for osteoporosis and contraindication to HRT. The study was a Master of Science project 14 and had received approval from the me-dical faculty research ethics committee. It was part of a larger multi-centre study concerning women’s health at perimenopause. All subjects gave written informed consent upon parti-cipation in the study. Nutritional knowledge, attitude and practices (KAP) and quantitative food frequency que-stionnaire (FFQ) in three languages was administered by a trained dietitian. The KAP consisted of 20 questions with each correct answer given a score of 1. Based on a maximal score of 20 points, the subjects were categorised into poor (0-9, <50%), moderate (10-14, 50-<75%) and high (15-20, ≥75%) scores. Both FFQ and KAP were modified from the instrument developed by the Cardio-vascular Intervention Group Study MOH-UIA-UKM-UM-UPM-USM-1998.15-17 Subjects were asked to state the frequency of intake of each kind of food listed per day, week or month and serving size was based upon the Malaysian Food Composition Tables.18 Food quanti-fication was aided by food photographs, matchboxes and household utensils. To adjust for differences in age of subjects, the weighted nutrient intake method was used for comparison to Malaysian RDAs.19 An energy intake (EI)/basal metabolic rate (BMR) ratio of <1.2 or >1.8 respectively indicated an estimation of EI below or above normal. Basal (BMR) was determined with the formula of Ismail et al.20 Food intake was converted to gram and analyzed using the software Diet 4 which was based on the Malaysian Food Composition Tables.18 Height, weight, hip and waist circumference were measured twice and taken to the nearest 0.1 standard unit measurement [Health-O-meter,USA]. Blood was profiled
for lipids, blood sugar and haemoglobin. Categorization for anthropometry, serum lipids, blood sugar and haemo-globin were according to population norms.21-24 Personal characteristics, medical and reproductive history were collected via questionnaires in three languages i.e. English, Malay and Chinese. A clinical examination was carried out followed by ultrasound in the gynaecology clinic. Mammogram, chest X-rays and bone scan were later done to rule out the presence of existing disease. Data was analysed using software SPSS version 9.0 [SPSS Inc, Chicago, USA]. Continuous variables were expressed as mean and standard deviation, and compared by the Student’s t test. Categorical data were compared using the Chi-squared test. Relationships between vari-ables were analysed by Pearson correlation and further tested by multiple regression analysis where appropriate. Differences were considered significant if P<0.05. Results Three hundred and sixty subjects participated in the study with an average age of 51.65 ± 5.40 years old; two fifths were in the age range of 45-49 and less than a tenth were above 60 years old (Table 1). Over two fifths (42.5%) were postmenopausal with an average age of menopause 49.89 ± 2.95 years old with a median of 50.0 years. The majority were Chinese, followed by Malays and Indians, reflecting an urban population distribution. Three quarters were married and significantly more premenopausal women had secondary and tertiary education compared to the post-menopausal, 85% versus 64% respectively (P<0.001). More premenopausal women were also currently employed (P<0.001) and hence had higher household income, 41.6% with monthly income above RM 3000 versus 21.0% for postmenopausal (P<0.005). The reproductive history was not significantly different between the two groups, except more post-menopausal women had reported using oral contraceptives (OCP) (P <0.05). The majority practiced a healthy lifestyle with two thirds (62%) exercising regularly. The average time spent on exercises was 2.5±3.7 hours per week, significantly different between pre and postmenopausal women (2.2±3.4 versus 3.0±3.9 hours/week, P <0.05). Only 9% regularly took alcohol - mostly reported as a medicinal tonic - one drink per day or less. Few women smoked with only 1% being regular smokers. Two thirds reported taking vitamin supplements (66%) and half (51%) also took calcium supplements. Vitamins and minerals taken on a daily basis included A, B complex, C, D, E, folic acid, multivitamins, calcium and magnesium. Supple-mentary foods included Malay traditional supplements such as jamu, mengkudu juice, pegaga and gamat, a sea cucumber extract. Neem, a traditional Indian herb and Chinese herbs such a ginseng, pa-chen, dong guai and lingqi were reported as well. Other supplements reported included evening primrose oil, royal jelly, spirulina, gingko biloba, protein powder, garlic, ginger, bee pollen, blackcurrant seed oil, goat's milk, wheatgrass and barley grass. Overall, more premenopausal women practiced food and vitamin supplementation compared to the postmenopausal women.
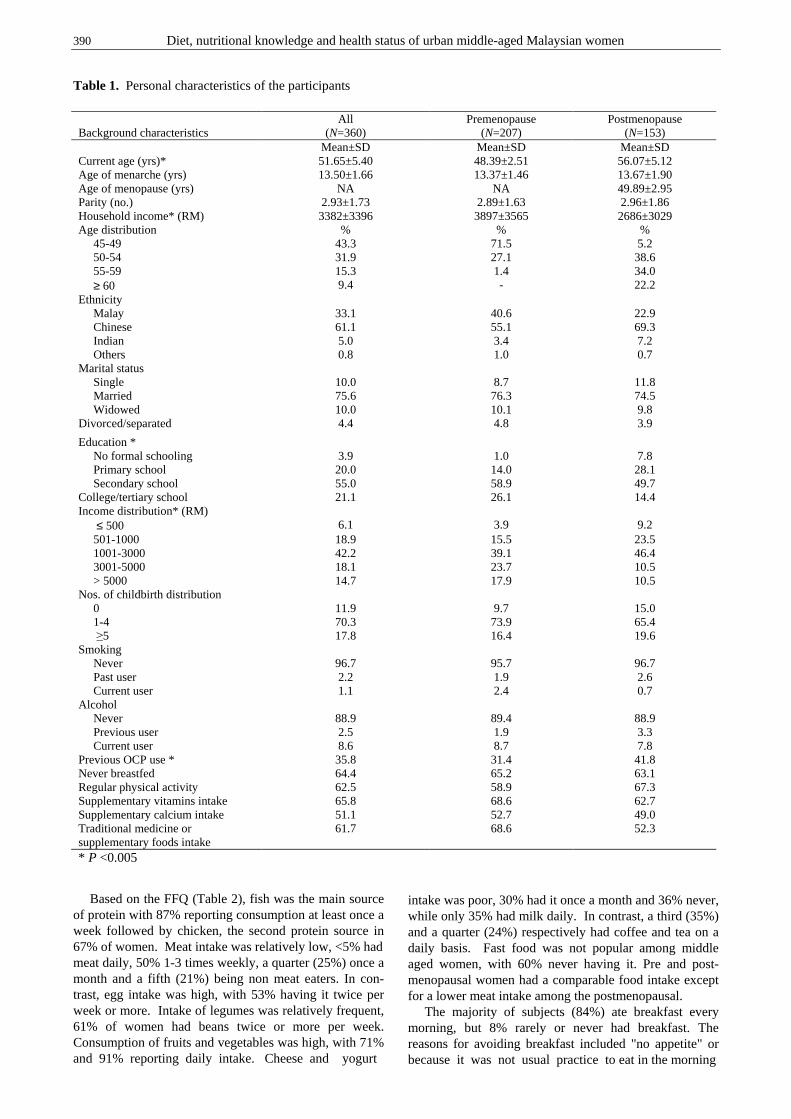
390 Diet, nutritional knowledge and health status of urban middle-aged Malaysian women
Table 1. Personal characteristics of the participants Based on the FFQ (Table 2), fish was the main source of protein with 87% reporting consumption at least once a week followed by chicken, the second protein source in 67% of women. Meat intake was relatively low, <5% had meat daily, 50% 1-3 times weekly, a quarter (25%) once a month and a fifth (21%) being non meat eaters. In con-trast, egg intake was high, with 53% having it twice per week or more. Intake of legumes was relatively frequent, 61% of women had beans twice or more per week. Consumption of fruits and vegetables was high, with 71% and 91% reporting daily intake. Cheese and yogurt
intake was poor, 30% had it once a month and 36% never, while only 35% had milk daily. In contrast, a third (35%) and a quarter (24%) respectively had coffee and tea on a daily basis. Fast food was not popular among middle aged women, with 60% never having it. Pre and post-menopausal women had a comparable food intake except for a lower meat intake among the postmenopausal. The majority of subjects (84%) ate breakfast every morning, but 8% rarely or never had breakfast. The reasons for avoiding breakfast included "no appetite" or because it was not usual practice to eat in the morning
Background characteristics
All (N=360)
Premenopause (N=207)
Postmenopause (N=153)
Mean±SD Mean±SD Mean±SD Current age (yrs)* 51.65±5.40 48.39±2.51 56.07±5.12 Age of menarche (yrs) 13.50±1.66 13.37±1.46 13.67±1.90 Age of menopause (yrs) NA NA 49.89±2.95 Parity (no.) 2.93±1.73 2.89±1.63 2.96±1.86 Household income* (RM) 3382±3396 3897±3565 2686±3029 Age distribution % % % 45-49 43.3 71.5 5.2 50-54 31.9 27.1 38.6 55-59 15.3 1.4 34.0 ≥ 60 9.4 - 22.2 Ethnicity Malay 33.1 40.6 22.9 Chinese 61.1 55.1 69.3 Indian 5.0 3.4 7.2 Others 0.8 1.0 0.7 Marital status Single 10.0 8.7 11.8 Married 75.6 76.3 74.5 Widowed 10.0 10.1 9.8 Divorced/separated 4.4 4.8 3.9
Education * No formal schooling 3.9 1.0 7.8 Primary school 20.0 14.0 28.1 Secondary school 55.0 58.9 49.7 College/tertiary school 21.1 26.1 14.4 Income distribution* (RM) ≤ 500 6.1 3.9 9.2 501-1000 18.9 15.5 23.5 1001-3000 42.2 39.1 46.4 3001-5000 18.1 23.7 10.5 > 5000 14.7 17.9 10.5 Nos. of childbirth distribution 0 11.9 9.7 15.0 1-4 70.3 73.9 65.4 ≥5 17.8 16.4 19.6 Smoking Never 96.7 95.7 96.7 Past user 2.2 1.9 2.6 Current user 1.1 2.4 0.7 Alcohol Never 88.9 89.4 88.9 Previous user 2.5 1.9 3.3 Current user 8.6 8.7 7.8 Previous OCP use * 35.8 31.4 41.8 Never breastfed 64.4 65.2 63.1 Regular physical activity 62.5 58.9 67.3 Supplementary vitamins intake 65.8 68.6 62.7 Supplementary calcium intake 51.1 52.7 49.0 Traditional medicine or supplementary foods intake
61.7 68.6 52.3
* P <0.005
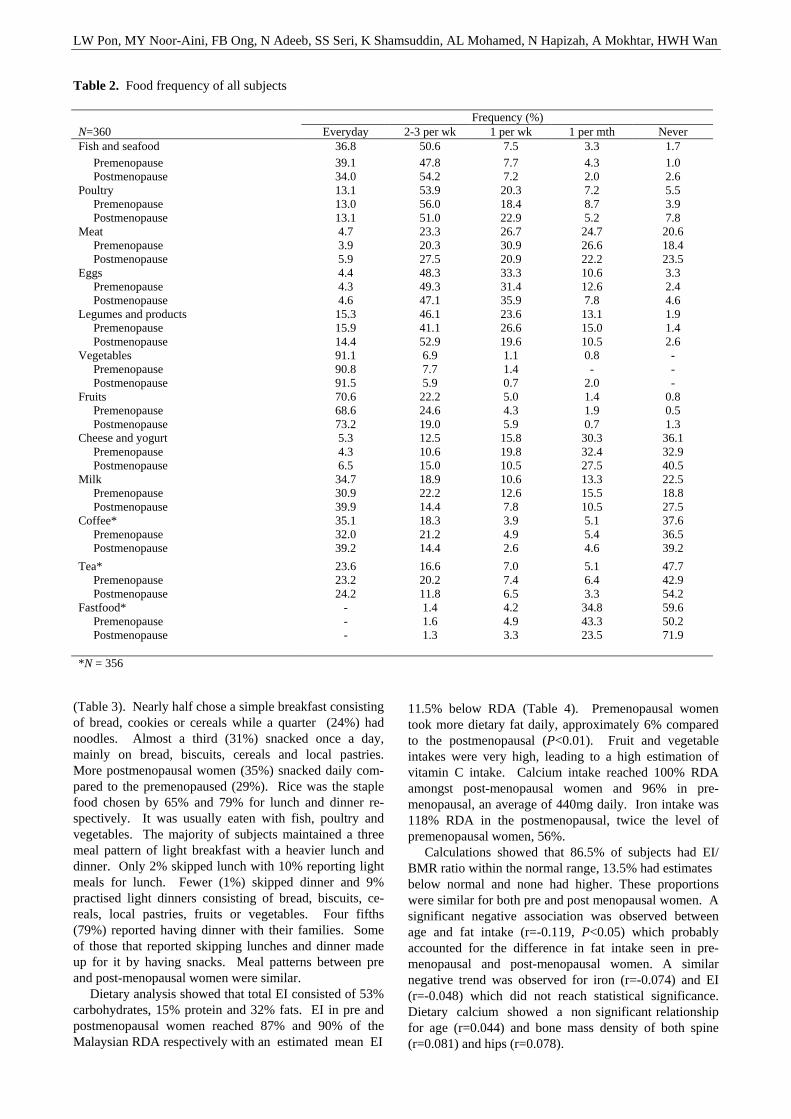
LW Pon, MY Noor-Aini, FB Ong, N Adeeb, SS Seri, K Shamsuddin, AL Mohamed, N Hapizah, A Mokhtar, HWH Wan
Table 2. Food frequency of all subjects
(Table 3). Nearly half chose a simple breakfast consisting of bread, cookies or cereals while a quarter (24%) had noodles. Almost a third (31%) snacked once a day, mainly on bread, biscuits, cereals and local pastries. More postmenopausal women (35%) snacked daily com-pared to the premenopaused (29%). Rice was the staple food chosen by 65% and 79% for lunch and dinner re-spectively. It was usually eaten with fish, poultry and vegetables. The majority of subjects maintained a three meal pattern of light breakfast with a heavier lunch and dinner. Only 2% skipped lunch with 10% reporting light meals for lunch. Fewer (1%) skipped dinner and 9% practised light dinners consisting of bread, biscuits, ce-reals, local pastries, fruits or vegetables. Four fifths (79%) reported having dinner with their families. Some of those that reported skipping lunches and dinner made up for it by having snacks. Meal patterns between pre and post-menopausal women were similar. Dietary analysis showed that total EI consisted of 53% carbohydrates, 15% protein and 32% fats. EI in pre and postmenopausal women reached 87% and 90% of the Malaysian RDA respectively with an estimated mean EI
11.5% below RDA (Table 4). Premenopausal women took more dietary fat daily, approximately 6% compared to the postmenopausal (P<0.01). Fruit and vegetable intakes were very high, leading to a high estimation of vitamin C intake. Calcium intake reached 100% RDA amongst post-menopausal women and 96% in pre-menopausal, an average of 440mg daily. Iron intake was 118% RDA in the postmenopausal, twice the level of premenopausal women, 56%. Calculations showed that 86.5% of subjects had EI/ BMR ratio within the normal range, 13.5% had estimates below normal and none had higher. These proportions were similar for both pre and post menopausal women. A significant negative association was observed between age and fat intake (r=-0.119, P<0.05) which probably accounted for the difference in fat intake seen in pre-menopausal and post-menopausal women. A similar negative trend was observed for iron (r=-0.074) and EI (r=-0.048) which did not reach statistical significance. Dietary calcium showed a non significant relationship for age (r=0.044) and bone mass density of both spine (r=0.081) and hips (r=0.078).
Frequency (%) N=360 Everyday 2-3 per wk 1 per wk 1 per mth Never Fish and seafood 36.8 50.6 7.5 3.3 1.7 Premenopause 39.1 47.8 7.7 4.3 1.0 Postmenopause 34.0 54.2 7.2 2.0 2.6 Poultry 13.1 53.9 20.3 7.2 5.5 Premenopause 13.0 56.0 18.4 8.7 3.9 Postmenopause 13.1 51.0 22.9 5.2 7.8 Meat 4.7 23.3 26.7 24.7 20.6 Premenopause 3.9 20.3 30.9 26.6 18.4 Postmenopause 5.9 27.5 20.9 22.2 23.5 Eggs 4.4 48.3 33.3 10.6 3.3 Premenopause 4.3 49.3 31.4 12.6 2.4 Postmenopause 4.6 47.1 35.9 7.8 4.6 Legumes and products 15.3 46.1 23.6 13.1 1.9 Premenopause 15.9 41.1 26.6 15.0 1.4 Postmenopause 14.4 52.9 19.6 10.5 2.6 Vegetables 91.1 6.9 1.1 0.8 - Premenopause 90.8 7.7 1.4 - - Postmenopause 91.5 5.9 0.7 2.0 - Fruits 70.6 22.2 5.0 1.4 0.8 Premenopause 68.6 24.6 4.3 1.9 0.5 Postmenopause 73.2 19.0 5.9 0.7 1.3 Cheese and yogurt 5.3 12.5 15.8 30.3 36.1 Premenopause 4.3 10.6 19.8 32.4 32.9 Postmenopause 6.5 15.0 10.5 27.5 40.5 Milk 34.7 18.9 10.6 13.3 22.5 Premenopause 30.9 22.2 12.6 15.5 18.8 Postmenopause 39.9 14.4 7.8 10.5 27.5 Coffee* 35.1 18.3 3.9 5.1 37.6 Premenopause 32.0 21.2 4.9 5.4 36.5 Postmenopause 39.2 14.4 2.6 4.6 39.2
Tea* 23.6 16.6 7.0 5.1 47.7 Premenopause 23.2 20.2 7.4 6.4 42.9 Postmenopause 24.2 11.8 6.5 3.3 54.2 Fastfood* - 1.4 4.2 34.8 59.6 Premenopause - 1.6 4.9 43.3 50.2 Postmenopause - 1.3 3.3 23.5 71.9 *N = 356
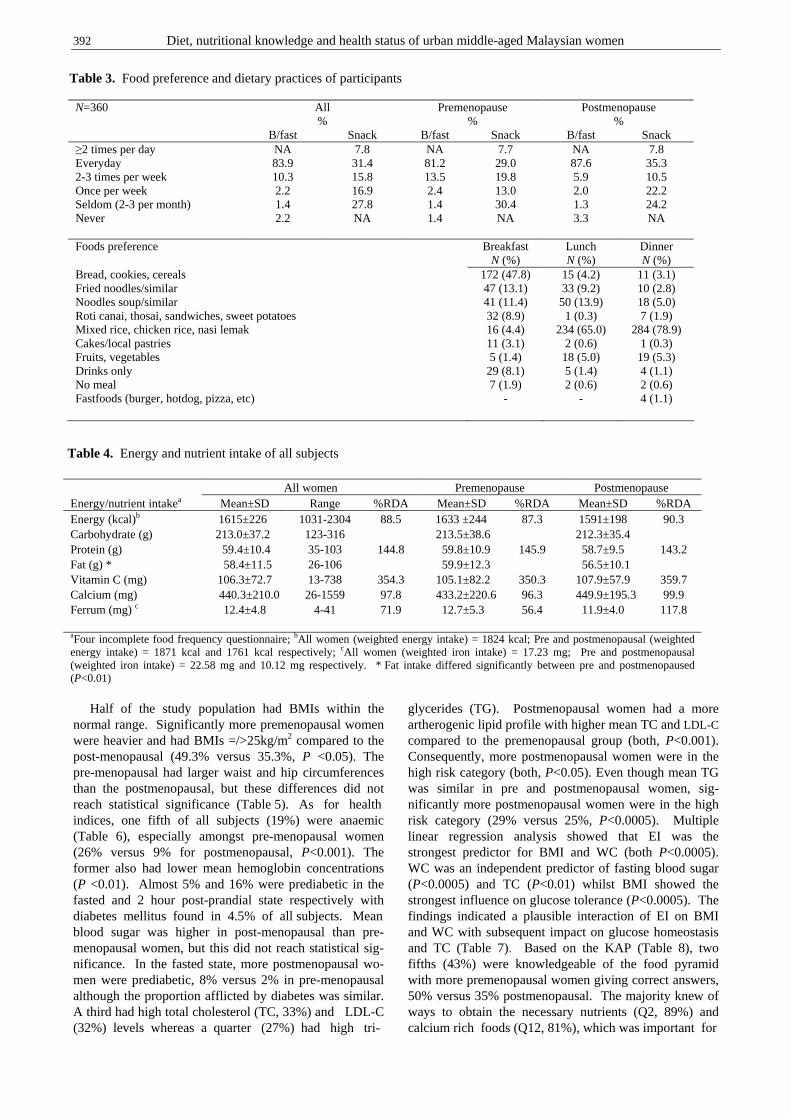
392 Diet, nutritional knowledge and health status of urban middle-aged Malaysian women
Half of the study population had BMIs within the normal range. Significantly more premenopausal women were heavier and had BMIs =/>25kg/m2 compared to the post-menopausal (49.3% versus 35.3%, P <0.05). The pre-menopausal had larger waist and hip circumferences than the postmenopausal, but these differences did not reach statistical significance (Table 5). As for health indices, one fifth of all subjects (19%) were anaemic (Table 6), especially amongst pre-menopausal women (26% versus 9% for postmenopausal, P<0.001). The former also had lower mean hemoglobin concentrations (P <0.01). Almost 5% and 16% were prediabetic in the fasted and 2 hour post-prandial state respectively with diabetes mellitus found in 4.5% of all subjects. Mean blood sugar was higher in post-menopausal than pre-menopausal women, but this did not reach statistical sig-nificance. In the fasted state, more postmenopausal wo-men were prediabetic, 8% versus 2% in pre-menopausal although the proportion afflicted by diabetes was similar. A third had high total cholesterol (TC, 33%) and LDL-C (32%) levels whereas a quarter (27%) had high tri-
glycerides (TG). Postmenopausal women had a more artherogenic lipid profile with higher mean TC and LDL-C compared to the premenopausal group (both, P<0.001). Consequently, more postmenopausal women were in the high risk category (both, P<0.05). Even though mean TG was similar in pre and postmenopausal women, sig-nificantly more postmenopausal women were in the high risk category (29% versus 25%, P<0.0005). Multiple linear regression analysis showed that EI was the strongest predictor for BMI and WC (both P<0.0005). WC was an independent predictor of fasting blood sugar (P<0.0005) and TC (P<0.01) whilst BMI showed the strongest influence on glucose tolerance (P<0.0005). The findings indicated a plausible interaction of EI on BMI and WC with subsequent impact on glucose homeostasis and TC (Table 7). Based on the KAP (Table 8), two fifths (43%) were knowledgeable of the food pyramid with more premenopausal women giving correct answers, 50% versus 35% postmenopausal. The majority knew of ways to obtain the necessary nutrients (Q2, 89%) and calcium rich foods (Q12, 81%), which was important for
N=360 All %
Premenopause %
Postmenopause %
B/fast Snack B/fast Snack B/fast Snack ≥2 times per day NA 7.8 NA 7.7 NA 7.8 Everyday 83.9 31.4 81.2 29.0 87.6 35.3 2-3 times per week 10.3 15.8 13.5 19.8 5.9 10.5 Once per week 2.2 16.9 2.4 13.0 2.0 22.2 Seldom (2-3 per month) 1.4 27.8 1.4 30.4 1.3 24.2 Never 2.2 NA 1.4 NA 3.3 NA Foods preference Breakfast Lunch Dinner N (%) N (%) N (%) Bread, cookies, cereals 172 (47.8) 15 (4.2) 11 (3.1) Fried noodles/similar 47 (13.1) 33 (9.2) 10 (2.8) Noodles soup/similar 41 (11.4) 50 (13.9) 18 (5.0) Roti canai, thosai, sandwiches, sweet potatoes 32 (8.9) 1 (0.3) 7 (1.9) Mixed rice, chicken rice, nasi lemak 16 (4.4) 234 (65.0) 284 (78.9) Cakes/local pastries 11 (3.1) 2 (0.6) 1 (0.3) Fruits, vegetables 5 (1.4) 18 (5.0) 19 (5.3) Drinks only 29 (8.1) 5 (1.4) 4 (1.1) No meal 7 (1.9) 2 (0.6) 2 (0.6) Fastfoods (burger, hotdog, pizza, etc) - - 4 (1.1)
Table 3. Food preference and dietary practices of participants
All women Premenopause Postmenopause Energy/nutrient intakea Mean±SD Range %RDA Mean±SD %RDA Mean±SD %RDA Energy (kcal)b 1615±226 1031-2304 88.5 1633 ±244 87.3 1591±198 90.3 Carbohydrate (g) 213.0±37.2 123-316 213.5±38.6 212.3±35.4 Protein (g) 59.4±10.4 35-103 144.8 59.8±10.9 145.9 58.7±9.5 143.2 Fat (g) * 58.4±11.5 26-106 59.9±12.3 56.5±10.1 Vitamin C (mg) 106.3±72.7 13-738 354.3 105.1±82.2 350.3 107.9±57.9 359.7 Calcium (mg) 440.3±210.0 26-1559 97.8 433.2±220.6 96.3 449.9±195.3 99.9 Ferrum (mg) c 12.4±4.8 4-41 71.9 12.7±5.3 56.4 11.9±4.0 117.8 aFour incomplete food frequency questionnaire; bAll women (weighted energy intake) = 1824 kcal; Pre and postmenopausal (weighted energy intake) = 1871 kcal and 1761 kcal respectively; cAll women (weighted iron intake) = 17.23 mg; Pre and postmenopausal (weighted iron intake) = 22.58 mg and 10.12 mg respectively. * Fat intake differed significantly between pre and postmenopaused (P<0.01)
Table 4. Energy and nutrient intake of all subjects
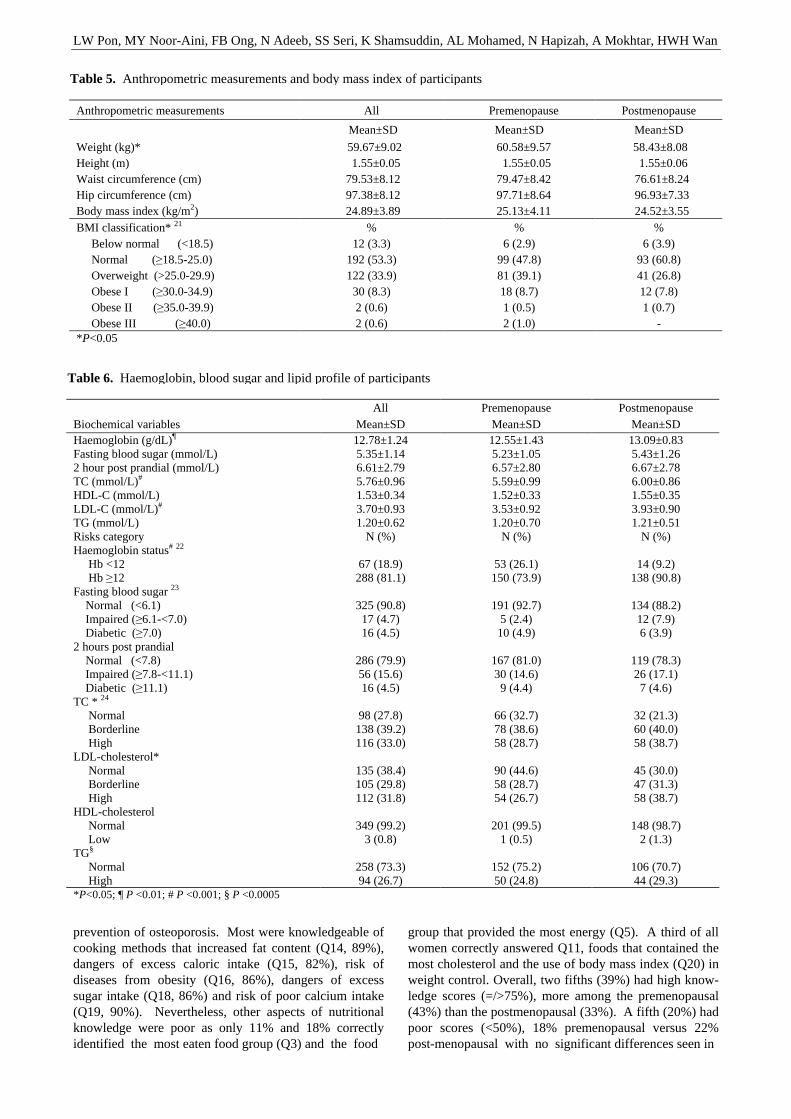
LW Pon, MY Noor-Aini, FB Ong, N Adeeb, SS Seri, K Shamsuddin, AL Mohamed, N Hapizah, A Mokhtar, HWH Wan
prevention of osteoporosis. Most were knowledgeable of cooking methods that increased fat content (Q14, 89%), dangers of excess caloric intake (Q15, 82%), risk of diseases from obesity (Q16, 86%), dangers of excess sugar intake (Q18, 86%) and risk of poor calcium intake (Q19, 90%). Nevertheless, other aspects of nutritional knowledge were poor as only 11% and 18% correctly identified the most eaten food group (Q3) and the food
group that provided the most energy (Q5). A third of all women correctly answered Q11, foods that contained the most cholesterol and the use of body mass index (Q20) in weight control. Overall, two fifths (39%) had high know-ledge scores (=/>75%), more among the premenopausal (43%) than the postmenopausal (33%). A fifth (20%) had poor scores (<50%), 18% premenopausal versus 22% post-menopausal with no significant differences seen in
Anthropometric measurements All Premenopause Postmenopause
Mean±SD Mean±SD Mean±SD
Weight (kg)* 59.67±9.02 60.58±9.57 58.43±8.08 Height (m) 1.55±0.05 1.55±0.05 1.55±0.06 Waist circumference (cm) 79.53±8.12 79.47±8.42 76.61±8.24 Hip circumference (cm) 97.38±8.12 97.71±8.64 96.93±7.33 Body mass index (kg/m2) 24.89±3.89 25.13±4.11 24.52±3.55 BMI classification* 21 % % % Below normal (<18.5) 12 (3.3) 6 (2.9) 6 (3.9) Normal (≥18.5-25.0) 192 (53.3) 99 (47.8) 93 (60.8) Overweight (>25.0-29.9) 122 (33.9) 81 (39.1) 41 (26.8) Obese I (≥30.0-34.9) 30 (8.3) 18 (8.7) 12 (7.8) Obese II (≥35.0-39.9) 2 (0.6) 1 (0.5) 1 (0.7) Obese III (≥40.0) 2 (0.6) 2 (1.0) - *P<0.05
Table 5. Anthropometric measurements and body mass index of participants
All Premenopause Postmenopause Biochemical variables Mean±SD Mean±SD Mean±SD Haemoglobin (g/dL)¶ 12.78±1.24 12.55±1.43 13.09±0.83 Fasting blood sugar (mmol/L) 5.35±1.14 5.23±1.05 5.43±1.26 2 hour post prandial (mmol/L) 6.61±2.79 6.57±2.80 6.67±2.78 TC (mmol/L)# 5.76±0.96 5.59±0.99 6.00±0.86 HDL-C (mmol/L) 1.53±0.34 1.52±0.33 1.55±0.35 LDL-C (mmol/L)# 3.70±0.93 3.53±0.92 3.93±0.90 TG (mmol/L) 1.20±0.62 1.20±0.70 1.21±0.51 Risks category N (%) N (%) N (%) Haemoglobin status# 22 Hb <12 67 (18.9) 53 (26.1) 14 (9.2) Hb ≥12 288 (81.1) 150 (73.9) 138 (90.8) Fasting blood sugar 23 Normal (<6.1) 325 (90.8) 191 (92.7) 134 (88.2) Impaired (≥6.1-<7.0) 17 (4.7) 5 (2.4) 12 (7.9) Diabetic (≥7.0) 16 (4.5) 10 (4.9) 6 (3.9) 2 hours post prandial Normal (<7.8) 286 (79.9) 167 (81.0) 119 (78.3) Impaired (≥7.8-<11.1) 56 (15.6) 30 (14.6) 26 (17.1) Diabetic (≥11.1) 16 (4.5) 9 (4.4) 7 (4.6) TC * 24 Normal 98 (27.8) 66 (32.7) 32 (21.3) Borderline 138 (39.2) 78 (38.6) 60 (40.0) High 116 (33.0) 58 (28.7) 58 (38.7) LDL-cholesterol* Normal 135 (38.4) 90 (44.6) 45 (30.0) Borderline 105 (29.8) 58 (28.7) 47 (31.3) High 112 (31.8) 54 (26.7) 58 (38.7) HDL-cholesterol Normal 349 (99.2) 201 (99.5) 148 (98.7) Low 3 (0.8) 1 (0.5) 2 (1.3) TG§ Normal 258 (73.3) 152 (75.2) 106 (70.7) High 94 (26.7) 50 (24.8) 44 (29.3) *P<0.05; ¶ P <0.01; # P <0.001; § P <0.0005
Table 6. Haemoglobin, blood sugar and lipid profile of participants
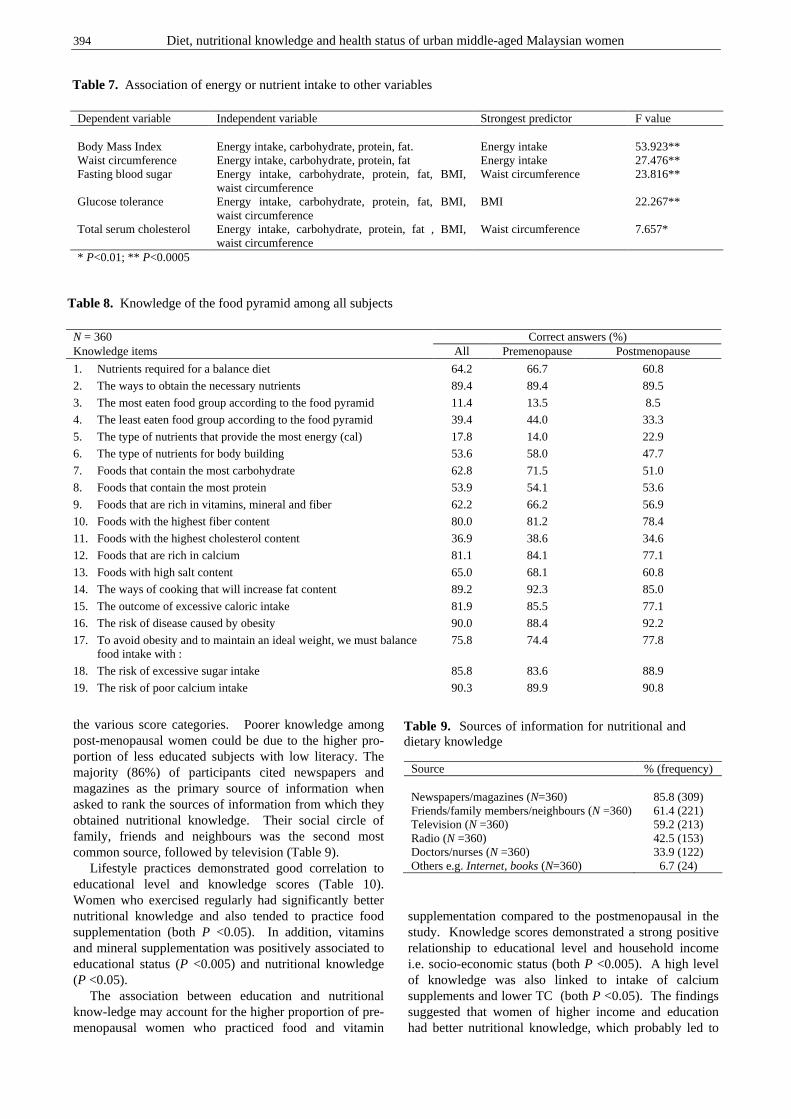
394 Diet, nutritional knowledge and health status of urban middle-aged Malaysian women
the various score categories. Poorer knowledge among post-menopausal women could be due to the higher pro-portion of less educated subjects with low literacy. The majority (86%) of participants cited newspapers and magazines as the primary source of information when asked to rank the sources of information from which they obtained nutritional knowledge. Their social circle of family, friends and neighbours was the second most common source, followed by television (Table 9). Lifestyle practices demonstrated good correlation to educational level and knowledge scores (Table 10). Women who exercised regularly had significantly better nutritional knowledge and also tended to practice food supplementation (both P <0.05). In addition, vitamins and mineral supplementation was positively associated to educational status (P <0.005) and nutritional knowledge (P <0.05). The association between education and nutritional know-ledge may account for the higher proportion of pre-menopausal women who practiced food and vitamin
supplementation compared to the postmenopausal in the study. Knowledge scores demonstrated a strong positive relationship to educational level and household income i.e. socio-economic status (both P <0.005). A high level of knowledge was also linked to intake of calcium supplements and lower TC (both P <0.05). The findings suggested that women of higher income and education had better nutritional knowledge, which probably led to
Dependent variable Independent variable Strongest predictor F value Body Mass Index Energy intake, carbohydrate, protein, fat. Energy intake 53.923** Waist circumference Energy intake, carbohydrate, protein, fat Energy intake 27.476** Fasting blood sugar Energy intake, carbohydrate, protein, fat, BMI,
waist circumference Waist circumference 23.816**
Glucose tolerance Energy intake, carbohydrate, protein, fat, BMI, waist circumference
BMI 22.267**
Total serum cholesterol Energy intake, carbohydrate, protein, fat , BMI, waist circumference
Waist circumference 7.657*
* P<0.01; ** P<0.0005
Table 7. Association of energy or nutrient intake to other variables
N = 360 Correct answers (%) Knowledge items All Premenopause Postmenopause
1. Nutrients required for a balance diet 64.2 66.7 60.8
2. The ways to obtain the necessary nutrients 89.4 89.4 89.5
3. The most eaten food group according to the food pyramid 11.4 13.5 8.5
4. The least eaten food group according to the food pyramid 39.4 44.0 33.3
5. The type of nutrients that provide the most energy (cal) 17.8 14.0 22.9
6. The type of nutrients for body building 53.6 58.0 47.7
7. Foods that contain the most carbohydrate 62.8 71.5 51.0
8. Foods that contain the most protein 53.9 54.1 53.6
9. Foods that are rich in vitamins, mineral and fiber 62.2 66.2 56.9
10. Foods with the highest fiber content 80.0 81.2 78.4
11. Foods with the highest cholesterol content 36.9 38.6 34.6
12. Foods that are rich in calcium 81.1 84.1 77.1
13. Foods with high salt content 65.0 68.1 60.8
14. The ways of cooking that will increase fat content 89.2 92.3 85.0
15. The outcome of excessive caloric intake 81.9 85.5 77.1
16. The risk of disease caused by obesity 90.0 88.4 92.2
17. To avoid obesity and to maintain an ideal weight, we must balance food intake with :
75.8 74.4 77.8
18. The risk of excessive sugar intake 85.8 83.6 88.9
19. The risk of poor calcium intake 90.3 89.9 90.8
Table 8. Knowledge of the food pyramid among all subjects
Source % (frequency) Newspapers/magazines (N=360) 85.8 (309) Friends/family members/neighbours (N =360) 61.4 (221) Television (N =360) 59.2 (213) Radio (N =360) 42.5 (153) Doctors/nurses (N =360) 33.9 (122) Others e.g. Internet, books (N=360) 6.7 (24)
Table 9. Sources of information for nutritional and dietary knowledge
LW Pon, MY Noor-Aini, FB Ong, N Adeeb, SS Seri, K Shamsuddin, AL Mohamed, N Hapizah, A Mokhtar, HWH Wan
more informed choices on food and lifestyle practices which in turn led to a better health status i.e. lower TC. Discussion The results of this study were not reflective of middle- aged Malaysian women in general, but an urban commu-nity with higher income and better education. The recruit-ment process had contributed to this bias as women who were highly motivated and health conscious would have volunteered to participate in this study. They would have already possessed a better health status, lower risk factors for development of diseases and be more compliant to intervention or advice. As expected, the women sampled had a satisfactory diet and healthy lifestyle i.e. 62% exer-cised regularly with 1% being smokers and 9% drank alcohol regularly. Alcohol was forbidden to Islamic prac-titioners, mainly Malays, which may also account for the overall low intake. Although not representative of the general population, the study included all major ethnic groups with a comparable urban distribution ratio. In contrast, previous studies had focused on nutrition and health in rural communities, a single ethnic group or industry. Consequently, the data from this fairly large study would provide a useful reference for future research into the subject. Food frequency assessment revealed that the overall diet was satisfactory. Rice was the staple food with fish and vegetables being consumed almost daily by the majo-rity of subjects. A three meal pattern of breakfast, lunch and dinner was practiced by the majority. Food choices were comparable to a report of middle-aged Malay adults10 and were healthier than a female population of electronic factory workers who had eggs as the main pro-tein source followed by chicken and fish with a lower consumption of fresh fruits and vegetables. The cost of healthy foods was cited as the main obstacle to con-suming them.31 The findings showed that EI consisted of 53% carbohydrates, 15% protein and 32% fats with carbohydrate and protein intake within the WHO recom-mendations.25 The estimated mean EI was 11% below
RDA, similar to previous studies.26-28 The study subjects had EI comparable to urban post-menopausal Chinese 29 but higher than rural adult women.30 Based on the EI/BMR ratio,20 FFQ estimation for majority were within normal with EI showing positive correlation to BMI (r=0.364, P<0.05). The proportion of low energy reporters was only 13.5%, less than other stu-dies.32,33 This may be partly explained by the fact that a blood sample was taken at the same time as the FFQ was administered, leading subjects to presume that nutrient intake was also being assessed via blood profile and therefore making subjects more cooperative with diet re-call.34 EI reduced with age, an observation consistent with local studies as well as other elderly popula-tions.26,35,36 Protein estimation was above 100% RDA as low quality protein from sources such as rice, a food staple, was factored in as well.28,35,36 A fat intake of 32% was higher than previously reported (26% and 30% for local adult women)28,37,38 and higher than the WHO recommendation of 30% for prevention of chronic di-seases.25 Fruit and vegetable intakes were very high leading to an estimation of vitamin C, 3.5 fold above RDA. The estimated value, however, was consistent with other studies.28,35 The study population on the whole had inadequate iron intake, reaching 72% RDA. The deficit was mainly among the premenopausal with an iron intake 56% RDA, contributing to a higher occurrence of iron deficient anae-mia. Exacerbating the occurrence of anaemia in some women would be irregular heavy bleeding due to hor-monal changes in the climacteric phase.39 In post-menopausal women, absence of cyclic bleeding mini-mised the loss of iron, reducing the risk of anaemia. The intake of iron also showed a negative trend with age im-plying a deterioration in nutritional intake as women grew older.26 Dietary calcium was estimated to reach 440mg daily, 98% RDA, comparable to other reports.29,35,40 Dairy pro-ducts were not the major source of dietary calcium with daily milk intake reported by a third while a minority of subjects, 5% had cheese and yogurt on a daily basis. The current level of dietary calcium was deemed insufficient by the Consensus Conference on Optimal Calcium In-take41 which recommend 1500mg for prevention of osteo-porosis among the postmenopausal. Half of the women in this study took calcium supplements demonstrating an awareness of osteoporosis prevention. Nevertheless, fur-ther efforts are needed to increase calcium intake among those postmenopausal as additional calcium had been shown to improve bone mass density in osteopenic and osteoporotic postmenopausal women with low habitual intake, <400mg per day.42 A third of all subjects in this study were dyslipidemic and 5% diabetic, mirroring the trend in the general population.10 The current population prevalence of diabetes mellitus was 8.2%,1 a fourfold increase from 2% in 1985.43 Hyperlipidemia was found in two fifths of a rural Malay community and evaluation using the global risk assessment indicator showed that 32% were at high risk for cardiovascular heart disease.44 Urbanites may have higher risks as a smaller study showed 84% pre and postmenopausal women had high serum cholesterol.45
Parameters Statistical outcome Exercise versus Educational level χ
2 =7.510 Household income χ
2 =3.708 Nutritional knowledge level χ
2 =8.558* Calcium supplementation χ
2 =0.945 Food supplementation χ
2 =4.965* Vitamins and mineral supplementation
Educational level χ2 =20.239**
Nutritional knowledge level χ2 =7.358*
Knowledge scores Educational level χ
2 = 71.052** Household income χ
2 = 28.361** Total serum cholesterol r = -0.133* Dietary calcium intake r = 0.199** * P<0.05; **P<0.005
Table 10. The association between knowledge scores, lifestyle factors and other parameters
396 Diet, nutritional knowledge and health status of urban middle-aged Malaysian women
In this study, postmenopausal women were leaner, ate less dietary fat and did more exercise compared to the premenopausal. A lower dietary fat intake was probably the result of lower meat intake as a fifth of postmeno-pausal women were none meat eaters. A consistent observation was made by Appleby et al.,46 that mean BMI was lower in non meat eaters than meat eaters, an effect mediated by higher dietary fiber intake and lower animal fat intake in the non meat eaters.47 The fat content of diet was shown to affect body fat as a function of dietary fat on EI whereby lowering the fat content of diet also reduces EI. A cause and effect relationship was observed in this study whereby EI had a positive impact on BMI and WC, an association observed in other populations.48-51 WC was an independent predictor of fasting blood sugar and TC whereas BMI was a significant factor on glucose tole-rance. The findings indicated a plausible interaction of EI on BMI and WC with subsequent impact on glucose homeostasis and TC, an observation reinforced by the association between WC and metabolic risk factors.52
While the postmenopausal were not deemed at risk of cardiovascular disease (CVD), they had riskier lipid profiles with higher TC which had arisen solely from an increased LDL-C. The findings indicated that the deterio-ration of the lipid profile was probably due to the con-sequence of intrinsic changes associated with the climac-teric transition and general aging 53-55 rather than changes in lifestyle and diet, as both aspects were comparable be-tween pre and postmenopausal women. Our results indicated that over-nutrition is a growing problem in the urban population; borne out by the higher prevalence of obesity amongst the younger premeno-pausal subjects whereas older postmenopausal women were leaner, an observation seen in other studies.10,56 In time, this cohort of premenopausal women will reach menopause, along with potentially higher risks of de-veloping morbid conditions. Of the three independent and significant factors impairing lipoprotein profiles i.e. menopause, age and increased weight, only obesity was modifiable by lifestyle changes.57 Hence, local wo-men should be advised to reduce caloric intake in order to maintain the ideal body weight, in lieu of a 2% reduction of BMR for every decade after the age of twenty.58 The reduction in caloric intake needs to be balanced against a substandard diet poor in calcium and iron - two minerals that were found to be insufficient in this study. The level of nutritional knowledge demonstrated by the study sample was higher than other local reports31,59 although the scores were not comparable. Poorer know-ledge observed among postmenopausal women could be due to the higher proportion of less educated subjects with low literacy, who could not understand or use health in-formation, or communicate well.60 Higher nutritional knowledge was related to socio-economic status of edu-cation and household income. Education and income, in addition to gender, cultural and psychological variables were important factors influencing nutrition knowledge and food practices in other populations.61,62 Education had been correlated with increased knowledge of risk fac-tors and a greater perception of control over the environ-ment and lifestyle and thus a sense of better risk control.63
The study showed that subjects who participated in regular exercise had higher nutritional knowledge scores64-66 and those who took supplements were more highly educated, similar to findings by other investi-gators.67,68 Nutritional knowledge demonstrated a sig-nificant inverse association to TC and a positive relation-ship to supplementary calcium intake; suggesting that nutritional knowledge had a direct impact on health and health maintenance. In certain high risk populations, acquired nutritional knowledge encouraged a positive attitude and practice with concomitant reduction in risk of developing chronic conditions.69-71 Reading materials such as magazines and newspapers were the main sources of information regarding food and nutrition for women in this sample, a finding reported by many authors. Nutri-tional knowledge could be taught and efficiently assimi-lated in a short period compared to changes in attitude and practice,72-74 making it an appropriate target to initiate improvement. Therefore, a call must be made for news-papers and magazines to give food and nutritional know-ledge prominence in their publications to help educate more readers towards better food and nutritional prac-tices. In conclusion, urban Malaysian women above 45 years of age had a satisfactory diet and healthy lifestyle. Total energy intake was 11.5% below Malaysian RDA, con-sisting of 53% carbohydrates, 15% protein and 32% fat. Iron intake was deficient, reaching 56% RDA in pre-menopausal women while calcium intake reached 440mg daily, but dairy products were not the main source. More premenopausal women (49%) were overweight or obese compared to the postmenopausal (35%) and the former consumed more dietary fat (6%). EI was the strongest predictor for BMI and WC, with WC itself an inde-pendent predictor of fasting blood sugar and TC while BMI had the strongest influence on glucose tolerance. Postmenopausal women had a more artherogenic lipid profile with significantly higher levels of TC and LDL-C than the premenopausal. Comparable nutrient intakes and lifestyles between pre and postmenopausal women suggested that health changes associated with menopause were mostly independent of diet. Knowledge scores demonstrated a strong positive rela-tionship to educational level and household income, life-style practices and TC. In turn, lifestyle practices of re-gular physical activity and vitamin/mineral supplemen-tation demonstrated good correlation to educational level and knowledge scores. Newspapers and magazines followed by the social circle were the main sources of nutritional information. To summarise, women of higher income and education had better nutritional knowledge which contributed to more informed food choices and lifestyle practices which in turn led to a better health status. Acknowledgement The authors gratefully acknowledge and thank the following for their assistance – Prof MA Jamil Yassin, Anson Ismail (Dept O&G, Ultrasound Unit); Ng KB, Ooi Teng Hong, Shuhaila Shohaimi, Hairun Bee (Dept of Rehabilitation); Prof Nor Azmi Kamaruddin, Norlinda Daut (Dept of Medicine, Bonescan Lab); Prof Nafikudin Hj Mahmud, Siti Zakiah Othman (Dept of Radiology, Radiology Unit), Prof Md Idris Mohd Nor (Dept of
LW Pon, MY Noor-Aini, FB Ong, N Adeeb, SS Seri, K Shamsuddin, AL Mohamed, N Hapizah, A Mokhtar, HWH Wan
Community Health, Statistics). Funding for the project came from USM Top Down Program IRPA No:06-02-05-9002 for which we would like to thank the program directors, Dato’ Prof Mafauzy Mohamed and Dato’ Prof Mustafa Embong. References 1. Ministry of Health Malaysia, Statistics 2004.
http://www.moh.gov.my/ (June 2005) 2. Calle EE, Thun MJ, Petrelli JM, Rodriguez C, Heath CW
Jr. Body-mass index and mortality in a prospective cohort of U.S. adults. N Engl J Med 1999; 341: 1097-1105.
3. Ismail MN, Chee SS, Nawawi H, Yusoff K, Lim TO, James WP. Obesity in Malaysia.Obes Rev 2002;3:203-208.
4. Ng TKW, Tee ES, Azriman R. Rural communities in nutritional transition:emergence of obesity, hypertension and hypercholesteronemia as public health problems in three kampungs in Bagan Datoh, Perak. Mal J Nutr 1995; 1: 129-139.
5. Ng TKW, Khor GL, Tee ES, Normah H. Nutritional assessment of rural villages and estates in Peninsular Malaysia: total blood cholesterol values in children, ado-lescent and adults. Asia Pac J Clin Nutr 2000. 9:115-121.
6. Norimah AK, Leung SW. Evaluation of nutritional status among a group of young Chinese adults in Kuala Lumpur. Asia Pac J Clin Nutr 2000; 9: 82-86.
7. Suzana S, Dixon RA, Earland J. Development of a screening tool for detecting undernutrition and dietary inadequacy among rural elderly in Malaysia: simple indices to identify individuals at risk. Int J Food Sci 1999; 50: 453-444.
8. Suzana S, Earland J, Suriah AR. Food intakes and habits of rural elderly Malays. Asia Pac J Clin Nutr 2000; 9:122-129.
9. Suzana S, Earland J, Suriah AR. Social and health profile of rural elderly Malays. Singapore Med J 2001; 42:208-213
10. Norimah AK, Kather HMM. Nutritional status and food habits of middle aged adults in selected areas of Selangor. Mal J Nutr 2003; 9: 125-136.
11. World Bank. 1991. Asia region population projections, 1990-1991 edition. Working papers WP5999. Washington: Department of Population and Human Resources.
12. Dept of Statistics Malaysia, 2001. Census 2000. http://www. statistics.gov.my (December 2001)
13. Tan PC. Social and economic security needs of older women in Asia. In Bulletin on Aging. Dept for Policy Coordination and Sustainable Development, United Nation, New York, 1995.
14. Pon LW. Effectiveness of healthy lifestyle and hormonal replacement therapy (HRT) on nutritional and health status of women aged 45 and above. Masters Medical Science, Universiti Kebangsaan Malaysia, 2002.
15. Norimah AK. Development of dietary assessment methods for use in the South Asian community. PhD Thesis. University of Southhampton, 1997.
16. Norimah AK, Margetts BM. Calibration of a food frequen-cy questionnaire developed for the South Asian community in the United Kingdom. Mal J Nutr 1997; 3:49-60.
17. Maisarah H. Kajian kalibrasi soal-selidik kekerapan makanan dengan merekod diet dikalangan komuniti Melayu di Lembah Kelang. BSc Thesis. Universiti Kebangsaan Malaysia, 1999.
18. Tee ES, Mohd-Ismail N, Mohd-Nasir A, Khatijah I. Nutrient composition of Malaysian foods (4th Edition). 1997. Malaysian Food Composition Database Programme c/o Institute for Medical Research, Kuala Lumpur.
19. Teoh ST. Recommended daily dietary intakes for Peninsular Malaysia. Med J Malaysia 1975; 30: 38- 42.
20. Ismail MN, Wan-Nudri WD, Zawiah H. Energy expen-diture studies to predict requirements of selected national athletes. Mal J Nutr 1997; 3: 71-81.
21. World Health Organization. Physical Status: The use and interpretation of anthropometry. Technical Report Series No. 854. Geneva, WHO, 1995.
22. WHO/UNICEF/UNU. IDA: Prevention, assessment and control. 1998. Report of a joint WHO/UNICEF /UNU con-sultation, Geneva. Geneva, WHO.
23. World Health Organization. Diabetes and non-communicable disease risk factor surveys: a field survey guide text. WHO/NCD/NCS/99.1. Geneva WHO, 1999.
24. NCEP-Executive summary of the third report of the National Cholesterol Education Program (NCEP) Expert Panel on Detection, Evaluation, and Treatment of high blood cholesterol in adults (Adults Treatment Panel III). JAMA 2001; 285: 2486-2497.
25. World Health Organization. Diet, nutrition, and the prevention of chronic diseases. Technical Report Series No. 797. Geneva, WHO, 1990.
26. Suriah AR, Zainorni MJ, Shafawi S, Suraya, MS, Zarina N, Wan-Zainuddin WA, Zalifah MK. Nutrient intake among elderly in southern Peninsular Malaysia. Mal J Nutr 1996; 2: 11-19.
27. Chee SS, Zawiah H, Ismail MN, Ng KK. Anthropometry, dietary patterns, and nutrient intake of Malaysian estate workers. Mal J Nutr 1996; 2: 122-126.
28. Chee SS, Ismail MN, Ng KK, Zawiah H. Food intake assessment of adults in rural and urban areas from four selected regions in Malaysia. Mal J Nutr 1997; 3: 91-102.
29. Chee WSS, Suriah AR, Zaitun Y, Chan SP, Yap SL, Chan YM. Dietary calcium intake in postmenopausal Malaysian women: comparison between the food frequency question-naire and three-day food records. Asia Pac J Clin Nutr 2002; 11: 142-146.
30. Khor GL, Zalilah MS. Dual forms of malnutrition in the same households in Malaysia – a case study among Malay rural households. Asia Pac J Clin Nutr 2003; 12: 427-438.
31. Lim HM, Chee HL, Kandiah M, Shamsuddin K, Jamaluddin J, Nor Anita MMN, Shuib R. Dietary and other factors associated with overweight among women factory workers in two electronic factories in Selangor. Mal J Nutr 2003; 9: 105-124.
32. Cook A, Pryer J, Shetty P. The problem of accuracy in dietary surveys. Analysis of the over 65 UK National Diet and Nutrition Survey. J Epidemiol Comm Healt 2000; 54: 611-616.
33. Westerterp KR, Goris AHC. Validity of the assessment of dietary intake: problems of misreporting. Clin Nutr Metab Care 2002; 5: 489-493.
34. Willett W. Food frequency methods. In Nutritional Epidemiology, 2nd Edition. Oxford University Press, New York, 1998; 74-94.
35. Shahar S, Earland J, Rahman SA. Food intake and habits of rural elderly Malays. Asia Pac J Clin Nutr 2000; 9: 122-129.
36. Energy intake. In Report on health and social subjects no 41. Dietary reference values for food energy and nutrients for United Kingdom. Dept of Health. Crown, copyright 1991; 15-39.
37. Fatimah A, Md-Idris M.N, Romzi MA, Faizah H. Energy, protein, fat, and CHO intake of underweight, normal weight, and obese government office workers in an urban area. Asia Pac J Clin Nutr 1996; 5: 88-91.
38. Ng TKW. Towards improved fat intake and nutrition for Malaysians. Mal J Nutr 1995; 1: 21-30.
398 Diet, nutritional knowledge and health status of urban middle-aged Malaysian women
39. McKinlay, SM. The normal menopause transition: an overview. Maturitas 1996; 23: 137-145.
40. Foo LH, Zaitun Y. Perkaitan di antara pengambilan kalsium dan factor-faktor gaya hidup dengan status kesi-hatan tulang di kalangan wanita selepas menopause. Mal J Nutr 2000; 6: 75- 95.
41. NIH (National Health Institute). Consensus Conference on Optimal Calcium Intake. NIH Consensus Development Panel on Optimal Calcium Intake. JAMA 1994; 212: 1942-1948.
42. New SA. Bone health: the role of micronutrients. Br Med Bull 1999; 55: 619-33.
43. Mustaffa BE. Diabetes mellitus in peninsular Malaysia: ethnic differences in prevalence and complications. Ann Acad Med Singapore 1985; 14: 272-276.
44. Nawawi HM, Nor IM, Noor IM, Karim NA, Arshad F, Khan R, Yusoff K. Current status of coronary risk factors among rural Malays in Malaysia. J Cardiovasc Risk 2002; 9: 17-23.
45. Damodaran, P, Subramaniam R, Omar SZ, Nadkarni P, Paramsothy M. Profile of a menopause clinic in an urban population in Malaysia. Singapore Med J 2000; 41: 431-435.
46. Appleby PN, Thorogood M, Mann JI, Key TJ. Low BMI in non meat eaters; possible roles of animal fats, dietary fibers and alcohol. Int J Obes 1998; 22: 454-60.
47. Key TJ, Davey GK. Prevalence of obesity is low in people who do not eat meat. BMJ 1996; 313: 816-17.
48. Popkin BM, Paeratakul S, Zhai F, Ge K. Dietary and environmental correlates of obesity in a population study in China. Obes Res 1995; 3 (Suppl): 135s-143s.
49. Heitmann BL, Lissner L, Sorensen TI, Bengtsson C. Dietary fat intake and weight gain in women genetically predisposed for obesity. Am J Clin Nutr 1995; 61:1213-7.
50. Bolton-Smith C, Woodward M. Dietary composition and fat to sugar ratios in relation to obesity. Int J Obes Relat Metab Disord 1994; 18:820-8.
51. Stookey JD, Adair LS, Popkin BM. Do protein and energy intakes explain long-term changes in body composition? J Nutr Health Aging 2005. 9:5-17.
52. Lear SA, Chen MM, Frohlich JJ, Birmingham CL. The relationship between waist circumference and metabolic risk factors: cohorts of European and Chinese descent. Metabolism 2002; 51:1427-32.
53. Stevenson JC, Crook D, Godsland IF. Influence of age and menopause in serum lipids and lipoproteins in healthy women. Atherosclerosis 1993; 98: 83-90.
54. Kuller, LH, Gutai JP, Meilahn E, Matthews KA, Plantinga P. Relationship of endogenous sex steroid hormones to lipids and apoproteins in postmenopausal women. Arteriosclerosis 1990; 10: 1058-1066.
55. Bush TL. The epidemiology of cardiovascular diseases in postmenopausal women. Ann. NY Acad. Sci. 1990. 592: 263-271.
56. Lim TO, Ding MHA, Suleiman AB, Kew ST, Maimunah AH, Rozita H, Rashid A. Distribution of blood glucose in a national sample of Malaysian adults. Med J Mal 2000; 55: 65-77.
57. Berg G, Mesch V, Boero L, Sayegh F, Prada M, Royer M, Muzzio ML, Schreier L, Siseles N, Benencia H. Lipid and lipoprotein profile in menopausal transition. Effect of hormones, age and fat distribution. Horm Metab Res 2004;. 36: 215-220.
58. Wing RR, Matthews KA, Kuller LH, Meilahn EN, Plantinga PL. Weight gain at the time of menopause. Arch Intern Med 1991; 151: 97-102.
59. Ruzita AT, Rasyedah AR. Penerimaan masyarakat terhadap bahan pendidikan pemakanan bercetak. Mal J Nutr 2001; 7: 51-60
60. Eng TR, Maxfield A, Patrick K, Deering MJ, Ratzan SC, Gustafson DH. Access to health information and support: a public highway or a private road. JAMA 1998; 280: 1371-1375.
61. Parmenter K, Waller J, Wardle J. Demographic variation in nutrition knowledge in England. Health Educ Res 2000; 15: 163-174.
62. Worsley A. Nutrition knowledge and food consumption: can nutrition knowledge change food behaviour? Asia Pac J Clin Nutr 2002; 11(suppl): S579-S585
63. Naimark BJ, Tate RB, Turner DM. Assessing women’s knowledge, behaviour and information needs about coronary heart disease. J Nursing Scholar 1999; 31:95-101.
64. Schmitz K, French SA, Jeffrey RW. Correlates of changes in leisure time physical activity over 2 years: The Healthy Worker Project. Prev Med 1997; 26: 570-579.
65. Lian WM, Goh LG, Pin CH, Wee S, Ye HC. Correlates of leisure-time physical activity in an elderly population in Singapore. Am J Public Health 1999; 89: 1578-1580.
66. Sternfeld B, Ainsworth BE, Quesenberry CP. Physical activity patterns in a diverse population of women. Prev Med 1999; 28: 313-323.
67. Lyle BJ, Mares-Perlman JA, Klein BE, Klein R, Greger JL. Supplement users differ from nonusers in demo-graphic, lifestyle, dietary and health characteristics. J Nutr 1998; 128 (12): 2355-2362.
68. Levy AS, Schucker RE. Patterns of nutrient intake among dietary supplement users: attitudinal and behavioral corre-lates. J Am Diet Assoc 1987; 87: 754-760.
69. Brunner E, White IR, Thorogood M, Bristow A, Curle D, Marmot MG. Can dietary intervention change diet and cardiovascular risk factors. Am J Public Health 1997; 87; 1415-1422.
70. Shewry MC, Smith WCS, Tunstall-Pedoe H. Health know-ledge and behaviour change: a comparison of Edinburgh and North Glasgow. Health Educ J 1990; 49:185-190.
71. Plaisted CS, Lin PH, Ard JD, McClure ML, Svetkey LP. The effects of dietary patterns on quality of life: a substudy of the Dietary Approaches to Stop Hypertension trial. J Am Diet Assoc 1999; 99 (suppl 8): S84-S94.
72. Krinke UB. Nutrition information topic and format pre-ferences of older adults. J Nutr Educ 1990;22: 292-297.
73. Zaitun Y, Low TS. Assessment of nutrition education needs among a sample of elderly Chinese in an urban area. Mal J Nutr 1995; 1: 41-50.
74. Almeida MDV, Graca P, Lappalainen R, Giachetti I, Kafatos A, Winter AMR, Kearney JM. Sources used and trusted by nationally-representative adults in the European Union for the information on healthy eating. Eur J Clin Nutr 1987; 51 (suppl): 16S-22S.
LW Pon, MY Noor-Aini, FB Ong, N Adeeb, SS Seri, K Shamsuddin, AL Mohamed, N Hapizah, A Mokhtar, HWH Wan
Original Article Diet, nutritional knowledge and health status of urban middle-aged Malaysian women LW Pon MSc
1, MY Noor-Aini PhD2, FB Ong PhD
3, N Adeeb FRCOG3, SS Seri MOG
3, K Shamsuddin PhD
4, AL Mohamed PhD5, N Hapizah MRCPath
6, A Mokhtar MRCOG7,
and HWH Wan MOG8
1Malaysian Palm Oil Promotion Council, Kuala Lumpur; 2Dept of Nutrition and Dietetic, Faculty of Allied Sciences, Universiti Kebangsaan Malaysia, Kuala Lumpur; 3Dept of Obstetrics & Gynaecology, Medical Faculty, Universiti Kebangsaan Malaysia, Kuala Lumpur; 4Dept of Community Medicine, Medical Faculty, Universiti Kebangsaan Malaysia, Kuala Lumpur; 5Dept of Medicine, International Medical University, Kuala Lumpur; 6Dept of Chemical Pathology, Medical Faculty, Universiti Kebangsaan Malaysia, Kuala Lumpu; 7Dept of Obstetrics & Gynaecology, Hospital Tengku Ampuan Afzan, Kuantan, Pahang; 8Dept of Obstetrics & Gynaecology, Hospital Serdang, Selangor
马来西亚城市中年妇女的饮食马来西亚城市中年妇女的饮食马来西亚城市中年妇女的饮食马来西亚城市中年妇女的饮食、、、、营养知识和健康状况营养知识和健康状况营养知识和健康状况营养知识和健康状况
此研究的目的是评价马来西亚城市中年妇女的营养,健康状况和营养知识。更年期对饮食和
健康指数的影响也在研究之例。本研究包括 360 位无疾病妇女,不使用激素代替治疗
(HRT),年龄≥4 5 岁并从 1999 年 11 月至 2001 年 10 月恢复完整的子宫。个人特征,人体
测量和血样的获得遵照临床检查。营养素的摄入和营养知识测定通过定量的食物频度问卷
(FFQ)调查和知识、行为、态度(KAP)调查。检查结果显示 51.65±5.40 岁的城市中年妇
女,能量摄入(EI)11%低于每日平均推荐量(RDA),由 53%碳水化合物,15%蛋白质和 32%
脂肪组成并随着年龄下降。受试人群中包括 42.5%更年期后的妇女有令人满意的饮食和健康
的生活方式。更年期前的妇女比更年期后的妇女通过另外的饮食消耗更多的膳食脂肪(6%)。
更年期前的妇女缺乏铁的摄入,占 56%的 RDA,促成了 26%贫血患病率。全部钙的摄入量达到
了每天 440mg,但是乳制品不是主要的来源。更年期前的妇女有更高血管硬化作用的脂肪剖
面,和显著性地高总胆固醇和 LDL-C 水平,但是更多的更年期前的妇女是超重/肥胖的(49%
比 35%)。EI 是强有力的 BMI 和腰围的预测器,腰围是一个独立的空腹血糖预测器,而 TC 和
BMI 强烈地影响葡萄糖耐糖量。39% 的妇女有高营养知识,而 20%的妇女营养知识贫乏。报
纸和杂志,还有患者的社交圈是主要的营养信息来源。营养知识和教育,家庭收入,维生素
/矿物质增补剂和有规律的身体锻炼成正相关,但和 TC 负相关。结论,城市中年妇女有一个
低铁和钙的饮食。营养知识和更健康的生活方式实施和更低 TC 正向关系。通过对更年期前
后妇女营养素和生活方式的比较,建议与更年期相关的健康状态的变化在很大程度上是不依
赖饮食。
关键词:关键词:关键词:关键词:食物频率、更年期、知识、健康、中年、妇女、城市、马来西亚。
400 Asia Pac J Clin Nutr 2006;15 (3): 400-405
Original Article Good oral health, adequate nutrient consumption and family support are associated with a reduced risk of being underweight amongst older Malaysian residents of publicly funded shelter homes Renuka Visvanathan FRACP, MBBS, PhD
1 and Zaiton Ahmad MMed, MD2
1 Department of Medicine, The University of Adelaide and Director, Aged and Extended Care Service, The Queen Elizabeth Hospital, South Australia, Australia 2Institute of Gerontology, University Putra Malaysia and Department of Community Health, University Putra Malaysia, Serdang, Malaysia
A low body mass index in older people has been associated with increased mortality. The main objective of this study was to identify factors associated with low body mass indices [BMIs] (< 18.5 kg/m2) in older residents of shelter care facilities in Peninsular Malaysia. 1081 elderly people (59%M) over the age of 60 years were surveyed using questionnaires determining baseline demographics, nutritional and cognitive status, physical function and psychological well being. Body mass index was also determined. Subjects were recruited from publicly funded shelter homes in Peninsular Malaysia. 14.3% of residents had BMIs < 18.5 kg/m2. Multivariate analyses (adjusted for age and sex) revealed that having no family (RR 1.98 [95%CI 1.40-2.82], P<0.001) and negative responses to statement 3 [I eat few fruits or vegetables or milk products] (RR 0.62 [95% CI 0.42-0.90]; P=0.013) and statement 5 [I have tooth or mouth problems that make it hard for me to eat] (RR 0.69 [95%CI 0.50-0.96]; P=0.023) of the ‘Determine Your Nutritional Health Checklist’ were independently associated with low BMIs (<18.5 kg/m2). Older people with no family support were at risk of becoming underweight. Older people who consumed fruits, vegetables or milk or had good oral health were less likely to be underweight. Nutrient intake, oral health and social support were important in ensuring healthy body weight in older Malaysians.
Key Words: Body mass index, oral health, nutrition, social support, poverty, homeless, elderly, shelter homes, Malaysia. Introduction In Malaysia, many older people who do not have family or financial support are housed in publicly funded shelter homes. There are nine such shelter homes ('Rumah Seri Kenangan) in Peninsular Malaysia, which provide social and rehabilitative support. Prior to this study, the health status of these older residents was not known. As the el-derly residents in these homes are financially disad-vantaged, most of them are dependant on the meals, clothes and medications provided to them at these homes.
One Malaysian study found that approximately 40% of older Malay residents (one ethnic group) of a rural village in Peninsular Malaysia were underweight with a body mass index (BMI) < 18.5 kg/m2 (Suzana et al.,2002).1 Therefore, there was a high likelihood that a large proportion of residents in these shelter homes would be at risk of being underweight. BMI is often used as an anthropometric mea-sure in the assessment of nutritional status (Visvanathan et al., 2005,Visvanathan et al., 2004).2,3 Several studies have shown that Asian populations when compared with Caucasian/European populations, have a higher body fat percent at similar BMI (Wang et al., 1994, Ministry of
Health Malaysia, 2003, Deurenberg et al., 2002).4-6 For this reason, in Malaysia, the healthy BMI range for adult Malaysians has been determined to be between 18.5 and 22.9 kg/m2 (Ministry of Health Malaysia, 2003).5 A BMI <18.5 kg/m2 is associated with increased mortality risk relative to healthier BMI in older people (Flegal et al., 2005, Taylor and Ostbye, 2001).7,8 Studies in Asians have also found that low body mass indices (BMIs- < 18.5 kg/m2) in adults are associated with illnesses and reduced work performance (Shetty and James, 1994).9 This poor health is partly because, older people Correspondence address: Renuka Visvanathan, Department of Medicine, The University of Adelaide and Director, Aged and Extended Care Service, The Queen Elizabeth Hospital, 28
Woodville Road, Woodville South 5011, South Australia, Australia Tel: + 61-8-8222 6887; Fax: + 61-8-8222 6042 Email: [email protected] Accepted 16th December 2005
R Visvanathan and Z Ahmad 401
people with low BMI, are likely to have a lack of lean mass (sarcopenia) and this is associated with poor health outcomes (Janssen et al., 2002).10 It is therefore important to identify underweight older people and institute re-medial strategies early. The primary aim of this study was to determine the factors independently associated with low BMIs (defined as <18.5 kg/m2). Materials and methods The study methodology has been described in detail elsewhere but is described briefly here (Visvanathan et al.,2005).2 Two research assistants interviewed 1081 resi-dents using questionnaires that had been translated into the official written and spoken Malaysian language (Bahasa Malaysia). One investigator (ZA) trained both research assistants. One investigator (ZA) translated the questionnaires whilst a second investigator (RV) verified its accuracy. Subjects who were younger than 60 years old and had resided in the shelter homes for less than three months were excluded. In total, between March and September 2003 there were a total of 1341 residents in these shelter homes but only 1126 residents were eligible to participate in this study. Of the 1126 residents approached, 45 did not participate due to poor health or severe dementia. Socio-demographic, body mass index (BMI), health (the presence of diabetes, stroke, ischemic heart disease, hypertension and osteoarthritis), nutritional (DETERMINE Your Nutritional Health Checklist), emo-tional (GDS-12R) and cognitive (ECAQ) status and phy-sical function (Barthel’s Index) were determined. In-formed consent was obtained from all 1081 subjects and/ or their carers (participation rate 96%). The study was performed under the auspices of the Department of Social Welfare, Malaysia. Ethics approval was obtained from the human research ethics committee of University Putra Malaysia. Body mass index Weight was measured using the same portable weighing scale (TANITA weighing scale) in light clothing (without shoes) to the nearest 0.1kg. Height (SECA body meter) was measured whilst the patient was standing to the nearest 0.5cm. BMI was calculated as weight in kilogram divided by height in meters squared. Subjects scoring less than 18.5 kg/m2 were said to be underweight in this study. Nutritional status The ‘DETERMINE Your Nutritional Health Checklist’ [NHC] (maximum score 21) is a simple questionnaire of 10 statements on a single page requiring yes/no answers (Omran and Morley, 2000).11 Statement [S] 1- I have an illness or condition that made me change the kind and/or amount of food that I eat (score 2); S2- I eat fewer than two meals per day (score 3); S3- I eat few fruits or vegetables or milk products (score 2); S4- I have 3 or more drinks of beer, liquor or wine almost every day (score 2); S5- I have tooth or mouth problems that make it hard for me to eat (score 2); S6- I don’t always have enough money to buy the food I need (score 4); S7- I eat alone most of the time (score 1); S8- I take 3 or more different prescribed or over-the-counter drugs a day (score 1); S9-Without wanting to, I have lost or gained 10
pounds in the last 6 months (score 1); S10-I am not always physically able to shop, cook and/or feed myself (score 2). In this study, subjects scoring 3 or more were considered to be at nutritional risk (AR) [3-5 moderate risk, > 6 high risk]. Cognition The Elderly Cognitive Assessment Questionnaire (ECAQ) was developed specifically for use among el-derly people in developing countries and was used to eva-luate cognitive status in this study (Kua and Ko, 1992).12
The questionnaire consists of 10 items grouped under 3 categories: memory (3 items), orientation (6 items) and memory recall (1 item). Subjects were classified in this study as experiencing probable (< 5), borderline (5-6) and no (>6) cognitive impairment [max score 10]. Physical function Ability to independently perform activities of daily living (ADL) was assessed using the 10-item modified Barthel Index. It has a maximum score of 20 and subjects were classified according to their scores; ‘moderately to very severely disabled’ (<14), ‘mildly disabled’ (15 to 19) and ‘fully independent’ (20) (Tornquist et al., 1990).13
Depression The 12 question Geriatric Depression Scale for people in residential care facilities (GDS-12R) was used to dia-gnose depression in this study (Sutcliffe et al., 2000).14 Developed from the GDS-15, 3 items found to be poor identifiers of depression in nursing and residential home populations were excluded: 1) the preference of going out rather than staying home; 2) the feeling of having more problems than other people; and 3) the feeling that most people were better off than them (Sutcliffe et al., 2000).14 In this study, subjects scoring of > 5 (maximum score of 12) were at risk of depression (Sutcliffe et al., 2000).14
Statistical Analysis Log-binomial regression univariate analysis of subject’s clinical characteristic based on low BMI (<18.5 kg/m2) was performed. Factors associated with this low BMI (P<0.12 by univariate analysis) were then included into a log-binomial regression multivariate analysis adjusting for age and sex yielding factors independently associated with low BMIs. We did not adjust for socio-economic status as people in these homes were poor and financially dependant on the financial support provided to them by these homes (i.e. minimal). SAS was the software pro-gram used (SAS Institute, inc, Cary, NC). P values <0.05 were considered to be statistically significant. Results The socio-demographic profile of this study population has been described elsewhere (Visvanathan et al., 2005).2 14.3% of the older people living in these shelter accom-modation were underweight with a BMI <18.5 kg/m2
(Visvanathan et al., 2005).2 The BMI was not deter-mined in 102 people as 93 were too physically depen-dent and nine others declined. There was no difference in terms of age (72 + 7.6[SD] vs. 73 + 7.2; P=0.19) and gender (58.5% vs. 58.8%; P=1.0) between those who had
402 Risk factors for underweight in disadvantaged Malay elderly
their BMI determined and those who did not. Table 1 shows the results of the univariate log-binomial regression analysis of subjects’ clinical charac-teristics, based on the baseline BMI. Subjects were grouped as not underweight (BMI>18.5kg/m2) and under-weight (BMI <18.5 kg/m2). Seventeen parameters were found to be potentially associated with (P<0.12) being underweight. These parameters were further evaluated in a multivariate log-binomial regression analysis [adjusted for age and sex]. The following parameters were not evaluated: 1) the nutritional score and nutritional status as individual statements from the NHC were included into the analysis; 2) sex as the analyses was subsequently adjusted for this; and 3) statement 8 on the NHC as the number of medications determined using the medical records was more accurate and this was included into the analysis instead. Having no family (RR 1.98 [95%CI 1.40-2.82], P<0.001) was associated with increased risk of being under-weight. Negative responses to statement 3 [I eat few fruits or vegetables or milk products] (RR 0.62 [95% CI 0.42-0.90]; P=0.013) and statement 5 [I have tooth or mouth problems that make it hard for me to eat] (RR 0.69 [95%CI 0.50-0.96]; P=0.023) of the NHC appeared to be protectively associated with a lower BMI. Discussion This study confirms for the first time in Malaysia that a large proportion (14.3%) of older people residing in these publicly funded shelter homes are underweight and have BMIs that are less than 18.5 kg/m2 (Visvanathan et al., 2005).2 Having no family was found to be independently associated with an increased risk of having a low BMI whilst denial of reduced fruits, vegetables or milk con-sumption and poor oral and dental health was shown to be associated with a reduced risk of being under-weight (BMI 18.5 kg/m2). In contrast to a previous study where almost 40% of rural subjects were underweight (BMI < 18.5kg/m2), only 14% of shelter home residents in this study were under-weight (Suzana et al., 2002).1 That study only inve-stigated Malay subjects whilst our study involved all the three major racial groups in Malaysia but this was unlikely to be the reason for the difference seen (total underweight 14%, Malays 12.8%, Chinese 16.2%, Indians 13.8%). The fact that many more people in 11 rural villages (N=350) were under-weight compared to already under-privileged shelter home residents (80% from rural area) is of major concern and this requires urgent detailed evaluation and management by Malaysian health autho-rities. In newly industrialized countries, poverty is common in rural regions and this, together with illiteracy may be contributing to the high rate of poor weight status seen amongst rural older people in the 2002 study by Suzana et al.,1,15(Piammongkol et al., 2004). Although not assessed in this study, low BMIs are associated with increased mortality and poor health. Therefore, the finding that almost 15% of older residents in these shelter care facilities in Malaysia were under-weight is also of major concern. In a very recent paper from the United States of America, a BMI <18.5 kg/m2 was associated with 33, 746 excess death relative to the
normal weight category (BMI 18.5 to < 25 kg/m2) (Flegal et al., 2005).7 People with low BMIs are very likely to also have sarcopenia (Iannuzzi-Sucich et al., 2002).16 Reduced fat free muscle mass or sarcopenia in older people is associated with poor health outcomes (Janssen et al., 2002, Janssen et al., 2004a, Janssen et al., 2004b).10,17,18 It has been suggested that a partial with-drawal of anabolic stimuli (e.g. growth hormone), espe-cially in men, and an increase in catabolic stimuli (e.g. inflammatory cytokines), especially in women, contribute to the development of sarcopenia in older people (Payette et al, 2003).19 A reduction in nutrient intake and physical activity is also thought to contribute to the development of sarcopenia in older people (Morley, 2001, Roubenoff and Hughes, 2000).20,21 Therefore, increasing nutrient intake, maintaining physical activity, maintenance of ana-bolic status (especially in men) and adequate treatment of medical illnesses (to reduce catabolism) may all be re-quired to various degrees to improve the health status of these older shelter home residents. Oral and dental health is very important in older peo-ple but unfortunately access to dental care is sometimes difficult. Older people who are poor, isolated and frail (as in this study) are more likely to not access dental services. In a recent study conducted in Australia, being edentulous was associated with being older, having no private dental insurance, being female, leaving school at less than 15 years of age, being poor, not owning a home, living in a rural area, and not being able to travel alone (Ringland et al., 2004).22 In one large Spanish study of 3460 adults aged 65 years and older, nutritional status was assessed using the Mini Nutritional Assessment (maximum score 30) (The Spanish Geriatric Oral Health Research Group, 2001).23 48% of the edentulous subjects and 43% of the dentate subjects were found to be under-nourished (score <24). Consistent with this, this study found that residents reporting no oral or dental health troubles were less likely to be underweight (and perhaps better nourished). Regular consumption of fruit and vegetables is said to be associated with a reduced risk of developing cancer, cardiovascular disease, stroke, Alzheimer disease, cata-ract, and functional decline (Liu 2003).24 Therefore, not surprisingly, the World Health Organization recommends adequate consumption of fruits, vegetables and milk products (Wahlqvist et al., 2002).25 Older people in this study who reported eating few fruits, vegetables and milk products were more likely to be underweight. As stated earlier, weight (and BMI) is often used as a surrogate marker of nutritional status and so older people who are not underweight are more likely to be better nourished (Visvanathan et al., 2004).2 Encouraging older people to consume fruits, vegetables and milk products should be strongly encouraged and part of any management policy. Older people in these shelter homes often did not own their own homes and had no income or savings. Most would have been dependent on support from family or lived in poverty for lengthy periods prior to admission. In this study, older people who had no family were more likely to be under-weight. Although we have no objective evidence to support this, it is very likely that older people with family were more likely to have had better access to nutritious food prior to admission than those without
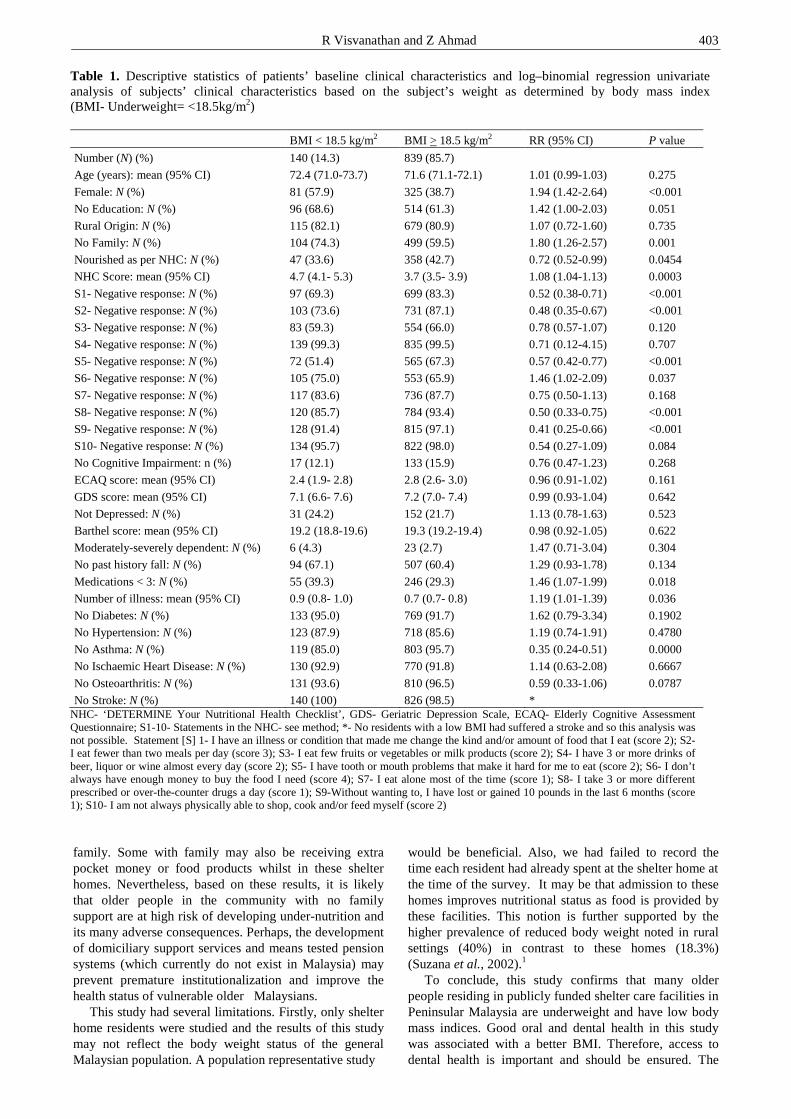
R Visvanathan and Z Ahmad 403
family. Some with family may also be receiving extra pocket money or food products whilst in these shelter homes. Nevertheless, based on these results, it is likely that older people in the community with no family support are at high risk of developing under-nutrition and its many adverse consequences. Perhaps, the development of domiciliary support services and means tested pension systems (which currently do not exist in Malaysia) may prevent premature institutionalization and improve the health status of vulnerable older Malaysians. This study had several limitations. Firstly, only shelter home residents were studied and the results of this study may not reflect the body weight status of the general Malaysian population. A population representative study
would be beneficial. Also, we had failed to record the time each resident had already spent at the shelter home at the time of the survey. It may be that admission to these homes improves nutritional status as food is provided by these facilities. This notion is further supported by the higher prevalence of reduced body weight noted in rural settings (40%) in contrast to these homes (18.3%) (Suzana et al., 2002).1 To conclude, this study confirms that many older people residing in publicly funded shelter care facilities in Peninsular Malaysia are underweight and have low body mass indices. Good oral and dental health in this study was associated with a better BMI. Therefore, access to dental health is important and should be ensured. The
Table 1. Descriptive statistics of patients’ baseline clinical characteristics and log–binomial regression univariate analysis of subjects’ clinical characteristics based on the subject’s weight as determined by body mass index (BMI- Underweight= <18.5kg/m2)
BMI < 18.5 kg/m2 BMI > 18.5 kg/m2 RR (95% CI) P value
Number (N) (%) 140 (14.3) 839 (85.7)
Age (years): mean (95% CI) 72.4 (71.0-73.7) 71.6 (71.1-72.1) 1.01 (0.99-1.03) 0.275
Female: N (%) 81 (57.9) 325 (38.7) 1.94 (1.42-2.64) <0.001
No Education: N (%) 96 (68.6) 514 (61.3) 1.42 (1.00-2.03) 0.051
Rural Origin: N (%) 115 (82.1) 679 (80.9) 1.07 (0.72-1.60) 0.735
No Family: N (%) 104 (74.3) 499 (59.5) 1.80 (1.26-2.57) 0.001
Nourished as per NHC: N (%) 47 (33.6) 358 (42.7) 0.72 (0.52-0.99) 0.0454
NHC Score: mean (95% CI) 4.7 (4.1- 5.3) 3.7 (3.5- 3.9) 1.08 (1.04-1.13) 0.0003
S1- Negative response: N (%) 97 (69.3) 699 (83.3) 0.52 (0.38-0.71) <0.001
S2- Negative response: N (%) 103 (73.6) 731 (87.1) 0.48 (0.35-0.67) <0.001
S3- Negative response: N (%) 83 (59.3) 554 (66.0) 0.78 (0.57-1.07) 0.120
S4- Negative response: N (%) 139 (99.3) 835 (99.5) 0.71 (0.12-4.15) 0.707
S5- Negative response: N (%) 72 (51.4) 565 (67.3) 0.57 (0.42-0.77) <0.001
S6- Negative response: N (%) 105 (75.0) 553 (65.9) 1.46 (1.02-2.09) 0.037
S7- Negative response: N (%) 117 (83.6) 736 (87.7) 0.75 (0.50-1.13) 0.168
S8- Negative response: N (%) 120 (85.7) 784 (93.4) 0.50 (0.33-0.75) <0.001
S9- Negative response: N (%) 128 (91.4) 815 (97.1) 0.41 (0.25-0.66) <0.001
S10- Negative response: N (%) 134 (95.7) 822 (98.0) 0.54 (0.27-1.09) 0.084
No Cognitive Impairment: n (%) 17 (12.1) 133 (15.9) 0.76 (0.47-1.23) 0.268
ECAQ score: mean (95% CI) 2.4 (1.9- 2.8) 2.8 (2.6- 3.0) 0.96 (0.91-1.02) 0.161
GDS score: mean (95% CI) 7.1 (6.6- 7.6) 7.2 (7.0- 7.4) 0.99 (0.93-1.04) 0.642
Not Depressed: N (%) 31 (24.2) 152 (21.7) 1.13 (0.78-1.63) 0.523
Barthel score: mean (95% CI) 19.2 (18.8-19.6) 19.3 (19.2-19.4) 0.98 (0.92-1.05) 0.622
Moderately-severely dependent: N (%) 6 (4.3) 23 (2.7) 1.47 (0.71-3.04) 0.304
No past history fall: N (%) 94 (67.1) 507 (60.4) 1.29 (0.93-1.78) 0.134
Medications < 3: N (%) 55 (39.3) 246 (29.3) 1.46 (1.07-1.99) 0.018
Number of illness: mean (95% CI) 0.9 (0.8- 1.0) 0.7 (0.7- 0.8) 1.19 (1.01-1.39) 0.036
No Diabetes: N (%) 133 (95.0) 769 (91.7) 1.62 (0.79-3.34) 0.1902
No Hypertension: N (%) 123 (87.9) 718 (85.6) 1.19 (0.74-1.91) 0.4780
No Asthma: N (%) 119 (85.0) 803 (95.7) 0.35 (0.24-0.51) 0.0000
No Ischaemic Heart Disease: N (%) 130 (92.9) 770 (91.8) 1.14 (0.63-2.08) 0.6667
No Osteoarthritis: N (%) 131 (93.6) 810 (96.5) 0.59 (0.33-1.06) 0.0787
No Stroke: N (%) 140 (100) 826 (98.5) * NHC- ‘DETERMINE Your Nutritional Health Checklist’, GDS- Geriatric Depression Scale, ECAQ- Elderly Cognitive Assessment Questionnaire; S1-10- Statements in the NHC- see method; *- No residents with a low BMI had suffered a stroke and so this analysis was not possible. Statement [S] 1- I have an illness or condition that made me change the kind and/or amount of food that I eat (score 2); S2- I eat fewer than two meals per day (score 3); S3- I eat few fruits or vegetables or milk products (score 2); S4- I have 3 or more drinks of beer, liquor or wine almost every day (score 2); S5- I have tooth or mouth problems that make it hard for me to eat (score 2); S6- I don’t always have enough money to buy the food I need (score 4); S7- I eat alone most of the time (score 1); S8- I take 3 or more different prescribed or over-the-counter drugs a day (score 1); S9-Without wanting to, I have lost or gained 10 pounds in the last 6 months (score 1); S10- I am not always physically able to shop, cook and/or feed myself (score 2)
404 Risk factors for underweight in disadvantaged Malay elderly
reported consumption of fruits, vegetables and milk pro-ducts was associated with a reduced risk of being under-weight and so should be strongly encouraged. Older people who lack family support are at high risk of developing under-nutrition and its adverse consequences and so targeting this population group early (perhaps with community support services) may be beneficial. Acknowledgement The authors would like to acknowledge the statistical assistance provided by Mr Justin Lokhorst, Department of Public Health, University of Adelaide. This study was funded by a grant to Dr Zaiton Ahmad from the University Putra Malaysia. References 1. Suzana S, Earland J, Suriah AR, Warnes AM. Social and
health factors influencing poor nutritional status among rural elderly Malays. J Nutr Health Aging 2002; 6: 363-369.
2. Visvanathan R, Zaiton A, Sherina MS, MuhamadYA. The nutritional status of 1081 elderly people residing in publicly funded shelter homes in Peninsular Malaysia. Eur J Clin Nutr 2005; 59: 318-324.
3. Visvanathan R, Newbury JW, Chapman I. Malnutrition in older people--screening and management strategies. Aust Fam Physician 2004; 33: 799-805.
4. Wang J, Thornton JC, Russell M, Burastero S, Heymsfield S, Pierson R N, Jr. Asians have lower body mass index (BMI) but higher percent body fat than do whites: comparisons of anthropometric measurements. Am J Clin Nutr 1994; 60: 23-28.
5. Ministry of Health Malaysia. Clinical practice guidelines on managament of obesity. Ministry of Health, Malaysia, 2003.
6. Deurenberg P, Deurenberg-Yap M, Guricci S. Asians are different from Caucasians and from each other in their body mass index/body fat per cent relationship. Obes Rev 2002; 3: 141-146.
7. Flegal KM, Graubard B I, Williamson DF, Gail M H. Excess deaths associated with underweight, overweight, and obesity. JAMA 2005; 293: 1861-1867.
8. Taylor DH, Jr., Ostbye T. The effect of middle- and old-age body mass index on short-term mortality in older people. J Am Geriatr Soc 200l; 49: 1319-1326.
9. Shetty P, James W. Body Mass Index- A Measure of Chronic Energy Deficiency in Adults. FAO:Rome, 1994.
10. Janssen I, Heymsfield SB, Ross R. Low relative skeletal muscle mass (sarcopenia) in older persons is associated with functional impairment and physical disability. J Am Geriatr Soc 2002; 50: 889-896.
11. Omran ML, Morley JE. Assessment of protein energy malnutrition in older persons, part I: History, examination, body composition, and screening tools. Nutrition 2000; 16: 50-63.
12. Kua EH, Ko SM. A questionnaire to screen for cognitive impairment among elderly people in developing countries. Acta Psychiatr Scand 1992; 85: 119-122.
13. Tornquist K, Lovgren M, Soderfeldt, B. Sensitivity, specificity, and predictive value in Katz's and Barthel's ADL indices applied on patients in long term nursing care. Scand J Caring Sci 1990; 4: 99-106.
14. Sutcliffe C, Cordingley L, Burns A, Mozley CG, Bagley H, Huxley P, Challis, D. A new version of the geriatric depression scale for nursing and residential home popu-lations: the geriatric depression scale (residential) (GDS-12R). Int Psychogeriatr 2000; 12: 173-181.
15. Piammongkol S, Marks GC, Williams G, Chongsuvi-vatwong V. Food and nutrient consumption patterns in third trimester Thai-Muslim pregnant women in rural southern Thailand. Asia Pac J Clin Nutr 204; 13: 236-241.
16. Iannuzzi-Sucich M, Prestwood KM, Kenny AM. Pre-valence of sarcopenia and predictors of skeletal muscle mass in healthy, older men and women. J Gerontol A Biol Sci Med Sci 2002; 57: M772-777.
17. Janssen I, Baumgartner RN, Ross R, Rosenberg IH, Roubenoff R. Skeletal muscle cutpoints associated with elevated physical disability risk in older men and women. Am J Epidemiol 2004a; 159: 413-421.
18. Janssen I, Shepard DS, Katzmarzyk PT, Roubenoff R. The healthcare costs of sarcopenia in the United States. J Am Geriatr Soc 2004b; 52: 80-85.
19. Payette H, Roubenoff R, Jacques PF, Dinarello CA, Wilson PW, Abad LW, Harris T. Insulin-like growth factor-1 and interleukin 6 predict sarcopenia in very old community-living men and women: the Framingham Heart Study. J Am Geriatr Soc 2003; 51: 1237-1243.
20. Morley JE. Anorexia, sarcopenia, and aging. Nutrition 2001; 17: 660-663.
21. Roubenoff R, Hughes VA. Sarcopenia: current concepts. J Gerontol A Biol Sci Med Sci 2000; 55: M716-724.
22. Ringland C, Taylor L, Bell J, Lim K. Demographic and socio-economic factors associated with dental health among older people in NSW. Aust N Z J Public Health 2004; 28: 53-61.
23. The Spanish Geriatric Oral Health Research Group. Oral health issues of Spanish adults aged 65 and over. Int Dent J 2001; 51: 228-234.
24. Liu RH. Health benefits of fruit and vegetables are from additive and synergistic combinations of phytochemicals. Am J Clin Nutr 2003; 78: 517S-520S.
25. Wahlqvist ML, Kouris-Blazos A, Savige G. Food-based dietary guidelines for older adults: healthy aging and prevention of chronic noncommunicable diseases (Annex 3). World Health Organization, 2002.

R Visvanathan and Z Ahmad 405
Original Article Good oral health, adequate nutrient consumption and family support are associated with a reduced risk of being underweight amongst older Malaysian residents of publicly funded shelter homes Renuka Visvanathan FRACP, MBBS, PhD
1 and Zaiton Ahmad MMed, MD2
1Department of Medicine, The University of Adelaide and Director, Aged and Extended Care Service, The Queen Elizabeth Hospital, South Australia, Australia 2Institute of Gerontology, University Putra Malaysia and Department of Community Health, University Putra Malaysia, Serdang, Malaysia
在马来西亚公益福利院的老人中,体重不足的发生率下降,与口腔健在马来西亚公益福利院的老人中,体重不足的发生率下降,与口腔健在马来西亚公益福利院的老人中,体重不足的发生率下降,与口腔健在马来西亚公益福利院的老人中,体重不足的发生率下降,与口腔健
康、足够的营养消费和家庭支持有关康、足够的营养消费和家庭支持有关康、足够的营养消费和家庭支持有关康、足够的营养消费和家庭支持有关
老年人越来越高的死亡率,与低的身体质量指数有关。这项研究的主要目的是鉴别与马来半
岛公益福利院的老人的低身体质量指数(BMIs)(< 18.5 kg/m2) 有关的因素。我们用问卷调查的形式调查年龄大于 60岁的 1081个老人(59%男性),研究基线人口统计学,营养和认知状况,身体功能和心理状况。同时测定身体质量指数。调查对象是从马来半岛的公益福利院
中招募的,14.3%的居民的身体质量指数<18.5 kg/m2。多元分析(对年龄和性别进行调整)
显示,低身体质量指数(BMIs)(< 18.5 kg/m2),与没有家庭(相对危险度 1.98 [95%置信区间 1.40-2.82],P<0.001),对调查问卷“您的营养健康状况清单”中的情境 3 [我几乎不吃水果、蔬菜和奶制品](相对危险度 0.62 [95%置信区间 0.42-0.90],P<0.013)、情境 5 [我有牙病或口腔疾病,使我吃东西很困难](相对危险度 0.69 [95%置信区间 0.50-0.96],P<0.023)的消极反映,分别独立相关。没有家庭支持的老人受到体重不足的威胁。吃水果、蔬菜或奶
制品,或口腔健康的老人则较少会体重不足。营养摄入,口腔健康和社会支持,对保证马来
西亚老人的健康体重是很重要的。 关键词:关键词:关键词:关键词:身体质量指数、口腔健康、营养、社会支持、贫穷、无家、老龄、福利院、马来西
亚。
406 Asia Pac J Clin Nutr 2006;15 (3): 406- 411
Original Article Structured triglyceride for parenteral nutrition: meta-analysis of randomized controlled trials
Yong Zhou MD1, Xiao-Ting Wu MD
1, Ni Li MD2, Wen Zhuang MD
1, Guanjian Liu PhD3,
Taixiang Wu, PhD3 and Mao-ling Wei BA
3
1Department of General Surgery, West China Hospital, Sichuan University, Chengdu, China 2Department of Ophthalmology, West China Hospital, Sichuan University, Chengdu, China 3Chinese Evidence-Based Medicine/Cochrane Center, Chengdu, China
This study assessed the safety and efficacy of structured triglyceride (ST) for parenteral nutrition. A meta-analysis of all the relevant randomized controlled trials (RCTs) was performed. Clinical trials were identified from the following electronic databases: MEDLINE, EMBASE, the Cochrane Controlled Trials Register, Chinese Bio-medicine Database. The search was undertaken in March 2005. Language was restricted to Chinese and English. Literature references were checked at the same time. Only RCTs were extracted and evaluated by two reviewers independently of each other. The statistical analysis was performed by RevMan4.2 software which was provided by the Cochrane Collaboration. A P value of <0.05 was considered statistically significant. Ten RCTs involving 236 patients were included. Eight of them compared ST with the long-chain triglyceride (LCT), and the combined results showed that the ST had significant effect on resting energy expenditure (weighted mean difference [WMD] = 1.54, 95%CI [1.26, 1.82], P<0.00001), plasma glycerol (WMD = 0.14, 95%CI [0.06, 0.22], P=0.0007), free fatty acids (WMD = 0.24, 95%CI [0.10, 0.37], P=0.0006), and β-hydroxybutyric acid (WMD = 0.14, 95%CI [0.06, 0.22], P=0.0007), but no differences was found regarding nitrogen balance (standardized mean difference [SMD] = 0.64, 95%CI [-0.30, 1.59], P= 0.18), respiratory quotient (WMD = -0.02, 95%CI [-0.04, 0.01], P=0.18), and plasma triglycerides (WMD = -0.10, 95%CI [-0.30, 0.10], P=0.32). Only two RCTs compared ST with the physical mixture of medium- and long-chain triglyceride (MCT/LCT), data from trials were not combined due to clinical differences between trials, and conclusions can not be drew from the present data. ST appeared to be safe and well tolerated. Further trials are required, especially compared with the MCT/LCT, with sufficient size and rigorous design.
Key Words: structured triglyceride, parenteral nutrition, meta-analysis, randomized controlled trials. Introduction Fat emulsions are an important component of parenteral nutrition (PN). They supply energy and essential fatty acids. Fat emulsions containing long-chain triglycerides (LCT) are the most widely used fats in PN, but only half of these LCTs are immediately metabolized for energy production, the rest being stored in adipose tissue. Further-more, the use of LCT may induce immunologic and me-tabolic side effects.1,2 Fat emulsions containing medium chain triglycerides (MCT) have been proposed for PN since MCT is hydrolyzed twice as fast as LCT and the resulting medium chain fatty acids (MCFA) are oxidised more raidly and more completely than long chain fatty acids (LCFA).3,4
But a pure MCT emulsion may cause metabolic acidosis, neurologic side effects, increased energy expenditure, and essential fatty acid deficiencies.5-7 To reduce the amount of MCFA and to provide the essential LCFA, the MCT are administered together with LCT, as a physical mixture (MCT/LCT). MCT/LCT emulsions have been suggested as an alternative energy source because of a partially non-carnitine-dependent transport into the mitochondria with a higher oxidation rate, a faster plasma clearance, and a decreased tendency to accumulate in the reticuloendothelial system.8, 9
To improve the safety of MCT, a structured triglyceride (ST) emulsion containing both MCFA and LCFA bound on the same glycerol backbone was developed. This structured molecule was designed to utilise the positive effects of MCFA while circumventing the side effects. ST has been well accepted as a fuel source for enteral nutrition.10, 11 Is it also safe and efficacious for PN? Some trials have shown its safety and efficacy for PN.12-30 However, most of these studies were of small to moderate sample sizes, and thus the clinical effectiveness of ST is not accepted throughout the medical community. In this meta-analysis, we assessed its safety and efficacy for PN.
Correspondence address: Prof Xiao-Ting Wu, Department of General Surgery, West China Hospital, Sichuan University, 37 Guo Xue Rd., Chengdu 610041, Sichuan Province, China. Tel: 86-28-85424110; Fax: 86-28-85422411 E-mail: [email protected] Accepted 20th October 2006

Y Zhou, X-T Wu, N Li, W Zhuang, G Liu, T Wu and M-l Wei 407
Methods Materials Randomized controlled trials (RCTs) of ST for PN were included in this meta-analysis. Language was restricted to Chinese and English. Search strategy Search was applied to the following electronic databases: the Cochrane Library (2005.3), MEDLINE (1966-2005.3), EMBASE (1980-2005.3) and Chinese Bio-medicine Database (1979-2005.3). Literature reference proceedings were handsearched at the same time. The searching words were structured triglyceride. Selection Inclusion criteria The initial inclusion criteria were (1) randomized controlled trials (RCT) regardless of whether they were single blind, double blind or not blinded; (2) the treatment group receiving ST for PN; and (3) inclusion of a parallel control group receiving LCT or MCT/LCT for PN. Exclusion criteria Studies that met the initial inclusion criteria were then further examined. Studies with duplicate publication, un-balanced matching, only abstract or incomplete data were excluded. When duplication occurred, the studies reported in conference proceedings, in earlier publications were excluded. Data collection and analysis Data were extracted independently by two reviewers according to the prespecified selection criteria. Dis-agreement was resolved by discussion. The following data were extracted: the baseline of trials; nitrogen ba-lance, resting energy expenditure (REE), respiratory quo-tient (RQ), triglycerides, glycerol, free fatty acides, β-Hydroxybutyric acid; the adverse events; the statistical consideration. Methodological quality was evaluated using the Jadad scale, based on randomization, double blinding, and withdrawals/dropouts.31 The scores range from one to five, one or two being considered as low quality, and three to five as high quality. In addition, concealment of the generated random allocation sequence was scored by the criteria adopted from The Cochrane Handbook.
Methodological quality was evaluated using the Jadad scale, based on randomization, double blinding, and with-drawals/dropouts.31 The scores range from one to five, one or two being considered as low quality, and three to five as high quality. In addition, concealment of the generated random allocation sequence was scored by the criteria adopted from The Cochrane Handbook. The statistical analysis was performed by RevMan4.2 soft-ware, which was provided by the Cochrane Collaboration. A P value of <0.05 was considered statistically signi-ficant. Meta-analysis was done with random effects mo-del or fixed effects model. Heterogeneity was checked by chi-square test. Fixed effects model was used when there was no heterogeneity of the results of the trials (P > 0.1). Otherwise, the random effects model was used. The result was expressed with standardized mean difference (SMD) or weighted mean difference (WMD) for the continuous variable, and with 95% confidence intervals (CI). Results There were 1128 papers relevant to the searching words. Through the steps of screening the title, reading the ab-stract and the entire article, ten RCTs involving 236 patients were included.12-21 Characteristics of studies in-cluded in meta-analysis of ST for PN is presented in Table 1. The ST group received ST 73403 (Fresenius Kabi AB, Sweden) or Structolipid (Fresenius Kabi AB, Sweden). This emulsion contains fractionated inter-esterified triglycerides with both MCFA and LCFA bound to the same glycerol backbone. The LCT group received Intralipid (Fresenius Kabi AB, Sweden) which contains 100% LCT from fractionated soybean oil. The MCT/LCT group received Medialipide (B. Braun, Boulogne, France) or Lipofundin (B. Braun, Melsungen AG, Germany). The MCT are administered together with LCT, as a physical mixture. Eight of them compared ST with the LCT, and the combined results showed that the ST had significant effect on REE (WMD=1.54,95%CI [1.26,1.82], P< 0.00001), plasma glycerol (WMD = 0.14, 95%CI [0.06, 0.22], P=0.0007), free fatty acids (WMD = 0.24, 95%CI [0.10, 0.37], P=0.0006), and β-hydroxybutyric acid (WMD = 0.14, 95%CI [0.06, 0.22], P=0.0007), but no differences was found regarding nitrogen balance (SMD = 0.64, 95%CI [-0.30, 1.59], P= 0.18), RQ (WMD = -0.02, 95% CI [-0.04, 0.01], P=0.18), and plasma triglycerides
Table 1. Characteristics of studies included in meta-analysis of structured triglyceride for parenteral nutrition.
Author Year Country Study design ST Control Cases Age
(Years) Sex
(M/F) Weight
(kg) Jadad Score
Sandstrom 1993 Sweden DB,RCT 73403 Intralipid 20 65 13/7 70 4 Nordenstrom 1995 Sweden CO,RCT 73403 Intralipid 9 29 9/0 75 2 Sandstrom 1995 Sweden CO,DB,RCT 73403 Intralipid 37 64 28/9 68 3 Chambrier 1999 France DB,RCT 73403 Medialipide 40 61 27/11 70 3 Bellantone 1999 Italy DB,RCT 73403 Intralipid 19 60.5 9/10 66.4 3
Wu 1999 China CO,RCT Structolipid Intralipid 16 54 * 71 2 Wu 2000 China CO,RCT Structolipid Intralipid 16 35 * 72 2
Rubin 2000 Israel CO,DB,RCT Structolipid Intralipid 22 43.3 14/8 53.9 4 Lindgren 2001 Sweden DB,RCT Structolipid Intralipid 30 55.9 16/4 * 4 Kruimel 2001 Sweden DB,RCT Structolipid Lipofundin 27 68 20/5 71 4
Abbreviations: RCT, randomized controlled trial; CO, cross-over; DB, double-blind; ST, structured triglyceride; M/F, Male/Female; * No data available.
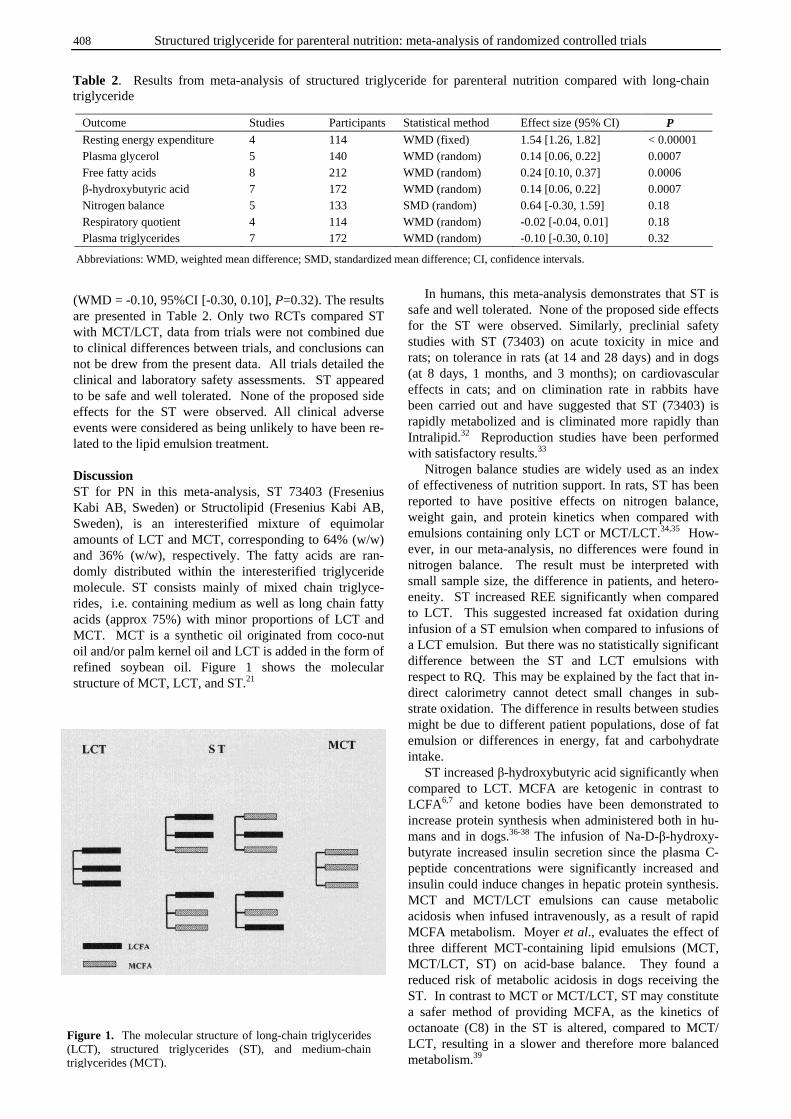
408 Structured triglyceride for parenteral nutrition: meta-analysis of randomized controlled trials
(WMD = -0.10, 95%CI [-0.30, 0.10], P=0.32). The results are presented in Table 2. Only two RCTs compared ST with MCT/LCT, data from trials were not combined due to clinical differences between trials, and conclusions can not be drew from the present data. All trials detailed the clinical and laboratory safety assessments. ST appeared to be safe and well tolerated. None of the proposed side effects for the ST were observed. All clinical adverse events were considered as being unlikely to have been re-lated to the lipid emulsion treatment. Discussion ST for PN in this meta-analysis, ST 73403 (Fresenius Kabi AB, Sweden) or Structolipid (Fresenius Kabi AB, Sweden), is an interesterified mixture of equimolar amounts of LCT and MCT, corresponding to 64% (w/w) and 36% (w/w), respectively. The fatty acids are ran-domly distributed within the interesterified triglyceride molecule. ST consists mainly of mixed chain triglyce-rides, i.e. containing medium as well as long chain fatty acids (approx 75%) with minor proportions of LCT and MCT. MCT is a synthetic oil originated from coco-nut oil and/or palm kernel oil and LCT is added in the form of refined soybean oil. Figure 1 shows the molecular structure of MCT, LCT, and ST.21
In humans, this meta-analysis demonstrates that ST is safe and well tolerated. None of the proposed side effects for the ST were observed. Similarly, preclinial safety studies with ST (73403) on acute toxicity in mice and rats; on tolerance in rats (at 14 and 28 days) and in dogs (at 8 days, 1 months, and 3 months); on cardiovascular effects in cats; and on climination rate in rabbits have been carried out and have suggested that ST (73403) is rapidly metabolized and is climinated more rapidly than Intralipid.32 Reproduction studies have been performed with satisfactory results.33 Nitrogen balance studies are widely used as an index of effectiveness of nutrition support. In rats, ST has been reported to have positive effects on nitrogen balance, weight gain, and protein kinetics when compared with emulsions containing only LCT or MCT/LCT.34,35 How-ever, in our meta-analysis, no differences were found in nitrogen balance. The result must be interpreted with small sample size, the difference in patients, and hetero-eneity. ST increased REE significantly when compared to LCT. This suggested increased fat oxidation during infusion of a ST emulsion when compared to infusions of a LCT emulsion. But there was no statistically significant difference between the ST and LCT emulsions with respect to RQ. This may be explained by the fact that in-direct calorimetry cannot detect small changes in sub-strate oxidation. The difference in results between studies might be due to different patient populations, dose of fat emulsion or differences in energy, fat and carbohydrate intake. ST increased β-hydroxybutyric acid significantly when compared to LCT. MCFA are ketogenic in contrast to LCFA6,7 and ketone bodies have been demonstrated to increase protein synthesis when administered both in hu-mans and in dogs.36-38 The infusion of Na-D-β-hydroxy-butyrate increased insulin secretion since the plasma C-peptide concentrations were significantly increased and insulin could induce changes in hepatic protein synthesis. MCT and MCT/LCT emulsions can cause metabolic acidosis when infused intravenously, as a result of rapid MCFA metabolism. Moyer et al., evaluates the effect of three different MCT-containing lipid emulsions (MCT, MCT/LCT, ST) on acid-base balance. They found a reduced risk of metabolic acidosis in dogs receiving the ST. In contrast to MCT or MCT/LCT, ST may constitute a safer method of providing MCFA, as the kinetics of octanoate (C8) in the ST is altered, compared to MCT/ LCT, resulting in a slower and therefore more balanced metabolism.39
Outcome Studies Participants Statistical method Effect size (95% CI) P Resting energy expenditure 4 114 WMD (fixed) 1.54 [1.26, 1.82] < 0.00001 Plasma glycerol 5 140 WMD (random) 0.14 [0.06, 0.22] 0.0007 Free fatty acids 8 212 WMD (random) 0.24 [0.10, 0.37] 0.0006 β-hydroxybutyric acid 7 172 WMD (random) 0.14 [0.06, 0.22] 0.0007 Nitrogen balance 5 133 SMD (random) 0.64 [-0.30, 1.59] 0.18 Respiratory quotient 4 114 WMD (random) -0.02 [-0.04, 0.01] 0.18 Plasma triglycerides 7 172 WMD (random) -0.10 [-0.30, 0.10] 0.32
Table 2. Results from meta-analysis of structured triglyceride for parenteral nutrition compared with long-chain triglyceride
Abbreviations: WMD, weighted mean difference; SMD, standardized mean difference; CI, confidence intervals.
Figure 1. The molecular structure of long-chain triglycerides (LCT), structured triglycerides (ST), and medium-chain triglycerides (MCT).
Y Zhou, X-T Wu, N Li, W Zhuang, G Liu, T Wu and M-l Wei 409
The clearance and oxidation of ST was faster com-pared with LCT in fasted unanesthetized rats by the study of Hultin et al.40 The hypothesis was also confirmed by this meta-analysis. The clearance rate of an emulsion from the blood is intrinsic to the relationship between the physicochemical properties of the emulsion droplets and a physiological response by the reticuloendothelial system (RES). Small emulsion particles are removed slower than larger droplets, and negatively or positively charged emulsified particles are removed quickly in comparison to neutral emulsion droplets. In conclusion, based on the meta-analysis, ST appeared to be safe and well tolerated. Further trials are required, especially compared with the MCT/LCT, with sufficient size and rigorous design. References 1. Palmblad J. Intravenous lipid emulsions and host defense:
a critical review. Clin Nutr 1991; 10: 303–308. 2. Sax HC. Practicalities of lipids: ICU patient, autoimmune
disease, and vascular disease. JPEN 1990; 14 Suppl 5: 223S-225S.
3. Sato N, Deckelbaum RJ, Neeser G, Carpentier YA, Kinney JM. Hydrolysis of mixed lipid emulsions containing medium-chain and long-chain triacylglycerol with lipoprotein lipase in plasma-like medium. JPEN 1994; 18: 112-118.
4. Deckelbaum RJ, Hamilton JA, Moser A, Bengtsson-Olivecrona G, Butbul E, Carpentier YA, Gutman A, Olivecrona T. Medium-chain versus long-chain triacyl-glycerol emulsion hydrolysis by lipoprotein lipase and hepatic lipase: implications for the mechanisms of lipase action. Biochemistry 1990; 29: 1136-1142.
5. Johnson RC, Young SK, Cotter R, Lin L, Rowe WB. Medium-chain-triglyceride lipid emulsion: metabolism and tissue distribution. Am J Clin Nutr 1990; 52: 502-508.
6. Miles JM, Cattalini M, Sharbrough FW, Wold LE, Wharen RE Jr, Gerich JE, Haymond MW. Metabolic and neurologic effects of an intravenous medium-chain triglyceride emulsion. JPEN 1991; 15: 37-41.
7. Cotter R, Taylor CA, Johnson R, Rowe WB. A metabolic comparison of a pure long-chain triglyceride lipid emulsion (LCT) and various medium-chain triglyceride (MCT)-LCT combination emulsions in dogs. Am J Clin Nutr 1987; 45: 927-939.
8. Christensen E, Hagve TA, Gronn M, Christophersen BO. Beta-oxidation of medium chain (C8-C14) fatty acids studied in isolated liver cells. Biochim Biophys Acta 1989; 1004: 187-195.
9. Bach AC, Babayan VK. Medium-chain triglycerides: an update. Am J Clin Nutr 1982; 36: 950-962.
10. Kasai M, Nosaka N, Maki H, Negishi S, Aoyama T, Nakamura M, Suzuki Y, Tsuji H, Uto H, Okazaki M, Kondo K. Effect of dietary medium- and long-chain triacylglycerols (MLCT) on accumulation of body fat in healthy humans. Asia Pac J Clin Nutr 2003; 12: 151-160.
11. Matsuo T, Matsuo M, Kasai M, Takeuchi H. Effects of a liquid diet supplement containing structured medium- and long-chain triacylglycerols on bodyfat accumulation in healthy young subjects. Asia Pac J Clin Nutr 2001; 10: 46-50.
12. Sandstrom R, Hyltander A, Korner U, Lundholm K. Structured triglycerides to postoperative patients: a safety and tolerance study. JPEN 1993; 17: 153-157.
13. Nordenstrom J, Thorne A, Olivecrona T. Metabolic effects of infusion of a structured-triglyceride emulsion in healthy subjects. Nutrition 1995; 11: 269-274.
14. Sandstrom R, Hyltander A, Korner U, Lundholm K. Structured triglycerides were well tolerated and induced increased whole body fat oxidation compared with long-chain triglycerides in postoperative patients. JPEN 1995; 19: 381-386.
15. Bellantone R, Bossola M, Carriero C, Malerba M, Nucera P, Ratto C, Crucitti P, Pacelli F, Doglietto GB, Crucitti F. Structured versus long-chain triglycerides: a safety, tole-rance, and efficacy randomized study in colorectal sur-gical patients. JPEN 1999; 23: 123-127.
16. Wu Guohao, Wu Zhaohan, Anders Thorne, Jorgen Nordenstrom. [Thermogenic and metabolic response of structured lipid emulsion in patients with liver failure] Parenteral and Enteral Nutrition (in Chinese) 1999; 6: 1-3.
17. Wu Guohao, Anders Thorne, Jorgen Nordenstrom. [Studies in healthy subjects with structured triglyceride and long-chain in triglyceride fat emulsions] Parenteral and Enteral Nutrition (in Chinese) 2000; 7: 4-7.
18. Rubin M, Moser A, Vaserberg N, Greig F, Levy Y, Spivak H, Ziv Y, Lelcuk S. Structured triacylglycerol emulsion, containing both medium- and long-chain fatty acids, in long-term home parenteral nutrition: a double-blind randomized cross-over study. Nutrition 2000; 16: 95-100.
19. Lindgren BF, Ruokonen E, Magnusson-Borg K, Takala J. Nitrogen sparing effect of structured triglycerides con-taining both medium-and long-chain fatty acids in critically ill patients; a double blind randomized controlled trial. Clin Nutr 2001; 20: 43-48.
20. Chambrier C, Guiraud M, Gibault JP, Labrosse H, Bouletreau P. Medium- and long-chain triacylglycerols in postoperative patients: structured lipids versus a physical mixture. Nutrition 1999; 15: 274-277.
21. Kruimel JW, Naber TH, van der Vliet JA, Carneheim C, Katan MB, Jansen JB. Parenteral structured triglyceride emulsion improves nitrogen balance and is cleared faster from the blood in moderately catabolic patients. JPEN 2001; 25: 237-244.
22. Lindgren BKF, Uppsala AB, Roukonen E, Takala J. Nitrogen sparing effect of structured triglycerides con-taining both medium- and long-chain fatty acids in criti-cally ill patients: a randomised controlled trial. JPEN 2000; 24: S18.
23. Rubin M, Moser A, Waserberg N, Grief F. Structured triglyceride emulsion, containing both medium- and long-chain fatty acids, in long-term home parenteral nutrition: a double-blind randomized cross-over study. Clin Nutr 1999; 18 Suppl 1: 47.
24. Flaatten H, Aanderud L, Carneheim C, Hagenfeldt L, Nordenstrom J. A randomized, single blind, cross-over study comparing a new structured triglyceride fat emul-sion (STG 73403) with Vasolipid? Clin Nutr 1995; 14 Suppl 2: 58.
25. Nordenstrom J, Johansson U, Thorne A, Hagenfeldt L. Metabolism of long-chain triglycerides (LCT) vs struc-tured triglycerides (STG) in chronic liver failure. Clin Nutr 1995; 14 Suppl 2: 59.
26. Sandstrom R, Hyltander A, Korner U, Lundholm K. Struc-tured triglycerides are well tolerated and induce increased whole body fat oxidation compared to long chain trigly-cerides in postoperative patients. Clin Nutr 1995; 14 Suppl 2: 3.
27. Thorne A. Thermogenic and metabolic response to struc-tured Triglycerides vs LCT in patients with liver cirrhosis. Clin Nutr 1995; 14 Suppl 2: 63.
410 Structured triglyceride for parenteral nutrition: meta-analysis of randomized controlled trials
28. Thorne A, Nordenstrom J, Carneheim C, Olivecrona T. Higher plasma elimination rate of structured triglycerides vs LCT-determined by hypertriglyceridaemic clamp technique. Clin Nutr 1993; 12 Suppl 2: 3.
29. Larsson J, Hammarstrom S, Permert J, Skullman S, Wiren M. The impact of a new structured triglyceride emulsion on clinical chemistry, nitrogen metabolism and platelet phospholipids in postoperative patients. Clin Nutr 1993; 12 Suppl 2: 32-33.
30. Forse A. Parenteral structured triglyceride emulsion im-proves nitrogen balance and is cleared faster from the blood in moderately catabolic patients. JPEN 2001; 25: 245.
31. Jadad AR, Moore RA, Carroll D, Jenkinson C, Reynolds DJ, Gavaghan DJ, McQuay HJ. Assessing the quality of reports of randomized clinical trials: is blinding nece-ssary? Control Clin Trials 1996; 17: 1-12.
32. Jonsson M, Johansson HE. Fat emulsion 73403-summary and evaluation of toxicological and pharmacological data (Updated version). Pharmacia Document No. 92 96 984, 1993
33. Jonsson M. Fat emulsion 73403-summary and evaluation of reproduction toxicological data. Pharmacia Document No. 20952 F,1993
34. Mok KT, Maiz A, Yamazaki K, Sobrado J, Babayan VK, Moldawer LL, Bistrian BR, Blackburn GL. Structured medium-chain and long-chain triglyceride emulsions are superior to physical mixtures in sparing body protein in the burned rat. Metabolism 1984; 33: 910-915.
35. Maiz A, Yamazaki K, Sobrado J, Babayan VK, Moldawer LL, Bistrian BR, Blackburn GL. Protein metabolism during total parenteral nutrition (TPN) in injured rats using medium-chain triglycerides. Metabolism 1984; 33: 901-909.
36. Nair KS, Welle SL, Halliday D, Campbell RG. Effect of beta-hydroxybutyrate on whole-body leucine kinetics and fractional mixed skeletal muscle protein synthesis in hu-mans. J Clin Invest 1988; 82: 198-205.
37. Crowe PJ, Royle GT, Wagner D, Burke JF. Does hyperketonemia affect protein or glucose kinetics in post-absorptive or traumatized man? J Surg Res 1989; 47: 313-318.
38. Umpleby AM, Chubb D, Boroujerdi MA, Sonksen PH. The effect of ketone bodies on leucine and alanine metabolism in dogs. Clin Sci (Lond) 1988; 74: 41-48.
39. Moyer E, Wennberg A, Ekman L, Bartholow LC. A metabolic comparison between MCT, MCT/LCT and structured lipids. Clin Nutr 1989; 8: 99.
40. Hultin M, Mullertz A, Zundel MA, Olivecrona G, Hansen TT, Deckelbaum RJ, Carpentier YA, Olivecrona T. Metabolism of emulsions containing medium- and long-chain triglycerides or interesterified triglycerides. J Lipid Res 1994; 35: 1850-1860.
Y Zhou, X-T Wu, N Li, W Zhuang, G Liu, T Wu and M-l Wei 411
Original Article Structured triglyceride for parenteral nutrition: meta-analysis of randomized controlled trials
Yong Zhou MD1, Xiao-Ting Wu MD
1, Ni Li MD2, Wen Zhuang MD
1, Guanjian Liu PhD3,
Taixiang Wu, PhD3 and Mao-ling Wei BA
3
1Department of General Surgery, West China Hospital, Sichuan University, Chengdu, China 2Department of Ophthalmology, West China Hospital, Sichuan University, Chengdu, China 3Chinese Evidence-Based Medicine/Cochrane Center, Chengdu, China
结构甘油三酯与肠外营养:随机对照试验的元分析结构甘油三酯与肠外营养:随机对照试验的元分析结构甘油三酯与肠外营养:随机对照试验的元分析结构甘油三酯与肠外营养:随机对照试验的元分析
本研究评价了结构甘油三酯对肠外营养的安全性和有效性,对所有相关的随机对照试验
(RCTs)进行了元分析。元分析所涉及到的临床研究是从 MEDLINE, EMBASE, the Cochrane
Controlled Trials Register, 中国生物医学数据库(Chinese Bio-medicine Database)
等电子数据库里筛选得到的。于 2005 年三月进行文献检索,检索的文献语言类型限为英语
和汉语,同时检查搜索到文献的参考文献。仅仅筛选随机对照试验,由两个互不干扰的校阅
者评价挑选。采用 Cochrane 公司提供的 RevMan4.2 软件包进行统计分析,P <0.05 视为显
著性差异。元分析共包括十个 RCTs,涉及到 236 病人。十个 RCTs 中有八个比较了结构甘油
三酯与长链甘油三酯(LCT),这些研究结果表明结构甘油三酯对静息能量消耗(加权平均差
[WMD] = 1.54, 95%CI [1.26, 1.82], P<0.00001)、血浆甘油(WMD = 0.14, 95%CI [0.06,
0.22], P=0.0007)、游离脂肪酸(WMD = 0.24, 95%CI [0.10, 0.37], P=0.0006)和 β-羟丁
酸 (WMD = 0.14, 95%CI [0.06, 0.22], P=0.0007)有显著的影响,但两者氮平衡(标准平
均差[SMD] = 0.64, 95%CI [-0.30, 1.59], P= 0.18)、呼吸系数(WMD = -0.02, 95%CI [-
0.04, 0.01], P=0.18)、和血浆甘油三酯(WMD = -0.10, 95%CI [-0.30, 0.10]P=0.32)之间
并没有差异。只有两个 RCTs 比较了结构甘油三酯与中链,长链甘油三酯的混和物
(MCT/LCT),由于研究间存在的临床差异而没有把这两个研究的数据结合起来分析,以目前
的研究数据也不能得出结论。结构甘油三酯对人体似乎是安全的,人体也具有很好的耐受
性。但这仍需进一步进行样本量足够的,设计严格的临床研究,特别是进行与 MCT/LCT 比较
的研究来证实。
关键词关键词关键词关键词:结构甘油三酯、肠外营养、元分析、随机对照试验。
412 Asia Pac J Clin Nutr 2006;15 (3):412- 417
Original Article The Glycemic Index of standard and diabetes-specific enteral formulas Zandrie Hofman MSc
1, Jenneke D.E. van Drunen MSc1 and Harm Kuipers PhD
2
1 Numico Research B.V., Wageningen, The Netherlands 2 Maastricht University, Maastricht, The Netherlands
A recent meta-analysis showed that foods with a low Glycemic Index (GI) have a clinically useful effect on glycemic control in patients with diabetes. Although diabetes-specific enteral formulas are commonly used for diabetic patients with insufficient oral intake, not much is known about the GI of these formulas. Therefore the purpose of this study was to assess the GI of several diabetes-specific formulas and to compare them with standard formulas. The randomised, double blinded, crossover study included twelve products which were tested in 7 – 10 individuals from a pool of 14 healthy volunteers. After an overnight fast, volunteers were given a portion of a product containing 25 grams of carbohydrate or the reference feed (200 ml containing 25 gram glucose) on different occasions in random order. Postprandial blood glucose levels were measured in venous whole blood for two hours after intake of the products and positive incremental area under the curve (AUC) was calculated for both the products and the reference feed. The GI of the test products was determined by dividing AUC (test products) by the AUC (reference feed). Enteral formulas varied widely in their GI values with the diabetes-specific enteral formulas being characterized by a significant (P=0.004) lower GI (average ±SEM: 19.4 ± 1.8) than standard formulas (42.1 ± 5.9). However, there was an overlap between the two types of formulas. Three of the diabetes-specific formulas had significantly lower GI than 3 of the standard products. Although there is some overlap with the GI of diabetes-specific and standard formulas, certain diabetes-specific formulas had very low GI values, which may be clinically beneficial due to better glycemic control. Therefore the use of diabetes-specific formulas with a low GI should be the preferred option for the nutritional management of diabetic patients in need of nutritional support.
Key Words: diabetes, hyperglycemia, clinical nutrition, glycemic index, nutritional treatment. Introduction A major nutritional treatment goal of diabetes is to nor-malize plasma glucose levels in both the fasting and the postprandial state.1 Recently, a review by diabetes experts concluded that besides fasting blood glucose, postprandial hyperglycemia is a risk indicator for micro- and macro-vascular complications, not only in patients with type 2 diabetes but also in those with impaired glucose tolerance.2 In addition, several studies documenting postprandial hyperglycemia and the risk for increased mortality suggest that lowering postprandial blood glucose levels might be even more beneficial than lowering of fasting blood glu-cose levels.3-5 Therefore, treatment targeting post-prandial blood glucose levels is expected to optimise overall gly-cemic control and thus improve long-term outcomes, including reduction of cardiovascular disease and all-cause mortality.3-6 Nutrition and diet are considered, both by medical professionals and health care organizations, as important tools in optimising blood glucose levels.1,2,6-8 Nutrition has a profound effect on changes in blood glucose and the postprandial blood glucose response is strongly influenced by the specific composition of the diet. Know-ledge on the postprandial blood glucose response to par-ticular foods might be useful in determining optimal nu-trition for hyperglycaemic patients. However, the post-prandial glucose response is influenced among others by product related factors and therefore cannot be predicted
based on product composition only.9,10 Both the quantity, as well as the quality of the carbohydrates appears to in-fluence blood glucose response to a meal.11 The presence of fibre in the diet has been shown to reduce post-prandial hyperglycemia,12 and the amount of fat in a meal has also been shown to influence the glycemic response to these meals .13 In order to compare the effects of specific foods on blood glucose response, Jenkins et al., introduced the Gly-cemic Index (GI).14 The GI can be defined as the area un-der the glucose response curve after consumption of a food containing 50 grams of carbohydrate (CHO), expressed as percentage of the area under the blood glucose response curve after intake of 50 grams of CHO in a standard food (glucose solution or white bread).10 The standard proce-dure is to assess the GI in healthy volunteers. Nevertheless, the concept of GI appears to be a useful tool in improving glycemic control in diabetic patients as demonstrated by several clinical trials.12,15-18 From a meta-analysis of randomised controlled trials it was concluded that low-GI foods in place of conventional or high-GI foods have a clinically useful effect on medium-
Correspondence address: Zandrie Hofman, Numico Research B.V., P.O. box 7005, 6400 CA Wageningen, The Netherlands Tel.: +31 317 467883; Fax: +31 317 466500 E-mail: [email protected] Accepted 8th November 2005
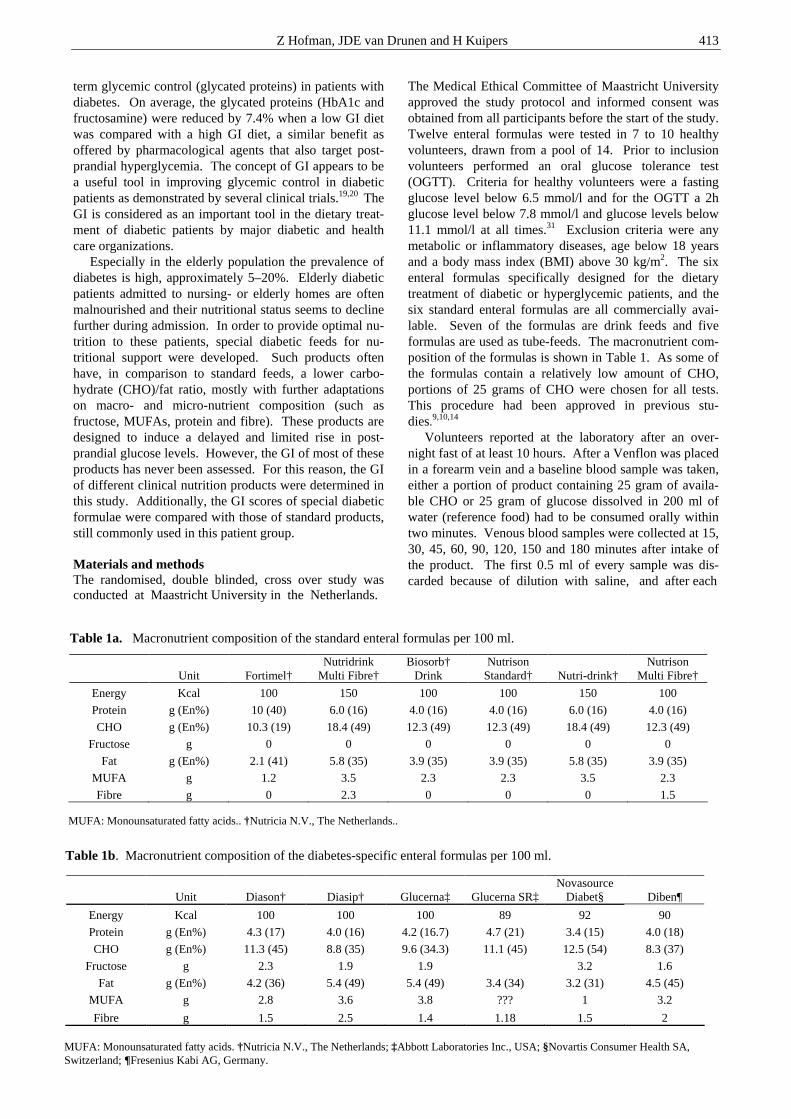
Z Hofman, JDE van Drunen and H Kuipers 413
term glycemic control (glycated proteins) in patients with diabetes. On average, the glycated proteins (HbA1c and fructosamine) were reduced by 7.4% when a low GI diet was compared with a high GI diet, a similar benefit as offered by pharmacological agents that also target post-prandial hyperglycemia. The concept of GI appears to be a useful tool in improving glycemic control in diabetic patients as demonstrated by several clinical trials.19,20 The GI is considered as an important tool in the dietary treat-ment of diabetic patients by major diabetic and health care organizations. Especially in the elderly population the prevalence of diabetes is high, approximately 5–20%. Elderly diabetic patients admitted to nursing- or elderly homes are often malnourished and their nutritional status seems to decline further during admission. In order to provide optimal nu-trition to these patients, special diabetic feeds for nu-tritional support were developed. Such products often have, in comparison to standard feeds, a lower carbo-hydrate (CHO)/fat ratio, mostly with further adaptations on macro- and micro-nutrient composition (such as fructose, MUFAs, protein and fibre). These products are designed to induce a delayed and limited rise in post-prandial glucose levels. However, the GI of most of these products has never been assessed. For this reason, the GI of different clinical nutrition products were determined in this study. Additionally, the GI scores of special diabetic formulae were compared with those of standard products, still commonly used in this patient group. Materials and methods The randomised, double blinded, cross over study was conducted at Maastricht University in the Netherlands.
The Medical Ethical Committee of Maastricht University approved the study protocol and informed consent was obtained from all participants before the start of the study. Twelve enteral formulas were tested in 7 to 10 healthy volunteers, drawn from a pool of 14. Prior to inclusion volunteers performed an oral glucose tolerance test (OGTT). Criteria for healthy volunteers were a fasting glucose level below 6.5 mmol/l and for the OGTT a 2h glucose level below 7.8 mmol/l and glucose levels below 11.1 mmol/l at all times.31 Exclusion criteria were any metabolic or inflammatory diseases, age below 18 years and a body mass index (BMI) above 30 kg/m2. The six enteral formulas specifically designed for the dietary treatment of diabetic or hyperglycemic patients, and the six standard enteral formulas are all commercially avai-lable. Seven of the formulas are drink feeds and five formulas are used as tube-feeds. The macronutrient com-position of the formulas is shown in Table 1. As some of the formulas contain a relatively low amount of CHO, portions of 25 grams of CHO were chosen for all tests. This procedure had been approved in previous stu-dies.9,10,14
Volunteers reported at the laboratory after an over-night fast of at least 10 hours. After a Venflon was placed in a forearm vein and a baseline blood sample was taken, either a portion of product containing 25 gram of availa-ble CHO or 25 gram of glucose dissolved in 200 ml of water (reference food) had to be consumed orally within two minutes. Venous blood samples were collected at 15, 30, 45, 60, 90, 120, 150 and 180 minutes after intake of the product. The first 0.5 ml of every sample was dis-carded because of dilution with saline, and after each
Unit Fortimel† Nutridrink
Multi Fibre† Biosorb†
Drink Nutrison
Standard† Nutri-drink† Nutrison
Multi Fibre†
Energy Kcal 100 150 100 100 150 100
Protein g (En%) 10 (40) 6.0 (16) 4.0 (16) 4.0 (16) 6.0 (16) 4.0 (16)
CHO g (En%) 10.3 (19) 18.4 (49) 12.3 (49) 12.3 (49) 18.4 (49) 12.3 (49)
Fructose g 0 0 0 0 0 0
Fat g (En%) 2.1 (41) 5.8 (35) 3.9 (35) 3.9 (35) 5.8 (35) 3.9 (35)
MUFA g 1.2 3.5 2.3 2.3 3.5 2.3
Fibre g 0 2.3 0 0 0 1.5
Table 1a. Macronutrient composition of the standard enteral formulas per 100 ml.
MUFA: Monounsaturated fatty acids.. †Nutricia N.V., The Netherlands..
Unit Diason† Diasip† Glucerna‡ Glucerna SR‡ Novasource
Diabet§ Diben¶
Energy Kcal 100 100 100 89 92 90
Protein g (En%) 4.3 (17) 4.0 (16) 4.2 (16.7) 4.7 (21) 3.4 (15) 4.0 (18)
CHO g (En%) 11.3 (45) 8.8 (35) 9.6 (34.3) 11.1 (45) 12.5 (54) 8.3 (37)
Fructose g 2.3 1.9 1.9 3.2 1.6
Fat g (En%) 4.2 (36) 5.4 (49) 5.4 (49) 3.4 (34) 3.2 (31) 4.5 (45)
MUFA g 2.8 3.6 3.8 ??? 1 3.2
Fibre g 1.5 2.5 1.4 1.18 1.5 2
Table 1b. Macronutrient composition of the diabetes-specific enteral formulas per 100 ml.
MUFA: Monounsaturated fatty acids. †Nutricia N.V., The Netherlands; ‡Abbott Laboratories Inc., USA; §Novartis Consumer Health SA, Switzerland; ¶Fresenius Kabi AG, Germany.
414 The Glycemic Index of standard and diabetes-specific enteral formulas
sample the catheter was flushed with physiological saline. Glucose concentration was measured in whole blood using a glucose analyser (EML-105, Radiometer, Copen-hagen, Denmark). The positive incremental area under the curve (AUC) was calculated according to the trape-zoidal rule.29 For each volunteer the AUC of the test pro-duct was expressed as a percentage of the AUC of the reference feed tested in the same volunteer. This results in a value representing the GI for each product. The mean GI for each test product was calculated and a one-factor analysis of variance (ANOVA) was performed to test for differences in GI between the products. In order to deter-mine differences between the products a least significant difference (LSD) post-hoc test was performed. Differen-ces between products were regarded significant when the LSD test showed significant differences (i.e. P<0.05) between the GI’s. Results In total 8 male and 6 female volunteers participated in the study. Average age (± standard deviation (SD)) was 22.6 ± 2.1 years, with a range from 20 to 26 and the average BMI (± SD) was 21.7 ± 2.0 (range of 19 to 26). The GI’s of the different enteral formulas are shown in Figure 1. The average GI of the diabetes-specific formulas was 19.4 ± 1.8 (mean ± standard error of mean (SEM), range 12 to 26). The diabetes-specific formulas showed a significant lower GI (P=0.004, Mann Whitney U test) when com-pared to the GI of the standard formulas (42.1±5.9, range 25 to 61). Analysis of variance (ANOVA) showed that there were significant differences in GI scores between the for-mulas (P=0.032). In order to find which formulas differed significantly from each other, a LSD multiple-comparison analysis was performed.
The three diabetes-specific formulas Diasip®, Glucerna® and Diason® had significantly lower GI scores than the three standard formulas Nutridrink®, Nutridrink Multi Fibre® and Biosorb Drink®. However, the other three diabetes-specific formulas Diben®, Glucerna SR® and Novasource Diabet® had only significantly lower GI scores when compared with the standard feed Nutri-drink®. They had no significantly lower GI scores com-pared to the other standard formulas. Significant results from the LSD test are indicated in Figure 1. Discussion In this study, the diabetes-specific formulas showed sta-tistically significant lower GI values than standard for-mulas (19.4 versus 42.1 respectively). Although there is some overlap with the GI of diabetes-specific and stan-dard formulas, certain diabetes-specific formulas had very low GIs. These low GI levels found for the diabetes-specific formulas and higher GI levels found for the stan-dard formulae are in line with previous findings on a very limited number of feeds.30,31 Diets with a low GI have shown beneficial effects on glycemic control16-19 and even insulin resistance.15,32,33 Recently it has been reported that consumption of a low GI diet for a period of only 4-weeks by type 2 diabetic patients showed improvement in glycemic control, fasting plasma glucose, HbA1c, glucose utilization and some lipid profiles, in comparison to a high GI diet.34 This suggests that a low GI diet might play an important role in the treatment and prevention of diabetes and related disorders. In addition, blood lipid status appears to improve as a result of the use of low GI foods.18,33 This is of particular interest for diabetic pa-tients as they often have dyslipidemia1 and an increased risk of coronary heart disease.6 Major health care and diabetic organizations like the World Health Organization22
0 20 40 60 80
Diasip
Glucerna
Diason
Diben
Glucerna SR
Novasource Diabet
Fortimel
Nutrison MF
Nutrison Standard
Biosorb Drink
Nutridrink MF
Nutridrink
Glycemic Index
n GI ± SEM
10 61 ± 19 a
10 53 ± 19 ab
9 50 ± 16 ab
10 34 ± 8 abc
10 28 ± 10 bc
8 25 ± 8 bc
10 26 ± 5 bc
9 23 ± 5 bc
7 22 ± 7 bc
9 17 ± 4 c
9 15 ± 3 c
7 12 ± 3 c
n GI ± SEM
10 61 ± 19 a
10 53 ± 19 ab
9 50 ± 16 ab
10 34 ± 8 abc
10 28 ± 10 bc
8 25 ± 8 bc
10 26 ± 5 bc
9 23 ± 5 bc
7 22 ± 7 bc
9 17 ± 4 c
9 15 ± 3 c
7 12 ± 3 c
Figure 1. Glycemic Index of tested enteral formulas (mean ± SEM)
c/b/a : GI scores without a common letter differ significantly (P<0.05, LSD multiple comparison test)
Z Hofman, JDE van Drunen and H Kuipers 415
the Diabetes and Nutrition Group (DNSG) of the Euro-pean Association for the study of Diabetes21 and the Dietitians Associations of Australia24 consider the GI as an important tool in the dietary treatment of diabetic patients. The GI of the 12 enteral formulas determined in this study vary widely from GI=12 for a diabetes-specific feed up to GI=61 for a standard supplement. The standard errors of some of the enteral formulas are relatively high (>15 for 3 enteral formulas). Methodological issues like testing the reference food only once, measuring plasma glucose levels in venous blood and not in capillary blood and the use of Glucometers could have been attributed to these large standard errors.35-37 However, despite these large standard errors, three diabetes-specific formulas Diasip®, Glucerna® and Diason® had significantly lower GI scores than the three standard formulas Nutridrink®, Nutridrink Multi Fibre® and Biosorb Drink®. A com-parison between the composition of enteral formulas with a low GI (diabetes-specific formulas) and those with a high GI (standard formulas) shows that, in general, a low GI formula is characterized by a lower carbohydrate con-tent, the presence of fructose and a higher fat content con-taining more MUFA’s. Furthermore, the low GI formulas contain relatively high amounts of fibre while standard enteral formulas, especially sip feeds, often do not contain fibre. The fibre containing standard formulas tested here, Nutridrink Multifibre® and Nutrison Multi-fibre®, contain only 3.1g fibre per portion given while the amount of fibre for the formula with the lowest GI (Diasip®) is much higher (7.1g fibre per portion given). This indicates that the presence of fibre could also influence the GI value. Previously, the choice of carbohydrates (e.g. fructose), and fibres has been shown to influence the postprandial glucose responses positively.11-13, 38, 39 Similarly to the effect of low GI diets, also diets with a high MUFA and low CHO content have been shown to improve glycemic control as well as lipoprotein status.40-42 In 1998, the consensus statement on nutritional support of tube-fed patients with diabetes already acknowledged these results and stated that replacing part of the CHO of a product with MUFAs can be an effective way to reach the objectives for good management of diabetes.43 A meta-analysis of the data concludes that there is good scientific support for high MUFA diets as an alternative to high CHO diets for medical nutrition therapy in dia-betes.44,45 Recently, Hung and co-workers concluded, based on a review of the available evidence, that diets high in MUFAs and fibre and with a low GI appear to be beneficial regarding insulin resistance, glycemic control and blood lipids.46 Similar to the effect of diets with low GI or low CHO and high MUFA content, the use of an enteral formula with a relative low CHO and high MUFA content for a period of 12 weeks in diabetic patients has shown to re-duce fasting and postprandial plasma glucose, plasma li-pids and HbA1c. It also improved clinical outcome para-meters, i.e. reduction in fevers, pneumonia, urinary tract infection, and pressure ulcers.47 A reduction in post-prandial plasma glucose has most likely lead to the re-duction in infectious complications as hyperglycemia is associated with an increased incidence of infectious com-
plications.3,48-50 In another study, two of the diabetes-specific enteral formulas that were also tested in this study (Diasip® and Diason®) were compared with the re-sponses of two standard enteral formulas (Biosorb Drink® and Nutrison Standard®). Again, the diabetes-specific formulas showed a lower postprandial glucose response in diabetic patients.51 Some of the enteral formulas tested in this study have a low CHO and a high fat content. The use of a low CHO, high fat diet for diabetic patients is often discouraged because of the concern that such diets may lead to weight gain.21 It is important to realize that the enteral formulas that were tested in this study are clinical nutrition pro-ducts. These clinical nutrition products are used to support hospitalised or otherwise institutionalised patients with an insufficient oral intake who require nutritional support. Such products are used under controlled con-ditions and are given according to the energy require-ments of the patient. In summary, this study shows that diabetes-specific enteral formulas are being characterized by a lower GI than standard formulas. However, only half of the tested diabetes-specific feeds had a very low GI whereas the re-maining ones showed some overlap with the GI of stan-dard formulas. As diets with a low GI have been shown to improve glycemic control, it is to be expected that the use of certain diabetes-specific formulas with a low GI show beneficial effects in the nutritional management of diabetic patients in need of nutritional support and should therefore be the preferred option. Acknowledgements The authors would like to thank all volunteers for their participation. Numico Research B.V. sponsored the study and provided the enteral formulas.
References 1. Franz MJ, Bantle JP, Beebe C, Brunzell J, Chiasson J,
Garg A. Nutrition principles and recommendations in diabetes. Diabetes Care 2004; 27(Suppl 1):S36-S46.
2. Heine RJ, Balkau B, Ceriello A, Del Prato S, Horton ES, Taskinen MR. What does postprandial hyperglycaemia mean? Diabet Med 2004; 21: 208-213.
3. Abrahamson MJ. Optimal glycemic control in type 2 diabetes mellitus: fasting and postprandial glucose in context. Arch Intern Med 2004; 164: 486-491.
4. Ceriello A. The possible role of postprandial hyper-glycaemia in the pathogenesis of diabetic complications. Diabetologia 2003; 46 Suppl 1: M9-16.
5. Bastyr EJ, Stuart CA, Brodows RG, Schwartz S, Graf CJ, Zagar A. Therapy focused on lowering postprandial glucose, not fasting glucose, may be superior for lowering HbA1c. IOEZ Study Group. Diabetes Care 2000; 23: 1236-1241.
6. Hanefeld M, Temelkova-Kurktschiev T. Control of post-prandial hyperglycemia-an essential part of good diabetes treatment and prevention of cardiovascular complications. Nutr Metab Cardiovasc Dis 2002;12:98-107.
7. Brand-Miller JC. Postprandial glycemia, glycemic index, and the prevention of type 2 diabetes. Am J Clin Nutr 2004; 80: 243-244.
8. Schafer RG, Bohannon B, Franz MJ, Freeman J, Holmes A, McLaughlin S. Translation of the diabetes nutrition recommendations for health care institutions. Diabetes Care 2003; 26 Suppl 1:S70-72.
416 The Glycemic Index of standard and diabetes-specific enteral formulas
9. Thorburn A, Brand J, Truswell A. The glycaemic index of foods. Med J Aust 1986; 144:580 - 582.
10. Truswell AS. Glycaemic index of foods. Eur J Clin Nutr 1992; 46 Suppl 2:S91-101.
11. Hu FB, van Dam RM, Liu S. Diet and risk of Type II diabetes: the role of types of fat and carbohydrate. Diabetologia 2001; 44: 805-817.
12. Jenkins AL, Jenkins DJ, Zdravkovic U, Wursch P, Vuksan V. Depression of the glycemic index by high levels of beta-glucan fiber in two functional foods tested in type 2 diabetes. Eur J Clin Nutr 2002; 56: 622-628.
13. MacIntosh CG, Holt SH, Brand-Miller JC. The degree of fat saturation does not alter glycemic, insulinemic or satiety responses to a starchy staple in healthy men. J Nutr 2003; 133: 2577-2580.
14. Jenkins D, Wolever T, Taylor R, Fielden H. Glycemic index of foods: a physiological basis for carbohydrate exchange. Am J Clin Nutr 1981; 34: 362-366.
15. Brand J, Colagiuri S, Crossman S, Allen A, Roberts D, Truswell A. Low glycemic index foods improve long-term glycemic control in NIDDM. Diabetes Care 1991; 13: 95-101.
16. Frost G, Wilding J, Beecham J. Dietary advice based on the glycaemic index improves dietary profile and metabolic control in type 2 diabetic patients. Diabet Med 1994; 11: 397 - 401.
17. Gilbertson H, Brand Miller J, Thorburn A, Evans S, Chondros P, Werther G. The effect of flexible low glycemic index dietary advice versus measured carbo-hydrate exchange diets on glycemic control in children with type 1 diabetes. Diabetes Care 2001; 24: 1137 - 1143.
18. Wolever T, Jenkins D, Vuksan V, AL J, Buckley GC. Beneficial effect of a low glycaemic index diet in type 2 diabetes. Diabet Med 1992; 9:451-458.
19. Brand-Miller J, Hayne S, Petocz P, Colagiuri S. Low-glycemic index diets in the management of diabetes: a meta-analysis of randomized controlled trials. Diabetes Care 2003; 26: 2261-2267.
20. Sievenpiper JL, Vuksan V. Glycemic index in the treatment of diabetes: the debate continues. J Am Coll Nutr 2004; 23: 1-4.
21. The Diabetes and Nutrition Group (DNSG) of the European Association for the Study of Diabetes (EASD). Recommendations for the nutritional management of patient with diabetes mellitus. Eur J Clin Nutr 2000; 54: 353-355.
22. World Health Organisation. Diet, Nutrition and the prevention of chronic diseases. Geneva: WHO; 2003. WHO technical report series 916.
23. Katanas H. Diets with low glycemic index are ready for practice. Nutrition Today 1999; 34:87-88.
24. Perlstein R, Willcox J, Hines C, Milsavljevic M. Dietitians Associations of Australia review paper: glycaemic index in dietary management. Aust J Nutr Diet 1997; 54: 57-63.
25. Thefeld W. Prevalence of diabetes mellitus in the adult German population. Gesundheitswesen 1999; 61:S85-S89.
26. Sinclair AJ, Gadsby R, Penfold S, Croxson SC, A.J. B. Prevalence of diabetes in care home residents. Diabetes Care 2001; 24: 1066-1068.
27. Allison S. Institutional feeding of the elderly. Curr Opin Clin Nutr Metab Care 2002; 5: 31-34.
28. Benbow S, Hoyte R, Gill G. Institutional dietary provision for diabetic patients. QJM 2001; 94: 27-30.
29. Allison D, Paultre F, Maggio C, Mezzitis N. The use of areas under curves in diabetic research. Diabetes Care 1995; 18:245-250.
30. Brand-Miller JC, Allwan C, Mahalski K, Brooks D. The glycaemic index of further Australian foods. Proc Nutr Soc Australia 1998; 22: 110.
31. Perry T, Mann J, Mehalski K, Wilson J et al. Glycaemic index of New Zealand foods. New Zealand Med J 2000; 113: 140-142.
32. Bjorck I, Liljeberg HG. Low glycaemic-index foods. Br J Nutr 2000; 83 (suppl 1): S149 - 155.
33. Jarvi A, Karlstrom B, Granfeldt Y, Bjorck I, Asp N, Vessby B. Improved glycemic control and lipid profile and normalized fibrinolytic activity on a low-glycemic index diet in type 2 diabetec patients. Diabetes Care 1999; 22: 10-18.
34. Rizkalla SW, Taghrid L, Laromiguiere M, Huet D, Boillot J, Rigoir A. Improved Plasma Glucose Control, Whole-Body Glucose Utilization, and Lipid Profile on a Low-Glycemic Index Diet in Type 2 Diabetic Men: A randomized controlled trial. Diabetes Care 2004; 27: 1866-72.
35. Velangi A, Fernandes G, Wolever TM. Evaluation of a glucose meter for determining the glycemic responses of foods. Clin Chim Acta 2005, 356: 191-198.
36. Wolever TM, Voster HH, Bjorck I, Brand-Miller J, Brighenti F, Mann JI, Ramdath DD, Granfeldt Y, Holt S, Perry T, Venter C, Xiaomei Wu. Determination of the glycaemic index of foods: interlaboratory study. Eur J Clin Nutr 2003; 57: 475-482.
37. Brouns F, Bjorck I, Frayn KN, Gibbs AL, Lang V, Slama G. Wolever TMS. Glycaemic index methodology. Nutrition Research Reviews 2005;18:145-171.
38. Moore MC, Davis SN, Mann SL, Cherrington AD. Acute fructose administration improves oral glucose tolerance in adults with type 2 diabetes. Diabetes Care 2001; 24:1882-1887.
39. Lee B, Wolever T. Effect of glucose, sucrose and fructose on plasma glucose and insulin responses in normal humans: comparison with white bread. Eur J Clin Nutr 1998; 52: 924-928.
40. Campbell L, Marmot P, Dyer J, Borkman M, Storlien L. The high-monounsaturated fat diet as a practical alter-native for NIDDM. Diabetes Care 1994; 17: 177-182.
41. Garg A, Grundy S, Koffler M. Effect of high carbohydrate intake on hyperglycemia, islet function and plasma lipoproteins in NIDDM. Diabetes Care 1992; 15:1572-1580.
42. Lerman-Garber I, Ichazo-Cerro S, Zamora-Gonzalez J, Cardoso-Saldana G, Posadas-Romero C. Effect of a high-monounsaturated fat diet enriched with avocado in NIDDM patients. Diabetes Care 1994; 17:311-315.
43. Consensus Roundtable on Nutrition Support of Tube-Fed patients with Diabetes. Consensus statement. Clin Nutr 1998; 17 (suppl 2): 63-65.
44. Ros E. Dietary cis-monounsaturated fatty acids and metabolic control in type 2 diabetes. Am J Clin Nutr 2003; 78 (3 Suppl): 617S-625S.
45. Garg A. High-monounsaturated-fat diets for patients with diabetes mellitus: a meta-analysis. Am J Clin Nutr 1998; 67 (3 Suppl): 577S-582S.
46. Hung T, Sievenpiper JL, Marchie A, Kendall CW, Jenkins DJ. Fat versus carbohydrate in insulin resistance, obesity, diabetes and cardiovascular disease. Curr Opin Clin Nutr Metab Care 2003; 6: 165-176.
47. Craig LD, Nicholson S, SilVerstone FA, Kennedy RD. Use of a reduced-carbohydrate, modified-fat enteral formula for improving metabolic control and clinical outcomes in long-term care residents with type 2 diabetes: results of a pilot trial. Nutrition 1998; 14: 529-534.
Z Hofman, JDE van Drunen and H Kuipers 417
48. Furnary A, Zerr K, Grunkemeier GL, Starr A. Continuous intravenous insulin infusion reduces the incidence of deep sternal wound infection in diabetic patients after cardiac surgical procedures. Ann Thorac Surg 1999; 67:352-360.
49. van den Berghe G, Wouters P, Weekers F, Verwaest C, Bruyninckx F, Schetz M, Vlasselaers D, Fernande P, Lauwers P, Bouillon R. Intensive insulin therapy in the surgical intensive care unit. N Engl J Med 2001; 345: 1359-1367.
50. Gerich JE. Clinical significance, pathogenesis, and ma-nagement of postprandial hyperglycemia. Arch Intern Med 2003; 163: 1306-1316.
51. Hofman Z, Van Drunen JD, De Later C, Kuipers H. The effect of different nutritional feeds on the postprandial glucose response in healthy volunteers and patients with type II diabetes. Eur J Clin Nutr 2004; 58: 1553-1556.
Original Article The Glycemic Index of standard and diabetes-specific enteral formulas Zandrie Hofman MSc
1, Jenneke D.E. van Drunen MSc1 and Harm Kuipers PhD
2
1 Numico Research B.V., Wageningen, The Netherlands 2 Maastricht University, Maastricht, The Netherlands
标准的和糖尿病特定肠道配方标准的和糖尿病特定肠道配方标准的和糖尿病特定肠道配方标准的和糖尿病特定肠道配方餐的血糖指数的血糖指数的血糖指数的血糖指数 最近的一项元分析结果表明, 低血糖指数 GI 的食物在临床上对糖尿病患者具有控制血糖水平
的作用。 尽管糖尿病患者口腔摄食不足,通常使用糖尿病特定肠道配方,但对这些配方的
GI 指数知道的不是很多。因此本项研究目的是为了评价几种专门为糖尿病特定配置的肠道配
方餐的 GI 指数, 以及与标准配方餐进行了比较。本项研究是一项随机的、双盲的、代表性
的研究, 其在 14 个健康的自愿者中选出 7~10 个对 12 种配方餐进行试验。经过一昼夜的禁
食后,我们随机地在不同时段给这些志愿者以任意顺序吃含有 25g 碳水化合物的配方餐或参
考餐(每 200ml 含 25g 的葡萄糖)进食 2 个小时后,取静脉血测定餐后血糖浓度,然后计算
配方餐和对照餐的正向递增 AUC 值。所调查的配方餐的 GI 指数等于被测配方餐的 AUC 值除
上对照餐的 AUC 值。肠道配方餐的 GI 值十分不同,肠道配方餐的特点是 GI 值(平均值±SEM: 19.4 ± 1.8)显著低于标准的配方餐(42.1 ± 5.9)(P=0.004)。但是肠道配方餐和标准
配方餐有一个交迭。三种专门为糖尿病患者配置的配方餐的 GI 值要比三种标准餐的 GI 值明
显低。尽管有些糖尿病特定配方餐和标准配方餐的 GI 值交迭,某些糖尿病特定配方餐的 GI
值很低,这些 GI 值低的糖尿病特定配方餐在临床上能更好的控制血糖。因此,低 GI 值的糖
尿病特定配方餐是对那些需要营养支持的糖尿病患者营养管理的首选。 关键词:关键词:关键词:关键词:糖尿病、高血糖症、临床营养、血糖指标、营养调理。
418 Asia Pac J Clin Nutr 2006;15 (3): 418-424
Original Article Low dose supplementation with two different marine oils does not reduce pro-inflammatory eicosanoids and cytokines in vivo Karen J Murphy PhD1, Karen Galvin PhD
2, Mairead Kiely PhD2,
Patrick A Morrissey PhD2, Neil J Mann PhD
3 and Andrew J Sinclair PhD4
1Child Health Research Institute, University of Adelaide, Urrbrae, South Australia 5064, Discipline of Physiology University of Adelaide, Adelaide, South Australia 5005, School of Medicine, Flinders University, Bedford Park, South Australia 5064, Australia 2Nutritional Sciences, Department of Food Science, Food Technology and Nutrition Technology, University College Cork, Ireland 3Food Science, RMIT University, GPO Box 2476V, Melbourne 3001, Australia 4School of Exercise and Nutrition Sciences, Deakin University, Burwood, Victoria 3125, Australia.
In view of the reported potential anti-inflammatory activity of the New Zealand green lipped mussel (NZGLM), we aimed to compare the effect of low dose marine oil supplementation, from mussels and fish, in reducing blood markers of inflammation. Thirty apparently healthy males and females were recruited from the general public in Melbourne, Australia to participate in a double blind, randomised, parallel intervention study. Subjects were consuming approximately 73 mg of omega-3 long chain polyunsaturated fatty acids (n-3 LCPUFA) daily in their background diet prior to the commencement of the intervention. Subjects were randomly assigned to consume either 2 mL/day of the NZGLM oil preparation (mixed with olive oil and dl-α-tocopherol) or fish oil preparation (also mixed with olive oil and dl-α-tocopherol) for six weeks. Two mL of the oils contained 241 mg and 181 mg of n-3 LCPUFA, respectively. Neutrophil phospholipid fatty acids, serum thromboxane B2 (TXB2), stimulated monocyte production of prostaglandin E2 (PGE2), interleukin-1β (IL-1β) and tumor necrosis factor α (TNFα) were measured. During the intervention, the total intakes of n-3 LCPUFA from the background diet and the supplements were 199 mg/d and 173mg/day for the NZGLM and FO groups, respectively. Following six weeks of supplementation, both groups showed a small, but significant increase in neutrophil phospholipid proportion of eicosapentaenoic acid. The NZGLM group also showed a significant increase in docosahexaenoic acid levels. There were no significant changes with time or treatment for TXB2, PGE2, IL-1β or TNFα. This study showed that low dose supplementation with n-3 LCPUFA from two different marine oil preparations showed no difference in inflammatory markers in this group of healthy individuals. Further studies are warranted including dose response trials and studies in populations with inflammatory conditions.
Key Words: NZGLM; fatty acids; n-3 LCPUFA; eicosanoid; cytokine, gas chromatography Introduction Immuno-inflammatory conditions such as inflammatory bowel disease and arthritis are debilitating diseases affecting thousands of people around the world. Inflamma-tion is generally caused by an increase in the production of pro-inflammatory eicosanoids and cytokines including pro-staglandin E2 (PGE2), thromboxane B2 (TXB2), and leuko-triene B4 (LTB4), interleukins 1, 2, 6 (IL), tumor necrosis factor alpha (TNFα) and interferon-γ.1 Traditional means of treating arthritis have included modulation of inflammatory mediator production with the use of non-steroidal anti-inflammatory drugs, however their use can result in ulceration of the gastric lining. Modulating the production of inflammatory mediators through dietary intervention with omega-3 long chain polyunsaturated fatty acids (n-3 LCPUFA) has been shown to reduce the symptoms of a number of inflammatory dis-
orders without detrimental side effects.2-4 Marine oils rich in n-3 LCPUFA, particularly fish oil, have been the focus of much clinical research. Hughes & Pinder5 speculated that n-3 LCPUFA can reduce the production of pro-inflammatory markers through inhibition of human antigen presenting cell expression, intracellular adhesion and vas-cular cell adhesion molecules and reduced T-cell re-sponses.6,7 Meydani and colleagues8 have shown that fish oil supplementation can reduce plasma levels of n-6 PUFA (arachidonic acid) and increase plasma levels of n-3 LCPUFA (eicosapentaenoic acid) as well as decreasing
Correspondence address: Dr KJ Murphy, University of Adelaide, White Campus, PMB1, Glen Osmond, South Australia, Australia 5064 Tel: + 61 8 8303 4901; Fax: + 61 8 8303 7109 Email: [email protected] Accepted 16th January 2006
KJ Murphy, K Galvin, M Kiely, PA Morrissey, NJ Mann and AJ Sinclair 419
levels of IL-1β, IL-2, IL-6, PGE2 and TNFα. Over the past 20 or so years, research on the New Zealand Green lipped mussel (NZGLM) (freeze dried powder or oil extracted from the powder) has indicated that these preparations might have therapeutic value in the treatment of inflammatory conditions including arthritis and asthma.9-11 The major fatty acids in the oil from the NZGLM include palmitic acid and the n-3 LCPUFA (docosahexaenoic acid; DHA and eicosapentaenoic acid; EPA).12-14 Whitehouse et al.,15 have reported that the NZGLM lipids (Lyprinol™) are more potent (on a mg/kg body weight dose rate) than fish oil in reducing induced inflammation in animals and that the bioactivity is related to the PUFAs. Furthermore, Dugas16 demonstrated, in vitro using cultured human monocytes, that IL-4 stimu-lated monocyte production of LTB4 in allergic patients was suppressed. In view of the reported potential anti-inflammatory activity of the NZGLM, the aim of the present study was to determine the efficacy of the NZGLM lipids in re-ducing markers of inflammation (PGE2, TXB2, IL-1β, TNFα), in comparison with a typical fish oil rich in n-3 LCPUFA. The dose of marine oil supplement was appro-ximately 200 mg/day and was chosen based on recom-mended intakes for the NZGLM product (Lyprinol™). Methods Subjects and study design This was a randomised, double blind, parallel study in which 30 apparently healthy subjects (14 males and 16 females) were recruited. Subjects consumed one of two marine oils for six weeks, followed by a two-week wash-out period. The subjects underwent a strict screening process and were excluded if they exhibited symptoms of inflammation (sore joints, stiffness), had a past history of first generation inflammatory disease, high blood cho-lesterol (>5.5 mM), high blood pressure (>140/90) or a body mass index (BMI) greater than 30, were taking anti-inflammatory medication, statins, blood pressure lowering medication or dietary supplements (fish, evening primrose and flaxseed oil). Dietary intake was measured prior to and during the intervention period using weighed food records (WFR), which were assessed using the Diet Version 4 software (Xyris Software, Pty Ltd, Qld, Austra-lia) with NUTTAB 95’ database. Where foods were not present in the software program, composition tables were obtained from dietary panels on individual food products and from the relevant food companies. The study was designed to limit exogenous dietary n-3 LCPUFA (EPA, docosapentaenoic acid; DPA & DHA) and substitute with a marine oil source of n-3 LCPUFA. According to fatty acid dietary analysis of WFR using Foodworks® dietary software program (Xyris Software, Pty Ltd, Qld, Australia), total n-3 LCPUFA from subjects’ background diet (in the weeks prior to baseline) in the FO and NZGLM groups were 63±54 mg/d and 83±18 mg/d, respectively (P>0.05). Subjects were asked to maintain their habitual intake of fish and green vegetables and consume no more than two serves of fatty fish (tuna, salmon, sardines) per week. Fasting blood and anthropometric measurements were taken at baseline (day 0), halfway (day 21), end (day 42)
and during the washout period at day 56 (post-supple-mentation). Blood was analysed for neutrophil phos-pholipid (PL) fatty acids, endotoxin-stimulated monocyte production of PGE2, IL-1β and TNFα and serum levels of TXB2. All subjects gave written informed consent before commencing the study and the study was approved by the Human Research Ethics Committee at RMIT University, Melbourne, Australia. Marine oil preparations and compliance Since the aim of the study was to compare the effect of two marine oils on inflammatory marker levels, the dose was based on oils as purchased rather than on a stan-dardised n-3 PUFA content. The NZGLM oil was supplied by Pharmalink International (Queensland, Australia) and the fish oil was supplied by Felton Grim-wade Bickford Pty Ltd (Oakleigh, Victoria, Australia). The study oil preparations were prepared by Felton Grim-wade Bickford Pty Ltd which involved combining each marine oil (1 part) with olive oil (2 parts) and vitamin E, to mimic the commercial capsules sold as Lyprinol™, which contain 50 mg NZGLM lipids, 150 mg olive oil and 0.225 µg of dl-α-tocopherol. Lemon flavouring was added to the oils to mask the natural odour. Subjects were randomly assigned to take one of the two marine oils (requested dose was 2 mL of oil daily for six weeks, delivered using a dropper). Two mL of the NZGLM preparation contained 241 mg n-3 LCPUFA, supplying 97 mg EPA and 72 mg DHA with 8 mg dl-α-tocopherol/mL (equiv. to approx. 11 Lyprinol™ cap-sules), and 2 mL of the fish oil preparation contained 181 mg n-3 LCPUFA, supplying 87mg EPA and 50mg DHA, with 8 mg dl-α-tocopherol/mL. Prior to the study, each subject was given a previously weighed and labelled bottle of the allocated oil. Upon completion of the supplementation period (at day 42), subjects were asked to return the bottle of oil. The amount of oil consumed was calculated by sub-tracting the weight of the bottle at day 42 from the weight of the bottle at day 0. To maintain compliance throughout the study, subjects were each contacted weekly during the intervention to discuss any issues arising from the supplementation. Levels of fatty acids in neutrophils were determined at day 0, 42 and 56 using gas chroma-tography (GC), to determine if subjects were consuming the oils. Anthropometry Subjects’ height and weight were recorded to calculate individuals BMI. Subjects had their percentage of body fat determined using a bioimpedance fat analyser (TBF-501 Tanita Corporation, Illinois, USA). Waist and hip measurements were taken using a metric tape measure to calculate the waist to hip ratio. Subjects’ blood pressure and pulse were measured using a digital auto inflating blood pressure monitor (Lumiscope Co, Inc., NJ, USA). Subjects were seated for 15 minutes prior to these mea-surements to allow for their blood pressure to stabilise. To eliminate experimenter variability and diurnal varia-tion, all measurements at each visit were conducted by KJM, at the same time and conducted at least twice to obtain a representative mean value.
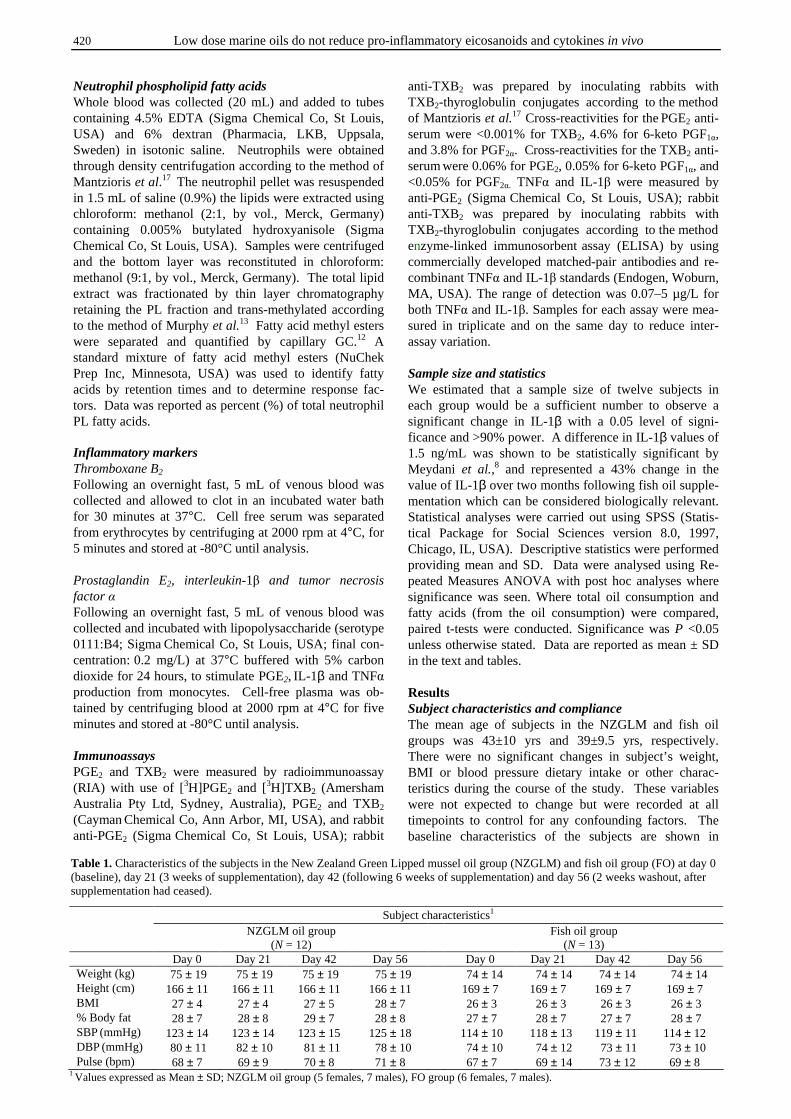
420 Low dose marine oils do not reduce pro-inflammatory eicosanoids and cytokines in vivo
Neutrophil phospholipid fatty acids Whole blood was collected (20 mL) and added to tubes containing 4.5% EDTA (Sigma Chemical Co, St Louis, USA) and 6% dextran (Pharmacia, LKB, Uppsala, Sweden) in isotonic saline. Neutrophils were obtained through density centrifugation according to the method of Mantzioris et al.17 The neutrophil pellet was resuspended in 1.5 mL of saline (0.9%) the lipids were extracted using chloroform: methanol (2:1, by vol., Merck, Germany) containing 0.005% butylated hydroxyanisole (Sigma Chemical Co, St Louis, USA). Samples were centrifuged and the bottom layer was reconstituted in chloroform: methanol (9:1, by vol., Merck, Germany). The total lipid extract was fractionated by thin layer chromatography retaining the PL fraction and trans-methylated according to the method of Murphy et al.13 Fatty acid methyl esters were separated and quantified by capillary GC.12 A standard mixture of fatty acid methyl esters (NuChek Prep Inc, Minnesota, USA) was used to identify fatty acids by retention times and to determine response fac-tors. Data was reported as percent (%) of total neutrophil PL fatty acids. Inflammatory markers Thromboxane B2 Following an overnight fast, 5 mL of venous blood was collected and allowed to clot in an incubated water bath for 30 minutes at 37°C. Cell free serum was separated from erythrocytes by centrifuging at 2000 rpm at 4°C, for 5 minutes and stored at -80°C until analysis. Prostaglandin E2, interleukin-1β and tumor necrosis factor α Following an overnight fast, 5 mL of venous blood was collected and incubated with lipopolysaccharide (serotype 0111:B4; Sigma Chemical Co, St Louis, USA; final con-centration: 0.2 mg/L) at 37°C buffered with 5% carbon dioxide for 24 hours, to stimulate PGE2, IL-1β and TNFα production from monocytes. Cell-free plasma was ob-tained by centrifuging blood at 2000 rpm at 4°C for five minutes and stored at -80°C until analysis. Immunoassays PGE2 and TXB2 were measured by radioimmunoassay (RIA) with use of [3H]PGE2 and [3H]TXB2 (Amersham
Australia Pty Ltd, Sydney, Australia), PGE2 and TXB2 (Cayman Chemical Co, Ann Arbor, MI, USA), and rabbit anti-PGE2 (Sigma Chemical Co, St Louis, USA); rabbit
anti-TXB2 was prepared by inoculating rabbits with
TXB2-thyroglobulin conjugates according to the method of Mantzioris et al.17 Cross-reactivities for the PGE2 anti-serum were <0.001% for TXB2, 4.6% for 6-keto PGF1α,
and 3.8% for PGF2α. Cross-reactivities for the TXB2 anti-serum were 0.06% for PGE2, 0.05% for 6-keto PGF1α, and <0.05% for PGF2α. TNFα and IL-1β were measured by anti-PGE2 (Sigma Chemical Co, St Louis, USA); rabbit anti-TXB2 was prepared by inoculating rabbits with
TXB2-thyroglobulin conjugates according to the method enzyme-linked immunosorbent assay (ELISA) by using commercially developed matched-pair antibodies and re-combinant TNFα and IL-1β standards (Endogen, Woburn,
MA, USA). The range of detection was 0.07–5 µg/L for
both TNFα and IL-1β. Samples for each assay were mea-sured in triplicate and on the same day to reduce inter-assay variation. Sample size and statistics We estimated that a sample size of twelve subjects in each group would be a sufficient number to observe a significant change in IL-1β with a 0.05 level of signi-ficance and >90% power. A difference in IL-1β values of 1.5 ng/mL was shown to be statistically significant by Meydani et al.,8 and represented a 43% change in the value of IL-1β over two months following fish oil supple-mentation which can be considered biologically relevant. Statistical analyses were carried out using SPSS (Statis-tical Package for Social Sciences version 8.0, 1997, Chicago, IL, USA). Descriptive statistics were performed providing mean and SD. Data were analysed using Re-peated Measures ANOVA with post hoc analyses where significance was seen. Where total oil consumption and fatty acids (from the oil consumption) were compared, paired t-tests were conducted. Significance was P <0.05 unless otherwise stated. Data are reported as mean ± SD in the text and tables. Results Subject characteristics and compliance The mean age of subjects in the NZGLM and fish oil groups was 43±10 yrs and 39±9.5 yrs, respectively. There were no significant changes in subject’s weight, BMI or blood pressure dietary intake or other charac-teristics during the course of the study. These variables were not expected to change but were recorded at all timepoints to control for any confounding factors. The baseline characteristics of the subjects are shown in
Subject characteristics1 NZGLM oil group
(N = 12) Fish oil group
(N = 13) Day 0 Day 21 Day 42 Day 56 Day 0 Day 21 Day 42 Day 56 Weight (kg) 75 ± 19 75 ± 19 75 ± 19 75 ± 19 74 ± 14 74 ± 14 74 ± 14 74 ± 14 Height (cm) 166 ± 11 166 ± 11 166 ± 11 166 ± 11 169 ± 7 169 ± 7 169 ± 7 169 ± 7 BMI 27 ± 4 27 ± 4 27 ± 5 28 ± 7 26 ± 3 26 ± 3 26 ± 3 26 ± 3 % Body fat 28 ± 7 28 ± 8 29 ± 7 28 ± 8 27 ± 7 28 ± 7 27 ± 7 28 ± 7 SBP (mmHg) 123 ± 14 123 ± 14 123 ± 15 125 ± 18 114 ± 10 118 ± 13 119 ± 11 114 ± 12 DBP (mmHg) 80 ± 11 82 ± 10 81 ± 11 78 ± 10 74 ± 10 74 ± 12 73 ± 11 73 ± 10 Pulse (bpm) 68 ± 7 69 ± 9 70 ± 8 71 ± 8 67 ± 7 69 ± 14 73 ± 12 69 ± 8
1 Values expressed as Mean ± SD; NZGLM oil group (5 females, 7 males), FO group (6 females, 7 males).
Table 1. Characteristics of the subjects in the New Zealand Green Lipped mussel oil group (NZGLM) and fish oil group (FO) at day 0 (baseline), day 21 (3 weeks of supplementation), day 42 (following 6 weeks of supplementation) and day 56 (2 weeks washout, after supplementation had ceased).
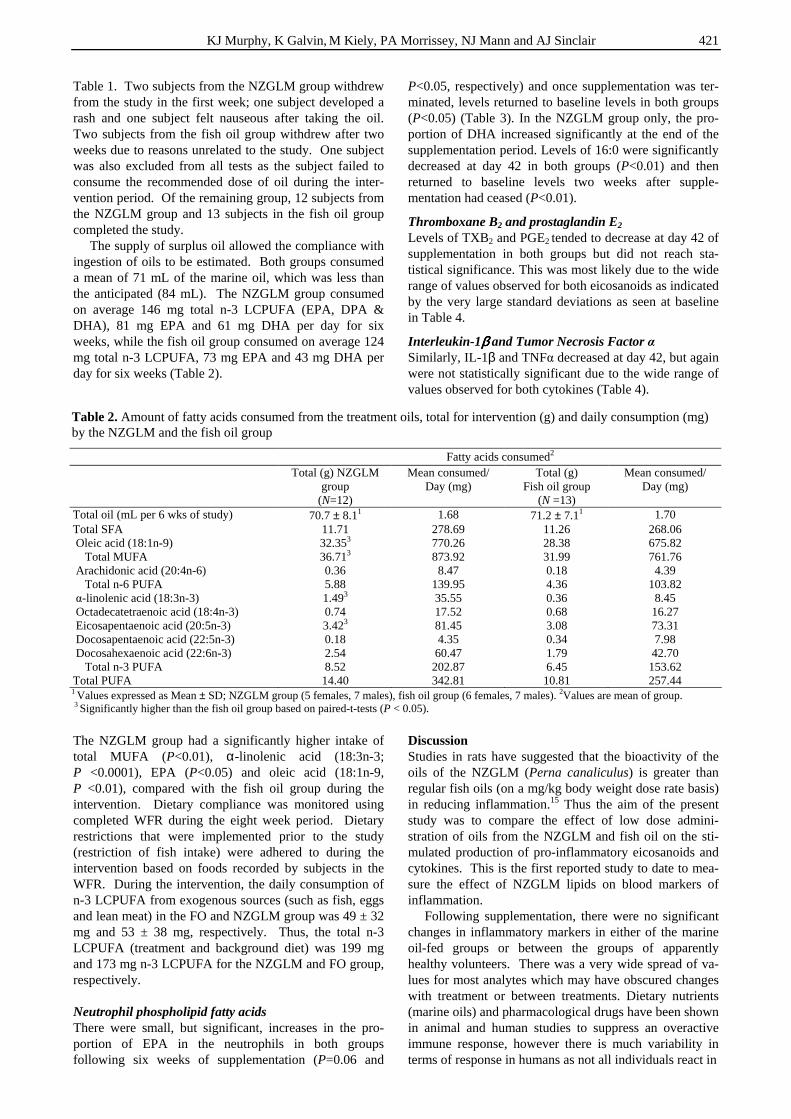
KJ Murphy, K Galvin, M Kiely, PA Morrissey, NJ Mann and AJ Sinclair 421
Table 1. Two subjects from the NZGLM group withdrew from the study in the first week; one subject developed a rash and one subject felt nauseous after taking the oil. Two subjects from the fish oil group withdrew after two weeks due to reasons unrelated to the study. One subject was also excluded from all tests as the subject failed to consume the recommended dose of oil during the inter-vention period. Of the remaining group, 12 subjects from the NZGLM group and 13 subjects in the fish oil group completed the study. The supply of surplus oil allowed the compliance with ingestion of oils to be estimated. Both groups consumed a mean of 71 mL of the marine oil, which was less than the anticipated (84 mL). The NZGLM group consumed on average 146 mg total n-3 LCPUFA (EPA, DPA & DHA), 81 mg EPA and 61 mg DHA per day for six weeks, while the fish oil group consumed on average 124 mg total n-3 LCPUFA, 73 mg EPA and 43 mg DHA per day for six weeks (Table 2). The NZGLM group had a significantly higher intake of total MUFA (P<0.01), α-linolenic acid (18:3n-3; P <0.0001), EPA (P<0.05) and oleic acid (18:1n-9, P <0.01), compared with the fish oil group during the intervention. Dietary compliance was monitored using completed WFR during the eight week period. Dietary restrictions that were implemented prior to the study (restriction of fish intake) were adhered to during the intervention based on foods recorded by subjects in the WFR. During the intervention, the daily consumption of n-3 LCPUFA from exogenous sources (such as fish, eggs and lean meat) in the FO and NZGLM group was 49 ± 32 mg and 53 ± 38 mg, respectively. Thus, the total n-3 LCPUFA (treatment and background diet) was 199 mg and 173 mg n-3 LCPUFA for the NZGLM and FO group, respectively. Neutrophil phospholipid fatty acids There were small, but significant, increases in the pro-portion of EPA in the neutrophils in both groups following six weeks of supplementation (P=0.06 and
P<0.05, respectively) and once supplementation was ter-minated, levels returned to baseline levels in both groups (P<0.05) (Table 3). In the NZGLM group only, the pro-portion of DHA increased significantly at the end of the supplementation period. Levels of 16:0 were significantly decreased at day 42 in both groups (P<0.01) and then returned to baseline levels two weeks after supple-mentation had ceased (P<0.01).
Thromboxane B2 and prostaglandin E2 Levels of TXB2 and PGE2 tended to decrease at day 42 of supplementation in both groups but did not reach sta-tistical significance. This was most likely due to the wide range of values observed for both eicosanoids as indicated by the very large standard deviations as seen at baseline in Table 4.
Interleukin-1ββββ and Tumor Necrosis Factor α Similarly, IL-1β and TNFα decreased at day 42, but again were not statistically significant due to the wide range of values observed for both cytokines (Table 4). Discussion Studies in rats have suggested that the bioactivity of the oils of the NZGLM (Perna canaliculus) is greater than regular fish oils (on a mg/kg body weight dose rate basis) in reducing inflammation.15 Thus the aim of the present study was to compare the effect of low dose admini-stration of oils from the NZGLM and fish oil on the sti-mulated production of pro-inflammatory eicosanoids and cytokines. This is the first reported study to date to mea-sure the effect of NZGLM lipids on blood markers of inflammation. Following supplementation, there were no significant changes in inflammatory markers in either of the marine oil-fed groups or between the groups of apparently healthy volunteers. There was a very wide spread of va-lues for most analytes which may have obscured changes with treatment or between treatments. Dietary nutrients (marine oils) and pharmacological drugs have been shown in animal and human studies to suppress an overactive immune response, however there is much variability in terms of response in humans as not all individuals react in
Table 2. Amount of fatty acids consumed from the treatment oils, total for intervention (g) and daily consumption (mg) by the NZGLM and the fish oil group
Fatty acids consumed2 Total (g) NZGLM
group (N=12)
Mean consumed/ Day (mg)
Total (g) Fish oil group
(N =13)
Mean consumed/ Day (mg)
Total oil (mL per 6 wks of study) 70.7 ± 8.11 1.68 71.2 ± 7.11 1.70 Total SFA 11.71 278.69 11.26 268.06 Oleic acid (18:1n-9) 32.353 770.26 28.38 675.82 Total MUFA 36.713 873.92 31.99 761.76 Arachidonic acid (20:4n-6) 0.36 8.47 0.18 4.39 Total n-6 PUFA 5.88 139.95 4.36 103.82 α-linolenic acid (18:3n-3) 1.493 35.55 0.36 8.45 Octadecatetraenoic acid (18:4n-3) 0.74 17.52 0.68 16.27 Eicosapentaenoic acid (20:5n-3) 3.423 81.45 3.08 73.31 Docosapentaenoic acid (22:5n-3) 0.18 4.35 0.34 7.98 Docosahexaenoic acid (22:6n-3) 2.54 60.47 1.79 42.70 Total n-3 PUFA 8.52 202.87 6.45 153.62 Total PUFA 14.40 342.81 10.81 257.44 1 Values expressed as Mean ± SD; NZGLM group (5 females, 7 males), fish oil group (6 females, 7 males). 2Values are mean of group. 3 Significantly higher than the fish oil group based on paired-t-tests (P < 0.05).
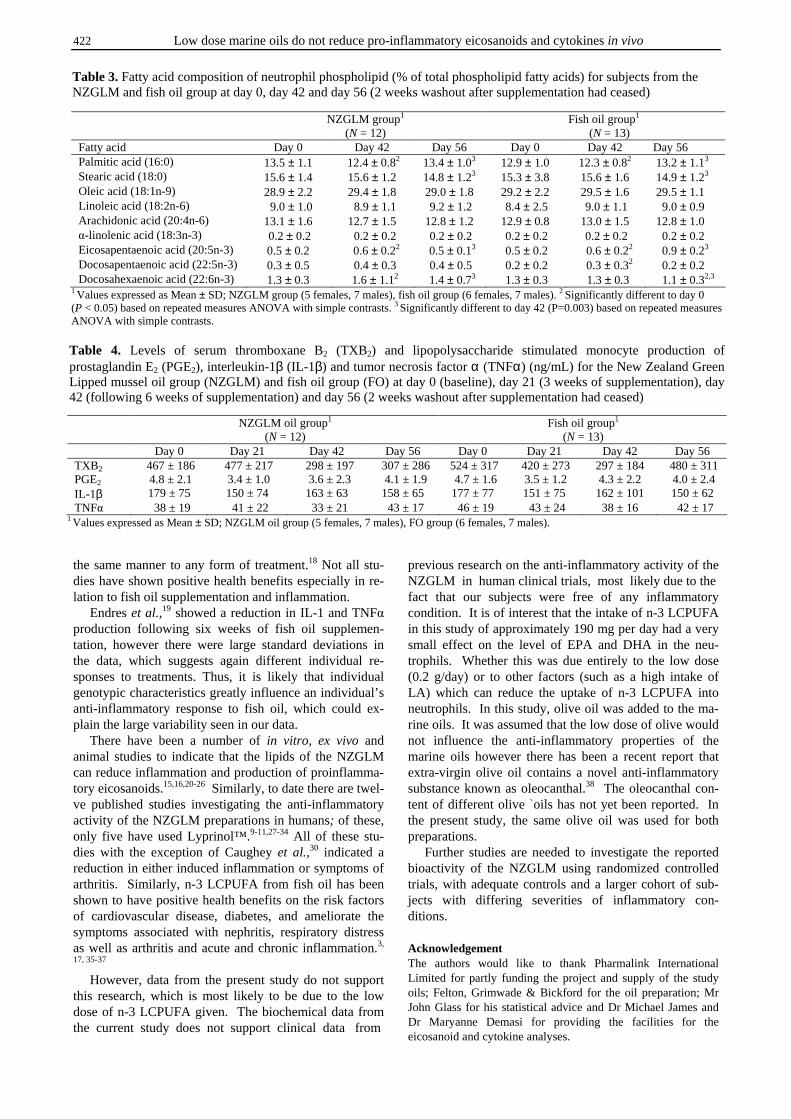
422 Low dose marine oils do not reduce pro-inflammatory eicosanoids and cytokines in vivo
the same manner to any form of treatment.18 Not all stu-dies have shown positive health benefits especially in re-lation to fish oil supplementation and inflammation. Endres et al.,19 showed a reduction in IL-1 and TNFα production following six weeks of fish oil supplemen-tation, however there were large standard deviations in the data, which suggests again different individual re-sponses to treatments. Thus, it is likely that individual genotypic characteristics greatly influence an individual’s anti-inflammatory response to fish oil, which could ex-plain the large variability seen in our data. There have been a number of in vitro, ex vivo and animal studies to indicate that the lipids of the NZGLM can reduce inflammation and production of proinflamma-tory eicosanoids.15,16,20-26 Similarly, to date there are twel-ve published studies investigating the anti-inflammatory activity of the NZGLM preparations in humans; of these, only five have used Lyprinol™.9-11,27-34 All of these stu-dies with the exception of Caughey et al.,30 indicated a reduction in either induced inflammation or symptoms of arthritis. Similarly, n-3 LCPUFA from fish oil has been shown to have positive health benefits on the risk factors of cardiovascular disease, diabetes, and ameliorate the symptoms associated with nephritis, respiratory distress as well as arthritis and acute and chronic inflammation.3,
17, 35-37 However, data from the present study do not support this research, which is most likely to be due to the low dose of n-3 LCPUFA given. The biochemical data from the current study does not support clinical data from
previous research on the anti-inflammatory activity of the NZGLM in human clinical trials, most likely due to the fact that our subjects were free of any inflammatory condition. It is of interest that the intake of n-3 LCPUFA in this study of approximately 190 mg per day had a very small effect on the level of EPA and DHA in the neu-trophils. Whether this was due entirely to the low dose (0.2 g/day) or to other factors (such as a high intake of LA) which can reduce the uptake of n-3 LCPUFA into neutrophils. In this study, olive oil was added to the ma-rine oils. It was assumed that the low dose of olive would not influence the anti-inflammatory properties of the marine oils however there has been a recent report that extra-virgin olive oil contains a novel anti-inflammatory substance known as oleocanthal.38 The oleocanthal con-tent of different olive ̀oils has not yet been reported. In the present study, the same olive oil was used for both preparations. Further studies are needed to investigate the reported bioactivity of the NZGLM using randomized controlled trials, with adequate controls and a larger cohort of sub-jects with differing severities of inflammatory con-ditions. Acknowledgement The authors would like to thank Pharmalink International Limited for partly funding the project and supply of the study oils; Felton, Grimwade & Bickford for the oil preparation; Mr John Glass for his statistical advice and Dr Michael James and Dr Maryanne Demasi for providing the facilities for the eicosanoid and cytokine analyses.
Table 3. Fatty acid composition of neutrophil phospholipid (% of total phospholipid fatty acids) for subjects from the NZGLM and fish oil group at day 0, day 42 and day 56 (2 weeks washout after supplementation had ceased)
NZGLM group1 (N = 12)
Fish oil group1 (N = 13)
Fatty acid Day 0 Day 42 Day 56 Day 0 Day 42 Day 56 Palmitic acid (16:0) 13.5 ± 1.1 12.4 ± 0.82 13.4 ± 1.03 12.9 ± 1.0 12.3 ± 0.82 13.2 ± 1.13 Stearic acid (18:0) 15.6 ± 1.4 15.6 ± 1.2 14.8 ± 1.23 15.3 ± 3.8 15.6 ± 1.6 14.9 ± 1.23 Oleic acid (18:1n-9) 28.9 ± 2.2 29.4 ± 1.8 29.0 ± 1.8 29.2 ± 2.2 29.5 ± 1.6 29.5 ± 1.1 Linoleic acid (18:2n-6) 9.0 ± 1.0 8.9 ± 1.1 9.2 ± 1.2 8.4 ± 2.5 9.0 ± 1.1 9.0 ± 0.9 Arachidonic acid (20:4n-6) 13.1 ± 1.6 12.7 ± 1.5 12.8 ± 1.2 12.9 ± 0.8 13.0 ± 1.5 12.8 ± 1.0 α-linolenic acid (18:3n-3) 0.2 ± 0.2 0.2 ± 0.2 0.2 ± 0.2 0.2 ± 0.2 0.2 ± 0.2 0.2 ± 0.2 Eicosapentaenoic acid (20:5n-3) 0.5 ± 0.2 0.6 ± 0.22 0.5 ± 0.13 0.5 ± 0.2 0.6 ± 0.22 0.9 ± 0.23 Docosapentaenoic acid (22:5n-3) 0.3 ± 0.5 0.4 ± 0.3 0.4 ± 0.5 0.2 ± 0.2 0.3 ± 0.32 0.2 ± 0.2 Docosahexaenoic acid (22:6n-3) 1.3 ± 0.3 1.6 ± 1.12 1.4 ± 0.73 1.3 ± 0.3 1.3 ± 0.3 1.1 ± 0.32,3
1 Values expressed as Mean ± SD; NZGLM group (5 females, 7 males), fish oil group (6 females, 7 males). 2 Significantly different to day 0 (P < 0.05) based on repeated measures ANOVA with simple contrasts. 3 Significantly different to day 42 (P=0.003) based on repeated measures ANOVA with simple contrasts.
Table 4. Levels of serum thromboxane B2 (TXB2) and lipopolysaccharide stimulated monocyte production of prostaglandin E2 (PGE2), interleukin-1β (IL-1β) and tumor necrosis factor α (TNFα) (ng/mL) for the New Zealand Green Lipped mussel oil group (NZGLM) and fish oil group (FO) at day 0 (baseline), day 21 (3 weeks of supplementation), day 42 (following 6 weeks of supplementation) and day 56 (2 weeks washout after supplementation had ceased) NZGLM oil group1
(N = 12) Fish oil group1
(N = 13) Day 0 Day 21 Day 42 Day 56 Day 0 Day 21 Day 42 Day 56 TXB2 467 ± 186 477 ± 217 298 ± 197 307 ± 286 524 ± 317 420 ± 273 297 ± 184 480 ± 311 PGE2 4.8 ± 2.1 3.4 ± 1.0 3.6 ± 2.3 4.1 ± 1.9 4.7 ± 1.6 3.5 ± 1.2 4.3 ± 2.2 4.0 ± 2.4 IL-1β 179 ± 75 150 ± 74 163 ± 63 158 ± 65 177 ± 77 151 ± 75 162 ± 101 150 ± 62 TNFα 38 ± 19 41 ± 22 33 ± 21 43 ± 17 46 ± 19 43 ± 24 38 ± 16 42 ± 17
1 Values expressed as Mean ± SD; NZGLM oil group (5 females, 7 males), FO group (6 females, 7 males).
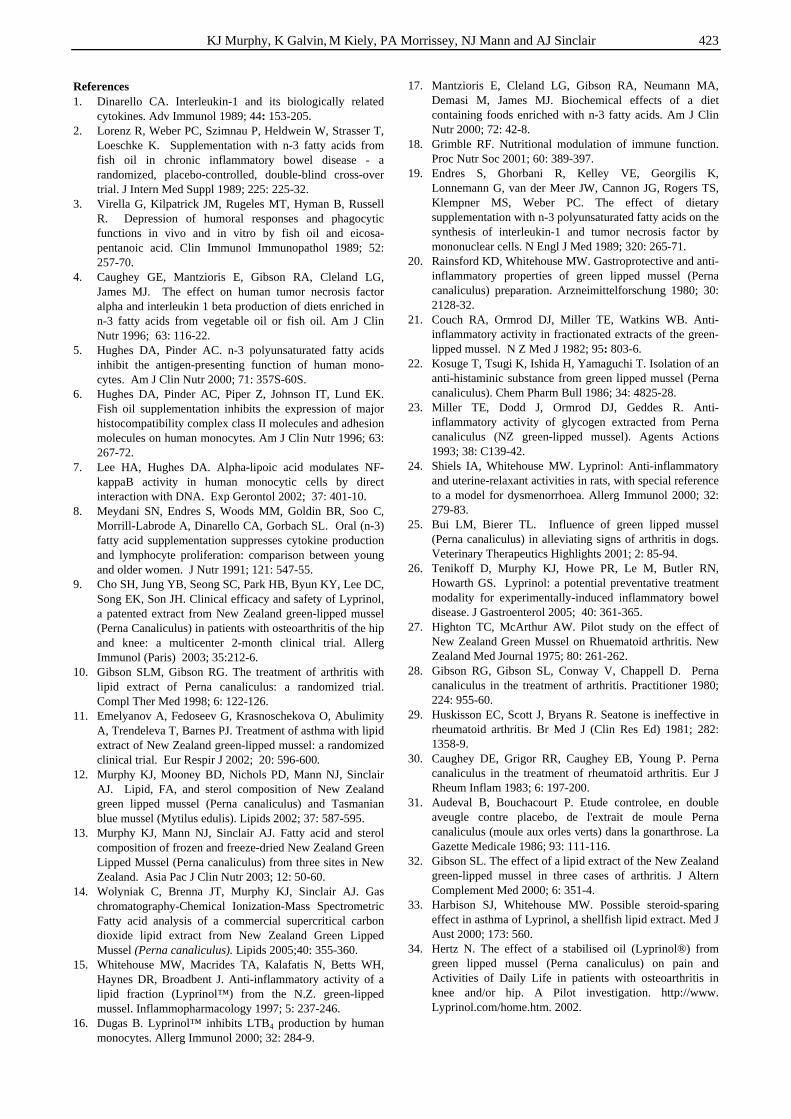
KJ Murphy, K Galvin, M Kiely, PA Morrissey, NJ Mann and AJ Sinclair 423
References 1. Dinarello CA. Interleukin-1 and its biologically related
cytokines. Adv Immunol 1989; 44: 153-205. 2. Lorenz R, Weber PC, Szimnau P, Heldwein W, Strasser T,
Loeschke K. Supplementation with n-3 fatty acids from fish oil in chronic inflammatory bowel disease - a randomized, placebo-controlled, double-blind cross-over trial. J Intern Med Suppl 1989; 225: 225-32.
3. Virella G, Kilpatrick JM, Rugeles MT, Hyman B, Russell R. Depression of humoral responses and phagocytic functions in vivo and in vitro by fish oil and eicosa-pentanoic acid. Clin Immunol Immunopathol 1989; 52: 257-70.
4. Caughey GE, Mantzioris E, Gibson RA, Cleland LG, James MJ. The effect on human tumor necrosis factor alpha and interleukin 1 beta production of diets enriched in n-3 fatty acids from vegetable oil or fish oil. Am J Clin Nutr 1996; 63: 116-22.
5. Hughes DA, Pinder AC. n-3 polyunsaturated fatty acids inhibit the antigen-presenting function of human mono-cytes. Am J Clin Nutr 2000; 71: 357S-60S.
6. Hughes DA, Pinder AC, Piper Z, Johnson IT, Lund EK. Fish oil supplementation inhibits the expression of major histocompatibility complex class II molecules and adhesion molecules on human monocytes. Am J Clin Nutr 1996; 63: 267-72.
7. Lee HA, Hughes DA. Alpha-lipoic acid modulates NF-kappaB activity in human monocytic cells by direct interaction with DNA. Exp Gerontol 2002; 37: 401-10.
8. Meydani SN, Endres S, Woods MM, Goldin BR, Soo C, Morrill-Labrode A, Dinarello CA, Gorbach SL. Oral (n-3) fatty acid supplementation suppresses cytokine production and lymphocyte proliferation: comparison between young and older women. J Nutr 1991; 121: 547-55.
9. Cho SH, Jung YB, Seong SC, Park HB, Byun KY, Lee DC, Song EK, Son JH. Clinical efficacy and safety of Lyprinol, a patented extract from New Zealand green-lipped mussel (Perna Canaliculus) in patients with osteoarthritis of the hip and knee: a multicenter 2-month clinical trial. Allerg Immunol (Paris) 2003; 35:212-6.
10. Gibson SLM, Gibson RG. The treatment of arthritis with lipid extract of Perna canaliculus: a randomized trial. Compl Ther Med 1998; 6: 122-126.
11. Emelyanov A, Fedoseev G, Krasnoschekova O, Abulimity A, Trendeleva T, Barnes PJ. Treatment of asthma with lipid extract of New Zealand green-lipped mussel: a randomized clinical trial. Eur Respir J 2002; 20: 596-600.
12. Murphy KJ, Mooney BD, Nichols PD, Mann NJ, Sinclair AJ. Lipid, FA, and sterol composition of New Zealand green lipped mussel (Perna canaliculus) and Tasmanian blue mussel (Mytilus edulis). Lipids 2002; 37: 587-595.
13. Murphy KJ, Mann NJ, Sinclair AJ. Fatty acid and sterol composition of frozen and freeze-dried New Zealand Green Lipped Mussel (Perna canaliculus) from three sites in New Zealand. Asia Pac J Clin Nutr 2003; 12: 50-60.
14. Wolyniak C, Brenna JT, Murphy KJ, Sinclair AJ. Gas chromatography-Chemical Ionization-Mass Spectrometric Fatty acid analysis of a commercial supercritical carbon dioxide lipid extract from New Zealand Green Lipped Mussel (Perna canaliculus). Lipids 2005;40: 355-360.
15. Whitehouse MW, Macrides TA, Kalafatis N, Betts WH, Haynes DR, Broadbent J. Anti-inflammatory activity of a lipid fraction (Lyprinol™) from the N.Z. green-lipped mussel. Inflammopharmacology 1997; 5: 237-246.
16. Dugas B. Lyprinol™ inhibits LTB4 production by human monocytes. Allerg Immunol 2000; 32: 284-9.
17. Mantzioris E, Cleland LG, Gibson RA, Neumann MA, Demasi M, James MJ. Biochemical effects of a diet containing foods enriched with n-3 fatty acids. Am J Clin Nutr 2000; 72: 42-8.
18. Grimble RF. Nutritional modulation of immune function. Proc Nutr Soc 2001; 60: 389-397.
19. Endres S, Ghorbani R, Kelley VE, Georgilis K, Lonnemann G, van der Meer JW, Cannon JG, Rogers TS, Klempner MS, Weber PC. The effect of dietary supplementation with n-3 polyunsaturated fatty acids on the synthesis of interleukin-1 and tumor necrosis factor by mononuclear cells. N Engl J Med 1989; 320: 265-71.
20. Rainsford KD, Whitehouse MW. Gastroprotective and anti-inflammatory properties of green lipped mussel (Perna canaliculus) preparation. Arzneimittelforschung 1980; 30: 2128-32.
21. Couch RA, Ormrod DJ, Miller TE, Watkins WB. Anti-inflammatory activity in fractionated extracts of the green-lipped mussel. N Z Med J 1982; 95: 803-6.
22. Kosuge T, Tsugi K, Ishida H, Yamaguchi T. Isolation of an anti-histaminic substance from green lipped mussel (Perna canaliculus). Chem Pharm Bull 1986; 34: 4825-28.
23. Miller TE, Dodd J, Ormrod DJ, Geddes R. Anti-inflammatory activity of glycogen extracted from Perna canaliculus (NZ green-lipped mussel). Agents Actions 1993; 38: C139-42.
24. Shiels IA, Whitehouse MW. Lyprinol: Anti-inflammatory and uterine-relaxant activities in rats, with special reference to a model for dysmenorrhoea. Allerg Immunol 2000; 32: 279-83.
25. Bui LM, Bierer TL. Influence of green lipped mussel (Perna canaliculus) in alleviating signs of arthritis in dogs. Veterinary Therapeutics Highlights 2001; 2: 85-94.
26. Tenikoff D, Murphy KJ, Howe PR, Le M, Butler RN, Howarth GS. Lyprinol: a potential preventative treatment modality for experimentally-induced inflammatory bowel disease. J Gastroenterol 2005; 40: 361-365.
27. Highton TC, McArthur AW. Pilot study on the effect of New Zealand Green Mussel on Rhuematoid arthritis. New Zealand Med Journal 1975; 80: 261-262.
28. Gibson RG, Gibson SL, Conway V, Chappell D. Perna canaliculus in the treatment of arthritis. Practitioner 1980; 224: 955-60.
29. Huskisson EC, Scott J, Bryans R. Seatone is ineffective in rheumatoid arthritis. Br Med J (Clin Res Ed) 1981; 282: 1358-9.
30. Caughey DE, Grigor RR, Caughey EB, Young P. Perna canaliculus in the treatment of rheumatoid arthritis. Eur J Rheum Inflam 1983; 6: 197-200.
31. Audeval B, Bouchacourt P. Etude controlee, en double aveugle contre placebo, de l'extrait de moule Perna canaliculus (moule aux orles verts) dans la gonarthrose. La Gazette Medicale 1986; 93: 111-116.
32. Gibson SL. The effect of a lipid extract of the New Zealand green-lipped mussel in three cases of arthritis. J Altern Complement Med 2000; 6: 351-4.
33. Harbison SJ, Whitehouse MW. Possible steroid-sparing effect in asthma of Lyprinol, a shellfish lipid extract. Med J Aust 2000; 173: 560.
34. Hertz N. The effect of a stabilised oil (Lyprinol®) from green lipped mussel (Perna canaliculus) on pain and Activities of Daily Life in patients with osteoarthritis in knee and/or hip. A Pilot investigation. http://www. Lyprinol.com/home.htm. 2002.
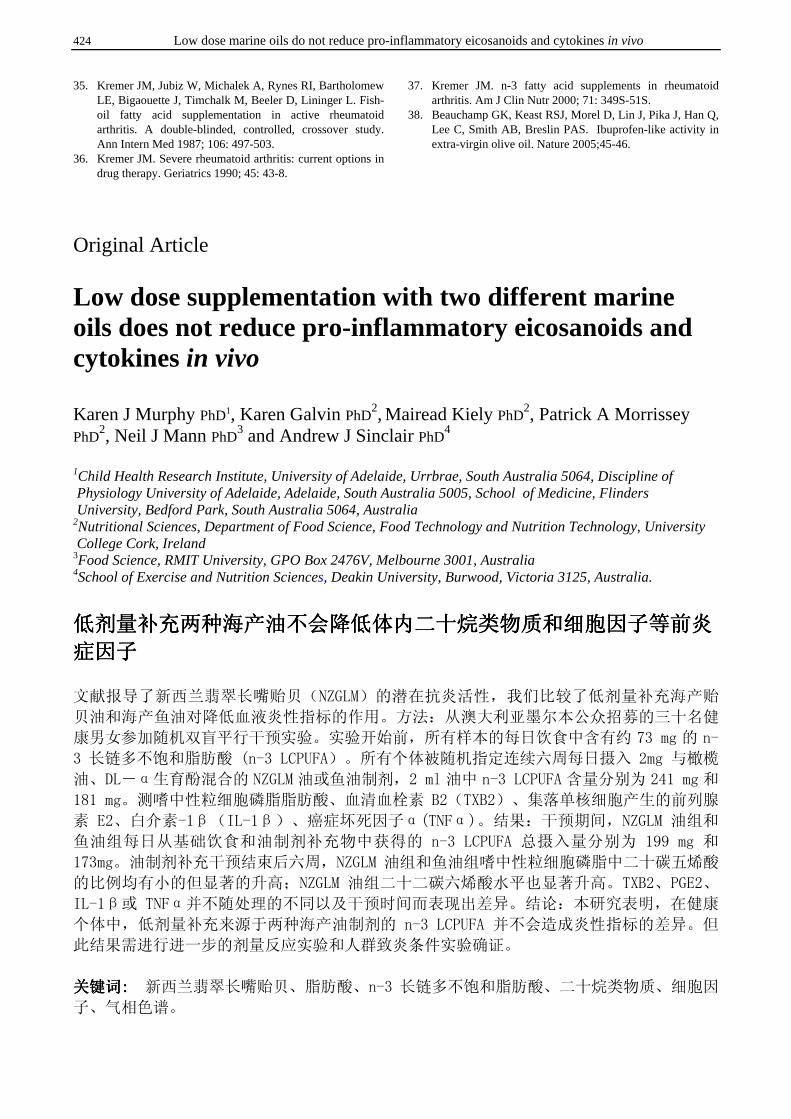
424 Low dose marine oils do not reduce pro-inflammatory eicosanoids and cytokines in vivo
35. Kremer JM, Jubiz W, Michalek A, Rynes RI, Bartholomew LE, Bigaouette J, Timchalk M, Beeler D, Lininger L. Fish-oil fatty acid supplementation in active rheumatoid arthritis. A double-blinded, controlled, crossover study. Ann Intern Med 1987; 106: 497-503.
36. Kremer JM. Severe rheumatoid arthritis: current options in drug therapy. Geriatrics 1990; 45: 43-8.
37. Kremer JM. n-3 fatty acid supplements in rheumatoid arthritis. Am J Clin Nutr 2000; 71: 349S-51S.
38. Beauchamp GK, Keast RSJ, Morel D, Lin J, Pika J, Han Q, Lee C, Smith AB, Breslin PAS. Ibuprofen-like activity in extra-virgin olive oil. Nature 2005;45-46.
Original Article Low dose supplementation with two different marine oils does not reduce pro-inflammatory eicosanoids and cytokines in vivo Karen J Murphy PhD1, Karen Galvin PhD
2, Mairead Kiely PhD2, Patrick A Morrissey
PhD2, Neil J Mann PhD
3 and Andrew J Sinclair PhD4
1Child Health Research Institute, University of Adelaide, Urrbrae, South Australia 5064, Discipline of Physiology University of Adelaide, Adelaide, South Australia 5005, School of Medicine, Flinders University, Bedford Park, South Australia 5064, Australia 2Nutritional Sciences, Department of Food Science, Food Technology and Nutrition Technology, University College Cork, Ireland 3Food Science, RMIT University, GPO Box 2476V, Melbourne 3001, Australia 4School of Exercise and Nutrition Sciences, Deakin University, Burwood, Victoria 3125, Australia.
低剂量补充两种海产油不会降低体内二十烷类物质和细胞因子等前炎低剂量补充两种海产油不会降低体内二十烷类物质和细胞因子等前炎低剂量补充两种海产油不会降低体内二十烷类物质和细胞因子等前炎低剂量补充两种海产油不会降低体内二十烷类物质和细胞因子等前炎
症因子症因子症因子症因子
文献报导了新西兰翡翠长嘴贻贝(NZGLM)的潜在抗炎活性,我们比较了低剂量补充海产贻
贝油和海产鱼油对降低血液炎性指标的作用。方法:从澳大利亚墨尔本公众招募的三十名健
康男女参加随机双盲平行干预实验。实验开始前,所有样本的每日饮食中含有约 73 mg 的 n-
3 长链多不饱和脂肪酸 (n-3 LCPUFA)。所有个体被随机指定连续六周每日摄入 2mg 与橄榄
油、DL-α生育酚混合的 NZGLM 油或鱼油制剂,2 ml 油中 n-3 LCPUFA 含量分别为 241 mg 和
181 mg。测嗜中性粒细胞磷脂脂肪酸、血清血栓素 B2(TXB2)、集落单核细胞产生的前列腺
素 E2、白介素-1β(IL-1β)、癌症坏死因子α(TNFα)。结果:干预期间,NZGLM 油组和
鱼油组每日从基础饮食和油制剂补充物中获得的 n-3 LCPUFA 总摄入量分别为 199 mg 和
173mg。油制剂补充干预结束后六周,NZGLM 油组和鱼油组嗜中性粒细胞磷脂中二十碳五烯酸
的比例均有小的但显著的升高;NZGLM 油组二十二碳六烯酸水平也显著升高。TXB2、PGE2、
IL-1β或 TNFα并不随处理的不同以及干预时间而表现出差异。结论:本研究表明,在健康
个体中,低剂量补充来源于两种海产油制剂的 n-3 LCPUFA 并不会造成炎性指标的差异。但
此结果需进行进一步的剂量反应实验和人群致炎条件实验确证。
关键词关键词关键词关键词: : : : 新西兰翡翠长嘴贻贝、脂肪酸、n-3 长链多不饱和脂肪酸、二十烷类物质、细胞因
子、气相色谱。
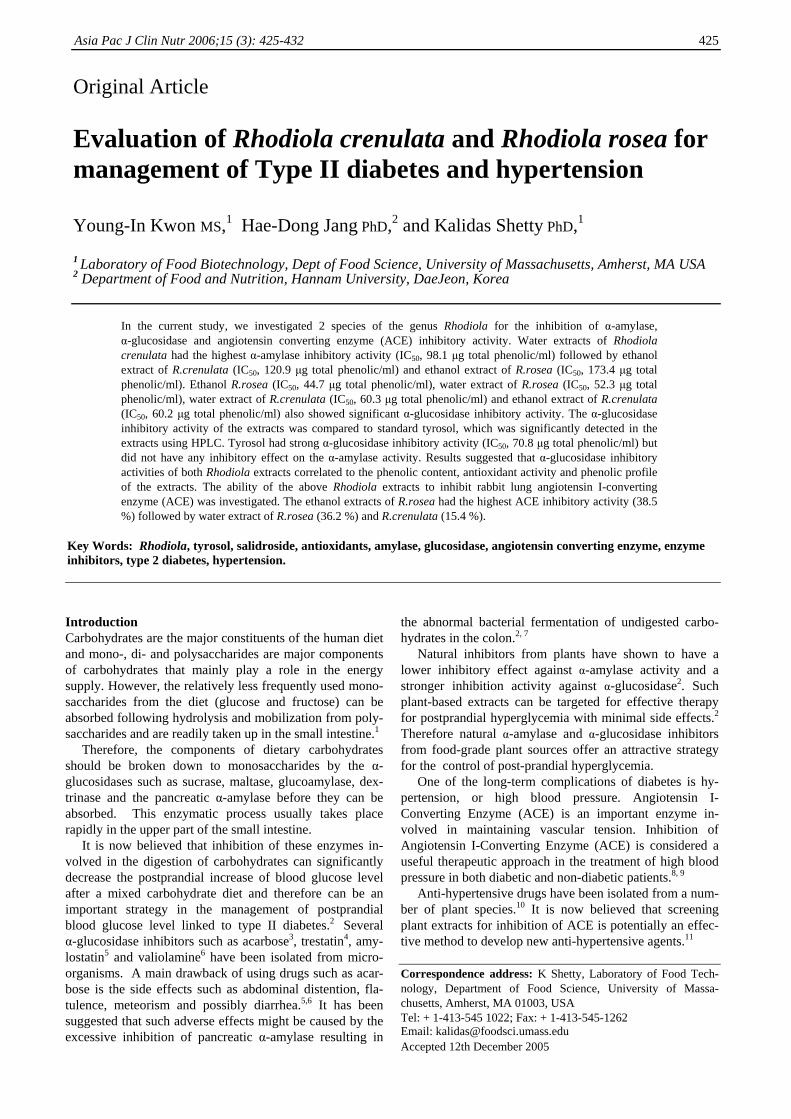
Asia Pac J Clin Nutr 2006;15 (3): 425-432 425
Original Article Evaluation of Rhodiola crenulata and Rhodiola rosea for management of Type II diabetes and hypertension Young-In Kwon MS,1 Hae-Dong Jang PhD,2 and Kalidas Shetty PhD,1
1 Laboratory of Food Biotechnology, Dept of Food Science, University of Massachusetts, Amherst, MA USA 2 Department of Food and Nutrition, Hannam University, DaeJeon, Korea
In the current study, we investigated 2 species of the genus Rhodiola for the inhibition of α-amylase, α-glucosidase and angiotensin converting enzyme (ACE) inhibitory activity. Water extracts of Rhodiola crenulata had the highest α-amylase inhibitory activity (IC50, 98.1 µg total phenolic/ml) followed by ethanol extract of R.crenulata (IC50, 120.9 µg total phenolic/ml) and ethanol extract of R.rosea (IC50, 173.4 µg total phenolic/ml). Ethanol R.rosea (IC50, 44.7 µg total phenolic/ml), water extract of R.rosea (IC50, 52.3 µg total phenolic/ml), water extract of R.crenulata (IC50, 60.3 µg total phenolic/ml) and ethanol extract of R.crenulata (IC50, 60.2 µg total phenolic/ml) also showed significant α-glucosidase inhibitory activity. The α-glucosidase inhibitory activity of the extracts was compared to standard tyrosol, which was significantly detected in the extracts using HPLC. Tyrosol had strong α-glucosidase inhibitory activity (IC50, 70.8 µg total phenolic/ml) but did not have any inhibitory effect on the α-amylase activity. Results suggested that α-glucosidase inhibitory activities of both Rhodiola extracts correlated to the phenolic content, antioxidant activity and phenolic profile of the extracts. The ability of the above Rhodiola extracts to inhibit rabbit lung angiotensin I-converting enzyme (ACE) was investigated. The ethanol extracts of R.rosea had the highest ACE inhibitory activity (38.5 %) followed by water extract of R.rosea (36.2 %) and R.crenulata (15.4 %).
Key Words: Rhodiola, tyrosol, salidroside, antioxidants, amylase, glucosidase, angiotensin converting enzyme, enzyme inhibitors, type 2 diabetes, hypertension.
Introduction Carbohydrates are the major constituents of the human diet and mono-, di- and polysaccharides are major components of carbohydrates that mainly play a role in the energy supply. However, the relatively less frequently used mono-saccharides from the diet (glucose and fructose) can be absorbed following hydrolysis and mobilization from poly-saccharides and are readily taken up in the small intestine.1
Therefore, the components of dietary carbohydrates should be broken down to monosaccharides by the α-glucosidases such as sucrase, maltase, glucoamylase, dex-trinase and the pancreatic α-amylase before they can be absorbed. This enzymatic process usually takes place rapidly in the upper part of the small intestine. It is now believed that inhibition of these enzymes in-volved in the digestion of carbohydrates can significantly decrease the postprandial increase of blood glucose level after a mixed carbohydrate diet and therefore can be an important strategy in the management of postprandial blood glucose level linked to type II diabetes.2 Several α-glucosidase inhibitors such as acarbose3, trestatin4, amy-lostatin5 and valiolamine6 have been isolated from micro-organisms. A main drawback of using drugs such as acar-bose is the side effects such as abdominal distention, fla-tulence, meteorism and possibly diarrhea.5,6 It has been suggested that such adverse effects might be caused by the excessive inhibition of pancreatic α-amylase resulting in
the abnormal bacterial fermentation of undigested carbo-hydrates in the colon.2, 7 Natural inhibitors from plants have shown to have a lower inhibitory effect against α-amylase activity and a stronger inhibition activity against α-glucosidase2. Such plant-based extracts can be targeted for effective therapy for postprandial hyperglycemia with minimal side effects.2 Therefore natural α-amylase and α-glucosidase inhibitors from food-grade plant sources offer an attractive strategy for the control of post-prandial hyperglycemia. One of the long-term complications of diabetes is hy-pertension, or high blood pressure. Angiotensin I-Converting Enzyme (ACE) is an important enzyme in-volved in maintaining vascular tension. Inhibition of Angiotensin I-Converting Enzyme (ACE) is considered a useful therapeutic approach in the treatment of high blood pressure in both diabetic and non-diabetic patients.8, 9 Anti-hypertensive drugs have been isolated from a num-ber of plant species.10 It is now believed that screening plant extracts for inhibition of ACE is potentially an effec-tive method to develop new anti-hypertensive agents.11 Correspondence address: K Shetty, Laboratory of Food Tech-nology, Department of Food Science, University of Massa-chusetts, Amherst, MA 01003, USA Tel: + 1-413-545 1022; Fax: + 1-413-545-1262 Email: [email protected] Accepted 12th December 2005
426 Young-In Kwon, Hae-Dong Jang and Kalidas Shetty
Rhodiola species, also known as “golden root” belongs to the plant family Crassulaceae.12 Rhodiola species grows primarily in dry sandy soils at high altitudes in the Arctic and mountain areas of Asia and Europe.13 Although food-grade Rhodiola species have been extensively stu-died as an adaptogen with various health-promoting effects, its properties remain largely unknown in the west. Traditional folk medicine in the Arctic and Himalayan areas used Rhodiola species as salads to increase physical endurance, longevity, resistance to high altitude sickness and to treat fatigue, depression, anemia, impotence, gastrointestinal ailments and infections.14 Studies in cell cultures, animals and humans have revealed antifatigue13, anti-stress, antihypoxic protection against the damaging effects of oxygen deprivation, anticancer, antioxidant, and immune enhancing effects.14 Rhodiola species increased essential energy metabolites, adenosine triphosphate (ATP), and creatine phosphate in the muscle and brain mitochondria in mice made to swim to their limit15. There are numerous chemical components of the Rhodiola ex-tracts that may be responsible for these beneficial health properties, but salidroside and its aglycone form, tyrosol, are considered the more important constituents in Rhodiola rosea and Rhodiola crenulata. The major objectives of this investigation are to deter-mine how dietary phytochemicals can be used as chemo-preventive or therapeutic agents in the treatment of dia-betes and hypertension. In this study Rhodiola extracts were found to inhibit the carbohydrate hydrolyzing en-zymes, α-amylase and α-glucosidase and to also inhibit the angiotensin I converting enzyme in vitro. Materials and Methods Rhodiola rosea and Rhodiola crenulata were supplied by Barington Nutritionals (Harrison, NY). α-amylase (EC 3.2.1.1), α-glucosidase (EC 3.2.1.20), angiotensin con-verting enzyme (EC 3.4.15.1) and Tyrosol standard were purchased from Sigma Chemical Co. (St. Louis, MO). Unless noted, all chemicals also were purchased from Sigma Chemical Co. (St. Louis, MO). Sample extraction Water extracts: A total of 1g of dried Rhodiola powders were added to 10 ml of distilled water and stirred for half an hour. The extract was then filtered through a Whatman # 2 filter and centrifuged at 10,000 x g for 10 min. Ethanol extracts [12%]: A total of 1g of dried Rhodiola powder were stirred in 10 ml of 12% concentration of ethanol at 40 oC for 2 hrs and cooled. The extract was then filtered through a Whatman # 2 filter and centrifuged at 10,000 x g for 10 min. Total phenolics assay The total phenolics was determined by an assay modified from Shetty et al., (1995)16 Briefly, one millilitre of extract was transferred into a test tube and mixed with 1ml of 95% ethanol and 5 ml of distilled water. To each sample 0.5 ml of 50% (v/v) Folin-Ciocalteu reagent was added and mixed. After 5 min, 1 ml of 5% Na2CO3 was added to the reaction mixture and allowed to stand for 60
min. The absorbance was read at 725 nm. The absor-bance values were converted to total phenolics and were expressed in milligram equivalents of gallic acid per grams dry weight (DW) of the sample. Standard curves were established using various concentrations of gallic acid in 95% ethanol. Antioxidant activity by 1, 1-diphenyl-2-picrylhydrazyl radical (DPPH) inhibition assay To 3 ml of 60 µM DPPH in ethanol, 250 µl of each ex-tract was added, the decrease in absorbance was moni-tored at 517 nm until a constant reading was obtained. The readings were compared with the controls, which contained 250 µl of 95% ethanol instead of the extract. The % inhibition was calculated by:
[ ] 100 inhibition %517
517517 xA
AAControl
ExtractControl
−=
α-Amylase inhibition assay Porcine pancreatic α-amylase (EC 3.2.1.1) was purchased from Sigma Chemical Co. A total of 500µl of extract and 500 µl of 0.02 M sodium phosphate buffer (pH 6.9 with 0.006 µM sodium chloride) containing α-amylase solution (0.5 mg/ml) were incubated at 25
oC for 10 minutes. After
pre-incubation, 500 µl of a 1% starch solution in 0.02 M sodium phosphate buffer (pH 6.9 with 0.006 M sodium chloride) was added to each tube at timed intervals. The reaction mixtures were then incubated at 25
oC for 10
minutes. The reaction was stopped with 1.0 ml of dinitro-salicylic acid colour reagent. The test tubes were then incubated in a boiling water bath for 5 minutes and cooled to room temperature. The reaction mixture was then diluted after adding 10ml distilled water and absorbance was measured at 540 nm.
[ ] 100 inhibition %540
540540 xA
AAControl
ExtractControl
−=
The IC50 of α-amylase inhibitory activity was defined as the amount of soluble phenolics that inhibits absorbance at 540 nm to 50 % of the maximum. α-Glucosidase inhibition assay α-Glucosidase (EC 3.2.1.20) was purchased from Sigma Chemical Co. 50 µl of sample solution and 100 µl of 0.1 M phosphate buffer (pH 6.9) containing α-glucosidase solution (1.0 U/ml) were incubated in 96 well plates at 25
oC for 10 minutes. After pre-incubation, 50 µl of 5 mM
p-nitrophenyl-α-D-glucopyranoside solution in 0.1 M phosphate buffer (pH 6.9) was added to each well at timed intervals. The reaction mixtures were incubated at 25
oC for 5 minutes. Before and after incubation, absor-
bance readings were recorded in a micro-array reader (Thermomax, Molecular device Co., Virginia, USA) at 405 nm and compared to a control which had 50 µl of buffer solution in place of the extract. The α-glucosidase inhibitory activity was expressed as % inhibition and was calculated as follows:
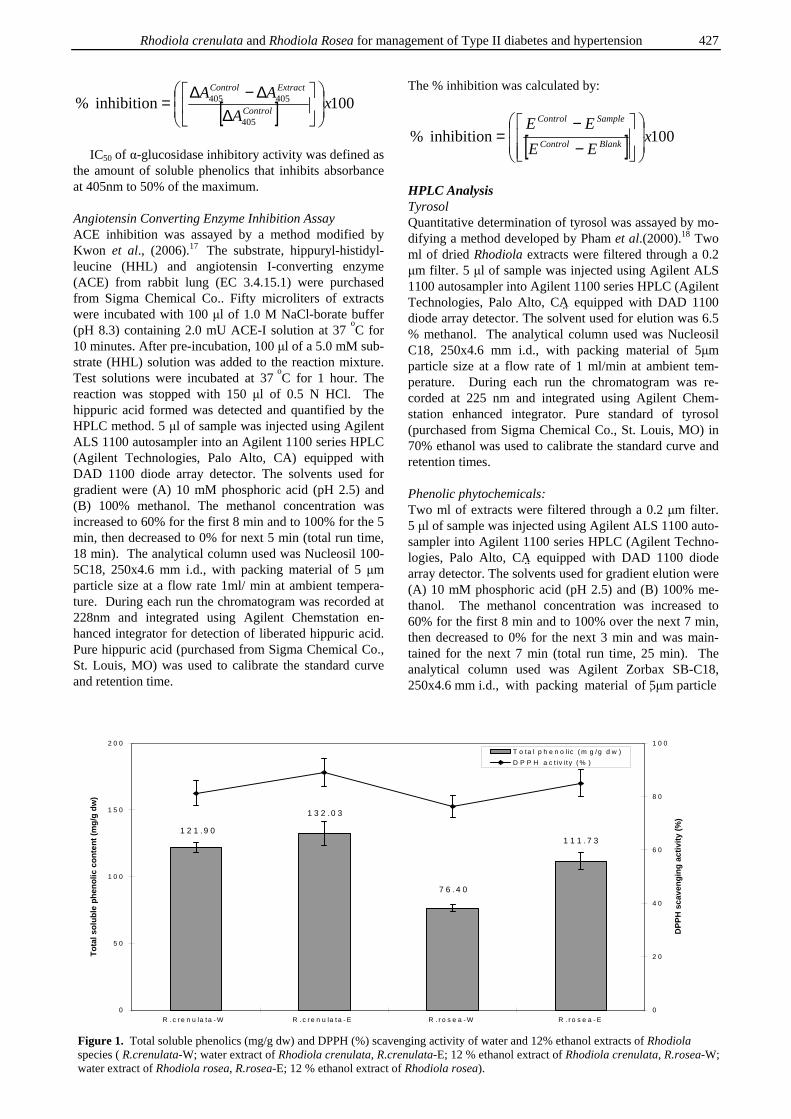
Rhodiola crenulata and Rhodiola Rosea for management of Type II diabetes and hypertension 427
[ ] 100 inhibition %405
405405 xA
AAControl
ExtractControl
∆∆−∆
=
IC50 of α-glucosidase inhibitory activity was defined as the amount of soluble phenolics that inhibits absorbance at 405nm to 50% of the maximum. Angiotensin Converting Enzyme Inhibition Assay ACE inhibition was assayed by a method modified by Kwon et al., (2006).17 The substrate, hippuryl-histidyl-leucine (HHL) and angiotensin I-converting enzyme (ACE) from rabbit lung (EC 3.4.15.1) were purchased from Sigma Chemical Co.. Fifty microliters of extracts were incubated with 100 µl of 1.0 M NaCl-borate buffer (pH 8.3) containing 2.0 mU ACE-I solution at 37
oC for
10 minutes. After pre-incubation, 100 µl of a 5.0 mM sub-strate (HHL) solution was added to the reaction mixture. Test solutions were incubated at 37
oC for 1 hour. The
reaction was stopped with 150 µl of 0.5 N HCl. The hippuric acid formed was detected and quantified by the HPLC method. 5 µl of sample was injected using Agilent ALS 1100 autosampler into an Agilent 1100 series HPLC (Agilent Technologies, Palo Alto, CA) equipped with DAD 1100 diode array detector. The solvents used for gradient were (A) 10 mM phosphoric acid (pH 2.5) and (B) 100% methanol. The methanol concentration was increased to 60% for the first 8 min and to 100% for the 5 min, then decreased to 0% for next 5 min (total run time, 18 min). The analytical column used was Nucleosil 100-5C18, 250x4.6 mm i.d., with packing material of 5 µm particle size at a flow rate 1ml/ min at ambient tempera-ture. During each run the chromatogram was recorded at 228nm and integrated using Agilent Chemstation en-hanced integrator for detection of liberated hippuric acid. Pure hippuric acid (purchased from Sigma Chemical Co., St. Louis, MO) was used to calibrate the standard curve and retention time.
The % inhibition was calculated by:
[ ] 100 inhibition % xEE
EEBlankControl
SampleControl
−−
=
HPLC Analysis Tyrosol Quantitative determination of tyrosol was assayed by mo-difying a method developed by Pham et al.(2000).18 Two ml of dried Rhodiola extracts were filtered through a 0.2 µm filter. 5 µl of sample was injected using Agilent ALS 1100 autosampler into Agilent 1100 series HPLC (Agilent Technologies, Palo Alto, CA�� equipped with DAD 1100 diode array detector. The solvent used for elution was 6.5 % methanol. The analytical column used was Nucleosil C18, 250x4.6 mm i.d., with packing material of 5µm particle size at a flow rate of 1 ml/min at ambient tem-perature. During each run the chromatogram was re-corded at 225 nm and integrated using Agilent Chem-station enhanced integrator. Pure standard of tyrosol (purchased from Sigma Chemical Co., St. Louis, MO) in 70% ethanol was used to calibrate the standard curve and retention times. Phenolic phytochemicals: Two ml of extracts were filtered through a 0.2 µm filter. 5 µl of sample was injected using Agilent ALS 1100 auto-sampler into Agilent 1100 series HPLC (Agilent Techno-logies, Palo Alto, CA�� equipped with DAD 1100 diode array detector. The solvents used for gradient elution were (A) 10 mM phosphoric acid (pH 2.5) and (B) 100% me-thanol. The methanol concentration was increased to 60% for the first 8 min and to 100% over the next 7 min, then decreased to 0% for the next 3 min and was main-tained for the next 7 min (total run time, 25 min). The analytical column used was Agilent Zorbax SB-C18, 250x4.6 mm i.d., with packing material of 5�µm particle
1 1 1 . 7 3
7 6 .4 0
1 3 2 .0 3
1 2 1 .9 0
0
5 0
1 0 0
1 5 0
2 0 0
R .c r e n u la ta - W R .c r e n u la ta - E R . r o s e a - W R .r o s e a - E
To
tal s
olu
ble
ph
eno
lic c
on
ten
t (m
g/g
dw
)
0
2 0
4 0
6 0
8 0
1 0 0
DP
PH
sca
ven
gin
g a
ctiv
ity
(%)
T o ta l p h e n o l ic ( m g /g d w )
D P P H a c t iv i t y ( % )
Figure 1. Total soluble phenolics (mg/g dw) and DPPH (%) scavenging activity of water and 12% ethanol extracts of Rhodiola species ( R.crenulata-W; water extract of Rhodiola crenulata, R.crenulata-E; 12 % ethanol extract of Rhodiola crenulata, R.rosea-W; water extract of Rhodiola rosea, R.rosea-E; 12 % ethanol extract of Rhodiola rosea).
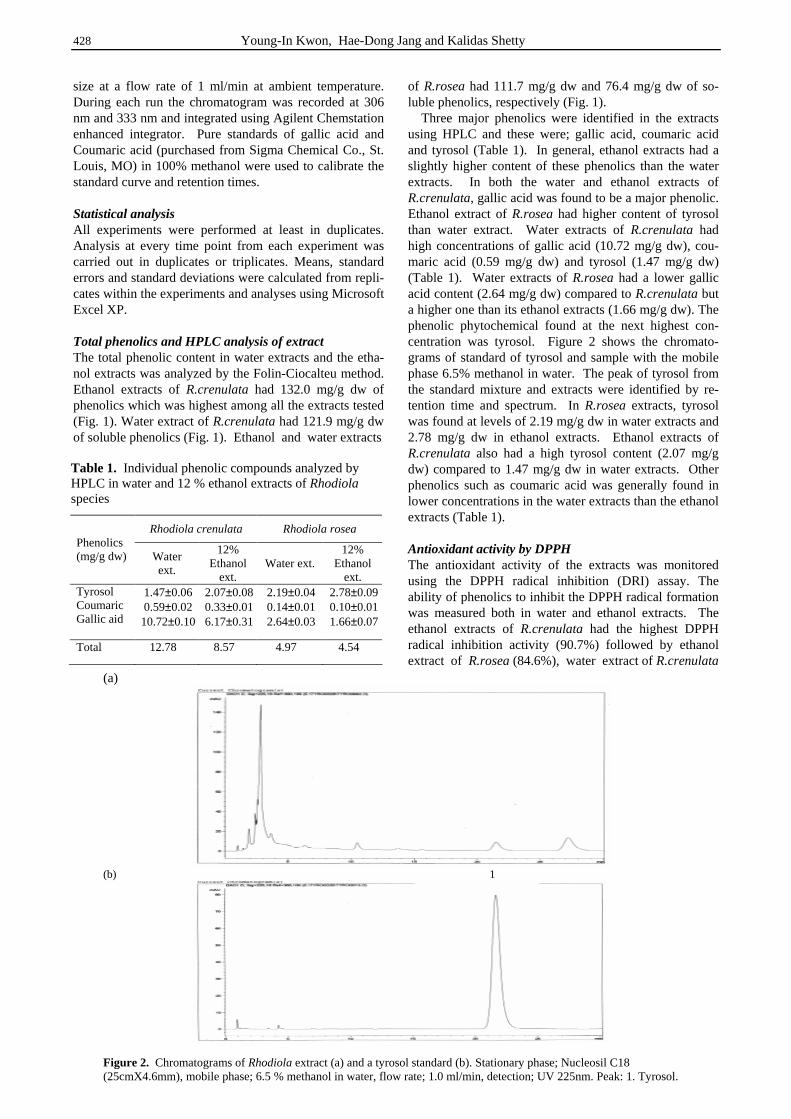
428 Young-In Kwon, Hae-Dong Jang and Kalidas Shetty
size at a flow rate of 1 ml/min at ambient temperature. During each run the chromatogram was recorded at 306 nm and 333 nm and integrated using Agilent Chemstation enhanced integrator. Pure standards of gallic acid and Coumaric acid (purchased from Sigma Chemical Co., St. Louis, MO) in 100% methanol were used to calibrate the standard curve and retention times. Statistical analysis All experiments were performed at least in duplicates. Analysis at every time point from each experiment was carried out in duplicates or triplicates. Means, standard errors and standard deviations were calculated from repli-cates within the experiments and analyses using Microsoft Excel XP. Total phenolics and HPLC analysis of extract The total phenolic content in water extracts and the etha-nol extracts was analyzed by the Folin-Ciocalteu method. Ethanol extracts of R.crenulata had 132.0 mg/g dw of phenolics which was highest among all the extracts tested (Fig. 1). Water extract of R.crenulata had 121.9 mg/g dw of soluble phenolics (Fig. 1). Ethanol and water extracts
of R.rosea had 111.7 mg/g dw and 76.4 mg/g dw of so-luble phenolics, respectively (Fig. 1). Three major phenolics were identified in the extracts using HPLC and these were; gallic acid, coumaric acid and tyrosol (Table 1). In general, ethanol extracts had a slightly higher content of these phenolics than the water extracts. In both the water and ethanol extracts of R.crenulata, gallic acid was found to be a major phenolic. Ethanol extract of R.rosea had higher content of tyrosol than water extract. Water extracts of R.crenulata had high concentrations of gallic acid (10.72 mg/g dw), cou-maric acid (0.59 mg/g dw) and tyrosol (1.47 mg/g dw) (Table 1). Water extracts of R.rosea had a lower gallic acid content (2.64 mg/g dw) compared to R.crenulata but a higher one than its ethanol extracts (1.66 mg/g dw). The phenolic phytochemical found at the next highest con-centration was tyrosol. Figure 2 shows the chromato-grams of standard of tyrosol and sample with the mobile phase 6.5% methanol in water. The peak of tyrosol from the standard mixture and extracts were identified by re-tention time and spectrum. In R.rosea extracts, tyrosol was found at levels of 2.19 mg/g dw in water extracts and 2.78 mg/g dw in ethanol extracts. Ethanol extracts of R.crenulata also had a high tyrosol content (2.07 mg/g dw) compared to 1.47 mg/g dw in water extracts. Other phenolics such as coumaric acid was generally found in lower concentrations in the water extracts than the ethanol extracts (Table 1). Antioxidant activity by DPPH The antioxidant activity of the extracts was monitored using the DPPH radical inhibition (DRI) assay. The ability of phenolics to inhibit the DPPH radical formation was measured both in water and ethanol extracts. The ethanol extracts of R.crenulata had the highest DPPH radical inhibition activity (90.7%) followed by ethanol extract of R.rosea (84.6%), water extract of R.crenulata
Rhodiola crenulata Rhodiola rosea Phenolics (mg/g dw) Water
ext.
12% Ethanol
ext. Water ext.
12% Ethanol
ext. Tyrosol Coumaric Gallic aid
1.47±0.06 0.59±0.02 10.72±0.10
2.07±0.08 0.33±0.01 6.17±0.31
2.19±0.04 0.14±0.01 2.64±0.03
2.78±0.09 0.10±0.01 1.66±0.07
Total 12.78 8.57 4.97 4.54
Table 1. Individual phenolic compounds analyzed by HPLC in water and 12 % ethanol extracts of Rhodiola species
(a)
(b) 1
Figure 2. Chromatograms of Rhodiola extract (a) and a tyrosol standard (b). Stationary phase; Nucleosil C18 (25cmX4.6mm), mobile phase; 6.5 % methanol in water, flow rate; 1.0 ml/min, detection; UV 225nm. Peak: 1. Tyrosol.
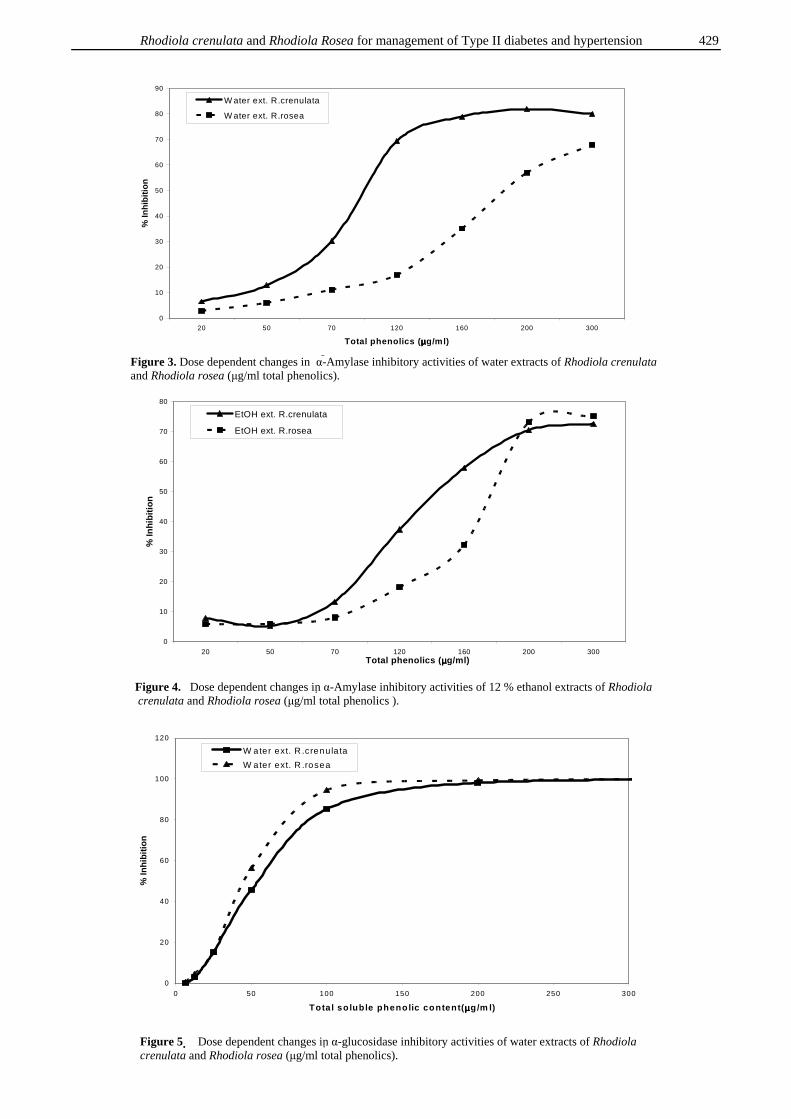
Rhodiola crenulata and Rhodiola Rosea for management of Type II diabetes and hypertension 429
0
10
20
30
40
50
60
70
80
20 50 70 120 160 200 300Total phenolics (µµµµg/ml)
% In
hib
itio
n
EtOH ext. R.crenulata
EtOH ext. R.rosea
Figure 4. Dose dependent changes in� α-Amylase inhibitory activities of 12 % ethanol extracts of Rhodiola crenulata and Rhodiola rosea (µg/ml total phenolics ).
0
10
20
30
40
50
60
70
80
90
20 50 70 120 160 200 300
Total phenolics (µµµµg/ml)
% In
hib
itio
n
W ater ext. R.crenulata
W ater ext. R.rosea
Figure 3. Dose dependent changes in α-�Amylase inhibitory activities of water extracts of Rhodiola crenulata and Rhodiola rosea (µg/ml total phenolics).
0
20
40
60
80
100
120
0 50 100 150 200 250 300
Total soluble phenolic content(µµµµg/m l)
% In
hib
itio
n
W ater ext. R .crenula ta
W ater ext. R .rosea
Figure 5 � Dose dependent changes in� α-glucosidase inhibitory activities of water extracts of Rhodiola crenulata and Rhodiola rosea (µg/ml total phenolics).
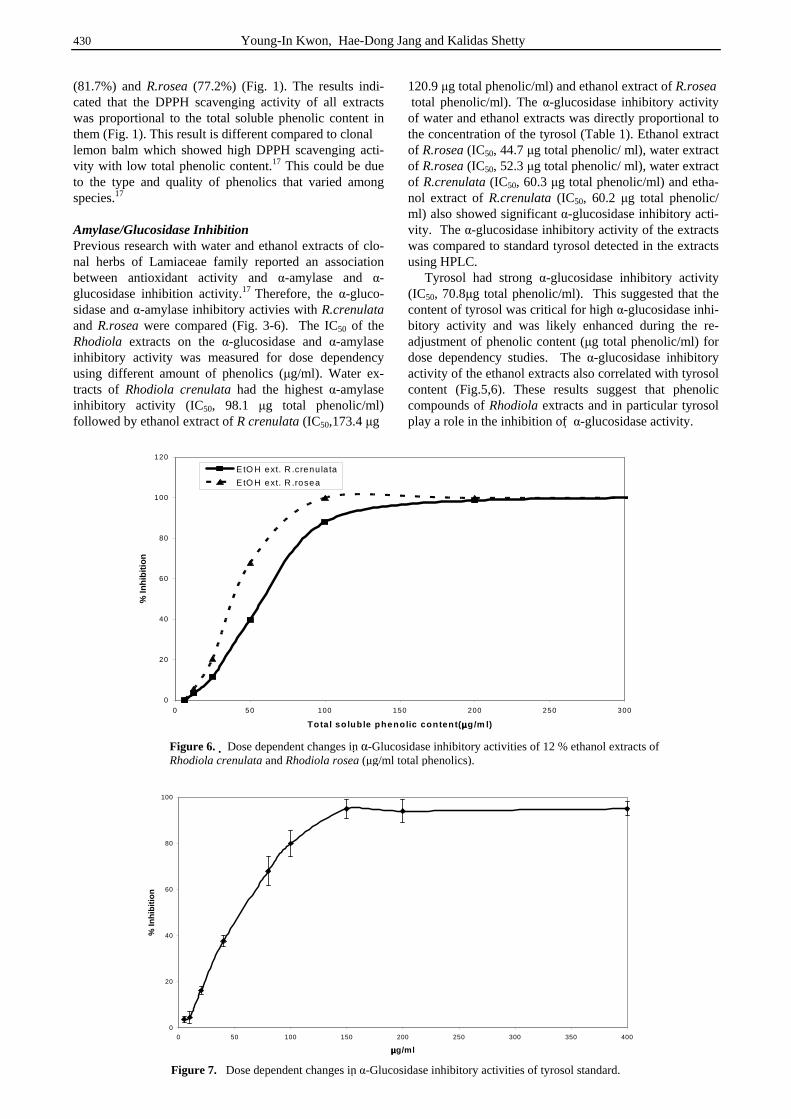
430 Young-In Kwon, Hae-Dong Jang and Kalidas Shetty
(81.7%) and R.rosea (77.2%) (Fig. 1). The results indi-cated that the DPPH scavenging activity of all extracts was proportional to the total soluble phenolic content in them (Fig. 1). This result is different compared to clonal lemon balm which showed high DPPH scavenging acti-vity with low total phenolic content.17 This could be due to the type and quality of phenolics that varied among species.17 Amylase/Glucosidase Inhibition Previous research with water and ethanol extracts of clo-nal herbs of Lamiaceae family reported an association between antioxidant activity and α-amylase and α-glucosidase inhibition activity.17 Therefore, the α-gluco-sidase and α-amylase inhibitory activies with R.crenulata and R.rosea were compared (Fig. 3-6). The IC50 of the Rhodiola extracts on the α-glucosidase and α-amylase inhibitory activity was measured for dose dependency using different amount of phenolics (µg/ml). Water ex-tracts of Rhodiola crenulata had the highest α-amylase inhibitory activity (IC50, 98.1 µg total phenolic/ml) followed by ethanol extract of R crenulata (IC50,173.4 µg
120.9 µg total phenolic/ml) and ethanol extract of R.rosea total phenolic/ml). The α-glucosidase inhibitory activity of water and ethanol extracts was directly proportional to the concentration of the tyrosol (Table 1). Ethanol extract of R.rosea (IC50, 44.7 µg total phenolic/ ml), water extract of R.rosea (IC50, 52.3 µg total phenolic/ ml), water extract of R.crenulata (IC50, 60.3 µg total phenolic/ml) and etha-nol extract of R.crenulata (IC50, 60.2 µg total phenolic/ ml) also showed significant α-glucosidase inhibitory acti-vity. The α-glucosidase inhibitory activity of the extracts was compared to standard tyrosol detected in the extracts using HPLC. Tyrosol had strong α-glucosidase inhibitory activity (IC50, 70.8µg total phenolic/ml). This suggested that the content of tyrosol was critical for high α-glucosidase inhi-bitory activity and was likely enhanced during the re-adjustment of phenolic content (µg total phenolic/ml) for dose dependency studies. The α-glucosidase inhibitory activity of the ethanol extracts also correlated with tyrosol content (Fig.5,6). These results suggest that phenolic compounds of Rhodiola extracts and in particular tyrosol play a role in the inhibition of � α-glucosidase activity.
0
20
40
60
80
100
120
0 50 100 150 200 250 300
Total so luble phenolic content(µµµµg/m l)
% In
hib
itio
n
EtO H ext. R .crenu la ta
E tO H ext. R .rosea
Figure 6. � Dose dependent changes in� α-Glucosidase inhibitory activities of 12 % ethanol extracts of Rhodiola crenulata and Rhodiola rosea (µg/ml total phenolics).
0
20
40
60
80
100
0 50 100 150 200 250 300 350 400
µµµµg/ml
% In
hib
itio
n
Figure 7. Dose dependent changes in� α-Glucosidase inhibitory activities of tyrosol standard.
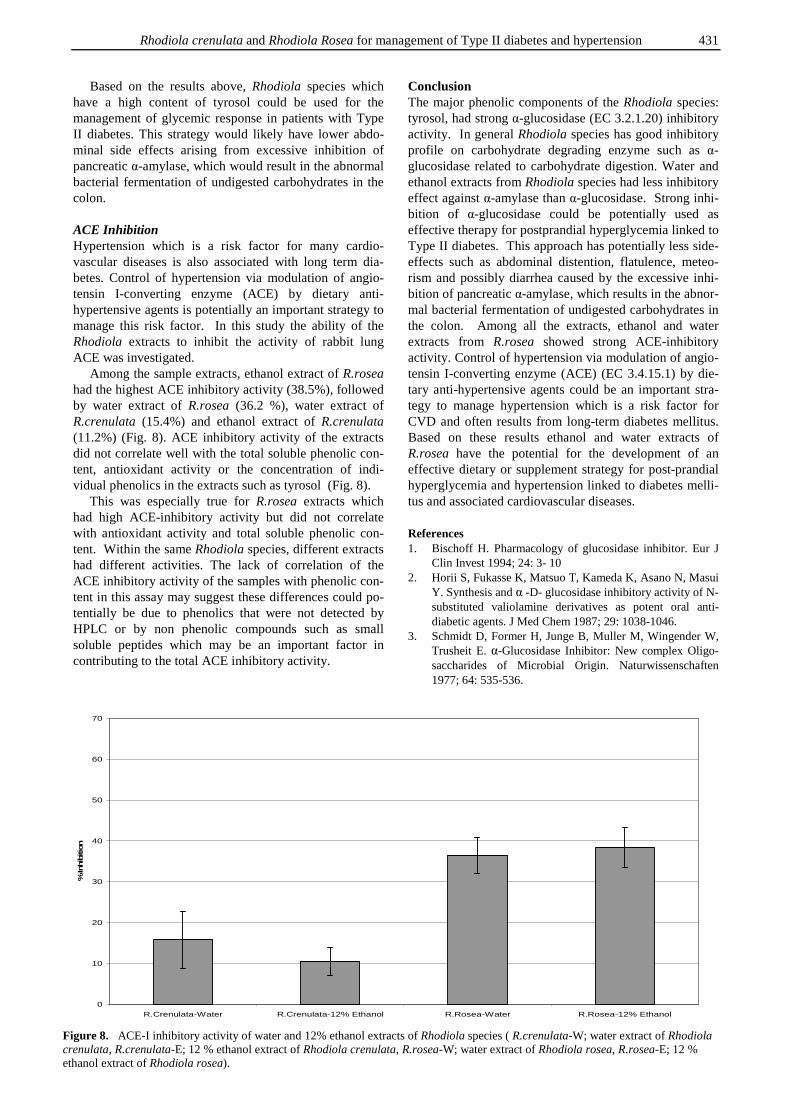
Rhodiola crenulata and Rhodiola Rosea for management of Type II diabetes and hypertension 431
Based on the results above, Rhodiola species which have a high content of tyrosol could be used for the management of glycemic response in patients with Type II diabetes. This strategy would likely have lower abdo-minal side effects arising from excessive inhibition of pancreatic α-amylase, which would result in the abnormal bacterial fermentation of undigested carbohydrates in the colon. ACE Inhibition Hypertension which is a risk factor for many cardio-vascular diseases is also associated with long term dia-betes. Control of hypertension via modulation of angio-tensin I-converting enzyme (ACE) by dietary anti-hypertensive agents is potentially an important strategy to manage this risk factor. In this study the ability of the Rhodiola extracts to inhibit the activity of rabbit lung ACE was investigated. Among the sample extracts, ethanol extract of R.rosea had the highest ACE inhibitory activity (38.5%), followed by water extract of R.rosea (36.2 %), water extract of R.crenulata (15.4%) and ethanol extract of R.crenulata (11.2%) (Fig. 8). ACE inhibitory activity of the extracts did not correlate well with the total soluble phenolic con-tent, antioxidant activity or the concentration of indi-vidual phenolics in the extracts such as tyrosol (Fig. 8). This was especially true for R.rosea extracts which had high ACE-inhibitory activity but did not correlate with antioxidant activity and total soluble phenolic con-tent. Within the same Rhodiola species, different extracts had different activities. The lack of correlation of the ACE inhibitory activity of the samples with phenolic con-tent in this assay may suggest these differences could po-tentially be due to phenolics that were not detected by HPLC or by non phenolic compounds such as small soluble peptides which may be an important factor in contributing to the total ACE inhibitory activity.
Conclusion The major phenolic components of the Rhodiola species: tyrosol, had strong α-glucosidase (EC 3.2.1.20) inhibitory activity. In general Rhodiola species has good inhibitory profile on carbohydrate degrading enzyme such as α-glucosidase related to carbohydrate digestion. Water and ethanol extracts from Rhodiola species had less inhibitory effect against α-amylase than α-glucosidase. Strong inhi-bition of α-glucosidase could be potentially used as effective therapy for postprandial hyperglycemia linked to Type II diabetes. This approach has potentially less side-effects such as abdominal distention, flatulence, meteo-rism and possibly diarrhea caused by the excessive inhi-bition of pancreatic α-amylase, which results in the abnor-mal bacterial fermentation of undigested carbohydrates in the colon. Among all the extracts, ethanol and water extracts from R.rosea showed strong ACE-inhibitory activity. Control of hypertension via modulation of angio-tensin I-converting enzyme (ACE) (EC 3.4.15.1) by die-tary anti-hypertensive agents could be an important stra-tegy to manage hypertension which is a risk factor for CVD and often results from long-term diabetes mellitus. Based on these results ethanol and water extracts of R.rosea have the potential for the development of an effective dietary or supplement strategy for post-prandial hyperglycemia and hypertension linked to diabetes melli-tus and associated cardiovascular diseases. References 1. Bischoff H. Pharmacology of glucosidase inhibitor. Eur J
Clin Invest 1994; 24: 3- 10 2. Horii S, Fukasse K, Matsuo T, Kameda K, Asano N, Masui
Y. Synthesis and α -D- glucosidase inhibitory activity of N-substituted valiolamine derivatives as potent oral anti-diabetic agents. J Med Chem 1987; 29: 1038-1046.
3. Schmidt D, Former H, Junge B, Muller M, Wingender W, Trusheit E. α-Glucosidase Inhibitor: New complex Oligo-saccharides of Microbial Origin. Naturwissenschaften 1977; 64: 535-536.
0
10
20
30
40
50
60
70
R.Crenulata-Water R.Crenulata-12% Ethanol R.Rosea-Water R.Rosea-12% Ethanol
% In
hib
itio
n
Figure 8. ACE-I inhibitory activity of water and 12% ethanol extracts of Rhodiola species ( R.crenulata-W; water extract of Rhodiola crenulata, R.crenulata-E; 12 % ethanol extract of Rhodiola crenulata, R.rosea-W; water extract of Rhodiola rosea, R.rosea-E; 12 % ethanol extract of Rhodiola rosea).
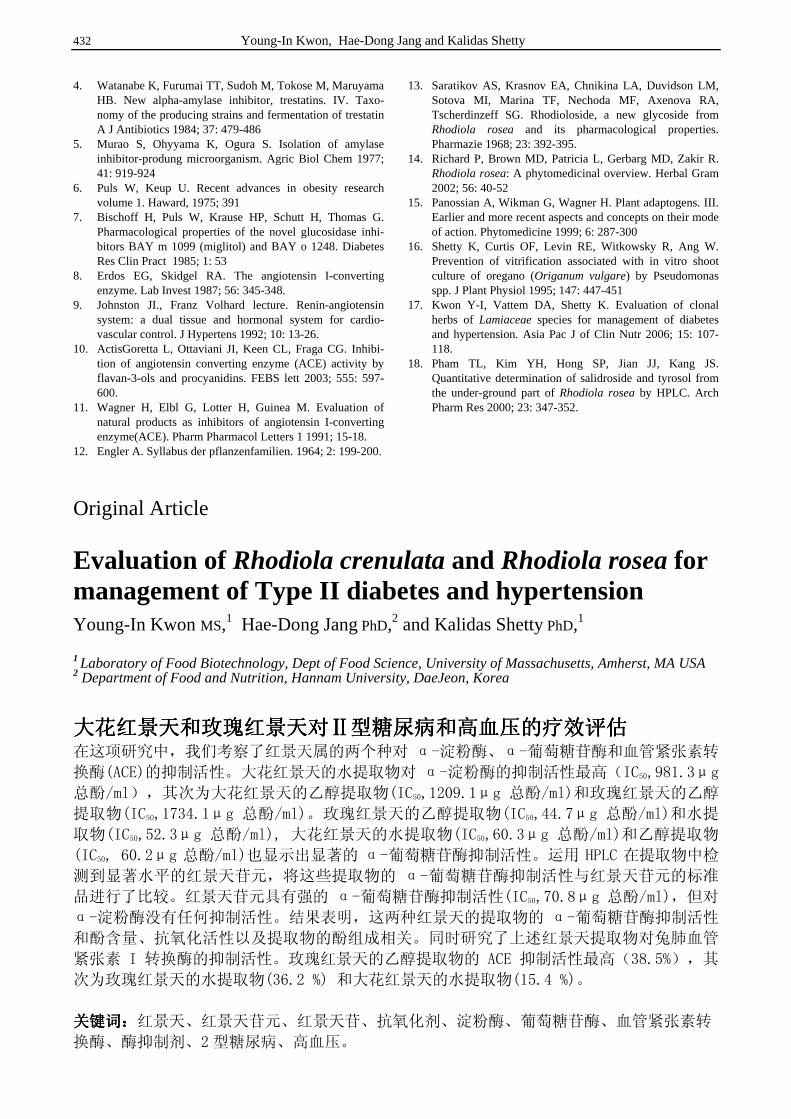
432 Young-In Kwon, Hae-Dong Jang and Kalidas Shetty
4. Watanabe K, Furumai TT, Sudoh M, Tokose M, Maruyama HB. New alpha-amylase inhibitor, trestatins. IV. Taxo-nomy of the producing strains and fermentation of trestatin A J Antibiotics 1984; 37: 479-486
5. Murao S, Ohyyama K, Ogura S. Isolation of amylase inhibitor-produng microorganism. Agric Biol Chem 1977; 41: 919-924
6. Puls W, Keup U. Recent advances in obesity research volume 1. Haward, 1975; 391
7. Bischoff H, Puls W, Krause HP, Schutt H, Thomas G. Pharmacological properties of the novel glucosidase inhi-bitors BAY m 1099 (miglitol) and BAY o 1248. Diabetes Res Clin Pract 1985; 1: 53
8. Erdos EG, Skidgel RA. The angiotensin I-converting enzyme. Lab Invest 1987; 56: 345-348.
9. Johnston JI., Franz Volhard lecture. Renin-angiotensin system: a dual tissue and hormonal system for cardio-vascular control. J Hypertens 1992; 10: 13-26.
10. ActisGoretta L, Ottaviani JI, Keen CL, Fraga CG. Inhibi-tion of angiotensin converting enzyme (ACE) activity by flavan-3-ols and procyanidins. FEBS lett 2003; 555: 597-600.
11. Wagner H, Elbl G, Lotter H, Guinea M. Evaluation of natural products as inhibitors of angiotensin I-converting enzyme(ACE). Pharm Pharmacol Letters 1 1991; 15-18.
12. Engler A. Syllabus der pflanzenfamilien. 1964; 2: 199-200.
13. Saratikov AS, Krasnov EA, Chnikina LA, Duvidson LM, Sotova MI, Marina TF, Nechoda MF, Axenova RA, Tscherdinzeff SG. Rhodioloside, a new glycoside from Rhodiola rosea and its pharmacological properties. Pharmazie 1968; 23: 392-395.
14. Richard P, Brown MD, Patricia L, Gerbarg MD, Zakir R. Rhodiola rosea: A phytomedicinal overview. Herbal Gram 2002; 56: 40-52
15. Panossian A, Wikman G, Wagner H. Plant adaptogens. III. Earlier and more recent aspects and concepts on their mode of action. Phytomedicine 1999; 6: 287-300
16. Shetty K, Curtis OF, Levin RE, Witkowsky R, Ang W. Prevention of vitrification associated with in vitro shoot culture of oregano (Origanum vulgare) by Pseudomonas spp. J Plant Physiol 1995; 147: 447-451
17. Kwon Y-I, Vattem DA, Shetty K. Evaluation of clonal herbs of Lamiaceae species for management of diabetes and hypertension. Asia Pac J of Clin Nutr 2006; 15: 107-118.
18. Pham TL, Kim YH, Hong SP, Jian JJ, Kang JS. Quantitative determination of salidroside and tyrosol from the under-ground part of Rhodiola rosea by HPLC. Arch Pharm Res 2000; 23: 347-352.
Original Article Evaluation of Rhodiola crenulata and Rhodiola rosea for management of Type II diabetes and hypertension Young-In Kwon MS,1 Hae-Dong Jang PhD,2 and Kalidas Shetty PhD,1
1 Laboratory of Food Biotechnology, Dept of Food Science, University of Massachusetts, Amherst, MA USA 2 Department of Food and Nutrition, Hannam University, DaeJeon, Korea
大花红景天大花红景天大花红景天大花红景天和和和和玫瑰红景天玫瑰红景天玫瑰红景天玫瑰红景天对Ⅱ型糖尿病和高血压的疗效评估对Ⅱ型糖尿病和高血压的疗效评估对Ⅱ型糖尿病和高血压的疗效评估对Ⅱ型糖尿病和高血压的疗效评估 在这项研究中,我们考察了红景天属的两个种对 α-淀粉酶、α-葡萄糖苷酶和血管紧张素转
换酶(ACE)的抑制活性。大花红景天的水提取物对 α-淀粉酶的抑制活性最高(IC50,981.3μg
总酚/ml),其次为大花红景天的乙醇提取物(IC50,1209.1μg 总酚/ml)和玫瑰红景天的乙醇
提取物(IC50,1734.1μg 总酚/ml)。玫瑰红景天的乙醇提取物(IC50,44.7μg 总酚/ml)和水提
取物(IC50,52.3μg 总酚/ml), 大花红景天的水提取物(IC50,60.3μg 总酚/ml)和乙醇提取物
(IC50, 60.2μg 总酚/ml)也显示出显著的 α-葡萄糖苷酶抑制活性。运用 HPLC 在提取物中检
测到显著水平的红景天苷元,将这些提取物的 α-葡萄糖苷酶抑制活性与红景天苷元的标准
品进行了比较。红景天苷元具有强的 α-葡萄糖苷酶抑制活性(IC50,70.8μg 总酚/ml),但对
α-淀粉酶没有任何抑制活性。结果表明,这两种红景天的提取物的 α-葡萄糖苷酶抑制活性
和酚含量、抗氧化活性以及提取物的酚组成相关。同时研究了上述红景天提取物对兔肺血管
紧张素 I 转换酶的抑制活性。玫瑰红景天的乙醇提取物的 ACE 抑制活性最高(38.5%),其
次为玫瑰红景天的水提取物(36.2 %) 和大花红景天的水提取物(15.4 %)。
关键词:关键词:关键词:关键词:红景天、红景天苷元、红景天苷、抗氧化剂、淀粉酶、葡萄糖苷酶、血管紧张素转
换酶、酶抑制剂、2 型糖尿病、高血压。
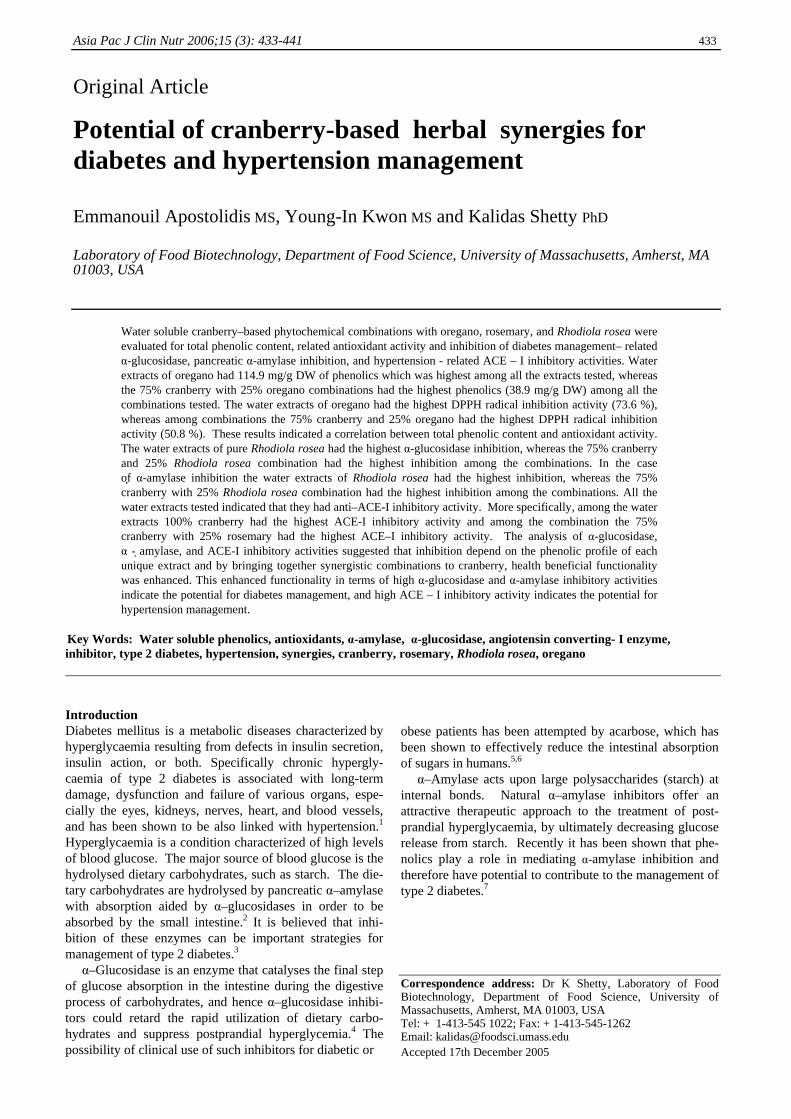
Asia Pac J Clin Nutr 2006;15 (3): 433-441 433
Original Article
Potential of cranberry-based herbal synergies for diabetes and hypertension management Emmanouil Apostolidis MS, Young-In Kwon MS and Kalidas Shetty PhD
Laboratory of Food Biotechnology, Department of Food Science, University of Massachusetts, Amherst, MA 01003, USA
Water soluble cranberry–based phytochemical combinations with oregano, rosemary, and Rhodiola rosea were evaluated for total phenolic content, related antioxidant activity and inhibition of diabetes management– related α-glucosidase, pancreatic α-amylase inhibition, and hypertension - related ACE – I inhibitory activities. Water extracts of oregano had 114.9 mg/g DW of phenolics which was highest among all the extracts tested, whereas the 75% cranberry with 25% oregano combinations had the highest phenolics (38.9 mg/g DW) among all the combinations tested. The water extracts of oregano had the highest DPPH radical inhibition activity (73.6 %), whereas among combinations the 75% cranberry and 25% oregano had the highest DPPH radical inhibition activity (50.8 %). These results indicated a correlation between total phenolic content and antioxidant activity. The water extracts of pure Rhodiola rosea had the highest α-glucosidase inhibition, whereas the 75% cranberry and 25% Rhodiola rosea combination had the highest inhibition among the combinations. In the case of�� α-amylase inhibition the water extracts of Rhodiola rosea had the highest inhibition, whereas the 75% cranberry with 25% Rhodiola rosea combination had the highest inhibition among the combinations. All the water extracts tested indicated that they had anti–ACE-I inhibitory activity. More specifically, among the water extracts 100% cranberry had the highest ACE-I inhibitory activity and among the combination the 75% cranberry with 25% rosemary had the highest ACE–I inhibitory activity. The analysis of α-glucosidase, α - �amylase, and ACE-I inhibitory activities suggested that inhibition depend on the phenolic profile of each unique extract and by bringing together synergistic combinations to cranberry, health beneficial functionality was enhanced. This enhanced functionality in terms of high α-glucosidase and α-amylase inhibitory activities indicate the potential for diabetes management, and high ACE – I inhibitory activity indicates the potential for hypertension management.
Key Words: Water soluble phenolics, antioxidants, α-amylase, α-glucosidase, angiotensin converting- I enzyme, inhibitor, type 2 diabetes, hypertension, synergies, cranberry, rosemary, Rhodiola rosea, oregano
Introduction Diabetes mellitus is a metabolic diseases characterized by hyperglycaemia resulting from defects in insulin secretion,
insulin action, or both. Specifically chronic hypergly-caemia of type 2 diabetes is associated with long-term damage, dysfunction and failure of various organs, espe-cially the eyes, kidneys, nerves, heart, and blood vessels, and has been shown to be also linked with hypertension.1 Hyperglycaemia is a condition characterized of high levels of blood glucose. The major source of blood glucose is the hydrolysed dietary carbohydrates, such as starch. The die-tary carbohydrates are hydrolysed by pancreatic α–amylase with absorption aided by α–glucosidases in order to be absorbed by the small intestine.2 It is believed that inhi-bition of these enzymes can be important strategies for management of type 2 diabetes.3 α–Glucosidase is an enzyme that catalyses the final step of glucose absorption in the intestine during the digestive process of carbohydrates, and hence α–glucosidase inhibi-tors could retard the rapid utilization of dietary carbo-hydrates and suppress postprandial hyperglycemia.4 The possibility of clinical use of such inhibitors for diabetic or
obese patients has been attempted by acarbose, which has been shown to effectively reduce the intestinal absorption of sugars in humans.5,6 α–Amylase acts upon large polysaccharides (starch) at internal bonds. Natural α–amylase inhibitors offer an attractive therapeutic approach to the treatment of post-prandial hyperglycaemia, by ultimately decreasing glucose release from starch. Recently it has been shown that phe-nolics play a role in mediating α-amylase inhibition and therefore have potential to contribute to the management of type 2 diabetes.7 Correspondence address: Dr K Shetty, Laboratory of Food Biotechnology, Department of Food Science, University of Massachusetts, Amherst, MA 01003, USA Tel: + 1-413-545 1022; Fax: + 1-413-545-1262 Email: [email protected] Accepted 17th December 2005
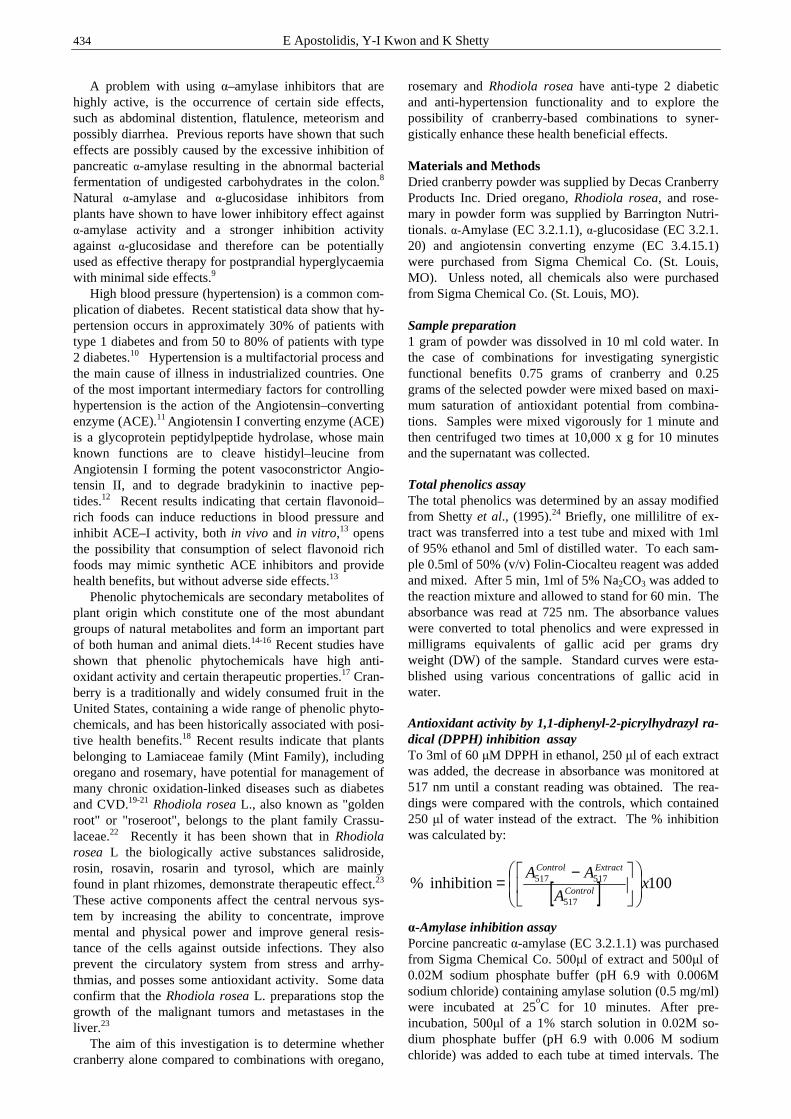
434 E Apostolidis, Y-I Kwon and K Shetty
A problem with using α–amylase inhibitors that are highly active, is the occurrence of certain side effects, such as abdominal distention, flatulence, meteorism and possibly diarrhea. Previous reports have shown that such effects are possibly caused by the excessive inhibition of pancreatic α-amylase resulting in the abnormal bacterial fermentation of undigested carbohydrates in the colon.8 Natural α-amylase and α-glucosidase inhibitors from plants have shown to have lower inhibitory effect against α-amylase activity and a stronger inhibition activity against α-glucosidase and therefore can be potentially used as effective therapy for postprandial hyperglycaemia with minimal side effects.9 High blood pressure (hypertension) is a common com-plication of diabetes. Recent statistical data show that hy-pertension occurs in approximately 30% of patients with type 1 diabetes and from 50 to 80% of patients with type 2 diabetes.10 Hypertension is a multifactorial process and the main cause of illness in industrialized countries. One of the most important intermediary factors for controlling hypertension is the action of the Angiotensin–converting enzyme (ACE).11 Angiotensin I converting enzyme (ACE) is a glycoprotein peptidylpeptide hydrolase, whose main known functions are to cleave histidyl–leucine from Angiotensin I forming the potent vasoconstrictor Angio-tensin II, and to degrade bradykinin to inactive pep-tides.12 Recent results indicating that certain flavonoid–rich foods can induce reductions in blood pressure and inhibit ACE–I activity, both in vivo and in vitro,13 opens the possibility that consumption of select flavonoid rich foods may mimic synthetic ACE inhibitors and provide health benefits, but without adverse side effects.13 Phenolic phytochemicals are secondary metabolites of plant origin which constitute one of the most abundant groups of natural metabolites and form an important part of both human and animal diets.14-16 Recent studies have shown that phenolic phytochemicals have high anti-oxidant activity and certain therapeutic properties.17 Cran-berry is a traditionally and widely consumed fruit in the United States, containing a wide range of phenolic phyto-chemicals, and has been historically associated with posi-tive health benefits.18 Recent results indicate that plants belonging to Lamiaceae family (Mint Family), including oregano and rosemary, have potential for management of many chronic oxidation-linked diseases such as diabetes and CVD.19-21 Rhodiola rosea L., also known as "golden root" or "roseroot", belongs to the plant family Crassu-laceae.22 Recently it has been shown that in Rhodiola rosea L the biologically active substances salidroside, rosin, rosavin, rosarin and tyrosol, which are mainly found in plant rhizomes, demonstrate therapeutic effect.23 These active components affect the central nervous sys-tem by increasing the ability to concentrate, improve mental and physical power and improve general resis-tance of the cells against outside infections. They also prevent the circulatory system from stress and arrhy-thmias, and posses some antioxidant activity. Some data confirm that the Rhodiola rosea L. preparations stop the growth of the malignant tumors and metastases in the liver.23 The aim of this investigation is to determine whether cranberry alone compared to combinations with oregano,
rosemary and Rhodiola rosea have anti-type 2 diabetic and anti-hypertension functionality and to explore the possibility of cranberry-based combinations to syner-gistically enhance these health beneficial effects. Materials and Methods Dried cranberry powder was supplied by Decas Cranberry Products Inc. Dried oregano, Rhodiola rosea, and rose-mary in powder form was supplied by Barrington Nutri-tionals. α-Amylase (EC 3.2.1.1), α-glucosidase (EC 3.2.1. 20) and angiotensin converting enzyme (EC 3.4.15.1) were purchased from Sigma Chemical Co. (St. Louis, MO). Unless noted, all chemicals also were purchased from Sigma Chemical Co. (St. Louis, MO). Sample preparation 1 gram of powder was dissolved in 10 ml cold water. In the case of combinations for investigating synergistic functional benefits 0.75 grams of cranberry and 0.25 grams of the selected powder were mixed based on maxi-mum saturation of antioxidant potential from combina-tions. Samples were mixed vigorously for 1 minute and then centrifuged two times at 10,000 x g for 10 minutes and the supernatant was collected. Total phenolics assay The total phenolics was determined by an assay modified from Shetty et al., (1995).24 Briefly, one millilitre of ex-tract was transferred into a test tube and mixed with 1ml of 95% ethanol and 5ml of distilled water. To each sam-ple 0.5ml of 50% (v/v) Folin-Ciocalteu reagent was added and mixed. After 5 min, 1ml of 5% Na2CO3 was added to the reaction mixture and allowed to stand for 60 min. The absorbance was read at 725 nm. The absorbance values were converted to total phenolics and were expressed in milligrams equivalents of gallic acid per grams dry weight (DW) of the sample. Standard curves were esta-blished using various concentrations of gallic acid in water. Antioxidant activity by 1,1-diphenyl-2-picrylhydrazyl ra-dical (DPPH) inhibition assay To 3ml of 60 µM DPPH in ethanol, 250 µl of each extract was added, the decrease in absorbance was monitored at 517 nm until a constant reading was obtained. The rea-dings were compared with the controls, which contained 250 µl of water instead of the extract. The % inhibition was calculated by:
[ ] 100 inhibition %517
517517 xA
AAControl
ExtractControl
−=
α-Amylase inhibition assay Porcine pancreatic α-amylase (EC 3.2.1.1) was purchased from Sigma Chemical Co. 500µl of extract and 500µl of 0.02M sodium phosphate buffer (pH 6.9 with 0.006M sodium chloride) containing amylase solution (0.5 mg/ml) were incubated at 25
oC for 10 minutes. After pre-
incubation, 500µl of a 1% starch solution in 0.02M so-dium phosphate buffer (pH 6.9 with 0.006 M sodium chloride) was added to each tube at timed intervals. The
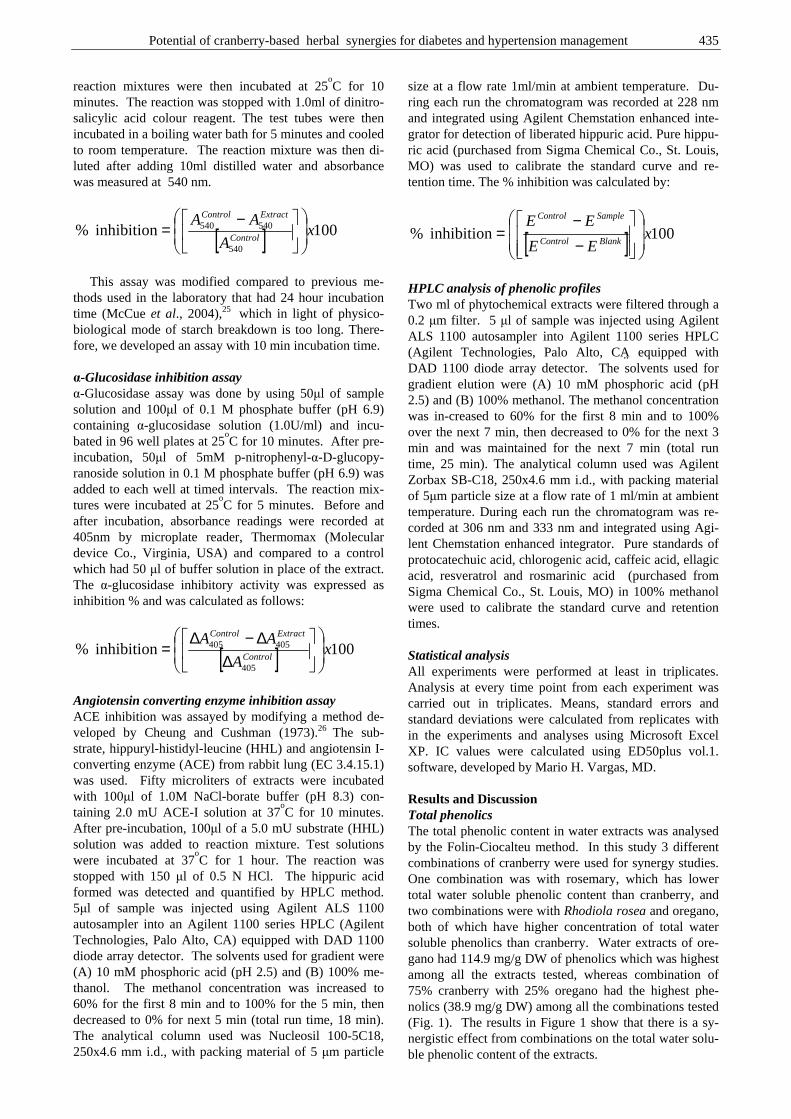
Potential of cranberry-based herbal synergies for diabetes and hypertension management 435
reaction mixtures were then incubated at 25oC for 10
minutes. The reaction was stopped with 1.0ml of dinitro-salicylic acid colour reagent. The test tubes were then incubated in a boiling water bath for 5 minutes and cooled to room temperature. The reaction mixture was then di-luted after adding 10ml distilled water and absorbance was measured at 540 nm.
[ ] 100 inhibition %540
540540 xA
AAControl
ExtractControl
−=
This assay was modified compared to previous me-thods used in the laboratory that had 24 hour incubation time (McCue et al., 2004),25 which in light of physico-biological mode of starch breakdown is too long. There-fore, we developed an assay with 10 min incubation time. α-Glucosidase inhibition assay α-Glucosidase assay was done by using 50µl of sample solution and 100µl of 0.1 M phosphate buffer (pH 6.9) containing α-glucosidase solution (1.0U/ml) and incu-bated in 96 well plates at 25
oC for 10 minutes. After pre-
incubation, 50µl of 5mM p-nitrophenyl-α-D-glucopy-ranoside solution in 0.1 M phosphate buffer (pH 6.9) was added to each well at timed intervals. The reaction mix-tures were incubated at 25
oC for 5 minutes. Before and
after incubation, absorbance readings were recorded at 405nm by microplate reader, Thermomax (Molecular device Co., Virginia, USA) and compared to a control which had 50 µl of buffer solution in place of the extract. The α-glucosidase inhibitory activity was expressed as inhibition % and was calculated as follows:
[ ] 100 inhibition %405
405405 xA
AAControl
ExtractControl
∆∆−∆
=
Angiotensin converting enzyme inhibition assay ACE inhibition was assayed by modifying a method de-veloped by Cheung and Cushman (1973).26 The sub-strate, hippuryl-histidyl-leucine (HHL) and angiotensin I-converting enzyme (ACE) from rabbit lung (EC 3.4.15.1) was used. Fifty microliters of extracts were incubated with 100µl of 1.0M NaCl-borate buffer (pH 8.3) con-taining 2.0 mU ACE-I solution at 37
oC for 10 minutes.
After pre-incubation, 100µl of a 5.0 mU substrate (HHL) solution was added to reaction mixture. Test solutions were incubated at 37
oC for 1 hour. The reaction was
stopped with 150 µl of 0.5 N HCl. The hippuric acid formed was detected and quantified by HPLC method. 5µl of sample was injected using Agilent ALS 1100 autosampler into an Agilent 1100 series HPLC (Agilent Technologies, Palo Alto, CA) equipped with DAD 1100 diode array detector. The solvents used for gradient were (A) 10 mM phosphoric acid (pH 2.5) and (B) 100% me-thanol. The methanol concentration was increased to 60% for the first 8 min and to 100% for the 5 min, then decreased to 0% for next 5 min (total run time, 18 min). The analytical column used was Nucleosil 100-5C18, 250x4.6 mm i.d., with packing material of 5 µm particle
size at a flow rate 1ml/min at ambient temperature. Du-ring each run the chromatogram was recorded at 228 nm and integrated using Agilent Chemstation enhanced inte-grator for detection of liberated hippuric acid. Pure hippu-ric acid (purchased from Sigma Chemical Co., St. Louis, MO) was used to calibrate the standard curve and re-tention time. The % inhibition was calculated by:
[ ] 100 inhibition % xEE
EEBlankControl
SampleControl
−−
=
HPLC analysis of phenolic profiles Two ml of phytochemical extracts were filtered through a 0.2 µm filter. 5 µl of sample was injected using Agilent ALS 1100 autosampler into Agilent 1100 series HPLC (Agilent Technologies, Palo Alto, CA�� equipped with DAD 1100 diode array detector. The solvents used for gradient elution were (A) 10 mM phosphoric acid (pH 2.5) and (B) 100% methanol. The methanol concentration was in-creased to 60% for the first 8 min and to 100% over the next 7 min, then decreased to 0% for the next 3 min and was maintained for the next 7 min (total run time, 25 min). The analytical column used was Agilent Zorbax SB-C18, 250x4.6 mm i.d., with packing material of 5µm particle size at a flow rate of 1 ml/min at ambient temperature. During each run the chromatogram was re-corded at 306 nm and 333 nm and integrated using Agi-lent Chemstation enhanced integrator. Pure standards of protocatechuic acid, chlorogenic acid, caffeic acid, ellagic acid, resveratrol and rosmarinic acid (purchased from Sigma Chemical Co., St. Louis, MO) in 100% methanol were used to calibrate the standard curve and retention times. Statistical analysis All experiments were performed at least in triplicates. Analysis at every time point from each experiment was carried out in triplicates. Means, standard errors and standard deviations were calculated from replicates with in the experiments and analyses using Microsoft Excel XP. IC values were calculated using ED50plus vol.1. software, developed by Mario H. Vargas, MD. Results and Discussion Total phenolics The total phenolic content in water extracts was analysed by the Folin-Ciocalteu method. In this study 3 different combinations of cranberry were used for synergy studies. One combination was with rosemary, which has lower total water soluble phenolic content than cranberry, and two combinations were with Rhodiola rosea and oregano, both of which have higher concentration of total water soluble phenolics than cranberry. Water extracts of ore-gano had 114.9 mg/g DW of phenolics which was highest among all the extracts tested, whereas combination of 75% cranberry with 25% oregano had the highest phe-nolics (38.9 mg/g DW) among all the combinations tested (Fig. 1). The results in Figure 1 show that there is a sy-nergistic effect from combinations on the total water solu-ble phenolic content of the extracts.
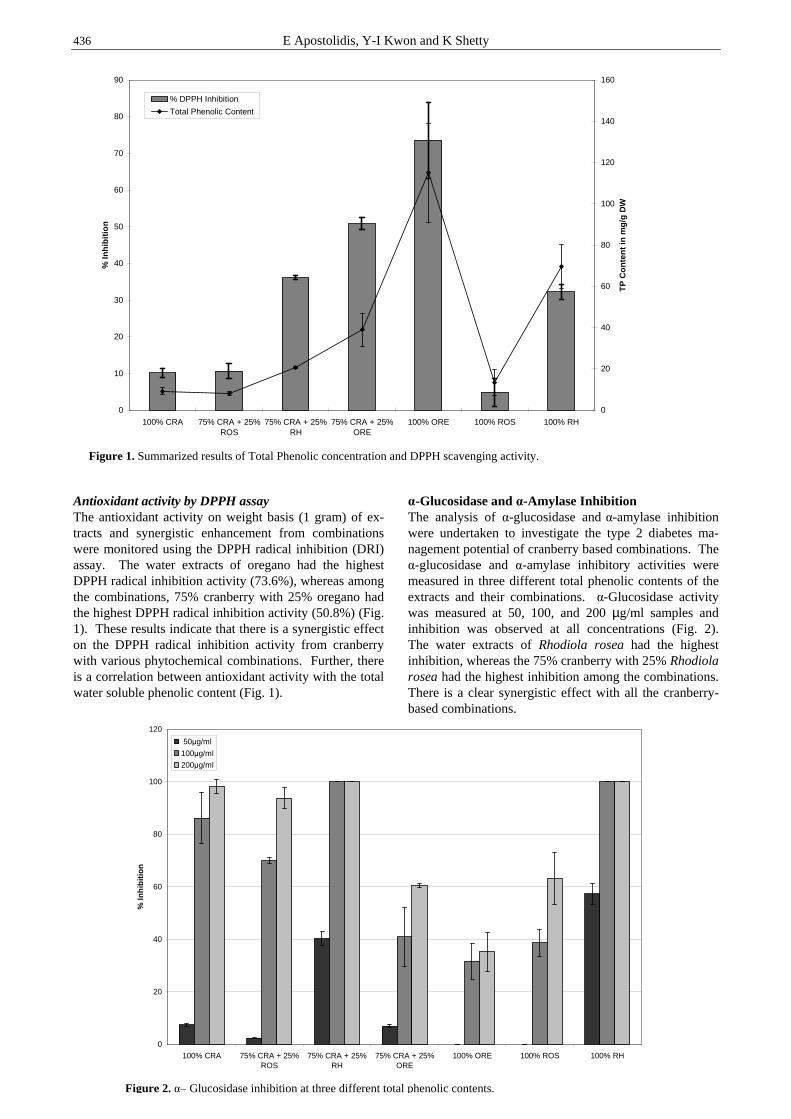
436 E Apostolidis, Y-I Kwon and K Shetty
Antioxidant activity by DPPH assay The antioxidant activity on weight basis (1 gram) of ex-tracts and synergistic enhancement from combinations were monitored using the DPPH radical inhibition (DRI) assay. The water extracts of oregano had the highest DPPH radical inhibition activity (73.6%), whereas among the combinations, 75% cranberry with 25% oregano had the highest DPPH radical inhibition activity (50.8%) (Fig. 1). These results indicate that there is a synergistic effect on the DPPH radical inhibition activity from cranberry with various phytochemical combinations. Further, there is a correlation between antioxidant activity with the total water soluble phenolic content (Fig. 1).
α-Glucosidase and α-Amylase Inhibition The analysis of α-glucosidase and α-amylase inhibition were undertaken to investigate the type 2 diabetes ma-nagement potential of cranberry based combinations. The α-glucosidase and α-amylase inhibitory activities were measured in three different total phenolic contents of the extracts and their combinations. α-Glucosidase activity was measured at 50, 100, and 200 µg/ml samples and inhibition was observed at all concentrations (Fig. 2). The water extracts of Rhodiola rosea had the highest inhibition, whereas the 75% cranberry with 25% Rhodiola rosea had the highest inhibition among the combinations. There is a clear synergistic effect with all the cranberry-based combinations.
0
10
20
30
40
50
60
70
80
90
100% CRA 75% CRA + 25%ROS
75% CRA + 25%RH
75% CRA + 25%ORE
100% ORE 100% ROS 100% RH
% In
hib
itio
n
0
20
40
60
80
100
120
140
160
TP
Co
nte
nt
in m
g/g
DW
% DPPH Inhibition
Total Phenolic Content
Figure 1. Summarized results of Total Phenolic concentration and DPPH scavenging activity.
0
20
40
60
80
100
120
100% CRA 75% CRA + 25%ROS
75% CRA + 25%RH
75% CRA + 25%ORE
100% ORE 100% ROS 100% RH
% In
hib
itio
n
50µg/ml
100µg/ml
200µg/ml
Figure 2. α– Glucosidase inhibition at three different total phenolic contents.
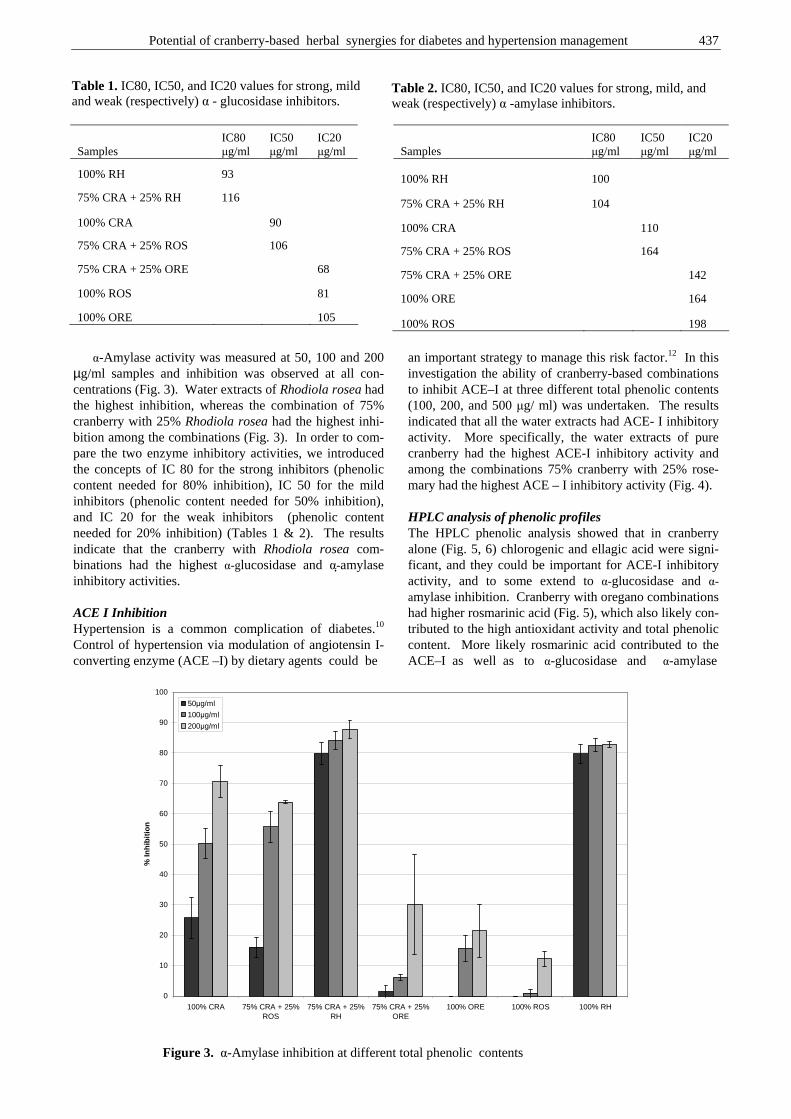
Potential of cranberry-based herbal synergies for diabetes and hypertension management 437
α-Amylase activity was measured at 50, 100 and 200 µg/ml samples and inhibition was observed at all con-centrations (Fig. 3). Water extracts of Rhodiola rosea had the highest inhibition, whereas the combination of 75% cranberry with 25% Rhodiola rosea had the highest inhi-bition among the combinations (Fig. 3). In order to com-pare the two enzyme inhibitory activities, we introduced the concepts of IC 80 for the strong inhibitors (phenolic content needed for 80% inhibition), IC 50 for the mild inhibitors (phenolic content needed for 50% inhibition), and IC 20 for the weak inhibitors (phenolic content needed for 20% inhibition) (Tables 1 & 2). The results indicate that the cranberry with Rhodiola rosea com-binations had the highest α-glucosidase and α-��amylase inhibitory activities. ACE I Inhibition Hypertension is a common complication of diabetes.10 Control of hypertension via modulation of angiotensin I-converting enzyme (ACE –I) by dietary agents could be
an important strategy to manage this risk factor.12 In this investigation the ability of cranberry-based combinations to inhibit ACE–I at three different total phenolic contents (100, 200, and 500 µg/ ml) was undertaken. The results indicated that all the water extracts had ACE- I inhibitory activity. More specifically, the water extracts of pure cranberry had the highest ACE-I inhibitory activity and among the combinations 75% cranberry with 25% rose-mary had the highest ACE – I inhibitory activity (Fig. 4). HPLC analysis of phenolic profiles The HPLC phenolic analysis showed that in cranberry alone (Fig. 5, 6) chlorogenic and ellagic acid were signi-ficant, and they could be important for ACE-I inhibitory activity, and to some extend to α-glucosidase and α-amylase inhibition. Cranberry with oregano combinations had higher rosmarinic acid (Fig. 5), which also likely con-tributed to the high antioxidant activity and total phenolic content. More likely rosmarinic acid contributed to the ACE–I as well as to α-glucosidase and α-amylase
Table 1. IC80, IC50, and IC20 values for strong, mild and weak (respectively) α - glucosidase inhibitors.
Samples IC80 µg/ml
IC50 µg/ml
IC20 µg/ml
100% RH 93
75% CRA + 25% RH 116
100% CRA 90
75% CRA + 25% ROS 106
75% CRA + 25% ORE 68
100% ROS 81
100% ORE 105
Table 2. IC80, IC50, and IC20 values for strong, mild, and weak (respectively) α -amylase inhibitors.
Samples IC80 µg/ml
IC50 µg/ml
IC20 µg/ml
100% RH 100
75% CRA + 25% RH 104
100% CRA 110
75% CRA + 25% ROS 164
75% CRA + 25% ORE 142
100% ORE 164
100% ROS 198
0
10
20
30
40
50
60
70
80
90
100
100% CRA 75% CRA + 25%ROS
75% CRA + 25%RH
75% CRA + 25%ORE
100% ORE 100% ROS 100% RH
% In
hib
itio
n
50µg/ml
100µg/ml
200µg/ml
Figure 3. α-Amylase inhibition at different total phenolic contents
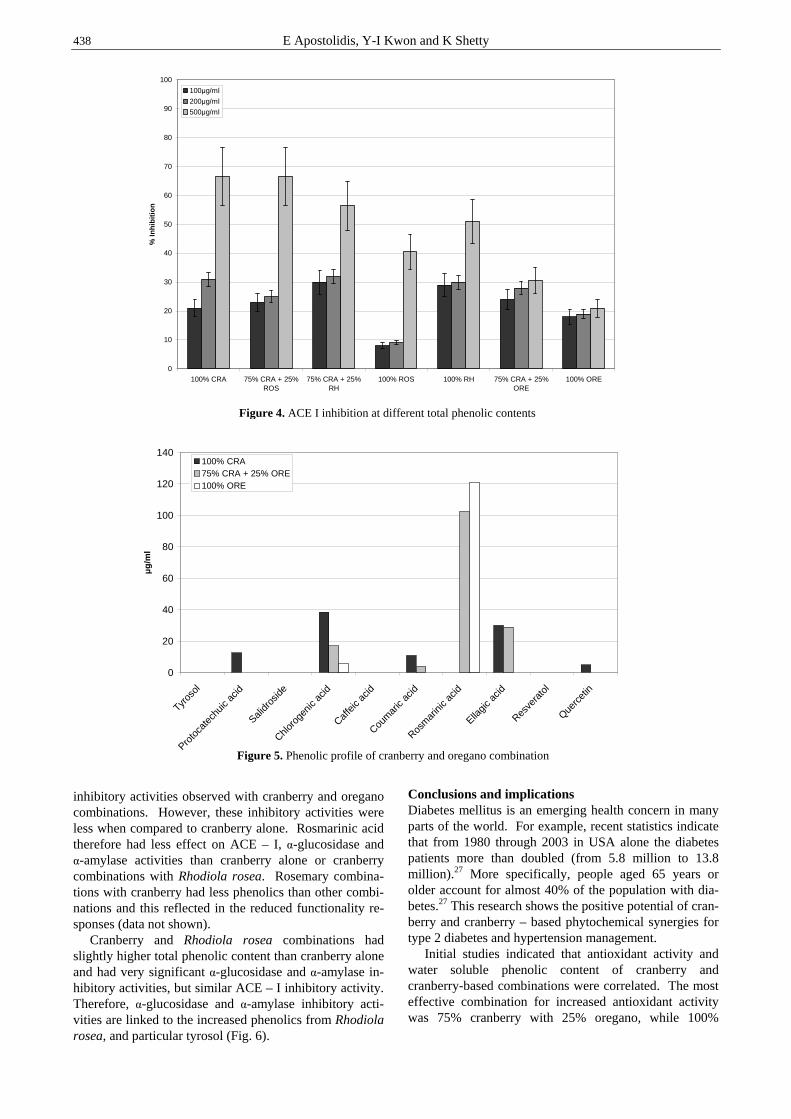
438 E Apostolidis, Y-I Kwon and K Shetty
inhibitory activities observed with cranberry and oregano combinations. However, these inhibitory activities were less when compared to cranberry alone. Rosmarinic acid therefore had less effect on ACE – I, α-glucosidase and α-amylase activities than cranberry alone or cranberry combinations with Rhodiola rosea. Rosemary combina-tions with cranberry had less phenolics than other combi-nations and this reflected in the reduced functionality re-sponses (data not shown). Cranberry and Rhodiola rosea combinations had slightly higher total phenolic content than cranberry alone and had very significant α-glucosidase and α-amylase in-hibitory activities, but similar ACE – I inhibitory activity. Therefore, α-glucosidase and α-amylase inhibitory acti-vities are linked to the increased phenolics from Rhodiola rosea, and particular tyrosol (Fig. 6).
Conclusions and implications Diabetes mellitus is an emerging health concern in many parts of the world. For example, recent statistics indicate that from 1980 through 2003 in USA alone the diabetes patients more than doubled (from 5.8 million to 13.8 million).27 More specifically, people aged 65 years or older account for almost 40% of the population with dia-betes.27 This research shows the positive potential of cran-berry and cranberry – based phytochemical synergies for type 2 diabetes and hypertension management. Initial studies indicated that antioxidant activity and water soluble phenolic content of cranberry and cranberry-based combinations were correlated. The most effective combination for increased antioxidant activity was 75% cranberry with 25% oregano, while 100%
0
20
40
60
80
100
120
140
Tyros
ol
Proto
cate
chuic
acid
Salidr
oside
Chloro
genic
acid
Caffe
ic ac
id
Coum
aric
acid
Rosm
arini
c acid
Ellagic
acid
Resve
rato
l
Querc
etin
µg
/ml
100% CRA75% CRA + 25% ORE100% ORE
0
10
20
30
40
50
60
70
80
90
100
100% CRA 75% CRA + 25%ROS
75% CRA + 25%RH
100% ROS 100% RH 75% CRA + 25%ORE
100% ORE
% In
hib
itio
n
100µg/ml
200µg/ml
500µg/ml
Figure 4.
Figure 5. Phenolic profile of cranberry and oregano combination
Figure 4. ACE I inhibition at different total phenolic contents

Potential of cranberry-based herbal synergies for diabetes and hypertension management 439
oregano had the highest antioxidant activity of all samples. These findings support previous investigations indicating that phenolic phytochemicals with antioxidant properties have additional health beneficial properties.19 In the case of α-amylase and α-glucosidase inhibitory activities the most effective combination was 75% cran-berry with 25% Rhodiola rosea, indicating synergistic enhancement of functionality. Although pure cranberry appeared to be a mild inhibitor (Tables 1,2) the com-bination with Rhodiola rosea had a strong synergistic inhibition (Tables 1,2). It is also important to emphasize that all the extracts and their combinations had higher α-glucosidase inhibitory activity and lower α-amylase inhi-bitory activity. However the exception was cranberry combination with Rhodiola rosea, where the effect was reversed with a slightly higher α-amylase inhibitory than α-glucosidase inhibitory activity. This is potentially an important finding to reduce the side effects of excessive high α-amylase inhibition of drug treatments.8 It is also an important finding that all Rhodiola rosea extracts appeared to be potentially more effective for type 2 dia-betes management, since all the Rhodiola rosea treat-ments, in combinations and alone, gave the highest α-amylase and α-glucosidase inhibitory activities. In the case of ACE-I inhibition, 75% cranberry with 25% rose-mary combination and 100% cranberry had the highest inhibitory activities. Finally, the results indicate that all the inhibitory acti-vities increased as we increased the phenolic dose, indi-cating dose dependence of water soluble phenolics for po-tential type 2 diabetes and hypertension management. Phenolics have been shown to have antioxidant and antimicrobial activities19,28 and this investigation indicates that properly optimized phenolic diets could be an im-portant strategy for type 2 diabetes and hypertension management.
References 1 Haffner SM. The importance of hyperglycemia in the
nonfasting state to the development of cardiovascular disease. Endocrine Rev 1998; 19: 583-592.
2 Elsenhans B, Caspary WF. Absorption of carbohydrates. In: Caspary WF, eds. Structure and function of the small intestine. Amsterdam Excerptia Medica, 1987; 139- 159.
3 Krentz AJ, Bailey CJ. Oral antidiabetic agents : current role in type 2 diabetes mellitus. Drugs 2005; 65: 385 – 411.
4 Watanabe J, Kawabata J, Kurihara H, Niki R. Isolation and identification of α–Glucosidase inhibitors from Tochu – cha (Eucommia ulmoides). Biosci. Biotech. Biocehm. 1997; 61: 177 - 178.
5 Jenkins DJ, Taylor RH, Goff DV, Fielden H, Misiewicz JJ, Sarson DL, Bloom SR, Alberti KG. Scope and specificity of acarbose in slowing carbohydrate absorption in man. Diabetes 1981; 30: 951 – 954.
6 Cheng AY, Fantus IG. Oral antihyperglycemic therapy for type 2 diabetes mellitus. Can Med Assoc J 2005;172:213 – 226.
7 McCue PP, Shetty K. Inhibitory effects of rosmarinic acid extracts on porcine pancreatic amylase in vitro. Asia Pac J Clin Nutr. 2004; 13: 101 – 106.
8 Bischoff H, Puls W, Krause HP, Schutt H, Thomas G. Pharmacological properties of the novel glucosidase inhibitors BAY m 1099 (miglitol) and BAY o 1248. Diabetes Res Clin Pract 1985; 1: 53.
9 Horii S, Fukasse K, Matsuo T, Kameda K, Asano N, Masui Y. Synthesis and α-D- glucosidase inhibitory activity of N-substituted valiolamine derivatives as potent oral anti-diabetic agents. J Med Chem 1987; 29: 1038-1046.
10 Landsberg L, Molitch M. Diabetes and hypertension: pathogenesis, prevention and treatment.Clin Exp Hypertens 2004; 26: 621 – 628
11 Hernadez–Ledesma B, Martin–Alvarez PJ, Pueyo A. Assessment of the Spectrophotometric method for deter-mination of Angiotensin–Converting–Enzyme Activity: Influence of the inhibition type. J Agric Food Chem 2003; 51: 4175 – 4179.
0
5
10
15
20
25
30
35
40
45
Tyros
ol
Proto
cate
chuic
acid
Salidr
oside
Chloro
genic
acid
Caffe
ic ac
id
Coum
aric
acid
Rosm
arini
c acid
Ellagic
acid
Resve
rato
l
Querc
etin
µg
/ml
100% CRA75% CRA + 25% RH100% RH
Figure 6. Phenolic profile of cranberry and Rhodiola rosea combination.

440 E Apostolidis, Y-I Kwon and K Shetty
12 Dzau VJ. Theodore Cooper Lecture: Tissue angiotensin and pathobiology of vascular disease: a unifying hypo-thesis. Hypertension 2001; 37: 1047 – 1052.
13 Actis – Goretta L, Ottaviani JL, Keen CL, Fraga CG. Inhibition of angiotensin converting enzyme (ACE) activity by flavan – 3 – ols and procyanidins. FEBS Letters. 2003; 555: 597 – 600.
14 Bravo L. Phenolic phytochemicals: chemistry, dietary sources, metabolism, and nutritional significance. Nutr Rev 1998; 56: 317-333.
15 Crozier A, Burns J, Aziz AA, Stewart AJ, Rabiasz HS, Jenkins GI, Edwards CA, Lean MEJ. Antioxidant flavonols from fruits, vegetables and beverages: measurements and bioavailability. Biol Res 2000; 33: 79-88
16 Vattem DA, Ghaedian R, Shetty K. Enhancing health benefits of berries through phenolic antioxidant enrich-ment: focus on cranberry. Asia Pac J Clin Nutr. 2005; 14: 120-30.
17 Paganga G, Miller N, Rice-Evans CA. The polyphenolic contents of fruits and vegetables and their antioxidant activities. What does a serving constitute? Free Radical Res 1999; 30:153-162.
18 Marwan AG, Nagel CW. Characterization of cranberry benzoates and their antimicrobial properties. J Food Sci 1986; 51: 1069-1070.
19 Shetty K. Biotechnology to harness the benefits of dietary phenolics; Focus on Lamiaceae. Asia Pac J Clin Nutr 1997; 6:162-171.
20 Shetty K. Phytochemicals: Biotechnology of phenolic phytochemicals for food preservatives and functional food applications. In: Francis FJ, eds. Wiley Encyclopedia of Food Science and Technology, 2nd Edition. New york Wiley Publishers, 1999; 1901-1909.
21 Shetty K. Biosynthesis of rosmarinic acid and applications in medicine. J Herbs Species and medicinal Plants 2001; 8: 161-181.
22 Brown RP, Gerbarg PL, Ramazanov Z. Rhodiola rosea: A Phytomedicinal Overview. HerbalGram. J Am Botanical Council 2002; 56: 40 - 52.
23 Kucinskaite A, Briedis V, Savickas A. Experimental analysis of therapeutic properties of Rhodiola rosea L. and its possible application in medicine. Medicina (Kaunas) 2004; 40: 614 – 619.
24 Shetty K, Curtis OF, Levin RE, Witkowsky R, Ang W. Prevention of vitrification associated with in vitro shoot culture of oregano (Origanum vulgare) by Pseudomonas spp. J Plant Physiology 1995; 147: 447-451.
25 McCue P, Vattem DA, Shetty K. Inhibitory effect of clonal oregano extracts against porcine pancreatic amylase in vitro. Asia Pac J of Clin Nutr 2004; 13: 401-408.
26 Cushman DW, Cheung HS. Spectrophotometeric assay and properties of angiotensin converting enzyme of rabbit lung. Biochem Pharmacol 1971; 20: 1637-1648.
27 Centers for Disease Control and Prevention, National Center for Health Statistics, Division of Health Interview Statistics, data from the National Health Interview Survey. U.S. Bureau of the Census, census of the population and population estimates. (www.cdc.gov/diabetes/statistics/)
28 Shetty K, Wahlqvist M. A model for the role of the proline linked pentose phosphate pathway in phenolic phyto-chemicals biosynthesis and mechanism of action for human health and environment applications. Asia Pac J Clin Nutr. 2004; 13: 1-24.
Potential of cranberry-based herbal synergies for diabetes and hypertension management 441
Original Article
Potential of cranberry-based herbal synergies for diabetes and hypertension management Emmanouil Apostolidis MS, Young-In Kwon MS and Kalidas Shetty PhD
Laboratory of Food Biotechnology, Department of Food Science, University of Massachusetts, Amherst, MA 01003, USA
以以以以酸果蔓为基础的草药间协同作用在糖尿病和高血压治疗方面具有潜酸果蔓为基础的草药间协同作用在糖尿病和高血压治疗方面具有潜酸果蔓为基础的草药间协同作用在糖尿病和高血压治疗方面具有潜酸果蔓为基础的草药间协同作用在糖尿病和高血压治疗方面具有潜
在功效在功效在功效在功效
本研究检验了水溶性酸果蔓与牛至、迷迭香和红景天混合后总酚的含量。酚类物质具有抗氧
化活性,并能抑制与糖尿病治疗相关的 α-葡萄糖苷酶、胰腺 α-淀粉酶的活性,与高血压
相关的血管紧张素转化酶的活性。在所有受测单一中药水提物中,以牛至水提物的总酚含量
最高,占干物质总量的 11.49%;而在所有受测中药混合物中,75%酸果蔓与 25%牛至的总酚
含量最高,占干物质总量的 3.89%。牛至水提物具有最高的二苯基 β 苦基肼游离基抑制活性
(73.6);而在所有混合物中,75%酸果蔓与 25%牛至混合物的二苯基 β 苦基肼游离基抑制
活性最高(50.8%)。上述结果表明水提物的总酚含量与其抗氧化活性具有相关性。纯红景
天水提物具有最高的 α-葡萄糖苷酶抑制活性;而在所有混合物中,75%酸果蔓与 25%红景天
混合物具有最高的 α-葡萄糖苷酶抑制活性。纯红景天水提物还具有最高的 α-淀粉酶抑制
活性;而在所有混合物中,75%酸果蔓与 25%红景天混合物具有最高的 α-淀粉酶抑制活性。
所有受测水提物均具抑制血管紧张素转化酶的功效。确切地说,在所有单一中药水提物中,
纯酸果蔓水提物具有最高的抑制血管紧张素转化酶的活性;在所有中药混合物中,75%酸果
蔓与 25%迷迭香具有最高的抑制血管紧张素转化酶的活性。对 α-葡萄糖苷酶、α-淀粉酶和
血管紧张素转化酶抑制活性的分析表明,单一中药水提物的抑制活性依赖于其总酚含量;其
它中药与酸果蔓混合后出现协同效应,对健康有利的功效得到增强。在高的 α-葡萄糖苷
酶、α-淀粉酶抑制活性方面增强的功效表明其在糖尿病治疗方面具有潜在功效;而高血管
紧张素转化酶的抑制活性表明其在高血压治疗方面具有潜在功效。
关键词:关键词:关键词:关键词:水溶性酚、抗氧化剂、α-淀粉酶、α-葡萄糖苷酶、血管紧张素转化酶、糖尿病、
高血压、协同作用、酸果蔓、迷迭香、红景天、牛至。

442 News & Views
Future Events
August 31-September 2nd, 2006 Physical Activity and Obesity International Conference Brisbane, Queensland, Australia www.obesitysatellitebrisbane2006.qut.edu.au September 1-2, 2006 Community Based Obesity Prevention A satellite conference to the international congress on obesity, Deakin University, Geelong, Victoria, Australia, [email protected] September 25-30, 2006 World Congress on Public Health Nutrition/ VII SENC Congress , www.nutrition2006.com September 25-30, 2006 10th International Congress on Obesity (ICD), Sydney www.ico2006.com September 28-30, 2006 I World Congress of Public Health Nutrition/VII Congress of the Spanish Community Nutrition Society www.nutrition2006.com October 15-18, 2006 Joint 8th IUNS-International Symposium on Clinical Nutrition (ISCN) and 5th Asia-Pacific Clinical Nutrition Society (APCNS) Conference 2006 Hangzhou, Zhe Jiang Province, China, Saturday. Theme: Food, Health and Economic Development http://www.2006iccn.org/ October 25-27, 2006 International Food & Health Innovation Conference, Malmo, Sweden www.skanefoodinnovation.con/ifhic2006 November 9, 2006 Aspen 2006 Annual Scientific Meeting, Sydney, NSW www.auspen.org.au November 22, 2006 Australian Association of Gerontology 39th National Conference, Sydney, NSW [email protected] November 29-December 22, 2006 Nutrition Society of Australia 30th Annual Scientific Meeting, Sydney, NSW www.fcconventions.com.au
April 25-26, 2007 3rd International Conference on Traditional Mediterranean Diet - MEDIET 2007, Athens [email protected] May 7-9, 2007 Federations of African Nutrition Societies FANUS meeting in Quazazate, Morocco www.africanutrition.org May 24-26, 2006 Dietitians Association of Australia 25th National Conference, Tasmania, Australia July 10-13, 2007 10th European Nutrition Conference, Paris www.fens2007.org September 9-13, 2007 10th Asian Congress of Nutrition, Taiwan www.2007acn.org.tw/ October 4-9 2009 19th International Congress of Nutrition, Bangkok, Thailand Global Nutrition Initiative. Contact: [email protected]; tel/fax: 662-590-4333
Asia Pacific Journal of Clinical Nutrition
Instructions for Authors AIMS AND SCOPE Asia Pacific Journal of Clinical Nutrition is the official journal of the Asia Pacific Clinical Nutrition Society (APCNS). The aims of the APCNS are to promote the education and training of clinical nutritionists in the region and to enhance the practice of human nutrition and related disciplines in their application to health and the prevention of disease. Asia Pacific Journal of Clinical Nutrition will publish original research reports, reviews, short communication, and letters to the editors. Letters to the editors may take several forms: they may be either very short articles (500 words) containing new material, case reports, or comments on previous papers or other topics of current interest. News, book reviews and other items will also be included. The acceptance criteria for all papers are the quality and originality of the research and its significance to our readership. Except where otherwise stated, manuscripts are peer-reviewed by two anonymous reviewers and the Editor. The Editorial Board reserves the right to refuse any material for publication and advises that authors should retain copies of submitted manuscripts and correspondence as material cannot be returned. Final acceptance or rejection rests with the Editorial Board.
SUBMISSION OF MANUSCRIPTS All articles submitted to the journal must comply with these instructions. Failure to do so will result in return of the manu-script and possible delay in publication. Manuscripts should be written so that they are intelligible to the professional reader who is not a specialist in the particular field. Where contributions are judged as acceptable for publication on the basis of scientific content, the Editor or the Publisher reserve the right to modify typescripts to eliminate ambiguity and repetition and improve communication between author and reader. If extensive alterations are required, the manuscript will be returned to the author for revision.
Covering letter Papers are accepted for publication in the journal on the under-standing that the content has not been published or submitted for publication elsewhere. This must be stated in the covering letter. Authors must also state that the protocol for the research project has been approved by a suitably constituted Ethics Committee of the institution within which the work was undertaken and that it conforms to the provisions of the Declaration of Helsinki in 1995 (as revised in Edinburgh 2000). All investigations on human subjects must include a statement that the subject gave informed consent and patient anonymity should be preserved. Any experiments involving animals must be demonstrated to be ethically acceptable and where relevant conform to National Guidelines for animal usage in research. Authors should declare any financial support or relationships that may pose conflict of interest.
Submission The original manuscript should be emailed to:
[email protected] Professor Mark L Wahlqvist Editor-in-Chief: Asia Pacific Journal of Clinical Nutrition, Asia Pacific Health and Nutrition Centre, Monash Asia
Institute, 8th Floor Menzies Building, Monash University, Wellington Road, Clayton, Victoria 3800, Australia.
Tel: +61 3 9905 8145; fax: +61 3 9905 8146.
Copyright Papers accepted for publication become copyright of HEC PRESS and authors will be asked to sign a transfer of copyright form. In signing the transfer of copyright it is assumed that authors have obtained permission to use any copyrighted or previously published material. All authors must read and agree to the conditions outlined in the Copyright Assignment Form,
and must sign the Form or agree that the corresponding author can sign on their behalf. Articles cannot be published until a signed Copyright Assignment Form has been received.
PREPARATION OF THE MANUSCRIPT Manuscripts should be doubled-spaced. The top, bottom and side margins should be 30 mm. All pages should be numbered consecutively in the top right-hand corner, beginning with the title page. Indent new paragraphs. Turn the hyphenation option off, including only those hyphens that are essential to the meaning.
Style Manuscripts should follow the style of the Vancouver agreement detailed in the ‘Uniform Requirements for Manuscripts Submitted to Biomedical Journals’, as presented in JAMA 1997;277:927–34 hhttp://www.acponline.org/ journals/ annals/01jan97/unifreqr.htm). The journal uses US/UK spelling and authors should therefore follow the latest edition of the Merriam–Webster’s Collegiate Dictionary/Concise Oxford Dictionary. Please indicate your pre-ference and use one or the other exclusively. If you do not specify, by default UK spelling will be used. All measurements must be given in SI units as outlined in the latest edition of Units, Symbols and Abbreviations: A Guide for Medical and Scientific Editors and Authors (Royal Society of Medicine Press, London). Abbre-viations should be used sparingly and only where they ease the reader’s task by reducing repetition of long, technical terms. Initially use the word in full, followed by the abbreviation in parentheses. Thereafter use the abbreviation. At the first mention of a chemical substance, give the generic name only. Trade names should not used. Drugs should be referred to by their generic names, rather than brand names.
Parts of the manuscript Manuscripts should be presented in the following order: (i) title page, (ii) abstract and keywords, (iii) text, (iv) acknowledge-ments, (v) references, (vi) figure legends, (vii) tables (each table complete with title and footnotes) and (viii) figures. Footnotes to the text are not allowed and any such material should be incorporated into the text as parenthetical matter.
Title page The title page should contain (i) the title of the paper, (ii) the full names of the authors and (iii) the addresses of the institutions at which the work was carried out together with (iv) the full postal and email address, plus facsimile and telephone numbers, of the author to whom correspondence about the manuscript, proofs and requests for offprints should be sent. In keeping with the latest guidelines of the International Committee of Medical Journal Editors, each author’s contri-bution to the paper is to be quantified. The title should be short, informative and contain the major key words. A short running title (less than 40 characters, including spaces) should also be provided.
Abstract and key words Articles must have an abstract that states in 250 words or less the purpose, basic procedures, main findings and principal conclusions of the study. The abstract should not contain abbre-viations or references. Five key words should be supplied below the abstract and should be taken from those recommended by the Index Medicus Medical Subject Headings (MeSH) browser list (http://www.nlm.nih.gov/mesh/meshhome.html). Text Authors should use subheadings to divide the sections of their manuscript: Introduction, Materials and methods, Results, Discussion, Acknowledgments, References.
Asia Pacific Journal of Clinical Nutrition
Acknowledgements The source of financial grants and other funding should be acknowledged, including a frank declaration of the authors’ industrial links and affiliations. The contribution of colleagues or institution should also be acknowledged. Thanks to anonymous reviewers are not allowed.
References The Vancouver system of referencing should be used. In the text, references should be cited using superscript Arabic numerals in the order in which they appear. If cited only in tables or figure legends, number them according to the first identification of the table or figure in the text. In the reference list, the references should be numbered and listed in order of appearance in the text. Cite the names of all authors. Names of journals should be abbreviated in the style used in Index Medicus. Reference to unpublished data and personal communi-cations should appear in the text only. References should be listed in the following form: Journal article
1. Tomaino RM, Decker EA. High fat meals and endothelial function. Nutr Rev 1998; 56: 334–343.
Book 2. Fildes VA. Breasts, bottles and babies. A history of infant
feeding. Edinburgh: Edinburgh University Press, 1986. Chapter in a Book
3. Willet WC. The use of biomarkers in nutritional epidemiolgy. In: Kok FJ, Veer PV, eds. Biomarkers of dietary exposure. London: Smith-Gordon, 1991; 9–14.
Tables Tables should be self-contained and complement, but not duplicate, information contained in the text. Tables should be numbered consecutively in Arabic numerals. Each table should be presented on a separate sheet of A4 paper with a comprehensive but concise legend above the table. Tables should be double-spaced and vertical lines should not be used to separate columns. Column headings should be brief, with units of measurement in parentheses; all abbreviations should be defined in footnotes. Footnote symbols: †, ‡, §, ¶, should be used (in that order) and *, **, *** should be reserved for P-values. The table and its legend/ footnotes should be understandable without reference to the text. All lettering/numbers used in tables should be font style 'times new roman' and font size 8.5 or 9.
Figures All illustrations (line drawings, bar charts and photographs) are classified as figures. Figures should be cited in consecutive order in the text. Figures should be sized to fit within the column (85 mm), intermediate (114 mm) or the full text width (177mm). Line figures or bar chart figures should be drawn in a computer graphics package (e.g EXCEL). All lettering used in figures should be font style 'times new roman' and font size 9. Important: All figures must be electonically inserted at the end of the manuscript (that has been typed in the word processing package WORD or in a separate file if a different computer program is used. Photographs should be supplied as sharp, glossy, black and white photographic prints and must be unmounted. Individual photographs forming a composite figure should be of equal contrast, to facilitate printing, and should be accurately squared. Photographs need to be cropped sufficiently to prevent the subject being recognized, or an eye bar used; otherwise, written permission to publish must be obtained. Magnifications should be indicated using a scale bar on the illustration. Colour photographs should be submitted as good quality, glossy colour prints. A charge of $A1,100/US$660 for the first three colour figures and $550/US$330 for each extra colour figure thereafter will be charged to the author.
Figure legends : Legends should be self-explanatory and typed on a separate sheet. The legend should incorporate definitions of any symbols used and all abbreviations and units of measurement should be explained so that the figure and its legend is understandable without reference to the text. (Provide a letter stating copyright authorisation if figures have been reproduced from another source.)
EMAILED MANUSCRIPTS: Authors should supply their
emailed paper formatted in the computer software WORD and forwarded to Prof. Mark Wahlqvist, [email protected]. The entire article (including tables and figures) should be supplied as a single file. If the figures cannot be inserted into the manuscript, provide as separate files. The following instructions should be adhered to:
• It is essential that the final, revised version of the accepted manuscript and the file emailed are identical.
• Do not use the carriage return (enter) at the end of lines within a paragraph.
• Turn the hyphenation option off. • Specify any special characters used to represent non-keyboard
characters. • Take care not to use l (ell) for 1 (one), O (capital o) for 0
(zero) or ß (German esszett) for b (Greek beta). • Use a tab, not spaces, to separate data points in tables. • If you use a table editor function, ensure that each data point
is contained within a unique cell, i.e. do not use carriage returns within cells.
• Digital figures must be supplied as .tif or .eps files at a resolution of at least 300 d.p.i (high-resolution print-outs are also required).
PROOFS, OFFPRINTS AND CHARGES FOR PAPERS Charges for accepted papers as of 1st July 2006: Charges consist of obligatory on-line subscription to APJCN for the year in which the paper is published by corresponding author or by author's institution. A paper may be exempt from the charges if at the time of submission all authors are financial members of the Asia Pacific Clinical Nutrition Society. Charges for accepted papers are payabale immediately on receiving letter of acceptance (please see subscription form for payment options).
Proofs: Proofs will be sent via email as a WORD file for-matted in APJCN style with 'tracking' activated so that all changes made to the manuscript by the author are clearly visible. Please also highlight all changes in yellow to ensure all edits are picked up. The edited proofs must be emailed within 5 days of receipt. Alterations to the text and figures (other than the essential correction of errors) are unacceptable at proof stage and authors may be charged for excessive alterations. Authors should therefore supply an email address to which proofs can be emailed. Proofs will be faxed if no email address is available. If absent, authors should arrange for a colleague to access their email, retrieve the emailed manu-script and check and return them to the publisher on their behalf.
Offprints: Free offprints are not provided to authors Charges: 50 offprints - AU$210 for 1-5 pages, $310 for >5 pages; 100 offprints - AU$270, 1-5 pages, AU$70 for >5 pages APJCN online & CD-ROM Past issues: Full papers are available free-of-charge; Journal abstracts and full papers will continue to be available on-line free-of-charge via the website http://www.healthyeatingclub.org/APJCN/ Volumes 1-13 can also be purchased on CD-ROM for AU$190 (see back cover of journal). Current issues: subscribers have on-line access to full papers on the website www.healthyeatingclub.org (password access).

.
Past issues - Free on-line access: abstracts and full papers www.healthyeatingclub.org/APJCN/
Journal issues from 1992 to 2004 on CD-ROM: The consolidated journal vol 1-13 can be purchased on CD-Rom for AU$190 by using the subscription form below.
Current Subscribers : on-line access to full papers from current year www.healthyeatingclub.org/APJCN/
Nutrition Society of Australia 30 years of Conference Proceedings (abstracts) Now available FREE on-line at www.healthyeatingclub.org/APJCN/
-----------------------------------------------------------------ORDER FORM--------------------------------------------------- subscriptions are for current calender year only – back issues wil l be supplied
for current calender year for late subscr iptions Please tick the boxes below corresponding to the type of subscription, whether you wish to
purchase the CD-ROM, order article reprints or single issues or pay for accepted papers (page charges)
Hard copy (including on-line access Online access only Personal Price: AU$195 AU$150 as of 1/7/2006 Institution: AU$400 AU$250 Past Issues of APJCN on CD-ROM: Volumes 1-13 AU$190 REPRINTS: Manuscripts 1-5 pages 50 copies AU$210 100 copies AU$270
Manuscripts >5 pages 50 copies AU$310 100 copies AU$370 Reprint details: vol………..issue……….pages……………title…...………………………………………...………………………………
SINGLE ISSUES: Year ………………Volume…………………Issue……………………….............. 1 copy AU$50.00
SINGLE PAPERS (pdf file): Year ………………Volume…………………Issue……………………….. 1 copy AU$20.00
CHARGES FOR ACCEPTED PAPERS as of 1/7/2006 obligatory on-line subscription to APJCN for year
in which paper is published by corresponding author ($150) or by author's institution ($250)
----------------------------------------------------------------------------------------------------------------------------------------------------------------------------
I enclose CHEQUE payment of ...........................(Australian citizens can pay by personal cheque, others must pay by BANK DRAFT in AUSTRALIAN CURRENCY ONLY) payable to HEC PRESS.
Direct Debit to HEC Press account: St George Bank Ltd, 99 Bell St, Preston Vic, Australia, 3072 BSB: 333-037 Account number: 552023032 swift code SGBLAU2S $AU ________________
I wish to pay by Visa MasterCard (Other cards are not accepted) Please debit my card no.
Amount in Australian dollars............................Expiry date on card…....…../.............………………….. …………….
Signature......................................……………………………………………………………………………………………….
Name...............................................................................................................................................................................
Address..............................................................................................................................................................................................
.................................................................................................................................Postcode........................................Telephone..............................................................Fax........................................................................................................... Please send me a receipt……Yes No Date this form was faxed/mailed…….…/………/…………......
Email (compulsory if want receipt or pdf file of paper or on-line access to APJCN)........................………….............................
On-line access Individuals - please provide preferred Username................................. Password....……....…......…..
Institutions – please provide IP address in C.I.D.R notation (network block&netmask)…………………………………..
Return this form to : HEC PRESS, c/o Dr Antigone Kouris-Blazos, PO Box 4121, McKinnon, Victoria, Australia, 3204.
Mob +61 0408551702 Fax +61 (0) 3 95154544 Email: [email protected]
Healthy Eating Club Pty Ltd ABN : 93 078 641 906
PO Box 4121,
McKinnon, Victoria 3204
Australia
Mob +61 0408551702 Fax +61 (0)3 95154544
www.healthyeatingclub.org
Asia Pacific Journal of Clinical Nutrition Editors: Prof. Mark Wahlqvist, Australia; Prof. Akira Okada, Japan; Prof Duo Li, China
Print ISSN: 0964-7058; Online ISSN: 1440-6047 Frequency: Quarterly (plus supplements)
HEC PRESS
APJCN SUBSCRIPTION FORM 2006
IMPORTANT
Asia Pacific Journal of Clinical Nutrition. Volume 15, Number 3, 2006
Contents: Review Article_____________________________________________________________________ Central obesity and risk of cardiovascular disease in the Asia Pacific Region ASIA PACIFIC COHORT STUDIES COLLABORATION
Original Articles____________________________________________________________________ Defining obesity by body mass index in the Thai population: an epidemiologic study CHATLERT PONGCHAIYAKUL, TUAN V NGUYEN, VONGSVAT KOSULWAT, NIPA ROJROONGWASINKUL, SOMSRI CHAROENKIATKUL, CHOOWONG PONGCHAIYAKUL, PATARA SANCHAISURIYA AND RAJATA RAJATANAVIN
Relation of anthropometric parameters to the functional assessment of HDL particle size in three ethnic cohorts HAMIDREZA ZAKERI, JIRI J FROHLICH AND SCOTT A LEAR
287 293
300
Use Of [14C]-sodium bicarbonate/urea to measure total energy expenditure in overweight men and women before and after low calorie diet induced weight loss NATALIE D LUSCOMBE, CHRISTOPHER TSOPELAS, MAX BELLON, PETER M CLIFTON, IAN KIRKWOOD AND GARY A WITTERT
307
Validity and reliability of BodyGem for measuring resting metabolic rate on Taiwanese women TSAN-HON LIOU, CHING-MIN CHEN, WAN-YU CHUNG AND NAIN-FENG CHU
Nutrition education in medical schools in Japan: results from a questionnaire survey HIDEO ORIMO, TOSHIRO SHIMURA AND TAKASHI SHIMADA
317
323
Nutritional status of pregnant women in Northeast Thailand CHRISTOPH U ANDERT, PATTARA SANCHAISURIYA, KANOKWAN SANCHAISURIYA, FRANK P SCHELP AND FLORIAN J SCHWEIGERT
329
Which mothers take folic acid and folate containing foods? COLIN BINNS, JANE SCOTT, NKEONYELU NWAFOR, KATHLEEN GRAHAM, WENDY ODDY AND ANDY LEE 335
Dietary and blood folate status of Malaysian women of childbearing age GEOK LIN KHOR, G DURAISAMY, SU PENG LOH AND TIMOTHY J GREEN 341
Anaemia and iron deficiency anaemia among young adolescent girls from the peri urban coastal area of Indonesia YUSTINA ANIE INDRIASTUTI KURNIAWAN, SITI MUSLIMATUN, ENDANG L ACHADI AND SOEMILAH SASTROAMIDJOJO
350
Goitre prevalence and the state of iodine nutrition in the sundarban delta of north 24-parganas in West Benegal AMAR K CHANDRA, SMRITIRATAN TRIPATHY, DISHARI GHOSH, ARIJIT DEBNATH AND SANJUKTA MUKHOPADHYAY
357
Determination of discretionary salt intake in an iodine deficient area of East Java-Indonesia using three different methods ANNASARI MUSTAFA, SITI MUSLIMATUN IR, JULIAWATI UNTORO IR, MARIA CPJ LAN IR AND YOHANES KRISTIANTO
362
Effects of probiotic or prebiotic supplemented milk formulas on fecal microbiota composition of infants OSCAR BRUNSER, GUILLERMO FIGUEROA, MARTIN GOTTELAND, ELIZABETH HASCHKE-BECHER, CORINE MAGLIOLA, FLORENCE ROCHAT, SYLVIA CRUCHET, RICHARD PALFRAMAN, GLENN GIBSON, FRANÇOISE CHAUFFARD AND FERDINAND HASCHKE
368
A population-based survey on infant feeding practice (0-2 years) in Hong Kong: breastfeeding rate and patterns among 3,161 infants below 6 months old WARREN TK LEE, SUSAN SH LUI, VERONICA CHAN, ERIC WONG AND JOSEPH LAU
377
Diet, nutritional knowledge and health status of urban middle-aged Malaysian women LW PON, MY NOOR-AINI, FB ONG, N ADEEB, SS SERI, K SHAMSUDDIN, AL MOHAMED, N HAPIZAH, A MOKHTAR AND HWH WAN
Good oral health, adequate nutrient consumption and family support are associated with a reduced risk of being underweight amongst older Malaysian residents of publicly funded shelter homes RENUKA VISVANATHAN AND ZAITON AHMAD
Structured triglyceride for parenteral nutrition: meta-analysis of randomized controlled trials YONG ZHOU, XIAO-TING WU, NI LI, WEN ZHUANG, GUANJIAN LIU, TAIXIANG WU AND MAO-LING WEI
The Glycemic Index of standard and diabetes-specific enteral formulas ZANDRIE HOFMAN, JENNEKE DE VAN DRUNEN AND HARM KUIPERS
Low dose supplementation with two different marine oils does not reduce pro-inflammatory eicosanoids and cytokines in vivo KAREN J MURPHY, KAREN GALVIN, MAIREAD KIELY, PATRICK A MORRISSEY, NEIL J MANN AND ANDREW J SINCLAIR
Evaluation of Rhodiola crenulata and Rhodiola Rosea for management of Type II diabetes and hypertension YOUNG-IN KWON, HAE-DONG JANG AND KALIDAS SHETTY
Potential of cranberry-based herbal synergies for diabetes and hypertension management EMANOUIL APOSTOLIDIS, YOUNG-IN KWON AND KALIDAS SHETTY
News and Views
388
400
406 412
418
425
433
442
HEC PRESS www.healthyeatingclub.org/APJCN/