effects of hydrodynamics and lagrangian transport on chemically reacting bubble flows
TRANSCRIPT
Chemical Engineering Science 59 (2004) 3907–3927www.elsevier.com/locate/ces
E�ects of hydrodynamics and Lagrangian transport onchemically reacting bubble 'ows
Athanas Koynov, Johannes G. Khinast∗
Department of Chemical and Biochemical Engineering, Rutgers University, Piscataway, NJ 08854, USA
Received 10 November 2003; accepted 17 May 2004
Abstract
The objective of this study is to investigate the dynamics of 'ows occurring in the wakes of rising bubbles of di�erent shapes andsizes. Di�erent wake dynamics can result in qualitatively di�erent mixing characteristics. In the case of fast gas–liquid reaction networks,reactions occur almost exclusively in the bubble wake. Thus, wake mixing can have a strong impact on the reaction yield and selectivity.Dynamic numerical simulations were performed to study the 'ow of liquid around bubbles of di�erent shapes. The obtained velocity andpressure :elds were used to investigate the liquid-phase mixing in the 'ow for each case. As a strong connection between mixing andchaos is known to exist, Lagrangian tracking of passive tracer particles was used to identify chaotic 'uid transport in the 'ows. Chaoticdynamics lead to folding and stretching of 'uid elements, which results in very e�ective mixing. To quantify mixing, stretching :eldswere computed for each 'ow case. Finally, di�erent liquid-phase chemical reaction networks were tested to illustrate the e�ects of mixingon chemical reaction yields and selectivities.? 2004 Elsevier Ltd. All rights reserved.
Keywords: Bubbles; Vortex-shedding; Chaotic mixing; Multiphase 'ows; Chemical reactions; Selectivity
1. Introduction
Many chemical reactors and other contacting devices areoperated in the presence of bubbles rising in a continuousliquid phase. Each bubble acts as a “micro-reactor”, wherea reactive gaseous component is transferred into the liquidphase, where it reacts to form various products. The dynam-ics of these “micro-reactors” are determined by various fac-tors, such as geometry, composition, pressure and temper-ature. Another important factor is the local hydrodynamicbehavior, which determines mixing of the reactants in thevicinity of the bubble and thus has signi:cant impact on theselectivity and yield of chemical reactions. It is for this rea-son that we focus our studies on the local hydrodynamicsclose to individual bubbles and on the impact of these hy-drodynamics on chemical reaction networks.
Multiphase reactors are used for many industrial pro-cesses, such as oxidations, hydrogenations or halogenations(Froment and Bischo�, 1990). Multiphase reactors can be
∗ Corresponding author. Tel.: +1 732 445 2970; fax: +1 732 445 2581.E-mail address: [email protected] (J.G. Khinast).
divided into two broad categories: continuous gas phase, dis-persed liquid phase (CGDL) reactors and continuous liquidphase, dispersed gas phase (CLDG) reactors. The latter cat-egory includes bubble columns, stirred vessels and jet loopreactors, where the gas phase is dispersed in the form ofbubbles. Bubble size and gas-holdup (which determine thegas–liquid interfacial area) can be controlled by appropri-ately changing the operating parameters, such as gas feedrate or stirrer speed, and by modifying the design, such assparger characteristics and reactor geometry. CLDG reac-tors often exhibit strong back mixing in the liquid phase,which can have a signi:cant impact on the eEciency of thereactor. For fast reaction systems, however, the backmix-ing and the macro-scale mixing patterns in the reactor areof secondary importance. If a reaction is fast enough, mostof the dissolved gas will be consumed within a short dis-tance from the gas–liquid interface. Therefore, the reactionwill occur primarily in a con:ned zone in close proximity tothe bubble surface (i.e., each bubble acts as an independentmicro-reaction device). In this case, the mixing around thebubble, and particularly in the bubble wake, will have thestrongest impact on the reaction selectivity, provided thatthe reaction network is mixing sensitive.
0009-2509/$ - see front matter ? 2004 Elsevier Ltd. All rights reserved.doi:10.1016/j.ces.2004.05.028

3908 A. Koynov, J.G. Khinast / Chemical Engineering Science 59 (2004) 3907–3927
The in'uence of mixing on chemical reactions was:rst studied for homogeneous systems by van Kreve-len (1958), Kramers (1958), and Danckwerts (1958).Parallel-consecutive reactions have been considered byPaul and Treybal (1971) (iodine and L-tyrosine), Bourne etal. (1977), Nienow et al. (1992) and many other researchgroups. The problem has been extended to the multiphasecase by Doraiswamy and Sharma (1984) and Ba ldyga andBourne (1999). In a recent study we investigated the impactof 2-D bubble dynamics on the selectivity of fast gas–liquidreactions using direct simulations of the 'ow around risingbubbles (Khinast, 2001). We found that the wake-type ofthe bubble may have signi:cant in'uence on the selectivityof various reaction networks. In the present study our anal-ysis is extended to include a detailed investigation of thewake and stretching dynamics as well as the local mixing.Mixing and its impact on chemical reaction networks hasbeen studied by many research groups and, recently, signif-icant progress in the understanding of laminar mixing wasmade based on the connection between chaos and mixing(mixing arises due to stretching and folding, which in turncan be related to chaotic transformations). Chaotic motiongreatly improves mixing eEciency in many 'ow systems,as shown by Aref (1984), Aref and Jones (1988), Swansonand Ottino (1990), Muzzio et al. (1991) and others.
Studies of the 'uid 'ow past solid obstacles date as farback as the sixteenth century, to drawings made by Leonardoda Vinci (Popham, 1946). A major focus of subsequent stud-ies was the development of accurate pendulum clocks forthe determination of a ship’s location at high sea. Construc-tion of these clocks required a detailed understanding of theair'ow (and drag) around a swinging pendulum. 1 Over theyears, both theoretical and experimental studies have beencarried out, in an e�ort to understand the hydrodynamics ofwake 'ows. A review on the subject is given by Bearmanand Graham (1980).
In our work direct numerical simulations (DNS) of theliquid 'ow around a bubble were performed. Two di�er-ent bubble shapes were considered—circular and elliptical.The 'ow is characterized by two parameters—the Reynoldsnumber and the aspect ratio of the bubble. The continuity andNavier–Stokes equations were solved for the liquid phasewith a perfect-slip boundary condition at the bubble surface.The validity of the model was then tested by the computa-tion of the drag and lift coeEcients from a force balance onthe bubble surface and a comparison with empirical modelsfound in the literature. The two di�erent bubble shapes werechosen because they result in fundamentally di�erent typesof bubble wakes. At low Reynolds numbers both the circu-lar and elliptical bubbles exhibit closed, steady wakes. Atintermediate Reynolds numbers the elliptical bubble wake
1 The Longitude Act was passed in England in 1714, in which Parlia-ment promised a prize of 20,000 pounds for the solution to the longitudeproblem. To win the prize, the inventor had to construct an accurate andreliable pendulum clock (Sobel, 1995).
develops two recirculation zones. At higher Reynolds num-bers the recirculation zones become unstable, and an un-steady, open wake develops, accompanied by periodic vor-tex shedding. In contrast to elliptical bubbles, the wake ofthe circular bubbles stays closed at all Reynolds numbersconsidered in this work.
In the case of solid bodies, recirculating wakes and vor-tex shedding always occur above a certain Reynolds num-ber, due to the generation of vorticity at the surface, whereboth normal and tangential components of the 'uid veloc-ity equal zero. For bubbles, however, at the gas–liquid sur-face the no-slip boundary condition is not satis:ed. In fact,the behavior of the liquid at the interface is better describedby a perfect slip boundary condition, corresponding to zeroshear stress at the surface. In real systems, the boundary con-dition should lie somewhere between the ideal no-slip andperfect-slip cases, depending on the purity of the 'uid, theconcentration of surfactants and the size of the bubble. At aperfect-slip boundary vorticity is created at rates inverselyproportional to the surface curvature (Moore, 1958). Thus,for spherical bubbles the surface curvature does not gener-ate enough vorticity to cause the formation of recirculationzones and vortex shedding.
In order to investigate the dynamical properties andmixing characteristics of the 'ow, our DNS-obtainedliquid-phase velocity :elds were analyzed. Analysis of the'ow includes identi:cation of the 'ow’s critical points,which in the case of two-dimensional incompressible 'owscan only be centers (elliptical points, such as the centers ofvortices) or saddles (hyperbolic points, such as the separa-tion of the 'ow from the bubble’s surface), followed by thedetermination of their stability. Additionally, a Lagrangiantracking algorithm was implemented for the purposes oftracking of the passive advection of 'uid elements by the'ow. Volume conservation, as dictated by the continuityequation, allows for the Lagrangian mechanics to be treatedas Hamiltonian. The two spatial coordinates of the 'uidelement can be regarded as equivalent to the canonicallyconjugate momentum and position variables in the Hamil-ton equation of a one-dimensional particle in a force :eld.Then the stream function of the 'ow assumes the role ofthe Hamiltonian (Jung et al., 1993). Due to these paral-lels, two-dimensional passive hydrodynamic transport canbe viewed as analogous to Hamiltonian scattering. It isknown from the theory of chaotic scattering that a parti-cle’s motion is organized around a non-attractive chaoticset (chaotic saddle), which consists of all periodic orbits inthe interaction region and their heteroclinic and homoclinicconnections. The study of the scattering process aims tosupply the important characteristics of this chaotic set.
While very useful for the understanding of the mecha-nism of mixing, analysis of dynamic scattering should becoupled with a quantitative description of the mixing pro-cess. A number of researchers have used stretching analy-sis of material segments (e.g., Horita et al., 1990; Muzzioet al., 1992). This technique helps to locate the regions of

A. Koynov, J.G. Khinast / Chemical Engineering Science 59 (2004) 3907–3927 3909
low and high stretching rates, which correspond to good andpoor local mixing, and can provide a considerable amountof quantitative information about the mixing process (Liuet al., 1994). In our study, an in:nitesimal vector’s evolutionis monitored as it is convected and stretched by the 'ow.This allows for a stretching :eld to be associated with thecorresponding velocity :eld, indicating the relative stretch-ing (and mixing) rate at each point in the domain. Anotherway to obtain stretching information is to consider the actualmechanism of stretching, i.e., to analyze what properties ofthe liquid 'ow :eld cause deformation of material elements.This approach has been implemented by Dresselhaus andTabor (1991) for the computation of stretching in general'ow :elds and has clari:ed the dependence of stretchingon the alignment of the material element with the straining:eld. A similar method is used by us.
This article is organized as follows: the next Section in-troduces the mathematical model for the 'ow around thebubble and supplies details on the numerical techniques usedto solve the model equations. In Section 3, the hydrody-namics of the 'ow, stretching and Lagrangian particle track-ing analyses are presented. This section aims to analyze the'ow to detect chaotic behavior and to quantify the mixingprocess by computing the stretching :elds for the di�erent'ow cases. Section 4 gives results on the transport of in-ert scalars, and Section 5 presents our results on how localmixing a�ects the selectivity of various reaction networks.
2. Mathematical model and numerical solution
The bubble model used to compute the local liquid-phase'ow :eld is similar to the one described in a previous pa-per (Khinast, 2001). Assumptions and details of the math-ematical model are presented there. The continuity, Navier–Stokes and mass balance equations are written in a 2-Dconformal, elliptical coordinate system (Fig. 1):
@(hu)@�
+@(hv)@’
= 0; (1)
@u@t
+uh
@u@�
+vh
@u@’
− v2
h2 h� +uvh2 h’
= − 1h
@P@�
+1
Re h
(@@�
(1h2
@hu@�
)
+@@’
(1h2
@hu@’
)− 2
h3
(h�
@hv@’
− h’@hv@�
))(2)
@v@t
+uh
@v@�
+vh
@v@’
+uvh2 h� − u2
h2 h’
= − 1h
@P@’
+1
Re h
(@@�
(1h2
@hv@�
)+
@@’
(1h2
@hv@’
)
− 2h3
(h’
@hu@�
− h�@hu@’
))(3)
y
U∞
u
v
x
ϕα
η0
η∞
η
Fig. 1. Elliptical coordinate system used in the simulations.
@ci@t
+1h
(u@ci@�
+ v@ci@’
)
=1
Peih2
(@2ci@�2 +
@2ci@’2
)+
m∑j=1
�ijrj(ci): (4)
Eq. (1) is the dimensionless continuity equation, Eqs. (2)and (3) the Navier–Stokes equations, and Eq. (4) is the massbalance of reactive species i in the 'ow. Half the interfocaldistance of the elliptical bubble a is used as characteristiclength, the terminal rise velocity U∞ is the reference velocityand the bulk concentration of the liquid-phase reactant cA; inis the reference concentration (cA; in =1 kmol=m3), resultingin the dimensionless set of variables
t =tU∞a
; P =P
U 2∞�; u =
uU∞
;
v =v
U∞; ci =
cicA; in
: (5)
The grid transformation, as described in Khinast (2001) isgiven by
x = a sinh � cos’ and y = a cosh � sin ’; (6)
where � ranges from �0 to ∞, and ’ from 0 to 2�. 2a is the in-terfocal distance of the elliptical bubble, i.e., a=
√d2
1 − d22,
where d1 = a cosh �0 (the major semi-axis of the ellipse),d2=a sinh �0 (the minor semi-axis of the ellipse), and � is theaspect ratio, i.e., the minor divided by the major semi-axisof the ellipse. Thus, �0 = ln
√(1 + �)=(1 − �). The dimen-
sionless scaling factors h and their respective derivatives inEqs. (1)–(4) are
h =√
cosh2 � − sin2 ’; h� =@h@�
=sinh � cosh �
h;
h’ =@h@’
= − sin ’ cos’h
: (7)
3910 A. Koynov, J.G. Khinast / Chemical Engineering Science 59 (2004) 3907–3927
Table 1Parameters used in the calculations
Parameter Value
cB;eq 0.081� 0.5, 0.98Re 1–200Sci 40–120
First reaction network:Da1 10 = Da2=Da1 5, 10, 20, 50
Second reaction network:Da1 0.004Da2 0.004Da3 0.01
The Reynolds number Re is de:ned as
Re =aU∞�
!: (8)
The Reynolds number used in this paper is the Reynoldsnumber, Re, based on the major axis of the ellipse. Thus,Re is related to Re by
Re = 2 cosh �0 Re: (9)
In many studies, the equivalent bubble diameter is used inthe bubble Reynolds number Reb. However, this would leadto very low Reynolds numbers for low aspect ratios (a 'atplate of length 2·d1 would lead to zero equivalent diameter).The bubble Reynolds number Reb based on the equivalentdiameter is given by
Reb =√� Re = 2 cosh �0
√� Re: (10)
The Peclet number for every species is
Pei =U∞aDi
= Re · Sci; (11)
where Sci is the Schmidt number of species i. The de:nitionof the DamkQohler number is given in Section 5.
The set of parameters used in the calculations is reportedin Table 1 and is typical for gas–liquid reactions at elevatedtemperatures and pressures. The bubble types studied are el-liptical and circular bubbles. For a circular bubble an aspectratio of 0.98 was used to approximate the geometry (� = 1would lead to a singular grid). Note that since it is assumedthat the bubble consists of a pure gas (e.g., hydrogen), nodepletion occurs and cB;eq remains constant.
In order to solve the reactive 'ow equations, a novelCFD-reaction solver was developed. The algorithm is basedon a :nite-di�erence, staggered-grid discretization of thespatial derivatives in the Navier–Stokes and continuity equa-tion, and a :nite-volume discretization of the mass balancesto guarantee mass conservation (Fletcher, 1997). The cho-sen grid is non-uniform, and depending on the magnitudeof velocity and concentration gradients a di�erent grid formass and momentum balances can be used. The Peclet num-bers in the mass balances are in the order of 104 leading
to oscillations in the liquid-phase concentrations. Thus, amixed scheme of donor-cell discretization (# = 1) and cen-tral di�erences (#= 0) was used. In the simulations, a valueof # = 0:1 was necessary, leading to a minimal deviationfrom the second-order results. Donor-cell discretization wasnot necessary in the NSE equation up to Reynolds numbersof 200. The resulting set of di�erential-algebraic equations(DAE) was integrated in time using the recently released,new version of LIMEX (Deu'hard et al., 1987; Ehrig etal., 1999). This solver is based on the extrapolation of asemi-implicit Euler discretization. Details on the numericalscheme can be found in Khinast (2001). In our computa-tions a 100 × 100 grid was used, where the far :eld bound-ary was chosen to be 40 times the bubble semi-axis d1 awayfrom the bubble surface. This distance results in suEcientlyaccurate resolution of the 'ow :eld.
For the purposes of Lagrangian tracking of passive 'uidmarkers, a :ne rectangular grid (600×300) was superim-posed over the elliptical 'ow domain. This Cartesian gridwith a width of 20 × d1 extends from 10 × d1 in front ofthe bubble to 20 × d1 behind the bubble. This geometryallows tracking and resolution of all essential 'uid dynam-ics. The values of the liquid-phase velocity at each Carte-sian grid point were obtained by converting the Cartesianinto elliptical coordinates, followed by a bi-cubic interpola-tion of the elliptical velocity :eld (Press et al., 1989) anda back-conversion into Cartesian velocities. Thus the vec-tor :eld u = [u; v]T was converted into Cartesian velocitiesU = [U; V ]T. The Lagrangian equation for the advection ofa passive 'uid particle in Cartesian coordinates is then
ddtx =U(x(t); t); (12)
where x(t) is the position of the particle. For the particletracking the velocity is locally interpolated again using abi-cubic interpolation at each spatial position, using the ve-locities at the surrounding grid points.
3. Hydrodynamics
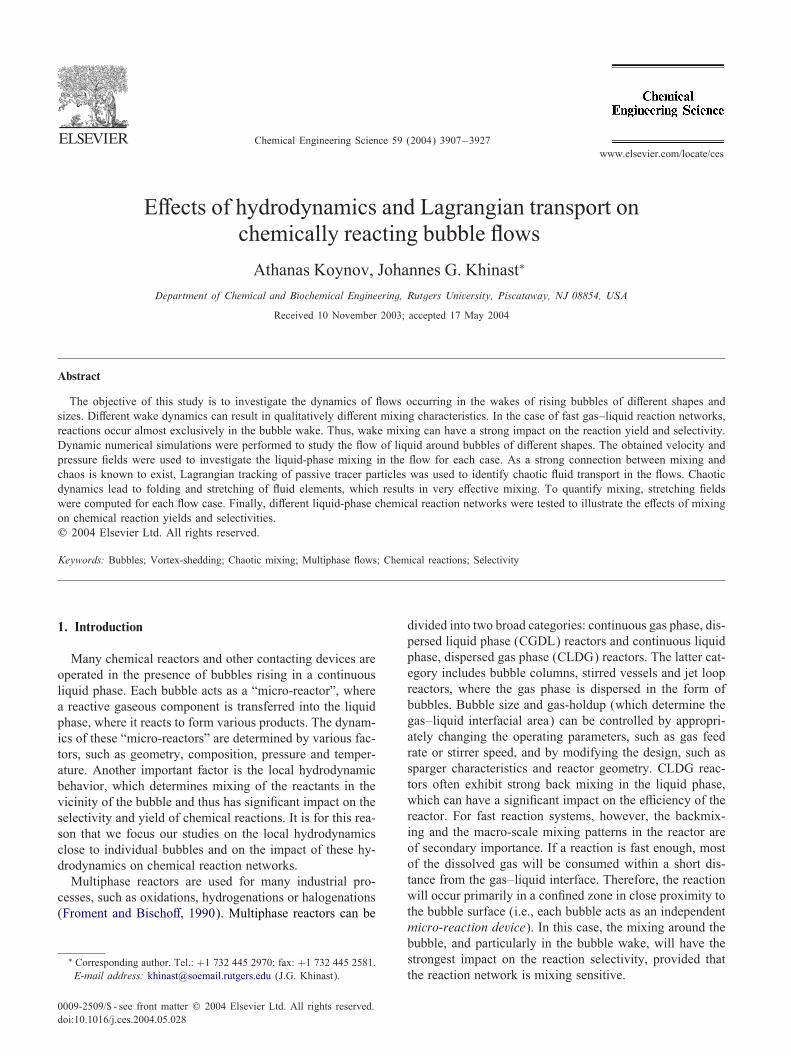
Fig. 2 presents an overview of the di�erent types of wakesthat can be obtained in the 'ow around a two-dimensionalobject with perfect slip boundary conditions. Simulation re-sults are shown for an elliptical bubble of aspect ratio 0.5and for Reynolds numbers between 1 and 200. Both vectorplots and stream traces are shown. In each plot the 'ow iscoming from the left side and 'owing toward the right side.As can be seen, three di�erent types of 2-D wakes are ob-tained. At low Reynolds numbers (Re = 1 and 5) the wakeis closed and the liquid 'ows smoothly around the bubble.At higher Reynolds numbers (Re¿ 8) a recirculation zoneforms (Re = 10 and 40). Above a Reynolds number of 52,a stable instationary vortex shedding 'ow develops. Snap-shots of the 'uid velocity vector-:elds and streamlines forRe = 60 and 200 are also shown in Fig. 2.
A. Koynov, J.G. Khinast / Chemical Engineering Science 59 (2004) 3907–3927 3911
Re=1 Re=40
Re=60
Re=200Re=10
Re=5
Fig. 2. Streamlines and vector plots of the 'ow around a rising elliptical bubble (� = 0:5) with a perfect slip boundary condition.
0 10 20 30 40
-0.020
-0.015
-0.010
-0.005
0.000
0.005
0.010
0.015
u Cen
terl
ine
[-]
Re
ucenterline
Fig. 3. Centerline velocity (at x = 1:2d1) behind the bubble as a functionof the Reynolds number.
Coming back to the low-Reynolds number case in Fig. 2,it can be seen that the hydrodynamics are controlled mainlyby viscous e�ects, resulting in a creeping-type 'ow. In thewake of the bubble, a zone of low liquid velocity forms, i.e.,in this region, the 'uid is essentially rising with the bubble.As the Reynolds number increases, this close-to-stagnantzone becomes larger, and the velocity di�erence to the out-side region, i.e., the 'ow past the wake zone, increases. Atsome point the di�erence between the velocities inside andoutside the zone is high enough for a cavity (a recircula-tion zone) to form behind the bubble. Fig. 3 shows a plotof the centerline component of the liquid velocity immedi-ately behind the bubble (at x = 1:2d1). The development ofthe recirculation zones coincides with the centerline veloc-ity becoming negative and occurs at a Reynolds number ofaround 8. This cavity consists of two symmetric circulationcells, as can be seen from the velocity :eld plots for Re=10and 40 in Fig. 2. As the Reynolds number increases, therecirculation zones grow in size. Fig. 4 shows the velocity:eld around the bubble for Re = 20. The streamtraces lie
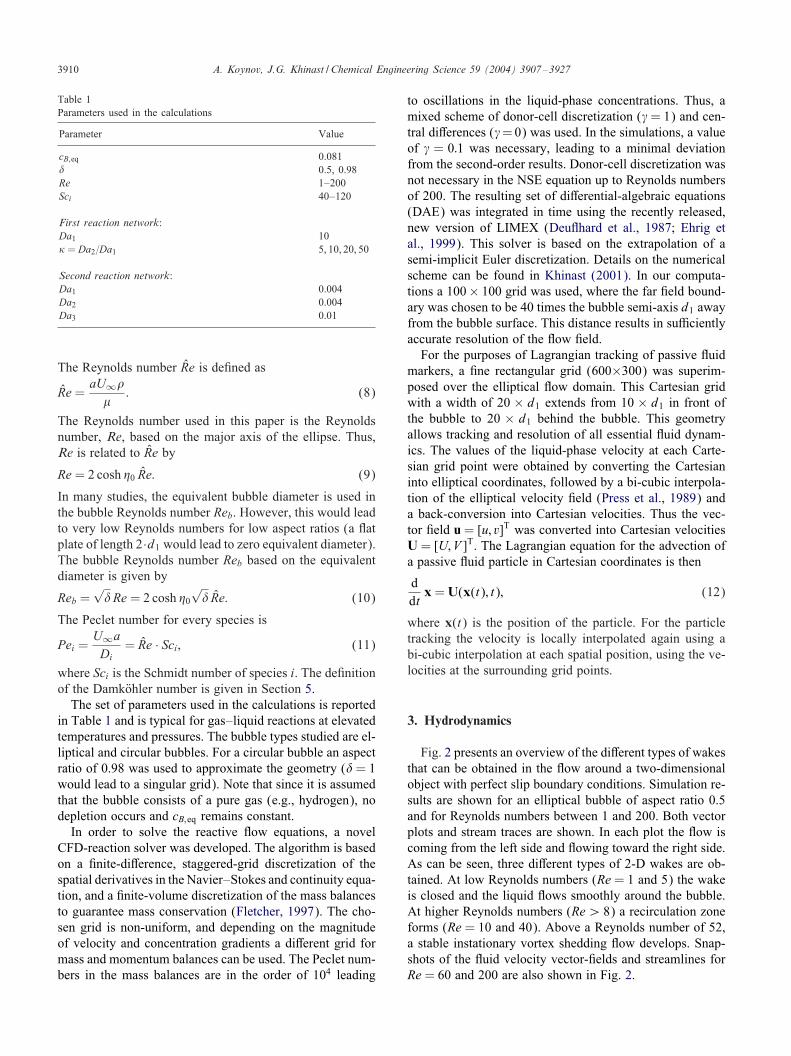
approximately along the separatrix curves, which are linesthat can end only at a hyperbolic point (intersection of aconvergence and a divergence line) or at in:nity. The :vehyperbolic points (or saddles) are identi:ed with the capitalletters A–E, where E is the stagnation point at the bubbleroof, A and C are the separation points close to the bub-ble edges, and B and D are the two stagnation points in therecirculation zone. Streamtraces cannot cross the separatri-ces, which means that a liquid element that did not origi-nate inside the recirculation zones cannot be advected intothem. Material transport in and out of the zones can occuronly through di�usion. This, as will be shown below, has asigni:cant in'uence on micromixing and chemical reactionselectivity.
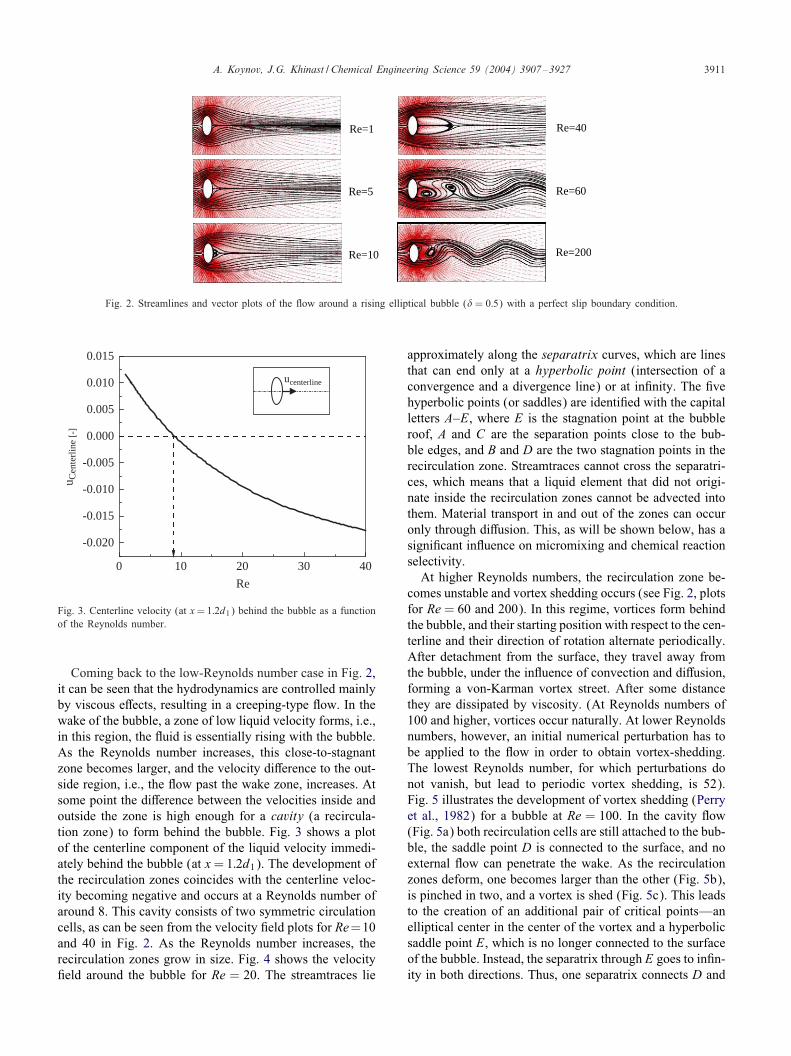
At higher Reynolds numbers, the recirculation zone be-comes unstable and vortex shedding occurs (see Fig. 2, plotsfor Re = 60 and 200). In this regime, vortices form behindthe bubble, and their starting position with respect to the cen-terline and their direction of rotation alternate periodically.After detachment from the surface, they travel away fromthe bubble, under the in'uence of convection and di�usion,forming a von-Karman vortex street. After some distancethey are dissipated by viscosity. (At Reynolds numbers of100 and higher, vortices occur naturally. At lower Reynoldsnumbers, however, an initial numerical perturbation has tobe applied to the 'ow in order to obtain vortex-shedding.The lowest Reynolds number, for which perturbations donot vanish, but lead to periodic vortex shedding, is 52).Fig. 5 illustrates the development of vortex shedding (Perryet al., 1982) for a bubble at Re = 100. In the cavity 'ow(Fig. 5a) both recirculation cells are still attached to the bub-ble, the saddle point D is connected to the surface, and noexternal 'ow can penetrate the wake. As the recirculationzones deform, one becomes larger than the other (Fig. 5b),is pinched in two, and a vortex is shed (Fig. 5c). This leadsto the creation of an additional pair of critical points—anelliptical center in the center of the vortex and a hyperbolicsaddle point E, which is no longer connected to the surfaceof the bubble. Instead, the separatrix through E goes to in:n-ity in both directions. Thus, one separatrix connects D and
3912 A. Koynov, J.G. Khinast / Chemical Engineering Science 59 (2004) 3907–3927
Fig. 4. Flow around an elliptical bubble (� = 0:5) at Re = 20. A; B; C; D; E—saddle points.
Fig. 5. Streamlines of the developing vortex-shedding 'ow around an elliptical bubble (� = 0:5) for Re = 100. A; B; C; D; E—saddle points. Arrowsindicate channel through which mass can 'ow into the wake.
A, another one D and B, and the separatrix going through Ereaches ±∞. Thus, a channel forms between this newly cre-ated separatrix (E;±∞) and separatrix (C, D, ∞) throughwhich 'uid can 'ow into the wake, enabling the supply offresh liquid-phase reactant into the reaction zone. Fig. 5dshows the formation of the channel.
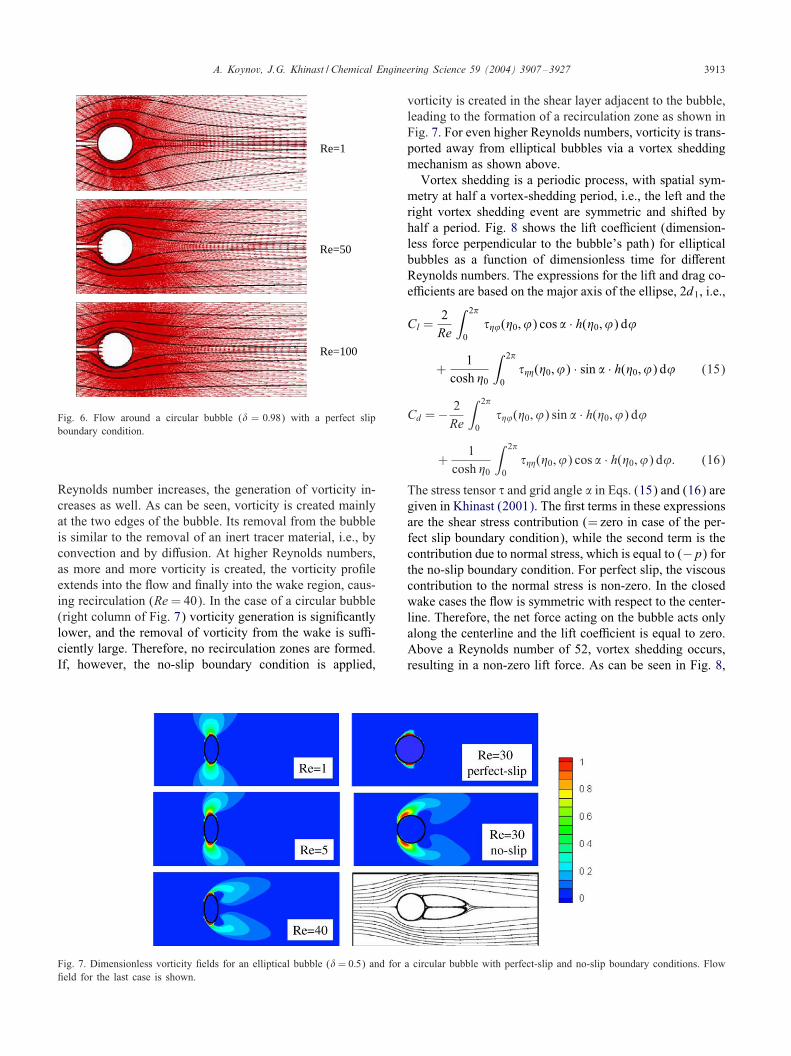
In the case of a circular bubble, the wake remains steadyand closed, and vortex shedding never occurs, regardlessof the strength of the perturbation applied. The 'ow :eldsaround a circular bubble are shown in Fig. 6 for Reynoldsnumbers of 1, 50 and 100. The streamtraces in the threecases are similar and show a steady, closed wake with norecirculation for each Reynolds number, indicating that notenough vorticity is created to cause the formation of vorticesor recirculation zones. Recirculation and vortex sheddingoccur due to vorticity being generated at rates higher than itsremoval rate. For solid bodies, the source of vorticity gen-eration is the shear layer at the no-slip surface. For bubbles,however, the no-slip boundary condition does not apply and
vorticity generation depends on the curvature of the bubbleas shown by Leal (1989). Only the increasing curvature ofnon-spherical bubbles creates suEcient vorticity to inducerecirculation or vortex shedding. Fig. 7 shows the contourplots of the dimensionless vorticity :elds ! around bubblesfor di�erent Reynolds numbers. The vorticity was computedas the absolute imaginary eigenvalues of the tensor A, i.e.,
! =(
dVdx
− @Udy
)= 2
√det(A − AT
2
); (13)
where A denotes the dimensionless dyadic tensor ∇U withelements
ai; j = @iUj; (14)
where @1 = @=@x and @2 = @=@y. Note that Fig. 7 showsthe dimensionless vorticity, which should be of O(1). Thedimensional vorticity ! scales with U∞=d1, and thus, if thegeometry of the bubble remains constant (i.e., d1 = const:)the vorticity scales with the Reynolds number. Thus, as the
A. Koynov, J.G. Khinast / Chemical Engineering Science 59 (2004) 3907–3927 3913
Re=1
Re=50
Re=100
Fig. 6. Flow around a circular bubble (� = 0:98) with a perfect slipboundary condition.
Reynolds number increases, the generation of vorticity in-creases as well. As can be seen, vorticity is created mainlyat the two edges of the bubble. Its removal from the bubbleis similar to the removal of an inert tracer material, i.e., byconvection and by di�usion. At higher Reynolds numbers,as more and more vorticity is created, the vorticity pro:leextends into the 'ow and :nally into the wake region, caus-ing recirculation (Re = 40). In the case of a circular bubble(right column of Fig. 7) vorticity generation is signi:cantlylower, and the removal of vorticity from the wake is suE-ciently large. Therefore, no recirculation zones are formed.If, however, the no-slip boundary condition is applied,
Fig. 7. Dimensionless vorticity :elds for an elliptical bubble (� = 0:5) and for a circular bubble with perfect-slip and no-slip boundary conditions. Flow:eld for the last case is shown.
vorticity is created in the shear layer adjacent to the bubble,leading to the formation of a recirculation zone as shown inFig. 7. For even higher Reynolds numbers, vorticity is trans-ported away from elliptical bubbles via a vortex sheddingmechanism as shown above.
Vortex shedding is a periodic process, with spatial sym-metry at half a vortex-shedding period, i.e., the left and theright vortex shedding event are symmetric and shifted byhalf a period. Fig. 8 shows the lift coeEcient (dimension-less force perpendicular to the bubble’s path) for ellipticalbubbles as a function of dimensionless time for di�erentReynolds numbers. The expressions for the lift and drag co-eEcients are based on the major axis of the ellipse, 2d1, i.e.,
Cl =2Re
∫ 2�
0+�’(�0; ’) cos , · h(�0; ’) d’
+1
cosh �0
∫ 2�
0+��(�0; ’) · sin , · h(�0; ’) d’ (15)
Cd = − 2Re
∫ 2�
0+�’(�0; ’) sin , · h(�0; ’) d’
+1
cosh �0
∫ 2�
0+��(�0; ’) cos , · h(�0; ’) d’: (16)
The stress tensor � and grid angle , in Eqs. (15) and (16) aregiven in Khinast (2001). The :rst terms in these expressionsare the shear stress contribution (= zero in case of the per-fect slip boundary condition), while the second term is thecontribution due to normal stress, which is equal to (−p) forthe no-slip boundary condition. For perfect slip, the viscouscontribution to the normal stress is non-zero. In the closedwake cases the 'ow is symmetric with respect to the center-line. Therefore, the net force acting on the bubble acts onlyalong the centerline and the lift coeEcient is equal to zero.Above a Reynolds number of 52, vortex shedding occurs,resulting in a non-zero lift force. As can be seen in Fig. 8,
3914 A. Koynov, J.G. Khinast / Chemical Engineering Science 59 (2004) 3907–3927
-0.8
-0.6
-0.4
-0.2
0
0.2
0.4
0.6
0.8
0 20 40 60 80 100 120 140
Dimensionless time [-]
Lif
t coe
ffic
ient
, Cl
Re=200Re=100
Re=60
Re<52
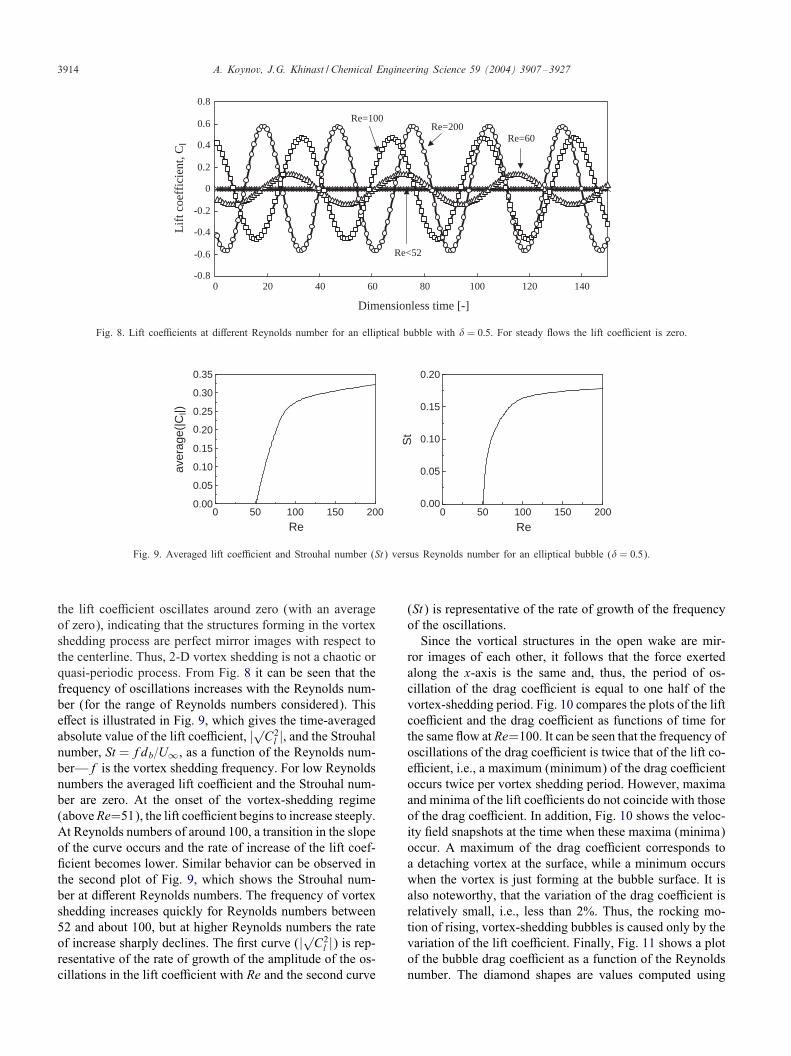
Fig. 8. Lift coeEcients at di�erent Reynolds number for an elliptical bubble with � = 0:5. For steady 'ows the lift coeEcient is zero.
0 50 100 150 2000.00
0.05
0.10
0.15
0.20
0.25
0.30
0.35
aver
age(
|Cl|)
Re0 50 100 150 200
0.00
0.05
0.10
0.15
0.20
St
Re
Fig. 9. Averaged lift coeEcient and Strouhal number (St) versus Reynolds number for an elliptical bubble (� = 0:5).
the lift coeEcient oscillates around zero (with an averageof zero), indicating that the structures forming in the vortexshedding process are perfect mirror images with respect tothe centerline. Thus, 2-D vortex shedding is not a chaotic orquasi-periodic process. From Fig. 8 it can be seen that thefrequency of oscillations increases with the Reynolds num-ber (for the range of Reynolds numbers considered). Thise�ect is illustrated in Fig. 9, which gives the time-averagedabsolute value of the lift coeEcient, |√C2
l |, and the Strouhalnumber, St = fdb=U∞, as a function of the Reynolds num-ber—f is the vortex shedding frequency. For low Reynoldsnumbers the averaged lift coeEcient and the Strouhal num-ber are zero. At the onset of the vortex-shedding regime(above Re=51), the lift coeEcient begins to increase steeply.At Reynolds numbers of around 100, a transition in the slopeof the curve occurs and the rate of increase of the lift coef-:cient becomes lower. Similar behavior can be observed inthe second plot of Fig. 9, which shows the Strouhal num-ber at di�erent Reynolds numbers. The frequency of vortexshedding increases quickly for Reynolds numbers between52 and about 100, but at higher Reynolds numbers the rateof increase sharply declines. The :rst curve (|√C2
l |) is rep-resentative of the rate of growth of the amplitude of the os-cillations in the lift coeEcient with Re and the second curve
(St) is representative of the rate of growth of the frequencyof the oscillations.
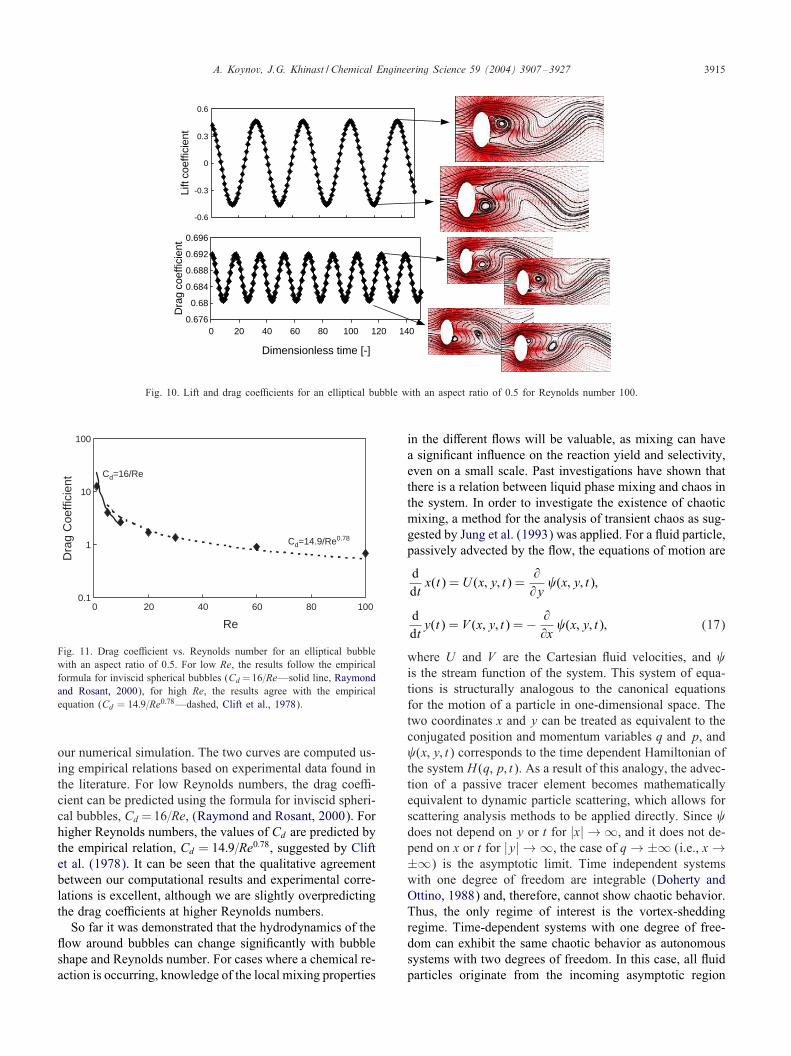
Since the vortical structures in the open wake are mir-ror images of each other, it follows that the force exertedalong the x-axis is the same and, thus, the period of os-cillation of the drag coeEcient is equal to one half of thevortex-shedding period. Fig. 10 compares the plots of the liftcoeEcient and the drag coeEcient as functions of time forthe same 'ow at Re=100. It can be seen that the frequency ofoscillations of the drag coeEcient is twice that of the lift co-eEcient, i.e., a maximum (minimum) of the drag coeEcientoccurs twice per vortex shedding period. However, maximaand minima of the lift coeEcients do not coincide with thoseof the drag coeEcient. In addition, Fig. 10 shows the veloc-ity :eld snapshots at the time when these maxima (minima)occur. A maximum of the drag coeEcient corresponds toa detaching vortex at the surface, while a minimum occurswhen the vortex is just forming at the bubble surface. It isalso noteworthy, that the variation of the drag coeEcient isrelatively small, i.e., less than 2%. Thus, the rocking mo-tion of rising, vortex-shedding bubbles is caused only by thevariation of the lift coeEcient. Finally, Fig. 11 shows a plotof the bubble drag coeEcient as a function of the Reynoldsnumber. The diamond shapes are values computed using
A. Koynov, J.G. Khinast / Chemical Engineering Science 59 (2004) 3907–3927 3915
-0.6
-0.3
0
0.3
0.6
Lift
coef
ficie
nt
0.676
0.68
0.684
0.688
0.692
0.696
0 20 40 60 80 100 120 140
Dimensionless time [-]
Dra
g co
effic
ient
Fig. 10. Lift and drag coeEcients for an elliptical bubble with an aspect ratio of 0.5 for Reynolds number 100.
0.1
1
10
100
0 20 40 60 80 100
Re
Dra
g C
oeffi
cien
t
Cd=14.9/Re0.78
Cd=16/Re
Fig. 11. Drag coeEcient vs. Reynolds number for an elliptical bubblewith an aspect ratio of 0.5. For low Re, the results follow the empiricalformula for inviscid spherical bubbles (Cd =16=Re—solid line, Raymondand Rosant, 2000), for high Re, the results agree with the empiricalequation (Cd = 14:9=Re0:78—dashed, Clift et al., 1978).
our numerical simulation. The two curves are computed us-ing empirical relations based on experimental data found inthe literature. For low Reynolds numbers, the drag coeE-cient can be predicted using the formula for inviscid spheri-cal bubbles, Cd = 16=Re, (Raymond and Rosant, 2000). Forhigher Reynolds numbers, the values of Cd are predicted bythe empirical relation, Cd = 14:9=Re0:78, suggested by Cliftet al. (1978). It can be seen that the qualitative agreementbetween our computational results and experimental corre-lations is excellent, although we are slightly overpredictingthe drag coeEcients at higher Reynolds numbers.
So far it was demonstrated that the hydrodynamics of the'ow around bubbles can change signi:cantly with bubbleshape and Reynolds number. For cases where a chemical re-action is occurring, knowledge of the local mixing properties
in the di�erent 'ows will be valuable, as mixing can havea signi:cant in'uence on the reaction yield and selectivity,even on a small scale. Past investigations have shown thatthere is a relation between liquid phase mixing and chaos inthe system. In order to investigate the existence of chaoticmixing, a method for the analysis of transient chaos as sug-gested by Jung et al. (1993) was applied. For a 'uid particle,passively advected by the 'ow, the equations of motion are
ddt
x(t) = U (x; y; t) =@@y
(x; y; t);
ddt
y(t) = V (x; y; t) = − @@x
(x; y; t); (17)
where U and V are the Cartesian 'uid velocities, and is the stream function of the system. This system of equa-tions is structurally analogous to the canonical equationsfor the motion of a particle in one-dimensional space. Thetwo coordinates x and y can be treated as equivalent to theconjugated position and momentum variables q and p, and (x; y; t) corresponds to the time dependent Hamiltonian ofthe system H (q; p; t). As a result of this analogy, the advec-tion of a passive tracer element becomes mathematicallyequivalent to dynamic particle scattering, which allows forscattering analysis methods to be applied directly. Since does not depend on y or t for |x| → ∞, and it does not de-pend on x or t for |y| → ∞, the case of q → ±∞ (i.e., x →±∞) is the asymptotic limit. Time independent systemswith one degree of freedom are integrable (Doherty andOttino, 1988) and, therefore, cannot show chaotic behavior.Thus, the only regime of interest is the vortex-sheddingregime. Time-dependent systems with one degree of free-dom can exhibit the same chaotic behavior as autonomoussystems with two degrees of freedom. In this case, all 'uidparticles originate from the incoming asymptotic region

3916 A. Koynov, J.G. Khinast / Chemical Engineering Science 59 (2004) 3907–3927
30
50
70
0 5 10 15Time of release [-]
Tim
e de
lay
[-]
20406080
100
1.85 1.9 1.95 2
0
20
40
60
80
0 5 10 15 20 25
Tim
e de
lay
[-]
(a)
(b)
Fig. 12. Trajectories of 'uid particles passively advected in the 'ow around (a) a solid cylinder and (b) an elliptical bubble with the corresponding timedelay functions.
(x → −∞) where the dynamics are not time dependent,move into the region close to the bubble where the dynam-ics are time dependent, and leave the domain at the out'owasymptotic region (x → ∞). It is known from the theory ofchaotic scattering that in an open system like this the onlychaotic dynamics possible are transient chaotic dynamics(Jung et al., 1993).
In our simulations, tracer particles were released into thedomain from the in'ow asymptotic region at regular timeintervals, and the time delay was measured. The time delayfunction is de:ned as the time it takes a particle to reach theout-'ow asymptotic region. An indicator of transient chaosis the presence of discontinuities in the time delay function.Each of these discontinuities has a fractal structure, with thetime a particle spends in the system reaching in:nity on thefractal set. In their study of scattering chaos in time-periodic'uid 'ows, Jung et al. (1993) performed 2D numerical sim-ulations of vortex shedding in the wake of a solid cylinderat Re= 250. Their simulations were repeated for the numer-ically analogous case of a 2D 'ow around a circular objectwith no-slip boundary conditions at the surface. These re-sults are shown in Fig. 12a. In the plot of the time delayfunction versus time of release, there are regularly occur-ring sets of singularities (plot in the right top corner). Thesecan be due to particles passing very close to the surface ofthe object, where the velocity is very low (these trajectoriesare the cause of the larger, spread-out structures), as well asto chaotic particle orbits in the wake (which correspond tothe sharp spikes). The latter type of orbits can be explainedin the following way: the velocities of vortices and inerttracer particles are di�erent from each other. Thus, a particlecan be “overrun” by a vortex. The particle can then remaintrapped in the vortex and leave the domain with it, resulting
in a spiraling motion, or it can pass from one vortex intoanother and spend a long (in:nite) time in the wake, mov-ing in a periodic trajectory. Fig. 12a also shows a number ofdi�erent trajectories, lying both on the continuous portionsof the time-delay curve and on the borders of the fractalset. Similar behavior can be expected for vortex-sheddingbubbles. Fig. 12b displays trajectories for marker particlesadvected by the 'ow. The corresponding time-delay curveis not smooth but shows structures similar to those of theformer case. The inset shows that there is :ne structure inthe discontinuities. However, one noteworthy di�erence be-tween the two systems is the absence of the larger, spread-outstructures in the time-delay function as they are seen in case(a). In the 'ow around a solid cylinder, the larger structuresare generated by trajectories passing very close to the solidsurface, where the liquid-phase velocity is very low due tothe no-slip boundary condition. At the surface of the bubble,however, the perfect-slip condition applies, and the parti-cles passing close to the bubble surface are not signi:cantlyslowed down, which explains the absence of the large struc-tures in the time-delay function plot. This is illustrated in thesurface velocity plot in Fig. 13, which shows the tangentialcomponent of the liquid velocity at the surface of the bub-ble as a function of the angular coordinate ’. It is non-zeroeverywhere, except at the saddle points. The sharp peaks inFig. 12b, i.e., the discontinuities in the time-delay function,are due to the complicated motion in the wake of the bubblearound a chaotic saddle. This saddle consists of the in:niteset of periodic and chaotic orbits in the phase space of thesystem (Jung et al., 1993). The stable manifolds of all theorbits, belonging to the chaotic saddle, extend into the in-'ow asymptotic region. If a particle enters the domain alongsuch a stable manifold, it will get trapped into a localized

A. Koynov, J.G. Khinast / Chemical Engineering Science 59 (2004) 3907–3927 3917
0.0
0.2
0.4
0.6
0.8
1.0
1.2
|uta
ngen
tial|
0 πϕ
2π
Fig. 13. Absolute value of the dimensionless tangential velocity componentat the surface of an elliptical bubble (� = 0:5) for Re = 40.
orbit and remain in the wake inde:nitely. All other particles,which lie only in the proximity of the stable manifolds, willeventually reach the out'ow asymptotic region. A particletrajectory can approach the vicinity of an unstable periodicorbit along its stable manifold, remain near it for a periodof time and then transfer to the vicinity region of anotherunstable periodic orbit via a heteroclinic connection. Thisprocess can repeat until the particle is released into the out-'ow region along the unstable manifold of a periodic orbit.This complicated particle motion, which can occur betweentrivial in'ow and out'ow conditions, is typical for scatter-ing (transient) chaos (Jung and Ziemniak, 1992). From thisanalysis it becomes clear that although vortex shedding isa periodic process, transport in the wake is chaotic, i.e.,chaotic 'uid–particle trajectories exist. Restated in the ter-minology of nonlinear dynamics, the Eulerian 7ow is peri-odic, but the Lagrangian transport is chaotic. Therefore, a'uid molecule (or catalyst particle) can in theory spend anin:nite time in the wake of a bubble.
The search for chaotic behavior in the system helps toidentify the 'ow conditions where good mixing will be ob-served. However, for the purpose of a direct comparisonof the mixing characteristics of the di�erent wake types, aquantitative method is necessary. In order to quantify mix-ing in a given 'ow, we computed the deformation (stretch-ing) of a material segment (Liu et al., 1994). One way ofcomputing stretching :elds is to follow the evolution of amaterial element as it is convected by the 'ow, where theelement can be represented by an in:nitesimal vector l. Forpractical reasons, it is suEcient to spread points over a :neenough grid covering the domain and to monitor the stretch-ing at each point. Another way to obtain a stretching ratesis to compute stretching rates with a procedure outlined byDresselhaus and Tabor (1991). The Lagrangian equation de-scribing the motion of an in:nitesimal material element l is
given byddtl(t) = (∇U)l(t) = A(t)l(t); l(t = 0) = l0: (18)
The instantaneous exponential stretching rate for a line ele-ment, as given by Batchelor (1956), is then
2line =ddt
log ‖l(t)‖: (19)
If we take the material element to be a directional unitvector g (no units), then the evolution equation (of thisconstant-length vector) becomesddtg= Ag− 〈g;Ag〉g: (20)
Using the equivalency
‖l(t)‖ = 〈l(t); g(t)〉; (21)
the instantaneous stretching rate can be written in Einsteinnotation as
2line =∑i; j
Sijgigj = 〈g;Sg〉 (22)
where
S(t) = 12 (A + AT): (23)
S is the symmetric part of A(t), the rate of strain tensor. Ifthe tensor S is rewritten in its proper basis {�1; �2; �3}, Swill be diagonal. This involves writing S as S(t) = XTDX,where the rows ofX are the positively oriented ortho-normaleigenvectors of S, and D is a diagonal matrix with the el-ements on its main diagonal equal to the eigenvalues of S,si, ordered in decreasing order. Since the continuity equa-tion is satis:ed for the 'ow, si = 0 has to be satis:ed. Thenew coordinate system, in which S is diagonal, is termedthe ‘strain basis’. In these coordinates
2line =∑
i
si52i (24)
where �=Xg. 5i is the cosine of the angle between �i and g.Eq. (24) shows the connection between the rate of stretchingof a material element and its alignment with the principalaxes of strain (Dresselhaus and Tabor, 1991). Better align-ment corresponds to a higher stretching rate. Perfect align-ment (for our 2-D 'ow) will occur for �= (±1; 0)T. In thiscase 2line =s1, i.e., the largest eigenvalue of S. The two con-clusions that can be drawn are as follows: (1) the maximumexponential stretching rate for a material element is equal tothe real part of the largest eigenvalue of the 'ow’s rate ofstrain tensor at this point; (2) whether this stretching is fullyachieved depends on the angle between the material elementand the eigenvector, associated with the largest eigenvalue.
Stretching :elds were computed using both of the dis-cussed methods, and the results were compared. In our im-plementation of the element-stretching-tracking method, asmall material element in the shape of a circle is positionedaround a point in the 'ow and is advected for a very shortperiod of time. Each point of this circle can be seen as
3918 A. Koynov, J.G. Khinast / Chemical Engineering Science 59 (2004) 3907–3927
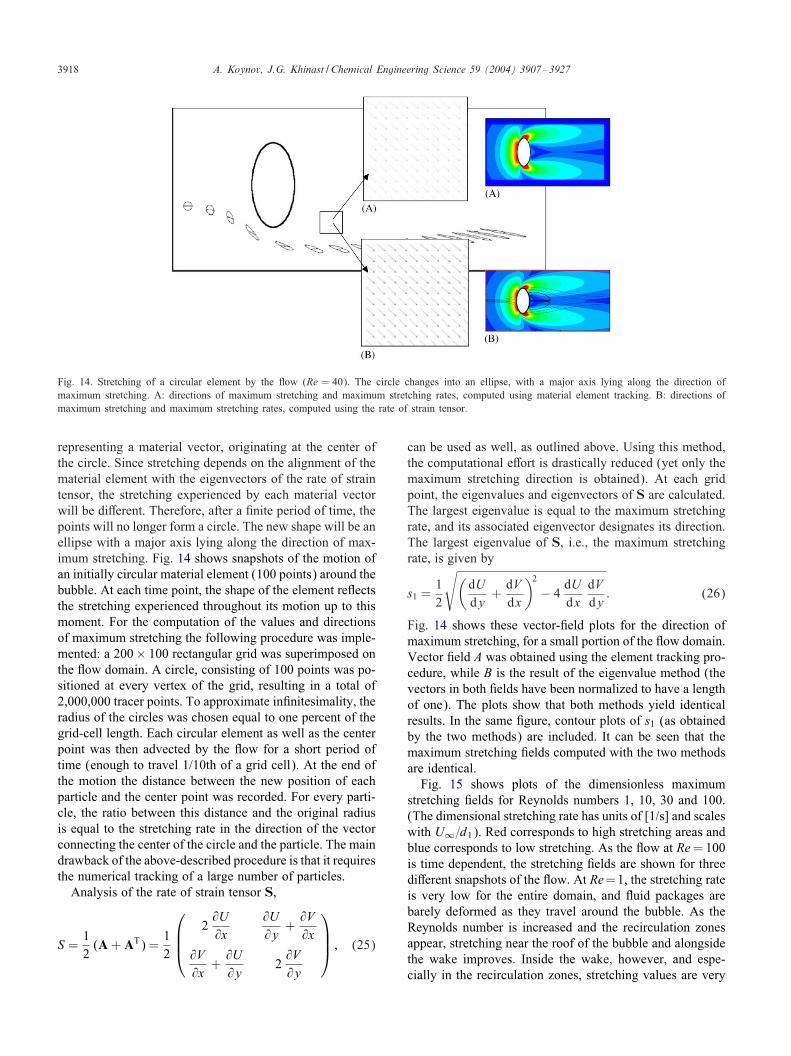
Fig. 14. Stretching of a circular element by the 'ow (Re = 40). The circle changes into an ellipse, with a major axis lying along the direction ofmaximum stretching. A: directions of maximum stretching and maximum stretching rates, computed using material element tracking. B: directions ofmaximum stretching and maximum stretching rates, computed using the rate of strain tensor.
representing a material vector, originating at the center ofthe circle. Since stretching depends on the alignment of thematerial element with the eigenvectors of the rate of straintensor, the stretching experienced by each material vectorwill be di�erent. Therefore, after a :nite period of time, thepoints will no longer form a circle. The new shape will be anellipse with a major axis lying along the direction of max-imum stretching. Fig. 14 shows snapshots of the motion ofan initially circular material element (100 points) around thebubble. At each time point, the shape of the element re'ectsthe stretching experienced throughout its motion up to thismoment. For the computation of the values and directionsof maximum stretching the following procedure was imple-mented: a 200 × 100 rectangular grid was superimposed onthe 'ow domain. A circle, consisting of 100 points was po-sitioned at every vertex of the grid, resulting in a total of2,000,000 tracer points. To approximate in:nitesimality, theradius of the circles was chosen equal to one percent of thegrid-cell length. Each circular element as well as the centerpoint was then advected by the 'ow for a short period oftime (enough to travel 1/10th of a grid cell). At the end ofthe motion the distance between the new position of eachparticle and the center point was recorded. For every parti-cle, the ratio between this distance and the original radiusis equal to the stretching rate in the direction of the vectorconnecting the center of the circle and the particle. The maindrawback of the above-described procedure is that it requiresthe numerical tracking of a large number of particles.
Analysis of the rate of strain tensor S,
S =12
(A + AT) =12
2@U@x
@U@y
+@V@x
@V@x
+@U@y
2@V@y
; (25)
can be used as well, as outlined above. Using this method,the computational e�ort is drastically reduced (yet only themaximum stretching direction is obtained). At each gridpoint, the eigenvalues and eigenvectors of S are calculated.The largest eigenvalue is equal to the maximum stretchingrate, and its associated eigenvector designates its direction.The largest eigenvalue of S, i.e., the maximum stretchingrate, is given by
s1 =12
√(dUdy
+dVdx
)2
− 4dUdx
dVdy
: (26)
Fig. 14 shows these vector-:eld plots for the direction ofmaximum stretching, for a small portion of the 'ow domain.Vector :eld A was obtained using the element tracking pro-cedure, while B is the result of the eigenvalue method (thevectors in both :elds have been normalized to have a lengthof one). The plots show that both methods yield identicalresults. In the same :gure, contour plots of s1 (as obtainedby the two methods) are included. It can be seen that themaximum stretching :elds computed with the two methodsare identical.
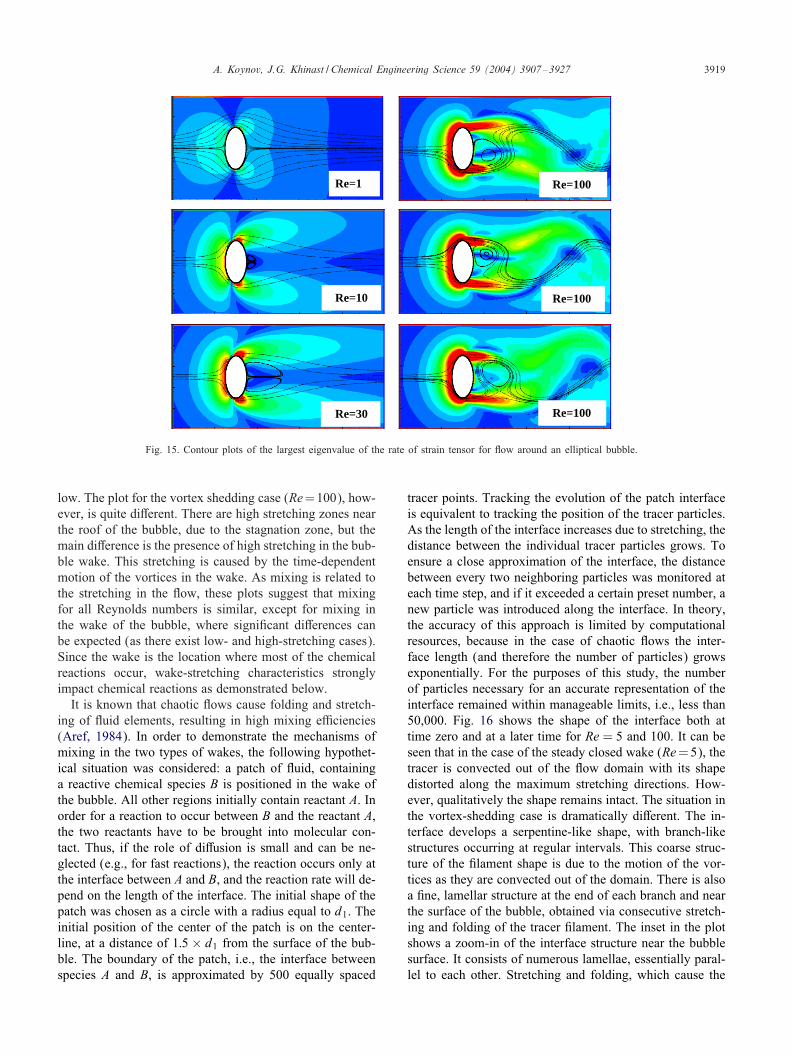
Fig. 15 shows plots of the dimensionless maximumstretching :elds for Reynolds numbers 1, 10, 30 and 100.(The dimensional stretching rate has units of [1/s] and scaleswith U∞=d1). Red corresponds to high stretching areas andblue corresponds to low stretching. As the 'ow at Re = 100is time dependent, the stretching :elds are shown for threedi�erent snapshots of the 'ow. At Re=1, the stretching rateis very low for the entire domain, and 'uid packages arebarely deformed as they travel around the bubble. As theReynolds number is increased and the recirculation zonesappear, stretching near the roof of the bubble and alongsidethe wake improves. Inside the wake, however, and espe-cially in the recirculation zones, stretching values are very
A. Koynov, J.G. Khinast / Chemical Engineering Science 59 (2004) 3907–3927 3919
Re=1
Re=10
Re=30
Re=100
Re=100
Re=100
Fig. 15. Contour plots of the largest eigenvalue of the rate of strain tensor for 'ow around an elliptical bubble.
low. The plot for the vortex shedding case (Re=100), how-ever, is quite di�erent. There are high stretching zones nearthe roof of the bubble, due to the stagnation zone, but themain di�erence is the presence of high stretching in the bub-ble wake. This stretching is caused by the time-dependentmotion of the vortices in the wake. As mixing is related tothe stretching in the 'ow, these plots suggest that mixingfor all Reynolds numbers is similar, except for mixing inthe wake of the bubble, where signi:cant di�erences canbe expected (as there exist low- and high-stretching cases).Since the wake is the location where most of the chemicalreactions occur, wake-stretching characteristics stronglyimpact chemical reactions as demonstrated below.
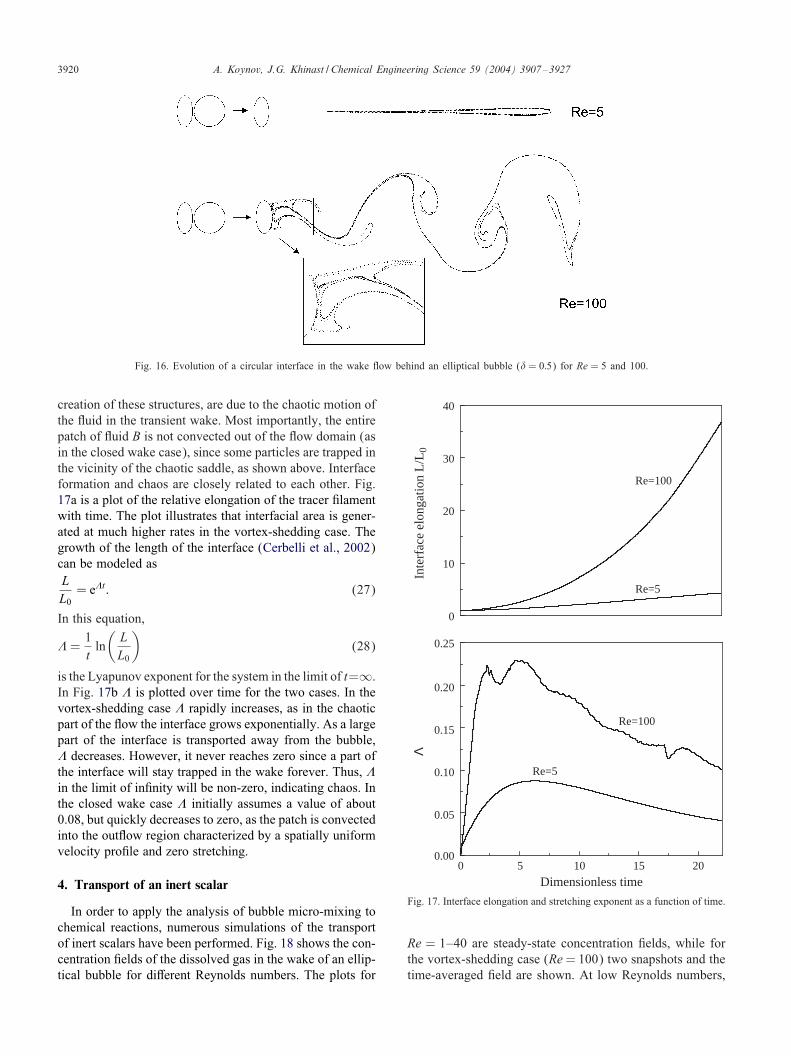
It is known that chaotic 'ows cause folding and stretch-ing of 'uid elements, resulting in high mixing eEciencies(Aref, 1984). In order to demonstrate the mechanisms ofmixing in the two types of wakes, the following hypothet-ical situation was considered: a patch of 'uid, containinga reactive chemical species B is positioned in the wake ofthe bubble. All other regions initially contain reactant A. Inorder for a reaction to occur between B and the reactant A,the two reactants have to be brought into molecular con-tact. Thus, if the role of di�usion is small and can be ne-glected (e.g., for fast reactions), the reaction occurs only atthe interface between A and B, and the reaction rate will de-pend on the length of the interface. The initial shape of thepatch was chosen as a circle with a radius equal to d1. Theinitial position of the center of the patch is on the center-line, at a distance of 1:5 × d1 from the surface of the bub-ble. The boundary of the patch, i.e., the interface betweenspecies A and B, is approximated by 500 equally spaced
tracer points. Tracking the evolution of the patch interfaceis equivalent to tracking the position of the tracer particles.As the length of the interface increases due to stretching, thedistance between the individual tracer particles grows. Toensure a close approximation of the interface, the distancebetween every two neighboring particles was monitored ateach time step, and if it exceeded a certain preset number, anew particle was introduced along the interface. In theory,the accuracy of this approach is limited by computationalresources, because in the case of chaotic 'ows the inter-face length (and therefore the number of particles) growsexponentially. For the purposes of this study, the numberof particles necessary for an accurate representation of theinterface remained within manageable limits, i.e., less than50,000. Fig. 16 shows the shape of the interface both attime zero and at a later time for Re = 5 and 100. It can beseen that in the case of the steady closed wake (Re= 5), thetracer is convected out of the 'ow domain with its shapedistorted along the maximum stretching directions. How-ever, qualitatively the shape remains intact. The situation inthe vortex-shedding case is dramatically di�erent. The in-terface develops a serpentine-like shape, with branch-likestructures occurring at regular intervals. This coarse struc-ture of the :lament shape is due to the motion of the vor-tices as they are convected out of the domain. There is alsoa :ne, lamellar structure at the end of each branch and nearthe surface of the bubble, obtained via consecutive stretch-ing and folding of the tracer :lament. The inset in the plotshows a zoom-in of the interface structure near the bubblesurface. It consists of numerous lamellae, essentially paral-lel to each other. Stretching and folding, which cause the
3920 A. Koynov, J.G. Khinast / Chemical Engineering Science 59 (2004) 3907–3927
Fig. 16. Evolution of a circular interface in the wake 'ow behind an elliptical bubble (� = 0:5) for Re = 5 and 100.
creation of these structures, are due to the chaotic motion ofthe 'uid in the transient wake. Most importantly, the entirepatch of 'uid B is not convected out of the 'ow domain (asin the closed wake case), since some particles are trapped inthe vicinity of the chaotic saddle, as shown above. Interfaceformation and chaos are closely related to each other. Fig.17a is a plot of the relative elongation of the tracer :lamentwith time. The plot illustrates that interfacial area is gener-ated at much higher rates in the vortex-shedding case. Thegrowth of the length of the interface (Cerbelli et al., 2002)can be modeled asLL0
= e7t: (27)
In this equation,
7 =1t
ln(
LL0
)(28)
is the Lyapunov exponent for the system in the limit of t=∞.In Fig. 17b 7 is plotted over time for the two cases. In thevortex-shedding case 7 rapidly increases, as in the chaoticpart of the 'ow the interface grows exponentially. As a largepart of the interface is transported away from the bubble,7 decreases. However, it never reaches zero since a part ofthe interface will stay trapped in the wake forever. Thus, 7in the limit of in:nity will be non-zero, indicating chaos. Inthe closed wake case 7 initially assumes a value of about0.08, but quickly decreases to zero, as the patch is convectedinto the out'ow region characterized by a spatially uniformvelocity pro:le and zero stretching.
4. Transport of an inert scalar
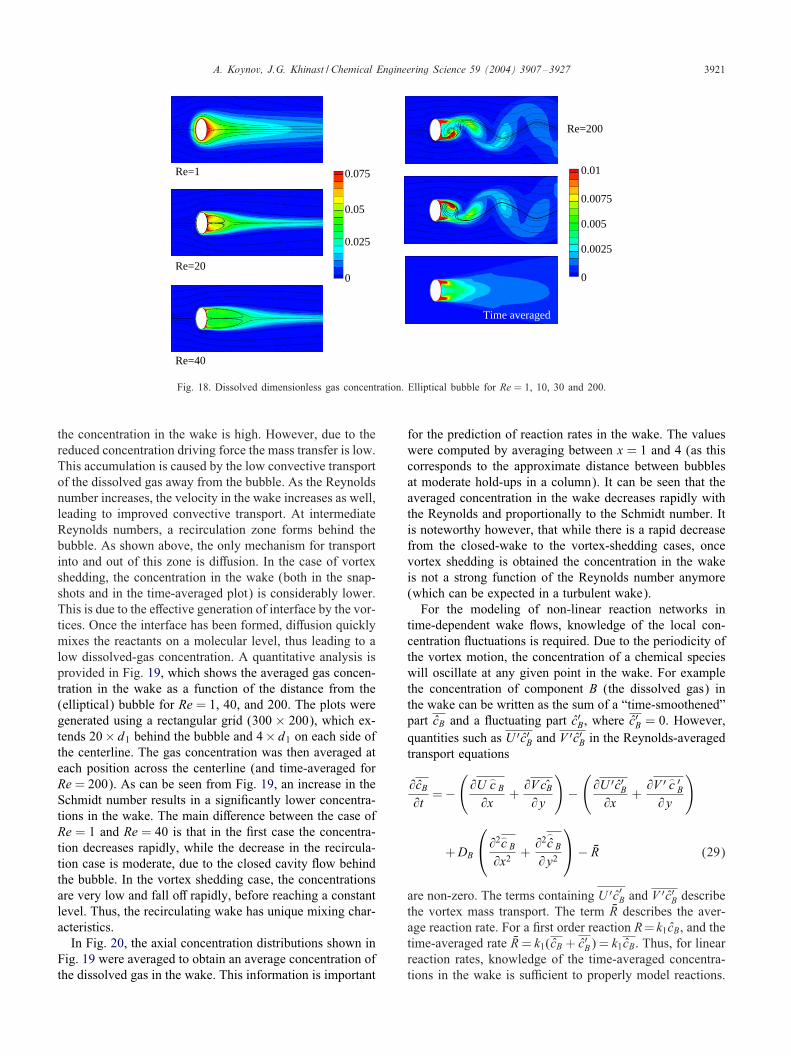
In order to apply the analysis of bubble micro-mixing tochemical reactions, numerous simulations of the transportof inert scalars have been performed. Fig. 18 shows the con-centration :elds of the dissolved gas in the wake of an ellip-tical bubble for di�erent Reynolds numbers. The plots for
0
10
20
30
40In
terf
ace
elon
gatio
n L
/L0
Re=100
Re=5
0 5 10 15 200.00
0.05
0.10
0.15
0.20
0.25
Λ
Dimensionless time
Re=100
Re=5
Fig. 17. Interface elongation and stretching exponent as a function of time.
Re = 1–40 are steady-state concentration :elds, while forthe vortex-shedding case (Re = 100) two snapshots and thetime-averaged :eld are shown. At low Reynolds numbers,
A. Koynov, J.G. Khinast / Chemical Engineering Science 59 (2004) 3907–3927 3921
Re=1
Re=20
Re=40
Re=200
Time averaged
0.075
0.05
0.025
0
0.01
0.0075
0.0025
0
0.005
Fig. 18. Dissolved dimensionless gas concentration. Elliptical bubble for Re = 1, 10, 30 and 200.
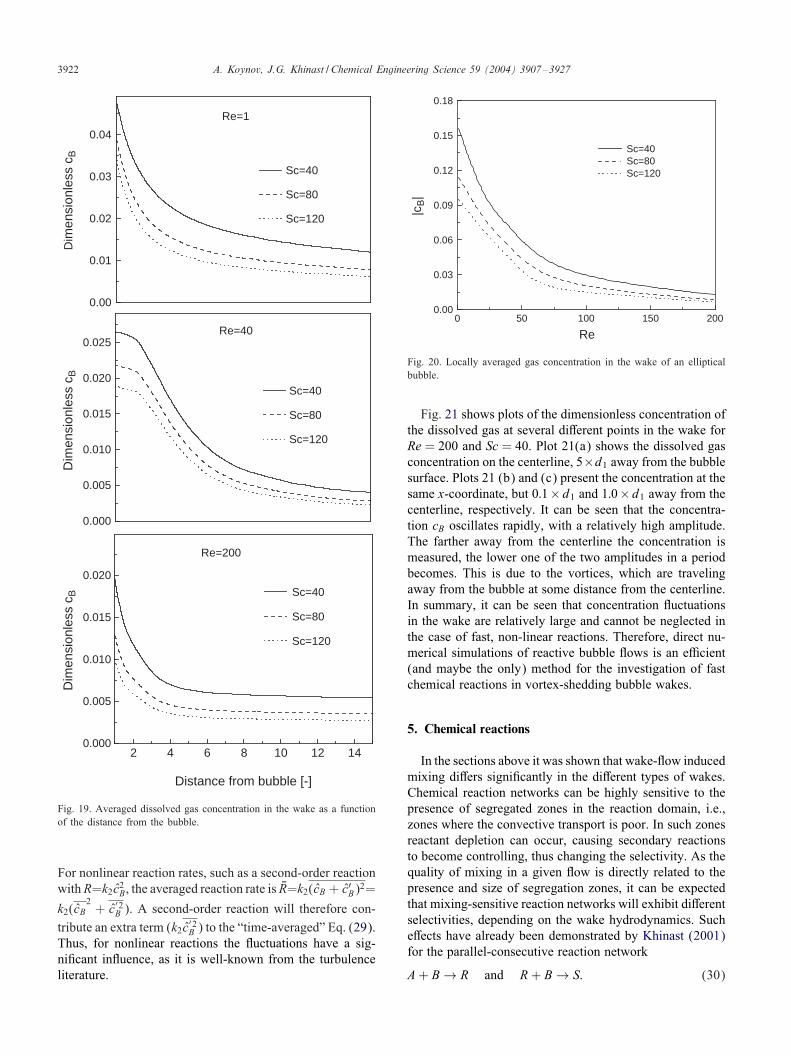
the concentration in the wake is high. However, due to thereduced concentration driving force the mass transfer is low.This accumulation is caused by the low convective transportof the dissolved gas away from the bubble. As the Reynoldsnumber increases, the velocity in the wake increases as well,leading to improved convective transport. At intermediateReynolds numbers, a recirculation zone forms behind thebubble. As shown above, the only mechanism for transportinto and out of this zone is di�usion. In the case of vortexshedding, the concentration in the wake (both in the snap-shots and in the time-averaged plot) is considerably lower.This is due to the e�ective generation of interface by the vor-tices. Once the interface has been formed, di�usion quicklymixes the reactants on a molecular level, thus leading to alow dissolved-gas concentration. A quantitative analysis isprovided in Fig. 19, which shows the averaged gas concen-tration in the wake as a function of the distance from the(elliptical) bubble for Re = 1, 40, and 200. The plots weregenerated using a rectangular grid (300 × 200), which ex-tends 20 × d1 behind the bubble and 4 × d1 on each side ofthe centerline. The gas concentration was then averaged ateach position across the centerline (and time-averaged forRe = 200). As can be seen from Fig. 19, an increase in theSchmidt number results in a signi:cantly lower concentra-tions in the wake. The main di�erence between the case ofRe = 1 and Re = 40 is that in the :rst case the concentra-tion decreases rapidly, while the decrease in the recircula-tion case is moderate, due to the closed cavity 'ow behindthe bubble. In the vortex shedding case, the concentrationsare very low and fall o� rapidly, before reaching a constantlevel. Thus, the recirculating wake has unique mixing char-acteristics.
In Fig. 20, the axial concentration distributions shown inFig. 19 were averaged to obtain an average concentration ofthe dissolved gas in the wake. This information is important
for the prediction of reaction rates in the wake. The valueswere computed by averaging between x = 1 and 4 (as thiscorresponds to the approximate distance between bubblesat moderate hold-ups in a column). It can be seen that theaveraged concentration in the wake decreases rapidly withthe Reynolds and proportionally to the Schmidt number. Itis noteworthy however, that while there is a rapid decreasefrom the closed-wake to the vortex-shedding cases, oncevortex shedding is obtained the concentration in the wakeis not a strong function of the Reynolds number anymore(which can be expected in a turbulent wake).
For the modeling of non-linear reaction networks intime-dependent wake 'ows, knowledge of the local con-centration 'uctuations is required. Due to the periodicity ofthe vortex motion, the concentration of a chemical specieswill oscillate at any given point in the wake. For examplethe concentration of component B (the dissolved gas) inthe wake can be written as the sum of a “time-smoothened”part cB and a 'uctuating part c′
B, where c′B = 0. However,
quantities such as U ′c′B and V ′c′
B in the Reynolds-averagedtransport equations
@cB@t
= −(
@U ˙c B
@x+
@V ˆcB@y
)−(
@U ′c′B
@x+
@V ′ ˙c ′B
@y
)
+DB
@2˙c B
@x2 +@2
˙
c B
@y2
− YR (29)
are non-zero. The terms containing U ′c′B and V ′c′
B describethe vortex mass transport. The term YR describes the aver-age reaction rate. For a :rst order reaction R= k1cB, and thetime-averaged rate YR = k1(cB + c′
B) = k1cB. Thus, for linearreaction rates, knowledge of the time-averaged concentra-tions in the wake is suEcient to properly model reactions.
3922 A. Koynov, J.G. Khinast / Chemical Engineering Science 59 (2004) 3907–3927
0.00
0.01
0.02
0.03
0.04
Dim
ensi
onle
ss c
B
Sc=40
Sc=80
Sc=120
Re=1
0.000
0.005
0.010
0.015
0.020
0.025
Dim
ensi
onle
ss c
B
Sc=40
Sc=80
Sc=120
Re=40
2 10 12 140.000
0.005
0.010
0.015
0.020
Dim
ensi
onle
ss c
B
Distance from bubble [-]
Sc=40
Sc=80
Sc=120
Re=200
4 6 8
Fig. 19. Averaged dissolved gas concentration in the wake as a functionof the distance from the bubble.
For nonlinear reaction rates, such as a second-order reactionwith R=k2c2
B, the averaged reaction rate is YR=k2(cB + c′B)2=
k2(cB2
+ c′2B ). A second-order reaction will therefore con-
tribute an extra term (k2c′2B ) to the “time-averaged” Eq. (29).
Thus, for nonlinear reactions the 'uctuations have a sig-ni:cant in'uence, as it is well-known from the turbulenceliterature.
0 50 100 150 2000.00
0.03
0.06
0.09
0.12
0.15
0.18
|cB|
Re
Sc=40Sc=80Sc=120
Fig. 20. Locally averaged gas concentration in the wake of an ellipticalbubble.
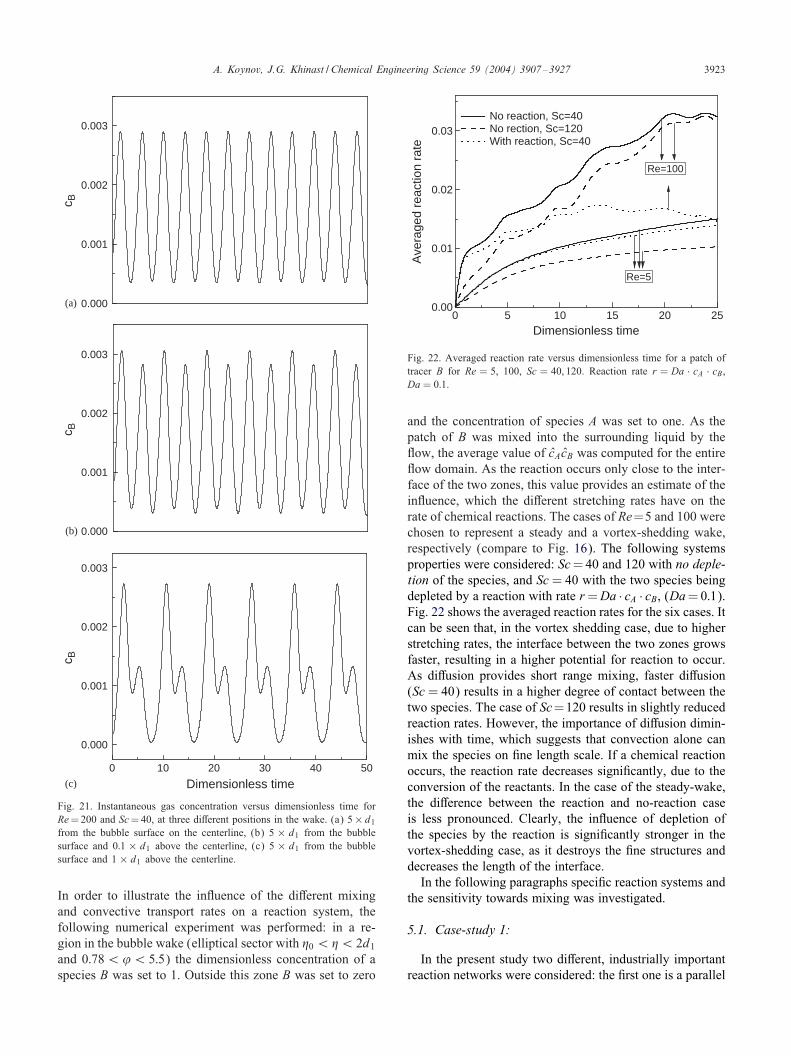
Fig. 21 shows plots of the dimensionless concentration ofthe dissolved gas at several di�erent points in the wake forRe = 200 and Sc = 40. Plot 21(a) shows the dissolved gasconcentration on the centerline, 5×d1 away from the bubblesurface. Plots 21 (b) and (c) present the concentration at thesame x-coordinate, but 0:1 ×d1 and 1:0 ×d1 away from thecenterline, respectively. It can be seen that the concentra-tion cB oscillates rapidly, with a relatively high amplitude.The farther away from the centerline the concentration ismeasured, the lower one of the two amplitudes in a periodbecomes. This is due to the vortices, which are travelingaway from the bubble at some distance from the centerline.In summary, it can be seen that concentration 'uctuationsin the wake are relatively large and cannot be neglected inthe case of fast, non-linear reactions. Therefore, direct nu-merical simulations of reactive bubble 'ows is an eEcient(and maybe the only) method for the investigation of fastchemical reactions in vortex-shedding bubble wakes.
5. Chemical reactions
In the sections above it was shown that wake-'ow inducedmixing di�ers signi:cantly in the di�erent types of wakes.Chemical reaction networks can be highly sensitive to thepresence of segregated zones in the reaction domain, i.e.,zones where the convective transport is poor. In such zonesreactant depletion can occur, causing secondary reactionsto become controlling, thus changing the selectivity. As thequality of mixing in a given 'ow is directly related to thepresence and size of segregation zones, it can be expectedthat mixing-sensitive reaction networks will exhibit di�erentselectivities, depending on the wake hydrodynamics. Suche�ects have already been demonstrated by Khinast (2001)for the parallel-consecutive reaction network
A + B → R and R + B → S: (30)
A. Koynov, J.G. Khinast / Chemical Engineering Science 59 (2004) 3907–3927 3923
0.000
0.001
0.002
0.003
c B
0.000
0.001
0.002
0.003
c B
0 10 20 30 40 50
0.000
0.001
0.002
0.003
c B
Dimensionless time
(a)
(b)
(c)
Fig. 21. Instantaneous gas concentration versus dimensionless time forRe = 200 and Sc = 40, at three di�erent positions in the wake. (a) 5 ×d1from the bubble surface on the centerline, (b) 5 × d1 from the bubblesurface and 0:1 × d1 above the centerline, (c) 5 × d1 from the bubblesurface and 1 × d1 above the centerline.
In order to illustrate the in'uence of the di�erent mixingand convective transport rates on a reaction system, thefollowing numerical experiment was performed: in a re-gion in the bubble wake (elliptical sector with �0 ¡�¡ 2d1
and 0:78¡’¡ 5:5) the dimensionless concentration of aspecies B was set to 1. Outside this zone B was set to zero
0 5 10 15 20 250.00
0.01
0.02
0.03No reaction, Sc=40No rection, Sc=120With reaction, Sc=40
Ave
rage
d re
actio
n ra
te
Dimensionless time
Re=100
Re=5
Fig. 22. Averaged reaction rate versus dimensionless time for a patch oftracer B for Re = 5, 100, Sc = 40; 120. Reaction rate r = Da · cA · cB,Da = 0:1.
and the concentration of species A was set to one. As thepatch of B was mixed into the surrounding liquid by the'ow, the average value of cAcB was computed for the entire'ow domain. As the reaction occurs only close to the inter-face of the two zones, this value provides an estimate of thein'uence, which the di�erent stretching rates have on therate of chemical reactions. The cases of Re=5 and 100 werechosen to represent a steady and a vortex-shedding wake,respectively (compare to Fig. 16). The following systemsproperties were considered: Sc = 40 and 120 with no deple-tion of the species, and Sc = 40 with the two species beingdepleted by a reaction with rate r =Da · cA · cB, (Da= 0:1).Fig. 22 shows the averaged reaction rates for the six cases. Itcan be seen that, in the vortex shedding case, due to higherstretching rates, the interface between the two zones growsfaster, resulting in a higher potential for reaction to occur.As di�usion provides short range mixing, faster di�usion(Sc = 40) results in a higher degree of contact between thetwo species. The case of Sc=120 results in slightly reducedreaction rates. However, the importance of di�usion dimin-ishes with time, which suggests that convection alone canmix the species on :ne length scale. If a chemical reactionoccurs, the reaction rate decreases signi:cantly, due to theconversion of the reactants. In the case of the steady-wake,the di�erence between the reaction and no-reaction caseis less pronounced. Clearly, the in'uence of depletion ofthe species by the reaction is signi:cantly stronger in thevortex-shedding case, as it destroys the :ne structures anddecreases the length of the interface.
In the following paragraphs speci:c reaction systems andthe sensitivity towards mixing was investigated.
5.1. Case-study 1:
In the present study two di�erent, industrially importantreaction networks were considered: the :rst one is a parallel
3924 A. Koynov, J.G. Khinast / Chemical Engineering Science 59 (2004) 3907–3927
κ =5
κ =10
κ =20
κ =50
0 20 40 60 80 100
0.4
0.5
0.6
0.7
0.8
0.9
Sele
ctiv
ity to
war
ds R
Re
k=5 k=10 k=20 k=50
Fig. 23. Selectivity towards product R versus Reynolds number for k = 5,10, 20, 50.
reaction network, which is frequently found in reactions ofindustrial importance (e.g., hydrogenations of alkadienes):
A + B → R and A + 2B → S: (31)
In this reaction a liquid-phase reactant A reacts with the dis-solved gas B to form the desired product R. A secondaryreaction occurs in parallel, in which the by-product (or im-purity) S is produced, for example in an overhydrogenationreaction. The dimensionless reaction rates are assumed tobe of di�erent order with respect to the dissolved gas, i.e.,
r1 = Da1 · cA · cB; r2 = Da2 · cA · c2B: (32)
In Eq. (32) the DamkQohler numbers are de:ned as
Da1 =a · k1 · cA; in
U∞; Da2 =
a · k2 · c2A; in
U∞: (33)
The ratio between Da2 and Da1 is , i.e., = Da2=Da1.Da1 was chosen equal to 10 and was given values of 5,10, 20, and 50. From Eq. (33) it can be seen that the localselectivity Ys, is equal to the ratio of the reaction rates, i.e.,Ys =Da1=(Da1 +Da2cB). Thus, the higher the concentrationof B, the lower is the local selectivity.
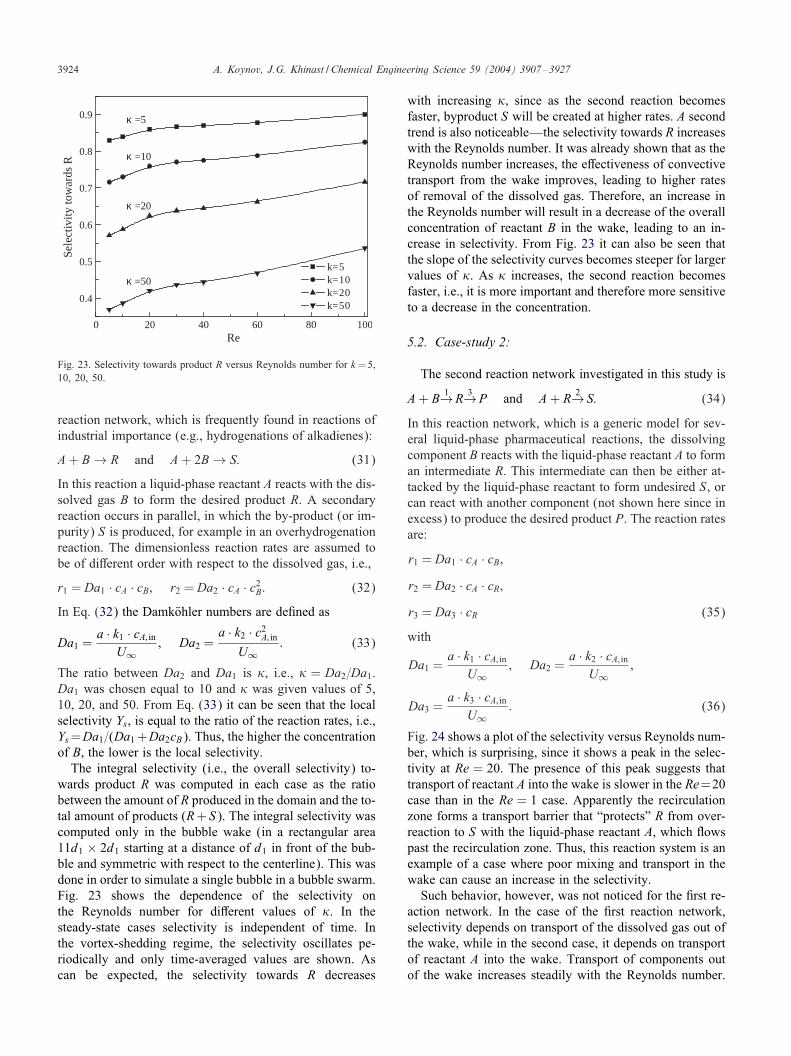
The integral selectivity (i.e., the overall selectivity) to-wards product R was computed in each case as the ratiobetween the amount of R produced in the domain and the to-tal amount of products (R+ S). The integral selectivity wascomputed only in the bubble wake (in a rectangular area11d1 × 2d1 starting at a distance of d1 in front of the bub-ble and symmetric with respect to the centerline). This wasdone in order to simulate a single bubble in a bubble swarm.Fig. 23 shows the dependence of the selectivity onthe Reynolds number for di�erent values of . In thesteady-state cases selectivity is independent of time. Inthe vortex-shedding regime, the selectivity oscillates pe-riodically and only time-averaged values are shown. Ascan be expected, the selectivity towards R decreases
with increasing , since as the second reaction becomesfaster, byproduct S will be created at higher rates. A secondtrend is also noticeable—the selectivity towards R increaseswith the Reynolds number. It was already shown that as theReynolds number increases, the e�ectiveness of convectivetransport from the wake improves, leading to higher ratesof removal of the dissolved gas. Therefore, an increase inthe Reynolds number will result in a decrease of the overallconcentration of reactant B in the wake, leading to an in-crease in selectivity. From Fig. 23 it can also be seen thatthe slope of the selectivity curves becomes steeper for largervalues of . As increases, the second reaction becomesfaster, i.e., it is more important and therefore more sensitiveto a decrease in the concentration.
5.2. Case-study 2:
The second reaction network investigated in this study is
A + B 1→R 3→P and A + R 2→ S: (34)
In this reaction network, which is a generic model for sev-eral liquid-phase pharmaceutical reactions, the dissolvingcomponent B reacts with the liquid-phase reactant A to forman intermediate R. This intermediate can then be either at-tacked by the liquid-phase reactant to form undesired S, orcan react with another component (not shown here since inexcess) to produce the desired product P. The reaction ratesare:
r1 = Da1 · cA · cB;r2 = Da2 · cA · cR;r3 = Da3 · cR (35)
with
Da1 =a · k1 · cA; in
U∞; Da2 =
a · k2 · cA; inU∞
;
Da3 =a · k3 · cA; in
U∞: (36)
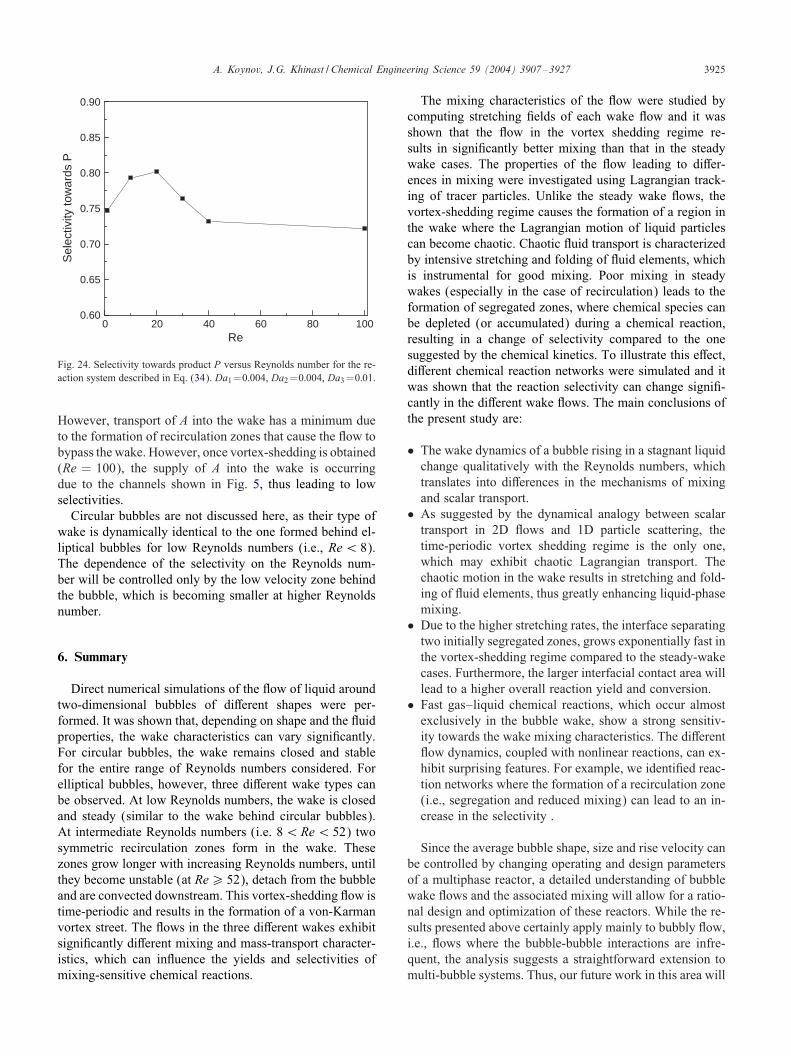
Fig. 24 shows a plot of the selectivity versus Reynolds num-ber, which is surprising, since it shows a peak in the selec-tivity at Re = 20. The presence of this peak suggests thattransport of reactant A into the wake is slower in the Re=20case than in the Re = 1 case. Apparently the recirculationzone forms a transport barrier that “protects” R from over-reaction to S with the liquid-phase reactant A, which 'owspast the recirculation zone. Thus, this reaction system is anexample of a case where poor mixing and transport in thewake can cause an increase in the selectivity.
Such behavior, however, was not noticed for the :rst re-action network. In the case of the :rst reaction network,selectivity depends on transport of the dissolved gas out ofthe wake, while in the second case, it depends on transportof reactant A into the wake. Transport of components outof the wake increases steadily with the Reynolds number.
A. Koynov, J.G. Khinast / Chemical Engineering Science 59 (2004) 3907–3927 3925
0 20 40 60 80 1000.60
0.65
0.70
0.75
0.80
0.85
0.90
Sel
ectiv
ity to
war
ds P
Re
Fig. 24. Selectivity towards product P versus Reynolds number for the re-action system described in Eq. (34). Da1 =0:004, Da2 =0:004, Da3 =0:01.
However, transport of A into the wake has a minimum dueto the formation of recirculation zones that cause the 'ow tobypass the wake. However, once vortex-shedding is obtained(Re = 100), the supply of A into the wake is occurringdue to the channels shown in Fig. 5, thus leading to lowselectivities.
Circular bubbles are not discussed here, as their type ofwake is dynamically identical to the one formed behind el-liptical bubbles for low Reynolds numbers (i.e., Re¡ 8).The dependence of the selectivity on the Reynolds num-ber will be controlled only by the low velocity zone behindthe bubble, which is becoming smaller at higher Reynoldsnumber.
6. Summary
Direct numerical simulations of the 'ow of liquid aroundtwo-dimensional bubbles of di�erent shapes were per-formed. It was shown that, depending on shape and the 'uidproperties, the wake characteristics can vary signi:cantly.For circular bubbles, the wake remains closed and stablefor the entire range of Reynolds numbers considered. Forelliptical bubbles, however, three di�erent wake types canbe observed. At low Reynolds numbers, the wake is closedand steady (similar to the wake behind circular bubbles).At intermediate Reynolds numbers (i.e. 8¡Re¡ 52) twosymmetric recirculation zones form in the wake. Thesezones grow longer with increasing Reynolds numbers, untilthey become unstable (at Re¿ 52), detach from the bubbleand are convected downstream. This vortex-shedding 'ow istime-periodic and results in the formation of a von-Karmanvortex street. The 'ows in the three di�erent wakes exhibitsigni:cantly di�erent mixing and mass-transport character-istics, which can in'uence the yields and selectivities ofmixing-sensitive chemical reactions.
The mixing characteristics of the 'ow were studied bycomputing stretching :elds of each wake 'ow and it wasshown that the 'ow in the vortex shedding regime re-sults in signi:cantly better mixing than that in the steadywake cases. The properties of the 'ow leading to di�er-ences in mixing were investigated using Lagrangian track-ing of tracer particles. Unlike the steady wake 'ows, thevortex-shedding regime causes the formation of a region inthe wake where the Lagrangian motion of liquid particlescan become chaotic. Chaotic 'uid transport is characterizedby intensive stretching and folding of 'uid elements, whichis instrumental for good mixing. Poor mixing in steadywakes (especially in the case of recirculation) leads to theformation of segregated zones, where chemical species canbe depleted (or accumulated) during a chemical reaction,resulting in a change of selectivity compared to the onesuggested by the chemical kinetics. To illustrate this e�ect,di�erent chemical reaction networks were simulated and itwas shown that the reaction selectivity can change signi:-cantly in the di�erent wake 'ows. The main conclusions ofthe present study are:
• The wake dynamics of a bubble rising in a stagnant liquidchange qualitatively with the Reynolds numbers, whichtranslates into di�erences in the mechanisms of mixingand scalar transport.
• As suggested by the dynamical analogy between scalartransport in 2D 'ows and 1D particle scattering, thetime-periodic vortex shedding regime is the only one,which may exhibit chaotic Lagrangian transport. Thechaotic motion in the wake results in stretching and fold-ing of 'uid elements, thus greatly enhancing liquid-phasemixing.
• Due to the higher stretching rates, the interface separatingtwo initially segregated zones, grows exponentially fast inthe vortex-shedding regime compared to the steady-wakecases. Furthermore, the larger interfacial contact area willlead to a higher overall reaction yield and conversion.
• Fast gas–liquid chemical reactions, which occur almostexclusively in the bubble wake, show a strong sensitiv-ity towards the wake mixing characteristics. The di�erent'ow dynamics, coupled with nonlinear reactions, can ex-hibit surprising features. For example, we identi:ed reac-tion networks where the formation of a recirculation zone(i.e., segregation and reduced mixing) can lead to an in-crease in the selectivity .
Since the average bubble shape, size and rise velocity canbe controlled by changing operating and design parametersof a multiphase reactor, a detailed understanding of bubblewake 'ows and the associated mixing will allow for a ratio-nal design and optimization of these reactors. While the re-sults presented above certainly apply mainly to bubbly 'ow,i.e., 'ows where the bubble-bubble interactions are infre-quent, the analysis suggests a straightforward extension tomulti-bubble systems. Thus, our future work in this area will
3926 A. Koynov, J.G. Khinast / Chemical Engineering Science 59 (2004) 3907–3927
include the study of the deformable clusters of reacting bub-bles, using methods like the one developed by Tryggvasonet al. (2001).
Notation
A the dyadic tensor ∇Ua half the interfocal distance of the ellipse, mai; j elements of tensor A, 1/sdb diameter of a volume-equivalent sphere, md1(2) major (minor) semi-axis of the ellipse, mcA; in bulk concentration of component A, kmol=m3
c′i 'uctuating part of the concentration of species i,
kmol=m3
ci concentration of component i, kmol=m3
ci dimensionless concentration of species iCd drag coeEcientCl lift coeEcientD diagonal tensor with the eigenvalues of S on its
main diagonalDi di�usion constant for component i in the liquid
phase, m2=sDa DamkQohler number, a · k · cA; in=U∞f frequency of vortex sheddingg unit vector, convected and stretched by the 'owh dimensionless scale factorH Hamiltonian of a dynamical system, Jk reaction rate constant, m3=kmol=sL length of tracer :lament, mL0 length of tracer :lament at time t = 0, ml in:nitesimal vector stretched by the 'ow, ml0 in:nitesimal vector stretched by the 'ow
at t = 0, mm number of grid points in ’-directionn number of grid points in �-directionP pressure, PaP dimensionless pressurep canonical momentum coordinatePei Peclet number for species i;=U∞a=Dq canonical position coordinateR reaction rate, kmol=m3sr dimensionless reaction rateRe Reynolds number based on a;=aU∞�=!Re Reynolds number, =d1U∞�=!Reb bubble Reynolds number based on equivalent
sphere diameter, =dbU∞�=!S symmetric part of Asi eigenvalues of S, 1/sSci Schmidt number for species i;=!=(� · D)St Strouhal number, =fdb=U∞t time, st dimensionless time˙u velocity in �-direction, m/sU liquid velocity vector in Cartesian coordinates,
m/s
u dimensionless velocity in �-directionu′ 'uctuating part of the velocity in �-direction, m/sU liquid velocity in the x-direction in the Cartesian
coordinate system, m/sU∞ terminal bubble rise velocity, m/s˙v velocity in ’-direction, m/sv dimensionless velocity in ’-directionv′ 'uctuating part of the velocity in ’-direction, m/sV liquid velocity in the y-direction in the Cartesian
coordinate system, m/sX tensor with the eigenvectors of S for columnsx position vector in the Cartesian coordinate
system, mx x-coordinate in the Cartesian coordinate
system, my y-coordinate in the Cartesian coordinate
system, mYs selectivity
Greek letters
, grid angle# up-winding factor� aspect ratio d2=d1
� transformed coordinate direction ratio of DamkQohler numbers, Da2=Da1
� vector with components 5i
5i cosine of the angle between g and �i7 Lyapunov exponent, 1/s! liquid viscosity, Pa s�ij stoichiometric coeEcient of reactant i in
reaction j�i eigenvectors of S2line exponential stretching rate of a material element� liquid density, kg=m3
� dimensionless stress tensor+ stress tensor, N=m2
’ transformed coordinate direction= stream function! dimensionless vorticity! vorticity, 1/s
Indices
eq equilibrium at the gas/liquid interfacein bulk concentrations bubble surface
Acknowledgements
We gratefully acknowledge support of this work by NSFGrant CTS 02098764 and ACS Grant 36283-G9.
A. Koynov, J.G. Khinast / Chemical Engineering Science 59 (2004) 3907–3927 3927
References
Aref, H., 1984. Stirring by chaotic advection. Journal of Fluid Mechanics143, 1.
Aref, H., Jones, S.W., 1988. Enhanced separation of di�using particlesby chaotic advection. Physics of Fluids A1, 470.
Ba ldyga, J., Bourne, J.R., 1999. Turbulent mixing and chemical reactions.Wiley, New York.
Batchelor, G.K., 1956. The e�ect of homogeneous turbulence onmaterial lines and surfaces. Proceedings of Royal Society LondonA213, 349.
Bearman, P.W., Graham, J.M.R., 1980. Vortex shedding from blu� bodiesin oscillatory 'ow: a report on Euromech. 119. Journal of FluidMechanics 99, 225.
Bourne, J.R., Crivelli, E., Rys, P., 1977. Mixing-disguised azo couplingreactions. Helv. Chimica Acta 60, 2944.
Cerbelli, S., Alvarez, M., Muzzio, F., 2002. Prediction and quanti:cationof micromixing intensities in laminar 'ows. A.I.Ch.E. Journal 4, 686.
Clift, R., Grace, J.R., Weber, M.E., 1978. Bubbles, Drops and Particles.Academic Press, New York.
Danckwerts, P.V., 1958. The e�ect of incomplete mixing on homogeneousreactions. Chemical Engineering Science 8, 93.
Deu'hard, P., Hairer, E., Zugck, J., 1987. One-step and extrapolationmethods for di�erential-algebraic systems. Numerische Mathematik51, 1.
Doherty, M.F., Ottino, J.M., 1988. Chaos in deterministic systems:strange attractors, turbulence, and applications in chemical engineering.Chemical Engineering Science 43, 139.
Doraiswamy, L.K., Sharma, M.M., 1984. Heterogeneous Reactions, Vol.2, Fluid–Fluid–Solid Reactions. Wiley, New York.
Dresselhaus, E., Tabor, M., 1991. The kinematics of stretching andalignment of material elements in general 'ow :elds. Journal of FluidMechanics 236, 415.
Ehrig, R., Nowak, U., Oeverdieck, L., Deu'hard, P., 1999. In: Bungartz,H.-J., Durst, F., Zenger, C. (Eds.), High Performance Scienti:c andEngineering Computing, Vol. 8. Lecture, Springer, Berlin, p. 233
Fletcher, C.A.J., 1997. Computational Techniques for Fluid Dynamics.Springer, New York.
Froment, G.F., Bischo�, K.B., 1990. Chemical Reactor Analysis andDesign. Wiley, New York.
Jung, C., Ziemniak, E., 1992. Hamiltonian scattering chaos in ahydrodynamical system. Journal of Physics 25, 3929.
Jung, C., Tel, T., Ziemniak, E., 1993. Application of scattering chaos ofparticle transport in a hydrodynamical 'ow. Chaos 4, 555.
Horita, T., Hata, H., Mori, H., 1990. Long-time correlations andexpansion-rate spectra of chaos in Hamiltonian systems. Progress inTheoretical Physics 83, 1065.
Khinast, J.G., 2001. Impact of 2-D bubble dynamics on the selectivity offast gas–liquid reactions. A.I.Ch.E. Journal 47, 2304.
Kramers, H., 1958. Physical factors in chemical reaction engineering.Chemical Engineering Science 8, 45.
Leal, L.G., 1989. Vorticity transport and wake structure for blu� bodiesat :nite Reynolds numbers. Physics of Fluids A 1 (1), 124.
Liu, M., Muzzio, F.J., Peskin, R.L., 1994. Quanti:cation of mixing inaperiodic chaotic 'ows. Chaos, Solitons and Fractals 4, 869.
Moore, D.W., 1958. Ph.D. Thesis, University of Cambridge.Muzzio, F.J., Swanson, P.D., Ottino, J.M., 1991. The statistics of
stretching and stirring in chaotic 'ows. Physics of Fluids A 3, 822.Muzzio, F.J., Swanson, P.D., Ottino, J.M., 1992. Mixing distributions
produced by multiplicative stretching in chaotic 'ows. InternationalJournal of Bifurcation and Chaos 2, 37.
Nienow, A.W., Drain, S.M., Boyes, A.P., Mann, R., El-Hamouz, A.M.,Carpenter, H.J., 1992. A new pair of reactions to characterize imperfectmacromixing and partial segregation in a stirred semi-batch reactor.Chemical Engineering Science 47, 2825.
Paul, E.L., Treybal, R.E., 1971. Mixing and product distribution for aliquid phase, second order, competitive-consecutive reaction. A.I.Ch.E.Journal 17, 718.
Perry, A.E., Chong, M.S., Lim, T.T., 1982. The vortex-shedding processbehind two-dimensional blu� bodies. Journal of Fluid Mechanics 116,77.
Popham, A.E., 1946. The Drawings of Leonardo da Vinci. Jonathan Cape.Press, W.H., Flannery, B.P., Teukolsky, S.A., Vetterling, W.T., 1989.
Numerical Recipes, The Art of Scienti:c Computing. CambridgeUniversity Press, Cambridge.
Raymond, F., Rosant, J.-M., 2000. A numerical and experimental study ofthe terminal velocity and shape of bubbles in viscous liquids. ChemicalEngineering Science 55.
Sobel, D., 1995. Longitude. Penguin Books, New York.Swanson, P.D., Ottino, J.M., 1990. A comparative computational and
experimental study of chaotic mixing of viscous 'uids. Journal ofFluid Mechanics 213, 227.
Tryggvason, G., Bunner, B., Esmaeeli, A., Juric, D., Al-Rawahi, N.,Tauber, W., Han, J., Nas, S., Jan, Y., 2001. A front-tracking methodfor the computations of multiphase 'ow. Journal of ComputationalPhysics 169, 708.
van Krevelen, D.W., 1958. Micro- and macro-kinetics. ChemicalEngineering Science 8, 5.