effect of non-structural carbohydrate dietary content on the productive performance of sarda...
TRANSCRIPT
Fulvia Bovera, Monica Isabella Cutrignelli, Serena Calabrò,Giovanni Piccolo, Raffaella Tudisco, Fabio Zicarelli,
Vincenzo Piccolo, Federico Infascelli
Dipartimento di Scienze Zootecniche e Ispezione degli Alimenti. Università di Napoli “Federico II”, Italy.
Corresponding author: Dr. Fulvia Bovera. DISCIZIA. Facoltà di Medicina Veterinaria, Università di Napoli“Federico II”. Via F. Delpino 1, 80137 Napoli, Italy - Tel. +39 081 4421914 - Fax: +39 081 292981 - Email:[email protected]
Paper received July 11, 2003; accepted October 8, 2003
Effect of non-structural carbohydrate dietary content
on the productive performance of Sarda primiparous ewes
ABSTRACT
In order to enhance our knowledge of milk sheep rationing, 30 Sarda primiparous ewes, for which single birth was diag-nosed by ultrasonography prior to lambing, were divided into two homogeneous groups (L-NSC and H-NSC) and fed iso-proteic diets containing different amounts of non-structural carbohydrates (NSC, 36 vs 40 % DM). The lambs wereweighed both at birth (between February and March 2002) and at sale (about one month later) in order to estimate milkproduced by their mothers during the lactation period, by using a specific equation developed on Sarda ewes. Individualmilk yield and quality were then monitored monthly until the ewes dried off (July 2002). Our results showed that groupH-NSC (which received the diet with the highest NSC content) was associated to the highest milk yield (P<0.01) duringthe suckling period. In contrast, in the milking period group L-NSC showed significantly higher (P<0.05) mean milk yield(996.2 vs 899.8 g/d) and fat and protein corrected milk yield (979.6 vs 877.7 g/d). Dietary treatments did not signifi-cantly affect milk composition.In conclusion, considering the milk production of each group as a function of the lactation month, group H-NSC had itsbest performance during the first two months of lactation, while group L-NSC was more productive during the remainingmonths. Also the percentage of protein, fat and casein of the milk during milking showed a similar trend. While the lat-ter parameters were higher in the H-NSC group during the first two months of milking, from the 4th control onward high-er levels were observed in the L-NSC group. These results suggest, at least for Sarda primiparous ewes, the adoption ofdiets with different contents of non-structural carbohydrates according to the productive period (40 %, DM basis, in thefirst two months of lactation, 36 %, DM basis, in subsequent months).
Key words: Non-structural carbohydrates, Sarda ewes, Milk production.
RIASSUNTOINFLUENZA DEL CONTENUTO DI CARBOIDRATI NON STRUTTURALI DELLA DIETA SULLE PERFOR-
MANCES PRODUTTIVE DI PECORE PRIMIPARE DI RAZZA SARDA.
Allo scopo di migliorare le conoscenze sul razionamento della pecora da latte, un mese prima del parto 30 pecore primi-pare di razza Sarda, per le quali, mediante tecnica ultrasonografica, era stato diagnosticato parto singolo, sono state divi-se in due gruppi omogenei (L-NSC e H-NSC) alimentati con due diete isoproteiche ma a diverso contenuto di carboidra-ti non strutturali (NSC, 36 vs 40 % s.s.). Gli agnelli sono stati pesati alla nascita (fine febbraio – inizio marzo 2002) e almomento della vendita (circa un mese più tardi) in modo da stimare il latte prodotto dalle madri durante il periodo di
ITAL.J.ANIM.SCI. VOL. 3, 61-70, 2004 61
* I.J.A.S. Imp. 01/04 21-12-2005 12:42 Pagina 61
62 ITAL.J.ANIM.SCI. VOL. 3, 61-70, 2004
allattamento, utilizzando una specifica equazione messa a punto per pecore di razza Sarda. Successivamente, è statacontrollata con cadenza mensile la produzione quanti-qualitativa di latte individuale fino alla messa in asciutta delle peco-re (fine luglio 2002).Dai risultati ottenuti è emerso che il gruppo alimentato con la dieta a maggior contenuto di NSC (H-NSC) ha presentatoproduzioni più elevate (P < 0,01) durante il periodo dell’allattamento, mentre nei mesi di mungitura il gruppo L-NSC hamostrato produzioni medie significativamente (P < 0,05) più elevate di latte sia reale (996,2 vs 899,8 g/d) che correttoin funzione del contenuto percentuale di grasso e di proteine (979,6 vs 877,7 g/d). Non sono, invece, emerse differen-ze significative tra i parametri della composizione chimica del latte imputabili alle due diete in esame. Considerando, infi-ne, la produzione di latte di ciascun gruppo in funzione del mese di lattazione, le migliori performance sono state forni-te durante i primi due mesi di lattazione dal gruppo (H-NSC) alimentato con la maggiore concentrazione di NSC, suc-cessivamente da quello L-NSC. Andamento simile hanno fatto registrare anche i contenuti percentuali di proteine, gras-so e caseina determinati sul latte munto: infatti essi, risultati più elevati nel gruppo H-NSC durante i primi due mesi dimungitura, sono stati a partire dal 4° controllo, maggiori nel gruppo L-NSC. Tali risultati suggeriscono, per pecore pri-mipare di razza Sarda, l’adozione di diete a differente contenuto di carboidrati non strutturali in funzione della fase pro-duttiva (40 % s.s. nei primi due mesi di lattazione, 36 % s.s. nella fase successiva).
Parole chiave: Carboidrati non strutturali, Pecore di razza Sarda, Produzione di latte.
Introduction
Sarda sheep are the most numerous of thethree main milk breeds recorded in the 1999genealogical book (Sarda, Comisana andMassese). There are about 4,700,000 (ASSON-APA, 2002) head raised above all in Sardinia andSicily (about 81 % of the Italian population)although the last few years have seen an increasein the centre-south (about 17 % of the Italian pop-ulation). Genetic selection implemented for Sardaewes long ago has contributed greatly to increas-ing milk production that was 137 ± 62 1itres per110 ± 34 days of milking for primiparous animalsin 1999 (Sanna et al., 2000). Knowledge of milkovine rationing, with beneficial effects for the pro-ductive potential of the sheep raised, has alsoimproved. Indeed, during the last few years,researchers in Italy and abroad have focused onthe effects of non-structural carbohydrate dietcontents of ewe production during each period inthe productive cycle. However, such research hasbeen scant or characterized by conflicting out-comes. Brown and Hogue (1985) noted in Finnishsheep during the first lactation weeks thatrations with a forage (F) to concentrates (C) ratioof 60 to 40 induced milk production much lowerthan rations with a 20 to 80 F to C ratio. In EastFriesian ewes intake and milk production were
higher (from the 120th day of lactation) in the ani-mals receiving 20 % of non-structural carbohy-drates (NSC) than in those receiving 35 % NSC(Cavani et al., 1990). Equally, in Sarda ewes withmore than three months of lactation fed dietswith different protein and NSC concentrations(14 vs 21 % and 29 vs 40 %, respectively), Cannaset al. (1998) noted that the group receiving a dietwith the lower concentration of non-structuralcarbohydrates showed a higher intake and milkproduction. Since all the above-mentioned publi-cations studied the effect of NSC only in singleparts of the lactation, the aim of the present studywas to extend our knowledge of this interestingtopic, evaluating the influence of two differentnon-structural carbohydrate concentrations indiets during the whole lactation period on themilk yield and quality of Sarda primiparous ewes.
Material and methods
Diets and feeding planThe study was carried out on a Sarda sheep
farm in the province of Caserta, Italy, where theanimals were divided into groups based on theirproduction level and kept indoors. The study con-cerned 30 pregnant sheep, for which single birthshad been diagnosed by echography. One monthbefore lambing, they were divided into two homo-
BOVERA et al.
* I.J.A.S. Imp. 01/04 21-12-2005 12:42 Pagina 62
ITAL.J.ANIM.SCI. VOL. 3, 61-70, 2004 63
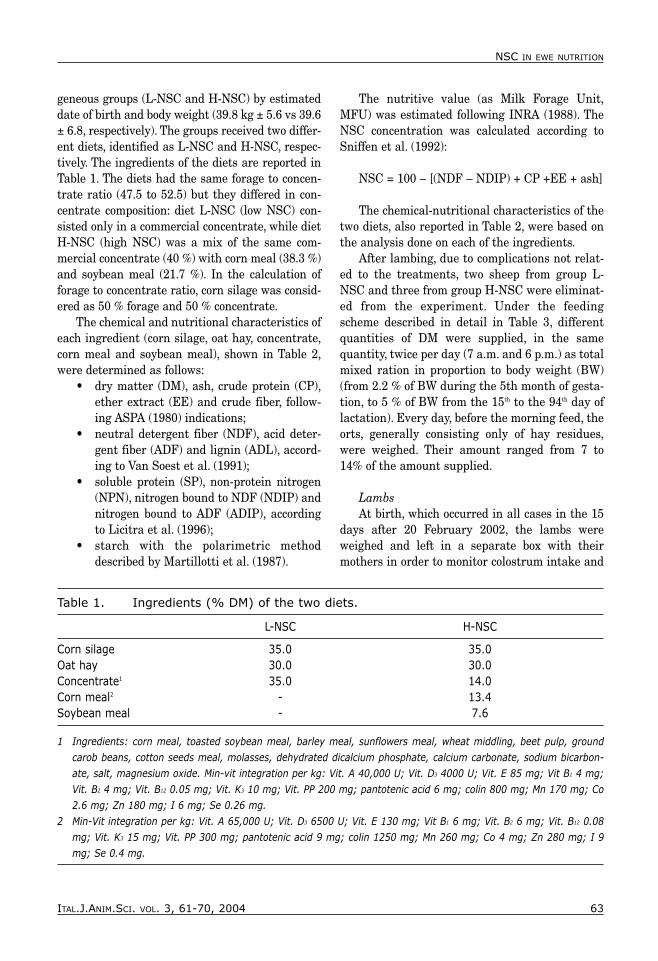
geneous groups (L-NSC and H-NSC) by estimateddate of birth and body weight (39.8 kg ± 5.6 vs 39.6± 6.8, respectively). The groups received two differ-ent diets, identified as L-NSC and H-NSC, respec-tively. The ingredients of the diets are reported inTable 1. The diets had the same forage to concen-trate ratio (47.5 to 52.5) but they differed in con-centrate composition: diet L-NSC (low NSC) con-sisted only in a commercial concentrate, while dietH-NSC (high NSC) was a mix of the same com-mercial concentrate (40 %) with corn meal (38.3 %)and soybean meal (21.7 %). In the calculation offorage to concentrate ratio, corn silage was consid-ered as 50 % forage and 50 % concentrate.
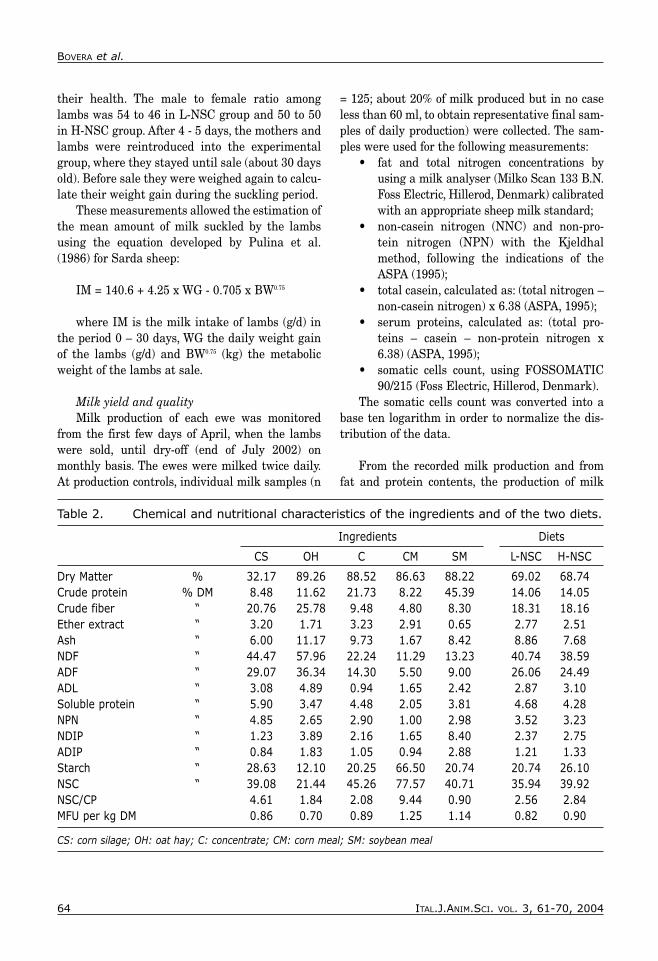
The chemical and nutritional characteristics ofeach ingredient (corn silage, oat hay, concentrate,corn meal and soybean meal), shown in Table 2,were determined as follows:
• dry matter (DM), ash, crude protein (CP),ether extract (EE) and crude fiber, follow-ing ASPA (1980) indications;
• neutral detergent fiber (NDF), acid deter-gent fiber (ADF) and lignin (ADL), accord-ing to Van Soest et al. (1991);
• soluble protein (SP), non-protein nitrogen(NPN), nitrogen bound to NDF (NDIP) andnitrogen bound to ADF (ADIP), accordingto Licitra et al. (1996);
• starch with the polarimetric methoddescribed by Martillotti et al. (1987).
The nutritive value (as Milk Forage Unit,MFU) was estimated following INRA (1988). TheNSC concentration was calculated according toSniffen et al. (1992):
NSC = 100 – [(NDF – NDIP) + CP +EE + ash]
The chemical-nutritional characteristics of thetwo diets, also reported in Table 2, were based onthe analysis done on each of the ingredients.
After lambing, due to complications not relat-ed to the treatments, two sheep from group L-NSC and three from group H-NSC were eliminat-ed from the experiment. Under the feedingscheme described in detail in Table 3, differentquantities of DM were supplied, in the samequantity, twice per day (7 a.m. and 6 p.m.) as totalmixed ration in proportion to body weight (BW)(from 2.2 % of BW during the 5th month of gesta-tion, to 5 % of BW from the 15th to the 94th day oflactation). Every day, before the morning feed, theorts, generally consisting only of hay residues,were weighed. Their amount ranged from 7 to14% of the amount supplied.
LambsAt birth, which occurred in all cases in the 15
days after 20 February 2002, the lambs wereweighed and left in a separate box with theirmothers in order to monitor colostrum intake and
NSC IN EWE NUTRITION
Table 1. Ingredients (% DM) of the two diets.
L-NSC H-NSC
Corn silage 35.0 35.0Oat hay 30.0 30.0Concentrate1 35.0 14.0Corn meal2 - 13.4Soybean meal - 7.6
1 Ingredients: corn meal, toasted soybean meal, barley meal, sunflowers meal, wheat middling, beet pulp, groundcarob beans, cotton seeds meal, molasses, dehydrated dicalcium phosphate, calcium carbonate, sodium bicarbon-ate, salt, magnesium oxide. Min-vit integration per kg: Vit. A 40,000 U; Vit. D3 4000 U; Vit. E 85 mg; Vit B1 4 mg;Vit. B2 4 mg; Vit. B12 0.05 mg; Vit. K3 10 mg; Vit. PP 200 mg; pantotenic acid 6 mg; colin 800 mg; Mn 170 mg; Co2.6 mg; Zn 180 mg; I 6 mg; Se 0.26 mg.
2 Min-Vit integration per kg: Vit. A 65,000 U; Vit. D3 6500 U; Vit. E 130 mg; Vit B1 6 mg; Vit. B2 6 mg; Vit. B12 0.08mg; Vit. K3 15 mg; Vit. PP 300 mg; pantotenic acid 9 mg; colin 1250 mg; Mn 260 mg; Co 4 mg; Zn 280 mg; I 9mg; Se 0.4 mg.
* I.J.A.S. Imp. 01/04 21-12-2005 12:42 Pagina 63
64 ITAL.J.ANIM.SCI. VOL. 3, 61-70, 2004
their health. The male to female ratio amonglambs was 54 to 46 in L-NSC group and 50 to 50in H-NSC group. After 4 - 5 days, the mothers andlambs were reintroduced into the experimentalgroup, where they stayed until sale (about 30 daysold). Before sale they were weighed again to calcu-late their weight gain during the suckling period.
These measurements allowed the estimation ofthe mean amount of milk suckled by the lambsusing the equation developed by Pulina et al.(1986) for Sarda sheep:
IM = 140.6 + 4.25 x WG - 0.705 x BW0.75
where IM is the milk intake of lambs (g/d) inthe period 0 – 30 days, WG the daily weight gainof the lambs (g/d) and BW0.75 (kg) the metabolicweight of the lambs at sale.
Milk yield and qualityMilk production of each ewe was monitored
from the first few days of April, when the lambswere sold, until dry-off (end of July 2002) onmonthly basis. The ewes were milked twice daily.At production controls, individual milk samples (n
= 125; about 20% of milk produced but in no caseless than 60 ml, to obtain representative final sam-ples of daily production) were collected. The sam-ples were used for the following measurements:
• fat and total nitrogen concentrations byusing a milk analyser (Milko Scan 133 B.N.Foss Electric, Hillerod, Denmark) calibratedwith an appropriate sheep milk standard;
• non-casein nitrogen (NNC) and non-pro-tein nitrogen (NPN) with the Kjeldhalmethod, following the indications of theASPA (1995);
• total casein, calculated as: (total nitrogen –non-casein nitrogen) x 6.38 (ASPA, 1995);
• serum proteins, calculated as: (total pro-teins – casein – non-protein nitrogen x6.38) (ASPA, 1995);
• somatic cells count, using FOSSOMATIC90/215 (Foss Electric, Hillerod, Denmark).
The somatic cells count was converted into abase ten logarithm in order to normalize the dis-tribution of the data.
From the recorded milk production and fromfat and protein contents, the production of milk
BOVERA et al.
Table 2. Chemical and nutritional characteristics of the ingredients and of the two diets.
Ingredients Diets
CS OH C CM SM L-NSC H-NSC
Dry Matter % 32.17 89.26 88.52 86.63 88.22 69.02 68.74Crude protein % DM 8.48 11.62 21.73 8.22 45.39 14.06 14.05Crude fiber “ 20.76 25.78 9.48 4.80 8.30 18.31 18.16Ether extract “ 3.20 1.71 3.23 2.91 0.65 2.77 2.51Ash “ 6.00 11.17 9.73 1.67 8.42 8.86 7.68NDF “ 44.47 57.96 22.24 11.29 13.23 40.74 38.59ADF “ 29.07 36.34 14.30 5.50 9.00 26.06 24.49ADL “ 3.08 4.89 0.94 1.65 2.42 2.87 3.10Soluble protein “ 5.90 3.47 4.48 2.05 3.81 4.68 4.28NPN “ 4.85 2.65 2.90 1.00 2.98 3.52 3.23NDIP “ 1.23 3.89 2.16 1.65 8.40 2.37 2.75ADIP “ 0.84 1.83 1.05 0.94 2.88 1.21 1.33Starch “ 28.63 12.10 20.25 66.50 20.74 20.74 26.10NSC “ 39.08 21.44 45.26 77.57 40.71 35.94 39.92NSC/CP 4.61 1.84 2.08 9.44 0.90 2.56 2.84MFU per kg DM 0.86 0.70 0.89 1.25 1.14 0.82 0.90
CS: corn silage; OH: oat hay; C: concentrate; CM: corn meal; SM: soybean meal
* I.J.A.S. Imp. 01/04 21-12-2005 12:42 Pagina 64
ITAL.J.ANIM.SCI. VOL. 3, 61-70, 2004 65
corrected to 6.5% of fat and 5.8% of protein(FPCM) was calculated using the equation report-ed by Serra et al. (1998):
FPCM (g) = (0.255 + 0.085 x F + 0.035 x P) x DMP
where: F is the percentage of fat, P the percent-age of protein and DMP daily milk production (g).
Statistical analysisAll the obtained results were analyzed with
the GLM procedure of SAS (2000) following themodel:
yijk = µ + αi + βj + αβij + εijk
where yijk is the single observation, µ the gen-eral mean, αi the diet effect (i = 1, 2), βj the effectof sex (lamb weight and weight gain) or milkingmonth (milk production and quality; j = M, F or1,…5), αβij is the interaction (diet x sex or diet xmilking month) and εijk the error.
The “intra-effect” comparison among themeans was performed by Tukey test (SAS, 2000).
Results and discussion
As shown in Table 2, the diets were isoproteicwhile diet L-NSC had the lowest non-structuralcarbohydrate (35.9 vs 39.9% of DM) and starch(20.7 vs 26.1 % of DM) contents and hence the low-est nutritive value (0.82 vs 0.90 MFU/kg DM).
NSC IN EWE NUTRITION
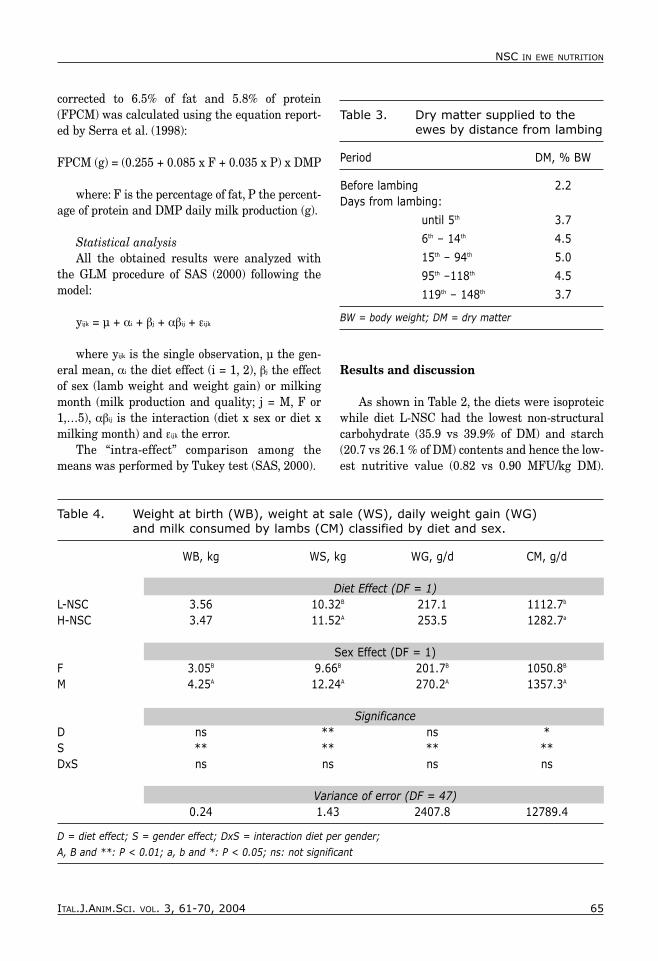
Table 3. Dry matter supplied to theewes by distance from lambing
Period DM, % BW
Before lambing 2.2Days from lambing:
until 5th 3.7
6th – 14th 4.5
15th – 94th 5.0
95th –118th 4.5
119th – 148th 3.7
BW = body weight; DM = dry matter
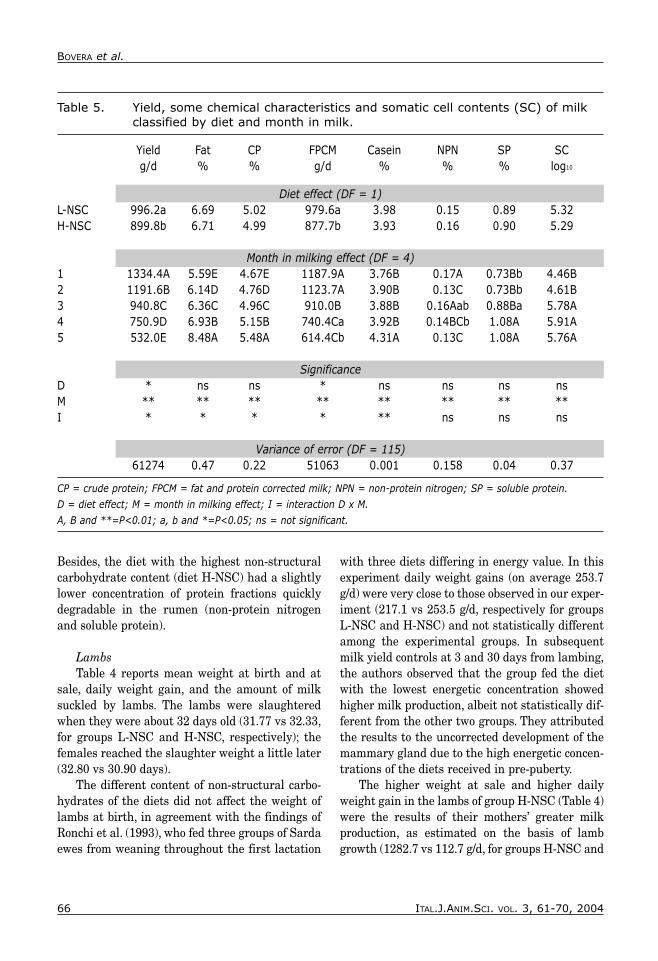
Table 4. Weight at birth (WB), weight at sale (WS), daily weight gain (WG) and milk consumed by lambs (CM) classified by diet and sex.
WB, kg WS, kg WG, g/d CM, g/d
Diet Effect (DF = 1)L-NSC 3.56 10.32B 217.1 1112.7b
H-NSC 3.47 11.52A 253.5 1282.7a
Sex Effect (DF = 1)F 3.05B 9.66B 201.7B 1050.8B
M 4.25A 12.24A 270.2A 1357.3A
SignificanceD ns ** ns *S ** ** ** **DxS ns ns ns ns
Variance of error (DF = 47)0.24 1.43 2407.8 12789.4
D = diet effect; S = gender effect; DxS = interaction diet per gender;A, B and **: P < 0.01; a, b and *: P < 0.05; ns: not significant
* I.J.A.S. Imp. 01/04 21-12-2005 12:42 Pagina 65
66 ITAL.J.ANIM.SCI. VOL. 3, 61-70, 2004
Besides, the diet with the highest non-structuralcarbohydrate content (diet H-NSC) had a slightlylower concentration of protein fractions quicklydegradable in the rumen (non-protein nitrogenand soluble protein).
LambsTable 4 reports mean weight at birth and at
sale, daily weight gain, and the amount of milksuckled by lambs. The lambs were slaughteredwhen they were about 32 days old (31.77 vs 32.33,for groups L-NSC and H-NSC, respectively); thefemales reached the slaughter weight a little later(32.80 vs 30.90 days).
The different content of non-structural carbo-hydrates of the diets did not affect the weight oflambs at birth, in agreement with the findings ofRonchi et al. (1993), who fed three groups of Sardaewes from weaning throughout the first lactation
with three diets differing in energy value. In thisexperiment daily weight gains (on average 253.7g/d) were very close to those observed in our exper-iment (217.1 vs 253.5 g/d, respectively for groupsL-NSC and H-NSC) and not statistically differentamong the experimental groups. In subsequentmilk yield controls at 3 and 30 days from lambing,the authors observed that the group fed the dietwith the lowest energetic concentration showedhigher milk production, albeit not statistically dif-ferent from the other two groups. They attributedthe results to the uncorrected development of themammary gland due to the high energetic concen-trations of the diets received in pre-puberty.
The higher weight at sale and higher dailyweight gain in the lambs of group H-NSC (Table 4)were the results of their mothers’ greater milkproduction, as estimated on the basis of lambgrowth (1282.7 vs 112.7 g/d, for groups H-NSC and
BOVERA et al.
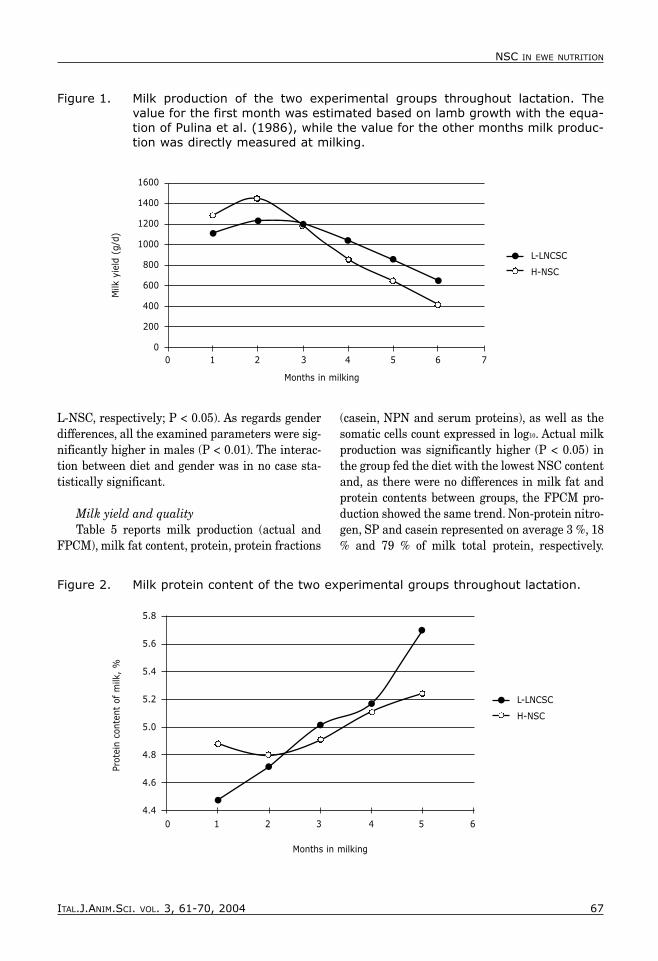
Table 5. Yield, some chemical characteristics and somatic cell contents (SC) of milkclassified by diet and month in milk.
Yield Fat CP FPCM Casein NPN SP SCg/d % % g/d % % % log10
Diet effect (DF = 1)L-NSC 996.2a 6.69 5.02 979.6a 3.98 0.15 0.89 5.32H-NSC 899.8b 6.71 4.99 877.7b 3.93 0.16 0.90 5.29
Month in milking effect (DF = 4)1 1334.4A 5.59E 4.67E 1187.9A 3.76B 0.17A 0.73Bb 4.46B2 1191.6B 6.14D 4.76D 1123.7A 3.90B 0.13C 0.73Bb 4.61B3 940.8C 6.36C 4.96C 910.0B 3.88B 0.16Aab 0.88Ba 5.78A4 750.9D 6.93B 5.15B 740.4Ca 3.92B 0.14BCb 1.08A 5.91A5 532.0E 8.48A 5.48A 614.4Cb 4.31A 0.13C 1.08A 5.76A
SignificanceD * ns ns * ns ns ns nsM ** ** ** ** ** ** ** **I * * * * ** ns ns ns
Variance of error (DF = 115)61274 0.47 0.22 51063 0.001 0.158 0.04 0.37
CP = crude protein; FPCM = fat and protein corrected milk; NPN = non-protein nitrogen; SP = soluble protein.D = diet effect; M = month in milking effect; I = interaction D x M.A, B and **=P<0.01; a, b and *=P<0.05; ns = not significant.
* I.J.A.S. Imp. 01/04 21-12-2005 12:42 Pagina 66
ITAL.J.ANIM.SCI. VOL. 3, 61-70, 2004 67
NSC IN EWE NUTRITION
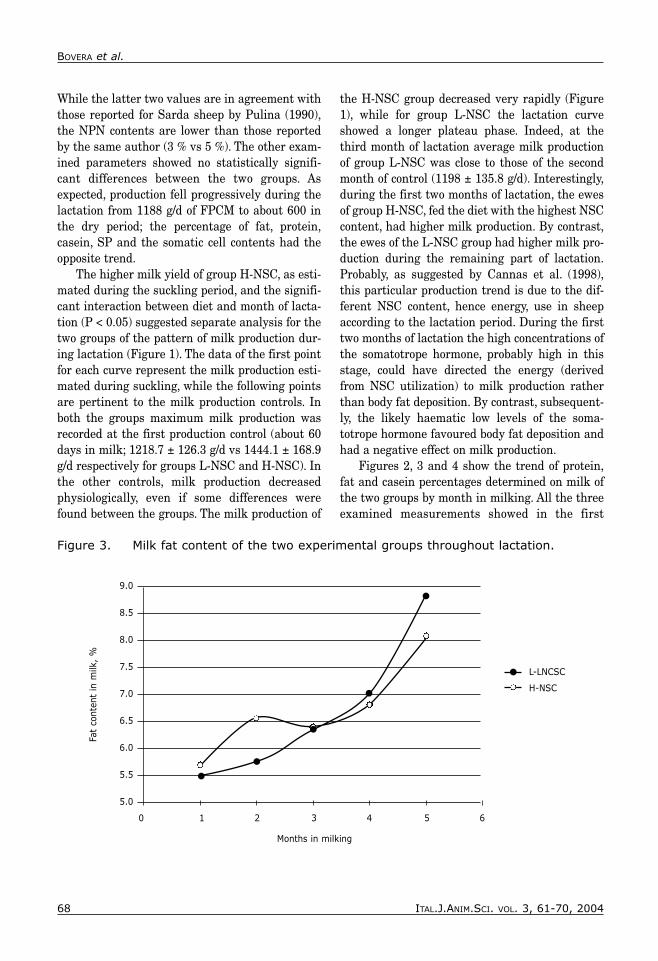
Figure 1. Milk production of the two experimental groups throughout lactation. Thevalue for the first month was estimated based on lamb growth with the equa-tion of Pulina et al. (1986), while the value for the other months milk produc-tion was directly measured at milking.
L-NSC, respectively; P < 0.05). As regards genderdifferences, all the examined parameters were sig-nificantly higher in males (P < 0.01). The interac-tion between diet and gender was in no case sta-tistically significant.
Milk yield and qualityTable 5 reports milk production (actual and
FPCM), milk fat content, protein, protein fractions
(casein, NPN and serum proteins), as well as thesomatic cells count expressed in log10. Actual milkproduction was significantly higher (P < 0.05) inthe group fed the diet with the lowest NSC contentand, as there were no differences in milk fat andprotein contents between groups, the FPCM pro-duction showed the same trend. Non-protein nitro-gen, SP and casein represented on average 3 %, 18% and 79 % of milk total protein, respectively.
Figure 2. Milk protein content of the two experimental groups throughout lactation.
L-LNCSC
H-NSC
Months in milking
Milk
yie
ld (
g/d)
0 1 2 3 4 5 6 7
1600
1400
1200
1000
800
600
400
200
0
Months in milking
0 1 2 3 4 5 6
5.8
5.6
5.4
5.2
5.0
4.8
4.6
4.4
Prot
ein
cont
ent
of m
ilk,
%
L-LNCSC
H-NSC
* I.J.A.S. Imp. 01/04 21-12-2005 12:42 Pagina 67
68 ITAL.J.ANIM.SCI. VOL. 3, 61-70, 2004
While the latter two values are in agreement withthose reported for Sarda sheep by Pulina (1990),the NPN contents are lower than those reportedby the same author (3 % vs 5 %). The other exam-ined parameters showed no statistically signifi-cant differences between the two groups. Asexpected, production fell progressively during thelactation from 1188 g/d of FPCM to about 600 inthe dry period; the percentage of fat, protein,casein, SP and the somatic cell contents had theopposite trend.
The higher milk yield of group H-NSC, as esti-mated during the suckling period, and the signifi-cant interaction between diet and month of lacta-tion (P < 0.05) suggested separate analysis for thetwo groups of the pattern of milk production dur-ing lactation (Figure 1). The data of the first pointfor each curve represent the milk production esti-mated during suckling, while the following pointsare pertinent to the milk production controls. Inboth the groups maximum milk production wasrecorded at the first production control (about 60days in milk; 1218.7 ± 126.3 g/d vs 1444.1 ± 168.9g/d respectively for groups L-NSC and H-NSC). Inthe other controls, milk production decreasedphysiologically, even if some differences werefound between the groups. The milk production of
the H-NSC group decreased very rapidly (Figure1), while for group L-NSC the lactation curveshowed a longer plateau phase. Indeed, at thethird month of lactation average milk productionof group L-NSC was close to those of the secondmonth of control (1198 ± 135.8 g/d). Interestingly,during the first two months of lactation, the ewesof group H-NSC, fed the diet with the highest NSCcontent, had higher milk production. By contrast,the ewes of the L-NSC group had higher milk pro-duction during the remaining part of lactation.Probably, as suggested by Cannas et al. (1998),this particular production trend is due to the dif-ferent NSC content, hence energy, use in sheepaccording to the lactation period. During the firsttwo months of lactation the high concentrations ofthe somatotrope hormone, probably high in thisstage, could have directed the energy (derivedfrom NSC utilization) to milk production ratherthan body fat deposition. By contrast, subsequent-ly, the likely haematic low levels of the soma-totrope hormone favoured body fat deposition andhad a negative effect on milk production.
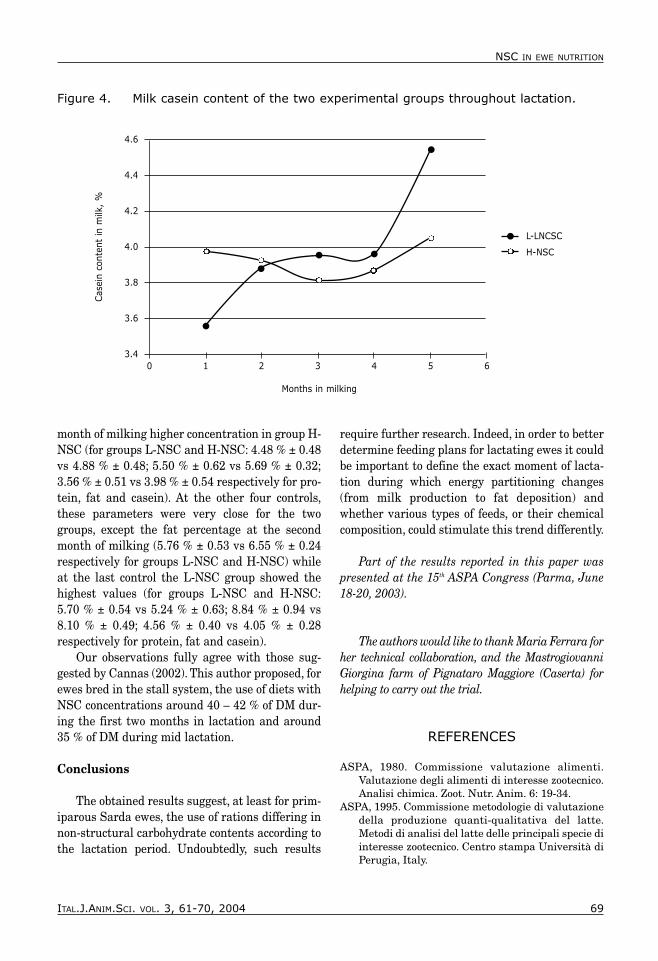
Figures 2, 3 and 4 show the trend of protein,fat and casein percentages determined on milk ofthe two groups by month in milking. All the threeexamined measurements showed in the first
BOVERA et al.
Figure 3. Milk fat content of the two experimental groups throughout lactation.
Months in milking
0 1 2 3 4 5 6
9.0
8.5
8.0
7.5
7.0
6.5
6.0
5.5
5.0
Fat
cont
ent
in m
ilk,
%
L-LNCSC
H-NSC
* I.J.A.S. Imp. 01/04 21-12-2005 12:42 Pagina 68
ITAL.J.ANIM.SCI. VOL. 3, 61-70, 2004 69
month of milking higher concentration in group H-NSC (for groups L-NSC and H-NSC: 4.48 % ± 0.48vs 4.88 % ± 0.48; 5.50 % ± 0.62 vs 5.69 % ± 0.32;3.56 % ± 0.51 vs 3.98 % ± 0.54 respectively for pro-tein, fat and casein). At the other four controls,these parameters were very close for the twogroups, except the fat percentage at the secondmonth of milking (5.76 % ± 0.53 vs 6.55 % ± 0.24respectively for groups L-NSC and H-NSC) whileat the last control the L-NSC group showed thehighest values (for groups L-NSC and H-NSC:5.70 % ± 0.54 vs 5.24 % ± 0.63; 8.84 % ± 0.94 vs8.10 % ± 0.49; 4.56 % ± 0.40 vs 4.05 % ± 0.28respectively for protein, fat and casein).
Our observations fully agree with those sug-gested by Cannas (2002). This author proposed, forewes bred in the stall system, the use of diets withNSC concentrations around 40 – 42 % of DM dur-ing the first two months in lactation and around35 % of DM during mid lactation.
Conclusions
The obtained results suggest, at least for prim-iparous Sarda ewes, the use of rations differing innon-structural carbohydrate contents according tothe lactation period. Undoubtedly, such results
require further research. Indeed, in order to betterdetermine feeding plans for lactating ewes it couldbe important to define the exact moment of lacta-tion during which energy partitioning changes(from milk production to fat deposition) andwhether various types of feeds, or their chemicalcomposition, could stimulate this trend differently.
Part of the results reported in this paper waspresented at the 15th ASPA Congress (Parma, June18-20, 2003).
The authors would like to thank Maria Ferrara forher technical collaboration, and the MastrogiovanniGiorgina farm of Pignataro Maggiore (Caserta) forhelping to carry out the trial.
REFERENCES
ASPA, 1980. Commissione valutazione alimenti.Valutazione degli alimenti di interesse zootecnico.Analisi chimica. Zoot. Nutr. Anim. 6: 19-34.
ASPA, 1995. Commissione metodologie di valutazionedella produzione quanti-qualitativa del latte.Metodi di analisi del latte delle principali specie diinteresse zootecnico. Centro stampa Università diPerugia, Italy.
NSC IN EWE NUTRITION
Figure 4. Milk casein content of the two experimental groups throughout lactation.
0 1 2 3 4 5 6
Cas
ein
cont
ent
in m
ilk,
%
L-LNCSC
H-NSC
Months in milking
4.6
4.4
4.2
4.0
3.8
3.6
3.4
* I.J.A.S. Imp. 01/04 21-12-2005 12:42 Pagina 69
70 ITAL.J.ANIM.SCI. VOL. 3, 61-70, 2004
ASSONAPA, 2002. Distribuzione geografica dellepopolazioni ovine. Home page address:www.assonapa.com.
BROWN, D.L., HOGUE, D.E., 1985. Effects of roughagelevel and physical form of diet on Finnisheep lac-tation. SID Research Digest. Fall 1985: 11-14.
CANNAS, A., PES, A., MANCUSO, R., VODRET, B., NUDDA,A., 1998. Effect of the dietary energy and proteinconcentration on the concentration of milk ureanitrogen in dairy ewes. J. Dairy Sci. 81:499-508.
CANNAS, A., 2002. Feeding of lactating ewes. In: G.Pulina (ed.) Dairy sheep feeding and nutrition.Avenue media, Bologna, Italy, pp 123-166.
CAVANI, C., BIANCONI, L., MONGARDI, D., 1990. Buccettedi soia e distillers di cereali nell’alimentazione dipecore da latte. pp 609 - 610 in Proc. 9th Nat.Congr.SIPAOC, Grado (GO), Italy.
INRA, 1988. Alimentation des bovines, ovins &caprins. INRA, Paris, France.
LICITRA, G., HERNANDEZ, T.M., VAN SOEST, P.J., 1996.Standarditation of procedures for nitrogen frac-tionation of ruminant feeds. Anim. Feed Sci.Technol., 57: 247-358.
MARTILLOTTI, F., ANTONGIOVANNI, M., RIZZI, L., SANTI,E., BITTANTE, G., 1987. Metodi di analisi per lavalutazione degli alimenti di impiego zootecnico.Ed. IPRA, Padova, Italy.
PULINA, G., ROSSI, G., BRANDANO, P., 1986. Stima dellaproduzione lattea della pecora in base al ritmo diaccrescimento dell’agnello. Ann. Facoltà diAgraria, Università di Sassari, Italy, 32: 43-48.
PULINA, G., 1990. Influenza dell’alimentazione sullaqualità del latte ovino. Informatore agrario. 37:31-38.
RONCHI, B., BERNABUCCI, U., LACETERA, N.G., BRETONI,G., 1993. Il livello nutritivo dallo svezzamento alprimo parto in agnelle di razza Sarda. 3.Ingestione di alimenti, stato nutrizionale e perfor-mance nel corso della gravidanza e del primomese di lattazione. pp 319 – 324 in Proc. 10th Nat.Congr. ASPA, Bologna, Italy.
SANNA, S.R., CARTA, A., CASU, S., 2000. Lo stato attualedello schema di selezione della pecora di razzaSarda. L’allevatore di ovini e caprini. 17(4): 1-6.
SAS, 2000. SAS/STAT® Software: Changes andEnhancements through Release 8.1. SAS InstituteInc., Cary, NC, USA.
SERRA, F.A., CANNAS, A., PULINA, G., 1998. Il raziona-mento: il principale problema dell’alimentazionedelle pecore in lattazione. L’allevatore di ovini ecaprini. 15(4): 1-4.
SNIFFEN, C.J., O’CONNOR, J.D., VAN SOEST, P.J., FOX,D.G., RUSSEL, J.B., 1992. A Net Carbohydrate andProtein System for evaluating cattle diets: II.Carbohydrate and protein availability. J. Anim.Sci. 70: 3562-3577.
VAN SOEST, P.J., ROBERTSON, J.B., LEWIS, B.A., 1991.Methods for dietary fiber, neutral detergent fiber,and nonstarch polysaccharides in relation to ani-mal nutrition. J. Dairy Sci. 74: 3583 – 3598.
BOVERA et al.
* I.J.A.S. Imp. 01/04 21-12-2005 12:42 Pagina 70