effect of michael adduction on peptide preservation in natural waters
TRANSCRIPT
This is an Accepted Manuscript, which has been through the Royal Society of Chemistry peer review process and has been accepted for publication.
Accepted Manuscripts are published online shortly after acceptance, before technical editing, formatting and proof reading. Using this free service, authors can make their results available to the community, in citable form, before we publish the edited article. We will replace this Accepted Manuscript with the edited and formatted Advance Article as soon as it is available.
You can find more information about Accepted Manuscripts in the Information for Authors.
Please note that technical editing may introduce minor changes to the text and/or graphics, which may alter content. The journal’s standard Terms & Conditions and the Ethical guidelines still apply. In no event shall the Royal Society of Chemistry be held responsible for any errors or omissions in this Accepted Manuscript or any consequences arising from the use of any information it contains.
Accepted Manuscript
Environmental ScienceProcesses & Impacts
rsc.li/process-impacts
View Article OnlineView Journal
This article can be cited before page numbers have been issued, to do this please use: G. A. McKee, M. E.
Kobiela and P. Hatcher, Environ. Sci.: Processes Impacts, 2014, DOI: 10.1039/C4EM00075G.
Environmental Science
Processes & Impacts RSCPublishing
PAPER
This journal is © The Royal Society of Chemistry 2014 G.A.McKee., 2014, 00, 1-3 | 1
Cite this: DOI: 10.1039/x0xx00000x
Received 27th January 2014, Accepted
DOI: 10.1039/x0xx00000x
www.rsc.org/
Effect of Michael Adduction on peptide preservation in natural waters
G.A. McKee,a M. E. Kobielaa and P. G. Hatchera ,
The reaction of peptides with chemicals already present in natural waters (such as polycyclic aromatic hydrocarbons) is one method that has been suggested to preserve peptides for the longer term. In this study we test whether the reaction of tetrapeptides with a model quinone can help stabilise the peptide in one polluted riverine system, Elizabeth River in Virginia, USA. We found that there is almost no difference in rate constants between the peptide and its quinone adduct (e.g. 6.62 versus 6.86 d-1 for AVFA and its respective adduct) However, when monitoring the removal of the adduct from natural water, we identified two new compounds that are formed as a result of its decomposition. Using tandem mass spectrometry we identified potential structures and mechanisms for the formation of these new compounds. These new compounds are more recalcitrant than their parent peptide-quinone adduct, since they remain in solution for 3-10 times longer. Based on our findings we postulate that the reaction of peptides with quinones can help preserve sections of the original peptide following an initial rearrangement of the original adduct, potentially explaining why seemingly labile peptides are observed in most natural waters.
Introduction
Proteinaceous compounds are key structures of many organisms and, as a consequence, they can be a major fraction of the dissolved organic nitrogen (DON) pool in marine and fresh water systems. Most proteins and peptides released into aqueous systems are rapidly removed mainly through enzyme catalysed hydrolysis1, but a small fraction is preserved in the DON and sediment organic nitrogen (SON) pools.2–7 The reasons why these proteins and peptides are not immediately hydrolysed are not well understood. A number of hypotheses have been suggested in past studies including: hydrophobic and non-covalent interactions,4 protection by membranes such as chloroplast,8 selective preservation,9 protection by encapsulation into organic matter (OM)10,11 and mineral matter, 12,13 chemical structure14,15 and formation of adducts to OM.14,16,17 Specifically, the formation of adducts to OM may increase the peptide size beyond the perceived limit for cell transport and intracellular metabolism.18 The adduction to quinones in aqueous systems is one of the proposed mechanisms for preservation of peptides in OM systems16 and will be investigated in more detail in this study. In most environmental systems conducive to the likely formation of
such adducts, the likely adduct receptors are quinones derived from the oxidative degradation of polycyclic aromatic hydrocarbons (PAHs).19 PAHs are common anthropogenic and natural contaminants released into the aqueous environment.20,21 There have been several studies suggesting that PAHs form adducts with OM, serving to reduce PAH bioavailability as well as that of the OM.22–26 Peptides are one type of OM that has been successfully linked to several adducts of PAHs, most notably quinones.27–29 The Michael reaction is a common reaction that occurs between quinones and primary amines.30 Quinone-peptide adducts are commonly formed in natural systems via a Michael reaction, catalysed by enzymes.19,20,28 It was demonstrated that the peptide glycine-glycine-glycine-arginine reacted with 1, 4-naphthoquinone (nap) via a Michael reaction.28 This suggests that these types of adducts can also form with humic acids and can thereby possibly serve to protect the peptide from degradation.28 However, there has been no direct evidence to date that this reaction affects the remineralisation of a peptide once bound to a quinone. In this study, we investigate the ability of Michael adduction to impact the removal of tetrapeptides from natural water using nap as a model quinone. In order to assess whether
Page 1 of 17 Environmental Science: Processes & Impacts
Env
iron
men
talS
cien
ce:P
roce
sses
&Im
pact
sA
ccep
ted
Man
uscr
ipt
Publ
ishe
d on
03
June
201
4. D
ownl
oade
d by
Col
orad
o St
ate
Uni
vers
ity o
n 12
/06/
2014
00:
00:5
8.
View Article OnlineDOI: 10.1039/C4EM00075G
PAPER Environmental Science Processes and Implications
2 | G.A.McKee., 2014, 00, 1-3 This journal is © The Royal Society of Chemistry 2014
adduction affects the preservation of peptides, we synthesised a series of nap-adducts and compared their removal in collected water from the Elizabeth River, Virginia, USA . We directly monitored temporal concentrations of the nap-adducts with high performance liquid chromatography (HPLC) and compared these to similar experiments with the un-adducted peptides to assess whether nap adduction had any effect on their removal rate from water. Experimental
Preparation of nap-adduct standards
For all syntheses, the highest quality reactants available were used. Fluorenylmethyloxycarbonyl chloride (FMOC) amino acids were purchased from Protein Technologies. Resins were purchased from Advanced ChemTech (alanine, glycine) and Nova Biochem (valine). Nap adducts to peptides were produced by initially forming an adduct with alanine, synthesising 1, 4-naphthoquinon-2-yl-alanine (nap-A). We used a method based upon that of Bittner et al. (2002), which describes a synthetic pathway for production of a related amino acid adduct, 1, 4-naphthoquinon-2-yl-glycine. The method was modified as follows: approximately 20 mmol of unprotected A (Acros) was dissolved in distilled deionised water (DDI, MilliQ 18.2 Ω) and added to a hot 40 mmol ethanol (Fisher) solution of nap (Acros). This solution was stirred at room temperature for 24 – 72 hours, after which the solution was removed by filtration, and the solid brought to dryness by rotary evaporation. Purification of nap-A used a silica gel column (grade 62, 60 – 200 mesh, 150 Å, Sigma-Aldrich) eluting the product with a 9:1 v/v mixture of methylene chloride (Acros)/methanol (Fisher) with average yields of 4 %. Using this method we synthesised the following peptides: alanine-valine-phenylalanine-alanine (AVFA), alanine-glutamic acid-glycine (AREG), and alanine-phenylalanine-arginine-valine (AFRV). Attachment of nap-A to other amino acids to yield the nap-adducts was facilitated by the use of FMOC solid phase peptide synthesis (SPPS) on an automated solid phase peptide synthesiser (PS3, Protein Technologies, AZ) to produce all of the peptides and nap-adducts used in this study; a method that reproducibly synthesises peptides of high purity.31–34 The details of the synthesis are described elsewhere.14 The synthesis protocol was the same for the nap adducted peptides and the un-adducted peptides except the following steps. Following stepwise addition of the amino acids to the resin the last step involved the addition of the purified nap-A, without any prior deprotection step. The workup procedure was exactly the same as for the un-adducted peptides, except that the last step was omitted because of low solubility, dissolution of the stock solutions was assisted by sonication for 1 – 2 hours. Thus, the nap-adducted peptides and un-adducted peptides were purified in chloroform by HPLC directly using a Shimadzu HPLC with a C18 column (Grace, Apollo 5 µ, 150 x 10 mm) attached to a photodiode array (PDA) detector equipped with a
fraction collector. Mobile phases were 0.05 M NaH2PO4 (Fisher) which was kept constant while the organic phase, methanol, was ramped on a gradient. Due to their unique characteristics, the gradient and flow rate were optimised for each peptide. The following nap-adducts were synthesised using this method: 1, 4-naphthoquinon-2-yl-alanine-valine-phenylalanine-alanine (nap-AVFA), 1, 4-naphthoquinon-2-yl-alanine-glutamic acid-glycine (nap-AREG), and 1, 4-naphthoquinon-2-yl-alanine-phenylalanine-arginine-valine (nap-AFRV). Pure peptides and adducts were collected using the fraction collector and the structure of each was confirmed by FT-ICR-MS and nuclear magnetic resonance (NMR) analysis (cf. SI Fig.s 1-6). Peptide and adduct yields were generally ~ 50 %. For FT-ICR-MS analysis, the relevant collected peaks were directly analysed on a Bruker Daltonics 12 Tesla Apex Qe 175 FT-ICR-MS at the College of Sciences major instrument cluster (COSMIC) facility at Old Dominion University (ODU). The collected fractions were acidified to pH 6 using formic acid (Sigma-Aldrich) and directly infused into the Apollo II electrospray (ESI) ion source at a rate of 120 µL/hr using a syringe pump. Polyethylene glycol was used as an external calibrant and was accumulated for 1.0 sec in the hexapole before being transferred to the ICR cell and 20 transients were co-added. The collected fractions were analysed using a 1.0 sec accumulation time in the hexapole with 10 co-added transients. Tandem mass spectrometry was achieved using the built in facility of the instrument within the cell, for collision induced dissociation (CID) of the selected nap-adduct products. A 4 MWord time domain was used for the free induction decay (FID). Zero-filling was completed once on the summed FID signal and then Sine-Bell apodised before Fourier transformation followed by magnitude calculation using the Bruker Daltonics Data Analysis software v. 1.3™. Resulting m/z data for each peptide and nap-adduct were confirmed as being correct by comparing to their exact mass. For 1H NMR analysis, a 400 MHz Bruker Avance spectrometer (Bruker Biospin, Inc.) located at the COSMIC facility was utilised. The pulse programme included water suppression for optimal spectral quality. Spectra were matched to simulated ones generated by a 1H NMR predictor (ACD Labs v. 9.0).
Sampling locations
Water was collected from Elizabeth River (ER) for all incubations in this study. ER is a major tributary of the Chesapeake Bay, surrounded by many industrial companies on both sides of the river, and its sources include groundwater from the Columbia and Yorktown aquifers and the Great Dismal Swamp.35–38 2.5 L of water was collected in a precombusted amber glass bottle from the side of the dock of the ODU sailing centre (30 cm depth) at 7.11 pm on 30th July 2010. Low tide had occurred at 7.02 pm low tide occurred (14.9 cm). The previous evening, a large rain storm (10.74 cm) occurred, contributing to the dissolved OM (DOM) in the river.
Page 2 of 17Environmental Science: Processes & Impacts
Env
iron
men
talS
cien
ce:P
roce
sses
&Im
pact
sA
ccep
ted
Man
uscr
ipt
Publ
ishe
d on
03
June
201
4. D
ownl
oade
d by
Col
orad
o St
ate
Uni
vers
ity o
n 12
/06/
2014
00:
00:5
8.
View Article OnlineDOI: 10.1039/C4EM00075G
Journal Name ARTICLE
This journal is © The Royal Society of Chemistry 2014 G.A.McKee., 2014, 00, 1-3 | 3
Incubation of peptides and adducts
Prior to collection of the ER water, stock solutions of the peptides were made at their maximum concentration, ranging from 0.001 – 0.002 M. Stock solutions were prepared on the same day as collection and were stored at 4 o C prior to their use. For each incubation bottle (precombusted, 60 mL amber bottles), 40 mL of ER water was added to each immediately prior to the addition of the peptides. Final concentrations of individual peptides were 10 µM in each incubation, except in a few experiments where concentrations were reduced due to limitations on the quantity of product available. Although the concentration of the peptides added to the natural waters in this study was significantly higher than natural levels, we assumed that the removal pathways suggested here are similar for natural levels. Previous experiments demonstrated that peptide incubations were very reproducible, so only one incubation bottle was prepared for each experiment .14 Each peptide was incubated for four weeks in DDI water alone as an experiment blank, and samples were collected at specific time points and monitored by HPLC. Results showed that all peptides were stable throughout the time period, with no change in their concentration and no appearance of additional peaks in HPLC chromatograms. All incubations were placed on an orbital shaker (VWR model 57018-754) that operated at 80 rpm. Incubations were carried out at room temperature (~ 24 oC) for 4 weeks and subsamples were harvested for analysis at specific time points. For each time point, a 2 mL aliquot was removed from each incubating bottle using an acid washed pipette tip, filtered using a 0.22 µm PVDF sterile filter and a 5 mL sterile polypropylene syringe, and placed in a precombusted 2 mL vial. All time point samples were frozen at - 14 oC immediately after collection, except 36, 48, 52 and 60 hour samples, which were stored at 4 o C, because HPLC analysis was planned for the following day. Previous experiments showed that storage of samples for up to 2 weeks at 4 o C did not significantly alter the peptide concentration monitored by HPLC (data not shown). Since nap-adduct incubations have not been previously shown to be reproducible, two of the adducts were incubated in two separate bottles (nap-AFRV and nap-AVFA). The reproducibility of chromatograms and resulting calculated concentrations suggested that nap-adduct experiments were reproducible (cf. Table 1). Abiotic control experiments were prepared using mercuric chloride (HgCl2), an effective treatment that prevents microbial activity.39–41 The previous studies of Liu et al. (2010) demonstrated that HgCl2 effectively quenched all microbial activity over their two week experiment using a concentration of 180 µM. In this study, we did not repeat their control on experiments involving the degradation of individual peptides, but confirmed that the activity of bacteria administered on nap adducted peptides could also be quenched with HgCl2
Monitoring of peptide concentrations by HPLC
Peptide and nap-adduct concentrations were monitored by HPLC during incubations. The mobile phases were 0.05 M NaH2PO4 and MeOH. The MeOH was ramped on a gradient that was optimised for each peptide or nap-adduct for time and optimal separation. Flow rate was 1 mL/min for all incubations except in cases where additional resolution was needed. Concentrations of each peptide were determined by comparison to standards analysed on the same day. The wavelengths monitored by UV-Vis were 210 nm for the un-adducted peptides and 264 nm for the Nap-adducts, chosen because they reflected maximum response by the detector. Duplicate runs resulted in high levels of agreement (peak areas were reproduced within 5 %). Newly formed peaks during nap-adduct incubations were collected using the fraction collector attached to the HPLC. Single incubations for the three nap-adducts were used for collection at two different time points, (12 and 168 hours). Due to the need for use of a high volatility buffer in FT-ICR-MS analysis, the aqueous solvent was changed to sodium bicarbonate (0.5 M) with no changes to the original gradients (consequently all peaks were sodiated in the spectra). Although retention times varied slightly among the different experiments; comparison to standards was sufficient to deduce the identity of each peak. Peaks were collected during a single run of each time point (12 and 168 hours) for the three Nap adducts and analysed by FT-ICR-MS as described above. For tandem MS analysis of the peaks, CID was employed on an m/z range of 1 Da centred on the mass spectral peak of interest. Collision voltage was altered until optimal fragmentation occurred. Exactly 10 co-added transients were accumulated in the ICR cell for each successfully fragmented peak. In this study first order kinetics were applied to the calculation of the rate constants for each peptide and adduct. Results and Discussion
Incubation of peptides and peptide adducts
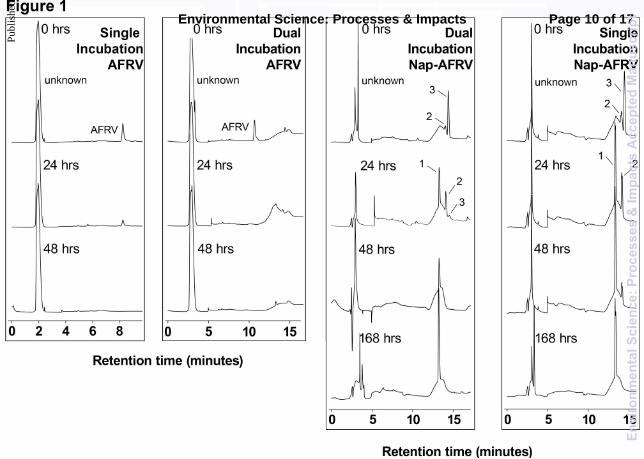
The HPLC chromatograms for selected time points for one of the peptides AFRV and adduct nap-AFRV are shown in Fig. 1. AFRV and nap-AFRV were incubated singly and together in one bottle (dual), to compare removal of AFRV and nap-AFRV in the incubations. In the case of AFRV, the rate constants for the single and dual incubations were 8.64 and 13.1 d-1 respectively (cf. Table 1). Although their rate constants differ, the retention times and areas of the peaks in the chromatograms for the two incubations for AFRV were similar. After 24 hours of incubation, AFRV was greatly reduced in concentration in both incubations and after 48 hours we were unable to detect it, indicating that the reason for rate constant differences of single and dual incubations was simply due to probable experimental error. This similarity in rate constants suggests that AFRV removal in ER water was not significantly affected by the presence of nap-AFRV.
Page 3 of 17 Environmental Science: Processes & Impacts
Env
iron
men
talS
cien
ce:P
roce
sses
&Im
pact
sA
ccep
ted
Man
uscr
ipt
Publ
ishe
d on
03
June
201
4. D
ownl
oade
d by
Col
orad
o St
ate
Uni
vers
ity o
n 12
/06/
2014
00:
00:5
8.
View Article OnlineDOI: 10.1039/C4EM00075G
PAPER Environmental Science Processes and Implications
4 | G.A.McKee., 2014, 00, 1-3 This journal is © The Royal Society of Chemistry 2014
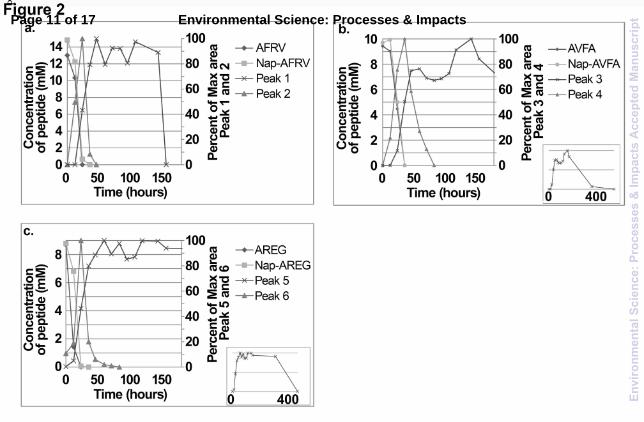
Nap-AFRV chromatograms, however, were different from those of AFRV. For nap-AFRV in the dual incubation, three peaks were observed: peak 3 was nap-AFRV, and peaks 1 and 2 were additional new peaks not previously observed in standards incubated in DDI water. At 0 hour, nap-AFRV was the dominant peak in the chromatogram, with only small amounts of peak 2 observable. This new peak must have formed immediately upon addition of the nap-AFRV to the water samples. After 24 hours of incubation there were three notable changes, firstly, nap-AFRV was significantly removed, secondly, peak 2 increased in intensity, and thirdly, peak 1 grew in. After 48 hours, only peak 1 was detectable, remaining after 168 hours of incubation, but completely disappeared by 500 hours (chromatogram not shown). The chromatograms representing singly incubated nap-AFRV were almost identical to those of nap-AFRV in the dual incubation experiment, suggesting that the presence of AFRV was not required in the incubation bottle to produce peaks 1 and 2. Moreover, the rate constants for each of the replicate experiments for the nap-AFRV single incubations and the dual incubations were very similar, demonstrating that this was a reproducible process (cf. Table 1). The evolution of peaks 1 and 2 was also reproducible. A control experiment in which nap-AFRV was incubated in DDI water for the same length of time as the ER water incubations showed that the nap-AFRV concentration remained constant and no additional peaks were observed (data not shown). This suggests that incubation of nap-AFRV in ER water, and either the associated microbial community or abiotic medium, was responsible for the production of peaks 1 and 2. A similar transformation may have occurred for the other nap-adducts studied: nap-AVFA and nap-AREG. The concentration graphs of the dual incubations of nap-AVFA + AVFA and nap-AREG + AREG in ER water are shown in Fig. 2 along with the data for the incubations of nap-AFRV + AFRV re-plotted for comparison purposes. The rate constants for each of the peptides and adducts were very similar for each incubation bottle (cf. Fig. 2; Table 1). The emergence of two additional different peaks in the incubations of nap-AFRV (peaks 1 and 2), were also observed in those of nap-AVFA (labelled peaks 3 and 4) and nap-AREG (labelled peaks 5 and 6) dual incubations. Fig. 2 shows that peaks 2, 4 and 6 followed a similar trend for all three adducts; increasing to a maximum concentration after 30 – 40 hours and then rapidly decreasing in concentration, followed by complete disappearance after 50 – 80 hours. A second set of peaks (peak 1, 3 and 5, respectively) emerged in each of the incubations after 24 hours and continued to increase in concentration, with several fluctuations, until removal after 150 hours for nap-AFRV and 500 hours for nap-AREG and nap-AVFA. Due to the fact that peaks 1, 3, 5 and 2, 4, 6 had similar production and disappearance patterns for all three adducts, it was logical to deduce that they may have involved similar transformations of the precursor adduct. To investigate the processes taking place, all the peaks were collected using the fraction collector attached to the HPLC and analysed further.
Identification of emergent peaks
Each of the collected peaks were analysed by electrospray ionisation (ESI)-Fourier transform ion cyclotron resonance mass spectrometry (FT-ICR-MS), including, when possible, use of tandem MS to fragment the compounds and aid in their identifications. We used accurate mass to charge (m/z) values (within 1 ppm of the selected mass) for each of the collected eluates from the HPLC. This enabled the assignment of an exact formula for each of the peaks observed by HPLC. To facilitate structure determination for each compound, we used tandem MS CID to fragment the peak and ascertain the elemental formulae for each of the fragments to a precision of 1 ppm. The success of tandem MS varied for each compound collected from the HPLC fraction collection; however, using all of the information available we propose the structure of collected peak. Proposed formation pathways were suggested for each peak based on likely chemical alterations. However, the exact mechanism and level of microorganisms involvement by in producing these compounds remain unknown and are beyond the scope of this work. .
Nap-AVFA peak 3: proposed structure and formation mechanism
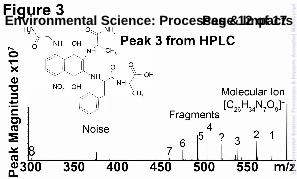
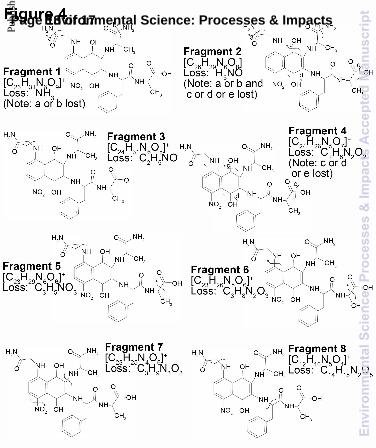
Peak 3 collected from the incubation of nap-AVFA, was determined to have a m/z value of 588.240234 Da. Tandem MS results for peak 3 (cf. Fig. 3) identified numerous neutral mass losses and fragment ions that enabled the determination of a structure for this new compound. The first step to determining the structure of peak 3 was the identification of a likely formula. Each of the fragmentation peaks observed in Fig. 3 were also assigned formulae with a high level of precision (cf. Fig. 4). Upon examining the fragmented ions’ formulae and comparing them to the formula options for the molecular ion, the only formula that contained consistently higher amounts of C, H, N and O than the determined molecular formulae was C26H33N7O9. We determined the exact mass of the fragments lost in the CID process and were able to suggest an overall structure of peak 3 (Fig. 4 and Table 2). All of the peaks that were assigned a formula are listed in Table 2. We focus our discussion on those fragments which enabled us to elucidate a possible structure for peak 3, and were therefore, examined in more detail and labelled in Fig 3 and 4,. For example, from fragment 1 (m/z 571.214703) and its associated isotopologue (m/z 572.218058), we postulated that there was a loss of at least one amine group. Several other peaks shown in Fig. 3 could be caused by the loss of an amine group (cf. Table 2). Fragment 2 showed an additional loss of a hydroxyl group, that the quinone was in the reduced form; this type of loss has been observed for hydroquinone MS fragmentation previously.42 Fragments 3 and 4 enabled us to suggest that an alanine initially attached in nap-AVFA lost the methyl group becoming glycine, since a
Page 4 of 17Environmental Science: Processes & Impacts
Env
iron
men
talS
cien
ce:P
roce
sses
&Im
pact
sA
ccep
ted
Man
uscr
ipt
Publ
ishe
d on
03
June
201
4. D
ownl
oade
d by
Col
orad
o St
ate
Uni
vers
ity o
n 12
/06/
2014
00:
00:5
8.
View Article OnlineDOI: 10.1039/C4EM00075G
Journal Name ARTICLE
This journal is © The Royal Society of Chemistry 2014 G.A.McKee., 2014, 00, 1-3 | 5
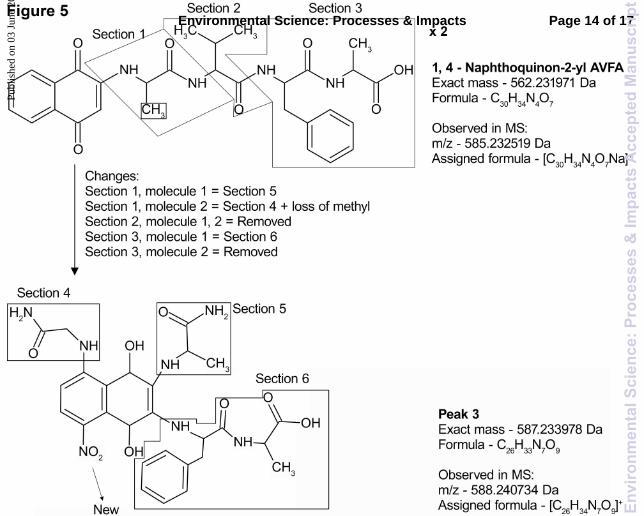
traditional amide bond breakage for peptide fragmentation explains the mass loss. Fragments 5 and 6 indicated that a carboxylic acid group was attached to the end of a chain, signifying hydrolysis of one of the peptide bonds. Fragment 7 allowed us to identify the presence of a complete alanine molecule and an additional nitro group, speculated to be attached on the ring. This led us to postulate that two molecules of nap-AVFA were necessary to form peak 3 since one of the two alanine molecules present in the molecular ion was difficult to access. The exact positions of the nitro and the glycine groups on nap cannot be determined from the mass spectral data. However, we speculated that they were attached at the positions indicated in Fig. 4, due to the electron density of the ring. Fragment 8 allowed us to postulate that phenylalanine and alanine were still attached but could be removed from the overall structure. Consequently, it appeared that valine was completely removed upon generation of this structure. Fragment 8 allowed us to confirm that molecules of nap-AVFA were necessary, since 3 alanine molecules were required to form peak 3. All of the fragments were formed by removing certain sections of the peptide backbone, leaving nap intact; this seems plausible based on past examination of fragmentation patterns.43 When accumulating the tandem MS data, the structure proposed in Fig. 3 explained all of the above listed fragments created during CID of peak 3 (cf. Fig. 4). Having suggested the likely structure of peak 3, we were able to suggest mechanisms to explain its formation from nap-AVFA. The proposed structure for peak 3 and the original nap-AVFA structure are shown in Fig. 5. Substantial modification of the original nap-AVFA occurred. Nap-AVFA was divided into three sections, showing the locations where bonds were broken and reformed to produce the proposed structure for peak 3. Section 1 contained alanine attached directly to nap (the synthesis assured this), and the additional amine was likely sourced from valine, a process that involved hydrolysing the amide bond between alanine and valine, likely through an intracellular/extracellular enzymatically driven process. Two different transformations occurred concerning section 1, involving two separate molecules of nap-AVFA. In the first transformation, section 1 remained unaffected as shown in Fig. 5 (section 5). In the second molecule of nap-AVFA, section 1 was detached from nap and reattached at position 8, on the benzene ring, ortho to the quinone, via a Michael reaction (section 4). This was coupled with the removal of the side chain methyl group. A reaction also occurred to attach nitrate at position 4 of the benzene ring, para to the attachment of section 4. Nitrate and nitrite have been found to react with PAHs in aqueous environments and could therefore be reacting in a similar way with nap-AVFA, although those reaction conditions were far removed from our incubations.44 The source of the nitrate/nitrite added to peak 3 was not clear, but we speculated that it is already present in the water. The concentration of nitrate/nitrite was measured as 9.7 µM in ER water, which is typical of an urban sourced river.35,45 Although this concentration was low, the electron poor character of the
quinone could induce nitrate/nitrite to react with it, thereby producing peak 3. Another possible mechanistic route for nitrate incorporation is through an iron catalysed nitration reaction, which has been postulated to occur in forest pore waters.46 The concentration of dissolved iron in the ER is relatively high, probably due to the large number of industrial sources surrounding the river, giving credence to the possibility of this mechanism.47 Both of these mechanisms are speculative, however, and investigation into the nitrite incorporation mechanism is beyond the scope of this work. Section 2 of nap-AVFA was lost completely in the formation of peak 3; the reason for this was not clear. Section 3 was detached from section 2, by hydrolysis of the amide bond between valine and phenylalanine, and then reattached to the meta carbon of the quinone via a Michael reaction (section 6). Likely due to the addition of the various groups around nap, the quinone remained in a reduced form; the reason for this was unclear but could be due to stabilisation via resonance or rapid oxidation in the presence of dissolved OM.
Nap-AFRV peak 1 proposed structure and formation mechanism
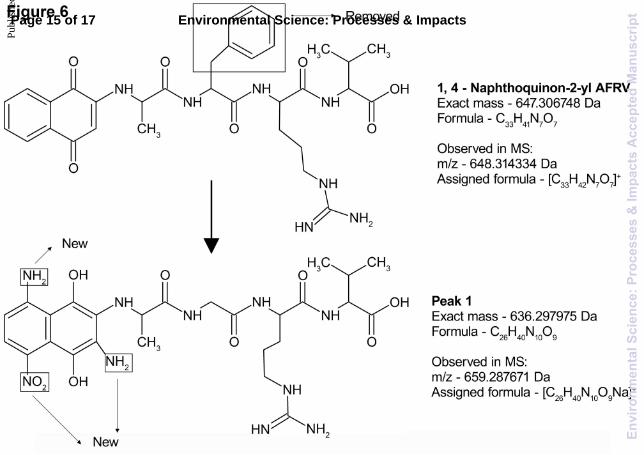
Unfortunately it was not possible to fragment either of the structures of peaks 1 and 5; so we used the structure and transformations of peak 3 as a guide to determine the most likely structures of peaks 1 and 5. Peak 1, formed during the incubation of nap-AFRV, was determined to have a m/z of 659.268671, corresponding to a molecular formula of [C26H40N10O9Na]+. The proposed structure of peak 1 is shown in Fig. 6, along with the structure of nap-AFRV, annotated with the points of change. The suggested changes were suggested primarily by examining the structure of nap-AFRV. We compared the formulae of these two molecules and assessed the loss in C, H, N and O contents. The overall loss to form peak 1 from nap-AFRV was C7H accompanied by the addition of N3O2. In order to maintain a similar H content in peak 1, it seemed reasonable to suggest that the benzyl side chain of phenylalanine could be lost. In addition, there are several bacteria that selectively remove and degrade aromatic structures in water, and we suggest that they are acting on nap-AFRV.48–50 The question of why these bacteria did not also attack nap was not clear, this could be because of steric hindrance by not allowing intracellular uptake of the peptide due to it being larger than 600 Da18 and its consequential enzymatic hydrolysis, but is likely due to the inherent strength of the bonds connecting nap to the rest of the peptide preventing hydrolysis. These same reasons could also explain the stability of phenylalanine present in peak 3 which remained attached to the backbone peptide structure of nap-AVFA throughout its transformation. In order to explain the addition of N and O to the structure of ap-AFRV, we considered small molecules that were composed only of these atoms as possible additions. In Fig. 3 and 4 it was suggested that a nitro group was added to nap. Therefore, it seemed reasonable that nitrate/nitrite might
Page 5 of 17 Environmental Science: Processes & Impacts
Env
iron
men
talS
cien
ce:P
roce
sses
&Im
pact
sA
ccep
ted
Man
uscr
ipt
Publ
ishe
d on
03
June
201
4. D
ownl
oade
d by
Col
orad
o St
ate
Uni
vers
ity o
n 12
/06/
2014
00:
00:5
8.
View Article OnlineDOI: 10.1039/C4EM00075G
PAPER Environmental Science Processes and Implications
6 | G.A.McKee., 2014, 00, 1-3 This journal is © The Royal Society of Chemistry 2014
also be an additive to nap-AFRV, thereby accounting for the addition of the N and O in the formula of peak 1. Thus far, in the suggested transformations to nap-AFRV to form peak 1, there has been a loss of C7H7 and the addition of NO2. The remaining difference in the formulae was N2H6. We suggested therefore, that the other change to nap-AFRV to produce peak 1 was the addition of two amine groups to nap. We postulated that these were added via a Michael addition reaction. Ammonia reacts readily with quinones via a Michael addition reaction and so the addition of amines to produce peak 1 is not unexpected. The remaining two hydrogens could be accounted for by the quinone being in the reduced form. Since peak 3 was found to be in a reduced form, it was reasonable to suggest that peak 1 might also contain a reduced quinone for similar reasons.
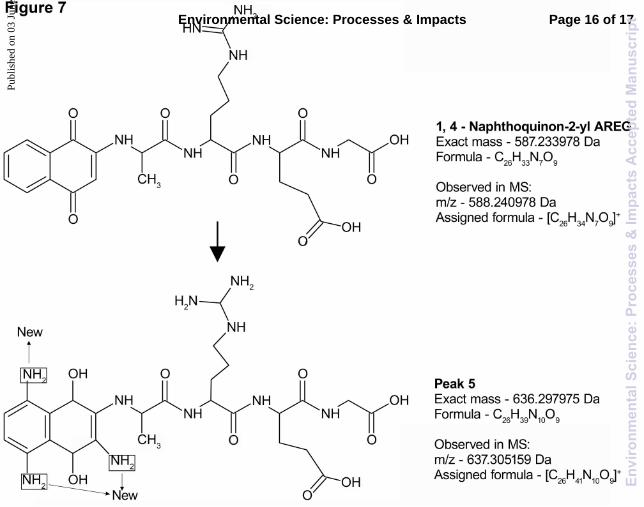
Nap-AREG peak 5 proposed structure and formation mechanism
The m/z resulting from the analysis of peak 5, formed during the incubation of nap-AREG was 637.305159 Da, with the assigned formula of [C26H41N10O9]+. We proposed that similar changes occurred to nap-AREG to produce peak 5 as those of nap-AFRV to produce peak 1. These are displayed on the structures in Fig. 7. Most of the peptide remained intact, with no changes to the backbone or sidechains. All of the changes occurring to nap-AFRV to produce peak 5 involved nap. The three amine groups added to nap were postulated to be via a Michael addition reaction. The quinone remained in the reduced form, similar to peaks 1 and 3. This is likely because of the addition of the amine groups, the assigned formula contained additional hydrogen’s that were not possible in the oxidised form. We postulated that the source of the amines was from the water itself, naturally dissolved in the water likely reacting through a Michael reaction, since peak 5 was only formed when incubated in ER water. The changes that occurred to nap-AVFA, nap-AFRV and nap-AREG to produce peaks 3, 1, and 5 respectively seemed to involve predominantly Michael addition to nap, and various alterations to the peptide chain. The reasons why these particular reactions occur were unknown; however, these newly formed compounds were more stable and resistant to degradation than the original adduct and the peptide alone.
Peaks 2, 4 and 6 proposed structure and formation mechanism
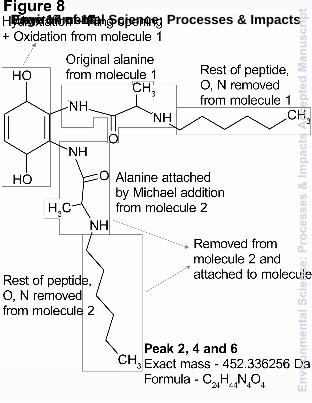
Other compounds formed as intermediates during the incubations of the three nap-adducts were labelled as peaks 2, 4 and 6. Following analysis of peaks 2, 4 and 6, the determined exact mass was the same for all three adducts (453.336256 Da). This was highly unexpected since the peptide structures for all three adducts were very different except the first alanine bonded to nap. After detailed investigation of a structure that could be formed from all three nap-adducts, we were able to
propose one as shown in Fig. 8. Tandem MS analysis of the collected peaks produced the same fragmentation pattern for each adduct; suggesting that they were the same structure. The fragments produced by tandem MS of all three peaks are H2O and H4O2. These fragments support the proposed loss of two hydroxyl groups, which are also explained with a reduced quinone form. This piece of information suggested that a quinone was still present in the molecule, which was reasonable considering nap was preserved in peaks 1, 3 and 5. The only plausible formula that could be assigned to peaks 2, 4 and 6 was [C24H45N4O4]+. This formula had almost complete saturation of H, which initially seemed difficult to explain due to the unsaturated levels of nap-AVFA, nap-AFRV and nap-AREG. Since a quinone was a component of this structure (as postulated from the fragmentation), only 2 further bonds could be saturated. Since this molecule was formed from all three of the adducts in this study, the resulting structure of peaks 2, 4 and 6 should contain the structural component that was common to all three original adducts. This component was nap-A. Considering the assigned formula, [C24H45N4O4]+, the N and O contents of this formula could be due to two alanine residues. We suggested that one alanine remained intact and attached to the quinone throughout the transformations to the original adducts. An attachment of a second alanine via a Michael adduction similar to what was suggested for peaks 1, 3 and 5 could occur using a second molecule of the adduct. Therefore, we were able to fully account for the N and O contents of the proposed formula. Although speculative, we suggest that the benzene ring was removed via a two-step process: to form phthalic anhydride first by opening the ring, then by oxidation and hydroxylation reactions. This type of reaction has been found to occur under hydrothermal conditions.51 Even though the incubations in this experiment were very different from hydrothermal conditions, it took 12 – 24 hours for this compound to be detected in the incubations in this study, which allowed this reaction to occur at a slower rate constant. The rest of the molecule must be composed of saturated alkyl chains since this was the only remaining part of the above formula not accounted for. The alkyl chains that constituted the majority of this structure were most likely derived from the original peptide chain, with the sidechains and N/O all removed through a series of hydrolysis, elimination and substitution reactions. The exact details of the mechanism(s) involved in these reactions for each of the nap-adducts was unknown at this stage.
Conclusions
Our main goal was to determine whether Nap adduction had any effect on the removal of peptides from water, which resulted in the discovery that the adduction of Nap greatly altered the removal pathway of peptides from natural water. During the incubations of three synthesised nap-adducted peptides nap-AVFA, nap-AFRV and nap-AREG, the nap
Page 6 of 17Environmental Science: Processes & Impacts
Env
iron
men
talS
cien
ce:P
roce
sses
&Im
pact
sA
ccep
ted
Man
uscr
ipt
Publ
ishe
d on
03
June
201
4. D
ownl
oade
d by
Col
orad
o St
ate
Uni
vers
ity o
n 12
/06/
2014
00:
00:5
8.
View Article OnlineDOI: 10.1039/C4EM00075G
Journal Name ARTICLE
This journal is © The Royal Society of Chemistry 2014 G.A.McKee., 2014, 00, 1-3 | 7
adducts themselves were removed from natural water at the same rate constant as the peptide alone. However, two new compounds were formed from each of these adducts. Following tandem MS and careful consideration, we were able to propose structures for each of the new compounds formed during nap incubation. Unfortunately, we could not determine the concentration of any of the new compounds in the water because the small amount collected by HPLC was used up completely during MS analysis. It seemed unlikely, due to the large difference in structures, that the two sets of peaks formed during the incubations of the three adducts were related. Therefore, two separate mechanistic pathways occurred to remove the adducts and form their respective degradation products. Nevertheless, Michael adduction of peptides to nap dramatically changed the way they were degraded in natural water, thereby showing that this pathway was a reasonable mechanism for large components of original peptides to be preserved in natural water. The more significant finding is that some of the peptide structural elements were preserved even though the original intact peptide was lost. This could partially explain why amide bonds are detected (by nuclear magnetic resonance) in ancient buried sediments9,52,53 or in aged water samples 54,55 while the yields of hydrolysable amino acids are significantly more diminished than would be suggested from the NMR data. Extensive modifications of the peptides resulting in the structures identified in this study could yield products that are unrecognisable as peptide derivatives during acid hydrolysis. Acknowledgements We thank Susan Hatcher of the COSMIC facility at ODU for help in analysing the samples, and members of the Hatcher group for helpful discussion. This work was funded in part by the Batten Endowment Fund at Old Dominion University and National Science Foundation project number OCE-0612712 Notes and references a Department of Chemistry and Biochemistry, 4402 Elkhorn Avenue, Old Dominion University, Norfolk, VA, 23529, USA. † Electronic Supplementary Information (ESI) available: SI Fig. 1 Results of analysis of the synthesised AFRV by (a) NMR and (b) FT-ICR-MS in positive ion mode. SI Fig. 2 Results of analysis of the synthesised AREG by (a) NMR and (b) FT-ICR-MS in positive ion mode. SI Fig 3 Results of analysis of the synthesised AVFA by (a) NMR and (b) FT-ICR-MS in positive ion mode. SI Fig. 4 Results of analysis of the synthesised 1, 4-naphthoquinon-2-yl-AFRV (nap-AFRV) by (a) NMR and (b) FT-ICR-MS in positive ion mode. SI Fig. 5 Results of analysis of the synthesised nap-AREG by (a) NMR and (b) FT-ICR-MS in positive ion mode. SI Fig 6 Results of analysis of the synthesised nap-AVFA by (a) NMR and (b) FT-ICR-MS in positive ion mode. See DOI: 10.1039/b000000x/
1. Z. Liu, S. Liu, J. Liu, and W. S. Gardner, Mar Chem, 2013, 157,
67–77. 2. R. A. Herbert, FEMS Microbiol. Rev., 1999, 23, 563–590. 3. R. G. Keil and D. L. Kirchman, Mar Chem, 1994, 45, 187–196. 4. R. T. Nguyen and H. R. R. Harvey, Geochim. Cosmochim. Acta,
2001, 65, 1467–1480. 5. L. C. Roth and H. R. Harvey, Mar Chem, 2006, 102, 33–45. 6. E. Tanoue, M. Ishii, and T. Midorikawa, Limnol Oceanogr , 1996,
41, 1334–1343. 7. A. D. Tappin, G. E. Millward, and M. F. Fitzsimons, Environ.
Chem. Lett., 2007, 5, 161–167. 8. E. K. Moore, B. L. Nunn, D. R. Goodlett, and H. R. Harvey,
Geochim. Cosmochim. Acta, 2012, 83, 324–359. 9. P. G. Hatcher, E. C. Spiker, N. M. Szeverenyi, and G. E. Maciel,
Nature, 1983, 305, 498–501. 10. H. Knicker and P. G. Hatcher, Naturwissenschaften, 1997, 84, 231–
234. 11. J. E. Tomaszewski, R. P. Schwarzenbach, and M. Sander, Environ
Sci Technol, 2011, 45, 6003–10. 12. L. M. Mayer, Geochim. Cosmochim. Acta, 1994, 58, 1271–1284. 13. L. M. Mayer, Chem Geol, 1994, 114, 347–363. 14. Z. Liu, M. E. Kobiela, G. A. McKee, T. Tang, C. Lee, M. R.
Mulholland, and P. G. Hatcher, Mar Chem, 2010, 119, 108–120. 15. J. Zhong, R. L. Sleighter, E. Salmon, G. A. McKee, and P. G.
Hatcher, Org Geochem, 2011, 42, 903–916. 16. P.-H. Hsu and P. G. Hatcher, Org Geochem, 2006, 37, 1694–1704. 17. M. C. Rillig, B. a. Caldwell, H. a. B. Wösten, and P. Sollins,
Biogeochemistry, 2007, 85, 25–44. 18. H. Nikaido and M. Vaara, Microbiol Rev, 1985, 49, 1–32. 19. M. K. Briggs, E. Desavis, P. A. Mazzer, R. B. Sunoj, S. A.
Hatcher, C. M. Hadad, and P. G. Hatcher, Chem. Res. Toxicol., 2003, 16, 1484–1492.
20. J. L. Bolton, M. A. Trush, T. M. Penning, G. Dryhurst, and T. J. Monks, Chem. Res. Toxicol, 2000, 13, 135–160.
21. S. K. Samanta, O. V Singh, and R. K. Jain, Trends Biotechnol., 2002, 20, 243–248.
22. A. Accardi-Dey and P. M. Gschwend, Environ Sci Technol, 2002, 36, 21–29.
23. W. D. Burgos and N. Pisutpaisal, J Contam Hydrol, 2006, 84, 107–126.
24. J. C. Means, S. G. Wood, J. J. Hassett, and W. L. Banwart, Environ Sci Technol, 1982, 16, 93–98.
25. M. Novoszad, M. H. Gerzabek, G. Haberhauer, M. Jakusch, H. Lischka, D. Tunega, and H. Kirchmann, Chemosphere, 2005, 59, 639–47.
26. G. E. Parris, Environ Sci Technol, 1980, 14, 1099–1106. 27. M. K. Briggs, E. Desavis, P. A. Mazzer, R. B. Sunoj, S. A.
Hatcher, C. M. Hadad, and P. G. Hatcher, Chem. Res. Toxicol., 2003, 16, 1484–1492.
28. P.-H. Hsu and P. G. Hatcher, Geochim. Cosmochim. Acta, 2005, 69, 4521–4533.
29. V. K. Tandon and H. K. Maurya, Tetrahedron Lett., 2009, 50, 5896–5902.
30. S. Bittner, S. Gorohovsky, O. Paz-Tal (Leri), and J. Y. Becker, Amino Acids, 2002, 22, 71–93.
31. W. C. Chan and P. D. White, Fmoc solid phase peptide synthesis: a practical approach, Oxford University Press New York, 2000.
32. D. S. King, C. G. Fields, and G. B. Fields, Int J Pept Protein Res, 1990, 36, 255–266.
33. R. B. Merrifield, J Am Chem Soc, 1963, 85, 2149–2154. 34. J. M. Stewart, J J Macromol Sci, Pure Appl Chem, 1976, 10, 259–
288. 35. M. A. Charette and K. O. Buesseler, Limnol Oceanogr, 2004, 49,
376–385. 36. J. R. Helms, A. Stubbins, J. D. Ritchie, E. C. Minor, D. J. Kieber,
and K. Mopper, Limnol Oceanogr, 2008, 53, 955–969. 37. E. C. Minor, B. J. Dalzell, A. Stubbins, and K. Mopper, Aq Sci,
2007, 69, 440–455. 38. M. M. Shafer, S. R. Hoffmann, J. T. Overdier, and D. E.
Armstrong, Environ Sci Technol, 2004, 38, 3810–3819.
Page 7 of 17 Environmental Science: Processes & Impacts
Env
iron
men
talS
cien
ce:P
roce
sses
&Im
pact
sA
ccep
ted
Man
uscr
ipt
Publ
ishe
d on
03
June
201
4. D
ownl
oade
d by
Col
orad
o St
ate
Uni
vers
ity o
n 12
/06/
2014
00:
00:5
8.
View Article OnlineDOI: 10.1039/C4EM00075G
PAPER Environmental Science Processes and Implications
8 | G.A.McKee., 2014, 00, 1-3 This journal is © The Royal Society of Chemistry 2014
39. C. Lee, J. I. Hedges, S. G. Wakeham, and N. Zhu, Limnol Oceanogr , 1992, 37, 117–130.
40. J. T. Trevors, J. Microbiol. Methods, 1996, 26, 53–59. 41. L. Tuominen, T. Kairesalo, and H. Hartikainen, Appl Environ
Microbiol, 1994, 60, 3454–3457. 42. D. E. Mason and D. C. Liebler, Chem. Res. Toxicol., 2000, 13,
976–982. 43. X. J. Tang, P. Thibault, and R. K. Boyd, Anal Chem, 1993, 65,
2824–2834. 44. J. Mack and J. R. Bolton, J Photochem Photobiol A Chem, 1999,
128, 1–13. 45. P. J. Mulholland, A. M. Helton, G. C. Poole, R. O. Hall, S. K.
Hamilton, B. J. Peterson, J. L. Tank, L. R. Ashkenas, L. W. Cooper, C. N. Dahm, W. K. Dodds, S. E. G. Findlay, S. V Gregory, N. B. Grimm, S. L. Johnson, W. H. McDowell, J. L. Meyer, H. M. Valett, J. R. Webster, C. P. Arango, J. J. Beaulieu, M. J. Bernot, A. J. Burgin, C. L. Crenshaw, L. T. Johnson, B. R. Niederlehner, J. M. O’Brien, J. D. Potter, R. W. Sheibley, D. J. Sobota, S. M. Thomas, R. O. H. Jr, and J. M. O. Brien, Nature, 2008, 452, 202–205.
46. E. A. Davidson, J. Chorover, and B. D. Dail, Glob. Change Biol., 2003, 9, 228–236.
47. L. Sun, H. Chen, H. a Abdulla, and K. Mopper, ESPI, 2014, 16, 757–763.
48. J. G. Leahy, K. D. Tracy, and M. H. Eley, FEMS Microbiol Ecol, 2003, 43, 271–276.
49. M. R. Smith, Biodegradation, 1990, 1, 191–206. 50. F. Widdel and R. Rabus, Curr. Opin. Biotechnol., 2001, 12, 259–
276. 51. J. A. Onwudili and P. T. Williams, J Supercrit Fluids, 2007, 39,
399–408. 52. J. C. del Rio, M. A. Olivella, H. Knicker, and F. Xavier C. de las
Heras, Org Geochem, 2004, 35, 993–999. 53. H. Knicker and P. G. Hatcher, Naturwissenschaften, 1997, 84, 231–
234. 54. L. I. Aluwihare, D. J. Repeta, S. Pantoja, and C. G. Johnson,
Science , 2005, 308, 1007–1010. 55. M. McCarthy, T. Pratum, J. Hedges, and R. Benner, Nature, 1997,
390, 150–154.
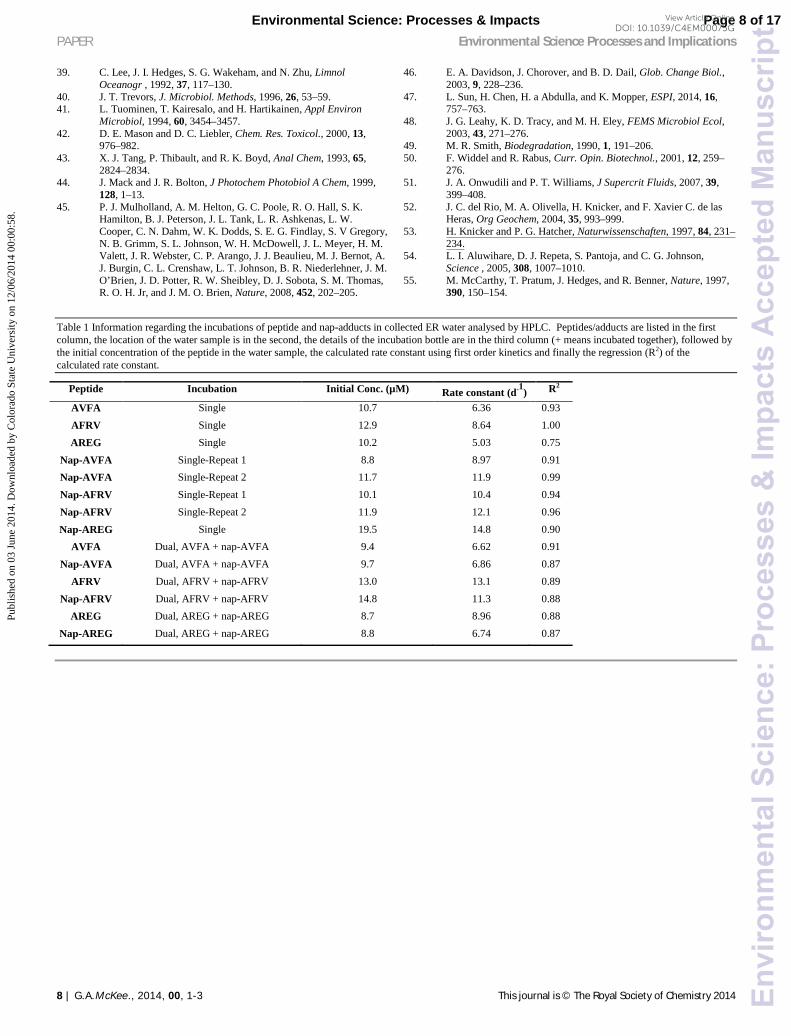
Table 1 Information regarding the incubations of peptide and nap-adducts in collected ER water analysed by HPLC. Peptides/adducts are listed in the first column, the location of the water sample is in the second, the details of the incubation bottle are in the third column (+ means incubated together), followed by the initial concentration of the peptide in the water sample, the calculated rate constant using first order kinetics and finally the regression (R2) of the calculated rate constant.
Peptide Incubation Initial Conc. (µM) Rate constant (d-1) R2
AVFA Single 10.7 6.36 0.93 AFRV Single 12.9 8.64 1.00 AREG Single 10.2 5.03 0.75
Nap-AVFA Single-Repeat 1 8.8 8.97 0.91 Nap-AVFA Single-Repeat 2 11.7 11.9 0.99 Nap-AFRV Single-Repeat 1 10.1 10.4 0.94 Nap-AFRV Single-Repeat 2 11.9 12.1 0.96 Nap-AREG Single 19.5 14.8 0.90
AVFA Dual, AVFA + nap-AVFA 9.4 6.62 0.91 Nap-AVFA Dual, AVFA + nap-AVFA 9.7 6.86 0.87
AFRV Dual, AFRV + nap-AFRV 13.0 13.1 0.89 Nap-AFRV Dual, AFRV + nap-AFRV 14.8 11.3 0.88
AREG Dual, AREG + nap-AREG 8.7 8.96 0.88 Nap-AREG Dual, AREG + nap-AREG 8.8 6.74 0.87
Page 8 of 17Environmental Science: Processes & Impacts
Env
iron
men
talS
cien
ce:P
roce
sses
&Im
pact
sA
ccep
ted
Man
uscr
ipt
Publ
ishe
d on
03
June
201
4. D
ownl
oade
d by
Col
orad
o St
ate
Uni
vers
ity o
n 12
/06/
2014
00:
00:5
8.
View Article OnlineDOI: 10.1039/C4EM00075G
Journal Name ARTICLE
This journal is © The Royal Society of Chemistry 2014 G.A.McKee., 2014, 00, 1-3 | 9
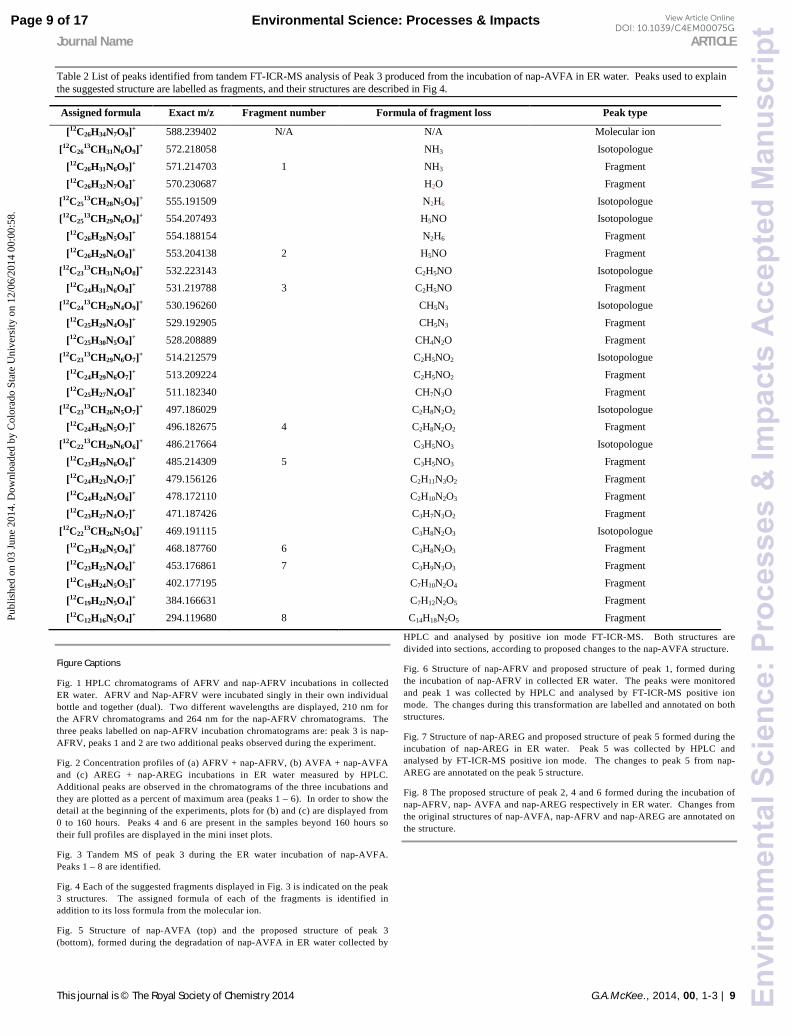
Table 2 List of peaks identified from tandem FT-ICR-MS analysis of Peak 3 produced from the incubation of nap-AVFA in ER water. Peaks used to explain the suggested structure are labelled as fragments, and their structures are described in Fig 4.
Assigned formula Exact m/z Fragment number Formula of fragment loss Peak type
[12C26H34N7O9]+ 588.239402 N/A N/A Molecular ion [12C26
13CH31N6O9]+ 572.218058 NH3 Isotopologue [12C26H31N6O9]+ 571.214703 1 NH3 Fragment [12C26H32N7O8]+ 570.230687 H2O Fragment
[12C2513CH28N5O9]+ 555.191509 N2H6 Isotopologue
[12C2513CH29N6O8]+ 554.207493 H5NO Isotopologue
[12C26H28N5O9]+ 554.188154 N2H6 Fragment [12C26H29N6O8]+ 553.204138 2 H5NO Fragment
[12C2313CH31N6O8]+ 532.223143 C2H5NO Isotopologue
[12C24H31N6O8]+ 531.219788 3 C2H5NO Fragment [12C24
13CH29N4O9]+ 530.196260 CH5N3 Isotopologue [12C25H29N4O9]+ 529.192905 CH5N3 Fragment [12C25H30N5O8]+ 528.208889 CH4N2O Fragment
[12C2313CH29N6O7]+ 514.212579 C2H5NO2 Isotopologue
[12C24H29N6O7]+ 513.209224 C2H5NO2 Fragment [12C25H27N4O8]+ 511.182340 CH7N3O Fragment
[12C2313CH26N5O7]+ 497.186029 C2H8N2O2 Isotopologue
[12C24H26N5O7]+ 496.182675 4 C2H8N2O2 Fragment [12C22
13CH29N6O6]+ 486.217664 C3H5NO3 Isotopologue [12C23H29N6O6]+ 485.214309 5 C3H5NO3 Fragment [12C24H23N4O7]+ 479.156126 C2H11N3O2 Fragment [12C24H24N5O6]+ 478.172110 C2H10N2O3 Fragment [12C23H27N4O7]+ 471.187426 C3H7N3O2 Fragment
[12C2213CH26N5O6]+ 469.191115 C3H8N2O3 Isotopologue
[12C23H26N5O6]+ 468.187760 6 C3H8N2O3 Fragment [12C23H25N4O6]+ 453.176861 7 C3H9N3O3 Fragment [12C19H24N5O5]+ 402.177195 C7H10N2O4 Fragment [12C19H22N5O4]+ 384.166631 C7H12N2O5 Fragment [12C12H16N5O4]+ 294.119680 8 C14H18N2O5 Fragment
Figure Captions
Fig. 1 HPLC chromatograms of AFRV and nap-AFRV incubations in collected ER water. AFRV and Nap-AFRV were incubated singly in their own individual bottle and together (dual). Two different wavelengths are displayed, 210 nm for the AFRV chromatograms and 264 nm for the nap-AFRV chromatograms. The three peaks labelled on nap-AFRV incubation chromatograms are: peak 3 is nap-AFRV, peaks 1 and 2 are two additional peaks observed during the experiment.
Fig. 2 Concentration profiles of (a) AFRV + nap-AFRV, (b) AVFA + nap-AVFA and (c) AREG + nap-AREG incubations in ER water measured by HPLC. Additional peaks are observed in the chromatograms of the three incubations and they are plotted as a percent of maximum area (peaks 1 – 6). In order to show the detail at the beginning of the experiments, plots for (b) and (c) are displayed from 0 to 160 hours. Peaks 4 and 6 are present in the samples beyond 160 hours so their full profiles are displayed in the mini inset plots.
Fig. 3 Tandem MS of peak 3 during the ER water incubation of nap-AVFA. Peaks 1 – 8 are identified.
Fig. 4 Each of the suggested fragments displayed in Fig. 3 is indicated on the peak 3 structures. The assigned formula of each of the fragments is identified in addition to its loss formula from the molecular ion.
Fig. 5 Structure of nap-AVFA (top) and the proposed structure of peak 3 (bottom), formed during the degradation of nap-AVFA in ER water collected by
HPLC and analysed by positive ion mode FT-ICR-MS. Both structures are divided into sections, according to proposed changes to the nap-AVFA structure.
Fig. 6 Structure of nap-AFRV and proposed structure of peak 1, formed during the incubation of nap-AFRV in collected ER water. The peaks were monitored and peak 1 was collected by HPLC and analysed by FT-ICR-MS positive ion mode. The changes during this transformation are labelled and annotated on both structures.
Fig. 7 Structure of nap-AREG and proposed structure of peak 5 formed during the incubation of nap-AREG in ER water. Peak 5 was collected by HPLC and analysed by FT-ICR-MS positive ion mode. The changes to peak 5 from nap-AREG are annotated on the peak 5 structure.
Fig. 8 The proposed structure of peak 2, 4 and 6 formed during the incubation of nap-AFRV, nap- AVFA and nap-AREG respectively in ER water. Changes from the original structures of nap-AVFA, nap-AFRV and nap-AREG are annotated on the structure.
Page 9 of 17 Environmental Science: Processes & Impacts
Env
iron
men
talS
cien
ce:P
roce
sses
&Im
pact
sA
ccep
ted
Man
uscr
ipt
Publ
ishe
d on
03
June
201
4. D
ownl
oade
d by
Col
orad
o St
ate
Uni
vers
ity o
n 12
/06/
2014
00:
00:5
8.
View Article OnlineDOI: 10.1039/C4EM00075G
Page 10 of 17Environmental Science: Processes & Impacts
Env
iron
men
talS
cien
ce:P
roce
sses
&Im
pact
sA
ccep
ted
Man
uscr
ipt
Publ
ishe
d on
03
June
201
4. D
ownl
oade
d by
Col
orad
o St
ate
Uni
vers
ity o
n 12
/06/
2014
00:
00:5
8.
View Article OnlineDOI: 10.1039/C4EM00075G
Page 11 of 17 Environmental Science: Processes & Impacts
Env
iron
men
talS
cien
ce:P
roce
sses
&Im
pact
sA
ccep
ted
Man
uscr
ipt
Publ
ishe
d on
03
June
201
4. D
ownl
oade
d by
Col
orad
o St
ate
Uni
vers
ity o
n 12
/06/
2014
00:
00:5
8.
View Article OnlineDOI: 10.1039/C4EM00075G
Page 12 of 17Environmental Science: Processes & Impacts
Env
iron
men
talS
cien
ce:P
roce
sses
&Im
pact
sA
ccep
ted
Man
uscr
ipt
Publ
ishe
d on
03
June
201
4. D
ownl
oade
d by
Col
orad
o St
ate
Uni
vers
ity o
n 12
/06/
2014
00:
00:5
8.
View Article OnlineDOI: 10.1039/C4EM00075G
Page 13 of 17Environmental Science: Processes & Impacts
Env
iron
men
talS
cien
ce:P
roce
sses
&Im
pact
sA
ccep
ted
Man
uscr
ipt
Publ
ishe
d on
03
June
201
4. D
ownl
oade
d by
Col
orad
o St
ate
Uni
vers
ity o
n 12
/06/
2014
00:
00:5
8.
View Article OnlineDOI: 10.1039/C4EM00075G
Page 14 of 17Environmental Science: Processes & Impacts
Env
iron
men
talS
cien
ce:P
roce
sses
&Im
pact
sA
ccep
ted
Man
uscr
ipt
Publ
ishe
d on
03
June
201
4. D
ownl
oade
d by
Col
orad
o St
ate
Uni
vers
ity o
n 12
/06/
2014
00:
00:5
8.
View Article OnlineDOI: 10.1039/C4EM00075G
Page 15 of 17 Environmental Science: Processes & Impacts
Env
iron
men
talS
cien
ce:P
roce
sses
&Im
pact
sA
ccep
ted
Man
uscr
ipt
Publ
ishe
d on
03
June
201
4. D
ownl
oade
d by
Col
orad
o St
ate
Uni
vers
ity o
n 12
/06/
2014
00:
00:5
8.
View Article OnlineDOI: 10.1039/C4EM00075G
Page 16 of 17Environmental Science: Processes & Impacts
Env
iron
men
talS
cien
ce:P
roce
sses
&Im
pact
sA
ccep
ted
Man
uscr
ipt
Publ
ishe
d on
03
June
201
4. D
ownl
oade
d by
Col
orad
o St
ate
Uni
vers
ity o
n 12
/06/
2014
00:
00:5
8.
View Article OnlineDOI: 10.1039/C4EM00075G
Page 17 of 17Environmental Science: Processes & Impacts
Env
iron
men
talS
cien
ce:P
roce
sses
&Im
pact
sA
ccep
ted
Man
uscr
ipt
Publ
ishe
d on
03
June
201
4. D
ownl
oade
d by
Col
orad
o St
ate
Uni
vers
ity o
n 12
/06/
2014
00:
00:5
8.
View Article OnlineDOI: 10.1039/C4EM00075G