effect of gold nanoparticle on electro _ optical properties of polysiloxane liquid crystal polymer
TRANSCRIPT
Journal of Industrial Engineering Research, 1(4) July 2015, Pages: 99-108
IWNEST PUBLISHER
Journal of Industrial Engineering Research
(ISSN: 2077-4559)
Journal home page: http://www.iwnest.com/AACE/
Corresponding Author: Khalid Al. Ammar Sokina Fakhry, Physics Department – college of Education for pure science–
Babylon University
E-mail: [email protected]
Effect of Gold nanoparticle on Electro _ Optical Properties of Polysiloxane Liquid
Crystal Polymer Khalid Al. Ammar Sokina Fakhry Physics Department – college of Education for pure science–Babylon University
A R T I C L E I N F O A B S T R A C T
Article history:
Received 20 March 2015
Accepted 25 May 2015 Available online 5 June 2015
Keywords: gold nanorod , polysiloxane , electro –
optic properties
We investigate the nonlinearity of a liquid crystal cell doped with gold nanoparticles
by considering their selective absorption. Such nonlinearities are promising for
optical processing applications and optical limiters. Systems displaying thermal nonlinearities are particularly attractive as the maximum nonlinearity may occur in
the absence of an applied field and additionally this nonlinearity can be controlled by
the reorientation of the liquid crystal. This study focuses on the electro-optic properties of polymers with a different molecular weights based on the polysiloxane
backbone, It is found that there is a strong coupling between the mesogenic side chain groups and the polymer chain that the elasticity of the polymer chain plays a strong
role even in the static electro – optic properties. The switching times (on) and (off)
have been measured through the period between planer and homotropic alignment which happens under the electrical field effect. Additionally, it is found that adding
gold nanoparticles moieties will decrease the phase transition temperatures and thus
decreasing of switching times. The variation of the threshold voltage is measured at constant steps below nematic – isotropic transition temperature (TNI) for series of
polymers. It is found that the high molecular weights of polymers have great
threshold voltage of the electro-optic response and this is related to the intrinsic elastic constant of the liquid crystal polymers. The performance of the electro_optical
cells has improved after add the gold would reduce the contribution of the dibole
moment of the cyano _groub baralle to the molecular long axis of the mesogenic unit and thus reduce density of the mesognic unit attached to polymer chaine and lead to a
Increases of dielectric anisotropic ( ∆Ԑ) and thus enhanced backbone mobility for the
system.
© 2015 IWNEST Publisher All rights reserved.
To Cite This Article: Khalid Al. Ammar Sokina Fakhry, Effect of Gold nanoparticle on Electro _ Optical Properties of Polysiloxane Liquid
Crystal Polymer. J. Ind. Eng. Res., 1(4), 99-108, 2015
INTRODUCTION
To work with nanoscale matter (10_9
m) every day is more important in both scientific and technological
activities ,a typical example is the case of metal nanoparticles which are an important part of this broad field of
study .Metallic nanoparticles are very interesting because of the high diversity of applications that are based on
their magnetic [ [1–2] ] , Due to their small size, metallic nanoparticles have a large surface area per volume unit
and therefore a high number of atoms at the surface [3] The doping of liquid crystals Polymer ( LCps ) with
nanoparticles has become a common method of improving their optical ,magnetic, electrical and physical
properties [4] For example ,ferroelectric nanoparticles have been shown to decrease the Fr´eedericksz threshold
and increase the birefringence of nematics [5-6] Hybrid nanostructures can be conceptualized from the
combination of gold nanoparticles with organic molecules ,dendrimers [7] polymers [8] polypeptides [9]
proteins [10] oligonucleotides [11] The gold in nanoparticle form has been known from the very beginning of
human civilization, e.g. in ancient Egypt and Rome, [12] but systematic scientific investigations and first
colloidal synthesis were performed much later in 1857 by Michal Faraday [13]. Ever since, the metal
nanoparticles have found various applications in industry, medicine and pharmacy and they have framed an
entire new field in nanoscience concerned with the nanoparticles’ synthesis, their chemical modifications and
investigation of their properties [14–15] gold nanoparticles ( AuNPs ) obtain much moreattention than the others.
AuNPs are the most stable metal nanoparticles presenting fascinating aspects, such as assembly of multiple
types involving material science, behavior of the individual particles, size-related electronic, magnetic, optical
properties, and applications to catalysis and biology [16-17]. Given the fact that the colloidal gold particles

100 Khalid Al. Ammar Sokina Fakhry, 2015
Journal of Industrial Engineering Research, 1(4) July 2015, Pages: 99-108
played a central role in the development and understanding of the basic colloidal chemistry and physics [18–19],
we will draw upon our understanding of colloidal dispersions to cite examples and theoretical insight relevant to
our system. The perusal of this classic literature also demonstrates how the pioneers recognized that various
observations, for example, color of colloidal gold solutions, could be attributed to the presence of rod-like
nanoparticles, The recent interest in gold nanoparticles is propelled by both the advances in our scientific
understanding of their synthesis and physical properties [20–21]
Experimental:
The procedures followed for the construction of electro – optic cells with predefined director orientation in
these investigations were similar to those developed for low molecular weight liquid crystal [90, 91]. Blazers
Z20 tin oxide-coated glass slides were used for all electro – optic cells constructed in this work. This was easily
cut and was sufficiently flat to allow the fabrication of cells with parallel plate separation to within a few
seconds of arc. The glass was cut into plate of approximately 6cm2 area, and etched using HCl acid with zinc
metal powder as a catalyst to give a 2 cm2 electrode surface. Each glass plate was then washed hand-by-hand in
soup and water and cleaned in an ultrasonic bath for 30 minutes at 65 oC. The plates were then rinsed in distilled
water and dried in an oven for 20 minutes at 60 oC. This treatment produced plates sufficiently clean for the
surface treatment procedure, which is the subject of the next section. In this work One technique was used to
achieve uniform planer alignment of the liquid crystal director. The cell electrodes were coated with a thin layer
of polyimide precursor [ consisting of a 5% solution of Rodehftal 322 (Rh one Poulenc chemical Ltd. ) in
dimethyl formaimed ] in dimethylformaimed], using a spin – coater running at 4,500 r.p.m these coated slides
were heated in an oven for 30 minutes at 80C̊ ̊ they were then rubbed at room temperature in a single direction
with a cloth using controlled repeatable procedure , heated again for 30 minutes at 130C̊ ,̊ finally it will be putted
for one hour at 200oC in the oven.
Cell filling by means of capillary effects are widely used for low molar mass liquid crystal compounds.
However, these methods cannot readily be applied to polymeric system due to their intrinsic high viscosity .
oven. As a consequence cell construction involved the following procedure a small portion of the selected
polymer sample was carefully applied to one of the treated glass electrodes this was then heated for some time
(typically 10-15 minutes) above the clearing point of the polymer in order to allow trapped air to escape . The
second glass electrode was then mounted above the first electrode, and the complete assembly inserted into a
homemade clamping frame. The electrodes were fixed permanently using (Araldite Rapid epoxy resin Ciba
Geigy) the majority of the cell used in this work were prepared using " kapton " sheet of nominal thickness
0.025 mm, as spacers, to separate the electrodes. The thickness of the cells were measured using micro meter
techniques, both gave similar results, with typical electrode separations in the range26 – 30 μm. the final step in
the preparation of the electro – optic cell was the connection of the leads which carried the electric field from
the power supply, A silver conductive adhesive ( A-500 Johnson matthey chemical Ltd. ) with ( 500-1000 )
μohm / cm3 resistivity was used to connect a thin PTFE coated wire to the electrodes of the cell care was taken
not to allow the conducting adhesive to stray on to the opposite plate since the resulting short circuit would
render the cell inoperative. To avoid a further possible short circuit, between the cell holder and the area
connecting the wires to the cell, the area was covered with a piece of "kapton" In general structure of the
polymer (poly-siloxane) studied in this search is shown in Fig. (3.2).This polymers were synthesized in the
chemistry department, university of Reading by Whitcombe. The polysiloxane contains on backbone with side
chain mesogenic moieties and non-mesogenic units attached via alkyl spacer units, compounds have been
synthesized with a repeat units in the backbone. Composites consisting of nematic liquid crystal (Polysiloxane)
and gold nanorods have been elaborated and investigated with a polarizing microscope, It was detected that the
nanorods form inside the oriented liquid crystal matrix their own self-assembling well-ordered structures, The
gold nanorods were inserted into liquid-crystal Polymer (LCp ) matrixes in very small amount (0.07 vol.%). In
order to obtain the composites based on gold nanorods and nematic LC, the latter was dissolved in ethanol, after
this, water suspension of nanoparticles covered by surfactant was added, and then the solvents were removed in
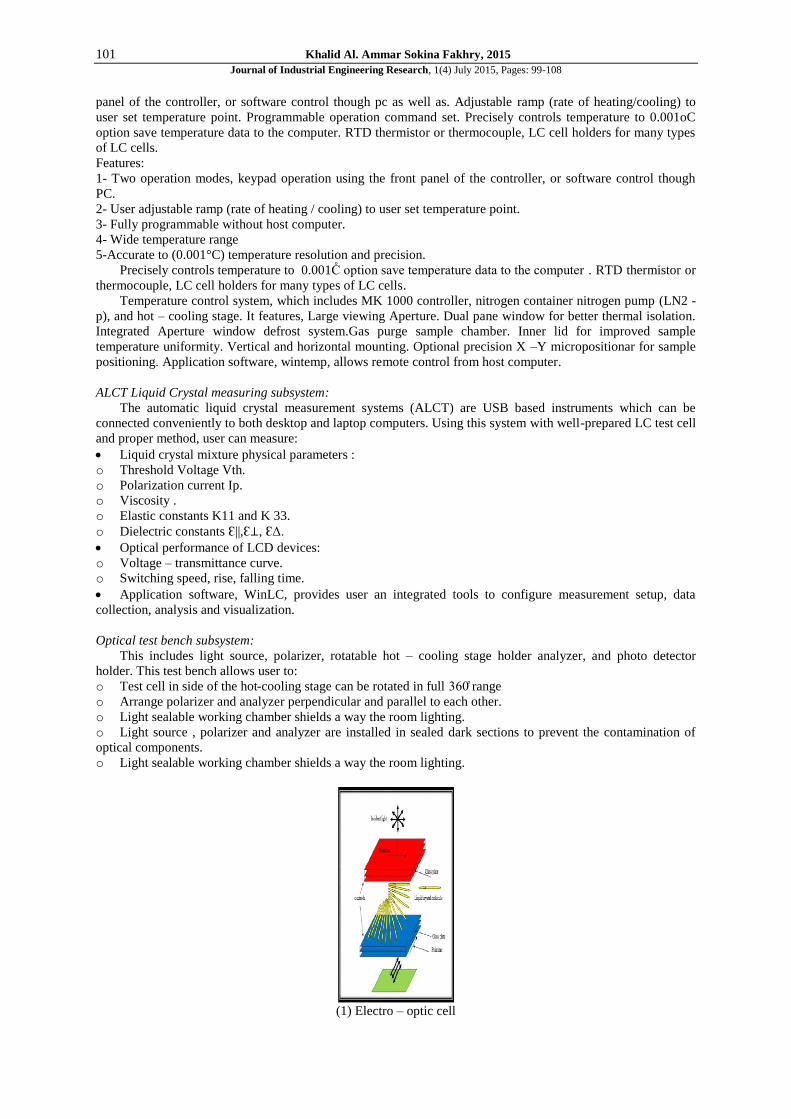
vacuum. The obtained nanocomposites (NC) were treated by ultrasound before the insertion into the cell.fig. (1)
shows the electro-optical cell construction.
Experimental Set-up:
The most important three devices were used in this work for electro – optic measurement are :
1. Mk 1000
2. Hcs 402
3. ALCT
The mk 1000 series temperature controller offers precision, accuracy , and stability for temperature
measurement and control. It provides temperature control resolution and precision to 0.001°C, accommodates
both Platinum RTD and individually calibrated thermistors as temperature sen, and can optionally control up to
four (4) instec hot and cold stages, plates, or chucks. Two operation modes, keypad operation using the front
101 Khalid Al. Ammar Sokina Fakhry, 2015
Journal of Industrial Engineering Research, 1(4) July 2015, Pages: 99-108
panel of the controller, or software control though pc as well as. Adjustable ramp (rate of heating/cooling) to
user set temperature point. Programmable operation command set. Precisely controls temperature to 0.001oC
option save temperature data to the computer. RTD thermistor or thermocouple, LC cell holders for many types
of LC cells.
Features:
1- Two operation modes, keypad operation using the front panel of the controller, or software control though
PC.
2- User adjustable ramp (rate of heating / cooling) to user set temperature point.
3- Fully programmable without host computer.
4- Wide temperature range
5-Accurate to (0.001°C) temperature resolution and precision.
Precisely controls temperature to 0.001C̊ option save temperature data to the computer . RTD thermistor or
thermocouple, LC cell holders for many types of LC cells.
Temperature control system, which includes MK 1000 controller, nitrogen container nitrogen pump (LN2 -
p), and hot – cooling stage. It features, Large viewing Aperture. Dual pane window for better thermal isolation.
Integrated Aperture window defrost system.Gas purge sample chamber. Inner lid for improved sample
temperature uniformity. Vertical and horizontal mounting. Optional precision X –Y micropositionar for sample
positioning. Application software, wintemp, allows remote control from host computer.
ALCT Liquid Crystal measuring subsystem:
The automatic liquid crystal measurement systems (ALCT) are USB based instruments which can be
connected conveniently to both desktop and laptop computers. Using this system with well-prepared LC test cell
and proper method, user can measure:
Liquid crystal mixture physical parameters :
o Threshold Voltage Vth.
o Polarization current Ip.
o Viscosity .
o Elastic constants K11 and K 33.
o Dielectric constants Ԑ||,Ԑ⊥, ԐΔ.
Optical performance of LCD devices:
o Voltage – transmittance curve.
o Switching speed, rise, falling time.
Application software, WinLC, provides user an integrated tools to configure measurement setup, data
collection, analysis and visualization.
Optical test bench subsystem:
This includes light source, polarizer, rotatable hot – cooling stage holder analyzer, and photo detector
holder. This test bench allows user to:
o Test cell in side of the hot-cooling stage can be rotated in full 360̊ range
o Arrange polarizer and analyzer perpendicular and parallel to each other.
o Light sealable working chamber shields a way the room lighting.
o Light source , polarizer and analyzer are installed in sealed dark sections to prevent the contamination of
optical components.
o Light sealable working chamber shields a way the room lighting.
(1) Electro – optic cell

102 Khalid Al. Ammar Sokina Fakhry, 2015
Journal of Industrial Engineering Research, 1(4) July 2015, Pages: 99-108
(2)A photograph of the work system.
(3) materials chemical structures
Table 1: Molecular weight and phase transition data polysiloxane
TNI C̊ Tg C̊ Dp Mw polymer
130 48 320 1.7×10⁶ 1
125 40 102 8.1×10⁵ 2
104 26 15 7.2×10⁴ 3
77 16 7 4.5×10³ 4
61 4 4 3.1×10³ 5
Results:
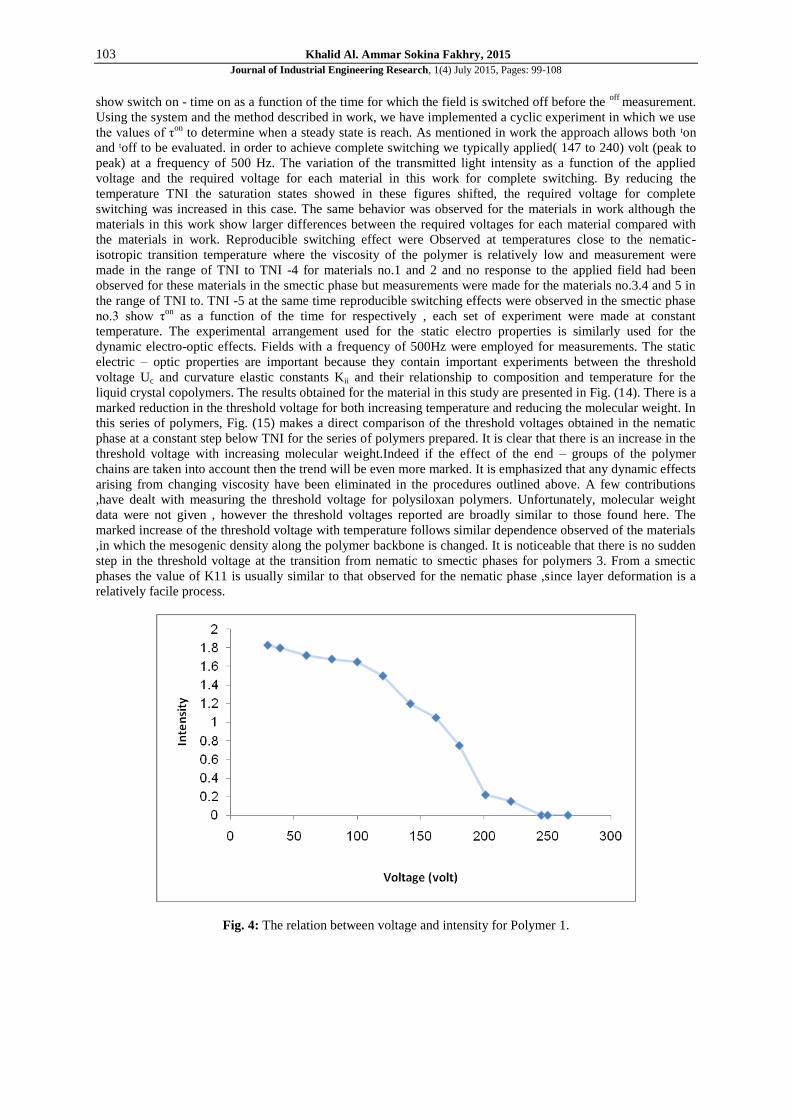
Figures (4-8) defined by which voltages necessary to make a complete switching, and from these Figures it
can be seen is the variation of the transmitted light intensity as a function of the applied voltage and the required
voltage for each material . For getting on the switching voltage must be the transmitted light intensity decrement
with increasing of the required voltage, so it can be determined to complete switching. The required voltage is
increased with increasing of molecular weight Mw this is due to viscosity η and the degree of entanglement
between the molecules are high. The same behavior was observed for the poly-siloxane liquid crystal ,although
there are some differences in the required voltage. The voltages for the complete orientation are identified,
applied to the cell, and calculates the required time to the occurrence of complete orientation. Where Fig. (9-13)
103 Khalid Al. Ammar Sokina Fakhry, 2015
Journal of Industrial Engineering Research, 1(4) July 2015, Pages: 99-108
show switch on - time on as a function of the time for which the field is switched off before the off
measurement.
Using the system and the method described in work, we have implemented a cyclic experiment in which we use
the values of τon
to determine when a steady state is reach. As mentioned in work the approach allows both ᵗon
and ᵗoff to be evaluated. in order to achieve complete switching we typically applied( 147 to 240) volt (peak to
peak) at a frequency of 500 Hz. The variation of the transmitted light intensity as a function of the applied
voltage and the required voltage for each material in this work for complete switching. By reducing the
temperature TNI the saturation states showed in these figures shifted, the required voltage for complete
switching was increased in this case. The same behavior was observed for the materials in work although the
materials in this work show larger differences between the required voltages for each material compared with
the materials in work. Reproducible switching effect were Observed at temperatures close to the nematic-
isotropic transition temperature where the viscosity of the polymer is relatively low and measurement were
made in the range of TNI to TNI -4 for materials no.1 and 2 and no response to the applied field had been
observed for these materials in the smectic phase but measurements were made for the materials no.3.4 and 5 in
the range of TNI to. TNI -5 at the same time reproducible switching effects were observed in the smectic phase
no.3 show τon
as a function of the time for respectively , each set of experiment were made at constant
temperature. The experimental arrangement used for the static electro properties is similarly used for the
dynamic electro-optic effects. Fields with a frequency of 500Hz were employed for measurements. The static
electric – optic properties are important because they contain important experiments between the threshold
voltage Uc and curvature elastic constants Kii and their relationship to composition and temperature for the
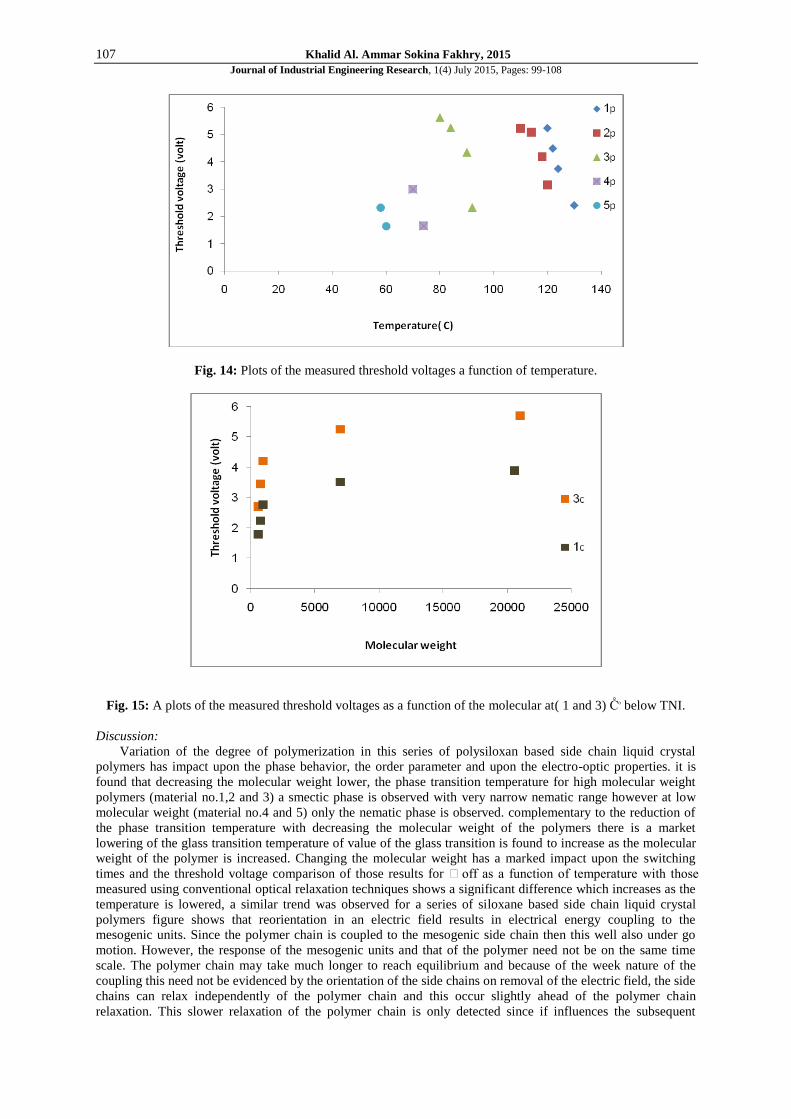
liquid crystal copolymers. The results obtained for the material in this study are presented in Fig. (14). There is a
marked reduction in the threshold voltage for both increasing temperature and reducing the molecular weight. In
this series of polymers, Fig. (15) makes a direct comparison of the threshold voltages obtained in the nematic
phase at a constant step below TNI for the series of polymers prepared. It is clear that there is an increase in the
threshold voltage with increasing molecular weight.Indeed if the effect of the end – groups of the polymer
chains are taken into account then the trend will be even more marked. It is emphasized that any dynamic effects
arising from changing viscosity have been eliminated in the procedures outlined above. A few contributions
,have dealt with measuring the threshold voltage for polysiloxan polymers. Unfortunately, molecular weight
data were not given , however the threshold voltages reported are broadly similar to those found here. The
marked increase of the threshold voltage with temperature follows similar dependence observed of the materials
,in which the mesogenic density along the polymer backbone is changed. It is noticeable that there is no sudden
step in the threshold voltage at the transition from nematic to smectic phases for polymers 3. From a smectic
phases the value of K11 is usually similar to that observed for the nematic phase ,since layer deformation is a
relatively facile process.
Fig. 4: The relation between voltage and intensity for Polymer 1.

104 Khalid Al. Ammar Sokina Fakhry, 2015
Journal of Industrial Engineering Research, 1(4) July 2015, Pages: 99-108
Fig. 5: The relation between voltage and intensity for Polymer 2.
0 50 100 150 200 250
Inte
nsi
ty
Voltage (volt)
Fig. 6: The relation between voltage and intensity for Polymer 3.
0 50 100 150
Inte
nsi
ty
Voltage (volt)
Fig. 7: The relation between voltage and intensity for Polymer 4.
0 50 100 150 200 250 300
Inte
nsi
ty
Voltage (volt)

105 Khalid Al. Ammar Sokina Fakhry, 2015
Journal of Industrial Engineering Research, 1(4) July 2015, Pages: 99-108
0 50 100 150 200
Inte
nsi
ty
Voltage (volt)
Fig. 8: The relation between voltage and intensity for Polymer 5.
0 500 1000 1500 2000
t o
n (
sec)
Time left off (sec)
127 cₒ
129 cₒ
Fig. 9: The relation between ᵗon and time left off for polymer 1
0 500 1000 1500 2000
t o
n (
sec)
Time left off (min)
119 c
124 c
Fig. 10: The relation between ᵗon and time left off for polymer 2.

106 Khalid Al. Ammar Sokina Fakhry, 2015
Journal of Industrial Engineering Research, 1(4) July 2015, Pages: 99-108
0 500 1000 1500 2000
t o
n (
sec)
Time left off (min)
100 cₒ
101 cₒ
103 cₒ
Fig. 11: The relation between ᵗon and time left off for polymer 3.
0 500 1000 1500 2000
t o
n (
se
c)
Time lift off (min)
71cₒ
75cₒ
Fig. 12: The relation between ᵗon and time left off for polymer 4.
0 500 1000 1500 2000
t o
n (
sec)
Time left off (min)
cₒ
60cₒ
Fig. 13: The relation between ᵗon and time left off for polymer 5.
107 Khalid Al. Ammar Sokina Fakhry, 2015
Journal of Industrial Engineering Research, 1(4) July 2015, Pages: 99-108
Fig. 14: Plots of the measured threshold voltages a function of temperature.
Fig. 15: A plots of the measured threshold voltages as a function of the molecular at( 1 and 3) C̊ₒ below TNI.
Discussion:
Variation of the degree of polymerization in this series of polysiloxan based side chain liquid crystal
polymers has impact upon the phase behavior, the order parameter and upon the electro-optic properties. it is
found that decreasing the molecular weight lower, the phase transition temperature for high molecular weight
polymers (material no.1,2 and 3) a smectic phase is observed with very narrow nematic range however at low
molecular weight (material no.4 and 5) only the nematic phase is observed. complementary to the reduction of
the phase transition temperature with decreasing the molecular weight of the polymers there is a market
lowering of the glass transition temperature of value of the glass transition is found to increase as the molecular
weight of the polymer is increased. Changing the molecular weight has a marked impact upon the switching
times and the threshold voltage comparison of those results for off as a function of temperature with those
measured using conventional optical relaxation techniques shows a significant difference which increases as the
temperature is lowered, a similar trend was observed for a series of siloxane based side chain liquid crystal
polymers figure shows that reorientation in an electric field results in electrical energy coupling to the
mesogenic units. Since the polymer chain is coupled to the mesogenic side chain then this well also under go
motion. However, the response of the mesogenic units and that of the polymer need not be on the same time
scale. The polymer chain may take much longer to reach equilibrium and because of the week nature of the
coupling this need not be evidenced by the orientation of the side chains on removal of the electric field, the side
chains can relax independently of the polymer chain and this occur slightly ahead of the polymer chain
relaxation. This slower relaxation of the polymer chain is only detected since if influences the subsequent

108 Khalid Al. Ammar Sokina Fakhry, 2015
Journal of Industrial Engineering Research, 1(4) July 2015, Pages: 99-108
response to the electric field. The range of homo polymers behaved in a similar manner to many other reported
liquid crystal polymers for example the switch on time decreased as the temperature was increased above the
glass transition, such effects are related to the reduction polymer viscosity. In this study it is found that the
higher molecular weight has the lower switch off times, this is attributed to the contribution from limited
segment lengths of the polymer back bone in work of this these is a suggestion has been made that the
differences in the molecular weight of the polymers.
REFERENCES
[1] Perez, JM., L. Josephson, T. O’Loughlin, D. Hogemann, R. Weissleder, 2002. Magnetic relaxation
switches capable of sensing molecular interactions. Nat Biotechnol, 20(8): 816–20.
[2] Hernando, A., P. Crespo, MA. Garcيa, 2005. Metallic magnetic nanoparticles. Sci World J, 5: 972–1001.
[3] Esumi, K., T. Hosoya, A. Suzuki, K.J. Torigoe, 2000. Colloids Interface Sci., 226(2): 346–52.
[4] Umadevi, T.H.S., G. Venkatchalam, 2014. Handbook of Liquid Crystals, 2nd ed. 5 (Wiley, New York, 2.
[5] Herrington, M.R., O. Buchnev, M. Kaczmarek and I. Nandhakumar, 2010. Mol. Cryst. and Liq. Cryst.
(527): 72.
[6] Reznikov, Y., O. Buchnev, O. Tereshchenko, V. Reshetnyak, A. Glushchenko and J. West, 2003. Appl.
Phys. Lett., 82: 1917.
[7] Shi, X., S. Wang, S. Meshinchi, ME. Van Antwerp, X. Bi, I. Lee, 2007. . Dendrimer-entrapped gold
nanoparticles as a platform for cancer-cell targeting and imaging. Small, 3(7): 1245–52.
[8] Shenhar, R., TB. Norsten, VM. Rotello, 2005. Polymer-mediated nanoparticle assembly: structural control
and applications. Adv Mater, 17(6): 657–69.
[9] Aili, D., K. Enander, J. Rydberg, I. Lundstrom, L. Baltzer, B. Liedberg, 2006. Aggregation-induced
folding of a de novo designed polypeptide immobilized on gold nanoparticles. J Am Chem Soc., 128(7):
2194–5.
[10] Bayraktar, H., CC. You, VM. Rotello, MJ. Knapp, 2007. Facial control of nanoparticle binding to
cytochrome C. J Am Chem Soc., 129(10): 2732–3.
[11] Li, Z., CA. Mirkin, 2005. G-quartet-induced nanoparticle assembly. J Am Chem Soc., 127(33):11568–9.
[12] Freestone, I., N. Meeks, M. Sax, C. Higgitt, 2007. The Lycurgus Cup- a Roman Nanotechnology, Gold
Bull. 40: 270–277.
[13] Faraday, M., 1857. The Bakerian Lecture: experimental relations of gold (and other metals) to light,
Philos. Trans. R. Soc. Lond., 147:145–181.
[14] Suzuki, M., Y. Niidome, S. Yamada, Heat-induced morphological control of gold nanoparticle films for
surface-enhanced Raman scattering (SERS) measurements,
[15] Wang, C.T., 2006. Photocatalytic activity of nanoparticle gold/iron oxide aerogels for azo dye degradation,
J. Non-Cryst. Solids 353 (2007) 1126–1133.Colloid Surf., A 284–285: 388–394.
[16] Safavi, A., G. Absalan, F. Bamdad, 2008. Effect of gold nanoparticle as a novel nanocatalyst on luminol–
hydrazine chemiluminescence system and its analytical application, Anal. Chim. Acta, 610: 243.
[17] Ghosh, P., G. Han, M. De, C.K. Kim, V.M. Rotello, 2008. Gold nanoparticles in delivery applications,
Adv. Drug Deliv. Rev., 60: 1307.
[18] Faraday, M., 1857. Philosophical Transactions of the Royal Society of London, 147 : 36.
[19] Bancroft, W.D., 1921. Applied Colloid Chemistry, McGraw-Hill Book Company, Inc., New York.
[20] El-Sayed, M.A., 2001. Accounts of Chemical Research, 34: 257–264.
[21] Burda, C., X.B. Chen, R. Narayanan, M.A. El-Sayed, 2005. Chemical Reviews, 105: 1025–1102.