effect of enterprise resource planning systems on the financial performance of sugar companies in...
TRANSCRIPT
EFFECT OF ENTERPRISE RESOURCE PLANNING SYSTEMS ON THE FINANCIAL
PERFORMANCE OF SUGAR COMPANIES IN KENYA.
DAVID SIKUKU
A Thesis Submitted in Partial Fulfillment of the Requirements for the Award of the Degree
of Master of Business Administration (Finance Option) of Masinde Muliro University of
Science and Technology
JUNE, 2014

i
DECLARATION DECLARATION BY THE CANDIDATE
This thesis is my original work prepared with no other than the indicated sources and support and
has not been presented elsewhere for a degree or any other award.
……………………… …………….........................
Sikuku David Date
MBA/G/81/08
DECLARATION BY THE SUPERVISOR
The undersigned certify that they have read and hereby recommend for acceptance of Masinde
Muliro University of Science and Technology a thesis/dissertation entitled “Effect of Enterprise
Resource Planning Systems on the Financial Performance of Sugar Companies in Kenya”.
1. Sign ………………………. ……………………...................
Mr. F.N. Kiongera Date
Department of Business Management
Masinde Muliro University of Science and Technology
2. Sign………………................. ………………………..........
Dr. N.C.O. Keya Date
Department of Sugar Technology
Masinde Muliro University of Science and Technology

ii
COPYRIGHT This thesis is copyright material protected under the Berne Convection, the Copyright Act 1999
and other international and national enactments in that behalf, on intellectual property. It may
not be reproduced by any means in full or in part except for short extracts in fair dealing so for
research or private study, critical scholarly review or discourse with acknowledgment, with
written permission of the Dean School of Graduate Studies on behalf of both the author and
Masinde Muliro University of Science and Technology.

iii
DEDICATION I dedicate this study work to the Sikuku’s that is , Gertrude, Amos, Grace, Eric, Lawrence,
Garret, Elizabeth, Oliver, Nourine, Eunice and Emmanuel who always encouraged and
motivated me to carry on. Through their un-wavering love and enormous support I was able to
successfully complete this study.
iv
ACKNOWLEDGEMENT My deepest appreciation and thanks go to my supervisors, Mr. Kiongera and Dr. Keya, for their
constructive suggestions, right criticisms and guidance that helped me stay on course and to
finish this scholarly work and the entire department business administration, MMUST.
I am also deeply indebted to my friends and course colleagues for their contributions in various
ways towards the completion of this work.
I extend my deepest gratitude to the management and staff of the sugar companies who helped
me to administer questionnaires, and to all the business system users who patiently bore the
displeasures of completing the questionnaires.
The moral support offered by family members who went a long way in sustaining my enthusiasm
in this work.
I finally give thanks to the almighty God for granting me great guidance, energy, wisdom and
academic intellect which enabled me to accomplish this work.

v
ABSTRACT Enterprise Resource Planning (ERP) system is most commonly referenced in the context of commercially available software systems. Although the term ERP system generally refers to a software system, it also encompasses the business processes that drive system requirements and capabilities. ERP Systems have transformed the way organizations go about the process of priority information system. The purpose of this study was to establish the effect of ERP systems on the financial performance of sugar companies in Kenya. Further the study sought to establish the effect of organizational factors on the financial performance of sugar companies in Kenya, and examined organizational factors affecting the relationship between ERP systems and financial performance of sugar companies in Kenya. The major components of ERP systems are; transactional systems, advanced applications systems and management decision support systems. Many entities in the world over are implementing ERP systems, however little research exists in this field. The study adopted a descriptive research and was carried out among three selected sugar millers. The following companies were selected for the study; Mumias Sugar Company Ltd, Nzoia Sugar Company Ltd and West Kenya Sugar Company Ltd since the researcher intended to collect cross-sectional data for sugar companies in Kenya. The target population included 152 licensed business system users of ERP systems in the sugar companies, and the study sample consisted of 48 business system users, a total of 32 of the 48 licensed business system users responded to the survey. However, 27 respondents were usable for the study. Information was obtained from respondents through stratified sampling. Besides reviewing literature on pertinent issues, the information was sourced through questionnaires administered to the respondents and also through content analysis of the financial statements of the selected companies for the period 2007 to 2010. This period was considered ideal as it is during this period the Kenyan economy was reorganizing in response to post election violence that was witnessed in late 2007 and early 2008 because of disputed presidential general election of 2007. Reliability and validity of the data collection tools was established through cronbach alpha test. The data was analyzed using SPSS version 20. Descriptive and inferential statistical tools including mean, one way Analysis of Variance (ANOVA) of 95% confidence, Karl Pearson’s zero order coefficient of correlation (Pearson Product Moment Correlation or simple correlation) was used to determine the direction and strength of the relationship between ERP and performance of the selected sugar firms. Further, Karl Pearson’s first order partial correlation coefficient (rxy.z) was used to ascertain the effect of moderating variables on the relationship between ERP systems and financial performance of sugar companies in Kenya. Simple regression analysis was used to model the relationship between ERP system and financial performance of sugar companies in Kenya. The relationship between ERP systems and the financial performance of sugar firms followed a regression model of the nature FP= α + β1 ERP+ e while the relationship between organizational factors and performance of sugar firms was of the nature FP= α + β2 OF + e. The outcome was statistically significant with a positive linear relationship between ERP and financial performance of sugar firms. On the other hand, organizational factors were found to be having a moderating effect on the relationship between ERP systems and financial performance of sugar firms. The findings are of importance to the Government of Kenya, shareholders, and stakeholders of sugar industry. Further, the findings form a basis of future research by other scholars.

vi
Table of Contents DECLARATION............................................................................................................................ I
COPYRIGHT ............................................................................................................................... II
DEDICATION............................................................................................................................. III
ACKNOWLEDGEMENT .......................................................................................................... IV
ABSTRACT .................................................................................................................................. V
LIST OF TABLES ................................................................................................................... VIII
LIST OF FIGURES .................................................................................................................... IX
LIST OF ABBREVIATIONS AND ACRONYMS ................................................................... X
OPERATIONAL DEFINITION OF KEY TERMS ................................................................ XI
CHAPTER ONE ........................................................................................................................... 1 INTRODUCTION ....................................................................................................................... 1
1.1 Background to the Study ................................................................................................... 1 1.2 Statement of the Research Problem ................................................................................... 5 1.3 Purpose of the Study .......................................................................................................... 6 1.4 Specific Objectives ............................................................................................................ 6 1.5 Hypotheses......................................................................................................................... 6 1.6 The Scope and Limitations of the Study ........................................................................... 7 1.7 Significance of the Study ................................................................................................... 7 1.8 Conceptual Framework...................................................................................................... 8
CHAPTER TWO .......................................................................................................................... 9 LITERATURE REVIEW ............................................................................................................ 9
2.1 Introduction ....................................................................................................................... 9 2.2 Moderating Variables. ..................................................................................................... 15 2.3 Empirical Literature Review. .......................................................................................... 18 2.4 Research Gaps ................................................................................................................. 21
CHAPTER THREE .................................................................................................................... 22 RESEARCH METHODOLOGY .............................................................................................. 22
3.1 Research Design .............................................................................................................. 22 3.2 Study Area ....................................................................................................................... 22 3.3 Study Population.............................................................................................................. 22 3.4 Sampling Techniques and Sample Size ........................................................................... 23 3.5 Data Collection Procedures. ............................................................................................ 23 3.6 Validity and Reliability of Research Instruments. ........................................................... 24 3.7 Data Analysis and Presentation Techniques. ................................................................... 25

vii
3.8 Ethical consideration ....................................................................................................... 26
CHAPTER FOUR ....................................................................................................................... 28 DATA ANALYSIS AND DISCUSSION ................................................................................. 28
4.1 Study Response Rate ....................................................................................................... 28 4.2 Demographic Factors. ...................................................................................................... 29 4.3 ERP Systems ................................................................................................................... 34 4.4 Inferential Statistics of ERP Dimensions ........................................................................ 41 4.5 Inferential Statistics of Moderating Variables. ................................................................ 42 4.6 Hypothesis testing and discussion ................................................................................... 43 4.7 Moderating effect of organizational factors on the relationship between ERP and the financial performance of sugar firms ..................................................................................... 48
CHAPTER FIVE ........................................................................................................................ 51 SUMMARY, CONCLUSIONS AND RECOMMENDATIONS ............................................. 51
5.1 Introduction ..................................................................................................................... 51 5.2 Summary of Findings ...................................................................................................... 51 5.3 Conclusions ..................................................................................................................... 51 5.4 Recommendations ........................................................................................................... 55 5.5 Areas of Further Research .............................................................................................. 55
REFERENCES ............................................................................................................................ 57
APPENDIX .................................................................................................................................. 61

viii
LIST OF TABLES Table 1. 1 ERP Installation in the Kenyan Market ......................................................................... 4
Table 3. 1 Sample Distribution ..................................................................................................... 23
Table 3.2 Reliability Test .............................................................................................................. 24
Table 3. 3 Hypothesis Testing Framework and Analytical Model ............................................... 26
Table 4.1 Breakdown of the Questionnaire Survey ...................................................................... 28
Table 4.2 Respondents Department .............................................................................................. 29
Table 4.3 Gender Distribution ...................................................................................................... 30
Table 4.4 Respondents Duration of Service in the Current Position ............................................ 30
Table 4.5 Respondents Duration of Service in the Current Organization .................................... 31
Table 4.6 Respondents Employement Position during the ERP Implementation ........................ 32
Table 4.7 Descriptive Statistics of the Independent variable ........................................................ 32
Table 4.8 Objectives of ERP Implementation .............................................................................. 36
Table 4. 9 Financial Performance Status before and after ERP Adoption .................................... 36
Table 4.10 ERP Systems Benefits ................................................................................................ 38
Table 4.11 Challenges of Adopting ERP systems ........................................................................ 39
Table 4.12 Organizational Factors affecting ERP systems ........................................................... 40
Table 4.13 Company Products Targets ......................................................................................... 40
Table 4.14 Correlation results for ERP dimensions...................................................................... 41
Table 4.15 Correlation of Organizational Factors ........................................................................ 43
Table 4.16 Correlation Results of ERP against financial peformance .......................................... 45
Table 4.17 Correlation results of organization factors on financial performance ....................... 47
Table 4.18 Results of the regression of modearting effect ........................................................... 48
Table 4.19 Correlation results when financial performance is held constant ...............................49
Table 4.20 Hypothesis testing framework and analytical model .................................................. 50

ix
LIST OF FIGURES Figure 1. 1 Conceptual Framework ................................................................................................ 8
Figure 2. 1 Enterprise Resource Planning:An integrative review ................................................. 10
Figure 4.1 Four Year Summary Review ....................................................................................... 34

x
LIST OF ABBREVIATIONS AND ACRONYMS ERP Enterprise Resource Planning
ROA Return on Assets
ROE Return on Equity
TCD Tones Crushed Per Day
ICT Information Communication technology
NSE Nairobi Securities Exchange
FP Financial performance
SPSS Statistical Package for Social Sciences
OF Organizational factors
MRP Manufacturing Resource Planning
MRPII Manufacturing Resource Planning II
SAP Systems Application Products
GDP Gross Domestic product
EABL East African Breweries Limited
KWAL Kenya Wines Agency ltd
KPLC Kenya Power & Lighting Company
KPA Kenya Ports Authority
PLM Product Lifecycle Management
CRM Customer Relationship Management
SKU Stock Keeping Unit
COMESA Common Markets of East & Southern Africa
COGS Cost of Goods Sold

xi
OPERATIONAL DEFINITION OF KEY TERMS ERP
Is a set of packaged application software modules, with an integrated architecture,
that can be used by organizations as their primary engine for integrating data,
processes and information technology, in real time, across internal and external
value chains.
Shakedown phase
Is a period attributed to employee learning resulting into more usage and
experience with the ERP system.
Performance
Is a method of measuring the success of the organization to ensure that it achieves
its goals. The success of an organization is gauged from several indicators both
qualitative and quantitative. These include financial and non financial
performance.
Return on Assets
Is a financial ratio that shows the percentage of profit that a company earns in
relation to its overall resources (Total Assets)
ROA=Net Income after tax/Total Assets
Return on Equity
Is the amount of net income returned as a percentage of shareholders equity. It is
often said to be the ultimate ratio or the “mother of all ratios” that can be obtained
from a company’s financial statement.
ROE=Net Income after Tax/Shareholders Equity

1
CHAPTER ONE
INTRODUCTION
1.1 Background to the Study
The adoption of ICT for business goes beyond simply buying an office computer and connecting
it to the internet. It is made more beneficial if it is set up with integrated information systems to
support the functional areas of the business. These areas include operations and management of
accounting, finances, manufacturing, production, transportation, sales and distribution, human
resource, supply chain, customer relationship and e-business. An example of such a system is the
Enterprise Resource Planning (ERP) Software (Torach, 2011).
Enterprise Resource Planning (ERP) is a generic term used to refer to management software that
includes modules such as production, finance, marketing and human resource and allows
companies to plan their goods and services (Stevenson, 2007). This software, used by many
enterprises, particularly by multinational corporations, has a critical role in increasing company
efficiency. ERP systems have their roots in the Manufacturing Resource Planning (MRP) system,
which later developed into Manufacturing Resource Planning II (MRPII) system. MRP system
was used to provide support for the production function. With the intervention of web-enabled
and open source technologies, the function of ERP has today assured added utility and
prominence to companies. The latest advancement in ERP software has been termed as ERP II
that is fully “internet-enabled” to facilitate access from remote locations (Lawton, 2000).
ERP systems help the different parts of an organization to share data and knowledge, reduce
costs and improve management of business processes (Stephen 2000, Buchhout and Nemec
1999). They also hope to provide increased flexibility to organizations in serving its customers.
The most commonly implemented ERP products are; BaaN, BPCS, IFS Applications, JD
Edwards, JBA Systems 21, mfg/pro, Movex, Navision (Microsoft), Oracle applications,
PeopleSoft, SAGE and SAP. With technological advancement, the main motivation of most
companies choosing ERP systems is to achieve an improvement in the management of the
financial aspect of their operations. The financial management module in ERP software is the
core module around which the other modules of the system revolve. The key elements of the

2
finance module of an ERP system include; general ledger controlling, accounts receivable,
accounts payable, cash management, fixed assets, budgeting and financial reporting and
analytics.
Kegode (2005), notes that sugarcane was first introduced in Kenya in 1902 by Asians
constructing the Mombasa-Uganda railway line. Today, the sugar sub-sector plays an important
role in the country’s economy. This sub-sector generates an estimated Kshs.12 billion annually,
provides approximately 500,000 jobs and supports livelihoods of about six million people. There
are, currently approximately 300,000 farmers involved in cane farming in the country. The
subsector accounts for about 15% of the agricultural GDP. The first sugar factory in Kenya was
set up at Miwani in 1922. Currently, the major millers are Miwani Sugar Company Ltd (1922),
Muhoroni Sugar Company Ltd (1966), Chemilil Sugar Company Ltd (1968), Mumias Sugar
Company Ltd (1973), Nzoia Sugar Company Ltd (1978), South Nyanza (SONY) Sugar
Company Ltd (1979), West Kenya Sugar Company Ltd (1981), Soin Sugar Company (2006),
Kibos Sugar and Allied Industries Ltd (2007) and Butali Sugar Company Ltd (2011). The two
older factories ceased operations: Ramisi sugar factory collapsed in 1988 and Miwani sugar
factory was put under receivership. Apart from the regular sugar mills, there are four licensed
and operational jaggery millers, namely; Lubao, Shajanand, Farm Industries and Homa Lime
jaggeries, who have a combined capacity of about 300 TCD. There are also in excess of nine
hundred informal and mostly mobile jaggeries, each which crushes between 3-35 tonnes of
sugarcane per day. The industry is facing pressures that include; globalization and the trend
towards mergers and alliances which requires financial stability and effective management of the
risks.
There is a continuing decline in productivity of the industry because the production technology
used is becoming increasingly obsolete. At the mill level, crushing of cane into sugar is
inefficient due to out of date technology and frequent breakdowns. At the farm level, cane yields
are low because smallholder farmers have little incentive to increase their output (such as by
using faster ripening seed varieties) as it would require higher maintenance, and they would not
be able to sell their extra produce in any case, due to limited milling capacity. In addition, mills
often owe money to farmers, who cannot be sure if or when they will receive payment. As a

3
result, farmers often fail to repay loans made to them by their out-grower associations.
Furthermore, farmers are generally paid for the amount of sugarcane they deliver to the mills in
terms of weight, rather than sucrose content. This does not incentivize farmers to improve the
quality of the cane they produce, which in turn reduces the efficiency of the mills (Ellis, Singh
and Ong’olo, 2010). Kegode (2010) points out that the Kenyan sugar industry has been revolving
around shortages, inefficiencies, inability to compete with imported sugar, perennial losses and
political interferences which cumulatively have a negative bearing on industry’s financial
performance. Despite huge stakeholder investments, self sufficiency in sugar has remained
elusive over the years as consumption continues to outstrip supply (Kegode, 2010).
Initially, implementation of an ERP package was possible only for very large multinationals and
infrastructure companies due to the high costs involved. However, today, many companies
around the globe have implemented ERP software and it is expected that in the near future an
even greater percentage of others will do the same (Mapara, 2005). Numerous researches have
been conducted on ERP implementation challenges. A significantly fewer number of research
has been performed on the realized ERP benefits. This is primarily due to the fact that it may
require up to five years before any benefits are realized (Poston and Grabski, 2001). Since ERP
systems are new, this type of data is seemingly not available as yet. Poston and Grabski (2001)
analyzed four financial performance measures before and after implementing ERP systems using
univariate tests and their results show that adoption of ERP leads to efficiency.
Hunton et al. (2003) also researched on the impact of ERP systems adoption and overall
organizational performance using financial ratios. However, their results fail to indicate a
performance improvement for ERP adopters. In Kenya, little has been done on the ERP system
usage. Majority of researches have focused on success factors and the key challenges to ERP
system implementation. Koske (2005) for example, analyses the impact of the use of ERP in
manufacturing companies in Kenya based on a survey of 16 companies. His results show that at
the organizational level, ERP has a very positive impact on the performance of companies.
Examples of companies that have adopted ERP systems in Kenya include Bamburi Cement,
Chevron Kenya Limited, Kenya Pipeline Company, Safaricom Ltd, Mumias Sugar Company,
Kenya Airways, East Africa Breweries Limited (EABL), Kenya Ports Authority, Nation Media

4
Group, Government of Kenya, Deacons (K) and Uchumi Group of Supermarkets. There is no
clear data on installed base but the table below shows the market domination.
Table1.1 ERP Installations in the Kenyan Market
ERP TARGET COMMENTS/CURRENT INSTALLATIONS
SAP Large enterprises and government KPLC, KENGEN, KPA, Kenya
Pipeline, Caltex
Oracle Financials Large enterprises and government Government of Kenya, Treasury
Baan Large enterprises Bidco, Firestone, Unga Ltd
Sage Line Small and Medium Sized enterprises KWAL, General Motors
Ebizframe Small and Medium Sized enterprises ACFC, Kenya Tea Development
Authority
ACCPAC Small and Medium Sized enterprises James Finlay, BASFEA
Sun Systems Small and Medium Sized enterprises Unilever Kenya, EABL
JD Edwards Large/Medium enterprises Shell & BP
(Source: Symphony Consulting)

5
1.2 Statement of the Research Problem
Enterprise Resource Planning systems or enterprise systems are software systems for business
management, integrating modules that support functional areas such as planning, manufacturing,
sales, marketing, distribution, accounting, financial, human resource management, project
management, inventory management, service and maintenance, transportation and e-business.
The challenge most entities encounter is in consolidating these heterogeneous systems within the
organization. Many companies prefer a system platform that would provide integration for
processes throughout the organization’s divisional systems to replace the previous transactional
systems. To handle challenges encountered by various transactional systems within an entity, a
common course of action has been the adoption of Enterprise Resource Planning (ERP) system.
“ERP systems are configurable information systems packages that integrate information and
information-based processes within and across functional areas in an organization” (Kumar &
Van Hillsgersberg, 2000).
Numerous researches have been conducted on ERP implementation challenges. A significantly
fewer amount of research have been performed on the realized ERP benefits. This is primarily
due to the fact that it may require up to five years before the benefits are realized (Poston and
Grabski, 2001). As these systems are new, this type of data is not seemingly available yet. Poston
and Grabski (2001) analyses four financial performance measures before and after implementing
ERP systems using univariate tests and their results show that adoption of ERP leads to
efficiency. Hunton et al (2003) also researched on the impact of ERP systems adoption and
overall organizational performance using financial ratios and their results fail to indicate a
performance improvement for ERP adopters.
In Kenya little has been done on the ERP system usage but majority of researches have focused
on success factors and the key challenges to its implementation. Koske (2005) for example
analyses the impact of use of ERP in manufacturing companies in Kenya using a survey of 16
companies and his results show that at the organizational level, ERP has very positive impact on
the performance of companies. In his work Koske (2005) did not demonstrate the nature of
organizational performance thus necessitated the need to research further in this under –

6
researched topic but narrowing down to financial performance of the sugar industry since
generalizing the entire manufacturing industry will not cater for the many sub sectors in it.
Therefore the study sought to find out the effect of enterprise resource planning systems on the
financial performance of sugar companies in Kenya.
1.3 Purpose of the Study
The general objective of this study was to assess the effect of Enterprise Resource Planning
systems on the financial performance of sugar companies in Kenya.
1.4 Specific Objectives
Specifically the study sought to:
i. To determine whether ERP systems have an impact on financial performance of sugar
companies in Kenya.
ii. To examine the effect of organizational factors on the financial performance of sugar
companies in Kenya.
iii. To establish the effect of organizational factors on the relationship between ERP systems
and financial performance in sugar companies in Kenya
1.5 Hypotheses
H01: ERP systems have no relationship with financial performance of sugar companies.
H02: Organizational factors do not affect the financial performance of sugar companies.
H03: Organizational factors do not affect the relationship between ERP system and
financial performance of sugar companies.

7
1.6 The Scope and Limitations of the Study
The researcher was interested specifically in exploring the effects of ERP systems on the
financial performance of sugar companies. The sugar industry was selected because of the many
challenges facing the sub-sector. It focused on the benefits of ERP systems, the organizational
factors affecting the adoption of ERP systems, and how they impact the financial performance of
sugar companies. The study was necessitated by the need for the sugar industry in Kenya to cut
production costs and increase efficiency so as to complete with cheap sugar imports from
COMESA.
The study focused on sugar companies that had implemented an ERP system by 31st December,
2010. Generally, the study was conducted in Mumias Sugar Company (listed on NSE), Nzoia
Sugar Company (state-controlled), and West Kenya Sugar Company Ltd (privately owned) but
specifically covering the finance and IT departments. However, Agriculture, Factory,
Commercial, Human Resources and Marketing were not considered in the study. By virtue of
the nature of their ownership, the three sugar companies were selected to represent the entire
population. The employees using ERP systems in the selected sugar companies were targeted as
the respondents. It was assumed in data analysis that the results obtained were representative of
the general population.
1.7 Significance of the Study
This study sought to investigate how ERP systems contribute to the financial performance of
sugar companies in Kenya. Based on the findings of this study, it is hoped that there will be a
theoretical and empirical improvement of ERP adoption, implementation and usage. The senior
managers who are charged with policy implementation will also find the study useful in terms of
handling the highlighted organizational factors during the implementation of ERP systems. The
government will also find this study meaningful since majority of sugar companies are state
controlled. Students pursuing business related courses at different levels would also find this
study useful. Finally, it is also hoped that this study will contribute to extant literature on ERP
systems and its influence of financial performance.
8
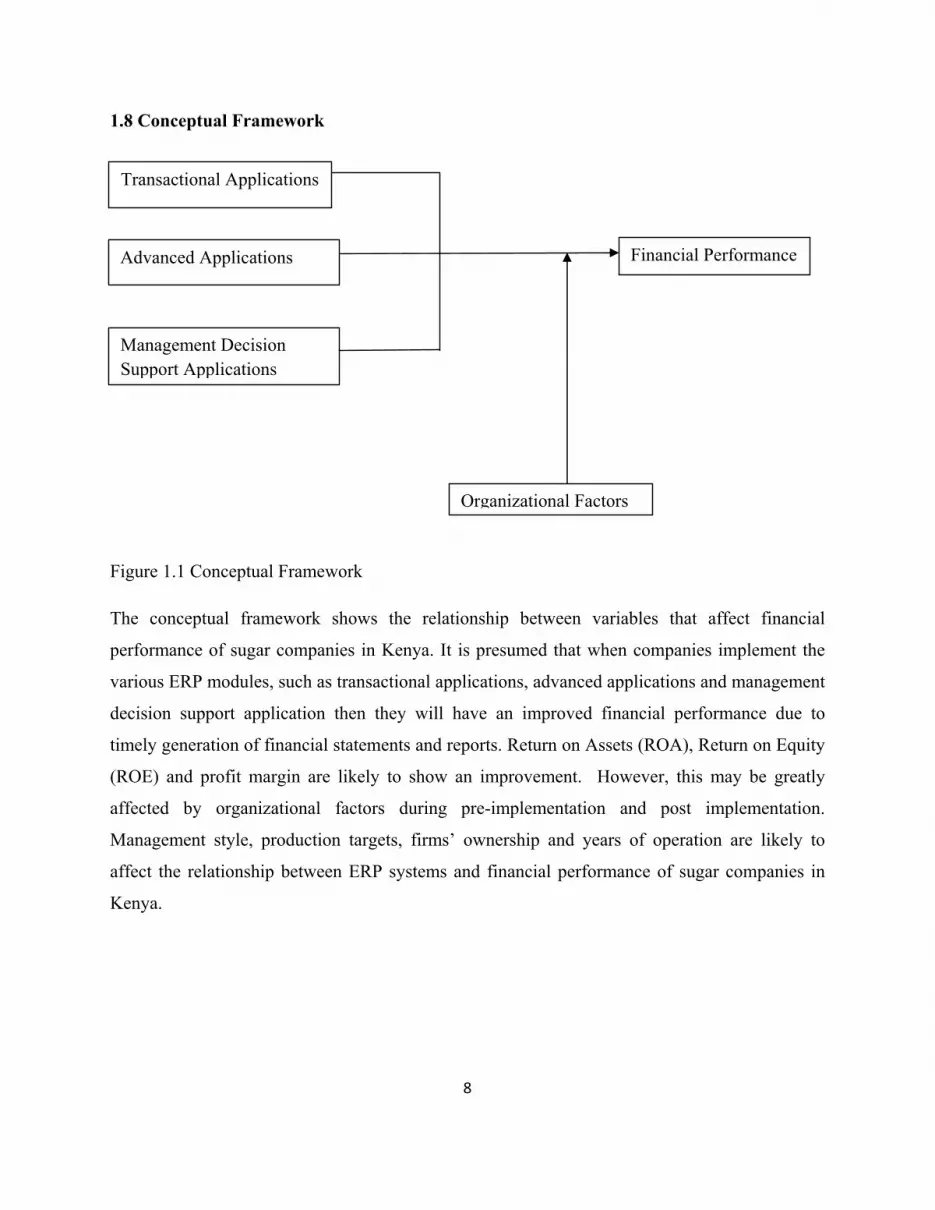
1.8 Conceptual Framework
Figure 1.1 Conceptual Framework
The conceptual framework shows the relationship between variables that affect financial
performance of sugar companies in Kenya. It is presumed that when companies implement the
various ERP modules, such as transactional applications, advanced applications and management
decision support application then they will have an improved financial performance due to
timely generation of financial statements and reports. Return on Assets (ROA), Return on Equity
(ROE) and profit margin are likely to show an improvement. However, this may be greatly
affected by organizational factors during pre-implementation and post implementation.
Management style, production targets, firms’ ownership and years of operation are likely to
affect the relationship between ERP systems and financial performance of sugar companies in
Kenya.
Transactional Applications
Advanced Applications
Management Decision Support Applications
Financial Performance
Organizational Factors

9
CHAPTER TWO
LITERATURE REVIEW
2.1 Introduction
This chapter will present an introduction of Enterprise Resource Planning (ERP) systems,
components as well as the life cycle. The relationship between ERP systems and financial
performance will also be presented.
2.1.1 ERP Systems Drury, (2004), observes that Enterprise Resource Planning (ERP) is a system that has enabled
organizations to exploit better their business information. ERP systems are significantly
distinguished from previous generations of information systems since they permit organizations
to integrate business processes and optimize the available resources (Stephen 2000). According
to Buckhout and Nemec, 1999 ERP is an information system that integrates an enterprise’
internal function working processes, standardizes internal data processing procedures and
combines the operational data generated by different functions. Davenport, 1998 describes ERP
systems as comprising of a commercial software package that promises the seamless integration
of all the information flowing through the company–financial, accounting, human resources,
supply chain and customer information”. A sentiment shared by O’Leary, 2001 who states, “ERP
systems are computer-based systems designed to process an organization’s transactions and
facilitate integrated and real-time planning, production, and customer response”.
Tadjer, (1998), emphasizes that ERP systems are one database, one application and a unified
interface across the entire enterprise”. ERP systems offer unique benefits to the organizations
implementing them. This they do by improving the decision making process of the organizations
through the provision of appropriate and timely information (Hunton et al. 2004). Globalization
has necessitated most companies to standardize processes and learn the best practices embedded
in ERP systems, which ensure quality and predictability in their global business interests by
reducing cycle time from order to delivery (Ross J. W, 1999). With the evolvement of ERP
systems, the interest in the impact that these systems have on organizational performance has

10
risen. Billions of dollars have been spent on these systems worldwide (Kalling, 2003). Yet,
conclusive results on the true benefits are still to be proven.
2.1.2 Components of ERP System The components of an ERP system are subdivided into modules as shown in the figure below.
Figure 2.1 Enterprise Resource Planning: An integrative review (Shehab E.M et al 2004 pg 363)
Gelinas et al, (2005) identified the following core modules of ERP systems. Supply chain
management (SCM) is one of the most important software modules for manufacturers. SCM
provides visibility into the entire supply chain, from start to finish. ERP SM modules typically
include components for forecasting, demand management, procurement and planning; delivery
modules such as logistics; and components for after-market issues like returns, installations and

11
contracts. Manufacturers can use customer relationship management (CRM) software to organize
and view data on individual customer transactions in one accessible place. ERP CRM modules
provide customer data integration, or master data management (MDM), which keeps track of
customers across all the sales channels from in-person (field sales) to phone (including
telemarketing) to online (teleservice and support)
With product lifecycle management (PLM) software, manufacturers can track the design and
attributes of a product throughout its lifecycle, from concept to end-of-life. The components that
make up ERP PLM modules include product data management (PDM), product design, portfolio
management, direct materials sourcing and customer needs management. Human capital
management is another one of the common ERP modules. ERP HCM modules function as the
core employee record, which details personnel actions, benefits administration and payroll,
position management and compliance with government regulations. ERP HCM covers three
areas of employee management: transactional, talent management and extended management.
Warehouse management systems (WMS) software is a must-have for manufacturers. ERP WMS
modules follow the distribution process involved with finished goods or materials from delivery
into the warehouse for storage through replenishment and picking for shipment to fulfill orders.
WMS modules also help synchronize and control stock on the shop floor. Manufacturers can
track physical manufacturing assets involved in production using ERP asset management
modules. Some of the daily functions that ERP asset management handles are maintenance
schedules, equipment uptime and downtime, inventory and warranty management and
compliance with hazardous materials and waste tracking regulations.
Financial management is a critical business function for manufacturers. ERP financial
management modules include functionality for general ledger, which is the core of ERP financial
management. These modules also handle functions for accounts payable and receivable, fixed
assets, financial reporting and treasury management. Order management systems take in data
from orders on the front end and make sure that orders get filled on the back end. Manufacturers
use ERP order management modules to fill product orders at the lowest possible cost. These
modules are equipped to handle functions such as automated order entry, viewing and tracking;

12
order status; cancelled transactions; order and credit limit validation and checking for duplicate
orders.
With project management software, manufacturers can organize and review the data around
project timelines and costs. These software systems are geared toward organizations that bill
clients based on their employees spend working on individual projects. ERP project management
modules handles: project definition, project costing & accounting, project portfolio management,
resource management and project billing. ERP inventory management modules move finished
goods through the production cycle. They are often tied into other functions, including shipping,
logistics, orders, and billing, on a broader scale, warehouse management. ERP order
management software includes functionality for inventory control, serial number tracking, bar
code printing, build materials and kitting, inventory valuation and SKU management.
2.1.3 ERP system life cycle. Markus and Tanis (1999) identify three phases in the lifecycle of an ERP system; the pre-
implementation phase, the implementation phase and the post implementation phase.
a) Pre-implementation phase
According to Ross (1999), the objective of the pre-implementation phase is to identify the ERP
package most appropriate for the organization and the technological infrastructure needed for it.
Usually, a committee is set up to conduct a feasibility study, to identify and select the ERP
solution, streamline the integration framework and access the cost implication of such a project.
b) Implementation phase
This is the main phase of the life cycle of the ERP project. During this phase, organizational
processes are re-designed to work with the ERP system (Vemuri and Palvia 2006). In many
cases, the implementation is done in parallel with the existing system in order to minimize any
interruption with ongoing operations. The ERP system is implemented, end users trained and
acceptance testing conducted (Ross, 1999).

13
c) Post implementation phase
The post implementation phase is normally the longest phase of the ERP life cycle and can last
several years. It consists of the period after ERP implementation. This phase is characterized
with reviews, support and system modifications and/or extensions. Usually a post-
implementation analysis is performed to measure the effectiveness of the ERP solution in
meeting its goals and objectives (Ross, 1999).
2.1.4 Reasons for implementing ERP Systems
Why do firms invest in ERP given the different alternatives for Information integration in a
business? The answer for this question lies between either technical gains e.g. replacing legacy
systems, or for business reasons e.g. improving operational performance and efficiency
(Nicolaou, 2004). Many technical reasons exist including the replacement of disparate systems
into a single integrated system (Hitt et al., 2002). The replacement of legacy of legacy systems
was very important for the boom of ERP during the late 1990s when companies wanted to
replace their legacy systems during the year 2000 (Y2K) with a more Y2K compliant solution so
they have invested into ERP systems (Anderson et al., 2003) ERP also provides a tested system
security basis which promises to keep the organization up to security standards and for providing
data security (FuB et al.,, 2007)
Business reasons also exist. This includes automation and reengineering of business processes
(Hitt et al., 2002). Other business reasons provided by Federici (2009) are better management,
better operations, better information availability and reengineering procedures, which are all
reasons for acquiring ERP. Other business reasons include enhancing cooperation and teamwork
between employees in the company. In addition, benefits expected from implementation of ERP
systems include tangible benefits like reducing costs, reducing operations time, and a lean
organization, while intangible benefits like information integration, better information quality,
and increase in customer satisfaction also exist (Loh et al., 2006;Nicolau, 2004). Such perceived
benefits are expected because ERP help make production inside manufacturing companies more
efficient by integrating information from other departments like sales and procurement into the

14
production system, which as a result helps eliminate costs and improve production schedules
(Matolcsy et al., 2005)
Firms may have several reasons for deciding to adopt ERP Systems depending on for example
industry and size. According to a survey regarding R/3 cited in Al-Mashari (2001), the most
common reason for implementing ERP, as well as its most achieved benefit, is standardization of
processes and systems. Another much cited reason for implementing ERP is the integration
benefits of the system. Other reasons for implementing ERP is problems of fragmentation due to
legacy systems and to solve the year 2000 problem. The year 2000 problem is a term for the
problems that could occur at the turn of the millennium. This meant that when the clocks struck
midnight on Jan. 1 2000, many computers would produce wrong answers or fail to operate
properly unless the computers’ software was repaired or replaced before that date. O’Leary
(2000) states that “one of the primary reasons for movement toward ERP is that the competition
has it [and that] a lot of ERP purchases are premised on the need just to stay in business”. Thus,
the implementation of an ERP System can be seen as a competitive necessity.
According to Hedman, 2002, to make the right business decisions, you need access to the right
information at the right time. With an ERP solution configured to your specific needs, you can
rest assured that you are receiving accurate data to make smart decisions. Even if you already
have an ERP solution in place, years of minor tweaking and connecting with disparate systems
may have turned it into a convoluted mess of obscure information. With a new ERP solution,
your business can put its trust in an up to date and reliable system.
Although the implementation of an ERP system brings many advantages, it may also bring
disadvantages. One of the main disadvantages is the lack of feature-function fit between
available packages and company needs (Markus & Tanis 1999). Al-Mashari (2001) states that
even the best product available can only fit 70% of all company processes. Further reasons for
not adopting ERP are the high costs of the infrastructure and the implementation. This reason is
most commonly stated regarding small firms. The implementation is not only costly but also
requires much time and patience. It also disturbs the routine work within an organization and
many hours of education is needed (Yen et al, 2002). Davenport (1998) argues that the

15
implementation of an ERP may result in the weakening of important sources of competitive
advantage, because it pushes a company towards generic processes, even if the company’s
competitiveness lies in its unique, customized processes. An implementation that has not been
carefully considered may therefore bring disaster rather than the much-sought benefits.
2.1.5 ERP Adoption in Kenya In the past years, a number of companies in Kenya have implemented ERP systems in their
organizations. Since Kenya Power & Lighting Company (KPLC) implemented the SAP system
in 1997, a number of other companies have also implemented similar products. In 2002, Kenya
Ports Authority (KPA), Telkom Kenya Limited and Kenya Pipeline Limited embarked on ERP
implementation. There are many others that also may be planning to implement these systems for
their operations. The major focus is on large ERP and inventory system. JD Edwards has carried
out a few ERP implementations in Kenyan Companies, primarily in the petroleum, soft drinks
and manufacturing sectors. SAP has been implemented in a large number of companies in the
power, transport and petroleum sector. The smaller ERP systems include; Navision, AccPac,
Great Plans and SUN Accounts system. There is no clear data on the total installed but the Table
1.1 is an indication of the market.
2.2 Moderating Variables. The organizational factors are assumed to moderate the relationship between ERP systems and
financial performance of sugar companies in Kenya.
2.2.1 Management Style According to Kegode 2005, the Sugar Industry in Kenya is in chaos, the current state of sugar
industry is primarily as a result of destructive political economy that has seen corruption,
mismanagement, lack of political goodwill, ruin the sector. The result has been a systematic
increase in poverty amongst farmers and subsequent decline in the sustainability and efficient
growth of the sub-sector. The situation has been exacerbated more by non-sequenced trade
liberalization trade policies, leading to unchecked entry of imported (often dumped) sugar into
the local market. The sector is currently operating under COMESA safeguard measures. The
Kenya Sugar sector is expected to have undertaken key reforms in various areas to build
competitiveness and introduce efficient management in the sugar supply chain. Consequently,

16
the institutional and legislative framework governing the sugar sub-sector must be urgently
overhauled in order to respond to an imminent threat that will affect the sector. The sector has
suffered greatly from factors such as external sugar market competition, combined with serious
internal inefficiencies and grandiose corruption that was coordinated by the policy maker’s
bureaucrats and key agents in the industry.
According to Wanyande (2001), poor management, corruption and vested political interests
have made Kenya's sugar industry so inefficient that the country's goal of attaining self-
sufficiency in sugar production will remain unattainable for a long time. The government has
contributed to the current inefficiency in several ways. The government formed the habit of
bailing out sugar companies from collapse by injecting huge amounts of money whenever the
companies were in the red. The companies were therefore assured of returns to their investment
and did not therefore find it necessary to be innovative and competitive. The government has
also been very lenient with those who illegally import sugar into the country, a factor that has
contributed to problems in the industry in that it has led to dumping. Many powerful people are
said to import sugar duty free and sell it at a much cheaper price than the locally produced sugar
and thus making it hard for the local companies to sell their stock. This problem has been
compounded by gross misappropriation of funds meant for improving operations in the industry.
There were also complaints of massive tax evasion in the sugar industry with the culprits going
scot-free. This is done by politically powerful individuals. We are here talking about corruption,
a vice that has become pervasive in the country. Another problem that has made the companies
difficult to manage is the practice in which the government provided loans to the companies and
did nothing to recover such loans. This means that a manager coming to the company finds the
company in such a huge debt that it cannot pay. This simply discourages the manager from even
starting to repay the loans.
The other problem that creates inefficiency in the sugar industry is the appointment of managers
on the basis of political considerations rather than merit. All the chairpersons of the government-
dominated sugar companies are political appointees. In some cases, they are people who failed to
get elective positions but were in good books with the powers that be. Their appointment is,
therefore, more of a political reward than merit that would aim at improving the management of

17
the companies. The same applies to the few local managers of these companies. Many of them
lack the requisite technical qualifications and knowledge, let alone interest, in the sugar industry.
One of the consequences of this is that the managers feel that their duty is to serve the interest of
the state and not necessarily the farmer. (Wanyande, 2001)
Secondly, such employees are uncertain of whether they will retain their jobs should there be a
change of government. Therefore, they resort to taking as much as possible from the companies
before being replaced. They thus turn and treat the companies as mere sources of personal capital
accumulation. There are several other dimensions to the problems in the sugar industry apart
from those caused directly by the state. Among these is the problem of management. According
to a number of farmers, sugar factories appear to lack capacity to collect cane from them. The
farmers observed that many times their cane dries up on the farms simply because the factories
do not collect it in time. The farmers also pointed out that even if they wanted to use their own
transport to take cane to the factories they could not do so since they have to get the okay from
the factory. This implies that either the factories do not have the capacity to receive a certain
amount or quantity of cane at any given time or that they simply are not sensitive to the interests
of the farmers. This is why farmers and politicians from the sugar belt often interpret this as a
deliberate act of sabotage to frustrate the community of sugar cane farmers. They often see the
hand of the state and therefore politics in all this. As a result many farmers become frustrated and
opt not to plant sugar cane and this, too, reduces the amount of cane available (Wanyande, 2001)
2.2.2 Production Targets Consequently, the production targets are not met. The high cost of processing sugar undoubtedly
has implications on the financial performance of the factories and eventually their capability to
pay farmers. Most factories are often unable to realize enough money to pay farmers at the
industry set prices. Indeed, late payment of farmers for cane delivered to the factories is a
common problem in the industry. From the foregoing, it is clear that the problems in the sugar
industry are mainly due to government policies and interference, which does not favor efficient
performance. Although, the government espouses privatization of the industry, it is dragging its
feet and seems not ready to release control over the milling companies. This has led to
18
management inefficiencies of the factories with the belief that the government will always bail
them out of their financial difficulties (Wanyande, 2001)
Every sugar company in the sugar belt area has a nucleus estate and an out growers' scheme. The
nucleus estates belong to the sugar company while the out growers' schemes cover the individual
or private sugar cane farmers. The idea behind the nucleus estates is simply to ensure a constant
supply of cane to the factories. They are some kind of safety valve or insurance just in case
farmers fail to deliver cane to the factories. It is, however, also a source of income for the factory
owners and a chance for them to participate in sugarcane farming. It is interesting to note that
despite the existence of nucleus estates, sugar factories have not been able to meet production
targets. Efficient management of the sugar factories is the key to the success of the sugar
industry (Wanyande, 2001). For a business that handles lots of transactions as a daily basis,
software is more than a necessity. In current competitive scenario, the best option is for
businesses to adopt effective enterprise software (Rai, 2010).
2.3 Empirical Literature Review.
The relation between ERP systems and organizational performance has evoked much interest
among researchers in the whole world. Good examples of ERP financial impact researches have
been conducted by Poston and Grabski (2001) and Hunton et al. (2003). Poston and Grabski
(2001) investigated the impact of ERP system implementation on an organization’s performance.
They examined 50 companies adopting ERP systems over a three-year post-implementation
phase. They concentrated on three major areas, which they presumed would illustrate ERP
system effects on economical performance. These were internal coordination costs, decision
information costs and external coordination costs. All of them are included with more detailed
cost categories. The results demonstrate a limited and insignificant positive correlation between
ERP and firm performance. However, they reported a significant decrease in the ratio of
employees to revenue in each of the 3 years and a significant improvement in the ratio of cost of
goods sold to revenue in year three. Overall, they noted that ERP firms exhibited efficiency gains
in some areas, but increased costs elsewhere seemed to offset such gains. These results are to say
the least wanting.

19
Companies are investing millions of dollars on ERP systems, which consequently fail to deliver
any financial benefits. Poston and Grabski (2001) identify a few reasons for the outcome of their
research. Firstly, as mentioned before, the ERP benefits on an organization may be realized only
after four to five years after the implementation phase. As the time frame in this research was
only three years, it might not have been sufficient. Secondly, Poston and Grabski (2001) suggest
that the true value of ERP systems is realized only after add-on packages such as Customer
Relationship Management (CRM) systems are utilized. Apparently the research did not include
examination of the impact of such features.
Thirdly, it is established that many companies reengineer their business processes while
implementing ERP thus making it difficult to compare previous performance with ERP post-
implementation performance. Therefore, referring to the first limitation, a longer time frame
might be sufficient in ERP financial impact research. Fourthly, macroeconomic or contextual
factors were not considered in this study. Thus, companies of a similar size and industry, which
have not implemented ERP, should have been included. Finally, organizational control or initial
objectives were not managed. Factors affecting organizational change should be distinguished
and measured in order to identify the true success of the ERP implementation. It could be that all
of the 50 companies failed in ERP implementation with little financial impacts. However, it
cannot be proven as the organizational factors are unknown.
Hunton et al. (2003), recognize a sixth reason for the results acquired by Poston and Grabski
(2001). During their research, they established that an earlier research carried out in 1996
discovered that financial gains encountered with the adoption of ERP are passed over to
customers who are charged lower prices. This notion is supported by various other researches
that Hunton et al. (2003) had examined. Hunton et al. wanted to extend the study done by Poston
and Grabski by examining ERP benefits from a wider and different perspective. The objective of
the study was to demonstrate whether or not the financial performance of a non-ERP adopter is
significantly lower than that of an ERP adopter. Their study used four different measures of
financial performance. The first one is the Return on Assets (ROA), which is a common measure
of performance and widely used in research. The two second measures are parts of ROA. These

20
are Return on Sales (ROS) and Asset Turnover (ATO). The last performance indicator is Return
on Investment (ROI).
The study by Hunton et al. (2003) examined 60 companies from which it was possible to acquire
performance information before and after ERP implementation for a sufficient number of years.
The sample included in addition, companies that had not implemented ERP in order to compare
and contrast results. The results by Hunton et al. (2003) indicate similar results as with the
Poston and Grabski (2001) study. No significant difference in ROA is recognized between pre-
and post-implementation performance of ERP companies. The difference among the two studies
is illustrated in that non-ERP adopting companies show a great decline in ROA. Similar results
were acquired with the other financial performance indicators (ROI, ROS, and ATO). However,
it is noted that the decline in financial performance figures for non-ERP adopting companies is
significant only for ROA and ROI.
Evidently, the study by Hunton et al. (2003) does not shed light to the ERP paradox and their
impact on organizational financial performance. Thus, it could be possible that these complex
systems that companies spend millions of dollars on are implemented only to sustain an already
acquired market position and not improve overall financial performance. The research
contributions by Poston and Grabski (2001) and Hunton et al. (2003) seem to reflect upon this
theme. However, various other researchers have identified other types of ERP benefits
(Laughlin, 1999; Plotkin, 1999; Mabert et al., 2001), but recognized that these benefits do not
occur until ERP systems have been successfully implemented and integrated into business
processes (Markus et al., 2001).
Closer home, Koske (2005) performed a study using a survey of 16 manufacturing companies in
Kenya to establish the impact of ERP use. The research findings showed that at organizational
level, ERP had a very positive impact on the performance of manufacturing companies in Kenya.
From this perspective ERP usage would not expect to see post implementation financial gains.
Such inconclusiveness creates room for further study.

21
2.4 Research Gaps
Many studies have been carried out on ERP activities in Kenya and other countries. There exists
a wealth of literature on ERP systems but only few studies have been carried out in Kenya, a lot
of research has been carried out focusing on the relationship between ERP systems and
organizational performance. Positive relations between ERP systems and performance have been
reported in some of the studies (Poston, 2001 and Koske 2005). Other studies like Hunton et al
(2003) do not shed light to the ERP paradox and their impact on organizational financial
performance. Empirical evidence reveals that little research attention has been devoted to
measuring the impact of ERP in sugar subsector in Kenya which forms part of the entire
Agricultural activities that is a dominant sector and accounts for approximately 24% of the
country’s GDP. It is against this background that the purpose of this study will be to determine
the effect of ERP systems on financial performance by assessing the effect of ERP systems on
financial performance of sugar companies in Kenya.
22
CHAPTER THREE
RESEARCH METHODOLOGY
3.1 Research Design
This study adopted a descriptive survey. The choice of this design was preferred because (Oso &
Owen, 2005) agreed that a survey is an excellent tool for it considers issues such as economy of
the design, rapid data collection and ability to understand a population from a part of it.The
researcher was interested in describing the relationship between ERP systems and financial
performance of sugar companies.
3.2 Study Area
Three sugar companies in Kenya, Mumias Sugar Company, Nzoia Sugar Company and West
Kenya Sugar Company were selected for this study. The study area was preferred because
Western Kenya by design is where the bulk of the sugar companies are located and
owned/controlled differently. In addition, all the firms have over 20 years experience in
manufacturing sugar in Kenya. Mumias Sugar Company, Nzoia Sugar and West Kenya represent
the interest of privatized, government owned and private sugar companies respectively. The
industry is controlled by the Kenya Sugar Board, KSB
3.3 Study Population
In the Kenyan business sector, most organizations still continue to use traditional accounting
software. However, a number of them are gradually upgrading to entry level ERP systems
supplied by major ERP vendors such as SAP, Syspro, Microsoft Navision and EbizFrame. The
study population was 152 system end users in Finance and ICT departments of the selected sugar
companies during the study period.

23
3.4 Sampling Techniques and Sample Size
Stratified sampling technique was used to categorize business system users in their strata i.e.
according to their division/function/departments. The sample was drawn from finance and ICT
departments within each selected company. The system administrators generated a supporting
listing of all system end users specified and thereafter the researcher randomized the list of every
section to reduce unfairness. The sample comprised 7 ICT users and 41 finance end users. A total
of 48 respondents were used for this study. Sample distribution is shown in Table 3.1.
Table 3.1 Sample Distribution
POPULATION SAMPLE 30%
ICT FINANCE TOTAL ICT FINANCE TOTAL %
END USERS END USERS USERS END USERS END USERS USERS
MUMIAS SUGAR 8 84 92 3 26 29 31.52%
WEST KENYA 3 12 15 1 4 5 30.00%
NZOIA SUGAR 9 36 45 3 11 14 31.11%
GRAND TOTAL 20 132 152 7 41 48 31.58%
Source; System Administrators (Selected Sugar Companies)
The sampling frame of this study was generated after consultation with the system administrators
of the selected sugar companies, who provided the system end users list. Kerlinger (1993) asserts
that a sample is representative if it is between 10% -30%. Out of 152 system end users, a sample
size of 48 respondents representing 31.58% was used to gather the findings.
3.5 Data Collection Procedures.
Primary and secondary data was used in the study after seeking permission from School of
Graduate studies and National Commission for Science Technology and Innovation (NACOSTI)
see attached research permit appendix 7.To generate primary data, a structured questionnaire was
administered to 48 respondents. The questionnaire included both open-ended and closed
questions which were administered to system end users of the selected divisions through drop
and pick. Structured questions were used because they offered an increased response rate and
were easily coded and analyzed while unstructured questions were used because they provide

24
more information as the respondents express their thoughts freely and spontaneously. In case of
the close ended questions, a Likert-type scale was used for the entire construct.Secondary data
came from annual financial statements & reports.
3.6 Validity and Reliability of Research Instruments.
The questionnaire was the main data collection instrument and hence to ensure that it is reliable
and valid; test-retest was done. To ensure content validity and relevance, the questionnaire was
pretested on a pilot set of respondents who did not form part of the study’s respondents but were
knowledgeable in the study aspects. This enabled the researcher to revise the questionnaire based
on the pilot feedback. On the other hand, to ensure face and construct validity, the questionnaire
was guided researchers conceptual framework. Piloting was carried out in Carried out in Mumias
Sugar Company production section whose findings were used in the final analysis aimed at
establishing the clarity.
The data was then analyzes and the results were correlated to determine their reliability
coefficients. The dependent and independent variables were found to be more reliable with alpha
coefficients of more than 0.70, which is acceptable in the non clinical research work as shown in
Table 3.2 below.
Table 3.2 Reliability Test
Reliability Statistics
Cronbach's Alpha Number of items
0.833 50
Source: Research data 2013
25
3.7 Data Analysis and Presentation Techniques.
Quantitative data collected from respondents was coded and analyzed using Statistical Package
for Social Sciences (SPSS V20). The data was first fed into a computer and analyzed using SPSS.
The study used both descriptive and inferential statistics during data analysis. Opened ended
questions were qualitatively analyzed using the basis of the frequency of responses while
numerical scores were awarded to closed ended questions. Descriptive statistics employed the
use of means, frequencies and percentages and for inferential statistics One-Way Analysis of
Variance (ANOVA) was applied to determine whether there are any significant differences
between ERP and financial performance of sugar companies in Kenya.
Karl Pearson’s zero order coefficient of correlation (Pearson Product Moment Correlation or
simple correlation) was used to determine the direction and strength of the relationship between
ERP and financial performance of sugar companies in Kenya. Further, Karl Pearson’s first order
partial correlation coefficient (rxy.z) was used to ascertain the moderating effect of factors
organizational factors on the relationship between ERP and financial performance. The
relationship between ERP and performance of sugar firms was expected to follow a regression
model of the nature FP= α + β1 ERP + e while the relationship between organizational factors
and financial performance was expected to follow a regression model of the nature FP= α + β2
OF + e where,
FP= Financial performance, α = intercept term, β1 and β2 = Beta coefficients,
ERP= Enterprise Resource Planning
OF= Organizational factors and
e= constant term
Karl Pearson’s zero and first order partial correlation coefficient test will be used to test
hypothesis as shown in the table 3.3.

26
Table 3.3 Hypothesis testing framework and analytical model
Hypothesis Hypothesis test Regression model
H01: ERP systems have no
relationship with financial
performance in sugar companies.
Karl Pearson’s zero
order coefficient of
correlation (Beta test)
Reject H01 if β1≠ O
FP = α + β1 ERP+ e
H02: Organizational factors do not
affect the financial performance of
sugar companies.
Karl Pearson’s zero
order coefficient of
correlation (Beta test)
Reject H02 if β2≠ 0
FP= α + β2 OF + e
H03: Organizational factors do not
affect the relationship between
ERP system usage and financial
performance of sugar companies.
First order partial
correlation coefficient
(rxy.z)
Reject H03 if
rxy.z1 ≠ rxyz2…≠ rxy.zn
≠ rxy.
FP= α + β3 OF + e
Source: Researcher 2013
3.8 Ethical consideration
Ethical considerations protect the rights of participants by ensuring confidentiality. It is unethical
for the researcher to share identifying information regarding the study with anyone not
associated with this study. This ethical consideration is necessary to maintain the integrity of the
study as well as the integrity of the researcher (Creswell, 2002).The respondents were assured of
the confidentiality of information given and were informed that their views were to be used for
the purpose of research only. All information used to fulfill the research objectives of this
research was gained from publicly accessible sources or directly from the companies being
researched. Furthermore, the researcher acquired relevant research permit authorizing him to
carry out research in the field of study. The first ethical consideration that the researcher will
consider in conducting the research is to obey the cardinal rule of voluntary participation

27
amongst participants. This ethical issue is supported by Curry (2006) who affirmed that when
doing a research, participants should not be coerced into taking part in the study. The researcher
considered cardinal rule of voluntary participation amongst participants.

28
CHAPTER FOUR
DATA ANALYSIS AND DISCUSSION
4.1 Study Response Rate
The survey questionnaire was sent to 48 business system users during the first week of May
2013. 20 questionnaires were picked immediately, after 2 weeks 12 more questionnaires were
collected. In total, 32 responses were received by end of May 2013 of which 27 were usable for
the study. The response rate was 67% while the response rate usable for the study was 56%. 10%
of the respondents failed to respond to the entire question asked in the questionnaire.
Table 4.1 Breakdown of the Questionnaire Survey
QUESTIONNAIRE NUMBER PERCENTAGE
Total number of questionnaires sent 48 100.00%
Total number of questionnaires completed by
respondents
32 66.67%
Total number of responses usable for the study. 27 56.25%
Source: Research data, 2013
Of the three companies surveyed, the superior ERP system used was found to be SAP; other
sugar millers were using other systems that were ERP solutions such as Ebizframe, Syspro &
Microsoft Navision. High level of information integration was the major benefit of ERP systems
usage. It was observed that the entire industry was switching over to SAP.

29
4.2 Demographic Factors.
The survey presents scanty information about the background information of the respondents
because the study targeted business system users and thus their personal characteristics were
considered inappropriate, the divisions they belonged whether ICT or Finance, the number of
modules used and duration of use. The key factor was to reach ERP business system users,
however, it should be noted that a large number of the finance and ICT personnel were not ERP
users because of the costly tag of licensing and as a result they import the information from the
ERP systems then later on convert it into spreadsheets for generation of various reports required.
Table 4.2 Respondents Department
Department Frequency Percentage Valid Percentage Cumulative Percentage
Finance 22 81.48 81.48 81.48
ICT 5 18.52 18.52 100.00
Total 27 100.00 100.00
Source: Research data, 2013
The findings in Table 4.2 reveal that 22 (81.48%) of the ERP system are Finance staff and 5
(18.52%) were from ICT. This means that the study population was well presented and majority
users are in Finance Department who were better placed to provide informed responses to the
range of issues covered in the study.

30
Table 4.3 Gender Distribution
Gender Frequency Percentage Valid Percentage Cumulative Percentage
Female 6 22.22 22.22 22.22
Male 21 77.78 77.78 100.00
Total 27 100.00 100.00
Source: Research data, 2013
The findings in Table 4.3 reveal that the majority (77.78%) were male while the female were
22.22%. The study reveals that both Finance and ICT divisions were male dominated. The
gender imbalance did not affect the study as the nature of the research and questions asked were
not gender sensitive and any unlikely error as a result of the gender imbalance may be tolerated.
Table 4.4 Respondents Duration of Service in the Current Position
Period Frequency Percentage Valid Percentage Cumulative Percentage
0-1 Year 6 22.22 22.22 22.22
1-2 Years 3 11.11 11.11 33.33
2-5 Years 5 18.52 18.52 51.85
5-10 Years 1 3.70 3.70 55.56
Over 10 Years 12 44.44 44.44 100.00
Total 27 100.00 100.00
Source: Research data, 2013

31
The study sought to know the duration of respondents in their current positions. The findings in
Table 4.4 indicates that 22.22% of the respondents had been in their current position for less than
one year, 11.11% of the respondent had been in their current position between one and two
years, 18.52 % of the respondents had been in their current position between two and five years,
3.70% of the respondents had been in their current position between five and ten years while
44.44% of the respondents had been in their current position for over ten years. This implies that
the study captured the views and opinions from a wider scope of the respondents with diverse
information about the respective sugar millers. The findings suggest that in order to recognize
the improved financial performance a proper understanding of ERP systems by the business
system users i.e. dynamic and technologically advanced.
Table 4.5 Respondents Duration of Service in the Current Organization
Period Frequency Percentage Valid Percentage Cumulative Percentage
0-1 Year 1 3.70 3.70 3.70
1-2 Years 3 11.11 11.11 14.81
2-5 Years 2 7.41 7.41 22.22
5-10 Years 4 14.81 14.81 37.04
Over 10 Years 17 62.96 62.96 100.00
Total 27 100 100
Source: Research data, 2013
The study sought to find out the duration of service of the respondents as employees of the
respective selected millers. The findings in Table 4.5 indicates that 3.70% had stayed in their
current organization for less than one year, 11.11% had stayed in their current organization
between one and two years, 7.41% had stayed in their current organization between two and five
years, 14.81% had stayed in the current organization between five and ten years while 62.96%
had stayed for over ten years in their current organization. This implies that most of the
respondents had the necessary information and knowledge about ERP usage and financial
performance of the respective selected sugar millers.

32
Table 4.6 Respondents Employment Position during the ERP Implementation
Status Frequency Percentage Valid Percentage Cumulative Percentage
Before 15 55.56 55.56 55.56
During 2 7.41 7.41 62.96
After 10 37.04 37.04 100.00
Total 27 100.00 100.00
Source: Research data, 2013
The findings in Table 4.6 revealed that 55.56% of the respondents were hired before the ERP
implementations, 7.41% were hired during the ERP implementation while 37.04% were hired
after ERP had been implemented.
Table 4.7 Descriptive Statistics of the independent variable.
Variables No Extent
Small Extent
Moderate Extent Large Extent
Very Large Extent
Sales & Distribution 0% 11% 30% 37% 22% Material Management 22% 7% 11% 48% 11% Quality management 19% 15% 30% 22% 15% Human Capital management 22% 19% 19% 33% 7% Project Management 30% 22% 19% 26% 4% Financial Accounting 0% 0% 7% 48% 44% Management Decision Support
22% 11% 26% 37% 4%
Source: Research data, 2013
In order to establish the usage of the ERP systems in various sugar mills in Kenya, the
respondents were asked to rate the extent to which various modules were utilized in their
respective organizations as shown in table 4.7. To a very large extent Financial Accounting
module and Sales & Distribution module were highly utilized at 44.44% and 22.22%
respectively. On the contrary Project management, Management Decision Support, Human
33
capital Management and material Management were not utilized at all at 29.63% and 22.22%.
This indicates that a complete ERP solution includes transactions modules, advanced
applications and management decision support modules. In one of the sugar millers it was noted
that they were upgrading their current version of the ERP system to a higher version and one of
the achievements likely to come with the new version included web-portal though with
upgrading cost. In addition it was observed that some millers had stand alone ERP systems for
each module that resulted in delayed decision making because it resulted in extracting reports
from different platforms then merging them manually which could result in data interference
thus giving imperfect reports hence wrong decision making. It was observed that upgrading of
ERP systems resulted in redesigning the existing business processes and customization of the
software.

34
4.3 ERP Systems
This section focuses on the impact of ERP systems on financial performance of sugar companies
in Kenya which was the core objective of the study (what is the effect of using ERP systems on
financial performance in sugar companies). Mumias Sugar Company Limited is one of the major
sugar millers operating in Kenya. It was started in 1973 and is currently the largest miller in the
country. It commands the biggest industry revenue and profits in Kenya as a result the figures
used for generalization were picked from its financial reports from 2007 to 2010. SAP ERP Best
Practices Solution was implemented in Mumias Sugar Company in 2006 by EIM Solutions Ltd.
The figure below depicted by key financial indicators will be used to analyze the core objective
of the study.
Figure 4.1 Four Year Summary Review.

35
The findings reveal that successful ERP usage leads to improved financial performance during
the first two years. However, it does not provide concrete reasons why the financial performance
is improved. According to Esteves (2009), it takes between 1 to 2 years for business benefits to
start materializing. It was also started that an ERP project doesn’t mature except after 3 years.
ERP benefits are expected to be achieved on a continuous basis after implementing the system
and not all at once. This is supported by Figure 4.1. ROE & ROA was gradually declining. Profit
margin on the other side was approximately at a constant level. It drives profits through
improved efficiencies and processes, faster decision making and better access to information
amongst others. Since profit margin is the superior financial measure then the study indicates
that ERP usage results in improved financial performance, however an intensive study should be
carried out for a longer time period and more financial measures. These findings agree with
(Gattiker and Goodhue 2005 and Matolcsy et al. (2005) that benefits start to appear after the
“shakedown” phase taking duration of 2 years or more. Poston and Grabski (2001) examined the
impact of ERP systems implementation on firm financial performance during an analysis period
of 3 years prior and 3 years after implementation. They found no significant improvements in the
ratios. However, the firms obtained a significant decrease of the COGS as a percentage of
revenue, in the third year after implementation. In a subsequent study, Hunton et al (2003) made
a comparative analysis of the financial performance of ERP adopters and non-ERP adopters.
Firm performance was measured over a 3 year time span. The results show that the financial
performance of non-adopters declined in time whereas the financial performance of adopter
remained at an approximately constant level. On the other hand Koske (2005) also demonstrated
that ERP use has a positive relation with the organizational performance of manufacturing
companies, however he doesn’t quantify the nature of the organizational performance. The
question about the realization of improved financial performance of ERP usage still remains
unanswered.
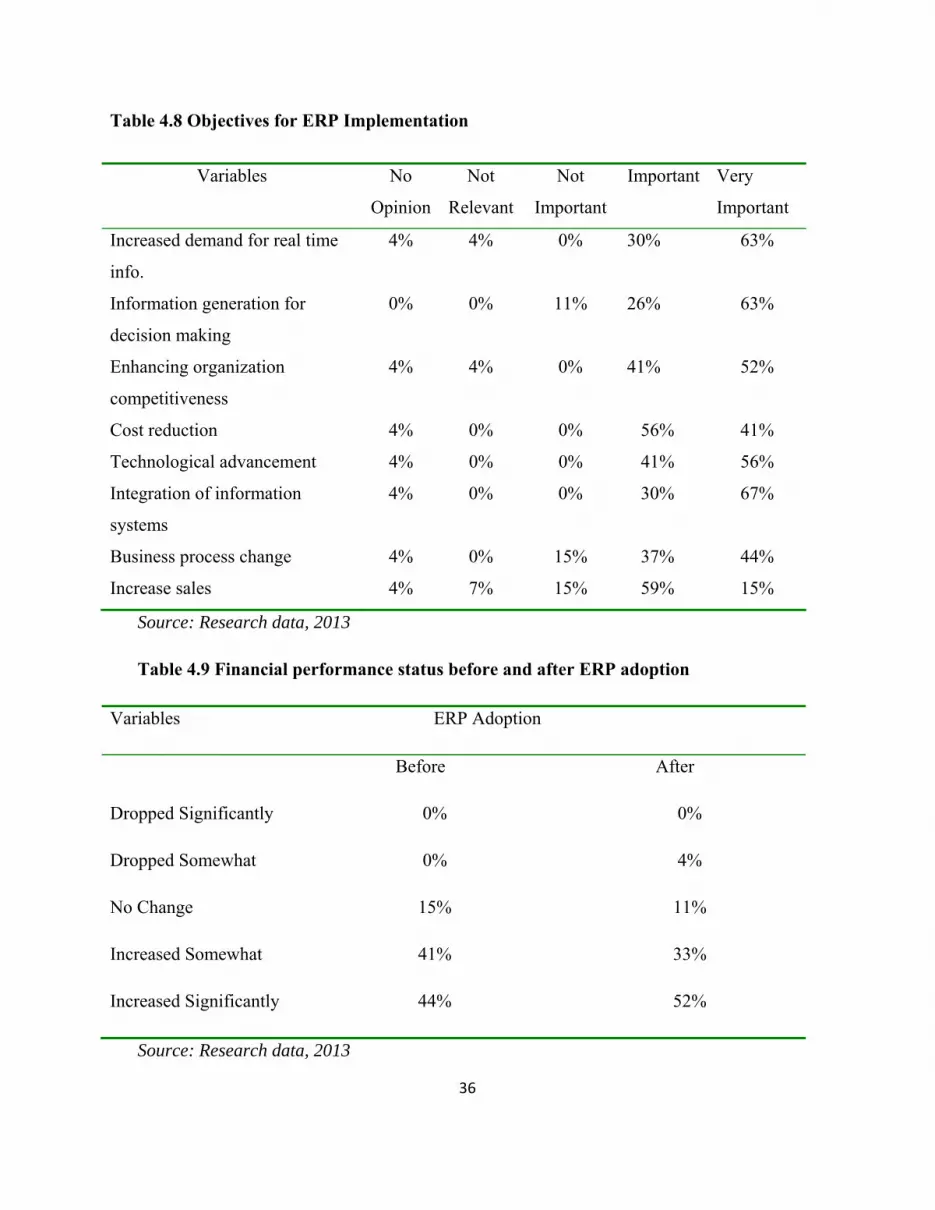
36
Table 4.8 Objectives for ERP Implementation
Variables No
Opinion
Not
Relevant
Not
Important
Important Very
Important
Increased demand for real time
info.
4% 4% 0% 30% 63%
Information generation for
decision making
0% 0% 11% 26% 63%
Enhancing organization
competitiveness
4% 4% 0% 41% 52%
Cost reduction 4% 0% 0% 56% 41%
Technological advancement 4% 0% 0% 41% 56%
Integration of information
systems
4% 0% 0% 30% 67%
Business process change 4% 0% 15% 37% 44%
Increase sales 4% 7% 15% 59% 15%
Source: Research data, 2013
Table 4.9 Financial performance status before and after ERP adoption
Variables ERP Adoption
Before After
Dropped Significantly 0% 0%
Dropped Somewhat 0% 4%
No Change 15% 11%
Increased Somewhat 41% 33%
Increased Significantly 44% 52%
Source: Research data, 2013

37
Question 10 of the questionnaire required the respondent to state the ideal financial performance
of the organization without use of business financial ratios. 44% of the usage response indicated
that the financial performance had increased significantly, 41% showed that the financial
performance had increased somewhat and 15% indicated that there was no change before
adoption and implementation of the ERP systems. On the other hand after successfully
implementation of ERP system solutions 52% showed that the financial performance had
increased significantly, 33% indicated that the financial performance had increased somewhat,
11% revealed that there was no change in the financial performance while 4% showed that the
financial performance had dropped somewhat. This finding also supports the notion that ERP
implementation require sometime before the actual realization are met. The use of non financial
indicator measures was necessitated because ratio analysis suffers some limitations: Ratio
analysis is static and not dynamic, so they may not provide the current performance in a firm,
lack of uniformity of sales throughout the year may create problems of comparison of company
sales because firms perform their activities at different periods during the year, and conformance
with industry standards is no guarantee that the firm is performing satisfactory and is managed
properly (Namusonge & Anyangu 2010).

38
Table 4.10 ERP Systems Benefits
Variables Not at all Low degree
Average Very high degree
Perfect
Increased flexibility in information generation
3.70% 0.00% 25.93% 29.63% 40.74%
Reduction of total operating & administration costs
7.41% 0.00% 44.44% 29.63% 18.52%
Increase in stock levels 3.70% 3.70% 48.15% 33.33% 11.11%Reduction in time for transaction processing
3.70% 0.00% 11.11% 44.44% 40.74%
Improved delivery times 3.70% 7.41% 14.81% 48.15% 25.93%Reduction in stock levels 14.81% 7.41% 25.93% 37.04% 14.81%Increased internal communication
7.41% 7.41% 11.11% 40.74% 33.33%
Reduction in errors in logistics
3.70% 3.70% 22.22% 55.56% 14.81%
Improved coordination between divisions
3.70% 3.70% 7.41% 55.56% 29.63%
Improved decision making process
3.70% 3.70% 14.81% 33.33% 44.44%
Improved quality of reports 3.70% 0.00% 18.52% 37.04% 40.74%
Source: Research data, 2013
A Likert scale was used to assess responses regarding the benefits of ERP systems usage by the
sugar millers, selected business system users were asked to evaluate what the classified as
important gains of using ERP solutions. Improved decision making process was ranked to be the
highest benefit accrued to the sugar millers as a result of ERP usage (44.44%), increased
flexibility in information generation, reduction in time for transaction processing and improved
quality of reports were next at 40.74%. Increased internal communication (33.33%), improved
deliveries and improved coordination between divisions (29.93%), reduction of total operating
and administration costs (18.52%). On the other extreme reduction in stock level was
indifference at 14.81%.

39
Table 4.11 Challenges of adopting ERP Systems
Variables No Challenge
Neutral Somehow Much Very Much
Employee resistance to change 15% 3% 30% 33% 19% Difficulties in data migration 7% 14% 26% 38% 15% Increased cost of operating the ERP system
11% 11% 30% 33% 15%
Difficulties in integrating the existing information systems
11% 11% 30% 33% 15%
Difficulties in restructuring personnel 15% 8% 33% 30% 14% Delays in implementing the ERP system
7% 11% 44% 26% 12%
Friction within senior management 37% 11% 26% 18% 8% Personnel training in ERP environment 11% 3% 45% 34% 7%
Source: Research data, 2013
The study reveals that sugar millers faces some challenges while adopting the ERP systems; the
study finds that employee resistance to change was the major challenge.ERP systems comes with
in-built controls and business process that is likely to lead to staff rationalization thus resulting to
high resistance from the employees, while management so it a cost cutting measure. Difficulties
in data migration, difficulties in integrating the existing information systems, difficulties in
restructuring personnel and increased cost of operating the ERP system are interrelated
challenges, such that a miller with difficult in data migration will definitely lead to difficult in
integrating the existing information systems. This leads increased cost of operating the ERP
systems. On the other hand, personnel training in ERP environment and friction within senior
management leads to delay in implementing ERP system. Another challenge that was observed
was high staff turnover. The high staff turnover was a protest from the finance users in one of the
selected company such that ICT personnel experienced to support ERP systems, in another
selected firm it was clearly pointed out that loosing project consultants before completion of the
project. Generally the use of foreign experts who do not understand the legacy system resulted in
increased cost of ERP systems especially while customizing the software. This is due to the high
cost of using the Virtual Private Network and conference talks they were always making to the
offshore team to give them insights, majority of the vendors were based in India while
consultants were locally sourced in Kenya.

40
Table 4.12 Organizational Factors affecting ERP Systems
Variables No
Extent
Small Extent Moderate
Extent
Large Extent Very Large
Extent
Production Targets 4% 7% 15% 41% 33%
Management Style 7% 0% 22% 48% 22%
Years of Operation 7% 4% 44% 26% 19%
Firm’s Ownership 15% 11% 41% 26% 7%
Source: Research data, 2013
It was cleared pointed out that to a very large extent production targets affected the financial
performance of sugar companies on adoption of ERP solutions at 33%. Various management
styles also affected the relationship between ERP usage and financial performance of sugar
companies at 22%. Years of operations to a moderate extent affected the relationship between
ERP systems usage and financial performance. Firm’s ownership didn’t affect the relationship.
Question 15 of the questionnaire sought to know the company production target without
necessarily using the units captured in their financial statements.
Table 4.13 Company Products Targets
Variables Always Sometimes Rarely
Exceeds Production Targets 0% 74% 26%
Meets Production Targets 19% 74% 7%
Fails to meet its Production Targets 4% 56% 41%
Source: Research data, 2013
Findings of table 4.13 reveals that, averagely the company met and exceeded the production
targets (74%) while 56% expressed that the firms failed to meet their production targets which as

41
a result affected the ratio analysis computation. This limitation as pointed out earlier affected the
relationship between ERP usage and financial performance of sugar companies in Kenya.
4.4 Inferential Statistics of ERP Dimensions
The study established the Pearson correlation coefficient among the various activities that built
up the independent variable (ERP). The various factors were grouped together through factor
dimension reduction where TR represents transactional, AD represents advanced application, and
MGT represents management decision support. The table below shows the relationship of the
activities.
Table 4.14 Correlation results for ERP dimensions
Correlations
TR AD MGT
TR
Pearson Correlation 1 0.566** 0.623**
Sig. (2-tailed) 0.000 0.000
N 48 48 48
AD
Pearson Correlation 0.566** 1 0.718**
Sig. (2-tailed) 0.000 .000
N 48 48 48
MGT
Pearson Correlation 0.623** 0.718** 1
Sig. (2-tailed) 0.000 0.000
N 48 48 48
**. Correlation is significant at the 0.01 level (2-tailed).
Source: Research data, 2013
42
From the results in the above table 4.14, it shows that management decision support element
represented as MGT had a statistically significant positive correlation (r =0.718 and p ≤0.01)
with advance application represented as AD. On the other hand management decision support
had a statistically significant positive correlation (r =0.623 and p ≤0.01) with transaction
element. Transaction element had a statistically significant positive correlation (r =0.566 and p
≤0.01) with advanced application. On the overall, there is statistically significant positive
correlation among the various enterprise resource planning. This implies that when one ERP
activity was affecting financial performance, the other activities were too affecting financial
performance.
4.5 Inferential Statistics of Moderating Variables.
The organizational factors which were moderating variable in the study included the
management style, firm ownership and production budget. From table 4.16, it can be established
that there is a statistically significant positive correlation in all the organizational factors. The
highest statistical correlation that was reported is between management style and firm
ownership(r=0.669, p value≤0.01), followed by management style and production
budget(r=0.533, and p value≤0.01, then firm ownership and production budget(r=0.508, p=0.01.
Therefore from the study, there exists statistically significant positive correlation among all the
organizational factors. This implies that as one factor was having a positive moderating effect on
the relationship between the independent and dependent variable, other factors were too having
the positive moderating effect at the same time.

43
Table 4.15 below illustrates the summary of the correlations of organizational factors
Table 4.15 correlation of organizational factors
Correlations of organizational factors
1 2 3
Management style
Pearson Correlation 1 0.669** 0.508**
Sig. (2-tailed) .000 0.000
N 48 219 48
Firm ownership
Pearson Correlation 0.669** 1 0.533**
Sig. (2-tailed) 0.000 0.000
N 48 48 48
Production Target
Pearson Correlation 0.508** 0.533** 1
Sig. (2-tailed) 0.000 0.000
N 48 48 48
**. Correlation is significant at the 0.01 level (2-tailed).
Source: Research data, 2013
4.6 Hypothesis testing and discussion
The central hypothesis of this research was to determine the effect of the independent variable
and the moderating variable on the dependent variable. To achieve this end, simple regression
analysis beta (β), this is equivalent to the Karl Pearson correlation coefficient (r) (Sekaram,
2003). Further, partial correlation analysis was used to test the hypothesis s presented in the
discussion below. The hypotheses were tested at 0.05 % significance level, with 95% confidence,
which is acceptable in non –clinical research works.

44
4.6.1 ERP systems usage has no relationship with financial performance in sugar companies. In order to determine whether the ERP systems usage has any effect on the financial
performance in sugar companies, the study set out the following hypothesis;
H01: ERP systems usage has no relationship with financial performance of sugar companies.
Correlation r (beta, β) was used to test this hypothesis. The test criteria is set such the study
rejects the null hypothesis H01 if β1≠0, otherwise the study will have failed to reject H01 if β1=0)
.To test the hypothesis, mean of financial performance (FP) was correlated with mean of ERP.
The results are shown in the table 4.16 below. The correlation results between the mean ERP and
the mean of financial performance (FP) had a beta term β1=0.782 at p=0.01.In the hypothesis
criteria, we were to reject H01 if β1≠0. However, from this results, the value of beta
β1=0.782≠0.The study therefore rejects the null hypothesis and conclude that using an ERP
system had a significant relationship with financial performance.

45
Table 4.16 Correlation results of ERP against financial performance
Model Summary
Model R R Square Adjusted R Square Std. Error of the Estimate
1 .782a .611 .610 1.53740
a. Predictors: (Constant), ERP
ANOVAa
Model Sum of Squares
Df Mean Square
F Sig.
1
Regression 806.643 1 806.643 341.278 .000b
Residual 512.900 217 2.364
Total 1319.543 218
a. Dependent Variable: FP
b. Predictors: (Constant), ERP
Coefficientsa
Model Unstandardized Coefficients
Standardized Coefficients
t Sig.
B Std. Error Beta
1 (Constant) 3.153 .563 5.598 .000
FP 2.551 .138 .782 18.474 .000
a. Dependent Variable: FP
Source: Research data, 2013
This correlation results in table 4.16 above show that enterprise resource planning usage had a
positive linear effect on the financial performance as represented in the figure. The results above
indicates that enterprise resource planning account for 61.1 % of the financial performance (r2 =
0.611) and the relationship followed a simple regression model of the nature FP= α + β1 ERP +e

46
where FP is the financial performance, α is the constant intercept of which in our case is 3.153
and beta β1= 0.782, which at times is referred to as the slope coefficient
4.6.2 Effect of organizational factors on the financial performance of sugar firms. The researcher determined whether organizational factors had any effect on the financial
performance of sugar manufacturing firms. The study set out the following hypothesis;
H02: Organizational factors do not affect the financial performance of sugar companies
The researcher used the correlation r (beta, β) to test this hypothesis. The test criteria is
set such the study rejects the null hypothesis H02 if β2≠0, otherwise the study will have failed to
reject H02 if β2=0) .To test the hypothesis, mean of financial performance (FP) was correlated
with mean of organizational factors (OF). The results are shown in the table 4.18. The correlation
results between the mean of participating in organizational factors and the mean of financial
performance (FP) had a beta term β2=0.688 at p=0.01.In the hypothesis criteria, we were to reject
H02 if β2≠0 However, from this results, the value of beta β2=0.688≠0.The study therefore rejects
the null hypothesis and conclude that organizational factors had a statistically significant positive
effect on the performance of sugar manufacturing firms.
This correlation results implies that organizational factors account for 68.8% of the financial
performance of sugar manufacturing firms.

47
Table 4.17 correlation results of organizational factors on financial performance
Model Summary
Model R R Square Adjusted R Square
Std. Error of the Estimate
1 .688a .474 .472 1.78843
a. Predictors: (Constant), OF
ANOVAa
Model Sum of Squares
Df Mean Square
F Sig.
1
Regression 625.475 1 625.475 195.554 .000b
Residual 694.068 217 3.198
Total 1319.543 218
a. Dependent Variable: FP
b. Predictors: (Constant), OF
Coefficientsa
Model Unstandardized Coefficients
Standardized Coefficients
t Sig.
B Std. Error Beta
1 (Constant) 4.924 .617 7.986 .000
OF 2.033 .145 .688 13.984 .000
a. Dependent Variable: FP
Source: Research data, 2013

48
The results in the table show that 47.4% of the financial performance of sugar firms can be
explained by organizational factors (r2 = 0.407) and the relationship followed a simple regression
model of the nature FP= α + β2 OF+ e where FP is the financial performance, α is the constant
intercept of which in our case is 4.924and beta β= 0.688.
The results in the above table show that 47.4% of the financial performance of sugar firms can be
explained by participating in environmental oriented activities (r2 = 0.407) and the relationship
followed a simple regression model of the nature FP= α + β3 ENS +e where FP is the financial
performance, α is the constant intercept of which in our case is 5.007 and beta β3= 0.691.
4.7 Moderating effect of organizational factors on the relationship between ERP and the
financial performance of sugar firms
The determination of the moderating effect of the organizational factors involved conducting
independent partial correlation analyses of ERP activities and financial performance, using the
respective individual organizational factors are controlling variables. The partial correlation
coefficients were then compared with the simple coefficients generated from the direct
correlation of ERP system and financial performance (r= 0.534) in order to determine the
magnitude and direction of the moderating effect of the organizational factors. To get this end,
the following null hypothesis was constructed to carry out the test.
H03 Organizational factors do not affect the relationship between ERP system usage and financial
performance of sugar companies.
We reject HO3 if rxy.z1 ≠ rxyz2 ≠ rxy.zn ≠ rxy., given FP= α + β3 O F+ e
Table 4.18 Results of the regression of moderating effect
Model Summary
Model R R Square Adjusted R Square Std. Error of the Estimate
1 .731a .534 .528 2.04980
a. Predictors: (Constant), Aggregate Mean of ERP dimensions
Source: Research data, 2013

49
The table summarizes the results of moderating effect of organizational factors on the
relationship between ERP usage and financial performance. We compare the values of first order
partial correlation coefficients The results indicate that rxy.z1 = 0.566,p=0.001, rxyz2 =0.0565,p=
0.000 , rxy.z3 = 0.559,p=0.000 and rxy.z3 = 0.573,p=0.000
Table 4.19 Correlation results when financial performance is held constant
Source: Research data, 2013
The results in Table 4.19 suggests that on the whole, organizational factors significantly affect
the relationship between ERP usage and financial performance (overall significance =0.000).
However, For instance, management style had significant negative moderating effect on the
relationship between ERP dimensions and financial performance (rxy.z =0.566, p =0.000), thus
indicating that the relationship between ERP activities and financial performance is higher when
management style is removed from the relationship. On overall, we reject our null hypothesis
H03 since rxy.z1 ≠ rxyz2 ≠ rxy.zn ≠ rxy. Therefore organizational factors affect the relationship
between ERP dimensions and financial performance of sugar firms
Moderator(Control
variable)
First order
partial
correlation
coefficient
rxy.z
Effect of organizational factor
moderation
(Compared to zero order simple
correlation coefficient of ERP
dimension and financial
performance rxy. =0.534
Significance
(p-value)
(p=0.05,
2 tailed)
Management style 0.566 Slightly negative 0.000
Firm ownership 0.565 Slightly negative 0.000
Production targets 0.559 Slightly negative 0.000
Year in operation 0.573 Slightly negative 0.000
Overall significance =0.000

50
The following Table shows the summary of the results
Table 4.20 Hypothesis testing framework and analytical model
Hypothesis Hypothesis test Rules Decision
H01: ERP systems usage has no
relationship with financial
performance in sugar companies.
Karl Pearson’s
zero order
coefficient of
correlation
(Beta test)
Reject H01 if β1≠ O
FP = α + β1 ERP+ e
β1=0.782≠ O
Rejected the
null hypothesis
H02: Organizational factors do
not affect the financial
performance of sugar companies.
Karl Pearson’s
zero order
coefficient of
correlation
(Beta test)
Reject H02 if β2≠ 0
FP= α + β2 OF + e
β1=0.688≠ O
Rejected the
null hypothesis
H03: Organizational factors do
not affect the relationship
between ERP system usage and
financial performance of sugar
companies.
First order
partial
correlation
coefficient
(rxy.z)
Reject H03 if
rxy.z1 ≠ rxyz2…≠ rxy.zn
≠ rxy.
0.566≠0.565≠0.559
≠0.573
Rejected the
null hypothesis
Source: Research Study, 2013
51
CHAPTER FIVE
SUMMARY, CONCLUSIONS AND RECOMMENDATIONS
5.1 Introduction
The study sought to establish the effects of ERP systems usage on the financial performance of
sugar companies in Kenya. The chapter presents a summary of the major findings of the study. It
also endeavours to discuss the implications of the findings on the relevant theories and draws the
necessary conclusions. The chapter further offers a summary on the data collected, analysis of
data, discussions of the findings on each research question and the logical interpretation resulting
from the findings. The key areas for further research are suggested.
5.2 Summary of Findings
From the theoretical and empirical literature reviewed, it was revealed that ERP systems usage
has a significant influence on the financial performance. The study sampled Mumias Sugar
Company, West Kenya Sugar Company and Nzoia Sugar Company and conducted a research on
various financial and non-financial variables. Based on a four year survey conducted between
2007 and 2010, 48 interviewees were considered for this research out of the entire population of
152 business system end users and a response rate of 56% obtained. ERP solution included SAP,
EbizFrame, Syspro and Microsoft Navision. Respondents were majorly from Finance and ICT
department, male respondents were 77.78% and female were 22.22%. On one hand over 40% of
the interviewees had been in their current position for over ten years. On the other hand over
60% claimed to have been with their current organization for over ten years hence possessing
information prior and after ERP adoption. This study established the benefits and challenges of
using ERP systems for sugar companies in Kenya. The evidence collected from these
respondents indicated that the most common motivation for ERP adoption was increased demand
for real time information at 63%. Unfortunately ERP usage didn’t increase the sales of the
participating millers however it was pointed out that it led to better profit margin maintenance
because of accurate selling prices. Using nonfinancial indicators it was clearly pointed out that
the financial performance of the selected millers significantly increased, supported by 52% of the
respondents. It was worth noting that high resistance from employees was the major challenge

52
encountered while using ERP systems since majority of the employees’ feared layoffs. The
major organizational factor affecting the relationship between ERP systems usage and financial
performance of sugar companies was ineffectiveness in meeting their production targets.
In order to determine whether the ERP systems usage has any effect on the financial
performance in sugar companies, the study set out the following hypothesis;H01: ERP systems
usage has no relationship with financial performance in sugar companies. The researcher used
the correlation r (beta, β) to test this hypothesis. The test criteria is set such the study rejects the
null hypothesis H01 if β1≠0, otherwise the study will have failed to reject H01 if β1=0) .To test the
hypothesis, mean of financial performance (FP) was correlated with mean of ERP. The
correlation results between the mean ERP and the mean of financial performance (FP) had a beta
term β1=0.782 at p=0.01.In the hypothesis criteria, we were to reject H01 if β1≠0. However, from
this results, the value of beta β1=0.782≠0.The study therefore rejects the null hypothesis and
conclude that participating in enterprise resource planning had a significant relationship with
financial performance.
This correlation results above show that enterprise resource planning had a positive linear effect
on the financial performance. The results above indicates that ERP systems account for 61.1 %
of the financial performance (r2 = 0.611) and the relationship followed a simple regression model
of the nature FP= α + β1 ERP +e where FP is the financial performance, α is the constant
intercept of which in our case is 3.153 and beta β1= 0.782, which at times is referred to as the
slope coefficient.
The researcher determined whether organizational factors had any effect on the financial
performance of sugar manufacturing firms. The study set out the following hypothesis;
H02: Organizational factors do not affect the financial performance of sugar companies
The researcher used the correlation r (beta, β) to test this hypothesis. The test criteria is set such
the study rejects the null hypothesis H02 if β2≠0, otherwise the study will have failed to reject H02

53
if β2=0) .To test the hypothesis, mean of financial performance (FP) was correlated with mean of
organizational factors (OF). The correlation results between the mean of participating in
organizational factors and the mean of financial performance (FP) had a beta term β2=0.688 at
p=0.01.In the hypothesis criteria, we were to reject H02 if β2≠0 However, from this results, the
value of beta β2=0.688≠0.The study therefore rejects the null hypothesis and conclude that
organizational factors had a statistically significant positive effect on the performance of sugar
manufacturing firms.
This correlation results implies that organizational factors account for 68.8% % of the financial
performance of sugar manufacturing firms.The results in the above table show that 40.74% of the
financial performance of sugar firms can be explained by organizational factors (r2 = 0.407) and
the relationship followed a simple regression model of the nature FP= α + β2 OF+ e where EP is
the financial performance, α is the constant intercept of which in our case is 4.924and beta β=
0.688.The results in the above table show that 47.8% of the business performance of sugar firms
can be explained by participating in environmental oriented activities (r2 = 0.478) and the
relationship followed a simple regression model of the nature FP= α + β3 ERP +e where FP is the
financial performance, α is the constant intercept of which in our case is 5.007 and beta β3=
0.691.
The determination of the moderating effect of the organizational factors involved conducting
independent partial correlation analyses of ERP activities and financial performance, using the
respective individual organizational factors are controlling variables. The partial correlation
coefficients were then compared with the simple coefficients generated from the direct
correlation of ERP usage and business performance (r= 0.534) in order to determine the
magnitude and direction of the moderating effect of the organizational factors. To get this end,
the following null hypothesis was constructed to carry out the test.H03 Organizational factors
have no moderating effect on the relationship between ERP and financial performance of the
sugar manufacturing firms.

54
We compared the values of first order partial correlation coefficients The results indicate that
rxy.z1 = 0.566,p=0.001, rxyz2 =0.0565,p= 0.000 , rxy.z3 = 0.559,p=0.000 and rxy.z3 =
0.573,p=0.000.The results suggests that on the whole, organizational factors significantly
moderate the relationship between ERP dimensions and financial performance (overall
significance =0.000). However, For instance, management style had significant negative
moderating effect on the relationship between ERP dimensions and financial performance (rxy.z
=0.566, p =0.000), thus indicating that the relationship between ERP activities and financial
performance is higher when management style is removed from the relationship. On overall, we
reject our null hypothesis H03 since rxy.z1 ≠ rxyz2 ≠ rxy.zn ≠ rxy. Therefore organizational factors
affect the relationship between ERP dimensions and financial performance of sugar firms.
5.3 Conclusions
This section will draw conclusions from the empirical result and discuss its implications. The
aim of the study attempted to find out if there was a change in the financial performance of sugar
companies that had implemented ERP systems. The result from the empirical study revealed that
that there was limited changes in the financial performance due to ERP usage. This meant that
over time with improved business process changes financial information is well maintained
hence real-time decision making leading to improved financial reporting. The results were
consistent with the findings in the literature reviewed.
The key benefits of using an ERP system are; increased flexibility in information generation,
reduction of total operating & administration costs, increase in stock levels, reduction in time for
transaction processing, improved delivery times, increased internal communication, reduction in
errors in logistics, improved coordination between divisions, improved decision making process
and improved quality of reports. It was discovered that the benefits vary with the age of the ERP
systems, mostly after the shakedown phase. This is mostly after several years when the
employees have learned the system.
The key challenges to ERP usage included; employee resistance to change, difficulties in data
migration from the legacy system to the ERP solution, increased cost of operating the ERP

55
systems, difficulties in interfacing the existing systems, difficulties in restructuring the personnel,
delays in implementing the ERP system, friction within senior management and personnel
training in ERP environment. Despite the many shortcomings, there are efforts to rectify them on
a daily basis. However the challenges negated the financial performance of sugar companies.
The findings also indicated that an ERP system was still a new concept since majority of the
sugar millers in the country were yet to switch to ERP.
5.4 Recommendations
As with any study, this study has certain limitations on the generalizability of the results, but this
also provides opportunities for future research. The study findings confirmed that ERP system
usage has a considerable influence on the financial performance of the selected sugar millers in
Kenya. This implies that proper utilization of ERP systems will result in increased financial
performance. The study, therefore, recommends that the selected sugar companies and other
entities seeking to expand through ERP implementation, it is vital to note that these
organizations should implement enterprise systems to manage their information resources,
increase efficiency in their operations and attain competitive advantage. The reviewed theoretical
and empirical literature revealed that as an entity grows and expand through ICT, they become
more complex in their systems usage. Therefore, one generic ERP system should be
implemented with all modules integrated. However the findings are characterized by lack of
generalisablity to the settings to other millers and countries because of other variables but not
limited to production targets.
5.5 Areas of Further Research
There are various possibilities to conduct further research based on the literature and empirical
findings. It would be interesting to study all sugar companies in Kenya since the study was more
of a cross sectional analysis. Future research could also look at core challenges of the ERP usage
and how they can be resolved. The time period of ERP system usage could be extended to over
four years so as to ascertain the financial performance of sugar companies during all cycles of
operation i.e. after “shakedown” phase. A more narrow study could be carried out to reveal
whether ERP systems have lead to improved financial performance when compared to entities

56
not using ERP systems. This would further explain and evaluate ERP systems ability to improve
financial performance. Also it could be feasible to conduct a research for four years before ERP
implementation and after implementation. In addition, a further research could be carried out
with more financial ratios. Lastly a comparison research could be done between manufacturing
companies and non-manufacturing companies using ERP systems.

57
REFERENCES Al-Mashari, M. (2001), “Process Orientation Through Enterprise resource Planning (ERP): A
Review of Critical Issues”, Knowledge and Process Management, Vol. 8 No. 3 p
175- 185
Anderson, M., C., Banker, R., D. & Ravindran, S. (2003). “The new productivity Paradox,”
Commnunication of the ACM, 46 (3), 91-94
Buckhout S., Frey E and Nemec J.Jr. (1999) Making ERP Succeed: Turning Fear into Promise,
Strategy & Business, and Vol.2
Creswell J. W. (2002), Research Design: A Qualitative, Quantitative and Mixed Method
Approaches. 2ndedn. Thousand Oaks’ California: Sega Publication Inc.
Curry, A. et al., (2006), Managing information and systems: The business perspectives. NY:
Taylor &b Francis
Davenport, T. H. (1998). Putting the enterprise into the enterprise system.
Harvard Business Review, 76(4), 121-131.
Drury C., (2004) Management and Cost Accounting, 6th edition, Thomson Learning.
Ellis, K., Singh, R. and Ong’olo, D. (2010). Assessing the economic impact of competition:
findings from Kenya, London, Overseas Development Institute.
Esteves, J. (2009). “A Benefits Realisation Road-Map Framework for ERP Usage in Small and
Medium-Sized Enterprise,” Journal of Enterprise Inforamtion, 22 (1/2), 25-35.
Federici, T. (2009). “Factors Influencing ERP Outcomes in SMEs: A Post-Introduction
assessment,” Journal of enterprises Information, 22(1/2), 81-98
FuB, C.,, Gmeiner, R., Schiereck, D. & Strahringer, S. (2007). “ERP usage in Banking:An
Exploratory Survey of the World’s largest Banks,” Information System Management,24,
155-171

58
Gattiker, T. & Goodhue, D. (2005). What Happens After ERP Implementation: Understanding
the Impact of interdependemce and differentiation of Plant-Level outcomes, MIS
Quarterly, 29 (3), 559-585.
Gelinas, U. J, Sutton, S/ G, and Hunton, J.E (2005) Accounting Information systems 6th Edition,
Thomson South-Western.
Hedman, J., Kalling. T. (2002) IT and Business Models, Liber, malmo
Hunton J.E., Lippincott B., Reck J.L., (2003) “Enterprise Resource planning Systems:
Comparing Firm performance of Adopters and Nonadopters”, International Journal of
Accounting Information Systems, Vol. 4
Hitt,L. M., Wu, D., J. & Zhou, X (2002) “Investment in Enterprise Resource Planning: Business
Impact and Productivity Measures, “Journal of Management information systems,19 (1),
71-98
Kalling T., (2003) “ERP Systems and the Strategic Management Processes that lead to
competitive advantage”, Information Resources management Journal, 16, 4, pp. 23-42
Kegode, P (2005) Economic governance reform in sugar sub-sector.Unpublished manuscript
Kegode, P. (2010). Economic Governance Reform in the Sugar Sub-sector, Paper submitted to
Center for Governance and Development.
Kerlinger, F.N. (1993). Foundations of Behavioral Research.New York: Holt, Rinehart &
Winston
Koske, P.K., (2005) Impact of use of ERP in manufacturing companies in Kenya. Unpublished
Master’s Thesis, University of Nairobi, Kenya.
Kumar, K. and Van Hillsgersberg, J. (2000). ERP experiences and evolution.
Communications of the ACM, 43(4), 23-26.
Laughlin, Stephen P. (1999). An ERP Game Plan.Journal of Business Strategy; January/February1999; 20(1). Lawton, G. (2000). Integrating ERP and CRM via the Web. SW Expert.

59
Legare T., (2002) The Role of Organizational factors in realizing ERP benefits. Information
Systems Management.
Mapara S, (2005)Kenyan supermarket chain uses its ERP System to turn its fortunes around;
Balancing Act.Retrieved on 8th March 2011, from http://www.balancingact-
africa.com/news/en/issue-no-261/top-story/kenyan-supermarket-c/en
Mabert, Vincent A.; Soni, Ashok; Venkataramanan, (2001). M.A. Enterprise Resource Planning:
Common Myths versus Evolving Reality. Business Horizons; May-June 2001.
Markus M.L., Tanis C., (1999) The Enterprise System Experience-From Adoption to success.
Framing the Domains of IT research; Glimpsing the Future through the Past. Pinnaflex
Education resources.
Matolcsy, Z.P. Booth, P. & Wieder, B. (2005). Economic Benefits of Enterprise Resource
Planning Systems: Some Empirical Evidence, Accounting & Finance, 45, 439-456.
Namusonge, G.S. Anyangu M. (2010) Business Finance Principles & practice. VDM Verlag Dr
Muller.
O’Leary, D. E. (2000). Enterprise Resource Planning Systems: Systems, Life
Cycle, Electronic Commerce, and Risk. UK: Cambridge University
Press.
Omondi, S, & Acosta, F. (2009) Exploratory research on IT projects: A case study of Kenya
Pipeline Ltd. Unpublished master of science in Information Technology thesis,
Strathmore University, Kenya.
Oso, W., & Onen, D., (2005) A General Guide To writing Research proposal and Report;
The Jomo Kenyatta Foundations.
Plotkin, Hal. (1999)ERPs: How to Make Them Work. Harvard Management Update; March 1999; 3-4. Poston R., Grabski S, (2001) Financial impacts of enterprise resource planning
implementations, International Journal of Accounting information Systems, Vol.2, Issue
4, pp 271-294.

60
Rai M., (2010) “Benefits of ERP Software in India and Benefits of ERP Software in Africa”
Global press release Journal, Vol 3
Ross J.W., (1999) The ERP Revolution: Surviving versus Thriving, Sloan School of
Management, center for information Systems Research, MIT Cambridge,MA.
Sekaram, S (2003), Research methods for business. A skill building approach, 4th edition, John
Wily and sons, Newyork,USA.
Shehab et al (2004) Enterprise Resource Planning: An integrative review Business process
Management Journal, 10, 4, pp. 359
Stephen J.Mraz, 2000“Keeping Up with ERP,” Machine Design.
Tadjer, R. (1998). Enterprise resource planning.Internetweek, Manhasset,
April 13.
Torach J, (2011)Improving Your Business with ERP Solutions; East African Business Week
(Kampala).Retrieved on 15th June 2011from
(http://www.www.busiweek.com/10/page.php?aid=58) Vemuri V.K., Palvia S.C., (2006) “Improvement in operational Efficiency Due to ERP Systems
Implementation Truth or Myth?”, Information Resource Management Journal; Apr-Jun
2006; 19,2, pp. 18-36
Wanyande P. (2001) “Management Politics in Kenya'sSugar Industry: Towards an Effective
Framework,” African Journal of Political Science; Vol 6,1 pp 123-140
61
APPENDIX APPENDIX 1 QUESTIONNAIRE TO END USERS
1. Name of organization……………………………………………………………..
2. Nature of ownership: Private ( ) State-controlled ( ) Dual ( )
3. Department….…………………… Gender Male ( ) Female ( )
4. How many years have you been in your current position?
i. Less than 1 year ( )
ii. 1-2 years ( )
iii. 2-5 years ( )
iv. 5-10 years ( )
v. Over 10 years ( )
5. How long have you worked in the current organization?
i. Less than 1 year ( )
ii. 1-2 years ( )
iii. 2-5 years ( )
iv. 5-10 years ( )
v. Over 10 years ( )
6. Were you in your current position during the ERP adoption?
i. I was in my position before ERP implementation ( )
ii. I was hired during ERP implementation ( )
iii. I was hired after the ERP package was implemented ( )
7. Which ERP product has your organization installed……………………..

62
8. Using a five point Likert scale given below, and by ticking an appropriate box below,
please indicate the extent to which the following modules have been utilized in your
company.
1 = No Extent 2= Small Extent 3= Moderate Extent 4 = Large Extent 5=Very Large Extent
1 2 3 4 5
Sales & Distribution
Materials Management
Quality Management
Human Capital Management
Project Management
Financial Accounting
Management Decision Support
9. Listed are objectives that led to ERP implementation. Please rate the importance of each
based on its influence on the financial performance of the organization.
Scale (1=No Opinion 2=Not Relevant 3=Not important 4=Important 5=Very important)
1 2 3 4 5
Increased demand for real time info.
Information generation for decision
making
Enhancing organization competitiveness
Cost reduction
Technological advancement
Integration of information systems
Business process change
Increase sales

63
10. What influence did adopting ERP have on your organizational financial performance?
a) Immediately following the adoption , financial performance ; ( Select one only)
i. Dropped significantly ( )
ii. Dropped somewhat ( )
iii. No change ( )
iv. Increased somewhat ( )
v. Increased significantly ( )
b) Today our financial performance has;
i. Dropped significantly ( )
ii. Dropped somewhat ( )
iii. No change ( )
iv. Increased somewhat ( )
v. Increased significantly ( )
11. Using a five point Likert scale given below, and by ticking an appropriate box, please
rate the extent to which the following variables influence the financial performance in
your company.
1 = No Extent 2= Small Extent 3= Moderate Extent 4 = Large Extent 5=Very Large Extent
1 2 3 4 5
Management Style
Production Targets
Firm’s Ownership
Years of operation

64
12. At the time your organization chose an ERP product, which benefits have accrued to your
organization? ( Tick accordingly)
Scale 1= Not at all; 2=low degree; 3=average; 4=very high degree; 5=Perfect
1 2 3 4 5
Increased flexibility in information generation.
Reduction of total operating and administration costs.
Increase in stock turnover.
Reduction in time for transaction processing.
Improved delivery times.
Reduction in stock levels.
Increased internal communication.
Reduction in errors in logistics.
Improved coordination between divisions.
Improved decision-making process.
Improved quality of reports.

65
13. Listed are some of the challenges that are encountered by ERP adopters. Please rank each
appropriately.
Scale (1=No challenge 2. Neutral 3=Somehow 4=Much 5=Very Much)
Challenges of ERP usage No
Challenge
Neutral Somehow Much Very
Much
Delays in implementing the ERP system.
Employee resistance to change
Difficulties in data migration
Personnel training in ERP environment
Increased costs of operating the ERP
system
Difficulties in integrating the existing
information systems.
Difficulties in restructuring personnel
Friction within senior management
14. By ticking an appropriate box below, please comment on the Company’s production
targets.
Always Sometimes Rarely
a) The Company exceeds its productions targets [ ] [ ] [ ]
b) The Company meets its production targets [ ] [ ] [ ]
c) The Company fails to meet its production targets [ ] [ ] [ ]
15. In your opinion what were the most important outcome of ERP usage?

66
APPENDIX 2 OPERATIONAL SUGAR COMPANIES IN KENYA.
1. Chemelil Sugar Company Ltd
2. Muhoroni Sugar Company Ltd
3. Mumias Sugar Company Ltd
4. Nzoia Sugar Company Ltd
5. South Nyanza (SONY) Sugar Company Ltd
6. West Kenya Sugar Company Ltd
7. Soin Sugar Company Ltd
8. Kibos Sugar and Allied Industries Ltd (KISAIL)
9. Butali Sugar Company Ltd
10. Sukari Sugar Company Ltd (Ndhiwa)
11. Transmara Sugar Company Ltd (Kilgros)
SUGAR COMPANIES EXPECTED TO START OPERATIONS SOON.
1. Kwale International Sugar Company Ltd (Msambweni)
2. Tana Delta Sugar Company Ltd

67
APPENDIX 3 SELECTED SUGAR COMPANIES FOR THE STUDY.
1. Mumias Sugar Company
2. Nzoia Sugar Company
3. West Kenya Sugar Company Ltd.

68
APPENDIX 4 SPECIFIC LOCATION OF SUGAR MILLS.
Source: www.unimaps.com
Mills Kakamega Zone Nyando Zone South Nyanza Zone Coastal Zone 1 = Mumias 5 = Soin 9 = Sukari 12 . (Proposed) Tana/TISP2 = West Kenya 6 = Kibos (defunct
Miwani also nearby) 10 = Sony 13. Kwale/ Kiscol
(Construction) 3 = Butali 7 = Chemelil 11 = Trans Mara4 = Nzoia 8 = Muhoroni

69
APPENDIX 5 RESEARCH PERMIT