effect of acetic acid on growth and ethanol fermentation of xylose fermenting yeast and...
TRANSCRIPT

Seediscussions,stats,andauthorprofilesforthispublicationat:https://www.researchgate.net/publication/242123941
EffectofAceticAcidonGrowthandEthanolFermentationofXyloseFermentingYeastandSaccharomycescerevisiae
ARTICLEinKASETSARTJOURNAL-NATURALSCIENCE·JANUARY2000
CITATIONS
9
READS
93
6AUTHORS,INCLUDING:
SavitreeLimtong
KasetsartUniversity
103PUBLICATIONS1,032CITATIONS
SEEPROFILE
VichienKitpreechavanich
KasetsartUniversity
51PUBLICATIONS335CITATIONS
SEEPROFILE
Availablefrom:SavitreeLimtong
Retrievedon:04February2016

«“√ “√∑“ß«‘™“°“√¢Õß¡À“«‘∑¬“≈—¬‡°…µ√»“ µ√å•
THE KASETSART JOURNALNatural Sciences
Volume 34, Number 1, 2000
ISSN 0075-5192
The Official Journal of Kasetsart UniversityPublished by the Kasetsart University, Bangkok 10900, Thailand
«‘∑¬“ “√‡°…µ√»“ µ√å
“¢“«‘∑¬“»“ µ√å
ªï∑’Ë ÛÙ ©∫—∫∑’Ë Ò
¡°√“§¡ - ¡’π“§¡ ÚıÙÛ
ISSN 0075-5192
THEKASETSART JOURNALNatural Sciences http://www.rdi.ku.ac.th
January – March 2000Volume 34 Number 1
«‘∑
¬“
“√‡°
…µ√»“
µ√å :
“¢“«
‘∑¬“»
“ µ√å ¡
°√“§
¡ - ¡
չҤ
¡ 2
543 ª
ï∑’Ë 3
4 ©
∫—∫∑
’Ë 1 T
he K
asetsa
rt Journ
al : N
atu
ral S
ciences J
anuary
- March
2000 V
olu
me 3
4 N
um
ber 1
Preliminary Report on Transfer Traits of Vegetative Propagation from Wild Rice Species to Oryza sativa via Distant
Hybridization and Embryo Rescue
............................................................................................................................Tao Dayun and Prapa Sripichitt 1
Effect of Mungbean Yellow Mosaic Virus (MYMV) on Yield and Yield Components of Mungbean
(Vigna radiata (L.) Wilczek)
........................................................................ G.S.S. Khattak, M.A. Haq, S.A. Rana, G. Abass and M. Irfag 12
Growth Period of Aquatic Plants for Birds Nesting at Bung Borapet, Nakhon Sawan
............................................... Suchada Sripen, Obhas Khobkhet, Sumon Masuthon and Sunanta Supanuchai 17
Study of Dropping Speed in Eggs of Oncomelania hupensis, a Snail Intermediate Host of Schistosomiasis
.......................... Xingjian Xu, Xianxiang Yang, Xiapin Li, Wei Zhang, Qingsang Pan and Zhengan Xiong 25
Selection for the Effective Species of Vesicular-Arbuscular Mycorrhizal Fungi on Soybean Root Infection
and Growth Enhancement
...................................................................................................................................................... Thongchai Mala 30
Residual Effects of 20 Annual Applications of Ammonium Sulfate and Triple Superphosphate for Corn
on Properties and Productivity of Oxic Paleustults
..........................................................................A. Suwanarit, I. Suwanchatri, J. Rungchuang and V. Verasan 40
Properties and Agricultural Potential of Skeletal Soils in Southern Thailand
.................................................................. Irb Kheoruenromne, Anchalee Suddhiprakarn and Sumitra Watana 52
Effect of Acetic Acid on Growth and Ethanol Fermentation of Xylose Fermenting Yeast and Saccharomyces cerevisiae
............................. Savitree Limtong, Tawatchai Sumpradit, Vichien Kitpreechavanich, Manee Tuntirungkij,
......................................................................................................................Tatsuji Seki and Toshiomi Yoshida 64
Cyanide Removal from Laboratory Wastewater Using Sodium Hypochlorite and Calcium Hypochlorite
...................................... Nusara Sinbuathong, Bussarin Kongseri, Panadda Plungklang and Roj Khun-anake 74
The Influence of Serum Concentration on tPA Production of CHO Cell
.............................................. Teerapatr Srinorakutara, Jin-Ho Jang, Mutsumi Takagi and Toshiomi Yoshida 79
Lectin Histochemistry of Glycoconjugates in Mandibular Gland of Chicken
.......................................................................... Apinun Suprasert, Surapong Arthitvong and Seri Koonjaenak 85
Prevalence of Antibody to Orientia tsutsugamushi in Dogs Along Thai - Myanmar Border
.............................................................................. Mongkol Chenchittikul, Decha Pangjai and Paijit Warachit 91
Process for Preparing Pre-fried and Frozen Sweetpotato French-fry Type Products
............................................................ Suparat Reungmaneepaitoon, Santi Tip-pyang and Sompoch Yai-eiam 98
Development of a Yogurt-type Product from Saccharified Rice
................................................................................ Chakamas Wongkhalaung and Malai Boonyaratanakornkit 107
Development of Instant High Fiber Processed Food
........ Plernchai Tangkanakul, Nednapis Vatanasuchart, Maradee Phongpipatpong and Patcharee Tungtrakul 117
Primary Productivity of the Pygmy Bamboo (Arundinaria pusilla) in the Dry Dipterocarp Forest at Sakaerat,
Nakhon Ratchasima
..................................................................................................................................................Niwat Ruangpanit 125
Electronic Knowledge Delivery: Developing a Web-based System for Computer Course
.................................................................................................................................................Anongnart Srivihok 139
Development of Water Allocation Strategy to Increase Water Use Efficiency of Irrigation Project
Varawoot Vudhivanich, Jesda Kaewkulaya, Ponsatorn Sopaphun, Watchara Suidee and Prapun Sopsathien 145
Superconducting Properties of (Bi,Pb)-Sr-Ca-Cu-O Ceramics
................................................................................................ Supreya Trivijitkasem and Wunchai Sratongluan 159
Removal of Naphthalene and 2, 4-Dinitrotoluene from Soils by Using Carboxymethyl-β-Cyclodextrin
................................................................................................................................................ Chatdanai Jiradecha 171

«‘∑¬“ “√‡°…µ√»“ µ√å
Home pages : http://www.ku.ac.th ·≈– http://www.rdi.ku.ac.th
∑’˪√÷°…“ : ÿæ®πå ‡øóòÕßøŸæß»å π¿“«√√≥ πæ√—µπ√“¿√≥å ÿ√π—πµå ÿ¿—∑√æ—π∏ÿå »ÿ¿¡“» æπ‘™»—°¥‘Ïæ—≤π“
∫√√≥“∏‘°“√ : «‘‡™’¬√ ¬ß¡“π‘µ™—¬
∫√√≥“∏‘°“√ºŸâ™à«¬ : ©°“¡“» «ß»å¢â“À≈«ß ÿ¿“æ ©—µ√“¿√≥å
°Õß∫√√≥“∏‘°“√ : «‘∑¬“»“ µ√å —ß§¡»“ µ√å
æ√»√’ ™—¬√—µπ“¬ÿ∑∏å π—π∑π“ °ªî≈°“≠®πå ÿ®‘πµå ¥’·∑â π“∂ æ—π∏ÿ¡π“«‘π‡ÕÁ® ‚√∫≈ πßπÿ™ »√’Õ—…Æ“æ√ “¬™≈ ‡°µÿ…“ Õ√ “ ÿ° «à“ßÕÿ∑—¬«√√≥ · ß«π‘™ ÿ«√√≥“ ∏ÿ«‚™µ‘ ÿ¥ƒ¥’ ª√–‡∑◊Õß«ß»å ºàÕßæ√√≥ µ√—¬¡ß§≈°Ÿ≈ª√–¿“√—® ÀÕ¡®—π∑πå ÿ¥“ ¿‘√¡¬å·°â«Õ¡√“ ∑Õߪ“π ∏“√‘π’ √Õ¥ πæ√ «“∑ «—≤π°Ÿ≈¬ÿæ“ ¡ß§≈ ÿ¢Õ¿‘π—π∑å ÿ¢ª√–‡ √‘∞°àÕ‚™§ ®—π∑«√“ß°Ÿ√ ¡π÷° §’√’‚µ°—≠®π“ ∏’√–°ÿ≈‰æ»“≈ «ÿ≤‘®”πߧåÕ“√’¬å ∏—≠°‘®®“πÿ°‘®
ºŸâ®—¥°“√ : Õ√«√√≥ «ß…å«“π‘™
ºŸâ™à«¬ºŸâ®—¥°“√ : «—π‡æÁ≠ π¿“∑‘«“Õ”π«¬
”π—°ß“π : ∂“∫—π«‘®—¬·≈–æ—≤π“·Ààß¡À“«‘∑¬“≈—¬‡°…µ√»“ µ√å ¡À“«‘∑¬“≈—¬‡°…µ√»“ µ√å ®µÿ®—°√ °√ÿ߇∑æœ 10900
«‘∑¬“ “√‡°…µ√»“ µ√å ‡ªìπ«“√ “√¢Õß¡À“«‘∑¬“≈—¬‡°…µ√»“ µ√å ́ ÷Ëßæ‘¡æ出¬·æ√àº≈ß“π∑“ß«‘™“°“√·¢πßµà“ßÊ ∑“ߥâ“π«‘∑¬“»“ µ√å·≈– —ߧ¡»“ µ√å ∑—Èß®“°¿“¬„π·≈–¿“¬πÕ°¡À“«‘∑¬“≈—¬ ‚¥¬«‘∑¬“ “√
‡°…µ√»“ µ√å “¢“«‘∑¬“»“ µ√å ¡’°”Àπ¥ÕÕ°ªï≈– 4 ©∫—∫ §◊Õ ‡¥◊Õπ¡’π“§¡ ¡‘∂ÿπ“¬π °—𬓬π ·≈–∏—𫓧¡·≈–«‘∑¬“ “√‡°…µ√»“ µ√å “¢“ —ߧ¡»“ µ√å ¡’°”Àπ¥ÕÕ°ªï≈– 2 ©∫—∫ §◊Õ ‡¥◊Õπ¡‘∂ÿπ“¬π ·≈–∏—𫓧¡
°“√·≈°‡ª≈’ˬπ«“√ “√ µ‘¥µàÕ ”π—°ÀÕ ¡ÿ¥ ¡À“«‘∑¬“≈—¬‡°…µ√»“ µ√å ®µÿ®—°√ °√ÿ߇∑æœ 10900
The Kasetsart Journal
Home pages : http://www.ku.ac.th and http://www.rdi.ku.ac.th
Advisor : Supot Faungfupong Napavarn Noparatnaraporn
Suranant Subhadrabandhu Supamard Panichsakpatana
Editor-in-Chief : Wichien Yongmanitchai
Assistant Editors : Chakamas Wongkhalaung, Suparp Chatraphorn
Editorial Board : Natural Sciences Social SciencesPornsri Chairatanayuth Nuntana KapilakanchanaSuchint Deetae Nath BhanthumnavinEd Sarobol Nongnuch SriussadapornSaichol Ketsa Orasa SuksawangUthaiwan Sangwanit Suwanna ThuvachoteSutruedee Prathuangwong Pongpan TrimongkholkulPraparat Hormchan Suda PhiromkaiwAmara Tongpan Tarinee RodsonPornsawat WathanakulYupa MongkolsukApinun SuprasertKorchoke ChantawarangulSomnuk KerethoGunjana TheeragoolPhaisan WuttijumnongAree Thunyakijjanukij
Manager : Orawan Wongwanich
Assistant Managers : Wanpen Napativaumnauy
Business Office : Kasetsart University Research and Development Institute (KURDI)Kasetsart University, Chatuchak, Bangkok 10900.
The Kasetsart Journal is a publication of Kasetsart University intended to make available the resultsof technical work in the natural and the social sciences. Articles are contributed by Kasetsart University facultymembers as well as by those from other institutions. The Kasetsart Journal : Natural Sciences edition is issuedfour times per year in March, June, September and December while The Kasetsart Journal : Social Sciencesedition is issued twice a year in June and December.
Exchange publications should be addressed toThe Librarian,Main Library,
Kasetsart University,Bangkok 10900, Thailand.

Kasetsart J. (Nat. Sci.) 34 : 1 - 11 (2000)
1 Food Crop Research Institute, Yunnan Academy of Agricultural Sciences, Kunming 650205, The People’s Republic of China.2 Department of Agronomy, Faculty of Agriculture, Kasetsart University, Bangkok 10900, Thailand.
INTRODUCTION
For Asian cultivated rice Oryza sativa, seedis the predominant way of propagation. Among 23
species of genus Oryza, there are different patterns
of vegetative propagation (Vaughan, 1994), whichcould be used to : 1) fix hybrid vigor (Xiu, 1995) 2)
breed for perennial rice (Schmit, 1996) 3) culture
ratooning rice (Krishnamurthy, 1988) and 4)multiply breeding lines and genetic stocks clonally
(Mahadevappa et al., 1989).
Tillering is a common trait of vegetative
Preliminary Report on Transfer Traits of Vegetative Propagationfrom Wild Rice Species to Oryza sativa via Distant Hybridization and
Embryo Rescue
Tao Dayun1 and Prapa Sripichitt2
ABSTRACT
There are diversified patterns of vegetative propagation in Oryza spp. If Oryza sativa is changedfrom annual type to perennial type via vegetative propagation, the perennial cultivar would be environmental
sound and economical viable. There would be a great potential to increase rice harvest area via ratoon
cropping or stubble cropping and some hope to break yield plateau via fixing heterosis by vegetativepropagation. Another advantage is that it would shorten the time interval from hybridization to form fixed
lines. A possible donor of the trait for ratoon or stubble cropping is O. rufipogon. The other species
possessing rhizome formation ability for breeding of perennial rice are O. longistaminata, O. officinalis,O. rhizomatis and O. australiensis. In this study perennial trait was transferred from wild species O.
longistaminata, O. rhizomatis and O. officinalis to cultivated rice (O. sativa) through distant hybridization.
Genotypes of O. sativa and wild species, pollen fertility of male species and environmental factors couldcontribute to crossability or germination rate of the resulting embryos. Finally “false” hybrid problem and
research on utilization of vegetative propagation in wild rice species were discussed.
Key words : vegetative propagation, wild rice, distant hybridization, embryo rescue, crossability
propagation of all species within genus Oryza,
which could be perennial (O. rufipogon, O.
glumaepatula, O. eichingeri, O. latifolia, O. alta,O. grandiglumis, O. longiglumis, O. meyeriana, O.
granulata) or annual (O. sativa, O. nivara, O.
meridionalis, O. glaberrima, O. barthii, O.punctata). Under certain environment, perennial
species O. glumaepatula has tillering ability as a
mean of vegetative propagation (Oka andMorishima, 1967), which could be used as a pattern
of vegetative propagation for all species of the
genus Oryza.

2 Kasetsart J. (Nat. Sci.) 34 (1)
Stem regeneration as indicated by ratooning,stubble planting (Mahadevappa et al., 1989) or
stoloniferous is also the common phenomenon
among all Oryza spp. especially perennial speciesof AA genome (Oka and Morishima, 1967) which
could also be used as a mean of vegetative
propagation for all species of the genus Oryza. O.australiensis, O. longistaminata, O. officinalis and
O. rhizomatis have a common trait of rhizome
(Vaughan, 1994), which usually could make thespecies perennial and adapt to temporal drought.
Thus it is the breeder’s ideal choice of breeding for
perennial ability in irrigated, upland or deepwaterrice.
Apomixis is the most promising way to fix
hybrid vigor (Hanna, 1995). However, the hope tofind obligate apomixis in Oryza spp. is dim. The
logical strategy is to transfer apomixis from other
remote species or to induce genetic mutation inOryza spp. In vitro propagation, especially artificial
seed, is another way to multiply rice or fix F1
heterosis (Juliano et al., 1993; Yoshida and Kata,1996).
From the viewpoint of breeding, strong
regeneration ability of stem is useful for breedingof rice ratooning. Rhizome is the most logical
pattern of propagation for breeding of perennial
rice especially upland rice (Schmit, 1996). Apomixisand in vitro propagation are the most promising
ways to fix heterosis of F1 hybrid.
In order to transfer rhizome character fromwild rice species to the cultivated species so as to
fix heterosis of rice, it is a prerequisite condition to
have diversified genetic resources. O.longistaminata, O. rhizomatis, O. officinalis and
O. australiensis should be the donors of perennial
character. This paper is to report preliminary resultsof transferring rhizome character from O.
longistaminata, O. officinalis, O. rhizomats to
cultivated rice so as to breed for perennial hybridrice via distant cross and embryo rescue.
MATERIALS AND METHODS
Cultivated riceKDML 105 (or Khao Dawk Mali 105, indica
rice)RD23 (indica rice)
CT6241-17-1-5-1 (japonica rice)
IR 42 (indica rice)
Wild speciesO. longistaminata (accession no. unknown)
was kindly supplied by Prof. Dr. Hiroshi Hyakutakewhich was derived from the Ministry of Agriculture
and Forestry, Japan.
O. rhizomatis (accession no. 20133) wassupplied by Pathumthani Rice Research Center,
Thailand and O. rhizomatis (accession no. W 95018
and accession no. unknown) were introduced fromInternational Rice Research Institute (IRRI) via
Yunnan Academy of Agricultural Sciences
(YAAS), China.O. officinalis (accession no. W9502 and
W9509) were introduced from IRRI via YAAS.
Planting methodAll materials were planted in pots and grown
in a greenhouse at the Department of Agronomy,
Kasetsart University. Each accession comprised 5-7 plants.
HybridizationHybridization was done between cultivated
rice and wild rice by emasculation of the female
parents. Upper one third of the glume of each
spikelet was cut off using scissors after 4 p.m..Then the anthers were removed using forceps. The
emasculated panicles were pollinated heavily from
the male parents one day afterwards for the durationof 3 days.

Kasetsart J. (Nat. Sci.) 34 (1) 3
Embryo rescueAfter pollination, ovaries were excised and
surface-sterilized by soaking in 75 % ethanol for 5
minutes followed by 25 % Chlorox contatining a
few drops of wetting agent, Tween 20, for 20minutes. After washing in sterilized distilled water
4 times, the lower part of the ovary was excised and
cultured on 1/4 MS (Murashige and Skoog, 1962)medium (3 % sucrose and 0.7 % agar, pH 5.8) in the
dark at 25°C (Guzman Emerita, 1983; Jena and
Khush, 1984). After germination, seedlings werekept in the light until they reached the three-leaf
stage. For acclimatization, the cultured bottles were
transferred to a room without direct sunlight forone week, then the seedlings were cultured in pipe
water with little NPK compound fertilizer for
another week before the plantlets were transplantedinto soil in pots and grown in a greenhouse.
Pollen fertilitySix spikelets were sampled from one panicle
of the wild species used as male parents before
anthesis. Pollen grains were crushed out and stained
with 2-KI solution. Dark, round and big pollengrains were considered as fertile ones, and about
1,000 pollen grains were counted for each material.
RESULTS
Observation on rhizome character of different
species of wild riceO. rhizomatis was collected from seasonally
dry grassland in Sri Lanka. The extensive thick rootsystem and rhizomes suggest its usefulness perhaps
as a source of drought tolerance (Vaughan, 1990).
It had vigorous tillers and the growth of rhizomedid not overlap with the main cropping. When
cutting the main cropping at maturation stage, all
rhizome grew and had tillers vigorously within 10days, and new ratooning tillers could head
simultaneously. However, the plant height and
panicle length of regenerated cropping were shorterthan the main cropping (Table 1). The cropping of
rhizome separating and planting was much better
than that of in situ plant.The perenniality of O. longistaminata was
due to permanent rhizome formation. It was easy to
form clonal population via rhizome propagation.However, tillering ability was weak and generation
overlapping was obvious. Thus, it was not easy to
induce panicle initiation.Both accessions of O. officinalis had rhizome
and strong tillering ability. Though they possessed
Table 1 Plant height and panicle length of the main cropping and ratoon cropping for different species
of wild rice.
Species Accession Plant height (cm) Panicle length (cm)
no. Main Ratoon Difference Main Ratoon Difference
O. officinalis W 9502 171 180.3 -9.3 29.8 31 -1.2
W 9509 150.2 174.3 -24.1 29.4 30.5 -1.1
O. rhizomatis W 95018 171.6 122.4 49.2** 31.4 22.4 9*O. rhizomatis 170.4 119 51.4** 27.9 22.4 5.5**
* ** indicate significance at the 0.05 and 0.01 level of probability, respectively.

4 Kasetsart J. (Nat. Sci.) 34 (1)
permanent rhizome formation and tillering, theplant usually showed synchronous flowers. When
cutting the plant at maturation stage, rhizome growth
and tiller formation were becoming vigorouslywithin 10 days, and there was no obvious change in
plant height, panicle length of main cropping and
those of regenerated cropping. This type ofvegetative propagation is promising for breeding
of perennial ability.
Crossability and germination rate of different
interspecific combinationsRD23/O. longistaminata could give the
highest percentage of seed set (42.86 %) (Table 2)since both parents have the same genome (AA),
followed by O. sativa/O. rhizomatis (0.26-19.3 %),
Table 2 Interspecific hybrids produced via embryo rescue.
Crosses No. florets Seed set No. embryos Germination No. hybrid
pollinated cultured rate plants
No. % (%)
RD 23/O. rhizomatis
(no. 20133) 172 14 8.14 8 50 1
(9 days old)
IR 42/O. rhizomatis
(no. 20133) 696 58 8.33 22 22.73 0
(5 days old)
KDML 105/O. rhizomatis
(no. 20133) 1,154 3 0.26 3 33.33 0
(8 days old)
RD 23/O. rhizomatis
490 83 16.94 45 0 0
(5-10 days old)
RD 23/O. rhizomatis
(W 95018) 1,011 196 19.39 27 0 0
(6-10 days old)
RD 23/O. officinalis
(W 9502) 479 8 1.67 3 0 0
(13 days old)
RD 23/O. officinalis
(W 9509) 388 27 6.96 2 0 0
(13 days old)
CT 6241/O. officinalis
(W 9502) 991 11 1.2 6 82.33 3
(15 days old)
RD 23/O. longistaminata 119 51 42.86 33 3.03 1(5-10 days old)

Kasetsart J. (Nat. Sci.) 34 (1) 5
and O. sativa/O. officinalis with the lowest seed set(1.2-6.96 %). O. rhizomatis (no. 20133) was crossed
with three different cultivars of O. sativa. Among
the three cultivars, KDML 105 gave the lowestseed set (0.26 %) while IR 42 exhibited the highest
seed set (8.33 %). The rate of seed set varied from
8.14 to 19.39 % when the cultivated variety RD23was used as a female parent and hybridized with
different accessions of O. rhizomatis, whereas the
percentage of seed set ranged from 1.67 to 6.96when RD23 was crossed with two different
accessions of O. officinalis. The results indicated
that there was crossability difference within thespecies of O. rhizomatis and O. officinalis.
In order to obtain interspecific hybrids,
embryo rescue is necessary. The embryos of O.sativa/O. rhizomatis began to degenerate about 8-
10 days after pollination and the embryo older than
10 day old was not sucessfully rescued. The hybridembryos of O. sativa/O. longistaminata began to
degenerate 6 days after pollination. The 5-10 day-
old embryos gave considerably low germinationrate (3.03 %). Development of the seeds of CT6241-
17-1-5-1/O. officinalis (no. W9502) was very poor,
but the degeneration rate was rather slow. Fifteen-day-old embryos could germinate quite well (82.33
%).
Relationship between crossability and pollen
fertility of male speciesPartial pollen sterility is a common
phenomenon for wild species of rice. The results of
Table 3 indicated that there was some relationship
between pollen fertility of male species andcrossability. The higher fertility of pollen caused
the higher percentage of seed set. To confirm the
concordance observation, five plants of O.rhizomatis (no. 20133) were crossed with RD23
separately and pollen fertility of each plant was
investigated. The results once again indicated thatthere was some relationship between pollen fertility
of male species (or different plant within accession)
and crossability (Table 4).
“False” hybrids problemFalse hybrid was an important problem for
distant cross breeding (Chen et al., 1989). From thereview of literatures, the average rate of false
hybrid for intraspecific hybridization was below 5
%. The self-fertilization seed set of emasculatedpanicles in this experiment was below 1 %.
However, the data in Table 2 shows that most
plantlets of embryo rescue were false hybrids. Itwas surprising that a few normal developmental
seeds were obtained when RD23 and IR42 were
Table 3 Pollen fertility of the male species and seed set of interspecific crosses.
No. florets Pollen fertility of Seed set
pollinated male species(%) No. %
RD 23/O. rhizomatis (no. 20133) 1,561 60.17 207 13.26
RD 23/O. rhizomatis 490 31.75 83 16.94
RD 23/O. rhizomatis (W 95018) 1,011 86.00 196 19.39RD 23/O. officinalis (W 9502) 497 16.08 8 1.67
RD 23/O. officinalis (W 9509) 388 51.31 27 6.96
CT 6241/O. officinalis (W 9502) 991 16.08 11 1.11RD 23/O. Longistaminata 199 64.49 51 42.86

6 Kasetsart J. (Nat. Sci.) 34 (1)
hybridized with O. rhizomatis, while the seedsgerminated normally. All plants of IR42/O.
rhizomatis (no. 20133) and 3 out of 7 plants of RD
23/O. rhizomatis (no. 20133) died after 6-7 days ofgermination, the remaining were all false hybrids.
RD23 was crossed with 5 separated plants
of O. rhizomatis (no. 20133). Each cross obtainedcould form very few normal seeds (Table 5).
However, all plants of these progenies were
apparently like the maternal parent in morphology.The rate of normal seed set was lower than 1 %,
which could be regard as true false hybrids of self
fertilization during the course of emasculation. The
normal seeds could be obtained for RD23/O.rhizomatis (no. 20133-3) as high as 10.67 %, which
could not explain the situation of self-fertilization.
Another possible explanation of false hybridis the pollen of wild species could induce
parthenogenesis, and the plant like the maternal
parent is presumed to be resulted from haploidgametes stimulated by the pollen of wild species.
This phenomenon is known as matromorphy
(Farooq et al., 1996). If it is true, there would beanother effective way to produce diploid plant of
rice from female gametophyte. To confirm the
hypothesis, CMS line V20A and Fl hybrid of
Table 4 Pollen fertility of the male plants of O. rhizomatis (no. 20133) and seed set of interspecificcrosses.
No. florets Pollen fertility of Seed setpollinated male plants
(%) No. %
RD 23/No. 20133-1 246 82.01 74 30.08
RD 23/No. 20133-2 451 50.39 37 8.20RD 23/No. 20133-3 300 54.46 72 24.00
RD 23/No. 20133-4 232 57.28 9 3.88
RD 23/No. 20133-5 332 39.55 15 4.52
Table 5 Normal seed set of certain interspecific hybrids.
No. florets Normal seeds obtained Germination
pollinated rateNo. % (%)
IR 23/O. rhizomatis (no. 20133) 362 2 0.55 100
RD 23/O. rhizomatis (no. 20133) 136 7 5.15 100
RD 23/O. rhizomatis (no. 20133-1) 246 2 0.81 100RD 23/O. rhizomatis (no. 20133-2) 451 9 1.96 100
RD 23/O. rhizomatis (no. 20133-3) 300 32 10.67 93.75
RD 23/O. rhizomatis (no. 20133-4) 232 2 0.86 100RD 23/O. rhizomatis (no. 20133-5) 332 2 0.60 100

Kasetsart J. (Nat. Sci.) 34 (1) 7
RD23/KDML 105 are suggested to be used asfemale parents to hybridize with O. rhizomatis (no.
20133 plant 3).
Preliminary observation on hybridsOne plant of RD23/O. rhizomatis, three
plants of CT6241-17-1-5-1/ O. officinalis (no.
W9502) and one plant of RD23/O. longistaminata
were morphological characterized. They were
intermediate in morphological characters between
the two parents, but much closer to their respectivewild parents (Figure 1-6). They headed much earlier
than their cultivated parents in winter. The spikelets
were awned, small and easy shattering. Somediscriminative traits such as ligule length of lower
leaves, presence of rhizome, presence of whorl of
branches at panicle base and spikelets inserted inthe lower half of lower panicle branches were
dominant or recessive traits in F1 generation
according to different interspecific hybrids (Table6).
Pollen fertility of RD23/O. rhizomatis (no.
20133) ranged from 0 to 1.54 %. No seed set wasobserved when the hybrid was backcrossed to
RD23; even 2,886 florets were pollinated by RD23.
RD23/O. longistaminata hybrid had rhizome andindehiscent anthers (Figure 7). Pollen fertility of
the hybrid was as low as 32.53 % while the male
parent O. longistaminata possessed 64.51 % pollenfertility before hybridization.
DISCUSSION
There are diversified pattern of vegetative
propagation in Oryza spp. If Oryza sativa is changedfrom annual habit to perennial type via vegetative
propagation, the perennial crop would have the
potential to provide environmental sound andeconomically viable alternatives for the use on
upland, irrigated, rainfed lowland and flood-prone
ecosystem (Schmit, 1996; Wagoner, 1990). There
might be an alternative to double or triple croppingof rice in tropical and subtropical area to expand
rice harvest area via ratooning (Krishnamurthy,
1988). Another advantage is to fix heterosis viavegetative propagation so as to make hybrid rice
become available to poor farmers and fragile
ecosystems (upland, flood-prone and rainfedlowland ecosystems) (Xiu, 1995). Subsequently,
rice yield per hectare could be increased on a large
scale. For breeding strategies, perennial charactercould shorten the time interval from hybridization
to form fixed lines. Thus, breeding rice for perennial
or vegetative character has environmental,economical, and theoretical preference.
Interspecific crossability is a complex
character which could be contributed by femalevariety of O. sativa, male species or accession of
wild rice, pollen fertility of male species or
accession, and environmental factors. The presentresults indicated that it is important to select
accession or plant of high pollen fertility as male
parent so as to get high seed set when interspecificcross is produced.
Nearly all hybrids between O. sativa and
wild species of the genus Oryza have beensuccessfully obtained (IRRI, 1993). Some useful
traits have been successfully transferred to O. sativa
from wild species of rice. However, very littleattention was paid on research and utilization of
propagation habit. There is a trend for food
production toward intensive and fragile area.Research and utilization of diversified vegetative
habit could partly meet today’s pressing global
concerns on agriculture, availability of food,conservation of resources, and sustainability of the
environment.
Finally, hybrid of RD23/O. longistaminata
might be useful for transferring rhizome character
from wild species to cultivated rice and to tag the
gene (s) responsible to rhizome formation becauseit has rhizome in Fl generation and relatively high

8 Kasetsart J. (Nat. Sci.) 34 (1)
Tab
le 6
Mor
phol
ogic
al c
hara
cter
s of
cer
tain
inte
rspe
cifi
c hy
brid
s.
Cro
sses
or
pare
nts
Res
cue
Tra
nspl
antin
gH
eadi
ngPl
ant
Pani
cle
Flag
Flag
Lig
ule
Lig
ule
Len
gth
Rhi
zom
eW
horl
of
Spik
elet
s in
sert
edda
teda
te (
m/d
)da
te (
m/d
)he
ight
leng
thle
afle
afle
ngth
of
leng
th o
fof
aw
npr
esen
cebr
anch
in th
e lo
wer
hal
f(m
/d)
(cm
)(c
m)
leng
thw
idth
flag
leaf
the
thir
d(c
m)
pres
ence
of lo
wer
pan
icle
(cm
)(c
m)
(mm
)le
af (
mm
)br
anch
es
RD
231
10/2
911
/41/
2796
24.5
461.
811
290
nono
yes
RD
23/
O. r
hizo
mat
is2
10/1
611
/10
12/1
780
21.5
331.
67
61.
0no
noye
s
O. r
hizo
mat
is (
no. 2
0133
)110
/29
11/4
1/20
6515
.523
.51.
12
50
yes
noye
sC
T 6
241-
17-1
-5-1
112
/18
1/13
3/28
6025
441.
74
170
nono
noC
T 6
241/
O. o
ffic
inal
is2
12/4
1/13
2/20
6519
282.
14
82.
5no
yes
no
O. o
ffic
inal
is (
W 9
502)
212
/18
1/13
3/17
120
3135
.52.
53
42
yes
yes
noR
D 2
3212
/28
1/27
4/9
102
2527
1.7
720
0.4
nono
yes
RD
23/
O. l
ongi
stam
inat
a212
/28
2/24
4/13
127
4169
2.3
3031
3.3
yes
noye
s
O. l
ongi
stam
inat
a3-
2/24
--
--
--
--
yes
--
1 D
irec
t ger
min
atio
n2
Em
bryo
res
cue
3 R
hizo
me
prop
agat
ion.

Kasetsart J. (Nat. Sci.) 34 (1) 9
Figure 1 Plants of RD 23 (left), RD 23/O.rhizomatis (middle) and O. rhizomatis
(no. 20133, right).
Figure 4 Panicles of CT 6241-17-1-5-1 (left),CT 6241/O. officinalis (middle) and
O. officinalis (no. W 9502, right).
Figure 2 Panicles of RD 23 (left), RD 23/O.rhizomatis (middle) and O. rhizomatis
(no. 20133, right).
Figure 5 Plants of RD 23 (left), RD 23/O.
longistaminata (middle) and O.longistaminata (right).
Figure 3 Plants of CT 6241-17-1-5-1 (left), CT
6241/O. officinalis (middle) and O.officinalis (no. W 9502, right).
Figure 6 Panicles of RD 23(lower) and RD 23/O.
longistaminata (upper).

10 Kasetsart J. (Nat. Sci.) 34 (1)
pollen fertility. It was different from other hybridsreported at least on rhizome expression (Ghesquiere,
1991).
ACKNOWLEDGEMENTS
This research was partly funded byTingthanathikul Foundation, Thailand. Our
profound gratitude also goes to Dr. Songkran
Chitrakorn, Pathumtani Rice Research Center,Thailand, Prof. Dr. Hiroshi Hyakutake, Japan
Science and Technology Cooperation and Dr. D.A.
Vaughan, IRRI, Philippines, for supplyingexperimental materials.
LITERATURE CITED
Chen, S. B., X. L. Duan and J. L. Fu. 1989. Genetic
variation in rice/sorghum hybrids and theirapplication in rice breeding, pp. 261-268. In
IRRI (ed.). Progress in Irrigated Rice Research.
IRRI, Manila.Farooq, S., N. Iqbal, T.M. Shah and M. Asghar.
1996. Problems and prospects for utilizing
Porteresia coarctata in rice breeding programs.Cereal Res. Comm. 24 (1) : 41-17.
Ghesquiere, A. 1991. Reexamination of genetic
control of the reproductive barrier betweenOryza longistaminata and O. sativa, and
relationship to rhizome expression, pp. 729-
730. In IRRI (ed.). Rice Genetics II, IRRI,Manila.
Guzman Emerita, V. de. 1983. Recent progress in
rice embryo culture at IRRI, pp. 215-228. InCell and Tissue Culture Techniques for Cereal
Crop Improvement. Proceedings of a
Workshop cosponsored by the Institute ofGenetics, Academia Sinica and IRRI. Science
Press, Beijing.
Hanna, W.W. 1995. Use of apomixis in cultivardevelopment. Adv. Agron. 54 : 333-350.
IRRI. 1993. Program Report for 1992. IRRI, Manila.
156 p.Jena, K. K. and G.S. Khush. 1984. Embryo rescue
of interspecific hybrids and its scope in rice
improvement. RGN 1 : 133-134.Juliano, A., D. A. Vaughan, C.Y. Wu and F.J.
Zapata. 1993. In vitro propagation of conserved
rice germplasm. IRRN 18(4) : 4-5.Krishnamurthy, K. 1988. Rice ratooning as an
alternative to double cropping in tropical Asia,
pp. 3-15. In W.H. Smith and V. Kumble (eds.).Rice Ratooning. IRRI, Manila.
Mahadevappa, M., N. D. Vishakantha, R. K. Sarma,
and K. G. Ovindaraj. 1989. Stubble planting-promising vegetative propagation method for
hybrid rice. IRRN 14 (4) : 9-10.
Murashige, T. and F. Skoog. 1962. A revisedmedium for rapid growth and bioassay with
Figure 7 Rhizome of RD 23/O. longistaminata
(F1 generation).

Kasetsart J. (Nat. Sci.) 34 (1) 11
tobacco tissue cultures. Physiol. Plant. 15 :474-497.
Oka, H. I. and H. Morishima. 1967. Variations in
the breeding systems of a wild rice, Oryza
perennis. Evolution 21 : 249-258.
Schmit, V. 1996. Improving sustainability in the
uplands through the development of a perennialupland rice, pp. 265-273. In C. Piggin, B.
Courtois, and V. Schmit (eds.). Upland Rice
Research in Partnership. Proceedings of theUpland Rice Consortium Workshop. 4-13
January 1996. Manila.
Vaughan, D. A. 1990. A new rhizomatous Oryza
species (Poaceae) from Sri Lanka. Bot. J.
Linnean Society 103 : 159-163.
Vaughan, D.A. 1994. The wild relatives of rice.IRRI, Manila, 137 p.
Wagoner, P. 1990 Perennial grain development :
Past efforts and potential for the future. CriticalRev. Plant Sci. 9 (5) : 381-408.
Xiu, L. Q. 1995. Breeding for Perennial Hybrid
Rice. Division Seminars of Plant Breeding,Genetics, and Biochemistry. IRRI, Manila. p.
Yoshida, T. and H. Kata. 1996. In vitro propagation
of hybrid rice (Oryza sativa L.). JARQ 30 : 9-14.
Received date : 14/10/98Aecepted date : 23/06/99

Kasetsart J. (Nat. Sci.) 34 : 12 - 16 (2000)
Effect of Mungbean Yellow Mosaic Virus (MYMV) on Yield andYield Components of Mungbean (Vigna radiata (L.) Wilczek)
G.S.S. Khattak1, M.A. Haq1, S.A. Rana2, G. Abass1 and M. Irfag1
ABSTRACT
Fourteen MYMV susceptible F3 progenies from a cross NM 92 x VC 1560D showed significantdifferences for MYMV disease infection, yield and yield components. These progenies suffered from 18.5
to 40.5 percent decrease in plant height, 11.7 to 64.0 percent reduction in number of pods per plant, 5.8 to
82.2 percent reduction in seeds per pod, 7.4 to 35.0 percent decrease in pod length, 10.6 to 53.3 percentreduction in 1000 seed weight and 32.2 to 78.6 percent decrease in grain yield per plant. The MYMV
incidence showed significant correlation (0.526) with the decrease in 1000 seed weight. The decrease in
yield and other yield components showed non significant positive correlation with MYMV incidence.Key words : mungbean yellow mosaic virus, yield, mungbean
1 Nuclear Institute for Agriculture and Biology, Faisalabad, Pakistan.2 Bahauddin Zakariya University, Multan, Pakistan.
INTRODUCTION
Mungbean Yellow Mosaic Virus (MYMV)
has been found widely distributed in India andPakistan causing enormous losses in the production
of several leguminous crops (Chenulu and Verma,
1988). The most seriously affected leguminouscrops by this disease are mungbean, blackgram and
soybean. It is the most destructive disease of
mungbean during summer season in Pakistan(Ahmad, 1975). MYMV disease is reported to be
transmitted by an insect vector, Bemisia tabaci and
not by seed, soil and mechanical inoculation (Nairand Nene, 1973; Ahmad and Harwood, 1973). The
effect of disease varies with cultivar to cultivar and
is subjected to the genetic make up of the cultivar.The present study reports the results on the
quantitative determination of the effect of MYMV
disease on the yield and yield components of the
susceptible F3 progenies from the cross of a localMYMV resistant variety NM 92 and an exotic
MYMV susceptible accession VC 1560D.
MATERIALS AND METHODS
Fourteen F3 MYMV susceptible progeniesresulting from a cross of NM 92 x VC 1560D along
with the MYMV susceptible parent VC 1560D
were planted in a randomized complete block designin three replications at Nuclear Institute for
Agriculture and Biology, Faisalabad – Pakistan
during summer 1997 in two sets of trial. Theprogenies were planted in 2 m long, 2 rows per plot
with 30 and 10 cm distances between rows and
pants respectively. Of the two sets of trials, one wasprotected from whiteflies invasion and hence from
MYMV infection, by spraying insecticide Polo at
the rate of 250 ml/ha at five days interval from 15th

day of sowing. The second trial was subjected tonatural invasion of white flies. The epiphytotic
conditions were created by planting mung kabuli
(MYMV susceptible check) around and in the trialafter each entry as a spreader for MYMV disease
inoculum to the vector (whitefly). Both the trials
were planted at a distance from each other tomaintain the ideal conditions of each trial.
The MYMV disease infection was recorded
in percent at the peak of the disease on the basis ofwhole plot in each replication from unprotected
(diseased) trial. At physiological maturity five plants
from each plot in each replication of protected(healthy) and unprotected (diseased) trial were
randomly selected and data were recorded for plant
height, pods per plant, pod length, seeds per pod,1000 seed weight and grain yield per plant. The
decrease over control in percent was calculated for
each character by the following formulla:
Decrease over control (%) =
Pr otected plot value – Unprotected plot value
Protected plot value×100
The analysis of variance of all the charactersand correlation coefficient between the MYMV
incidence and decrease in yield and yields
components were performed on microcomputerusing MSTATC Software.
RESULTS AND DISCUSSION
All the entries in both sets of trial were
found significantly different from each other for allthe characters (Table 1) Effect of MYMV infection
on yield and yield components of F3 susceptible
progenies of mungbean varied greatly (Table 2).All the entries were invariably affected by virus
infection and suffered 18.5 to 82.2 percent in seeds
per pod. Pod length, though much less affected,suffered from 7.4 to 35.0 percent decrease. The
seed size and grain yield per plant suffered from
10.6 to 52.3 percent and 32.2 to 78.6 percentreduction respectively. Singh (1981) reported the
disease to cause considerable reduction in growth
components and upto 38.2 percent reduction inplant height of mungbean. Chand and Verma (1983)
Table 1 Mean square values from ANOVA of yield and yield components of F3 progenies of mungbean
evaluated in two sets of trial.
SOV Disease Plant Pods per Seeds per Pod length 1000 seed Grain yield
incidence height plant pod (cm) wt (g) per plant(%) (cm) (g)
Protected
Rep. - 1.48NS 1.98* 0.02NS 0.31NS 3.56* 0.17
Ent. - 57.75** 23.22** 1.27** 1.31** 71.93** 5.27**
Error - 2.27 0.53 0.05 0.15 0.63 0.59
Unprotected
Rep. 1.63NS 0.91NS 0.46NS 0.17NS 0.08NS 0.15NS 0.05NS
Ent. 89.08** 78.44** 49.62** 0.94** 0.79** 67.98** 2.92**
Error 5.38 0.63 0.47 0.06 0.05 1.10 0.27
*,** = Significant at P<0.05 and 0.01 respectively.
NS = Non significant.
Kasetsart J. (Nat. Sci.) 34 (1) 13

14 Kasetsart J. (Nat. Sci.) 34 (1)
Tab
le 2
MY
MV
inci
denc
e (%
) an
d de
crea
se o
ver
cont
rol (
%)
of y
ield
and
yie
ld c
ompo
nent
s du
e to
MY
MV
in m
ungb
ean
F3 p
roge
nies
.
Ent
/D
isea
sePl
ant h
eigh
tPo
d le
ngth
Seed
s/Po
dPo
ds/P
lant
1000
see
d w
eigh
tG
rain
yie
ld/P
lant
Prog
eny
inci
denc
e(c
m)
(cm
)(g
)(g
)
(%)
H. p
lant
sD
. Pla
nts
Dec
reas
eH
. pla
ntD
. Pla
nts
Dec
reas
eH
. pla
ntD
. Pla
nts
Dec
reas
eH
. pla
nts
D. P
lant
sD
ecre
ase
H. p
lant
D. P
lant
sD
ecre
ase
H. p
lant
D. P
lant
sD
ecre
ase
over
over
over
over
over
over
cont
rol
cont
rol
cont
rol
cont
rol
cont
rol
cont
rol
(%)
(%)
(%)
(%)
(%)
(%)
1.58
.0fg
63.1
cde
50.8
a19
.58.
1f7.
0cde
13.6
6.9e
6.5e
fg5.
827
.9a
10.2
ef63
.446
.9g
40.5
cde
13.6
10.2
ef3.
3efg
67.6
2.68
.0de
61.8
de48
.6b
21.4
8.1f
7.5b
7.4
8.3d
7.0b
cd15
.722
.3de
19.0
a14
.842
.4h
37.9
fg10
.68.
7g5.
9a32
.2
3.65
.7e
56.8
f40
.9f
28.0
9.1d
e6.
8de
25.3
8.7c
d6.
6def
24.1
21.9
e17
.5b
20.1
52.7
e41
.4cd
21.4
11.5
abcd
e4.
7bcd
59.1
4.66
.3e
61.9
de36
.8h
40.5
9.0d
e7.
2bcd
20.0
8.7c
d6.
5efg
25.3
22.1
e10
.4ef
52.9
50.2
f37
.9fg
24.5
10.1
efg
3.1f
g69
.3
5.66
.0e
56.6
f39
.0g
31.1
8.4e
f7.
0cde
16.7
8.3d
6.3f
g24
.121
.7e
12.9
d40
.654
.2d
42.1
c22
.311
.0cd
ef3.
5ef
68.2
6.71
.3cd
56.9
f36
.4h
36.0
8.8d
e6.
8cde
22.7
8.6d
6.9c
d19
.818
.4g
11.4
e38
.054
.7cd
44.3
b19
.08.
8g3.
5ef
60.2
7.72
.0cd
67.9
a44
.5d
34.5
9.5b
cd6.
8cde
28.4
9.1b
6.1g
hi33
.027
.2a
9.8f
64.0
46.6
g37
.4gh
19.7
11.7
abcd
2.5g
78.6
8.75
.0bc
56.7
f39
.4g
30.5
8.8d
e6.
8cde
22.7
8.5d
6.3f
gh25
.925
.9b
10.3
ef60
.251
.7e
40.2
de22
.211
.5ab
cde
3.2f
g72
.29.
57.7
fg60
.6e
49.4
b18
.59.
4cd
7.2b
cd23
.48.
5d6.
8de
20.0
23.8
c18
.4ab
22.7
42.8
h35
.3i
17.5
9.7f
g3.
8def
60.8
10.
56.3
g62
.0de
39.8
fg35
.89.
1de
8.2a
9.9
9.3a
b7.
3abc
21.5
24.6
c18
.5ab
24.8
47.5
g39
.1ef
g17
.711
.2bc
de3.
8def
66.1
11.
61.4
f51
.8g
39.2
g24
.310
.1ab
8.2a
18.8
9.0b
c7.
4ab
82.2
23.5
cd18
.2ab
22.6
49.5
f35
.7hi
27.9
12.3
abc
5.2a
b57
.712
.71
.6cd
66.3
ab49
.9ab
24.7
8.9d
e6.
8cde
30.9
9.3b
5.9h
i36
.621
.4e
18.9
a11
.755
.6bc
39.5
ef29
.012
.9a
5.1a
bc60
.5
13.
77.1
ab65
.4ab
c46
.1c
29.5
10.3
a6.
7e35
.09.
7a5.
7i41
.220
.1f
14.9
c25
.956
.6ab
45.9
ab18
.912
.6ab
4.2c
de66
.7
14.
54.1
g62
.6de
49.1
b21
.69.
9abc
7.2b
c27
.39.
3ab
6.1g
hi34
.418
.7g
8.3g
55.6
55.9
bc46
.7a
16.5
10.7
def
2.5g
76.6
VC
1560
D80
.0a
64.2
bcd
42.8
e33
.39.
1de
7.9a
13.2
9.1b
7.6a
16.5
21.9
e18
.1ab
17.4
57.4
a27
.4i
52.3
12.7
a3.
7def
70.9
(Par
ent)
H-H
ealth
y D
-Dis
ease
d

Kasetsart J. (Nat. Sci.) 34 (1) 15
reported that mungbean cultivars might suffer 66.6percent decrease in plant yield and 25.7 percent
decrease in 1000 seed weight due to MYMV. Ayub
et al. (1989) reported reduction upto 91.6, 24.7,56.6 and 80.2 percent for pod number, pod size,
seed/pod and plant yield respectively in mungbean.
The variation in the effect of MYMV onyield and yield components among the F3 progenies
in the present study may be explained on the basis
of differences in the genetic make up of the progeniesresulting from new recombinations due to crossing
over of the genetic material during meiosis. The
variation may also be expected on the basis of earlyor late infection of the cultivars, as early and
severely infected plants usually bear much number
of pods while latter infection has been reported todelay plant maturity and yield (Singh, 1980, Singh
et al. 1982).
The decrease in yield and yield componentswas positively correlated with MYMV incidence
(Table 3) indicating that the MYMV disease affected
each component and decreased yield as well.Decrease in 1000 seed weight showed highest
significant correlation coefficient (0.526) with
MYMV disease amongst all the yield components.
This adverse effect of MYMV incidence on 1000seed weight might be the main cause of decrease in
yield. Yohe and Poehlman (1975) also reported
significant and negative correlation between virusscore and yield and yii $ components.
LITERATURE CITED
Ahmad, M. 1975. Screening of mungbean (Vigna
radiata) and urdbean (Vigna mungo)germplasm for resistance to yellow mosaic
virus. J. Agri. Res. 13(1): 349-354.
Ahmad, M. and R.F. Harwood. 1973. Studies onwhitefly-transmitted yellow mosaic disease of
cowpea (Vigna unguiculata). Plant Dis. Rep.
62 : 224-226.Ayub, M.A., M.B. Ilyas, and M.A.R.Bhatti. 1989.
Growth responses of mungbean cultivars to
mungbean yellow mosaic virus infection. Pak.J .Phytopath. 1 (1-2) : 38.
Chand, P. and J.P. Verma. 1983. Effect of yellow
mosaic on growth components and yield ofmungbean and urdbean. Haryana Agri. Univ.
J. Res. 13(1) : 98-102.
Chenulu, V.V. and A. Verma. 1988. Virus andvirus like diseases of pulse crops commonly
grown in India, pp. 338-370. In B. Baldev,
S.Ramajunam, and H.K. Jain (eds.). PulseCrops, New Delhi, Oxford and IBH.,
Nair, N.G. and Y.L. Nene. 1973. Studies on the
yellow mosaic of urdbean (Phaseolus mungo
L.) caused by mungbean yellow mosaic virus.
2. virus-vector relationships. Indian J. Farm
Science 1: 62-70.Singh, B.R., M. Singh, M.D. Yadav, and
S.M.Dinghra. 1982. Yield loss in mungbean
due to yellow mosaic. Sci. and Culture 48 (12): 435-436.
Singh, J.B. 1981. Effect of viruses on growth
components and yield of mungbean (Vigna
radiata) and urdbean (Vigna mungo). Indian
Table 3 Correlation between disease (MYMV)
incidence and decrease in yield and yield
components due to MYMV in mungbeanF3 progenies.
Character Disease (MYMV)
incidence
Plant height 0.434
Seeds per pod 0.024Pod length 0.254
Pods per plant 0.149
1000 seed wt. 0.526*
Grain yield per plant 0.033
* = Significant at P<0.05

16 Kasetsart J. (Nat. Sci.) 34 (1)
Phytopath. 33(7): 405-408.Singh, R.N. 1980. Natural infection of bean by
mungbean yellow mosaic virus. Indian J.
Mycol. and Pl. Pathol. 9(1) : 124-126.Yohe, J.M. and Poehlman. 1975. Regressions,
correlations, and combining ability in
mungbeans (Vigna radiata (L.) Wilczek). Trop.Agric. Trinidad. 52(4) : 343-352.
Received date : 25/11/98Accepted date : 28/06/99

Kasetsart J. (Nat. Sci.) 34 : 17 - 24 (2000)
Growth Period of Aquatic Plants for Birds Nestingat Bung Borapet, Nakhon Sawan
Suchada Sripen1, Obhas Khobkhet2, Sumon Masuthon1 and Sunanta Supanuchai3
ABSTRACT
Studies on the growth period of aquatic plants that were to be nested by birds was undertaken at BungBorapet, Changwat Nakorn Sawan. It was found that the minimum densities of various plants for bird
nesting were different and depended on nesting conditions. Salvinia cucullata Roxb., Potamogeton
malaianus Miq. and Pheudoraphis spinescens Vickery with density of 267, 203 and 229 g m-2were usedfor nesting by Hydrophasianus chirurgus, respectively. While Porphyrio porphyrio, Porzana cinerea and
Ixobrychus cinnamoneus preferred to nest over the water level, therefore, Eichhornia crassipes (Mart.)
Solms, Pheudoraphis spinescens Vickery, Typha angustifolia L. and Nelumbo nucifera Gaerth with thedensities of 1,050, 464, 4,133 an 886 g m-2 were utilized, respectively. Growth period requirements of
aquatic plants also differed accordingly to plant species and environmental factors. Pseudoraphis
spinescens required the longest period of 11-15 months, whilst Potamogeton malaianus required theshortest period of 5 months. Whereas, Eichhornia crassipes, Nelumbo nucifera and Typha angustifolia
required the period of 6 months, Salvinia cucullata required 7 months. The physical and chemical quality
of the water obtained from Bung Borapet were found suitably for all common aquatic plants in thefollowing ranges : depth of 135-345 cm, water transparency of 57-182 cm., temperature of 27.5-29.2 °C,
DO of 2.9-5.2 mg/l, B.O.D. of 2.1-3.1 mg/l, alkalinity of 95.2-108.9 mg/l, pH of 7.2-7.8. The average
amounts of base nutrient, nitrate, phosphate and potassium were 0.16, 0.01 and 3.9 mg/l, respectively. Theground-table soil was characterized as clay with the pH of 5.1 and 1% organic matter.
Key words : growth period, aquatic plant, bird nesting, Bung Borapet
INTRODUCTION
Bung Borapet is a big source of fresh water
of Nakhon Sawan province and also of the central
region of Thailand. This fruitful swamp is servedfor the fresh fishery development center and for the
source of fishery cultures. With the great density of
various aquatic plants, the swamp is characterized
to be the suitable habitat and nesting of several
birds, and has been notified as the animal forbiddenarea since 1975. Results from the great density of
various aquatic plants has led to the sedimentation
and more shallowness. To solve this problem, theDepartment of Fishery launched the project for
water drainage and area renovation during February
to October, 1992. This caused an ecology change in
1 Department of Botany, Faculty of Science, Kasetsart University, Bangkok 10900, Thailand.2 Department of Forest Biology, Faculty of Forestry, Kasetsart University, Bangkok 10900, Thailand.3 Kongtong School, Department of General Education, Ministry of Education, Bangkok, Thailand.

18 Kasetsart J. (Nat. Sci.) 34 (1)
the lost of a number of aquatic plants along with themore impact of severely weeds such as
Pseudoraphis spinescens. This ecological change
also had impact to several aquatic plants requiredfor bird nesting.
Recently, a number of aquatic plants in
Bung Borapet has declined progressively accordingto the report of 73 species identified (Sripen, 1979)
to 46 species (Plordprasop, 1982). After the swamp
drainage in 1992 and re-reservoir, the Division ofFresh Fishery reported for the only remaining 32
species. Suchada (1987) pointed out that factors
influencing the growth of aquatic plants including,the water depth level, light, water transparency,
temperature, gases content, and the chemical
component of minerals and compounds. Otherfactors affecting the distribution of aquatic plants
were wind, water level, rainfall, and the competition
among the plants (Amornrat, 1984). Study onnesting and laying behavior of birds in Bung Borapet
(Siriporn, 1983) revealed more than 10 species : 1
species in the area of water-level aquatic plants, i.e.
Hydrophasianus chirurgus ; 5 species in the area of
emerged aquatic plants, i.e. Hydrophasianus
chirurgus, Dendrocygna javanica, Metopidius
indicus, Ixobrychus cinnamoneus, and Ixobrychus
sinensis ; 6 species in the area of sedges, i.e.
Ixobrychus cinnamoneus, Ixobrychus sinensis,Dupetor flavicollis, Dendrocygna javanica, and
Gallicrex cineru ; 3 species in the area of aquatic
forest, i.e. Ixobrychus cinnamoneus, Dendrocygna
javanica, and Porzana cinerea. Wildlife
Conservation Division (1983) reported 11 species
of birds that required nesting materials from theaquatic plants, i.e. Salvinia cucullata, Nelumbo
nucifera, Scirgus grossus , Eichhornia crassipes,
Typha angustifolia and Pheudoraphis spinescens.Obhas (1991) found more than 107 species of birds
in the Bung Borapet, those that nested only around
the edge of the swamp were about 14 species. Mostof the birds mest in rainy season during July. This
indicated the significance of aquatic plants onnesting behaviors, particularly the water birds. The
objectives of this study were, therefore, to determine
the effects of growth period and density of particularaquatic plants on bird nesting behaviors in the
Bung Borapet, and to evaluate the factors
influencing the growth of water birds, i.e. physicaland chemical properties of water and ground-table
soil of the swamp. The information obtained,
particularly on the elementary biology, will be veryuseful and can be exploited for area management to
facilitate further development correspondingly with
the maximized preservation of resources andenvironment with less disadvantage.
MATERIALS AND METHODS
The aquatic plants nested by the birds at Bung
Borapet were utilized in the study were :1. Cuculate salvini, Salvinia cucullata Roxb.
2. Deepreenam, Patamogeton malaianus
Miq.
3. Narrow leaved Typha angustifolia L.
cattail,
4. Water hyacinth, Eichhornia crassipes (Mart)
Solms
5. Sacred lotus, Nelumbo nucifera Gaerth.
6. Yak preak nam, Pseudoraphis spinescens
Vickery.
The birds studied at Bung Boraphet were :-
1. Nok E Jaew Hydrophasianus chirurgus
2. Nok E Koang Porphyrio porphyrio
3. Nok Unchun Porzana cinerea
Kue Khao4. Nok Yang Fai Ixobrychus cinnamoneus
Thummada
5. Nok Yang Fai Ixobrychus sinensis
Hua Dum
6. Nik Yang Dum Dupetor flavicollis
7. Nok Ped Dang Dendrocygna javanica
8. Nok Prik Metopidius indicus

Kasetsart J. (Nat. Sci.) 34 (1) 19
Density of bird nesting aquatic plantsOn the area of the swamp where bird nesting
could be observed, the 1 × 1 quadrat was used for
the collecting of sampling aquatic plants, i.e. S.
cucullata, E. crassipes, P. malaianus, N. nucifera,
T. angustifolia, and P. spinescens. Sampling plants
were then determined for fresh and dry weight, anddensity (biomass) per m2. In all cases, maximum
number of practical samplings were suggested.
Growth period of bird nesting aquatic plantsThree plots of the size 2 × 2 m were assigned
for each of the investigated floating aquatic plants,i.e. S. cucullata and E. crassipes. For the submerged
and emergent aquatic plants such as P. malaianus,
N. nucifera, and T. angustifolia, a plot size of 5 × 3m was assigned for each plants. All aquatic plants
were allowed for their natural growth and then
samplings were executed by using a 1 × 1 mquadrat. Sampling plants were analyzed for fresh
and dry weight as well as the density at monthly
interval. For the P. spinescens, only the naturallywell growth plot of the size 5 × 3 m was selected to
determine for growth change at monthly interval
using the same sampling method.The data observed for plant density (per m2)
of each plant were compared for the growth period
that in turn was suitable for bird nesting accordingto the method indicated.
Water quality of the swampThe Van-dron water sampling tube was
used for the collecting of sampling water from 4
sites of the Bung Borapet. These sites were assignedfor the evaluation of the amount of water soluble
oxygen, B.O.D. value, pH, nitrate (NO3-N),
phosphate (PO4-P) and potassium (K) using theStandard Method (Swingle, 1969). The pH value
was measured wiith pH-meter. The values of water
transparency and depth were obtained through theSecchi dich. Temperature was measured with
thermometer. Data were collected at monthlyinterval for the period of 12 months from May 1993
to April 1994.
The study was conducted on the area ofinternal edge of the Bung Borapet, Nakhon Sawan
Province. Four sites were selected for sampling of
the water swamp. The first site was the outlet ofwaterway close to the Fresh Water Fisheries
Development Center, Amphur Muang, Changwat
Nakhon Sawan. The second site was at the center ofthe Bung Borapet, Ban Kloe Ta Seng. The third site
was at the first inlet of waterway, Klong Bon, Ban
Panomset while the fourth site was the second inletof waterway, Klong Huayhin, Amphur Tha Ta Ko.
In addition, plot layout for the growth study
of the aquatic plants was assigned at the center ofthe Bung closely to the Bung Borapet Conservation
Section, Ban Kloe Ta Seng.
RESULTS AND DISCUSSION
Density of bind nesting aquatic plantsThe results from the study on density of the
plants that birds can nest was calculated as the
relative density to the dry weight m-2 basis (Table1 and Table 2). It was found that density of each
plant differed greatly depending upon the condition
of nesting behavior of different birds. Those nestingat the water level, e.g. H. chirurgus, preferred not
much dense materials such as S. cucullata at the
lowest density of 267 g m-2, P. malaianus of 203g m-2 and P. spinescens of 229 g m-2. For birds
nesting over the water level, i.e. P. porphyrio, P.
cinerea, I. cinnamoneus, I. sinensis, and M. indicus,required the more dense materials such as E.
crassipes, P. spinescens, and T. angustifolia, at the
densities of 1,050, 454 and 4,133 g m-2, respectively.In case of N. nucifera, most of the birds did not
require to nest directly but preferred the leaves that
floated at the water level and over the water levelfor hiding or supplementing nesting materials. The

20 Kasetsart J. (Nat. Sci.) 34 (1)
Table 1 Species of aquatic plants and species of birds living on the plants at Bung Borapet.
Aquatic plants Bird species
1 2 3 4 5 6 7 8
S. cucullata + + +
E. crassipes + + + + +P. malaianus + + +
T. angustifolia + + + + +
N. nucifera +P. spinescens + + + + + +
1. H. chirirgus
2. D. flavicollis
3. P. porphyrio
4. P. cinerea
5. I. sinensis
6. I. cinnamoneus
7. D. javanica
8. M. indicus
Table 2 The biomass (gm/m2) of some aquatic plants that birds can nest at Bung Borapet, Nakhon Sawan.
Aquatic plant Sample 1* Sample 2 Sample 3 Average
Salvinia cucullata Roxb. 267* 320 389 325.3
Eichhornia crassipes (Mart.) Solms 1,050* 1,225 1,365 1,213.3Potamogeton malaianus Miq. 203* 240 285 242.7
Nelumbo nucifera Gaertn 886* 1,064 1,132 1,027.3
Typha angustifolia L. 4,133* 5,227 5,887 5,075.6Pheudoraphis spinescens Vickery1 229* 264 321 271.3
Pheudoraphis spinescens Vickery2 454* 543 678 561.7
1 = nesting at the water level
2 = nesting over the water level* = lowest density of aquatic plants that birds can nesting
clump of this plant that birds preferred wouldnormally have the emergent leaves at the density at
least 886 g m-2.
Moreover, the requirement of more suitablenesting materials was considered, e.g. for the ability
of supporting the weight of bird’ s egg and body.
For example, H. chirurgus, G. cinerea, andD.flavicollis preferred to nest a rough one on the
cluster of S. cucullata, P. malaianus, or the decayed
plants and laid their eggs over the water level. Bycontrast, P. porphyrio preferred to nest over the
water level in the area of dense aquatic plants and

Kasetsart J. (Nat. Sci.) 34 (1) 21
hided their nests in the clump of E. crassipes orbeneath the leaves of N. nucifera. This place of
nesting would be very secure in preventing of not
to be dispersed easily by wind and swamp water. Itwas also noticed that birds might use different
nesting materials, e.g. in the past, H. chirurgus use
S. cucullata to build up 2-3 layers of the nest(Division of Wildlife Conservation, 1983). But
today, the birds preferred more to nest on the dead
clump of P. malaianus and P. spinescens at thewater level.
Growth period of bind nesting aquatic plantsThe growth period of S. cucullata, E.
crassipes, P. malaianus, N. nucifera, and T.
angustifolia in Bung Borapet through theobservation of dry weight (g m-2) and the ecological
change of aquatic plants after the re-reservoir of the
swamp water since January 1993 to April 1994,indicated that growth period of each plant required
for bird nesting differed significantly depending on
plant species and environmental conditions. P.
malaianus required the shortest period of 5 months,
whilst, E. crassipes, N. nucifera and T. angustifolia
required 6 months. The other, S. cucullata required7 mouths and P. spinescen required 11-15 mouths.
It was then considered that at the time of study, the
swamp condition was probably most suitable forthe growth of P. malaianus.
The average of water level of 229 cm over
the year would be best suitable for the growth of P.
malaianus (Chanpen, 1983). The average of water
transparency was relatively high of 113 cm due to
rainfall and less removal of the alluvium causingfull light of this plant. On the contrary other aquatic
plants e.g. S. cucullata and E. crassipes that were
mixed with N. nucifera or algae had faster earlygrowth stage than those of the loose clumps. Yet
lower growth rate was noticed at the later stage of
growth due to shading of the above water levelleaves of N. nucifera. Besides the annually growth
habit, growth period of the aquatic plants in BungBorapet was influenced by the infestation of the
insect larvae in the family Noctuidae. The larvae
preferred to maintain feeding on the emergentleaves and the reproductive parts of the plants
causing death of the aquatic plants. This type of
ecosytem change occurs at leat once a year duringAugust to September.
In case of P. spinescens, the study was
emphazied on growth change of the plantspredominating over the swamp at the time of water
drainage and commencing of re-reservoir of the
water. Well growth of the plants at the early stagewas noticed correspondingly with plant elongation.
Thereafter, the growth declined due to no longer
adaptation to the very long period of submergence.At the time of this study, it was noticed that the
birds began to use P. spinescens for nesting in 2
types, the one at the water level and that over thewater level. And the birds, espectially H. chirurgus,
preferred to use more P. spinescens than in the past.
Water quality of the swampDetailed study in both physical and chemical
water qualities through the analyses of samplingwater from the 4 designated sites revealed that the
Bung Borapet water was characterized to be suitable
for normal growth and the living of most animalsand plants (table 3). The average of water level over
the year was 135-345 cm and none of any adverse
effects on the classified layers of water temperaturewas detected. The average of 113 cm of water
transparency was considered as relatively clear
water. The 28.5oC mean temperature was claimedto be optimal range for the growth of living
organisms in the swamp. Water soluble oxygen
(D.O.) content at the average of 4.4 mg/l was alsodenoted in the optimal range (Swigle, 1969). Except
that of the second inlet of the waterway where a
relatively lower value of 2.9 mg/l was observed dueto severe waste water release from houses located

22 Kasetsart J. (Nat. Sci.) 34 (1)
around the edge of the swamp correspondingly
with the high density of aquatic plants. B.O.D
value of the swamp averaged 2.6 mg/l eventhougha high value of 3.1 mg/l from the second inlet of the
waterway was detected. Hence, the swamp water
was considered acceptably and was not claimed tobe waste water according to the standard B.O.D.
value in the range of 1.5-4.0 mg/l given for the
ground–surface soil water quality (Division ofEnvironmental Quality Standard, 1991). The
average of pH was 7.5. The average of base nutrients
was 102.5 mg/l. The average amount of nitrate,phosphate and potassium were 0.16, 0.01 and 3.9
mg/l, respectively. The amount of swamp nutrients
was acceptably in the case of being natural waterresource, but was considered relatively low in the
sense of plant water quality causing poor growth of
the plants. The porn bottom soil of the swamp wasclassified as clay with relatively low organic matter
of 1%. In addition, poor growth of the submerged
plants was also denoted.According to the Bung Borapet
Development Project, the processes of water
drainage, the clean out of the pond bottom soil, andthe drying out of the ground-surface wamp would
result in the marked change of the ecosystem
towards the drought prone area. These would reflect
directly to the growth of a number of aquatic plants
in quantity and species. In addition, indirectinfluence was noticed for animals that required
those plants. The authors would suggest the
modified methods of water drainage that mighthave less adverse effects on the ecosystem of the
swamp, at the same time would serve the maximum
objectives of the project as follows :1. No fully water drainage at once is strongly
recommended to avoid the severe effects on
aquatic plants. At the same time, sequential zonesfor step further development should be designed.
For instance, the water drainage at certain zone
planned for the development will be use for aquaticanimal preserve or serve as the preservation area of
the living and nesting birds. This can be done
through the preserve of the area in the way whichcauses less ecosystem change along with other
developmental processes.
2. Long period of drying out of the ground-surface should be avoided to prevent the lost of
tuberous aquatic plants. At the same time some
inland weeds such as P. spinescens would disperseover the swamp. This weed was considered to be
one of the noxious weeds due to the tolerance to
Table 3 Chemical and physical properties of water at Bung Borapet.
Depth 135 – 345 cm 240 cm
Water Transparency 57 – 182 cm 113 cmTemperature 27.5 – 29.5 °C 28.5 °C
pH 7.2 – 7.8 7.5
D.O. 2.9 – 5.2 4.4B.O.D. 2.1 – 3.1 2.6
Base nutrient
- nitrate 0.16 mg/l- phosphate 0.01 mg/l
- potassium 3.9 mg/l

Kasetsart J. (Nat. Sci.) 34 (1) 23
either drought and submerge area in the swamp.Moreover, the weed grows and disperses quickly,
therefore is difficult to control. After the re-reservoir
of the swamp water, some of this weed would diecausing bad smell and the shallowness of the swamp.
It is suggested that water drainage should commence
in dry season from December when the water levelis certainly low. The clean up of the pond bottom
soil must complete prior to the coming rainy season.
Supply of water in the early stage of re-reservoir isessentially to allow the period that all aquatic plants
can grow well since June which is the time that bird
nesting could commence at least 3-4 months earlierthan usual.
CONCLUSION
The conclusion of the studies could be drawn as
follows :1. A study on density of the aquatic plants
that birds can nest revealed the lowest density of
each plant to be differed according to therequirement of different birds. All birds apparently
preferred N. nucifera as hiding place or for a
supplemented nesting materials at the lowest densityof 886 g m-2.
2. The growth periods of the aquatic plants
that birds can nest differed greatly depending onplant species and environmental conditions. Birds
could nest in 2 types : the one over the water level
at the period of 11 months and, that of the waterlevel at 15 months. For aquatic plants mixed with
N. nucifera or algae would grow well in the early
stage due to the better and firmly clumps of theplants. But later, poor growth was denoted due to
the shading effects of the leaves of N. nucifera.
3. Results from the analyses of physicaland chemical qualities revealed the swamp water to
be acceptable for normal standard of the living
organisms.4. The competition of soil at the ground-
surface level of the swamp was characterized asclay with pH 5.1 and 1% of organic matter.
LITERATURE CITED
Amornrat Sermwattanakul. 1984. Dispersal of the
aquatic plants and their related animals inBung Borapet, Nakhon Sawan. M.S. thesis,
Kasetsart University, Bangkok. (In Thai)
Chanpen Praklongwong. 1983. Study on thebotanical of Potamogeton malaianus Miq. at
Bung Borapet. M.S. thesis, Kasetsart
University, Bangkok. (In Thai)Division of Environmental Quality Standard. 1991.
The Water Quality Standard in Thailand. Office
of the Environmental Policy and PlanningCommittee, Bangkok. 135 p. (In Thai)
Division of Fresh Water Fisheries. 1992. The Survey
of Biofishery in Bung Borapet during thePeriod of Water Preservation. Department of
Fisheries, Ministry of Agriculture and Co-
operative, Bangkok. 79 p. (In Thai)Obhas Kobket. 1991. The White-eyed River Matin
and other birds in Bung Borapet. Royal Institute
Journal 17(1) : 19-35. (In Thai)Ploadprasop Suraswadi. 1983. The Improvement
and Development of Bung Borapet. Additional
study in 1982-1983. The Institute of SocialScience, Chulalongkorn University, Bangkok.
131 p. (In Thai)
Siriporn Tongaree. 1983. Study on bird nesting andlaying in the area of Bung Borapet. M.S.
Special Problem, Kasetsart University,
Bangkok. (In Thai)Suchada Sripen. 1987. Aquatic Plants. Department
of Botany, Faculty of Science, Kasetsart
University, Bangkok. 233 p. (In Thai)Sripen, S. 1979. Study on the Aquatic Weeds at
Borapet Lake, p. 385. In Proceeding 7th Asia
Pacific Weed Sci. Soc. Conf., Sydney,Australia.

24 Kasetsart J. (Nat. Sci.) 34 (1)
Swingle, H.S. 1969. Method of Analysis for WaterOrganic Matter and Pond Bottom Soils Used
in Fisheries Research. Auburn University,
Alabama. 119 p.Wildlife Conservation Division. 1983. Study on
the population and nesting laying of the birds
in the forbidden area of Bung Borapet, Nakhon
Sawan. Department of Forestry, Ministry ofAgriculture and Co-operative, Bangkok. 85 p.
(In Thai)
Received date : 18/10/99Accepted date : 29/12/99

Kasetsart J. (Nat. Sci.) 34 : 25 - 29 (2000)
Study of Dropping Speed in Eggs of Oncomelania hupensis,a Snail Intermediate Host of Schistosomiasis
Xingjian Xu,1 Xianxiang Yang,1 Xiapin Li,1 Wei Zhang,2
Qingsang Pan2 and Zhengan Xiong2
ABSTRACT
Oncomelana hupensis (Gredler, 1881) is an intermediate host of Schistosomiasis japonica in China.
In order to understand the factors controlling sedimentation and drifting of adult snails and snail eggs in
rivers, three aspects were investigated by experiment. Firstly, the specific gravity of the snail eggs whichwas found to be 2.29 g/cm3 ; secondly, the range of dropping speed of the snail eggs through a water column
which was found to be 1.19 to 3.77 cm/s; thirdly, a formula to determine dropping speed of the eggs was
established. The formula was statistically validated by comparison with observed values. The results arerelevant to both the development and design of irrigation schemes, and also to river management, where
dispersal of snails and their eggs needs to be controlled.
Key words : dropping speed, Oncomelania hupensis, snail eggs
1 Hubei Institute of Schistosomiasis Control, Wuhan 430070, The People’s Republic of China.2 Science Institute of Yangtze River, Water Conservancy Commission of Yangtze River, Wuhan, The People’s Republic of China.
INTRODUCTION
Schistosomiasis is now endemic in 74countries and territories of the world and
Schistosoma japonica is mainly distributed in
Southeast Asian and the Western Pacific Region(WHO, 1991). One of the most difficult problems
for schistosomiasis control is the dispersal of the
snail intermediate host along rivers and irrigationschemes. This dispersal expands the endemic areas
of schistosomiasis and increases the prevalence of
the disease (Hunter, 1993; Mott, 1990). It isimportant, therefore, to explore methods for
controlling the snail host. The ecology of the water
snails in relation to water flow has been well-researched and some effective models have been
proposed (Dussart, 1987; Yin et al., 1987; Bolton,
1988; Xu and Fang, 1989; Yang et al., 1992; Green
et al., 1992).
S. japonica is mainly distributed in eightprovinces in the southern part of China, with foci in
five provinces along the middle and lower reaches
of the Yangtze River (MPH, 1991; Mao, 1990).Oncomelania hupensis, the intermediate snail host
of S. japonica, is mainly distributed on banksides
of rivers, ditches and irrigation schemes throughoutthe flood plain and the snail habitats are increasing
year by year. The disease seriously threatens farming
and the daily life of local people, and also affectsthe socioeconomic development of these areas
(MPH, 1989; Chen, 1989; Xu and Fang, 1990).
Thus, snail control is one of the most importantfactors for disease control. To understand the
parameters which might control the drifting and

26 Kasetsart J. (Nat. Sci.) 34 (1)
dropping of snails and their eggs in rivers, theexperiments on specific gravity and dropping speed
for the adult snails have been carried out (Xu et al.
1996). The aim of present study was to carry outmeasurement on the specific gravity and dropping
speed for the eggs of O. hupensis, to contribute to
the development of a solid basis for the preventionof snail dispersal.
MATERIALS AND METHODS
Snail eggs were obtained from snail habitats
in Han Yang county in Hubei province at the end ofApril 1997. Adult snails were collected and put in
a bowl of mud at 25 °C for 15 days. After two
weeks, the snails were removed and snail eggswere washed from the surface of the mud in the
bowl. All eggs selected for measurement were in
the primitive gut embryonic stage. A 25 ml specificgravity flask was used to determine specific gravity.
Dropping speed was measured in a water-filled
glass tube of 160 cm in length and 4.5 cm indiameter, in which a water column of 130 cm
length was available to observe the eggs dropping.
Measurement of the specific gravity of the snaileggs was carried out in accordance with the routine
measurement method for the determination of
specific gravity of river silt in China of Sha (1963).The snail eggs washed from the mud bowl
were collected by suction tube in a tissue culture
dish 9 cm in diameter. The snail eggs were weighedand separated on Whatman’s No. 4 filter paper for
8 h to absorb excess surface water from the eggs.
The flask containing the eggs was put into adesiccator for 8 h to continue the drying process.
The snail eggs were weighed, placed in a graduated
flask and made up to 25 ml; the flask was then filledwith distilled water and shaken gently before being
weighed on a balance. Thus the weight included
graduated flask, the snail eggs and distilled water.The distilled water and snail eggs were then
discarded from the flask. The flask was dried insideand outside, distilled water was added to the level
of 25 ml and the flask was weighed again; thus the
weight included only graduated flask and distilledwater.
The following formula was used to calculate
the specific gravity of the snail eggs :SGe = ge / ge + g1 – g2 * SGH2Owhere,
SGe = Specific gravity of the snail eggs. (g/cm3)
ge = Weight of the snail eggs (g)
g1 = Weight of flask plus distilled water (g)g2 = Weight of the snail eggs plus flask and
distilled water (g)
SGH2O = Specific gravity of distilled waterat 4 °C (g/cm3)
Measurement of dropping speed of snaileggs in stable water. The diameter of each snailegg was measured under the microscope. The egg
was put into the 160 cm glass tube and dropping
speed was measured directly (MWE, 1965).Establishment and deduction of formula
for dropping speed of snail eggs. The formula for
snail eggs dropping speed in stable water was basedon the established principle for measuring the
dropping speed of a round object (Qian and Wan,
1983). The difference between the theoreticallypredicted and the measured values was statistically
investigated.
RESULTS
Specifix gravity of snail eggs. The meanspecific gravity was 2.29 ± 0.0162 g/cm3, ranging
from 2.25 to 2.33 g/cm3.
Dropping speed of the snail eggs. Thediameter of each of 84 snail eggs was measured; 74
eggs had shapes which resembled a spherical pill.
The range of diameter of the snail eggs was 0.43 to0.83 mm; the dropping speed of the snail eggs was

Kasetsart J. (Nat. Sci.) 34 (1) 27
2.48 ± 0.2614 cm/s ranging from 1.19 to 3.77cm/s.
Establishment and deduction of theformula for dropping speed of the snail eggs. Asnail egg drops with uniform acceleration when
water resistance and the specific gravity of the egg
become balanced. Because the shape of the snaileggs is similar to spherical pill, the force (G) acting
on the eggs in stable water is given by G = π/6*d3
(γ1-γ0)............(1) (Qian and Wan, 1983).where,
G = Gravitational force acting on the snail
eggs in water (g)F = Water resistance
W = Dropping speed of the snail eggs in
stable water (cm/s)Ca = Resistance coefficient
γ1 = Specific gravity of the snail eggs (g/
cm3)γ0 = Specific gravity of water (g/cm3)
g = Gravity plus speed (cm/s)
d = Diameter of the snail eggs (mm)Snail eggs which drop in water meet water
resistance. The resistance equation of the snail
eggs in stable water isF = Ca * γ1 * π/4 * d2 * w2 /2g............(2)
When G = F, the resistance snail eggs drop
with uniform acceleration. The equation is thereforeCa = 4/3 (γ1 - γ0) / γ0 * gd / w2............(3)
Based on a general principle of silt motion,
there is a resistance coefficient (Rd ........ alsocalled circumflow Rd). The function of the
relationship is given by :
Ca = f (Rd)............(4)In which Rd = wd / v , where w = dropping speed
of the snail eggs; d = diameter of the snail eggs; and
v = flow rate. When a correlation was made withthe experimental data, the result was
Ca = 250 / Rd............(5)
Therefore, the dropping speed formula ofthe snail eggs in stable water can be formed from
equation (3) and (5), and is :w = 4/750v * (γ1 - γ0) / γ0 * gd2............(6)
The unit of each symbol in the formula is: w
= cm/s; d = cm; γ1 = 2.29 g/cm3; γ0 = 1 g/cm3; g =98 cm/s2, which can change with the water
temperature.
A t test was used to investigate the differencebetween the practical measured value and the
predicted value of the dropping speed. With P >
50%, there was no significant difference betweenthe predicted and measured value.
DISCUSSION
Oncomelania hupensis is distributed mainly
in marshland and lakes in southern China. The peakegg laying period is spring and autumn of every
year. The snail eggs are light and small, so they drift
easily in the flood season. Once the eggs settle insuitable hatching sites, new snail populations
develop. Therefore, it is important to try to control
the dispersal of snails and their eggs in irrigationschemes in endemic areas.
The snails lay eggs at the edge of lakes and
rivers. When eggs are laid on moist mud, the eggsbecome covered with soft mud so that they have the
appearance of a small mud pill. It has been observed
that if the mud layer comes off at the firstdevelopment stage of the eggs, the eggs do not
develop into a juvenile snail (Guo, 1983). Thus, the
mud layer seems to plays an important role in thegrowth phase of the snail eggs. Microscopic
observation showed that the drying procedures
used here did not damage the internal or externalphysical and biological characteristics of the eggs.
The measured values would therefore appear to be
reliable.The specific gravity of the eggs of O.
hupensis is an indispensable basic physical
parameter in the calculation of dropping speed anddrift distance for snail eggs in still- and running-

28 Kasetsart J. (Nat. Sci.) 34 (1)
water. This information may contribute to atheoretical basis for the prevention of snail dispersal
in the field.
Based on the dropping speed of snail eggsmeasured in this study, the drifting style of the snail
eggs can be compared with the dropping speed of
silt in rivers. Usually, 0.5 mm diameter silt particlesare suspended in flowing water but drop at a rate of
5.67 cm/s in still water. Our results show the
dropping speed for snail eggs to be 1.19 to 3.77cm/s, which is lower than the result for silt that is
suspended as drift in rivers. Therefore, it can be
inferred that snail egg dispersal will at least conformwith the drift of silt in the rivers. These observations
may have practical value for developing engineering
measures to control and mitigate the dispersal ofsnails and their eggs.
CONCLUSIONS
Investigations were carried out into specific
gravity and dropping speed of snail eggs and anappropriate formula has been devised to link these
parameters. Statistical analysis showed no
significant difference between measured valuesand the values predicted from a formula for dropping
speed based on Newtonian principles. The result
could be used as a basic parameter in the control ofOncomelania hupensis when water conservation
facilities are designed or rebuilt in areas in which
Schistosomiasis is endemic.
ACKNOWLEDGEMENT
The study was supported by UNDP/
WORLD BANK/WHO Special Program for
Research and Training in Tropical Diseases (TDR);Ministry of Public Health and Chinese Scholarship
Council in China. The authors gratefully
acknowledge the help of Dr. Banpot Napompeth(National Biological Control Research Center,
Kasetsart University, Thailand) and Dr. GeorgesDussart (Canterbury Christ Church University
College, UK) in the revision of the manuscript.
LITERATURE CITED
Bolton, P. 1988. Schistosomiasis control inirrigation schemes in Zimbabwe. Journal of
Tropical Medicine and Hygiene 91 : 107-114.
Chen, M.G. 198. Schistosomiasis control programin the People’s Republic of China : A review.
Southeast Asian Journal of Tropical Medicine
and Public Health 20 : 511-517.Dussart, G.B. 1987. Effect of water flow on the
detachment of some aquatic pulmonate
gastropods. American Malacogical Bulletin5 : 65-72.
Gredler, V. 1881. Zur Conchylien-Fauna von China.
Jahrbuch Deutsch Malackozoologie Gesamt8 :119-132.
Green, P., Dussart, G., and C. Gibson. 1992.
Surfacing and water leaving behaviour of thefreshwater pulmonate snail Lymnaea peregra
(Muller), Biomphalaria glabrata (Say) and
Bulinus jousseaumei (Dautzenberg). Journalof Molluscan Studies 58 : 169-179.
Guo, Y.H. 1983. Scanning observation on
Oncomelania hupensis with electronmicroscope. Treatise compilation of Chinese
Molluscs Society. Science Press, Beijing,
China 1 : 81-83.Hunter, J.M. 1993. Parasitic Diseases in Water
Resources Development : the Need for
Intersectoral Negotiation. Geneva, WorldHealth Organisation. 12 p.
Mao, S.B. 1990. Schistosomiasis biology and
schistosomiasis control. People’s Health Press,Beijing, Chiina. p. 260-330.
Mott, K.E. 1990. Parasitic diseases and urban
development. Bulletin of World HealthOrganisation 68 : 691-698.

Kasetsart J. (Nat. Sci.) 34 (1) 29
Ministry of Public Health (MPH). 1989.Consultative Committee of Schistosomiasis
Control in China. National report on prevalence
of Schistosomiasis in 1988. Chinese Journal ofSchistosomiasis Control 1 : 5-7
Ministry of Public Health (MPH). 1991.
Consultative Committee of Schistosomiasis
Control in China. National report on prevalence
of Schistosomiasis in 1990. Chinese Journal of
Schistosomiasis Control 3 : 193-194.Ministry of Water Electricity (MWE). 1965. Rules
of operation on earthwork. Chinese Industry
Press. Beijing, China. p. 2-22Qian, L. and Z.H. Wan, 1983. Silt movement
kinetics. Chinese Science Press, Beijing, China.
p. 36-88.Sha, Y.Q. 1963. Silt motion theory. Chinese Science
Press, Beijing, China. p. 20-45.
WHO. 1991. Schistosomiasis control. Geneva,World Health Organisation.
Xu, X.J. and T.Q. Fang. 1989. Observation on
collecting Oncomelania hupensis when thesluices open during flood season in Yangtze
River. Kasetsart J. (Nat. Sci.) 22 : 251-260.Xu, X.J. and T.Q. Fang. 1990. Relationship between
sluicing for irrigation and spreading of
Oncomelania hupensis in Hubei province.Kasetsart Journal (Nat. Sci.) 23 : 281-286.
Xu, X.J., X.X. Yang, and X.P. Li 1996.
Establishment and deduction of a formula ofthe snail dropping speed in stable water. Hubei
Journal of Preventive Medicine 7 : 26-28.
Yang, X.X, X.J. Xu, and Z.H. Yu. 1992. Observationon preventing snail drift through an inverted
siphon. Chinese Journal of Zoology 27(4) : 12-
15.Yin, C.M., T.S. Wan, D..S. Mao, L.C, He and Z.,G.
Ding. 1987. The study of prevention the snail
from spreading with double blocking nets atthe ditches. Chinese Journal of Zoology 33 :
194-196.
Received date : 16/09/99Accepted date : 20/12/99

Kasetsart J. (Nat. Sci.) 34 : 30 - 39 (2000)
INTRODUCTION
Vesicular-arbuscular mycorrhizal fungi(VAMF) is one of the most interesting soil
microorganisms which can solubilize fixed
phosphate and retentive phosphate in soil. Throughobservation, it was found that VAMF enhanced
plant growth and P uptake particularly in the soil
with low to moderate P level (Schenck, 1982;Bolan, 1991). In certain soils with high level of P,
positive relations between VAMF and plant growth
were also found (Kiernan et al; 1984., Mala et al.,
1997). However, many species of VAMF can notenhance plant growth and P uptake of plant even in
low fertile soils, mainly due to some limiting
conditions appearing in the soils. The quantity ofavailable P is one of the important factors which
limits the efficiency of VAMF. The mechanisms
for acquisition of P and other mineral nutrients intheir deficient soils, drought tolerance and protection
Selection for the Effective Speciesof Vesicular-Arbuscular Mycorrhizal Fungi
on Soybean Root Infection and Growth Enhancement
Thongchai Mala
ABSTRACT
The selection for the effective species of vesicular-arbuscular mycorrhizal fungi (VAMF) wasconducted in the greenhouse of Soil Science Department, Kasetsart University at Kamphaengsaen
Campus. Nine VAMF species, from pot production in Yangtalard soil, consisted of Acaulospora dilatata,
Acaulospora scrobiculata, Entrophospora colombiana, Gigaspora sp. No 2, Glomus aggregatum, G.
claroideum, G. geosporium, G. tenuis and Scutellospora sp. were inoculated to SJ5 soybeans grown in a
6–litre clay pots with sterilized sand medium. The results revealed that various VAMF had different
abilities to infect soybean roots. The VAMF species having fast infection rate and high intensities of rootcolonization were E. colombiana, A. scrobiculata, G. aggregatum, G. geosporium and Scutellospora sp.
The intensities of root colonization were 96.75, 95.25, 93.75, 90.50 and 89.25 %, respectively. The ability
of VAMF on hyphal development in soil were differed among species. G. aggregatum, G. geosporium,
Scutellospora sp. and E. colombiana had greater hyphal development than the rest while their lengths of
extraradical hyphae at harvest period were 168.33, 137.37, 134.85 and 128.90 cm, respectively. Finally,
high yield and high mycorrhizal dependency were found in plants inoculated with Scutellospora sp., E.
colombiana, G. aggregatum and G. geosporium. These VAMF species showed high potential to enhance
soybean growth and should be further examined with different levels and kinds of phosphorus fertilizer in
various conditions.Key words: extraradical hyphae, root infection, soybean, vesicular-arbuscular mycorrhizal fungi.
Department of Soil Science, Faculty of Agriculture, Kasetsart University, Kamphaengsaen Campus, Nakhon Pathom 73140, Thaialnd.

of plant root from destruction by pathogen ofmycorrhizal plants are described (Bolan, 1991).
Therefore, the compatibility among certain soil
environment, plants and VAMF species must berealized in order to acquire appropriate benefit
from VAMF-plant association. VAMF are differed
in their responses to phosphate application, producedifferent amounts of hyphae in the soil even at the
same phosphate treatment (De Miranda and Harris,
1994). Most of VAMF species decrease theirabilities on infecting plant roots with increasing
phosphate application but some species can tolerate
and show high activity even in high phosphateconditions (Marschner and Dell, 1994). The study
on various VAMF species and levels of rock
phosphate which are suitable for the application tosome soils in order to obtain maximum return from
individual plant cultivation is highly recommended.
The objective of this experiment is to compare theeffectiveness of selected VAMF species on soybean
growth enhancement.
MATERIALS AND METHODS
The experiment was conducted in thegreenhouse of Soil Science Department, Kasetsart
University at Kamphaengsaen Campus using
completely randomized design with 4 replications.Treatments consisted of soybean plants grown in
six-litre clay pots without VAMF(control) and
nine other species of VAMF; Acaulospora dilatata,
Acaulospora scrobiculata, Entrophospora
colombiana, Gigaspora sp. No 2., Glomus
aggregatum, G. clariodeum, G. geosporium, G.
tenuis and Scutellospora sp. Before starting the
experiment, the surface of every 6-litre clay pot
was cleaned and sterilized using 70 % ethyl alcohol.Seven kilograms of sterilized sand for individual
pot was prepared. Inoculums of VAMF were
prepared in sterilized Yangtalard soil as describedby Mala et al.(1997). Individual species of
mycorrhiza was inoculated into the soil by mixing1,000 ml of soil with 200 ml of inoculum. The
mixture of inoculum (inoculum layer) was spreaded
and pressed down into the pot, then, 600 ml of theremaining soil was topped over the inoculum layer,
leveled and pressed down. Sterilized inoculum was
used in the control treatment.Four-surface sterilized SJ5 soybean seeds
were sowed at 2 cm deep under the soil surface.
Water and nutrient solution were alternativelyapplied (Asher, 1975). One plant per pot was left
after 2-week emergence in the greenhouse until
harvest. Insecticide (monocrotophos) was sprayedtwice at 6 and 10 weeks after planting. The
percentage of mycorrhizal root infection using
Grideline Intersect Method (Shenck, 1982;Giovanetti and Mosse, 1980), length of extraradical
hyphae (Bethlenfalvay and Ames, 1987) and plant
height were determined both at 6 weeks afterplanting and at harvest time. Measurement of stem,
root dry weight, yield and yield component were
also conducted. Mycorrhizal dependency onsoybean yield (MDSY) were determined according
to Plenchette et al. (1983) as follows:
MDSY = Yi Yo
Yo
−
where Yi = yield of VAMF inoculated soybean;Yo = yield of control soybean.
Data were analyzed using analysis ofvariance procedure and the significance between
average means were compared using Duncan’s
new multiple range test at 95 % confidence.
RESULTS AND DISCUSSION
Colonization of VAMF on SJ5 soybean root
Colonization of VAMF on the root is the
first indication of relationships between the twosymbionts. The fungal structures in root and soil of
various VAMF were illustrated in Figure 1. In
Kasetsart J. (Nat. Sci.) 34 (1) 31

32 Kasetsart J. (Nat. Sci.) 34 (1)
contrast, there was not any structure of VAMFinfected to plant root in control plant (Figure 1-a).
There were many types of structures such as
intraradical hyphae, arbuscules, vesicles, restingspores and extraradical hyphae when plants were
inoculated with A. dilatata, A. scrobiculata, E.
colombiana, G. aggregatum, G. claroideum, G.
geosporium and G. tenuis (Figure 1-b, c, d, f, g, h,
and i). In plant inoculated with Gigaspora sp. No.
2 and Scutellospora sp., vesicle in plant roots werenot found. However, extraradical and intraradical
resting spores were found together with similar
fungal structures as found in other species (Figure1-e and j).
The main structures of various VAMF found
at harvest period were different (Table 1). Vesicleswere main structures found in roots inoculated with
E. colombiana and G. aggregatum, meanwhile,
arbuscules were prominent in Scutellospora sp.inoculation but hyphae were prominent in the
remaining species.
The intensity of colonization showed thetendency of VAMF ability on enhancing plant
growth. In this experiment, the abilities of various
VAMF on soybean root colonization wereillustrated in Table 2. Root infection percentages of
soybean caused by various VAMF at both stages,such as 6-week and harvest periods, were found to
be highly significant. Four species of VAMF, E.
colombiana, G. geosporium, Scutellospora sp. andG. aggregatum showed very high potential of
soybean root infection, meanwhile the rest of the
species showed rather low potential at 6 week-period. The most rapidly effective species at 6
weeks was E. colombiana (89.75 %) and the lowest
infection was found in soybean inoculated with A.
dilatata ( 7.75 %).
At harvest, the intensity of root infection of
various VAMF species were examined. Highpotential species (group a) which showed a very
high percentage of root infection were E.
colombiana, A. scrobiculata, G. aggregatum, G.
geosporium and Scutellospora sp. with the range of
infection were 89.25-96.75 %. The minimum
infection was found in A. dilatata inoculation as24.25 %.
The intensity of root infection of individual
VAMF species at harvest period was increased ascompared to its intensity at 6 weeks. In Some
species whose infections along the plant root
developed rapidly in the early stage (E. colombiana),the intensity of infection at this stage was further
Table 1 Main structure of VAMF found in the root of SJ5 soybean.
VAMF Main Quantity(%)
structure (compared to the whole VAMF structures)
A. dilatata Hyphae 95.95A. scrobiculata Hyphae 69.14
E. colombiana Vesicle 56.58
Gigaspora sp. No 2 Hyphae 87.39G. aggregatum Vesicle 46.15
G. claroideum Hyphae 68.00
G. geosporium Hyphae 55.96G. tenuis Hyphae 59.35
Scutellospora sp. Arbuscule 43.00

Kasetsart J. (Nat. Sci.) 34 (1) 33
Figure 1 Characteristics of VAMF root colonization on SJ5 soybean root ( a = non-inoculation, b = A.
dilatata, c = A. scrobiculata, d = E. colombiana, e = Gigaspora sp. No. 2, f = G. aggregatam,
g = G. claroideum, h = G. geosporium, i = G. tenuis and j = Scutellospora sp., bar = 0.2 mm).
progressed continuously and finally reached thepeak at 96.75 %. Certain species showed moderate
potential of infection at 6 weeks, such as G.
geosporium, Scutellospora sp. (71.00 and 69. 25%); however, the development of infection was
quite fast at harvest stage for these species up to
90.50 and 89.25 %, respectively. The species which
showed high ability for increasing infection from 6weeks to harvest period of plant growth was A.
scrobiculata. The root infection at 6 weeks was 31.
25 % and increased up 64 % to 95.25 % atharvest .
The difference of root infection between
two stages of plant growth explained how VAMF

34 Kasetsart J. (Nat. Sci.) 34 (1)
can enhance soybean successfully at differentgrowth stage. The species which infected plant root
intensively in early stage was also showed the
signal of high potential to enhance plant growth.The species which infected the plant root with
slower rate will be losing this advantage. Generally,
the infection rates of various VAMF are different.By determining the interval of root infection
intensity between two periods of plant growth, it
was found that the root infection of some VAMFspecies increased in a very high intensity, meanwhile
those of root infection caused by other species
increased in negligible amount. These roles maysuggest the categories that, the colonization on
plant root of those VAMF in early stage (6 weeks)
were highly intensive depending upon individualVAMF ability to infect and developing their
colonization through host root. VAMF in this group
were E. colombiana, G. geosporium andScutellospora sp. which initially infected host root
at a very fast rate and the intensity increased abruptly
to reach above 70 % within 6 weeks. These VAMF,however, still further developed colonies actively
and spreading their infection continuously to other
parts of plant root and reached their peak at harvestas shown in Table 2. The another category is that,
the intensity of root infection in early stage was low
due to the slowly development of VAMF on thehost root. This group of VAMF such as Gigaspora
sp. and A. dilatata, showed low root infectious
intensity at both stages of plant growth. Due to thelow efficiency on root infection at both stages, root
infectious intensity of both species were 21.50 and
7. 75 % at 6 weeks, and the development of rootinfection in the second stage was slowly occurred.
Their intensities of infection were 41.50 and 24.25
% which increased to 20.00 and 16.50 %,respectively.
In case of other species, the intensity of root
infection was at moderate level. But thedevelopment of VAMF occurred very fast in the
second stage which caused high intensity of root
Table 2 Colonization of various VAMF species on the root of soybean.
VAMF Root infection(%) Increased infectionAt 6 weeks At harvest after 6 weeks
Non inoculation(control) 0f 0f 0
A. dilatata 7.75f 24.25e 16.50
A. scrobiculata 31.25d-e 95.25a 64.00E. colombiana 89.75a 96.75a 7.00
Gigaspora sp. No 2 21.50e 41.50d 20.00
G. aggregatum 54.50c 93.75a 39.25G. claroideum 46.75c 79.25b 32.50
G. geosporium 71.00b 90.50a-b 19.50
G. tenuis 33.75d 62.25c 28.50Scutellospora sp. 69.25b 89.25a-b 20.00
CV.(%) 18.93 11.39
F-test ** **
Note: Means in each column followed by the same letter are not significant by DMRT at 95 % of confidence.

Kasetsart J. (Nat. Sci.) 34 (1) 35
infection at harvest. The VAMF in this groupincluding A. scrobiculata, G. aggregatum, G.
claroideum and G. tenuis showed the increasing of
colonization as 64.00, 39.25, 32.50 and 28.50 %,respectively.
The differences of VAMF manner, extent
and their abilities on infecting plant root wereattributed (Bolan, 1991; Abbott and Gazey, 1994).
Factors affecting VAMF infection may come from
the differences in inoculum quantity, types ofVAMF species, concentration of VAMF propagules
in inoculum, kinds of plant and concerned
environments. This experiment was carried out inthe same environment with the same amount of
inoculum. The quantity of spore of each VAMF
was above 40 spores/g. Various inoculums wereproduced and stored in the same condition.
Therefore, the difference in ability of VAMF on
infecting soybean root may be due to thecompatibility of individual VAMF on soybean
plant.
Extraradical hyphae of VAMFThe length of extraradical hyphae of
different VAMF species inoculated to SJ5 soybean
was illustrated in Table 3. The results of statistical
analysis of the extraradical hyphae of variousVAMF at both periods of plant growth were highly
significant. Three species of VAMF, G.
aggregatum, Scutellospora sp. and G. geosporium,showed prominent ability to produce extraradical
hyphae at 6 weeks as much as 47.65, 61.73 and
65.15 cm g-1of soil. Meanwhile, the other specieshad shorter extraradical hyphae.
After 6 weeks, the extraradical hyphae of
certain VAMF associating with SJ5 soybeandeveloped intensively through soil volume. Since
the rate of hyphal development of various VAMF
from the early stage to 6 weeks was different, theextraradical hyphae of 4 species, E. colombiana,
Scutellospora sp., G. geosporium and G.
aggregatum at harvest period were longer than 1 mg-1 meanwhile those of the remaining species were
Table 3 Length of extraradical hyphae of various VAMF associated with soybean(cm g-1).
VAMF At 6 weeks At harvest Increasing after 6 week
Non inoculation(control) 0d 0d 0
A. dilatata 37.53b-c 45.83c 8.30A. scrobiculata 27.38b-c 62.38c 35
E. colombiana 36.95b-c 128.90b 91.95
Gigaspora sp. No 2 20.58c-d 41.95c 21.37G. aggregatum 47.65a-b 168.33a 120.68
G. claroideum 26.98b-c 58.73c 31.75
G. geosporium 65.15a 137.37a-b 72.23G. tenuis 24.73b-c 28.75c-d 4.02
Scutellospora sp. 61.73a 134.85a-b 73.12
C.V.(%) 41.04 27.68
F-test ** **
Note: Means in each column followed by the same letter are not significant by DMRT at 95 % of confidence.

36 Kasetsart J. (Nat. Sci.) 34 (1)
shorter.Extraradical hyphae of G. geosporium,
Scutellospora sp. and G. aggregatum developed
thoroughly to the soil. The hyphal length of threespecies in soil at harvest was conspicuous which
increased more than 72 cm g-1. Markedly, the
hyphal length of E. colombiana at the first stage ofplant growth was moderate at 36.95 cm g-1, then,
the hyphae developed rapidly afterward and the
length was increased up to 91.95 cm at harvestperiod. This result revealed that 4 species of VAMF
are conspicuous having high potential on the
development of extraradical hyphae and enhancingplant growth through these special structures. The
result was coincided with the suggestion of De
Miranda and Harris (1994), who examined 3 speciesof VAMF using sorghum plant and found that
Scutellospora heterogama produced extraradical
hyphae more profusely than others. In contrast,
Abbott and Robson (1985) found that Glomus
calospora and Acaulospora laevis were prominent
on producing more hyphae in soil when associated
with subterranean clover. Finally, Abbott andRobson (1985) suggested that extraradical hyphae
are the important device for enhancing plant growth.
Normally, nutrients are taken up throughextraradical hyphae and then translocated to plant
root. Longer hyphae will have more advantages of
absorbing nutrients beyond the depletion zone ofnormal root.
The effects of VAMF on growth of SJ5 soybeanThe height of SJ5 soybean inoculated with
different VAMF at 6 weeks was significant at both
periods of measurement as shown in Table 4. The
group “a” of VAMF species, G. aggregatum, E.
colombiana and Scutellospora sp., exposed high
potential to stimulate the growth of soybean
Table 4 The effects of VAMF on growth of SJ5 soybean.
VAMF Plant height(cm) Dry weight(g plant-1)At 6 weeks At harvest Increased height Shoot Root
Non inoculation(control) 25.9c 37.0b 11.1 0.58c 0.50d
A. dilatata 35.1b-c 37.3b 2.2 0.53c 0.58d
A. scrobiculata 31.6b-c 34.7b 3.1 0.67b-c 0.84c-d
E. colombiana 43.1a-b 52.7a-b 9.6 1.68a 2.04a
Gigaspora sp. No 2 36.1b-c 38.0b 1.9 0.67b-c 0.96c-d
G. aggregatum 42.6a-b 58.5a 15.9 1.77a 1.68a-b
G. claroideum 34.9b-c 41.4a-b 6.5 0.82b-c 1.34b-c
G. geosporium 38.1b-c 42.5a-b 4.4 1.08b 1.54a-b
G. tenuis 35.3b-c 36.5b 1.2 0.59c 0.65d
Scutellospora sp. 52.5a 57.3a 4.8 1.90a 1.89a-b
C.V.(%) 20.81 27.24 – 29.23 29.45
F-test ** * – ** **
Note: Means in each column followed by the same letter are not significant by DMRT at 95 % of confidence.

Kasetsart J. (Nat. Sci.) 34 (1) 37
presented as measured by plant height at 6 weeks.The height of soybean inoculated with those three
species were 42.6, 43.1 and 52.3 cm, respectively.
Plants inoculated with other VAMF species wereshorter, while the height of non-inoculated plant in
control treatment was shortest.
The tallest group of soybeans at harvestperiod were those inoculated with G. aggregatum,
Scutellospora sp. and E. colombiana, while the
shortest plants were those inoculated with A.
scrobiculata at 34.7 cm. In soybeans inoculated
with G. aggregatum, plant height was up to 15.8 cm
at 6 weeks, reaching the peak of growth at harvestperiod at 58.5 cm. Some VAMF species exposed
rather low efficiency in stimulating plant height
during the period from 6 weeks to harvest. Thesegroups were A. scrobiculata, G. tenuis, A. dilatata
and Gigaspora sp. No. 2. Plant height inoculated
with those species was in the range of 34.7 to 38.0cm.
Although the height of soybean in every
treatment increased after 6 weeks, plant-height ofmost treatments increased negligibly.
Interestingly, the plant inoculated with
individual species of VAMF included Scutellospora
sp., E. colombiana and G. aggregatum grew very
fast and produced over 40 cm of plant height at 6
weeks. Consequently, plant height was increasedrather distinctively in most of the treatments except
those inoculated with Scutellospora sp. which the
increased height was only 4.75 cm. This resultsuggested that VAMF enhanced plant growth at 6
weeks stage and when the enhancement of VAMF
was prominent, the growth of soybean was furtherenhanced through harvest period by that particular
VAMF.
On the contrary, other group of VAMFcaused soybean plant height to develop slowly at
the first stage of growth. Later, plant height still
developed in the same manner excepted for non-inoculation treatment. The difference of plant height
between two stages of plant growth of this groupwere lower than 6.45 cm. These plants were those
inoculated by G. tenuis, G. claroideum, Gigaspora
sp. No. 2, G. geosporium, A. scrobiculata and A.
dilatata.
The dry weight of soybean was determined
in term of shoot and root dry weight as shown inTable 4. Different species of VAMF influenced the
shoot dry weight. The shoot dry weight of soybean
in treatments inoculated with Scutellospora sp., G.
aggregatum and E. colombiana were 1.90, 1.77
and 1.68 g plant-1, accomplished in the higher
quantity than the ability of the other species. Theminimal dry weight was found in soybean inoculated
with A. dilatata and in non-inoculated soybean as
0.53 and 0.58 g plant-1, respectively.Root dry weight of soybean inoculated with
different species of VAMF was highly significant.
The maximum root dry weight was found in soybeaninoculated with E. colombiana. In this treatment,
the root of plant developed intensively through the
volume of soil which was determined as root dryweight at 2.04 g plant-1, but the root distribution
declined sequentially to 1.89, 1.68, 1.54 and 1.34 g
plant-1 of soybeans inoculated with Scutellospora
sp., G. aggregatum, G. geosporium and G.
claroideum, respectively. The minimal root dry
weight was found in non-inoculated treatment at0.50 g plant-1.
Effects of VAMF on soybean yieldThe number of pod, seed and yield of
soybean inoculated with different VAMF species
were highly significant. But the size of seed
presented as 100-seed weight was significant (Table5). VAMF-inoculated soybean had more quantities
of pod, number of seed and seed size than those of
non-inoculated plant. The group of soybeaninoculated with Scutellospora sp., G. aggregatum,
E. colombiana and G. geosporium had more
quantities of pod than those of plant inoculated

38 Kasetsart J. (Nat. Sci.) 34 (1)
with the other species. The maximum quantity ofpod was found in soybean inoculated with
Scutellospora sp. at 28.28 pod plant -1.
The number of soybean seed affected byVAMF inoculation is similar in effect to the number
of pod. Four species of VAMF, Scutellospora sp.
G. aggregatum, G. geosporium and E. colombiana,had high potential to enhance soybean yield of
47.50, 41.50, 40.75 and 39.75 seed plant-1,
respectively. The remaining from the rest specieswas lower as compared to those one.
The larger seed size were found on plant
inoculated with G. claroideum, E. colombiana,Scutellospora sp. and G. aggregatum, compared to
the rest of the species. They showed the 100 -seed
weight of 15.95, 15.18, 13.81 and 13.65 g,respectively, with the smallest seed size found in
non-inoculated soybean or control plant.
Similar to the effect on yield component,four species of VAMF accomplished higher soybean
yield were Scutellospora sp., E. colombiama, G.
aggregetum and G. geosporium, gave the yield as
much as 6.42, 5.77, 5.37 and 4.34 g plant-1,
respectively (Table 5). Since non-inoculated plantgave the yield of 0.44 g plant-1, the yield above this
level will come from the encouragement of VAMF
affectability. Scutellospora sp. had highest abilityto accomplish the increased yield as much as 5.98
g plant-1. E. colombiana, G. aggregatum and G.
geosporium gave less encouragment to soybeanyield and their encouragement were 5.33, 4.97 and
3.90 g plant-1. Meanwhile, A. dilatata gave least
encouragement at 0.31 g plant-1.In term of mycorrhizal dependency on
soybean yield, five species of VAMF had high
potential to enhance soybean growth and raised thelevel of soybean yield as shown in Table 5. Those
species were Scutellospora sp., E. colombiana, G.
aggregatum, G. geosporium and G. claroideum.The mycorrhizal dependency of attributed-VAMF
Table 5 Effects of VAMF on SJ5 soybean yield, yield component and mycorrhizal dependency onsoybean yield (MDSY).
VAMF Number of Number of 100-seed Yield MDSYpod plant-1 seed plant-1 weight(g) (g plant-1)
Non inoculation(control) 3.75c 5.75c 7.63d 0.44e 0
A. dilatata 6.00b-c 8.25c 9.29c-d 0.75d-e 0.71
A. scrobiculata 12.25b 17.25b-c 11.28a-d 1.99d 3.52E. colombiana 23.75a 39.75a 15.18a-b 5.77a 12.11
Gigaspora sp. No 2 8.00b-c 12.75c 11.72a-d 1.55d-e 2.52
G. aggregatum 26.00a 41.50a 13.65a-c 5.37a-b 11.21G. claroideum 11.75b 26.75b 15.95a 3.90c 7.86
G. geosporium 22.25a 40.75a 10.83a-d 4.34b-c 8.86
G. tenuis 8.25b-c 15.00b-c 10.11b-d 1.55d-e 2.52Scutellospora sp. 28.25a 47.50a 13.81a-c 6.42a 13.59
C.V.(%) 27.04 34.07 27.02 26.96
F-test ** ** * **
Note: Means in each column followed by the same letter are not significant by DMRT at 95 % of confidence.

Kasetsart J. (Nat. Sci.) 34 (1) 39
on plant enhancement to increase the yield overcontrol were 13.59, 12.11, 11.21, 8.86 and 7.86,
respectively. These increased yields were obviously
encouraged by individual VAMF. The mycorrhizaldependency of the remaining VAMF were lower
than those species attributed above.
CONCLUSION
The effectiveness of various VAMF in thisexperiment is different. Certain species of VAMF
showed high potential on infecting soybean root
and consequently enhanced plant growth. The yieldof SJ5 soybean inoculated with Scutellospora sp.
was the highest at 6.24 g plant-1. Three species of
VAMF, E. colombiana, G. aggregatum and G.
geosporium were also high potential species of
high effectiveness on plant stimulation and obtain
high yield in the order of 5.77, 5.37 and 4.34 gplant-1, respectively. Therefore, these VAMF
should be further examined with soybean in different
phosphate conditions.
LITURATURE CITED
Abbott, L. K. and A. D. Robson. 1985. Formation
of external hyphae in soil by four species of
vesicular-arbuscular mycorrhizal fungi. NewPhytol. 99 : 245-255.
Abbott, L. K. and C. Gazey. 1994. An ecological
view of the formation of VA mycorrhizas.Plant and Soil 159 : 69-78.
Asher, C. J. 1975. Plant Nutrition I : Practical
Notes. Department of Agriculture, Universityof Queensland. 35 p.
Bethlenfalvay, G. I. and R. N. Ames. 1987.
Comparision of two methods for quantifyingextraradical mycelium of vesicular-arbuscular
mycorrhizal fungi. Soil Sci. Soc. Am. J., 51 :
834-837.Bolan, N. S. 1991. A critical review on the role of
mycorrhizal fungi in the uptake of phosphorusby plants. Plant and Soil 134 : 189-207.
Giovanetti, M. and B. Mosse. 1980. An evaluation
of techniques for measuring vesicular-arbuscular mycorrhizal infection in roots. New
Phytol. 84 : 489-500.
Kiernan, J. M., J. W. Hendrix, L. P. Stoltz, and D.M. Maronex. 1984. Characterization of
strawbery plants produced by tissue culture
and infected with specific mycorrhizal fungi.Hort. Sci. 19 : 883-885.
Mala, T., S. Vangnai, P. Suwanarit, C. Suwanarat,
C. Hongprayoon, W. Phuengsaeng, and J.Phumpetch. 1997. The Utilization of Vesicular
Arbuscular Mycorrhizal Fungi Associated with
Cassava as a Mean to Improve PhosphateAvailability in Acid Soil. Final report submitted
to National Research Council of Thailand. 83
p.Marschner, H. and B. Dell. 1994. Nutrient uptake
in mycorrhizal symbiosis. Plant and Soil 159 :
89-102.De Miranda, J. C. C. and P. J. Harris. 1994. The
effect of soil phosphorus on the external
mycelium growth of arbuscular mycorrhizalfungi during the early stages of mycorrhizal
formation. Plant and Soil 166 : 271-280.
Plenchette, C., J. A. Fortin, and V. Furlan. 1983.Growth response of several plant species to
mycorrhiza in soil of moderate P-fertility. I.
Mycorrhizal dependency under fieldconditions. Plant and Soil 70 : 199-209.
Schenck, N. C. 1982. Methods and Principles of
Mycorrhizal Research. The AmericanPhytopathological Society, St. Paul, MN, USA.
244 p.
Received date : 16/09/99Accepted date : 20/12/99

Residual Effects of 20 Annual Applications of Ammonium Sulfateand Triple Superphosphate for Corn on Properties and Productivity
of Oxic Paleustults
A. Suwanarit1 , I. Suwanchatri2, J. Rungchuang3 and V. Verasan1
ABSTRACT
The residual effects of 20 successive annual applications of N and P fertilizer for corn productionon properties and productivity of an Oxic Paleustults were examined by field experiment. The experiment
consisted of 4 application rates of N and P fertilizer, i.e., 0-0, 60-60, 120-120, and 180-180 kg N-P2O5/ha/
year in the forms of ammonium sulfate and triple superphosphate.The pH of the surface soil and sub-soil was decreased with increased rates of the fertilizers with
more pronounced effects in the sub-soil. The EC of the surface soil was not affected by the fertilization
while that of the sub-soil was increased with increased rates of the fertilizer. The CEC of the surface soilwas not affected by the fertilizers while that of the sub-soil decreased with increased rates of the fertilizers.
The OM and total-N contents of the surface soil tended to increase with increased rates of the fertilizer while
those of the sub-soil were not affected by the fertilization. The available P of the surface soil wasdramatically increased with increased rates of the fertilizers while that of the sub-soil was less affected. The
exchangeable K, Ca and Mg either tended to decrease or significantly decreased with increased rates of the
fertilizer, with more pronounced effect in the sub-soil. The DTPA-extractable Fe of the surface soil wasincreased with increased rates of the fertilizers while that of the sub-soil was not affected by the
fertilization. The DTPA-extractable Mn and Zn of the top-layer soil was slightly increased with increased
rates of the fertilizer whereas those of the middle-layer soil were similarly decreased by the threeapplication rates of fertilizer and those of the bottom-layer soil were not affected. The DTPA-extractable
Cu of soils of the top and middle layers was slightly increased with increased rates of the fertilizer whereas
that of the bottom-layer soil was slightly decreased with increased rates of the fertilizer. The bulk densityof the surface soils showed slight trends to decrease with increased rates of the fertilizers while that of the
sub-soil showed no effect of the fertilizers. The aggregation of the soil was decreased with increased rates
of the fertilizers. The hydraulic conductivity of the saturated soils was not affected by the fertilization. Theinfection on corn roots of arbuscular mycorrhizal fungi (AMF) showed consistent trends to decrease with
increased rates of the fertilizer whereas AMF spore intensity in the soil was not affected by low rates of
the fertilizer but decreased with increased rates of the fertilizer at high rates of fertilizer. The populationof the free-living N2-fixing bacteria in the soil showed consistent trends to increase with increased rates
of the fertilizer. The productivity of the soil was increased with increased rates of the fertilizers.
Key words : ammonium, fertilizer, properties, long-term, phosphorus, productivity, soil
Kasetsart J. (Nat. Sci.) 34 : 40 - 51 (2000)
1 Department of Soil Science, Faculty of Agriculture, Kasetsart University, Chatuchak, Bangkok 10900, Thailand.2 Central Laboratory, Faculty of Natural Resources, Prince of Songkla University, Hadyai, Songkla 90110, Thailand.3 The National Corn and Sorghum Reasearch Center, Kasetsart University, Pakchong, Nakhon Ratchasima Province, Thailand.

INTRODUCTION
Though nitrogen and phosphorus fertilizers
have been widely used to increase crop yields, dataon a long-term basis on effects of these fertilizers
on properties and productivity of soil are scarce and
have been of continuing concern. Results of long-term application of fertilizers so far reported sug-
gested that the length of successive application of
the fertilizers and cropping conditions and/or crop-ping system were among factors influencing the
conclusions. The results of study by Owensby et al.
(1969), for example, led to a conclusion that annualapplication of N and P fertilizers at different rates
for 20 year for bromgrass did not affect organic
matter (OM) content of the soil whereas results ofstudy by Schwab et al. (1990), who worked with
the same plots as those of Owensby et al. (1969),
led to a conclusion that, after 40 annual applica-tions with the fertilizers, organic matter content of
the soil increased with increased rates of the nitro-
gen fertilizer. Moreover, Hasathon (1982), work-ing with lowland rice soils, reported that OM
contents of the soils increased with increased rates
of ammonium sulfate applied for rice in the previ-ous 5 years.
This paper presents results of a study on
effects of 20 annual applications of ammoniumsulfate and triple superphosphate for corn grown
on a Reddish Brown Lateritic soil in Thailand on
chemical, physical and biological properties andproductivity of the soil.
MATERIALS AND METHODS
Site and soilThe experiment was conducted on a
Pakchong series soil, clayey kaolinitic, Oxic
Paleustults at the National Corn and Sorghum
Research Center, Nakhon Ratchasima Province,Thailand.
Design and treatmentsA randomized complete block design with
6 treatments and 3 replications had been employed.
However, only four of the treatments were ac-counted for in this study. Each plot measured 7.5m
x 15.0m. Alleys of 175 cm and 75 cm had been
inserted between the two adjacent plots along theshorter and the longer sides of the plots, respec-
tively. The treatments studied were as follows.
F0: without fertilizer application.F60: application of 60 and 60 kg N and
P2O5/ha/year as ammonium sulfate and triple su-
perphosphate in annual cropping with corn duringthe previous 20 years.
F120: as F60 but the rates of fertilizers had
been 120 and 120 kg N and P2O5/ha/year.F180: as F60 but the rates of fertilizers had
been 180 and 180 kg N and P2O5/ha/year.
Throughout the previous 20 years, all of theplots were planted to corn during the late rainy
season (mid July to November) in each year. The N
fertilizer was applied by balanced split applicationat planting and one month after planting whereas
all of the P fertilizer was applied at planting. The
fertilizers at planting were mixed and applied bybanding under the soil surface on one side of each
corn row. The fertilizer at one month after planting
was applied by banding on the soil surface on oneside of each corn row. In the present cropping, all
of the plots were planted to corn and received no
fertilizer.
Basal fertilizer and crop residue managementZnSO4 at the rate of 62.5 kg/ha was applied
to all treatments in the second and third annual
cropping to ensure adequate supply of Zn. During
the 20 years prior to the present study, only cornears were removed from the plots. The stubble
from each cropping was left on the plots and then
chopped and plowed into the soil when land wasprepared at about one month before the following
Kasetsart J. (Nat. Sci.) 34 (1) 41

42 Kasetsart J. (Nat. Sci.) 34 (1)
cropping.
Soil sampling and sample preparationSoil samples for chemical analysis were
taken a few weeks before the crop residue incorpo-
ration into the soil. Within area of 25cm × 75cm
across the direction of the corn rows, the soil wasdug up in three separated layers, i.e., at 0-15cm, 15-
30cm, and 30-60cm depths. The soil from each
layer was crushed, well mixed and quartered. Onequarter of the soil was then taken and proceeded
with the preceding process. This process was re-
peated until a quarter of about 2 kg of soil wasobtained. The soil sample obtained was then air-
dried and crushed to pass a 2-mm sieve.
Soil samples for physical properties exami-nation were taken from the central area of 3m × 3m
of each plot before plowing for the present crop-
ping. Undisturbed soil samples for bulk densityand hydraulic conductivity examination were taken
with steel cylindrical (63.71 cc) soil samplers.
Samples from the centers of the surface (0-15cmdepths) and sub-surface (15-30cm depths) layers
were taken as representatives of the surface soil and
sub-soil, respectively. From each plot, two kinds ofsamples were taken, one from the center between
two adjacent hills of corn stumps and another from
the center between two adjacent rows of cornstumps. Each kind of sample was taken from two
sites in each plot. Soil clods for aggregate examina-
tion were also taken from the two kinds of sites butonly one sample of each kind was taken.
One composite soil sample for examination
of population of arbuscular mycorrhizal fungi(AMF) and free-living N2-fixing bacteria was taken
from the central area of 3m × 3m of each plot at one
week before harvest of the present cropping. Sur-face soil (0-15 cm depth) from three squares, each
measuring 50cm × 50cm and having two stumps of
corn plants (grown 75 cm between rows and 25 cmbetween hills of one plant) in the central area, was
dug out, put together and well mixed. An aliquot ofthe soil was then taken for the examination.
Analyses of soil and plant samplesChemical properties: pH of the soils were
measured with pH meter according to Peech (1965).
Saturation extracts of the soils for electrical con-ductivity (EC) measurement were obtained ac-
cording to Bower and Wilcox (1965). The cation
exchange capacity (CEC) was measured accordingto Chapman (1965), using neutral N NH4OAc and
10% NaCl as saturating and replacing solutions,
respectively. OM content of the soil was measuredaccording to Walkley and Black (1934). Total N
content of the soil was measured by Kjeldhal
method (Jackson, 1958), using the H2SO4 + Na2SO4+ Se digestion mixture. The available P was meas-
ured by Bray II method (Olsen and Dean, 1965).
Exchangeable K, Ca and Mg were measured asdescribed by Pratt (1965), using neutral N NH4OAc.
Extractrable Fe, Mn, Zn and Cu were measured
using DTPA according to Linsay and Norvell(1978).
Physical properties: The core soil samples
were ovened at 105°C to constant weights forgravimetric bulk density determination. Aggregate
analysis of the soils was done by wet seiving
according to Kemper and Chepil (1965). The hy-draulic conductivity of saturated soils was deter-
mined according to Klute (1965), respectively. The
state of aggregation was the proportion of the totalsample weight occurring in the aggregates of larger
than 0.25mm. The degree of aggregations was the
proportion (m1-m2)/(ms-m2), where m1 was theweight of aggregates larger than 0.25mm, m2 the
weight of primary particles larger than 0.25mm
and ms the total sample weight. The mean weight-diameter was the sum of products of (1) the mean
diameter of each size fraction and (2) the propor-
tion of the total sample weight occurring in thecorresponding size fraction.

Kasetsart J. (Nat. Sci.) 34 (1) 43
Biological properties: Infection in cornroot and spore intensity in the soil of AMF in the
soil was determined according to Danial and Skip-
per (1987). Number of the free-living N2-fixingbacteria was determined by the Total Plate Count
Technique.
Uptake of N, P and K: Grain and stubble ofcorn were analyzed for N, P and K by wet digestion
(Jackson, 1958). Total N in the digest was then
measured with micro Kjeldhal distillation method(Bremner, 1965). P content of the digest was meas-
ured with the vanadomolybdophosphoric yellow
calorimetric method (Jackson, 1958) using aSpectronic-20 colorimeter. K content of the digest
was measured by flame photometry.
RESULTS AND DISCUSSION
pH, EC, CEC and OMpH, EC, CEC and %OM of the soils are
shown in Figure 1.
In all of the three soil layers, pH decreasedwith increased rates of the fertilizers with more
pronounced changes in the lower soil layers. The
effects of fertilizers on pH were presumably dueprimarily to oxidation of the applied NH4-ions
which released H+ ions. More pronounced effects
in the lower layers were presumably results oflower buffering capacities of the soils due to lower
OM contents. The results were slightly different
from those obtained by Tattao (1987), who workedwith the same experimental plots after fertilization
for 10 years and found decreases in pH of the
surface soil (at 0-30cm depths) with increased ratesof the fertilizers but only trends of decreases in pH
of the sub-soils (at 30-100cm depths) with in-
creased rates of the fertilizers.EC of the top-layer soil was not affected by
the fertilizer application while those of the middle-
layer and bottom-layer soils generally increasedwith increased rates of the fertilizers. The effects of
0.81
0.98
0.870.951.
461.60
1.411.49
3.04
2.77
2.81
2.69
0
2
4
6
F0 F60
F120
F180 F0 F60
F120
F180 F0 F60
F120
F180
0-15 cm depth 15-30 cm depth
a a
30-60 cm depth
Treatments
% O
M
aaa a a a a
a a a
12.3
12.3
13.1
13.1
13.8
13.5
14.115
.0
17.3
18.7
17.1
17.4
0
7
14
21
28
F0 F60
F120
F180 F0 F60
F120
F180 F0 F60
F120
F180
0-15 cm depth 15-30 cm deptha a
30-60 cm depth
Treatments
CE
C, c
mol
/100
g aaa a a a a a b b
1.29
1.30
0.84
0.48
1.08
1.06
1.0
1
0.70
1.19
1.27
1.15
1.22
0.0
0.5
1.0
1.5
2.0
F0 F60
F120
F180 F0 F60
F120
F180 F0 F60
F120
F180
0-15 cm depth 15-30 cm deptha a
30-60 cm depth
Treatments
EC
, mS/
cm aa
ab b b
a
ab
b b
4.84
4.805.135.87
5.325.93
6.206.
81
6.27
6.697.
11
7.22
0
4
8
12
F0 F60
F120
F180 F0 F60
F120
F180 F0 F60
F120
F180
0-15 cm depth 15-30 cm depth
bc c
30-60 cm depth
Treatments
pH
aba aa a a a
b b b
Figure 1 pH, EC, CEC and %OM of soils asaffected by rates of N and P fertilizers
applied in the previous 20 years. Within
each group, bars with a common letterwere not significantly different by
DMRT.05. % CV: 3.2%, 8.4% and 3.3%;
17.1%, 13.0% and 23.4%; 14.0%,10.8% and 8.1%; 5.3%, 29.3% and
11.9% for pH, EC, CEC and %OM of
soils, each at 0-15cm, 15-30cm and 30-60cm depths, respectively. F0, F60, F120,
and F180 : application with 0 and 0, 60
and 60, 120 and 120, 180 and 180 kg Nand P2O5/ha/year in the previous 20
years.

44 Kasetsart J. (Nat. Sci.) 34 (1)
fertilizers were more pronounced in the bottomlayer. The results suggested that free salts from the
fertilizers were mostly leached down to the lower
layers.CEC of the top-layer soil was not affected
by the fertilization whereas those of soils of the
middle and bottom layers either showed consistenttrends to decrease or significantly increased with
increased rates of the fertilizers. The effects of
fertilizers on the lower-layer soils were presum-ably due to lower pH which resulted in more
dissolution and leaching from the profile of
sesquioxides which were sources of pH-dependentcharges. However, the CEC of the top-layer soil
was not affected by the fertilizers since the reduc-
tion in CEC as a result of reduction of sesquioxidescontent was compensated for by the CEC from the
increased OM contents. The results were not in
agreement with those of Tattao (1987) whichshowed trends of increases in CEC’s of the surface
soil and sub-soil with increased rates of the fertiliz-
ers.OM contents of the top-layer soils showed
consistent trends to increase with increased rates of
the fertilizers whereas those of soils of the middleand bottom layers showed no effect of the fertiliza-
tion. The increases in OM content of the top layer
soil were presumably due to increased root growthin response to increased rates of the fertilizers of
corn grown in the previous cropping. The results
were similar to those of Tattao (1987) which showedtrends of increases in %OM of the surface soil and
sub-soil with increased rates of the fertilizers up to
F120 but only a slight trend of increase from F180.
Total N, extractable P and exchangeable K, Caand Mg in soils
Amounts of total N, extractable P and ex-
changeable K, Ca and Mg in the soils are shown in
Figure 2.Total-N contents of the top-layer soils
1.39
1.29
1.29
1.15
1.01
0.77
0.74
0.63
0.71
0.49
0.51
0.42
0.0
0.5
1.0
1.5
2.0
F0 F60
F120
F180 F0 F60
F120
F180 F0 F60
F120
F180
0-15 cm depth 15-30 cm deptha a
30-60 cm depth
Treatments
Exc
hang
eabl
e M
g, c
mol
/100
g
aa
ab b b a
b b b
4.6
4.6
3.75.
7
6.8
7.0
6.89.1
13.2
14.6
13.9
14.4
0
6
12
18
24
F0 F60
F120
F180 F0 F60
F120
F180 F0 F60
F120
F180
0-15 cm depth 15-30 cm depth
a a
30-60 cm depth
Treatments
Exc
hang
eabl
e C
a, c
mol
/100
g
aa
a a a a
ac b b
0.06
0.10
0.08
0.10
0.080.
15
0.14
0.17
0.370.580.55
0.58
0.0
0.2
0.4
0.6
0.8
1.0
F0 F60
F120
F180 F0 F60
F120
F180 F0 F60
F120
F180
0-15 cm depth 15-30 cm depth
a
a
30-60 cm depth
Treatments
Exc
hang
eabl
e K
, cm
ol/1
00g
aa
a a a a a a a a
1.84
1.74
1.851.21
5.63
4.05
3.10
1.60
58.5
9
45.5
9
18.9
3
4.62
0
30
60
90
F0 F60
F120
F180 F0 F60
F120
F180 F0 F60
F120
F180
0-15 cm depth 15-30 cm depth
cc
30-60 cm depth
Treatments
Ava
ilabl
e P
, mg/
kg
b
a a ab b c a a a a
0.05
4
0.06
2
0.05
6
0.06
1
0.10
6
0.08
2
0.09
3
0.09
0
0.16
1
0.14
8
0.14
5
0.13
5
0.0
0.1
0.2
0.3
F0 F60
F120
F180 F0 F60
F120
F180 F0 F60
F120
F180
0-15 cm depth 15-30 cm depth
a a
30-60 cm depth
Treatments
Tot
al N
, %
aa
a a a aa a a a
Figure 2 Amounts of total N, available P andexchangeable K, Ca and Mg of soils asaffected by rates of N and P fertilizerapplied in the previous 20 years. % CV:6.2%, 24.3% and 11.2%; 21.0%, 21.9%and 19.1%; 14.0%, 35.5% and 17.0%;5.5%, 18.6% and 6.7%; 6.3%, 14.3%and 15.5% for N, P, K, Ca and Mg ofsoils, each at 0-15cm, 15-30cm and 30-60cm depths, respectively. Refer toFigure 1 for captions.

Kasetsart J. (Nat. Sci.) 34 (1) 45
showed consistent trends to increase with increasedrates of the fertilizers whereas those of soils of the
middle and bottom layers showed no effect of the
fertilization. The increases in total-N content of thetop-layer soil were presumably due to the trends to
increase with increased rates of the fertilizers of
OM content of the soil. The results were similar tothose of Tattao (1987) which showed trends of
increases in total-N content with increased rates of
the fertilizer up to F120 but only a slight trend ofincrease from F180 in the case of surface soil and
trends to increase with increased rates of the ferti-
lizers in the case of sub-soil.Extractable P of the top-layer soils increased
markedly with increased rates of the fertilizers
whereas those of the middle-layer soils slightlyincreased with increased rates of the fertilizers and
those of the bottom-layer soils were not affected by
the fertilization. The results showed that very littleof the fertilizer P was moved down to the middle
and bottom layers. The results were in good agree-
ment with those of Tattao (1987) who worked withthe same experimental plots after fertilization for
10 years.
Exchangeable K of soils in the three layerswere not affected by F60 and F120 but showed
trends to be decreased by F180. This effect of
fertilization was presumably due to the increase insoil acidity as a result of the fertilization which was
largest in the case of F180. The results were slightly
different from those of Tattao (1987) which showedtrends of increases in exchangeable K by the ferti-
lization both in the cases of surface soil and sub-
soil.Exchangeable Ca of the top-layer soils
generally showed trends to decrease with increased
rates of the fertilizers whereas those of the middle-layer soils showed similar trends of decreases by
F60, F120 and F180. Exchangeable Ca of the bottom-
layer soils were similarly decreased by F120 andF180 and was most markedly decreased by the F60.
Figure 3 Amounts of extractable Fe, Mn, Zn and
Cu of soils as affected by rates of N andP fertilizers applied in the previous 20
years. % CV: 14.0%, 10.8% and 8.1%;
18.3%, 13.9% and 22.1%; 11.0%,22.8% and 12.7%; 7.2%. 12.5% and
19.3% for Fe, Mn, Zn and Cu of soils,
each at 0-15cm, 15-30cm and 30-60cmdepths, respectively. Refer to Figure 1
for captions.
0.94
0.90
1.01
1.101.
54
1.331.65
1.271.
69
1.55
1.51
1.48
0
1
2
3
F0 F60
F120
F180 F0 F60
F120
F180 F0 F60
F120
F180
0-15 cm depth 15-30 cm depth
a a
30-60 cm depth
Treatments
Ext
ract
able
Cu,
mg/
kg
aaa
a aa
a a a a
0.42
0.53
0.56
0.54
1.37
1.29
1.401.
91
3.25
3.11
2.442.67
0
2
4
6
F0 F60
F120
F180 F0 F60
F120
F180 F0 F60
F120
F180
0-15 cm depth 15-30 cm depth
a a
30-60 cm depth
Treatments
Ext
ract
able
Zn,
mg/
kg
aaa a a a
a a a a
15231916
43324153
152
134
116
98
0
100
200
300
F0 F60
F120
F180 F0 F60
F120
F180 F0 F60
F120
F180
0-15 cm depth 15-30 cm depth
aa
30-60 cm depth
Treatments
Ext
ract
able
Mn,
mg/
kg
aaa b b ab
a a a a
11.5
13.5
12.1
12.4
14.1
13.9
14.3
12.5
12.9
7.8
5.3
4.4
0
6
12
18
24
F0 F60
F120
F180 F0 F60
F120
F180 F0 F60
F120
F180
0-15 cm depth 15-30 cm depth
b
c
30-60 cm depth
Treatments
Ext
ract
able
Fe,
mg/
kg
aa
a a a aa a
aa
These effects of fertilization were presumably thenet results of the effects of fertilization on soil
acidity and the increased uptake of Ca. The ratio
between the increased uptake of Ca by the previouscorn crops in response to fertilization and the

46 Kasetsart J. (Nat. Sci.) 34 (1)
amounts of Ca carried by the applied triple super-phosphate for F60 was presumably higher than
those for F120 and F180 resulting in larger decrease
in the amount of exchangeable Ca relative to ratesof the fertilizers. The results for the top layer well
agreed with those of Tattao (1987) who worked
with the same experimental plots after fertilizationfor 10 years. However, Tattao (1987) found in-
creases in exchangeable Ca with increased rates of
the fertilizers in the case of sub-soil which wasregarded as soil at the 30-100cm depths.
Exchangeable Mg of soils of the three layers
showed effects of the fertilization that were similarto the effects on the exchangeable Ca but the effects
on Mg were more pronounced than those on Ca,presumably due to lower Mg content of the applied
triple superphosphate. Tattao (1987) obtained
results on exchangeable Mg similar to thosementioned above in the case of exchangeable Ca.
Extractable Fe, Mn, Zn and Cu in soilsExtractable Fe of the top-layer soils gener-
ally increased with increased rates of the fertilizers
whereas those of the middle-layer soils showedsimilar trends to be increased by the three treat-
ments and those of the bottom-layer soils showed
no effect of the fertilization (Figure 3). The resultssuggested that the amount extractable Fe in the top-
Figure 4 Mean weight diameter (MWD), state of aggregation, degree of aggregation, bulk density and
hydraulic conductivity of soils as affected by rates of N and P fertilizers applied in the previous20 years. % CV: 11.3% and 12.4%; 6.8% and 9.5%; 7.9% and 9.4%; 1.9% and 4.7%; and 29.2%
and 14.1% for MWD, state of aggregation, degree of aggregation, bulk density and hydraulic
conductivity at 0-15cm and 15-30cm depths, respectively. Refer to Figure 1 for captions.
1.16
1.10
1.15
1.08
1.16
1.15
1.09
0.74
0.0
0.5
1.0
1.5
2.0
F0
F60
F12
0
F18
0 F0
F60
F12
0
F18
0
Treatments
MW
D, m
m
0-15 cm depth 15-30 cm depth
a a a a a a aa
80.6
76.0
76.7
69.9 80
.9
81.5
75.9
67.9
0
40
80
120
F0
F60
F12
0
F18
0 F0
F60
F12
0
F18
0
Treatments
Stat
e of
Agg
rega
tion,
%
0-15 cm depth 15-30 cm deptha a a a
a a aa
79.0
74.0
75.3
68.4 79
.9
78.1
72.0
68.8
0
40
80
120
F0
F60
F12
0
F18
0 F0
F60
F12
0
F18
0
Treatments
Deg
ree
of A
ggre
gati
on,
%
0-15 cm depth 15-30 cm deptha a a a
a a a a
1.28
1.29
1.26
1.24 1.38
1.31
1.34
1.36
0
1
2
3
F0
F60
F12
0
F18
0 F0
F60
F12
0
F18
0
Treatments
Bul
k de
nsity
, gm
/cm
3
0-15 cm depth 15-30 cm depth
a a a a a a a a
0.73
2.53
1.39
1.20 0.
30
1.05
1.02 0.
19
0
1
2
3
4
F0
F60
F12
0
F18
0 F0
F60
F12
0
F18
0
Treatments
Hyd
raul
ic c
ondu
ctiv
ity,
cm/h
r
0-15 cm depth 15-30 cm depth
aa
a aa
a aa

Kasetsart J. (Nat. Sci.) 34 (1) 47
layer soil depended primarily on soil acidity. Greaterextractable Fe in soils of the middle and bottom
layers, in the case of the unfertilized plots, than that
of the top-layer soil suggested that amounts ofextractable Fe of the middle and bottom layers
were more dependent on soil aeration than on soil
acidity and thus showed no effect of the fertiliza-tion. The results for the top layer well agreed with
those of Tattao (1987) who worked with the same
experimental plots after fertilization for 10 years.However, Tattao (1987) found trends of increases
in extractable Fe with increased rates of the fertiliz-
ers in the sub-soil.Extractable Mn and Zn of the top-layer soils
showed consistent trends to increase with increased
rates of the fertilizers whereas those of the middle-layer soils showed comparable decreases by the
three fertilizer treatments and those of the bottom-
layer soils showed no effect of the fertilization. Theresults suggested that the amounts of extractable
Mn and Zn in the top-layer soil depended primarily
on pH of the soil. Similar decreases in extractableMn and Zn in the middle-layer soils by F60, F120and F180 were presumably net results of removal of
Mn and Zn by the corn crops which increased withincreased rates of the fertilizers and the solubility
of Mn and Zn which were higher in the soils
subjected to higher rates of fertilizers because oflower pH’s. The results for the top layer well
agreed with those of Tattao (1987). However, Tattao
(1987) found trends of increases in extractable Fewith increased rates of the fertilizers in the sub-soil.
Amounts of extractable Cu of soils of the
top and the middle layers showed trends of slightincreases with increased rates of the fertilizers
whereas those of the bottom-layer soils showed
trends of decreases with increased rates of thefertilizers. The results suggested that the amounts
of extractable Cu of soils of the top and middle
layers depended primarily on soil acidity. Thetrends to decrease with increased rates of the ferti-
lizers of the extractable Cu in the bottom-layer soilssuggested that acidity of the soil was not the main
factor affecting it. The results of Schwab et al.
(1990), which showed no effects of applicationwith ammonium nitrate for 40 years on DTPA-
extractable Cu in soil, supported this postulation.
Physical propertiesBulk density of the surface soils showed
slight trends to decrease with increased rates of thefertilizers while that of the sub-soil showed no
effect of the fertilizers (Figure 4). The results were
presumably due to the positive effects of thefertilization on OM contents of the soil. These
results were similar to those of Tattao (1987) who
worked with the same experimental plots afterfertilization for 10 years. State of aggregation and
degree of aggregation of both the surface soil and
sub-soil decreased with increased rates of thefertilizers (Figure 4). The effects of fertilization on
aggregation were presumably due primarily to the
increased acidity as a result of the fertilizationwhich in turn resulted in increased dispersion of
soil particles. The aggregate-size distribution
showed that proportion of the soil mass bound intosmaller aggregates increased with increased rates
of the fertilizers whereas that bound into larger
aggregates decreased with increased rates of thefertilizers resulting in increased aggregate-size
uniformity with increased rates of the fertilizers
(Figure 5). Mean weight diameters of aggregatesalso either tended to decrease or significantly
decreased with increased rates of the fertilizers
(Figure 4). The results thus showed that theaggregation decreased with increased rates of the
fertilizers and agreed well with results of Tattao
(1987) who worked with the same experimentalplots after fertilization for 10 years. Hydraulic
conductivity of the saturated soils was not effected
by the fertilization (Figure 4).

48 Kasetsart J. (Nat. Sci.) 34 (1)
F0 F60 F120 F180
10.8 a
16.7 a
23.7 a
25.5 a
14.8 a
14.5 a
16.9 a
23.0 a
21.4 ab
14.7 a
14.6 a
14.5 a
21.3 a
26.7 a
14.5 a
18.5 a
18.0 a
19.3 a
15.6 b
17.0 a
0%
20%
40%
60%
80%
100%
F0 F60 F120 F180
2.00-5.00
1.00-2.00
0.50-1.00
0.25-0.50
0.10-0.25
< 0.10
Agg
rega
tion
Treatments
Aggregate
diameter, mm
Aggregate-Size Distribution at 0-15cm Depth
8.6 a 9.5 a 8.7 a 11.6 a
F0 F60 F120 F180
8.2 ab
10.9 a
16.3 a
25.0 a
24.9 a
14.7 a
5.0 b
14.6 a
19.3 a
19.9 a
27.3 a
14.0 a
11.7 a
13.8 a
17.9 a
22.5 a
18.8 ab
15.4 a
11.9 a
20.2 a
23.5 b
24.6 a
13.4 b
6.4 b
0%
20%
40%
60%
80%
100%
F0 F60 F120 F180
2.00-5.00
1.00-2.00
0.50-1.00
0.25-0.50
0.10-0.25
< 0.10
Agg
rega
tion
Treatments
Aggregate
diameter, mm
Aggregate-Size Distribution at 15-30cm Depth
Figure 5 Aggregate size distribution of soils at 0-15cm and 15-30cm depths as affected by rate of NP
fertilizer applied in the previous 20 years. % CV: in case of 0-15 cm depth, 20.3%, 14.6%,
10.3%, 15.6%, 23.9%; and 21.0% for aggregate sizes 2.00-5.00mm, 1.00-2.00mm, 0.50-1.00mm, 0.25-0.50mm, 0.10-0.25mm and 0.10mm, respectively, and 20.1%, 20.8%, 12.4%,
9.6%, 30.0% and 28.3%for aggregate sizes 2.00-5.00mm, 1.00-2.00mm, 0.50-1.00mm, 0.25-
0.50mm, 0.10-0.25mm and 0.10mm, respectively, in the case of 15-30cm depth. Refer to Figure1 for captions.
Figure 6 AMF infection of corn roots, intensity of AMF spores in the soils and intensity of free-living
N2-fixing bacteria in the soils as affected by rate of NP fertilizer applied in the previous 20 years.
% CV: 5.9%, 12.3% and 13.3%, respectively. Refer to Figure 1 for captions.
86.7
83.3
78.9
73.3
0
40
80
120
F0
F60
F12
0
F18
0
Treatments
Infe
ctio
n, %
a a a a
AMF Infection
14.2
14.8
12.8
10.0
0
5
10
15
20
F0
F60
F12
0
F18
0
Treatments
No.
of
spor
es/g
soi
l
a aab
b
AMF Spores
1210
1279 13
14
1340
0
1000
2000
F0
F60
F12
0
F18
0
Treatments
Cel
ls/g
soi
l (x
104 )
a a a a
N2-Fixing Bacteria

Kasetsart J. (Nat. Sci.) 34 (1) 49
Biological propertiesThe infection on corn roots of AMF showed
consistent trends to decrease with increased rates
of the fertilizers whereas AMF spore intensity inthe soil was not affected by F60 but decreased with
increased rates of the fertilizers when the rates were
higher than that of F60 (Figure 6). The result onAMF spore intensity was slightly different from
that of Tattao (1987) who found trends of increase
in spore intensity with increased rates of the ferti-lizers up to F120 but a trend of decrease by F180.
The total plate counts of the free-living
nitrogen-fixing bacteria in the soil showed consist-ent trends to increase with increased rates of the
fertilizers. The results were different from those of
Tattao (1987) which showed no significant effectof the fertilization on Azotobacter spp. population
up to F120 and a trend of decrease in the population
by F180.
Soil productivityGrain yields of corn showed no effects of
F60, a trend to be increased by F120 and was
increased by F180 whereas stubble yield showed
consistent trends to increase with increased rates ofthe fertilizers (Figure 7). The uptake of N, P and K
either showed trends to increase or significantly
increased with increased rates of the fertilizers(Figure 7). The results therefore showed that pro-
ductivity of the soil increased with increased ratesof the fertilizers.
CONCLUSIONS
pH of the surface soil and sub-soil de-
creased with increased rates of the fertilizers withmore pronounced effects in the sub-soil. EC of the
surface soil was not affected by the fertilization
while that of the sub-soil increased with increasedrates of the fertilizers. CEC of the surface soil was
not affected by the fertilizers while that of the sub-
soil decreased with increased rates of the fertiliz-ers. OM and total N contents of the surface soil
tended to increase with increased rates of the ferti-
lizers while those of the sub-soil were not affectedby the fertilization. Available P of the surface soil
was dramatically increased with increased rates of
the fertilizers while that of the sub-soil was lessaffected. Exchangeable K, Ca and Mg either tended
to decrease or significantly decreased with in-
creased rates of the fertilizers, with more pro-nounced effect in the sub-soil. DTPA-extractable
Fe of the surface soil increased with increased rates
of the fertilizers while that of the sub-soil was notaffected by the fertilization. DTPA-extractable Mn
and Zn of the surface soil slightly increased with
increased rates of the fertilizers whereas those ofthe middle-layer soil were similarly decreased by
Figure 7 Grain (15% moisture) yields, dry stubble yields and total uptake of N, P and K of corn as affected
by rates of NP fertilizer applied in the previous 20 years. % CV: 14.4%, 10.1%, 9.9%, 15.7%
and 21.9% for grain, stubble, N, P and K, respectively. Refer to Figure 1 for captions.
2093
1991
2489 31
76
2849
3171
3477 37
51
0
2000
4000
6000
F0
F60
F12
0
F18
0 F0
F60
F12
0
F18
0
Treatments
Yie
ld, k
g/ha
Grain Stubble
a a ab
ba a a a
8.5 10.6
12.7
16.2
39.0
39.9
44.1
43.862
.1
48.2
42.4
41.7
0
30
60
90
F0
F60
F12
0
F18
0 F0
F60
F12
0
F18
0 F0
F60
F12
0
F18
0
Treatments
Tot
al u
ptak
e, k
g/ha
N P K
a aa
b
a ab bc c a a a a

50 Kasetsart J. (Nat. Sci.) 34 (1)
the three rates of fertilizers and those of the bottom-layer soil were not affected. DTPA-extractable Cu
of soils of the top and middle layers slightly in-
creased with increased rates of the fertilizerswhereas that of the bottom-layer soil slightly de-
creased with increased rates of the fertilizers.
Bulk density of the surface soils showedslight trends to decrease with increased rates of the
fertilizers while that of the sub-soil showed no
effect of the fertilizers. Aggregation of the soildecreased with increased rates of the fertilizers.
Hydraulic conductivity of the saturated soils was
not effected by the fertilization.Infection on corn roots of AMF showed
consistent trends to decrease with increased rates
of the fertilizers whereas AMF spore intensity inthe soil was not affected by low rates of the fertiliz-
ers but decreased with increased rates of the ferti-
lizers at high rates of fertilizers. Population of thefree-living nitrogen-fixing bacteria in the soils
showed consistent trends to increase with increased
rates of the fertilizers.Productivity of the soil increased with in-
creased rates of the fertilizers, with grain yield of
plot with the highest fertilizer rate being about151% relative to that of the non-fertilized plot.
ACKNOWLEDGMENT
The authors express their appreciation to
Kasetsart University for financial support on thiswork.
LITERATURE CITED
Bremner, J. M. 1965. Total nitrogen, pp. 1149-
1178. In C. A. Black, D. D. Evans, J. L. White,
L. E. Ensminger, and F. E. Clark (eds.). Meth-ods of Soil Analysis. Part 2: Chemical and
Microbiological Properties. Amer. Soc.
Agron., Inc., Madison, Wisconsin.
Bower, C. A. and L. V. Wilcox. 1965. Soluble salts,pp. 933-951. In C. A. Black, D. D. Evans, J. L.
White, L. E. Ensminger, and F. E. Clark (eds.).
Methods of Soil Analysis. Part 2: Chemicaland Microbiological Properties. Amer. Soc.
Agron., Inc., Madison, Wisconsin.
Chapman , H. D. 1965. Cation-exchang capacity,pp. 891-901. In C. A. Black, D. D. Evans, J. L.
White, L. E. Ensminger, and F. E. Clark (eds.).
Methods of Soil Analysis. Part 2: Chemicaland Microbiological Properties. Amer. Soc.
Agron., Inc., Madison, Wisconsin.
Danial, D. H. and H. D. Skipper. 1987. Method forthe recovery and quantitative estimation of
propagules from soil, pp. 29-36. In N. C.
Schenck (ed.). Method and Principle ofMycorrhizal research. Am. Phytopathol. Soc.,
St. Paul, Minnesota.
Hasathon, Y. 1982. Influences of long-term ammo-nium sulfate application to paddy soils of the
central plain on chemical properties and
growth, yields and chemical composition ofrice. M. S. thesis, Kasetsart University, Bang-
kok.
Jackson, M. L. 1958. Soil Chemical Analysis.Prentice-Hall, Inc. Engelwood Cliffs, N. J.
488 p.
Kemper, W. D. and W. S. Chepil. 1965. Sizedistribution of aggregates, pp. 499-519. In C.
A. Black, D. D. Evans, J. L. White, L. E.
Ensminger, and F. E. Clark (eds.). Methods ofSoil Analysis. Part I: Physical and Mineralogi-
cal Properties, Including Statistics of Meas-
urement and Sampling. Amer. Soc. Agron.,Inc., Madison, Wisconsin.
Klute, A. 1965. Laboratory measurement of hy-
draulic conductivity of saturated soil, pp. 210-221. In C. A. Black, D. D. Evans, J. L. White,
L. E. Ensminger, and F. E. Clark (eds.). Meth-
ods of Soil Analysis. Part I: Physical andMineralogical Properties, Including Statistics

Kasetsart J. (Nat. Sci.) 34 (1) 51
of Measurement and Sampling. Amer. Soc.Agron., Inc., Madison, Wisconsin.
Lindsay, W. L. and W. A. Norvel. 1978. Develop-
ment of a DTPA soil test for zinc, iron, manga-nese and copper. Soil Sci. Soc. Am. J. 42 : 421-
428.
Olsen, S. R. and L. A. Dean. 1965. Phosphorus, pp.1035-1049. In C. A. Black, D. D. Evans, J. L.
White, L. E. Ensminger, and F. E. Clark (eds.).
Methods of Soil Analysis. Part 2: Chemicaland Microbiological Properties. Amer. Soc.
Agron., Inc., Madison, Wisconsin.
Owensby, E. C., K. L. Anderson, and D. A. Whitney.1969. Some chemical properties of silt loan
soil after 20 years nitrogen and phosphorus
fertilization of smooth bromgrass (Bromus
inermis, Leyss). Soil Sci. 108 : 24-29.
Peech, M. 1965. Hydrogen-ion activity, pp. 914-
926. In C. A. Black, D. D. Evans, J. L. White,L. E. Ensminger, and F. E. Clark (eds.). Meth-
ods of Soil Analysis. Part 2: Chemical and
Microbiological Properties. Amer. Soc.Agron., Inc., Madison, Wisconsin.
Pratt, P. F. 1965. Potassium, pp. 1022-1034. In C.A. Black, D. D. Evans, J. L. White, L. E.
Ensminger, and F. E. Clark (eds.). Methods of
Soil Analysis. Part 2: Chemical and Microbio-logical Properties. Amer. Soc. Agron., Inc.,
Madison, Wisconsin.
Schwab, A. P., C. E. Owensby, and S. Kulyingyong1990. Changes in soil chemical properties due
to 40 years of fertilization. Soil Sci. 149 : 35-
43.Tattao, D. 1987. Influence of Long-Term N-P
Fertilizers, Cropping Systems and Rainfall on
Corn Yields and on Soil Properties. Ph.D.thesis. Kasetsart University, Bangkok.
Walkley, A. and C. A. Black. 1934. An examina-
tion of the Degtjareft method for determiningsoil organic matter and proposal in modifica-
tions of chromic acid titration method. Soil
Sci. 37 : 29-38.
Received date : 9/01/98Accepted date : 8/09/98

Kasetsart J. (Nat. Sci.) 34 : 52 - 63 (2000)
Properties and Agricultural Potential of Skeletal Soilsin Southern Thailand
Irb Kheoruenromne, Anchalee Suddhiprakarn and Sumitra Watana
ABSTRACT
A study on properties and agricultural potential of skeletal soils in Southern Thailand placed a majoremphasis on representative skeletal soils that can be found in large extent, moderate extent and limited
extent in the region. Study method included field investigation and pedon analysis of the representative
soils and collecting soil samples from their genetic horizons, and laboratory analysis on their physical andchemical properties to evaluate their vital properties and their agricultural potential. Eight representative
soil series included Chumphon series, Khao Khat series, Nong Khla series, Phato series, Ranong series,
Phayom Ngam series, Sawi series and Yi-ngo series.Results of the study revealed that most of them are upland soils mainly occupying undulating and
rolling terrains with a major slope range of 3-8 percent. Most of them are deep to very deep, highly leached,
well developed Ultisols. The skeletal materials in these soils vary but the ones that can be found frequentlyare ironstone nodules. Their basic fertility status is generally poor and problem on available phosphorus
in most soils exists. Their high extractable acidity is also a vital adversary property that can affect their
exchange properties markedly whereas the presence of skeletal materials in the soils does not appear to poseany serious problem on their uses and management. These soils are not suited for paddy rice but they are
moderately suited for upland field crops and livestock pasture, and well suited for tree crops including fruit
trees with different degrees of problem on topography and the presence of skeletal materials. Since thesesoils have been used mainly for rubber and fruit tree production, land use problem on them can be coped
with quite well by the use of existing agricultural technologies. Therefore, sustainability in their use, at
present, is somewhat achieved.Key words : skeletal soils, ironstone nodules, Ultisols, agricultural potential, Southern Thailand
Department of Soil Science, Faculty of Agriculture, Kasetsart University, Bangkok 10900, Thailand.
INTRODUCTION
Skeletal soils are those having substantial
amount of coarse materials present within 50centimeters from the soil surface (Soil Survey
Staff, 1975). They were considered problem soils
in Thailand (Panichapong, 1982). It was reportedthat skeletal soils can be found extensively in upper
Northeast and substantial area of these soils are inSouthern Thailand (Vijarnsorn, 1984). Basic
properties of these skeletal soils vary in many
aspects, i.e., nature of skeletal materials, depth ofsoils and their specific ecology (Dee-saeng, 1993).
Their agricultural uses and potential, in general, are
poor to very poor (Chintaskul, 1989). The uses ofthese soils for crop practices in Thailand become

more common nowadays due to the need of land forcropping practices. In Southern Thailand, these
soils have been used generally for tree crop
production such as for para rubber, tropical fruittrees and oil palm and problems on their uses, so
far, have been least reported. It appears that the
soils can support the uses in this aspect sufficiently.This study was conducted on skeletal soils
in Southern Thailand with three objectives including
1) to determine the vital properties of the skeletalsoils, 2) to evaluate their agricultural potential, and
3) to analyze problems on their uses.
MATERIALS AND METHODS
Method of the study consisted of two parts:field investigation and laboratory analysis. The
field study included identification, pedon analysis
and sampling of skeletal soils distributed in SouthernThailand by standard field study method
(Kheoruenromne, 1987; Soil Survey Division Staff,
1993) using several soil maps published by theLand Development Department, Ministry of
Agriculture and Cooperatives as guides to locations
of the soils. The Laboratory analysis was on thephysical and chemical properties of the soil samples
collected from the field using standard methods of
soil analysis (Soil Survey Laboratory Staff, 1992).Parameters involved in the laboratory analysis of
the soil samples include particle size distribution,
chemical properties related to major plant nutrientspresent in the soils and chemical parameters
indicating their exchange properties.
RESULTS AND DISCUSSION
Ecology and profile models of skeletal soilsResults of field investigation indicated that
many skeletal soils can be found in Southern
Thailand. However, some of them are quite similar
or can be grouped together. From the groups of
these skeletal soils, seven soil series representingmost of them were chosen to be studied in details.
These are Chumphon series which can be found
extensively in Southern Thailand, Khao Khat series,Nong Khla series and Phato series which can be
found in a moderate extent, Phayom Nyam series,
Sawi series and Yi-ngo series which can be foundin a limited extent in Southern Thailand (Vijarnsorn,
1985).
Some data on ecology of skeletal soils inSouthern Thailand are summarized in Table 1. It is
clear that most of skeletal soils have been formed
on old alluvial deposits and residuum and colluviumderived from clastic sedimentary and
metasedimentary rocks such as shale, phyllite and
quartzitic sandstone on undulating to rolling andhilly terrains. Most of them are well drained soils
and their uses are mainly for tree crop production
such as para rubber and tropical fruit trees. Theecology of these skeletal soils appears to be different
from what can be seen for skeletal soils in the North
and Northeast of Thailand (Kheoruenromne, 1991).Profile models of these skeletal soils are
shown in Figures 1, 2 and 3. Chumphon series, a
skeletal soil that can be found rather extensively inSouthern Thailand (Figure 1) is a very deep soil and
the coarse fragments are ironstone nodules. This is
a highly developed soil and have a distinct profilefeature. The profile models of Khao Khat series,
Nong Khla series, Phato series and Ranong series
(Figure 2) illustrate well of skeletal soils havingdifferent nature of the coarse fragment and profile
arrangement relating to the presence of coarse
materials. Khao Khat and Nong Khla series areboth deep and well developed soils and plinthite
layer in the Khao Khat profile does not limit root
penetration seriously. Both profiles indicate a welldeveloped soils. For Phato and Ranong series, their
profile features indicate a similar nature of the
coarse materials as being rock fragments. However,the arrangement of soil horizons in their profile is
Kasetsart J. (Nat. Sci.) 34 (1) 53

54 Kasetsart J. (Nat. Sci.) 34 (1)
Tab
le 1
Eco
logy
of
skel
etal
soi
ls in
Sou
ther
n T
haila
nd.
1/ D
rain
age
: WD
= w
ell d
rain
ed, S
PD =
som
ewha
t poo
rly
drai
ned
2/ R
= a
nnua
l rai
nfal
l, T
= r
ange
of
mea
n an
nual
tem
pera
ture

Kasetsart J. (Nat. Sci.) 34 (1) 55
different. Based on their profile models, Phatoseries can be considered a deep soil whereas Ranong
series is generally a shallow soil and its quartzitic
sandstone parent material can limit penetration ofplant roots. Within this group of skeletal soils
found in a moderate extent in southern Thailand,
Ranong series portrays the soil of poorest profile
Texture: C = Clay, GC = Gravelly clay; GSL =Gravelly sandy loam, L = Loam,
SL = Sandy loam, SGC = Slightly gravelly
clay, VGC = Very gravelly clayVGCL = Very gravelly clay loam;
VGSCL = Very gravelly sandy clay
loamStructure: SBK = Subangular blocky, 1 = Weak,
2 = Moderate
Figure 2 Profile models of some skeletal soilsfound in a moderate extent in Southern
Thailand.
feature to support the use of land for cropping
practices.
Phayom Ngam series, Sawi series and Yi-ngo series are skeletal soils found in a limited
extent in Southern Thailand. Skeletal materials in
Phayom Ngam and Sawi series are ironstonenodules, and somewhat broken plinthite layer exists
in Phayom Ngam series. This layer does not appear
to restrict penetration of plant roots either. Both of
Texture: GSL = Gravelly sandy loam,SGSL = Slightly gravelly sandy loam,
VGC =Very gravelly clay,
VGSC = Very gravelly sandy clayStructure: SBK =Subangular blocky, 1 = Weak,
2 = Moderate
Figure 1 Profile model of a skeletal soil foundrather extensively in Southern
Thailand.

56 Kasetsart J. (Nat. Sci.) 34 (1)
Texture: GC = Gravelly clay, GCL = Gravelly
clay loam, GSCL = Gravelly sandy clay
loam,GSL = Gravelly sandy loam, SL = Sandy
loam SiC = Silty clay,
VGCL = Very gravelly clay loamStructure: ABK = Angular blocky, SBK =
Subangular blocky,
1 = Weak, 2 = Moderate
Figure 3 Profile models of some skeletal soils
found in a limited extent in Southern
Thailand.
However, the condition would also depend on theirspecific physico-chemical properties.
Physical properties and status of basic fertility
of skeletal soilsTable 2 summarizes data on particle size
distribution, organic matter and available
phosphorus and potassium of a skeletal soil found
rather extensively in Southern Thailand (Chumphonseries). A vital parameter found in this soil as
indicated in Table 2 is the relatively sandy nature in
the upper part of its profile and the sharp break inthe amount of clay from the depth of 30 centimeters
downwards. This condition when added with the
low organic matter content, very low availablephosphorus and low available potassium making
its basic fertility status rather poor.
Four skeletal soils found in a moderatelyextent in Southern Thailand have been studied.
They are Khao Khat series, Nong Khla series,
Phato series and Ranong series. Table 3 summarizesdata on particle size distribution, organic matter
content and available phosphorus and potassium of
these soils. Khao Khat and Nong Khla series haverelatively finer texture comparing to that of Phato
and Ranong series. Considering data on organic
matter available phosphorus and potassium of thesesoils it appears that all the more clayey soils tend to
have a better basic fertility status than the sandy
ones. It should be noted here, that organic mattercontent values in the surface layer of these soils
show no problem for crop practices. Available
phosphorus data is too low for general cropproduction in these soils. Available potassium
values however, are varied but most of them except
those in Ranong series appear to be within a readilymanageable range. Therefore, another vital property
of these skeletal soils is the available phosphorus in
their fine earths.Data on particle size distribution, organic
matter and available nutrients of Phayom Ngam
these soils illustrate a generally deep and highlydeveloped soils. Yi-ngo series is a very deep, well
drained and highly developed soils having quartz
gravels as skeletal materials. This differs from theother soils within this group substantially. Another
characteristic deviating from other soils is the thick
surface layer in this soil making it more supportivefor crops with a shallow rooting zone.
Both data on the ecology of these soils and
their profile models suggested quite clearly thatthese soils are readily manageable for crop practices.

Kasetsart J. (Nat. Sci.) 34 (1) 57
Table 2 Particle size distribution in fine earths (USDA grading), organic matter (O.M.) and availablenutrients of a skeletal soil found rather extensively in Southern Thailand.
Depth Horizon Particle size distribution (g kg-1) Textural 1/ O.M. Avail.P Avail.K(cm) Sand Silt Clay class (g kg-1) ← (mg kg-1 ) →
Chumphon series0-10 A 710 210 80 SL 9.1 1.2 5410-20 Bw 700 190 110 SL 3.3 0.8 2420-30 Btc1 690 190 120 SL 3.6 1.0 1830-75 Btc2 460 150 390 SC 3.6 0.7 4575-115 Btc3 420 130 450 C 2.1 1.0 39115-185+ Btc4 470 190 340 C 4.6 1.2 36
1/ C = Clay, SC = Sandy clay, SL = Sandy loam.
Table 3 Particle size distribution in fine earths (USDA grading), organic matter (O.M.) and available
nutrients of some skeletal soils found in a moderate extent in Southern Thailand.
Depth Horizon Particle size distribution (g kg-1) Textural 1/ O.M. Avail.P Avail.K
(cm) Sand Silt Clay class (g kg-1) ← (mg kg-1 ) →
Khao Khat series0-10 A 270 470 260 SiL 39.0 4.1 14310-22 Bc 235 385 380 CL 23.4 1.7 6222-65 Btc 140 335 525 C 7.1 1.3 4165-122+ Bv 185 395 620 C 8.1 1.9 35Nong Khla series0-8 Ap 330 250 420 C 23.4 2.0 678-18 Bt1 205 190 605 C 24.1 3.7 4718-35 Bt2 170 170 660 C 20.8 1.9 3235-75 Btc1 155 110 735 C 21.1 1.4 2975-110+ Btc2 150 110 740 C 21.1 1.4 29Phato series0-12/17 Ap 735 165 100 SL 16.2 2.5 5017-35 Bt1 690 200 110 SL 8.4 1.7 3835-50/55 Bt2 670 180 150 SL 4.8 1.2 4155-110+ Bc 595 175 230 SL 3.6 0.9 59Ranong series0-10 A 680 260 60 SL 17.2 4.3 3910-20 Bc1 680 270 50 SL 6.9 2.9 3020-47 Bc2 690 250 60 SL 1.9 1.6 2147-100+ C ---------------------- Saprolite of quartzitic sandstone ----------------------
1/ C = Clay, CL = Clay loam, SiL = Silt loam, SL = Sandy loam.

58 Kasetsart J. (Nat. Sci.) 34 (1)
Table 4 Particle size distribution in fine earths (USDA grading), organic matter (O.M.) and available
nutrients of some skeletal soils found in a limited extent in Southern Thailand.
Depth Horizon Particle size distribution (g kg-1) Textural 1/ O.M. Avail.P Avail.K
(cm) Sand Silt Clay class (g kg-1) ← (mg kg-1 ) →
Phayom Ngam series
0-15 A 445 315 240 SCL 35.4 3.1 6415-29 Bw 390 270 340 SCL 30.7 3.9 38
29-65 Btc 330 215 450 C 18.1 3.3 29
65-155+ Bvg 323 205 470 C 7.5 1.1 29Sawi series
0-9 Ap 710 235 55 SL 13.8 1.9 39
9-25 Bw 705 230 65 SL 7.6 1.8 2125-52/58 Bt 700 235 65 SL 2.4 1.4 26
58-110+ Btc 580 270 150 SL 1.5 1.9 36
Yi-ngo series0-22 Ap 521 354 125 SL 17.2 64.2 62
22-50 Btc1 472 312 216 SL 8.8 60.8 48
50-135 Btc2 421 338 241 SL 3.8 58.2 36135-160+ C 434 366 200 SL 1.7 59.1 33
1/ C = Clay, SCL = Sandy clay loam, SL = Sandy loam.
series, Sawi series and Yi-ngo series, skeletal soilsthat occupy a limited extent in Southern Thailand
are summarized in Table 4. Phayom Ngam series is
only soil having clayey texture where clay contentdetermines the activities and chemical properties
of the soil. Also, this soil differs from other two soil
series in this group in its more poorly drainedenvironment. The trend for their basic fertility
relating to the amount of clay present in the fine
earths follows what can be found in other groups ofskeletal soils. The soils do not have any problem on
organic matter content and their available potassium
values are also within a readily manageable range.Available phosphorus in general is the problem for
Phayom Ngam and Sawi series but very high
values of available phosphorus were found in theanalysis of soil samples collected from the profile
of Yi-ngo series. This makes basic fertility status of
Yi-ngo series relatively better than the other twosoils for a general cropping practices (Sanchez,
1976).
Data on physical properties and basic fertilityof these skeletal soils found in Southern Thailand
indicate mildly that most of them have a generally
light texture in their fine earths. Most of them havemanageable level of organic matter content and
available potassium. Available phosphorus in these
soils can vary markedly and most of them have toolow available phosphorus. This aspect should be
looked into in using them for crop practices.
Exchange properties of skeletal soils in SouthernThailand
Table 5 summarizes laboratory analyticaldata related to exchange properties in the fine
earths of Chumphon series, a skeletal soil found

Kasetsart J. (Nat. Sci.) 34 (1) 59
rather extensively category being highly leached,
well developed soil poor exchange properties of
this soil can be expected. Though this poor soil stillfavour cation exchange in the soil system since its
delta pH (∆ pH) is negative, other chemical
parameters such as the low extractable bases,relatively high extractable acidity, relatively low
cation exchange capacity and low base saturation
make them have poor exchange properties in theirfine earths. With at least 35 percent by volume of
coarse fragments in the soils the overall exchange
properties of soil mass can be quite poor.Table 6 summarizes laboratory data related
to exchange properties in the fine earths of four soil
series found in a moderate extent in SouthernThailand. Normally, the pH level of these soils do
not pose any serious condition and they also favour
cation exchange judging from their negative deltapH values. The problem of their exchange properties
generally lies in their low extractable basic cations
and their markedly high extractable acidity. Thisimplies the excessive acidic cations (H+, Al3+) in
the soil system affecting balance of plant nutrient
status. The cation exchange capacity values of
these soils range widely but depending on their
extractable acidity mainly since their base saturationcan be considered quite low. This condition in the
soils can be quite serious for crop practices and
their soil-fertilizer management. The condition inKhao Khat and Nong Khla series is more serious
than the one in Phato and Ranong series.
Laboratory analytical data related toexchange properties in the fine earths of three
skeletal soils found in a limited extent in Southern
Thailand are summarized in Table 7. Pattern of thedata on their exchange properties appear to strictly
follow those of the ones shown in Table 6. Though
it is obvious that their soil system still favour cationexchange, acidic cations in the soils adversely
affect their cation exchange capacity and base
saturation. The excessive extractable acidic cationsin Phayom Ngam series makes its cation exchange
poorest. A moderate condition on cation exchange
properties of these soils can be found in Sawiseries. Among these three soils the exchange
properties of Yi-ngo series are the best one.
Table 5 Laboratory analytical data related to exchange properties in the fine earths of a skeletal soil foundrather extensively in Southern Thailand.
Depth Horizon pH (1:1) Extractable bases Sum E.A.1/ C.E.C.2/ B.S.3/
(cm) H2O KCl Ca Mg Na K bases (sum) %
← cmol kg-1→
Chumphon series0-10 A 6.0 4.8 1.9 0.3 0.1 0.1 2.4 3.7 6.1 5610-20 Bw 5.5 3.8 0.8 0.2 0.1 0.1 1.2 3.7 4.9 22
20-30 Btc1 5.3 3.9 0.9 0.2 0.1 0.1 1.3 4.4 5.7 23
30-75 Btc2 5.7 4.1 4.0 0.9 0.2 0.1 5.2 7.6 12.8 3875-115 Btc3 5.7 4.2 4.0 1.1 0.2 0.1 5.4 7.3 12.7 37
115-185+ Btc4 5.6 4.1 3.4 1.3 0.2 0.1 5.0 5.6 10.6 34
1/ E.A. = Extractable acidity
2/ C.E.C. (sum) = Cation exchange capacity by the sum of E.A. and sum of bases
3/ B.S. = Base saturation

60 Kasetsart J. (Nat. Sci.) 34 (1)
Table 6 Laboratory analytical data related to exchange properties in the fine earths ofsome skeletal soils found in a moderate extent in Southern Thailand.
Depth Horizon pH (1:1) Extractable bases Sum E.A.1/ C.E.C.2/ B.S.3/
(cm) H2O KCl Ca Mg Na K bases (sum) %
← cmol kg-1→
Khao Khat series
0-10 A 5.1 4.2 0.7 1.0 0.1 0.1 1.9 19.8 21.7 910-22 Bc 5.0 4.0 0.1 1.1 0.1 0.1 1.4 15.8 17.2 8
22-65 Btc 5.5 4.2 0.1 0.2 0.1 0.1 0.5 13.4 13.9 4
65-122+ Bv 5.7 4.1 0.1 0.1 0.2 0.1 0.5 13.0 13.5 4Nong Khla series
0-8 Ap 4.6 3.7 0.3 0.3 0.2 0.1 0.9 12.5 13.4 7
8-18 Bt1 4.9 3.8 0.3 0.2 0.3 0.1 0.9 12.7 13.6 718-35 Bt2 5.0 3.7 0.2 0.1 0.2 0.1 0.6 12.8 13.4 4
35-75 Btc1 5.4 3.8 0.2 0.1 0.2 0.1 0.6 12.5 13.1 5
75-110+ Btc2 5.5 3.8 0.2 0.1 0.2 0.1 0.6 12.5 13.1 5Phato series
0-12/17 Ap 4.8 4.0 0.5 0.2 0.1 0.1 0.9 4.9 5.8 15
17-35 Bt1 4.8 3.9 0.2 0.1 0.1 0.1 0.5 3.9 4.4 1135-50/55 Bt2 4.8 3.7 0.2 0.1 0.1 0.1 0.5 3.9 4.4 11
55-110+ Bc 4.9 3.7 0.2 0.1 0.1 0.1 0.5 5.2 5.7 9
Ranong series0-10 A 4.6 4.0 0.9 0.1 0.2 0.1 1.3 3.4 4.7 28
10-20 Bc1 4.5 4.0 0.5 0.1 0.2 0.1 0.9 3.3 4.2 21
20-47 Bc2 5.0 4.0 0.2 0.1 0.1 0.1 0.4 1.4 1.8 2247-100+ C --------------------------Saprolite of quartzitic sandstone--------------------------
1/ E.A. = Extractable acidity
2/ C.E.C. (sum) = Cation exchange capacity by the sum of E.A. and sum of bases3/ B.S. = Base saturation
Data related to exchange properties of theseskeletal soils indicate few of their common vital
properties. Firstly, these skeletal soils possess a
system favouring cation exchange. Secondly, dueto their highly leached and well developed nature
their exchange complex is generally affected
strongly by the acidic cations since the extractableacidity values are generally higher than their total
extractable basic cations. Thirdly, the high amount
of clay in the fine earths of these soils does not reallygive positive effect on their exchange properties.
Some of the soils with high clay content in the fine
earths appear to show more adverse effect of theacidic cations. These conditions of their exchange
properties seem to suggest that soil-fertilizer
management in crop practices for these soils shouldnot emphasize the cation form of fertilizer elements
too strongly. Anionic forms of nutrients should

Kasetsart J. (Nat. Sci.) 34 (1) 61
also be considered more seriously for a moreefficient fertilizer management. The presence of
skeletal materials in these soils would not have
strong negative effect in soil-crop practices.Based on their morphology and data on
their properties these soils can be classed mainly as
Ultisols. Chumphon series and Yi-ngo series areHapludults; Khao Khat series is Plinthudult; Nong
khla series, Phato series and Sawi series are
Paleudults, Phayom Ngam series is a Plinthaquult.However, Ranong series is a Udorthent (Soil Survey
Staff, 1998).
Table 7 Laboratory analytical data related to exchange properties in the fine earths of some skeletal soilsfound in a limited extent in Southern Thailand.
Depth Horizon pH (1:1) Extractable bases Sum E.A.1/ C.E.C.2/ B.S.3/
(cm) H2O KCl Ca Mg Na K bases (sum) %
← cmol kg-1→
Phayom Ngam series
0-15 A 4.8 3.8 0.3 0.2 0.3 0.1 0.9 15.0 15.9 615-29 Bw 4.8 3.7 0.2 0.1 0.4 0.1 0.8 10.6 11.4 8
29-65 Btc 5.1 3.8 0.2 0.1 0.4 0.1 0.8 10.1 10.9 7
65-155+ Bvg 5.1 3.7 0.1 0.1 0.3 0.1 0.6 12.0 12.6 5Sawi series
0-9 Ap 5.3 4.4 0.9 0.2 0.1 0.1 1.3 2.6 3.9 33
9-25 Bw 5.5 4.3 0.9 0.2 0.1 0.1 1.3 2.3 3.6 3625-52/58 Bt 6.3 4.6 0.1 0.2 0.1 0.1 0.5 1.7 2.2 23
58-110+ Btc 6.1 3.8 0.1 0.3 0.1 0.1 0.5 2.5 3.0 17
Yi-ngo series0-22 Ap 4.7 3.7 0.3 0.1 7.8 0.6 8.8 5.3 14.1 62
22-50 Btc1 4.5 3.7 0.3 0.2 7.7 1.3 9.5 5.1 14.6 65
50-135 Btc2 4.7 3.9 0.4 0.2 7.2 0.8 8.6 7.5 16.1 53135-160+ C 5.1 3.9 0.2 0.2 0.6 0.6 1.6 4.5 6.1 26
1/ E.A. = Extractable acidity
2/ C.E.C. (sum) = Cation exchange capacity by the sum of E.A. and sum of bases
3/ B.S. = Base saturation
Agricultural potential of skeletal soils inSouthern Thailand
Data on ecology, profile models and physicaland chemical properties of these skeletal soils
illustrate that these soils are generally deep soils
having skeletal materials of different nature but themost common one is the ironstone nodule.
Generally, the soils are well developed, highly
leached Ultisols and their fine earths have poorexchange properties. Though their surface layers
would appear to possess a better quality for crop
practices, the condition within the whole soils inmost of them are poor. This is a typical condition of
Ultisols in the humid tropics. Based on their
properties and morphology most of these soils can

62 Kasetsart J. (Nat. Sci.) 34 (1)
be classed into U-IVct according to the landcapability classification system and P-Vt, N-IIIct,
F-IIct (T-IIct), L-IItc according to land suitability
classification (FAO, 1976; Land ClassificationDivision and FAO Project Staff, 1973) where U
indicates upland cropping, P = paddy rice, N = non-
flooded annual crops (upland field crops), F = fruittrees, T = tree crops, L = livestock pasture, IV =
marginally suited (land capability classification) V
= not suited, III = moderately suited, II = well suited(for suitability classess of paddy rice, upland field
crops and fruit trees or tree crops) and II = moderately
suited (for suitability class of livestock pasture).Two limiting parameters can be envisioned for
these soils include topography (t) and gravels or
coarse materials (c) in the soils.In a strict sense these skeletal soils do not
have potential for lowland crop production in
agriculture. They are moderately suitable for uplandfield crop and livestock pasture, well suited for
fruit trees and tree crop production with two inherent
problems, slope and coarse materials in the soils.From these analyses it should be noted that these
skeletal soils in Southern Thailand can be used
readily in crop practices but attention on types ofcrops is needed.
Sustainable uses of skeletal soils in SouthernThailand
Development of crop production and
practices in Southern Thailand has been quiteadaptive to climatic and soil conditions. For the
upland region including areas occupied by skeletal
soils, para rubber and fruit tree have beenemphasized. The general condition on agricultural
technology is also directed to perennial tree crop
production. These include both soil-fertilizermanagement and integrated pest management. As
indicated in Table 1 on the ecology of the skeletal
soils, most of them are now supporting para rubberplanting with some limited part under fruit trees.
Stands of these crops are quite acceptable and theiryields have been quite satisfactory with common
plantation and orchard management basing on
existing technologies. Therefore, the overallagricultural use of upland soils including the skeletal
ones in most parts of Southern Thailand can be
considered stable and productive.A factor that can affect the stability of land
use on these soils is strictly economic. Marketing
of the products, at time, becomes problem, but withthe relatively fast development in agro-industry in
the country the situation can be sustained for a good
period of time. Though it appears to be somewhataccidental the use of skeletal soils in Southern
Thailand at present is well adapted and generally
sustainable.
CONCLUSION
Results of the study on vital properties and
agricultural potential of skeletal soils in Southern
Thailand revealed that most of them are uplandsoils mainly occupying undulating and rolling
terrains with a major slope range of 3-8 percent.
Most of them are deep to very deep, highly leachedand well developed Ultisols. The skeletal materials
in these soils vary but ones that can be found
frequently are ironstone nodules. Their basic fertilitystatus is generally poor and available phosphorus
problem in most soils exists. Their high extractable
acidity can affect their exchange propertiesmarkedly whereas the presence of skeletal materials
does not appear to pose serious problem on their
uses and management.Evaluation of their suitability for cropping
reveals that they are not suited for paddy rice, but
they are moderately suited for upland field cropsand livestock pasture, and well suited for tree crops
including fruit trees with different degrees of
problem on topography and the presence of skeletalmaterials. Since they have been used mainly for

Kasetsart J. (Nat. Sci.) 34 (1) 63
rubber and fruit tree production, land use problemon them can be coped with quite well by the use of
existing agricultural technologies. Therefore,
sustainability in their use, at present, is somewhatachieved.
ACKNOWLEDGEMENT
This study was a part of the Project on
Properties and Fertility of Skeletal Soils in Thailandsupported by research fund granted through the
Kasetsart University Research and Development
Institute (KURDI), Kasetsart University, Bangkok.
LITERATURE CITED
Chintaskul, P. 1989. An Analysis on Types and
Properties of Laterite in Sakon Nakhon Basin,
Northeast Thailand. Ph.D. Thesis, KasetsartUniversity, Bangkok. (in Thai with English
Abstract).
Dee-saeng, B. 1993. Characteristics of SkeletalSoils on a Toposequence in Sakon Nakhon
Basin. M.S. Thesis, Kasetsart University,
Bangkok. (in Thai with English Abstract).FAO. 1976. A Framework for Land Evaluation.
FAO Soils Bulletin No. 32. Rome. 87 p.
Kheoruenromne, I. 1987. Soil Survey LaboratoryManual. Department of Soil Science, Faculty
of Agriculture, Kasetsart University, Bangkok.
187 p. (in Thai).Kheoruenromne, I. 1991. Soils of Thailand-
Characteristics, Distribution and Uses.
Department of Soil Science, Faculty ofAgriculture, Kasetsart University, Bangkok.
651 p. (in Thai).
Land Classification Division and FAO ProjectStaff. 1973. Soil Interpretation Handbook for
Thailand. Department of Land Development,
Ministry of Agriculture and Cooperatives,
Bangkok. 135 p.Panichapong, S. 1982. Problem Soils of Thailand;
Their Characteristics, Distribution and
Utilizsation. Ph.D. Thesis, The University ofTokyo, Tokyo.
Sanchez, P.A. 1976. Properties and Management
of Soils in the Tropics. John Wiley and SonsInc., New York. 617 p.
Soil Survey Division Staff. 1993. Soil Survey
Manual. United States Department ofAgriculture, Washington D.C. 437 p.
Soil Survey Laboratory Staff. 1992. Soil Survey
Laboratory Methods Manual. Soil SurveyInvestigation Report No. 42, United States
Department of Agriculture, Washington D.C.
400 p.Soil Survey Staff. 1975. Soil Taxonomy-A basic
system of soil classification for making and
interpreting soil survey. United StatesDepartment of Agriculture. U.S. Government
Printing Office, Washington D.C. 754 p.
Soil Survey Staff. 1998. Keys to Soil Taxonomy.8th ed., United States Department of
Agriculture. U.S. Government Printing Office,
Washington D.C. 326 p.Vijarnsorn, P. 1984. Skeletal soils of Thailand, pp.
F2.1-F2.14. In Proceedings of the Fifth ASEAN
Soil Conference, Vol. 1. Department of LandDevelopment, Ministry of Agriculture and
Cooperatives. Bangkok, Thailand.
Vijarnsorn, P. 1985. General Soil Map of theSouthern Region, Thailand (scale 1:500,000).
Department of Land Development, Ministry
of Agriculture and Cooperatives. Bangkok (2map sheets).
Received date : 1/06/99Accepted date : 19/10/99

Kasetsart J. (Nat. Sci.) 34 : 64 - 73 (2000)
indicated that xylose fermenting yeasts did not
ferment well in undetoxified hydrolysate. Ferrari et
al. (1992) reported that acetic acid in the eucalyptuswood hemicellulose acid hydrolysate caused low
pH, reduced the ethanol production rate and yield
of Pichia stipitis fermentation. Its toxicity dependednot only on the concentration but also the pH of
hydrolysate. Some investigators reported the
inhibitory effects of acetic acid on activities of
Effect of Acetic Acid on Growth and Ethanol Fermentationof Xylose Fermenting Yeast and Saccharomyces cerevisiae
Savitree Limtong1 , Tawatchai Sumpradit1, Vichien Kitpreechavanich1, Manee Tuntirungkij2 , Tatsuji Seki3 and Toshiomi Yoshida3
ABSTRACT
Growth of some xylose fermenting yeasts, Candida shehatae, Pichia stipitis CBS5773, fusant F101
and fusant F198, was completely inhibited in xylose medium added with 0.5% v/v acetic acid which caused
the reduction of pH to 4.1. Only one xylose fermenting strain, Pachysolen tannophilus NRRL-Y2460,showed relatively low growth and ethanol fermentation. However, in the medium added with 1.0% v/v
acetic acid (pH 3.7) all of these strains were completely inhibited. When the medium was adjusted by
hydrochloric acid to pH 4.1 and 3.7, all xylose fermenting strains showed almost the same growth as in themedium without pH adjustment (pH 6.2). In glucose medium added with 0.5% v/v acetic acid, various
strains of Saccharomyces cerevisiae, M30, Sc90, N1, G/3, G/5, G/2, TJ3 and SH1089, grew with lower
specific growth rate and provided lower maximal cell concentration rate than in medium without addingacetic acid (pH 6.2). All strains, except N1, produced slightly higher maximal ethanol concentration.
However, all of them yielded lower ethanol production rate. Among S. cerevisiae, strain B120 was more
sensitive to acetic acid than the others since its growth was completely inhibited by 0.5% v/v acetic acid.In glucose medium, 0.5% v/v acetic acid did the same role as in xylose medium to xylose fermenting strains.
Hence, the xylose fermenting yeasts revealed higher sensitivity to acetic acid than S. cerevisiae.
Key words : acetic acid, xylose fermenting yeast, ethanol fermentation, xylose fermentation,Saccharomyces cerevisiae
INTRODUCTION
Hydrolysate of lignocellulose contains not
only a mixture of sugars, mainly glucose from
cellulose and xylose from hemicellulose, but alsosome substances that exert inhibitory effects on
yeast such as acetic acid, furfural and lignin
derivatives (Tsao et al., 1982; Olsson and Hahn-Hagerdal, 1993). Linden and Hahn-Hagerdal (1989)
1 Department of Microbiology, Faculty of Science, Kasetsart University, Bangkok 10900, Thailand.2 Central Laboratory and Greenhouse Complex, Kasetsart University Research Development Institute, Kasetsart University,
Kamphaengsaen Campus, Nakhon Pathom 73140, Thailand.
3 International Center for Biotechnology, Osaka University, Yamadaoka, Suita-shi, Osaka 565, Japan.

several yeasts. For examples; Mariorella et al.
(1983) showed the inhibitory effects of different
metabolic products of yeast including acetic acid.
Pampulha and Loureioro (1989) and Ferrari, et al.(1992) indicated the important role of undissociate
form of acetic acid which diffuse into yeast cells,
causing decreased pH of cytoplasm and inhibitingthe activity of some enzymes, especially endolase,
phosphoglyceromutase, aldolase and
triosephosphate isomerase. Phowchinda et al.
(1995) showed the inhibitory effect of acetic on
growth and fermentation activity of Saccharomyces
cerevisiae and indicated that it was more effectiveon the biomass synthesis than on ethanol production.
However, there were no comparative study on
sensitivity to acetic acid between xylose fermentingyeast and S. cerevisiae. Therefore, in this study the
inhibitory effect of acetic acid on growth and
ethanol fermentation of some xylose fermentingyeasts and some strains of S. cerevisiae was
demonstrated, as well as comparison on sensitivity
of both yeasts to acetic acid.
MATERIALS AND METHODS
Yeast strainsYeast used in this study included
Saccharomyces cerevisiae strain Sc90, M30, N1,
TJ3, B120, G/2, G/3, G/5 and SH1089 and wildstrains of xylose fermenting yeast, Candida
shehatae, Pichia stipitis CBS5773, Pachysolen
tannophilus NRRL-Y2460. Fusant F101, a fusantfrom intergeneric protoplast fusion of P. stipitis
CBS5773 and S. cerevisiae AM12, and F198, a
fusant from intraspecific protoplast fusion of P.
stipitis CBS5773 (Chomtong, 1995) were also
included.
Growth and ethanol fermentationInoculum was prepared by inoculation of
24 h culture of yeast cultivated on a slant YPD agar
(1% yeast extract, 2% peptone, 2% D-glucose and1.2% agar) or YPX agar (same ingredient as YPD
except D-xylose was used instead of D-glucose),
depending on yeast strains, into 50 ml of YPD brothor YPX broth in 250 ml flask and incubated on a
rotary shaker, 200 rpm, at room temperature for 24
h. Cells were harvested, washed twice andresuspended in distilled water.
Fermentation was carried out in 100 ml of
YPD18 broth (YPD broth containing 18% D-glucose) or YPX4 broth (YPX broth containing 4%
D-xylose) in 250 ml Erlenmeyer flask. In acetic
acid treatment, pre-calculated volume ofconcentrated acetic acid was added prior to
sterilization. For comparative study on effect of pH
1 N hydrochloric acid was used. Inoculum wasadded into the medium to obtain the initial cell
concentration, as optical density (OD) at 660 nm, at
1.0. Incubation was performed at room temperatureon a rotary shaker at 180 rpm.
AnalysesEthanol was determined by gas
chromatography (Shimadzu GC-9A, Japan) and
propanol was used as internal standard. Cell
concentration was quickly determined as OD at660 nm by Spectrophotometer (Shimadzu model
UV-240, Japan).
RESULTS AND DISCUSSIONS
Effect of acetic acid on growth and ethanolfermentation in xylose medium of xylosefermenting yeast
In xylose medium (4% xylose and pH 6.2),P. stipitis CBS5773 showed the highest specific
growth rate (µ), 0.21 h-1 though its maximal cell
concentration measured as OD at 660 nm, was thelowest, 33.6, at 96 h (Figure 1 A). This yeast also
produced the highest ethanol concentration, 1.51%
w/v after 36 h, with the highest ethanol production
Kasetsart J. (Nat. Sci.) 34 (1) 65

66 Kasetsart J. (Nat. Sci.) 34 (1)
Figure 1 Growth of C. shehatae (◆ ), P. stipitis
CBS5773 (▲), Pa. tannophilus NRRL-
Y2460 ( ), F101 (■ ) and F198 (● ) in
xylose medium without (A) and with pHadjustment by HCl to pH 4.1 (B) and 3.7
(C).
Figure 2 Ethanol fermentation of C. shehatae (◆ ),
P. stipitis CBS5773 (▲), Pa. tannophilus
NRRL-Y2460 ( ), F101 (■ ) and F198(● ) in xylose medium without (A) and
with pH adjustment by HCl to pH 4.1
(B) and 3.7 (C).

Kasetsart J. (Nat. Sci.) 34 (1) 67
rate of 0.41 g/l/h (Figure 2A). Likewise, the twofusants, F198 and F101, produced ethanol at 1.44
and 1.41% w/v after 36 h with the production rate
of 0.40 and 0.39 g/l/h, respectively. C. shehatae
accumulated 1.40 % w/v of ethanol at 48 h with low
production rate of 0.29 g/l/h, while Pa. tannophilus
NRRL-Y2460 produced only 0.77% w/v of ethanolwith the lowest production rate of 0.10 g/l/h.
Accordingly, Pa. tannophilus NRRL-Y2460
revealed the lowest specific growth rate, 0.158 h-1,though its maximal OD was the highest, 47.0.
Addition of 0.5% v/v acetic acid into xylose
medium resulted in reduction of pH to 4.1.Cultivation of xylose fermenting yeasts in this
medium showed that only Pa. tannophilus NRRL-
Y2460 could grow with low specific growth rate,0.076 h-1, and yielded low maximal cell
concentration as OD at 29.30 after 96 h. This yeast
produced maximal ethanol concentration, 0.56%w/v at 120 h resulted in production rate of 0.046 g/
l/h. In 1.0% v/v acetic acid treatment causing pH
reduction to 3.7, no xylose fermenting yeasts wereobserved in the medium. The results obviously
indicated the inhibitory effect of acetic acid to
growth and fermentation of xylose fermentingyeasts. These findings agreed with the report of
Ferrari et al. (1992) on inhibitory effect of acetic
acid on ethanol fermentation by P. stipitis in acidhydrolysate of hemicellulose in eucalyptus wood
which contained various products including 3%
xylose and 1% acetic acid. In addition they reportedflocculation of yeast and lost of viability after
inoculation, however, growth was resumed after a
period of time.To exhibit the effect of acetic acid on
reduction of growth and ethanol fermentation and
not from low pH caused by adding the acid,experiments were carried out in xylose medium
where pH was adjusted by 1 N hydrochloric acid to
the same pH level as obtained by adding aceticacid. Results showed that growth and ethanol
production by each xylose fermenting yeast inxylose medium with pH adjusted to 4.1 and 3.7
were not much different as compared to the control
(Figure 1B, 1C, 2A and 2B). On the contrary, theproduction rate of each xylose fermenting yeast in
the medium with hydrochloric acid treatment was
slightly higher than in the normal xylose medium(pH 6.2), except C. shehatae (Figure 3B) where
ethanol production rate was markedly improved
from 0.29 g/l/h in normal xylose medium to 0.45 g/l/h, in both treated media. Subsequently, the specific
growth rate of most xylose fermenting yeasts in
hydrochloric treated media was slightly higher ascompared to the control (Figure3A). These indicated
Figure 3 Specific growth rate (A) and ethanol
production rate (B) of C. shehatae, P.
stipitis CBS5773, Pa. tannophilus
NRRL-Y2460, F101 and F198 in xylose
medium without (■ ) and with pH adjust-ment by HCl to pH 4.1 ( ), and 3.7 ( ).
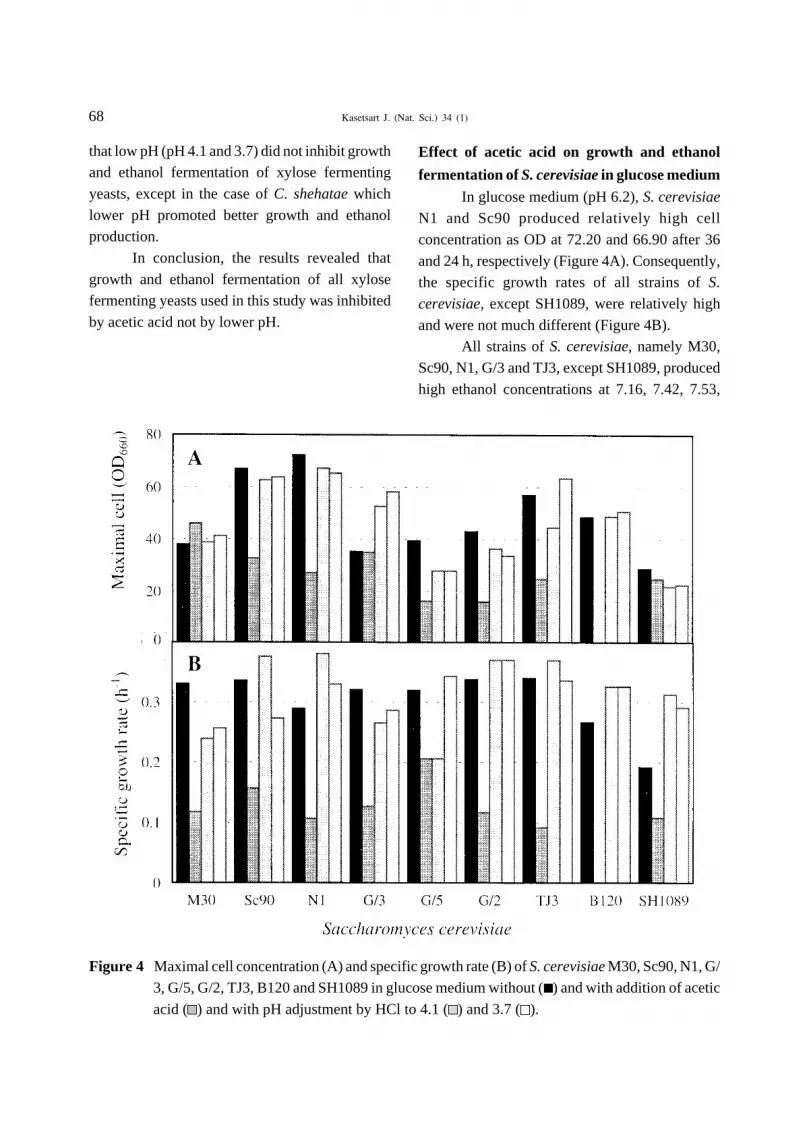
68 Kasetsart J. (Nat. Sci.) 34 (1)
Effect of acetic acid on growth and ethanol
fermentation of S. cerevisiae in glucose mediumIn glucose medium (pH 6.2), S. cerevisiae
N1 and Sc90 produced relatively high cell
concentration as OD at 72.20 and 66.90 after 36
and 24 h, respectively (Figure 4A). Consequently,the specific growth rates of all strains of S.
cerevisiae, except SH1089, were relatively high
and were not much different (Figure 4B).All strains of S. cerevisiae, namely M30,
Sc90, N1, G/3 and TJ3, except SH1089, produced
high ethanol concentrations at 7.16, 7.42, 7.53,
that low pH (pH 4.1 and 3.7) did not inhibit growthand ethanol fermentation of xylose fermenting
yeasts, except in the case of C. shehatae which
lower pH promoted better growth and ethanolproduction.
In conclusion, the results revealed that
growth and ethanol fermentation of all xylosefermenting yeasts used in this study was inhibited
by acetic acid not by lower pH.
Figure 4 Maximal cell concentration (A) and specific growth rate (B) of S. cerevisiae M30, Sc90, N1, G/
3, G/5, G/2, TJ3, B120 and SH1089 in glucose medium without (■ ) and with addition of acetic
acid ( ) and with pH adjustment by HCl to 4.1 ( ) and 3.7 ( ).

Kasetsart J. (Nat. Sci.) 34 (1) 69
Figure 5 Maximal ethanol concentration (A) and production rate (B) of S. cerevisiae M30, Sc90, N1,
G/3, G/5, G/2, TJ3, B120 and SH1089 in glucose medium without (■ ) and with addition of aceticacid ( ) and with pH adjustment by HCl to 4.1 ( ) and 3.7 ( ).
7.32 and 7.48% w/v, respectively, at fairly shortfermentation time of 24 h with relatively high
production rates of 2.98, 3.09, 3.13, 3.05 and 3.11
g/l/h, respectively (Figure 5B). On the other hand,ethanol produced by strains G/5, G/2 and B120
were similar at 36 h, 7.63, 7.42 and 7.07% w/v,
respectively, with slightly longer incubation timeof 36 h and hence their production rates were lower.
For S. cerevisiae SH1089 lowest concentration of
ethanol of 5.97% w/v was obtained after 48 h withthe lowest production rate of 1.24 g/l/h.
By addition of 0.5 and 1.0% v/v acetic acid
into glucose medium, pH changes of the mediumwere similar to those observed in xylose medium.
Likewise no growth of all S. cerevisiae strains were
observed in medium added with 1.0% v/v. Withaddition of 0.5% v/v acetic acid, only S. cerevisiae
B120 could not grow while the other strains
produced comparable maximal cell concentrationto those in basal glucose. However, the specific
growth rates were slightly lower (Figure 4A and
4B). Though all strains, except S. cerevisiae N1,yielded slightly higher maximal ethanol
concentration, their production rates were lower

70 Kasetsart J. (Nat. Sci.) 34 (1)
than in normal glucose medium (Figure 5B).The results revealed that acetic acid at 0.5%
v/v reduced maximal cell concentration but had no
effect on maximal ethanol concentration of S.
cerevisiae. However, both specific growth rate and
ethanol production rate decreased. These findings
confirmed the report of Phowchinda et al. (1995)which concluded that acetic acid inhibited the
activities of S. cerevisiae and the inhibition was
more effective on the biomass synthesis than ethanolsynthesis.
Comparison on the effect of acetic acid on
ethanol production rate and specific growth rate ofS. cerevisiae in the medium added with 0.5% v/v
acetic acid showed that the inhibition on production
rate ranged from 67.7% to 27.5% and on specificgrowth rate were 72.9 to 35.6% (Figure 6). The
results indicated stronger inhibition of acetic acid
on specific growth rate than on production rate.In the medium where pH was adjusted to 4.1
by hydrochloric acid specific growth rate of N1was the highest, while G/2 showed the highest
specific growth rate in medium with pH was at 3.7
(Figure 4B). As far as ethanol fermentation wasconcerned, all strains of S. cerevisiae demonstrated
high performance in pH adjusted medium. At pH
4.1, N1 produced high ethanol concentration, 8.44%w/v at 12 h, with the highest production rate, 7.03
g/l/h (Figure 5), while G/3 produced the highest
ethanol concentration, 8.58% w/v at 24 h, withproduction rate of only 3.57 g/l/h. On the contrary,
B120 produced the lowest ethanol concentration,
7.75% w/v, with the lowest production rate, 1.61 g/l/h. At pH 3.7, Sc90 fermented ethanol with the
highest production rate, 6.85 g/l/h, while ethanol
produced was 8.23% w/v at 12 h.Comparison on the effect of both acids
revealed that growth and ethanol fermentation of S.
cerevisiae were inhibited by acetic acid not by lowpH as reported by Phowchinda et al. (1995).
Figure 6 The percentage of inhibition on specific growth rate (A) and ethanol production rate (B) ofvarious strains of S. cerevisiae M30, Sc90, N1, G/3, G/5, G/2, TJ3, B120 and SH1089 in glucose
medium added with 0.5% v/v acetic acid comparing with the rates in medium without addition
of acetic acid.

Kasetsart J. (Nat. Sci.) 34 (1) 71
Comparison on effect of acetic acid on growthand ethanol fermentation of xylose fermentingyeast and S. cerevisiae in glucose medium
Ethanol fermentation in glucose medium
without adding acetic acid (pH 6.2) by xylose
fermenting yeasts was compared to two strains ofS. cerevisiae, M30 and Sc90. The result showed
that both strains of S. cerevisiae produced higher
ethanol concentration and at the higher rate than allxylose fermenting strains (Figure 7C). Among
xylose fermenting strains tested in this work, Pa.
tannophilus NRRL-Y2460 produced the highestethanol concentration of 6.45% w/v at 48 h, with
the highest production rate of 1.34 g/l/h. In contrast,
P. stipitis CBS 5773 produced only 3.39% byweight at 72 h with production rate of 0.47 g/l/h. In
addition the specific growth rate of both strains of
S. cerevisiae was higher than those of all xylosefermenting strains (Figure 7A).
In the medium added with 0.5% v/v acetic
acid, no growth and ethanol fermentation of C.
shehatae, P. stipitis CBS5773, F101 and F198
Figure 7 Growth and ethanol fermentation of C. shehatae (◆ ), P. stipitis CBS5773 (▲), Pa. tannophilus
NRRL-Y2460 ( ), F101 (■ ), F198 (● ), S. cerevisiae M30 (✲ ) and S. cerevisiae Sc 90 (▼) in
glucose medium without (A, C) and with addition of 0.5% v/v acetic acid (B, D).

72 Kasetsart J. (Nat. Sci.) 34 (1)
were observed. P. tannophilus NRRL-Y2460 wasthe only xylose fermenting yeast that could grow
and ferment ethanol (Figure 7B). However, it grew
at lower specific growth rate, 0.059 h-1, andproduced lower ethanol concentration, 4.44% by
weight at 96 h, with lower production rate, 0.46 g/
l/h. For S. cerevisiae, strain M30 produced nearlythe same cell concentration as in glucose medium
without adding acetic acid, while Sc90 provided
much lower cell concentration (Figure 7B).However, the specific growth rates of both strains
of S. cerevisiae were much lower than in medium
without adding acetic acid.
CONCLUSION
In conclusion, acetic acid at the
concentration of 0.5% v/v completely inhibited
growth of most xylose fermenting yeasts, C.
shaehatae, P. stipitis CBS5773 and the two xylose
fermenting fusants, F101 and F198, in medium
containing glucose and xylose as a sole source ofcarbon. However, Pa. tannophilus NRRL-Y2460
relatively tolerated to acetic acid since it could
grow and ferment ethanol in both media added with0.5% v/v acetic acid. This acid plays the same role
on growth and ethanol fermentation of various
strains of glucose fermenting yeast, S. cerevisiae.Despite most strains of S. cerevisiae investigated in
this study showed higher tolerance to acetic acid
than xylose fermenting yeasts. The inhibition ongrowth and ethanol fermentation was proved to be
the result from acetic acid and not from low pH as
shown by hydrochloric acid.
ACKNOWLEDGMENTS
This research was supported by the National
Research Council of Thailand and Kasetsart
University Research and Development Institute,Kasetsart University, Thailand. The authors thank
Assistant Professor Dr.Sarote Sirisansaneeyakulfor his helpful discussion. We also thank Dr.Wichien
Yongmanitchai for English editing this manuscript.
LITERATURE CITED
Chomtong, S. 1995. Construction of new yeasthybrid for ethanol production from xylose by
protoplast fusion technique. M.S. Thesis,
Kasetsart University. Bangkok.Fanta, G.F., T.P. Abbott, A.I. Herman, R.C. Burr,
and W.M. Doane. 1984. Hydrolysis of wheat
straw hemicellulose with trifluoroacetic acid:Fermentation of xylose with Pachysolen
tannophilus. Biotechnology Bioengineering
26 : 1122-1125.Ferrari, M.E., E. Neirotti, C. Albornoz, and E.
Saucedo. 1992. Ethanol production from
eucalyptus wood hemicellulose hydrolysateby Pichia stipitis. Biotechnology
Bioengineering 40 : 753-759.
Linden, T. and B. Hahn-Hagerdal. 1989.Fermentation of lignocellulose hydrolysates
with yeasts and xylose isomerase. Enzyme
Microbiology 1: 583-589.Maiorella, B., H.W., Blanch, and C.R. Wilke,
1983. By-product inhibition effects on
ethanolic fermentation by Saccharomyces
cerevisiae. Biotechnology Bioengineering
25 : 103-121.
Olsson, L. and B. Hahn-Hagerdal. 1993.Fermentative performance of bacterial and
yeasts in lignocellulose hydrolysate. Process
Biochemistry 28 : 249-257.Pampulha, M.E. and M.C. Loureiro-Dias. 1989.
Interaction of the effect of acetic acid and
ethanol on inhibition of fermentation inSaccharomyces cerevisiae. Biotechnology
Letters 11 : 269-274.
Pampulha, M.E. and M.C. Loureiro-Dias. 1990.Activity of glycolytic enzymes of

Kasetsart J. (Nat. Sci.) 34 (1) 73
Saccharomyces cerevisiae in the presence ofacetic acid. Applied Microbiology
Biotechnology 34 : 375-380.
Phowchinda, O., M.L Delia-Dupuy, and P.Strehaiano. 1995. Effects of acetic acid on
growth and fermenting activity of
Saccharomyces cerevisiae. BiotechnologyLetters 17(2) : 237-242.
Tsao, G.T., M.R. Ladisch, M. Voloch, and P.Bienkowski. 1982. Production of ethanol and
chemicals for cellulosic materials. Process
Biochemistry Sep/Oct : 34-38.
Received date : 16/04/99Accepted date : 8/11/99

Kasetsart J. (Nat. Sci.) 34 : 74 - 78 (2000)
INTRODUCTION
The high toxicity of cyanide to life is welldefined. Seventy mg KCN has a 50% chance of
killing a 70 kg person within 15 minutes (Lygre,
1994). Standard regulation for the maximumcontaminant level (MCL) of cyanide in wastewater,
set by the Ministry of Science Technology and
Environment, is 0.2 mg/l as HCN, i.e., 0.182 mg/las CN-. Cyanide concentrations up to 30 mg/l have
been successfully treated in biological process
(Eckenfelder, 1966). Cyanide concentration was
Cyanide Removal from Laboratory Wastewater UsingSodium Hypochlorite and Calcium Hypochlorite
Nusara Sinbuathong1, Bussarin Kongseri2, Panadda Plungklang3
and Roj Khun-anake2
ABSTRACT
Removal of cyanide (CN-) from laboratory wastewater using sodium hypochlorite (NaOCl) andcalcium hypochlorite (Ca(OCl)2) were performed at the reaction time of 30 minutes. The product of
chlorination at an alkaline pH of 12.3 was CNO - which could be oxidized further to N2. Colorimetric
method was used to determine the amount of CN- before and after chemical treatments. The optimum dosesof chemicals used were determined. It was found that 100% removal of this contaminant could be achieved.
The optimum doses and chemical costs of NaOCl and Ca(OCl)2 varied depending on the initial cyanide
concentration. The optimum doses of NaOCl and Ca(OCl) 2 for 100% CN- removal were Y = 17.3X andY = 3.32 X, respectively (where X = initial CN- concentration in mg/l, and Y = chemical dose in mg/l). The
chemical costs of NaOCl and Ca(OCl) 2 were Y = 0.69 X and Y = 0.50X, respectively (where X = initial
CN- concentration in mg/l, and Y = cost, baht/m3 of wastewater). Ca(OCl)2 is more effective than NaOClconsidering the cost and dosage used.
Key words: cyanide removal , laboratory wastewater, chlorination
1 Scientific Equipment Centre, Kasetsart University Research and Deveolpment Institute (KURDI), Kasetsart University, Bangkok
10900, Thailand.2 Department of Environmental Science, Thammasart University, Bangkok 12121, Thailand.3 Water Quality Control Division, Provincial Water Works Authority, Bangkok 10210, Thailand.
reduced from 75,000 mg/l to 0.2 mg/l after 18 daysof treatment using electrolytic oxidation under
optimum operating condition (Easton, 1967).
Electrolytic oxidation is economical and efficientfor use with concentrated waste. However, treating
dilute solution has some restriction because low
conductivity results in poor current efficiency (Larryet al., 1982). Alkali chlorination is another technique
used for cyanide treatment. The first reaction product
is cyanogen chloride(CNCl), a highly toxic gas. Atan alkali pH, CNCl hydrolyzes to cyanate ion
(CNO-), which has low toxicity. The CNO- can be

oxidized further by chlorine at a nearly neutral pHto CO2 and N2 (APHA and AWWA, 1992).
Cyanide generated from most laboratory
wastewater is usually in CN- form as used incalibration curve for determination of cyanide.
These standards must be freshly prepared because
they gradually lose strength. Moreover, thedissolved KCN salt used as standards are in alkali
solutions. Thus, pH of standard solutions are above
12 which is an optimum condition for cyanideremoval. In the case of concentration and volume
of cyanide from laboratory wastewater is not high,
chlorination may be the appropriate technique touse. In this study, chlorine compounds were used
instead of chlorine gas (Cl2). The method was
focused on the chemical optimum doses and costsof chlorine compounds for removal at various
cyanide concentrations.
MATERIALS AND METHODS
The wastewater with CN- concentrationsranging from 1-100 mg/l were prepared in NaOH
solutions. The pH of these solutions were already at
12.3 which needed not be adjusted further. Differentamount of NaOCl or Ca(OCl)2 was added to each
cyanide concentration. The reaction time was set at
30 minutes. The residual CN- left at any dose wasdetermined by colorimetric method at maximum
absorption of 587 nm (APHA and AWWA, 1992).
The graphs were plotted to show the relationship ofresidual cyanide and the amount of NaOCl and
Ca(OCl)2 added to determine the optimum doses
for each initial CN-concentration. The chemicalcosts were calculated from the optimum doses.
After that, the relationships showing the different
initial cyanide concentrations and the optimumdoses of chemical for CN- removal and costs were
expressed in the form of graphs and equations. The
calculated doses were also tested with the laboratorywastewater containing high CN- concentration.
RESULTS AND DISCUSSION
The optimum doses of chemical were
defined as the amount of NaOCl or Ca(OCl)2 usedto achieve MCL and 100% removal. At 10 mg/l
cyanide removal, the optimum doses of NaOCl
were 86.8 mg/l and 90 mg/l to get MCL and 100 %CN-removal, respectively (Figure 1). At this initial
cyanide concentration, the optimum doses of
Ca(OCl)2 were 20 mg/l and 22 mg/l to achieveMCL and 100% CN- removal, respectively (Figure
2). The optimum doses of chemical varied
depending on the initial cyanide concentrations.These results were determined and summarized in
Table1 and 2 and the graphs were plotted
accordingly as shown in Figure 3 and 4.Chemicals used in CN- removal varied
depending on the initial cyanide concentrations of
0-100 mg/l (Figure 3 and 4). In case of usingNaOCl, the relationships were:-
Y = 17.3 X (for 100%CN- removal) (1)
Y = 15.2 X (for MCL) (2)
Figure 1 The optimum doses of NaOCl for 10
mg/l initial CN- removal.
0.182
2
4
6
8
10
50 86.8 150
90
Residual CN- (mg/l)
NaOCl dose (mg/l)
0
Kasetsart J. (Nat. Sci.) 34 (1) 75

76 Kasetsart J. (Nat. Sci.) 34 (1)
Figure 2 The optimum doses of Ca(OCl)2 for 10
mg/l initial CN- removal.
22
0.00
4.00
8.00
12.00
0 10 3020 40
Residual CN- (mg/l)
Ca(OCl)2 dose(mg/l)
0.1820
500
Y = 15.2 X
Y = 17.3 X
Initial CN- conc (mg/l)
0 10 40 60 80 100
2000
1500
1000
(for 100% removal)
(for MCL)
NaOCl (mg/l)
Figure 3 The optimum doses of NaOCl for cya-nide removal at various initial concen-
trations.
As for Ca(OCl)2 , the relationships were:-
Y = 3.32 X (for 100% CN-removal) (3)Y = 2.93 X (for MCL) (4)
where
X = initial CN- concentration (mg/l)Y = chemical dose (mg/l)
In chlorination using chlorine gas, 2.7mg/l of Cl2 was required for 1 mg/l of CN- (Larry
et al., 1982). Compare to this study, 17.3 mg/l of
NaOCl or 3.32 mg/l of Ca(OCl)2 was required for1 mg/l of CN-.
The 0.67 mg/l CN- laboratory wastewater
Table 1 The optimum doses of NaOCl for cyanide
removal at various initial concentrations.
Initial CN- NaOCl dose (mg/l) forconcentration MCL 100%
(mg/l) removal
0.20 n.a. 5
1.00 8.7 133.75 6.3 20
5.90 25.8 30
10.00 86.8 9050.00 823.1 850
100.00 1502.6 1750
n.a. = not analyzed
Table 2 The optimum doses of Ca(OCl)2 forcyanide removal at various initial
concentrations.
Initial CN- Ca(OCl)2 dose (mg/l) for
concentration MCL 100 %
(mg/l) removal
0.20 n.a. 2.21.00 2.68 3.0
3.75 9.13 15.0
5.90 13.85 30.010.00 20.00 22.0
50.00 126.49 130.0
100.00 303.85 350.0
n.a. = not analyzed

Kasetsart J. (Nat. Sci.) 34 (1) 77
was treated with NaOCl and Ca(OCl)2 at the doses
obtained from equations (1) and (3), respectively.The experiments were also done with the 88.0
mg/l CN- laboratory wastewater. There was no
cyanide detected after treatment.Moreover, test was also done on high CN-
concentration of laboratory wastewater (270 mg/l)
using Ca(OCl)2 at the dose calculated from equation(3). It was found that 98.89 % of CN- was removed.
The remaining cyanide of 2.99 mg/l was gradually
removed and meet the standard regulation of 0.182mg/l as CN- (MCL) after 47 hours .
Considering the oxidation reaction of
chlorine compound which has been changing fromCN- to CNO-, hypochlorite ion (OCl-) is the active
chlorine group in the oxidation process. The
Ca(OCl)2 has 2 groups of OCl- presenting moreeffective in oxidation than NaOCl. Therefore, the
lower dosage of Ca(OCl)2 was used in cyanide
removal.The chemical cost was calculated from the
optimum dose of NaOCl and Ca(OCl)2 (commercial
grade NaOCl costs 40 baht/kg and Ca(OCl)2 costs150 baht/kg). The chemical costs depended on the
initial cyanide concentrations were summarized in
Table 3.For 100% CN- removal, the relationships
were:-
Y = 0.69 X (for NaOCl) (5)Y = 0.50 X (for Ca(OCl)2) (6)
where
X = initial CN- concentration (mg/l)Y = chemical cost (baht/m3)
0.08 baht was required to remove 1 cubicmetre of 1 mg/l CN- wastewater using chlorine gas
( Cl2 costs 30 baht/kg) whereas 0.69 , 0.50 baht was
required to remove 1 cubic metre of 1 mg/l CN-
using NaOCl and Ca(OCl)2, respectively.
Although the costs of using chlorine
compounds are higher than using chlorine gas inremoving the same amount of CN- and wastewater
volume, but chlorine compounds are recommended
as the practical alternative for CN- removal fromlaboratory wastewater which contains less volume
than industrial wastewater. The chlorine compounds
are readily available and not dangerous to use whilethe handling process is much more convenient
Figure 4 The optimum doses of Ca(OCl)2 for
cyanide removal at various initial con-
centrations.
0
50
100
150
200
250
300
350
400
0 100 12020 40 60 80
Initial CN- conc. (mg/l)
Ca(OCl)2 (mg /l)
Y = 2.93 X (for MCL)
Y = 3.32 X(for 100% removal)
Table 3 Chemical costs for 100% CN-removal at
various initial cyanide concentrations.
Initial CN- NaOCl cost Ca(OCl)2cost
conc.(mg/l) (baht/m3) (baht/m3)
0.20 0.2 0.33
1.00 0.5 0.45
3.75 0.8 2.255.90 1.2 4.50
10.00 3.6 3.30
50.00 34.0 19.50100.00 70.0 52.50

78 Kasetsart J. (Nat. Sci.) 34 (1)
ACKNOWLEDGEMENTS
We would like to express our sincere thanks
to KURDI for grant support and also to Dr. AmaraThongpan for reviewing this manuscript.
LITERATURE CITED
Lygre, D.G. 1994. General, Organic and Biological
Chemistry. Brooks/Cole Publishing Company,California. 670 p.
Eckenfelder, W.W. 1966. Industrial Water
Pollution Control. McGraw-Hill Book Company,New York . 400 p.
Easton, J.K. 1967. Electrolytic Decomposition of
Concentrated Cyanide Plating Wastes, JournalWater Pollution Control Federation. 39:1621.
Larry, D. B. , F. Joseph , Judkins, Jr. and L.W.
Barron. 1982. Process Chemistry for Waterand Wastewater Treatment. Prentice-Hall
INC., Englewood Cliffs, New Jersey. 510p.
American Public Health Association (APHA) andAmerican Water Work Association (AWWA).
1992. Standard Method for the Examination
of Water and Wastewater, 19 th ed. VictorGraphics INC. , Maryland . 1268 p.
Received date : 15/10/99Accepted date : 29/12/99
Figure 5 The chemical costs for 100% CN- re-
moval at various initial cyanide concen-
trations.
0
20
40
60
80
0 100 12020 40 60 80Initial CN- conc. (mg/l)
Chemical cost ( baht / m3)
NaOCl
Y = 0.69 X
Y = 0.50 X
Ca(OCl)2
compared to chlorine gas. Using equations (1),
(3), (5) and (6), to remove an equal amount of
CN-, Ca(OCl)2 was 5.2 and 1.4 times more effectivethan NaOCl considering the dosage and cost.
CONCLUSION
The removal of CN- from laboratory
wastewater using either NaOCl or Ca(OCl)2 couldbe achieved. The optimum dose and cost of each
chemical have been reported. Ca(OCl)2 was more
effective than NaOCl considering the cost anddosage. We, therefore, have an alternative of using
these 2 chemicals instead of chlorine gas.

Kasetsart J. (Nat. Sci.) 34 : 79 - 84 (2000)
INTRODUCTION
Tissue culture medium is always
supplemented with serum to provide the cell with
necessary growth factors and trace mineral. Thecomposition of serum is complex and ill-defined.
More importantly, serum is the most expensive raw
material in cell culture medium. In addition, serumproteins contaminate the product and subsequently
increase purification costs. Therefore, it is desirable
to reduce the amount of serum or other growthfactors used in the production of the desired product
while maximizing volumetric productivity.
Reduction of the percentage of NCS in theculture medium is an important aim in animal cell
The Influence of Serum Concentrationon tPA Production of CHO Cell
Teerapatr Srinorakutara1 , Jin-Ho Jang2 , Mutsumi Takagi2 and Toshiomi Yoshida2
ABSTRACT
The effect of initial serum concentration on cell growth, and the production of tissue plasminogen
activator (tPA) is investigated across batch fermentation of a Chinese hamster ovary (CHO) growing in
newborn calf serum (NCS) medium. It was found that initial serum concentration influenced on CHO cellgrowth rate and cell yield. At high-serum content, the uptake rate of glucose decreased although the specific
growth rate was higher, indicating a serum component becoming growth limiting. An average glucose
uptake rate in 10% (v/v) NCS medium was 13.84 mg/106 cells/h as in 1% (v/v) NCS medium was 18.17mg/106 cells/h. It was also found that the tPA or the maximum tPA productions increased with initial serum
concentration. At 7.12% NCS, the maximum tPA production gave the highest value (5.55 mg/l). The effect
of initial serum concentration on the main product was similar to that of major by-product (e.g. lactate andammonia).
Key words: serum medium, tPA, CHO cell, animal fermentation
culture, because of improved economy, easierpurification of products (e.g. tPA) and a better
defined production process (van der Pol et al.,
1990).While these media are highly optimized, a
lower cost alternative is desirable for large-scale
protein production, which is also serum-free andsupports reasonably good cell growth and
recombinant protein production. Also, when
specific formulas are desired, it is useful to knowwhat the necessary components are for designing a
simple yet effective medium without a painstaking
optimization process. Other investigators havesought to replace the serum to reduce cost, reduce
lot-to-lot variability in serum, reduce potential risk
1 Thailand Institute of Scientific and Technological Research, 196 Phahonyothin Road, Chatuchak, Bangkok 10900, Thailand.2 ICBiotech, Osaka University, 2-1, Yamada-oka, Suita, Osaka 565, Japan.

80 Kasetsart J. (Nat. Sci.) 34 (1)
of contamination by mycoplasma, and reduce theprotein load in the supernatant to facilitate
downstream processing of recombinant proteins
(Donaldson and Shuler, 1998).In this study, the effect of initial serum
concentration on growth rate, maximum cell yield
and tPA production rate on the production of tPAwas studied on CHO cultured in spinner bottles.
MATERIALS AND METHODS
Cell Line, medium and cultivation methodsCHO ATCC CRL-9606, a Chinese hamster
ovary (CHO) cells producing tPA used in this studywas kindly provided by International Center of
Biotechnology (ICBiotech), Osaka University,
Japan. The original culture medium consisted of10.64 g/l Ham’s F-12 (ICN Biomedicals Inc., Ohio,
USA) supplement with 10% (v/v) NCS (GIBGO
Laboratories Life Technologies Inc., USA), 500nM methotrexate (MTX, Sigma), 1.18 g/l NaHCO3(Wako Pure Chemical Industries Ltd., Japan), and
200 µl of 1,000 units penicillin G or 1 mgstreptomycin (Sigma). The inoculumn was prepared
from stock culture of cells scaled to 10 ml of 10%
(v/v) NCS medium in 55 cm2 petridishes. Thepetridishes were then incubated in CO2 SANYO
MCO-345 incubator (SANYO, Japan) at 37oC, 5%
CO2 concentration for 3 days. Cells in petridishesused as seed were fully-grown to 8.8 × 10⁵ viable
cells/ml before introduction to the four 100-ml
spinner bottles (HARIO Co., Ltd., Tokyo, Japan).Four 100-ml spinner bottles with working volume
of 30 ml of serum free medium contained the NCS
at concentration of 1, 2, 5, and 10%(v/v) respectivelyand were then put into a CuSO4 solution bath with
magnetic stirrer SW-600S (NISSIN Scientific
Corp., Japan). The CuSO4 solution bath wascontrolled at 37°C and 70 rpm. In order to control
pH, the CuSO4 solution bath was surface-aerated
with humidified air containing 5% CO2 through a
0.2 mm membrane airfilter (Millipore). CO2concentration was daily checked using “FYRITE”
Bacharach (Bacharach Inc., Pittsburgh, USA). The
initial cell concentration in spinner bottles wasapproximately 2 × 10⁵ cells/ml.
Analytical MethodsSample consisting of 750 µl suspended cells
was taken daily, and was divided into 2 parts. The
1st part, 250 µl suspended cells, was used for
determination of cell concentration and viabilityby tryphan blue exclusion on a hemacytometer.
The 2nd part, 500 µl suspended cells, was centrifuged
using TOMY high-speed refrigeratedmicrocentrifuge MX-150 (TOMY TECH USA Inc.)
at 4°C, 1000 rpm for 4 min. The supernatant was
then used for determination of glucose and lactateconcentrations using biochemistry analyzer YSI
2700-D SELECT (YSI Incorporated, Yellow
Springs Instrument Co., Ltd., Yellow Springs,OHIO 45384-0279, USA). The remaining
supernatant was aliquoted and stored at –20°C for
later analysis of ammonia, glutamine, and tPAcontents.
An enzymatic method was used to determine
ammonium concentration using a NH3 kit (WakoPure Chemical Industries Ltd., Japan).
Glutamine and glutamate concentrations
were determined using biosensor BF-4 (OjiScientific Instruments, Hyogo, Japan).
The Biopool Imulyse tPA (Biopool
international, CA, USA), an immunoassay (ELISA)for the quantitative determination of single-chain
and two-chain tPA antigen in human plasma or in
other biological fluids, such as cell culturesupernatants, was used to determine tPA
concentration.
Determination of specific growth rate and
metabolic quotientsThe specific growth rate, µ, assuming

Kasetsart J. (Nat. Sci.) 34 (1) 81
negligible cell lysis, was calculated from datacollected during the exponential growth phase and
is defined as follows:
µ = 1
x
dx
dtv
t ..................................... (1)
Where xv denotes the concentration of viablecells and t denotes the cultivation time. The specific
metabolic quotient calculations for glucose
consumption and lactate formation (qGlu and qLac,respectively) were also based on data collected
during the exponential phase of growth. They are
defined as follows:
–qGlu = 1
x
d Glu
dtv
[ ] ............................ (2)
qLac = 1
x
d Lac
dtv
[ ] ............................ (3)
where [Glu] and [Lac] are glucose and lactateconcentrations respectively.
Glutamine spontaneously decomposes
following first-order kinetics to pyrroilidonecarboxylate and ammonia (Tritsch and Moore,
1962). The specific glutamine composition and
ammonia production rates (qGlu and qNH4+,respectively) were determined by accounting for
the degradation of glutamine at 37°C (Glacken et
al., 1988; Ozturk and Palsson, 1990).
− [ ]d G In
dt= k[G In] + qG InXv ............. (4)
d NH4+[ ]
dt= k G In q X
NH v [ ] + +4
....... (5)
where [Gln] is the glutamine concentration (mM ormg); [NH4
+] is the ammonia ion concentration
(mM or mg); k is the first-order rate constant for
glutamine decomposition (h-1). Since the first-order decomposition rate varied with serum and
medium components (Miller et al., 1988; Ozturk
and Palsson, 1990) the values of k were measured
experimentally.The yield coefficients of glucose consumed
to lactate produced and of glutamine consumed to
ammonia produced (YLac/Glu and YNH4+
/Gln,respectively) are defined as follows:
YLac / Glu = q
qLac
Glu
........................................ (6)
YNH4
+ =q
q
NH
G In
4+
...................................... (7)
The specific tPA productivity, qtPA was
based on the data obtained from each batch cycle:
qtPA =tPA tPA
x dtvtc
[ ] − [ ]
∫0
0
........................ (8)
where [tPA] and [tPA]0 denote the concentration oftPA and the initial concentration of tPA for each
batch cycle, respectively.
RESULTS AND DISCUSSION
Culture Time (h)
0 20 40 60 80 100 120 140 160 180
Viable Cell concentration (105 cells/ml)
2
3
4
5
6
789
1
10
Culture Time v 1% NCS Culture Time v 2% NCS Culture Time v 5% NCS Culture Time v 10% NCS
Figure 1 The growth curves for CHO ATCC
CRL-9606 cultivated in four spinner
bottles containing 1, 2, 5, and 10% (v/v)initial NCS concentrations.
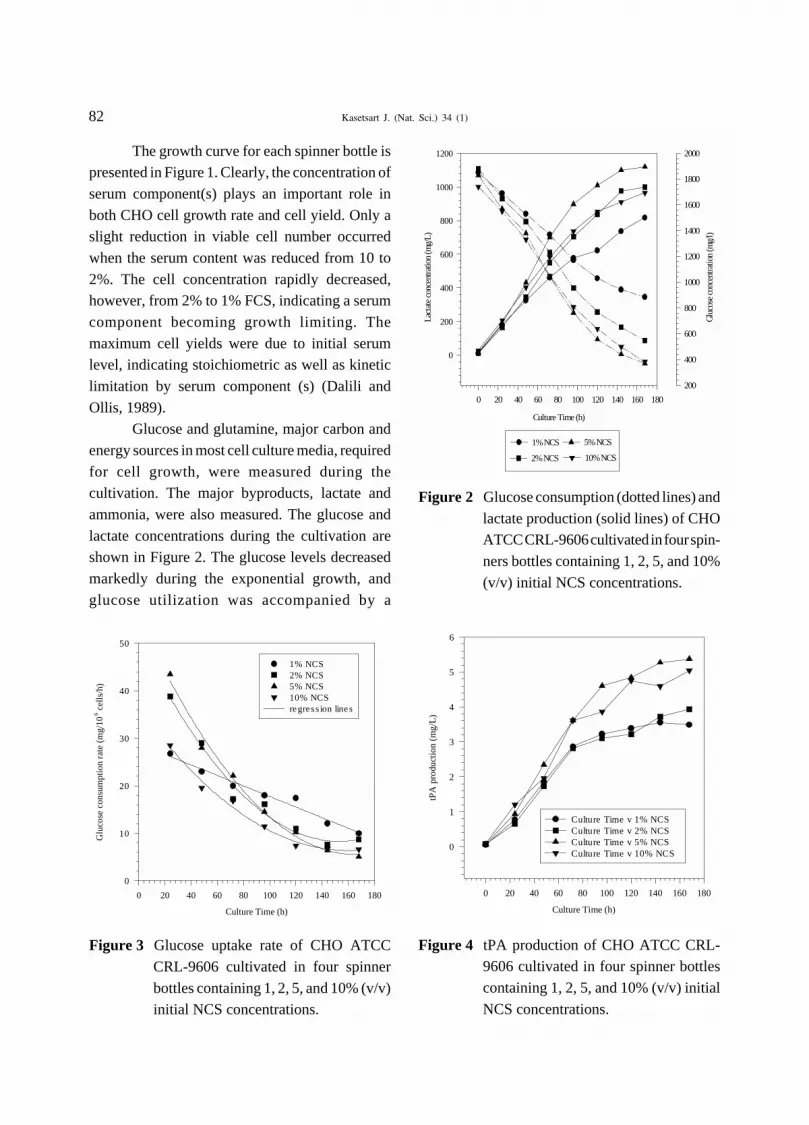
82 Kasetsart J. (Nat. Sci.) 34 (1)
The growth curve for each spinner bottle ispresented in Figure 1. Clearly, the concentration of
serum component(s) plays an important role in
both CHO cell growth rate and cell yield. Only aslight reduction in viable cell number occurred
when the serum content was reduced from 10 to
2%. The cell concentration rapidly decreased,however, from 2% to 1% FCS, indicating a serum
component becoming growth limiting. The
maximum cell yields were due to initial serumlevel, indicating stoichiometric as well as kinetic
limitation by serum component (s) (Dalili and
Ollis, 1989).Glucose and glutamine, major carbon and
energy sources in most cell culture media, required
for cell growth, were measured during thecultivation. The major byproducts, lactate and
ammonia, were also measured. The glucose and
lactate concentrations during the cultivation areshown in Figure 2. The glucose levels decreased
markedly during the exponential growth, and
glucose utilization was accompanied by a
Figure 2 Glucose consumption (dotted lines) and
lactate production (solid lines) of CHOATCC CRL-9606 cultivated in four spin-
ners bottles containing 1, 2, 5, and 10%
(v/v) initial NCS concentrations.
Figure 4 tPA production of CHO ATCC CRL-9606 cultivated in four spinner bottles
containing 1, 2, 5, and 10% (v/v) initial
NCS concentrations.
Figure 3 Glucose uptake rate of CHO ATCC
CRL-9606 cultivated in four spinner
bottles containing 1, 2, 5, and 10% (v/v)initial NCS concentrations.
Culture Time (h)
0 20 40 60 80 100 120 140 160 180
Lactate concentration (mg/L)
0
200
400
600
800
1000
1200
Glucose concentration (mg/l)
200
400
600
800
1000
1200
1400
1600
1800
2000
1% NCS
2% NCS
5% NCS
10% NCS
Culture Time (h)
0 20 40 60 80 100 120 140 160 180
Glucose consumption rate (mg/106 cells/h)
0
10
20
30
40
50
1% NCS 2% NCS 5% NCS 10% NCS regression lines
Culture Time (h)
0 20 40 60 80 100 120 140 160 180
tPA production (mg/L)
0
1
2
3
4
5
6
Culture Time v 1% NCS Culture Time v 2% NCS Culture Time v 5% NCS Culture Time v 10% NCS

Kasetsart J. (Nat. Sci.) 34 (1) 83
corresponding accumulation of lactate. Glucosewas not a limiting nutrient for cell growth in all
culture conditions tested.
With high-serum medium, the uptake rateof glucose decreased (Figure 3), although the
specific growth rate was higher (Fig. 1). This result
indicated that the cells utilize glucose moreefficiently in high-serum medium. An average
glucose uptake rate of the cells in 10% (v/v) NCS
medium was 13.84 mg/106 cells/h, while the averageglucose uptake rate increased to 18.17 mg/106
cells/h in 1% (v/v) NCS medium.
Although tPA production (Figure 4) ormaximum tPA production (Figure 5) increased
with initial serum concentration and reached the
highest maximum tPA production (5.5498 mg/l) at7.12 % (v/v) NCS, at higher serum content some
factor(s) might become inhibitory for tPAproduction. The effect of initial serum concentration
on the main product (tPA) was similar to that of the
major by-products (e.g. lactate and ammonia).Concentration of tPA and lactate gave the highest
values at 5% (v/v) NCS (Figure 4) as the highest
ammonia production was at 10% (v/v) NCS(Figure 6). Concentration of serum at 5% (v/v)
NCS may be a more suitable value for producing
the tPA and lactate.Next to sugar, glutamine is the most
abundant constituent of tissue culture media (Eagle,
1955). It has been long established that themetabolism of glutamine can provide significant
quantities of energy in mammalian cells (Reitzer et
al., 1979). This cellular energy is produced via totalor partial oxidation of glutamine. The complete
oxidation of glutamine to CO2 occurs via the TCA
cycle, whereas its partial oxidation is accomplishedby a linear pathway, which involves several
intermediates of the TCA cycle. The end product of
Figure 6 Ammonia (NH3) production of CHO
ATCC CRL-9606 cultivated in four spin-
ner bottles containing 1, 2, 5, and 10%(v/v) initial NCS concentrations.
Figure 5 Relationship between initial serum con-
centrations and maximum tPA concen-
trations for cultivation of CHO ATCCCRL-9606 grown in spinner bottles. The
line shown is regression of initial serum
concentration against maximum tPAconcentration, with a regression coeffi-
cient of r2 = 0.98.
Initial serum concentration (% v/v)
0 2 4 6 8 10 12
Maximum
tPA concentration (mg/l)
2
3
4
5
6
7
regression coefficient (r2) = 0.98
Culture Time (h)
0 20 40 60 80 100 120 140 160 180
NH
3 concentration (mg/L)
0
5
10
15
20
25
30
Culture Time v 1% NCS Culture Time v 2% NCS Culture Time v 5% NCS Culture Time v 10% NCS

84 Kasetsart J. (Nat. Sci.) 34 (1)
this pathway is pyruvate and /or lactate. By analogyto naming the oxidation of glucose to lactate as
glycolysis, McKeehan (1982) has coined the term
glutaminolysis for the partial oxidation of glutamine.Data for concentration of glutamine and glutamate
in spinner bottles containing 1, 2, 5, and 10% (v/v)
NCS determined as a function of time were notshown in this report because some data was lost.
However, from the remaining data it showed that
the concentration of glutamine decreased with time.Unfortunately, amino acid was not analyzed
in this study because of limitation of research time.
Therefore, no amino acids data lead to lacking ofinformation concerning available effect of amino
acid components on such as tPA production and so
on.
ACKNOWLEDGEMENT
The authors wish to thank the UNESCO, for
financial support throughout this work. The authors
express their sincere thanks to the technical staff ofthe international center of biotechnology
(ICBiotech) for providing the facilities and technical
assistance throughout this work. Finally, the authorswould like to thank Ms Toshiko Nagai and Ms
Kumiko Gojo for financial arrangement.
LITERATURE CITED
Dalili, M. and D.F. Ollis. 1989. Transient kinetic ofhybridoma growth and monoclonal antibody
production in serum-limited cultures.
Biotechnology and Bioengineering 33 : 984-990.
Donaldson, M.S. and M. L. Shuler. 1998. Low-cost
serum medium for the BTI-Tn5B1-4 insectcell line. Biotechnology Progress 14 : 573-
579.
Eagle, H. 1955. Nutritional needs of mammaliancells in tissue culture. J. Biol. Chem. 214 : 839.
Glacken, M.W., R.J. Fleischaker, and A.J. Sinskey.
1988. Reduction of waste product excretionvia nutrient control: possible strategies for
maximizing product and cell yields on serum
in cultures for mammalian cells. Biotechnologyand Bioengineering 28 : 1376-1389.
Lee, G.M., A. Varma, and B.O. Palsson. 1991.
Production of monoclonal antibody using free-suspended and immobilized hybridoma cells:
effect of serum. Biotechnology and
Bioengineering 38 : 821-830.McKeehan, W.L. 1982. Glutaminolysis in animal
cells. Cell Biol. Int. Rep. 6 : 635.
Miller, W.M., C.R. Wilke, and H.W. Blanch. 1988.Transient responses of hybridoma metabolism
to changes in oxygen supply rate in continuous
culture. Bioprocess Eng. 3 : 103-111.Ozturk, S.S. and B.O. Palsson. 1990. Chemical
decomposition of glutamine in cell culture
media type, pH, and serum concentration.Biotechnol. Prog. 6 : 121-128.
Reitzer, L.J., B.M. Wice, and D. Kennel. 1979.
Evidence that glutamine, not sugar, is themajor energy source for culture HeLa cells. J.
Biol. Chem. 254 : 2669-2674.
Tritsch, G.L. and G.E. Moore. 1962. Spontaneousdecomposition of glutamine in cell culture
media. Exp. Cell Res. 28 : 360-364.
van der Pol, L., G. Zijlstra, M. Thalen, and J.Tramper. 1990. Effect of serum concentration
on production of monoclonal antibodies and
shear sensitivity of a hybridoma. BioprocessEngineering 5 : 241-245.
Received date : 12/05/99Accepted date : 8/11/99

Kasetsart J. (Nat. Sci.) 34 : 85 - 90 (2000)
INTRODUCTION
A number of glycoconjugates are present inanimal tissue, particularly on the secretory granules
and cell surface. These molecules contain
carbohydrate chains with a specific sequence. Inthe submandibular gland of different mammals,
numerous histochemical studies have been made
on glycoconjugates elaborated by their secretorycells (Shackleford and Wilborn 1968; Laden et al.,
1984). However, little information is available as
to the detail histochemical properties ofglycoconjugates in the comparable mandibular
gland of chicken. Recently, various kinds of lectins
were employed to detect sugar residues inglycoconjugates (Goldstein and Hayes, 1978; Roth
1978; Schulte et al., 1984). In view of the
Lectin Histochemistry of Glycoconjugatesin Mandibular Gland of Chicken
Apinun Suprasert, Surapong Arthitvong and Seri Koonjaenak
ABSTRACT
The distribution of glycoconjugates in the chicken mandibular gland was studied by means of lightmicroscopic histochemical methods. The staining procedures employed were horseradish peroxidase
conjugated lectin, Alcian blue pH 2.5-periodic acid-Schiff (AB pH 2.5-PAS), and high iron diamine-alcian
blue pH 2.5 (HID-AB pH 2.5). The lectins used in the present study were Concanavalin A (Con A), Ricinus
communis agglutinin-I (RCA-I), wheat germ agglutinin (WGA), Dolichos biflorus agglutinin (DBA), Ulex
europeues agglutinin - I (UEA-I), Limax flavus agglutinin (LFA), Lotus tetragonolobus agglutinin (LTA)
and peanut agglutinin (PNA). According to the results obtained, acidic and neutral glycoconjugates withα-D-mannose, α- D-glucase, β-D-galactose, N-acetyl-D-glucasamine, α-L-fucose and sialic acid residues
were visualized in the secretory cells of chicken mandibular gland.
Key words : lectin, glycoconjugates, mandibular gland, chicken
circumstance mentioned above, attempts were made
to analyze glycoconjugates involved in the
mandibular gland of chicken, employing thecurrently available light microscopic methods of
peroxidase - conjugated lectins.
MATERIALS AND METHODS
Mandibular glands from both male andfemale adult Brown Leghorn chicken were fixed
by immersion with 10% formalin containing 2%
calcium acetate for 12 h at 4°C. or in Carnoy’s fluidfor 6 hours at room temperature. The tissue
specimens were then processed to embed in
paraplast. Sections were made at 3 µm thick andstained with the following histological and
histochemical procedures. Hematoxylin and Eosin
Department of Anatomy, Faculty of Veterinary Medicine, Kasetsart University, Bangkok 10900, Thailand.

86 Kasetsart J. (Nat. Sci.) 34 (1)
(H&E), alcian blue pH 2.5-periodic acid-Schiff(AB pH 2.5-PAS), and high iron diamine alcian
blue pH 2.5 (HID-AB pH 2.5). To access the
saccharide residues further, the peroxidase-conjugated lectin-diaminobenzidine procedure was
performed to the paraplast sections. Following
lectins were employed : Concanavalin A (Con A),Ricinus communis agglutinin-I (RCA-I), wheat
germ agglutinin (WGA), Dolichos biflorus
agglutinin (DBA), Ulex europeus agglutinin-I(UEA-I), Limax flavus agglutinin (LFA), Lotus
tetragonolobus agglutinin ( LTA) and peanut
agglutinin (PNA). All these lectin preparationsconjugated with peroxidase were purchased from
E.Y. Laboratory (San Mateo, California, U.S.A.).
To detect sialic acid residues, sections were treatedwith neuraminidase (from Arthrobacter ureafaciens
Marukinshoyu Co. Ltd., Japan) 1 unit/ml in acetate
buffer pH 5.3 containing CaCl2 at 39-41°C for 12-
16 hours prior to staining with LFA or PNA, or ABpH 2.5-PAS.
RESULTS AND DISCUSSION
The secretory epithelium of the chicken
mandibular gland was found to consist exclusivelyof mucous cells (Figure 1). Which agreed with the
previous report (Suprasert et al., 1986). The staining
results of the mucous cells are listed in Table 1. Inthe mucous cells, the AB pH 2.5-PAS stained cells
were reddish blue (Figure 2). However, they
changed into red with AB pH 2.5-PAS after enzymedigestion with neuraminidase. In the mucous cells
of mandibular gland, furthermore, the dual staining
with HID-AB pH 2.5 resulted in blue colorationtogether with some pin point staining of black color
around certain area (Figure 3). The binding patterns
of Con A (Figure 4), RCA-I, PNA (Figure 5), LFA
Table 1 Histochemical staining of mucous cells in mandibular gland of the chicken.
Lectins References Intensity1 Binding specificities
Con A Kiernan 1975 2 Br α-D-glucase,α-D-mannoseRCA-I Yamada and Shimizu ,1977 1-2 Br β-D-galactose
WGA Goldstein and Hayes, 1978 1 Br β-D-Glc NAC
DBA Goldstein and Hayes, 1978 O α-D-Gal NACUEA-I Goldstein and Hayes, 1978 O α-L-fucose
LFA Schulte et al., 1984 2 Br Neu AC.
LTA Goldstein and Hayes ,1978 2 Br α-L-fucosePNA Stoward et al., 1980 1-3 Br Gal β 1-3-Gal NAC
N2)-LFA Schulte et al., 1984 O Neu AC lost to stain
AB pH 2.5-PAS Spicer et al., 1967 3 BM Acidic and neutral glycoconjugateHID-AB pH 2.5 Spicer et al., 1967 2 B Bl* Sulfated and nonsulfated
glycoconjugates
N2-AB pH 2.5-PAS Spicer et al., 1967 2-3 M Neu AC lost to stain with AB pH 2.5
1) B = Blue, Bl = Black, Br = Brown, M = MagentaO = negative staining. Number indicates intensity of staining reaction.
2) Neuraminidase
* All mucous cells stain blue. However, there are some pin point staining of black coloration around certain area.

Kasetsart J. (Nat. Sci.) 34 (1) 87
Figure 1 The secretory portions of chicken mandibular gland consist of a single layer of high columnar
cells, which contain a flattened nucleus in the basal cytoplasm. The cytoplasm stain lightly witheosin. Hematoxylin and eosin. X 260.
Figure 2 In the mucous cells of chicken mandibular glands, the dual staining with AB pH 2.5-PAS result
in deep blue coloration. X 260.Figure 3 The dual staining with HID-AB pH 2.5 results in blue coloration with some pin point staining
of black color around certain areas.
Figure 4 The mucous cells exhibit moderate positive reaction. Con A. X 260Figure 5 As in Figure 4. PNA. X 260

88 Kasetsart J. (Nat. Sci.) 34 (1)
Figure 6 All mucous cells are moderately reactive. LFA. X 260Figure 7 The mucous cells are stained negatively with LFA after neuraminidase digestion. X 260
Figure 8 The mucous cells exhibit variable intensities of positive reaction. LTA. X 260
Figure 9 The mucous cells are weakly stained with WGA. X 260

Kasetsart J. (Nat. Sci.) 34 (1) 89
(Figure 6) and LTA (Figure 8), was moderately tointensely stained the stored secretion products of
mucous cells. However, they were weakly stained
with WGA (Figure 9) but negatively stained withDBA and UEA-I.
The staining patterns with PNA, LFA, and
LTA corresponded to the presence of terminalgalactose-(1-3) N-acetylgalactosamine, terminal
sialic acid and α -L-fucose residues respectively.
The negative staining with LFA (Figure 7) and thechange in color from deep blue to magenta with AB
pH 2.5-PAS of mucous granules of mucous cells
after neuraminidase digestion further confirmedthe presence of acidic glycoconjugates with terminal
sialic acid residues (Spicer et al.,1967, Schulte et
al., 1984). Furthermore, glycoconjugates with α-D-mannose, α-D-glucose and β-D-galactose were
also confirmed the previous study (Suprasert et al.,
1986) as judged from their positive staining withCon A and RCA-I. The weakly WGA and
negativiely DBA reactions are taken to be an
evidence that the mucous cells contain small amountof N-acetylglucosamine residues but they are devoid
of N-acetylgalactosamine residues.
Comparison the staining specificities of theUEA-I and LTA in the mucous cells of the chicken
mandibular gland, each having a nominal binding
specificity for α-L-fucose residues, revealed someinteresting findings. The UEA-I reactivity could be
attributed to the presence of O-glycosidically-linked
secretory glycoprotein whereas the LTA bindingwas restricted to the presence of N-linked
glycoprotein (Schulte and Spicer ,1983). The
positive LTA but negative UEA-I reactionsconfirmed the different binding affinity for the
same terminal sugar having different glycosidic
linkage.The main function of the mandibular gland,
through its salivary secretion is known to be
lubrication of food boli and prevention ofmicroorganism and chemicals in oral cavity. Sialic
acid is believed to play an essential role of thelubrication and protection in the digestive tract
(Werner et al., 1982). The physiological role of
terminal galactose and terminal fucose residuesfound in the chicken mandibular gland must await
further investigation.
LITERATURE CITED
Goldstein, I.J. and C.E. Hayes 1978. The lectins :Carbohydrate-binding proteins of plant and
animals. Adv. Carbohyd. Chem. Biochem. 35
: 127-340.Kiernan, J.A. 1975. Localization of α-D-glucosyl
and αD-glucasyl and -D mannosyl groups s.
Concanavalin A and horseradish peroxidase.Histochemistry 44 : 39-45.
Laden, S.A., B.A. Schulte, and S.S. Spicer 1984.
Histochemical evaluation of secretoryglycoproteins in human salivary glands with
lectin-horseradish peroxidase conjugates. J.
Histochem. Cytochem. 32 : 965-972.Roth, J. 1978. The lectins : Molecular probes in cell
biology and membrane research. Exp. Path.
Suppl. 3 : 186Schulte, B.A. and S.S. Spicer 1983. Light
microscopic detection of sugar residues in
glycoconjugates in salivary glands and thepancreas with lectin -horseradish peroxidase.
Histochem. J. 15 : 1217-1238.
Schulte, B.A., S.S. Spicer, and R.L. Miller 1984.Histochemical localization of sialoglyco-
conjugates with sialic acid-specific lectin from
slug Limax flavus. Histochem. J. 18 : 1125-1132.
Shackleford, J.M. and W.H. Wilborn 1968.
Structural and histochemical diversity inmammalian salivary glands. Alabama J. Med.
Sci. 5 : 180-203.
Spicer, S.S., R.G. Horn, and T.J. Leppi. 1967.Histochemistry of connective tissue

90 Kasetsart J. (Nat. Sci.) 34 (1)
mucopolysaccharides,pp.251-303. In B.M.Wagner and D.E. Smith (eds). The Connective
Tissue. Williams and Wilkins, Baltimore
Stoward, P.J., S.S. Spicer, and R.T. Miller. 1980.Histochemical reactivity of peanut lectin-
horseradish peroxidase conjugate. J.
Histochem. Cytochem. 28 : 979-990.Suprasert, A., T. Fujioka, and K. Yamada. 1986.
Glycoconjugates in the secretory epithelium
of the chicken mandibular gland. Histochem.J. 18 : 115-121.
Werner, R., K. Eckart, B. Christian, and G.
Wolfgang. 1982. Biological significance of
sialic acid, pp 263-305. In R. Schauer (ed.)Sialic acid : Chemistry, Metabolism and
Function. Cell Biology Monographs vol. 10,
Springer New York.Yamada, K. and S. Shimizu. 1977. The
histochemistry of galactose residues of
complex carbohydrates as studied byperoxidase-labeled Ricinus Communis
agglutinin. Histochem. 53 : 143-156.
Received date : 22/03/99Accepted date : 27/08/99

Kasetsart J. (Nat. Sci.) 34 : 91 - 97 (2000)
Prevalence of Antibody to Orientia tsutsugamushi inDogs Along Thai - Myanmar Border
Mongkol Chenchittikul, Decha Pangjai and Paijit Warachit
ABSTRACT
Three hundred and ninety six dog sera collected from ten provinces along Thai-Myanmar borderin 1997 were tested for antibody to Orientia tsutsugamushi by Indirect Fluorescent Antibody test (IFA).
The average percentage of positive antibody (Ab) to scrub typhus in all provinces was 39.65%. The Ab
prevalence to scrub typhus in each province ranged from 21.95 to 62.16%, northern provinces had thehighest prevalence (54.00%) whereas southern provinces had the lowest prevalence (24.39%). Geometric
mean titer (GMT) of the Ab in dog sera were 1:191 (range from 1:100 to 1:594). GMT of the Ab in Chiengrai
province was the highest titer (1:594) and Chumphon province was the lowest titer (1:100).Key words : dog, IFA, Orientia tsutsugamushi,prevalence, scrub typhus
National Institute of Health, Department of Medical Sciences, Ministry of Public Health, Nontaburi 11100, Thailand.
INTRODUCTION
Scrub typhus, caused by Orientia
tsutsugamushi (Rickettsia tsutsugamushi), is afebrile disease (Frances et al., 1997), transmitted to
man by the bite of an infected, larval mite (chigger)
of the family Trombiculidae, order Acarina.Numerous cases were reported from Kwe Noi
Valley and Phuket in 1943 (Oaks et al., 1983).
However, scrub typhus in Thai patient was firstconfirmed by serology in 1952 (Thainua, 1952).
Since then, it has been recognized as endemic in
Thailand. Since 1973, every cases had to reportedas the surveillance disease to the Division of
Epidemiology, Ministry of Public Health. Recently,
the reported cases in 1995-1997 were 1,203, 1,210,and 2,064 respectively (Division of Epidemiology,
1995; 1996; 1997).The highest prevalence of scrub
typhus was in the north and the lowest prevalencewas in the south.
Rodents have been recorded as being naturalhost of scrub typhus rickettsia (Azad and Beard,
1998). Dogs infected with O. tsutsugamushi were
found in the endemic area of Vietnam and PeninsularMalaysia (Alexander et al., 1972; Huxsoll et al.
1977). In Thailand, isolation of O. tsutsugamushi
from rodents had been reported (Traub et al., 1954).Seroprevalence of scrub typhus in human also had
been carried out, demonstrated that human was
exposed to O. tsutsugamushi (Johnson et al., 1982),but serosurveys on dogs had not been conducted.
This report presents the serosurvey of scrub typhus
in dogs along Thai-Myanmar border.
MATERIALS AND METHODS
SeraSerum samples of 396 Dogs were collected
from ten provinces in November 1997 along Thai-Myanmar border, Thailand for an epidemiological

92 Kasetsart J. (Nat. Sci.) 34 (1)
survey of plague (Figure 1). Two villages fromeach province were selected randomly for collecting
the samples. Dogs were privately owned and belong
to inhabitants of the respective study areas. Bloodsamples were collected from cephalic vein and
allowed to clot. The serum samples were maintained
at -20°C prior to testing.
Serological testThe sera were tested for antibodies specific
to the three prototype (Gilliam, Karp and Kato)
strains of O. tsutsugamushi, Rickettsia typhi
Wilmington strian and Thai tick typhus TT118
strain. An indirect fluorescent antibody test (IFA)
using fluorescein conjugated goat anti-dog IgG(Kirkegaard Perry Laboratories Inc., America)
were employed in the IFA. The IFA was performed
as described previously (Tamura et al., 1984).Serum dilution, beginning at 1:25 were test for
screening. Positive sera were further diluted two
fold serially, titer ≥1:50 was considered as positiveserodiagnosis (Huxsoll et al., 1977).
�����������������
������� ��
���������
���
������������
����������
����������
�������������������
��������������
���
����� �
Figure 1 Map of Thailand showing ten provinces along Thai-Myanmar border from which specimens
were collected.

Kasetsart J. (Nat. Sci.) 34 (1) 93
(Northern : Chiang Mai, Chiang Rai, Tak, MaeHong Son, Central : Phetchaburi, Ratchaburi,
Kanchanaburi, Prachuap Khiri Khan, Southern :
Chumphon, Ranong) are 56,404,166,23,1,11,2,5,1and 0 respectively (Division of Epidemiology,
1997). The sum of reported cases in three parts of
Thailand were presented in Figure 2. This figurealso showed the GMT of dog antibodies in each
part.
DISCUSSION
The prevalence of antibodies to scrub typhusin dogs along Thai-Myanmar border, Thailand
were 39.65 %. The data presenting here have
demonstrated that natural infections of scrub typhusoccur in dogs in every province along Thai-
Myanmar border, Thailand. All villages in this
study were rural areas. This correlated to the formerstudy by Johnson et al. (1982) which showed 77%
of seroprevalence in rural Thai village. And also,
O. tsutsugamushi could be isolated from patientsand rodents in rural areas (Trishnananda et al.,
1964).
The prevalence of scrub typhus antibodiesin three parts of Thailand was correlated well with
the number of reported patient cases. Northern part
was the high risk areas than central and southernparts, respectively.
The prevalence of antibodies to scrub typhus
were not only varied by province but also byvillage. The highest prevalence of antibodies was
84.21% at Muang Na village, Chiang Mai where as
Klong Loi village in Prachuap Khiri Khan showedthe lowest with a prevalence of 4.76% . For GMT,
the highest was 1:635 at Rong village, Chiang Rai,
but the lowest was 1:71 at Wang Ta Kian village,Tak.
The present study correlated well with the
previous studies. Alexander et al. (1972) showed45% of antibodies against O. tsutsugamushi in
RESULTS
Of the 396 dog serum samples, the number
of antibody positive against O. tsutsugamushi was157 (39.65%). All sera were negative for R. typhi
and TT118. The samples collected from 10
provinces ranged from 37-42 cases/province(average 39.6). The prevalence of antibodies to
scrub typhus were varied (Table 1) by provinces
(range from 21.95 to 62.16%). Chiang Mai had thehighest prevalence with 62.16% where as Prachuap
Khiri Khan and Chumphon had the lowest with
21.95%. Geometric mean titer (GMT) of the Ab indog sera were 1:191 (range from 1:100 to 1:594).
GMT of the Ab in Chiengrai province was the
highest titer (1:594) and Chumphon province wasthe lowest titer (1:100).
Table 2 showed the prevalence of antibodies
to scrub typhus in each village (range from 4.76 to84.21). The highest prevalence of antibodies was
84.21% at Muang Na village, Chiang Mai where as
Klong Loi village in Prachuap Khiri Khan showedthe lowest with a prevalence of 4.76%. For GMT,
the highest titer was 1:635 at Rong village, Chiang
Rai. The lowest titer was 1:71 at Wang Ta Kianvillage, Tak.
Table 3 showed the prevalence of antibodies
against scrub typhus rickettsia in dog in threedifferent geographical parts of Thailand. Northern
provinces were the highest, with a prevalence of
54.00% and southern provinces were the lowest,with a prevalence of 24.39%. GMT of the Ab in dog
sera in three parts were highly significant difference
(p<0.01). However, it was not different betweencentral and northern parts (p>0.05). The GMT in
northern part (1:220) was highly significant
difference (p<0.01) from southern part (1:111).But GMT in central part (1:190) was only significant
difference from southern part (p<0.05).
From the Annual Epidemiological report,in 1997 the reported cases in the studied provinces

94 Kasetsart J. (Nat. Sci.) 34 (1)
Tab
le 1
The
pre
vale
nce
of a
ntib
odie
s to
scr
ub ty
phus
in d
ogs
in 1
0 pr
ovin
ces.
Prov
ince
Num
ber
Ant
ibod
ies
tite
rG
MT
a)%
Pos
itive
exam
ined
<1:
251:
251:
501:
100
1:20
01:
400
1:80
01:
1600
1:32
00
Chi
ang
Rai
3715
10
12
77
31
594
21/3
7 (5
6.76
)
Chi
ang
Mai
3714
01
57
62
02
279
23/3
7 (6
2.16
)M
ae H
ong
Son
378
77
93
30
00
107
22/3
7 (5
9.46
)
Tak
3924
06
26
10
00
110
15/3
9 (3
8.46
)
Rat
chab
uri
4125
11
41
34
11
348
15/4
1 (3
6.59
)Ph
etch
abur
i42
282
21
62
10
018
912
/42
(28.
57)
Prac
huap
Khi
ri
K
han
4132
01
42
11
00
159
9/41
(21
.95)
Kan
chan
abur
i40
173
74
61
11
013
220
/40
(50.
00)
Chu
mph
on41
257
23
31
00
012
69/
41 (
21.9
5)
Ran
ong
4122
84
34
00
00
100
11/4
1 (2
6.83
)T
otal
396
210
2931
3640
2516
54
191
157/
396
(39.
65)
a) G
MT
, Geo
met
ric
Mea
n tit
er

Kasetsart J. (Nat. Sci.) 34 (1) 95
Table 2 The prevalence of antibodies to scrub typhus in dogs in 20 villages.
Provinces Villages No. examined No. positive (%) GMTa)
Chiang Rai Viang Hom 20 12 (60.00) 566
Rong 17 9 (52.94) 635Chiang Mai Aruno Tai 18 7 (38.89) 135
Muang Na 19 16 (84.21) 383
Mae Hong Son Mae Sa Riang 20 12 (60.00) 100Mae Ja Ton 17 10 (58.82) 115
Tak Rim Mei 19 7 (36.84) 181
Wang Ta Kian 20 8 (40.00) 71Ratchaburi Bo Moo 20 7 (35.00) 400
Tago Lang 21 8 (38.09) 308
Phetchaburi Teng Nuea 21 4 (19.05) 200Suan Yai Pattana 21 8 (38.10) 183
Prachuap Khiri Khan Dan Sing Khon 20 8 (40.00) 168
Klong Loi 21 1 (4.76) 100Kanchanaburi Tai Mhuang 20 9 (45.00) 147
Pra Chum Mai 20 11 (55.00) 121
Chumphon Ran Tad Phom 19 3 (15.79) 79Santi Nimitr 22 6 (27.27) 159
Ranong Nai Krung 20 5 (25.00) 115
Had Tun 21 6 (28.57) 89Total 396 157 (39.65) 191
a) GMT, Geometric Mean titer
���
���
���
���
���
�
���
���
���
���
������ ���� � ������
�
��
���
���
���
���
��������� �������� ���
������������ ����
�������� ����������
�
Figure 2 Number of reported cases and geometric mean titer of dogs in three studied parts.

96 Kasetsart J. (Nat. Sci.) 34 (1)
military scout and tracker dogs worked in ruralareas in Vietnam. Huxsoll et al. (1977) also showed
the seroprevalence antibodies in dog in Malaysian
rural areas.Dogs usually live in the same habitat as
human and are frequently exposed to the same
disease organisms. But their movements in thescrub areas are more frequently than man. So, they
are more risk of infection by scrub typhus rickettsia
than man. It is recommended to use dogs as sentinelsfor scrub typhus and also in determining areas of
potential risk to man.
Antibodies against R. typhi were not detectedin this study. This supported that murine typhus
was a disease of urban areas where man and rats
shared the same habitat in Southeast Asia but not inrural areas (Brown et al., 1988; Sankasuwan et al.,
1969). Okabayashi et al. (1996) also showed that
wild rats in rural areas of Thailand were not foundantibodies against R. typhi. However, it was contrast
to 38% of sero-prevalence to R. typhi in dogs in
rural areas in Malaysia and 0.4% of prevalence inthe Suez Canal area in Egypt (Huxsoll et al., 1977;
Soliman et al., 1989).
Antibodies against TT118 were also notfound in this study. This disease may be more
prevalence in the areas near the forest. Two of three
reported cases were working and living near theforest areas (Sirisanthana et al., 1994). However,
Okabayashi et al., (1996) showed a 64.71%
prevalence of antibody to Thai tick typhus (TT118)in wild rats in rural areas of Thailand.
LITERATURE CITED
Alexander A.D., L.N. Binn, B. Elisberg, P. Husted,
D.L. Huxsoll, J.D. Marshall,Jr., C.F. Needy,and A.D. White.1972. Zoonotic infections in
military scout and tracker dogs in Vietnam.
Infection and Immunity 5 : 745-749.Azad A.F. and C.B. Beard. 1998. RickettsialT
able
3T
he p
reva
lenc
e of
ant
ibod
ies
to s
crub
typh
us in
dog
s in
3 p
arts
.
Part
Num
ber
Ant
ibod
y ti
ter
%
GM
Ta)
exam
ined
<1:
251:
251:
501:
100
1:20
01:
400
1:80
01:
1600
1:32
00Po
ssiti
ve
Nor
th15
061
814
1718
179
33
81/1
50 (
54.0
0)22
0
Cen
tral
164
102
611
1315
77
21
56/1
64 (
34.1
5)19
0P
<0.
01
P<
0.05
Sout
h82
4715
66
71
00
020
/82
(24.
39)
111
Tot
al39
621
029
3136
4025
165
415
7/39
6 (3
9.65
)
a) G
MT
, G
eom
etri
c M
ean
titer

Kasetsart J. (Nat. Sci.) 34 (1) 97
pathogens and their arthropod vector. EmergingInfectious Diseases 4 : 179-186.
Brown A.E., S.R. Meek, N. Maneechai, and G.E.
Lewis. 1988. Murine typhus among Khmersliving at an evacuation site on the Thai-
Kampuchean border. Am. J. Trop. Med. Hyg.
38 : 168-171.Division of Epidemiology. 1995. Annual
Epidemiological Surveillance Report, Ministry
of Public Health, Bangkok. 310 p.Division of Epidemiology. 1996. Annual
Epidemiological Surveillance Report, Ministry
of Public Health, Bangkok. 307 p.Division of Epidemiology. 1997. Annual
Epidemiological Surveillance Report, Ministry
of Public Health, Bangkok. 304 p.Frances S.P., C. Eamsila, and D. Strickman. 1997.
Antibodies to Orientia tsutsugamush in soldiers
in northern Thailand. Southeast Asian J. Trop.Med. Public Health 28 : 666-668.
Huxsoll D.L., A. Shirai, D.M. Robinson, L.F. Yap,
and B.L. Lim. 1977. Presence of antibodies toscrub typhus and murine typhus in dogs from
Selangor, Peninsular Malaysia. Southeast
Asian J. Trop. Med. Pub. Hlth. 8 : 232-235.Johnson D.E., J.W. Crum, S. Hanchalay, and C.
Saengruchi. 1982. Sero-epidemiological
survey of Rickettsia tsutsugamushi in a ruralThai village. Trans. R. Soc. Trop. Med. Hyg.
76 : 1-3.
Oaks S.C. Jr, R.L. Ridgway, A. Shirai, and J.C.Twartz. 1983. Scrub typhus. Institute for
Medical Research Bulletin No.21, Malaysia. :
1-4.Okabayashi T., K. Tsutiya, Y. Muramatsu, H.
Ueno, and C. Morita. 1996. Serological survey
of spotted fever group rickettsia in wild rats inThailand in the 1970s. Microbiol. Immunol.
40 : 895-898.
Sankasuwan V., P. Pongpradit, P. Bodhidatta, K.Thonglongya, and P. E. Winter. 1969. Murine
typhus in Thailand. Trans. Roy. Soc. Trop.
Med. Hyg. 63 : 639-643.Sirisanthana T., V. Pinyopornpanit, V. Sirisanthana,
D. Strickman, D. J. Kelly, and G. A. Dasch.
1994. First cases of spotted fever grouprickettsiosis in Thailand. Am. J. Trop. Med.
Hyg. 50 : 682-686.
Soliman A.K., A.M. Botros, T.G. Ksiazck, H.Hoogstraal, I. Helmy, and J. C. Morrill. 1989.
Seroprevalence of Rickettsia typhi and
Rickettsia conorii infection among rodentsand dogs in Egypt. Ann. Trop. Med. Hyg. 92 :
345-349.
Tamura A., K. Takahashi, T. Tsuruhara, H.Urakami, S. Miyamura, H. Sekikawa, M.
Kenmotsu, M. Shibata, S. Abe, and H. Nezu.
1984. Isolation of Rickettsia tsutsugamushi
antigenically different from Kato, Karp and
Gilliam strains from patients. Microbiol.
Immunol. 28 : 873-882.Thainua M.A. 1952. Case report of scrub typhus. J.
Med. Assoc. Thai. 35 : 9-27.
Traub R., P.T. Johnson, M.L. Miesse, and R. E.Elbel. 1954. Isolation of Rickettsia
tsutsugamushi from rodents from Thailand.
Am. J. Trop. Med. Hyg. 3 : 356-359.
Received date : 10/09/99Accepted date : 29/12/99

Kasetsart J. (Nat. Sci.) 34 : 98 - 106 (2000)
Process for Preparing Pre-fried and FrozenSweetpotato French-fry Type Products
Suparat Reungmaneepaitoon1, Santi Tip-pyang2 and Sompoch Yai-eiam1
ABSTRACT
Three processes for producing pre-fried and frozen sweetpotato French-fry type products wereinvestigated. The best process was obtained by blanching sweetpotato strips in 0.5% of disodium acid
pyrophosphate (SAPP) solution for 1-2 min, followed by partially frying in hot oil at 176°C for 20 sec.
These sweetpotato strips were partially dehydrated with hot air oven at 176°C for 4 min, packaged in LDPEbags, and then stored at –20°C. Chemical, physical and sensory properties of a sweetpotato French-fry type
product were also determined. Analysis included measurements of yields, moisture loss during process,
moisture content, reducing sugar, oil content, vitamin C, color, texture and sensory panel scores for color,odor, flavor and texture. The best process produced a pre-fried sweetpotato product contained reducing
sugar and oil content of about 2-3% and 7-10% respectively. The pre-fried products had a good stability
in frozen storage for one year period and were acceptable in the sensory scores for color, odor, flavor andtexture.
Key words : sweetpotato, french-fry, pre-fried, frozen
1 Institute of Food Research and Product Development, Kasetsart University Bangkok 10900, Thailand.2 Department of Chemistry, Faculty of Science, Chulalongkorn University., Bangkok 10500, Thailand.
INTRODUCTION
Sweetpotatoes (Ipomoea batatas L) havebeen grown for domestic consumption in Thailand
for many years. Commercial plantations are very
few. Home and cottage-scale processing units havesupplied products to local markets on a daily basis.
These processed products such as boiled
sweetpotato in heavy syrup etc. must be consumedwithin one to two days, due to short shelf-life.
Calories contribution by sweetpotato in the diet is
quite small because people consume sweetpotatoas dessert and snackfood product.
Since 1987 the Government of Thailand has
had a National Policy Plan (1987-1991) to promote
commercial production through activities led by
the Department of Agriculture and Department of
Agriculture Extension. In this regard, food industryis required extensive research to develop an
appropriate technology for processing a product
with a longer shelf-life and to meet consumerpreferences.
One prospective product is the frozen
French-fry product. Recently, the rate of French-fries consumption from white potatoes have
increased rapidly in fast-food shops. If a similar
product prepared from sweetpotatoes are available,it might be acceptable to a larger number of
consumers and would be a value-added product
from sweetpotatoes.

The sweetpotato French-fry type productwas judged of good quality and acceptability by
consumer panels. (Walter and Hoover, 1986) Since
roots are harvested seasonally and storage costs arehigh, roots should be processed into a finished
product.
The objectives of this study were to providean improved process to produce a pre-fried and
frozen French-fry type product from sweetpotato
having a low oil content, and the moisture contentabout 30 to 32% and to evaluate chemical, physical
and sensory changes of the sweetpotato French-fry
type product from various processes.
MATERIALS AND METHODS
Raw materialsApproximately 250 kg sweetpotatoes (Kaset
cultivar) were obtained from a producer in Suphan
Buri province. The roots were kept for one week at30°C and 65% relative humidity before processing
into strips and frozen.
Processing conditionsRoots were processed into two sizes of the
French-fry type strips. The roots were washed,
hand-peeled, rinsed and sliced into so-calledshoestring strips with an average length about 9-10
cm and cross-sectional side dimension of 6 mm ×6 mm and 8 mm × 8 mm with vegetable slicer(Robot Coupe, France). Small or uneven strips
were discarded to improve product uniformity.
These sweetpotato strips were then processed intoa French-fry type following the flowchart in Figure
1. Three processes were done for producing the
frozen French-fry type product. The deep fat fryerused in this study was NSF Testing Laboratory
having a capacity of 15 kg of frying oil.
All strips were packaged in low densitypolyethylene bags and stored in a freezer at –20°C.
After one week and one year storage time, theywere thawed and analyzed for yields, weight loss,
physical and chemical properties. They were fried
in palm oil at 176oC at different periods (Table 1)for sensory panel test.
Chemical analysesThe analyses were performed on samples of
products handled and processed under various
processing treatments. All chemical analyses wereperformed in duplication. Dry matter was
determined by weighing duplicated samples before
and after drying in oven at 102 ± 3°C for 2 hr. Oilcontent of fried strips was determined by Soxhlet
Extraction with petroleum ether for 16 hr, followed
by evaporation of the solvent and weighing theresidues. Reducing sugar was determined using
Fehling’s solution described by Lane and Eynon
(AOAC. 1990). Ascorbic acid was determinedusing 2, 6-Dichloroindophenol titration method
(AOAC, 1990).
Physical measurementsYields, weight losses and size of pre-fried
sweetpotato strips were determined.Color CIELAB L* a* b* C* and h were
determined from reflectance measurement with a
ACS Spectro-sensor II (Applied Color System,inc. Princeton, NJ 08543). Four rows of strips were
placed side by side in 5 cm × 4 cm cell. Color data
were determined with daylight illuminant induplicate.
Shear measurements were made using an
Instron Universal Testing Machine. (Model 1140).Samples of 15 g pre-fried product and 2.5 g finish-
fried product were placed perpendicular to the
blades of a Kramer shear cell with a slotted bottomand kg shearing force measured. The cross-head
speed was set at 200 mm/min. The shear force for
each treatment was determined 5 times.
Kasetsart J. (Nat. Sci.) 34 (1) 99

100 Kasetsart J. (Nat. Sci.) 34 (1)
Sweetpotato
Washing
Peeling
Cutting
Soaking in 0.5% SAPPSolution for 5 min.
Process (BF1) Process (SF2) Process (SF3)
Blanching in 0.5%SAPP solutionfor 1-2 min.
1. Frying in hot oil at 176oCfor 20 sec.
1. Frying in hot oil at176oC for 20 sec.
Steaming for 1-2 min. Steaming for 1-2 min.
1. Frying in hot oil at176o C for 20 sec.
2. Frying in hot oil at 176oCfor 20 sec.
2. Frying in hot oil at176oC for 20 sec
Drying in oven at176o C for 4 min.
Drying in oven at 176oCfor 4 min.
Steaming for 1-2 min.
Freezing at ï20oC Freezing at -20 oC 3. Frying in hot oil at176oC for 20 sec
Drying in oven at176oC for 4 min
Freezing at ï20oC.
Figure 1 Process of preparing of French-fry type products from sweetpotato.
Sensory evaluationSensory evaluations were performed on all
finish-fried products. For panel evaluation, thefrozen strips were fried at 176°C for 50-150 seconds.
The finish-fried products were presented to 10
members of research staff of Institute of FoodResearch and Product Development. Panels were
served coded samples on white plate and were
asked to evaluate color, odor, flavor, texture andoverall acceptability. Sensory scores were judged
with a score range from 1 to 9 on the following
scoring system. 1 dislike extremely, 2 dislike very
much, 3 dislike moderately, 4 dislike slightly, 5neither like nor dislike, 6 like slightly, 7 like
moderately, 8 like very much, 9 like extremely.
Statistical analysesThe data collected were analyzed by the
analysis of variance (ANOVA) using the statistically
analysis system (Duncan’s Multiples range test).

Kasetsart J. (Nat. Sci.) 34 (1) 101
RESULTS AND DISCUSSION
Process for pre-fried productSweetpotato pre-fried products were
prepared from various processing treatments. The
first process (BF1) comprised only one partial
frying steps, under controlled time and temperatureconditions, the second process (SF2) had two partial
frying steps, the third process (SF3) had three
partial frying steps after steaming or blanching step(Figure 1). There were differences in products for
dry matter, oil content, reducing sugar, vitamin C,
yield, size, weight loss, shear force measurements.These data are presented in Table 1-3. The data
from this study indicated that processing treatments
affected these properties differently. The overalleffect was to reduce the weight of sweetpotato
French-fry type product from about 30% to about
47% of the weight of the original strips, and tocause a concentration of solid on the surface for
improved surface texture.
Chemical compositional analysisThe data of the composition of pre-fried
prodcuts indicated that both samples of pre-fried
products produced by steaming and frying in oil 2and 3 times were higher in reducing sugar than the
blanched sample (Table 1). Blanching process used
in this study extracted more sugar from the samples.Blanching the sweetpotato strips caused decrease
Table 1 Effect of various processing treatments on dry matter, fat, reducing sugar, vitamin C of
sweetpotato French-fry type products.
Processing Dry matter Fat Reducing sugar Vitamin C
treatments (g/100 g) (g/100 g) (g/100g) (g/100 g d.b) (mg/100 g d.b)
Fresh sweetpotato 30.34 - 6.31 20.79 63.75
Pre-fried product
BF 1-66 44.35 9.82 2.10 4.73 50.90SF 2-66 49.36 13.98 6.00 12.15 40.06
SF 3-66 59.46 18.22 5.30 8.91 30.75
BF 1-88 42.12 7.54 2.14 5.08 52.14
SF 2-88 48.89 11.08 6.10 12.47 36.32
SF 3-88 56.62 14.48 5.60 9.89 29.00
Finish-fried product Frying time (sec)
BF1-F66 72.72 26.16 90 9.15SF2-F66 75.91 24.26 60 8.30
SF3-F66 81.22 25.37 50 6.13
BF1-F88 72.47 31.34 150 10.42SF2-F88 73.78 24.88 120 8.26
SF3-F88 81.88 23.22 105 6.90
d.b - dry weight basis

102 Kasetsart J. (Nat. Sci.) 34 (1)
Table 2 Effect of various processing treatments on frying time, cross sectional size, yield and weight loss,of pre-fried sweetpotato French-fry type product.
Processing Size Yield (n = 4) Weight loss (n=4)
treatments (mm) (g/100 g w.b.) (g/100 g d.b.) (g/100 g w.b)
Pre-fried productBF1-66 5.5 × 5.5 69.26 28.81 30.73
SF2-66 4.5 × 5.5 55.94 29.21 44.06
SF3-66 4.0 × 4.0 52.73 32.99 47.27
BF1-88 7.6 × 7.6 67.44 26.38 32.56
SF2-88 7.4 × 7.2 62.27 29.77 37.73SF3-88 6.4 × 6.2 58.50 33.12 41.50
w.b. - wet weight basis, d.b - dry weight basis
Table 3 Effect of various processing treatments on color values and shear measurements of sweetpotato
French-fry type product.
Processing CIELAB SYSTEM Shear force
Treatments L* a* b* C* h (Kg.)
Pre-fried productBF 1-66 75.38 -1.45 29.86 29.89 92.79 23.37
SF 2-66 68.60 -0.87 24.65 24.67 92.02 26.87
SF 3-66 67.80 -0.13 27.80 27.80 90.27 28.16
Finish-fried productBF1-F66 62.69 1.29 28.53 28.56 87.35 23.32
SF2-F66 59.87 1.22 29.64 29.66 87.65 22.66
SF3-F66 58.57 5.43 24.86 25.44 77.67 24.32
Pre-fried productBF1 -88 70.75 -1.24 30.56 30.58 92.32 23.32
SF2 -88 65.74 -1.28 25.65 25.68 92.86 25.12
SF3 -88 63.11 -2.30 24.69 24.80 95.33 26.82
Finish-fried productBF1-F88 62.35 -0.95 24.46 24.48 92.22 20.62
SF2-F88 60.15 3.21 25.46 25.66 82.82 22.50
SF3-F88 60.18 2.84 24.85 25.01 83.49 26.25
L* is the lightness a* is the red-green color component b* is the yellow-blue color componentC* is the chroma (saturation) = (a*2 + b*2)1/2 h is the hue angle = arctan (b*/a*)

Kasetsart J. (Nat. Sci.) 34 (1) 103
in dry matter because part of sugars and otherwater-soluble materials were extracted by the hot
water. Pre-fried sweetpotato products of BF1
process had reducing sugar content of 2-3% andalso had the lowest oil content in average 7-10 %.
Vitamin C content in this product was higher
compared to those of the other products (50.90-52.14 mg/100 g dry weight basis), which indicated
high nutritious value for BF1 processing product.
Sensory evaluationThe sensory scores for sweetpotato French-
fry type product odor, flavor showed no significantdifference among types of processing treatments
(Table 5 and 6). Panelists scored the odor and
flavor of products between slightly like andmoderately like. Most panelists score the odor and
flavor of products in both sizes processed in BF1 as
like moderately, due to the lower content of flavorand reducing sugar (2-3 %). It is likely that when a
blanching or water extraction step is used, some of
the flavor components will also be extracted.Blanching was effective in lowering the reducing
sugar content of sweetpotato strips. The scores for
sweetpotato French-fry type product color showedsignificant difference (P< 0.05) among types of
process. Panelists scored the color of products
between slightly like and very much like. The meanscores of sweetpotato French-fry type product of
BF1 process was the highest in color, texture,
overall acceptability among other products as shownin Table 5, 6. Toma et al (1986) reported that darker
french fried product were produced from potatoes
of lower specific gravity because of the higherreducing sugar content. The gray discoloration was
thought to be caused by the reaction between o-
dihydroxyphenols and iron III (Hoover, 1963) anddiscoloration is nonenzymatic browning, which
results when reducing sugars condense with amino
groups (Spark, 1969). The rate of this reactionincreased at high temperatures attained in oil frying.
The discoloration could be reduced if the o-dihydroxyphenol-Fe III and sugar-amino reaction
were minimized.
The L*, a*, b*, C*, h color values arepresented in Table 3. Three partial frying steps
decreased L* value as indicating a change to a
darker product. The L*, a*, b* color values weresimilar in all pre-fried products of SF2 and SF3
processes. The color of sweetpotato pre-fried
products of BF1 process were lighter (higher L*value) than product of SF2 process and SF3 process
(Table 4). Frying decreased L* and caused an
increase in a* values as anticipated indicating achange to a darker, more red product.
Mean scores for texture and overall
acceptability also showed trend toward a maximumat BF1 process. Mean scores for texture and overall
acceptability of the best product were rated between
moderately like and very much like. The quality ofbest product maintained crispiness on the exterior,
moist mealy interior and golden yellow in color.
Product of twice partial frying process (SF2) hadcrisp slight tough exterior, dry mealy interior and
sweet taste. Product of SF3 process had very crisp
exterior, darker color, dry tough interior, sweettaste, smallest size under standard size among
other products. (Table 2).
Processing treatments affected the shearforce of strips (Table 3). Pre-fried and finish-fried
strips of the SF3 process were tougher than strips of
SF2 process due to surface hardening and moistureloss during processing so it required greater force
to shear relative to others.
Pre-fried product stability during storageOverall acceptability of sweetpotato French-
fry type products throughout the one year frozen
storage period, were rated between slightly likeand very much like in all sensory categories by the
panelists. (Table 7).
Mean scores of sensory evalution of

104 Kasetsart J. (Nat. Sci.) 34 (1)
Tab
le 4
Col
or d
iffe
renc
e of
sw
eetp
otat
o Fr
ench
-fry
type
pro
duct
s by
com
pari
ng to
BF1
pro
cess
.
Proc
essi
ngC
IEL
AB
DIF
FER
EN
CE
Exp
lana
tion
of c
olor
trea
tmen
tD
E*
DL
*D
a*D
b*D
C*
DH
*
SF2-
668.
41-6
.58
0.58
-5.2
1-5
.23
-0.3
6D
arke
r, m
ore
red,
less
sat
urat
ed th
an B
F1-6
6
SF3-
667.
97-7
.58
1.32
-2.0
6-2
.10
-1.2
7D
arke
r, m
ore
red,
less
sat
urat
ed th
an B
F1-6
6
SF2-
F66
3.03
-2.8
2-0
.10
1.11
1.11
0.15
Dar
ker,
mor
e gr
een,
mor
e sa
tura
ted
than
BF1
-F66
SF3-
F66
6.89
-4.1
34.
11-3
.67
-3.1
1-4
.55
Dar
ker,
mor
e re
d, le
ss s
atur
ated
than
BF1
-F66
SF2-
887.
01-5
.01
-0.0
5-4
.91
-4.9
00.
27D
arke
r, m
ore
gree
n, le
ss s
atur
ated
than
BF1
-88
SF3-
889.
69-7
.64
-1.0
7-5
.07
-5.7
91.
45D
arke
r, m
ore
gree
n, le
ss s
atur
ated
than
BF1
-88
SF2-
F88
4.81
-2.2
14.
151.
001.
08-4
.11
Dar
ker,
mor
e re
d, m
ore
satu
rate
d th
an B
F1-F
88
SF3-
F88
4.38
-2.1
83.
780.
390.
53-3
.77
Dar
ker,
mor
e re
d, m
ore
satu
rate
d th
an B
F1-F
88
CIE
LA
B D
IFFE
RE
NC
ED
L*
is th
e lig
htne
ss d
iffe
renc
e
Da*
is th
e re
d-gr
een
colo
r di
ffer
ence
Db*
is th
e ye
llow
-blu
e co
lor
diff
eren
ceD
E*
= [
(DL
*)2
+ (
Da*
)2 +
(D
b*)2
] 1/
2
DC
*=
[(D
a*)2
+ (
Db*
)2]1
/2
DH
*=
[(D
E*)
2 -
(DL
*)2
- (D
C*)
2 ] 1
/2

Kasetsart J. (Nat. Sci.) 34 (1) 105
Table 5 Mean sensory scores* of French-fry type product (size 6 × 6) of sweetpotatoes subjected tovarious processing treatments.
Processing Color Odor Flavor Texture Overalltreatments acceptability
BF1-F66 7.80a 7.20a 7.20a 7.40a 7.50a
SF2-F66 6.90b 7.00a 6.70a 6.60b 6.50b
SF3-F66 6.80b 7.10a 7.00a 7.00ab 6.95ab
* - Hedonic scale where 9-like extremely; 1-dislike extremely (n-10)
- Means followed by the same letter are not significantly different within each column at P<0.05 level.
Table 6 Mean sensory scores* of French-fry type product (size 8 × 8) of sweetpotato subjected to various
processing treatments.
Processing Color Odor Flavor Texture Overall
treatments acceptability
BF1-F88 8.00a 7.20a 7.40a 7.20a 7.50a
SF2-F88 6.80b 6.70a 6.80a 6.50b 6.60b
SF3-F88 6.65b 6.70a 6.70a 6.30b 6.60b
* - Hedonic scale where 9-like extremely; 1-dislike extremely (n-10)
- Means followed by the same letter are not significantly different within each column at P<0.05 level.
Table 7 Effect of different processes on mean sensory scores* of French-fry type product after one yearfrozen storage period.
Processing Color Odor Flavor Texture Overall
treatments acceptability
BF1-F66 7.40a 7.40a 7.33a 7.36a 7.50a
SF2-F66 7.13a 6.93a 7.06a 7.06a 7.10a
SF3-F66 6.83a 6.93a 6.86a 6.66a 6.86a
* - Hedonic scale where 9-like extremely; 1-dislike extremely (n-15)- Means followed by the same letter are not significantly different within each column at P<0.05 level.
sweetpotato french-fry type product were not
statistically different (P<0.05). Peroxide values ofoil extracted from the pre-fried products were below
10 mEq/kg, indicating not to be affected by the
process treatment, and the products had no rancid
taste during storage time (Table 8). A rancid tasteoften begins to be noticeable when PV values is
between 20 and 40 mEq/kg (Pearson, 1976).

106 Kasetsart J. (Nat. Sci.) 34 (1)
Table 8 Moisture, oil content, and the peroxide value (mEq/Kg) of oil extraction from sweetpotato pre-fried prodcut after one year frozen storage period.
Pre-fried product Moisture Oil Peroxide value% % (mEq/Kg Fat)
BF1-66 59.36 9.81 7.76
SF2-66 47.33 13.45 7.92
SF3-66 43.99 16.34 7.30
CONCLUSION
Improved process to produce a pre-friedsweetpotato French-fry type product having a low
oil content was to blanch sweetpotato strips in hot
water at 100°C containing 0.5% SAPP and partiallyfried in hot oil at 176°C for 1-2 min to give an oil
content 7-10%. The sweetpotato strips were frozen
and packaged for later finish frying. The quality ofproduct had a crisp, palatable outer surface, golden
yellow uniform color, a fluffy interior, enhance
flavor and relative low oil perception.
ACKNOWLEDGEMENT
The authors are grateful to International
Potato Center (CIP) for funding this work.
LITERATURE CITED
AOAC. 1990. Official Method of Analysis (15thed). The Association of Official Analytical
Chemists, Washington, D.C. 1298 p.
Hoover, M.W. 1963. Preservation of the natural
color in processed sweetpotato products. Food
Technol. 17 : 128.Pearson, D. 1976. The chemical analysis of food.
7th ed. Churchill Livingstone, Edinburg
London and New York. 575 p.Spark, A.A. 1969. Role of amino acids in
nonenzymatic browning. J. Science Food
Agric. 20 : 308.Toma, R.B., H.K. Leung, J. Augustin and W.M.
Iritani. 1986. Quality of French fried potatoes
as affected by surface freezing and specificgravity of raw potatoes. J. Food Sci. 51 (5) :
1213.
Walter, W.M. Jr. and M.W. Hoover. 1986.Preparation, evaluation and analysis of a
French-fry-type product from sweetpotatoes.
J. Food Sci. 51 (5) : 967.
Received date : 26/03/99Accepted date : 4/11/99

Kasetsart J. (Nat. Sci.) 34 : 107 - 116 (2000)
Development of a Yogurt-type Product from Saccharified Rice
Chakamas Wongkhalaung and Malai Boonyaratanakornkit
ABSTRACT
A yogurt-type product from saccharified rice was developed. Jasmine rice was saccharified withamylolytic enzymes at 55 °C. Changes of reducing sugars, sugar components and compositions during
hydrolysis were studied to obtain optimum condition and yield of glucose. Rice milk was prepared by
fortification of saccharified rice with 3 % casein, 3% soybean oil and 0.4 % calcium lactate to improve bothnutritive quality and organoleptic properties.
Mixed cultures of Lactobacillus acidophilus and L. casei subsp. rhamnosus were used for lactic
fermentation of rice milk. The effect of beta glycerophosphate, inoculum size and incubation period wereinvestigated. Improvement for a more palatable yogurt was achieved by blending rice yogurt with pectin
and strawberry preserve. Resulted rice-based yogurt with strawberry contained 3.05 % protein, 2.67 % fat,
24.4 % glucose, 1.5 % sucrose, 47 mg/100g of calcium, 0.86 % acidity as lactic, pH 3.48 and lactic bacteriacount of 7.6 × 10⁷ CFU/g. Sensory evaluation revealed that rice-based yogurt with strawberry was well
accepted by panelists when compared with commercial strawberry yogurt. Shelflife of rice-based yogurt
stored at 4 °C was at least 20 days.Key words : rice based yogurt, rice milk, lactic acid fermentation, saccharified rice
Institute of Food Research and Product Development, Kasetsart University, Bangkok 10900, Thailand.
INTRODUCTION
Lactic acid fermentation of cereals has been
studied extensively in the past few decades. Yogurt-
like products have been produced from variouskinds of cereals such as liquefied starch (Shin,
1989); prefermented and extruded rice flour (Lee et
al., 1992); and cooked maize meal mixture (Zulu et
al., 1997). A product, socalled Risogurt, was
produced from mixture of fermented rice and soy
protein isolate (Mok et al., 1991). Method forproducing a highly concentrated lactic product
from rice with improved quality by a secondary
enzymatic treatment during fermentation wasfurther developed by Mok et al. (1993).
Development of lactic beverages from mixture of
rice and soybean were also reported by Lee et al.
(1988).
The cultures starter for lactic fermentation
of yogurt-like products from cereals and other non-dairy raw materials were often Lactobacillus,
Streptococcus and Leuconostoc spp. A mixed
culture of Streptococcus thermophilus,
Lactobacillus bulgaricus and L. plantarum were
used by Shin (1989). Lee et al. (1992) compared
different kinds of lactic acid bacteria, namely,Leuconostoc mesenteroides, L.plantarum, L. casei
and L. lactis subsp. diacetylactis in fermentation of
pre-fermented and extruded rice flour. S.
thermophilus and L. mesenteroides have been used

108 Kasetsart J. (Nat. Sci.) 34 (1)
as starter for a yogurt-like product from rice flourand soymilk mixture (Collado et al., 1994).
Tominaga and Sato (1996) reported the production
of fermented beverage from rice flour using enzymehydrolysis followed by lactic fermentation by L.
mesenteroides. Other lactic bacteria used for
developing a fermented rice product was amylolyticBifidobacterium spp. (Park et al., 1997).
This paper reported a method to develop a
new yogurt-type product by lactic fermentation ofsaccharified rice using Lactobacillus spp. as starter
cultures.
MATERIALS AND METHODS
Rice Jasmine rice (Khao Dok Mali 105)was used in this experiment. It contains 8.17 %
protein, 1.1 % fat and 79.5 % starch, of which 17.3
% are amylose (P. Tungtrakool, unpublished data).Enzyme Heat stable alpha amylase from
Bacillus licheniformis, Termamyl 120L, and
amyloglucosidase from Aspergillus niger, AMG300L, were obtained from Novo (Novo Nordisk
Co., Bagsvaerd, Denmark). According to Novo
Nordisk ’s Standard Method, one KiloNovo alphaamylase Unit (1 KNU) is the amount of enzyme
which breaks down 5.26 g starch per hour at pH 5.6,
temperature 37 °C and reaction time 7-20 min. OneNovo Amyloglucosidase Unit (AGU) is defined as
the amount of enzyme which hydrolyzes 1
micromole maltose per unit at pH 4.3, temperature25 °C and reaction time 30 min. Both enzymes are
food grade products complied with FAO/WHO
JECFA and FCC recommendations for food gradeenzymes.
Microorganisms Lactic acid bacteria
(LAB) used in this study were Lactobacillus
acidophilus (IFRPD 2013) and L. casei subsp.
rhamnosus (IFRPD 2020) from Culture Collections
of Institute of Food Research and ProductDevelopment, Kasetsart University, Thailand. The
strains were cultured and maintained on MRSmedium (de Man et al., 1960).
Analytical methods Reducing sugars were
determined by DNS method (Chaplin and Kennedy,1986). Sugar composition was analyzed by HPLC
(Sugars Analyzer I, Waters Associates, Milford,
MA, USA) using Sugar Pak column. Thetemperature of column was 90 °C with 50 mM
EDTA-deionized water at flow rate of 0.2 ml/min
and 20 µl injection volume. DifferentialRefractometer Detector, Waters 410, was used.
Titratable acidity as lactic acid was determined by
the method of Frazier et al. (1968). Proximatecomposition and calcium content were determined
by the methods of AOAC (1990). Color was
determined by Spectraflash SF 600 Plus (DataColor International, USA) and viscosity by
Brookfield Viscometer (Model LV, Brookfield
Engineering Laboratories, USA).Total viable count, yeast, mold and coliforms
were determined according to AOAC (1990). LAB
was detected by plating method on MRS Mediumsupplemented with 0.5 % CaCO3 and counting the
colonies surrounding with clear zones.
Saccharification process Rice was washedand soaked in water at 1:2.5 ratio, wt by wt, for
about 30 min. It was adjusted to pH 6.5, heated up
to 90-95 ° and 0.2 % Termamyl was added. Therice mixture was held at this temperature for 2 hr.
Saccharification process was carried out using 0.2
% of AMG at 55 °C, pH 5.0 for about 24 hr.Suspension obtained was filtered through 350-
mesh nylon (Monyl 140T) to remove coarse solids.
It was then heated at 90 °C for 30 min to sterilizeand inactivate the enzymes.
Preparation of rice milk Saccharified rices
was adjusted to 18 °Brix before blending with 3 %casein, 3 % soybean oil and 0.4 % calcium lactate.
The mixture was homogenized for 3 min at high
speed (Ultra-Turax, Janke u. Kunkel KG, Staufen,I Breisgar) and pasteurized at 90 °C for 15 min. The

Kasetsart J. (Nat. Sci.) 34 (1) 109
rice milk was instantaneously subjected to lacticacid fermentation.
Lactic acid fermentation Two strains of
Lactobacillus, L. acidophilus 2013 and L. casei
2020, were used as starter in this study. They were
propagated separately in MRS medium for 24 hr at
37 °C to get viable cell counts in the range of 108 to109 CFU/g. Beta glycerophosphate was added at
different concentrations to enhance growth of LAB.
Various inoculum sized at 2, 3 and 4 % as well asincubation periods of 18, 24 and 36 hr were
investigated.
Preparation of rice-based yogurtImprovement of texture and flavor of rice-based
yogurt obtained after lactic fermentation was made
by addition of pectin and strawberry preserve. Themixture was blended with 1 % pectin and 20 % fruit
preserve in a mixer (Bamix, Model M 133,
Switzerland). Strawberry flavor (F 11720 UniversalFlavors, 0.1 %) and color (Winner’s Ponceur 4 R ,
0.03 %) were also added to disguise the fermented
rice odor and simulate strawberry dairy yogurt.The product was kept chilling at 4 °C for 1-2 hr
before sensory testing.
Sensory evaluation Sensory evaluation ofrice-based yogurt was performed in comparison
with commercial dairy yogurt of the same flavor.
They were scored for color, odor, flavor, texture/consistency and overall acceptability by 20
expereinced panels, using 9-point hedonic scale
rating from dislike very much (1) to like extremely(9).
Keeping quality and safety Strawberry
rice-based yogurt was kept at 4 °C for 20 days.Samples were taken during storage to examine for
titratable acidity, pH, LAB and non-LAB counts,
yeast, mold and coliforms.
RESULTS AND DISCUSSIONS
Saccharified riceRice was saccharified in closed container at
55 °C for 24 hr, during which samples were drawn
for analysis of reducing sugars and sugar
composition. Reducing sugar at 0 hr in cooked,liquefied solution before adding AMG was 9.36 %.
During the first few hours of saccharification, the
rate of hydrolysis was markedly high and sugarproduced was about double (18.9%) of the original
amount as shown in Figure 1. After that the rate was
gradually increased until about 20-21 hr when itreached the maximum content (23.8 %). Prolonged
incubation to 24 hr did not give higher yield of
reducing sugars.Sugar composition by HPLC revealed that
at 0 hr, major sugars in the solution were higher
oligosaccharides (Degree of polymerization [DP]= 3 and DP > 3) and maltose (DP =2) with only
small amount of glucose i.e. 15.74, 6.5 and 2.86 %,
respectively. However, after 30 min, glucoseincreased to 8.67 while higher oligosaccharides
decreased to 5.72 % (Figure 2). As saccharification
proceeded, glucose increased somewhat linearlyafter 1, 2, 3 and 4 hrs of incubation. Maltose
liberated was eventually broken down to glucose
and remained at low concentration in the solution.At 18th hr, 16.92 % glucose was obtained with
higher oligosaccharides and maltose comprised for
about 2 %. Saccharification process was consideredcompleted after 20-21 hr when maximum amount
of glucose (23.8 %) was produced with only 0.5 %
higher oligosaccharides and 0 % maltose left . Theyield of hydrolysis (100 x g glucose produced /
expected glucose in starch, dry basis) was 81 % and
the yield of glucose was 89.1 g per 100-g ricestarch. Glucose yield was calculated from the real
amount obtained in the saccharified solution
excluding glucose that remained in the spent solidremoved by filtration.

110 Kasetsart J. (Nat. Sci.) 34 (1)
0
5
1 0
1 5
2 0
2 5
Red
ucin
g s
ugar
(%
)
0 0 . 5 1 2 3 4 1 8 2 1 2 4
T i m e ( h r )
Figure 1 Changes of reducing sugars during saccharification of rice by amylolytic enzymes at 55 °C.
0
5
1 0
1 5
2 0
2 5
0 0 . 5 1 2 3 4 1 8 2 1 2 4
T i m e ( h r )
Sug
ar c
once
ntra
tion
(%)
G l u c o s e
M a l t o s e
D P 3
H i g h e r o l i g o s a c c h a r i d e s
Figure 2 Changes of sugars compositions during saccharification process of rice by amylolytic enzymesat 55 °C.
Preparation of rice milkSaccharified rice when adjusted to 18 °
Brix, contained 17.25 % reducing sugars. After
fortification with 3 % casein, 3 % soybean oil and
0.4 % calcium lactate and homogenized, the resultedsuspension obtained was called rice milk due to its
milky color similar to that of cow’s milk (Table 1).
The lightness was a little lower but it was less
greenish and yellowish than that of cow’s milk.Casein comprised for higher protein content and
soybean oil increased fat content as well as provided
smooth texture of the product. Calcium lactate is asalt of lactic acid which is very soluble in water and
has a high percentage of calcium and the lactate ion
is the L(+) isomer, the same as the naturally presentisomer in human. Fortification of calcium lactate to

Kasetsart J. (Nat. Sci.) 34 (1) 111
other products such as orange juice, calcium-enriched beverages and drinking yogurt was
recommended at 0.3 - 1.5 % level resulting in
calcium enrichment of 40-200 mg per 100 g product(Anonymous, 1993). Concentration of calcium
lactate higher than 0.4 % resulted in precipitation
of calcium salt in the rice milk.
Lactic fermentation of rice milkFrom preliminary study of Chakamas et al.
(1992), L casei 2020 and L acidophilus 2013 wereselected for lactic fermentation of rice hydrolysed
by koji prepared from Amylomyces rouxii. Since
both strains proved to grow well and produced upto 0.6 % lactic acid in hydrolyzed rice, they were
also used in this experiment as single inoculum andas the mixed cultures for lactic fermentation. The
effect of beta glycerophosphate(BG) is shown in
Figure 3. BG seemed to enhance acid production,especially when mixed culture (1 % each) was used
as starter. BG at 0.5 % level helped increasing the
acidity up to 0.8 % compared to 0.67 % of thecontrol. Sodium salt of beta glycerophosphate was
widely used in fermented dairy products,
particularly yogurt, drinking yogurt and cheesesince it was effective as buffering agent suitable for
growth of LAB and increased lactic acid production
(Rebecchi et al., 1993).The incubation period of 24 hr gave the
product with 0.8 % acidity and flavor and odor was
Table 1 Color measurement of rice milk in comparison with fresh cow’s milk.
Factors Rice milk Cow’s milk
Lightness (L*) 90.25 93.50a* (+ : red; - : green) -0.89 -1.93
b* (+ :yellow; - : blue) 2.86 16.25
C* (Chroma) 3.00 6.54H* (arctan) 107.28 107.13
0
2
4
6
8
10
12
0 0.25% 0.50%
Beta-glycerophosphate concentration
Aci
dity
as
lact
ic a
cid
(g
/l) L. acidophilus 2013
L. casei 2020
LA 2013 + LC 2020
Figure 3 Effect of beta-glycerophosphate on acidity of rice milk fermented with 2 % LAB at 37 °C for24 hr.

112 Kasetsart J. (Nat. Sci.) 34 (1)
0
2
4
6
8
1 0
1 2
18 hr 24 h r 30 h r
Incubat ion per iod
Aci
dity
as
lact
ic a
cid
(g
/l)
L . ac idophi lus 2013
L. casei 2020
LA 2013 + LC 2020
0
2
4
6
8
10
12
2% 3% 4%
Inoculum size
Aci
dity
as
lact
ic a
cid
(g
/l)
L. acidophilus 2013
L. casei 2020
LA 2013 + LC 2020
Figure 5 Effect of inoculum size on acidity of rice milk fermented at 37 °C for 24 hr.
found to be more palatable than the longer period.After 36-hr incubation, either using as single or
mixed cultures, the sour taste of the saccharified
rices was too profound (Figure 4). Inoculum sizehigher than 2 % gave no advantage for lactic
fermentation both when the strains were used
separately and as mixed culture (Figure 5). L.
acidophilus 2013 could grow well and produce
high lactic acid during the first stage of incubation
but it also gave strong acidic smell. L. casei 2020produced slower rate of lactic acid but the odor was
much more favorable. Combination of the twostrains, at 1 % each, resulted in the product with
appropriate acidity and improved flavor than when
separately used. Therefore, it has been chosen forthe fermentation of saccharified rice fortified with
0.5 % beta glycerophosphate for 24 hr at 37 °C.
Resulted rice-based yogurt contained 0.8% lacticacid at pH 3.58 and lactic bacteria count of 1.0 × 10⁸
CFU/g.
L. acidophilus and L. casei are consideredto be probiotics and they are natural inhabitants of
Figure 4 Effect of incubation period on acidity of rice milk fermented with 2% LAB at 37 °C.

Kasetsart J. (Nat. Sci.) 34 (1) 113
the intestinal tracts (Saloff-Coste, 1997). L. casei,
Shirota has been used in Yakult, which is a well-
recognized drinking yogurt-like product. L. casei
subsp. rhamnosus, a human origin strain, wasreported to be used in fruit-flavored drink and
yogurt from whey (Salminen et al., 1991), and as a
direct-to-vat inoculum for fermented milk (Russell,1996).
Rice-based yogurt preparationRice-based yogurt obtained after 24-hr lactic
fermentation contained 0.8 % as lactic acid, pH
3.48 and viable cell count of LAB of 1.0 × 10⁸ CFU/
g. The curd was well set, yet relatively soft butwithout separation of the liquid on the surface of
curd. Texture and consistency of the yogurt could
be improved by addition of 1 % pectin. Moreover,in order to enhance acceptability, 20 % strawberry
preserve was employed instead of sugar. The
preserve used which contains 65 % total sugar,consists of of 57 % glucose and 8 % sucrose. This
would result in about 11 % glucose and 1.6 %
sucrose in the resulted rice yogurt. The rice curdwas blended with the fruit and pectin to make
custard-type or swiss-style yogurt (Sellars andBabel, 1970). Strawberry flavor and color were
also added to disguise the fermented rice odor and
simulate strawberry dairy yogurt. After chilling at4 °C for 1-2 hr, texture of the curd became smooth
and firmer with a light pink color and strawberry
odor. Some physicochemical properties of rice-based yogurt in comparison with commercial dairy
yogurt are shown in Table 2. Despite protein content
of rice-based yogurt was a little lower than dairyyogurt, fat content was also lower and can be
furtherly adjusted to give a low-fat and cholesterol-
free product. The major component of sugars wasglucose with small amount of sucrose derived from
the preserve. Acidity was 0.8 % as lactic acid and
0.14 % as citric acid from the preserve.
Sensory evaluationThe overall acceptability of strawberry rice-
based yogurt with 0.86 % acidity as lactic, pH 3.58and LAB count of 7.6 × 10⁷ was rated by the
panelists as like moderately (6.85) which was
comparable with commercial strawberry dairyyogurt (6.98) as shown in Table 3. Commercial
Table 2 Physico-chemical properties of strawberry added rice-based yogurt in comparison with commercialdairy yogurt with strawberry.
Rice-based yogurt Commercial dairy yogurt
Protein (%) 3.05 4.0Fat (%) 2.67 2.8
Ash (%) 0.26
Carbohydrate 25.1 27.0Glucose (%) 24.4 16.8
Sucrose (%) 1.5 9.9
Calcium (mg/100 g) 47 117Acidity (% as lactic acid) 0.86 1.02
pH 3.48 4.2
Viscosity (cps) 3,900 4,200Viable LAB count (CFU/g) 7.6 × 10⁷ 3.4 × 10⁹

114 Kasetsart J. (Nat. Sci.) 34 (1)
yogurt was slightly preferred in all categories testedbut the differences were not significant at 95 %
confidential level.
Shelf-life study of Rice-based yogurtShelf-life study revealed that during 6 day-
storage at 4 °C, pH of rice-based yogurt decreased
slightly from 3.58 to 3.40 and remained unchanged.Acidity gradually increased throughout 20-day
storage while number of LAB increased from 7.6 ×10⁷ CFU/g (day 1) to 4.5 × 10⁸ at day 6 anddecreased thereafter to 103 at day 20 (Table 4).
Coliforms, yeasts, mold and bacteria other than
LAB were not detected during storage up to 20days. LAB counts of two commercial dairy yogurts
after 10 day-storage were none and 8 × 10⁴ CFU/g
even though both contained about 1 % acidity.
CONCLUSION
Saccharification of Jasmine rice with
amylolytic enzymes at 55 °C yielded the highestamount of reducing sugar after 21 hr. Sugar
composition of saccharified rice by HPLC revealed
that 98 % was glucose and only 2 % were higheroligosaccharides (DP>3). Saccharified rice at 18 °Brix when fortified with 3% casein, 3% soybean oil
and 0.4% calcium lactate, homogenized andpasteurized, resulted in rice milk for lactic acid
fermentation.
Mixed culture of L. acidophilus and L. casei
subsp. rhamnosus, 1 % each, were selected for
lactic fermentation of rice milk. Optimum
conditions for lactic fermentation were as follows:rice milk added with 0.5 % beta glycerophosphate
Table 4 Shelf-life study of Rice-based yogurt with strawberry.
Day LAB count Lactic acid
(CFU/g) (%) pH
1 7.6 × 10⁷ 0.86 3.58
2 9.8 × 10⁷ 0.94 3.524 1.3 × 10⁸ 1.10 3.45
6 4.5 × 10⁸ 1.13 3.40
8 1.5 × 10⁷ 1.20 3.4010 5.6 × 10⁶ 1.18 3.40
13 1.9 × 10⁴ 1.25 3.40
16 1.0 × 10⁴ 1.26 3.4020 9.8 × 10³ 1.26 3.50
Table 3 Sensory evaluation of rice-based yogurt and commercial dairy yogurt with strawberry.
Color Odor Flavor Texture Acceptability
Commercial dairy yogurt 7.35a 6.87 a 7.10 a 7.18 a 6.98 a
Rice-based yogurt 6.70 a 6.73 a 6.75 a 7.05 a 6.85 a
* Values of each column with the same letter are not significantly different at 0.05 level.

Kasetsart J. (Nat. Sci.) 34 (1) 115
as substrate; 2% inoculum and 37°C incubation for24 hr. Resulted product contained 0.8% lactic acid,
pH 3.58 and lactic bacteria count of 1.0 × 10⁸ CFU/
g. This rice yogurt was used as base to prepareswiss-style type yogurt by blending with 20%
strawberry preserve, 1 % pectin and flavoring and
coloring agents.Rice-based yogurt with strawberry consisted
of 3.05 % protein, 2.68 % fat, 24.4 % glucose, 1.5
% sucrose, 47 mg/100g of calcium, 0.86 % acidityas lactic, pH 3.58 and lactic bacteria count of 7.6 ×10⁷ CFU/g. The viscosity was 3,900 centipoises
and could be kept at 4 °C for at least 20 days withoutdeterioration and separation of liquid. No
contamination from other microflora was dectected
throughout the storage period and at day 20, 9.8 ×10³ CFU/g of viable lactic bacteria remained in the
product. Sensory evaluation indicated that rice-
based yogurt with strawberry was accepted bypanelists when compared with commercial
strawberry yogurt with no significant difference at
0.05 % level.
ACKNOWLEDGEMENT
The research was partially supported by
National Research Council of Thailand. The authors
acknowledged the technical assistance of Ms.Suparat Reungmaneepaitoon for Spectroflash SF
600 color measurement and Brookfield viscosity
determination.
LITERATURE CITED
A.O.A.C. 1990. Official Method of Analysis, 15th
ed. Association of Official Analytical Chemists
Washington D. C. 1298 p.Anonymous. 1993. Lactic Acid, pp. 56-60. In Asia
Pacific Food Industry. A P Food Industry
Publication Pte Ltd. Singapore.Chakamas Wongkhalaung, M. Boonyaratana-
kornkit, P. Chimanage and P Thammarate.1992. Process Development of Rice-based
Product through Lactic Acid Fermentation. A
Thai-ASEAN Project Report submitted toNational Research Council of Thailand. 47 p.
Chaplin, M.F. and J.F. Kennedy. 1986.
Carbohydrate Analysis. IRL Press. Oxford,Washington D.C. 450 p.
Collado, L.S., R.C. Mabesa, M.J.V. Sumague and
C.K. Mok. 1994. Yogurt-like products fromriceflour and soymilk. Philippine Agriculturist
77 (3) : 307-319.
deMan, J.C., M.C. Rogasa and M.E. Sharpe. 1960.A medium for the cultivation of lactobacilli. J.
Appl. Bacteriol. 23 : 130-135.
Frazier, W. C., E.H. Marth and R.H. Diebel. 1968.Laboratory Manual for Food Microbiology.
4th ed. Burgess Publishing Company,
Minneapolis, Minn., USA. 122 p.Lee, C.H., K.C.Min, M. Souane, M.J. Chung, T.E.
Mathiasen and J. Adler-Nissen. 1992.
Fermentation of prefermented and extrudedrice flour by the lactic acid bacteria from
Sikhae. Food Biotechnology, 6(3) : 239-255.
Lee, Cherl Ho, M. Souane and Ki-Hyung Rhu.1988. Effects of prefermentation and extrusion
cooking on the lactic fermentation of rice-
soybean based beverage. Korean J. of FoodSc. Technol. 20 (5) : 666-673.
Mok Chulkyoon, Jinsuk Han, Young Jin Kim,
Namsoo Kim, Dae Young Kwon andYoung June Nam. 1991. Risogurt, a mixture of
lactic acid fermented rice and soybean protein
: development and properties. Korean J. ofFood Sc. Technol. 23(6) : 745-749.
Mok Chulkyoon, Young Jung Nam and Young Jin
Kim. 1993. Method for producing highlyconcentrated, lactic-acid fermented product
utilizing unground grainy rice and improving
qualities thereof by the secondary, enzymatictreatment at fermentation. United States Patent

116 Kasetsart J. (Nat. Sci.) 34 (1)
No. US 5219597. USA.Park, J.H., H.K. Song, J.B. Ahn, G.E. Ji and C.
Mok. 1997. Rice fermentation by Korean
amylolytic Bifidobacterium spp. Korean J. ofFood Sci. and Technol. 29 (3) : 581-587.
Rebecchi, A., S. Bertuzzi, F. Lcchini, V. Bottazzi
and E. Brambilla. 1993. Lactic acid bacteriafor Grana Cheese production. 5. Lactic
microflora activity in whey buffered with
sodium beta-glicerophosphate. Scienza eTecnica Lattiero Casearia (Italy) 44(6) : 377-
388.
Russell, P. 1996. Yogurt and fermented milks – aChanging area. International Milk Industry.
98(11) : 5-6, 8-9.
Salminen, S., S. Gorbach and K. Salminen. 1991.Fermented whey drink and yogurt-type product
manufactured using Lactobacillus strain. Food
Technology (USA), June 1991. 45(6) : 112.Saloff-Coste, C.J. 1997. Lactobacillus acidophilus.
Danone World Newsletter 13 : 1-7.Sellars, R.L. and F.J. Babel. 1970. Cultures for the
Manufacture of Dairy Product. CHR. Hansen’s
Laboratory, Inc. West Maple Street, Wisconsin.Shin Dong Hwa. 1989. A yogurt like product
development from rice by lactic acid bacteria.
Korean J. Food Sci. Technol. 21 : 686-690.Tominaga, M. and K. Sato. 1996. Lactic acid
fermentation of saccharified solution from rice
flour. Journal of Food Science 61(3) : 627-631.
Zulu, R.M., V.M. Dillon and J.D. Owens. 1997.
Munkoyo beverage, a traditional Zambianfermented maize gruel using Rhynchosia root
as amylase source. International Journal of
Food Microbiology 34(3) : 249-258.
Received date : 15/10/99Accepted date : 17/01/00

Kasetsart J. (Nat. Sci.) 34 : 117 - 124 (2000)
INTRODUCTION
In recent years, epidemiological evidence
has suggested that a reduction in dietary fiber is
related to an increase in certain diseases such asdiverticulosis (Painter and Burkitt, 1971) and
colonic cancer (Burkitt, 1971). Dietary fiber acted
as a bulking agent that increased intestinal motilityand moisture content of feces (Forsythe et al.,
1976). It was postulated that those effects were
important in preventing disease of the colon(Trowell, 1973). Other studies showed evidence
that plant fiber could decrease serum cholesterol
level (Forsythe et al., 1976; Tsia et al., 1976) and
Development of Instant High Fiber Processed Food
Plernchai Tangkanakul, Nednapis Vatanasuchart,Maradee Phongpipatpong and Patcharee Tungtrakul
ABSTRACT
Five high fiber processed foods were formulated by using high fiber sources such as beans,
unpolished rice, sesame. The product formulas were : I) kidney bean : unpolished rice : white sesame
(70:20:10), II) kidney bean : sweet potato : job’s tears seed (45:35:20), III) mungbean : pineapple : pumpkin(50:30:20), IV) corn : mungbean : unpolished rice (60:30:10), and V) banana : pumpkin : corn : unpolished
rice (30:25:25:20). These products were prepared in powder form by drum dryer and then ground with pin
mill. The particle size, bulk density and viscosity of the plain products ranged from 141.6 - 186.5 µm, 0.75- 0.82 g/ml and 1,750-7,208 cps, respectively. After flavoring with sugar, skimmed milk, cocoa or vanilla,
the Water Absorption Index (WAI) and water activity (aw) of flavored products ranged from 2.81-5.59 and
0.27-0.31, respectively. Flavored products prepared for sensory evaluation were conducted by addingwarm water in four different ratio, products to water as 1:3, 1:4, 1:5 and 1:6 by weight. The results showed
that the ratio 1:4 of most formulas had scores of acceptance ranged from 6.29-7.35 which was higher than
the other ratios. Protein, fat and total dietary fiber of all flavored products ranged from 14.54-20.50 , 1.02-4.25, and 5.89-11.88 g/100 g , respectively.
Key words: high fiber, instant food, dietary fiber, drum dryer
improved oral glucose tolerance in humans (Kay,
1982).In view of the recently proposed
physiological role and medical advantage of dietary
fiber, along with the increasing interestdemonstrated in the scientific and consumer world,
it was the interest of food research and product
development to examine more closely theapplication of fiber ingredients in commercial
formulations. It led to the purpose of this study to
develop a profile of high-fiber processed food byusing several potential sources of dietary fiber as
the ingredients.
Institute of Food Research and Product Development, Kasetsart University, Bangkok 10900, Thailand.

118 Kasetsart J. (Nat. Sci.) 34 (1)
MATERIALS AND METHODS
1. Products preparationPulses, cereals, sesame and seeds were used
as potential sources of dietary fiber in the products.
Five product formulas are shown in as follows.
Formula Fiber source Ratio
I kidney bean : unpolished
rice : white sesame 70:20:10II kidney bean : sweet
potato : job’s tears seed 45:35:20III mungbean : pineapple :
pumpkin 50:30:20IV corn : mungbean :
unpolished rice 60:30:10V banana : pumpkin : corn :
unpolished rice 30:25:25:20
Products were formulated to meet
Recommended Daily Dietary Allowances forhealthy Thais which should contain protein about
20% of total energy and 5 g/100 g of dietary fiber
(RDA,1989). Process of high fiber food productionis shown as flow chart.
2. Physical propertiesParticle size Twenty five grams of milled
product were placed on the largest of a descending
60 , 80 , 100 mesh stainless steel U.S. Standard
Sieves that were fitted with a pan and cover. The“nested” sieves were shaken for 10 min ,
disassembled and contents were stirred lightly ,
then shaked for an additional 5 min. The residue oneach sieve was carefully removed with the aid of a
brush and weighed. Each residue was expressed as
percent by weight of the original sample.Density determinations For density
determination , a calibrated graduate cylinder was
Weighed raw materials
↓Cooked
↓Mixed
↓ ← added water
Ground
↓Drum dryer (Surface Temp. 135
o C , 4 rpm , clearance 0.1 mm.)
↓Pin mill
↓Plain product
↓ ← added sugar , skimmed milk powder , cocoa, vanilla
Flavored product

Kasetsart J. (Nat. Sci.) 34 (1) 119
filled, with each milled product and slightly shaked.The contents of milled product in the cylinder were
weighed and the average of triplicate determinations
was expressed as g/ml.Bulk density Bulk density was measured
with a calibrated graduate syringe (open and packed
with cotton). The syringe was filled with a knownamount of sample , which varied somewhat
depending on particle size and density. Pressure
was applied manually until additional pressurewould not furtherly reduce the volume.
Viscosity Viscosity was measured by using
a Brookfield model RVT viscometer with no. 3, 4,5 spindle at 50 rpm (Synchro-Lectric Viscometer
model RVT Brookfield engineering Laboratories,
INC).Water Absorption Index (WAI) Water
Absorption Index was measured by the procedure
of Anderson et al., 1969.Water activity (aw) Water activity was
measured by Novasina EEJA –3 at 25°C.
3. Chemical compositionMoisture, ash, protein and fat were analysed
by following AOAC procedure (1990). Dietary
fiber was determined by enzymatic gravimetricmethod (AOAC, 1990).
4. Preparation of flavored productsFlavoring agents and carboxy methyl
cellulose (CMC) were added into each formula
accordingly as follows.
Ingredients High fiber processed food formula number
(g) I II III IV V
Plain product 50 50 50 50 50Sugar 25 25 25 25 25
Skimmed milk 20 20 24.8 24.95 24.95
powder
Cocoa powder 4.95 4.95 - - -
Vanilla - - 0.15 - -
CMC 0.05 0.05 0.05 0.05 0.05
5. Sensory evaluation of flavored productsSensory evaluation of flavored products
was tested by adding warm water in the ratio of
instant powder to water, 1:3 1:4 1:5 and 1:6. Color,
odor , flavor , thickness , texture and acceptancewere evaluated by 20 experience panelists. The
acceptance was done using the 9-point hedonic
scale (max. value 9 = like extremely , min. value 1= dislike extremely) , whereas color , odour ,
flavor , thickness and texture were determined by
5-point scale for perceived intensity scores (max.value = 5, min. value = 1) (ASTM, 1968). Color
tone , strength of smell , sweetness and viscosity of
the tested products were comparatively justified.The hedonic and scoring rating were
analysed by Analysis of variance (Randomized
Complete Block Design) and Duncan’s MultipleRange Test at 95% confidential level.
RESULTS AND DISCUSSION
Materials selected to develop instant high
fiber processed foods were red kidney bean,mungbean, white sesame seeds, unpolished rice,
corn, sweet potato, pumpkin, pineapple, job’s tear
and banana. These food sources provided eithernutritional value, dietary fiber, fruity flavor and/or
color to the developing products. For nutritional
value point of view, protein content was the mostconcern. Red kidney bean, mungbean, white sesame
seeds and job’s tear contained a considered amount
of protein. The amounts of dietary fiber were highin red kidney beans , mungbean and sesame which
were 30.2 , 28.9 and 22.3 g/100 g (dry weigh basis),
respectively (Puwastien, 1990), whereas , dry matterof pumpkin, corn, sweet potato, pineapple, banana,
job’s tear and unpolished rice contained lower fiber
of 16.4, 13.4, 8.6, 8.0, 6.6, 4.15 and 2.4 g/100 g,respectively (Puwastien, 1990).

120 Kasetsart J. (Nat. Sci.) 34 (1)
Physical propertiesThe results showed that most of the particle
size (> 50%) of the formula I II III and IV ranged
from 180 - 150 µm (Table 1) which were smaller
than the particle size of the formula V (average186.5 µm). Mix of different particle sizes in one
formula implied existing of various fiber sizes.
Kimura (1977) reported that mix of various particlesize of fiber increased rate of water absorption in
human. Therefore, the formula I and II should be
superior to the formula III, IV and V.WAI of formula I was the lowest, 2.81,
while that of formula V was the highest, 5.59. The
result indicated that formula V imbibed more waterthan formula I as demonstrated by Chen et al.
(1988). Sieve size as well influenced on the water
absorption. Water absorption could be decreasedby the reduction of powder particle size (Cadden,
1987) , suggesting that small size of materials
might be less porous and would be unable to imbibeas much water as large size. This study displayed
WAI trend similar to Cadden (1987) except formulaI (Table 1). From calculating carbohydrate content,
formula I, II, III, IV and V contained 48.3, 59.1,
66.9, 70.7 and 82.4 g/ 100g (dry weight basis),respectively. Amount of carbohydrate might affect
water absorption, illustrated in formula I. Besides
that type of carbohydrate, starch or cellulose, alsoinfluenced water absorption.
Sensory evaluationDeveloped products displayed their
characteristic in color depend upon the ingredients.
Formula I and II contained red kidney beans,
therefore, both formulas had red-purplish tone.Mungbean provided greenish color and pineapple,
pumpkin and corn gave yellowish color to the
formula III and IV. Color of formula V was similarto formula III and IV, but brighter in yellow caused
by banana.
Each formula was designed to haveindividual characteristic in odor. Formula I expected
Table 1 Physical properties of plain and flavored products.
Property High fiber processed food formula number
I II III IV V
Plain product
Particle size*60-80 mesh (250-180 µm) 39.4 25.2 4.2 5.6 56.7
80-100 mesh (180-150 µm) 50.1 62.1 67.5 78.0 35.7
>100 mesh (<150 µm) 10.7 12.7 28.3 16.7 7.6Particle size (µm) 175.0 166.2 141.6 153.0 186.5
Direct density (g/ml) 0.66 0.62 0.66 0.60 0.54
Bulk density (g/ml) 0.82 0.75 0.82 0.80 0.79Viscosity (cps) 1750 6040 3820 7208 6440
Flavored product
Water Absorption Index (WAI) 2.81 3.75 3.80 3.80 5.59Water activity (aw) 0.27 0.31 0.30 0.31 0.27
* Percent of sample retained on U.S. standard sieves

Kasetsart J. (Nat. Sci.) 34 (1) 121
kidney bean flavor mix with cocoa. Job’s tear andcocoa powder contributed odor to the formula II.
Formula III was dressed with vanilla. Corn and
banana were natural odor in formula IV and V,respectively.
Sensory evaluation of flavored products is
shown in Table 2. The ratio of 1:4 in most formulas
had higher acceptance scores than the others. Inparticularly, the formula IV obtained the highest
scores. The reason was formula IV contained corn
up to 60%. This amount of corn provide good odorand flavor to the product. Panelists’ commendation
revealed that odor was the most important factor
for them to decide their preference.
Table 2 Sensory evaluation of 5 formulas of high fiber processed food.
Ratio Mean(Instant powder :
water) Color Odor Flavor Thickness Texture acceptance
Formula I
1 : 3 4.19a 3.44a 3.63a 4.44a 2.56a 6.25ab
1 : 4 3.00b 2.88ab 2.69b 3.06b 2.06b 7.00a
1 : 5 2.25c 2.63b 2.00c 2.25c 1.81b 6.13ab
1 : 6 1.38d 2.69ab 1.38d 1.31d 1.63b 5.50b
Formula II
1 : 3 4.07a 2.57a 3.43a 4.64a 2.36a 5.86a
1 : 4 3.21b 3.07a 2.71b 3.50b 2.29a 6.29a
1 : 5 2.14c 2.86a 2.21c 2.43c 2.07a 6.36a
1 : 6 1.43d 2.93a 1.50d 1.79d 1.86a 5.79a
Formula III 1 : 3 3.88a 2.41a 3.82a 4.41a 1.94a 5.94b
1 : 4 2.88b 2.47a 2.94b 3.18b 1.71ab 7.24a
1 : 5 2.18c 2.29a 2.41c 2.12c 1.47bc 7.18a
1 : 6 1.65d 2.18a 1.53d 1.24d 1.29c 5.71b
Formula IV
1 : 3 3.70a 3.00ab 3.40a 4.45a 2.50a 5.35b
1 : 4 2.95b 3.10a 2.90b 3.25b 1.95b 7.35a
1 : 5 2.30c 2.60b 2.10c 2.35c 1.90b 6.95a
1 : 6 1.75d 2.10c 1.50d 1.40d 1.60b 5.70b
Formula V
1 : 3 4.15a 3.54a 3.92a 4.62a 1.38a 5.15b
1 : 4 3.23b 2.77b 2.92b 3.38b 1.38a 7.15a
1 : 5 2.77c 2.38b 2.23c 2.62c 1.31a 6.92a
1 : 6 2.23d 1.77c 1.62d 1.77d 1.31a 6.69a
*In each formula, mean in the same column having different superscripts were significantly different
according to DMRT (P < 0.05)

122 Kasetsart J. (Nat. Sci.) 34 (1)
In all developed products, there was anunsatisfied characteristic of gritty texture. This
gritty texture may be caused by bean hull, corn seed
pericarp, sesame seed coat and cellulose inpineapple. Those coarse particles distributed
irritating effect to the throat. The result of this
experiment agreed to the previous report that If afiber with low water holding capacity was added to
a beverage system , the beverage may have a gritty
texture (Schmidl et al., 1985). However, throatirritated feeling could be minimized by increasing
water content (Table 2). The bigger number on
texture represented the more irritating feeling.
Chemical compositionThe protein contents of plain formula I to IV
ranged from 18.59 - 21.99 g per 100 g whichaccounted as 24.17% , 23.10% , 27.56% and 23.12%
of total calories, respectively (Table 3). These were
higher than the contents in the flavored products,which were 20.71% 20.08% 22.35% and 21.84%
of total calories, respectively. Among 5 formulas,the protein contents of plain (10.75 g/100g) and
flavored (14.54 g/100g) of formula V were the
lowest, 12.0% and 16.11% of total calories,respectively. The reason was main ingredients were
banana, pumpkin, corn and unpolished rice which
were naturally low in protein contents.Fat contents of all plain products, formula I
to V, accounted as 22.83%, 6.18%, 3.61%, 9.43%
and 7.83% of total calories, respectively. FormulaI provided highest fat content according to one of
the components was sesame which contained fat
56.2 g/100 g. (Nutrition Division, 1992).The results showed that the plain formula I
had a very high dietary fiber contents of 20.59 g/
100g. The reason was that 70% of total weight of allingredients were red kidney beans which were rich
in dietary fiber, 27.7 g/100g (Puwastien, 1990).
The plain formula II and III also provided a highlevel of dietary fiber of 15.38 - 15.85 g/100g which
was found to be associated with the selected
Table 3 Chemical composition of 5 formulas of plain and flavored high fiber processed food (per 100 g).
Product Moisture Protein Fat Ash Dietary fiber CHO Energy(g) (g) (g) (g) (g) (g) (Kcal)
Plain
Formula I 3.91 20.11 8.44 2.86 20.59 (5.84)* 44.09 332.76
Formula II 3.71 18.59 2.21 2.72 15.85 (4.49) 56.92 321.93Formula III 2.95 21.99 1.28 3.47 15.38 (4.36) 54.93 319.20
Formula IV 3.77 19.74 3.58 2.96 12.35 (3.50) 57.60 341.58
Formula V 2.82 10.75 3.12 2.85 8.62 (2.44) 71.84 358.44
Flavored
Formula I 3.08 18.07 4.25 3.10 11.88 (3.37)* 59.62 349.01Formula II 2.78 17.62 1.02 3.14 7.63 (2.16) 67.81 350.90
Formula III 2.48 20.50 3.21 3.56 6.26 (1.77) 63.99 366.85
Formula IV 2.90 19.57 1.46 3.43 5.89 (1.67) 66.75 358.42Formula V 2.35 14.54 1.46 3.28 5.96 (1.69) 72.41 360.94
* The numbers in the parenthesis referred to the contents of dietary fiber in g/1 - 0Z serving

Kasetsart J. (Nat. Sci.) 34 (1) 123
ingredients, kidney bean and mungbean The plainformula V possessed the lowest of dietary fiber of
8.62 g/100g.
The amount of dietary fiber in flavoredproducts ranged from 5.96 to 11.88 g/100 g which
were substantially higher than some commercial
products. It was reported that dietary fiber contentsof commercial breakfast cereal ranged from 0.2 -
34.06 g/100g (Jwuang, 1979; Baker, 1981; Douglass
et al., 1982; Mongeau and Brassard, 1982; Marlett,1992).
The flavored powder of formula I, II, III, IV
and V providing energy ranged from 319.20 -358.44 Kcal equaling 4.88% 9.00% 14.93% 4.93%
and 0.70%, respectively,which were greater than
the plained formulas. The increasing calorie wasdue to sugar and skimmed milk, 36.7 Kcal/100g,
(Whitney and Hamilton, 1981).
CONCLUSION
All of the flavored products provided dietaryfiber ranged from 5.89 - 11.88 g/100 g which were
substantially higher than thore of some comercial
products. The most preference one was Formula IVdue to accustomed and adored fragrance of corn. In
this study, the production cost of Formula IV
calculated only on raw materials was 40 baht / kg.The cost could certainly be reduced if industrial
scale was conducted. Producing these higher
nutritional products would provide another optionfor consumers who concern of their health.
ACKNOWLEDGEMENT
We would like to acknowledge Kasetsart
University Research and Development Institute(KURDI) for a grant to support this study.
LITERATURE CITED
Anderson, R.A., H.F. Conway, V.F. Pfeifer, and
E.L. Griffin Jr. 1969. Gelatinization of corngrits by roll and extrusion cooking. Cereal Sci.
Today. 14 : 4.
AOAC. Official methods of analysis. 1990 15 thed. Association of Official Analytical
Chemists, Arlington, Virginia. 1298 p.
ASTM, 1968. Manual on Sensory Testing Methods.American Society for Testing and Materials,
Philadelphia, 77p.
Baker D. 1981. Fiber in breakfast cereal. J FoodSci. 46 : 396.
Burkitt, D.P. 1971. Epidemiology of cancer of the
colon and rectum. Cancer. 28 : 3.Cadden, A.M. 1987. Comparative effects of particle
size reduction on physical structure and water
binding properties of several plant fiber. J.Food Sci. 52 : 1595.
Chen, H., C.L. Rubenthaler, H.K. Leung, and J.D.
Baranowski. 1988. Chemical, physical , andbaking properties of apple fiber compared
with wheat and oat bran. Cereal Chem. 65 :
244.Douglass, J., R. Mathews, and F. Hepburn. 1982.
Composition of Food : Breakfast Cereals -
Raw , Processed, Prepared. Rev USDAAgriculture Handbook No. 8 – 8.
Forsythe, W.A., Chenoweth, and M.R. Bennink.
1976. The effect of various dietary fibers onserum cholesterol and laxation in the rat. J.
Nutr. 106 : 26.
Jwuang, W.J., M.E. Zabik. 1979. Enzyme neutraldetergent fiber analysis of selected commercial
and home - prepared foods. J Food Sci. 44 :
924.Kay, R.M. 1982 Dietary fiber. J. Lip Res. 23 : 221.
Kimura, K.K. 1977. High fiber diet - who need it?
Cereal Food World 22 : 16.Marlett,. J.A. 1992. Content and composition of

124 Kasetsart J. (Nat. Sci.) 34 (1)
dietary fiber in 117 frequently consumed foods.J. Am Diet Assoc. 92 : 175.
Mongeau, R., R. Brassard. 1982. Determination of
neutral detergent fiber in breakfast cereals :Pentose , hemicellulose , cellulose , and lignin.
J. Food Sci. 47 : 550.
Nutrition Division , Department of health , Ministryof public health. 1992. Nutritive Values of
Thai Foods. 48 p.
Painter, N.S. and D.P. Burkitt. 1971. Diverticulardisease of the colon : A deficiency disease of
western civilization. BMJ. 2 : 450.
Puwastien, P., U. Valaipatchara, and R.Kongkachuichai. 1990. Dietary fiber content
in common Thai food. J. Nutr. Assoc.
(Thailand) 24 : 43.RDA, 1989. The Committee on Recommended
Daily Dietary Allowances, Dept. of Health,
Ministry of Public Health. 161p.Schmidl, M.K., T.P. Labuza. 1985. Low calorie
formulations cutting calories , keeping quality.
Prepared Foods. 154 : 118.Trowell, H.1973. Dietary fiber , ischaemic heart
disease and diabetes mellitus. J. Nutr Soc. 32
: 151.Tsia, A.C., J. Elias, J.J. Kelly, R.C. Lin, and J.R.K.
Robson. 1976. Influence of certain dietary
fibers on serum and tissue cholesterol in rats.J. Nutr. 106 : 118.
Whitney, E.N. and E.M.N. Hamilton. 1981. Table
of food composition. Understanding nutrition,2 nd ed. (St. Paul , Minn ; West) : A 43.
Received date : 19/03/99Accepted date : 25/11/99

Kasetsart J. (Nat. Sci.) 34 : 125 - 138 (2000)
Primary Productivity of the Pygmy Bamboo (Arundinaria pusilla)in the Dry Dipterocarp Forest at Sakaerat, Nakhon Ratchasima
Niwat Ruangpanit
ABSTRACT
The aboveground and belowground biomass of Arundinaria pusilla in two strata of the drydipterocarp forest were monthly harvested and net primary production, accumulation and disappearance
rates by compartment were estimated. These data were further utilized for determination of system transfer
functions and the efficiency of energy capture. The results indicated that the aboveground standing cropof standing live, standing dead and litter varied considerably through different sampling intervals within
and between each stratum. More belowground biomass was concentrated in the upper soil layer and the
amount declined with an increase in depth. The community annual aboveground net primary productionwas estimated on ash-free basis to be 210 gm-2 on stratum 1 and 329 gm-2 on stratum 2 and the belowground
net production was 2,844 gm-2 on stratum 1 and 2,884 gm-2 on stratum 2. The accumulation of standing
dead (256 gm-2) and litter (214 gm-2) on stratum 1 was greater than the standing dead (198 gm-2) and litter(137 gm-2) on stratum 2. Annual disappearance of litter was also higher on stratum 1 (149 gm-2) than that
of stratum 2 (119 gm-2). But the belowground disappearance was much greater on stratum 2 (2,794
gm-2) than that of stratum 1 (2,573 gm-2). Annual efficiency of energy capture was estimated to be 1.77percent on stratum 2 and 1.86 percent on stratum 1based on 50 percent usable solar insolation. It was shown
that the belowground portion of Arundinaria pusilla played an important role in the dynamics of the system
as a whole. This study confirmed that the belowground biomass in this kind of plant community shouldbe considered as being very important in the study of the ecosystem functions.
Key words : biomass, primary production, system transfer function, energy flow
Department of Forest Biology, Faculty of Forestry, Kasetsart University, Bangkok 10900, Thailand.
INTRODUCTION
With the rising demand for food in the
world and increasing competition for the use of
natural and agricultural land, the efforts of manyscientists concerned with food production have
been directed towards raising production and
improving the efficiency of productivity fromexisting areas of cultivated land. Hence, primary
productivity of natural communities remains a
major area for ecological research.
Optimal use of primary producers dependson accurate understanding of the amount and
dynamics of herbage biomass. Analyses of
ecosystem processes are also dependent on theaccuracy of biomass estimates and the seasonal
patterns of biomass dynamics. The most important
fact, however, is that, without a knowledge of

126 Kasetsart J. (Nat. Sci.) 34 (1)
primary productivity, the ecosystem functioning isnot known as well as the calculation of an energy
budget for any ecosystem as a whole is impossible.
The present study was concerned with theestimation of the primary productivity of
Arundinaria pusilla the predominant perennial grass
community (known in Thai as Yaaphet) in the drydipterocarp forest at Sakaerat Environmental
Research Station (SERS), Pak Thong Chai, Nakhon
Ratchasima.The objective of the study was to determine:
1) seasonal variation in the aboveground and
belowground plant biomass; 2) aboveground andbelowground net primary producton and turnover;
3) net accumulation and disappearance rates; 4)
system transfer functions; 5) the calorific contentof biomass compartments; 6) efficiency of energy
capture; and 7) annual energy flow.
MATERIALS AND METHODS
According to the differences in size, heightand density of the stands, the study area was divided
into two strata. Stratum 2 is normally located on
soil which displays greater prominence of sandstoneboulders or rock out crop than that of stratum 1.
Three replications of 25 × 30 m were randomly
selected on each stratum. The aboveground andbelowground biomass were harvested monthly.
On each sampling date, ten sample plots of the
aboveground biomass were randomly selected andclipped at ground level by using 0.25 × 1.00 m
rectangular quadrats on each replication. Three
samples of belowground biomass were alsocollected in each plot by using a soil core method
to a depth of 40 cm, and divided into 0-10, 10-20,
20-30 and 30-40 cm sections. All plant materialswere oven-dried at 70°C for 48 hours and then
weighed to the nearest 0.01 g. The energy content
of each compartment was determined by using Parradiabatic bomb calorimeter.
The aboveground net primary production(ANP) was estimated using three methods, the
community peak standing crop (Odum, 1960;
Hadley and Kieckhefer, 1963), the sum of positiveincrease in biomass (Kelly et al., 1974) and the sum
of positive change in biomass plus mortality.
According to Singh and Yadava (1974) the sum ofpositive increases in standing dead for only those
sampling intervals which correspond to a positive
change in biomass is called mortality. Thebelowground net primary production (BNP) was
determined by a summation of the positive changes
in the belowground biomass on successive samplingdates (Sims and Singh, 1971; Singh and Yadava,
1974). The turnover rate of belowground biomass
was calculated by using the ratio betweenbelowground net production and maximum
belowground biomass which poposed by Dahlman
and Kucera (1965).Total net primary production (TNP) was
determined simply by adding the aboveground net
production (ANP) and belowground net production(BNP). System transfer functions, net accumulation
and disappearance rates were determined following
the method described by Grodins (1963), Golley(1965), and Sims and Singh (1971). The poduction
of standing dead (SD) was calculated by the
summation of positive changes in the standing cropof standing dead on successive sampling dates,
which represents the transfer of standing live to the
standing dead compartment. Litter production (L)was estimated from the sum of positive differences
in litter through the successive sampling dates.
Litter disappearance (LD) has been derived byadding the negative differences in the litter values
between different sampling intervals. Root or
belowground disappearance (RD) was representedby the summation of significant negative changes
in the belowground biomass on successive sampling
dates. Total disappearance (TD) was the sum oflitter disappearance (LD) and root disappearance

Kasetsart J. (Nat. Sci.) 34 (1) 127
(RD). In order to estimate the efficiency of energycapture and the flow of energy in the system, all
biomass values in gm-2 were converted to energy
values by multiplying those values with theappropriate calorific content of the harvested
samples and expresses in kcal m-2.
RESULTS AND DISCUSSION
Seasonal variation in the aboveground biomassThe aboveground standing crop of live,
dead, and litter, both on stratum 1 and stratum 2,
varied considerably through different samplingintervals (Tables 1 and 2).
The standing live standing crop on both
strata peaked in November at 364 gm-2 on stratum1 and 313 gm-2 on stratum 2. The average standing
live vegetation was 259 gm-2 on stratum 1 and 196
gm-2 on stratum 2.Ruangpanit (1981) estimated that the live
herbage of Arundinaria pusilla was 275 gm-2,
divided into 128 gm-2 stem biomass and 147 gm-2
leaf biomass. The standing live vegetation
decreased on all sampling dates after the peak with
minor fluctuations through to the last samplingdate in March.
Standing dead material was evaluated in the
same manner as standing live on both strata. Thestanding dead on stratum 1 peaked in March at 202
gm-2 and at 194 gm-2in February on stratum 2. The
rapid increase of this component in the dry seasonwas probably caused by the transfer of standing
live vegetation into this compartment after life
cycles were completed. The maximum rate ofincrease of standing dead material on stratum 1 and
stratum 2 was 3.01 and 3.77 gm-2 day-1, respectively,
both being recorded in January.The standing crop of ground litter on both
strata peaked in May at 237 gm-2 on stratum 1 and
199 gm-2 on stratum 2. The amount of litter on bothstrata then declined steadily through the wet season
starting from May and increased again during thedry season in February. Fluctuations in the amount
of litter were the net result of litter production and
disappearance by decomposition. The increase inthe amount of litter in the early part of the growing
season was probably caused by the addition of
material from the standing dead crop and the deathof green vegetation. It is also possible that part of
the litter could have been carried over from the
previous year. The gain in the amount of litterduring the dry season was indicative of the transfer
from standing dead to litter. The decline during the
growing season represents the decomposition oflitter. Lewis (1969) pointed out that litter fall was
most rapid during the dormant season, but
decomposition proceed more rapidly during warm,moist periods.
Seasonal variation in the belowground biomassThe belowground biomass in the upper 40
cm of soil profile on both strata exhibited the same
seasonal trend (Tables 3 and 4); only the maximumand minimum amounts of biomass occurred on
different dates. The seasonal peak on both strata
was recorded in February; with 3,623 gm-2 onstratum 1 and 3,481 gm-2 on stratum 2. On the
average, there were about 2,668 gm-2 of
belowground biomass in the upper 40 cm of soilprofile on stratum 1 and about 2,589 gm-2 on
stratum 2.
Both strata had a greater belowgroundbiomass during the early wet season followed by a
decline and increase immediately following the
decline again thereafter. Generally, the mid-seasondip in belowground biomass and subsequent
recovery was probably the result of stored
carbohydrates being utilized for growth and thenthe carbohydrates were restored later in the same
season.
The variation of belowground biomass onboth strata occurred primarily in the top 10 cm of

128 Kasetsart J. (Nat. Sci.) 34 (1)
Table 1 Seasonal variation in standing live, standing dead and litter standing crop (gm-2 dry mater ± SE1)(ash-free dry wt in parenthesis) of Arundinaria pusilla in the dry dipterocarp forest stratum 1.
Sampling date Standing live Standing dead Litter Total
Apr. 155.24 ± 14.26 80.51 ± 7.32 113.61 ± 9.11 349.36(143.43) (73.83) (100.09) (317.35)
May 307.56 ± 28.27 135.01 ± 17.40 236.65 ± 19.03 679.22
(287.57) (126.06) (183.14) (569.77)Jun. 290.90 ± 38.98 138.44 ± 21.44 215.02 ± 21.44 644.36
(267.69) (131.02) (174.60) (573.31)
Jul. 290.13 ± 2.31 87.55 ± 13.09 147.07 ± 18.70 524.75(265.50) (83.25) (118.92) (467.67)
Aug. 343.40 ± 38.09 79.84 ± 9.44 166.95 ± 16.37 590.19
(319.08) (73.39) (149.52) (541.99)Sep. 315.89 ± 29.81 142.65 ± 13.59 160.32 ± 11.43 618.86
(292.64) (132.75) (136.98) (562.37)
Oct. 282.46 ± 28.58 123.95 ± 12.04 141.75 ± 14.38 548.16(256.93) (113.72) (118.57) (498.22)
Nov. 364.27 ± 30.03 69.61 ± 5.76 90.84 ± 6.30 524.72
(335.82) (65.48) (81.62) (482.92)Dec. 320.38 ± 28.54 50.93 ± 6.81 71.42 ± 8.72 442.73
(290.62) (48.10) (64.37) (403.09)
Jan. 268.01 ± 25.21 103.83 ± 13.99 92.40 ± 8.24 464.24(244.53) (97.20) (82.32) (424.05)
Feb. 107.61 ± 23.53 197.12 ± 15.63 116.90 ± 6.84 421.63
(100.53) (182.22) (103.69) (386.44)Mar. 58.87 ± 8.21 202.02 ± 13.85 184.73 ± 10.02 445.62
(55.56) (187.90) (164.65) (408.21)
Average 258.73 117.62 144.81 521.15
(238.33) (109.58) (132.21) (471.12)
1 Standard error of the mean.
the soil profile and decreased with an increase in
depth. It was possible that the size and amount of
rhizome of Arundinaria pusilla which dominatedthe belowground biomass caused more variation.
Bartos and Sims (1974) believed that the variation
in the amount of root mass in the grassland rangecould come from the fluctuation in the amount of
plant crowns. The dynamics of belowground
biomass, however, may be interpreted either using
concepts of growth and decomposition, or theconcept of translocation of photosynthate material
down to or up from the root, or the combination of
both.

Kasetsart J. (Nat. Sci.) 34 (1) 129
Table 2 Seasonal variation in standing live, standing dead and litter standing crop (gm-2 dry mater ± SE1)
(ash-free dry wt in parenthesis) of Arundinaria pusilla in the dry dipterocarp forest stratum 2.
Sampling date Standing live Standing dead Litter Total
Apr. 209.54 ± 18.39 90.59 ± 7.80 101.41 ± 11.24 401.54
(191.06) (82.07) (91.23) (364.36)May 191.23 ± 21.84 120.01 ± 19.66 199.44 ± 23.99 510.68
(178.15) (113.17) (155.74) (447.06)
Jun. 184.78 ± 26.18 125.11 ± 20.59 188.09 ± 19.94 497.98(170.04) (117.49) (143.66) (431.19)
Jul. 227.24 ± 29.40 92.04 ± 14.30 164.36 ± 20.10 438.64
(212.08) (86.51) (133.30) (431.89)Aug. 286.30 ± 25.54 112.24 ± 17.35 141.56 ± 18.35 540.10
(267.52) (103.03) (124.88) (495.43)
Sep. 206.71 ± 20.04 139.03 ± 16.32 113.49 ± 10.23 459.23(191.27) (127.91) (92.72) (411.90)
Oct. 228.76 ± 31.23 100.82 ± 15.46 123.17 ± 12.40 452.75
(210.19) (94.22) (106.73) (411.14)Nov. 312.74 ± 30.86 91.42 ± 17.94 116.68 ± 11.28 520.84
(287.60) (84.94) (105.40) (477.94)
Dec. 255.63 ± 24.52 58.27 ± 6.96 71.17 ± 8.59 385.07(232.39) (54.64) (64.67) (351.70)
Jan. 147.84 ± 23.03 76.93 ± 11.01 75.16 ± 9.26 299.93
(133.25) (70.76) (66.40)) (270.41))Feb. 55.79 ± 5.79 193.86 ± 20.63 143.49 ± 8.44 393.14
(51.94) (175.99) (122.97) (350.90)
Mar. 50.08 ± 9.56 115.50 ± 13.59 123.92 ± 8.19 289.50(46.92) (105.94) (108.33) (261.19)
Average 196.38 109.65 130.16 436.19
(181.03) (101.39) (109.67) (392.09)
1 Standard error of the mean
Aboveground net primary productionThe annual net production based on the
community peak standing crop, sum of positivechanges in biomass plus mortality and summation
of positive biomass increase on dry matter basis
were 364, 342 and 287 gm-2, respectively, onstratum 1 and 313, 228 and 208 gm-2 on statum 2
(Table 5). In every case the estimate of annual
aboveground net production on stratum 1 was more
productive than that on stratum 2, probably becausethe larger number of rock outcrops on stratum 2
retarded the growth and distribution of Arundinaria
pusilla. It should be pointed out that the communitypeak standing crop gave maximum estimates of net

130 Kasetsart J. (Nat. Sci.) 34 (1)
Table 3 Belowground biomass (gm-2 dry mater ± SE1) (ash-free dry wt in parenthesis) of Arundinaria
pusilla in various soil depth in the dry dipterocarp forest stratum 1.
Sampling Soil depth (cm) Total
date 1 - 10 10 – 20 20 – 30 30 - 40
Apr. 1306.84 ± 181.08 354.95 ± 32.03 140.52 ± 10.35 74.24 ± 12.00 1876.55(1108.72) (275.62) (108.79) (55.72) (1548.85)
May 1376.57 ± 111.08 1055.36 ± 100.93 155.77 ± 12.62 108.48 ± 10.61 2696.18
(1101.53) (818.33) (119.72) (85.32) (2124.90)Jun. 1602.60 ± 181.45 1331.37 ± 181.45 125.28 ± 11.90 66.50 ± 11.88 3125.75
(1290.41) (1041.93) (96.29) (52.30) (2480.93)
Jul. 1511.66 ± 132.04 674.76 ± 83.33 163.06 ± 10.13 89.04 ± 9.92 2438.52(1262.39) (554.45) (125.33) (70.03) (2012.20)
Aug. 1877.28 ± 210.27 824.70 ± 120.17 180.70 ± 6.33 118.87 ± 7.53 3001.58
(1619.53) (710.00) (137.77) (93.55) (2551.85)Sep. 1393.01 ± 136.13 760.53 ± 106.53 181.62 ± 4.97 114.45 ± 13.19 2449.61
(1204.26) (623.41) (138.49) (90.07) (2056.23)
Oct. 1793.69 ± 166.93 649.91 ± 85.35 176.53 ± 17.29 98.10 ± 8.20 2718.23(1535.94) (543.78) (134.57) (77.20) (2291.49)
Nov. 1846.65 ± 204.39 569.64 ± 95.75 142.51 ± 16.38 92.58 ± 14.55 2651.38
(1624.68) (493.42) (106.55) (72.80) (2297.45)Dec. 1446.77 ± 181.60 594.01 ± 72.17 151.79 ± 20.01 85.95 ± 13.69 2278.52
(1192.76) (491.37) (113.49) (63.29) (1861.01)
Jan. 1986.78 ± 213.36 718.91 ± 111.49 174.55 ± 17.71 70.48 ± 11.99 2950.72(1660.95) (582.46) (130.51)) (55.43)) (2429.35)
Feb. 2516.78 ± 322.57 842.26 ± 140.86 159.30 ± 8.66 104.95 ± 8.28 3623.29
(2195.39) (634.14) (123.33) (78.78) (3031.64)Mar. 1338.66 ± 183.66 616.70 ± 69.88 158.64 ± 7.83 94.34 ± 9.58 2202.34
(1174.67) (491.39) (122.82) (70.81) (1859.69)
Average 1666.44 749.43 159.19 93.17 2668.22
(1414.28) (604.28) (121.47) (72.11) (2212.13)
1 Standard error of the mean
production over the other two methods. On stratum
1, net production based on the community peakwas 6 percent more than the sum of positive change
in biomass plus mortality and 21 percent more than
the summation of positive biomass increase. A
similar trend occurred on stratum 2, where net
production based on the community peak was 17and 34 percent more than estimated by the sum of
positive changes in biomass plus mortality and
summation of positive biomass increase

Kasetsart J. (Nat. Sci.) 34 (1) 131
respectively. However, each method of calculation
has its own application and the difference in netproduction varied depending on the method of
estimation and the sampling interval utilized.
For further discussion in aboveground net
production, however, the estimates obtained by
sum of positive changes in biomass plus mortalityhas been used primarily because this method is well
adapted for determining the primary productivity.
Singh and Yadava (1974) also found this method
Table 4 Belowground biomass (gm-2 dry mater ± SE1) (ash-free dry wt in parenthesis) of Arundinaria
pusilla in various soil depth in the dry dipterocarp forest stratum 2.
Sampling Soil depth (cm) Total
date 1 - 10 10 – 20 20 – 30 30 - 40
Apr. 1692.41 ± 191.10 655.75 ± 105.00 149.80 ± 16.94 74.46 ± 16.01 2582.42
(1402.67) (513.49) (115.98) (55.89) (2088.03)
May 1624.87 ± 146.98 1299.42 ± 163.92 156.87 ± 13.18 82.85 ± 21.04 3164.01(1263.01) (960.53) (120.57) (65.16) (2409.27)
Jun. 1353.51 ± 158.80 684.31 ± 84.05 104.06 ± 23.71 26.07 ± 9.74 2167.95
(1127.20) (560.04) (79.98) (20.50) (1787.72)Jul. 1498.93 ± 157.73 705.59 ± 93.30 142.07± 8.10 83.30 ± 6.57 2429.89
(1285.78) (586.91) (109.20) (65.52) (2047.41)
Aug. 1589.14 ± 136.67 997.70 ± 219.67 175.43 ± 16.24 97.22 ± 11.28 2859.49(1325.50) (845.35) (133.73) (76.51) (2381.09)
Sep. 1516.36 ± 162.50 608.88 ± 95.58 170.35 ± 15.75 85.51 ± 16.46 2381.10
(1325.50) (503.94) (129.86) (67.30) (2004.90)Oct. 1291.40 ± 129.04 574.61 ± 146.30 188.24 ± 19.08 95.23± 10.72 2149.48
(1104.15) (480.03) (143.49) (74.95) (1802.62)
Nov. 1946.21 ± 176.01 530.47 ± 101.24 116.00 ± 14.78 75.72 ± 11.01 2668.40(1761.51) (462.04) (86.73) (59.55) (2369.83)
Dec. 1287.35 ± 119.09 478.67 ± 63.66 86.83 ± 19.95 37.12 ± 15.64 1889.97
(1042.11) (395.76) (64.92) (29.19) (1531.98)Jan. 1760.75 ± 275.88 637.65 ± 134.14 144.72 ± 17.61 90.59 ± 8.90 2633.71
(1458.43) (527.97) (108.21)) (71.24) (2165.85)
Feb. 2579.15 ± 254.65 605.50 ± 69.39 186.04 ± 8.04 109.81 ± 7.24 3480.50(2221.42) (446.62) (144.03) (82.42) (2894.49)
Mar. 1994.53 ± 242.17 433.63 ± 47.48 157.31 ± 8.13 80.20 ± 7.12 2665.67
(1618.16) (337.84) (121.79) (60.20) (2137.99)
Average 1677.88 685.18 148.14 78.17 2589.38(1409.48) (551.71) (113.20) (60.70) (2135.10)
1 Standard error of the mean

132 Kasetsart J. (Nat. Sci.) 34 (1)
appears to be the best estimate compared to theothers. Since this method was the only method in
the study that took mortality into account and gave
the estimates in between the other two methods, itis reasonable to utilize this method for further
discussion.
Belowground net primary production andturnover
Estimates of annual belowground netproduction on strata 1 and 2 were 3,426 g m-2 (9.39
g m-2 day-1) and 3,383 g m-2 (9.27 m-2 day-1),
respectively (Table 6). The turnover rate ofbelowground biomass was calculated by the method
proposed by Dahlman and Kucera (1965). The
ratio between belowground net production andmaximum belowground biomass gave a turnover
value. It was estimated that approximately 95
percent of the belowground biomass in stratum 1and 97 percent in stratum 2 of Arundinaria pusilla
would be replaced each year (Table 6). The figures
were rather high compared to the grassland range intemperate zones. Nilsson (1970) found that about
50 percent of the root would be replaced each year
or turnover every two years. Dahlman and Kucera(1965) indicated that 25 percent of the root system
in grassland range would be replaced each year,
producing turnover rate of roots every four years.In the ungrazed shortgrass prairie, Sims and Singh
(1971) reported the turnover rate was 36 percent
per year.
Net primary production, accumulation anddisappearance rates
Net primary production, accumulation and
disappearance rates by compartments for stratum 1
and 2 are presented in Table 7.These data showed that total net production
(3,212 g m-2), aboveground net production (329 g
m-2), and belowground net production (2,883g m-2) as well as their rates of production on
stratum 1 were greater than those on stratum 2. The
Table 5 Comparison of estimates of aboveground net primary production of Arundinaria pusilla basedon three methods of estimation in the dry dipterocarp forest strata 1 and 2.
Method of estimating production Stratum 1 Stratum 2
ANP 1/ Rate of ANP 1/ Rate of (g m-2) production (g m-2) production
(g m-2 day-1) (g m-2 day-1)
1. Based on the community 364.27 ± 30.032/ 0.99 312.74 ± 30.86 0.86peak standing crop (335.82)3/ (0.92) (287.60) (0.79)
2. Based on the sum of 341.90 0.93 227.75 0.62
positive change in biomass (328.84) (0.90) (210.33) (0.58)plus mortality
3. Based on the sum of positive 287.40 0.79 207.55 0.57
increase in biomass (276.61) (0.76) (193.81) (0.53)
1/ ANP = annual aboveground net production2/ Standard error of the mean3/ Ash-free dry weight in parenthesis.

Kasetsart J. (Nat. Sci.) 34 (1) 133
Table 6 Annual belowground net production and turnover rate of belowground biomass in the drydipterocarp forest stratum 1 and 2. (ash-free dry weight in (g m-2) parenthesis)
Stratum Belowground net production1/ Rate of production Maximum biomass Turnover(g m-2) (g m-2 day -1) (g m-2) %
1 3425.65 9.39 3623.29 94.5
(2883.58) (7.90) (3031.64) (95.1)
2 3382.58 9.27 3480.50 97.2(2844.33) (7.79) (2894.49) (98.2)
1/ Based on the sum of positive changes in biomass on successive sampling dates.
Table 7 Annual net primary production accumulation and disappearance rates (ash-free basis) by
compartments of Arundinaria pusilla in the dry dipterocarp forest strata 1 and 2.
Compartment Stratum 1 Stratum 2
gm-2 gm-2day-1 gm-2 gm-2day1
Total net primary production (TNP) 3212.42 8.80 3054.66 8.37
Aboveground net primary production (ANP) 328.84 0.90 210.33 0.58
Standing dead (SD) 256.35 0.70 198.17 0.54Litter (L) 213.93 0.59 136.82 0.37
Litter disappearance (LD) 149.37 0.41 119.72 0.33
Belowground net primary production (BNP) 2883.58 7.90 2844.33 7.79Belowground biomass disappearance (RD) 2572.74 7.05 2794.37 7.66
Total disappearance (TD) 2722.11 7.46 2914.09 7.98
rate of accumulation of organic matter in thestanding dead compartment was also greater on
stratum 1 than on stratum 2. Moreover,
accumulation of organic material in the littercompartment was higher on stratum 1 (214 g m-2)
than on stratum 2 (137 g m-2). Annual diappearance
of litter was also higher on stratum 1 than onstratum 2. But the belowground disappearance as
well as the total disappearance, was much greater
on stratum 2 than on stratum 1, although thebelowground net production on both strata were
only slightly different.
There was an annual surplus of 490 g m-2 ofdry matter on stratum 1, much higher than that on
stratum 2 (140 g m-2). This is because the rate of
belowground biomass disappearance on stratum 2(7.66 g m-2 day-1) was greater than that on stratum
1 (7.05 g m-2 day-1) although there was a higher rate
of litter disappearance, 0.41 g m-2 day-1 on stratum1 compared to 0.33 g m-2 day-1 on stratum 2. It was
clear that the belowground portion of this kind of
grass plays an important role in the dynamic of thesystem as a whole. This study confirmed that the
belowground biomass in this kind of plant

134 Kasetsart J. (Nat. Sci.) 34 (1)
community should be considered as being very
important in the study of the ecosystem functions.
System transfer functionThe system transfer function is the quantity
by which the system block multiplied the input to
generate the output (Grodin, 1963) or it is the ratio
of output to input (Golley, 1965). The systemtransfer function for the whole year on strata 1 and
2 is presented in Table 8. The functions were
calculated using the compartment values in Table 7.On the annual basis, the transfer functions
on stratum 1 had 10 percent aboveground and 90
percent belowground production campared to 7percent aboveground and 93 percent belowground
production on stratum 2. There was 78 percent of
aboveground net production which found its wayinto the standing dead compartment on stratum 1
and about 94 percent on stratum 2. The annual
transfer of standing dead to litter was 84 percent onstratum 1 and 42 percent on stratum 2. This
amounted to 65 percent of the aboveground net
production on stratum 1 and 39 percent on stratum2. It is evident that some direct transfer may also
occur from the live vegetation to the litter
compartment. Galley (1965) stated that a relativeamount of litter might be contributed by current
live vegetation. Uresk et al. (1975) noted that littermay increase from live herbage because of rain,
hail, wind and insects. Of the total litter produced,
70 percent on stratum 1 and 88 percent on stratum2 were decomposed within the same year.
The annual transfer from belowground net
production to belowground disappearance was 89percent on stratum 1 and 98 percent on stratum 2.
Within the year, about 85 percent of total net
production disappeared from the system on stratum1 and 95 percent on stratum 2. This gave on annual
net gain of total net production of about 15 percent
on stratum 1 and 5 percent on stratum 2.
Calorific content of biomass compartmentsCalorific content of Arundinaria pusilla
was determined by a composite sample from both
strata. The average calorific values of standing
live, standing dead, litter and belowground biomasswere 4.312, 4.375, 4.237 and 4.462 kcal g-1 ash-
free dry weight, respectively. Biomass in g m-2
may be converted to energy by multiplying thesevalues by the appropriate calorific equivalents to
estimate the standing crop of energy in the
community. On an ash-free basis, the energystored aboveground was 2,029 kcal m-2 on stratum
1 and about 1,689 kcal m-2 on stratum 2. The
Table 8 System transfer functions of Arundinaria pusilla in the dry dipterocarp forest.
Compartments Stratum 1 Stratum 2
TNP to ANP 0.102 0.069
TNP to BNP 0.898 0.931ANP to SD 0.780 0.942
SD to L 0.835 0.690
ANP to L 0.650 0.651L to LD 0.698 0.875
BNP to RD 0.892 0.892
TNP to TD 0.847 0.954
Note : For notation see table 7.

Kasetsart J. (Nat. Sci.) 34 (1) 135
average energy stored belowground fluctuated
around 9,900 to 9,588 kcal m-2 on stratum 1 and 2,respectively.
Efficiency of energy captureIn order to determine the energy capture in
aboveground and belowground production in kcalm-2, the appropriate mean calorific value mentioned
above has been used to convert the aboveground
and belowground net production on both stratafrom g m-2 to kcal m-2 (Table 9). The efficiency of
energy capture was expressed as percentages of
energy within the visible portion of the spectrumwhich was assumed to be 50 percent of the total
solar insolation (Golley, 1960; Odum, 1971). The
efficiency values have been calculated and presentedin Table 9, which includes the aboveground,
belowground and total net production on both
strata.The efficiency of annual energy capture for
aboveground net production on stratum 1 (0.18%)
was more efficient than that on stratum 2 (0.12%).The efficiency of energy capture of aboveground
net production was less than that of belowground
net production. The efficiency of energy capture inbelowground (1.68%) and total net production
(1.86%) on stratum 1 was more than that in
Table 9 Usable solar insolation, annual net primary production and efficiency of annual energy capture(ash-free dry weight) of Arundinaria pusilla in the dry dipterocarp forest stratum 1 and 2.
Energy used by compartments Annual net primary 2/ Efficiency (%)production (kcal m-2)
Stratum 1 Stratum 2 Stratum 1 Stratum 2
Usable solar insolation1/ 767,845 767,845 - -
Abeveground net production 1,418 907 0.18 0.12Belowground net production 12,867 12,691 1.68 1.65
Total net production 14,285 13,598 1.86 1.77
1/ 50% of total solar insolation.2/ Net production/usable solar insolation.
belowground (1.65%) and total net production
(1.77%) on stratum 2.In the shortgrass ecosystem Sims and Singh
(1971) reported that the efficiency of total net
production based on 50 percent of solar insolationwas 0.57 at the Pawnee and 0.19 percent at the
Pantex site. Klipple and Costello (1960) found theefficiency based on 45 percent of solar insolation
was 1.3 percent. However, for most ecosystems
the annual efficiency of solar energy conversion inthe visible spectrum into net production potentially
was near 1 percent or less (Woodwell and Whittaker,
1968).These data indicated that the variation of the
efficiency values depended on the time intervals
and the estimation of solar insolation used in thedetermination, as well as the community types of
vegetation under study.
Annual energy flowBased on the system transfer functions in
table 8, the estimate of the annual energy flowthrough the primary producer compartments on
stratum 1 and 2 of Arundinaria pusilla in the dry
dipterocarp ecosystem is depicted in Figures 1 and2, respectively. The usable solar insolation was
767, 845 kcal m-2, based on 50 percent of the

136 Kasetsart J. (Nat. Sci.) 34 (1)
incident solar energy. Golley (1965) estimated therespiration by analyzing the CO2 content of the air
in a chamber around the plant and found that about
47 percent of gross primary production was lostthrough respiration. Values of gross primary
production and respiation in the present study were
based on the assumption that, in general, 50 percentof the gross primary production was dissipated by
respiration and the remaining 50 percent was total
net primary production (Odum, 1971).There was a surplus of energy on both sites,
15 percent on stratum 1 and 5 percent on stratum 2.
More surplus energy was stored in belowground
than aboveground on stratum 1 but on the contraryfor stratum 2. Arundinaria pusilla on stratum 1
stored 36.5 percent surplus energy in aboveground
production and 63.5 percent in belowgroundproduction. But Arundinaria pusilla on stratum 2
stored 63.9 percent surplus energy in aboveground
production and 36.1 percent in belowgroundproduction.
Therefore, if these two strata remain
Figure 1 Annual energy flow (kcal m-2) through primary producer compartment of Arundinaria pusilla
in the dry dipterocarp forest stratum 1.
Figure 2 Annual energy flow (kcal m-2) through primary producer compartment of Arundinaria pusilla
in the dry dipterocarp forest stratum 2.
Kasetsart J. (Nat. Sci.) 34 (1) 137
unburned or ungrazed for a long period of time, thesurplus of energy in the form of organic matter
would probably accumulate and increase soil
organic matter and eventually improve soil moisturestorage. The excess production, therefore, may
change the environmental conditions of the
ecosystem in the longrun. But in reality, plants andlitter in this dry dipterocarp forest were burned out
every year during the dry season. In order to reduce
the ground fuel and utilize the surplus energy of thesystem efficiently, the introducing of cattle raising
in this forest at the early of the growing season
should be carried out every year. However, a studyof the nutrient cycling of the undergrowth in this
ecosystem is recommended.
ACKNOWLEDGEMENTS
This research study was sponsored by theNational Research Council of Thailand and under
the close supervision of the Faculty of Forestry,
Kasetsart University. The author is extremelygrateful to the Agriculture Chemistry Division for
their valuable assistance in chemical analyses.
Special appreciation must be expressed to the staffof SERS for their assistance in the field and use of
their facilities.
LITERATURE CITED
Bartos, D.L. and P.L. Sims. 1974. Root dynamicsof a shortgrass ecosystem. Journal of Range
Management. 27 : 33-36.
Dahlman, R.C. and C.L. Kucera. 1965. Rootproductivity and turnover in native prairie.
Ecology 46 : 84-89.
Golley, F.B. 1960. Energy dynamics of a foodchain in an old field community. Ecological
Monographs 30 : 187-206.
. 1965. Structure and function of anold-field broomsedge community. Ecological
monographs 35 : 113-137.Grodins, F.S. 1963. Control theory and biological
systems. Columbia University Press, New
York. 205 p.Hadley, E.B. and B.J. Kieckhefer. 1963.
Productivity of two prairie grasses in relation
to fire frequency. Ecology 44 : 389-395.Kelly, J.M., G.M. van Dyne and W.F. Harris.
1974. Comparison of three methods of assesing
grassland productivity and biomass dynamics.The American Middland Naturalist 92 :
357-367.
Klipple, G.E. and D.F. Costello. 1960. Vegetationand cattle responses to different intensities of
grazing on shortgrass ranges on the central
Great Plains. United State Department ofAgriculture. Technical Bulletin number 1216.
82 p.
Lewis, J.K. 1969. Primary producers in grasslandecosystem, pp. 241-1 to 241-87. In R.L. Dix
and R.G. Beidleman (eds.). The grassland
ecosystem : A preliminary synthesis. RangeScience Department. Science Series. No.2
supplement. Colorado State University, Fort
Collins, Colorado.Nilsson, J. 1970. Notes on the biomass and
productivity of belowground organs of a south-
Swedish hay-meadow. Botanist Notiser 123 :183-194.
Odum, E.P. 1960. Organic production and turnover
in old-field succession. Ecology 41 : 34-49. . 1971. Fundamentals of Ecology. 3rd
ed. W.B. Saunders Co. 574 p.
Ruangpanit, N. 1981. Some ecologicalcharacteristics of Arundinaria pusilla. Forest
Research Bulletin Number 80, Faculty of
Forestry, Kasetsart University. Bangkok. 21 p.Sims, P.L. and J.S. Singh. 1971. Herbage dynamics
and net primary production in certain ungrazed
and grazed grassland in North America, pp.59-124 In N.R. Frech (ed.). Preliminary

138 Kasetsart J. (Nat. Sci.) 34 (1)
analysis of structure and function in grassland.Range Science Department. Science Series
Number 10, Colorado State University, Fort
Collins, Colorado.Singh, J.S. and P.S. Yadava. 1974. Seasonal
variation in composition, plant biomass, and
net primary productivity of a tropical grasslandat Kurushetra, India. Ecological Monographs
44 : 351-356.
Uresk, D.W., P.L. Sims, and D.A. Jameson. 1975.
Dynamics of blue grama within a shortgrassecosystem. Journal of Range Management 28
: 205-208.
Woodwell, G.M. and R.H. Whittaker. 1968. Primaryproduction in terrestrial ecosystems. American
Zoologist 8 : 19-30.
Received date : 9/08/99Accepted date : 30/12/99

Kasetsart J. (Nat. Sci.) 34 : 139 - 144 (2000)
Electronic Knowledge Delivery: Developing a Web-based Systemfor Computer Course
Anongnart Srivihok
ABSTRACT
The universe of information provided on the World Wide Web (WWW) has been delivered to userstremendously. These millions of Web documents induce the oversupply of information. The study which
improved a Web-based system development might increase the successful experience and satisfaction of
users. This present study identifies the WWW publishing and highlights methods and tools for developinga Web-based system. Further, this paper describes the design and the development of a Web-based system
for a computer course. The system allows a personalised user interface and a presentation of course
materials through the WWW.Key words: Web-based system, electronic knowledge, WWW, development.
Department of Computer Science, Faculty of Science, Kasetsart University, Bangkok 10900, Thailand.
INTRODUCTION
The WWW is a wide area hypermediainformation system providing a global access to
large amounts of documents (Foo and Lim, 1997).
The multitude of Web sites has created muchcomment on the existence of information overload.
Hyper Text Markup Language (HTML) is a
hypermedia language used to build WWWdocuments. This language allows the user to define
the logical organizational and various formats
including ordinary text documents, graphics,multimedia, hyperlinks to other HTML documents
and Internet resources. Hyperlinks are powerful
utilities for navigating and cross referencinginformation. The WWW resource has a unique
address namely Uniform Resource Locator (URL).
Components of web publishingThe essential elements required for
publishing and access information on the WWWare as follows:
1. Web server. It is compulsory that an
individual or enterprise subscribes to an informationsystem service providing access to the internet.
Organizations which have substantial computing
resources can set up their own HTTP server andconnect to the internet.
2. HTML authoring tool. To compose
the Web pages an authoring tool is needed. Webpages are made of HTML which is an ASCII text
file consisting of HTML tags. Common text editors
can be used for this task. To create commercial ormore complicated HTML, such as multimedia Web
pages, a higher functionality tool such as Perl
(O’Rielley and Associates Inc., 1998), HoTMetal(SoftQuad, 1998) and FrontPage (Microsoft
Corporation, 1998) are used for PC based editors.
Alternatively, Pheonix (University of Chicago,1998) , EMAChhm (Minar, 1998) and HoTMetal

140 Kasetsart J. (Nat. Sci.) 34 (1)
(SoftQuad, 1998) are Unix based editors.3. Web browser. Web browsers are client
software which can be used to navigate and access
the large volume of Web pages stored in differentWeb servers on the internet. The browsers are text
and graphics-based, however the later is more
preferred because they can display graphics andicons which are more user friendly. The most
commonly used Web browsers are Netscape
Communicator (Netscape Communications 1998)and Microsoft Internet Explorer (Microsoft
Corporation 1998).
Development of web-based systemsPrevious studies have suggested different
factors involved in the design and development of
the Web-based systems. These factors include stylesof Web sites, objectives of designers, communities
of users and spectrum of tasks (Schneiderman,
1997) and domains of user works (Erskni, David,Carter-Tod and Burton, 1997; Picciano, 1998).
Interestingly, no study has introduced the
framework or the relationships between the factorsof the system development.
As in any development process of
Information Systems, it requires the developers toundertake a number of related activities. Benyon
(1997)’s study proposes six essential processes for
developing Web-based systems. They includesystem specification, instructional design,
multimedia design, integration, implementation
and evolution. However, Benyon (1997) suggeststhat new tools and approaches are needed to enhance
the effective development of a Web-based system.
Thus, a study of the comprehensive process ofdesign and development of Web-based system is
required to improve the efficiency and the
effectiveness of the system.This paper aims to present a model of Web-
based system development and to provide tools and
methods to guide Web designers. Besides,
difficulties of the Web publication and somerecommendations for improving communication
through the WWW will be presented.
MATERIALS AND METHODS
A web-based system for computer courseCPI is a Web-based teaching system
designed for an undergraduate course named
418211 Computer Programming I. It is a 3 credit
course which is offered at the Department ofComputer Science, Faculty of Science, Kasetsart
University.
Various Web-publishing tools had been usedfor developing CPI. These tools include a Web
server, a Web browser and HTML authoring tools.
First, the Web server (HTTP) is a Sun Sparc 1000Eresiding at the Department of Computer Science,
Faculty of Science, Kasetsart University. This server
is connected to the Internet via Kasetsart Universitynetwork. Second, the two commonly used Web
browsers, Netscape Navigator (Netscape
Communications, 1998) and Microsoft InternetExplorer (Microsoft Corporation, 1998), can be
used for CPI. The former browser is preferred
because it is more popular in Thailand. Third,HTML authoring tools are text editor and Web
authorizer. The text editor, Microsoft Word 97,
was used to compose large text documents for theWeb. Additionally, Perl (O’Reilley and Associates
Inc., 1998) and Java (Sun Microsystems Inc., 1998)
were selected to build more attractive features onWeb sites and allow users to interact with the
system easily.
The Computer Programming I course wasused as the information profile designed to be
published on the WWW. The information profile
was broken systematically and logically to treestructures revealed in Figure 1. The hierarchical
tree structure can be used as a model to define and
cross-link the components of the Web-based system.

Kasetsart J. (Nat. Sci.) 34 (1) 141
The hyperlinks connect different informationtogether, further cross-hierarchical tree structures
can be connected by linking these structures. For
this purpose, these structures are used for making amodel to publish Web documents.
The Web home page referring to the first
document intended to be viewed is placed at the topof the tree. This home page includes an introduction
and a main menu of documents within the
publication. Generally, it is associated with aparticular web site, person, named collection, or
private or public enterprise. The main menu consists
of the hyperlinks to other home pages or documents.With the homepage, the main menu of CPI
contains the principal focus and is differentiated
into different common components as depicted inFigure 2.
The components of CPI1. Chapters. The important parts of each
chapter are selected and published on the Web
pages. The reasons are the limitations of the space
on the Web site and a large graphic Web pagerequires overly long response time. Users can
download full text of all chapters from the server by
using the given password. The materials in thesechapters are comprehensive and fulfilled the
requirements provided in the course outline.
2. Exercises. The exercises of each chapterare provided in both HTML and text.
3. Help. It offers the details of hardware
and software configuration required to work withthe system. Furthermore, it includes the
methodology in download document files provided
by the lecturer.4. Course Syllabus. It provides the
objectives of the course, course outline, course
description, text books, contact address, gradingsystem and schedule.
5. News. It reveals an announcement which
the information from the lecturer to users such asassignments and current news.
6. General Information. It provides the
objectives of the current Web-based system.
Figure 1 Information profile of 418211 Computer Programming I course on Web sites.
418211
News General Chapters Exercises Syllabus Help Information
Announcement
I/O commands Data types Control Structure Array Records
Files Pointers Sorting Searching

142 Kasetsart J. (Nat. Sci.) 34 (1)
By using HTML tools, the Web documentsare coupled and cross-linked with the detailed
information provided for each component. As the
information comes from various sources ofdocuments, it is noted that the published information
should be uniform and homogenous. Consequently,
a schedule of regular maintenance to manageproposed changes and to present information is
also required to enhance overall effectiveness and
efficiency of the system.
RESULTS AND DISCUSSIONS
Since June 1998, CPI was published on the
Web. Students who enroll in 418211 Computer
Programming I class can access the course materialson Web sites and communicate with the lecturer via
email through the links provided on the Web page.
However, there are still problems in utilisation ofthe system. These problems are presented in the
following paragraphs.
Difficulties of web-based system implemen-
tationSome problems of CPI implementation have
been raised by the users after the system was
published on the WWW.
1. Inappropriate search engine. There aremany search engines provided in the WWW
includes Lycos, Infoseek, Excite and Yahoo.
Interestingly, these engines often provide verylong lists of matching documents if the index is
provided. Then, the documents have to be navigated
one at a time. The home page of the document isrevealed in order to access the hypermedia areas
via hyperlinks. This is performed until the relevant
information is delivered. That is appropriate forsearching information from several resources. Still
this is time consuming and unsuitable for cases
when a specific and detailed query is known.Additionally, not many search engines in other
languages from English are provided. Applying
English-based search engine to a foreign language
Figure 2 CPI home page using Netscape Communication, the URL address is http://www.sci.ku. ac.th/~fsciang2/index.html.

Kasetsart J. (Nat. Sci.) 34 (1) 143
database such as Thai creates some difficulties indata presentation on the Web. In this case,
developers need to build their own search engine
for specific purposes and tasks.2. Degradation of performance. The large
number of WWW users decrease the system
performance, the network is overloaded due to theextremely heavy traffic. This situation always occurs
with the popular Web sites. It leads to the frustration
of the users and loss of interest in utilization of theWWW.
3. Maintainability of publication. As the
time passes, more information is always added onthe WWW. This can result in a high growth rate of
Web documents. As a result this will lead to the
point which is difficult to maintain and ensure theaccuracy of information. It is suggested that the
management of Web documents is needed.
4. Data transmission. In developingcountries such as Thailand, there are various
limitations of data transmission. These factors
include poor communication infrastructure, low-cost devices, and low-bandwidth wireless access.
Since the data transmission is very slow, multimedia
which require high speed of transmission cannot beapplied on the Web effectively. The text version of
Web-based system is recommended for this case.
CONCLUSIONS
The major contribution of this study is anattempt to present tools and methods in developing
a Web-based system. CPI has been implemented to
demonstrate the research idea and allow the structureand contents to publish on the Web. The design is
practical and might be used in developing a
prototype for Web-based systems, specifically acourseware for internal or for distance learning.
Future research on the development of Web
publishing might be done to improve theeffectiveness and efficiency of the system. The
study of the new designing techniques or theframework of Web-based system is recommended
for further research.
ACKNOWLEDGEMENT
The author would like to acknowledge theKasetsart University Research and Development
Institute for providing funding for this study.
LITERATURE CITED
Benyon, D., D. Stone, and M. Woodroffe. 1997.Experience with developing multimedia
courseware for the World Wide Web: the need
for better tools and clear pedagogy. Int. J.Human-Computer Studies. 47 : 197-218.
Erskni, L. E., R. David, N. Carter-Tod and J. K.
Burton. 1997. Dialogical techniques for thedesign of web sites. Int. J. Human-Computer
Studies. 47 : 169-195.
Exite Inc. 1998. Exite. Available http://www.exite.com/home/, July 1998.
Foo, S. and E. P. Lim. 1997. A hypermedia database
to manage World-Wide-Web documents.Information & Management. 31 : 235-250.
Infoseek Corporation. 1998. Infoseek Guide.
Available http://www.infoseek.com/ home,July 1998.
Lycos Inc. and Carnegie Mellon University. 1998.
Lycos. Available http://lycos.com/, July 1998.Microsoft Corporation. 1998. Microsoft FrontPage.
Available http://www.microsoft. com/
frontpage/, July 1998.Microsoft Corporation. 1998. Internet Explorer.
Available http://www.microsoft.com/
windows/ie/default.html, July 1998.Minar N. 1998. Emacshhm. Available http://
www.santafe.edu/~nelson/tools/, July 1998.
Netscape Communications. 1998. NetscapeCommunicator. WWW browser. Available

144 Kasetsart J. (Nat. Sci.) 34 (1)
ht tp : / /www.ne tscape .com/browsers /index.html, July 1998.
O’Reilley and Associates Inc. 1998. Perl. Available
http://www.perl.com/pace/pub, July 1998.Picciano, A. G. 1998. Developing an Asynchronous
Course Model at a Large, Urban University. J.
Asynchronous Learning. 2 : 1-14.Schniederman, B. 1997. Designing information-
abundant web sites: issues and
recommendations. Int. J. Human-ComputerStudies. 47 : 5-29.
SoftQuad. 1998. HoTMetal Pro 5.0/ HoTMetal
1.0. Available http://www.sq.com/ products/
hotmetal/, July 1998.Sun Microsystems Inc. 1998. The source for Java
Technology. Available http://www.
java.sun.com/, July 1998.University of Chicago, IL. 1998. Phoenix HTML
Editor. Available http://www.bsd.
uchicago.edu/index2.html/, July 1998.Yahoo Inc. 1998. Yahoo. Available http://
www.yahoo. com/, July 1998.
Received date : 13/10/98Aecepted date : 23/06/99

Kasetsart J. (Nat. Sci.) 34 : 145 - 158 (2000)
INTRODUCTION
Whenever the water available is less than
the expected amount or the irrigation water
requirements exceed the availability, the watershortage takes place even in the irrigated area. The
issues of high irrigation water requirements is
usually related to the efficiency in water delivery
Development of Water Allocation Strategy to IncreaseWater Use Efficiency of Irrigation Project
Varawoot Vudhivanich1, Jesda Kaewkulaya1, Ponsatorn Sopaphun1,Watchara Suidee2 and Prapun Sopsathien3
ABSTRACT
In development of water allocation strategy to meet crop water requirement and to utilize rainfall
effectively, a computerized water allocation scheduling and monitoring system named WASAM 2 wasdeveloped. Song Phi Nong irrigation project was selected as a case study. WASAM 2 was used for water
allocation scheduling in Song Phi Nong project for 3 cultivation seasons of 1994 dry and wet seasons and
1995 dry season. The discharge at 5 key regulators which are the entrance to 5 water masters weremonitored on daily basis. The actual delivery performance of the 3 studied seasons indicated that the actual
measured discharge was about 20-30% higher than the recommended WASAM 2 discharge because Song
Phi Nong project was the downstream project and had to take all the remaining water from the upstreamPhanom Tuan project. It is recommended that the water allocation scheduling system of Song Phi Nong
and Phanom Tuan projects will be combined into one system to increase the efficiency in water allocation.
The average irrigation efficiency of Song Phi Nong was 37.6% in dry season and 28.5% in wet season.WASAM 2 increased the wet season efficiency by 3-5%. The irrigation efficiency in the dry season was
on the average 7.7% higher than that in the wet season. Some water master has the efficiency up to 46.9%
in dry season. The irrigation efficiency of the project is still low by two reasons : (1) being unable tocompletely control the discharge, and (2) high seepage loss in the canal system.
Key words : water allocation, water management, irrigation efficiency, Mae Klong
and application. As commonly known, the projectirrigation efficiency in Thailand is still low at only
30-50%. If the project irrigation efficiency is
increased, it can improve water shortage problemat more cost effectively than developing the new
water resources project.
In order to improve the water deliverly,application efficiency and the equity of water
1 Department of Irrigation Engineering, Kasetsart University, Kamphaengsaen, Nakhon Pathom 73140, Thailand.2 College of Irrigation, Royal Irrigation Department, Nonthaburi 11120, Thailand.3 Regional Office 10, Royal Irrigation Department, Kanchanaburi 71110, Thailand.

146 Kasetsart J. (Nat. Sci.) 34 (1)
distribution among the head-and-end users, RoyalIrrigation Department (RID) has developed various
water allocation system including Water
Management Systems (WMS) of the Greater ChaoPhraya Irrigation Project having an irrigated area
of over 7.0 million rai. The main feature of WMS
is the prediction of planting area for 1-2 weeks inadvance and the utilization of return flow in the
downstream irrigation project. The computer
program was developed for calculation of waterrequirements on block basis; each block
representing an area of approximately 50,000 rai
(Chalong, 1984). On the same purpose, WaterAllocation Scheduling and Monitoring system or
WASAM was developed for the Greater Mae Klong
Irrigation Project (GMKIP). The main purpose ofWASAM is to determine the required discharge of
the canal section, 3,000-5,000 rai each, from the
long term average potential evapotranspiration(ETo), crop coefficient (Kc) and the cropping pattern
surveyed at the beginning of the season. The
irrigation water requirements are adjusted accordingto the field wetness and the deviation of the actual
rainfall from the anticipated value. The main
improvement of WASAM is to incorporate thehydraulic properties of the canal in water allocation
planning. Besides, the actual water distribution in
the canal system (at several key regulators) ismonitored on weekly basis in order to check field
water delivery performance (Ilaco/Empire M&T,
1984; 1985; 1986(a); 1986(b); 1986(c)). Later onWASAM has been applied to Lam Pao (RID,
1988(a); 1988(c)) and Nong Wai (RID,
1988(d))irrigation projects in the Northeast ofThailand. Water Use Analysis (WUA) program
was also developed to assist the irrigation engineer
in evaluation of water use efficiency of the LamPao project at zone, water master and main canal
levels (RID, 1988 (b)).
Although WMS, WASAM and WUA aregood tools for project water allocation, they require
a lot of field data including planting area, rainfalland flow measuring data. Good trained field staff
and additional expenditures are needed to implement
these water allocation system. This prohibits theapplication of these systems except in the irrigation
project having water management expert and special
funding system.As mentioned above, the project water
allocation techniques which responses to the crop
water requirements, reduces the water losses andincreases an effective use of rainfall in such way
that the irrigation efficiency of an irrigation project
increases, need to be developed. The objective ofthis research is to develop an effective water
allocation scheduling and monitoring system of an
irrigation project.
MATERIALS AND METHODS
Song Phi Nong irrigation project in
Suphanburi province which is a typical irrigation
project in Mae Klong basin is selected for the study.The methods adopted for this research are :
(1) to study the existing method of water
allocation in Song Phi Nong irrigation project,identify the problems and constraints,
(2) to evaluate irrigation efficiency of the
present condition and use as a benchmark forevaluating the effectiveness of the improved water
allocation method,
(3) to analyze the basic data and informationrequired for effective water allocation and design
the data collection and processing system which
are appropriated to the project,(4) to develop water allocation method
which takes into consideration of crop water
requirement, canal delivering capacity and effectiveutilization of rainfall.
(5) to Develop WASAM 2 computer
program to be a tool for project water allocation.

Kasetsart J. (Nat. Sci.) 34 (1) 147
Present water allocation practices of Song Phi
Nong Irrigation ProjectSong Phi Nong irrigation project is one of
the 3 irrigation projects on the upper left bank of
GMKIP, having the command area of 416,106 rai.
Its upstream and downstream projects receivingirrigation water from the same 2L canal are Phanom
Tuan and Banglane. The project divides the
operation and maintenance responsibility into 5water masters (43 zones) as shown in Table 1.
There are totally 39 operation and maintenance
staffs where 20 are zoneman. Each zoneman isresponsible for O&M in an approximated area of
20,000 rai which is exceeding the normal criteria of
RID, 5,000-10,000 rai per zoneman. Therefore, theproject is in shortage of field O&M staff which may
effect the water delivery control practices.
The principle of water allocation of GMKIPand Song Phi Nong irrigation project is to allocate
water on weekly basis according to crop water
requirements. Thursday (6.00 am.) is the first dayof the irrigation week. Upstream control with
continuous delivery is practiced in the main and
lateral canals while rotation delivery is practiced atthe tertiary level of paddy growing area (almost no
on-farm water distribution system in sugarcane
area). Each farm ditch has a fixed duration-varieddischarge rotation schedule.
At the beginning of irrigation week
(Thursday at 6:00 pm), all the regulators are adjustedby zoneman according to the new water allocation
schedule. The adjustment normally starts in
sequence from the most upstream to the downstreamregulators according to the upstream control
concept. In order to check the actual water
distribution, Song Phi Nong project has set the flowmonitoring points at the head regulator of 5L-2L,
the main intakes to water master section 2, 3, 4 and
5, and at the cross regulator of 2L at km 22.700, themain headworks of the project. However, the project
is lack of field staff to do the routine daily
measurement and most of the regulators areuncalibrated.
At the present, the management of Song Phi
Nong project faces the following problems :(1) unreliable water supply since Song Phi
Nong is located on the downstream of Phanom
Tuan project,(2) too few number of rain gages, only 4
stations (Uthong, Song Phi Nong, Kamphaengsaen
and Phanom Tuan), are used in water allocationscheduling,
(3) most of the key regulators are not
calibrated, assuming 0.7 of the discharge coefficient,resulting in uncorrected delivery and distribution
of water to the farm land,
(4) many farmers in water master 2 and 3pump water directly from the main canal because
Table 1 Division of responsibility for O&M in Song Phi Nong Irrigation Project.
Water Responsible area Zone Command area Main crop
master (rai)
1 Bor Suphan 1-8 92,734 Sugarcane
2 Nong Phaw 9-18 106,421 Sugarcane3 Talad Khet 19-25 59,904 Sugarcane
4 Jorrakhe Sarmpun 26-32 55,375 Paddy (2 crops a year)
5 Sra Punglarn 33-43 101,672 Paddy (2 crops a year)Total 416,106

148 Kasetsart J. (Nat. Sci.) 34 (1)
of lack of farm turn outs, making difficulty in thewater delivery control and oftenly unfair water
distribution to tail-end users.
The existing WASAM computer programwhich was originally developed by Ilaco/Empire
M&T for GMKIP in 1985 had some drawback in
real practices. It requires a large number of fielddata exceeding the capability of field staff to handle
the daily data collection effectively. WASAM has
no capability for evaluation of managementperformance of an irrigation project. Lastly the
WASAM computer program is not user friendly
making it difficult to use. Therefore, the existingWASAM needs improvement.
RESULTS AND DISCUSSIONS
Development of WASAM 2Due to the shortcoming of the existing
WASAM as mentioned earlier, WASAM 2 wasdeveloped to help the irrigation engineer in charge
of an irrigation project in calculation of the required
discharge of the regulators, in evaluation of thewater management performance and in monitoring
analysis of the actual water distribution. The
differences between WASAM 2 and the existingWASAM are shown in Figure 1.
In calculation of the required discharge, the
Song Phi Nong Irrigation Project is divided into 57canal sections as shown in Figure 2. Each canal
section is the canal reach between two regulators.
The irrigation water requirements of each canalsection is first calculated using the following
equations :
R(N) =
EV ES CF w I LP w I COR RE RS A I NI
NC( ) * ( , ) ( , ) ( ) * ( , )
, *
1 1
378 0001
+ + −[ ]=∑
SUE(w1, I)
..........(1)
R(N) = Irrigation water requirement of canalsection N in week W (cms)
EV(ES) = Weekly potential evapotranspiration
of station ES (mm)CF(w1,I) = Crop factor of crop I at the age of w1
weeks
NC = No. of crop types (there are 6 typesof crop ; 1 = dry season paddy ; 2 =
wet season paddy ; 3 = sugarcane ; 4
= upland crop ; 5 = fruit tree and 6 =fish pond)
LP(w1,I) = Weekly land preparation and
percolation of crop I at the age of w1weeks (mm)
COR = Correction factor due to rainfall or
field wetness conditionsRE(RS) = Expected rainfall of station RS (mm)
A(I,N) = Area of crop I in canal section N (rai)
SUE(w1,I) = Service unit irrigation efficiency ofcrop I at the age of w1 weeks
The required discharge of any canal section(N) is calculated as follow :
Q(N) = R(N)+ Q I LOSS NI
M( ) ( )+
=∑
1
............ (2)
WhereQ(N) = Required discharge of canal section
N (cms)
R(N) = Irrigation water requirements ofcanal section N (cms)
Q(I) = Required discharge of the
downstream canal section I (cms)LOSS(N) = Conveyance losses from the source
of water supply to canal section N
(cms)The calculated Q(N) is thus adjusted
according to the following water distribution
criteria :(1) If Q (N) < 0.4 Qmin(N) (the discharge
is too small)

Kasetsart J. (Nat. Sci.) 34 (1) 149
Figure 1 Comparison of the structure of the WASAM 2 and WASAM (Vudhivanich et al.,1998).

150 Kasetsart J. (Nat. Sci.) 34 (1)
Figure 2 Schematic diagram showing the structure of canal sections of Song Phi Nong Irrigation Project.

Kasetsart J. (Nat. Sci.) 34 (1) 151
Q (N) = 0and D (N) > 0 (special counter for shortage)
(2) If 0.4 Qmin(N) < Q (N) < Qmin(N)
Q (N) = Qmin (N) (to maintain the minimumsupply level in section N)
Except R (N) = 0 and the canal sections
branching off directly from section N do not requireto maintain the minimum supply level in N.
If Q (N) has to increase to Qmin (N), the
excessive allocation water, V = Q (N)-Qmin (N),will be distributed to the M downstream canal
sections according to the following rules :
- allocate V to the canal section with D(I)>0by the amount of D(I),
- allocate the remainder V to increase the
discharge of the M downstream sections to Qmin,- allocate the remainder proportionally to
the allocated amount.
(3) If Qmin (N) < Q (N) < Qmax (N)No adjustment is needed.
(4) If Q (N) > Qmax (N)
Q (N) = Qmax (N)Water deficit will take place.
P (deficit) = Q (N) - Qmax (N)
The deficit P is allocated to the Mdownstream canal sections proportionally to the
allocated amount.
The irrigation efficiency is calculated bythe following equation :
IE(L) =R N
QI
J
ply
' ( )
sup
=∑
1 .................................... (3)
WhereIE(L) = Irrigation efficiency of water master L
(%)
R’(N) = Net irrigation water requirements ofcanal section N (cms)
R’(N) =
EV ES CF w I LP w I ER RSI
NC( ) * ( , ) ( , ) ( ) *
,
1 1
378 0001
+ −[ ]=∑ A(I, N)
.............(4)
J = No. of canal section in water master LER(RS) = Effective rainfall of station RS (mm)
QSupply = (Qin–Qout) of water master L (cms)
Required basic data for water allocation by
WASAM 2As Shown in Figure 1, the basic data required
for water allocation are
- the potential evapotranspiration (ETo)- the expected rainfall and effective
rainfall
- the crop coefficients- the land preparation water requirements
- the percolation in paddy field
- the canal system data- the discharge monitoring points
The monthly ETo of 2 stations ; (1)
Kamphaengsaen located on the south of the projectand (2) Uthong on the north, was calculated via the
CROPWAT 5.7 computer program (Smith, 1992).
The monthly ETo calculated from the long termaverage agroclimatological data (more than 20
years) is shown in Table 2.
The simple average rainfall is used as theexpected rainfall in WASAM 2. The effective
rainfall was derived by the simulation model via
Water Use Study Model Version 4 (Kamnertmanee,1989). In the simulation, it is assumed that the
maximum, normal and minimum water levels are
130, 100 and 70 mm respectively for paddy and 0,0, and –65 mm for non-paddy. The daily rainfall of
4 stations having the reconds of more than 40 years
(1953-1992) was used to derive the relationshipbetween rainfall and effective rainfall on weekly
basis. The formula is shown below :
If R < R* ; RE = RIf R > R* ; RE = AxR+B........................(5)

152 Kasetsart J. (Nat. Sci.) 34 (1)
crops including dry season paddy, wet season paddy,sugarcane, upland crops, fruit tree. The weighted
crop coefficients are shown in Table 4.
The land preparation water requirement is250 mm for paddy and 50 mm for sugarcane. The
land preparation is progressed at decreasing rate of
25.2, 22, 18.8, 15.2, 12 and 6.8 % of the total areafrom week 1 to week 6 respectively for paddy and
at uniform rate during Jan.-Apr. for sugarcane. The
percolation in paddy field is 0.5 mm/day in wetseason and 1 mm/day in dry season (Ilaco/Empire
M&T, 1984).
The canal conveyance loss measured byInflow-Outflow Method from 3 different locations
on 3 types of canal showed that the loss rate was
very high as shown in Table 5.The canal system of Song Phi Nong
Irrigation Project is divided into 57 sections for
water allocation calculation by WASAM 2. Thedetail of the canal sections are the name, location,
canal section number, number of the upstream
section, maximum and minimum discharges,conveyance loss rate, zone, water master section,
ETo station number, rainfall station number,
command area, etc, (Vudhivanich et al., 1998).For monitoring and evaluation purposes,
the discharge of 5 main regulators as shown in
Table 6 were measured on daily basis. The zonemen
Table 2 Monthly potential evapotranspiration(ETo) in mm at Kamphaengsaen and
Uthong stations.
Month Station %
Kamphaengsaen Uthong Difference
Jan. 116.8 118.2 1.19
Feb. 123.2 125.9 2.13Mar. 164.6 171.6 4.07
Apr. 168.3 177.6 5.23
May. 152.6 166.7 8.41Jun. 128.1 138.6 7.53
Jul. 134.5 142.9 5.88
Aug. 126.2 136 7.2Sep. 116.4 119.5 2.59
Oct. 116.3 118.3 1.7
Nor. 111.6 117.9 5.35Dec. 111.3 117.8 5.51
Table 3 R*, A and B in effective rainfall formulas.
Month For paddy For non-paddy
R* A B R* A B
Nov.-Apr. 59 0.55 26.10 29 0.78 6.38
May. 53 0.44 29.68 25 0.63 9.25Jun. 55 0.46 29.70 27 0.70 8.10
Jul. 60 0.75 15.00 26 0.65 9.10
Aug. 50 0.56 22.00 25 0.64 9.00Sep. 42 0.39 25.62 22 0.42 12.76
Oct. 30 0.25 22.50 18 0.27 13.14
Where
R = the weekly rainfall (mm)RE = the weekly effective rainfall (mm)
R*,A,B = the constants which depend on the crop
types and the month of year, see Table3.
WASAM 2 was designed to calculate the
water requirements of fish pond and 5 different

Kasetsart J. (Nat. Sci.) 34 (1) 153
Table 4 Weighted crop coefficients.
Types of CropWeek Dry season Wet season Sugarcane Upland Fruit tree Fish pond
paddy paddy 5 years 3 years crops
1 0.13 0.13 0.47 0.48 0.3 0.5 1.0
2 0.36 0.36 0.47 0.48 0.3 0.5 1.0
3 0.57 0.57 0.46 0.47 0.3 0.5 1.04 0.76 0.76 0.44 0.43 0.3 0.5 1.0
5 0.91 0.91 0.44 0.43 0.7 0.5 1.0
6 1.03 1.03 0.44 0.43 0.7 0.5 1.07 1.07 1.07 0.44 0.43 0.7 0.5 1.0
8 1.09 1.09 0.60 0.58 0.9 0.5 1.0
9 1.10 1.10 0.70 0.64 1.2 0.5 1.010 1.10 1.10 0.70 0.64 1.0 0.5 1.0
11 1.10 1.10 0.70 0.64 1.0 0.5 1.0
12 1.11 1.09 0.80 0.74 0.7 0.5 1.013 1.14 1.08 0.91 0.87 0.5 0.5 1.0
14 1.17 1.07 0.91 0.87 0.5 0.5 1.015 1.20 1.06 0.91 0.87 0.5 0.5 1.0
16 1.21 1.04 0.91 0.87 0.5 1.0
17 1.17 1.02 1.06 1.03 0.5 1.018 1.02 0.9 1.06 1.03 0.5 1.0
19 0.77 0.69 1.06 1.03 0.5 1.0
20 0.52 0.48 1.06 1.03 0.5 1.021 0.3 0.28 1.12 1.1 0.5 1.0
22 0.11 0.09 1.15 1.13 0.5 1.0
23 1.15 1.13 0.5 1.024 1.15 1.13 0.5 1.0
25 1.16 1.14 0.5 1.0
26-29 1.19 1.18 0.5 1.030-37 0 0 0.5 1.0
38-41 1.18 1.17 0.5 1.0
42 1.04 11.00 0.5 1.043-45 1.02 0.98 0.5 1.0
46-52 0.5 1.0

154 Kasetsart J. (Nat. Sci.) 34 (1)
Table 5 Canal conveyance loss rate.
Types of canal Conveyance loss rate
(% of Qmax/km)
Lined main canal 0.44Lined lateral 0.91
Unlined lateral 2.35
Table 6 Discharge monitoring points.
Monitoring point Canal section Location Main regulators of
no. no. water master section
1 2 2L cross regulator at km 22.70 12 14 5L-2L head regulator at km 0.020 2,3,4 and 5
3 26 5L-2L cross regulator at km 9.813 3,4 and 5
4 34 5L-2L cross regulator at km 26.401 45 42 3R-5L-2L head regulator at km 0.020 5
2. The water management performance of the pastweek, in terms of irrigation efficiency, of the 5
water master sections and of the project was
evaluated.The weekly allocated discharge or “adviced
discharge” of the 5 main regulators was compared
with the actual discharge in Figure 3. The projectand water master irrigation efficiency of the 3
seasons was compared with the values during 1991-
1993, the period before WASAM 2 was used, asshown in Figure 4.
Dry season 1994Figure 3(1) – Figure 3(5) show the actual
discharges of water master section 1 to be very
close to the WASAM 2 adviced discharge. The
actual discharges of water master sections 2-5 wereabout 10-50% higher than the adviced values,
particularly during the last few weeks of the dry
season. The analysis of the actual water distributionfound that although the 2L cross regulator at km
22.700 (Figure 3(1)) was one of the two head
regulators for the project; it was the tail end structureof Phanom Thuan Irrigation Project. By the present
water management practice of Song Phi Nong, this
regulator controlled water distribution to the mostupstream area of the project (zone 1 of water master
section 1). Zoneman usually tried to control the
discharge as WASAM 2 adviced. On the opposite,the 5L-2L head regulator at km 0.020 (Figure 3(2))
is responsible for the measurement and report to thewater management officer of Song Phi Nong
Irrigation Project by Wednesday. All the five
regulators were calibrated in field for the accuratecontrol of the discharge.
Performance analysis of water allocation with
WASAM 2WASAM 2 was used for water allocation of
Song Phi Nong Irrigation Project for 3 consecutive
seasons of ;
- dry season 1994 (Feb.-Jun.)- wet season 1994 (Jul.-Nov.)
- dry season 1995 (Feb.-Jun.)
On weekly basis, the ETo, rainfall, plantingarea, canal system data and field wetness conditions
were analyzed by WASAM 2 on Tuesday. The
irrigation water requirements of each canal sectionwere calculated using Equation 1. Consequently,
the discharge allocated to the 5 main regulators and
each canal section were calculated using Equation

Kasetsart J. (Nat. Sci.) 34 (1) 155
Figure 3 Comparison of WASAM 2 adviced discharge and actual discharge at 5 main regulators in dry
and wet season 1994 and dry season 1995.
which was the entrance to water master section 2-5, was recognized as the tail part of the system.
Whenever there was the excess water from Phanom
Thuan, it would distribute to this regulator and itwould do so for the water deficit. The degree of the
problem was higher for the further downstream
regulators. This could be seen by the delivery
performance of 3R-5L-2L head regulator at km
0.020 (water master section 5) where the actual andthe adviced discharges were most different.
This study indicated that the water
management of the large scale irrigation projectsuch as GMKIP was a lot more difficult than a
small irrigation project. The water management

156 Kasetsart J. (Nat. Sci.) 34 (1)
practices of the upstream project such as PhanomThuan had a direct effect to the downstream project
such as Song Phi Nong.
The irrigation efficiency of dry season 1994was 39.8 % which was about the average value for
an irrigation project. However, it was about 2-3 %
higher than that of the dry season irrigationefficiency of 1991-1993 which had the efficiency
between 36.7-38.3 %.
The irrigation efficiency of Song Phi Nongwas not high because of 2 reasons. First, the seepage
loss in the canal system was high. Second, the
actual discharge was higher than the adviced onebecause the water management practices of Phanom
Thuan had some effects on Song Phi Nong as
mentioned before.
Wet season 1994Figure 3(6) – Figure 3(10) show the actual
discharges delivered to the 5 water master sectionsto be 20-30 % higher than the WASAM 2 adviced
discharges in most of the wet season (week 29-48).
This was caused by the excess water from PhanomThuan Project . Song Phi Nong was unable to
completely control the flow. The operation of
Phanom Thuan Project could affect the water supplyto Song Phi Nong. However, the excess water
affected the water distribution of the 5 water master
sections almost equally.The irrigation efficiency was 32.1 %. It was
3-5 % higher than the efficiency during 1991-1993
because WASAM 2 used the rainfall moreeffectively.
Dry season 1995As shown in Figure 3(11) - 3(15), the actual
discharge during week 7-16 (Feb.-Apr.) was veryclose to the adviced discharge, except the case of
Figure 4 Irrigation efficiency of Song Phi Nong Irrigation Project and 5 water master sections during
1991-1995.
WMS = Water Master Section

Kasetsart J. (Nat. Sci.) 34 (1) 157
5L-2L cross regulator at km 26.401 (the downstreamregulator). The actual discharge of this regulator
was 20-30 % higher than the adviced one, However
during the later period of the season (week 17-22),all 5 water master sections got water more than the
WASAM 2 adviced value similar to the situation of
the previous 2 seasons.
CONCLUSION
The performance of WASAM 2 for water
allocation analyzed from the comparison of the
actual and the adviced discharges and the irrigationefficiency indicated that WASAM 2 could help
improing the irrigation efficiency in wet season
more than dry season. However the irrigationefficiency in the dry season was on the average
7.7% higher than that of the wet season.
The difficulty in discharge control wasfound. The actual discharge was about 20-30 %
higher than the WASAM 2 adviced value because
of the operation effect of the upstream PhanomThuan Project. This reduced the irrigation efficiency
of Song Phi Nong Project. It is recommended that
the water allocation system of the two projects is tobe integrated in one system in order to improve the
water management of Song Phi Nong Project.
ACKNOWLEDGEMENTS
This research was financially supported bythe National Research Council of Thailand.
LITERATURE CITED
Ilaco/Empire M&T. 1984. Water Management and
O&M Report No.5 : Water AllocationScheduling and Monitoring at Project Level,
Supporting Document 5.4 - Crop Water
Requirement. Mae Klong Irrigation Project.Royal Irrigation Dept. Bangkok. 28 p.
Ilaco/Empire M&T. 1985. Water Management andO&M Report No.5 : Water Allocation
Scheduling and Monitoring at Project Level,
Supporting Document 5.3 - Rainfall Estimate.Mae Klong Irrigation Project. Royal Irrigation
Dept. Bangkok. 39 p.
Ilaco/Empire M&T. 1986(a). Water Managementand O&M Report No.5 : Water Allocation
Scheduling and Monitoring at Project Level,
Supporting Document 5.5 - General ProgramDescription (revised). Mae Klong Irrigation
Project. Royal Irrigation Dept. Bangkok. 60 p.
Ilaco/Empire M&T. 1986(b). Water Managementand O&M Report No.5 : Water Allocation
Scheduling and Monitoring at Project Level,
Supporting Document 5.6 - ComputerOperator’s Manual (revised). Mae Klong
Irrigation Project. Royal Irrigation Dept.
Bangkok. 109 p.Ilaco/Empire M&T. 1986(c). Water Management
and O&M Report No.9 : Review of Key O&M
Staff and Their Job Descriptions. Mae KlongIrrigation Project. Royal Irrigation Dept.
Bangkok. 35 p.
Kamnertmanee, M. 1989. Computer Modelling ofWater Use in Mae Klong River Basin M.S.
Thesis, Kasetsart Univ. Bangkok.
RID. 1988 (a). Computer Program Manual LAMPAO WASAM. Chi Basin Water Management
Improvement Project. Min. of Agr. and Agr.
Coop. Bangkok. 52 p.RID. 1988 (b). Computer Program Manual : Water
Use Analysis LAM PAO. Chi Basin Water
Management Improvement Project. Min. ofAgr. and Agr. Coop. Bangkok. 42 p.
RID. 1988 (c). Technical Note 25 :
Hydrometeorological Data Recording LAMPAO. Chi Basin Water Management
Improvement Project. Min. of Agr. and Agr.
Coop. Bangkok. 64 p.RID. 1988 (d). Maintenance of Irrigation Projects

158 Kasetsart J. (Nat. Sci.) 34 (1)
and Operation. Final Operation Report(Computer Operation Manuals). Min. of Agr.
and Agr. Coop. Bangkok. 75 p.
Smith, M. 1992. CROPWAT : A Computer Programfor Irrigation Planning and Management,
Irrigation and Drainage Paper No. 46. FAO.
Rome. 126 p.Vudhivanich, V., J. Kaewkulaya, and P. Sopaphun.
1998. Development of Water AllocationStrategy to Increase Water Use Efficiency of
Irrigation Project. Research Report. Nat. Res.
Council of Thailand. Bangkok. 228 p.
Received date : 7/07/99Accepted date : 29/10/99

Kasetsart J. (Nat. Sci.) 34 : 159 - 170 (2000)
INTRODUCTION
High critical temperature ,TC, copper oxide
superconductors are based on perovskite-likestructure. The Bi-based superconducting oxide is
well known to have mixed structure of Bi-2212 low
TC and Bi-2223 high TC phases, which involvesseveral layers that insulate the CuO2 layer, the
main superconducting zone.
It was found that substituting lead for part ofbismuth increased easily volume fraction of high-
TC phase, and a number of mechanisms wereproposed to explain the reaction route in forming
this phase. Yet, the formation mechanisms have
not been well understood. Rhee et al. (1989) studiedthe effects of Pb on the formation of the high TCphase with various Bi/Pb ratios and found that
substitution of 30% Pb for Bi was the most preferablefor forming high TC phase.
Partial substitution of bismuth by lead in Bi
system shows three types of superconductingcompounds : (Bi,Pb)2Sr2CuOx semiconducting
Superconducting Properties of (Bi,Pb)-Sr-Ca-Cu-O Ceramics
Supreya Trivijitkasem and Wunchai Sratongluan
ABSTRACT
Sixteen specimens of four initial nominal composition ceramics were synthesized by solid statereaction for a given initial cation ratio (Bi:Pb)/Sr = (1.5:0.5)/2.0, and the varied cation ratio Ca/Cu = 2.5/
4.0 , 2.5/4.5 , 3.0/4.0 and 3.5/4.5.
SEM images of each specimen showed different grain sizes with porous structure. The grain sizeincreased with sintering time. The specimen synthesized by reground-repressed process and sintered for
50 h , possessed smallest grain size. Three different grain structures were observed. The platelike dark gray
grain , flake-pellet bright grain and sphere-like bright grain corresponded to high TC phase, low TC phaseand Ca2PbO4, respectively. The platelike grain changed to granular after the second grinding.
XRD spectra showed high TC phase coexisting with low TC phase and Ca2PbO4 in each specimen.
The ratio of lattice parameter of high TC and low TC phases , c/a , were 6.84-6.88 and 5.70-6.02,respectively. Magnetic-susceptibility measurement showed that TC was significantly affected by the
composition changed. Each specimen revealed nearly the same onset critical temperature, TC onset , at
107.0-108.5 K. TC and HC2 increased when the sintering time was extended from 50 h to 100 h. Anintermediate ground-pressed process enhanced TC but depressed HC2 at 90 K. The optimum atomic ratio
leading to the formation of the Bi-2223 phase was Ca/Cu = 0.75. The highest TC=106.0 K belonged to the
specimen which was sintered for 100 h by an intermediate ground-pressed process, the critical field at 90K was 427 A/m. The highest HC2= 539 A/m at 90 K belonged to the specimen which was sintered for 100
h by reground-repressed process,and TC=105.2 K.
Key words : fixed (Bi:Pb)/Sr , varied Ca/Cu , superconductivity
Department of Physics, Faculty of Science, Kasetsart University, Bangkok,10900,Thailand.

160 Kasetsart J. (Nat. Sci.) 34 (1)
phase,(Bi,Pb)2Sr2CaCu2Oy low TC phase and(Bi,Pb)2Sr2Ca2Cu3Oz high TC phase with
superconducting transition temperatures of ~7 K ,
~ 80 K and ~110 K, respectively. It is obvious thatthe 110 K superconducting phase is likely the most
interesting one for practical applications; and the
most efficient way to synthesize this phase is tostart with initial composition close to the nominal
composition (Bi,Pb)2 Sr2Ca2Cu3Oz.
Kikuchi et al. (1989) reported characteristicsof Bi-Pb-Sr-Ca-Cu oxide superconductor closely
related to the preparatory conditions such as the
sintering temperature and cooling rate. Xu et al.(1990) studied the superconductivity and
microstructure of Bi1.92Pb0.48Sb0.1Sr2Ca2Cu3.2Oxand Bi1.8Pb0.3Sb0.1Sr2Ca2Cu3Oy samples, theyfound that different superconducting behavior due
to different sintering conditions and were controlled
by powder grain size and chemical activity.Kusano et al. (1994) annealed the Pb-
substituted Bi ceramics at 500 °C to 850 °C and
subsequently reheating at 850 °C, they reportedthat the composition of high TC phase changed
while the superconducting properties remained
unaffected. Toledano et al. (1995) examined theeffect of varying the ratio (Bi:Pb)/Cu as well as the
ratio Sr/Ca, and found that the kinetics of forming
high TC phase greatly enhanced by an excess ofcalcium , while an excess of strontium prevented its
formation.
Sung and Hellstrom (1995) found thatCa2PbO4 had both positive and negative roles in
forming (Bi,Pb)-2223. The positive role was Ca
and Pb which released from Ca2PbO4 reacted with(Bi,Pb)-2212 and CuO to form (Bi,Pb)-2223. The
negative role was Ca which could also react with
CuO to form (Sr,Ca)2CuO3, since forming(Sr,Ca)2CuO3 added an extra reaction path to form
(Bi,Pb)-2223.
The extensive studies for the equilibrium ofthe lead-substitute system as a function of
composition and temperature has been performedby us recently. The phase equilibrium of Bi1.5Pb0.5Sr2.0Ca2.0Cu3.5Os and Bi1.5Pb0.5Sr2.0Ca2.5Cu3.5Oβwere determined (1999), the second compositionwith atomic ratio Ca/Cu = 0.71 formed more high
TC phase. Prunglag et al. (1997) determined the
phase equilibrium of (Bi0.85Pb0.15)2.0Sr2.0CaxCuyOα , 2.0 ≤ x ≤ 3.5 and 3.0 ≤ y ≤ 4.5, and found
that high TC phase increased when the atomic ratio
of Ca to Cu was 0.75.In order to complete the knowledge of the
range of the 2223 phase, this study was extended to
nominal compositions of (Bi : Pb): Sr : Ca : Cu=(1.5 : 0.5) : 2.0 : x : y , here x=2.5,2.5,3.0,3.5 and
y= 4.0,4.5,4.0,4.5, respectively. The procedure of
determination of the phase equilibrium wasdescribed in another paper (1999). In the present
work the influence of calcium and copper contents
for the formation of the 2223 phase with varioussintering conditions are reported. The results of x-
ray diffraction (XRD) spectra and scanning electron
microscope (SEM) observations are specified.Superconductivity determined from AC
susceptibility as a function of temperature are
discussed. The high critical field will becharacterized in a separate study.
MATERIALS AND METHODS
The starting materials were Bi2O3 (99.5% ,
purity) , PbO (99.0%), SrCO3 (98.0%), CaCO3(99.0%) and CuO (99.0%), powders were weighed
in the cation ratio of (Bi:Pb):Sr:Ca:Cu = (1.5:0.5):
2.0:2.5:4.0 , (1.5:0.5):2.0: 2.5:4.5 , (1.5: 0.5): 2.0:3.0:4.0 and (1.5:0.5):2.0:3.5:4.5. The powders were
mixed and ground in a mortar and pestle for 1 h , put
the mixed powders in an alumina crucible andcalcined in air at 800 °C for 12 h at a heating rate of
10 °C/min , then ground and cold pressed at 107
MPa into pellet with dimension of 13.1 mm diameterand ~4.7 mm thickness, sintered (first time) in air

Kasetsart J. (Nat. Sci.) 34 (1) 161
Table 1 Initial atomic ratio, mass change ∆m/m0and mass density ρ of specimens, here I,
II denotes number of pressing and 50,
100 denotes 50, 100 h in sintering.
Specimen (Bi:Pb):Sr:Ca:Cu ∆m/mo ρ(%) (g/cm3)
IA50 (1.5:0.5):2.0:2.5:4.0 1.72 3.63IA100 3.55 3.04IIA50 1.65 3.98IIA100 3.32 3.76IB50 (1.5:0.5):2.0:2.5:4.5 1.81 3.90IB100 3.45 3.82IIB50 1.59 4.05IIB100 3.07 3.92IC50 (1.5:0.5):2.0:3.0:4.0 3.29 3.08IC100 3.69 3.02IIC50 2.22 3.44IIC100 3.57 3.27ID50 (1.5:0.5):2.0:3.5:4.5 2.35 3.47ID100 2.64 3.43IID50 1.78 3.61IID100 2.48 3.47
at 840 °C for 20 h, the heating rate from 800-840 °C was 5 °C/min. The specimen was cooled down in
the furnace until 300 °C and quenched in air. Then
the process was repeated by not reground-repressed(process I) or reground-repressed (process II), and
sintered (second time) the specimen at 845 °C in air
for 50 h or 100 h. Weight and diameter of specimenswere measured before and after sintering process.
Mass density of the bulk specimens were
determined by density determination (Sartorius).The identification of the superconducting phases
was deduced from x-ray powder diffraction spectra
at room temperature with Ni-filtered Cukα radiationat 30 kV and 25 mA, on a Philips model PW 3710
wide angle goniometer. Microstructure was taken
by SEM , JEOL, model JSM-220A.AC susceptibility measurement was
performed by means of an AC susceptometer ,
Lake Shore model 7130. The pellet specimen wascut in a rectangular shape of dimensions
~1.5x1.6x9.1 mm3 and mass ~0.1 g , cooled the
specimen down to 45-55 K in the AC susceptometerby zero field cooling (ZFC) , then applied AC
magnetic field Hac(t)=H sin ωt at the fundamental
frequency f= 125 Hz and various field amplitude H.The specimen was heated at a rate of 0.86 °C/min
and fundamental susceptibility χ was recorded as a
function of increasing temperature.
RESULTS AND DISCUSSION
Four initial nominal compositions , Bi1.5Pb0.5 Sr2.0 Ca2.5 Cu4.0 Oa (A) , Bi1.5 Pb0.5 Sr2.0Ca2.5 Cu4.5 Ob (B) , Bi1.5 Pb0.5 Sr2.0 Ca3.0 Cu4.0 Oc(C) and Bi1.5 Pb0.5 Sr2.0 Ca3.5 Cu4.5 Od (D) , were
prepared by the conventional solid state reaction.
Initial atomic ratio , mass density and mass change,∆m/m0, of the specimens are shown in Table 1;
here ∆m= m0-m , m0 was mass of pellet specimen
before the first sintering in process I or before thesecond sintering in process II, and m was mass of
pellet specimen after the second sintering.
Mass change of the specimen is shown inFigure 1 (a). Here m0 of process I and process II
were not at the same condition. It was found that
the mass of specimens decreased significantly whensintering time ts increased ; the mass lost was due
to evaporation of specific chemical substance, such
as PbO, of specimen.Mass density of the specimen depended on
the process of synthesis as shown in Figure1(b).
The specimen sintered for 50 h by intermediatereground-repressed process, revealed highest mass
density and least mass lost. Specimen IA100 and
IC100 exhibited lowest mass density ρ=3.0 g/cm3
, while the mass density of specimen IIA50 increased
significantly as shown in Figure 1 (b).
The powder XRD patterns of 16 pellet

162 Kasetsart J. (Nat. Sci.) 34 (1)
specimens were recorded from 2θ = 3°-70° as
shown in Figure 2. The 2θ ranging from 20°-40°was a specifically region for pointing out of themain superconducting phases of (Bi,Pb)-2212 and
(Bi,Pb)-2223. Peaks corresponding to different
phases were marked by various patterns for clarity.XRD pattern showed peaks belonging to
the high TC (Bi,Pb)-2223 phase (H) as a majorcomponent together with peaks due to the low TC(Bi,Pb)-2212 phase (L). The high TC phase was
labeled in the form of (00P) and (11Q); here P andQ were even and odd number, respectively. There
was no peak of semiconducting phase (Bi,Pb)-
2201 at 2θ =21.9°. Each specimen showed a peakat 2θ =17.8° which belonged to Ca2PbO4. The
present of Ca2PbO4 was known to result in a liquid
phase which accelerated the anisotropic growth of(Bi,Pb)-2223 phase.
The diffraction peaks of (002)H, (002)L,
(115)L and (0012)H appeared at 2θ=4.7°,4.8°,27.7° and 28.8°, respectively. It could be seen from
Figure 2 that more high TC phase appeared in
specimen C and D than specimen A and B. Onlystrong diffraction peaks of (002)H appeared in
specimen A, B and D, while specimen C exhibited
both diffraction peaks of (002)H and (002)L.The peak intensity of (002)H of specimen
IC100 was stronger than specimen IC50, partly
due to more Ca2PbO4 occurred in specimen IC50.
The peak intensity of (0012)H and (119)H of
specimen C became stronger, while (115)L becameweaker with increasing sintering time ts. More high
TC phase was formed in specimen C than the others
and the formation of the high TC phase in eachspecimen enhanced when the sintering time
increased.Lattice parameter, a,b,c,c/a; and cell volume
v of low and high TC phases are shown in Table 2.
The crystal structure of low TC phase was tetragonal;the ratio of c/a was between 5.70-6.02 and cell
volume v was between 867-967(A°)3. The crystal
structure of high TC phase was orthorhombic; theratio of c/a was between 6.84-6.88, and cell volume
v was 1036-1120 (A°)3.
Since the Bi(Pb)-Sr-Ca-Cu-O ceramicscontains five cations, the phase relations for forming
2223 phase are more complicated. In order to
characterized the formation of phase in thespecimen, microstructure of all specimens were
carried out by SEM.
Figure 3 showed grain orientation ofspecimens. Each specimen was polycrystal and the
grains were anisotropic. Three different grain
structures were observed; the platelike dark graygrain, flake-pellet bright grain and sphere-like bright
grain corresponded to high TC phase, low TC phase
Figure 1 (a) Mass change and (b) mass density vs. atomic ratio Ca/Cu of specimens.

Kasetsart J. (Nat. Sci.) 34 (1) 163
Figure 2 Powder x-ray diffraction patterns of specimen (a) A , (b) B , (c) C and (d) D ; ■ denotes peakdue to Ca2PbO4, ▲ denotes low TC (Bi,Pb)-2212 phase and ◆ denotes high TC (Bi,Pb)-2223
phase.

164 Kasetsart J. (Nat. Sci.) 34 (1)
Table 2 Lattice parameter (a,b,c,c/a) and cell volume (v) of low TC and high TC phases.
Specimen Tetragonal Orthorhombic
a(A°) c(A°) c/a v(A°)3 a(A°) b(A°) c(A°) c/a v(A°)3
IA50 5.3109 31.0600 5.8483 876.1000 5.4692 5.4555 37.5438 6.8646 1120.2026
IA100 5.3084 31.0851 5.8558 875.9505 5.4205 5.4153 37.1394 6.8517 1090.1763
IIA50 5.2952 31.1107 5.8752 872.3289 5.3924 5.3829 36.9718 6.8563 1073.1712
IIA100 5.3126 31.0773 5.8497 877.1243 5.3894 5.3672 36.8428 6.8362 1065.7144
IB50 5.2831 31.1214 5.8907 868.6419 5.4477 5.4421 37.3661 6.8591 1107.7901
IB100 5.2824 31.0711 5.8820 866.9973 5.3938 5.3842 36.9295 6.8467 1072.4806
IIB50 5.2831 31.1214 5.8907 868.6419 5.3841 5.3614 36.8423 6.8428 1036.5014
IIB100 5.3021 31.0928 5.8642 874.0890 5.3821 5.3661 36.8256 6.8422 1063.5559
IC50 5.3964 30.7791 5.7036 896.3223 5.4285 5.4024 37.1896 6.8508 1090.6568
IC100 5.5296 31.6138 5.7172 966.6386 5.4313 5.4239 37.2398 6.8565 1097.0409
IIC50 5.4411 30.9978 5.6970 917.7075 5.4826 5.4043 37.7136 6.8788 1117.4395
IIC100 5.3160 31.0968 5.8497 878.7911 5.4044 5.3851 36.9888 6.8442 1076.4937
ID50 5.2984 31.2026 5.8891 875.9519 5.4133 5.4054 37.0981 6.8531 1085.5294
ID100 5.2575 31.6374 6.0175 874.4991 5.3739 5.3771 36.8418 6.8557 1064.9768
IID50 5.2608 31.6409 6.0144 875.6941 5.4423 5.4211 37.3058 6.8548 1100.6424
IID100 5.2618 31.6085 6.0072 875.1299 5.3868 5.3743 36.9556 6.8604 1069.8749
and Ca2PbO4, respectively. The areas with black
contrast corresponded to pores. The grain sizeincreased with sintering time. The platelike grain
changed to granular after second grinding. The
broad face of grain corresponded to the ab plane.The specimen sintered for 50 h by reground-
repressed process, exhibited the smallest grain size
and relatively dense, while the intermediate ground-pressed specimen showed more porous structure.
The grain size of specimen IIC100 was smaller and
more ordering than specimen IC100. The SEMmicrograph of specimen IIC100 showed that the
grains were oriented more dense than specimen
IC100,which was agree well with the mass densityof the specimen.
Zero-field-cooled measurement of the
superconducting transition was determined fromheating curve of fundamental susceptibility χ=χ/-
iχ//. The applied field amplitude for each running
were H=0.1,1,10,50,100,200,300,400 and 500 A/m. Figure 4 shows temperature dependence of
external susceptibility at field amplitude H=0.1 A/
m of specimen A and B. Figure 5 shows χ(T) of
specimen C and D at various fields.AC susceptibility was separated into 2
components : real part or dispersive component χ/
and imaginary part or dissipative component χ//. χ/
and χ// showed two steps of superconducting
transition. According to Mazaki et al. (1988), the
upper component of heating curve of χ/
corresponded to high TC phase, which was regarded
as the superconductivity of the grain or the bulk
phase; and the lower component of χ/ correspondedto low TC phase, which was regarded as the
diamagnetism due to the Josephson-like coupling
or the coupling phase. Two maxima of χ//
corresponded to intrinsic and coupling losses,
respectively.
It was obvious from Figure 5 that χ/ of lowTC phase had stronger amplitude dependence than
χ/ of high TC phase. The second maximum of
heating curve χ// (T) in process II of all specimens

Kasetsart J. (Nat. Sci.) 34 (1) 165
Figure 3 SEM micrographs of powder specimen showing microstructural characteristics.
was smaller than that in process I, i.e. , there wasonly small intrinsic loss in reground–repressed
process.
According to Sumiyama et al.(1989), thediamagnetism attributed to the Josephson-like weak
coupling was sensitive to the synthetic conditions
and grain contact-structure.When the applied field H was lower than
low critical field HC1 , χ/ would show perfect
diamagnetism, i.e. , χ/ = –1, exactly in SI unit; andχ// =0 , since the magnetization was linear reversible
and lossless. When H>HC1, χ/ increased from -1
and χ// ≠ 0. But the data in Figure 4 and Figure 5were not corrected for demagnetization factor,
hence χ/ deviated from –1.Critical temperature was determined from
χ/ at applied external field amplitude H=0.1 A/m
and f = 125 Hz. The onset of the coupling betweengrains in χ/ (T) was defined as critical temperature
TC of the specimen, and Tc onset was defined as the
temperature at which χ/ and χ// separated into 2parts. Table 3 shows atomic ratio of Ca/Cu, critical
temperature and onset of critical temperature of
specimens. Each specimen revealed TC onset at107.0-108.5 K.
Figure 6(a) shows critical temperature TCas a function of atomic ratio Ca/Cu, which increaseswith increasing sintering time; reground-repressed
IA50 IA100 IIA50 IIA100
IB50 IB100 IIB50 IIB100
IC50 IC100 IIC50 IIC100
ID50 ID100 IID50 IID100

166 Kasetsart J. (Nat. Sci.) 34 (1)
Table 3 Atomic ratio, critical temperature TC ,onset of critical temperature TC onset and high critical fieldHc2 at 90 K of specimens.
Specimen Ca/Cu Tc (K) Tc onset (K) Hc2 (A/m)
IA50 2.5/4.0=0.62 100.2 107.2 175IA100 102.8 107.5 195
IIA50 98.2 107.0 145
IIA100 101.3 107.3 266IB50 2.5/4.5=0.56 94.0 107.1 7
IB100 96.8 107.4 24
IIB50 92.0 107.0 5IIB100 94.6 107.2 38
IC50 3.0/4.0=0.75 104.2 108.1 352
IC100 106.0 108.5 427IIC50 104.0 108.0 408
IIC100 105.2 108.2 539
ID50 3.5/4.5=0.78 104.8 108.0 300ID100 105.7 108.3 416
IID50 103.0 107.8 335
IID100 105.1 108.1 527
process depresses slightly the critical temperature.
The synthetic process that provided higher critical
temperature was to sinter specimen at 845°C for100 h by an intermediate ground-pressed process.
TC of all specimens were significantly
affected by the composition changed. The highestcritical temperature was 106.0 K which belonged
to specimen IC100, atomic ratio of Ca/Cu=0.75.
The next higher TC =105.7 K belonged to specimenID100. The other 2 compositions , IA100 and
IB100 revealed much lower critical temperature ,
TC=102.8K and 96.8 K, respectively. It could beseen from Figure 1(b) and Figure 6(a) that lower
mass density pellet specimen revealed higher TC.
Low and high critical field of the specimencould be determined from the AC χ measurement
at various magnetic field. The onset of the first
maximum of χ// ≠ 0 from heating curve was definedas low critical field HC1(T), and the onset of the
coupling between grain in χ/(T) at various field wasdefined as high critical field HC2 (T) of the specimen
(Dodrill and Krause. 1996).
The temperature dependence of HC2 at 90 Kare shown in Table 3 and Figure 6(b). HC2 at 90 K
of process II was higher than that of process I, and
HC2 increased with sintering time. It was obviousfrom Figure 6(b) that HC2 of specimen C was
slightly higher than specimen D. The highest
HC2=539 A/m at 90 K belonged to specimen IIC100,while specimen IID100 showed HC2= 527 A/m at
90 K. The high critical field of the other 2
compositions, IIA100 and IIB100 were much lower.HC2 at 90 K of specimen II-50 was lower
than that of specimen I-100. Specimen IC100 which
exhibited highest TC revealed rather low HC2 = 427A/m at 90 K. Hence the optimum atomic ratio that
formed more volume fraction of Bi-2223 phase
was Ca/Cu = 0.75. The best synthetic condition that

Kasetsart J. (Nat. Sci.) 34 (1) 167
Figure 4 Volume susceptibility of specimen A and B as a function of increasing temperature T, at
H=0.1A/m and f=125 Hz.

168 Kasetsart J. (Nat. Sci.) 34 (1)
Figure 5 Volume susceptibility of specimen C and D as a function of increasing temperature T, at f=125Hz and various field amplitude H, here a,b,c,d,e,f,g,h and i denotes H=0.1,1,10,
50,100,200,300,400 and 500 A/m, respectively.

Kasetsart J. (Nat. Sci.) 34 (1) 169
lead to higher TC and highest HC2 at 90 K was to
sinter the specimen at 845°C for 100 h by reground-repressed process.
CONCLUSION
Sixteen specimens of four initial nominalcomposition ceramics were synthesized by solid
state reaction. The fixed initial cation ratio was
(Bi:Pb)/Sr = (1.5:0.5)/2.0 and the varied ratioswere Ca/Cu = 2.5/4.0, 2.5/4.5, 3.0/4.0 and 3.5/4.5.
Mass density, critical temperature and high
critical field of the specimen depended on theprocess of synthesis.
More mass loss was found when the sintering
time was prolonged. The mass lost,∆m/ m0 , of thespecimens was 1.59-3.69% .
Mass density decreased with increasing
sintering time. Specimen sintered for 50 h byintermediate reground-repressed process revealed
the highest mass density and least mass lost.
Powder XRD pattern taken from the pelletspecimen showed that each specimen contained
Bi-2223, Bi-2212 and Ca2PbO4 phases. More high
TC phase was formed in the specimen than low TCphase, when the duration of the sintering was
prolonged. The ratio of lattice parameter of high TCand low TC phases were c/a=6.84-6.88 ,and 5.70-
6.02, respectively.
SEM micrograph revealed different grainsizes in each specimen. Three different grain
structures were found; platelike dark gray grain ,
flake-pellet bright grain and sphere-like bright graincorresponded to high TC phase, low TC phase and
Ca2PbO4, respectively. The areas with black
contrast corresponded to pores. The grain size ofspecimen I-100 was larger than that of specimen II-
100, which was sintered by reground-repressed
process; that is the platelike grain changed togranular after the second grinding.
The AC susceptibility χ =χ/-iχ// depended
on temperature T, and was separated into 2 parts :real susceptibility χ/ and imaginary susceptibility
χ// at T<TC onset. Magnetic-susceptibility
measurements showed that TC was significantlyaffected by the composition changed, and TCincreased while mass density decreased with
increasing sintering time. Each specimen revealednearly the same onset critical temperature, TC onset= 107.0-108.5 K. Critical temperature TC and high
critical field HC2 were determined from χ/. Eachspecimen showed increasing TC and HC2 at 90 K
when the sintering time was extended from 50 h to
100 h. Reground-repressed process depressed TCbut enhanced HC2 at 90 K.
The highest TC and HC2 belonged to the
Figure 6 (a) Critical temperature and (b) high critical field at 90 K vs. atomic ratio Ca/Cu of specimens.

170 Kasetsart J. (Nat. Sci.) 34 (1)
initial composition Bi1.5 Pb0.5 Sr2.0 Ca3.0 Cu4.0 OCwhose initial atomic ratio of Ca/Cu was 0.75. The
specimen IIC100, which was sintered for 100 h by
reground-repressed process, exhibited asuperconducting transition at 105.2 K and highest
critical field HC2=539 A/m at 90 K, while the
specimen IC100 exhibited the highest TC=106.0 Kand much lower critical field, HC2= 427 A/m at 90
K. Critical temperature and HC2 at 90 K of specimen
IID100 were slightly lower than that of specimenIIC100.
ACKNOWLEDGEMENT
The authors are grateful to the Kasetsart
University Research and Development Institutefor the grant support of this paper under project No.
7.41 .
LITERATURE CITED
Dodrill, B. C. and J. K. Krause. 1996. AC magneticsusceptibility measurements of organic
superconducting materials. Mol. Cryst. Liq.
Cryst. 284 p.Kikuchi, A. , M. Matsuda, M. Takata, M. Tshii, T.
Yamashita, and H. Koinuma. 1989. Influence
of cooling rate on superconductingcharacteristics of Bi-Pb-Sr-Ca-Cu-O ceramics.
Jpn. J. Appl. Phys. 28 (3) : L371-L372.
Kusano, Y. , T. Nanba, J. Takada, T. Egi, Y. Ikeda,and M. Takano. 1994. Segregation and
dissolution reactions of the 2223 phase in the
Bi,Pb-Sr-Ca-Cu-O system on annealing in air.Phys. C. 219 : 366-370.
Mazaki, H. , T. Ishida, and T. Sakuma. 1988. Two-
step superconducting transition of a Bi-Sr-Ca-Cu-O system. Jpn. J. Appl. Phys. 27 (5) :
L811-L813.
Prunglag, N., S. Trivijitkasem, and K.Treechairusmee. 1997. Study of super-
conductor in (Bi0.85Pb0.15)2.0Sr2.0Cax
CuyO10-s when 2.0≤x≤3.5 and 3.0≤y≤4.5, pp.310-316. In The 35th Kasetsart University
Annual Conference, Science section. Bangkok.
Rhee, C. K. , C. J. Kim, H. G. Lee, I. H. Kuk, J. M.Lee, I. S. Chang, C. S. Rim, P. S. Han , S. I.
Pyun, and D. Y. Won. 1989. Effects of Pb
content on the formation of the high-TC phasein the (Bi,Pb)-Sr-Ca-Cu-O system. Jpn. J. Appl.
Phys. 28 (7) : L1137-L1139.
Sumiyama, A. , H. Endo, J. Tsuchiya, N. Kijima,M. Mizuno, and Y. Oguri. 1989. A.C.
susceptibility of superconducting Bi- (Pb)-Sr-
Ca-Cu-O system. Jpn. J. Appl. Phys. 28 (3) :L373-L376.
Sung, Y. S. and E. E. Hellstrom. 1995. A s t u d y
of reactions amongst (Bi,Pb)Sr2Ca2Cu3Ox andphases on the line between CaO and CuO to
form (Bi,Pb)2Sr2Ca2Cu3Ox. Phys. C. 252 :
155-159.Toledano, J. C. , D. Morin, J. Schneck, H. Fagir, O.
Monnereau, G. Vacquier, P. Strobel, and V.
Barnole. 1995. Stability of the 2223 phase inthe lead-substituted bismuth cuprates. Phys.
C. 253 : 53-62.
Trivijitkasem, S. and W. Sratongluan. 1999.Microstructural evolution in forming Bi 2223
superconductor from Bi-Pb-Sr-Ca-Cu-O
system. The Kasetsart J. (Nat. Science) 33 (4): 554-563.
Trivijitkasem, S. and W. Sratongluan. 1999. Grain
orientation and growth of high TC Bi(Pb)-Sr-Ca-Cu-O superconductor, pp. 160-168. In The
37th Kasetsart University Annual Conference,
Science section. Bangkok.Xu, Q., Z. Chen, G. Meng, and D. Peng. 1990.
Microstructure and superconductivity in Bi-
Sr-Ca-Cu-O system doped with Pb and Sb.Jpn. J. Appl. Phys. 29 (10) : L1918-L1923.
Received date : 17/08/99Accepted date : 27/12/99

Kasetsart J. (Nat. Sci.) 34 : 171 - 178 (2000)
INTRODUCTION
The remediation of subsurface (both soils
and groundwater) has been the most costly andtime consuming part of site cleanups. After the
source of contamination has been removed and
treated, contaminated soils and groundwater maystill remain and require treatment. Nowadays in-
situ technologies have become very attractive for
treating contaminated soils and groundwaterbecause of lower costs, less disruption to the
environment, and reduced worker exposure to
Removal of Naphthalene and 2, 4-Dinitrotoluene from Soilsby Using Carboxymethyl-βββββ-Cyclodextrin
Chatdanai Jiradecha
ABSTRACT
Spillage of petroleum and petroleum products from the underground storage tanks has caused
significant contamination of groundwater aquifers by organic contaminants. These compounds are
generally difficult to remove since the chemicals are hydrophobic, having a low solubility and thereforeprefer to adsorb onto the soil. The ability of carboxymethyl-β-cyclodextrin (CMCD) to increase the
solubilities of contaminants in soils was studied. Furthermore, studied partitioning of soil-contaminants
and CMCD-contaminants were also included. Soils consisting of 7.4% clay content and 2.2% organiccarbon content were used as contaminated soils. Naphthalene and 2, 4-dinitrotoluene (2, 4-DNT) were
selected as the representative low polarity organic contaminants. In the batch studies, the partition
coefficient between soil-naphthalene and soil-2, 4-DNT were 51.3 and 5.6 L/kg. In addition, 269.2 and 22.4L/kg were determined from the partitioning between CMCD-naphthalene and CMCD-2, 4-DNT respectively.
The results from column experiments showed that CMCD greatly enhanced the removal of naphthalene
and 2, 4-DNT from soils. Using 0.01 N NaNO3 as the flushing agent, 32 and 40% of naphthalene and 2,4-DNT were removed. Meanwhile, 70 and 72% naphthalene and 2, 4-DNT were removed after 2 g/L
CMCD solution was flushed through the soil columns.
Key words : CMCD, naphthalene, 2, 4-dinitrotoluene, solubility
hazardous materials. Addition of agents such as
organic cosolvents and surfactants are known toincrease the transport of low polarity organics from
the soils (Laha and Luthy, 1992; Edward et al.,
1994; Thangamani and Gina, 1994). However, ithas been found that both cosolvents and surfactants
have some disadvantages for soil remediation
applications. Cosolvents are not effective insolubilizing the organics unless their volume-
fraction concentrations are above 10%, and
surfactants form high-viscosity emulsions that aredifficult to remove from the soils (Wang and
Department of Environment Engineering, Faculty of Engineering, Kasetsart University, Bangkok 10900, Thailand.

172 Kasetsart J. (Nat. Sci.) 34 (1)
Brusseau, 1993). Furthermore, synthetic surfactantsinhibit microbial activity in soils thereby reducing
their natural bioremediation capability. Hence,
contaminant transport-enhancing additives that donot adsorb or retain in the soil, and also do not
inhibit natural soil microbial activity are desired.
One such type of additives is the microbially-produced compounds, known as biosurfactants
which can enhance low-polarity and nonpolar
organics contaminant removal from soils withoutaccumulating in the soil, or affecting the natural
microbial activity.
Another class of microbially-producedcompounds that is known to increase the aqueous
solubilities of low polarity organics by forming
water-soluble 1:1 inclusion complexes are calledcyclodextrins. Cyclodextrins are produced from
starch by bacteria, and are widely used in the
pharmaceutical industry to improve the dissolutionof non-polar drugs. These are cyclic oligosaccarides
containing 6-8 glucose units arranged to form a
hydrophobic shell, and a 5-8 °A hydrophobic cavity.It is demonstrated that carboxymethyl-β-
cyclodextrin (CMCD) is a highly water soluble,
anionic, non-emulsifying and non-toxiccyclodextrin. Biodegradable cyclodextrins can form
complex with cationic heavy metals, significantly
enhance the aqueous solubility of low polarityorganic compounds, and hence enhance their
removal from soils (Brusseau et al., 1997). The
hydrophobic cavity of β-cyclodextrin is reported to
be 0.346 nm3. Hence, low polarity organiccontaminants that have molecular volume (MV)
less than 0.346 nm3 are likely to form inclusion
compounds with β-cyclodextrin.
MATERIALS AND METHODS
Materials. Naphthalene and 2, 4-
dinitrotoluene (2, 4-DNT) were selected as the test
compounds. The physical and chemical propertiesof these compounds are shown in Table 1.
Carboxymethyl-β-cyclodextrin (CMCD) was used
as additive agent to increase the solubility of thetest compounds. The soil samples were collected
up to a depth of 12 inches after clearing the top 2
inches of debris and grass. The samples werebrought to the laboratory for analysis in polyethylene
bottles. The soils were sieved, and the fraction
passing a No. 10 (2 mm) sieve was air dried andstored at room temperature in polyethylene bottles.
The physical and chemical properties of these soils
are shown in Table 2.Adsorption tests. Samples for the
determination of adsorption isotherms were
prepared by adding a known amount of adsorbentinto a series of 40 mL vials (Teflon-lined vial caps)
that contained 25 mL of 0.01 N NaNO3 and different
amounts of contaminant. The solution was adjustedto the desired pH (4.0, 6.5 and 9.0) by adding 0.01
N HNO3 or 0.01 N NaOH prior to adding the
adsorbate. These vials were rotated in the tumbler
Table 1 Physical and chemical properties of naphthalene and 2, 4-dinitrotoluene.
Properties Naphthalene 2,4-dinitrotoluene
Formula C10H8 CH3C6H3(NO2)2Molecular weight 128.17 182.14
Density (g/cm3) 1.145 1.321
Molecular volume (nm3) 0.186 0.229Solubility (mg/L) 35.5 300

Kasetsart J. (Nat. Sci.) 34 (1) 173
for 3 days. The samples were filtered through 0.45mm nylon membrane filters and analyzed by the
UV spectrophotometer (Perkin Elmer Lambda 3A)
at wavelengths 276 and 250 nm for naphthaleneand 2, 4-DNT at the end of the tests.
Contaminants-CMCD partition tests.These tests were prepared by adding a known
amount of contaminant into a series of 40 mL vials
(Teflon-lined vial caps) that contained 25 mL of0.01 N NaNO3 and different amounts of CMCD.
The amount of contaminant added was
approximately 10 times higher than the solubilitylimit. The solution was adjusted to the desired pH
(4.0, 6.5 and 9.0) by adding 0.01 N HNO3 or 0.01
N NaOH prior to adding the adsorbate. These vialswere rotated in the tumbler for 3 days. The samples
were filtered through 0.45 mm nylon membrane
filter and the filtrate was analyzed by the UVspectrophotometer at the end of the test.
Column tests. Polycarbonate columns 2.54
cm in diameter and 4 cm long were used throughoutthe experiments. The columns were packed in
incremental steps with dry soils to establish uniform
bulk density. Soil was prevented from leaching outof the columns by nylon membrane filter paper
supported on stainless steel screen. After packing,
the columns were slowly wetted from the bottom
with electrolyte (0.01 N NaNO3) and contaminantsolution. During this procedure the effluent from
the columns was collected and determined for the
contaminant. Elution experiments were conductedafter the contaminant solution was pumped through
the soil columns for 14 days. The effluent solution
was analyzed by the UV spectrophotometer atvarious times to determine the amount of
naphthalene and 2, 4-DNT. After 14 days of elution,
the contaminated soils were extracted by placingthe contaminated soils in glass containers containing
methanol for 1 day. Two types of elution
experiments were conducted: (1) elution with 0.01N NaNO3 solution, (2) elution with 2 and 5 g/L of
CMCD and 0.01 N NaNO3 solution.
RESULTS
Adsorption isotherm. Adsorption isothermequations such as Freundlich and Langmuir
equations were used to simulate the experimental
data. The plot between the solid phase and aqueousphase naphthalene concentrations is shown in Figure
1. The relationship between solid phase and aqueous
phase 2, 4-DNT concentrations is shown in Figure2.
Naphthalene oncentration, (mg/L
1 2 3 4 5 6 7 8 9 1
Naphthalene dsorption, (m
300
400
500
600
700
800
Freundlich isotherLangmuir Isotherm
c cc
a
Figure 1 Adsorption isotherm of naphthalene in
soil.
Table 2 Characteristic parameters of test soil.
Soil type I
pH 7.2
Organic matter content 4.9 %Organic carbon content 2.2 %
Specific gravity 2.46
Clay content 7.4 %Silt content 17.4 %
Sand content 75.2 %
pHzpc 7.0Soil type Sandy loam

174 Kasetsart J. (Nat. Sci.) 34 (1)
2, 4 Dinitrotoluene oncentration,
0 2 4 6 8 10 12 14 16 18
2, 4initrotoluene
orptio
150
200
250
300
350
Freundlich isothermLangmuir Isotherm
c
ads
d
Naphthalene oncentration, (mg/L)
0 2 4 6 8 10 12 1
Naphthalene dsorption, (
0
200
400
600
800
1000
1200
pH 6.5 pH 4
pH 9
a
c
2, 4 initrotoluen oncentration, mg/L
0 2 4 6 8 10 12 14 16 18
2, 4 initrotoluendsorption, mg/kg
150
200
250
300
350
400
pH 6.5 pH 4 pH 9
ad
d e c
Figure 2 Adsorption isotherm of 2, 4-dinitroto-
luene in soil.
Figure 3 Adsorption isotherm for naphthalene atpH 4, 6.5 and 9.
Figure 4 Adsorption isotherm for 2, 4-dinitroto-
luene at pH 4, 6.5 and 9.Figure 5 Plot of relative aqueous-phase naphtha-
lene concentration versus the CMCD
concentration.
Figure 6 Plot of relative aqueous-phase 2, 4-dinitrotoluene concentration versus the
CMCD concentration.
Figure 7 Plot of the relative aqueous-phase naph-
thalene concentration versus the CMCD
concentration at pH 4, 6.5 and 9.
Concentration of CMCD, (kg/L)
0.00 0.02 0.04 0.06 0.08
Relative que
ous-hase oncentra
tion
0
5
10
15
20
25c
ap
Concentration of CMCD, (kg/L)
0.00 0.02 0.04 0.06 0.080
1
2
3
4
ap
cRelative que
ous-hase oncentra
tion
Concentration of CMCD, (kg/L)
0.00 0.02 0.04 0.06 0.08
0
5
10
15
20
25
30
pH 4 pH 6.5 pH 9
ap
cRelative que
ous-hase oncentra
tion

Kasetsart J. (Nat. Sci.) 34 (1) 175
To understand the effect of pH on thesorption capacity of soils, three adsorption isotherms
with different pH were conducted at the same time
using the exact procedure. Figure 3 and 4 show theadsorption data obtained for naphthalene and 2, 4-
DNT at different pH values.
Partition between contaminants andCMCD. The relative aqueous-phase concentrations
(St/S0) of naphthalene and 2, 4-DNT were plotted
against the CMCD concentration in Figures 5 and
Figure 8 Plot of relative aqueous-phase 2, 4-
dinitrotoluene concentration versus the
CMCD concentration at pH 4.5, 6 and 9.
Figure 9 Elution of soil contaminated with naph-
thalene using CMCD and NaNO3 solu-tion.
Figure 10 Elution of soil contaminated with 2, 4-
dinitrotoluene using CMCD and NaNO3
solution.
Concentration of CMCD, (kg/L)
0.00 0.02 0.04 0.06 0.080
1
2
3
4
pH 4 pH 6.5 pH 9
ap
cRelative que
ous-hase oncentra
tion
1.0
0.8
0.6
0.4
0.2
0.0
Nap
htha
lene
frac
tion
rem
oval
0 20 40 60 80 100 120 140 160 180
Number of pore volume
0.01 N NaNO3 SolutionCMCD (2 g/L)CMCD (5 g/L)
1.0
0.8
0.6
0.4
0.2
0.0
2,4
Din
itrot
olue
ne fr
actio
n re
mov
al
0 20 40 60 80 100 120 140 160 180
Number of pore volume
0.01 N NaNO3 SolutionCMCD (2 g/L)
6 respectively. Furthermore, to determine the effect
of pH on the partition of naphthalene and 2, 4-DNT
to the soil, three different pH solutions were preparedsimultaneously by the same procedure. The plots
between the aqueous-phase concentration versus
the CMCD concentration at three different pHvalues are shown in Figures 7 and 8 for naphthalene
and 2, 4-DNT respectively.
Column tests. A comparison between the
log Kd and log Kcw values from the above
experiments reveals that both naphthalene and 2, 4-DNT have log Kcw values higher than log Kdvalues. These results suggest that CMCD has the
ability to extract naphthalene and 2, 4-DNT fromthe soils. Column tests were conducted to confirm
these results. The results from column experiments
were plotted between number of pore volumes ofelutant versus contaminant fraction removed.
Elution curves for naphthalene and 2, 4-DNT
removal from the soil are shown in Figures 9 and 10respectively.

176 Kasetsart J. (Nat. Sci.) 34 (1)
DISCUSSION
Adsorption isotherm. Relative to the
Langmuir isotherm, the results show that theFreundlich isotherm is a better fit to the experimental
data according to the sum of square error (SSE)
between the experimental and model results.Freundlich partition coefficients were determined
for each system by plotting the sorption capacity
versus the aqueous concentrations for naphthaleneand 2, 4-DNT. It has been determined for
hydrophobic compounds that, if the equilibrium
aqueous phase concentration is less than one half ofthe solute water solubility, sorption isotherms to
natural sediments are linear (Karickhoff et. al.,
1979). Assuming that the constant 1/n = 1, andusing only the linear portion of the curve, the
partition coefficient is then the slope of the line
(Roger, 1989). The log Kd values for naphthaleneand 2, 4-DNT were found to be 1.71 and 0.75
respectively. Relative to the naphthalene system,
the capacity of the soil for 2, 4-DNT was muchsmaller. This result demonstrated that naphthalene
has a stronger affinity to the soil surface than 2, 4-
DNT. Due to the lower solubility of naphthalene,water can cause naphthalene to sorb onto the
hydrophobic surface of the soils more than 2, 4-
DNT since naphthalene attempts to minimize itscontact with water and migrates to the relatively
hydrophobic soil organic matter.
The effect of pH on the sorption capacity ofsoils indicates that the log Kd values between the
soils and naphthalene were 1.78, 1.76, and 1.71 at
pH 4, 6.5, and 9 respectively. The log Kd values for2, 4-DNT at pH 4, 6.5, and 9 were 0.86, 0.75, and
0.71. Using statistical t-test, there was no statistically
significant difference in the log Kd values ofnaphthalene and 2, 4- DNT at the three different pH
at the 95 percent confidence interval. The results
indicate that the solution pH has no effect on thesorption capacity of naphthalene and 2, 4-DNT in
soils. However, a charge-induced dipole interactioncould occur between a positively charged surface
and the electron-rich π system of the PAHs (Mader
et al.,1997). At pH lower than pHzpc, the soilsurface becomes positively charged and tends to
interact with the negative charges in the electron-
rich π system of naphthalene and 2, 4-DNT. Thisinteraction causes the affinity of the soils to increase
at lower pH. From this study, it is obvious that the
surface charge density does not affect sorptioncapacity since the dominant force is hydrophobic
interaction. Meanwhile, the surface charge tends to
affect the affinity of the soils by electrostaticinteraction.
Partition between contaminants andCMCD. Linear regression was performed for thesedata following the contaminant/CMCD partition
model. The linear equation fitted the observed data
closely for both contaminants. The CMCD/waterpartition coefficient (Kcw) for naphthalene and 2,
4-DNT were obtained from linear regression of St/
S0 versus the concentration of CMCD. The log Kcwfor naphthalene and 2, 4-DNT were found to be
2.43 and 1.35 respectively. The log Kcw reported
by Wang and Brusseau (1993) for naphthalene/hydroxypropyl-β-cyclodextrin (HPCD) was about
2.72, which is higher than naphthalene/CMCD
measured in this research. Since HPCD and CMCDare both β-cyclodextrin having 0.346 nm3 cavity
(Szejtli, 1982), the difference in the partition of the
contaminants may be due to the charge of thecarboxylic functional groups and the polarity of the
CMCD molecules (Brusseau, 1997). Hence, HPCD
having less polarity and no charge functional groupsmay cause larger sorption of contaminants. The
results from this study indicate that CMCD can
enhance the solubility of naphthalene and 2, 4-DNT due to the hydrophobic cavity of the CMCD.
The log Kcw for naphthalene is higher than
2, 4-DNT as naphthalene is more hydrophobic andhas a smaller molecular volume. This causes the

Kasetsart J. (Nat. Sci.) 34 (1) 177
arrangement of naphthalene into the CMCDhydrophobic cavity to be easier and stronger
compared to 2, 4-DNT. The molecular volumes of
naphthalene and 2, 4-DNT were calculated fromthe density and were found to be 0.186 and 0.229
nm3 respectively. The results from this study
indicate that CMCD produces a significant increasein the apparent aqueous solubilities of naphthalene
and 2, 4-DNT due to its hydrophobic cavity.
The log Kcw for naphthalene at pH 4, 6.5,and 9.0 were 2.46, 2.43, and 2.42 while the log Kcwfor 2, 4-DNT were 1.34, 1.35, and 1.34 at pH 4, 6.5,
and 9.0. Using statistical t-test, there was nostatistically significant difference in the log Kcwvalues of naphthalene and 2, 4-DNT at the three
different pH values at the 95 percent confidenceinterval. The results confirmed that the solution pH
has no effect on the partition between the
contaminants and CMCD and has little effect onthe naphthalene and 2, 4-DNT solubilities. So the
increase in the solubilization of naphthalene and 2,
4-DNT is strongly dependent upon the complexationbetween the hydrophobic cavity of CMCD and low
polarity organic compounds.
The formation ratio for the naphthalene/CMCD and 2, 4-DNT/CMCD inclusion complexes
were determined from the amount of CMCD added.
At pH 4 and 6.5, the formation of the naphthalene/CMCD inclusion complexes was 1 to 0.07 (mole
CMCD : mole naphthalene) while at pH 9 it was 1
to 0.06. The 1 to 0.03 (mole CMCD : mole 2, 4-DNT) 2, 4-DNT/CMCD inclusion complexes were
found at pH 4, 6.5, and 9. The formation value of
naphthalene inclusion complexes is higher thanthat of 2, 4-DNT as naphthalene has a smaller
molecular size that enables easier arrangement into
the CMCD cavity. However, the naphthalene and2, 4-DNT inclusion complexes values were less
than the assumed 1 to 1 inclusion complexes value
as described by Blyshak et al., 1989.Column tests. Clearly, CMCD greatly
enhanced the removal of naphthalene and 2, 4-DNT from soils as compared to the NaNO3 solution.
For example, 70 percent of the initial naphthalene
was removed by 2 g/L CMCD solution and 72percent was removed by 5 g/L of CMCD solution
after 160 pore volumes of flushing as compared to
32 percent using NaNO3 solution. Furthermore, 73percent of the initial 2, 4-DNT was removed after
140 pore volumes of 2g/L CMCD solution was
pumped through the column while only 40 percentwas removed by the NaNO3 solution. Adding more
CMCD did not affect the total naphthalene removal.
It may be that the diffusion of the contaminantsfrom the soils to the bulk liquid was rate limited.
Furthermore, naphthalene and 2, 4-DNT could not
be completely removed from the soils as thedesorption of these contaminants by the hard soil
organic matter domain is slow and only partially
reversible (Huang, 1997). However, it can increasethe removal rate of naphthalene. At 50 pore volumes
of CMCD flushing, the percent naphthalene
removed increased from 38 to 49 percent whenCMCD solution concentration increased from 2 to
5 g/L. Since the Kcw value is higher than the Kdvalue, naphthalene and 2, 4-DNT tend to leave thesoils and complex with CMCD in the aqueous
solution. The total removal efficiencies for
naphthalene and 2, 4-DNT are approximately equalsince the Kd and Kcw values for naphthalene and 2,
4-DNT differs slightly.
The study of low polarity organiccompounds in enhancing solubility show that
CMCD greatly enhances the desorption and elution
of naphthalene and 2, 4-DNT, which were used asrepresentative low polarity organic contaminants.
The partition coefficients between contaminants
and CMCD (Kcw) were determined by using thecontaminants/CMCD model. The results show that
this linear equation fitted the experimental data
extremely well for both naphthalene and 2, 4-DNT.Furthermore, there was no difference in Kcw values

178 Kasetsart J. (Nat. Sci.) 34 (1)
for naphthalene and 2, 4-DNT when the pH waschanged. Further research will be focused on the
removal of low polarity organic contaminants from
low hydraulic conductivity soils based oncyclodextrin.
LITERATURE CITED
Brusseau, M.L., X.J. Wang, and W.Z. Wang. 1997.
Simultaneous elution of heavy metals andorganic compounds from soil by cyclodextrin.
Environ. Sci. Technol. 31(4) : 1087-1092.
Edwards, D.A., Z. Liu, and R.G. Luthy. 1994.Surfactant solubilization of organic compounds
in soil/aqueous systems. J. Envir. Engrg. 24(1)
: 5.Huang, W. 1997. Sorption and desorption by soils
and sediments: effects of sorbent heterogeneity.
Ph.D. Dissertation, University of Michigan,Michigan.
Karickhoff, S.W., D.S. Brown, and T.A. Scott.
1979. Sorption of hydrophobic pollutants onnatural sediments. Water Research 11 (3) :
241.
Laha, S. and R.G. Luthy. 1992. Effects of nonionic
surfactants on the solubilization andmineralization of phenanthrene in soil-water
systems. Biotechnology and Bioengineering
40 : 1367.Mader, B.T., K.U. Goss and S.J. Eisenreich. 1997.
Sorption of nonionic, hydrophobic organic
chemicals to mineral surfaces. Environ. Sci.Technol. 31(4) : 1079-1086.
Rogers, J.A. 1989. Humidity effects on low
temperature thermal desorption of adsorbedvolatile organic compounds from soil. Ph.D.
Dissertation, Illinois Institute of Technology,
Illinois.Thangamani, S. and S.S Gina. 1994. Effect of
anionic biosurfactant on hexadecane
partitioning in multiphase systems. Environ.Sci. Technol. 28(12) : 1993.
Wang, X.J. and M.L. Brusseau. 1993. Solubilization
of some low-polarity organic compounds byhydroxypropyl-b-cyclodextrin. Environ. Sci.
Technol. 27(13) : 2021-2025.
Received date : 18/10/99Accepted date : 30/12/99

NOTICE TO CONTRIBUTORS
The Kasetsart Journal (Natural Science) is published by Kasetsart University Research andDevelopment Institute (KURDI) under authorization by Kasetsart University to serve the interest of
scientists and researchers. Research articles must report original work in any aspects of natural sciences.
The Journal emphasizes and promotes the highest standards of ethics in the conduct of reporting research.Appropriateness is judged by the degree of application of the scientific approach to study of problems
related to natural sciences. The governing operational factor is the general soundness and integrity of
science being reported as judged by peer reviewers and/or the scientific editors. The Journal is publishedquarterly and dues in March, June, September and December.
GENERAL EDITORIAL POLICIES
Authorship criteria and author responsibilitiesKasetsart Journal is proud of the high quality of research reported in its journals and is dedicated
to maintaining its high level of professionalism. However, because of reports of fraud and plagiarism in
the scientific literature, we remind authors of their obligations when submitting manuscripts for publication.Authorship criteria. Authorship is restricted to those who (1) have contributed substantially to one or
more of the following aspects of the work (conception, planning, execution, writing, interpretation, and
statistical analysis) and (2) are willing to assume public responsibility for the validity of the work.Exclusivity of work. The corresponding author must verify, on behalf of all authors (if more than one),
that neither this manuscript nor one with substantially similar content has been published, accepted for
publication, or is being considered for publication elsewhere.
CopyrightCopyright to published manuscripts becomes the sole property of the KURDI. In instances
where the work cannot be copyrighted (works authored solely by government employees as part of their
employment duties), this requirement is waived.
Reproduction of all or a portion of a Kasetsart Journal article by anyone, excluding authors, isprohibited, unless permission is received from KURDI. Authors have the right to reproduce extracts from
the paper with proper acknowledgment and retain the right to any patentable subject material that might
be contained in the article.
DisclaimerOpinions expressed in articles published in this journal are those of the author(s) and do not
necessarily represent opinions of the KURDI. KURDI does not guarantee the appropriateness for any
purpose, of any method, product, process, or device described or identified in an article. Trade names, when
used, are only for identification and do not constitute endorsement by KURDI.
Criteria for manuscript acceptanceManuscript acceptability is based primarily on appropriateness and importance of the topic;

clarity of objectives; originality; appropriateness of the experimental design, methods and statisticalanalysis; depth of the investigation; substance of the results; thoroughness with which the results are
discussed and appropriateness of the conclusions.
ReprintsFollowing acceptance of a paper and prior to publication, the author will be given appropriate
number of reprints free of charge.
MANUSCRIPT REQUIREMENTS
Unless otherwise stipulated, the style and format of manuscripts submitted to Kasetsart Journal
(Natural Science) should follow the “Scientific Style and Format: The CBE Manual for Authors, Editorsand Publishers” 1994, 6th ed. (Cambridge University Press, New York). For convenience, refer to articles
in the latest issue of the journal for details or contact the Kasetsart Journal editorial office with your
questions.Use the English language (American spelling and usage) and the SI system (Système International
d’Unitès, often referred to as “International Units”) for measurements and units.
Manuscripts on original researchManuscripts on original research should include the following elements.
Title page, as p. 1. Include:
• Full title (be concise)
• Name(s) of author(s) and author affiliation(s) with complete address(es)• Contact information for the corresponding author, including full name, complete mailing address,
telephone, fax, and electronic mailing address.
• Previous address of author(s) if research was conducted at a place different from current affiliation.
Abstract Page, as p. 2. Include:
• An abstract not exceeding 200 words; all acronyms and abbreviations defined; no references cited.State what was done, how it was done, major results, and conclusions.
• Five key words for indexing purposes.
Introduction. In two pages or less, review pertinent work, cite key references, explain importance of
the research, and state objectives of your work.
Materials and Methods. Provide sufficient detail so work can be repeated. Describe new methods in
detail; accepted methods briefly with references. Use subheadings as needed for clarity.
Use of Trade names. Trade names are to be avoided in defining products whenever possible. Ifnaming a product trade name cannot be avoided, the trade names of other like products also should be
mentioned, and first use should be accompanied by the superscript symbol TM followed in parentheses by
the owner’s name. If a product trade name is used, it is imperative that the product be described in sufficient

detail so the nature of the product will be understood by professionally trained readers. Do not use tradenames in titles.
Use of abbreviations and acronyms. At fist text use, define in parentheses. Do not use
abbreviations and acronyms in titles.Statistical analysis. If variation within a treatment (coefficient of variation, the standard
deviation divided by the mean) is small (less than 10%) and difference among treatment means is large
(greater than 3 standard deviations), it is not necessary to conduct a statistical analysis. If the data do notmeet these criteria, appropriate statistical analysis must be conducted and reported.
Results and Discussion. Present and discuss results concisely using figures and tables as needed. Donot present the same information in figures and tables. Compare results to those previously reported, and
clearly indicate what new information is contributed by the present study.
Conclusion. State conclusions (not a summary) briefly.
Literature Cited. List only those references cited in the text. Required format of references is describedbelow.
Acknowledgments. List sources of financial or material support and the names of individuals whosecontributions were significant but not deserving of authorship. Acknowledgment of an employer’s
permission to publish will not be printed.
Appendix. This section is rarely needed in a research paper but can be added if deemed necessary (e.g.,
complicated calculations, detailed nomenclature).
Tables. Number each table with Arabic numerals. Place a descriptive caption at the top of each table.
Print one table per page. Columns and their headings are usually (but not always) used to display the
dependent variable(s) being presented in the table. Foot-notes should be identified by lower case lettersappearing as superscripts in the body of the table and preceding the footnote below the table. The same data
should not appear in both tables and figures.
Figures (graphs, charts, line drawings, photographs). Supply one illustration per page with the figurenumber indicated in the lower comer of page; figure and figure numbers should appear on the same page.
Figure captions should be double-spaced and listed consecutively on page(s) separate from figures: use
Arabic numerals. Include one original set of illustrations with an original manuscript, marked,“ORIGINAL.” Illustrations for other copies of the manuscript may be photocopies, provided they are clear.
Exceptions are photomicrographs, gel electrophoretic patterns, etc.; furnish four glossy photographs for
each of these.Authors are responsible for obtaining permission to reproduce previously copyrighted illustrations.
Proof or certification of permission to reproduce is required.
Lettering, data lines, and symbols must be sufficiently large so as to be clearly visible when the figureis reduced to a size commonly used in the journal. When a color presentation is deemed necessary, please
note this in the cover letter of the submission.

REFERENCE FORMAT
Manuscripts should follow the name-year reference format of the Council of Science Editors(formerly Council of Biology Editors). Cite only necessary publications. Primary rather than secondary
references should be cited, when possible. It is acceptable to cite work that is “in press” (i.e., accepted but
not yet published) with the pertinent year and volume number of the reference. Work that is “submitted”but not yet accepted should not be cited.
In text. Cite publications in text with author name and year. Three or more authors use “et al.”
In parenthetical citations, separate author and year with a comma. Use suffixes a, b and c to separatepublications in same year by the same author. Semi-colons separate citations of different authors. Cite two
or more publications of different authors in chronological sequence, from earliest to latest. For example:
• The starch granules are normally elongated in the milk stage (Brown, 1956).• Smith et al. (1994) reported growth on vinasse.
• …and work (Dawson and Briggs 1984,1987) has shown that . . .
• …and work (Dawson 1984; Briggs 1999) has shown that . . .
In Literature Cited section. List only those references cited in the text. References should be
listed alphabetically by the first author’s last name. Single author precedes same author with Co-authors.Type references flush left as separate paragraphs. Do not indent manually. Let the text wrap with first line
hanging indented. Use the following format.
• Journal articles: Author(s). Year. Article title. Journal title, volume number: inclusive pages.Example: Citation in text: (Smith et al., 1999)
Smith J.B., L.B. Jones and K.R. Rackly. 1999. Maillard browning in apples. J. Food Sci. 64: 512-518.
• Books: Author(s) or editor(s). Year. Title. Publisher name. Place of publication. Number of pages.Example: Citation in text: (Spally and Morgan, 1989)
Spally M.R. and S.S. Morgan. 1989. Methods of Food Analysis. 2nd ed. Elsevier. New York. 682 p.
• Chapter: Author(s) of the chapter. Year. Title of the chapter, pages of the chapter. In author(s) oreditor(s). Title of the book. Publisher. Place of publication.
Example: Citation in text: (Rich and Ellis, 1998)
Rich R.Q. and Ellis M.T. 1998. Lipid oxidation in fish muscle, pp. 832-855. In Moody J.J. and W. Lasky,(eds). Lipid Oxidation in Food. 6th ed. Pergamon. New York.
For journal abbreviations and other examples of reference formats please refer to articles in a2000 issue of this journal or contact the editorial office at KURDI.
EDITORIAL REVIEW AND PROCESSING
Peer Review. All submitted manuscripts are screened by the Scientific Editor for importance,substance, appropriateness for the journal, general scientific quality, and amount of new information
provided. Those failing to meet current standards are rejected without further review. Those meetings these
initial standards are sent to expert referees for peer review. Referees identities are not disclosed to the

author. Author identities are also not disclosed to the referees. Referee comments are reviewed by anAssociate Editor and he/she, often after allowing the author to make changes in response to the referee’s
comments, advises the Scientific Editor to either accept or reject the manuscript. The Scientific Editor
informs the author of the final decision.Rejected manuscripts. Rejected manuscripts may, in some instances, be appropriate for
publication in other journals. Rejected manuscripts including original illustrations and photographs will
be returned to authors.Accepted manuscripts. The author(s) will be asked to review a copyedited pageproof. The
author(s) is responsible for all statements appearing in the galley proofs. The author will be informed of
the estimated date of publication.Inquiries regarding status of the manuscript. Direct inquiries to: Orawan Wongwanich,
Manager, Kasetsart University Research and Development Institute (KURDI), Kasetsart University, 50
Pahonyothin Road, Chatuchak, Bangkok 10900, Tel. 66-2-579-0032, 579-5548, 561-1474, Fax. 66-2-561-1474, E-mail: [email protected].
INSTRUCTIONS FOR SUBMITTING A MANUSCRIPT
Submit the following items.Cover letter. Identify the corresponding author and provide his/her full name, address, numbers
for telephone and fax, and e-mail address.
Manuscript. Double-space all components of the manuscript except tables. Type on one sideof A4 paper. Use one inch margins. Number all pages.
Send an original manuscript (with original figures, marked “ORIGINAL”) and 3 photocopies.
Hard copies are required. Staple each manuscript copy, including the original manuscript in the upper leftcomer. Include no paper clips or binders.
Disk. Include an IBM-formatted, 3-l/2" disk, containing the manuscript in Microsoft Word
(version 97 preferred).
MAIL MANUSCRIPT TO:
Orawan Wongwanich, Manager,
Kasetsart University Research and Development Institute (KURDI)Kasetsart University,
50 Pahonyothin Road, Chatuchak,
Bangkok 10900, ThailandTel. 66-2-579-0032, 579-5548, 561-1474
Fax. 66-2-561-1474
E-mail: [email protected]

PRE-SUBMISSION CHECKLIST
(See “Instructions for Authors” for additional information.)
Cover letter & form❏ Full contact information for the corresponding author (full name, address, phone,
fax, e-mail).
Manuscript❏ Original manuscript (with original figures, marked çORIGINALé)❏ Three photocopies
❏ Page numbering
❏ Each manuscript stapled in upper left corner (no Paper clips or binders)❏ Abstract of less than 200 words
❏ 5 key words
❏ Figure captions listed consecutively on a page separate from figuresDISK
❏ 3-l/2 in IBM-formatted disk with full manuscript Microsoft Word (version 97 preferred) file.
(Submission of the title page and abstract by electronic means is an acceptable alternative.)

Text and Journal Publication Co., Ltd.54 Chulalongkon 42 Phatumwon Bangkok 10330 ‚∑√. 611-7312, 215-4470, 215-0155