educators' perceptions of high-stakes testing in low ... - core
TRANSCRIPT
Walden UniversityScholarWorks
Walden Dissertations and Doctoral Studies Walden Dissertations and Doctoral StudiesCollection
2015
Educators' Perceptions of High-Stakes Testing inLow and High Poverty SchoolsNatasha Marie DomondWalden University
Follow this and additional works at: https://scholarworks.waldenu.edu/dissertations
Part of the Educational Psychology Commons, and the Psychology Commons
This Dissertation is brought to you for free and open access by the Walden Dissertations and Doctoral Studies Collection at ScholarWorks. It has beenaccepted for inclusion in Walden Dissertations and Doctoral Studies by an authorized administrator of ScholarWorks. For more information, pleasecontact [email protected].
brought to you by COREView metadata, citation and similar papers at core.ac.uk
provided by Walden University
Walden University
College of Social and Behavioral Sciences
This is to certify that the doctoral dissertation by
Natasha Domond
has been found to be complete and satisfactory in all respects, and that any and all revisions required by the review committee have been made.
Review Committee
Dr. Sandra Caramela-Miller, Committee Chairperson, Psychology Faculty Dr. Joseph Rocchio, Committee Member, Psychology Faculty Dr. Donna Heretick, University Reviewer, Psychology Faculty
Chief Academic Officer Eric Riedel, Ph.D.
Walden University 2015
Abstract
Educators’ Perceptions of High-Stakes Testing in Low and High Poverty Schools
by
Natasha M. Domond
EdS, Florida A&M University, 2007
MS, Florida A&M University, 2006
Dissertation Submitted in Partial Fulfillment
of the Requirements for the Degree of
Doctor of Philosophy
Psychology
Walden University
November 2015
Abstract
Since the development and implementation of the No Child Left Behind Act (NCLB) of
2002, educators have received pressure from local, state, and federal policyholders for
students to achieve academically and for schools to make adequate yearly progress to
avoid state and federal sanctions. The purpose of this study was to examine educators’
perceptions of the effects of high-stakes testing and the accountability policies in high
poverty and low poverty schools. The theoretical frameworks were conservation of
resources theory, jobs demands-resources model, and job autonomy and control theory.
Research questions focused on understanding educators’ perception of high-stakes testing
regarding curricula, instructional practices, available instructional support, and job
satisfaction. A cross-sectional, quasi-experimental design was used to obtain both
quantitative and qualitative with a sample of 200 teachers and 6 principals, respectively.
To investigate the differences in responses between teachers, a two-way factorial analysis
of variance was used. Quantitative findings indicated that teachers in lower poverty
schools had a lower perception when it came to the curricula, instructional method, and
instructional support. Teachers in lower poverty schools expressed higher job
satisfaction. Qualitative findings showed that principals felt that the Georgia Professional
Standards teaches how to pass the test and does not give students the opportunity to apply
what is learned. These findings illuminate the role of poverty in high-stakes testing and
accountability policies; they also assist policymakers and stakeholders in identifying
supports needed to ensure that all children succeed.
Educators’ Perceptions of High-Stakes Testing in the Low and High Poverty Schools
by
Natasha M. Domond
EdS, Florida A&M University, 2007
MS, Florida A&M University, 2006
Dissertation Submitted in Partial Fulfillment
of the Requirements for the Degree of
Doctor of Philosophy
Psychology
Walden University
November 2015
Dedication
I would like to dedicate my research to all of the educators, mentors, and support staff
who work extremely hard in making sure all students live up to their optimal potential.
The passion and commitment do not go unnoticed. You may not hear it all the time, but
just know you are sincerely appreciated.
Acknowledgments
First and foremost, I would like to thank God for seeing me through and helping
me make my dreams possible. I would also like to thank my chair, Dr. Caramela-Miller;
committee member, Dr. Rocchio; and my University Research Reviewer (URR), Dr.
Heretick for the words of encouragement and suggestions during this doctoral writing
process. This process has not been an easy road, but given Dr. Caramela-Miller’s
guidance and motivation to continue, I was able to get through this process. For this, I am
forever grateful.
I would also like to thank the educators who have helped me develop and pushed
me to think in-depth about my research and the direction I should go. I would also like to
thank the principals who gave me the opportunity to include their school in my research
and participate in the interviews.
A special thank you goes to my family, friends, editors and colleagues (Lindsey,
Antonya, Dr. Etienne, Kia, Joshua, Dr. Trimble and Dr. Jacobs) for being there
continuously and for being supportive over the years. My son, Darius, selflessly gave up
mommy time in order for me to write and rewrite drafts. Darius is my primary source of
motivation to complete my dissertation and to continue to strive to make a better life for
him. I am forever grateful to all those at whatever organization and to everyone else I did
not mention who contributed in some fashion to the successful completion of this
dissertation.
i
Table of Contents
List of Tables ...................................................................................................................... v
List of Figures ................................................................................................................... vii
Chapter 1 ............................................................................................................................. 1
Introduction ......................................................................................................................... 1
Background of the Study .....................................................................................................3
Problem Statement ...............................................................................................................9
Purpose of the Study ..........................................................................................................10
Research Questions and Hypotheses .................................................................................11
Theoretical Framework for the Study ................................................................................15
Nature of the Study ............................................................................................................17
Definitions ..........................................................................................................................18
Assumptions .......................................................................................................................22
Scope and Delimitations ....................................................................................................22
Limitations .........................................................................................................................23
Significance ........................................................................................................................23
Summary ............................................................................................................................24
Chapter 2 ........................................................................................................................... 26
ii
Introduction ........................................................................................................................26
Literature Search Strategy ..................................................................................................26
Theoretical Foundation and Conceptual Framework .........................................................27
Literature Review Related to Key Variables and/or Concepts ..........................................30
Summary and Conclusions ................................................................................................54
Chapter 3 ........................................................................................................................... 56
Introduction ........................................................................................................................56
Research Design and Rationale .........................................................................................56
Research Questions and Hypotheses .................................................................................57
Methodology ......................................................................................................................61
Threats to Validity .............................................................................................................68
Summary ............................................................................................................................80
Chapter 4 .......................................................................................................................... 82
Introduction ........................................................................................................................82
Data Collection ..................................................................................................................82
Summary and Transiton ...................................................................................................133
Chapter 5: Discussion, Conclusions, and Recommendations ......................................... 137
iii
Introduction ......................................................................................................................137
Interpretation of Findings ................................................................................................137
Limitation of Study ..........................................................................................................143
Recommendations ............................................................................................................144
Implications for Social Change ........................................................................................145
Conclusion .......................................................................................................................146
References ....................................................................................................................... 147
Appendix A: Teacher Demographic Questions .............................................................. 166
Appendix B: Teacher Paper/Pencil Survey Instrument .................................................. 167
Appendix C: Job Satisfaction Scale- Paper/Pencil Survey ............................................. 171
Appendix D: Teacher Computer Survey Instrument ...................................................... 175
Appendix E: Job Satisfaction Scale-Computer Survey .................................................. 179
Appendix F: Principal Paper/Pencil Survey Instrument ................................................. 183
Appendix G: Principal Computer Survey Instrument ..................................................... 188
Appendix H: Teacher Consent Form .............................................................................. 190
Appendix I: Principal Consent Form ............................................................................. 192
Appendix J: Teacher Advance Notice Letter .................................................................. 194
Appendix K: Principal Advance Notice Letter ............................................................... 195
Appendix L: Teacher Follow-up Letter .......................................................................... 196
iv
Appendix M: Principal Follow-up Letter ....................................................................... 197
Appendix N: Rater Confidentiality Agreement .............................................................. 198
v
List of Tables
Table 1. Planned Sample Size…………………... ........................................................... 62
Table 2. Assessing the Variables………………… .......................................................... 72
Table 3. Frequency and Percentages for Participants’ Demographics ............................. 84
Table 4. Reliability……………………………….. .......................................................... 85
Table 5. Descriptives for Key Variables (N = 196) .......................................................... 87
Table 6. Between Subjects Effects for Perception of Curriculum .................................... 88
Table 7. Perception of Curriculum Means for Main Effects and Interactions .................. 89
Table 8. Between Subjects Effects for Perception of Instructional Methods ................... 94
Table 9. Perception of Instructional Methods Means for Main Effects and Interactions . 95
Table 10. Between Subjects Effects for Perception of Instructional Support ................. 100
Table 11. Perception of Instructional Support Means for Main Effects and Interaction. 100
Table 12. Between Subjects Effects for Job Satisfaction ............................................... 104
Table 13. Job Satisfaction Means for Main Effects and Interactions ............................. 104
Table 14. Definitions of Themes for Research Question 9 ............................................. 107
Table 15. Frequency of Themes for Research Question 9 .............................................. 108
Table 16. Frequency of Themes for Research Question 9 for Low and High Poverty
School…………………………………………….. ....................................................... 112
Table 17. Definitions of Themes for Research Question 10 ........................................... 113
Table 18. Frequency of Themes for Research Question 10 ............................................ 113
Table 19. Frequency of Themes for Research Question 10 for Low and High Poverty
Schools…………………………………………………. ............................................... 121
vi
Table 20. Definitions of Themes for Research Question 11 ........................................... 122
Table 21. Frequency of Themes for Research Question 11 ............................................ 122
Table 22. Frequency of Themes for Research Question 11 for Low and High Poverty
Schools……………………………………………………….. ...................................... 128
Table 23. Definitions of Themes for Research Question 12 ........................................... 128
Table 24. Frequency of Themes for Research Question 12 ............................................ 129
Table 25. Frequency of Themes for Research Question 12 for Low and High Poverty
Schools……………………………………………………………. ............................... 133
vii
List of Figures
Figure 1: Plotted means for perception of curriculum by subject taught. ......................... 90
Figure 2: Plotted means for perception of curriculum by school type. ............................. 91
Figure 3: Plotted means for perception of curriculum by subject taught and school type.92
Figure 4: Plotted means for perception of instructional method by school type. ............. 96
Figure 5: Plotted means for perception of instructional method by subject taught. ......... 97
Figure 6: Plotted means for perception of instructional method by subject taught and
school type. ....................................................................................................................... 98
Figure 7: Plotted means for perception of instructional support by subject taught. ....... 101
Figure 8: Plotted means for perception of instructional support by school type. ........... 102
Figure 9: Plotted means for perception of job satisfaction by school type. .................... 105
1
Chapter 1
Introduction
There is an achievement gap between students from different socioeconomic and racial
backgrounds in primary and secondary educational institutions. For approximately 40 years,
researchers have been mindful of the significant discrepancy in academic achievement between
children who live in lower poverty communities and children who reside in higher poverty
communities (Kellow & Jones, 2008). There are several reasons for these discrepancies,
including the lack of available resources, such as books and materials, the educators’ inadequate
level of preparation, the amount of training obtained, environmental factors, family factors, and
low expectations (Waber, Gerber, Turcios, Wagner, & Forbes, 2006). Children from socially
disadvantaged backgrounds perform poorer than children who have more advantage (Waber et
al., 2008).
In an effort to close the achievement gap, policymakers at both federal and state levels
have incorporated high-stakes testing (HST) and accountability measures. Although there have
been provisional acts to decrease the achievement gaps at the state level, it was not until 2001
that federal policies incorporated the No Child Left Behind Act (NCLB, 2002) in order to offer
punishments and rewards to school districts, schools, and teachers based on the performance of
the students. In order for this particular southeastern state to meet adequate yearly progress
(AYP), the state used performance standards to provide educators with clear expectations for the
implementation of instruction, assessment, and student work. According to the state’s
department of education, the performance standards provide specific guidelines on what students
should know and master. Assessments measure these skills and knowledge sets to determine
2
how well students are able to manipulate learned information.). In order to assess these
standards, this southeastern state established a HST, designed to measure the students’ skills and
knowledge as outlined in the performance standards. The HST assessment provides academic
achievement status on multiple levels, which includes student, school, system, and state levels.
According to the state’s department of education, HST scores reveal the students’ strengths and
weaknesses in order to offer appropriate instructional interventions, according to the
performance standards.
I designed this study to examine the effects of a southeastern state’s test-based,
accountability system, that is, the performance standards and the HST. More specifically, the
study examined the educators’ perception of high-stakes testing on the curricula, instructional
method, availability of instructional supports, and the job satisfaction in the school environment.
Collectively, the information gained through analyzing the educators’ perception of test-based
accountability policies served to develop an understanding of the experiences of those in the high
and low poverty level secondary schools. Although there are numerous studies comparing
testing and accountability, few researchers have evaluated the relationship between these factors
to schools on different poverty levels.
In this introductory chapter, I provide background information focused on federal and
state-level accountability policies, as well as the involved issues and their impact. I then discuss
the purpose of the research and the research questions. I also discuss the four factors examined
and provide an overview of the proposed methodology.
3
Background of the Study
Background on NCLB
In January 2001, President George W. Bush affirmed his intention to amend the federal
Elementary and Secondary Education Act (1965). The intention was to enrich the public
education system for every child, from every background, in every part of America (United
States Department of Education, 2004a). One year later, President Bush signed into law the
NCLB Act (2002). The foundation of the NCLB accountability system is the requirement that
every school must make AYP, as measured by the performance of the students on the high-stakes
tests taken each year.
Students are required to exemplify academic achievement progress in the areas of math
and reading beginning in Grade 3 throughout high school. The scores of the high-stakes tests
must improve yearly for the school to avoid any sanctions. The score reports present the results
in percentage form, depicting the prevalence of students who meet the state required goal in each
subject and grade level. Furthermore, each state must determine whether all schools and districts
have made AYP by evaluating the percentage rates of students who have met the test score goals,
the number of test participants, the number of high school graduates, and the additional measure
of attendance for elementary and middle school students. No Child Left Behind stresses
accountability for all students. Therefore, schools are required to measure AYP for several
subgroups, including English language learners (ELL), special education students, students from
all levels of socioeconomic status (SES), and races or ethnicities (NCLB, 2002).
After two years in need of improvement status (NCLB, 2002), a school faces a series of
sanctions. During the first year of not meeting standards, known as the school improvement
4
phase, the district must provide the option to parents to transfer their child to another public
school that made AYP, including public charter schools. The failing school must also submit a
school improvement plan. Then, the local educational agency serving the failing school is
required to provide technical assistance and is specifically tasked with identifying and addressing
problems regarding providing instructional support, analyzing data from assessments, reviewing
students’ work, and exploring parental involvement (NCLB, 2002).
According to NCLB, if the school does not make AYP for another year, the impending
sanctions will include those previously noted and the requirement for the provision of
supplemental services. Furthermore, the longer period of time a school has the failing school
status, the more imposing the sanctions will become. After the fifth year of not making AYP, the
local educational agency must implement one of several alternatives, such as reopen the school
as a public charter school, implement a new curriculum, or extend the school year or school day.
There is also a requirement that each state and district issue report cards with statewide and
school-by-school data for all school districts. The primary goal of NCLB (2002) is for all
students to meet grade level expectations by the year 2014.
Background on a Southeastern State’s Implementation of NCLB The NCLB (2002) places a significant emphasis on increasing academic achievement for
all students, regardless of ethnicity, race, socioeconomic status (SES), limited English
proficiency, or students with disabilities on the local, state, and federal levels. The federal
government instructed all states to establish state academic standards and a testing protocol
aligned with the federal guidelines (NCLB, 2002). The United States Department of Education
5
approved this southeastern state’s final revision of the state accountability policy on June 7,
2004.
Revising and aligning the current Quality Core Curriculum (QCC) into a new curriculum,
referred to as the state’s performance standards, was the initial step made during the modification
process of adapting the NCLB policy. In 2008, the department of education in a southeastern
region proposed that the state’s curriculum lacked substance, did not meet national standards,
and was impossible to complete in 12 years of education. Further, this ambiguous nature of the
QCC forced teachers to assume the nature and characteristics of the required teaching and
instruction, thereby not really knowing exactly how these students should be prepared to undergo
the testing. According to the department of education in a southeastern region, teachers used the
curriculum as a form of reference rather than as a guide to provide quality instruction.
The southeastern state’s department of education explained that the establishment of the
state’s performance standards was a product of the audit, comparing national standards from
other high achieving states and counties, with a gain in expertise from teachers, state and
national professionals, and consultants. The department of education in a southeastern region
also stated that the premise of the state’s performance standards is to provide teachers with
explicit guidance in terms of their expectations of students, more in-depth standards for content,
and the implementation of teachers’ best practices. The department of education also noted that
the previous QCC based the HST on the current state’s performance standards.
According to the southeastern state’s department of education, as a measurement for
AYP, the middle schools utilize the HST. Students who are in the special education program
also used the state’s alternate assessment. To ensure that all students are performing adequately

6
by 2014 the state’s department of education will increase the Annual Measurable Objectives
(AMO) every year in math and reading for all students regardless of subgroups categories.
Another revision required that all teachers be highly qualified in the content areas of certification
(United States Department of Education: Office of Elementary and Secondary Education, 2008).
This southeastern state incorporated three criteria in order for schools to meet AYP. All
public schools must meet the established AMO, including all subgroups of students in the areas
of mathematics, reading, and English/language arts on the HST, according to the state’s
department of education. Secondly, in the core subject areas, at least 95% of each subgroup
must take the test. In addition, each school must decide on a second criterion, including
attendance, meeting standards on the science or social science portion of the HST or the writing
assessment, or receive a percentage that exceeds HST standards in the areas of mathematics,
English/language arts, science, or social studies. The state’s department of education provides
alternative ways for schools to make AYP, which include confidence interval, multiyear
averaging, direct comparison of students’ performance between the HST and AMO, safe harbor,
and federal flexibility for schools that did not make AYP due to the students with disabilities.
In an effort for parents to make informed decisions about students’ school placement and
supplemental services, the southeastern region department of education guarantees that scores be
reported for the HST and the state’s alternate assessment in a timely manner. This is important
because it provides the schools with the opportunity to develop and implement the school
improvement plan, provides public school choice, and provides supplemental or instructional
extension services, all of which are mandated by the NCLB policy.
7
This southeastern state recently developed a set of core standards in English/language arts
and mathematics for grades kindergarten through Grade 12. As a result, the Common Core State
Standards (CCSS) were established and released on June 2, 2010. According to the state’s
department of education, the premise of the CCSS is to prepare students for success in college
and 21st century careers. In other words, the goal of CCSS is to provide students with the skills
necessary to become successful in college and in their careers, which is consistent with the
expectations across colleges and careers from other states, and requires higher order thinking so
that learned materials are relevant. In addition, according to the southeastern state’s department
of education, the CCSS was the next step from the state’s performance standards. The timeline
for implementation of the CCSS in the classrooms was during the 2012-2013 school year. The
focus of this research study was primarily on the state’s performance standards.
While there are volumes of research comparing testing and accountability, few
researchers have evaluated the relationship between these factors to schools on different poverty
levels. There are even fewer studies focused on secondary schools. Previous researchers have
focused on high poverty schools without comparisons to low poverty schools. They also focused
on a small sample size of different poverty level schools (Sunderman & Mickelson, 2000;
Sunderman, Tracey, Kim, & Orfield, 2004).
Previous researchers have found that various poverty levels have significantly more
influence on children’s academic performance in school than on management, operations, and
policies of the schools (Burney & Beilke, 2008; Cuthrell, Stapleton, & Ledford, 2010). Poverty
level is a strong indicator of academic success for children. Students who are in low poverty
schools are more likely to perform better than those who are in the high poverty schools (Choi,
8
Seltzer, Herman, & Yamashiro, 2004). Everson and Millsap (2004) found there is a strong
correlation between students living in poverty and standardized achievement scores among high
school students.
Focusing on the consequences of high-stakes testing does not provide a comprehensive
understanding of its effects; therefore, this research examined effects between two distinct
contexts of low and high poverty schools. According to Aud et al. (2011), high poverty schools
are public schools where more than 75% of the students are eligible for the free or reduced-price
lunch (FRPL). Aud et al. also defined low poverty schools as schools with 25% or fewer
students eligible for FRPL. Furthermore, the percentage of students eligible for the FRPL
program provides an indicator for the concentration of low-income students within a school.
I designed this research to focus on the middle school level (Grades 6-8) for several
reasons. The first reason is that primary schools have been the site for most test-based
accountability practices. In Chapter 2, I discussed previous research with well-represented
middle schools. Hamilton et al. (2007) further demonstrated that educators’ responses were
general across all grade levels. However, the discrepancy between grade levels was not specific
and the sampling did not exclusively include middle schools.
Further, teachers in the middle schools present instruction in specialty content areas,
whereas elementary school teachers teach all of the required subjects. Focusing on middle
schools would allow me the unique opportunity to examine the relationship between those who
teach the tested subjects (reading, English/language arts, and mathematics) and those who teach
the nontested subjects (social studies, science). In addition, middle school teachers typically
have a greater number of students per class when compared to elementary school teachers
9
(Wells, 2010). Middle school teachers teach the same subject over several periods during the
day, which are approximately five classes with 30 to 35 students in each class. Wells (2010)
noted that elementary school teachers have the same limited number of pupils, perhaps in the
same room, the majority of the day. Therefore, middle school teachers who teach tested subjects
are responsible for ensuring students perform satisfactorily on high-stakes testing.
The third reason for focusing on middle schools is because it is likely for test scores to
decrease as the grade level increases, middle school educators may be under greater pressure in
terms of testing and accountability policies. Previous test score data, from the past several years
in the school district selected for this proposed research, revealed the percentage of students who
performed on Level 3, the exceeds standards level, were consistently lower in eighth grade than
in elementary grades. For example, Reading test scores from of 2009 to 2010 revealed 13%
more third grade students fell in the exceeds standards range when compared to eighth grade
students (Wells, 2010).
There was varied performance between elementary and middle schools. In schools that
historically scored poorly, middle school educators are more likely to allocate a majority of their
efforts to making AYP. In additional, middle school teachers feel more pressure due to an
overemphasis of high-stakes testing.
Problem Statement
At both the state and federal levels, high-stakes testing and accountability policies have
been implemented to reduce the academic achievement gap and increase opportunities for
children who attend high poverty schools. No Child Left Behind (2002) places accountability on
educators to meet AYP in the various schools, regardless of a particular school’s poverty level,
10
and this requirement continues to be a challenge. Ingersoll (2004) suggested a social expectation
that high poverty schools perform commensurate with low poverty schools. However, those
students in the high poverty schools may score academically and motivationally lower than their
counterparts, and may have fewer resources and limited parental involvement (Ingersoll, 2004).
In addition, due to the high emphasis on testing, many teachers perceive their working conditions
as being less favorable than in the past. Given the stress of HST, it heightens job pressures and
reduces professional satisfaction (Darling-Hammond, 2004; Hale-Jinks, Knopf, & Kemple,
2006; Ingersoll, 2004). It is important to understand how educators respond to the accountability
policies related to student performance, from the perspective of both teachers and principals in
both high and low poverty schools. As a result, researchers have not focused extensively on how
testing and accountability relates to different poverty levels of schools.
Purpose of the Study
The purpose of the study was to examine a group of teachers who teach in low and high
poverty schools and their perception of the testing accountability policy. Specifically, I focused
on the different perceptions of middle school teachers in the areas of curricula, available
resources, instructional method, and job satisfaction. I assessed the differences using
instruments designed to compare the impact of accountability, developed by Vogler (2008), and
to measure level of job satisfaction. Additionally, the purpose of this qualitative study was to
examine the perception of principals in high and low poverty schools. Principals completed
open-ended questions to describe their perception of the current curricula in their schools,
instructional methods, available resources, and job satisfaction.
11
Research Questions and Hypotheses
Individual schools may respond differently to high-stakes testing and accountability
policies, depending on the poverty level of the school. As a result, I divided the research
questions for this study in four groups. These groups consisted of middle school teachers and
principals from both high and low poverty schools. The contextual factors for each group were
curricula, instructional methods, available instructional support, and job satisfaction.
Research Question 1 (Quantitative)
Are there group differences between middle school teachers from low and high poverty
schools regarding perception of curricula?
Null Hypothesis (H01): There will be no group differences between middle school teachers
from low and high poverty schools regarding the current curricula.
Alternative Hypothesis (H11): There will be group differences between middle school
teachers from low and high poverty schools regarding the current curricula.
Research Question 2 (Quantitative)
Are there group differences between middle school teachers from low and high poverty
schools regarding perception of instructional methods?
Null Hypothesis (H02): There will be no group differences between middle school teachers
from low and high poverty schools regarding the current instructional method.
Alternative Hypothesis (H12): There will be group differences between middle school
teachers from low and high poverty schools regarding the current instructional method.
12
Research Question 3 (Quantitative)
Are there are group differences between middle school teachers from low and high poverty
schools regarding perception of availability of instructional support?
Null Hypothesis (H03): There will be no group differences between middle school teachers
from low and high poverty schools regarding the availability of instructional support.
Alternative Hypothesis (H13): There will be group differences between middle school
teachers from low and high poverty schools regarding the availability of instructional support.
Research Question 4 (Quantitative)
Are there group differences between middle school teachers from low and high poverty
schools regarding perception of job satisfaction?
Null Hypothesis (H04): There will be no group differences between middle school teachers
from low and high poverty schools regarding their level of job satisfaction.
Alternative Hypothesis (H14): There will be group differences between middle school
teachers from low and high poverty schools regarding their level of job satisfaction.
Research Question 5 (Quantitative)
Are there group differences between middle school teachers who teach tested subjects and
teachers who teach non-tested subjects regarding perception of curricula?
Null Hypothesis (H05): There will be no group differences between middle school teachers
who teach tested subjects and teachers who teach nontested subjects regarding the current
curricula.
13
Alternative Hypothesis (H15): There will be group differences between middle school
teachers who teach tested subjects and teachers who teach nontested subjects regarding the
current curricula.
Research Question 6 (Quantitative)
Are there group differences between middle school teachers who teach tested subjects and
teachers who teach non-tested subjects regarding perception of instructional method?
Null Hypothesis (H06): There will be no group differences between middle school teachers
who teach tested subjects and teachers who teach nontested subjects regarding the current
instructional method.
Alternative Hypothesis (H16): There will be group differences between middle school
teachers who teach tested subjects and teachers who teach non-tested subjects regarding the
current instructional method.
Research Question 7 (Quantitative)
Are there group differences between middle school teachers who teach tested subjects and
teachers who teach non-tested subjects regarding perception of instructional support?
Null Hypothesis (H07): There will be no group differences between middle school teachers
who teach tested subjects and teachers who teach nontested subjects regarding the current
instructional support.
Alternative Hypothesis (H17): There will be group differences between middle school
teachers who teach tested subjects and teachers who teach nontested subjects regarding the
current instructional support.
14
Research Question 8 (Quantitative)
Are there group differences between middle school teachers who teach tested subjects and
teachers who teach nontested subjects regarding perception of job satisfaction?
Null Hypothesis (H08): There will be no group differences between middle school teachers
who teach tested subjects and teachers who teach nontested subjects regarding their level of job
satisfaction.
Alternative Hypothesis (H18): There will be group differences between middle school
teachers who teach tested subjects and teachers who teach nontested subjects regarding their
level of job satisfaction.
Research Question 9 (Qualitative)
What are the perceptions of middle school principals from low and high poverty schools
regarding their perception of curricula?
Research Question 10 (Qualitative)
What are the perceptions of middle school principals from low and high poverty schools
regarding their perception of instructional methods?
Research Question 11 (Qualitative)
What are the perceptions of middle school principals from low and high poverty schools
regarding their perception of availability of instructional support?
Research Question 12 (Qualitative)
What are the perceptions of middle school principals from low and high poverty schools
regarding their perception of availability of job satisfaction?
15
Theoretical Framework for the Study
The conservation of resources theory (COR) is a foundational theory that may assist in
understanding why lost resources have a greater impact on job satisfaction than gained resources
(Hobfoll, 1989, 2001). The jobs demands-resources (JD-R) Model was also utilized, which
describes that individuals can avoid the negative effects of stress if adequate resources are
available (Hakanen, Bakker, & Schaufeli, 2006). Lastly, job autonomy and control makes
teachers more satisfied (Pearson & Moomow, 2005).
The JD-R Model assists in understanding teachers’ stress. This model serves to explain if
resources are available to meet the high demands of NCLB accountability policies, then teachers
will experience low levels of stress and burnout. Consequently, job demand alone does not
result in stress or burnout if the resources are available to meet those demands. The JD-R Model
consists of two broad categories, which are job demands and job resources. Job demand relates
to different facets of a job, which involve physical, social, psychological or organizational
stability (Demerouti, Bakker, Nachreiner, & Schaufeli, 2001). Researchers have found higher
job demand occurs when there are high expectations of teachers (Hakanen, et al., 2006). In this
research, there was an examination of work overload in efforts to describe educators’
psychological pressure (Skaalvik & Skaalvik, 2009).
The JD-R Model also describes characteristics of a job, which involve physical, social,
psychological, and organizational stability, in relation to reducing job demands and its
relationship with psychological and physiological costs, efficiency in accomplishing work goals,
and opportunities to encourage personal growth, learning, and development. For that reason, job
resources are not only important for teachers to become self-sufficient and to be able to cope
16
with job demands but also it serve as teachers’ independence (Hakanen, et al., 2006).
Researchers have found that there is a strong correlation between lack of resources and the
increase of educators’ burnout. The relationship between high demands/lack of job resources to
burnout/lack of worker engagement is a description of the JD-R model. This research study
focused on job control (Taris, Schreurs, & Van Iersel-Van Silfhout, 2001) and supervisory
support (Coladarci, 1992; Leiter & Maslach, 1988; Rosenholtz & Simpson, 1990).
The demand-control model, also known as the job strain model, describes autonomy and
control established by Scandinavian researchers in the late 1970s (Karasek, 1979; Karasek,
Baker, Marxer, Ahlbom, & Theorell, 1981; Karasek & Theorell, 1990). Job demands, such as
workload, deadline, and decision latitude, including autonomy and control, are factors that
explain job strain (Guglielmi & Tatrow, 1998). The relationship between these two factors can
either predict positive or negative correlations to job strain. For example, the higher the decision
control and the lower job demands, then the lower the amount of psychological strain. Whereas,
the lower the decision control and the higher the job demands, the greater the psychological
strain. Lowering job demands while increasing control can reduce job stress (Guglielmi &
Tatrow, 1998). This study specifically focused on the amount of control and the high job
demands involved in incorporating a specific curriculum and instructional methods in order to
meet the state’s performance standards.
Within the demand-control model, teacher autonomy is one characteristic of teacher
motivation related to job satisfaction (Pearson & Moomba, 2005). Researchers found that
teachers decide to remain in the teaching profession to preserve autonomy in the classroom
(Brunetti, 2001). Furthermore, teacher motivation and autonomy relate to both job satisfaction
17
and job stress (Davis & Wilson, 2000; Pearson & Hall, 1993). The more intrinsically motivated,
the more satisfied the teachers were in their jobs and the less stress they experienced (Davis &
Wilson, 2000). Subsequently, several other studies found constraints on autonomy, such as
perceived lack of control and sense of powerlessness, are associated to tension, frustration, and
anxiety among teachers (Bacharach, Bauer, & Conely, 1986; Blasé & Matthews, 1984; Cedoline,
1982; Dinham & Scott, 1992; Dworkin, Haney, Dworkin, & Telschow, 1990; Evers, 1987;
Lortie, 1975; Natale, 1993; Woods, 1989; & Yee, 1991).
This research also focused on available resources. Therefore, I used the COR theory to
describe three circumstances in which psychological pressure occurs. Hakanen et al. (2006)
found that these three circumstances are when resources are in jeopardy, resources lost, and
investments made and no reciprocation of those resources is given. The idea of loss of resources
is more significant than the opportunity of gaining resources. In other words, employees are less
effective in working situations where they feel they have lost resources. Hakanen et al. also
explained, according to the COR theory, this energetic process is considered as a loss process
that is expected to be more important than the gain process. Furthermore, it is important to
understand, which poor job resources are directly related to burnout and obliquely related to low
levels of work engagement.
Nature of the Study
This research uses a single-stage, cross-sectional quantitative survey design. Educators
completed a self-administered questionnaire with both closed and open-ended questions to
determine the effect of the independent variable, high and low poverty schools, on the dependent
variable, curricula, instructional practices, available instructional support, and job satisfaction. I
18
used the survey design to provide detailed information and economical and timely data collection
(Creswell, 2003). In Chapter 3, I further described the methodology.
Definitions
Academic learning time: Academic learning time is a portion of allocated time in a
subject area in which a student is actively engaged in the activities or with the learning material
being used in the classroom, and in which those activities and learning materials are aligned with
the objective of the lesson (Fisher et al., 1980).
Adequate yearly progress (AYP): A term established by the No Child Left Behind
legislation, which is a measurement used to determine whether a school system or school campus
has satisfactorily made academic achievement progress when relative to those of annual
measurable objectives. The state government labels a school as not making AYP if the school
fails to demonstrate the established percentage of students meeting or exceeding standards in
math and reading/language arts (NCLB, 2002).
Allocated time (scheduled time). Allocated time refers to the number of minutes
allocated for teaching (Carroll, 1963). Allocated time also includes the amount of time that the
state, district, school, or teacher provides the student for instruction (Berliner, 1990).
Behaviorist instructional method: The behaviorist instructional method emphasizes a
teacher-centered approach in the classrooms, in which the teacher is the transmitter of knowledge
to the student. Specific observable behaviors are for assessments. For example, lecture,
questions with one correct answer, rote drill and practice, recitation, and independent student
practice are the behaviorist instructional method approach (Ornstein & Hunkins, 2009).
19
Burnout: Burnout is considered a syndrome of exhaustion, cynicism, and reduced
professional efficacy (Maslach, Jackson, & Leiter, 1996).
Constructivist instructional methods: The constructivist instructional method approach is
when the teacher becomes the facilitator in a student-centered classroom. The student have the
opportunity to develop his/her knowledge based on discoveries or understandings obtained
through focused learning experiences. Examples of this approach in the learning environment
are open-ended discussion, student-initiated questions, problem solving, inquiry,
experimentation, cooperative learning, and individual student and group reflection (Mayer,
2004).
Curriculum: Teachers uses curriculum to teach students intended and unintended
information, skills, and attitudes (Sowell, 2000). For the purpose of this study, the pacing of
curricula, the standardization of curricula and the time of allocation across subjects.
High poverty schools: High poverty schools are public schools that have more than 75%
of the students who are eligible for the free or reduced-price lunch ([FRPL] Aud et al., 2011).
High-stakes testing: High-stakes testing (HST) is considered to be “the use of
standardized testing measures as criteria for determining the quality of schools, promotion of
children to the next grade, high school graduation, teacher bonuses, or the governance of a
school” (Gunzenhauser, 2003, pp. 52-53); “testing with substantial consequences for educators
or students” (Koretz, 2002a, p. 753).
Instructional method: Instructional method is “the elements included in instruction for
supporting the achievement of the learning objective" (Reiser & Dempsey, .p. 314).
20
Instructional support: Instructional support programs are those many and varied efforts
to intervene when learning difficulties become apparent (Walmsley & Allington, 1995). For the
purpose of this study, instructional support and resources available to teachers in order to
improve academic success and to meet AYP, such as shifting instructional resources from non-
tested subjects to tested subjects (Ladd & Zelli, 2002). Other examples include providing
additional opportunities for professional development (Rouse et al., 2007); reducing class size
(Goldhaber & Hannaway, 2004); providing additional instructional staff (i.e., classroom aides)
(Stecher & Chun, 2001); and increasing the proportion of school spending devoted to instruction
(Chiang, 2009).
Instructional time: Instructional time is considered allocated minutes per class period that
is designated to teach student specific knowledge, concepts, and skills aligned with the
curriculum, which does not include time spent during downtime, transition time, non-
instructional activities, etc. (Anderson, 1983; Aronson et al., 1998).
Job satisfaction: Job satisfaction is “a pleasurable or positive emotional state resulting
from the appraisal of one’s job or job experiences” (Locke, 1976, p. 1304).
Low poverty schools: Low Poverty Schools are public schools with 25% or fewer
students eligible for free or reduced-price lunch (FRPL; Aud et al., 2011).
Middle school: According to the state’s department of education, middle school is a
school that consist of grades six, seven and eight; usually 11-15 year-old students.
No Child Left Behind of 2001 (NCLB): On January 8, 2002, President Bush signed the No
Child Left Behind Act of 2001 (NCLB) that reauthorized the Elementary and Secondary
Education Act (ESEA). NCLB significantly raising expectations for states, local school districts,
21
and schools, in that all students have to meet or exceed state standards in reading and
mathematics within twelve years (NCLB, 2002).
Pacing of curricula: Pacing of curricula is “the speed with which students move through
the material to be learned” (Broghy, 1979, pg 736).
Perception: Perception is gaining an intelligent interest in the values of human beings;
understanding or insight into people or objects (Winker, 1988).
Performance level: According to the state’s department of education, a range of scores
that defines a specific level of performance, as articulated in the Performance Level Descriptors.
The HST has three performance levels: 1) Does Not Meet the Standard (650-799), 2) Meets the
Standard (800-849), and 3) Exceeds the Standard (850-950). In essence, the performance level
provides more meaning to the scale score.
School Improvement Plan: A document developed by a school and approved by the LEA
to serve as a blueprint for guiding the school’s continuous improvement and progress toward
identified student achievement objectives and targets (NCLB, 2002).
Standardization of curricula: In 1983, in order to guarantee that the students are learning
the same knowledge and academic skills, regardless of the school or district in which they reside,
the public education in the United States adopted a neoliberal approach, which mandated the
states to align the components of the high-stakes tests with the instructional standards (Hursh
2007).
State’s performance standards: According to the state’s department of education, the
state’s performance standards provide clear expectations for assessment, instruction, and student
work. They define the level of work necessary for a student to accomplish in order to master the
22
standards. Performance standards incorporate content standards but expand upon them by
providing suggested sample tasks, sample student work, and teacher commentary.
Teacher autonomy: The perception teachers have regarding whether they control
themselves and their work environment (Pearson & Hall, 1993).
Time: Time is the degree to which students have enough time to learn the material taught
(Carroll, 1963; Slavin, 1994).
Assumptions
For the purpose of this study, there were three assumptions. The first assumption was
that the environment of accountability established by the NCLB of 2001 would be continuing in
future education legislation. The second assumption was that the southeastern state would
continue to use the HST in order to measure students’ academic achievement set forth by state’s
performance standards. Finally, I assumed that the participants would respond honestly to the
interview questions.
Scope and Delimitations
The major delimitation of this study was the participants and the time used for this study.
I purposely selected participants from six middle schools in a public school district located in a
large suburban school district in a southeastern state. The middle schools selected demonstrated
a high or low poverty level of the school’s student population. The timeframe expected for
collecting data involved several months during the school year, during the summer and during
the new school year. I was the primary person collecting data for this study.
23
Limitations
Merriam (1998) proposed limitations in relations to the research design of a case study
research. A limitation of this case study research was the potential for bias, which might be a
factor in this study. I worked at another school in the same school district where the conducted
study took place and might have a professional relationship with some of the participants in the
study. Chapter 3 addressed the issue of potential bias in the sections titled: Threats to Data
Quality and Ethical Issues. Another limitation was the generalizability of the research. It is
unfeasible to generalize a small sample size to all public middle schools.
Significance
The significance of the study provides an understanding of the potential differential
effects of testing and accountability policies on low and high poverty schools and the issue of
test-based accountability in secondary schools. Unfortunately, due to high demands, teachers
and administrators are resorting to other measures, such as changing students’ answers on the
HST, in order to meet AYP. It is important to understand the effects of test-based accountability
measures and the way teachers respond within the classrooms when they are attempting to apply
accountability policies appropriately (Hamilton et al., 2007).
Gaining information on principals’ and teachers’ perspectives on high-stakes testing
concerning curricula, instructional methods, available instructional support, and job satisfaction
will provide administrators on the school, district, state and federal levels with valuable
information to support educators. As a result, teachers’ morale will increase while teacher
retention will decrease. This will decrease the academic achievement gap among students.
24
Summary
In Chapter 1, I introduced this study as well as background information concerning the
educators’ perception of the NCLB of 2001 accountability policies. I included information about
the current instructional issues that educators face in order to meet AYP for these students. I
explained the purpose of this study, which was to explore the principals’ and teachers’
perception of available resources, administrative support, instructional methods, and job
satisfaction in the middle school setting. The chapter included the theoretical frameworks for
this study, which entails COR (Hobfoll, 1989, 2001), JD-R (Hakanen, Bakker, & Schaufeli,
2006), and job autonomy and control (Pearson & Moomow, 2005). In addition, I presented
definition of terms, assumptions, and limitations for this study. Lastly, I described the
significance of this study in relation to positive social change concerning educators’ ability to
become effective in order to implement NCLB in Chapter 1.
In Chapter 2, I included a review of the literature related to this study. The introduction
describes the major sections of the review and organizational structure. In addition, the search
strategies used for this literature review. Major research studies related to this topic are
described, as well as major themes found in the literature. The summary and conclusion
discussed the gaps and deficiencies in the prior research, as well as the placement of this study in
the body of the literature. In Chapter 3, I included the research design and approach of these
variables, instruments used to measure these variables, setting and sample of the participants,
measures of ethical protection, and data collection and analysis. In Chapter 4, I included the
time frame for data collection and recruitment procedures, the discrepancy in data collection,
demographic data, external validity, and the reliability of the study. The results and the summary
25
of these results were also included. In Chapter 5, I will further summarize the finding of this
research. In addition, I will delve into the social change implications of this study as well as the
applications for psychologists and educators. I will discuss the limitations of this study in further
detail and describe the recommendations for further research relevant to strengths gleaned from
the current study.
26
Chapter 2
Introduction
The NCLB policy reform act created a paradigm shift in education, which placed great
emphasis on accountability and high-stakes testing (Heller, 2005). The NCLB (2001) policy
premise is to ensure all students are receiving quality education as measured by statewide testing.
The increasing demand for accountability also increased the need for standards-based reform and
high-stakes testing (Hamilton et al., 2008). This reform placed great pressure on the school,
district, and federal level to ensure schools meet AYP to avoid sanctions.
Literature Search Strategy
In exploring the impact of testing and accountability policies and the analytical
framework, I used a variety of keywords. This literature review included, but is not limited to,
journal articles contained within the academic databases of PsycINFO, PsycARTICLES,
PsycBOOKS, Psychology: a SAGE full-text database, ERIC, Education Research Complete, and
Education: a SAGE full-text database. Keywords and phrases used in the database search
included high-stakes testing, poverty, minority and instructional methods, socioeconomic status,
NCLB and stress, retention and NCLB, accountability and NCLB, urban and NCLB, job
autonomy and control, open system, stress and accountability, and poverty level and NCLB.
This comprehensive and systematic search method assisted in identifying the historical
foundation, gaps in the current literature, and need for further research comparing testing and
accountability policies in low- and high-poverty middle schools.
In the following paragraphs, I examine the conceptual framework, the role of testing and
accountability in NCLB, and the influences in high- and low-poverty level schools. The chapter
27
includes a comprehensive review of the literature relating to how the accountability policies
influence the curriculum, instructional methods, availability of instructional support, and job
satisfaction. The review also examines the impact of high-stakes testing and accountability
policies on schools, the influence of poverty level on implementation of local-level policies,
educators’ perception of NCLB, and the methodological review.
Theoretical Foundation and Conceptual Framework
The conceptual framework of the effect of NCLB centers on the educators’ perception
and change of action in order to increase test scores and to make AYP. Due to the demands of
NCLB, teachers must have the resources to assure that students receive adequate instruction.
The job demand-resources (JD-R) model describes two ways in which working conditions can
affect the employees’ health. One way is the excessive amount of stressors from a job in which
employees are unable to adapt accordingly (Bakker, Demerouti, Hakanen, & Xanthopoulou,
2007). For example, the high degree of physical, social, or organizational demands of NCLB
requires educators to apply themselves physically and/or mentally, which may cause
physiological and/or psychological stress, such as burn out and job satisfaction (Bakker et al.,
2007; Hockey, 1997). Meijman and Mulder (1998) explained job demands are not essentially
harmful to an educator’s well-being; however, job can be stressful when employees are unable to
recover from difficulties situations or cope appropriately given their employers’ expectations. For
instance, the state should prepare teachers with materials and resource for trying to ensure their
students are prepared to take and pass statewide tests. They may feel stressed if they do not have
reliable resources and materials even though the expectation is that their students will perform
adequately when compared to their peers at other schools where resources are readily available.
28
Another aspect of the JD-R model is the resources that employees receive in order to
satisfy or meet the accountability demands. According to Demerouti et al. (2001), job resources
are available in multiple forms, such as physical, psychological, social, or organizational
elements. These resources can help teachers address the physical and psychological stress of
meeting educational goals and encourage professional, personal, or learning development. For
example, these resources can include salary, administrative support, autonomy, control, and
educators’ skills and performance (Bakker et al., 2007). Resources, such as supervisory support,
influences teachers’ job satisfaction and burnout, in that if teachers feel as though their
administrators are supportive and they are there to assist them, then teachers may feel some level
of satisfaction. Leiter and Harvie (1997, 1998) examined employees who have a sense of
fairness and supportiveness from their supervisors and found that they are less likely to
experience burnout and be more accepting of significant changes. On the other hand, not
providing resources may lead to withdrawal from responsibilities and lack of motivation and
commitment (Bakker, Demerouti, & Schaufeli, 2003). This will be detrimental to students’
achievement in the classroom, which will also affect student performance on high-stakes testing
and ultimately the schools’ meeting AYP.
In order to understand how vital resources are to educators in meeting federal demands, it
is important to understand the conservation of resources theory (COR; Hobfoll, 1989, 2002).
Hobfoll explained that individuals try to acquire, preserve, and guard possessions that are
valuable, whether materialistically, personally, socially, and/or energetically. Individuals may
experience stress if their jobs are threatened or if individuals’ resources deleted (Hobfoll, 1989,
2002). For example, a decline in funding for programs and resources, such as instructional
29
materials, salary, professional development, and available training, may affect teachers’ job
satisfaction. The decrease in any of these programs and/or resources will have some effect on
students’ performance.
Policy makers in the U.S. Department of Education set the standards of NCLB policy on
the federal level in which states, school districts and schools must adhere too. These demands
may affect principals’ and teachers’ autonomy and control. Therefore, the framework that
conceptualizes this aspect is the job autonomy and control. In order to have an efficient
organization, it is important to provide employees with autonomy and allow them to be included
in the decision-making process (Ozturk, 2011). In an education reform shift, such as the
accountability policy act, teachers’ autonomy is encouraged (Ozturk, 2011). Pearson and
Moomaw (2006) further explain that in order to solve the current dilemma with the schools,
administrators should concede autonomy and give teachers’ power. Relinquishing creative
power to teachers gives them the opportunity to have effective decision-making control in
planning educational instructions, methods, curriculum, and materials (Pearson & Moomaw,
2006). Encouraging teacher autonomy has many beneficial factors. It will give teachers some
ownership in implementing measures in order for students to perform adequately, which will also
affect job satisfaction. Acknowledging the teachers’ professional expertise and giving them the
power to take more control, guarantees that their responsibly and job role will be accomplished
appropriately (Ozturk, 2011).
30
Literature Review Related to Key Variables and Concepts
Effects of School Poverty Level
In 2001, the premise of NCLB was to close the achievement gap among students and to
hold schools accountable. As a result, in order to fulfill the demands of NCLB, educators were
no longer paying attention to the overall environmental circumstances of students; instead, they
placed more emphasis on making AYP (Darling-Hammond, 2004). For example, NCLB does
not seem to consider significantly academically delayed children and the academic impact of the
poverty line on students (Darling-Hammond, 2004). In other words, having a clear
understanding of influencing factors that may impede students’ performance will give educators
the opportunity to address those needs, as opposed to solely focusing on test scores. Therefore,
meeting the high expectations set by NCLB may be a challenge due to the increased focus on test
scores as a measure of school and teacher performance (Darling-Hammond, 2004).
In terms of research that focuses on the effects of test-based, accountably policies and
schools’ poverty level, Moon, Callahan, and Tomlinson (2003) examined the differences
between the instructional methods of teachers in high poverty schools and those in low poverty
schools. Researchers found that testing accountability greatly influence instruction regardless of
the poverty level of the school. In other words, teachers from both environments dedicated a
majority of the class time reviewing and practicing the questions of the test until the
administration of the test. However, other researchers found conflicting evidence. Wallace
(2002) researched the differences of instructional methods among a high poverty and low
poverty elementary schools in Texas. Wallace found that teachers in the high poverty schools
focused more on the test when compared to low poverty schools. McNeil and Valenzuela (2001)
31
also found that as opposed to teachers challenging students intellectually, teachers in the high
poverty schools placed higher emphasis on teaching to the test. Not only does poverty level have
some influence on teaching methods, but it also influences the percentage of minorities in a
given school
Several studies examined schools with a proportion of minority students. In New Jersey,
Firestone et al. (2002) surveyed 300 fourth-grade teachers and found that, test preparation
practices were used more often in districts where more than 60% of the students were minorities
found that, districts where more than 60% of the students were minorities, used test preparation
practices more often. Kim and Sunderman (2004), Madaus and Clarke (2001), McNeil and
Valenzuela (2001), and Williams et al. (2005) obtained similar results on predominantly minority
schools.
Studies also examine the difference between instructional practices among urban and
suburban schools. One study found that, in urban schools in Massachusetts, teaching to the test
is more evident than in suburban schools (Luna & Turner, 2001). Furthermore, Pedulla et al.
(2003) examined responses from educators concerning their perspective on testing and
accountability policies. They concluded that the majority of classroom time in the urban schools
focused on preparing for the test and the instruction guided by the test. Meanwhile, suburban
schools’ instructional methods focused on the curriculum and not the test.
Poverty Level and the Implementation of Accountability Policy on School
Historically, the implementation of a new reform on the school level, such as the NCLB
policy, affected schools differently, especially schools that are considered high-poverty schools.
The ineffectiveness of a policy is a product of ambiguity and lack of knowledge on how to
32
implement these policies in schools that are low performing and high-poverty. For example, in
1976, McLaughlin found the guidelines and the intent of the law for the funds in the Title I
mandated programs were unclear, which led to both appropriate and inappropriate uses of the
funds. In other words, the content of the policy is not the deciding factor of whether the policy
will be effective; rather, it is the implementation of the policy and detriments in high-poverty
schools when compared to a low-poverty school due to the special needs of the school. Due to
the federal guidelines not being clear for local use, the interpretation of the program was
inconsistent throughout the local level. Another historical example of the correlation of school
reform to the quality of implementation on a local level offered in a study conducted by Berman
and McLaughlin (1978) in the 1970s called the RAND Change Agent Study. Berman and
McLaughlin showed that the expectation of the school reform should be consistent across both
local, district, and school level in order for the implementation to be successful. A recent study
by Borman in 2005 described this same phenomenon.
It is important to understand the various factors to consider when implementing high-
stakes testing policies in a high-poverty school. Several researchers found that there are different
challenges and needs depending on the level of poverty of the students, as well as the
communities, in which there are high-poverty schools (Darling-Hammond, 2004; Esch et al.,
2005; Horng, 2009). These challenges may interfere with applying accountability measures,
such as curricula, teaching instructions, and availability of resources in order to increase
students’ performance level. In addition, the turnover rate is high among highly qualified
teachers from high-poverty schools when compared to low-poverty schools (Clotfelter, Ladd, &
Vigdor, 2005; Jackson, 2008; NCES, 2005; McCabe, 2008). Due to the different circumstances
33
and the challenges, high poverty schools may respond to policy change and school reform
differently, often, because of the quality of their teachers and the relative clarity or ambiguity of
the implementation process.
Although the premise of the NCLB accountability act is to improve students’ academic
success by narrowing the achievement gap, to facilitate high performance learning culture
through rigorous curricula, and to improve graduation rates, the implementation of a new policy
is challenging, depending on the poverty level of the school. These challenges not only affect
students but also educators. If teachers’ perceptions of the students are negative, then their
perception of the school climate will be negative as well, especially since teachers are change
agents within the schools (Gehrke, 2005). According to a longitudinal study conducted by
Mistry et al. (2009), when teachers have high expectations of their students, especially students
considered academically at-risk, then their expectations have a positive influence on academic
achievement outcomes of the students. It is important to understand how poverty level produces
different outcomes and has an influence on schools’ ability to implement federal policies
effectively. This is the reason this proposed research focuses on the differences of educators’
responses between low and high poverty schools.
High-Stakes Testing and Accountability Policies on Schools
This review examines factors, such as curricula, instructional methods, available
instructional support, and job satisfaction. These four factors influence educators’ perception,
given the pressures of the accountability policies. In terms of curricula, researchers have shown
that schools made provisions due to accountability policies, such as allocating additional time on
tested subjects, as opposed to non- tested subjects, and aligning the curriculum and standards
34
according to the tested subjects (Faulkner & Cook, 2006; McGuire, 2007; Schemo, 2007;
Watanabe, 2007). Research has also shown that educators alter the instructional methods, such
as increasing emphasis on tested subjects and pacing of the curriculum, in order to prepare
students for the test (Berryhill et al., 2009; Brown & Clift, 2010). Instructional support and
resources for low performing schools may depend on the distribution of support throughout a
school district, as well as for a particular school (Bacolod et al., 2009; Chiang, 2009; Goldhaber
& Hannaway, 2004; Rouse et al., 2007). Furthermore, on the school level, researchers have
found that educators modify the school’s environment, such as allocating additional instructional
resource from non-tested subjects to tested subjects (McGuire, 2007; Schemo, 2007). Schools
also provides additional professional development to educators (Rouse et al., 2007) and reduce
class sizes (Goldhaber & Hannaway, 2004). Due to responses of accountability policies, schools
also increase the spending on resources such as instruction and instructional material (Chiang,
2009). It is important to understand how the accountability measures have influenced these
factors. Educators make provisions in order to meet state standards requirement and to increase
student performance.
Job satisfaction is also an area affected due to accountability policy pressures. Educators
reported adverse job satisfaction due to the additional pressure in order to meet AYP (Crocco &
Costigan, 2007; Jackson, 2008; Leithwood et al., 2010). These pressures include educators
feeling as though they are not valued and respected professional educators; there are extreme
high expectations to improve low-performing students’ achievement level; and there is
ambiguity of which instructional approach to use in order to improve achievement level.
35
Impact on Curriculum
Time allocation across subjects. When evaluating the effects of testing accountability
policies, it is important to understand the influences of subject areas not considered for the
promotion or retention of the child. In other words, in this southeastern state, in order to retain
or promote an eighth grade student, the student must pass the reading and math portion of the
HST. The social studies and science portions are also given; however, they are not promotional
subjects. Because of these expectations, teachers and administrators modifies instructional time
in order to focus on those tested subject areas.
According to Eisner (1994), a null curriculum refers to contents not taught in schools
either intentionally or by disregard, although the level of importance is the same. For example,
researchers have found that test-based accountability guides the curriculum by restricting the
focus on non- promotional subject areas and emphasizing an increased focus on those areas
monitored for AYP (Faulkner & Cook, 2006; Watanabe, 2007). Schemo (2007) and McGuire
(2007) both stated that there is an adverse impact on non-tested subject because of limited
attention and instructional time given as compared to tested subjected areas. In fact, these
subject areas are nonexistent at some schools. These modifications to the instructional time are
an effort to increase students’ test scores and to focus on students who require supplemental
instruction.
According to a recent report from the Center for Education Policy, McMurrer (2007)
noted significant differential educational outcomes for students concerning the narrowing of the
curriculum. In terms of allocation of instructional time, four significant changes occurred since
the 2001-2002 school year in which 62% of the schools noted that they allocated more time in
36
reading and math, 44% of the schools reduced time for non-tested areas and the tested content
are the primary focus. McMurrer (2008) also reported that lower performing schools use the null
curriculum more than schools that are higher performing.
Pacing of curricula. High-stakes testing accountability policies influence curriculum,
instruction, and pacing of the curricula. Many districts establish pacing plans in order to unify
the curriculum (Brown & Clift, 2010). According to Brown and Clift, some individuals perceive
this positively in that it helps teachers to know what to teach and how long to teach it. Teachers
found that state assessments are helpful in providing guidance on the content, as well as pacing.
Some teachers did not feel that the pressure of assessment significantly affected their
instructional practices (Faulkner & Cook, 2006), whereas other teachers felt as though the pace is
too fast and does not allow flexibility to ensure their students understand the lesson. Brown and
Clift also noted that educators allot a significant amount of time to prepare the students on what
is on the test. Principals also discouraged higher-level of thinking while encouraging more
multiple-choice questions in the classroom (Brown & Clift, 2010). Although there are
conflicting reviews on pacing the curricula, many teachers use this strategy in the classroom due
to the rigorous nature of the curricula.
Furthermore, Berryhill, Linney, and Fromewick (2009) explained that 80% of teachers
noted having either limited time to fulfill their duties aligned with the accountability policies or
having too many tasks to complete related to accountability policies. Moreover, Berryhill et al.
also noted that half of the teachers stated available time to complete other goals is nonexistent.
These goals include academic and nonacademic goals, such as ensuring all students understand
and master the material, thoroughly teaching all of the lessons, maintaining academic
37
engagement, and developing the students’ positive social skills. According to Berryhill, et al., it
is difficult for teachers to fulfill these duties, especially when time for the standardized tests
administration is approaching.
Standardization of curricula. High-stakes testing accountability has also affected the
curriculum standards, such as narrowing of the curriculum (Dillon, 2006, Jerald, 2006; Manzo,
2005). Narrowing of the curriculum is associated with the pressures linked with NCLB in which
teachers dedicated more time on the reading and math areas while decreasing time in other
subject areas. Furthermore, according to other researchers, due to the increase of standardized
curriculum and high-stakes testing, teachers have less autonomy in implementing diverse
instructions into their classroom (Achinstein & Ogawa, 2006; Sloan, 2006). Watanabe (2007)
examined the effects of testing and accountability policies on the classroom level, in which she
noted that high-stakes testing forces teachers to focus on testing content areas as opposed to
other content that are not included on the test. In other words, teachers cater their curriculum
and instruction to what will be the primary focus of the test. This occurs in classrooms of
students who are low performing and predominantly from minority and low-income backgrounds
(Watanabe, 2005). Additionally, McMurrer (2007) indicated that less than 31% of the time
allocated to instruction geared to non-content areas not focused on by NCLB.
Another modification that implemented due to NCLB guidelines is narrowing the
instructional day in order to emphasize the test content. Research conducted by Stullich et al.
(2006) suggested that 52% of schools revised the school day in order to focus on the content of
the test identified as needing improvement. In other words, there was a decrease in instructional
time for classes, such as music, physical education, and art, in order to dedicate more time to the
38
assessed content areas. For example, Hannaway (2007) explained that from the years 1999-2000
to 2003-2004, the amount of time allocated for math in elementary school increased 40% due to
accountability policies. According to the Center on Education Policy in 2006, high-poverty
districts reported implementing additional time on tested subjects and spending more time on
those subjects when compared to other schools. For example, instead of spending the national
average of 90 minutes for reading instruction, they were averaging 113 minutes. McMurrer
(2007) identified a decrease of 57 minutes in the areas of art and music, 50 minutes from recess,
and 40 minutes from physical education, so students could gain additional remedial instruction in
order to pass the test. In the Center of Educational Policy, McMurrer indicated that the reduction
of extracurricular class time has been the norm since the implementation of the NCLB act in
2001-2002, although no evidence shows that this resulted in improved test scores.
Unfortunately, although time taken away in art, physical education, and music classes, no
evidence showed that this strategy is effective in increasing academic performance.
Impact on Instructional Methods
Instructional methodology. Behaviorist and constructivist instructional methods were
the focus in this study. In the learning environment, behaviorists believe presenting information
in smaller parts facilitates learning. Teachers’ use of direct teaching strategies and learning is
repetitious until the information becomes automatic. In other words, teachers may focus on
conditioning the student behavior. They provide stimulus material and prompt correct responses.
Teachers develop individualized instruction and seat exercises and provide constant assessment
of learning for each skill before moving to the next skill. Behaviors are measured, diagnosed,
and predicted in order understand students’ behaviors. In the behaviorist model, teachers’ lesson
39
plans consist of a reinforcement schedule, aligned with standardized assessments (Dunkin &
Biddle, 1981). Assigned seatwork is one teaching method normally used to gauge student
engagement, as opposed to student understanding (Anderson, Brubaker, Alleman-Brooks, &
Duffy, 1985; Wells, Hirshberg, Lipton, & Oakes, 1995; Good & Brophy, 2000). Other examples
of behaviorist instructional method may include lecture, questions with one correct answer, rote
drill and practice, recitation, and independent student practice.
On the other hand, the constructivist methodology has a completely different approach to
learning, in which it eliminates the drill and practice methods of instruction (Dewey, 1902).
John Dewey, one of the modern constructivist theorists, believed that students’ learning should
evolve from students’ experiences rather than fixed or determined learning style. According to
constructivist theorists, student learning is the process of creating meaning, and students must
become productive learners with the capacity to take accountability for their own learning
(Marzano, 1992). Marzano also stated that the main objective is for students to become
independent learners with the capability to continue to learn throughout their lives. Teachers are
facilitators in the learning environment, in which teachers establish learning goals where students
develop their understanding of the curriculum, as opposed to teachers simply assessing students’
ability levels (Good & Brophy, 2000). Constructivist instructional method may include group
discussion, collaboration, interaction, open-ended discussion, experiments, cooperative learning,
student-driven questions, and student/group reflections.
Test preparation. Some research has found that teachers tend to focus the majority of
their instructional time on preparing students for the test due to accountability policies. A study
conducted by Faulkner and Cook (2006) indicated that the majority of the teachers felt as though
40
the assessment dictated what needed to be taught in the classroom and how to teach it. Teachers
felt that this resulted in ineffective, unethical, and teacher-focused instructional practices.
Teachers also noted research-based assessment strategies are completely different from the
statewide assessments. Furthermore, teachers explained that the research-based assessments are
the most authentic way to gain an understanding of whether or not students fully comprehend the
curriculum taught at that particular school as opposed to the statewide assessment, which focuses
on where all students in the state should be functioning. One must take into consideration that
not all schools are making AYP; therefore, the needs of students will be different. Research-
based assessments are flexible enough to assess those students’ ability level. While some
teachers oppose allowing the test to dictate what and how instruction should be taught, some
teachers think that having some guidance on what should be taught has a positive influence on
instruction and instructional strategies (Faulker & Cook, 2006).
Faulkner and Cook noted that teachers mentioned allocating blocks of instructional time,
which amount to weeks, in order to develop students’ writing portfolios and for test preparation.
Statewide testing leads to high frustration levels for teachers due to the decreased instructional
time to focus on other content areas. As a result, due to time constraints, teachers resort to
covering the curriculum quickly instead of thoroughly teaching the curriculum. This ultimately
minimizes academic experiences in the classroom and places less emphasis on higher-order and
critical thinking skills (Kane, 2007). Furthermore, Berryhill et al. (2009) found that 35% of
teachers indicated that they no longer assure all students master a specific lesson before moving
onto the next lesson. Another change includes emphasizing less differentiated instruction; for
example, 15% of the teachers no longer incorporate group work and 20% admit to using teacher-

41
directed instruction. The strict timeline affects not only the teachers’ morale and stress level but
also what the students are attaining.
Supplemental support. Research studies have found that educators spend more time on
students who are struggling to pass the statewide test and those who are at risk of failing. For
example, according to Lazear (2006), the purpose of NCLB is to ensure that students who are
struggling academically and usually falling through the cracks receive intensive interventions.
Lazear stated that narrowing the curriculum helps students to learn missing fundamental skills in
order to be successful. McMurrer (2007) also noted that those students who did not meet
standards received additional assistance in order to make some academic gains. A majority of
teachers and educators noted that at-risk students and those close to passing the test received
additional support (Hamilton et al., 2007). For example, the school district in this proposed
research incorporates Extended Learning Time (ELT) in the school day, which is a class for
those students who at-risk or failed the HST. Some districts have additional funding to invest
additional resources to ensure the at-risk students pass the test. Unfortunately, some districts do
not have the funds. For example, Neil and Schanzenbach (2007) concluded that, in Chicago,
purposely neglected students unable to meet standards due to insufficient funds to make AYP.
However, according to Lazear (2006), in relation to students who have been struggling
and working below grade level, NCLB set extremely high standards that were difficult for those
students to attain within the set timeframe. Lazear explained that programs are taken away that
seemed to encourage and excite students to learn higher functioning skills and simple adaptive
skills. The majority of the students who are trying to master skills in order to pass the high-
stakes tests are exemplifying knowledge through rote memory of the core curriculum. This
42
dismisses those students who need to acquire non-rote memory skills or higher order thinking
skills in order to be contributing citizens in society (Lazear, 2006).
Student placement. There are increasing numbers of students in alternative placements
within individual schools, such as the special education or English language learner program.
Some schools are finding ways to reduce the impact of lower-performing students on high-stakes
test scores. A longitudinal study conducted in Texas by Heilig and Darling-Hammond (2008)
found that school districts excluded low performing students and schools from taking statewide
tests. Due to those students, such as students in the special education program and those who
speak other languages, not taking the state test, schools made AYP. In other situations in Texas,
teachers in an urban elementary school admitted to placing students in special education as an
effort to improve schools performance (Booher-Jennings, 2005). Deere and Strayer (2003) also
found similar results in which administrators strategically excluded specific students from taking
the statewide test in Texas. Student placement is not only a problematic issue in the state of
Texas but also in other states. For example, in Florida, administrators staffed students into the
special education program in order to exclude them from taking the test, which was common in
schools not making AYP (Figlio & Getzler, 2002). In Chicago public schools, data showed that
a large amount of students placed in special education or exempted from testing after the
implementation of testing accountability policies, (Jacob, 2004). In high schools in New York,
Monk, Sipple, and Killeen (2001) found that there was an increasing amount of students placed
in the General Education Development (GED) programs. In an effort to meet AYP, those
students are placed in special education or GED programs to increase the possibility of that
school meeting AYP, which may lead to children being misclassified as having a disability.
43
Student retention. More of the literature has focused on the effects of high-stakes
testing on dropout rates than the comparison of high-stakes testing and retention. Historically,
significant data exist on the topic of retention (Eide & Goldhaber, 2005). The existing data does
not show positive educational outcome in retention of students, such as social development and
academic achievement; moreover, within 2-3 years, students are more likely to drop out of
school (Jimerson, Woeher, & Kaufman, 2007) and have poor self-esteem (Bowman, 2005;
Dawson, 1998; Jimerson, 2001; Thomas, 1992). According to Roderick and Nagoka (2005),
students are more likely to perform higher, academically, if pressured to pass the test in order to
meet promotion or graduation requirements. Not only was state-wide testing put in place to hold
teachers accountable and make sure students are able to increase their understanding of the skills
but also to minimize social promotion. Some opposed the idea of allowing the performance on a
high-stakes test to be the sole indicator of students’ promotion to the next grade. Roderick and
Nagoka noted that national educational organizations, such as the American Educational
Research Association (AERA) and the National Association of School Psychologist (NASP),
disagree with the concept of allowing performance on a single test to be a primary influence for
retention. Reardon and Galindo (2002) found that poor test performance mainly affected
students who were minorities, those who fell in the low socioeconomic status, and those who
were already at-risk of retention or dropping out due to a history of low academic performance.
Other countries, whose educational systems do not function the same way, show completely
different results, in terms of retention. Compared to the United Kingdom, Norway, Japan,
Sweden and Denmark, which have a 0% dropout rate, the United States’ retention rates fell from
15% to 19% (Holmes, 2006).
44
Currently, in this southeastern state, students mandated to take the HST in Grades 1
through 8 in the content areas of reading, English/language arts, and mathematics. Students
required assessments in Grades 3 through 8 in the areas of science and social studies. Students
are also mandated take a writing assessment and national norm-referenced tests (Mewborn,
2009). The requirements for the promotional grades, which are Grades 3, 5, and 8, are for
students to achieve grade level standards on the HST in the areas of reading and math. Although
science and social studies are part of the HST, they do not apply to the promotional
requirements, as stated by the state’s department of education.
Impact on Availability of Instructional Supports
According to the accountability policies, schools that do not meet AYP are required to
implement a school improvement plan and/or face a series of sanctions. The school’s
improvement plan may include instructional support, in which the school must provide
resources, such as additional instructional time and supplemental resources. For example,
Rouse, Hannaway, Goldhaber and Figlio (2007) explained the State of Florida’s accountability
system in which Florida assigns letter grades (e.g., “A,” “B”) to represent the schools’
performance on achievement tests. Schools received sanctions because of low-performing
grades (Ds and Fs) as well as additional assistance, whereas high-performing schools receive
rewards. The lower the grade, the more assistance the school will receive, and the F schools are
first priority for assistance, such as the Just Read, Florida! program. Just Read, Florida! provides
reading coaches to these low performing schools to implement research-based reading
intervention in order to increase reading scores. Rouse et al. also explained that the state of
Florida has an Assistance Plus program, which is designed to allocate resources and targeted
45
funding to these schools through the State Board of Education. The Assistance Plus teams of
experts help improve the schools by providing constant communication through conference calls
and reports. This assists in monitoring progress and providing feedback to schools and districts.
They also make sure the curriculum, assessment and course materials complement one another.
The Assistance Plus teams are also required to provide technical assistance for the schools and
educators through examining the students’ achievement documentation and providing
professional development to teachers (Rouse et al., 2007). Some of the other changes that
occurred due to student performances included implementing block scheduling, reducing class
size, providing additional remedial courses for struggling students while decreasing the attention
to gifted students, increasing instructional time, and providing teachers additional time for
planning (Rouse et al., 2007).
Similarly, Chiang (2009) discovered that Florida’s low-performing schools increased
spending on resources such as instruction and instructional material. Bacolod et al. (2009) found
that schools in the State of California also provided additional resources due to students’
performance because of the accountability policies. According to the state’s department of
education, there are Supplemental Educational Services (SES), which the state uses to provide
additional instructional support in order to raise the academic achievement scores of students
who are in low-performing schools. Instructional support aligned with the content and
instruction given at the local educational agencies (LEAs), as well as with the state’s
performance standards, includes tutoring, remediation, and other educational interventions. The
goal of SES is to provide high quality, research-based interventions in order to increase student
achievement. The intent is for these interventions to be supplemental. In other words, it is an
46
addition to the regular school day; therefore, students are receiving additional time for
instruction. On the other hand, some research showed limited effects of accountability polices
when distributing resources and funds. For instance, research of Chicago schools revealed
limited changes due to the accountability system (Jacob, 2004).
Impact on Job Satisfaction
In order to understand and improve factors that contribute to teacher satisfaction, it is
important to gain an understanding of teachers’ perception in the educational setting. There are
studies that examined the effects of high-stakes testing and accountability polices on the morale
and job satisfaction of teachers. According to Crocco and Costigan (2007), when the local
schools establish school reform and accountability practices, teachers’ perspectives remained
undermined and not taken into consideration. Moreover, teachers’ perceptions resulted in low
job satisfaction due to narrowing the curriculum, which effects teachers’ creativity and
autonomy, personal and professional growth, and establishing meaningful relationships with
students. Jackson (2008) also found similar results in which teachers’ moral and job satisfaction
decreased due to high-stakes testing and accountability policies. If teachers are satisfied in their
environment, they are apt to be more enthusiastic on becoming successful in the educational
setting (Jackson, 2008).
In relation to high and low poverty schools, McCabe’s (2008) study examined teachers’
reasons for transferring from high-poverty to low-poverty schools in New York City. McCabe
found that test-based accountability policy implementation, such as administrative support, daily
pressure of test preparation, students’ behavioral difficulties, and teachers’ salaries, were
deciding factors to transfer to a low-poverty school. In fact, teachers in high-poverty schools are
47
more likely to transfer out, or consider transferring when compared to teachers in low-poverty
schools (Jackson, 2008). The Schools and Staffing Survey (SSS) and the Teacher Follow-Up
Survey (TFS) revealed that almost half of new teachers usually leave within five years of
teaching, while teacher turnover rate is higher in high-poverty schools than in low-poverty
schools (National Center for Education Statistics [NCES], 2005). Given that high poverty
schools have unique challenges when compared to low poverty schools, the morale of teachers
will vary.
Another factor that influences teachers’ satisfaction is the way teachers feel they are
treated. If teachers feel they are treated with respect as professionals, in which teachers are
involved in the decision making process, teachers are more likely to feel satisfied (Center for
Comprehensive School Reform and Improvement [CSRI], 2007). According to Leithwood,
Patten, and Jantzi (2010), teachers want to feel as though their contribution and participation are
valued and considered in terms of what the students, classrooms, schools and teachers need in
order to be successful. Furthermore, Fullan (2008) also supports getting teachers more involved
in the decision-making process. Fullan explained principals should lead consciously, meaning
aligning all teachers on the same educational level and encouraging interaction on the same level
through learning and implementation. This perspective of leading is consistent with Kowalski’s
(2008) point of view, in which teachers want to feel respected and valued as worthy and capable
educators. In other words, in order for teachers to be encouraged and enthusiastic in
implementing accountability policies, educational leaders should engage the teachers’
involvement.
48
Leadership practices also influence teachers’ job satisfaction. According to Gorton et al.
(2007), teachers’ views of their principals’ leadership methods and practices have an effect on
the educational setting, whether positive or negative. Furthermore, Fullan (2008) explained the
correlation between principals’ leadership methods to teachers’ job satisfaction. Fullan stated
that principals have a direct and indirect influential impact every day of a teachers’ workday.
Understanding this phenomenon is vital because it can affect the teachers’ daily performance.
Most importantly, once principals have an understanding of the relationship between leadership
methods and job satisfaction, they will be able to implement any strategic methods in order to
improve job satisfaction (Fullan, 2008).
Literature of Educators’ Perceptions of NCLB
Researchers have found that teachers have both positive and negative perceptions of
NCLB (Sunderman et al., 2004). In 2003, following the implementation of NCLB accountability
policies, the National Board on Educational Testing and Public Policy (NBETPP) examined the
different viewpoints and positions of teachers concerning the accountability policies and high-
and low- stakes testing (Pedulla et al., 2003). The research revealed that the higher the stakes of
the test, the more it influenced the instruction (Pedulla et al., 2003). It was also explained that
teachers that are in states where high-stakes testing is mandated felt the most demands to make
sure the students perform adequately academically, the curriculum and standards are aligned, and
allocate more time to prepare students for the test when compared to other teachers in low-stakes
testing states (Pedulla et al., 2003). The stressors of high-stakes testing place great pressure on
teachers; as a result, they may modify their educational pedagogy in order to meet state
standards.
49
After NBETPP released their findings, they concluded that elementary school teachers
needed instructional materials and programs that aligned to the state academic standards (Pedulla
et al., 2003). As a part of the NCLB act, the Reading First program provided low-income
schools additional assistance for those students who struggle to read. As a result, NCLB
encouraged state school districts to align their curricula to state requirements and invest in
instructional aides to increase students’ performance level. Roller (2005) found that teachers
have positive views on two factors of NCLB, both of which would improve students’
achievement. These two factors include requiring professional development and implementing
research-based instruction in the classrooms. Roller also found that teachers from Reading First
schools were supportive of NCLB than those who are not. Roller concluded the reason for the
different opinions was because teachers in Reading First schools favored the professional
development and research based instructions. Teachers also supported the program because
Reading First also provided external professional guidance to the schools in order to implement
the program correctly (Roller, 2005). If teachers can see the benefits of the accountability
policy, such as attaining additional resources, assistance, and programs, then teachers will be
more receptive to change.
In an ethnographic study, Sloan (2006) examined teachers’ perceptions of accountability
policies over three years through visits, observing classrooms, and interviewing teachers,
administrators, and parents. One of the teachers Sloan was working closely with expressed her
concerns about accountability. The teacher stated that over the three years, the accountability
measure positively influenced her instructional method of choice. Even though the teacher
expressed high strain due to the policy demands and considered another field to work in, Sloan
50
observed there were positive academic improvements due to the state’s implementation of a
strict and intensive curriculum. For instance, Sloan stated that her class received additional
writing interventions because of quarterly assessments turned in to the district. She noticed the
writing scores improved since the beginning of the year; as a result, her views about conducting
the informal writing assessment changed from being unwarranted (Sloan, 2006). In order for
teachers to be responsive to the accountability policies, they have to see positive results in
academic performance.
However, other teachers do not perceive the accountability measures the same way. For
example, another teacher in Sloan’s research stated that she was irritated and angry about the
accountability measures. Sloan noticed minimal change in her instructional methods during the
three-year study; however, she adhered to the core curriculum. The third teacher, a veteran,
admired by everyone because of his unique instructional method did not implement the state
standards and core lessons in the classroom. This teacher was somewhat knowledgeable about
the accountability policy, however not receptive to implementation in the classroom. As a result,
due to his assessment scores, the district administrators assigned a curriculum coach to his class
(Sloan, 2006). The teachers perceive accountability policies different, which resulted in different
outcomes in student achievement performance.
Sloan (2006) concluded teachers’ responses to curriculum associated with the
accountability policies varied, teachers’ responses to the curricula depended on the individual
school climate. Sloan also noted that many of the previous research studies were intentionally
ambiguous to the specific issue of the teacher quality and equality. Instead, research exposed
teachers as being resistant to change. As students’ performance increases, teachers who were
51
initially resistant accepted and understood the importance of the accountability policies (Sloan,
2006).
Other researchers, such as Finnigan and Gross (2007), also revealed similar results in that
teachers’ views on NCLB accountability polices varied. According to a mixed method study
conducted by Finnigan and Goss, although teachers understood the necessity for the
accountability policies and standards, they felt as though the implementation did not coincide
with the challenges that they faced. No Child Left Behind uses rewards and sanctions as
reinforcement to encourage teachers to increase student performance level on high-stakes testing.
Finnigan and Goss studied the effects of accountability policies on teacher motivation. They
found that in the schools that did make AYP, teachers were primarily motivated to raise students’
performance (Finnigan & Gross, 2007). On the other hand, if that school consistently did not
make AYP, the morale and the enthusiasm of the teachers would decrease due to the high
demands. Finnigan and Goss also reported that the longer the school did not met AYP, the lower
the teacher retention rate of the school. It is important for federal, state, and school-level policy
makers to find other ways to continue to motivate teachers in schools that are consistently
failing.
Hamilton, Stecher, Russell, Marsh, and Miles (2008) also studied the standards-based
accountability (SBA). According to the SBA theory, modifications of instructional classroom
methods are strongly dependent on the school’s reaction to SBA (Hamilton et al., 2008). The
authors depicted the SBA theory as a feedback loop in which the federal government mandates
the state to adhere to the standards. It also required the districts to establish curricula aligned to
the standards, the curriculum applied in the schools, and then teachers align the curriculum to

52
their lesson plans and in the classrooms. At that time, evaluation of what students know from the
standards, the state receives results, and based on those results, schools receive rewards or
sanctions, then the process starts again.
Researchers found that although teachers modified their instructional methods due to
accountability policies, teachers were committed to their own educational style (Kersten &
Pardo, 2007; Sloan, 2006). Hamilton et al. (2008) discovered that teachers’ opposition to the
policy was a result of the educator’s teaching philosophy. They also found that the SBA policy
encouraged teachers to be aware and knowledgeable of successful teaching methods, allocating
more instructional time to teaching the core curriculum and utilizing data in order to make
decisions. Conversely, teachers admitted that making student achievement a focal point was due
to the high demands of making AYP not because they felt it was the best instructional method
(Hamilton et al., 2008). Teachers also admitted to narrowing the curriculum to tested content
and concentrating more time on student who almost met expectations than on students who met
standards or student who were far below standards (Hamilton et al, 2008).
In 2006, Sloan discovered that, although teachers are more knowledgeable on how to
increase students’ test scores, the methods used contradicted their pedagogical stance on what is
good teaching. Mintrop and Trujillo (2007) found similar results in that teachers stated that,
even though they were able to increase student academic scores by concentrating on
standardization, aligning, and structuring the core curriculum, they were not necessarily
incorporating best teaching practices into the classrooms. For example, instead of focusing on
engaging the students academically, they focus more on narrowing the curriculum to what will
be on the test (Mintrop & Trujillo, 2007).
53
Mintrop and Trujillo (2007) found that educators in schools making AYP were receptive
and willing to implement the accountability policy, concentrated on correlating the state
standards to the curricula, and used a core literacy program such as Reading First. For those
children who did not meet expectations, they provided additional supplemental instruction within
the core remedial literacy program (Mintrop & Trujillo, 2007). Although the teachers had
reservations about the successfulness of the social science and science subjects taught within the
core literacy program, they were dedicated to teaching the state standards (Mintrop & Trujillo,
2007). In addition, the teachers assumed that the strategies implemented considered successful
in order to meet AYP. As a result, according to Mintrop and Trujillo, the school’s accountability
policy encourages teachers to focus on students’ progress given the state’s high-stakes testing
scores. Furthermore, Abrams, Pedulla, and Madaus (2003) found that teachers relinquished their
pedagogical perspective on what is effective teaching methods to a format this structured by the
state’s high stakes test. The teachers also admitted to structuring their classroom instruction in
order to prepare students to perform higher on the test due to the accountability demands
(Abrams, Pedulla, & Madaus, 2003).
In 2007, Nichols and Berliner focused on how the accountability policy negatively affects
teachers. More specifically, they assessed critically the methods used in the NCLB
accountability policy. Nichols and Berliner not only noted teaching to the test as one of the
negative consequence of the high-stakes testing but also pressures to cheat, demoralization, low
morale, and degradation of the teaching profession.
54
Summary and Conclusions
According to previous research, there are various factors influenced by accountability
policies. The four areas associated with and examined in this study in reference to educators’
perception of high-stakes testing are curriculum, instructional methods, availability of
instructional support, and job satisfaction. With regard to curriculum, research revealed that
schools align the curriculum to the state standards or goals, alter the pacing of the curriculum or
combine tested subjects with non-tested subjects in order to adhere to the accountability policy
(Hamilton et al., 2007; Jones & Egley, 2004; Mabry et al., 2003; Schleisman, 1999). As for
instructional methods, educators focus more on students who are considered at-risk or did not
meet standards, concentrate on lessons to test preparation and test-taking skills, or consider
placing students in alternative educational programs, such as special education or English
language learner programs (Pedulla et al., 2003; Luna & Turner, 2001; Jones & Egley, 2004;
Grant, 2000).
Implementation of the accountability policy influences instructional support. Reportedly,
school districts provide additional support to schools that are considered low performing, such as
instructional resources (e.g., staff support and materials; Bacolod et al., 2009; Chiang, 2009;
Goldhaber & Hannaway, 2004; Rouse et al., 2007). Furthermore, research has found that
schools would shift additional instructional resources from non-tested subjects to tested subjects
(Ladd & Zelli, 2002). Schools would provide supplementary opportunities for professional
development (Rouse et al., 2007; Stecher & Chun, 2001; Stecher et al., 2000) and reduce the
class size (Goldhaber & Hannaway, 2004). Schools also provide additional instructional staff,
55
such as classroom aides (Stecher et al., 2000; Stecher & Chun, 2001), and allocate more
resources towards instruction (Chiang, 2009).
Educators have also reported a shift in the level of job satisfaction since the
implementation of the accountability act. Due to the pressure of the accountability, research
have found that educators satisfaction have been unfavorably affected by the additional pressure
to meet AYP (Abrams, 2004; Hargrove et al., 2000; Jones et al., 1999; Pedulla et al., 2003;
Taylor et al., 2002). Teachers expressed the adverse effects of the accountability policy, such as
pressures to increase significant performance levels considered unreasonable, feeling of doubt to
increase performance level with respect to instructional methods, and feeling of unappreciated or
insulted when implementing accountability policies.
There are numerous studies on accountability policies and the effects on poverty level
and other specified characteristics including the location of the school, the number of minority
enrollment, and the current academic status of the schools. However, literature examining the
consequences of accountability policies based on the characteristics of the schools and students
is limited. This research emphasized the curriculum, in terms of which subjects are critical for
students to pass in order to meet AYP, instructional support, job satisfaction, and instructional
methods, which explained the amount of instructional time educators dedicate and the measures
taken in order to prepare students for high-stakes testing. In addition, I examined the effect these
factors have on the implementation of test-based accountability policies. In Chapter 3, I included
the research design and approach of these variables, instruments used to measure these variables,
setting and sample of the participants, measures of ethical protection, and data collection and
analysis.
56
Chapter 3
Introduction
Research Design and Rationale
This study used a cross-sectional, quasi-experimental design to obtain both quantitative
and qualitative information to determine the effect of the independent variable, the
implementation of high-stakes testing in high and low poverty schools, on the dependent
variables curricula, instructional practices, available instructional support, and job satisfaction.
Specifically for this research, I selected a cross-sectional survey design because data collected at
one particular time while examining multiple data at once. Additionally, this study was a natural
experimental design because the groups were compared naturally occurring groups on
independent groups. I used the data collected in this study from principals to examine their
perception regarding curricula, instructional practices, available instructional support, and job
satisfaction.
There have been recent shifts from the quantitative statistics approach towards the
qualitative and mixed methods approach in educational research. According to prior research in
education, mixed methods research combines quantitative and qualitative methods and the
opportunity to gain a more in depth understanding of educational research, which is a
multifaceted subject (Creswell, Slope, Clark, & Green, 2006). Studies that solely focus on
quantitative methods do not portray a holistic view of accountability practices, nor is it
comprehensive enough to provide a clear view of the school’s demographics, histories, and daily
function (Hall & Ryan, 2011).
57
Using a qualitative method includes inquiring into qualitative thinking to gain further
knowledge about relationships within context, on a variety of levels and from different
viewpoints (Mason, 2006). Furthermore, implementing a mixed-method approach is vital in
education because it can provide a more multifaceted understanding (Horn, 2004). Although,
this study did not utilize a mixed-method approach, it consisted of open-ended questions used to
examine educators’ perceptions of the educational accountability policy.
In the quantitative section of this study, I explored data concerning teachers’ perceptions
on job satisfaction, availability of instructional support, instructional methods, and curriculum.
In addition, I examined the differences and similarities in the responses of perceptions of
teachers who instruct science and social studies compared to those who teach math, reading, and
English language arts. Open-ended questions aided in further understanding and explaining the
common experiences and perceptions of teachers and principals. This chapter, illustrated the
research design and approach, along with the setting and sample for the research study, the
strategy for data collection and analysis, and the instrumentation and materials used to conduct
the study. Finally, the description of the protection of human participants was included.
Research Questions and Hypotheses
Individual schools may respond differently to high-stakes testing and accountability
polices, depending on the poverty level of the school. As a result, I measured the research
questions for this study in four groups. These groups consist of middle school teachers and
principals from both high and low poverty schools. The variables examined in each group are
curricula, instructional methods, available instructional support, and job satisfaction.
58
Research Question 1 (Quantitative)
Are there group differences between middle school teachers from low and high poverty
schools regarding perception of curricula?
Null Hypothesis (H01): There will be no group differences between middle school teachers
from low and high poverty schools regarding the current curricula.
Alternative Hypothesis (H11): There will be group differences between middle school
teachers from low and high poverty schools regarding the current curricula.
Research Question 2 (Quantitative)
Are there group differences between middle school teachers from low and high poverty
schools regarding perception of instructional methods?
Null Hypothesis (H02): There will be no group differences between middle school teachers
from low and high poverty schools regarding the current instructional method.
Alternative Hypothesis (H12): There will be group differences between middle school
teachers from low and high poverty schools regarding the current instructional method.
Research Question 3 (Quantitative)
Are there group differences between middle school teachers from low and high poverty
schools regarding perception of availability of instructional support?
Null Hypothesis (H03): There will be no group differences between middle school teachers
from low and high poverty schools regarding the availability of instructional support.
Alternative Hypothesis (H13): There will be group differences between middle school
teachers from low and high poverty schools regarding the availability of instructional support.
59
Research Question 4 (Quantitative)
Are there group differences between middle school teachers from low and high poverty
schools regarding perception of job satisfaction?
Null Hypothesis (H04): There will be no group differences between middle school teachers
from low and high poverty schools regarding their level of job satisfaction.
Alternative Hypothesis (H14): There will be group differences between middle school
teachers from low and high poverty schools regarding their level of job satisfaction.
Research Question 5 (Quantitative)
Are there group differences between middle school teachers who teach tested subjects and
teachers who teach nontested subjects regarding perception of curricula?
Null Hypothesis (H05): There will be no group differences between middle school teachers
who teach tested subjects and teachers who teach nontested subjects regarding the current
curricula.
Alternative Hypothesis (H15): There will be group differences between middle school
teachers who teach tested subjects and teachers who teach nontested subjects regarding the
current curricula.
Research Question 6 (Quantitative)
Are there group differences between middle school teachers who teach tested subjects and
teachers who teach nontested subjects regarding perception of instructional method?
Null Hypothesis (H06): There will be no group differences between middle school teachers
who teach tested subjects and teachers who teach nontested subjects regarding the current
instructional method.
60
Alternative Hypothesis (H16): There will be group differences between middle school
teachers who teach tested subjects and teachers who teach nontested subjects regarding the
current instructional method.
Research Question 7 (Quantitative)
Are there group differences between middle school teachers who teach tested subjects and
teachers who teach nontested subjects regarding perception of instructional support?
Null Hypothesis (H07): There will be no group differences between middle school teachers
who teach tested subjects and teachers who teach nontested subjects regarding the current
instructional support.
Alternative Hypothesis (H17): There will be group differences between middle school
teachers who teach tested subjects and teachers who teach nontested subjects regarding the
current instructional support.
Research Question 8 (Quantitative)
Are there group differences between middle school teachers who teach tested subjects and
teachers who teach nontested subjects regarding perception of job satisfaction?
Null Hypothesis (H08): There will be no group differences between middle school teachers
who teach tested subjects and teachers who teach nontested subjects regarding their level of job
satisfaction.
Alternative Hypothesis (H18): There will be group differences between middle school
teachers who teach tested subjects and teachers who teach nontested subjects regarding their
level of job satisfaction.
61
Research Question 9 (Qualitative)
What are the perceptions of middle school principals from low and high poverty schools
regarding their perception of curricula?
Research Question 10 (Qualitative)
What are the perceptions of middle school principals from low and high poverty schools
regarding their perception of instructional methods?
Research Question 11 (Qualitative)
What are the perceptions of middle school principals from low and high poverty schools
regarding their perception of availability of instructional support?
Research Question 12 (Qualitative)
What are the perceptions of middle school principals from low and high poverty schools
regarding their perception of availability of job satisfaction?
Methodology
Population
All teachers in the selected schools, who met the qualifications, received invitations to
participate. The minimum sample size of 210 was needed and was determined using a sample
size table (Universal Accreditation Board, 2003) for 5% error and a 95% confidence level and
verified with sample size calculation software (Wessa, 2009) for 5% error and a 95% confidence
level. Two hundred and ten participants were needed to create an effect size (ɳ2) = .25, power =
.95, α = .05. The principals completed only the open-ended section of the survey as opposed to
both the quantitative and qualitative portion of the study.
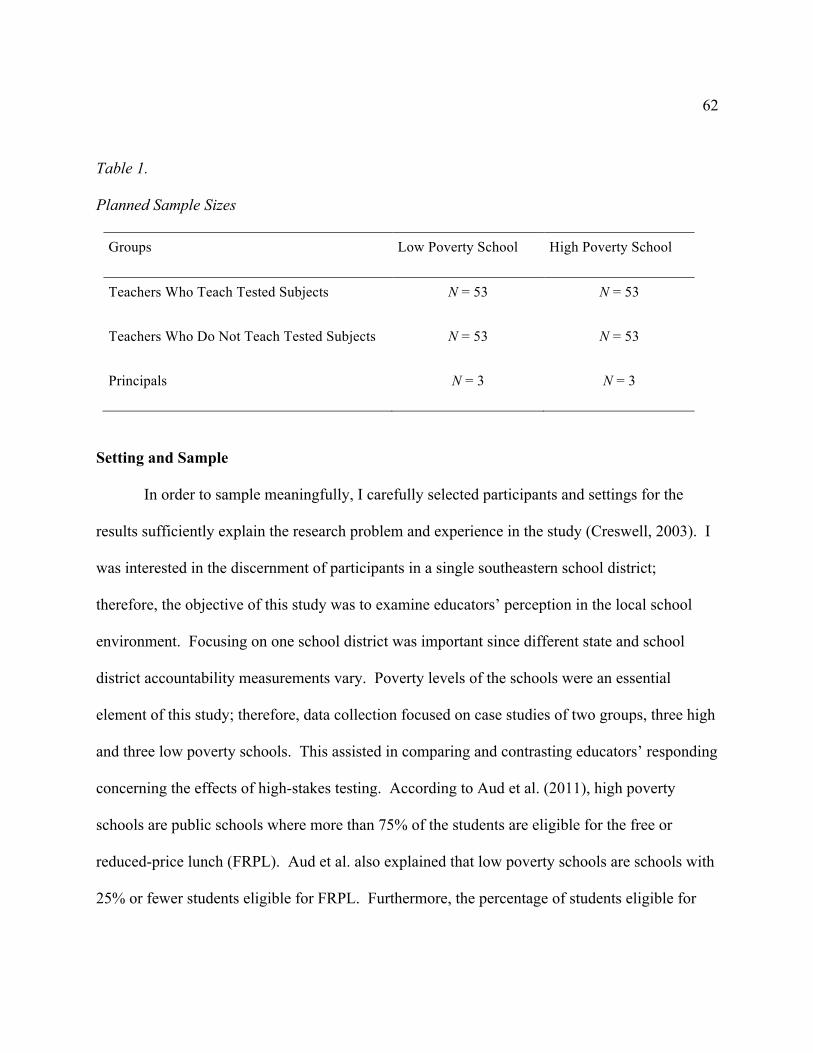
62
Table 1.
Planned Sample Sizes
Groups Low Poverty School High Poverty School
Teachers Who Teach Tested Subjects N = 53 N = 53
Teachers Who Do Not Teach Tested Subjects N = 53 N = 53
Principals N = 3 N = 3
Setting and Sample
In order to sample meaningfully, I carefully selected participants and settings for the
results sufficiently explain the research problem and experience in the study (Creswell, 2003). I
was interested in the discernment of participants in a single southeastern school district;
therefore, the objective of this study was to examine educators’ perception in the local school
environment. Focusing on one school district was important since different state and school
district accountability measurements vary. Poverty levels of the schools were an essential
element of this study; therefore, data collection focused on case studies of two groups, three high
and three low poverty schools. This assisted in comparing and contrasting educators’ responding
concerning the effects of high-stakes testing. According to Aud et al. (2011), high poverty
schools are public schools where more than 75% of the students are eligible for the free or
reduced-price lunch (FRPL). Aud et al. also explained that low poverty schools are schools with
25% or fewer students eligible for FRPL. Furthermore, the percentage of students eligible for
63
the FRPL program provided an indicator for the concentration of low-income students within a
school. To make certain of the schools’ classification, the schools chosen would have considered
high or low poverty schools for the past three school years, as opposed to relying on data in a
single school year. After listing all the schools that meet either criterion, I randomly selected
three schools from each extremity to participate.
Procedures for Recruitment, Participation, and Data Collection
I first consulted with the principal in each school to clarify the purpose of the study and
to discuss the selection of potential participants. Purposefully selected participants focused on
the qualifications and their willingness to participate in the study. Within the schools considered
either high or low poverty schools, all English language arts, math, science, and social studies
teachers invited to participate in the study. In addition, the principals in all six schools were
included. There were two subgroups after obtaining teachers names. One subgroup included
teachers who taught math, and English/language arts classes. The second subgroup included
teachers who taught science and social studies.
Instrumentation and Operationalization of Constructs
I used a survey instrument to gather information on the various dependent variables under
study. The survey instrument used gathered quantitative data as well as narrative responses to
open-ended questions. The latter helped to gain further information of educators’ perceptions.
Teacher survey. The first survey consisted of a modified version of the survey
instrument developed by Vogler in 2000 (see Appendixes B and D) and was used to gather
information regarding the educators’ perception factors affected by high-stakes testing. I
obtained established validity and reliability for this instrument, as well as the permission to use
64
and modify the instrument. Initially, Vogler developed the instrument to compare the impact of
accountability examinations on Mississippi and Tennessee social studies teachers’ instructional
practices. Thus, the modified version of the survey is necessary to adapt to focus on teachers’
perception of the state’s high-stakes testing. I made minor changes to Questions 31, 32, and 48.
I deleted questions 13 and 14 because they are repeated questions. These minor modifications
had minor impact on the instrument’s psychometric strengths.
Vogler (2008) noted that researchers used two approaches to obtain the validity and
reliability of the survey instrument. Initially, 36 high school teachers reviewed 54 items of the
draft for the content validity of the survey. More specifically, they focused on the clarity and
completeness in relation to the application of instructional practices and the potential significant
factors. As a result, they condensed the survey to 48 items. For the second approach, 34
different high school teachers used test-retest reliability. They completed the final revision of
the 48 items survey instrument, then again after 3 weeks. To assess the reliability of the survey,
I used a comparison of the response pattern of the test sessions. According to Vogler, the results
of the assessment revealed a Cronbach’s alpha was .82, which is above the .70 required to
guarantee reliability of the instrument. This signifies a high positive relationship between both
tests (Vogler, 2008).
This modified survey instrument consisted of a section to document the degree to which
middle school teachers perceive the impact of high-stakes accountability on instructional
practices. The first section of the survey consisted of three sections: (a) instructional strategies
(1-20), (b) teaching techniques (21-27), and (c) instructional materials and tools (28-40). A
Likert-type scale was used, with responses shown as “D” for don’t use, “R” for rarely, “O” for
65
occasionally, “RU” for regularly use, “M” for mostly, and “NA” for not applicable. For survey
analysis, I used the following point system. Responses for “D” for a not used instructional
strategy for the value of “1.” Responses for “R” for a rarely used strategy were given a value of
“2.” Responses for “O” for an occasionally used strategy were given a value of “3.” Responses
for “R” for a regularly used strategy were given a value of “4.” Responses for “M” for a mostly
used strategy were given a value of “5.” Responses of “NA” for not applicable were given a
value of “0.”
For Part II, a Likert-type scale was used, with responses designated “SD” for strongly
disagree, “D” for disagree, “U” for undecided, “A” for agree, and “SA” for strongly agree. I
used the following point system for survey analysis. Responses of “SD” for strongly disagree
were given a value of “1.” Responses of “D” for disagree were given a value of “2.” Responses
of “U” for undecided were given a value of “3.” Responses of “A” for agree were given a value
of “4.” Responses of “SA” for strongly agree were given a value of “5.”
Demographics. The third section was the demographic information (see Appendixes A).
This included collecting information pertaining to gender, subject taught, position, years of
experience, and level of degree obtained. I did not note any identifiable markers associated to
any survey responses.
Job Descriptive Index (JDI) and Job in General (JIG). I used the fourth section, Job
Descriptive Index (JDI) and Job in General (JIG), to gather quantitative data of teachers’
satisfaction (see Appendixes C and E). The JDI includes five components measuring the areas of
Work on Present Job, Pay, Opportunities for Promotion, Supervision, and People on your Present
Job (Balzer et al., 2000). I have found that these five factors have significant influence on job
66
satisfaction in the work place. The purpose of the JIG scale was to understand job satisfaction in
the profession, as a whole. The participants are to think of the work they do at the present. For
each phrase or words, they are to indicate how it describes their work. For example,
“Fascinating”, “Satisfying”, “Good”, “Exciting”, “Rewarding”, and “Uninteresting”. Each
component consist of three choices, “Yes” if it describes your job, “No” if it does not describe it,
and “?” if the participant cannot decide.
I scored the five AJDI subscales and AJIG scale by assigned numerical values to the yes,
no, and cannot decide response. About half of the items were worded favorably (e.g.,
satisfying), so that a yes response indicated respondent satisfaction. For the favorable items, yes
responses received 3 points, no responses received 0 points, and undecided responses received 1
point. The remaining items were worded unfavorably (e.g., dull), meaning that a yes response
indicated dissatisfaction. These unfavorable items were reverse scored; no responses received 3
points, yes responses received 0 points, and undecided responses received 1 point. The
undecided responses always received a score of 1 point, both before and after reverse scoring.
Furthermore, the undecided responses tended to be closer to an unfavorable response (i.e., score
of 0) than to a favorable response (i.e., score of 3). A mean score of 1.77 and above indicated
satisfaction with the respondent's job, and a mean score of 1.23 and below indicated
dissatisfaction with the respondent's job. The range of scores between 1.23 and 1.77 represented
an ambivalent feeling regarding the respondent's job satisfaction (Stanton, Balzer, Smith, Parra,
and Ironson, 2002).
Previous research used the JDI extensively. According to DeMeuse (1985) and Zedeck
(1987), since the creation of the survey, JDI is the most commonly used job satisfaction
67
assessment in the United States. Other researchers stated that the JDI is the most cautiously
developed measurement to assess job satisfaction (Vroom, 1964). In 1987, 1996, 1997, and
2009, the JDI was revised in order to renorm the items, establish new national norms, and to
refine the scale. According to Carson et al., (2002), the construct validity of the JDI was
assessed, which reported that the internal consistency and test-retest reliability were appropriate,
it was consistent to a nomological network of job satisfaction relationships, and it established
convergent and discriminant validity.
In 2002, Stanton et al. developed an abridged version of JDI (AJDI), in order to reduce
completion time, reduce weariness in completing the survey, and increase the available space on
the survey. Most importantly, these adjustments were necessary, and it did not jeopardize the
internal consistency and validity of the original survey. Given that the JDI/JIG was the second
survey provided, it was necessary to reduce the administration time by giving the abridged
version of JDI (AJDI) and JIG (AJIG). The AJDI consist of 25 of 72 items in the JDI, and the
AJIG consist of 8 of 18 items in the JIG. At this time, the JDI Research Group is located at
Bowling Green State University, which is responsible for preserving and modernizing the
instrument, developing new instruments, and storing data from others who used the JDI and JIG.
I obtained an official letter of permission from Bowling Green State University to use the scales
in the study.
Principal Survey. The principal survey consisted of open-ended questions concerning
their instructional method, instructional strategies, administrative/teachers support, and resources
available (see Appendixes F and G). This gave educators the opportunity explain their
perception and experiences in these subject areas, how to be more successful in meeting
68
instructional goals. I developed the questions after reviewing the structured questions from the
surveys used in this study. I wanted to give participants an opportunity to provide more detail
about their perception concerning the dependent variables. After questions were developed, five
independent reviewers, which consisted of three teachers, two principals, and one assistant
principal provided feedback of regarding the developed questions. I met with each reviewer to
read the questions one at a time to ensure clarity. The reviewers provided valuable feedback,
which resulted in changes to the wording of many of the questions in order to aid with the
understanding of the questions.
Threats to Validity
I assessed the reliability and validity for the AJDI and AJIG. On the AJDI, the highest
level of satisfaction is a 54, ranging from 0 to 54. The reliability of the AJDI subscales is
reportedly above the .70 required to ensure reliability. As for the AJIG, the 8-item survey given
concurrently with the AJDI, reported similar results to the AJDI ranging from 0 to 54 with 54
representing the highest level of general satisfaction with a job. The results of the Cronbach’s
alpha estimates revealed a correlation coefficient of .92 (Stanton et al., 2002), which is above the
.70 required to guarantee reliability of the instrument. The result indicates the items are
intentionally measuring the similar fundamental concept (Cronbach, 1951). The AJIG can also
predict the potential of intention to quit. In terms of the validity, I used a meta-analysis the
instrument’s component, which resulted in convergent validity, criterion related validity, and
content validity (Balzer et al., 2000). As mentioned previously, these modifications of the
original instrument did not risk the internal consistency and validity.
69
Data Collection
To examine the effects of high-stakes testing on perceptions concerning curricula,
instructional practices, available instructional support, and job satisfaction within high and low
poverty school, I used a single-stage, cross sectional survey design consisting of closed and
open-ended questions. After attaining the district’s and individual school’s authorization to
conduct the research, I gathered teacher responses on a self-administered questionnaire. The
survey instrument (see Appendixes A, B, C, D, E, and F) was distributed to qualifying teachers
in the pre-selected schools.
In order to increase response outcome, I implemented a similar process, such as the four-
phase administration process recommended by Salant and Dillman, (Creswell, 2003). After
obtaining assistance with the school personnel, I placed advance notice letters (see Appendixes I
and J), consent forms (Appendixes G and H), and paper/pencil surveys (see Appendixes A, B,
and F) in the teachers’ and principal’s boxes. Utilizing a web-based survey also expedited the
data collection. After four to eight days, I placed another letter in the teachers’ office box in the
participating schools reminding them that it is available (see Appendix L). Then, a week later,
teachers and principals received another follow-up postcard in their boxes, then, again after three
weeks. The data collection process took four weeks to complete (Creswell, 2003).
Quantitative Data Analysis
I divided the survey instrument into four sections. The first section consisted of
comparing the impact of accountability survey, the second section consisted of qualitative
questions, the third contained demographic information, and job satisfaction was the last section.
As stated earlier, the minimum sample size of 218 was needed and was determined using a
70
sample size table (Universal Accreditation Board, 2003) for 5% error and a 95% confidence
level and verified with sample size calculation software (Wessa, 2009) for 5% error and a 95%
confidence level. Two hundred and ten participants were needed to create an effect size (ɳ2) =
.25, power = .95, α = .05. The results of the study will be reported using appropriate quantitative
statistics as stated by Spatz (2005) and the Statistical Package for Social Science Grad Pack
(SPSS) for Windows, Version 17.0.
I assessed the reliability of the scales by computing a Cronbach’s alpha for the surveys
that associate to the dependent variables. According to Nunnally and Bernstein (1994), the
reliability coefficients should meet the acceptance criteria of .70. According to Stanton et al.
(2001), from the five items from the aJDI reached a Cronbach’s alpha of .752. In terms of the
aJIG scale, Stanton et al. found to have a Cronbach’s alpha of .92. As for the impact of
accountability survey, Vogler’s (2008) analysis reached Cronbach’s alpha of .84 on the factors
considered “student-centered instruction” and a Cronbach’s alpha of .77 on the factors
considered “teacher-centered instruction”.
The teachers’ quantitative data was analyzed descriptively prior to conducting
significance tests, therefore means, standard deviations, and line graphs, which included
constructed for each dependent variable by group (high poverty schools and low poverty
schools). The descriptive statistics allowed me to identify potential data entry errors and to
determine the characteristics of the data prior to addressing the hypotheses, such as the normality
of the data (Field, 2009).
The first eight research questions and hypotheses were addressed by conducting a two-
way factorial analysis of variance (ANOVA) given that the effect of two independent grouping
71
variables (high/low poverty schools and tested/nontested subjects) was evaluated simultaneously
and the dependent variables (job satisfaction, curriculum, instructional method and instructional
support) is parametric (Field, 2009). The main effect for school poverty level (low, high) was
evaluated, the main effect for subject taught (tested, not tested) was evaluated, and the
interaction between the two independent variables was evaluated (Field, 2009). Since each
grouping variable was comprised of only two levels, post hoc analyses were not necessary (Field,
2009). I evaluated the statistical assumption of homogeneity of variance by conducting Levene’s
test of equality of error variances. Statistical significance determined by a p < .05, assuming a
one-tailed test (Field, 2009).
Since the independent variables are categorical and the dependent variables are
continuous variables, I utilized a 2 x 2 ANOVA, meanwhile including main effects for poverty
level of schools and courses taught. An examination of the two-way contingency table for each
of the analysis indicated whether there was a relationship between the independent variable and
the dependent variables. As for the demographic information, I summarized the demographic
characteristics of the participants prior to analyzing their response on the questionnaires.
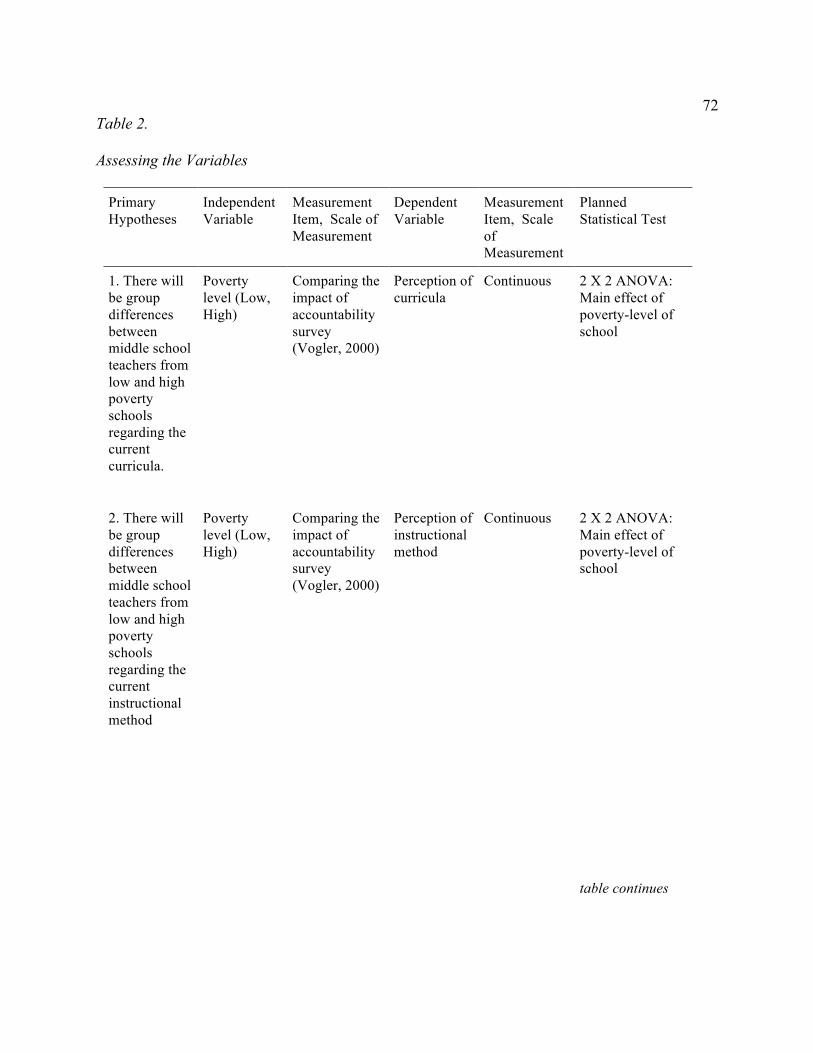
72
Table 2.
Assessing the Variables
Primary Hypotheses
Independent Variable
Measurement Item, Scale of Measurement
Dependent Variable
Measurement Item, Scale of Measurement
Planned Statistical Test
1. There will be group differences between middle school teachers from low and high poverty schools regarding the current curricula.
Poverty level (Low, High)
Comparing the impact of accountability survey (Vogler, 2000)
Perception of curricula
Continuous 2 X 2 ANOVA: Main effect of poverty-level of school
2. There will be group differences between middle school teachers from low and high poverty schools regarding the current instructional method
Poverty level (Low, High)
Comparing the impact of accountability survey (Vogler, 2000)
Perception of instructional method
Continuous 2 X 2 ANOVA: Main effect of poverty-level of school table continues
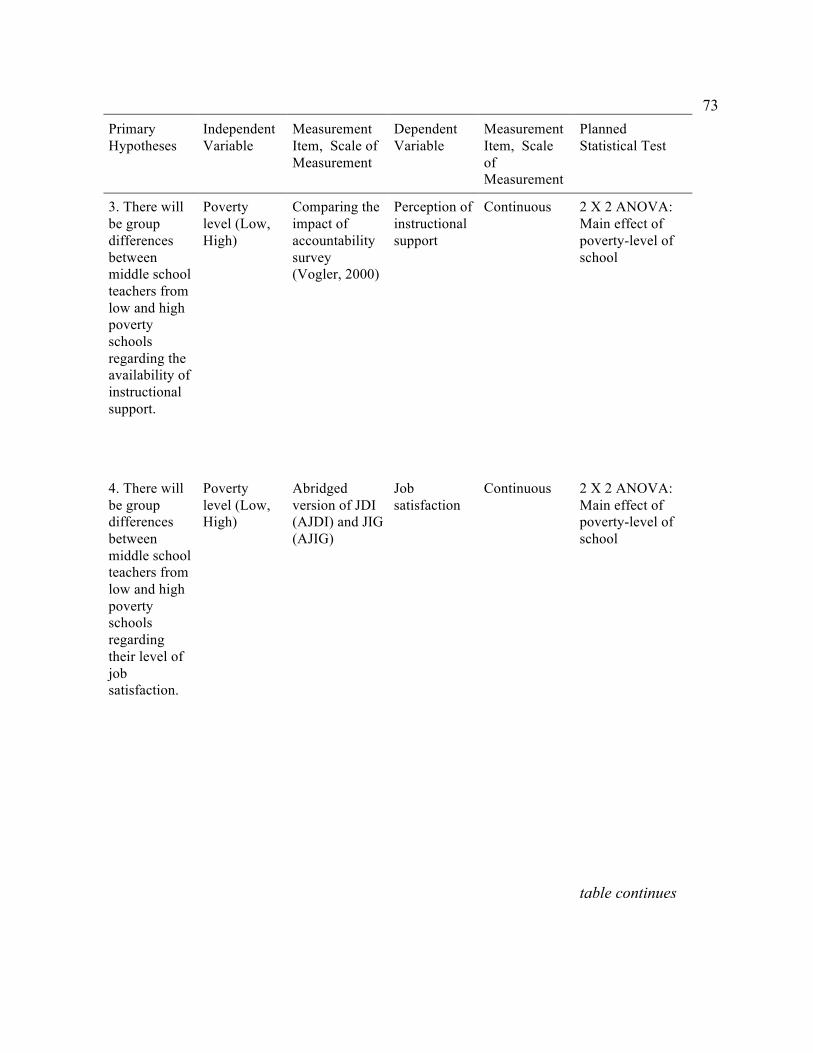
73
Primary Hypotheses
Independent Variable
Measurement Item, Scale of Measurement
Dependent Variable
Measurement Item, Scale of Measurement
Planned Statistical Test
3. There will be group differences between middle school teachers from low and high poverty schools regarding the availability of instructional support.
Poverty level (Low, High)
Comparing the impact of accountability survey (Vogler, 2000)
Perception of instructional support
Continuous 2 X 2 ANOVA: Main effect of poverty-level of school
4. There will be group differences between middle school teachers from low and high poverty schools regarding their level of job satisfaction.
Poverty level (Low, High)
Abridged version of JDI (AJDI) and JIG (AJIG)
Job satisfaction
Continuous 2 X 2 ANOVA: Main effect of poverty-level of school table continues
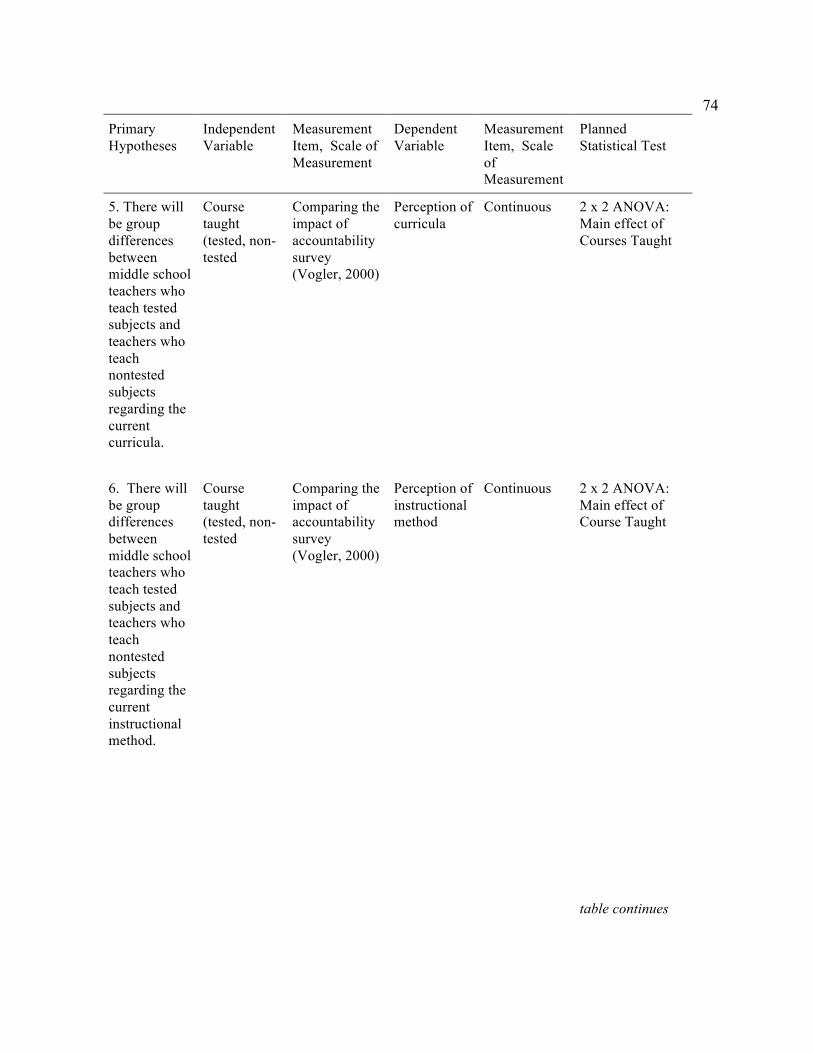
74
Primary Hypotheses
Independent Variable
Measurement Item, Scale of Measurement
Dependent Variable
Measurement Item, Scale of Measurement
Planned Statistical Test
5. There will be group differences between middle school teachers who teach tested subjects and teachers who teach nontested subjects regarding the current curricula.
Course taught (tested, non-tested
Comparing the impact of accountability survey (Vogler, 2000)
Perception of curricula
Continuous 2 x 2 ANOVA: Main effect of Courses Taught
6. There will be group differences between middle school teachers who teach tested subjects and teachers who teach nontested subjects regarding the current instructional method.
Course taught (tested, non-tested
Comparing the impact of accountability survey (Vogler, 2000)
Perception of instructional method
Continuous 2 x 2 ANOVA: Main effect of Course Taught table continues
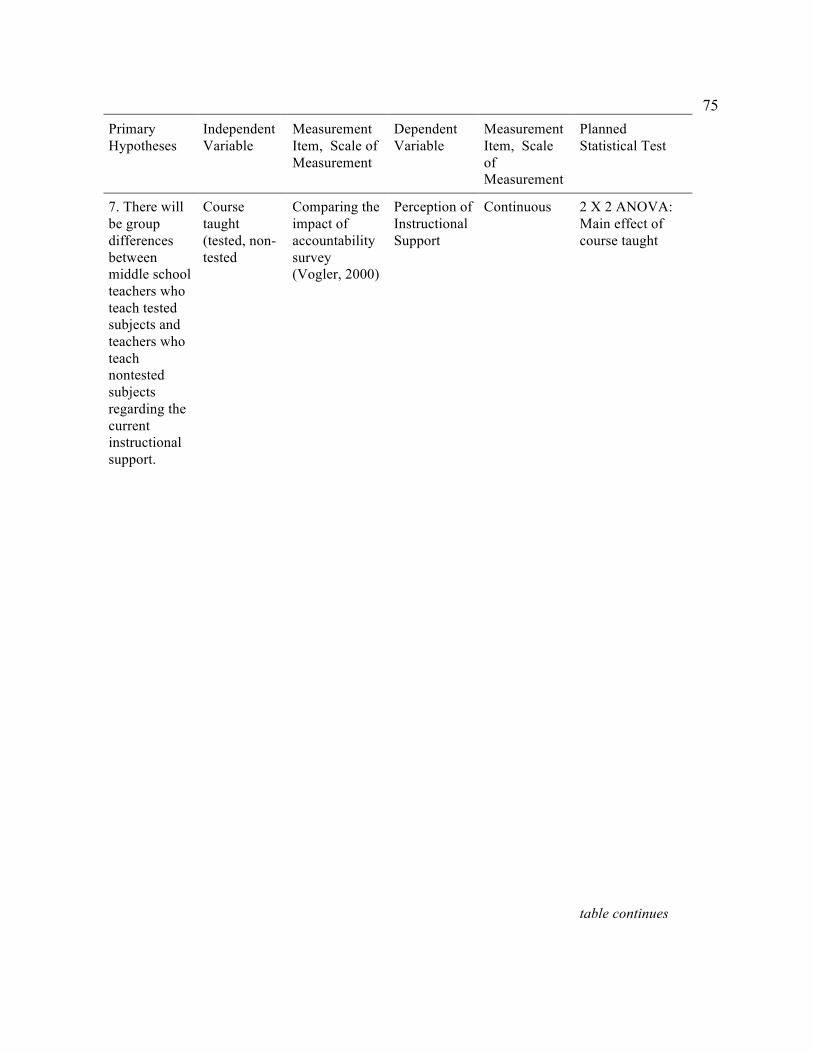
75
Primary Hypotheses
Independent Variable
Measurement Item, Scale of Measurement
Dependent Variable
Measurement Item, Scale of Measurement
Planned Statistical Test
7. There will be group differences between middle school teachers who teach tested subjects and teachers who teach nontested subjects regarding the current instructional support.
Course taught (tested, non-tested
Comparing the impact of accountability survey (Vogler, 2000)
Perception of Instructional Support
Continuous 2 X 2 ANOVA: Main effect of course taught table continues
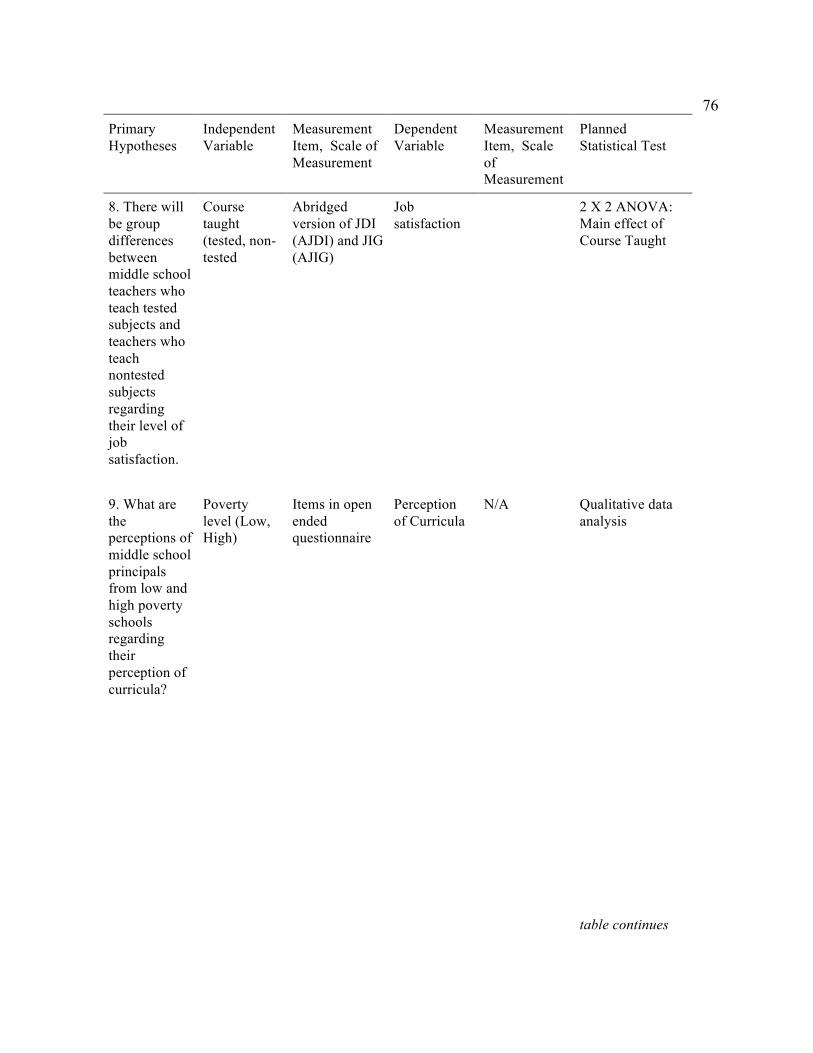
76
Primary Hypotheses
Independent Variable
Measurement Item, Scale of Measurement
Dependent Variable
Measurement Item, Scale of Measurement
Planned Statistical Test
8. There will be group differences between middle school teachers who teach tested subjects and teachers who teach nontested subjects regarding their level of job satisfaction.
Course taught (tested, non-tested
Abridged version of JDI (AJDI) and JIG (AJIG)
Job satisfaction
2 X 2 ANOVA: Main effect of Course Taught
9. What are the perceptions of middle school principals from low and high poverty schools regarding their perception of curricula?
Poverty level (Low, High)
Items in open ended questionnaire
Perception of Curricula
N/A Qualitative data analysis table continues
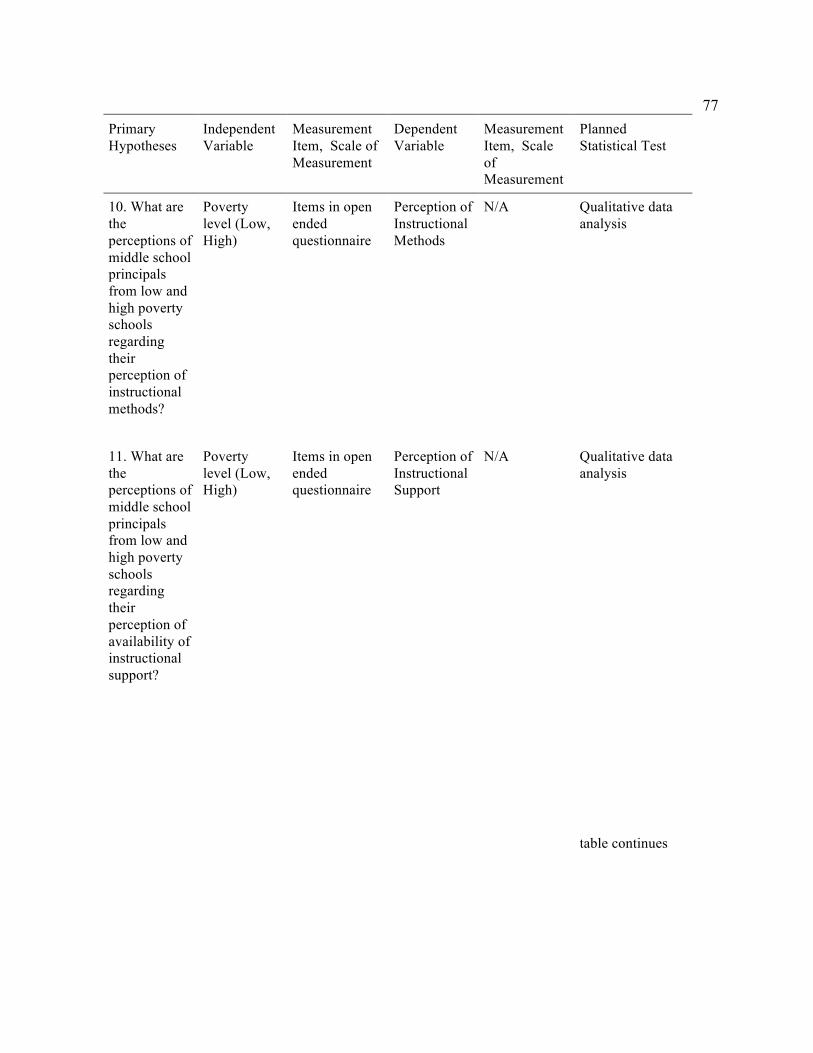
77
Primary Hypotheses
Independent Variable
Measurement Item, Scale of Measurement
Dependent Variable
Measurement Item, Scale of Measurement
Planned Statistical Test
10. What are the perceptions of middle school principals from low and high poverty schools regarding their perception of instructional methods?
Poverty level (Low, High)
Items in open ended questionnaire
Perception of Instructional Methods
N/A Qualitative data analysis
11. What are the perceptions of middle school principals from low and high poverty schools regarding their perception of availability of instructional support?
Poverty level (Low, High)
Items in open ended questionnaire
Perception of Instructional Support
N/A Qualitative data analysis table continues
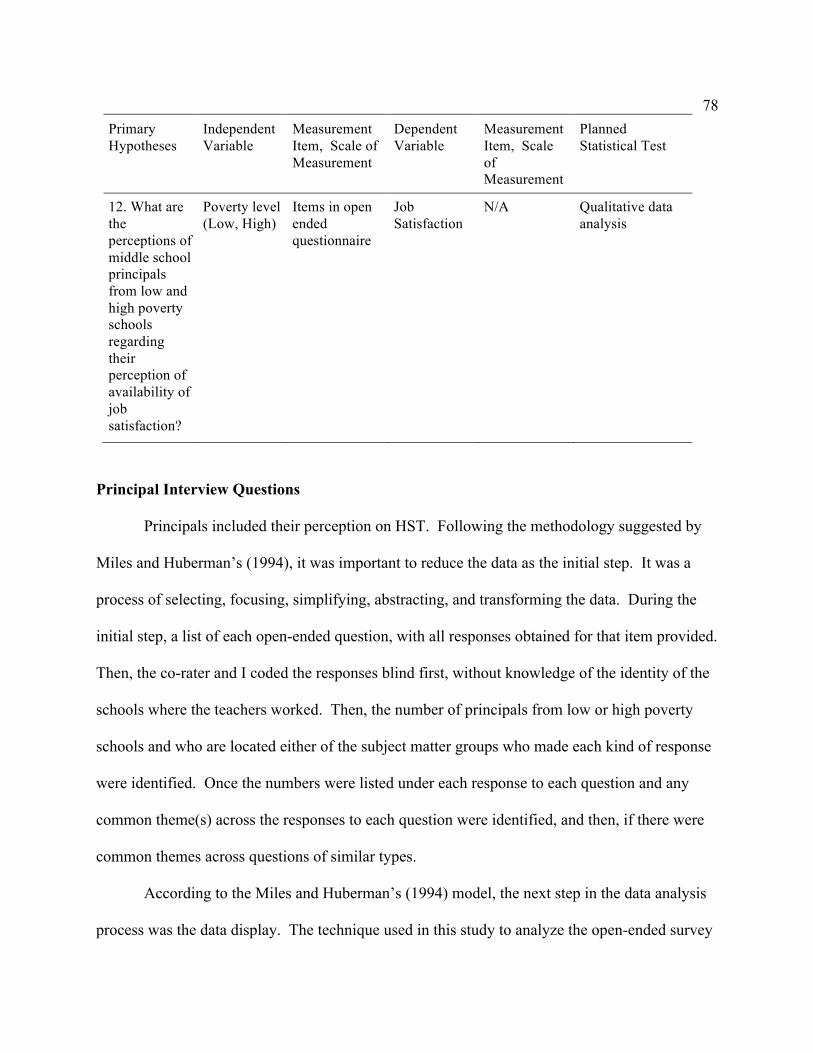
78
Primary Hypotheses
Independent Variable
Measurement Item, Scale of Measurement
Dependent Variable
Measurement Item, Scale of Measurement
Planned Statistical Test
12. What are the perceptions of middle school principals from low and high poverty schools regarding their perception of availability of job satisfaction?
Poverty level (Low, High)
Items in open ended questionnaire
Job Satisfaction
N/A Qualitative data analysis
Principal Interview Questions
Principals included their perception on HST. Following the methodology suggested by
Miles and Huberman’s (1994), it was important to reduce the data as the initial step. It was a
process of selecting, focusing, simplifying, abstracting, and transforming the data. During the
initial step, a list of each open-ended question, with all responses obtained for that item provided.
Then, the co-rater and I coded the responses blind first, without knowledge of the identity of the
schools where the teachers worked. Then, the number of principals from low or high poverty
schools and who are located either of the subject matter groups who made each kind of response
were identified. Once the numbers were listed under each response to each question and any
common theme(s) across the responses to each question were identified, and then, if there were
common themes across questions of similar types.
According to the Miles and Huberman’s (1994) model, the next step in the data analysis
process was the data display. The technique used in this study to analyze the open-ended survey
79
items was a cross-case synthesis because this case study consisted of two cases, high and low
poverty schools. As a result, the purpose of this study was to compare and contrast the impact of
testing and accountability policies in the two different environments. For the schools selected to
participate, I drew comparisons and contrasts among teachers and principals, as well as
documented any patterns discovered. More specifically, I examined the comparisons and
contrasts pertaining to specific aspects of the research question across the several groups. These
groups comprised of comparing and contrasting principals in high-poverty schools to those
principals in low-poverty schools.
A co-rater (see Appendix N) reviewed each open-ended question and the responses to
assist in analyzing the findings of the responses. The co-rater chosen was a person who was
familiar with qualitative studies. The co-rater was a person who is a doctoral degree recipient
that conducted a qualitative study. According to Creswell (1998), the peer review procedure for
qualitative studies has some similar characteristics of the inter-rater reliability, frequently used in
quantitative studies. The co-rater reviewed all data, to collect themes, and to provide any
corrective feedback for consistency of themes that the interviewer observed. The co-rater was
blind to the themes the interviewer derived and guided by the research questions provided by the
interview and the interview questions with the responses of each participant to gather themes.
The co-rater provided feedback with themes found from the responses of each participant from
the interview questions. I reported the open-ended data using summary statements and
supporting excerpts from the survey responses. Among the findings presented was a summary of
the frequency of responses in each coded category and among the different groups.
80
Ethical Procedure
There were protective measures in place in order to protect the rights of human
participants. Prior to the data collection process, I obtained Walden IRB approval (approval
number: 04-17-13-0146684). I invited all teachers who qualified from the selected schools to
participate. Participation was voluntary. The first page of the survey instrument (see Appendixes
H and I) included detailed information about the study and a consent to participate. This page
consisted of the background information about the study, procedures, voluntary nature of the
study, risks and benefits of the study, compensation, and confidentiality. The next page provided
the IRB approval number, as well as the contact information for administrative at Walden
University and myself for questions or concerns. Although I designed the survey to be
anonymous to protect the participants’ confidentiality, the participants had to identify which
school they work at in order for me to know the poverty level of the school. However, the
reported did not include the school’s information. I used the schools' information solely for
analytical purposes. The report did not include any other identifiable markers associated to any
survey responses. Each participant was associated with a randomized number. All data
received, is on a secured, password protected site and jump drive. At the end of the data review
and analysis, I will maintain the data in a locked storage file cabinet for five years and then
destroy it.
Summary
This study and research design focused on investigating educators’ perceptions of the
effects of high-stakes testing and the accountability policies in high poverty and low poverty
middle schools within a southeastern school district. This study utilized a cross-sectional, quasi-
81
experimental design to obtain both quantitative and qualitative information to determine the
effect of the independent variable, the implementation of high-stakes testing in high and low
poverty schools, on the dependent variables curricula, instructional practices, available
instructional support, and job satisfaction. Specifically, I collected qualitative data from
principals in order to examine their perception regarding curricula, instructional practices,
available instructional support, and job satisfaction. Included in the study was a detailed
description of the research design and methodology. In addition, I included information
pertaining to the nature of the study, the primary variables under investigation, assessments
administered and the statistical analysis related to the study.
82
Chapter 4
Introduction
Data Collection
Time Frame for Data Collection and Recruitment Procedures
In Chapter 3, I stated that, in order to increase response outcome, I would implement a
similar process, such as the four-phase administration process recommended by Salant and
Dillman (1994). After obtaining assistance from the school personnel, I placed advance notice
letters (see Appendixes I and J), consent forms (see Appendixes G and H), and paper/pencil
surveys (see Appendixes A, B, and F) in the teachers’ and principals’ boxes. Web-based survey
expedited the data collection process. After four to eight days, the teachers received another
letter in their office box in the participating schools reminding them of the availability of the
web-based survey (see Appendix L). Then, a week later, I placed another follow-up postcard in
their boxes, and then again after three weeks. The expectation was that data collection would
occur within four weeks (Creswell, 2014).
Discrepancies from Original Data Plan. There was a discrepancy in data collection
from the plan presented in Chapter 3. Given the lack of participants during those four weeks, I
had to modify the data collection process. Initially, I sent recruitment web links to
approximately 312 adults with a response rate of approximately 16%. I submitted another IRB
application to Walden’s IRB committee on June 20, 2013, in order to gain approval to distribute
surveys during or after a staff meeting in the participating schools. The IRB committee and the
school principals approved the modifications on August 13, 2013. This gave the participants a
clear understanding of the research, and they had the opportunity to ask additional questions
83
pertaining to the research. After discussing the research, I disseminated the surveys. At that
point, the teachers filled out the surveys and return them in a box in the front office or complete
it online. After one to two weeks, the teachers received another reminder letter in their boxes.
With that modification, I obtained more participation from teachers. I sent recruitment web links
and paper-pencil surveys to approximately 312 adults with a response rate of approximately
28%. Given the modification of the data collection method, having to obtain approval from the
IRB committee, and given the educators’ spring break, high-stakes testing administration and
summer vacation, the data collection process was longer than expected.
To address the first eight research questions and hypotheses I conducted a two-way
factorial analysis of variance given that the effect of two independent grouping variables
(high/low poverty schools and tested/nontested subjects) simultaneously and the dependent
variables (job satisfaction, curriculum, instructional method and instructional support) are
parametric (Field, 2009). The main effect for school poverty level (low, high), the main effect
for subject taught (tested, not tested), and the interaction between the two independent variables
were evaluated (Field, 2009).
Baseline for Descriptive Demographic Data
As shown in Table 3, the frequencies and percentages for the participants’demographic
were reported. The sample size was 200 participants. The majority of the participants were
female 73% (n = 144); 51% (n = 102) were from high poverty schools and the remaining 49.0%
(n = 98) were from low poverty schools. Fifty-two percent (n = 103) taught non-tested subjects
and 40.0% (n = 97) taught tested subjects. Years of experience varied with the largest
percentages of participants having 10 to 14 years of experience (26.0%, n = 52), 19.0% (n = 38)
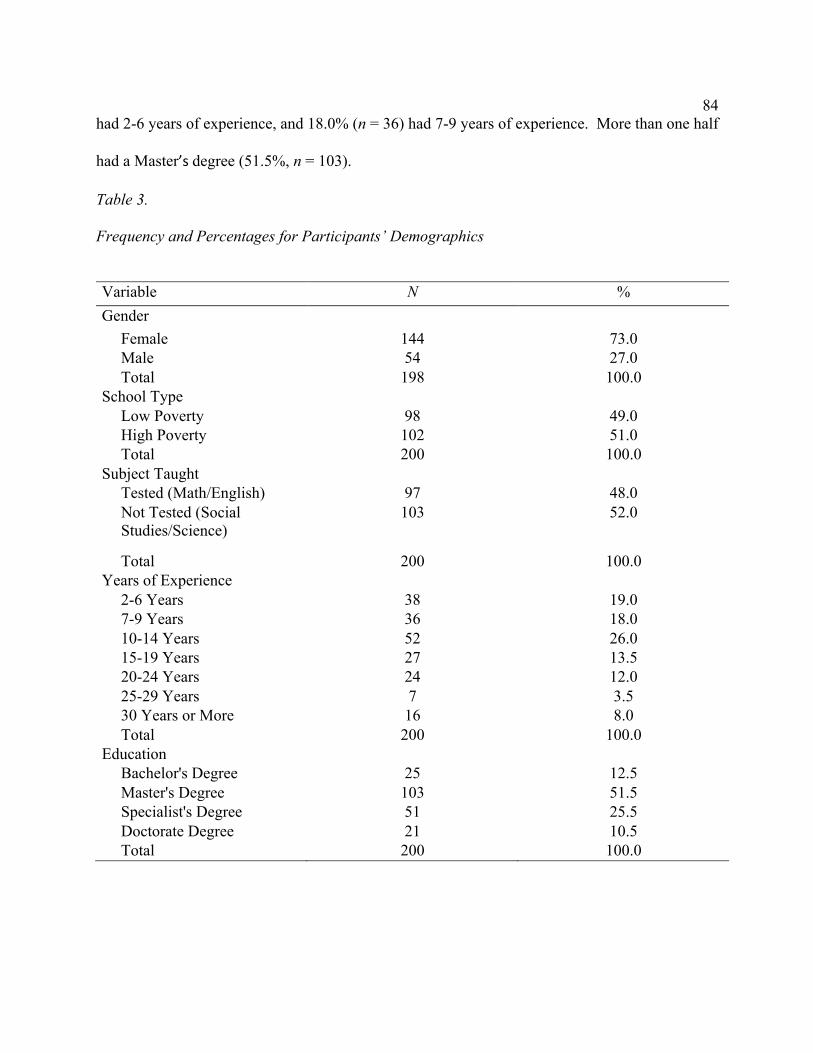
84
had 2-6 years of experience, and 18.0% (n = 36) had 7-9 years of experience. More than one half
had a Master’sdegree (51.5%, n = 103).
Table 3.
Frequency and Percentages for Participants’ Demographics
Variable N % Gender
Female 144 73.0 Male 54 27.0 Total 198 100.0
School Type Low Poverty 98 49.0 High Poverty 102 51.0 Total 200 100.0
Subject Taught Tested (Math/English) 97 48.0 Not Tested (Social Studies/Science)
103 52.0
Total 200 100.0 Years of Experience
2-6 Years 38 19.0 7-9 Years 36 18.0 10-14 Years 52 26.0 15-19 Years 27 13.5 20-24 Years 24 12.0 25-29 Years 7 3.5 30 Years or More 16 8.0 Total 200 100.0
Education Bachelor's Degree 25 12.5 Master's Degree 103 51.5 Specialist's Degree 51 25.5 Doctorate Degree 21 10.5 Total 200 100.0
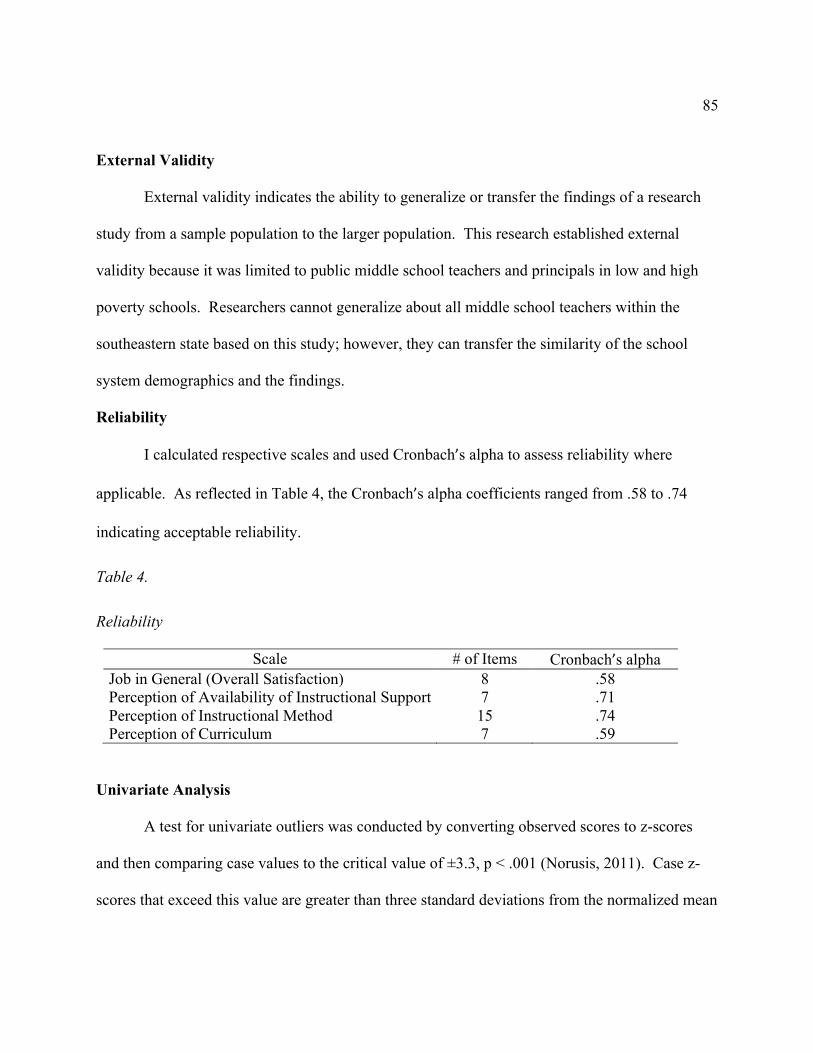
85
External Validity
External validity indicates the ability to generalize or transfer the findings of a research
study from a sample population to the larger population. This research established external
validity because it was limited to public middle school teachers and principals in low and high
poverty schools. Researchers cannot generalize about all middle school teachers within the
southeastern state based on this study; however, they can transfer the similarity of the school
system demographics and the findings.
Reliability
I calculated respective scales and used Cronbach’s alpha to assess reliability where
applicable. As reflected in Table 4, the Cronbach’s alpha coefficients ranged from .58 to .74
indicating acceptable reliability.
Table 4.
Reliability
Scale # of Items Cronbach’s alpha Job in General (Overall Satisfaction) 8 .58 Perception of Availability of Instructional Support 7 .71 Perception of Instructional Method 15 .74 Perception of Curriculum 7 .59
Univariate Analysis
A test for univariate outliers was conducted by converting observed scores to z-scores
and then comparing case values to the critical value of ±3.3, p < .001 (Norusis, 2011). Case z-
scores that exceed this value are greater than three standard deviations from the normalized mean
86
and should be investigated and potentially removed. For Job satisfaction, three cases exceeded
the criterion of +/- 3.3 with values of -3.70; I excluded these cases from the dataset. For
Perception of Curriculum, one case exceeded the criterion of +/- 3.3 with a value of -3.59; I
removed this case from the data set. The removal of four outliers reduced the sample to 196
cases for subsequent analysis.
Results
Descriptive Statistics
The descriptive statistics for key variables are in Table 5. Job Satisfaction scores ranged
from 5.00 to 21.00 with an average score of 13.68 (SD = 2.32). Perception of the Availability of
Instructional Support ranged from 1.86 to 5.00 with an average score of 3.81 (SD = 0.66).
Perception of Instructional Method ranged from 2.27 to 4.67 with an average score of 3.37 (SD =
0.50). Perception of Curriculum ranged from 1.14 to 4.00 with an average score of 2.68 (SD =
0.42).
Skewness. To test if the distribution are significantly skewed variables, I divided the
skew coefficients by the skew standard error of 0.23 to obtain the z-skew coefficients (see Table
5). Tabachnick and Fidell (2007) suggested that z-skew coefficients exceeding the critical value
of ±3.3 (p<.001) may indicate non-normality. However, none of the variables had z-skew
coefficients above the critical value of ±3.3. Thus, the assumption of normality was met.
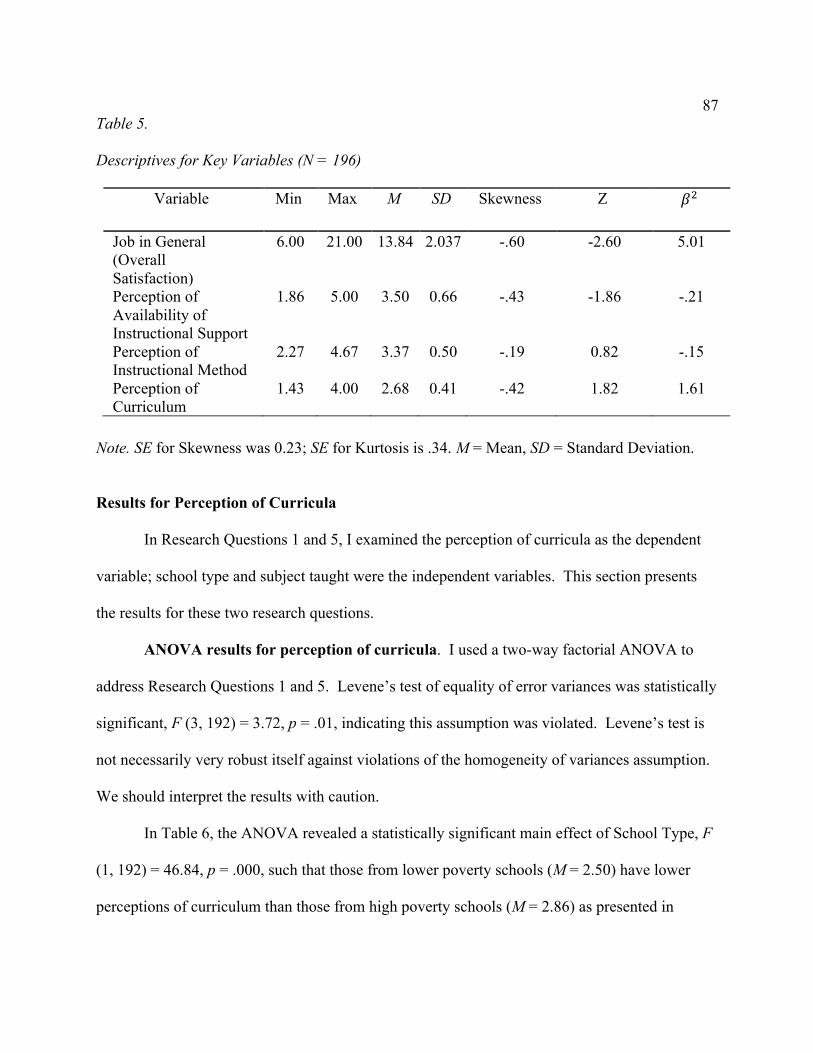
87
Table 5.
Descriptives for Key Variables (N = 196)
Variable Min Max M SD Skewness Z !"
Job in General (Overall Satisfaction)
6.00 21.00 13.84 2.037 -.60 -2.60 5.01
Perception of Availability of Instructional Support
1.86 5.00 3.50 0.66 -.43 -1.86 -.21
Perception of Instructional Method
2.27 4.67 3.37 0.50 -.19 0.82 -.15
Perception of Curriculum
1.43 4.00 2.68 0.41 -.42 1.82 1.61
Note. SE for Skewness was 0.23; SE for Kurtosis is .34. M = Mean, SD = Standard Deviation.
Results for Perception of Curricula
In Research Questions 1 and 5, I examined the perception of curricula as the dependent
variable; school type and subject taught were the independent variables. This section presents
the results for these two research questions.
ANOVA results for perception of curricula. I used a two-way factorial ANOVA to
address Research Questions 1 and 5. Levene’s test of equality of error variances was statistically
significant, F (3, 192) = 3.72, p = .01, indicating this assumption was violated. Levene’s test is
not necessarily very robust itself against violations of the homogeneity of variances assumption.
We should interpret the results with caution.
In Table 6, the ANOVA revealed a statistically significant main effect of School Type, F
(1, 192) = 46.84, p = .000, such that those from lower poverty schools (M = 2.50) have lower
perceptions of curriculum than those from high poverty schools (M = 2.86) as presented in
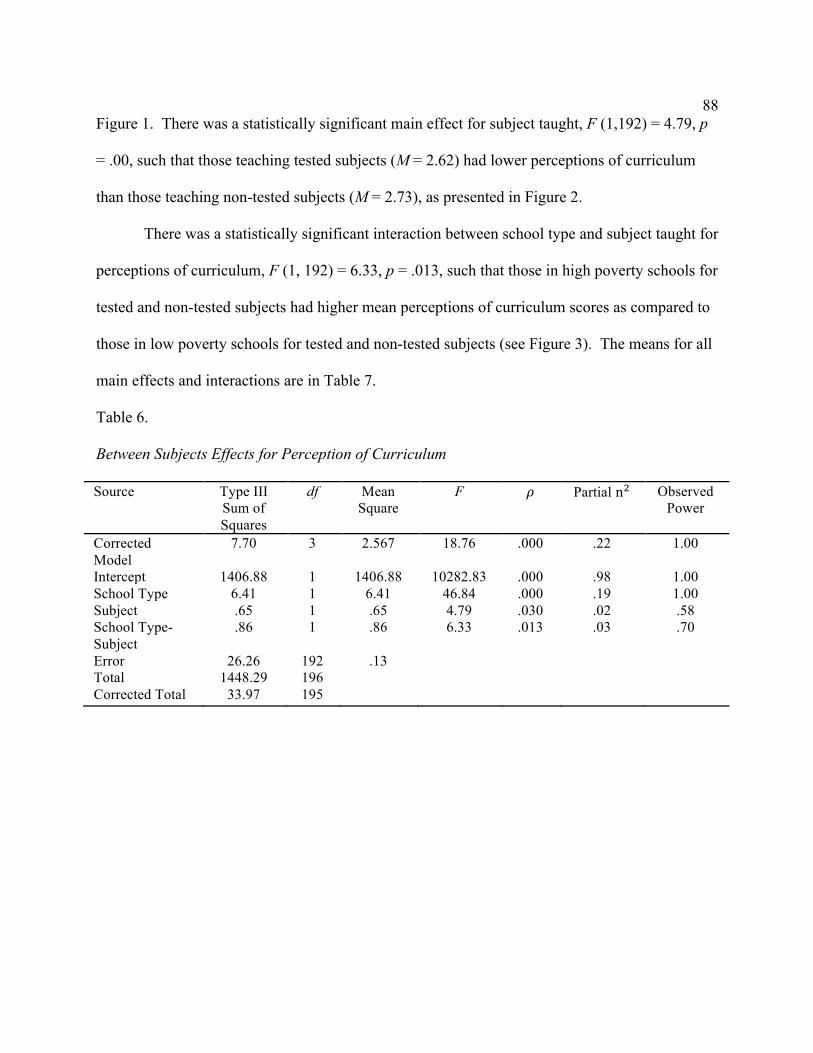
88
Figure 1. There was a statistically significant main effect for subject taught, F (1,192) = 4.79, p
= .00, such that those teaching tested subjects (M = 2.62) had lower perceptions of curriculum
than those teaching non-tested subjects (M = 2.73), as presented in Figure 2.
There was a statistically significant interaction between school type and subject taught for
perceptions of curriculum, F (1, 192) = 6.33, p = .013, such that those in high poverty schools for
tested and non-tested subjects had higher mean perceptions of curriculum scores as compared to
those in low poverty schools for tested and non-tested subjects (see Figure 3). The means for all
main effects and interactions are in Table 7.
Table 6.
Between Subjects Effects for Perception of Curriculum
Source Type III Sum of Squares
df Mean Square
F # Partial n" Observed Power
Corrected Model
7.70 3 2.567 18.76 .000 .22 1.00
Intercept 1406.88 1 1406.88 10282.83 .000 .98 1.00 School Type 6.41 1 6.41 46.84 .000 .19 1.00 Subject .65 1 .65 4.79 .030 .02 .58 School Type-Subject
.86 1 .86 6.33 .013 .03 .70
Error 26.26 192 .13 Total 1448.29 196 Corrected Total 33.97 195
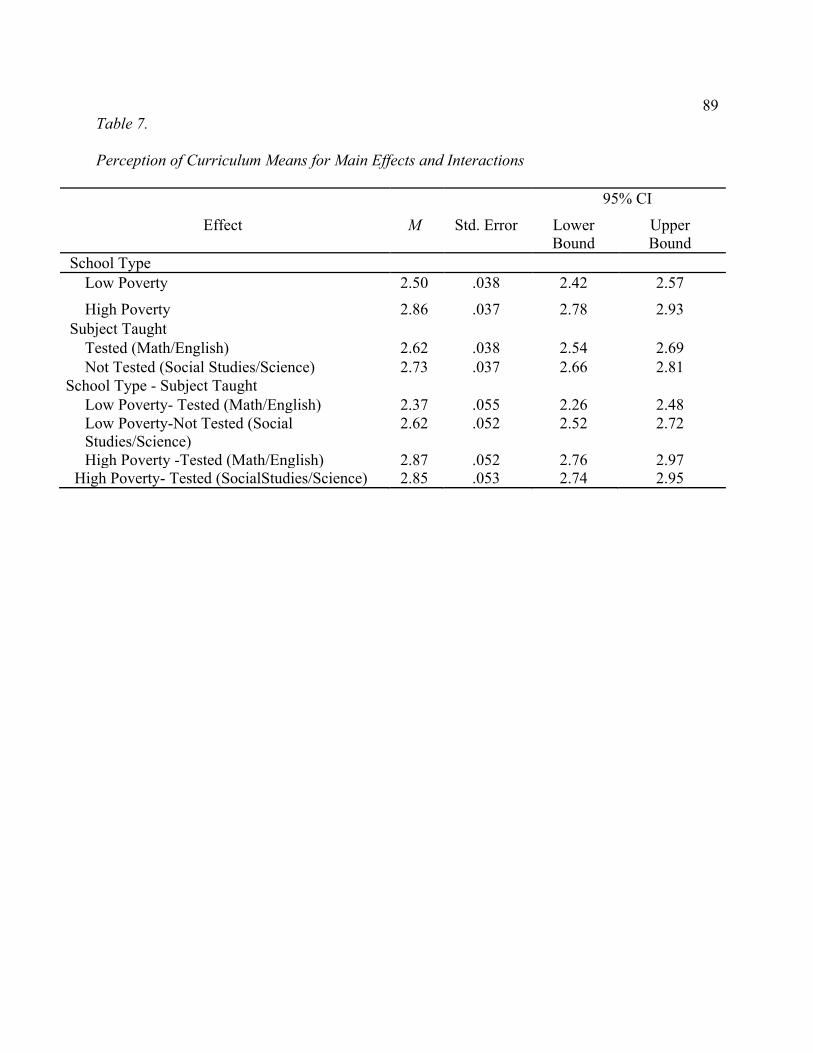
89
Table 7.
Perception of Curriculum Means for Main Effects and Interactions
95% CI
Effect M Std. Error Lower Bound
Upper Bound
School Type Low Poverty 2.50 .038 2.42 2.57
High Poverty 2.86 .037 2.78 2.93 Subject Taught
Tested (Math/English) 2.62 .038 2.54 2.69 Not Tested (Social Studies/Science) 2.73 .037 2.66 2.81
School Type - Subject Taught Low Poverty- Tested (Math/English) 2.37 .055 2.26 2.48 Low Poverty-Not Tested (Social Studies/Science)
2.62 .052 2.52 2.72
High Poverty -Tested (Math/English) 2.87 .052 2.76 2.97 High Poverty- Tested (SocialStudies/Science) 2.85 .053 2.74 2.95
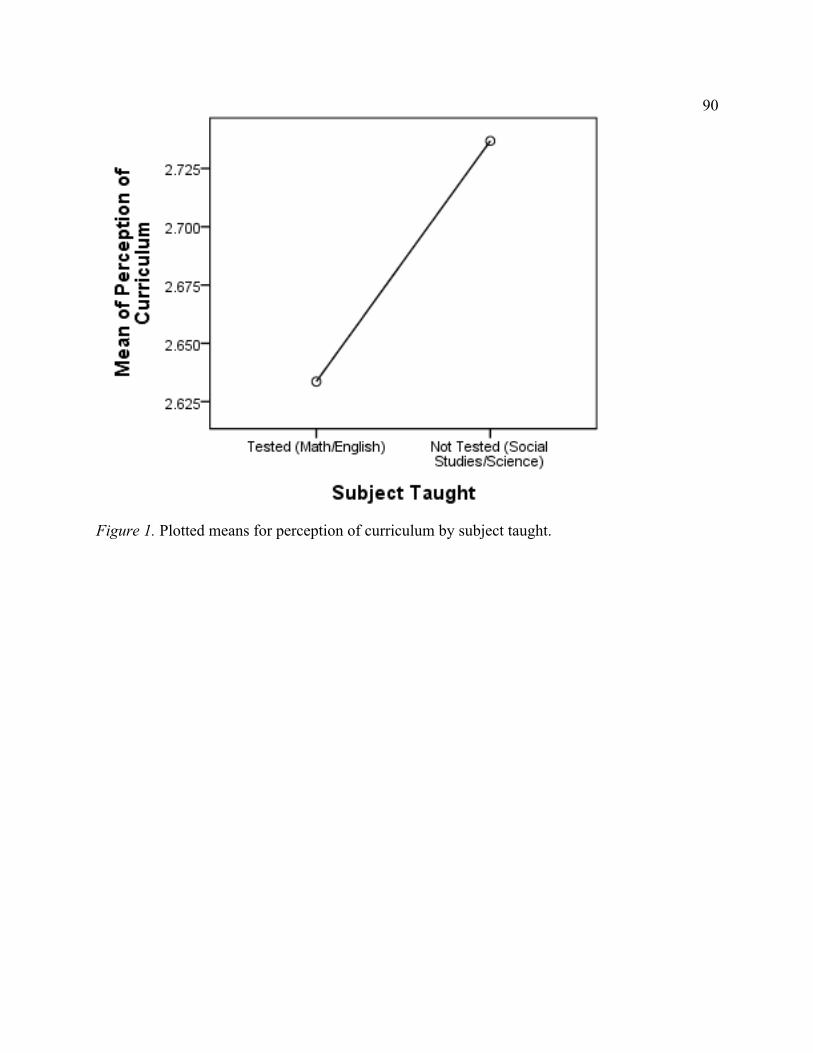
90
Figure 1. Plotted means for perception of curriculum by subject taught.
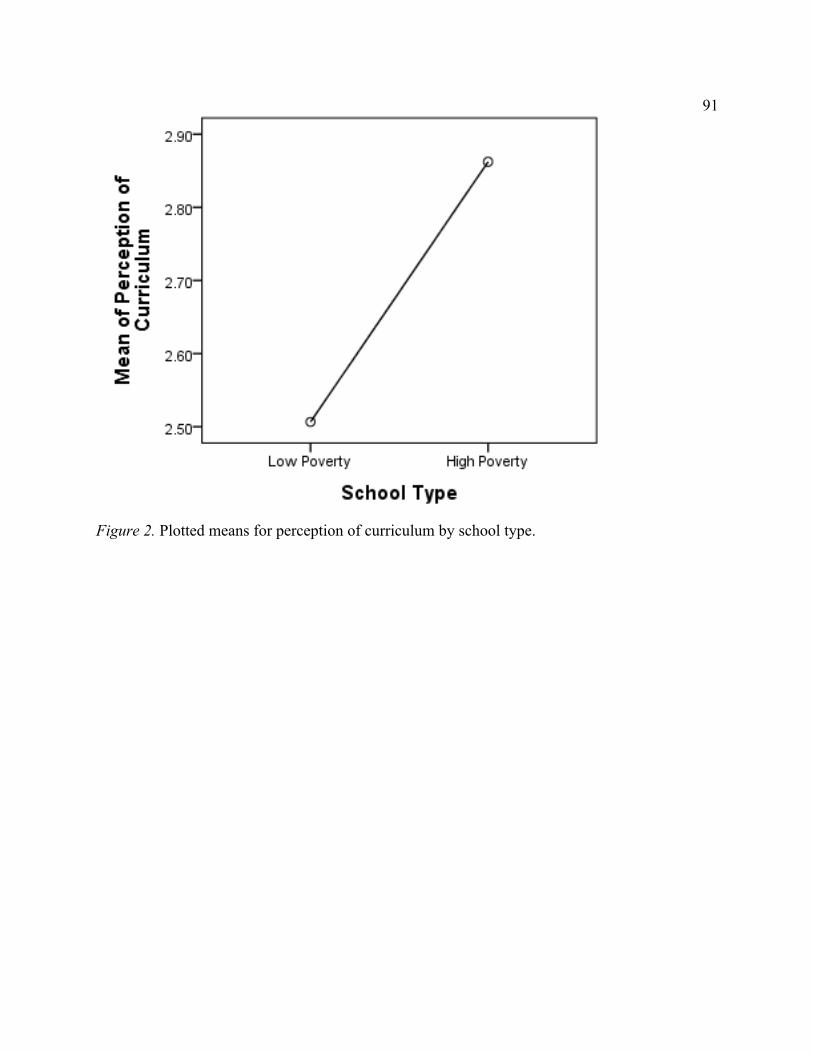
91
Figure 2. Plotted means for perception of curriculum by school type.
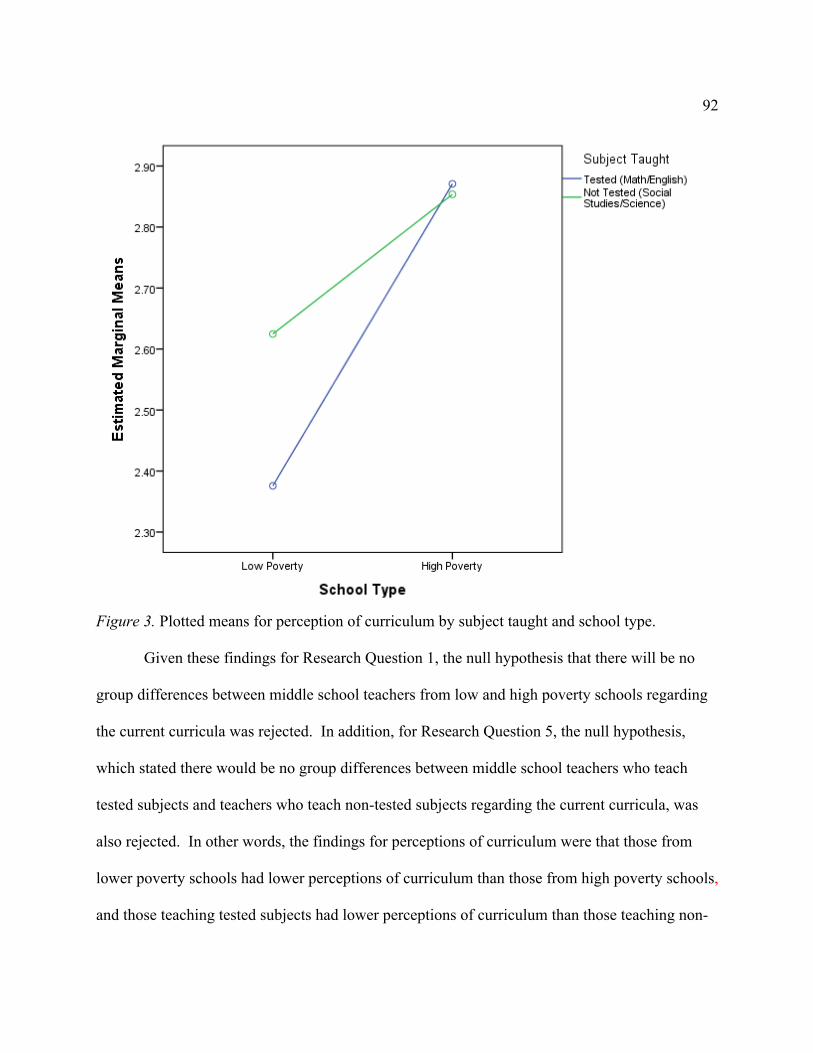
92
Figure 3. Plotted means for perception of curriculum by subject taught and school type.
Given these findings for Research Question 1, the null hypothesis that there will be no
group differences between middle school teachers from low and high poverty schools regarding
the current curricula was rejected. In addition, for Research Question 5, the null hypothesis,
which stated there would be no group differences between middle school teachers who teach
tested subjects and teachers who teach non-tested subjects regarding the current curricula, was
also rejected. In other words, the findings for perceptions of curriculum were that those from
lower poverty schools had lower perceptions of curriculum than those from high poverty schools,
and those teaching tested subjects had lower perceptions of curriculum than those teaching non-

93
tested subjects did. In addition, there was a statistically significant interaction between school
type and subject taught for Perception of Curriculum, such that those in high poverty schools for
tested and non-tested subjects had higher mean perceptions of curriculum scores as compared to
those in low poverty schools for tested and non-tested subjects.
Results for Perception of Instructional Methods
In Research Questions 2 and 6, I examined the instructional methods as the dependent
variable; school type and subject taught were the independent variables. In this section, I
presented the results for these two research questions.
ANOVA results for perception of instructional method. I used a two-way factorial
ANOVA to address Research Questions 2 and 6. Levene’s test of equality of error variances was
statistically significant, F (3, 192) = 2.89, p = .037, indicating this assumption was violated. As
presented in Table 8, the ANOVA revealed a statistically significant main effect of School Type,
F (1, 192) = 21.54, p = .001, such that those from lower poverty schools (M = 3.21) have lower
perceptions of instructional methods than those from high poverty schools (M = 3.52), as
presented in Figure 4. There was a statistically significant main effect for subject taught, F
(1,192) = 9.54, p = .002, such that those teaching tested subjects (M = 3.26) had lower
perceptions of instructional methods than those teaching non-tested subjects (M = 3.47), as
presented in Figure 5. In addition, there was a statistically significant interaction between school
type and subject taught for perception of instructional methods, F (1, 192) = 15.62, p = .001,
such that those in high poverty schools for tested and non-tested subjects had higher perception
of instructional methods than those in low poverty schools for tested and non-tested subjects (see
Figure 6). Table 9 contains the means for all main effects and interactions.
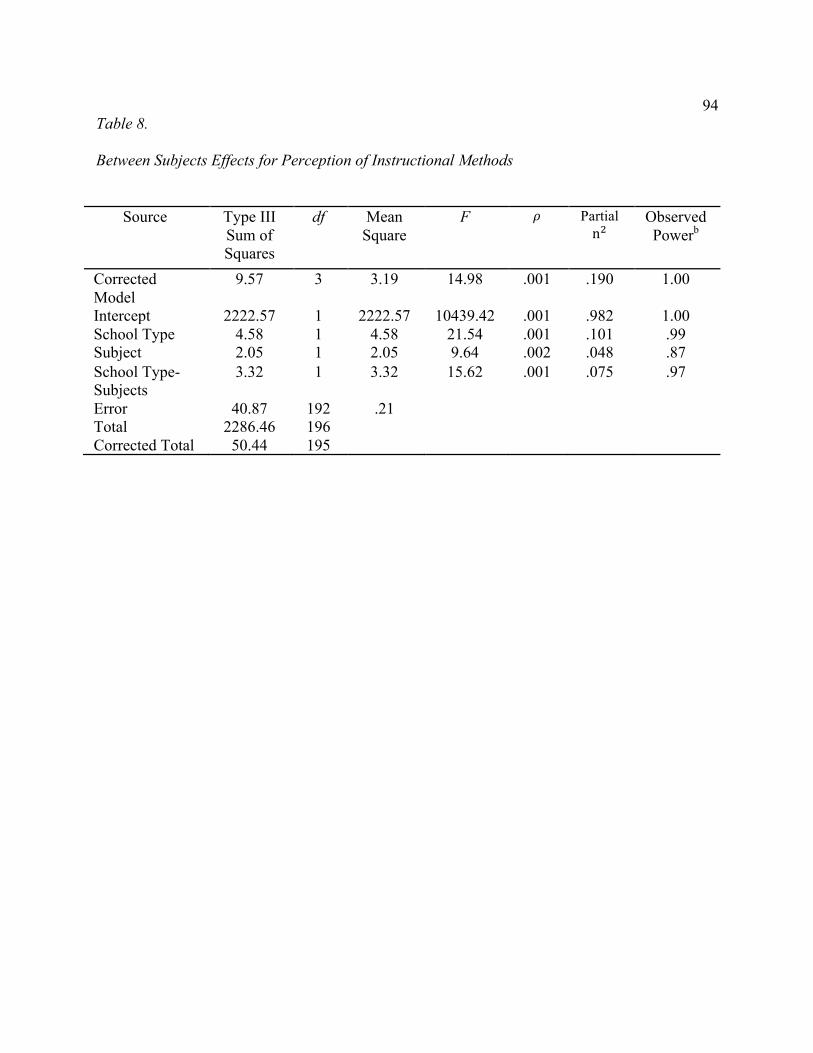
94
Table 8.
Between Subjects Effects for Perception of Instructional Methods
Source Type III
Sum of Squares
df Mean Square
F # Partial n"
Observed Powerb
Corrected Model
9.57 3 3.19 14.98 .001 .190 1.00
Intercept 2222.57 1 2222.57 10439.42 .001 .982 1.00 School Type 4.58 1 4.58 21.54 .001 .101 .99 Subject 2.05 1 2.05 9.64 .002 .048 .87 School Type- Subjects
3.32 1 3.32 15.62 .001 .075 .97
Error 40.87 192 .21 Total 2286.46 196 Corrected Total 50.44 195
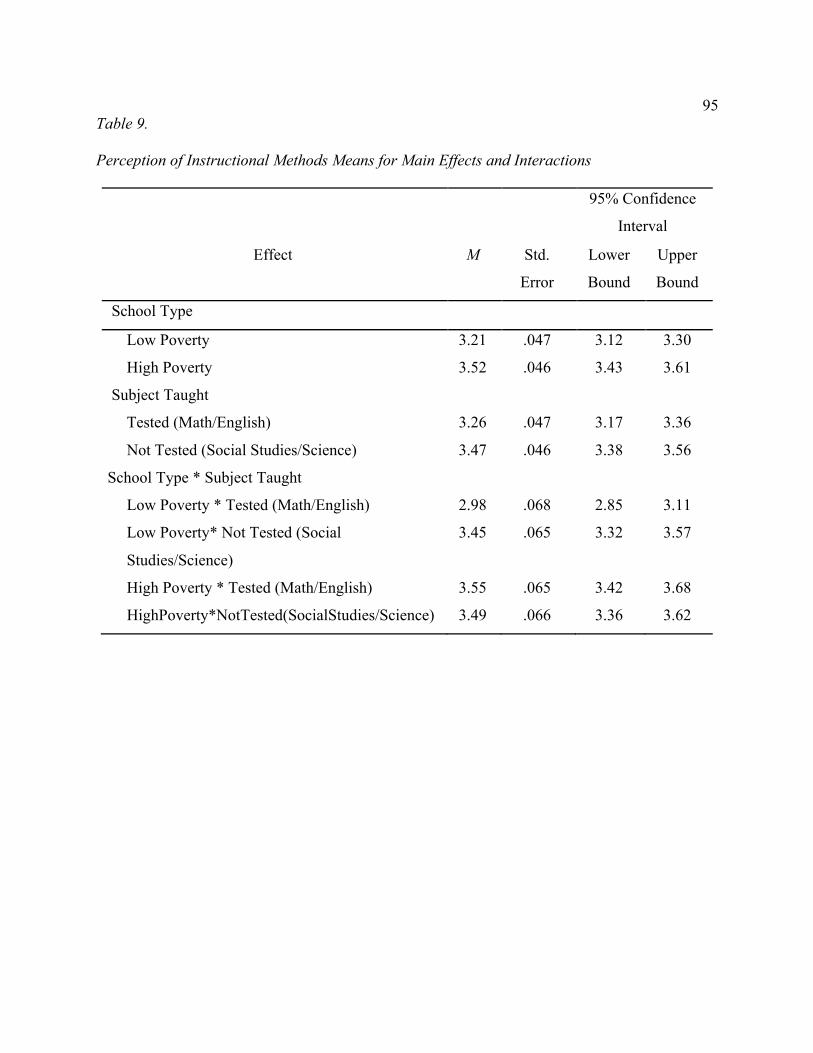
95
Table 9.
Perception of Instructional Methods Means for Main Effects and Interactions
95% Confidence
Interval
Effect M Std.
Error
Lower
Bound
Upper
Bound
School Type
Low Poverty 3.21 .047 3.12 3.30
High Poverty 3.52 .046 3.43 3.61
Subject Taught
Tested (Math/English) 3.26 .047 3.17 3.36
Not Tested (Social Studies/Science) 3.47 .046 3.38 3.56
School Type * Subject Taught
Low Poverty * Tested (Math/English) 2.98 .068 2.85 3.11
Low Poverty* Not Tested (Social
Studies/Science)
3.45 .065 3.32 3.57
High Poverty * Tested (Math/English) 3.55 .065 3.42 3.68
HighPoverty*NotTested(SocialStudies/Science) 3.49 .066 3.36 3.62
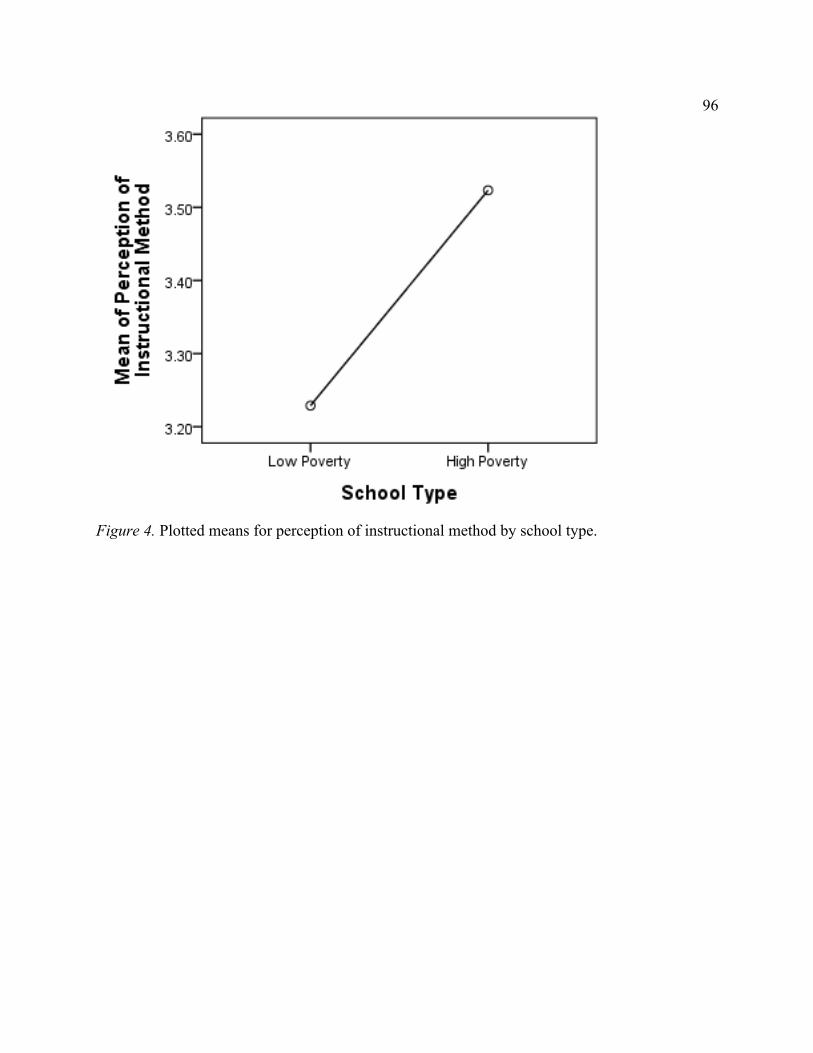
96
Figure 4. Plotted means for perception of instructional method by school type.

97
Figure 5. Plotted means for perception of instructional method by subject taught.
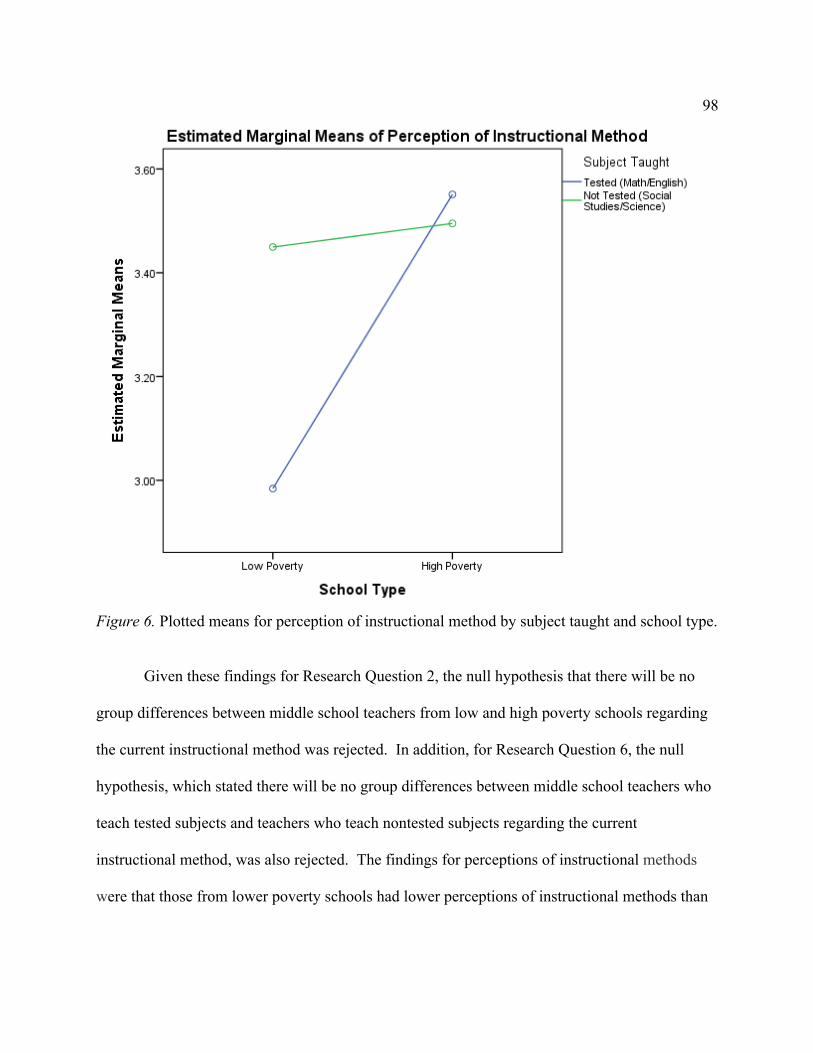
98
Figure 6. Plotted means for perception of instructional method by subject taught and school type.
Given these findings for Research Question 2, the null hypothesis that there will be no
group differences between middle school teachers from low and high poverty schools regarding
the current instructional method was rejected. In addition, for Research Question 6, the null
hypothesis, which stated there will be no group differences between middle school teachers who
teach tested subjects and teachers who teach nontested subjects regarding the current
instructional method, was also rejected. The findings for perceptions of instructional methods
were that those from lower poverty schools had lower perceptions of instructional methods than
99
those from high poverty schools and that those teaching tested subjects had lower perceptions of
instructional methods than those teaching non-tested subjects. In addition, there was a
statistically significant interaction between school type and subject taught for perception of
instructional methods, such that those in high poverty schools for tested and non-tested subjects
had higher perception of instructional methods scores than those in low poverty schools for
tested and non-tested subjects.
Results for Perception of Instructional Support
In Research Questions 3 and 7, I examined the perception of instructional support as the
dependent variable; school type and subject taught were the independent variables. This section
presents the results for these two research questions.
ANOVA results for perception of current instructional support. A two-way factorial
ANOVA addressed Research Questions 3 and 7. Levene’s test of equality of error variances was
statistically significant, F (3, 192) = 9.56, p = .001, indicating a violation of this assumption. In
Table 10, the ANOVA revealed a statistically significant main effect of School Type, F (1, 192)
= 19.82, p = .000, such that those from lower poverty schools (M = 3.31) have lower perceptions
of instructional support than those from high poverty schools (M = 3.68, SD = 0.20), as presented
in Figure 7. There was a statistically significant main effect for subject (F (1,192) = 45.70, p =
.00) such that those teaching tested subjects (M = 3.21) had lower perceptions of instructional
support than those teaching non-tested subjects (M = 3.21), as presented in Figure 8. There was
no statistically significant interaction between school type and subject taught for perception of
instructional support, F (1, 192) = 0.18, p = .665. The means for all main effects and interactions
are in Table 11.
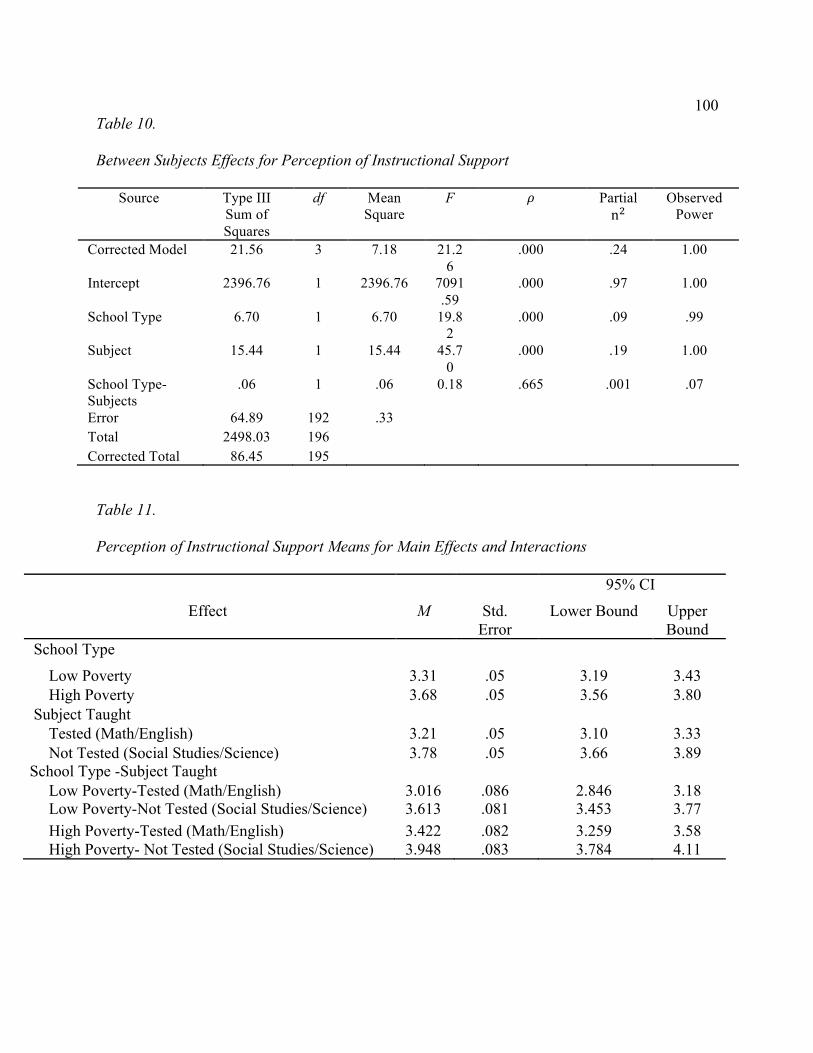
100
Table 10.
Between Subjects Effects for Perception of Instructional Support
Source Type III Sum of Squares
df Mean Square
F # Partial n"
Observed Power
Corrected Model 21.56 3 7.18 21.26
.000 .24 1.00
Intercept 2396.76 1 2396.76 7091.59
.000 .97 1.00
School Type 6.70 1 6.70 19.82
.000 .09 .99
Subject 15.44 1 15.44 45.70
.000 .19 1.00
School Type-Subjects
.06 1 .06 0.18 .665 .001 .07
Error 64.89 192 .33 Total 2498.03 196 Corrected Total 86.45 195
Table 11.
Perception of Instructional Support Means for Main Effects and Interactions
95% CI
Effect M Std. Error
Lower Bound Upper Bound
School Type
Low Poverty 3.31 .05 3.19 3.43 High Poverty 3.68 .05 3.56 3.80
Subject Taught Tested (Math/English) 3.21 .05 3.10 3.33 Not Tested (Social Studies/Science) 3.78 .05 3.66 3.89
School Type -Subject Taught Low Poverty-Tested (Math/English) 3.016 .086 2.846 3.18 Low Poverty-Not Tested (Social Studies/Science) 3.613 .081 3.453 3.77 High Poverty-Tested (Math/English) 3.422 .082 3.259 3.58 High Poverty- Not Tested (Social Studies/Science) 3.948 .083 3.784 4.11
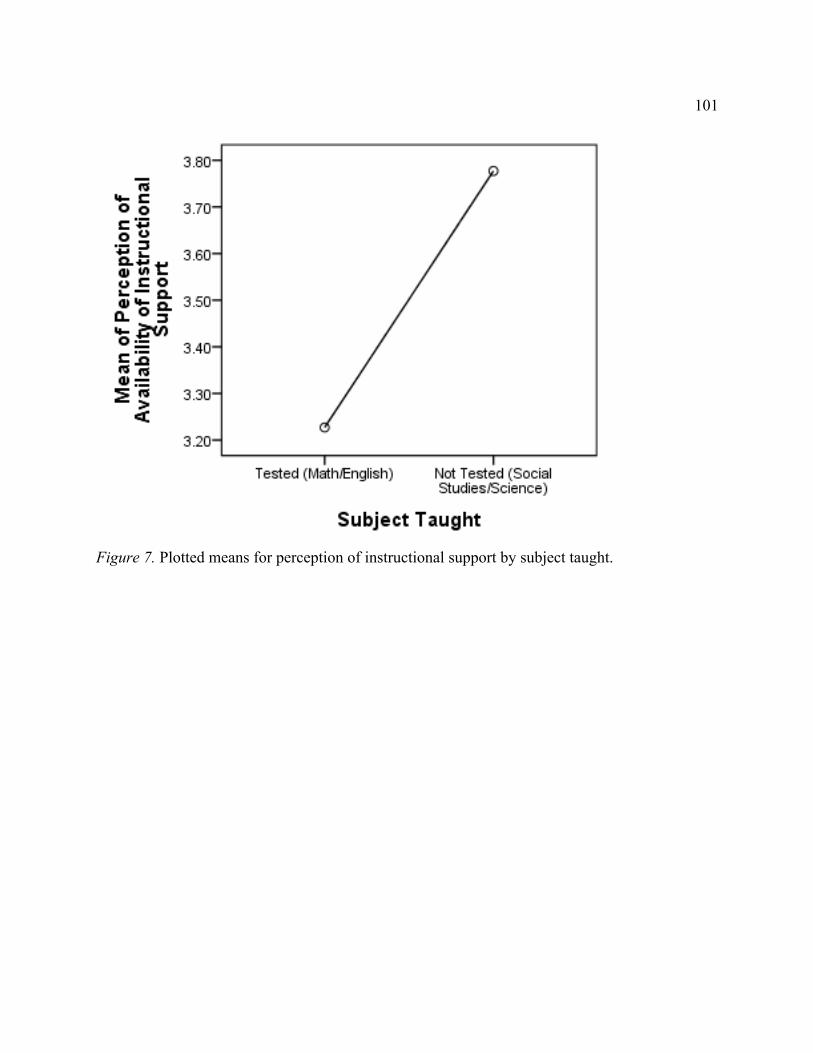
101
Figure 7. Plotted means for perception of instructional support by subject taught.
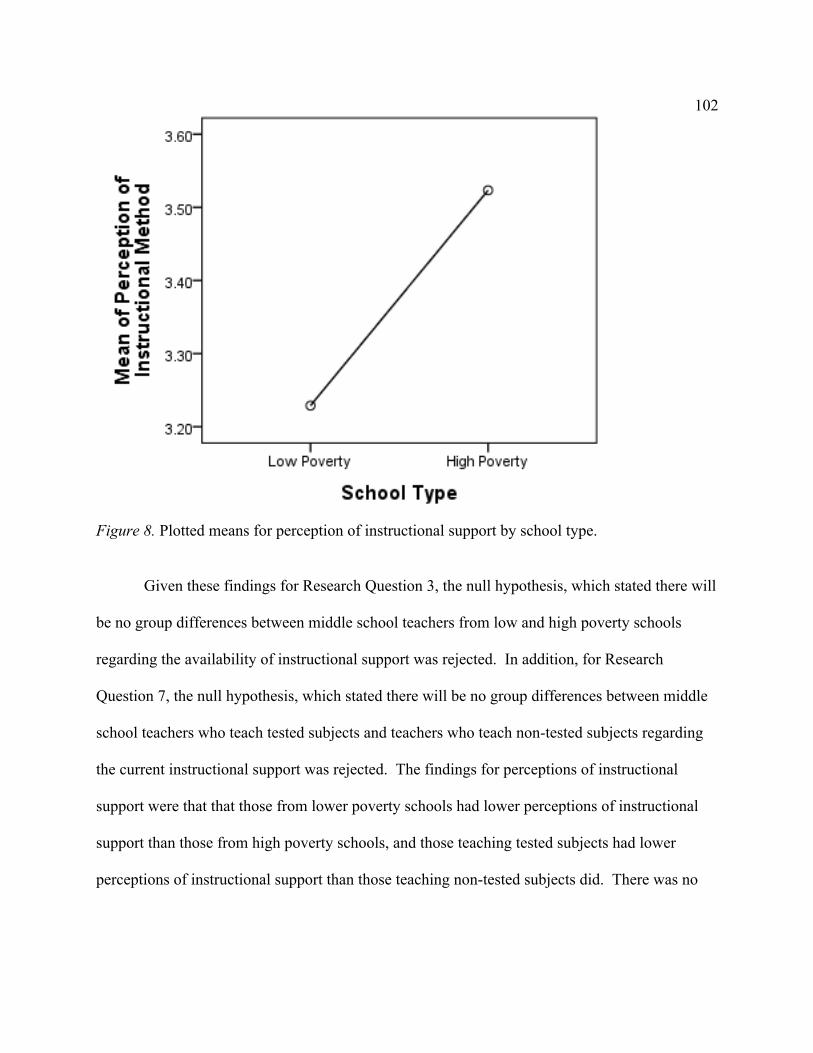
102
Figure 8. Plotted means for perception of instructional support by school type.
Given these findings for Research Question 3, the null hypothesis, which stated there will
be no group differences between middle school teachers from low and high poverty schools
regarding the availability of instructional support was rejected. In addition, for Research
Question 7, the null hypothesis, which stated there will be no group differences between middle
school teachers who teach tested subjects and teachers who teach non-tested subjects regarding
the current instructional support was rejected. The findings for perceptions of instructional
support were that that those from lower poverty schools had lower perceptions of instructional
support than those from high poverty schools, and those teaching tested subjects had lower
perceptions of instructional support than those teaching non-tested subjects did. There was no
103
statistically significant interaction between school type and subject taught for perception of
instructional support.
Results for Perception of Job Satisfaction
In Research Questions 4 and 8, I noted that perception of job satisfaction was the
dependent variable; school type and subject taught were the independent variables. I presented
the results for these two research questions in this section.
ANOVA results for job satisfaction. A two-way factorial ANOVA addressed Research
Questions 4 and 8. Levene’s test of equality of error variances was not statistically significant, F
(3, 192) = 1.91, p = .128, indicating this assumption was not violated. In Table 12, there was a
lack of a statistically significant main effect for subject, F (1,192) = 2.26, p = .134. However,
the ANOVA revealed a statistically significant main effect of School Type (F (1, 192) = 10.50, p
= .001), such that those from lower poverty schools (M = 14.30, SD = 0.20) have higher job
satisfaction than those from high poverty schools (M = 13.38, SD = 0.20), as presented in Figure
9. There was no statistically significant interaction between school type and subject taught for
job satisfaction, F (1, 192) = .039, p = .84. Table 13 displays the means for all main effects and
interactions.
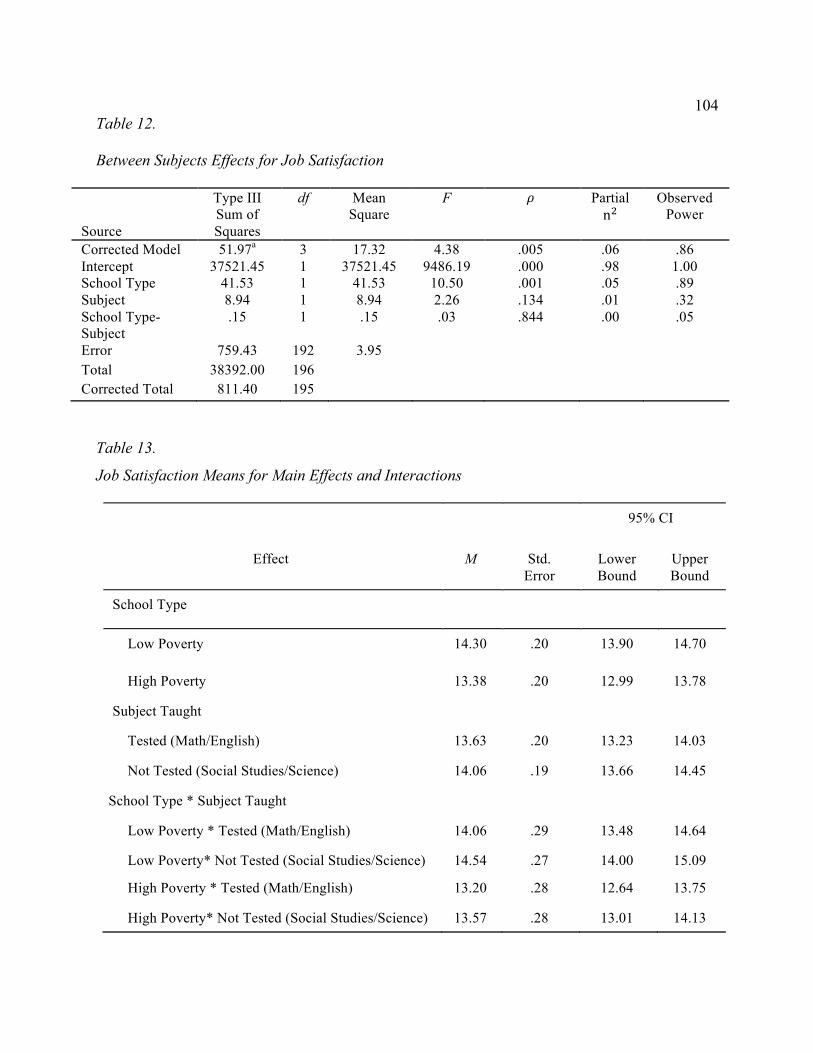
104
Table 12.
Between Subjects Effects for Job Satisfaction
Source
Type III Sum of Squares
df Mean Square
F # Partial n"
Observed Power
Corrected Model 51.97a 3 17.32 4.38 .005 .06 .86 Intercept 37521.45 1 37521.45 9486.19 .000 .98 1.00 School Type 41.53 1 41.53 10.50 .001 .05 .89 Subject 8.94 1 8.94 2.26 .134 .01 .32 School Type-Subject
.15 1 .15 .03 .844 .00 .05
Error 759.43 192 3.95 Total 38392.00 196 Corrected Total 811.40 195
Table 13.
Job Satisfaction Means for Main Effects and Interactions
95% CI
Effect M Std. Error
Lower Bound
Upper Bound
School Type
Low Poverty 14.30 .20 13.90 14.70
High Poverty 13.38 .20 12.99 13.78
Subject Taught
Tested (Math/English) 13.63 .20 13.23 14.03
Not Tested (Social Studies/Science) 14.06 .19 13.66 14.45
School Type * Subject Taught
Low Poverty * Tested (Math/English) 14.06 .29 13.48 14.64
Low Poverty* Not Tested (Social Studies/Science) 14.54 .27 14.00 15.09
High Poverty * Tested (Math/English) 13.20 .28 12.64 13.75
High Poverty* Not Tested (Social Studies/Science) 13.57 .28 13.01 14.13
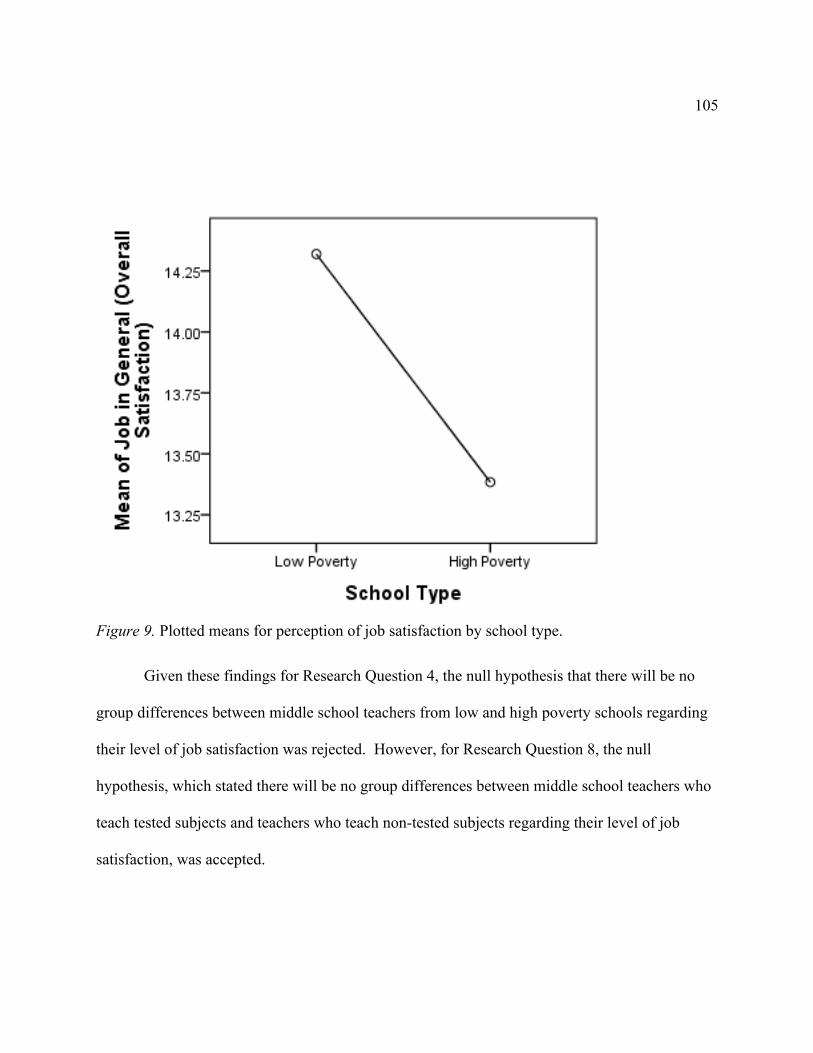
105
Figure 9. Plotted means for perception of job satisfaction by school type.
Given these findings for Research Question 4, the null hypothesis that there will be no
group differences between middle school teachers from low and high poverty schools regarding
their level of job satisfaction was rejected. However, for Research Question 8, the null
hypothesis, which stated there will be no group differences between middle school teachers who
teach tested subjects and teachers who teach non-tested subjects regarding their level of job
satisfaction, was accepted.
106
Principal Interview Results
I interviewed the principals from three low poverty and three high poverty schools, and
analyzed the results thematically. The process of qualitative data analysis involves “making
sense out of text and data…and preparing the data for analysis, conducting different analyses,
moving deeper and deeper into understanding the data, representing the data, and making an
interpretation of the larger meaning of the data”(Creswell, 2009, p. 183). I searched for patterns
and themes through analysis of the interviews and coding of the data in NVivo 9.0. My goal was
to describe the participants’perceptions with regard to the topics addressed for the qualitative
research questions of the focus group participants. The first level of identification occurred
during the initial review of each interview transcript. Upon receiving the transcripts, I read each
transcript, analyzed the data for each interview, and then conducted open coding to facilitate the
coding process.
I used open coding, which utilizes a brainstorming technique described by Corbin and
Strauss (2008), to “open up the data to all potentials and possibilities contained within them” (p.
160). The data analysis process included the following steps:
1. Review all interview transcripts.
2. Import the data into NVIVO.
3. Code the data in NVIVO using open coding.
4. Define the properties of the dominant themes.
5. Refine themes as needed to reflect participants’ perceptions.
The coding process identified 20 primary themes. Four groups consist of the themes,
with each category focusing on one of the four research questions. The findings for each
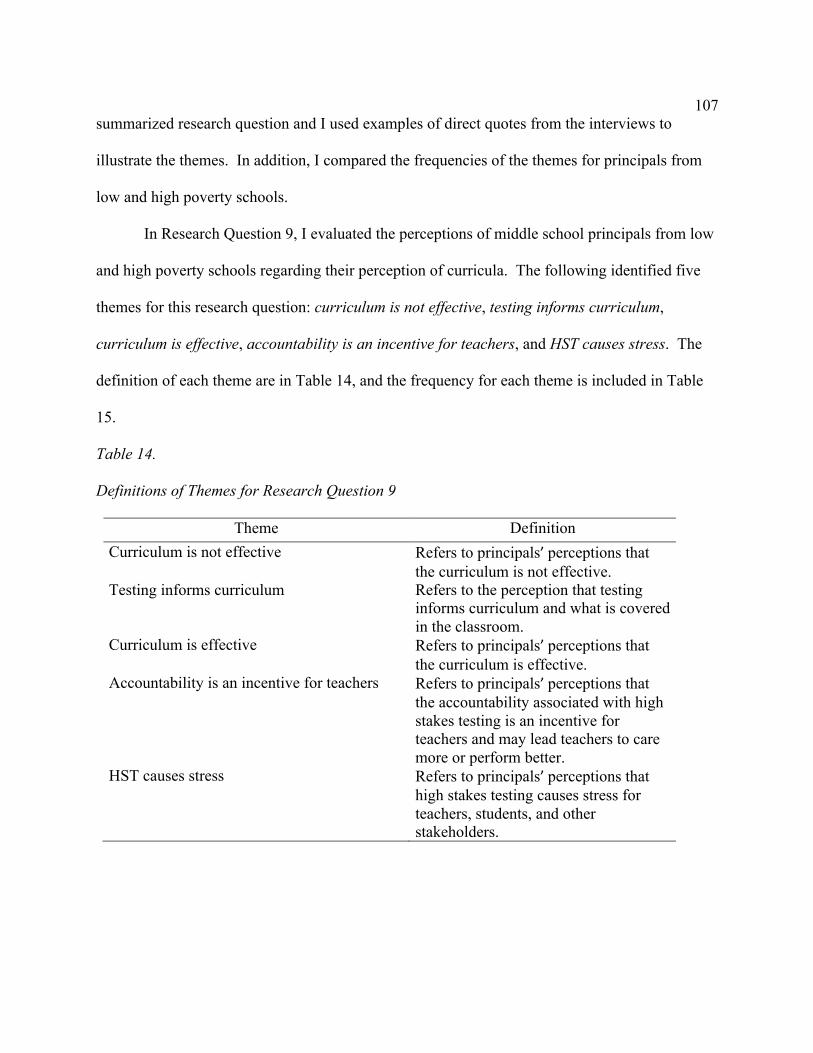
107
summarized research question and I used examples of direct quotes from the interviews to
illustrate the themes. In addition, I compared the frequencies of the themes for principals from
low and high poverty schools.
In Research Question 9, I evaluated the perceptions of middle school principals from low
and high poverty schools regarding their perception of curricula. The following identified five
themes for this research question: curriculum is not effective, testing informs curriculum,
curriculum is effective, accountability is an incentive for teachers, and HST causes stress. The
definition of each theme are in Table 14, and the frequency for each theme is included in Table
15.
Table 14.
Definitions of Themes for Research Question 9
Theme Definition Curriculum is not effective Refers to principals’perceptions that
the curriculum is not effective. Testing informs curriculum Refers to the perception that testing
informs curriculum and what is covered in the classroom.
Curriculum is effective Refers to principals’perceptions that the curriculum is effective.
Accountability is an incentive for teachers Refers to principals’perceptions that the accountability associated with high stakes testing is an incentive for teachers and may lead teachers to care more or perform better.
HST causes stress Refers to principals’perceptions that high stakes testing causes stress for teachers, students, and other stakeholders.
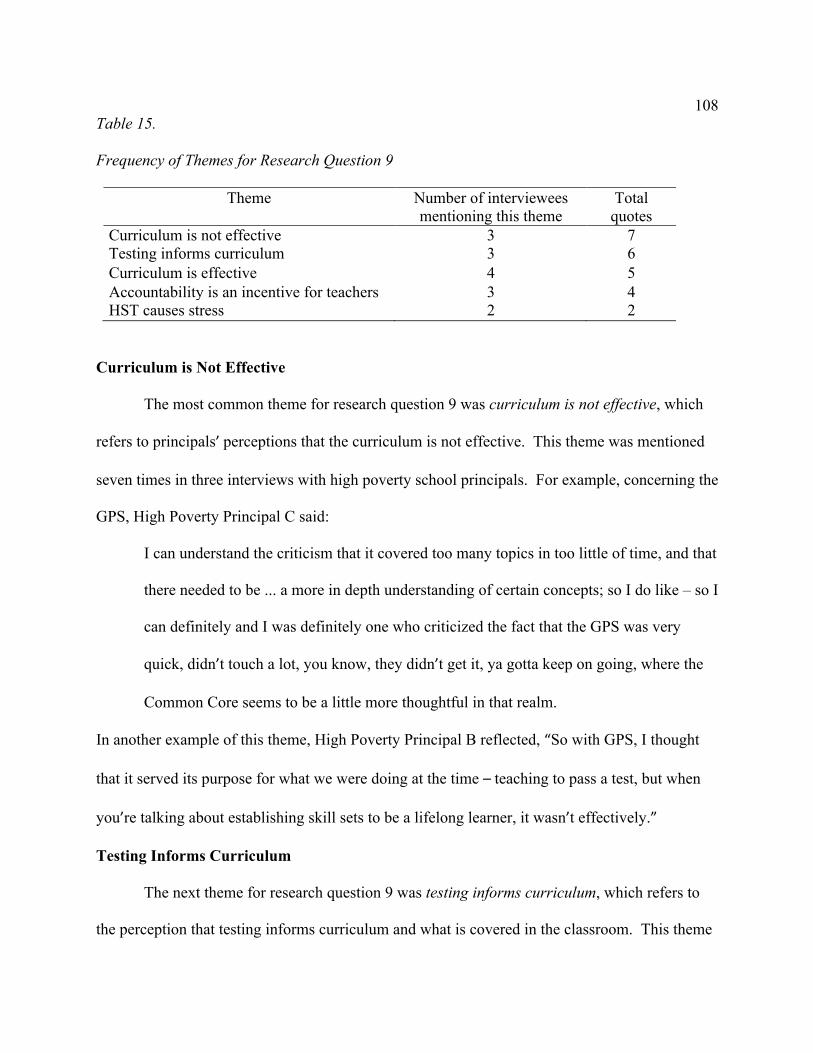
108
Table 15.
Frequency of Themes for Research Question 9
Theme Number of interviewees mentioning this theme
Total quotes
Curriculum is not effective 3 7 Testing informs curriculum 3 6 Curriculum is effective 4 5 Accountability is an incentive for teachers 3 4 HST causes stress 2 2
Curriculum is Not Effective
The most common theme for research question 9 was curriculum is not effective, which
refers to principals’perceptions that the curriculum is not effective. This theme was mentioned
seven times in three interviews with high poverty school principals. For example, concerning the
GPS, High Poverty Principal C said:
I can understand the criticism that it covered too many topics in too little of time, and that
there needed to be ... a more in depth understanding of certain concepts; so I do like – so I
can definitely and I was definitely one who criticized the fact that the GPS was very
quick, didn’t touch a lot, you know, they didn’t get it, ya gotta keep on going, where the
Common Core seems to be a little more thoughtful in that realm.
In another example of this theme, High Poverty Principal B reflected, “So with GPS, I thought
that it served its purpose for what we were doing at the time –teaching to pass a test, but when
you’re talking about establishing skill sets to be a lifelong learner, it wasn’t effectively.”
Testing Informs Curriculum
The next theme for research question 9 was testing informs curriculum, which refers to
the perception that testing informs curriculum and what is covered in the classroom. This theme
109
was mentioned 6 times in three (3) interviews. High Poverty School Principal B explained,
“Well, when we’re just speaking of preparation for the CRCT, I think the teachers do a
phenomenal job because we are teaching for students to master on a test that assess basic skills,
basically.”High Poverty School Principal C stated, “Reality is what doesn’t get measured or
doesn’t get evaluated, kids cannot get done.” Low Poverty School Principal A explained as
follows:
I was about to say, if we had no test, would there still be the same quality of instruction?
You know, I’m not sure that there would be in any educational environment because you
have to have some way to assess that. And, do I think that all the extensive testing stifles
creativity to a certain extent? Yes, I do. Yeah. I do think it does.
Curriculum is Effective
The next theme for research Question 9 was curriculum is effective, which refers to
principals’perceptions that the curriculum is effective. This theme was mentioned five times in
four interviews. For example, High Poverty School Principal C mentioned,
Of course, no, nothing is ever perfect, but I think in terms of that it’s a step in the right
direction. In terms of emphasizing literacy, it’s in the same direction. It got – I think
they’ve probably been more criticisms coming with, it’s very broad – more science and
social studies where we’re still working on GPS standards. We’re just trying to figure
out how to integrate these literacy standards and I think teachers need a little more
support in terms of what that looks like, but I – there’s definitely pluses; there’s definitely
some improvement.
110
Low Poverty School Principal B said,
You know, I think that’s the state’s job, especially with the Common Core. I’m an
advocate of the Common Core, because I think, as I mentioned, every state needs to be
teaching the same thing at the same pace, so when kids move – and just so – when we
compare our test scores to Oregon, for example, we’re not comparing apples to oranges.
Finally, Low Poverty School Principal C said, “I feel that CCGPS is improved over the last
curriculum.”
Accountability is an Incentive for Teachers
The next theme for research Question 9 was accountability is an incentive for teachers,
which refers to principals’perceptions that the accountability associated with high stakes testing
is an incentive for teachers and may lead teachers to care more or perform better. This theme
was mentioned four times in three interviews. For example, High Poverty School Principal A
explained, “This school, specifically, there is pressure to perform and so I think that people feel
that pressure of being held accountable, especially with what has gone on in other buildings or in
the news.” High Poverty School Principal B stated:
I think at least in terms of –in terms of [High Poverty School B] –the teachers can create
whatever and work together and collaborate to create whatever activities they feel best
supplement, but they do need to make sure that by the end of the year, they hit those –ya
know –they hit those standards.
Low Poverty School Principal A indicated:
In a perfect world, a teacher is going to give quality instruction regarding – regardless of
whatever high stakes test there is – a good teacher is. Your average teachers are more
111
motivated by that test, because they know it’s used to evaluate them. It’s not used to
evaluate them formally, but I publish the scores with my faculty, here, so the scores are
linked to the teacher; so there’s a little motivation there, a little competitive motivation,
which I think is a healthy thing.
High Stakes Testing (HST) Causes Stress
The next theme for research Question 9 was HST causes stress, which refers to
principals’perceptions that the accountability associated with high stakes testing is an incentive
for teachers and may lead teachers to care more or perform better. This theme was mentioned
two times in two interviews; only low poverty principals mentioned this theme. Low Poverty
School Principal B said that a negative of testing include “stress and worry for students, parents,
and teachers.”
Low Poverty School Principal C said, “The HST does become the primary focus, in which it
stresses the teachers, parents and especially the students.”
Comparison of the Frequency of Themes for Research Question 9 by School Type
Table 16 includes the frequency of themes for research Question 9 by school type. I
highlighted the differences between the frequencies by school type. In comparison to principals
from low poverty schools, principals from high poverty schools more frequently mentioned that
the curriculum is not effective (n = 7), that testing informs curriculum (n = 5), and that
accountability is an incentive for teachers (n = 3). Alternatively, principals from low poverty
schools were more likely, than principals from high poverty schools, to mention that the
curriculum is effective (n = 3) and that HST causes stress (n = 2).
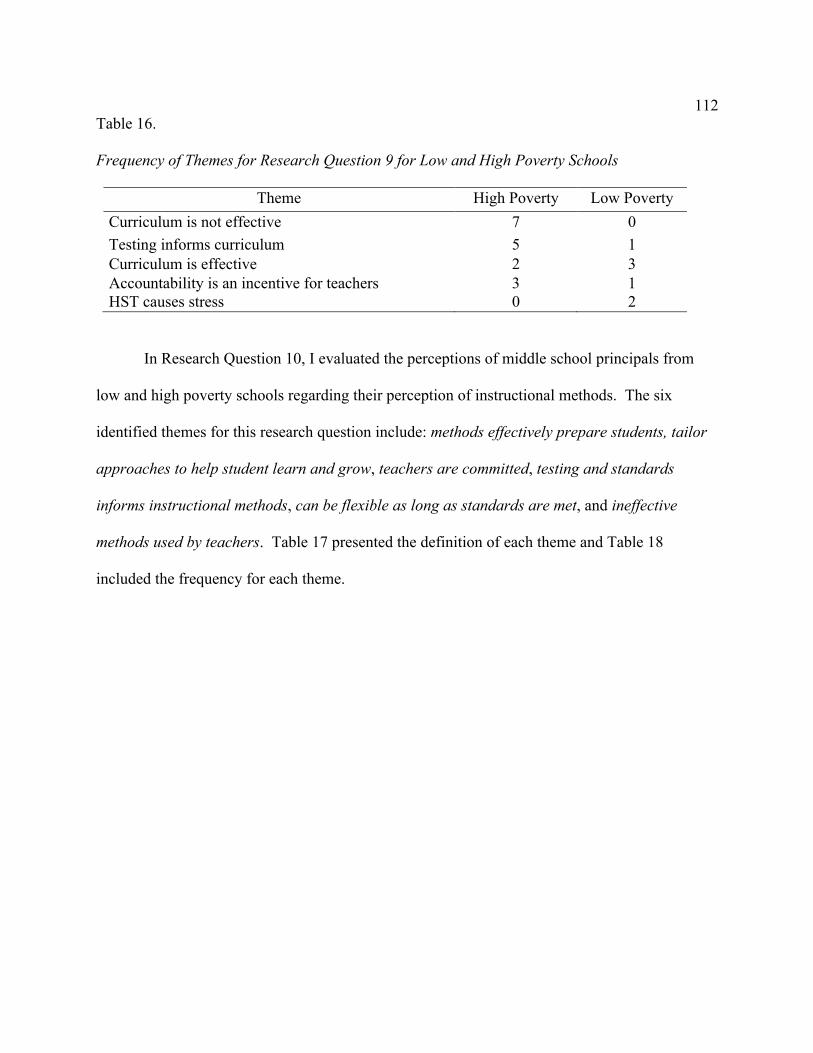
112
Table 16.
Frequency of Themes for Research Question 9 for Low and High Poverty Schools
Theme High Poverty Low Poverty Curriculum is not effective 7 0 Testing informs curriculum 5 1 Curriculum is effective 2 3 Accountability is an incentive for teachers 3 1 HST causes stress 0 2
In Research Question 10, I evaluated the perceptions of middle school principals from
low and high poverty schools regarding their perception of instructional methods. The six
identified themes for this research question include: methods effectively prepare students, tailor
approaches to help student learn and grow, teachers are committed, testing and standards
informs instructional methods, can be flexible as long as standards are met, and ineffective
methods used by teachers. Table 17 presented the definition of each theme and Table 18
included the frequency for each theme.
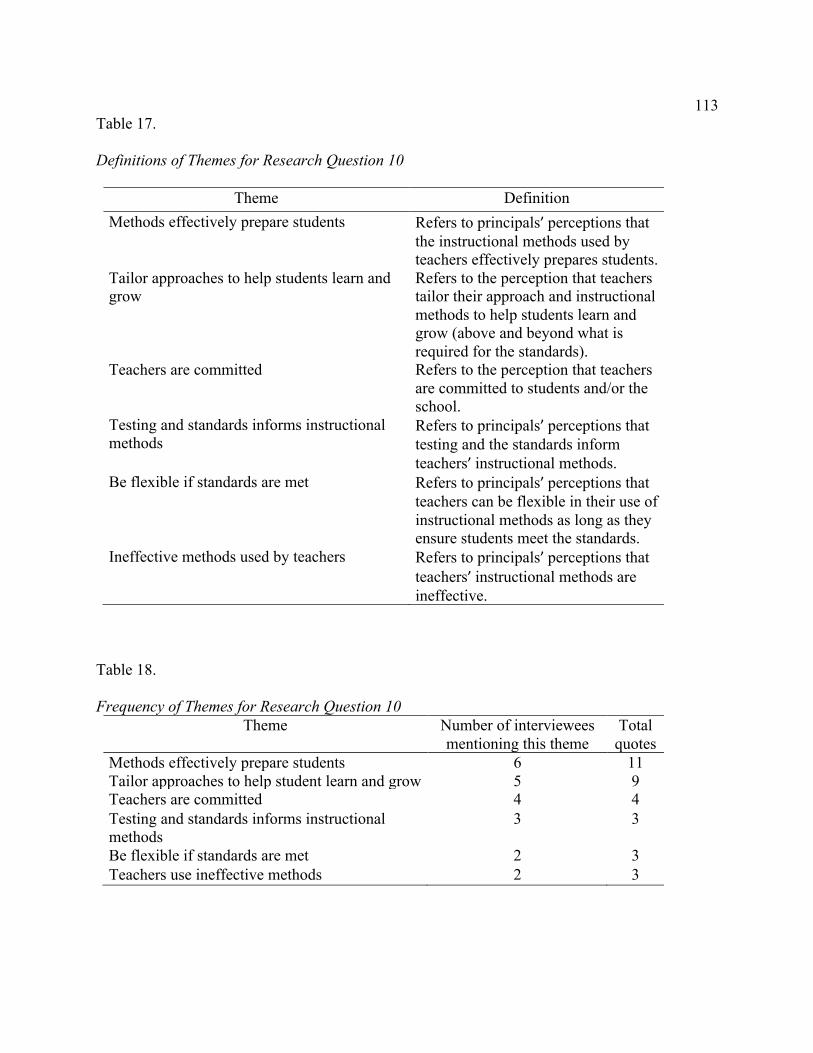
113
Table 17.
Definitions of Themes for Research Question 10
Theme Definition Methods effectively prepare students Refers to principals’perceptions that
the instructional methods used by teachers effectively prepares students.
Tailor approaches to help students learn and grow
Refers to the perception that teachers tailor their approach and instructional methods to help students learn and grow (above and beyond what is required for the standards).
Teachers are committed Refers to the perception that teachers are committed to students and/or the school.
Testing and standards informs instructional methods
Refers to principals’perceptions that testing and the standards inform teachers’instructional methods.
Be flexible if standards are met Refers to principals’perceptions that teachers can be flexible in their use of instructional methods as long as they ensure students meet the standards.
Ineffective methods used by teachers Refers to principals’perceptions that teachers’instructional methods are ineffective.
Table 18. Frequency of Themes for Research Question 10
Theme Number of interviewees mentioning this theme
Total quotes
Methods effectively prepare students 6 11 Tailor approaches to help student learn and grow 5 9 Teachers are committed 4 4 Testing and standards informs instructional methods
3 3
Be flexible if standards are met 2 3 Teachers use ineffective methods 2 3
114
Methods Effectively Prepare Students
The most common theme for Research Question 10 was methods effectively prepare
students, which refers to principals’perceptions that the instructional methods used by teachers
effectively prepares students. This theme was mentioned 11 times in three interviews. High
Poverty School Principal A mentioned teachers’passion was effective:
I think the difference is not the number of years of experience, but the amount of passion
that the teacher has. There are some veteran teachers that are very passionate about what
they do. So, I think that’s the difference – the passion.
High Poverty School Principal B explained that methods were effective because students leave
prepared:
I want to make sure that when students leave me, I don’t care who they go to, high school
they go to, that they can be successful, ‘cause they’ve been equipped with the basic skills
–not even the basic skills –advance the basic skills, ‘cause they should come to me with
the basic skills, but if they did or didn’t, leaving here with strategies, information,
knowledge that will help them be successful at the next level.
Low Poverty School Principal B said, “The quality of instruction was very rigorous, challenging,
and exciting for students.” Similarly, Low Poverty School Principal C stated, “I feel good about
the quality of instruction provided by my teachers.”
Tailor Approaches to Help Students Learn and Grow
The next theme for Research Question 10 was tailor approaches to help students learn
and grow, which refers to the perception that teachers tailor their approach and instructional
methods to help students learn and grow (above and beyond what is required for the standards).
115
This theme was mentioned nine times in five (5) interviews. High Poverty School Principal A
explained how teachers adjust approaches:
I think that if teachers adjust their instruction, they can be prepared. I think they adjust to
the needs of the student. Because, we have a lot of special needs students in our building,
we have deaf and hard-hearing students in our building, severe and profound disability
students, a lot of our population are English language learners; and so the whole culture
of this building, teachers have to adapt to those different types of students.
You know, it depends on the teacher. Some teachers do a great job of differentiating
their instruction, having very relevant lessons that get the students involved, then on
occasion you can go to another teacher and their lessons are very basic.
High Poverty School Principal B indicated the importance of tailoring approaches:
It is an adjustment, once again, for teachers to teach, because they’re teaching –what kids
once had to learn in middle school, they’re being exposed to it in elementary school.
What they once had to be exposed to in high school, they’re being exposed to it in middle
school. So, it’s early exposure, it’s more …and you have to be –when they’re talking
about reading, writing, and arithmetic, now, you really have to have those skills sets in
order to be successful.
In a final example, Low Poverty School Principal A stated the following:
Now, a good teacher – and I’ve got a lot of good ones – they’re gonna get creative and be
creative within the parameters that we’ve been given. Now you ask if those tests dictate
– well we’re supposed to be covering all of the standards, so they don’t really dictate that
much – but, we know what skills they access, so you’re focusing extra attention on that;
116
but I also believe a good teacher has to be innovative and has to be creative, ‘cause that’s
just part of their being. They can’t be the same ol’ same ol’ every day, ‘cause that’s the
way – I’d be bored if we did the same thing every day. The kids get bored, too. I think it
doesn’t stifle creativity, if you’re a good teacher. So that’s my answer – my long answer
to that.
Teachers Are Committed
The next theme for Research Question 10 was teachers are committed, which refers to
the perception that teachers are committed to students and/or the school. This theme was
mentioned four times in four interviews. High Poverty School Principal B stated that:
Fortunately, I have a beautiful team. My team is wonderful. They respect my position,
they respect – they respect my position; they respect the decisions that I make, but the
great thing about me is that I don’t make decisions in isolation. I’m very inclusive. I
don’t know it all; therefore, I depend on my teachers to – like my administrators and
teacher-leaders to give input on what we’re doing, therefore, when we are making critical
decisions about the school, it’s not coming directly from me; everyone is giving direction
on how we should go. Now, the final decision is mine, but I want to be inclusive,
because they may have a better way of achieving the goal than I do. So, because that’s
the way I’ve worked for over the last four-going-on-five years now, that I’ve – my
leadership be it teacher-leaders and the administrators, I think I have their full support.
High Poverty School Principal C explained:
Yeah, I think there are teachers that do want to do well – do well by the students. I think
that they are vested in seeing students succeed. We may have differences of opinion as to
117
how that looks, or what have you, but I really don’t think there’s a teacher in this building
that wants to just barely – or I’ll say there’s a very few teachers in this building that are
just about, “I’m just gonna do the bare minimum. I’m just here for the pay.” I think
those teachers that have been flustered and disillusioned, they generally find their way
out the door, one way or another. But I think the vast, vast, majority of the teachers want
the school to be successful, want the students to be successful and are committed to doing
that.
Low Poverty School Principal A explained:
And I try to solicit their input as much as I can, but on some issues at the end of the day –
they just really want you to make a decision. There are some things they don’t want to
input to and they’re fine with me just deciding which way to go. But, yeah, I feel I do
have their support, and client surveys and the like also support that. The teachers that
complete them.
Low Poverty School Principal C simply stated, “Yes, we have a positive school climate and a
team mentality. Everyone is working towards the same goal…increase student achievement.”
Testing and Standards Inform Instructional Methods
The next theme for Research Question 10 was testing and standards inform instructional
methods, which refers to principals’perceptions that testing and the standards inform teachers’
instructional methods. This theme was mentioned three times in the three interviews with Low
Poverty School Principals. Low Poverty School Principal B said, “We have been looking at
national standard for years to make sure we are competitive against any other students in the
118
state.” Low Poverty School Principal C stated, “Yes we do a lot of collaborative planning in
content areas, so that inexperienced teachers are teaching exactly what the veterans are.”
Be Flexible if Standards are Met
The next theme for Research Question 10 was be flexible if standards are met, which
refers to principals’perceptions that teachers can be flexible in their use of instructional methods
as long as they ensure students meet the standards. This theme was mentioned three times in two
interviews with High Poverty School Principals. For example, High Poverty School Principal B
said:
Well, the interesting thing is even though we have Common Core now, Georgia has opted
not to change the test from my understanding – for whatever reason, I think budget
reasons – but with that being the case, once again that focus is on assessment. I’m
looking at – looking at the standards what skills students need that can be generalized
across the board to where they can be successful regardless of the content, regardless of
the level. We have to – our mentality has to change on how students learn, what they
need to learn, and how we approach that from an educative standpoint. How do we
transfer the information we know to them? How do we transfer the strategies to learn and
retain the lesson – I mean – information to them? We have to equip them with those skill
sets. Once again, assessments are always going to be there. They’re going to be there –
you need an assessment to get in college, a certain score to make to get into the college of
your choice, you need a certain score in high school to graduate within the course
examinations, middle school with the CRCT, same with elementary school; so,

119
assessments are going to be there, but let’s not make that the one and sole indicator on
how well a student’s doing or can do.
High Poverty School Principal C stated:
I think that you do need to have certain expectations about what you can and should be
able to produce at the end of the school year; so, I don’t have a problem with having a
state curriculum and actually don’t have a problem with there being a national
curriculum, ‘cause I’m a student who moved around, you know, in middle school, so it’s
fair to be able to say, your typical Seventh or Eighth Grade kid should know and be able
to produce this kind of work. So I don’t have a problem with that. I also don’t think that
the standards are so scripted that the teacher doesn’t have the flexibility to implement
what they do.
Teachers Use Ineffective Methods
The next theme for Research Question 10 was teachers use ineffective methods, which
refers to principals’perceptions that teachers’instructional methods are ineffective. This theme
was mentioned three times in two interviews. High Poverty School Principal A said, “There are
some stagnate teachers who’re stuck in their own ways and don’t really get it.”In a detailed
response, High Poverty School Principal B explained:
I feel like we’re forcing it. We have to force it on some teachers, because they are so
accustomed to teaching in one manner. They teach to the whole instead of looking at the
individual needs of a child. Every child comes in at a different level, different ability, so
you have to find out where they are, start them from where they are, and then build upon
that. When you teach to the whole there’s some very advanced kids, who you will miss,
120
there’s some kids missing some very basic skills who you will miss and they will be lost
if you’re teaching to the middle; but if you’re teaching to the lower kids, you’re going to
lose those average and above average students. Or if you’re teaching to such a rigorous
level, those other kids are going to shut down. So you have to individualize; you have to
differentiate your instruction to meet those kids where they are. Our teachers have a
difficult time with that because they have been so accustomed to teaching to the whole,
not looking to the individual needs of the student. So, it’s a work in progress, I mean,
everything seems like it’s a work in progress, because look at the state of education
where we are.
Comparison of the Frequency of Themes for research Question 10 by School Type
In Table 19 reflects the frequency of themes for research Question 10 by school type and
highlights the differences between the frequencies by school type. In comparison to principals
from low poverty schools, principals from high poverty schools more frequently mentioned that
teachers tailor approaches to help student learn and grow (n = 6), that teachers can be flexible as
long as standards are met (n = 3), and that teachers use ineffective methods (n = 3).
Alternatively, principals from low poverty schools were more likely than principals from high
poverty schools to mention that instructional methods effectively prepare students (n = 7) and
that testing and standards informs instructional methods (n = 3). The frequencies for the theme
teachers are committed were similar for the school types.
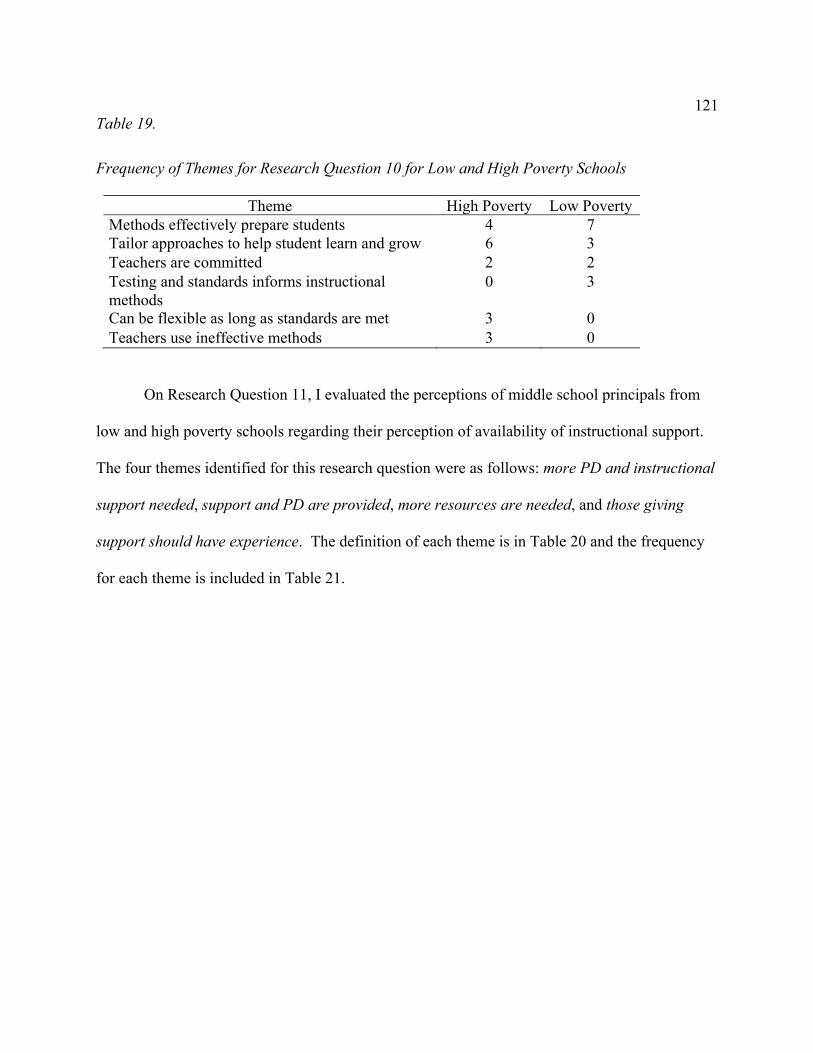
121
Table 19.
Frequency of Themes for Research Question 10 for Low and High Poverty Schools
Theme High Poverty Low Poverty Methods effectively prepare students 4 7 Tailor approaches to help student learn and grow 6 3 Teachers are committed 2 2 Testing and standards informs instructional methods
0 3
Can be flexible as long as standards are met 3 0 Teachers use ineffective methods 3 0
On Research Question 11, I evaluated the perceptions of middle school principals from
low and high poverty schools regarding their perception of availability of instructional support.
The four themes identified for this research question were as follows: more PD and instructional
support needed, support and PD are provided, more resources are needed, and those giving
support should have experience. The definition of each theme is in Table 20 and the frequency
for each theme is included in Table 21.
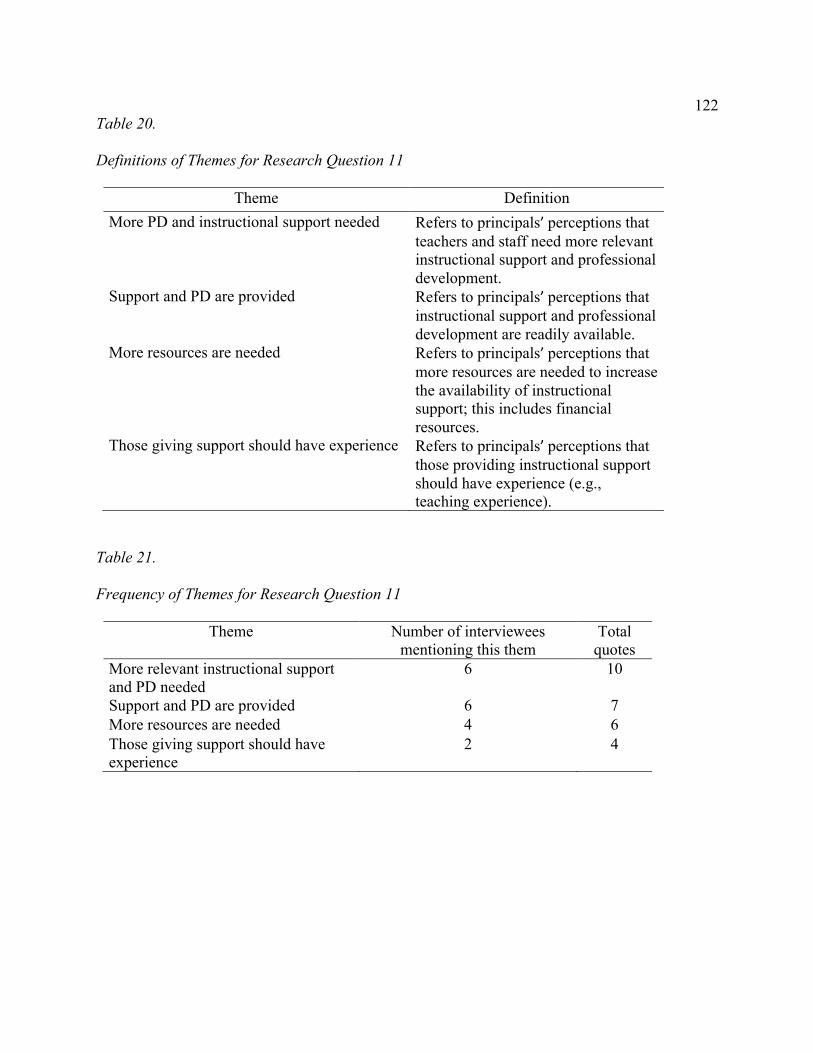
122
Table 20.
Definitions of Themes for Research Question 11
Theme Definition More PD and instructional support needed Refers to principals’perceptions that
teachers and staff need more relevant instructional support and professional development.
Support and PD are provided Refers to principals’perceptions that instructional support and professional development are readily available.
More resources are needed Refers to principals’perceptions that more resources are needed to increase the availability of instructional support; this includes financial resources.
Those giving support should have experience Refers to principals’perceptions that those providing instructional support should have experience (e.g., teaching experience).
Table 21.
Frequency of Themes for Research Question 11
Theme Number of interviewees mentioning this them
Total quotes
More relevant instructional support and PD needed
6 10
Support and PD are provided 6 7 More resources are needed 4 6 Those giving support should have experience
2 4
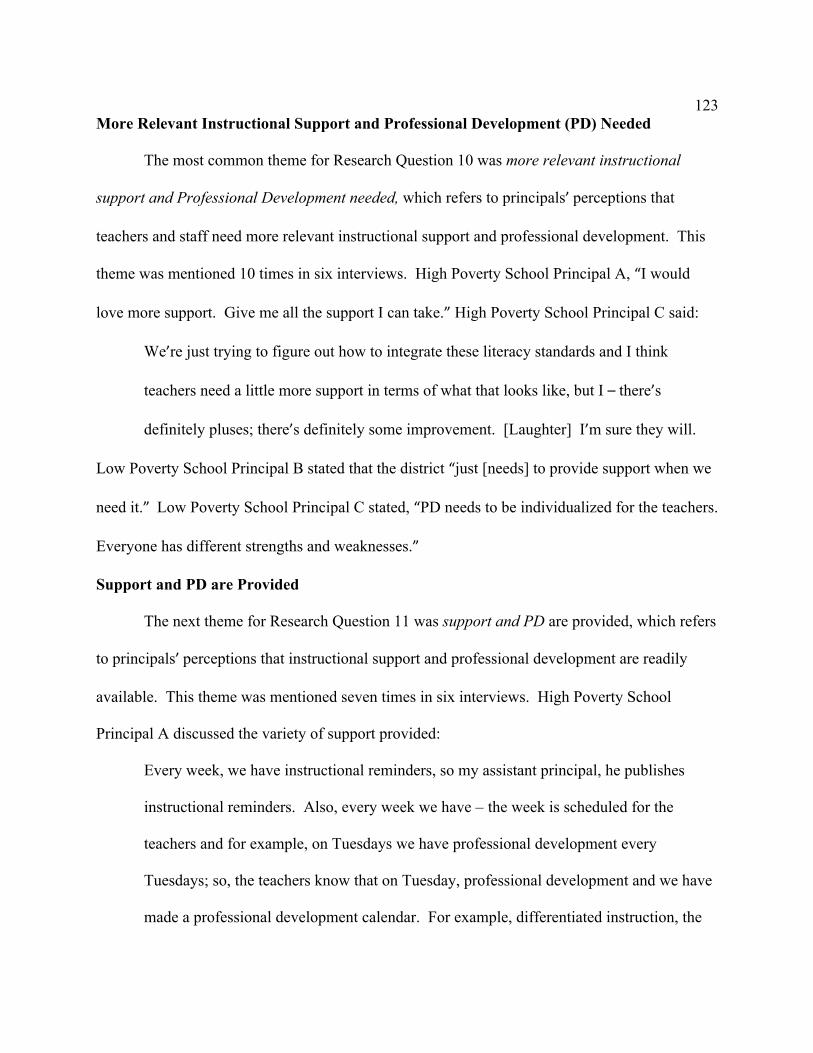
123
More Relevant Instructional Support and Professional Development (PD) Needed
The most common theme for Research Question 10 was more relevant instructional
support and Professional Development needed, which refers to principals’perceptions that
teachers and staff need more relevant instructional support and professional development. This
theme was mentioned 10 times in six interviews. High Poverty School Principal A, “I would
love more support. Give me all the support I can take.” High Poverty School Principal C said:
We’re just trying to figure out how to integrate these literacy standards and I think
teachers need a little more support in terms of what that looks like, but I –there’s
definitely pluses; there’s definitely some improvement. [Laughter] I’m sure they will.
Low Poverty School Principal B stated that the district “just [needs] to provide support when we
need it.”Low Poverty School Principal C stated, “PD needs to be individualized for the teachers.
Everyone has different strengths and weaknesses.”
Support and PD are Provided
The next theme for Research Question 11 was support and PD are provided, which refers
to principals’perceptions that instructional support and professional development are readily
available. This theme was mentioned seven times in six interviews. High Poverty School
Principal A discussed the variety of support provided:
Every week, we have instructional reminders, so my assistant principal, he publishes
instructional reminders. Also, every week we have – the week is scheduled for the
teachers and for example, on Tuesdays we have professional development every
Tuesdays; so, the teachers know that on Tuesday, professional development and we have
made a professional development calendar. For example, differentiated instruction, the
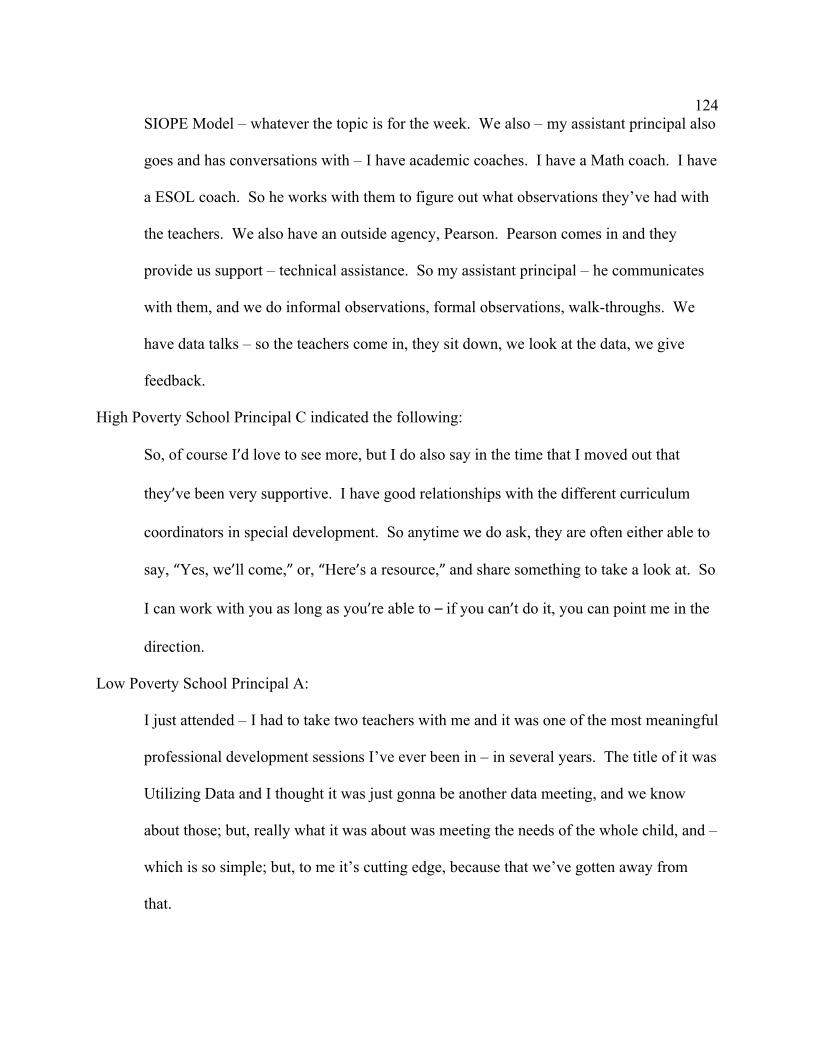
124
SIOPE Model – whatever the topic is for the week. We also – my assistant principal also
goes and has conversations with – I have academic coaches. I have a Math coach. I have
a ESOL coach. So he works with them to figure out what observations they’ve had with
the teachers. We also have an outside agency, Pearson. Pearson comes in and they
provide us support – technical assistance. So my assistant principal – he communicates
with them, and we do informal observations, formal observations, walk-throughs. We
have data talks – so the teachers come in, they sit down, we look at the data, we give
feedback.
High Poverty School Principal C indicated the following:
So, of course I’d love to see more, but I do also say in the time that I moved out that
they’ve been very supportive. I have good relationships with the different curriculum
coordinators in special development. So anytime we do ask, they are often either able to
say, “Yes, we’ll come,”or, “Here’s a resource,”and share something to take a look at. So
I can work with you as long as you’re able to –if you can’t do it, you can point me in the
direction.
Low Poverty School Principal A:
I just attended – I had to take two teachers with me and it was one of the most meaningful
professional development sessions I’ve ever been in – in several years. The title of it was
Utilizing Data and I thought it was just gonna be another data meeting, and we know
about those; but, really what it was about was meeting the needs of the whole child, and –
which is so simple; but, to me it’s cutting edge, because that we’ve gotten away from
that.
125
Low Poverty School Principal B stated, “AP are to provide ongoing support in areas of teaching
and learning with areas of assessment, curriculum, and instruction, especially with managing and
promoting differentiating instruction.”
More Resources are Needed
The next theme for Research Question 11 was more resources are needed, which refers
to principals’perceptions that more resources are needed to increase the availability of
instructional support; this includes financial resources. This theme was mentioned six times in
four interviews. With regard to more resources needed, High Poverty School Principal B
explained:
[We need] Just continued support, continued support. Support comes in many forms.
Support when they understand what you are working with in the building. I think what
the district needs to understand, once again, when we focus on just an assessment and just
a test, then we kind of get off track. I need support in many ways. I need human support
– those resources, rather, I need financial support to give us what we need, because my
needs here at [High Poverty School B is different than another school. I need support
when we have those concerns and calls that may come in.
Low Poverty School Principal A stated:
Well, money would always be a lovely thing. We’re not a Title I School, but we really
struggle on the money portion of it. We have a very generous PTSA, and they do share
their funds with us to a certain extent – those they – funds that they make from
fundraisers. Elementaries are a little bit different, because they do – they have
126
afterschool programs and they make a little money off of that. We don’t do afterschool
in middle school, so the financial part of it is limited.
Low Poverty School Principal B said, “We need more funds to fully provide exceptional PD.
However, we have become resourceful, and we use talents of our teachers to spread knowledge
and skills to one another.” Low Poverty School Principal C mentioned, “We need better
textbooks and more for students. More money in my operating budget.”
Those Giving Support Should Have Experience
The next theme for Research Question 11, those giving support should have experience,
which refers to principals’perceptions that those providing instructional support should have
experience (e.g., teaching experience). This theme was mentioned four times in two interviews
with High Poverty School Principals. High Poverty School Principal B said that:
Well, my – I expect my assistant principals to be instructional leaders just like I’m the
instructional leader in the building. The days of being disciplinarian assistant principals
are gone. You have to be the instructional leader. Therefore, when you are in a
classroom, you need to understand what best practices are, what good teaching looks like,
what strategies are being implemented in the classroom and then provide feedback to the
teachers. You need to be able to conduct and hold meetings with the teachers and discuss
those strategies you observed. And then you also need to be able to look at data, ‘cause
data is important. Data tells you where you are and where you need to go. So being able
to analyze data, talk with teachers about data – you need to have those skills just as an
administrator to be able to effectively assist teachers in the classroom.
127
High Poverty School Principal C indicated:
When I look for assistant principals, I look for people who are good at teaching because
if you’re going to be a leader to teachers, then you should be a teacher-leader. You
should be able to go into a classroom and be able to teach – and be able to teach above
what most teachers are able to do. So I tend to look for assistant principals that are
instructionally sound, that were great teachers to begin with, because then they have the
knowledge instructional strategy and how to deliver the curriculum in a way that would
benefit the teachers. ‘Cause one thing for teachers is, if they don’t think you know, then
why am I going to step up to the plate when you don’t even know where the plate is. So I
think, I consciously look towards that and I try to look for two separate assistant
principals that have varied skill set, or have skill sets in the areas that we need to be better
on.
Comparison of the Frequency of Themes for research Question 11 by School Type
Table 22 includes the frequency of themes for research Question 11 by school type and
highlights the differences between the frequencies by school type. In comparison to principals
from low poverty schools, principals from high poverty schools more frequently mentioned that
more relevant instructional support and PD needed (n = 6) and that those giving support should
have experience (n = 4). Alternatively, principals from low poverty schools were more likely
than principals from high poverty schools to mention that Support and PD are provided (n = 4)
and that more resources are needed (n = 4).
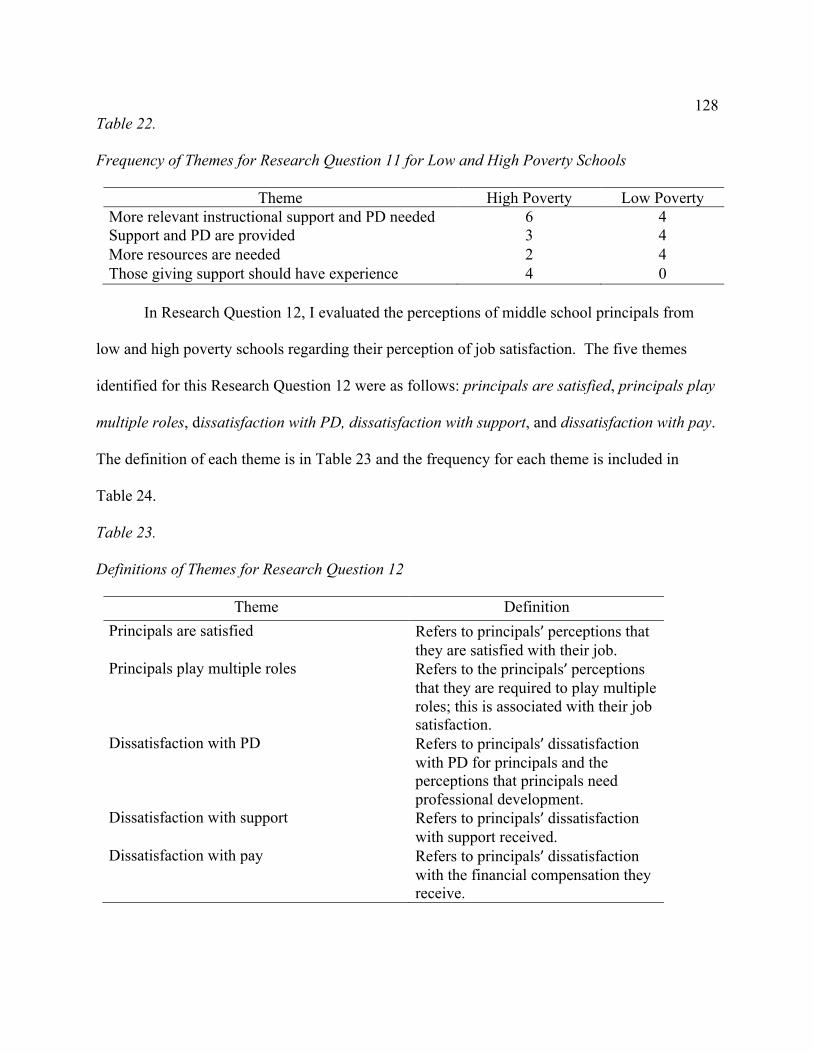
128
Table 22.
Frequency of Themes for Research Question 11 for Low and High Poverty Schools
Theme High Poverty Low Poverty More relevant instructional support and PD needed 6 4 Support and PD are provided 3 4 More resources are needed 2 4 Those giving support should have experience 4 0
In Research Question 12, I evaluated the perceptions of middle school principals from
low and high poverty schools regarding their perception of job satisfaction. The five themes
identified for this Research Question 12 were as follows: principals are satisfied, principals play
multiple roles, dissatisfaction with PD, dissatisfaction with support, and dissatisfaction with pay.
The definition of each theme is in Table 23 and the frequency for each theme is included in
Table 24.
Table 23.
Definitions of Themes for Research Question 12
Theme Definition Principals are satisfied Refers to principals’perceptions that
they are satisfied with their job. Principals play multiple roles Refers to the principals’perceptions
that they are required to play multiple roles; this is associated with their job satisfaction.
Dissatisfaction with PD Refers to principals’dissatisfaction with PD for principals and the perceptions that principals need professional development.
Dissatisfaction with support Refers to principals’dissatisfaction with support received.
Dissatisfaction with pay Refers to principals’dissatisfaction with the financial compensation they receive.
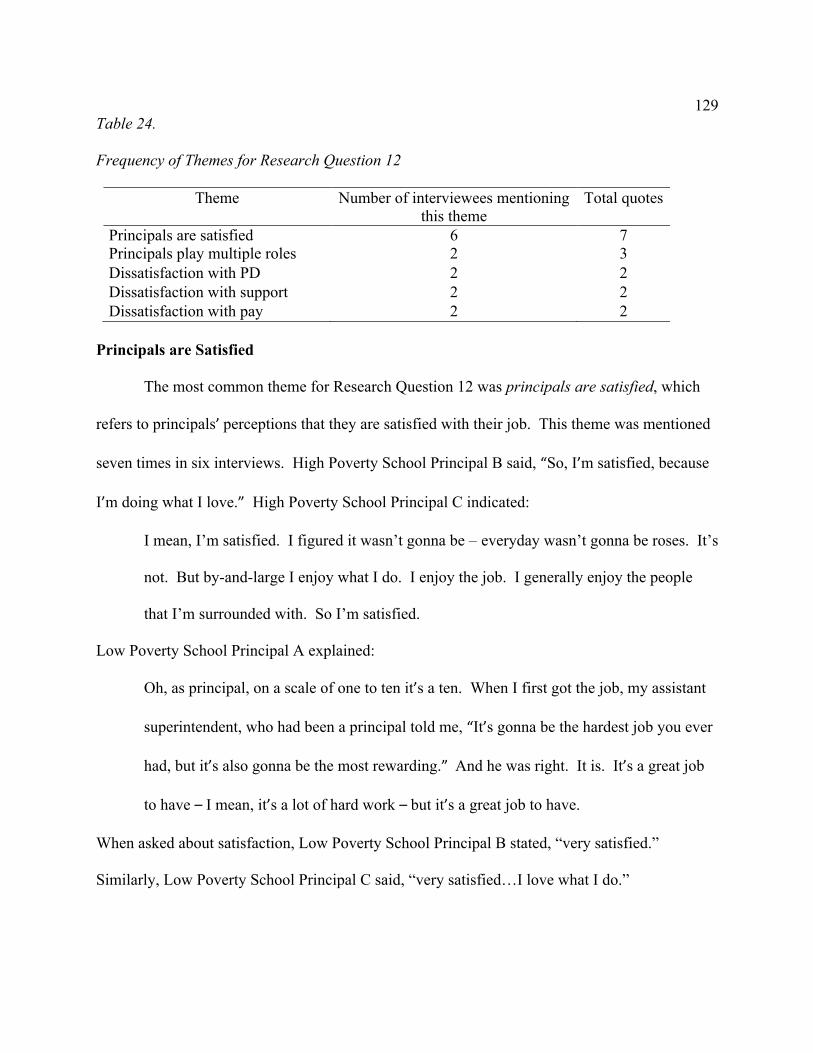
129
Table 24.
Frequency of Themes for Research Question 12
Theme Number of interviewees mentioning this theme
Total quotes
Principals are satisfied 6 7 Principals play multiple roles 2 3 Dissatisfaction with PD 2 2 Dissatisfaction with support 2 2 Dissatisfaction with pay 2 2
Principals are Satisfied
The most common theme for Research Question 12 was principals are satisfied, which
refers to principals’perceptions that they are satisfied with their job. This theme was mentioned
seven times in six interviews. High Poverty School Principal B said, “So, I’m satisfied, because
I’m doing what I love.” High Poverty School Principal C indicated:
I mean, I’m satisfied. I figured it wasn’t gonna be – everyday wasn’t gonna be roses. It’s
not. But by-and-large I enjoy what I do. I enjoy the job. I generally enjoy the people
that I’m surrounded with. So I’m satisfied.
Low Poverty School Principal A explained:
Oh, as principal, on a scale of one to ten it’s a ten. When I first got the job, my assistant
superintendent, who had been a principal told me, “It’s gonna be the hardest job you ever
had, but it’s also gonna be the most rewarding.”And he was right. It is. It’s a great job
to have –I mean, it’s a lot of hard work –but it’s a great job to have.
When asked about satisfaction, Low Poverty School Principal B stated, “very satisfied.”
Similarly, Low Poverty School Principal C said, “very satisfied…I love what I do.”
130
Principals Play Multiple Roles
The next theme for Research Question 12 was principals play multiple roles, which refers
to the principals’perceptions that they are required to play multiple roles; this is associated with
their job satisfaction. This theme was mentioned three times in two interviews with High
Poverty School Principals. High Poverty School Principal B explained this:
Well, there’s frustrating days as a principal. If I could just be a principal that come in and
have the model student, walk in the building, great teachers in the classroom –in every
classroom –and learning is going on at its highest level in every classroom and I can
direct the instruction that’s going on, that would be utopia; that would be perfect. But,
it’s all the hats you have to wear as a principal. I mean, you’re being tugged and pulled in
so many directions, and it’s a balancing act. You have to balance all of it, or you can
truly become very frustrated. There are many things that –many people who need you,
but then the people who need you, they don’t realize that they’re not the only ones who
need you, and what’s important to them at that point is a matter of urgency to them; but, I
have an urgent matter over here.
High Poverty School Principal C stated:
The role of a principal is like a constant who’s on that. You’re constantly getting
interrupted in these things, and so you’re never –it’s hard to find time to sit down and
think and just –just think, because of the nature of the job; so, it would be nice to have
those kinds of things. You know if I was asking for above and beyond.
131
Dissatisfaction with PD
The next theme for Research Question 12 was dissatisfaction with PD, which refers to
principals’dissatisfaction with PD for principals and the perceptions that principals need
professional development. This theme was mentioned two times in two interviews with High
Poverty School Principals. High Poverty School Principal A explained his/her dissatisfaction
with PD:
A lot of the role of the principal –a lot of the task are “on the job”type tasks. So, for
example, professional development for a principal, “Do you need better customer
service?”–those would be professional development. So either you have it or you don’t.
But then as far as payroll –somebody needs to sit with me and teach me how to do
payroll, attendance for my staff, hiring, posting for a new position. So those kinds of
things…
High Poverty School Principal C indicated:
I’ll also think just like teachers should be developed, I think leaders should also have
continually development opportunities. And so that would be something I’d like to see
more of is more –not so much operational like, what should I do if –if I had a staff
allegation, “What should I do this,”but how –as a leader what can I do to better reach my
constituents. Give me the ability –give me the time and space to be able to sit back and
reflect on what I’m doing and to make plans, or to work with others and make plans.
Dissatisfaction with Support
The next theme for Research Question 12 was dissatisfaction with support, which refers
to principals’dissatisfaction with support received. This theme was mentioned two times in two
132
interviews. High Poverty School Principal A was dissatisfied with the support and explained
that more support was needed from the district:
Providing support as far as resolution to issues and concerns, for example, if we reach out
to the district with a question or concern, make sure there’s a timely response; not
necessarily give me the answer, but at least, “I’m working on it,”–some kind of
response. The district also can help principals with management of their schedule. A lot
of times, as the principal, I’m needed elsewhere; I can’t be in my building. So, if I can’t
be in my building, I’m somewhere else. And then when I come back then it’s trying to
catch-up, catch-up. Then as principal you always feel like you’re behind.
Low Poverty School Principal C also expressed dissatisfaction with the level of support and said
this dissatisfaction could be addressed if they “include us on decision making that goes on in my
school. Make us feel we have an input on what’s going on.”
Dissatisfaction with Pay
The next theme for Research Question 12 was dissatisfaction with pay, which refers to
principals’dissatisfaction with the financial compensation they receive. This theme was
mentioned two times in two interviews with High Poverty School Principals. High Poverty
School Principal A said, “Give us more money. [Laughter] Right. Salary is always a plus.”
High Poverty School Principal C explained:
I think, of course right now probably the biggest and most obvious is the fact that you’ve
got a lot of furlough days. You have a lot of reduction in pay. You’re asking more
responsibilities, but still reducing our pay. And so –and I think that goes across the
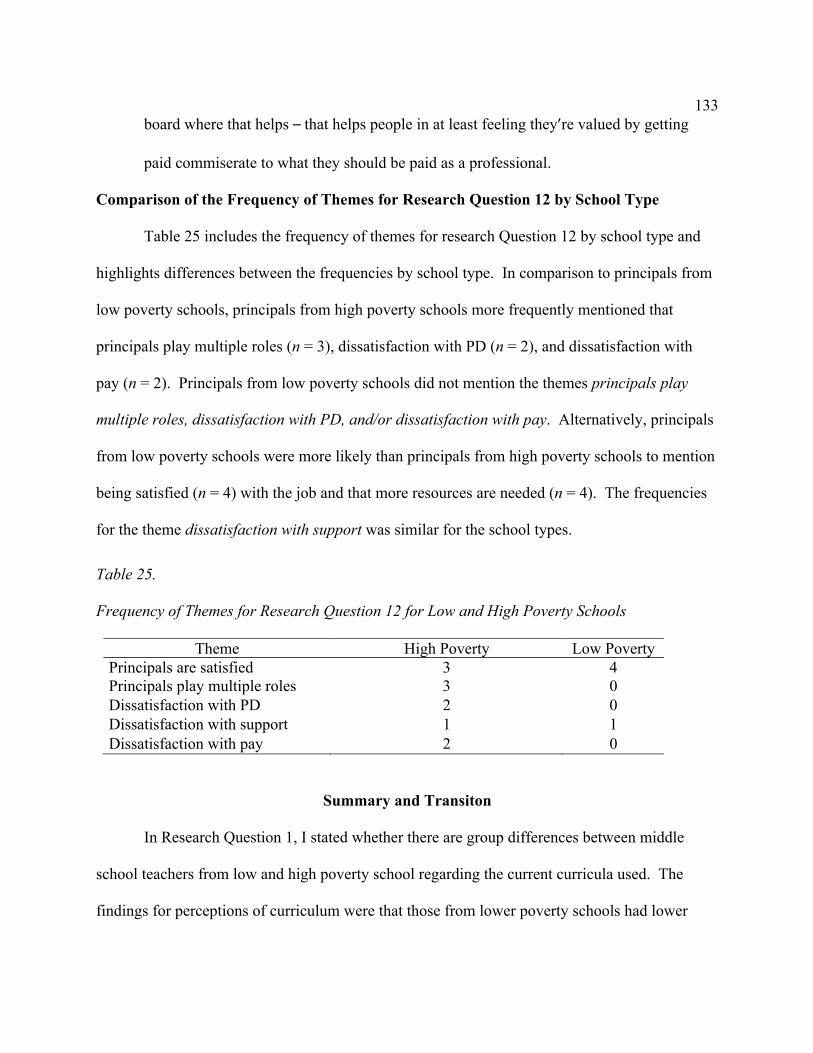
133
board where that helps –that helps people in at least feeling they’re valued by getting
paid commiserate to what they should be paid as a professional.
Comparison of the Frequency of Themes for Research Question 12 by School Type
Table 25 includes the frequency of themes for research Question 12 by school type and
highlights differences between the frequencies by school type. In comparison to principals from
low poverty schools, principals from high poverty schools more frequently mentioned that
principals play multiple roles (n = 3), dissatisfaction with PD (n = 2), and dissatisfaction with
pay (n = 2). Principals from low poverty schools did not mention the themes principals play
multiple roles, dissatisfaction with PD, and/or dissatisfaction with pay. Alternatively, principals
from low poverty schools were more likely than principals from high poverty schools to mention
being satisfied (n = 4) with the job and that more resources are needed (n = 4). The frequencies
for the theme dissatisfaction with support was similar for the school types.
Table 25.
Frequency of Themes for Research Question 12 for Low and High Poverty Schools
Theme High Poverty Low Poverty Principals are satisfied 3 4 Principals play multiple roles 3 0 Dissatisfaction with PD 2 0 Dissatisfaction with support 1 1 Dissatisfaction with pay 2 0
Summary and Transiton
In Research Question 1, I stated whether there are group differences between middle
school teachers from low and high poverty school regarding the current curricula used. The
findings for perceptions of curriculum were that those from lower poverty schools had lower
134
perceptions of curriculum than those from high poverty schools, and those teaching tested
subjects had lower perceptions of curriculum than those teaching non-tested subjects did. In
Research Question 5, I stated whether there are group differences between middle school
teachers who teach tested subject and teachers who teach nontested subjects regarding the
current curricula used. There was a statistically significant interaction between school type and
subject taught for Perception of Curriculum, such that those in high poverty schools for tested
and non-tested subjects had higher mean perceptions of curriculum scores as compared to those
in low poverty schools for tested and non-tested subjects.
In Research Question 2, I stated whether there are group differences between middle
school teachers from low and high poverty school regarding the current instructional method
used. The findings for perceptions of instructional method were that those from lower poverty
schools had lower perceptions of instructional methods than those from high poverty schools and
that those teaching tested subjects had lower perceptions of perception of instructional methods
than those teaching non-tested subjects. In Research Question 6, I stated whether there are group
differences between middle school teachers who teach tested subject and teachers who teaches
nontested subjects regarding the current instructional being used. In addition, there was a
statistically significant interaction between school type and subject taught for perception of
instructional methods, such that those in high poverty schools for tested and non-tested subjects
had higher perception of instructional methods scores than those in low poverty schools for
tested and non-tested subjects.
In Research Question 3, I stated whether there are group differences between middle
school teachers from low and high poverty school regarding the current instructional support
135
used. The findings for perceptions of instructional support were that those from lower poverty
schools had lower perceptions of instructional support than those from high poverty schools, and
those teaching tested subjects had lower perceptions of instructional support than those teaching
non-tested subjects. In Research Question 7, I stated whether there are group differences
between middle school teachers who teach tested subject and teachers who teach nontested
subjects regarding the current instructional support used. There was no statistically significant
interaction between school type and subject taught for perception of instructional support.
In Research Question 4, I asked whether there are group differences between middle
school teachers from low and high poverty school regarding their job satisfaction. The findings
for job satisfaction were that those from lower poverty schools had higher job satisfaction than
those from high poverty schools. In Research Questions 8, I asked whether there are group
differences between middle school teachers who teach tested subject and teachers who teaches
nontested subjects regarding their job satisfaction. There was no statistically significant
interaction between school type and subject taught, nor was there a main effect of subject, for job
satisfaction.
As for the principal interview questions, the coding process identified 20 primary themes
that were delineated into four groups, with each category focusing on one of the four research
questions. I summarized the findings for each research question and used examples of direct
quotes from the interviews to illustrate the themes. In addition, she compared the frequencies of
the themes for principals from low and high poverty schools.
Research questions focused on principals’ perception regarding the curricula,
instructional support, job satisfaction and instructional methods. Principals from both low and
136
high poverty schools had very similar concerns when it comes to these variables. As for
Research Question 9, the main themes for curricula were that they felt as though the curriculum
is not effective, testing informs curriculum, accountability is an incentive for teachers and HST
causes stress. In terms of the instructional methods, the main themes were methods effectively
prepare students, tailor approaches to help student learn and grow, teachers are committed,
testing and standards informs instructional methods, can be flexible as long as standards are met,
and ineffective methods used by teachers. In Research Question 11, I focused on the perceptions
of middle school principals from low and high poverty schools regarding their perception of
availability of instructional support. The themes that the principals mentioned regarding the
instructional support were that more professional development and instructional support needed,
support and professional development provided, more resources are needed, and those giving
support should have experience. In Research Question 12, I focused on the perceptions of
middle school principals from low and high poverty schools regarding their perception of job
satisfaction. The principals state that they are satisfied, play multiple roles, dissatisfaction with
professional development, dissatisfaction with support, and are dissatisfaction with pay.
In Chapter 5, I will further summarize the finding of this research. In addition, I will
delve into the social change implications of this study as well as the applications for
psychologists and educators. I will discuss the limitations of this study in further detail and
describe the recommendations for further research relevant to strengths gleaned from the current
study.
137
Chapter 5: Discussion, Conclusions, and Recommendations
Introduction
Summary of Findings
The results from this study indicated that teachers in lower poverty schools had a lower
perception when it came to the curricula, instructional method, and instructional support within
the schools. In addition, it revealed that teachers in lower poverty schools had higher job
satisfaction when compared to their counterparts, teachers in high poverty schools. In terms of
teachers teaching tested subjects and those teaching non-tested subjects, teachers who taught
tested subjects had a lower perception in the areas of curricula, instructional methods, and
instructional support. However, in terms of job satisfaction, there were no group differences
between those who taught tested subjects and those who taught non-tested subjects with job
satisfaction. As for principals, they felt that the GPS teaches how to pass the test, and it does not
give the students the opportunity to apply what is learned.
Interpretation of Findings
This research discovered that low poverty school teachers had a lower perception in
regards to the curricula, instructional method, and instructional support. High poverty school
teachers are influenced by the accountability policies when compared to their counterparts,
which supports the fact that poverty levels have a great impact on student success. According to
Pawloski (2014), poverty is more instrumental to academic performance than even gestational
exposure to cocaine. Pawloski also noted that 66% of a child’s academic performance is a direct
reflection of the child‘s environment; meanwhile genetics influences 34% of a child‘s academic
achievement. Therefore, given the correlation between language acquisition, knowledge
138
attainment, and poverty level, it is vital to address the needs of child as soon as they enroll in
school; conversely, these interventions do not provide support structures in the child's
environment, which has a significant impact on a child's learning (Neuman, 2013). In 2009,
Oliver indicated, in relation to test scores, while poverty levels increase in a school, the academic
achievement decreases, which indicates that high poverty schools have a direct association with
academic success. As a result, in order for teachers to be equipped in helping students gain
academic achievement, principals must assist them by finding ways for teachers to believe they
are qualified to teach students from poverty, minority students, and low achieving students
(Evans, 2009).
This research also suggested that teachers in low poverty schools have a higher job
satisfaction than teachers in high poverty schools. This information is necessary to understand
because administrators on the school, district, state, and federal level should have knowledge of
how to better support teachers, especially since they place accountability on teachers to ensure
each student is successful. The objective of NCLB (2001) was to have every child score high on
the test, perform on grade level in the areas of reading and math by the year 2014 (Rubin, 2011).
Since the implementation of NCLB (2001), teaching in the U.S. has become increasingly
demanding and stressful to those who continue to stay in education, with a particular threat posed
to English and reading teachers due to the accountability on state assessments (Rubin, 2011).
Although there are numerous negative factors to consider, poverty level or poor living
environment not accounted for when placing sole responsibility on teachers; therefore, it does
leave teachers feeling frustrated and blamed (Hahs-Vaughan & Scherff, 2008).
In terms of the current curricula used in the classroom, high poverty principals were more

139
likely to indicate that the curriculum is not practical, testing informs curriculum, and
accountability is an incentive for teachers. Administrators felt that although their teachers do an
exceptional job in preparing students, the GPS is very broad, required teachers to speed through
the curriculum, and the concepts were unclear to teach the standards. However, the new
Common Core Georgia Professional Standards (CCGPS) are more detailed and thorough. I
noted that the accountability that is associated with HST gives teachers incentives and may
encourage teachers to perform better. It forces teachers to be more accountable regarding
content taught in the classroom. Principals further explained that they pressured to perform and
to meet AYP, given what has been occurring in other schools and in the news. For example, in
the cheating scandal, teachers and administrators were charged and is currently in court for
changing students’ answers on the testing materials.
On the other hand, principals from low poverty schools noted that the curriculum is
effective in teaching what is necessary for the classroom. In their perceptive, testing is required
in order have some cohesiveness throughout the district. It is also required in order to assess
content taught in the classroom. However, it does suppress the teachers’ creativity when
implementing the curriculum. Interviewees expressed that the pressure and accountability policy
of HST lead to stress for teachers, students, and parents. Principals further explained that HST
becomes the primary focus in teaching and learning as opposed to enjoying the experiences of
teaching and learning.
In terms of the instructional methods, principals from high poverty schools were more
likely to report that their teachers tailor approaches to help students learn and grow, can be
flexible as long as they are meeting standards, and use ineffective methods. Teachers adjust their
140
instruction according to the needs of the student. Some teachers can differentiate their
instructional approach in order to get students more involved; however, there are other teachers
who used basic methods. I found that there are teachers who are resistant to change and wants to
continue to teach in a manner that is not innovative. Teachers teach in one method and expect all
children to grasp the concepts regardless of the recommendation that all children perform on
different ability level. It is important to individualize the instruction to address every child’s
needs.
On the other hand, more principals from low poverty schools reported that the methods
teachers’ uses in their classroom are effective to prepare students and that testing and standards
inform instructional methods. Principals reported that teachers provided quality of instructions.
Principals also noted that the quality of instruction was rigorous, challenging, and it also made
the students excited. Principals also reported that testing and standards influence content taught
in the classroom because those standards ensure that the students are competitive against any
student across the state. Collaborative planning in content areas in the school is also important to
make sure that inexperienced teachers are teaching what the veterans are.
Principals from both low and high poverty schools feel teachers are committed.
Principals expressed that they had an excellent team of teachers in which they respect their
principals and the principals’ decision. The principals noted that when making decisions, they
are very inclusive in getting the teachers involved in order to provide more autonomy. Due of
this leadership method, teachers and administers support and trust their final decision. In
addition, principals felt that a majority of their teachers want to do well in teaching students by
ensuring their students and school are successful. Educators may have a difference of opinion in
141
the implementation process, but their intentions are in the right place.
In terms of principals’ perception of availability of instructional support, high poverty
principals noted that more relevant instructional support and professional development are
needed, and those that are giving support should have more experience. Interviewees expressed
that additional support is always wanted, especially on topics that are relevant to the issues and
the needs of the school (for example, how to integrate literacy standards in the class and how that
looks like). Professional development is not only required for teachers, but for assistant
principals as well. Administrators rely heavily on their assistant principals to be instructional
leaders and not just disciplinarian assistant principals. Principals expect them to be very
knowledgeable and experienced in understanding what are best practices, how it looks in the
classroom, what instructional strategies implemented, and provide constructive feedback to
teachers in meetings. Assistant principals are required to interpret and analyze data in order to
know where they are currently and where they need to go to increase student success.
Principals in low poverty schools frequently reported that they need more resources to
increase the availability of instructional support, which also includes funding. Although the
schools are low poverty schools, money is an issue. According to Klein (2009), there have been
major criticisms when it comes to funding for No Child Left Behind and its requirements to
increase student achievement. Reportedly, although states and local school districts are required
to meet annual yearly progress, resources to meet these standards are limited. Smith (2005)
further explained that property taxes are where schools typically get their funding, in other words
the higher the property taxes, the more money the school will receive. With this in mind, if the
school considered a high poverty school, they will have less funding coming from property tax
142
revenues. Although, they may obtain supplementary federal funds based on their Title I status.
Principals also noted that they have difficulty providing exceptional professional development.
As a result, principals depend on their teachers who have specific skills in certain areas to
disseminate information and to spread knowledge to their colleagues. They also expressed that
more funds needed for more textbooks and for better textbooks for students.
In terms of job satisfaction, principals in high poverty schools reported that they play
multiple roles, are dissatisfied with professional development and are dissatisfied with pay.
Having to attend to many tasks prevents them from focusing on what needs to be done and even
being well prepared to do those tasks (for example, payroll). One principal stated having
professional support on how to do payroll, attendance for staff, hiring, and posting for a new
position would be helpful. Having more time and space to address more learning needs of the
student by having some sort of reflection and planning process would be more beneficial.
Principals are also required to be out of the building continuously for meetings, which makes
them feel as though they are behind with duties in the schoolhouse. They feel as though they are
always falling behind in their duties as principals. Having more leadership development would
help with the principals’ day-to-day load as well. In terms of the dissatisfaction with support,
principals feel as though they need more support from the district to help solve issues in the
building. Having a quicker response to their problems or concerns or even some
acknowledgment and a follow through would be beneficial and helpful to principals. They also
mention having input in the decision-making on what goes on in the individual school will give
them the autonomy in meeting the needs of the individual schools. Allowing some autonomy
will give principals ownership and allow them to feel as though they are part of the decision-
143
making process. Lastly, increase in salary is always a plus for principals. Every year, the district
implements furlough days due to budget cuts but still require or add more responsibilities.
Principals feel as though, although there are increases in responsibilities it is not being valued by
the pay received. In other words, the job responsibilities should be commensurate with the pay.
Limitations of the Study
Several limitations in this research addressed, including a self-report examination of
teachers’ and principals’ perceptions of the curricula, available resources, instructional support
and job satisfaction as a result of the high stakes testing. Historically, self-report research is a
vital facet of all social science; conversely, it has imperfect power to enlighten. Self-report
methods are constrained to theory-bound measurement; in other words, in order for a method to
have construct validity, it must be associated to a theory—a researcher must know what they
expect to measure before they measure it (Haeffel & Howard, 2010).
Many researchers would debate whether a theory-driven research is restrictive. As
researchers, we are responsible for struggling with the unbiased nature of such data (Lather,
2006). Furthermore, there are also disputes associated to the truthfulness and importance of self-
report measures produced from the viewpoint of the researcher and “reflect the researcher’s
notion of what classroom life is about” (Kaplan, Katz, & Flum, 2011, p. 172). As a result,
mixed-methods reveal what is occurring in the schools. In addition, it helped to minimize my
biases in having a prevalent influence and emboldening a proactive, cooperative research
experience. Nonetheless, the self-report is flawed method of investigation and its limitations.
Another limitation of this research was the potential for bias, which might be a factor in
this study because I worked at another school in the same school district where the conducted
144
study took place and might have a professional relationship with some of the participants in the
study. Another limitation was the generalizability of the research. It is unfeasible to generalize a
small sample size to all public middle schools.
Recommendations
Given the guidelines of NCLB of 2001, each year the requirements for meeting AYP will
increase due to the goal of 100% of the students meeting expectancy by the year 2014-2015.
Recently, in 2013, there were criminal charges against 35 educators in Atlanta, Georgia,
including the district’s superintendent. The court indicted these educators for cheating on the
state’s standardized tests with charges varying from making false statements to racketeering. In
this incident of cheating, teachers went through great lengths to ensure their school met AYP.
This included educators meeting over the weekend to erase and correct incorrect answers,
arranging classroom seating so lower ability students could see the answer sheets of higher
ability students, and looking at the next day’s test questions and discussing the questions with the
class (Croft, 2014). These actions were usual. According to Croft, the school system fired high
school principals and 130 educators faced disciplinary actions for cheating on student
assessments in Philadelphia. Cheating scandals have also appeared across the country in states,
such as California, Arizona, Michigan, Ohio, Florida, and Washington, DC (Croft, 2014).
Each year, teachers will continue to feel greater pressure to provide students with the
instructional support needed in order to pass the HST. As a result, in terms of professional
application, this research intends to provide policymakers and stakeholders at all levels
information on educator support and financial influences. This may include budget conditions,
145
future reduction in overall spending, and limits on the growth of future spending affect public
education, as well as, how these factors might apply additional pressures on educators.
This study can also provide valuable research to policymakers and other stakeholders at
the federal, state, and district levels, since the federal government is currently in the process of
reauthorizing the NCLB of 2001. Incorporating other methods to assess students’ knowledge of
state standards, such as portfolios and class projects, will result in less pressure and testing
anxiety for students, teachers, and administrators. Allowing students to display what they have
learned through other methods will challenge and encourage students to use critical thinking
skills and to think analytically.
Implications for Social Change
Positive social change and implication from this intended research is that it will explore
the importance of utilizing various interventions, depending on the poverty level of the school.
In other words, educators from high poverty schools may respond differently to high-stakes
accountability policies than those in low poverty schools, as it relates to curricula, instructional
methods, availability of instructional support and job satisfaction. This is especially important
for fairness or equity between both environments when considering the family position on
providing supplemental aid to assist the students with improving their academics.
It is important to consider poverty as a central focus of this research. High poverty
families face many challenges, such as homelessness, children not having any type of formal
education prior to the age of six, and children coming to school unkempt. Evans (2004) noted
that there are serious effects of poverty, such as the child’s socio-emotional, cognitive, and
146
physical abilities, as well as families’. Evans reported that the home structure influenced by
parents’ responsiveness, connection between family members, stability in the home, and
consistency. There are few positive educational influences in the home, such as having
established homework time, exposure to books, and other educational activities (Evans, 2004).
As a result, not only may students from high poverty schools need additional support and unique
supplemental aids when compared to their counterpart, but teachers and administrators may face
with similar challenges. Understanding how poverty level influences the implications of high-
stakes testing and accountability policies is important.
Conclusion
This research is a platform for educators to have a voice on what they need to meet AYP.
Educators from both high and low poverty schools perceive great level of stress due to the
accountabilities policies. Teachers and principals, especially from high poverty schools,
acknowledge the need for more assistance and support from the local and district level
administrators. Given the strict policies that are in place, educators feel that they are more in
need of support on how to apply what is required of them to meet AYP. This includes income,
administrative support, more teachers that are experienced, professional development, and
instructional materials.
147
References
Abrams, L. M. (2004). Teachers’ views on high-stakes testing: Implications for the classroom.
Tempe, AZ: Education Policy Studies Laboratory.
Abrams, L.M., Pedulla, J.J., & Madaus, G.F. (2003) Views from the classroom: Teachers'
opinions of statewide testing programs. Theory into Practice, 42(1), 18-29.
doi.org/10.1207/s15430421tip4201_4
Anderson, L. W. (1983). Policy implications of research on school time. The School
Administrator, 40, 25-28.
Anderson, L., Brubaker, N., Alleman-Brooks, J., & Duffy, G. (1985) A qualitative study of
seatwork in first-grade classrooms. Elementary School Journal, 86, 123-140.
doi.org/10.1086/461438
Aronson, J., Zimmerman, J., & Carlos, L. (1998). Improving at the PACE Media/Education
Writers Seminar, San Francisco. Student achievement by extending school: Is it just a
matter of time? Paper presented.
Aud, S., Hussar, W., Planty, M., Snyder, T., Bianco, K., Fox, M., . . . Drake, L. (2011). The
condition of education 2011 (NCES 2010-028). National Center for Education Statistics,
Institute of Education Sciences, U.S. Department of Education. Washington, DC.
Retrieved from http://nces.ed.gov/pubs2010/2010028.pdf
Bacharach, S. B., Bauer, S. C., & Conley, S. (1986). Organizational analysis of stress: The case
of elementary and secondary schools. Work and Occupations, 13, 7-32.
doi.org/10.1177/0730888486013001002
148
Bacolod, M., DiNardo, J., & Jacobson, M. (2009). Beyond incentives? Do schools use
accountability rewards productively? (NBER Working Paper 14775). Cambridge, MA:
National Bureau for Economic Research. doi.org/10.3386/w14775
Bakker, A. B., Demerouti, E., Hakanen, J. J., & Xanthopoulou, D. (2007). Job resources boost
work engagement, particularly when job demands are high. Journal of Educational
Psychology, 99(2). 274-284. doi.org/10.1037/0022-0663.99.2.274
Bakker, A. B., Demerouti, E., & Schaufeli, W. B. (2003). Dual processes at work in a call centre:
An application of the job demands–resources model. European Journal of Work and
Organizational Psychology, 12, 393–417. doi.org/10.1080/13594320344000165
Balzer, W. K., Kihm, J. A., Smith, P. C., Irwin, J. L., Bachiochi, P. D.,…Parra, L. F. (2000).
Users’ manual for the Job Descriptive Index (JDI; 1997 version) and the Job in General
scales. In J. M. Stanton and C. D. Crossley (Eds.), Electronic resources for the JDI and
JIG. Bowling Green, OH: Bowling Green State University.
Berliner, D. C. (1990). What’s all the fuss about instructional time? New York: Teachers
College Press. Retrieved from http://courses.ed.asu.edu/berliner/readings/fuss/fuss.htm
Blasé, J. J., & Matthews, K. (1984). How principals stress teachers. The Canadian School
Executive, 4, 8-11.
Broghy, J. E. (1979). Teacher behavior and its effects. Journal of Educational Psychology, 71(6).
733-750. doi.org/10.1037/0022-0663.71.6.733
Brunetti, G. J. (2001). Why do they teach? A study of job satisfaction among long-term high
school teachers. Teacher Education Quarterly, 28(3), 49-74.
149
Burney, V. H., & Beilke, J. R. (2008). The Constraints of Poverty on High Achievement. Journal
for the Education of the Gifted, 31(3), 171-197.
Carroll, J. B. (1963). A model of school learning. Teachers College Record, 64, 723-733.
Carson, K. P., Kinicki, A. J., McKee-Ryan, F. M., and Schriesheim, C. A. (2002, February).
Assessing the construct validity of the Job Descriptive Index: A review and meta-
analysis. Journal of Applied Psychology, 87(1), 14-32. doi.org/10.1037/0021-
9010.87.1.14
Cedoline, A. J. (1982). Job burnout in public education: Symptoms, causes, and survival skills.
New York, NY: Teachers College Press.
Chiang, H. (2009). How accountability pressure on failing schools affects student achievement.
Journal of Public Economics, 93(1), 1045-1057. doi.org/10.1016/j.jpubeco.2009.06.002
Choi, K., Seltzer, M., Herman, J., Yamashiro, K., & California Univ., L. A. (2004). Children left
behind in AYP and non-AYP schools: Using student progress and the distribution of
student gains to validate AYP. CSE Report 637. Center for Research on Evaluation
Standards and Student Testing CRESST. Retrieved from
http://www.eric.ed.gov/PDFS/ED483404.pdf.
Coladarci, T. (1992). Teachers’ sense of efficacy and commitment to teaching. Journal of
Experimental Education, 60, 323-337. doi.org/10.1080/00220973.1992.9943869
Creswell, J. W. (2014). A concise introduction to mixed methods research. SAGE Publications.
Creswell, J.W. (2007). Qualitative inquiry and research design: Choosing among five traditions
(2nd ed.). Thousand Oaks, C.A.: Sage.
150
Creswell, J. W. (2003). Research design: Qualitative, quantitative, and mixed methods
approaches (2nd ed.). Thousand Oaks, C.A.: SAGE publications.
Creswell, J. W., Slope, R., Plano Clark, V., & Green. (2006). How interpretative qualitative
research extends mixed methods research. Research in the Schools, 13(1), 1-11.
Croft, M. (2014). The End of Erasures: Updating Test Security Laws and Policies for
Computerized Testing. Retrieved from
http://www.act.org/research/policymakers/pdf/EndofErasures.pdf
Cronbach, L. J. (1951). Coefficient alpha and the internal structure of tests. Psychometric, 16,
297-334. doi.org/10.1007/BF02310555
Cuthrell, K., Stapleton, J., & Ledford, C. (2010). Examining the culture of poverty: Promising
practices. Preventing School Failure, 54(2), 104-110.
doi.org/10.1080/10459880903217689
Darling-Hammond, L. (2004). Standards, accountability, and school reform. Teachers College
Record, 106(6), 1047-1085. doi.org/10.1111/j.1467-9620.2004.00372.x
Davis, J., & Wilson, S. M. (2000). Principals’ efforts to empower teachers: Effects on teacher
motivation and job satisfaction and stress. The Clearing House, 73(6), 349-357.
doi.org/10.1080/00098650009599442
Demerouti, E., Bakker, A. B., Nachreiner, F., & Schaufeli, W. B. (2001). The job demands–
resources model of burnout. Journal of Applied Psychology, 86, 499–512.
doi.org/10.1037/0021-9010.86.3.499
DeMeuse, K. P. (1985). A compendium of frequently used measures in industrial/organizational
psychology. The Industrial-Organizational Psychologist, 23, 53-59.
151
Dewey, J. (1902). The child and the curriculum. Chicago: The University of Chicago Press.
Dinham, S., & Scott, C. (1996). Teacher satisfaction, motivation and health: Phase one of the
teacher 2000 project. Presented at the annual meeting of the American Educational
Research Association. EDRS Availability: Microfiche.
Dworkin, A. G., Haney, C. A., Dworkin, R. J., & Telschow, R. L. (1990). Stress and illness
behavior among urban public school teachers. Educational Administration Quarterly, 26,
60-72. doi.org/10.1177/0013161X90026001004
Esch, C. E., Chang-Ross, C. M., Guha, R., Humphrey, D. C., Shields, P. M., Tiffany-Morales, . .
. Woodworth, K. R. (2005). The status of the teaching profession 2005. Santa Cruz, CA:
The Center for the Future of Teaching and Learning.
Evans, A. (2009). No Child Left Behind and the quest for educational equity: The role of
teachers’ collective sense of efficacy. Leadership and Policy in Schools, 8, 64-91.
doi.org/10.1080/15700760802416081
Evers, T. B. (1987, April). Factors affecting teachers job satisfaction in a number of high
schools Michigan. Paper presented at the annual meeting of American Educational
Research Association, Washington D.C.
Everson, H. T., & Millsap, R. E. (2004). Beyond individual differences: Exploring school effects
on SAT scores. Educational Psychologist, 39, 157-172.
doi.org/10.1207/s15326985ep3903_2
Faulkner, S. A., & Cook, C. M. (2006). Testing vs. teaching: The perceived impact of assessment
demands on middle grades’ instructional practices. Research in Middle Level Education,
29(7).
152
Field, A. (2009). Discovering statistics using SPSS (3rd ed.). Thousand Oaks, CA: Sage
Publications, Inc.
Finnigan, K. S., & Gross, B. (2007). Do accountability policy sanctions influence teacher
motivation? Lessons from Chicago's low-performing schools. American Educational
Research Journal, 44(3), 594-629. doi.org/10.3102/0002831207306767
Firestone, W., Monfils, L., Camilli, G., Schorr, R., Hicks, J., & Mayrowetz, D. (2002). The
ambiguity of test preparation: A multimethod analysis in one state. Teachers College
Record, 104(7), 485-523. doi.org/10.1111/1467-9620.00211
Fisher, C. W., Berliner, D. C., Fully, N. N., Marliave, R. S., Cahen, L. S., & Dishaw, M. M.
(1980). Teaching behaviors, academic learning time and student achievement: An
overview. In C. Denham & A. Lieberman (Eds.), Time to learn (pp. 7-32). Washington,
DC: National Institute of Education.
Gehrke, R. S. (2005). Poor schools, poor students, successful teachers. Kappa Delta Pi, 42(1),
14-17. doi.org/10.1080/00228958.2005.10532079
Good, T., & Brophy, J. (8th ed.). (2000). Looking in classrooms. New York: Longman.
Gorton, R., Alston, J., & Snowden, P. (2007). School leadership & administration:
Important concepts, case studies, & simulations. New York, NY: McGraw-Hill.
Grant, S. G. (2000). Teachers and tests: Exploring teachers’ perceptions of changes in the New
York State testing program. Education Policy Analysis Archives, 8(14).
doi.org/10.14507/epaa.v8n14.2000
Gunzenhauser, M.G. (2003). High-stakes testing and the default philosophy of education. Theory
into Practice, 42(1), 51-58. doi.org/10.1207/s15430421tip4201_7
153
Haeffel, G. J., & Howard, G. S. (2010). Self-report: Psychology's four-letter word. American
Journal of Psychology, 123(2), 181-188. doi.org/10.5406/amerjpsyc.123.2.0181
Hahs-Vaughn, D., & Scherff, L. (2008). Beginning English teacher attrition, mobility, and
retention. Journal of Experimental Education, 77, 21-53. doi: 10.3200/JEXE.77.1.21-54
Hakanen, J., Bakker, A., & Schaufeli, W. B. (2006). Burnout and work engagement among
teachers. Journal of School Psychology, 43, 495-513. doi.org/10.1016/j.jsp.2005.11.001
Hale-Jinks, C., Knopf, H., & Kemple, K. (2006). Tackling teacher turnover in child care:
Understanding causes and consequences, identifying solutions. Childhood Education,
82(4), 219-226. doi.org/10.1080/00094056.2006.10522826
Hall, J. N., & Ryan, K. E. (2011). Educational accountability: A qualitatively driven mixed-
methods approach. Qualitative Inquiry. 17(1) 105-115.
doi.org/10.1177/1077800410389761
Hamilton, L., Stecher, B., Marsh, J., McCombs, J. S., Robyn, A., Russell, J. L., … Barney, H.
(2007). Standards-based accountability under No Child Left Behind: Experiences of
teachers and administrators in three states. Santa Monica, CA: RAND.
Hamilton, L. S., Stecher, B. M., & Yuan, K. (2008). Standards-based reform in the United
States: History, research, and future directions. Washington D. C.: Center of Education
Policy.
Hargrove, T. Y., Jones, M. G., Jones, B. D., Hardin, B., Chapman, L., & Davis, M. (2000).
Unintended consequences of high-stakes testing in North Carolina: Teacher perceptions.
ERS Spectrum, 18(4), 21-25.
154
Heller, B. (2005). Testing is here to stay. Kappan, 86(8), 261-273.
Horn, R. A. (2004). The new federal definition of educational research: Implications for
educators. The Teacher Educator, 39, 196-211. doi.org/10.1080/08878730409555341
Hobfoll, S. E. (1989). Conservation of resources: A new attempt at conceptualizing stress.
American Psychologist, 44, 513-524. doi.org/10.1037/0003-066X.44.3.513
Hobfoll, S. E. (2001). The influence of culture, community, and the nested-self in the stress
process: Advancing conservation of resources theory. Applied Psychology: An
International Review, 50, 337-370. doi.org/10.1111/1464-0597.00062
Horng, E. (2009). Teacher Tradeoffs: Disentangling Teachers' Preferences for Working
Conditions and Student Demographics. American Educational Research
Journal, 46(3), 690-717. doi.org/10.3102/0002831208329599
Hursh, D. (2007). Assessing No Child Left Behind and the Rise of Neoliberal Education
Policies. American Educational Research Journal, 44, 493–518.
doi.org/10.3102/0002831207306764
Ingersoll, R. (2004). Why do high-poverty schools have difficulty staffing their classrooms with
qualified teachers? Washington, D.C.: Center for American Progress.
Jones, B. D., & Egley, R. J. (2004). Voices from the frontlines: Teachers’ perceptions of high-
stakes testing. Education Policy Analysis Archives, 12(39).
doi.org/10.14507/epaa.v12n39.2004
Jones, L. V. (2001). Assessing achievement versus high-stakes testing: A crucial contrast.
Educational Assessment, 7(1), 21-28. doi.org/10.1207/S15326977EA0701_3
155
Jones, M. G., Jones, B. D., Hardin, B., Chapman, L., Yarbrough, T., & Davis, M. (1999). The
impact of high-stakes testing on teachers and students in North Carolina. Phi Delta
Kappan, 81(3), 199-203.
Kaplan, A., Katz, I., & Flum, H. (2012). Motivation theory in educational practice: Knowledge
claims, challenges, and future directions. In K. R. Harris, S. G. Graham, & T. Urdan
(Eds.), APA Educational Psychology Handbook Vol. 2: Individual differences, cultural
considerations, and contextual factors in educational psychology (Ch. 7, pp. 165-194).
Washington, DC: American Psychological Association. doi.org/10.1037/13274-007
Karasek, R. A. (1979). Job demands, job decision latitude, and mental strain: Implications for job
redesign. Administrative Science Quarterly, 24, 285-307. doi.org/10.2307/2392498
Karasek, R. A., Baker, D., Marxer, F., Ahlbom, A., & Theorell, T. (1981). Job decision latitude,
job demands, and cardiovascular disease: A prospective study of Swedish men. American
Journal of Public Health, 71, 694-705. doi.org/10.2105/AJPH.71.7.694
Karasek, R. A., & Theorell, T. (1990). Healthy work. New York, N.Y.: Basic Book.
Kellow, J. T., & Jones, B. D. (2008). The effects of stereotypes on the achievement gap:
Reexamining the academic performance of African American high school students.
Journal of Black Psychology, 34 (1), 94-120. doi.org/10.1177/0095798407310537
Kersten, J., & Pardo, L. (2007). Finessing and hybridizing: Innovative literacy practices
in reading first classrooms. The Reading Teacher, 61(2), 146-154.
doi.org/10.1598/RT.61.2.4
156
Kim, J., & Sunderman, G. L. (2004). Large mandates and limited resources: State response to
the No Child Left Behind Act and implications for accountability. Cambridge, MA: The
Civil Rights Project at Harvard University.
Klein, A. (2009). Affect of stimulus on NCLB renewal mulled. Education Week, 28(24), 19-24.
Koretz, D. (2002). Limitations in the use of achievement tests as measures of educators'
productivity. In E. Hanushek, J. Heckman, and D. Neal (Eds.), Designing Incentives to
Promote Human Capital. Special issue of The Journal of Human Resources, 37(4), 752-
777. doi.org/10.2307/3069616
Lather, P. (2006). Paradigm proliferation as a good thing to think with: Teaching research in
education as a wild profusion. International Journal of Qualitative Studies in Education,
19(1), pp. 35-56. doi.org/10.1080/09518390500450144
Locke, E. A. (1976). The nature and causes of job satisfaction. In M. D. Dunnette (Ed.),
Handbook of industrial and organizational psychology (pp. 1297-1349). Chicago, IL:
Rand McNally.
Ladd, H. F., & Zelli, A. (2002). School-based accountability in North Carolina: The responses of
school principals. Educational Administration Quarterly, 38(4), 494-529.
doi.org/10.1177/001316102237670
Leithwood, K., Patten, S., & Jantzi, D. (December, 2010). Testing a conception of how
school leadership influences student learning. Educational Administration
Quarterly 46, 671-706. Retrieved December 28, 2010 from eaq.sagepub.com at
Capella University. doi.org/10.1177/0013161X10377347.
157
Leiter, M. P., & Maslach, C. (1988). The impact of interpersonal environment on burnout and
organizational commitment. Journal of Organizational Behavior, 9, 297-308.
doi.org/10.1002/job.4030090402
Leiter, M.P., & Harvie, P. (1997) The correspondence of supervisor and subordinate perspectives
on major organizational change. Journal of Occupational Health Psychology, 2, 1-10.
doi.org/10.1037/1076-8998.2.4.343
Leiter, M.P., & Harvie, P. (1998). Conditions for staff acceptance of organizational change:
Burnout as a mediating construct. Anxiety, Stress, & Coping, 11, 1-25.
doi.org/10.1080/10615809808249311
Lortie, D. C. (1975). Schoolteacher: A sociological study. Chicago, IL: University of Chicago
Press.
Luna, C., & Turner, C. L. (2001). The impact of the MCAS: Teachers talk about highstakes
testing. English Journal, 91(1), 79-87. doi.org/10.2307/821659
Mabry, L., Poole, J., Redmond, L., & Schultz, A. (2003). Local impact of state-mandated testing.
Education Policy Analysis Archives, 11(22). doi.org/10.14507/epaa.v11n22.2003
Madaus, G. F., & Clarke, M. (2001). The adverse impact of high stakes testing on minority
students: Evidence from 100 years of test data. In G. Orfield & M. Kornhaber (Eds.),
Raising standards or raising barriers? Inequality and high stakes testing in public
education (pp. 85-106). New York, NY: Century Foundation.
Marzano, R. (1992). A different kind of classroom: Teaching with dimensions of learning.
Alexandria, Virginia: Association for Supervision and Curriculum Development.
158
Maslach, C., Jackson, S. E., & Leiter, M. P. (1996). Maslach burnout inventory manual (3rd ed.).
Palo Alto: Consulting Psychologists Press.
Mason, J. (2006). Mixing methods in a qualitatively-driven way. Qualitative Research 6(1), 9-
25. doi.org/10.1177/1468794106058866
Mayer, R. E. (2004). Should there be a three strikes rule against pure discovery learning? The
case for guided methods of instruction. American Psychologist, 59(1), 14-19.
doi.org/10.1037/0003-066X.59.1.14
McCabe, E. M. (2008). The role of accountability in teacher attrition from high- to low poverty
schools. Unpublished doctoral dissertation, The George Washington University,
Washington, D.C.
McNeil, L., & Valenzuela, A. (2001). The harmful impact of the TAAS system of testing in
Texas: Beneath the accountability rhetoric. Austin, T.X.: University of Texas
Department of Curriculum and Instruction and the Center for Mexican American Studies.
Meijman, T. F., & Mulder, G. (1998). Psychological aspects of workload. In P. J. D. Drenth &
H. Thierry (Eds.), Handbook of work and organizational psychology, 2, 5–33. Hove,
England: Psychology Press.
Merriam, S. B. (1998). Qualitative research and case study applications in education (Rev. ed.).
San Francisco, CA: Jossey-Bass Publishers.
Merriam, S. B. (Ed.). (2002). Qualitative research in practice: Examples for discussion and
analysis. San Francisco: Jossey-Bass.
Mewborn, D. S. (2009). Education Reform. The New Georgia Encyclopedia. Retrieved
from http://www.georgiaencyclopedia.org.
159
Miles, M. B., & Huberman, A. M. (1994). Qualitative data analysis. Thousand Oaks, C.A.: Sage
Publications.
Mintrop, H., & Trujillo, T. (2007). The practical relevance of accountability systems for
school improvement: A descriptive analysis of California schools. Educational
Evaluation and Policy Analysis, 29(4), 319-352. doi.org/10.3102/0162373707309219
Mistry, R., White, E., Benner, A., & Huynh, V.. (2009). A Longitudinal Study of the
Simultaneous Influence of Mothers' and Teachers' Educational Expectations on Low-
income Youth's Academic Achievement. Journal of Youth and Adolescence, 38(6), 826-
838. DOI:1742909091).
Moon, T. R., Callahan, C. M., & Tomlinson, C. A. (2003). Effects of state-testing programs on
elementary schools with high concentrations of student poverty Good news or bad news?
Current Issues in Education, 6(8).
Natale, J. A. (1993, July). Why teachers leave. The Executive Educator, 15(7), 14-18.
National Center for Education Statistics. (2005). The condition of education. Washington, DC:
Author.
Neuman, S. (2013). The American dream: Slipping away? Faces of Poverty, (70)8, 18-22.
Nichols, S. L., & Berliner. D. C. (2007). Collateral damage: How high-stakes testing corrupts
America’s schools. Cambridge, MA: Harvard Education Press.
No Child Left Behind Act of 2001. (2002). Pub. L. No. 107-110, 115 Stat., 1425, 20 U.S.C. §§
6301 et seq.
160
Norusis, M. (2011). The SPSS guide to data analysis for SPSS/PC+. New Jersey: Prentice
Hall.Nunnally, J. C., & Bernstein, I. H. (1994). Psychometric Theory (3rd ed.). New
York: McGraw-Hill.
Ornstein, A. C. & Hunkins, F. P. (2009). Curriculum: Foundations, principles, and issues.
Boston, MA: Pearson.
Öztürk, İ. H. (2011). Curriculum Reform and Teacher Autonomy in Turkey: The case of the
history teaching. International Journal of Instruction 4(2), 112-118.
Pawloski, T. (2014, March). From F to A: Impact of leadership and sustained professional
development in high-poverty schools. Speech presented at North Carolina Association for
School Administrators Conference, Raleigh, NC.
Pearson, L. C. & Hall, B. C. (1993). Initial construct validation of the teaching autonomy scale.
Journal of Educational Research, 86(3), 172-177.
doi.org/10.1080/00220671.1993.9941155
Pearson, L. C., & Moomaw, W. (2005). The relationship between teacher autonomy and stress,
work satisfaction, empowerment, and professionalism. Educational Research Quarterly,
29(1), 37-53.
Pearson L. C. & Moomaw W. (2006), Continuing validation of the teaching autonomy scale. The
Journal of Educational Research, 100(1), 44-51. doi.org/10.3200/JOER.100.1.44-51
Pedulla, J. J., Abrams, L. M, Madaus, G. F., Russell, M. K., Ramos, M. A., & Miao, J.
(2003). Perceived effects of state-mandated testing programs on teaching and
learning: Findings from a national survey of teachers. Boston, MA: National Board on
Educational Testing and Public Policy at Boston University.
161
Reiser, R.A. & Dempsey, J.V. (2007). Trends and issues in instructional design (2nd ed.). Upper
Saddle River, NJ: Pearson Education, Inc.
Roller, C. M., (2005). No child left behind: A survey of its impact on IRA members.
Retrieved from http://www.reading.org/downloads/resources/
NCLB survey 022005.pdf
Rosenholtz, S. J., & Simpson, C. (1990). Workplace conditions and the rise and fall of teachers’
commitment. Sociology of Education, 63, 241-257. doi.org/10.2307/2112873
Rouse, C. E., Hannaway, J., Goldhaber, D., & Figlio, D. (2007). Feeling the Florida heat: How
low-performing schools respond to voucher and accountability pressure (NBER Working
Paper 13681). Cambridge, MA: National Bureau for Economic Research.
Rubin, D. (2011). The disheartened teacher: Living in the age of standardization, high- stakes
assessments, and No Child Left Behind (NCLB). Changing English, 18, 407-416.
doi.org./10.1080/1358684X.2011.630197
Salant, P., & Dillman, D. A. (1994). How to conduct your own survey. New York, NY: John
Wilely and Sons.
Schleisman, J. (1999, October). An in-depth investigation of one school district’s responses to an
externally mandated, high-stakes testing program in Minnesota. Paper presented at the
Annual Meeting of the University Council for Educational Administration, Minneapolis,
MN.
Skaalvik, E. M., & Skaalvik, S. (2009). Does school context mater? Relations with teacher
burnout and job satisfaction. Teaching and Teacher Education, 25, 518-524.
doi.org/10.1016/j.tate.2008.12.006
162
Slavin, R. E. (1994). Quality, appropriateness, incentive, and time: A model of instructional
effectiveness. International Journal of Educational Research, 21(2), 141-157.
doi.org/10.1016/0883-0355(94)90029-9
Sloan, K. (2006). Teacher identity and agency in school worlds: Beyond the all-
Good/All-bad discourse on accountability-explicit curriculum policies.
Curriculum Inquiry, 36(2), 119-152. doi.org/10.1111/j.1467-873X.2006.00350.x
Sowell, E. J. (2000). Curriculum: An integrative introduction. Upper Saddle River, NJ: Merrill.
Spatz, Chris. (2005). Basic statistics: Tales of distributions (8th ed.). Pacific Grove, CA:
Brooks/Cole.
Stanton, J., Sinar, E., Balzer, W., Julian, A., Thoresen, P., & Aziz, S. (2002). Development of a
compact measure of job satisfaction: The abridged job descriptive index. Educational and
Psychological Measurement, 61, 1104-1122. doi.org/10.1177/001316440206200112
Stecher, B., Barron, S., Chun, T., & Ross, K. (2000). The effects of the Washington state
education reform on schools and classrooms (CSE Technical Report). Los Angeles, CA:
National Center for Research on Evaluation, Standards, and Student Testing (CRESST).
Stecher, B., & Chun, T. (2001). School and classroom practices during two years of education
reform in Washington state (CSE Technical Report). Los Angeles, CA: National Center
for Research on Evaluation, Standards, and Student Testing (CRESST).
Sunderman, G. L., & Mickelsen, H. (2000). Implementing Title I school wide programs in a
complex policy environment: Integrating standards and schools and school reform in the
Chicago public schools. Journal of Negro Education, 69(4), 361-375.
doi.org/10.2307/2696251
163
Sunderman, G. L., Tracey, C. A., Kim, J., & Orfield, G. (2004). Listening to teachers:
Classroom realities and No Child Left Behind. Cambridge, M.A.: The Civil Rights
Project at Harvard University.
Taris, T. W., Schreurs, P. J. G., & van Iersel-van Silfhout, I. J. (2001). Job stress, job strain, and
psychological withdrawal among Dutch staff: Towards a dual-process model for the
effects of occupational stress. Work and Stress. 15, 283-296.
doi.org/10.1080/02678370110084049
Taylor, G., Shepard, L., Kinner, F., & Rosenthal, J. (2002). A survey of teachers perspectives on
high-stakes testing in Colorado: What gets taught, what gets lost. Los Angeles, CA:
National Center for Research on Evaluation, Standards, and Student Testing.
U.S. Department of Education, Office of Elementary and Secondary Education. (2008). State of
Georgia: Consolidated state application accountability workbook.
Washington, DC: Author.
Universal accreditation board handout #16 accreditation study course (2003). Retrieved from
http://www.praccreditation.org/secure/documents/coachHO16.PDF/coachHO16.PDF
Vroom, V. H. (1964). Work and motivation. New York: John Wiley & Sons, Inc. Zedek, S.
(1987, October). Satisfaction in union members and their spouses. Paper presented at the
Job Satisfaction: Advances in Research and Practice Conference, Bowling Green, Ohio.
Vogler, K.E. (2000). The impact of high stakes, state mandated student performance assessment
on 10th grade English, mathematics, and science teachers’ instructional practices.
Lowell, MA: University of Massachusetts Press.
164
Vogler, K. E. (2008). Comparing the impact of accountability examinations on Mississippi and
Tennessee Social Studies teachers’ instructional practices. Educational Assessments, 13,
1-32. doi.org/10.1080/10627190801968158
Waber, D. P., Gerber, E. B., Turcios, V, Y., Wagner, E. R., & Forbes, P. W. (2006). Executive
Functions and performance on high-stakes testing in children from urban schools.
Developmental Neuropsychology, 29(3), 459-477. doi.org/10.1207/s15326942dn2903_5
Wallace, V. L. (2002). Teachers and administrators under pressure: The case of Texas. In G.
Hillocks, Jr. (Ed.), The testing trap: How state writing assessments control learning, 85-
102. New York, NY: Teachers College Press.
Walmsley, S.A., & Allington, R.L. (1995). Redefining and reforming instructional support
programs for at-risk students. In R.L. Allington & S.A. Walmsley (Eds.), No quick fix:
Rethinking literacy programs in America's elementary schools (pp. 19–41). New York,
NY: Teachers College Press; Newark, DE: International Reading Association.
Watanabe, M. (2007). Displaced teacher and state priorities in a high-stakes
accountability context. Educational Policy, 21(2), 311-368.
doi.org/10.1177/0895904805284114
Wessa, P. (2009), Free Statistics Software (version 1.1.23-r3) [computer software], Retrieved
from http://www.wessa.net/
Williams, T., Kirst, M., Haertel, E., et al. (2005). Similar students, different results: Why do
some schools do better? A large-scale survey of California elementary schools
serving low-income students. Mountain View, CA: EdSource.
165
Winker, I. E. (1988). Parent and teacher perceptions of importance of guidance and counseling
goals. Unpublished master’s thesis, University of Wisconsin- Stout, Menomonie.
Woods, P. (1989). Stress and the teacher role. In M. Cole & S. Walker (Eds.), Teaching and
stress (pp. 36-32). Buckingham, England: Open University Press.
Yee, S. M. (1991). Career in the classroom: When teaching is more than a job. New York, NY:
Teachers College Press.
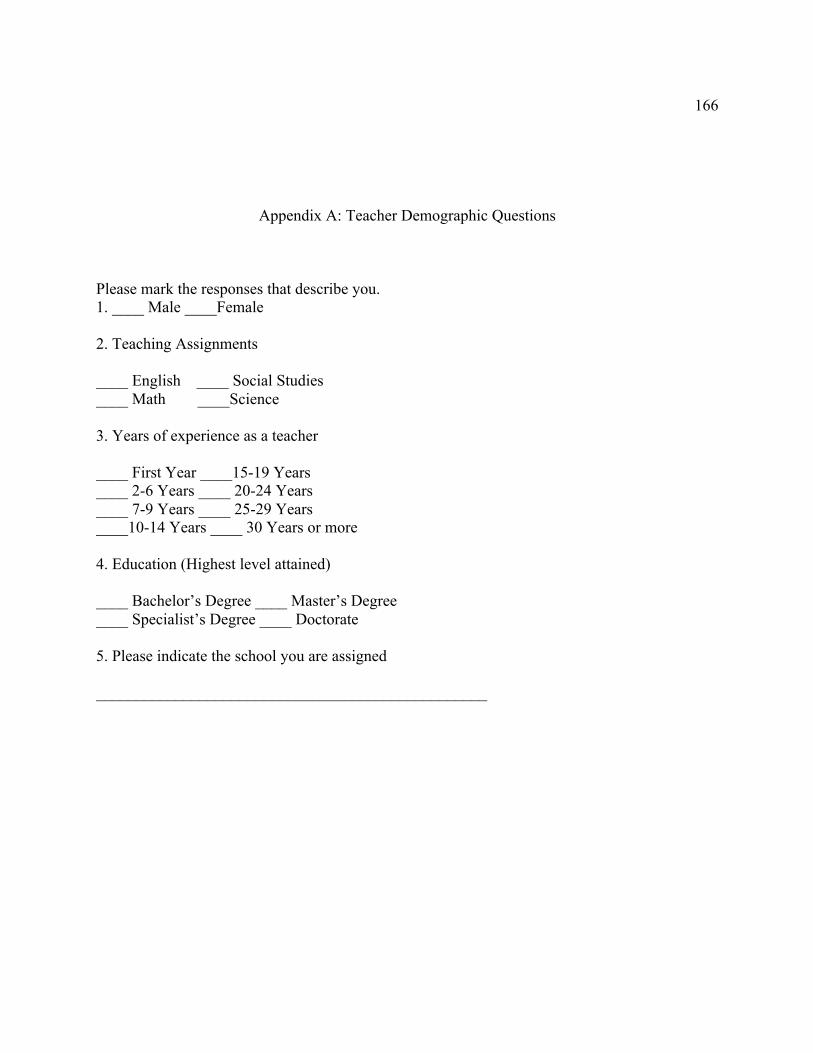
166
Appendix A: Teacher Demographic Questions
Please mark the responses that describe you. 1. ____ Male ____Female 2. Teaching Assignments ____ English ____ Social Studies ____ Math ____Science 3. Years of experience as a teacher ____ First Year ____15-19 Years ____ 2-6 Years ____ 20-24 Years ____ 7-9 Years ____ 25-29 Years ____10-14 Years ____ 30 Years or more 4. Education (Highest level attained) ____ Bachelor’s Degree ____ Master’s Degree ____ Specialist’s Degree ____ Doctorate 5. Please indicate the school you are assigned _________________________________________________
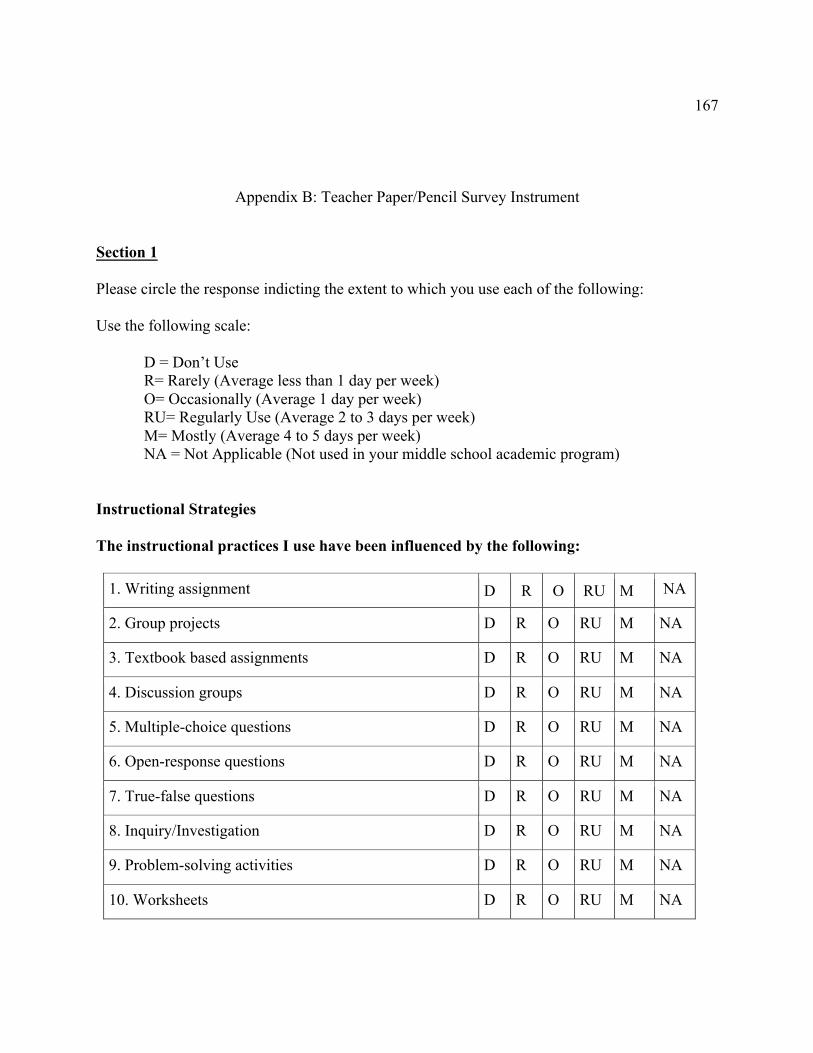
167
Appendix B: Teacher Paper/Pencil Survey Instrument
Section 1 Please circle the response indicting the extent to which you use each of the following: Use the following scale: D = Don’t Use R= Rarely (Average less than 1 day per week) O= Occasionally (Average 1 day per week) RU= Regularly Use (Average 2 to 3 days per week)
M= Mostly (Average 4 to 5 days per week) NA = Not Applicable (Not used in your middle school academic program)
Instructional Strategies The instructional practices I use have been influenced by the following:
1. Writing assignment D R O RU M NA
2. Group projects D R O RU M NA
3. Textbook based assignments D R O RU M NA
4. Discussion groups D R O RU M NA
5. Multiple-choice questions D R O RU M NA
6. Open-response questions D R O RU M NA
7. True-false questions D R O RU M NA
8. Inquiry/Investigation D R O RU M NA
9. Problem-solving activities D R O RU M NA
10. Worksheets D R O RU M NA
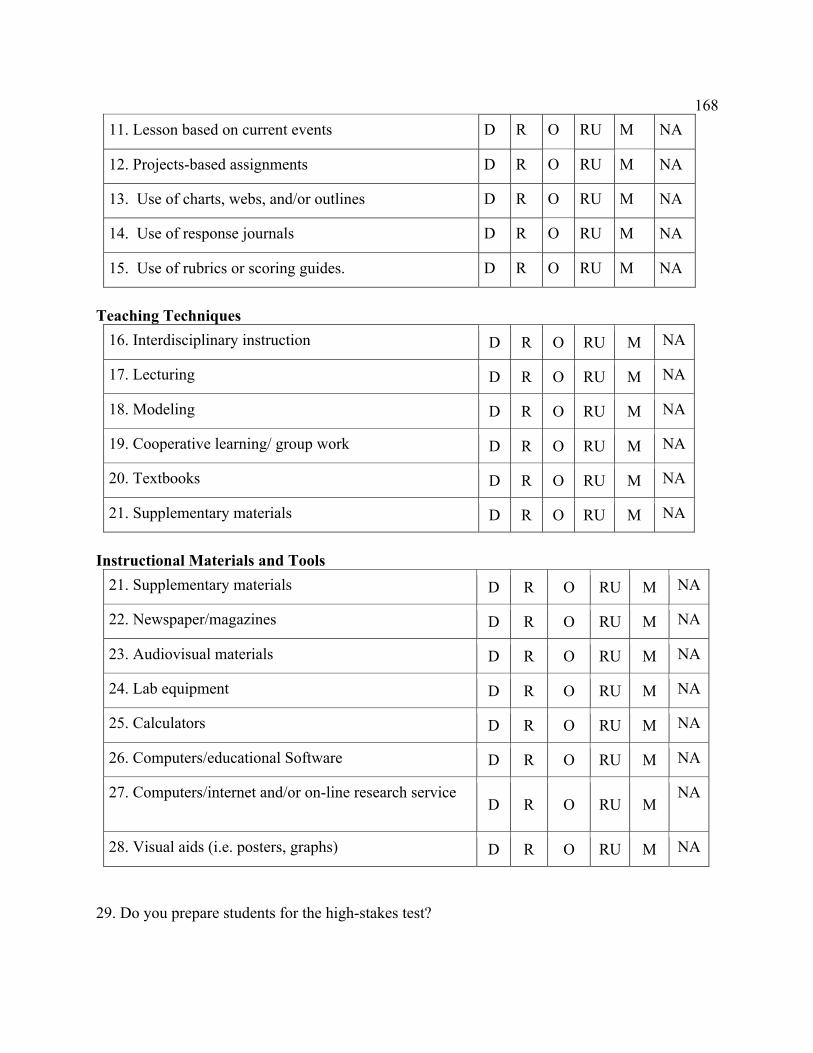
168
11. Lesson based on current events D R O RU M NA
12. Projects-based assignments D R O RU M NA
13. Use of charts, webs, and/or outlines D R O RU M NA
14. Use of response journals D R O RU M NA
15. Use of rubrics or scoring guides. D R O RU M NA
Teaching Techniques
16. Interdisciplinary instruction D R O RU M NA
17. Lecturing D R O RU M NA
18. Modeling D R O RU M NA
19. Cooperative learning/ group work D R O RU M NA
20. Textbooks D R O RU M NA
21. Supplementary materials D R O RU M NA
Instructional Materials and Tools
21. Supplementary materials D R O RU M NA
22. Newspaper/magazines D R O RU M NA
23. Audiovisual materials D R O RU M NA
24. Lab equipment D R O RU M NA
25. Calculators D R O RU M NA
26. Computers/educational Software D R O RU M NA
27. Computers/internet and/or on-line research service D R O RU M
NA
28. Visual aids (i.e. posters, graphs) D R O RU M NA
29. Do you prepare students for the high-stakes test?
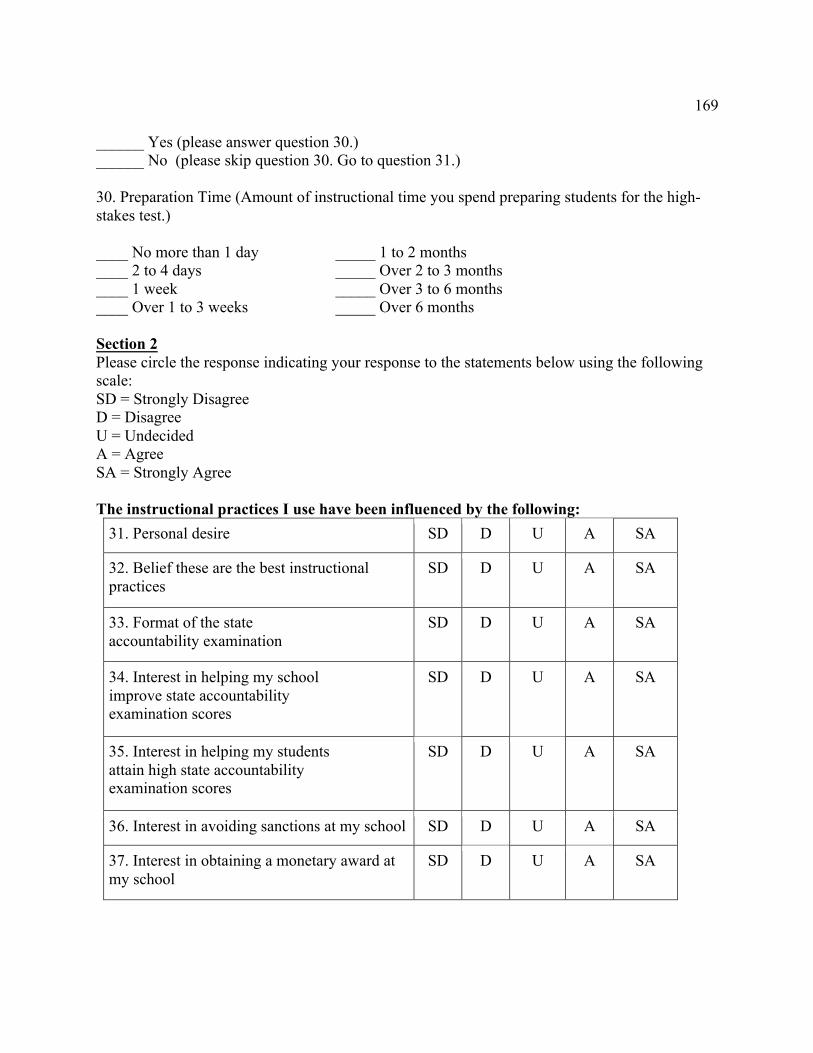
169
______ Yes (please answer question 30.) ______ No (please skip question 30. Go to question 31.) 30. Preparation Time (Amount of instructional time you spend preparing students for the high-stakes test.) ____ No more than 1 day _____ 1 to 2 months ____ 2 to 4 days _____ Over 2 to 3 months ____ 1 week _____ Over 3 to 6 months ____ Over 1 to 3 weeks _____ Over 6 months Section 2 Please circle the response indicating your response to the statements below using the following scale: SD = Strongly Disagree D = Disagree U = Undecided A = Agree SA = Strongly Agree The instructional practices I use have been influenced by the following:
31. Personal desire SD D U A SA
32. Belief these are the best instructional practices
SD D U A SA
33. Format of the state accountability examination
SD D U A SA
34. Interest in helping my school improve state accountability examination scores
SD D U A SA
35. Interest in helping my students attain high state accountability examination scores
SD D U A SA
36. Interest in avoiding sanctions at my school SD D U A SA
37. Interest in obtaining a monetary award at my school
SD D U A SA
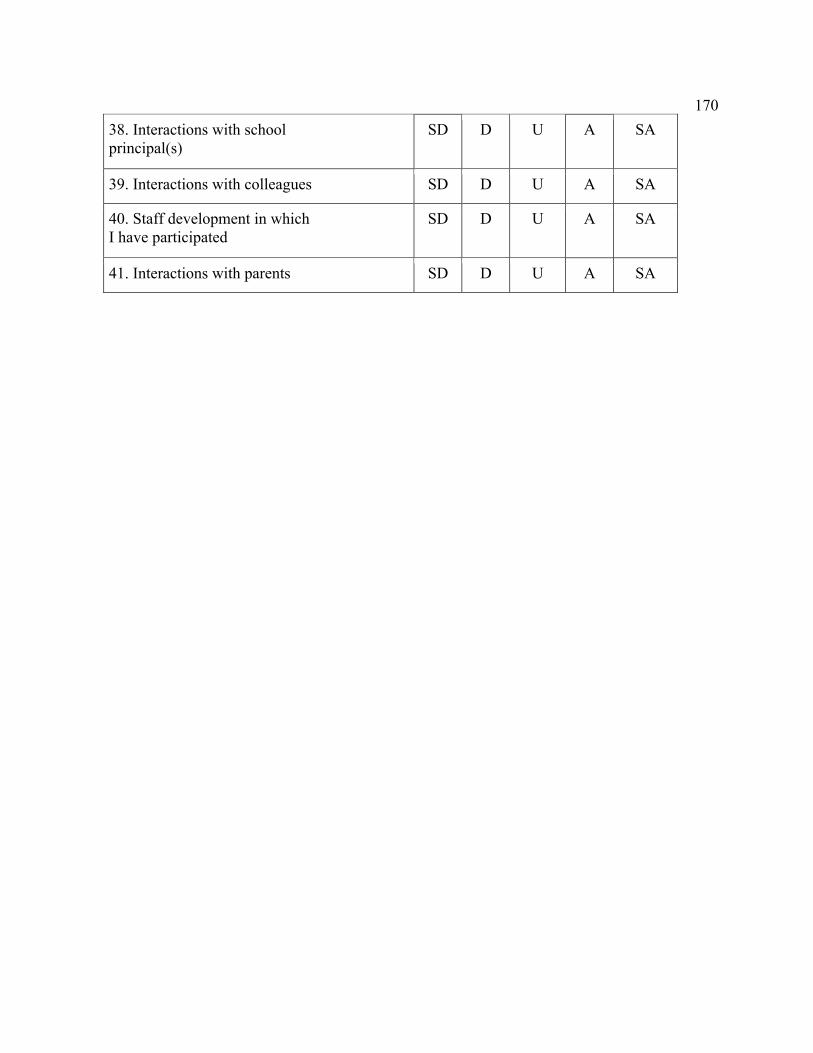
170
38. Interactions with school principal(s)
SD D U A SA
39. Interactions with colleagues SD D U A SA
40. Staff development in which I have participated
SD D U A SA
41. Interactions with parents SD D U A SA
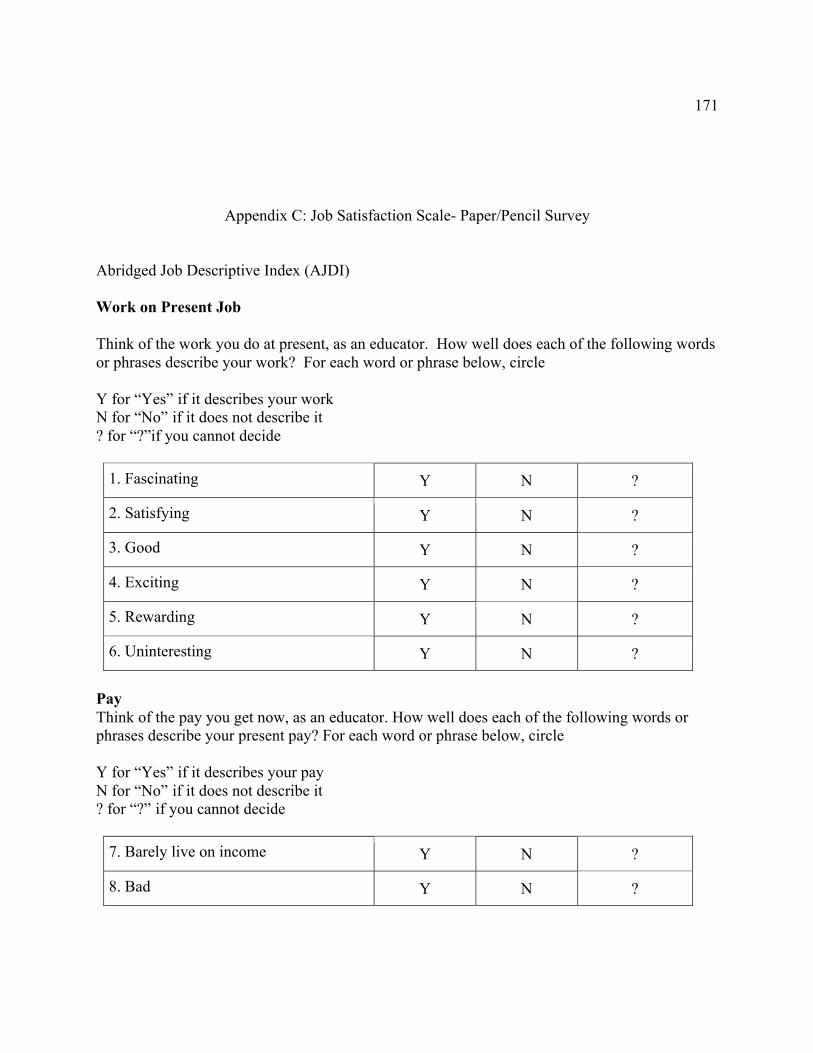
171
Appendix C: Job Satisfaction Scale- Paper/Pencil Survey
Abridged Job Descriptive Index (AJDI) Work on Present Job Think of the work you do at present, as an educator. How well does each of the following words or phrases describe your work? For each word or phrase below, circle Y for “Yes” if it describes your work N for “No” if it does not describe it ? for “?”if you cannot decide
1. Fascinating Y N ?
2. Satisfying Y N ?
3. Good Y N ?
4. Exciting Y N ?
5. Rewarding Y N ?
6. Uninteresting Y N ?
Pay Think of the pay you get now, as an educator. How well does each of the following words or phrases describe your present pay? For each word or phrase below, circle Y for “Yes” if it describes your pay N for “No” if it does not describe it ? for “?” if you cannot decide
7. Barely live on income Y N ?
8. Bad Y N ?
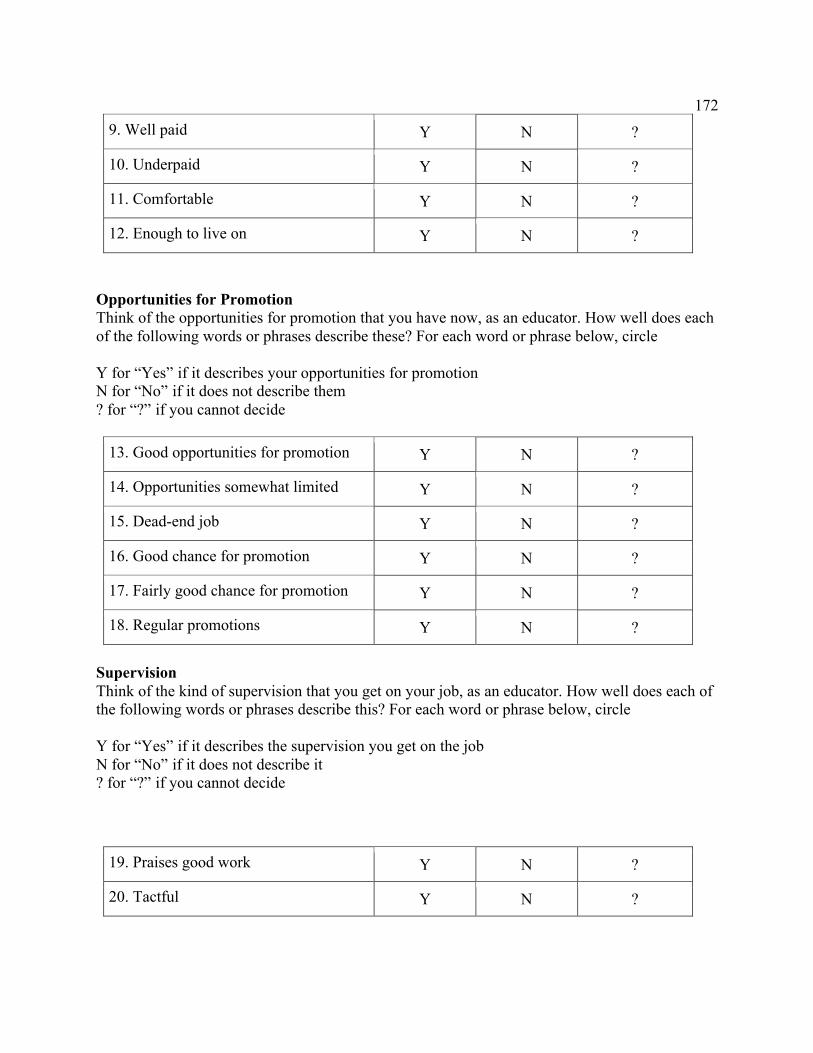
172
9. Well paid Y N ?
10. Underpaid Y N ?
11. Comfortable Y N ?
12. Enough to live on Y N ?
Opportunities for Promotion Think of the opportunities for promotion that you have now, as an educator. How well does each of the following words or phrases describe these? For each word or phrase below, circle Y for “Yes” if it describes your opportunities for promotion N for “No” if it does not describe them ? for “?” if you cannot decide
13. Good opportunities for promotion Y N ?
14. Opportunities somewhat limited Y N ?
15. Dead-end job Y N ?
16. Good chance for promotion Y N ?
17. Fairly good chance for promotion Y N ?
18. Regular promotions Y N ?
Supervision Think of the kind of supervision that you get on your job, as an educator. How well does each of the following words or phrases describe this? For each word or phrase below, circle Y for “Yes” if it describes the supervision you get on the job N for “No” if it does not describe it ? for “?” if you cannot decide
19. Praises good work Y N ?
20. Tactful Y N ?
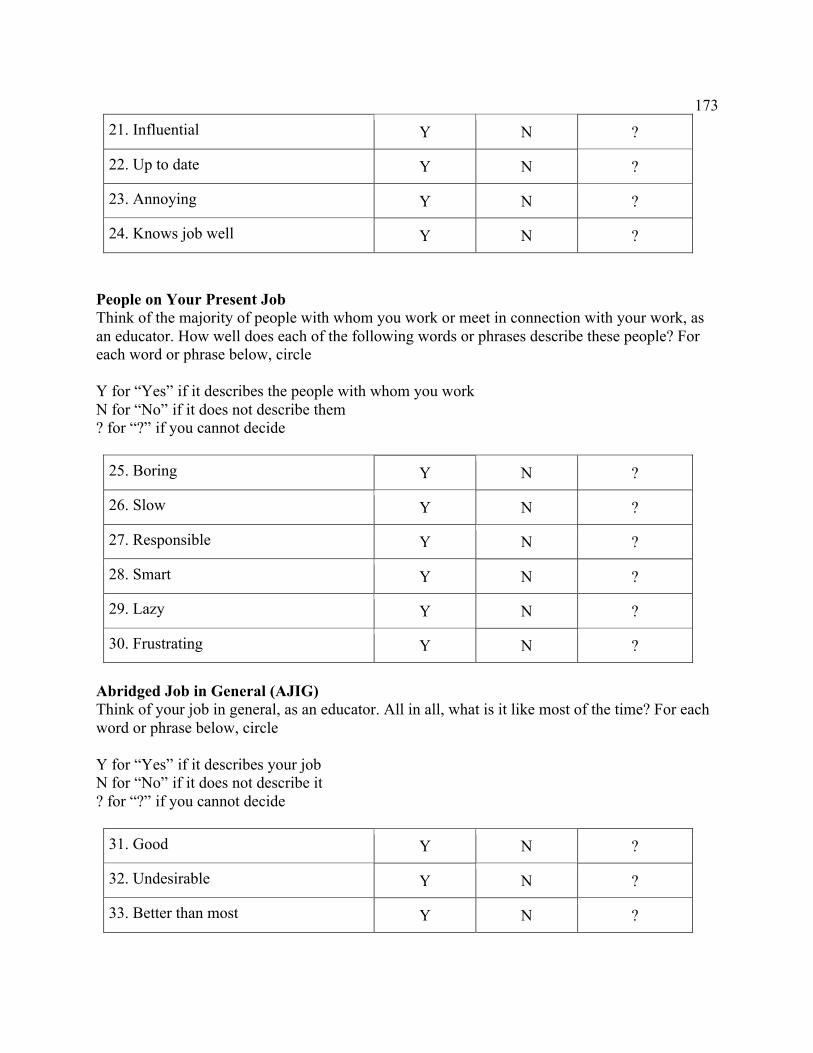
173
21. Influential Y N ?
22. Up to date Y N ?
23. Annoying Y N ?
24. Knows job well Y N ?
People on Your Present Job Think of the majority of people with whom you work or meet in connection with your work, as an educator. How well does each of the following words or phrases describe these people? For each word or phrase below, circle Y for “Yes” if it describes the people with whom you work N for “No” if it does not describe them ? for “?” if you cannot decide
25. Boring Y N ?
26. Slow Y N ?
27. Responsible Y N ?
28. Smart Y N ?
29. Lazy Y N ?
30. Frustrating Y N ?
Abridged Job in General (AJIG) Think of your job in general, as an educator. All in all, what is it like most of the time? For each word or phrase below, circle Y for “Yes” if it describes your job N for “No” if it does not describe it ? for “?” if you cannot decide
31. Good Y N ?
32. Undesirable Y N ?
33. Better than most Y N ?
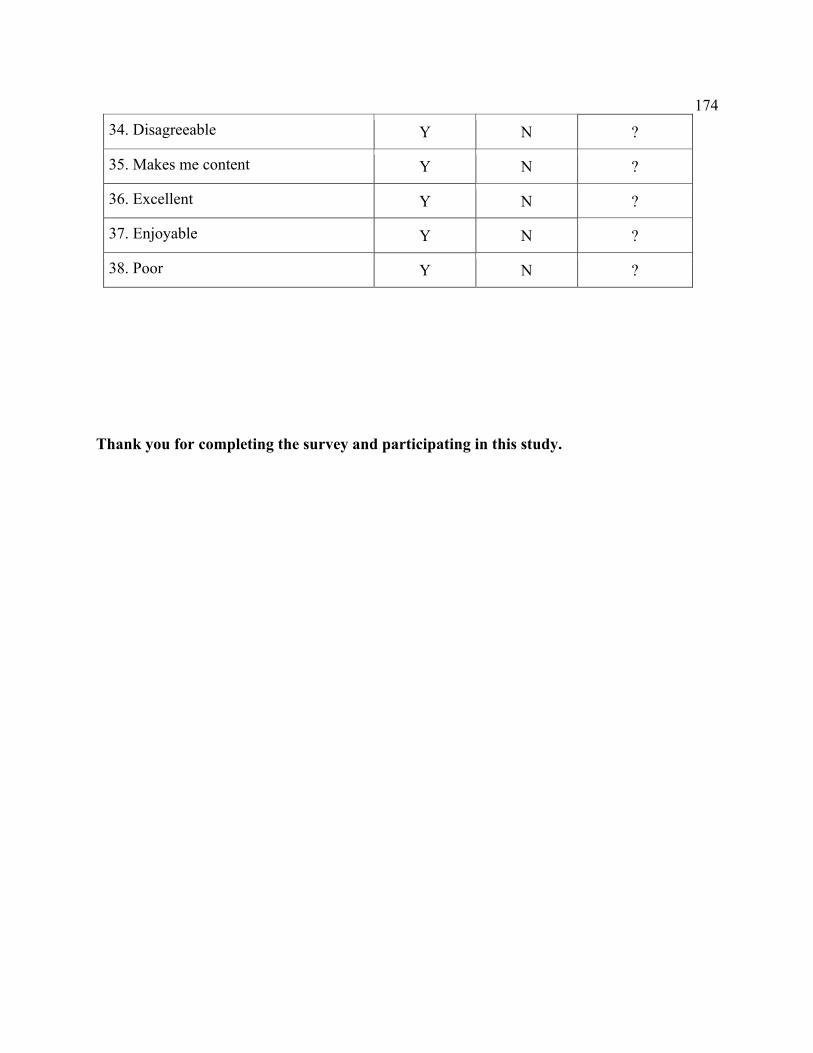
174
34. Disagreeable Y N ?
35. Makes me content Y N ?
36. Excellent Y N ?
37. Enjoyable Y N ?
38. Poor Y N ?
Thank you for completing the survey and participating in this study.
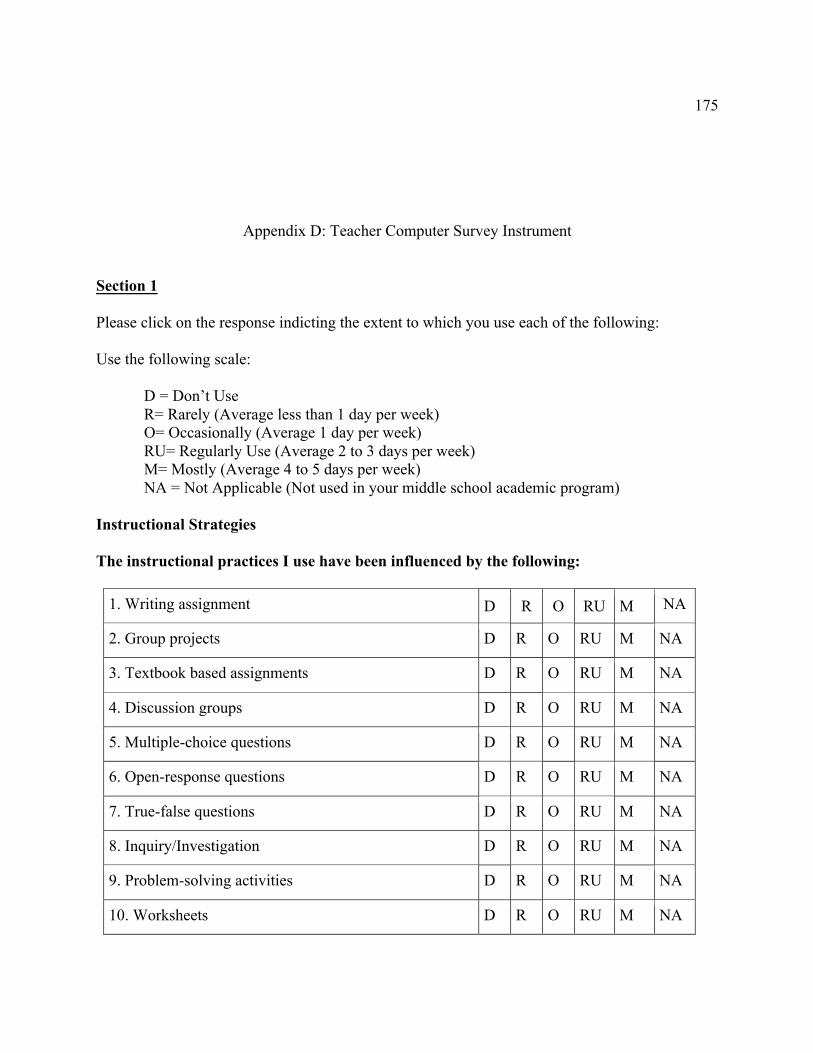
175
Appendix D: Teacher Computer Survey Instrument
Section 1 Please click on the response indicting the extent to which you use each of the following: Use the following scale: D = Don’t Use R= Rarely (Average less than 1 day per week) O= Occasionally (Average 1 day per week) RU= Regularly Use (Average 2 to 3 days per week)
M= Mostly (Average 4 to 5 days per week) NA = Not Applicable (Not used in your middle school academic program)
Instructional Strategies The instructional practices I use have been influenced by the following:
1. Writing assignment D R O RU M NA
2. Group projects D R O RU M NA
3. Textbook based assignments D R O RU M NA
4. Discussion groups D R O RU M NA
5. Multiple-choice questions D R O RU M NA
6. Open-response questions D R O RU M NA
7. True-false questions D R O RU M NA
8. Inquiry/Investigation D R O RU M NA
9. Problem-solving activities D R O RU M NA
10. Worksheets D R O RU M NA
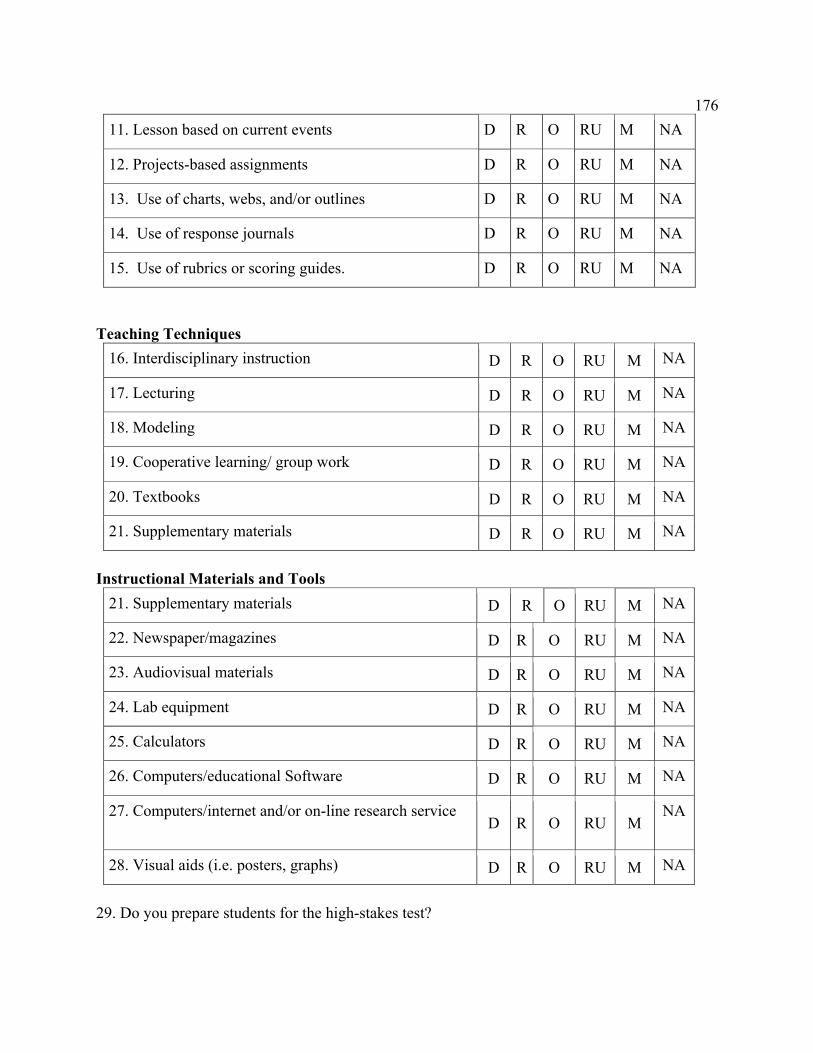
176
11. Lesson based on current events D R O RU M NA
12. Projects-based assignments D R O RU M NA
13. Use of charts, webs, and/or outlines D R O RU M NA
14. Use of response journals D R O RU M NA
15. Use of rubrics or scoring guides. D R O RU M NA
Teaching Techniques
16. Interdisciplinary instruction D R O RU M NA
17. Lecturing D R O RU M NA
18. Modeling D R O RU M NA
19. Cooperative learning/ group work D R O RU M NA
20. Textbooks D R O RU M NA
21. Supplementary materials D R O RU M NA
Instructional Materials and Tools
21. Supplementary materials D R O RU M NA
22. Newspaper/magazines D R O RU M NA
23. Audiovisual materials D R O RU M NA
24. Lab equipment D R O RU M NA
25. Calculators D R O RU M NA
26. Computers/educational Software D R O RU M NA
27. Computers/internet and/or on-line research service D R O RU M
NA
28. Visual aids (i.e. posters, graphs) D R O RU M NA
29. Do you prepare students for the high-stakes test?
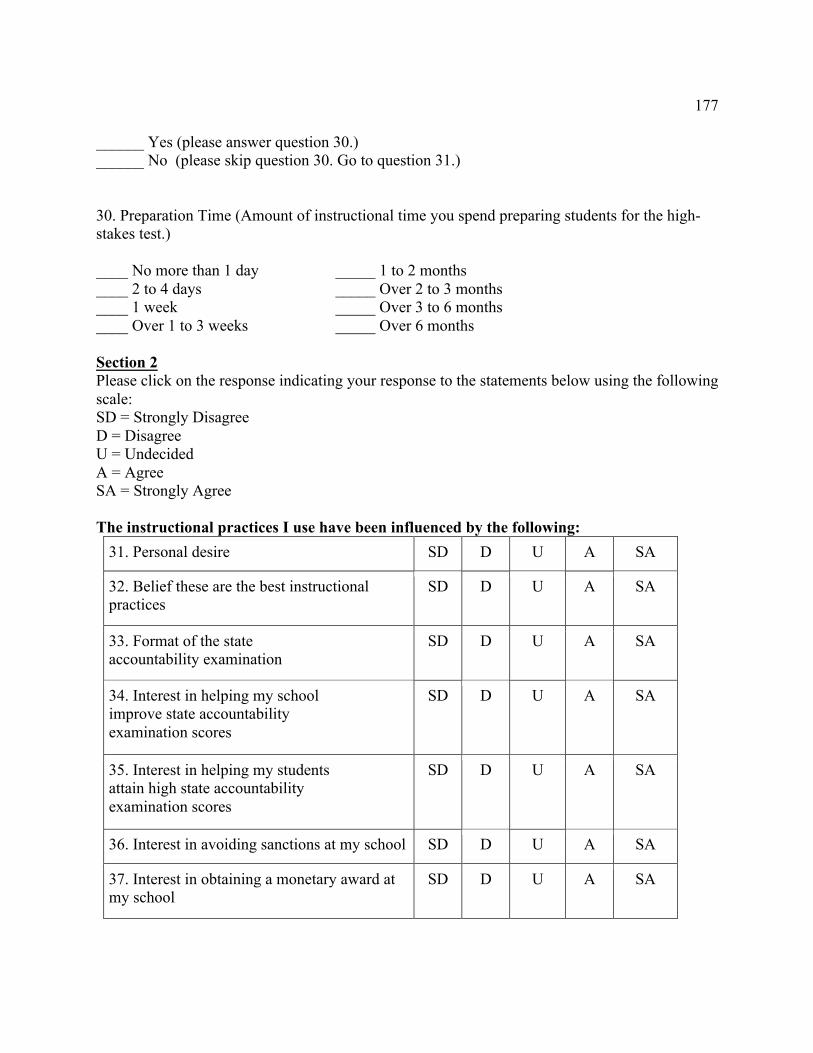
177
______ Yes (please answer question 30.) ______ No (please skip question 30. Go to question 31.) 30. Preparation Time (Amount of instructional time you spend preparing students for the high-stakes test.) ____ No more than 1 day _____ 1 to 2 months ____ 2 to 4 days _____ Over 2 to 3 months ____ 1 week _____ Over 3 to 6 months ____ Over 1 to 3 weeks _____ Over 6 months Section 2 Please click on the response indicating your response to the statements below using the following scale: SD = Strongly Disagree D = Disagree U = Undecided A = Agree SA = Strongly Agree The instructional practices I use have been influenced by the following:
31. Personal desire SD D U A SA
32. Belief these are the best instructional practices
SD D U A SA
33. Format of the state accountability examination
SD D U A SA
34. Interest in helping my school improve state accountability examination scores
SD D U A SA
35. Interest in helping my students attain high state accountability examination scores
SD D U A SA
36. Interest in avoiding sanctions at my school SD D U A SA
37. Interest in obtaining a monetary award at my school
SD D U A SA

178
38. Interactions with school principal(s)
SD D U A SA
39. Interactions with colleagues SD D U A SA
40. Staff development in which I have participated
SD D U A SA
41. Interactions with parents SD D U A SA
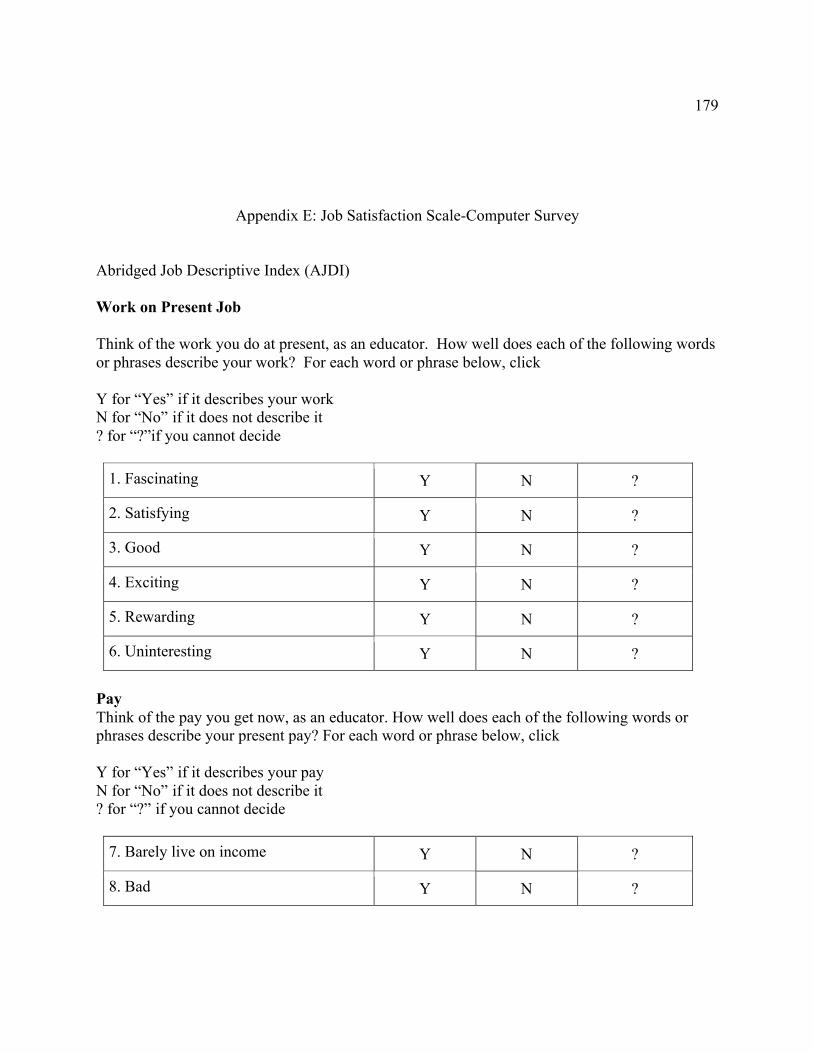
179
Appendix E: Job Satisfaction Scale-Computer Survey
Abridged Job Descriptive Index (AJDI) Work on Present Job Think of the work you do at present, as an educator. How well does each of the following words or phrases describe your work? For each word or phrase below, click Y for “Yes” if it describes your work N for “No” if it does not describe it ? for “?”if you cannot decide
1. Fascinating Y N ?
2. Satisfying Y N ?
3. Good Y N ?
4. Exciting Y N ?
5. Rewarding Y N ?
6. Uninteresting Y N ?
Pay Think of the pay you get now, as an educator. How well does each of the following words or phrases describe your present pay? For each word or phrase below, click Y for “Yes” if it describes your pay N for “No” if it does not describe it ? for “?” if you cannot decide
7. Barely live on income Y N ?
8. Bad Y N ?
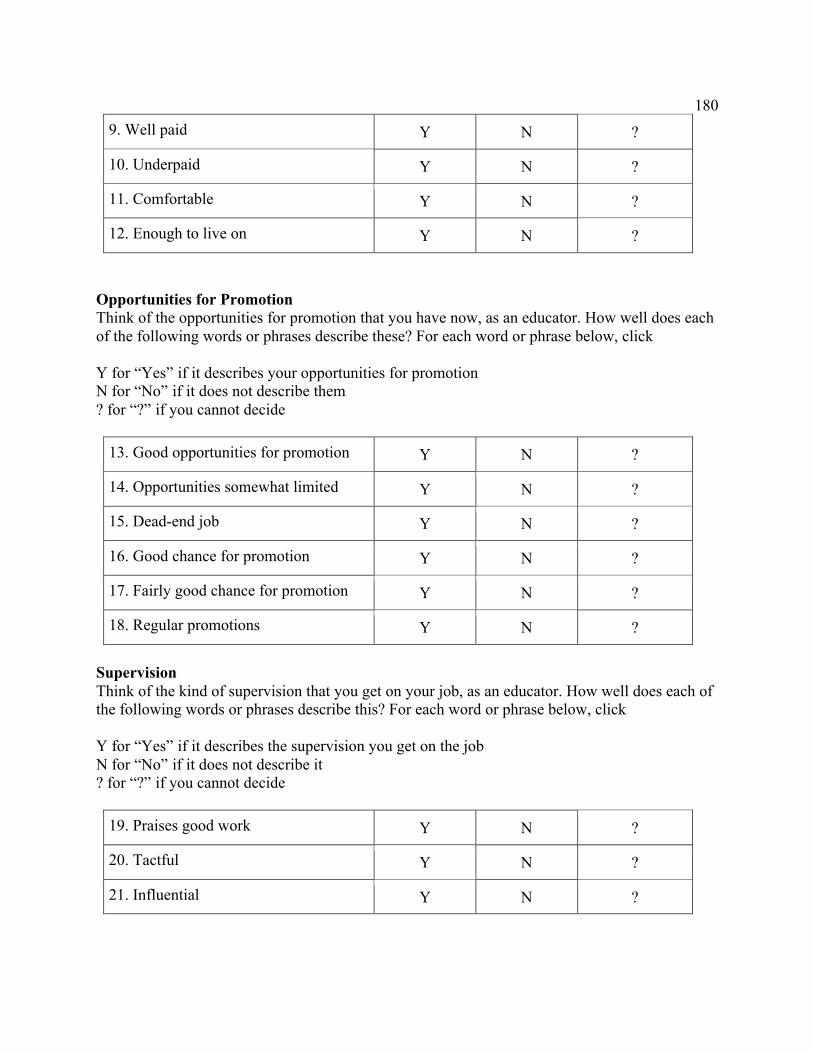
180
9. Well paid Y N ?
10. Underpaid Y N ?
11. Comfortable Y N ?
12. Enough to live on Y N ?
Opportunities for Promotion Think of the opportunities for promotion that you have now, as an educator. How well does each of the following words or phrases describe these? For each word or phrase below, click Y for “Yes” if it describes your opportunities for promotion N for “No” if it does not describe them ? for “?” if you cannot decide
13. Good opportunities for promotion Y N ?
14. Opportunities somewhat limited Y N ?
15. Dead-end job Y N ?
16. Good chance for promotion Y N ?
17. Fairly good chance for promotion Y N ?
18. Regular promotions Y N ?
Supervision Think of the kind of supervision that you get on your job, as an educator. How well does each of the following words or phrases describe this? For each word or phrase below, click Y for “Yes” if it describes the supervision you get on the job N for “No” if it does not describe it ? for “?” if you cannot decide
19. Praises good work Y N ?
20. Tactful Y N ?
21. Influential Y N ?
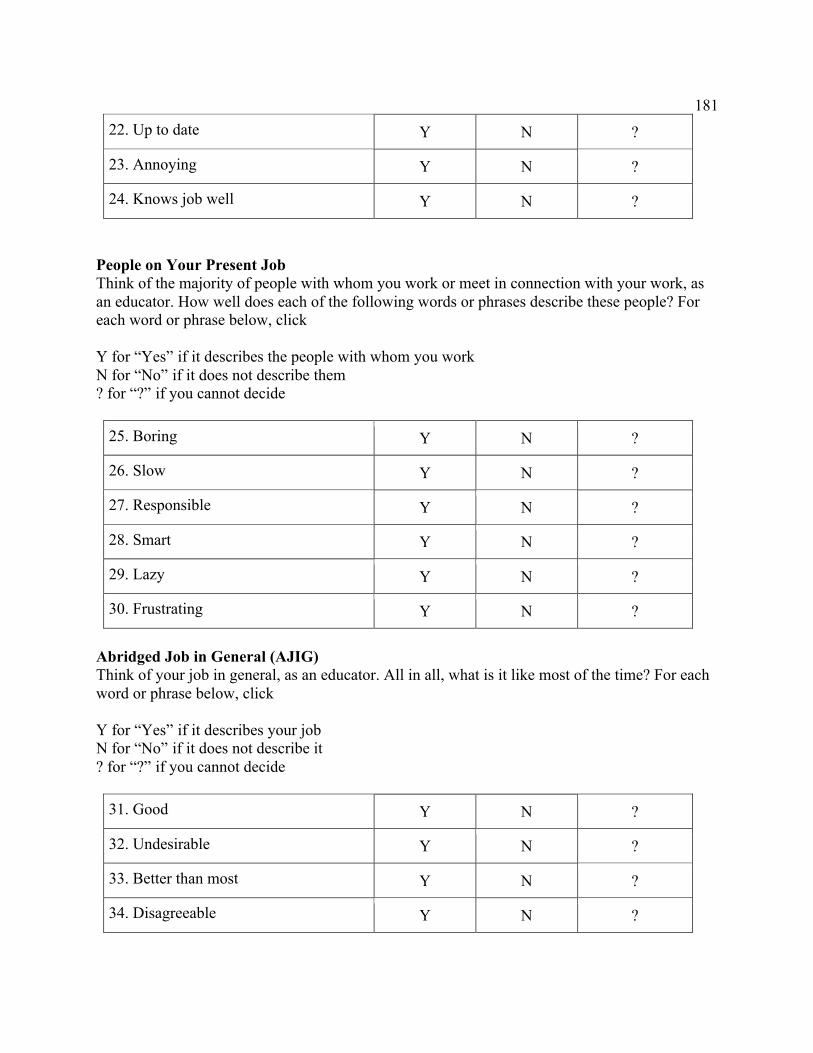
181
22. Up to date Y N ?
23. Annoying Y N ?
24. Knows job well Y N ?
People on Your Present Job Think of the majority of people with whom you work or meet in connection with your work, as an educator. How well does each of the following words or phrases describe these people? For each word or phrase below, click Y for “Yes” if it describes the people with whom you work N for “No” if it does not describe them ? for “?” if you cannot decide
25. Boring Y N ?
26. Slow Y N ?
27. Responsible Y N ?
28. Smart Y N ?
29. Lazy Y N ?
30. Frustrating Y N ?
Abridged Job in General (AJIG) Think of your job in general, as an educator. All in all, what is it like most of the time? For each word or phrase below, click Y for “Yes” if it describes your job N for “No” if it does not describe it ? for “?” if you cannot decide
31. Good Y N ?
32. Undesirable Y N ?
33. Better than most Y N ?
34. Disagreeable Y N ?
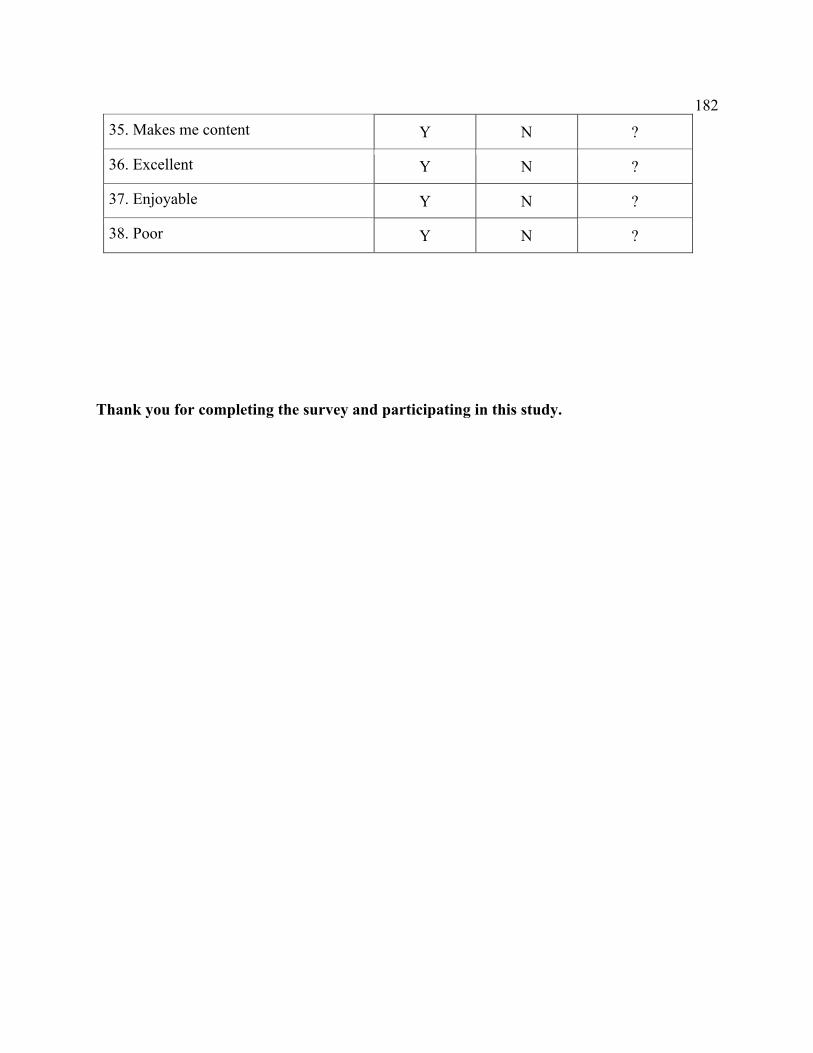
182
35. Makes me content Y N ?
36. Excellent Y N ?
37. Enjoyable Y N ?
38. Poor Y N ?
Thank you for completing the survey and participating in this study.
183
Appendix F: Principal Paper/Pencil Survey Instrument
Please mark the responses that describe you. 1. ____ Male ____Female 2. Position ______Principal ______ Assistant Principal 2. Experience in your current position ____ First Year ____15-19 Years ____ 2-6 Years ____ 20-24 Years ____ 7-9 Years ____ 25-29 Years ____10-14 Years ____ 30 Years or more 4. Education (Highest level attained) ____ Bachelor’s Degree ____ Master’s Degree ____ Specialist’s Degree ____ Doctorate 5. School assignment: ________________________________________________________________________ 6. Describe how you feel about the quality of instruction displayed during instruction by teachers by their content area in preparation for the high-stakes test. ______________________________________________________________________________
______________________________________________________________________________
______________________________________________________________________________
______________________________________________________
7. Do you feel the quality of instruction is affected by pressure of the high-stakes test? ______________________________________________________________________________
______________________________________________________________________________
184
______________________________________________________________________________
______________________________________________________
8. Describe how the teachers adjust their instruction to meet the needs of the students. ______________________________________________________________________________
______________________________________________________________________________
______________________________________________________________________________
______________________________________________________
9. How do you feel about the instructional methods your teachers use on a daily basis in their
classroom? ______________________________________________________________________________
______________________________________________________________________________
______________________________________________________________________________
______________________________________________________
10. How do you feel about the state’s curriculum being taught used in your building? ______________________________________________________________________________
______________________________________________________________________________
______________________________________________________________________________
______________________________________________________
11. Do you feel that your students are adequately prepared to learn the standards being taught?
Why or why not? ______________________________________________________________________________
______________________________________________________________________________
185
______________________________________________________________________________
______________________________________________________
12. In what ways have your teachers been prepared to use a broad variety of instructional
strategies in their classroom? ______________________________________________________________________________
______________________________________________________________________________
______________________________________________________________________________
______________________________________________________
13. Describe your expectations, as it pertains to instructional support, from your assistant
principals. ______________________________________________________________________________
______________________________________________________________________________
______________________________________________________________________________
______________________________________________________
14. Describe your expectations, as it pertains to instructional support, from your school district. ______________________________________________________________________________
______________________________________________________________________________
______________________________________________________________________________
______________________________________________________
15. Describe your feelings about the amount of professional development available for your
teachers. Do you feel they need more opportunities? Do your teachers take advantage of professional development training opportunities?
______________________________________________________________________________
______________________________________________________________________________
186
______________________________________________________________________________
______________________________________________________
16. Do you feel you have support from your teachers in the administrative decisions you make to
increase students’ academic performance? Why or why not? ______________________________________________________________________________
______________________________________________________________________________
______________________________________________________________________________
______________________________________________________
17. Please describe what kind of instructional resources you need from the district. ______________________________________________________________________________
______________________________________________________________________________
______________________________________________________________________________
______________________________________________________
18. What impact has the high-stakes testing had on your role and responsibilities?
Positive:________________________________________________________________
______________________________________________________________________________
__________________________________________________________________
Negative:______________________________________________________________________
______________________________________________________________________________
____________________________________________________________
19. How satisfied are you with your chosen profession in the field of education? ______________________________________________________________________________
______________________________________________________________________________
187
______________________________________________________________________________
______________________________________________________
20. Has No Child Left Behind influenced your perception of the profession? ______________________________________________________________________________
______________________________________________________________________________
______________________________________________________________________________
______________________________________________________
21. What can the district do to make principals more satisfied in their profession? ______________________________________________________________________________
______________________________________________________________________________
______________________________________________________________________________
______________________________________________________
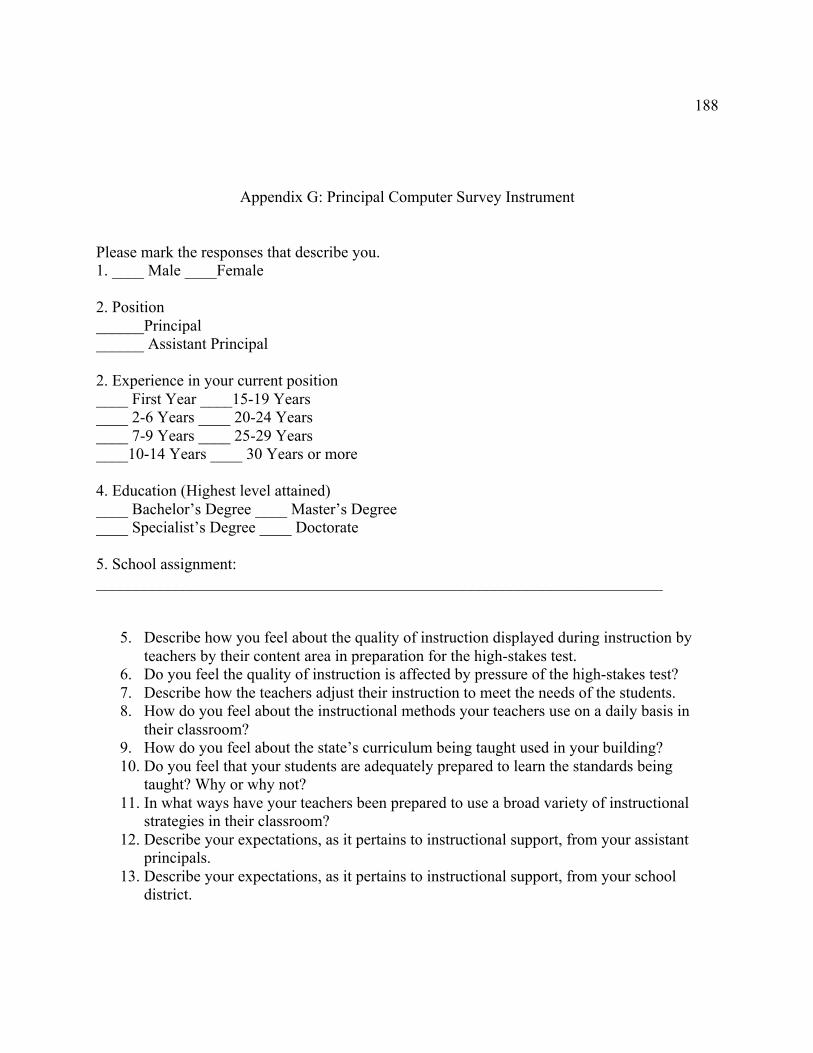
188
Appendix G: Principal Computer Survey Instrument
Please mark the responses that describe you. 1. ____ Male ____Female 2. Position ______Principal ______ Assistant Principal 2. Experience in your current position ____ First Year ____15-19 Years ____ 2-6 Years ____ 20-24 Years ____ 7-9 Years ____ 25-29 Years ____10-14 Years ____ 30 Years or more 4. Education (Highest level attained) ____ Bachelor’s Degree ____ Master’s Degree ____ Specialist’s Degree ____ Doctorate 5. School assignment: _______________________________________________________________________
5. Describe how you feel about the quality of instruction displayed during instruction by teachers by their content area in preparation for the high-stakes test.
6. Do you feel the quality of instruction is affected by pressure of the high-stakes test? 7. Describe how the teachers adjust their instruction to meet the needs of the students. 8. How do you feel about the instructional methods your teachers use on a daily basis in
their classroom? 9. How do you feel about the state’s curriculum being taught used in your building? 10. Do you feel that your students are adequately prepared to learn the standards being
taught? Why or why not? 11. In what ways have your teachers been prepared to use a broad variety of instructional
strategies in their classroom? 12. Describe your expectations, as it pertains to instructional support, from your assistant
principals. 13. Describe your expectations, as it pertains to instructional support, from your school
district.
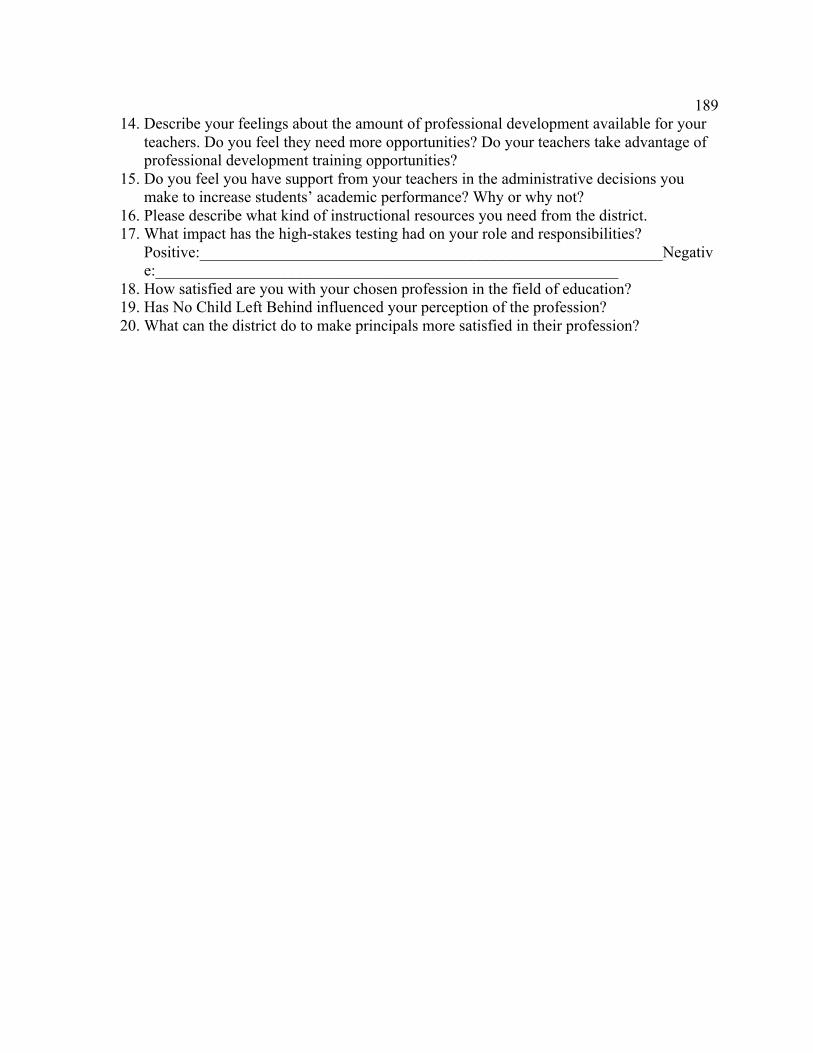
189
14. Describe your feelings about the amount of professional development available for your teachers. Do you feel they need more opportunities? Do your teachers take advantage of professional development training opportunities?
15. Do you feel you have support from your teachers in the administrative decisions you make to increase students’ academic performance? Why or why not?
16. Please describe what kind of instructional resources you need from the district. 17. What impact has the high-stakes testing had on your role and responsibilities?
Positive:__________________________________________________________Negative:__________________________________________________________
18. How satisfied are you with your chosen profession in the field of education? 19. Has No Child Left Behind influenced your perception of the profession? 20. What can the district do to make principals more satisfied in their profession?
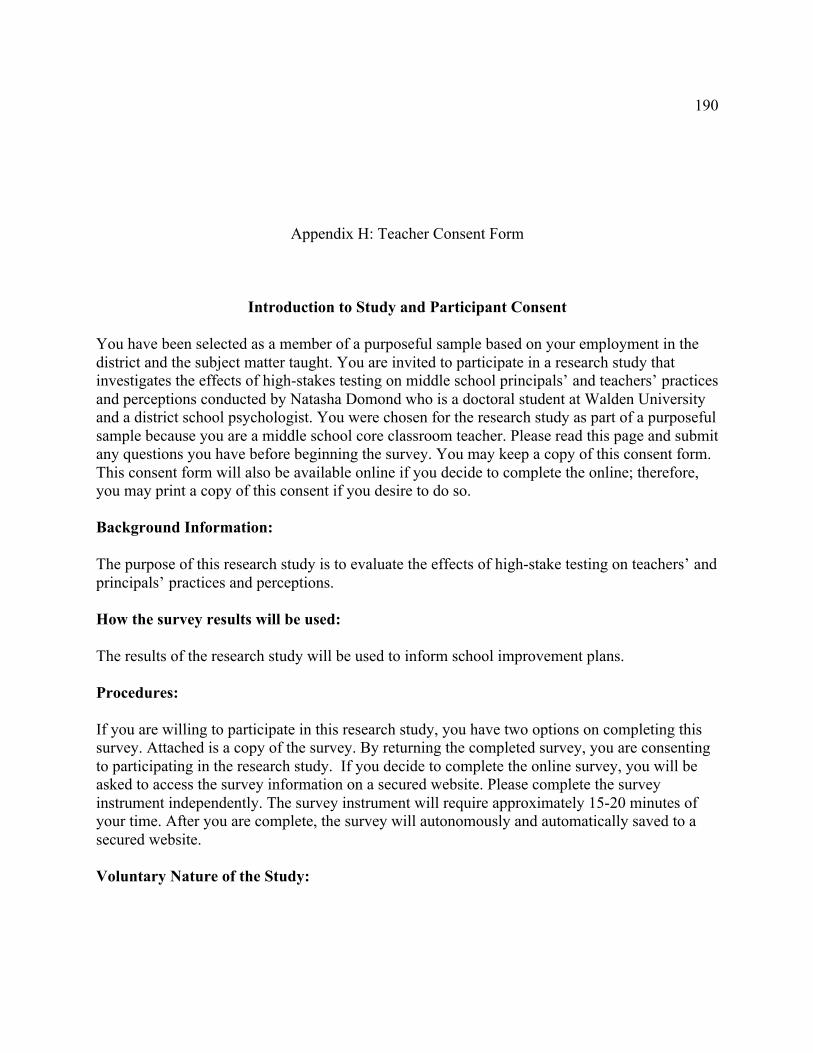
190
Appendix H: Teacher Consent Form
Introduction to Study and Participant Consent
You have been selected as a member of a purposeful sample based on your employment in the district and the subject matter taught. You are invited to participate in a research study that investigates the effects of high-stakes testing on middle school principals’ and teachers’ practices and perceptions conducted by Natasha Domond who is a doctoral student at Walden University and a district school psychologist. You were chosen for the research study as part of a purposeful sample because you are a middle school core classroom teacher. Please read this page and submit any questions you have before beginning the survey. You may keep a copy of this consent form. This consent form will also be available online if you decide to complete the online; therefore, you may print a copy of this consent if you desire to do so. Background Information: The purpose of this research study is to evaluate the effects of high-stake testing on teachers’ and principals’ practices and perceptions. How the survey results will be used: The results of the research study will be used to inform school improvement plans. Procedures: If you are willing to participate in this research study, you have two options on completing this survey. Attached is a copy of the survey. By returning the completed survey, you are consenting to participating in the research study. If you decide to complete the online survey, you will be asked to access the survey information on a secured website. Please complete the survey instrument independently. The survey instrument will require approximately 15-20 minutes of your time. After you are complete, the survey will autonomously and automatically saved to a secured website. Voluntary Nature of the Study:
191
Your participation is voluntary. Your refusal to participate will involve no penalty or loss of benefits to which you are otherwise entitled. This means that everyone will respect your decision of whether or not you want to be in the study. No one will treat you differently if you decide not to be in the study. You may discontinue participation at any time without penalty or loss of benefits to which you are otherwise entitled. Risks and Benefits of Being in the Study: Participating in survey completion presents no risk, as participants are not personally identified. By returning the completed survey or completing the survey on online, you are consenting to participating in the research study. The benefits of the study include self-reflection on professional practices and responses that will provide insight used to inform future professional development. Compensation: There is no compensation for survey completion. Confidentiality: Any information you provide will be kept anonymous. Personally identifiable information and the specific name of the school or the site will not be included in the final report. In other words, the researcher will not use your information for any purposes outside of this research project. The researcher will not include your name or anything else that could identify you in any reports of the study. The actual survey instrument utilized will not contain your personal information; it is designed to be anonymous. Contacts and Questions: The researcher’s name is Natasha Domond. You may ask any questions you have now, or if you have questions later, you may contact the researcher at [email protected]. The research supervisor, Dr. Caramela-Miller can be contacted at [email protected]. A Walden representative, a Research Participant Advocate, is also available to talk privately about your rights and can be contacted at 800-925-3368 ext.3121210. Walden University’s approval number for this study is 04-17-13-0146684 and it expires on April 16, 2014.
192
Appendix I: Principal Consent Form
Introduction to Study and Participant Consent
You have been selected as a member of a purposeful sample based on your employment in the district and the subject matter taught. You are invited to participate in a research study that investigates the effects of high-stakes testing on middle school principals’ and teachers’ practices and perceptions conducted by Natasha Domond who is a doctoral student at Walden University and a district school psychologist. You were chosen for the research study as part of a purposeful sample because you are a middle school core classroom teacher. Please read this page and submit any questions you have before beginning the survey. You may keep a copy of this consent form. This consent form will also be available online if you decide to complete the online; therefore, you may print a copy of this consent if you desire to do so. Background Information: The purpose of this research study is to evaluate the effects of high-stake testing on teachers’ and principals’ practices and perceptions. How the survey results will be used: The results of the research study will be used to inform school improvement plans. Procedures: If you are willing to participate in this research study, you have two options on completing this survey. Attached is a copy of the survey. By returning the completed survey, you are consenting to participating in the research study. If you decide to complete the online survey, you will be asked to access the survey information on a secured website. Please complete the survey instrument independently. The survey instrument will require approximately 15-20 minutes of your time. After you are complete, the survey will autonomously and automatically saved to a secured website. Also, it should be noted that a co-rater will be utilized to review each open-ended question and the responses to assist in analyzing the findings of the responses in order to increase inter-rater reliability.
193
Voluntary Nature of the Study: Your participation is voluntary. Your refusal to participate will involve no penalty or loss of benefits to which you are otherwise entitled. This means that everyone will respect your decision of whether or not you want to be in the study. No one will treat you differently if you decide not to be in the study. You may discontinue participation at any time without penalty or loss of benefits to which you are otherwise entitled. Risks and Benefits of Being in the Study: Participating in survey completion presents some risk, as participants are personally identified due to the number of administrators in the building; however, information will be confidential and will be used to analysis purposes. The name of the schools in this study will also remain be confidential. By returning or completing the survey online, you are consenting to participating in the research study. The benefits of the study include self-reflection on professional practices and responses that will provide insight used to inform future professional development. Compensation: There is no compensation for survey completion. Confidentiality: Any information you provide will be kept confidential. Personally identifiable information and the specific name of the school or the site will not be included in the final report. In other words, the researcher will not use your information for any purposes outside of this research project. The researcher will not include your name or anything else that could identify you in any reports of the study. The actual survey instrument utilized will only contain the school you are assigned; however that information will remain confidential. Contacts and Questions: The researcher’s name is Natasha Domond. You may ask any questions you have now, or if you have questions later, you may contact the researcher at [email protected]. The research supervisor, Dr. Caramela-Miller can be contacted at [email protected]. A Walden representative, a Research Participant Advocate, is also available to talk privately about your rights and can be contacted at 800-925-3368 ext.3121210. Walden University’s approval number for this study is 04-17-13-0146684 and it expires on April 16, 2014.
194
Appendix J: Teacher Advance Notice Letter
Dear Educator,
You have been selected as a member of a purposeful sample and are invited to participate in a
research study. This study investigates the effects of high-stakes testing on middle school
teachers and principals practices and perceptions conducted by Natasha Domond, who is a
district school psychologist and a doctoral student at Walden University. You were chosen for
the study as part of a random sample because you are an English teacher, a Math teacher, a
Science teacher, or a Social Studies teacher in the district being studied by the researcher. There
are two options on completing the survey. There is the paper/pencil version and the computer
survey online. Attached is a copy of the hard copy of the survey and the consent form. The
survey will be available on ______. The secured website is surveymoneky.com, in which you
can assess additional information about the survey and the survey instrument. After agreeing to
participate, you may proceed to complete the survey, which will be autonomously and
automatically saved. I sincerely appreciate your consideration.
Thank You,
Natasha M. Domond
195
School Psychologist Doctoral Candidate Walden University
Appendix K: Principal Advance Notice Letter
Dear Educator,
You have been selected as a member of a purposeful sample and are invited to participate in a
research study. This study investigates the effects of high-stakes testing on middle school
teachers and principals practices and perceptions conducted by Natasha Domond, who is a
district school psychologist and a doctoral student at Walden University. I have obtained
permission to conduct my study for my Walden dissertation from the district.
You were chosen for the study as part of a random sample because you are a principal in the
district being studied by the researcher. There are two options on completing the survey. There is
the paper/pencil version and the computer survey online. Attached is a copy of the hard copy of
the survey and the consent form. The survey will be available on ______. The secured website is
surveymoneky.com, in which you can assess additional information about the survey and the
survey instrument. After agreeing to participate, you may proceed to complete the survey, which
will be autonomously and automatically saved. I sincerely appreciate your consideration.
Thank You,
Natasha M. Domond
196
School Psychologist Doctoral Candidate Walden University
Appendix L: Teacher Follow-up Letter
Dear Educator,
Just a friendly reminder, that you have been selected as member of a purposeful selected
sample and are invited to participate in a research study that investigates the effects of high-
stakes testing on middle school teachers practices and perceptions conducted by Natasha
Domond, who is a district school psychologist and a doctoral student at Walden University. I
have obtained permission to conduct my study for my Walden dissertation from the district. If
you have not done so already, please do not forget to complete the survey on
www.surveymonkey.com. The last day to access the survey will be ______. I sincerely
appreciate your consideration.
Thank You,
Natasha M. Domond School Psychologist Doctoral Candidate Walden University
197
Appendix M: Principal Follow-up Letter
Dear Educator,
Just a friendly reminder, that you have been selected as member of a purposeful selected
sample and are invited to participate in a research study that investigates the effects of high-
stakes testing on middle school principals practices and perceptions conducted by Natasha
Domond, who is a district school psychologist and a doctoral student at Walden University. I
have obtained permission to conduct my study for my Walden dissertation from the district. If
you have not done so already, please do not forget to complete the survey on
www.surveymonkey.com. The last day to access the survey will be ______. I sincerely
appreciate your consideration.
Thank You,
Natasha M. Domond School Psychologist Doctoral Candidate Walden University
198
Appendix N: Rater Confidentiality Agreement
You are being asked to be an additional rater in a qualitative study that incorporates open-ended questions. Interrater reliability increases the likelihood that there will be agreement among the coders. This study is being conducted by Natasha Domond who is a doctoral student at Walden University. Background Information: This study seeks to evaluate the effects of high-stake testing on teachers’ and principals’ practices and perceptions. Eligibility: A coder who currently does not work in the participating schools will be excluded from participating. Procedure: If you agree to be a rater you will be asked to conduct the following:
• Thoroughly examine each interview protocol. • Code the data. • Return all data in a timely manner to the researcher. • Maintain all information regarding participants’ data confidential.
Voluntary Nature of Coding: There will be no compensation from agreeing to be a coder for this study Statement of Consent: I have read the above information and I feel I understand the study well enough to make a decision about my involvement. By my signature, I am agreeing to the terms described above. Printed Name of Coder ____________________________________ Date of consent ____________________________________
199
Coder’s Written or Electronic* Signature ____________________________________ Researcher’s Written or Electronic* Signature __________________________________ Electronic signatures are regulated by the Uniform Electronic Transactions Act. Legally, an "electronic signature" can be the person’s typed name, their email address, or any other identifying marker. An electronic signature is just as valid as a written signature as long as both parties have agreed to conduct the transaction electronically.