educating limited-english-proficient students in washington state
TRANSCRIPT

DOCUMENT RESUME
ED 451 311 UD 034 092
AUTHOR Bylsma, PeteTITLE Educating Limited-English-Proficient Students in Washington
State.
INSTITUTION Washington Office of the State Superintendent of PublicInstruction, Olympia.
PUB DATE 2000-12-00NOTE 143p.; Funding for this project was provided by the
Transitional Bilingual Instruction Program, a state fundedprogram.
AVAILABLE FROM Resource Center, Office of Superintendent of PublicInstruction, P.O. Box 47200, Olympia, WA 98504-7200. Tel:888-595-3276 (Toll Free); email: [email protected];Web site: http: / /www.kl2.wa.us.
PUB TYPE Reports Descriptive (141)EDRS PRICE MF01/PC06 Plus Postage.DESCRIPTORS Academic Achievement; *Bilingual Education; Diversity
(Student); Educational Finance; Elementary SecondaryEducation; Enrollment Trends; Family Income; FinancialSupport; *Limited English Speaking; Public Education;Socioeconomic Status
IDENTIFIERS Washington
ABSTRACTThis study examined data from Washington school districts
with approved state programs for limited English proficient (LEP) studentsduring 1999-00. Data came from district annual reports; student informationfrom districts with significant numbers of LEP students; and reviews ofresearch on bilingual and LEP education. Overall, students' academicperformance was better when they had significant exposure to instruction inboth English and their primary language. Most LEP students received little orno instruction in their primary language. Although most program funding wentto staff-related costs, lack of qualified teachers who spoke other languagesand the numbers of languages spoken by students within a district limited thepossibility of providing adequate bilingual instruction. Many factorsinfluenced amount of time students spent in state LEP programs, includingfamily socioeconomic status, amount of education received before entering theprogram, and program structure and administration. The number of LEP studentscontinued to grow in 1999-00, although at a slower rate than in 1998-99. Sixappendixes present: federal education programs supporting LEP students;languages spoken; length of stay data; districts operating programs for LEPstudents; summary of research on programs for LEP students; and end-of-yearreport form, 1999-00. (Contains 62 references.) (SM)
Reproductions supplied by EDRS are the best that can be madefrom the original document.

U.S. DEPARTMENT OF EDUCATIONOffice of Educational Research and Improvement
EDUCATIONAL RESOURCES INFORMATIONCENTER (ERIC)
El This document has been reproduced asreceived from the person or organizationoriginating it.
Minor changes have been made toimprove reproduction quality.
Points of view or opinions stated in thisdocument do not necessarily representofficial OERI position or policy.
PERMISSION TO REPRODUCE ANDDISSEMINATE THIS MATERIAL HAS
BEEN GRANTED BY
B.11 P,-tter.500
6.1%44
THE E CATIONAL RESOURCESc. IA 43
INFORMATION CENTER (ERIC)1
Dr. Terry BergesonState Superintendent of
Public Instruction
ucatin
invite n lis roficient
to ents inas in ton tate
I
BEST COPY AVAILABLE
2
December 2000

About This Document
This document can be obtained by placing an order on our Web site (www.k12.wa.us);by writing the Resource Center, Office of Superintendent of Public Instruction, PO Box47200, Olympia, WA 98504-7200; or by calling the Resource Center toll-free at (888)595-3276. If requesting more than one copy, contact the Resource Center to determine ifprinting and shipping charges apply.
This material is available in alternative format upon request. Contact the Resource Centerat (888) 595-3276, TTY (360) 664-3631, or e-mail [email protected]. TheOffice of Superintendent of Public Instruction complies with all federal and state rulesand regulations and does not discriminate on the basis of race, color, national origin, sex,disability, age, or marital status.
For more information about the contents of this document, please contact:
Helen Malagon, SupervisorBilingual EducationOffice of Superintendent of Public InstructionPO BOX 47200Olympia, WA 98504-7200E-mail: hmalagon @ospi.wednet.edu
The contents of this document can be reproduced without permission. Funding for thisproject was provided by the Transitional Bilingual Instruction Program, a state-fundedprogram.
Acknowledgements
This report was prepared by Pete Bylsma, Director of Research and Evaluation. Manyother staff at the Office of Superintendent of Public Instruction helped prepare thisdocument, including Debora Merle, Lisa Ireland, Tani Schwent, Sherrie Keller, HelenMalagon, Richard Gomez, Steve Shish, and Mike Dooley. The review of research relatedto length of stay and program effectiveness issues was conducted by Thomas Stritikusfrom the University of Washington and Patrick Manyak from California StateUniversity/Fullerton. Staff in 46 districts provided student-level data on LEP students incertain grades.
3

Educating Limited-English-ProficientStudents in Washington State
Dr. Terry BergesonState Superintendent of Public Instruction
Cheryl L. Mayo, Deputy SuperintendentLearning and Teaching
B.J. Wise, Assistant SuperintendentSpecial Populations
Richard Gomez, DirectorBilingual and Migrant Education
Helen Malagon, SupervisorBilingual Education
Pete Bylsma, DirectorResearch and Evaluation
December 2000
4

CONTENTSExecutive Summary 1
Section 1 Introduction 4
BackgroundWashington's Program For LEP StudentsObjectives, Scope, and Methodology
Section 2 Staffing and Instruction 8
Most Expenditures Are Staff-RelatedStaffing IssuesInstructional Strategies and Programs
Section 3 Students Served 18
Total LEP Student EnrollmentUneven Distribution of LEP StudentsGrades of Students ServedStudents Served by Other.Programs
Section 4 Languages Spoken 25
Number of Students Speaking Various LanguagesWide Disparity in the Number of Languages
Section 5 Length of Stay and Academic Performance 31
BackgroundLEP Students Leaving and Remaining in the ProgramTest Score TrendsRelationship with Family IncomeImpact of Programs on Academic Achievement and Length of StayOther Factors Influencing Length of Stay
Section 6 Conclusion and Next Steps 43
Study ImplicationsTopics for Further Research
Appendix
A Federal Education Programs Supporting LEP Students 47
B Languages Spoken 48
C Length of Stay Data 50
D Districts Operating Programs for LEP Students 75
E Summary of Research on Programs for LEP Students 95
F End-of-Year Report Form, School Year 1999-2000 126
5

Abbreviations
ELL English language learnersESL English-as-a-second languageFTE full-time equivalentITBS Iowa Test of Basic SkillsLEP limited English proficientOSPI Office of Superintendent of Public InstructionWASL Washington Assessment of Student Learning
6
EXECUTIVE SUMMARY
Background As Washington becomes a more diverse society, the state's transitional bilingualinstruction program is serving an increasing number and percentage of studentswho speak languages other than English and have English language skilldeficiencies that impair their learning in regular classrooms. Students with limitedEnglish proficiency (LEP) often have lower levels of academic performance,higher rates of grade retention, and higher dropout rates than their English-fluentpeers. As the number of LEP students grows and higher academic standards are putin place, issues related to meeting the needs of these students are getting morescrutiny. The Legislature requires the Office of Superintendent of PublicInstruction to review the program each year, and the Governor requested additionalinformation related to the program.
Results inBrief
Some have been concerned about the rising cost of the program. The programprovides extra funding to districts for services to these students. In school year1999-2000, the state provided about $38 million for the program. This total was11 percent more than the previous year due to increases in LEP enrollment andper pupil funding. Districts supplemented state funding with about $12 million inlocal funds. Hence, districts spent about $50 million in state and local fundseducating LEP students last year.
Our analysis of data from the program and review of recent research on differentapproaches used to educate LEP students found that students' long-term academicperformance is better when they have significant exposure to instruction in bothEnglish and their primary language. However, most LEP students in the statereceive little or no instruction in their primary language. Although most programfunding is spent on staff-related costs, the current lack of qualified teachers thatspeak other languages and the number of different languages spoken by studentsacross the range of grades within a district limit the possibility of many schoolsproviding instruction in both English and students' primary language. We alsofound that many factors influence the amount of time students spend in the stateprogram. A student's background, such as family socioeconomic status andamount of education received before entering the program, can influence theamount of time spent in the program. How the program is structured andadministered also can affect the time spent in the program. These issues needmore attention in the future.
Staffing & Most funds for educating LEP students are spent for staff salaries and benefits.Instruction One obstacle facing the education of LEP students is the shortage of qualified
teachers to provide instruction. Although research has consistently found thatstudents perform better when provided more intensive instruction in their primarylanguage, few students receive this type of instruction in part because of this
Educating LEP Students in Washington State 1
StudentsServed
LanguagesSpoken
relative shortage of qualified teachers. Most instruction for LEP students inWashington is provided by instructional aides who often lack much formaltraining in second language learning strategies. These aides typically provideintensive instruction in English-as-a-second language (ESL) in a classroomsetting but provide little or no instruction in the students' primary language. Thus,the program is more accurately called an ESL program. Fewer than half of allteachers of LEP students have an ESL endorsement.
The number of LEP students continued to grow in school year. 1999-2000,although at a slower rate than in the previous year. The increase is influenced byseveral factors, including the faster growth of the non-English speaking studentpopulation due to higher immigration and birth rates, and a higher rate of studentsentering rather than exiting the program. LEP students are not evenly distributedacross the statesome districts serve a large number and/or a high percentage ofLEP students, while other districts serve few or no LEP students. Some districtshave experienced a dramatic increase in the number of LEP students they serve,while others are serving fewer LEP students. Half of all LEP students are found inGrades K-3, and many are served by other state and/or federal programs as well.
A total of 159 different languages were represented in the program in school year1999-2000. Spanish was spoken by more students (62 percent) than studentsspeaking all the other languages combined. Six other languages were spoken by atleast 1,000 students, and about 85 percent of all LEP students in Washingtonspoke either Spanish or one of these other six languages. The number of studentsspeaking the language of new refugee groups (Bosnian, Somali, Ukrainian) hasgrown dramatically, while the number speaking the major southeast Asianlanguages (Vietnamese, Cambodian, Lao) has declined. Some districts have manydifferent languages spoken among their LEP students, while many other districtsserve only LEP students whose primary language is Spanish.
Length of Stay The program is intended to provide temporary services for up to three years until& Student LEP students can develop adequate English language skills. About 25 percent ofAchievement the state's LEP students left the program in school year 1999-2000, and a
majority had been in the program no more than two years. However, nearly 28percent of the students have remained in the program for more than three years.
Many factors can affect a student's length of stay in the program. Exiting theprogram depends on meeting certain academic achievement standards, andlearning academic terminology in another language can take years. Thus, LEPstudents tend to have lower scores on achievement tests. Test scores are alsoinfluenced by socioeconomic factorsdistricts and schools with higherpercentages of LEP students tend to have higher percentages of students fromlow-income families. Students who come from poor families typically have lowertest scores, and those who are both poor and not proficient in English have ahigher risk of academic failure.
8Educating LEP Students in Washington State 2

Next Steps
Other factors affect the length of stay in the program. Those served in specialeducation or migrant programs and with lower levels of previous education andEnglish-speaking ability when entering the program average more time in theprogram. Students speaking certain languages tend to stay in the program longer.Some factors relate to the way a program is designed, such as the quality or typeof program administered, the extent to which the primary language is used ininstruction, and the relative ease with which students enter and exit the program.National research has found that the more instruction provided in the students'primary language, the better their academic achievement. However, most LEPstudents in Washington receive little or no instruction in their primary language.
This report identifies a number of issues that need further scrutiny. Action isalready underway to address some of these issues. However, other issues need tobe explored in order to improve the effectiveness of the program and ultimatelythe performance of LEP students.
Educating LEP Students in Washington State 3
9

INTRODUCTIONSECTION 1
BACKGROUND
The United States is becoming a more ethnically and linguistically diversesociety. Over 90 percent of recent immigrants come from non-English-speakingcountries, and many of these immigrants arrive with little or no formal education.Minority groups also have higher birth rates, and many native-born ethnic groupmembers do not speak English in the home. These immigration and birth patternsare contributing to the increase in the linguistic diversity of our public schools.This is especially true in the West and in urban areas where limited Englishproficient (LEP)' students are concentrated. Nationwide, the number of LEPstudents increased by an estimated 57 percent between 1990 and 1997.Washington ranked 14th in terms of the percentage of LEP students in publicschools in 1995-96.2
There is great variation among students whose primary language is not English.Some are recent arrivals from foreign countries while others have been born andraised in the United States. The level of education received prior to immigratingto the U.S., family socioeconomic status, and cultural background also differ.Students coming from the same country may speak different languages ordialects. In addition, differences exist within groups. For example, the first waveof southeast Asian refugees was comprised of highly educated people, whilesubsequent refugees tended to be less well educated. Thus, generalizations aboutany group of students may mask important background characteristics that areimportant to understand when designing appropriate curricular interventions.
Students not proficient in using the English language have a higher risk ofacademic failure. When children with little or no previous exposure to the Englishlanguage enter the public schools, they are often unable to profit fully frominstruction in English. Research has found that LEP students tend to have lowerlevels of academic performance in math and reading, higher rates of graderetention, and much higher dropout rates than their English-fluent peers.3 As thenumber of LEP students in public schools continues to grow and higher academicstandards are put into place, issues related to meeting the needs of these studentsand assessing their academic progress are receiving greater scrutiny.
These students are also referred to as English language learners (ELL).2Nearly all the states ranked higher than Washington were in the West, according to a 1998 report by
the National Clearinghouse on Bilingual Education.3 In 1992, students speaking English with difficulty dropped out of school at four times the rate oftheir English-fluent peers.
10Educating LEP Students in Washington State 4
Section 1 Introduction
WASHINGTON'S PROGRAM FOR LEP STUDENTS
Educating LEP students is primarily a state and local responsibility. While thefederal government provides support for LEP students through variousprograms,districts say they rely heavily on state aid and local revenue to fund English-language acquisition programs.4 The Transitional Bilingual Instruction Act of1979, which was amended in 1984, provides extra state funding to Washingtondistricts for services to students who have a primary language other than Englishand have English language skill deficiencies that impair their learning in regularclassrooms.5 The major objective of the transitional bilingual instruction programis for students to develop competence in English language skills. Instructionalassistance is restricted to students who have very little or no English speakingability and are in most need of help, as defined by the eligibility requirements.6
Bilingual education is the use of two languages as mediums of instruction,English and one other. The non-English language is a bridge, a language the childunderstands, that can be used while English skills are being acquired. As a studentlearns more English, there is a corresponding decrease in the use of the primarylanguage. This is the "transitional" aspect of the program as established inWashington. Although the program is for "bilingual instruction," relatively fewstudents in the program actually receive much formal instruction in their primarylanguage. Thus, the program could more accurately be called an ESL program.
Program Funding
Districts receive extra state funding for each eligible LEP student. This funding isallocated based on the average number of LEP students enrolled each month. Inschool year 1999-00, the state provided about $691 for each of the 55,651 LEPstudents.? The rate per eligible student is $711 for school year 2000-01, which isabout 3 percent more than in school year 1999-00. The per pupil amount isadjusted annually and is about 18 percent more than the base amount provided forall students.
In school year 1999-00, the state provided a total of $38.4 million for theprogram, an 11 percent increase from the previous year. Figure 1-1 shows thegrowth of state funding for the program over the last 15 years. The figure does not
4 See Public Education: Title I Services Provided to Students With Limited English Proficiency, U.S.General Accounting Office, December 1999.
Beginning in 1979, LEP students were funded along with certain special education students aspart of a "special needs" grant. In 1984, funding for the program was set up as a separateallocation. Other program changes were made in the 1984 law, including how eligible students areidentified.6 The transitional bilingual instruction program operates under the authority of RCW 28.A180.060and as detailed in chapter 392-160 WAC.7 This was the average number of students enrolled in the program each month, as reported bydistricts on the most recent P223-H report. The total number of LEP students served by theprogram was 66,281see Sections 3 for more information on enrollment issues.
Educating LEP Students in Washington State 5

Section 1 Introduction
adjust the funding amounts for inflation. Appropriations for the 1999-2001biennial budget were for $73.5 million.
Figure 1-1: Growth in Program Funding$40,000,000
$35,000,000 4,
$30,000,000
$25,000,000
$20,000,000
$15,000,000
$10,000,000 1$5,000,000
$0
A (2) c) 0 (0 V A Cb c=54, '27, cb c%) cb 0V V A' V N ('S V V V A' 4i cY4, V V (21. cbc5 cb cb c0
* Not adjusted for inflation School Year
The state is not the only source of revenue for the program. Districts can chooseto supplement their state program funds with funds raised at the local level forprograms educating LEP students. In school year 1999-00, districts used about$11.9 million in local funding for educating LEP students. In addition, variousfederal programs can be used to support LEP students, including funding fromTitle I and programs for migrant, immigrant, and special education. (Appendix Aprovides more information on these programs.) However, the federal funding isminimal compared to state and local funding.
Program Eligibility
Program funding is intended for those with the greatest need, so not all studentswho have a primary language other than English may be eligible. To be eligible, astudent must have a primary language other than English and their Englishlanguage skills must be sufficiently deficient or absent to impair learning in anall-English classroom. The program is for eligible students in grades K-12.8
To identify eligible pupils, districts conduct an initial assessment to determine astudent's language proficiency. Students are eligible if they score below aminimum level on an oral language proficiency test administered by the district.9
8 Beginning in school year 1997-98, prekindergarten students were no longer eligible for bilingualprogram services.9 Most districts use the Language Assessment Scales (LAS or Pre-LAS) to determine initialeligibility. The LAS cut-off score for eligibility is Level 3Limited English Speaker and the rangeof the total score is between 65-74. A bilingual advisory committee is currently studying theassessments in order to recommend that only one be used statewide.
Educating LEP Students in Washington State 6
12

Section 1 Introduction
An annual reassessment must be made for a student to continue in the program.Eligibility ends whenever the student scores above the 35th percentile in thereading and language arts portions of an approved norm-referenced written test.Students cannot stay in the program more than three school years unless theirEnglish language skills remain below the 35th percentile. Districts must haveempirical evidence to keep a student in the program for more than three years.I°
OBJECTIVES, SCOPE, AND METHODOLOGY
The Legislature requires the Office of Superintendent of Public Instruction (OSPI)to review the bilingual program and report each year on the results of that review.In addition, in May 2000 Governor Locke requested OSPI to use availableresources to provide updated information related to LEP and bilingual programsto his office and the Legislature by December 2000. This report providesinformation on the bilingual program for LEP students in school year 1999-2000as well as historical information. It also provides information requested by theGovernor. Specifically, this report discusses the following topics:
Staffing patterns and instruction to implement the program.Enrollment patterns of students who have participated in the program and howthe patterns have changed over time.The languages spoken by students in the program.The amount of time that students spend in the program, the impact thatprograms for LEP students have on their academic achievement and the lengthof stay in these types of programs, and factors influencing the length of stay.
To address these topics, we examined data obtained from all 185 districts that hadan approved state program for LEP students in school year 1999-2000. The datawere provided on the district annual reports (see Appendix F). We also used datareported by districts in previous years. The district reports were checked forconsistency, and districts were contacted when discrepancies were found.However, the accuracy of the data in these reports was not verified."
Since school-level data are not collected on the program, most of the reportprovides data aggregated at the district leve1.12 To supplement the district-leveldata, we analyzed selected student-level information obtained from 46 districtsthat enrolled 80 percent of all LEP students in the state." We also reviewed recentresearch related to bilingual education and instruction of LEP students.I4
I° The State Auditor is examining the evidenCe that selected districts have used to keep a studentin the program.11 See Section 2 for information about data limitations.12 Districts began reporting the number of LEP students at the school building in the fall of 2000.13 Data for over 15,000 LEP students in selected grades at 618 schools were analyzed.14 Tom Stritikus from the University of Washington and Patrick Manyak from California StateUniversity/Fullerton reviewed the relevant literature. OSPI also published a summary of researchon the education of LEP students in 1999.
Educating LEP Students in Washington State13
7

STAFFING AND INSTRUCTIONSECTION 2
. Nearly all expenditures used to educate LEP students are for staff, mainlysalaries. Although research has found that students perform better whenprovided more intensive instruction in their primary language, few studentsreceive this type of instruction. One reason for this is the relative shortage ofqualified teachers. Most instruction for LEP students in Washington isprovided by instructional aides, typically in a classroom setting with someESL instruction. Less than half the teachers in the program have anendorsement in teaching either ESL or bilingual education.
MOST EXPENDITURES ARE STAFF-RELATED
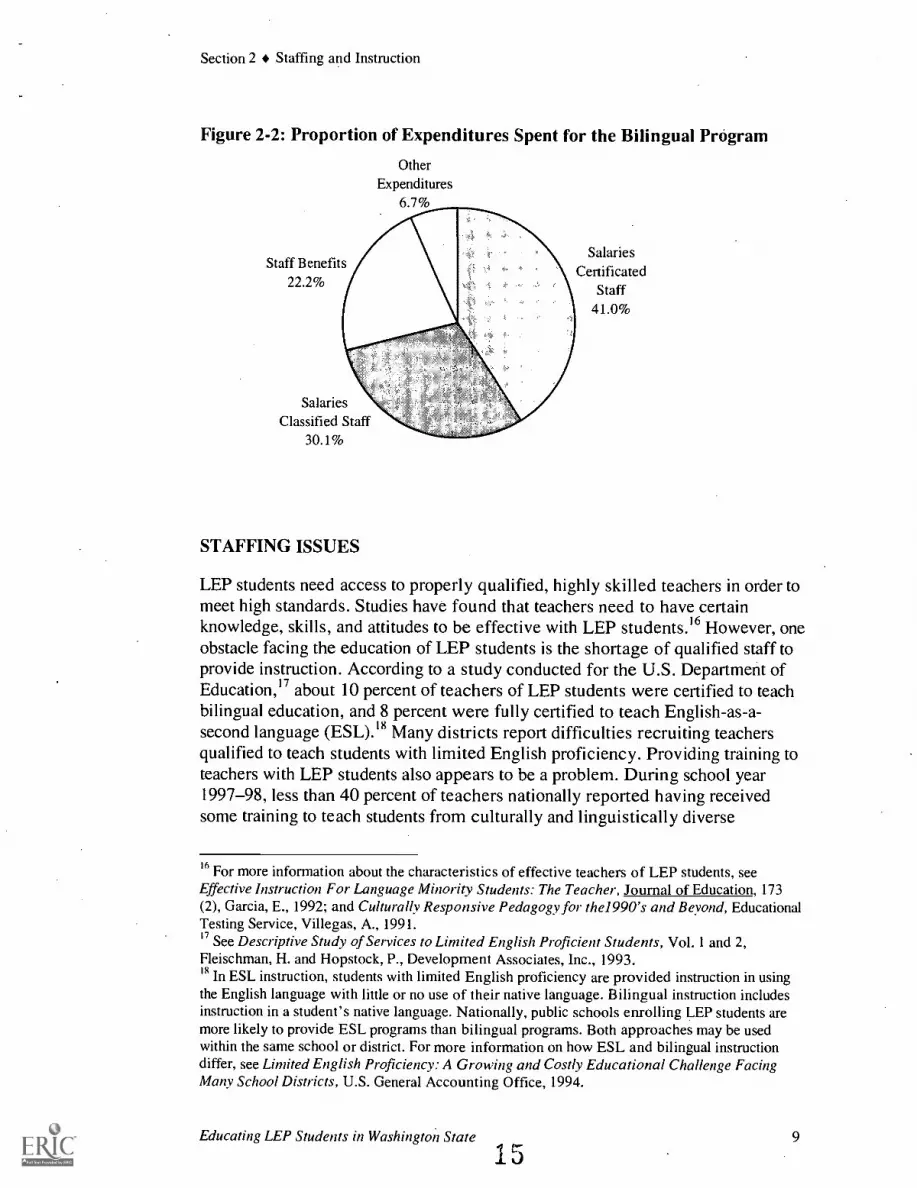
In school year 1999-00, expenditures for educating LEP students totaled $52.3million. Of this amount, about 73 percent came from the state, 23 percent camefrom the local districts themselves, and 4 percent came from federal sources.15
Of the nonfederal funding for educating LEP students, 95 percent was spent oninstruction-related activities, mainly in the form of salaries and benefits forteachers and instructional aides. Figures 2-1 and 2-2 show the amounts andproportions spent on various categories in school year 1999-00.
Figure 2-1: Staff Costs Account for Most Expenditures for LEP Students
$20,000,000
$15,000,000
$10,000,000
$5,000,000
$0
Salaries - Salaries -Certificated Classified
Staff Staff
Staff Benefits OtherExpenditures
Note: Excludes expenditures related to federal funding.
15 The state does not keep track of how funds from different revenue sources are spent on variousprograms, so an analysis of expenditures for the program includes other sources of funding besidesstate funds designated for the bilingual program.
Educating LEP Students in Washington State 148
Section 2 Staffing and Instruction
Figure 2-2: Proportion of Expenditures Spent for the Bilingual Program
Staff Benefits22.2%
OtherExpenditures
6.7%
SalariesClassified Staff
30.1%
STAFFING ISSUES
SalariesCertificated
Staff41.0%
LEP students need access to properly qualified, highly skilled teachers in order tomeet high standards. Studies have found that teachers need to have certainknowledge, skills, and attitudes to be effective with LEP students.I6 However, oneobstacle facing the education of LEP students is the shortage of qualified staff toprovide instruction. According to a study conducted for the U.S. Department ofEducation," about 10 percent of teachers of LEP students were certified to teachbilingual education, and 8 percent were fully certified to teach English-as-a-second language (ESL),III Many districts report difficulties recruiting teachersqualified to teach students with limited English proficiency. Providing training toteachers with LEP students also appears to be a problem. During school year1997-98, less than 40 percent of teachers nationally reported having receivedsome training to teach students from culturally and linguistically diverse
16 For more information about the characteristics of effective teachers of LEP students, seeEffective Instruction For Language Minority Students: The Teacher, Journal of Education, 173(2), Garcia, E., 1992; and Culturally Responsive Pedagogy for the1990's and Beyond, EducationalTesting Service, Villegas, A., 1991.17 See Descriptive Study of Services to Limited English Proficient Students, Vol. 1 and 2,Fleischman, H. and Hopstock, P., Development Associates, Inc., 1993."In ESL instruction, students with limited English proficiency are provided instruction in usingthe English language with little or no use of their native language. Bilingual instruction includesinstruction in a student's native language. Nationally, public schools enrolling LEP students aremore likely to provide ESL programs than bilingual programs. Both approaches may be usedwithin the same school or district. For more information on how ESL and bilingual instructiondiffer, see Limited English Proficiency: A Growing and Costly Educational Challenge FacingMany School Districts, U.S. General Accounting Office, 1994.
Educating LEP Students in Washington State 9
15
Section 2 Staffing and Instruction
backgrounds.'9 A study conducted for the Legislature found similar problems inWashington .2()
In the current education reform movement that aims to have all students meethigh academic standards, schools face a challenge to find and train staff to meetthe needs of the growing number of students with limited English proficiency.The newly formed Professional Educator Standards Board has recommended thatseveral alternative certification methods be used to increase the number ofteachers for ESL programs.
Qualifications and Training
The qualifications of teachers of LEP students funded by the state program inWashington and their training are significantly better than the national numbersmentioned above. Of the Washington teachers who provided instruction to LEPstudents in school year 1999-2000,45 percent had an ESL endorsement and 17percent had a bilingual endorsement. (Some teachers have both an ESL andbilingual endorsement.)
In terms of training, 96 of the 185 districts (52%) involved in the programprovided some inservice training on ESL and bilingual education to teachers.More districts (64 percent) provided such training to instructional aides. Trainingon multicultural issues was lessabout 30 percent of the districts provided suchtraining to either teachers or aides.
Teachers in the program averaged more than 10 hours of inservice training inESL or bilingual education. Instructional aides averaged more than eight hoursof such training.Teachers in the program averaged about four hours of multicultural trainingduring the year, and aides averaged about three hours of such training.
The above numbers apply to staff funded by the state program and do not apply tostaff who may be educating LEP students and who are paid from other fundingsources. Data are not provided on the qualifications and training of staff hired bya district with other funds and are providing instruction to LEP students. Somedistricts have a significant number of staff hired to educate LEP students who arenot funded by the state program.
Types of Staff
Districts have relied more heavily on instructional aides than certificated teachersto provide instruction to LEP students. In school year 1999-00, the number of
19 See Study of Education Resources and Federal Funding: Preliminary Report, U.S. Departmentof Education, 1999.20 See K -12 Transitional Bilingual Instruction Program, Report 92-3, Legislative BudgetCommittee, February 1992.
Educating LEP Students in Washington State 1 6 10

Section 2 Staffing and Instruction
teachers involved in the program increased while the number of aides declined bya larger amount. Thus, the number of FTE staff involved in the programdecreased slightly. In school year 1999-00, there were 2,556 staff involved inproviding instruction in the program-1,722 were instructional aides, more thandouble the number of teachers (834). In terms of full-time equivalent (FTE) staffinvolved in the program, aides represented about 56 percent of the total FTEs inschool year 1999-00, which is less than in the previous two years. Table 2-1 andFigure 2-3 provide more information on the FTE staffing trends.
Table 2-1: Five-Year Staffing Trends (in FTEs)
Type of Staff (FTE) 1995-96 1996-97 1997-98 1998-99 1999-00Certificated staff 362 402 389 435 467
Percent of total 44.3% 45.4% 40.0% 40.0% 43.8%
Classified staff 455 483 584 654 600Percent of total 55.7% 54.6% 60.0% 60.0% 56.2%
Total FTEs 817 885 973 1,089 1,067
Figure 2-3: Change in FTE Staff Involved in the Bilingual Program
700
600
500
400
300
200
100
0
1 9 9 5-96 1996 -97 19 9 7-98 1998-99 1999-00
0Teachers Instructional aides
Student/Staff Ratios
With more instructional aides involved in the program, the LEP students per aideratio is lower than the raiio of LEP students per teacher. The student/staff ratioscan be measured in different ways by using the total number of students and staffin the program, the average number of students served per month, and the totalnumber of FTE staff. The ratios are slightly smaller when measured in terms ofthe average number of students served and much larger when measured in termsof FTE staff. Table 2-2 shows various ratios for school year 1999-00. Theaverage number of students per FTE teacher is about the same as the previous
Educating LEP Students in Washington State 11

Section 2 Staffing and Instruction
year because more teachers are involved in the program, but the ratio of LEPstudents per FTE staff is higher because more students were served and fewerFTE staff were involved in the program (see Figure 2-4).
Table 2-2: LEP Student/Bilingual Program Staff Ratios(School Year 1999-00)
Teachers Aides All StaffTotal staff 834 1,722 2,556
Staff FTE 467 600 1,067
Student/staff ratio'(based on total studentsand total staff)
79.5 38.5 25.9
Student/staff ratio2(based on average number ofstudents served and total staff)
66.7 32.3 21.8
Student/staff ratio2(based on average number ofstudents served and FTE staff)
119.2 92.8 52.2
Ratio based on the total (66,281) number of LEP students served.2 Ratio based on the average (55,651) number of LEP students served.
Figure 2-4: LEP Student/Program Staff Ratios, Two-Year Trend
125
rrQ01 0
119.6 119.2
92.8''75 79.6
5052.247.8
25
0
Student/teacher Student/aide Student/all staff
TYPE OF RATIO
0 1998 -99 01999-00
INSTRUCTIONAL STRATEGIES AND PROGRAMS
Nationwide a variety of instructional strategies and approaches have beenimplemented in recent decades with the goal of teaching the large LEP studentpopulation. These range from having no instruction in the student's primary
18Educating LEP Students in Washington State 12

Section 2 Staffing and Instruction
language and providing only ESL instruction to providing instruction over anextended period in both English and the student's primary language.21
In Washington, the services provided to LEP students are described in two ways:instructional focus and program model. Instructional focus describes the methodsby which students are actually instructed with differing emphases andmethodologies. Program model describes the setting or circumstances in whichthe services are delivered. These approaches may have different types ofeffectiveness.
Instructional Focus
Most (68%) LEP students receive little or no instruction in their primarylanguage, according to district reports. Due to staffing constraints and the numberof languages that are spoken in some districts, it may not be possible to provideany instruction in a student's primary language. Most districts rely on intensiveESL instruction to educate LEP students. Districts with large numbers of LEPstudents speaking a particular language have a greater ability to offer instructionin that language.
Districts report their instructional focus in four categories, which are definedbelow. In addition, some districts report that they provide instruction using someother strategy or a combination of strategies.
1. Primary Language Development: Language development in both Englishand the primary language is the focus. The goal is to enable the student tobecome academically and socially fluent in both languages.
2. Academic Language Development: Academic skills and literacy areprovided in the primary language with additional intensive ESL instruction.When the student reaches moderate English reading competency, academicinstruction in the primary language is discontinued.
3. Limited Assistance in the Primary Language: Students are provided withintensive ESL instruction with additional basic skills and literacy offered inEnglish with limited assistance in the primary language. This may includeacademic tutoring provided by noncertificated personnel, translations,interpretations, etc.
4. No Primary Language Support: Students are provided with intensive ESLinstruction and may receive other special instructional services which enablethem to participate in regular all-English classrooms.
21 The Supreme Court has ruled that it is illegal to place a student with limited English proficiencyinto a regular English-only classroom and provide no special instruction support (Lau v. Nichols).
Educating LEP Students in Washington State 19 13
Section 2 Staffing and Instruction
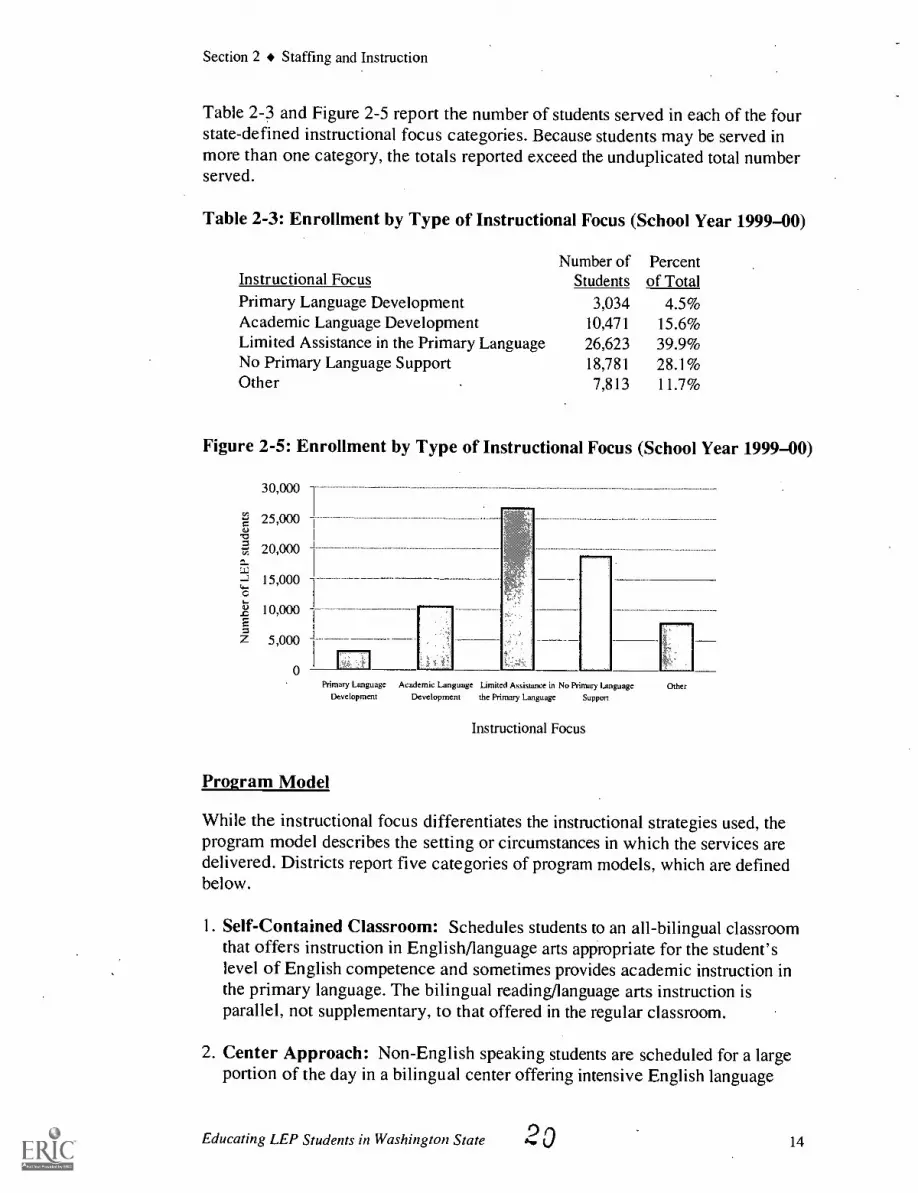
Table 2-3 and Figure 2-5 report the number of students served in each of the fourstate-defined instructional focus categories. Because students may be served inmore than one category, the totals reported exceed the unduplicated total numberserved.
Table 2-3: Enrollment by Type of Instructional Focus (School Year 1999-00)
Number of PercentInstructional Focus Students of TotalPrimary Language Development 3,034 4.5%Academic Language Development 10,471 15.6%Limited Assistance in the Primary Language 26,623 39.9%No Primary Language Support 18,781 28.1%Other 7,813 11.7%
Figure 2-5: Enrollment by Type of Instructional Focus (School Year 1999-00)
30,000
25,000
20,000
15,000
10,000
5,000
0Primary Language Academic Language Limited Assistance in No Primary Language Other
Development Development the Primary Language Support
Instructional Focus
Program Model
While the instructional focus differentiates the instructional strategies used, theprogram model describes the setting or circumstances in which the services aredelivered. Districts report five categories of program models, which are definedbelow.
1. Self-Contained Classroom: Schedules students to an all-bilingual classroomthat offers instruction in English/language arts appropriate for the student'slevel of English competence and sometimes provides academic instruction inthe primary language. The bilingual reading/language arts instruction isparallel, not supplementary, to that offered in the regular classroom.
2. Center Approach: Non-English speaking students are scheduled for a largeportion of the day in a bilingual center offering intensive English language
Educating LEP Students in Washington State 14
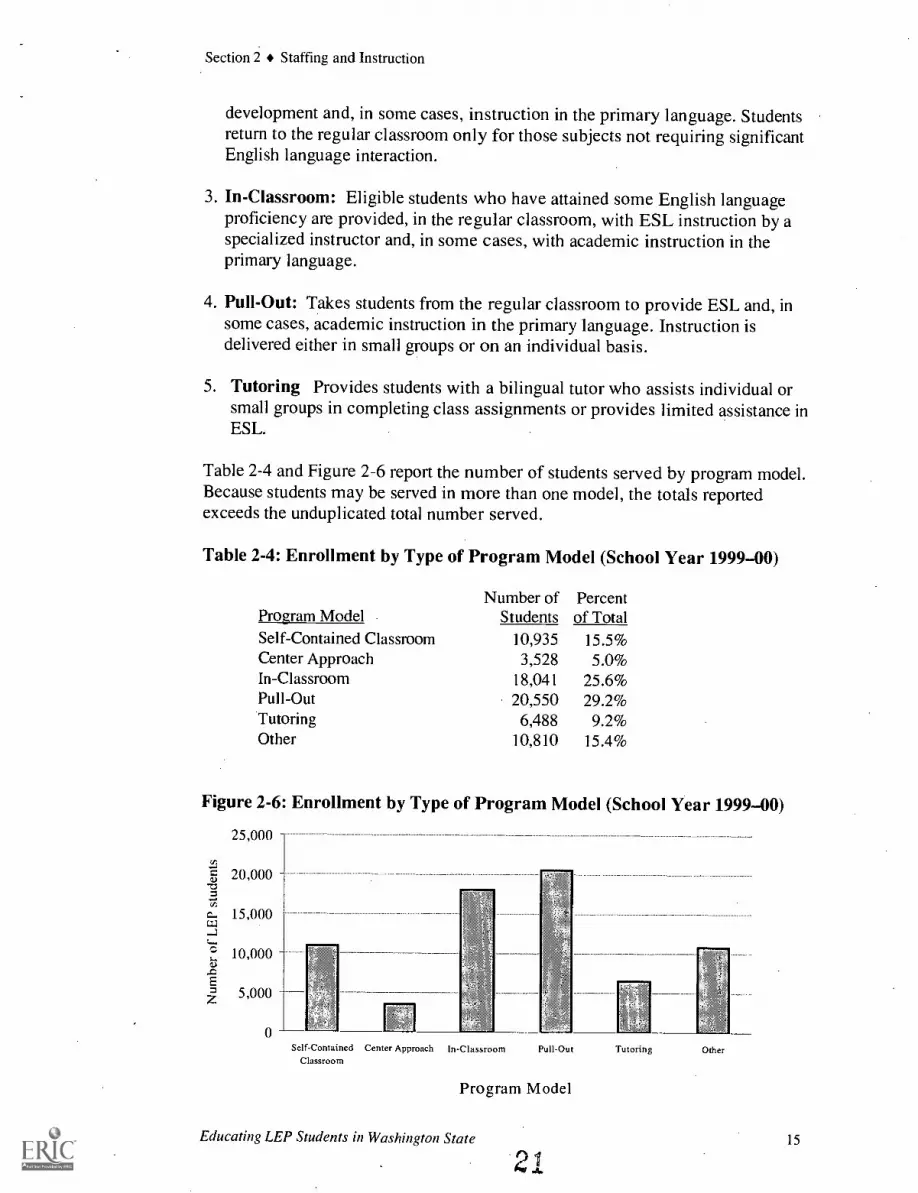
Section 2 Staffing and Instruction
development and, in some cases, instruction in the primary language. Studentsreturn to the regular classroom only for those subjects not requiring significantEnglish language interaction.
3. In-Classroom: Eligible students who have attained some English languageproficiency are provided, in the regular classroom, with ESL instruction by aspecialized instructor and, in some cases, with academic instruction in theprimary language.
4. Pull-Out: Takes students from the regular classroom to provide ESL and, insome cases, academic instruction in the primary language. Instruction isdelivered either in small groups or on an individual basis.
5. Tutoring Provides students with a bilingual tutor who assists individual orsmall groups in completing class assignments or provides limited assistance inESL.
Table 2-4 and Figure 2-6 report the number of students served by program model.Because students may be served in more than one model, the totals reportedexceeds the unduplicated total number served.
Table 2-4: Enrollment by Type of Program Model (School Year 1999-00)
Number of PercentProgram Model Students of TotalSelf-Contained Classroom 10,935 15.5%Center Approach 3,528 5.0%In-Classroom 18,041 25.6%Pull-Out 20,550 29.2%Tutoring 6,488 9.2%Other 10,810 15.4%
Figure 2-6: Enrollment by Type of Program Model (School Year 1999-00)
25,000
20,000
15,000
10,000
5,000
0Self-Contained Center Approach
ClassroomIn-Classroom
RIERIM
Pull-Out
Program Model
Tutoring Other
Educating LEP Students in Washington State 15
4.a

Section 2 Staffing and Instruction
Effectiveness
Research has been conducted to determine the effectiveness of differentapproaches for educating LEP students. In general, studies have found that themore instruction that is provided in the student's primary language, the better theoverall academic performance of the student over a long-term period.22 It isbelieved that developing proficiency in one language promotes the developmentof proficiency in a second language. Our analysis of student-level data from 46districts was consistent with this conclusion. We found that the average length oftime LEP students had spent in the program was less when they were receivingmore intensive instruction in their primary language along with instruction inEnglish.23 LEP students who received more intensive instruction in their primarylanguage outside their regular classroom averaged less time in the program, whilestudents receiving somewhat limited assistance only in the context of their regularclassroom averaged the longest amount of time in the program. These findingswould indicate that more academic instruction needs to be given in the student'sprimary language rather than simply relying only on English-language instruction.However, the shortage of trained staff to provide instruction in many primarylanguages limits this possibility.
Due to a number of data limitations, these results should be viewed with cautionuntil more research can be conducted.24 The data OSPI receives from districtsrelated to the instructional focus and program model categories are not verifiedfor accuracy, so the results noted above should be considered estimates of howinstruction is provided statewide. Even if these data were verified, the categoriesare not exhaustive, not mutually exclusive, and are broadly defined and thereforesubject to interpretation when districts prepare their reports. We found some
, confusion among districts regarding how to characterize their instructional focusand programs when we asked districts about their data. In addition, some districtsmove LEP students from one type of program to another over time as the studentsimprove their English language skills, but districts have not been asked to providethis type of data. Research has been hampered in other parts of the country bysimilar problems related to the lack or inaccuracy of data. In addition, the qualityof a program will influence its effectiveness, so poorly implemented programswill cancel out the effects of successful programs in evaluation studies. Someresearchers say it would be better to observe the components of programs,
22 The effects of different instructional approaches may not be seen in the short-term sincelanguage acquisition in an academic context is a long-term process. See Reading and SecondLanguage LearnersResearch Report, OSPI, April 1999, and School Effectiveness for LanguageMinority Students, Thomas, W. and Collier, V., National Clearinghouse for Bilingual Education,December 1997.23
Students receiving a significant amount of instruction in their primary language as well asinstruction in English averaged 2.3 years in the program; students who were provided ESLinstruction in a regular classroom averaged 3.8 years in the program. Nearly all districts involvedin the program in Washington provide the same kind of approach from year to year, so analyses oflength of stay over time does not appear to be affected by changes in educational approaches.24 A number of major studies are scheduled to be released in 2001.
Educating LEP Students in Washington State 16n4 4

Section 2 Staffing and Instruction
principally in the classroom, rather than simply comparing programs based onimprecise labels.25 OSPI plans to take steps to improve the definitions used in thedistrict reports and gather the types of information that can be used to helpevaluate the program.
Section 5 and Appendix E provide more information about the effectiveness ofprograms for LEP students. Section 6 provides information about additionalresearch that needs to be conducted.
25lmproving Schools For Language Minority Students, August, D., & Hakuta, K. (Eds.), NationalAcademy Press, 1997.
Educating LEP Students in Washington State 17
23

STUDENTS SERVEDSECTION 3
The number and percentage of LEP students in Washington continues to grow,but at a slower rate than last year. LEP students are not evenly distributedacross the state. Some districts serve either a large number or a high percentageof LEP students, while other districts serve few or no LEP students. Moreover,some districts have experienced a high rate of growth in their LEP studentpopulation, while other districts are serving fewer LEP students. Half of theLEP students are found in Grades K-3. Many are served by other state orfederal programs as well.
TOTAL LEP STUDENT ENROLLMENT
A total of 66,281 students were served by the program in school year 1999-00.This total represents a 6.7 percent increase from the previous year total but aslower rate of growth than in school year 1998-99 (9.1%). The average monthlyenrollment in the program was 55,651 in school year 1999-00. This number isused for state funding purposes. The program serves slightly more males (52.8percent) than females (47.2 percent). This proportion of males to females hasremained about the same for the past 15 years.
The percentage of LEP students in the state has slowly risen over time (see Table3-1 and Figure 3-2). In school year 1999-00, 6.7 percent of the state's studentswere in the program, up from 6.3 percent in the previous year. The increase in thelevel of LEP students in the state is influenced by several factors. First, the non-English speaking student population is growing faster than the English-speakingstudent population because of higher immigration and birth rates.26 In addition,when a district develops an approved program, its LEP students would be addedto the number of students in the program. More districts had approved program inschool year 1999-00 than in any year in the past decade. Finally, the increase isinfluenced by a higher rate of students entering the program compared to the rateof students exiting the program. In school year 1999-00, 20,545 students enteredthe program and 16,474 left the program, a net difference of 4,171. (See Section 5for more information on those leaving the program and factors affecting theirlength of stay in the program.)
26According to the U.S. Census Bureau, both the Asian and Hispanic populations have a higher
percentage of the total Washington population in 1999 than in 1990. It is hard to determine thecause of the increasebirth rates, refugee flows from abroad and other states, the strength of theeconomy in different parts of the country, and the relative quality of ESL programs can all affectthe growth of the non-English speaking population.
a
Educating LEP Students in Washington State 18
24

Section 3 Students Served
Table 3-1: Growth of LEP Student Enrollment
YearTotal
Enrollment'TotalLEP'
PercentLEP
1986-87 756,340 16,352 2.2%1987-88 770,538 17,800 2.3%1988-89 785,854 21,062 2.7%1989-90 805,913 24,279 3.0%1990-91 833,906 28,473 3.4%1991-92 862,423 34,338 4.0%1992-93 889,680 38,735 4.4%1993-94 908,017 44,266 4.9%1994-95 928,669 47,214 5.1%1995-96 945,283 50,737 5.4%1996-97 964,642 54,124 5.6%1997-98 977,818 56,939 5.8%1998-99 990,884 62,132 6.3%1999-00 992,088 66,281 6.7%
Average headcount based on the P-223.
Figure 3-1: Percentage of LEP Students Statewide Has Gradually Increased'
2.7%
4.0%3:4%-
3.0%
5:47e4.9%
5.1%5.6%
5'8%6.3%
6.7%
0\4150,o)o454) 41o)o)o) 5) 5) 5) 5') 5) 5)5)
cg° '4V 00'1" cbcl' or of\'' oi) o)5` oi) qb or\ ofb\ \`') \ \) \) \ N.c)\ \c"
Percentage is based on the total number of LEP students served and the totalnumber of students in the state (i.e., headcounts).
UNEVEN DISTRIBUTION OF LEP STUDENTS
LEP students are not evenly distributed across the state. A total of 185 districtshad students in the program in school year 1999-00, which is 63 percent of thestate's districts. The percentage has remained about the same the past few years.These 185 districts enroll over 95 percent of the state's total student population.
Educating LEP Students in Washington State 25 19
Section 3 Students Served
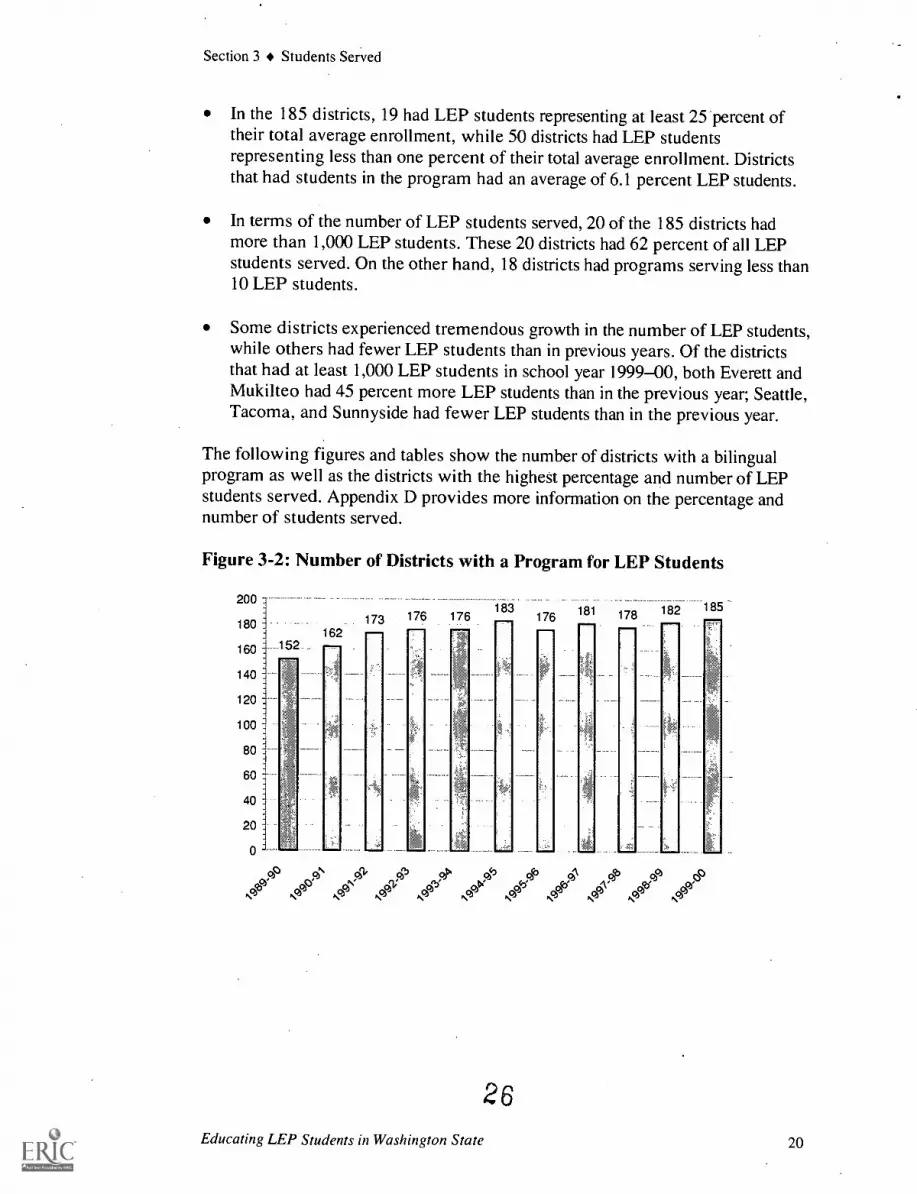
In the 185 districts, 19 had LEP students representing at least 25 percent oftheir total average enrollment, while 50 districts had LEP studentsrepresenting less than one percent of their total average enrollment. Districtsthat had students in the program had an average of 6.1 percent LEP students.
In terms of the number of LEP students served, 20 of the 185 districts hadmore than 1,000 LEP students. These 20 districts had 62 percent of all LEPstudents served. On the other hand, 18 districts had programs serving less than10 LEP students.
Some districts experienced tremendous growth in the number of LEP students,while others had fewer LEP students than in previous years. Of the districtsthat had at least 1,000 LEP students in school year 1999-00, both Everett andMukilteo had 45 percent more LEP students than in the previous year; Seattle,Tacoma, and Sunnyside had fewer LEP students than in the previous year.
The following figures and tables show the number of districts with a bilingualprogram as well as the districts with the highest percentage and number of LEPstudents served. Appendix D provides more information on the percentage andnumber of students served.
Figure 3-2: Number of Districts with a Program for LEP Students
200
180
160
140
120
100
80
60
40
20
173 176 176162
183176 181 178 182. 185
26Educating LEP Students in Washington State 20

Section 3 Students Served
Table 3-2: Districts With At Least 25 Percent LEP Students(School Year 1999-00)
District Average LEPEnrollment'
TotalStudents'
Percent LEPStudents
1. Palisades 35 43 82.3%2. Orondo 118 169 69.7%3. Toppenish 1,997 3,269 61.1%4. Wahluke 749 1,323 56.6%5. Roosevelt 11 20 54.8%6. Bridgeport 299 595 50.2%7. Brewster 394 957 41.1%8. Pasco 3,107 7,943 39.1%9. Prescott 99 258 38.3%10. Royal 436 1,216 35.8%11. Manson 234 653 35.8%12. Othello 880 2,842 31.0%13. Warden 264 869 30.3%14. Yakima 3,983 13,162 30.3%15. Wapato 918 3,099 29.6%16. North Franklin 499 1,795 27.8%17. Cape Flattery 149 551 27.1%18. Mabton 220 858 25.7%19. Sunnyside 1,235 4,898 25.2%
15,627 44,520 31.1%
Monthly average
Table 3-3: Districts With At Least 1,000 LEP Students (School Year 1999-2000)
District
Total LEP Students(School Year) Percent Increase
in LEP Studentsin Past Year1999-2000 1998-1999
1. Seattle 5,447 5,584 -2.5%2. Yakima 4,600 4,491 2.4%3. Pasco 3,914 3,537 10.7%4. Kent 2,611 2,354 10.9%5. Toppenish 2,417 2,313 4.5%6. Vancouver 2,121 1,921 10.4%7. Tacoma 2,029 2,234 -9.2%8. Federal Way 1,838 1,610 14.2%9. Highline 1,789 1,735 3.1%10. Bellevue 1,758 1,687 4.2%11. Edmonds 1,430 1,362 5.0%12. Mukilteo 1,403 963 45.7%13. Mount Vernon 1,397 1,092 27.9%14. Kennewick 1,366 1,357 0.7%15. Wenatchee 1,343 1,326 1.3%16. Lake Washington 1,245 1,225 1.6%17. Sunnyside 1,211 1,311 -7.6%18. Everett 1,135 782 45.1%19. Wapato 1,032 1,000 3.2%20. Evergreen (Clark) 1,004 861 16.6%
Total 41,090 38,745 6.1%
Educating LEP Students in Washington State 21

Section 3 Students Served
Figure 3-3: Districts Serving At Least 1,000 LEP Students(School Year 1999-00)
1Seattle 5,447
Yakima I 4,600
3Pasco 3,914
Kent1 2,61:1
Toppenish 1 2,417
Vancouver 12,121
Tacoma t 2,029
Federal-Way I 1,838
Highline 1 1,789
Bellevue I 1,758
Edmonds 1 1,430
Mukilteo 1 1,403
Mount Vernon I 1,397
Kennewick 1,366
Wenatchee I 1,343
Lake Washington 1 1,245
Sunnyside g 1 1,211
Everett 1 1,135
Wapato 1,032
Evergreen (Clark) 1 1,004
0 1,000 2,000 3,000 4,000 5,000 6,000
Number of LEP students served
GRADES OF STUDENTS SERVED
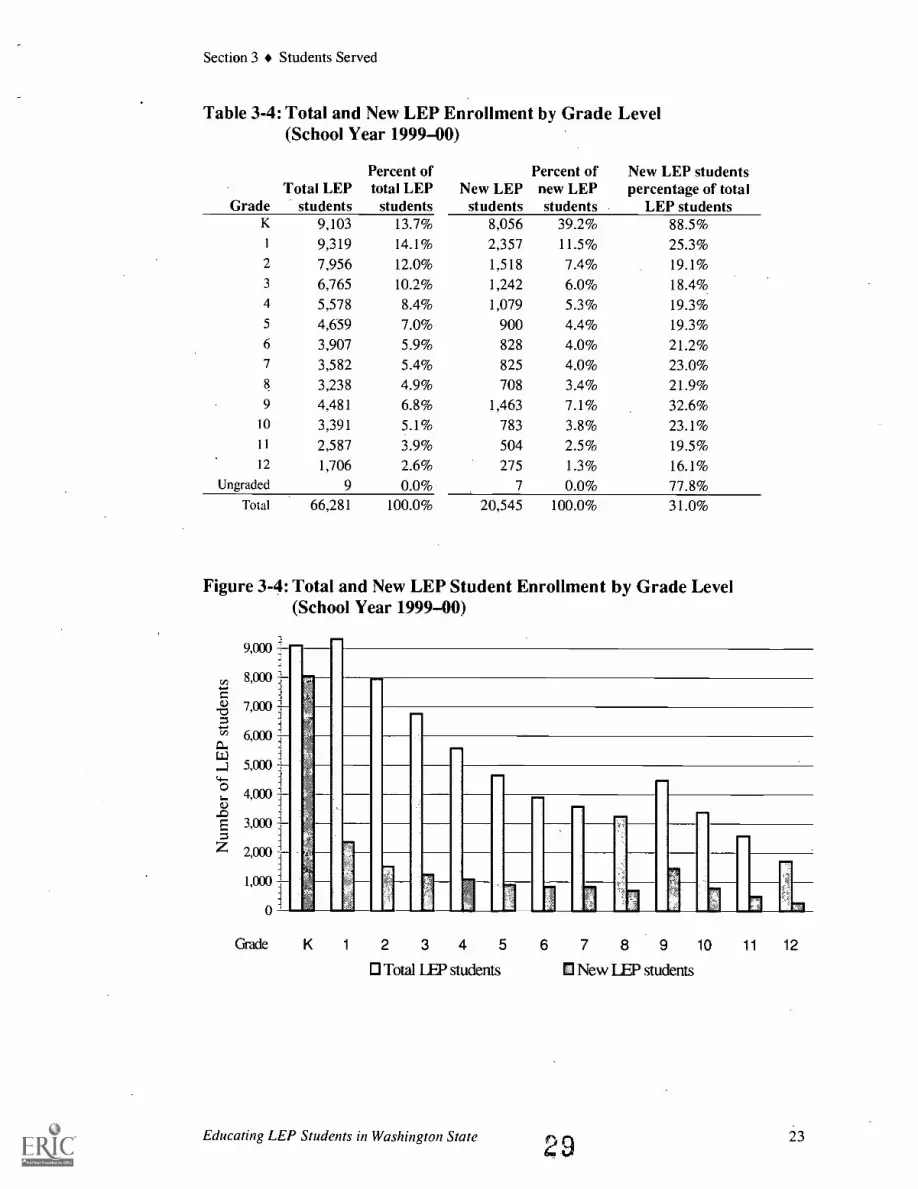
Most students served by the program are in the early grades. LEP students ingrades K-3 accounted for 50 percent of the LEP students served in school year1999-00. The percentage of LEP students gradually declines in the higher grades.New LEP studentsthose served for the first time by the districtrepresented 31percent of the total LEP student enrollment. As expected, LEP students inkindergarten comprise most of the new students. Grade 9 shows an increase in thenumber of new and total LEP students compared to the earlier grades. Table 3-4and Figure 3-4 show for each grade level the number of total and new LEPstudents served.
28Educating LEP Students in Washington State 22
Section 3 Students Served
Table 3-4: Total and New LEP Enrollment by Grade Level(School Year 1999-00)
GradeTotal LEP
students
Percent oftotal LEP
studentsNew LEP
students
Percent ofnew LEPstudents
New LEP studentspercentage of total
LEP studentsK 9,103 13.7% 8,056 39.2% 88.5%
1 9,319 14.1% 2,357 11.5% 25.3%2 7,956 12.0% 1,518 7.4% 19.1%3 6,765 10.2% 1,242 6.0% 18.4%4 5,578 8.4% 1,079 5.3% 19.3%5 4,659 7.0% 900 4.4% 19.3%6 3,907 5.9% 828 4.0% 21.2%7 3,582 5.4% 825 4.0% 23.0%8 3,238 4.9% 708 3.4% 21.9%9 4,481 6.8% 1,463 7.1% 32.6%
10 3,391 5.1% 783 3.8% 23.1%11 2,587 3.9% 504 2.5% 19.5%12 1,706 2.6% 275 1.3% 16.1%
Ungraded 9 0.0% 7 0.0% 77.8%Total 66,281 100.0% 20,545 100.0% 31.0%
Figure 3-4: Total and New LEP Student Enrollment by Grade Level(School Year 1999-00)
9,000
8,000
7,000
6,000
5,000
4,000
3,000
2,000
1,000
0
Grade
1
K 1 2 3 4 5 6 7 8 9 10 11 12
Total LEP students New LEP students
Educating LEP Students in Washington State 29 23

Section 3 Students Served
STUDENTS SERVED BY OTHER PROGRAMS
Some students with limited English proficiency also receive other services. Table3-5 and Figure 3-5 provide more information on LEP students receiving servicesfrom other federal and state programs. The high number of students served byTitle I reflects the fact than many LEP students are enrolled in schools that have"schoolwide" Title I programs, which apply to all students in the school. It also,reflects the fact that LEP students tend to come from low-income families (seeSection 7 for more information on this issue).
Table 3-5: Number and Percentage of LEP Students Receiving Support byOther Programs (School Year 1999-00)
Other programs supportingLEP studentsTitle ITitle I Migrant EducationSpecial Education (state or federal)Learning Assistance Program
Number of LEP students Percent of allserved by other program LEP students
32,683 49.3%13,058 19.7%4,151 6.3%
13,924 21.0%
Figure 3-5: Number of LEP Students Receiving Support by Other Programs(School Year 1999-00)
Learning AssistanceProgram
Special Education(state or federal)
Title I MigrantEducation
Title I (any program)
0 5,000 10,000 15,000 20,000 25,000 30,000 35,000Number of LEP students
30
Educating LEP Students in Washington State 24

LANGUAGES SPOKENSECTION 4
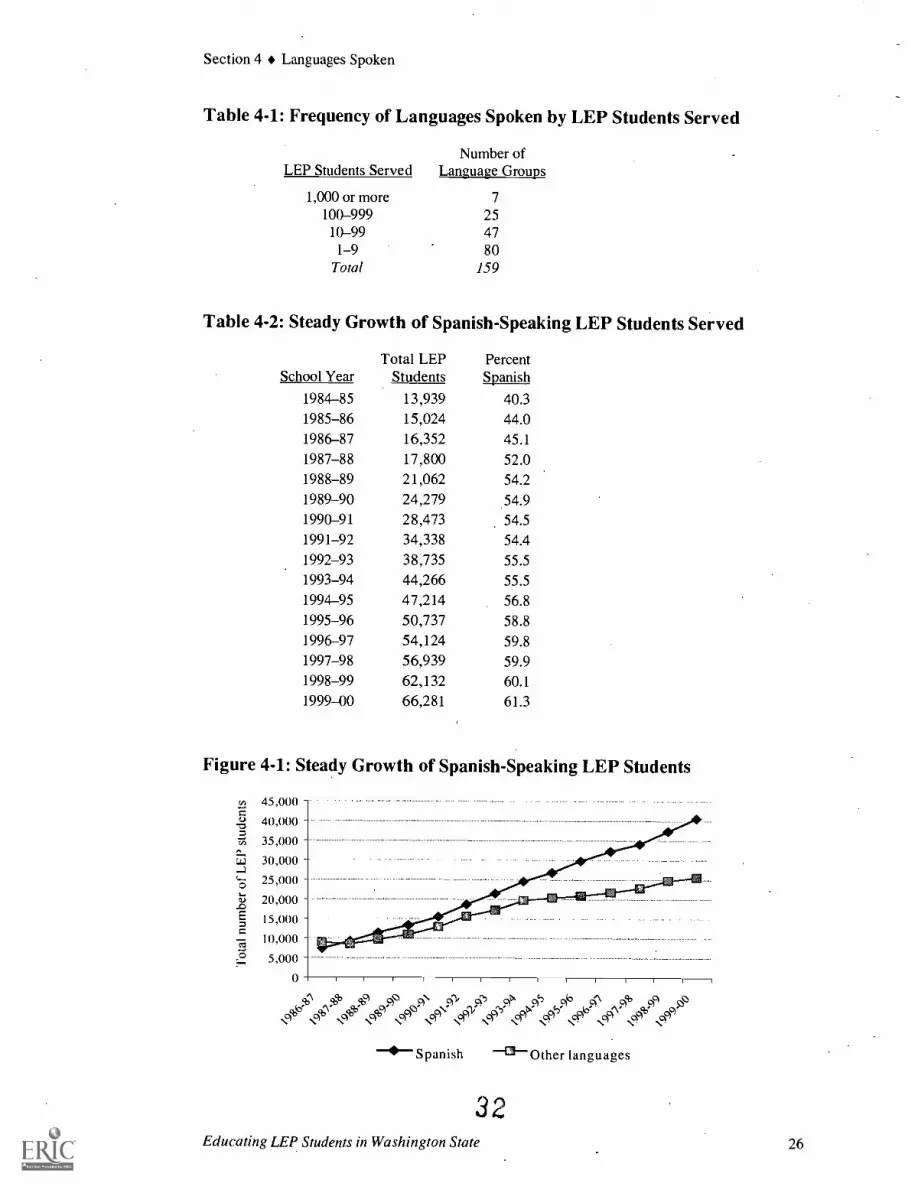
A total of 159 languages were represented in the program, 10 fewer than inthe previous year. However, 85 percent of the students spoke either Spanishor one of six other languages. Some districts have many different languagesspoken among their LEP students, while many other districts serve only LEPstudents whose primary language is Spanish. The number of studentsspeaking some languages has grown dramatically, while the numberspeaking other languages has declined.
NUMBER OF STUDENTS SPEAKING VARIOUS. LANGUAGES
A total of 159 primary, non-English languages were represented among thestudents served by the program in school year 1999-00.27 For the last 13 years,students speaking Spanish accounted for more LEP students than studentsspeaking all the other languages combined. In school year 1999-00, Spanish wasthe primary language spoken by 61 percent of all LEP students. While thepercentage of Spanish speaking students in Washington has gradually increased ata steady pace, the percentage is still less than the national averageabout 75percent of LEP students speak Spanish nationwide.
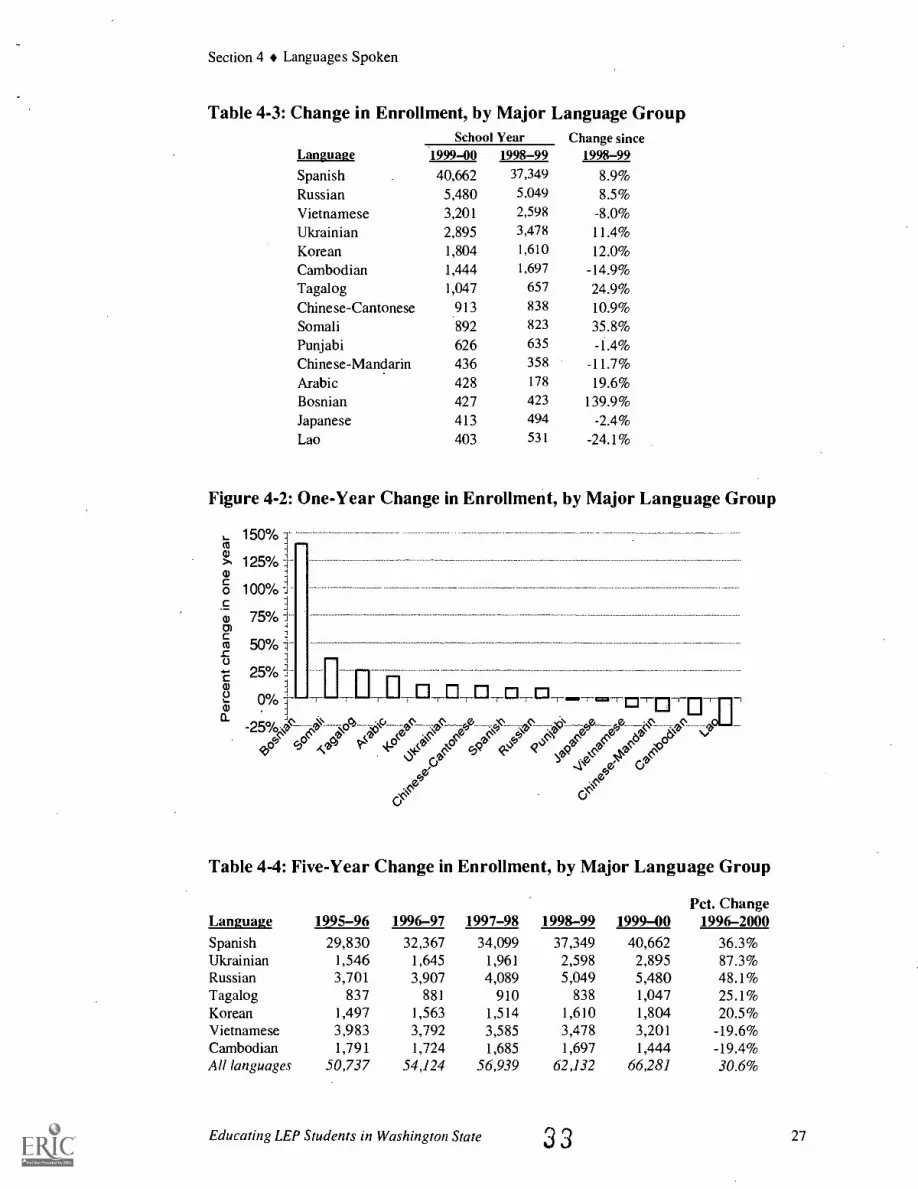
Besides Spanish, six other languages were spoken by at least 1,000 students inWashington: Russian, Vietnamese, Ukrainian, Korean, Cambodian, and Tagalog.About 24 percent of all Washington LEP students spoke one of these sixlanguages. In contrast, over half of the 159 languages were spoken by less than 10students statewide.
Overall, the rate of increase in the number of students speaking languages otherthan Spanish has slowed. Nevertheless, the number of students speaking somelanguages has risen rapidly. For example, in one year the number of LEP studentsspeaking Somali increased about 36 percent and the number speaking Bosnianincreased 140 percent. On the other hand, the number speaking the majorsoutheast Asian languages (Vietnamese, Cambodian, and Lao) all had largedeclines. These fluctuations are closely related to the timing of when refugeesarrived in the United States.
The following tables and figures provide more information on the number ofstudents speaking the various languages represented in the program. Appendix Blists the number of students speaking the different languages in the program.
27 Some districts could not identify the names of the languages spoken by their LEP students, sothere may be more than 159 languages spoken by LEP students statewide.
Educating LEP Students in Washington State 25
Section 4 Languages Spoken
Table 4-1: Frequency of Languages Spoken by LEP Students Served
Number ofLEP Students Served Language Groups
1,000 or more 7
100-999 2510-99 47
1-9 80Total 159
Table 4-2: Steady Growth of Spanish-Speaking LEP Students Served
School YearTotal LEP
StudentsPercentSpanish
1984-85 13,939 40.31985-86 15,024 44.01986-87 16,352 45.11987-88 17,800 52.01988-89 21,062 54.21989-90 24,279 54.91990-91 28,473 54.51991-92 34,338 54.41992-93 38,735 55.51993-94 44,266 55.51994-95 47,214 56.81995-96 50,737 58.81996-97 54,124 59.81997-98 56,939 59.91998-99 62,132 60.1
1999-00 66,281 61.3
Figure 4-1: Steady Growth of Spanish-Speaking LEP Students
45,000
40,000
35,000
30,000
25,000
20,000
15,000
10,000
5,000
0
\ A 4, to cb ,A'ID % ofcc'
c)e of' 0" N! ea, a, e) es es q es ese,) es e) es es es a e) es q es es
4 Spanish 43Other languages
32Educating LEP Students in Washington State 26
Section 4 Languages Spoken
Table 4-3: Change in Enrollment, by Major Language GroupSchool Year Change since
Language 1999-00 1998-99 1998-99
Spanish 40,662 37,349 8.9%Russian 5,480 5,049 8.5%Vietnamese 3,201 2,598 -8.0%Ukrainian 2,895 3,478 11.4%Korean 1,804 1,610 12.0%Cambodian 1,444 1,697 -14.9%Tagalog 1,047 657 24.9%Chinese-Cantonese 913 838 10.9%Somali 892 823 35.8%Punjabi 626 635 -1.4%Chinese-Mandarin 436 358 -11.7%Arabic 428 178 19.6%Bosnian 427 423 139.9%
Japanese 413 494 -2.4%Lao 403 531 -24.1%
Figure 4-2: One-Year Change in Enrollment, by Major Language Group
150%
125%
100%
75°/0
50%
25%1-LIFr.
-25%.\eP CP) ..4\ oP.(. _6 Ns,
tks-2 A V .0' 17).
t- e 4(L ,?)9 4,0
eC.) o
ee
4.4
0000oommm mm mmmol'immarum
Table 4-4: Five-Year Change in Enrollment, by Major Language Group
Language 1995-96 1996-97 1997-98 1998-99
Spanish 29,830 32,367 34,099 37,349Ukrainian 1,546 1,645 1,961 2,598Russian 3,701 3,907 4,089 5,049Tagalog 837 881 910 838Korean 1,497 1,563 1,514 1,610Vietnamese 3,983 3,792 3,585 3,478Cambodian 1,791 1,724 1,685 1,697All languages 50,737 54,124 56,939 62,132
Educating LEP Students in Washington State 33
Pct. Change1999-00 1996-2000
40,662 36.3%2,895 87.3%5,480 48.1%1,047 25.1%1,804 20.5%3,201 -19.6%1,444 -19.4%
66,281 30.6%
27

Section 4 Languages Spoken
Figure 4-4: Some Languages Increase While Others Decline5,500
5,000
4,500
4,000
3,500
3,000
2,500
2,000
1,500
1,000
500
0
Ukrainian Russian Taga og Korean Vietnamese Cambodian
0 1995-96 n 1996-97 01997-98 01998 -99 1999-00
Figure 4-5: Five-Year Growth of LEP Students, Selected Languages
100%87.3%
80%
60%
36.3%
48.1%
40%
20%
30.6%25.1
20.5%
0%
All Spanish Ukrainian Russian Tagalog Koreanlanguages
-20% .Mal!
-19.4% 9.6%Cambodian Vietnamese
WIDE DISPARITY IN THE NUMBER OF LANGUAGES
Some districts provide instruction to LEP students speaking many differentlanguages. In school year 1999-00, 19 districts served students that spoke morethan 20 languages (see Table 4-5). In contrast, some districts serve many studentswho speak the same language-56 districts had at least 20 LEP students and morethan 95 percent of their LEP students speaking Spanish (see Table 4-6). Figure 4-6 shows how the number of languages served varied considerably in school year1999-00. Appendix D provides more information on the number of languagesspoken in the districts.
3 4
Educating LEP Students in Washington State 28

Section 4 Languages Spoken
Table 4-5: Districts Serving More Than 20 Languages (School Year 1999-00)
District Number ofLanguages
Total LEPEnrollment
LEP Enrollment toLanguages Ratio
1. Kent 72 2,611 36.32. Seattle 59 5,447 92.33. Edmonds 55 1,430 26.04. Bellevue 50 1,758 35.25. High line 49 1,789 36.56. Lake Washington 47 1,245 26.57. Renton 47 841 17.98. Shoreline 45 561 12.59. Federal Way 44 1,838 41.8
10. Vancouver 38 2,121 55.811. Tukwila 36 688 19.112. Northshore 36 443 12.313. Mukilteo 35 1,403 40.114. Evergreen (Clark) 33 1,004 30.415. Spokane 33 899 27.216. Tacoma 31 2,029 65.517. Everett 31 1,135 36.618. Clover Park 25 691 27.619. Bellingham 22 425 19.3
Table 4-6: Districts With at Least 95 Percent LEP Students Speaking Spanish'(School Year 1999-00)
District Total LEPStudents
TotalSpanish-Speaking
LEP StudentsPercentSpanish
1. Yakima 4,600 4,556 99.0%2. Pasco 3,914 3,779 96.6%3. Wenatchee 1,343 1,308 97.4%4. Sunnyside 1,211 1,203 99.3%5. Wapato 1,032 1,014 98.3%6. Othello 978 973 99.5%7. Wahluke 885 884 99.9%8. Prosser 636 633 99.5%9. Quincy 628 624 99.4%10. Walla Walla 630 607 96.3%11. Burlington-Edison 549 540 98.3%12. Royal 536 536 100.0%13. Grandview 518 517 99.8%14. North Franklin 504 496 98.1%'15. Brewster 469 469 100.0%16. Bridgeport 344 344 100.0%17. Granger 340 340 100.0%18. Lake Chelan 323 317 98.1%19. Warden 309 308 99.7%20. Mabton 268 268 100.0%21. Manson 261 261 100.0%22. Highland 229 227 99.1%23. White Salmon 223 222 99.6%24. Okanogan 184 184 100.0%25. East Valley (Yakima) 152 152 100.0%26. Orondo 147 147 100.0%Continued on next page
Educating LEP Students in Washington State 3 5 29

Section 4 Languages Spoken
TotalDistrict Total LEP Spanish-Speaking Percent
Students LEP Students Sputish27. Kiona-Benton 139 137 98.6%28. Oroville 120 120 100.0%29. Selah 121 120 99.2%30. Shelton , 122 118 96.7%31. Mount Adams 118 118 100.0%32. Prescott 118 118 100.0%33. Cashmere 115 115 100.0%34. Naches Valley 97 95 97.9%35. Zillah 94 94 100.0%36. Sedro Woolley 97 93 95.9%37. Tonasket 90 90 100.0%38. Union Gap 88 88 100.0%39. West Valley (Yakima) 89 85 95.5%40. Omak 79 77 97.5%41. Chehalis 76 75 98.7%42. Entiat 52 52 100.0%43. Dayton 45 45 100.0%44. Kittitas 45 45 100.0%45. Palisades 45 45 100.0%46. La Conner 43 43 100.0%47. Touchet 42 42 100.0%48. Finley 41 41 100.0%49. Pateros 39 39 100.0%50. Enumclaw 37 37 100.0%51. Quinault Lake 37 37 100.0%52. Woodland 36 36 100.0%53. Conway 35 34 97.1%54. Waterville 34 34 100.0%55. Sequim 31 31 100.0%56. Lind 28 28 100.0%
Total 23,366 23,041 98.6%
Only districts serving at least 20 LEP students are listed. A total of 13 districts servingfewer than 20 LEP students have only Spanish-speaking students in the program.
Figure 4-6: Number of Languages Served Among Districts
70
60
50
40
30
20
I0
0
2620 19
10
2-5 6-10 11-15 16-20 21 +
Number of Languages Served
36Educating LEP Students in Washington State 30
LENGTH OF STAY ANDACADEMIC PERFORMANCE
SECTION 5
The state program is intended to provide temporary support services for up tothree years until LEP students can develop adequate English language skills.Concerns have been raised about students staying in the program longer thanthree years. While most students have been in the program no more than twoyears, about 28 percent had been in the program for more than three years,and about 10 percent had been in the program from more than five years.
The length of stay in the program depends not only on a student's Englishlanguage ability but also on how students perform on academic tests. LEPstudents tend to have lower scores on achievement tests. Many factors affecthow students perform on tests, so these factors affect their length of stay inthe program as well. Some students tend to stay in the program longer, suchas those from low-income families, those with little previous education andlow English language proficiency when entering the program, and thoseserved by special education and migrant programs. Students speaking certainlanguages tend to stay in the program longer. Program-related factors mayaffect a student's length of stay as well, such as the quality or type of programadministered, the extent to which the primary language is used in instruction,and the relative ease with which students enter and exit the program.
BACKGROUND
The purpose of the program is to provide temporary services for up to three yearsuntil LEP students can develop adequate English language skills. Thus,instruction is provided in a "transitional" program. As discussed in Section 2,students are eligible to enter the program if they score below a certain level on anoral language proficiency test. Each year districts reassess their LEP students todetermine if they can continue in the program. Eligibility ends when a studentscores above the 35th percentile in the reading and language arts portions of anapproved norm-referenced written test. Students cannot stay in the program morethan three years unless their English language skills remain below the 35thpercentile. Districts must have empirical evidence to keep a student in theprogram for more than three years.
Concerns have been raised about the length of time students spend in the program.Each LEP student generates extra funding for the district, and the number ofstudents in the program continues to grow at a faster pace than the overall studentpopulation. The growth in the program can be a result of many factors, as discussedin Section 3. However, many students stay in the program for more than theintended three years, which contributes to the growing number of students served.
Educating LEP Students in Washington State 31
J7

Section 5 Length of Stay & Academic Performance
OSPI examined various issues related to the length of stay of students served bybilingual and ESL programs. Specifically, we examined the amount of time thatstudents spend in the program, the impact that programs for LEP students have ontheir academic achievement and the length of stay in these types of programs, andfactors that influence the length of stay. This section contains information related tothese issues based on analyses of district and student-level data and publishedresearch.
LEP STUDENTS LEAVING AND REMAINING IN THE PROGRAM
LEP students leave the program in several ways. They can be transitioned out ofthe program by meeting the exit performance criteria. A student meeting the exitcriteria is expected to perform adequately in a regular, all-English classroom. Astudent can also leave the program by either graduating or dropping out of school.Finally, some students leave for other reasons.
Approximately 25 percent of the LEP students served during school year 1999-00left the program. Ten percent (6,619) were either transitioned out of or graduatedfrom the program. (Appendix C lists this information by each district.) Another 15percent (9,855) left for other reasons. Tables 5-1 and 5-2 provide moreinformation about the number of LEP students leaving the program.
Table 5-1: Status of Students Served in the Last Five Years
Percent1995-96 1996-97 1997-98 1998-99 1999-00 of Total
Exited program 12,045 13,379 13,824 13,898 16,474 24.9%Graduated 1,173 1,194 1,080 1,117 1,221 1.8%Transitioned 3,919 4,102 5,007 5,095 5,398 8.1%Dropped out 1,043 1,018 1,297 1,079 1,365 2.1%Unknown/other reasons 5,910 7,065 6,440 6,607 8,490 12.8%
Continuing in program 38,682 40,745 43,115 48,234 49,807 75.1%Promoted 37,683 39,745 41,678 46,674 47,959 72.4%Retained 1,009 1,000 1,437 1,560 1,848 2.8%
Total LEP students served 50,737 54,124 56,939 62,132 66,281 100.0%
Table 5-2: Number and Percent of Students Transitioned or Graduated fromthe Program by Time in Program (School Year 1999-00)
Time in ProgramNumber
Served
Number of LEPStudents Transitioned
or Graduated'
Percent of TotalNumber Served
(66,281)
Percent of NumberServed, by Time
in ProgramLess than 1 year 22,359 1,199 1.8% 5.4%1-2 years 15,805 1,638 2.5% 10.4%2-3 years 9,640 1,369 2.1% 14.2%3-4 years 6,904 955 1.4% 13.8%4-5 years 4,646 643 1.0% 13.8%More than 5 years 6,927 815 1.2% 11.8%Total 66,281 6,619 10.0% 10.0%
1 Does not include others who exited the program through other means.
Educating LEP Students in Washington Skate 32
38
Section 5 Length of Stay & Academic Performance
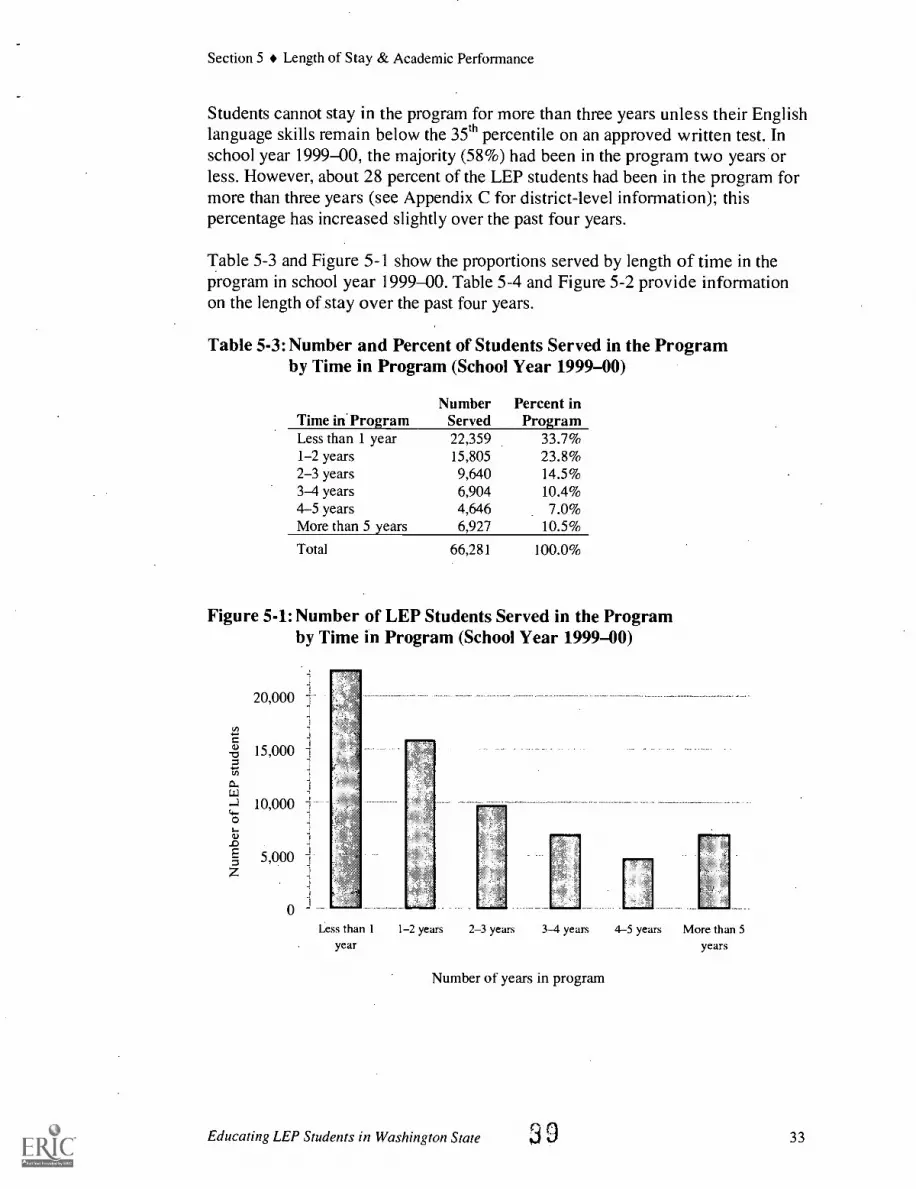
Students cannot stay in the program for more than three years unless their Englishlanguage skills remain below the 35th percentile on an approved written test. Inschool year 1999-00, the majority (58%) had been in the program two years orless. However, about 28 percent of the LEP students had been in the program formore than three years (see Appendix C for district-level information); thispercentage has increased slightly over the past four years.
Table 5-3 and Figure 5-1 show the proportions served by length of time in theprogram in school year 1999-00. Table 5-4 and Figure 5-2 provide informationon the length of stay over the past four years.
Table 5-3: Number and Percent of Students Served in the Programby Time in Program (School Year 1999-00)
Time in.ProgramNumber
ServedPercent inProgram
Less than 1 year 22,359 33.7%1-2 years 15,805 23.8%2-3 years 9,640 14.5%3-4 years 6,904 10.4%4-5 years 4,646 7.0%More than 5 years 6,927 10.5%
Total 66,281 100.0%
Figure 5-1: Number of LEP Students Served in the Programby Time in Program (School Year 1999-00)
20,000
15,000
Less than 1 1-2 years 2-3 years 3-4 years 4-5 years More than 5year
Number of years in program
Educating LEP Students in Washington State 3 0
years
33

Section 5 Length of Stay & Academic Performance
Table 5-4: Trend in the Number of Students Served in the ProgramTime inProgram 1996-97 1997-98 1998-99 1999-00< 1 year 18,943 19,228 21,862 22,3591-2 years 13,531 13,589 13,869 15,8052-3 years 9,742 9,190 9,331 9,6403-4 years 4,871 6,240 6,386 6,9044-5 years 3,247 3,417 4,246 4,646> 5 years 5.275 5.275 6.438 6.927Total 54,124 56,939 62,132 66,281
Figure 5-2: Trend in the Percentage of Students Served More Than Three Years
35%
30%
25%
20%
15%
10%
5%
0%
Enrolled > 5 years Enrolled 4-5 years
1996-97 01997-98
Enrolled 3-4 years
1998-99 01999-00
Enrolled > 3 years
1996-97 1997-98 1998-99 1999-00Enrolled more than 3 years 24.7% 26.2% 27.5% 27.9%
Enrolled 3-4 years 9.0% 11.0% 10.3% 10.4%Enrolled 4-5 years 6.0% 6.0% 6.8% 7.0%Enrolled > :5 years 9.7% 9.3% 10.4% 10.5%
TEST SCORE TRENDS
The length of stay in the state program depends not only on a student's Englishlanguage ability but also on performance on academic tests. Research has foundthat children do not learn a second language effortlessly and that they may requiremany years to reach grade-level academic ability in the new language. Many LEPstudents may be able to speak and understand English, but they may haveproblems reading and writing English proficiently.
Thus, students who are not proficient in using the English language have a higherrisk of academic failure. Often they do not profit fully from instruction in English,and many LEP students have low levels of academic performance in English,have higher rates of grade retention, and have much higher dropout rates thantheir English-fluent peers. An analysis of student performance in Washington
Educating LEP Students in Washington State 34
4 0

Section 5 Length of Stay & Academic Performance
shows a clear relationship between the level of LEP students in a district anddistrict averages on various state assessments. The results of the Grade 4 and 7WASL show that when the level of LEP students in a district is greater than 15percent, the percentage of students meeting the standard in both mathematics andreading declines rapidly (see Figures 5-3 and 5-4). The same pattern exists inother grades for other tests (see Table 5-5).
Figure 5-3: Districts With Higher Levels of LEP Students Have Lower Levelsof Students Meeting Math Standards (School Year 1999-00)
50
40
30
20
10
0State < =5 > 5 & <= 10 > 108,;<=- 15 > 15 &<= 20 >20&<=-5 >25
District percent of LEP students
['Math 4th grade (3 Math 7th grade
Figure 5-4: Districts With Higher Levels of LEP Students Have Lower Levelsof Students Meeting Reading Standards (School Year 1999-00)
70360
50oA
.F. 40
30
20
10
0State <=5 >5 &<= 10 > 10&<= 15 >15 (4:<= 20 >20&<=25 >25
District percent of LEP students
Reading 4th grade 0 Reading 7th grade
41Educating LEP Students in Washington State 35

Section 5 Length of Stay & Academic Performance
Table 5-5: Test Scores Decline as District LEP Percentage Increases2X(School Year 1999-00)
Percent MeetingWASL Standard
State Percentage of District LEP Students
Average < 5 >5 & <10 >10 & <15 >15 & <20 >20 & <25 >25
Grade 4 math 41.6 44.7 40.9 42.0 30.5 24.6 18.4Grade 7 math 28.2 30.3 27.6 28.9 19.1 18.0 11.9
Grade 4 reading 65.4 69.2 65.5 62.3 53.9 49.3 38.3Grade 7 reading 41.5 44.9 39.1 38.3 33.4 29.9 19.5
3-yr WASL Avg.Grade 4 math 36.8 39.7 35.4 36.2 27.1 20.5 14.8Grade 7 math 24.2 26.0 23.4 24.4 17.0 13.9 9.4
Grade 4 reading 60.2 63.9 59.0 56.1 47.1 43.2 33.3Grade 7 reading 40.2 43.4 38.0 36.6 33.2 26.5 19.4
ITBS Percentile
Grade 3 math 63 63.6 60.3 65.6 51.1 39.9 38.0Grade 6 math 56 57.9 54.5 58.0 46.2 40.5 37.6
Grade 3 reading 56 57.9 53.6 57.5 41.3 37.6 31.2Grade 6 reading 54 56.4 51.0 55.0 40.4 38.5 29.2
Pct. Low-Income 31.1% 25.3% 34.1% 42.2% 48.8% 58.5% 65.7%
RELATIONSHIP WITH FAMILY INCOME
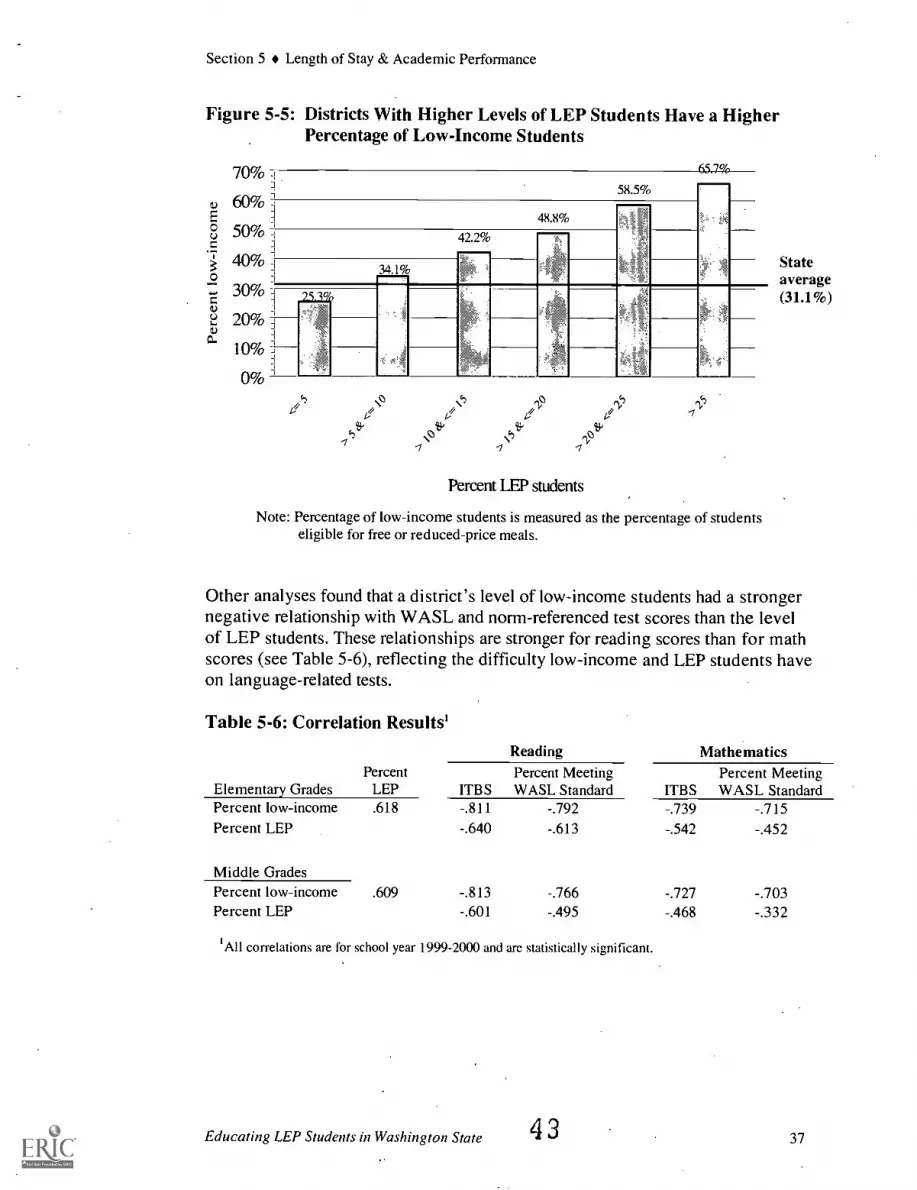
Many factors affect how a student performs on a test, so many factors affect theirlength of stay in the program. Research has consistently shown that test scores areclosely linked to family income-students from low-income families tend to scorelower on achievement tests than students from wealthier families. Districts andschools that have a higher percentage of LEP students also tend to have a higherpercentage of students from low-income families (see Figure 5-5)29 Whilestudents who are either poor or have limited English proficiency are more at risk,having both characteristics greatly increases their likelihood of educationalfailure.3° We found that LEP students in schools with higher levels of low-incomefamilies tended to stay in the program longer, even though they do not enter theprogram with lower language proficiency scores. Districts and schools that havehigher percentages of both LEP and low-income students face a stiffer challengein having all students meet high standards than do districts and schools with lowerproportions of such students.
28 Weighted averages are shown for all 296 districts.29 The correlation between a district's percentage of LEP students and percentage of low-incomestudents was .618.3° Unpublished results from the Early Childhood Longitudinal Study, National Center forEducation Statistics, U.S. Department of Education, February 2000. Additional factors that canplace a student at risk include being from a home with a single parent and being from a home thathas a low level of parental education (e.g., high school dropout).
Educating LEP Students in Washington State 36
42
Section 5 Length of Stay & Academic Performance
Figure 5-5: Districts With Higher Levels of LEP Students Have a HigherPercentage of Low-Income Students
a)
E0Ua
0
Ca)
a)a.
70%J.
60% 1.
50%J
40% :1=
30%
20%
10%
0%
58.5%
65 7 °%
48.8%
42.2%
34.1%
.25.404,
c-,1'1' e '1'De e
o59' We t'-
Percent I EP students
tih
Note: Percentage of low-income students is measured as the percentage of studentseligible for free or reduced-price meals.
Stateaverage(31.1%)
Other analyses found that a district's level of low-income students had a strongernegative relationship with WASL and norm-referenced test scores than the levelof LEP students. These relationships are stronger for reading scores than for mathscores (see Table 5-6), reflecting the difficulty low-income and LEP students haveon language-related tests.
Table 5-6: Correlation Results'
Percent
Reading MathematicsPercent Meeting Percent Meeting
Elementary Grades LEP ITBS WASL Standard ITBS WASL StandardPercent low-income .618 -.811 -.792 -.739 -.715Percent LEP -.640 -.613 -.542 -.452
Middle GradesPercent low-income .609 -.813 -.766 -.727 -.703Percent LEP -.601 -.495 -.468 -.332
'All correlations are for school year 1999-2000 and are statistically significant.
Educating LEP Students in Washington State 43 37
Section 5 Length of Stay & Academic Performance
IMPACT OF PROGRAMS ON ACADEMIC ACHIEVEMENTAND LENGTH OF STAY
One criterion that has been used to assess the effectiveness of educational modelsserving LEP students has been their "length of stay" in the particular programs inquestion. This raises two issues: (1) how long it takes to learn academic English,and (2) the impact of instruction in a student's primary language on the ability tolearn English. Appendix E provides more information on these issues.
Developing Proficiency in "Academic English" Takes Years
For many LEP students, schools provide their first significant contact withEnglish. Several major studies have emphasized the long-term nature of learningEnglish. Since the language used in school is unique and becomes increasinglycomplex as students progress from one grade to the next, the task of achievingproficiency in academic English becomes even more difficult.
Numerous studies have found that it takes more than three years for LEP studentsto achieve academic proficiency in English. LEP students, especially those atintermediate levels of language development, exhibit a large discrepancy betweenoral language development and reading and writing skills. One researcher recentlyfound that for LEP students who enter school in kindergarten, it is not until the 5'grade that lagging reading and writing abilities merged with oral abilities.3IOthers have found that it takes even longer to achieve grade-level proficiency inacademic subjects in another language. Even under ideal language learningconditions (e.g., advantaged students, support of the home language, andcognitively demanding curriculum), the process can take up to ten years forstudents to fully develop an academic knowledge of English.
Effect of Instruction in the Primary Language on Length of Stay
Most research suggests that continued development of the first language plays apositive and significant role in successful second-language development. Studieshave found that proficiency in a student's primary language is a predictor in theirfuture English-language development and that instruction in the primary languagedoes not hinder English-language development. In general, research has found thefollowing regarding the academic achievement of LEP students, which affects thelength of stay in Washington's program.
The greater a student's proficiency in the primary language, the more likely thestudent will become proficient in English in the future.The use of primary-language instruction with LEP students contributes to theirdevelopment of and academic achievement in English.Instructing LEP students only in English does not in and of itself result insuperior achievement in English.
31 Setting Expected Gains For Non And Limited English Proficient Students, De Avila, E.,National Center for Bilingual Education, Resource Collection Series (8), 1997.
Educating LEP Students in Washington State 38

Section 5 Length of Stay & Academic Performance
Children in effectively implemented bilingual programs develop language andliteracy skills in two languages and benefit from the transfer of these skillsacross languages.
States are taking different approaches to educating LEP students. The citizens ofCalifornia recently passed a proposition that effectively eliminated bilingualeducation (see box below). Texas has taken the opposite approach, expandingbilingual education in light of recent research findings (see box on next page).
California's Proposition 227
In June 1998 California voters passed Proposition 227 which was to end bilingual education.The law required all children in California public schools "to be taught English by beingtaught in English." Voters had the perception that instruction provided in students' primarylanguage hindered the acquisition of English and was responsible for poor academicachievement among LEP students. (In 1998, less than one-third of California's 1.5 millionLEP students were enrolled in a bilingual program taught by a teacher who had bilingualcredentials, so their low academic scores could not be attributed to bilingual programs.)
Children now entering California's public schools with very little English are to be"observed" for 30 calendar days. This generally occurs in an English-language classroom.After 30 days, school personnel must decide if a child has enough fluency in English tomanage in a mainstream English classroom. If not, the student is eligible to receive one yearof "Sheltered English Immersion," a program of English language instruction that requiresinstruction to be "nearly all" in English (the definition of "nearly all" is left to the district'sdiscretion). After one year, children are expected to integrate into mainstream Englishclassrooms where instruction is required to be "overwhelmingly" in English. Teachers anddistrict personal face legal liability if they do not implement the law fully.
The only legal alternative is through a parental waiver process. Children with speciallanguage needs, or whose parents request it, can be placed in "Alternative Programs," mostlikely some form of bilingual program that includes instruction in the child's primarylanguage. The child must first go through the 30-day observation period. Some districts,particularly those with longstanding bilingual programs, have pursued district-wide waiversin order to maintain their existing programs.
When California released its test scores in August 2000, several national newspapers ranstories about how LEP students had higher scores, "proving" the success of the approach.However, further analysis of the test data found that the approach may not be working.
Scores of native English speakers rose as well, just like those of LEP students.Scores rose in districts that retained bilingual education.Scores rose more among native English speakers from low-performing schools thanamong LEP students in those schools.If the English-immersion approach worked, California should have seen a dramaticincrease in the number of LEP students "redesignated" as being fluent in English thenext year. However, after two years the annual redesignation rate had improved less thanone percentage point (from 7.0 to 7.8 percent). Some districts that kept bilingualeducation have rates above the state average, while districts that eliminated bilingualprograms and were touted by newspapers as "proving" the success of the approach haverates below the state average.
Educating LEP Students in Washington State45
39

Section 5 Length of Stay & Academic Performance
Since learning academic English takes many years, any evaluation of the merits ofdifferent educational approaches needs to examine their long-term effects. Oneongoing longitudinal study has examined the academic performance of studentswho entered kindergarten with no proficiency in English and who came from alow socioeconomic background.32 The study found that academic achievement ofstudents was about the same through grade 3, regardless of the type of programapproach. However, student achievement by grade 11 was much greater for thosewho had been in elementary school programs that provided significant instructionin their primary language for 4-6 years (see Figure 5-6).
Figure 5-6: Average Performance of Grade 11 Students Who StartedKindergarten as Non-English Speakers
70
6052
61
Nationalfor50 average
all students40 35
30 24
20
10
0
ESL pullout taught Early exit bilingual Late exit bilingual Two-waytraditionally education education developmental
bilingual educationSource: Thomas and Collier (1997)
The Texas Approach
Prior to this year, Texas policy mandated that districts with 20 or more LEP studentsspeaking the same language in the same grade must provide bilingual instruction, in eitheran "early" or "late" exit program. These two exit programs provide students instruction intheir primary language, to a diminishing degree, over either three or five years. (Districtsmust provide ESL instruction if they do not meet the 20-student criterion.) In response to theresearch of Thomas and Collier, Texas has eliminated the "early exit" option. Districts arenow providing instruction in students' primary language over a longer period of time and thetransition to ESL or English-only classes takes place at a slower pace. The state is alsoconsidering the elimination of traditional ESL pullout programs.
Texas is making changes related to the training of "regular" classroom teachers as well. Itnow pays the full tuition for teachers interested in obtaining an ESL and/or bilingualendorsement and who will teach LEP students. The state's goal is to have all classroomteachers fully endorsed in ESL instruction. Many teacher education programs in Texas arenow requiring all new teachers to have at least six credits of ESL training.
32 School Effectiveness For Language-Minority Children, Thomas, W., & Collier, V., NationalClearinghouse for Bilingual Education, December 1997. The same results were found with othercohorts of students with similar backgrounds.
Educating LEP Students in Washington State46 40

Section 5 Length of Stay & Academic Performance
While time and resources limited the scope of our analysis of these issues inWashington, we found similar patterns when analyzing data on more than 15,000LEP students. As noted in Section 2, we found that students who were receivingsignificant instruction in both their primary language and in English averaged lesstime in the program than those who received less instruction in their primarylanguage.
OTHER FACTORS INFLUENCING LENGTH OF STAY
In addition to the family background and the type of educational approach used,other factors can contribute to the number of students staying in the programbeyond three years in Washington.
Students can enter the program more easily than they can exit the program.Oral language abilities are assessed to enter the program, but academic criteria,based on a written test, are used to exit the program. LEP students generallyscore below their English-speaking peers on academic tests. As noted above,LEP students often come from low-income families. Thus, students may stay inthe program for general academic reasons apart from their English-languageproficiency.
Poorly implemented programs will not educate LEP students as effectively aswell-run programs that use proven language acquisition strategies. Researchhas been hampered by a lack of information on the quality of programs. Poorlyrun programs will cancel out the effects of successful programs in evaluationstudies.
The quality of instruction and the level of expectations can affect the length ofstay. Students with well-qualified teachers who have high expectations tend tohave higher levels of academic achievement.
Districts in Washington that serve many LEP students tend to have an averagelength of stay that is longer than districts serving fewer students.33 The reasonfor this trend is unclear. Perhaps districts with a large number of students in theprogram may have difficulty finding enough qualified staff to meet students'needs. These districts may rely more heavily on the regular classroom teacher,who may not be sufficiently trained, to provide instruction to LEP students.
Some LEP students simply take longer to achieve English proficiency thanothers. Based on our analysis of data provided by 46 districts on over 15,000LEP students, we found the following patterns:34
Students who arrive with little or no formal education average more time inthe program than those who have received some previous education.
33 Different analyses examining the relationship between length of stay and the number of LEPstudents served all found the same positive relationship and were all statistically significant.34 Results from multiple regression analyses and correlations were statistically significant.
Educating LEP Students in Washington State 47 41

Section 5 Length of Stay & Academic Performance
Students who speak the languages of less-developed countries tend to beenrolled longer in the program than other LEP students who speak thelanguages of more-developed countries. Students from more-developedcountries may have had some exposure to English or another secondlanguage before entering American schools; students from less-developedcountries may be affected by socioeconomic factors that are closely linked tolower test scores, as discussed earlier in this section.Migrant LEP students and those in special education programs tend to beenrolled in the program longer.Students who enter the program with lower language proficiency scoresstay in the program longer. These students simply have more to learn,which affects their time in the program.
Some research has found that students of different ages learn a second language atdifferent speeds. For example, immigrant students under age 12 with at least twoyears of education in their native country reach average achievement levels in fiveto seven years. However, students older than age 12 who face challenging subjectmatter in a second language may take as long as ten years to catch up. While olderstudents were in the program in Washington longer than younger students, thismay be due to the fact that younger students had already left the program, leavinga relatively few older students in the program who have been served for a longerperiod of time. Without longitudinal analyses of entry and exit data for studentsserved by the program, we cannot determine if age is related to length of stay.Studies of how age affects language acquisition have come to differentconclusions.
48
Educating LEP Students in Washington State 42

CONCLUSION AND NEXT STEPSSECTION 6
The previous sections raise a number of issues that have implications about theway the program is designed and implemented. Some work is underway toaddress some of these issues. For example, a bilingual advisory committee isexploring the possibility of (1) selecting one test to determine program eligibility,(2) developing English language achievement standards to monitor studentprogress toward English fluency, and (3) designing a data collection system thatwould enable ongoing assessment and monitoring of program effectiveness. Inaddition, the State Auditor is examining a sample of districts to determine theextent to which students are transitioned out of the program properly.
Discussion needs to occur about other issues as well. This section describes someof the implications of this report and the types of research that need to beconducted in the future in order to improve the effectiveness of the program andultimately the performance of LEP students.
STUDY IMPLICATIONS
Research has shown the benefit of academic instruction in a student's primarylanguage while the student learns English, both in terms of the impact on thelength of stay in the program and the future academic success of LEP students.However, the sheer number of languages spoken in many districts and a shortageof well-trained staff who can provide bilingual or ESL instruction potentiallymakes LEP students more at risk of failing to meet the state's high academicstandards. Thus, ways need to be found to improve the instruction of the growingnumber of LEP students while operating under staff-related constraints.
Providing Primary Language Instruction: Recent comprehensive studies ofprograms serving LEP students confirm a strong positive relationship between theamount of instruction students receive in their primary language and (1) the rate atwhich they acquire English as a second language, and (2) the long-term academicachievement of LEP students. Linguistic development, cognitive development, andacademic development are interdependent processes and should all be supportedsimultaneously if educators are to succeed in developing deep levels of Englishproficiency among LEP students. So to the extent possible, schools need to provideLEP students with cognitively complex academic instruction through their firstlanguage for as long as possible, while providing cognitively complex instructionthrough the second language for part of the school day in increasing amounts asEnglish proficiency increases.
Educating LEP Student's in Washington State 49 43

Section 6 Conclusions and Next Steps
Improving the Quality of Curriculum: LEP students can and should beexpected to participate in high-quality curriculum. If a curriculum is properlydesigned for LEP students, they can learn challenging content in language arts,mathematics, and science while gaining literacy in English. Most schools tend totreat the education of LEP students as a remedial issue, assuming LEP studentsmust learn English before they can learn the standard curriculum designed for"mainstream" students. Exemplary schools studied by the U.S. Department ofEducation show that assumption is not warranted (see Appendix E).35 Thisrequires a shift from a teacher-centered to a student-centered instructionalphilosophy.
Improving Staff Quality: LEP students need access to properly qualified, highlyskilled teachers. Yet teaching aides continue to be responsible for the majority ofspecialized ESL instruction that LEP students receive. Moreover, LEP studentsare likely to spend most of their time with "regular" classroom teachers who haveneither the background nor training in educating second language learners.Districts can actively support schools with LEP students by helping with teacherand aide recruitment and by providing professional development opportunities toall staff who have contact with LEP students. OSPI can also explore ways to helpdistricts identify sources of additional funding to help address this issue. Theadditional funds could be used for various purposes, such as paying tuition costsassociated with ESL/bilingual coursework or providing a small stipend forteachers who acquire endorsements.
Focus on Program Components: Programs are a complex series of components,and programs that share the same "label" can vary greatly, both in terms of theseunderlying components and in terms of student achievement outcomes. A betterapproach to finding effective methods of educating LEP students is to go beyonda debate about broad program categories and identify district, school, andclassroom level factors that support the academic achievement of the students.
Improving Program Data: Each year OSPI collects information from districtsreceiving program funding, checks the data for internal consistency, and contactsdistricts when discrepancies were found. Nevertheles's, these district-level datahave a number of limitations. The student-level data collected as part of the stateassessments (e.g., WASL and ITBS) provide information about students enrolledin language-acquisition programs and the languages spoken, but problems havebeen found with the accuracy and completeness of these data as well. Studies ofprogram effectiveness for LEP students are often flawed because of: (1)inaccurate or misleading program labeling, or widely divergent implementation ofsimilarly labeled programs; (2) the lack of longitudinal data and randomsampling; and (3) the lack of classroom observations and interviews with programstakeholders (including school staff, students, parents, and community members).Current OSPI data collection forms ask for district-level data on instructional
35 For more information on the findings, conclusions, and case studies, see School Reform andStudent Diversity, Volumes I and II, U.S. Department of Education, April 1997.
Educating LEP Students in Washington State0
44
Section 6 Conclusions and Next Steps
focus and program delivery without regard to variations of implementation. Whenstudent-level data are aggregated to the district level, analyses of individualstudent characteristics cannot occur.
These data limitations make it difficult to conduct a comprehensive review ofprograms serving LEP students in Washington. Better data are needed at thestudent and school levels in order to answer questions related to programeffectiveness.
TOPICS FOR FUTURE RESEARCH
While many research questions need to be answered about the education of LEPstudents, answering two general questions would help determine the relativeeffectiveness of programs administered in Washington. These questions relate tohow various program and instructional approaches and the resources outside theschool (e.g., community involvement) impact both student achievement and thelength of stay in the program.
1. How do variations in program components and implementation impactacademic achievement and length of stay in programs serving LEPstudents in Washington State?
To answer this question, information needs to be collected at the school andstudent level using a mixture of qualitative and quantitative methodologies.Selecting a group of Washington schools for case study analyses (includingsurveys, interviews, and classroom observations) would allow for an analysis ofspecific program components and the quality of program implementation ratherthan comparing programs based on imprecise labels. In addition to providing acatalog of "best practices" that could be disseminated to schools that serve LEPstudents, a number of interesting questions could be answered using these data.For instance, once schools with particularly effective combinations of programcomponents have been identified, student-level data could be collected to form thebaseline for a longitudinal analysis of the length of stay and achievement in well-run programs. Another benefit of case studies of programs serving LEP studentsis that the information gathered will allow OSPI to amend end-of-year reportingforms to request more specific data from schools and districts with regard to thecomponents of programs that are actually in place in schools and districts inWashington State.
Undertaking other longitudinal studies using randomly selected students inprograms throughout the state would provide specific baseline data that wouldallow for the analysis of individual student characteristics upon program entry,during the time they spend in the program, and in the years following their exitfrom the program. The collection of data aggregated at the district level precludesthe possibility of analyzing the student characteristics (e.g., English-languageproficiency upon program entry, migrant or special education status, and
Educating LEP Students in Washington State
5145

Section 6 Conclusions and Next Steps
statewide assessment scores) of individuals who may exit "early" or "late" fromprograms. These analyses would also allow for comparisons with nationallongitudinal research which suggests that students in certain types of bilingualprograms make significant gains on norm-referenced English-languageachievement tests during the years following program participationgains thatare undetected by program evaluations focused on short-term achievement.
2. How do community resources devoted to English-language acquisition,and school-community partnerships supporting second-languagelearners, impact the success of LEP programs in schools?
Research has found that school-community connections are part of thecharacteristics of successful schools. However, LEP students have unique needsthan may require different forms of school-community partnerships. Schools inneighborhoods with programs that provide support to second-language learnersoutside of school are likely to have more success with those students in school.However, research to provide evidence of this likelihood is scarce. Case studies ofschools in such neighborhoods and of schools that have forged meaningfulpartnerships with community organizations would shed light on the relativeimportance of these connections in terms of English-language development,academic achievement, and length of stay for students in programs. Results of thistype of research would provide information to schools seeking to developrelationships with community-based organizations.
52
Educating LEP Students in Washington State 46

APPENDIX A
FEDERAL EDUCATION PROGRAMSSUPPORTING LEP STUDENTS
Various federal education programs can provide funding for LEP students. Thetable below describes these programs and the estimated funding amountsavailable nationally for school year 1999-00.
Table A-1: Federal Education Programs That Can Provide Support Servicesto LEP Students
Federal Program a
Education for DisadvantagedChildren (Title I)
FY 1999Funding (est.)b$7.7 billion
Program Description
Bilingual Education Act(20 USC 7401-7491)
Emergency ImmigrantEducation Program(20 USC 7541-7549)
Helps disadvantaged children succeed inschools. LEP students may participate if theycome from disadvantaged backgrounds andare at risk of failing in school or if they attenda school that has a schoolwide program.
$224 million Helps ensure that LEP students master Englishand develop high levels of academicattainment in content areas. Provides bothstate and local grants.
$150 million Provides grants to school districts withunexpectedly large increases in the studentpopulation due to immigration.
Migrant Education Program(20 USC 6391-6399)
Carl D. Perkins VocationalEducation and AppliedTechnology Act(20 USC 2301 et Seq.)Individuals with DisabilitiesEducation Act(20 USC 1400 et Seq.)
$355 million
$1.2 billion
$5.1 billion
Provides funds to states to help educate thechildren of migrant agricultural workers,including migratory fishers and dairy workers.Provides funds to improve the quality ofvocational education and provide access tovocational training to special populations,such as disadvantaged and disabled students.Supports special education for infants,toddlers, children, and youth with disabilities.
a Other federal programs may also support services to LEP students, so long as these studentsqualify to receive services under the programs' guidelines for participation.
b Estimate based on U.S. Department of Education Fiscal Year 1999 Budget.
Source: Public Education: Title I Services Provided to Students With Limited English Proficiency,U.S. General Accounting Office, December 1999.
Educating LEP Students in Washington State 53 47

APPENDIX B
LANGUAGES SPOKEN
Table B-1: Languages Spoken by LEP Students, by Number of Students
Students Language Students Language Students Language Students Language40,662 Spanish 51 Chinese-Fukienese 8 Kmhmu 2 Mongolian5,480 Russian 47 Indonesian 8 Malayalam 2 Navajo3,201 Vietnamese 43 Quileute 8 Swedish 2 Nyanja2,895 Ukrainian 38 Swahili 7 Kakwa 2 Pali1,444 Cambodian 37 Moldavian 7 Manchu 2 Pohnpeian1,804 Korean 32 Tongan 6 Bengali 2 Romansch1,047 Tagalog 26 Chamorro 6 Finnish 2 Slovak
913 Chinese-Cantonese 24 Turkish 6 Ibo 2 Suri892 Somali 23 Afrikaans 6 Pahlavi 2 Urian626 Punjabi 22 Estonian 6 Sudanese-Arabic 1 Berber436 Chinese-Mandarin 22 Fijian 5 Chao 1 Bisaya428 Arabic 20 Cebuano 5 Georgian 1 Chewa427 Bosnian 20 Haitian Creole 5 Kazakh 1 C.R. Sehapti413 Japanese 20 Tibetan 5 Krio 1 Coptic403 Lao 19 African 5 Nuer 1 Cowichan347 Sahaptian 18 Czech 5 Sinhalese 1 Dire333 Samoan 18 Italian 4 Acholi 1 Durcese330 Rumanian 17 Byelorussian 4 Creole 1 Eritai322 Hmong 17 Dutch 4 Icelandic (old) 1 Guarani242 Amharic 16 Burmese 4 Liberian 1 Jamaican230 Tigrinya 16 Cham 4 Twi 1 Kannada224 Serbo-Croation 16 Ethiopian 3 Akan 1 Kishinau208 Hindi 16 Norwegian 3 Croation 1 Kru190 Makah 15 Armenian 3 Igbo 1 Luo177 Mien 14 Greek-Modern 3 Luganda 1 Marquesan163 Farsi 14 Khmer 3 Malay 1 Native American145 Ilokano 13 Chuuk 3 Marathi 1 Nez Perce132 Thai 13 Hungarian 3 Mordvin 1 Nigerian120 Oromo 13 Lithuanian 3 Nepali 1 Ouolof118 German 12 Egyptian-Arabic 3 Trukese 1 Salish117 Kurdish 12 Gijarati 3 Yakima 1 Sao115 Urdu 12 Hebrew-Modern 2 Azerbaijani 1 Taishan
87 Bulgarian 12 Hoh 2 Bekol 1 Uigur85 French 12 Tilugu 2 Chungki 1 Ute84 Portuguese 11 Danish 2 Fallani 1 Yap77 Polish 11 Papago 2 Ga 1 Yoruba70 Albanian 11 Wolof 2 Hopi 58 Unknown62 Chinese-Taiwanese 10 Latvian 2 Inuktitut61 Toishanese 9 Pashto 2 Javanese56 Marshallese 9 Tamil 2 Kikuyu 159 languages55 Mixteco 8 Hawaiian 2 Kinyarwanda 66,281 students
Educating LEP Students'in Washington State 48
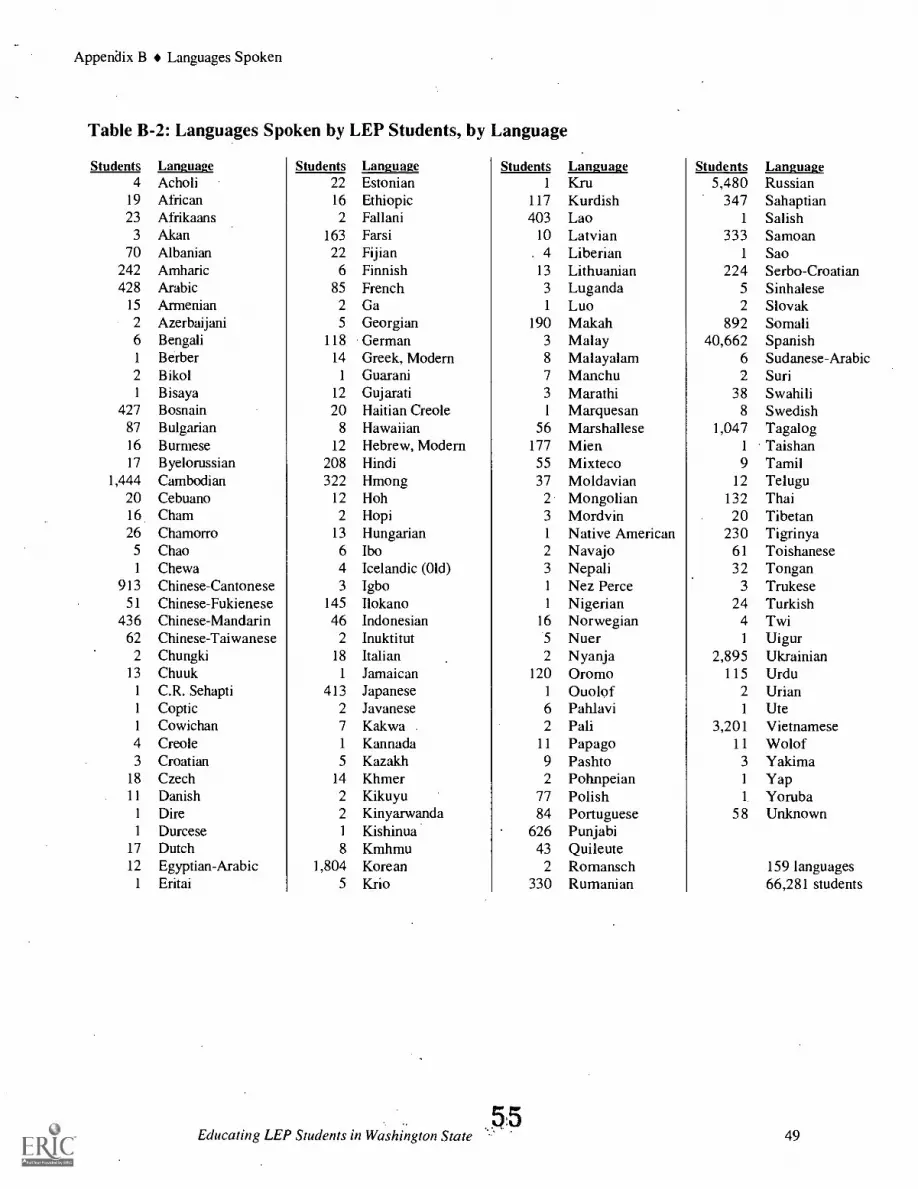
Appendix B Languages Spoken
Table B-2: Languages Spoken by LEP Students, by Language
Students Language Students Language Students Language Students Language4 Acholi 22 Estonian 1 Kru 5,480 Russian
19 African 16 Ethiopic 117 Kurdish 347 Sahaptian23 Afrikaans 2 Fallani 403 Lao 1 Salish
3 Akan 163 Farsi 10 Latvian 333 Samoan70 Albanian 22 Fijian . 4 Liberian 1 Sao
242 Amharic 6 Finnish 13 Lithuanian 224 Serbo-Croatian428 Arabic 85 French 3 Luganda 5 Sinhalese
15 Armenian 2 Ga 1 Luo 2 Slovak2 Azerbaijani 5 Georgian 190 Makah 892 Somali6 Bengali 118 German 3 Malay 40,662 Spanish1 Berber 14 Greek, Modern 8 Malayalam 6 Sudanese-Arabic2 Bikol 1 Guarani 7 Manchu 2 Suri1 Bisaya 12 Gujarati 3 Marathi 38 Swahili
427 Bosnain 20 Haitian Creole 1 Marquesan 8 Swedish87 Bulgarian 8 Hawaiian 56 Marshallese 1,047 Tagalog16 Burmese 12 Hebrew, Modern 177 Mien 1 Taishan17 Byelorussian 208 Hindi 55 Mixteco 9 Tamil
1,444 Cambodian 322 Hmong 37 Moldavian 12 Telugu20 Cebuano 12 Hoh 2 Mongolian 132 Thai16 Cham 2 Hopi 3 Mordvin 20 Tibetan26 Chamorro 13 Hungarian 1 Native American 230 Tigrinya
5 Chao 6 Ibo 2 Navajo 61 Toishanese1 Chewa 4 Icelandic (Old) 3 Nepali 32 Tongan
913 Chinese-Cantonese 3 Igbo 1 Nez Perce 3 Trukese51 Chinese-Fukienese 145 Ilokano 1 Nigerian 24 Turkish
436 Chinese-Mandarin 46 Indonesian 16 Norwegian 4 Twi62 Chinese-Taiwanese 2 Inuktitut 5 Nuer 1 Uigur
2 Chungki 18 Italian 2 Nyanja 2,895 Ukrainian13 Chuuk 1 Jamaican 120 Oromo 115 Urdu
1 C.R. Sehapti 413 Japanese 1 Ouolof 2 Urian1 Coptic 2 Javanese 6 Pahlavi 1 Ute1 Cowichan 7 Kakwa 2 Pali 3,201 Vietnamese4 Creole 1 Kannada 11 Papago 11 Wolof3 Croatian 5 Kazakh 9 Pashto 3 Yakima
18 Czech 14 Khmer 2 Pohnpeian 1 Yap11 Danish 2 Kikuyu 77 Polish 1 Yoruba
1 Dire 2 Kinyarwanda 84 Portuguese 58 Unknown1 Durcese 1 Kishinua 626 Punjabi
17 Dutch 8 Kmhmu 43 Quileute12 Egyptian-Arabic 1,804 Korean 2 Romansch 159 languages
1 Eritai 5 Krio 330 Rumanian 66,281 students
5:5Educating LEP Students in Washington State 49

APPENDIX C
LENGTH OF STAY DATA
STUDENTS TRANSITIONED OR GRADUATED
Table C-1: By District (alphabetical)Table C-2: By Number ServedTable C-3: By Percent Transitioned or Graduated
STUDENTS ENROLLED MORE THAN THREE YEARS
Table C-4: By District (alphabetical)Table C-5: By Number ServedTable C-6: By Percent Enrolled More Than Three Years
56
Educating LEP Students iriyashington State 50
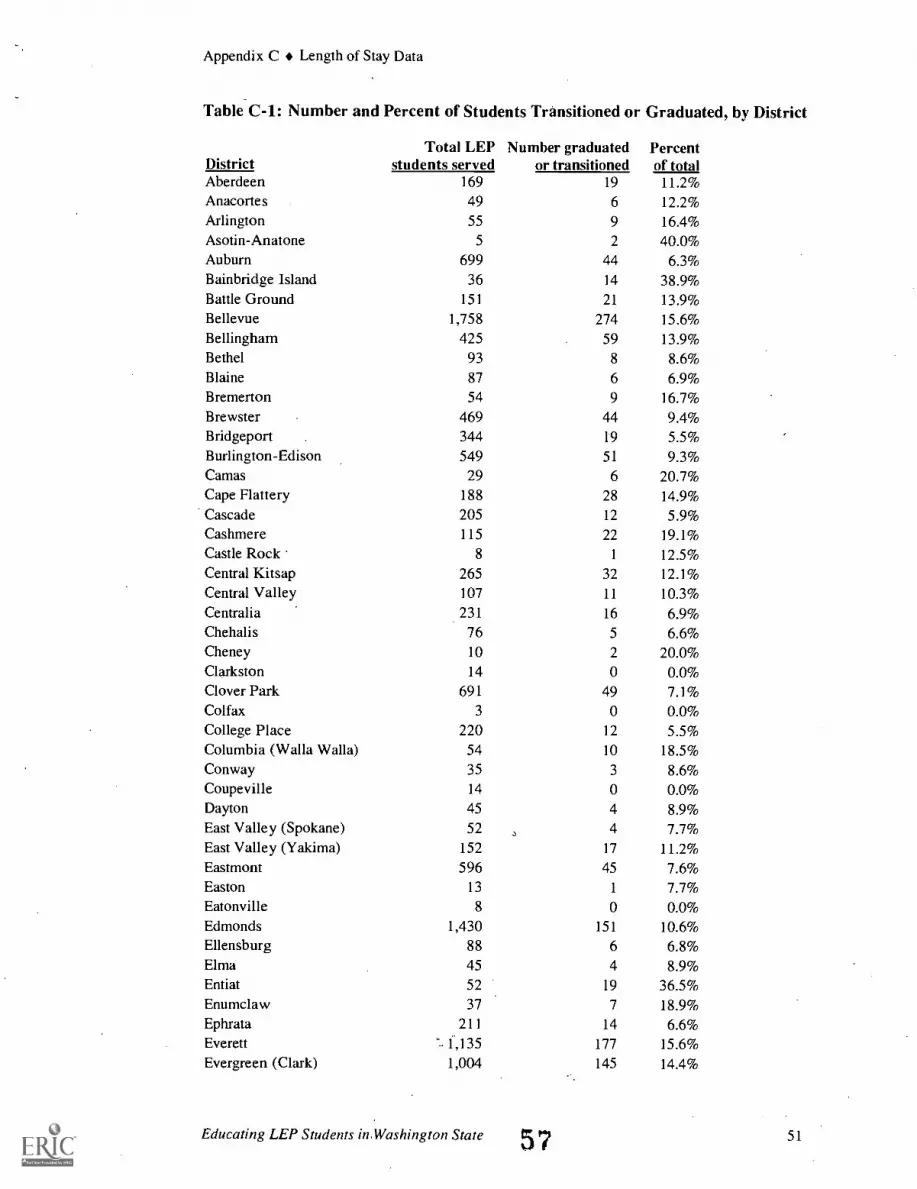
Appendix C Length of Stay Data
Table C-1: Number and Percent of Students Transitioned or Graduated, by District
Total LEP Number graduated PercentDistrict students served or transitioned of totalAberdeen 169 19 11.2%Anacortes 49 6 12.2%Arlington 55 9 16.4%Asotin-Anatone 5 2 40.0%Auburn 699 44 6.3%Bainbridge Island 36 14 38.9%Battle Ground 151 21 13.9%Bellevue 1,758 274 15.6%Bellingham 425 59 13.9%Bethel 93 8 8.6%Blaine 87 6 6.9%Bremerton 54 9 16.7%Brewster 469 44 9.4%Bridgeport . 344 19 5.5%Burlington-Edison 549 51 9.3%Camas 29 6 20.7%Cape Flattery 188 28 14.9%Cascade 205 12 5.9%Cashmere 115 22 19.1%Castle Rock 8 1 12.5%Central Kitsap 265 32 12.1%Central Valley 107 11 10.3%Centralia 231 16 6.9%Chehalis 76 5 6.6%Cheney 10 2 20.0%Clarkston 14 0 0.0%Clover Park 691 49 7.1%Colfax 3 0 0.0%College Place 220 12 5.5%Columbia (Walla Walla) 54 10 18.5%Conway 35 3 8.6%Coupeville 14 0 0.0%Dayton 45 4 8.9%East Valley (Spokane) 52 ., 4 7.7%East Valley (Yakima) 152 17 11.2%Eastmont 596 45 7.6%Easton 13 1 7.7%Eatonville 8 0 0.0%Edmonds 1,430 151 10.6%Ellensburg 88 6 6.8%Elma 45 4 8.9%Entiat 52 19 36.5%Enumclaw 37 7 18.9%Ephrata 211 14 6.6%Everett "-. 1,135 177 15.6%Evergreen (Clark) 1,004 145 14.4%
Educating LEP Students in.Washington State 57 51

Appendix C Length of Stay Data
Total LEP Number graduated PercentDistrict students served or transitioned of totalFederal Way 1,838 376 20.5%Ferndale 179 36 20.1%Fife 102 1 1.0%Finley 41 3 7.3%Franklin Pierce 181 19 10.5%Goldendale 47 8 17.0%Grandview 518 4 0.8%Granger 340 69 20.3%Granite Falls 5 0 0.0%Green Mountain 9 0 0.0%Highland 229 62 27.1%High line 1,789 294 16.4%Hoquiam 84 20 23.8%Issaquah 204 35 17.2%Kelso 101 9 8.9%Kennewick 1,366 67 4.9%Kent 2,611 192 7.4%Kiona-Benton City 139 3 2.2%Kittitas 45 3 6.7%La Center 7 0 0.0%La Conner 43 1 2.3%Lake Chelan 323 28 8.7%Lake Stevens 81 26 32.1%Lake Washington 1,245 118 9.5%Lakewood 16 5 31.3%Liberty 2 2 100.0%Lind 28 0 0.0%Longview 225 16 7.1%Lyle 12 0 0.0%Lynden 216 5 2.3%Mabton 268 15 5.6%Manson 261 22 8.4%Marysville 184 0 0.0%Mead 85 10 11.8%Mercer Island 95 18 18.9%Meridian 146 11 7.5%Methow Valley 5 1 20.0%Monroe 132 5 3.8%Montesano 7 0 0.0%Moses Lake 536 9 1.7%Mossyrock 5 0 0.0%Mount Adams 118 16 13.6%Mount Baker 121 18 14.9%Mount Vernon 1,397 19 1.4%Mukilteo 1,403 285 20.3%Naches Valley 97 16 16.5%Naselle-Grays Riv. Valley 6 0 0.0%Nine Mile Falls 2 2 100.0%
Educating LEP Students in Washington State 58 52
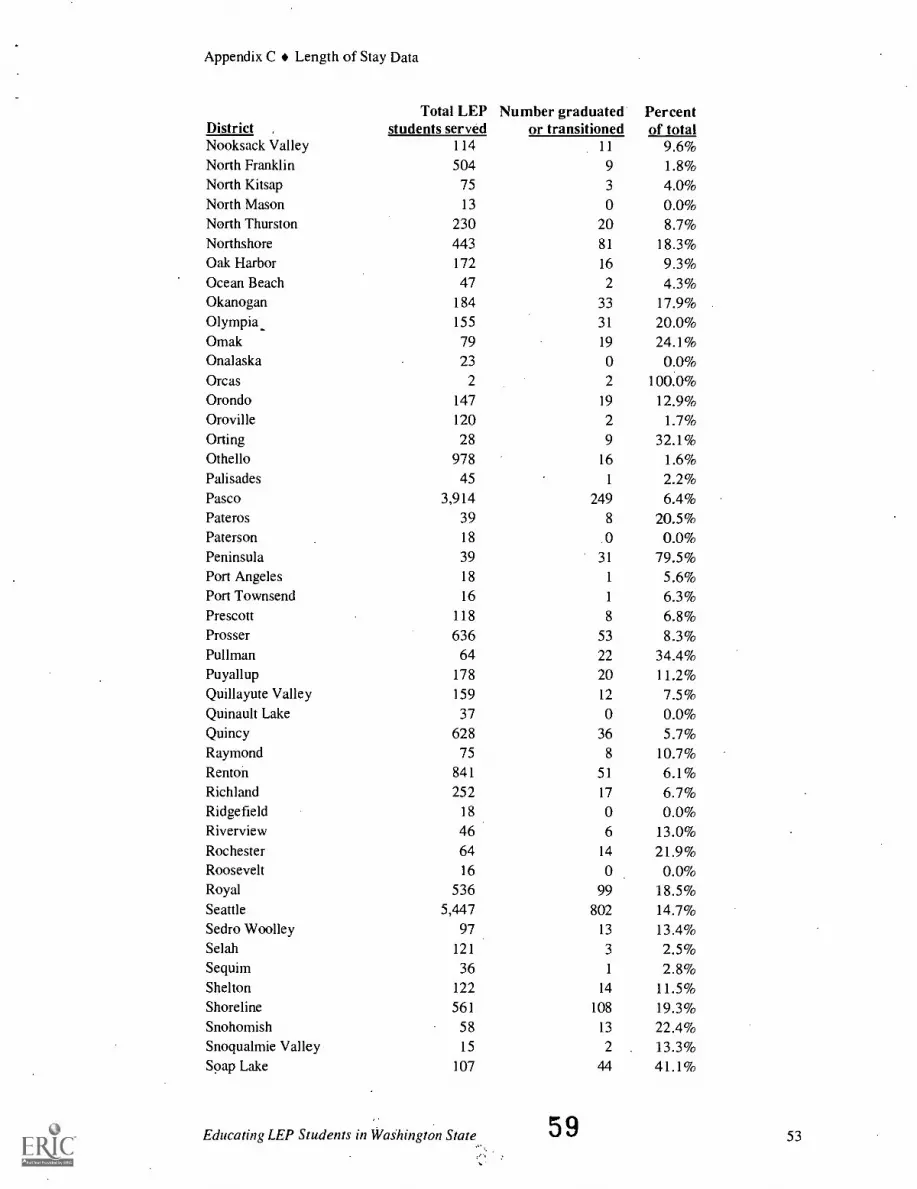
Appendix C Length of Stay Data
Total LEP Number graduated PercentDistrict students served or transitioned of totalNooksack Valley 114 11 9.6%North Franklin 504 9 1.8%North Kitsap 75 3 4.0%North Mason 13 0 0.0%North Thurston 230 20 8.7%Northshore 443 81 18.3%Oak Harbor 172 16 9.3%Ocean Beach 47 2 4.3%Okanogan 184 33 17.9%Olympia_ 155 31 20.0%Omak 79 19 24.1%Onalaska 23 0 0.0%Orcas 2 2 100.0%Orondo 147 19 12.9%Oroville 120 2 1.7%Oiling 28 9 32.1%Othello 978 16 1.6%Palisades 45 1 2.2%Pasco 3,914 249 6.4%Pateros 39 8 20.5%Paterson 18 0 0.0%Peninsula 39 31 79.5%Port Angeles 18 1 5.6%Port Townsend 16 1 6.3%Prescott 118 8 6.8%Prosser 636 53 8.3%Pullman 64 22 34.4%Puyallup 178 20 11.2%Quillayute Valley 159 12 7.5%Quinault Lake 37 0 0.0%Quincy 628 36 5.7%Raymond 75 8 10.7%Renton 841 51 6.1%Richland 252 17 6.7%Ridgefield 18 0 0.0%Riverview 46 6 13.0%Rochester 64 14 21.9%Roosevelt 16 0 0.0%Royal 536 99 18.5%Seattle 5,447 802 14.7%Sedro Woolley 97 13 13.4%Selah 121 3 2.5%Sequim 36 1 2.8%Shelton 122 14 11.5%Shoreline 561 108 19.3%Snohomish 58 13 22.4%Snoqualmie Valley 15 2 13.3%Soap Lake 107 44 41.1%
Educating LEP Students in Washington State 59 53

Appendix C Length of Stay Data
Total LEP Number graduated PercentDistrict students served or transitioned of totalSouth Bend 54 8 14.8%South Kitsap 55 13 23.6%South Whidbey 6 0 0.0%Southside 1 0 0.0%Spokane 899 89 9.9%Stanwood 45 1 2.2%Steilacoom 55 4 7.3%Stevenson-Carson 11 0 0.0%Sultan 18 3 16.7%Sumner 76 5 6.6%Sunnyside 1,211 182 15.0%Tacoma 2,029 275 13.6%Tahoma 36 10 27.8%Tenino 21 0 0.0%Thorp 1 0 0.0%Toledo , 5 0 0.0%Tonasket 90 7 7.8%Toppenish 2,417 113 4.7%Touchet 42 10 23.8%Trout Lake 3 0 0.0%Tukwila 688 41 6.0%Tumwater 53 13 24.5%Union Gap 88 4 4.5%University Place 141 41 29.1%Vancouver 2,121 87 4.1%Vashon Island 13 3 23.1%Wahkiakum 1 0 0.0%Wahluke 885 64 7.2%Walla Walla 630 63 10.0%Wapato 1,032 115 11.1%Warden 309 26 8.4%Washougal 55 3 5.5%Waterville 34 2 5.9%Wenatchee 1,343 69 5.1%West Valley (Spokane) 69 0 0.0%West Valley (Yakima) 89 17 19.1%White River 8 0 0.0%White Salmon Valley 223 40 17.9%Win lock 53 4 7.5%Woodland 36 3 8.3%Yakima 4,600 128 2.8%Yelm 36 3 8.3%Zillah 94 26 27.7%
State 66,281 6,619 10.0%
60Educating LEP Students in Washington State 54
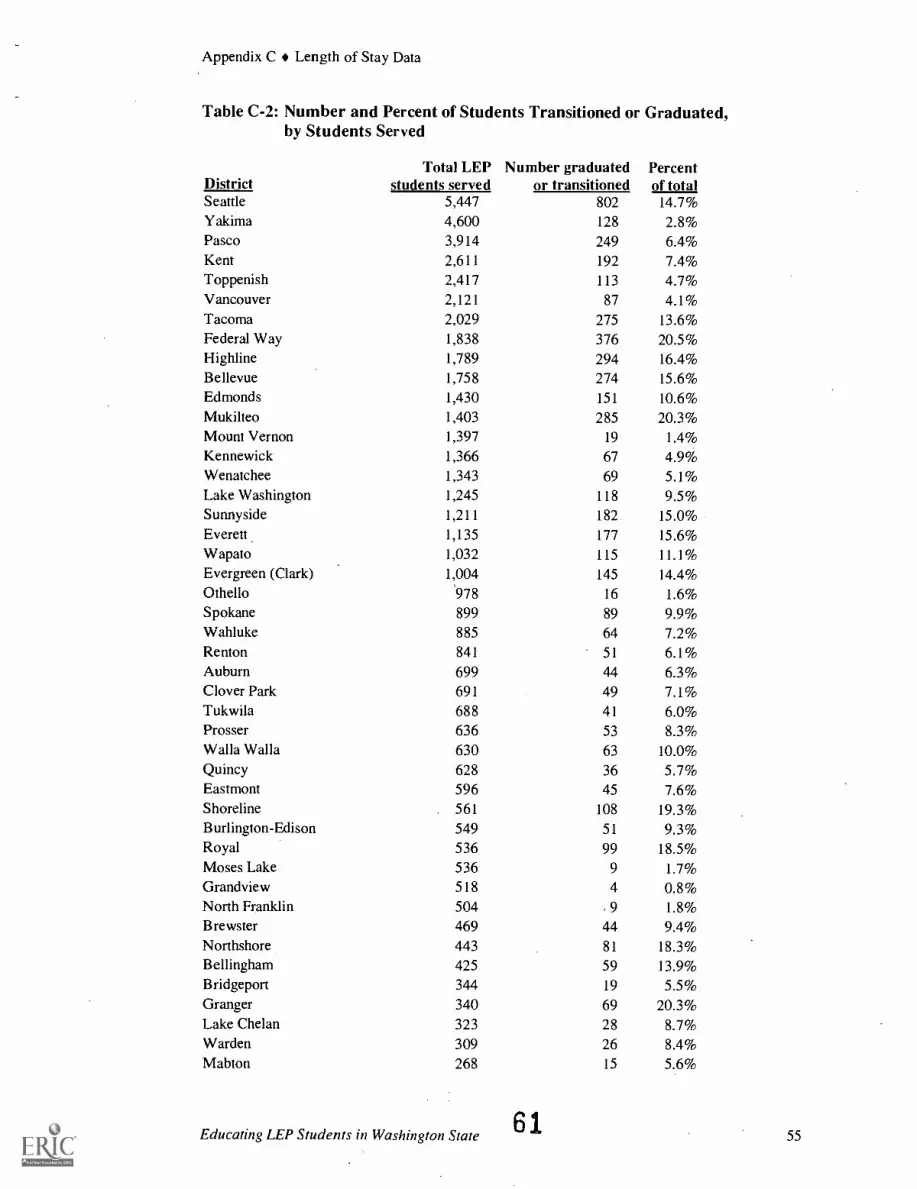
Appendix C Length of Stay Data
Table C-2: Number and Percent of Students Transitioned or Graduated,by Students Served
Total LEP Number graduated PercentDistrict students served or transitioned of totalSeattle 5,447 802 14.7%Yakima 4,600 128 2.8%Pasco 3,914 249 6.4%Kent 2,611 192 7.4%Toppenish 2,417 113 4.7%Vancouver 2,121 87 4.1%Tacoma 2,029 275 13.6%Federal Way 1,838 376 20.5%High line 1,789 294 16.4%Bellevue 1,758 274 15.6%Edmonds 1,430 151 10.6%Mukilteo 1,403 285 20.3%Mount Vernon 1,397 19 1.4%Kennewick 1,366 67 4.9%Wenatchee 1,343 69 5.1%Lake Washington 1,245 118 9.5%Sunnyside 1,211 182 15.0%Everett 1,135 177 15.6%Wapato 1,032 115 11.1%Evergreen (Clark) 1,004 145 14.4%Othello '978 16 1.6%Spokane 899 89 9.9%Wahluke 885 64 7.2%Renton 841 51 6.1%Auburn 699 44 6.3%Clover Park 691 49 7.1%Tukwila 688 41 6.0%Prosser 636 53 8.3%Walla Walla 630 63 10.0%Quincy 628 36 5.7%Eastmont 596 45 7.6%Shoreline 561 108 19.3%Burlington-Edison 549 51 9.3%Royal 536 99 18.5%Moses Lake 536 9 1.7%Grandview 518 4 0.8%North Franklin 504 . 9 1.8%Brewster 469 44 9.4%Northshore 443 81 18.3%Bellingham 425 59 13.9%Bridgeport 344 19 5.5%Granger 340 69 20.3%Lake Chelan 323 28 8.7%Warden 309 26 8.4%Mabton 268 15 5.6%
Educating LEP Students in Washington State 6155
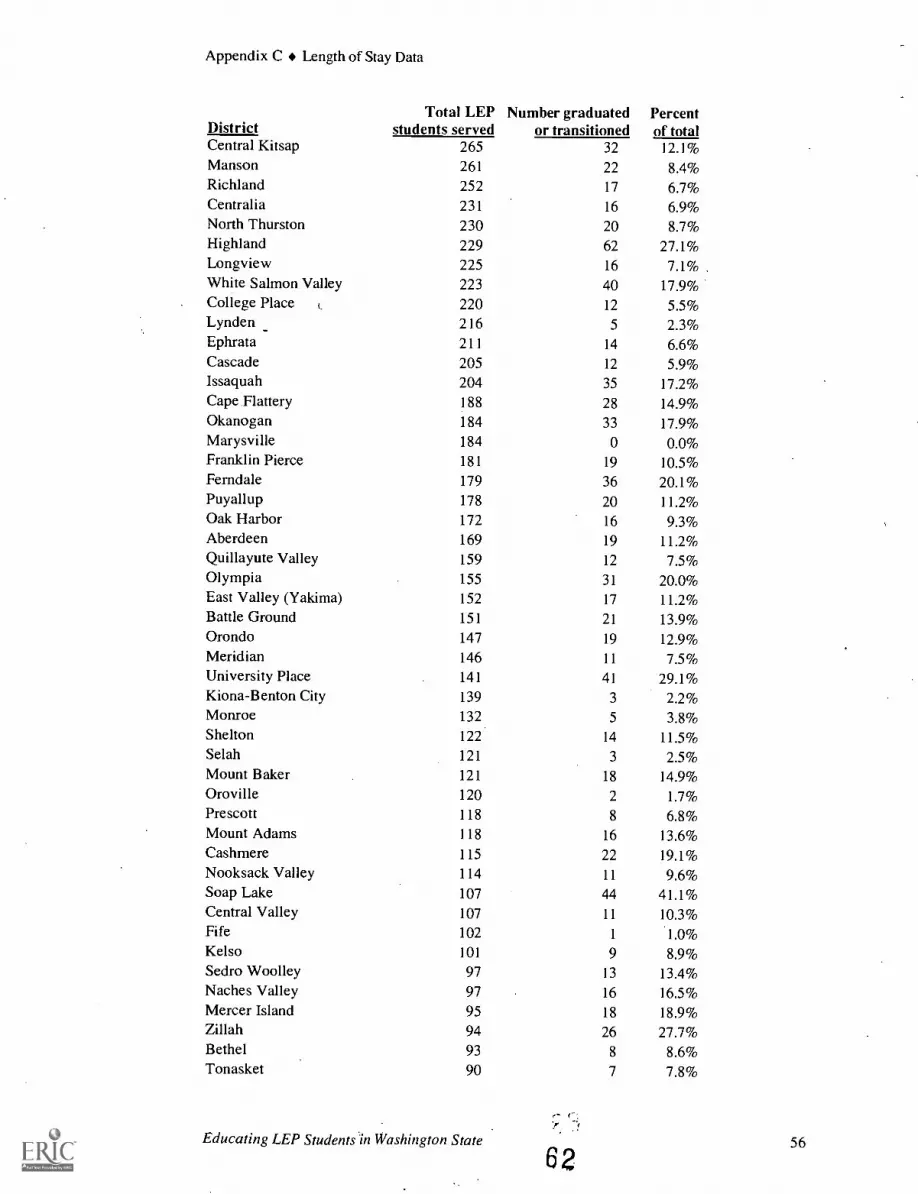
Appendix C Length of Stay Data
Total LEP Number graduated PercentDistrict students served or transitioned of totalCentral Kitsap 265 32 12.1%Manson 261 22 8.4%Richland 252 17 6.7%Centralia 231 16 6.9%North Thurston 230 20 8.7%Highland 229 62 27.1%Longview 225 16 7.1%White Salmon Valley 223 40 17.9%College Place ( 220 12 5.5%Lynden 216 5 2.3%Ephrata 211 14 6.6%Cascade 205 12 5.9%Issaquah 204 35 17.2%Cape Flattery 188 28 14.9%Okanogan 184 33 17.9%Marysville 184 0 0.0%Franklin Pierce 181 19 10.5%Ferndale 179 36 20.1%Puyallup 178 20 11.2%Oak Harbor 172 16 9.3%Aberdeen 169 19 11.2%Quillayute Valley 159 12 7.5%Olympia 155 31 20.0%East Valley (Yakima) 152 17 11.2%Battle Ground 151 21 13.9%Orondo 147 19 12.9%Meridian 146 11 7.5%University Place 141 41 29.1%Kiona-Benton City 139 3 2.2%Monroe 132 5 3.8%Shelton 122 14 11.5%Selah 121 3 2.5%Mount Baker 121 18 14.9%Oroville 120 2 1.7%Prescott 118 8 6.8%Mount Adams 118 16 13.6%Cashmere 115 22 19.1%Nooksack Valley 114 11 9.6%Soap Lake 107 44 41.1%Central Valley 107 11 10.3%Fife 102 1 1.0%Kelso 101 9 8.9%Sedro Woolley 97 13 13.4%Naches Valley 97 16 16.5%Mercer Island 95 18 18.9%Zillah 94 26 27.7%Bethel 93 8 8.6%Tonasket 90 7 7.8%
Educating LEP Students 'in Washington State 56
62

Appendix C Length of Stay Data
Total LEP Number graduated PercentDistrict students served or transitioned of totalWest Valley (Yakima) 89 17 19.1%Union Gap 88 4 4.5%Ellensburg 88 6 6.8%Blaine 87 6 6.9%Mead 85 10 11.8%Hoquiam 84 20 23.8%Lake Stevens 81 26 32.1%Omak 79 19 24.1%Sumner 76 5 6.6%Chehalis 76 5 6.6%Raymond 75 8 10.7%North Kitsap 75 3 4.0%West Valley (Spokane) 69 0 0.0%Rochester 64 14 21.9%Pullman 64 22 34.4%Snohomish 58 13 22.4%Washougal 55 3 5.5%Steilacoom 55 4 7.3%South Kitsap 55 13 23.6%Arlington 55 9 16.4%South Bend 54 8 14.8%Columbia (Walla Walla) 54 10 18.5%Bremerton 54 9 16.7%Win lock 53 4 7.5%Tumwater 53 13 24.5%Entiat 52 19 36.5%East Valley (Spokane) 52 4 7.7%Anacortes 49 6 12.2%Ocean Beach 47 2 4.3%Goldendale 47 8 17.0%Riverview 46 6 13.0%Stanwood 45 1 2.2%Palisades 45 1 2.2%Kittitas 45 3 6.7%Elma 45 4 8.9%Dayton 45 4 8.9%La Conner 43 1 2.3%Touchet 42 10 23.8%Finley 41 3 7.3%Peninsula 39 31 79.5%Pateros 39 8 20.5%Quinault Lake 37 0 0.0%Enumclaw 37 7 18.9%Yelm 36 3 8.3%Woodland 36 3 8.3%Tahoma 36 10 27.8%Sequim 36 1 2.8%Bainbridge Island 36 14 38.9%
Educating LEP Students in Washington State 63 57

Appendix C Length of Stay Data
Total LEP Number graduated PercentDistrict students served or transitioned of totalConway 35 3 8.6%Waterville 34 2 5.9%Camas 29 6 20.7%Orting 28 9 32.1%Lind 28 0 0.0%Onalaska 23 0 0.0%Tenino 21 0 0.0%Sultan 18 3 16.7%Ridgefield 18 0 0.0%Port Angeles 18 1 5.6%Paterson 18 0 0.0%Roosevelt 16 0 0.0%Port Townsend 16 1 6.3%Lakewood 16 5 31.3%Snoqualmie Valley 15 2 13.3%Coupeville 14 0 0.0%Clarkston 14 0 0.0%Vashon Island 13 3 23.1%North Mason 13 0 0.0%Easton 13 1 7.7%Lyle 12 0 0.0%Stevenson-Carson 11 0 0.0%Cheney 10 2 20.0%Green Mountain 9 0 0.0%White River 8 0 0.0%Eatonville 8 0 0.0%Castle Rock 8 1 12.5%Montesano 7 0 0.0%La Center 7 0 0.0%South Whidbey 6 0 0.0%
. Naselle-Grays Riv. Valley 6 0 0.0%Toledo 5 0 0.0%Mossyrock 5 0 0.0%Methow Valley 5 1 20.0%Granite Falls 5 0 0.0%Asotin-Anatone 5 2 40.0%Trout Lake 3 0 0.0%Colfax 3 0 0.0%Orcas 2 2 100.0%Nine Mile Falls 2 2 100.0%Liberty 2 2 100.0%Wahkiakum 1 0 0.0%Thorp 1 0 0.0%Southside 1 0 0.0%
State 66,281 6,619 10.0%
64Educating LEP Students in Washington State 58
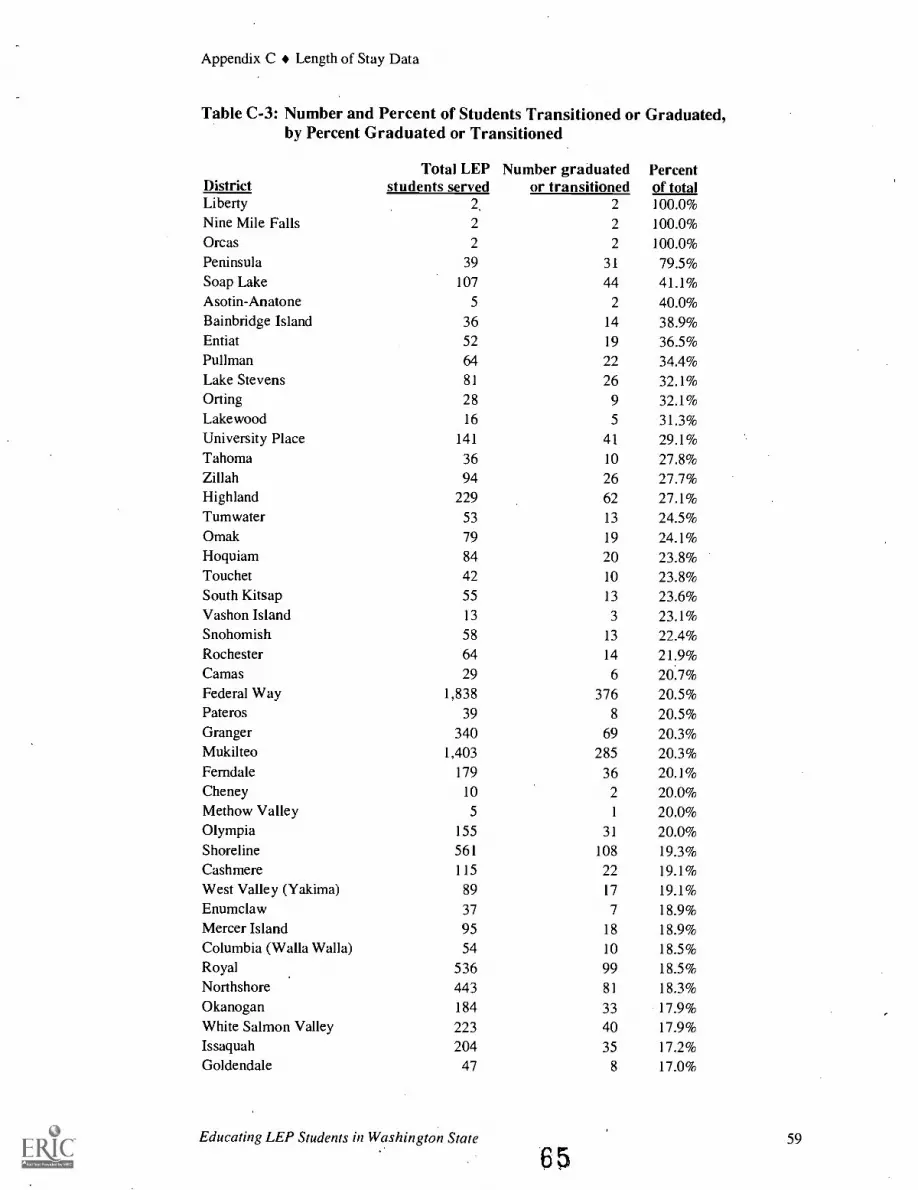
Appendix C Length of Stay Data
Table C-3: Number and Percent of Students Transitioned or Graduated,by Percent Graduated or Transitioned
Total LEP Number graduated PercentDistrict students served or transitioned of totalLiberty 2, 2 100.0%Nine Mile Falls 2 2 100.0%Orcas 2 2 100.0%Peninsula 39 31 79.5%Soap Lake 107 44 41.1%Asotin-Anatone 5 2 40.0%Bainbridge Island 36 14 38.9%Entiat 52 19 36.5%Pullman 64 22 34.4%Lake Stevens 81 26 32.1%Orting 28 9 32.1%Lakewood 16 5 31.3%University Place 141 41 29.1%Tahoma 36 10 27.8%Zillah 94 26 27.7%Highland 229 62 27.1%Tumwater 53 13 24.5%Omak 79 19 24.1%Hoquiam 84 20 23.8%Touchet 42 10 23.8%South Kitsap 55 13 23.6%Vashon Island 13 3 23.1%Snohomish 58 13 22.4%Rochester 64 14 21.9%Camas 29 6 20.7%Federal Way 1,838 376 20.5%Pateros 39 8 20.5%Granger 340 69 20.3%Mukilteo 1,403 285 20.3%Ferndale 179 36 20.1%Cheney 10 2 20.0%Methow Valley 5 1 20.0%Olympia 155 31 20.0%Shoreline 561 108 19.3%Cashmere 115 22 19.1%West Valley (Yakima) 89 17 19.1%Enumclaw 37 7 18.9%Mercer Island 95 18 18.9%Columbia (Walla Walla) 54 10 18.5%Royal 536 99 18.5%Northshore 443 81 18.3%Okanogan 184 33 17.9%White Salmon Valley 223 40 17.9%Issaquah 204 35 17.2%Goldendale 47 8 17.0%
Educating LEP Students in Washington State 59
65
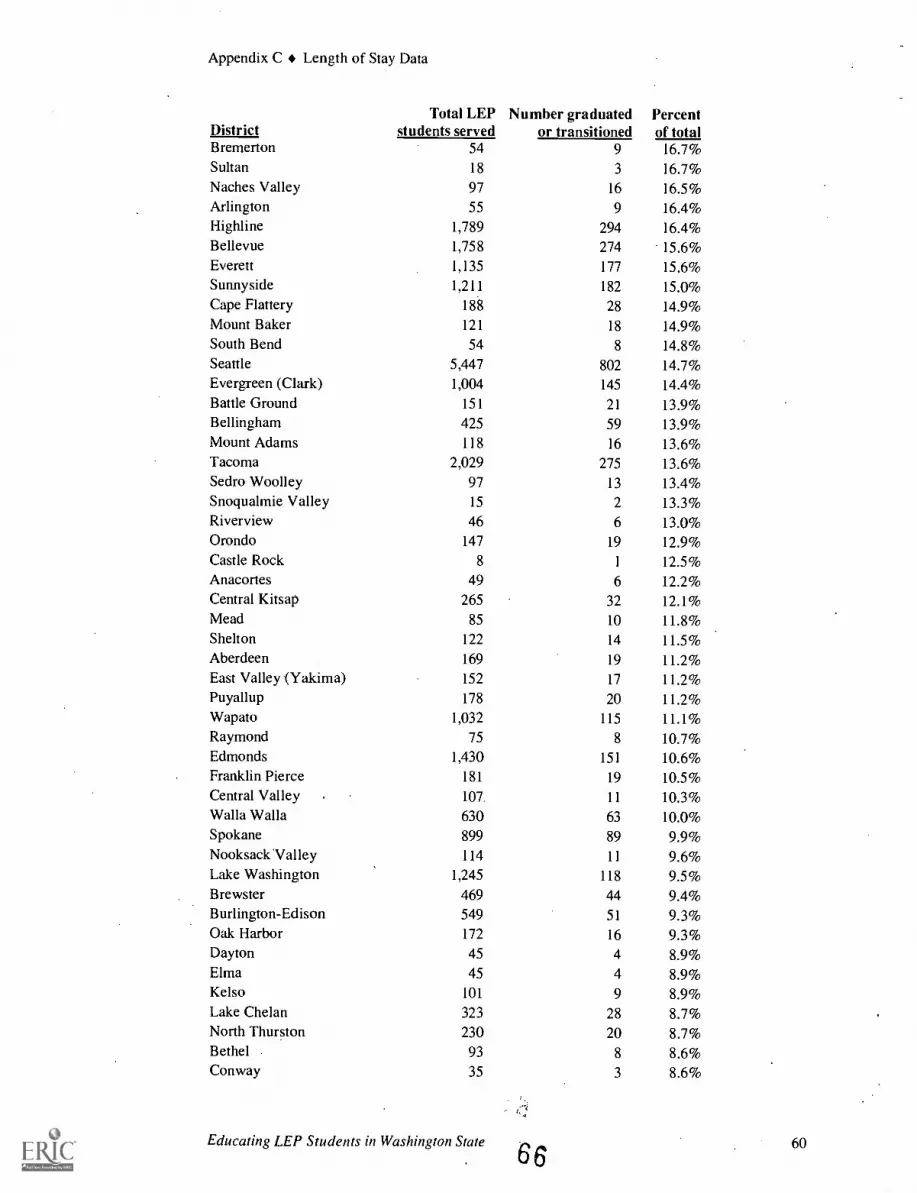
Appendix C Length of Stay Data
Total LEP Number graduated PercentDistrict students served or transitioned of totalBremerton 54 9 16.7%Sultan 18 3 16.7%Naches Valley 97 16 16.5%Arlington 55 9 16.4%High line 1,789 294 16.4%Bellevue 1,758 274 15.6%Everett 1,135 177 15.6%Sunnyside 1,211 182 15.0%Cape Flattery 188 28 14.9%Mount Baker 121 18 14.9%South Bend 54 8 14.8%Seattle 5,447 802 14.7%Evergreen (Clark) 1,004 145 14.4%Battle Ground 151 21 13.9%Bellingham 425 59 13.9%Mount Adams 118 16 13.6%Tacoma 2,029 275 13.6%Sedro Woolley 97 13 13.4%Snoqualmie Valley 15 2 13.3%Riverview 46 6 13.0%Orondo 147 19 12.9%Castle Rock 8 1 12.5%Anacortes 49 6 12.2%Central Kitsap 265 32 12.1%Mead 85 10 11.8%Shelton 122 14 11.5%Aberdeen 169 19 11.2%East Valley (Yakima) 152 17 11.2%Puyallup 178 20 11.2%Wapato 1,032 115 11.1%Raymond 75 8 10.7%Edmonds 1,430 151 10.6%Franklin Pierce 181 19 10.5%Central Valley 107. 11 10.3%Walla Walla 630 63 10.0%Spokane 899 89 9.9%Nooksack 'Valley 114 11 9.6%Lake Washington 1,245 118 9.5%Brewster 469 44 9.4%Burlington-Edison 549 51 9.3%Oak Harbor 172 16 9.3%Dayton 45 4 8.9%Elma 45 4 8.9%Kelso 101 9 8.9%Lake Chelan 323 28 8.7%North Thurston 230 20 8.7%Bethel . 93 8 8.6%Conway 35 3 8.6%
Educating LEP Students in Washington State66 60
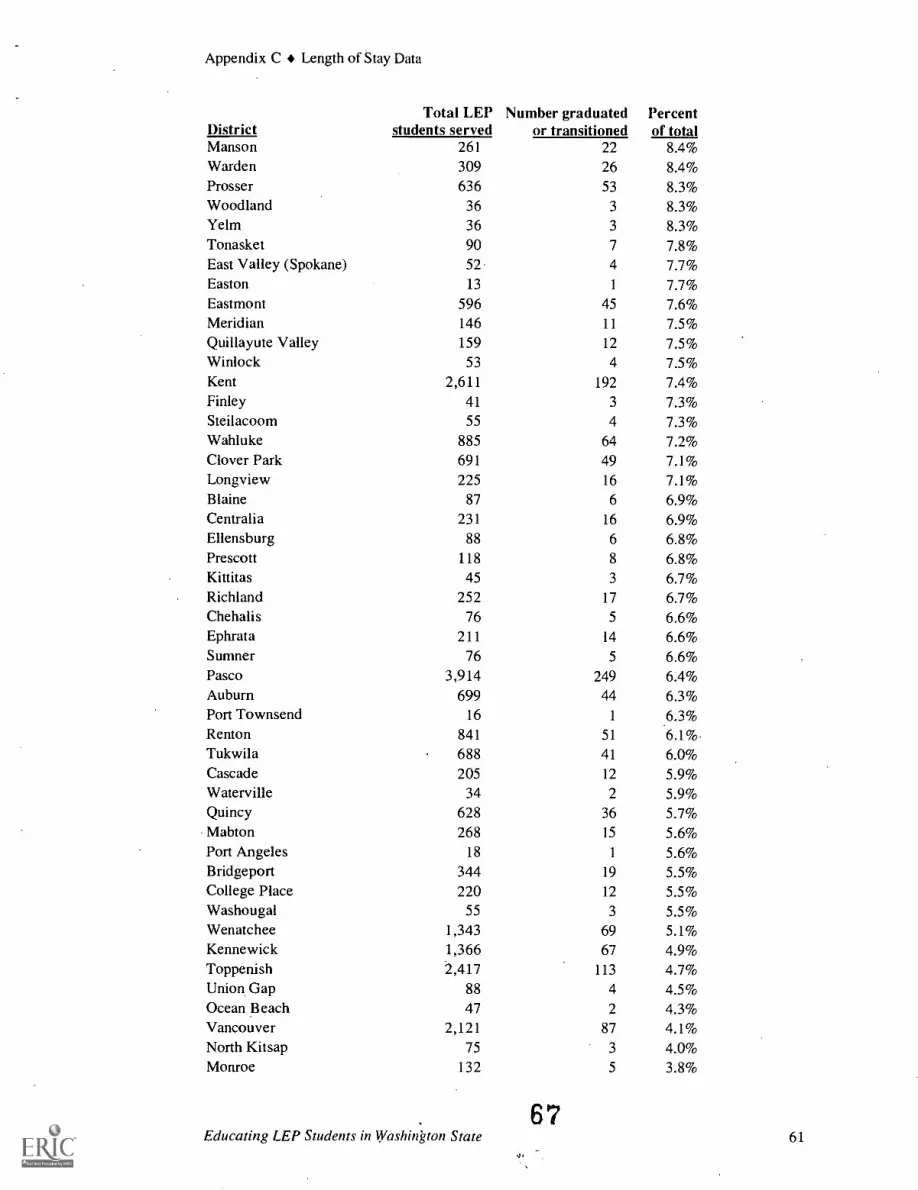
Appendix C Length of Stay Data
Total LEP Number graduated PercentDistrict students served or transitioned of totalManson 261 22 8.4%Warden 309 26 8.4%Prosser 636 53 8.3%Woodland 36 3 8.3%Yelm 36 3 8.3%Tonasket 90 7 7.8%East Valley (Spokane) 52 4 7.7%Easton 13 1 7.7%Eastmont 596 45 7.6%Meridian 146 11 7.5%Quillayute Valley 159 12 7.5%Win lock 53 4 7.5%Kent 2,611 192 7.4%Finley 41 3 7.3%Steilacoom 55 4 7.3%Wahluke 885 64 7.2%Clover Park 691 49 7.1%Longview 225 16 7.1%Blaine 87 6 6.9%Centralia 231 16 6.9%Ellensburg 88 6 6.8%Prescott 118 8 6.8%Kittitas 45 3 6.7%Richland 252 17 6.7%Chehalis 76 5 6.6%Ephrata 211 14 6.6%Sumner 76 5 6.6%Pasco 3,914 249 6.4%Auburn 699 44 6.3%Port Townsend 16 1 6.3%Renton 841 51 6.1%Tukwila 688 41 6.0%Cascade 205 12 5.9%Waterville 34 2 5.9%Quincy 628 36 5.7%Mabton 268 15 5.6%Port Angeles 18 1 5.6%Bridgeport 344 19 5.5%College Place 220 12 5.5%Washougal 55 3 5.5%Wenatchee 1,343 69 5.1%Kennewick 1,366 67 4.9%Toppenish 2,417 113 4.7%Union Gap 88 4 4.5%Ocean Beach 47 2 4.3%Vancouver 2,121 87 4.1%North Kitsap 75 3 4.0%Monroe 132 5 3.8%
67Educating LEP Students in Washinkton State 61

Appendix C Length of Stay Data
Total LEP Number graduated PercentDistrict students served or transitioned of totalSequim 36 1 2.8%Yakima 4,600 128 2.8%Selah 121 3 2.5%La Conner 43 1 2.3%Lynden 216 5 2.3%Kiona-Benton City 139 3 2.2%Palisades 45 1 2.2%Stanwood 45 1 2.2%North Franklin 504 9 1.8%Moses Lake 536 9 1.7%Oroville 120 2 1.7%Othello 978 16 1.6%Mount Vernon 1,397 19 1.4%Fife 102 1 1.0%Grandview 518 4 0.8%Clarkston 14 0 0.0%Colfax 3 0 0.0%Coupeville 14 0 0.0%Eatonville 8 0 0.0%Granite Falls 5 0 0.0%Green Mountain 9 0 0.0%La Center 7 0 0.0%Lind 28 0 0.0%Lyle 12 0 0.0%Marysville 184 0 0.0%Montesano 7 0 0.0%Mossyrock 5 0 0.0%Naselle-Grays Riv. Valley 6 0 0.0%North Mason . 13 0 0.0%Onalaska 23 0 0.0%Paterson 18 0 0.0%Quinault Lake 37 0 0.0%Ridgefield 18 0 0.0%Roosevelt 16 0 0.0%South Whidbey 6 0 0.0%Southside 1 0 0.0%Stevenson-Carson 11 0 0.0%Tenino 21 0 0.0%Thorp 1 0 0.0%Toledo 5 0 0.0%Trout Lake 3 0 0.0%Wahkiakum 1 0 0.0%West Valley (Spokane) 69 0 0.0%White River 8 0 0.0%State 66,281 6,619 10.0%
68Educating LEP Students in Washington State 62
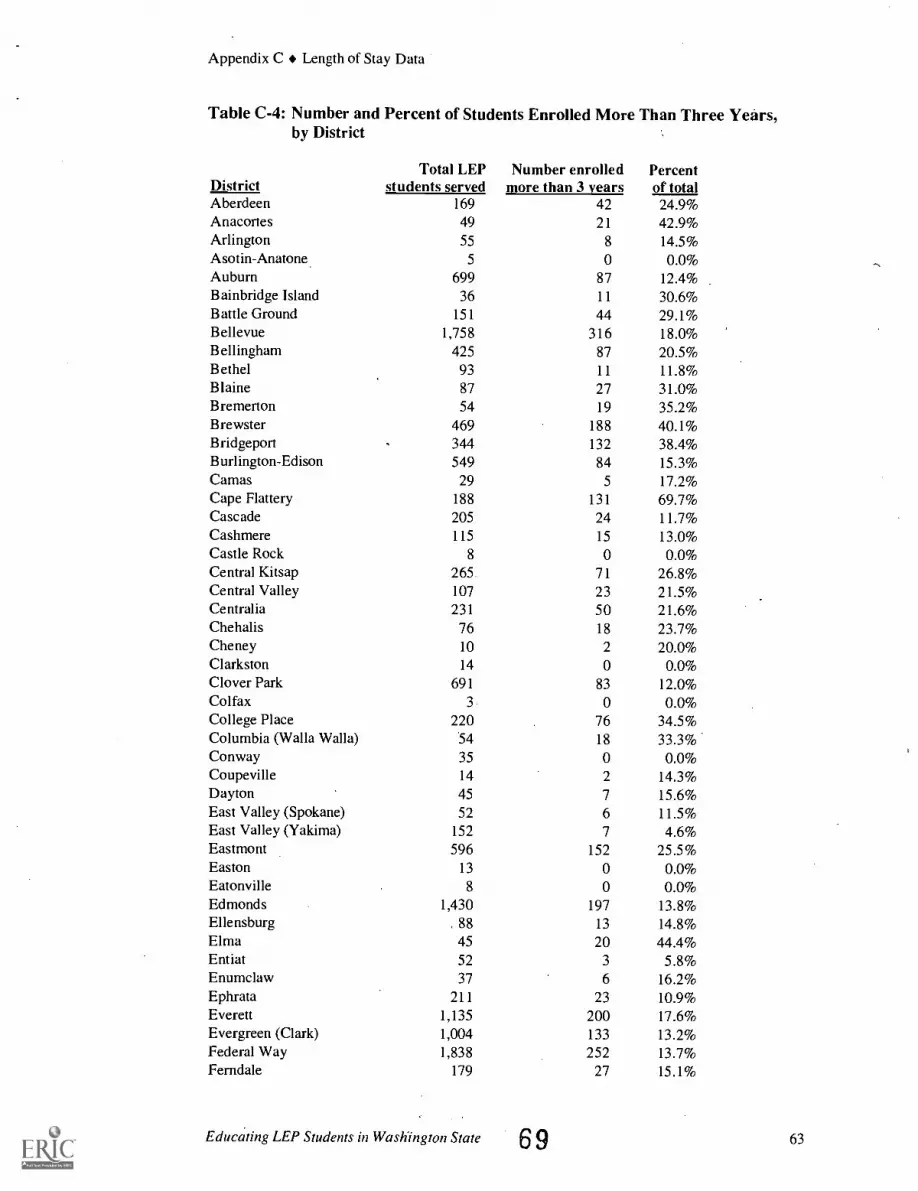
Appendix C Length of Stay Data
Table C-4: Number and Percent of Students Enrolled More Than Three Years,by District
Total LEP Number enrolled PercentDistrict students served more than 3 years of totalAberdeen 169 42 24.9%Anacortes 49 21 42.9%Arlington 55 8 14.5%Asotin-Anatone 5 0 0.0%Auburn 699 87 12.4%Bainbridge Island 36 11 30.6%Battle Ground 151 44 29.1%Bellevue 1,758 316 18.0%Bellingham 425 87 20.5%Bethel 93 11 11.8%Blaine 87 27 31.0%Bremerton 54 19 35.2%Brewster 469 188 40.1%Bridgeport , 344 132 38.4%Burlington-Edison 549 84 15.3%Camas 29 5 17.2%Cape Flattery 188 131 69.7%Cascade 205 24 11.7%Cashmere 115 15 13.0%Castle Rock 8 0 0.0%Central Kitsap 265 71 26.8%Central Valley 107 23 21.5%Centralia 231 50 21.6%Chehalis 76 18 23.7%Cheney 10 2 20.0%Clarkston 14 0 0.0%Clover Park 691 83 12.0%Colfax 3 0 0.0%College Place 220 76 34.5%Columbia (Walla Walla) 54 18 33.3%Conway 35 0 0.0%Coupeville 14 2 14.3%Dayton 45 7 15.6%East Valley (Spokane) 52 6 11.5%East Valley (Yakima) 152 7 4.6%Eastmont 596 152 25.5%Easton 13 0 0.0%Eatonville 8 0 0.0%Edmonds 1,430 197 13.8%Ellensburg , 88 13 14.8%Elma 45 20 44.4%Entiat 52 3 5.8%Enumclaw 37 6 16.2%Ephrata 211 23 10.9%Everett 1,135 200 17.6%Evergreen (Clark) 1,004 133 13.2%Federal Way 1,838 252 13.7%Ferndale 179 27 15.1%
Educating LEP Students in Washington State 6 9 63
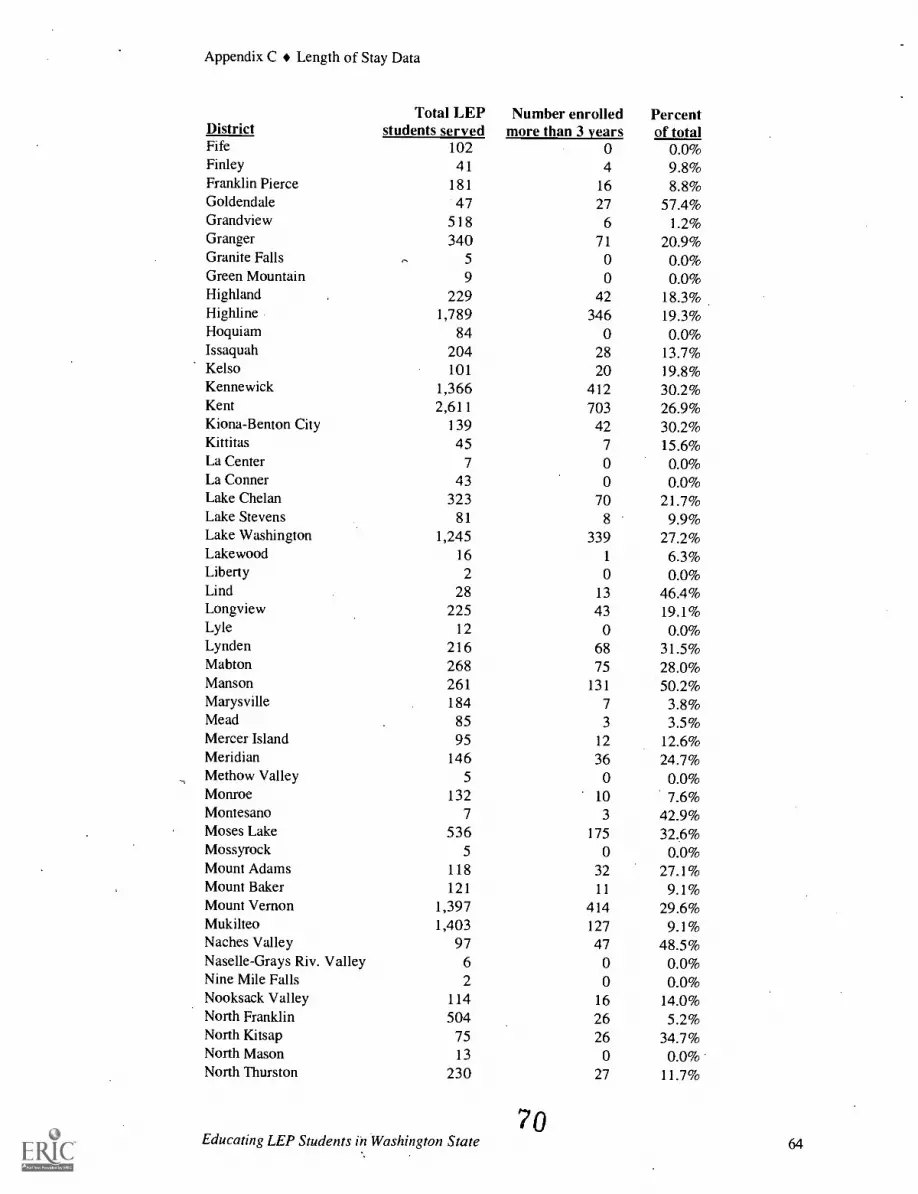
Appendix C Length of Stay Data
Total LEP Number enrolled PercentDistrict students served more than 3 years of totalFife 102 0 0.0%Finley 41 4 9.8%Franklin Pierce 181 16 8.8%Goldendale 47 27 57.4%Grandview 518 6 1.2%Granger 340 71 20.9%Granite Falls , 5 0 0.0%Green Mountain 9 0 0.0%Highland 229 42 18.3%High line 1,789 346 19.3%Hoquiam 84 0 0.0%Issaquah 204 28 13.7%Kelso 101 20 19.8%Kennewick 1,366 412 30.2%Kent 2,611 703 26.9%Kiona-Benton City 139 42 30.2%Kittitas 45 7 15.6%La Center 7 0 0.0%La Conner 43 0 0.0%Lake Chelan 323 70 21.7%Lake Stevens 81 8 9.9%Lake Washington 1,245 339 27.2%Lakewood 16 1 6.3%Liberty 2 0 0.0%Lind 28 13 46.4%Longview 225 43 19.1%Lyle 12 0 0.0%Lynden 216 68 31.5%Mabton 268 75 28.0%Manson 261 131 50.2%Marysville 184 7 3.8%Mead 85 3 3.5%Mercer Island 95 12 12.6%Meridian 146 36 24.7%Methow Valley 5 0 0.0%Monroe 132 10 7.6%Montesano 7 3 42.9%Moses Lake 536 175 32.6%Mossyrock 5 0 0.0%Mount Adams 118 32 27.1%Mount Baker 121 11 9.1%Mount Vernon 1,397 414 29.6%Mukilteo 1,403 127 9.1%Naches Valley 97 47 48.5%Naselle-Grays Riv. Valley 6 0 0.0%Nine Mile Falls 2 0 0.0%Nooksack Valley 114 16 14.0%North Franklin 504 26 5.2%North Kitsap 75 26 34.7%North Mason 13 0 0.0%North Thurston 230 27 11.7%
7oEducating LEP Students in Washington State 64

Appendix C Length of Stay Data
Total LEP Number enrolled PercentDistrict students served more than 3 years of totalNorthshore 443 53 12.0%Oak Harbor 172 24 14.0%Ocean Beach 47 18 38.3%Okanogan 184 56 30.4%Olympia 155 47 30.3%Omak 79 45 57.0%Onalaska 23 0 0.0%Orcas 2 0 0.0%Orondo 147 48 32.7%Oroville 120 29 24.2%Orting 28 3 10.7%Othello 978 289 29.6%Palisades 45 9 20.0%Pasco 3,914 1882 48.1%Pateros 39 0 0.0%Paterson 18 0 0.0%Peninsula 39 0 0.0%Port Angeles 18 3 16.7%Port Townsend 16 0 0.0%Prescott 118 54 45.8%Prosser 636 194 30.5%Pullman 64 3 4.7%Puyallup 178 24 13.5%Quillayute Valley 159 61 38.4%Quinault Lake 37 0 0.0%Quincy 628 178 28.3%Raymond 75 39 52.0%Renton 841 133 15.8%Richland 252 33 13.1%Ridgefield 18 0 0.0%Riverview 46 5 10.9%Rochester 64 7 10.9%Roosevelt 16 4 25.0%Royal 536 192 35.8%Seattle 5,447 2,232 41.0%Sedro Woolley 97 14 14.4%Selah 121 31 25.6%Sequim 36 8 22.2%Shelton 122 37 30.3%Shoreline 561 52 9.3%Snohomish 58 15 25.9%Snoqualmie Valley 15 0 0.0%Soap Lake 107 21 19.6%South Bend 54 19 35.2%South Kitsap 55 7 12.7%South Whidbey 6 0 0.0%Southside 1 0 0.0%Spokane 899 127 14.1%Stanwood 45 14 31.1%Steilacoom 55 2 3.6%Stevenson-Carson 11 5 45.5%
Educating LEP Students in Washington State 71 65
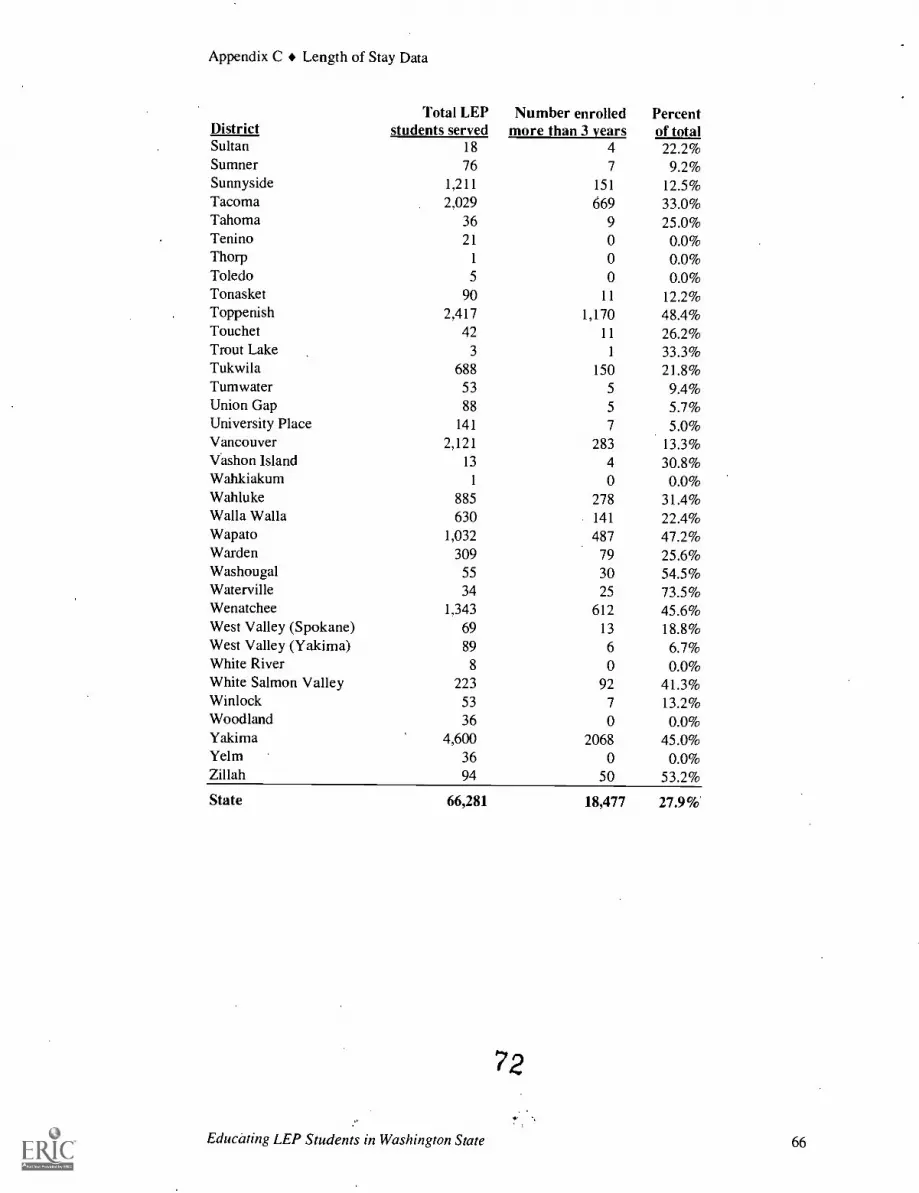
Appendix C Length of Stay Data
Total LEP Number enrolled PercentDistrict students served more than 3 years of totalSultan 18 4 22.2%Sumner 76 7 9.2%Sunnyside 1,211 151 12.5%Tacoma 2,029 669 33.0%Tahoma 36 9 25.0%Tenino 21 0 0.0%Thorp 1 0 0.0%Toledo 5 0 0.0%Tonasket 90 11 12.2%Toppenish 2,417 1,170 48.4%Touchet 42 11 26.2%Trout Lake 3 1 33.3%Tukwila 688 150 21.8%Tumwater 53 5 9.4%Union Gap 88 5 5.7%University Place 141 7 5.0%Vancouver 2,121 283 13.3%Vashon Island 13 4 30.8%Wahkiakum 1 0 0.0%Wahluke 885 278 31.4%Walla Walla 630 141 22.4%Wapato 1,032 487 47.2%Warden 309 79 25.6%Washougal 55 30 54.5%Waterville 34 25 73.5%Wenatchee 1,343 612 45.6%West Valley (Spokane) 69 13 18.8%West Valley (Yakima) 89 6 6.7%White River 8 0 0.0%White Salmon Valley 223 92 41.3%Winlock 53 7 13.2%Woodland 36 0 0.0%Yakima 4,600 2068 45.0%Ye Im 36 0 0.0%Zillah 94 50 53.2%
State 66,281 18,477 27.9%
72
Educating LEP Students in Washington State 66

Appendix C Length of Stay Data
Table C-5: Number and Percent of Students Enrolled More Than Three Years,by Number Served
Total LEP Number enrolled PercentDistrict students served more than 3 years of totalSeattle 5,447 2,232 41.0%Yakima 4,600 2,068 45.0%Pasco 3,914 1,882 48.1%Kent 2,611 703 26.9%Toppenish 2,417 1,170 48.4%Vancouver 2,121 283 13.3%Tacoma 2,029 669 33.0%Federal Way 1,838 252 13.7%High line 1,789 346 19.3%Bellevue 1,758 316 18.0%Edmonds 1,430 197 13.8%Mukilteo 1,403 127 9.1%Mount Vernon 1,397 414 29.6%Kennewick 1,366 412 30.2%Wenatchee 1,343 612 45.6%Lake Washington 1,245 339 27.2%Sunnyside 1,211 151 12.5%Everett 1,135 200 17.6%Wapato. 1,032 487 47.2%Evergreen (Clark) 1,004 133 13.2%Othello 978 289 29.6%Spokane 899 127 14.1%Wahluke 885 278 31.4%Renton 841 133 15.8%Auburn 699 87 12.4%Clover Park 691 83 12.0%Tukwila 688 150 21.8%Prosser 636 194 30.5%Walla Walla 630 141 22.4%Quincy 628 178 28.3%Eastmont 596 152 25.5%Shoreline 561 52 9.3%Burlington-Edison 549 84 15.3%Moses Lake 536 175 32.6%Royal 536 192 35.8%Grandview 518 6 1.2%North Franklin 504 26 5.2%Brewster 469 188 40.1%Northshore 443 53 12.0%Bellingham 425 87 20.5%Bridgeport 344 132 38.4%Granger 340 71 20.9%Lake Chelan 323 70 21.7%Warden 309 79 25.6%Mabton 268 75 28.0%Central Kitsap 265 71 26.8%Manson 261 131 50.2%Richland - . 252 33 13.1%
73Educating LEP Students in Washington State 67

Appendix C Length of Stay Data
Total LEP Number enrolled PercentDistrict students served more than 3 years of totalCentralia 231 50 21.6%North Thurston 230 27 11.7%Highland 229 42 18.3%Longview 225 43 19.1%White Salmon Valley 223 92 41.3%College Place 220 76 34.5%Lynden 216 68 31.5%Ephrata 211 23 10.9%Cascade 205 24 11.7%Issaquah 204 28 13.7%Cape Flattery 188 131 69.7%Marysville 184 7 3.8%Okanogan 184 56 30.4%Franklin Pierce 181 16 8.8%Ferndale 179 27 15.1%Puyallup 178 24 13.5%Oak Harbor 172 24 14.0%Aberdeen 169 42 24.9%Quillayute Valley 159 61 38.4%Olympia 155 47 30.3%East Valley (Yakima) 152 7 4.6%Battle Ground 151 44 29.1%Orondo 147 48 32.7%Meridian 146 36 24.7%University Place 141 7 5.0%Kiona-Benton City 139 42 30.2%Monroe 132 10 7.6%Shelton 122 37 30.3%Mount Baker 121 11 9.1%Selah 121 31 25.6%Oroville 120 29 24.2%Mount Adams 118 32 27.1%Prescott 118 54 45.8%Cashmere 115 15 13.0%Nooksack Valley 114 16 14.0%Central Valley 107 23 21.5%Soap Lake 107 21 19.6%Fife 102 0. 0.0%Kelso 101 20 19.8%Naches Valley 97 47 48.5%Sedro Woolley 97 14 14.4%Mercer Island 95 12 12.6%Zillah 94 50 53.2%Bethel 93 11 11.8%Tonasket 90 11 12.2%West Valley (Yakima) 89 6 6.7%Ellensburg 88 13 14.8%Union Gap 88 5 5.7%Blaine 87 27 31.0%Mead 85 3 3.5%Hoquiam 84 0 0.0%
74Educating LEP Students in Washington State 68

Appendix C Length of Stay Data
Total LEP Number enrolled PercentDistrict students served more than 3 years of totalLake Stevens 81 8 9.9%Omak 79 45 57.0%Chehalis 76 18 23.7%Sumner 76 7 9.2%North Kitsap 75 26 34.7%Raymond 75 39 52.0%West Valley (Spokane) 69 13 18.8%Pullman 64 3 4.7%Rochester 64 7 10.9%Snohomish 58 15 25.9%Arlington 55 8 14.5%South Kitsap 55 7 12.7%Steilacoom 55 2 3.6%Washougal 55 30 54.5%Bremerton 54 19 35.2%Columbia (Walla Walla) 54 18 33.3%South Bend 54 19 35.2%Tumwater 53 5 9.4%Win lock 53 7 13.2%East Valley (Spokane) 52 6 11.5%Entiat 52 3 5.8%Anacortes 49 21 42.9%Goldendale 47 27 57.4%Ocean Beach 47 18 38.3%Riverview 46 5 10.9%Dayton 45 7 15.6%Elma 45 20 44.4%Kittitas 45 7 15.6%Palisades 45 9 20.0%Stanwood 45 14 31.1%La Conner 43 0 0.0%Touchet 42 11 26.2%Finley , 41 4 9.8%Pateros 39 0 0.0%Peninsula 39 0 0.0%Enumclaw 37 6 16.2%Quinault Lake 37 0 0.0%Bainbridge Island 36 11 30.6%Sequim 36 8 22.2%Tahoma 36 9 25.0%Woodland 36 0 0.0%Ye lm 36 0 0.0%Conway 35 0 0.0%Waterville 34 25 73.5%Camas 29 5 17.2%Lind 28 13 46.4%Orting 28 3 10.7%Onalaska 23 0 0.0%Tenino 21 0 0.0%Paterson 18 0 0.0%Port Angeles 18 3 16.7%
75Educating LEP Students in Washington State 69

Appendix C Length of Stay Data
Total LEP Number enrolled PercentDistrict students served more than 3 years of totalRidgefield 18 0 0.0%Sultan 18 4 22.2%Lakewood 16 1 6.3%Port Townsend 16 0 0.0%Roosevelt 16 4 25.0%Snoqualmie Valley 15 0 0.0%Clarkston 14 0 0.0%Coupeville 14 2 14.3%Easton 13 0 0.0%North Mason 13 0 0.0%Vashon Island 13 4 30.8%Lyle 12 0 0.0%Stevenson-Carson 11 5 45.5%Cheney 10 2 20.0%Green Mountain 9 0 0.0%Castle Rock 8 0 0.0%Eatonville 8 0 0.0%White River 8 0 0.0%La Center 7 0 0.0%Montesano 7 3 42.9%Naselle-Grays Riv. Valley 6 0 0.0%South Whidbey 6 0 0.0%Asotin-Anatone 5 0 0.0%Granite Falls 5 0 0.0%Methow Valley 5 0 0.0%Mossyrock 5 0 0.0%Toledo 5 0 0.0%Colfax 3 0 0.0%Trout Lake 3 1 33.3%Liberty 2 0 0.0%Nine Mile Falls 2 0 0.0%Orcas 2 0 0.0%Southside 1 0 0.0%Thorp 1 0 0.0%Wahkiakum 1 0 0.0%
State 66,281 18,477 27.9%
76
Educating LEP Students in Washington State 70

Appendix C Length of Stay Data
Table C-6: Number and Percent of Students Enrolled More Than Three Years,by Percent Enrolled More Than Three Years
Total LEP Number enrolled PercentDistrict students served more than 3 years of totalWaterville 34 25 73.5%Cape Flattery 188 131 69.7%Goldendale 47 27 57.4%Omak 79 45 57.0%Washougal 55 30 54.5%Zillah 94 50 53.2%Raymond 75 39 52.0%Manson 261 131 50.2%Naches Valley 97 47 48.5%Toppenish 2,417 1,170 48.4%Pasco 3,914 1,882 48.1%Wapato 1,032 487 47.2%Lind 28 13 46.4%Prescott 118 54 45.8%Wenatchee 1,343 612 45.6%Stevenson-Carson 11 5 45.5%Yakima 4,600 2,068 45.0%Elma 45 20 44.4%Anacortes 49 21 42.9%Montesano 7 3 42.9%White Salmon Valley 223 92 41.3%Seattle 5,447 2,232 41.0%Brewster 469 188 40.1%Bridgeport 344 132 38.4%Quillayute Valley 159 61 38.4%Ocean Beach 47 18 38.3%Royal 536 192 35.8%Bremerton 54 19 35.2%South Bend 54 19 35.2%North Kitsap 75 26 34.7%College Place 220 76 34.5%Columbia (Walla Walla) 54 18 33.3%Trout Lake 3 1 33.3%Tacoma 2,029 669 33.0%Orondo 147 48 32.7%Moses Lake 536 175 32.6%Lynden 216 68 31.5%Wahluke 885 278 31.4%Stanwood 45 14 31.1%Blaine 87 27 31.0%Vashon Island 13 4 30.8%Bainbridge Island 36 11 30.6%Prosser 636 194 30.5%Okanogan 184 56 30.4%Olympia 155 47 30.3%Shelton 122 37 30.3%Kennewick 1,366 412 30.2%Kiona-Benton City 139 42 30.2%
Educating LEP Students in Washington State 77 71
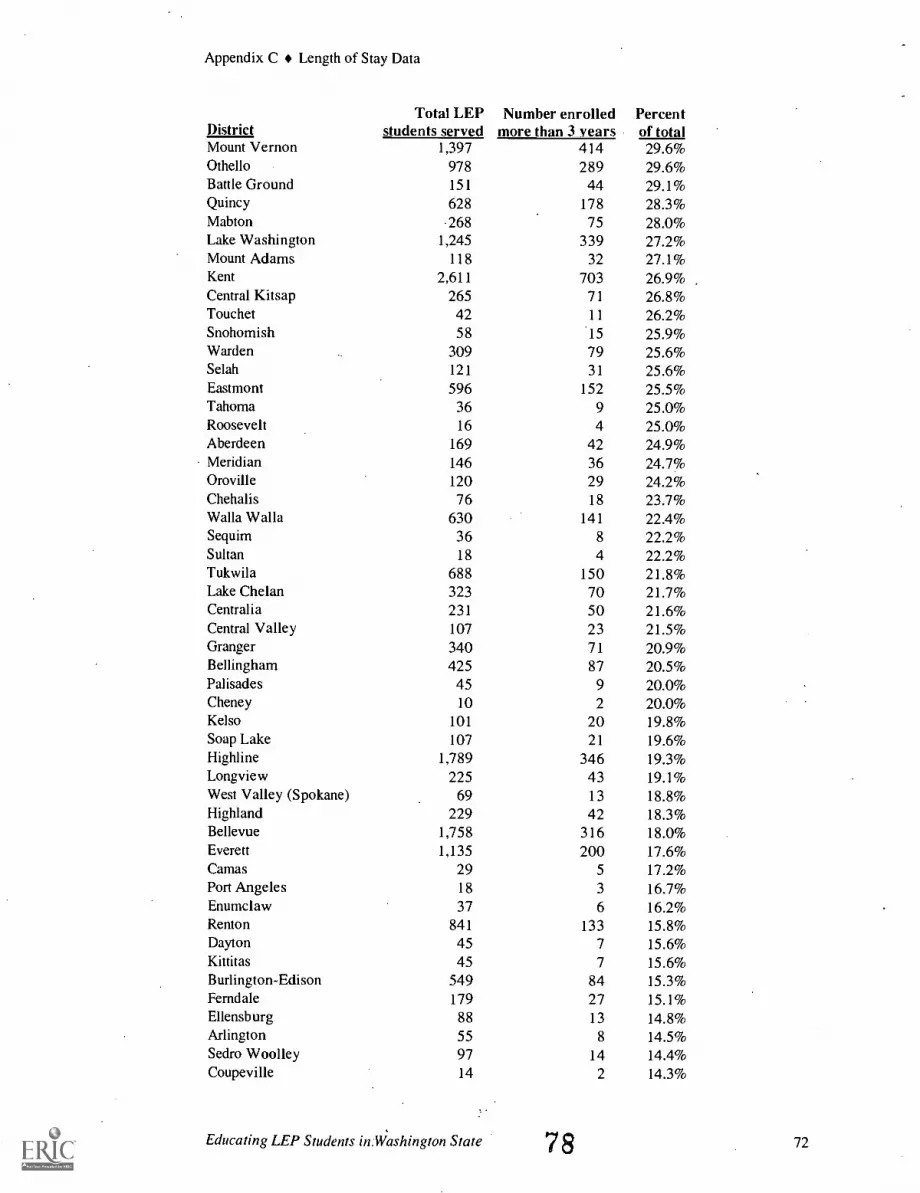
Appendix C Length of Stay Data
Total LEP Number enrolled PercentDistrict students served more than 3 years of totalMount Vernon 1,397 414 29.6%Othello 978 289 29.6%Battle Ground 151 44 29.1%Quincy 628 178 28.3%Mabton .268 75 28.0%Lake Washington 1,245 339 27.2%Mount Adams 118 32 27.1%Kent 2,611 703 26.9%Central Kitsap 265 71 26.8%Touchet 42 11 26.2%Snohomish 58 .15 25.9%Warden 309 79 25.6%Selah 121 31 25.6%Eastmont 596 152 25.5%Tahoma 36 9 25.0%Roosevelt 16 4 25.0%Aberdeen 169 42 24.9%Meridian 146 36 24.7%Oroville 120 29 24.2%Chehalis 76 18 23.7%Walla Walla 630 141 22.4%Sequim 36 8 22.2%Sultan 18 4 22.2%Tukwila 688 150 21.8%Lake Chelan 323 70 21.7%Centralia 231 50 21.6%Central Valley 107 23 21.5%Granger 340 71 20.9%Bellingham 425 87 20.5%Palisades 45 9 20.0%Cheney 10 2 20.0%Kelso 101 20 19.8%Soap Lake 107 21 19.6%High line 1,789 346 19.3%Longview 225 43 19.1%West Valley (Spokane) 69 13 18.8%Highland 229 42 18.3%Bellevue 1,758 316 18.0%Everett 1,135 200 17.6%Camas 29 5 17.2%Port Angeles 18 3 16.7%Enumclaw 37 6 16.2%Renton 841 133 15.8%Dayton 45 7 15.6%Kittitas 45 7 15.6%Burlington-Edison 549 84 15.3%Femdale 179 27 15.1%Ellensburg 88 13 14.8%Arlington 55 8 14.5%Sedro Woolley 97 14 14.4%Coupeville 14 2 14.3%
Educating LEP Students in:IYU shington State 78 72
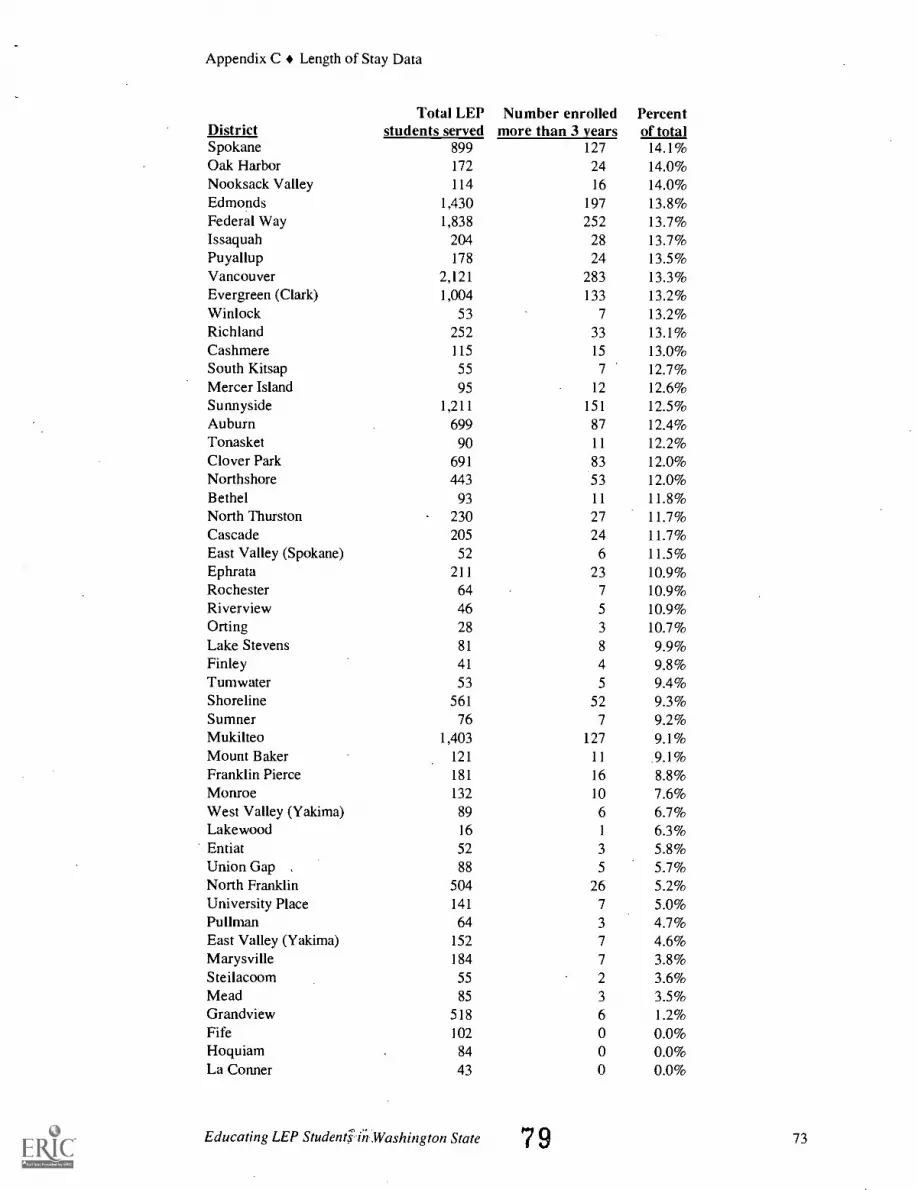
Appendix C Length of Stay Data
Total LEP Number enrolled PercentDistrict students served more than 3 years of totalSpokane 899 127 14.1%Oak Harbor 172 24 14.0%Nooksack Valley 114 16 14.0%Edmonds 1,430 197 13.8%Federal Way 1,838 252 13.7%Issaquah 204 28 13.7%Puyallup 178 24 13.5%Vancouver 2,121 283 13.3%Evergreen (Clark) 1,004 133 13.2%Win lock 53 7 13.2%Richland 252 33 13.1%Cashmere 115 15 13.0%South Kitsap 55 7 12.7%Mercer Island 95 12 12.6%Sunnyside 1,211 151 12.5%Auburn 699 87 12.4%Tonasket 90 11 12.2%Clover Park 691 83 12.0%Northshore 443 53 12.0%Bethel 93 11 11.8%North Thurston 230 27 11.7%Cascade 205 24 11.7%East Valley (Spokane) 52 6 11.5%Ephrata 211 23 10.9%Rochester 64 7 10.9%Riverview 46 5 10.9%Orting 28 3 10.7%Lake Stevens 81 8 9.9%Finley 41 4 9.8%Tumwater 53 5 9.4%Shoreline 561 52 9.3%Sumner 76 7 9.2%Mukilteo 1,403 127 9.1%Mount Baker 121 11 9.1%Franklin Pierce 181 16 8.8%Monroe 132 10 7.6%West Valley (Yakima) 89 6 6.7%Lakewood 16 1 6.3%Entiat 52 3 5.8%Union Gap , 88 5 5.7%North Franklin 504 26 5.2%University Place 141 7 5.0%Pullman 64 3 4.7%East Valley (Yakima) 152 7 4.6%Marysville 184 7 3.8%Steilacoom 55 2 3.6%Mead 85 3 3.5%Grandview 518 6 1.2%Fife 102 0 0.0%Hoquiam 84 0 0.0%La Conner 43 0 0.0%
Educating LEP Studen6.in. Washington State 79 73

Appendix C Length of Stay Data
Total LEP Number enrolled PercentDistrict students served more than 3 years of totalPateros 39 0 0.0%Peninsula 39 0 0.0%Quinault Lake 37 0 0.0%Woodland 36 0 0.0%Yelm 36 0 0.0%Conway 35 0 0.0%Onalaska 23 0 0.0%Tenino 21 0 0.0%Paterson 18 0 0.0%Ridgefield 18 0 0.0%Port Townsend 16 0 0.0%Snoqualmie Valley 15 0 0.0%Clarkston 14 0 0.0%Easton 13 0 0.0%North Mason 13 0 0.0%Lyle 12 0 0.0%Green Mountain 9 0 0.0%Castle Rock 8 0 0.0%Eatonville 8 0 0.0%White River 8 0 0.0%La Center 7 0 0.0%Naselle-Grays Riv. Valley 6 0 0.0%South Whidbey 6 0 0.0%Asotin-Anatone 5 0 0.0%Granite Falls 5 0 0.0%Methow Valley 5 0 0.0%Mossyrock 5 0 0.0%Toledo 5 0 0.0%Colfax 3 0 0.0%Liberty 2 0 0.0%Nine Mile Falls 2 0 0.0%Orcas 2 0 0.0%Southside 1 0 0.0%Thorp 1 0 0.0%Wahkiakum 1 0 0.0%
State 66,281 18,477 27.9%
GO
Educating LEP Students in Washington State 74
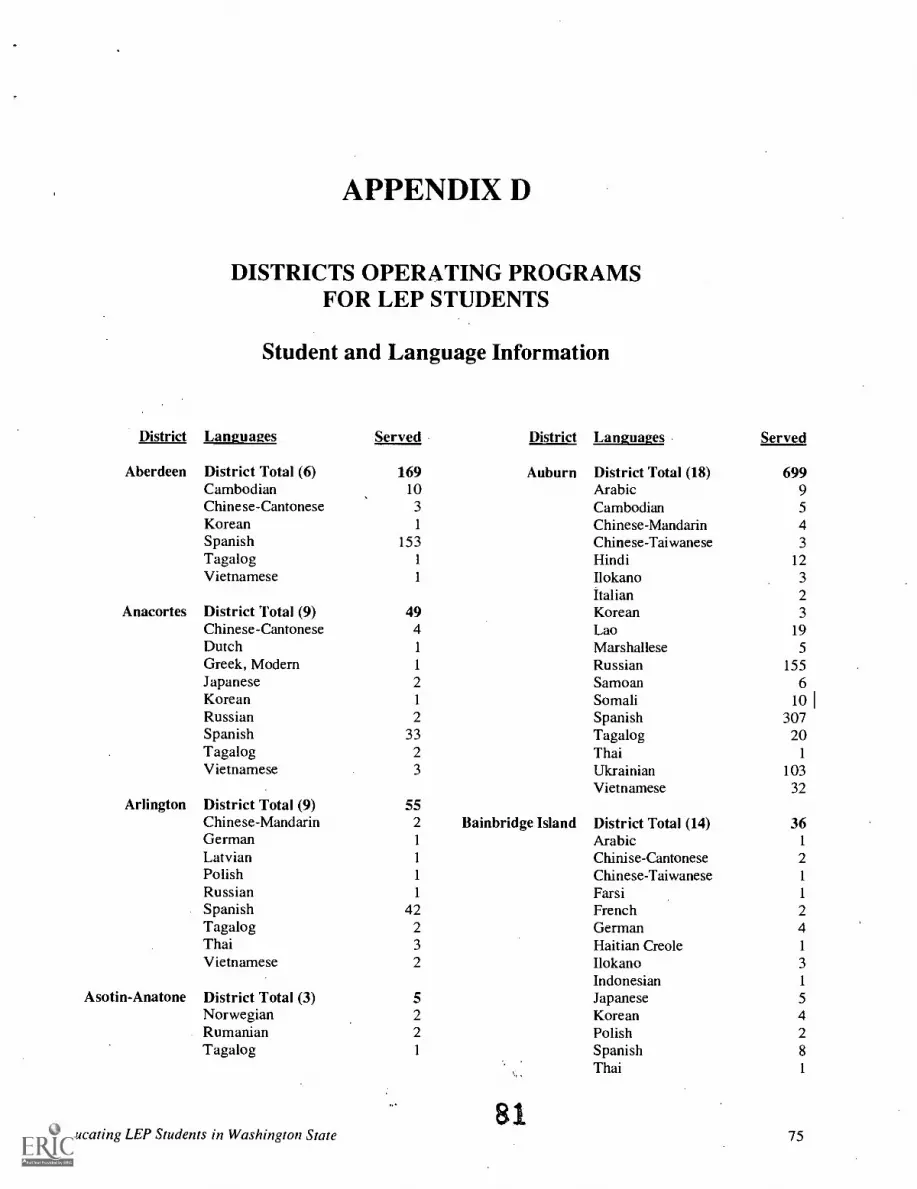
APPENDIX D
DISTRICTS OPERATING PROGRAMSFOR LEP STUDENTS
Student and Language Information
District Languages Served District
Aberdeen District Total (6) 169 AuburnCambodian 10Chinese-Cantonese 3Korean 1
Spanish 153Tagalog 1
Vietnamese 1
Anacortes District Total (9) 49Chinese-Cantonese 4Dutch 1
Greek, Modern 1
Japanese 2Korean 1
Russian 2Spanish 33Tagalog 2Vietnamese 3
Arlington District Total (9) 55Chinese-Mandarin 2 Bainbridge IslandGerman 1
Latvian 1
Polish 1
Russian 1
Spanish 42Tagalog 2Thai 3Vietnamese 2
Asotin-Anatone District Total (3) 5Norwegian 2Rumanian 2Tagalog 1
81Educating LEP Students in Washington State
Languages Served
District Total (18) 699Arabic 9Cambodian 5Chinese-Mandarin 4Chinese-Taiwanese 3Hindi 12Ilokano 3Italian 2Korean 3Lao 19Marshallese 5Russian 155Samoan 6Somali 10Spanish 307Tagalog 20Thai 1
Ukrainian 103Vietnamese 32
District Total (14) 36Arabic 1
Chinise-Cantonese 2Chinese-Taiwanese 1
Farsi 1
French 2German 4Haitian Creole 1
Ilokano 3Indonesian 1
Japanese 5Korean 4Polish 2Spanish 8Thai 1
75
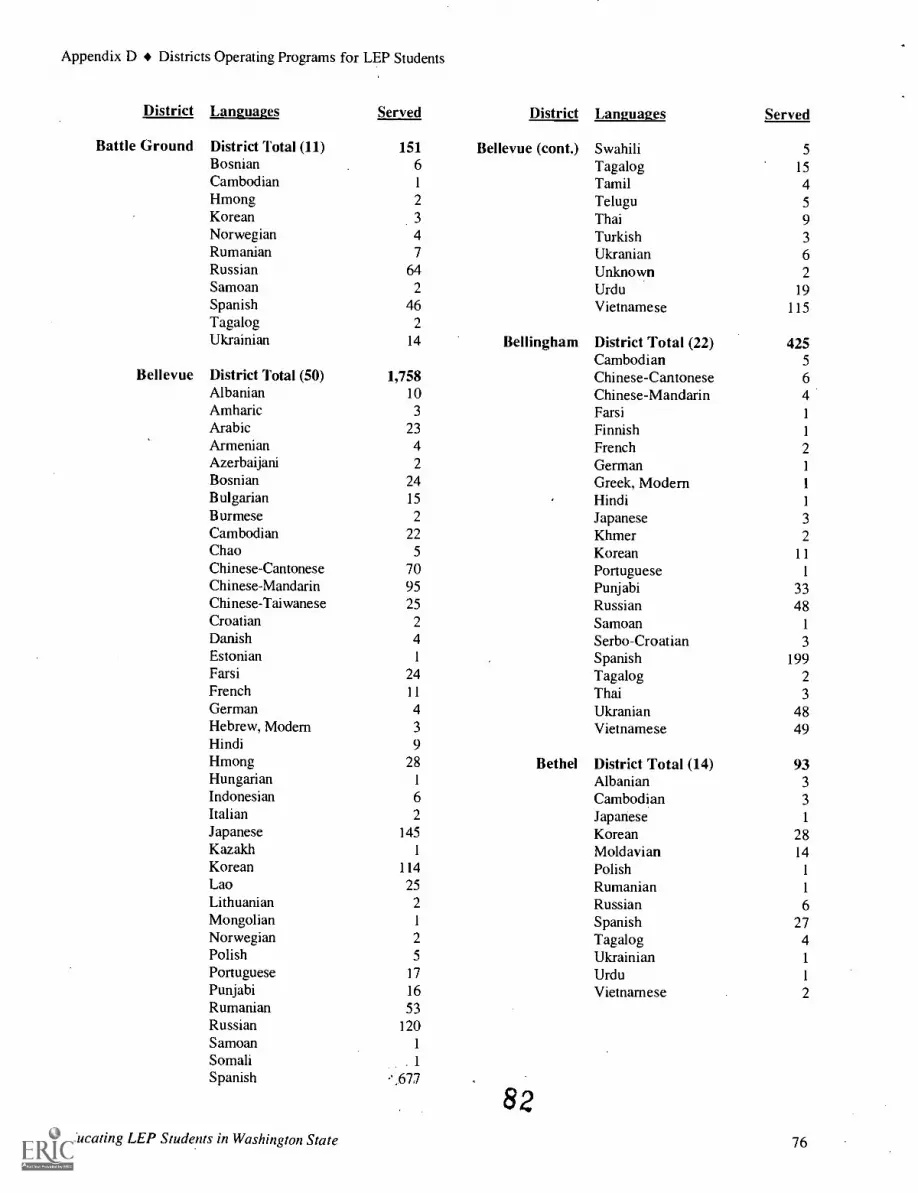
Appendix D Districts Operating Programs for LEP Students
District Languages Served District Languages Served
Battle Ground District Total (11) 151 Bellevue (cont.) Swahili 5Bosnian 6 Tagalog 15Cambodian 1 Tamil 4Hmong 2 Telugu 5Korean 3 Thai 9Norwegian 4 Turkish 3Rumanian 7 Ukranian 6Russian 64 Unknown 2Samoan 2 Urdu 19Spanish 46 Vietnamese 115Tagalog 2Ukrainian 14 Bellingham District Total (22) 425
Cambodian 5Bellevue District Total (50) 1,758 Chinese-Cantonese 6
Albanian 10 Chinese-Mandarin 4Amharic 3 Farsi 1
Arabic 23 Finnish 1
Armenian 4 French 2Azerbaijani 2 German 1
Bosnian 24 Greek, Modern 1
Bulgarian 15 Hindi 1
Burmese 2 Japanese 3Cambodian 22 Khmer 2Chao 5 Korean 11Chinese-Cantonese 70 Portuguese 1
Chinese-Mandarin 95 Punjabi 33Chinese-Taiwanese 25 Russian 48Croatian 2 Samoan 1
Danish 4 Serbo-Croatian 3Estonian 1 Spanish 199Farsi 24 Tagalog 2French 11 Thai 3German 4 Ukranian 48Hebrew, Modem 3 Vietnamese 49Hindi 9Hmong 28 Bethel District Total (14) 93Hungarian 1 Albanian 3Indonesian 6 Cambodian 3Italian 2 Japanese 1
Japanese 145 Korean 28Kazakh 1 Moldavian 14Korean 114 Polish 1
Lao 25 Rumanian 1
Lithuanian 2 Russian 6Mongolian 1 Spanish 27Norwegian 2 Tagalog 4Polish 5 Ukrainian 1
Portuguese 17 Urdu 1
Punjabi 16 Vietnamese 2Rumanian 53Russian 120SamoanSomali . 1
Spanish .',677
82Educating LEP Students in Washington State 76

Appendix D Districts Operating Programs for LEP Students
District Languages Served District
Blaine District Total (11) 87 Cape FlatteryArabic 1
Chinese-Cantonese 1 CascadeChinese-Mandarin 1
Chinese-Taiwanese 1
Fijian 2Hindi 4 CashmerePunjabi 5Russian 46Spanish 18 Castle RockTagalog 1
Ukrainian 6
Bremerton District Total (14) 54 Central KitsapCebuano 2Chamorro 1
Chinese-Mandarin 1
Hawaiian 1
Japanese 1
Korean 4Kurdish 10Punjabi 1
Samoan 3
Spanish 11
Tagalog 10Tamil 1
Trukese 1
Vietnamese 7
Brewster District Total (1) 469Spanish 469
Bridgeport District Total (1) 344Spanish 344
Central ValleyBurlington Edison District Total (4) 549
German 1
Russian 5
Spanish 540Vietnamese 3
Camas District Total (10) 29Chinese-Mandarin 2Chinese-Taiwanese 1
Ethiopic 1
Japanese 1
Korean 1
Lithuanian 1
Russian 15Spanish 3Ukrainian 3Urdu 1
83.
Educating LEP Students in Washington State
Languages Served
Makah 188
District Total (2) 205French 1
Spanish 204
District Total (1) 115Spanish 115
District Total (2) 8Russian 5Spanish 3
District Total (19) 265Arabic 6Chamorro 4Chinese-Cantonese 2Chinese-Mandarin 9Chungki 1
Gujarati 1
Haitian Creole 3Hawaiian 4Ilokano 3
Japanese 5Korean 9Kurdish 17Papago 3Russian 4Samoan 4Spanish 27Tagalog 155Thai 5Vietnamese 3
District Total (19) 107Albanian 3Arabic 2Armenian 3Berber 1
Bulgarian 2Cambodian 1
Chinese-Mandarin 3Farsi 2French 2Greek 2Korean 5Polish 2Punjabi 3Russian 41Serbo-Croatian 5Spanish 18Ukrainian 2Urdu 3Vietnamese 7
77
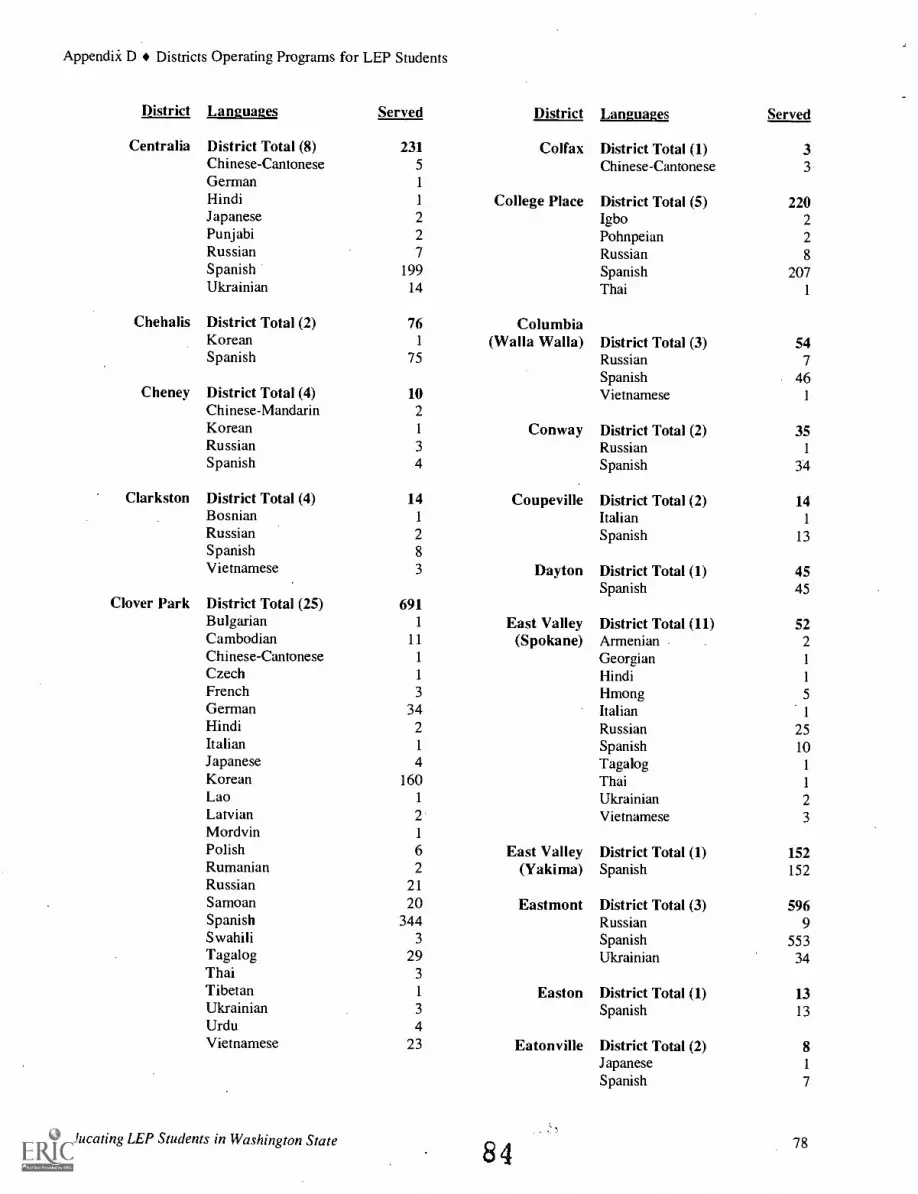
Appendii D Districts Operating Programs for LEP Students
District Languages Served District
Centralia District Total (8) 231 ColfaxChinese-Cantonese 5
German 1
Hindi 1 College PlaceJapanese 2Punjabi 2Russian 7Spanish 199Ukrainian 14
Chehalis District Total (2) 76 ColumbiaKorean 1 (Walla Walla)Spanish 75
Cheney District Total (4) 10Chinese-Mandarin 2Korean 1 ConwayRussian 3Spanish 4
Clarkston District Total (4) 14 CoupevilleBosnian 1
Russian 2Spanish 8Vietnamese 3 Dayton
Clover Park District Total (25) 691Bulgarian 1 East ValleyCambodian 11 (Spokane)Chinese-Cantonese 1
Czech 1
French 3
German 34Hindi 2Italian 1
Japanese 4Korean 160Lao 1
Latvian 2Mordvin 1
Polish 6 East ValleyRumanian 2 (Yakima)Russian 21Samoan 20 EastmontSpanish 344Swahili 3Tagalog 29Thai 3Tibetan 1 EastonUkrainian 3Urdu 4Vietnamese 23 Eatonville
Educating LEP Students in Washington State84
Languages Served
District Total (1) 3Chinese-Cantonese 3
District Total (5) 220Igbo 2Pohnpeian 2Russian 8Spanish 207Thai 1
District Total (3) 54Russian 7Spanish 46Vietnamese 1
District Total (2) 35Russian 1
Spanish 34
District Total (2) 14Italian 1
Spanish 13
District Total (1) 45Spanish 45
District Total (11) 52Armenian 2Georgian 1
Hindi 1
Hmong 5
Italian 1
Russian 25Spanish 10Tagalog 1
Thai 1
Ukrainian 2Vietnamese 3
District Total (1) 152Spanish 152
District Total (3) 596Russian 9Spanish 553Ukrainian 34
District Total (1) 13Spanish 13
District Total (2) 8Japanese 1
Spanish 7
78

Appendix D Districts Operating Programs for LEP Students
District Languages Served District
Edmonds District Total (55) 1,430 Edmonds (cont.)Akan 3Amharic 5Arabic 43 EllensburgArmenian 1
Bulgarian 21Cambodian 32Cebuano 1
Chinese-Cantonese 35Chinese-Mandarin 22Chinese-Taiwanese 1
Danish 1 ElmaEgyptian-Arabic 3
Estonian 1
Ethiopic 4Farsi 23Fijian 8Finnish 2 EntiatFrench 2Georgian 1
German 4 EnumclawGreek, Modern 5Gujarati 1
Hindi 25 EphrataHungarian 3Ibo 1
Icelandic (old) 1
Ilokano 5Indonesian 4Japanese 9Korean 195Kurdish 3
Lao 7 EverettMalayalam 1
Nepali 1
Oromo 1
Polish 6Portuguese 6Punjabi 19Romansch 1
Rumanian 13Russian 93Serbo-Croatian 50Somali 1
Spanish 365Swahili 1
Tagalog 50Telugu 1
Thai 6Tigriny 13Turkish 4Twi 2Ukrainian 151Urdu 25
Educating LEP Students in Washington State 85
Languages Served
Vietnamese 147Wolof 1
District Total (6) 88Chinese-Taiwanese 1
Javanese 1
Korean 2Punjabi 1
Spanish 82Vietnamese 1
District Total (6) 45Cambodian 12Chinese-Cantonese 3
Japanese 1
Spanish 29
District Total (1) 52Spanish 52
District Total (1) 37Spanish 37
District Total (7) 211German 1
Marathi 1
Punjabi 1
Russian 10Spanish 179Ukrainian 17Vietnamese 2
District Total (31) 1,135Arabic 117Bosnian 4Bulgarian 2Cambodian 19Chinese-Cantonese 5
Chinese-Mandarin 3Farsi 6French 1
German 4Hindi 3Hmong 6Hungarian 2Indonesian 1
Japanese 1
Korean 47Kurdish 1
Lao 14
Marshallese 16Pali 1
Polish 4Punjabi 24
79
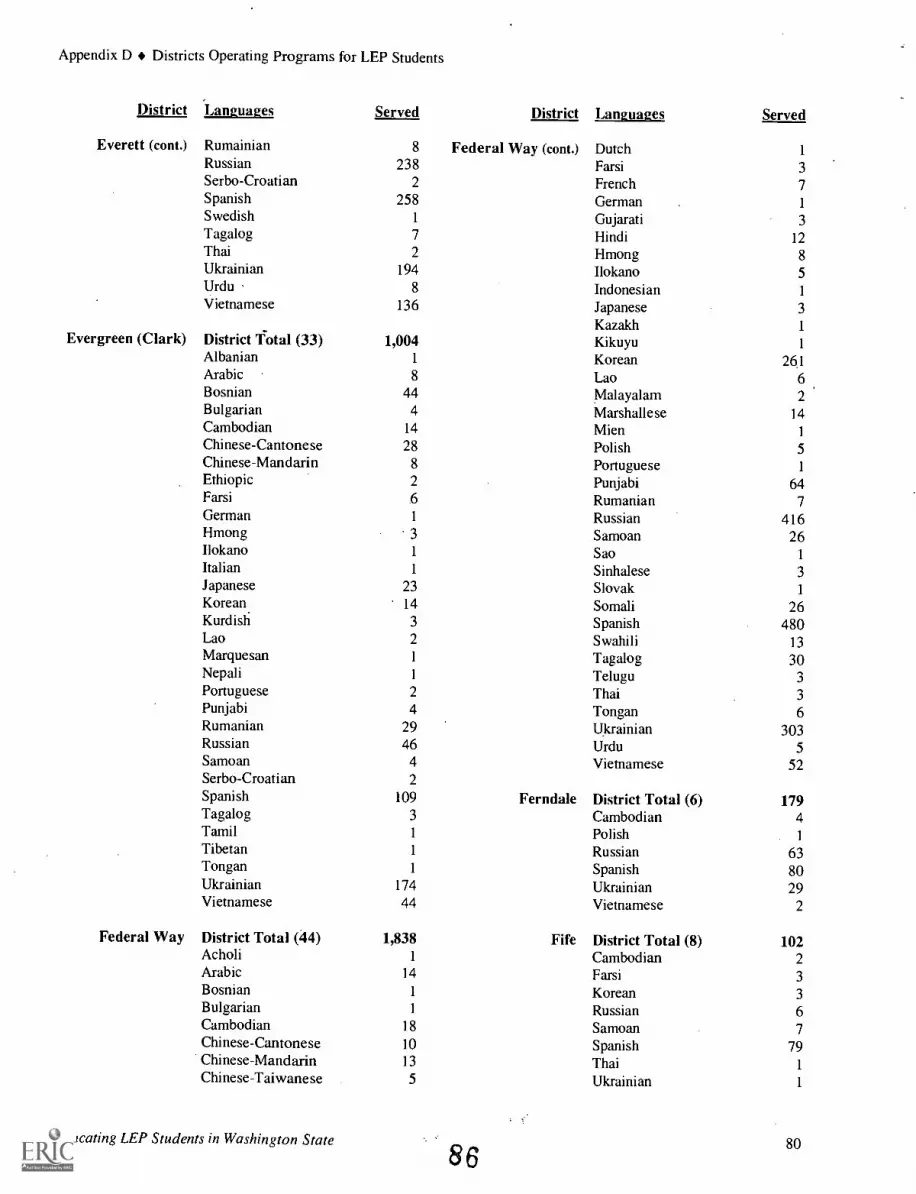
Appendix D Districts Operating Programs for LEP Students
District Languages Served District
Everett (cont.) Rumainian 8 Federal Way (cont.)Russian 238Serbo-Croatian 2Spanish 258Swedish 1
Tagalog 7Thai 2Ukrainian 194Urdu 8Vietnamese 136
Evergreen (Clark) District Total (33) 1,004Albanian 1
Arabic 8Bosnian 44Bulgarian 4Cambodian 14Chinese-Cantonese 28Chinese-Mandarin 8Ethiopic 2Farsi .6
German 1
Hmong 3Ilokano 1
Italian 1
Japanese 23Korean. 14Kurdish 3Lao 2Marquesan 1
Nepali 1
Portuguese 2Punjabi 4Rumanian 29Russian 46Samoan 4Serbo-Croatian 2Spanish 109 FerndaleTagalog 3Tamil 1
Tibetan 1
Tongan 1
Ukrainian 174Vietnamese 44
Federal Way District Total (44) 1,838 FifeAcholi 1
Arabic 14Bosnian 1
Bulgarian 1
Cambodian 18Chinese-Cantonese 10Chinese-Mandarin 13Chinese-Taiwanese 5
Educating LEP Students in Washington State
86
Languages Served
Dutch 1
Farsi 3French 7German 1
Gujarati 3Hindi 12Hmong 8Ilokano 5Indonesian 1
Japanese 3Kazakh 1
Kikuyu 1
Korean 261Lao 6Malayalam 2Marshallese 14Mien 1
Polish 5Portuguese 1
Punjabi 64Rumanian 7Russian 416Samoan 26Sao 1
Sinhalese 3Slovak 1
Somali 26Spanish 480Swahili 13Tagalog 30Telugu 3Thai 3Tongan 6Ukrainian 303Urdu 5Vietnamese 52
District Total (6) 179Cambodian 4Polish 1
Russian 63Spanish 80Ukrainian 29Vietnamese 2
District Total (8) 102Cambodian 2Farsi 3Korean 3Russian 6Samoan 7Spanish 79Thai 1
Ukrainian 1
80
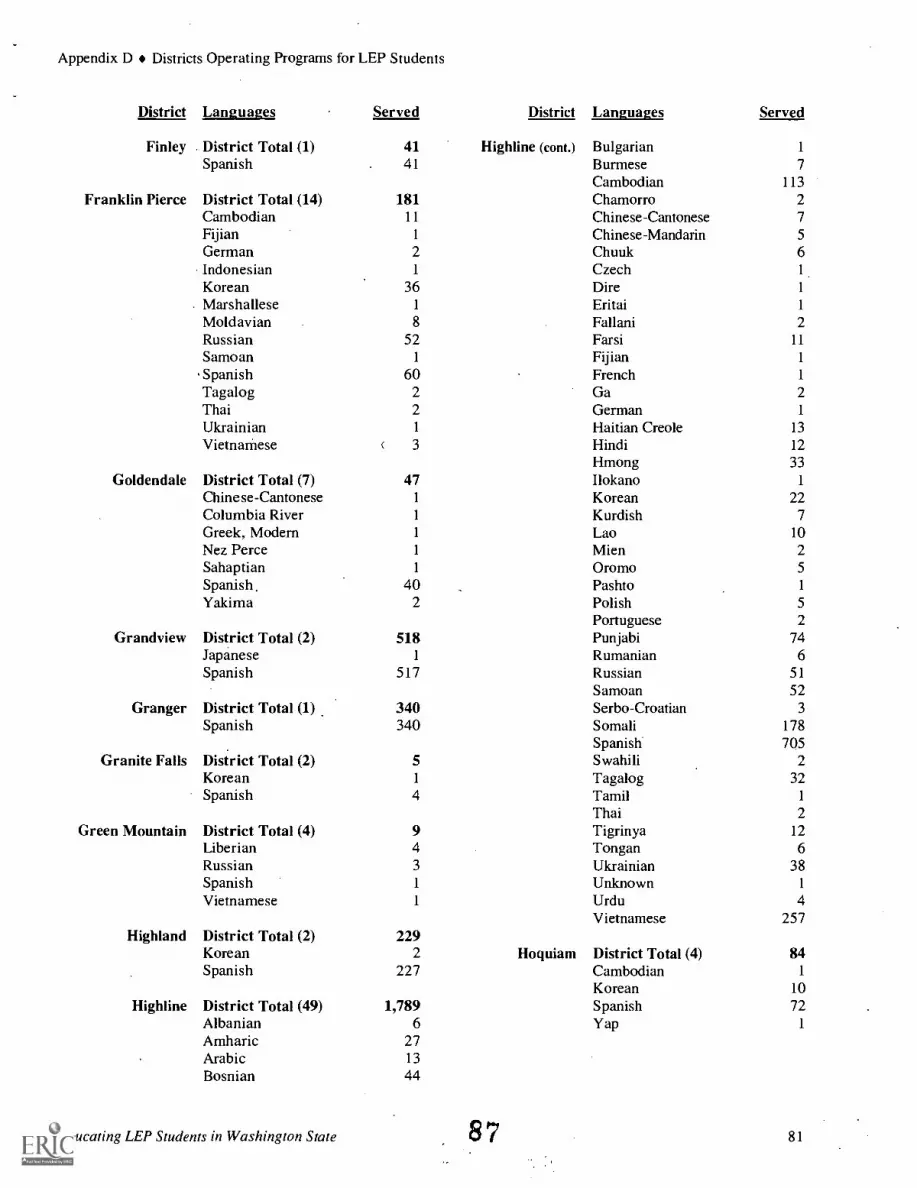
Appendix D Districts Operating Programs for LEP Students
District Languages Served District
Finley District Total (1) 41 High line (cont.)Spanish 41
Franklin Pierce District Total (14) 181Cambodian 11
Fijian 1
German 2Indonesian 1
Korean 36Marshallese 1
Moldavian 8Russian 52Samoan 1
Spanish 60Tagalog 2Thai 2Ukrainian 1
Vietnamese 3
Goldendale District Total (7) 47Chinese-Cantonese 1
Columbia River 1
Greek, Modern 1
Nez Perce 1
Sahaptian 1
Spanish, 40Yakima 2
Grandview District Total (2) 518Japanese 1
Spanish 517
Granger District Total (1) 340Spanish 340
Granite Falls District Total (2) 5Korean 1
Spanish 4
Green Mountain District Total (4) 9Liberian 4Russian 3
Spanish 1
Vietnamese 1
Highland District Total (2) 229Korean 2 HoquiamSpanish 227
High line District Total (49) 1,789Albanian 6Amharic 27Arabic 13Bosnian 44
Educating LEP Students in Washington State 87
Languages Served
Bulgarian 1
Burmese 7Cambodian 113Chamorro 2Chinese-Cantonese 7Chinese-Mandarin 5
Chuuk 6Czech 1.Dire 1
Eritai 1
Fa llani 2Farsi 11
Fijian 1
French 1
Ga 2German 1
Haitian Creole 13Hindi 12Hmong 33Ilokano 1
Korean 22Kurdish 7Lao 10Mien 2
Oromo 5
Pashto 1
Polish 5
Portuguese 2Punjabi 74Rumanian 6Russian 51Samoan 52Serbo-Croatian 3
Somali 178Spanish 705Swahili 2Tagalog 32Tamil 1
Thai 2
Tigrinya 12Tongan 6Ukrainian 38Unknown 1
Urdu 4Vietnamese 257
District Total (4) 84Cambodian 1
Korean 10Spanish 72Yap 1
81

Appendix D Districts Operating Programs for LEP Students
District Languages Served District Languages
Issaquah District Total (18) 204 Kent (cont.) AmbaricChinese-Cantonese 6 ArabicChinese-Fukienese 37 ArmenianFarsi 6 BengaliFrench 1 BosnianHebrew, Modern 1 BulgarianHmong 13 BurmeseIndonesian 1 ByelorussianJapanese 16 CambodianKorean 29 ChamorroLao 2 ChewaMarshallese 2 Chinese-CantoneseMien 1 Chinese-MandarinPortuguese 2 CroatianRussian 7 CzechSpanish 72 EthiopicTagalog 4 FarsiThai 2 FrenchUkrainian 2 German
GujaratiKelso District Total (8) 101 Hindi
Cambodian 7 HmongLao 2 IboMoldavian 2 IlokanoRumanian 1 IndonesianRussian 10 ItalianSpanish 75 JapaneseTagalog 2 JavaneseUkrainian 2 Kakwa
KannadaKennewick District Total (18) 1,366 Khmer
Afrikaans 2 KmhmuAlbanian 3 KoreanAmharic 2 KrioArabic 4 KurdishBosnian 90 LaoChinese-Cantonese 6 LithuanianFarsi 3 MalayalamFrench 2 MienGerman 1 NavajoItalian 1 NepaliKakwa 4 NuerKorean 4 NyanjaKurdish 1 OuolofLao 16 PolishRussian 77 PortugueseSpanish 1,111 PunjabiUkrainian 15 RumanianVietnamese 24 Russian
SamoanKent District Total (71) 2,611 Serbo-Croatian
Acholi 3 SlovakAfrikaans 1 SomaliAlbanian 7 Spanish
Educating LEP Students in Washington State88
Served
411
1
2
943
441
2
1
4131
1
2
1
11
3
41
228
3
1
3
211
1
3
1
92
552
3712
25
1
1
1
5
1
1
125
20421
3062410
1
197559
82
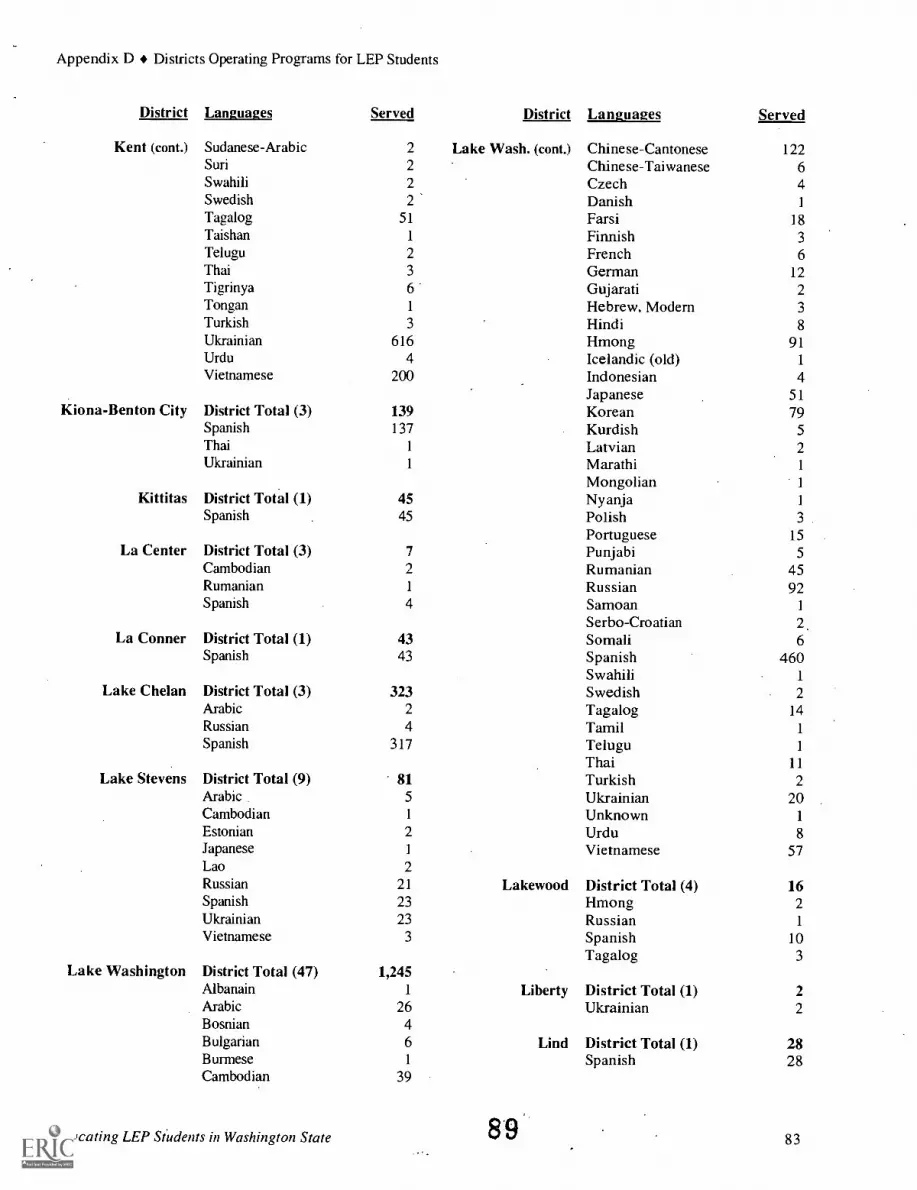
Appendix D Districts Operating Programs for LEP Students
District Languages Served District
Kent (cont.) Sudanese-Arabic 2 Lake Wash. (cont.)Suri 2Swahili 2Swedish 2Tagalog 51Taishan 1
Telugu 2Thai 3
Tigrinya 6Tongan 1
Turkish 3
Ukrainian 616Urdu 4Vietnamese 200
Kiona-Benton City District Total (3) 139Spanish 137Thai 1
Ukrainian 1
Kittitas District Total (1) 45Spanish 45
La Center District Total (3) 7Cambodian 2Rumanian 1
Spanish 4
La Conner District Total (1) 43Spanish 43
Lake Chelan District Total (3) 323Arabic 2Russian 4Spanish 317
Lake Stevens District Total (9) 81Arabic 5Cambodian 1
Estonian 2Japanese 1
Lao 2Russian 21 LakewoodSpanish 23Ukrainian 23Vietnamese 3
Lake Washington District Total (47) 1,245Albanain 1 LibertyArabic 26Bosnian 4Bulgarian 6 LindBurmese 1
Cambodian 39
Educating LEP Students in Washington State 89
Languages Served
Chinese-Cantonese 122Chinese-Taiwanese 6Czech 4Danish 1
Farsi 18Finnish 3French 6German 12Gujarati 2Hebrew, Modern 3Hindi 8Hmong 91Icelandic (old) 1
Indonesian 4Japanese 51Korean 79Kurdish 5Latvian 2Marathi 1
Mongolian 1
Nyanja 1
Polish 3Portuguese 15Punjabi 5Rumanian 45Russian 92Samoan 1
Serbo-Croatian 2Somali 6Spanish 460Swahili 1
Swedish 2Tagalog 14Tamil 1
Telugu 1
Thai 11Turkish 2Ukrainian 20Unknown 1
Urdu 8Vietnamese 57
District Total (4) 16Hmong 2Russian 1
Spanish 10Tagalog 3
District Total (1) 2Ukrainian 2
District Total (1) 28Spanish 28
83

Appendix D Districts Operating Programs for LEP Students
District Languages
Longview District Total (11)CambodianChinese-CantoneseEthiopicGujaratiHindiJapaneseKoreanRussianSpanishTonganVietnamese
Lyle District Total (1)Spanish
Lynden Dktrict Total (8)CambodianGermanHindiPunjabiRussianSpanishUkrainianVietnamese
Mabton
Manson
Marysville
District Total (1)Spanish
District Total (1)Spanish
District Total (17)CambodianChinese-TaiwaneseCzechEgyptian-ArabicFarsi
. JapaneseKoreanKurdishLaoPunjabiRomanschRussianSpanishTagalogThaiUkrainianVietnamese
Mead District Total (15)BulgarianChinese-Taiwanese
Educating LEP Students in Washington State
Served
22520
81
21
1
1
30151
1
9
12
District
Mead (cont.)
12 Mercer Island
21621
1
2018
1701
3
268268
261261
1843
1
271
1
126.
1
8
1
69214
1
13
15
8572
Meridian
Methow Valley
Monroe
90
Languages Served
German 3
Indonesian 3
Kinyarwanda 2Korean 10Marshallese 3
Portuguese 1
Rumanian 41Serbo-Croatian 1
Spanish 4Tagalog 3
Ukrainian 2Urdu 1
Vietnamese 2
District Total (17) 95Albanian 3
Bosnian 3
Chinese-Cantonese 6Chinese-Mandarin 26Danish 2German 1
Japanese 6Korean 26Kurdish 2
Norwegian 1
Polish 3
Punjabi 1
Rumanian 1
Russian 3
Serbo-Croatian 3
Spanish 7
Tagalog
District Total (7) 146Cambodian 1
Punjabi 13Russian 51Serbo-Croatian 2
Spanish 42Ukrainian 35Unknown 2
District Total (1) 5Spanish 5
District Total (4) 132Albanian 5
Latvian 5
Spanish 121
Ukrainian 1
84
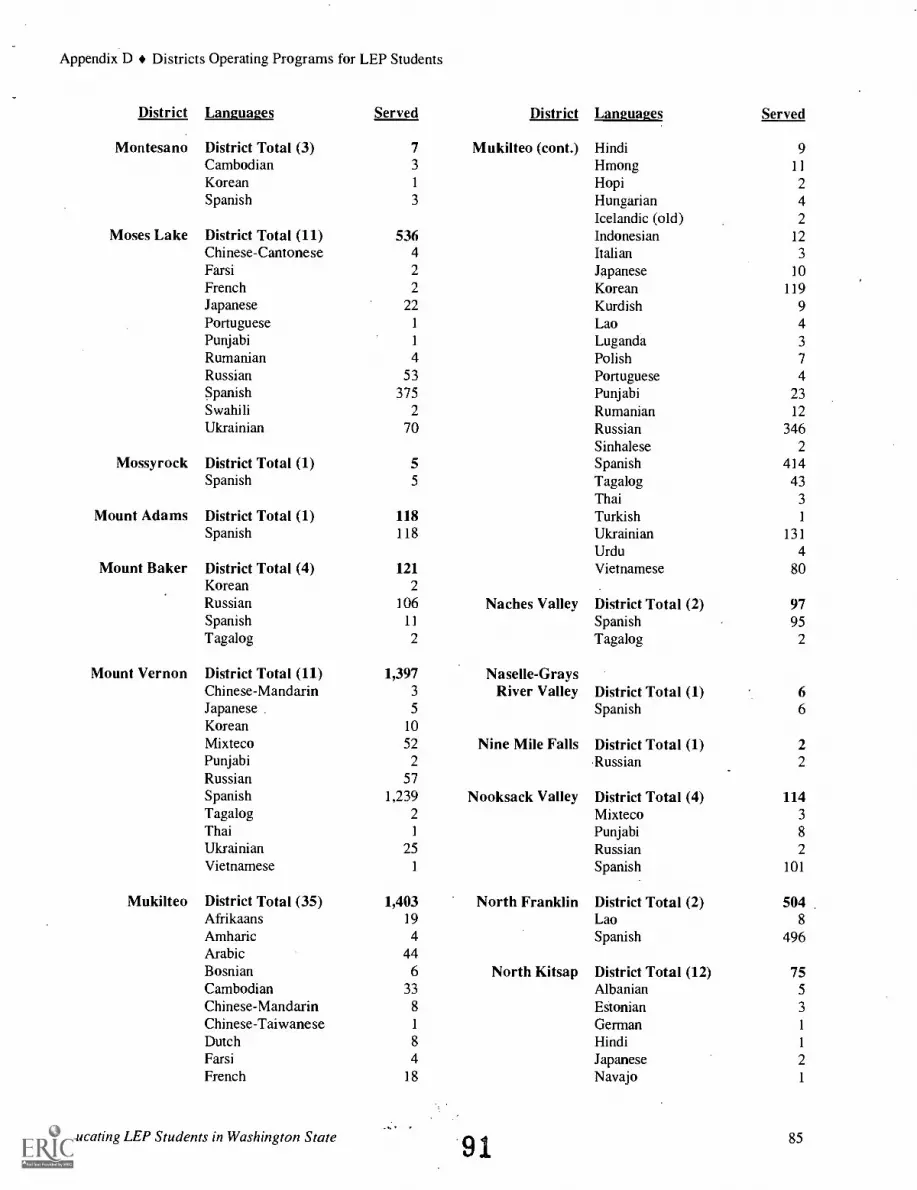
Appendix D Districts Operating Programs for LEP Students
District Languages Served District
Montesano District Total (3) 7 Mukilteo (cont.)Cambodian 3
Korean 1
Spanish 3
Moses Lake District Total (11) 536Chinese-Cantonese 4Farsi 2French 2Japanese 22Portuguese 1
Punjabi 1
Rumanian 4Russian 53Spanish 375Swahili 2Ukrainian 70
Mossyrock District Total (1) 5Spanish 5
Mount Adams District Total (1) 118Spanish 118
Mount Baker District Total (4) 121Korean 2Russian 106 Naches ValleySpanish 11
Tagalog 2
Mount Vernon District Total (11) 1,397 Naselle-GraysChinese-Mandarin 3 River ValleyJapanese 5
Korean 10Mixteco 52 Nine Mile FallsPunjabi 2Russian 57Spanish 1,239 Nooksack ValleyTagalog 2Thai 1
Ukrainian 25Vietnamese 1
Mukilteo District Total (35) 1,403 North FranklinAfrikaans 19Amharic 4Arabic 44Bosnian 6 North KitsapCambodian 33Chinese-Mandarin 8
Chinese-Taiwanese 1
Dutch 8
Farsi 4French 18
Educating LEP Students in Washington State 91
Languages Served
Hindi 9Hmong 11
Hopi 2
Hungarian 4Icelandic (old) 2Indonesian 12Italian 3
Japanese 10Korean 119Kurdish 9Lao 4Luganda 3
Polish 7
Portuguese 4Punjabi 23Rumanian 12Russian 346Sinhalese 2Spanish 414Tagalog 43Thai 3
Turkish 1
Ukrainian 131Urdu 4Vietnamese 80
District Total (2) 97Spanish 95Tagalog 2
District Total (1) 6Spanish 6
District Total (1) 2Russian 2
District Total (4) 114Mixteco 3Punjabi 8Russian 2Spanish 101
District Total (2) 504Lao 8Spanish 496
District Total (12) 75Albanian 5Estonian 3German 1
Hindi 1
Japanese 2Navajo 1
85
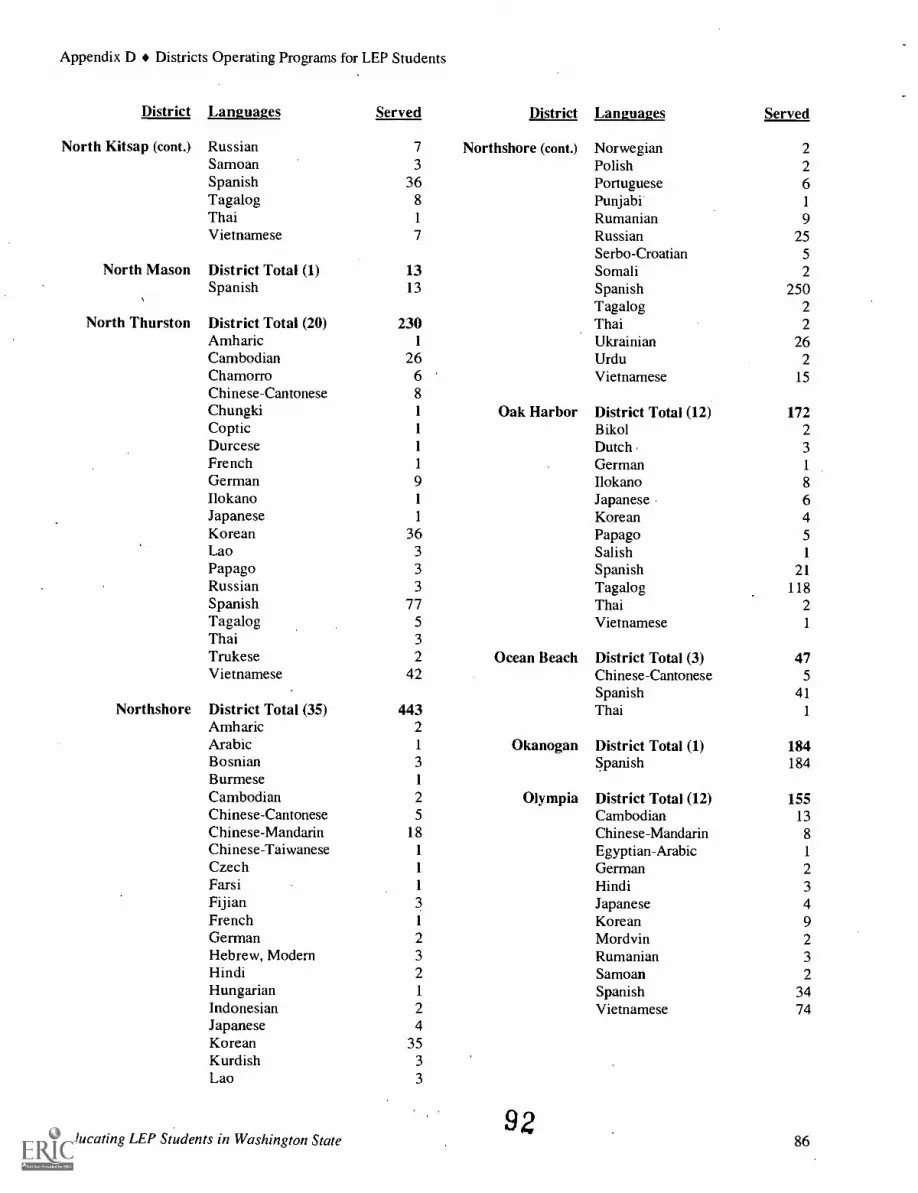
Appendix D Districts Operating Programs for LEP Students
District Languages Served District
North Kitsap (cont.) Russian 7 Northshore (cont.)Samoan 3Spanish 36Tagalog 8Thai 1
Vietnamese 7
North Mason District Total (1) 13Spanish 13
North Thurston District Total (20) 230Amharic 1
Cambodian 26Chamorro 6Chinese-Cantonese 8Chungki 1 Oak HarborCoptic 1
Durcese 1
French 1
German 9Ilokano 1
Japanese 1
Korean 36Lao 3Papago 3Russian 3Spanish 77Tagalog 5Thai 3Trukese 2 Ocean BeachVietnamese 42
Northshore District Total (35) 443Amharic 2Arabic 1 OkanoganBosnian 3Burmese 1
Cambodian 2 OlympiaChinese-Cantonese 5Chinese-Mandarin 18Chinese-Taiwanese 1
Czech 1
Farsi 1
Fijian 3French 1
German 2Hebrew, Modern 3Hindi 2Hungarian 1
Indonesian 2Japanese 4Korean 35Kurdish 3Lao 3
9 2Educating LEP Students in Washington State
Languages Served
Norwegian 2Polish 2Portuguese 6Punjabi 1
Rumanian 9Russian 25Serbo-Croatian 5Somali 2Spanish 250Tagalog 2Thai 2Ukrainian 26Urdu 2Vietnamese 15
District Total (12) 172Bikol 2Dutch 3German 1
Ilokano 8Japanese 6Korean 4Papago 5Salish 1
Spanish 21Tagalog 118Thai 2Vietnamese 1
District Total (3) 47Chinese-Cantonese 5
Spanish 41Thai 1
District Total (1) 184Spanish 184
District Total (12) 155Cambodian 13Chinese-Mandarin 8Egyptian-Arabic 1
German 2Hindi 3Japanese 4Korean 9Mordvin 2Rumanian 3Samoan 2Spanish 34Vietnamese 74
86
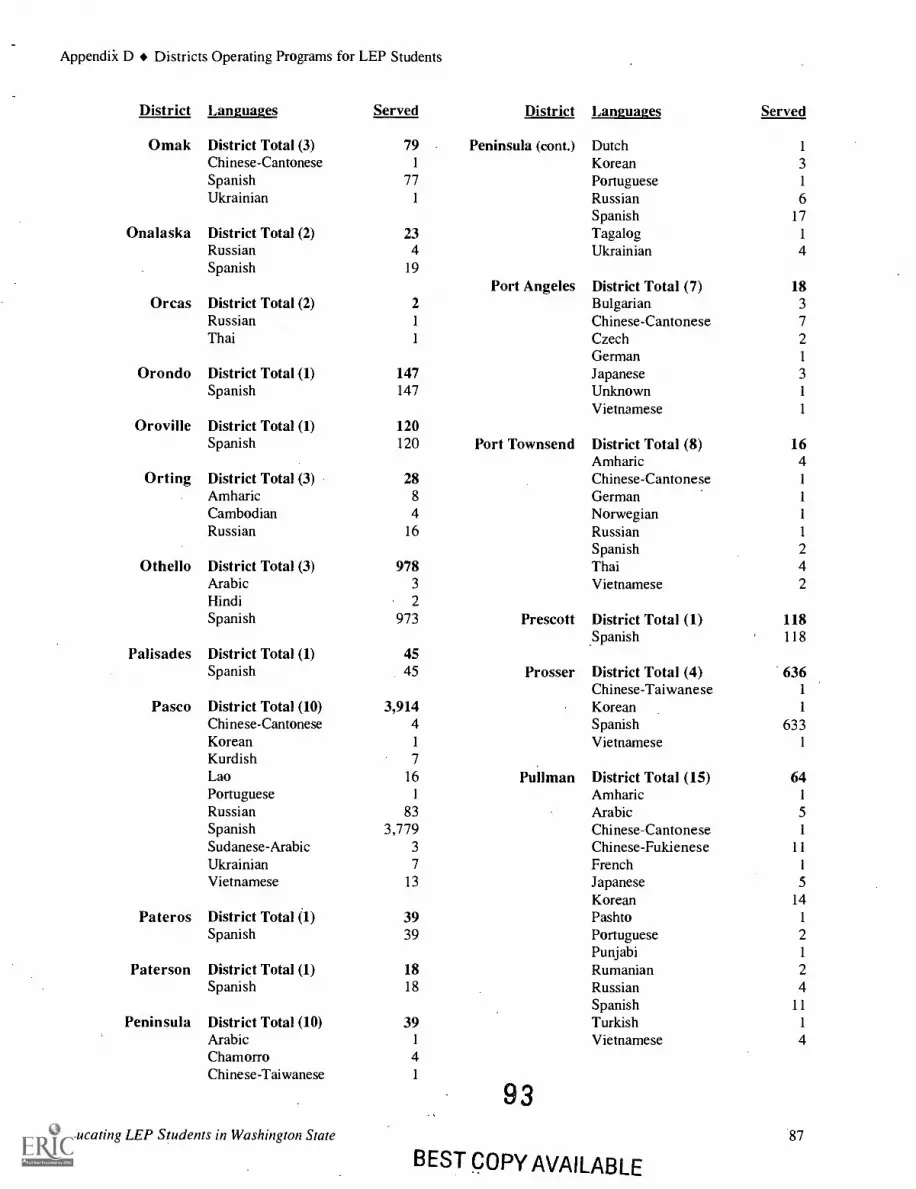
Appendik D Districts Operating Programs for LEP Students
District Languages Served District
Omak District Total (3) 79 Peninsula (cont.)Chinese-Cantonese 1
Spanish 77Ukrainian 1
Onalaska District Total (2) 23Russian 4Spanish 19
Port AngelesOrcas District Total (2) 2
Russian 1
Thai 1
Orondo District Total (1) 147Spanish 147
Oroville District Total (1) 120Spanish 120 Port Townsend
Orting District Total (3) 28Amharic 8
Cambodian 4Russian 16
Othello District Total (3) 978Arabic 3
Hindi 2
Spanish 973 Prescott
Palisades District Total (1) 45Spanish 45 Prosser
Pasco District Total (10) 3,914Chinese-Cantonese 4Korean 1
Kurdish 7Lao 16 PullmanPortuguese 1
Russian 83Spanish 3,779Sudanese-Arabic 3
Ukrainian 7Vietnamese 13
Pateros District Total (1) 39Spanish 39
Paterson District Total (1) 18Spanish 18
Peninsula District Total (10) 39Arabic 1
Chamorro 4Chinese-Taiwanese 1
Educating LEP Students in Washington State
93
Languages Served
Dutch 1
Korean 3
Portuguese 1
Russian 6Spanish 17Tagalog 1
Ukrainian 4
District Total (7) 18Bulgarian 3Chinese-Cantonese 7
Czech 2German 1
Japanese 3Unknown 1
Vietnamese 1
District Total (8) 16Amharic 4Chinese-Cantonese 1
German 1
Norwegian 1
Russian 1
Spanish 2Thai 4Vietnamese 2
District Total (1) 118Spanish 118
District Total (4) 636Chinese-Taiwanese 1
Korean 1
Spanish 633Vietnamese 1
District Total (15) 64Amharic 1
Arabic 5
Chinese-Cantonese 1
Chinese- Fukienese 11
French 1
Japanese 5
Korean 14Pashto 1
Portuguese 2Punjabi 1
Rumanian 2Russian 4Spanish 11
Turkish 1
Vietnamese 4
87
BEST COPY AVAILABLE
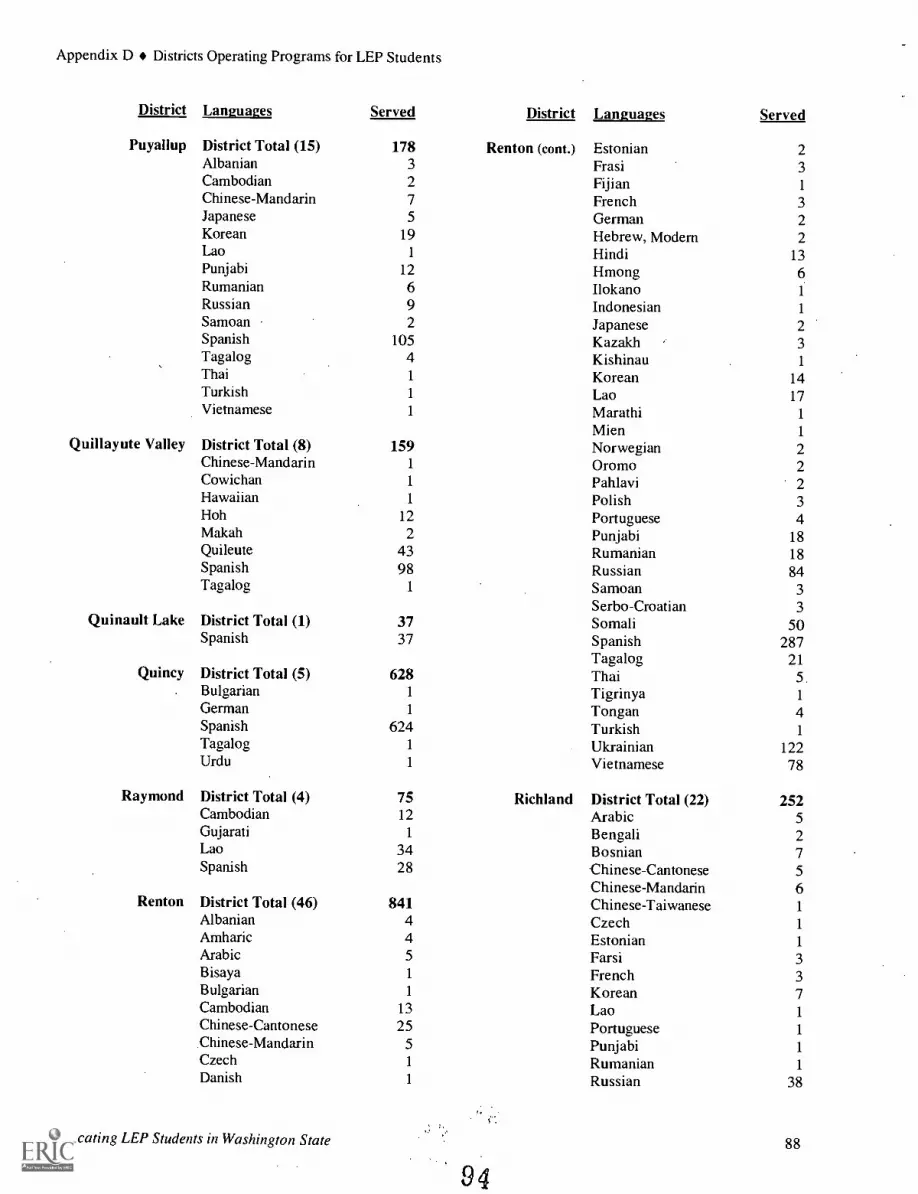
Appendix D e Districts Operating Programs for LEP Students
District Languages Served District Languages Served
Puyallup District Total (15) 178 Renton (cont.) Estonian 2Albanian 3 Frasi 3Cambodian 2 Fijian 1
Chinese-Mandarin 7 French 3Japanese 5 German 2Korean 19 Hebrew, Modern 2Lao 1 Hindi 13Punjabi 12 Hmong 6Rumanian 6 Ilokano 1
Russian 9 Indonesian 1
Samoan 2 Japanese 2Spanish 105 Kazakh 3Tagalog 4 Kishinau 1Thai 1 Korean 14Turkish 1 Lao 17Vietnamese 1 Marathi 1
Mien 1
Quillayute Valley District Total (8) 159 Norwegian 2Chinese-Mandarin 1 Oromo 2Cowichan 1 Pahlavi 2Hawaiian 1 Polish 3Hoh 12 Portuguese 4Makah 2 Punjabi 18Quileute 43 Rumanian 18Spanish 98 Russian 84Tagalog 1 Samoan 3
Serbo-Croatian 3Quinault Lake District Total (1) 37 Somali 50
Spanish 37 Spanish 287Tagalog 21
Quincy District Total (5) 628 Thai 5.. Bulgarian 1 Tigrinya 1
German 1 Tongan 4Spanish 624 Turkish 1
Tagalog 1 Ukrainian 122Urdu 1 Vietnamese 78
Raymond District Total (4) 75 Richland District Total (22) 252Cambodian 12 Arabic 5Gujarati 1 Bengali 2Lao 34 Bosnian 7Spanish 28 hinese-Cantonese 5
Chinese-Mandarin 6Renton District Total (46) 841 Chinese-Taiwanese 1
Albanian 4 Czech 1
Amharic 4 Estonian 1
Arabic 5 Farsi 3Bisaya 1 French 3Bulgarian 1 Korean 7Cambodian 13 Lao 1
Chinese-Cantonese 25 Portuguese 1
Chinese-Mandarin 5 Punjabi 1
Czech 1 Rumanian 1Danish 1 Russian 38
Educating LEP Students in Washington State 88

Appendix D Districts Operating Programs for LEP Students
District Languages Served District
Richland (cont.) Serbo-Croatian 32 Seattle (cont.)Spanish 39Thai 2Ukrainian 81Urdu 2Vietnamese 13
Ridgefield District Total (5) 18Lithuanian 2Rumanian 1
Russian 6Spanish 7Vietnamese 2
Riverview District Total (6) 46Cambodian 1
German 1
Hmong 9Korean 1
Lao 2Spanish 32
Rochester District Total (4) 64Amharic 4Cambodian 1
Spanish 58Thai 1
Roosevelt District Total (1) 16Spanish 16
Royal District Total (1) 536Spanish 536
Seattle District Total (57) 5,447Afrikaans 19Amharic -155Arabic 27Bengali 2Burmese 1 Sedro WoolleyCambodian 350Cebuano 17Cham 16Chinese-Cantonese 396Chinese-Fukienese 1
Chinese-Mandarin 112 SelahChinese-Taiwanese 4Creole 4Czech 2Farsi 9 SequimFijian 3French 9German 4Greek, Modern 4
Educating LEP Students in Washington State 95
Languages Served
Hindi 28Hmong 43Ibo 1
Ilokano 91Indonesian 1
Jamaican 1
Japanese 25Kikuyu 1
Kmhmu . 6Korean 37Lao 143Lithuanian 2Malay 2Mien 166Native American 1
Oromo 110Pahlavi 4Pashto 4Portuguese 5
Punjabi 15
Rumanian 2Russian 54Samoan 79Serbo-Croatian . 12Somali 362Spanish 1,423Swahili 7Tagalog 280Thai 18Tibetan 11
Tigrinya 172Toishanese 61Tongan 11
Turkish 3Ukrainian 4Unknown 50Urdu 12Vietnamese 1,065
District Total (4) 97Korean 2Spanish 93Tagalog 1
Ute 1
District Total (2) 121Russian 1
Spanish 120
District Total (3) 36Chinese-Cantonese 2Spanish 31Vietnamese 3
89

Appendii D Districts Operating Programs for LEP Students
District Languages Served District
Shelton District Total (4) 122 SnohomishKorean 1
Russian 1
Spanish 118Tagalog 2
Shoreline District Total (44) 561Albanian 6Amharic 6Arabic 14
Bosnian 3
Burmese 1
Cambodian 4Chinese-Cantonese 36Chinese-Mandarin 20Chinese-Taiwanese 1 Snoqualmie ValleyChuuk 3
Danish 1
Farsi 7
German 1
Hindi 18 Soap LakeHmong 8
Ibo 1
Igbo I
Ilokano 2Indonesian 5 South BendJapanese 8
Khmer 1
Korean 122Krio 3Luo 1
Malay 1 South KitsapMarshallese 1
Norwegian 2Pashto 2Punjabi 12
Rumanian 1
Russian 41Somali 7Spanish 67Swahili 1
Tagalog 27Thai 6Tibetan 7 South WhidbeyTigrinya 16Turkish 3
Twi 2Uigur 1
Ukrainian 23Urdu 10 SouthsideVietnamese 58.
Educating LEP Students in Washington State 96
Languages Served
District Total (13) 58Arabic 2Cambodian 1
Chinese-Mandarin 1
German 1
Hindi 1
Hmong 1
Korean 2Lithuanian 1
Punjabi 1
Russian 2Spanish 40Ukrainian 4Vietnamese 1
District Total (3) 15Arabic 1
Lao 1
Spanish 13
District Title (3) 107Russian 17Spanish 58Ukrainian 32
District Title (4) 54Cambodian 2Korean 1
Lao 3Spanish 48
District Title (10) 55Chamorro 6Chinese-Cantonese 2Ha;,vaiian 1
Hindi 1
Japanese 1
Korean 11Rumanian 2Spanish 16Tagalog 14Vietnamese 1
District Total (4) 6Cambodian 2Russian 1
Spanish 2Thai 1
District Total (1) 1Spanish 1
90

Appendix D Districts Operating Programs for LEP Students
District Languages Served District
Spokane District Total (32) 899 StevensonCarsonAlbanian 7Amharic 4Arabic 4 SultanBulgarian 8Byelorussian 11
Chinese-Cantonese 5Chinese-Mandarin 4.Chu uk 2Ethiopic 1 SumnerFarsiFijian 1
Georgian 1
German 1
Haitian Creole 1
Hindi 1
Hmong 38Hungarian 1
Japanese 2Korean 1
Lao 5Marshallese 14Moldavian 4Punjabi 5 SunnysideRumanian 4Russian 503Serbo-Croatian 84Somali 1
Spanish 31Tagalog 1
Thai 1 TacomaUkrainian 91Vietnamese 55
Stanwood District Total (4) 45Albanian 1
Korean 2Spanish 41Vietnamese 1
Steilacoom District Total (13) 55Chinese-Cantonese 4Dutch 1
German 1
Hindi 1
Inuktitut 1
Korean 11
Russian 2Samoan 6Spanish 9Tagalog 2Ukrainian 10Unknown 1
Vietnamese 6
Educating LEP Students in Washington State 97
Languages Served
District Total (1) 11Spanish 11
District Total (4) 18Byelorussian 2Lao 2PunjabiSpanish 13
District Total (12) 76Chinese-Cantonese 1
Chinese-Mandarin 1
Farsi 2Inuktitut 1
Italian 1
Korean 4Polish 1
Rumanian 1
Russian 2Spanish 57Tagalog 2Vietnamese 3
District Total (5) 1,211Arabic 4KoreanSpanish 1,203Tagalog 2Yakima 1
District Total (31) 2,029Afrikaans 1
Arabic 2Bulgarian 1
Cambodian 497Chinese-Cantonese 2Chinese-Fukienese 1
Chinese-Mandarin 3Czech 1
Estonian 3Farsi 1
French 2Hawaiian 1
Ilokano 1
Japanese 1
Korean 57Kurdish 3
Lao 23Moldavian 9Nigerian 1
Portuguese 4Rumanian 5Russian 351Samoan 60
91

Appendix D Districts Operating Programs for LEP Students
District Languages Served District Languages Served
Tacoma (cont.) Somali 1 Tukwila (cont.) Ethiopic 4Spanish 532 Farsi 3Swahili 1 Fijian 2Tagalog 15 German 3Thai 3 Haitain Creole 2Ukrainian 112 Hindi 1
Vietnamese 334 Hmong 1
Yoruba 1 Ilokano 1
Indonesian 1
Tahoma District Total (10) 36 Khmer 2Cambodian 1 Korean 2Chinese-Cantonese 1 Kurdish 3Chinese-Mandarin 1 Lao 5Italian 1 Mien 2Korean 3 Oromo 2Rumanian 2 Pali 1
Russian 5 Pashto 1
Spanish 6 Polish 6Ukrainian 9 Punjabi 17Vietnamese 7 Russian 31
Samoan 14Tenino District Total (3) 21 Somali 50
Cambodian 6 Spanish 280Dutch 2 Tagalog 16Spanish 13 Thai 6
Tigrinya 10Thorp District Total (1) 1 Tongan 2
Spanish 1 Ukrainian 6Vietnamese 25
Toledo District Total (1) 5Spanish 5 Tumwater District Total (8) 53
Farsi 1
Tonasket District Total (1) 90 Korean 14Spanish 90 Lao 1
Samoan 2Toppenish District Total (3) 2,417 Spanish 15
Chinese-Cantonese 2 Tagalog 4Sahaptian 346 Tamil 1
Spanish 2,417 Vietnamese 15
Touchet District Total (1) 42 Union Gap District Total (1) 88Spanish 42 Spanish 88
Trout Lake District Total (1) 3 University Place District Total (14) 141Spanish 3 Chinese-Cantonese 1
Chinese-Mandarin 4Tukwila District Total (36) 688 Chinese-Taiwanese 3
Albanian 1 Egyptian-Arabic 1
Amharic 7 French 1
Armenian 3 Italian 1
Bosnian 131 Japanese 4Bulgarian 5 Korean 77Cambodian 35 Russian 10Chinese-Cantonese 7 Spanish 5
Educating LEP Students in Washington State 92
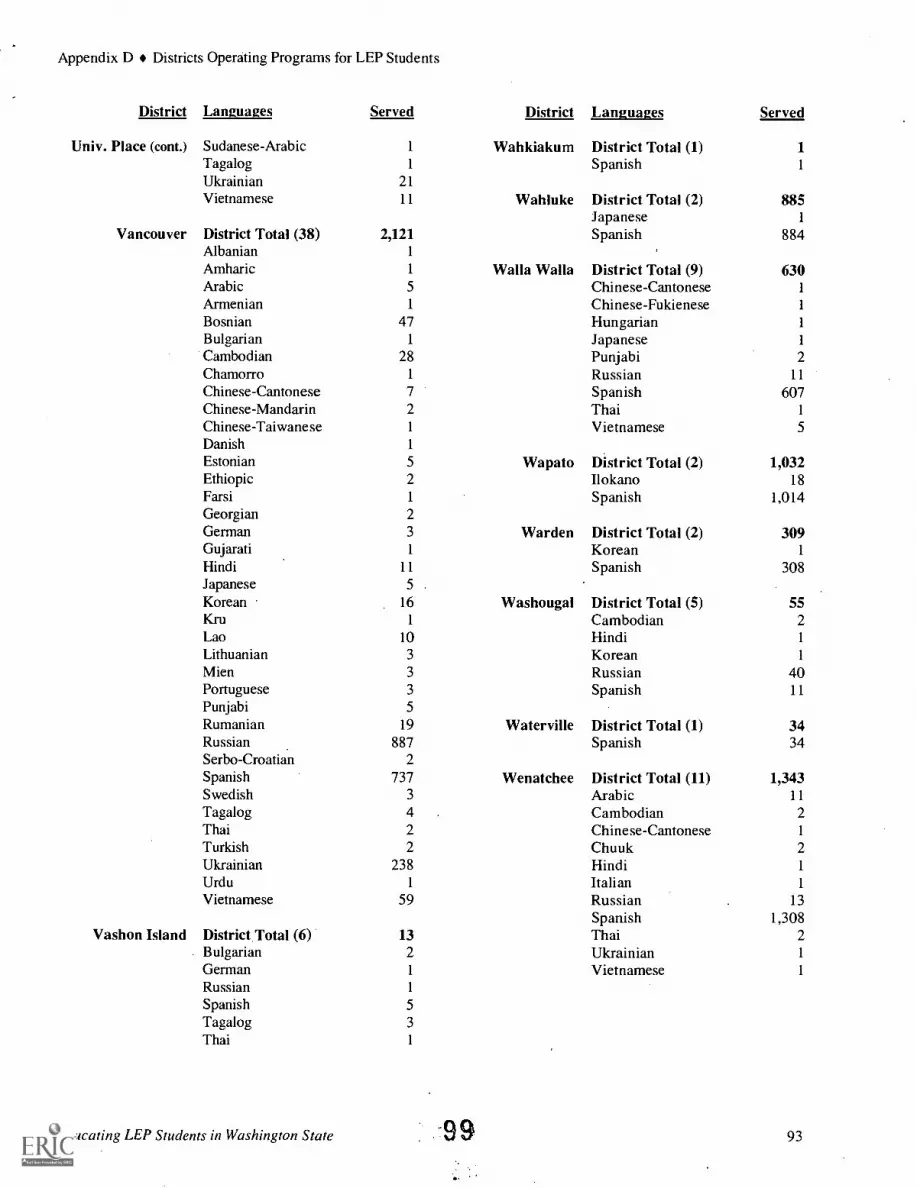
Appendix D Districts Operating Programs for LEP Students
District Languages Served District Languages Served
Univ. Place (cont.) Sudanese-Arabic 1 Wahkiakum District Total (1) 1Tagalog 1 Spanish 1
Ukrainian 21Vietnamese 11 Wahluke District Total (2) 885
Japanese 1
Vancouver District Total (38) 2,121 Spanish 884Albanian 1
Amharic 1 Walla Walla District Total (9) 630Arabic 5 Chinese-Cantonese 1
Armenian 1 Chinese- Fukienese 1
Bosnian 47 Hungarian 1
Bulgarian 1 Japanese 1
Cambodian 28 Punjabi 2Chamorro 1 Russian 11Chinese-Cantonese 7 Spanish 607Chinese-Mandarin 2 Thai 1
Chinese-Taiwanese 1 Vietnamese 5Danish 1
Estonian 5 Wapato District Total (2) 1,032Ethiopic 2 Ilokano 18Farsi 1 Spanish 1,014Georgian 2German 3 Warden District Total (2) 309Gujarati 1 Korean 1
Hindi 11 Spanish 308Japanese 5Korean 16 Washougal District Total (5) 55Kru 1 Cambodian 2Lao 10 Hindi 1
Lithuanian 3 Korean 1
Mien 3 Russian 40Portuguese 3 Spanish 11Punjabi 5Rumanian 19 Waterville District Total (1) 34Russian 887 Spanish 34Serbo-Croatian 2Spanish 737 Wenatchee District Total (11) 1,343Swedish 3 Arabic 11Tagalog 4 Cambodian 2Thai 2 Chinese-Cantonese 1
Turkish 2 Chuuk 2Ukrainian 238 Hindi 1
Urdu 1 Italian 1
Vietnamese 59 Russian 13Spanish 1,308
Vashon Island District Total (6) 13 Thai 2Bulgarian 2 Ukrainian 1
German 1 Vietnamese 1
Russian 1
Spanish 5Tagalog 3
Thai 1
Educating LEP Students in Washington State 99 93

Appendix D Districts Operating Programs for LEP Students
District Languages
West Valley(Spokane)
West Valley(Yakima)
White River
White SalmonValley
Win lock
Woodland
Yakima
Yelm
District Total (7)Chinese-MandarinHmongPolishRussianSpanishTagalogWolof
District Total (2)KoreanSpanish
District Total (4)KoreanPolishRussianSpanish
District Total (2)RussianSpanish
District Total (2)EstonianSpanish
District Total (1)Spanish
District Total (15)ArabicCambodianChinese-CantoneseGujaratiJapaneseKoreanLaoManchuPunjabiRussianSerbo-CroatianSpanishThaiUrianVietnamese
District Total (4)CambodianSpanishTagalogThai
Zillah Spanish (all)
Educating LEP Students in Washington State
Served
691
61
31
191
10
894
85
81
1
24
2231
222
534
49
3636
4,6009241
1
22
7
3
2
3
4,5562
24
362
321
1
94
I 00 94

APPENDIX E
SUMMARY OF RESEARCH ON PROGRAMSFOR LEP STUDENTS
CONTENTS
1. Executive Summary, Reading and Second Language Learners: Research ReportOffice of Superintendent of Public Instruction, April 1999.
2. How LEP Students Can Meet High Standards (Summary of School Reform and StudentDiversity, Volumes I and II, U.S. Department of Education, April 1997).
3. Creating Opportunities for the Academic Success of Linguistically Diverse Students: WhatDoes the Research Say? Prepared for OSPI by Thomas Stritikus, University of Washingtonand Patrick Manyak, California State University/Fullerton, November 2000.
101Educating LEP Students in Washington State 95
Appendix E Stimmary of Research on Programs for LEP Students
Reading and Second Language LearnersResearch Report
Office of Superintendent of Public InstructionApril 1999
EXECUTIVE SUMMARY
This document provides a synthesis of the research on teaching and learning to read in English as itrelates to students in U.S. public schools who speak little or no English. Focusing attention onchildren of primary acquisition age (the period between birth and the onset of puberty during whichmany researchers and theorists consider children to be natural language acquirers), this researchsummary addresses the following questions:
What are the prerequisites that children need to meet in order to become proficient readers inEnglish-as-a-second language?If English-language learners (ELLs) are experiencing difficulties reading in English, is it alanguage problem or a reading problem?What are the school, program, and classroom characteristics that support the reading developmentof ELLs?
The following is a summary of the primary findings.
For children, the acquisition of English-as-a-second language is a developmental process that issimilar in many respects to the first-language acquisition process. As a developmental process,second-language acquisition cannot be rushed (although it can be facilitated through effectiveinstructional techniques, the creation of supportive classroom environments, etc.). In fact,research has shown that even in those educational contexts most conducive to second-languageacquisition, initially non-English speaking children require five to seven years to acquire a levelof English proficiency that allows them to sustain academic achievement at a level equivalent tothat of their native-English speaking peers.
As with their first language, children learn a second language as a result of their need tocommunicate with others. Their emphasis, particularly during the early stages of the acquisitionprocess, is on getting the meaning of messages across rather than on grammatical form.
Because second-language acquisition is a developmental process, the linguistic "errors" made byindividual ELLs are usually not random, but instead are indicative of the learner's presentknowledge of English. These errors provide a picture of the child's growing language proficiencyand should be used as insight into the instructional needs of the child.
Educating LEP Students in Washington State 102 96

Appendix E Summary of Research on Programs for LEP Students
Children acquire language naturally and, in the long run, often obtain a higher level of proficiencyin a second language than adults. Over the short run, adults learn second languages more quicklythan young children. Common misconceptions about the ease with which children acquire secondlanguages are harmful when they produce expectations that are impossible for children to meet.Educators should understand that learning a second language is a process that is just as difficultfor a child as it is for an adult, if not more so.
The ability of an ELL to participate in seemingly effortless communication with his or her peerson the playground or in other "context-embedded" situations is often wrongly perceived as anindication of readiness for English-only instruction in the regular classroom. In fact, the languageskills needed by an ELL in such situations are simplistic in terms of their linguistic and cognitivecharacteristics and should not be considered sufficient for effective functioning within thespecialized, "context-reduced" discourse of the mainstream classroom.
The completion of the first-language acquisition process among ELLs (normally occurring aroundthe age of puberty) is of vital importance. The failure to complete this process may result incognitive difficulties for the child as well as difficulties in acquiring a second language.
Children with strong first-language skills will acquire a second-language more quickly thanchildren with less developed first-language skills. Many of the language skills learned in the firstlanguage will transfer to the second language.
Linguistic development, cognitive development, and academic development are interdependentprocesses and must all be supported simultaneously if educators are to succeed in developingdeep levels of English proficiency among ELLs. To do this, schools should provide ELLs withcognitively complex academic instruction through their first language for as long as possible,while providing cognitively complex instruction through the second language for part of theschool day. In addition, educators should employ interactive discovery learning approaches toteaching the academic curriculum through both languages.
ELLs face a number of challenges in learning to read in English. Among these challenges islimited English proficiency itself, due, to the critical role English proficiency (especiallyvocabulary size) plays in reading comprehension. Similarly, ELLs initially lack the phonemic andphonological awareness, as well as an understanding of the alphabetic principle, requisite forlearning to read in English. Another challenge involves the fact that the background knowledgethat ELLs bring to the reading process is usually very different from the background knowledgepresupposed in the English reading material they encounter in the classroom; such a mismatchcan interfere with reading comprehension. Finally, ELLs often face sociopolitical challenges suchas discontinuities between the culture of their school and that of their home in terms ofeducational values and expectations.
Initial reading instruction should be conducted in an ELL's first language whenever possible.Many of the reading skills and strategies acquired in a student's first language can be transferredto English reading.
103Educating LEP Students in Washington State 97
Appendix E Summary of Research on Programs for LEP Students
Initial reading instruction in an ELL's first language is not detrimental to the child's acquisition ofEnglish. On the contrary, initial instruction in the second language can have negative short-termand long-term impact on student achievement.
Formal reading instruction in English should be delayed until a reasonable level of oralproficiency in English is acquired by the student. During this period, the ELL must be supportedin acquiring the requisite "reading readiness" for English, including a sufficiently developedEnglish vocabulary (approximately several thousand words), phonological and phonemicawareness in relation to the English language, and initial awareness of the alphabetic principle.The complex process of providing such support should be carried out while incorporating thestudents' background knowledge. Furthermore, this process should simulate the developmentalprocess that native-English speakers experience while developing reading readiness at an earlierage. It is recommended that this process be implemented in an age-appropriate way through achallenging curriculum in non-threatening, enriched classroom environments.
Both before and after the introduction of formal reading instruction in English, ELLs should beimmersed in language learning experiences that provide optimal conditions for building theEnglish vocabulary necessary for the domain of school. These activities should be purposeful,meaningful, challenging, contextually rich, and age appropriate.
Immigrant ELLs who arrive in the United States during their teenage years need extra support tomeet high school requirements. It is particularly important that these students receive instructionalsupport through their first language or through intensive sheltered English to do grade level workin that language.
Testing should emphasize how much an ELL has learned and not how much the child does notknow in comparison to a native-English speaker. The standards developed for state and schooldistrict performance assessments are based on the typical performance of native-English speakerson these assessments. But because ELLs' lack of English proficiency places them at adisadvantage when taking standardized tests conducted in English, many of these studentsinitially achieve well below this level of typical native-English speaker performance on suchassessments. Because of this, while the average native-English speaking student needs to makeonly ten months worth of academic progress in each ten-month school year to meet thesestandards, these ELLs must make substantially larger yearly gains to "catch up" with their native-English speaking peers. Given this fact, assessment data reflecting such gains should be viewed aspositive, irrespective of whether or not the ELL has achieved the performance standards set fornative-English speakers.
Recent comprehensive studies of programs serving ELLs confirm a strong positive correlation (1)between the long-term academic achievement of ELLs and the degree of instructional supportthese students receive in their first language and (2) between the amount of formal school ELLsexperience in their first-language and the rate at which they acquire English as a second language.In contrast, several earlier studies had reported little difference between various program models(i.e., early exit bilingual, ESL, structured immersion, etc.) in terms of ELL academic achievementand English acquisition outcomes. These studies lack validity due to both their short-termperspective and their limited focus on student achievement in the early grades.
Educating LEP Students in Washington State104 98

Appendix E Summary of Research on Programs for LEP Students
Programs that provide ELLs with long-term first-language instructional support (i.e., late-exit[developmental] bilingual education and two-way developmental bilingual education) have beenshown to succeed in producing long-term ELL achievement in English reading and otheracademic areas that reaches parity with that of native-English speakers, while programs with littleor no first-language support (e.g., structured immersion and early-exit [transitional] bilingualeducation) do not.
Programs are not unitary but a complex series of components; programs that share the samenominal label can vary greatly, both in terms of these underlying components and in terms ofstudent achievement outcomes. Therefore, a more sophisticated approach to finding effectivemethods of educating ELLs is to go beyond a debate over broad programmatic categories to aneffort to identify those school- and classroom-level factors that support the academic achievementof these students. Research suggests that the following school- and classroom-level factors areeffective in supporting the academic achievement of language-minority students: positiveclassroom and schoolwide climates; the use of effective grouping strategies; instructionalstrategies that enhance understanding; the provision of cognitively complex, on-grade-levelinstruction; the provision of a balanced curriculum; the provision of ample opportunities forstudents to practice English; school efforts to build school-home collaboration; and effective staffdevelopment.
Several popular reading programs are used to instruct ELLs. Many of these lack publishedresearch data to support their effectiveness with this student population. Both Success for All andReading Recovery have published research relative to these students. While indicators are thatboth these programs have been used successfully, some findings remain contentious especiallywith regard to Reading Recovery.
105Educating LEP Students in Washington State 99
Appendix E Summary of Research on Programs for LEP Students
HOW LEP STUDENTSCAN MEET HIGH STANDARDS
The U.S. Department of Education recently reported the results of a study that examined exemplaryschool reform efforts involving the education of LEP students. The study noted "lessons learned"about what helps LEP students master English while being held to high content standards. Theselessons were based on an intensive analysis of eight schools that showed exemplary results in theireducation of LEP students. This appendix briefly summarizes these lessons.36
LEP students can and should be expected to participate in high-quality curriculuminstruction and performance. It is not unreasonable to expect good academic achievement andpersonal development from these students. If a curriculum is properly designed for LEP students,they can learn challenging content in language arts, mathematics, and science while gainingliteracy in English. Most schools tend to treat the education of LEP students as a remedial issue,assuming LEP students must learn English before they can learn the standard curriculum designedfor "mainstream" students. The exemplary schools show that assumption is not warranted.
A comprehensive schoolwide vision that includes high expectations for all students isessential to the success of both mainstream and LEP students. The entire school communityneeds to have a shared vision of high expectations, cultural recognition and validation,community involvement and commitment, openness to external partnering and research. Inaddition, school staff need to be empowered to be leaders, given the time and resources to learnand the freedom to adjust programs as needs change, and involve the whole community inembracing all cultures and languages.
A schoolwide approach to restructuring teaching units and time enhances the teaching andlearning environment for LEP students. The schools with exemplary programs worked as ateam to restructure their organizations to implement their shared vision. This allowed schools tocreate and use innovative learning environments that worked for LEP and mainstream students.The schools organized schooling into smaller units to create a more personalized and cooperativelearning setting. The schools also promoted teacher collaboration, extended the school day andyear, broadened inclusive decision-making structures, and integrated social and health servicesinto school operations.
Qualified staff need to engage LEP students in meaningful, in-depth learning opportunitiesacross subject areas. Trained teachers developed curricular and instructional strategies that putlearning in context. Students worked both independently and in heterogeneous groups. Thelearning situations included hands-on experience and active discovery methods across subjectareas. These strategies were effective as long as they were taught by trained and qualified teachers
36 For more information on the findings, conclusions, and case studies, see School Reform and Student Diversity, VolumesI and II, U.S. Department of Education, April 1997.
Educating LEP Students in Washington State106 100
Appendix E Summary of Research on Programs for LEP Students
Language development strategies can be adapted to ensure LEP students have access to corecurriculum while developing their English language skills. The eight case study schools allused the LEP students' primary language as a tool to deliver core curriculum instruction. Suchinstruction was integrated into bilingual programs that gradually transitioned the LEP studentsinto mainstream classes. The transition from classes where instruction was delivered in theprimary language to mainstream classes was carefully planned and supported with activities suchas after-school tutoring.
External partners can have a direct influence on improving educational programs for LEPstudents. All the exemplary schools used outside educational research and/or resources to meettheir various needs. The partnerships brought new ideas, helped the schools apply the research,and reduced isolation. Using outside resources allowed schools to develop better curriculum,implement instructional strategies, and design effective and meaningful assessment systems.
Districts play a critical role in supporting quality education for LEP students. Districts canactively support schools with LEP students by helping with teacher and aide recruitment,providing professional development opportunities, ensuring access to a high-quality curriculumfor all LEP students, providing high-quality instruction materials and assessments in nativelanguages, setting high content and performance standards, and aligning language programsacross school levels.
107
Educating LEP Students in Washington State 101
Appendix E Summary of Research on Programs for LEP Students
Creating Opportunities for the Academic Success ofLinguistically Diverse Students: What Does the Research Say?
Prepared for OSPI by
Thomas StritikusUniversity of Washington
and
Patrick ManyakCalifornia State University/Fullerton
November 2000
Abbreviations Used
ELL English language learnersESL English-as-a-second languageMBE maintenance bilingual educationTBE transitional bilingual education
4.08
Educating LEP Students in Washington State 102

Appendix E Summary of Research on Programs for LEP Students
EXECUTIVE SUMMARY
This paper consists of a review of the current research regarding the schooling of Limited EnglishProficient (LEP) students. The review draws from seminal studies in the fields of second-languagedevelopment, education, psychology and linguistics. It is intended to serve as a guide for thosecharged with program development and implementation for LEP students. The discussion in thisreport centers on three main topics:
The effectiveness of various instructional programs for LEP studentsThe length of stay of LEP students in various program typesFactors which influence program implementation for LEP students
The major findings of this report are summarized below:
Effectiveness
Since bilingual education programs differ widely in quality, poor programs have tended tocancel out the effects of successful programs in evaluation studies and reviews.The majority of the studies compare transitional bilingual education and submersion or largelyundefined ESL programs. Less data exists to assess the effects of well-defined ESL, structuredimmersion, maintenance bilingual education, and two-way developmental bilingual programs.Primary-language instruction has beneficial effects in programs labeled "bilingual" andprograms labeled "immersion."The use of primary-language instruction with LEP students contributes to their developmentof and academic achievement in English.
Length of Stay
LEP students require several years of support before they develop full English proficiency.Successful development of "academic English" requires cognitively demanding curriculumfor LEP students.Continued development of a child's first language plays a positive role in the development ofEnglish.
Program Characteristics
Programs, which view students' home languages and cultures resources, have achievedsuccessful academic results.The education of LEP students requires a school-wide commitment.Well-trained and qualified teachers play a vital role in the education of LEP students.
109Educating LEP Students in Washington State 103

Appendix E Summary of Research on Programs for LEP Students
EFFECTIVENESS OF VARIOUS INSTRUCTIONAL PROGRAMSFOR ENGLISH-LANGUAGE LEARNERS
According to the 1990 U.S. Census, 6.3 million children in the United States spoke a language other thanEnglish at home. In 1993-94, State Education Agencies reported that 7% of all U.S. schoolchildren wereEnglish-language learners and that the number of such students was increasing by 10% annually. A variety ofinstructional programs have been devised and implemented over the last several decades with the goal ofeffectively instructing this large population of linguistically diverse students. This paper reviews the results ofexisting research that has evaluated the academic achievement of English-language learners in relation to theseinstructional programs. In the following box, we identify the six types of programs that appear in this review(labels and descriptions closely follow those provided by August and Hakuta, 1997, pp. 19-20).
Instructional Programs for English-Language Learners in the U.S.
Submersion: Students are placed in regular English-only classrooms and are given no special instructionalsupport. (This approach is illegal in the U.S. as a result of Supreme Court decision in Lau v. Nichols.)
English as a Second. Language (ESL): No instruction in a student's primary language; ESL is taught eitherthrough pullout programs or is integrated with academic content throughout the day.
Structured Immersion: Instruction conducted in English to a classroom of English-language learners. Anattempt is made to adjust the level of English so that subject matter is comprehensible.
Transitional Bilingual Education (TBE): Students receive some degree of instruction in their primarylanguage for a period of time; however, the goal of the program is transition to English-only instruction asrapidly as possible (within 1-3 years).
Maintenance Bilingual Education (MBE): Students receive instruction in their primary language and inEnglish throughout the elementary school years (K-6) with the goal of developing academic proficiency inboth languages.
Two-Way Developmental Bilingual Programs: Language majority and language minority students areinstructed together in the same program with the goal of each group achieving bilingualism and biliteracy.
A Summary of Key Studies and Reviews
Since the receipt of federal funding for bilingual education requires some form of program evaluation,hundreds of small-scale studies on the effectiveness of bilingual programs have been done over the last 30years. However, since the late 1970's, a small number of national-level evaluation studies and several reviewsof small-scale evaluation studies have dominated the debate about the effectiveness of instructionalprogramsfor English-language learners (ELL). While these studies and reviews represent influential scholarly efforts,they reach highly contradictory conclusions. Critics have pointed out a number of serious flaws in each project.Table 1 presents a concise summary of the studies and reviews, their main conclusions, and the significantcriticisms leveled against them. Following this table, we discuss several issues raised by the studies andreviews in more detail and draw several conclusions from this discussion.
110Educating LEP Students in Washington State 104

Appendix E Summary of Research on Programs for LEP Students
Table 1 Key Studies and Reviews of Research on the Effectiveness of Instructional Programs forEnglish-Language Learners
Stud Scone and Method Conclusions CritiquesAIR (Dannoff,1978)
Evaluation of students in 38federally funded Spanish-English bilingual programsand comparable students notin such programs. (Studentswere tested twice during oneschool year.)
Bilingual education had noconsistent impact on English-language learners' academicachievement.
.
1) Lumps together a wide varietyof programs under the label"bilingual education."2) Two-thirds of the children inthe "control group" hadpreviously been in bilingualprograms.
Baker & Dekanter(1981)
Review of 28"methodologicallyacceptable", studies onbilingual educationprograms that askedwhether TBE was moreeffective than otherinstructional programs.
No consistent evidence tosupport the superiority ofTBE over alternative formsof instruction.
1) Inappropriate or misleadinglabeling of programs.2) Double standard ofmethodological acceptabilityexcludes studies favorable tobilingual education and includesthose that found TBE harmful.
Willig (1985) Meta-analysis of 23 of the28 studies reviewed byBaker & Dekanter(eliminating studies doneoutside the U.S.).
1) Small to moderate effectsin favor of bilingualeducation.2) The better the researchdesign of a study, the moresupportive its findings wereof bilingual education.
1) Lack of data in the studiesjeopardizes the meta-analysisprocess.2) Includes the same study morethan once in the analysis. (Acommon practice in meta-analysis that may compromisethe validity of the inferentialstatistical analysis.)3) May control for variables thataffected program outcomes.
Ramirez (1992) Longitudinal comparison ofover 2000 Spanish-speakingstudents in structuredimmersion, TBE, and MBEprograms at nine sites. (Fivehad only one type ofprogram.)
1) After four years, studentsin structured immersion andTBE programs demonstratedcomparable achievement inEnglish.2) Students in MBEprograms showed the mostgrowth in English readingand language skills, andmath.
1) Conclusions compromised bynon-comparability of sites.2) No random assignment toimmersion and TBE programswithin schools.3) Excessive use of statisticalmethods to overcome basicdesign flaws.
Rossel & Baker(1996)
Review of 72"methodologicallyacceptable" studies thatcompare studentachievement in TBE andalternative instructionalprograms.
1) TBE was onlyoccasionally better thansubmersion and ESL andnever better than structuredimmersion.2) TBE was worse thanstructured immersion withregard to English readingachievement in 83% of thecases.
1) Inaccurate and arbitrarylabeling of programs.2) Criteria for methodologicalacceptability are unclear andapplied arbitrarily.3) 90% of the studiesdemonstrating the superiority of"structured immersion" wereinterpreted by their authors assupporting bilingual education.4) Inaccurate reporting of datafrom French immersionprograms. .
Educating LEP Students in Washington State1i
BEST COPY AVAILABLE
105

Appendix E Summary of Research on Programs for LEP. Students
Stud Scope and Method Conclusions CritiquesAugust & Hakuta Federally funded report of 1) National-level & smaller- The report focuses on research in(1997) research on language scale evaluations suffer from isolation from theory. Thus, it
minority schooling that methodological flaws. does not sufficiently consider theincludes a review of 2) There is evidence for the research support for theoreticalnational-level and smaller- benefits of primary- language positions that could in turnscale program evaluations. instruction in various types of
programs.inform policy.
3) Instead of conductingevaluations to determine onebest program, researchshould discover sets ofprogram components thatwork in particular settings.
NYC Public Examined the number of 1) Consistency ofSchools' Division years students were served programmatic approach wasof Assessment & in ELL programs, their an important determinant ofAccountability longitudinal progress after exit rate.(2000) exiting, and the
characteristics of those whopassed the English Regentsexam.
2) ELL students may requirespecial accommodations tomeet the Regents Englishrequirement for graduation.
Texas Education Review of the significant 1) Extensive training andAgency and Texas features of seven elementary staff development inA&M University at school sites with successful bilingual education wasCorpus Christi(2000)
LEP programs important for both teachersand administrators.2) Effective instruction wasnot dependent on a specificmodel of bilingual education,but on instructional focusappropriate for the languageand academic levels ofstudents.3) Parents were supportiveand actively involved in theschool. There was consistentteacher/parentcommunication.4) Spanish and English wereused as languages ofinstruction.
Learning from the Research
Although the studies and reviews described in Table 1 represent the principal scholarly attempts to address thecomparative effectiveness of instructional programs for English-language learners, they clearly fail to resolvethe issue. Nevertheless, taken together the research offers a number of lessons regarding the debate overbilingual education and the nature of the research that has fueled it. Building on the information presented inTable 1 and other studies of LEP programs, the following discussion draws conclusions on the effectiveness ofprograms serving English-language learners.
Sampling. The AIR study (Dannoff, 1978) makes particularly salient the possibility for flaws in the creation ofequivalent treatment and control groups necessary for program' evaluation. A majority of the students in the
Educating LEP Students in Washington State 112 106

Appendix E Summary of Research on Programs for LEP Students
study's control group i.e., children who were not in bilingual programs during the year of the study hadpreviously been in bilingual programs. As a result, it is uncertain whether these students' achievement was dueto the instruction they received in English-only classrooms or to their earlier experience in bilingual programs.Therefore, as August and Hakuta (1997) conclude, "the AIR study did not compare bilingual education with nobilingual education" (p. 140). Despite this rather fatal flaw, Baker and Dekanter (1981), Willig (1985), andRossel and Baker (1996) include the AIR study in their reviews of "methodologically acceptable" studiesbecause it did, ostensibly, include a control group. The past educational experience of children reflects just oneof the many factors that could render a control group unsuitable and jeopardize the validity of programevaluations. Since random sampling is virtually impossible in the evaluation of instructional programs forEnglish-language learners (parents of English-language learners have choice over the type of instruction theirchildren receive), these factors will likely continue to plague such studies.
Program Labels. The reliance on program labels with little control for the vagaries of implementation in theevaluation studies and the inaccurate and arbitrary use of such labels in the research reviews criticallycompromise the conclusions of both types of projects. As a program evaluation, the AIR study (Dannoff, 1978)lumped together a wide variety of programs under the label "bilingual education" and made no effort todistinguish between high-quality and low-quality bilingual programs. Thus, as Gray (1977) points out, poorlydesigned, poorly implemented, and under-resourced programs cancelled out the positive effects of high-qualityprograms. The reviews undertaken by Baker and Dekanter (1981) and Rossel and Baker (1996) reveal anotherproblem with program labeling: labels appear inaccurately and arbitrarily assigned and thus mislead readerswith regard to the instructional programs that they designate. For example, Krashen (1996) and Cummins(1999) point out that the El Paso Independent School District (1987) program and the Pena-Hughes and Solis(1980) program that Rossel and Baker labeled respectively as submersion and structured immersion actuallyincluded a consistent primary-language instructional component through Grade 4.
Several scholars have also pointed out Rossel and Baker's problematic inclusion of Canadian Frenchimmersion programs in the category "structured immersion" (Cummins, 1999; Dicker, 1996; Krashen, 1996).This critique represents a particularly weighty concern since, as Cummins (1999) points out, "Seven of the 10studies that Rossel and Baker claim support structured immersion over TBE were studies of French immersionprograms in Canada" (p. 29). Bilingualism is the explicit goal of the French immersion programs, whichtypically immerse English-speaking students in French during kindergarten and Grade 1 and then beginEnglish language arts instruction in Grade 2. While Rossel (1996) has argued that these programs can beconsidered "structured immersion" up until the point that English-language instruction occurs, they arebilingual enrichment programs designed to promote bilingualism among children who speak the majoritylanguage and are members of the majority culture in Canada. The students in these programs experience whatLambert (1975) referred to as additive bilingualism. Additive bilingualism occurs when learning .a secondlanguage does not threaten the learners' native language. In contrast, subtractive bilingualism takes place whenminority-language speakers learn the majority language and in the process lose proficiency in their nativelanguage. August and Hakuta (1997) cite the distinction between additive and subtractive bilingualism as anexplanation of why:
...an immersion program in Canada succeeds in teaching French to English-speaking students whocontinue to maintain full proficiency in English and to function at a high academic level, while animmersion program to teach English to Spanish-speaking immigrants in the United States often results inboth a shift to monolingualism in English and academic failure. (p. 32)
Thus, Rossel and Baker's (1996) conclusion about the promise of structured immersion programs for languageminority children in the U.S. is actually based on studies that offer little insight into the suitability ofimmersion instruction for such children. In addition, their claims were based on programs that actuallyinvolved primary-language instruction.
Educating LEP Students in Washington State 113 107
Appendix E Summary of Research on Programs for LEP Students
Recognizing this type of inaccurate and misleading use of program labels, August and Hakuta (1997) call forcareful documentation of program implementation through classroom observation in future evaluationresearch. More generally, they argue for the need to consider programs according to the specific componentsrather than comparing programs based on imprecise labels. Based on the evidence, we concur with theseconclusions and echo August and Hakuta's well-stated position:
...the key issue is not finding a program that works for all children and all localities, but rather finding aset of program components that works for the children in the community of interest, given the goals,demographics, and resources of that community. (p. 147)
Lack of Data on Alternative Programs. The vast majority of the evaluation researchhas compared students inTBE programs with students in no program (submersion) or vaguely defined ESL programs, largely ignoringMBE and two-way developmental bilingual programs. While Ramirez (1992) included MBE programsinvolving 170 students from three school districts in his evaluation, only programs in one district consistentlymet the established criterion of 40% Spanish-language instruction throughout the study. Because Ramirez didnot compare these MBE programs directly to immersion or TBE programs, the findings regarding theachievement of the students in these programs are bitterly contested. Ramirez emphasized that the growthcurve for the students in the MBE program that utilized the most primary-language instruction showed"continued acceleration in the rate of growth" compared to the national norm on an English-languagestandardized test (p. 25). In contrast, the growth rate of the children in the immersion and TBE programsslowed as grade level increased. Ramirez concluded, "late-exit students appear to be gaining on students in thegeneral population" (p. 25). However, critics of the study suggest that the growth patterns may indicate that thestudents in the MBE program fell behind peers in other programs during the early grades and thus had to catchup during later grades (Baker, 1992; Rossel, 1992). The point that we consider salient with regard to thisdispute is that while the findings suggest that MBE may represent a promising instructional approach forEnglish-language learners, there is no data that incontrovertibly substantiates its effects. Similarly, althoughmany supporters of bilingual education consider the two-way developmental bilingual program as an ideal,there is little data available to assess this model. Mahrer and Christian (1993)"reviewed evaluation studies oftwo-way programs and found that many of the programs evidenced positive language development andachievement outcomes for both English-language learners and native English speakers. However, since mostof the studies did not utilize a control group, they do not provide definitive evidence of the superiority of two-way bilingual programs when compared with other approaches.
Longitudinal Data. Many of the evaluation studies have conducted relatively short-term assessment of childrenin bilingual and English-only programs, measuring achievement over a one- to two-year period. This approachappears particularly dubious in light of the limited longitudinal data available on the achievement of English-language learners. As mentioned previously, Ramirez (1992) found important differences in the growth curvesof children in immersion, TBE, and MBE programs during the later elementary grades that favored thechildren in MBE programs. Similarly, preliminary findings from a study-in-progress analyzing achievementdata from a series of 3-6 year longitudinal studies involving 24,000 language minority students indicates thatchildren in two-way developmental bilingual and MBE programs experience a sharp increase in English-language achievement after five to seven years of schooling (Thomas & Collier, 1997). These data suggest thatchildren in certain bilingual programs may make significant gains in English-language achievement toward theend of elementary school gains that are undetected by program evaluations focused on short-termachievement.
Primary-Language Instruction. Like August and Hakuta (1997), we conclude that Willig's (1985) meta-analysis and Gersten and Woodward's (1995) analysis of the El Paso bilingual immersion programsdemonstrate the beneficial effect of primary-language instruction for English-language learners regardless ofwhether it occurs in programs labeled bilingual or immersion. .
Educating LEP Students in Washington State114
108
Appendix E Summary of Research on Programs for LEP Students
In the following box, we succinctly state four key conclusions drawn from the preceding discussion. Theseconclusions reveal our conviction that existing program evaluation research suffers from a number of seriousshortcomings and that by itself provides little conclusive evidence about the relative merit of the range ofinstructional programs designed for English-language learners. However, in order to bypass this roadblock, thenext section presents an alternative perspective on research regarding the schooling of English-languagelearners that offers important insights into policy and practice.
Conclusions Regarding Program Effectiveness for English-Language Learners
Existing studies and reviews on program effectiveness for English-language learners are seriously compromised by anumber of flaws, including but not limited to the following: 1) lack of random sampling; 2) inaccurate and misleadingprogram labeling and/or widely divergent forms of implementation of similarly labeled programs; 3) lack oflongitudinal data; 4) over-reliance on statistical manipulation to correct weaknesses in research design.
Since bilingual education programs differ widely in quality, poor programs have tended to cancel out the effects ofsuccessful programs in evaluation studies and reviews.
The majority of the studies compare TBE and submersion or largely undefined ESL programs. Less data exists toassess the effects of well-defined ESL, structured immersion, MBE, and two-way developmental bilingual programs.
Primary-language instruction has evidenced beneficial effects in programs labeled "bilingual" and programs labeled"immersion."
The Instruction of English-Language Learners: Research, Theory, and Policy
The belief that tightly controlled program evaluations can directly inform policy decisions on the schooling ofEnglish-language learners represents a fundamental assumption underlying the research reviewed in thepreceding section. Cummins (1999) calls this orientation to research the "Research-Policy" paradigm. TheResearch-Policy paradigm holds that "methodologically acceptable" research that carefully controls forintervening variables can compare student outcomes across programs and thus identify the program thatproduces superior achievement. Based on findings from such studies, policy-makers can then confidentlyanoint one instructional program as the best for English-language learners despite differences in settings andsituations. Cummins argues that this is an unrealistic and unhelpful way to view research on language minorityschooling and the relation of this research to policy. First, he points out that it has proven virtually impossibleto conduct the kind of rigorously controlled studies that the Research-Policy paradigm requires. Second, hequestions the premise that educational research can be translated directly into policies that apply uniformlyacross dissimilar settings and circumstances. Third, he suggests that the Research-Policy paradigm's narrowfocus on controlled program evaluations ignores a large body of research on the instruction of English-language learners that could inform policy in important ways. After discussing these shortcomings of theResearch-Policy paradigm, Cummins argues that an alternative "Research-Theory-Policy" paradigm provesmore adequate for understanding the role of research in determining educational policy. The Research-Theory-Policy paradigm assumes that "Research findings cannot be directly applied across contexts" (Cummins, 1999,p. 26). Instead, the findings from individual research studies serve to construct and test theories, which, in turn,can inform policy decisions in different settings. Table 2 summarizes the differences between the Research-Policy and Research-Theory-Policy paradigms.
BEST COPY AVAILABLE
11.5Educating LEP Students in Washington State 109
Appendix E Summary of Research on Programs for LEP Students
Table 2 A Summary of Two Paradigms of the Relationship between Research and Policy
ParadigmRole of Research inDetermining Polic
Research Viewed asValuable for Polic
Strengths and/orWeaknesses
Research-Policy Research directly guides Rigorously quantitative 1) Rigorously controlledParadigm policy by identifying the studies that compare studies are virtually
superior program model. outcomes of programswhile controlling for allintervening variables,
impossible to conduct.2) Findings may notgeneralize across contexts.3) Ignores a large body ofrelevant research.
Research-Theory-Policy Research contributes to All research that confirms 1) Includes all relevantParadigm and tests theoretical or disconfirms research.
principles that explain theoretically generated 2) Theoretical principlesdiverse phenomena. predictions (including can be applied flexiblyThese theoretical evaluations that compare across contexts.principles inform policy students' progress to 3) Requires carefullydecisions. norms and case studies of
effective programs).considered policy decisionsthat take into accountdifferent local conditions.
As the preceding chart indicates, we find that the Research-Theory-Policy paradigm offers a more powerfulway of interpreting educational research and applying it to policy. In the following section, we consider theevidence for three competing theories that could serve inform policy regarding the instruction of English-language learners.
Three Theories Explaining the Academic Achievement of English-Language Learners
Three basic theories have been offered to explain research on the language development and academicachievement of English-language learners: the "maximum exposure" theory, the "linguistic interdependence"theory, and the "spaced learning" theory. Based on the Research-Theory-Policy paradigm, we suggest that ifone of these theories proves superior to the other, this theory should play a significant role in informing policyregarding the instruction of English-language learners.
The maximum exposure theory holds that despite a number of intervening variables, the quantity of a learner'sexposure to a language will determine his or her success in acquiring that language. Thus, more exposure toEnglish will result in superior acquisition of and academic performance in English. In contrast, the linguisticinterdependence principle argues that developing proficiency in one language promotes the development ofproficiency in a second language, provided that the learner has sufficient exposure to the second language(Cummins, 1991, 1996). The spaced learning theory (Rossel, 1992; Rossel and Baker, 1996) represents analternative to the first two opposing theories. This alternative posits the notion of diminishing returns withregard to continuous exposure to a second language in early stages of learning.
Two types of data testify to the explanatory potential of the linguistic interdependence hypothesis. First, asCummins (1999) points out, data from studies on well-implemented bilingual programs around the worldconsistently reveal that "Students do not lose out in their development of academic skills in the majoritylanguage despite spending a considerable amount of instructional time learning through the minority language"(p. 31). Troike (1978), Krashen and Biber (1988), and Mahrer and Christian (1993) document this kind ofpattern for students in bilingual education programs in the U.S., while Cummins and Corson (1997) providesimilar evidence from bilingual programs in a number of other countries. Since many of these studies lackcontrol groups, they are ignored in discussions dominated by the Research-Policy paradigm. However, whenviewed from the Research-Theory-Policy persliective, these cases provide important evidence supporting the
Educating LEP Students in Washington State'116 110
Appendix E Summary of Research on Programs for LEP Students
linguistic interdependence hypothesis. Studies aimed at discovering the relationship between reading acrosslanguages represent a second category of findings that support the notion of linguistic interdependence. Forinstance, studies on Spanish-speaking children in the U.S. (Durgunoglu, 1998; Durgunoglu, Nagy, Hancin-Bhatt, 1993; Faltis, 1986) and on Turkish-speaking children in Holland (Verhoeven, 1994) confirm thatchildren's reading skills in their primary language effectively transfer to reading in a second language. Thesefindings demonstrate that the development of literacy in a primary language contributes to the development ofliteracy in a second language.
While data from these sources support the linguistic interdependence theory, the maximum exposurehypothesis does not hold up well in the face of evidence from successful bilingual programs. The maximumexposure hypothesis predicts that every program utilizing primary- language instruction (thus decreasing thequantity of children's exposure to the second language) will inhibit students' achievement in the secondlanguage. Since a number of studies contradict this prediction (Cummins & Corson, 1997; Gersten &Woodward, 1995; Krashen & Biber, 1988; Troike, 1978), the maximum exposure hypothesis seems to holdlittle explanatory power.
Rossel and Baker (1996) have introduced a third theory that seeks to explain how children in successfulbilingual programs can achieve as well as or better than children in English-only programs on English-language assessments without resorting to the principle of linguistic interdependence. Having described aseries of older psychological experiments that show that subjects engaged in highly repetitive tasks, such asmemorizing nonsense syllables, perform better when practice is interrupted by rest, they conclude that "aconstant barrage of material to learn overloads the memory process and interferes with learning" (p. 38).Rossel and Baker then suggest that this conclusion may explain the experience of language learners who areconfronted with continuous instruction in the new language at early stages of acquisition. Since this continuousinstruction does not allow the learners to rest "between new words" (p. 39), it may hamper their acquisition ofthe language. Based on this view, Rossel and Baker suggest that "bilingual education programs, because theyprovide a needed rest from constant exposure to the new language, can produce better learning at the earlystages of learning a second language" (p. 39).
We find Rossel and Baker's (1996) application of the theory of spaced learning to the research on children inbilingual education programs highly speculative. First, there is little reason to believe that findings fromexperiments involving tasks such as memorizing lists of nonsense syllables contribute any insight into theprocess of learning a second language. Rossel and Baker themselves point out that "learning a language is notexactly identical" (p. 38) to the boring, repetitive tasks used in the psychological research that. they cite.Second, the spaced learning theory simply does not address the transfer of literacy skills across languages orthe achievement of children in successful bilingual programs that involve years of primary-languageinstruction both phenomena are well-explained by the principle of linguistic interdependence.
Linguistic Interdependence and the Instruction of English-Language Learners
The preceding discussion demonstrates the solid evidence supporting the principle of linguisticinterdependence and the lack of support for the theories of maximum exposure and spaced learning with regardto the language acquisition and academic achievement of English-language learners. Consequently, we believethat the theoretical principle of linguistic interdependence represents an important tool for policy-makers andeducators concerned with the schooling of English-language learners. While the Research-Theory-Policyparadigm does not seek to provide a definitive conclusion about a single type of instructional program that willbe successful for English-language learners in all situations, the principle of linguistic interdependence doescontribute the following important insights:
The use of primary-language instruction with English-language learners contributes to theirdevelopment of and academic achievement in English;
Educating LEP Students in Washington State 117 111
Appendix E Summary of Research on Programs for LEP Students
Instructing English-language learners only in English does not in and of itself result in superiorachievement in English; andChildren in effectively implemented bilingual programs develop language and literacy skills in twolanguages and benefit from the transfer of these skills across languages.
While these insights do support the value of bilingual enrichment programs aimed at fostering bilingualism andbiliteracy, they must be considered alongside the values, goals, and resources of local settings in order todetermine the most appropriate instructional programs for English-language learners. Such an approach wouldfoster flexible policy decisions that are informed by the best research knowledge on the linguistic andcognitive consequences of learning in two languages, and also account for the numerous context-specificfactors that influence the academic success of linguistically diverse children. (See Attachment I for adiscussion of the legal obligations placed upon districts by the Office of Civil Rights.)
LENGTH OF STAY IN PROGRAMS
As the debate over bilingual education has developed, one criterion that has been presented to assess theeffectiveness of particular program types serving LEP students has been the length of time students stay in theparticular programs in question. (See Attachment II for a discussion of the 1998 California law which attemptsto end bilingual education.) One perspective has held that programs, which exit students at higher and fasterrates, are more effective than programs in which LEP students spend more time. From a research perspective,the "faster is better" approach overlooks several important questions related to the way students develop asecond language and the amount of time required to do so. In this section of the report, we review how second-language development research informs the discussion regarding factors, which influence the length of stay inprograms serving LEP students. The discussion will center on the following questions:
How long does it take students to develop a second language? What is "academic English?" How is itrelevant to LEP students' stay in programs?; andWhat are the characteristics of programs, which best facilitate proficiency in a second language?
The Development of "Academic English:" How Long Does it Take?
For many second-language learners, American schools provide the first significant contact with English(Garcia, 1999). This has raised the question of how long it takes for students to develop proficiency in English.It is a truism of first-language research that most students learn the language spoken in their homes to more orless the same degree. The apparent ease of first-language development has obscured many important factsabout the complexity of the process of second-language development (McLaughlin, 1984; de Villiers & deVilliers, 1979; Bialystok & Hakuta, 1994). Several major studies in the area of second-language developmenthave emphasized the long-term nature of the process (Cummins, 1981; Collier, 1987; Snow 1987; Thomas &Collier, 1997; Hakuta, Butler & Witt, 2000). Making the task even more difficult for LEP students is that theirdevelopment of English occurs in the context of school, which requires a particularly demanding type oflanguage usage. Colliers (1987) explains how the context of schooling confounds the difficulty of learning asecond language:
Immigrant students of school age who must acquire a second language in the context of schooling need todevelop full proficiency in all language domains (structures and semantics of phonology, inflectionalmorphology, syntax, vocabulary, discourse, pragmatics, and paralinguistics) and all language skills(listening, speaking, reading, writing, and metalinguistic knowledge of the language) for use in all thecontent areas (language arts, mathematics, science, and social studies). Language used in school is uniqueto that context, and it becomes increasingly complex from one grade to the next (p. 618).
Educating LEP Students in Washington State
1 1 8112

Appendix E Summary of Research on Programs for LEP Students
Simply put, LEP students must not only learn the structure of their new language and how to use it a variety ofsituations, but also how to use it in educational situations. Knowing a language well enough to be able toparticipate in school contexts requires more than structural knowledge.
James Cummins (1981; 1991), based upon his study of second-language development in children, developed amodel introducing two distinct stages of language proficiency. The first stage involves second-languageproficiency in an interpersonal level of communication (termed basic interpersonal communications, or BICS).During such communication, language is deeply embedded in context and the language learner is able to relyon nonlinguistic information such as gestures, intonation, and facial cues to facilitate understanding. Thesecond stage involves the second-language proficiency needed for success in school (termed cognitiveacademic language proficiency, or CALP). Once the learner enters into the dimension of CALP, he or sheneeds to have mastered higher levels of vocabulary (very often technical in nature), more advanced listeningskills, increased reliance on print, and decreased reliance on contextual clues (including nonverbalcommunication). The tasks the learner is faced with become more cognitively, academically, and linguisticallychallenging. This transitional developmental "moment," when second-language learners acquire CALP, is thethreshold in Cummins' model.
The distinction between these two types of second-language proficiency is of particular importance to LEPstudents' length of stay in programs. These findings suggest that oral proficiency is not a predictor of successin cognitively demanding learning situations. The findings support the research that in order to build"academic English" of the kind necessary to succeed in programs, students need multiple years of support.
De Avila (1997) documents that LEP students, especially those at intermediate levels of languagedevelopment, exhibit a large discrepancy between oral language development and reading and writing skills.The author documents that for LEP students who enter school in kindergarten, it is not until grade 5 thatlagging reading and writing abilities merge with oral abilities. These finding suggest that removing academicsupport from students too early might limit their chances to fully develop the range of language skills neededto be successful in academic settings.
In a study of 1,548 advantaged LEP students, Collier (1987) documented that it took between four and eightyears to reach the 50th NCE on standardized tests across all subject areas. It is important to note that thestudents in the sample were receiving significant second-language development support and came fromadvantaged backgrounds in their home country. The study indicates that even when academic support andhome variables are favorable, the process of fully developing a second language takes several years. Collier'sfindings are significant due to both the size of the sample and the range of ages within the study.
Wong-Fillmore's (1983), qualitative study of four classrooms over three years, examined the languagedevelopment of Cantonese and Spanish speaking kindergarten students in both bilingual and Englishimmersion classrooms. Using extensive classroom observation data, the study found that 90% of the studentshad not developed the English proficiency level necessary to "handle its full use in the classroom or in textbooks" (p. 169). The study confirmed the finding of many of the large quantitative studies that LEP studentsneed several years of cognitively demanding curriculum before their second language is fully developed.
Using quantitative data on 1,210 immigrant students in Canada, Cummins (1981) analyzed the amount of timeneeded to learn English based on the age upon arrival and the length of residence in Canada. The study showedthat it took five to seven years for immigrant students to approach grade level norms on cognitive-academicmeasures. This study made the initial distinction between "Basic Interpersonal Communicative Skills" andlanguage use that is more cognitively and academically demanding.
Educating LEP Students in Washington State 113
119

Appendix E Summary of Research on Programs for LEP Students
Hakuta, Butler, and Witt (2000), using recent data gathered from the San Francisco Bay Area and datacollected from the Canadian studies (Cummins, 1981), examined English proficiency as a function of length ofexposure to English. Examining several factors of student language development, the study concluded thatEnglish oral proficiency requires a period of three to five years, and academic English proficiency requiresbetween four and seven years.
These data make the case that even in the best case scenario, second-language development is a process thattakes time. We believe that oversimplification of the process of second-language development is in partresponsible for the spate of state and national proposals to provide as little as one year of academic languagedevelopment for LEP students in America. Based on the conclusions of studies related to the length of timerequired to develop both oral and academic proficiency, we find these proposals to be inadequate in addressingthe needs of the LEP students. Consequently, any policy-based discussion of the "length of stay in program"must be rooted in what we know about the time needed to develop a second language.
Factors Which Influence Length of Stay
Much of the early research on language development concentrated on the role that individual differences playin second-language development. This translated to school responses focusing on the "critical period" forsecond-language learning. The assumption existed that the younger the learner the better. However, severalreviews of major research studies concluded that while a critical period exists for first-language learning, thisdoes not apply to the learning of a second language (Bialystok and Hakuta, 1994; August and Hakuta, 1997).
The Role of First-Language Development. Some evidence suggests that continued development of the firstlanguage plays a large role in contributing to successful second-language development. Collier (1987) foundthat LEP children in English-only settings took longer to develop grade appropriate language skills than didLEP students who began English instruction in grades 2-6. Garcia (1999) notes that an LEP students' homelanguage is a tremendous instructional resource. The cognitively demanding task of developing a first languageplays a significant role in how a second language is developed. Garcia's findings offer a way of interpretingthe findings of Collier (1987). Students who are introduced to a second language before their first language isfully developed may miss out on developing the full range of cognitive skills that comes from complete first-language development..
August and Hakuta (1997) concluded that children's native language proficiency is a predictor of their futureEnglish language development. Similarly, Thomas and Collier (1997) found that age of arrival is not anaccurate predicator of length of stay in programs because of the significant role that formal schooling in thefirst language plays in second-language development. In their study, students who arrived from their homecountry and were placed in ESL classes between the ages of eight and 11 had significant differences in theamount of time needed for English-language development based the amount of schooling they had in their firstlanguage. Along these lines, August and Hakuta (1997) added that use of first-language instruction does nothinder English-language development.
In a qualitative study of classroom practice, Wong-Fillmore & Valadez (1986) have shown that the context andnature of instructional settings for immigrant students play a large role in second-language development. Theyfound that students often are placed in instructional settings where the emphasis is exclusively on English,limiting the opportunity for second-language learners to engage in cognitively demanding curriculum.
These studies make the case that continued primary-language development, particularly in literacy andcognitively demanding content areas, can have potential long-term benefits for the development of English(Cummins, 1991; Garcia, 1988, and Wong Fillmore & Valadez, 1986).
Educating LEP Students in Washington State 120.114

Appendix E Summary of Research on Programs for LEP Students
Summary
The research reviewed in this report broadens the question regarding length of stay in programs serving LEPchildren. The report stresses that developing English is a complex developmental process that lasts severalyears. Major studies in the area of second-language development have documented that even under ideallanguage learning conditions (advantaged students, support of the home language, and cognitively demandingcurriculum) the process can take up to ten years for students to fully develop an academic knowledge ofEnglish. In addition to the time of development, the studies reviewed in this report have highlighted thepositive role that first-language literacy and development play in the development of a second language.
PROGRAM IMPLEMENTATION
A growing body of research has concerned itself with coming to an understanding of school-widecharacteristics that shape program implementation in positive ways. This research has shifted the emphasisaway from program types and labels to consideration of the characteristics of schools that contribute toexemplary teaching practices. In addition, the research related to program implementation has examined therole that teacher training and school staffing have played in the effective implementation of programs. Weexamine two areas of research to address the issue of program implementation and student achievement:
School-wide characteristics influencing program implementation; andThe role of properly trained teachers.
School-wide Characteristics
Research on'effective implementation of programs has highlighted the connection between students' homeculture and the nature of school instruction. Both the National Council of the Teachers of English and theInternational Reading Association have stated that a school's orientation to a student's home language andculture was vital to successful program implementation. The notion that schools must be responsive to theneeds of students and the cultural resources they bring to the classroom is highlighted in a report of theNational Association of the Education of Young Children (1997):
Early childhood education can best help linguistically and culturally diverse children and their families byacknowledging and responding to the importance of the child's home language and culture. Administrativesupport for bilingualism as a goal is necessary within the educational setting. Educational practice shouldfocus on educating children toward the "school culture",while preserving and respecting the diversity ofthe home language and culture that each child brings to the early learning setting. (p. 12)
Rather than program name, this analysis indicates that policy-makers must concern themselves with the culturebehind particular programs and their orientation toward the students they teach.
A second aspect of successful program implementation is related to school-wide commitment to the goals ofsuccessful second-language development. The length of time needed to develop a second language requiresthat the education of LEP students be the responsibility of the entire school. In an extensive case study of twoelementary schools and one middle school, Miramontes, Nadueau and Commins (1997) detailed the process bywhich exemplary practices for LEP students were connected to school-wide decision-making. In studying thethree schools, the authors identified basic premises for effective instruction for LEP students. Their analysisoffers policy-makers guiding principles that will influence not only the length of stay in programs but also thenature of the educational experiences within the various program types.
Educating LEP Students in Washington State. 115
.121
Appendix E Summary of Research on Programs for LEP Students
Active learning. Knowledge is best acquired when learners actively participate in meaningful activitiesthat are constructive in nature and appropriate to the level of development.The primary-language foundation. The more comprehensive the use of primary language, the greaterthe potential for linguistically diverse students to be academically successful. There are always ways tonurture the primary language regardless of school resources.Strategies for second-language development. Second-language development creates an addeddimension to instructional decision-making. Instruction must reflect specific strategies designed tomeet the needs of second-language learners.Contexts for second-language development. Second-language instruction must be organized to providestudents with the time, experiences, and opportunities they needed to fully develop languageproficiency. This requires a range of social and academic contexts in which both language and contentare emphasized.Sociocultural and political implications. Sociocultural factors and political context must be consideredin making decisions regarding every aspect of the program planning.Teachers as decision-makers. Teachers are decision-makers. As part of the learning community, theyare all equally responsible for decisions regarding the instructional program for linguistically diversestudents.
The components outlined for effective programmatic implementation are based upon actual practices thatworked in diverse schools with limited resources. They are based in a commitment to viewing the homelanguage and culture of LEP students as an important instructional resource.
In addition to the basic premises highlighted by the work of Miramontes et al. (1997), several studies havehighlighted school-wide characteristics that facilitate the education of LEP students. While not dealing withprogram implementation in a narrow sense, these studies offer a framework for effective program developmentand implementation. In the following box, we summarize their findings.
Characteristics of Effective Schools
Cultural Validation. Students' home cultures and languages are viewed as instructional resources. In addition to theuse of first language in instruction, effective schools supported and developed ethnic identities in students. Cross-cultural understandings were built and maintained (California Tomorrow, 1995; Berman, 1992; Thomas & Collier,1997).
Shared Vision. Members of the school community shared a commitment to unified goals related to the education ofLEP students. This included teachers serving as key decision-makers. The academic success of LEP studentswastreated as school-wide goal. All teachers in the school community felt responsible for the education of LEP students(Lucas, 1997; Berman, 1992; McLeod, 1996; U.S. Department of Education, 1998; Garcia, 1988).
Protection and Extension of Instructional Time through Coordination. Schools utilized after school programs, cross-age tutoring, and voluntary Saturday school in a highly coordinated fashion to pool resources to serve LEP students(Berman, 1992; McLeod, 1996).
The considerable body of data related to effective schooling for LEP students makes the case that schools mustnot only be concerned with ensuring that children develop the English-language skill necessary for successfulparticipation in schools, but must also consider the nature of the environment in which that learning takesplace. The body of literature reviewed here makes the case that the way the school views the home languageand culture of students and the nature of decision-making play significant roles in successful programimplementation. In addition, these data make the case that the education of LEP students must be a school-wide endeavor.
Educating LEP Students in Washington State 122 116

Appendix E Summary of Research on Programs for LEP Students
Issues Related to Teacher Training
A second issue related to overall program effectiveness relates to the quality of the personnel working in theprogram. A growing body of research focuses attention on the role that qualified and well-trained teachers playin educational change (Hanushek, 1986, 1992). Research conducted in Tennessee found that teachers definedas "least effective" had actualized only minor gains with their students as compared to teachers defined as"most effective."
A recent study commissioned by the State of Texas (2000) found that high teacher expectations played a rolein student success. Teachers in the study were committed to high expectations for their students and thistranslated into effective practice. August and Hakuta (1997) highlight the role that teacher expectations play instudents' development of a second language. Both the role of high expectations and the complexity of second-language learning processes create the need for well-trained and qualified teachers.
Garcia (1992) and Villegas (1991) examined teachers who were identified as "effective" by their schools anddistricts. The two studies identified distinct and interlocking domains related to effective teaching for LEPstudents. Three are summarized below.
Knowledge. Credentialed teachers with specific training in multicultural and bilingual education, highdegrees of content area competency, and knowledge of specific strategies for second-languagedevelopment.Skills. Teaching techniques that allow students to focus on meaning, thematic instruction, instructionfocused on demanding academic content, and English taught through content areas.Disposition. Teachers with a personal commitment to seeing their LEP students become highacademic achievers.
Research on teachers' role in academic achievement of LEP students makes a clear case that LEP studentsneed access to properly qualified, highly skilled teachers. The teaching of LEP students has for too long beenrelegated to uncredentialed teaching assistants. In the face of the research evidence supporting the need forproperly trained and highly qualified professionals, it is our conclusion that this trend clearly limits thepotential academic success of future generations of students.
123Educating LEP Students in Washington State;, 117

Appendix E Summary of Research on Programs for LEP Students
ATTACHMENT I
Office of Civil Rights Guidelines for Programs.Serving English-Language Learners
To be in accordance with the OCR, districts' ELL programs must include the followingcomponents:
The district's educational theory and goals for its program of services;
The district's methods for identifying and assessing the students to be included in thedistrict's ELL program;
The specific components of the district's program of English language development andacademic services for ELL students;
The specific staffing and other resources to be provided to ELL students under thedistrict's ELL program;
The district's method and procedures for transitioning and/or exiting students from itsELL program, and for monitoring their success afterward;
The district's method for evaluating the effectiveness of its program for ELL students.
1 24
Educating LEP Students in Washington State 118

Appendix E Summary of Research on Programs for LEP Students
ATTACHMENT II
California's Proposition 227
Proposition 227, known by its proponents as the "English for the Children" initiative, passed with a 61%majority of California voters on June 2, 1998. The initiative was an example of "people making law," writtenin response to apparent widespread discontent with the state's policies regarding the education of English-language learners in public schools. The passage of Proposition 227 marked a significant event in California'seducational history. Never before had the voting public been asked to vote on a specific educational strategy.Curriculum and programmatic decisions for students have generally been the responsibility of the educationcommunity. Proposition 227 marked a reversal of this trend. Gandara, et al., (2000) argue that because of this,the law was opposed by every major educational association in the state.
The intent of the Proposition was to end bilingual education. Specifically, the law required that "All children inCalifornia public schools shall be taught English by being taught in English" (California Education Code,Chapter 3, Article I. Section 305). The law represents the latest policy move in a long and often contentiousdebate surrounding bilingual education. California, one of the first states to enact a comprehensive bilingualeducation bill, has been at the center of that debate. Following the historic Lau vs. Nichols (1974) SupremeCourt decision requiring schools to take affirmative steps to ensure the meaningful participation of Englishlearners, the Chacon-Moscone Bilingual-Bicultural Act of 1976 was passed. It declared that "the primary goalof all programs under this article [was], as effectively and efficiently as possible, to develop in each childfluency in English" (California Education Code, 1976, Section 52161), while at the same time ensuring thatthey had access to the core curriculum. The law established that the preferred manner for doing so was theprimary-language instruction.
Rumberger and Gandara (2000) argue that because of the controversy surrounding the preference towardprimary-language instruction, no policy action was taken to provide certified bilingual teachers for all Englishlearners. In 1998, only one-third of California's 1.5 million English learner students were in classrooms taughtby teachers who held the Bilingual Crosscultural, Language and Academic Development (B-CLAD)credential. Gandara, et al., (2000) stress this point as a crucial part of exposing some of the faulty logic behindProposition 227:
Proponents of Proposition 227 contend that bilingual education had failed as a pedagogicalstrategy and should be abounded. Evidence for its failure was found in the continuingunderachievement of English learners and the low rate that English learners were reclassified asFluent English Proficient. Yet, the fact was, less than one-third of all English learners wereenrolled in a bilingual program prior to the passage of Proposition 227, so their poor academicachievement could not be attributed to these programs (Gandara, et al., 2000, p. 5).
Although such information was made available to the California electorate, Proposition 227 passed. Theassumption underlying the initiative was that teaching children in their native language served only to holdthem back in their acquisition of English and therefore in their future success.
Upon its passage, Proposition 227 became a part of the California Education Code (#300-340). As requiredwithin its text, districts throughout the state were given only 60 days for implementation. Under this neweducation code, children entering California Public Schools with very little English must be "observed" for aperiod of 30 calendar days. Generally this observation period occurs in an English-language classroom(Gandara, et al., 2000). After 30 days, school personnel must decide if children have enough fluency in Englishto manage in a mainstream English classroom. If not, they are eligible to receive one year of "ShelteredEnglish Immersion," also referred to as "Structured English Immersion." A program of English language
Educating LEP Students in Washington State 125 119

Appendix E *. Summary of Research on Programs for LEP Students
instruction not described in detail in the law except for the requirement that instruction be "nearly all" inEnglish (with the definition for the term "nearly all" left up to the district's discretion).
After one year, children are normally expected to integrate into mainstream English classrooms, whereinstruction is required to be "overwhelmingly" in English. If parents or legal guardians find that district orschool personnel, including classroom teachers, "willfully and repeatedly refuse" to provide Englishinstruction as required, they have the right to sue for damages. Thus, in order to avoid legal liability it wasnecessary for teachers and district personal to understand and to implement the law fully. Given the ambiguityof many of the law's provisions, the threat of legal sanction created a great sense of insecurity with manydistrict and school personnel across the state (Stritikus & Garcia, in press).
The only legal alternative to Sheltered English Immersion and/or mainstream English classrooms is theparental waiver process. According to the new law, children who have special language needs, or whoseparents specifically request it, can be placed in "Alternative Programs," most likely some form of bilingualprogram which includes instruction in the child's primary language. In order for a child to be enrolled in anAlternative Program, the parent or guardian must visit the school annually and sign a waiver requesting theplacement. However, the first year a child enters California schools she must go through 30 days of"observation," generally conducted in English language classrooms, even if she has a signed waiver. Once the30 days is completed, the child can enroll in an Alternative Program.
Despite its attempt to prescribe a uniform solution for the education of linguistically and culturally diversestudents across the state, the law's impact on educational services for language minority students has variedwidely from district to district, school to school, and in some cases classroom to classroom. Garcia, Curry-Rodriguez, & Stritikus (in press) report that some districts across the state have used the waiver clause of thelaw to pursue district wide waivers, others have implemented the English Only provisions of the law, and athird group has left the primary decisions up to individual schools. Districts with longstanding histories ofbilingual programs were more likely to pursue parental waivers in order to maintain their existing programsthan were districts with weaker primary-language programs (Gandara, et al., 2000; Garcia, et al., in press).
The Gandara, et al. study of the initial implementation of Proposition 227 in 22 schools in California foundthat the new law and the statewide emphasis on high stakes assessment caused teachers to shift their focusfrom broader meaning based literacy activities such as story telling and reading-for meaning, to skill-basedliteracy activities to be tested on the statewide assessment. In classrooms observed in the study, literacyinstruction became more reductive and narrow in scope. Language and literacy were rarely used as tools inoverall academic development. Heavy emphasis was placed on decoding and oral development.
Making Sense of Test Data
Several national newspapers including The New York Times and The Los Angeles Times ran stories in thedays following the release of California's SAT-9 scores. A headline on the front page of The New York Timesread, "Increase in Test Scores Counters Dire Forecasts of Bilingual Ban" (The New York Times, 2000, August20). Bilingual education has taken a front and center position in national discourse. As an excerpt from theMercury News indicates, the examination of the influence of Proposition 227 has focused on rising test scores.Student performance on the SAT-9, a test considered by many test experts to be an inaccurate andinappropriate measure of culturally and linguistically diverse students' academic achievement (Garcia, 2000),has become the yardstick by which the success of Proposition 227 is being measured.
Further analysis of the test data raises some important critiques about the accuracy of such claims. Analysis ofstatewide scores by Hakuta and his colleagues (2000) revealed the following problems with the claimregarding the success of Proposition 227 based on test scores:
Educating LEP Students in Washington State. 126 120
Appendix E Summary of Research on Programs for LEP Students
SAT-9 scores increased just as much in some school districts that retained bilingual education.SAT-9 scores increased in school districts that never had bilingual education, and therefore were notimpacted by Proposition 227.SAT-9 scores rose for both LEP students and native English speakers. In fact, the rise for nativeEnglish speakers from poor performing schools was dramatic and larger than for LEP students
The analysis of test scores and the influences that Proposition 227 had on teachers, and classroom practicethrough the implementation of the law indicates that Proposition 227 is not the "magic bullet" for the educationof LEP students.
127Educating LEP Students in Washington State- 121
Appendix E Summary of Research on Programs for LEP Students
ATTACHMENT III
References
August, D., & Hakuta, K. (Eds.). (1997). Improving schools for language minority students. Washington, DC:National Academy Press.
Baker, K. (1992). Ramirez, et al.: Led by bad theory. Bilingual Research Journal, 16, 91-104.
Baker, K. & Dekanter, A. (1981). Effectiveness of bilingual education: A review of the literature. Washington,DC: U.S. Department of Education.
Berman, P. (1992). Meeting the challenge of language diversity: An evaluation of California programs forpupils with limited proficiency in English. Presented at American Educational Research Association.
Bialystok, E. & Hakuta, K. (1994). In other words. New York: Basic Books.
California Tomorrow. (1995). The unfinished journey: Restructuring schools in a diverse society. SanFrancisco, CA: Author.
Collier, V. P. (1987). Age and rate of acquisition of second language for academic purposes. TESOLQuarterly, 21, 617-641.
Cummins, J. (1981). Age on arrival and immigrant second-language learning in Canada: A reassessment.Applied Linguistics, 11(2), 132-149.
Cummins, J. (1984). Bilingualism and special education: Issues in assessment and pedagogy. San Diego, CA:College-Hill Press Inc.
Cummins, J. (1991). Interdependence of first- and second-language proficiency in bilingual children. In E.Bialystok (Ed.), Language processing in bilingual children (pp. 70-89). Cambridge: Cambridge UniversityPress.
Cummins, J. (1996). Negotiating identities: Education for empowerment in a diverse society. Ontario, CA:CABE.
Cummins, J. (1999). Alternative paradigms in bilingual education research: Does theory have a place.Educational Researcher, 28, 26-32.
Cummins, J. & Corson, D. (Eds). (1997). Bilingual education. Dordrecht, The Netherlands: Kluwer AcademicPublishers.
Dannoff, M. (1978). Evaluation of the impact of ESEA Title VII Spanish-English bilingual educationprograms. Technical Report. Washington DC: American Institutes for Research.
De Avila, E. (1997). Setting expected gains for non and limited English Proficient students. NCBE ResourceCollection Series (8).
de Villers, P.A. & de Villiers, J.G. (1979). Early language. Cambridge, MA: Harvard University Press.
Edikating LEP Students in Washington State32.8
122

Appendix E Summary of Research on Programs for LEP Students
Dicker, S. (1996). RTE Forum: Letters from readers. Research in the Teaching of English, 30, 373-376.
Durgunoglu, A. (1998). Acquiring literacy in English and Spanish in the United States. In A. Durgunoglu & L.Verhoeven (Eds.), Literacy development in a multilingual context. Mahwah, NJ: Lawrence ErlbaumAssociates.
Durgunoglu, A., Nagy, W., & Hancin-Bhatt, B. (1993). Cross-language transfer of phonological awareness.Journal of Educational Psycholo.y, 85, 453-465.
El Paso Independent School District. (1987). Interim report of the five-year bilingual education pilot 1986-1987 school year. El Paso, TX: Office for Research and Evaluation.
Faltis, C. (1986). Initial cross-linguistic reading transfer in bilingual second grade classrooms. In E. Garcia, &B. Flores, (Eds.), Language and literacy research in bilingual education (pp. 145-158). Tempe, AZ: ArizonaState University.
Gandara, P., Maxwell-Jolly, J., Garcia, E., Asato, J., Gutierrez, K., Stritikus, T., & Curry, J. (2000). The InitialImpact of Proposition 227 on the Instruction of English Learners. Santa Barbara, CA: Linguistic MinorityResearch Institute. Available on the www at uclmrinet.ucsb.edu.
Garcia, E. (1988). Effective schooling for language minority students (NCBE Focus: Occasional Papers inBilingual Education No. 1) (Online). Washington, DC: The National Clearinghouse for Bilingual Education.Available: http://www.ncbe.gwu.edu/ncbepubs/classics/effective.html.
Garcia, E. (1992). Effective instruction for language minority students: The teacher. Journal of Education,173 (2), 130-141.
Garcia, E. (1999). Understanding and meeting the challenge of student cultural diversity. Boston, MA:Houghton Mifflin Company.
Garcia, E. (2000). API test is an injustice to students with limited English. San Francisco Chronicle, January31, guest editorial, Section A, 19.
Gersten, R., & Woodward, J. (1995). A longitudinal study of transitional and immersion bilingual educationprograms in one district. The Elementary School Journal, 95, 223-239.
Gray, T. (1977). Response to AIR study "Evaluation of the impact of ESEA Title VII Spanish/Englishbilingual education program." Arlington, VA: Center for Applied Linguistics.
Hakuta, K., Butler, Y.G., & Witt, D. (2000) How long does it take English learners to attain proficiency? SantaBarbara, CA: University of California Linguistic Minority Research Institute Policy Report.http://www.lmri.ucsb.edu/RESDISS/hakuta.pdf
Hanushek, E.A. (1986). The economics of schooling: Production and efficiency in public schools. Journal ofeconomic literature, XXIV, 1141-1177.
Hanushek, E.A. (1992). The trade-off between child quantity and quality. Journal of political economy,1992.
Krashen, S. (1996). Under attack: The case against bilingual education. Culver City, CA: Language EducationAssociates.
129Educating LEP Students in Washington State 123
BEST COPY AVAILABLE

Appendix E Summary of Research on Programs for LEP Students
Krashen, S., & Biber, D. (1988). On course: Bilingual education's success in California. Sacramento, CA:California Association for Bilingual Education.
Lambert, W. (1975). Culture and language as factors in learning and education. In A. Wolfgang, (Ed.),Education of immigrant students (pp. 55-83). Toronto: Ontario Institute for Studies in Education.
Lau v. Nichols, 414 U.S. 563, 94 S. Ct. 786, 39 L. Ed. 2d1 1974.
Lucas, T. (1997). Into, through, and beyond secondary school: Critical transitions for immigrant youths. TheNational Center for Restructuring Education, Schools, and Teaching. Teachers College, NY: ColumbiaUniversity.
Mahrer, C., & Christian, D. (1993). A review of findings from two-way bilingual education evaluation reports.Santa Cruz, CA: National Center for Research on Cultural Diversity and Second Language Learning.
McLaughlin, B. (1984). Second-language acquisition in childhood: Vol. 1 Preschool children. Hillsdale, NJ:Lawrence Erlbaum.
McLeod, B. (1996). School reform and student diversity: Exemplary schooling for language minoritystudents. Washington, George Washington University: Institute for the Study of Language and Education.
Miramontes, 0., Nadeau, A., & Commins, N. (1997). Linguistic diversity and effective school reform: Aprocess for decision making. New York, NY: Teachers College Press.
National Association for the Education of Young Children. (1997). Leadership in early age and education.Washington, D.C.: Authors.
National Center for Educational Statistics. (1994). Mini-digest of educational statistics 1994. Washington,D.C.: U.S. Department of Education.
National Center for Educational Statistics. (1999). The NAEP 1998 reading report card.
Washington, D.C.: U.S. Department of Education.
New York City Board of Education (2000). ELL subcommittee research studies progress report. Prepared bythe New York Public Schools Division of Assessment and Accountability.http: / /www.nycenet.edu /daa/ reports /ELL_Research_Studies.pdf
Pena-Hughes, E., & Solis, J. (1980). ABCs. Unpublished report. McAllen Independent School District.
Ramirez, D. (1992). Executive summary. Bilingual Research Journal, 16, 1-62.
Rossel, C. (1992). Nothing matters? A critique of the Ramirez longitudinal study of instructional programs forlanguage-minority children. Bilingual Research Journal, 16, 159-186.
Rossel, C. (1996). RTE Forum: Letters from readers. Research in the Teaching of English, 30, 376-385.
Rossel, C., & Baker, K. (1996). The effectiveness of bilingual education. Research in the Teaching of English,30, 7-74.
Educating LEP Students in Washington State
"1
130124

Appendix E Summary of Research on Programs for LEP Students
Rumberger, R. and Gandara, P. (2000). The schooling of English learners. In G. Hayward and E. Burr (Eds.)Conditions of Education 2000. Berkeley, CA: Policy Analysis for California Education.
Snow, C.E. (1987). Beyond conversation: Second-language learners' acquisition of description andexplanation. In J.P. Lantlof & A. Labarca (Eds.), Research in second-language learning: Focus on theclassroom (pp. 3-16). Norwood: NJ, Ablex.
Stritikus, T., & Garcia, E. (ippress). Education of limited English proficient students in California schools: Anassessment of the influence of Proposition 227 on selected teachers and classrooms. The Bilingual ResearchJournal.
Texas Education Agency. (2000). The Texas successful school study: Quality education for limited Englishproficient students.
Thomas, W., & Collier, V. (1997). School effectiveness for language-minority children. Washington, DC:National Clearinghouse for Bilingual Education.
Troike, R. (1978). Research evidence for the effectiveness of bilingual education. NABE Journal, 3, 12-24.
United States Department of Education. (1998). No more excuses: Final report of US Hispanic dropoutproject. Washington, DC: Author.
Verhoeven, L. (1994). Transfer in bilingual development. Language Learning, 44, 381-415.
Villegas, A. M. (1991). Culturally responsive pedagogy for the1990's and beyond. Princeton, NJ:Educational Testing Service.
Willig, A. (1985). A meta-analysis of selected studies on the effectiveness of bilingual education. Review ofEducational Research, 55(3), 269-317.
Wong-Fillmore, L. (1983). The language learner as an individual: Implications of research on individualdifferences for the ESL teacher. In M. Clarke & J.Handscome (eds.), in TESOL '82. Pacific perspectives onlanguage learning and teaching. Washington, DC: Teachers of English to Speakers of Other Languages.
Wong Fillmore, L. and Valadez, C. (1986). Teaching bilingual learners. In M. C. Wittrock (Ed.), Handbook ofresearch on teaching (3rd ed., pp. 648-685). New York: Macmillan.
131
Educating LEP Students in Washington State 125

APPENDIX F
END OF YEAR REPORT FORMSCHOOL YEAR 1999-2000
Educating LEP Students in Washington State 132 126
ESD Co is
OFFICE OF SUPERINTENDENT OF PUBLIC INSTRUCTIONSpecial Populations
Old Capitol Bldg., PO BOX 47200Olympia, WA 98504-7200
(360) 864-0655 or TOD (360) 684-3631
1999-00 TRANSITIONAL BILINGUALINSTRUCTIONAL PROGRAM
END-OF-YEAR REPORT
TRANSMITTAL SHEET
District Name
Name and Position of Person on Record to Complete Report
Telephone Number)
The signature below is an assurance that Transitional Bilingual Instructional Program (TBIP) guidelines have beenfollowed in collecting and reporting the data submitted for this report.
Signature Date
Please report the number of different buildings by level in which a TBIP was operated.
Number ofBuildings Grades Served
Elementary Building
Jr. High/Middle-Level Building
High School Building
Other (please indicate grade span)
RETURN ORIGINAL AND ONE COPY OF THIS COMPLETED REPORT NO LATER THAN AUGUST 2. 2000, TO:
HELEN MALAGONSUPERVISOR, BILINGUAL EDUCATION
OFFICE OF SUPERINTENDENT OF PUBLIC INSTRUCTIONOLD CAPITOL BUILDING
PO BOX 47200OLYMPIA WA 98504-7200
133FORM SPI 1051E (Rev 6/00)

Transitional Bilingual Instructional ProgramI I
ESD CoDist
1
SECTION ISTUDENTS SERVEDReport the total number of students served in bilingual programs funded by TBIP funds during the time period of July 1,1999, through June 30,2000. These figures are unduplicated counts. Each participant is counted only onceregardless of the number of days of service, number of subjects, or number of times the student enters or leaves theprogram. Please check your entries carefully, the totals for A, B, and C (section C is on pages 3-7, the final total is onpage 7) must be equal. For each grade level, in section A report the number of students who were new to the TBIP thisyear, and in section C (pages 3-7) report the number of students new to the TBIP by language code.
A. Total number of students served by grade and gender.,
GradeNumber Served
Male Female TotalNumber New*
to Program
1
2
3
4
5
6
8
9
10
11
12
Ungraded
Total
B. Number of students served by time span in the TBIP.
Time Span Number Served
1. 1-180 days (1 year or less)
2. 181-360 days (more than 1, up to 2 years)
3. 361-540 days (more than 2, up to 3 years)
4. 541-720 days (more than 3, up to 4 years)
5. 721-900 days (more than 4, up to 5 years)
6. More than 5 years
Total
The totals for A, B, and C must be equal(Note: Final total for C can be found on page 7)
* New means the first time served in program in Washington.
134FORM SPI,1051E (Rev 6/00) Page 2

Code
344094284018037113
103
203205024321345098281285311081105112237516021265041236197139158215267025325043509443254510026181
161
013029032303155
019165
144
123
315031
AcholiAfrikaansAkanAlbanianArabicAmharicArmenianAymaraAyula-BambaraAzerbaijaniBalineseBamanaBambaraBantuBashkirBassaBembaBengaliBerberBikolBosnianBulgarianBuriatBurmeseByelorussianCakchiquelCambodianCebuanoChagataiChamorroCheremisChewaChinese-CantoneseChinese- FukieneseChinese-MandarinChinese-TaiwaneseChungkiChuvashCopticCornishCzechDanishDutchEfikEgyptian-ArabicEstonianEthiopicEweFarsiFijianFinnish
FORM SPI 1051E (Rev 6/00)
Transitional Bilingual Instructional Program
SECTION ISTUDENTS SERVED (Continued)C. Number of Students Served by Primary Language Background
Number Number NewServed to Program
1999-00Participants:
number servedbeyond 3 years
Estimated #to be served inthe 2000-2001
school year
ESD
Estimated # ofstudents to be
served in excessof three yearsin 2000-2001
135
CoDist
Page 3

Code
034002096342308115004009136147077011337238039346183015082062100192048064005042044294511242128250319208326347132302122332047260148218259074222054020186056
FlemishFrenchFulaFulfuldeGe-KayapoGeorgianGermanGreek, ModernGujaratiHaitian CreoleHausaHebrew, ModemHereroHiligaynonHindiHmongHokkienHungarianIboIcelandic (Old)IgboIlokanoIndonesianIrishItalianJapaneseJavaneseJudezmoKakwaKambaKannadaKashmiriKazakhKhalkhaKhmerKikambaKikuyuKinyarwandaKirgizKongoKoreanKpelleKrioKruKumeyaayKurdishLaoLappLatvianLingalaLithuanian
FORM SPI 1051E (Rev 6/00)
Transitional Bilingual Instructional Program
SECTION ISTUDENTS SERVED (Continued)C. Number of Students Served by Primary Language Background
Number Number NewServed to Program
1999-00Participants:
number servedbeyond 3 years
Estimated #to be served inthe 2000-2001
school year
ESD
I
Co
I
Estimated # ofstudents to be
served in excessof three yearsin 2000-2001
136 Page 4

Code
129 Luchuan111 Luganda274 Luhya275 Luo504 Makah276 Makonde277 Makua189 Malay137 Malayalam168 Manchu187 Mandingo256 Maori071 Marathi322 Marquesan512 Marshallese199 Maya-Quiche117 Mende296 Meru264 Michif506 Mien513 Moldavian049 Mongolian050 Mordvin248 Mundu320 Nanai057 Nepali316 Niuean030 Norwegian273 Nyanja266 Oromo078 Osmanli162 Pahlavi088 Pali175 Papago269 Pashto297 Pedi289 Pima016 Polish091 Portuguese170 Provencal514 Pulau-Guai127 Punjabi036 Quechua503 Quileute185 Romansch012 Rumanian006 Russian343 Rwanda505 Sahaptian502 Salish172 Samoan
FORM SPI 1051E (Rev 6/00)
Transitional Bilingual Instructional Program
SECTION ISTUDENTS SERVED (Continued)C. Number of Students Served by Primary Language Background
Number Number NewServed to Program
1999-00 Estimated #Participants: to be served in
number served the 2000-2001beyond 3 years school year
ESD
Estimated # ofstudents to be
served in excessof three yearsin 2000-2001
137Page 5

Code
040014163270090193130271201220101003291221145086028087305278072089287279045051507070106515085119053166097230017080204079046146095501280084286
SanskritSerbo-CroatianShonaSindhiSinhaleseSlovakSlovenianSogdianSomaliSonraiSothoSpanishStoneySudanese-ArabicSusuSwahiliSwedishTagalogTajikiTamazightTamilTeluguTemneTesoThaiTibetanTigrinyaTocharianTonganTrukeseTswanaTurkicTurkishTuvinTwiUigurUkrainianUrduUrianUzbekVietnameseWolofXhosaYakimaYaoYorubaZezeru
FORM SPI 1051E (Rev 6/00)
Transitional Bilingual Instructional Program
SECTION ISTUDENTS SERVED (Continued)C. Number of Students Served by Primary Language Background
Number Number NewServed to Program
1999-00Participants:
number servedbeyond 3 years
Estimated #to be served inthe 2000-2001
school year
ESD
I
Col;M
Estimated # ofstudents to be
served in excessof three yearsin 2000-2001
138Page 6
Transitional Bilingual Instructional Program
SECTION ISTUDENTS SERVED (Continued)C. Number of Students Served by Primary Language Background
CodeOtherOtherOtherOtherOtherOtherOtherOtherOtherOtherOtherOtherOtherOtherOtherOtherOtherOtherOtherOtherOtherOtherOtherOtherOtherOtherOtherOtherOtherOther
Total All, Pages 3-7
NumberServed
1999-00Participants:
Number New number servedto Program beyond 3 years
Estimated #to be served inthe 2000-2001
school year
ESD Co ist
1
Estimated # ofstudents to be
served in excessof three yearsin 2000-2001
The totals for A, B, and C must be equal(Note: Totals for A and B can be found on page 2)
Total A (pg 2)
Total B (pg 2)
Total C (above)
Check Totals
Number Number NewServed To Program
Are the numbers in each column the same? Yes (continue on to page 8)No (review and correct data)
139FORM SPI 1051E (Rev 6/00)
Page 7
ESD CoTransitional Bilingual Instructional Program
SECTION IIPROGRAM STAFF(Teachers)
A. For all teachers providing direct instructional services to students in the TBIP, complete thefollowing information.
Column 1: Indicate the total number of bilingual-funded teachers employed in the district, regardless of theamount of time they work.
Column 2: Indicate the total number of the teachers from Column 1 who have an ESL endorsement.Column 3: Indicate the total number of the teachers from Column 1 who have a bilingual endorsement.Column 4: Indicate the total number of district supported inservice clock hours, paid for by the TBIP, for
ESUbilingual education that teachers from Column 1 received during the time period from July 1,1999, through June 30, 2000.
Column 5: Indicate the total number of district-supported inservice clock hours for multicultural education, paidfor by the TBIP, that teachers from Column 1 received during the time period fromJuly 1, 1999, through June 30, 2000.
Column 6: Indicate the total bilingual-funded teacher FTE.
B.
(1)
TBIP FundedTotal Teachers(Head Count)*
(2)
Number ofTeachers From
Column 1Who Are
ESL Endorsed
(3)
Number ofTeachers FromColumn 1 WhoAre Bilingual
Endorsed
(4)
Total hours ofInservice Trainingin ESL/bilingualthe Teachers
in ThisProgram Received
(5)
Total hours ofDistrict Supported
Inservice inMulitcultural
Teachers in ThisProgram Received
(6)
TBIP TotalTeacher FTE
(Instructional Assistants)For all instructional assistants providing direct instructional services to students in the TBIP, complete thefollowing information.
Column 1: Indicate the total number of bilingual-funded instructional assistants employed in the district, regardless ofthe amount of time they work.
Column 2: Indicate the total number of bilingual-funded instructional assistants from Column 1 who are working towarda degree.
Column 3: Indicate the total number of district supported inservice clock hours, paid for by the TBIP, for ESUbilingualeducation that instructional assistants from Column 1 received during the time period from July 1, 1999,through June 30, 2000.
Column 4: Indicate the total number of district-supported inservice clock hours for multicultural education, paid for bythe TBIP, that instructional assistants from Column 1 received during the time period from July 1, 1999,through June 30, 2000.
Column 5: Indicate the total bilingual-funded instructional assistant FTE.
(1) (2) (3) (4) (5)Total TBIP Funded Total Number of Total hours of Total hours of Total TBIP
Instructional Instructional Inservice Training District Supported InstructionalAssistant Assistants From in ESL/bilingual Inservice in Assistant FTE
(Head Count)* Column 1 Working Instructional MulitculturalToward a Degree Assistants in This Instructional
Program Received Assistants in ThisProgram Received
Include only those persons who have direct instructional contact with students in the TBIP. Do not include buildingor district staff who have general administrative (i.e., rioninstructional) responsibilities.
FORM SPI 1051E (Rev 6/00) 140Page 8

Transitional Bilingual Instructional Program
SECTION IIIPROGRAM DESCRIPTION
A. For each instructional focus,indicate the total number of studentsserved from July 1, 1999, through June 30, 2000.
Instructional Focus Code*
(1) (2) (3) (4) (5)
TotalServed
* Instructional Focus Codes
in [ftFor each service delivery,indicate the total number of studentsserved from July 1, 1999, through June 30, 2000.
Service Delivery Code**
(1) (2) (3) (4) (5) (6)
TotalServed
1. Primary Language Development: Language development in both English and the primary language of the student is thefocus of the program. The goal is to enable the student to become academically and socially fluent in both languages.
2. Academic Language Development: Academic skills and literacy are provided in the primary language with additionalintensive English-as-a-second language (ESL) instruction. When the student reaches moderate English readingcompetency, academic instruction in the primary language is discontinued.
3. Limited Assistance in the Primary Language: Intensive ESL instruction is provided with additional basic skills andliteracy offered in English and with limited assistance in the primary language. This may include academic tutoring providedby noncertificated personnel, translations, interpretations, etc.
4. No Primary Language Support: The student is provided with intensive ESL and may receive other specialinstructional services which enable the student to participate in regular all-English classrooms.
5. Alternative Instructional Program.
** Service Delivery Codes
1. Self-Contained Classroom: Eligible students are assigned to a bilingual classroom which offers instruction in Englishreading/language arts appropriate for the student's level of English competency and, in some cases, academic instruction in theprimary language. The bilingual reading/language arts program is parallel to the program offered in mainstream regular classes.
2. Center Approach: Non-English speaking students are assigned for a large portion of the school day to a bilingual centeroffering intensive English language development and, in some cases, academic instruction in the primary language. Studentsparticipate in the regular school program only in those classes not requiring a great deal of English language interaction.
3. In-Classroom: Eligible students who have attained some English language proficiency are provided, within the context ofthe regular mainstream classrooms, with ESL instruction by a specialized instructor and, in some cases, with academicinstruction in the primary language.
4. Pull-Out: Eligible students are taken out of mainstream classrooms for ESL and, in some cases, for regular academicinstruction in the primary language. Instruction is delivered in small groups or on an individual basis.
5. Tutoring: Eligible students are provided with a bilingual tutor who assists individuals or small groups incompleting class assignments or provides limited assistance in ESL.
6. Other
141
FORM SPI 1051E (Rev 6/00) Page 9
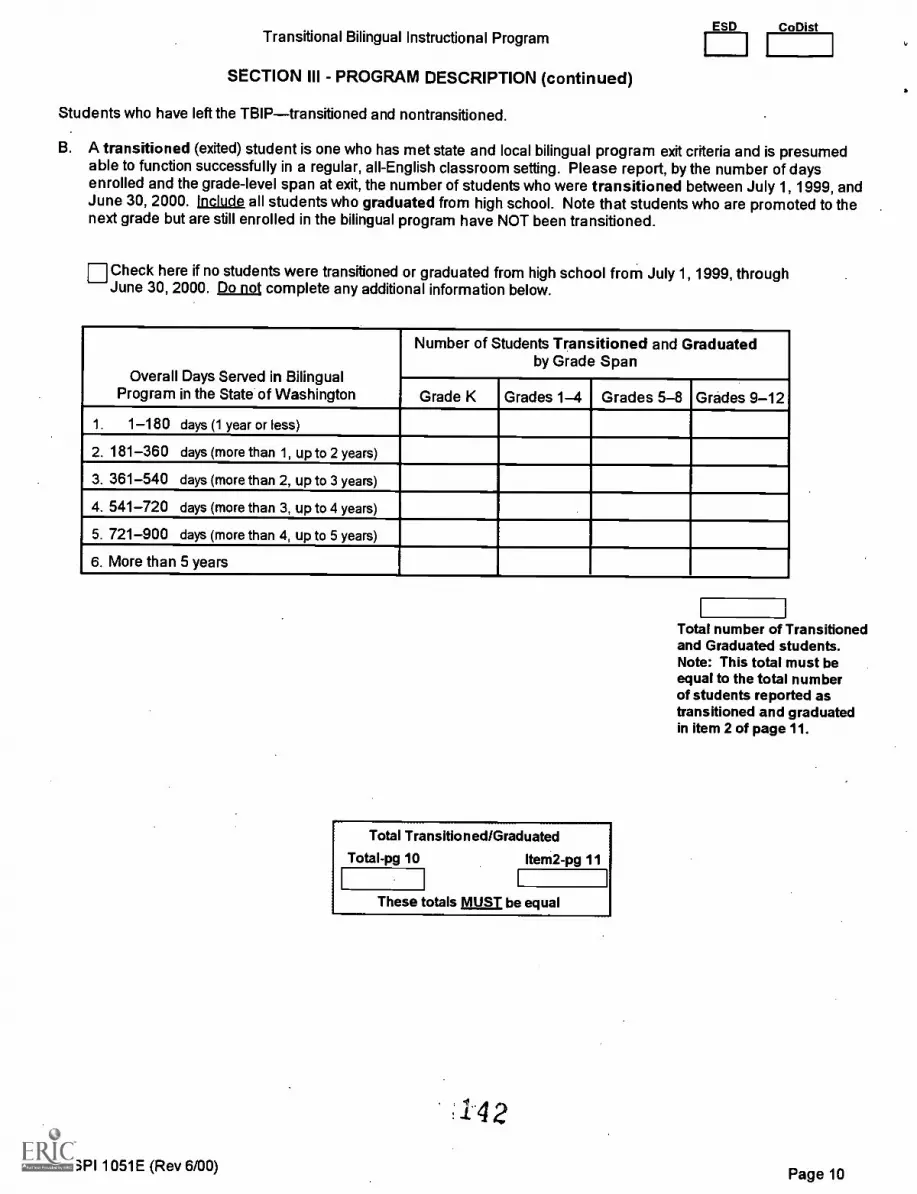
Transitional Bilingual Instructional Program
SECTION III - PROGRAM DESCRIPTION (continued)
Students who have left the TBIPtransitioned and nontransitioned.
ESD CoDist
B. A transitioned (exited) student is one who has met state and local bilingual program exit criteria and is presumedable to function successfully in a regular, all-English classroom setting. Please report, by the number of daysenrolled and the grade-level span at exit, the number of students who were transitioned between July 1,1999, andJune 30,2000. Jnclude all students who graduated from high school. Note that students who are promoted to thenext grade but are still enrolled in the bilingual program have NOT been transitioned.
ri Check here if no students were transitioned or graduated from high school from July 1,1999, throughJune 30,2000. Do not complete any additional information below.
Overall Days Served in BilingualProgram in the State of Washington
Number of Students Transitioned and Graduatedby Grade Span
Grade K Grades 1-4 Grades 5-8 Grades 9-12
1. 1-180 days (1 year or less)
2. 181-360 days (more than 1, up to 2 years)
3. 361-540 days (more than 2, up to 3 years)
4.541-720 days (more than 3, up to 4 years)
5. 721-900 days (more than 4, up to 5 years)
6. More than 5 years
FORM SPI 1051E (Rev 6/00)
Total Transitioned/Graduated
Total-pg 10 Item2-pg 11
These totals MUST, be equal
X42
Total number of Transitionedand Graduated students.Note: This total must beequal to the total numberof students reported astransitioned and graduatedin item 2 of page 11.
Page 10

ESD Co DistTransitional Bilingual Instructional Program
SECTION IVADDENDUM
1. Please provide a count of all students served in the TBIP (from Section I.C.) who were also served in eachof the following federal, state, or local programs (students may be reported more than once.)
ProgramNumberServed
Title I
Title I Migrant Education Program
Special Education, Federal or State
Learning Assistance Program (LAP)
2. Please indicate the status of all students served in the TBIP during the 1999-00 school year.
Status of Students ServedNumberServed
Graduated*
Transitioned*
Dropped Out
Continuing in ProgramRetained
Continuing in ProgramPromoted
Left for Unknown Reasons .
Left for Other Reasons
Total Number of Students Served(This total must be the same as the totalsreported on pages 2 and 7.)
Total Transitioned/Graduated
Total-pg 10 Item2-pg 11
These totals MUST, be equal
This total must be equalto the total reported in Bon page 10*
3. Of the students reported as new to the program this year (A. on page 2), how many students in middle and highschool had no prior formal education?
GradeNumber New to Program With no PriorFormal Education
6
7
8
9
10
11
12
143FORM SPI 1051E (Rev 6/00) Page 11

U.S. Department of EducationOffice of Educational Research and Improvement (OEM)
National library of Education (N11)Educational Resources Informatibn Center (8c)
NOTICE
REPRODUCTION BASIS.
This document is covered by a signed "Reproduction Release(Blanket) form (on file within the ERIC system), encompassing allor classes of documents from its source organization and, therefore,does not require a "Specific Document" Release form.
This document is Federally-ftmded, or carries its own permdssion toreproduce, or is otherwise in the public domai:a and, therefore, maybe reproduced by ERIC without a signed ReproductionRelease. form(either "Specific Document" or "Blanket').
EFF-O9 (9/97)
U.S. DEPARTMENT OF EDUCATIONOffice of Educational Research and Improvement
EDUCATIONAL RESOURCES INFORMATIONCENTER (ERIC)
61( This document has been reproduced asreceived from the person or organizationoriginating it.
Minor changes have been made toimprove reproduction quality.
Points of view or opinions stated in thisdocument do not necessarily representofficial OERI position or policy.
PERMISSION TO REPRODUCE ANDDISSEMINATE THIS MATERIAL HAS
BEEN GRANTED BY
B.1" PA-ties-son
WiAsttiitIoL) tt.S.perietiman %IN% c,
TO THE E CATIONAL RESOURCESINFORMATION CENTER (ERIC)
1
N
7t1Cr)CD
Dr. Terry BergesonState Superintendent of
Public Instruction
Educating
Limited-English-Proficient
Students in
Washington State
BEST COPY AVAILABLE
2
December 2000
(AD

About This Document
This document can be obtained by placing an order on our Web site (www.k12.wa.us);by writing the Resource Center, Office of Superintendent of Public Instruction, PO Box47200, Olympia, WA 98504-7200; or by calling the Resource Center toll-free at (888)595-3276. If requesting more than one copy, contact the Resource Center to determine ifprinting and shipping charges apply.
This material is available in alternative format upon request. Contact the Resource Centerat (888) 595-3276, TTY (360) 664-3631, or e-mail erickson @ospi.wednet.edu. TheOffice of Superintendent of Public Instruction complies with all federal and state rulesand regulations and does not discriminate on the basis of race, color, national origin, sex,disability, age, or marital status.
For more information about the contents of this document, please contact:
Helen Malagon, SupervisorBilingual EducationOffice of Superintendent of Public InstructionPO BOX 47200Olympia, WA 98504-7200E-mail: hmalagon @ospi.wednet.edu
The contents of this document can be reproduced without permission. Funding for thisproject was provided by the Transitional Bilingual Instruction Program, a state-fundedprogram.
Acknowledgements
This report was prepared by Pete Bylsma, Director of Research and Evaluation. Manyother staff at the Office of Superintendent of Public Instruction helped prepare thisdocument, including Debora Merle, Lisa Ireland, Tani Schwent, Sherrie Keller, HelenMalagon, Richard Gomez, Steve Shish, and Mike Dooley. The review of research relatedto length of stay and program effectiveness issues was conducted by Thomas Stritikusfrom the University of Washington and Patrick Manyak from California StateUniversity/Fullerton. Staff in 46 districts provided student-level data on LEP students incertain grades.
3