economic value of non-timber forest products among paser
TRANSCRIPT
Economic value of non-timber forest products amongPaser Indigenous People of East KalimantanSaragih, B.
CitationSaragih, B. (2011, November 10). Economic value of non-timber forestproducts among Paser Indigenous People of East Kalimantan. Retrievedfrom https://hdl.handle.net/1887/18078 Version: Not Applicable (or Unknown)
License:Licence agreement concerning inclusion ofdoctoral thesis in the Institutional Repository ofthe University of Leiden
Downloaded from: https://hdl.handle.net/1887/18078 Note: To cite this publication please use the final published version (ifapplicable).
Economic value of non-timber forest products among Paser Indigenous People of
East Kalimantan
ISBN/EAN 978-90-5113-097-3
© Bernaulus Saragih, 2011
All rights reserved. Save exception stated by the law, no part of this publication may be reproduced, stored in a retrieval system of any nature, of transmitted in any form or by any means, electronic, mechanical, photocopying, recording or otherwise, included a complete or partial transcription, without the prior written permission of the author, application for which should be addressed to author.
The options expressed in this publication are those of the author and do not necessarily reflect the views of Tropenbos International or University of Leiden.
Cover photo: Bernaulus SaragihCover design: Aritta SuwarnoPrinted by: Desa Putera, Jakarta, Indonesia
Economic value of non-timber forest products among Paser Indigenous People of East Kalimantan
Proefschrift
ter verkrijging van de graad van Doctor aan de Universiteit Leiden,
op gezag van Rector Magnificus prof. mr. P.F. van der Heijden,volgens besluit van het College voor Promoties
te verdedigen op 10 november 2011klokke 16.15 uur
door
Bernaulus Saragih
geboren te Hutatinggir (Indonesië)
in 1968

iv
Promotiecommissie
Promotor: Prof. dr. G.A. Persoon Co-promotor: Dr. ir. H.H. de Iongh
Overige leden: Prof. dr. R. Boot (Universiteit Utrecht) Prof. dr. A.J. Dietz
Prof. dr. L.J. Slikkerveer Prof.dr.Wawan Kustiawan (Universitas Mulawarman)

v
Table of Contents
Acknowledgements ......................................................................................................iContents .....................................................................................................iiiAbbreviations .................................................................................................... xv
Chapter 1 Research backgroundNon-timber forest products a neglected resource in forest management1.1. Introduction ......................................................................................................11.2. Valuation of forest ecosystem function ................................................................3 1.2.1. The ecological function of forests ..............................................................3 1.2.1.1. Forest and climate change ...............................................................4 1.2.1.2. Soil protection, flood prevention and water collection.....................5 1.2.2. Products from tropical forests ....................................................................8 1.2.2.1. Timber production from forests ......................................................8 1.2.2.2. Forest as a source of energy ...........................................................10 1.2.2.3. Non-timber forest products...........................................................11 1.2.3. The problem of deforestation ..................................................................13 1.2.3.1. The link between poverty and deforestation ..................................14 1.2.3.2. The role of agriculture in deforestation ..........................................14 1.2.3.3. The role of macro-economics in deforestation ...............................15 1.2.3.4. Property and deforestation ............................................................161.3. Research framework and objectives ...................................................................16 1.3.1. Research objectives ..................................................................................17 1.3.2. Research questions ..................................................................................171.4. Organization of the book ..................................................................................181.5. End notes ....................................................................................................19
vi
Chapter 2 Theoretical context towards valuation of environment and tropical forest ecosystem 1.1. Introduction ....................................................................................................211.2. Theoretical foundation of environmental valuation ...........................................21 2.2.1. Total economic value ...............................................................................22 2.2.2. The use value ...........................................................................................22 2.2.3. The option value .....................................................................................23 2.2.4. The existence value ..................................................................................23 2.2.5. Pareto optimality .....................................................................................23 2.2.6. Market failure and externalities ...............................................................24 2.2.7. Property right and stakeholders ...............................................................24 2.2.8. The nature of public goods ......................................................................25 2.2.9. The concept of shadow pricing ................................................................262.3. Time and the problem of discounting in valuation ............................................26 2.31. Cost benefit analysis ................................................................................27 2.3.2. The use of environmental values ..............................................................29 2.3.3. Current techniques of environmental valuation .......................................31 2.3.4. Direct methods of valuation ...................................................................32 2.3.4.1. The travel cost methods ................................................................32 2.3.4.2. Hedonic pricing ...........................................................................33 2.3.4.3. Contingent valuation methods ......................................................34 2.3.5. Indirect methods of valuation..................................................................35 2.3.6. Combining direct and indirect methods ..................................................362.4. A critique of valuation methodologies ...............................................................36 2.4.1. General problems with valuation methods ..............................................37 2.4.1.1. Determining what we mean by the environment ..........................37 2.4.1.2. The Problem of Money ................................................................38 2.4.1.3. The problem of compensation ......................................................39 2.4.1.4. The effect of elasticity on value ......................................................39 2.4.1.5. The problem associated with Hedonic pricing ..............................40 2.4.1.6. Problems associated with contingent valuation methods .............40 2.4.1.7. Problems with direct dose-response methods ................................42 2.4.1.8. The need for non-monetary evaluation.........................................42 2.4.1.9. Combining different approach to valuation..................................432.5. End notes ....................................................................................................43
Chapter 3 Methods and research frameworkHow is the economic value of non-timber forest products measured?3.1. Introduction ....................................................................................................453.2. Methods of measurement of NTFPs economic values .......................................46 3.2.1. Research village selection methods ......................................................46
vii
3.2.2. Selecting the students and the field assistants ......................................47 3.2.3. Preparation in Samarinda prior to travel to the study sites ..................47 3.2.4. The importance of interaction between the fieldwork team and the ...... villagers ...............................................................................................483.3. Field work procedures and data collection in the villages ...................................49 3.3.1. The introductory meeting ...................................................................49 3.3.2. Participatory mapping and landuse of the villages ...............................51 3.3.3. Conducting the households survey .....................................................523.4. Methods of estimating proportion and quantities ..............................................533.5. Other data collecting activitiesin the fieldwork villages ......................................543.6. Collecting data relating to commercial extraction of rattan, honey, and hunting ....................................................................................................553.7. Problems with data collection ...........................................................................563.8. Using collected data to model the village economy and calculate the value of forest inputs ....................................................................................................57 3.8.1. Estimating household labour inputs ....................................................58 3.8.2. Labour input values ............................................................................58 3.8.3. The contribution of productive capital to the household and village production processes ...........................................................................58 3.8.4. Households wealth holdings distribution ............................................603.9. Using data to evaluate household output values:................................................61 3.9.1. Farming values ...................................................................................61 3.9.2. Non-timber forest products values ......................................................61 3.9.2.1. Hunting values.............................................................................61 3.9.2.2. Fishing catches values ...................................................................62 3.9.2.3. Rattan harvesting values ...............................................................62 3.9.2.4. Wild bee honey production values ...............................................63 3.9.2.5. Forest food and vegetable collection values ...................................63 3.9.2.6. Medicinal plants extraction values ................................................64 3.9.2.7. Fuelwood collections values .........................................................64 3.9.2.8. Handicrafts values ........................................................................643.10. The accounting framework .............................................................................643.11. Modelling the village economy to calculate the net village product .................653.12. Determining the value of forest inputs from net village product .....................66
Chapter 4 Research areaPasir District, the district of forest or oil-palm?4.1. Introduction ....................................................................................................694.2. Geography and land use ....................................................................................694.3. Population ....................................................................................................72 4.3.1. Demography .......................................................................................73 4.3.2. Cultural and social aspects ..................................................................74
viii
4.3.3. Employment .......................................................................................75 4.3.4. Economy ............................................................................................774.4. Forestry sector ...................................................................................................78 4.4.1. Logging ..............................................................................................79 4.4.2. Non-timber forest products ................................................................804.5. Research sites ...................................................................................................814.6. The village of Pinang Jatus ...............................................................................844.7. The village of Rantau Layung ...........................................................................854.8. The village of Muluy .........................................................................................864.9. Other comparative village studies ......................................................................87
Chapter 5 Resource management and the use of non-timber forest products5.1. Introduction ....................................................................................................89 5.1.1. Methods .............................................................................................90 5.1.2. Research area ......................................................................................90 5.1.3. Objectives ...........................................................................................905.2. Results the village study of resource management ..............................................90 5.2.1. Traditional land arrangement ..............................................................92 5.2.1.1. Forest land (tana alas) ..................................................................96 5.2.1.2. Home garden (pangeramu) ...........................................................97 5.2.1.3. Rattah garden ..............................................................................99 5.2.1.4. Management of honey trees .......................................................101 5.2.2. Exogenous management ...................................................................102 5.2.2.1. Rubber (Hevea brasiliensis) .........................................................102 5.2.2.2. Palm oil .....................................................................................1035.3. The use of non-timber forest products ............................................................104 5.3.1. The prominent NTFP use ................................................................104 5.3.2. Village production of NTFPs ............................................................111 5.3.2.1. Number of species used ..............................................................111 5.3.2.2. Volume of extraction ..................................................................113 5.3.3. NTFPs collectors and users groups ...................................................114 5.3.3.1. NTFPs collectors .......................................................................114 5.3.3.2. NTFPs user groups ....................................................................115 5.3.3.3. Contribution of NTFP to subsistence ........................................115 5.3.3.4. NTFPs in nutrition ....................................................................116 5.3.3.5. Vegetables ..................................................................................116 5.3.3.6. Protein .......................................................................................117 5.3.3.7. Fruits .........................................................................................118 5.3.3.8. NTFPs consumption in forest ....................................................119 5.3.3.9. Medicinal NTFPs .....................................................................119
ix
5.4. The major results of the NTFP inventory for potential development ..............122 5.4.1. Trees .................................................................................................122 5.4.2. Rattans .............................................................................................1245.5. Conclusions ..................................................................................................125
Chapter 6Non-timber forest products economic values in research villages6.1. Introduction ..................................................................................................1296.2. The village of Rantau Layung ..........................................................................129 6.2.1. Households labour input values ............................................................130 6.2.2. Households capital production values ..................................................132 6.2.3. Estimating household outputs values .....................................................134 6.2.3.1. Farm output values ....................................................................134 6.2.3.2. Hunting output values ..............................................................135 6.2.3.3. Fishing output values .................................................................136 6.2.3.4. Rattan harvesting values .............................................................136 6.2.3.5. Wild honey collection values ......................................................137 6.2.3.6. Food and fruits collection values ................................................137 6.2.3.7. Sugar palm values ......................................................................137 6.2.3.8. Handicrafts values ......................................................................138 6.2.3.9. Fuel wood consumption values ..................................................138 6.2.3.10. Other output values .................................................................138 6.2.4. The total value of the net village outputs ..............................................139 6.2.4.1. Village inputs .............................................................................139 6.2.4.2. Village outputs ...........................................................................139 6.2.4.3. The derivation of the use value of forest inputs ...........................1406.3. The village of Pinang Jatus .............................................................................142 6.3.1. Households labour inputs values ..........................................................143 6.3.2. Capital input values .............................................................................144 6.3.2.1. Farm output values .....................................................................145 6.3.2.2. Hunting output values ...............................................................146 6.3.2.3. Fishing output values .................................................................147 6.3.2.4. Rattan harvesting values .............................................................147 6.3.2.5. Wild honey collection values ......................................................148 6.3.2.6. Food and fruits collection values ................................................148 6.3.2.7. Sugar palm values ......................................................................149 6.3.2.8. Handicrafts values ......................................................................149 6.3.2.9. Fuel wood consumption values ...................................................149 6.3.2.10. Other output values .................................................................150 6.3.3. The total value of net village outputs .....................................................151 6.3.3.1. Village input values .....................................................................151 6.3.3.2. Village output values ...................................................................152
x
6.3.3.3. The derivation of the use value of forest inputs ...........................1526.4. The village of Muluy ......................................................................................153 6.4.1. Households labour inputs values ......................................................154 6.4.2. Capital production values ................................................................155 6.4.3. Estimating household outputs values ..............................................156 6.4.3.1. Farm output values ...................................................................156 6.4.3.2. Hunting and fishing output values ............................................156 6.4.3.3. Rattan harvesting values ............................................................157 6.4.3.4. Wild honey collection values .....................................................157 6.4.3.5. Handicrafts and palm wine values ..............................................157 6.4.3.6. Fuel wood consumption values ..................................................158 6.4.3.7. Food, fruits and others NTFPs values .......................................158 6.4.4. The total value of the net village outputs ...........................................159 6.4.5. The derivation of the use value of forest inputs .................................160 6.5. Conclusions ..................................................................................................160
Chapter 7The comparison of NTFPs economic value in villages economy7.1. Introduction ..................................................................................................163 7.2. The geographical and demographic differences of the villages .........................1637.3. The comparison of labour supply and sectoral outputs ...................................165 7.4. The comparison of household capital distribution ..........................................168 7.5. The distribution of capital stock .....................................................................169 7.6. The comparison of farm output values ...........................................................170 7.7. The comparison of forest use inputs in household outputs .............................174 7.8. Analysis of the village production functions ....................................................178 7.9. Conclusions ..................................................................................................181
Chapter 8Non-economic aspects of forest values8.1. Introduction ..................................................................................................183 8.2. Social and cultural dimensions of forest values ...............................................183 8.3. Analysis of local framework influencing the use of NTFP ..............................186 8.3.1. Methodology ........................................................................................186 8.3.2. Methods of analysis ..............................................................................188 8.4. People perceptions on the role of forest and environment in the life ................188 8.4.1. People’s response to their rights to resources ..........................................189 8.4.2. People’s perceptions of future development ...........................................192 8.4.3. Social ties and kinship ...........................................................................195 8.5. Attitudes towards forest and the environmental change ...................................197 8.5.1. The differences in attitudes between villages .........................................199 8.5.2. Gender differences response to alternative development options ...........202
xi
8.5.3. People’s perceptions on environmental change in forest ........................202 8.5.4. Perceptions on forest function ..............................................................204 8.5.5. Gender differences in the assessment of forest function ........................206 8.6. Paser indigenous people cosmovision ...............................................................209 8.7. Conclusions ..................................................................................................212 Chapter 9Synthesis and recommendations9.1. Introduction ....................................................................................................... 213 9.2. Forest value beyond timber ...............................................................214 9.3. The income accounting framework approach to valuation .............................216 9.4. Incorporating a non-monetary dimension to environmental values ...............216 9.5. Drawbacks and omissions .............................................................................217 9.6. Cultural and social capital roles in sustainability ...........................................219 9.7. NTFPs prioritisation ....................................................................................219 9.8. Providing financial capital as a development tool ..........................................221 9.9. Promoting agriculture ecosystem base ..........................................................2229.10. Institutional change .....................................................................................223 9.11. Policy strategies for sustainability .................................................................224 9.12. Direction for further research .......................................................................226 9.13. Conclusions ..................................................................................................227
References .....................................................................................231Appendix .....................................................................................247Summary .....................................................................................305Samenvatting .....................................................................................309Curriculum vitae ...................................................................................315
xii
List of Tables
Table 1.1. The relation between stumpage fees and reforestation costs .....................9Table 3.1. The conversion of local weighting system to standardised system ........53Table 3.2. Prices used in the calculation of the value of productive capital stock in Rantau Layung, Pasir Districts .................................................60Table 4.1. Population of Pasir, East Kalimantan and Indonesia, 1961-2004 ..........73Table 4.2. Labour market structure of East Kalimantan and Indonesia 1994 and 2004 .....................................................................................76Table 4.3. Log production of East Kalimantan 1994-2004
(volume in million m3) .........................................................................80Table 4.4. Forest area and different functions in Pasir District ..............................83Table 4.5. Summary of social and economic indicators of three villages at research sites ........................................................................................86Table 5.1. Land use system based on traditional categories in Rantau Layung ......95Table 5.2. Estimated potential of rattan harvesting, based on age, class and species in Rantau Layung and Pinang Jatus ..................................100Table 5.3. Prominent NTFPs use in Rantau Layung and Pinang Jatus ...............106Table 5.4. Current harvesting methods and marketing level of prominent NTFPs species ....................................................................................109Table 5.5. The use of plants in village study based on category used ....................112Table 5.6. The use of animals in village study based on category used .................112Table 5.7. Forestry and agriculture production in research villages ......................113Table 5.8. NTFPs as source of vegetables.............................................................117Table 5.9. NTFP as protein source ......................................................................118Table 5.10. Medicinal plants known and used in RL and PJ..................................121Table 5.11. Stock of selected NTFP in stands before and eight years after commercial logging in Rantau Layung ................................................123Table 6.1 Estimated labour time and values in Rantau Layung in 2005 ..............132Table 6.2. Calculation of the value of productive capital stock in Rantau Layung, Pasir District .......................................................................................133Table 6.3. Summary of activities and village output values in Rantau Layung in 2005 (Rupiah) .......................................................141Table 6.4. Summary of households’ labour-time and estimated values in Pinang Jatus in 2005 ......................................................................144Table 6.5. Value of productive capital stock in Pinang Jatus, Pasir District ..........145Table 6.6. Summary of activities and village output values in
Pinang Jatus in 2005 (in Rupiah) ........................................................151Table 6.7. Labour inputs and estimated value in Muluy in 2006 .........................155Table 6.8. Activities and output values in Muluy in 2006 ....................................159Table 7.1. Basic indicators of the three research villages’ attributes ......................164Table 7.2. Comparison of labour inputs in the villages’ economy ........................166
xiii
Table 7.3. Comparison of labour price based on output and labour time spent in the research villages ............................................168Table 7.4. Comparison of capital availability in the research villages (Rp.) in 2005 ...............................................................................................168Table 7.5. Comparison of cost of holding capital in the research villages .............169Table 7.6. Comparison of forestry and farm products prices at village gate level in the research villages .................................................................171Table 7.7. Comparison of households’ activities and output values in the research villages .........................................................................173Table 7.8. Comparison of forest output values in three Paser villages 2005 ..........174Table 7.9. Comparison of the output values of forest plants sources, including rattan and honey ................................................................176Table 7.10. Comparison of forest residual values in the research villages ................179Table 8.1. An example of a prepared data sheet for responses to questions used
to elicit qualitative data .......................................................................195Table 8.2. Economic profitability of rattan, rubber and palm-oil plantations .......198Table 8.3. Summary of results from the analysis of variance of men’s and women’s responses to questions on development issues .................199Table 8.4. Probabilities associated with men’s responses to selected development
items in relation to the family, the community, and the children’s lives ........................................................................200
Table 8.5. Village differences in probabilities associated with men’s responses to selected development items in relation to the family, the community, and the children’s lives ...............................................201Table 8.6. Probabilities associated with women’s responses to
selected development items in relation to the family, the community, and the children’s lives ...............................................201
Table 8.7. Village differences in probabilities associated with Women’s responses to selected development items in relation to the
family, the community, and the children’s lives....................................202Table 8.8. Men’s perspectives on environmental changes in the three Paser villages ......................................................................................203Table 8.9. Probabilities associated with all men’s and women’s responses to selected development issues .............................................205Table 8.10. Men’s perspectives on the environment in three Paser villages (%) ......205Table 8.11. Differences in forest function between villages ....................................205Table 8.12. Summary of the results of an analysis of variance of responses to
questions on forest function ................................................................206Table 8.13. Gender differences in perception of forest functions ...........................207Table 8.14. How perception of forest function vary across villages,
for both men and women ...................................................................172Table 9.1. Non-timber values obtained from previous studies..............................214
xiv
List of figures
Figure 2.1. Demand for environmental goods and services .....................................22Figure 2.2. Total Economic Value when elasticities of demand and supply are different ..........................................................................................40Figure 4.1. East Kalimantan’s forest distribution for concession area .......................70Figure 4.2. The research area of Gunung Lumut Protection Forest, Pasir District-East Kalimantan .............................................................88Figure 5.1. Traditional land use management in Rantau Layung.............................94Figure 5.2. Small-scale coffee plantation in Rantau Layung ....................................98Figure 5.3. Rattan canes of Segah (Calamus caecius Blume) ...................................100Figure 5.4. Bee’s nest in Koompassia trees ..............................................................101Figure 5.5. Small-scale rubber plantation in Rantau Layung .................................103Figure 5.6. Palm-oil plantation in Pasir .................................................................104Figure 5.7. Transportation of rattan canes in Rantau Layung ................................105Figure 5.8. Woman in making rattan basketry in Mului Village ............................123Figure 6.1. Household participation in various activities in
Rantau Layung in 2005 ......................................................................130Figure 7.1. Comparison of labour-time budget in research villages ......................167Figure 7.2. Comparison of activities and output values in the research villages .....172Figure 7.3. Comparison of forest values in the research villages .............................175Figure 7.4. Comparison of village output values from non-farm activities .............177Figure 8.1. The ritual for celebrating rice harvesting ............................................185Figure 8.2. Assigning people’s responses to development issues .............................187Figure 8.3. Sawn timber a men domain activities in research area .........................192Figure 8.4. Forest as source of income; selling timber is the men’s activity. ............209Figure 8.5. A statue made of ironwood in Rantau Layung ....................................211
xv
Acknowledgements
This thesis could not have been completed without the help and support of many people I cannot mention here.
This study originated from the Tropenbos Balikpapan Programme on behalf of the Trade-off Biodiversity Project. I received a lot of help from the Tropenbos staff, especially the car driver Pak Sariman. Thanks also to the Team Leader at Tropenbos Balikpapan, Dr. Dicky Simarangkir, for his support and understanding. In addition I want to thank his staff Mba Ellis, Shanti, Lusi, Widya, Retno Wulandari, Ais, Indra, and Fleur Deul. Without the facilitation and support of Tropenbos, this research would never have become a reality. Special acknowledgement should be made of Prof. Rene Boot, the Director of Tropenbos International, Dr. Roderick Zagt, and the staff of Tropenbos International in Wageningen.
I am further indebted to the people of the villages of Rantau Layung, Pinang Jatus and Muluy, who provided me and my team with a second home during the research – thank you for your patience and cooperation but above all for the information that they provided.
In the capital of Pasir District, Tana Grogot, we found a warm-hearted sanctuary with the staff of the District officer of Forestry and Bappeda (Board Planning Agency) and of the Bupati (District Head).
In Samarinda, I wish to thank Prof Wawan Kustiawan, a former dean of the Faculty of Forestry at Mulawarman University and the Scientific Coordinator of the Tropenbos Balikpapan Programme. I also thank my students, who have helped me to collect my field data.
I would also like to express my thanks to the Netherlands Fellowship Programme (NFP) and the NUFFIC Huygens Programme for their support of my scholarship and

xvi
research funds, which were the key to my studies. Many thanks too to the International Office of Leiden University.
I also want to thank the following important people who have contributed so much to my studies: my promotor Prof. Gerard Persoon, and co-promotor Dr. Hans de Iongh. I am also grateful to Prof. Reimar Schefold for his supervision at an early stage of the research project. Thanks in particular to the former CML staff members Annelies Oskam and Edith de Roos.
Finally I want to thank my wife, Celiyani br Girsang S.Pd and my daughter, Kinanti Pricillia Octaviany br Saragih for their invaluable patience and support.
Leiden, September 2011 Bernaulus Saragih
1
Chapter 1 Research Background
Non-timber forest products: a neglected resource in forest management
1.1 Introduction
Trees have been used by people for many purposes throughout history; to build shelters, make tools, smelt metals, provide warmth, cook food and construct homes. Each of these activities results in a reduction of tree cover. When the human population was smaller and more stable than it is at present, and technology was less advanced, this reduction had relatively little impact on the resource as a whole. Natural processes of regeneration were able to counteract the effects of this continuous harvesting, and the nomadic nature of human lifestyles over the centuries allowed the natural ecological balance to be largely restored. With the numbers of humans increasing and the forest being exploited for timber at much higher rates, this practice has become unsustainable.
The Department of Forestry of Indonesia (MOF) (2009) estimates that approximately 142 million ha of closed forest and woodland existed in Indonesia at the beginning of the 1970s, and by the year 2008, this had been reduced to around 112 million ha (a 20 per cent reduction in forty years), although it is difficult to determine such figures accurately. Especially in those areas that were allocated for shifting cultivation and conversion for agricultural development, there does seem to be clear evidence that forest conversion has been part of the ‘natural’ processes of development in various regions of Indonesia (MOF 2009).
Besides the conversion of forest for agricultural development, timber has been the major single product of Indonesian forestry since the late Seventies. Logging has been viewed as an opportunity to develop the country’s economy and its importance is indicated by national efforts to regulate and develop the legislation to support this activity. The results of this is that timber processing industries and export grew faster in the late Eighties, and Indonesia became the main tropical plywood exporter to the global market at the beginning of Nineties. Finally, the income from selling timber and
Economic value of non-timber forest products among Paser Indigenous People of East Kalimantan
2
timber products was second only to Indonesia’s oil and gas revenues between 1985 and 2001 (Ministry of Trade (MOT) 2006).
Timber has been viewed as the focus of forest management in Indonesia and, for more than 30 years, it has been the main cause of forest destruction, including the reduction of non-timber forest products (NTFPs) and the economic potential of the country’s forests. The production of timber is well regulated and organised, and the markets for timber are highly visible and well established. The situation for NTFPs is different; there are few regulations, low visibility and incomplete production figures in terms of forest products statistics. This situation, along with the low contribution that NTFPs make to national revenues, has led many policymakers to perceiving them as minor products (ASMINDOO 2007).
However, NTFP’s added value to the national economy has been long neglected. This is reflected in the national statistics of Indonesia from 1970 to 2000, which only record the economic value of rattan and its products. Forest fruits, animals and other products are neglected. Consequently, the economic value of NTFPs has a limited impact in determining policy decisions and for other government purposes. Despite this lack of visibility, there is no doubt that NTFPs play a crucial role in indigenous households in remote areas (Colfer et al. 1997; Godoy, Bawa & Pearce 1993; De Beer & Dermott 1996).
The tropical forest in the Province of East Kalimantan is one of the richest forest areas worldwide and harbours an enormous diversity of plant and animal species (Whitmore et al. 1990; MacKinnon et al. 1997). This province is also home to many indigenous peoples who are highly dependent on forest products (timber and non-timber forest products (NTFP) for their livelihoods. This includes the use of forest plants and animal products for subsistence and as a source of income (Weinstock 1981). This province is also a place where ancient wisdom has valued the conservation of nature for the benefit of mankind (Sardjono 1986; Colfer et al. 1995; De Beer & Dermott 1996; Menon 1986).
The role of NTFP in this province and its importance for the socio-cultural life of rural households has been studied by many researchers (most of these studies were conducted at the beginning of the 1990s). A regional focus for research has been the northern part of East Kalimantan (Colfer 1997; Fried 1997) and the Mahakam Basin River, (Grossmann 1997) and the central part of Kutai and CIFOR in the Malinau and Nunukan areas, as well as the west of Kutai (Matius 2002). These studies were gained in momentum following, or simultaneous to, the rise of NTFP studies in Latin America and some parts of Africa. Examples of NTFP studies from Colombia are: Dominguez & Gomez 1990; Galeano 1991; Van der Hammen 1991 and Rodriguez 1991. Examples of NTFP studies in French Guyana are: Van Andel 1998; Van Andel & Reinders 1999. In Ivory Coast: Bonnehin 1992; in Cameroon: Van Dijk 1999 and in South East Asia and Indonesia: Godoy 1986; De Beer & Dermott 1996; Valkenburg 1997 and De Jong 2002.
3
1. Research background
There are many other reports that are not published internationally, but which contribute to the understanding of rural people and their dependency on forests and forest products. However, the documentation on the economic value of NTFPs in Pasir District and, in particular, for the indigenous people of Paser is non-existent. This research is an effort to redress this and to collect data on the use of NTFPs and to assess their importance for the indigenous household economy. Its aim is to broaden the knowledge base on the economic value of NTFPs and their contribution to tropical forest sustainability in the Pasir District, in the southern part of East Kalimantan.
1.2 Valuation of forest ecosystem function
A fundamental aspect of forest economies today is the definition of appropriate economic values for the forest, its products and its environment. The effective capture of these environmental values facilitates the internalisation of negative externalities. At the same time, prices for forest resources can become more representative of their Total Economic Value, and environmental services will no longer be taken to be a free commodity. The objective of this chapter, therefore, is to identify which aspects of the forest ecosystem need to be included in this process of economic valuation.
1.2.1 The ecological functions of forests
Forests play a role in a number of important ecosystem functions and services. Within forests, vegetation supplies support for soil formation processes and influences its moisture content. Forests provide habitats for numerous plant and animal species and, in addition, make a significant contribution to the maintenance of global atmospheric conditions, by circulating gases such as oxygen and carbon dioxide (CO2) through the process of photosynthesis. The following sections of this chapter address the ecological functions of the forest in East Kalimantan.
Some of the forest dependent species may play a crucial role in future human well-being, such as providing material for medicines, facilitating the potential breeding of pest-resistant strains of crops, or even to provide basic food resources. Without even considering the ethical questions involved in the conservation and preservation of these species, the economic arguments alone could provide adequate motivation for policymakers and other stakeholders to reappraise the way they use these valuable resources.
The total number of living species in the world has been estimated at between ten and one-hundred million, and approximately one half of all species live in areas that can be classified as tropical forests, even though this represents geographically only about 7 per cent of the earth’s land surface (World Resources Institute 2008). Of the total global biome, only about 1.4 million species have actually been identified and described
Economic value of non-timber forest products among Paser Indigenous People of East Kalimantan
4
(CIFOR 2009; Stuart et al. 2010), and far fewer have been analysed either chemically or genetically (World Resource Institute 2008).
The fact that approximately one half of all medicines is based on wild species, and that the output of prescription and non-prescription drugs from the world pharmaceutical industry has been valued at more than US$ 40 billion per year (CIFOR 2008), gives some indication of the economic potential that may lie within these forests. Looking only at the pharmaceutical potential of biodiversity, the current rate of species loss – approximately 1,000-10,000 species per year (UNDP 2004) – represents a significant potential loss to future human well-being. At this rate, it is estimated that half of all the species alive today could become extinct by the year 2050. Thus, tropical deforestation, the principal cause of biodiversity loss, is clearly a process not compatible with the accepted concept of sustainability and intergenerational equity.
An example to illustrate the economic importance of genetic materials for biodiversity is provided by the estimate of benefits gained from improvement of agriculture made as a result of the application of wild strains in crops and pest-resistant crops. Taking all agricultural production into account, the US Department of Agriculture estimated in 2006 that contributions from genetic plant material lead to productivity increases with a farm-gate value of more than US$ 1 billion annually (US Dept. of Agriculture 2006). There is little doubt, therefore, that without the utilisation of wild strains of plants found in natural habitat, significant outputs and production increases of the agricultural sector would not have been achieved in the past. Since any loss of such wild genetic materials will undoubtedly reduce potential applications for future generations, loss of tropical forests, which are home to more species than any other ecosystem, should be prevented if global sustainability is to be achieved.
1.2.1.1 Forest and climate change
The role of tropical forests in mitigating climate change has been addressed in various international conferences and seminars. One important meeting taking place in Indonesia, was the Bali Conference for Climate Change (COP1) in December 2007. This conference again raised the issue of increased CO2 constitutes in the atmosphere, which has been identified as one of the causes of the conversion and destruction of tropical forest (Ministry Of Environment (MOE) 2008). The current concentration of CO2 in the atmosphere is 357 parts per million by volume (ppmv), compared with 280 ppmv in pre-industrial times (IPCC 2007). Because of this change in the level of atmospheric CO2, which is currently increasing at 0.5 per cent per annum, concern has grown about the possibility of long-term changes in global climate patterns. Approximately 40 per cent of CO2 emissions resulting from human activity remain in the atmosphere over the longer term (Wuebbles & Edmonds 1991; IPCC 2007). This indicates that atmospheric changes are likely the result, at least in part, of human action.
5
1. Research background
The role of forests in relation to atmospheric CO2 is twofold. Growing forests absorb CO2 into their cellular structure, forming a store of carbon. When these forests are cut down, this stored carbon is released into the atmosphere as CO2. Deforestation is thought to be a major cause of emissions (Houghton et al. 1991). Because of the high biomass of flora and fauna in moist tropical forests, these areas function as a carbon sink, along with the oceans, the atmosphere and fossil fuels. Estimates of the value of this total global biomass pool are in the range of 550-830 billion tons of CO2 (Bouwman 1990), and since forests contain possibly as much as 85 per cent of global biomass of carbon (Sedjo 1992), changes in the level of forest cover will have an effect on both emissions and absorptions of CO2. As a result of the sequestration potential of re-growth, it is theoretically possible to develop forestry policies that support sustainability, but which still allow a degree of forest harvesting. To achieve this, more detailed data from both the natural and social sciences is required (COP13 2008).
Attempts to quantify the effects of deforestation on climate change have been made by Mc Kinsey (2009), modelling data from the Intergovernmental Panel on Climate Change (IPCC). These models suggest that a total halt to deforestation by the year 2020 would result in a 6 per cent reduction in both global warming and in rising sea levels, compared with the base scenario used by the IPCC, which assumes no policy on deforestation. To achieve the same degree of reduction in climate change by reducing methane emissions, the projected level of such emissions would have to be reduced as much as 50 per cent. Although the zero deforestation scenario used in this model is an extreme case, and one which is unlikely to be achieved, it does indicate that policies to reduce deforestation are, to some degree, likely to have a beneficial effect on anticipated global climate change.
The value of this carbon sequestration function of forests is another aspect of forest values that has previously been ignored by policymakers. Only recently has it become a focal point of discussions within the UNFCCC. Recent research, such as Martin (2010), suggests that the carbon storage value of forests far exceeds the extractive values of both timber and non-timber products. This value has been computed on the basis of the assumption that the human impact on climate change is a real phenomenon, and that costs associated with atmospheric carbon build-up can be realistically calculated. Estimates of sequestration values depend on the type of forest and on the subsequent land use following conversion. The value of carbon storage function of tropical forests ranges from between US$ 600 to US$ 4,400 per ha (Martin 2010). If such sequestration values were to be included in the calculation of the Total Economic Value of forests, investment decisions on alternative land use options may well result in different outcomes.
1.2.1.2 Soil protection, flood prevention and water collection
Forests plays a key role in the structure of the earth’s surface. Roots of most types of trees penetrate into the ground and spread out, providing anchorage points for soil to
Economic value of non-timber forest products among Paser Indigenous People of East Kalimantan
6
collect and solidify. When these are cut down, roots rot away and the supportive fibres can no longer provide stability to the soil. Very quickly, rain and surface water run down amongst the roots, soon eroding the soil and washing it away. This is a particularly serious problem in tropical forests, for two reasons: Firstly, the soil in such areas is often very shallow, and so, in a very short period of time, little soil is left to support any form of vegetation. Secondly, in tropical areas, rainfall patterns are such that large volumes pour down in a short time, greatly exacerbating the effects of soil erosion (World Bank 1992).
A number of studies have attempted to look more closely at the relationship between the removal of forest cover and the loss of important ecological functions and services. In Zaire for example, a period of rapid population growth brought about severe deforestation in some areas (mostly as a result of fuel wood cutting and land clearance for crops), and as a result, soil erosion and declining soil fertility occurred (WRI 1995).
It has been shown that as deforestation occurs, accelerated run-off resulted in localised flooding and reduced hydrological cycling (Bruijnzeel 1990). Sedimentation in water bodies and rivers is a problem created by the loss of the ecological functions of forests. This occurs as soil is washed into water courses and contributes to the likelihood of flooding, as well as the disruption of water supplies further downstream. In addition, it creates problems during the process of purification of water for home consumption, as the concentration of particulate matter to be removed is far higher than would normally occur. In Mexico, the amount of sediment produced annually by soil erosion has been estimated at 365 million tons, with 31 per cent of this being deposited in the water catchment area before reaching the sea (Martinez-Menez & Fernandez 1984). If this water is not caught in man-made reservoirs, which often act as a sink, and high levels of sediment-filled water reach the sea, then serious siltation of estuaries and ports can occur, obviously having a negative external effect on inland and coastal navigation.
Flooding caused by deforestation has been observed in a number of locations in the world, especially downstream from hilly areas in countries such as Indonesia and the Philippines. Incidences of flooding and soil erosion have been observed in Sumatra and Java and, notably, soil erosion and landslides killed many people in a number of provinces in Central and East Java in January 2006 (Kompas, January 2006). Suggestions on how to prevent this type of problem have included a reduction in the rate of trees being cut, and extensive reforestation programmes.
Attempts have been made to quantify the degree of soil degradation and sedimentation damage, but this is very difficult due to the various types of forest formations and the difficulty in identifying the exact source of sedimentation. There are many seasonal differences in rates of sedimentation, for example in areas where rain falls more heavily in some months than others, during wet months more material is likely to be dislodged than in the dry months. This problem of soil erosion and sedimentation also manifests as landslides in hilly areas, as can be seen frequently in the Philippines, Colombia,
7
1. Research background
Indonesia (Java) and other areas where deforestation is taking place on mountainous terrain.
According to the World Resources Institute (2007), 41 per cent of the soil degradation in Latin America is the result of deforestation, while in Asia the figure is 40 per cent. In North America, however, only 4 per cent of soil degradation is the result of deforestation. One of the main reasons for this low figure in North America is the type of agricultural activities. On that continent, rates of deforestation are generally much lower than in tropical areas. In the case of Europe, although the net amount of forest cover is increasing, deforestation still occurs in some areas, and the amount of soil erosion resulting from this is estimated to be 38 per cent of the total (WRI 2007).
The social costs of soil degradation and the loss of other ecological services of forests in Mexico has been estimated at (a final lower bound figure) US$ 4 billion (Adger et al. 1995). Although it may be possible to criticise the methodology of such estimates, there is little doubt that forests have important ecological functions, and by removing the trees and other flora, these valuable functions will be lost.
There has been a study of a lesser-known ecological function of forests in Northern Chile (Schemenauer & Cereceda 1994). Estimates were made of the water collection potential of high altitude forest, and it was found that significant amounts of water per day could be collected from such locations. This is made possible by the fact that at certain high altitudes, meteorological conditions result in frequent and extensive fog and mist extending over forested areas, and the trees and other vegetation act as ‘condensing agents’, causing the water droplets in the fog to drip down into the soil. With the construction of appropriate collecting devices, this water can be tapped for irrigation and consumption in lower altitudes areas. It is interesting to note that such water collecting devices have been found in Inca Pirca, in Southern Ecuador, dating back to the Inca civilisation in pre-Colombian times, and these are still in use today. Other contemporary tribes in the mountains of Northern Colombia rely on similar traditional methods as the source for their water, and have expressed concern to the UN at the changes in meteorological patterns affecting their water supplies.
Other examples of studies where ecosystem functions have been undermined by deforestation include studies in Tanzania (Kaoneka & Solberg 1994), Thailand (Muttamaran & Sales 1994) and India (Das et al. 1994). In all of these cases it has been shown that deforestation has been a major factor in bringing about soil erosion, sedimentation and flooding. Overall, the local, regional and global impact of the systematic reduction of forest cover is having a significant negative impact, both on major world ecosystems and on large numbers of the world’s people.
Economic value of non-timber forest products among Paser Indigenous People of East Kalimantan
8
1.2.2 Products from tropical forest
Tropical forest provides a large variety of products that are useful to humans, in terms of both timber as well as non-timber forest products. The latter include food products such as fruits, nuts and fungi, and of course protein from animals, fish and birds. Trade in wildlife can also be used for income generation, as can trade in decorative plants, such as orchids and bromelias. A range of fibres and resins are found in the forest ecosystems, and these have importance applications in the production of a wide variety of paints, dyes and cosmetic products. Among the most important and valuable of non-timber forest products are pharmaceutical materials, from both plants and animals.
1.2.2.1 Timber production from forests
Since Indonesian independence in 1945, forests have been viewed as great potential for national economic development. Timber has been a major construction material in most parts of the country. Although politicians have been conscious of the depletion of the resources, it is only recently that more attention has been paid to the introduction of policies that promote more long-term sustainable development of forest. Between 1970 and 1985, the timber industry in Indonesia consistently exported all types of unprocessed round timber or logs. One of the tragic results of this was massive forest destruction and subsequent loss of forest functions and services (including, e.g. increased soil erosion). In addition, fires swept over huge areas of Kalimantan, devastating as much as 3.2 million hectares of forest in 1982 and 1983. These fires were the result of burning the land after logging; a way of preparing the land for agriculture. It was not until the end of the 1994 that it was recognised that the formerly forested areas were not very suitable for agriculture. Subsequently, there has been a slow reversion back to forest.
Today, the result of this short-term profit-maximizing approach to forestry can be seen everywhere in Indonesia. In Sumatra and Kalimantan more than half of primary forests have been exploited (CIFOR 2007). Most timber concessions have gone and the production of timber from natural forest has been reduced from 11 million m3 in 1979 to 5 million m3 in 2000 for East Kalimantan alone. Fast-growing species of timber are expected to become the main source of timber production in the near future. In many tropical forest areas the traditional hardwoods, such as ebony and mahogany, are almost extinct, and other species are to take their place, to meet the hardwood demand. In most of the Indonesian forested land, timber extraction took place at an equally rapid rate. Fortunately, however, the low level of technology applied to lumber meant that some natural regeneration occurred in most areas. Government policy encouraged reforestation projects, such as ‘menanam sejuta pohon’ or ‘planting a million trees’, in the areas of land under forest management programmes. In addition, lowering the national timber production quota has also reduced the deforestation rate to its current level of 1.8 per cent, from 2.2 per cent in 1994 (MOF 2006).
9
1. Research background
1 This is based on the reforestation fee of extracted timber of US $16 per cubic meter and the domestic timber price of $100 per cubic meter.
The rate of global expansion of timber and industrial wood products, including paper, peaked in 1973 and then levelled off at about 1.5 billion m3 per year (FAO 1986). Although the use of timber in construction worldwide has slowed down, (as substitute building materials have been introduced), paper consumption continues to increase, especially with the expansion of office technology (ITTO, 2006). Major importers are predominantly developed nations, with Western Europe, Japan, China and the US accounting for a total of 76 per cent of imports by value. Since 60 per cent of world exports of timber and pulp come from managed softwood forests in temperate zones, a large proportion of this timber demand can possibly be met on a sustainable basis. With respect to tropical forests, however, Malaysia and Indonesia rank fifth and sixth, respectively, as exporters of timber on the world market; a worrying statistic given the fact that few forests in those areas are managed in a sustainable way under current Forest Stewardship Council (FSC) certification schemes (CIFOR 2007; ITTO 2008).
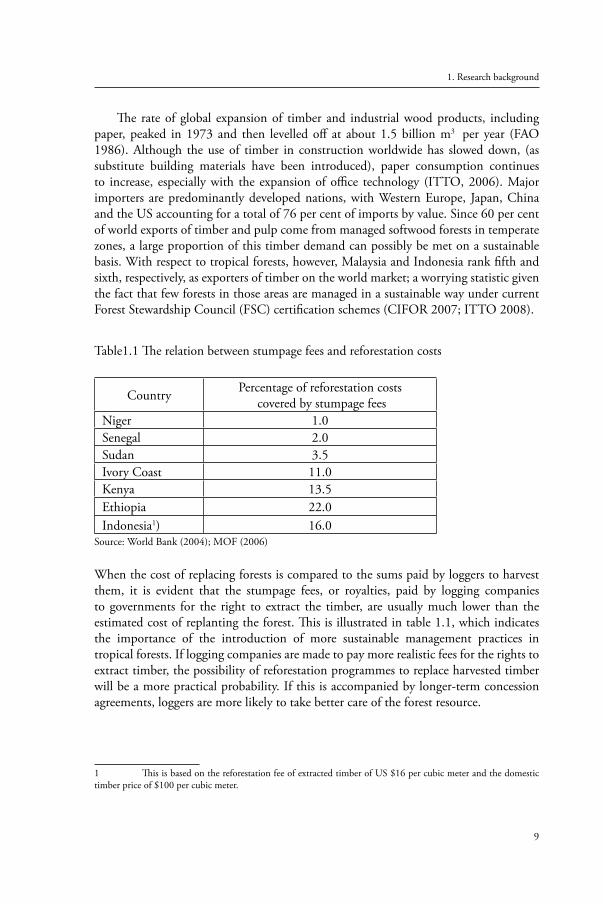
Table1.1 The relation between stumpage fees and reforestation costs
Country Percentage of reforestation costs covered by stumpage fees
Niger 1.0Senegal 2.0Sudan 3.5Ivory Coast 11.0Kenya 13.5Ethiopia 22.0Indonesia1) 16.0
Source: World Bank (2004); MOF (2006)
When the cost of replacing forests is compared to the sums paid by loggers to harvest them, it is evident that the stumpage fees, or royalties, paid by logging companies to governments for the right to extract the timber, are usually much lower than the estimated cost of replanting the forest. This is illustrated in table 1.1, which indicates the importance of the introduction of more sustainable management practices in tropical forests. If logging companies are made to pay more realistic fees for the rights to extract timber, the possibility of reforestation programmes to replace harvested timber will be a more practical probability. If this is accompanied by longer-term concession agreements, loggers are more likely to take better care of the forest resource.
Economic value of non-timber forest products among Paser Indigenous People of East Kalimantan
10
1.2.2.2 Forests as a source of energy
As a milestone in human development, the use of fire began the onslaught on global forests, and the widespread introduction of iron, steel and steam during the nineteenth century gave rise to a rapid increase in the demand for charcoal and fuel wood. The growth of international trade and use of steamships, which took this demand to all parts of the world, resulted in millions of square kilometers of North American forests being logged, with coastal areas of many parts of Africa, Asia, South America and Australia suffering the same fate (Williams 1982). With speedy profitability being the main motive for timber companies, ‘a cut out and get out’ philosophy was adopted, often resulting in the clear-cutting of forests. Similar developments have occurred more recently in Kalimantan.
The total production in East Kalimantan alone reached its peak in 1979, with 11 million m3 of timber being produced. A major factor in the economic losses of this region has been that all this timber was being exported without further processing and, therefore, no added-value to be gained by the country. The total timber exported from East Kalimantan in the period 1970 to 1985 (before industrialisation) reached a volume of 150 million m3 (Saragih 1996).
The FAO estimates that 53 per cent of global wood production is used to generate energy in the form of cooking materials. Hence, forests provide the primary fuel source for 70 per cent of families in developing countries. There is little doubt that, in the past, most of the forest area in industrialised countries has been cut for construction and fuel wood. It is estimated that, at present, as many as 2 billion people in the world are dependent on wood for energy (FAO 2006) and in these cases, a total of 0.45m3 is needed for one person per day (Arnold & Jogma 1998). This reflects the strong demand for fuel wood, and in some African countries as much as 90 per cent of all energy is provided from timber sources (CIFOR 2006). In Asia, only 42 per cent of fuel comes from wood, while in Latin America the figure is only 30 per cent (Dunkerley & Ramsey 1983). These figures suggest that the fuel wood problem is greatest in Africa, while in other areas the cutting of timber for cooking and heating is likely to have a much less significant effect on forest cover.
In many countries this has had serious consequences for the rate of deforestation and, as a result, forests have been thinned and depleted, soil eroded, habitat lost and flooding has occurred. In addition to problems arising from general population growth, an imbalance in regional population distribution also creates fuel wood problems. For example, in the Kano province of Northern Nigeria, the demand for fuel wood is five times greater than the supply, whereas in other areas of the country a surplus of fuel wood exists (Williams 1992). Since the Seventies, the total global production of fuel wood and charcoal has risen from about 1,200 million m3 per annum to over 1,600 million m3 per annum, with more than 80 per cent of this production and consumption taking place in developing countries (CIFOR 2006).
11
1. Research background
In a number of nations, the quantity of fuel wood demanded is consistently larger than the supply. The effect of this is to create a situation of continuously increasing prices. This is demonstrated by the increasing prices of fuel wood in many parts of the world, such as Nepal, Bolivia, Peru, Haiti, Turkey, Ethiopia, Sudan and India (FAO 2003). The same pattern is also found in East Kalimantan where the price of fuel wood has increased by 150 per cent in the period 2001 to 2005 (BPS Kaltim 2006). The impact of increasing prices is made worse by the fact that the majority of people in these areas, who are consuming this fuel, are from very low income groups who cannot afford an alternative available substitute, such as kerosene. This is illustrated by a study of Western and Sub-Saharan Africa (Anderson & Fiswick 1984), which shows that in virtually all areas of the region, the quantity of fuel wood demand regularly exceeds available supplies by between 30 and 200 per cent and, as a result, the price rapidly increases. Wood has now become so scarce in some areas that it often consumes between 20 per cent and 40 per cent of the total cash income of urban households, and this is more than the expenditure on food. In Nepal, women and children can spend as much as 100 to 300 days per year per household collecting and transporting fuel wood (FAO 2006), a situation which is clearly already unsustainable, given indications that the supply of wood is unable to meet demand, except at higher prices. Increased prices are often a direct result of an increase in the time taken to collect fuel wood. This implies that less time is available for those family members to participate in food production and other activities, eventually reaching a point where it is simply not feasible to collect fuel wood.
The collection and burning of fuel wood is essential for billions of people worldwide and represents a total of 1,408 million m3 of wood, equal to 65,000 km2 of woodland, each year (FAO 2006). Even with the introduction of efficient stoves and changes in dietary practice, the demand for fuel wood is set to continue to rise as the human population grows. Thus, the main problem is that increased consumption results in unsustainable levels of extraction of fuel wood. Furthermore, it appears unlikely that this problem will be solved without extensive reforestation programmes and the introduction of community participation in forest management schemes (CIFOR 2006).
1.2.2.3 Non-timber forest products
Conventional economic analysis of forest resources has often tended to ignore non-timber products (NTFP). This is illustrated by some older publications by the FAO (1982, 2006), although more recent editions have attempted to include such data. Non-timber forest products include any kind of fruit, nuts, honey, bark, roots, fungi, resin, animal products or organic chemicals that originate in a forest ecosystem. All forests, in both temperate and tropical areas, have some non-timber products, but because of the huge range of plant species found in the latter, the importance of these ‘by-products’, and the economic potential, is much greater in tropical forests. One major advantage
Economic value of non-timber forest products among Paser Indigenous People of East Kalimantan
12
of viewing these products as potential income generators, is that they can usually be harvested without major damage being done to the ecosystem. In addition, the methods of collection of such products are inevitably labour intensive, and this often means that they are appropriate to the surplus-labour situations found in many tropical forested areas. Furthermore, since indigenous forest peoples are usually familiar with these types of product and the methods of collecting them, they are well suited to, and skilled in this type of work.
When taking all of these diverse forms of income generation into account, the potential from non-timber products could be very large, and the actual economic value that they currently have is also very significant. For example, in Malaysia it is estimated that there are over 1,250 non-timber plant species used by humans, representing about one sixth of all known species in the area (Jacobs 1982). Extrapolating this proportion to the entire area of global tropical forests suggests that as many as 15,000 plant species in these areas could have potential for material or medicinal use. Looking at individual products, we get some idea of the commercial potential of this type of product. Rattan, as a species of climbing palm, prolific in many forested areas, is used extensively in the production of furniture, mats and baskets. In Indonesia alone, export of rattan amounted to US$ 350 million in 2006 (MOT 2007), while patchouli oil and other related non-food oils earned US$ 48 million per annum for that country (Tceknavorian-Asenbauer & Wijesekera 1992; De Beer & McDermott 1998). Indonesia in particular is quite advanced in its exploitation of non-timber forest products and, in 2007, the total value of the export of such products (mainly rattan, bamboo and crafts) from that country amounted to US$ 400 million (MOT 2007).
At the household level, non-timber forest products are also important as a source of food. Although the individual monetary value of such minor food and drink products may be relatively low, their importance must not be ignored due to the fact that they provide an important source of vitamins, proteins and minerals to the household diet. The examination of the nutritional value of forest foods used by Amerindians in Venezuela by Melnyk and Bell (1996), suggests that the high nutritional content of such foods makes a significant contribution to the health of forest dwelling people. Colfer (1986) examined the role of forest plants for medicinal purposes in the village of Long Segar, East Kalimantan and concluded that as many as 127 plant species were used for preventative healthcare and for curing diseases by traditional healers. WWF (2003) reported the use of plants by the people of Lundayeh in the Kayan Mentarang National Park of East Kalimantan. The Lundayeh people used 58 species of plants for building materials, 53 species for edible foods, 36 species for fuel wood, 52 species for traditional medicines and 47 species for various tools and equipment. Studies in Africa have demonstrated the nutritional importance by identifying that vitamins A, B2 and C are supplied by many forest food products (Becker 1983), and they have pointed out that such products are also used widely to add flavour and variety to staple foods (Ogle & Grivetti 1985). Work in Malaysia (Caldwell & Enoch 1972) has shown that wild
13
1. Research background
leaves of forest plants contain three to four times the amount of riboflavin compared to domestic leaf vegetables, and greater amounts compared to nuts, fish, milk or eggs. Recognition of the important nutritional role played by forest food products has been further illustrated by the FAO (1992) and the International Institute for Environmental Development (IIED 1994).
In addition to food plants, forests provide an important source of protein through the extraction of wild meat and fish. In Northern Zaire, it has been estimated (Mbaelele 1987) that fish and bush meat provide 95 per cent of animal protein for both rural and urban dwellers. In other parts of Africa, research has suggested that, although the figures may vary per region, protein from wildlife plays an important role in household diets. In southern Nigeria, for example, research by Ajaye (1979) suggested that 80 per cent of the village households consume bush meat while in Sierra Leone (Smith et al. 1979) and 55 per cent of village households regularly use bush meat. A study by Grossmann (1997) in the central part of East Kalimantan revealed that 35 per cent of protein meat in two villages under observation was provided by the wild animals hunted from the forest areas. From this it seems clear that for people living in forest areas, the consumption of meat and fish has real importance, and one on which, realistically, a monetary value can be placed. A further consideration here is that forest foods also provide a crucial role for those households suffering during the economic hardship. Given the example of marginal difference in productivity between subsistence and starvation in many different households (Ogle 1984), this suggests that minor forest food products have an important role to play in food security within forest communities.
In addition to the many products and services already mentioned, another dimension of the benefits arising from forest use can be attributed to income from the export of plants and exotic flowers, handicraft items produced by forest dwellers, and from the produce of saleable services for the purposes of ecotourism. To gain a truly holistic assessment of forest values, all of these need to be considered, and if we fail to include them in the analysis of forest potential, we reduce the chances of achieving a sustainable system of management of the forest ecosystem.
1.2.3 The problem of deforestation
Tropical forests account for about 50 per cent of global forest cover (FAO 2006). They can be further subdivided into dry and moist forest, and of the moist forests rainforests account for two thirds, while the rest is deciduous. Deciduous forests are usually on the edges of the rainforest, and are characterised by more distinctive wet and dry seasons. Although there is also serious depletion in the dry forests, the rainforests are considered to be a more pressing concern, as they are by far the richest in terms of biomass and biodiversity. There have been many studies examining the various causes of tropical deforestation, but no clear consensus has yet emerged as to a single major cause, except for the consideration that deforestation is the result of undervaluing of the resource
Economic value of non-timber forest products among Paser Indigenous People of East Kalimantan
14
itself. The main reason for this undervaluation is because many of the products of the forest ecosystem are traded in informal markets, and little data exist enabling a rigorous examination of these markets. Furthermore, most of the valuable ecosystem services provided by such forests have been considered as ‘free goods’, and are not traded in any way (Durning 1993). This perception of the services of tropical forests as a free good is something that must be changed if the current rate of deforestation is to be slowed.
1.2.3.1 Link between poverty and deforestation
An exploration of the link between forests and poverty has been undertaken in the last two decades. The research of Durning (1989) and the CIFOR study in 2003 have suggested that deforestation will be worse in situations of extreme poverty, such as in Rwanda, but that this is not always the case. In some poor countries, such as Sri Lanka, the rate of deforestation has been slowed down significantly, in spite of widespread poverty, as a result of the introduction of forest management techniques. In Nepal, though poverty is extreme, deforestation is down to 0.8 per cent per annum from an original rate of 1.4 per cent; a significant decline from previous levels. This has been achieved (through necessity) as a result of strict government control (FAO 2006).
In other poor countries, such as Zaire, the figure for deforestation is still worryingly high (Durning 1993) and probably the result of a combination of permitted and illegal logging activities, as well as rural encroachment on forest margins. In spite of this high figure, the deforestation rate in Mexico is three times higher than that of Zaire, even though Mexico is a much more affluent country (FAO 2003).
It is notable that the worst deforestation rates have occurred in the past in Latin America, and to some extent this reflects the lack of government control and probability of corrupt practices being used to allow logging to take place unchecked. In relation to Brazil, this is confirmed by research (CIFOR 2003), which suggests that sustainable forestry management on a commercial scale was non-existent in the Amazon. However, these data also indicate that in areas of high population pressure, such as Brazil, Indonesia and Mexico, deforestation rates are likely to be higher than in areas where population growth is slower. It is clear that there are links between poverty and deforestation rates, but the various factors causing the links need to be examined further (Angelson & Wunder 2003).
1.2.3.2 The role of agriculture in deforestation
CIFOR (2003) concluded that 60 per cent of all deforestation results from the expansion of agricultural settlements, and there have been many studies conducted to investigate the role of agriculture in the deforestation processes. Forest farmers (estimated worldwide to be over 140 million) may occupy over one fifth of the forest area. Taking into account the family size, which is typical for forest farming groups, and the forest clearance
15
1. Research background
associated with adequate food production, it is reasonable to conclude that as much as 200,000 km2 of primary and secondary forest are being cleared each year to maintain current subsistence levels amongst forest dwellers (Myers 1980; CIFOR 2003).
In contrast to this, a further examination of the relationship between farmers and forests has revealed some interesting issues. For example, the assumption of a simple linear relationship between population growth, agricultural expansion and deforestation has been questioned (CIFOR 2003). It is also claimed that much of this type of deforestation is the result of the production of lifestyle related products, such as stimulants, sugar and tobacco. This suggests that to put the blame for deforestation solely on shifting cultivators in less developed countries may be a mistake.
In another study (Burns et al. 1994), rural encroachment on forests is seen to be an important factor leading to deforestation. This is also the case for economic decline, since it has the effect of driving people into marginal land when alternative employment opportunities disappear. On the other hand, growth of service industries and secondary education seem to have had the opposite effect. Burns’ study used a world system theoretic perspective, and is based on structural equation models that are used to identify direct and indirect effects on deforestation. According to the study by Burns et al. (1994), areas currently most at risk from deforestation are at the periphery and semi-periphery of the forest. Overall, it is clear from all the studies that the causes of deforestation vary considerably in different parts of the world.
1.2.3.3 The role of macro-economics in deforestation.
Various types of economic and social policies have been blamed for deforestation. Policies on transportation, rural development, taxes and royalties on timber harvests, the promotion of domestic processing industries, and agriculture, have all had an impact on land use in tropical forests. An examination of these policies has been undertaken using a general equilibrium framework by Deacon (1995). It was found that many policies in developing countries, which were designed to encourage the development process in general, tended to increase rates of deforestation.
A more detailed investigation (World Bank 2006) found that in Indonesia taxation policy resulted in price distortion, to the extent that companies could bear production costs 2.5 higher than overseas competitors and still be viable on the world market. The direct impact of this on the forests is detrimental, since Indonesian plywood production consumes 15 per cent more raw material per unit of output than similar industries in neighbouring countries.
In Malaysia, the policy of assigning logging rights across huge areas of forest has created monopolies within the timber industry. Market failure leads to private profit maximising firms ‘mining’ the resource for short-term gains, rather than following a
Economic value of non-timber forest products among Paser Indigenous People of East Kalimantan
16
more sensible long-term policy. A major side-effect of this is the severe degradation of the forest disruption of the social and economic structure of indigenous forest dwellers (Heyzer 1995), such as the Penan and Kelabit peoples in Sarawak. It seems that while some economic policies may be more damaging than others, government policies in several countries have contributed in a positive way to the non-sustainable use of tropical forests.
1.2.3.4 Property rights and deforestation
The role of property rights in the deforestation process has been examined by several authors (Mendelsohn 1994; Deacon 1994; Minter, 2009 a.o.) and it appears that when land tenure is even slightly insecure, resources will be used in a non-sustainable way. This result appears to be confirmed in a cross-sectional study of 120 countries (Deacon 1994) that also showed that government instability, and the inability to enforce ownership rights, led to insecure land tenure and consequent deforestation.
In many parts of the world, forested areas have traditionally been viewed as common property resources, with free access to all. This works well when a strong social structure and the systems of traditional practices exist and impose a discipline on the inhabitants of the area (Dove 1994; De Jongh 2002). This discipline has traditionally been the means by which natural balances can be maintained and restored, and in some societies these practices still continue. Examples of this can be seen in the Kayan Mentarang National Park of East Kalimantan with the Lundayeh community and the people of Dayak in Mahakam (Matius et al. 2003; Grosmann 1997; Colfer 2008). It is with such groups that the issue of land tenure is creating a serious problem today, as population pressure is making it more difficult for these groups to exercise their traditional land use rights. This results in the loss of significant benefits both now and in the future.
Research framework and objectives1.3
This research was developed in the framework of the Tropenbos Kalimantan Programme and the Trade-off of Biodiversity Project in Gunung Lumut Protection Forest and Extension Area of Pasir District, East Kalimantan. The Trade-off Biodiversity Project was developed with the aim to formulate recommendations on the integration of forest exploitation timber and non-timber forest products serving local people and biodiversity conservation.
This research project was developed following an agreement by Tropenbos International, the Institute of Environmental Sciences (CML), Leiden University and the Faculty of Forestry of Mulawarman University, Samarinda, Indonesia. Funding from NUFFIC, under the Netherlands Fellowship Programme (NFP), has made this research possible in the period 2004 to 2008.
17
1. Research background
The research began in January 2004 with a visit of staff of the Institute of Environmental Sciences Leiden (CML) in order to prepare a research proposal and to obtain the approval of the supervisors. This was followed by data collection in the Pasir District between 2004 and 2007. Field research was interrupted by annual three month visits to CML, Leiden University, during 2004 to 2007. The finalisation of this dissertation was conducted between 2008 and 2010.
1.3.1 Research objectives
In order to address the research issues and to contribute to the formulation of recommendations on the integration of forest exploitation timber and non-timber forest products serving local people and biodiversity conservation, three research objectives were formulated:
(1) To study the economic value of non-timber forest products for households of Paser indigenous people
(2) To determine the factors influencing the extraction and marketing of NTFPs in the research area
(3) To develop possible interventions by synthesis and recommendations
1.3.2 Research questions
To rightly assess the economic value and factors influencing the use of NTFPs in the research area a holistic approach is required. Such a holistic approach requires answers to the following questions:
(1) What is the dominant NTFP used by the indigenous people of Paser?
(2) What is the economic value of NTFPs for indigenous Paser people?
(3) What are the factors influencing indigenous people’s use of NTFPs?
(4) What is the actual and potential extraction of relevant NTFPs in the forest research area?
(5) What are the most relevant local frame conditions influencing NTFP exploitation?
(6) To what extent can the cultivation and collection of NTFPs change the biodiversity values of forests?
(7) How far can current conditions be influenced in order to improve local people’s income from NTFPs?
Economic value of non-timber forest products among Paser Indigenous People of East Kalimantan
18
1.4 The organisation of this book
This book is divided into nine chapters. Each chapter is started with a short introduction, followed by the objectives and the methods of data collection. Chapter one discusses the introduction to this research and consists of background research and the important functions of forests for both environmental and economic aspects. It concludes after a description of the research objectives and questions. Chapter two discusses the theoretical context regarding the valuation of environment and tropical forest ecosystems. It begins with an introduction to the foundation of environmental valuation and is followed by a discussion of the total economic value, and some determination of the natural resource values. Methods and general problems in valuation methods are also discussed in Chapter two, which closes with endnotes that summarise the overall discussion.
Chapter three discusses the methods used to measure the economic value on non-timber forest products. It starts with the method of study site selection, fieldwork procedures, methods of estimating proportion and quantities, and the methods of using data collection to model and calculate village economy and the value of forest inputs. It describes the method of using data to evaluate household output values and closes with modelling the village economy by calculating the net village products.
Chapter four describes the research area of East Kalimantan in general and the District of Paser in particular. Chapter four also explains the geography and land use system of the province and district of Paser, its population, demography, social aspects, employment, economy and forestry sector. Research sites are also described in the context of their forest and forest functions, people, current use of natural resources and their access to the use of forest and forest products. The three village research areas and other comparative villages are also described at the end of this chapter.
Chapter five discusses the resource management and the use of non-timber forest products by the people of Paser in three research village areas and other comparative villages. It begins with the methods of collecting data and briefly describes the objectives of the chapter. This is followed by a description of the existing resource use among the community. This chapter also describes the land use system of each village in terms of both traditional land arrangements as well as the adoption of monoculture systems, such as rubber and palm oil plantations. Forest products and prominent use are also discussed, in particular for rattan products, wild honey harvesting and the production of other important non-timber forest products, such as wild animals, fruits, vegetables, medicinal plants, etc. Their contribution to subsistence income and providing cash is examined and the chapter concludes with the major results from an inventory, which describes the potential for development of the resources for sources of (alternative) income for the community.
Chapter six describes the results of the calculation of the economic value of non-timber forest products for each village at the research sites. It begins with the calculation
19
1. Research background
of the economic value for the village of Rantau Layung, followed by the village of Pinang Jatus and the village of Muluy. It assesses the household labour inputs in each village, the contribution of capital stocks to the production system, and it estimates the households’ outputs. Households’ outputs were estimated by assessing farm outputs, hunting, fishing, rattan harvesting, wild honey collection, forest food and fruit collection, palm sugar, handicrafts, and fuel wood consumption. Chapter six concludes with the derivation of the forest use values and summarises the total economic value of NTFPs in the village research area.
Chapter seven analyses the comparison of the economic values of NTFPs in three different research villages. Comparisons are made for labour supply, sectoral outputs, household capitals and output distribution among the villages. These comparisons are designed to evaluate the level of village dependency on forest resources and their dependency on NTFP’s values.
Chapter eight describes the non-economic value of NTFPs at the research sites. This includes the social and cultural values of forests and their products, such as social ties and kinship, cosmovision and property rights. A valuation is also made of the people’s perceptions on current development issues such as government programmes on rural development, their responses to future development and their attitudes towards the changes in their rights to resources.
This thesis is concluded with a synthesis in chapter 9. This chapter begins with a discussion of non-timber forest products economic values and it compares the findings of other researchers. This is followed by the constraints of the research and the sources of possible data weaknesses, as well as a discussion on cultural and social capital, NTFP prioritisation, policy strategy and some possible interventions for better economic development of the research area. Chapter nine concludes with suggestions for further research, including the recommendation that further studies can overcome the comprehensive valuation of tropical forest functions in the Paser District of East Kalimantan.
1.5. End notes for chapter one
It is clear from the introduction above that sustainable development is a complex and difficult goal, but that it is a global goal that people throughout the world consider worth achieving. It is also clear that forestry has an important role to play in our survival. Forest management, therefore, can make a significant contribution to the global goal of sustainable development. Without improved forest management practices, global sustainable development is unlikely to be achieved, because of the impact of that forest ecosystems have on both climate change and biodiversity potential. When we look at the contribution of forests to various aspects of human well-being it seems irrational to destroy them. Nevertheless, in the last 40 years, such significant changes have taken
Economic value of non-timber forest products among Paser Indigenous People of East Kalimantan
20
place within the forests and their ecosystems that if these changes continue unchecked, then the existence of forests in the future will no longer be a certainty.
An important way to ensure the future maintenance and protection of tropical forest is to develop methods of forest management that allow income to be generated both today and in the future. It is important for policymakers around the world to shift the paradigm of tropical forest management from one based on the removal and export of natural resources, to one based on environmental stewardship. However, there is little evidence of such a paradigm shift taking place any time soon. It is suggested that in the future change may be brought about through the development and implementation of a number of management options and services provided by forests and, in particular in tropical regions, it should be possible to encourage stakeholders to take a longer-term view of their use of the resource, and to stimulate them to conserve it for the use of future generations. The means to achieve this and the examination of its complex functions and values could be one of the possible answers to tropical forest sustainability.
The global nature of deforestation is something that policymakers must come to terms with if sustainability is to be achieved. This problem must be addressed on an international level, rather than being left to the discretion of individual governments. Naturally, the priorities of policymakers in developing countries must concern the ability of their people to make best use of their own resources, and clearly they will view the problem differently from those concerned with the global environment. In view of these considerations, the achievement of sustainable development will therefore depend on two main foundations:
An increased understanding of the economic and biophysical interrelationships •that are characterised by the modern worldThe development of appropriate attitudes, policies and the institutional •necessities to bring about the inevitable changes that are a pre-requisite to sustainability
An appropriate valuation of the economic value of non-timber forest products for rural households’ economies will assign the monetary values of resources for a community. This is clearly an important issue in the achievement of sustainability, and it is hoped that this work will make some contribution to that debate. In addition, however, by emphasising the importance of non-monetary values, it is hoped that policymakers will accept the need to afford traditional lifestyles with more importance than has been the case in the past. As a result, it may be possible to establish a greater degree of security for forest dependent people’s way of life, while at the same time bringing about a real improvement to the standard of living for these currently very under-represented groups. It is one aspect of the first of these two concerns that is addressed in this study, where the use of non-timber forest products and their economic value in household economies of the indigenous Paser people of East Kalimantan are examined.
21
Chapter 2
Theoretical Context Regarding the Economic Valuation of the Environment and Tropical Forest Ecosystems
2.1 Introduction
The concept of value has been addressed by many disciplines, but conventional economics estimates what something is worth based on our preferences, and using a unit of money as a measure of value. Preferences are determined by a number of factors and vary between different interest groups. This makes them both subjective and dynamic. Measurement of such ‘fuzzy’ variables is a difficult task.
The objective of this chapter is to investigate how the problem of valuation is addressed in environmental economics with special reference to non-timber forest products (NTFPs).
2.2 The theoretical foundation of tropical forest economic valuation
Conventional neoclassical analysis of a market situation involves an examination of the demand for and supply of a good or service. In the case of environmental goods and services, such a framework implies that prices are similarly determined by the supply and demand for those goods and services. Any monetary value applied to the environment should represent the value placed on it by society. Given the usual assumption of optimising the value of the natural resources that we have, the value will be at a minimum where the marginal costs of using it are equal to the marginal benefits derived from it. With increasing marginal benefits, net value will increase. In the case of environmental goods or services, the costs and benefits are usually referred to as social cost and social benefit. This contrasts with more conventional models, which commonly use private costs and benefits associated with neoclassical market models (Pearce & Turner 1990). The demand for environmental goods and services can be depicted graphically and is shown in figure 2.1.
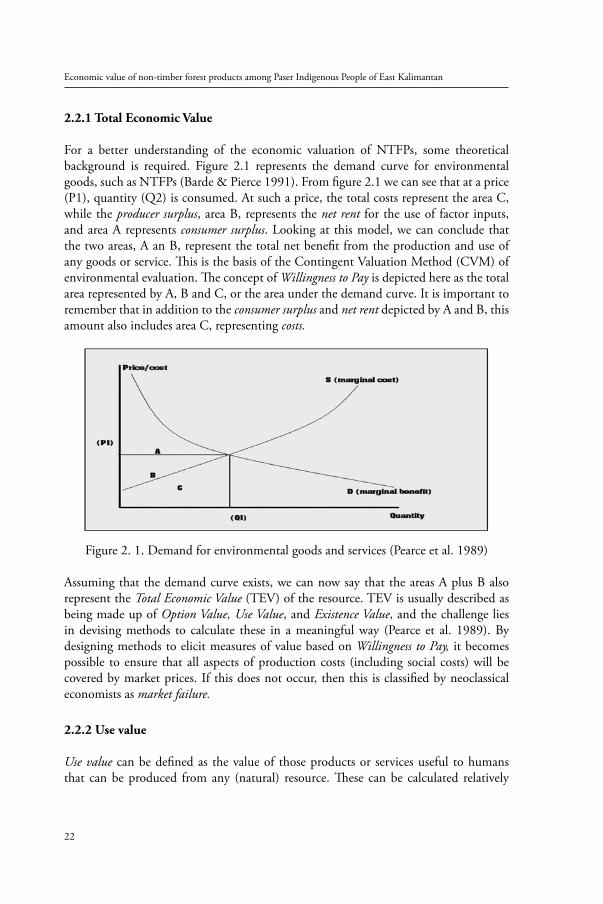
Economic value of non-timber forest products among Paser Indigenous People of East Kalimantan
22
2.2.1 Total Economic Value
For a better understanding of the economic valuation of NTFPs, some theoretical background is required. Figure 2.1 represents the demand curve for environmental goods, such as NTFPs (Barde & Pierce 1991). From figure 2.1 we can see that at a price (P1), quantity (Q2) is consumed. At such a price, the total costs represent the area C, while the producer surplus, area B, represents the net rent for the use of factor inputs, and area A represents consumer surplus. Looking at this model, we can conclude that the two areas, A an B, represent the total net benefit from the production and use of any goods or service. This is the basis of the Contingent Valuation Method (CVM) of environmental evaluation. The concept of Willingness to Pay is depicted here as the total area represented by A, B and C, or the area under the demand curve. It is important to remember that in addition to the consumer surplus and net rent depicted by A and B, this amount also includes area C, representing costs.
Figure 2. 1. Demand for environmental goods and services (Pearce et al. 1989) Assuming that the demand curve exists, we can now say that the areas A plus B also represent the Total Economic Value (TEV) of the resource. TEV is usually described as being made up of Option Value, Use Value, and Existence Value, and the challenge lies in devising methods to calculate these in a meaningful way (Pearce et al. 1989). By designing methods to elicit measures of value based on Willingness to Pay, it becomes possible to ensure that all aspects of production costs (including social costs) will be covered by market prices. If this does not occur, then this is classified by neoclassical economists as market failure.
2.2.2 Use value
Use value can be defined as the value of those products or services useful to humans that can be produced from any (natural) resource. These can be calculated relatively
23
2. Theoretical context regarding the economic valuation of the environment and tropical forest ecosystems
easily, and monetary values can be placed upon them. Shadow Pricing is the general approach used to generate prices for environmental attributes, with the Travel Cost Method, Hedonic pricing and surveys of Willingness to Pay being specific applications of this approach (Pearce et al. 1989).
2.2.3 Option value
Some economists also include the option value in the valuation process. This value keeps open the option to use a resource in the future. This is essentially an expression of the consumers’ preferences for the preservation of a natural resource in the case where a change arises in terms of its use (Kengen 2007).
2.2.4 Existence value
Existence value is the final and most complex part of Total Economic Value; certainly, it is the most difficult to measure. Sometimes referred to as the Preservation value, the existence value is based on intrinsic value, which implies that the environment has a value of its own, totally unrelated to the value placed upon it by human beings (Godoy et al.1993). Statistically, these intrinsic values can be described as fuzzy values, which do not fit in well with conventional methods of analysis implied by the Marshalian Demand Curve, such as the one described in figure 2.1. This is a major criticism levelled at many attempts to evaluate the environment. Trying to understand the world in terms of econometric models may be unrealistic, and failing to take these fuzzy variables into account may make conventional econometric analysis unreliable as an effective measure of environment value. This is the case in Indonesia, where many NTFP products are not used and their functions are not yet known. However, this does not mean that the resource is without value for the environment and future human generations (CIFOR 2007).
2.2.5 Pareto optimality
Pareto optimality refers to an important aspect of neoclassical analysis, concerning the way in which the benefits and the TEV are well distributed between economic agents. This is effectively a criterion of social desirability, which demonstrates how resource allocation is at an optimum when an agent’s welfare cannot be increased without causing a reduction in the welfare of other agents. The fundamental theorem of welfare economics tells us that anequilibrium in the perfect market will be a Pareto optimum situation (Begg et al. 1994); hence, the stress in the economic analysis lies on the role of markets. It is important to remember, however, that Pareto optimum level production is only likely to exist in theory, since the idea is based on the hypothetic concept of perfect
Economic value of non-timber forest products among Paser Indigenous People of East Kalimantan
24
competition, which depends on strong assumptions such as consumer rationality, perfect knowledge and zero transaction costs. Thus, according to this theory, resource allocation can be classified as efficient when the Pareto criterion is satisfied.
2.2.6 Market failure and externalities
According to neoclassical theory, market failure is said to occur when an equilibrium between marginal costs and benefit does not exist – so a Pareto efficient outcome does not occur. In such a situation, the price is influenced by either demand or supply factors, or both, in such a way that the market mechanism does not function. The outcome of the situation in which this occurs in relation to the environment is where the social or public costs are not covered by the market price; this results in externalities.
Externalities refers to the external cost resulting from any economic activity. For example, costs that are incurred by society rather than by individual economic agents. These involve two criteria: loss of welfare and lack of compensation for this loss. Pollution is a classic example of an externality, since it results from the actions of individual agents, but it reduces the welfare of other agents in the society without compensating them for their loss. The policy problem is to identify the value of this loss of welfare and then to implement financial and institutional mechanisms in order to assimilate these costs into the accounting structure facet by the agent responsible for bringing about the loss. An example of how the costs of environmental damage may be internalised is demonstrated by the imposition of a corporate social responsibility (CSR) tax in West Kutai in East Kalimantan province, for the removal of gold and minerals beyond the community (Rio Tinto 1999). Through the imposition of this tax, revenues can be collected from companies and used to make reparations for any damage they may have caused in the course of mineral extraction. This is an example of the polluter pays principle, which removes the externality by enforcing a compensatory payment.
In relation to environmental issues, market failures arise when such externalities exist. Often, they are caused by policy failures (Cornes & Sandler 1996). These occur when governments fail to implement adequate legislation to ensure that compensation for environmental damage is somehow paid by those responsible for it. One of the causes of policy failure is associated with the question of property rights.
2.2.7 Property rights and stakeholders
Property rights related to the use of resources – and in particular the use of forest resources – have been discussed in many publications (Persoon et al 2004; CIFOR 2006; World Bank 1992; CBD 1993). In practice, the common use of the term refers to the actual ownership of land or other property; however, in relation to its use in
25
2. Theoretical context regarding the economic valuation of the environment and tropical forest ecosystems
economics, the term refers to the right to use a resource, whether it is owned or not. In some situations, property rights can be private, or may be a communal or free resource. In the case of the atmosphere, for example, this is seen as a free resource, since it is not owned or controlled by any agent; yet, all economic agents have a right to use it for their survival. Common property resources also include open access areas, such as deep oceans and areas of tropical forests. In the latter case, these resources may technically be owned by a government, or by individuals, but people dwelling in the forests have a de facto right to use these resources. Thus, they must also be considered as stakeholders. The term stakeholders refers to all economic agents who have some form of property right on the resource. Successful resource management requires that all stakeholders should be involved in the decision-making process related to its use. Only by including the views of all stakeholders can an accurate estimate of social costs be made, and the existence of externalities, if any, can be identified.
The situation of common property resources exists in many areas of tropical forest. This is especially the case in more inaccessible areas, such as the upper Mahakam of Central Borneo. According to neoclassical theory, society’s total net benefit from land will be lower under a common property regime (Todaro 1994), and individual agents may be unwilling to invest capital or labour in any infrastructure improvement that has a common benefit. This is illustrated by the case of poor farmers being unwilling to limit rice cultivation in a forest farm area, in order to gain more rice in the future to meet the household needs. That said, in many parts of the world, indigenous resources management strategies have evolved. This is illustrated in a study by Colfer (1996) of forest resources in Borneo, or a case study about water management in the Philippines by Siy (1982). The development of a personal commitment and participation on the ground is crucial for the success of local management strategies. As Siy (1982) puts it, ‘in order to discourage free-riding, it is necessary to develop incentives and sanctions which promote long term participation and involvement in group tasks.’
2.2.8 The nature of public goods
The environment and its various attributes have often been described as public goods. Public goods are those that have a variety of characteristics, in particular, they are said to be non-rival and non-excludable (Cornes & Sandler 1996). This means the consumption of that good by one person does not prevent its consumption by anyone else. Moreover, it is impossible to prevent anyone from consuming it. Public goods can exist in nature, and include elements such as clean air, pleasant scenery or warm sunshine. In the past, these elements have been considered by economists to be free goods. However, this has resulted in market failure, in the sense that their value is not accounted for in conventional private or public accounting frameworks. In many cases, when private action brings about a reduction in the availability or quality of such public goods, then an externality is said to exist, and institutional mechanisms are
Economic value of non-timber forest products among Paser Indigenous People of East Kalimantan
26
needed in order to address the loss of public amenity. This is the case, for example, with atmospheric pollution resulting from traffic or electricity generation.
Extensive research has been carried out on the nature of public goods and externalities, and much of this is summarised by Corners and Sandler (1996). These authors also demonstrate how conventional neoclassical economic theory tries to address this in order to establish how prices can be applied to public or semi-public goods. Due to the non-excludability mentioned above, the problem of pricing public and semi-public goods is very complex, and raises an issue that has come to be known as free-riding. This refers to situations where consumers may gain some benefit from a good or service, without payment for it being enforced. The problem of pricing public goods, and the accompanying problems of externalities and free-riding, constitute an important area of research in environmental economics, one that, to date, has failed to integrate the economic concern for allocation efficiency with the distributional concerns associated with equity or social justice. Once again, progress can be made in this area if more information can be collected about the resource use-values of various stakeholders. Furthermore, it is hoped that by identifying some of these use-values, this type of research will make an important contribution to solving the problem of free-riding.
2.2.9 The concept of shadow pricing
Shadow pricing is a means of attempting to put a figure on the value of social costs. This approach has been used for many years in welfare and development economics as a method of reflecting the true social opportunity cost of using resources. This can be explained as the value of all goods that will have to be given up by society in order to provide enough resources for the project to be undertaken. The shadow prices are assumed to represent marginal social costs, which generally indicate consumers’ willingness to use resources and the value society places upon them. In practice, however, it is rather difficult to estimate marginal social costs accurately.
An interesting example of how shadow pricing can be applied to environmental evaluation is given in the work of Greenomics (2000), which attempts to assess the shadow price of Kayan Mentarang National Park in East Kalimantan. By analysing the flows of products generated by this land to the people in the district, they show how those benefit flows are able to influence the local government to pay more attention to the protection of forest land.
2.3 Time and the problem of discounting in valuation
The conceptual problem of the valuation of NTFPs is further complicated by the issue of sustainability and the links between economy and ecology. An increasing body of literature is available on this subject, (which we shall return to later in section 4),
27
2. Theoretical context regarding the economic valuation of the environment and tropical forest ecosystems
but much of the debate hinges on the concept of time, and how it should be used in evaluation procedures.
In order to bring about a more sustainable approach to development, the question of time is clearly important, both, from the point of view of the timescale of our analysis and from the point of view of discounting. The use of discounting is an attempt to bring about a temporal distribution of environmental effects, which is achieved by weighing current effects against future effects (Pearce & Turner 1990). Any discount rate above zero implies a preference for the present over the future. This is related to the fact that benefits that appear far into the future seem unimportant in the present. This clearly creates an ethical problem when trying to take account of ecological and ecosystem processes that influence the very life support system of the planet.
Another important consideration relating to interest/discount rates is the concept of Capital Productivity. This refers to the fact that capital invested in productive resources (capital formation) will generate a stream of future income in excess of its current value. As long as the future benefits of this investment are worth more than the current benefits, it is rational – in neoclassical terms – to proceed. Complicated further by the existence of uncertainty and risk, (which are assumed to increase with time), the value of benefit or cost is thought to decline as risk and uncertainty increase (Pearce & Turner 1990).
2.3.1 Cost Benefit Analysis: the foundation of monetary valuation methods
By using shadow prices, a calculation of the monetary value of both costs and benefits can be made. The application of Cost Benefit Analysis (CBA) attempts to measure the monetary value of the social advantages of a project, in comparison to its costs (Todaro 1994). Used as a rational decision-support tool, this technique assesses the viability of projects at the planning stage, based on neoclassical principles of economic efficiency. On the basis of this type of analysis, a project is not viewed as worthwhile in terms of CBA, unless the value of resource-benefits are greater than the value of the benefits when the resources are replaced or destroyed by the project. This damage assessment can be compared to the benefit assessment, which will produce a final figure to indicate the net social benefit. If this comparison yields a positive value, the project under consideration will be seen as favourable; whereas, if a negative value results, it is more likely to be shelved (George & Shorey 1980). The procedure for conducting a CBA follows the following basic structure:
The problem needs to be clearly identified, with the reasons for the study clearly •expressed.Social costs and social benefits must be identified, after literature reviews, preliminary •investigations, and possibly a pilot study.Costs are measured by conventional methods.•Benefits are measured by an assessment of individuals’ • willingness to pay.
Economic value of non-timber forest products among Paser Indigenous People of East Kalimantan
28
The flow of benefits minus costs over time is calculated, and then discounted to •give the Net Present Value.Intangible or un-quantified effects are described qualitatively, and compared to the •quantified values.
In a perfect hypothetical world this procedure may function effectively, resulting in a more sustainable allocation of resources; however, in the real world, errors in calculations such as these, and the uncertainties associated with ecological interactions, combine to render it less useful. Furthermore, the distributional problems of both costs and benefits are not dealt with in this type of analysis (Fauzi 2004). Consequently, conflict may arise between different interest groups. The level of conflict may be affected by the various outcomes. In addition, no consideration is given to how these costs and benefits may be spread over time, and so some positive solutions could be unsustainable in the long term. Methodological problems such as these have been illustrated by number of recent road development projects in Indonesia. The development of road construction crossing a national park is expected to attract illegal immigrants, who will encroach on the land. Thus, although benefits should be going to the people in the area affected, in reality the benefits of this development will go to the illegal immigrants. The forest is subsequently degraded by land encroachment. That these projects were approved in the first place reflects the fact that, for some of those affected, insufficient value was placed on the more esoteric aspects of environment value. This counts especially for the existence –and optional values – of woodland areas damaged during the road construction process.
Another problem arising from the use of conventional neoclassical analysis is that it depends on the calculation of the Net Present Value (NPV). To calculate this, we first have to maximise the sum of benefits minus costs. Mathematically, this can be presented using the following formula (Barde & Pearce 1991):
where Bt and Ct are the benefits and costs in time period t, using a discount rate of r, and for a time horizon T.
If all costs and benefits are measured using the same units (valuta), then this calculation is straight forward; if they are not, the calculation is not possible, and the analysis is reduced to being a cost effectiveness analysis. This is an analysis where benefits analysis is identified and the social welfare function is maximised. It is important that any value assigned to either costs or benefits accurately reflects society’s valuations. One of the major problems with this is determining the means of assessing values when markets do no exist. This is especially true in the case of public goods, or in situations that reflect some form of market failure. Furthermore, although costs may sometimes be relative
29
2. Theoretical context regarding the economic valuation of the environment and tropical forest ecosystems
simple to identify, benefits are more difficult to identify and measure. A benefit to one person is not always a benefit to another, and the degree of benefit gained will vary from person to person, particularly in the case of public goods, or in the use of open access resources. The calculation of the benefit cost of NTFP extraction for this study will follow the method explained above. It is conducted to compare the economic value of NTFPs with the economic value of other agriculture products such as palm oil.
2.3.2 The use of environmental values
Calculating the value of any resource will give an estimate of what it is worth in terms of its non-development option. If we are able to calculate this accurately, we can use it as a yardstick to evaluate any development proposal, in order to ensure that only those developments that generate income greater than the Total Economic Value (TEV) would be acceptable to policymakers. More explicitly, to evaluate the feasibility of any development project, we can use the following formula (Barde & Pearce 1991):
where:
Benefit derived from the development Costs of making the development Total Economic Value Costs of Conservation
It is clear from this equation that an efficient system of environmental valuation is an essential part of the effective management of natural resources, and it contributes to the project evaluation design.
As outlined in Section 3.1, in order to take account of the future, the values in the equation [3.1] are discounted, as most people tend to value the future less than the present (Pearce & Turner 1990). This can be referred to as social time preference. Another serious criticism levelled at environmental evaluation techniques concerns the choice of discount rates. At this point, it is worth noting that different discount rates can produce different results: a project may seem positive at one discount rate but may seem negative at another. According to conventional views of investment appraisal (Lumby1991), as long as the value obtained from equation [3.1] is positive, the development project is expected to generate positive net- benefits. Disregarding any distributional inequality, in terms of social benefits, this may lead to an increase in human well-being or other measures of the standard of living. From this, it is clear that policy failures will inevitably result from a lack of concern about social time preference rates, and in the case of tropical forest ecosystems, such mistakes could have irreversible consequences.
Economic value of non-timber forest products among Paser Indigenous People of East Kalimantan
30
To prevent possible errors, the government of East Kalimantan needs to take more care with decisions related to environmental attributes. If the traditional neoclassical profit-maximising approach is taken as a principle, focused on private costs and benefits, we may find that initially a project is seen as profitable and worthwhile (having a positive net present value). However, at a second glance, if we take a more holistic long term approach by including environmental variables in our appraisal, we may find that the same project would have a negative net present value, and should therefore not be undertaken.
Although environmental evaluation is a complex task, adding such methods to conventional investment appraisal techniques could prevent marginal economic activities from being undertaken at the expense of irreplaceable natural resources. In the past, this has occurred in such places as East Kalimantan (CIFOR 2007) where the palm oil plantations have been established in areas of cleared forest. At the time, it was seen as a viable development strategy for the region of East Kalimantan, one that offered tax breaks and subsidies for new exogenous species of timber plantations. The result of this development is that the production of timber from plantations has increased, but with a productivity rate so slow as to make it virtually uneconomic (BPS 2008). To make matters worse, the plantations of oil palm and timber estates have caused serious soil erosion and now the area can be used for little else (CIFOR 2006). Hopefully, improved methods of environmental evaluation will contribute to the prevention of such mistakes in the future.
A publication by Costanza et al.,(1997), on the question of valuation, has raised considerable debate. This paper attempts to estimate ‘The Value of the World’s Ecosystem Services and Natural Capital’, clearly an extremely complex and controversial task. On the basis of an extensive literature review, the authors were able to produce a figure for the value of the ‘entire biosphere’, based on 17 different ecosystem services, from 16 different biomes. Most of the values included in this estimate are based on non-market services, such as the regulation of the chemical composition of the atmosphere, or the maintenance of soil quality, and a wide range of valuation methods have been used in the various studies included in the estimate. The final computed value of the flow of services from the biosphere ranged from US$ 16-54 trillion (1012) per year, significantly more than the total global value Gross National Product of US$ 18 trillion per year. This finding again shows the important value of the environment. It confirms that incorporating the values of forest ecosystem products such as the use of NTFPs gives a more complete understanding of the total environmental value.
While the authors themselves have pointed out the ‘crude and imperfect methods used’ (Constanza 1997), and a number of other writers have highlighted other methodological weaknesses (Ayres 1998; Hueting 1998; Daly 1998), it is still an important contribution to a research area that is very much in its infancy. To understand the difficulties associated with such a task, it is necessary to examine the various valuation methodologies used, and the weaknesses to which they may be subject.
31
2. Theoretical context regarding the economic valuation of the environment and tropical forest ecosystems
2.3.3 Current techniques of the forest ecosystem valuation
Three basic approaches to forest ecosystem valuation are used frequently today. They all attempt to assign monetary values to forest attributes, and can be identified as:
Market based methods1. (from both direct and indirect market statistics, such as the travel cost method, and hedonic pricing);Revealed preference methods2. (where, in the absence of actual markets, preferences of consumers are assessed through surveys, e.g. Contingent Valuation);Statistical analysis3. (such as identifying response linkages, e.g. investigation of the mortality and morbidity impacts of pollutants) (CIFOR 2003).
Based on the motivation behind them, all attempts at forest ecosystem valuation can be classified into the following categories:
Those that try to estimate values for existing forest ecosystem assets. A well-•known example of this is the work done by Bann (2007), the valuation of non-timber values of tropical forest ecosystem.Those that try to estimate the degree of damage projects are • likely to cause, exemplified by the World Bank (1994) study of pollution and congestion impacts in Thailand.Those that try to estimate how much environmental damage the project or •production technique has actually caused. An example is the Exxon Valdez tanker spill of 1989. In this case, an oil slick was released covering an estimated 1000 sq. miles of the Prince William Sound (Goldsmit & Hildyard 1990).Those that try to estimate the benefits of projects, such as the improvement of •water quality; e.g. Bockstael (1987).Those that try to estimate how economic variables such as employment, income, •etc., will be influenced by alternative resource uses. An example of this is provided by the study of the effect of flooding in the Falce Valley in the Po Delta, Italy (Munda & Nijkamp 1995)Those that try to measure ecosystem health, such as the work by Costanza •and Perrings (1990), which implies the need for weightings to be used to take account of the relative importance of the many different facets of what makes up the environment.
The choice of valuationmethod selected will depend on a number of factors. Clearly, if one wants to develop fiscal policies to counteract environmental damage, one needs to look to various types of information and relationships between the damaging activity and the social costs incurred by them. On the other hand, if the objective is to assess the various income potentials for alternative land uses, we need to look at how the environment is likely to be influenced by the different option. Thus,we can identifywhich option has the maximum net social benefit. Another factor that will influence the choice of the evaluation method used, is the cost of study. A long and comprehensive survey
Economic value of non-timber forest products among Paser Indigenous People of East Kalimantan
32
is costly to run, but a reduction in comprehensiveness may reduce its validity and reliability. Due to the nature of NTFPs, a combination of market based techniques and the preference methods were used for my study. A reason for this is that certain (parts of ) NTFPsare not traded at all andare used for subsistence needs only. However, other (parts of ) NTFPsare produced for markets. Therefore, the use of contingent valuation method is appropriate. 2.3.4 Direct methods of valuation
Direct methods of valuation are market based. These methods are designed to measure the monetary value of forest gains (or losses) resulting from forest NTFP production. The use of these methods is directly related to some forest ecosystem features (such as clean water). When using these methods, we try to identify individual values expressed either in terms of willingness to pay (for a benefit), or in terms of willingness to accept (compensation for a loss of environmental benefit).
The basis of this direct approach to valuation is the principle that individual preferences count, and that individuals are the best judge of their own welfare. As a result, the analysis is based on data collected directly from conventional, implicit or artificial markets (Pearce & Turner 1990), and shadow prices are used to calculate forest ecosystem values. From the willingness to pay values derived by these market surveys, a demand curve for the attribute can be constructed, and the level of consumer surplus can be measured. According to the neoclassical approach, this consumer surplusindicates the level of social welfare associated with the consumption of the forest products. One of the earliest attempts to assign monetary values to the forest ecosystem was developed to enable more effective management of National Parks in the US(Hotelling1949). This became a popular method of environmental valuation, now known as the travel cost method.
The method of direct valuation is used, for example, to measure the economic value of the production of wild honey. By knowing the value of honey production to the household economy, the willingness of villagers to maintain this resource will also be known. So, theoretically, their willingness to maintain this resource can be used as an indicator of the value of the forest ecosystem services to this community.
2.3.4.1 The Travel Cost Method
The Travel Cost Method (TCM) of valuation evolved from the work done by Hotelling (1949), on US National Parks, and is based on the idea that the value placed by society on specific environmental attributes, is indicated by how much people actually pay to travel to a particular location. This is an extension of Recreational Demand Model, which specifically looks at values placed on time and the choice of site visits. Extensive
33
2. Theoretical context regarding the economic valuation of the environment and tropical forest ecosystems
examples exist for studies of this type done in the US, where the method has been used frequently to evaluate the benefits of improvements in recreational facilities. It has also been used in other developed countries and, to a lesser extent, in developing countries such as Malaysia, Indonesia and Thailand. In studies by Bockstaelet al.(1987), the method has been used to look at improvements in water quality.
One of the main problems of this method is the estimate of time. One of the most important variables used by TCM is the time spent in travelling to the site, as well as the cost of transportation and entrance fees. Most studies use figures for the price of time as approximately one third of the average hourly wage. The results of these studies reveal a high degree of sensitivity between the time-value variable and the final results. Atransaction bias may also occur, resulting from the fact that the data do not include information from households that do not use the site (Smith & Kaoru 1990). Distortions may have the effect of causing estimations of benefits to be unreliable.
The basis of the TCM is that any increase in environmental quality will lead to increases in the level of consumer surplus, which will indicate how welfare has increased. The changes in consumer surplus arise due to the shifts in the demand curve, caused by changes in demand for the environmental attribute, as a result of its improvement. By summing up over all households, the total value of that improvement can be calculated. For this method, large amounts of data are needed, and both continuous and discrete data models are used.
There is no doubt that this method has been widely used and frequently refined to the point that it has produced many results, which have had a positive input on environmental management strategies, particulary in relation to recreation sites, as well as for the provision of basic infrastructure such as water services. The large amount of data required by the method, and the problem of time-value estimation, make the use of this method in developing countries rather dificult. However, when applied to specific recreational benefits related to tourism, it can be of significant use.
2.3.4.2 Hedonic pricing
Another method using implicit markets is known as the Hedonic Price Method. This type of assessment uses differences in household or land prices to indicate differences in environmental qualities, and therefore different environmental values. Environmental valuation by hedonic pricing is based on direct information from the market. It is also based on links between the consumption of certain goods and services and the consumption of newly marketed goods and services (including environmental attributes). The underlying assumption of the approach is that the prices of land will reflect the quality of their environmental attributes. It is a type of study that tries to identify the relationship between the environmental attributes and the price in relation to the market. It is usually based on cross-sectional data, to avoid having to control other
Economic value of non-timber forest products among Paser Indigenous People of East Kalimantan
34
variables over time. Multiple regression techniques are used to identify the degree to which property differentials are due to environmental variables in order to estimate how many individuals would be willing to pay for an improvement of that environmental attribute, and what the social value would be.
Early attempts to use this method (Thibodeau & Ostro 1981), used commercial and recreational activities as the basis for wetland valuation. In developing countries, Jimenez (1983) investigated improvements in sanitation services in Manila, while Markandya (1991) attempted to estimate the benefits of the new sewage system in the capital of El Salvador. However, because of the data requirements, this methodology is most suited for developed economies, where comprehensive data on property markets are available. An example of this is given by Cropper and Oates (1992), where various environmental factors influencing property prices were identified. Although this method can be of value in certain circumstances, it does seem that the result may be unreliable if the quality of data is poor, and if the estimated model fails to represent all explanatory variables (Markandya 1991).
The method of hedonic pricing has not been used for the valuation of the economic value of NTFPs and, therefore, this method was not used in this study. In general, the hedonic method is mostly applicable tourban situations.
2.3.4.3 Contingent valuation methods
The method is based on artificial markets and preferences, which do not actually exist, but which are described hypothetically by respondents in a survey. An example of this is a survey asking farmers how much they would value greater wildlife for hunting animals around their village. Another example is asking these farmers how much they would value a clean water supply (assuming that one does not currently exist). This type of hypothetical valuation is known as the Contingent Valuation Method, and it has become increasingly accepted in recent years. According to a survey of a large number of CVM studies, there area number of constraints when using this method (Mitchell & Carson 1989). However, the response of individuals to hypothetical questions is a consistent indicator of their actual behaviour.Popular in the valuation of NTFPs, this method is now gaining ground in tropical countries. One of the best known of these studies is that by Wollenberg et al. (2002), who investigated the income of forest dwellers from NTFPs in Kalimantan, and also Caldecott (1988), who estimated the total value of hunting in Sarawak. Several other valuation studies have been undertaken using this approach, including those of Angelson and Wunder (2003), and Kengen (2007). The increased interest in this method in recent years is possibly due to the fact that it may be the only suitable method available in some specific situations. In addition, it is a method that can be applied in many different situations that requireforest product values, such as in this study.
35
2. Theoretical context regarding the economic valuation of the environment and tropical forest ecosystems
2.3.5 Indirect methods of valuation
Statistical methods for valuation rely on the existence of a relationship between environmental attribute (e.g. pollution) and a change in an observable human behaviour or condition, such as health. Once this dose-response relationship is established, it is then assessed in terms of the economic value of its effect. An example of this would be the man-hours lost as a result of illness caused by working conditions, such as in a coal mine or asbestos plant. In these cases, benefits were observed to be greater than the cost of the filters and, thus, the management could be easily convinced of the usefulness of using filters.
This method of valuation is especially useful in situations where adequate price and expenditure data are not available. It is effective in situations where there are clear relationships between pollution and material damage, such as those that occur in buildings, between soil erosion and declining agricultural yields, and between pollution and aquatic ecosystems (Markandya 1992). For greatest reliability, these dose-response linkages need to be analysed with a behavioural model of the demand for the goods and services that are affected, although this has only been done in a few cases, such as in a study examining the impact of forest fires in East Kalimantan (GTZ 1999).
In developing countries, where market methods based on revealed preferences are not feasible, and where people may be unaware of the effects of an environmental change, this method is preferred above more direct methods of valuation. Once the dose-response relationship is established, a monetary damage function is constructed (physical damage multiplied by the value per unit of damage) and analysed using multiple regression techniques. Similarly, benefits are calculated on the basis of damage avoided. Seminal work in this field has been done by Lave and Seskin (1977) and, since then, a great deal of research has investigated various aspects of it. Watson and Jaksch (1982) examined household cleaning and maintenance costs resulting from air pollution, and found that, as pollution levels fell, expenditure on these items fell as well, indicating a positive gain in welfare by the amount saved. This type of result is widely used to justify a clean air policy (OECD 1989).
One widely accepted estimate of material damage in the US is provided in the study by Horst et al. (1986), which found a significant relationship between pollution in four major cities and the level of material damage measured there, the value for which was then calculated. It provides a good example of macro-epidemiology, relating pollution to mortality. Later work in this area extended the relationship between environmental change and morbidity, although this is much less clear-cut. Application of the indirect method in the agricultural sector is also important. The effect of air pollution on crops is well documented and a complex analysis allows us to look at what the case would be at different levels of pollution.
Economic value of non-timber forest products among Paser Indigenous People of East Kalimantan
36
2.3.6 Combining direct and indirect methods: Multi-criteria valuation methods
Multi-Criteria Analysis (MCA) is a decision tool designed to cope with both qualitative and quantitative data. Compared with standard neoclassical techniques, this method allows the analyst to take account of a wider variety of factors before taking a decision (Munda & Nijkamp1995). There are two approaches to MCA: the first is known as ‘goal programming’ and is based on a standard linear programming framework; the second is the analytical hierarchy process (AHP), which uses a series of paired-comparisons for preference ratings. The relative importance of various criteria is accounted for in this type of analysis through the use of criteria weights, and this way the preferences are identified. The AHP is used to develop decision priorities using a mathematical process known as synthesisation. This more sophisticated method developed by Saaty (1980), has the advantage of allowing the application of both positive and normative approaches to the problem solving situation, moving away from the rigid marginal analysis favoured by neoclassical theorists. The inclusion of the normative aspect makes the analysis more comprehensive, but critics of the methodology point out that it brings a measure of subjectivity to the final result. The difficulty can be overcome to some extent, however, if both the analyst and the decision-makers are aware of the specific, analytical meanings for the criteria weights used in the underlying model.
In MCA, problems can be divided into two basic types (Belton 1990): (1)valuation problems characterized by the need to choose between direct defined alternatives; (2)design problems, which can be described as those where it is necessary to identify a preferred alternative, and from which there may be an infinite set of possibilities, limited only by situational constraints.
The objective of either of these approaches is the same, i.e. to make a decision on value. However, the method of reaching the solution is not the same, and the solution itself may also differ. The brief analysis of this complex technique presented here, serves to illustrate the need for more research to be done on valuation methodologies in general. It is clear that a more comprehensive approach is needed when designing valuation strategies, and this provides support for the assertion that an interdisciplinary approach is the best way to address this issue.
2.4 A critique of NTFP valuation methodologies
Welfare depends on a variety of variables, including such things as income, access to basic infrastructure, availability of public facilities, and environmental quality. As a result, attempts to access welfare benefits will inevitably be met with difficulty. While some of these welfare-influencing variables may be easily measured in the conventional econometric sense, some of them, especially those relating to environmental quality, are not. These factors may possibly be measured both quantitatively and qualitatively, and the ability to integrate the two types of data into the problem-solving process will
37
2. Theoretical context regarding the economic valuation of the environment and tropical forest ecosystems
possibly result in more efficient techniques of forest ecosystem valuation. Some of the major difficulties of the conventional valuation methods are discussed below.
2.4.1General problems with valuation methods
Many problems exist with the various methods of forest function valuation. These include methodological problems, such as sampling procedures, survey models, and avoidance of various forms of bias, such as cultural or socio-economic factors influencing the results. In addition to these design problems, we are also faced with serious conceptual problems in product valuation. Under a neoclassical framework, we tackle the problem from the point of view of market failure, and we try to estimate the costs and benefits of forest change on the basis of preferences and utility. The conversion of utility to monetary values is plagued with difficulty, a point made early on in the debate by Krutilla (1967).
The use of consumer choices as a means of identifying product values is the traditional approach, but the concept of existence values makes this inappropriate. This point has been highlighted (Smith 1990), and it has been suggested that when measuring existence values, conventional valuation methods contribute little to our understanding of the trade-offs people would be willing to make, where non-use values are important. Smith (1990) also suggests that the degree of trade-off will depend upon how much is known about forest resources, which implies that as our knowledge of the environment increases, our valuation of it is likely to rise as well. A further problem with indirect methods in particular is the fact that individuals adapt to changes in the environment, so the ceteris paribus assumption used in neoclassic economic analysis cannot hold. It means that the assumption of input-output ratio remaining constant over time is incorrect, most likely resulting in an underestimation of the benefits of those changes using such a method.
2.4.1.1 Determining the definition of forest
Forest function may need to be defined when we want to explain what we mean by forest and environment. From an anthropocentric viewpoint, the environment is considered a life-support ecosystem. By identifying the forest as an ecosystem in itself, it must be acknowledged that it is at least partially organic, and a brief observation of any organic life-form shows that a reduction of the whole into its parts changes the basic nature of that organism. In a laboratory situation, neatly dissecting a frog into its parts, and then putting them together again in a bowl, does not replicate the original frog. This demonstrates a major weakness with the more reductionist neoclassical approach.
In literature, the terms ‘forests’ and ‘forestry’ are not used consistently. In what follows, we will refer to ‘forests’ in a way that is comparable to the definition of the Food
Economic value of non-timber forest products among Paser Indigenous People of East Kalimantan
38
and Agriculture Organization of the United Nations (FAO), i.e. forests with at least 10 per cent crown cover, including both open woodlands and plantations. In some cases, we refer to agro-forestry and trees on farms but, in principle, we count these activities as part of forestry, not agriculture, because both can produce similar outputs as forests.
By determining that forests are something that affect us all, we need to try to assign some form of global value to them, as well as simply taking the sum of their parts. There have been attempts to quantify this by a number of authors (Costanza 1997, 1998; Barde & Pearce 1991; Wollenberg 2003; Angelsen & Wunder 2003). Although such attempts have been controversial, it is generally agreed that, if the use option and existence values can be adequately captured, then the acceptable value of forest resources can be computed.
2.4.1.2 The problem of money
A problem faced by many studies is the choice of money as the numeric value in statistical analysis. This has been examined by Brekke (1994), who points out that using money as a numeric value will have the effect of putting a greater weight on judgments if compared to those who do not use money as numeric. This has a distributional implication, as higher income groups tend to value money less than lower income groups. As a consequence, the inputs into valuation figures by lower income groups will have more effect.
It is common for the use of money and its time preferences to be a major problem in the valuation of NTFP economic value. This problem is related to the units of money used in the calculation – whether the local currency is used or converted into a well-known currency such as the US dollar. If money is our operational unit, then any additional US dollar corresponds to the same amount of cardinal utility as any other US dollar, irrespective of income or other characteristics of the person receiving that dollar. It is obviously not realistic, as the value of a US dollar in terms of purchasing power, or utility, varies greatly from place to place and from person to person. The consequence of this is that if other values are used as a numeric unit in an evaluation problem, different results may be produced. For example, if the selected numeric unit is kilograms of NTFP production, instead of money, a completely different conclusion from the study could result. In practice, this means that the choice of numeric units favours different interest groups in society, but it may be possible to use a system of welfare weighting in calculations in order to overcome this. It is worth noting at this point, however, that by estimating the monetary value of environment resources, it becomes possible for policymakers to assimilate this information into their existing accounting procedures, thus possibly promoting more sustainable management strategies.
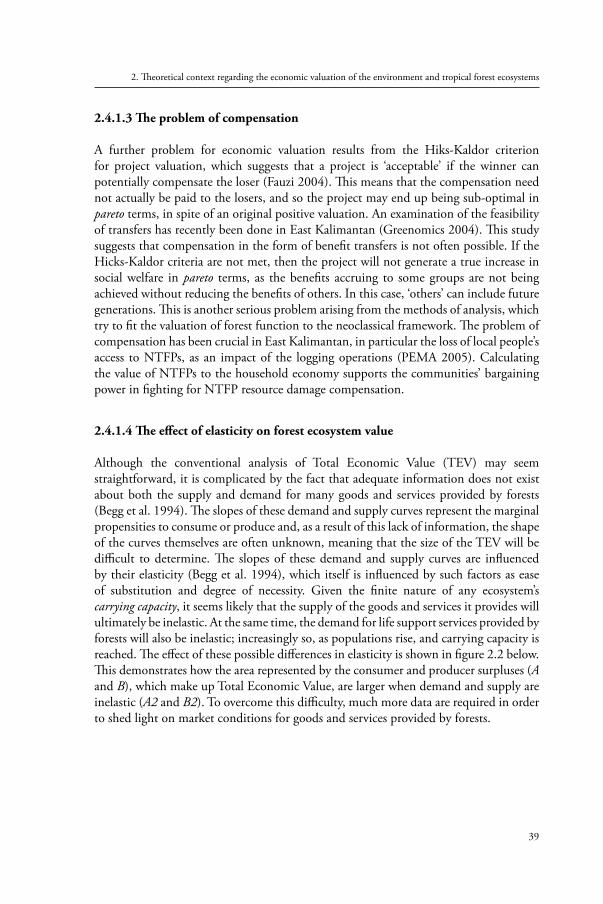
39
2. Theoretical context regarding the economic valuation of the environment and tropical forest ecosystems
2.4.1.3 The problem of compensation
A further problem for economic valuation results from the Hiks-Kaldor criterion for project valuation, which suggests that a project is ‘acceptable’ if the winner can potentially compensate the loser (Fauzi 2004). This means that the compensation need not actually be paid to the losers, and so the project may end up being sub-optimal in pareto terms, in spite of an original positive valuation. An examination of the feasibility of transfers has recently been done in East Kalimantan (Greenomics 2004). This study suggests that compensation in the form of benefit transfers is not often possible. If the Hicks-Kaldor criteria are not met, then the project will not generate a true increase in social welfare in pareto terms, as the benefits accruing to some groups are not being achieved without reducing the benefits of others. In this case, ‘others’ can include future generations. This is another serious problem arising from the methods of analysis, which try to fit the valuation of forest function to the neoclassical framework. The problem of compensation has been crucial in East Kalimantan, in particular the loss of local people’s access to NTFPs, as an impact of the logging operations (PEMA 2005). Calculating the value of NTFPs to the household economy supports the communities’ bargaining power in fighting for NTFP resource damage compensation.
2.4.1.4 The effect of elasticity on forest ecosystem value
Although the conventional analysis of Total Economic Value (TEV) may seem straightforward, it is complicated by the fact that adequate information does not exist about both the supply and demand for many goods and services provided by forests (Begg et al. 1994). The slopes of these demand and supply curves represent the marginal propensities to consume or produce and, as a result of this lack of information, the shape of the curves themselves are often unknown, meaning that the size of the TEV will be difficult to determine. The slopes of these demand and supply curves are influenced by their elasticity (Begg et al. 1994), which itself is influenced by such factors as ease of substitution and degree of necessity. Given the finite nature of any ecosystem’s carrying capacity, it seems likely that the supply of the goods and services it provides will ultimately be inelastic. At the same time, the demand for life support services provided by forests will also be inelastic; increasingly so, as populations rise, and carrying capacity is reached. The effect of these possible differences in elasticity is shown in figure 2.2 below. This demonstrates how the area represented by the consumer and producer surpluses (A and B), which make up Total Economic Value, are larger when demand and supply are inelastic (A2 and B2). To overcome this difficulty, much more data are required in order to shed light on market conditions for goods and services provided by forests.
Economic value of non-timber forest products among Paser Indigenous People of East Kalimantan
40
Figure 2. 2. Total Economic Value when elasticities of demand and supply are different (adapted from Constanza et al. 1997)
2.4.1.5 Problems associated with hedonic pricing
The Hedonic pricing method is subject to a number of difficulties, because this method can really only be applied in situations where the prices in the market are known, and when consumers are flexible enough to be able to indicate choices through their actions in that market. This is not always the case in developing countries, so this method has had limited application in the past. Although some attempts have been made to reduce the bias results when using the Hedonic Pricing Method, it still has some questionable features (Markandya 1992).
2.4.1.6 Problems associated with the Contingent Valuation Methodology
A major problem with the use of the Contingent Valuation Method is the difference in the values arrived at using either the Willingness to Pay (WTP) (for a benefit), or Willingness to Accept (WTA) (compensation for a loss). The purpose of conducting Contingent Valuation Surveys is to elicit responses from which we can construct a hypothetical demand curve. Since the utility (and preference) can vary along the length of the demand curve, we have to take account of this in our estimates of how changes in preferences will affect the environment.
The asymmetry of WTP and WTA measures is, to some extent, explained by the argument that benefits represent a purchase structure, while losses are more akin to a compensation structure. Psychologists have tried to explain the differences between WTA and WTP as an indication of Cognitive Dissonance (Pearce & Turner 1990), a concept well-known in psychological evaluation procedures. This supports the idea that some of the problems arising in valuation analyses may be avoided if interdisciplinary expertise is used at the design stage of the study.
41
2. Theoretical context regarding the economic valuation of the environment and tropical forest ecosystems
One of the first studies to reveal the differences between WTP and WTA was that by Bishop and Heberlein (1979). Recent work has been based on this, such as that of Kengen (2007). It is argued that the differences between the two values can be reduced by the removal of uncertainties. Again, this implies that a more careful survey design could remove these difficulties, or possibly a factor could be calculated statistically to correct the difference between the two values. Obviously great potential exists for future research into this issue. As Smith and Karou (1990) point out, the problems associated with environmental and resource valuation are more likely to be solved if efforts are made to use all forms of behavioural information.
Since the object of such studies is to obtain a realistic value from hypothetical questions, it is very important that the survey or questions are designed in a way that reality is replicated as much as possible. The study needs to be conducted carefully to avoid errors, so that the bids (valuations) reflect the value of the hypothetical commodity or service as accurately as possible. An example of a project that has been treated in this way is the study on the Greenomics (2000) in Kayan Mentarang National Park, which produced a figure of US$21 million for the value of benefits to the local community, even though the area was previously described as a low-rent district (where values might be expected to be lower).
The expectation that values would be lower in low-rent districts, highlights one of the major criticisms of this method: It tends to be weighted in favour of higher income groups, as their WTP and WTA values are likely to be higher. Other criticisms provide the basis for a vast amount of literature on the CVM that questions the accuracy of the method. Problems such as embedding (when a respondent has a different understanding of a concept from how the products are used (Kahneman & Knetsch 1992), starting point bias, and vehicle bias may occur. These are ways in which the result can be influenced, and the value of bids can be distorted, by both the level of possible values summed in the survey questions, and the proposed means of payment used to finance the people (Wollenberg et al. 2003). For example, some respondents may react negatively to the suggestion of increasing levels, and this will influence their WTP values. Other design problems result from the fact that in some countries the languages used do not have a conditional tense and, as a result, translation of CVM questions poses a difficulty.
A study by Peterson et al. (1995) found that respondents gave different WTA values, depending on their level of moral responsibility. This is an example of an experimental approach to direct valuation. Using the Paired Comparison Method (a recognised psychometric approach), the researchers were able to assess the effect of sole or shared responsibility on the role of WTA environmental losses. This fits in with research into land tenure and on deforestation, which also shows that people place higher values on natural resource when it is under their control.
Economic value of non-timber forest products among Paser Indigenous People of East Kalimantan
42
2.4.1.7 Problems with direct dose-response methods
There is no doubt that direct methods of valuation can have important policy impact and the potential for their use is great, but unfortunately this type of study often meets much criticism, resulting from the use of the concept of value of life. The type of WTP is not a monetary value that represents the value of an individual’s life, but represents a reduction in the risk, as a result of a new environmental condition. If measures bring about a reduction in the risk of dying by a disease, the monetary value of this represents a summary of the WTP and a change in probability, not the figure required to prevent dying. Much literature addresses aspects of mortality and morbidity valuations, sometimes referred to as riskanalysis, and the method is still being refined (Opschoor 1998).
In a controversial paper, Pearce (1995) used this type of analysis to evaluate problems of traffic pollution in Bangkok. He concluded that environmental benefits would accrue. Highlighting the vast potential benefits from conserved natural assets, he suggested that the most effective way of capturing them is not only to improve the means of valuing these assets, but also to design new institutions to deal with them (Pearce 1998). This suggests a move towards a more ecological approach of economic valuation, and away from the conventional neoclassical view.
2.4.1.8 The need for non-monetary valuation
The sustainability of the use of tropical forests is one of the most complex problems facing policymakers in today’s world. When the concept of sustainable development is applied, the problem of understanding how the best use of our resources can be made is even more difficult. The tropical forest ecosystem and its resources are all subject to a large degree of uncertainty and, being highly interrelated, their various functions and relationships are poorly understood. Attempts to find the ecosystem values of tropical forests, based only on monetary methods, do not allow for ill-defined values and qualities as yet unknown, to be included.
The understanding of the links between the economic and ecological worlds is still relatively imperfect, although increasing knowledge and technological changes have brought more clarity. Increasing public awareness, both nationally and internationally, is bringing pressure on policymakers to make the right choice both economically and, increasingly, ecologically. The experience of gold mining in East Kalimantan, which polluted the Mahakam River with its high chemical contents of waste water, is a good example. The Mining sector was forced to pay compensation and a huge payment for the loss of clean water for the community. This has highlighted the extent of the public ecological awareness, and the economic power that it wields.
43
2. Theoretical context regarding the economic valuation of the environment and tropical forest ecosystems
The non-monetary valuation of NTFPs will help policymakers and foresters to understand more of the role of forests in the livelihood of local people such as the Paser community. It will also provide a better understanding of the forest and its ecosystem value, rather than just measuring its resources as a single product – timber. This can prevent unnecessary damage, by providing sufficient information to the government and to foresters, as well as to the local community, about the importance of maintaining sustainable uses of forests for rural development.
2.4.1.9 Combining different approaches to valuation
In a paper on the past and future of project appraisals, Wilmshurst (1995), senior economist at the British Overseas Development Agency, presented an overview of the methods of environmental evaluation. In his conclusion, he raised some issues for the future, stressing the necessity of the definition of objectives in evaluation procedures, as well as the probable need for institutional change. Both of these points reflect the situation today, which has given rise to four different approaches to environmental evaluation:
the • Efficiency school advocates pseudo-market valuation, while the • Equity school sees the priorities of income distribution as more important, recommending Welfare Weighting. the • Ecological School sees the necessity of respecting ecosystem integrity, andthe • Philosophical School proposes the ideas that consumer sovereignty should be limited in line with ethical and psychological considerations.
Each of these approaches has its merits, and there is no doubt that they need not be mutually exclusive. An approach to valuation that could combine these various ideas would certainly go some way towards arriving at a consensus about what we mean by environmental valuation. A more interdisciplinary approach to the difficulties coupled with a method of analysis that considers both hard and stochastic data, will possibly overcome some of methodological problems mentioned above.
2.5 End notes
Conventional methods of economic analysis are based on neoclassical roots, with concepts like preference, indifference and maximisation of utility. These methods were developed by mathematical necessity, based on rigid and often unrealistic assumptions. They provide economic solutions to policy problems, but they may have unfortunate consequences. In many developing countries, where policymakers have used rigid neoclassic development models, these decisions often bear little relation to reality (Jepma 1995; Deacon 1995). Such failed development policy can be seen in a number of South East Asian countries, such as Indonesia, where governments have used subsidies to stimulate activity and
Economic value of non-timber forest products among Paser Indigenous People of East Kalimantan
44
employment in one sector of the economy (such as industry), which subsequently may have had very negative economic effects in another sector (such as food production, resulting in food shortages or starvation in the long run).
Other governments in Latin America and Asia have considered their forests to be a national resource (Fearnside 1998), and they have tried to maximise the profits from them by selling valuable timber, without taking into account the long-term and irreparable damage to the economy, or to the environment as a whole. This has brought about serious problems of soil erosion, flooding and general land degradation. These problems have contributed to the increased poverty typical of some developing countries (Pearce et al. 1990).
The study by Costanza et al. (1997) has tried to evaluate the ecosystem values of forest. Opschoor (1998) has pointed out the need ‘for additional research [...] especially in the area of methodology.’ In relation to complex ecosystems such as tropical forests, any improvement in valuation methodology will require the collection of a wide range of information. It will also enable decision-makers to be better informed, and it is with this in mind that this study of NTFP-use by indigenous forest dwellers has been designed. By identifying current use-values of the products and services of tropical forests, it is likely that more accurate and reliable estimates of the Total Economic Value of the forest resource will be developed. By focusing on indigenous forest dwellers, the interests of an important group of stakeholders will be highlighted, thus enabling decisions to be made that are more in line with the spirit of achieving the goals of a comprehensive understanding of the forest ecosystem values.
From the analysis of the methods used in the valuation of environmental and forest ecosystem functions it can be concluded that there is no consensus regarding which method is better for valuations. It depends on the objective, the area of study, and also the time and budget researchers have. This study is an attempt to contribute to the debate about current development methods, by selecting two of the methods explained above as tools for NTFP product monetary valuation and analysis. Market Base Technique and the Contingent Valuation methods will be used for this study. The use of these methods will be elaborated in the subsequent chapters.
45
Chapter 3 Methods and Research Framework
How is the economic value of non-timber forest products measured?
3.1 Introduction
This chapter discusses the methods of measurement used in the economic evaluation of non-timber forest products (NTFPs)in the household economy of the Paser indigenous people of East Kalimantan in three research villages –Rantau Layung, Pinang Jatus and Muluy. Because of the nature of NTFPs, it is important to undertake the assessment in a transparent and scientifically sound manner at the local level. The methods used for the assessment were developed based on references by forest economists (Gregory 1987; Panayotou& Ashton 1992; Godoy &Bawa 1993) and by botanists (Kesler&Sidiyasa1999; Valkenburg 1997; Sliket al. 2006), ethno-botanists (Matius 2005; De Jong 2002; Leamanet al.1991), economist (Sykes 1996) and anthropologists (Colfer 1997; De Beer & McDermott 1997; Persoonet al. 2004).
This chapter begins with the methods of measurement used in the economic evaluation of NTFPs. I will first explain the process used to select the researchvillages; I will then provide details of the methods and site selection used in this section. This is followed by details of the preparations for fieldwork in Samarinda (the home base of the researcher) and on the relations between the villagers and the research team, the fieldwork procedures and the data collection in the villages. Finally, I will describe the methods used for data collection outside the study area, the methods used for the collection of data relating to commercial rattan extraction and the methods of data collection in the district capital and province of Samarinda. Also discussed are the methods used to analyse the interregional marketing flow of NTFPs. The next section discusses the constraints of data collection and how the data are used for the calculation of household inputs. Finally, I will discuss the use of data to evaluate the household output values and modelling of the village economy.
Economic value of non-timber forest products among Paser Indigenous People of East Kalimantan
46
3.2. Methods of measurement used in economic evaluation of NTFPs
3.2.1 Research village selection methods
In any socio-economic study, it is important to undertake preliminary investigations of the target population prior to conducting the work. To this end, it was necessary to make a preliminary reconnaissance visit to Pasir, in order to organise institutional agreements such as research permits, and to gain a good understanding of the conditions at the potential study area. This preliminary visit, which took place during January-February 2004, provided an opportunity to select and identify the villages to be studied, and to select the local fieldwork team. In addition, a number of local organisations were contacted, and interviews were conducted with their representatives, including the Head of the District (Bupati), the District Forestry Department, the District Agriculture Department, the Provincial Bureau of Environmental and Protection (BAPEDALDA), the District TransmigrationOffice, and some NGOs and the private companies, such as logging and mining concessions. Last but not least, I also visited the indigenous community leaders in each village (Kepalaadat).
Subsequent field visits were arranged to the district capital and villages surrounding the GunungLumutProtection Forest (GLPF) and extension areas. A total of 13 villages were visited during the preliminary survey, with the aim of obtaining an overview and insight into the general patterns of NTFP use in the region, and in order to observe the interactions of indigenous peoples within the GunungLumutProtectionForest. Based on areconnaissance visit at the beginning of 2004, three of the 13 villages visited during this preliminary survey were selected as research villages.
The criteria used for the selection of the three villages were:(1) distance to GLPF, with a preference for villages close to the forest;(2) ethnicity (with the presence of Paser Dayak preferred);(3) use of NTFPs, with active NTFP use preferred.
The specific village research sites in each village were selected on the basis of their current use of NTFPs, their willingness to cooperate with the research team, and their position in relation to the Gunung Lumut Protection Forest. The importance of selecting villages close to GLPF was also to conform to the objectives of the Tropenbos research project, since GLPF had been selected as a focal area for theTropenbos Kalimantan Programme.
After the selection of the research villages, village heads were invited to participate in the study as paid field assistants. In each case, they agreed to join the research as a member of the team. During the pre-study period, all field assistants were given a short training and supporting material (notebooks, pencils, GPS, etc.) to prepare them for the fieldwork. It was assumed that by including the village heads in this way that this would ensure community support for the study and, specifically, that the gathering of data from households would be easier. In addition, a comparison could be made of
47
3. Method and research framework
the impact of different income sources on the level of well-being of the people in the different villages.
The data collection was conducted from April 2004 until the end of 2007, during fieldwork periods of two to three months. This fieldwork was interrupted by visits to Leiden University (CML) for data analyses and thesis writing from February to April 2005, from March to May 2006, and finally, from April to June in 2007.
3.2.2 Selecting the students and the field assistants.
Contact was made with students of the Faculty of Forestry at the Mulawarman University, Samarinda, with a view to possible participation in this research project, through the office of Tropenbos International in Balikpapan, and through the Faculty of Forestry itself. Students expressing an interest were briefed in full on the rationale and methods of the research project. Those students who were selected were also given an introductory training and were provided with literature for further reading, in order to familiarise themselves with the general background of the research project. At the same time, in consultation with the selected students, a number of contact persons in the district were identified, who could potentially provide information for the benefit of the study. In total, six undergraduate students were selected to be involved in the research project. Initially, it was planned that the six students would be distributed equally into the three villages selected in the research area. However, this turned out not to be possible, since their topics were interrelated. Finally, it was decided to ask the selected students to work together with the principal researcher. As a research team, we moved to the different villages one by one, after completing data collection for each village.
The first field data collection was conducted in Rantau Layung, Muluy and Pinang Jatus at the beginning of April 2004. These three villages were also visited to make a formal agreementwith the Adat Chief (KepalaAdat) and villagers, requesting permission to conduct the studyand to use their village facilities. In all cases, a very positive response was received, making it clear that the village heads concerned were keen to participate. I also agreed to share the outcomes of the study with the villagers, for their possible benefit.
3.2.3 Preparations in Samarinda prior to travel to the study sites
After the research proposal was approved by the supervisors in December 2003, the researcher returned to Indonesia and started to prepare the field visits. This included the preparation of introductory letters for visits, as well as the collecting of supplies. The time was also used for the selection of students from the Mulawarman University. In principle, the six selected students organized their research independently, however, they received clear instructions on the research objectives and research questions from
Economic value of non-timber forest products among Paser Indigenous People of East Kalimantan
48
the prinicipal researcher. They were supervised both by the principal researcher and by their own supervisor at the Forestry Faculty in relation to the development of proposals, fieldwork methods and data analysis.
The students used the data for their thesis diploma, since this is a requirement for the Faculty of Forestry. Each student was obliged to conduct a research project and write a thesis on the basis of field research, for the finalization of their study at the university.
We also visited the Provincial Forest Department in Samarinda to discuss the theme of research with the Head of the office. This revealed interesting information, especially in terms of their current interest in sustainable forest management and also in the use of non-timber forest products. We also discussed the role of the forestry sector in the provincial economy and the current issues related to my research in East Kalimantan.
3.2.4 The importance of interaction between the fieldwork team and the villagers
Due to its economic and political history, Pasiris a district that can be described as a ‘transitional economy’. It is a district with high levels of poverty and hardship for local communities. The Pasir District, within the province of East Kalimantan, is among those districts with little economic and political influence. This has been the case since colonial times. To some extent, the population of the district had a reputation of being ‘lazy, poor and mystic.’Local communities in this district have not been widely consulted on development issues compared to other districts in Java. As a result, the majority of Paser people have very low incomes compared with other ethnic groups in the region, and they often live below the BKKBN ‘poverty line’ (LPMD Pasir 2005).
In rural areas in many parts of Indonesia, small local communities are often suspicious of strangers. Although an element of this exists in the local Pasir societies, they tend to be more trusting and straightforward in their dealings with people from outside. Once a stranger has been accepted into the community, then there is trust. In my research, it was important to foster a certain level of trust and acceptance between local communities and the research team, in order to ensure the smooth operation of data collection.
In general, the lives of the Paser people have been controlled by the local government, and permits (obtained via the district government) are necessary before visits can be made. As part of the permit process, the local authorities made field visits, to investigate the proper implementation of our research, in line with the permits. An important aspect of our fieldwork was the relationship between the team leader, students, and the field assistants, and the villagers themselves. Due to the nature of our research, especially with respect to the planned participatory research activities, it was essential that there
49
3. Method and research framework
be a commitment by the field assistants to the overall objectives of the study. They also had to be aware of the real relevance of the research to the local community. I succeeded in doing this by selecting village heads who were interested in the objectives of research, and who sincerely felt that it may have some benefit for Paser people. It was possible to build a degree of mutual respect and trust within the team and with the villagers. The feeling of mutual respect and trust clearly influenced the way local people responded to the interviews in which they participated.
The idea of selecting village heads as field assistants was key to the principle of participatory research. The inclusion of the Adat Chief was also important, as these people already had a relationship of respect within the village. By coincidence, two of the five students involved in the research were also from the Paser District and were fluent in the local languages and dialects. Their knowledge contributed to a positive attitude of the villagers towards the research team, creating a bond of respect and trust. When the team was introduced to the villagers, the students contributed to a good collaboration.
3.3 Fieldwork procedure and data collection in the villages
3.3.1 The introductory meeting
Upon arrival in each research village, we first met withthe KepalaAdat or village community chief, who is the traditional head of the village. The researchers went first to the house of the KepalaAdat, where a short introduction was given about the research team and the objectives of the research.After this initial welcome, the team gave a brief explanation of the research and the working plan,and also indicated the timing of the research. The introduction was not only important for getting to know eachother, but also to explain the objectives and methods used to conduct the interviews, the time available and the preferred location of the interviews.
Most of the villagers attended these initial meetings with the village heads. Indeed, almost all households were represented on these occasions. This was even the case when some men were out collecting rattan or hunting or cutting trees in the forest. In each village, the team of researchers were introduced by the KepalaAdat or by the Kepala Desa (Head of the village). A brief talk was given on the objective of the project, explaining the interest in sustainable development and what it may mean to a community such as theirs.
During the meeting, lists were made of the people involved in various activities, such as rattan harvesting, handicrafts and hunting. The names of those absent from the meeting were also noted. These lists were later used to build up a picture of which households participated in which activities. This greatly helped the team in identifying those households that could be included in the surveys of the various activities. Diaries
Economic value of non-timber forest products among Paser Indigenous People of East Kalimantan
50
were distributed to one member per household, and detailed explanations were given of how to complete them. Due to the high level of literacy in Pasir, it was not a big problem to find someone from each household, capable of completing the diary.
During the meetings, questions were allowed, and on each occasion a number of people had questions about why the research team was there, how their village had been selected to participate, and what the research was for. Some people wanted to know if the researchers were from the government, or from some department or company. It also became clear that it was an advantage that the team was not formally representing government or the private sector, since this gave more independence. It was also made clear that there would be no direct benefit to the village in terms of monetary income or future investments as a result of the study and that there would also not be a negative impact from the research. Finally, it was stressed that the research may have longer-term benefits through an impact on policy.
At the introductory village meetings, it became clear that the term ‘sustainability’ was something that most of the people had heard off, although a small number of people had never heard the term. On the whole, the ideas underlying the concept were something that the majority of villagers understood. They were clearly able to link the concept with their own experiences. Although an interest in the concept of ‘sustainability and development’ was present, it was apparent that, for most people, feeding the family and improving the standard of living were the highest priority.
Throughout the study, it was made clear that there would be no payment for the participation in surveys. In each village, the introductory meeting was brought to a close after about an hour, and a group photograph was taken of those present. At the end of the meeting, a representative of the group (usually the village head) once again welcomed us to their village and confirmed their willingness to participate.
There is no doubt that incorporation of the Paser field assistants into the project contributed to the success of our field research. This had a positive influence on the attitude of local people and, thus, on the quality of the data collected. The fact that people in the survey villages felt they were talking ‘to one of their own’, had an important impact on the details of the collected responses. The informal nature of the interviews conducted with participants also had a beneficial effect.
For the purposes of analysis, the data collected were standardised, with pre-structured survey forms, across households. The assistants completed these pre-structured data recording sheets during and sometimes after the interviews. The forms were designed to keep the interviews as informal as possible, rather than being a highly structured interview with strangers. The fact that field assistants were also farmers in their own rights (their wife, or their children, or they were sons of farmers) helped to ensure that data recorded was realistic, and representative of the actual situation in their village. It was unlikely that respondents would give unrealistic responses to the questions when
51
3. Method and research framework
the enumerators understood the local situation. In any case, the fact that Paser people are straightforward and honest by nature, also helped in proper data gathering.
3.3.2 Participatory mapping and landuse of the villages
After meeting with the villagers, the next task was to develop a participatory village map and to identify the location of houses, farms, forest areas and other features, such as the rattan gardens, honey, river, the school and settlement. This was done using a participatory process that involved all of the people in the village. The participatory mapping was conducted in two steps: step one was conducted in the house of the Kepala Adat, using an existing map of the village developed by the local government as background information. A larger-scale copy of this map was made, which was easier forthe local villagers to read. The existing map was produced in 2001 by the local government, without the participation of the villagers. The enlarged copy of the map was put on the wall of the meeting room and one by one the participants were called to indicate their home, farms (land), forest area, rattan gardens, and paddy rice cultivation. The entire process took almost a week to complete, at which point all households had located their household’s properties on the map.
The second step was to make a comparison of the map with features in the field, in order to check the accuracy of the map. The research team was accompanied by the villagers during this field visit, which was guided by the traditional village head (Kepala Adat). It was assumed that he is the person with the best understanding of the village area and its boundaries. The process of field checking took almost a month as most of the villagers worked in their garden during this period of mapping. Thus, the research team had to rely on the availability of the villagers in order to complete the mapping process. As part of this process, we also visited the areas of the village that border with other villages. This was usually done by using a small canoe (ketingting), or by walking through the forest area. We also surveyed village boundaries using a car. This also provided an opportunity to visit former logging concession areas. This kind of transportation had to be used because the distances covered were great and the surface areas claimed by the villagers was usually very large. For example, according to a map prepared by the local government, the village surface area of Rantau Layung is 18,000 ha. However it was difficult to check the boundaries in the field, since most of the area is covered by natural and secondary forest, with river forests and mountain forest. Other important data were collected during these field checks, this included the position of rattan gardens, honey trees, coffee or agriculture crops, paddy rice cultivation, as well as determining who the owner is. The position of gardens was documented using GPS and gardens positions were marked in the participatory map.
After finishing field checks, the villagers were again invited to look at the new map and to double check the location of their rattan garden, honey trees, farm or paddy rice cultivation, cash crops, and settlements. This process was conducted in the meeting
Economic value of non-timber forest products among Paser Indigenous People of East Kalimantan
52
room of the village head. During this process, many participants corrected the position of items such as boundaries of farmland, also in response to the claims by others. One of the important results of this participatory mapping was that it turned out to be a good tool for the villagers to try to remember and recognize their land and farm boundaries, from one family to another, by using the river and planted trees inside their gardens as landmarks. Once the boundaries of the garden of a certain family were assigned, with mutual agreement, the others would follow more easily.
The most surprising result of the mapping process was that most of the villagers turned out to know their forest area and its boundaries very well. Indeed, they could recognize that certain land belongs to a specific household. The result of the participatory mapping is shown in figure 5.2 in chapter 5.
3.3.3 Conducting the household surveys
On the basis of the information gathered by the participatory mapping, and the lists of names of the household heads collected during the village meeting, the research team was split up to cover sections of the village and to include all households in the village survey. The field assistants and students worked in pairs (usually one male and female), going first to the households that were the farthest away from the research station (home), then walking towards the centre point of each village. This way, all households in the village were systematically covered.
During the first field visits, conversations were conducted with the male heads of the household, usually by the male research assistant. The senior female member of the households were interviewed separately at this time, usually by the female research assistant. In some cases these structured conversations were conducted with two female members of a household, but usually the interviews were done individually. Each of these surveys took one to two hours to complete, depending on the nature of the household and the character of the person being interviewed. The efforts made to create a relaxed atmosphere for the discussion also meant that more time was needed than may otherwise have been the case. However, this was considered as essential in order to establish trust and to obtain accurate answers from those being surveyed. In most cases, appointments were made with heads of households so that the survey would not interfere with their daily routine. Data from all of these structured conversations were recorded and at the end of each visit, the evaluation was made for the data sheets.
When all of the datasheets were completed, the next stage was to collect data about the farmer’s household production and extraction. This was done, where possible, by interviewing a different family member (such as a son, brother or grandfather) from each household. Information on handicrafts, hunting, fishing, rattan harvesting, honey, and other NTFP collection, was then gathered systematically from those households. Structured interviews were also conducted with both elders and youths. All the collected
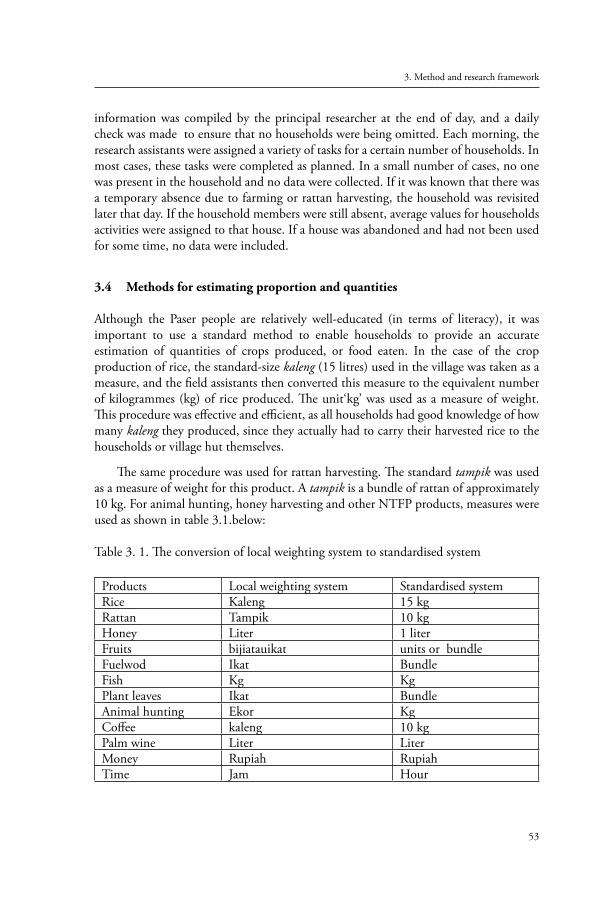
53
3. Method and research framework
information was compiled by the principal researcher at the end of day, and a daily check was made to ensure that no households were being omitted. Each morning, the research assistants were assigned a variety of tasks for a certain number of households. In most cases, these tasks were completed as planned. In a small number of cases, no one was present in the household and no data were collected. If it was known that there was a temporary absence due to farming or rattan harvesting, the household was revisited later that day. If the household members were still absent, average values for households activities were assigned to that house. If a house was abandoned and had not been used for some time, no data were included.
3.4 Methods for estimating proportion and quantities
Although the Paser people are relatively well-educated (in terms of literacy), it was important to use a standard method to enable households to provide an accurate estimation of quantities of crops produced, or food eaten. In the case of the crop production of rice, the standard-size kaleng (15 litres) used in the village was taken as a measure, and the field assistants then converted this measure to the equivalent number of kilogrammes (kg) of rice produced. The unit‘kg’ was used as a measure of weight. This procedure was effective and efficient, as all households had good knowledge of how many kaleng they produced, since they actually had to carry their harvested rice to the households or village hut themselves.
The same procedure was used for rattan harvesting. The standard tampik was used as a measure of weight for this product. A tampik is a bundle of rattan of approximately 10 kg. For animal hunting, honey harvesting and other NTFP products, measures were used as shown in table 3.1.below:
Table 3. 1. The conversion of local weighting system to standardised system
Products Local weighting system Standardised systemRice Kaleng 15 kgRattan Tampik 10 kgHoney Liter 1 literFruits bijiatauikat units or bundleFuelwod Ikat BundleFish Kg KgPlant leaves Ikat BundleAnimal hunting Ekor KgCoffee kaleng 10 kgPalm wine Liter LiterMoney Rupiah RupiahTime Jam Hour
Economic value of non-timber forest products among Paser Indigenous People of East Kalimantan
54
The pebble method was used to estimate proportions. The interviewee was given 100 small pebbles and asked to share them out to represent the various portions of the items in question. For example, when women were asked about the type of food they ate, they were able to use this method to indicate quite accurately what proportion, by volume, they would consume. This method was also used in interviews with men, when estimating the proportion of farm production used for food in the home. However, many of the men interviewed had a problem with this method, as many of the proportions of products were not documented and were not consumed during harvesting, and the men interviewed often did not remember the proportions.
3.5 Other data collecting activities in the fieldwork villages
In addition to the household surveys, other activities were also conducted to collect background information for the project. To promote friendly and open relations between the villagers and the study team joint sport activities were conducted. A volley ball match between the research team, visitors, and the villagers, (home team), was played every Sunday or sometimes during the week in the afternoon after returning from the forest or gardens. Other activities were initiated to provide a more comprehensive ‘snapshot’ of the economic and social conditions in each village including:
Forest walks with the head of village or • adat chiefFormal interviews with the teachers, guru • ngajior dai (dai_is a person appointed by local government to facilitate Muslim prayers in the village)Collection of soil and plant samples from a number of gardens and the forest•Group meetings with young, hunters, collectors of medicinal plants, etc.•Interviews with NTFPs traders, local middlemen, and NGOs •Visits to neighbouring villages with a senior villager•Talking during swimming in the rivers•Collecting honey at night with a group of collectors•Observations on price fluctuations of industrial (goods), prices in stores •(warung) and product availabilityVisits to logging camps or concession areas.•
All of this information, together with the data from the individual diaries, is used to verify and to cross-check information on the structured data sheets, ensuring a measure of reliability for the data as a whole.
After village data collection, the household surveys were completed, and as many data sheets as possible were collected for each household. A total of 126 data sheets of various types were collected from the village of RantauLayung, 76 data sheets were collected from Pinang Jatus, and 54 data sheets from Muluy. In addition, a total of 82 diaries were collected, varying in quality and quantity. The quality of diaries varied from fully completed diaries, with entries for each day of the survey, to those containing only
55
3. Method and research framework
sketchy information about the family for just one or two days. Altogether, the surveys included in this study cover 123 households, representing 577 household members.
3.6 Collecting data relating to the commercial extraction of rattan, honey and hunting
Some research has been done on the use of rattan (climbing palms) in the region of East Kalimantan (Valkenburg 1997; Matius 2005; Fried 1997). Since the rattan harvested from this area can be classified as NTFP product, it provides a good example of a product which can be commercially extracted. Rattan grows in clumps of 10 to 70 stems (see Chapter 5 on resource management) of what is known as clonal palms. Clonal palms have the ability to self- regenerate, as long as some part of the original stem and root system are left intact. This requires that those involved in harvesting understand this principle, and it also implies that areas of forest utilised for such harvesting are large enough to allow the growth and regeneration; so, for example, they are not converted for paddy rice cultivation.
Since the economic importance of rattan extraction is relevant to the valuation of NTFPs in the region, contact was made with many companies involved in this in East Kalimantan and South Kalimantan. The company PT. Srikaya, a Banjar Baru based rattan industry, was very cooperative, and made available their records for the market share of rattan in South Kalimantan. Contact was also made with logging companies in order to investigate their role in forest management and their impact on rattan transportation in this region.
The survey team travelled along the river of Kasunge to assess the position and size of each rattan garden owned by villagers, and several sample plots were selected for the measurement of the potential for extraction. During plot assessment we also observed the age of the rattan and the spatial distribution, as well as density. At the plots themselves, we also measured the DBH (Diameter Breath Height) of trees, species of tree, potential for extraction, and the level of regeneration. The overall results of these assessments will be discussed separately in Chapter five.
Data collection also took place in the district capital Tanah Grogot and along the Trans-Kalimantan highway from the SimpangPait to Balikpapan and to Tanah Grogot in the Province of East Kalimantan. Rattan product chains werefollowed up to the factory gate of the rattan processing industries in Banjar Baru (South Kalimantan). In addition, several visits were conducted to collect data from the offices of local district government in Tanah Grogot. These visits aimed to complement the role of NTFPs in the Pasir District economy.
Economic value of non-timber forest products among Paser Indigenous People of East Kalimantan
56
3.7 Problems with data collection
Due to the enthusiasm and dedication of the students and the research assistants, and the genuine interest in the project expressed by the villagers, there were surprisingly few difficulties in the data collection process. The few problems we did encounter had to do with logistics rather than the quality of data collected. These included:
Time being wasted as a result of research assistants arriving too late to meet •with household members, who had already left for their farms (this was solved by making follow-up appointments )Time was used up by the need to walk quite long distances around the village. •This was a particular issue in Rantau Layung, where the households are widely dispersed. As a consequence, research assistants often had to walk as much as three to five km perday. Some households could only be reached by canoe, which we had to borrow from and paddle with the help of the villagers. However this was not always possibleOn rainy days, the research assistants were not keen to go out early in the •morning and needed to be persuaded, or they waited until the rain stoppedIt was necessary to take care and respect prayer times, since there was a strong •Islamic influence in the community. This was especially the case when making interviews on Fridays, when most of the villagers went to the mosque.Daily checks had to be made by the principal researcher to ensure that no •households were omittedFood supplies had to be conserved by the principal researcher during each •village visit, and care had to be taken to ensure that these were not consumed too rapidly at the beginning of the survey; something some of the field assistants were reluctant to rememberTransport from village to village took a great deal of time. In particular, Pinang •Jatus and Rantau Layung were difficult to reach and transportation was very expensiveIn the early part of the study, some mistakes were made in the interpretation •of certain questions (this was corrected overtime)It was not always possible to obtain data from all households (due to the fact •that the family was away)Students or research assistants in Tanah Grogot had more problems with •reluctance to reply by those approached to participate in the various market surveys, due to a suspicion that this was some kind of government income assessment for tax purposesAt the end of the research period, both time and money ran out, and the •fieldwork in Muluy had to be carried out in a shorter time span. This was largely due to the fact that visits to Muluy incurred high transportation costs, since it was the furthest village for the research team to reach
57
3. Method and research framework
Sometimes the field assistants miss interpreted answers or responses during •interviews. Sometimes, these misinterpretations were caused by too long interviews or by the attitude of the householders, who were unwilling to answer certain questions on sensitive subjects.
In spite of these relatively minor problems, the fieldwork was completed effectively, and the research objective was achieved.
3.8 Using collected data to model the village economy and calculate the value of forest inputs
In all types of economies, production results about the inputs of land, labour and capital, and thus any production analysis, require data. The household surveys provided raw data, which not only describes the village households per se, but also provides a foundation for more detailed economic analysis. In the context of the forest economies featured in this research, similar productive inputs are required, and each of these, along with output values, must be included in the analysis. On the basis of the data collected during fieldwork, it became possible to produce an empirical model of the local economy. As a result, the value of natural capital use could be determined.
The need to classify natural capital separately from the overall produced capital was clear, as this approach is conventionally used in economics. It is certainly a pressing issue in the resolution of environmental management problems. In the past, products from natural capital have often been regarded as ‘free goods’, and this has led to their under-valuation. As a result, a situation has emerged where externalities are said to result from natural resource exploitation. In order to achieve sustainable development, we must remove these external costs, and internalise them by including some value for this natural capital use in our accounting systems. In practice, this may also mean that, as we exploit our natural resources, we must convert some portion of this natural capital into manufactured capital. As Perrings (1996: 235) said: An economy cannot be said to be developing sustainably unless there is the conversion of natural capital into produced capital yields as an aggregate of both natural and produced capital which is non-declining. As in many other countries, this situation also appears to be the case in Indonesia, either at a local level or nationally.
One of the main objectives of this study was to identify the value of income flow from natural capital used as household inputs in these villages. In this case, natural capital is in the form of non-timber forest products and services. In order to be able to calculate the value of these forest inputs, it was first necessary to construct an accounting model of the village economy, based on all of the known inputs and outputs of each household in the village. By using such an accounting framework, it became possible to examine in more detail, the economic structure of the villages as a whole.
Economic value of non-timber forest products among Paser Indigenous People of East Kalimantan
58
3.8.1 Estimating household labour inputs
Household labour was calculated on the basis of the effective working hours of men, women and children. During the fieldwork, information on time allocation by households was collected, and details from older men or women were cross-checked with the household diaries, in order to establish how household members allocated their time between different daily activities. The distribution of this labour within households in each village is shown and discussed in Chapter 6. The figures shown represent the total households hours by activity, calculated on the basis of the collected data, and weighted according to the demographic characteristics of each household.
The annual number of household time budgets were estimated on the assumption that work is done for 306 days peryear, and consists of 51 weeks per year, with Sunday taken as day of rest. This assumption is made on the basis of qualitative data from the households. These data also suggest that the total amount of work done throughout the year varied very little, and no households had any period in which they did not work. In respect of fuelwood, the daily hours reported by households are multiplied by 360 days peryear, since this commodity is needed every day. For non-timber product collection, including rattan, the weekly reported hours are multiplied by the number of monthly working hours in one year and this allows for the calculation of total labour spent on each activity in the whole year (see section 3.13.2 of this chapter).
3.8.2 Labour input values
The value of households’ labour supply is calculated using the well-established methodology of shadow wages, which is based on the opportunity cost of labour and represents what could have been earned in an alternative labour opportunity (Todaro 1994; Godoy, Lubowski&Markandya 1993). In this case, an alternative labour opportunity is taken to be the potential earnings from rattan harvesting, a marketable labour option available to all in this region. On the basis of data collected from those actually involved in the rattan harvesting, this alternative hypothetical wage rate is assumed to be Rp. 5,000 per hour. This is based on average costs of forest labour in the region. This value is, of course, an accounting value of labour, as opposed to an actual value of wages received by these households.
3.8.3 The contribution of productive capital to the household and village production processes
The method of calculating household capital is based on a wealth-ranking process, which involves the identification of capital wealth items held by each household (Todaro 1994; Godoy, Lubowski&Markandya 1993).This was done by collecting detailed information about the household’s wealth from both, men and women in each household. Base prices of commodities selected for the purpose of the calculation of capital stock were identified
59
3. Method and research framework
by a survey of a range of retail outlets in Simpang Pait, thus ensuring a representative price for each commodity. Clearly, some variations exist between the prices of similar commodities from different sources. For example, a mandau (a long knife) and a shovel (and other farm tools) may either be produced in East Kalimantan or it may have been imported from the People’s Republic of China (PRC) or Taiwan. As a result, there are significant price differences. Even among imported tools a significant price variation exists when comparing the prices of similar goods from the PRC, Taiwan, Malaysia, or Thailand, compared with similar goods from Australia or European countries. To illustrate this: an axe can cost anywhere between Rp. 30,000 and Rp. 75,000 in Pasir, depending on its origin. To try to take these different prices into account when estimating capital values, the prices used for these calculations are computed averages from the various types of commodities concerned.
Some commodities, such as beds and chairs, musical instruments, toys and kitchen equipment, are even more variable in price, depending on the source of manufacture and the quality of the material used. Again, the prices used for these items in this calculation represent a calculated average for the cost of such an item in a Paser household. These calculated averages are not meant to represent the actual purchase price of such a commodity in a city store. For animals, the price of Rp. 25,000 per kg is used as an indicator, based on a price of Rp. 50,000 for a chicken of approximately 2kg. Chicken are sold at between Rp. 35,000-Rp. 75,000 per animal and have been used as the indicator for the price of meat, as these are the most likely animals to be kept in such households. However, we have assumed that this price could be used to represent the meat price for young deer or dogs, which may also be held as animal stock.
Since the villages in the study are a minimum two days travel from the capital, using normally available transportation, the prices of consumption goods and capital items are not the same if compared with Balikpapan or Samarinda. The price difference is the result of both the transportation costs to the area, and the actions of various suppliers. These suppliers often attempt to maximise their profits by exploiting this situation. The value of capital stock in these villages was also estimated by identifying properties per household. Regional price variations were alsotaken into account during interviews in Tanah Grogot, Samarinda and Balikpapan. When commodities were brought in from Balikpapan or Samarinda, the prices used are calculated on the basis of selling prices in Balikpapan, multiplied by 2.0 to take into account the high transportation and other costs associated with trade in this region. The multiplying factor of 2.0 has been estimated on the basis of several price comparisons between the region and the capital, during the fieldwork period. For the commodities that are produced locally by craftsmen, such as canoes and sifters, the price differentials are not applicable. As a consequence, these commodities are priced by using the normal market price in the local markets in the area.
All prices were taken directly from information given by craftsmen, and by surveys in the local markets at Simpang Pait and Tanah Grogot. Table 3.2 shows the regionally
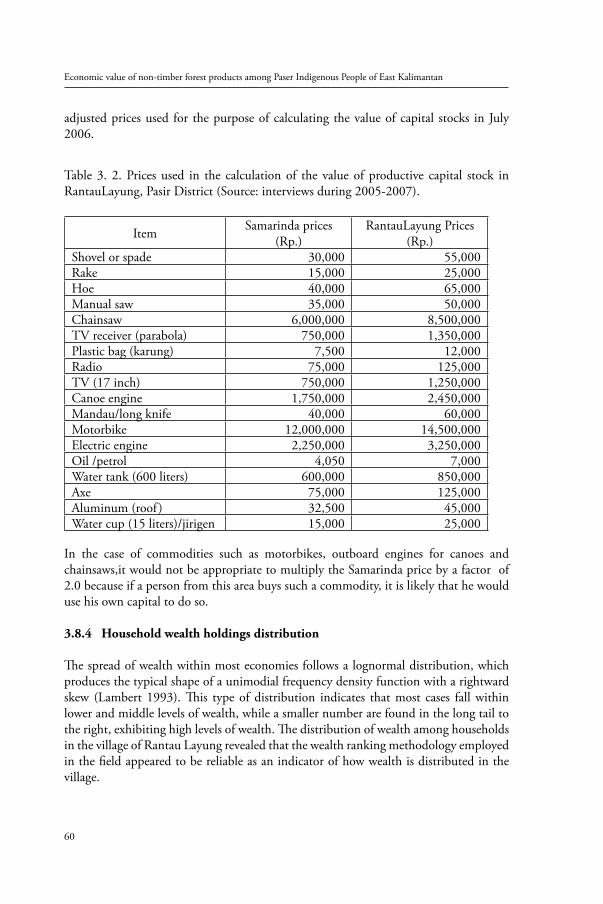
Economic value of non-timber forest products among Paser Indigenous People of East Kalimantan
60
adjusted prices used for the purpose of calculating the value of capital stocks in July 2006.
Table 3. 2. Prices used in the calculation of the value of productive capital stock in RantauLayung, Pasir District (Source: interviews during 2005-2007).
Item Samarinda prices (Rp.)
RantauLayung Prices (Rp.)
Shovel or spade 30,000 55,000Rake 15,000 25,000Hoe 40,000 65,000Manual saw 35,000 50,000Chainsaw 6,000,000 8,500,000TV receiver (parabola) 750,000 1,350,000Plastic bag (karung) 7,500 12,000Radio 75,000 125,000TV (17 inch) 750,000 1,250,000Canoe engine 1,750,000 2,450,000Mandau/long knife 40,000 60,000Motorbike 12,000,000 14,500,000Electric engine 2,250,000 3,250,000Oil /petrol 4,050 7,000Water tank (600 liters) 600,000 850,000Axe 75,000 125,000Aluminum (roof ) 32,500 45,000Water cup (15 liters)/jirigen 15,000 25,000
In the case of commodities such as motorbikes, outboard engines for canoes and chainsaws,it would not be appropriate to multiply the Samarinda price by a factor of 2.0 because if a person from this area buys such a commodity, it is likely that he would use his own capital to do so.
3.8.4 Household wealth holdings distribution
The spread of wealth within most economies follows a lognormal distribution, which produces the typical shape of a unimodial frequency density function with a rightward skew (Lambert 1993). This type of distribution indicates that most cases fall within lower and middle levels of wealth, while a smaller number are found in the long tail to the right, exhibiting high levels of wealth. The distribution of wealth among households in the village of Rantau Layung revealed that the wealth ranking methodology employed in the field appeared to be reliable as an indicator of how wealth is distributed in the village.
61
3. Method and research framework
Capital inputs in production have an impact on costs in two ways. One of the capital costs represents capital depreciation, for which a 20 per cent depreciation rate is used and for the cost using the capital (the imputed interest rate), a 15 per cent rate is used in the study.
3.9 Using data to evaluate household output values
Farming is the mainstay of life in these villages, but wild animals and plants also contribute significantly to the diets of forest dwelling people. Due to a lack of purchasing power, buying meat from any outside source does not usually occur in these households, and supplies of fuelwood, roofing and handicraft materials are also important products gathered from the forest, as are medicinal plants. The value of all of these must be included in the village accounts. In the following sub-chapters the valuation methods are further explained.
3.9.1 Farming values
From the data collected from farmers, and cross-checked with the men’s and women’s data sheets, the monetary value of farm output can be calculated. This calculation is based on the estimated crop outputs, and on prices for those crops in the village itself, or on the local market. The prices were calculated from farm surveys, where farmers reported crop prices plus by often using observations at the nearest market. Averages of these given and observed prices are used in the calculation of farm output values. By multiplying the household output of each crop by its price, it is possible to estimate the monetary value of farm output and by summing up across all households, the value of farm output per village is calculated.
3.9.2 Non-timber forest products values
3.9.2.1 Hunting values
Animals caught in the forest provide a major source of protein for the people of these villages. During the survey period, hunters were asked about their catches, and details were noted of how much was caught and how often hunting and trapping was done. Estimates were produced from this, and annual totals were calculated on the basis of 48 weeks of weekly total staking into account the seasonal fluctuations. Qualitative data from hunters suggested that seasonal variation in hunting does exist, so this seasonal spread was important. Furthermore, the results show that these seasonal fluctuations were expressed by a variation in the types of animals caught, rather than the quantities caught. In the cases where hunting was a side activity undertaken by the household according to the time allocation records, detailed recordings of catches have not been taken, but weight averages were inserted as an estimated value. Since wild boar are caught
Economic value of non-timber forest products among Paser Indigenous People of East Kalimantan
62
only by non-Muslims, the figures for these catches are not included in the estimate used as the average value for other hunting households. The figures shown in the appendix 7 represents data based on hunting catches reported in 2005, during the dry season, from April to September. Since hunting is more difficult in the wet season, this figure is likely to produce an overestimate of hunting catches in the area.
3.9.2.2 Fishing catches values
All households were questioned about their fishing activities, and those who regularly work on fishing were asked to participate in a specific interview on this subject. This facilitated the collection of some interesting and useful data about the population’s fishing activities, and it enabled some estimates to be made of the value of these fish catches to households. Since fishing is a form of household output, its value needs to be included in the commodities that reflect the economic significance of the forest to its inhabitants. This means that the value of fish caught within its waters must be included in the assessment of the ‘economic value’ of the forest itself.
Fishing catches are influenced by season, time and location. The length of a fishing trip was calculated from the travel time to the reported fishing site (times two, for the return journey), plus an average of two hours of fishing time. Data on household fishing trips were taken from the heads of households and from the women’s data sheets. The values of fishing catches were based on the estimated weights of the catches, the type of fish caught, and the market price of the various fish species. Although a relatively large variety of fish was caught by all fishermen, the fish values are based on the top three fish species caught, using the appropriate market price. For those households where fishing was reported, but no specific figures were collected, estimates of their outputs were calculated based on the average value of catches for all reporting households. This figure was adjusted with a household correction factor, based on the hours spent fishing perhousehold. Although some variation occurs in the proportions of fish used at home, and fish that is bartered or sold, this does not affect the total value of the fish itself to the village, or the extent to which it contributes to the Gross Village Product. Using the collected data on the weight of fish catches for the species caught and the specific market prices for the fish species caught, a relatively realistic figure of the households output of fish can be arrived at. This figure can then be included as one of the output values to the NVP.
3.9.2.3 Rattan harvesting values
Rantau Layung is one of the major villages for the harvesting of rattan canes, and from there, the stems (cane) or rattan parts are taken to the village and collected for industrial furniture processing in South Kalimantan. The values used here simply represent the estimated number of rattan stems (canes) harvested, multiplied by the purchasing price (from the trader or company agent) at the village gate per stem.
63
3. Method and research framework
3.9.2.4 Wild bee honey production values
The estimated value of honey production follows the same calculation as for rattan. The volume of honey collection was obtained from the data sheets of the households interviewed. The price of honey was determined by the selling price at village level per litre. The total value of honey production can be calculated, since the number of people involved in the harvest and the volume of extraction per person are also known, as well as the selling price of honey at the village gate.
3.9.2.5 Forest food and vegetable collection values
The estimated values of forest plants used for food, vegetables, and medicinal plants in the household were another important part of our research. The actual value of handicrafts, roofing materials, etc., made from forest plants by members of the household, represent another form of household output, which comes directly from the utilisation of non-timber forest products. This highlights the economic importance of these forest products for the well-being of households, and the values should be estimated to cover this benefit.
From the data provided by the household survey, we find that the forest regularly provides food and drinking items that supplement the family diet. Although many of the forest products are seasonal, the different fruiting season of various trees indicates that there is a fairly constant supply of these supplementary foods throughout the year. Other types of NTFP food, such as palm heart, are available all year round and can be collected at any time. The amount of time spent on collecting NTFPs from the forest is determined from the survey data. Using the average weight of plants, etc., brought from the forest on such collecting trips, it is possible to assess the overall weight collected by each household. Proportions of NTFPs used for each household are reported for things such as medicine, food, etc. and from this, the weight of NTFPs used for food and other uses can be calculated.
For the purpose of valuing forest foods and vegetables, a shadow price is used, based on the market prices in Simpang Pait, the nearest market to study area and the place where all products are sold at different prices for different species. In other seasons, other fruits will take the place of these foods, but their prices are determined at village level. Therefore, the price of fruit is based on local market prices. By multiplying the weight of NTFPs used as food or vegetables with the existing or shadow prices per kg, the monetary value of these products can be assigned to this nutritional use of forest plants.
Economic value of non-timber forest products among Paser Indigenous People of East Kalimantan
64
3.9.2.6 Medicinal plants extraction values
Using the method previously described to assess the value of forest food and vegetables based on the weights of plants collected in the forest, and the proportions of that used for medicinal purposes, values for the medicinal use of forest plants can be estimated. Details of this are shown in table 1,part 2. The market price of Euricoma Longifolia or pasakbumi (widely used for medicinal purposes),is used as a proxy for the value of medicinal plants.
3.9.2.7 Fuelwood collection values
From households’ interview data sheets, information was collected about the amount of time spent by people collecting fuelwood. The value of this is based on the assumption of collection rates being, on average, 15lbs or 10 kg per hour. The figure is based on an assessment of fuelwood loads collected during the survey period. Using the local price of kerosene (minyak tanah) as a shadow price for fuelwood, the monetary value of the wood can be calculated. From observations in the village, and on the basis of statements by householders, it can be assumed that 10kg of wood is equivalent to one litre of kerosene in terms of how much cooking service it can provide. On this basis, 10kg of fuel wood can be valued at Rp. 7,500.
3.9.2.8 Handicrafts values
Handicrafts are fundamental to the Paser indigenous way of life, as it is through the use of various handicrafts items that food is processed and produced. The monetary value of these handicrafts was calculated based on the craftsman’s estimate of the weekly earnings from items made. This estimate is cross-checked by calculating the value of the number of items produced and applying the village market price for each item. These estimates are then converted to annual values, based on 50 weeks of output per annum.
3.10 The accounting framework
The use of an accounting framework to calculate the importance of the forest as a resource is an attempt to overcome the problems associated with conventional environmental valuation. Conventional measures of economic value often fail to account for environmental impacts (Markandya&Perrings 1992), and in the case of tropical forest valuation, the lack of inclusion of the value of non-timber forest products results in an under-valuation of the resource as a whole (Godoy &Syafran 1986). Resource auditing procedures, which may be useful in other circumstances, fail in this case. This is because of problems such as the lack of clearly defined markets, uncertainty regarding both current and future demand and supply of forest products, and the lack of detailed information about how these resources are used.
65
3. Method and research framework
There are a number of disadvantages associated with the widely accepted United Nations System of National Accounts (Sullivan 1999). The two major ones are the fact that no provision is made either for the inclusion of the value of environmental goods and services, or for the depletion of the resource over time (Repetto 1988). While this study cannot overcome these problems, it does attempt to include some otherwise ignored values. This study also tries to highlight the need for a more holistic approach to forest resource assessment. In addition, the data collected here about current rates of use of NTFPs could be of use to future research attempting to calculate rates of resource depletions.
3.11 Modelling village economy to calculate the Net Village Product
The main objective of the evaluation study was to examine the extent to which non-timber forest products (NTFPs) are important to forest households, and to estimate the monetary value of their worth in such an economy. In particular, my research makes an attempt to extend the valuation process beyond the monetary sphere, to include the flows of natural capital and ecosystem services, which are utilised by households, and to examine these in a way that takes account of the social and biophysical impacts they may have. The data collected from the three villages in my research area reveals how NTFPs contribute to the households as a source of: food, vegetables, income from rattan, income from wild honey, construction materials, fuelwood, medicinal plants, handicrafts, fishing, and the trapping and hunting of wild animals.
As a means of estimating the value of this NTFP use, a model for the village economy is developed, and the value of the Gross Village Product (GVP) is calculated. This model is based on the usual accounting framework, as used in the calculation of Gross National Product, but it is modified to represent the simpler economy found in a subsistence village. The model of the village economy is calculated based on research by Todaro 1994; Godoy, Lubowski & Markandya 1993), which is developed on the basis of the usual equilibrium accounting assumption that:
Value of household input = value of household outputs
here:
Household inputs = wLh + rKh + δKh + pfFh
where :
W = wage rate
Economic value of non-timber forest products among Paser Indigenous People of East Kalimantan
66
Lh= weighted hours worked by household h (weighted for men, women and children labour inputs);
R = rate of interest for the use of capital in production;Kh = productive capital used by household h;δ = capital depreciation rate;pf = implicit price of each unit of nature (forest) used;Fh= implicit quantity of nature (forest) used by household h
Similarly: n hHousehold outputs = ∑ pi Qi i=1
here:i= counter for NTFPs; hunting, fishing, handicrafts, rattan, farming outputs, etc.pi = price of the good;Qi
h = quantity of that good produced by household h
All values used here refer to the period of one year and so, for convenience, the time subscript (t) usually applied is omitted. The value of ‘savings’ (ΔK) is included in this equation as an output, identified by one of the Qi
h values. However, without inter-temporal household data, it is impossible to identify any specific value for capital accumulation by households. As a result, this value is included in the total of ‘value added’ associated with the use of the forest.By equating the value of household inputs and outputs, we get: nwLh + rKh + δKh + pfF
h= Σ piQih (1)
t=1
To build the complete model of the village, then, we need to aggregate the data; the Net Village Product (NVP) is obtained by summing across all households h;
H H nNVP = Σ(wLh+ rKh + Kh + pfFh) = Σ ΣpiQi
h (2) h=1 h=1 i=1
The Gross Village Product is converted to the Net Village Product through the process of depreciation, including in Equation (1) as δKh.
3.12 Determining the value of forest inputs from Net Village Product
The value of pfFh will be derived as a residual from the completed equation of all other inputs and outputs. This residual represents the contribution made to NVP by the various NTFPs, and each of these is in the form of output values from village activities generated by the use of forest resources. This is shown as the equation:
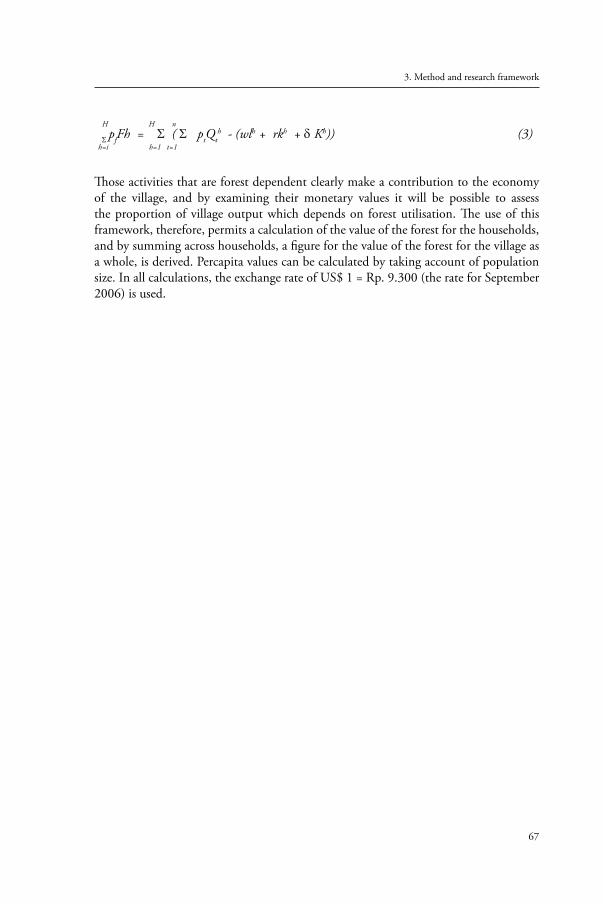
67
3. Method and research framework
H H n
Σ pfFh = Σ ( Σ ptQth - (wlh + rkh + δ Kh)) (3)
h=i h=1 t=1
Those activities that are forest dependent clearly make a contribution to the economy of the village, and by examining their monetary values it will be possible to assess the proportion of village output which depends on forest utilisation. The use of this framework, therefore, permits a calculation of the value of the forest for the households, and by summing across households, a figure for the value of the forest for the village as a whole, is derived. Percapita values can be calculated by taking account of population size. In all calculations, the exchange rate of US$ 1 = Rp. 9.300 (the rate for September 2006) is used.

Economic value of non-timber forest products among Paser Indigenous People of East Kalimantan
68
69
Chapter 4
Research Area
4.1. Introduction
This chapter provides an overview of the research area and, in particular, the Pasir District in the province of East Kalimantan. It covers the land use system, climate, soil formation, geography and the socio-economics of the human population. This chapter also examines the situation before and after the new policy of decentralisation that was introduced in 1998. This new policy caused drastic changes, resulting in an increase in local government revenues, an increase in the number of districts, a reduction in the role of forest extraction in government revenues, and the construction of many new district capitals and infrastructural facilities in the province.
The economic development and the associated development of transportation facilities and natural gas and coal exploitation has triggered a significant migration of people from Java and other islands in Indonesia to East Kalimantan during the past 30 years. Consequently, human migration has put more pressure on natural resources and on indigenous communities who live in poorly accessible and under-developed areas, and who manage the land in a traditional way to produce crops for subsistence. Indigenous peoples have been marginalised by these developments. They have been unable to compete with these migrants due to their lower capacity in terms of knowledge and skills as compared to the migrants, who have more education and information.
4.2. Geography and land use
The province of East Kalimantan is located in the Indonesian part of the island of Borneo (figure 4.1 below). It covers approximately 208,657 km2, which is about 14 per cent of the Indonesian land area. This province consists of 9 districts, 4 municipalities and 1,299 villages with a total population of 3.3 million people (BPS Kaltim 2009). Geologically, East Kalimantan consists mainly of tertiary sedimentary rocks. The soils are
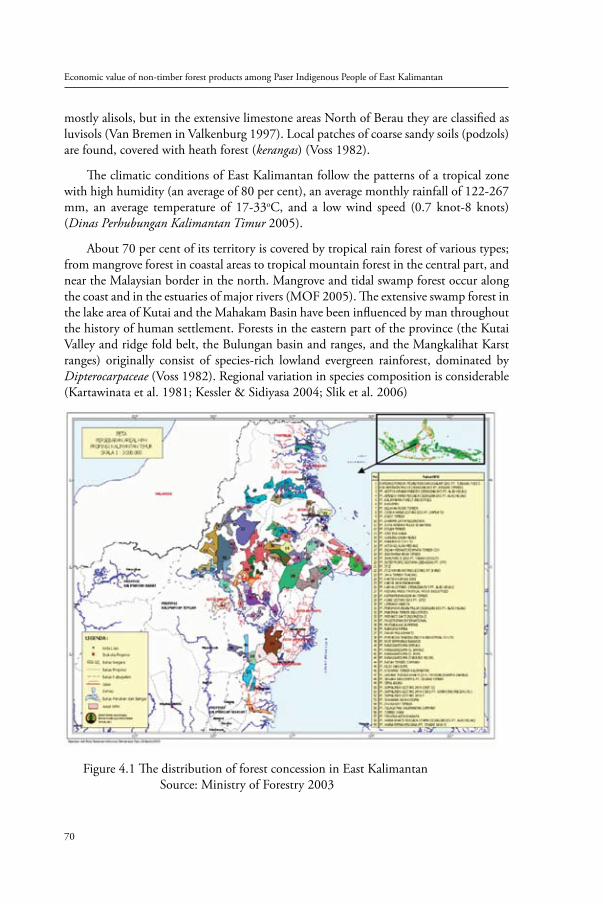
Economic value of non-timber forest products among Paser Indigenous People of East Kalimantan
70
mostly alisols, but in the extensive limestone areas North of Berau they are classified as luvisols (Van Bremen in Valkenburg 1997). Local patches of coarse sandy soils (podzols) are found, covered with heath forest (kerangas) (Voss 1982).
The climatic conditions of East Kalimantan follow the patterns of a tropical zone with high humidity (an average of 80 per cent), an average monthly rainfall of 122-267 mm, an average temperature of 17-33oC, and a low wind speed (0.7 knot-8 knots) (Dinas Perhubungan Kalimantan Timur 2005).
About 70 per cent of its territory is covered by tropical rain forest of various types; from mangrove forest in coastal areas to tropical mountain forest in the central part, and near the Malaysian border in the north. Mangrove and tidal swamp forest occur along the coast and in the estuaries of major rivers (MOF 2005). The extensive swamp forest in the lake area of Kutai and the Mahakam Basin have been influenced by man throughout the history of human settlement. Forests in the eastern part of the province (the Kutai Valley and ridge fold belt, the Bulungan basin and ranges, and the Mangkalihat Karst ranges) originally consist of species-rich lowland evergreen rainforest, dominated by Dipterocarpaceae (Voss 1982). Regional variation in species composition is considerable (Kartawinata et al. 1981; Kessler & Sidiyasa 2004; Slik et al. 2006)
Figure 4.1 The distribution of forest concession in East Kalimantan Source: Ministry of Forestry 2003
71
4. Research area
Most of the remnant primary forest is at an elevation of 500-1000 m above sea-level, but mountain ranges of over 1500 m exist in the western part of the province. The presence of logging concessions since the 1970s has changed the vegetation cover of the lowland and hilly area of forest primary forest to secondary forest or even degraded logged-over areas with elephant grass (Imperata cylindrica). The number of logging concessions has increased from 65, in the 1970s, to 106 in the 1980s. However, the number of logging concessions has been reduced drastically since 2000. In 2005, the number of logging concessions in East Kalimantan was 61, with a total concession area of 5.89 million ha. According to MOF (2003), the rate of deforestation in East Kalimantan is increasing annually. A late start in the economic-development programme and the concentration of economic development in Java for more than 30 years, are the most important issues to have an impact on deforestation in this province. But, compared to other Indonesian larger islands the remaining forests in this region are in a better condition (MOF-FAO 2006).
The botanical diversity of Borneo is illustrated by the presence of 84 families and 370 genera of vascular plants, comprising at least one big tree species for each genus (defined as either 35 cm DBH or over 20 metres tall), as listed by Whitmore et al. (1990). Ashton (1989) gives an estimate of 10,000-15,000 species of vascular plants (Spermatophytes) and states that the flora of Borneo, and especially the Indonesian provinces of Kalimantan, are still under-collected. Whereas the collecting intensity for Sundaland (excluding the Penninsular Malaysia) is 46 specimens per 100 km2, the collecting density for Borneo as a whole is only 35 specimens per km2. Kessler et al. (1992) has added 8500 individual plants to the collection effort. . Kessler’s collections mainly comprise trees from the Balikpapan-Samarinda area.
The forest found at the research area is commonly referred to as lowland evergreen rainforest of mixed dipterocarps. This forest type, dominated by the dipterocarp family, is the original vegetation cover of the non-seasonal, lowland areas of Sundaland, comprising the Penninsular Malaysia, Sumatra, Java, Borneo and Pallawan (Richards in Valkenburg 1997). Bratawinata (1986) and Soedjito (1980, 1987) have added some quantitative data on the species composition of tropical mountain forest to our knowledge on the forest in the uplands areas.
The detailed studies by Kartawinata et al. (1981), Riswan (1987) and MacKinnon et al. (1997) have yielded information on the botanical composition of the lowland evergreen rainforest in the eastern part of the province. Kesler and Sidiyasa (1984) provide an account of the economically and ecologically important trees in the Balikpapan-Samarinda area. A publication by Puri (2001) described some 240 species of plants, important from the point of view of ethno-botany, in the northern part of Bulungan, East Kalimantan. This publication has expanded our current knowledge of species diversity and ethno-botany in the East Kalimantan region.

Economic value of non-timber forest products among Paser Indigenous People of East Kalimantan
72
Besides the forest cover, East Kalimantan also has agricultural areas, shifting cultivation and oil palm plantations. The development of timber estates and oil palm plantations has increased the conversion of forest areas by about 2 per cent per year. This conversion has increased further in recent years in areas where the national policy for the development of two million ha of oil palm will be implemented. East Kalimantan is one of the Indonesian provinces that is involved in this policy implementation. Oil palm has, to some extent, been valued as an alternative source for employment opportunity, since a drastic reduction in the forestry industry has reduced the labour input in this sector since 2001. This project is also triggered by the fact that many former logging concessions are viewed as unproductive land and therefore have to be converted to oil palm. Based on the Provincial Statistics for East Kalimantan 2005, we can conclude that the forest area that has been converted to oil palm plantation since the 1980s is close to 600,000 ha and another 1.6 million ha has been converted into transmigration settlement sites, road construction, industrial estates and timber estate areas.
4.3. Population
In statistical terms, East Kalimantan is one of the largest provinces of Indonesia. It is also one of the least populated and the wealthiest provinces in the archipelago. The entire province covers a land area of about 208,657 km2, which is almost twice as large as the island of Java. In spite of this difference in surface, East Kalimantan has a population of 3.3 million (BPS Kaltim 2009). Per capita income in the province is over triple the national average. Much of this is derived from the extraction of minerals and natural resources, of which oil, natural gas, coal, and logging are the most important.
The southern part of East Kalimantan is a relatively urbanised area with fertile agricultural land and a well-developed road network. The rest of the province is mainly covered with rainforest and very sparsely populated. Road connections within the province and other parts of Kalimantan are underdeveloped, which explains the relative importance of air, sea and river transport.
Administratively, the province is divided into eleven districts and four municipalities. Samarinda is the provincial capital and the new district capitals are: Sangata, Malinau and Melak, which have been growing faster than the older district capitals in the province since 2000.
Compared to other districts in the province, the Pasir District is more developed in terms of agriculture and this is the first district to be involved in the programme for industrial oil palm development, launched by the Department of Agriculture in the 1980s. The surface area of Pasir District is only 10.42 per cent of East Kalimantan province and it has a total population of 171,000 people, which represents 6.24 per cent of the total population of the province. The average population density in the district of Pasir is 7.90 people per km2 (Kalimantan Timur Dalam Angka 2007).
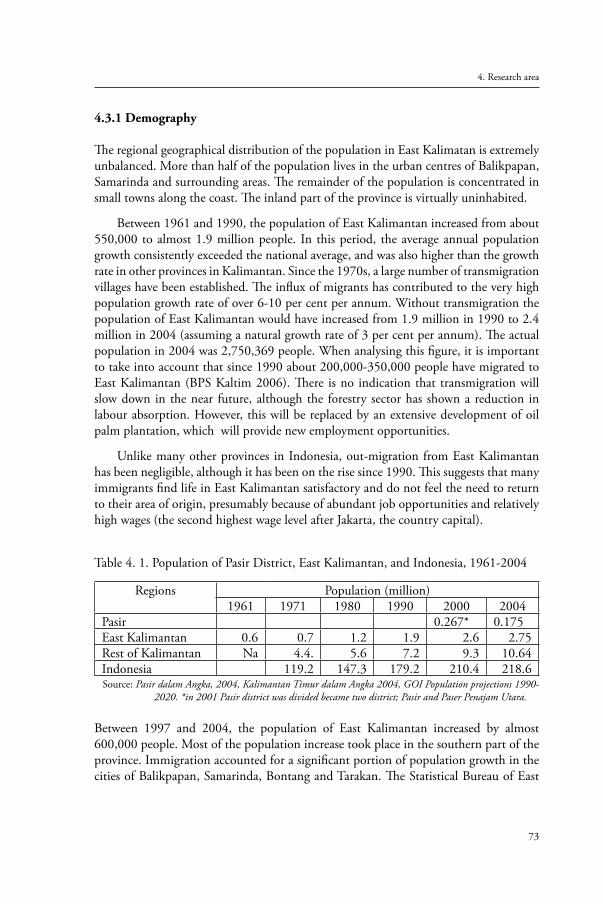
73
4. Research area
4.3.1 Demography
The regional geographical distribution of the population in East Kalimatan is extremely unbalanced. More than half of the population lives in the urban centres of Balikpapan, Samarinda and surrounding areas. The remainder of the population is concentrated in small towns along the coast. The inland part of the province is virtually uninhabited.
Between 1961 and 1990, the population of East Kalimantan increased from about 550,000 to almost 1.9 million people. In this period, the average annual population growth consistently exceeded the national average, and was also higher than the growth rate in other provinces in Kalimantan. Since the 1970s, a large number of transmigration villages have been established. The influx of migrants has contributed to the very high population growth rate of over 6-10 per cent per annum. Without transmigration the population of East Kalimantan would have increased from 1.9 million in 1990 to 2.4 million in 2004 (assuming a natural growth rate of 3 per cent per annum). The actual population in 2004 was 2,750,369 people. When analysing this figure, it is important to take into account that since 1990 about 200,000-350,000 people have migrated to East Kalimantan (BPS Kaltim 2006). There is no indication that transmigration will slow down in the near future, although the forestry sector has shown a reduction in labour absorption. However, this will be replaced by an extensive development of oil palm plantation, which will provide new employment opportunities.
Unlike many other provinces in Indonesia, out-migration from East Kalimantan has been negligible, although it has been on the rise since 1990. This suggests that many immigrants find life in East Kalimantan satisfactory and do not feel the need to return to their area of origin, presumably because of abundant job opportunities and relatively high wages (the second highest wage level after Jakarta, the country capital).
Table 4. 1. Population of Pasir District, East Kalimantan, and Indonesia, 1961-2004
Regions Population (million)1961 1971 1980 1990 2000 2004
Pasir 0.267* 0.175East Kalimantan 0.6 0.7 1.2 1.9 2.6 2.75 Rest of Kalimantan Na 4.4. 5.6 7.2 9.3 10.64Indonesia 119.2 147.3 179.2 210.4 218.6
Source: Pasir dalam Angka, 2004, Kalimantan Timur dalam Angka 2004, GOI Population projections 1990-2020. *in 2001 Pasir district was divided became two district; Pasir and Paser Penajam Utara.
Between 1997 and 2004, the population of East Kalimantan increased by almost 600,000 people. Most of the population increase took place in the southern part of the province. Immigration accounted for a significant portion of population growth in the cities of Balikpapan, Samarinda, Bontang and Tarakan. The Statistical Bureau of East
Economic value of non-timber forest products among Paser Indigenous People of East Kalimantan
74
Kalimantan estimates that spontaneous immigrants may account for over one third of all immigrants (or 150,000 since 1990). The rapid increase of the population of Pasir District can also be attributed to spontaneous transmigration (see table 4.1.above).
4.3.2 Cultural and social aspects
There is a large diversity of linguistic, religious, cultural and social aspects of population groups between the various regions in East Kalimantan. Malay and Bugis immigrants, who are mostly Muslim, are a majority in the southern part of the province and in most coastal areas. In the northern and northwestern parts of the province, there are sizeable minorities of ethnic groups and indigenous Dayak peoples. Some 80 separate regional languages and dialects are spoken in East Kalimantan (Devung 1997).
Three ethnic groups can be categorised as indigenous to the inland of Borneo: the Kutai, Dayak and Banjar. Dayak is the term for the indigenous peoples who occupy the interior part of Borneo. The majority of Dayak converted to Christianity over a hundred years ago. The Kutai ethnic group dominates the area of the Mahakam Basin and the middle part of the Kutai Basin. The majority of the Kutai people are Muslim. The Banjar groups dominate some parts of the city of Samarinda and trade in the region.
At the present time, the majority of East Kalimantan communities are exogenous, mainly consisting of Buginese, Javanese and other migrants from Sumatra, Sulawesi and other parts of Indonesia. These groups mainly occupy the coastal region of East Kalimantan and are found especially in the urban centres and industrial areas. They dominate the government and private sectors, and they are also dominant in the political system, demonstrated by their influence in provincial politics and the economy. Another ethnic group that must be mentioned is the ethnic Chinese. They are small in number, but have strong influences in the local economy and on the social life of East Kalimantan. To a large extent, they control the business sector and the distribution of industrial goods in most of the urban areas, such as Samarinda, Balikpapan, Bontang and Tarakan. These exogenous groups overshadow the majority of indigenous people in economic terms.
Despite a high heterogeneity in the language and dialects spoken, as well as in the religion, ethnicity and culture of the population of East Kalimantan, ethnic conflict has been very rare. At least in, less conflicts have been reported in this province compared to others such as West Kalimantan (Sanggau), Central Kalimantan (Sampit) or in Sulawesi (Poso) and Maluku (Ambon) island. This relative stability and absence of conflict may also be one of main reasons why both the economy and population of East Kalimantan is growing faster than other provinces in Kalimantan or Indonesia.
The Paser people, who live in the Pasir District, see themselves as Dayak. This awareness of their ethnic background has become even stronger since the ethnic conflict in West and Central Kalimantan between Maduranise and Dayaks, which began in
75
4. Research area
1994. The Paser would rather be identified as Dayak, rather than Pasir Mayang or Banjar (Maunati 2004)12.
Most of the indigenous peoples in Borneo (Dayak) are descendants of immigrants who arrived from Southern China (Taiwan) 7000 years ago (Bellwood 1997). They were hunters and gatherers and only recently settled down as shifting cultivators. Although some form of primitive agriculture or selective use of plants leading to ‘wild gardens’ is believed to have existed in Borneo for the last 5,000-6,000 years (Hutterer 1984; Bellwood 1997), they have lived in and interacted with the forest for thousands of years. They possess and practice their own unique traditional knowledge to utilize and maintain the forest. They are highly dependent on various resources for subsistence and their main resources come from the primary forest, young and old secondary forests, rice fields and home gardens (Matius et al. 2003).
4.3.3 Employment
Although the economic structure of East Kalimantan is very different from the rest of Indonesia, the structure of the labour market is broadly similar. As in most other parts of Indonesia, the services sector has replaced agriculture as the single most important source of employment and now provides almost 50 per cent of all jobs. The agricultural sector is characterised by a significant degree of underemployment, and the proportion of the agricultural workforce has declined continuously in the 1990s as the growth of employment opportunities in other sectors, notably mining and manufacturing, allowed labour to move into more remunerative occupations.
Data on employment in forestry are not available as these figures are now included in statistics for the agricultural sector. According to the Regional Committee of the Indonesian Association for Timber Companies of East Kalimantan (MPI 2007), forestry related jobs cover about 6-8 per cent of the total employment in the province; most of these forestry jobs are in logging. The importance of wood processing has decreased with the increasingly short supply of logs and the influence of the international markets, which continue to show a preference for certified timber. This increasing demand for certified timber implies a reduction in Indonesian plywood exports, due to the unavailability of certificates signifying sustainable forest management. Until 2007 only two out of 65 logging concessions in East Kalimantan were able to obtain a sustainable timber certification from the Forest Stewardship Council (FSC).
In the period 1994-2004, almost 370,000 new jobs were created in East Kalimantan, mainly in services and manufacturing (BPS Kaltim 2007).While employment in forestry and mining has increased substantially since 1990, there has been a negative 2 To some extent the term Dayak is also used for the Christian people of Borneo (Commans 1990; Maunati 2004), but this perception is only present in the area where the influence of Islam is not as strong as in the southern part of Pasir where they have very close interaction with Banjar (an ethnic group that is heavily influenced by Islam) (see also Artha, Kaltim Post, Dec 312005).
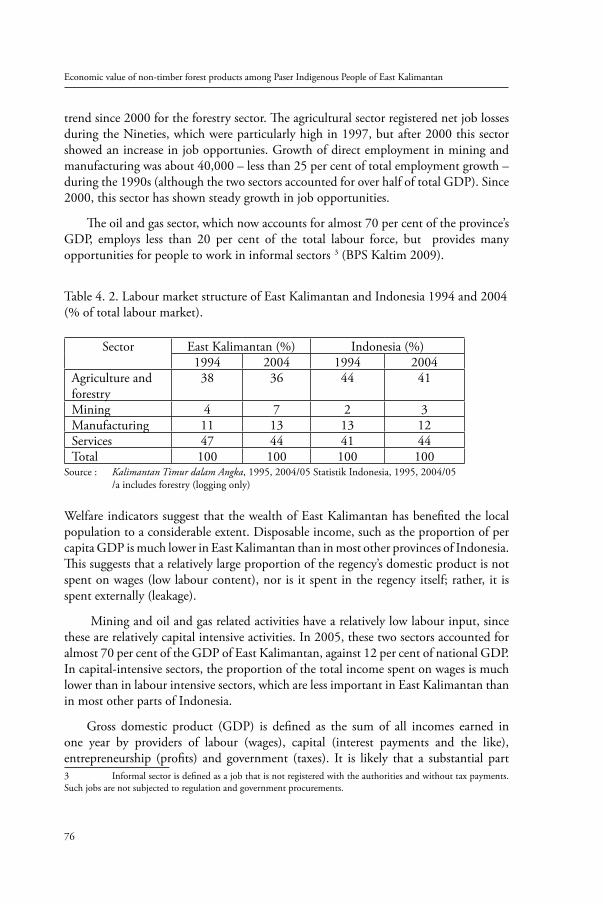
Economic value of non-timber forest products among Paser Indigenous People of East Kalimantan
76
trend since 2000 for the forestry sector. The agricultural sector registered net job losses during the Nineties, which were particularly high in 1997, but after 2000 this sector showed an increase in job opportunies. Growth of direct employment in mining and manufacturing was about 40,000 – less than 25 per cent of total employment growth – during the 1990s (although the two sectors accounted for over half of total GDP). Since 2000, this sector has shown steady growth in job opportunities.
The oil and gas sector, which now accounts for almost 70 per cent of the province’s GDP, employs less than 20 per cent of the total labour force, but provides many opportunities for people to work in informal sectors23 (BPS Kaltim 2009).
Table 4. 2. Labour market structure of East Kalimantan and Indonesia 1994 and 2004 (% of total labour market).
Sector East Kalimantan (%) Indonesia (%)1994 2004 1994 2004
Agriculture and forestry
38 36 44 41
Mining 4 7 2 3Manufacturing 11 13 13 12Services 47 44 41 44Total 100 100 100 100
Source : Kalimantan Timur dalam Angka, 1995, 2004/05 Statistik Indonesia, 1995, 2004/05/a includes forestry (logging only)
Welfare indicators suggest that the wealth of East Kalimantan has benefited the local population to a considerable extent. Disposable income, such as the proportion of per capita GDP is much lower in East Kalimantan than in most other provinces of Indonesia. This suggests that a relatively large proportion of the regency’s domestic product is not spent on wages (low labour content), nor is it spent in the regency itself; rather, it is spent externally (leakage).
Mining and oil and gas related activities have a relatively low labour input, since these are relatively capital intensive activities. In 2005, these two sectors accounted for almost 70 per cent of the GDP of East Kalimantan, against 12 per cent of national GDP. In capital-intensive sectors, the proportion of the total income spent on wages is much lower than in labour intensive sectors, which are less important in East Kalimantan than in most other parts of Indonesia.
Gross domestic product (GDP) is defined as the sum of all incomes earned in one year by providers of labour (wages), capital (interest payments and the like), entrepreneurship (profits) and government (taxes). It is likely that a substantial part 3 Informal sector is defined as a job that is not registered with the authorities and without tax payments. Such jobs are not subjected to regulation and government procurements.
77
4. Research area
of all sources of income earned in East Kalimantan is actually spent in other regions. Firstly, most capital investment in the province is financed from savings generated in other parts of Indonesia or abroad. Payments for the use of capital are, therefore, received by financial institutions outside East Kalimantan. Secondly, there is no large forestry or mining company with headquarters in the province itself. Profits from operations in the regency are typically used to cross-subsidise operations in, for instance, Jakarta. Finally, a significant proportion of taxes collected by the local and provincial governments are transferred to the central government and not spent in East Kalimantan. Taxes on company profits generated in East Kalimantan are usually paid in the province where the company has based its headquarters.
4.3.4 Economy
The economy of East Kalimantan is characterised by a heavy dependence on the extraction of mineral and natural resources, mainly oil, coal, natural gas and logging. In 1997, the GDP of East Kalimantan was estimated at approximately Rp. 20 trillion (constant 1993 prices), or over US$ 8 billion at the 1997 exchange rate (US$ 1 = Rp. 11,000). Rich in mineral and natural resources, the per capita GDP in East Kalimantan (about US$ 4,000 in 1997) is far above the national average, and ranks third behind Jakarta and Riau provinces, the largest oil-producing provinces.
Low in population densities and with an underdeveloped road network, the provincial economy also has the characteristics of an island economy, with high transportation costs, dependence on a limited range of economic activities, and an inflexible market for labour and goods.
Excluding oil and gas, the forestry sector accounts for about 20 per cent of the provincial GDP, against less than 5 per cent for Indonesia as a whole. Manufacturing (unrelated to oil and gas) is as important in East Kalimantan as in most other parts of Indonesia, especially wood processing. Agriculture is of minor importance in most areas of East Kalimantan, except for Pasir, where this district is the main producer of crude palm oil in the province. Although agriculture has contributed 14 per cent of national GDP (1997), this is different in the province of East Kalimantan. Services continue to dominate the provincial and national economies.
The economic development of East Kalimantan can be divided into a period before and after decentralisation (before 1998 and after 1998). Before decentralisation, East Kalimantan’s economy was influenced by the implementation of large-scale investment projects, such as the development of offshore oil and gas fields, and the construction of large manufacturing plants and wood industries. After decentralisation, the economic growth was triggered by the government policy to reallocate the tax received from natural resource extraction such as oil, gas and timber, of which East Kalimantan is one of the main producers. Based on the Law of Financial Balance between Central and
Economic value of non-timber forest products among Paser Indigenous People of East Kalimantan
78
Local Government (UU no. 23 and 25 tahun 1999 as changed by the No. 33 of 2004) collected tax had to be reinvested in the region, in order to enhance the local economy and to produce commodities.
Before decentralisation or from 1994-1997, the economy of East Kalimantan expanded by 20 per cent, with a peak of 8 per cent in 1996 alone. Rapid growth in the non-oil mining and services sectors (mainly transportation and trading) accounted for over half of total GDP growth in this four year period. The growth in the services sector was fuelled by large-scale investments in agriculture and manufacturing, which more than doubled from US$ 1.2 billion in 1993 to over US$ 3 billion in 1995.
In 2005, after the decentralisation policy was initiated, the economic growth in East Kalimantan increased further, as the province received more tax payments for extracted natural resources back from the central government, as a result of the new Law of Autonomy and Financial Balancing between Central Government and Local Autonomy Region No. 33 Year 2004.
The pattern of economic growth after decentralisation illustrates the dependence of East Kalimantan on the central government policy in the reallocation of tax received from natural resources exploitation. This implies that the economy of this region is still very dependent on natural resource extraction, and this may be the reason why the local government also issued many licenses for the exploitation of timber, coal, and other natural resources in the autonomy era. This is illustrated by the large number of small-scale logging concessions and local licenses for coal mining. The distinction between local government authority and central government’s authority is also stipulated in the Law of Financial Balancing System. In this law, authority is differentiated in terms of the scope and scale of business, The scale is defined by its surface area and potential volume of economic benefit that can be generated.
By excluding the oil and gas sectors, gross domestic product increased by almost 10 per cent per annum in real terms during 1994-1997, and by about 40 per cent per annum during 1998-2005, while the income of the local government increased by an average of 200 per cent per annum (2001-2005).34 (BPS Kaltim 2000).
4.4. Forestry sector
Even though the economy of East Kalimantan is heavily dependent on the exploitation of mining and oil, the well-being of its largely rural based population is still mostly dependent on forest resources.
4 In 1996, the provincial government of East Kalimantan received an annual budget for Rp. 800 billion only. However, in 2005 they received Rp. 4 trillion. The district of Kutai received about Rp. 400 billion from central government in 1995, and since 2003 this district has received between Rp. 2.7 trillion to Rp. 5.6 trillion in 2007.
79
4. Research area
Of the province’s 17 million ha of forests, based on the Forestry Agreement 1982, 10.2 million ha has been allocated for timber exploitation and the rest (6.8 million ha) is allocated for protection forest, national parks, nature conservation areas, and forest conversions for agriculture purposes. It should be noted that no part of the forests in East Kalimantan is formally allocated to local (indigenous) people as a source of non-timber forest products, and the management of their agricultural shifting cultivation system (see map 4.1). Most of the village areas as well as shifting cultivation areas belong to logging concessions. A map produced by the Ministry of Forestry in 2003 (see map 4.1.) indicates this situation and there seems to be a contradiction between the needs of local people for forests as a source of subsistence and the allocation of forests to timber concessions or for conversion to agricultural land. The needs of local people in relation to forests and forest products were not taken into account before the allocation of forest areas for logging.
East Kalimantan is one of the main producers of timber and plywood in the country. Indeed, the province has produced 2 million m3 of logs annually since 1990, most of which are processed for plywood exported to China, Europe and the US. The plywood industry has been the major source of employment and income for the people in the provincial capital of Samarinda, since the ban on the exportation of logs was implemented in 1983/84. Thirty four plywood industries had been established in East Kalimantan byl the end of 1990s, with a production capacity of plywood of more than 3 million m3. The booming of the plywood industry was one of the main reasons for the migration of people to East Kalimantan in the late Seventies and until the end of the 1990s. However, this industry could only maintain its position until 2000. After this period, the plywood industry has been in decline and its production and labour input have reduced, due to the shortage of logs as a raw material. Statistical reports about the East Kalimantan industrial sector state that the existing number of plywood industries in 2005 had fallen to only five, from 34 in 1990 (BPS Kaltim 2009).) This condition could exist because the logging concessions and plywood industry were not implementing the certification systems for sustainable forest management (FSC). Most companies managed their business for short term gain and this has serious implications for the sustainability of forest extraction and the overall economy.
4.4.1 Logging
The forests of East Kalimantan contain large numbers of commercial timber species belonging to the Dipterocarp family, of which Shorea spp. (meranti), Dryobalanops (kapur) and Shorea spp. (keruing) are the most important. Between 1993 and 1997 reported log production decreased from approximately 5.5 million m3 per annum to less than 4 million m3 per annum, or about 13 per cent of national production. Forest fires provide an explanation for the low production figure in 1997. The decrease in previous years can be ascribed to the gradual disappearance of easily accessible, high
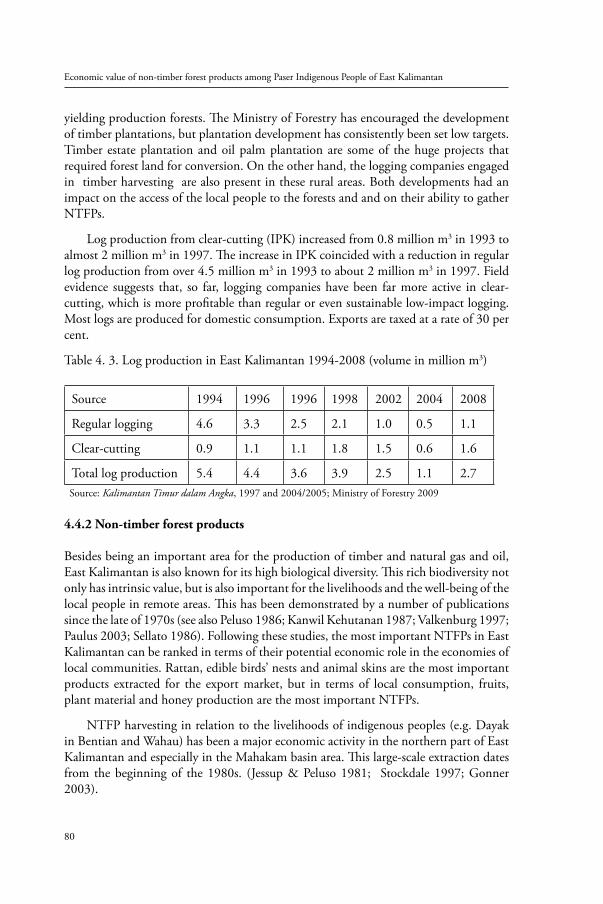
Economic value of non-timber forest products among Paser Indigenous People of East Kalimantan
80
yielding production forests. The Ministry of Forestry has encouraged the development of timber plantations, but plantation development has consistently been set low targets. Timber estate plantation and oil palm plantation are some of the huge projects that required forest land for conversion. On the other hand, the logging companies engaged in timber harvesting are also present in these rural areas. Both developments had an impact on the access of the local people to the forests and and on their ability to gather NTFPs.
Log production from clear-cutting (IPK) increased from 0.8 million m3 in 1993 to almost 2 million m3 in 1997. The increase in IPK coincided with a reduction in regular log production from over 4.5 million m3 in 1993 to about 2 million m3 in 1997. Field evidence suggests that, so far, logging companies have been far more active in clear-cutting, which is more profitable than regular or even sustainable low-impact logging. Most logs are produced for domestic consumption. Exports are taxed at a rate of 30 per cent.
Table 4. 3. Log production in East Kalimantan 1994-2008 (volume in million m3)
Source 1994 1996 1996 1998 2002 2004 2008
Regular logging 4.6 3.3 2.5 2.1 1.0 0.5 1.1
Clear-cutting 0.9 1.1 1.1 1.8 1.5 0.6 1.6
Total log production 5.4 4.4 3.6 3.9 2.5 1.1 2.7 Source: Kalimantan Timur dalam Angka, 1997 and 2004/2005; Ministry of Forestry 2009
4.4.2 Non-timber forest products
Besides being an important area for the production of timber and natural gas and oil, East Kalimantan is also known for its high biological diversity. This rich biodiversity not only has intrinsic value, but is also important for the livelihoods and the well-being of the local people in remote areas. This has been demonstrated by a number of publications since the late of 1970s (see also Peluso 1986; Kanwil Kehutanan 1987; Valkenburg 1997; Paulus 2003; Sellato 1986). Following these studies, the most important NTFPs in East Kalimantan can be ranked in terms of their potential economic role in the economies of local communities. Rattan, edible birds’ nests and animal skins are the most important products extracted for the export market, but in terms of local consumption, fruits, plant material and honey production are the most important NTFPs.
NTFP harvesting in relation to the livelihoods of indigenous peoples (e.g. Dayak in Bentian and Wahau) has been a major economic activity in the northern part of East Kalimantan and especially in the Mahakam basin area. This large-scale extraction dates from the beginning of the 1980s. (Jessup & Peluso 1981; Stockdale 1997; Gonner 2003).
81
4. Research area
Many researchers have reported the importance of the extraction of NTFPs by indigenous peoples. Jessup and Peluso (1981) studied the functions of the forest for indigenous people’s food in East Kalimantan and they considered minor forest products as common property.. Menon (1986) studied the economic value of rattan in East Kalimantan to national revenues. In 1989, Seibert and Lahjie reported on traditional systems of honey gathering in the interior of East Kalimantan. Priaksukmana and Amblani (1988) were the first researchers to study the economic profitability of small-holder rattan plantations in middle part of the Mahakam Basin.
Statistics for East Kalimantan from 2001-2004 reported the importance of some NTFPs in this region in terms of the level of extraction (Dinas Kehutanan 2009). However, the volume of extraction is only available for rattan and iron wood shingles. The shortage of data for other products is due to the lack of documentation of NTFP production at village- or district level, and also that district producers do not report their production periodically at the provincial level. This is also one of the reasons why the marketing and development of NTFPs for local income for local people is not recognised by policymakers, since the magnitude of their contribution to the local economy is difficult to quantify.
4.5. Research sites
The Pasir District was formerly a part of the South Kalimantan province. It was registered under the Kewedanaan (District) of Kota Baru. The Sultan of Kutai was a traditional ruler in this region, long before Indonesian independence, and Pasir District became part of East Kalimantan province in 1959, after a long process of negotiation between the community of Pasir and the central government. In fact, the community of Pasir preferred to be part of the province of East Kalimantan, taking into account their past relations with the Sultan of Kutai. For example, the former king of Pasir was married to the daughter of the Sultan (king) of Kutai, an alliance that strengthened the relationship further (Assegaf 1997; Artha 2005).
Following the euphoria of reformation after the Indonesian economic and political crisis in 1997/98, the Pasir District was subdivided into two smaller districts – Pasir and Paser Penajam Utara. This split was based on the Government Regulation No. 7 in 2002, which also stipulated that four sub-districts of Pasir are part of Paser Penajam Utara District.
The present Pasir District is located in the southern part of East Kalimantan. The district covers approximately 11,603.94 km2, which is about 5.47 per cen of the total land area of the province. The district of Pasir is located some 120 km to the southwest of the city of Balikpapan, between 0o 45’-2o27’ and 115o36’-166o57’ east. The total population of Pasir District was 175,000 in 2005 and they inhabit 8 sub districts with a total of 109 villages. The Pasir population mainly comprises migrants from Java,
Economic value of non-timber forest products among Paser Indigenous People of East Kalimantan
82
Sulawesi (Buginese), and immigrants from Sumatra and other parts of Indonesia. A minority of the communities belong to Banjar and the Paser indigenous people.
Local people in Pasir represent a multitude of cultures, languages, dialects and religions. During the past decade, organised and spontaneous migration of single people, families and whole communities from outside and inside East Kalimantan has resulted in a dramatic increase in the population size, density and diversity in the Pasir area. Four major groups can be distinguished: (1) Paser indigenous peoples; a collective term for the people with different cultures and languages but all indigenous to the inland of Pasir. This group is largely Muslim and they primarily practice swidden agriculture; (2) Banjar people, also indigenous to Borneo but originally from South Kalimantan province; they have a strong presence in government, trading and business in Pasir District; (3) Buginese people, a third major group in Pasir District who mainly occupy the coastal area where they work as fishermen and traders of timber; (4) migrants from other provinces; the majority originate from Muslim communities from East Java, Central Java, West Timor, South Sulawesi and Sumatra and they work in state-owned oil palm plantations; and (5) ethnic Chinese descendants who control the distribution of industrial and manufacturing goods in the capital of Pasir District, Tanah Grogot.
Based on the population census in 2009, the main sources of income of the people in the Pasir District are: agricultural crops and oil palm plantations, forest products, coal mining, fisheries and subsistence agriculture systems. The average annual gross domestic product is 600 billion Rupiah or US$ 75 million (US$ 1 = Rp. 8,000).
The origin of the Paser indigenous people is not clear. Different stories reveal that they probably originate from Sulawesi, or that they are a sub tribe of Dayak Benuag from the upper Mahakam River. The last story is supported by the fact that there are numerous similar words used in both languages. Paser indigenous people consist of four sub-ethnic groups: Paser Adang, Paser Samuntai, Paser Tikas, and Paser Balih. Every community has an adat leader selected by the community (Padebang, personal communication, 2004), (University of Indonesia Report 2002), (University of Hasanuddin Report 2002). Weinstock (in Gonner 2002), suggests that people in the Gunung Lumut originate from the Dayak Luangan, a sub-tribal group of Dayak who are found in Meratus and the hinterland of Borneo.
Land use in the Pasir area can be classified into four major categories: forestry, agriculture, settlements, and swampy areas used for wet rice plantation and fish ponds in mangrove areas. The forest area of Pasir consists of production forest, protection forest and conversion forest. Agricultural land consists of shifting cultivation or fallow, oil palm plantation and other agriculture crops. Table 4.4 shows the divisions of land and its area size in the Pasir District.
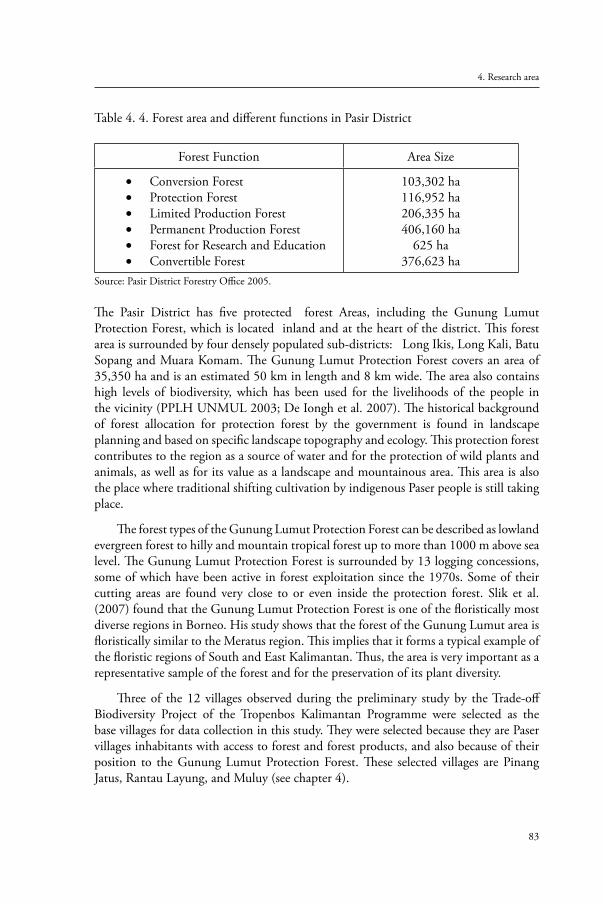
83
4. Research area
Table 4. 4. Forest area and different functions in Pasir District
Forest Function Area Size
Conversion Forest•Protection Forest•Limited Production Forest•Permanent Production Forest•Forest for Research and Education•Convertible Forest•
103,302 ha116,952 ha206,335 ha406,160 ha
625 ha376,623 ha
Source: Pasir District Forestry Office 2005.
The Pasir District has five protected forest Areas, including the Gunung Lumut Protection Forest, which is located inland and at the heart of the district. This forest area is surrounded by four densely populated sub-districts: Long Ikis, Long Kali, Batu Sopang and Muara Komam. The Gunung Lumut Protection Forest covers an area of 35,350 ha and is an estimated 50 km in length and 8 km wide. The area also contains high levels of biodiversity, which has been used for the livelihoods of the people in the vicinity (PPLH UNMUL 2003; De Iongh et al. 2007). The historical background of forest allocation for protection forest by the government is found in landscape planning and based on specific landscape topography and ecology. This protection forest contributes to the region as a source of water and for the protection of wild plants and animals, as well as for its value as a landscape and mountainous area. This area is also the place where traditional shifting cultivation by indigenous Paser people is still taking place.
The forest types of the Gunung Lumut Protection Forest can be described as lowland evergreen forest to hilly and mountain tropical forest up to more than 1000 m above sea level. The Gunung Lumut Protection Forest is surrounded by 13 logging concessions, some of which have been active in forest exploitation since the 1970s. Some of their cutting areas are found very close to or even inside the protection forest. Slik et al. (2007) found that the Gunung Lumut Protection Forest is one of the floristically most diverse regions in Borneo. His study shows that the forest of the Gunung Lumut area is floristically similar to the Meratus region. This implies that it forms a typical example of the floristic regions of South and East Kalimantan. Thus, the area is very important as a representative sample of the forest and for the preservation of its plant diversity.
Three of the 12 villages observed during the preliminary study by the Trade-off Biodiversity Project of the Tropenbos Kalimantan Programme were selected as the base villages for data collection in this study. They were selected because they are Paser villages inhabitants with access to forest and forest products, and also because of their position to the Gunung Lumut Protection Forest. These selected villages are Pinang Jatus, Rantau Layung, and Muluy (see chapter 4).
Economic value of non-timber forest products among Paser Indigenous People of East Kalimantan
84
4.6 The village of Pinang Jatus
The name ‘Pinang Jatus’ originates from the words of Pinang, meaning a palm (Areca catechu) used by villagers as a condiment and for utensils, and Jatus, meaning one hundred or (seratus in Bahasa Indonesia). The history behind this village name was explained to me by Pak Kinken (an old man of Pinang Jatus). He explained that long time ago there was a woman in the old village (before they named it Pinang Jatus), who was found guilty of harvesting a pinang belonging to her neighbour, without permission. Villagers agreed to punish her by forcing her to plant one hundred pinang seedlings in the neighbour’s land. This story indicates the importance of such palms for the people of Pinang Jatus. Indeed the palm is still important for the daily lives of these people today and numerous pinang palm trees can be found in this village.
The community of Pinang Jatus consists of 56 households, with a total of 265 people in 2005). The village is 24 km from the sub-district capital of Simpang Pait and 65 km from the District capital of Tanah Grogot. This village is located in the northern part of the Gunung Lumut Protection Forest. Like other villages in the Gunung Lumut area, the economic situation of Pinang Jatus is poor due to its lack of transportation and low accessibility to the market. The road is muddy and dirty during the rainy seasons and dusty during the dry seasons. Public transport is hard to find during the rainy season and generally only available during dry periods. The transportation facilities to the village are heavily dependent on logging companies.
The people of Pinang Jatus work mainly for subsistence by undertaking shifting cultivation, hunting wild animals and collecting forest plants. They also have small additional cash crops for generating income. During the last decade, the presence of three logging companies nearby (PT. Telake Mandiri Sejahtera, PT. Mentari and PT. Basuimex), has increased the accessibility and the mobility of the people of Pinang Jatus. The change of the transportation system from boating on the river to the use of cars and trucks has had an important impact on the life of Pinang Jatus people.
In the past, when boats were the main form of transportation, the regular market was hard to reach. It could take several weeks to make the journey to the market and to return home. Today, the market can be reached by car, which saves travel time significantly The improved mobility to the market forced people to get find increasing amounts of cash income in order to be able to buy the attractive industrial goods on sale there. . The accessibility of transportation is much better in Pinang Jatus compared to the other two selected villages in the research area. However, the role of the concession area in Pinang Jatus for economic development is not satisfactory if we compare this with the timber extracted by the logging company. It seems that their claim on the natural resources has affected the opportunities for forest exploitation by local people.
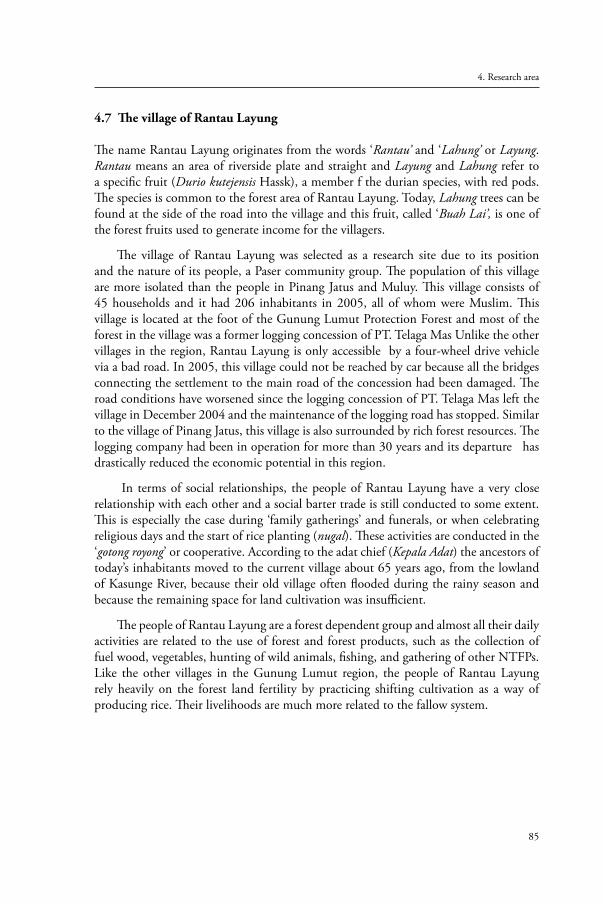
85
4. Research area
4.7 The village of Rantau Layung
The name Rantau Layung originates from the words ‘Rantau’ and ‘Lahung’ or Layung. Rantau means an area of riverside plate and straight and Layung and Lahung refer to a specific fruit (Durio kutejensis Hassk), a member f the durian species, with red pods. The species is common to the forest area of Rantau Layung. Today, Lahung trees can be found at the side of the road into the village and this fruit, called ‘Buah Lai’, is one of the forest fruits used to generate income for the villagers.
The village of Rantau Layung was selected as a research site due to its position and the nature of its people, a Paser community group. The population of this village are more isolated than the people in Pinang Jatus and Muluy. This village consists of 45 households and it had 206 inhabitants in 2005, all of whom were Muslim. This village is located at the foot of the Gunung Lumut Protection Forest and most of the forest in the village was a former logging concession of PT. Telaga Mas Unlike the other villages in the region, Rantau Layung is only accessible by a four-wheel drive vehicle via a bad road. In 2005, this village could not be reached by car because all the bridges connecting the settlement to the main road of the concession had been damaged. The road conditions have worsened since the logging concession of PT. Telaga Mas left the village in December 2004 and the maintenance of the logging road has stopped. Similar to the village of Pinang Jatus, this village is also surrounded by rich forest resources. The logging company had been in operation for more than 30 years and its departure has drastically reduced the economic potential in this region.
In terms of social relationships, the people of Rantau Layung have a very close relationship with each other and a social barter trade is still conducted to some extent. This is especially the case during ‘family gatherings’ and funerals, or when celebrating religious days and the start of rice planting (nugal). These activities are conducted in the ‘gotong royong’ or cooperative. According to the adat chief (Kepala Adat) the ancestors of today’s inhabitants moved to the current village about 65 years ago, from the lowland of Kasunge River, because their old village often flooded during the rainy season and because the remaining space for land cultivation was insufficient.
The people of Rantau Layung are a forest dependent group and almost all their daily activities are related to the use of forest and forest products, such as the collection of fuel wood, vegetables, hunting of wild animals, fishing, and gathering of other NTFPs. Like the other villages in the Gunung Lumut region, the people of Rantau Layung rely heavily on the forest land fertility by practicing shifting cultivation as a way of producing rice. Their livelihoods are much more related to the fallow system.
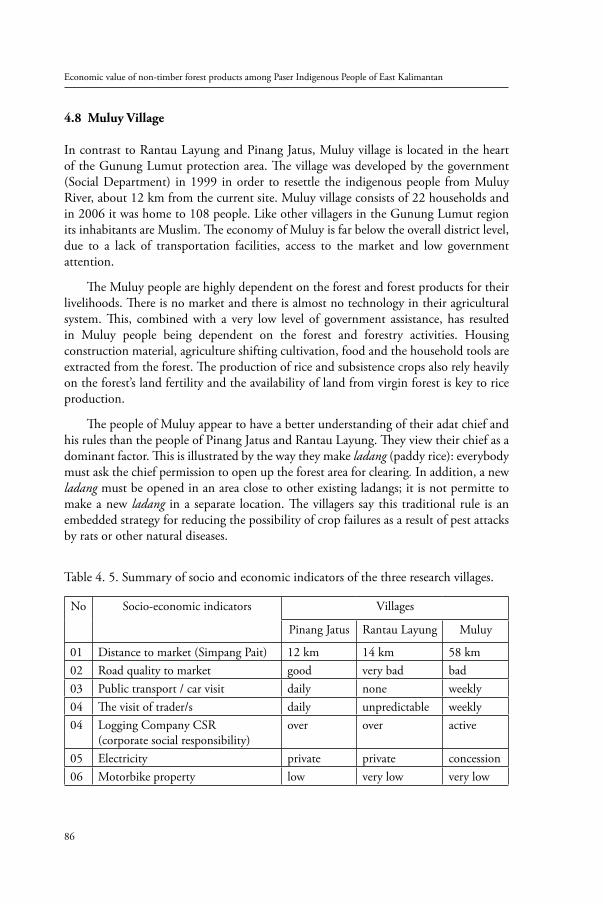
Economic value of non-timber forest products among Paser Indigenous People of East Kalimantan
86
4.8 Muluy Village
In contrast to Rantau Layung and Pinang Jatus, Muluy village is located in the heart of the Gunung Lumut protection area. The village was developed by the government (Social Department) in 1999 in order to resettle the indigenous people from Muluy River, about 12 km from the current site. Muluy village consists of 22 households and in 2006 it was home to 108 people. Like other villagers in the Gunung Lumut region its inhabitants are Muslim. The economy of Muluy is far below the overall district level, due to a lack of transportation facilities, access to the market and low government attention.
The Muluy people are highly dependent on the forest and forest products for their livelihoods. There is no market and there is almost no technology in their agricultural system. This, combined with a very low level of government assistance, has resulted in Muluy people being dependent on the forest and forestry activities. Housing construction material, agriculture shifting cultivation, food and the household tools are extracted from the forest. The production of rice and subsistence crops also rely heavily on the forest’s land fertility and the availability of land from virgin forest is key to rice production.
The people of Muluy appear to have a better understanding of their adat chief and his rules than the people of Pinang Jatus and Rantau Layung. They view their chief as a dominant factor. This is illustrated by the way they make ladang (paddy rice): everybody must ask the chief permission to open up the forest area for clearing. In addition, a new ladang must be opened in an area close to other existing ladangs; it is not permitte to make a new ladang in a separate location. The villagers say this traditional rule is an embedded strategy for reducing the possibility of crop failures as a result of pest attacks by rats or other natural diseases.
Table 4. 5. Summary of socio and economic indicators of the three research villages.
No Socio-economic indicators Villages
Pinang Jatus Rantau Layung Muluy
01 Distance to market (Simpang Pait) 12 km 14 km 58 km 02 Road quality to market good very bad bad 03 Public transport / car visit daily none weekly 04 The visit of trader/s daily unpredictable weekly 04 Logging Company CSR
(corporate social responsibility)over over active
05 Electricity private private concession 06 Motorbike property low very low very low
87
4. Research area
07 Mobility high low very low 08 Communal property low high very high09 Share and barter low high very high 10 The use of cash very high high low 11 Role of adat chief low high very high 12 Claim to forest area(communal) high high high 13 Household claim for land/forest exist not clear not clear 14 Education level low very low very low15 Cooperative culture ‘gotongroyong’ rare strong very strong16 Village status in terms of economy*) swadaya tertinggal tertinggal 17 The involvement in trees cutting high low none 18 Agriculture diversification high low very low 19 The involvement in palm oil high none none 20 The use of NTFP high very high very high 21 The availability of credit (bank loan) very low very low none
*) the status was made by local government in favor of national standard; swadaya = less develop, tertinggal=poor. Source: Field results observation in 2004-2005.
Based on observations from 2004-2005, it seems that this village and its community have a very slow economic and agricultural system. We found that there is almost no innovation in their agriculture and living facilities. The only shift has been the collection of rattan, which began in 2005, following a long period without harvesting. This change was the result of a failure in rice production in 2005, which forced villagers to seek other sources of subsistence.
The fact that the logging concession operating in the area must use the village road to access their sit can be seen as a stroke of luck for the Muluy people, who consequently can claim that there have been many social problems resulting from logging, even though the logging company is currently harvesting far from the village.
4.9 Other comparative village studies
Four other villages were observed during the research period (2004-2007). These villages have similarities in terms of their economic development, number of households (less than 100), ethnicity (all belong to Paser), and religion (Islam). They differ in terms of distance and accessibility to local markets, and the influence of government or logging companies. These villages are: Belimbing (no.4), Rantau Buta (No.5), Uko/Muara Komam (No.7), Swanselotung (No.6), and Simpang Pait, a market centre of the region (see Map 4.2).
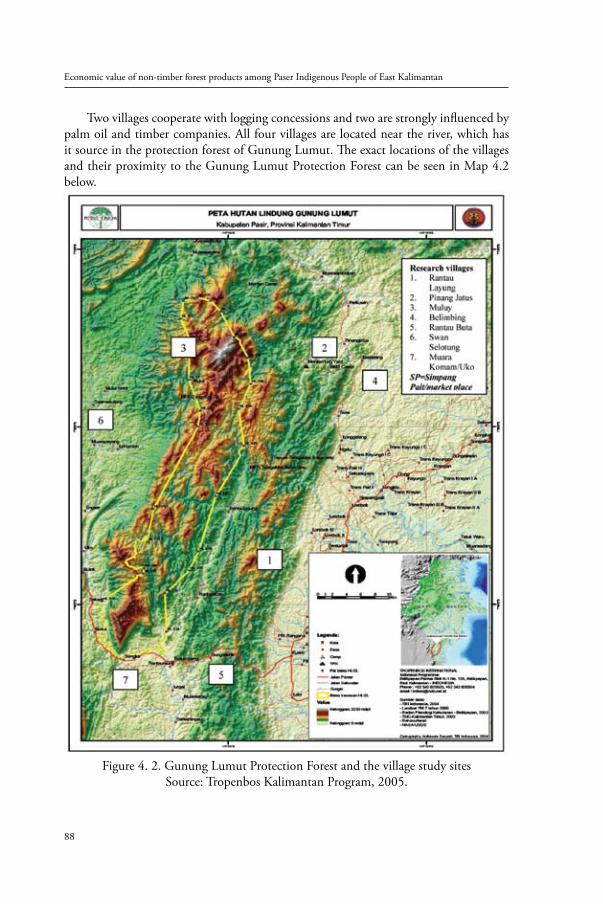
Economic value of non-timber forest products among Paser Indigenous People of East Kalimantan
88
Two villages cooperate with logging concessions and two are strongly influenced by palm oil and timber companies. All four villages are located near the river, which has it source in the protection forest of Gunung Lumut. The exact locations of the villages and their proximity to the Gunung Lumut Protection Forest can be seen in Map 4.2 below.
Figure 4. 2. Gunung Lumut Protection Forest and the village study sitesSource: Tropenbos Kalimantan Program, 2005.
89
Chapter 5
Resource management and the use of non-timber forest products
5.1. Introduction
This chapter aims to describe the resource management and use of non-timber forest products (NTFPs) in the household economy of three Paser villages. Data for this objective were collected by employing various methods: using semi-structured interviews, bookkeeping, focus group discussions, field observations related to forest activities, participatory mapping and plot measurements as have been described in Chapter 3. The identification of plants used was conducted with the assistance of a dendrologist from the Faculty of Forestry of Mulawarman University, Samarinda and the Forest Research Institute of Wanariset at Samboja. The collection of plant specimens was only done if the plants could not be identified in the field. The traditional or local names of the plants were recorded on the basis of information obtained from the field assistant and with the help of people such as adat chiefs, traditional healers, collectors and local hunters.
The plants were categorised based on types of use, as well as on the location where the plant was found or collected by the people. The plant classifications were differentiated into two categories of economic importance – cash generating income and subsistence use. The determination of the possible impact of harvesting on the resource was also analysed by assessing existing harvesting methods.
Observation of traditional land use systems and their role in natural resource management were also made, with the aim of assessing the potential role of culture in resource management. The role of traditional rules in the harvesting and collecting of NTFPs was studied. This was done by observing how people make small rattan gardens, and how they collect wild honey. In addition, how traditional regulations play a role in the competition and mitigation of land claims by villagers was also examined. Finally, at the end of this chapter, a conclusion about resource use is drawn, on the basis of the findings and discussions of the Paser people resource management and their livelihood.
Economic value of non-timber forest products among Paser Indigenous People of East Kalimantan
90
5.1.1 Methods
This chapter is written on the basis of 123 household interviews, field observations, plots measurements, participatory mapping and visits to the nearest markets of the three villages studiedin the period 2004 to 2006. These villages are located in the Paser District and, specifically, in the Gunung Lumut Protection Forest areas. The methods of collecting data and information for this objective have been discussed in Chapter 3.
5.1.2 Research area
Data collection was conducted mainly in the village of Rantau Layung and two other villages – Pinang Jatus and Muluy – were taken for comparison. According to the map produced by the Regional office of Planning and Development of Pasir District in 2003, Rantau Layung village covers approximately 5,000 ha of land, Pinang Jatus is 6,000 ha, and Muluy covers about 8,000 ha. These areas cover primary forests, secondary forests, agricultural and farm areas, rivers, gardens as well as settlements. The total area covered by the three villages within the Gunung Lumut Forest Area, is approximately 52,000 hectares.
5.1.3 Objectives
The main objectives of this chapter are to provide information for further quantification the economic value of NTFPs as will be calculated in Chapter 6. This will be covered by the data about the prominent use of NTFPs, harvesting methods, categories of NTFP use, volume of extraction per household, and the resource distribution of NTFPs. With the aim of assessing the potential role of culture in resource management, we also observed the traditional land use systems and the claims to natural resources. The role played by traditional rules in the competition and mitigation among villagers was also examined. Finally, the conclusion can be drawn that the use of forest and forest products by the indigenous people of Paser plays a substantial role in the rural economy.
5.2 Results: The village study of resource management
My field observation reveals that the basic element of the land use system in the study area is the umo,or ladang (swidden rice field). In each of the three villages, rice is the main crop for most families. The system involves cutting and burning (slash and burn) the forest cover, normally between June and September. Rice (and other crops) are planted and taken care of (weeding, guarding from pests) and finally harvested. In this area, only one rice crop is harvested from the ladang per year.
The development of the rice cultivation area can be easily determined by looking at the fallowand forest areas which have regenerated naturally over long periods of time. (Semok, pers.comm, 2006; see also Colfer et al.1997). The regeneration is possible since the population numbers in the villages are very low in comparison to the availability
91
5. Resource management and the use of non-timber forest products
of the forest area. But in the future this might not be possible as the conversion of forest for non-traditional purposes is increasing year on year (see also Tri 2009). The presence of outsidersin the region encroaching on forest land for business (not for rice cultivation) is having a significant impact and is forcing the local people to reevaluate their use of adat forest and encourages them to claim land for private purposes. Another concern is that adat land can be taken by the local government and then rented out to private companies in the form of HGU.15 A HGU is a special permit, which allows the land or forest area to be managed by a company for a long period, between 20 and 70 years, for the development of palm oil, agriculture or coal mining. In such cases, there is a real possibility of adat rights being disregarded. This increases pressure to distribute adat forest to households in the village. It seems that the demand for recognition of households’ land and certification has increased as awareness of outsiders’ occupation grows and in reaction to the insecurity of adat rights in forest areas.26 This has also changed the attitude of local people from careful husbandry to careless and opportunistic exploitation.
Serious efforts have been made by some adat chiefs to convince and persuade villagers that the worry of losing control of adat forest can be dealt with if the community follows adat rules. However, this command is generally only followed by old families and the chief ’s relatives, and is disregarded by many young families, in particular those who have lived with urban people. On the other hand, the chief himself sometimes disregards adat law and, as is the case in Perkuin and Pinang Jatus, he has made adat forest the property of his family. Such actions make the management of adat forest even harder. Young families tends to seek an easy way of gathering money for the household’s needs and are often involved in selling timber and land to private investors or outsidecompanies. This situation is mainly found in the village close to the area of oil palm plantations and transmigration areas. Forest as common property land can only be maintained in those village areas located in remote parts and with poor access to the market and oil palm plantations, such as in the villages of Rantau Layung and Muluy Interviews with adat chiefs in these villages revealed that:
‘…we are fully committed to serving our community in many activities, from opening land for paddy cultivation, forest products’ collection and rules for the birth and death of men, but we have never been paid by the government like the Kepala Desa have; they sit a few hours in their office for a few days in a month and then they get a salary at the end of month..(Semok, the Adat Chief of Rantau Layung)’.
5 HGU, Hak Guna Usaha is the right to use land, for a period of between 20 to 70 years, and is obtained by private companies from the government for palm oil or other agriculture development. This land allocation is without the consent of the local communities as the land is perceived as belonging to the state forest and part of the conversion forest area. In fact, most of this land has been claimed by local people as belonging to their property.6 Adat law and its claim to forest land in the Gunung Lumut Protection Forest area has been studied by Bakker (2006). His findings reveal that this claim is the subject of ongoing discussions between the community and the local government.
Economic value of non-timber forest products among Paser Indigenous People of East Kalimantan
92
The different roles of adat chiefs and kepala desa are not clear enough to be understood by the villagers; however, to some extent the villagers show more respect to the adat chief, not because the adat chief is older than the kepala desa, but because he is more responsible for villagers’ lifestyle and he has a vision for the village’s future. Unfortunately, this vision is not always understood by the kepala desa, particularly in relation to the exploitation of remnants of the forest area.
The dualism of village leadership has provoked many natural resource conflicts between the followers of adat chiefs and the kepala desas. The villages of Rantau Layung and Pinang Jatus are representative of this current problematic condition of different arguments and visions about how to approach village development.
It can be concluded that the role of adat and its rules in the management of forests and forest products can only be maintained if there is an institutionalisation of adat supported by local and national government. The role of adat in forest preservation seems to be diminished by the presence of outsiders who appear to be influencing younger generations to exploit and redistribute forest areas for household property. Adat chiefs have many difficulties dealing with forest management since there is no clear policy from the local government to support their (adat right) claim to the forest and to prevent forest areas from being occupied by outsiders and private companies. To some extent, adat administration, rules and claims to forest land are viewed by the government as an obstacle to the economic development of villages and, in particular, to plans to exploit forest resources (Padebang, personal communication, 2007). Lack of government support for adat’s role in forest management has reduced the power of the adat chief and this contributes to the degradation of village unity. It has increased the conflict of interests among villagers on forest products and it leads to fragmentation and conversion of their forests.
5.2.1 Traditional land arrangement
If we look at the vegetation of the land, the village of Rantau Layung and Pinang Jatus are encircled by an initial ring of home gardens. Then, there is a ring of farm or shifting cultivation land, including annual crops. This is followed by secondary forest of mixed natural and mature trees. The last ring is an area of primary forest and former logging concessions, the so-called alas nareng.
Figure 5.1 describes the current traditional land use in Rantau Layung, based on a publication by CIFOR (2002) and participatory mapping in 2006. This map shows how the people of Rantau Layung differentiated their village land into several categories. These categories deal largely with the function of the land, the vegetation cover and human influences on the land. The main categories are: home garden, ladang or rice/paddy cultivation, rattan gardens, rubber, oil palm, and forest area (tana alas/alas nareng). These categories determine various factors, such as natural processes, human
93
5. Resource management and the use of non-timber forest products
disturbance and socio-economic purposes. Human disturbance of land, such as logged-over forest area and former shifting cultivation area are categorised as ‘Tana alas and Awa pangeramu’. These traditional terms refer to the main benefits produced from the land and also the historical background of the land.
Tana means soil or land, and alas means forest. The same holds for Awa Pangeramu, which means the land or place where people can collect various forest and non-timber forest products, like rattan and fruits. The name given to the specific land also describes the geography and historical background of the land, in terms of being the source of NTFPs, or crops, or other valuable purposes. The use of a land certificate as the official recognition of the right to land is not common among the villagers. The claims for specific land by certain households are not valid if there is no proof that the land belongs to the family or ancestors. However, household land is acknowledged in particular in favour of descendants from known parents. The recognition of a household’s claim on land is generally through the common understanding of the villagers. There is no clear distinction of land for a newly married couple within the household. They may obtain a new piece of land if they open up a forest area or if it is given to them by their parents.
Economic value of non-timber forest products among Paser Indigenous People of East Kalimantan
94
Source of data:Land use Planning of Pasir District- Topographical map of Pasir- Participatory mapping in Rantau - Layung by PADI (NGO)Mapping of most important NTFPs - resource in Rantau Layung by author 2006.
Figure 5. 1. Current traditional land arangement in Rantau Layung
95
5. Resource management and the use of non-timber forest products
There is usually a common understanding among villagers regarding the recognition of village borders. Field observations reveal that it has become more important for villagers to discuss village borders rather than particular households’ claims for forest land. This issue has become important since the introduction of the policy of decentralization, which granted each village a special right to establish a small-scale timber concession within the forest area belonging to the local community. This right was given by the central government as part of a scheme to find resources for the rural economy and to prevent the threatened rural crisis following the wider Indonesian economic crisis in 1998.
Overlapping land claims between villages is common, especially when there is no village participation and intervillage participatory mapping. Fortunately, this condition has not become a source of serious conflict since the policy of giving small-scale timber concessions to villagers was abolished by the government before the clash occurred.37
One particular claim by a village that forest land belongs to them was recognised by the border villages but others are still in debate. Intervillage borders are usually recognised by natural landscape features such as rivers, stones, mountains or hills, but they can also be man made, such as fallow areas, graves or field huts. There has been no inter-village participatory mapping in the region to bring clarity to overlapping or conflicting claims.
Table 5. 1. Land use system based on traditional categories in Rantau Layung
No Land Use Main formation Main use01 Tana Alas Primary foret/logged over
forestHunting,trees for contruction, Wild honey bees and NTFPs
02 Alas nareng
Secondary forest (old gardens, Fruit and trees )
Hunting, trees for construction, NTFPs
03 Awa Umo Paddy rice cultivation Rice 04 Awa
PangeramuSecondary forest/Lou lati Wild honey, palm wine,
medicinal NTFPs.05 Awa
Pangekulo/Secondary forest of rattan gardens,(Lati Piara)
Rattan, fruit, coffee, NTFPs
06 Tana Ekang
Forest which known to have ghost
Cultural/magic, NTFPs,
07 Straat Area for settlement Housing, home gardens, grave, public facilities
Source: Participatory mapping in 2006.
7 The Ministry of Forestry of Indonesia issued the policy No.310 in 2000 to allow the people around the forest to harvest timber. It designated 100 ha of primary forest area for each family in the village in response to the local people’s demand for reform in the forestry sector. But, this policy was abolished in 2002 because of misinterpretations and its negative impact on forest sustainability (Pioneer 2002).
Economic value of non-timber forest products among Paser Indigenous People of East Kalimantan
96
5.2.1.1 Forest land (tana alas)
My field work showed that the traditional land use system in Rantau Layung can be differentiated into: tana alas = primary forest, awa ngumo, old secondary forest, awa pangeramu, secondary forest (fruit gardens), awa pangekulo fallow areas, and alas nareng the gardens (forest gardens), and the straat, settlement. Each of these land uses has a different function in terms of production, but the great difference is only in the type of vegetation cover and the succession of the trees, as shown in table 5.1.
As previously mentioned, the main vegetation cover of tana alas are natural tree species and, therefore, the use of this land for the collection of trees and non-timber products is frequent. Non-timber products extracted from this land include wild animals (rusa or deer), birds, wild honey and plants for food and medicines. But the extraction of NTFPs in this land is not particularly intensive because of its distance and certain natural features , which can make people scared to enter the land individually. Consequently, the collection of products from this land is usually conducted by groups of people. Indeed, it is hard to find a single person who will enter this area and collect NTFPs all by himself. Alas nareng is land of very old secondary forest. This can be part of the former shifting cultivation and former rattan gardens which are no longer productive because the rattan has already been damaged or has decayed due to the tree canopy that stops the sun from penetrating the undergrowth. This causes shadow or darkness, which prevents the young rattan seedlings from growing.
Lou lati refers to the land used for collecting NTFPs. This land is mainly covered by secondary forest or former logging concessions. Wild animals can be hunted here and the main product of this land is wild honey. Wild honey is produced from the Koompalsia trees that grown on this land. Due to its function as a source of wild honey and animals, this land is seen as being common property and so it is subject to adat regulation. Other products produced from this land are palm wine or sugar wine and medicinal plants.
Awa pangekulo or latipiara is the land used for rattan gardens or other perennial crops such as coffee, and fruit trees. It is also used for cattle. .This land is found in the alluvial soil of riverbanks. Sometimes the area is flooded during the rainy season, and it is close to the settlement area. Most rattan sega (Calamus caecius) cultivation is located in this area. This land is also rich with big trees, some of which are honey trees. People are not allowed to cut these trees because of their position on theriverbank. They are important for soil erosion prevention. This is land used most intensively by the villagers due to its proximity to the houses and its fertility in comparisonwith other land use types.
The land of awa umo, is the current paddy rice cultivation and young fallow areas. This land is a place where people practice rice cultivation and where they have their
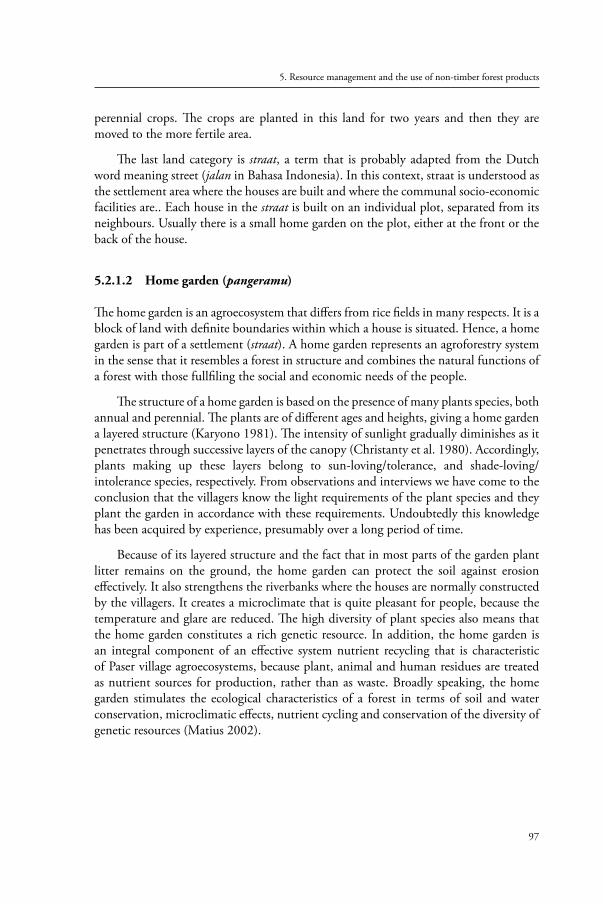
97
5. Resource management and the use of non-timber forest products
perennial crops. The crops are planted in this land for two years and then they are moved to the more fertile area.
The last land category is straat, a term that is probably adapted from the Dutch word meaning street (jalan in Bahasa Indonesia). In this context, straat is understood as the settlement area where the houses are built and where the communal socio-economic facilities are.. Each house in the straat is built on an individual plot, separated from its neighbours. Usually there is a small home garden on the plot, either at the front or the back of the house.
5.2.1.2 Home garden (pangeramu)
The home garden is an agroecosystem that differs from rice fields in many respects. It is a block of land with definite boundaries within which a house is situated. Hence, a home garden is part of a settlement (straat). A home garden represents an agroforestry system in the sense that it resembles a forest in structure and combines the natural functions of a forest with those fullfiling the social and economic needs of the people.
The structure of a home garden is based on the presence of many plants species, both annual and perennial. The plants are of different ages and heights, giving a home garden a layered structure (Karyono 1981). The intensity of sunlight gradually diminishes as it penetrates through successive layers of the canopy (Christanty et al. 1980). Accordingly, plants making up these layers belong to sun-loving/tolerance, and shade-loving/intolerance species, respectively. From observations and interviews we have come to the conclusion that the villagers know the light requirements of the plant species and they plant the garden in accordance with these requirements. Undoubtedly this knowledge has been acquired by experience, presumably over a long period of time.
Because of its layered structure and the fact that in most parts of the garden plant litter remains on the ground, the home garden can protect the soil against erosion effectively. It also strengthens the riverbanks where the houses are normally constructed by the villagers. It creates a microclimate that is quite pleasant for people, because the temperature and glare are reduced. The high diversity of plant species also means that the home garden constitutes a rich genetic resource. In addition, the home garden is an integral component of an effective system nutrient recycling that is characteristic of Paser village agroecosystems, because plant, animal and human residues are treated as nutrient sources for production, rather than as waste. Broadly speaking, the home garden stimulates the ecological characteristics of a forest in terms of soil and water conservation, microclimatic effects, nutrient cycling and conservation of the diversity of genetic resources (Matius 2002).
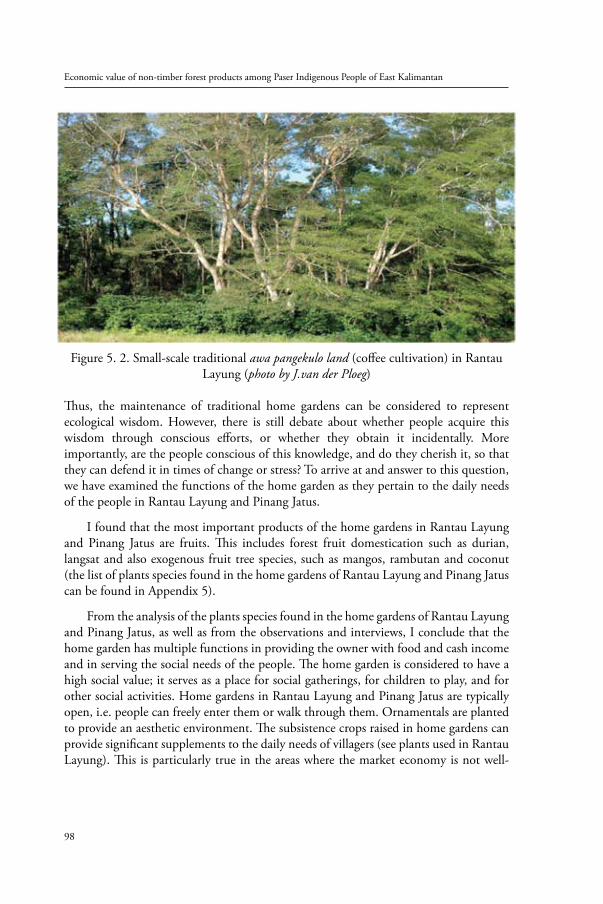
Economic value of non-timber forest products among Paser Indigenous People of East Kalimantan
98
Figure 5. 2. Small-scale traditional awa pangekulo land (coffee cultivation) in Rantau Layung (photo by J.van der Ploeg)
Thus, the maintenance of traditional home gardens can be considered to represent ecological wisdom. However, there is still debate about whether people acquire this wisdom through conscious efforts, or whether they obtain it incidentally. More importantly, are the people conscious of this knowledge, and do they cherish it, so that they can defend it in times of change or stress? To arrive at and answer to this question, we have examined the functions of the home garden as they pertain to the daily needs of the people in Rantau Layung and Pinang Jatus.
I found that the most important products of the home gardens in Rantau Layung and Pinang Jatus are fruits. This includes forest fruit domestication such as durian, langsat and also exogenous fruit tree species, such as mangos, rambutan and coconut (the list of plants species found in the home gardens of Rantau Layung and Pinang Jatus can be found in Appendix 5).
From the analysis of the plants species found in the home gardens of Rantau Layung and Pinang Jatus, as well as from the observations and interviews, I conclude that the home garden has multiple functions in providing the owner with food and cash income and in serving the social needs of the people. The home garden is considered to have a high social value; it serves as a place for social gatherings, for children to play, and for other social activities. Home gardens in Rantau Layung and Pinang Jatus are typically open, i.e. people can freely enter them or walk through them. Ornamentals are planted to provide an aesthetic environment. The subsistence crops raised in home gardens can provide significant supplements to the daily needs of villagers (see plants used in Rantau Layung). This is particularly true in the areas where the market economy is not well-
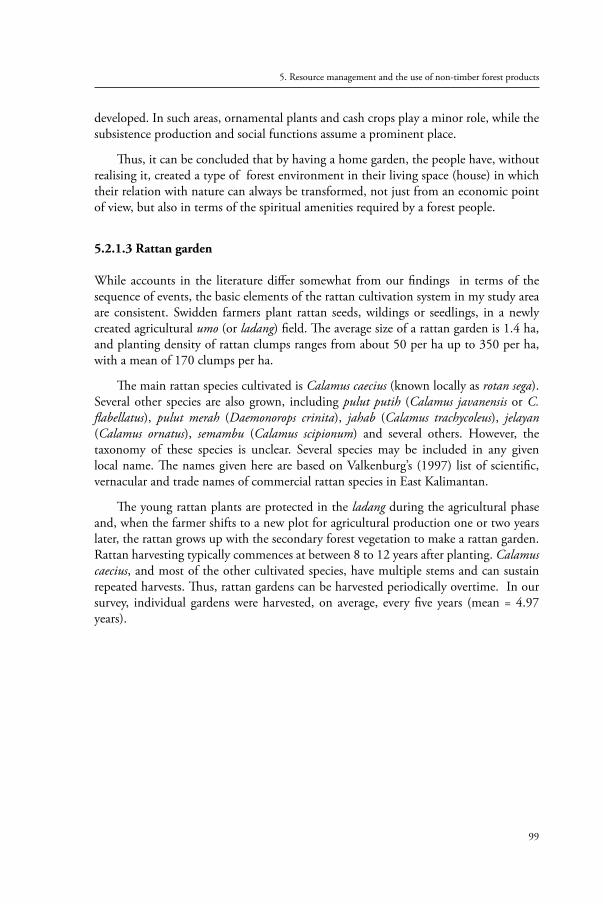
99
5. Resource management and the use of non-timber forest products
developed. In such areas, ornamental plants and cash crops play a minor role, while the subsistence production and social functions assume a prominent place.
Thus, it can be concluded that by having a home garden, the people have, without realising it, created a type of forest environment in their living space (house) in which their relation with nature can always be transformed, not just from an economic point of view, but also in terms of the spiritual amenities required by a forest people.
5.2.1.3 Rattan garden
While accounts in the literature differ somewhat from our findings in terms of the sequence of events, the basic elements of the rattan cultivation system in my study area are consistent. Swidden farmers plant rattan seeds, wildings or seedlings, in a newly created agricultural umo (or ladang) field. The average size of a rattan garden is 1.4 ha, and planting density of rattan clumps ranges from about 50 per ha up to 350 per ha, with a mean of 170 clumps per ha.
The main rattan species cultivated is Calamus caecius (known locally as rotan sega). Several other species are also grown, including pulut putih (Calamus javanensis or C. flabellatus), pulut merah (Daemonorops crinita), jahab (Calamus trachycoleus), jelayan (Calamus ornatus), semambu (Calamus scipionum) and several others. However, the taxonomy of these species is unclear. Several species may be included in any given local name. The names given here are based on Valkenburg’s (1997) list of scientific, vernacular and trade names of commercial rattan species in East Kalimantan.
The young rattan plants are protected in the ladang during the agricultural phase and, when the farmer shifts to a new plot for agricultural production one or two years later, the rattan grows up with the secondary forest vegetation to make a rattan garden. Rattan harvesting typically commences at between 8 to 12 years after planting. Calamus caecius, and most of the other cultivated species, have multiple stems and can sustain repeated harvests. Thus, rattan gardens can be harvested periodically overtime. In our survey, individual gardens were harvested, on average, every five years (mean = 4.97 years).
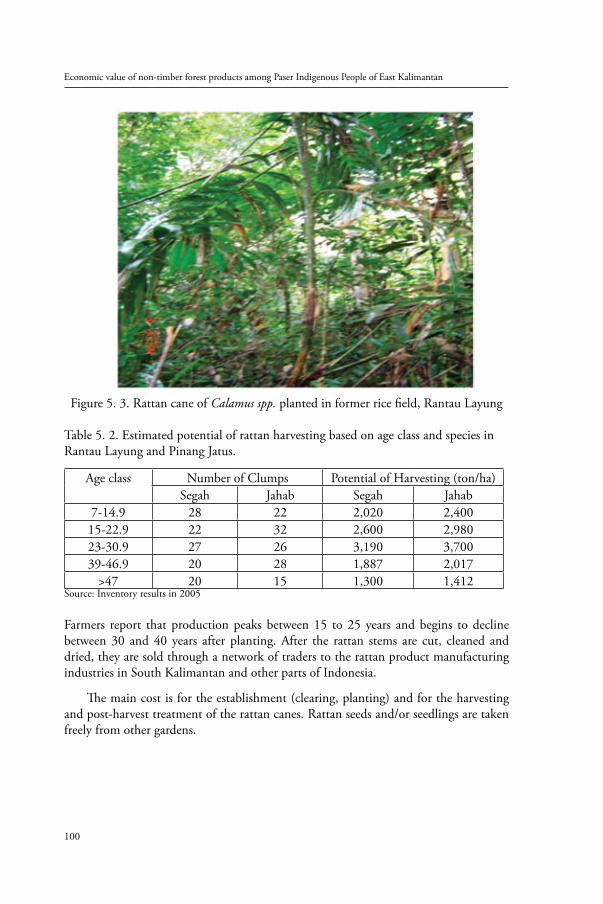
Economic value of non-timber forest products among Paser Indigenous People of East Kalimantan
100
Figure 5. 3. Rattan cane of Calamus spp. planted in former rice field, Rantau Layung
Table 5. 2. Estimated potential of rattan harvesting based on age class and species in Rantau Layung and Pinang Jatus.
Age class Number of Clumps Potential of Harvesting (ton/ha)Segah Jahab Segah Jahab
7-14.9 28 22 2,020 2,40015-22.9 22 32 2,600 2,98023-30.9 27 26 3,190 3,70039-46.9 20 28 1,887 2,017
>47 20 15 1,300 1,412Source: Inventory results in 2005
Farmers report that production peaks between 15 to 25 years and begins to decline between 30 and 40 years after planting. After the rattan stems are cut, cleaned and dried, they are sold through a network of traders to the rattan product manufacturing industries in South Kalimantan and other parts of Indonesia.
The main cost is for the establishment (clearing, planting) and for the harvesting and post-harvest treatment of the rattan canes. Rattan seeds and/or seedlings are taken freely from other gardens.
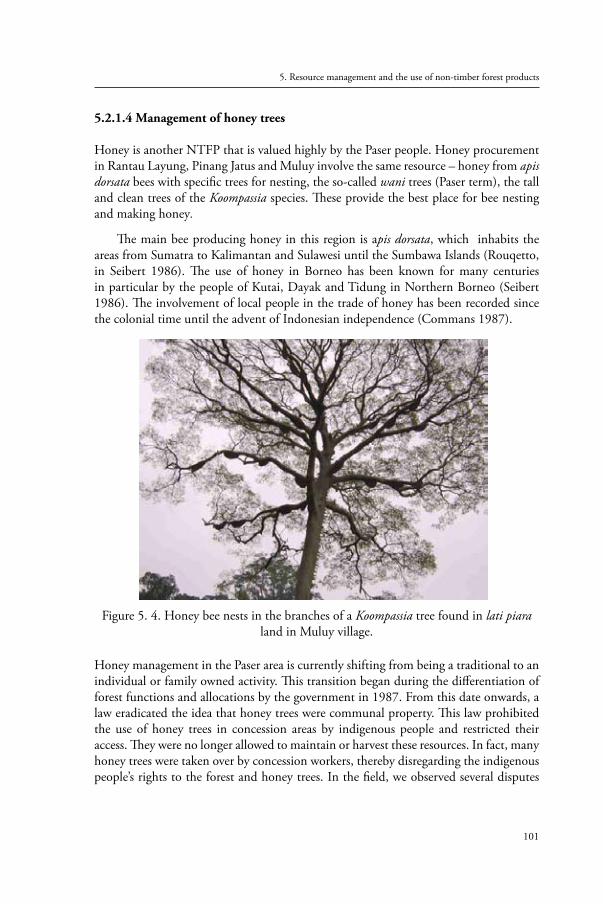
101
5. Resource management and the use of non-timber forest products
5.2.1.4 Management of honey trees
Honey is another NTFP that is valued highly by the Paser people. Honey procurement in Rantau Layung, Pinang Jatus and Muluy involve the same resource – honey from apis dorsata bees with specific trees for nesting, the so-called wani trees (Paser term), the tall and clean trees of the Koompassia species. These provide the best place for bee nesting and making honey.
The main bee producing honey in this region is apis dorsata, which inhabits the areas from Sumatra to Kalimantan and Sulawesi until the Sumbawa Islands (Rouqetto, in Seibert 1986). The use of honey in Borneo has been known for many centuries in particular by the people of Kutai, Dayak and Tidung in Northern Borneo (Seibert 1986). The involvement of local people in the trade of honey has been recorded since the colonial time until the advent of Indonesian independence (Commans 1987).
Figure 5. 4. Honey bee nests in the branches of a Koompassia tree found in lati piara land in Muluy village.
Honey management in the Paser area is currently shifting from being a traditional to an individual or family owned activity. This transition began during the differentiation of forest functions and allocations by the government in 1987. From this date onwards, a law eradicated the idea that honey trees were communal property. This law prohibited the use of honey trees in concession areas by indigenous people and restricted their access. They were no longer allowed to maintain or harvest these resources. In fact, many honey trees were taken over by concession workers, thereby disregarding the indigenous people’s rights to the forest and honey trees. In the field, we observed several disputes
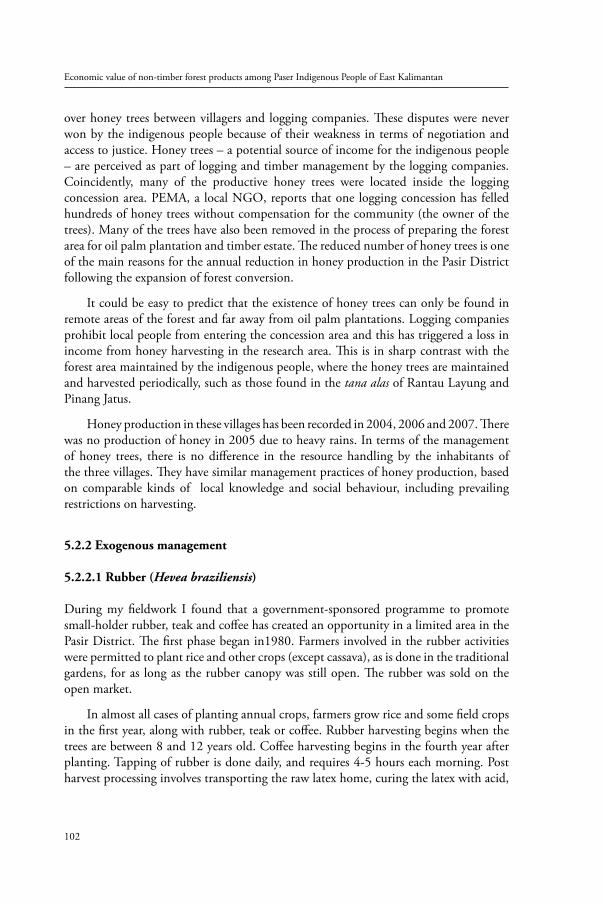
Economic value of non-timber forest products among Paser Indigenous People of East Kalimantan
102
over honey trees between villagers and logging companies. These disputes were never won by the indigenous people because of their weakness in terms of negotiation and access to justice. Honey trees – a potential source of income for the indigenous people – are perceived as part of logging and timber management by the logging companies. Coincidently, many of the productive honey trees were located inside the logging concession area. PEMA, a local NGO, reports that one logging concession has felled hundreds of honey trees without compensation for the community (the owner of the trees). Many of the trees have also been removed in the process of preparing the forest area for oil palm plantation and timber estate. The reduced number of honey trees is one of the main reasons for the annual reduction in honey production in the Pasir District following the expansion of forest conversion.
It could be easy to predict that the existence of honey trees can only be found in remote areas of the forest and far away from oil palm plantations. Logging companies prohibit local people from entering the concession area and this has triggered a loss in income from honey harvesting in the research area. This is in sharp contrast with the forest area maintained by the indigenous people, where the honey trees are maintained and harvested periodically, such as those found in the tana alas of Rantau Layung and Pinang Jatus.
Honey production in these villages has been recorded in 2004, 2006 and 2007. There was no production of honey in 2005 due to heavy rains. In terms of the management of honey trees, there is no difference in the resource handling by the inhabitants of the three villages. They have similar management practices of honey production, based on comparable kinds of local knowledge and social behaviour, including prevailing restrictions on harvesting.
5.2.2 Exogenous management
5.2.2.1 Rubber (Hevea braziliensis)
During my fieldwork I found that a government-sponsored programme to promote small-holder rubber, teak and coffee has created an opportunity in a limited area in the Pasir District. The first phase began in1980. Farmers involved in the rubber activities were permitted to plant rice and other crops (except cassava), as is done in the traditional gardens, for as long as the rubber canopy was still open. The rubber was sold on the open market.
In almost all cases of planting annual crops, farmers grow rice and some field crops in the first year, along with rubber, teak or coffee. Rubber harvesting begins when the trees are between 8 and 12 years old. Coffee harvesting begins in the fourth year after planting. Tapping of rubber is done daily, and requires 4-5 hours each morning. Post harvest processing involves transporting the raw latex home, curing the latex with acid,
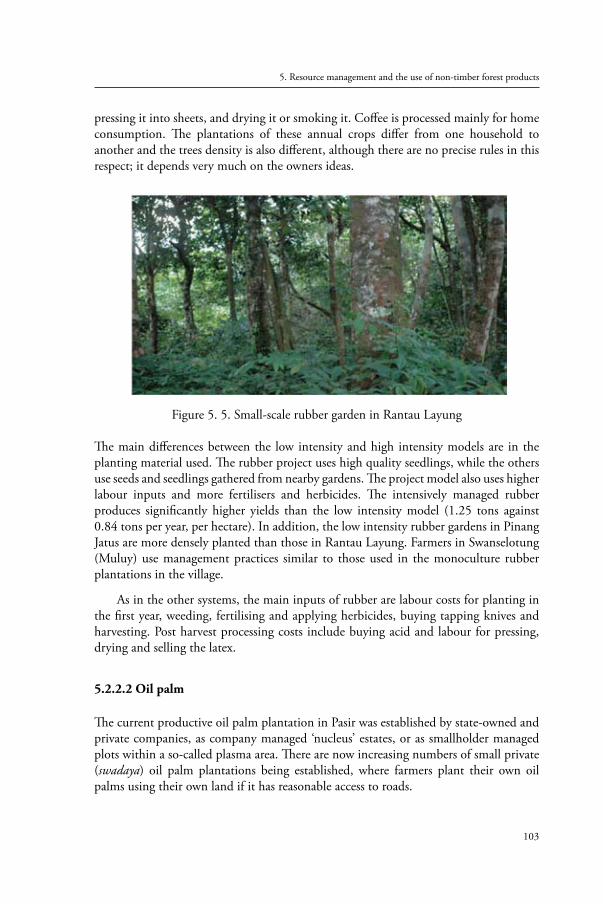
103
5. Resource management and the use of non-timber forest products
pressing it into sheets, and drying it or smoking it. Coffee is processed mainly for home consumption. The plantations of these annual crops differ from one household to another and the trees density is also different, although there are no precise rules in this respect; it depends very much on the owners ideas.
Figure 5. 5. Small-scale rubber garden in Rantau Layung
The main differences between the low intensity and high intensity models are in the planting material used. The rubber project uses high quality seedlings, while the others use seeds and seedlings gathered from nearby gardens. The project model also uses higher labour inputs and more fertilisers and herbicides. The intensively managed rubber produces significantly higher yields than the low intensity model (1.25 tons against 0.84 tons per year, per hectare). In addition, the low intensity rubber gardens in Pinang Jatus are more densely planted than those in Rantau Layung. Farmers in Swanselotung (Muluy) use management practices similar to those used in the monoculture rubber plantations in the village.
As in the other systems, the main inputs of rubber are labour costs for planting in the first year, weeding, fertilising and applying herbicides, buying tapping knives and harvesting. Post harvest processing costs include buying acid and labour for pressing, drying and selling the latex.
5.2.2.2 Oil palm
The current productive oil palm plantation in Pasir was established by state-owned and private companies, as company managed ‘nucleus’ estates, or as smallholder managed plots within a so-called plasma area. There are now increasing numbers of small private (swadaya) oil palm plantations being established, where farmers plant their own oil palms using their own land if it has reasonable access to roads.
Economic value of non-timber forest products among Paser Indigenous People of East Kalimantan
104
In my analysis, I focused on small private plantations of oil palms as these are accessible for individual farmers. The main costs involved are for land clearing, planting, fertilising, herbicides, and tools for harvesting. The main outputs of the traditional system are rice and some fields crops (in year one) and oil palm kernels (beginning in the fourth year). In our sample, the oldest gardens were 27 years. The production of kernel is according to the following assumptions: years 4 to 12 – increased; years 13 to 19 – constant; years 20 to 22 – 15 per centdecrease; years 23 to 25 – 30 per cent decrease (State-owned company of PTP XIII Nusantara 2006).
Figure 5. 6. State-owned oil palm industrial estate in Pasir
5.3 The use of non-timber forest products
5.3.1 Prominent NTFP use
Available statistics for forest products from the Pasir District only list items leaving the district. In the context of this study, the trade volumes for five NTFPs were regularly recorded: rattans (most small size diameter), gaharu (eaglewood), wild honey (apis dorsata), sarang burung (edible birds’ nests), tengkawang (illipe nuts) and penyamakan kulit (reptiles skins for processing) (Forestry Department of Pasir 2005; Department of Trade and Industry of Pasir 2005). The statistical data at district level indicates that the production of NTFPs has been reduced. Every year a number of products have disappeared from the statistical records. This lack of data may be caused by the producers or collectors not reporting their production or sales, but it may also be caused by the fact that the collection or harvesting ceased due to overexploitation (District officer, personal communication, 2005). Products such as eaglewood and animal skins have not been registered in the statistics since 1996 (see Appendix 2).
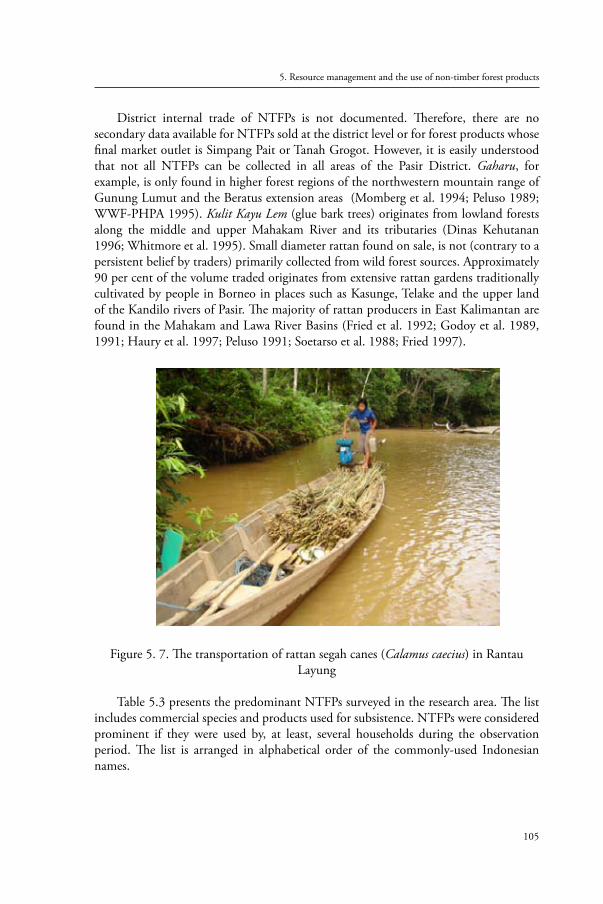
105
5. Resource management and the use of non-timber forest products
District internal trade of NTFPs is not documented. Therefore, there are no secondary data available for NTFPs sold at the district level or for forest products whose final market outlet is Simpang Pait or Tanah Grogot. However, it is easily understood that not all NTFPs can be collected in all areas of the Pasir District. Gaharu, for example, is only found in higher forest regions of the northwestern mountain range of Gunung Lumut and the Beratus extension areas (Momberg et al. 1994; Peluso 1989; WWF-PHPA 1995). Kulit Kayu Lem (glue bark trees) originates from lowland forests along the middle and upper Mahakam River and its tributaries (Dinas Kehutanan 1996; Whitmore et al. 1995). Small diameter rattan found on sale, is not (contrary to a persistent belief by traders) primarily collected from wild forest sources. Approximately 90 per cent of the volume traded originates from extensive rattan gardens traditionally cultivated by people in Borneo in places such as Kasunge, Telake and the upper land of the Kandilo rivers of Pasir. The majority of rattan producers in East Kalimantan are found in the Mahakam and Lawa River Basins (Fried et al. 1992; Godoy et al. 1989, 1991; Haury et al. 1997; Peluso 1991; Soetarso et al. 1988; Fried 1997).
Figure 5. 7. The transportation of rattan segah canes (Calamus caecius) in Rantau Layung
Table 5.3 presents the predominant NTFPs surveyed in the research area. The list includes commercial species and products used for subsistence. NTFPs were considered prominent if they were used by, at least, several households during the observation period. The list is arranged in alphabetical order of the commonly-used Indonesian names.
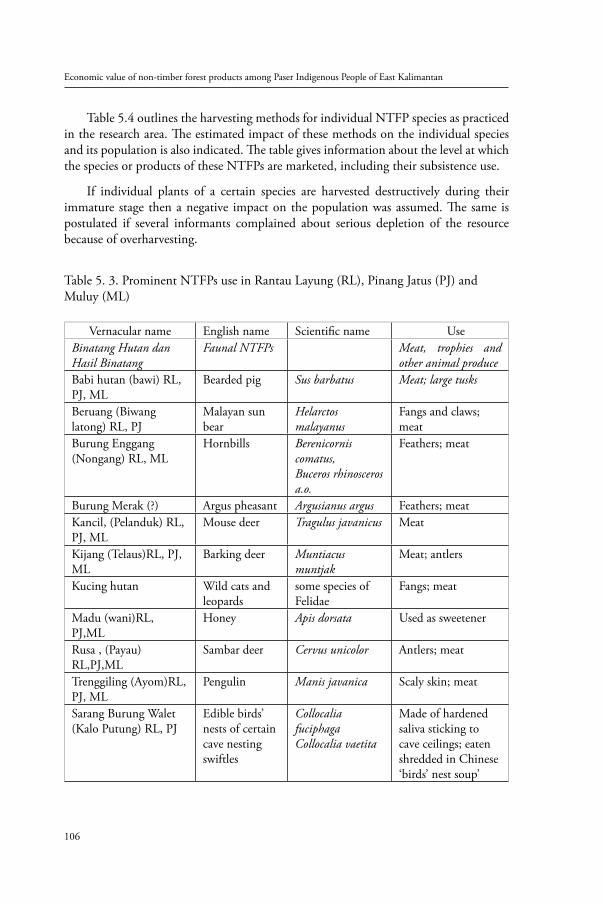
Economic value of non-timber forest products among Paser Indigenous People of East Kalimantan
106
Table 5.4 outlines the harvesting methods for individual NTFP species as practiced in the research area. The estimated impact of these methods on the individual species and its population is also indicated. The table gives information about the level at which the species or products of these NTFPs are marketed, including their subsistence use.
If individual plants of a certain species are harvested destructively during their immature stage then a negative impact on the population was assumed. The same is postulated if several informants complained about serious depletion of the resource because of overharvesting.
Table 5. 3. Prominent NTFPs use in Rantau Layung (RL), Pinang Jatus (PJ) and Muluy (ML)
Vernacular name English name Scientific name UseBinatang Hutan danHasil Binatang
Faunal NTFPs Meat, trophies and other animal produce
Babi hutan (bawi) RL, PJ, ML
Bearded pig Sus barbatus Meat; large tusks
Beruang (Biwang latong) RL, PJ
Malayan sun bear
Helarctos malayanus
Fangs and claws; meat
Burung Enggang (Nongang) RL, ML
Hornbills Berenicornis comatus,Buceros rhinosceros a.o.
Feathers; meat
Burung Merak (?) Argus pheasant Argusianus argus Feathers; meatKancil, (Pelanduk) RL, PJ, ML
Mouse deer Tragulus javanicus Meat
Kijang (Telaus)RL, PJ, ML
Barking deer Muntiacus muntjak
Meat; antlers
Kucing hutan Wild cats and leopards
some species of Felidae
Fangs; meat
Madu (wani)RL, PJ,ML
Honey Apis dorsata Used as sweetener
Rusa , (Payau) RL,PJ,ML
Sambar deer Cervus unicolor Antlers; meat
Trenggiling (Ayom)RL, PJ, ML
Pengulin Manis javanica Scaly skin; meat
Sarang Burung Walet (Kalo Putung) RL, PJ
Edible birds’ nests of certain cave nesting swiftles
Collocalia fuciphagaCollocalia vaetita
Made of hardened saliva sticking to cave ceilings; eaten shredded in Chinese ‘birds’ nest soup’
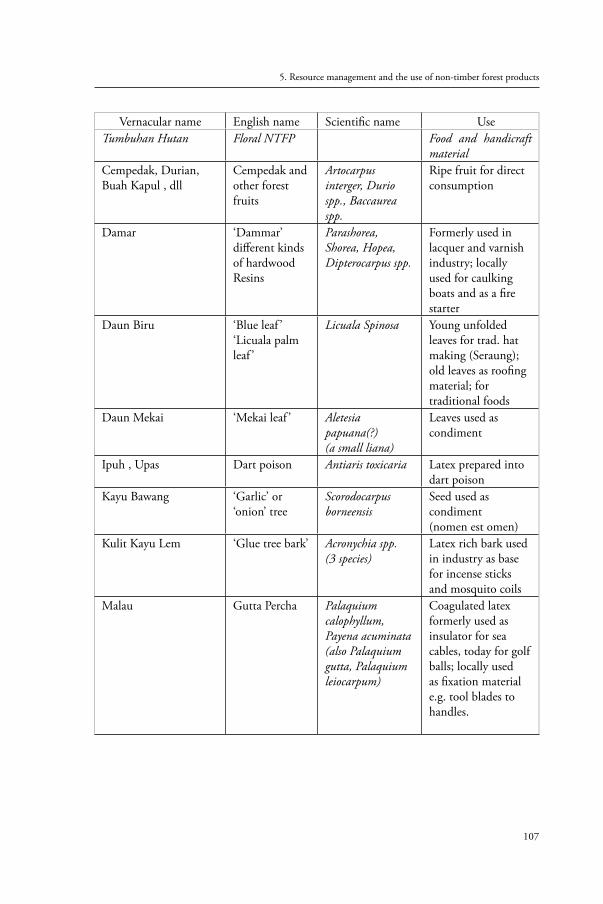
107
5. Resource management and the use of non-timber forest products
Vernacular name English name Scientific name UseTumbuhan Hutan Floral NTFP Food and handicraft
materialCempedak, Durian, Buah Kapul , dll
Cempedak and other forest fruits
Artocarpus interger, Durio spp., Baccaurea spp.
Ripe fruit for direct consumption
Damar ‘Dammar’ different kinds of hardwood Resins
Parashorea, Shorea, Hopea, Dipterocarpus spp.
Formerly used in lacquer and varnish industry; locally used for caulking boats and as a fire starter
Daun Biru ‘Blue leaf ’‘Licuala palm leaf ’
Licuala Spinosa Young unfolded leaves for trad. hat making (Seraung); old leaves as roofing material; for traditional foods
Daun Mekai ‘Mekai leaf ’ Aletesia papuana(?)(a small liana)
Leaves used as condiment
Ipuh , Upas Dart poison Antiaris toxicaria Latex prepared into dart poison
Kayu Bawang ‘Garlic’ or ‘onion’ tree
Scorodocarpus borneensis
Seed used as condiment (nomen est omen)
Kulit Kayu Lem ‘Glue tree bark’ Acronychia spp.(3 species)
Latex rich bark used in industry as base for incense sticks and mosquito coils
Malau Gutta Percha Palaquium calophyllum,Payena acuminata (also Palaquium gutta, Palaquium leiocarpum)
Coagulated latex formerly used as insulator for sea cables, today for golf balls; locally used as fixation material e.g. tool blades to handles.
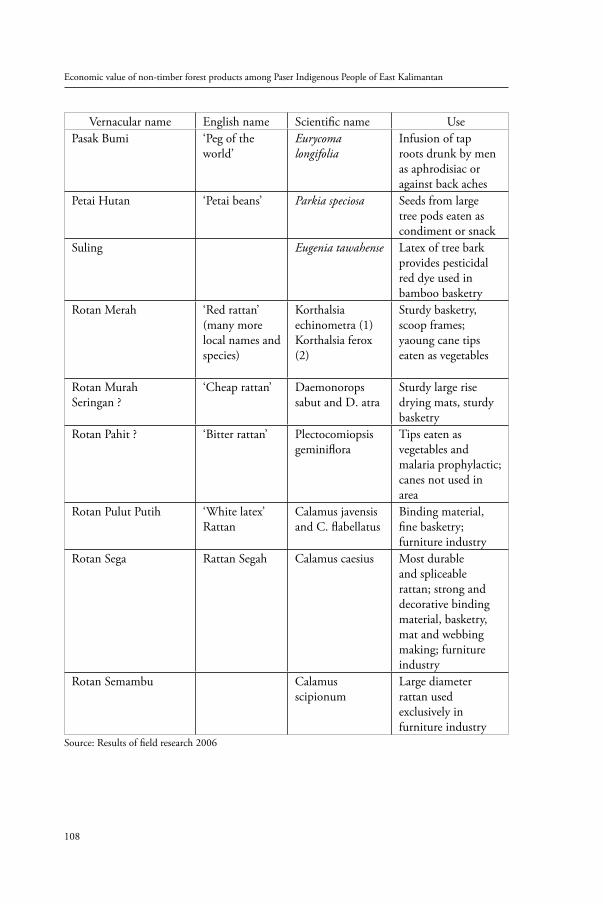
Economic value of non-timber forest products among Paser Indigenous People of East Kalimantan
108
Vernacular name English name Scientific name UsePasak Bumi ‘Peg of the
world’Eurycoma longifolia
Infusion of tap roots drunk by men as aphrodisiac or against back aches
Petai Hutan ‘Petai beans’ Parkia speciosa Seeds from large tree pods eaten as condiment or snack
Suling Eugenia tawahense Latex of tree bark provides pesticidal red dye used in bamboo basketry
Rotan Merah ‘Red rattan’ (many more local names and species)
Korthalsia echinometra (1)Korthalsia ferox (2)
Sturdy basketry, scoop frames; yaoung cane tips eaten as vegetables
Rotan MurahSeringan ?
‘Cheap rattan’ Daemonorops sabut and D. atra
Sturdy large rise drying mats, sturdy basketry
Rotan Pahit ? ‘Bitter rattan’ Plectocomiopsis geminiflora
Tips eaten as vegetables and malaria prophylactic; canes not used in area
Rotan Pulut Putih ‘White latex’ Rattan
Calamus javensis and C. flabellatus
Binding material, fine basketry; furniture industry
Rotan Sega Rattan Segah Calamus caesius Most durable and spliceable rattan; strong and decorative binding material, basketry, mat and webbing making; furniture industry
Rotan Semambu Calamus scipionum
Large diameter rattan used exclusively in furniture industry
Source: Results of field research 2006
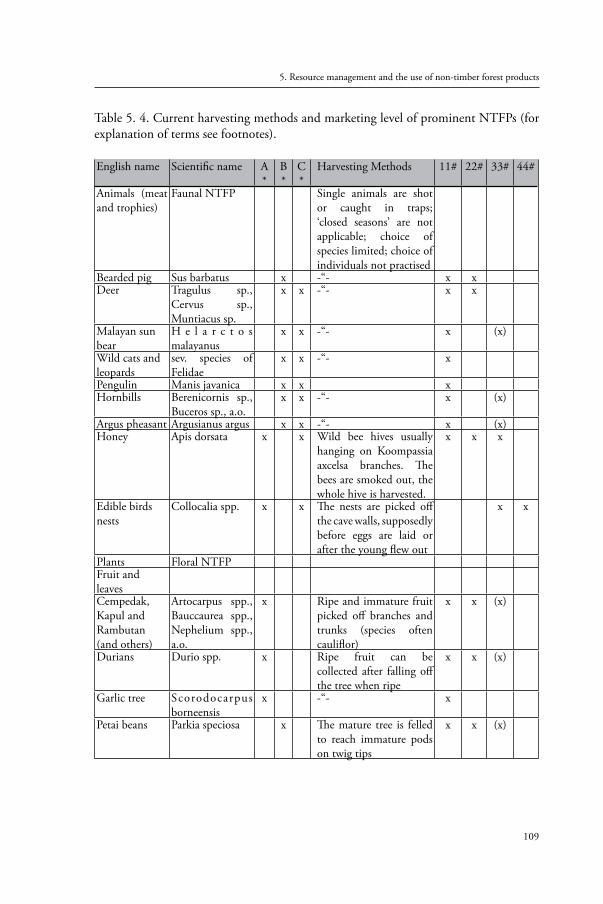
109
5. Resource management and the use of non-timber forest products
Table 5. 4. Current harvesting methods and marketing level of prominent NTFPs (for explanation of terms see footnotes).
English name Scientific name A*
B*
C*
Harvesting Methods 11# 22# 33# 44#
Animals (meat and trophies)
Faunal NTFP Single animals are shot or caught in traps; ‘closed seasons’ are not applicable; choice of species limited; choice of individuals not practised
Bearded pig Sus barbatus x -“- x xDeer Tragulus sp.,
Cervus sp., Muntiacus sp.
x x -“- x x
Malayan sun bear
H e l a r c t o s malayanus
x x -“- x (x)
Wild cats and leopards
sev. species of Felidae
x x -“- x
Pengulin Manis javanica x x xHornbills Berenicornis sp.,
Buceros sp., a.o.x x -“- x (x)
Argus pheasant Argusianus argus x x -“- x (x)Honey Apis dorsata x x Wild bee hives usually
hanging on Koompassia axcelsa branches. The bees are smoked out, the whole hive is harvested.
x x x
Edible birds nests
Collocalia spp. x x The nests are picked off the cave walls, supposedly before eggs are laid or after the young flew out
x x
Plants Floral NTFPFruit and leavesCempedak, Kapul and Rambutan (and others)
Artocarpus spp., Bauccaurea spp., Nephelium spp., a.o.
x Ripe and immature fruit picked off branches and trunks (species often cauliflor)
x x (x)
Durians Durio spp. x Ripe fruit can be collected after falling off the tree when ripe
x x (x)
Garlic tree Scorodocarpus borneensis
x -“- x
Petai beans Parkia speciosa x The mature tree is felled to reach immature pods on twig tips
x x (x)
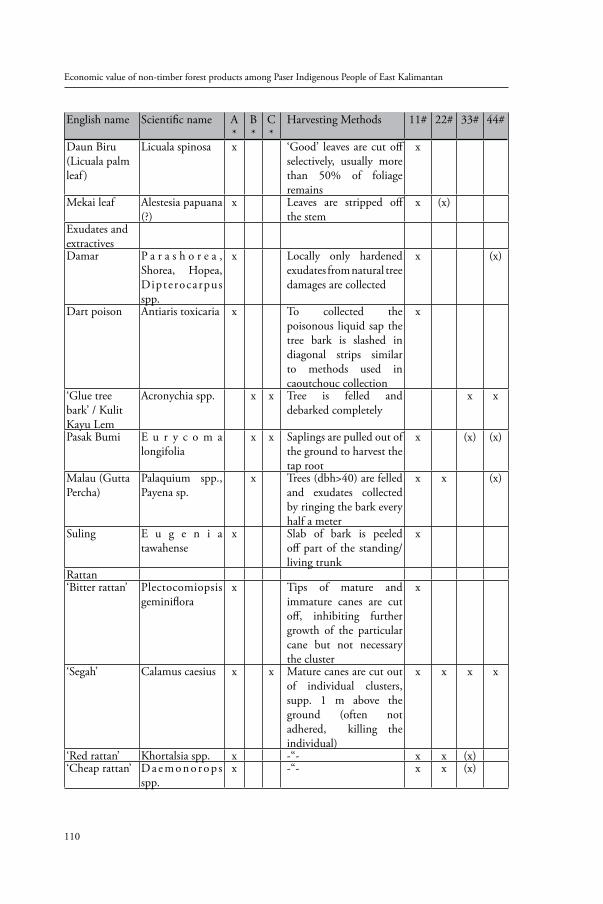
Economic value of non-timber forest products among Paser Indigenous People of East Kalimantan
110
English name Scientific name A*
B*
C*
Harvesting Methods 11# 22# 33# 44#
Daun Biru(Licuala palm leaf )
Licuala spinosa x ‘Good’ leaves are cut off selectively, usually more than 50% of foliage remains
x
Mekai leaf Alestesia papuana (?)
x Leaves are stripped off the stem
x (x)
Exudates and extractivesDamar P a r a s h o r e a ,
Shorea, Hopea, Dipterocarpus spp.
x Locally only hardened exudates from natural tree damages are collected
x (x)
Dart poison Antiaris toxicaria x To collected the poisonous liquid sap the tree bark is slashed in diagonal strips similar to methods used in caoutchouc collection
x
‘Glue tree bark’ / Kulit Kayu Lem
Acronychia spp. x x Tree is felled and debarked completely
x x
Pasak Bumi E u r y c o m a longifolia
x x Saplings are pulled out of the ground to harvest the tap root
x (x) (x)
Malau (Gutta Percha)
Palaquium spp., Payena sp.
x Trees (dbh>40) are felled and exudates collected by ringing the bark every half a meter
x x (x)
Suling E u g e n i a tawahense
x Slab of bark is peeled off part of the standing/living trunk
x
Rattan ‘Bitter rattan’ Plectocomiopsis
geminiflorax Tips of mature and
immature canes are cut off, inhibiting further growth of the particular cane but not necessary the cluster
x
‘Segah’ Calamus caesius x x Mature canes are cut out of individual clusters, supp. 1 m above the ground (often not adhered, killing the individual)
x x x x
‘Red rattan’ Khortalsia spp. x -“- x x (x)‘Cheap rattan’ Da e m o n o ro p s
spp.x -“- x x (x)
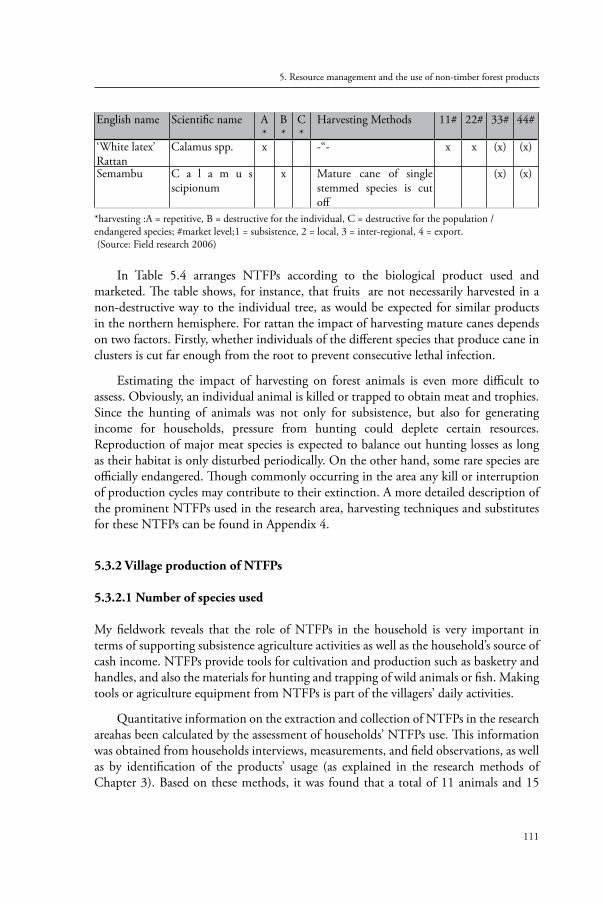
111
5. Resource management and the use of non-timber forest products
English name Scientific name A*
B*
C*
Harvesting Methods 11# 22# 33# 44#
‘White latex’ Rattan
Calamus spp. x -“- x x (x) (x)
Semambu C a l a m u s scipionum
x Mature cane of single stemmed species is cut off
(x) (x)
*harvesting :A = repetitive, B = destructive for the individual, C = destructive for the population /endangered species; #market level;1 = subsistence, 2 = local, 3 = inter-regional, 4 = export. (Source: Field research 2006)
In Table 5.4 arranges NTFPs according to the biological product used and marketed. The table shows, for instance, that fruits are not necessarily harvested in a non-destructive way to the individual tree, as would be expected for similar products in the northern hemisphere. For rattan the impact of harvesting mature canes depends on two factors. Firstly, whether individuals of the different species that produce cane in clusters is cut far enough from the root to prevent consecutive lethal infection.
Estimating the impact of harvesting on forest animals is even more difficult to assess. Obviously, an individual animal is killed or trapped to obtain meat and trophies. Since the hunting of animals was not only for subsistence, but also for generating income for households, pressure from hunting could deplete certain resources. Reproduction of major meat species is expected to balance out hunting losses as long as their habitat is only disturbed periodically. On the other hand, some rare species are officially endangered. Though commonly occurring in the area any kill or interruption of production cycles may contribute to their extinction. A more detailed description of the prominent NTFPs used in the research area, harvesting techniques and substitutes for these NTFPs can be found in Appendix 4.
5.3.2 Village production of NTFPs
5.3.2.1 Number of species used
My fieldwork reveals that the role of NTFPs in the household is very important in terms of supporting subsistence agriculture activities as well as the household’s source of cash income. NTFPs provide tools for cultivation and production such as basketry and handles, and also the materials for hunting and trapping of wild animals or fish. Making tools or agriculture equipment from NTFPs is part of the villagers’ daily activities.
Quantitative information on the extraction and collection of NTFPs in the research areahas been calculated by the assessment of households’ NTFPs use. This information was obtained from households interviews, measurements, and field observations, as well as by identification of the products’ usage (as explained in the research methods of Chapter 3). Based on these methods, it was found that a total of 11 animals and 15
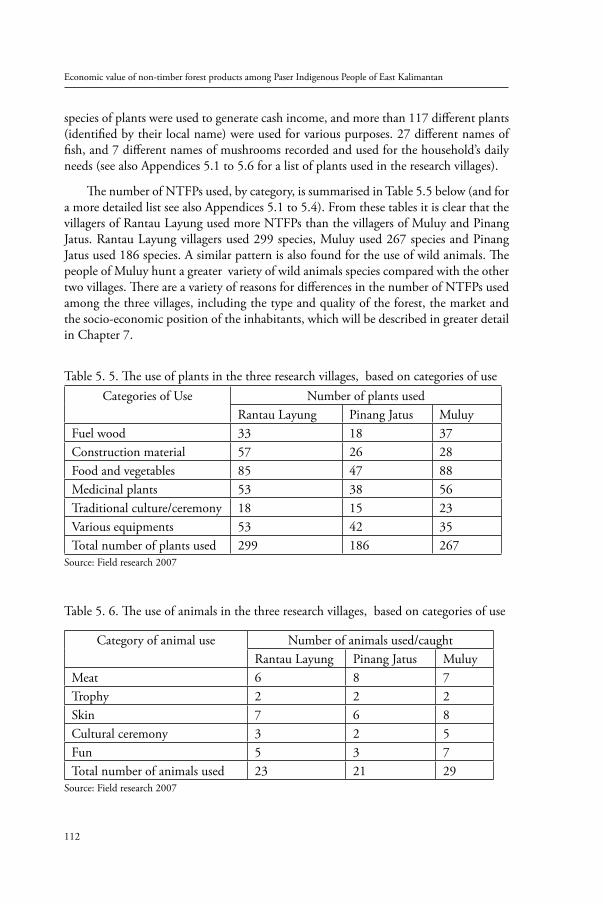
Economic value of non-timber forest products among Paser Indigenous People of East Kalimantan
112
species of plants were used to generate cash income, and more than 117 different plants (identified by their local name) were used for various purposes. 27 different names of fish, and 7 different names of mushrooms recorded and used for the household’s daily needs (see also Appendices 5.1 to 5.6 for a list of plants used in the research villages).
The number of NTFPs used, by category, is summarised in Table 5.5 below (and for a more detailed list see also Appendices 5.1 to 5.4). From these tables it is clear that the villagers of Rantau Layung used more NTFPs than the villagers of Muluy and Pinang Jatus. Rantau Layung villagers used 299 species, Muluy used 267 species and Pinang Jatus used 186 species. A similar pattern is also found for the use of wild animals. The people of Muluy hunt a greater variety of wild animals species compared with the other two villages. There are a variety of reasons for differences in the number of NTFPs used among the three villages, including the type and quality of the forest, the market and the socio-economic position of the inhabitants, which will be described in greater detail in Chapter 7.
Table 5. 5. The use of plants in the three research villages, based on categories of useCategories of Use Number of plants used
Rantau Layung Pinang Jatus MuluyFuel wood 33 18 37Construction material 57 26 28Food and vegetables 85 47 88Medicinal plants 53 38 56Traditional culture/ceremony 18 15 23Various equipments 53 42 35Total number of plants used 299 186 267
Source: Field research 2007
Table 5. 6. The use of animals in the three research villages, based on categories of use
Category of animal use Number of animals used/caughtRantau Layung Pinang Jatus Muluy
Meat 6 8 7Trophy 2 2 2Skin 7 6 8Cultural ceremony 3 2 5Fun 5 3 7Total number of animals used 23 21 29
Source: Field research 2007
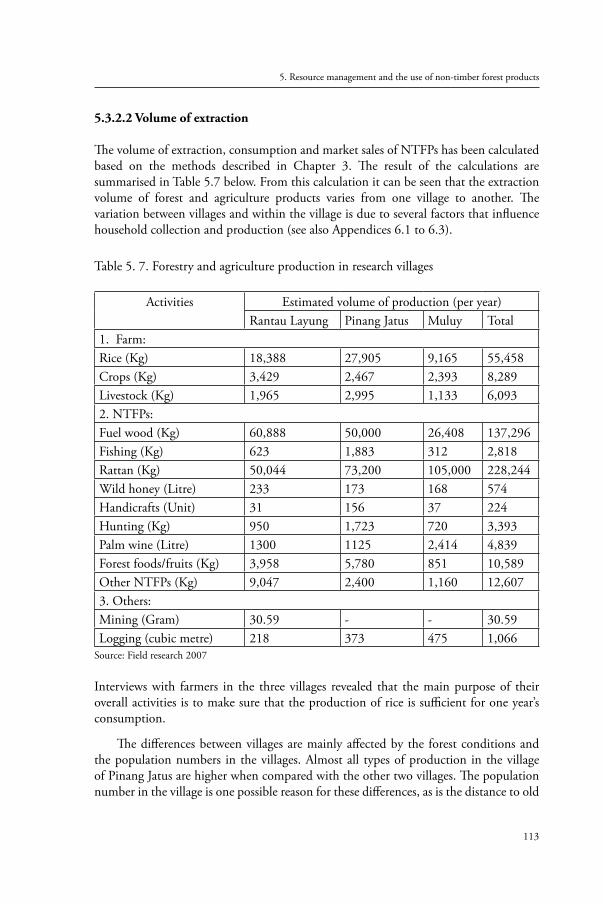
113
5. Resource management and the use of non-timber forest products
5.3.2.2 Volume of extraction
The volume of extraction, consumption and market sales of NTFPs has been calculated based on the methods described in Chapter 3. The result of the calculations are summarised in Table 5.7 below. From this calculation it can be seen that the extraction volume of forest and agriculture products varies from one village to another. The variation between villages and within the village is due to several factors that influence household collection and production (see also Appendices 6.1 to 6.3).
Table 5. 7. Forestry and agriculture production in research villages
Activities Estimated volume of production (per year)Rantau Layung Pinang Jatus Muluy Total
1. Farm:Rice (Kg) 18,388 27,905 9,165 55,458Crops (Kg) 3,429 2,467 2,393 8,289Livestock (Kg) 1,965 2,995 1,133 6,0932. NTFPs:Fuel wood (Kg) 60,888 50,000 26,408 137,296Fishing (Kg) 623 1,883 312 2,818Rattan (Kg) 50,044 73,200 105,000 228,244Wild honey (Litre) 233 173 168 574Handicrafts (Unit) 31 156 37 224Hunting (Kg) 950 1,723 720 3,393Palm wine (Litre) 1300 1125 2,414 4,839Forest foods/fruits (Kg) 3,958 5,780 851 10,589Other NTFPs (Kg) 9,047 2,400 1,160 12,6073. Others:Mining (Gram) 30.59 - - 30.59Logging (cubic metre) 218 373 475 1,066
Source: Field research 2007
Interviews with farmers in the three villages revealed that the main purpose of their overall activities is to make sure that the production of rice is sufficient for one year’s consumption.
The differences between villages are mainly affected by the forest conditions and the population numbers in the villages. Almost all types of production in the village of Pinang Jatus are higher when compared with the other two villages. The population number in the village is one possible reason for these differences, as is the distance to old
Economic value of non-timber forest products among Paser Indigenous People of East Kalimantan
114
growth forest, land fertility and the accessibility to markets. Based on the calculations for all villages, it is clear that rice production reaches the highest volume of all 14 main activities, followed by rattan and fuel wood collection in the forestry sector. The three villages have similar patterns of subsistence, which are mainly based on slash-and-burn agriculture and collection of forest products. More detailed household production is shown in Appendices 6.1 to 6.3.
5.3.3 NTFP collectors and users groups
5.3.3.1 NTFP collectors
NTFP collection in primary forests was almost exclusively conducted by men. Bachelors are usually the only ones willing to spend long periods of time in the forest. Today, most of the NTFP harvest is used for subsistence and collection takes place simultaneously while working in the forest fields or in the forest gardens. Yields are taken home and processed. Traditional specialities, like collection of dart poison and medicinal plants, are the only NTFPs actively searched for by older men.
Useful NTFPs sighted on long hunting trips are remembered for later collection rather than harvested on the spot. Special collecting trips may be planned to pick up these products. Hunting is done by men of all ages as long as they still feel strongh enough. Young men prefer to hunt with trained dogs and shotguns (usually handmade). Night hunts are also common along the former logging roads with the help of flashlights and motorbikes. Older men and market-oriented hunters prefer to establish long semi-permanent noose-trap lines at walking distance from their villages or near farm huts. Traditional blow piping is rarely practiced. A few older men still use the blow pipes to ward off birds and small mammals from home gardens or cash crop plantations.
Special working groups are formed to collect marketable forest species and when large quantities are sought. Collection trips usually last between one and three weeks. Such trips are often funded by traders who provide loans to be paid back using the targeted forest product. Claimed interest and security of a buyer is often the initial incentive for commercial NTFP collection. In Rantau Layung and Pinang Jatus no commercial NTFP harvesting party was active as prices offered were not considered profitable enough. Groups of Javanese and Timorese people living in transmigration areas close to oil palm plantations however collected fruits and were also involved in hunting within the Rantau Layung territory during the research period.
‘Women do not go into the primary forest’. This was the predominant answer of female and male informants to the question of whether women ever collect NTFPs from primary forest. Though women are primarily in charge of collecting wild plants for cooking, women do so exclusively in their fields and fallows and alongside rivers near settlements. Even old growth forests bordering their farms are rarely entered by women. NTFP collection groups of mixed gender are an exception to the rule. They are
115
5. Resource management and the use of non-timber forest products
occasionally formed for a one or two day trip to collect large amounts of NTFP that are of special interest to women. Sometimes an unmarried women and her relatives may join commercial NTFP collection trips as helpers or as camp cooks with equal profit sharing, as is often the case of wild honey harvesting.
5.3.3.2 NTFPs user groups
The type of people using certain NTFPs differs almost with each product. Gender, age and socio-economic conditions are criteria delimitating distinct user groups. No single group can be considered more dependent on certain NTFPs than any other. Only one type of household may be called independent of NTFPs. In the following paragraphs I will provide more information on the types of user groups and the range of NTFPs that are collected by them.
Because of the relatively strict traditional division of labour, some materials are processed only by men (e.g. damar, ipuh, malau), others only by women (daun biru,dDaun mekai, suling). The final products may be used by all members of the household (e.g. diverse types of food, hats, caulked boats and strong farm tools). Other materials are processed by both sexes at different stages (e.g. rattan and game), while the use of the final product is traditionally allocated to one group only (e.g. certain types of rattan for baskets).
Older people usually prefer to use NTFPs rather than their modern substitutes for subsistence. Reasons observed are: (a) familiarity with typical NTFP characteristics; (b) distinct product qualities of NTFPs and substitutes; and (c) the historical/traditional or emotional value of certain NTFPs. An exception is the use of medicinal plants. Older people prefer traditional medicines for fighting diseases above the use of modern medicines.
By contrast, young people prefer industrial goods to forest products where available. It takes less time and knowledge to buy ready-made items than to collect and prepare certain products. The modern image of these products is that they are highly valued. Due to this disinterest, most young people born in the research area have not learned to identify the forest plants, even though some of them are still used by their parents.
5.3.3.3 Contribution of NTFP to subsistence
The collection of most NTFPs needed for subsistence is a task that can be dealt with in one or two days per year, per product (e.g. damar, ipoh, suling). These are special products that are rarely used. These NTFPs are considered sufficiently available, replaceable or indispensable. Consequently, they have not developed a local market price and have been neglected in the analysis.
Economic value of non-timber forest products among Paser Indigenous People of East Kalimantan
116
In general NTFP collection for subsistence takes place:in old growth forest adjacent to fields and young fallows (• tana alas), while working on the farm fields or while harvesting rattan, and •during hiking trips. Sometimes special boat trips are made to specific NTFP •sites further away, deeper into the forest. These are sites that have usually been detected during earlier hunting or honey harvesting trips.
Only hunting is a fairly regular NTFP related activity. It is valued even if the result is not predictable or satisfying. A successful hunter is highly esteemed in the community. Hunting is actually called a hobby by many men.
Cultivation of some prominent forest fruits and rattan species for subsistence is practiced in local mixed orchards and home gardens. All households in Rantau Layung and Pinang Jatus planted a few seedlings of local NTFP rattan species like the small-diameter rattan of Calamus caecius. In Pinang Jatus, cash crops and introduced fruit species dominate local agroforestry systems and especially home gardens. Cultivation of rattan and other NTFPs for subsistence are also reported in Muluy.
5.3.3.4 NTFP in nutrition
Over a period of half a year (May to November 2005) 21 households could be convinced to keep food diaries. Only meals with rice are considered ‘real food’ and diary keepers noted only side dishes cooked and served along with this staple food. For example, they failed to note consumption of fresh fruit and baked sweets that are sometimes served for breakfast or as a snack. In addition, no distinct information was obtained on the amounts eaten per day. However, a total of 2,186 family days dish combinations were recorded, accounting for almost 5,500 meals (2.5 meals a day). Furthermore, the average number of meals containing game, fish, wild vegetables and/or edible forest plants could be calculated.
5.3.3.5 Vegetables
Most vegetables consumed are seasonal and perennial species are inter-cropped in rain fed rice fields or cultivated in home gardens (see table 5.8). In addition, 33 wild growing plant species were eaten in the village as a vegetable, condiment or relish. Further differentiation of habitat and origin revealed the following: 4 species have been introduced into the area as farm crops but run wild, with no further need of tending (e.g. bamboo); 21 species depend on open (disturbed) sites such as riverbanks and young fallows (e.g. ferns and several Zigniberaceae); 8 species are collected primarily in old growth forest.
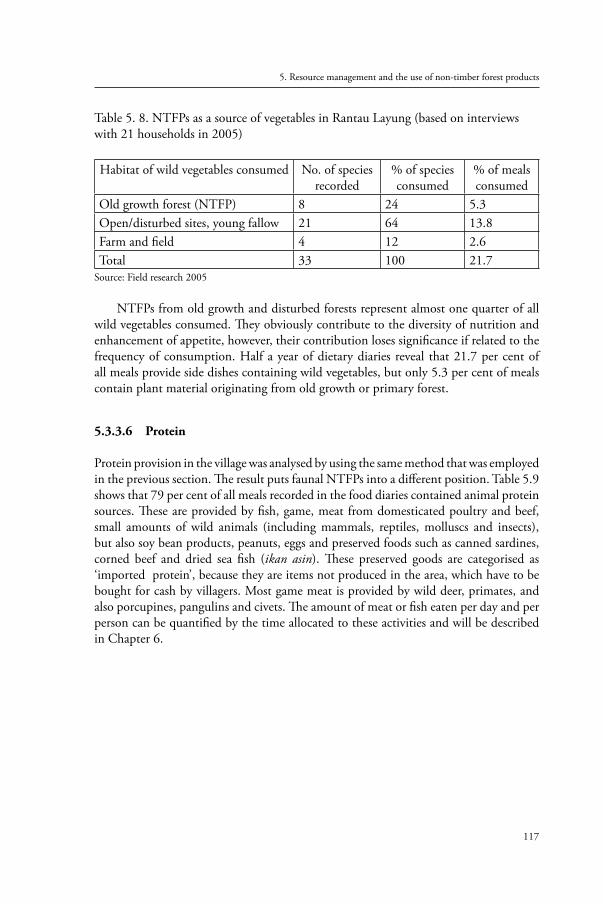
117
5. Resource management and the use of non-timber forest products
Table 5. 8. NTFPs as a source of vegetables in Rantau Layung (based on interviews with 21 households in 2005)
Habitat of wild vegetables consumed No. of species recorded
% of species consumed
% of meals consumed
Old growth forest (NTFP) 8 24 5.3Open/disturbed sites, young fallow 21 64 13.8Farm and field 4 12 2.6Total 33 100 21.7
Source: Field research 2005
NTFPs from old growth and disturbed forests represent almost one quarter of all wild vegetables consumed. They obviously contribute to the diversity of nutrition and enhancement of appetite, however, their contribution loses significance if related to the frequency of consumption. Half a year of dietary diaries reveal that 21.7 per cent of all meals provide side dishes containing wild vegetables, but only 5.3 per cent of meals contain plant material originating from old growth or primary forest.
5.3.3.6 Protein
Protein provision in the village was analysed by using the same method that was employed in the previous section. The result puts faunal NTFPs into a different position. Table 5.9 shows that 79 per cent of all meals recorded in the food diaries contained animal protein sources. These are provided by fish, game, meat from domesticated poultry and beef, small amounts of wild animals (including mammals, reptiles, molluscs and insects), but also soy bean products, peanuts, eggs and preserved foods such as canned sardines, corned beef and dried sea fish (ikan asin). These preserved goods are categorised as ‘imported protein’, because they are items not produced in the area, which have to be bought for cash by villagers. Most game meat is provided by wild deer, primates, and also porcupines, pangulins and civets. The amount of meat or fish eaten per day and per person can be quantified by the time allocated to these activities and will be described in Chapter 6.
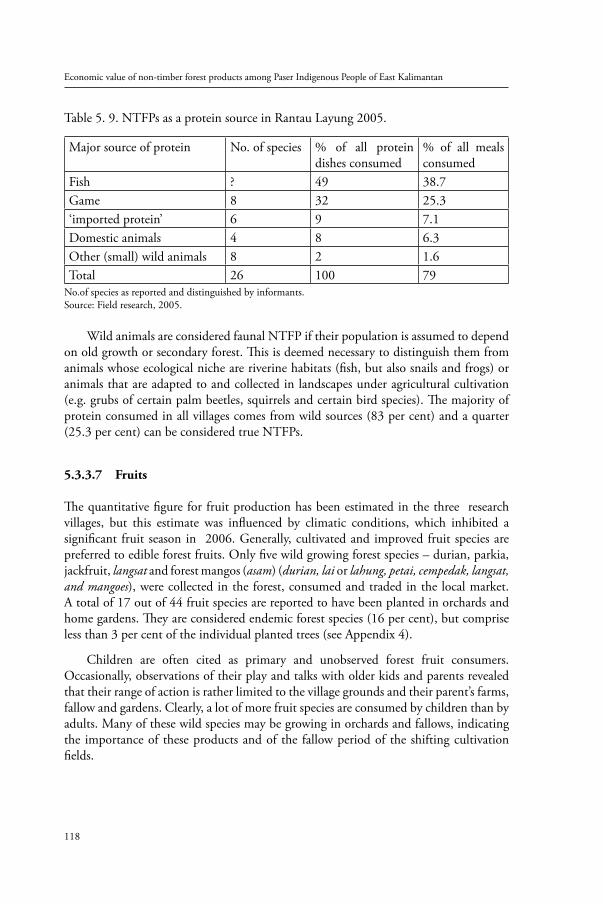
Economic value of non-timber forest products among Paser Indigenous People of East Kalimantan
118
Table 5. 9. NTFPs as a protein source in Rantau Layung 2005.
Major source of protein No. of species % of all protein dishes consumed
% of all meals consumed
Fish ? 49 38.7Game 8 32 25.3‘imported protein’ 6 9 7.1Domestic animals 4 8 6.3Other (small) wild animals 8 2 1.6Total 26 100 79
No.of species as reported and distinguished by informants.Source: Field research, 2005.
Wild animals are considered faunal NTFP if their population is assumed to depend on old growth or secondary forest. This is deemed necessary to distinguish them from animals whose ecological niche are riverine habitats (fish, but also snails and frogs) or animals that are adapted to and collected in landscapes under agricultural cultivation (e.g. grubs of certain palm beetles, squirrels and certain bird species). The majority of protein consumed in all villages comes from wild sources (83 per cent) and a quarter (25.3 per cent) can be considered true NTFPs.
5.3.3.7 Fruits
The quantitative figure for fruit production has been estimated in the three research villages, but this estimate was influenced by climatic conditions, which inhibited a significant fruit season in 2006. Generally, cultivated and improved fruit species are preferred to edible forest fruits. Only five wild growing forest species – durian, parkia, jackfruit, langsat and forest mangos (asam) (durian, lai or lahung, petai, cempedak, langsat, and mangoes), were collected in the forest, consumed and traded in the local market. A total of 17 out of 44 fruit species are reported to have been planted in orchards and home gardens. They are considered endemic forest species (16 per cent), but comprise less than 3 per cent of the individual planted trees (see Appendix 4).
Children are often cited as primary and unobserved forest fruit consumers. Occasionally, observations of their play and talks with older kids and parents revealed that their range of action is rather limited to the village grounds and their parent’s farms, fallow and gardens. Clearly, a lot of more fruit species are consumed by children than by adults. Many of these wild species may be growing in orchards and fallows, indicating the importance of these products and of the fallow period of the shifting cultivation fields.
119
5. Resource management and the use of non-timber forest products
5.3.3.8 NTFP consumption in the forest
An especially interesting case of direct NTFP consumers are the commercial NTFP collectors and working groups of logging companies camping inside the forest. Participatory observation confirmed that the amount of time that can be spent working in the forest is limited by the amount of rice that can be taken along. Most of the working teams live on a diet of rice, canned food, instant noodles and, occasionally, fresh fish from the river.
Old people’s stories of families during World War Two and during the long migrations also tell of edible plants in the forest, which today are not known or available in amounts or with a nutritional balance necessary to prevent diseases and starvation. Although palm hearts and rattan tips provide vegetable dishes and relishes year round, their vitamin content is very limited. Most edible forest fruits only ripen irregularly and during relatively short seasons. Preparing staple food from sago (starchy pith of Eugeissona spp. trunks) and other edible but not easily processed plants is a laborious endeavour. Furthermore, time allocated for regular hunting competes significantly with the performance of other tasks.
5.3.3.9 Medicinal NTFPs
Plant medicines appear to only play a significant role in Rantau Layung. Indeed, medicinal plants are almost never used in Pinang Jatus now because of the availability and accessibility of the market and the public healthcare facilities available in this village. People prefer and almost exclusively use modern medicines provided by the state or by company healthcare (as is the case in Muluy).Where fresh plant material is used for medicinal purposes, these are usually cultivated spices and fruit species or introduced Jamu ingredients.84
For a WWF study on ‘Dayak Kenyah Forest Medicine’, Leaman (1995) surveyed and tested plants and animal products that, according to three Kenyah peoples in the Apau Kayan have medicinal or toxic properties. Leaman found that only 5 per cent of the 200 medicinal species recorded depend exclusively on primary forest habitats. An additional 38 per cent (76) of species occur in primary forest. More than half (57 per cent) of the recorded species were collected and cultivated in young secondary forest and disturbed sites. No data were collected on the actual use of these plants. However, many people in Pinang Jatus appeared to prefer packaged medicines (rarely available) or no treatment at all, to traditional cures.
8 Jamu is the Indonesian collective term for traditional remedies. Originating from Java, over centuries Jamu have been produced from fresh and dried plant material. The concept of use and effect of original Jamu is closely linked with Buddhist and Islamic influences on Malayan culture. Their traditional relevance in Indonesia is only adopted by ethnic groups with Malayan cultural roots (Tuschinsky 1992).
Economic value of non-timber forest products among Paser Indigenous People of East Kalimantan
120
Leaman’s report includes a valuable list of species, including vernacular names in the Kenyah Uma Tukung dialect spoken in the Mahakam Basin. In combination with the description of plant species, preparation or remedies and respective applications, this report allows us to cross-check the relevance of this knowledge in Rantau Layung and Pinang Jatus. .
Ten women and nine men of different age groups in Rantau Layung were queried about their knowledge and actual use of 34 NTFPs selected from Leaman’s list. Akapre is occasionally used in the forest by 8 men. Seven species of plants had been used by 1 or 2 people only. Another 14 NTFP species had never been used and were identified for other than medicinal properties. The users, with one exception, were all older than fifty.
Medicinal use of the species had generally occurred only once or twice in the first year after the move of the informants to Rantau Layung between 15 and 35 years ago. Most people aged below thirty did not know the species or their medical uses at all. This is one reason why they could not be inventorised Names of medicinal NTFP species traditionally known and actually used in Rantau Layung and Pinang Jatus and the number of respective users are shown in Table 5.10 below and in Appendix 5.4.
In Pinang Jatus, the results of the inventory of NFTPs used as medicines or toxins depends exclusively on reports by the informants. When interviewing about medicinal plants growing in old growth forest, 6 out of 17 villagers claimed they did not know any use for these plants. Four respondents stated that they only used the medicinal species planted in their home gardens. Two respondents collected natural remedies in young fallows and on the riverside. Only five respondents mentioned the use of the following NTFP: pasak bumi (Eurycoma longifolia), kayu ulin or ironwood (Eusideroxylon zwageri), kayu raya, and akar sampai (an unidentified small climber growing in heavily disturbed forest areas). Only the first two species are also included in Leaman’s list.
Young men from Rantau Layung could identify only three NTFPs actually used as remedies or poisons. Akapre (Tetracera scandes) is frequently used in the forest for its properties as antiseptic drinking water. The free- flowing cell water from dissected parts of the stem is also used to wash dry and infected eyes. The latex of ipuh (Antiaris toxicaria) is frequently collected by older men as a base for rarely used dart poison. The use of pasak bumi, a male aphrodisiac and remedy against backaches, has been introduced by Banjarese people. A decoction of the roots is now drunk by young and old men in Rantau Layung and Pinang Jatus.
Pasak bumi (Euricoma longifolia) is the only locally available medicinal NTFP plant known to have a market value at the provincial level. This market potential is not yet known to many people within the research area and should not be promoted since its harvesting is destructive to the immature plants and it will reduce the resource.
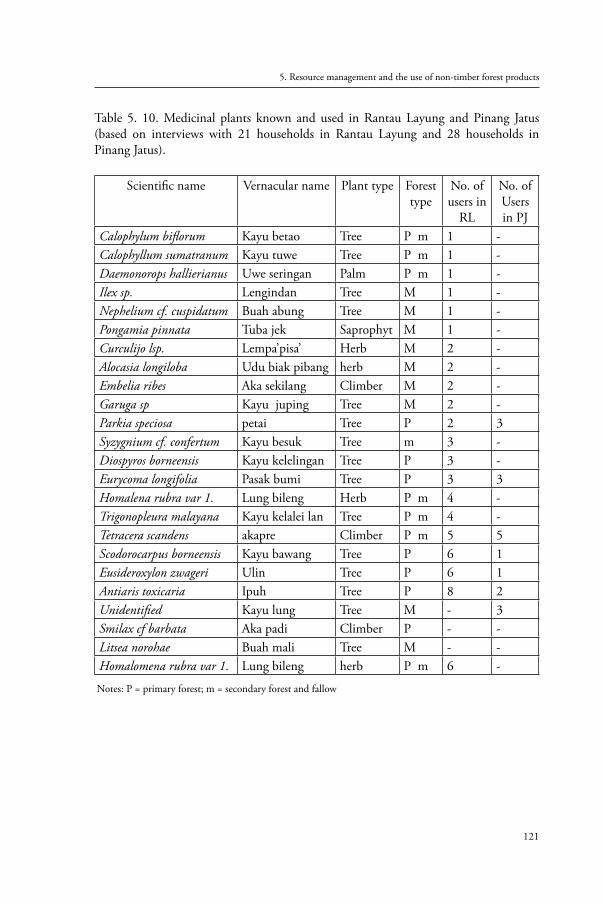
121
5. Resource management and the use of non-timber forest products
Table 5. 10. Medicinal plants known and used in Rantau Layung and Pinang Jatus (based on interviews with 21 households in Rantau Layung and 28 households in Pinang Jatus).
Scientific name Vernacular name Plant type Forest type
No. of users in
RL
No. of Users in PJ
Calophylum biflorum Kayu betao Tree P m 1 -Calophyllum sumatranum Kayu tuwe Tree P m 1 -Daemonorops hallierianus Uwe seringan Palm P m 1 -Ilex sp. Lengindan Tree M 1 -Nephelium cf. cuspidatum Buah abung Tree M 1 -Pongamia pinnata Tuba jek Saprophyt M 1 -Curculijo lsp. Lempa’pisa’ Herb M 2 -Alocasia longiloba Udu biak pibang herb M 2 -Embelia ribes Aka sekilang Climber M 2 -Garuga sp Kayu juping Tree M 2 -Parkia speciosa petai Tree P 2 3Syzygnium cf. confertum Kayu besuk Tree m 3 -Diospyros borneensis Kayu kelelingan Tree P 3 -Eurycoma longifolia Pasak bumi Tree P 3 3Homalena rubra var 1. Lung bileng Herb P m 4 -Trigonopleura malayana Kayu kelalei lan Tree P m 4 -Tetracera scandens akapre Climber P m 5 5Scodorocarpus borneensis Kayu bawang Tree P 6 1Eusideroxylon zwageri Ulin Tree P 6 1Antiaris toxicaria Ipuh Tree P 8 2Unidentified Kayu lung Tree M - 3Smilax cf barbata Aka padi Climber P - -Litsea norohae Buah mali Tree M - -Homalomena rubra var 1. Lung bileng herb P m 6 -
Notes: P = primary forest; m = secondary forest and fallow
Economic value of non-timber forest products among Paser Indigenous People of East Kalimantan
122
5.4. The major results of the NTFP inventory for potential development
5.4.1. Trees
On average, mature individuals of certain commercial fruit species are seldom encountered, with only one recorded in every fourhectares or even less frequently. No clustering of individual plants on certain sites was observed. The occurrence of ipuh (Antiaris toxicaria) appears to be even less frequent. One particular tree, considered an exceptionally rare species by locals, was recognised by informants in Rantau Layung and another tree, was recognised by the people of Pinang Jatus. Though these two trees were shown to the researcher in stands similar to those of the NTFP inventory no antiaris toxicaria tree was seen during the survey.
Malau or gutta percha (Palaqium gutta or P. calophyllum) has the highest density of NTFP trees in the research area. The relative abundance of malau (5.2 mature individuals per ha) has to be explained as the sum of two botanical species (malau putih (Ind.) = Palaqium callophyllum, malau merah (Ind.) = Payena cuminata). I estimate that these species are still available in relatively high numbers – 2.6 mature and 52 immature individuals per hectare. Clustering of mature trees and regeneration in the same plots has been observed. Both species seem to prefer well-drained sandy soils.
Pasak bumi (Eurycoma longifolia) has an average distribution of 36.2 individuals per hectare. This high abundance has to be explained by the fact that informants were unable to distinguish mature and immature trees. Firstly, this monopodial tree is a small understory species (Stoian 1992). Secondly, all juveniles are considered mature or harvestable as only their tap roots can be pulled out of the ground. In terms of stock, pasak bumi has the highest density of harvestable individuals per hectare. Some clustering has been observed. Eurycoma longifolia seems to prefer well-drained sandy soils.
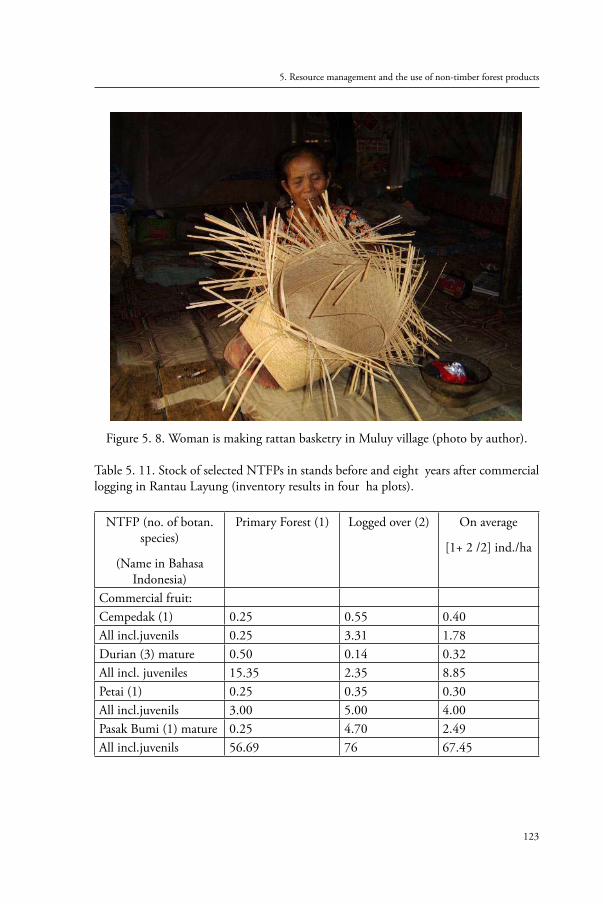
123
5. Resource management and the use of non-timber forest products
Figure 5. 8. Woman is making rattan basketry in Muluy village (photo by author).
Table 5. 11. Stock of selected NTFPs in stands before and eight years after commercial logging in Rantau Layung (inventory results in four ha plots).
NTFP (no. of botan. species)
(Name in Bahasa Indonesia)
Primary Forest (1) Logged over (2) On average
[1+ 2 /2] ind./ha
Commercial fruit:Cempedak (1) 0.25 0.55 0.40All incl.juvenils 0.25 3.31 1.78Durian (3) mature 0.50 0.14 0.32All incl. juveniles 15.35 2.35 8.85Petai (1) 0.25 0.35 0.30All incl.juvenils 3.00 5.00 4.00Pasak Bumi (1) mature 0.25 4.70 2.49All incl.juvenils 56.69 76 67.45
Economic value of non-timber forest products among Paser Indigenous People of East Kalimantan
124
Honey trees (5) taller than 10 m
1.25 2.25 2.00
All including less 10 m 16 14 15Non Commercial products:Daun biru (1) mature 14.85 25.41 20All icl.juvenils 14.85 39.22 27Kayu bawang (1) mature
1.86 0 0.98
All incl.juvenils 8.79 2.21 5.50Suling(2) mature 1.36 0.28 0.82All including juveniles 1.86 0.28 1.07Ipoh (1) mature 0 2.00 1.00 All incl. juvenils o 3.25 1.63
Rattan Semambu (mature)
All incl. juvenils
1.25
2.50
2.21
3.50
1.73
3.00
Rattan Seringan (mature)
All incl. juvenils
10.40
89.0
5.52
80.25
7.46
84.96
Source: Field research, 2006
5.4.2. Rattans
Palms and rattans (palmae) are the only currently relevant NTFPs from the class of monocotyledons found in old growth forest. Useful NTFP species from this family have a generally higher population density than NTFP-producing tree species. According to inventory data, rotan semambu (Calamus scipionum) is considered to be almost as rare as forest fruit tree species. An average of only one mature individual per four ha has been recorded. Though semambu is generaly considered infrequent by local informants this figure has to be taken cautiously. Rattan semambu is a durable, multi-functional and easily identifiable rattan species that is in high demand in the market. The scarcity of mature individuals may be a result of overharvesting in the past and the lack of cultivation compared with rattan segah (Calamus caecius).
Rattan segah (Calamus caecius) is the most important palm generating income in the region. This species belongs to a small diameter class and grows in a cluster and clonal sprouts if the canes are cut above 1 m from the top of the roots. A calculation of rattans of different age classes on a plot of about four hectares revealed the fact that the cluster
125
5. Resource management and the use of non-timber forest products
density ranges from 67 to 126 clusters per ha. And the measurement in each of the plots revealed that each cluster has 12 to 130 canes with different lengths and ages. The potential harvesting of each cluster was measured and revealed the number of mature canes ranging from 3 to 22 canes or an average of 0.2 to 1.6 tons of raw rattan per ha for one season of harvesting. The maximum potential of harvesting was found in rattan gardens of 15 years old. This age is the peak of rattan segah harvesting when compared with the production from gardens of 10 and 25 yearsBased on the mapping and the interviews with the people of Rantau Layung, it is clear that the rattan segah plantation in this village was established a long time ago and that this palm is also highly valued for its use for agricultural tools and utensils (see Appendix 9). Its durability is also valued for furniture and export products. Many products made from rattan segah are found in rattan processing industries in South Kalimantan. The area size of smallholder rattan cultivation in Rantau Layung and Pinang Jatus was found to be 4.2 ha per household with a total area of 172 ha.
Based on survey conducted in some plots in Rantau Layung and Pinang Jatus it was found a total of 34 species of rattans in Rantau Layung and Pinang Jatus. Of these, only 11 species were recognised in the national and international markets. This means that most of the species found in this region are classified as lesser known species. The market surveys of rattan processing industries in Pasir and South Kalimantan in 2006, it was found that 11 out of 34 species of rattan identified already have a market price.
5.5. Conclusion
Chapter 6 describes the results of the data collection of NTFP use in the research area. Information about NTFP use in three different Paser indigenous villages was generated using various methods of data collection. These data include social and physical aspects of NTFPs.
The research revealed that Paser indigenous people collected various NTFPs from different types of forest and land, such as young fallow areas, secondary forest, and old growth forest including former logging areas. It also revealed that forest and land is traditionally classified into land use categories that are differentiated based on human intervention and natural characteristics.
Traditionally, land use management is classified into: forest for logging, home garden, settlement or home, fallow areas, honey and NTFPs areas, and spiritual forest areas. Each type of land has a specific function which can be differentiated by its products. Different types of land and forest producing NTFPs have been identified.
Based on these findings, it can be concluded that collecting non-timber forest products is a major time-consuming activity, second only to rice cultivation. Almost half of households’ labour time is allocated for collection of NTFPs. It has been indicated
Economic value of non-timber forest products among Paser Indigenous People of East Kalimantan
126
that without NTFP collection there would be significant unemployment in village areas. The role of the forest as an ‘office’ for the villagers to generate income or products is another important social aspect, which local governments must take into consideration when developing village employment opportunities.
People’s interaction with the forest can only be understood if we adopt a holistic approach to their livelihoods. On the one hand, indigenous people are forced to enter the forest to collect following fruiting seasons in order not to lose these products. On the other hand, indigenous people are also forced to enter the forest to collect firewood. This interaction shows us that from production to consumption, as well as for saving goods or services, the forest plays an important role in almost all aspects of local people’s needs.
The role of NTFPs has been observed for agriculture tools and equipment, for foods and medicines, for house construction, for spiritual purposes and for generating income. NTFPs also make a crucial contribution to agriculture production in their role as a source of fertiliser for rice cultivation, producing poisons or toxins to fight off insects or diseases, as well as being used for fences to keep out animals. The forest’s role as a source of NTFP products for agriculture can be divided into two main functions: (1) providing nutrients or organic fertiliser for paddy rice cultivation, and (2) supporting paddy rice maintenance and post harvesting handling. NTFPs are also used in the care and handling of agriculture products such as rice basketry made of rattan. These roles indicate that without NTFPs it would be difficult to obtain sufficient rice production for local people. This means that local people’s agriculture activities are strongly affected by the existence and the sustainability of NTFPs.
From the result of interviews with the villagers, it is also clear that non-timber forest products are highly valued by the indigenous people, who see them as more than just goods or products. These products are also imbued with spiritual values and are linked to forest and human relationships. The forest and its ecosystem is also perceived as a place where ‘ghosts’ or ‘souls’ of ancestors reside. Paser people believe that the forest is a place and a source of imagination, which connects them with ‘God’; a place where they can communicate and pray.
From the production and consumption data of NTFPs in the previous section it can also assumed that rice production is key to agriculture and forestry related activities of the Paser indigenous people. More than half of the labour supplies in the research villages were devoted to rice production. This indicates that people in the research area depend on their own rice production to fulfill their needs. This is the result of two possible conditions in the research area: first, that rice is the main source of food for the indigenous people of Paser; and second, that the accessibility of village studies to market and imported products is very low. Villagers in the research area are forced into self-sufficient rice production with a very limited contribution from other production factors, such as technology, fertilisers and with a very low market influence.
127
5. Resource management and the use of non-timber forest products
Based on the existing skills and knowledge of the villagers’, it can be summarised that agriculture production in the research area relies heavily on the soil contribution of the forest. The implication of this land use system is the increasing number of forest conversions for paddy rice cultivation, following the increased demand due to population growth.
The research also reveals that local people have begun to domesticate several forest plants. This is conducted both purposively and by coincident action. Many forest fruits were eaten at home and the seeds were incidentally thrown away in thet home garden. The subsequent growth enriches the garden’s tree composition. At the same time, some forest fruits seedling were taken from the forest and cultivated by farmers in their home gardens or paddy rice fields in the aim of domesticating forest products.
It seems that Paser indigenous people have developed various survival strategies that reflect their nature and isolation. They maintain the balance between their needs and resource capability to supply their demand. This traditional wisdom can be maintained in the future if population growth is? and there is sufficient forest land for cultivation.
Given these findings, it can be concluded that the standard of living of the Paser indigenous people will deteriorate if the government and foresters do not take into account the importance of the forest and its products for this community. Disregarding NTFPs in the policy of forest management will not only result in the depletion of NTFP resources, but also devalu the forest. Ultimately, this will lead to economic, social and environmental problems for these village communities.

Economic value of non-timber forest products among Paser Indigenous People of East Kalimantan
128
129
Chapter 6
Economic Value of Non-timber Forest Products in the Research Villages
6.1. Introduction
For each of the three villages in this study, the collected data have been used to construct a set of accounts, on the basis of accounting procedures as described in Chapter 3, section 3.11. In these villages, household earnings generated from the exploitation of timber are also included in order to show the total forest output for the household economy and to compare the value between timber and non-timber. However, these figures are largely calculated on the basis of the non-timber values of forest. Through the analysis of both inputs and outputs, a set of accounts for each village can be developed, and the value of forest inputs used by villagers can be derived. This value can serve as an indicator of the use value of the forest for the people who depend upon it for their livelihoods. Each village will be considered separately, and subsequent comparisons will be made between them in Chapter 7. Tables to illustrate various selections of these accounts are provided in the appendices of this book. 6.2. The village of Rantau Layung
The village of Rantau Layung is located on the river bank of Kasunge in the sub-district of Batu Sopang in Pasir District (see map in Chapter 3, Research area) and in the densely dipterocarp lowland forest area of the Gunung Lumut Protection Forest. It is a small village in the hilly forest area and it is situated on a tributary of the Kasunge River. It is approximately 30 km from Batu Kajang, the sub-district of Batu Sopang, and 14 km from the sub-district’s market centre of Simpang Pait. It is home to 206 people living in 45 households.
As described in Chapter 4, Rantau Layung village was also the resettlement village of the Paser nomadic people in the area of the Kasunge River. The village was established in the late 1950’s to facilitate a resettlement programme for Paser indigenous people.
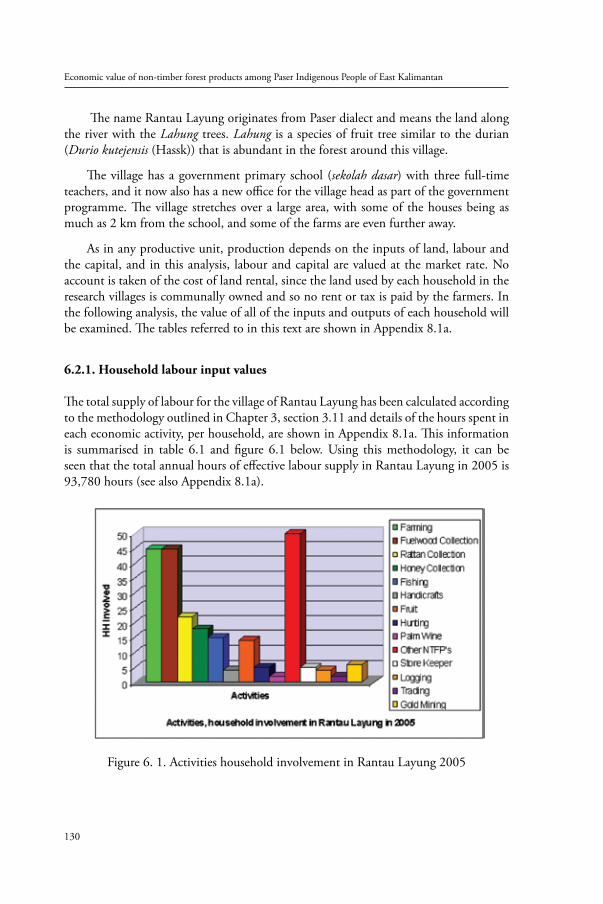
Economic value of non-timber forest products among Paser Indigenous People of East Kalimantan
130
The name Rantau Layung originates from Paser dialect and means the land along the river with the Lahung trees. Lahung is a species of fruit tree similar to the durian (Durio kutejensis (Hassk)) that is abundant in the forest around this village.
The village has a government primary school (sekolah dasar) with three full-time teachers, and it now also has a new office for the village head as part of the government programme. The village stretches over a large area, with some of the houses being as much as 2 km from the school, and some of the farms are even further away.
As in any productive unit, production depends on the inputs of land, labour and the capital, and in this analysis, labour and capital are valued at the market rate. No account is taken of the cost of land rental, since the land used by each household in the research villages is communally owned and so no rent or tax is paid by the farmers. In the following analysis, the value of all of the inputs and outputs of each household will be examined. The tables referred to in this text are shown in Appendix 8.1a.
6.2.1. Household labour input values
The total supply of labour for the village of Rantau Layung has been calculated according to the methodology outlined in Chapter 3, section 3.11 and details of the hours spent in each economic activity, per household, are shown in Appendix 8.1a. This information is summarised in table 6.1 and figure 6.1 below. Using this methodology, it can be seen that the total annual hours of effective labour supply in Rantau Layung in 2005 is 93,780 hours (see also Appendix 8.1a).
Figure 6. 1. Activities household involvement in Rantau Layung 2005
131
6. Economic Value of Non-timber Forest Products in the Research Villages
It is clear from these figures that farming, fuel wood and other NTFPs are by far the most important activities in which these villagers are engaged. Non-timber forest products collection is the next most time consuming activity, followed by the fuel wood and store keeping. Collection of NTFPs is focused on vegetables, foods, mushrooms and medicinal plants, but rattan collection is the most important in terms of time spent, closely followed by wild honey and fruit collection. In total, NTFPs consume 25.75 per cent of the total labour time in the village. This indicates that the collection and processing of NTFPs are the second most important activities undertaken by people in Rantau Layung. The collection of other non-timber forest products only takes a small amount of people’s time, but, nevertheless, every household participates to some degree. The materials collected are used for food, medicinal purposes, handicrafts and construction material for houses or village huts.
Table 6.1 below also shows the distribution of household labour in Rantau Layung and it can be calculated the labour values per household are Rp. 5,328,406.25 per annum, with this being the imputed value of the aggregate household labour supply. These values have been estimated by applying a shadow wage of Rp. 3,125 per hour, based on the opportunity cost of labour in logging concessions. Using this shadow wage of Rp. 3,125 per hour, the total annual imputed value of labour for the village is Rp. 293,062,500. This is not to be interpreted as representing the money income of the households; rather, it is an estimate of the accounting value of the labour inputs of households in all of the economic activities in which they participate.
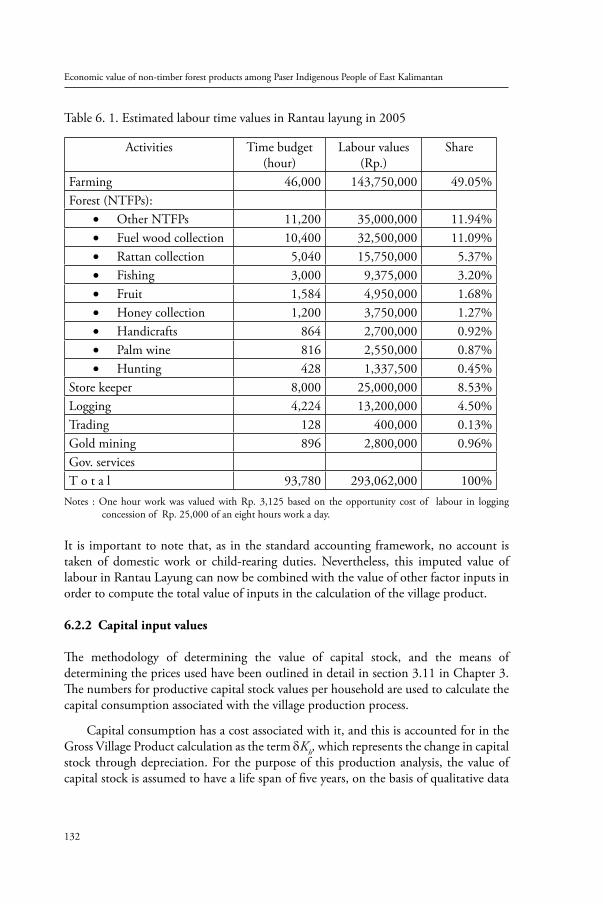
Economic value of non-timber forest products among Paser Indigenous People of East Kalimantan
132
Table 6. 1. Estimated labour time values in Rantau layung in 2005
Activities Time budget (hour)
Labour values (Rp.)
Share
Farming 46,000 143,750,000 49.05%Forest (NTFPs):
Other NTFPs• 11,200 35,000,000 11.94%Fuel wood collection• 10,400 32,500,000 11.09%Rattan collection• 5,040 15,750,000 5.37%Fishing • 3,000 9,375,000 3.20%Fruit • 1,584 4,950,000 1.68%Honey collection • 1,200 3,750,000 1.27%Handicrafts • 864 2,700,000 0.92%Palm wine• 816 2,550,000 0.87%Hunting • 428 1,337,500 0.45%
Store keeper 8,000 25,000,000 8.53%Logging 4,224 13,200,000 4.50%Trading 128 400,000 0.13%Gold mining 896 2,800,000 0.96%Gov. servicesT o t a l 93,780 293,062,000 100%
Notes : One hour work was valued with Rp. 3,125 based on the opportunity cost of labour in logging concession of Rp. 25,000 of an eight hours work a day.
It is important to note that, as in the standard accounting framework, no account is taken of domestic work or child-rearing duties. Nevertheless, this imputed value of labour in Rantau Layung can now be combined with the value of other factor inputs in order to compute the total value of inputs in the calculation of the village product.
6.2.2 Capital input values
The methodology of determining the value of capital stock, and the means of determining the prices used have been outlined in detail in section 3.11 in Chapter 3. The numbers for productive capital stock values per household are used to calculate the capital consumption associated with the village production process.
Capital consumption has a cost associated with it, and this is accounted for in the Gross Village Product calculation as the term δKh, which represents the change in capital stock through depreciation. For the purpose of this production analysis, the value of capital stock is assumed to have a life span of five years, on the basis of qualitative data
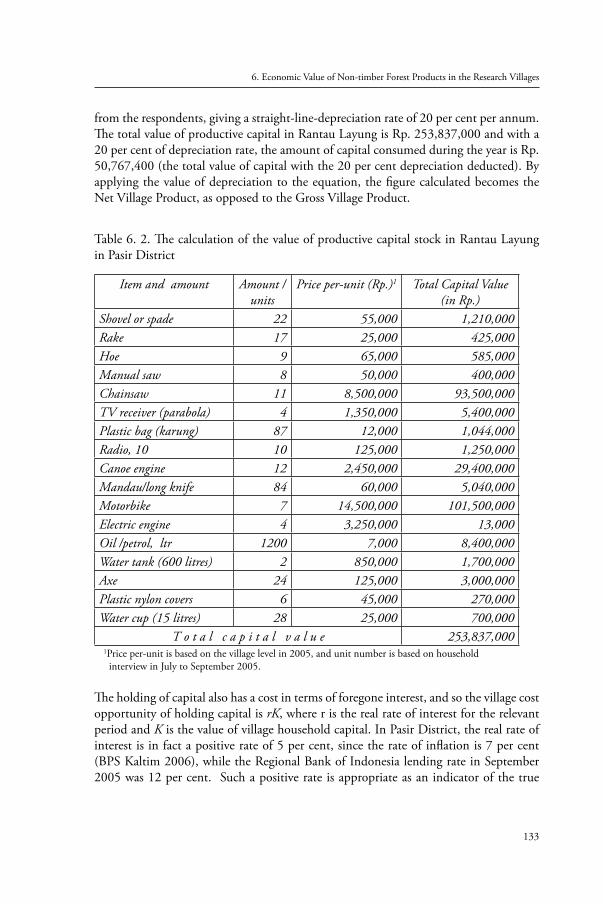
133
6. Economic Value of Non-timber Forest Products in the Research Villages
from the respondents, giving a straight-line-depreciation rate of 20 per cent per annum. The total value of productive capital in Rantau Layung is Rp. 253,837,000 and with a 20 per cent of depreciation rate, the amount of capital consumed during the year is Rp. 50,767,400 (the total value of capital with the 20 per cent depreciation deducted). By applying the value of depreciation to the equation, the figure calculated becomes the Net Village Product, as opposed to the Gross Village Product.
Table 6. 2. The calculation of the value of productive capital stock in Rantau Layung in Pasir District
Item and amount Amount /units
Price per-unit (Rp.)1 Total Capital Value (in Rp.)
Shovel or spade 22 55,000 1,210,000Rake 17 25,000 425,000Hoe 9 65,000 585,000Manual saw 8 50,000 400,000Chainsaw 11 8,500,000 93,500,000TV receiver (parabola) 4 1,350,000 5,400,000Plastic bag (karung) 87 12,000 1,044,000Radio, 10 10 125,000 1,250,000Canoe engine 12 2,450,000 29,400,000Mandau/long knife 84 60,000 5,040,000Motorbike 7 14,500,000 101,500,000Electric engine 4 3,250,000 13,000Oil /petrol, ltr 1200 7,000 8,400,000Water tank (600 litres) 2 850,000 1,700,000Axe 24 125,000 3,000,000Plastic nylon covers 6 45,000 270,000Water cup (15 litres) 28 25,000 700,000
T o t a l c a p i t a l v a l u e 253,837,000 1Price per-unit is based on the village level in 2005, and unit number is based on household
interview in July to September 2005.
The holding of capital also has a cost in terms of foregone interest, and so the village cost opportunity of holding capital is rK, where r is the real rate of interest for the relevant period and K is the value of village household capital. In Pasir District, the real rate of interest is in fact a positive rate of 5 per cent, since the rate of inflation is 7 per cent (BPS Kaltim 2006), while the Regional Bank of Indonesia lending rate in September 2005 was 12 per cent. Such a positive rate is appropriate as an indicator of the true
Economic value of non-timber forest products among Paser Indigenous People of East Kalimantan
134
opportunity cost of capital use in this situation, and so a rate of return of 12 per cent will be employed in the calculation of the Net Village Product for Rantau Layung and the other villages. This is thought to be representative of the more usual rate of return on capital and, on this basis, the opportunity cost of the capital used in production in Rantau Layung reaches a total of Rp. 30,460,440 per annum.
6.2.3. Estimating household output values
All household outputs from different activities need to be taken into account. These are the values of outputs from all of the productive activities of the households, and these include farming, fishing, fuel wood collection, hunting, palm wine, rattan, honey, other NTFPs, storekeeping, trading and production of handicrafts.
6.2.3.1. The assessment of farm outputs
The main costs include labour (mainly family labour) for land selection, slash and burn, felling and cutting trees, burning the cut vegetation, land preparation (racking/clearing soil), planting, weeding, guarding the crops (against animal pests), harvesting and carrying the crops home. Along with rice, farmers typically plant field crops such as vegetables, cassava, banana, ground nut and maize, which are harvested two years after planting over a period of about three months. This system relies on rainfall and available soil fertility. Farmers do not employ irrigation or fertilisation. The mean rice yield per hectare is 109.6 kaleng (cans), equal to 1,315.2 kg. This yield is consistent with that recorded by other researchers like Colfer (1998), Haury and Saragih (1996) and Belcher et al. (2003) in nearby areas.
Assessment of the farm outputs in Rantau Layung has produced a product profile typical of subsistence farming in tropical rainforests. The wide range of crops farmed by most households reflects the varied nature of a farm of Paser people, where a large number of crops are planted together in a relatively haphazard way. This great variety of crops provides a degree of food security for households, as total crop failure is extremely unlikely to occur. On average, over 45 crops may be planted, in addition to rice, and a system of agroforestry is used by all farms.
Because of the extreme poverty of these households, little livestock is kept, and the only animals in the villages are dogs used by men when they go hunting, and a small number of buffalo trained for timber extraction. Domesticated pigs are not found here as the households are Muslim. They do not have the capital to invest in other domestic animals. A small number of chickens are kept by a few households, and the eggs collected from them are included as farm output.
135
6. Economic Value of Non-timber Forest Products in the Research Villages
The volume of crop output by household is calculated, as explained in the previous chapter, from data collected from farmers, male heads of households and senior female members of the households. The monetary value of this output can be calculated from the prices for crops in the village itself, or in the local market. These prices were calculated from farm surveys, where farmers reported crop prices, plus observations at the nearest market of many occasions during the study period. The average of these prices is used in the calculation of farm output values. By multiplying the household output of each crop by its price, it is possible to estimate the monetary value of farm output. By summing across all households, the value of village farm output is calculated, and this is shown in table 6.3 on page 114 (see also Appendix 8.2a). From this table, it can be seen that the average value of farming is Rp. 1,967,055 per household, while the total value for the village as a whole is Rp 88,540,000 or 20.32 per cent of the total village output. As farming represents one of the major sectors of the village economy, this figure is an important part of the calculation of the Net Village Product.
6.2.3.2. Hunting and trapping
Traditionally, ‘bush-meat’ has provided the main source of protein for these households, and villagers do not keep domestic animals of any sort as a source of food. In this village, the majority of hunters consider deer (of the six main wild animals) as the most valuable animal to hunt since they are relatively easy to catch. This fact highlights the importance of the forest for communities such as these, and the contribution it makes to both food security and community health. In addition, it is clear that the value of hunting revenues should be included in the assessment of Net Village Products (NVP). Estimates of the value of hunting catches are shown in table 6.3 and Appendix 8.2a. These values are based on the estimated numbers of animals caught by hunters, and the market price for those animals, as reported by hunters and observed in the nearest market.
Several households in Rantau Layung do not participate in hunting or trapping activities for various reasons, not least of which is the difficulty of ensuring success. The relatively high return of hunting suggested by the figures in table 3 reflects the skills required to be successful as hunter, and the steady demand for the meat. Those households that are not involved in hunting obtain meat by barter or receive it as a gift from a family member, friend or neighbour. This is a type of informal inter-household credit market, which serves an important social welfare role in the community.
The value of hunting and trapping in Rantau Layung comes to a total 1.09 per cent of the total village output. Taken across all households in the village, hunting contributes an average value of Rp.4,749,000 per annum, which is clearly a significant amount. This highlights once again the importance of the forest for the well-being of these forest dwellers, and it is important to note that any programme to improve the standard of living of these villagers is also likely to have an indirect benefit to the forest ecosystem, as it is likely to lead to a decrease in the consumption of wild animals as a
Economic value of non-timber forest products among Paser Indigenous People of East Kalimantan
136
source of food. On the other hand, if the standard of living of the habitants of villages such as this fails to improve, it is likely that there will be an increasingly unsustainable demand for deer and other animals from the forest, once again putting pressure on the integrity of the forest ecosystem itself. The impact of poverty on the ecosystem was already well documented by WCED in 1997, and if the diversity of the Gunung Lumut Forest area is to be maintained, the improvements must be made to the standard of living of the people living within them (Saragih, 2006)
6.2.3.3. Fishing output
It is well known that deforestation can have a dramatic effect on the watersheds of the river courses and, to some extent, the availability of clean rivers with fish reflects the fact that the forest ecosystem is functioning well. An assessment of the value of fish is therefore another indicator of the value of those ecosystem services to local inhabitants, and of course it also must be included as part of the Net Village Product.
The field survey in 2005 revealed that fishermen recognised 26 species of fish found in their river, but only five of these species are consumed because some fish are poisonous and others are very small, which makes them difficult to catch.
The most popular method of fishing in this village is with a net, with over 55 per cent of the fishermen considering this the most effective method. The traditional method of catching fish is to use poison made from forest plants. This remains an important practice, with 30 per cent of fishermen believing it o be the most effective method. The use of forest plants such as Bauhinia and Byrsonima crassifolia once again highlights why the forest is considered important to households such as these, since these plants contribute significantly to fish catches. This also applies to the various traps used, as these are also made from forest plants like bubu or traps made of rattan and bamboo.
A wide variety of fish is caught in Rantau Layung waters. It is clear that these and other species all provide important protein to the household diet, and their value should be included in the calculation of the output values of the NVP. Details of the value of fish catches in Rantau Layung are given in table 6.4 and it can be seen that the value of the fishing catches per household in Rantau Layung was Rp. 7,792,000 or 1.78 per cent of the total village outputs in 2005.
6.2.3.4. Rattan harvesting
Harvesting of rattan canes is the most prominent NTFP collection activity for generating cash for the 45 households observed in Rantau Layung. The average monthly earnings per collecting household is Rp. 41,703. Table 6.3 and Appendix 8.2a give details of harvesting figures, and the estimated value of Rp. 22,520,000 for the annual value of
137
6. Economic Value of Non-timber Forest Products in the Research Villages
rattan harvesting in Rantau Layung represents another sector in the village economy. For the village of Rantau Layung rattan representS the most important source of cash income to the villagers, which must be included in the calculation of NVP.
6.2.3.5. Wild honey collection
Using the same method described for the calculation of rattan, the value of wild honey collected in Rantau Layung can be estimated. Harvesting of wild honey or wani, a local term for the apis dorsata nests hanging in the branches of Koompalsia malacensis or Koompassia excelsa trees, is an important activity for the people in this village. Table 6.3 provides details of harvesting figures, and the estimated value of Rp10,495,000 per annum. The value of honey collection in Rantau Layung represents another important sector of forest products for the village economy. For the village of Rantau Layung, honey collection represents 2.40 per cent of the total annual income and this is an important source of cash income to the villagers and this must also be included in the net village calculation.
6.2.3.6. Forest food and fruit collection
Details of the types of food and fruit gathered from the forest have been given in the previous chapter and in Appendices 5 and 6. It is shown that for the households involved in this activity, in addition to rattan and honey collection, the food and fruits coming from the forest are mainly for home consumption. However, they make an important contribution to the household diet and thus they need to be included. On average, 14 of the 45 households observed in Rantau Layung regularly collect food plants from the forest. In addition, villagers, especially children, consume forest foods and fruits informally whenever they are in the forest. Although no account is taken of this informal individual forest food consumption, an attempt is made here to include the value of regularly selected forest foods, using the methodology outlined in the previous chapter. The monetary value of these forest foods can be calculated on a household basis and then summed across all households to give the total value of forest food and fruits for the village total value. Table 6.3 (on page 114) conservatively estimates this figure to be Rp. 13,853,000 and this again will be included as part of the Net Village Product. Species list of plants used for fruits and food are also given in Appendices 4 and 5.3.
6.2.3.7 Palm sugar
Harvesting of wild enau or Arenga pinnata for making gula aren or red sugar is an important activity for some households in Rantau Layung. With average monthly earnings per collecting household of Rp. 189,583, the estimated value of Rp. 4,550,000 per annum for palm wine harvesting in Rantau Layung represents 1.04 per cent of the total annual income. This forest plant contributes to the villager’s economy and is an
Economic value of non-timber forest products among Paser Indigenous People of East Kalimantan
138
important source of cash income; therefore, it must be included in the calculation of the Net Village Product.
6.2.3.8 Handicrafts value
As can be seen from table 6.3, only four households or six people in this village actually consider handicrafts as an activity in which they regularly participate. In other households, some small items may be made when necessary, but these are not included in this calculation as their value cannot realistically be estimated. This suggests that the value of handicraft output tends to be underestimated, rather than overestimated. The low village value of Rp 2,008,000 accounted for by handicraft reflects the small number of households that consider handicrafts to be a source of income.
Basketry, hammock-making and weaving are the most frequent craft activities in Rantau Layung, and the materials used, as well as the products price at village level, are shown in Appendix 10.
This indicates once again the importance of non-timber forest products to village households, since they provide the materials for essential household items, which are made using traditional craft techniques. One of the reasons why few households earn an income from handicraft work in this village is the problem of transportation to the nearest market. Taking goods to a very uncertain market involves a seven-hour round-trip paddling in a canoe. It seems likely that this reduces the incentive to get involved in this type of work. Nevertheless, this handicraft value is part of the village output.
6.2.3.9 Fuel wood consumption
The collection of fuel wood is a very important household activity in all villages of this type, since it provides the main source of energy for cooking. Performing the duty of collecting fuel wood varies from house to house, with some households relying on child labour, while in others it is an activity in which all family members participate. The methodology used to value the use of fuel wood has been explained in the previous chapter and, from table 6.3, it can be seen that the total estimated value of fuel wood, to be included in the NVP of Rantau Layung, is Rp. 15,222,000 or 3.49 per cent of the total annual output values for Rantau Layung villagers. The list of plants used as fuel wood is shown in Appendix 5.2.
6.2.3.10 Other output values Using the same method described for the calculation of forest foods and fruits, the value of other NTFP plants used in Rantau Layung can be estimated. A variety of plants is used by households, who all collect different plants on different occasions for various
139
6. Economic Value of Non-timber Forest Products in the Research Villages
purposes, such as for medicines, condiments or for spiritual ceremonies. Determining a market price for these plants is not easy, as they are not sold within the villages. Only some of these products are sold in Simpang Pait, the nearest market to Rantau Layung, but the market price here is not truly representative of their value because of other factors, such as transport costs. To overcome this problem, the price of gaharu (eaglewood) and pasak bumi (Eurycoma longifolia) is used as a proxy for all plants. On this basis, the total annual value of medicinal plants can be calculated. A breakdown of this is shown in table 3 and the final total is undoubtedly a conservative estimate. Indeed, this figure is likely to be much higher if a substitute pricing method, based on malaria treatment, is used. Since these medicinal plants represent another household output, this estimated value is included in the value of total NVP.
Some of the villagers are involved in government jobs, such as teaching, village administration and rural development agencies and they are paid by local government on a monthly basis. Many villagers are also involved in storekeeping, logging and trade. The annual total value of these other income sources is Rp. 265,900,000. This represents 61 per cent of the total annual income in 2005.
6.2.4 The total value of net village output
Referring back to the previous chapter, which outlined the calculation of Net Village Product (NVP), the equation (2) explains how the NVP is calculated: H H nNVP =∑(wLh + rKh + δKh + pfF
h ) = Σ ∑ piQih (2) h =1 h=1 i=1
6.2.4.1 Village inputs
The computation of all productive inputs, ( wLh + rKh + δ Kh + pfFh) is shown in detail in the attached appendix, and table 3 summarises these, showing the value of the labour and capital use, as well as depreciation, along with the computation of pfFh (value of forest use).
6.2.4.2 Village outputs
Table 6.3 provides a summary of all the values of all of the household outputs, n∑ i=1 piQih i = 1
This table indicates that some households are notably more productive than others, with some variation between households occurring in the relative sizes of the various sectors. This is not surprising, and is certainly worthy of further investigation. In addition, a
Economic value of non-timber forest products among Paser Indigenous People of East Kalimantan
140
deeper understanding of the links within and between households is revealed by the qualitative data to be analysed at a later stage.
The total value of outputs of all economically productive activities in Rantau Layung is Rp. 435,632,000. This gives an average per household value of Rp.9,680,000. This figure is inserted in the formula for the estimation of the derived value of forest inputs.
6.2.4.3 The derivation of the use-value of forest inputs in Rantau Layung
To compute this value, we need to sum across all households for all outputs and inputs, and the values of the forest residual pfF
h will be determined by re-arrangement of the known values, using the formula:
H H n
Σ pf Fh = Σ ( Σ pt Qt
h - (wlh + rkh + δ Kh)) (3) h=i h=1 t=1
The forest residual (pf Fh) represents the contribution made to the production process by
land, i.e. the rent. It can also be described as the ‘value added from nature’, or the value of the forest resource to the Paser people of the village of Rantau Layung.
In this particular case, for Rantau Layung in 2005, the total of this value added forestry is Rp. 328,802,000, Rp. 230,752,000 of which represents the value generated by the anthropogenic use of non-timber products from the forest. It is important to note here that no amount has been included for the value of timber products, as these are not part of non-timber products. Therefore, the value of total village output including the value of timber is Rp 435,632,000. This amount can be estimated because the number of trees used for timber (not only for subsistence construction, but also for the market) is relatively small as the government will confiscate the timber it believes to be derived from illegal logging.
The population of Rantau Layung consists of 206 men, women and children and, on the basis of the above estimate of total value of rent, or value added obtained from the forest, the per capita value is Rp 2,114,718 per year. Using this per capita figure, it is possible that for the average household of 4.57 people in Rantau Layung, the value of the contribution derived from the forest to household income per year would be Rp. 1,596,126, Rp. 1,120,155 of which comes from NTFPs. The relatively significant amount of income accrued from the forest could have important implications for the people in the village, and in other similar villages nearby.
Another way to look at the relative importance of the various productive inputs, is to examine their relationship with the level of outputs. In this village, the total value of capital use, in the form of foregone interest and capital depreciation, is Rp. 50,767,400 (see section 2.2 above), while the total value of outputs in the village is Rp. 435,632,000
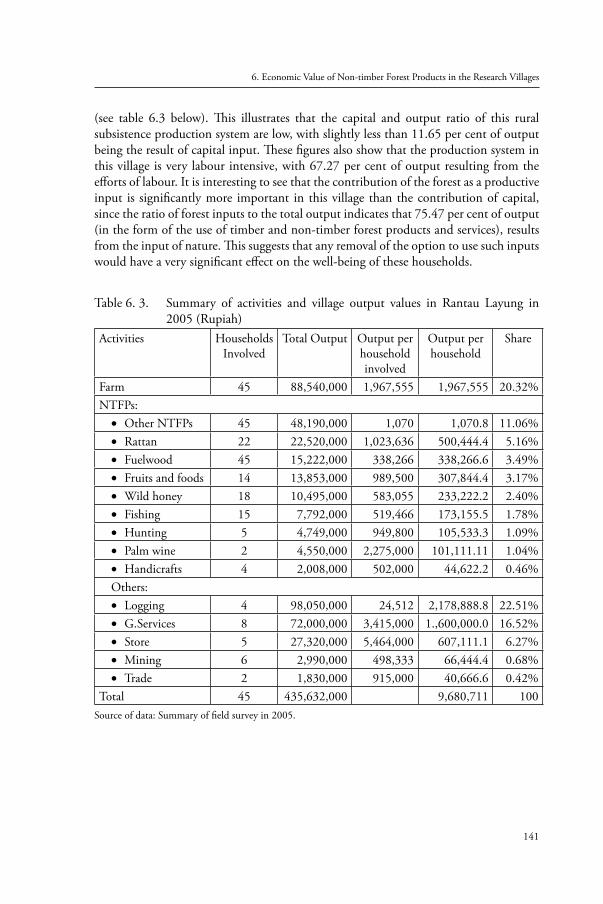
141
6. Economic Value of Non-timber Forest Products in the Research Villages
(see table 6.3 below). This illustrates that the capital and output ratio of this rural subsistence production system are low, with slightly less than 11.65 per cent of output being the result of capital input. These figures also show that the production system in this village is very labour intensive, with 67.27 per cent of output resulting from the efforts of labour. It is interesting to see that the contribution of the forest as a productive input is significantly more important in this village than the contribution of capital, since the ratio of forest inputs to the total output indicates that 75.47 per cent of output (in the form of the use of timber and non-timber forest products and services), results from the input of nature. This suggests that any removal of the option to use such inputs would have a very significant effect on the well-being of these households.
Table 6. 3. Summary of activities and village output values in Rantau Layung in 2005 (Rupiah)
Activities HouseholdsInvolved
Total Output Output per household involved
Output per household
Share
Farm 45 88,540,000 1,967,555 1,967,555 20.32%NTFPs:
Other NTFPs• 45 48,190,000 1,070 1,070.8 11.06%Rattan • 22 22,520,000 1,023,636 500,444.4 5.16%Fuelwood• 45 15,222,000 338,266 338,266.6 3.49%Fruits and foods• 14 13,853,000 989,500 307,844.4 3.17%Wild honey• 18 10,495,000 583,055 233,222.2 2.40%Fishing• 15 7,792,000 519,466 173,155.5 1.78%Hunting • 5 4,749,000 949,800 105,533.3 1.09%Palm wine• 2 4,550,000 2,275,000 101,111.11 1.04%Handicrafts• 4 2,008,000 502,000 44,622.2 0.46%
Others:Logging• 4 98,050,000 24,512 2,178,888.8 22.51%G.Services• 8 72,000,000 3,415,000 1.,600,000.0 16.52%Store• 5 27,320,000 5,464,000 607,111.1 6.27%Mining • 6 2,990,000 498,333 66,444.4 0.68%Trade• 2 1,830,000 915,000 40,666.6 0.42%
Total 45 435,632,000 9,680,711 100Source of data: Summary of field survey in 2005.
Economic value of non-timber forest products among Paser Indigenous People of East Kalimantan
142
6.3. The village of Pinang Jatus
The name Pinang Jatus is derived from the words Pinang and Jatus. Pinang is a kind of palm (Areca catechu) and an important plant used as a condiment and for spiritual purposes. It is commonly used in food such as spadix. The term jatus means one hundred or seratus (Ind.). There is a story that the village was named Pinang Jatus because, long ago, an unmarried woman was forced to plant one hundred pinang (Areca catechu) seedlings by the villagers as a punishment for her stealing the pinang belonging to her neighbour (Kepala Adat in press.comm., 2004).
Pinang Jatus village consists of 56 households and 265 inhabitants. The average household size is 4.73 people, with a total of 127 men in the village and 138 women. On average, these households cultivate 2.2 ha of land, which is divided into rattan gardens, rice fields, and field for cultivating other cash crops such as cassava, palm oil and coffee.
Houses in the village are spread out along the road. While some are located in close proximity to each other, there are some houses within the village that can be as much as two miles apart. A mosque has recently been built in the village, funded by small-scale logging in Pinang Jatus. A church was built five years ago, but some older villagers still follow their own religion, a variety of Hinduism known locally as Kaharingan. The village has a small school with four rooms and three full-time teachers. It is poorly equipped and sparsely furnished. There is no healthcare centre (puskesmas) in Pinang Jatus.
The distance from the village to the centre of the sub-district is 24 km and it is 65 km to the district capital of Tanah Grogot. This village is located in the northern part of the Gunung Lumut Protection Forest. Like the other villages in the Gunung Lumut area, the economic situation of Pinang Jatus is poor due to very few development activities, poor transportation facilities and low accessibility to the market.
The people of Pinang Jatus work mainly for subsistence and undertake shifting cultivation and the collection of forest products, timber and non-timber products such as hunting wild animals, collecting forest plants, and making handicrafts from forest palm products like rattan and bamboo. The most prominent NTFPs harvested by the people of Pinang Jatus are honey, rattan, fuel wood, forest fruits, and wildlife. The figures of these collections are shown in Chapter 5. This section is aimed at evaluating the monetary value of these products.
The arrival of three logging companies in a village nearby (PT. Telake Mandiri Sejahtera, PT. Mentari and PT. Basuimex) during the last decade has increased the accessibility and the mobility of the people of Pinang Jatus, as they shift from using the river to the road. This change of transportation system has had a considerable impact on the life of Pinang Jatus people. When the river was the only mode of transport, the
143
6. Economic Value of Non-timber Forest Products in the Research Villages
regular market was hard to reach. It took one or even two weeks to make the trip to the market and return home again. Today, the market can be visited daily if necessary, at relatively low cost. Access to the market has enabled the people in Pinang Jatus to get more involved in the cash economy. At the same time, this implies a need to generate more cash in order to be able to buy the industrial goods available in the market, which are perceived more attractive than traditional NTFP products.
6.3.1 Household labour input values
The household labour costs for this village are calculated on the basis of the effective working hours of men, women and children. The distribution of this labour between various household economic activities is shown in Appendix 8.1b and summarised in Table 6.4 below. This table indicates that the total time spent by villagers in economic activities is 122,494 hours per annum, with 48.35 per cent spent on farming, 2.51 per cent spent on handicraft work, 14.12 per cent on fuel wood collection, 8.63 per cent on fishing, and 8.82 per cent on rattan collection. 44.26 per cent of the total labour time is spent collecting non-timber forest products, something that almost all households participate in.
Table 6.4 shows the average labour time spent on each activity by participating households only; it is not the average across the village as a whole. This indicates that there is some variation in how families organise themselves, although almost all are involved to some extent in farming, fuel wood collection and collection of non-timber forest products. None of the households participate in all activities, but all are involved in six to ten of the 14 activities in the village. In other words, each household undertakes at least six activities in order to fulfill their household subsistence needs, as well as for income generating activities.
The total estimated annual value of labour inputs in Pinang Jatus is calculated by applying the previously explained shadow labour value. This is taken to be employment in a logging concession at Rp. 3,125 per hour. The value of labour estimated in this way is shown in Table 6.4 below and, from this, it can be seen that, on average, households invest labour worth Rp. 6,835,602 per annum, with the total value of village labour in Pinang Jatus in 2005 being Rp. 382,793,750.
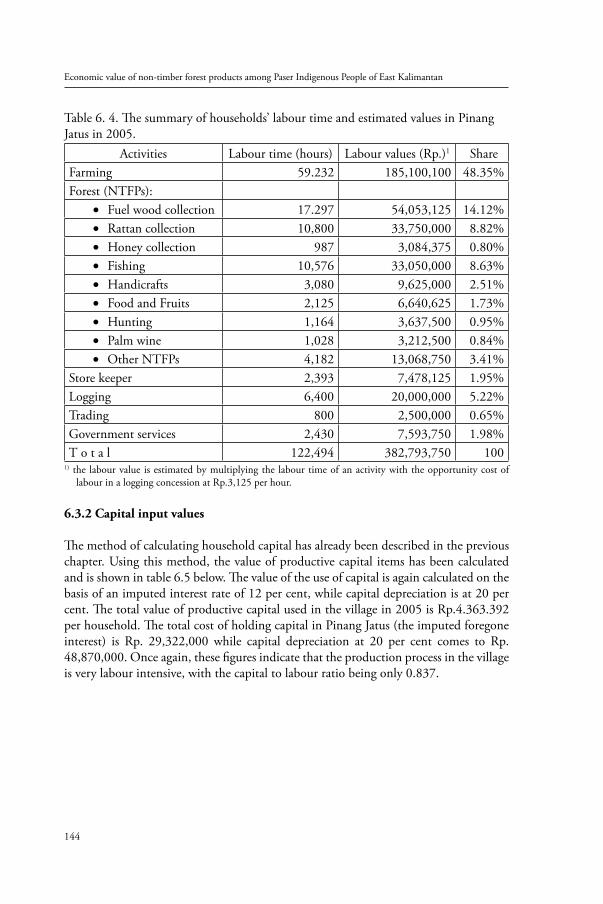
Economic value of non-timber forest products among Paser Indigenous People of East Kalimantan
144
Table 6. 4. The summary of households’ labour time and estimated values in Pinang Jatus in 2005.
Activities Labour time (hours) Labour values (Rp.)1 Share Farming 59.232 185,100,100 48.35%Forest (NTFPs):
Fuel wood collection• 17.297 54,053,125 14.12%Rattan collection• 10,800 33,750,000 8.82%Honey collection • 987 3,084,375 0.80%Fishing • 10,576 33,050,000 8.63%Handicrafts • 3,080 9,625,000 2.51%Food and Fruits • 2,125 6,640,625 1.73%Hunting • 1,164 3,637,500 0.95%Palm wine• 1,028 3,212,500 0.84%Other NTFPs• 4,182 13,068,750 3.41%
Store keeper 2,393 7,478,125 1.95%Logging 6,400 20,000,000 5.22%Trading 800 2,500,000 0.65%Government services 2,430 7,593,750 1.98%T o t a l 122,494 382,793,750 100
1) the labour value is estimated by multiplying the labour time of an activity with the opportunity cost of labour in a logging concession at Rp.3,125 per hour.
6.3.2 Capital input values
The method of calculating household capital has already been described in the previous chapter. Using this method, the value of productive capital items has been calculated and is shown in table 6.5 below. The value of the use of capital is again calculated on the basis of an imputed interest rate of 12 per cent, while capital depreciation is at 20 per cent. The total value of productive capital used in the village in 2005 is Rp.4.363.392 per household. The total cost of holding capital in Pinang Jatus (the imputed foregone interest) is Rp. 29,322,000 while capital depreciation at 20 per cent comes to Rp. 48,870,000. Once again, these figures indicate that the production process in the village is very labour intensive, with the capital to labour ratio being only 0.837.
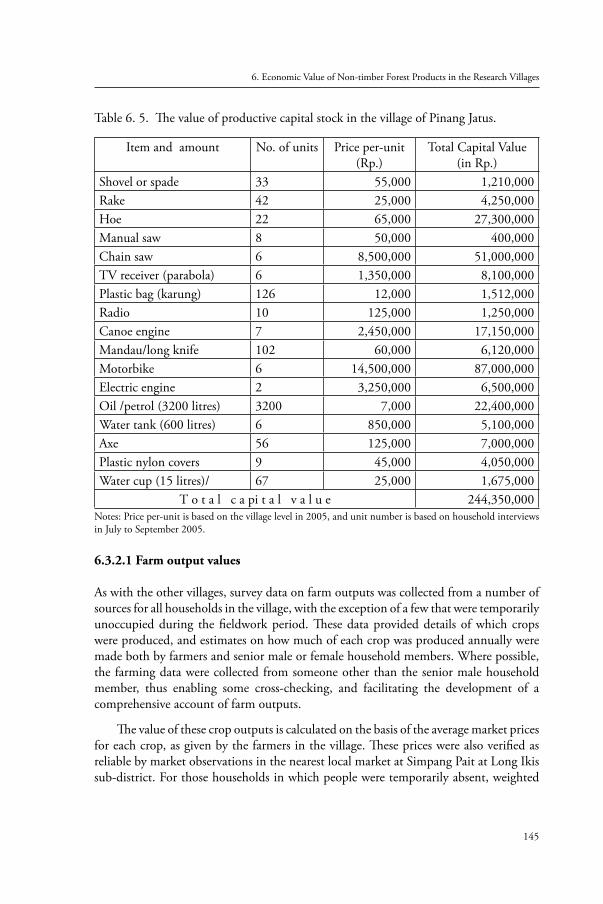
145
6. Economic Value of Non-timber Forest Products in the Research Villages
Table 6. 5. The value of productive capital stock in the village of Pinang Jatus.
Item and amount No. of units Price per-unit (Rp.)
Total Capital Value (in Rp.)
Shovel or spade 33 55,000 1,210,000Rake 42 25,000 4,250,000Hoe 22 65,000 27,300,000Manual saw 8 50,000 400,000Chain saw 6 8,500,000 51,000,000TV receiver (parabola) 6 1,350,000 8,100,000Plastic bag (karung) 126 12,000 1,512,000Radio 10 125,000 1,250,000Canoe engine 7 2,450,000 17,150,000Mandau/long knife 102 60,000 6,120,000Motorbike 6 14,500,000 87,000,000Electric engine 2 3,250,000 6,500,000Oil /petrol (3200 litres) 3200 7,000 22,400,000Water tank (600 litres) 6 850,000 5,100,000Axe 56 125,000 7,000,000Plastic nylon covers 9 45,000 4,050,000Water cup (15 litres)/ 67 25,000 1,675,000
T o t a l c a pi t a l v a l u e 244,350,000Notes: Price per-unit is based on the village level in 2005, and unit number is based on household interviews in July to September 2005.
6.3.2.1 Farm output values
As with the other villages, survey data on farm outputs was collected from a number of sources for all households in the village, with the exception of a few that were temporarily unoccupied during the fieldwork period. These data provided details of which crops were produced, and estimates on how much of each crop was produced annually were made both by farmers and senior male or female household members. Where possible, the farming data were collected from someone other than the senior male household member, thus enabling some cross-checking, and facilitating the development of a comprehensive account of farm outputs.
The value of these crop outputs is calculated on the basis of the average market prices for each crop, as given by the farmers in the village. These prices were also verified as reliable by market observations in the nearest local market at Simpang Pait at Long Ikis sub-district. For those households in which people were temporarily absent, weighted
Economic value of non-timber forest products among Paser Indigenous People of East Kalimantan
146
averages were calculated for the total value of crop output, based on the size of the farm used, and the amount of household labour devoted to farming.
Estimates of the total value of all crops produced in the village of Pinang Jatus during 2005 are shown in Table 6.6 and more details are given in Appendix 8.2b. From these figures it can be seen that the total value of farm outputs of the village in 2005 is Rp.109,560,000, which taken per household gives an average farm output of Rp.1,956,428 per annum.
6.3.2.2. Hunting output values
Seven households in Pinang Jatus regularly participate in hunting and trapping, spending an average of six hours per week in that activity during seven months of hunting periods in one year. A few wild animals are caught, but most households hunt for meat, or trap animals for the wildlife trade. In this village, deer are significantly more important to hunters and trappers than birds are. This highlights the importance of this wildlife trade in deer meat, which is organised by traders for the distribution to the nearest market consumers in Balikpapan and Samarinda. In Simpang Pait, the nearest market to Pinang Jatus, wildlife traders from Balikpapan or Samarinda are to be seen on every market day purchasing parrots, deer and other animals at very low prices.
In Pinang Jatus, several households do not participate in hunting or trapping activities for various reasons, not least because of the difficulty of ensuring success. Table 6 suggests that the relatively high returns from hunting reflects the skills required to be successful as a hunter, as well as the steady demand for meat. Efforts to obtain meat by buying or exchanging it for something else are often noted in those families not involved in hunting. They may also receive meat as a gift from family members, friends or neighbours. This kind of distribution functions as a type of informal inter-household market, which also serves as an important social welfare role in the community.
The provision of meat for protein is important to the household diet, and in addition to chicken and fish, the main animals frequently caught for food are wild deer and wild pigs. The methodology of how the hunting and trapping values are calculated has been previously explained. The estimated value of the total hunting and trapping catches in Pinang Jatus in 2005 is shown in Appendix 8.2b. It is clear that the revenue from hunting contributes only 2.38 per cent of the total village output. Although the amount of catches used directly by the household varies, on average, 15 per cent is used at home, while 85 per cent is sold or exchanged. Of those households that hunt regularly, two households go hunting twice a week or more, four households go once a week, and one household goes twice a month or less. Most hunters (four households) spend one day or less per hunting trip, while two go for one to two days, and one household spends one week or more on each hunting trip.
147
6. Economic Value of Non-timber Forest Products in the Research Villages
Taking only those households that participate regularly in hunting and trapping, the average catches per year is worth Rp. 230,821 per household. This figure represents an important part of the use value of the forest itself, since the availability of animals and birds for hunting is clearly dependent on the health of the whole forest ecosystem. The total imputed value of hunting and trapping in Pinang Jatus in 2005 is estimated at Rp.12,926,000. This equates to Rp. 1,846,670 per participating household and this figure is included as an output value in the calculation of the Net Village Product.
6.3.2.3 Fishing output values
Eighteeen households in Pinang Jatus regularly participate in fishing. This is a relatively high figure given that this village is visited daily by a market agent selling industrial goods. He buys fresh fish in return. In many cases, the fishermen in Pinang Jatus travel a long way to their fishing sites, even as far as the river in the hinterland, which can take four to seven hours paddling. Table 3.3 provides details of annual fishing catches in Pinang Jatus and, from this, it can be seen that the total value of catches in the village is Rp. 27,500,000.
The contribution of fishing to Pinang Jatus households is especially important, since fish provides a regular source of protein to the diet, and an average of Rp. 1,527,000 is earned per year, per participating household. As with hunting, fishing values are an indicator of the value of the forest, since the availability of river fish is highly dependent on the ecosystem integrity of the forest itself. It is well-known that deforestation can have a dramatic effect on the watersheds of the river courses and, as a consequence, the availability of clean rivers with fish reflects, to some extent, the efficient functioning of forest ecosystem services. Therefore, an assessment of the value of the fish is another indicator of the value of those ecosystem services to local inhabitants.
6.3.2.4 Rattan harvesting values
Just as in Rantau Layung, the villagers in Pinang Jatus the collection of rattan canes is a main source of cash income. Twenty-five households were observed to be involved in rattan collection in 2005. By employing the same methods that have been described for Rantau Layung in the previous section, the average household value of rattan collection in Pinang Jatus is Rp. 1,464,000 per annum, and it generates a monthly income of Rp. 122,000 for each household involved. The total value of rattan harvesting in Pinang Jatus in 2005 was Rp. 36,600,000 or 6.74 per cent of the total village output. This value represents another sector in the village economy. For the village of Pinang Jatus, rattan harvesting represents the most important source of cash income from NTFPs, which must be included in the calculation of NVP.
Economic value of non-timber forest products among Paser Indigenous People of East Kalimantan
148
6.3.2.5 Honey bee collection values
Using the same method described for the calculation of rattan, an estimate of the value of wild honey collected in Pinang Jatus can be made. Harvesting of wild honey or wani, a local term for the apis dorsata nests found hanging in branches of Koompassia malacensis or Koompassia excelsa trees is also an important activity for the people in Pinang Jatus. Table l7 and Appendix 8.2b provide details of harvesting figures and show that 18 households were involved in wild honey harvesting and the average harvesting value per household participating is Rp. 480,000. The total estimated value of honey in 2005 was Rp. 8,640,000. This figure demonstrates another important sector of forest as the wild honeybees existence is heavily dependent on the forest ecosystem and the trees providing foods for the bees. Wild honey collection is an important source of cash income fo the villagers.
6.3.2.6 Forest food and fruit collection values
In Chapter five, it was shown that a number of species of plants are used by the people in the research area for food and vegetables. Indeed, it can be seen that 82 per cent of all forest plants collected are used for food and vegetables. Most of the food collected from the forest is in the form of seeds, leaves, shoots, stems, roots and palm hearts. Seasonal variation does occur in the availability of specific forest foods, but generally villagers felt that certain kinds of forest foods are available year round, at fairly similar levels of harvesting efforts.
Thirty-seven out of 56 (67 per cent) Pinang Jatus households collect food and vegetables from the forest on a regular basis. The procedure for calculating the values of forest food and vegetables are the same as those used (and previously outlined) for Rantau Layung. The estimated value of this collected forest food and vegetables is shown in tables 5.2 and 6.2 and in Appendix 8.2b. The monetary value of these forest foods can be calculated on a household basis, and then summed across all households to give the total value of forest food and vegetables for all the villages. Table 6, below, conservatively estimates afigure of Rp. 23,125,000 or Rp. 625,486 per household, per annum, and this is included as part of the Net Village Product.
Details of the types of food and fruit gathered from the forest are shown in table 6.6 and it is clear that in addition to the collection of rattan and honey, the food and vegetables coming from the forest are mainly for home consumption and that they make an important contribution to the household diet.
149
6. Economic Value of Non-timber Forest Products in the Research Villages
6.3.2.7 Palm sugar values
The harvesting of wild enau or Arenga pinnata for making gula aren or red sugar is another important activity for some households in Pinang Jatus. Five households in particular are involved in making palm sugar and gula merah or red sugar, and the collection of palm leaves for roof material and handicrafts material (sapu and ijuk). This activity is conducted on a monthly basis and follows the palm fruit seasons.
The calculation of the value of palm wine, roofing materials and leaves from the palm trees are based on the prices in the nearest market at Simpang Pait. Taking into account the five households in the village involved in this activity, the total amount of this source is Rp. 900,000 per household per year, and the total imputed value is Rp. 4,500,000 per year for the whole village.
6.3.2.8 Handicrafts values
As demonstrated in Rantau Layung, handicrafts are very important to every Paser household as the means of processing rattan canes for agriculture and household equipment. In addition, all households use baskets, fish traps, rattan mats (lampit), and other crafts items in their daily lives, and all of these are made from various forest plants. In most households, some craftwork is done only when it is needed, but in others, there are people who specialise in handicraft production. Overall, a total of 14 households in Pinang Jatus spend some time making handicrafts, almost exclusively producing items that are useful to the household, and for which there is a steady demand. The earnings resulting from handicraft work in the village are shown in table 6.6 and Appendices 6.2 and 8.2b. From this it can be seen that the total value of handicrafts per household is Rp. 600,000 per annum and the total output of this activity is Rp.10,200,000 per annum.
This indicates once again the importance of non-timber forest products to village households, since they provide the materials for essential household items, which are made using traditional craft techniques. Reasons for the large number of households in this village that are able to earn an income from their handicraft work include the presence of a logging company, the development of palm oil plantations and the availability of transportation to the nearest market.
6.3.2.9 Fuel wood consumption values
As in most subsistence villages, fuel wood is the main source of energy used for cooking, and the average number of hours spent by Pinang Jatus households in fuel wood collection is six hours per week, or two hours per trip, and the average household time allocated for fuel wood collection is 300 hours per annum. The duty of collecting fuel
Economic value of non-timber forest products among Paser Indigenous People of East Kalimantan
150
wood varies from house to house, with some households relying on child labour, while in others it is an activity that all family members participate in. The methodology used to value the use of fuel wood has been explained in the previous chapter, and from table 6.6 below, it can be seen that the total estimated value of fuel wood, to be included in the NVP of Rantau Layung, is Rp. 25,000,000.
6.3.2.10 Other output values Besides the use of prominent NTFPs, as mentioned above, there are also many other NTFPs used by villagers, some of which are sold to the nearest market. By using the same method described for the calculation of forest foods, the value of other NTFP plants used in Pintang Jatus can be estimated. Villagers use plants for medicines, but also for spiritual purposes and some households collect different plants for varying purposes. Determining a market price for these products is not easy, as they are not always sold within the villages. In Simpang Pait, the nearest market to Pintang Jatus, ,only some of these products are sold but the market price here is not truly representative of their value because of a number of other factors such as transport costs. To overcome this problem, the price of the main products being traded, such as leaves, seeds, roots, gaharu (eaglewood), and pasak bumi (Eurycoma longifolia), is used as a proxy for all plants. On this basis, the total annual value of medicinal plants is calculated. A breakdown of this is shown in table 6.6, and the final total is undoubtedly a conservative estimate. Indeed, it is likely to be much higher if a substitute pricing method, based on malaria treatment, is used. Since these medicinal plants represent another household output, this estimated value is to be included in the value of total NVP.
Another income source that is important to mention here is the wage labour or employment for the government. Teachers and officers of the village administration or rural development agencies are paid by local government on a monthly basis.
The last activity that must be mentioned is another type of off-farm labour, which includes storekeeping, working for logging companies, or timber cutting and trading. The average household income from these sectors is Rp. 5,064,000 per annum and the annual total value of these other sources of income comes to Rp. 283,599,000. This represents 41.64 per cent of the total annual income in 2005.
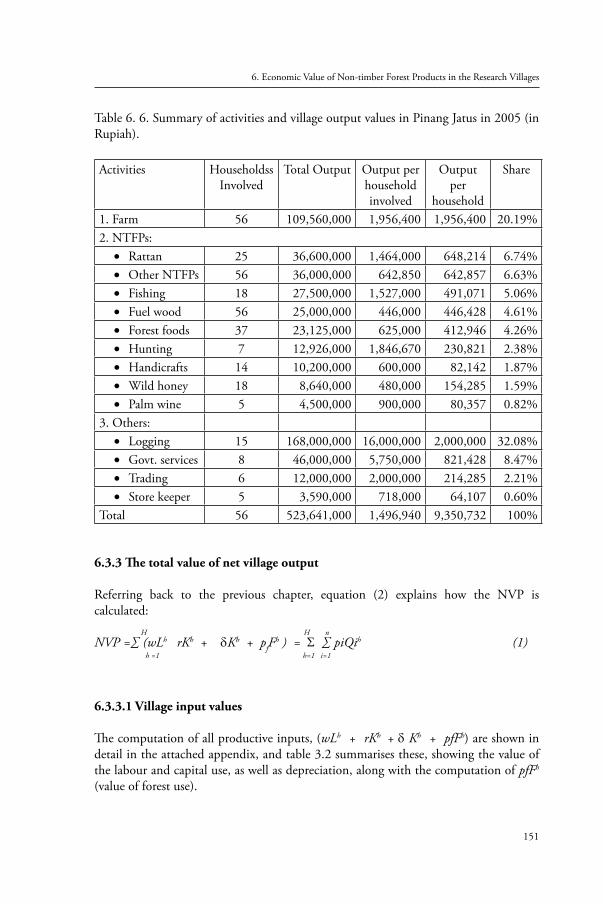
151
6. Economic Value of Non-timber Forest Products in the Research Villages
Table 6. 6. Summary of activities and village output values in Pinang Jatus in 2005 (in Rupiah).
Activities HouseholdssInvolved
Total Output Output per household involved
Output per
household
Share
1. Farm 56 109,560,000 1,956,400 1,956,400 20.19%2. NTFPs:
Rattan • 25 36,600,000 1,464,000 648,214 6.74%Other NTFPs• 56 36,000,000 642,850 642,857 6.63%Fishing• 18 27,500,000 1,527,000 491,071 5.06%Fuel wood• 56 25,000,000 446,000 446,428 4.61%Forest foods• 37 23,125,000 625,000 412,946 4.26%Hunting • 7 12,926,000 1,846,670 230,821 2.38%Handicrafts• 14 10,200,000 600,000 82,142 1.87%Wild honey• 18 8,640,000 480,000 154,285 1.59%Palm wine• 5 4,500,000 900,000 80,357 0.82%
3. Others:Logging• 15 168,000,000 16,000,000 2,000,000 32.08%Govt. services• 8 46,000,000 5,750,000 821,428 8.47%Trading• 6 12,000,000 2,000,000 214,285 2.21%Store keeper• 5 3,590,000 718,000 64,107 0.60%
Total 56 523,641,000 1,496,940 9,350,732 100%
6.3.3 The total value of net village output
Referring back to the previous chapter, equation (2) explains how the NVP is calculated: H H nNVP =∑ (wLh rKh + δKh + pfF
h ) = Σ ∑ piQih (1) h =1 h=1 i=1
6.3.3.1 Village input values
The computation of all productive inputs, (wLh + rKh + δ Kh + pfFh) are shown in detail in the attached appendix, and table 3.2 summarises these, showing the value of the labour and capital use, as well as depreciation, along with the computation of pfFh (value of forest use).
Economic value of non-timber forest products among Paser Indigenous People of East Kalimantan
152
6.3.3.2 Village output values
Table 6.6 above provides a summary of all the values of all of the household outputs,
H n NVP=Σ ∑piQih h=1 i=1 (2)
A closer look at this table indicates that some households are notably more productive than others, with some variation between households occurring in the relative sizes of the various sectors. This is not surprising, and is certainly worthy of further investigation. In addition, a deeper understanding of the links within and between households can be built up from the qualitative data to be analysed at a later date.
The total value of outputs of all economically productive activities in Pinang Jatus is Rp. 523,641,000, which gives an average per household value of Rp. 9,350,730. This figure is inserted in the formula in order to estimate the derived value of forest inputs.
6.3.3.3 The derivation of the use-value of forest inputs in Pinang Jatus
To compute this value, we need to sum across all households for all outputs and inputs, and the values of the forest residual pfF
h can be determined by re-arranging the known values, using the formula:
H H n Σ
pf Fh = Σ ( Σ pt Qt
h - (wlh + rkh + δ Kh)) (3) h=i h=1 t=1
The forest residuals (pf Fh) are shown in table 6.6 and represent the contribution made
to the production process by land, i.e. the rent. It can also be described as the ‘value added from nature’, or the value of the forest resource to the Paser indigenous people of Pinang Jatus village.
In this particular case, for Pinang Jatus in 2005, the total of this value added from the forest is Rp. 352,491,000, of which Rp. 184,491,000 (34 per cent) represents the value generated by the anthropogenic use of non-timber products from the forest, and Rp. 112,000,000 is from timber products. This amount can be estimated because a number of trees used for timber are destined not only for subsistence construction, but also for the market. However, this is a temporary activity since the government has stopped the issuing permits for small-scale timber cutting. It is difficult to continue these activities as the government could confiscate any timber as an illegal product.
The population of Pinang Jatus consists of 265 men, women and children. On the basis of the above estimate of total value of rent, or added value from the forest, the per capita value for the village is Rp. 1,330,154 per year. Using this per capita figure, it is
153
6. Economic Value of Non-timber Forest Products in the Research Villages
possible that for the average household in Pinang Jatus (4.73 people), the value of the contribution from the forest made to household income per year is Rp. 6,294,821. Rp. 695,192 of which is derived from NTFPs. The relatively significant amount of income accrued from the forest could have important implications for the people of Pinang Jatus. This shows again that NTFPs make an important contribution to increasing the per capita income of people in Pinang Jatus since farming only accounts for 20.94 per cent. NTFPs allow villagers to maintain their lifestyle even though their community still experiences poverty and a per capita income was only Rp. 2,047,509 in 2006. This is very low compared with the overall district of Pasir per capita income of Rp. 12,000,000 in the same year (BPS Pasir 2006).
Another way to look at the relative importance of the various productive inputs is to examine their relationship to the level of outputs. Table 5 shows that the total value of capital use in Pinang Jatus, in the form of foregone interest and capital depreciation, is Rp. 48,870,000. Table 6.6 shows that the total value of outputs in the village is Rp. 523,641,000. This illustrates that the capital and output ratio of this rural subsistence production system are low, with slightly less than 9.33 per cent of output being the result of capital input. These figures also show that the production system in this village is very labour intensive, with 73.10 per cent of output resulting from the efforts of labour. It is interesting to see that the contribution of the forest as a productive input is significantly more important in this village than the contribution of capital. The ratio of forest inputs to total output indicates that 64.96 per cent of output (in the form of the use of timber and non-timber forest products) results from the input of nature. This suggests that any removal of the option to use inputs would have a very significant effect on the well-being of these households.
6.4. Muluy village
Muluy is a resettlement village for Paser indigenous people. The village was developed in 2001 for the nomadic people in the area of the Muluy River. The village is located in the heart of the Gunung Lumut Protection Forest, about 59 km from the Kalimantan Trans-Highway of Long Ikis and 92 km from the district capital of Tanah Grogot. The village is part of the sub-district (kecamatan) of Muara Komam and consists of 22 households and 106 people. Due to its small population, this village has not been categorised as ‘Desa’ by the government. This can be seen in the village infrastructure, which has no village staff or village head. This is one of the Swanselotung’s housing cluster (RT) or ‘Dusun’. The difference between Muluy village and the other two research villages is the villager’s cohesiveness in terms of following their adat chief, especially during the Palindung leadership.
The process of development in Muluy village was quite different from the other two villages in this study, since its population originates from only one area. This has the advantage that the community is more tightly-knit and cohesive and leads to
Economic value of non-timber forest products among Paser Indigenous People of East Kalimantan
154
stronger links between families and households. In contrast to the other villages, Muluy has evolved more naturally. In spite of this, individual Muluy households tend to be less typically Paser and more like the Dayak households in Meratus or the Mahakam Basin.
In terms of the analysis of how people in the area use the forest, Muluy provides a good set of household data from a survey of 22 houses, representing a total of 106 people. The survey includes all those households situated along the road that lies within 6 km of the base camp of the logging concession of PT. RKR.
The average household in the village is made up of 4.8 people, with a total of 48 men in the village, 33 women and 24 children. Overall, these households cultivate 17.6 hectares of land, which is divided into 18 farm plots with an average of 0.8 hectares per household.
Houses in this village are situated in a small settlement area in close proximity to each other. A few households have constructed their small house in the form of a ‘village hut’ where they stay during the agricultural rice plantation period. In terms of religion, Muluy adhere to Islam, although some traditions relating to their ‘old’ religion persist, especially in dealing with the cultivation and harvesting of rice, as well as in producing medicines. The village has a small government school with two temporary teachers, and no healthcare or public facilities. Many NGOs have used Muluy village as a target for their community development and to explore the link between indigenous people and natural resource use. However, there has been no significant change in village facilities or in terms of education and income as a result of these activities. This has led to the people of Muluy being wary of outsiders, and sometime it is difficult to get them to open up about their internal problems as they believe outsiders are not trustworthy.
6.4.1 Household labour input values
Household labour is calculated on the basis of the effective working hours of men, women, and children. The distribution of the estimated labour time between various economic activities in which the households are involved, is shown in Appendix8.1c and summarised in table 6.7 below. It can be seen that the total time spent by villagers in economic activities is 40,915 hours per annum, with 57.03 per cent spent in farming, 6.15 per cent on collecting rattan, 5.86 per cent on fuel wood collection, 5.86 per cent on logging and 6.45 per cent on the collection of other NTFPs. More than 40 per cent of their labour time is spent on non-timber forest products activities. This indicates that there is some similarity among the households. Nevertheless, there is also some variation of household activities. On average, 10 out of 14 activities are conducted by each household in order to meet their daily needs.
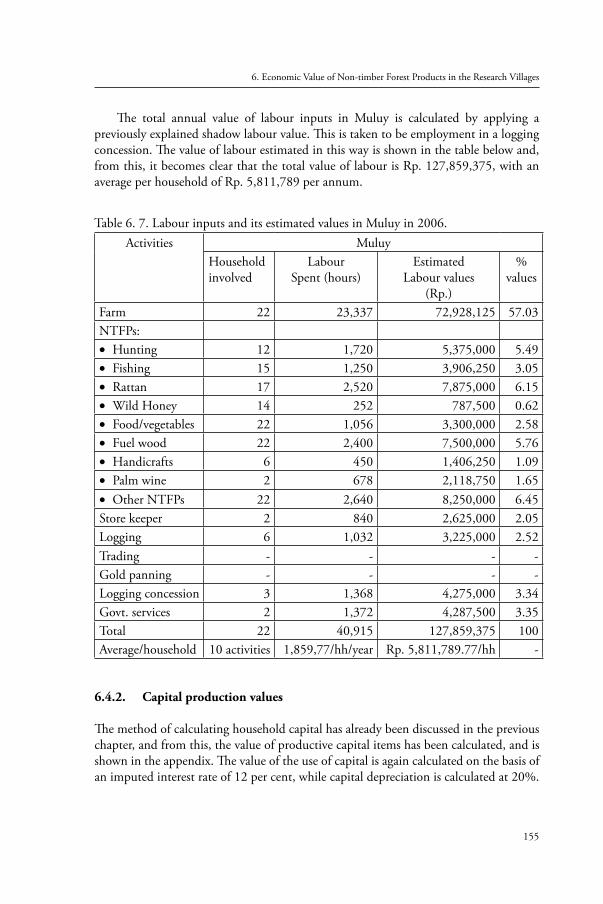
155
6. Economic Value of Non-timber Forest Products in the Research Villages
The total annual value of labour inputs in Muluy is calculated by applying a previously explained shadow labour value. This is taken to be employment in a logging concession. The value of labour estimated in this way is shown in the table below and, from this, it becomes clear that the total value of labour is Rp. 127,859,375, with an average per household of Rp. 5,811,789 per annum.
Table 6. 7. Labour inputs and its estimated values in Muluy in 2006.Activities Muluy
Household involved
LabourSpent (hours)
Estimated Labour values
(Rp.)
%values
Farm 22 23,337 72,928,125 57.03NTFPs:
Hunting• 12 1,720 5,375,000 5.49Fishing• 15 1,250 3,906,250 3.05Rattan • 17 2,520 7,875,000 6.15Wild Honey• 14 252 787,500 0.62Food/vegetables• 22 1,056 3,300,000 2.58Fuel wood• 22 2,400 7,500,000 5.76Handicrafts• 6 450 1,406,250 1.09Palm wine• 2 678 2,118,750 1.65Other NTFPs• 22 2,640 8,250,000 6.45
Store keeper 2 840 2,625,000 2.05Logging 6 1,032 3,225,000 2.52Trading - - - -Gold panning - - - -Logging concession 3 1,368 4,275,000 3.34Govt. services 2 1,372 4,287,500 3.35Total 22 40,915 127,859,375 100Average/household 10 activities 1,859,77/hh/year Rp. 5,811,789.77/hh -
6.4.2. Capital production values
The method of calculating household capital has already been discussed in the previous chapter, and from this, the value of productive capital items has been calculated, and is shown in the appendix. The value of the use of capital is again calculated on the basis of an imputed interest rate of 12 per cent, while capital depreciation is calculated at 20%.
Economic value of non-timber forest products among Paser Indigenous People of East Kalimantan
156
The total value of productive capital used in the village of Muluy is Rp. 82,440,000, which, on average, equals Rp. 3,747,272 per household. The total cost of holding capital in Muluy (the imputed foregone interest) is Rp. 9,892,800 per annum, while capital depreciation at 20 per cent comes to Rp. 16,488,000. Once again, these figures indicate that the production process in the village is very labour intensive, with the capital to labour ratio being 4.95 per cent.
6.4.3. Estimating household output values
6.4.3.1. Farm output values
As with the other villages, survey data on farm outputs was collected from a number of sources for all households in Muluy village (with the exception of a few houses that were temporarily unoccupied during the fieldwork period). This data provides details about which crops were produced. Estimates of how much of each crop was produced annually were made both by farmers and senior male or female household members. Where possible, the farming data were collected from the households during interviews with family members, thus enabling some cross-checking to be done, and facilitating the development of a comprehensive account of farm outputs.
The value of these crop outputs is calculated on the basis of the average market prices for each crop, as given by the farmers in the village. These prices were also verified by observations in the nearest local market at Simpang Pait, in the sub-district of Long Ikis. For those households where people were temporarily absent, weighted averages were calculated for the total value of crop output, based on the size of the farm and the amount of household labour devoted to farming.
Estimates of the total value of all crops produced in the village of Muluy during 2006 are shown in table 6.3 and Appendix 8.2c. From these figures, it can be seen that the total value of farm outputs for the village in 2006 was Rp. 40,666,000. This gives an average farm output per household of Rp. 1,848,450 per annum.
6.4.3.2. Hunting and fishing values
Twelve households regularly are involved in hunting in Muluy and 15 households are involved in fishing. The average annual labour time spent on hunting activities is 143 hours per household, and 140 hours are devoted per household to fishing. The variety of wild animals hunted for meat and sold to the nearest market is shown in Appendix 12.
Birds are important to the hunters and trappers of Muluy village. This is illustrated by the figures shown in Appendix 8.3 and summarised in table 6.8 below. Again, this wildlife is mainly hunted for the purpose of household entertainment rather than for selling to the market as bush meat. The estimation of the economic value of hunting and
157
6. Economic Value of Non-timber Forest Products in the Research Villages
fishing is shown in table 6.8 and comes to Rp. 3,900,000 for fishing and Rp. 3,600,000 for hunting. These activities consume 3.05 per cent of labour time for fishing and 4.20 per cent for hunting. Both of these values contributed to 3.75 per cent of the village output values.
6.4.3.3. Rattan harvesting values
The number of households involved in rattan harvesting in Muluy during the research period was 17 households, or 77.27 per cent of the households in the village. This high level of involvement in rattan collection is due to the culture of harvesting, which is conducted in groups of families and follows seasonal patterns. The method used to calculate the value of rattan harvesting involves measuring the volume of extraction in the year observed and multiplying this by the price of rattan at the village gate level.
As shown in table 8, the value of rattan harvesting in Muluy is Rp. 52,500,000. This figure comes from the production 150 tons of raw rattan in 2006. In reality, the amount could be higher, but cross-checks with the company which bought the rattan from Muluy village reveal similar amounts.
Rattan contributes to 26.27 per cent of the total village output values and it was the second largest source of income, after farm products, during 2006. Rattan is the highest source of economy from the NTFP sector.
6.4.3.4. Wild honey collection values
From Table 6.8 it can be seen that wild honey collection contributes 4.50 per cent of the total output values in Muluy’s economy. This sector provides a source of labour for 14 households, with net output values of Rp. 8,212,500 per year. This value represents the importance of honey collection in household economies, in particular in terms of providing a household sweetener, which can be used as a substitute for industrially-produced sugar. Another important aspect of wild honey collection is the maintenance of the trees in which wild honey is hosted. If the forest where the Koompassia tree is found is not taken care of, then there will be a serious impact on honey production.
6.4.3.5. Handicrafts and palm sugar values
By employing the same methods of calculating handicrafts and palm sugar values as were discussed in the previous chapter, the value of palm wine and handicrafts can be measured in the village of Muluy. There are six households involved in handicraft and two households engaging in the collection of palm sugar. Together, these activities consumed 2.74 per cent of village labour time – 1.65 per cent for palm wine and 1.09 per cent for handicrafts. Only eight households in the village (36.36 per cent) are involved in these two sources.
Economic value of non-timber forest products among Paser Indigenous People of East Kalimantan
158
The monetary value of these activities can also be measured using the methods described in the previous chapter and amounts to Rp. 560,000 per annum for handicrafts and Rp. 4,450,000 for palm sugar. The contribution of these sectors is only 4.51 per cent of the total village output.
6.4.3.6. Fuel wood values
As in most of the villages in this region, fuel wood is the main source of energy used for cooking in the village of Muluy. All households participate in the use of fuel wood and its economic value can be calculated using the level of consumption and the local market prices for wood used for fuel.
From the table in Appendix 8.1c it can be seen that the labour time used for collecting fuel wood in Muluy is 2,400 hours; an average 110 hours per household, per annum. From this, we can deduce that collecting fuel wood is one of the main activities of the people in the village, as all households and all family members are involved in this activity.
Appendix 8.2c shows that the monetary value of fuel wood is Rp. 13,200,000, or Rp. 545,000 per household, per annum. This value is the fourth most important source for meeting household needs and contributes to 6.61 per cent of the total village output values. Looking at the importance of this sector for the village economy also shows the significance of the forest in terms of providing free fuel wood for the people in the village, and again this has to be included in the calculation of the village values.
6.4.3.7. Fruits, foods and others NTFP values
A wide variety of forest plants and trees species are used by the people of Muluy for many purposes, as described in Chapter five. Using the same methods as those employed for the villages of Rantau Layung and Pinang Jatus, it is possible to calculate the value of fruit, food and other NTFPs in the village of Muluy.
Data from table 6.8, below, reveals the importance of these products, where all households are involved and high levels of labour time are committed to these activities. From ttable 6.3 and Appendices 8.1c and 8.2c it can be seen that the share of labour time for food and fruit collection is 1,056 hours, or 48 hours per household, per annum. 2,640 hours are given over to collecting other NTFPs, with the total for both sectors reaching 3,696 hours per annum. Appendix 8.2c and table 6.8 below reveal that all households are involved in these activities, which are very important for the village of Muluy.
In terms of monetary value, fruit and food account for Rp. 14,650,000, or Rp. 665,000 per household, per annum. NTFPs have a value of Rp. 17,400,000, or Rp. 790,910 per household, per annum. These values are 15.04 per cent of the total village
159
6. Economic Value of Non-timber Forest Products in the Research Villages
output. Once again this proves the crucial importance of nature to the people and, therefore, it must be calculated into the total village output values.
6.4.4. Total input and output for village products The value of all inputs and outputs for the village of Muluy are shown in table 6.8. From the figures, it is possible once again to determine the total value of the net village product and, thus, by derivation, the residual value of forest use by the people in this village.
Table 6. 8. Activities, output and residual value of forest in Muluy in 2006
Activity Input and Output values HhInv.
Labour input values ( Rp.)
Share of input
%
Output values(Rp.)
Share of output
%
Net output values per
sector (Rp.)Farm 22 72,928,125 57.03 40.666,000 20.35 -32,262,125NTFPs:
Hunting• 12 5,375,000 4.20 3.600,000 1.80 -1,775,000Fishing• 15 3,906,250 3.05 3.900,000 1.95 -6,250Rattan • 17 7,875,000 6.15 52.500,000 26.27 44,625,000Wild Honey• 14 787,500 0.62 9.000,000 4.50 8,212,500Food/fruits• 22 3,300,000 2.58 14.650,000 7.33 11,350,000Fuel wood• 22 7,500,000 5.86 13.200,000 6.61 5,700,000Handicrafts• 6 1,406,250 1.09 0.560,000 0.28 -846,250Palm wine• 2 2,118,750 1.65 8.450,000 4.23 6,331,250Other NTFPs• 22 8,250,000 6.45 17.400,000 8.71 9,150,000
Store keeper 2 2,625,000 2.05 2.500,000 1.25 -125,000Logging 6 3,225,000 2.52 8.800,000 4.29 5,575,000Concession 3 4,275,000 3.34 12.600,000 6.42 8,325,000Gov. services 2 4,287,500 3.35 12.000,000 6.01 7,712,500-Cost of capital (12%)-Depreciation (20%)
13,493,28822,488,000
Total 22 163,840,712 100 199,822,000 100Input-output (Total Net Village Product)/forest residues 35,981,288Net forest residues per-household 1,635,513.09
*): Data for Muluy is based on the collected data in 2006 or one year after the collection in Rantau Layung and Pinang Jatus. There is no significant difference in the economic situation between 2005 and 2006 and this made it possible to compare the economic conditions of Muluy, Rantau Layung and Pinang Jatus.
Economic value of non-timber forest products among Paser Indigenous People of East Kalimantan
160
As with the other villages in this study, inputs into the village production of Muluy are limited to the use of labour, the use of capital, and the use of nature in the form of forest use. The total annual value for this village input is Rp. 163,840,712. The value of all these village inputs is combined with all the values of outputs to produce the value of the net village product.
Since the land in this village is perceived as communal property, no calculation is made for land rent. This implies that households are not subject to government taxation. Using equation (2) from the previous chapter to calculate the value of NVP, it can be seen that the total value of village product for Muluy in 2006 was Rp. 199,822,000. After deducting the total village input, the residual is Rp. 35,981,288. Taking the 22 households of the village, this suggests that the average net value of household output is Rp. 1,635,513 per annum. This is the product of time and effort of household members, the input of product capital, and the use of nature in the form of non-timber forest products provided by the forest ecosystem.
6.4.5 The derivation of the value of forest inputs in Muluy As in the other villages, the value of forest inputs is derived as a residue. Table 6.8 above and Appendix 6 show that the total forest residual value is Rp. 35,981,288, giving a household average of Rp. 1,635,513.09 per annum. This significant figure is the amount that can be said to be value added to production as a result of the use of nature in the form of timber and non-timber forest products by the households.
It can be seen from table 6.8 that the differences between the input and output values have shown positive residues in general, but in some sectors, such as farming, hunting, fishing, handicrafts, and storekeeping the residue is negative. This can be explained by the fact that many households were not producing rice due to attacks by pests and animals. The same is true for hunting and fishing outputs. Many hours and trips have been spent hunting without bringing back any animals or fish. In terms of handicrafts, it could be the result of an underestimation of outputs as the products were mainly used for subsistence, and the activity was conducted at varying times, which may not have been covered by the interviews.
6.5. Conclusions
The calculated figures for the value of non-timber forest products in the three research villages actually represent the value added to labour and capital inputs by the use of the primary resource – land and forest. This amount, therefore, is equivalent to the rent of that factor of production. This figure is not insignificant, and it would certainly be important to include such rents in any assessments of alternative development strategies.
161
6. Economic Value of Non-timber Forest Products in the Research Villages
Since exploitation of this natural capital in these villages is small-scale and considered to be non-depleting, it is not necessary for this analysis to depreciate the value of natural capital use. The important factor to consider in this case, however, is the fact that this estimated level of rent accruing to land and nature, as a result of these uses of non-timber forest products and services of that resource is, ceteris paribus, an infinite income stream. This has significant implications for sustainability, and it is important that, if the quality of the income stream is to be preserved, action must be taken to ensure that this communal property resource is not depleted by the decisions and actions of the current generation of both local residents and policymakers.
Estimates such as these can be used as an indicator of the amount of compensation that would have to be paid in the event of such villages losing their access to the forest as a household input. Such a situation may arise, for example, in a location that is to be taken over for the development of timber estate, logging concessions and palm oil in the research villages. This would result in the loss of access to this common property resource. These figures, when combined with estimated timber values (from concessions) could also be used as a guide for the purpose of evaluating the cost of a palm oil plantation, forest fire, flooding, or other such ecological disruption. There is no doubt from this analysis, that the importance of NTFPs has not been highlighted in the current government programme for forest timber cutting and for the development of palm oil. The data shows that the existence of the forest is important for food security in villages such as these. In addition, the role of non-timber forest products is essential to the lifestyle of these forest dwellers, as without the contribution of forest products and services, the whole way of life of Paser people would be unsupportable. It also suggests that it is certainly in the interest of the Pasir District policymakers to look more carefully at total forest income potentials, rather than concentrating solely on the timber income potentials of forest resources.
Inevitably, as with any survey-based approach, there is bound to be a degree of error in these calculations, and so an element of error will exist in the valuation estimates demonstrated here. The procedure of using an income accounting framework to estimate the value the use of non-timber forest products and services is one which, to some extent at least, overcomes some of the more major difficulties associated with conventional valuation methods. On the basis of the accounting methodology used here, in each of the villages, the proportion of output accounted for by forest inputs is not unimportant. Therefore, even taking any error into account, the value added from nature, as demonstrated by this analysis, is quite significant. For example, as a proportion of the Net Village Product, the value of these forest inputs represents 36.79 per cent in Rantau Layung, 42.29 per cent in Pinang Jatus and 72.39 per cent in Muluy. Possible reasons for the differences that exist between the villages’ economy and NTFPs contribution to household economy will be examined in the next chapter.

Economic value of non-timber forest products among Paser Indigenous People of East Kalimantan
162
163
Chapter 7
The comparison of the economic value of NTFPs to the economies of the three research villages
7.1. Introduction
Through close inspection of the data from three villages, Muluy, Pinang Jatus and Rantau Layung, it is possible to make comparisons and identify how resource-use differs between them. Some of these differences highlight the various livelihood choices available in these villages, and indicates the trade-off which may exist between different choices set. Some of geographic and demographic characteristics of the villages are highlighted in the second section, followed by an examination of the differences in the levels of household capital and its distribution within the villages in Section 3. Section 4 addresses the issue of the use of forest inputs in village production. An analysis of village production functions is provided in Section 5, followed by some conclusions in Section 6.
7.2. Geographical and demographic characteristics of the villages
Table 7.1 describes the characteristics of the village research sites. These villages have many similar characteristics. Although this is a relatively small sample, these similarities suggest that the Paser population in the research area is relatively homogenous in lifestyle and in socio-economic profile. The findings relating to the households of this study may well apply to other similar households in this type of environment.
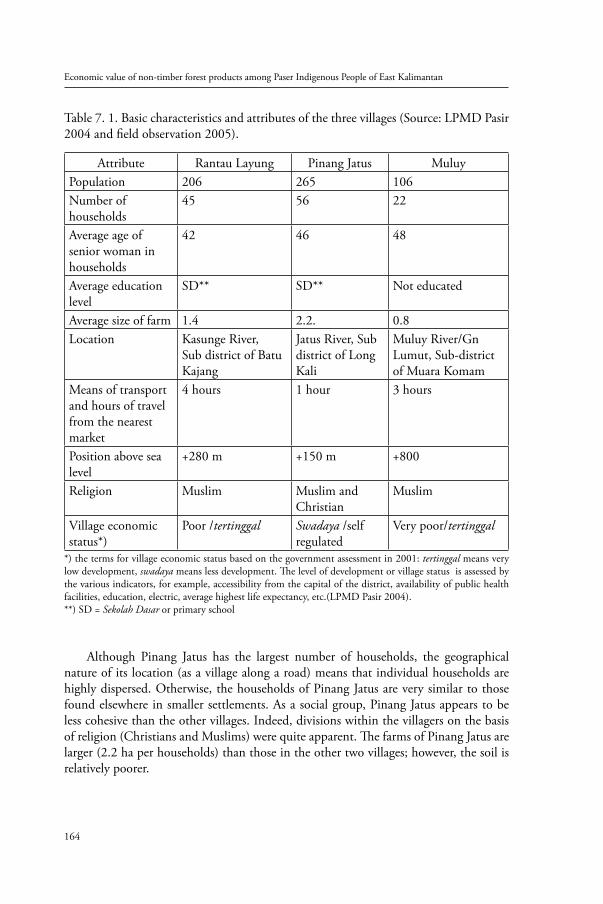
Economic value of non-timber forest products among Paser Indigenous People of East Kalimantan
164
Table 7. 1. Basic characteristics and attributes of the three villages (Source: LPMD Pasir 2004 and field observation 2005).
Attribute Rantau Layung Pinang Jatus MuluyPopulation 206 265 106Number of households
45 56 22
Average age of senior woman in households
42 46 48
Average education level
SD** SD** Not educated
Average size of farm 1.4 2.2. 0.8Location Kasunge River,
Sub district of Batu Kajang
Jatus River, Sub district of Long Kali
Muluy River/Gn Lumut, Sub-district of Muara Komam
Means of transport and hours of travel from the nearest market
4 hours 1 hour 3 hours
Position above sea level
+280 m +150 m +800
Religion Muslim Muslim and Christian
Muslim
Village economic status*)
Poor /tertinggal Swadaya /self regulated
Very poor/tertinggal
*) the terms for village economic status based on the government assessment in 2001: tertinggal means very low development, swadaya means less development. The level of development or village status is assessed by the various indicators, for example, accessibility from the capital of the district, availability of public health facilities, education, electric, average highest life expectancy, etc.(LPMD Pasir 2004).**) SD = Sekolah Dasar or primary school
Although Pinang Jatus has the largest number of households, the geographical nature of its location (as a village along a road) means that individual households are highly dispersed. Otherwise, the households of Pinang Jatus are very similar to those found elsewhere in smaller settlements. As a social group, Pinang Jatus appears to be less cohesive than the other villages. Indeed, divisions within the villagers on the basis of religion (Christians and Muslims) were quite apparent. The farms of Pinang Jatus are larger (2.2 ha per households) than those in the other two villages; however, the soil is relatively poorer.
165
7. The comparison of the economic value of NTFPs to the economies of the three research villages
The average of organic content of soil samples was taken at a number of sites in each village. From this it can be seen that the soil in Rantau Layung is richer in nutrients than the other villages, particularly compared to Pinang Jatus. The average organic matter in the soil at Pinang Jatus is 5.4 per cent, in Rantau Layung it is 7.2 per cent and in Muluy it is 6.8 per cent (PPLH UNMUL 2002). These soil samples also indicate that in the three villages, the farm soil (just after clearing and burning) has a higher organic content than the soil taken from non-farm (forest) sources. This demonstrates the short-term enriching effect of the slash-and-burn methods used in these villages, and bears out the well-known fact that the nutrients in areas of forest are predominantly in the vegetation, rather than in the soil. This is further explained by fact that in the three study villages, the rivers are characterised by dense forest cover. During the rainy season there is a high sediment load in the river. During the dry season the flow suddenly drops to a very low level of debit as a result of the inability of top soil to retain rain water (PPLH UNMUL 2002). One way in which farmers could possibly improve soil quality in these areas, would be to plant nitrogen fixing trees and crops in their fields. This strategy could be incorporated with other agroforestry measures to try to improve farm productivity. Clearly, however, this is an area requiring further research, including field trials, to investigate the impact and effectiveness of such schemes.
7.3. Comparison of labour supply and sector outputs Table 7.2 and figure 7.1 show the different labour supply in the village research sites. The difference is significant in terms of the percentage of the sector to total village output. In this chapter, I will discuss the differences in the village activities and their contribution to the village output.
The variation in the quantity of labour supplied by households in the villages tends to support the idea that farmers in Rantau Layung benefit from good soil, yet they are not motivated to work it to its full potential. As can be seen from table 7.2, the total number of household labour hours is lowest in Muluy and highest in Pinang Jatus, with households in Rantau Layung falling between the two. These data suggest that households with better environmental or economic endowments, such good soil (Rantau Layung), or better market access (Pinang Jatus), will need to put in less labour than those where natural and economic conditions are less favourable (Muluy). This highlights the fact that within the classification of ‘subsistence agriculture’, there is a degree of heterogeneity amongst households. This is demonstrated in the study villages by the fact that the percentage of household labour time spent on farming in Rantau Layung is higher than in Pinang Jatus and Muluy.
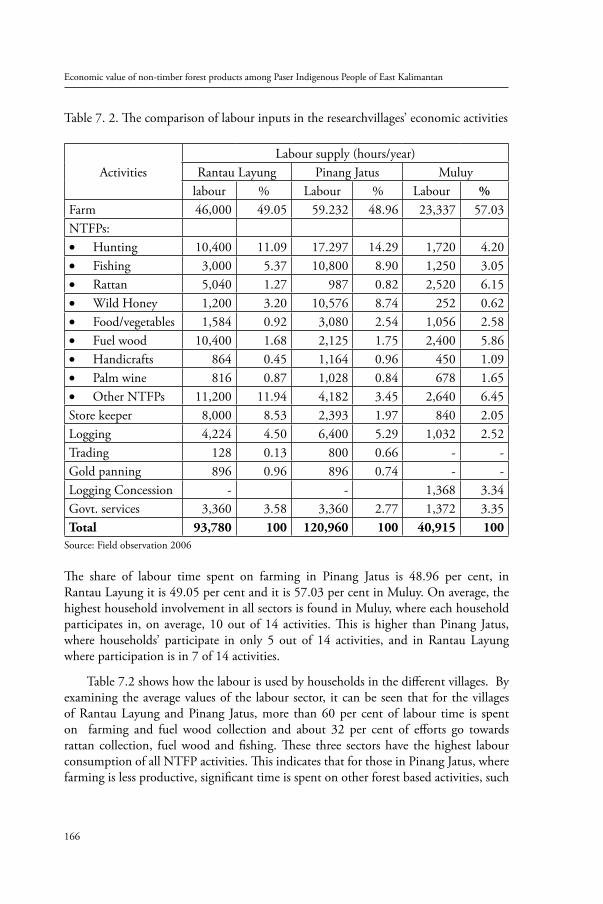
Economic value of non-timber forest products among Paser Indigenous People of East Kalimantan
166
Table 7. 2. The comparison of labour inputs in the researchvillages’ economic activities
ActivitiesLabour supply (hours/year)
Rantau Layung Pinang Jatus Muluylabour % Labour % Labour %
Farm 46,000 49.05 59.232 48.96 23,337 57.03NTFPs:
Hunting• 10,400 11.09 17.297 14.29 1,720 4.20Fishing• 3,000 5.37 10,800 8.90 1,250 3.05Rattan • 5,040 1.27 987 0.82 2,520 6.15Wild Honey• 1,200 3.20 10,576 8.74 252 0.62Food/vegetables• 1,584 0.92 3,080 2.54 1,056 2.58Fuel wood• 10,400 1.68 2,125 1.75 2,400 5.86Handicrafts• 864 0.45 1,164 0.96 450 1.09Palm wine• 816 0.87 1,028 0.84 678 1.65Other NTFPs• 11,200 11.94 4,182 3.45 2,640 6.45
Store keeper 8,000 8.53 2,393 1.97 840 2.05Logging 4,224 4.50 6,400 5.29 1,032 2.52Trading 128 0.13 800 0.66 - -Gold panning 896 0.96 896 0.74 - -Logging Concession - - 1,368 3.34Govt. services 3,360 3.58 3,360 2.77 1,372 3.35Total 93,780 100 120,960 100 40,915 100
Source: Field observation 2006
The share of labour time spent on farming in Pinang Jatus is 48.96 per cent, in Rantau Layung it is 49.05 per cent and it is 57.03 per cent in Muluy. On average, the highest household involvement in all sectors is found in Muluy, where each household participates in, on average, 10 out of 14 activities. This is higher than Pinang Jatus, where households’ participate in only 5 out of 14 activities, and in Rantau Layung where participation is in 7 of 14 activities.
Table 7.2 shows how the labour is used by households in the different villages. By examining the average values of the labour sector, it can be seen that for the villages of Rantau Layung and Pinang Jatus, more than 60 per cent of labour time is spent on farming and fuel wood collection and about 32 per cent of efforts go towards rattan collection, fuel wood and fishing. These three sectors have the highest labour consumption of all NTFP activities. This indicates that for those in Pinang Jatus, where farming is less productive, significant time is spent on other forest based activities, such
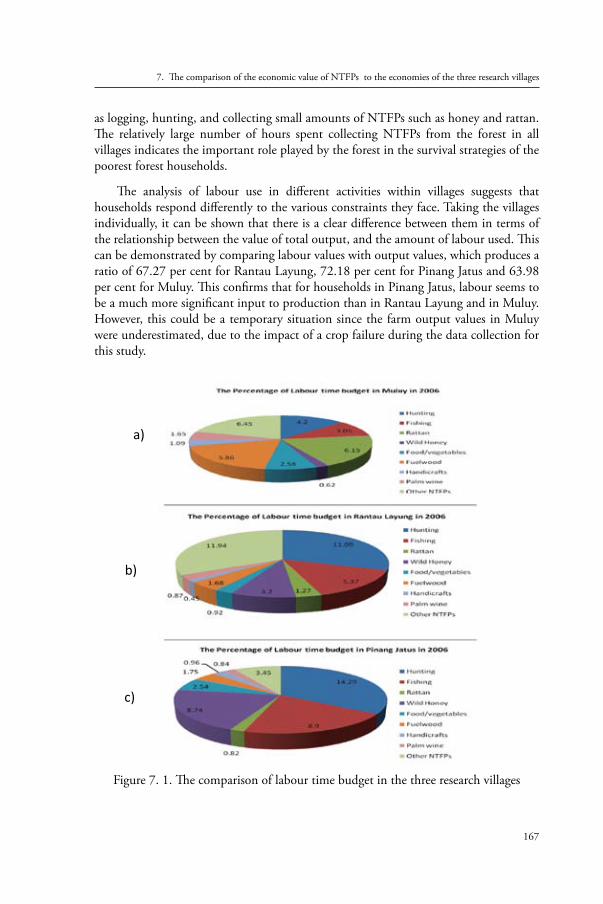
167
7. The comparison of the economic value of NTFPs to the economies of the three research villages
as logging, hunting, and collecting small amounts of NTFPs such as honey and rattan. The relatively large number of hours spent collecting NTFPs from the forest in all villages indicates the important role played by the forest in the survival strategies of the poorest forest households.
The analysis of labour use in different activities within villages suggests that households respond differently to the various constraints they face. Taking the villages individually, it can be shown that there is a clear difference between them in terms of the relationship between the value of total output, and the amount of labour used. This can be demonstrated by comparing labour values with output values, which produces a ratio of 67.27 per cent for Rantau Layung, 72.18 per cent for Pinang Jatus and 63.98 per cent for Muluy. This confirms that for households in Pinang Jatus, labour seems to be a much more significant input to production than in Rantau Layung and in Muluy. However, this could be a temporary situation since the farm output values in Muluy were underestimated, due to the impact of a crop failure during the data collection for this study.
Figure 7. 1. The comparison of labour time budget in the three research villages
a)
b)
c)
Economic value of non-timber forest products among Paser Indigenous People of East Kalimantan
168
Examining labour productivity, it is found that the labour price in Muluy is more productive than in the other villages. Based on the calculation of total output and the total input in these villages, one hour of labour in Muluy earns Rp. 4,883. This price is more than in the village of Rantau Layung where it is Rp. 4,645 and in Pinang Jatus where one hour of labour is worth Rp. 4.356. It is surprising that these village labour prices are all above the opportunity cost of working in the logging concession, which is priced at Rp. 3,125 per hour. This could be one of the reasons why the Paser people do not have much interest in working in logging concessions, since their daily forest and farm activities could earn them more. Table 7. 3. The comparison of labour price based on output and labour time in the three research villages.
Village Total Output(1)
Labour time(2)
Labour Price(1:2)
Rantau Layung Rp.435,632,000 93,780 hours Rp. 4,645/hourPinang Jatus Rp.533,641,000 122,494 hours Rp. 4,356/hourMuluy Rp.199,822,000 40,915 hours Rp. 4,883/hourAll villages RP. 1,169,095,000 257,189 hours Rp. 4,545.66/hour
Notes: labour price is equal to US$.0.5 per hour ($.1 = Rp. 9,000)
7.4 Comparison of household capital distribution in each village
The total value of productive capital in each village was shown in the previous section and this effect on the productive capacity of the villages is indicated by a correlation between total productive capitals and the total value of village output. As in any other economic system, those using productive capital most efficiently will accumulate more wealth, and this has occurred in a number of households in the three villages. Although the number of households is greatest in Pinang Jatus, the total productive capital is clearly greatest in Rantau Layung, where there are fewer households than in Pinang Jatus. The level of productive capital available to households is, on average, also greatest in Rantau Layung. This correlates with the fact that it is the most productive of the three villages.
Table 7. 4. Comparison of capital availability in the three research villages (Rupiah) (based on field work 2006) .Capital and values Rantau Layung Pinang Jatus MuluyTotal village productive capital 296,212,000 244,350,000 82,440,000Average productive capital, by household
4,881,480 4,363,392 3,747,272
Cost of total village productive capital use per annum
30,460,440 29,322,000 9,892,800
169
7. The comparison of the economic value of NTFPs to the economies of the three research villages
The cost of household capital use is made up of the cost of holding that capital (the foregone interest), and the depreciation of that capital over time. This is calculated on an annual basis and is shown in table 7.5.
Table 7. 5. Comparison of cost of holding capital in the three research villages (Rupiah) (based on field work in 2006).
Cost of capital use Rantau Layung Pinang Jatus MuluyCapital cost per year (12%) 30,460,440 29,322,000 9,892,800Depreciation (20%) 50,767,400 48,870,000 16,488,000Total Productive capital use per-year 81,227,840 78,192,000 26,380,800Average productive capital use (Rp) per-hh 1,805,063 1,396,285 1,199,127
From this table it can be seen that, on average, households in Rantau Layung use considerably more capital in the production process than households in either Pinang Jatus or Muluy. The effects of using higher levels of capital in production suggests that output levels will be greater. However, in the case of these villages, production is very labour intensive, so variation in levels of capital use have only marginal effects on output relative to the ratio made by labour.
7.5 Comparison of capital stock distribution
Productive capital is distributed between the households in the three study villages as follows: The majority of households in the three villages have low to middle standards of living, with just a few households reaching higher levels. My fieldwork shows that in all cases, those few households with greater productive capital stock are those owning valuable equipment such as chainsaws, motorbikes and canoe engines.
This figure clearly shows that 82 households fall withi this range, and the majority of these Paser households owned productive capital stocks worth between Rp. 2 million and Rp. 32 million. A total of 7 out of the 123 households included in the survey have productive capital holdings of Rp. 32 million or more, and 34 households have capital stock of less than Rp. 2 million. By looking more closely at each village, we can see the villages differences in terms of capital distribution. This comparison illustrates the relatively higher levels of capital stock available for production in Pinang Jatus, where 12 households (21 per cent) have productive capital holdings of over Rp. 15 million, while in Rantau Layung the corresponding number is only 4 (8 per cent), and in Muluy, 2 (9 per cent) have holdings of more than Rp. 15 million. In addition, although the village of Rantau Layung is the richest overall in terms of capital holdings, the distribution of the income is more unequal, with more households having a lower range of incomes. However, in comparison to Pinang Jatus, a higher proportion fall into the higher income groups.
Economic value of non-timber forest products among Paser Indigenous People of East Kalimantan
170
7.6 Comparison of households’ output values
All farms in these villages use a system of slash and burn and later use a system of inter-cropping, in which a large number of different crops are grown in the field. This is a typical pattern found in forest communities such as these (Dove 1998; Matius 2004).
Table 7.6 shows the sectors’ output values for all activities in the research area. This data shows how the value of forest inputs varies both between the activities involved and between villages. The values shown in some sectors reflect situations where the estimated inputs in those sectors may be greater than the estimated outputs. This is because the relevant output is too small to have been included here. To correct this, more detailed information on these micro-consumption values would need to be collected at a future date.
The distribution of forest inputs across the various sectors at a household level in each village, as shown in table 7.6, also indicates the relative importance of forest inputs in the various income generating activities of the households. It again highlights the fact that the high value of forest inputs such as fishing, rattan, honey, as well as other NTFPs and farming in Pinang Jatus, reflects the higher prices in that area for outputs generated by forest resources. This figure shows the relatively low monetary value of plant collection from the forest for various uses, but since this plants provide fuel, medicines, food and vegetables, handicrafts material, the full value of their worth must reflect all of these.
The larger numbers of households that use forest plants, relative to the numbers involved in fishing and collecting fuel wood, is another dimension of the importance of forest resources. In addition, the reliance placed on such plants by a large proportion of the households in these villages reflects the importance of the forest itself for local inhabitants.
171
7. The comparison of the economic value of NTFPs to the economies of the three research villages
Table 7. 6. Comparison of households’ output values in the study villages (based on field observation in 2005 and 2006).
ActivityRantau Layung Pinang Jatus Muluy*)
Hh Inv.
ValueRp.mio % Hh
Inv.Value
Rp.mio % HhInv.
ValueRp.mio %
Farm 45 88.540 20.32 56 109.560 20.94 22 40.666 20.35NTFPs:
Hunting• 5 4.749 1.09 7 12.926 2.64 12 3.600 1.80Fishing• 15 7.792 7.78 18 27.500 5.37 15 3.900 1.95Rattan • 22 22.520 5.16 25 36.600 6.98 17 52.500 26.27Wild Honey• 18 10.495 2.49 18 8.640 1.67 14 9.000 4.50Food/vegetables• 14 13.853 3.17 37 23.120 4.41 22 14.650 7.33Fuel wood• 45 15.222 3.49 56 25.000 4.77 22 13.200 6.61Handicrafts• 4 20.08 0.46 14 10.200 1.96 6 0.560 0.28Palm wine• 2 4.550 1.04 5 4.500 0.85 2 8.450 4.23Others NTFPs• 45 48.190 11.06 56 36.000 6.97 22 17.400 8.71
Store keeper 5 27.320 6.27 5 3.590 0.68 2 2.500 1.25Logging 4 98.050 22.51 7 112.000 20.66 6 8.800 4.29Trading 2 1.830 0.42 6 12.000 2.29 - - -Gold panning 6 29.90 0.68 - - - - - -Concession - - 8 56.000 10.32 3 12.600 6.42Govt. services 72.000 16.52 8 46.000 8.57 2 12.000 6.01Total 45 435.632 100 56 523.641 100 22 199.822 100Per household 9.680.7 - 9.350.7 - 9,082.82 -The average of all village is Rp. 9,391,048 per household or Rp. 1,988,156.08 per capita
*): Data for Muluy is based on data collected in 2006 or one year after the collection in Rantau Layung and Pinang Jatus. There is no such significant difference in the economic situation between 2005 and 2006 and this made it possible to compare the economic conditions of Muluy, Rantau Layung and Pinang Jatus.
Economic value of non-timber forest products among Paser Indigenous People of East Kalimantan
172
Figure 7. 2. Comparison of activities and output values in the three research villages (based on fieldwork in 2006).
It is interesting to note the significant differences that exist between the villages in terms of production of specific crops. These differences are the result of variation in households tastes (for example, the large amount of coffee being grown in Rantau Layung, local demand for Aleurites mollucana (kemiri ) nuts in Pinang Jatus and cassava in Muluy) and show how households vary in their response to their environment and geographical factors, such as soil and water supply.
Marketing conditions are another significant influence on farm output. The pattern in Rantau Layung and Muluy tends to reflect the strong localised nature of production and trade. In Muluy, on average, 92 per cent of output is used at home, and only 8 per cent is sold, mostly in the village. A similar situation is found in Rantau Layung where most of the products are consumed at home and only 18 per cent of them are sold, both
173
7. The comparison of the economic value of NTFPs to the economies of the three research villages
in the market and at the village level. This contrasts with the figures for Pinang Jatus, where different conditions exist. The village is nearer to the market and it is accessible by road, making it much easier for villagers to transport their produce in bulk. In this village, only 64 per cent of farm output is used at home and 36 per cent is sold or exchanged. Figure 7.2 below shows the distribution of total households output values in the villages.
Although some variations in prices for farm produce do exists between the villages, it seems likely that these are influenced more by market access conditions rather than by demand and supply factors. This is because, on average, prices in Rantau Layung are generally lower than in other villages, reflecting the fact that very few buyers come to this village, resulting in a lower level of effective market demand. Although the situation in Rantau Layung is one where potential farm productivity is greater, lower frequency of visits of traders means there is little motivation for farmers to increase their output significantly, due to the difficulty associated with transportation of large volumes of crops. In Pinang Jatus, however, farmers are encouraged to produce a higher level of output, as a result of the high prices brought about by the strong and effective demand from consumers in Simpang Pait. As a result, most of the crops produced are sold at higher prices.
Table 7. 7. Comparison of forestry and farm products prices at village gate levels in the three research villages (based on fieldwork in 2006).
Farm ProductsVillage gate prices (Rp)
Rantau Layung Pinang Jatus MuluyRice, per-kg1. 3,500 3,750 3,600Rattan, per-kg wet2. 450 500 350Coffee, per-kg dry3. 5,000 5,500 4,750Durian, per-unit4. 3,500 4,000 2,500Mango, per-kg5. 2,000 2,500 2,250Bananas, per-unit6. 15,000 16,500 17,000Beans, per-kg7. 6,500 7,000 5,000Cassava, per-kg8. 750 700 850Chili, per-kg9. 4,500 5,000 4,000Pineapple, per-unit10. 1,250 1,500 1,750Timber (m3)11. 450,000 450,000 450,000Gold (gram)12. 98,000 - -Bush meat (Kg)13. 7,500 7,500 5,000Durian (Kg)14. 3,500 5,000 3,000Chicken (domesticated)(Kg)15. 35,000 35,000 35,000
Source of data: The result of field observation in September 2006.
Economic value of non-timber forest products among Paser Indigenous People of East Kalimantan
174
7.7 Comparison of forest inputs in household output production
In addition to the use of labour and capital to produce output, households in these villages make use of a significant amount of forest inputs in the production process. The total value of these forest inputs in each village is shown in table 7.6. Figure 7.3 shows how these forest inputs contribute to the output values of the villages.
The varying degrees to which individuals make use of such forest resources highlights the fact that household survival strategies vary considerably according to local and regional conditions. While trade-offs will exist between the different available choices, it is clear that in most households, open access use of these common property resources is an important de facto right for Paser people living in the forest, and one which can only be protected by ensuring continued survival of the forest ecosystem. The distribution of forest inputs across the various sectors at a household level in each village is shown in Table 7.8. Figure 7.3 also indicates the relative importance of forest inputs in the various income generating activities of the households. This once again highlights the fact that the high value of forest inputs in fishing, rattan, honey, and others NTFPs and farming in Pinang Jatus, reflects higher prices in that area for outputs generated by forest resources. This figure shows the relatively low monetary value of plant collection from the forest for various uses. However, since these plants provide fuel, medicines, food and vegetables, handicrafts material, the full value of their worth must reflect all of these.
Table 7. 8. The comparison of forest output values in three Paser villages 2005.
ActivityRantau Layung Pinang Jatus Muluy*)Rp.mio % Rp.mio % Rp.mio %
NTFPs:Hunting• 4.749 1.09 12.926 2.38 3.600 1.83Fishing• 7.792 7.78 27.500 5.06 3.900 1.99Rattan • 22.520 5.16 36.600 6.74 52.500 26.80Wild Honey• 10.495 2.49 8.640 1.59 9.000 4.59Food/vegetables• 13.853 3.17 23.125 4.26 14.650 7.48Fuel wood• 15.222 3.49 25.000 4.61 13.200 6.74Handicrafts• 2.008 0.46 10.200 1.87 -0.560 0.28Palm wine• 4.550 1.04 -4.500 0.82 8.450 2.47Other NTFPs• 48.190 11.06 36.000 6.63 17.400 8.88
Logging 98.050 22.51 112.000 20.66 8.800 4.49Logging Concession - 56.000 10.32 12.600 6.43Total 227.429 52.20% 352.498 64.96% 127.277 64.99%Total without logging 129.379 29.69% 184.498 34.00% 105.877 54.06%
175
7. The comparison of the economic value of NTFPs to the economies of the three research villages
Figure 7. 3. Comparison of NTFP output values in research villages.
The large numbers of households that use forest plants, relative to the numbers involved in fishing and collecting fuel wood, is another dimension of the importance of forest resources. In addition, the reliance placed on such plants by a large proportion of the households in these villages reflects the importance of the forest itself for local inhabitants.
Table 7.9 highlights the importance of plant use in these villages. In addition, it demonstrates the importance of rattan and honey. Of the plants collected from the forest, some are used at home, while some are used for sale or exchange. Taking the plants that are collected from the forest in Rantau Layung, excluding rattan, honey and fuel wood, most plants (82 pe cent) are consumed at home, while 18 per cent are sold to the nearest market. Similar figures exist for Pinang Jatus where 79 per cent of plants are consumed and only 21 per cent sold or exchanged with neighbours or the nearest market. By contrast, in Muluy, 94 per cent of plants collected are used at home, while only 6 per cent are used for sale or exchange.
Economic value of non-timber forest products among Paser Indigenous People of East Kalimantan
176
Table 7. 9. Comparison of the output values of forest plants sources, including rattan and honey.
Activity
Rantau Layung Pinang Jatus Muluy*)
Rpmillion
% to total
village output
Rp million
% to total
village output
Rpmillion
% to total
village output
Rattan • 22.520 5.16 36.600 6.74 52.500 26.80Wild Honey*• 10.495 2.49 8.640 1.59 9.000 4.59Food/vegetables• 13.853 3.17 23.125 4.26 14.650 7.48Fuel wood• 15.222 3.49 25.000 4.61 13.200 6.74Other NTFPs• 48.190 11.06 36.000 6.63 17.400 8.88
Total Plants values 110.280 25.37% 129.363 23.83% 106.750 54.49%the inclusion of honey in the plants products is due to the role of honey trees of Koompalsia spp. as the host •for wild bees.
It is interesting to examine how individual households use forest plants. For those households participating in the collection of plants from the forest on a regular basis in Muluy, for example, the average value of those collected plants was Rp.4,852,272 in 2005. This a not insubstantial figure, and is higher than the corresponding figures for both Rantau Layung – Rp.2,450,666 and Pinang Jatus – Rp.2,310,053. These figures suggest that householders in Muluy in particular make greater use of forest plants than householders in the other villages. Nevertheless, the collection of wild plants from the forest is an important activity for almost all households.
Another factor to be considered is the fact that that forest foods and vegetables are an essential supply of vitamins and minerals to the often impoverished diet associated with subsistence households. Furthermore, the importance of handicrafts to households in all villages can be seen from table 8. However, it is important to note that this may also be an under representation of their full value, since all households produce some craft for their own domestic use, but only those households doing handicraft regularly to earn income have been included in these figures.
When questioned about the use of the forest, and the items which would be missed most if they were to disappear, the responses of householders varied between the villages. Householders in all the villages showed a high proportion of responses indicating that food would be missed, with the figure for Rantau Layung being 33 per cent, with a total of 28 per cent being made up of wild forest fruits. In Pinang Jatus the figure indicating that food would be missed was 18 per cent, with 7 per cent mentioned specifically as vegetables and fruit. In Muluy, 42 per cent mentioned food and vegetables, with 18 per cent mentioned as fruits. This confirms the idea that forest foods are of major importance for forest dwelling people, and that they supply essential vitamins and minerals to their diet.
177
7. The comparison of the economic value of NTFPs to the economies of the three research villages
In addition to food items, building materials are considered of great importance in a village. In Rantau Layung, 52 per cent of responses indicated building materials as an important item that would be missed. The figures were similar for the other villages, with 42 per cent in Pinang Jatus and 49 per cent in Muluy. One of the possible reasons for this low variation between the actual use of plants and appreciation of their importance is the fact that medicinal plants are usually collected and used by women, whereas the respondents to the questions on what would be missed if the forest disappeared were both men and women. It is likely that men wouldnot necessarily think of medicinal plants as readily as women.
Figure 7. 4. Comparison of non-farm output values.
Other frequently occurring illnesses are fever, malaria, stomach ache and colds. Since the medicines for these diseases are not available in the village healthcare centres, householders are even more reliant on the use of forest plants and often prefer to treat
b)
a)
Economic value of non-timber forest products among Paser Indigenous People of East Kalimantan
178
themselves using medicinal plants from forest. On average, women knew of and regularly used 22 different medicinal plants (see Chapter 5). According to 56 women surveyed, children suffered from the most illness, most of which occurred between November and January. This was thought to be because during the wet season, water in the rivers is easily polluted by erosion from logging activities. As a result, less opportunity exists for taking clean drinking water from the river. Also, small pools of stagnant water (breeding grounds for mosquitoes) are left standing after rains. The widespread use of medicinal plants in these villages again highlights the importance of non-timber forest products to forest dwelling people, and it is clear that this importance goes well beyond the monetary sphere.
In all of these villages, a wide variety of fish are caught, and those listed here are the major ones, most commonly found in catches in the wet season (September to November). Details of the types of fish most widely caught in the research area are shown in the appendix to Chapter 5. From this it can be seen that there is some variation in the types of fish caught in the fishing grounds of the different villages.
Although the presence of some species is seasonal, it is acknowledged by all the fishermen in this area that fishing in the wet season is more difficult than in dry season, when fish populations tend to be more concentrated in smaller bodies of water. It is interesting to note that fish catches were selective due to the fact that some fish could contain poison and would be dangerous to consume.
7.8. Analysis of village production functions
The analysis of production functions in all types of economy has produced a massive literature. From this it can be seen that the attempts to model production activities both in industrial and agriculture sectors, is a complex task. Clearly the data requirements and models suitable for industrial economies are different from those found in subsistence economies such as the ones in this study. Nevertheless, it is possible to analyse some aspects of subsistence production activities using conventional analytical techniques.
The classical study of Bliss and Stern (1982) makes a detailed examination of production and other economic activities within a rural Indian village and shows the value of using standard analytical techniques in non-standard situations. Other writers have looked more specifically at agricultural production, both from a bottom-up representative farmer approach, and from a top-down national counting approach, where the more macro-economic dimensions of agriculture and its relations with other sectors of the national economy, are examined. Village level analysis has also been done, and these combine aspects of the two other approaches, allowing a bottom-up approach to be applied to a more macro-economic framework (Biggs 1982). This approach has a number of disadvantages, and in addition to facilitating a more detailed study of inter-community markets and market failures, it allows for a more specific approach
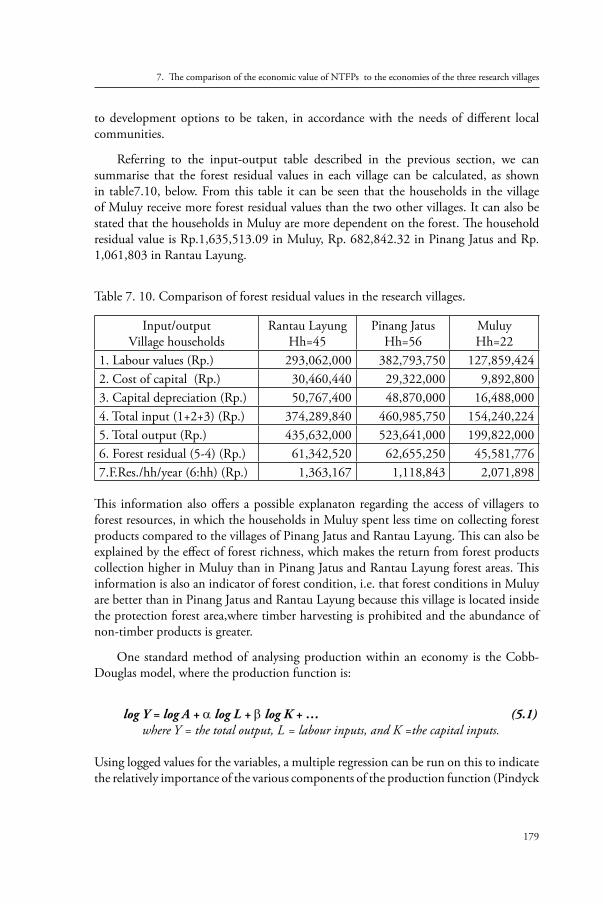
179
7. The comparison of the economic value of NTFPs to the economies of the three research villages
to development options to be taken, in accordance with the needs of different local communities.
Referring to the input-output table described in the previous section, we can summarise that the forest residual values in each village can be calculated, as shown in table7.10, below. From this table it can be seen that the households in the village of Muluy receive more forest residual values than the two other villages. It can also be stated that the households in Muluy are more dependent on the forest. The household residual value is Rp.1,635,513.09 in Muluy, Rp. 682,842.32 in Pinang Jatus and Rp. 1,061,803 in Rantau Layung.
Table 7. 10. Comparison of forest residual values in the research villages.
Input/outputVillage households
Rantau LayungHh=45
Pinang JatusHh=56
MuluyHh=22
1. Labour values (Rp.) 293,062,000 382,793,750 127,859,4242. Cost of capital (Rp.) 30,460,440 29,322,000 9,892,8003. Capital depreciation (Rp.) 50,767,400 48,870,000 16,488,0004. Total input (1+2+3) (Rp.) 374,289,840 460,985,750 154,240,2245. Total output (Rp.) 435,632,000 523,641,000 199,822,0006. Forest residual (5-4) (Rp.) 61,342,520 62,655,250 45,581,7767.F.Res./hh/year (6:hh) (Rp.) 1,363,167 1,118,843 2,071,898
This information also offers a possible explanaton regarding the access of villagers to forest resources, in which the households in Muluy spent less time on collecting forest products compared to the villages of Pinang Jatus and Rantau Layung. This can also be explained by the effect of forest richness, which makes the return from forest products collection higher in Muluy than in Pinang Jatus and Rantau Layung forest areas. This information is also an indicator of forest condition, i.e. that forest conditions in Muluy are better than in Pinang Jatus and Rantau Layung because this village is located inside the protection forest area,where timber harvesting is prohibited and the abundance of non-timber products is greater.
One standard method of analysing production within an economy is the Cobb-Douglas model, where the production function is:
log Y = log A + α log L + β log K + … (5.1)where Y = the total output, L = labour inputs, and K =the capital inputs.
Using logged values for the variables, a multiple regression can be run on this to indicate the relatively importance of the various components of the production function (Pindyck

Economic value of non-timber forest products among Paser Indigenous People of East Kalimantan
180
& Rubinfeld 1981). Although this is a vast area of potential investigation, which is beyond the scope of this present research, this procedure can be used to examine some of the factors influencing the various activities which make up the production function in these village economies. To illustrate, a preliminary examination of forest use (in the form of non-timber forest products use) and fishing is include here.
To examine the factors influencing the extent of forest use by households, a regression analysis, such as that described above, has been run, on all the households of the study and on the individual villages.
For the purposes of this preliminary examination, the model tested is:
Value of forest use = f (hunting, rattan, fuel wood, wild honey, food and fruit, labour supply, capital availability, family size, crafts, fish, and palm wine) (5.2)
In this analysis, it has been important to include explanatory variables that are not part of the equations used in the determination of forest values as outlined in section 4. And so, dummy variables are used to indicate simply if a household is involved in, fr example, hunting, rather than using the value of the hunting output as the explanatory variable. The same procedure is applied to rattan harvesting and handicrafts. From this analysis, taking all households together, R2 = 0.47, which indicates that the model can only explain 47 per cent of the variation in the value of forest use. Nevertheless, three of the explanatory variables are statistically significant at the 5 per cent level, suggesting that they do have an effect on how much households are likely to make use of the forest, in terms of their use of non-timber resources. The three significant variables are the number of women in the household, and whether or not the household participates in hunting and handicraft activities. To some extent, this provides statistical support for the priori intuition that these variables would be important to forest households, and are likely to influence the extent to which a household would make use of forest resources.
When some procedure is applied to the individual villages, some differences are revealed. In the village of Pinang Jatus, where the sample is largest with 56 households, R2 = 0.37, again suggesting a rather weak model, but nevertheless indicating that hunting and rattan collection are statistically significant. In the case of Rantau Layung, with 45 households, an R2 of 0.42 shows that only fuel wood and other NTFPs are a significant explanatory variable. This is also the case in Muluy, although in this village, where there are only 22 households, R2 = 0.62. One thing revealed by this analysis is the importance of rattan in all of these villages, and the fact that in Pinang Jatus handicrafts are more important as a livelihood strategy than in the other villages. In addition, the role of women as users of forest resources is highlighted as a significant variable. Although
181
7. The comparison of the economic value of NTFPs to the economies of the three research villages
these figures are not definitive, and the model itself can be improved, this analysis does indicate that the type of data collected in this research may be used by those who wish to apply econometric techniques to understand the underlying processes in economies such as these.
In terms of the fishing output, the model examined investigates the relationship:
Value of fishing = f (crop values, hunting, rattan, handicraft, capitals, and labour availability, family size and location) (5.3.)
In this case R2 = 0.62 for the 123 households combined, with participation in hunting being a significant explanatory variable, along with the household labour supply, and the number of children to feed. A further variable revealed in this regression is that the dummy for the village of Muluy is negatively significant at the 5 per cent level. This confirms the fact that in Muluy, there is less likelihood that households will participate in fishing as an activity, mainly as there is no major river flowing through the village.
When examined independently, each village produces different results. In the case of Muluy, participation in hunting is the only significant explanatory variable, with R2 = 0.37, while in Rantau Layung, R2= 0.65, indicating a better fit with family size appearing as a significant variable, along with a negatively significant value for capital availability. This latter point seems to confirm that in this village, particularly the value of fishing does not depend on a household having access to high levels of capital availability. This is something that was indicated in the other villages, but was not statistically significant. Another interesting difference between the villages was revealed by the fact that in Rantau Layung, the only significant explanatory variable is a negative one, relating to the value of crop output. This suggests that in this village it may be that households that have poorer farms become more involved in fishing.
The attempt to analyse the data from these villages using standard econometric techniques demonstrates how different livelihood options may be adopted by different households. An interesting area for further research is to try to improve on the model used in this type of analysis, and to try to identify more accurately what determines the various preferences that householders have for the utilisation of their time.
7.9. Conclusion
It is clear from the above analysis that the findings of this study reflect a picture of subsistence forest livelihoods that depend heavily on the utilisation of forest products and services. The villages in this study provide a sample of households that reflects different preferences for a variety of income generating activities. The analysis suggests that labour availability, market conditions and geographical variables are the main factors influencing the decisions about land use and survival strategies made by these people.
Economic value of non-timber forest products among Paser Indigenous People of East Kalimantan
182
While individual differences between households have been revealed, it is clear from the comparisons made here that a degree of overall homogeneity of households does exist. This suggests that findings from this study have possible application in similar forest households elsewhere. Policy implications arising from these findings are to be examined later. In the next chapter, the policy and social dimension of forest values will be explored.
183
Chapter 8
Non-economic dimensions of NTFP use
8.1 Introduction
This chapter discusses the social and cultural dimensions of non-timber forest products (NTFPs) in the research area. This is a crucial aspect of any analysis of tropical forest use. As has been shown in the previous chapters, there is no doubt that NTFPs play a significant role in the economy of Paser people, but their importance goes well beyond the economic sphere. In an attempt to include this non-economic dimension, qualitative information on people’s perceptions of a number of issues was collected from all participating households. This chapter begins with a review of the literature on social and cultural dimensions of NTFP in section 2 and is followed by an analysis of people’s perceptions of the local conditions influencing the use of NTFPs in Section 3. The following analysis provides an heuristic insight into social, cultural and political dimensions, and these are included here as a means of broadening the concept of economic value and to highlight another dimension of value, as perceived by the forest dwelling people of the Gunung Lumut Protection Forest.
8.2 Social and cultural dimensions: A review
Literature on non-economic environmental values ranges across a whole spectrum of disciplines, most notably philosophy, anthropology, ethnography, linguistics, psychology and political science. Even within the economic disciplines, interest in such issues is growing, in the field of economic environmental valuation itself, and especially within the realm of ecological economics. As Knetsch (1994) puts it, referring to the question of valuation, there is much need for ‘a greater willingness to explore alternatives to current practices’. While the extent and breadth of this literature warrants a study in its own right, it is inappropriate to attempt this here, so only a sample will be reviewed.
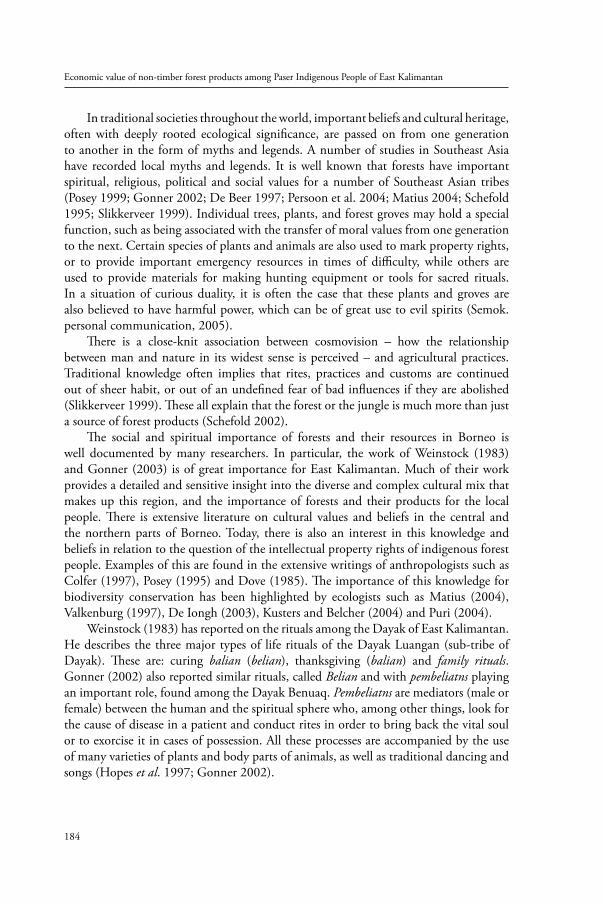
Economic value of non-timber forest products among Paser Indigenous People of East Kalimantan
184
In traditional societies throughout the world, important beliefs and cultural heritage, often with deeply rooted ecological significance, are passed on from one generation to another in the form of myths and legends. A number of studies in Southeast Asia have recorded local myths and legends. It is well known that forests have important spiritual, religious, political and social values for a number of Southeast Asian tribes (Posey 1999; Gonner 2002; De Beer 1997; Persoon et al. 2004; Matius 2004; Schefold 1995; Slikkerveer 1999). Individual trees, plants, and forest groves may hold a special function, such as being associated with the transfer of moral values from one generation to the next. Certain species of plants and animals are also used to mark property rights, or to provide important emergency resources in times of difficulty, while others are used to provide materials for making hunting equipment or tools for sacred rituals. In a situation of curious duality, it is often the case that these plants and groves are also believed to have harmful power, which can be of great use to evil spirits (Semok. personal communication, 2005).
There is a close-knit association between cosmovision – how the relationship between man and nature in its widest sense is perceived – and agricultural practices. Traditional knowledge often implies that rites, practices and customs are continued out of sheer habit, or out of an undefined fear of bad influences if they are abolished (Slikkerveer 1999). These all explain that the forest or the jungle is much more than just a source of forest products (Schefold 2002).
The social and spiritual importance of forests and their resources in Borneo is well documented by many researchers. In particular, the work of Weinstock (1983) and Gonner (2003) is of great importance for East Kalimantan. Much of their work provides a detailed and sensitive insight into the diverse and complex cultural mix that makes up this region, and the importance of forests and their products for the local people. There is extensive literature on cultural values and beliefs in the central and the northern parts of Borneo. Today, there is also an interest in this knowledge and beliefs in relation to the question of the intellectual property rights of indigenous forest people. Examples of this are found in the extensive writings of anthropologists such as Colfer (1997), Posey (1995) and Dove (1985). The importance of this knowledge for biodiversity conservation has been highlighted by ecologists such as Matius (2004), Valkenburg (1997), De Iongh (2003), Kusters and Belcher (2004) and Puri (2004).
Weinstock (1983) has reported on the rituals among the Dayak of East Kalimantan. He describes the three major types of life rituals of the Dayak Luangan (sub-tribe of Dayak). These are: curing balian (belian), thanksgiving (balian) and family rituals. Gonner (2002) also reported similar rituals, called Belian and with pembeliatns playing an important role, found among the Dayak Benuaq. Pembeliatns are mediators (male or female) between the human and the spiritual sphere who, among other things, look for the cause of disease in a patient and conduct rites in order to bring back the vital soul or to exorcise it in cases of possession. All these processes are accompanied by the use of many varieties of plants and body parts of animals, as well as traditional dancing and songs (Hopes et al. 1997; Gonner 2002).
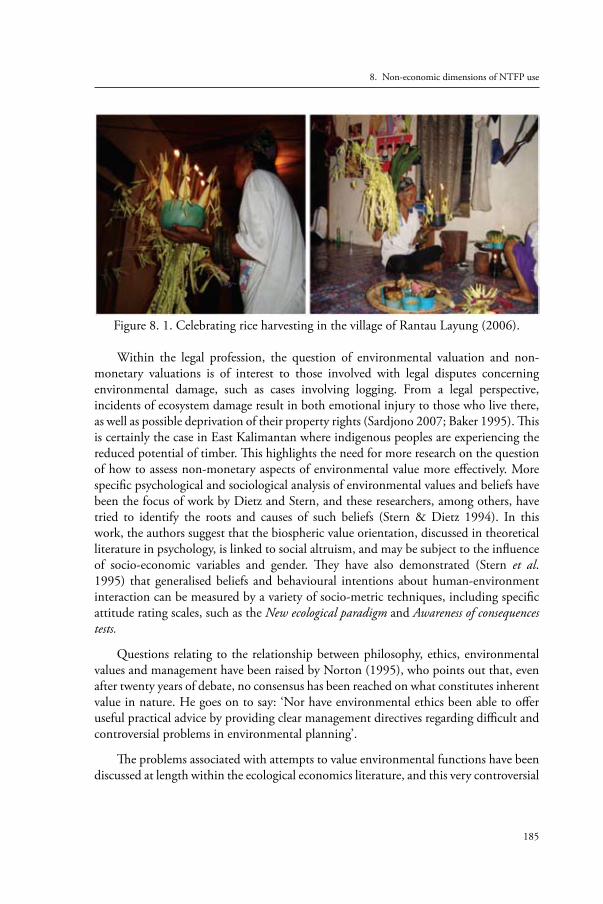
185
8. Non-economic dimensions of NTFP use
Figure 8. 1. Celebrating rice harvesting in the village of Rantau Layung (2006).
Within the legal profession, the question of environmental valuation and non-monetary valuations is of interest to those involved with legal disputes concerning environmental damage, such as cases involving logging. From a legal perspective, incidents of ecosystem damage result in both emotional injury to those who live there, as well as possible deprivation of their property rights (Sardjono 2007; Baker 1995). This is certainly the case in East Kalimantan where indigenous peoples are experiencing the reduced potential of timber. This highlights the need for more research on the question of how to assess non-monetary aspects of environmental value more effectively. More specific psychological and sociological analysis of environmental values and beliefs have been the focus of work by Dietz and Stern, and these researchers, among others, have tried to identify the roots and causes of such beliefs (Stern & Dietz 1994). In this work, the authors suggest that the biospheric value orientation, discussed in theoretical literature in psychology, is linked to social altruism, and may be subject to the influence of socio-economic variables and gender. They have also demonstrated (Stern et al. 1995) that generalised beliefs and behavioural intentions about human-environment interaction can be measured by a variety of socio-metric techniques, including specific attitude rating scales, such as the New ecological paradigm and Awareness of consequences tests.
Questions relating to the relationship between philosophy, ethics, environmental values and management have been raised by Norton (1995), who points out that, even after twenty years of debate, no consensus has been reached on what constitutes inherent value in nature. He goes on to say: ‘Nor have environmental ethics been able to offer useful practical advice by providing clear management directives regarding difficult and controversial problems in environmental planning’.
The problems associated with attempts to value environmental functions have been discussed at length within the ecological economics literature, and this very controversial
Economic value of non-timber forest products among Paser Indigenous People of East Kalimantan
186
area has generated much debate. In response to a publication on the value of ecosystem services (Costanza et al. 1997), a number of authors have suggested certain issues to be addressed. For example, Opschoor (1998) highlights the need to consider the views of all stakeholders in attempting the value ecosystems, while Hueting et al.(1998) point out that the Total Economic Value of functions is much more than the sum of producer and consumer values, as argued in conventional environmental economics literature. In the same discussion, Turner et al. (1998) draw attention to the many pitfalls associated with such attempts at valuation, and they argue that the case for more research into questions related to socio-economic choices and their environmental impacts.
Overall, this small sample of the literature concerning non-monetary valuations of environmental resources confirms the need for broadening of perspectives, to enable us to take more account of the reciprocal nature of the links between human action and environmental quality. It is with this in mind, that these issues of the social values of forest use are presented here.
8.3 Local framework conditions influencing the NTFP use
The need for analysis of the importance of non-monetary valuation has been discussed in Chapter 2 and the section above, and one of the ways that this may be assessed in the present research context is demonstrated here.
8.3.1 Methodology
In order to collect data on these broader social, cultural and political values, a number of questions on the subject were posed to men and women in all participating households in the three study villages. Examples of the types of questions asked are shown in Box 8.1 below, and examples of all data sheets used in the study are given in the Appendix.
As with the quantitative data collected, these questions were asked during structured interviews, conducted by researchers and field assistants in the homes of the respondents, and an attempt was made to collect this information in an informal way, ensuring that all views were represented. For consistency, responses were recorded on pre-prepared data sheets, and for the purpose of analysis, these were classified into categories of response.
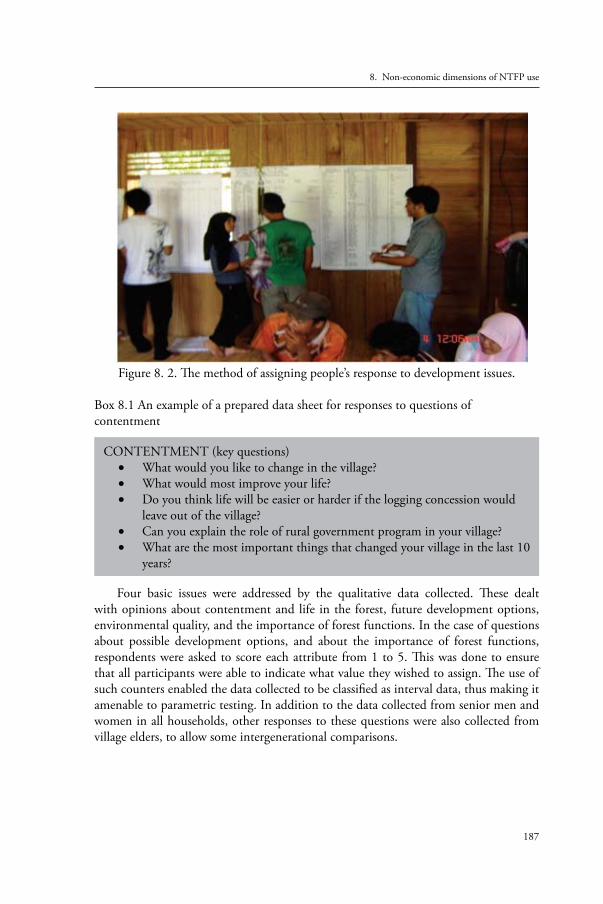
187
8. Non-economic dimensions of NTFP use
Figure 8. 2. The method of assigning people’s response to development issues.
Box 8.1 An example of a prepared data sheet for responses to questions of contentment
Four basic issues were addressed by the qualitative data collected. These dealt with opinions about contentment and life in the forest, future development options, environmental quality, and the importance of forest functions. In the case of questions about possible development options, and about the importance of forest functions, respondents were asked to score each attribute from 1 to 5. This was done to ensure that all participants were able to indicate what value they wished to assign. The use of such counters enabled the data collected to be classified as interval data, thus making it amenable to parametric testing. In addition to the data collected from senior men and women in all households, other responses to these questions were also collected from village elders, to allow some intergenerational comparisons.
CONTENTMENT (key questions)What would you like to change in the village?•What would most improve your life?•Do you think life will be easier or harder if the logging concession would •leave out of the village?Can you explain the role of rural government program in your village?•What are the most important things that changed your village in the last 10 •years?
Economic value of non-timber forest products among Paser Indigenous People of East Kalimantan
188
8.3.2 Methods of analysis
In this attempt to capture the social dimension of forest values, three types of qualitative information were gathered. Nominal data – relating to how life is influenced by the forest – and ordinal data – such as those relating to perceptions of environmental change – were collected from all occupied households. In addition, interval data were used to assess the attitudes of both men and women on development options and on the importance of various forest functions, where scores 1 to 5 were assigned. In order to evaluate the information statistically, this raw data is summarised in the tables, and appropriate analytical techniques are then applied. Various techniques could be used to test this type of data, including regression analysis, chi squares and analysis of variance (Downie & Health 1970). Given that this is a preliminary investigation of these social values, evaluation of these data is limited here in responses, with analysis of variance being the main method used to identify the sources of variance, and t-tests used to test these for significance. The use of statistical analysis in this section is aimed to complement the qualitative information of socio-cultural and political dimensions of NTFP use in the villages study.
8.4 Perceptions on the role of forest and environment
Generally, there is an a priori assumption that people who live in forest environments will feel some affinity with the forest as an entity, resulting in some implicit measure of value placed upon it. While it is impossible to estimate this in the conventional economic sense, it is important to try to understand more about it. One way of doing this is to examine how forest dwelling people perceive their environment, and how they feel about living inside the forest. It is with this in mind that questions on such issues have been included in this study. The answers to these questions have produced a body of discontinuous data – partly nominal and partly based on dichotomous choices (yes/no). Such data does not lend itself to powerful statistical analysis, and so in these cases responses are simply displayed as percentages in each group, as shown in Appendix 13. From this table it can be seen that 90 per cent of men in Pinang Jatus think that the forest is generally important for their families; in Rantau Layung the corresponding figure is even higher at 95.7 per cent, but in Muluy it is somewhat lower at 89 per cent. For women in Pinang Jatus, 95 per cen feel that the forest is important, while in Rantau Layung the figure is 93.3 per cent and in Muluy, only 89.1 per cent of women feel that way.
For all men and women interviewed, plants from the forest are considered essential to life. This is true in the sense that, in order to make mats, baskets or other objects of rattan, and to eat wild food plants such as sago starch, and the use of various plants for vegetables, a productive forest is essential.
189
8. Non-economic dimensions of NTFP use
From these interviews it can be summarised that forestry activities are considered to be a necessary part of Paser people’s livelihood and it is not without reason that they are perceived as being ‘forest farmers’. Collection of NTFPs for commercial purposes is crucial for the livelihood of this community ‘who know the forest better’. Exceptions are young Paser men who, for example, participate in gold-rush type activities such as the search for gaharu or eaglewood far from home. The experience, adventure and thrilling hopes for sudden wealth seem even more important than the actual chances of generating a relevant income. This is the modern answer to a tradition known as pelesai, where inland people went to companies and cities along the Kalimantan highways, looking for adventure, wealth and modern industrial goods.
8.4.1 Rights to resources
National policies on forest management have a tendency to deprive local people of legal and practical access to forest and forest products (see also Persoon et al. 2004). National land use allocation and the protection of the Gunung Lumut forest and plantation estates generally disregards local communities (Bakker 2006) and their demand and traditional rights for adequate conservation of NTFPsand forested land (Pema, personal communication, 2005). Joint land use planning and consecutive arrangements between investors and local communities were made after decentralisation in 2000, and depend heavily on the good will of the companies (Jusuf, personal communication, 2006).
Forest products that generate high profit margins have been officially taken out of the hands of indigenous people. The official arguments to do so include better and controlled management and increased national income from a licensing system, levies and income taxes. The predominant examples in East Kalimantan are the timber trade and the harvesting of edible birds’ nests. Similar attempts to regulate rattan collection in natural forests have failed due to falling prices, current low profits per area, and the fact that most commercial rattan is already produced in smallholder rattan plantations.
Though management regulations have increased and levies are being collected by the forestry administration, the legal income possibilities of local people have decreased. At the same time, traditional harvesting regulations have become groundless, while ‘modern’ management control is insufficient. Short term high expenditures by current investors and continued but now unregulated and illegal harvesting by local people, in addition to migrants, lead to rapid depletion of resources.
In Chapter 4 it was shown that Paser indigenous people belongs to the sub-ethnic group of Dayak. The Dayak consists of 14 sub-ethnic groups, one of which is the Luangan. The Dayak community mainly occupied the hinterland and the border areas of Malaysia and Indonesia in Borneo (Weinstock 1983). Paser people belong to the sub-group of the Luangan, who belong to the Barito language family (together with the
Economic value of non-timber forest products among Paser Indigenous People of East Kalimantan
190
Ngaju, the Ot Danum and the Ma’anyan) (Silander 1995; Ave 1972 in Gonner 2003). Weinstock (1983) further divides the Luangan into 14 subgroups: Tunjung (Tonyoi), Pahu, Benuag, Bentian, Purei, Taboyan (Tiwoian), Bawo, Pake Kerau (Lawangan), Malang, Bayan, Dusun Tengah, Dusun Wito, Dusun Dayeh, and Pasir.
As in many other areas of Borneo, ethnicity and the concept of belonging to a specific tribal group (above village or watershed level) are not well developed among Paser people. Similar to the ethnonyms Iban, Land Dayak, or Ngaju, the name Paser was never used locally in the sense in which it had been used by ethnographers in the past (Gonner 2003; UNHAS 2003). It is therefore more a concept that organises indigenous groups along a cultural and linguistic scale in order to stress socio-cultural differences (although there is always some kind of overlap).
The term Paser is sometime confused with Pasir. Paser relates to the ethnicity of a sub-group of Dayak in the region of the Gunung Lumut, and Pasir refers to the district name or the official government administration. These two terms are sometimes even confused by the people in this region. In response to the euphoria of autonomy, the government of Pasir changed the name of the district from Kabupaten Pasir to Kabupaten Paser in August 2007.
The government’s recognition of the Paser entity, by introducing the nameKabupaten Paser, was expected at the initial stage of the process of accepting indigenous people’s rights to resources. However, it has not been achieved, not least because these processes take a long time and the presence of district policymakers is quite low. An example of this is found in the case stipulating the Hak Adat and Ulayat of Paser indigenous people in the local regulation (PERDA) in 2005. The District Head (Bupati) of Pasir agreed to issue Peraturan Daerah or PERDA, which stipulates the traditional norms and rights to resources. However, it was not implemented because of pressure by parliament members who were worried about the consequences of these new regulations, including increased claims by indigenous Paser people for lands already in use as oil palm plantations.
The policymakers in Pasir District were much more aware of the consequences of stipulating indigenous people rights in PERDA for the industrial or big companies than for the indigenous people. This could be another reason why the government programme for rural areas was never fully implemented.
This lack of recognition of the Paser indigenous people’s rights to natural resources has increased the concerns of these people about their livelihoods, not just in the present, but also in the future. A clear negative impact of this is the limitation of the rights to collect wild honey in the logging concession areas and the tax that has to be paid for selling rattan harvested from small-scale rattan gardens. According to the informants, there are many wild honey trees in logging concessions areas belonging to them but they cannot be harvested or maintained because the concessionaires do not allow them to enter the area where honey trees are located. Some concessions holders deny this,
191
8. Non-economic dimensions of NTFP use
but say that they are afraid that people want to conduct illegal logging inside their concession areas, while other concession holders admit that it is true that they do not allow people from the village to enter their logging concession area because, they say, the local people already have their own forest. When they were asked about the wild honey trees in their concession area that belong to the indigenous people, it became clear from their answers that the concession holders are not well informed about the rights of the indigenous people with respect to wild honey trees. The logging concession holders are under the impression that indigenous people’s rights to resources and forest products in the concession area have been abolished by the granting of the concession to the logging company.
The loss of access to wild honey in the logging concession area has reduced the potential benefits of the forest for Paser indigenous people. The logging operation in the nearby village area has also reduced the potential harvesting of wild honey outside the logging concession areas (Semok & Lawut, personal communication, 2005). This is because of the damage done to the forest. There are less flowers inside the forest from which the bees can collect the nectar. This is particularly the case for flowers from important timber species like Shorea and Dipterocarp trees. This situation is deteriorating further now that staff of logging companies are collecting the honey themselves, without taking care of its sustainability. It is argued that one of the reasons that this happens is because the company’s workers are not recruited from the indigenous population.
A similar pattern exists for rattan production. Chapter 5 has already explained that most of the rattan canes produced in this region come from small-scale rattan gardens. However, the government perceives this harvest as originating from natural forests, which requires a licence or certificate and also permits the transportation and marketing of rattan. There is also an obligation for the collector to pay a resource tax, which is paid according to species and the volume of rattan transported. The use of a certificate or a licence to trade rattan from the village to the factory gates has made rattan transportation more expensive. The costs associated with rattan transportation are paid by the farmers through a reduction in the purchasing price at the village gate. In other words, the buyers are shifting the costs of handling, transporting and paying tax on rattan canes to the farmers, even though the benefits gained by the farmers are much lower compared to those obtained by the traders.
Figure 8.3 below provides details of rattan price reductions in the last 20 years, from US$ 0.8 per kg in 1986 to just US$ 0.06 in 2007. This price is not sufficient to support the development of new rattan gardens or even to maintain existing ones, as the benefits of rattan cultivation are less than those obtained from other agricultural crops, like palm oil.
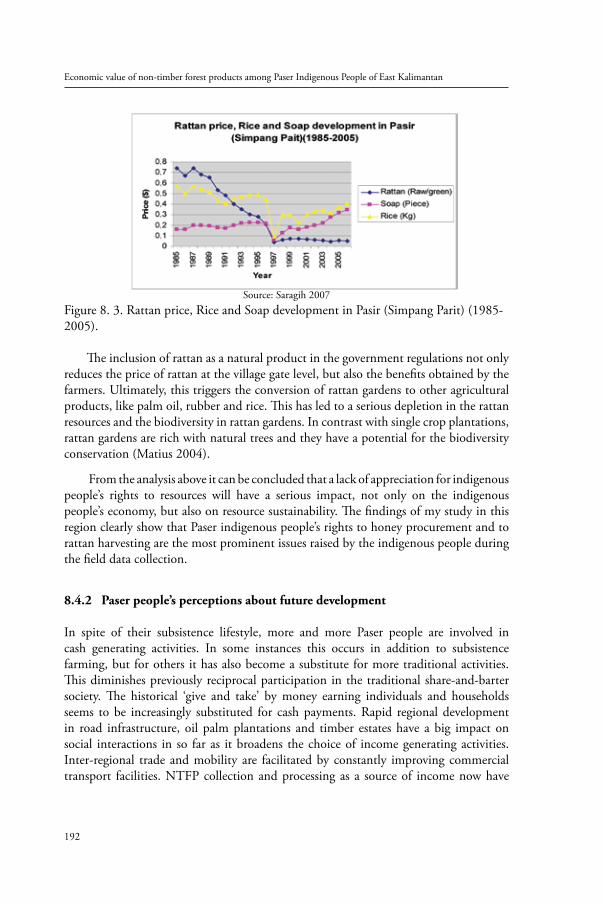
Economic value of non-timber forest products among Paser Indigenous People of East Kalimantan
192
Source: Saragih 2007Figure 8. 3. Rattan price, Rice and Soap development in Pasir (Simpang Parit) (1985-2005).
The inclusion of rattan as a natural product in the government regulations not only reduces the price of rattan at the village gate level, but also the benefits obtained by the farmers. Ultimately, this triggers the conversion of rattan gardens to other agricultural products, like palm oil, rubber and rice. This has led to a serious depletion in the rattan resources and the biodiversity in rattan gardens. In contrast with single crop plantations, rattan gardens are rich with natural trees and they have a potential for the biodiversity conservation (Matius 2004).
From the analysis above it can be concluded that a lack of appreciation for indigenous people’s rights to resources will have a serious impact, not only on the indigenous people’s economy, but also on resource sustainability. The findings of my study in this region clearly show that Paser indigenous people’s rights to honey procurement and to rattan harvesting are the most prominent issues raised by the indigenous people during the field data collection.
8.4.2 Paser people’s perceptions about future development
In spite of their subsistence lifestyle, more and more Paser people are involved in cash generating activities. In some instances this occurs in addition to subsistence farming, but for others it has also become a substitute for more traditional activities. This diminishes previously reciprocal participation in the traditional share-and-barter society. The historical ‘give and take’ by money earning individuals and households seems to be increasingly substituted for cash payments. Rapid regional development in road infrastructure, oil palm plantations and timber estates have a big impact on social interactions in so far as it broadens the choice of income generating activities. Inter-regional trade and mobility are facilitated by constantly improving commercial transport facilities. NTFP collection and processing as a source of income now have
193
8. Non-economic dimensions of NTFP use
to compete with timber production, wage labour, employment and sales of cash and subsistence farm crops.
The interviews revealed that the majority of people living in these villages consider themselves to be ‘happy’, with the responses of the men and women of Rantau Layung being the most positive. However, in all villages, a higher proportion of women say they are happy compared to men. Some variation exists in people’s attitudes towards the future of life in the village, as indicated by their responses to questions concerning their views about their children. In general, men seem to want the children to stay in the village much more than women do, with 85 per cent of men in Muluy expressing this view, but only 61 per cent in Pinang Jatus. When asked about prospects for the future, the majority of both men and women in all villages felt that the future is likely to be easier than the present, with scores for this question ranging from 57 per cent to 65 per cent. This also indicates that a sizeable proportion of all villagers are not so optimistic about the future. Similarly, when questioned about improvements to their lives, the responses were varied. For example, 51 per cent of both men and women in Pinang Jatus felt their lives would be improved by a job or more money, while only 24 per cent of men in Rantau Layung and 32 per cent of women in Muluy felt this way.
If we look at the lifestyle of a subsistent farmer, it is not unreasonable to find respondents (men and women) who say they are happy. Having stored enough rice for consumption for a whole year would be reason enough to say that he/she is ‘happy’, in the sense that there is no serious problem with food. This perception was found among all older villagers, both men and women. Those male respondents who said they were unhappy were mainly found in the younger generations, among people already used to having cash and who tend to participate in cash generating activities. In particular, when we asked about the abolition of small-scale logging in the village, the young generations reported that they were not happy at all with current government policies.
When asked what they thought they would most like to change in the village, responses were quite varied, and these are shown in Appendix 13. From this, it can be seen that for men, most improvements in life in the village would arise from an improvement in the standard of living, better transport and better sources of cash income. In addition to these changes, more women than men would also like to see better healthcare facilities, more shops or businesses for handicrafts, and other lifestyle opportunities for young women. If we compare these with the responses about ultural change, more women than men would like nothing to change in their village. This implies that the maintenance of a traditional lifestyle is perhaps more important to some women than to men.
How people feel about improvements in their own personal lives is shown in Appendix 13. While this has rarely been examined within Paser communities, it may have important policy implications. From this data and analysis, it is interesting to note that when questioned about improving their own lives, the issue of better education and the
Economic value of non-timber forest products among Paser Indigenous People of East Kalimantan
194
availability of more cash are mentioned more frequently by men than by women; while more women than men suggest improvements such as a better handicrafts market, better health and getting a job. These possible gender differences highlight the importance of using participatory methods of data collection in order to enable a range of views to be included in the decision-making process. These perceptions may influence what people would like to happen in the process of development, and so people’s views for a number of development options have been examined in more detail in the next section.
When the villagers were asked about issues relating to the future development of their village, the responses are quite surprising. They have mixed feelings, and this could be as a result of their experiences in the past. Some people see ‘development’ as an opportunity to improve their own standard of living, while others associate it with the extraction of natural resources, without benefits for local people; this increases their concerns about the future. Their concerns relate to the insecurity of the forest, access to products and the insecurity of future market development.
The insecurity of future market development was a major issue raised by the respondents when discussing NTFPs and, in particular, rattan. The market for rattan in the past has proven un stable and the price has decreased, because of local resource depletion, the low quality of products and also because of the obligation to use a license for transportation (see section 8.4.1 above).
It is not without reason that many households have already converted their rattan gardens to other agriculture crops. This conversion might well happen without full calculation of the possible impact on the household and environment. The decision was often made on the basis of the idea that the opportunity costs of making or maintaining rattan gardens are less advantageous than for oil palm or rubber. It is found that the majority of respondents believe that rattan is no longer the promising crop that it was fifteen or twenty years ago. This feeling is supported by the results of this study, which show that the price of rattan has not improved since the last 15 years. For some households it is the right time to make a decision to shift to another crop.
Surprisingly, our findings reveal that the returns on investment in small-scale rattan cultivation are less attractive when compared with palm oil, but positive compared with a rubber plantation. Most likely, the conversion of rattan gardens into oil palm plantation will generate more income. Table 8.2 below indicates that the Net Benefit Cost Ratio (BCR) of a rattan garden is 1.62. It is less attractive when compared with palm oil, which has a BCR of 1.76. The Internal Rate of Return (IRR) of rattan is 18.17 per cent and this rate is higher than rubber (13.26 per cent) but lower than oil palm (20.52 per cent).
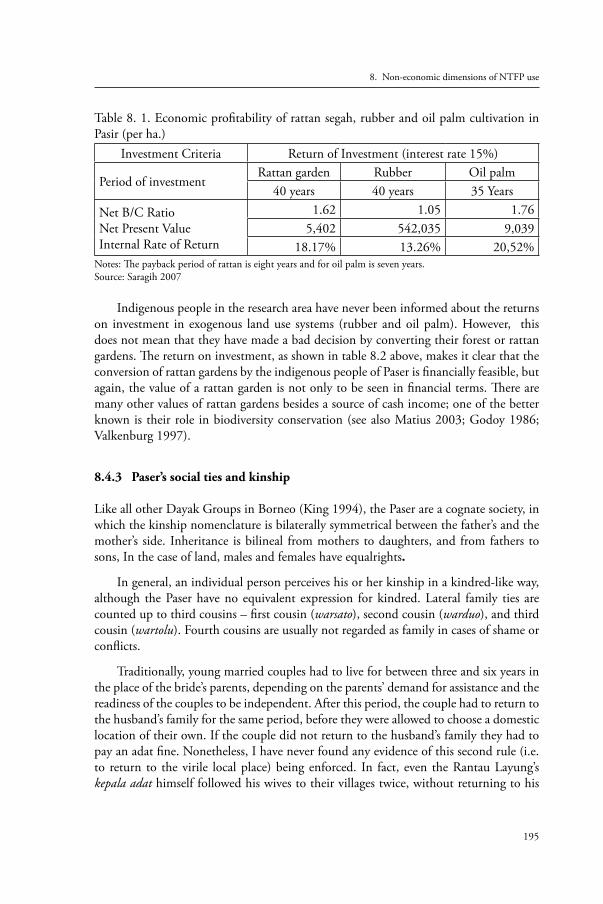
195
8. Non-economic dimensions of NTFP use
Table 8. 1. Economic profitability of rattan segah, rubber and oil palm cultivation in Pasir (per ha.)
Investment Criteria Return of Investment (interest rate 15%)
Period of investmentRattan garden Rubber Oil palm
40 years 40 years 35 Years
Net B/C RatioNet Present ValueInternal Rate of Return
1.62 1.05 1.76 5,402 542,035 9,039
18.17% 13.26% 20,52%Notes: The payback period of rattan is eight years and for oil palm is seven years.Source: Saragih 2007
Indigenous people in the research area have never been informed about the returns on investment in exogenous land use systems (rubber and oil palm). However, this does not mean that they have made a bad decision by converting their forest or rattan gardens. The return on investment, as shown in table 8.2 above, makes it clear that the conversion of rattan gardens by the indigenous people of Paser is financially feasible, but again, the value of a rattan garden is not only to be seen in financial terms. There are many other values of rattan gardens besides a source of cash income; one of the better known is their role in biodiversity conservation (see also Matius 2003; Godoy 1986; Valkenburg 1997).
8.4.3 Paser’s social ties and kinship
Like all other Dayak Groups in Borneo (King 1994), the Paser are a cognate society, in which the kinship nomenclature is bilaterally symmetrical between the father’s and the mother’s side. Inheritance is bilineal from mothers to daughters, and from fathers to sons, In the case of land, males and females have equalrights.
In general, an individual person perceives his or her kinship in a kindred-like way, although the Paser have no equivalent expression for kindred. Lateral family ties are counted up to third cousins – first cousin (warsato), second cousin (warduo), and third cousin (wartolu). Fourth cousins are usually not regarded as family in cases of shame or conflicts.
Traditionally, young married couples had to live for between three and six years in the place of the bride’s parents, depending on the parents’ demand for assistance and the readiness of the couples to be independent. After this period, the couple had to return to the husband’s family for the same period, before they were allowed to choose a domestic location of their own. If the couple did not return to the husband’s family they had to pay an adat fine. Nonetheless, I have never found any evidence of this second rule (i.e. to return to the virile local place) being enforced. In fact, even the Rantau Layung’s kepala adat himself followed his wives to their villages twice, without returning to his
Economic value of non-timber forest products among Paser Indigenous People of East Kalimantan
196
parents’ place. Due to this de facto uxorical pattern, the parent in-law of a man plays an important social role. In Rantau Layung, the most predominant pattern in collective swiddens was the combination of sons-in-law with their wives’ families, and the authority of a father-in-law must be respected more than that of a man’s own father.
Although marriage prescriptions are less strict today, in 17 out of 22 recent cases the husband still followed his wife, while there was a 5:2 ratio of village exogamy against endogamy. In 17 cases the respective spouse (12 men, 5 women) married into Rantau Layung, in 7 cases they married out of Rantau Layung, and in 10 cases couples married within the village. Traditionally, marriages between cross-cousins (marriage of the mother-brother’s daughter) of any degree were regarded as favourable, while parallel cousin (marriage of the father-sister’s daughter) marriages were regarded as pamali or taboo.
An even more severe adat offence is the marriage of partners from different genealogical levels. Counting from a common ancestor, one partner might belong to a different generation although both are of similar age. Such a case would be regarded as an incestuous marriage, for example, between father (mother) and daughter (son) or uncle (aunt) and niece (nephew). It would have to be purified with a ngelas adat or cure ceremony. Semok (the kepala adat of Rantau Layung) says that the mythological rationale for this cultural habit is similar to that found in Benuaq Temputn Sahuq Sumakng (Hopes et al. 1997).
King (1994) mentioned that in most Bornean societies the largest percentage of households can be categorised as nuclear or stem families. This definition also fits the Indonesian administrative view that regards married couples with their children as families (keluarga) and households (counted as kepala keluarga). However, the ‘household’ is not necessarily synonymous with the domestic unit, as 45 households shared 37 domestic units (individual houses or family) in Rantau Layung. In several cases, the domestic units inhabited by external families, generally include three generations and, thus, constitute several households. While food is often shared between the households of a domestic unit, financial income is usually managed individually by each nuclear family.
Hence, the household appears to be the relevant unit in terms of resource and capital allocation, although there is a close cooperation that extends floatingly along kinship lines. On a larger scale the predominant social organisation in Rantau Layung and Pinang Jatus is kinship, with a strong relationship between parents and their children, as well as with the core family, including other close family members.
The net links between 45 nuclear families in Rantau Layung are directly related to one another. There is only one exceptional family in Rantau Layung, which is not linked with the net because this family comes from another region. The head of this household was appointed as Dai Pembangunan or Muslim teacher by the government.
197
8. Non-economic dimensions of NTFP use
Although intra-village conflicts are said to be motivated individually or by cross-family ties, even at the family level, the core of a fluctuating group that usually opposes the village chief and his followers is constituted by two households without direct links to the village chief ’s families or the net. These observations stress the great importance of close family members, while the kindred level (defined locally as the wartolu level) covers the whole community of Rantau Layung due to the dense web created by marriages. Apart from marriages, many other social aspects are regulated by traditional adat law. This unwritten law is handed down from one generation to the next and supervised by the traditional village chief (kepala adat) and is acknowledged by the elders (also from other villages). Cases of violations of adat law are usually discussed in a meeting (berinok or berembug), often including many people who function as witnesses (Ind. saksi), or who contribute their comments until a consensus is found. Financial fines and ritual payments are imposed in terms of the adat currency with lampokg (a little pot) being the smallest unit, valued at Rp. 15,000. This is followed by Jogo (a white plate) valued at Rp. 50,000; antang (large Chinese jar) valued Rp. 75,000; and gong (a bronze gong) valued at Rp. 150,000.
Land tenure is also regulated under adat law. There are two modes of land tenure among the Paser: (1) circulating usufruct systems, and (2) devolvable usufruct systems. In the first case, no permanent usufruct is acquired by the clearing of primary forest, and everyone has the same right to use a fallow forest originally cleared by others. Examples of this mode are found in the Awa Uma and Pangeramu (see Chapter 5 on traditional land arrangements) of Rantau Layung, where households can make new ladang or dry rice fields in the former rice growing area of neighbouring or other villagers. The second example is the rattan garden, this is a property of a family that has planted rattan seedlings in the land and then handed the land over to their children.
Tenure rights are derived from the clearing of a piece of primary forest and extended to the further use of the subsequent fallow, including the establishment of forest gardens. These gardens are later divided among the children, including those who have permanently left the village. If other people establish gardens on these respective fallows, land tenure remains with the primary owner, while the usufruct (Ind. hak pakai) of the planted crops belongs to the new farmer.
8.5 Attitudes towards the forest and environmental changes
Paser people’s (men and women) views on various development issues in the villages are shown in Appendices 14a, b and c. These tables indicate the mean scores assigned to each issue by all respondents (representing 100 per cent of occupied household), and their standard deviations. This suggests that some variation exists in how such issues influence their own families and the community and the indication of how such issues influence their children’s lives. From these tables, it is clear that Paser people (men and women) have various views on various development issues in the villages.
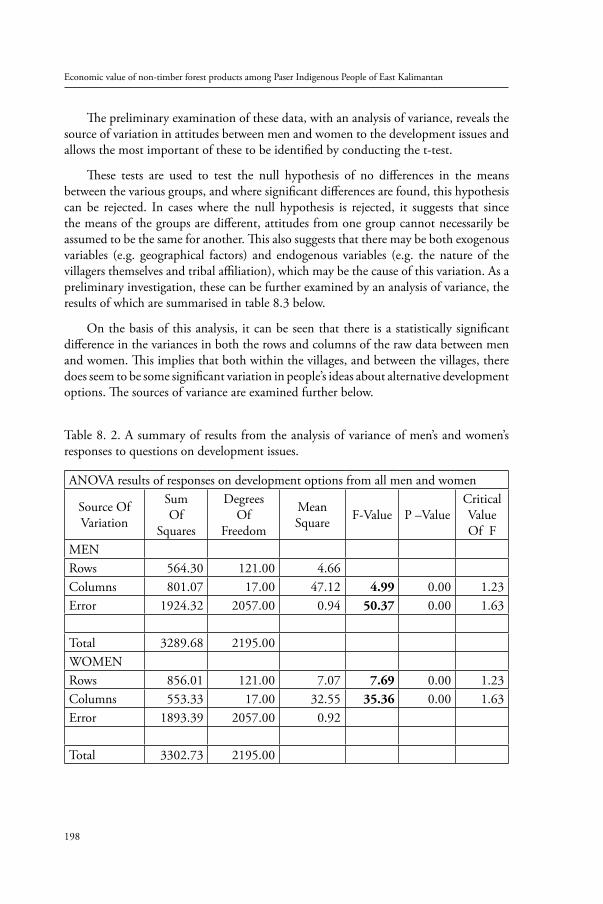
Economic value of non-timber forest products among Paser Indigenous People of East Kalimantan
198
The preliminary examination of these data, with an analysis of variance, reveals the source of variation in attitudes between men and women to the development issues and allows the most important of these to be identified by conducting the t-test.
These tests are used to test the null hypothesis of no differences in the means between the various groups, and where significant differences are found, this hypothesis can be rejected. In cases where the null hypothesis is rejected, it suggests that since the means of the groups are different, attitudes from one group cannot necessarily be assumed to be the same for another. This also suggests that there may be both exogenous variables (e.g. geographical factors) and endogenous variables (e.g. the nature of the villagers themselves and tribal affiliation), which may be the cause of this variation. As a preliminary investigation, these can be further examined by an analysis of variance, the results of which are summarised in table 8.3 below.
On the basis of this analysis, it can be seen that there is a statistically significant difference in the variances in both the rows and columns of the raw data between men and women. This implies that both within the villages, and between the villages, there does seem to be some significant variation in people’s ideas about alternative development options. The sources of variance are examined further below.
Table 8. 2. A summary of results from the analysis of variance of men’s and women’s responses to questions on development issues.
ANOVA results of responses on development options from all men and women
Source OfVariation
SumOf
Squares
DegreesOf
Freedom
MeanSquare F-Value P –Value
Critical ValueOf F
MENRows 564.30 121.00 4.66Columns 801.07 17.00 47.12 4.99 0.00 1.23Error 1924.32 2057.00 0.94 50.37 0.00 1.63
Total 3289.68 2195.00WOMENRows 856.01 121.00 7.07 7.69 0.00 1.23Columns 553.33 17.00 32.55 35.36 0.00 1.63Error 1893.39 2057.00 0.92
Total 3302.73 2195.00
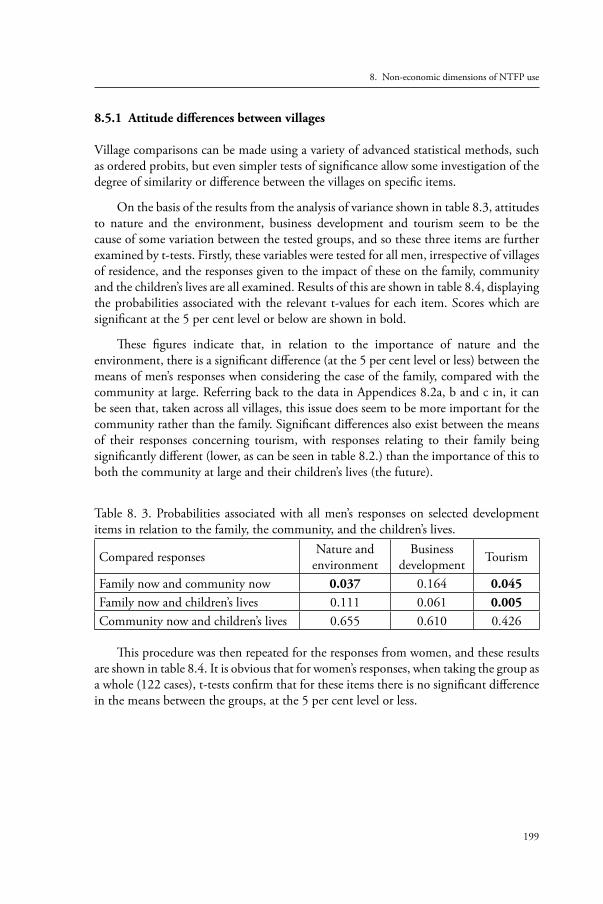
199
8. Non-economic dimensions of NTFP use
8.5.1 Attitude differences between villages
Village comparisons can be made using a variety of advanced statistical methods, such as ordered probits, but even simpler tests of significance allow some investigation of the degree of similarity or difference between the villages on specific items.
On the basis of the results from the analysis of variance shown in table 8.3, attitudes to nature and the environment, business development and tourism seem to be the cause of some variation between the tested groups, and so these three items are further examined by t-tests. Firstly, these variables were tested for all men, irrespective of villages of residence, and the responses given to the impact of these on the family, community and the children’s lives are all examined. Results of this are shown in table 8.4, displaying the probabilities associated with the relevant t-values for each item. Scores which are significant at the 5 per cent level or below are shown in bold.
These figures indicate that, in relation to the importance of nature and the environment, there is a significant difference (at the 5 per cent level or less) between the means of men’s responses when considering the case of the family, compared with the community at large. Referring back to the data in Appendices 8.2a, b and c in, it can be seen that, taken across all villages, this issue does seem to be more important for the community rather than the family. Significant differences also exist between the means of their responses concerning tourism, with responses relating to their family being significantly different (lower, as can be seen in table 8.2.) than the importance of this to both the community at large and their children’s lives (the future).
Table 8. 3. Probabilities associated with all men’s responses on selected development items in relation to the family, the community, and the children’s lives.
Compared responses Nature andenvironment
Businessdevelopment Tourism
Family now and community now 0.037 0.164 0.045Family now and children’s lives 0.111 0.061 0.005Community now and children’s lives 0.655 0.610 0.426
This procedure was then repeated for the responses from women, and these results are shown in table 8.4. It is obvious that for women’s responses, when taking the group as a whole (122 cases), t-tests confirm that for these items there is no significant difference in the means between the groups, at the 5 per cent level or less.
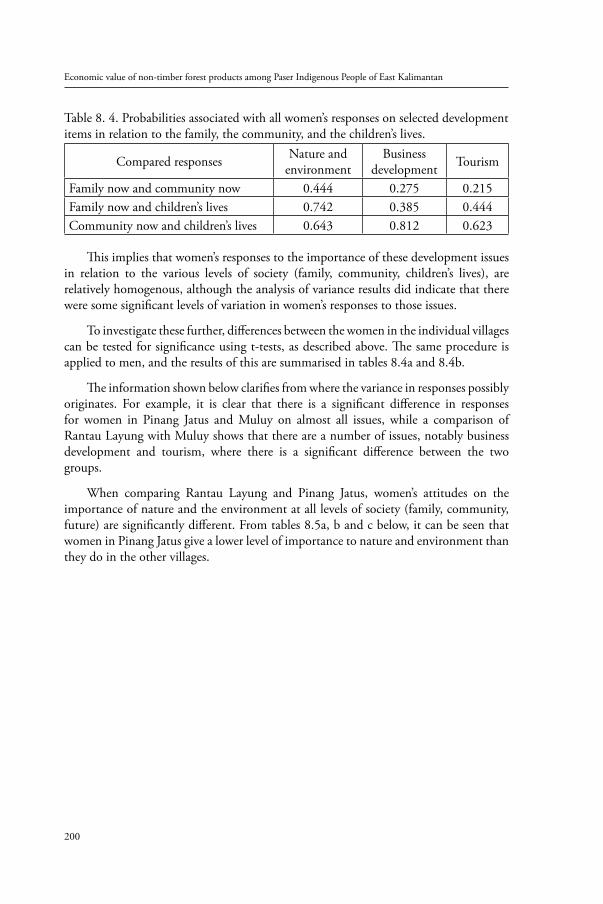
Economic value of non-timber forest products among Paser Indigenous People of East Kalimantan
200
Table 8. 4. Probabilities associated with all women’s responses on selected development items in relation to the family, the community, and the children’s lives.
Compared responses Nature andenvironment
Businessdevelopment Tourism
Family now and community now 0.444 0.275 0.215Family now and children’s lives 0.742 0.385 0.444Community now and children’s lives 0.643 0.812 0.623
This implies that women’s responses to the importance of these development issues in relation to the various levels of society (family, community, children’s lives), are relatively homogenous, although the analysis of variance results did indicate that there were some significant levels of variation in women’s responses to those issues.
To investigate these further, differences between the women in the individual villages can be tested for significance using t-tests, as described above. The same procedure is applied to men, and the results of this are summarised in tables 8.4a and 8.4b.
The information shown below clarifies from where the variance in responses possibly originates. For example, it is clear that there is a significant difference in responses for women in Pinang Jatus and Muluy on almost all issues, while a comparison of Rantau Layung with Muluy shows that there are a number of issues, notably business development and tourism, where there is a significant difference between the two groups.
When comparing Rantau Layung and Pinang Jatus, women’s attitudes on the importance of nature and the environment at all levels of society (family, community, future) are significantly different. From tables 8.5a, b and c below, it can be seen that women in Pinang Jatus give a lower level of importance to nature and environment than they do in the other villages.
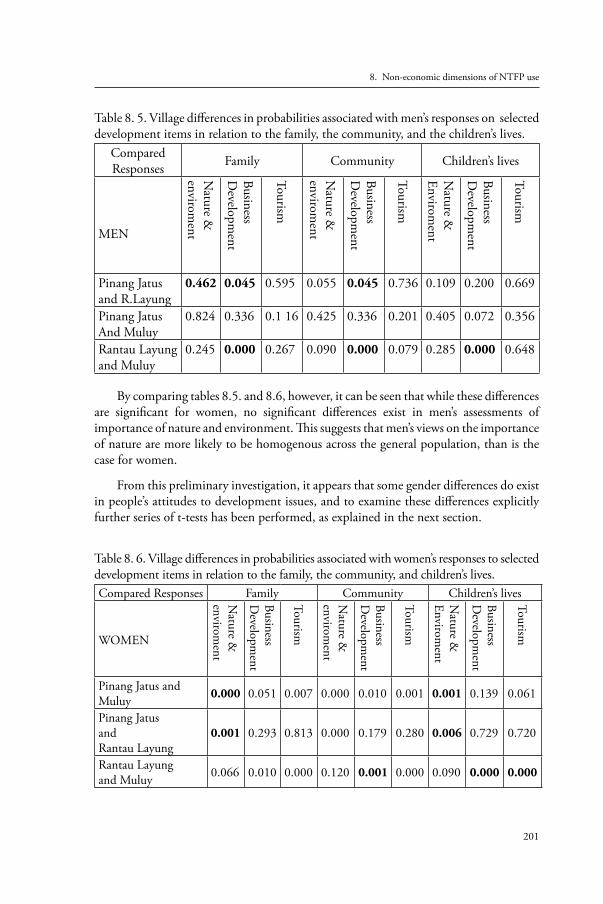
201
8. Non-economic dimensions of NTFP use
Table 8. 5. Village differences in probabilities associated with men’s responses on selected development items in relation to the family, the community, and the children’s lives.
ComparedResponses Family Community Children’s lives
MEN
Nature &
envirom
ent
BusinessD
evelopment
Tourism
Nature &
envirom
ent
BusinessD
evelopment
Tourism
Nature &
Envirom
ent
BusinessD
evelopment
Tourism
Pinang Jatus and R.Layung
0.462 0.045 0.595 0.055 0.045 0.736 0.109 0.200 0.669
Pinang JatusAnd Muluy
0.824 0.336 0.1 16 0.425 0.336 0.201 0.405 0.072 0.356
Rantau Layungand Muluy
0.245 0.000 0.267 0.090 0.000 0.079 0.285 0.000 0.648
By comparing tables 8.5. and 8.6, however, it can be seen that while these differences are significant for women, no significant differences exist in men’s assessments of importance of nature and environment. This suggests that men’s views on the importance of nature are more likely to be homogenous across the general population, than is the case for women.
From this preliminary investigation, it appears that some gender differences do exist in people’s attitudes to development issues, and to examine these differences explicitly further series of t-tests has been performed, as explained in the next section.
Table 8. 6. Village differences in probabilities associated with women’s responses to selected development items in relation to the family, the community, and children’s lives.Compared Responses Family Community Children’s lives
WOMEN
Nature &
envirom
ent
BusinessD
evelopment
Tourism
Nature &
envirom
ent
BusinessD
evelopment
Tourism
Nature &
Envirom
ent
BusinessD
evelopment
Tourism
Pinang Jatus and Muluy 0.000 0.051 0.007 0.000 0.010 0.001 0.001 0.139 0.061
Pinang Jatusand Rantau Layung
0.001 0.293 0.813 0.000 0.179 0.280 0.006 0.729 0.720
Rantau Layungand Muluy 0.066 0.010 0.000 0.120 0.001 0.000 0.090 0.000 0.000
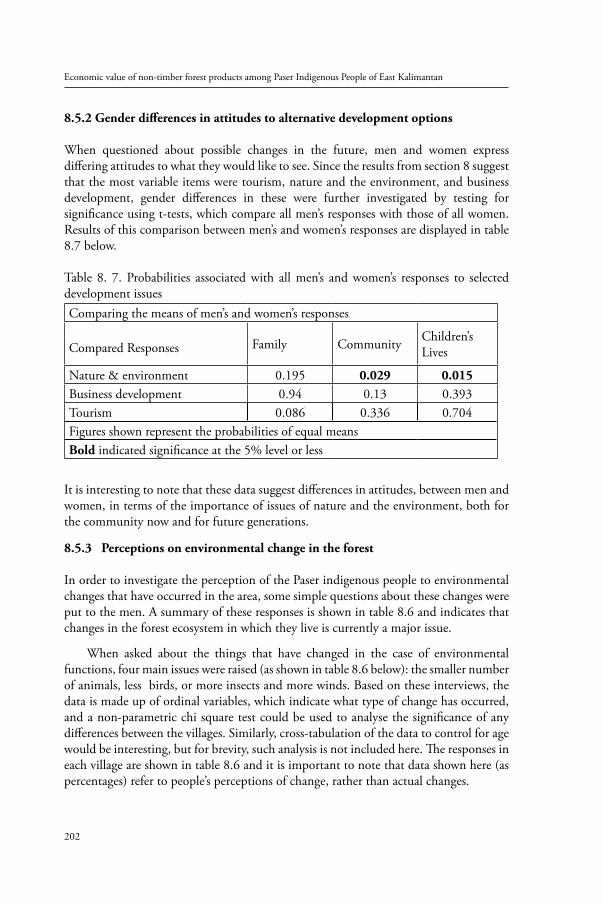
Economic value of non-timber forest products among Paser Indigenous People of East Kalimantan
202
8.5.2 Gender differences in attitudes to alternative development options
When questioned about possible changes in the future, men and women express differing attitudes to what they would like to see. Since the results from section 8 suggest that the most variable items were tourism, nature and the environment, and business development, gender differences in these were further investigated by testing for significance using t-tests, which compare all men’s responses with those of all women. Results of this comparison between men’s and women’s responses are displayed in table 8.7 below.
Table 8. 7. Probabilities associated with all men’s and women’s responses to selected development issues Comparing the means of men’s and women’s responses
Compared Responses Family Community Children’sLives
Nature & environment 0.195 0.029 0.015Business development 0.94 0.13 0.393Tourism 0.086 0.336 0.704Figures shown represent the probabilities of equal means Bold indicated significance at the 5% level or less
It is interesting to note that these data suggest differences in attitudes, between men and women, in terms of the importance of issues of nature and the environment, both for the community now and for future generations.
8.5.3 Perceptions on environmental change in the forest
In order to investigate the perception of the Paser indigenous people to environmental changes that have occurred in the area, some simple questions about these changes were put to the men. A summary of these responses is shown in table 8.6 and indicates that changes in the forest ecosystem in which they live is currently a major issue.
When asked about the things that have changed in the case of environmental functions, four main issues were raised (as shown in table 8.6 below): the smaller number of animals, less birds, or more insects and more winds. Based on these interviews, the data is made up of ordinal variables, which indicate what type of change has occurred, and a non-parametric chi square test could be used to analyse the significance of any differences between the villages. Similarly, cross-tabulation of the data to control for age would be interesting, but for brevity, such analysis is not included here. The responses in each village are shown in table 8.6 and it is important to note that data shown here (as percentages) refer to people’s perceptions of change, rather than actual changes.
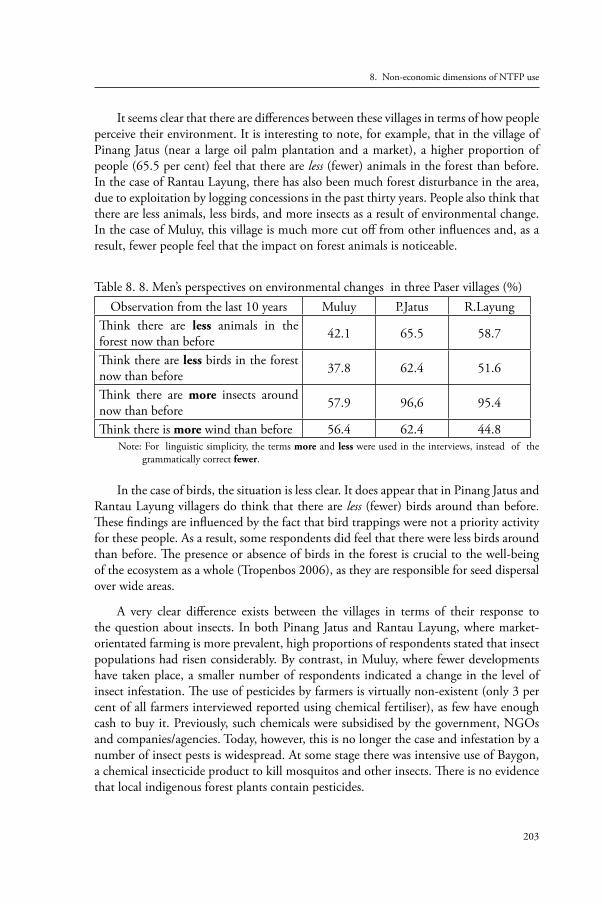
203
8. Non-economic dimensions of NTFP use
It seems clear that there are differences between these villages in terms of how people perceive their environment. It is interesting to note, for example, that in the village of Pinang Jatus (near a large oil palm plantation and a market), a higher proportion of people (65.5 per cent) feel that there are less (fewer) animals in the forest than before. In the case of Rantau Layung, there has also been much forest disturbance in the area, due to exploitation by logging concessions in the past thirty years. People also think that there are less animals, less birds, and more insects as a result of environmental change. In the case of Muluy, this village is much more cut off from other influences and, as a result, fewer people feel that the impact on forest animals is noticeable.
Table 8. 8. Men’s perspectives on environmental changes in three Paser villages (%)Observation from the last 10 years Muluy P.Jatus R.Layung
Think there are less animals in the forest now than before 42.1 65.5 58.7
Think there are less birds in the forest now than before 37.8 62.4 51.6
Think there are more insects around now than before 57.9 96,6 95.4
Think there is more wind than before 56.4 62.4 44.8Note: For linguistic simplicity, the terms more and less were used in the interviews, instead of the
grammatically correct fewer.
In the case of birds, the situation is less clear. It does appear that in Pinang Jatus and Rantau Layung villagers do think that there are less (fewer) birds around than before. These findings are influenced by the fact that bird trappings were not a priority activity for these people. As a result, some respondents did feel that there were less birds around than before. The presence or absence of birds in the forest is crucial to the well-being of the ecosystem as a whole (Tropenbos 2006), as they are responsible for seed dispersal over wide areas.
A very clear difference exists between the villages in terms of their response to the question about insects. In both Pinang Jatus and Rantau Layung, where market-orientated farming is more prevalent, high proportions of respondents stated that insect populations had risen considerably. By contrast, in Muluy, where fewer developments have taken place, a smaller number of respondents indicated a change in the level of insect infestation. The use of pesticides by farmers is virtually non-existent (only 3 per cent of all farmers interviewed reported using chemical fertiliser), as few have enough cash to buy it. Previously, such chemicals were subsidised by the government, NGOs and companies/agencies. Today, however, this is no longer the case and infestation by a number of insect pests is widespread. At some stage there was intensive use of Baygon, a chemical insecticide product to kill mosquitos and other insects. There is no evidence that local indigenous forest plants contain pesticides.
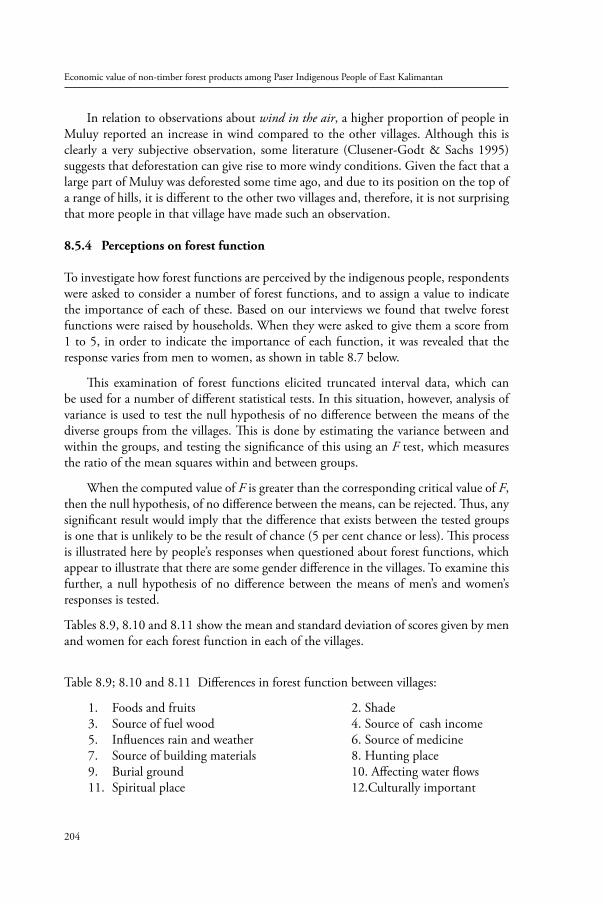
Economic value of non-timber forest products among Paser Indigenous People of East Kalimantan
204
In relation to observations about wind in the air, a higher proportion of people in Muluy reported an increase in wind compared to the other villages. Although this is clearly a very subjective observation, some literature (Clusener-Godt & Sachs 1995) suggests that deforestation can give rise to more windy conditions. Given the fact that a large part of Muluy was deforested some time ago, and due to its position on the top of a range of hills, it is different to the other two villages and, therefore, it is not surprising that more people in that village have made such an observation.
8.5.4 Perceptions on forest function
To investigate how forest functions are perceived by the indigenous people, respondents were asked to consider a number of forest functions, and to assign a value to indicate the importance of each of these. Based on our interviews we found that twelve forest functions were raised by households. When they were asked to give them a score from 1 to 5, in order to indicate the importance of each function, it was revealed that the response varies from men to women, as shown in table 8.7 below.
This examination of forest functions elicited truncated interval data, which can be used for a number of different statistical tests. In this situation, however, analysis of variance is used to test the null hypothesis of no difference between the means of the diverse groups from the villages. This is done by estimating the variance between and within the groups, and testing the significance of this using an F test, which measures the ratio of the mean squares within and between groups.
When the computed value of F is greater than the corresponding critical value of F, then the null hypothesis, of no difference between the means, can be rejected. Thus, any significant result would imply that the difference that exists between the tested groups is one that is unlikely to be the result of chance (5 per cent chance or less). This process is illustrated here by people’s responses when questioned about forest functions, which appear to illustrate that there are some gender difference in the villages. To examine this further, a null hypothesis of no difference between the means of men’s and women’s responses is tested.
Tables 8.9, 8.10 and 8.11 show the mean and standard deviation of scores given by men and women for each forest function in each of the villages.
Table 8.9; 8.10 and 8.11 Differences in forest function between villages:
Foods and fruits 2. Shade1. Source of fuel wood 4. Source of cash income3. Influences rain and weather 6. Source of medicine5. Source of building materials 8. Hunting place7. Burial ground 10. Affecting water flows9. Spiritual place 12.Culturally important11.
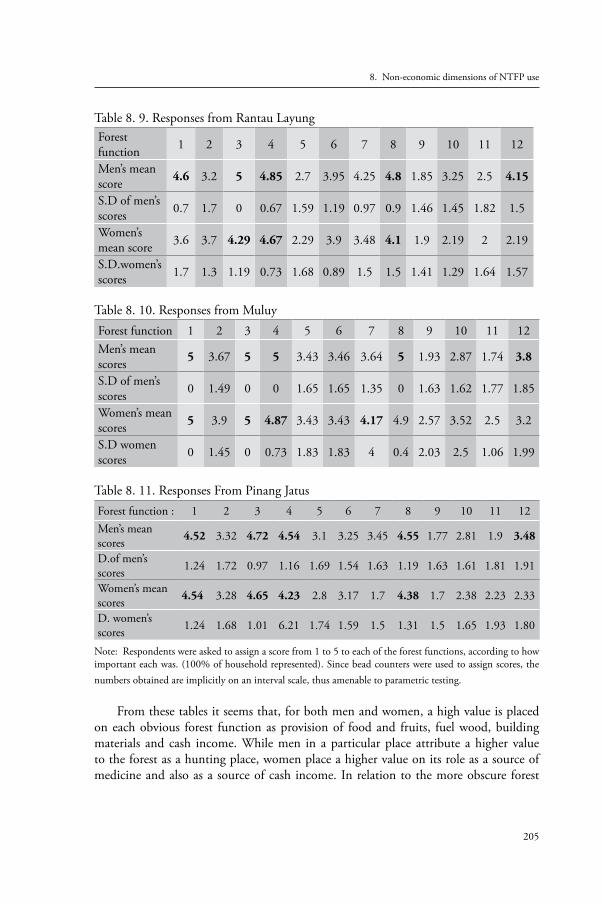
205
8. Non-economic dimensions of NTFP use
Table 8. 9. Responses from Rantau LayungForest function 1 2 3 4 5 6 7 8 9 10 11 12
Men’s mean score 4.6 3.2 5 4.85 2.7 3.95 4.25 4.8 1.85 3.25 2.5 4.15
S.D of men’s scores 0.7 1.7 0 0.67 1.59 1.19 0.97 0.9 1.46 1.45 1.82 1.5
Women’s mean score 3.6 3.7 4.29 4.67 2.29 3.9 3.48 4.1 1.9 2.19 2 2.19
S.D.women’s scores 1.7 1.3 1.19 0.73 1.68 0.89 1.5 1.5 1.41 1.29 1.64 1.57
Table 8. 10. Responses from MuluyForest function 1 2 3 4 5 6 7 8 9 10 11 12Men’s mean scores 5 3.67 5 5 3.43 3.46 3.64 5 1.93 2.87 1.74 3.8
S.D of men’s scores 0 1.49 0 0 1.65 1.65 1.35 0 1.63 1.62 1.77 1.85
Women’s mean scores 5 3.9 5 4.87 3.43 3.43 4.17 4.9 2.57 3.52 2.5 3.2
S.D women scores 0 1.45 0 0.73 1.83 1.83 4 0.4 2.03 2.5 1.06 1.99
Table 8. 11. Responses From Pinang JatusForest function : 1 2 3 4 5 6 7 8 9 10 11 12Men’s mean scores 4.52 3.32 4.72 4.54 3.1 3.25 3.45 4.55 1.77 2.81 1.9 3.48
D.of men’s scores 1.24 1.72 0.97 1.16 1.69 1.54 1.63 1.19 1.63 1.61 1.81 1.91
Women’s mean scores 4.54 3.28 4.65 4.23 2.8 3.17 1.7 4.38 1.7 2.38 2.23 2.33
D. women’s scores 1.24 1.68 1.01 6.21 1.74 1.59 1.5 1.31 1.5 1.65 1.93 1.80
Note: Respondents were asked to assign a score from 1 to 5 to each of the forest functions, according to how important each was. (100% of household represented). Since bead counters were used to assign scores, the numbers obtained are implicitly on an interval scale, thus amenable to parametric testing.
From these tables it seems that, for both men and women, a high value is placed on each obvious forest function as provision of food and fruits, fuel wood, building materials and cash income. While men in a particular place attribute a higher value to the forest as a hunting place, women place a higher value on its role as a source of medicine and also as a source of cash income. In relation to the more obscure forest
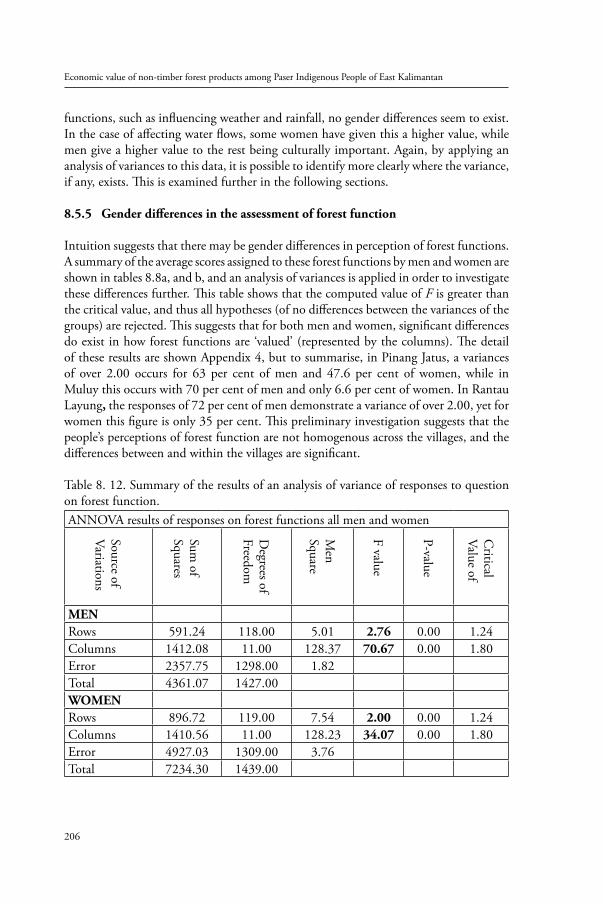
Economic value of non-timber forest products among Paser Indigenous People of East Kalimantan
206
functions, such as influencing weather and rainfall, no gender differences seem to exist. In the case of affecting water flows, some women have given this a higher value, while men give a higher value to the rest being culturally important. Again, by applying an analysis of variances to this data, it is possible to identify more clearly where the variance, if any, exists. This is examined further in the following sections.
8.5.5 Gender differences in the assessment of forest function
Intuition suggests that there may be gender differences in perception of forest functions. A summary of the average scores assigned to these forest functions by men and women are shown in tables 8.8a, and b, and an analysis of variances is applied in order to investigate these differences further. This table shows that the computed value of F is greater than the critical value, and thus all hypotheses (of no differences between the variances of the groups) are rejected. This suggests that for both men and women, significant differences do exist in how forest functions are ‘valued’ (represented by the columns). The detail of these results are shown Appendix 4, but to summarise, in Pinang Jatus, a variances of over 2.00 occurs for 63 per cent of men and 47.6 per cent of women, while in Muluy this occurs with 70 per cent of men and only 6.6 per cent of women. In Rantau Layung, the responses of 72 per cent of men demonstrate a variance of over 2.00, yet for women this figure is only 35 per cent. This preliminary investigation suggests that the people’s perceptions of forest function are not homogenous across the villages, and the differences between and within the villages are significant.
Table 8. 12. Summary of the results of an analysis of variance of responses to question on forest function.ANNOVA results of responses on forest functions all men and women
Source ofVariations
Sum of
Squares
Degrees of
Freedom
Men
Square
F value
P-value
Critical
Value of
MENRows 591.24 118.00 5.01 2.76 0.00 1.24Columns 1412.08 11.00 128.37 70.67 0.00 1.80Error 2357.75 1298.00 1.82Total 4361.07 1427.00WOMENRows 896.72 119.00 7.54 2.00 0.00 1.24Columns 1410.56 11.00 128.23 34.07 0.00 1.80Error 4927.03 1309.00 3.76Total 7234.30 1439.00
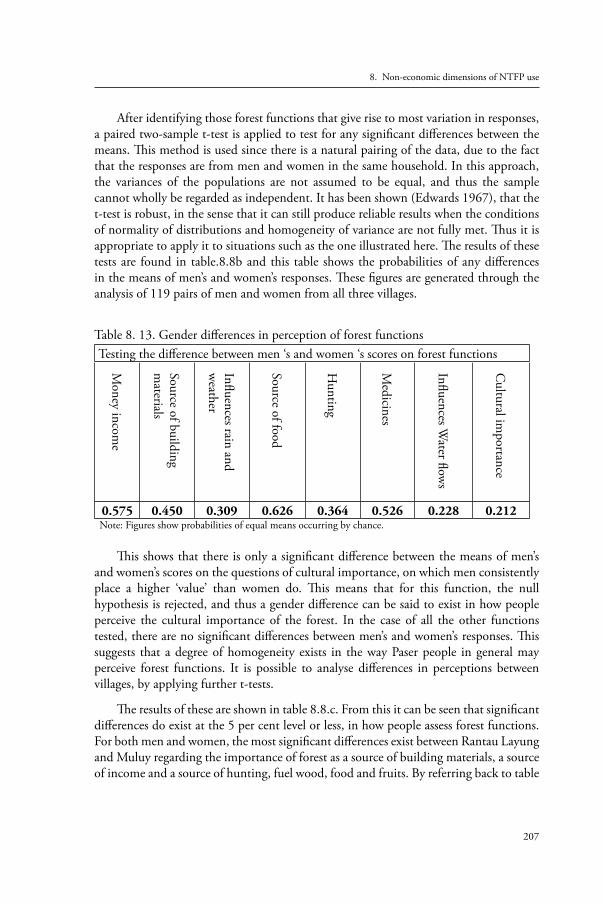
207
8. Non-economic dimensions of NTFP use
After identifying those forest functions that give rise to most variation in responses, a paired two-sample t-test is applied to test for any significant differences between the means. This method is used since there is a natural pairing of the data, due to the fact that the responses are from men and women in the same household. In this approach, the variances of the populations are not assumed to be equal, and thus the sample cannot wholly be regarded as independent. It has been shown (Edwards 1967), that the t-test is robust, in the sense that it can still produce reliable results when the conditions of normality of distributions and homogeneity of variance are not fully met. Thus it is appropriate to apply it to situations such as the one illustrated here. The results of these tests are found in table.8.8b and this table shows the probabilities of any differences in the means of men’s and women’s responses. These figures are generated through the analysis of 119 pairs of men and women from all three villages.
Table 8. 13. Gender differences in perception of forest functions Testing the difference between men ‘s and women ‘s scores on forest functions
Money incom
e
Source of building m
aterials
Influences rain and w
eather
Source of food
Hunting
Medicines
Influences Water flow
s
Cultural im
portance
0.575 0.450 0.309 0.626 0.364 0.526 0.228 0.212 Note: Figures show probabilities of equal means occurring by chance.
This shows that there is only a significant difference between the means of men’s and women’s scores on the questions of cultural importance, on which men consistently place a higher ‘value’ than women do. This means that for this function, the null hypothesis is rejected, and thus a gender difference can be said to exist in how people perceive the cultural importance of the forest. In the case of all the other functions tested, there are no significant differences between men’s and women’s responses. This suggests that a degree of homogeneity exists in the way Paser people in general may perceive forest functions. It is possible to analyse differences in perceptions between villages, by applying further t-tests.
The results of these are shown in table 8.8.c. From this it can be seen that significant differences do exist at the 5 per cent level or less, in how people assess forest functions. For both men and women, the most significant differences exist between Rantau Layung and Muluy regarding the importance of forest as a source of building materials, a source of income and a source of hunting, fuel wood, food and fruits. By referring back to table
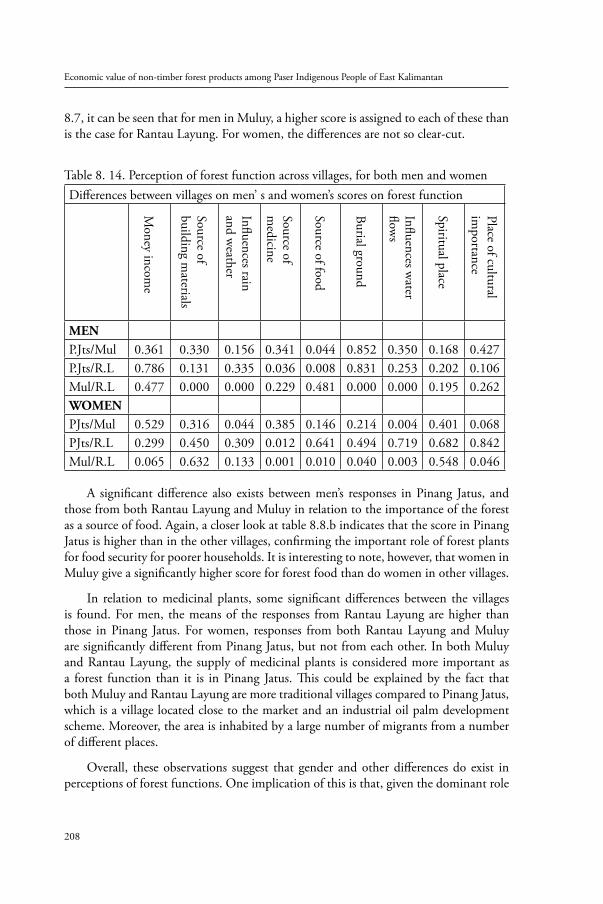
Economic value of non-timber forest products among Paser Indigenous People of East Kalimantan
208
8.7, it can be seen that for men in Muluy, a higher score is assigned to each of these than is the case for Rantau Layung. For women, the differences are not so clear-cut.
Table 8. 14. Perception of forest function across villages, for both men and women Differences between villages on men’ s and women’s scores on forest function
Money incom
e
Source of building m
aterials
Influences rain and w
eather
Source of m
edicine
Source of food
Burial ground
Influences water
flows
Spiritual place
Place of cultural im
portance
MENP.Jts/Mul 0.361 0.330 0.156 0.341 0.044 0.852 0.350 0.168 0.427P.Jts/R.L 0.786 0.131 0.335 0.036 0.008 0.831 0.253 0.202 0.106Mul/R.L 0.477 0.000 0.000 0.229 0.481 0.000 0.000 0.195 0.262WOMENPJts/Mul 0.529 0.316 0.044 0.385 0.146 0.214 0.004 0.401 0.068PJts/R.L 0.299 0.450 0.309 0.012 0.641 0.494 0.719 0.682 0.842Mul/R.L 0.065 0.632 0.133 0.001 0.010 0.040 0.003 0.548 0.046
A significant difference also exists between men’s responses in Pinang Jatus, and those from both Rantau Layung and Muluy in relation to the importance of the forest as a source of food. Again, a closer look at table 8.8.b indicates that the score in Pinang Jatus is higher than in the other villages, confirming the important role of forest plants for food security for poorer households. It is interesting to note, however, that women in Muluy give a significantly higher score for forest food than do women in other villages.
In relation to medicinal plants, some significant differences between the villages is found. For men, the means of the responses from Rantau Layung are higher than those in Pinang Jatus. For women, responses from both Rantau Layung and Muluy are significantly different from Pinang Jatus, but not from each other. In both Muluy and Rantau Layung, the supply of medicinal plants is considered more important as a forest function than it is in Pinang Jatus. This could be explained by the fact that both Muluy and Rantau Layung are more traditional villages compared to Pinang Jatus, which is a village located close to the market and an industrial oil palm development scheme. Moreover, the area is inhabited by a large number of migrants from a number of different places.
Overall, these observations suggest that gender and other differences do exist in perceptions of forest functions. One implication of this is that, given the dominant role
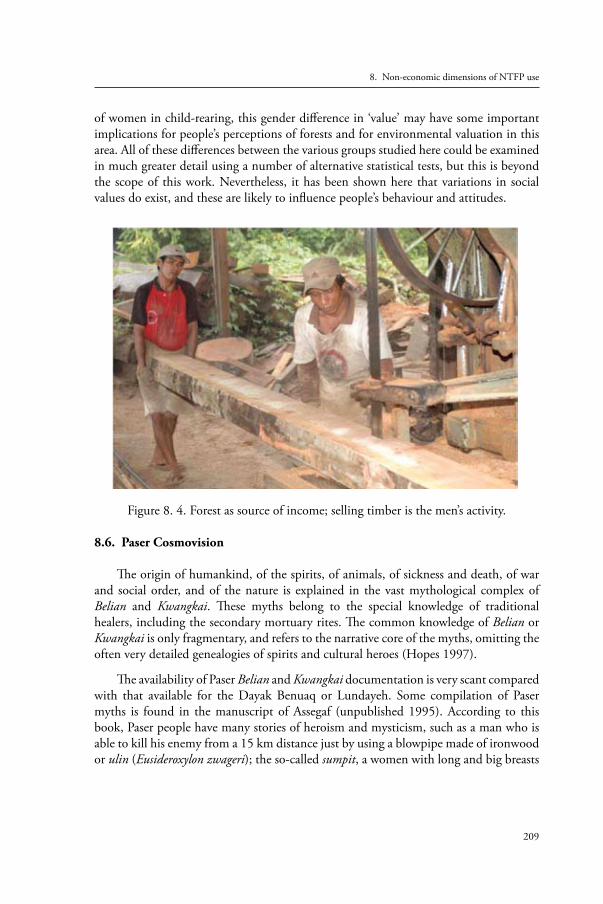
209
8. Non-economic dimensions of NTFP use
of women in child-rearing, this gender difference in ‘value’ may have some important implications for people’s perceptions of forests and for environmental valuation in this area. All of these differences between the various groups studied here could be examined in much greater detail using a number of alternative statistical tests, but this is beyond the scope of this work. Nevertheless, it has been shown here that variations in social values do exist, and these are likely to influence people’s behaviour and attitudes.
Figure 8. 4. Forest as source of income; selling timber is the men’s activity.
8.6. Paser Cosmovision
The origin of humankind, of the spirits, of animals, of sickness and death, of war and social order, and of the nature is explained in the vast mythological complex of Belian and Kwangkai. These myths belong to the special knowledge of traditional healers, including the secondary mortuary rites. The common knowledge of Belian or Kwangkai is only fragmentary, and refers to the narrative core of the myths, omitting the often very detailed genealogies of spirits and cultural heroes (Hopes 1997).
The availability of Paser Belian and Kwangkai documentation is very scant compared with that available for the Dayak Benuaq or Lundayeh. Some compilation of Paser myths is found in the manuscript of Assegaf (unpublished 1995). According to this book, Paser people have many stories of heroism and mysticism, such as a man who is able to kill his enemy from a 15 km distance just by using a blowpipe made of ironwood or ulin (Eusideroxylon zwageri); the so-called sumpit, a women with long and big breasts
Economic value of non-timber forest products among Paser Indigenous People of East Kalimantan
210
who can defeat gerombolan19 while feeding her baby; and a man who can reach the top of a wild honey tree without climbing. There are also myths about transmitting a disease to someone who has made a mistake and he would never been cured of this disease if he does not come back to apologise. There were many stories or myths told by respondents during the field research but most of these stories dealt with ghosts or were about trying to generate fear among the listeners.
The general perception of the people in East Kalimantan, that the Paser people are Pengguna-guna (Ind.) or mysterious people, has existed since long ago. In the documentary reports made during Dutch colonial times, Ian Black mentions that the Paser have a strong and different attitude towards the presence of the Dutch military in Tanah Grogot (current capital district) in 1912 than they do about their presence in the Martapura King Region in South Kalimantan. The war against the Dutch military in Pasir was led by the King of Pasir Sandurangas. They repelled the Dutch military troops, forcing them to return back to their base in South Kalimantan. Later, these troops, with the help of soldiers belonging to the Sultan Martapura, came back to conquer the Pasir (Black 1990). Constructing a negative image about the Paser being a backward or pengguna-guna group of people was used as a method to defeat their cohesiveness. In fact, this method was employed not only by the colonial authorities, but also by the Suharto regime in order to promote the transmigration programme and industrial oil palm development in Pasir.
According to Lawut (adat chief of Pinang Jatus) the villagers in his village originate from two regions. The first group came from Mount Lumut or a forest area, and the second group came from the North Barito River or Central Kalimantan. He called the first group ‘the men of the forest’ (orang hutan) and they were seen as ‘second class’ human beings who do not have a right to be appointed as kepala adat but who can be elected as kepala desa (village chief ). The main reason for this perception is that people from the forest do not fit into adat roles and, therefore, they cannot be elected as adat chief. Attempts to discuss this issue with respondents confirmed that this group is viewed as ‘forest people’ or orang hutan. It also became clear that the appointment of a orang hutan member as kepala adat was said to be the cause of some diseases that occured in the village of Pinang Jatus a long time ago.
The impact of this stratification is also found in land and forest products properties. An example is the property of wild honey trees in the forest, which are almost all managed by the family of the adat chief. The adat chief also manages the land close to the honey trees and claims them as his family property. Another example is the small-scale timber in the village forest area of Pinang Jatus. This business is operated by relatives of the adat chief and he controls all the benefits from this site, distributing them only among his family or relatives. This situation differs slightly with that in Rantau Layung, where
9 Gerombolan is the term for certain group of people who come to collect the village property by force and by burning the village. According to Semok (adat chief of Rantau Layung) it happened during the Second World War or before the region was handed over from the Dutch to the Japanese authorities in 1942.
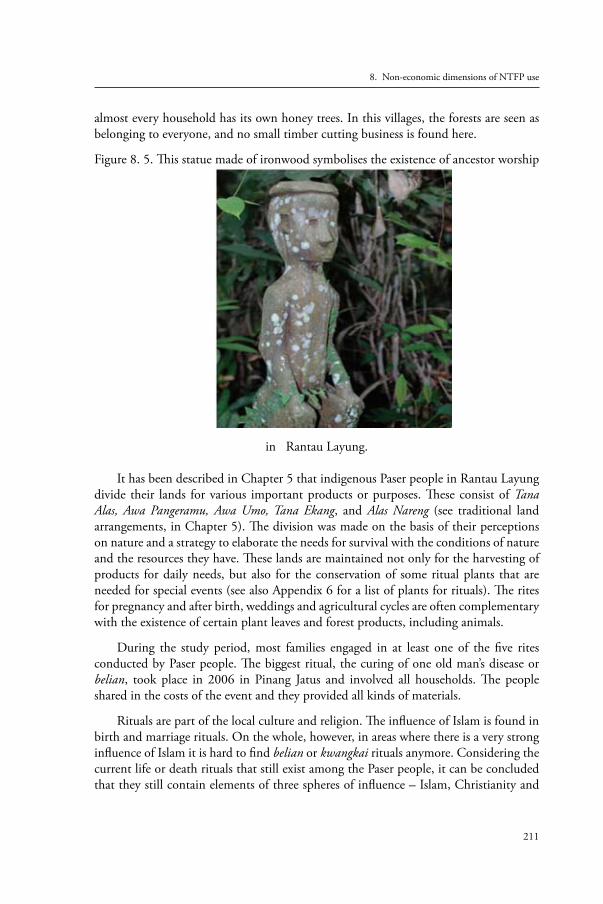
211
8. Non-economic dimensions of NTFP use
almost every household has its own honey trees. In this villages, the forests are seen as belonging to everyone, and no small timber cutting business is found here.
Figure 8. 5. This statue made of ironwood symbolises the existence of ancestor worship
in Rantau Layung.
It has been described in Chapter 5 that indigenous Paser people in Rantau Layung divide their lands for various important products or purposes. These consist of Tana Alas, Awa Pangeramu, Awa Umo, Tana Ekang, and Alas Nareng (see traditional land arrangements, in Chapter 5). The division was made on the basis of their perceptions on nature and a strategy to elaborate the needs for survival with the conditions of nature and the resources they have. These lands are maintained not only for the harvesting of products for daily needs, but also for the conservation of some ritual plants that are needed for special events (see also Appendix 6 for a list of plants for rituals). The rites for pregnancy and after birth, weddings and agricultural cycles are often complementary with the existence of certain plant leaves and forest products, including animals.
During the study period, most families engaged in at least one of the five rites conducted by Paser people. The biggest ritual, the curing of one old man’s disease or belian, took place in 2006 in Pinang Jatus and involved all households. The people shared in the costs of the event and they provided all kinds of materials.
Rituals are part of the local culture and religion. The influence of Islam is found in birth and marriage rituals. On the whole, however, in areas where there is a very strong influence of Islam it is hard to find belian or kwangkai rituals anymore. Considering the current life or death rituals that still exist among the Paser people, it can be concluded that they still contain elements of three spheres of influence – Islam, Christianity and
Economic value of non-timber forest products among Paser Indigenous People of East Kalimantan
212
Kaharingan. Some of the older people in the village of Rantau Layung and Pinang Jatus were Christian and Kaharingan followers before they converted to Islam in the late 1970s. Kaharingan is recognised as a variant of Hindu Dharma and has been officially acknowledged as a religion of the Dayak in Kalimantan Borneo since 1986 (Gonner 2003).
The cosmovision of tribal groups has been discussed by many ethno-botanists and anthropologists (Weinstock 1983; Slikkerveer 1999; Gonner 2002; Schefold 2002). It is not the objective of my study to go deeper into this subject and, therefore, any exploration and analysis of this is only with the aim of providing preliminary information for further research.
8.7 Conclusions The outcome of the social and cultural analysis of people’s perceptions confirms the existence of indigenous environmental knowledge regarding the forest services and their role in the indigenous local culture. The analysis also confirms that the perception of future development and environmental damage has increased the concerns of the villagers with respect to the future use of resources and their sustainability. This condition is a result of the lack of government recognition of their rights to natural resources, in particular for the collection of wild honey in logging concession areas and for the rattan produced from small-scale cultivated gardens.
The analysis of the different perceptions of forest functions between and within the villages among men and women and other groups has been presented in this chapter. All of these differences between the various groups studied here could be examined in much greater detail using a number of alternative statistical tests, but this is beyond the scope of this work. Nevertheless, it has been shown here that variations in social values do exist, and these are likely to influence people’s behaviour and attitudes to their environment and forest conditions.
In addition, this section has been an attempt to broaden the economic concept of value by revealing qualitative data about forest resources. Given the current emphasis on participatory forest management and stakeholder involvement, any assessment of forest value should not ignore this type of information, as it has important policy implications.
By investigating this perception and the social and cultural dimensions of forest values, it is clear that the forest itself is fundamental to the way of life of the Paser indigenous people. This is important to remember when considering alternative uses of forest resources. The impacts that these may have on local people and the implications of this for policymakers are discussed in Chapter 9.
213
Chapter 9
Synthesis and recommendations
9.1 Introduction The purpose of the economic valuation of forest resources is not necessarily to put a total value on nature, but rather to make the value of forest use explicit (Michael 1995). As one can see in the literature, there has been a great deal of interest in estimating the total economic value (TEV) of forests (Gregory 1987; Kumari 1995; Adger et al. 1995). The TEV is an aggregate of (1) total use value, plus (2) total non-use value. The total use value can be divided into the direct use value, indirect use value and optional use value. Total non-use value includes existence value and bequest value (see also Chapter 2). Different values are estimated in a particular situation by applying specific techniques. The TEV is expected to be the sum of the various values (Bann 1995).
The main objective of this research was to study and analyse the importance of non-timber forest products (NTFPs) as a component of the resource base of tropical forest. Following a discussion of currently used valuation techniques in Chapter 2, an attempt has been made to quantify the use-value of these products in monetary terms. Although clearly the value of an ecosystem goes far beyond its direct use value (Constanza et al. 1998), an identification of such use-values can form the basis of an estimate of the Total Economic Value of that resource (Pearce 1998).
The ecological importance of non-timber forest products is still not fully understood (Peters 1994), but some aspects of this have been discussed in Chapter 2, along with an account of strategies for forest management in Chapter 4. An outline of the state of forest resources and their role in the Paser context is provided in Chapter 5, and on the basis of the methodology used here, as outlined in Chapters 6, 7 and 8, a monetary value for NTFPs used by Paser indigenous people has been estimated.
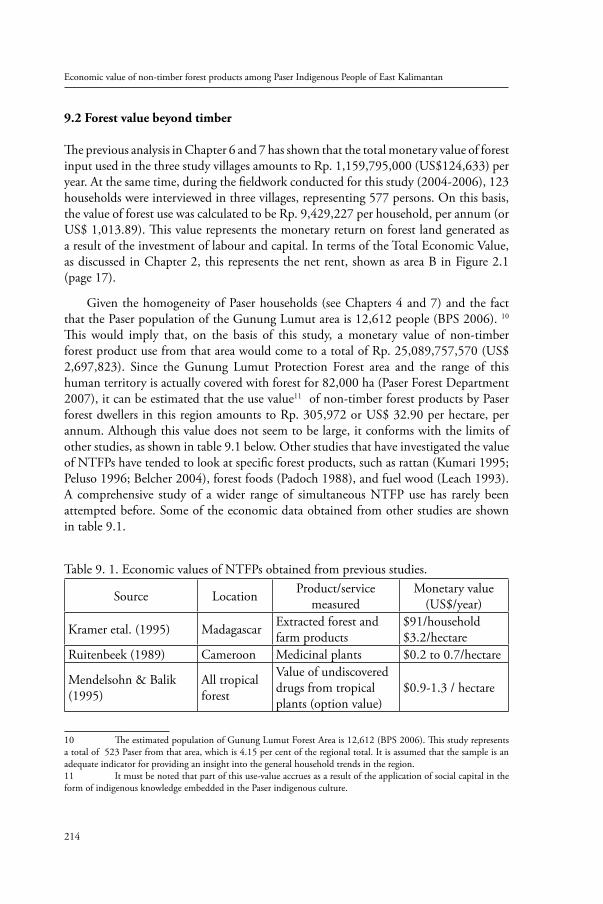
Economic value of non-timber forest products among Paser Indigenous People of East Kalimantan
214
9.2 Forest value beyond timber
The previous analysis in Chapter 6 and 7 has shown that the total monetary value of forest input used in the three study villages amounts to Rp. 1,159,795,000 (US$124,633) per year. At the same time, during the fieldwork conducted for this study (2004-2006), 123 households were interviewed in three villages, representing 577 persons. On this basis, the value of forest use was calculated to be Rp. 9,429,227 per household, per annum (or US$ 1,013.89). This value represents the monetary return on forest land generated as a result of the investment of labour and capital. In terms of the Total Economic Value, as discussed in Chapter 2, this represents the net rent, shown as area B in Figure 2.1 (page 17).
Given the homogeneity of Paser households (see Chapters 4 and 7) and the fact that the Paser population of the Gunung Lumut area is 12,612 people (BPS 2006).110 This would imply that, on the basis of this study, a monetary value of non-timber forest product use from that area would come to a total of Rp. 25,089,757,570 (US$ 2,697,823). Since the Gunung Lumut Protection Forest area and the range of this human territory is actually covered with forest for 82,000 ha (Paser Forest Department 2007), it can be estimated that the use value112 of non-timber forest products by Paser forest dwellers in this region amounts to Rp. 305,972 or US$ 32.90 per hectare, per annum. Although this value does not seem to be large, it conforms with the limits of other studies, as shown in table 9.1 below. Other studies that have investigated the value of NTFPs have tended to look at specific forest products, such as rattan (Kumari 1995; Peluso 1996; Belcher 2004), forest foods (Padoch 1988), and fuel wood (Leach 1993). A comprehensive study of a wider range of simultaneous NTFP use has rarely been attempted before. Some of the economic data obtained from other studies are shown in table 9.1.
Table 9. 1. Economic values of NTFPs obtained from previous studies.
Source Location Product/service measured
Monetary value(US$/year)
Kramer etal. (1995) Madagascar Extracted forest and farm products
$91/household$3.2/hectare
Ruitenbeek (1989) Cameroon Medicinal plants $0.2 to 0.7/hectare
Mendelsohn & Balik (1995)
All tropical forest
Value of undiscovered drugs from tropical plants (option value)
$0.9-1.3 / hectare
10 The estimated population of Gunung Lumut Forest Area is 12,612 (BPS 2006). This study represents a total of 523 Paser from that area, which is 4.15 per cent of the regional total. It is assumed that the sample is an adequate indicator for providing an insight into the general household trends in the region.11 It must be noted that part of this use-value accrues as a result of the application of social capital in the form of indigenous knowledge embedded in the Paser indigenous culture.
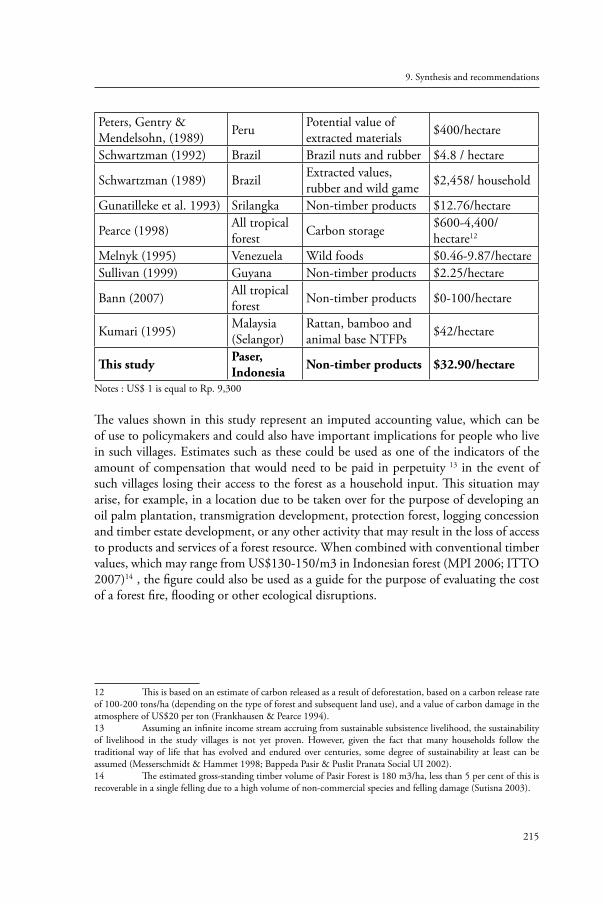
215
9. Synthesis and recommendations
Peters, Gentry & Mendelsohn, (1989) Peru Potential value of
extracted materials $400/hectare
Schwartzman (1992) Brazil Brazil nuts and rubber $4.8 / hectare
Schwartzman (1989) Brazil Extracted values, rubber and wild game $2,458/ household
Gunatilleke et al. 1993) Srilangka Non-timber products $12.76/hectare
Pearce (1998) All tropical forest Carbon storage $600-4,400/
hectare12
Melnyk (1995) Venezuela Wild foods $0.46-9.87/hectareSullivan (1999) Guyana Non-timber products $2.25/hectare
Bann (2007) All tropical forest Non-timber products $0-100/hectare
Kumari (1995) Malaysia(Selangor)
Rattan, bamboo and animal base NTFPs $42/hectare
This study Paser, Indonesia Non-timber products $32.90/hectare
Notes : US$ 1 is equal to Rp. 9,300
The values shown in this study represent an imputed accounting value, which can be of use to policymakers and could also have important implications for people who live in such villages. Estimates such as these could be used as one of the indicators of the amount of compensation that would need to be paid in perpetuity313 in the event of such villages losing their access to the forest as a household input. This situation may arise, for example, in a location due to be taken over for the purpose of developing an oil palm plantation, transmigration development, protection forest, logging concession and timber estate development, or any other activity that may result in the loss of access to products and services of a forest resource. When combined with conventional timber values, which may range from US$130-150/m3 in Indonesian forest (MPI 2006; ITTO 2007)144, the figure could also be used as a guide for the purpose of evaluating the cost of a forest fire, flooding or other ecological disruptions.
12 This is based on an estimate of carbon released as a result of deforestation, based on a carbon release rate of 100-200 tons/ha (depending on the type of forest and subsequent land use), and a value of carbon damage in the atmosphere of US$20 per ton (Frankhausen & Pearce 1994).13 Assuming an infinite income stream accruing from sustainable subsistence livelihood, the sustainability of livelihood in the study villages is not yet proven. However, given the fact that many households follow the traditional way of life that has evolved and endured over centuries, some degree of sustainability at least can be assumed (Messerschmidt & Hammet 1998; Bappeda Pasir & Puslit Pranata Social UI 2002). 14 The estimated gross-standing timber volume of Pasir Forest is 180 m3/ha, less than 5 per cent of this is recoverable in a single felling due to a high volume of non-commercial species and felling damage (Sutisna 2003).
Economic value of non-timber forest products among Paser Indigenous People of East Kalimantan
216
9.3 The income accounting framework approach to valuation
Difficulties associated with the income accounting methodology are relatively well known but, in spite of these, economic analysis in virtually every country in the world depend upon it. In spite of its wide application in the macro-economic sphere, the methodology has not previously been applied to the valuation of environmental resources and it is hoped that this study demonstrates that such a procedure can be used to good effect in certain circumstances. It is clearly a relatively data-intensive method, which can only be used when relevant data are available. This research also shows that it can be used to assess the value of nature as an input to production. The need to incorporate nature into production functions has been highlighted by Binswanger (1998), and this study shows that it is possible, in some situations, to do this relatively easily. Given the serious philosophical and methodological difficulties associated with conventional environmental valuation techniques, the identification of monetary values for environmental resources using this approach may well take the valuation debate a step forward.
9.4 Incorporating a non-monetary dimension to environmental values
An important prerequisite to achieving sustainability is the need to incorporate monetised environmental values in decision-making; however, there are many aspects of environmental attributes that cannot be assigned a monetary value. As a result, it is important to widen the utilitarian concept of value favoured by neo-classical economics, to incorporate a broader spectrum of what is meant by the term ‘value’. From a philosophical and ethical perspective, values may have an anthropocentric or biocentric focus, while the ecological approach stresses the fact that environmental values should incorporate some acknowledgement of the vital life-support functions provided by ecosystems. In contrast to this, the sociological approach argues that values are based on cultural norms and standards, the institutional approach stresses that values are influenced by property rights, and in psychology, values represent embedded concepts generated by our upbringing and genetic background.
From a practical perspective, although it may be difficult to bring all these interpretations together, it is useful to bear in mind that any monetary value applied to the environment should represent the value placed on it by society as a whole (see also Chapter 8), in the event of the resources being used up. As a result, it is important that any attempt to place a value on a resource should incorporate the views of all those involved, and in addition, some non-monetary dimensions reflecting the broader interpretation of value, should be included. In this study, an attempt is made to do this by incorporating some assessment of the social and cultural values attributed to forest resources by the Paser people in the Gunung Lumut Protection Forest Area. This was outlined in Chapter 8, and it has been shown that for these forest dwelling people,
217
9. Synthesis and recommendations
non-timber forest products play an essential role in their lives, and failure to incorporate this into the decision-making process is not only likely to lead to an economic miss-allocation of resources, but may also bring about a cultural weakening that is not in line with the spirit of sustainability, as defined by Agenda 21 (UNCED 1992).
9.5 Drawbacks and omissions
As with any study, the quality of data used is crucial to the reliability and validity of the results. During the fieldwork conducted for this research, I took every care to capture an accurate coverage of the economic life of Paser villagers, and on the basis of the collected information, aggregation facilitated the generation of annual values. Difficulties always arise with aggregation procedures, but from a practical perspective these are relatively minimal compared to the huge cost savings resulting from the use of the methodology outlined in this thesis. The values generated in this study provide an informed estimate of direct use-values, and while they provide a useful starting point, they can certainly be improved through the incorporation of additional data collected during different seasons or over longer time periods.
Without more comprehensive details about hunting and fishing catches, estimates of revenues generated from them cannot be regarded as definitive. As a result, the values of these items must be seen in this context. Although the wildlife values arrived at in this study represent a sizeable portion of the total NTFP value, the amount is only Rp. 21,275,000 or 5.3 per cent of the total forest output values in all villages. These are, nevertheless, underestimates of their full monetary value since no attempt is made here to include the value of the ecological functions provided by the numerous species involved.
In the case of any estimates based on market prices, several problems arise. One of the most obvious is the fact that the obtained values will reflect the purchasing power of the currency of the country concerned. In the case of countries such as Indonesia, a number of factors have contributed to low currency values and, as a result, values obtained from market prices there will be much lower than those obtained in studies elsewhere, when the currency (and the economy) are stronger. Not only does this make international comparisons of values more difficult, but it also means that even when purchasing power parity convention factors are used for currency conversions, values calculated from the study in one country cannot easily be applied to another. In addition, from a theoretical perspective, values based on market prices do not represent Total Economic Value since they do not include the value of ‘consumer surpluses’.
In this study, an example of a weakness in this valuation methodology was demonstrated in the calculation of medicinal plants. By using the price of Pasak bumi (Eurycoma longifolia) as a representation of the value of all types of medicinal plants, some estimate is made of the possible value of these plants to the Paser households. It is
Economic value of non-timber forest products among Paser Indigenous People of East Kalimantan
218
clear that such plants could have important applications within the global economy. In real terms, both their current and optional values are likely to be much higher. Much more detailed information on the extent and frequency of the use of such plants is needed to facilitate more accurate estimates of this value, but at least the figures here offer some baseline for comparison. An alternative approach to the valuation of such values could be made on the basis of plants used for malaria treatment, using the cost of conventional malaria medicines as a proxy for their value. This has not been attempted here as it has not been possible to obtain accurate figures from the Paser health authorities. It has to be remembered, therefore, that the estimate included in my thesis cannot be considered to be an accurate representation of the full use-value of medicinal plants, and these figures certainly do not represent the possibly huge option values that individual plants may have.
Since the focus of this work has been to estimate the use values of NTFPs, no carbon values have been included, and no attempt has been made to assess the value of water consumption and flowers, such as wild orchids, since they are not used by Paser people in this area. These both represent important aspects of non-timber values, and in the case of wild flowers, their importance includes their value as amenities, as well as the very important ritual role that they play in cultural ceremonies. Their exclusion inevitably means that the final values calculated here are likely to underestimate the full use-value of non-timber forest products.
Negative residuals, which have arisen for certain activities in some households (as shown in the analysis in Chapter 7), can be explained in a number of ways:
In some households, it may be the case that crops have been damaged by pest •attacks, which can destroy whole crops, thus resulting in lower outputs in relation to labour inputs.Some households may have overestimated the hours spent on various •activities.Some households may have overestimated (for a variety of reasons) their •output levels.In some households, although a man is said to be a resident, he is actually living •elsewhere, and therefore does not have a real input into the labour supply. This may be particularly relevant where a man has left his family, but that fact is not publicly acknowledged.Data errors may occur in collecting information from certain households, and •some households may be made up of an extended family, yet details may have been reported by individuals relating to their immediate familyAlthough some errors in calculation may always be present in exercises such
as these, some of the weaknesses described above could be overcome if the study had been conducted over a whole year period, taking detailed measures of all activities from
219
9. Synthesis and recommendations
all households. While this would not be impossible, it would be extremely costly, and given the fact that the figures generated in this study are not out of line with similar studies, this does not seem to be necessary. From the point of view of development policy applications, obtaining information relatively rapidly is very important and thus more in-depth approaches, which are more time-consuming, may be impractical.
9.6. Cultural and social capital
One of the objectives of this study has been to highlight the social and cultural dimensions of resource endowments in Paser communities, and to incorporate them into our concept of value as it applies to tropical forest resources. It is recognised that the process of sustainable development requires more than economics and technological change. The achievement of sustainable rural livelihoods, for Paser people in particular, depends on the effective utilisation of all resource endowments within their forest area, in addition to their financial and physical capital, which also includes the social and cultural capital they have.
The importance of the social and cultural dimension of forest use has been highlighted in Chapter 8, and by including traditional non-monetary values into the system of environmental valuation, it is more likely that alternative lifestyles will be secured and this broader meaning of sustainability will be achieved. The cultural dimensions, the way of using NTFPs and their response to forest change and the future use of NTFPs is an example of traditional knowledge, and highlighting its value has been discussed. I hope that this result will make some contribution to the achievement of forest use sustainability in the research area.
There is no doubt that technological change in agricultural development has an important role to play in sustaining both food supplies, and the environment as a whole (Aldye et al. 1998). The need to integrate technological and scientific knowledge with more traditional and cultural forms of knowledge is one way in which this goal may be achieved.
The need for this change of focus has arisen out of an increasing awareness of the role played by nature, and the realisation that our ecosystem is finite. The need to incorporate nature as a component of the production function has been clearly demonstrated, but it has also been pointed out that it will be necessary to undertake a re-orientation of the economic theory that is used as a guideline for today’s practical and political dimensions (Biswanger 1993). Such a reorientation of economic theory, questioning as it does the methodology of conventional neo-classical economics, represents a paradigm shift, which by definition implies a reorientation of the world view around which reality is organised (Tacconi 1998). As a result, the alternative ‘ecological economics’ paradigm has evolved, representing ‘an issue-driven discipline, concerned with the analysis and the achievement of sustainability’ (Constanza et al. 1991).
Economic value of non-timber forest products among Paser Indigenous People of East Kalimantan
220
9.7. NTFPs prioritisation
Renewable resources need to be managed in such a way as to enable them to be renewed through the maintenance of biodiversity, hydrological cycles, soil fertility and essential vegetative cover. These principles are crucial if sustainability is to be achieved and, in relation to tropical forests, they are often overlooked in the drive to generate income from forested areas. When governments are faced with increasing demands from growing populations, adverse global economic conditions and political pressure, it is often difficult for them to devise ways of meeting the needs of both current and future generations.
One of the reasons why deforestation continues to occur so rapidly in many forested countries is the fact that income from timber extraction is often seen as the only economically viable land use option. The decision is made on the basis of the net present value of projected income flows resulting from the sale of timber. One of the problems with this decision-making process is the fact that the discounting process involved in the calculation of the net present value, often implies a preference for the present over the future, with benefits appearing in the future seeming to be totally unimportant. It does seem clear that if the value of NTFPs can be incorporated into the appraisal process, it may well be that the decision to allow a logging concession will seem less optimal. The opportunity cost of the logging operation will be higher due to the loss of NTFP income flows. In addition, logging revenues tend to be limited over time, whereas income flows from the sustainable harvest of NTFPs have the potential to generate infinite income streams.
Failure to account for both monetary and non-monetary NTFP values in the decision-making process implies that decisions to remove forest resources often have devastating effects on the well-being of forest dwellers. This happens when the materials, food and medicines to which they normally have access, are no longer available, but this loss is not compensated for in any way since its value is unmeasured. This is clearly sub-optimal in Pareto terms, and it is certainly not sustainable, since the way of life for those dependent on these resources is undermined, possibly forever.
One particular aspect of NTFP use is as an emergency food supply. Fortunately for the majority of those living in the study villages, this emergency use of forest foods is not a frequent occurrence. Nevertheless, over 90 per cent of these households collect such food on a regular basis. During my fieldwork period in 2006, the common food collected from the forest included sagu, bamboo (embut), and wild cempedak. Although there is clearly a significant seasonal variation in the availability of these forest foods, it is generally recognised by local inhabitants that in seasons when foods are not available, other food products come into season and the prices of these are fairly consistent throughout the year. As shown in Chapter 5, the variety of foods gathered from the forest also makes an important contribution to the quality of the diet of forest dwellers, providing a range of essential vitamins and minerals.
221
9. Synthesis and recommendations
By highlighting the importance of these forest products, and incorporating their use into forest management strategies, it may become possible to not only increase food security in such communities, but also to promote possible income generating activities based on NTFP and services. These could include better marketing strategies for existing products, as demonstrated by the harvesting and export of rattan from Sanggau or wild honey in the Lake of Sentarum in West Kalimantan (SFDP 2004). Other income generating activities could arise through wise use of forest ecosystem services, by the development of markets, such as the one found in the nearby area of Penajam Pasir Utara District, for rattan, forest fruits, wild honey, orchid farming, or the domestication of wild animal species like the sambar deer (Cervus unicolor) for the production of bush-meat.
9.8. Providing financial capital as a development tool
As in most subsistence economies, these villages exhibit high labour capital ratio indicating that production is a very labour intensive activity (as can be seen inChapters 6 and 7). This is confirmed by data from the qualitative survey, which reveal that one of the main market failures in the villages is that of the capital market. Capital market failure is a major factor contributing to the poverty in villages of this type, and it is a serious problem that is unlikely to be solved if left in the hands of the free market, since transport and secure costs in such remote areas are very high. Although it cannot be certain that an increase in financial development is a prerequisite to national economic development, it is certain that the lack of regional financial development is a significant hindrance to the development of rural communities in Paser.
The policy implication of this for the government is that action should be taken to promote the development of rural banking and credit markets, to facilitate an increase in the use of capital and technology in these villages. This could be achieved by the development of ‘village banking’, or a ‘village cooperative’, where the government or a funding agency lends a sum of money to the village as a whole. This money is then distributed as small loans to households on an individual basis. Another possibility is that the local government facilitates villagers in gaining markets for their products, the benefits of which can be transferred to the villagers. Through this system, households are also encouraged to make small-scale savings and, as a result, a gradual mobilisation of credit within the community is developed.
Pioneered by Grameen in Bangladesh, micro-banking systems have already been implemented in over 25 countries in Latin America, Asia and the Pacific. In most cases the loans range between US$80-US$100. An estimated total of US$2.5 billion has already been successfully mobilised worldwide for these small scale loans, and repayment rates consistently exceed 90 per cent (World Bank 2002). This is now seen as
Economic value of non-timber forest products among Paser Indigenous People of East Kalimantan
222
an important way of helping poor communities and, in particular, it is seen as a way of empowering women in rural areas.
9.9. Promoting the agricultural ecosystem base
As discussed in Chapter 5, the agricultural production of these villages depends on the availability of soil nutrients in the forest area. Furthermore, the fertility of the soil in rice slash-and-burn fields is higher than in the fallow areas. This indicates that the availability of forest areas for rice production is crucial for the communities. This means that the conversion of forest for agricultural development will be continued if the technology and new systems are not adopted. This will reduce the forested land in this region.
As explained in Chapters 5 and 7, approximately every household in each of the three villages needs 1.4 hectares of forest land to ensure that rice production is available for a one year period, assuming that there is no crop failure. The forest land that is opened up for rice cultivation varies from one village to another, and it also varies from one household to another. This is influenced by the soil fertility and the number of household members. Thus, this system will not be maintained if the increasing population is not followed by the availability of the forest land. That said, this strategy has survived for many centuries and it has made the people self-sufficient rice producers as the number of inhabitants is small compared to the area of forest land they have.
I also found that the level of organic material in the farm soil was higher than the level in the forest soil, reflecting the short-term enriching effect of the slash-and-burn methods used here. Farmers generally acknowledged that every year they clear a plot of about one to two (average 1.4) hectares per family, with each plot being used for a period of two to three years. The cutting of the forest on the field is an annual event, performed in the dry season by the households in the villages, and the new fields are cleared either in new forest areas, or in the secondary forests.
This implies that in this type of slash-and-burn system, the fallow period for used plots needs to be very long (about 15 years according to farmers interviewed); much longer than the useful growing time for each piece of land. In spite of this, it does seem possible that a sustainable loop of slash-and-burn agriculture could be designed to cater for household needs, if each household was given a piece of land large enough to cover the fallow cycle (Weidelt 1998).
This could be calculated by the size of farmland holdings per household and divided by the duration of agricultural usefulness per field cut and then multiplied with the required fallow period per plot, plus the duration of usefulness (Rambo 1984; Weidelt 1998). Taking the average size of households farm of my study (calculated as 1.4 hectares), with a 15 year fallow period and a 2.5 year duration of usefulness, the area of a sustainable slash-and-burn system for the average household in my study would have
223
9. Synthesis and recommendations
to be 10.9 hectares. In a system such as this, at any one time, the majority of this land would be in various stages of fallow. However, this would result in a multi-aged stand of regenerated forest, which has been shown to promote higher levels of biodiversity in forest ecosystems.
Given the high degree of deforestation attributed to slash-and-burn farmers, the development of sustainable loop systems for communities could contribute to more sustainable management of forest resources. This is an area of research worthy of future investigation. Although these groups have frequently been blamed for deforestation, it has often been the case that their techniques have been misunderstood by migrant communities from other areas.15125 These people often have little or no knowledge of forest ecology and their only experience with farming techniques is practiced in completely different systems and under different topographic conditions. As a result, deforestation rates, particularly in transmigration areas along the highways of Pasir area have been alarmingly high, while at the same time, many farms have failed, and the settlers have moved on, encroaching further on the forest.
In order to promote a more sustainable approach to forest agriculture, however, it has become essential to change the approach to forest farming. Although to some extent, this process has begun with the adoption of permanent and agroforestry techniques, recent programs by the Paser District government to plant rubber with coffee and cacao is a new adoption of the agricultural model. One way in which this can possibly be brought about, is by incorporating the traditional farming skills with modern agriculture, and producing farm strategies that take account of both ecological and economic factors.
9.10. Contributing to the sustainability of Paser lifestyles through institutional change
In the part of Paser where my research was conducted, there is currently no shortage of forest land, although the land held by Paser people as ‘reservations’ or as ‘protected’, is both fixed, and legally defined. At the present time, although the Paser people are calling for their areas to be extended, it seems unlikely that they will be increased by the government in the foreseeable future. This inevitably means that as human population increases in the villages, pressure on forest land will increase, shortening the fallow periods, and eventually leading to soil degradation and other indicators of unsustainability. In order to address this possibility, it would be useful for policymakers to assess potential village size and determine land space requirements for these subsistence
15 Pasir District has been the major destination of the transmigration programme of Suharto’s regime since the 1980s. In 2004, the total population of Pasir originating from transmigration was 98,000 people (Pasir BPS 2005). This programme has had a huge impact on the existence and development of palm oil companies, which were a major employer in this sector and also for the opening of forest area for new settlement and agriculture areas. Until recently, more than 375,000 hectares of primary forest in Pasir had been converted to palm oil, timber estates, agriculture development and for new settlements.
Economic value of non-timber forest products among Paser Indigenous People of East Kalimantan
224
communities by considering population growth, technological development and soil fertility. Furthermore, given the degree of self-sufficiency of households in this study, this estimate of land space requirement could provide a basis for the calculation of a sustainability indicator, such as an ‘ecological footprint’ (Wackernagel & Rees 1996).
9.11 Policy strategies for sustainability
One of the main objectives of this study is to find possible interventions to improve the income from NTFPs for the local people. This is in line with the findings in previous chapters that non-timber forest products are valuable commodities, not just in the monetary sense, but also in the sense of social and cultural significance. It is hoped that this information will be used by policymakers, not only in Paser, but in other forested areas of the country. If this does occur, it may be possible to develop more sustainable forest management strategies, This would allow local people to capitalise on the wealth of their resources, by increasing value added and by securing potential income streams for future generations.
One of the main issues raised by the respondents during the research period was the property rights of local people over the resources and, in particular, in respect o the rattan gardens and wild honey trees. A lack of appreciation of the indigenous people’s rights to these resources has influenced the management and the sustainability of these resources and, ultimately, affected the livelihoods of this community. It was problematic for communities when the resource use rights of some wild honey trees were transferred to the government or other groups, like logging concessions.
Some possible interventions that could contribute to a real eradication of poverty in these areas are:
The policy intervention• , which would legalize the traditional rights to rattan gardens and wild honey trees. The envisioned implication of this policy change is to reduce the costs of handling and transporting rattan canes, abolishing the use of licences to transport rattan canes, and to declare this product as a non-regulated commodity like other agricultural products. In addition, it would abolish the forestry levies (tax) on raw rattan canes coming from cultivated gardens. This means that the central government has to change its perception that rattan products from this region do not count as the products of natural growth; rather, that they are a product of small-holder rattan cultivation. The same provision would also give local people access to logging concessions in order to collect and maintain wild honey trees. The users should feel free to enter the concession area and secure their right to harvest honey from these trees. The most important thing is to promote legal sanctions and to punish concession holders who have felled wild honey trees.Bridging the market:• many products failed to reach the market as a result of low accessibility to market centres or because of the high costs of transportation.
225
9. Synthesis and recommendations
The provision of affordable, better local and regional transportation for both passengers and freight would improve the quality of life in forest village households. However, care must also be taken, since in many cases market accessibility is often followed by overexploitation of forest resources, as in the case of the collection of birds’nests and gaharu or eaglewood. Presumably this will not be the case for those products where the management and production system is known by local people, such as for rattan and domesticated fruits. The development of local industries• is another way to bridge the distance to the market. Developing an industrial base for the exploitation and processing of NTFPs would provide employment opportunities and reduce the cost of NTFP marketing. This could include the processing and packaging of rattan, handicrafts, ‘bush teas’, herbs, coffee, medicinal plants and forest fruit processing.Improving the knowledge:• an inventory of resource knowledge appears to be very important for forest dwelling people. This will tell them what products they have, where the products can be found and at what time this product can be collected or harvested. The aim of improved management approaches is to determine the full potential of a resource and to allow the people to develop a tentative harvest schedule during the period of one year. This effort is important to secure their annual income source and to maintain product availability, thus preventing any difficulties in case of crop failure or market shortages. It would also deal with the current conservation status, because the villagers often think that certain products may still be available, even though their stocks have | been greatly diminished. This is likely to happen when villagers are not used to any monitoring or recording system. This is another way to reduce the vulnerability of income from a high variety of resources, different seasonality and small amounts of harvesting volume. This type of knowledge will also enable them to make a plan for better marketing and to predict the outcome of the harvesting. Many traders cease to buy products because the volume is unpredictable, due to the absence of documentation. It is also important to introduce knowledge about improved and new designs for handicraft products that follow market trends. Another important aspect is the provision of technical assistance in rattan processing and handling. All this will contribute to the sustainability of this resource and the economy of the villagers.Another important aspect is the maintenance and the transfer of traditional •knowledge to the younger generations. It is hard to find members of the younger generation who are interested in learning about the traditional knowledge (such as knowledge related to medicinal plants, planting rattan, and management of wild honey trees). They view this lifestyle as belonging to a ‘backward’ culture and the symbols of poverty have stimulated them to leave their own cultural heritage and become a demanding generation looking
Economic value of non-timber forest products among Paser Indigenous People of East Kalimantan
226
for industrial products, something that makes them heavily dependent on generating a cash income. Workshops• to disseminate the principles of sustainability, which enable some integration of traditional and scientific knowledge, would be another way of convincing the new generation that life can be better if they are willing to learn their own cultural values and combine it with scientific knowledge.
9.12. Direction for further research
In response to the controversial paper on ecosystem values by Constanza et al. (1998), Opschoor (1998) and Godoy (1989) have pointed out that there is much need for additional research ‘especially in the area of methodology’. Although the study outlined here has made some contribution to this methodology debate (see Chapter 3), there are still many aspects that need further research. One possible direction for this would be to apply this methodology elsewhere, as a means of assessing values for other types of environmental attributes. Furthermore, this study has shown the benefit of including qualitative data alongside quantitative, and more work needs to be done on methods to integrate the different types of data more fully. One way in which this can be done is through the use of Multi-Criteria-Analysis, and again this is an important area to which further research could be directed.
There are a number of possible areas of further research into development strategies utilising non-timber forest products. For example, research is needed into the application of indigenous forest plants as insecticides, and this could be conducted in a participatory manner, with field trials in villages. Other work could investigate the potential for the marketing and export of exotic products such as orchids or medicinal plants, which are found within forest areas. Domestication of local species for meat production could produce sustainable income flows from both local sales and exports, but research would need to be conducted into the feasibility of such a project.
Some indications of local farmers’ willingness towards such novel approaches to agricultural development are indicated by the interview results shown in Chapter 8. 67 per cent of the households would be interested in trying new crops on their farms, while 12 per cent stated that they would not be interested. If such projects proved to be successful, they could contribute both to securing better household incomes and more sustainable use of forest resources.
Opportunities for the development of ecotourism in the area should be examined. From the qualitative data collected during the study, an examination of people’s perception of this development option indicated that tourism is perceived as relatively positive. Although people generally did not currently consider it to be important for their family, they did feel that it could be important in their children’s lifetime. In this area, developments in ecotourism could include such things as the provision of adventure
227
9. Synthesis and recommendations
travel and rafting, wildlife watching and photography, and cultural performances such as honey harvesting. All of these activities would generate employment and income, both locally and nationally. In order to achieve the greatest degree of local benefit however, such developments would have to be organised on the basis of participatory management, designed to keep within the carrying capacity of the environment in the area, and incorporated as part of a regional strategy for ecotourism development in Paser.
The term ‘forest functions’ used in this study actually refers to the products and services provided by the forest. Attempts to place a monetary value on these have been discussed in Chapters 6 and 7, and they have been compared with other research results (as shown at the beginning of this chapter). Based on these findings, I conclude that a total valuation of the forest ecosystem and its products is difficult if not impossible. In order to gain a greater insight, much more work needs to be done to investigate both the nature and the value of such services. In addition, further research into the important area of carbon sequestration values is recommended (Kishor & Constantino 1993; Pearce 1996). One other possible area of research in this region, which may be useful, would be to compare the perceptions of policymakers to forest functions with those indicated by indigenous Paser people, as shown in Chapter 8. Through analysis of the differences in perception, possible reasons for policy failures may be identified, and also a broader understanding of the meaning of the term ‘forest functions’ may be developed.
9.13. Conclusions
This study has demonstrated a method of assessment of the actual use values of non-timber forest products in monetary terms. In addition, it has incorporated other qualitative aspects of value, to illustrate the need to broaden the utilitarian concept of value currently favoured by economists and policymakers. If survival of forest communities and their ecosystems is to be achieved, it is important that non-monetary values must be respected, and since it is realised that timescales commonly used in economic analysis are usually far shorter than those relevant to ecological cycles, the need has arisen to reassess the ways in which we perceive the world and its resources, as well as the way we make our decisions about their use. Clearly, this has serious implications for conventional neo-classical economies, and suggests that the time has come to accept some degree of paradigm shift within the discipline.
The calculated figures for the use value of NTFPs and the ecological services in these villages actually represent the value added to labour and capital inputs by the use of the primary resource, land and forest. This amount, therefore, is equivalent to the rent of that factor of production. This figure is not insignificant, and it would certainly be important to include such rents in any assessments of alternative development strategies. Since exploitation of the natural capital in these villages is small-scale and considered
Economic value of non-timber forest products among Paser Indigenous People of East Kalimantan
228
to be non-depleting, it is not necessary, as part of this analysis, to depreciate the value of the natural capital use. The important factor to consider in this case, however, is the fact that the estimated level of rent accruing to land and nature, as a result of the use of NTFPs and their services is, ceteris paribus, an infinite income stream. It has significant implications for sustainability and it is important that, if the quality of the income stream is to be preserved, action must be taken to ensure that this communal property resource is not depleted by the decisions and actions of both the local residents and the policymakers of the current generation.
Estimates such as these could be used as an indicator of the amount of compensation that would need to be paid in the event of such villages losing their access to the forest as a household. Such a situation may arise, for example, in a location which is to be taken over for the purpose of developing a timber estate and palm oil in the research area. In other villages, a logging concession or an oil palm plantation was established, resulting in the loss of access to this common property resource. These figures, when combined with estimated timber values (from the concession), could also be used for the purpose of evaluating the cost of an oil palm plantation, a forest fire, flooding, or other ecological disruption. There is no doubt from this analysis that the importance of NTFPs has not been highlighted in the government programme for forest timber cutting and for the development of palm oil industries. People in these villages would be significantly worse off if no forest existed for their use, and the data show that the existence of the forest is important for food security in forest villages such as these. In addition, the role of non-timber forest products is essential to the lifestyle of the forest dwellers. Without this contribution, the way of life of Paser people would be unsupportable. It also suggests that it should certainly be in the interest of the Pasir District policymakers to look more carefully at the total forest income potentials, rather than concentrating solely on the timber income potentials of forest resources.
In spite of the undeniable role of NTFPs, timber is commercially the most important product in this region. As much as NTFPs tend to be the poor person’s lot, the benefits from timber often seem to be captured only by the company or by people holding positions of power or authority. The main reason for this is that indigenous people’s involvement in the utilisation, as well as in the benefit sharing, of timber extraction was not taken into account by the government in the allocation of the forest area for logging concessions.
My analysis also confirms that different perceptions of forest functions between and within the villages and among gender and other groups do exist. All of these differences between the groups studied here could be examined in much greater detail, with a number of alternative statistical tests, but this is beyond the scope of this work. Nevertheless, it has been shown that variations in social values do exist, and these are likely to influence people’s behaviour and attitudes to their environment and forest conditions.
229
9. Synthesis and recommendations
On the basis of the accounting methodology used here, in each of the villages, the proportion of output accounted for by forest inputs is not unimportant. Therefore, even taking into account any error, the value added from nature, as demonstrated by this analysis, is quite significant.
Recognition of the importance of non-economic or socio-cultural capital serves to highlight the need to incorporate all groups within society in the valuation process. This is essential as a means of ensuring that the interests of all stakeholders are represented, and that all aspects of value are included. In order to include a wide range of information into the decision-making process, the use of multi-criteria analysis is recommended as a viable alternative to the narrower cost-benefit analysis and contingent valuation methods commonly used today. By incorporating traditional knowledge with a wider range of data from a variety of disciplines such as ecology, hydrology and economics, a much broader knowledge base can be developed, possibly resulting in more meaningful policy decisions. This is one important direction for future research but, hopefully, by increasing our knowledge of forest use today, this study has firstly broadened our knowledge base and, in the long run, it will contribute both to the empowerment of local forest dwelling people and to the achievement of more sustainable strategies of tropical forest management.

Economic value of non-timber forest products among Paser Indigenous People of East Kalimantan
230
231
References
Adams, R.M. (1982). An economic assessment of air pollution damages to selected annual crops in Sothern California. Jurnal of Environmental Economics and Management 9:42-58.
Adger, W.N., Brown, K., Cervigni, R. and Moran, D.1995. Total economic value of forests in Mexico. Ambio, 24 (5):286-296.
Aldye, J.E., Hrubovcak, J., and Vasada, U., 1998. The role of technology in sustaining agriculture and the environment. Ecological economics 26:81-96.
Ajayi, S.S., 1979. Utilisation of forest wildlife in West Africa. FAO, Roma.
Anonim, 2001. Kumpulan Peraturan Pelaksanaan Otonomi Daerah Jilid I. Med Press.
Anderson, D. and Fiswick, R. 1984. Fuelwood consumption and deforestation in African countries. World Bank Staff Working Paper no. 704. Washington
Arnold, J.E.M and Ruiz Perez, M.(eds.) 1995. Current issues in Non-timber forest products. Proceedings of the workshop “research on NTFP” Hot Springs, Zimbabwe 28 August – 2 September 1995. CIFOR-ODA.
Arnold, J.E.M., and Jogma, 1978. Fuelwood and charcoal in developing countries. Unasylva 29:2-9.
Arrow, K. 1963. Uncertainty and the welfare economics of medical care. American Economic Review 53:941-973
Ayres, R.U. (1998). The price-value paradoks. Ecological Economics 25:17-20.
Ayres, W.S. and Dixon, J.A.,1995. Economic and ecological benefits of reducing emissions of sulfur oxides in the Sostanj region of Slovenia. Environment Department Paper No.009. Washington, DC, World Bank.
Economic value of non-timber forest products among Paser Indigenous People of East Kalimantan
232
Bakker,L.,2006. Land Administration and Hak Ulayat; A comparison of policies in the East Kalimantan districts of Pasir and Nunukan. Paper in CML-Tropenbos Workshop 19 May 2006 Leiden-The Netherlands
Bann, C., 2005. The economic value of tropical forests. The centre for economic research on the global environment (CSERGE), University College London.
Barde, J.P. and Pearce, D.W.(eds.) (1991). Valuing the environment. Earthscan, London.
Barnes, D.F., Openshaw, K., Smith, K.R., and Vandeplas, R. 1993. The design and diffusion of improved cooking stoves. Wolrd bank Research Observer 8:119-141.
Bawa, K. and Hall. P.,1993. Methods to Assess the Impacts of Extraction on Non-Timber Tropical Forest Products on Plants Populations. Economic Botany 47 (3)pp.234-247. The New York Botanical Garden, New York.USA.
Begg, D., Fsicher, S., and Dornbusch, R. (1994). Economics. McGraw-Hill, London.Belcher, B. (1999). A Production to Consumption System Approach : Lessons from the
Bamboo and Rattan Sectors in Asia. CIFOR Bogor.Belcher, B. 1999. Bulungan Project Research-CIFOR, Jakarta.Belcher, B., and Kusters, K., 2004. Forest Products, Livelihoods and Conservation; Case
studies of non-timber forest products systems volume 1- Asia.
Belton, V., 1990. Multi-criteria design analysis – Practically the only way to choose. In Hendry, L.C. and Eglese, R.W (eds.) Operational Research Tutorial Papers. Operations Research Society, London.
Bennet,C.1996. Policy option of Forest Products Added Value. Natural Resource Management of Indonesia. MOF-USAID. Jakarta.
Bergland, O., Magnussen, K., and Navrud, S. 1995. Benefit transfer: Testing for accuracy and reliability. Conference paper, EAERE, Umea.
Biggs, S.D. 1982. Agriculture models and rural poverty. In: Langham, M.R. and Retzalf, R.H. (eds.) Agriculture sector analysis in Asia. Singapore University Press, Singapore.
Bishop, J. and Heberlin, T.A. (1979). Measuring values of extra market goods: Are indirect measures biased?. American Journal of Agricultural Economics 61:926-930.
Binswanger,H.C.,1989. Brazilian Policies that encourage deforestation in the Amazon. World Bank Environment Department Working Paper No. 16 ,Washington DC.
Binswanger,H.C., 1998. Making sustainability work. Ecological Economics 27:3-11.
Black, I. ….., The “Lastposten”: Eastern Kalimantan and the Dutch in the Nineteenth and Early Twentieth Centuries. South East Asia Journal. 281.
Bliss, C.J. and stern, N.H. 1982. Pelanpur: The economy of an Indian Village. Oxford University Press, Oxford.
233
References
Board Planning Office of Pasir and University of Indonesia, 2002. Penelitian tentang komunitas adat terpencil di Kabupaten Pasir. Lembaga Penelitian Universitas Indonesia-Jakarta.
Bockstael, N.E. (1987). Measuring the benefits of water quality improvements using Recreational Demand Models. Environmental Protection Agency, Washington DC.
Boden, T.A., Sepanski, R.J. and Stoss, F.W.,, 1991. Trends 91: A compendium of Data on Global Change. Oak Ridge National Laboratory, Tennessee
Bonheim, 1992.Bouwman, A.F., 1990. Exchange of greenhouse gases between terrestrial ecosystems and
the atmosphere. in Bouwman A.F. (ed.) Soils and the green house effect. Wiley, Chichester.
Bratawinata, A. (1986). Bestandsgliedrung eines bergregenwaldes in Ost Kalimantan/Indonesien nach floristischen und structurellen Merkmalen. PhD Thesis, Georg August Universitat, Gottingen, Germany.
Bray,J.R. and Curtis. 1957. An Ordination of the upland forest communities of southern Wisconsin. Ecol. Monographs 27: 325-349.
Brekke,K.A. (1994). The Numeraire Matters in Cost Benefit Analysis. Discussion Paper, Statistics Norway.
Brown, K., Pearce., D.W., Perrings,C., and Swanson, T.,1993. Economics and the Conservation of Global Biological Diversity. Working paper no.2. Global Environmental Facility, Washington D.C.
Bruijnzeel, L.A.,1990. Hydrology of Moist tropical forests and effects of conversion: A state of knowledge review. Free University. Amsterdam.
Badan Pusat Satistik, regional office of East Kalimantan. Kalimantan Timur Dalam Angka; 2004,2005,2006. Samarinda.
Burns, T.J., Kick, E.L., and Murry, D.A.1994. Demography, development and deforestation in world-system perpective. International Journal of Comaparative Sociology 35:221-239.
CBD, 2003. Convention on Biological Diversity. http://www.cbd.com.Caldwell, M.J. and Enoch, I.C. 1972. Riboflavin content of Laysian leaf vegetables.
Ecology of food and nutrition 1:301-312.Clusener G, and Sachs, I., 1995. Brazillian perspective on sustainable development of
the Amazon Region. UNESCO, Paris. Colfer, C., Peluso, N.L., Chung C.S. 1995. Beyond Slash and Burn: Lessons from the
Kenyah on Improving Rain Forest management in Borneo.Colfer, C.,1999. Shifting Cultivators of Indonesia: Marauders or managers of the forest?
Rice production and forest use among the Uma” Jalan of East Kalimantan, FAO Community Forestry Case Study series 6..
Colfer, C., 2008. Human Health and Forests A Global Overview of Issues, Practice and Policy. People and Plants International Conservation Series. Earthscan London.
Economic value of non-timber forest products among Paser Indigenous People of East Kalimantan
234
Constanza, R., 1998. The value of ecosystem services. Ecological economics 25:1.Constanza, R., and Perrings, C. (1990). A flexible assurance bonding system for
improved environmental management. Ecological Economics 2:57-75.Constanza, R., d’Arge, R., de Groot, R., Farber, S., Grasso, M., Hannon, B., Limburg,
K., Naeem, S., O’neill, R.V., Paruelo,J., Raskinet, R.G., Sutton,p. and van den Belt, M., 1997. The value of the world ecosystem services and natural capital. Nature 387:253-260.
Commans, M. 1987. Manusia Dayak, Dahulu, sekarang dan masa depan.Jakarta. PT. Gramedia.
Corners, R. and Sandler,T. (1996). The Theory of Externalities, Public Goods and Club Goods. Cambridge University Press, Cambridge.
Cropper, M.L. and Qates, W.E. (1992). Environmental economics; A survey. Journal of Economic Literature 30:675-740.
Das, B.K., Singh,M., Borkar, M.D. 1994. Sediment accumulation rate in the lakes of Kumaun Himalaya, India. Environmental Geology 23:114-118.
Daly, H.E. 1989. Towards a measure of sustainable social net product. In: Ahmad, Y.J. El Serafy, S., and Lutz, E. (eds.) Environmetal Accounting for Sustainable Development. World Bank, Washington D.C.
De Beer J.H. and MC Dermott, M.J., 1996. The economic Value of Non-Timber Forest Products in Southern Asia. IUCN Second Revised Edition. Amsterdam.
De Iongh,H.,Perssoon G.A.,and Kustiawan W.(eds.),2007. Option for Biodiversity Conservation and Sustainable Use in Lowland Forest of Southeast Borneo. Proceedings of a workshop organized by CML-Tropenbos,19 May,2006, Leiden-Nhe Netherlands.
De Jong, W. 2002. Forest Products and Local Forest Management in West Kalimantan, Indonesia: Implications for Conservation and Development. Tropenbos-Kalimantan Series 6. Wageningen, the Netherlands.
De Jong, W. 2002. Forest Products and Local Forest Management in West Kalimantan, Indonesia: Implications for Conservation and Development. Tropenbos-Kalimantan Series 6. Wageningen, The Netherlands.
Deacon,R.T. (1995). Assessing the relationship between government policy and deforestation. Journal of Environmental Economics and Management 28:1-18.
Devung, S., 2002. The people of Lundayeh and their socio-economic, WWF report on Kayan Mentarang biodiversity expedition.WWF-East Kalimantan.
Dijk, J.F.W. 1999. Non-Timber Forest Products in the Bipindi-Akom II Region, Cameroon. A Socio-economic and ecological Assessment. Tropenbos-Cameroon Series 1.
Dominiquez,C. and Gomez, A.1990. La economia extractiva en la Amazonia colombiana1850-1930. Tropenbos-Colombia and Corporacion Araracuara, Santafe de Bogota, Colombia.
Dove,M.R. 1994. Marketing the Rain Forest: Green Pancea or Red Herring? Asia Pacific Issues. Analysis from the East-West Center, No.13 (may).
235
References
Downie and Health, 1970. Basic statistical methods. Harper International, New York and London.
Durning, A.,1989. Poverty and the environment: reversing the downward spiral. Worldwatch paper 92. Washington D.C.
Dunkerley, J. and Ramsey, W., 1983. Analysis of energy prospects and problems of developing countries. World Resource Institute, Washington D.C.
Durning, A., 1993. Saving the forests: what it will take? Worldwatch Paper 92. Washington D.C.
Durst, Patrick B., Ann Bishop (eds.) FAO1995. Beyond Timber : Social Economic and Cultural dimensions of Non-Wood Forest Product in Asia and the Pacific- Proceedings of a Regional Expert Consultation 28 Nov-2 Dec.1994,FAO/RAP, Bangkok.
El Serafy, S. 1991. The environment as capital. In: Constanza R. (eds.) Ecological Economics; The science and management of sustainability. Columbia University Press, New York.
Falconer, J (FAO). 1990. The Major Significance of “Minor Forest Products-the Local Use and Value of Forests in the West African Humid Forest Zone. Community Forestry Note No. 1, FAO Rome.
FAO, 1994.Community Forestry Tools Book. FAO Roma.FAO, 1991. Non-Woods Forest Products : the way ahead. FAO Forestry Paper 48,
FAO,Rome,Italy.Farnworth, N.R. 1988. Screening plants for new medicines. In : Wilson, E.O and Peter,
F.M. (eds.) Biodiversity. National Academy Press. Washington D.C.Fearnside, P. (1998). Deforestation impacts, Environmental Services and The
International Community. Paper Presented to the Amazonia 2000 conference, University of London.
Fleisher, A.A and Tollison, R.D. (1991). The Shadow Price of Shunsine. Public Finance 3:405-415.
Fried, S.T, 1995. Writing for their lives: Bentian Dayak Authors and Indonesian Development Discourse, Dissertation, Cornell University.
Fricker,T. 1996. Income Generation and Marketing Strategies for Non-Timber Forest Products. A Guide lines. Course Module in Training Forest Products Marketing in South East Asia. FAO-Regional Community Forestry Training Centre (RECOFTC) Bangkok.
Galeano, 1991.George, K.D. and Shprey, J.1980. The allocation of resources; Theory and policy, Allen
and Unmin, London.Gonner, C. 2003. Forest Tribe of Borneo. Men and Biosphere. No. Godoy and syafran, 1986. The effects of government policy on rattan small-holder
cultivation cultivation. Journal of Economic Botany, vol 3-1986.Godoy, R.A. and Bawa, K.S. 1993. The economics value of sustainable harvest of plants
and animals from the tropical forest; assumptions, hypothesis and methods. Economic Botany 47:215-219.
Economic value of non-timber forest products among Paser Indigenous People of East Kalimantan
236
Godoy,R. Ruben Lubowski, and Anil Markandya. 1993. A Method for the Economic Valuation of Non-Timber Tropical Forest Products. Economica Botany 47 (3)pp.220-233.1993. The New York Botanical Garden, Bronx, NY, USA.
Gold Smith, E. and Hildyard, N. (1990). The Earth Report II. Beazley, LondonGonner, C., 2002. Forest Tribe of Borneo. Man and Bisophere.Greenomics, 200O. Economic Value of Kayan Mentarang National Park for Local
Community. WWF-Kayan Mentarang. Tarakan.Gregory, G,R. 1987. Resource Economic for Foresters. John Wiley and Sons. USAGriffiths, A and Wall,S. (eds.)1999. Applied Economics : An Introductory Course.
Prentice Hall. London.Grossmann,C. 1997. Significance and Development Potential of Non-Wood Forest
Products in Central East Kalimantan. GTZ-MOF Document No.13. Samarinda-Indonesia.
Gunatilleke, I.A.U.N., Gunatilleke, C.V.S. and Abeygunawardena, P.,1993. Interdisciplinary research towards management of non-timber forest products in lowland rainforest of Srilangka. Economic Botany 47:282-290
Haury, D and Saragih,B. 1997. Low Rattan Farm Gate Price : Causes and Implications. Sustainable Forest Management Project (SFMP) document No.12 (1997). GTZ-SFMP Samarinda- Indonesia.
Heyzer, N., 1995. Gender, population and environment in the context of deforestation. A Malaysian case study. Insititute of Development Studies Bulletin 26:40-46.
Hirsch, E. and Roderick P.N., 2000. Commercialisation of Non-timber forest products: Review and Analysis of Research. FAO-CIFOR, Bogor-Indonesia.
Hiks, J.R. (1946). Value and Capital (2nd edition) Clarendon Press, Oxford.Holdgate., 1993.Hopes, M. Madrah and Karaakng. 1997. TEMPUTN, Myths of The Benuaq and
Tunjung Dayak. Puspa Swara. Jakarta.Hopes, Michael. 1997. Ilmu, Magic and Divination amongst The Benuaq and Tunjung
Dayak. Puspa Swara. Jakarta.Horst, R.L., Manuael, E.H., Balc, R.M., Tapiero, J.K., Brennan, K.M. and Duff, M.C.
1994). A Damage Function Assessment of Building Materials. The Impact of Acidic Deposition. Environmental Protection Agency, Washington DC.
Hoteling, H. (1949). The Economics of Public Recreation- An Economic Survey of The Monetary Valuation of Recreation in the National Parks. National Parks Service, Wasington, DC.
Houghton, R.A., Skole, D.L., and lefkowitz, D.S., 1991. Changes in the landscape of Latin America between 1850 and 1985: Net release of CO2 to the atmosphere. Forest Ecology and Management 38:173-199.
Hueting, R., Reijnders, B., de Boer, B., Lambooy, J. and Jansen, H., 1998. The concept of environmental function and its valuation. Ecological economics 25:31-37.
Hutterer K.L., Rambo T. and George Lovelace (1985) (eds.). Sultural values and human ecology in Southeast Asia. Michigan papers on South and Southeast Asia, the University of Michigan number.27.
237
References
Hutterer, K.L., 1984. Ecology and evolution of agriculture in Southeast Asia. In: A.T. Rambo and P.E. Sajise (eds.): An introduction to Human Ecology Researcgh on Agriculture Systems in Southeast Asia, University of the Philippines at Los Banos, Laguna, 75-97.
IIED, 1994. The hidden harvest: The role of wild foods in agriculture systems. Research series 3:1. London.
ITTO, 2007. Tropical Forest and Outlook, International Tropical Timber Organization, Yokohama, Japan.
Jacobs, M. 1982. The study of minor forest products. Flora Malesiana Bulletin, 35:3768-3782.
Jepma CCCJ., 1995. Tropical Deeforesttation. A Socio-Economic Approach. Earthscan Publication Limited UK.
Jepma, C.J.,1995. Tropical Deforestation, A socio-economics approach. Earthscan, London.
Jessup, T. Peluso, N.L. 1986. Minor Forest Products as Common Property Resource In East Kalimantan, Indonesia. Proceedings of the Conference on Common Property Resource Management April 21-26, 1985. NRC National Academy Press Washington D.C. pp505-531.
Jimenez, E. (1983). The Magnitudes and Determinants of Home Improvements in Self-Help Housing: Manila’s Tondo Project. Land Economics 59:70-83
Kahneman, D. and Knetsch, J.L.1992. Contingent valuation and the value of public goods. Reply. Journal of environmental management 22:90.
Kartawinata, K., Abdulhadi, R. and Partomihardjo, T. (1981). Composition and structure of a lowland Dipterocarp forest at Wanariset, East Kalimantan. Malaysian Forester 44 (2&30: 397-406.
Kesler, P.J.A. and Sidiyasa , K. (1994) Trees of The Balikpapan-Samarinda area, East Kalimantan Indonesia : a manual to 280 selected species. (Tropenbos series 7). The Tropenbos Foundation, Wageningen, The Netherlands.
Kishor, N.M. and Constantino, F.,1993. Rough estimates of environmental values from primary forests.
Kompas News on 12 and 17 September. Kompas Website : WWW.Kompas.comKramer, R., Sharma, N. and Munasinghe, M.,1995. Valuing Tropical Forests:
Methodology and Case Study of Madagaskar. Environment Paper No.13 World Bank, Washington, D.C.
Krutilla, J.V. (1967). Conservation Reconsidered. American Economic Review 57:777-786.
Kumari, K., 1995. An Environmental and economic assessment of forest management options: A case study in Malaysia. World Bank series 26. Washington D.C.
Lambert, P.J., 1993. The distribution and retribution of income, a mathematical analysis. Manchester University Press. Manchester.
Lave, L. and Seskin, E. (1977). Air Pollution and Human Health. Jhon Hopkins University Press, Baltimore
Economic value of non-timber forest products among Paser Indigenous People of East Kalimantan
238
Leach,G., 1993. Farm trees and wood markets: A Review and Economic Appraisal. Stockholm Environment Institute, Stockholm
Leaman, D.J. 1995. Malaria remedies of the kenyah of the Apo-Kayan, East Kalimantan, Indonesian Borneo. A qualitative assessment of local concensus as an indicator of biological efficacy. Journal of Ethnopharmacology, vol.46, 1:1-16.
Lecup, I. 1996. Marketing Development Strategy of Non-Timber Forest Products. Module in Training of Non-Timber Forest Marketing in South East Asia. FAO regional Community Training Centre (RECOFTC) Bangkok.
LPMD.2004. Pasir district’s bureau for poverty alleviation, Strategy Penanggulangan Kemiskinan di Pasir.
Lumby, S. (1979). Investment Appraisal and Financing Decisions. Chapman and Hall, London
Madrah, D.T. 2001. Adat Sukat Dayak Benuaq dan Tonyooi. Puspa Swara. Jakarta. Markandya,A. ( 1991). The Economic Appraisal of Projects: The Environmental
Dimensions. Inter-American Development Bank, Washington D.C.Markandya, A., and Ricardson, J., (eds.)1992. A reader in Environmental Economics.
Earthscan, London.Martin, J.M., 1998. Ethnobotani, sebuah manual pemuliharaan “Manusia dan
Tumbuhan”. People Plants. Natural History Publication Borneo.Translated by Maryati Moahmed).
Martinez-Menez, M.R., and Fernandez, J., 1984. An evaluation of degradation resulting from hydrological disruption at the national level. Proceedings of XVII Congreso Nacional de La Ciencia del Suelo, Mexico.
Matius, P., 2004. Plant diversity and utilization of rattan garden: A contribution to participatory biodiversity conservation within Benuag Tribe in East Kalimantan Indonesia. PhD dissertation at the University of Freiburg, Germany.
Maunati, Y.,2004. Identitas Dayak: Komodifikasi dan Politik Kebudayaan. LKiS Jogjakarta, Indonesia.
Melnyk, M.,1995. The contribution of forest foods to the livelihoods of the Huottuja (piaroa) people of Southern Venezuela. Ph.D. Thesis, ICCET, University of London.
Melnyk, M.,and Bell, N., 1996. The direct use values of tropical moist forest foods: the Huottuja (Piaroa) Ameridians of Venezuela. Ambio 25:7.
Mendelsohn, R., and Balik, M., 1995. The value of undiscovered pharmaceuticals in tropical forest. Economic Botany; 49:223-228
Menon K. 1986. Rattan Processing and Marketing, Case study of Indonesia. MOF-Indonesia Jakarta.
Messerschimdt D.A., and Hammett, A.L., 1998. Local Knowledge of alternative Forest Resources: Its relevance for resource management and economic development. Journal of Sustainable Forestry, Vol.7:21-52.
Methods for the Development and Conservation of Forest Products for Local Communities. Centre for International Forestry Research (CIFOR) Bogor, Indonesia.
239
References
Mbaelele, M.,1987. Data on small and medium scale game utilisation in the rainforest in Zaire. Paper presented at the International Symposium of Wildlife Management in Sub-Saharan Africa, Harare.
Michael, S.G. 1995. Economic valuation of the multiple use of forests: the case of Bwindi Impenetrable Park (BINP), Uganda. University of Edinburgh, UK.
Mishan, E.J.(1975). Cost Benefit Analysis. Allen and Unwin, LondonMitchell, R.A. and Carson, R.T. 1989. Using surveys to value public goods: the
contingent valuation methods. Resource for the future, Washington D.C.Myers, N., 1980. Conservation of tropical moist forest. U.S. National Academy of
Science.Myers, N., 1983. A wealth of wild species. Westview, Boulder.MOF-FAO, 1996. Final Forest Resources Statistic Report. Annex 2 Kalimantan.
Directorate General of Forest Inventory and Land Use Planning Ministry of Forestry, Republic of Indonesia in Cooperation with Food and Agriculture Organization of the United Nations. Jakarta.
MOF-FAO. 1986. The inventory of rattan in Indonesia. Departement of Forestry of Indonesia-Jakarta.
MOF, 2006.Laporan penggunaan kawasan hutan untuk kepentingan perkebunan, Jakarta.
Momberg, F., Jessup, T., and Puri, R., 1994. Gaharu collecting in the Kayan Mentarang Nature Reserve: Problems and prospects for sustainable community based forest management in East Kalimantan Indonesia. WWF Indonesia Program.
Monokaran, N. and Wong, K.M. 1985. Proceedings of “The Rattan Seminars” 2nd-4th October 1984 Kuala Lumpur, Malaysia. The Rattan Information Centre, Forest Research Institute. Kepang, Malaysia.
MPI, 2006. Masyarakat Perkayuan Kalimantan Timur, Daftar harga kayu bulat 2006Munda, G. and Nijkamp,P. ( 1995). Decisions Support Methods in Environmental
Planning. 25th Annual Development Conference, DPPC, BradfordMuksin, 1994. Study pelaksanaan lelang sarang Burung Wallet di Kabupaten Berau.
LSM-Plasma, Kalimantan Timur. Samarinda-Indonesia.Muttamara, S., and Sales, C.L., 1994. Water quality management of the Chao Phraya
river. Environmental Technology 15:501-516.Namgyel, P. 1996. Beyond Timber-What Value of the Forest?. A Rapid Rural Appraisal
Study on Non-timber Forest Products in the Nahi Gewog, Wangdue-Phodrang Dzongkhag, Western Bhutan. FRC/BG-IFMP GTZ paper No. 1 Thimphu, Bhutan.
Norton, 1995.Ogino, K. (1995). Why Biodiversity and Forest Conservation are Needed. Proceedings
of an International Seminar on Community Development and Conservation of Forest Biodiversity Through Community Forestry. Ausaid-Danced and Unep-Recoftc Bangkok, October 26-28, 1994. Thailand.
Economic value of non-timber forest products among Paser Indigenous People of East Kalimantan
240
Ogle, B, and grivetti, L.E. 1985. Legacy of the chameleon: Edible wild plants in the Kingdom of Swaziland: a cultural, ecological and nutritional study. Ecology of food and nutrition 16:193-208 and 17:1-64.
Ogle, B., 1984. Wild plant resources. Ceres 101:38-40.Opschoor, J.B., 1998. The value of ecosystem services; whose values? Ecological
Economics 25: 41-43.Ostorm, E., Schroeder, L. and Wayne, S. (1982). Institutional Incentives and Sustainable
Development: Infrastructure Policies in Perfective. Westview Press, Colorado.Overman, H and Demmer, J. 1999. The Effects of Wealth on the use of Forest Resources :
The Case of The Tawahka Ameredians, Honduras. Seminar Proceedings : NTFP Research in the Tropenbos Programme : Results and Perpectives. Tropenbos Foundation Wageningen, The Netherlands.
Padoch, C.,1988. The economic importance and marketing of forest and fallow products in the Iquitos region. Advances in Economic Botany 5:74-89
Pasir Forest Department, 2007. Laporan Tahunan Kehutanan Pasir (sementara).Pasir District.
Payne,J., Francis,CM., Phillipps, K., Kartikasari, S.N.,2000. Panduan Lapangan Mamalia di Kalimantan, Sabah, Sarawak dan Brunai Darussalam. Wildlife Conservation Society dan The Sabah Society Malaysia.
Panayotou, T. and Ashton, P. 1992. Not by timber alone, economics and ecology for sustaining tropical forests, World Bank, Washington D.C.
Pearce, D.W., 1995. Integrating environment into development planning: Where have we get to? 25th conference, DPPC. Bradford.
Pearce, D.W., 1996. Can non-market values save the world’s forests?Paper presented to the Symposium on Non-market benefits of Forestry, UK Forestry Commision, June 1996, Edinburgh.
Pearce D.W,Markandya, A., and Barbier, E.B., 1989. Blueprint for a green economy. Earthscan Publications, London
Pearce, D. and Markandya, A (1993) Marginal Opportunity Cost as A Planning Concept in Natural Resource Management. Economic Botany 47 (3) pp: 18-32. The New York Botanical Garden, Bronx, USA.
Pearce, D.W. and Moran,D. 1994. The economic value of biodiversity. Earthscan. London.
Pearce, D.W., and Turner, R.K. (1990). Economics of Natural Resources and the Environment. Harvester-Wheatsheaf, London.
Pearce, D.W., Barbier, E., and Markandya, A. (1989). Blue Print of a Green Economy. Earthscan Publications, London.
Peluso, 1986. Rattan Industries in East Kalimantan. Forestry Department Paper, FAO, Roma.
Peluso, Nancy L 1989. The Role of Non-Timber Forest Products in Shifting Cultivation Communities and Households : Current Knowledge and Prospects for Development. MOF-FAO, Jakarta.
241
References
Persoon,G.A. and Der Ploeg J.,2006. A Socio economic survey in the Gunung Lumut Forest area. CML Leiden University-Tropenbos workshop 19 May 2006 Leiden-The Netherlands.
Persoon, G.A, Tessa M.,Slee B., and Hammen C.,V.,D., 2004. The position of indigenous peoples in the management of tropical forests. Tropenbos series 23.Tropenbos International Wageningen, the Netherlands.
Peters, M., Gentry, A., and mendelsohn, R., 1989. Valuation of an Amazon Rain Forest. Nature 339:655-656
Peters,C.M. 1994. Sustainable harvest of Non-Timber Plants Resources in Tropical Moist Forest: An ecological Primer. The Biodiversity Support Program USAID-TNC_World Resources Institude, Washington-USA.
Peterson, G.L.,1995. Moral responsibility effects in valuation of WTA for public and private goods by the method of paired comparison, conference paper, EAERE Umea.
Pasey, D., Dutfield, G., and Plenderleith, K., 1995.Collaborative research and intellectual property rights. Biodiversity and conservation 4:8.
Prance, G.T., (1993). Biodiversity the Richness of Life. Commemorative Lecture 1993. International Cosmos Prize. 108-122
Priasukmana, S. and Amblani, 1988. Rattan Segah di daerah Bentian Besar Kalimantan Timur (Rattan Segah (calamus cecius) cultivation in Bentian East Kalimantan). Wanatrop (3)2.
Puri R.K. (2001). Bulungan Ethnobiology Handbook. CIFOR-PROSEA-East West Centre. Bogor- Indonesia.
PPLH, 2002. Survey on Ecology and socio-economic of Gunung Lumut Pasir. University of Mulawarman-Bappeda Pasir, Samarinda-Indonesia.
Rambo, T., 1982. Human ecology research on tropical agroecosistem in Southeast Asia. In Journal of Tropical Geography, vol.3, No.1. June 1882. East West Environment and Policy Institute Page 87-99.
Rambo,T., and Sjise, P.E., (eds.).,1984. An introduction to humahn ecology research om agricultureal systems in South East Asia. East-West Environment and policy Institute and University of the Phili[[ines at Los banos.
Razali W.M, Dransfield J., and Manokaran, 1992. Aguide to the Cultivation of, Rattan. Forest Research Institute Malaysia, Kepong. Kuala Lumpur.
Repetto, R.1988. Resources and Economics Accounts. OECD Environment Committee, Group on State of the Environment, Paris.
Riswan, S. (1987). Structure and floristic composition of a mixed dipterocarp forest at Lempake, East Kalimantan, pp435-457 in : Kostermans, A.J.G.H (ed.) Proceedings of Third Round Table Conference on Dipterocarps (16-20 April 1985, Mulawarman University, Samarinda, East Kalimantan-Indonesia.
Rio-Tinto Indonesia.2001. The preparation for departure of closing the coal mining in Kutai Barat District East Kalimantan-Indonesia.PT.KEM.
Economic value of non-timber forest products among Paser Indigenous People of East Kalimantan
242
Rodriguez, C.A and Hammen M.C.1999. Non-Timber Forest Products and Indigenous Management of The Forest in The middle Caqueta River : Complementary and New Options. Seminar Proceedings NTFP Research in the Tropenbos Programme : Results and Perpectives 28 January 1999. Tropenbos Foundation Wageningen, the Netherlands.
Rowe, R., Sharma, N. and Browder, J.,1992. Deforestation: problems, causes, and concerns. In: Sharma, N., and Dubuquem, I (eds.). managing the world’s Forests: Looking for balance Between Conservation and Development. Kendall Hunt, New York.
Ros-Tonen, 1999. Refining Concepts, Objectives and Research Questions For NTFP Research. Seminar proceedings : NTFP Research in the Tropenbos Programme : Results and Perpectives 28 January 1999. Tropenbos Foundation Wageningen, the Netherlands.
Ros-Tonen, Andel, et al., 1998. Methods for Non-Timber Forest Products Research. The Tropenbos Experience. Tropenbos Documents 14. Wageningen, The Netherlands.
Ros-Tonen, M., Dijkman, W and Lammerts va Bauren, E. 1995. Commercial and Sustainable Extraction of Non-Timber Forest Products. Towards a Policy and management Oriented Research Strategy. The Tropenbos Foundation, Wageningen, the Netherlands.
Ros-Tonen,M., 1999(eds). NTFP Research in The Tropenbos Programme : Results and Perspectives. The Tropenbos Foundation Wageningen, The Netherlands.
Ruhiyat, 1990. Nutrient cycling in tropical forestry. In proceedings of international symposium on soil of tropical forestry, Balikpapan 1995.
Ruitenbeek, J. 1989. The rainforest supply price. Ecological economics: 1:57-78Saaty, T.L.,1980. The Analytical Hierarchy Process. Mc Graw-Hill, New York.Saragih, B., 2006. Economic value of Non-timber forest products among Paser
indogenous people of East Kalimantan; The fragile economic resources?. Journal of Socio-Humanity Vol 1 no.2, 2006,p17-33. Research Center of Mulawarman University Samarinda-East Kalimantan, Indonesia.
Saragih, B., 2006. The effects of decentralization of rattan marketing in Paser district. Journal of Natural and Life Sciences, Vol.1.2006. University of Mulawarman Samarinda-Indonesia.
Saragih, B., 2005. Forest Value beyond timber, an approach towards total valuation of forest ecosystem. Journal of Frontier.
Saragih, B., Matius., P.,Hangkueng, J.J.H, 2002. Potensi Pengembangan Hasil Hutan Bukan Kayu di Kabupaten Berau-Kalimantan Timur. Report EU-BEFMP Project, Berau.
Saragih, B. and Sutedjo, 2002. Socio-economic value of Non-timber forest products in the Sub-district of Muara Wahau East Kutai. The report of ITTO-Faculty of Forestry University of Mulawarman Research Project.
243
References
Saragih, B., 1999. Rattan marketing in East Kalimantan, a case study from Lambing. Master thesis at the University of Georg August Gottingen, Germany.
Sardjono, A. 1990. Die Lembo-kultur in Ost-klimantan – Ein Model fur die Entwicklung agroforstlicher Landnutzung in den Feuchttropen. Dissertation, Hamburg University.
Schulze, W. (1983). The Economic Benefit of Preserving Visibility in the National Park Lands of the South West. Natural Resources Journal 23:25-36.
Scoons, I.,1998. Sustainable Rural Livelihoods; A Framework for Analysis. IDS Working Paper No. 72. IDS, Brighton.
Seibert B. and Lahjie, A. 1984. honey Gathering by People in the Interior of East Kalimantan. Duta Rimba pp 153-157.
Sedjo, R.A., 1992. Property rights, genetic resources and biotechnological change. Journal of Law and Economics 35:199-215.
Schefold, R. 1995. Function follows form: On the ritual efficacy of plants and textiles in Indonesia. Indonesia Circle No. 66, 1995.
Schefold, R. (2006) Visions of the wilderness on Siberut in a comparative Southeast Asian Persfective in Geoffrey B and C. Cynthia eds.Tribal communities in the Malay world; historical, cultural and social persfective.Institute of Southeast Asian Studies, Singapore
Schulze, W., 1983. The economic benefits of preserving visibility in the national [arklands of the South West. Natural Resources Journal 23:25-36.
Schemeneauer, R.S., and Cerededa, P. 1994. Fog collections role in water planning for developing countries. Natural resources forum 18:91-100.
Sellato B.J.L and Guerreiro, A.J. 1984. Traditional Migration in Borneo : The Kenyah case. Borneo Research Bulletin 16 (1)pp 12-28.
Shannon, C.E. and Weaver. 1949. The Mathematical Theory of Communication. Univ. Illionis Press, Urbana.
Sheil Douglas, et., al. 2004. Mengeksplorasi Keanekaragaman hayati, lingkungan, dan pandangan masyarakat local mengenai berbagai landskap hutan: Metode-metode penilaian landskap secara multidisipliner. Center for International Forestry Research (CIFOR) Bogor-Indonesia
Simons, A.J.,1996. ICRAF’s Strategy for Domestication of Non-Wood Tree Products. Paper presented at the International Conference on Domestication and Commercialization of Non-Timber Forest Products in Agroforestry Systems, 19-23 February 1996, Nairobi, Kenya. Pp 8-12.
Sirait, M.T. 1992. Keanekaragaman Jenis Kegunaan Rotan serta Pengelolaan Sumberdaya Alam oleh Masyarakat Desa Long Uli Kaltim. Samarinda WWF Samarinda Project Report.
Siy, R. Y. (1982). Community Resource Management : Lessons from the Zanjera. University of the Philippines Press, Quezon City.
Economic value of non-timber forest products among Paser Indigenous People of East Kalimantan
244
Slik F.,Hovenkamp P., Iqbal M., and Raes N., 2006. Structure, plants species diversity and plant species composition of the Gunung Lumut Protection Forest. CML Leiden University-Tropenbos workshop, 19 May 2006 Leiden The Netherlands.
Smith, V.E., 1979. Household food consumption in rural Sierra Leone. Nutrition Planning. Information Service, Ann Arbor Mi.
Smith, V.K. and Karou,Y. ( 1990). Signals or noise? Explaining the variation in recreation benefits estimates. American Journal of Agricultural Economics 72:12-17.
Soejito, H. (1980). Laporan Penelitian “Interaction Between people and forests” kerjasama antara MAB Indonesia-Amerika di Long Sungai Barang dan Long Segar di Kalimantan Timur, Herbarium BOgoriense, LBN, LIPI, Jakarta.
Soejito, H. (1987). Nutrient dynamics following shifting cultivation in Long Sungai Barang, East Kalimantan, Indonesia. Proceedings workshop on impact of man’s activity on Tropical upland Forest Ecosystem, Faculty of Forestry University Pertanian Malaysia. PP537-563.
Stockdale, M.C. 1991. Inventory Methods and Ecological Studies relevant the Management of Wild Population of Rattan. Dissertation University of Oxford.
Sullivan, C., 1999. Valuation of Non-Timber Forest Products: A Case Study for three Ameridian villages in Guyana. PhD dissertation at Keele University.
Sunderlin, W.D, Pradnja R.I.A, Riyanto,E., and Angelsen, A., 2000. The effect of Indonesia’s economic crisis on small farmers and natural forest cover in the outer islands. CIFOR occasional paper No. 28 (E), Bogor-Indonesia.
Sutisna, M. 2003. Aspek silvikultur pengelolaan hutan tropis Kalimantan, Fakultas Kahutanan Universitas Mulawarman Samarinda.
Swartzmann, S., 1989. Land distribution and social costs of frontier development in Brazil: Social and historical context of extractive reserves. In Nepstad, D. and Swartman, S. (eds.) Non-timber forest products from tropical forest : Evaluation of a conservation and Development Strategy. New York Botanical Garden, New York.
UNDP, 1994. Earth summit in focus no.6. Washington D.C.UNDP 1991. Human development report. Washington D.C.U.S. Dept. of Agriculture, Agricultural research service 1985. Introduction, classification,
maintenance, evaluation, and documentation of plant Germoplasm. Washington D.c.
Tacconi, L., 1998. Scientific methodology for ecological economics. Ecological economics 27:91-106
Thibodeau, F.R. and Ostro, B.D. (1981). An economic analysis of wetland protection. Journal of Environmental Management 1: 7-14.
Todaro, M.P. (1994). Economic Development. Longman, London.Tomothy, J.B. and Bontawee, B. (eds).1994. Measuring and Monitoring Biodiversity in
Tropical and Temperate forest. CIFOR-IUFRO, Bogor-Indonesia.Valkenburg, J.L.C.H., 1997. Non-Timber Forest products of East Kalimantan. Potential
for Sustainable Use. Kalimantan tropenbos Program Series 16.
245
References
Van Andel T. and Reinders, M. 1999. Non-Timber forest Products in Guyana’s Northwest District: Potential and Pitfalls. Seminar Proceedings NTFP Research in the Tropenbos Programme: Results and Perfectives 28 January 1999. The Tropenbos Foundation Wageningen, The Netherlands.
Van Andel,T.R., 1998. Commercial exploitation of non-timber forest products in the Northwest District Guyana. Caribean Journal of Agriculture and Natural Resources 2 (1) : 15-28.
Van der Hammen, M.C.1996. Manipulationof Forest succession by the yakuna and Matapi Indians of the Colombian Amazone. Tropenbos Newsletter 12:2-4
Van Dick, 1999. Van Laar A. and Akca,A. 1997. Forest Mensuration. Cuvillier verlag, Gottingen
Germany.Voss, F. (1982). Natural Resources Inventory, TAD report 9, revised edition. East
Klimantan Transmigration Development Project (TAD). HWWA-Institute fur Wirtschaftsforschung, Hamburg, Germany.
Wackernegel, M. and Rees, W., 1996. Our ecological footprint. New society press. Philadelphia.
Watson, W.D. and Jasckh,J.A. ( 1982). Air Pollution –Household soiling and consumer welfare lossess. Journal of Environmental Economics and Management 9: 248-262.
Weinstock, J.A.1981. Kaharingan: Borneo’s old religion becomes Indonesia’s newest religion. Borneo Research Bulletin, vol.13, No. 1:47-8
Weisntock, J.A. 1983. Rattan: Ecological Balance in a Borneo Rainforest. Economic Botany, 37, 1:58-68.
Weidelt, J.J.H.,1998. Tropical forest sylviculture. University of Gottingen, Germany.Whitmore, T.C., (1990). An Introduction to Tropical rain Forests. Oxford, UK.,
Clarendon Press.Whitmore, T.C., Tandra, I.G.M., and Sutisna, M (eds.) (1990). Tree Flora of Indonesia,
Cheklist for Kalimantan (part I 1+2, part II) Bogor, Forest Research and Development Centre, Indonesia.
Wigley, T.M.L.1993. Climate change and forestry, Commonwealth Forestry Review 72:4.
Wiersum, F. 1999. Understanding Diversity in NTFP Management: A Neglected Issue in NTFP Research. Seminar Proceedings NTFP Research in The Tropenbos Programme: Results and Perfectives 28 January 1999. Tropenbos Foundation, the Netherlands.
Wiersum, F. and van Dijk. 1999. NTFP Resource Management as an Options for Multiple Use Forest Management in South Cameroon. Seminar Proceedings. NTFP Research in the Tropenbos Programme: Results and Perfectives 28 January 1999. Tropenbos Foundation, Wageningen the Netherlands.
Wilmschurst, J. (1995). An ODA Perspective on the Past and Future of Project Appraisal. 25th. Anniversary Conference, DPPC, Bradford.

Economic value of non-timber forest products among Paser Indigenous People of East Kalimantan
246
Wilson, E.O.,1992. The diversity of life, Cambridge University Press, Cambridge.Wollenberg, E. and Ingles, A. (eds.).1999. Incomes from the Forest. CIFOR, Bogor
Indonesia.World bank 1995. Indonesian Industrial Forestry Sector Outlook. Ministry of Trade
and Industry Republic of Indonesia, Jakarta.World Bank, (1994). Mitigating Pollution and Congestion Impacts in a High Growth
Economy Thailand. World Bank, Washington D.C.World Bank, 1997. World Development Report. Washington DC.World Commision on Environment and Development. 1987. Our Common Future.
Oxford University Press, Oxford.World Resource Institute 1994. World resources 1945-95. Oxford University Press.
Oxford
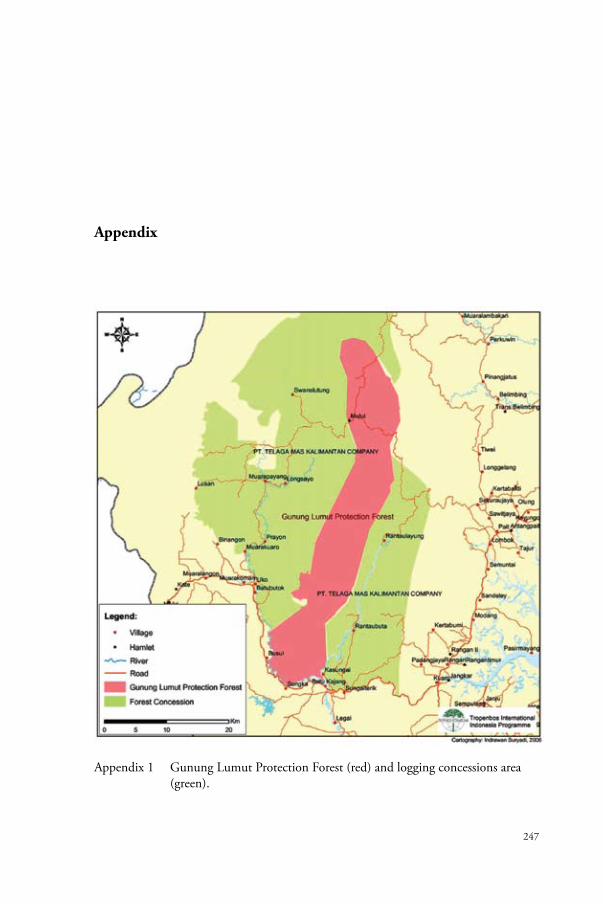
247
Appendix 1 Gunung Lumut Protection Forest (red) and logging concessions area (green).
Appendix
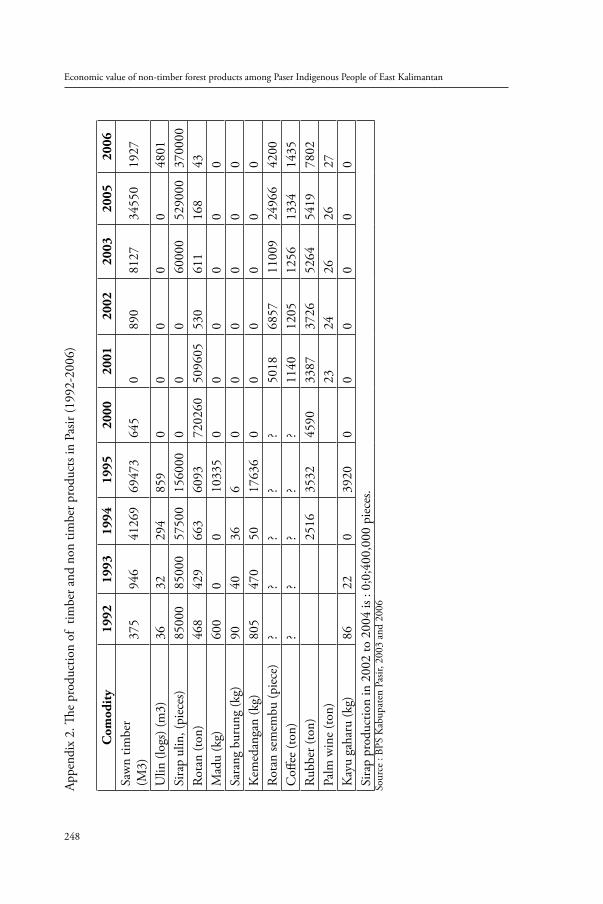
Economic value of non-timber forest products among Paser Indigenous People of East Kalimantan
248
Appe
ndix
2. Th
e pr
oduc
tion
of t
imbe
r and
non
tim
ber p
rodu
cts i
n Pa
sir (1
992-
2006
)
Com
odit
y19
9219
9319
9419
9520
0020
0120
0220
0320
0520
06Sa
wn
timbe
r(M
3)37
594
641
269
6947
364
50
890
8127
3455
019
27
Ulin
(log
s) (m
3)36
3229
485
90
00
00
4801
Sira
p ul
in, (
piec
es)
8500
085
000
5750
015
6000
00
060
000
5290
0037
0000
Rota
n (to
n)46
842
966
360
9372
0260
5096
0553
061
116
843
Mad
u (k
g)60
00
010
335
00
00
00
Sara
ng b
urun
g (k
g)90
4036
60
00
00
0K
emed
anga
n (k
g)80
547
050
1763
60
00
00
0Ro
tan
sem
embu
(pie
ce)
??
??
?50
1868
5711
009
2496
642
00C
offee
(ton
)?
??
??
1140
1205
1256
1334
1435
Rubb
er (t
on)
2516
3532
4590
3387
3726
5264
5419
7802
Palm
win
e (to
n)23
2426
2627
Kay
u ga
haru
(kg)
8622
039
200
00
00
0Si
rap
prod
uctio
n in
200
2 to
200
4 is
: 0;0
;400
,000
pie
ces.
Sour
ce :
BPS
Kab
upat
en P
asir,
200
3 an
d 20
06
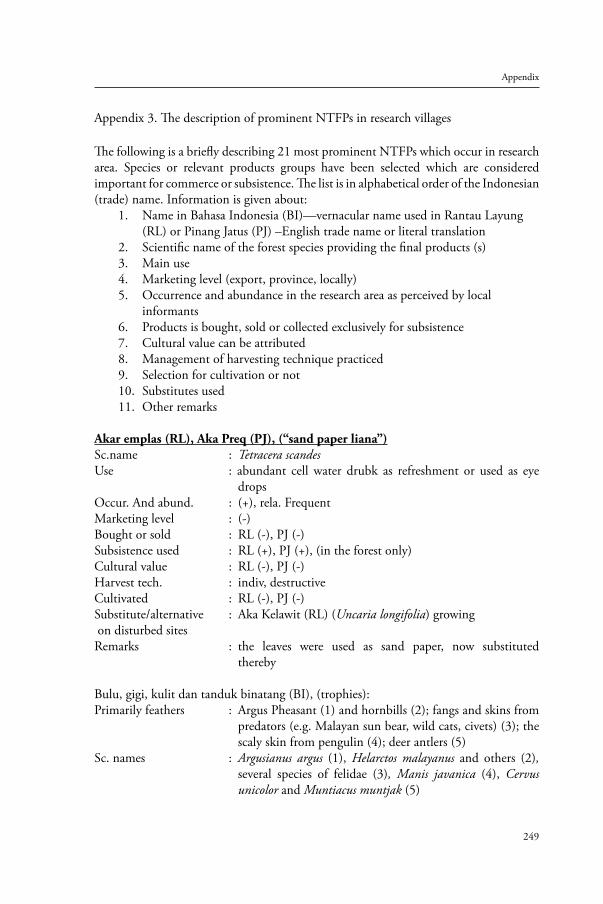
249
Appendix
Appendix 3. The description of prominent NTFPs in research villages
The following is a briefly describing 21 most prominent NTFPs which occur in research area. Species or relevant products groups have been selected which are considered important for commerce or subsistence. The list is in alphabetical order of the Indonesian (trade) name. Information is given about:
Name in Bahasa Indonesia (BI)—vernacular name used in Rantau Layung 1. (RL) or Pinang Jatus (PJ) –English trade name or literal translationScientific name of the forest species providing the final products (s)2. Main use3. Marketing level (export, province, locally)4. Occurrence and abundance in the research area as perceived by local 5. informantsProducts is bought, sold or collected exclusively for subsistence6. Cultural value can be attributed7. Management of harvesting technique practiced8. Selection for cultivation or not9. Substitutes used10. Other remarks11.
Akar emplas (RL), Aka Preq (PJ), (“sand paper liana”)Sc.name : Tetracera scandesUse : abundant cell water drubk as refreshment or used as eye
dropsOccur. And abund. : (+), rela. FrequentMarketing level : (-)Bought or sold : RL (-), PJ (-)Subsistence used : RL (+), PJ (+), (in the forest only)Cultural value : RL (-), PJ (-)Harvest tech. : indiv, destructiveCultivated : RL (-), PJ (-)Substitute/alternative : Aka Kelawit (RL) (Uncaria longifolia) growing on disturbed sitesRemarks : the leaves were used as sand paper, now substituted
thereby
Bulu, gigi, kulit dan tanduk binatang (BI), (trophies):Primarily feathers : Argus Pheasant (1) and hornbills (2); fangs and skins from
predators (e.g. Malayan sun bear, wild cats, civets) (3); the scaly skin from pengulin (4); deer antlers (5)
Sc. names : Argusianus argus (1), Helarctos malayanus and others (2), several species of felidae (3), Manis javanica (4), Cervus unicolor and Muntiacus muntjak (5)
Economic value of non-timber forest products among Paser Indigenous People of East Kalimantan
250
Uses : feathers and skins are used in traditional dancing costumes; fangs as decoration for baby carriers; antlers and pengulin skin as wall decoration; meat of all these animals is eaten
Occur. And abund. : (+), rareMarketing level : locally, provinceBoght or sold : RL (+), PJ (substitutes bought)Subsistence use : RL (+), PJ (+)Cultural value : RL (+), PJ (+)Harvesting tech. : individual and destructive, possible population depletive.
Animal is killed, no “close season”, no taboos, no attempt to distinguish and spare certain species or gravid females
Substitution/alter. : plastics fang and paper feathersRemarks : only hornbill are hunted for their feathers, all other animals
are trapped “accidentally” while hunting for game. The cultural value especially of feathers and fang is very high and animlas are getting rare. Most trophies encountered are old and inherited. High demand for (expensive substitutes). Most of these species are internationally protected
Cempedak (BI), (also” cempedak”), kind of fruit somewhat similar to jackfruit)Sc.name : Artocarpus integerUse : fruit eatenOccur.and abund. : (+), rel.frequentMarketing level : local, provincialBought or sold : RL (-), PJ (-)Subsistence use : RL (+), PJ (+)Cultural value : (RL (-), PJ (-)Harvesting tech. : non-destructive; cauliflorous fruit are easily picked off the
trunkCultivated : RL (+), PJ (-)Remarks : Fruit is small as compared with jackfruit, planted in fallow
or close to village
Daging (BI), (game) : primarily deer “rusa” (1), “Kijang” (2), “kancil” (4) Sc. Name : Cervus unicolor (1), Muntiacus muntjak (2), Tragulus
javanicus (3)Use : meat eatenOccur.and abund. : (+), frequentMarketing level : Locally (district)Bought or sold : RL (+), PJ (+)Subsistence use : RL (+), PJ (+)Cultural value : RL (high), PJ (high)
251
Appendix
Harvesting tech. : individual, destructive, possible population depletive. Animal is killed, no “close season”, nop taboos, no attempt to distinguish and spare certain species or gravid females (catching a latter is lucky!, two in one)
Cultivated : RL (-), PJ (-)Substitute/alter. : domesticated chicken and fish Remarkas : domesticated chicken are raised primarily as “saving” for
family festivies in case hunt isd not lucky. The Paser craze for hunting deers is the most obvious cultural religious difference distinguishing from Christians (i.e. Paser vs. “intruding” timor and toraja for hunting wild boar.
Damar (BI), hardened resins)Sc.name : Shorea, Parashorea, Hopea, DipterocarpusUse : naturally exuded and hardened resin used for caulking
boatsOccur.and abund. : (+), plentyMarketing level : (-)Bought or sold : RL (-), PJ (-)Sunsistence use : RL (+), PJ (+)Cultural value : RL (-), PJ (-)Harvesting tech. : non-destructive; huge clumps of hardened resin fall off
formerly damaged tree parts and are easily picked off the ground
Cultivated : RL (-), PJ (-)Subsistence/alt. : oil-fuel, candleRemarks : up to second world war different kind of damar were used in
large amounts in lacquer and varnish industry. A speciality market exists, served e.g. by old small holder plantations in Sumatra. Different qualities (depending on tree species and product quality) are distinguished but not in research area. Low quality of damar is abundant and easy to collect so no local market develops for local use (see also, Syafruddin et al., 1994)
Daun Biru (BI), (“Blue leaf”, licuala palm leaf )Sc.name : Licuala spinosaUse : young leaves for hat making “seraung” old leaves for roofing,
wrapping, and cooking traditrional foodsOccur.and abund. : RL (+) in primary forest, PJ (+) rel.frequentMarketing level : RL (-), PJ (-)Bought or sold : RL (-), PJ (-)
Economic value of non-timber forest products among Paser Indigenous People of East Kalimantan
252
Cultural value : RL (+) very high, PJ (+) very highHarvesting tech. : non destructive, the very short stemmed licuala palm
produces only one new ;eaf at a time. Cutting this one central folded leaf used for hat making does not harm the palm much. Cutting of all good older leaves for roofing most probably inhibits growth for a while but does not kill the plant.
Cultivated : RL (-), PJ (-)Substitution/alter. : dep.on use ; leaves of Ziniberaceae (young secondary forest),
pandanaceae (planted in swampy areas), Nypah fruticans (secondary forest, esp. in brackwish water, shingles traded upriver), plastic canvas, corrugated iron (roofing)—none (for hats and food aid)
Remarks : no interview partner had ever though about planting licuala or had any idea if how) that would work. Using L. leaves as roofing material for farm huts is considered typical for RL not for PJ.
Daun Mekai (BI), Usen Udu (RL), (“Mekai leaf”Sc.name : Alestesia papuana (?) (a small liana)Use : dried leaves used as a condimentOccur.and abund. : RL (+), PJ (+) but in frequentMarketing level : -Subsistence use : RL (+), PJ (+)Bought or sold : RL (-), PJ (-)Cultural value : RL (-), PJ (-)Harvesting tech. : non-destructive for mature lianas; all leaves within reach are
stripped off the stemCultivated : RL (-), PJ (-)Substitute/alter. : salt, “pexin” (monosodium glutamate)Remarks : Today “mekai” leaf are uased in primarily one dish by the
Dayak Kenyah.
Gaharu (BI), Sekau (RL), (Aloe wood or Eagle wood)Sc.name : Aquilaria beccariana (possl. Also A. malaccencis and
Gonystylus spp.)Use : presumably fungus infected wood with black cell fillings is
used in perfumes and incense woodOccur.and abund. : RL (rare), PJ (rare)Marketing level : exportBought or sold : RL (+), PJ (+)Subsistence use : RL (-), PJ (-)
253
Appendix
Cultural value : RL (-), PJ (-)Substitute/alter : (-)Remarks : Gaharu has been traded for centuries”from Borneo” but
is actually limited to higher mountain ranges; currently highly priced; the Gunung Lumut Forest Areas was major supplier of Gaharu during 1980s from Pasir Dsitrict from the species of A. malaccencis and Gonystylus spp (Semok and Saruntung pers.comm., 2005).
Madu (BI), RL (wani), Honey beesSc.name : Apis dorsataUse : sweetenerOccur.and abund. : RL;frequent; PJ ;frequentMarketing level : localBought or sold : RL (Sold), PJ (Sold)Cultural value : RL (+), PJ (+)Substitutes : sugar cane, palm wine, and sugarRemarks : honey bees are harvested during dry season in October
to December, the bees are hanging in 3 species of timber (Koompalsi spp), well distributed in forest area of Rantau Layung and Pinang Jatus. The production of honey seems to be available only for certain period of time. Collectors of honey in RL informed that the production period could takes once in four years.
Ipuh (BI), Upas (RL), Dart PoisonSc.name : Antiaris toxicariaUse : latex prepared into dart poisonOccur.and abund : RL (+) rare, PJ (-)Bought or sold : RL (-), PJ (-)Subsistence use : RL (+), PJ (-)Harvesting tech. : non destructive; the bark is cut like tapping rubberCultivated : RL (-), PJ (-)Substitute/alt. : (shot guns, air guns)Remarks : the tree is very rare in the area but the few trees in the
surrounding RL close to Gunung Lumut Forest Protection are known to many.
Kayu bawang (BI), Ja’ui (RL), (Garlic tree)Sc.name : Scorodocarpus borneensisUse : seed use as a condiment (tasting a bit like old garlic-
onions)
Economic value of non-timber forest products among Paser Indigenous People of East Kalimantan
254
Occur.and abund. : (+), rel. frequentMarketing level : (-)Bought or sold : RL (-), PJ (-)Subsistence use : RL (+), PJ (+)Cultural value : RL (-), PJ (-)Harvesting tech. : non-destructive; fruits are small nuts with a hard shell
falling of the tree when ripeCultivated : RL (-), PJ (-)Substitute/alter. : onions, garlicRemarks : its subsistence value has declined since the availability of
onions and garlic. All men interview partners from RL dislike the taste while woman like it.
Kayu lem (BI), (‘glue tree”) Sc.name : Acronychia spp (3 species undifferentiated by informants)Use : Latex rich bark used in industry as base for incense sticks
and mosquito coilsOccur.and abund. : alluvial or swampy forest areas in a river side Marketing : exportSubsistence value : RL (+), PJ (-)Cultural value : RL (-), PJ (-)Harvesting tech. : indiv. Destructive; trees are felled, trunk and larger branches
then debarked. As only felled trees dbh>20 cm have been observed regeneration with juvenile thinner bark may keep up at least the next generation.
Cultivated : RL (-), PJ (-)Subsistence/alter. : (-)Remarks : occurrence in swampy areas down river from RL, low price,
collected in villages down river since 1994, harvestable stock almost depleted.
Malau (BI), Tekipai (RL, PJ), Gutta PerchaSc.name : Palaqium gutta, P. leiocarpum, P.calophyllum, Payena
acuminataUse : coagulated latex used as fixation e.g. of tool blades to
handlesOccur.and abund. : RL (+), rel. frequentMarketing level : provinceBought or sold : RL (-), PJ (+)Cultural value : RL (-), PJ (-)Harvesting tech. : indiv.destructive trees are felled and tapped in deep ring
cuts approximately every 60cm along the trunk. Juvenile trees semm to be spared due to scarce latex production
255
Appendix
Cultivated : RL (-), PJ (-)Substitute/alter. : other fruitRemarks : in its high times Gutta Percha was used as insulator for
submarine telegraphy cables substituted today by satellite technology. Up today golf balls are made from Gutta Percha. Most other uses (industrial and subsistence) are substituted by different kinds of plastic.
Pasak Bumi (BI), (“peg of the world”)Sc. name : Eurycoma longifoliaUse : infusion of tap roots drunk by men as aphrodisiac or against
“back aches”Occur.and abund. : rare (over exploit in the past)Marketing level : provinceBought or sold : RL (sold), PJ (-)Subsistence use : RL (+), PJ (+)Cultural value : RL (-), PJ (-)Harvesting tech. : individual destructive; to obtain the straight tap roots as
long as possible the whole (small) trees is pulled out of usually sandy soils. Non information was available on maximum size or size at maturity.
Substitute/alter. : (-)Remarks : the use of “Pasak Bumi” is a Kutai tradition relatively new
to the Dayaks but imitated by young bachelors (Grossman, 1997). In Samarinda (the province capital), cups made of root wood and chips are sold in souvenir shops and on the nigh market.
Petai hutan (BI), “petai beans”Sc.name : Parkia speciosaUse : seeds eaten as condiment or snackOccur.and abund. : RL (+), PJ (+) InfrequentMarketing level : local and district levelBought or sold : RL (+), PJ (+) both soldSubsistence use : RL (+), PJ (+)Cultural value : RL (-), PJ (-)Harvesting tech. : individual destructive; mature trees are considered too high
for climbing, the overstory tree is felled to obtain not fully ripened pods growing on twig tips
Cultivated : RL (-), PJ (-)Substitutes/alter. : petai cina (BI); beta alo’ (RL), cultivated tree bearing similar
but much smaller pods and seeds (Leucaena glauca)
Economic value of non-timber forest products among Paser Indigenous People of East Kalimantan
256
Rotan (BI), Rattan :
Small-diameter size: Rattan segah, Jahab,Ttohiti, Seringan Sc.name : Calamus caecius, Calamus trachycoleus, Daemonorops
crinita, Use : canes used in basketry and other handicraft growing tips
of many species are used as vegetable or condiment (like bamboo shoots but very bitter)
Occur.and abund. : RL and PJ is frequentMarketing level : provincial and exportBought or sold : RL and PJ both soldHarvesting tech. : not destructive for clustering species (all above) but cut half
meter above the ground; commercial collectors in natural forest seem not to adhere to this rule
Cultivated : RL;sega and jahab, PJ; SegaSubstitute/alter. : dep.on use; plastic and nylon cords; wire; plastic mats,
nails; etc.Remarks : these rattan species are found in old productive garden and
established as small cultivation in the village of Rantau Layung and Pinang Jatus
Large Diameter RattanRotan semambu (BI)Sc.name : Calamus scipionumUse : furniture making (frame)Occur.and abund. : rareSubsistence use : RL (-), PJ (-)Marketing level : province and inter-provinceBought or sold : RL (-) PJ (-)Cultural value : RL (-), PJ(-)Harvesting tech. : individual destructive,solitary speciesCultivated : RL (-), PJ (-)Substitute/alter. : -Remarks : since 1984 the collection of semambu had been intensively
conducted by outsiders as well as the people of RL and PJ, this caused the depletion of this species in research area and there is no significant cultivation as compared with rattan segah (Lawut and Semok, pers.comm, 2005)
257
Appendix
Sarang Burung (BI), edible birds nest Sc.name : Collocalia fuchiphaga, C. vestita (different cave nesting
swifts)Use : eaten in Chinese”bird nest soup”Occur,and abund. : RL (rare), PJ (-)Marketing level : exportSubsistence use : RL (-), PJ (-)Cultural value : RL (-), PJ (+)Harvesting tech. : theoretically non destructive to a live individual, practically
population depletive; the nests made of hardened saliva are sticking to cave ceilings and walls. They could be scrapped off twice before eggs are laid if then a full breeding phase is made possible.
Cultivated : RL (-), PJ (-)Substitute : -Remarks : very high price; a few nesting cave known in the mountain
region of RL and Muara Komam (the village near by), Saruntung a former birnests collectors informed that the collection of birdnests was main business in the region during 80s and today only few caves produced birdnests. (totally there are 36 caves produced birdnests in Pasir District and majority of them found in Gunung Lumut and Beratus mountain region, Pasir Forest Dept. 2005).
Suling (RL), no BI or English name known Sc.name : Eugenia tawahense (?) Eugenia spp. (two species used)Use : gluey dark red latex the bark used as red dye and insecticide
on items made of split bambooOcc.and abund. : rel. frequent in RL, PJ (-)Bought or sold : RL (-), PJ (-)Cultural value : RL (+), PJ (-)Subsistence value : RL (+), PJ (-)Harvesting tech. : non destructive Cultivated : RL (-), PJ (-)Substitute/alter. : -Remarks : if only part of the bark used (only small quantities are
needed) the tree lives on. If large quantities are needed the tree is felled and debarked.
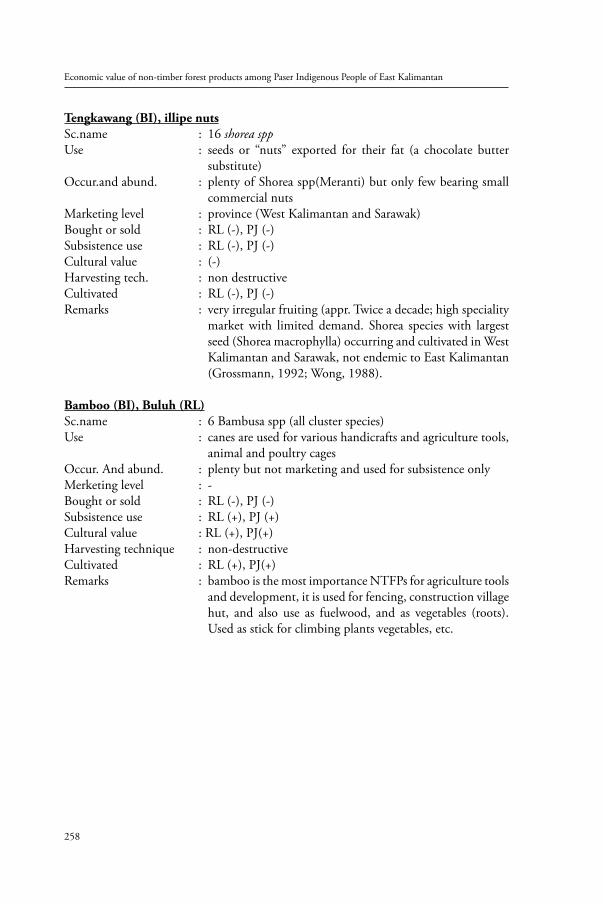
Economic value of non-timber forest products among Paser Indigenous People of East Kalimantan
258
Tengkawang (BI), illipe nutsSc.name : 16 shorea sppUse : seeds or “nuts” exported for their fat (a chocolate butter
substitute)Occur.and abund. : plenty of Shorea spp(Meranti) but only few bearing small
commercial nutsMarketing level : province (West Kalimantan and Sarawak)Bought or sold : RL (-), PJ (-)Subsistence use : RL (-), PJ (-)Cultural value : (-)Harvesting tech. : non destructiveCultivated : RL (-), PJ (-)Remarks : very irregular fruiting (appr. Twice a decade; high speciality
market with limited demand. Shorea species with largest seed (Shorea macrophylla) occurring and cultivated in West Kalimantan and Sarawak, not endemic to East Kalimantan (Grossmann, 1992; Wong, 1988).
Bamboo (BI), Buluh (RL)Sc.name : 6 Bambusa spp (all cluster species)Use : canes are used for various handicrafts and agriculture tools,
animal and poultry cagesOccur. And abund. : plenty but not marketing and used for subsistence onlyMerketing level : -Bought or sold : RL (-), PJ (-)Subsistence use : RL (+), PJ (+)Cultural value : RL (+), PJ(+)Harvesting technique : non-destructiveCultivated : RL (+), PJ(+)Remarks : bamboo is the most importance NTFPs for agriculture tools
and development, it is used for fencing, construction village hut, and also use as fuelwood, and as vegetables (roots).Used as stick for climbing plants vegetables, etc.
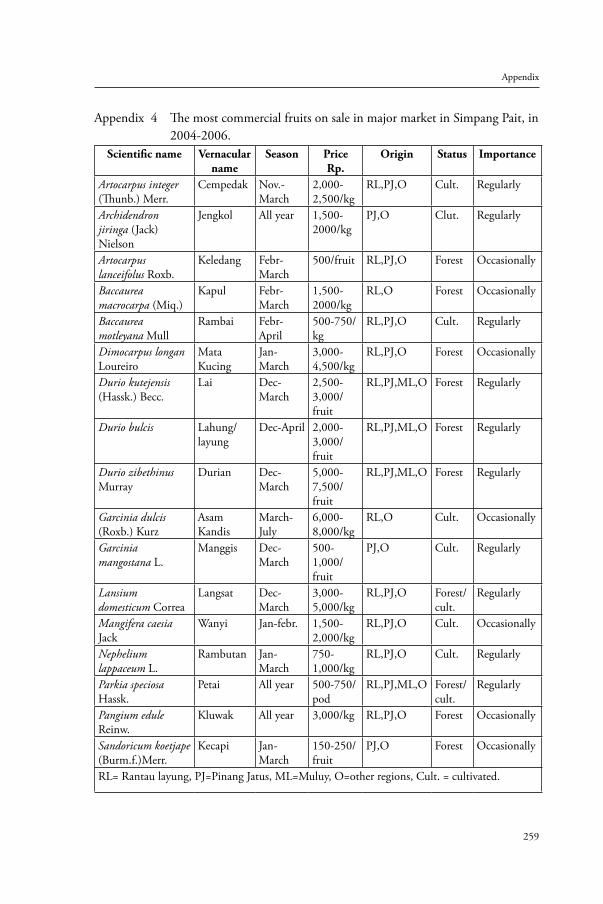
259
Appendix
Appendix 4 The most commercial fruits on sale in major market in Simpang Pait, in 2004-2006.
Scientific name Vernacular name
Season PriceRp.
Origin Status Importance
Artocarpus integer (Thunb.) Merr.
Cempedak Nov.-March
2,000-2,500/kg
RL,PJ,O Cult. Regularly
Archidendron jiringa (Jack) Nielson
Jengkol All year 1,500-2000/kg
PJ,O Clut. Regularly
Artocarpus lanceifolus Roxb.
Keledang Febr-March
500/fruit RL,PJ,O Forest Occasionally
Baccaurea macrocarpa (Miq.)
Kapul Febr-March
1,500-2000/kg
RL,O Forest Occasionally
Baccaurea motleyana Mull
Rambai Febr-April
500-750/kg
RL,PJ,O Cult. Regularly
Dimocarpus longan Loureiro
Mata Kucing
Jan-March
3,000-4,500/kg
RL,PJ,O Forest Occasionally
Durio kutejensis (Hassk.) Becc.
Lai Dec-March
2,500-3,000/fruit
RL,PJ,ML,O Forest Regularly
Durio bulcis Lahung/layung
Dec-April 2,000-3,000/fruit
RL,PJ,ML,O Forest Regularly
Durio zibethinus Murray
Durian Dec-March
5,000-7,500/fruit
RL,PJ,ML,O Forest Regularly
Garcinia dulcis (Roxb.) Kurz
Asam Kandis
March-July
6,000-8,000/kg
RL,O Cult. Occasionally
Garcinia mangostana L.
Manggis Dec-March
500-1,000/fruit
PJ,O Cult. Regularly
Lansium domesticum Correa
Langsat Dec-March
3,000-5,000/kg
RL,PJ,O Forest/cult.
Regularly
Mangifera caesia Jack
Wanyi Jan-febr. 1,500-2,000/kg
RL,PJ,O Cult. Occasionally
Nephelium lappaceum L.
Rambutan Jan-March
750-1,000/kg
RL,PJ,O Cult. Regularly
Parkia speciosa Hassk.
Petai All year 500-750/pod
RL,PJ,ML,O Forest/cult.
Regularly
Pangium edule Reinw.
Kluwak All year 3,000/kg RL,PJ,O Forest Occasionally
Sandoricum koetjape (Burm.f.)Merr.
Kecapi Jan-March
150-250/fruit
PJ,O Forest Occasionally
RL= Rantau layung, PJ=Pinang Jatus, ML=Muluy, O=other regions, Cult. = cultivated.
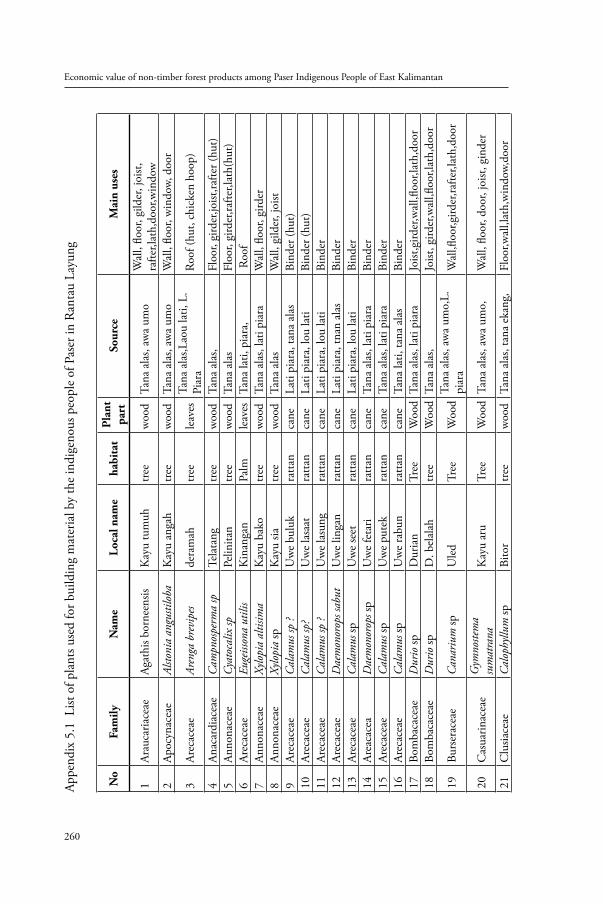
Economic value of non-timber forest products among Paser Indigenous People of East Kalimantan
260
Appe
ndix
5.1
List
of p
lant
s use
d fo
r bui
ldin
g m
ater
ial b
y th
e in
dige
nous
peo
ple
of P
aser
in R
anta
u La
yung
No
Fam
ilyN
ame
Loca
l nam
eha
bita
tPl
ant
part
Sour
ce
Mai
n us
es
1Ar
auca
riace
aeAg
athi
s bor
neen
sisK
ayu
tum
uhtre
ew
ood
Tana
ala
s, aw
a um
oW
all,
floor
, gild
er, j
oist,
ra
fter,l
ath,
door
,win
dow
2Ap
ocyn
acea
eAl
stoni
a an
gusti
loba
Kay
u an
gah
tree
woo
dTa
na a
las,
awa
umo
Wal
l, flo
or, w
indo
w, d
oor
3Ar
ecac
eae
Aren
ga b
revi
pes
dera
mah
tree
leav
esTa
na a
las,L
aou
lati,
L.
Piar
aRo
of (h
ut, c
hick
en h
oop)
4An
acar
diac
eae
Cam
pnos
perm
a sp
Tela
tang
tre
ew
ood
Tana
ala
s,Fl
oor,
gird
er,jo
ist,ra
fter (
hut)
5An
nona
ceae
Cyat
ocal
ix sp
Pelin
itan
tree
woo
dTa
na a
las
Floo
r, gi
rder
,rafte
r,lat
h(hu
t)6
Arec
acea
eEu
geiss
ona
utili
sK
inan
gan
Palm
leav
esTa
na la
ti, p
iara
, R
oof
7An
nona
ceae
Xylo
pia
altis
ima
Kay
u ba
kotre
ew
ood
Tana
ala
s, la
ti pi
ara
Wal
l, flo
or, g
irder
8An
nona
ceae
Xy
lopi
a sp
K
ayu
siatre
ew
ood
Tana
ala
sW
all,
gild
er, j
oist
9Ar
ecac
eae
Cal
amus
sp ?
Uw
e bu
luk
ratta
nca
neLa
ti pi
ara,
tana
ala
sBi
nder
(hut
)10
Arec
acea
eC
alam
us sp
?U
we
lasa
atra
ttan
cane
Lati
piar
a, lo
u la
tiBi
nder
(hut
)11
Arec
acea
eC
alam
us sp
?U
we
lasu
ngra
ttan
cane
Lati
piar
a, lo
u la
tiBi
nder
12Ar
ecac
eae
Dae
mon
orop
s sab
utU
we
linga
nra
ttan
cane
Lati
piar
a, tn
an a
las
Bind
er13
Arec
acea
e C
alam
us sp
Uw
e se
etra
ttan
cane
Lati
piar
a, lo
u la
tiBi
nder
14
Area
cace
aD
aem
onor
ops s
pU
we
feta
rira
ttan
cane
Tana
ala
s, la
ti pi
ara
Bind
er
15Ar
ecac
eae
Cal
amus
sp
Uw
e pu
tek
ratta
nca
neTa
na a
las,
lati
piar
aBi
nder
16Ar
ecac
eae
Cal
amus
spU
we
rabu
nra
ttan
cane
Tana
lati,
tana
ala
sBi
nder
17
Bom
baca
ceae
D
urio
sp
Dur
ian
Tree
W
ood
Tana
ala
s, la
ti pi
ara
Joist
,gird
er,w
all,fl
oor,l
ath,
door
18Bo
mba
cace
ae
Dur
io sp
D. b
elal
ahtre
eW
ood
Tana
ala
s, Jo
ist, g
irder
,wal
l,floo
r,lat
h,do
or
19Bu
rser
acea
eC
anar
ium
sp
Ule
d Tr
ee
Woo
d Ta
na a
las,
awa
umo,
L.pi
ara
Wal
l,floo
r,gird
er,ra
fter,l
ath,
door
20C
asua
rinac
eae
Gym
noste
ma
sum
atra
naK
ayu
aru
Tree
W
ood
Tana
ala
s, aw
a um
o,W
all,
floor
, doo
r, jo
ist, g
inde
r
21C
lusia
ceae
C
alop
hyllu
m sp
Bito
r tre
ew
ood
Tana
ala
s, ta
na e
kang
,Fl
oor,w
all,l
ath,
win
dow,
door
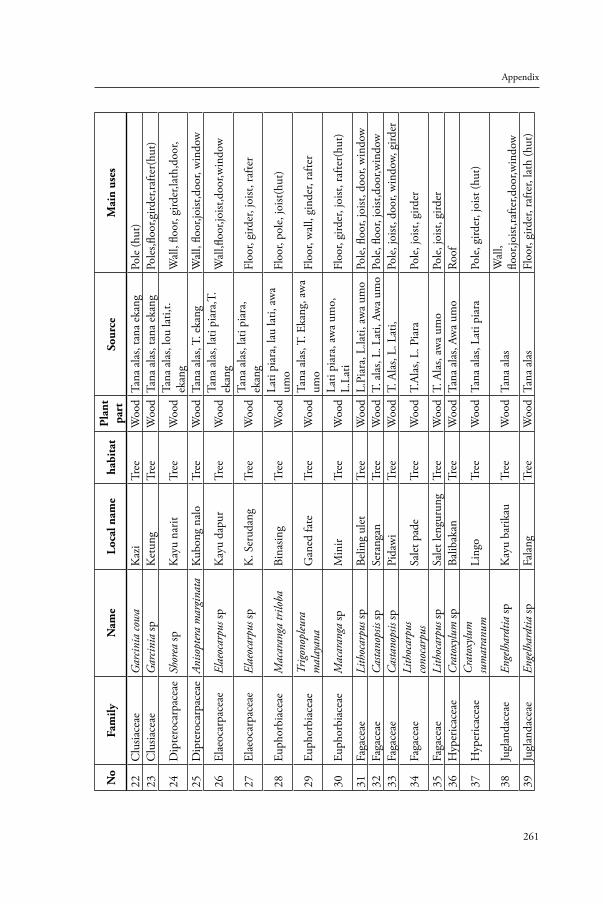
261
Appendix
No
Fam
ilyN
ame
Loca
l nam
eha
bita
tPl
ant
part
Sour
ce
Mai
n us
es
22C
lusia
ceae
G
arcin
ia co
wa
Kaz
i Tr
ee
Woo
d Ta
na a
las,
tana
eka
ngPo
le (h
ut)
23C
lusia
ceae
G
arcin
ia sp
Ket
ung
Tree
W
ood
Tana
ala
s, ta
na e
kang
Pole
s,floo
r,gird
er,ra
fter(
hut)
24D
ipte
roca
rpac
eae
Shor
ea sp
Kay
u na
ritTr
ee
Woo
d Ta
na a
las,
lou
lati,
t. ek
ang
Wal
l, flo
or, g
irder
,lath
,doo
r,
25D
ipte
roca
rpac
eae
Aniso
pter
a m
argi
nata
Kub
ong
nalo
Tree
W
ood
Tana
ala
s, T.
eka
ngW
all,
floor
,joist
,doo
r, w
indo
w
26El
aeoc
arpa
ceae
Elae
ocar
pus s
pK
ayu
dapu
rTr
ee
Woo
d Ta
na a
las,
lati
piar
a,T.
ekan
gW
all,fl
oor,j
oist,
door
,win
dow
27El
aeoc
arpa
ceae
Elae
ocar
pus s
p K
. Ser
udan
gTr
ee
Woo
d Ta
na a
las,
lati
piar
a,
ekan
gFl
oor,
gird
er, j
oist,
rafte
r
28Eu
phor
biac
eae
Mac
aran
ga tr
iloba
Bina
sing
Tree
W
ood
Lati
piar
a, la
u la
ti, a
wa
umo
Floo
r, po
le, j
oist(
hut)
29Eu
phor
biac
eae
Trig
onop
leura
m
alay
ana
Gan
ed fa
teTr
ee
Woo
d Ta
na a
las,
T. E
kang
, aw
a um
oFl
oor,
wal
l, gi
nder
, raf
ter
30Eu
phor
biac
eae
Mac
aran
ga sp
Min
ir Tr
ee
Woo
d La
ti pi
ara,
aw
a um
o,
L.La
tiFl
oor,
gird
er, j
oist,
rafte
r(hu
t)
31Fa
gace
aeLi
thoc
arpu
s sp
Belin
g ul
etTr
ee
Woo
d L.
Piar
a, L
.lati,
aw
a um
o Po
le, fl
oor,
joist
, doo
r, w
indo
w32
Faga
ceae
Cas
tano
psis
spSe
rang
anTr
ee
Woo
d T.
ala
s, L.
Lat
i, Aw
a um
oPo
le, fl
oor,
joist
,doo
r,win
dow
33Fa
gace
aeC
asta
nops
is sp
Pida
wi
Tree
W
ood
T. A
las,
L. L
ati,
Pole
, joi
st, d
oor,
win
dow,
gird
er
34Fa
gace
aeLi
thoc
arpu
s co
noca
rpus
Sale
t pad
eTr
ee
Woo
d T.
Alas
, L. P
iara
Pole
, joi
st, g
irder
35Fa
gace
aeLi
thoc
arpu
s sp
Sale
t len
guru
ngTr
ee
Woo
d T.
Ala
s, aw
a um
oPo
le, j
oist,
gird
er36
Hyp
eric
acea
eC
rato
xylu
m sp
Balib
akan
Tr
ee
Woo
d Ta
na a
las,
Awa
umo
Roof
37H
yper
icac
eae
Cra
toxy
lum
su
mat
ranu
mLi
ngo
Tree
W
ood
Tana
ala
s, La
ti pi
ara
Pole
, gird
er, j
oist
(hut
)
38Ju
glan
dace
aeEn
gelh
ardt
ia sp
K
ayu
barik
auTr
ee
Woo
d Ta
na a
las
Wal
l, flo
or,jo
ist,ra
fter,d
oor,w
indo
w39
Jugl
anda
ceae
Enge
lhar
dtia
spFa
lang
Tr
ee
Woo
d Ta
na a
las
Floo
r, gi
rder
, raf
ter,
lath
(hut
)
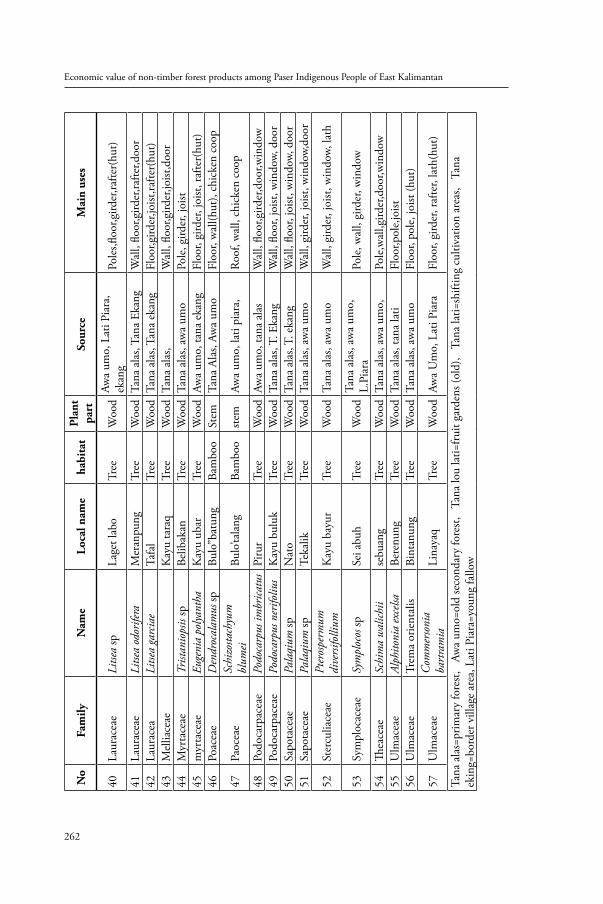
Economic value of non-timber forest products among Paser Indigenous People of East Kalimantan
262
No
Fam
ilyN
ame
Loca
l nam
eha
bita
tPl
ant
part
Sour
ce
Mai
n us
es
40La
urac
eae
Litse
a sp
Lage
t lab
oTr
ee
Woo
d Aw
a um
o, L
ati P
iara
, ek
ang
Pole
s,floo
r,gird
er,ra
fter(
hut)
41La
urac
eae
Litse
a od
orife
raM
eran
pung
Tr
ee
Woo
d Ta
na a
las,
Tana
Eka
ngW
all,
floor
,gird
er,ra
fter,d
oor
42La
urac
eaLi
tsea
garc
iae
Tafa
lTr
ee
Woo
d Ta
na a
las,
Tana
eka
ngFl
oor,g
irder
,joist
,rafte
r(hu
t)43
Mel
liace
aeK
ayu
tara
qTr
ee
Woo
d Ta
na a
las,
Wal
l, flo
or,g
irder
,joist
,doo
r44
Myr
tace
aeTr
istan
iops
is sp
Belib
akan
Tr
ee
Woo
d Ta
na a
las,
awa
umo
Pole
, gird
er, j
oist
45m
yrta
ceae
Euge
nia
polya
ntha
Kay
u ub
arTr
ee
Woo
d Aw
a um
o, ta
na e
kang
Floo
r, gi
rder
, joi
st, ra
fter(
hut)
46Po
acea
eD
endr
ocal
amus
spBu
lo”b
atun
gBa
mbo
o St
em
Tana
Ala
s, Aw
a um
oFl
oor,
wal
l(hut
), ch
icke
n co
op
47Pa
ocea
eSc
hizo
stach
yum
bl
umei
Bulo
’tala
ngBa
mbo
o ste
mAw
a um
o, la
ti pi
ara,
Ro
of, w
all,
chic
ken
coop
48Po
doca
rpac
eae
Podo
carp
us im
brica
tus
Piru
r Tr
ee
Woo
d Aw
a um
o, ta
na a
las
Wal
l, flo
or,g
irder
,doo
r,win
dow
49Po
doca
rpac
eae
Podo
carp
us n
erifo
lius
Kay
u bu
luk
Tree
W
ood
Tana
ala
s, T.
Eka
ngW
all,
floor
, joi
st, w
indo
w, d
oor
50Sa
pota
ceae
Pala
qium
sp
Nat
o Tr
ee
Woo
d Ta
na a
las,
T. e
kang
Wal
l, flo
or, j
oist,
win
dow,
doo
r51
Sapo
tace
aePa
laqi
um sp
Teka
likTr
ee
Woo
d Ta
na a
las,
awa
umo
Wal
l, gi
rder
, joi
st, w
indo
w,do
or
52St
ercu
liace
aePt
eros
perm
um
dive
rsifo
llium
Kay
u ba
yur
Tree
W
ood
Tana
ala
s, aw
a um
oW
all,
gird
er, j
oist,
win
dow,
lath
53Sy
mpl
ocac
eae
Sym
ploc
os sp
Sei a
buh
Tree
W
ood
Tana
ala
s, aw
a um
o,
L.Pi
ara
Pole
, wal
l, gi
rder
, win
dow
54Th
eace
ae
Schi
ma
wal
ichii
sebu
ang
Tree
W
ood
Tana
ala
s, aw
a um
o,
Pole
,wal
l,gird
er,d
oor,w
indo
w55
Ulm
acea
eAl
phito
nia
exce
lsaBe
renu
ng
Tree
W
ood
Tana
ala
s, ta
na la
tiFl
oor,p
ole,
joist
56U
lmac
eae
Trem
a or
ient
alis
Bint
anun
g Tr
ee
Woo
d Ta
na a
las,
awa
umo
Floo
r, po
le, j
oist
(hut
)
57U
lmac
eae
Com
mer
soni
a ba
rtra
mia
Lina
yaq
Tree
W
ood
Awa
Um
o, L
ati P
iara
Floo
r, gi
rder
, raf
ter,
lath
(hut
)
Tana
ala
s=pr
imar
y fo
rest,
Aw
a um
o=ol
d se
cond
ary
fore
st,
Tana
lou
lati=
fruit
gard
ens (
old)
, T
ana
lati=
shift
ing
culti
vatio
n ar
eas,
Tan
a ek
ing=
bord
er v
illag
e ar
ea, L
ati P
iara
=you
ng fa
llow
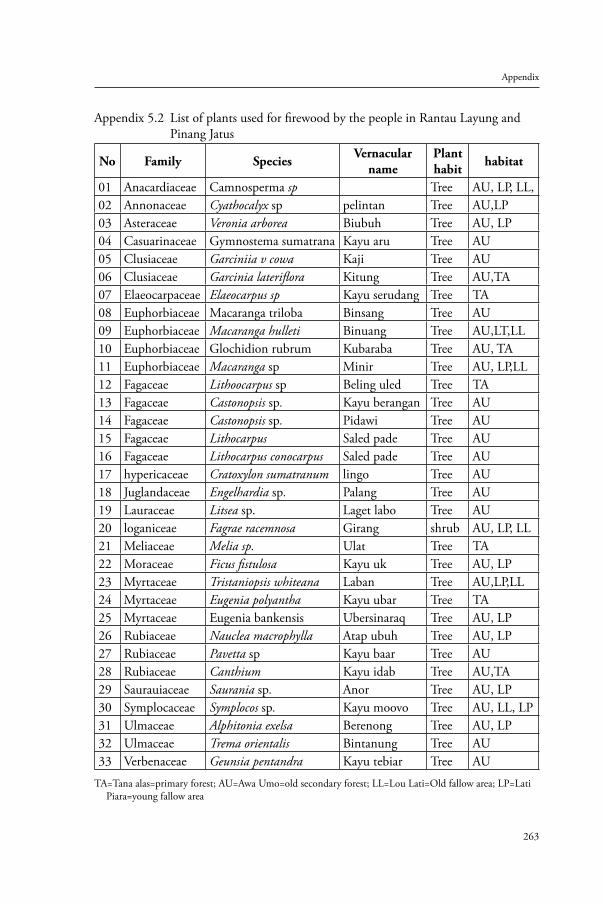
263
Appendix
Appendix 5.2 List of plants used for firewood by the people in Rantau Layung and Pinang Jatus
No Family Species Vernacular name
Plant habit habitat
01 Anacardiaceae Camnosperma sp Tree AU, LP, LL,02 Annonaceae Cyathocalyx sp pelintan Tree AU,LP03 Asteraceae Veronia arborea Biubuh Tree AU, LP04 Casuarinaceae Gymnostema sumatrana Kayu aru Tree AU05 Clusiaceae Garciniia v cowa Kaji Tree AU06 Clusiaceae Garcinia lateriflora Kitung Tree AU,TA07 Elaeocarpaceae Elaeocarpus sp Kayu serudang Tree TA08 Euphorbiaceae Macaranga triloba Binsang Tree AU09 Euphorbiaceae Macaranga hulleti Binuang Tree AU,LT,LL10 Euphorbiaceae Glochidion rubrum Kubaraba Tree AU, TA11 Euphorbiaceae Macaranga sp Minir Tree AU, LP,LL12 Fagaceae Lithoocarpus sp Beling uled Tree TA13 Fagaceae Castonopsis sp. Kayu berangan Tree AU14 Fagaceae Castonopsis sp. Pidawi Tree AU15 Fagaceae Lithocarpus Saled pade Tree AU16 Fagaceae Lithocarpus conocarpus Saled pade Tree AU17 hypericaceae Cratoxylon sumatranum lingo Tree AU18 Juglandaceae Engelhardia sp. Palang Tree AU19 Lauraceae Litsea sp. Laget labo Tree AU20 loganiceae Fagrae racemnosa Girang shrub AU, LP, LL21 Meliaceae Melia sp. Ulat Tree TA22 Moraceae Ficus fistulosa Kayu uk Tree AU, LP23 Myrtaceae Tristaniopsis whiteana Laban Tree AU,LP,LL24 Myrtaceae Eugenia polyantha Kayu ubar Tree TA25 Myrtaceae Eugenia bankensis Ubersinaraq Tree AU, LP26 Rubiaceae Nauclea macrophylla Atap ubuh Tree AU, LP27 Rubiaceae Pavetta sp Kayu baar Tree AU28 Rubiaceae Canthium Kayu idab Tree AU,TA29 Saurauiaceae Saurania sp. Anor Tree AU, LP30 Symplocaceae Symplocos sp. Kayu moovo Tree AU, LL, LP31 Ulmaceae Alphitonia exelsa Berenong Tree AU, LP32 Ulmaceae Trema orientalis Bintanung Tree AU33 Verbenaceae Geunsia pentandra Kayu tebiar Tree AU
TA=Tana alas=primary forest; AU=Awa Umo=old secondary forest; LL=Lou Lati=Old fallow area; LP=Lati Piara=young fallow area
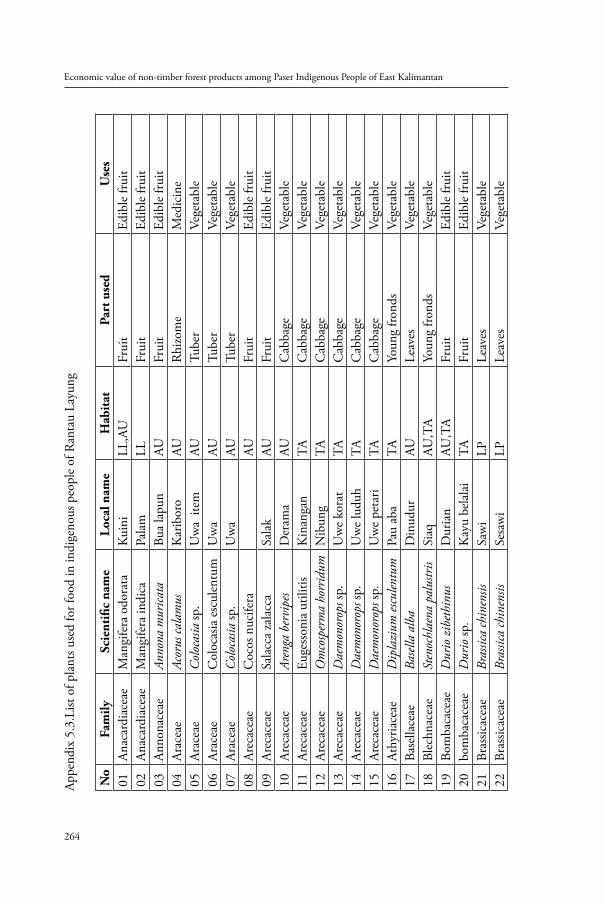
Economic value of non-timber forest products among Paser Indigenous People of East Kalimantan
264
Appe
ndix
5.3
.List
of p
lant
s use
d fo
r foo
d in
indi
geno
us p
eopl
e of
Ran
tau
Layu
ng
No
Fam
ily
Scie
ntifi
c na
me
Loca
l nam
e H
abit
at
Part
use
d U
ses
01An
acar
diac
eae
Man
gife
ra o
dora
taK
uini
LL
,AU
Frui
t Ed
ible
frui
t02
Anac
ardi
acea
e M
angi
fera
indi
ca
Pala
m
LLFr
uit
Edib
le fr
uit
03
Anno
nace
ae
Anno
na m
urica
ta
Bua
lapu
nAU
Frui
t Ed
ible
frui
t 04
Arac
eae
Acor
us ca
lam
us
Kar
ibor
o AU
Rhi
zom
e M
edic
ine
05Ar
acea
e C
oloc
asia
sp.
Uw
a it
emAU
Tube
rVe
geta
ble
06Ar
acea
e C
oloc
asia
esc
ulen
tum
Uw
a
AUTu
ber
Vege
tabl
e 07
Arac
eae
Col
ocas
ia sp
.U
wa
AUTu
ber
Vege
tabl
e 08
Arec
acea
e C
ocos
nuc
ifera
AU
Frui
t Ed
ible
frui
t 09
Arec
acea
e Sa
lacc
a za
lacc
aSa
lak
AUFr
uit
Edib
le fr
uit
10Ar
ecac
eae
Aren
ga b
ervi
pes
Der
ama
AUC
abba
ge
Vege
tabl
e 11
Arec
acea
e Eu
gess
onia
util
itis
Kin
anga
n TA
Cab
bage
Ve
geta
ble
12Ar
ecac
eae
Om
cosp
erm
a ho
rrid
um
Nib
ung
TAC
abba
ge
Vege
tabl
e 13
Arec
acea
e D
aem
onor
ops s
p.U
we
kora
tTA
C
abba
ge
Vege
tabl
e 14
Ar
ecac
eae
Dae
mon
orop
s sp.
Uw
e lu
duh
TAC
abba
ge
Vege
tabl
e 15
Arec
acea
e D
aem
onor
ops s
p.U
we
peta
ri TA
Cab
bage
Ve
geta
ble
16At
hyria
ceae
D
ipla
zium
escu
lentu
m
Pau
aba
TAYo
ung
frond
s Ve
geta
ble
17Ba
sella
ceae
Ba
sella
alb
a D
inud
ur
AULe
aves
Ve
geta
ble
18Bl
echn
acea
e St
enoc
hlae
na p
alus
tris
Siaq
AU
,TA
Youn
g fro
nds
Vege
tabl
e19
Bom
baca
ceae
D
urio
zib
ethi
nus
Dur
ian
AU,T
AFr
uit
Edib
le fr
uit
20bo
mba
cace
aeD
urio
sp.
Kay
u be
lala
iTA
Frui
t Ed
ible
frui
t21
Bras
sicac
eae
Bras
sica
chin
ensis
Sa
wi
LPLe
aves
Ve
geta
ble
22Br
assic
acea
e Br
assic
a ch
inen
sis
Sesa
wi
LPLe
aves
Ve
geta
ble
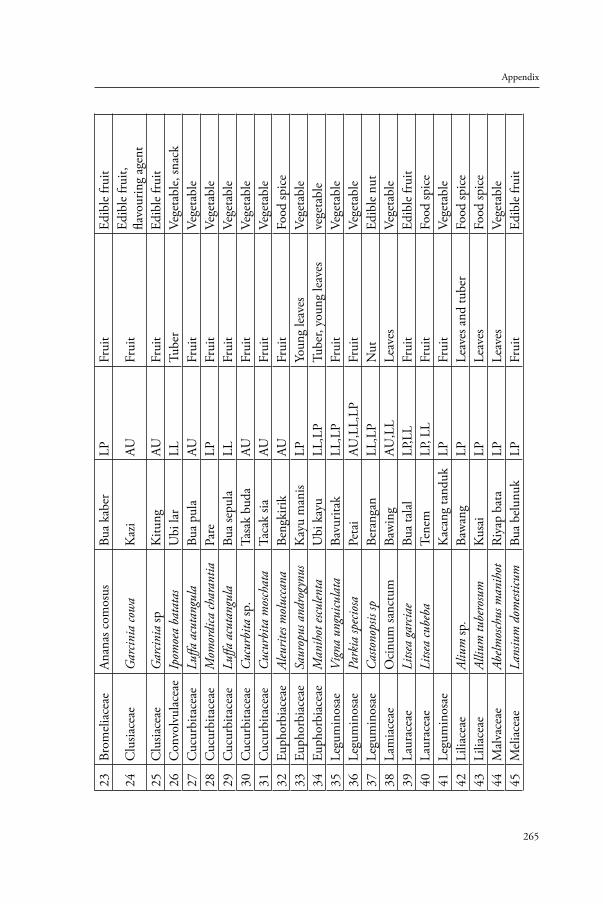
265
Appendix
23Br
omel
iace
ae
Anan
as c
omos
us
Bua
kabe
r LP
Frui
t Ed
ible
frui
t
24C
lusia
ceae
G
arcin
ia co
wa
Kaz
i AU
Frui
t Ed
ible
frui
t, fla
vour
ing
agen
t25
Clu
siace
ae
Gar
cinia
sp
Kitu
ng
AUFr
uit
Edib
le fr
uit
26C
onvo
lvul
acea
e Ip
omoe
a ba
tata
sU
bi la
rLL
Tube
r Ve
geta
ble,
snac
k27
Cuc
urbi
tace
ae
Luffa
acu
tang
ula
Bua
pula
AUFr
uit
Vege
tabl
e 28
Cuc
urbi
tace
ae
Mom
ordi
ca ch
aran
tia
Pare
LP
Frui
t Ve
geta
ble
29C
ucur
bita
ceae
Lu
ffa a
cuta
ngul
aBu
a se
pula
LL
Frui
t Ve
geta
ble
30C
ucur
bita
ceae
C
ucur
bita
sp.
Tasa
k bu
da
AUFr
uit
Vege
tabl
e31
Cuc
urbi
tace
ae
Cuc
urbi
ta m
osch
ata
Taca
k sia
AUFr
uit
Vege
tabl
e32
Euph
orbi
acea
e Al
eurit
es m
oluc
cana
Beng
kirik
AU
Frui
t Fo
od sp
ice
33Eu
phor
biac
eae
Saur
opus
and
rogy
nus
Kay
u m
anis
LPYo
ung
leav
es
Vege
tabl
e 34
Euph
orbi
acea
e M
anih
ot es
culen
ta
Ubi
kay
u LL
,LP
Tube
r, yo
ung
leav
esve
geta
ble
35Le
gum
inos
ae
Vign
a un
guicu
lata
Ba
vurit
ak
LL,L
PFr
uit
Vege
tabl
e 36
Legu
min
osae
Pa
rkia
spec
iosa
Pe
tai
AU,L
L,LP
Frui
t Ve
geta
ble
37Le
gum
inos
ae
Cas
tono
psis
spBe
rang
an
LL,L
PN
ut
Edib
le n
ut38
Lam
iace
ae
Oci
num
sanc
tum
Baw
ing
AU,L
LLe
aves
Ve
geta
ble
39La
urac
eae
Litse
a ga
rcia
e Bu
a ta
lal
LP,L
LFr
uit
Edib
le fr
uit
40La
urac
eae
Litse
a cu
beba
Te
nem
LP
, LL
Frui
t Fo
od sp
ice
41Le
gum
inos
ae
Kac
ang
tand
ukLP
Frui
t Ve
geta
ble
42Li
liace
ae
Aliu
m sp
. Ba
wan
g LP
Leav
es a
nd tu
ber
Food
spic
e 43
Lilia
ceae
Al
lium
tube
rosu
m
Kus
ai
LPLe
aves
Fo
od sp
ice
44M
alva
ceae
Ab
elmos
chus
man
ihot
R
iyap
bat
a LP
Leav
es
Vege
tabl
e 45
Mel
iace
ae
Lans
ium
dom
esticu
m
Bua
belu
nuk
LPFr
uit
Edib
le fr
uit
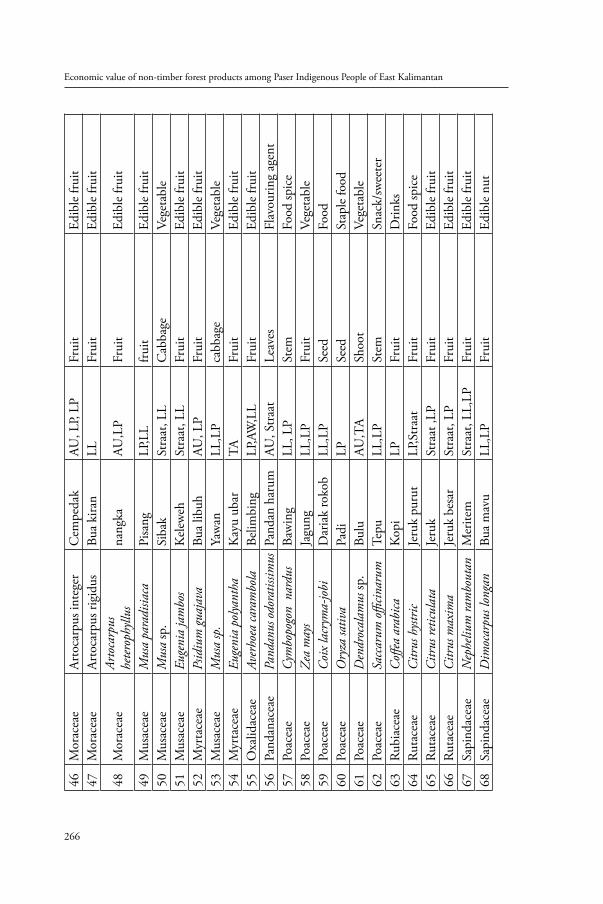
Economic value of non-timber forest products among Paser Indigenous People of East Kalimantan
266
46M
orac
eae
Arto
carp
us in
tege
rC
empe
dak
AU, L
P, LP
Frui
t Ed
ible
frui
t 47
Mor
acea
e Ar
toca
rpus
rigi
dus
Bua
kira
n LL
Frui
t Ed
ible
frui
t
48M
orac
eae
Arto
carp
us
hete
roph
yllus
na
ngka
AU,L
PFr
uit
Edib
le fr
uit
49M
usac
eae
Mus
a pa
radi
siaca
Pisa
ngLP
,LL
fruit
Edib
le fr
uit
50M
usac
eae
Mus
a sp
. Si
bak
Stra
at, L
LC
abba
ge
Vege
tabl
e51
Mus
acea
e Eu
geni
a ja
mbo
sK
elew
eh
Stra
at, L
LFr
uit
Edib
le fr
uit
52M
yrta
ceae
Ps
idiu
m g
uaja
va
Bua
libuh
AU
, LP
Frui
t Ed
ible
frui
t 53
Mus
acea
e M
usa
sp.
Yaw
an
LL,L
Pca
bbag
eVe
geta
ble
54M
yrta
ceae
Eu
geni
a po
lyant
ha
Kay
u ub
ar
TAFr
uit
Edib
le fr
uit
55O
xalid
acea
e Av
erho
ea ca
ram
bola
Be
limbi
ng
LP,A
W,L
LFr
uit
Edib
le fr
uit
56Pa
ndan
acea
e Pa
ndan
us o
dora
tissim
us P
anda
n ha
rum
AU, S
traa
tLe
aves
Fl
avou
ring
agen
t57
Poac
eae
Cym
bopo
gon
nar
dus
Baw
ing
LL, L
PSt
em
Food
spic
e58
Poac
eae
Zea
may
s Ja
gung
LL
,LP
Frui
t Ve
geta
ble
59Po
acea
e C
oix
lacr
yma-
jobi
Dar
iak
roko
bLL
,LP
Seed
Fo
od
60Po
acea
e O
ryza
sativ
a Pa
di
LPSe
ed
Stap
le fo
od61
Poac
eae
Den
droc
alam
us sp
. Bu
lu
AU,T
ASh
oot
Vege
tabl
e62
Poac
eae
Sacc
arum
offi
cinar
um
Tepu
LL
,LP
Stem
Sn
ack/
swee
ter
63Ru
biac
eae
Coff
ea a
rabi
ca
Kop
i LP
Frui
t D
rinks
64
Ruta
ceae
C
itrus
hys
tric
Jeru
k pu
rut
LP,S
traa
tFr
uit
Food
spic
e65
Ruta
ceae
C
itrus
retic
ulat
a Je
ruk
Stra
at ,L
PFr
uit
Edib
le fr
uit
66Ru
tace
ae
Citr
us m
axim
a Je
ruk
besa
r St
raat
, LP
Frui
t Ed
ible
frui
t67
Sa
pind
acea
e N
ephe
lium
ram
bout
anM
erite
mSt
raat
, LL,
LPFr
uit
Edib
le fr
uit
68Sa
pind
acea
e D
imoc
arpu
s lon
gan
Bua
mav
uLL
,LP
Frui
t Ed
ible
nut
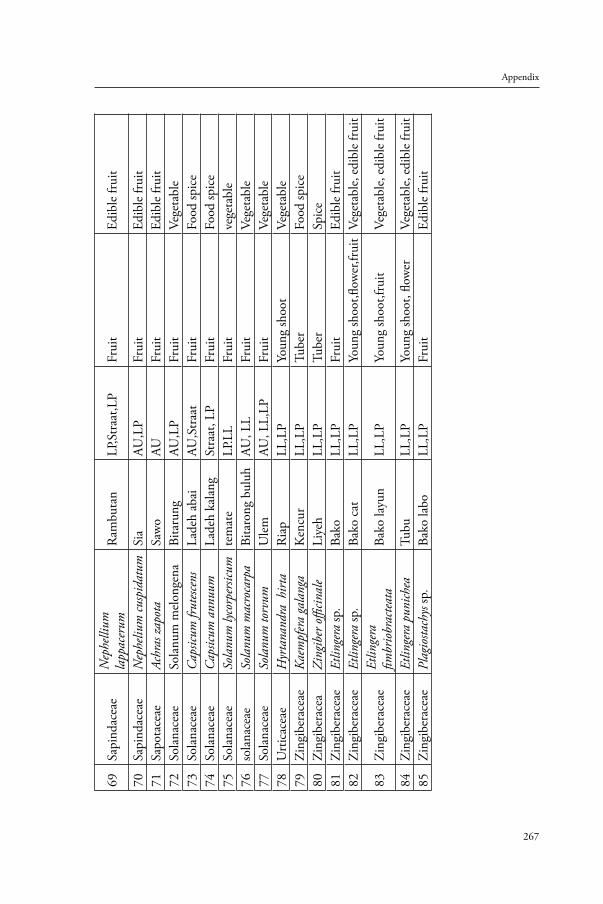
267
Appendix
69Sa
pind
acea
e N
ephe
llium
la
ppac
erum
Ram
buta
n LP
,Str
aat,L
PFr
uit
Edib
le fr
uit
70Sa
pind
acea
e N
ephe
lium
cusp
idat
um
Sia
AU,L
PFr
uit
Edib
le fr
uit
71
Sapo
tace
ae
Achr
as z
apot
aSa
wo
AUFr
uit
Edib
le fr
uit
72So
lana
ceae
So
lanu
m m
elon
gena
Bi
taru
ng
AU,L
PFr
uit
Vege
tabl
e 73
Sola
nace
ae
Cap
sicum
frut
escen
sLa
deh
abai
AU,S
traa
tFr
uit
Food
spic
e 74
Sola
nace
ae
Cap
sicum
ann
uum
La
deh
kala
ng
Stra
at, L
PFr
uit
Food
spic
e 75
So
lana
ceae
So
lanu
m ly
corp
ersic
um
tem
ate
LP.L
LFr
uit
vege
tabl
e76
sola
nace
aeSo
lanu
m m
acro
carp
aBi
taro
ng b
uluh
AU, L
LFr
uit
Vege
tabl
e77
Sola
nace
ae
Sola
num
torv
um
Ule
m
AU, L
L,LP
Frui
t Ve
geta
ble
78U
rtic
acea
e H
yrta
nand
ra h
irta
Ria
p LL
,LP
Youn
g sh
oot
Vege
tabl
e 79
Zing
iber
acea
e Ka
empf
era
gala
nga
Ken
cur
LL,L
PTu
ber
Food
spic
e 80
Zing
iber
acea
Zi
ngib
er o
fficin
ale
Liye
h LL
,LP
Tube
r Sp
ice
81Zi
ngib
erac
eae
Etlin
gera
sp.
Bako
LL
,LP
Frui
t Ed
ible
frui
t 82
Zing
iber
acea
e Et
linge
ra sp
. Ba
ko c
at
LL,L
PYo
ung
shoo
t,flow
er,fr
uit
Vege
tabl
e, ed
ible
frui
t
83Zi
ngib
erac
eae
Etlin
gera
fim
brio
brac
teat
aBa
ko la
yun
LL,L
PYo
ung
shoo
t,fru
itVe
geta
ble,
edib
le fr
uit
84Zi
ngib
erac
eae
Etlin
gera
pun
ichea
Tu
bu
LL,L
PYo
ung
shoo
t, flo
wer
Vege
tabl
e, ed
ible
frui
t85
Zing
iber
acea
e Pl
agio
stach
ys sp
.Ba
ko la
boLL
,LP
Frui
t Ed
ible
frui
t
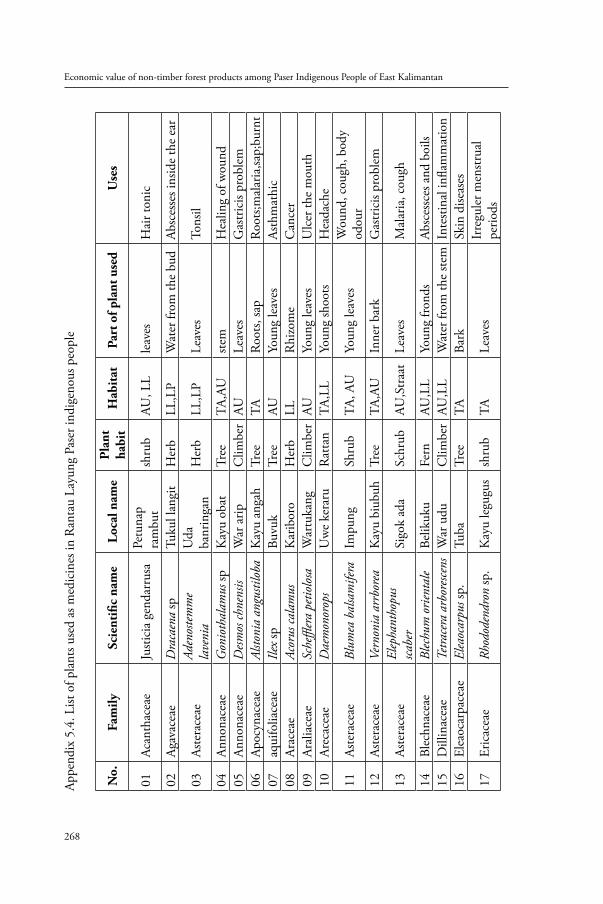
Economic value of non-timber forest products among Paser Indigenous People of East Kalimantan
268
Appe
ndix
5.4
. List
of p
lant
s use
d as
med
icin
es in
Ran
tau
Layu
ng P
aser
indi
geno
us p
eopl
e
No.
Fam
ilySc
ient
ific
nam
eLo
cal n
ame
Plan
t ha
bit
Hab
itat
Part
of p
lant
use
dU
ses
01Ac
anth
acea
e Ju
stici
a ge
ndar
rusa
Pe
tuna
p ra
mbu
t sh
rub
AU, L
Lle
aves
Hai
r ton
ic
02Ag
avac
eae
Dra
caen
a sp
Tuku
l lan
git
Her
b LL
,LP
Wat
er fr
om th
e bu
dAb
sces
ses i
nsid
e th
e ea
r
03As
tera
ceae
Ad
enos
tem
me
lave
nia
Uda
ba
nrin
gan
Her
b LL
,LP
Leav
es
Tons
il
04An
nona
ceae
G
onio
thal
amus
spK
ayu
obat
Tr
ee
TA,A
Uste
mH
ealin
g of
wou
nd05
Anno
nace
ae
Desm
os ch
nens
is W
ar a
rip
Clim
ber
AULe
aves
G
astr
icis
prob
lem
06Ap
ocyn
acea
e Al
stoni
a an
gusti
loba
K
ayu
anga
h Tr
ee
TARo
ots,
sap
Root
s;mal
aria
,sap;
burn
t07
aqui
folia
ceae
Ilex
spBu
vuk
Tree
AU
Youn
g le
aves
As
thm
athi
c08
Arac
eae
Acor
us ca
lam
us
Kar
ibor
o H
erb
LLR
hizo
me
Can
cer
09Ar
alia
ceae
Sc
heffl
era
petio
losa
W
artu
kang
C
limbe
r AU
Yo
ung
leav
es
Ulc
er th
e m
outh
10Ar
ecac
eae
Dae
mon
orop
s U
we
kera
ruR
atta
n TA
,LL
Youn
g sh
oots
Hea
dach
e
11As
tera
ceae
Bl
umea
bal
sam
ifera
Im
pung
Sh
rub
TA, A
UYo
ung
leav
es
Wou
nd, c
ough
, bod
y od
our
12As
tera
ceae
Ve
rnon
ia a
rrbo
rea
Kay
u bi
ubuh
Tr
ee
TA,A
UIn
ner b
ark
Gas
tric
is pr
oble
m
13As
tera
ceae
El
epha
ntho
pus
scabe
r Si
gok
ada
Schr
ub
AU,S
traa
tLe
aves
M
alar
ia, c
ough
14Bl
echn
acea
e Bl
echu
m o
rient
ale
Belik
uku
Fern
AU
,LL
Youn
g fro
nds
Absc
essc
es a
nd b
oils
15D
illin
acea
e Te
trace
ra a
rbor
escen
sW
ar u
duC
limbe
r AU
,LL
Wat
er fr
om th
e ste
mIn
testi
nal i
nflam
mat
ion
16El
eaoc
arpa
ceae
El
eaoc
arpu
s sp.
Tuba
Tr
ee
TABa
rk
Skin
dise
ases
17Er
icac
eae
Rhod
oden
dron
sp.
Kay
u le
gugu
ssh
rub
TALe
aves
Ir
regu
ler m
enstr
ual
perio
ds
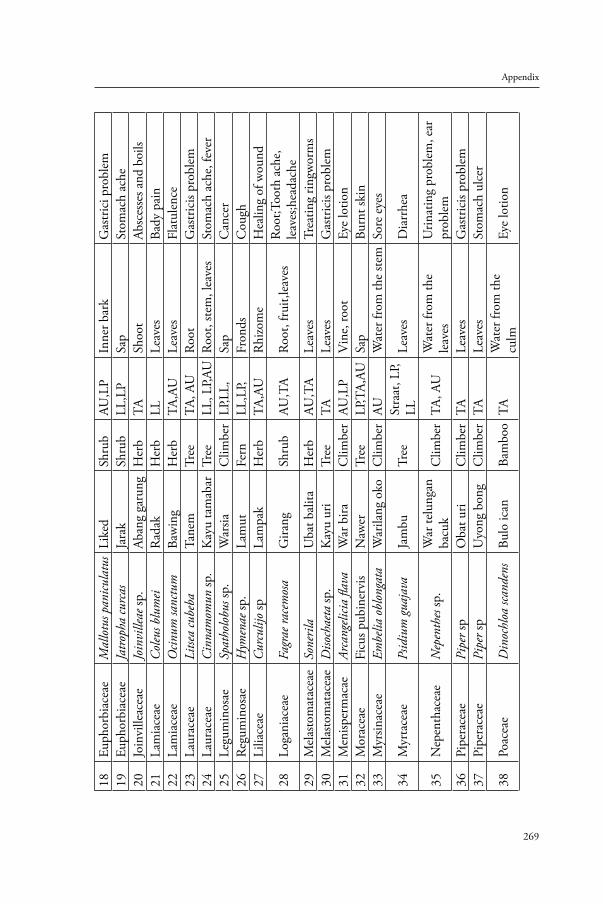
269
Appendix
18Eu
phor
biac
eae
Mal
lotu
s pan
icula
tus
Like
d Sh
rub
AU,L
PIn
ner b
ark
Gas
tric
i pro
blem
19Eu
phor
biac
eae
Jatro
pha
curc
as
Jara
kSh
rub
LL,L
PSa
p St
omac
h ac
he
20Jo
invi
lleac
eae
Join
ville
ae sp
.Ab
ang
garu
ng
Her
b TA
Shoo
t Ab
sces
ses a
nd b
oils
21La
mia
ceae
C
oleu
s blu
mei
Rad
ak
Her
b LL
Leav
es
Bady
pai
n22
Lam
iace
ae
Ocin
um sa
nctu
m
Baw
ing
Her
b TA
,AU
Leav
es
Flat
ulen
ce
23La
urac
eae
Litse
a cu
beba
Ta
nem
Tr
ee
TA, A
U
Root
G
astr
icis
prob
lem
24La
urac
eae
Cin
nam
omun
sp.
Kay
u ta
mab
ar
Tree
LL
, LP,A
URo
ot, s
tem
, lea
ves
Stom
ach
ache
, fev
er
25Le
gum
inos
ae
Spat
holo
bus s
p.W
arsia
C
limbe
r LP
,LL,
Sap
Can
cer
26Re
gum
inos
ae
Hym
enae
sp.
Lam
ut
Fern
LL
,LP,
Fron
ds
Cou
gh
27Li
liace
ae
Cur
culij
o sp
Lam
pak
Her
b TA
,AU
Rhi
zom
e H
ealin
g of
wou
nd
28Lo
gani
acea
e Fa
grae
race
mos
a G
irang
Sh
rub
AU,T
ARo
ot, f
ruit,
leav
es
Root
;Too
th a
che,
le
aves
;hea
dach
e 29
Mel
asto
mat
acea
e So
neril
a U
bat b
alita
H
erb
AU,T
ALe
aves
Tr
eatin
g rin
gwor
ms
30M
elas
tom
atac
eae
Diso
chae
ta sp
.K
ayu
uri
Tree
TA
Le
aves
G
astr
icis
prob
lem
31M
enisp
erm
acae
Ar
cang
elicia
flav
a W
ar b
ira
Clim
ber
AU,L
PV
ine,
root
Eye
lotio
n32
M
orac
eae
Ficu
s pub
iner
vis
Naw
er
Tree
LP
,TA,
AUSa
p Bu
rnt s
kin
33M
yrsin
acea
e Em
belia
obl
onga
ta
War
ilang
oko
C
limbe
r AU
Wat
er fr
om th
e ste
mSo
re e
yes
34M
yrta
ceae
Ps
idiu
m g
uaja
va
Jam
bu
Tree
St
raat
, LP,
LLLe
aves
D
iarr
hea
35N
epen
thac
eae
Nep
enth
es sp
. W
ar te
lung
an
bacu
k C
limbe
r TA
, AU
Wat
er fr
om th
e le
aves
Urin
atin
g pr
oble
m, e
ar
prob
lem
36
Pipe
race
ae
Pipe
r sp
Oba
t uri
Clim
ber
TA
Leav
es
Gas
tric
is pr
oble
m
37
Pipe
race
ae
Pipe
r sp
Uyo
ng b
ong
Clim
ber
TA
Leav
es
Stom
ach
ulce
r
38Po
acea
e D
inoc
hloa
scan
dens
Bu
lo ic
an
Bam
boo
TA
Wat
er fr
om th
e cu
lmEy
e lo
tion
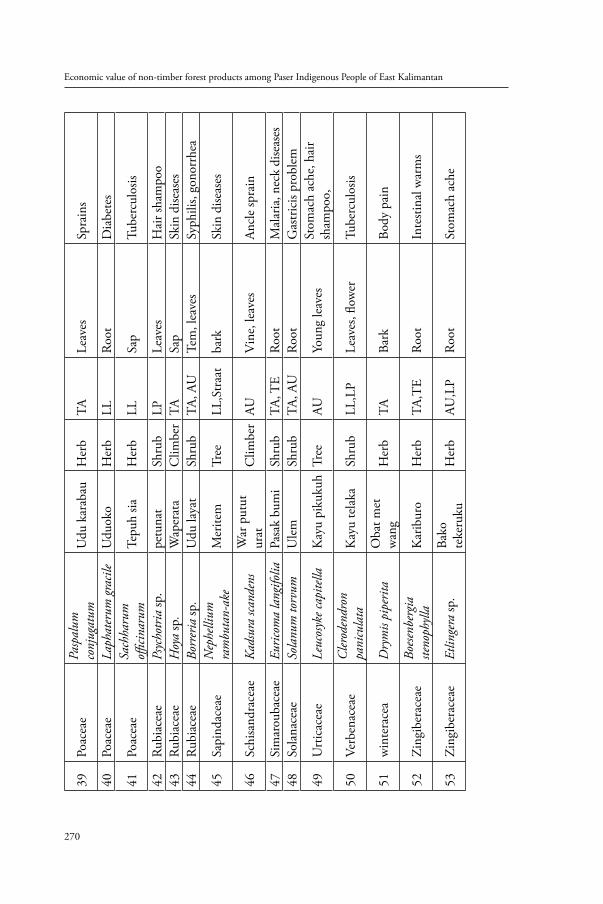
Economic value of non-timber forest products among Paser Indigenous People of East Kalimantan
270
39Po
acea
e Pa
spal
um
conj
ugat
um
Udu
kar
abau
H
erb
TA
Leav
es
Spra
ins
40
Poac
eae
Laph
ater
um g
racil
e U
duok
o H
erb
LLRo
ot
Dia
bete
s
41
Poac
eae
Sach
haru
m
officin
arum
Tepu
h sia
H
erb
LLSa
p Tu
berc
ulos
is
42Ru
biac
eae
Psyc
hotri
a sp
.pe
tuna
tSh
rub
LPLe
aves
H
air s
ham
poo
43
Rubi
acea
e H
oya
sp.
Wap
erat
a C
limbe
r TA
Sap
Skin
dise
ases
44
Rubi
acea
e Bo
rrer
ia sp
.U
du la
yat
Shru
b TA
, AU
Tem
, lea
ves
Syph
ilis,
gono
rrhe
a
45Sa
pind
acea
e N
ephe
llium
ra
mbu
tan-
ake
Mer
item
Tr
ee
LL,S
traa
tba
rkSk
in d
iseas
es
46Sc
hisa
ndra
ceae
Ka
dsur
a sca
nden
s W
ar p
utut
ur
at
Clim
ber
AUV
ine,
leav
esAn
cle
spra
in
47Si
mar
ouba
ceae
Eu
ricom
a la
ngifo
lia
Pasa
k bu
mi
Shru
b TA
, TE
Root
M
alar
ia, n
eck
dise
ases
48So
lana
ceae
So
lanu
m to
rvum
U
lem
Sh
rub
TA, A
URo
ot
Gas
tric
is pr
oble
m
49U
rtic
acea
e Le
ucos
yke c
apite
lla
Kay
u pi
kuku
h Tr
ee
AUYo
ung
leav
es
Stom
ach
ache
, hai
r sh
ampo
o,
50Ve
rben
acea
e C
lerod
endr
on
pani
cula
taK
ayu
tela
kaSh
rub
LL,L
PLe
aves
, flow
er
Tube
rcul
osis
51w
inte
race
aD
rym
is pi
perit
a O
bat m
et
wan
g H
erb
TA
Bark
Bo
dy p
ain
52Zi
ngib
erac
eae
Boese
nber
gia
steno
phyll
aK
arib
uro
H
erb
TA,T
ERo
ot
Inte
stina
l war
ms
53
Zing
iber
acea
e Et
linge
ra sp
. Ba
ko
teke
ruku
H
erb
AU,L
PRo
ot
Stom
ach
ache
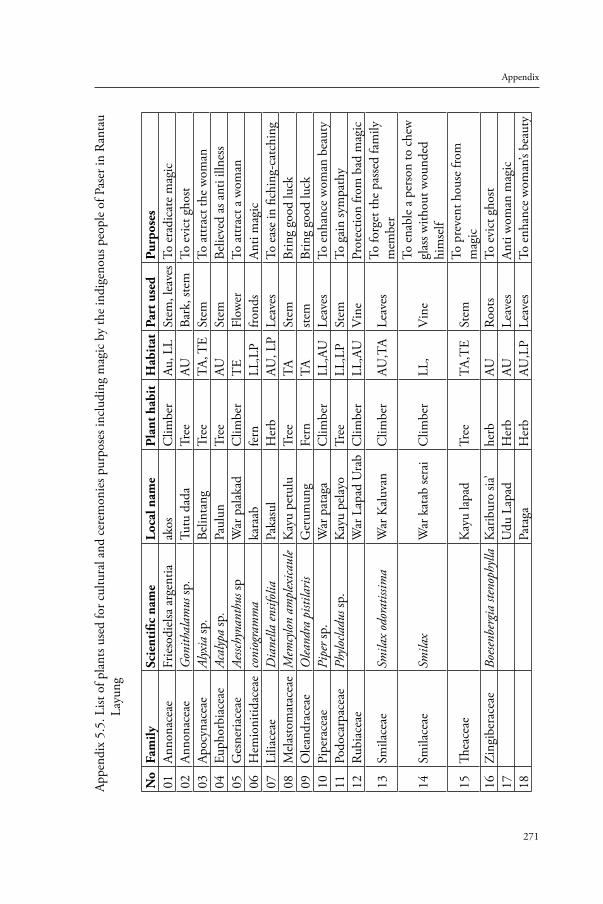
271
Appendix
Appe
ndix
5.5
. List
of p
lant
s use
d fo
r cul
tura
l and
cer
emon
ies p
urpo
ses i
nclu
ding
mag
ic b
y th
e in
dige
nous
peo
ple
of P
aser
in R
anta
u La
yung
No
Fam
ily
Scie
ntifi
c na
me
Loca
l nam
e Pl
ant h
abit
H
abit
at P
art u
sed
Purp
oses
01
Anno
nace
ae
Frie
sodi
elsa
arg
entia
ak
osC
limbe
r Au
, LL
Stem
, lea
ves
To e
radi
cate
mag
ic02
Anno
nace
ae
Gon
ithal
amus
sp.
Tutu
dad
a Tr
ee
AUBa
rk, s
tem
To e
vict
gho
st03
Apoc
ynac
eae
Alyx
ia sp
. Be
linta
ng
Tree
TA
, TE
Stem
To
attr
act t
he w
oman
04Eu
phor
biac
eae
Acal
ypa
sp.
Paul
un
Tree
AU
Stem
Be
lieve
d as
ant
i illn
ess
05G
esne
riace
ae
Aessc
hyna
nthu
s sp
War
pal
akad
C
limbe
r T
EFl
ower
To
attr
act a
wom
an06
Hem
ioni
tidac
eae
coni
ogra
mm
aka
raab
fern
LL,L
Pfro
nds
Anti
mag
ic07
Lilia
ceae
D
iane
lla en
sifol
ia
Paka
sul
Her
b AU
, LP
Leav
es
To e
ase
in fi
chin
g-ca
tchi
ng08
Mel
asto
mat
acea
e M
emcy
lon
ampl
exica
ule
Kay
u pe
tulu
Tr
ee
TA
Stem
Br
ing
good
luck
09O
lean
drac
eae
Olea
ndra
pist
ilaris
G
erum
ung
Fern
TA
stem
Brin
g go
od lu
ck10
Pipe
race
ae
Pipe
r sp.
W
ar p
atag
a C
limbe
r LL
,AU
Leav
es
To e
nhan
ce w
oman
bea
uty
11Po
doca
rpac
eae
Phylo
cladu
s sp.
Kay
u pe
layo
Tr
ee
LL,L
PSt
em
To g
ain
sym
path
y 12
Rubi
acea
e W
ar L
apad
Ura
bC
limbe
r LL
,AU
Vin
e Pr
otec
tion
from
bad
mag
ic
13Sm
ilace
ae
Smila
x od
orat
issim
aW
ar K
aluv
anC
limbe
r AU
,TA
Leav
es
To fo
rget
the
pass
ed fa
mily
m
embe
r
14Sm
ilace
ae
Smila
x W
ar k
atab
sera
iC
limbe
r LL
,V
ine
To e
nabl
e a
pers
on to
che
w
glas
s with
out w
ound
ed
him
self
15Th
eace
ae
Kay
u la
pad
Tree
TA
,TE
Stem
To
pre
vent
hou
se fr
om
mag
ic16
Zing
iber
acea
e Bo
esenb
ergi
a ste
noph
ylla
Kar
ibur
o sia
’he
rbAU
Root
s To
evi
ct g
host
17U
du L
apad
Her
b AU
Leav
es
Anti
wom
an m
agic
18Pa
taga
H
erb
AU,L
PLe
aves
To
enh
ance
wom
an’s
beau
ty
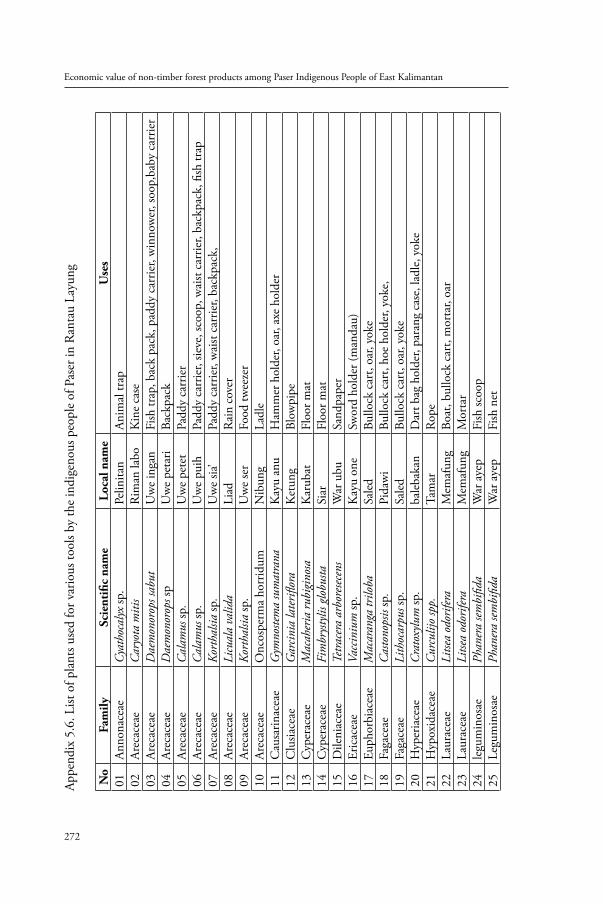
Economic value of non-timber forest products among Paser Indigenous People of East Kalimantan
272
Appe
ndix
5.6
. List
of p
lant
s use
d fo
r var
ious
tool
s by
the
indi
geno
us p
eopl
e of
Pas
er in
Ran
tau
Layu
ng
No
Fam
ilySc
ient
ific
nam
eLo
cal n
ame
Use
s01
Anno
nace
ae
Cyat
hoca
lyx sp
.Pe
linita
n An
imal
trap
02Ar
ecac
eae
Car
yota
miti
s R
iman
labo
K
ine
case
03
Ar
ecac
eae
Dae
mon
orop
s sab
ut
Uw
e in
gan
Fish
trap
, bac
k pa
ck, p
addy
car
rier,
win
now
er, s
oop,
baby
car
rier
04Ar
ecac
eae
Dae
mon
orop
s sp
Uw
e pe
tari
Back
pack
05Ar
ecac
eae
Cal
amus
sp.
Uw
e pe
tet
Padd
y ca
rrie
r06
Arec
acea
e C
alam
us sp
. U
we
puih
Pa
ddy
carr
ier,
sieve
, sco
op, w
aist
carr
ier,
back
pack
, fish
trap
07Ar
ecac
eae
Kort
halsi
a sp
.U
we
sia’
Padd
y ca
rrie
r, w
aist
carr
ier,
back
pack
,08
Arec
acea
e Li
cual
a va
lida
Liad
R
ain
cove
r09
Arec
acea
e Ko
rtha
lsia
sp.
Uw
e se
r Fo
od tw
eeze
r10
Arec
acea
e O
ncos
perm
a ho
rrid
um
Nib
ung
Ladl
e 11
Cau
sarin
acea
e G
ymno
stem
a su
mat
rana
Kay
u an
u H
amm
er h
olde
r, oa
r, ax
e ho
lder
12
Clu
siace
ae
Gar
cinia
late
riflor
a K
etun
g Bl
owpi
pe13
Cyp
erac
eae
Mac
aher
ia ru
bigi
nosa
Kar
ubat
Fl
oor m
at
14C
yper
acea
e Fi
mbr
ysty
lis g
lobu
staSi
ar
Floo
r mat
15
Dile
niac
eae
Tetra
cera
arb
orese
cens
W
ar u
bu
Sand
pape
r 16
Eric
acea
e Va
ccin
ium
sp.
Kay
u on
eSw
ord
hold
er (m
anda
u)17
Euph
orbi
acea
e M
acar
anga
trilo
ba
Sale
d Bu
llock
car
t, oa
r, yo
ke18
Faga
ceae
C
asto
nops
is sp
. Pi
daw
i Bu
llock
car
t, ho
e ho
lder
, yok
e,
19Fa
gace
ae
Lith
ocar
pus s
p.
Sale
d Bu
llock
car
t, oa
r, yo
ke20
H
yper
iace
ae
Cra
toxy
lum
sp.
bale
baka
nD
art b
ag h
olde
r, pa
rang
cas
e, la
dle,
yok
e21
Hyp
oxid
acea
e C
urcu
lijo
spp.
Tam
ar
Rope
22
Laur
acea
e Li
tsea
odor
ifera
M
emaf
ung
Boat
, bul
lock
car
t, m
orta
r, oa
r23
Laur
acea
e Li
tsea
odor
ifera
Mem
afun
g M
orta
r24
legu
min
osae
Phan
era
sembi
fida
War
aye
pFi
sh sc
oop
25Le
gum
inos
ae
Phan
era
sembi
fida
War
aye
pFi
sh n
et
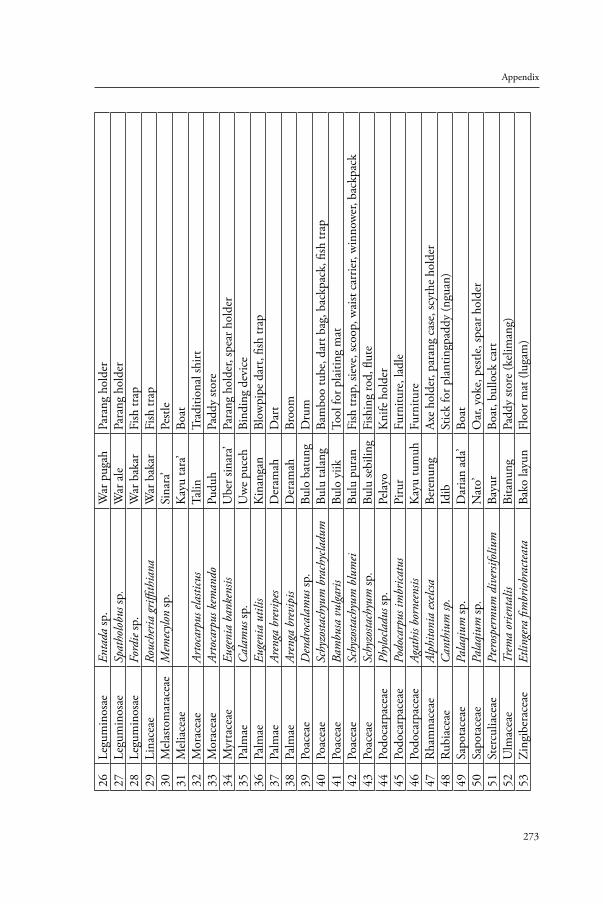
273
Appendix
26
Legu
min
osae
En
tada
sp.
War
pug
ahPa
rang
hol
der
27Le
gum
inos
ae
Spat
holo
bus s
p.W
ar a
lePa
rang
hol
der
28Le
gum
inos
ae
Ford
ie sp
.W
ar b
akar
Fi
sh tr
ap29
Lina
ceae
Ro
uche
ria g
riffith
iana
War
bak
ar
Fish
trap
30
Mel
asto
mar
acea
e M
emec
ylon
sp.
Sina
ra’
Pestl
e 31
Mel
iace
ae
Kay
u ta
ra’
Boat
32
M
orac
eae
Arto
carp
us el
astic
us
Talin
Tr
aditi
onal
shirt
33M
orac
eae
Arto
carp
us k
eman
do
Pudu
h Pa
ddy
store
34M
yrta
ceae
Eu
geni
a ba
nken
sis
Ube
r sin
ara’
Para
ng h
olde
r, sp
ear h
olde
r35
Palm
ae
Cal
amus
sp.
Uw
e pu
ceh
Bind
ing
devi
ce
36Pa
lmae
Eu
geni
a ut
ilis
Kin
anga
n Bl
owpi
pe d
art,
fish
trap
37Pa
lmae
Ar
enga
bre
vipe
s D
eram
ah
Dar
t 38
Palm
ae
Aren
ga b
revi
pis
Der
amah
Br
oom
39Po
acea
e D
endr
ocal
amus
sp.
Bulo
bat
ung
Dru
m
40Po
acea
e Sc
hyzo
stach
yum
bra
chyc
ladu
mBu
lu ta
lang
Ba
mbo
o tu
be, d
art b
ag, b
ackp
ack,
fish
trap
41Po
acea
e Ba
mbu
sa v
ulga
risBu
lo y
iik
Tool
for p
laiti
ng m
at42
Poac
eae
Schy
zosta
chyu
m b
lum
eiBu
lu p
uran
Fish
trap
, sie
ve, s
coop
, wai
st ca
rrie
r, w
inno
wer
, bac
kpac
k43
Poac
eae
Schy
zosta
chyu
m sp
. Bu
lu se
bilin
g Fi
shin
g ro
d, fl
ute
44Po
doca
rpac
eae
Phylo
cladu
s sp.
Pela
yo
Kni
fe h
olde
r 45
Podo
carp
acea
e Po
doca
rpus
imbr
icatu
s Pi
rur
Furn
iture
, lad
le
46Po
doca
rpac
eae
Agat
his b
orne
ensis
K
ayu
tum
uh
Furn
iture
47
Rha
mna
ceae
Al
phito
nia
exelc
sa
Bere
nung
Ax
e ho
lder
, par
ang
case
, scy
the
hold
er
48Ru
biac
eae
Can
thiu
m sp
. Id
ib
Stic
k fo
r pla
ntin
gpad
dy (n
guan
)49
Sapo
tace
ae
Pala
qium
sp.
Dar
ian
ada’
Boat
50
Sapo
tace
ae
Pala
qium
sp.
Nat
o’O
ar, y
oke,
pes
tle, s
pear
hol
der
51St
ercu
liace
ae
Pter
ospe
rmum
div
ersif
oliu
m
Bayu
r Bo
at, b
ullo
ck c
art
52
Ulm
acea
e Tr
ema
orien
talis
Bi
tanu
ng
Padd
y sto
re (k
elim
ang)
53
Zing
iber
acea
e Et
linge
ra fi
mbr
iobr
acte
ata
Bako
layu
n Fl
oor m
at (l
ugam
)
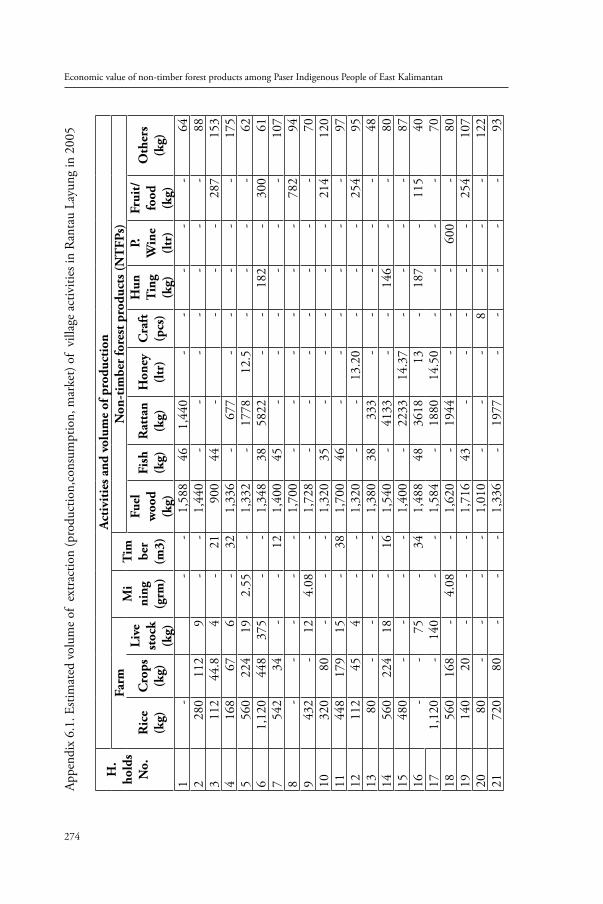
Economic value of non-timber forest products among Paser Indigenous People of East Kalimantan
274
Appe
ndix
6.1
. Esti
mat
ed v
olum
e of
ext
ract
ion
(pro
duct
ion,
cons
umpt
ion,
mar
ket)
of v
illag
e ac
tiviti
es in
Ran
tau
Layu
ng in
200
5
H.
hold
sN
o.
Act
ivit
ies a
nd v
olum
e of
pro
duct
ion
Farm
Mi
ning
(g
rm)
Tim be
r
(m3)
Non
-tim
ber
fore
st p
rodu
cts (
NT
FPs)
Ric
e (k
g)C
rops
(kg)
Live
st
ock
(kg)
Fuel
woo
d (k
g)
Fish
(k
g)R
atta
n (k
g)H
oney
(l
tr)
Cra
ft
(pcs
)
Hun
Tin
g (k
g)
P.W
ine
(ltr
)
Frui
t/fo
od
(kg)
Oth
ers
(kg)
1-
--
1,58
846
1,44
0-
--
--
642
280
112
9-
-1,
440
--
--
--
-88
311
244
.84
-21
900
44-
--
-28
715
34
168
676
-32
1,33
6-
677
--
--
-17
55
560
224
192.
55-
1,33
2-
1778
12.5
--
--
626
1,12
044
837
5-
-1,
348
3858
22-
-18
2-
300
617
542
34-
-12
1,40
045
--
--
--
107
8-
--
--
1,70
0-
--
--
-78
294
943
2-
124.
08-
1,72
8-
--
--
--
7010
320
80-
--
1,32
035
--
--
-21
412
011
448
179
15-
381,
700
46-
--
--
-97
1211
245
4-
-1,
320
--
13.2
0-
--
254
9513
80-
--
-1,
380
3833
3-
--
--
4814
560
224
18-
161,
540
-41
33-
-14
6-
-80
1548
0-
--
-1,
400
-22
3314
.37
--
--
8716
--
75-
341,
488
4836
1813
-18
7-
115
4017
1,12
0-
140
--
1,58
4-
1880
14.5
0-
--
-70
1856
016
8-
4.08
-1,
620
-19
44-
--
600
-80
1914
020
--
-1,
716
43-
--
--
254
107
2080
--
--
1,01
0-
--
8-
--
122
2172
080
--
-1,
336
-19
77-
--
--
93
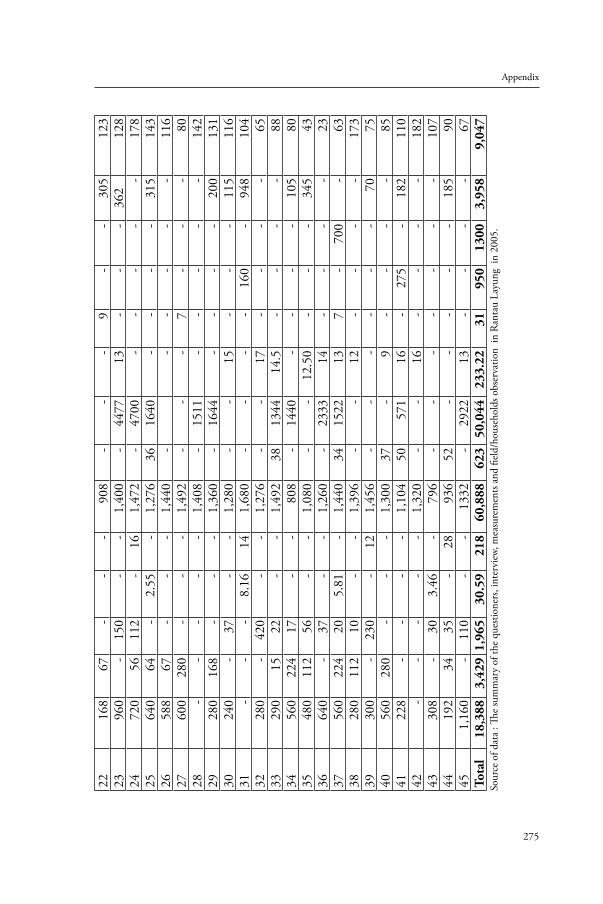
275
Appendix
2216
867
--
-90
8-
--
9-
-30
512
323
960
-15
0-
-1,
400
-44
7713
--
-36
212
824
720
5611
2-
161,
472
-47
00-
--
--
178
2564
064
-2.
55-
1,27
636
1640
--
--
315
143
2658
867
--
-1,
440
--
--
--
116
2760
028
0-
--
1,49
2-
--
7-
--
8028
--
--
-1,
408
-15
11-
--
--
142
2928
016
8-
--
1,36
0-
1644
--
--
200
131
3024
0-
37-
-1,
280
--
15-
--
115
116
31-
--
8.16
141,
680
--
--
160
-94
810
432
280
-42
0-
-1,
276
--
17-
--
-65
3329
015
22-
-1,
492
3813
4414
.5-
--
-88
3456
022
417
--
808
-14
40-
--
-10
580
3548
011
256
--
1,08
0-
-12
.50
--
-34
543
3664
0-
37-
-1,
260
-23
3314
--
--
2337
560
224
205.
81-
1,44
034
1522
137
-70
0-
6338
280
112
10-
-1,
396
--
12-
--
-17
339
300
-23
0-
121,
456
--
--
--
7075
4056
028
0-
--
1,30
037
-9
--
--
8541
228
--
--
1,10
450
571
16-
275
-18
211
042
--
--
-1,
320
--
16-
--
-18
243
308
-30
3.46
-79
6-
--
--
--
107
4419
234
35-
2893
652
--
--
-18
590
451,
160
-11
0-
-13
32-
2922
13-
--
-67
Tota
l18
,388
3,42
91,
965
30.5
921
860
,888
623
50,0
4423
3.22
3195
013
003,
958
9,04
7So
urce
of d
ata
: The
sum
mar
y of
the
ques
tione
rs, i
nter
view
, mea
sure
men
ts an
d fie
ld/h
ouse
hold
s obs
erva
tion
in R
anta
u La
yung
in
2005
.
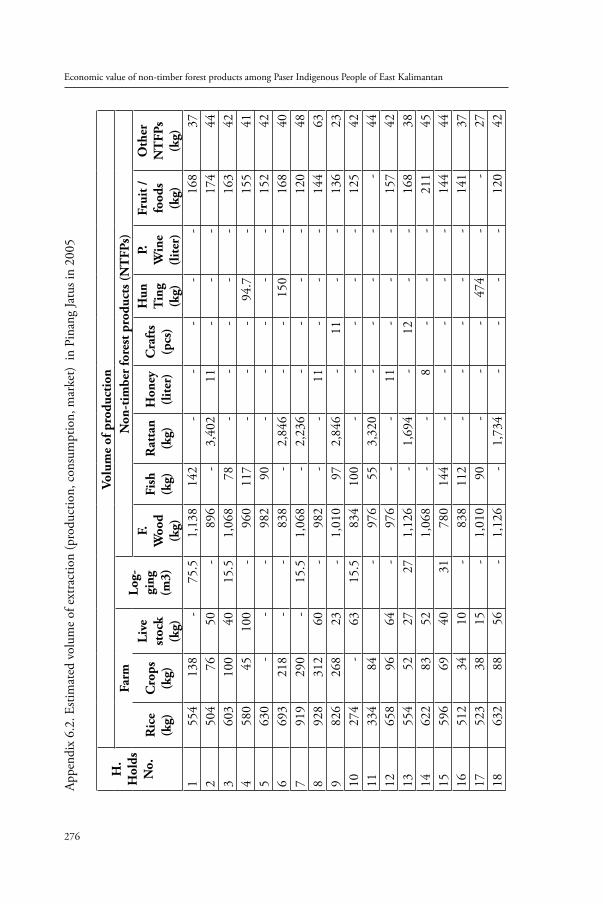
Economic value of non-timber forest products among Paser Indigenous People of East Kalimantan
276
Appe
ndix
6.2
. Esti
mat
ed v
olum
e of
ext
ract
ion
(pro
duct
ion,
con
sum
ptio
n, m
arke
t) in
Pin
ang
Jatu
s in
2005
H.
Hol
dsN
o.
Volu
me
of p
rodu
ctio
nFa
rmLo
g-gi
ng
(m3)
Non
-tim
ber
fore
st p
rodu
cts (
NT
FPs)
Ric
e (k
g)C
rops
(k
g)
Live
st
ock
(kg)
F.W
ood
(kg)
Fish
(kg)
Rat
tan
(kg)
Hon
ey(l
iter
)C
raft
s(p
cs)
Hun
Tin
g(k
g)
P.W
ine
(lit
er)
Frui
t /fo
ods
(kg)
Oth
er
NT
FPs
(kg)
155
413
8-
75.5
1,13
814
2-
--
--
168
372
504
7650
-89
6-
3,40
211
--
-17
444
360
310
040
15.5
1,06
878
--
--
-16
342
458
045
100
-96
011
7-
--
94.7
-15
541
563
0-
--
982
90-
--
--
152
426
693
218
--
838
-2,
846
--
150
-16
840
791
929
0-
15.5
1,06
8-
2,23
6-
--
-12
048
892
831
260
-98
2-
-11
--
-14
463
982
626
823
-1,
010
972,
846
-11
--
136
2310
274
-63
15.5
834
100
--
--
-12
542
1133
484
-97
655
3,32
0-
--
--
4412
658
9664
-97
6-
-11
--
-15
742
1355
452
2727
1,12
6-
1,69
4-
12-
-16
838
1462
283
521,
068
--
8-
--
211
4515
596
6940
3178
014
4-
--
--
144
4416
512
3410
-83
811
2-
--
--
141
3717
523
3815
-1,
010
90-
--
474
--
2718
632
8856
-1,
126
-1,
734
--
--
120
42
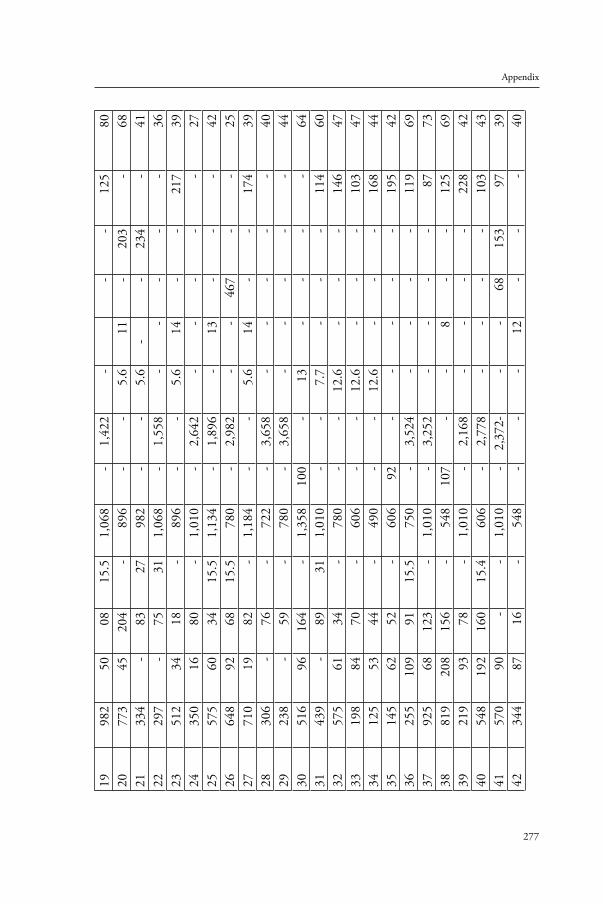
277
Appendix
1998
250
0815
.51,
068
-1,
422
--
-12
580
2077
345
204
-89
6-
-5.
611
-20
3-
6821
334
-83
2798
2-
-5.
6-
-23
4-
4122
297
-75
311,
068
-1,
558
--
--
-36
2351
234
18-
896
--
5.6
14-
-21
739
2435
016
80-
1,01
0-
2,64
2-
--
--
2725
575
6034
15.5
1,13
4-
1,89
6-
13-
--
4226
648
9268
15.5
780
-2,
982
--
467
--
2527
710
1982
-1,
184
--
5.6
14-
-17
439
2830
6-
76-
722
-3,
658
--
--
-40
2923
8-
59-
780
-3,
658
--
--
-44
3051
696
164
-1,
358
100
-13
--
--
6431
439
-89
311,
010
--
7.7
--
-11
460
3257
561
34-
780
--
12.6
--
-14
647
3319
884
70-
606
--
12.6
--
-10
347
3412
553
44-
490
--
12.6
--
-16
844
3514
562
52-
606
92-
--
--
195
4236
255
109
9115
.575
0-
3,52
4-
--
-11
969
3792
568
123
-1,
010
-3,
252
--
--
8773
3881
920
815
6-
548
107
--
8-
-12
569
3921
993
78-
1,01
0-
2,16
8-
--
-22
842
4054
819
216
015
.460
6-
2,77
8-
--
-10
343
4157
090
--
1,01
0-
2,37
2--
-68
153
9739
4234
487
16-
548
--
-12
--
-40
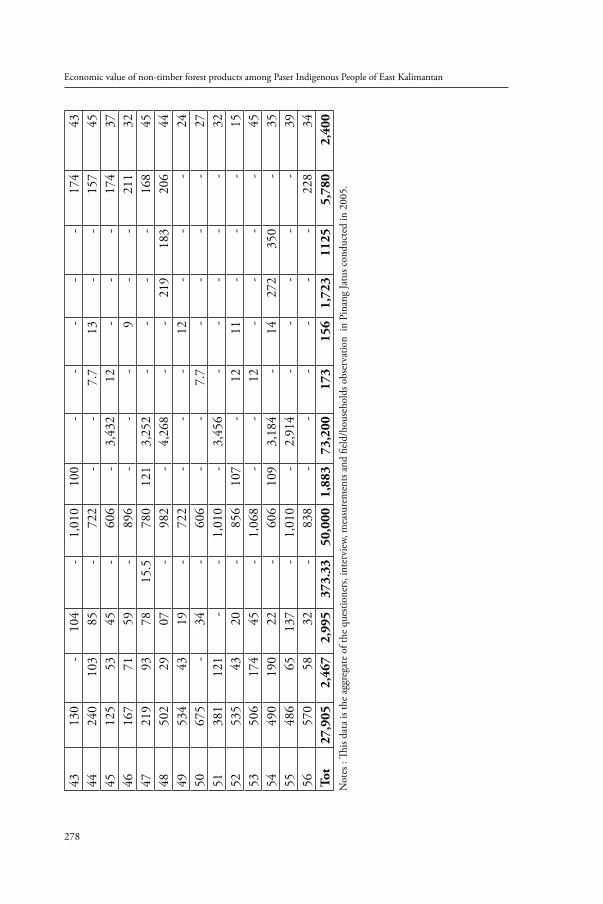
Economic value of non-timber forest products among Paser Indigenous People of East Kalimantan
278
4313
0-
104
-1,
010
100
--
--
-17
443
4424
010
385
-72
2-
-7.
713
--
157
4545
125
5345
-60
6-
3,43
212
--
-17
437
4616
771
59-
896
--
-9
--
211
3247
219
9378
15.5
780
121
3,25
2-
--
-16
845
4850
229
07-
982
-4,
268
--
219
183
206
4449
534
4319
-72
2-
--
12-
--
2450
675
-34
-60
6-
-7.
7-
--
-27
5138
112
1-
-1,
010
-3,
456
--
--
-32
5253
543
20-
856
107
-12
11-
--
1553
506
174
45-
1,06
8-
-12
--
--
4554
490
190
22-
606
109
3,18
4-
1427
235
0-
3555
486
6513
7-
1,01
0-
2,91
4-
--
--
3956
570
5832
-83
8-
--
--
-22
834
Tot
27,9
052,
467
2,99
537
3.33
50,0
001,
883
73,2
0017
315
61,
723
1125
5,78
02,
400
Not
es :
This
data
is th
e ag
greg
ate
of th
e qu
estio
ners
, int
ervi
ew, m
easu
rem
ents
and
field
/hou
seho
lds o
bser
vatio
n in
Pin
ang
Jatu
s con
duct
ed in
200
5.
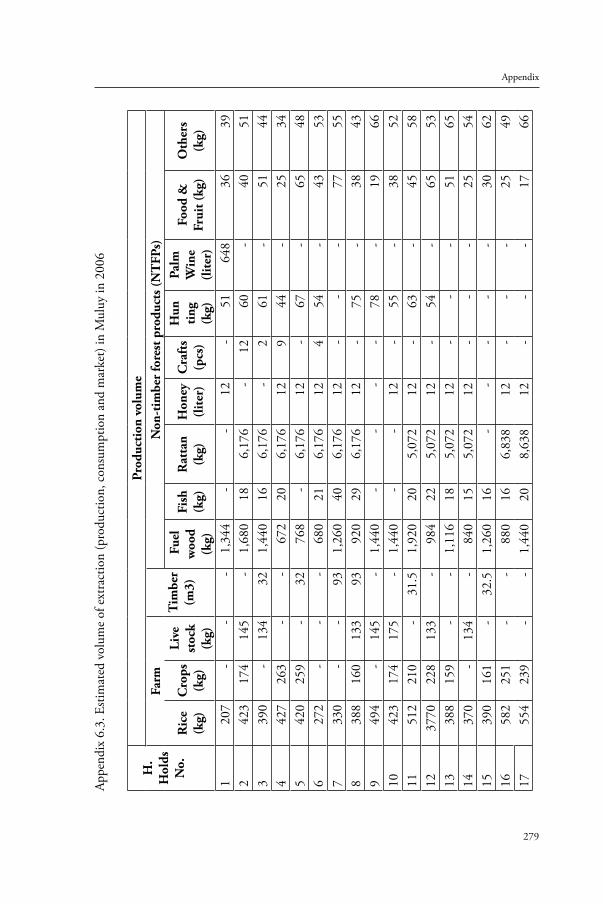
279
Appendix
Appe
ndix
6.3
. Esti
mat
ed v
olum
e of
ext
ract
ion
(pro
duct
ion,
con
sum
ptio
n an
d m
arke
t) in
Mul
uy in
200
6
H.
Hol
dsN
o.
Prod
ucti
on v
olum
eFa
rmT
imbe
r (m
3)
Non
-tim
ber
fore
st p
rodu
cts (
NT
FPs)
Ric
e (k
g)C
rops
(k
g)
Live
stoc
k (k
g)
Fue
l w
ood
(kg)
Fish
(kg)
Rat
tan
(kg)
Hon
ey(l
iter
)C
raft
s(p
cs)
Hun
ting
(k
g)
Palm
Win
e (l
iter
)
Food
&
Frui
t (kg
)O
ther
s (k
g)
120
7-
--
1,34
4-
-12
-51
648
3639
242
317
414
5-
1,68
018
6,17
6-
1260
-40
513
390
-13
432
1,44
016
6,17
6-
261
-51
444
427
263
--
672
206,
176
129
44-
2534
542
025
9-
3276
8-
6,17
612
-67
-65
486
272
--
-68
021
6,17
612
454
-43
537
330
--
931,
260
406,
176
12-
--
7755
838
816
013
393
920
296,
176
12-
75-
3843
949
4-
145
-1,
440
--
--
78-
1966
1042
317
417
5-
1,44
0-
-12
-55
-38
5211
512
210
-31
.51,
920
205,
072
12-
63-
4558
1237
7022
813
3-
984
225,
072
12-
54-
6553
1338
815
9-
-1,
116
185,
072
12-
--
5165
1437
0-
134
-84
015
5,07
212
--
-25
5415
390
161
-32
.51,
260
16-
--
--
3062
1658
225
1-
-88
016
6,83
812
--
-25
4917
554
239
--
1,44
020
8,63
812
--
-17
66
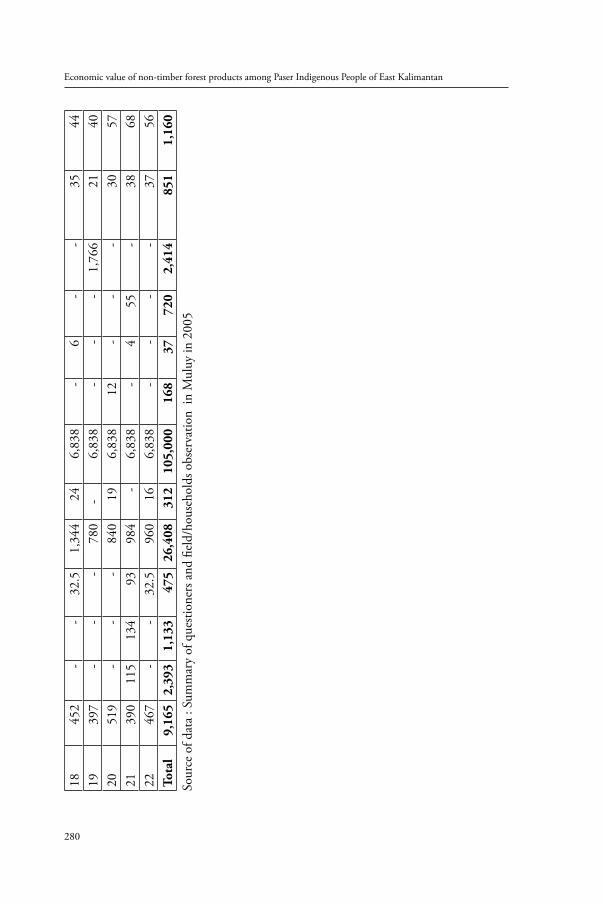
Economic value of non-timber forest products among Paser Indigenous People of East Kalimantan
280
1845
2-
-32
.51,
344
246,
838
-6
--
3544
1939
7-
--
780
-6,
838
--
-1,
766
2140
2051
9-
--
840
196,
838
12-
--
3057
2139
011
513
493
984
-6,
838
-4
55-
3868
2246
7-
-32
.596
016
6,83
8-
--
-37
56To
tal
9,16
52,
393
1,13
347
526
,408
312
105,
000
168
3772
02,
414
851
1,16
0So
urce
of d
ata
: Sum
mar
y of
que
stion
ers a
nd fi
eld/
hous
ehol
ds o
bser
vatio
n in
Mul
uy in
200
5
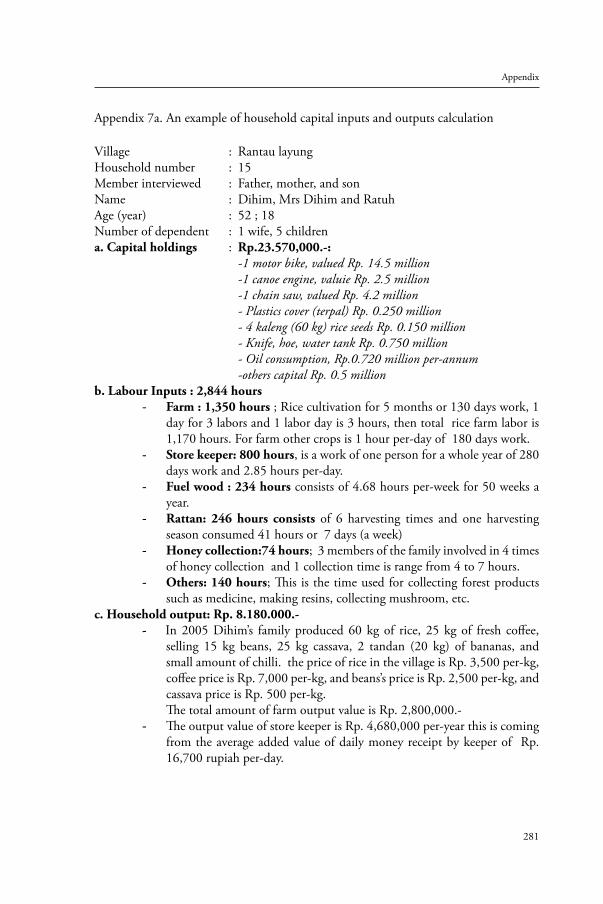
281
Appendix
Appendix 7a. An example of household capital inputs and outputs calculation
Village : Rantau layung Household number : 15 Member interviewed : Father, mother, and sonName : Dihim, Mrs Dihim and RatuhAge (year) : 52 ; 18 Number of dependent : 1 wife, 5 childrena. Capital holdings : Rp.23.570,000.-: -1 motor bike, valued Rp. 14.5 million -1 canoe engine, valuie Rp. 2.5 million -1 chain saw, valued Rp. 4.2 million - Plastics cover (terpal) Rp. 0.250 million - 4 kaleng (60 kg) rice seeds Rp. 0.150 million - Knife, hoe, water tank Rp. 0.750 million - Oil consumption, Rp.0.720 million per-annum -others capital Rp. 0.5 millionb. Labour Inputs : 2,844 hours
Farm : 1,350 hours- ; Rice cultivation for 5 months or 130 days work, 1 day for 3 labors and 1 labor day is 3 hours, then total rice farm labor is 1,170 hours. For farm other crops is 1 hour per-day of 180 days work.Store keeper: 800 hours- , is a work of one person for a whole year of 280 days work and 2.85 hours per-day.Fuel wood : 234 hours- consists of 4.68 hours per-week for 50 weeks a year.Rattan: 246 hours consists- of 6 harvesting times and one harvesting season consumed 41 hours or 7 days (a week)Honey collection:74 hours- ; 3 members of the family involved in 4 times of honey collection and 1 collection time is range from 4 to 7 hours.Others: 140 hours- ; This is the time used for collecting forest products such as medicine, making resins, collecting mushroom, etc.
c. Household output: Rp. 8.180.000.-- In 2005 Dihim’s family produced 60 kg of rice, 25 kg of fresh coffee,
selling 15 kg beans, 25 kg cassava, 2 tandan (20 kg) of bananas, and small amount of chilli. the price of rice in the village is Rp. 3,500 per-kg, coffee price is Rp. 7,000 per-kg, and beans’s price is Rp. 2,500 per-kg, and cassava price is Rp. 500 per-kg.The total amount of farm output value is Rp. 2,800,000.- The output value of store keeper is Rp. 4,680,000 per-year this is coming - from the average added value of daily money receipt by keeper of Rp. 16,700 rupiah per-day.
Economic value of non-timber forest products among Paser Indigenous People of East Kalimantan
282
Fuelwood value is Rp.350,000,- This coming from the measurement of - the price of fuelwood per-bundle is Rp. 1,500,- and the consumption of Mr.Dihim’s fuelwood per year is 233 bundles per annum.Rattan value is Rp. 1,005,000,- is coming from the selling of 2,333 kg of - green rattan in 2005. and the green rattan price is Rp. 450,-per-kgHoney collection value is Rp. 647,000,-. This is coming from the - collection of 15.50 liters of wild honey and the price of honey at village is Rp. 45,000 per-liter.Others NTFPs value is Rp. 1.302,000,- this come from family collection - of gaharu and the pasak bumi (eaglewood or Aquilaria spp. and Eurycoma longifolia).
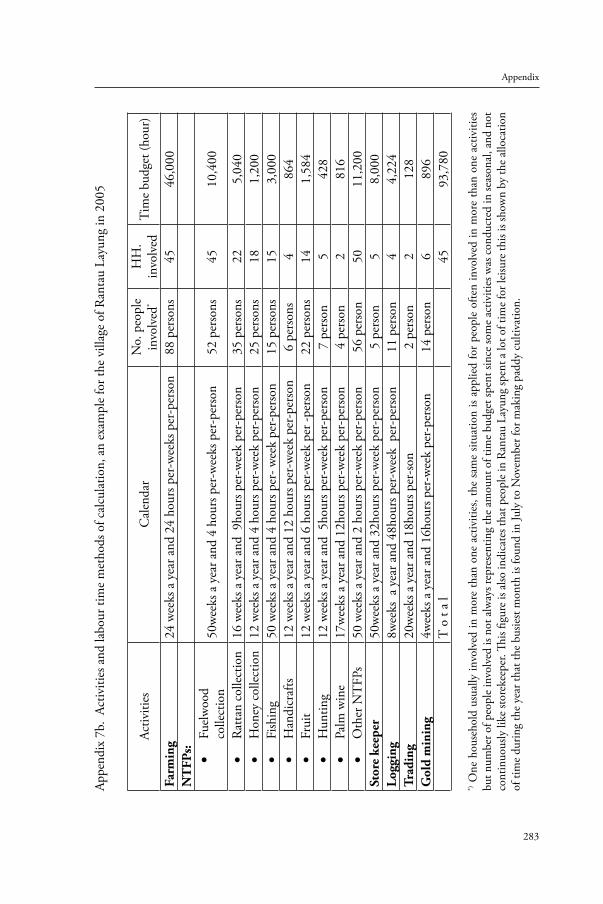
283
Appendix
Appe
ndix
7b.
Act
iviti
es a
nd la
bour
tim
e m
etho
ds o
f cal
cula
tion,
an
exam
ple
for t
he v
illag
e of
Ran
tau
Layu
ng in
200
5
Activ
ities
Cal
enda
rN
o. p
eopl
e in
volv
ed*
HH
.in
volv
edTi
me
budg
et (h
our)
Farm
ing
24 w
eeks
a y
ear a
nd 2
4 ho
urs p
er-w
eeks
per
-per
son
88 p
erso
ns45
46,0
00N
TFP
s: Fu
elw
ood
•co
llect
ion
50w
eeks
a y
ear a
nd 4
hou
rs p
er-w
eeks
per
-per
son
52 p
erso
ns45
10,4
00
Rat
tan
colle
ctio
n•
16 w
eeks
a y
ear a
nd 9
hour
s per
-wee
k pe
r-pe
rson
35 p
erso
ns22
5,04
0H
oney
col
lect
ion
•12
wee
ks a
yea
r and
4 h
ours
per
-wee
k pe
r-pe
rson
25 p
erso
ns18
1,20
0Fi
shin
g •
50 w
eeks
a y
ear a
nd 4
hou
rs p
er- w
eek
per-
pers
on15
per
sons
153,
000
Han
dicr
afts
•12
wee
ks a
yea
r and
12
hour
s per
-wee
k pe
r-pe
rson
6 pe
rson
s4
864
Frui
t •
12 w
eeks
a y
ear a
nd 6
hou
rs p
er-w
eek
per -
pers
on22
per
sons
141,
584
Hun
ting
•12
wee
ks a
yea
r and
5ho
urs p
er-w
eek
per-
pers
on7
pers
on5
428
Palm
win
e•
17w
eeks
a y
ear a
nd 1
2hou
rs p
er-w
eek
per-
pers
on4
pers
on2
816
Oth
er N
TFP
s•
50 w
eeks
a y
ear a
nd 2
hou
rs p
er-w
eek
per-
pers
on56
per
son
5011
,200
Stor
e ke
eper
50w
eeks
a y
ear a
nd 3
2hou
rs p
er-w
eek
per-
pers
on5
pers
on5
8,00
0Lo
ggin
g 8w
eeks
a y
ear a
nd 4
8hou
rs p
er-w
eek
per
-per
son
11 p
erso
n4
4,22
4Tr
adin
g 20
wee
ks a
yea
r and
18h
ours
per
-son
2 pe
rson
212
8G
old
min
ing
4wee
ks a
yea
r and
16h
ours
per
-wee
k pe
r-pe
rson
14 p
erso
n6
896
T o
t a
l 45
93,7
80
*) O
ne h
ouse
hold
usu
ally
invo
lved
in m
ore
than
one
act
iviti
es, t
he sa
me
situa
tion
is ap
plie
d fo
r pe
ople
ofte
n in
volv
ed in
mor
e th
an o
ne a
ctiv
ities
bu
t num
ber o
f peo
ple
invo
lved
is n
ot a
lway
s rep
rese
ntin
g th
e am
ount
of t
ime
budg
et sp
ent s
ince
som
e ac
tiviti
es w
as c
ondu
cted
in se
ason
al, a
nd n
ot
cont
inuo
usly
like
stor
ekee
per.
This
figur
e is
also
indi
cate
s tha
t peo
ple
in R
anta
u La
yung
spen
t a lo
t of t
ime
for l
eisu
re th
is is
show
n by
the
allo
catio
n of
tim
e du
ring
the
year
that
the
busie
st m
onth
is fo
und
in Ju
ly to
Nov
embe
r for
mak
ing
padd
y cu
ltiva
tion.
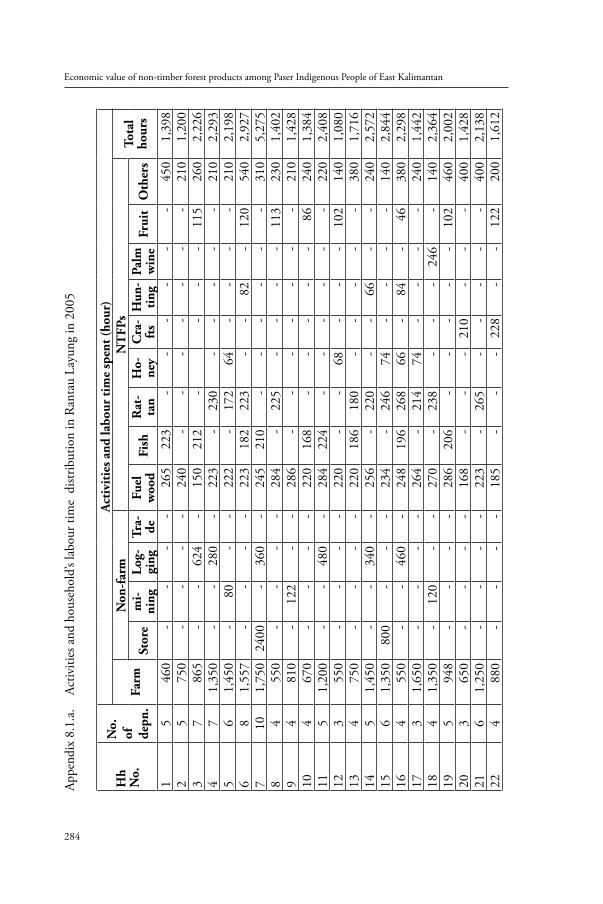
Economic value of non-timber forest products among Paser Indigenous People of East Kalimantan
284
Appe
ndix
8.1
.a.
Activ
ities
and
hou
seho
ld’s
labo
ur ti
me
dist
ribut
ion
in R
anta
u La
yung
in 2
005
Hh
No.
No.
of
de
pn.
Act
ivit
ies a
nd la
bour
tim
e sp
ent (
hour
)
Farm
Non
-far
mN
TFP
sTo
tal
hour
sSt
ore
mi-
ning
Log-
ging
Tra- de
Fuel
woo
dFi
shR
at-
tan
Ho-
ney
Cra
-ft
sH
un-
ting
Palm
win
eFr
uit
Oth
ers
15
460
--
--
265
223
--
--
--
450
1,39
82
575
0-
--
-24
0-
--
--
--
210
1,20
03
786
5-
-62
4-
150
212
--
--
115
260
2,22
64
71,
350
--
280
-22
3-
230
--
--
-21
02,
293
56
1,45
0-
80-
-22
2-
172
64-
--
-21
02,
198
68
1,55
7-
--
-22
318
222
3-
-82
-12
054
02,
927
710
1,75
024
00-
360
-24
521
0-
--
--
-31
05,
275
84
550
--
--
284
-22
5-
--
-11
323
01,
402
94
810
-12
2-
-28
6-
--
--
--
210
1,42
810
467
0-
--
-22
016
8-
--
--
8624
01,
384
115
1,20
0-
-48
0-
284
224
--
--
--
220
2,40
812
355
0-
--
-22
0-
-68
--
-10
214
01,
080
134
750
--
--
220
186
180
--
--
-38
01,
716
145
1,45
0-
-34
0-
256
-22
0-
-66
--
240
2,57
215
61,
350
800
--
-23
4-
246
74-
--
-14
02,
844
164
550
--
460
-24
819
626
866
-84
-46
380
2,29
817
31,
650
--
--
264
-21
474
--
--
240
1,44
218
41,
350
-12
0-
-27
0-
238
--
-24
6-
140
2,36
419
594
8-
--
-28
620
6-
--
--
102
460
2,00
220
365
0-
--
-16
8-
--
210
--
-40
01,
428
216
1,25
0-
--
-22
3-
265
--
--
-40
02,
138
224
880
--
--
185
--
-22
8-
-12
220
01,
612
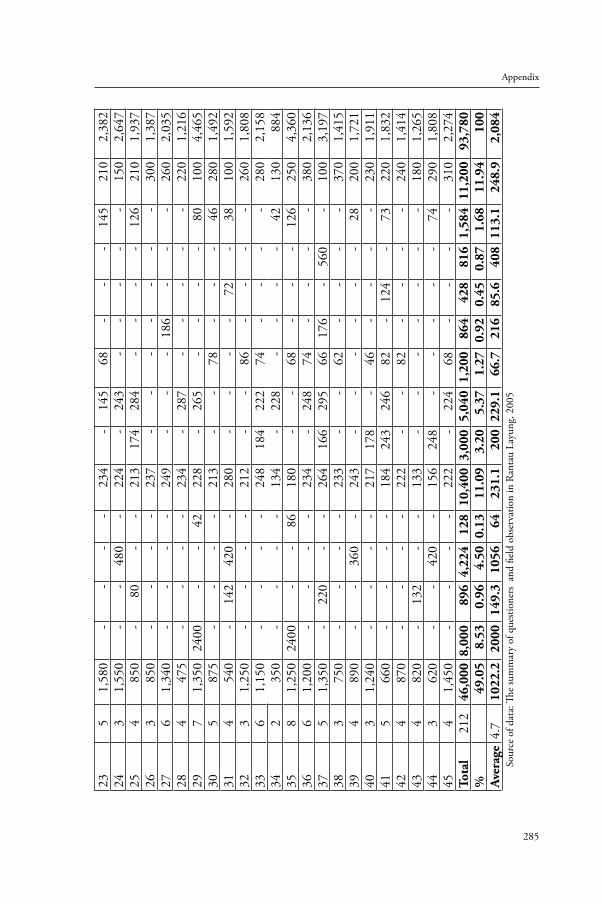
285
Appendix
235
1,58
0-
--
-23
4-
145
68-
--
145
210
2,38
224
31,
550
--
480
-22
4-
243
--
--
-15
02,
647
254
850
-80
--
213
174
284
--
--
126
210
1,93
726
385
0-
--
-23
7-
--
--
--
300
1,38
727
61,
340
--
--
249
--
-18
6-
--
260
2,03
528
447
5-
--
-23
4-
287
--
--
-22
01,
216
297
1,35
024
00-
-42
228
-26
5-
--
-80
100
4,46
530
587
5-
--
-21
3-
-78
--
-46
280
1,49
231
454
0-
142
420
-28
0-
--
-72
-38
100
1,59
232
31,
250
--
--
212
--
86-
--
-26
01,
808
336
1,15
0-
--
-24
818
422
274
--
--
280
2,15
834
235
0-
--
-13
4-
228
--
--
4213
088
435
81,
250
2400
--
8618
0-
-68
--
-12
625
04,
360
366
1,20
0-
--
-23
4-
248
74-
--
-38
02,
136
375
1,35
0-
220
--
264
166
295
6617
6-
560
-10
03,
197
383
750
--
--
233
--
62-
--
-37
01,
415
394
890
--
360
-24
3-
--
--
-28
200
1,72
140
31,
240
--
--
217
178
-46
--
--
230
1,91
141
566
0-
--
-18
424
324
682
-12
4-
7322
01,
832
424
870
--
--
222
--
82-
--
-24
01,
414
434
820
-13
2-
-13
3-
--
--
--
180
1,26
544
362
0-
-42
0-
156
248
--
--
-74
290
1,80
845
41,
450
--
--
222
-22
468
--
--
310
2,27
4To
tal
212
46,0
008,
000
896
4,22
412
810
,400
3,00
05,
040
1,20
086
442
881
61,
584
11,2
0093
,780
%
49.0
58.
530.
964.
500.
1311
.09
3.20
5.37
1.27
0.92
0.45
0.87
1.68
11.9
410
0Av
erag
e4.
710
22.2
2000
149.
310
5664
231.
120
022
9.1
66.7
216
85.6
408
113.
124
8.9
2,08
4So
urce
of d
ata:
The
sum
mar
y of
que
stion
ers
and
field
obs
erva
tion
in R
anta
u La
yung
, 200
5
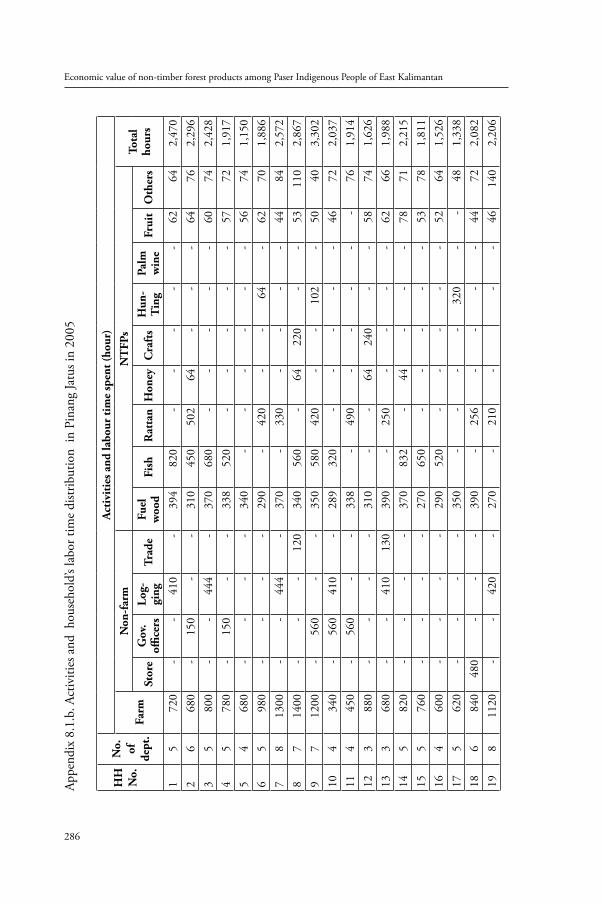
Economic value of non-timber forest products among Paser Indigenous People of East Kalimantan
286
Appe
ndix
8.1
.b. A
ctiv
ities
and
hou
seho
ld’s
labo
r tim
e di
strib
utio
n in
Pin
ang
Jatu
s in
2005
HH
No.
No.
of
de
pt.
Act
ivit
ies a
nd la
bour
tim
e sp
ent (
hour
)
Farm
Non
-far
mN
TFP
sTo
tal
hour
sSt
ore
Gov
. offi
cers
Log-
ging
Trad
e Fu
elw
ood
Fish
Rat
tan
Hon
eyC
raft
sH
un-
Tin
gPa
lmw
ine
Frui
t O
ther
s
15
720
--
410
-39
482
0-
--
--
6264
2,47
02
668
0-
150
--
310
450
502
64-
--
6476
2,29
63
580
0-
-44
4-
370
680
--
--
-60
742,
428
45
780
-15
0-
-33
852
0-
--
--
5772
1,91
75
468
0-
--
-34
0-
--
--
-56
741,
150
65
980
--
--
290
-42
0-
-64
-62
701,
886
78
1300
--
444
-37
0-
330
--
--
4484
2,57
28
714
00-
--
120
340
560
-64
220
--
5311
02,
867
97
1200
-56
0-
-35
058
042
0-
-10
2-
5040
3,30
210
434
0-
560
410
-28
932
0-
--
--
4672
2,03
711
445
0-
560
--
338
-49
0-
--
--
761,
914
123
880
--
--
310
--
6424
0-
-58
741,
626
133
680
--
410
130
390
-25
0-
--
-62
661,
988
145
820
--
--
370
832
-44
--
-78
712,
215
155
760
--
--
270
650
--
--
-53
781,
811
164
600
--
--
290
520
--
--
-52
641,
526
175
620
--
--
350
--
--
320
--
481,
338
186
840
480
--
-39
0-
256
--
--
4472
2,08
219
811
20-
-42
0-
270
-21
0-
--
4614
02,
206
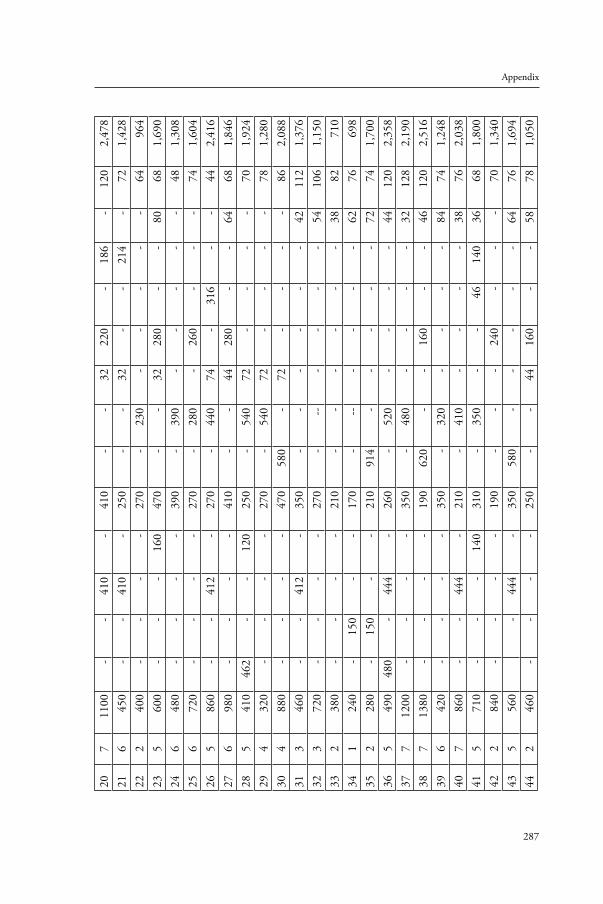
287
Appendix
207
1100
--
410
-41
0-
-32
220
-18
6-
120
2,47
821
645
0-
-41
0-
250
--
32-
-21
4-
721,
428
222
400
--
--
270
-23
0-
--
--
6496
423
560
0-
--
160
470
--
3228
0-
-80
681,
690
246
480
--
--
390
-39
0-
--
--
481,
308
256
720
--
--
270
-28
0-
260
--
-74
1,60
426
586
0-
-41
2-
270
-44
074
-31
6-
-44
2,41
627
698
0-
--
-41
0-
-44
280
--
6468
1,84
628
541
046
2-
-12
025
0-
540
72-
--
-70
1,92
429
432
0-
--
-27
0-
540
72-
--
-78
1,28
030
488
0-
--
-47
058
0-
72-
--
-86
2,08
831
346
0-
-41
2-
350
--
--
--
4211
21,
376
323
720
--
--
270
---
--
--
5410
61,
150
332
380
--
--
210
--
--
--
3882
710
341
240
-15
0-
-17
0-
---
--
-62
7669
835
228
0-
150
--
210
914
--
--
-72
741,
700
365
490
480
-44
4-
260
-52
0-
--
-44
120
2,35
837
712
00-
--
-35
0-
480
--
--
3212
82,
190
387
1380
--
--
190
620
--
160
--
4612
02,
516
396
420
--
--
350
-32
0-
--
-84
741,
248
407
860
--
444
-21
0-
410
--
--
3876
2,03
841
571
0-
--
140
310
-35
0-
-46
140
3668
1,80
042
284
0-
--
-19
0-
--
240
--
-70
1,34
043
556
0-
444
-35
058
0-
--
--
6476
1,69
444
246
0-
--
-25
0-
-44
160
--
5878
1,05
0
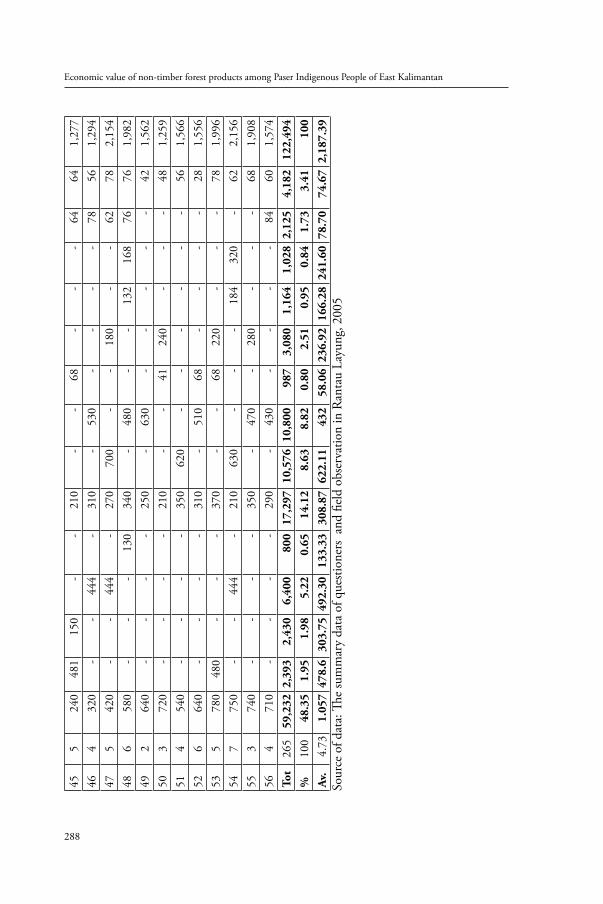
Economic value of non-timber forest products among Paser Indigenous People of East Kalimantan
288
455
240
481
150
--
210
--
68-
--
6464
1,27
746
432
0-
-44
4-
310
-53
0-
--
-78
561,
294
475
420
--
444
-27
070
0-
-18
0-
-62
782,
154
486
580
--
-13
034
0-
480
--
132
168
7676
1,98
249
264
0-
--
-25
0-
630
--
--
-42
1,56
250
372
0-
--
-21
0-
-41
240
--
-48
1,25
951
454
0-
--
-35
062
0-
--
--
-56
1,56
652
664
0-
--
-31
0-
510
68-
--
-28
1,55
653
578
048
0-
--
370
--
6822
0-
--
781,
996
547
750
--
444
-21
063
0-
--
184
320
-62
2,15
655
374
0-
--
-35
0-
470
-28
0-
--
681,
908
564
710
--
--
290
-43
0-
--
-84
601,
574
Tot
265
59,2
322,
393
2,43
06,
400
800
17,2
9710
,576
10,8
0098
73,
080
1,16
41,
028
2,12
54,
182
122,
494
%
100
48.3
51.
951.
985.
220.
6514
.12
8.63
8.82
0.80
2.51
0.95
0.84
1.73
3.41
100
Av.
4.73
1.05
747
8.6
303.
7549
2.30
133.
3330
8.87
622.
1143
258
.06
236.
9216
6.28
241.
6078
.70
74.6
72,
187.
39So
urce
of d
ata:
The
sum
mar
y da
ta o
f que
stion
ers
and
field
obs
erva
tion
in R
anta
u La
yung
, 200
5
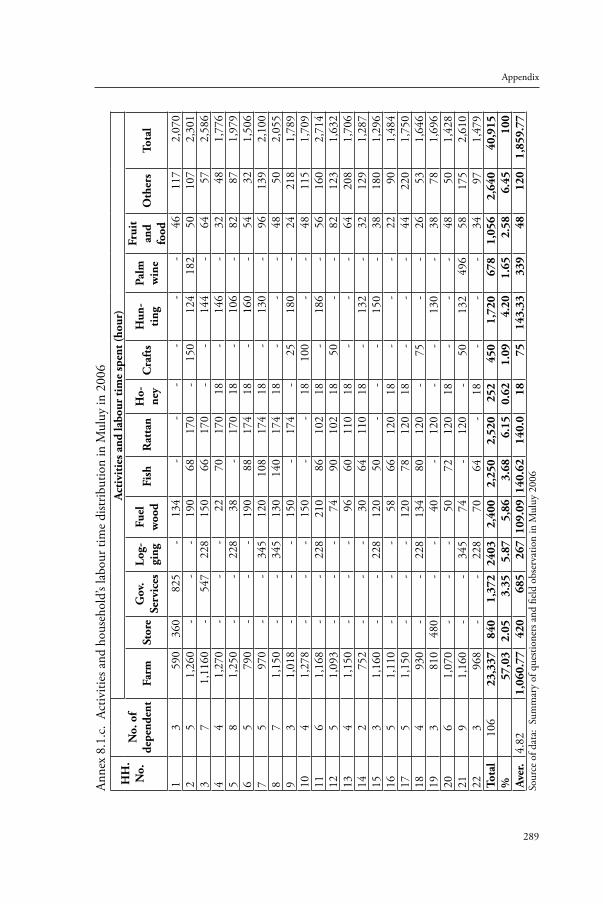
289
Appendix
Anne
x 8.
1.c.
Act
iviti
es a
nd h
ouse
hold
’s la
bour
tim
e di
strib
utio
n in
Mul
uy in
200
6
HH
.N
o.
No.
of
depe
nden
t
Act
ivit
ies a
nd la
bour
tim
e sp
ent (
hour
)
Farm
Stor
eG
ov.
Serv
ices
Log-
ging
Fuel
woo
dFi
shR
atta
nH
o-ne
yC
raft
sH
un-
ting
Palm
win
e
Frui
t an
d fo
od
Oth
ers
Tota
l
13
590
360
825
-13
4-
--
--
-46
117
2,07
02
51,
260
--
-19
068
170
-15
012
418
250
107
2,30
13
71,
1160
-54
722
815
066
170
--
144
-64
572,
586
44
1,27
0-
--
2270
170
18-
146
-32
481,
776
58
1,25
0-
-22
838
-17
018
-10
6-
8287
1,97
96
579
0-
--
190
8817
418
-16
0-
5432
1,50
67
597
0-
-34
512
010
817
418
-13
0-
9613
92,
100
87
1,15
0-
-34
513
014
017
418
--
-48
502,
055
93
1,01
8-
--
150
-17
4-
2518
0-
2421
81,
789
104
1,27
8-
--
150
--
1810
0-
-48
115
1,70
911
61,
168
--
228
210
8610
218
-18
6-
5616
02,
714
125
1,09
3-
--
7490
102
1850
--
8212
31,
632
134
1,15
0-
--
9660
110
18-
--
6420
81,
706
142
752
--
-30
6411
018
-13
2-
3212
91,
287
153
1,16
0-
-22
812
050
--
-15
0-
3818
01,
296
165
1,11
0-
--
5866
120
18-
--
2290
1,48
417
51,
150
--
-12
078
120
18-
--
4422
01,
750
184
930
--
228
134
8012
0-
75-
-26
531,
646
193
810
480
--
40-
120
--
130
-38
781,
696
206
1,07
0-
--
5072
120
18-
--
4850
1,42
821
91,
160
--
345
74-
120
-50
132
496
5817
52,
610
223
968
--
228
7064
-18
--
-34
971,
479
Tota
l10
623
,337
840
1,37
224
032,
400
2,25
02,
520
252
450
1,72
067
81,
056
2,64
040
,915
%
57,0
32.
053.
355.
875,
863.
686.
150.
621.
094.
201.
652.
586.
4510
0Av
er.
4.82
1,06
0.77
420
685
267
109.
0914
0.62
140.
018
7514
3.33
339
4812
01,
859.
77So
urce
of d
ata:
Sum
mar
y of
que
stion
ers a
nd fi
eld
obse
rvat
ion
in M
uluy
200
6
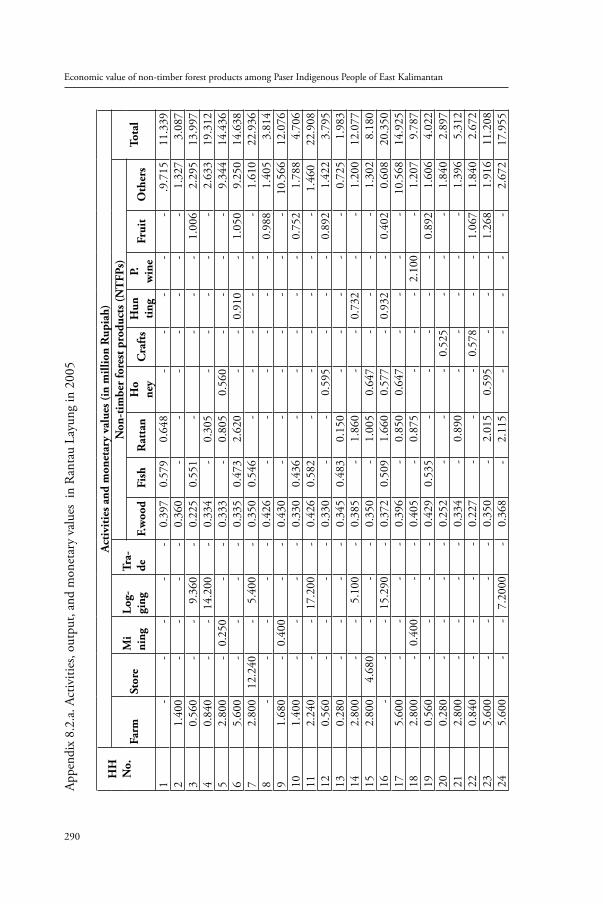
Economic value of non-timber forest products among Paser Indigenous People of East Kalimantan
290
Appe
ndix
8.2
.a. A
ctiv
ities
, out
put,
and
mon
etar
y va
lues
in
Ran
tau
Layu
ng in
200
5
HH
No.
Act
ivit
ies a
nd m
onet
ary
valu
es (i
n m
illio
n R
upia
h)
Farm
Stor
e M
ini
ngLo
g-gi
ng
Tra-
de
Non
-tim
ber
fore
st p
rodu
cts (
NT
FPs)
Tota
lF.
woo
dFi
shR
atta
nH
one
yC
raft
sH
unti
ngP.
win
eFr
uit
Oth
ers
1-
--
--
0.39
70.
579
0.64
8-
--
--
.9.7
1511
.339
21.
400
--
--
0.36
0-
--
--
--
1.32
73.
087
30.
560
--
9.36
0-
0.22
50.
551
--
--
1.00
62.
295
13.9
974
0.84
0-
-14
.200
-0.
334
-0.
305
--
--
-2.
633
19.3
125
2.80
0-
0.25
0-
-0.
333
-0.
805
0.56
0-
--
-9.
344
14.4
366
5.60
0-
--
-0.
335
0.47
32.
620
--
0.91
0-
1.05
09.
250
14.6
387
2.80
012
.240
-5.
400
-0.
350
0.54
6-
--
--
-1.
610
22.9
368
--
--
-0.
426
--
--
--
0.98
81.
405
3.81
49
1.68
0-
0.40
0-
-0.
430
--
--
--
-10
.566
12.0
7610
1.40
0-
--
-0.
330
0.43
6-
--
--
0.75
21.
788
4.70
611
2.24
0-
-17
.200
-0.
426
0.58
2-
--
--
-
1.4
6022
.908
120.
560
--
--
0.33
0-
-0.
595
--
-0.
892
1.42
23.
795
130.
280
--
--
0.34
50.
483
0.15
0-
--
--
0.72
51.
983
142.
800
--
5.10
0-
0.38
5-
1.86
0-
-0.
732
--
1.20
012
.077
152.
800
4.68
0-
--
0.35
0-
1.00
50.
647
--
--
1.30
28.
180
16-
--
15.2
90-
0.37
20.
509
1.66
00.
577
-0.
932
-0.
402
0.60
820
.350
175.
600
--
--
0.39
6-
0.85
00.
647
--
--
10.5
6814
.925
182.
800
-0.
400
--
0.40
5-
0.87
5-
--
2.10
0-
1.20
79.
787
190.
560
--
--
0.42
90.
535
--
--
-0.
892
1.60
64.
022
200.
280
--
--
0.25
2-
--
0.52
5-
--
1.84
02.
897
212.
800
--
--
0.33
4-
0.89
0-
--
--
1.39
65.
312
220.
840
--
--
0.22
7-
--
0.57
8-
-1.
067
1.84
02.
672
235.
600
--
--
0.35
0-
2.01
50.
595
--
-1.
268
1.91
611
.208
245.
600
--
7.20
00-
0.36
8-
2.11
5-
--
--
2.67
217
.955
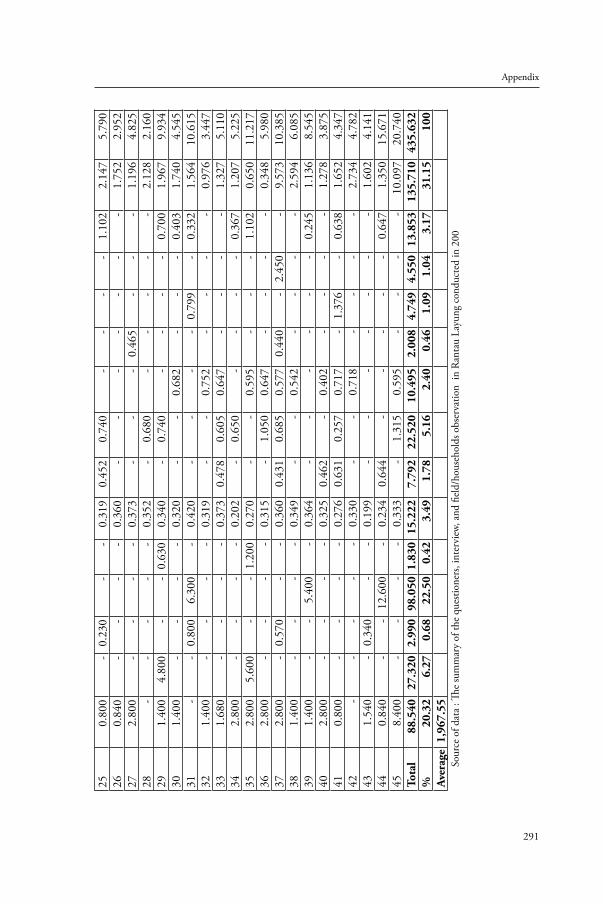
291
Appendix
250.
800
-0.
230
--
0.31
90.
452
0.74
0-
--
-1.
102
2.14
75.
790
260.
840
--
--
0.36
0-
--
--
--
1.75
22.
952
272.
800
--
--
0.37
3-
--
0.46
5-
--
1.19
64.
825
28-
--
--
0.35
2-
0.68
0-
--
--
2.12
82.
160
291.
400
4.80
0-
-0.
630
0.34
0-
0.74
0-
--
-0.
700
1.96
79.
934
301.
400
--
--
0.32
0-
-0.
682
--
-0.
403
1.74
04.
545
31-
-0.
800
6.30
0-
0.42
0-
--
-0.
799
-0.
332
1.56
410
.615
321.
400
--
--
0.31
9-
-0.
752
--
--
0.97
63.
447
331.
680
--
--
0.37
30.
478
0.60
50.
647
--
--
1.32
75.
110
342.
800
--
--
0.20
2-
0.65
0-
--
-0.
367
1.20
75.
225
352.
800
5.60
0-
-1.
200
0.27
0-
-0.
595
--
-1.
102
0.65
011
.217
362.
800
--
--
0.31
5-
1.05
00.
647
--
--
0.34
85.
980
372.
800
-0.
570
--
0.36
00.
431
0.68
50.
577
0.44
0-
2.45
0-
9.57
310
.385
381.
400
--
--
0.34
9-
-0.
542
--
--
2.59
46.
085
391.
400
--
5.40
0-
0.36
4-
--
--
-0.
245
1.13
68.
545
402.
800
--
--
0.32
50.
462
-0.
402
--
--
1.27
83.
875
410.
800
--
--
0.27
60.
631
0.25
70.
717
-1.
376
-0.
638
1.65
24.
347
42-
--
--
0.33
0-
-0.
718
--
--
2.73
44.
782
431.
540
-0.
340
--
0.19
9-
--
--
--
1.60
24.
141
440.
840
--
12.6
00-
0.23
40.
644
--
--
-0.
647
1.35
015
.671
458.
400
--
--
0.33
3-
1.31
50.
595
--
--
10.0
9720
.740
Tota
l88
.540
27.3
202.
990
98.0
501.
830
15.2
227.
792
22.5
2010
.495
2.00
84.
749
4.55
013
.853
135.
710
435.
632
%
20.3
26.
270.
6822
.50
0.42
3.49
1.78
5.16
2.40
0.46
1.09
1.04
3.17
31.1
510
0Av
erag
e1,
967.
55So
urce
of d
ata
: The
sum
mar
y of
the
ques
tione
rs, i
nter
view
, and
fiel
d/ho
useh
olds
obs
erva
tion
in R
anta
u La
yung
con
duct
ed in
200
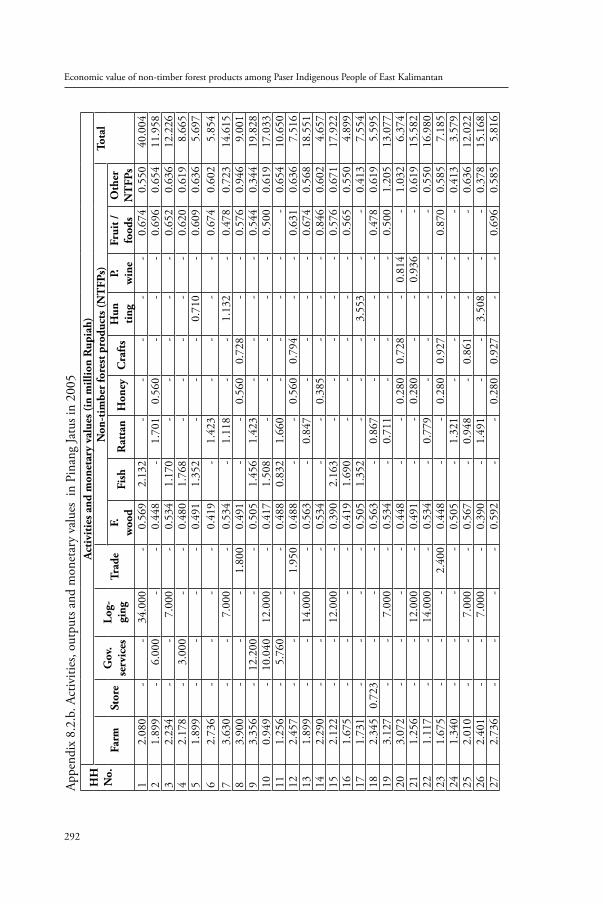
Economic value of non-timber forest products among Paser Indigenous People of East Kalimantan
292
Appe
ndix
8.2
.b. A
ctiv
ities
, out
puts
and
mon
etar
y va
lues
in
Pina
ng Ja
tus i
n 20
05
HH
No.
Act
ivit
ies a
nd m
onet
ary
valu
es (i
n m
illio
n R
upia
h)
Farm
Stor
e G
ov.
serv
ices
Log-
ging
Tr
ade
Non
-tim
ber
fore
st p
rodu
cts (
NT
FPs)
Tota
lF.
woo
dFi
shR
atta
nH
oney
Cra
fts
Hun
ting
P.w
ine
Frui
t /fo
ods
Oth
er
NT
FPs
12.
080
--
34.0
00-
0.56
92.
132
--
--
-0.
674
0.55
040
.004
21.
899
-6.
000
--
0.44
8-
1.70
10.
560
--
-0.
696
0.65
411
.958
32.
234
--
7.00
0-
0.53
41.
170
--
--
-0.
652
0.63
612
.226
42.
178
-3.
000
--
0.48
01.
768
--
--
-0.
620
0.61
98.
665
51.
899
--
--
0.49
11.
352
--
-0.
710
-0.
609
0.63
65.
697
62.
736
--
--
0.41
9-
1.42
3-
--
-0.
674
0.60
25.
854
73.
630
--
7.00
0-
0.53
4-
1.11
8-
-1.
132
-0.
478
0.72
314
.615
83.
900
--
-1.
800
0.49
1-
-0.
560
0.72
8-
-0.
576
0.94
69.
001
93.
356
-12
.200
--
0.50
51.
456
1.42
3-
--
-0.
544
0.34
419
.828
100.
949
-10
.040
12.0
00-
0.41
71.
508
--
--
-0.
500
0.61
917
.033
111.
256
-5.
760
--
0.48
80.
832
1.66
0-
--
--
0.65
410
.650
122.
457
--
-1.
950
0.48
8-
-0.
560
0.79
4-
-0.
631
0.63
67.
516
131.
899
--
14.0
00-
0.56
3-
0.84
7-
--
-0.
674
0.56
818
.551
142.
290
--
-0.
534
--
0.38
5-
--
0.84
60.
602
4.65
715
2.12
2-
-12
.000
-0.
390
2.16
3-
--
--
0.57
60.
671
17.9
2216
1.67
5-
--
-0.
419
1.69
0-
--
--
0.56
50.
550
4.89
917
1.73
1-
--
-0.
505
1.35
2-
--
3.55
3-
-0.
413
7.55
418
2.34
50.
723
--
-0.
563
-0.
867
--
--
0.47
80.
619
5.59
519
3.12
7-
-7.
000
-0.
534
-0.
711
--
--
0.50
01.
205
13.0
7720
3.07
2-
--
-0.
448
--
0.28
00.
728
-0.
814
-1.
032
6.37
421
1.25
6-
-12
.000
-0.
491
--
0.28
0-
-0.
936
-0.
619
15.5
8222
1.11
7-
-14
.000
-0.
534
-0.
779
--
--
-0.
550
16.9
8023
1.67
5-
--
2.40
00.
448
--
0.28
00.
927
--
0.87
00.
585
7.18
524
1.34
0-
--
-0.
505
-1.
321
--
--
-0.
413
3.57
925
2.01
0-
-7.
000
-0.
567
-0.
948
-0.
861
--
-0.
636
12.0
2226
2.40
1-
-7.
000
-0.
390
-1.
491
--
3.50
8-
-0.
378
15.1
6827
2.73
6-
--
-0.
592
--
0.28
00.
927
--
0.69
60.
585
5.81
6
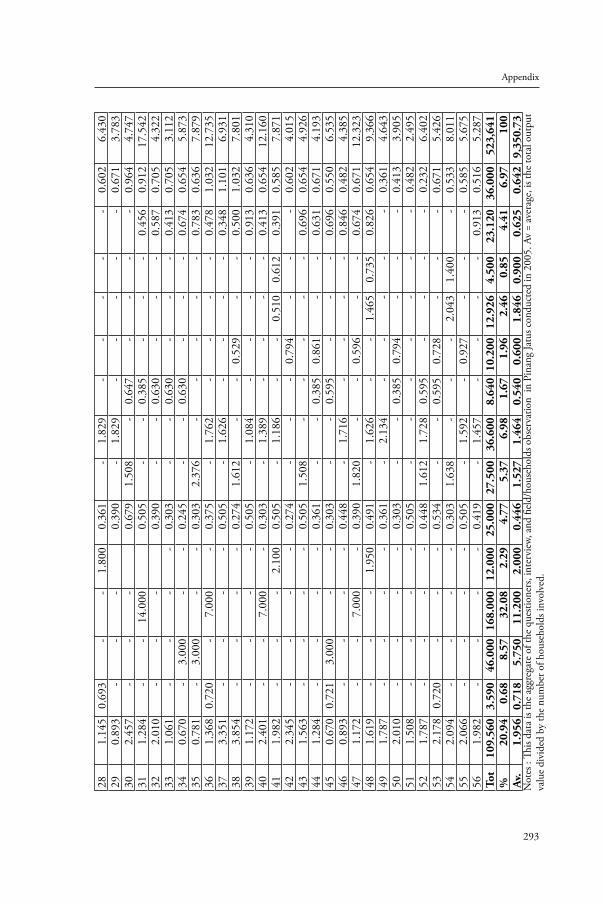
293
Appendix
281.
145
0.69
3-
-1.
800
0.36
1-
1.82
9-
--
--
0.60
26.
430
290.
893
--
-0.
390
-1.
829
--
--
-0.
671
3.78
330
2.45
7-
--
0.67
91.
508
-0.
647
--
--
0.96
44.
747
311.
284
--
14.0
000.
505
--
0.38
5-
--
0.45
60.
912
17.5
4232
2.01
0-
--
0.39
0-
-0.
630
--
-0.
587
0.70
54.
322
331.
061
--
--
0.30
3-
-0.
630
--
-0.
413
0.70
53.
112
340.
670
-3.
000
--
0.24
5-
-0.
630
--
-0.
674
0.65
45.
873
350.
781
-3.
000
--
0.30
32.
376
--
--
-0.
783
0.63
67.
879
361.
368
0.72
0-
7.00
0-
0.37
5-
1.76
2-
--
-0.
478
1.03
212
.735
373.
351
--
--
0.50
5-
1.62
6-
--
-0.
348
1.10
16.
931
383.
854
--
--
0.27
41.
612
--
0.52
9-
-0.
500
1.03
27.
801
391.
172
--
--
0.50
5-
1.08
4-
--
-0.
913
0.63
64.
310
402.
401
--
7.00
0-
0.30
3-
1.38
9-
--
-0.
413
0.65
412
.160
411.
982
--
-2.
100
0.50
5-
1.18
6-
-0.
510
0.61
20.
391
0.58
57.
871
422.
345
--
--
0.27
4-
--
0.79
4-
--
0.60
24.
015
431.
563
--
--
0.50
51.
508
--
--
-0.
696
0.65
44.
926
441.
284
--
--
0.36
1-
-0.
385
0.86
1-
-0.
631
0.67
14.
193
450.
670
0.72
13.
000
--
0.30
3-
-0.
595
--
-0.
696
0.55
06.
535
460.
893
--
--
0.44
8-
1.71
6-
--
-0.
846
0.48
24.
385
471.
172
--
7.00
0-
0.39
01.
820
--
0.59
6-
-0.
674
0.67
112
.323
481.
619
--
-1.
950
0.49
1-
1.62
6-
-1.
465
0.73
50.
826
0.65
49.
366
491.
787
--
--
0.36
1-
2.13
4-
--
--
0.36
14.
643
502.
010
--
--
0.30
3-
-0.
385
0.79
4-
--
0.41
33.
905
511.
508
--
--
0.50
5-
--
--
--
0.48
22.
495
521.
787
--
--
0.44
81.
612
1.72
80.
595
--
--
0.23
26.
402
532.
178
0.72
0-
--
0.53
4-
-0.
595
0.72
8-
--
0.67
15.
426
542.
094
--
--
0.30
31.
638
--
-2.
043
1.40
0-
0.53
38.
011
552.
066
--
--
0.50
5-
1.59
2-
0.92
7-
--
0.58
55.
675
561.
982
--
--
0.41
9-
1.45
7-
--
-0.
913
0.51
65.
287
Tot
109.
560
3.59
046
.000
168.
000
12.0
0025
.000
27.5
0036
.600
8.64
010
.200
12.9
264.
500
23.1
2036
.000
523,
641
%
20.9
40.
688.
5732
.08
2.29
4.77
5.37
6.98
1.67
1.96
2.46
0.85
4.41
6.97
100
Av.
1.95
60.
718
5.75
011
.200
2.00
00.
446
1.52
71.
464
0.54
00.
600
1.84
60.
900
0.62
50.
642
9,35
0.73
Not
es :
This
data
is th
e ag
greg
ate
of th
e qu
estio
ners
, int
ervi
ew, a
nd fi
eld/
hous
ehol
ds o
bser
vatio
n in
Pin
ang
Jatu
s con
duct
ed in
200
5. A
v =
aver
age,
is th
e to
tal o
utpu
t va
lue
divi
ded
by th
e nu
mbe
r of h
ouse
hold
s inv
olve
d.
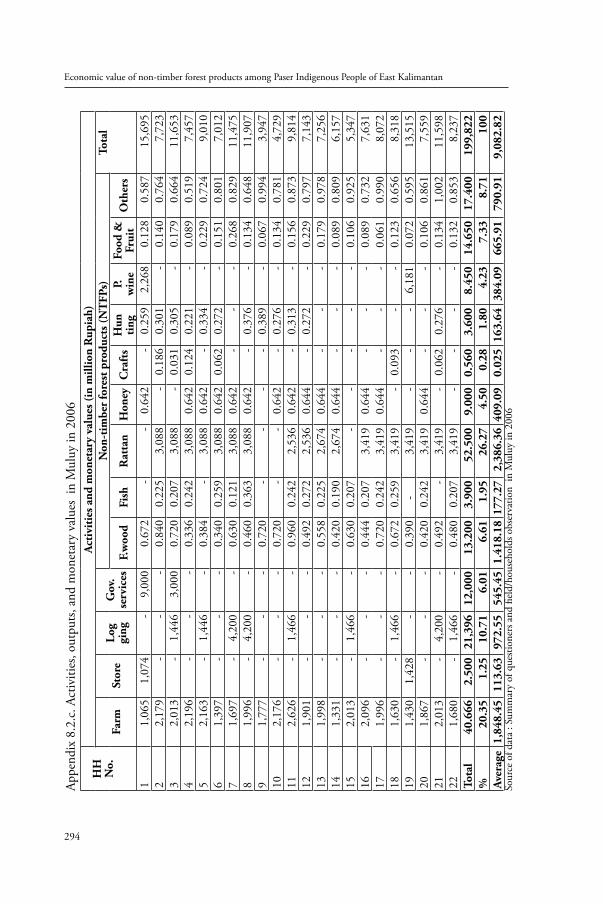
Economic value of non-timber forest products among Paser Indigenous People of East Kalimantan
294
Appe
ndix
8.2
.c. A
ctiv
ities
, out
puts,
and
mon
etar
y va
lues
in
Mul
uy in
200
6
HH
No.
Act
ivit
ies a
nd m
onet
ary
valu
es (i
n m
illio
n R
upia
h)
Farm
Stor
e Lo
ggi
ng
Gov
. se
rvic
es
Non
-tim
ber
fore
st p
rodu
cts (
NT
FPs)
Tota
l
F.w
ood
Fish
Rat
tan
Hon
eyC
raft
sH
unti
ngP.
win
eFo
od &
Fr
uit
Oth
ers
11,
065
1,07
4-
9,00
00.
672
--
0.64
2-
0.25
92,
268
0.12
80.
587
15,6
952
2,17
9-
--
0.84
00.
225
3,08
8-
0.18
60.
301
-0.
140
0.76
47,
723
32,
013
-1,
446
3,00
00.
720
0.20
73,
088
-0.
031
0.30
5-
0.17
90.
664
11,6
534
2,19
6-
--
0.33
60.
242
3,08
80.
642
0.12
40.
221
-0.
089
0.51
97,
457
52,
163
-1,
446
-0.
384
-3,
088
0.64
2-
0.33
4-
0.22
90.
724
9,01
06
1,39
7-
--
0.34
00.
259
3,08
80.
642
0.06
20.
272
-0.
151
0.80
17,
012
71,
697
-4,
200
-0.
630
0.12
13,
088
0.64
2-
--
0.26
80.
829
11,4
758
1,99
6-
4,20
0-
0.46
00.
363
3,08
80.
642
-0.
376
-0.
134
0.64
811
,907
91,
777
--
-0.
720
--
--
0.38
9-
0.06
70.
994
3,94
710
2,17
6-
--
0.72
0-
-0.
642
-0.
276
-0.
134
0.78
14,
729
112,
626
-1,
466
-0.
960
0.24
22,
536
0.64
2-
0.31
3-
0.15
60.
873
9,81
412
1,90
1-
--
0.49
20.
272
2,53
60.
644
-0.
272
-0.
229
0.79
77,
143
131,
998
--
-0.
558
0.22
52,
674
0.64
4-
--
0.17
90.
978
7,25
614
1,33
1-
--
0.42
00.
190
2,67
40.
644
--
-0.
089
0.80
96,
157
152,
013
-1,
466
-0.
630
0.20
7-
--
--
0.10
60.
925
5,34
716
2,09
6-
--
0.44
40.
207
3,41
90.
644
--
-0.
089
0.73
27,
631
171,
996
--
-0.
720
0.24
23,
419
0.64
4-
--
0.06
10.
990
8,07
218
1,63
0-
1,46
6-
0.67
20.
259
3,41
9-
0.09
3-
-0.
123
0.65
68,
318
191,
430
1,42
8-
-0.
390
-3,
419
--
-6,
181
0.07
20.
595
13,5
1520
1,86
7-
--
0.42
00.
242
3,41
90.
644
--
-0.
106
0.86
17,
559
212,
013
-4,
200
-0.
492
-3,
419
-0.
062
0.27
6-
0.13
41,
002
11,5
9822
1,68
0-
1,46
6-
0.48
00.
207
3,41
9-
--
-0.
132
0.85
38,
237
Tota
l40
.666
2.50
021
,396
12,0
0013
.200
3.90
052
.500
9.00
00.
560
3.60
08.
450
14.6
5017
.400
199,
822
%
20.3
51.
2510
.71
6.01
6.61
1.95
26.2
74.
500.
281.
804.
237.
338.
7110
0Av
erag
e1,
848.
4511
3.63
972.
5554
5.45
1.41
8.18
177.
272,
386.
3640
9.09
0.02
516
3.64
384.
0966
5.91
790.
919,
082.
82So
urce
of d
ata
: Sum
mar
y of
que
stion
ers a
nd fi
eld/
hous
ehol
ds o
bser
vatio
n in
Mul
uy in
200
6
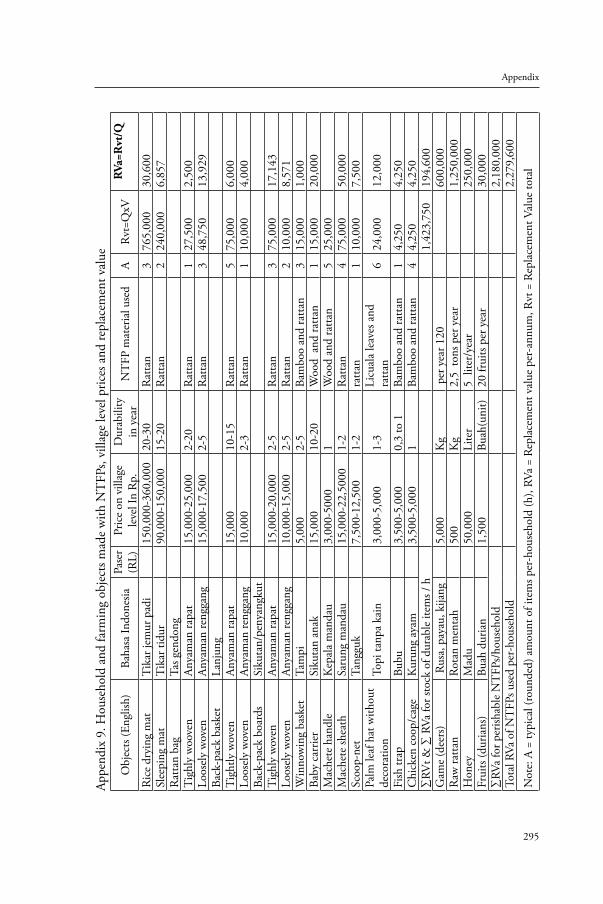
295
Appendix
Appe
ndix
9. H
ouse
hold
and
farm
ing
obje
cts m
ade
with
NT
FPs,
villa
ge le
vel p
rices
and
repl
acem
ent v
alue
Obj
ects
(Eng
lish)
Baha
sa In
done
siaPa
ser
(RL)
Pric
e on
vill
age
leve
l In
Rp.
Dur
abili
tyin
yea
rN
TFP
mat
eria
l use
dA
Rvt
=QxV
RVa
=Rvt
/Q
Ric
e dr
ying
mat
Tika
r jem
ur p
adi
150,
000-
360,
000
20-3
0R
atta
n3
765,
000
30,6
00Sl
eepi
ng m
atTi
kar t
idur
90,0
00-1
50,0
0015
-20
Rat
tan
224
0,00
06,
857
Rat
tan
bag
Tas g
endo
ngTi
ghly
woo
ven
Anya
man
rapa
t15
,000
-25,
000
2-20
Rat
tan
127
,500
2,50
0Lo
osel
y w
oven
Anya
man
reng
gang
15,0
00-1
7,50
02-
5R
atta
n3
48,7
5013
,929
Back
-pac
k ba
sket
Lanj
ung
Tigh
tly w
oven
Anya
man
rapa
t15
,000
10-1
5R
atta
n5
75,0
006,
000
Loos
ely
wov
enAn
yam
an re
ngga
ng10
,000
2-3
Rat
tan
110
,000
4,00
0Ba
ck-p
ack
boar
dsSi
kuta
n/pe
nyan
gkut
Tigh
ly w
oven
Anya
man
rapa
t15
,000
-20,
000
2-5
Rat
tan
375
,000
17,1
43Lo
osel
y w
oven
Anya
man
reng
gang
10,0
00-1
5,00
02-
5R
atta
n2
10,0
008,
571
Win
now
ing
bask
etTa
mpi
5,00
02-
5Ba
mbo
o an
d ra
ttan
315
,000
1,00
0Ba
by c
arrie
rSi
kuta
n an
ak15
,000
10-2
0W
ood
and
ratta
n1
15,0
0020
,000
Mac
hete
han
dle
Kep
ala
man
dau
3,00
0-50
001
Woo
d an
d ra
ttan
525
,000
Mac
hete
shea
thSa
rung
man
dau
15,0
00-2
2,50
001-
2R
atta
n 4
75,0
0050
,000
Scoo
p-ne
tTa
nggu
k7,
500-
12,5
001-
2ra
ttan
110
,000
7,50
0Pa
lm le
af h
at w
ithou
t de
cora
tion
Topi
tanp
a ka
in3,
000-
5,00
01-
3Li
cual
a le
aves
and
ra
ttan
624
,000
12,0
00
Fish
trap
Bubu
3,50
0-5,
000
0,3
to 1
Ba
mbo
o an
d ra
ttan
14,
250
4,25
0C
hick
en c
oop/
cage
Kur
ung
ayam
3,50
0-5,
000
1Ba
mbo
o an
d ra
ttan
44,
250
4,25
0∑
RVt &
∑ R
Va fo
r sto
ck o
f dur
able
item
s / h
1,42
3,75
019
4,60
0G
ame
(dee
rs)
Rus
a, p
ayau
, kija
ng5,
000
Kg
per
yea
r 120
60
0,00
0R
aw ra
ttan
Rota
n m
enta
h50
0K
g2,
5 to
ns p
er y
ear
1,25
0,00
0H
oney
Mad
u50
,000
Lite
r5
lite
r/ye
ar25
0,00
0Fr
uits
(dur
ians
)Bu
ah d
uria
n1,
500
Buah
(uni
t)20
frui
ts pe
r yea
r30
,000
∑RV
a fo
r per
ishab
le N
TFP
s/ho
useh
old
2,18
0,00
0To
tal R
Va o
f NT
FPs u
sed
per-
hous
ehol
d2,
279,
600
Not
e: A
= ty
pica
l (ro
unde
d) a
mou
nt o
f ite
ms p
er-h
ouse
hold
(h),
RVa
= Re
plac
emen
t val
ue p
er-a
nnum
, Rvt
= R
epla
cem
ent V
alue
tota
l
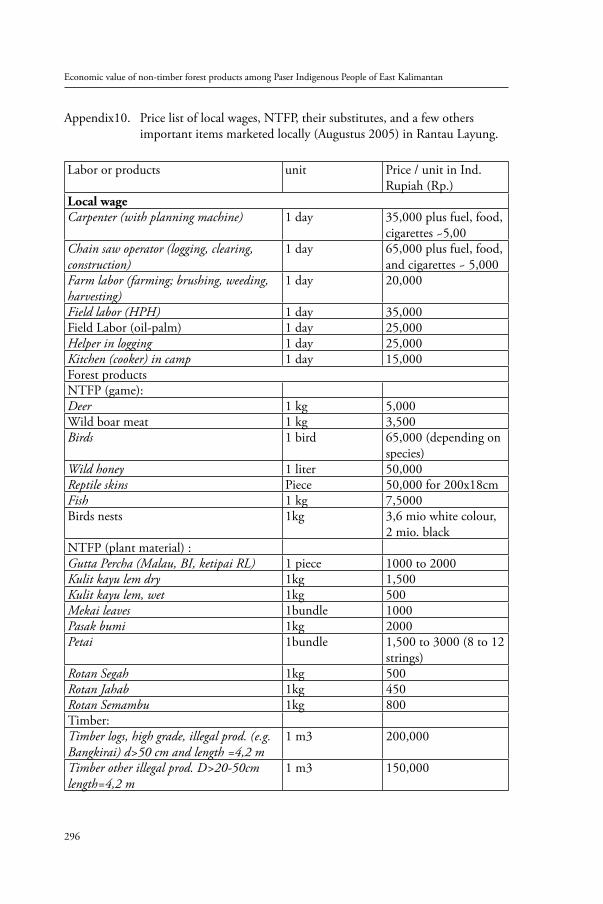
Economic value of non-timber forest products among Paser Indigenous People of East Kalimantan
296
Appendix10. Price list of local wages, NTFP, their substitutes, and a few others important items marketed locally (Augustus 2005) in Rantau Layung.
Labor or products unit Price / unit in Ind. Rupiah (Rp.)
Local wageCarpenter (with planning machine) 1 day 35,000 plus fuel, food,
cigarettes ~5,00Chain saw operator (logging, clearing, construction)
1 day 65,000 plus fuel, food, and cigarettes ~ 5,000
Farm labor (farming; brushing, weeding, harvesting)
1 day 20,000
Field labor (HPH) 1 day 35,000 Field Labor (oil-palm) 1 day 25,000Helper in logging 1 day 25,000Kitchen (cooker) in camp 1 day 15,000Forest productsNTFP (game):Deer 1 kg 5,000Wild boar meat 1 kg 3,500Birds 1 bird 65,000 (depending on
species)Wild honey 1 liter 50,000Reptile skins Piece 50,000 for 200x18cm Fish 1 kg 7,5000Birds nests 1kg 3,6 mio white colour,
2 mio. black NTFP (plant material) :Gutta Percha (Malau, BI, ketipai RL) 1 piece 1000 to 2000Kulit kayu lem dry 1kg 1,500Kulit kayu lem, wet 1kg 500Mekai leaves 1bundle 1000Pasak bumi 1kg 2000Petai 1bundle 1,500 to 3000 (8 to 12
strings)Rotan Segah 1kg 500Rotan Jahab 1kg 450Rotan Semambu 1kg 800Timber:Timber logs, high grade, illegal prod. (e.g. Bangkirai) d>50 cm and length =4,2 m
1 m3 200,000
Timber other illegal prod. D>20-50cm length=4,2 m
1 m3 150,000
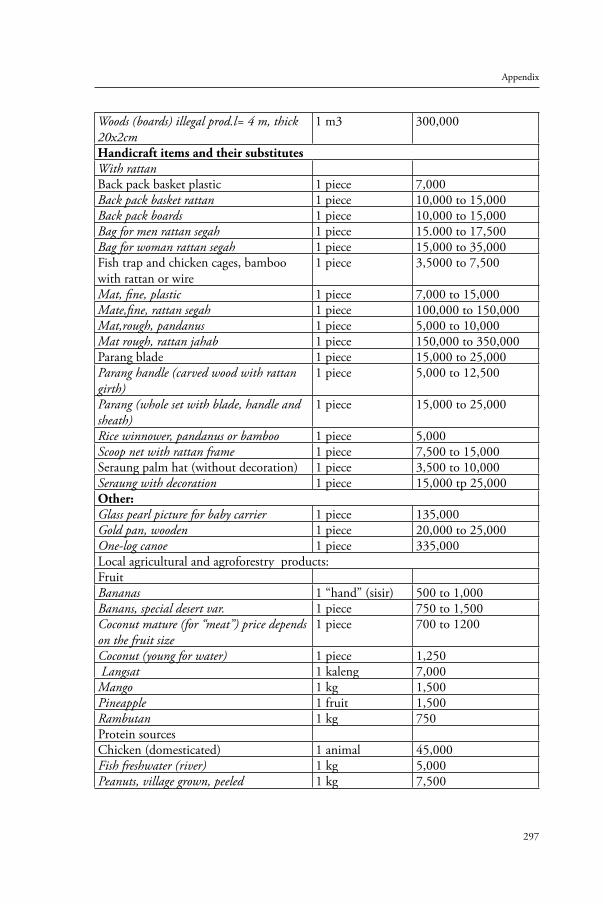
297
Appendix
Woods (boards) illegal prod.l= 4 m, thick 20x2cm
1 m3 300,000
Handicraft items and their substitutesWith rattanBack pack basket plastic 1 piece 7,000Back pack basket rattan 1 piece 10,000 to 15,000Back pack boards 1 piece 10,000 to 15,000Bag for men rattan segah 1 piece 15.000 to 17,500Bag for woman rattan segah 1 piece 15,000 to 35,000Fish trap and chicken cages, bamboo with rattan or wire
1 piece 3,5000 to 7,500
Mat, fine, plastic 1 piece 7,000 to 15,000Mate,fine, rattan segah 1 piece 100,000 to 150,000Mat,rough, pandanus 1 piece 5,000 to 10,000Mat rough, rattan jahab 1 piece 150,000 to 350,000Parang blade 1 piece 15,000 to 25,000Parang handle (carved wood with rattan girth)
1 piece 5,000 to 12,500
Parang (whole set with blade, handle and sheath)
1 piece 15,000 to 25,000
Rice winnower, pandanus or bamboo 1 piece 5,000Scoop net with rattan frame 1 piece 7,500 to 15,000Seraung palm hat (without decoration) 1 piece 3,500 to 10,000Seraung with decoration 1 piece 15,000 tp 25,000Other:Glass pearl picture for baby carrier 1 piece 135,000Gold pan, wooden 1 piece 20,000 to 25,000One-log canoe 1 piece 335,000Local agricultural and agroforestry products:FruitBananas 1 “hand” (sisir) 500 to 1,000Banans, special desert var. 1 piece 750 to 1,500Coconut mature (for “meat”) price depends on the fruit size
1 piece 700 to 1200
Coconut (young for water) 1 piece 1,250 Langsat 1 kaleng 7,000Mango 1 kg 1,500Pineapple 1 fruit 1,500Rambutan 1 kg 750Protein sourcesChicken (domesticated) 1 animal 45,000Fish freshwater (river) 1 kg 5,000Peanuts, village grown, peeled 1 kg 7,500
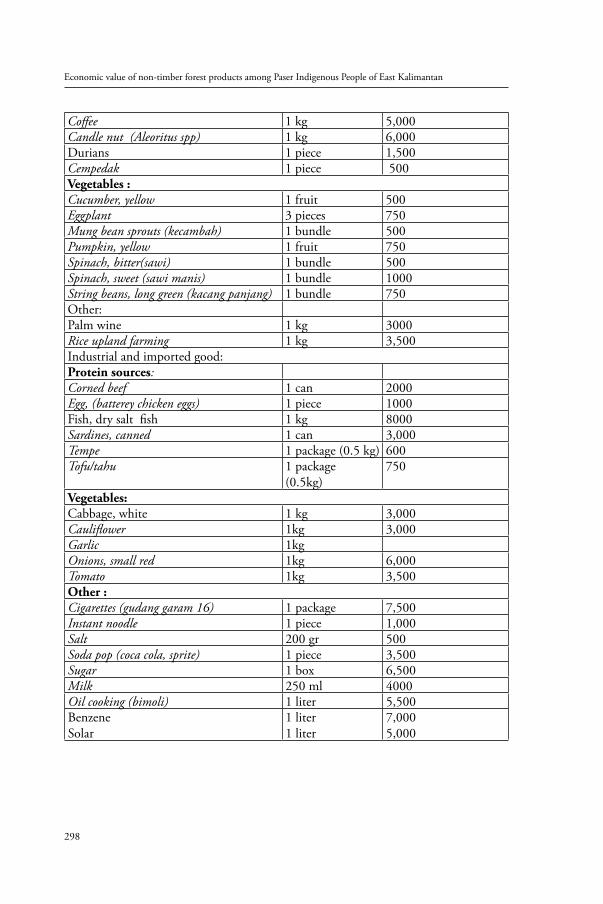
Economic value of non-timber forest products among Paser Indigenous People of East Kalimantan
298
Coffee 1 kg 5,000Candle nut (Aleoritus spp) 1 kg 6,000Durians 1 piece 1,500 Cempedak 1 piece 500Vegetables :Cucumber, yellow 1 fruit 500Eggplant 3 pieces 750Mung bean sprouts (kecambah) 1 bundle 500Pumpkin, yellow 1 fruit 750Spinach, bitter(sawi) 1 bundle 500Spinach, sweet (sawi manis) 1 bundle 1000String beans, long green (kacang panjang) 1 bundle 750Other:Palm wine 1 kg 3000Rice upland farming 1 kg 3,500Industrial and imported good:Protein sources:Corned beef 1 can 2000Egg, (batterey chicken eggs) 1 piece 1000Fish, dry salt fish 1 kg 8000Sardines, canned 1 can 3,000Tempe 1 package (0.5 kg) 600Tofu/tahu 1 package
(0.5kg)750
Vegetables:Cabbage, white 1 kg 3,000Cauliflower 1kg 3,000Garlic 1kgOnions, small red 1kg 6,000Tomato 1kg 3,500Other :Cigarettes (gudang garam 16) 1 package 7,500Instant noodle 1 piece 1,000Salt 200 gr 500Soda pop (coca cola, sprite) 1 piece 3,500Sugar 1 box 6,500Milk 250 ml 4000Oil cooking (bimoli) 1 liter 5,500Benzene Solar
1 liter1 liter
7,0005,000
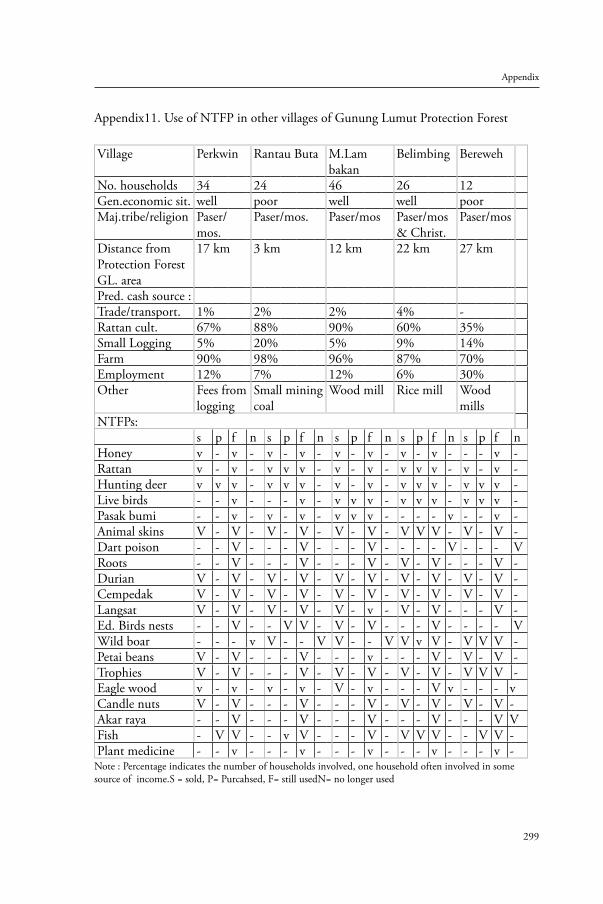
299
Appendix
Appendix11. Use of NTFP in other villages of Gunung Lumut Protection Forest
Village Perkwin Rantau Buta M.Lambakan
Belimbing Bereweh
No. households 34 24 46 26 12Gen.economic sit. well poor well well poorMaj.tribe/religion Paser/
mos.Paser/mos. Paser/mos Paser/mos
& Christ.Paser/mos
Distance from Protection Forest GL. area
17 km 3 km 12 km 22 km 27 km
Pred. cash source :Trade/transport. 1% 2% 2% 4% -Rattan cult. 67% 88% 90% 60% 35%Small Logging 5% 20% 5% 9% 14%Farm 90% 98% 96% 87% 70%Employment 12% 7% 12% 6% 30%Other Fees from
loggingSmall mining coal
Wood mill Rice mill Wood mills
NTFPs:s p f n s p f n s p f n s p f n s p f n
Honey v - v - v - v - v - v - v - v - - - v -Rattan v - v - v v v - v - v - v v v - v - v -Hunting deer v v v - v v v - v - v - v v v - v v v -Live birds - - v - - - v - v v v - v v v - v v v -Pasak bumi - - v - v - v - v v v - - - - v - - v -Animal skins V - V - V - V - V - V - V V V - V - V -Dart poison - - V - - - V - - - V - - - - V - - - VRoots - - V - - - V - - - V - V - V - - - V -Durian V - V - V - V - V - V - V - V - V - V -Cempedak V - V - V - V - V - V - V - V - V - V -Langsat V - V - V - V - V - v - V - V - - - V -Ed. Birds nests - - V - - V V - V - V - - - V - - - - VWild boar - - - v V - - V V - - V V v V - V V V -Petai beans V - V - - - V - - - v - - - V - V - V -Trophies V - V - - - V - V - V - V - V - V V V -Eagle wood v - v - v - v - V - v - - - V v - - - vCandle nuts V - V - - - V - - - V - V - V - V - V -Akar raya - - V - - - V - - - V - - - V - - - V VFish - V V - - v V - - - V - V V V - - V V -Plant medicine - - v - - - v - - - v - - - v - - - v -
Note : Percentage indicates the number of households involved, one household often involved in some source of income.S = sold, P= Purcahsed, F= still usedN= no longer used
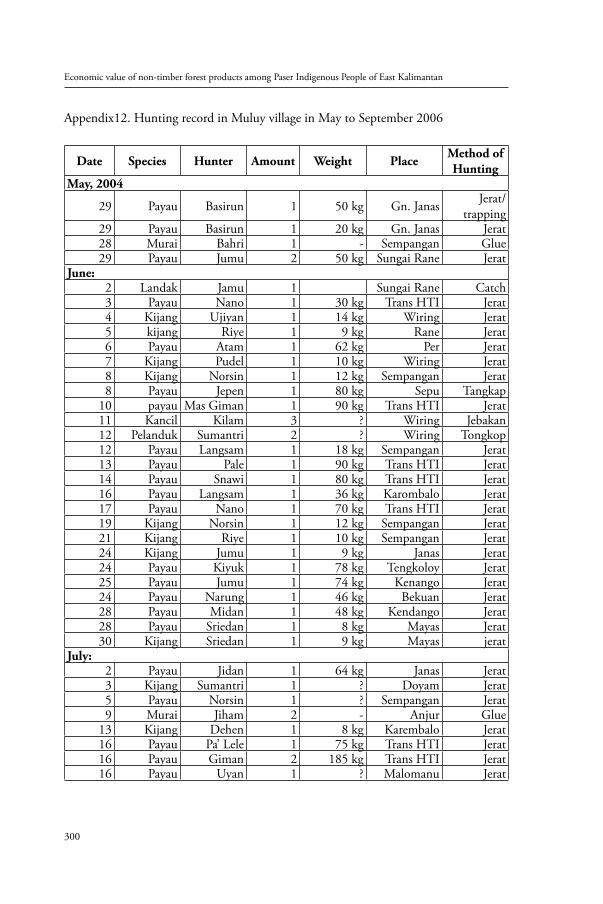
Economic value of non-timber forest products among Paser Indigenous People of East Kalimantan
300
Appendix12. Hunting record in Muluy village in May to September 2006
Date Species Hunter Amount Weight Place Method of Hunting
May, 2004
29 Payau Basirun 1 50 kg Gn. Janas Jerat/trapping
29 Payau Basirun 1 20 kg Gn. Janas Jerat28 Murai Bahri 1 - Sempangan Glue29 Payau Jumu 2 50 kg Sungai Rane Jerat
June:2 Landak Jamu 1 Sungai Rane Catch3 Payau Nano 1 30 kg Trans HTI Jerat4 Kijang Ujiyan 1 14 kg Wiring Jerat5 kijang Riye 1 9 kg Rane Jerat6 Payau Atam 1 62 kg Per Jerat7 Kijang Pudel 1 10 kg Wiring Jerat8 Kijang Norsin 1 12 kg Sempangan Jerat8 Payau Jepen 1 80 kg Sepu Tangkap
10 payau Mas Giman 1 90 kg Trans HTI Jerat11 Kancil Kilam 3 ? Wiring Jebakan12 Pelanduk Sumantri 2 ? Wiring Tongkop12 Payau Langsam 1 18 kg Sempangan Jerat13 Payau Pale 1 90 kg Trans HTI Jerat14 Payau Snawi 1 80 kg Trans HTI Jerat16 Payau Langsam 1 36 kg Karombalo Jerat17 Payau Nano 1 70 kg Trans HTI Jerat19 Kijang Norsin 1 12 kg Sempangan Jerat21 Kijang Riye 1 10 kg Sempangan Jerat24 Kijang Jumu 1 9 kg Janas Jerat24 Payau Kiyuk 1 78 kg Tengkoloy Jerat25 Payau Jumu 1 74 kg Kenango Jerat24 Payau Narung 1 46 kg Bekuan Jerat28 Payau Midan 1 48 kg Kendango Jerat28 Payau Sriedan 1 8 kg Mayas Jerat30 Kijang Sriedan 1 9 kg Mayas jerat
July:2 Payau Jidan 1 64 kg Janas Jerat3 Kijang Sumantri 1 ? Doyam Jerat5 Payau Norsin 1 ? Sempangan Jerat9 Murai Jiham 2 - Anjur Glue
13 Kijang Dehen 1 8 kg Karembalo Jerat16 Payau Pa’ Lele 1 75 kg Trans HTI Jerat16 Payau Giman 2 185 kg Trans HTI Jerat16 Payau Uyan 1 ? Malomanu Jerat
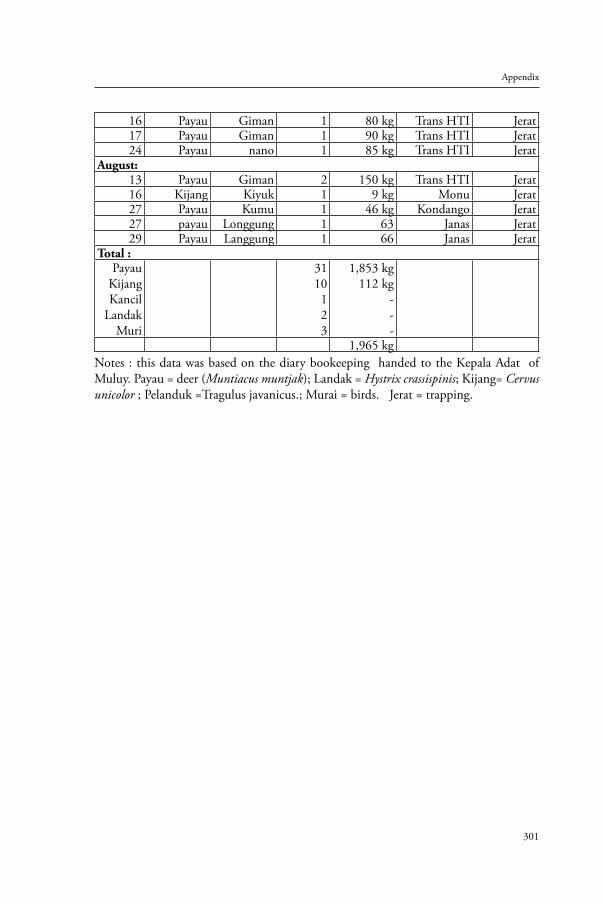
301
Appendix
16 Payau Giman 1 80 kg Trans HTI Jerat17 Payau Giman 1 90 kg Trans HTI Jerat24 Payau nano 1 85 kg Trans HTI Jerat
August:13 Payau Giman 2 150 kg Trans HTI Jerat16 Kijang Kiyuk 1 9 kg Monu Jerat27 Payau Kumu 1 46 kg Kondango Jerat27 payau Longgung 1 63 Janas Jerat29 Payau Langgung 1 66 Janas Jerat
Total :Payau
KijangKancil
LandakMuri
3110123
1,853 kg112 kg
---
1,965 kgNotes : this data was based on the diary bookeeping handed to the Kepala Adat of Muluy. Payau = deer (Muntiacus muntjak); Landak = Hystrix crassispinis; Kijang= Cervus unicolor ; Pelanduk =Tragulus javanicus.; Murai = birds. Jerat = trapping.
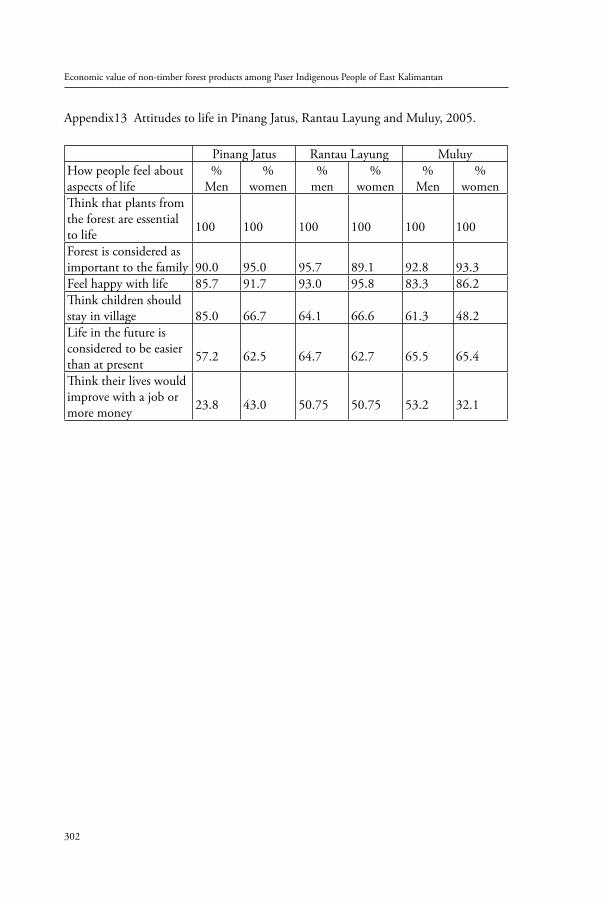
Economic value of non-timber forest products among Paser Indigenous People of East Kalimantan
302
Appendix13 Attitudes to life in Pinang Jatus, Rantau Layung and Muluy, 2005.
Pinang Jatus Rantau Layung MuluyHow people feel about aspects of life
%Men
%women
%men
%women
%Men
%women
Think that plants from the forest are essential to life 100 100 100 100 100 100
Forest is considered as important to the family 90.0 95.0 95.7 89.1 92.8 93.3Feel happy with life 85.7 91.7 93.0 95.8 83.3 86.2Think children should stay in village 85.0 66.7 64.1 66.6 61.3 48.2Life in the future is considered to be easier than at present 57.2 62.5 64.7 62.7 65.5 65.4
Think their lives would improve with a job or more money 23.8 43.0 50.75 50.75 53.2 32.1
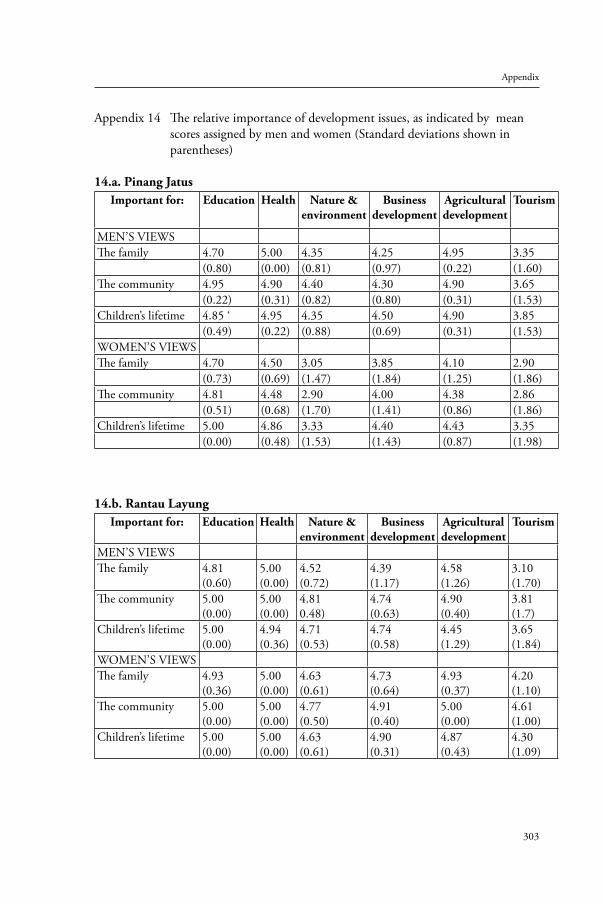
303
Appendix
Appendix 14 The relative importance of development issues, as indicated by mean scores assigned by men and women (Standard deviations shown in parentheses)
14.a. Pinang JatusImportant for: Education Health Nature &
environmentBusiness
developmentAgriculturaldevelopment
Tourism
MEN’S VIEWSThe family 4.70 5.00 4.35 4.25 4.95 3.35
(0.80) (0.00) (0.81) (0.97) (0.22) (1.60)The community 4.95 4.90 4.40 4.30 4.90 3.65
(0.22) (0.31) (0.82) (0.80) (0.31) (1.53)Children’s lifetime 4.85 ‘ 4.95 4.35 4.50 4.90 3.85
(0.49) (0.22) (0.88) (0.69) (0.31) (1.53)WOMEN’S VIEWSThe family 4.70 4.50 3.05 3.85 4.10 2.90
(0.73) (0.69) (1.47) (1.84) (1.25) (1.86)The community 4.81 4.48 2.90 4.00 4.38 2.86
(0.51) (0.68) (1.70) (1.41) (0.86) (1.86)Children’s lifetime 5.00 4.86 3.33 4.40 4.43 3.35
(0.00) (0.48) (1.53) (1.43) (0.87) (1.98)
14.b. Rantau LayungImportant for: Education Health Nature &
environmentBusiness
developmentAgriculturaldevelopment
Tourism
MEN’S VIEWSThe family 4.81
(0.60)5.00(0.00)
4.52(0.72)
4.39(1.17)
4.58(1.26)
3.10(1.70)
The community 5.00(0.00)
5.00(0.00)
4.810.48)
4.74(0.63)
4.90(0.40)
3.81(1.7)
Children’s lifetime 5.00(0.00)
4.94(0.36)
4.71(0.53)
4.74(0.58)
4.45(1.29)
3.65(1.84)
WOMEN’S VIEWSThe family 4.93
(0.36)5.00(0.00)
4.63(0.61)
4.73(0.64)
4.93(0.37)
4.20(1.10)
The community 5.00(0.00)
5.00(0.00)
4.77(0.50)
4.91(0.40)
5.00(0.00)
4.61(1.00)
Children’s lifetime 5.00(0.00)
5.00(0.00)
4.63(0.61)
4.90(0.31)
4.87(0.43)
4.30(1.09)
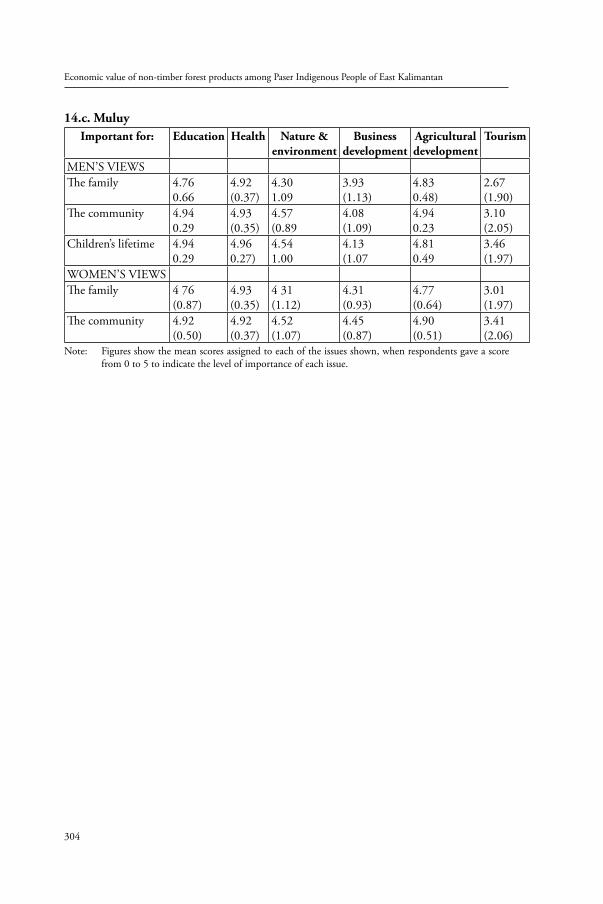
Economic value of non-timber forest products among Paser Indigenous People of East Kalimantan
304
14.c. MuluyImportant for: Education Health Nature &
environmentBusiness
developmentAgriculturaldevelopment
Tourism
MEN’S VIEWSThe family 4.76
0.664.92(0.37)
4.301.09
3.93(1.13)
4.830.48)
2.67(1.90)
The community 4.940.29
4.93(0.35)
4.57(0.89
4.08(1.09)
4.940.23
3.10(2.05)
Children’s lifetime 4.940.29
4.960.27)
4.541.00
4.13(1.07
4.810.49
3.46(1.97)
WOMEN’S VIEWSThe family 4 76
(0.87)4.93(0.35)
4 31(1.12)
4.31(0.93)
4.77(0.64)
3.01(1.97)
The community 4.92(0.50)
4.92(0.37)
4.52(1.07)
4.45(0.87)
4.90(0.51)
3.41(2.06)
Note: Figures show the mean scores assigned to each of the issues shown, when respondents gave a score from 0 to 5 to indicate the level of importance of each issue.
305
Summary
The use of forest products by the indigenous people in Indonesia have been a major concern of researchers and policymakers since the beginning of the Seventies and the distribution of the country’s forest for logging concessions. This distribution was conducted without considering the value of non-timber forest products (NTFPs) for local people or their needs and their role in forest and environment conservation. There have been many indications that indigenous people face difficulties in fulfilling their daily needs due to decreasing numbers of NTFP resources – an result of exploitation by logging concessions.
The increasing demands for the recognition of indigenous people’s rights to natural resources and resource management in East Kalimantan is also result of increased international attention for development issues and, in particular, indigenous people’s right to resources. East Kalimantan is one of the regional focuses of these studies and, in particular, the Mahakam Basin. One of the important aspects of these studies is the use of non-timber forest products and its socio-economic values for indigenous people. This is particularly important in the region where non-timber forest products play an important role for rural households, such as in the central part of Kutai and the northern part of the Mahakam River, in areas such as Muara Lawa and West Kutai. However, thus far, Paser District has failed to gain sufficient attention. This study of NTFPs economic value in Paser District is expected to contribute more comprehensive information on the use of non-timber forest products in East Kalimantan.
Another reason for the economic valuation of NTFPs in Paser is to examine the current government policy regarding their management, which views forest value as being much more related to timber and timber products. The forestry sector and its related institutions pay more attention to timber as a main product of the forest and disregard the role of non-timber forest products in the forest ecosystem and for the economy of indigenous people in terms of forest management. The government’s view,
Economic value of non-timber forest products among Paser Indigenous People of East Kalimantan
306
that NTFPs are not important products in forest management, can be derived from two main factors: first, the high prices of timber, which makes the contribution of timber export very significant to the Indonesian (government) economy. This is in contrast with non-timber forest products, which are often invisible in the market, difficult to access, and their contribution to government revenues is very small. Second, the role of NTFPs in indigenous people’s livelihoods, and for the environment, for the forest ecosystem and nature, and for the future development of human needs has, up to now, been poorly understood, not least due to the lack of research in this area. These two reasons caused non-timber forest products to be undervalued and, ultimately, neglected in the allocation of natural forest for logging concessions and for other forest conversions. The lack of attention by government and policymakers to NTFPs has also had a serious impact on the sustainability of forest and non-timber forest products, and it tends to marginalize indigenous peoples.
My research was conducted in an effort to show how the forest and its resources play an important role in the livelihoods of the Dayak indigenous people of Paser. It is conducted with the aim of assessing and evaluating the importance of NTFPs in indigenous people’s household economy, by determining the number of wild plants and animals used for households needs. The assessment includes the use of NTFPs for household subsistence needs, for markets or cash income, as well as for cultural and spiritual values. This study also collects indigenous peoples’ perceptions on current development issues relating to both forest and environmental conditions. After collecting the number of NTFPs used in all households the second step of study was to conduct the economic valuation of each NTFP in order to generate the monetary values of all NTFPs at the household and village levels. The monetary value of each product was estimated on the basis of their extraction volume at the household level, which was determined by the consumption and market selling volume of each NTFP at household level. This volume is then multiplied by the price of each product. The price of the product was determined using two methods: market base techniques and the contingent valuation methods. Data collections were made at various levels of indigenous peoples’ activities, including in the forest, at home and at the nearest market, by following the flow of the products. The market chain traced begins from farmers or household level until the end user of the products in the city or market near the research area. Various methods of interviews and field measurements of natural and socio-cultural aspects of forest and non-timber forest products were employed to generate data for the study.
The selection of the Gunung Lumut region for field study follows the framework of the Tropenbos Kalimantan Programme, the Trade-off of Biodiversity Project in Gunung Lumut Protection Forest and Extension Area of the District of Pasir in East Kalimantan. The Trade-off Biodiversity Project was developed with the aim to formulate recommendations on the integration of forest exploitation, timber and non-timber forest products and to serve local people and biodiversity conservation. The research project was started following an agreement by Tropenbos International, the Institute
307
Summary
of Environmental Sciences (CML), Leiden University and the Faculty of Forestry of Mulawarman University-Samarinda, Indonesia. Gunung Lumut region is a protected area but inhabited by the indigenous people of Paser and six former logging concession areas.
From the data collection perspective, this study represents 123 households, with 577 inhabitants, in three different Paser indigenous villages as a main data source. Each village studied has a different access to market and government development programmes. The average number of household members is four. The village economic status is in the form of transition, from barter to cash income or individual methods. Data collection was made in the period 2004 to 2007. Consequently, the data and information in this study represents only the condition and the situation in these years.
The assessment of the use of forest plants and forest wild animals in village research revealed that Paser indigenous people used more than 299 plants for various purposes, such as: for construction materials, for fuel wood, for food sources and for vegetables, for medicines and for various cultural rituals or amenities. 29 wild species of animals were used as meat sources, for skins and for trophy, for game and for fun, and for rituals.
The calculation of forest products’ monetary values in the household economy of Paser indigenous people shows that the forest contributed Rp. 9,391,048 to the households’ annual budget and 30 per cent of this was derived from non-timber forest products. In terms of residual values, the average forest resource contribution to the household economy is Rp. 1,517,969 per year. This indicates that the forest and forest products are the main source of the livelihoods of the Paser people.
This study also demonstrates a method of assessment of the actual use-values of non-timber forest products in monetary terms. The calculated figures of the use-value of forest products also represents the value added to labour and capital inputs by the use of the primary resources: land and forest. It is suggested that it would certainly be in the interest of the Pasir District’s policymakers to look more carefully at the total forest income potential of forest resources, rather than concentrating solely on timber income. It is also suggested that forest land should be not viewed as a solution for industrial development, such as oil palm development, in which forest resources have not been properly evaluated.
This monetary value can be used by policymakers or government agencies to impose compensation for local people who have lost their access to forest resources as a consequence of forest conversion or forest allocation for logging concessions or for palm oil plantations. This value can also be used as a preliminary calculation for the assessment of externalities if forests are to be converted or changed for other agriculture development programmes.
The current government programme in the research area indicates that the use of plants and wild animals by the indigenous people of Paser is perceived as unimportant
Economic value of non-timber forest products among Paser Indigenous People of East Kalimantan
308
for aspects of forest function. This can be observed by the high forest conversion rate in the last decade, for agriculture purposes such as palm oil, timber estate industries and coal mining, which is damaging non-timber forest products resources. This condition was triggered by the policy that did not show the economic values of NTFPs in monetary terms of government expenditures and policymakers were not aware of these values. This view influenced the methods of forest management, which tended to value forest products for market only without considering their role for the economy of indigenous people, and, ultimately resulted in unsustainable use of the forest.
There is no doubt from the results of this study that the importance of NTFPs has not been highlighted in the government programme for timber exploitation and forests conversion for agriculture development. It is clear, too, that the people in the research villages would be significantly worse off if no forest existed for their use.
The economic valuation of forest resources, as discussed in this study, is designed to make the value of forest use explicit, and not necessarily to put a total value on nature. As one can note in the literature, there has been much interest in estimating the total economic value (TEV) of forests. The discussion of economic value and non-economic dimensions of the forest in this study has increased the (monetary) value of the forest, even though this is still far from the description of the Total Economic Value (TEV). This means that it is necessary to undertake further study in the Gunung Lumut region in order to capture the TEV of this area for local people and the environment. Different values can be generated by a particular situation and by different techniques. The TEV of Gunung Lumut can be estimated by the sum of the various values.
This study defines and analyses the importance of non-timber forest products (NTFP) as a component of the resource base of tropical forest. Following a discussion of currently used valuation techniques, an attempt has been made to quantify the use-value of these products in monetary terms. Although, clearly, the value of an ecosystem goes far beyond its direct use value, an identification of such use-values in this study forms the basis of an estimate of the total economic value of the Gunung Lumut resource.
The ecological importance of non-timber forest products is still not fully understood, but some aspects of this have been discussed in my study, along with an account of strategies for forest management. An outline of the state of forest resources and their role in the Paser context, provides an estimate, through this study and on the basis of the methodology used here, a monetary value for NTFPs used by Paser indigenous people. This should be considered by the local government as a way to promote the importance of NTFPs for forest management and sustainable development.
309
Samenvatting
Het gebruik van bosproducten door inheemse volken in Indonesië is een belangrijk onderwerp van onderzoekers en beleidsmakers geweest in het begin van de jaren ’70 van de vorige eeuw omdat de bossen ernstig verstoord werden door houtkapmaatschappijen. Deze verstoring vond plaats zonder enige zorg voor de betekenis en de behoeften van de zgn. bosbijproducten of de niet-houtbosproducten voor de lokale mensen of de inheemse gemeenschappen of voor hun rol voor het beheer van het bos en de natuurbescherming. Er zijn veel aanwijzingen dat inheemse volken problemen ondervinden bij het bevredigen van hun dagelijkse behoeften vanwege de achteruitgang van de bosbijproducten door de impact van de exploitatie van de bossen door houtkapmaatschappijen.
De toenemende behoefte aan erkenning van de rechten van inheemse volken ten aanzien van natuurlijke hulpbronnen en het beheer erover in Indonesië was ook een gevolg van de internationale ontwikkeling op dit gebied. Oost-Kalimantan is in dit opzicht de regionale focus in Indonesië en het stroomgebied van de Mahakam rivier is dit in het bijzonder. Eén van de belangrijke aspecten van deze studies is het gebruik van bosbijproducten en hun sociaal-economische betekenis voor inheemse volken. Dit is in het bijzonder van belang in het gebied waar bosbijproducten een grote rol spelen in rurale huishoudens zoals in het centrale deel van het district Kutai en het noordelijke deel van de Mahakam rivier, zoals in districten Muara Lawa en West-Kutai. Het Paser district daarentegen kreeg nauwelijks belangstelling en daarom heb ik mij gericht op de studie van de economische betekenis van bosproducten om zodoende een bijdrage te kunnen leveren aan de kennis over het gebruik van bosbijproducten in Oost-Kalimantan.
Een ander element in de studie van de economische betekenis van bosbijproducten in Paser is gerelateerd aan het huidige overheidsbeleid dat veel meer is gericht op hout en houtproducten. De bosbouwsector en de hieraan gerelateerde instellingen besteden veel meer aandacht aan hout als het belangrijkste bosproduct en zij verwaarlozen de
Economic value of non-timber forest products among Paser Indigenous People of East Kalimantan
310
rol van bosbijproducten voor de economie van de inheemse gemeenschappen en voor het bosbeheer. De redenen waarom de overheid zo weinig aandacht besteedde aan de bosbijproducten bij het beheer van het bos zijn tweeledig: ten eerste was de prijs van hout hoog waardoor houtexport een belangrijke bijdrage leverde aan de Indonesische economie, terwijl de bosbijproducten in de markt grotendeels onzichtbaar waren. Hun omvang en betekenis zijn moeilijk in te schatten en het belang ervan voor de overheid is zeer klein. Ten tweede was de rol van bosbijproducten voor het leven van inheemse volken en voor de natuur en het bosecosysteem, en ook voor de toekomstige bevrediging van menselijke behoeften, niet goed begrepen vanwege onvoldoende onderzoek. Door deze twee redenen werden bosbijproducten ondergewaardeerd en soms zelfs genegeerd bij de toewijzing van natuurlijk bos aan houtkapmaatschappijen en ten behoeve van andere bestemmingen via bosconversie. Gebrek aan aandacht voor bosbijproducten van de kant van de overheid en de beleidsmakers heeft een serieuze impact gehad op de duurzaamheid van het bosgebruik, inclusief de bosbijproducten. Het heeft ook bijgedragen aan de marginalisering van de inheemse volken.
Mijn onderzoek is gericht op een poging om aan te tonen hoe het bos en de daarin besloten natuurlijke hulpbronnen een belangrijke rol spelen in het bestaan van de inheemse Dayak bevolking in Paser. Het is gedaan met het doel het belang van bosbijproducten voor de economie van huishoudens van de inheemse bevolking te beoordelen door het aantal wilde planten en dieren dat gebruikt wordt voor huishoudbehoeften vast te stellen. Deze beoordeling omvat het gebruik van niet-houtbosproducten voor eigen gebruik, voor verkoop en voor de markt, en voor culturele en spirituele waarden. Deze studie heeft zich ook gericht op de percepties van de lokale bevolking met betrekking tot de huidige bos- en milieuomstandigheden. Na het verzamelen van gegevens over het gebruik van bosbijproducten op huishoudniveau, is een tweede stap gezet om de economische waardering van alle producten die hiermee gemaakt worden, vast te stellen zowel op huishoud- als op dorpsniveau. De waarde van ieder product, uitgedrukt in geld, werd geschat op basis van de totale beschikbare hoeveelheid op huishoudniveau, en die werd bepaald door de consumptie en de hoeveelheid van ieder bosbijproduct die op de markt werd gebracht. Deze hoeveelheid werd dan vermenigvuldigd met de prijs van ieder product. Deze prijs werd op twee manieren bepaald: technieken gebaseerd op de markt en diverse waarderingsmethoden. Dataverzameling geschiedde op het niveau van de activiteiten van lokale bevolking. Deze omvatten activiteiten in het bos, thuis en op de lokale markten waarbij telkens de stroom van de producten werd gevolgd. De marktketen begon telkens bij de boeren of op huishoudniveau en liep tot de eindgebruiker van de producten in de stad of de markt in de buurt van het onderzoeksgebied. Verschillende interviewtechnieken en veldmethoden om de ecologische en de sociaal-culturele aspecten van bos en bosproducten vast te stellen werden gebruikt om de gegevens voor deze studie te verzamelen.
De selectie van de Gunung Lumut regio als veldlocatie werd bepaald in het kader van het Tropenbos Kalimantan Programma en in het bijzonder het Trade off
311
Samenvatting
Biodiversity Project in en rond het beschermde gebied van Gunung Lumut van het Paser district in Oost-Kalimantan. Dit Trade off Biodiversity Project was opgezet met het doel aanbevelingen te formuleren voor de integratie van bosexploitatie, hout en bosbijproducten en was mede gericht op de behoeften van de lokale bevolking en biodiversiteitbescherming. Het onderzoeksproject was geformuleerd op basis van een overeenkomst tussen Tropenbos International, het Instituut voor Milieuwetenschappen van Universiteit Leiden (CML) en de Bosbouw Faculteit van Mulawarman University in Samarinda (Oost-Kalimantan). Gunung Lumut is een beschermd gebied dat wordt bewoond door de Paser bevolking. In het verleden waren er zes houtkapmaatschappijen actief.
De dataverzameling waarop deze studie is gebaseerd, bestaat vooral uit de studie van 123 huishoudens in drie verschillende dorpen van de inheemse Paser bevolking en gegevens verkregen uit twee additionele dorpen. In totaal omvat de studie gegevens over 577 mensen. Alle dorpen die zijn opgenomen in de studie, verschillen van elkaar ten aanzien van toegang tot de markt en de mate waarin de overheid ontwikkelingsprogramma’s tot uitvoering brengt. Het gemiddelde aantal mensen dat tot een huishouden behoort, ligt rond de vier. Alle dorpen bevinden zich in verschillende stadia van economische transitie, die loopt van een ruileconomie naar een economie gebaseerd op cashstromen. Verzameling van gegevens vond plaats in verschillende perioden tussen 2004 en 2007. De informatie en analyse ervan zijn daarom dan ook gebaseerd op de situatie in deze jaren.
De analyse van het gebruik van bosplanten en de wilde dieren uit het bos in de onderzoeksdorpen tonen aan dat de Paser bevolking meer dan 300 planten gebruikt voor verschillende doeleinden zoals voedsel, medicijnen, constructiemateriaal, brandhout, diverse religieuze rituelen en andere behoeften. Tenminste 29 soorten wilde dieren worden gebruikt voor hun vlees, voor hun huiden. Dieren of hun producten worden ook gebruikt bij rituelen.
De berekening van de monetaire waarde van de bosproducten in de huishoudeconomie van de Pasir bevolking toont aan dat deze Rp 9.391.048 bedraagt in het gemiddelde huishoudbudget en dat 30% hiervan afkomstig is van de bosbijproducten. Dit geeft aan dat het bos en de bosproducten de belangrijkste bron van bestaan is voor de Paser bevolking.
De studie demonstreert ook een waarderingsmethode van de feitelijke gebruikswaarde van bosbijproducten uitgedrukt in geld. De berekende cijfers van de gebruikswaarde van de bosproducten reflecteert tevens de toegevoegde waarde van de arbeid van de kapitaalsinput bij het gebruik van de primaire hulpbronnen land en bos. Gesuggereerd wordt dat het zeker van belang zou zijn als de beleidsmakers van het Paser district nauwkeuriger zouden kijken naar het potentieel van het totale inkomen uit de hulpbronnen uit het bos, in plaats van zich uitsluitend te richten op het inkomen verkregen uit hout. Gesuggereerd wordt ook dat het land dat nu bedekt is met bos
Economic value of non-timber forest products among Paser Indigenous People of East Kalimantan
312
niet alleen beschouwd zou moeten worden vanuit een perspectief van industriële ontwikkeling, zoals voor de ontwikkeling van palmolieplantages, waarin de waarde van het bos zelf niet op de juiste waarde wordt gewaardeerd.
Deze monetaire waarde kan gebruikt worden door de beleidsmakers en overheidsinstanties bij de berekening van de compensatiebetalingen aan de lokale bevolking voor het verlies van het bos als gevolg van bosconversie of vanwege toewijzing van het bos aan houtkapmaatschappijen of voor oliepalmplantages. Deze waarde kan ook gebruikt worden als een voorlopige berekening voor de waardering van externalities indien de bossen worden geconverteerd of gebruikt voor andere landbouwkundige ontwikkelingsprogramma’s.
Overheidsprogramma’s die momenteel in het onderzoeksgebied worden uitgevoerd tonen aan dat het gebruik van planten en wilde dieren voor de inheemse bevolking van Paser als een onbelangrijk aspect van het bos wordt beschouwd. Dit blijkt onder andere uit de sterke mate waarin het bos de afgelopen tien jaar is omgezet in andere vormen van landgebruik zoals oliepalmplantages, houtplantages en mijnbouw, hetgeen zeer schadelijk is voor de bosbijproducten. Dit bleek op basis van het beleid waarbij de economische waarde van de bosbijproducten niet werden uitgedrukt in financiële termen bij de berekeningen van de overheid. Beleidsmakers waren zich eenvoudig niet bewust van deze waarde. Dit beïnvloedde de methoden van bosbeheer die bedoeld waren om de bosproducten te waarderen voor hun waarde voor de markt maar zonder hun rol en betekenis voor de economie van de inheemse bevolking hierbij te betrekken, wat uiteindelijk resulteerde in het niet-duurzame gebruik van het bos.
Er is geen twijfel dat uit het resultaat van deze studie blijkt dat het belang van bosbijproducten niet wordt onderkend in de overheidsprogramma’s voor houtexploitatie en bosconversie ten behoeve van agrarische ontwikkeling. De economie van de mensen in de dorpen in het studiegebied zou veel slechter zijn als zij niet de beschikking hadden over het bos.
De economische waardering van de hulpbronnen in het bos zoals besproken in deze studie is bedoeld om de waarde van bosgebruik expliciet te maken, en niet noodzakelijkerwijs om de totale waarde van de natuur aan te geven. Zoals blijkt uit de literatuur is er veel belangstelling geweest voor het schatten van de totale economische waarde (TEV) van bossen. De discussie over economische waarde en de niet-economische dimensie van bos in deze studie, heeft de waarde van het bos en de monetaire waarde ervan vergroot, hoewel het nog ver verwijderd is van de totale economische waarde (TEV) hetgeen betekent dat het nodig is om een vervolgstudie te doen in het gebied van Gunung Lumut om die totale waarde voor de lokale mensen en het milieu vast te stellen. Verschillende waarden kunnen worden gegenereerd door verschillende technieken. De TEV van Gunung Lumut kan geschat worden als de som van de verschillende typen waarden.
313
Samenvatting
Deze studie heeft het belang van de bosbijproducten als component van het tropische bos aangegeven en geanalyseerd. In aansluiting op een discussie over waarderingstechnieken die tegenwoordig gebruikt worden, is een poging ondernomen om de gebruikswaarde van deze producten in monetaire termen uit te drukken. Het is zonder meer duidelijk dat de waarde van een ecosysteem ver uitstijgt boven de directe gebruikswaarde ervan. Een identificatie van zulke gebruikswaarden in deze studie is de basis geweest door een schatting van de totale economische waarde van het bos van Gunung Lumut.
Het ecologische belang van bosbijproducten is nog steeds niet volledig duidelijk, maar verschillende aspecten ervan zijn in deze studie besproken naast een verslag van strategieën van bosbeheer. Een beschrijving van de hulpbronnen in het bos en hun rol binnen de context van het Paser district is hier gegeven. Op basis hiervan is een methodologie ontwikkeld waardoor de monetaire waarde van de bosbijproducten zoals gebruikt door de Paser bevolking kon worden geschat. Deze zou gebruikt moeten worden door de lokale overheid in de beschouwingen over het belang van bosbijproducten in het bosbeheer en ten behoeve van duurzame ontwikkeling.

Economic value of non-timber forest products among Paser Indigenous People of East Kalimantan
314
315
About the Author
Bernaulus Saragih was born on July 1st, 1968 in Hutatinggir, Simalungun, North Sumatra, Indonesia and received his strata one degree (Ir.) in forest management from the Faculty of Forestry of the Mulawarman University in 1992. He subsequently worked for three years in a logging concession as a production manager, before he was appointed as a member of staff at the Forestry Faculty of the Mulawarman University,Samarinda, East Kalimantan, Indonesia in 1995.
He joined the GTZ-IGFP project as a junior advisor in 1995-1996, with the main task to analyse the production and distribution of logging concessions in East Kalimantan. He joined the FAO-RECOFTC training for forest products marketing in Bangkok, Thailand in 1996. Between August 1996 and July 1997 he joined the GTZ-SFMP (Sustainable forest management project) as a junior advisor for non-timber forest products marketing.
He obtained his Master’s degree in Tropical Forestry in 1999 from the University of Gottingen, Germany, focusing on the importance of non-timber forest products in rural economies and tropical forest management. In the same year he returned to the Faculty of Forestry at Mulawarman University.
After finishing his Master’s programme, he joined several research projects, including the EU-BFMP project for non-timber forest products and sustainable management of forest in Berau in 2000, the ITTO-Ministry of Forestry project for evaluating the role of traditional culture in forest management in 2002, and as an advisory member of the parliament of Bulungan District, East Kalimantan in 2002.
He is also a prominent contributor of articles on environment and forestry issues to the biggest newspaper in East Kalimantan, and in 2005 he was appointed as Editor-in-Chief of the Mulawarman University journal ‘Natural and Life Sciences’.
316
His many years of experience working with non-timber forest products motivated him to undertake a guided PhD study in the field of valuation of non-timber forest products. This began with his involvement in the Trade-off Biodiversity Project of the Tropenbos Kalimantan Programme and the Centre for Environmental Science (CML), Leiden University and the Faculty of Forestry of Mulawarman University in 2003-2009.