economic, environmental and grid-resilience benefits of
TRANSCRIPT
Articleshttps://doi.org/10.1038/s41560-021-00915-5
1Energy Analysis & Environmental Impacts Division, Energy Technologies Area, Lawrence Berkeley National Laboratory, Berkeley, CA, USA. 2Institute of the Environment and Sustainability, University of California, Los Angeles, CA, USA. 3Department of Agricultural and Resource Economics, University of California, Berkeley, CA, USA. ✉e-mail: [email protected]
Scientific consensus asserts that global greenhouse gas (GHG) emissions must be reduced by 45% from 2010 levels by 2030 to limit global warming to 1.5 °C and minimize climate catastro-
phe1. The US freight rail sector provides a unique opportunity for aggressive near-term climate action. It transports more goods than any other rail system in the world2 and depends on diesel fuel, which accounts for over 90% of the rail sector’s total energy consumption3. Currently transporting 40% of national intercity freight4, its capac-ity is projected to double by 20505. Without substantial changes to its propulsion system, the US freight rail system will be responsible for half the global diesel used in the freight rail sector by the same year2. These diesel locomotives emit 35 million tonnes of CO2 each year and produce air pollution that causes about 1,000 premature deaths annually, accounting for approximately US$6.5 billion in health damage costs per year6,7. Despite being more fuel efficient than trucks, these locomotives produce close to twice the air pol-lution damages compared with heavy-duty trucks per unit of fuel consumed owing to less stringent pollution controls on locomo-tives6,8. Since 2015, new and remanufactured locomotives have been required to install a catalytic converter, reducing nitrogen oxides (NOx) and fine particulate matter (PM2.5) emissions by 80–90% by 20409. Notably, these measures do not impact GHG emissions.
Efforts to identify zero-emissions pathways for freight rail are underway, with national sector-wide emissions-reductions tar-gets and more stringent Environmental Protection Agency (EPA) emissions-reductions requirements for the US freight rail sector10. A few viable pathways have emerged for achieving zero emissions: rail network electrification via catenary, hydrogen fuel cells and battery-powered locomotives. The catenary approach involves elec-trifying part or all of the rail network via overhead lines coupled with grid-scale storage of renewable energy and it has been more thoroughly investigated11,12. Hydrogen fuel cells have also received increased attention13–15, although their zero-emissions potential depends on the source of hydrogen and the process used to extract it16. Nearly all hydrogen is currently produced with fossil fuels17.
We consider the battery-electric pathway on the basis of leverag-ing recent technological advances to add battery cars to existing diesel-electric locomotives. This approach allows rail operators to exploit existing surplus renewable energy sources at low prices.
Three recent developments support a US transition to battery-electric rail: plummeting battery prices, increasing battery energy densities and access to cheap renewable electricity. Between 2010 and 2020, battery energy densities tripled and battery pack prices declined 87% (ref. 18). Average industry prices are expected to reach US$100 kWh–1 by 2023 and US$58 kWh–1 by 2030, with some automakers already achieving lithium-ion battery pack prices of US$100 kWh–1 (ref. 19). At the same time, electricity from renewable sources costs about half as much as electricity from fos-sil fuels20. A few studies have considered battery-electric rail pro-pulsion, but their price estimates are outdated owing to the rapid innovation in battery technology and none consider the effects of charging-infrastructure capacity use on infrastructure costs2,21. Prior studies have also relied on average service-level electricity tar-iffs, which overestimate charging costs because they do not account for potential to charge batteries when surplus renewable electric-ity is available or consider economies of scale of transmission- or distribution-level services on routes with high travel volumes.
We examine the case for zero-emission, battery-electric pro-pulsion in the US freight rail sector on the basis of current and forecasted energy storage technologies combined with access to renewable energy at industrial rates. We consider only Class I railroads here, defined as railroads that earn over US$505 million in revenue per year, which together accounted for 94% of freight rail revenue in 201922. We show that a 241-km range (the average daily distance travelled by US Class I freight trains) can be achieved using a single boxcar equipped with a 14-MWh battery and inverter, while consuming half the energy consumed by diesel trains. At near-future battery prices (US$100 kWh–1), battery-electric trains can achieve parity with diesel-electric trains if environmen-tal costs are included or if rail companies can access wholesale
Economic, environmental and grid-resilience benefits of converting diesel trains to battery-electricNatalie D. Popovich 1, Deepak Rajagopal 2, Elif Tasar3 and Amol Phadke 1 ✉
Nearly all US locomotives are propelled by diesel-electric drives, which emit 35 million tonnes of CO2 and produce air pollution causing about 1,000 premature deaths annually, accounting for approximately US$6.5 billion in annual health damage costs. Improved battery technology plus access to cheap renewable electricity open the possibility of battery-electric rail. Here we show that a 241-km range can be achieved using a single standard boxcar equipped with a 14-MWh battery and inverter, while consuming half the energy consumed by diesel trains. At near-future battery prices, battery-electric trains can achieve parity with diesel-electric trains if environmental costs are included or if rail companies can access wholesale electricity prices and achieve 40% use of fast-charging infrastructure. Accounting for reduced criteria air pollutants and CO2 emissions, switching to battery-electric propulsion would save the US freight rail sector US$94 billion over 20 years.
NATuRE ENERgy | VOL 6 | NOVEmBER 2021 | 1017–1025 | www.nature.com/natureenergy 1017
Articles Nature eNergy
electricity prices and achieve 40% use of fast-charging infrastruc-ture. Accounting for reduced criteria air pollutants and CO2 emis-sions, switching to battery-electric propulsion could save the US freight rail sector US$94 billion over 20 years. We consider the sen-sitivity of our results to battery pack assumptions, electricity rates and diesel prices.
Technical feasibility of battery-electric propulsionUS Class I locomotives are diesel-electric: a diesel engine drives an electric generator that powers traction motors to drive the axles. Such a locomotive can be converted to battery-electric by adding one or more battery tender cars, referred to as tender cars, with wiring that delivers electricity to the drivetrain. A tender car could transmit electricity via cable to the locomotive’s central electri-cal bus and then transmit that electricity to the traction motors. Alternating current (a.c.) and direct current (d.c.) traction motors have different retrofit requirements; both types are used in US loco-motives, although a.c. motors are increasingly common. The d.c. locomotive requires only cables and a charge controller from the battery tender car, incurring negligible cost. Each locomotive with an a.c. traction motor would require a transformer (we account for this cost under charging infrastructure in the electricity tariffs) and an onboard inverter for the 3.3-MW traction motor. Alternatively, traction motors could be added under battery tender cars as a cab-less locomotive (rail representative, personal communication).
The freight rail sector is three to four times more fuel efficient (revenue-tonne l–1 of diesel) than road-based freight, on aver-age4. This advantage provides trains with a margin for adding the battery-related weight, volume and energy consumption needed to achieve a sufficient daily range while maintaining very high efficiency. In addition, the nature of battery technology and rail operations provides plentiful opportunities for recharging during long hauls. Here, we show that adding a single boxcar of battery equipment could enable battery-powered trains to achieve requisite
operational ranges while surpassing the energy efficiency of diesel-electric trains.
Our analysis is based on a representative Class I train operat-ing in California, with four 3.3-MW locomotives pulling 100 boxcars and 6,806 revenue-tonnes (or tonnes of payload). A stan-dard 14.6-m boxcar has a rated payload capacity of 114 t (ref. 23), although some heavy-duty cars can carry up to 337 t (ref. 24). We use lithium ferrous phosphate (LFP) batteries because they have a longer cycle life and lower temperatures25 than do lithium nickel manganese cobalt oxide (NMC) batteries and are more economical given the distances travelled by freight trains (2.4 million km over 20 years)26. Furthermore, LFP batteries require negligible service maintenance, have a recharge rate up to 4C (ref. 27), are cheaper than lithium titanate oxide (LTO), are not sensitive to unpredict-able price fluctuations in cobalt or nickel28 and can operate over a wide range of temperatures29. While LTO presents some advantages relative to LFP, such as extreme fast charging, we select LFP due to the lower price, higher energy density, higher voltage30 and relative stability31. Assuming the current best energy density achieved by LFP batteries, a single boxcar could accommodate a 14-MWh bat-tery with a 241-km range on a single charge, the average distance travelled between stops for US Class I freight trains. Our estimate is much larger than existing estimates based on outdated battery energy densities that suggest a single tender car could carry only 5.1–6.2 MWh (refs. 13,32).
Using cell-specific energy figures for LFP batteries and a typical packing fraction (cell weight per pack weight) of 0.76 (ref. 33), we estimate the total weight of a 14-MWh battery plus inverter to be 114 t, well within the 121-t constraint of certain sections of the US rail network, such as bridges34. Assuming the ratio of pack energy density (kWh l–1) to pack specific energy (kWh kg–1) is the same as at the cell level, we estimate a total battery volume of 39 m3. The com-bined volume of the battery plus inverter (13.7 m3) is about 40% of the estimated volume of a standard boxcar (129 m3) (ref. 23). Hence,
US$0.149
US$0.074
US$0.050US$0.037
US$0.030 US$0.025
US$0.149
US$0.074
US$0.050US$0.037
$0.030 US$0.025
US$0.027
US$0.027
US$0.026
US$0.026US$0.026
US$0.026
US$0.033
US$0.033
US$0.033
US$0.033US$0.033
US$0.033
US$0.177
US$0.102
US$0.076
US$0.064US$0.057
US$0.051
US$0.185
US$0.110
US$0.084
US$0.072US$0.064
US$0.059
0
0.02
0.04
0.06
0.08
0.10
0.12
0.14
0.16
0.18
0.20
10 20 30 40 50 60 10 20 30 40 50 60
ERCOT direct-access customer Illustrative CAISO scenario
Ene
rgy
pric
e (U
S$
kWh–1
)
Station utilization (percentage of hours per day station is used)
Infrastructure Generation T&D Demand charge
a b
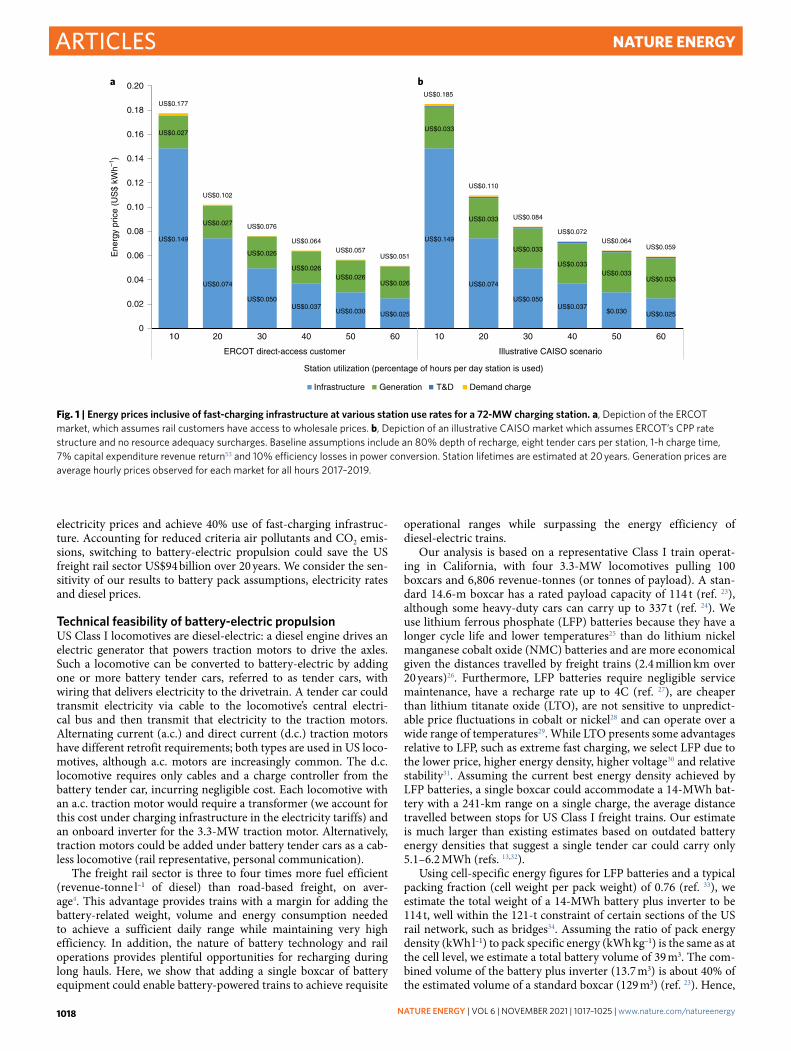
Fig. 1 | Energy prices inclusive of fast-charging infrastructure at various station use rates for a 72-MW charging station. a, Depiction of the ERCOT market, which assumes rail customers have access to wholesale prices. b, Depiction of an illustrative CAISO market which assumes ERCOT’s CPP rate structure and no resource adequacy surcharges. Baseline assumptions include an 80% depth of recharge, eight tender cars per station, 1-h charge time, 7% capital expenditure revenue return53 and 10% efficiency losses in power conversion. Station lifetimes are estimated at 20 years. Generation prices are average hourly prices observed for each market for all hours 2017–2019.
NATuRE ENERgy | VOL 6 | NOVEmBER 2021 | 1017–1025 | www.nature.com/natureenergy1018
ArticlesNature eNergy
it is feasible on a weight and volume basis to achieve a 241-km range using a single boxcar equipped with a 14-MWh battery and inverter.
The energy consumed by battery freight trains increases by 5% (241-km range) because of the additional battery weight but it is still about half the energy consumed by diesel trains owing to the high efficiency of all-electric drives. After accounting for the aver-age energy intensity of the sector35, diesel locomotive engine effi-ciency21 and cooling requirements for the battery, we estimate that trains with a 241-km range (14-MWh battery) require approxi-mately 0.0345 kWh revenue-tonne-km–1 with LFP technology. For comparison, an existing estimate of the energy requirements for battery-electric locomotives with regenerative braking is 0.014 kWh tonne-km–1 (ref. 21). Existing passenger rail battery-electric locomotives in Japan have larger batteries for the operating ranges (for example, 3.6 MWh for a 27-km route) but the maximum ranges are not reported15. Preliminary findings from a battery-electric loco-motive demonstration project in California suggest that our esti-mates are reasonable (rail representative, personal communication).
Battery-powered trains with at least a 241-km range should have ample opportunity to charge during long routes while remaining on schedule. The average length of a US Class I freight haul is 1,662 km (ref. 3). Class I freight rail routes include 30- to 45-min stops for crew changes every 240–400 km, at which point batteries could be recharged. Longer routes also include a refuelling stop at the midpoint for 1–2 h (rail representative, personal communication). Technological advances enable charging rates of 30 min to 1 h for fully charging each cell (1–2C charging) for commercially available LFP batteries, although LFP technology can theoretically achieve 4C charging25. Although not considered in this analysis, the potential ability to swap a discharged battery car with a charged battery car could provide additional flexibility at stations that are well-staffed and receive sufficient through-traffic each day. There appears to be notable downtime during which charged cars can be swapped with discharged cars as boxcars typically sit idle for up to 25 h at a time36.
The centralized and scheduled nature of freight rail opera-tion and dispatch can enable high use of fast-charging infrastruc-ture, leading to lower costs. We estimate the cost of a 72-MW charging station connected at the transmission level that can charge eight tender cars at a time (for example, two trains with four tender cars each). Using historical prices from the Electric Reliability Council of Texas (ERCOT37) and California Independent System Operator (CAISO38), we estimate the levelized cost of electricity-plus-charging to be between US$0.051 kWh–1 (60% use, ERCOT) and US$0.185 kWh–1 (10% use, CAISO) (Fig. 1). Phadke et al. discuss the effect of rate design on charging costs39. Because these costs are shared across the number of trains using the charging stations, stations with higher travel volumes have potential to be the most cost-effective locations.
Table 1 | Historical wholesale energy prices in ERCOT and CAISO
Historical (2017–2019)
CAISO38 ERCOT37
Percentage of hours under US$30 mWh–1 60 76
Percentage of hours under US$45 mWh–1 87 91
Average price of eight cheapest hours of the day (US$ mWh–1)
17.5 16.9
Average price of 12 cheapest hours of the day (US$ mWh–1)
20.3 18.4
Average price of eight cheapest hours on the most expensive day (US$ mWh–1)
69.4 44.3
These prices reflect only the price of generation and do not include fast-charging infrastructure, T&D or demand charges. The percentage of hours observed under a specific price point is calculated as the average hourly wholesale price observed for all days in the timeframe.
0
0.02
0.04
0.06
0.08
0.10
0.12
0.14
0.16
0.18
0.20
0.22
0.24
0.26
0 0.1 0.2 0.3 0.4 0.5 0.6 0.7 0.8 0.9 1.0 1.1 1.2 1.3 1.4 1.5 1.6
Brea
k-ev
en e
lect
ricity
pric
e (U
S$ k
Wh–1
)
Diesel price (US$ l–1)
Current electricity prices (withoutcharging infrastructure)
2019 rail sectordiesel price
Battery price = US$50 kWh–1
Battery price = US$100 kWh–1
Battery price = US$200 kWh–1
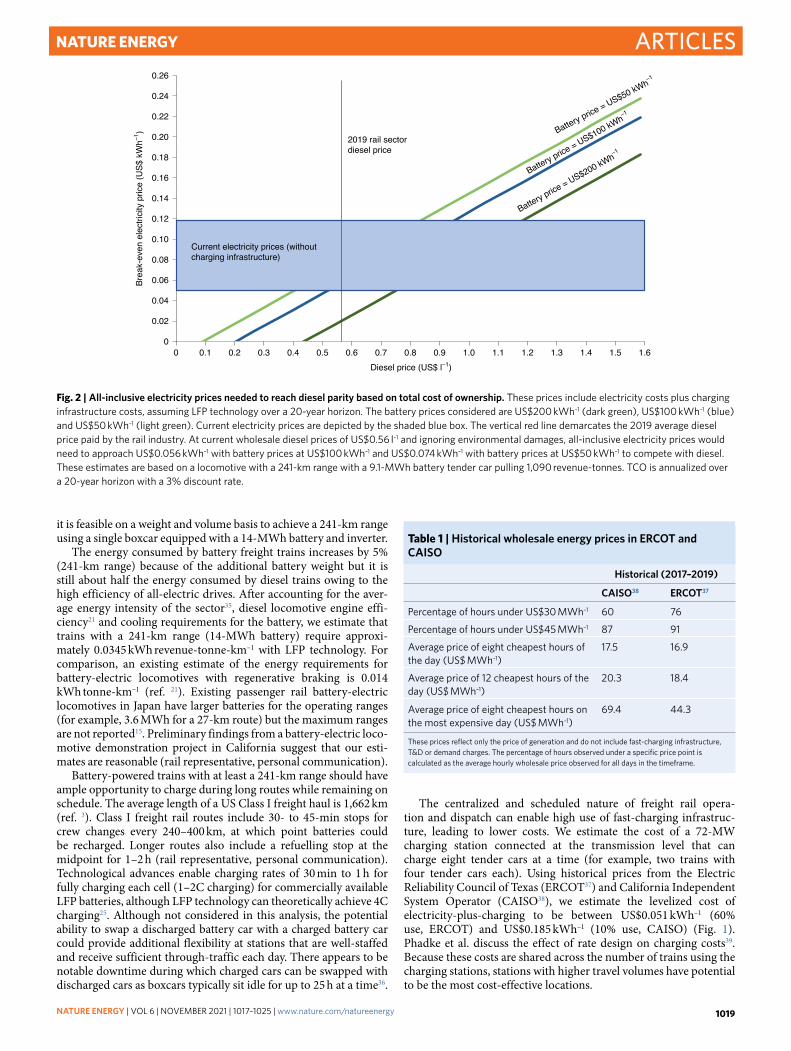
Fig. 2 | All-inclusive electricity prices needed to reach diesel parity based on total cost of ownership. These prices include electricity costs plus charging infrastructure costs, assuming LFP technology over a 20-year horizon. The battery prices considered are US$200 kWh–1 (dark green), US$100 kWh–1 (blue) and US$50 kWh–1 (light green). Current electricity prices are depicted by the shaded blue box. The vertical red line demarcates the 2019 average diesel price paid by the rail industry. At current wholesale diesel prices of US$0.56 l–1 and ignoring environmental damages, all-inclusive electricity prices would need to approach US$0.056 kWh–1 with battery prices at US$100 kWh–1 and US$0.074 kWh–1 with battery prices at US$50 kWh–1 to compete with diesel. These estimates are based on a locomotive with a 241-km range with a 9.1-mWh battery tender car pulling 1,090 revenue-tonnes. TCO is annualized over a 20-year horizon with a 3% discount rate.
NATuRE ENERgy | VOL 6 | NOVEmBER 2021 | 1017–1025 | www.nature.com/natureenergy 1019
Articles Nature eNergy
Achieving parity with dieselAt near-future battery prices (US$100 kWh–1), battery-electric trains can achieve parity with diesel-electric trains if environmental costs are included or if rail companies can access wholesale electric-ity prices and achieve 40% use of fast-charging infrastructure. The charging cost for a battery-electric train includes the cost of charg-ing infrastructure and electricity. The cost of charging infrastruc-ture is mainly driven by its use factor. We assume use of 30–50%, owing to centralized train scheduling and high volumes of traffic on
most routes13. Electricity costs can be reduced by avoiding charging when electricity prices are high. In certain markets, such as ERCOT, demand and fixed transmission charges can be avoided by avoid-ing charging during critical peak pricing (CPP) hours, which occur during fewer than 50 h per year37. Average wholesale generation prices in key organized US markets for the last 3 years are less than US$0.021 kWh–1 during the lowest-priced 12 h in a day (Table 1). We use these values for the base case in the total cost of ownership (TCO) and net present value (NPV) calculations37,38.
Table 2 | Input parameters for levelized unit charging costs in existing ERCOT and illustrative CAISO market for 72 MW station
Cost component ERCOT CAISO units
Electricity generation Price a retail electricity provider would pay to pass through the real-time price to a retail customer, on the basis of ERCOT prices 2017–201937 and ERCOT day-ahead market clearing prices for capacity54
26.5 Illustratively modelled as the price an energy service provider would pay to pass through the real-time price to a direct-access customer, not including resource adequacy payments, on the basis of CAISO real-time prices 2017–201938, California renewable portfolio standards55, renewable energy certificate prices56 and CAISO fees57
32.9 US$ mWh–1
Transmission and distribution
T&D charges paid by a transmission-connected customer in Oncor service territory, charging only at non-critical-peak times58
0.3 T&D charges paid by a transmission-connected customer in Oncor service territory, charging only at non-critical-peak times58
0.3 US$ mWh–1
Electrical equipment Average of best-case electric vehicle supply equipment (EVSE) costs, taken to be (1) the balance of system (BOS) costs of grid-tied storage and (2) industry-projected EVSE costs, on the basis of utility-scale solar plus storage BOS costs48 and inverter lifetime59
34.8 US$ mWh–1
Grid connection Average levelized US grid connection cost for utility-scale solar photovoltaic (PV) projects60 2.4 US$ mWh–1
Operations and maintenance
Cost of (1) inverter maintenance for a PV plant, (2) preventive maintenance and inspection, averaged for both an existing electric bus charging station and the electrical/wiring inspection costs of a PV plant and (3) estimated structural maintenance59
4.8 US$ mWh–1
Installation Installation costs associated with grid-tied storage, grid-connected storage cost of installation, labour and equipment, engineering, procurement and construction (EPC), overhead and interconnection48
7.5 US$ mWh–1
Capital Return owed on capital investment, on the basis of California investor-owned utility rates of return53 7%
1.09
4.76
2.51
3.45
Diesel locomotive cost over 20 years
2.18
1.28
2.470.54 0.13
1.39
Milli
on U
S$
0
Battery
Electric
ity
Chargi
ng in
frastr
uctur
e
Mainten
ance
Criteria
pollut
ants
CO 2 emiss
ions
Mainten
ance
Fuel
Criteria
pollut
ants
CO 2 emiss
ions
2
4
6
8
10
12
14
a b
0
2
4
6
8
10
12
14Battery-electric cost per locomotive over 20 years
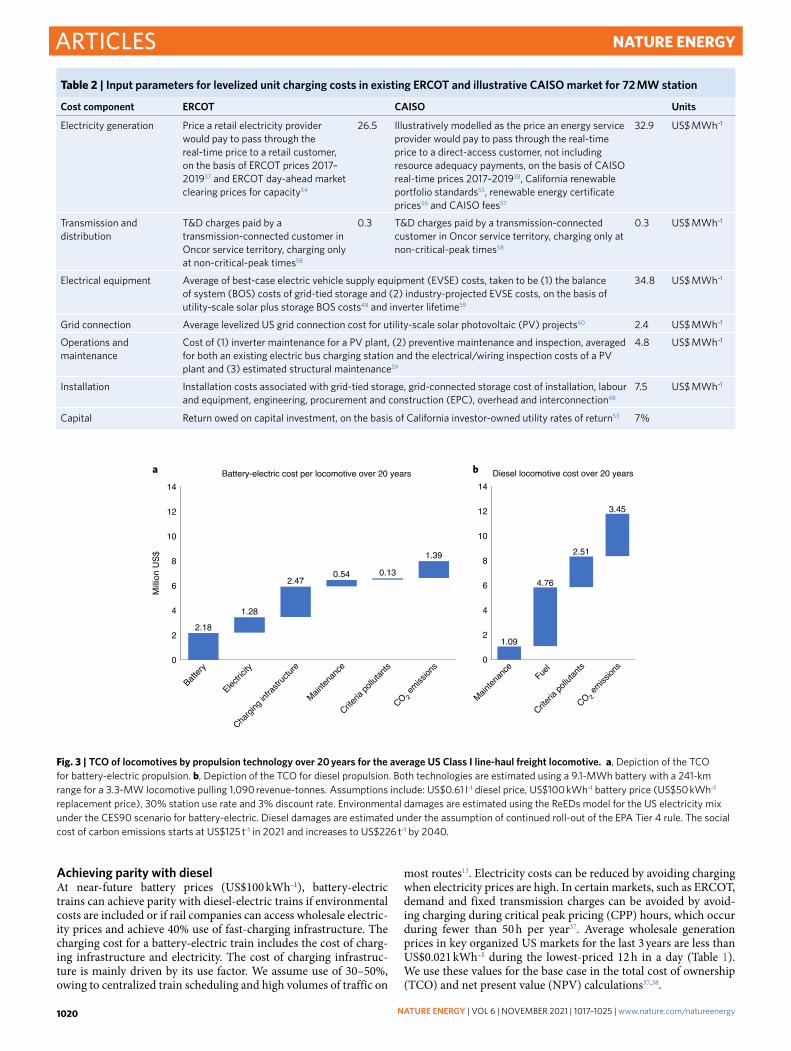
Fig. 3 | TCO of locomotives by propulsion technology over 20 years for the average uS Class I line-haul freight locomotive. a, Depiction of the TCO for battery-electric propulsion. b, Depiction of the TCO for diesel propulsion. Both technologies are estimated using a 9.1-mWh battery with a 241-km range for a 3.3-mW locomotive pulling 1,090 revenue-tonnes. Assumptions include: US$0.61 l–1 diesel price, US$100 kWh–1 battery price (US$50 kWh–1 replacement price), 30% station use rate and 3% discount rate. Environmental damages are estimated using the ReEDs model for the US electricity mix under the CES90 scenario for battery-electric. Diesel damages are estimated under the assumption of continued roll-out of the EPA Tier 4 rule. The social cost of carbon emissions starts at US$125 t–1 in 2021 and increases to US$226 t–1 by 2040.
NATuRE ENERgy | VOL 6 | NOVEmBER 2021 | 1017–1025 | www.nature.com/natureenergy1020
ArticlesNature eNergy
Using the energy requirement of 0.0345 kWh revenue-tonne-km–1 for LFP batteries, we estimate electricity prices necessary to achieve parity with diesel for a battery-powered train with a 241-km range pulling 1,090 revenue-tonnes. We estimate the capital cost of required battery capacity and the associated cost of charging, inclu-sive of battery weight, cooling requirements and inverter. Figure 2 depicts the relationships among battery prices, diesel prices and electricity prices needed to motivate a switch to battery-powered trains. To achieve parity with 2019 diesel prices reported by the rail industry (averaging US$0.56 l–1 of diesel (ref. 40)), all-inclusive elec-tricity prices (electricity generation plus amortized charging costs) must reach US$0.056 kWh–1 with near-future LFP technology priced at US$100 kWh–1; this calculation excludes environmental costs. At average US diesel prices (US$0.66 l–1), electricity prices must reach US$0.072 kWh–1 with US$100 kWh–1 batteries. For context, average US industrial tariffs are US$0.064 kWh–1, excluding infrastructure costs41. If major markets followed tariff rules like ERCOT’s CPP structure, freight railroads could realize electricity costs (including charging-infrastructure costs) under US$0.07 kWh–1 if they reach 40% use of charging infrastructure—thus achieving parity with diesel-powered trains. Including environmental costs relaxes the requisite price of electricity-plus-charging infrastructure to break even with diesel. Table 2 describes the inputs used to estimate unit charging costs for the ERCOT market for a 72-MW charging station that could accommodate two trains charging simultaneously at 1C.
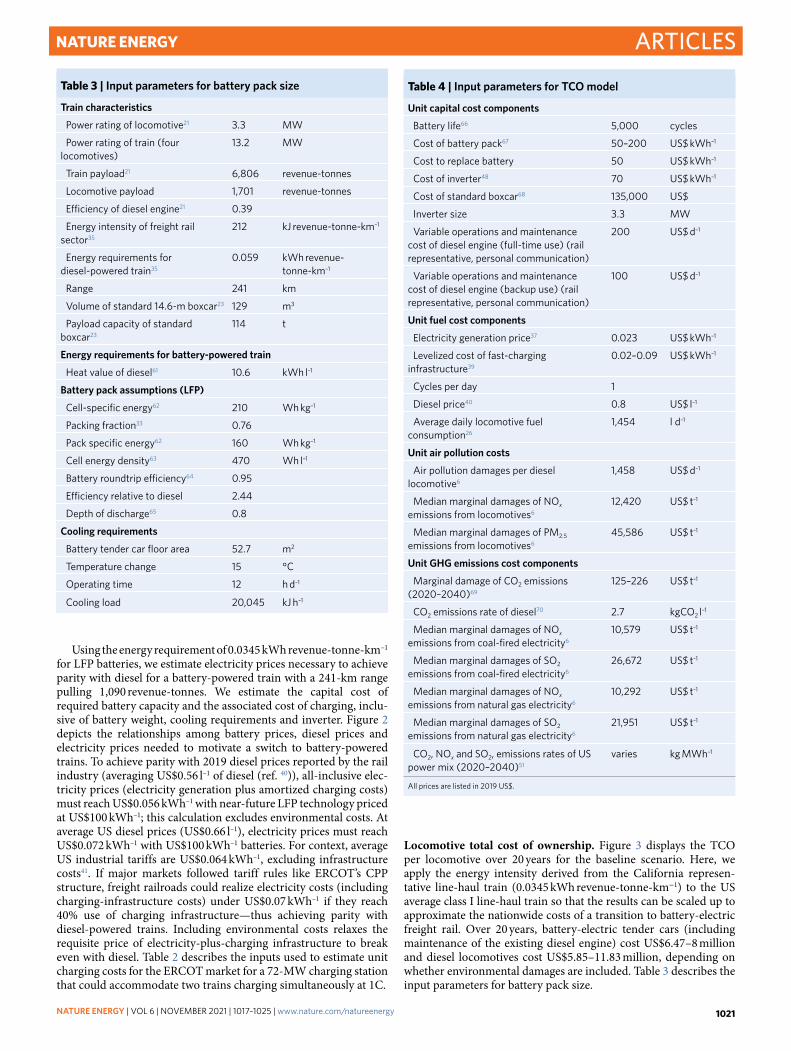
Locomotive total cost of ownership. Figure 3 displays the TCO per locomotive over 20 years for the baseline scenario. Here, we apply the energy intensity derived from the California represen-tative line-haul train (0.0345 kWh revenue-tonne-km−1) to the US average class I line-haul train so that the results can be scaled up to approximate the nationwide costs of a transition to battery-electric freight rail. Over 20 years, battery-electric tender cars (including maintenance of the existing diesel engine) cost US$6.47–8 million and diesel locomotives cost US$5.85–11.83 million, depending on whether environmental damages are included. Table 3 describes the input parameters for battery pack size.
Table 3 | Input parameters for battery pack size
Train characteristics
Power rating of locomotive21 3.3 mW
Power rating of train (four locomotives)
13.2 mW
Train payload21 6,806 revenue-tonnes
Locomotive payload 1,701 revenue-tonnes
Efficiency of diesel engine21 0.39
Energy intensity of freight rail sector35
212 kJ revenue-tonne-km–1
Energy requirements for diesel-powered train35
0.059 kWh revenue- tonne-km–1
Range 241 km
Volume of standard 14.6-m boxcar23 129 m3
Payload capacity of standard boxcar23
114 t
Energy requirements for battery-powered train
Heat value of diesel61 10.6 kWh l–1
Battery pack assumptions (LFP)
Cell-specific energy62 210 Wh kg–1
Packing fraction33 0.76
Pack specific energy62 160 Wh kg–1
Cell energy density63 470 Wh l–1
Battery roundtrip efficiency64 0.95
Efficiency relative to diesel 2.44
Depth of discharge65 0.8
Cooling requirements
Battery tender car floor area 52.7 m2
Temperature change 15 °C
Operating time 12 h d–1
Cooling load 20,045 kJ h–1
Table 4 | Input parameters for TCO model
unit capital cost components
Battery life66 5,000 cycles
Cost of battery pack67 50–200 US$ kWh–1
Cost to replace battery 50 US$ kWh–1
Cost of inverter48 70 US$ kWh–1
Cost of standard boxcar68 135,000 US$
Inverter size 3.3 mW
Variable operations and maintenance cost of diesel engine (full-time use) (rail representative, personal communication)
200 US$ d–1
Variable operations and maintenance cost of diesel engine (backup use) (rail representative, personal communication)
100 US$ d–1
unit fuel cost components
Electricity generation price37 0.023 US$ kWh–1
Levelized cost of fast-charging infrastructure39
0.02–0.09 US$ kWh–1
Cycles per day 1
Diesel price40 0.8 US$ l–1
Average daily locomotive fuel consumption26
1,454 l d–1
unit air pollution costs
Air pollution damages per diesel locomotive6
1,458 US$ d–1
median marginal damages of NOx emissions from locomotives6
12,420 US$ t–1
median marginal damages of Pm2.5 emissions from locomotives6
45,586 US$ t–1
unit gHg emissions cost components
marginal damage of CO2 emissions (2020–2040)69
125–226 US$ t–1
CO2 emissions rate of diesel70 2.7 kgCO2 l–1
median marginal damages of NOx emissions from coal-fired electricity6
10,579 US$ t–1
median marginal damages of SO2 emissions from coal-fired electricity6
26,672 US$ t–1
median marginal damages of NOx emissions from natural gas electricity6
10,292 US$ t–1
median marginal damages of SO2 emissions from natural gas electricity6
21,951 US$ t–1
CO2, NOx and SO2, emissions rates of US power mix (2020–2040)51
varies kg mWh–1
All prices are listed in 2019 US$.
NATuRE ENERgy | VOL 6 | NOVEmBER 2021 | 1017–1025 | www.nature.com/natureenergy 1021
Articles Nature eNergy
Table 4 describes the key input parameters used in the TCO anal-ysis, which represent current and near-term forecasted technology and prices. We use a diesel price of US$0.61 l–1, halfway between 2019 rail-reported fuel costs40 and US average prices. We include diesel engine maintenance costs in the TCO for battery-electric locomotives to maintain flexibility of dual fuel capability should train operators choose to dispatch battery tender cars to relieve power constraints on the grid. Even a modest price on external envi-ronmental damages would be sufficient to make battery-electric locomotives cost-competitive with diesel-electric locomo-tives at near-future battery prices (US$100 kWh–1) and current electricity-plus-charging-infrastructure prices (US$0.070 kWh–1).
Sector-wide net present value. We investigate the NPV over 20 years to the freight rail sector of converting diesel-electric locomo-tives to battery-electric, comparing the capital and operating costs along with costs of damages from CO2 and criteria air pollutants. Whereas the TCO compares each propulsion technology separately, the NPV compares the sector-wide savings of battery-electric rela-tive to diesel. The NPV of the baseline battery-electric scenario leads to a US$15 billion cost without environmental considerations, US$44 billion in savings when accounting for criteria pollution abatement and US$94 billion in savings with CO2 emissions reduc-tions. The main determinants of the economic returns are the sta-tion use rates and the price of diesel fuel. Our analysis shows that battery-electric trains are cost-effective today if diesel-electric trains internalize the costs of environmental damages, even at battery prices of US$250 kWh–1 and low station use rates of 25%.
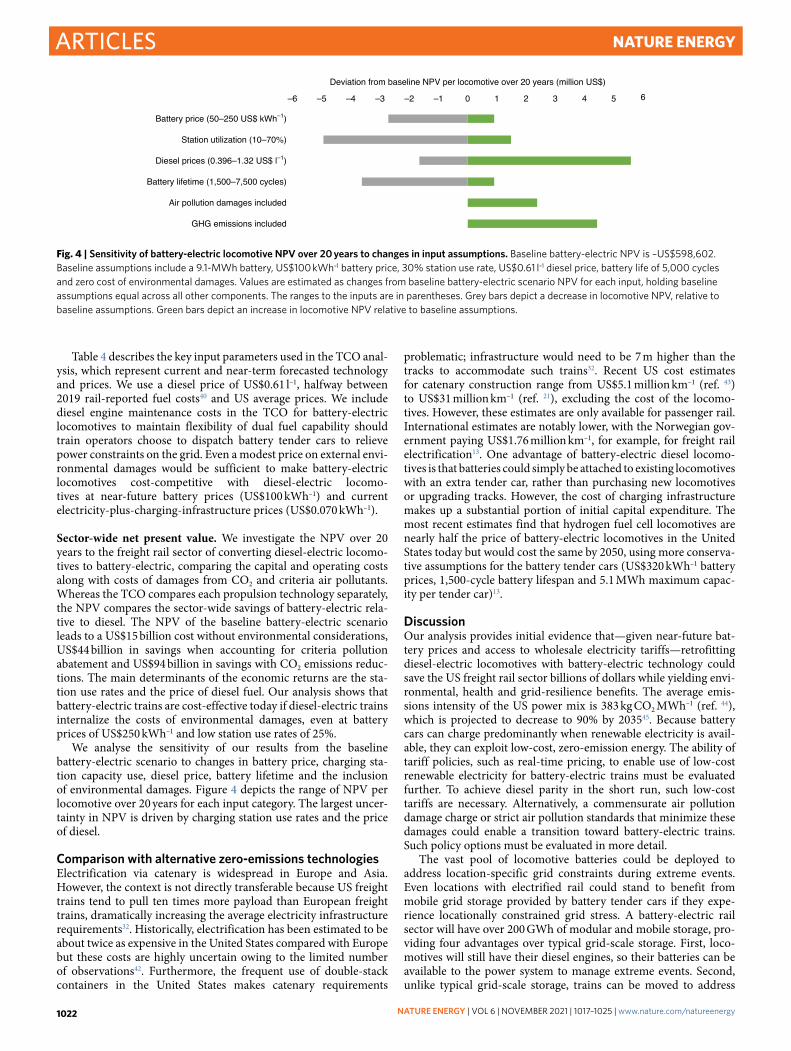
We analyse the sensitivity of our results from the baseline battery-electric scenario to changes in battery price, charging sta-tion capacity use, diesel price, battery lifetime and the inclusion of environmental damages. Figure 4 depicts the range of NPV per locomotive over 20 years for each input category. The largest uncer-tainty in NPV is driven by charging station use rates and the price of diesel.
Comparison with alternative zero-emissions technologiesElectrification via catenary is widespread in Europe and Asia. However, the context is not directly transferable because US freight trains tend to pull ten times more payload than European freight trains, dramatically increasing the average electricity infrastructure requirements32. Historically, electrification has been estimated to be about twice as expensive in the United States compared with Europe but these costs are highly uncertain owing to the limited number of observations42. Furthermore, the frequent use of double-stack containers in the United States makes catenary requirements
problematic; infrastructure would need to be 7 m higher than the tracks to accommodate such trains32. Recent US cost estimates for catenary construction range from US$5.1 million km–1 (ref. 43) to US$31 million km–1 (ref. 21), excluding the cost of the locomo-tives. However, these estimates are only available for passenger rail. International estimates are notably lower, with the Norwegian gov-ernment paying US$1.76 million km–1, for example, for freight rail electrification13. One advantage of battery-electric diesel locomo-tives is that batteries could simply be attached to existing locomotives with an extra tender car, rather than purchasing new locomotives or upgrading tracks. However, the cost of charging infrastructure makes up a substantial portion of initial capital expenditure. The most recent estimates find that hydrogen fuel cell locomotives are nearly half the price of battery-electric locomotives in the United States today but would cost the same by 2050, using more conserva-tive assumptions for the battery tender cars (US$320 kWh–1 battery prices, 1,500-cycle battery lifespan and 5.1 MWh maximum capac-ity per tender car)13.
DiscussionOur analysis provides initial evidence that—given near-future bat-tery prices and access to wholesale electricity tariffs—retrofitting diesel-electric locomotives with battery-electric technology could save the US freight rail sector billions of dollars while yielding envi-ronmental, health and grid-resilience benefits. The average emis-sions intensity of the US power mix is 383 kg CO2 MWh–1 (ref. 44), which is projected to decrease to 90% by 203545. Because battery cars can charge predominantly when renewable electricity is avail-able, they can exploit low-cost, zero-emission energy. The ability of tariff policies, such as real-time pricing, to enable use of low-cost renewable electricity for battery-electric trains must be evaluated further. To achieve diesel parity in the short run, such low-cost tariffs are necessary. Alternatively, a commensurate air pollution damage charge or strict air pollution standards that minimize these damages could enable a transition toward battery-electric trains. Such policy options must be evaluated in more detail.
The vast pool of locomotive batteries could be deployed to address location-specific grid constraints during extreme events. Even locations with electrified rail could stand to benefit from mobile grid storage provided by battery tender cars if they expe-rience locationally constrained grid stress. A battery-electric rail sector will have over 200 GWh of modular and mobile storage, pro-viding four advantages over typical grid-scale storage. First, loco-motives will still have their diesel engines, so their batteries can be available to the power system to manage extreme events. Second, unlike typical grid-scale storage, trains can be moved to address
–6 –5 –4 –3 –2 –1 0 1 2 3 4 5 6
Battery price (50–250 US$ kWh–1)
Station utilization (10–70%)
Diesel prices (0.396–1.32 US$ l–1)
Battery lifetime (1,500–7,500 cycles)
Air pollution damages included
GHG emissions included
Deviation from baseline NPV per locomotive over 20 years (million US$)
Fig. 4 | Sensitivity of battery-electric locomotive NPV over 20 years to changes in input assumptions. Baseline battery-electric NPV is –US$598,602. Baseline assumptions include a 9.1-mWh battery, US$100 kWh–1 battery price, 30% station use rate, US$0.61 l–1 diesel price, battery life of 5,000 cycles and zero cost of environmental damages. Values are estimated as changes from baseline battery-electric scenario NPV for each input, holding baseline assumptions equal across all other components. The ranges to the inputs are in parentheses. Grey bars depict a decrease in locomotive NPV, relative to baseline assumptions. Green bars depict an increase in locomotive NPV relative to baseline assumptions.
NATuRE ENERgy | VOL 6 | NOVEmBER 2021 | 1017–1025 | www.nature.com/natureenergy1022
ArticlesNature eNergy
location-specific power system constraints. Third, because the bat-teries sit on railcars, which can be attached to or detached from freight trains, they can be flexibly deployed to charge and discharge in optimal locations—charging where prices are low and discharg-ing where the grid is most constrained. Fourth, the four major play-ers in the freight rail industry have maintained a market share of 85% (ref. 46) and each could control large amounts of mobile energy storage, in contrast to fragmented storage ownership that requires highly efficient markets for optimal use. Large-scale modular and mobile storage from trains could support the power system in sev-eral ways with appropriate vehicle-to-grid infrastructure, includ-ing supplying power to the grid during extreme price or demand events, supporting temporary decommissioning of the transmission and distribution (T&D) infrastructure during wildfire events and providing emergency backup power to critical loads in the case of outages. Preliminary estimates of the most expensive 90 hours per year in the ERCOT market, for example, show that batteries could be discharged at US$200 kWh–1, potentially generating enough rev-enue to pay for the upfront battery cost in a single year37. Planning and deploying bidirectional charging infrastructure to optimize grid services via charging and discharging of battery-electric tender cars will be required to capture the full economic and environmen-tal value of battery-electric trains. Further research is needed on the deployment and operation of such infrastructure.
Although we estimate battery sizes for average daily freight train ranges, much smaller batteries can substantially mitigate air pollu-tion damages. Assuming most damages result from concentrated populations around railyards, train operators may wish to add just enough capacity to run trains on battery power in these areas. BNSF Railway is currently pursuing this approach as part of a project funded by the California Air Resources Board to reduce emissions around railyards47. Additional battery tender cars could be added to the consist (sequence of cars) to increase the range of the locomo-tive. Further research could provide insight into optimal ranges for different trip lengths and locations.
MethodsScenario. We estimate the levelized TCO to convert the US freight rail sector from diesel to battery-electric locomotives over 20 years. We begin with a baseline scenario of average charging costs (which capture both electricity tariffs and costs of installing fast-charging infrastructure), no consideration of environmental benefits and no further decline in battery prices. This scenario represents the economics without any policy intervention in approximately the year 2023. We then consider the sensitivity of our results to changes in charging costs (reflecting cases in which low-cost renewable electricity can be used), forecasted battery price declines and inclusion of the value of environmental benefits. Low renewable electricity prices can be achieved by implementing policies such as real-time pricing, with tariffs linked to wholesale market prices and environmental regulations that capture the economic value of environmental benefits39. Such prices are already observed, for example, in California during certain times of the day.
Battery size. We estimate battery size on the basis of the specifications of trains currently operating in California, representative of line-haul trains consisting of four 3.3-MW locomotives carrying 6,806 revenue-tonnes21. Using the average energy requirements of the diesel baseline at 0.059 kWh revenue-tonne-km–1 and the relative efficiency of battery power over diesel engines, we estimate that each locomotive requires a 14-MWh battery to pull 1,701 revenue-tonnes for 241 km with LFP technology. Batteries incur an efficiency loss due to the need to cool the battery system. We upsize the battery to accommodate air conditioning requirements for the battery tender car. We estimate the energy required to cool the entire volume of the boxcar by 15 °C over 12 h of the day.
Charging cost. We adapt the method from previous research on TCO of electrifying the trucking sector39 to the rail sector, estimating the unit cost of charging as the total of the levelized cost of equipment, the cost of generation and the cost of T&D. We model the unit charging cost for a retail customer who is able to access wholesale energy prices in ERCOT territory. This scenario is realistic under current regulations. The levelized cost of equipment is defined as the minimum price per unit of energy delivered (kWh) that a charging service provider should charge the consumer to break even on the investment in charging equipment and grid interconnection39.
Sector-wide cost of ownership. We use a straightforward energy balance approach using national data on train revenue-tonne-km and diesel fuel consumption to estimate the energy required to transport the same payload under battery-electric propulsion. To ensure that our sector-wide results do not overestimate electricity requirements, we use the national average estimates to calculate sectoral costs, benefits and emissions. Whereas the California representative line-haul locomotive used to estimate energy requirements pulls 1,701 revenue-tonnes, the national average line-haul Class I freight locomotive carries only 1,090 revenue-tonnes. We estimate that this load requires a 9.1-MWh battery per locomotive, after adjusting for battery weight and cooling requirements.
Each locomotive with an a.c. traction motor requires an onboard inverter for the 3.3-MW traction motor at US$70 kWh–1 (ref. 48). We borrow existing methods to estimate charging costs that include electricity and fast-charging-infrastructure costs, where the equipment cost per kWh decreases as a function of capacity use, defined as the number of hours the station is used each day39. Assuming a capacity use rate of 50%, amortized fast-charging-infrastructure costs plus energy are US$0.048 kWh–1. We estimate a low-cost scenario of US$0.048 kWh–1 (50% capacity use) and a high-cost scenario of US$0.07 kWh–1 (25% capacity use) inclusive of the levelized cost of fast-charging infrastructure. Given the flexibility in charging times, we expect that train operators would have access to the lowest energy prices.
We estimate our baseline scenario at battery prices of US$100 kWh–1. Data from China, which has the highest amount of heavy-duty electric vehicles (HDEV), show that battery prices for buses and other HDEVs are somewhat lower than the average battery prices for light-duty electric vehicles (LDEV) in China and globally19. While some of this difference in the average battery pack price for HDEVs in China and rest of the world is attributable to their use of different types of battery chemistries, China’s production of HDEVs is much greater than that of any other country in the world. Hence, the price of battery packs for HDEVs in the United States is likely to come close to the price of battery packs for LDEVs with economies of scale. Others have similarly suggested that such economies of scale could soon emerge within the HDEV sector49,50. We calculate environmental impacts by comparing diesel emissions to baseline emissions from electricity generation using projected US emissions. Nationwide emissions are modelled using National Renewable Energy Laboratory’s Regional Energy Deployment System (ReEDs) model51 under the 90% clean energy by 2035 scenario45. Using median marginal damages from locomotives estimated in 20116, combined with EPA’s projected NOx and PM2.5 emissions reductions under the existing Tier 4 requirements for locomotives52, we project the total damages from criteria pollutants assuming a constant linear reduction in PM2.5 and NOx, which corresponds to existing forecasted trajectories7.
Data availabilityThe data that support the results of this study are provided as Supplementary Data. Source data are provided with this paper.
Received: 6 January 2021; Accepted: 30 August 2021; Published online: 11 November 2021
References 1. IPCC Special Report on Global Warming of 1.5 °C (eds Masson-Delmotte, V.
et al.) (WMO, 2018). 2. The Future of Rail: Opportunities for Energy and the Environment
(International Energy Agency, 2019); https://doi.org/10.1787/9789264312821-en
3. Davis, S. C. & Boundy, R. G. Transportation Energy Data Book (Oak Ridge National Laboratory, 2020); https://doi.org/10.1146/annurev.energy.14.1.375
4. Freight Rail & Preserving the Environment (Association of American Railroads, 2020).
5. Liu, L. et al. Emission projections for long-haul freight trucks and rail in the United States through 2050. Environ. Sci. Technol. 49, 11569–11576 (2015).
6. Goodkind, A. L., Tessum, C. W., Coggins, J. S., Hill, J. D. & Marshall, J. D. Fine-scale damage estimates of particulate matter air pollution reveal opportunities for location-specific mitigation of emissions. Proc. Natl Acad. Sci. USA 116, 8775–8780 (2019).
7. Federal Railroad Administration Railroad Energy Intensity and Criteria Air Pollutant Emissions (US Department of Transportation, 2018).
8. Bureau of Transportation Statistics National Transportation Statistics (US Department of Transportation, 2018).
9. Office of Transportation and Air Quality U.S. EPA’s New Program to Control Pollution from Locomotives and Marine Diesels (US Environmental Protection Agency, 2008).
10. Regulations for Emissions from Heavy Equipment with Compression-Ignition (Diesel) Engines (US Environmental Protection Agency, 2020); https://www.epa.gov/regulations-emissions-vehicles-and-engines/regulations-emissions- heavy-equipment-compression
11. Caltrain Modernization Program Peninsula Corridor Electrification Project January 2019 Monthly Progress Report (Caltrain, 2019).
NATuRE ENERgy | VOL 6 | NOVEmBER 2021 | 1017–1025 | www.nature.com/natureenergy 1023
Articles Nature eNergy
12. Bogdanov, D. et al. Radical transformation pathway towards sustainable electricity via evolutionary steps. Nat. Commun. 10, 1077 (2019).
13. Zenith, F., Isaac, R., Hoffrichter, A., Thomassen, M. S. & Møller-Holst, S. Techno-economic analysis of freight railway electrification by overhead line, hydrogen and batteries: case studies in Norway and USA. Proc. Inst. Mech. Eng. F 234, 791–802 (2020).
14. Moriarty, P. & Honnery, D. Prospects for hydrogen as a transport fuel. Int. J. Hydrog. Energy 44, 16029–16037 (2019).
15. Thorne, R., Amundsen, A. H. & Sundvor, I. Battery Electric and Fuel Cell Trains: Maturity of Technology and Market Status TOI Report 1737/2019 (Institute of Transport Economics, 2019).
16. How Clean Are Hydrogen Fuel Cell Electric Vehicles? California Leading the Way on Clean-Hydrogen Policies (Union of Concerned Scientists, 2014).
17. The Future of Hydrogen (International Energy Agency, 2019); https://doi.org/10.1787/1e0514c4-en
18. Field, K. BloombergNEF: lithium-ion battery cell densities have almost tripled since 2010. CleanTechnica https://cleantechnica.com/2020/02/19/ bloombergnef-lithium-ion-battery-cell-densities-have-almost-tripled- since-2010/ (2020).
19. Henze, V. Battery pack prices cited below US$100/kWh for the first time in 2020, while market average sits at US$137/kWh. BloombergNEF https://about.bnef.com/blog/battery-pack-prices-cited-below-100-kwh-for-the-first-time- in-2020-whilemarket-average-sits-at-137-kwh/ (2020).
20. Lazard’s Levelized Cost of Energy Analysis—Version13.0 (Lazard, 2019). 21. Dick, T. C., Ouyang, Y. & Fullerton., G. Transitioning to a Zero or Near-Zero
Emission Line-Haul Freight Rail System in California: Operational and Economic Considerations (State of California Air Resources Board, 2016).
22. Railroad 101 (Association of American Railroads, 2021). 23. BNSF Railway. Boxcars. BNSF Railway https://www.bnsf.com/ship-with-bnsf/
ways-of-shipping/equipment/boxcars.html (2020). 24. Kasgro Rail Corporation. Equipment list. Kasgro Rail Corporation http://www.
kasgro.com/equipment.html (2020). 25. Federal Railroad Administration Assessment of Battery Technology for Rail
Propulsion Application (US Department of Transportation, 2017). 26. Bureau of Transportation Statistics. Table 4-17: Class I rail freight fuel
consumption and travel. Bureau of Transportation Statistics https://www.bts.gov/archive/publications/national_transportation_statistics/table_04_17 (2020).
27. National Rail Freight Infrastructure Capacity and Investment Study (Cambridge Systematics, 2007).
28. Wentker, M., Greenwood, M. & Leker, J. A bottom-up approach to lithium-ion battery cost modeling with a focus on cathode active materials. Energies 12, 504 (2019).
29. Hannan, M. A., Hoque, M. M., Hussain, A., Yusof, Y. & Ker, P. J. State-of-the-art and energy management system of lithium-ion batteries in electric vehicle applications: issues and recommendations. IEEE Access 6, 19362–19378 (2018).
30. Tomaszewska, A. et al. Lithium-ion battery fast charging: a review. eTransportation 1, 100011 (2019).
31. Miao, Y., Hynan, P., Von Jouanne, A. & Yokochi, A. Current li-ion battery technologies in electric vehicles and opportunities for advancements. Energies 12, 1074 (2019).
32. Technology Assessment: Freight Locomotives (California Air Resources Board, 2016).
33. Phadke, A., Khandekar, A., McCall, M., Karali, N. & Rajagopal, D. Long-haul Battery Electric Trucks are Technically Feasible and Economically Compelling Working Paper (International Energy Studies Group, Lawrence Berkeley National Laboratory, 2019).
34. Allowable Gross Weight Shipments (Union Pacific Corporation, accessed 14 December 2020); https://www.up.com/aboutup/reference/maps/allowable_ gross_weight/index.htm
35. US Department of Transportation Bureau of Transportation Statistics. Energy intensity of class I railroad freight service. US Department of Transportation Bureau of Transportation Statistics https://www.bts.gov/content/energy- intensity-class-i-railroad-freight-service (2021).
36. United States Securities and Exchange Commission Form 10-K (Union Pacific Corporation, 2020).
37. Electric Reliability Council of Texas. Historical RTM load zone and hub prices. Electric Reliability Council of Texas http://mis.ercot.com/misapp/ GetReports.do?reportTypeId=13061&reportTitle=Historical (2020).
38. LCG Consulting. CAISO (California ISO): Real-time price. LCG Consulting http://www.energyonline.com/Data/GenericData.aspx?DataId=19&CAISO___ Real-time_Price (2020).
39. Phadke, A., McCall, M. & Rajagopal, D. Reforming electricity rates to enable economically competitive electric trucking. Environ. Res. Lett. 14, 124047 (2019).
40. Surface Transportation Board. Annual report financial data. Surface Transportation Board https://prod.stb.gov/reports-data/economic-data/annual- report-financial-data/ (2020).
41. US Energy Information Administration. Electric Power Monthly Table 5.6.A. Average price of electricity to ultimate customers by end-use sector. US Energy Information Administration https://www.eia.gov/electricity/monthly/ epm_table_grapher.php?t=epmt_5_6_a (2021).
42. Weiss, W. D., Hayes, H. I. & Shaw, P. L. Comparative catenary costs—European and U.S. main line railroad electrification. Transp. Res. Rec. 939, 44–48 (1983).
43. Peninsula Corridor Joint Powers Board Staff Report (Caltrain, 2019). 44. Carnegie Mellon University, Scott Institute for Energy Innovation.
US power sector CO2 emissions intensity. Carnegie Mellon University https://emissionsindex.org/ (2021).
45. 2035 The Report: Plummeting Solar, Wind, and Battery Costs Can Accelerate Our Clean Electricity Future (Univ. California Berkeley, Goldman School of Public Policy, 2020).
46. Mazareanu, E. Leading North American railroads in 2019, based on operating revenue. Statistica https://www.statista.com/statistics/271613/leading-north- american-railroad-companies-based-on-revenue/ (2021).
47. Business Wire. BNSF awarded US$22.6 million state grant for clean technology pilot program. Business Wire https://www.businesswire.com/ news/home/20181011005675/en/ (2018).
48. Fu, R. et al. 2018 U.S. Utility-scale Photovoltaics-Plus-Energy Storage System Costs Benchmark (NREL, 2018); https://www.nrel.gov/docs/fy19osti/72401.pdf
49. Hall, D. & Lutsey, N. Estimating the Infrastructure Needs and Costs for the Launch of Zero-Emission Trucks Technical Report (International Council on Clean Transportation, 2019).
50. Advanced Clean Trucks Total Cost of Ownership Discussion Document—Preliminary Draft for Comment (California Air Resources Board, 2019).
51. Brown, M. et al. Regional Energy Deployment System (ReEDS) Model Documentation: Version 2019 (NREL, 2019); https://www.nrel.gov/docs/fy20osti/74111.pdf
52. EPA Finalizes More Stringent Emissions Standards for Locomotives and Marine Compression-Ignition Engines (U.S. Environmental Protection Agency Office of Transportation and Air Quality, 2008).
53. Decision on Test Year 2020 Cost of Captial for the Major Energy Utilities (California Public Utilities Commission, 2021); https://docs.cpuc.ca.gov/ PublishedDocs/Published/G000/M322/K633/322633896.PDF
54. Electric Reliability Council of Texas. DAM ancillary service plan. Electric Reliability Council of Texas http://mis.ercot.com/misapp/GetReports.do? reportTypeId=12316&reportTitle=DAM%20Ancillary%20ServicePlan&showHTMLView=&mimicKey (2021).
55. California Public Utilities Commission. RPS procurement rules. California Public Utilities Commission https://www.cpuc.ca.gov/industries-and-topics/ electrical-energy/electric-power-procurement/rps/rps-compliance-rules- and-process (2021).
56. Dan Pinkel, B. & Weinrub, A. What the Heck is a REC? (Local Clean Energy Alliance, 2013).
57. Finance Department GMC and Other Rates for 2004–2020 (California Independent System Operator, 2020).
58. Tariff for Retail Delivery Service (Oncor Electric Delivery Company LLC, 2017).
59. Budgeting for Solar PV Plant Operations & Maintenance: Practices (Electric Power Research Institute, 2015).
60. Renewable Power Generation Costs in 2019 (International Renewable Energy Agency, 2020).
61. US Energy Information Administration. Energy conversion calculators. US Energy Information Administration https://www.eia.gov/energyexplained/ units-and-calculators/energy-conversion-calculators.php#dieselcalc (2021).
62. Kane, M. VW-related Guoxuan high-tech launches record-setting 210 Wh/kg LFP battery cells. Inside EVs https://insideevs.com/news/481770/guoxuan-210-whkg-lfp-battery-cells/ (2021).
63. BatPaC: Battery Manufacturing Cost Estimation (Argonne National Laboratory, 2020).
64. Build Your Dreams New Energy (BYD, 2017); https://s3-ap-southeast-2. amazonaws.com/solarworksfiles/public/byd/B-Box+2017.pdf
65. Miles, A. The secret life of an EV battery. CleanTechnica https://cleantechnica.com/2018/08/26/the-secret-life-of-an-ev-battery/ (2018).
66. Berdichevsky, G. & Yushin, G. The Future of Energy Storage—Towards A Perfect Battery with Global Scale (Sila Nanotechnologies, 2020).
67. Henze, V. Battery pack prices fall as market ramps up with market average at US$156/kWh in 2019. BNEF https://about.bnef.com/blog/battery-pack- prices-fall-as-market-ramps-up-with-market-average-at-156-kwh-in- 2019/ (2019).
68. Turner, J. Can the US railroad freight sector avoid a shortage of boxcars? Railway Technology https://www.railway-technology.com/features/us-railroad- freight-boxcars/ (2019).
69. Carleton, T. & Greenstone, M. Updating the United States government’s social cost of carbon. SSRN https://doi.org/10.2139/ssrn.3764255 (2021).
70. Emission Factors for Greenhouse Gas Inventories (US Environmental Protection Agency, 2021).
NATuRE ENERgy | VOL 6 | NOVEmBER 2021 | 1017–1025 | www.nature.com/natureenergy1024

ArticlesNature eNergy
AcknowledgementsThe following authors received funding for this work from the Hewlett Foundation under grant number 2019-9467: N.P., E.T. and A.P. J. Zuboy provided unparalleled editing prowess to make this paper comprehensible to the reader. Representatives from BNSF, Wabtech, California Air Resources Board, Tesla, Southern California Edison and the California Energy Commission each provided constructive feedback to inform the underlying assumptions of our analysis.
Author contributionsA.P. conceived the idea and guided the project. N.P. conducted the analysis, refined the methods, curated data and wrote the draft. D.P. developed the methods for levelized costs of charging infrastructure. E.T. collected the preliminary data and conducted the initial analysis of the working paper version of this manuscript.
Competing interestsThe authors declare no competing interests.
Additional informationSupplementary information The online version contains supplementary material available at https://doi.org/10.1038/s41560-021-00915-5.
Correspondence and requests for materials should be addressed to Amol Phadke.
Peer review information Nature Energy thanks Federico Zenith and the other, anonymous, reviewer(s) for their contribution to the peer review of this work.
Reprints and permissions information is available at www.nature.com/reprints.
Publisher’s note Springer Nature remains neutral with regard to jurisdictional claims in published maps and institutional affiliations.
Open Access This article is licensed under a Creative Commons Attribution 4.0 International License, which permits use, sharing, adap-tation, distribution and reproduction in any medium or format, as long
as you give appropriate credit to the original author(s) and the source, provide a link to the Creative Commons license, and indicate if changes were made. The images or other third party material in this article are included in the article’s Creative Commons license, unless indicated otherwise in a credit line to the material. If material is not included in the article’s Creative Commons license and your intended use is not permitted by statu-tory regulation or exceeds the permitted use, you will need to obtain permission directly from the copyright holder. To view a copy of this license, visit http://creativecommons.org/licenses/by/4.0/.
© The Author(s) 2021
NATuRE ENERgy | VOL 6 | NOVEmBER 2021 | 1017–1025 | www.nature.com/natureenergy 1025