economic empowerment of women through resilient
TRANSCRIPT
Economic Empowerment of Women through Resilient Agriculture Supply Chains:A Geospatial and Temporal Analysis in Southwestern Bangladesh
Pub
lic D
iscl
osur
e A
utho
rized
Pub
lic D
iscl
osur
e A
utho
rized
Pub
lic D
iscl
osur
e A
utho
rized
Pub
lic D
iscl
osur
e A
utho
rized

Economic Empowerment of Women through Resilient Agriculture Supply Chains:A Geospatial and Temporal Analysis in Southwestern Bangladesh
Yuka Makino
Maya Brahmam
Juan Carlos Vargas
Sulhee Yoon
© 2019 International Bank for Reconstruction and Development / The World Bank
1818 H Street NW, Washington, DC 20433
Telephone: 202-473-1000; Internet: www.worldbank.org
Some rights reserved
��������������� �������������������������� �������������������������������������� ����������������������� �������������
������� ������������ ���������������������������!��������������� ������������� ����"������!��#����������������!��$�����
��������������������� ����� ������������������������������������ ��������� � ��������������������� �������������
���$������������ ����������$�������������������$�������������� �������$��������%� �$������������������������� �����
������������������������������������������������� ���$����������������������������� �����
Nothing herein shall constitute or be considered to be a limitation upon or waiver of the privileges and immunities of The World Bank,
�������������������������������!� �
����������������������������� � ��������&���������'�!��$���������������#����$�������(������&������� ��� �������!�����
������� ����������������������������������)��������� �����������������������!������������&���������'�!��$����
Rights and Permissions
������������!���������� ������*����!��*�$$����&����������+�5�6'<���������=**��>�+�5�6'<?�
����@AA�����!���$$������A��������A��A+�5A�����E� ������*����!��*�$$����&��������������������������������������� ����������
transmit, and adapt this work, including for commercial purposes, under the following conditions:
AttributionFG����������������������������@�>���J������J�������$�$��K����*�����L������� �M������>�����O5QU��
V"����$���"$����$���������$�����������X���������&���������M������*�����@�&�'������������ ���$�����&�����������
M����������������� ����Y���� ������������������#*��Z������@�*����!��*�$$����&����������**��>�+�5�6'<
TranslationsF6��������������������������������������������� ��������������� ������$���������������������������@�����������������
������������� ����������� ������� ������ ������������� �� �����[�������� ������������������������ ������������������
����������������������������������������������
AdaptationsF6���������������� ����������������������������� ��������������� ������$���������������������������@������������
� ������������������������������������ ������L������� ����������������� ��������� ������������������������������������������
����������������������� ����������� ���������� ��� ����������� �����
Third-party contentF������� ����� ������������������������������$������������������������������ ��������������������
��� ������������� ������������������������������������� \����\���� ��� �!� ������$��������������������� ����������������
������������������������������������� �����������������������$�������������$�������������$��������������������������6�����������
����\��������$��������������������������������������������� ���$�������������$������������� � ����������\������ �����������
��$���������$��������������������"��$����������$����������������� ����������������$��� �������������(����������$�����
&���]����������������� ��������������� ����� ���� ������� �����G�������������������� �����'�����
Q^Q^�_�M�����`���������������#*�O5j++��EM&q����@�O5O\xOO\OyOxq��\$���@���������z��� �������
*�!�������@�{�'��& ����!���ZZ*
*�!�� �����@�{�'��& ����!���ZZ*
Acronyms and Abbreviations 07Executive Summary 08Acknowledgements 10Data Limitations and Assumptions 11Introduction 12
Chapter 1 Economic and Enterprise Analysis 15Women, Entrepreneurship and SMEs 20Initial Selected Products 22Product Characterization 24
Chapter 2 Sociodemographic and Labor Force Analysis 33���������� ���� 34Multisectoral Assessment 56Insight: Linking Economic Products and Socioeconomic Assessment 69
Chapter 3 Spatial Economic Structure Analysis 79Dairy 82Fisheries 86Floriculture 90Environmental Challenges 94
Chapter 4 ���� � ����������������������������� 97Value Chain Functionality and Agglomeration 100Three Indexes for Barrier Evaluation 104
Discussion Women-driven SMEs Value Chains 107Selection of Candidate Sites 108Value Chain Diagnostics and Assessment 110From Site Visits to Validation with Stakeholders 114
Annex Annex A. Field Visit Insights 118Annex B. Technical Details 124Annex C. Data Catalog - Geospatial 128Annex D. Data Catalog - Trade Export Data 130Annex E. References 140
Table of Contents

6 Economic Empowerment of Women through Resilient Agriculture Supply Chains: A Geospatial and Temporal Analysis in Southwestern Bangladesh
7
AOI Area of Interest
BARC Bangladesh Agricultural Research Council
BBS Bangladesh Bureau of Statistics
BFS Bangladesh Flower Society
BRAC Bangladesh Rural Advancement Committee
DoF Department of Fishery
EU European Union
BFFEA Bangladesh Frozen Fish Exporters Association
GDP Gross Domestic Product
GOB Govenment of Bangladesh
HSC Higher Secondary School Certificate
ITC International Trade Center
LGED Local Government Engineering Department
NJILP Nuton Jibon Livelihood Improvement Project
NREL National Renewable Energy Laboratory
OSM Open Street Map
RMG Ready-made Garment
SCITI Small and Cottage Industries Training Institute
SDF Social Development Foundation
SME Small-to-medium Enterprise
SSC Secondary School Certificate
SWOT Strength, Weaknesses, Opportunities, and Threats
USAID United States Agency for International Development
Acronyms and Abbreviations
8 Economic Empowerment of Women through Resilient Agriculture Supply Chains: A Geospatial and Temporal Analysis in Southwestern Bangladesh
Executive Summary
8
The purpose of this report is to present the findings from a study on the Economic Empowerment of Women through Resilient Agriculture Supply Chains: A Geospatial and temporal Ananlysis in Southwestern Bangladesh. Recognizing that a common weakness in transport corridors has been the lack of participation and limited benefits accruing to the communities through which a corridor passes, World Bank investments in transport infrastructure are increasingly complemented by activities that facilitate the competitiveness of micro and small enterprises and economic opportunities for women and other disadvantaged people, and integrate gender-responsiveness into trade facilitation and logistics initiatives.
This geospatial and temporal value chain analysis in southwestern Bangladesh adopts a five-step methodology which overlays economic and initial enterprise analysis along this transport corridor, analyzes human capital (with particular focus on women) and the labor force along transport corridors, considers risk management in the value chain analysis, evaluates the economic structure of a value chain, and restructures the opportunities and gaps in areas where agglomerated economic activities were identified.
The report includes a total of four components: Chapter1 - Identification and characterization of agricultural products that are representative of women driven, small-to-medium enterprises (SMEs) (See definition of women-driven SMEs on page 14)Chapter 2 - A geographical diagnosis of the population’s sociodemographic and infrastructure conditions, and identification of constraints and opportunities regarding women-driven SMEs Chapter 3 - Value chain analysis for three agriculture products (fisheries, floriculture, and dairy) selected from Chapter 1. Analyses are represented in two formats: 1) diagrams, and 2) visualizations of spatial distributionChapter 4 - Economic agglomeration and barriers for women-driven SME participation
Chapter 1 starts with the identification of four (4) products in the agriculture sector that were selected through economic filters in order to identify those with large current and potential contributions to women-driven SMEs. From this selection, the study applies a spatial econometric approach using datasets from secondary sources, which allows for the evaluation of the territory’s geographical and productive structure. The type of criteria includes an exploration of export trade value, domestic consumption, and productive capacity of each zila (see definition of Zilas and Upazilas on page 14).
Chapter 2 applies geostatistical analytics to determine the geographic profile of the population based on demographic composition, such as age and gender, to identify the size and spatial distribution of the current labor force as well as to examine density and population distribution across the study region. This diagnosis is categorized into five (5) characteristics including demographics, infrastructure, social conditions, economic conditions, and socioeconomic status of women. Geographic representations are derived from the latest census conducted by the Bangladesh Bureau of Statistics, 2011. The analysis identifies areas with the most favorable conditions for the promotion of women-driven SMEs by using results from the multisectoral opportunities analysis.
Chapter 3 examines two types of economic structure of value chains for three products using both diagrammatic and spatial approaches. Diagrammatic representation is based on value-chain framework diagrams (Porter, 1985), representing different activities and states of development of the product from raw materials to the final commercialization. Spatial representation is developed through a geographic visualization approach that aids in identifying gaps and opportunities associated with spatial clusters of productive infrastructure.
99
Chapter 4 explores gaps and the most promising opportunities by integrating the results from Chapter 3. The results represent the clusters of economic zones in the region. In addition, this section identifies and evaluates barriers to participation of women-driven SMEs through three indexes: 1) women’s empowerment potential, 2) social services, and 3) infrastructure.
This geospatial and temporal analysis will help determine the capacity levels of women’s skills and identify gaps within the study region. In addition, it will help identify opportunities for women entrepreneurs and sectors and commodities that could be developed along the transport and trade corridors. The analysis will help identify the bottlenecks that will need to be addressed to ensure effective and efficient supply chains, and indicate specific regions of focus in southwestern Bangladesh.
Min:0 Max: 3
1
2
3
1
23
4
Max: 18Min: 2
Benapole Landport
2 31 4 5
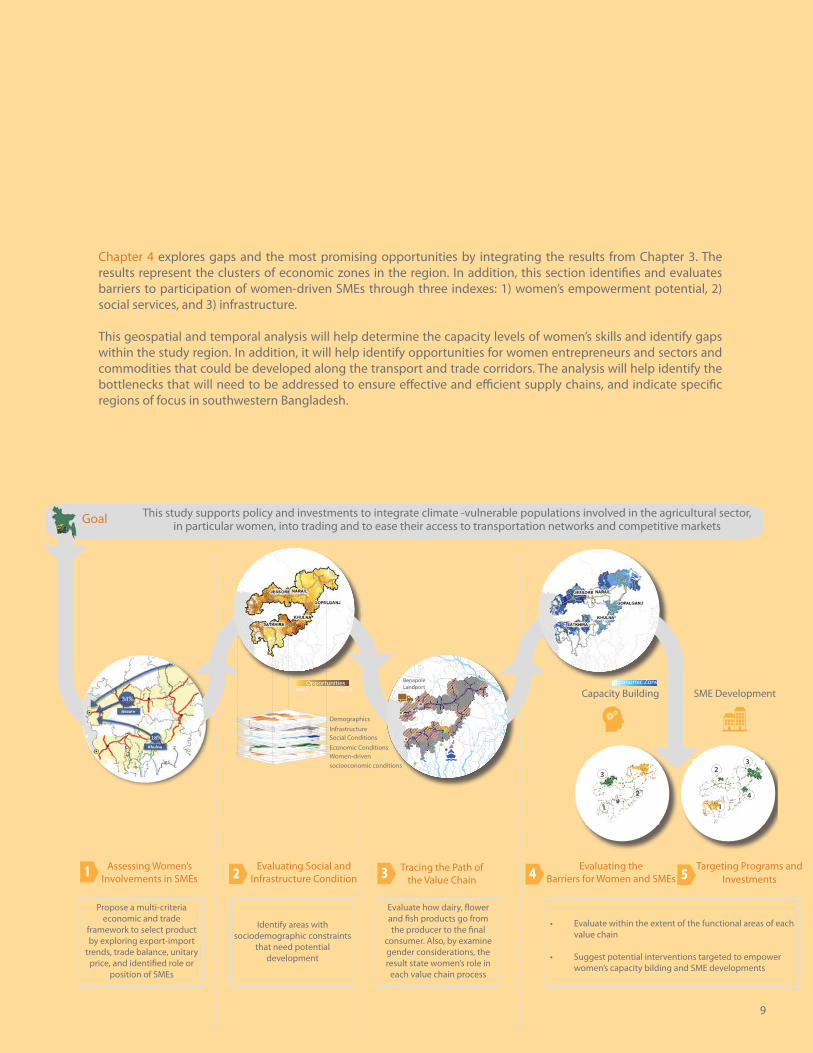
Goal This study supports policy and investments to integrate climate -vulnerable populations involved in the agricultural sector, in particular women, into trading and to ease their access to transportation networks and competitive markets
Assessing Women’s Involvements in SMEs
Evaluating Social and Infrastructure Condition
Tracing the Path of the Value Chain
Evaluating the Barriers for Women and SMEs
Targeting Programs and Investments
Capacity Building SME DevelopmentEconomic ZoneOpportunities
DemographicsInfrastructureSocial ConditionsEconomic ConditionsWomen-driven socioeconomic conditions
Propose a multi-criteria economic and trade
framework to select product by exploring export-import
trends, trade balance, unitary price, and identified role or
position of SMEs
Identify areas with sociodemographic constraints
that need potential development
Evaluate how dairy, flower and fish products go from the producer to the final
consumer. Also, by examine gender considerations, the result state women’s role in
each value chain process
Evaluate within the extent of the functional areas of each value chain
Suggest potential interventions targeted to empower women’s capacity bilding and SME developments
10 Economic Empowerment of Women through Resilient Agriculture Supply Chains: A Geospatial and Temporal Analysis in Southwestern Bangladesh
Acknowledgements
10
This report, Economic Empowerment of Women through Resilient Agriculture Supply Chains: A Geospatial and Temporal Analysis in Southwestern Bangladesh, will not only inform regional trade and connectivity in southwestern Bangladesh but also contribute valuable insights for women’s livelihoods and agriculture investment.
The authors of this report are Yuka Makino, Senior Disaster Risk Management Specialist, World Bank; Maya Brahmam, Senior Communications Officer, World Bank Group; Juan Carlos Vargas, Founding Principal, GeoAdaptive, LLC; and Sulhee Yoon, Senior Data Scientist, GeoAdaptive LLC. This report presents the results of a geospatial and temporal value-chain analysis designed by GeoAdaptive LLC.
The authors would like to recognize the in-depth research conducted by the entire GeoAdaptive team. They would also like to thank Sumir Lal, Director ECRGP and Jill Wilkins, Director, ECREP of the World Bank for their support of this effort.
This report could not have been completed without the insights and recommendations of experts from across a number of sectors at the World Bank, including Manievel Sene, Senior Agriculture Specialist, South Asia; Aphichoke “Andy” Kotikula, Senior Economist, Gender; Luiza Nora, Senior Social Development Specialist; Maha Ahmed, Rural Development Specialist, South Asia Region; Diep Nguyen Van Houtte, Lead Transport Specialist; Erik Nora, Senior Operations Officer, South Asia Region; Muneeza Mehmood Alam, Economist, Transport, South Asia Region; Yue Li, Senior Economist, South Asia Region; Christoph Pusch, Practice Manager, South Asia Climate Change & Disaster Risk Management; and Sanjay Srivastava, Program Leader, Bangladesh. Thanks also go to Amani Haque and Md. Faruk Hossain from the World Bank Dhaka office for their help in coordinating the logistics for the field visits and project team consultations in Bangladesh.
In addition, many experts in Bangladesh provided invaluable contributions to help shape the research. These include the Ministry of Agriculture, Bangladesh; the Ministry of Commerce, Bangladesh; the Bangladesh Bureau of Statistics; the Social Development Foundation; the Bangladesh Rural Advancement Committee (BRAC); WorldFish; the Bangladesh Flower Association; the Bangladesh Agricultural Research Council; the Department of Fishery and Bangladesh Frozen Fish Exporters (BFFEA); the Bangladesh Agro-Processing Association (BAPA); the Bangladesh Foreign Trade Institute; CARE, Bangladesh; Dairy Revolution and Meat Production (DRMP); the Federation of the Bangladesh Chamber of Commerce and Industry; Hortex Foundation; the Metropolitan Chamber of Commerce and Industry in Bangladesh; the SME Foundation; and the Women Entrepreneurs Association of Bangladesh.
Finally, the authors would like to thank the women of southwestern Bangladesh for welcoming our team into their homes and businesses and demonstrating how hard they work to provide for their families and their strong interest in contributing to the economic development of their communities.
The study was funded by the South Asia Trade Facilitation Program (SARTFP), and the authors would like to thank Mandakini Kaul of SARTFP and the Australian Government for their support of this research.
Economic Empowerment of Women through Resilient Agriculture Supply Chains: A Geospatial and Temporal Analysis in Southwestern Bangladesh
11
Data Limitations and Assumptions
This report covers research done during 2017. During this period, consultations with The World Bank and external stakeholders, spatial analytics, and field visits were conducted. Certain assumptions were made for the study, and data and methodological limitations are presented in this section.
�� Data LimitationsAlthough missing data were collected during a mission in November 2017, most of the data and research findings are based on both tabular and geospatial data from multiple government sources in Bangladesh. The data collected are limited only by the datasets made available publicly by the Government of Bangladesh.The timeliness of the data is subject to the time period during which the data was collected and produced by public entities in Bangladesh, such as the Bangladesh Bureau of Statistics.
Also, because this project aimed to apply geostatistical analysis at the most disaggregated level of the geographic unit- at the upazila level, there were limitations in incorporating data into analysis when these were recorded in aggregate, such as at the zila level.
�� Methodological Limitations and AssumptionsDespite the advantages offered in this project, its methodological application includes assumptions made by using economic and socially disaggregated datasets. In response to this challenge, the study uses a simplified but coherent function of the economic aggregation that allows for territorialization. Details of methodological assumptions are described in Annex B.
�� Assumptions for Product SelectionIn order to select products for value chain and activities that offer a greater contribution to increase women’s role in SMEs, this project analyzed the performance of agricultural sectors from three economic proxies of Bangladesh: 1) SME Clusters (SME Foundation, 2013), and 2) Women Entrepreneurs Directory (SME Foundation, 2015), and 3) trade data that were reported to the International Trade Center (ITC) database.
These sources of data were used as a reference to validate against product growth and to keep commodity data consistent through the analysis. Despite the existence of domestic trade statistics from the Export Promotion Bureau of Bangladesh, this study used the ITC dataset because it provides accurate estimates of commodity exports, as a joint effort from World Trade Organization (WTO) and United Nations Conference for Trade and Development (UNCTAD). It should be noted that trade data statistics from the Export Promotion Bureau of Bangladesh do not mirror the trade figures reported by the ITC database.
�� Assumptions for Transportation AccessIn terms of physical accessibility, this project assumed that the primary source to reach a destination is a personal vehicle and created a transportation model adopting a concept of mobility applying Cost Distance using up-to-date street segments of Bangladesh. The results provided the estimation of travel time (minutes) to the nearest source for each 30*30m cell based surface area that conveys land use.
�� Assumptions for Socioeconomic AssessmentIn order to identify underlying spatial patterns of sociodemographic and infrastructure constraints and opportunities, this study developed a comprehensive index that conveys 19 conditions of socioeconomic status of people in the project area. While this approach identified coexistence of socioeconomic conditions based on the territorial patterns, social and spatial inequality by sector (e.g. education, health, and income) would need to be quantified in order to develop scalable policy solutions to empower populations to alleviate poverty and achieve better life outcomes.
12 Economic Empowerment of Women through Resilient Agriculture Supply Chains: A Geospatial and Temporal Analysis in Southwestern Bangladesh
Introduction
The issue of the economic participation of women in Bangladesh is imperative since integration of women into workforce will be necessary if the country is to maintain high levels of the GDP growth over the long term. Women’s economic empowerment is not just about access to economic assets but also to the physical infrastructure that provides transformative changes.
In the area of interest (AOI), the border area between the Jessore district in Bangladesh and the state of Bengal of India, Benapole presents itself as unique space for economic prosperity based on its geographic location as the main gateway for Indo-Bangla trade. Despite the country’s economic growth and socioeconomic development in recent years, gender roles and the rural-urban divide drastically affect the distribution of opportunities. The southwestern Bangladesh region faces constraints relative to poverty, inequality, and the natural environment which is affected by salt water intrusion and changing patterns of rainfall.
Given these conditions, this project conducted an integrated and systematic spatial approach that aims to inform strategies and the implementation of economic and human development initiatives that could improve the current role of women entrepreneurs in SMEs.
Objectives
To identify products derived from row crops, livestock (ranching) and fisheries that are inclusive of women-driven SMEs, and to pursue resilience in agriculture supply chainsTo identify the sociodemographic characteristics of the AOI and to assess the current and potential labor forceTo develop an integrated assessment of the project based on an analysis of supply and demandTo develop an analysis that presents clusters of opportunities and barriers where social and infrastructure agglomerations are present (Growth Pole Identification)
Scope
The study carries out a spatially explicit, in-depth socioeconomic and productivity assessment based on “GeoAdaptive’s Inclusive Spatio-Temporal Value Chain Analysis”, which will provide a foundation for the capacity building for women-driven SMEs. The study will identify the main barriers of participation in SMEs by women entrepreneurs in specific economic sectors across the Jessore District and the northern edge of the Sathkira District.
The activities associated with this technical cooperation are organized into four (4) chapters, each of them with a set of activities and products that will help identify critical conditions or interventions that should be considered in designing economic development strategies in this region of Bangladesh.
This study included field visits to Bangladesh that enabled the acquisition of data and first-hand experience, in support of the desktop-based research process. The combination of first and secondary datasets enabled greater understanding of the study area and how raw materials are transformed into value-added products.
13
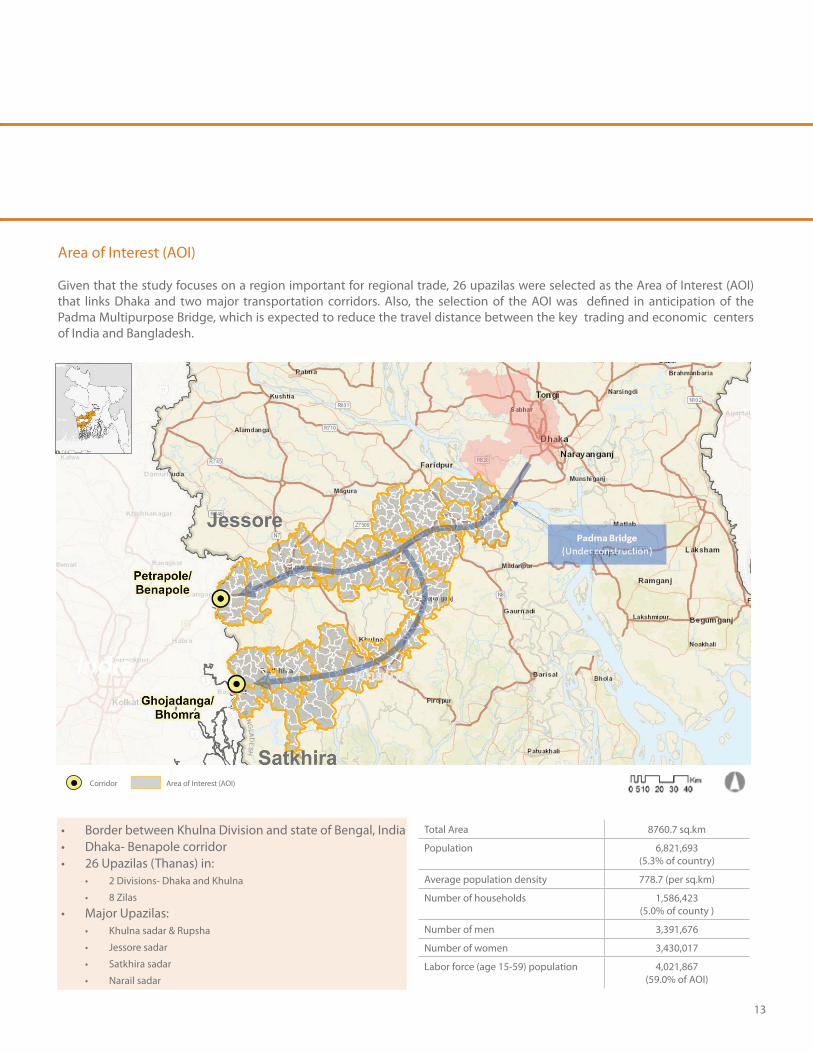
Border between Khulna Division and state of Bengal, IndiaDhaka- Benapole corridor26 Upazilas (Thanas) in:
2 Divisions- Dhaka and Khulna
8 Zilas
Major Upazilas:Khulna sadar & Rupsha
Jessore sadar
Satkhira sadar
Narail sadar
Total Area 8760.7 sq.km
Population 6,821,693 (5.3% of country)
Average population density 778.7 (per sq.km)
Number of households 1,586,423(5.0% of county )
Number of men 3,391,676
Number of women 3,430,017
Labor force (age 15-59) population 4,021,867(59.0% of AOI)
Area of Interest (AOI)
Area of Interest (AOI)
Given that the study focuses on a region important for regional trade, 26 upazilas were selected as the Area of Interest (AOI) that links Dhaka and two major transportation corridors. Also, the selection of the AOI was defined in anticipation of the Padma Multipurpose Bridge, which is expected to reduce the travel distance between the key trading and economic centers of India and Bangladesh.
Corridor
14 Economic Empowerment of Women through Resilient Agriculture Supply Chains: A Geospatial and Temporal Analysis in Southwestern Bangladesh
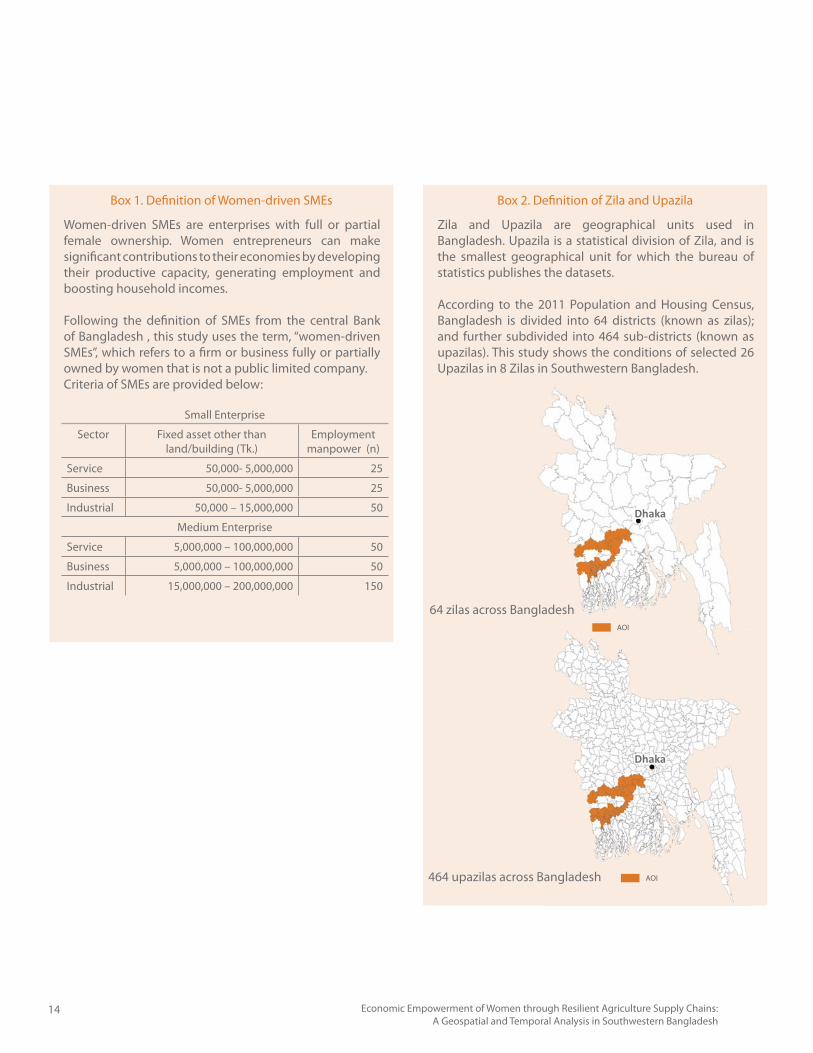
Women-driven SMEs are enterprises with full or partial female ownership. Women entrepreneurs can make significant contributions to their economies by developing their productive capacity, generating employment and boosting household incomes.
Following the definition of SMEs from the central Bank of Bangladesh , this study uses the term, “women-driven SMEs”, which refers to a firm or business fully or partially owned by women that is not a public limited company. Criteria of SMEs are provided below:
Box 1. Definition of Women-driven SMEs
Zila and Upazila are geographical units used in Bangladesh. Upazila is a statistical division of Zila, and is the smallest geographical unit for which the bureau of statistics publishes the datasets.
According to the 2011 Population and Housing Census, Bangladesh is divided into 64 districts (known as zilas); and further subdivided into 464 sub-districts (known as upazilas). This study shows the conditions of selected 26 Upazilas in 8 Zilas in Southwestern Bangladesh.
Box 2. Definition of Zila and Upazila
Small Enterprise
Sector Fixed asset other than land/building (Tk.)
Employment manpower (n)
Service 50,000- 5,000,000 25
Business 50,000- 5,000,000 25
Industrial 50,000 – 15,000,000 50
Medium Enterprise
Service 5,000,000 – 100,000,000 50
Business 5,000,000 – 100,000,000 50
Industrial 15,000,000 – 200,000,000 150
64 zilas across Bangladesh
464 upazilas across Bangladesh
Dhaka
Dhaka
AOI
AOI
Chapter 1 Economic and Enterprise Analysis
15
16 Economic Empowerment of Women through Resilient Agriculture Supply Chains: A Geospatial and Temporal Analysis in Southwestern Bangladesh
Product Selection & Characterization
Image by GeoAdaptive
17
BACKGROUND
While textiles (including ready- made garments [RMG]) are the primary economic engine accounting for about 91% of exports of the country (USD 34.4 Billion in 2016 (Observatory of Economic Complexity [OEC]), more than 38% of the population earn their income in agriculture, representing the largest employment sector in the country (BBS, 2011). Over 60 different types of agricultural crops are produced (Bangladesh Agricultural Yearbook, 2016), ranging from jute to pulses, fresh fruits, seafood, and livestock. In southwestern Bangladesh, production is focused on flower and pulses (lentils) which are typically grown on small and medium plots of land where water management is critical (SME Cluster, 2013).
OBJECTIVES
This section describes the analytical approach and results of the agricultural product selection process. The project focused on the trade corridor that crosses the Benapole-Kolkata border, which is dominated by male merchants. Given this gender imbalance, the objective of product selection was to identify agricultural products with the greatest potential to increase the involvement of women in the productive sector. The analysis of this sector included two specific objectives:
To explore and identify the most relevant products for women-driven SMEs in southwestern BangladeshTo characterize these selected products according to export trade, domestic consumption and regional productivity
In order to provide a general overview of the regional economy in southwestern Bangladesh, this section begins with an assessment of trade flows and trends. Next, a summary is provided of the three phases of the product selection process, specifically:1. Assessing women, entrepreneurship and SMEs
from: a) SME Clusters report (SME Foundation, 2013); and b) Women Entrepreneurs Directory (SME Foundation, 2015)
2. Identifying opportunities and challenges for selected products
3. characterizing each product selected based on relevant economic indicators
18 Economic Empowerment of Women through Resilient Agriculture Supply Chains: A Geospatial and Temporal Analysis in Southwestern Bangladesh
Trade Trends in Southwestern Bangladesh
Across all economic sectors in the country, most of the transformational activity occurs in Dhaka and Chittagong where goods can then be easily exported through Dhaka International Airport or the Chittagong naval shipping port (McKinsey & Company, 2011).
The structural composition of the RMG sector and textile industries therefore is not inclusive of the geographical areas in the south-southwestern regions of the country, which can be characterized as rural. This lack of involvement in the region is largely due to the deltaic environment, which necessitates large infrastructure investments in order to transport goods across major waterways and create regional interconnectivity.
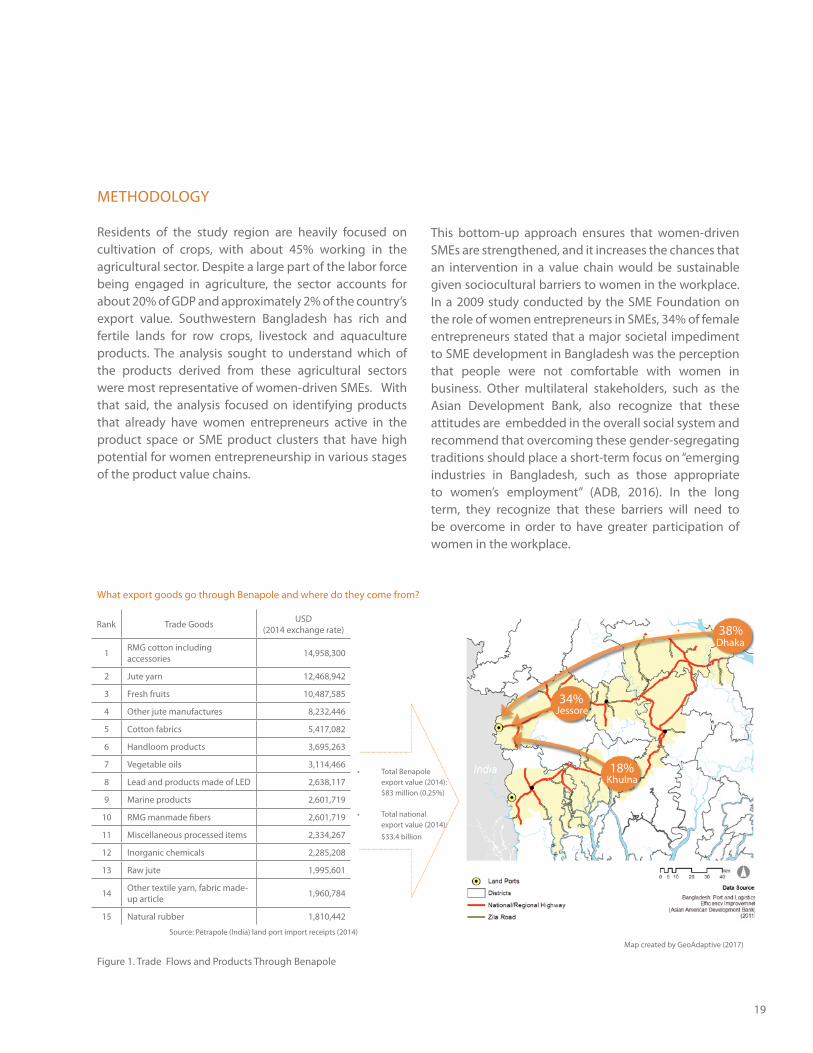
The Padma Multipurpose Bridge, which has an estimated cost of $3.7 billion dollars (ADB, 2010), is an example of the type of the large infrastructure projects that are being built in order to integrate the south-southwestern region of Bangladesh. Currently, the fastest route from Jessore to Dhaka is approximately six (6) hours, which includes a ferry ride, whereas the fastest route by land increases the travel time to approximately 8.5 hours. Despite the lack of accessibility, a high volume of goods travel through Dhaka to Benapole-Bhomra corridor, with Benapole as a primary point for the transfer of goods into Petrapole (India). Even with the RMG sector’s dominance, 3 out of the 5 goods with the largest trade value flowing into Petrapole (India) were agricultural (Figure 1).
Constraints Related to Gender Norms
Social norms are considered to be indicative of economic trends and demands for products (Elster, 1989). From 2008 to present, Bangladesh has shown a gender transformation regarding education. Access to education for women has grown over recent years, increasing to about 72.5% of women attaining secondary education in 2016. Also, to help address social inequalities, the Bangladesh government and NGOs (e.g. BRAC) have initiated microfinance programs that have improved access to capital for over 11 million women.
However, due to sociocultural norms in Bangladesh, women continue to experience inequality, especially in rural Bangladesh. While the total number of women who are of working age tends to be higher than men (BBS, 2011), there is a persistent gender imbalance against women, as identified in various forms including economic participation, health and access to finance (WEF, 2017)
19
38%
34%
18%
Dhaka
Jessore
Khulna
Figure 1. Trade Flows and Products Through Benapole
What export goods go through Benapole and where do they come from?
Rank Trade Goods USD (2014 exchange rate)
1 RMG cotton including accessories 14,958,300
2 Jute yarn 12,468,942
3 Fresh fruits 10,487,585
4 Other jute manufactures 8,232,446
5 Cotton fabrics 5,417,082
6 Handloom products 3,695,263
7 Vegetable oils 3,114,466
8 Lead and products made of LED 2,638,117
9 Marine products 2,601,719
10 RMG manmade fibers 2,601,719
11 Miscellaneous processed items 2,334,267
12 Inorganic chemicals 2,285,208
13 Raw jute 1,995,601
14 Other textile yarn, fabric made-up article 1,960,784
15 Natural rubber 1,810,442
Total Benapole export value (2014):$83 million (0.25%)
Total national export value (2014):$33.4 billion
Source: Petrapole (India) land port import receipts (2014)
Map created by GeoAdaptive (2017)
METHODOLOGY
Residents of the study region are heavily focused on cultivation of crops, with about 45% working in the agricultural sector. Despite a large part of the labor force being engaged in agriculture, the sector accounts for about 20% of GDP and approximately 2% of the country’s export value. Southwestern Bangladesh has rich and fertile lands for row crops, livestock and aquaculture products. The analysis sought to understand which of the products derived from these agricultural sectors were most representative of women-driven SMEs. With that said, the analysis focused on identifying products that already have women entrepreneurs active in the product space or SME product clusters that have high potential for women entrepreneurship in various stages of the product value chains.
This bottom-up approach ensures that women-driven SMEs are strengthened, and it increases the chances that an intervention in a value chain would be sustainable given sociocultural barriers to women in the workplace. In a 2009 study conducted by the SME Foundation on the role of women entrepreneurs in SMEs, 34% of female entrepreneurs stated that a major societal impediment to SME development in Bangladesh was the perception that people were not comfortable with women in business. Other multilateral stakeholders, such as the Asian Development Bank, also recognize that these attitudes are embedded in the overall social system and recommend that overcoming these gender-segregating traditions should place a short-term focus on “emerging industries in Bangladesh, such as those appropriate to women’s employment” (ADB, 2016). In the long term, they recognize that these barriers will need to be overcome in order to have greater participation of women in the workplace.
20 Economic Empowerment of Women through Resilient Agriculture Supply Chains: A Geospatial and Temporal Analysis in Southwestern Bangladesh
1.1. Women, Entrepreneurship and SMEs
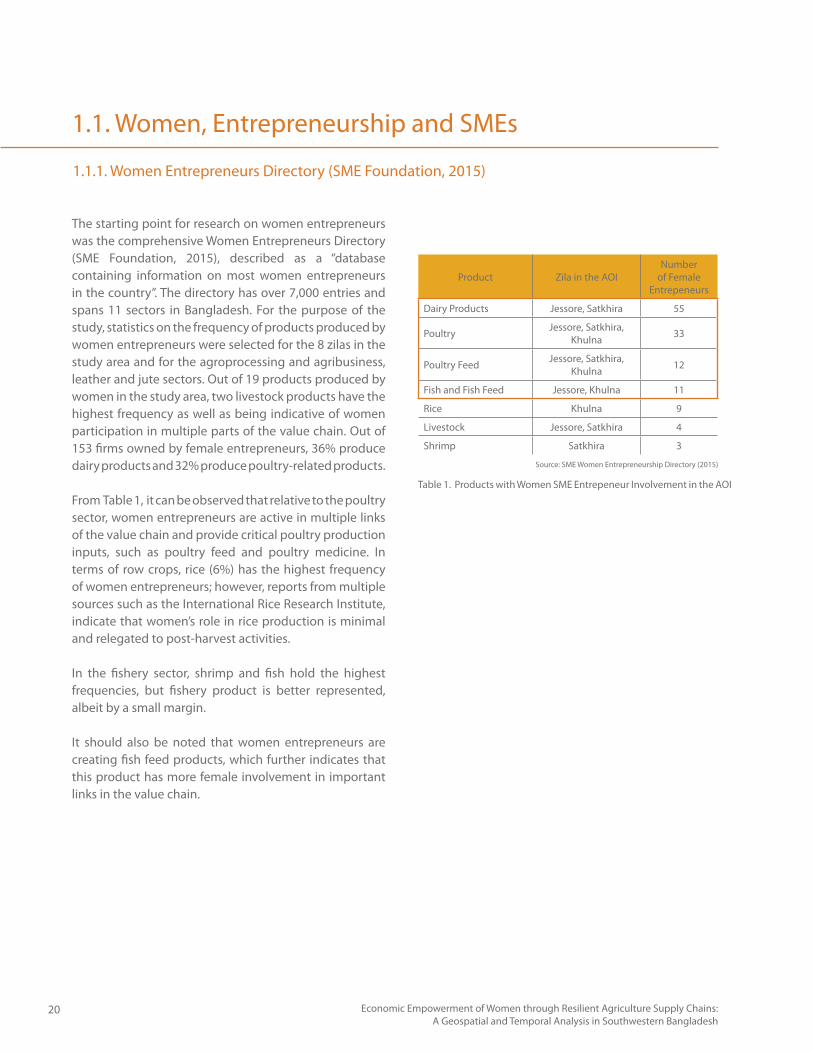
The starting point for research on women entrepreneurs was the comprehensive Women Entrepreneurs Directory (SME Foundation, 2015), described as a “database containing information on most women entrepreneurs in the country”. The directory has over 7,000 entries and spans 11 sectors in Bangladesh. For the purpose of the study, statistics on the frequency of products produced by women entrepreneurs were selected for the 8 zilas in the study area and for the agroprocessing and agribusiness, leather and jute sectors. Out of 19 products produced by women in the study area, two livestock products have the highest frequency as well as being indicative of women participation in multiple parts of the value chain. Out of 153 firms owned by female entrepreneurs, 36% produce dairy products and 32% produce poultry-related products.
From Table 1, it can be observed that relative to the poultry sector, women entrepreneurs are active in multiple links of the value chain and provide critical poultry production inputs, such as poultry feed and poultry medicine. In terms of row crops, rice (6%) has the highest frequency of women entrepreneurs; however, reports from multiple sources such as the International Rice Research Institute, indicate that women’s role in rice production is minimal and relegated to post-harvest activities.
In the fishery sector, shrimp and fish hold the highest frequencies, but fishery product is better represented, albeit by a small margin.
It should also be noted that women entrepreneurs are creating fish feed products, which further indicates that this product has more female involvement in important links in the value chain.
Product Zila in the AOINumber
of Female Entrepeneurs
Dairy Products Jessore, Satkhira 55
Poultry Jessore, Satkhira, Khulna 33
Poultry Feed Jessore, Satkhira, Khulna 12
Fish and Fish Feed Jessore, Khulna 11
Rice Khulna 9
Livestock Jessore, Satkhira 4
Shrimp Satkhira 3
1.1.1. Women Entrepreneurs Directory (SME Foundation, 2015)
Table 1. Products with Women SME Entrepeneur Involvement in the AOI
Source: SME Women Entrepreneurship Directory (2015)
21
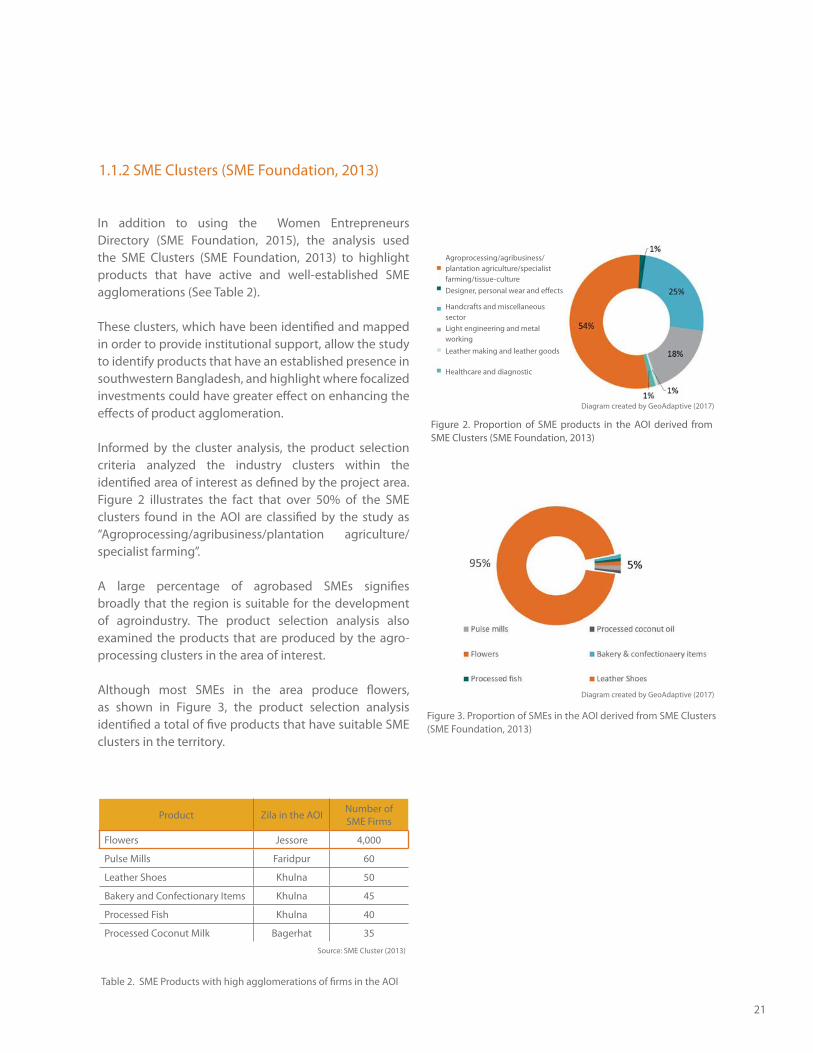
1.1.2 SME Clusters (SME Foundation, 2013)
Figure 3. Proportion of SMEs in the AOI derived from SME Clusters (SME Foundation, 2013)
Product Zila in the AOI Number of SME Firms
Flowers Jessore 4,000
Pulse Mills Faridpur 60
Leather Shoes Khulna 50
Bakery and Confectionary Items Khulna 45
Processed Fish Khulna 40
Processed Coconut Milk Bagerhat 35
In addition to using the Women Entrepreneurs Directory (SME Foundation, 2015), the analysis used the SME Clusters (SME Foundation, 2013) to highlight products that have active and well-established SME agglomerations (See Table 2).
These clusters, which have been identified and mapped in order to provide institutional support, allow the study to identify products that have an established presence in southwestern Bangladesh, and highlight where focalized investments could have greater effect on enhancing the effects of product agglomeration.
Informed by the cluster analysis, the product selection criteria analyzed the industry clusters within the identified area of interest as defined by the project area. Figure 2 illustrates the fact that over 50% of the SME clusters found in the AOI are classified by the study as “Agroprocessing/agribusiness/plantation agriculture/specialist farming”.
A large percentage of agrobased SMEs signifies broadly that the region is suitable for the development of agroindustry. The product selection analysis also examined the products that are produced by the agro-processing clusters in the area of interest.
Although most SMEs in the area produce flowers, as shown in Figure 3, the product selection analysis identified a total of five products that have suitable SME clusters in the territory.
Table 2. SME Products with high agglomerations of firms in the AOI
Figure 2. Proportion of SME products in the AOI derived from SME Clusters (SME Foundation, 2013)
Agroprocessing/agribusiness/plantation agriculture/specialist farming/tissue-cultureDesigner, personal wear and effects
Handcrafts and miscellaneous sectorLight engineering and metal working Leather making and leather goods
Healthcare and diagnostic
Diagram created by GeoAdaptive (2017)
Diagram created by GeoAdaptive (2017)
Source: SME Cluster (2013)
22 Economic Empowerment of Women through Resilient Agriculture Supply Chains: A Geospatial and Temporal Analysis in Southwestern Bangladesh
1.2. Initial Selected Products
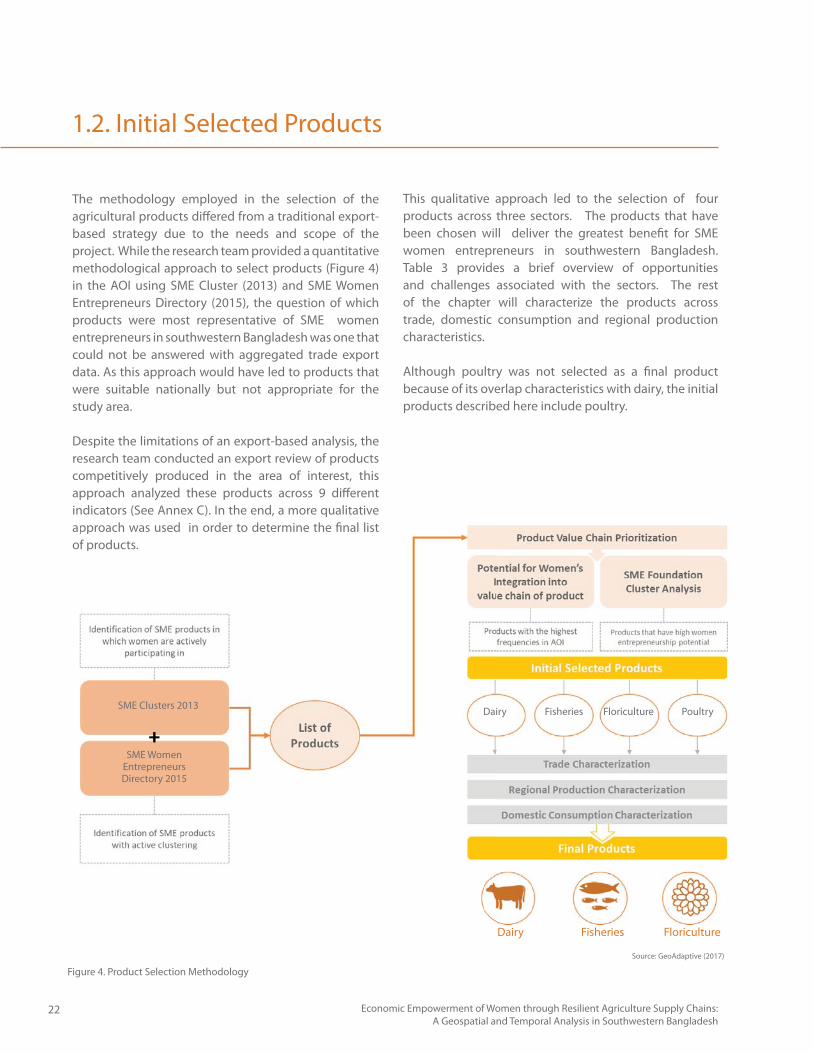
Figure 4. Product Selection Methodology
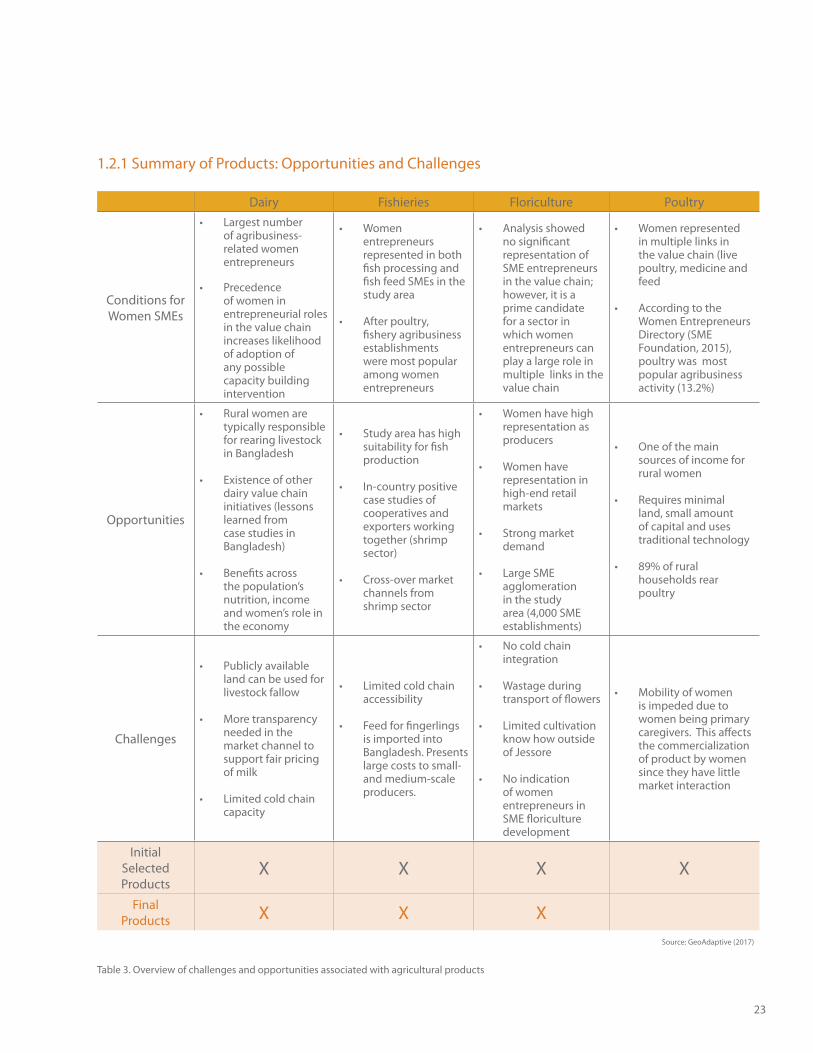
This qualitative approach led to the selection of four products across three sectors. The products that have been chosen will deliver the greatest benefit for SME women entrepreneurs in southwestern Bangladesh. Table 3 provides a brief overview of opportunities and challenges associated with the sectors. The rest of the chapter will characterize the products across trade, domestic consumption and regional production characteristics.
Although poultry was not selected as a final product because of its overlap characteristics with dairy, the initial products described here include poultry.
The methodology employed in the selection of the agricultural products differed from a traditional export-based strategy due to the needs and scope of the project. While the research team provided a quantitative methodological approach to select products (Figure 4) in the AOI using SME Cluster (2013) and SME Women Entrepreneurs Directory (2015), the question of which products were most representative of SME women entrepreneurs in southwestern Bangladesh was one that could not be answered with aggregated trade export data. As this approach would have led to products that were suitable nationally but not appropriate for the study area.
Despite the limitations of an export-based analysis, the research team conducted an export review of products competitively produced in the area of interest, this approach analyzed these products across 9 different indicators (See Annex C). In the end, a more qualitative approach was used in order to determine the final list of products.
pproach was used in order to determine the final list f products.
Source: GeoAdaptive (2017)
SME Clusters 2013
SME WomenEntrepreneursDirectory 2015
Dairy Fisheries Floriculture Poultry
Dairy Fisheries Floriculture
23
Dairy Fishieries Floriculture Poultry
Conditions for Women SMEs
Largest number of agribusiness-related women entrepreneurs
Precedence of women in entrepreneurial roles in the value chain increases likelihood of adoption of any possible capacity building intervention
Women entrepreneurs represented in both fish processing and fish feed SMEs in the study area
After poultry, fishery agribusiness establishments were most popular among women entrepreneurs
Analysis showed no significant representation of SME entrepreneurs in the value chain; however, it is a prime candidate for a sector in which women entrepreneurs can play a large role in multiple links in the value chain
Women represented in multiple links in the value chain (live poultry, medicine and feed
According to the Women Entrepreneurs Directory (SME Foundation, 2015), poultry was most popular agribusiness activity (13.2%)
Opportunities
Rural women are typically responsible for rearing livestock in Bangladesh
Existence of other dairy value chain initiatives (lessons learned from case studies in Bangladesh)
Benefits across the population’s nutrition, income and women’s role in the economy
Study area has high suitability for fish production
In-country positive case studies of cooperatives and exporters working together (shrimp sector)
Cross-over market channels from shrimp sector
Women have high representation as producers
Women have representation in high-end retail markets
Strong market demand
Large SME agglomeration in the study area (4,000 SME establishments)
One of the main sources of income for rural women
Requires minimal land, small amount of capital and uses traditional technology
89% of rural households rear poultry
Challenges
Publicly available land can be used for livestock fallow
More transparency needed in the market channel to support fair pricing of milk
Limited cold chain capacity
Limited cold chain accessibility
Feed for fingerlings is imported into Bangladesh. Presents large costs to small- and medium-scale producers.
No cold chain integration
Wastage during transport of flowers
Limited cultivation know how outside of Jessore
No indication of women entrepreneurs in SME floriculture development
Mobility of women is impeded due to women being primary caregivers. This affects the commercialization of product by women since they have little market interaction
Initial SelectedProducts
X X X X
Final Products X X X
1.2.1 Summary of Products: Opportunities and Challenges
Table 3. Overview of challenges and opportunities associated with agricultural products
Source: GeoAdaptive (2017)
24 Economic Empowerment of Women through Resilient Agriculture Supply Chains: A Geospatial and Temporal Analysis in Southwestern Bangladesh
1.3. Product Characterization
1.3.1 Livestock- Dairy Products
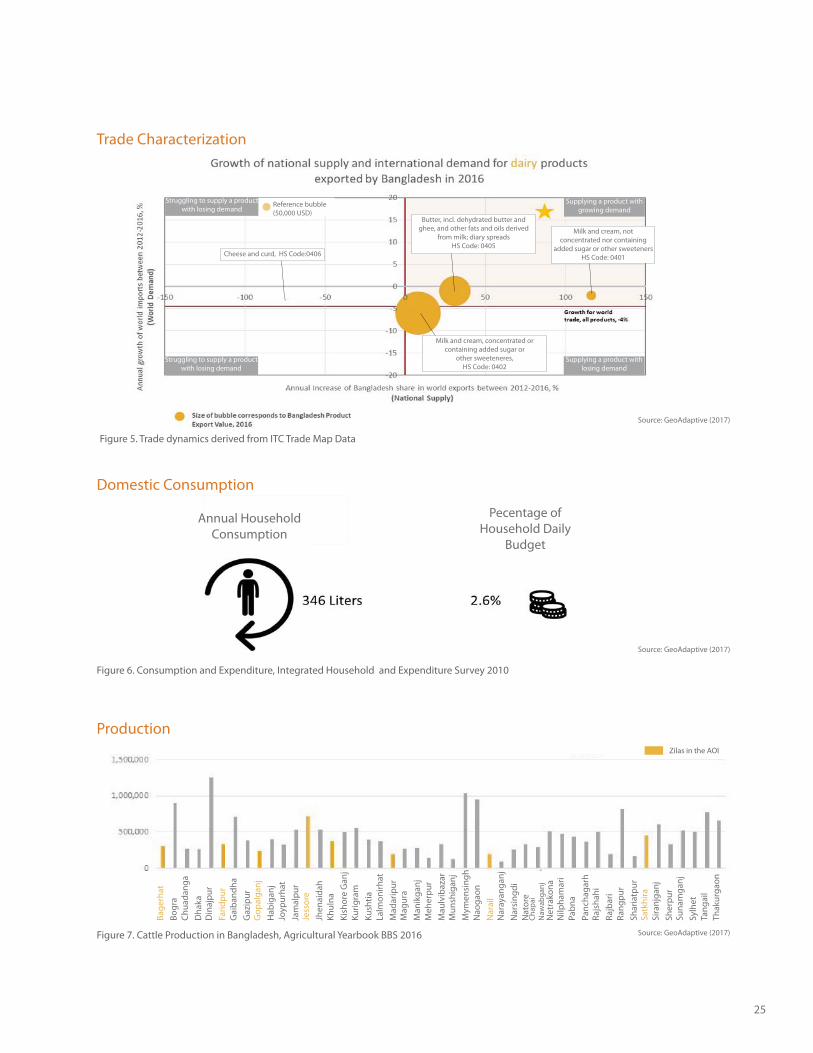
On the international stage, two products derived from dairy are positioned to be competitive for Bangladesh. Butter derived from milk fat and unsweetened milk are experiencing worldwide import growth at a steadier pace than the average for all products at -4%.1 This bodes well since products derived from milk fat have increased their market share by 31% from 2012-2016. Unsweetened milk has the best potential for export profitability given that it has increased its market share by 116.5% in a 4 year period (2012-2016) and relative to the total export value of other products, it is still a growing sector.
Domestic consumption of milk was calculated using the Income and Household Survey of 2010. Daily consumption of milk at the household level is approximately 1 liter. A large portion of households in Bangladesh have one or two heads of cattle in order to meet the household demand for milk. The balance of trade for dairy-derived products also indicates strong domestic demand for dairy products.
Lastly, in order to understand the regional production of cattle, Figure 7 identifies the districts in Bangladesh that are producing the most head of cattle. Within the study area the largest producer is Jessore followed by Satkhira.
1 Retrieved from the International Trade Centre (ITC) Trade map of Bangladesh (from 2012 to 2016) on HS Code 0405 products- butter and other fats and oils derived from milk; dairy spreads
25
Figure 5. Trade dynamics derived from ITC Trade Map Data
Milk and cream, not concentrated nor containing
added sugar or other sweeteners HS Code: 0401
Supplying a product with growing demand
Butter, incl. dehydrated butter and ghee, and other fats and oils derived
from milk; diary spreadsHS Code: 0405
Supplying a product with losing demand
Struggling to supply a product with losing demand
Struggling to supply a product with losing demand
Reference bubble (50,000 USD)
Cheese and curd, HS Code:0406
Milk and cream, concentrated or containing added sugar or
other sweeteneres, HS Code: 0402
Figure 6. Consumption and Expenditure, Integrated Household and Expenditure Survey 2010
Figure 7. Cattle Production in Bangladesh, Agricultural Yearbook BBS 2016
Annual Household Consumption
Pecentage of Household Daily
Budget
Trade Characterization
Domestic Consumption
ProductionZilas in the AOI
Source: GeoAdaptive (2017)
Source: GeoAdaptive (2017)
Bage
rhat
Bogr
aCh
uada
nga
Dha
kaD
inaj
pur
Farid
pur
Gai
band
haG
azip
urG
opal
ganj
Hab
igan
jJo
ypur
hat
Jam
alpu
rJe
ssor
eJh
enai
dah
Khul
naKi
shor
e G
anj
Kurig
ram
Kush
tiaLa
lmon
irhat
Mad
arip
urM
agur
aM
anik
ganj
Meh
erpu
rM
aulv
ibaz
arM
unsh
igan
jM
ymen
sing
hN
aoga
onN
arai
lN
aray
anga
njN
arsi
ngdi
Nat
ore
Chap
ai
Naw
abga
nj
Source: GeoAdaptive (2017)
Net
rako
naN
ilpha
mar
iPa
bna
Panc
haga
rhRa
jsha
hiRa
jbar
iRa
ngpu
rSh
aria
tpur
Satk
hira
Sira
njga
njSh
erpu
rSu
nam
ganj
Sylh
etTa
ngai
lTh
akur
gaon
26 Economic Empowerment of Women through Resilient Agriculture Supply Chains: A Geospatial and Temporal Analysis in Southwestern Bangladesh
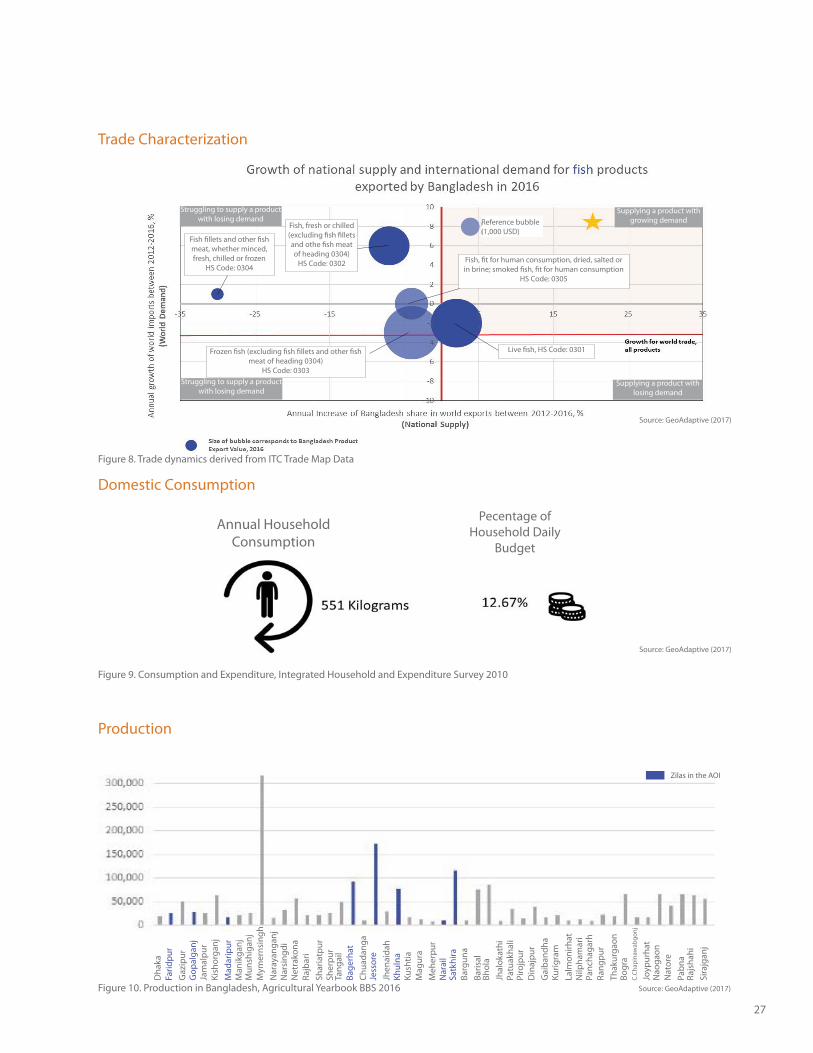
1.3.2 Fisheries
Bangladesh products derived from fisheries include products of processed fish such a fish fillets, frozen fish, dried fish, or live and fresh fish meat. In total, Bangladesh exported five types of fish products in 2016. While demand for each of them is higher that the average of all goods, increase in Bangladesh market share has decreased over the last four years (2012-2016) for 4 out of the 5 products. The fact that Bangladesh is not performing well in growing sectors points to supply-side barriers for these products. A product such as “Fish, fresh or chilled (excluding fish fillets and other fish meat of heading, HS Code: 0304)” could be enhanced through improvements to cold storage facilities or by regional trade agreements that cut down transport time for these type of goods.
Fishery products are highly consumed domestically as shown in Figure 9, which illustrates the fact that households eat more and spend more on fish, second only to grains such as rice and wheat.
This primary protein of choice is widely produced in Bangladesh, however the northern district of Mymensingh has clear advantage, producing over 316 thousand metric tons of fish, almost 100 thousand tons more than the second largest fish producing district of Comilla. Jessore and Satkhira are third and fourth, respectively, and are the two largest producers within the AOI.
1.3. Product Characterization
27
Supplying a product with growing demand
Supplying a product with losing demand
Struggling to supply a product with losing demand
Struggling to supply a product with losing demand Reference bubble
(1,000 USD)Fish fillets and other fish meat, whether minced, fresh, chilled or frozen
HS Code: 0304
Fish, fresh or chilled (excluding fish fillets and othe fish meat of heading 0304)
HS Code: 0302 Fish, fit for human consumption, dried, salted or in brine; smoked fish, fit for human consumption
HS Code: 0305
Live fish, HS Code: 0301Frozen fish (excluding fish fillets and other fish meat of heading 0304)
HS Code: 0303
Figure 10. Production in Bangladesh, Agricultural Yearbook BBS 2016
Pecentage of Household Daily
Budget
Figure 8. Trade dynamics derived from ITC Trade Map Data
Annual Household Consumption
Figure 9. Consumption and Expenditure, Integrated Household and Expenditure Survey 2010
Trade Characterization
Domestic Consumption
Production
Zilas in the AOI
Source: GeoAdaptive (2017)
Source: GeoAdaptive (2017)
Source: GeoAdaptive (2017)
Dha
kaFa
ridpu
rG
azip
urG
opal
ganj
Jam
alpu
rKi
shor
ganj
Mad
arip
urM
anik
ganj
Mun
shig
anj
Mym
erns
ingh
Nar
ayan
ganj
Nar
sing
diN
etra
kona
Rajb
ari
Shar
iatp
urSh
erpu
rTa
ngai
lBa
gerh
atCh
uada
nga
Jess
ore
Jhen
aida
hKh
ulna
Kush
tiaM
agur
aM
eher
pur
Nar
ail
Satk
hira
Barg
una
Baris
alBh
ola
Jhal
okat
hiPa
tuak
hali
Piro
jpur
Din
ajpu
rG
aiba
ndha
Kurig
ram
Lalm
onirh
atN
ilpha
mar
iPa
ncha
garh
Rang
pur
Thak
urga
onBo
gra
C.Ch
apin
awab
gonj
Joyp
urha
tN
aoga
onN
ator
ePa
bna
Rajs
hahi
Sira
jgan
j
28 Economic Empowerment of Women through Resilient Agriculture Supply Chains: A Geospatial and Temporal Analysis in Southwestern Bangladesh
1. 3. Product Characterization
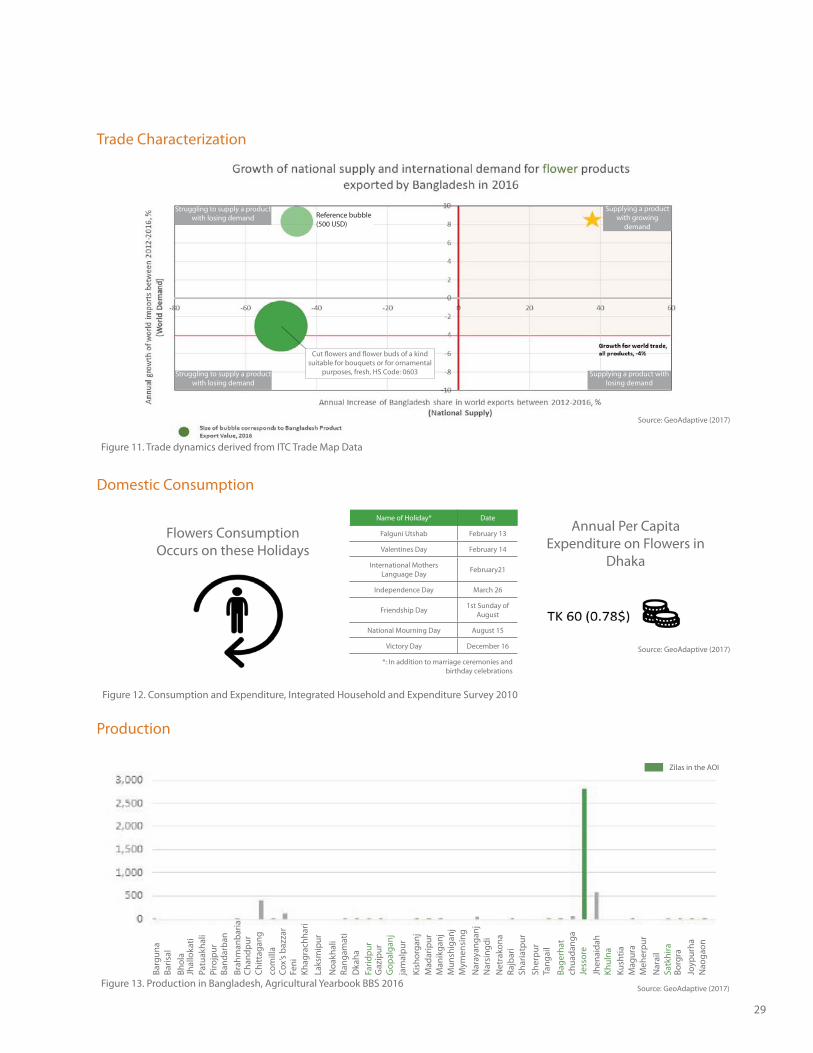
1. 3.3 Floriculture
In recent years, the production of flowers in Bangladesh has dramatically decreased as evidenced by a 50% decrease in market share over the course of 4 years (2012-2016). In a study about enhancing trade in southwestern Bangladesh, the USAID reported that flowers need to be transported by land to urban centers in order to reach a link in the air freight network. As a sector, cut flowers experienced a contraction in its worldwide import growth over the same time period.
Despite a decrease in export growth for cut flowers, domestic demand in Bangladesh for flowers continues to increase, keeping pace with the country’s GDP growth. Sales of cut flowers in the country have grown from 3.23 million in the 1990’s to 259 million in 2015. Evidence for the continued growth of the center can be found in the increasing production of flowers, in 2013, total production of flowers was approximately 4,000 tons, in 2016 cut flower production reached over 29,000 tons.
Used in weddings and birthdays, Figure 12 identifies all the major holidays in which flowers demand spikes, with some residents in Dhaka spending a total of about 63 Takas ($.78) over the course of a year in flower purchases.
29
Figure 13. Production in Bangladesh, Agricultural Yearbook BBS 2016
Supplying a product with growing
demand
Supplying a product with losing demand
Struggling to supply a product with losing demand
Struggling to supply a product with losing demand Reference bubble
(500 USD)
Cut flowers and flower buds of a kind suitable for bouquets or for ornamental
purposes, fresh, HS Code: 0603
Figure 11. Trade dynamics derived from ITC Trade Map Data
Flowers Consumption Occurs on these Holidays
Figure 12. Consumption and Expenditure, Integrated Household and Expenditure Survey 2010
Name of Holiday* Date
Falguni Utshab February 13
Valentines Day February 14
International Mothers Language Day February21
Independence Day March 26
Friendship Day 1st Sunday of August
National Mourning Day August 15
Victory Day December 16
*: In addition to marriage ceremonies and birthday celebrations
Pecentage of Household Daily
Budget
Annual Per Capita Expenditure on Flowers in
Dhaka
Trade Characterization
Domestic Consumption
Production
Zilas in the AOI
Source: GeoAdaptive (2017)
Source: GeoAdaptive (2017)
Source: GeoAdaptive (2017)
Barg
una
Bhol
a
Patu
akha
liPi
rojp
ur
Brah
man
baria
Chan
dpur
Chitt
agan
gco
mill
aCo
x’s
bazz
arFe
niKh
agra
chha
riLa
ksm
ipur
Noa
khal
iRa
ngam
ati
Farid
pur
Baris
al
Jhal
loka
ti
Band
arba
n
Dka
ha
Gop
alga
njG
azip
ur
Kish
orga
njja
mal
pur
Man
ikga
njM
adar
ipur
Mym
ensi
ngM
unsh
igan
j
Nar
sing
diN
aray
anga
nj
Net
rako
na
Shar
iatp
urRa
jbar
i
Tang
ail
Sher
pur
Bage
rhat
Jess
ore
chua
dang
a
Khul
naJh
enai
dah
Kush
tia
Meh
erpu
rM
agur
a
Satk
hira
Nar
ail
Borg
ra
Nao
gaon
Joyp
urha
30 Economic Empowerment of Women through Resilient Agriculture Supply Chains: A Geospatial and Temporal Analysis in Southwestern Bangladesh
1. 3. Product Characterization
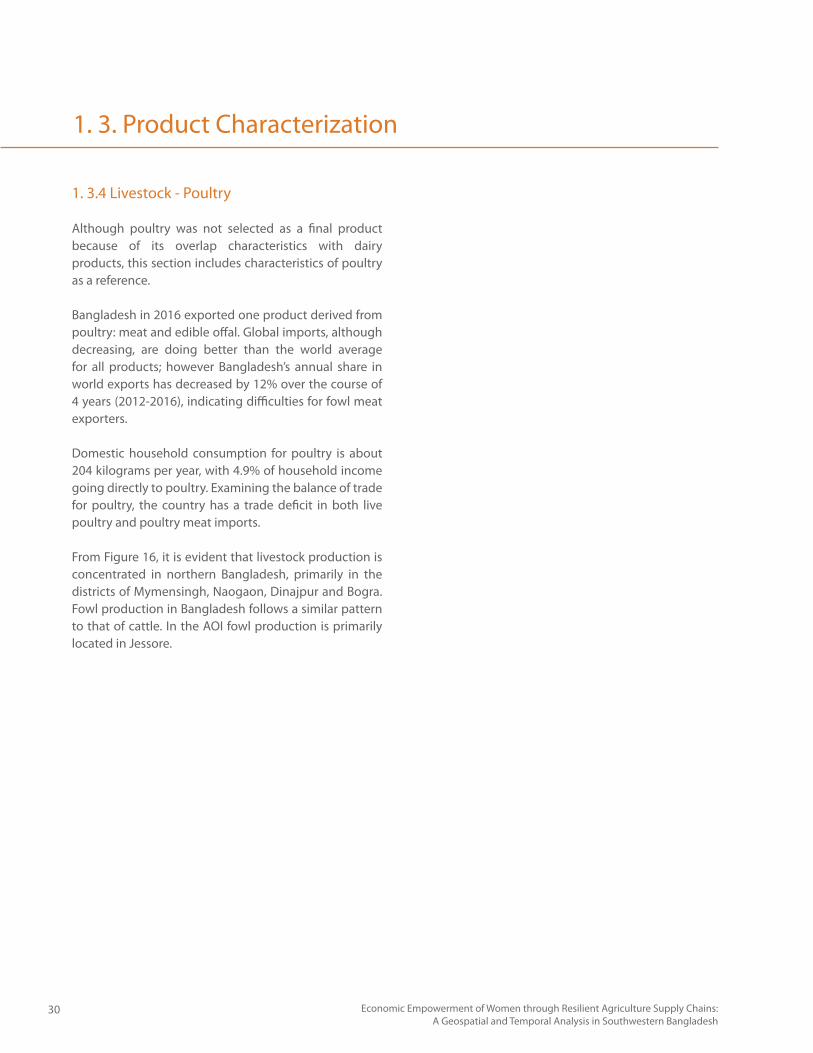
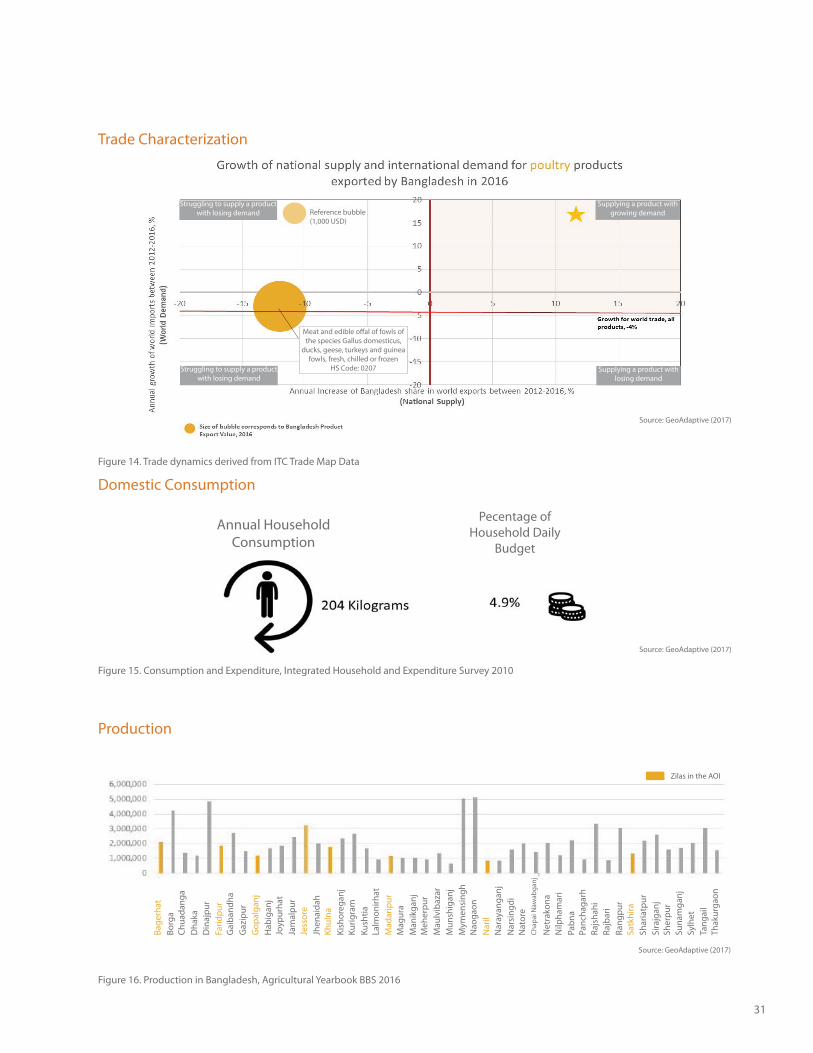
1. 3.4 Livestock - Poultry
Although poultry was not selected as a final product because of its overlap characteristics with dairy products, this section includes characteristics of poultry as a reference.
Bangladesh in 2016 exported one product derived from poultry: meat and edible offal. Global imports, although decreasing, are doing better than the world average for all products; however Bangladesh’s annual share in world exports has decreased by 12% over the course of 4 years (2012-2016), indicating difficulties for fowl meat exporters.
Domestic household consumption for poultry is about 204 kilograms per year, with 4.9% of household income going directly to poultry. Examining the balance of trade for poultry, the country has a trade deficit in both live poultry and poultry meat imports.
From Figure 16, it is evident that livestock production is concentrated in northern Bangladesh, primarily in the districts of Mymensingh, Naogaon, Dinajpur and Bogra. Fowl production in Bangladesh follows a similar pattern to that of cattle. In the AOI fowl production is primarily located in Jessore.
31
Figure 16. Production in Bangladesh, Agricultural Yearbook BBS 2016
Pecentage of Household Daily
Budget
Figure 14. Trade dynamics derived from ITC Trade Map Data
Annual Household Consumption
Figure 15. Consumption and Expenditure, Integrated Household and Expenditure Survey 2010
Supplying a product with growing demand
Supplying a product with losing demand
Struggling to supply a product with losing demand
Struggling to supply a product with losing demand
Meat and edible offal of fowls of the species Gallus domesticus,
ducks, geese, turkeys and guinea fowls, fresh, chilled or frozen
HS Code: 0207
Reference bubble (1,000 USD)
Trade Characterization
Domestic Consumption
Production
Zilas in the AOI
Source: GeoAdaptive (2017)
Source: GeoAdaptive (2017)
Source: GeoAdaptive (2017)
Bage
rhat
Borg
aCh
uada
nga
Dha
kaD
inaj
pur
Farid
pur
Gai
band
haG
azip
urG
opal
ganj
Hab
igan
jJo
ypur
hat
Jam
alpu
rJe
ssor
eJh
enai
dah
Khul
naKi
shor
egan
jKu
rigra
mKu
shtia
Lalm
onirh
atM
adar
ipur
Mag
ura
Man
ikga
njM
eher
pur
Mau
lvib
azar
Mun
shig
anj
Mym
ensi
ngh
Nao
gaon
Nar
ilN
aray
anga
njN
arsi
ngdi
Nat
ore
Chap
ai N
awab
ganj
Net
rako
naN
ilpha
mar
iPa
bna
Panc
haga
rhRa
jsha
hiRa
jbar
iRa
ngpu
rSa
tkhi
raSh
aria
tpur
Sira
jgan
jSh
erpu
rSu
nam
ganj
Sylh
etTa
ngai
lTh
akur
gaon

32 Economic Empowerment of Women through Resilient Agriculture Supply Chains: A Geospatial and Temporal Analysis in Southwestern Bangladesh
Chapter 2 Sociodemographic and Labor Force Analysis
33
34 Economic Empowerment of Women through Resilient Agriculture Supply Chains: A Geospatial and Temporal Analysis in Southwestern Bangladesh
Geospatial Profiling
Image by GeoAdaptive
35
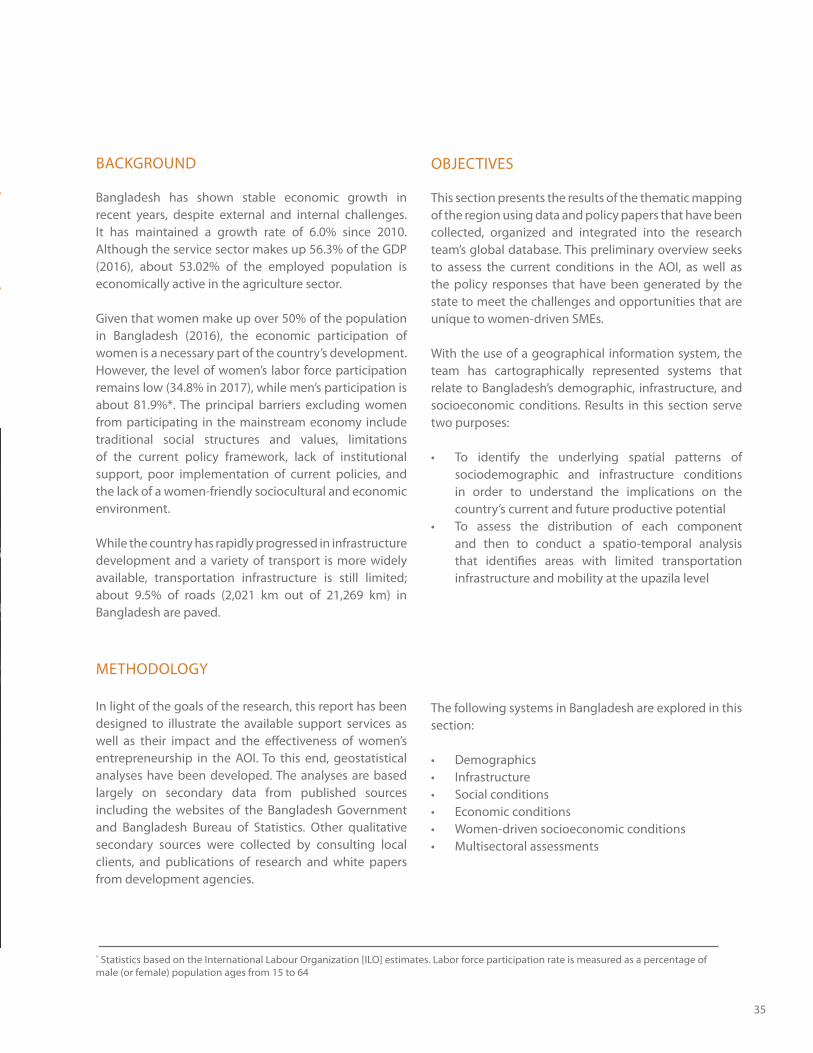
BACKGROUND
Bangladesh has shown stable economic growth in recent years, despite external and internal challenges. It has maintained a growth rate of 6.0% since 2010. Although the service sector makes up 56.3% of the GDP (2016), about 53.02% of the employed population is economically active in the agriculture sector.
Given that women make up over 50% of the population in Bangladesh (2016), the economic participation of women is a necessary part of the country’s development. However, the level of women’s labor force participation remains low (34.8% in 2017), while men’s participation is about 81.9%*. The principal barriers excluding women from participating in the mainstream economy include traditional social structures and values, limitations of the current policy framework, lack of institutional support, poor implementation of current policies, and the lack of a women-friendly sociocultural and economic environment.
While the country has rapidly progressed in infrastructure development and a variety of transport is more widely available, transportation infrastructure is still limited; about 9.5% of roads (2,021 km out of 21,269 km) in Bangladesh are paved.
METHODOLOGY
In light of the goals of the research, this report has been designed to illustrate the available support services as well as their impact and the effectiveness of women’s entrepreneurship in the AOI. To this end, geostatistical analyses have been developed. The analyses are based largely on secondary data from published sources including the websites of the Bangladesh Government and Bangladesh Bureau of Statistics. Other qualitative secondary sources were collected by consulting local clients, and publications of research and white papers from development agencies.
OBJECTIVES
This section presents the results of the thematic mapping of the region using data and policy papers that have been collected, organized and integrated into the research team’s global database. This preliminary overview seeks to assess the current conditions in the AOI, as well as the policy responses that have been generated by the state to meet the challenges and opportunities that are unique to women-driven SMEs.
With the use of a geographical information system, the team has cartographically represented systems that relate to Bangladesh’s demographic, infrastructure, and socioeconomic conditions. Results in this section serve two purposes:
To identify the underlying spatial patterns of sociodemographic and infrastructure conditions in order to understand the implications on the country’s current and future productive potentialTo assess the distribution of each component and then to conduct a spatio-temporal analysis that identifies areas with limited transportation infrastructure and mobility at the upazila level
The following systems in Bangladesh are explored in thissection:
DemographicsInfrastructureSocial conditionsEconomic conditionsWomen-driven socioeconomic conditionsMultisectoral assessments
* Statistics based on the International Labour Organization [ILO] estimates. Labor force participation rate is measured as a percentage of male (or female) population ages from 15 to 64
36 Economic Empowerment of Women through Resilient Agriculture Supply Chains: A Geospatial and Temporal Analysis in Southwestern Bangladesh
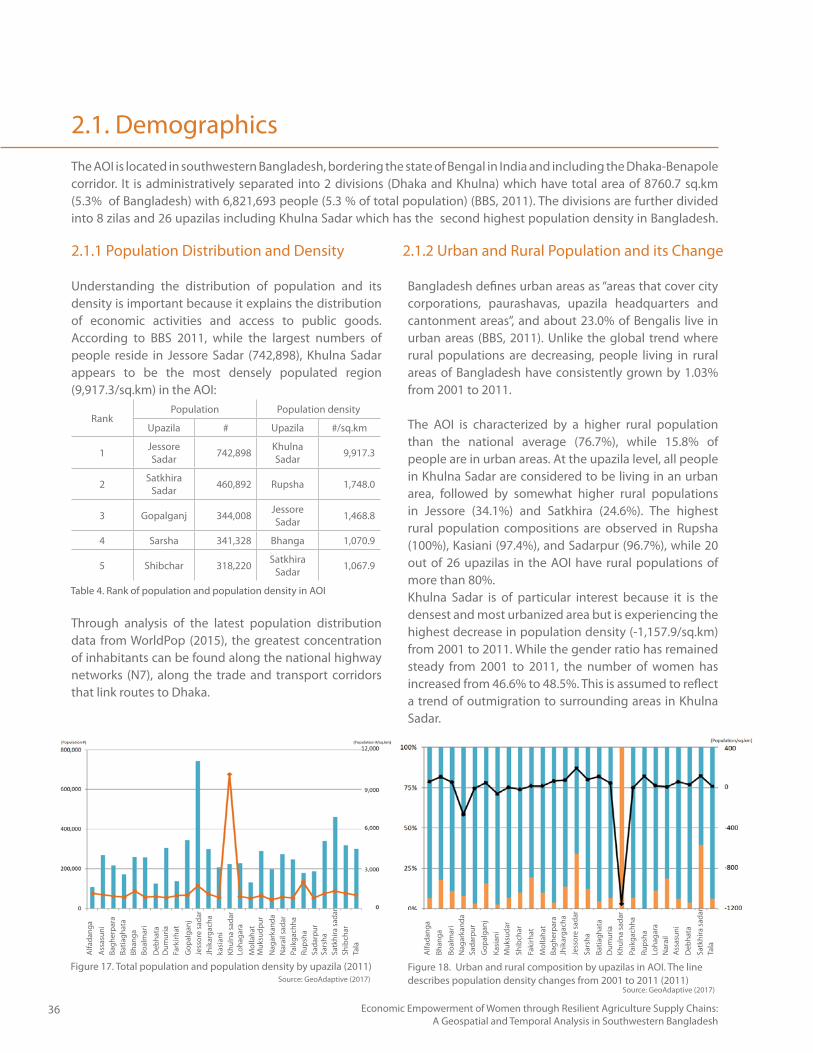
2.1. Demographics
2.1.1 Population Distribution and Density
Understanding the distribution of population and its density is important because it explains the distribution of economic activities and access to public goods. According to BBS 2011, while the largest numbers of people reside in Jessore Sadar (742,898), Khulna Sadar appears to be the most densely populated region (9,917.3/sq.km) in the AOI:
RankPopulation Population density
Upazila # Upazila #/sq.km
1 Jessore Sadar 742,898 Khulna
Sadar 9,917.3
2 Satkhira Sadar 460,892 Rupsha 1,748.0
3 Gopalganj 344,008 Jessore Sadar 1,468.8
4 Sarsha 341,328 Bhanga 1,070.9
5 Shibchar 318,220 Satkhira Sadar 1,067.9
Through analysis of the latest population distribution data from WorldPop (2015), the greatest concentration of inhabitants can be found along the national highway networks (N7), along the trade and transport corridors that link routes to Dhaka.
The AOI is located in southwestern Bangladesh, bordering the state of Bengal in India and including the Dhaka-Benapole corridor. It is administratively separated into 2 divisions (Dhaka and Khulna) which have total area of 8760.7 sq.km (5.3% of Bangladesh) with 6,821,693 people (5.3 % of total population) (BBS, 2011). The divisions are further divided into 8 zilas and 26 upazilas including Khulna Sadar which has the second highest population density in Bangladesh.
Bangladesh defines urban areas as “areas that cover city corporations, paurashavas, upazila headquarters and cantonment areas”, and about 23.0% of Bengalis live in urban areas (BBS, 2011). Unlike the global trend where rural populations are decreasing, people living in rural areas of Bangladesh have consistently grown by 1.03% from 2001 to 2011.
The AOI is characterized by a higher rural population than the national average (76.7%), while 15.8% of people are in urban areas. At the upazila level, all people in Khulna Sadar are considered to be living in an urban area, followed by somewhat higher rural populations in Jessore (34.1%) and Satkhira (24.6%). The highest rural population compositions are observed in Rupsha (100%), Kasiani (97.4%), and Sadarpur (96.7%), while 20 out of 26 upazilas in the AOI have rural populations of more than 80%. Khulna Sadar is of particular interest because it is the densest and most urbanized area but is experiencing the highest decrease in population density (-1,157.9/sq.km) from 2001 to 2011. While the gender ratio has remained steady from 2001 to 2011, the number of women has increased from 46.6% to 48.5%. This is assumed to reflect a trend of outmigration to surrounding areas in Khulna Sadar.
Figure 17. Total population and population density by upazila (2011) Figure 18. Urban and rural composition by upazilas in AOI. The line describes population density changes from 2001 to 2011 (2011)
Table 4. Rank of population and population density in AOI
Alfa
dang
aA
ssas
uni
Bagh
erpa
raBa
tiagh
ata
Bhan
gaBo
alm
ari
Deb
hata
Dum
uria
Fark
irhat
Gop
alga
njJe
ssor
e sa
dar
Jhik
arga
cha
kasi
ani
Khul
na s
adar
Loha
gara
Mol
laha
tM
uksu
dpur
Nag
arka
nda
Nar
ail s
adar
Paik
gach
haRu
psha
Sada
rpur
Sars
haSa
tkhi
ra sa
dar
Shib
char
Tala
Alfa
dang
aBh
anga
Boal
mar
iN
agar
kand
aSa
darp
urG
opal
ganj
Kasi
ani
Muk
suda
rSh
ibch
arFa
kirh
atM
olla
hat
Bagh
erpa
raJh
ikar
gach
aJe
ssor
e sa
dar
Sars
haBa
tiagh
ata
Dum
uria
Khul
na s
adar
Paik
gach
haRu
psha
Loha
gara
Nar
ail
Ass
asun
iD
ebha
taSa
tkhi
ra sa
dar
Tala
2.1.2 Urban and Rural Population and its Change
Source: GeoAdaptive (2017)Source: GeoAdaptive (2017)
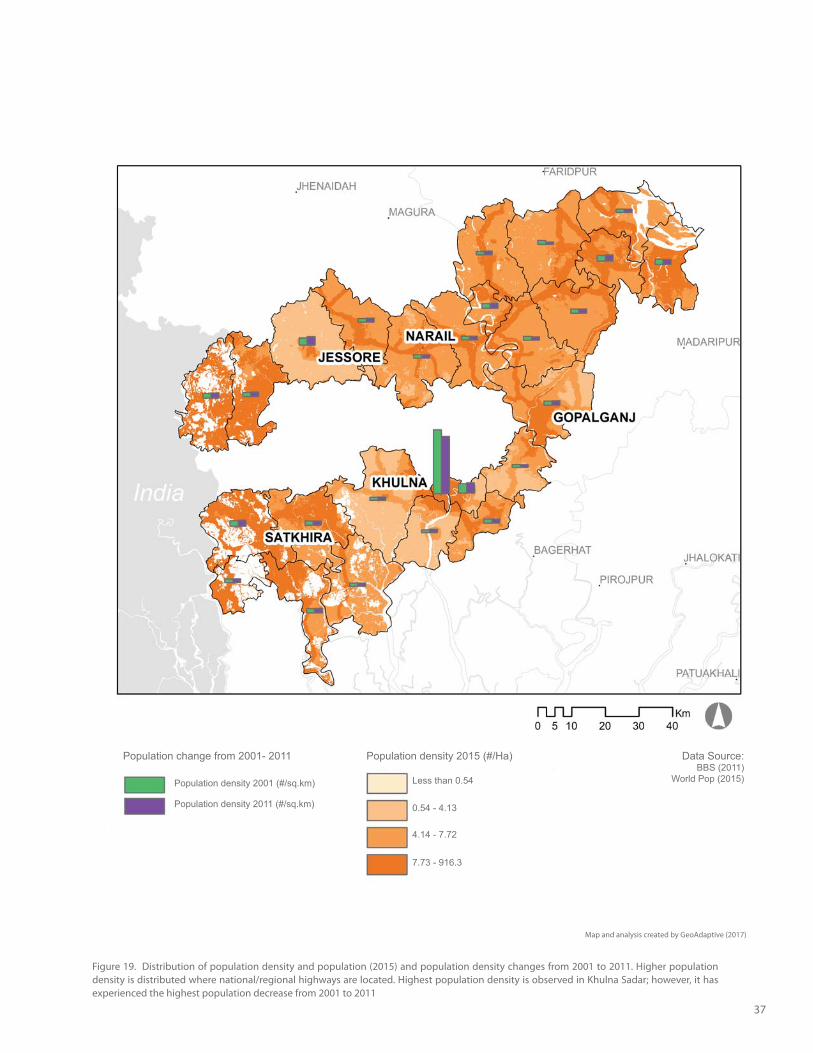
37
Figure 19. Distribution of population density and population (2015) and population density changes from 2001 to 2011. Higher population density is distributed where national/regional highways are located. Highest population density is observed in Khulna Sadar; however, it has experienced the highest population decrease from 2001 to 2011
Population density 2001 (#/sq.km)
Population density 2011 (#/sq.km)
Population density 2015 (#/Ha)Population change from 2001- 2011
Map and analysis created by GeoAdaptive (2017)
Less than 0.54
0.54 - 4.13
4.14 - 7.72
7.73 - 916.3
Data Source:BBS (2011)
World Pop (2015)
38 Economic Empowerment of Women through Resilient Agriculture Supply Chains: A Geospatial and Temporal Analysis in Southwestern Bangladesh
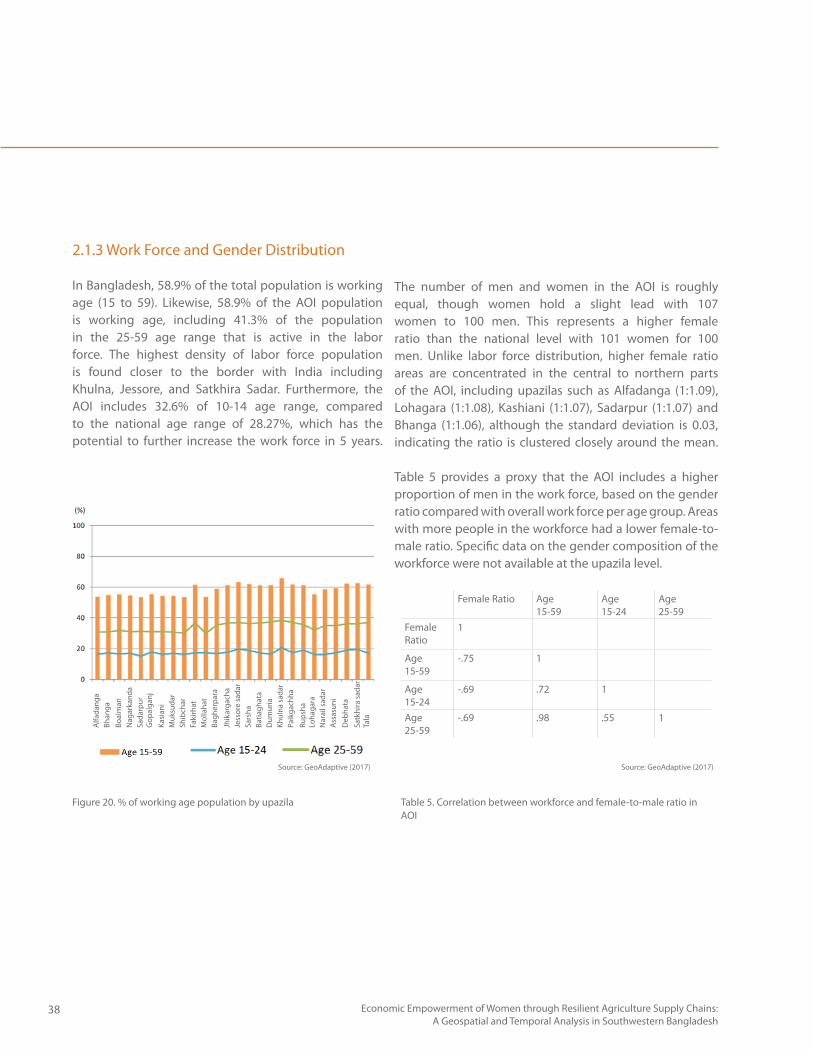
2.1.3 Work Force and Gender Distribution
In Bangladesh, 58.9% of the total population is working age (15 to 59). Likewise, 58.9% of the AOI population is working age, including 41.3% of the population in the 25-59 age range that is active in the labor force. The highest density of labor force population is found closer to the border with India including Khulna, Jessore, and Satkhira Sadar. Furthermore, the AOI includes 32.6% of 10-14 age range, compared to the national age range of 28.27%, which has the potential to further increase the work force in 5 years.
The number of men and women in the AOI is roughly equal, though women hold a slight lead with 107 women to 100 men. This represents a higher female ratio than the national level with 101 women for 100 men. Unlike labor force distribution, higher female ratio areas are concentrated in the central to northern parts of the AOI, including upazilas such as Alfadanga (1:1.09), Lohagara (1:1.08), Kashiani (1:1.07), Sadarpur (1:1.07) and Bhanga (1:1.06), although the standard deviation is 0.03, indicating the ratio is clustered closely around the mean.
Table 5 provides a proxy that the AOI includes a higher proportion of men in the work force, based on the gender ratio compared with overall work force per age group. Areas with more people in the workforce had a lower female-to-male ratio. Specific data on the gender composition of the workforce were not available at the upazila level.
Female Ratio Age15-59
Age15-24
Age25-59
Female Ratio
1
Age 15-59
-.75 1
Age 15-24
-.69 .72 1
Age 25-59
-.69 .98 .55 1
Table 5. Correlation between workforce and female-to-male ratio in AOI
Figure 20. % of working age population by upazila
Alfa
dang
aBh
anga
Boal
mar
iN
agar
kand
aSa
darp
urG
opal
ganj
Kasi
ani
Muk
suda
rSh
ibch
arFa
kirh
atM
olla
hat
Bagh
erpa
ra
Jhik
arga
cha
Jess
ore
sada
rSa
rsha
Batia
ghat
aD
umur
iaKh
ulna
sad
arPa
ikga
chha
Rups
haLo
haga
raN
arai
l sad
arA
ssas
uni
Deb
hata
Satk
hira
sada
rTa
la
Source: GeoAdaptive (2017) Source: GeoAdaptive (2017)
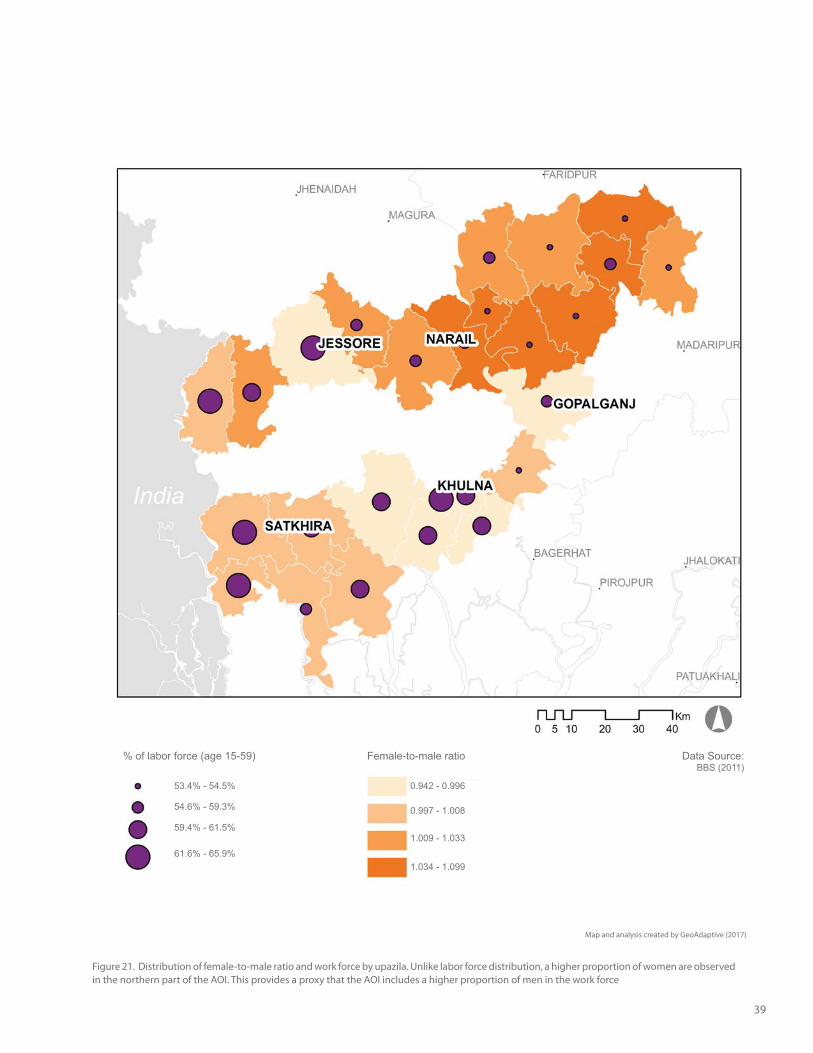
39
Figure 21. Distribution of female-to-male ratio and work force by upazila. Unlike labor force distribution, a higher proportion of women are observed in the northern part of the AOI. This provides a proxy that the AOI includes a higher proportion of men in the work force
Data Source:BBS (2011)
Map and analysis created by GeoAdaptive (2017)
53.4% - 54.5%
54.6% - 59.3%
% of labor force (age 15-59)
59.4% - 61.5%
61.6% - 65.9%
Female-to-male ratio
0.942 - 0.996
0.997 - 1.008
1.009 - 1.033
1.034 - 1.099
40 Economic Empowerment of Women through Resilient Agriculture Supply Chains: A Geospatial and Temporal Analysis in Southwestern Bangladesh
2.2. Infrastructure
2.2.1 Road and Public Transportation
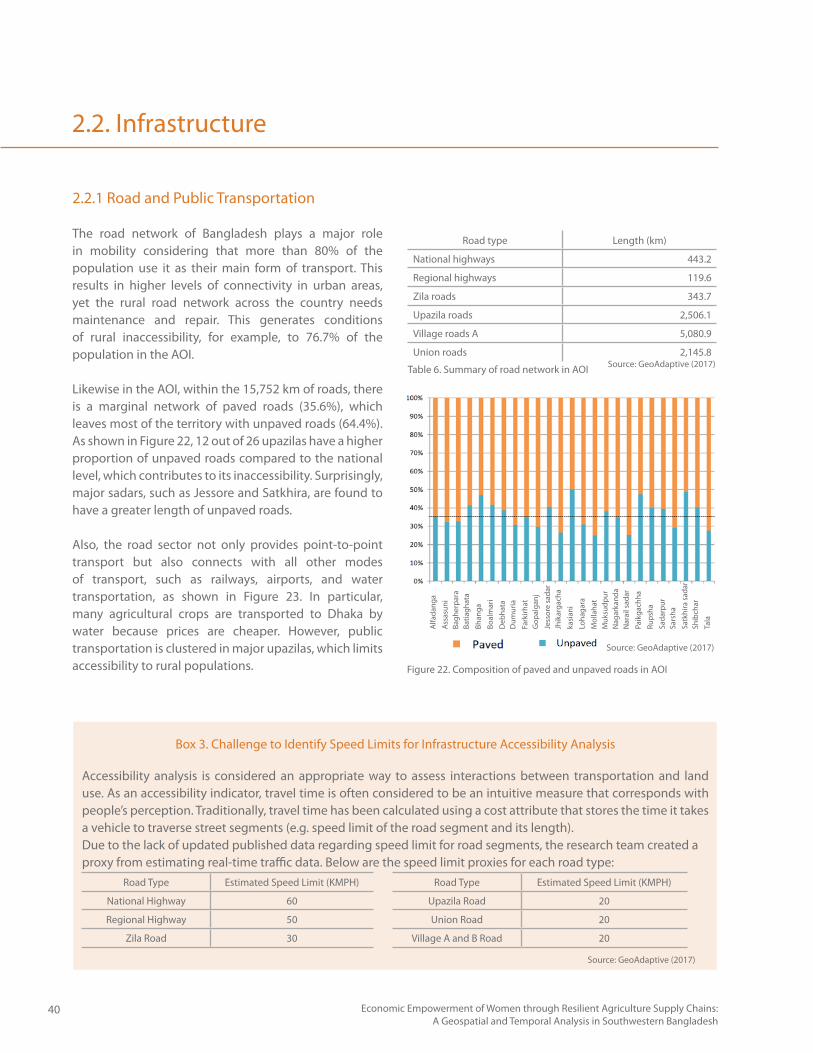
The road network of Bangladesh plays a major role in mobility considering that more than 80% of the population use it as their main form of transport. This results in higher levels of connectivity in urban areas, yet the rural road network across the country needs maintenance and repair. This generates conditions of rural inaccessibility, for example, to 76.7% of the population in the AOI.
Likewise in the AOI, within the 15,752 km of roads, there is a marginal network of paved roads (35.6%), which leaves most of the territory with unpaved roads (64.4%). As shown in Figure 22, 12 out of 26 upazilas have a higher proportion of unpaved roads compared to the national level, which contributes to its inaccessibility. Surprisingly, major sadars, such as Jessore and Satkhira, are found to have a greater length of unpaved roads.
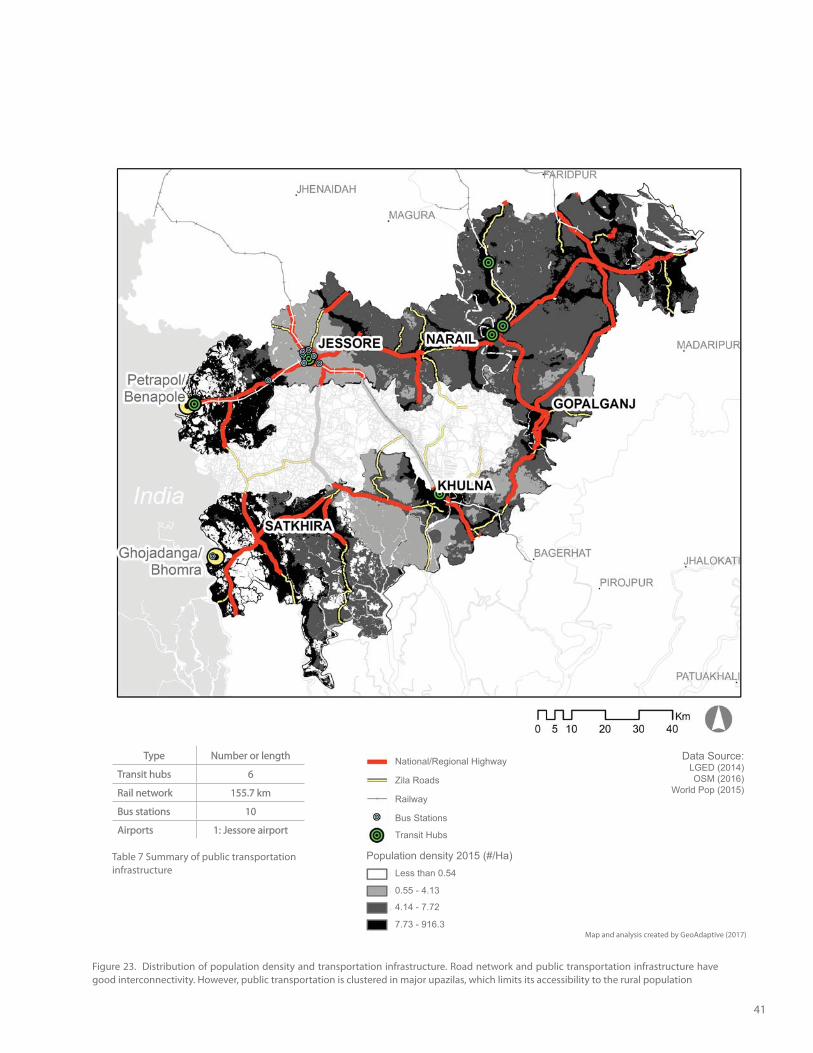
Also, the road sector not only provides point-to-point transport but also connects with all other modes of transport, such as railways, airports, and water transportation, as shown in Figure 23. In particular, many agricultural crops are transported to Dhaka by water because prices are cheaper. However, public transportation is clustered in major upazilas, which limits accessibility to rural populations.
Road type Length (km)
National highways 443.2
Regional highways 119.6
Zila roads 343.7
Upazila roads 2,506.1
Village roads A 5,080.9
Union roads 2,145.8
Table 6. Summary of road network in AOI
Figure 22. Composition of paved and unpaved roads in AOI
Box 3. Challenge to Identify Speed Limits for Infrastructure Accessibility Analysis
Accessibility analysis is considered an appropriate way to assess interactions between transportation and land use. As an accessibility indicator, travel time is often considered to be an intuitive measure that corresponds with people’s perception. Traditionally, travel time has been calculated using a cost attribute that stores the time it takes a vehicle to traverse street segments (e.g. speed limit of the road segment and its length). Due to the lack of updated published data regarding speed limit for road segments, the research team created a proxy from estimating real-time traffic data. Below are the speed limit proxies for each road type:
Road Type Estimated Speed Limit (KMPH) Road Type Estimated Speed Limit (KMPH)
National Highway 60 Upazila Road 20
Regional Highway 50 Union Road 20
Zila Road 30 Village A and B Road 20
Alfa
dang
aA
ssas
uni
Bagh
erpa
raBa
tiagh
ata
Bhan
gaBo
alm
ari
Deb
hata
Dum
uria
Fark
irhat
Gop
alga
njJe
ssor
e sa
dar
Jhik
arga
cha
kasi
ani
Loha
gara
Mol
laha
tM
uksu
dpur
Nag
arka
nda
Nar
ail s
adar
Paik
gach
haRu
psha
Sada
rpur
Sars
haSa
tkhi
ra sa
dar
Shib
char
Tala
Source: GeoAdaptive (2017)
Source: GeoAdaptive (2017)
Source: GeoAdaptive (2017)
41
Figure 23. Distribution of population density and transportation infrastructure. Road network and public transportation infrastructure have good interconnectivity. However, public transportation is clustered in major upazilas, which limits its accessibility to the rural population
Type Number or length
Transit hubs 6
Rail network 155.7 km
Bus stations 10
Airports 1: Jessore airport
Table 7 Summary of public transportation infrastructure
Population density 2015 (#/Ha)
National/Regional Highway
Zila Roads
Railway
Bus Stations
Transit Hubs
Map and analysis created by GeoAdaptive (2017)
Data Source:LGED (2014)OSM (2016)
World Pop (2015)
Less than 0.54
0.55 - 4.13
4.14 - 7.72
7.73 - 916.3
42 Economic Empowerment of Women through Resilient Agriculture Supply Chains: A Geospatial and Temporal Analysis in Southwestern Bangladesh
2.2.2 Electricity
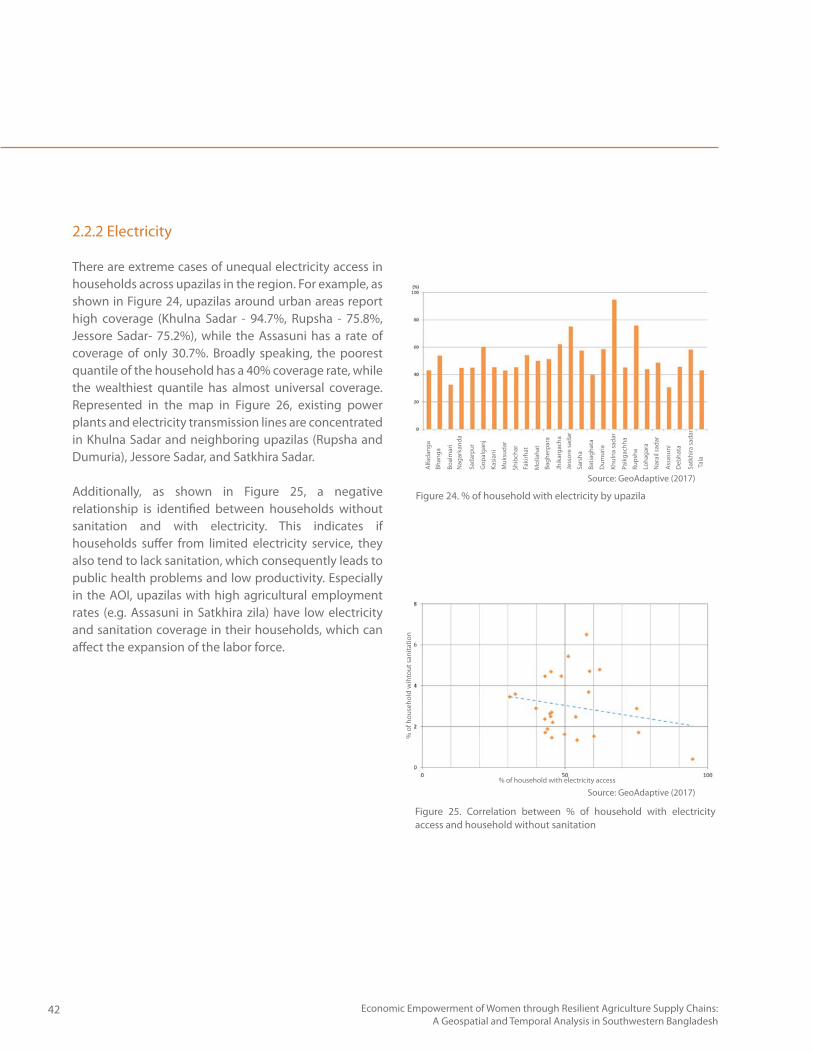
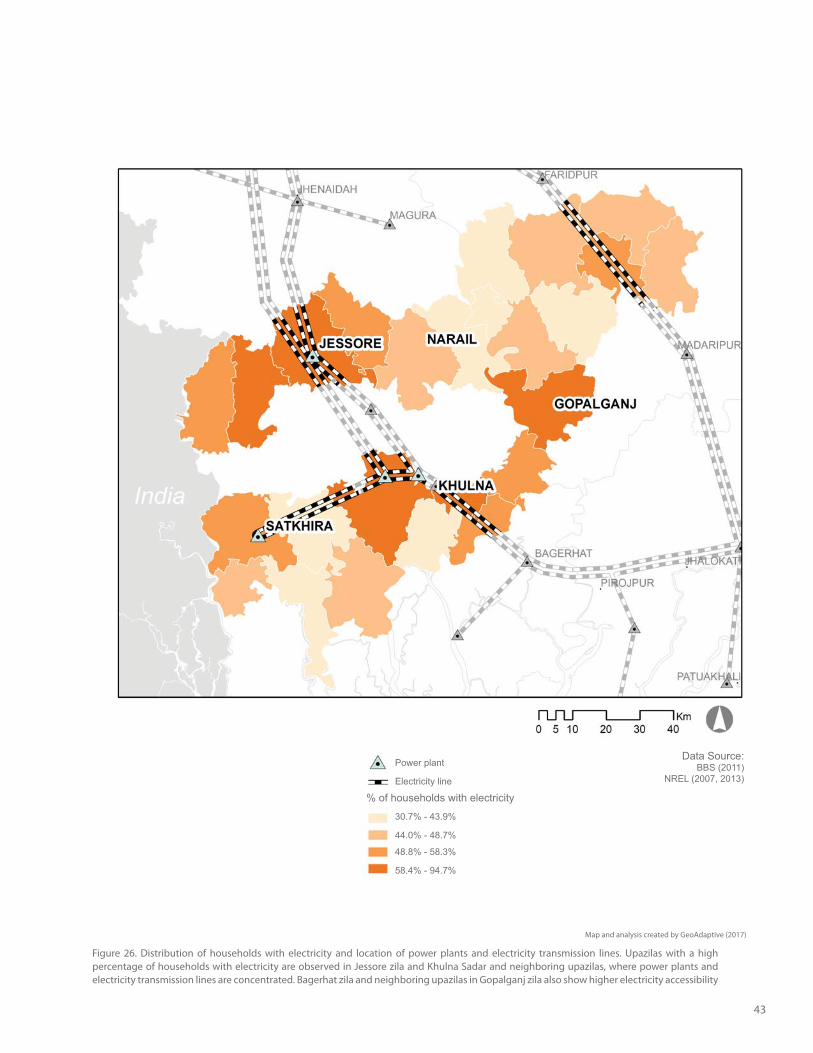
There are extreme cases of unequal electricity access in households across upazilas in the region. For example, as shown in Figure 24, upazilas around urban areas report high coverage (Khulna Sadar - 94.7%, Rupsha - 75.8%, Jessore Sadar- 75.2%), while the Assasuni has a rate of coverage of only 30.7%. Broadly speaking, the poorest quantile of the household has a 40% coverage rate, while the wealthiest quantile has almost universal coverage. Represented in the map in Figure 26, existing power plants and electricity transmission lines are concentrated in Khulna Sadar and neighboring upazilas (Rupsha and Dumuria), Jessore Sadar, and Satkhira Sadar.
Additionally, as shown in Figure 25, a negative relationship is identified between households without sanitation and with electricity. This indicates if households suffer from limited electricity service, they also tend to lack sanitation, which consequently leads to public health problems and low productivity. Especially in the AOI, upazilas with high agricultural employment rates (e.g. Assasuni in Satkhira zila) have low electricity and sanitation coverage in their households, which can affect the expansion of the labor force.
Figure 24. % of household with electricity by upazila
Figure 25. Correlation between % of household with electricity access and household without sanitation
Alfa
dang
aBh
anga
Boal
mar
iN
agar
kand
a
Sada
rpur
Gop
alga
nj
Kasi
ani
Muk
suda
r
Shib
char
Faki
rhat
Mol
laha
t
Bagh
erpa
ra
Jhik
arga
cha
Jess
ore
sada
r
Sars
ha
Batia
ghat
a
Dum
uria
Khul
na s
adar
Paik
gach
ha
Rups
ha
Loha
gara
Nar
ail s
adar
Ass
asun
i
Deb
hata
Satk
hira
sada
rTa
la
% of household with electricity access
% o
f hou
seho
ld w
ihto
ut s
anita
tion
Source: GeoAdaptive (2017)
Source: GeoAdaptive (2017)
43
Figure 26. Distribution of households with electricity and location of power plants and electricity transmission lines. Upazilas with a high percentage of households with electricity are observed in Jessore zila and Khulna Sadar and neighboring upazilas, where power plants and electricity transmission lines are concentrated. Bagerhat zila and neighboring upazilas in Gopalganj zila also show higher electricity accessibility
Map and analysis created by GeoAdaptive (2017)
Data Source:BBS (2011)
NREL (2007, 2013)
Power plant
% of households with electricity Electricity line
30.7% - 43.9%
44.0% - 48.7%
48.8% - 58.3%
58.4% - 94.7%
44 Economic Empowerment of Women through Resilient Agriculture Supply Chains: A Geospatial and Temporal Analysis in Southwestern Bangladesh
2.3. Social Conditions
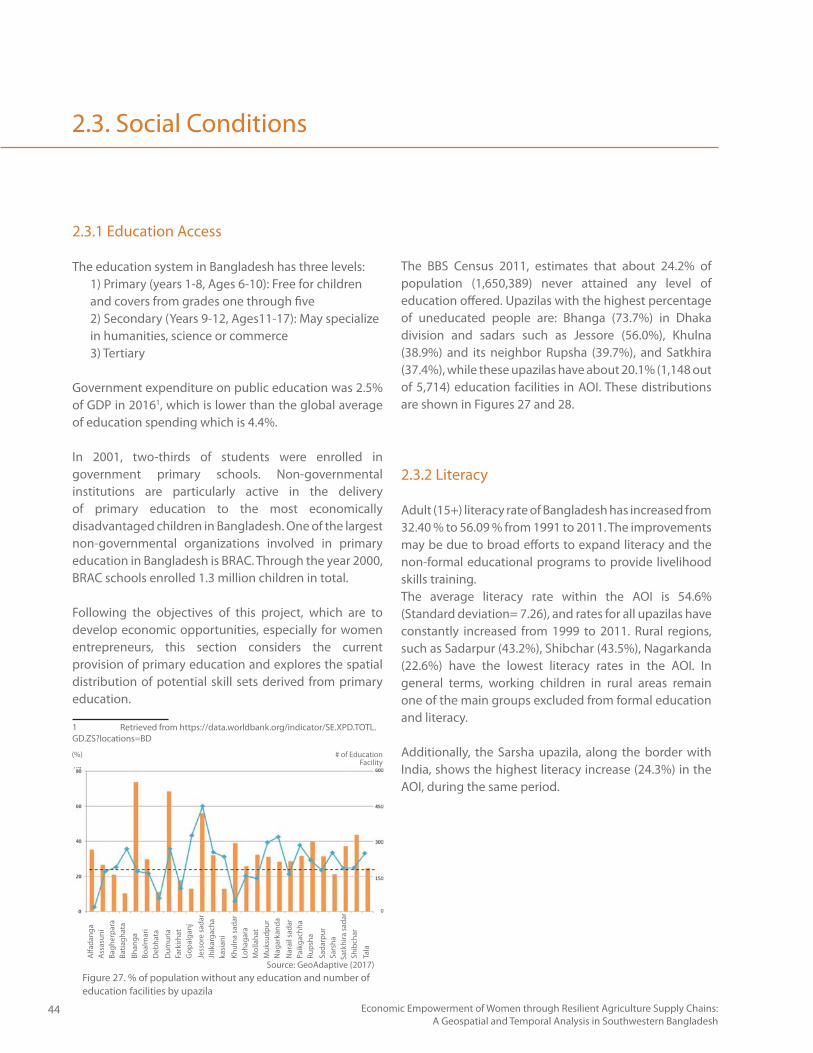
2.3.1 Education Access
The education system in Bangladesh has three levels:1) Primary (years 1-8, Ages 6-10): Free for children and covers from grades one through five2) Secondary (Years 9-12, Ages11-17): May specialize in humanities, science or commerce3) Tertiary
Government expenditure on public education was 2.5% of GDP in 20161, which is lower than the global average of education spending which is 4.4%.
In 2001, two-thirds of students were enrolled in government primary schools. Non-governmental institutions are particularly active in the delivery of primary education to the most economically disadvantaged children in Bangladesh. One of the largest non-governmental organizations involved in primary education in Bangladesh is BRAC. Through the year 2000, BRAC schools enrolled 1.3 million children in total.
Following the objectives of this project, which are to develop economic opportunities, especially for women entrepreneurs, this section considers the current provision of primary education and explores the spatial distribution of potential skill sets derived from primary education.
1 Retrieved from https://data.worldbank.org/indicator/SE.XPD.TOTL.GD.ZS?locations=BD
Figure 27. % of population without any education and number of education facilities by upazila
2.3.2 Literacy
Adult (15+) literacy rate of Bangladesh has increased from 32.40 % to 56.09 % from 1991 to 2011. The improvements may be due to broad efforts to expand literacy and the non-formal educational programs to provide livelihood skills training.The average literacy rate within the AOI is 54.6% (Standard deviation= 7.26), and rates for all upazilas have constantly increased from 1999 to 2011. Rural regions, such as Sadarpur (43.2%), Shibchar (43.5%), Nagarkanda (22.6%) have the lowest literacy rates in the AOI. In general terms, working children in rural areas remain one of the main groups excluded from formal education and literacy.
Additionally, the Sarsha upazila, along the border with India, shows the highest literacy increase (24.3%) in the AOI, during the same period.
The BBS Census 2011, estimates that about 24.2% of population (1,650,389) never attained any level of education offered. Upazilas with the highest percentage of uneducated people are: Bhanga (73.7%) in Dhaka division and sadars such as Jessore (56.0%), Khulna (38.9%) and its neighbor Rupsha (39.7%), and Satkhira (37.4%), while these upazilas have about 20.1% (1,148 out of 5,714) education facilities in AOI. These distributions are shown in Figures 27 and 28.
Alfa
dang
aA
ssas
uni
Bagh
erpa
raBa
tiagh
ata
Bhan
gaBo
alm
ari
Deb
hata
Dum
uria
Fark
irhat
Gop
alga
njJe
ssor
e sa
dar
Jhik
arga
cha
kasi
ani
Khul
na s
adar
Loha
gara
Mol
laha
tM
uksu
dpur
Nag
arka
nda
Nar
ail s
adar
Paik
gach
haRu
psha
Sada
rpur
Sars
haSa
tkhi
ra sa
dar
Shib
char
Tala
# of EducationFacility
(%)
Source: GeoAdaptive (2017)
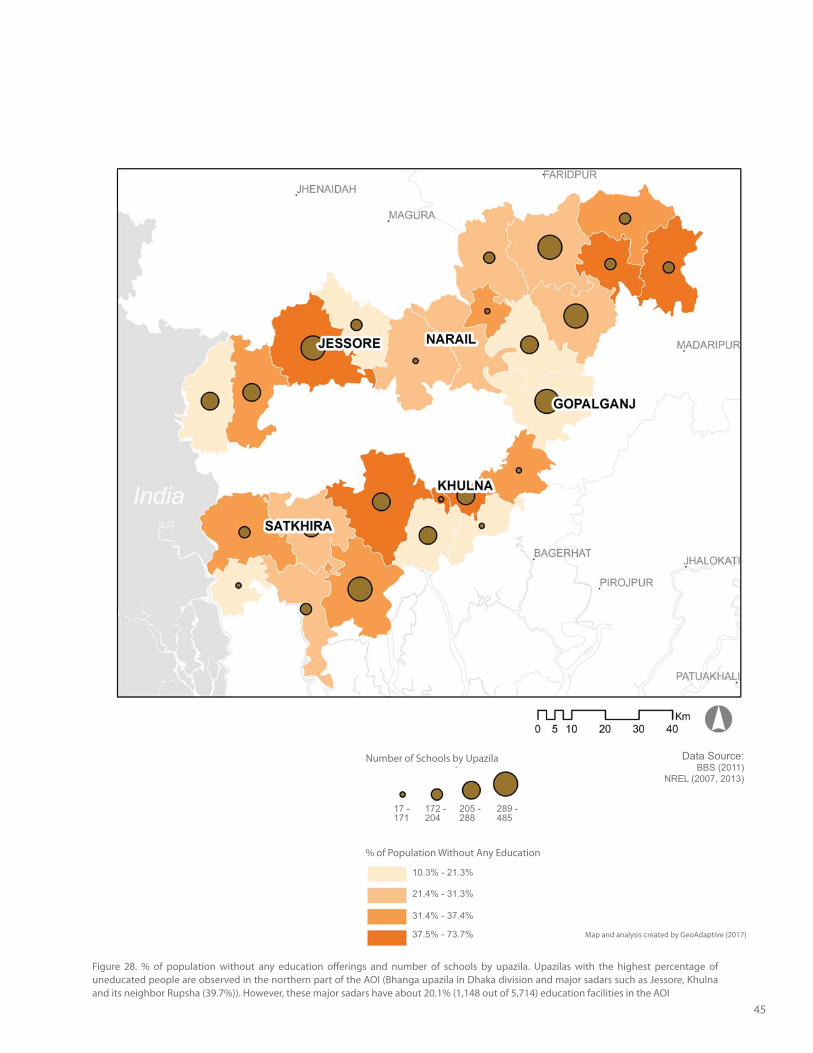
45
Figure 28. % of population without any education offerings and number of schools by upazila. Upazilas with the highest percentage of uneducated people are observed in the northern part of the AOI (Bhanga upazila in Dhaka division and major sadars such as Jessore, Khulna and its neighbor Rupsha (39.7%)). However, these major sadars have about 20.1% (1,148 out of 5,714) education facilities in the AOI
% of Population Without Any Education
Number of Schools by Upazila
Map and analysis created by GeoAdaptive (2017)
Data Source:BBS (2011)
NREL (2007, 2013)
10.3% - 21.3%
21.4% - 31.3%
31.4% - 37.4%
37.5% - 73.7%
17 - 171
172 -204
289 - 485
205 -288
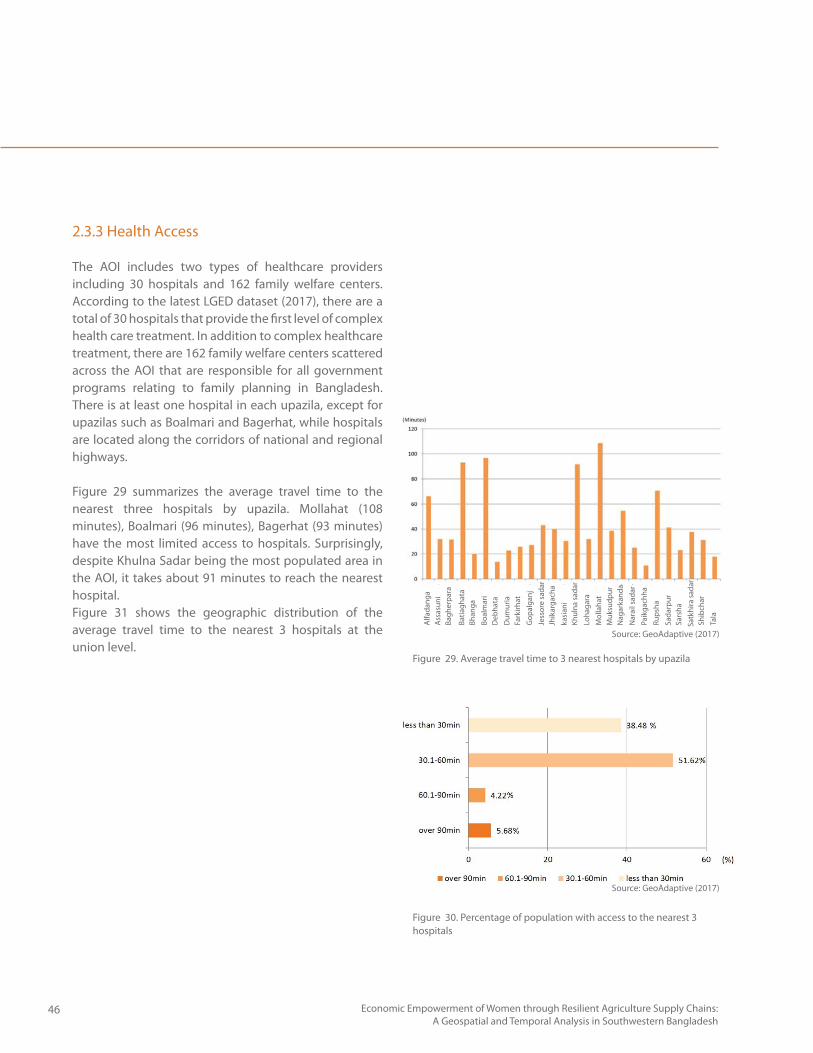
46 Economic Empowerment of Women through Resilient Agriculture Supply Chains: A Geospatial and Temporal Analysis in Southwestern Bangladesh
2.3.3 Health Access
The AOI includes two types of healthcare providers including 30 hospitals and 162 family welfare centers. According to the latest LGED dataset (2017), there are a total of 30 hospitals that provide the first level of complex health care treatment. In addition to complex healthcare treatment, there are 162 family welfare centers scattered across the AOI that are responsible for all government programs relating to family planning in Bangladesh. There is at least one hospital in each upazila, except for upazilas such as Boalmari and Bagerhat, while hospitals are located along the corridors of national and regional highways.
Figure 29 summarizes the average travel time to the nearest three hospitals by upazila. Mollahat (108 minutes), Boalmari (96 minutes), Bagerhat (93 minutes) have the most limited access to hospitals. Surprisingly, despite Khulna Sadar being the most populated area in the AOI, it takes about 91 minutes to reach the nearest hospital. Figure 31 shows the geographic distribution of the average travel time to the nearest 3 hospitals at the union level.
Figure 29. Average travel time to 3 nearest hospitals by upazila
Figure 30. Percentage of population with access to the nearest 3 hospitals
Alfa
dang
aA
ssas
uni
Bagh
erpa
ra
Batia
ghat
aBh
anga
Boal
mar
iD
ebha
taD
umur
iaFa
rkirh
atG
opal
ganj
Jess
ore
sada
rJh
ikar
gach
aka
sian
iKh
ulna
sad
arLo
haga
raM
olla
hat
Muk
sudp
urN
agar
kand
aN
arai
l sad
arPa
ikga
chha
Rups
haSa
darp
urSa
rsha
Satk
hira
sada
rSh
ibch
arTa
la
Source: GeoAdaptive (2017)
Source: GeoAdaptive (2017)
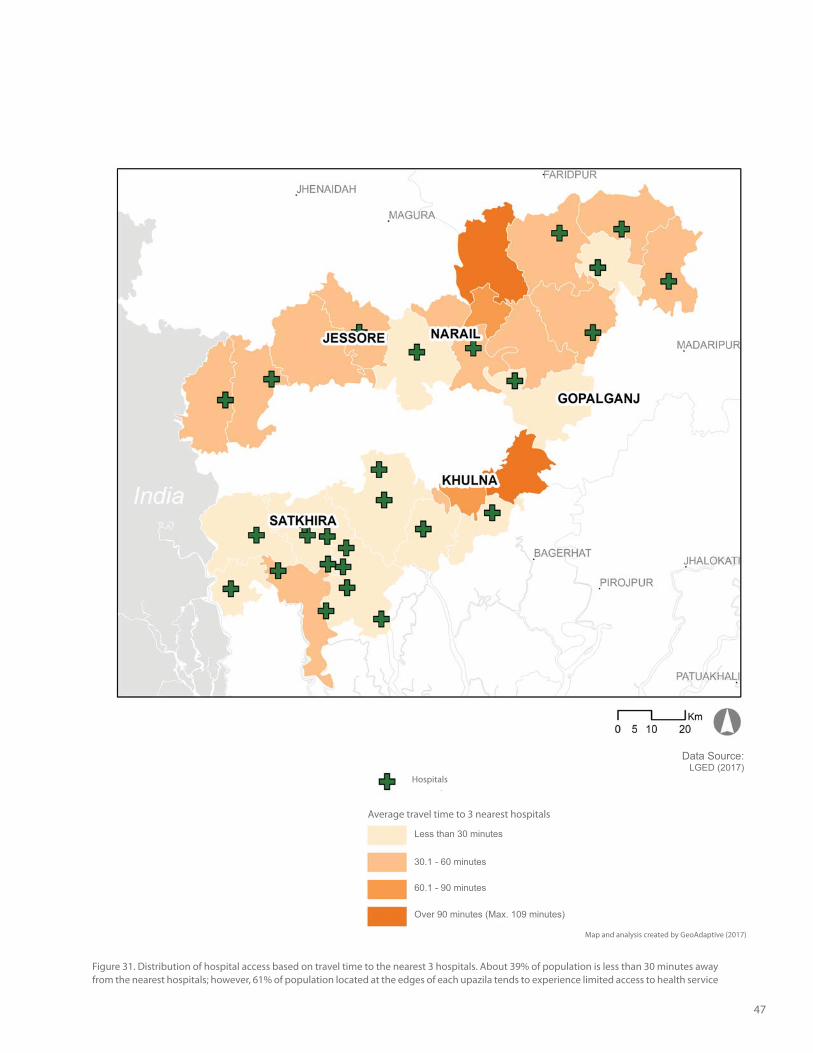
47
Figure 31. Distribution of hospital access based on travel time to the nearest 3 hospitals. About 39% of population is less than 30 minutes away from the nearest hospitals; however, 61% of population located at the edges of each upazila tends to experience limited access to health service
Hospitals
Map and analysis created by GeoAdaptive (2017)
Data Source:LGED (2017)
Average travel time to 3 nearest hospitals
Less than 30 minutes
30.1 - 60 minutes
60.1 - 90 minutes
Over 90 minutes (Max. 109 minutes)
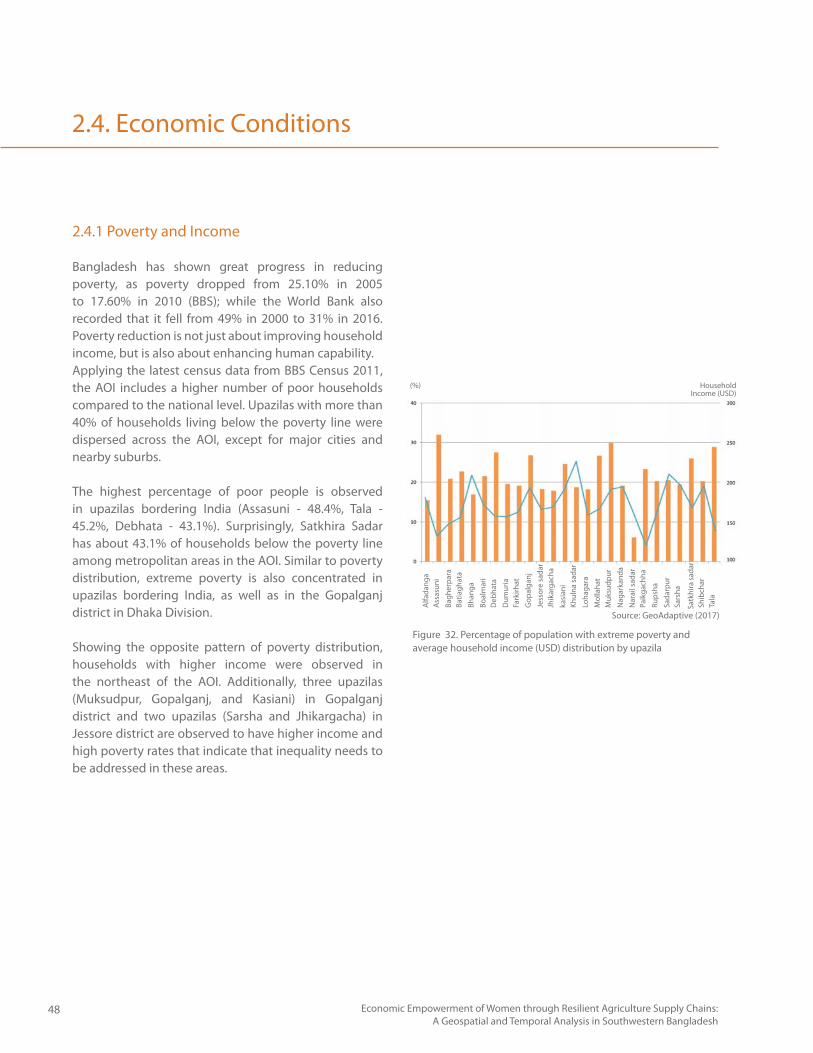
48 Economic Empowerment of Women through Resilient Agriculture Supply Chains: A Geospatial and Temporal Analysis in Southwestern Bangladesh
2.4. Economic Conditions
2.4.1 Poverty and Income
Bangladesh has shown great progress in reducing poverty, as poverty dropped from 25.10% in 2005 to 17.60% in 2010 (BBS); while the World Bank also recorded that it fell from 49% in 2000 to 31% in 2016. Poverty reduction is not just about improving household income, but is also about enhancing human capability.Applying the latest census data from BBS Census 2011, the AOI includes a higher number of poor households compared to the national level. Upazilas with more than 40% of households living below the poverty line were dispersed across the AOI, except for major cities and nearby suburbs.
The highest percentage of poor people is observed in upazilas bordering India (Assasuni - 48.4%, Tala - 45.2%, Debhata - 43.1%). Surprisingly, Satkhira Sadar has about 43.1% of households below the poverty line among metropolitan areas in the AOI. Similar to poverty distribution, extreme poverty is also concentrated in upazilas bordering India, as well as in the Gopalganj district in Dhaka Division.
Showing the opposite pattern of poverty distribution, households with higher income were observed in the northeast of the AOI. Additionally, three upazilas (Muksudpur, Gopalganj, and Kasiani) in Gopalganj district and two upazilas (Sarsha and Jhikargacha) in Jessore district are observed to have higher income and high poverty rates that indicate that inequality needs to be addressed in these areas.
Figure 32. Percentage of population with extreme poverty and average household income (USD) distribution by upazila
Alfa
dang
aA
ssas
uni
Bagh
erpa
raBa
tiagh
ata
Bhan
gaBo
alm
ari
Deb
hata
Dum
uria
Fark
irhat
Gop
alga
njJe
ssor
e sa
dar
Jhik
arga
cha
kasi
ani
Khul
na s
adar
Loha
gara
Mol
laha
tM
uksu
dpur
Nag
arka
nda
Nar
ail s
adar
Paik
gach
haRu
psha
Sada
rpur
Sars
ha
Satk
hira
sada
rSh
ibch
arTa
la
HouseholdIncome (USD)
(%)
Source: GeoAdaptive (2017)
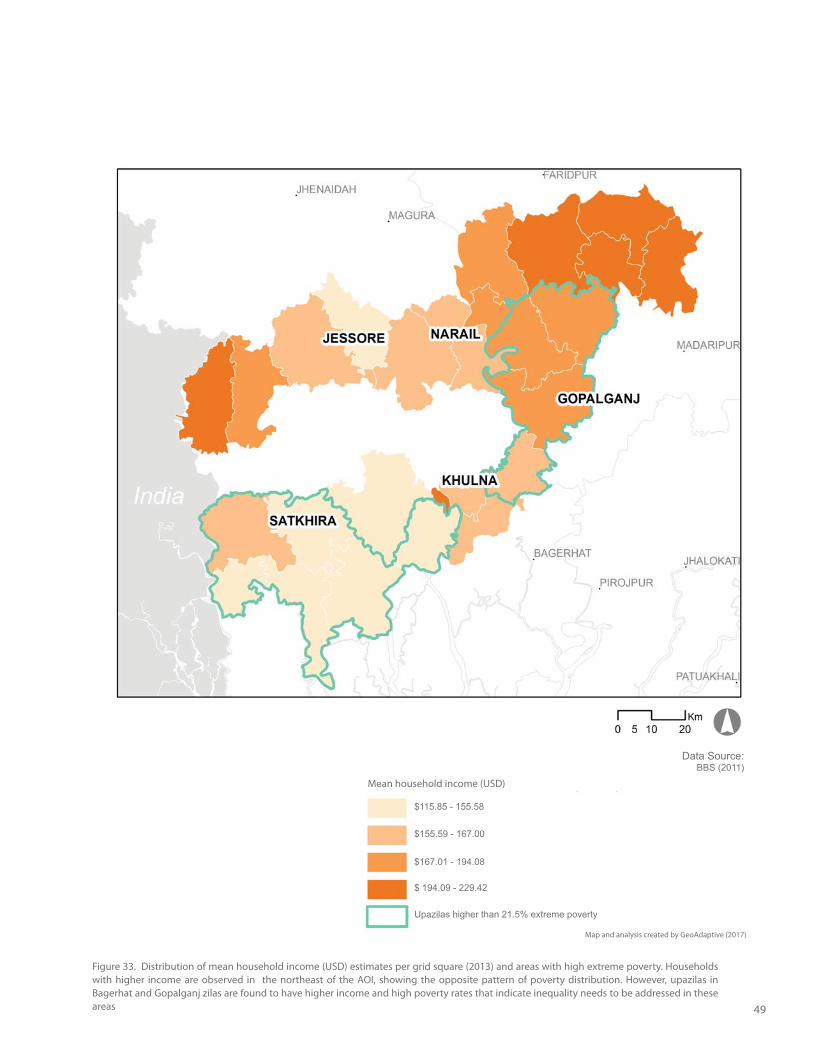
49
Figure 33. Distribution of mean household income (USD) estimates per grid square (2013) and areas with high extreme poverty. Households with higher income are observed in the northeast of the AOI, showing the opposite pattern of poverty distribution. However, upazilas in Bagerhat and Gopalganj zilas are found to have higher income and high poverty rates that indicate inequality needs to be addressed in these areas
BBS (2011)
Map and analysis created by GeoAdaptive (2017)
Data Source:BBS (2011)
Mean household income (USD)
$155.59 - 167.00
$167.01 - 194.08
$ 194.09 - 229.42
Upazilas higher than 21.5% extreme poverty
$115.85 - 155.58
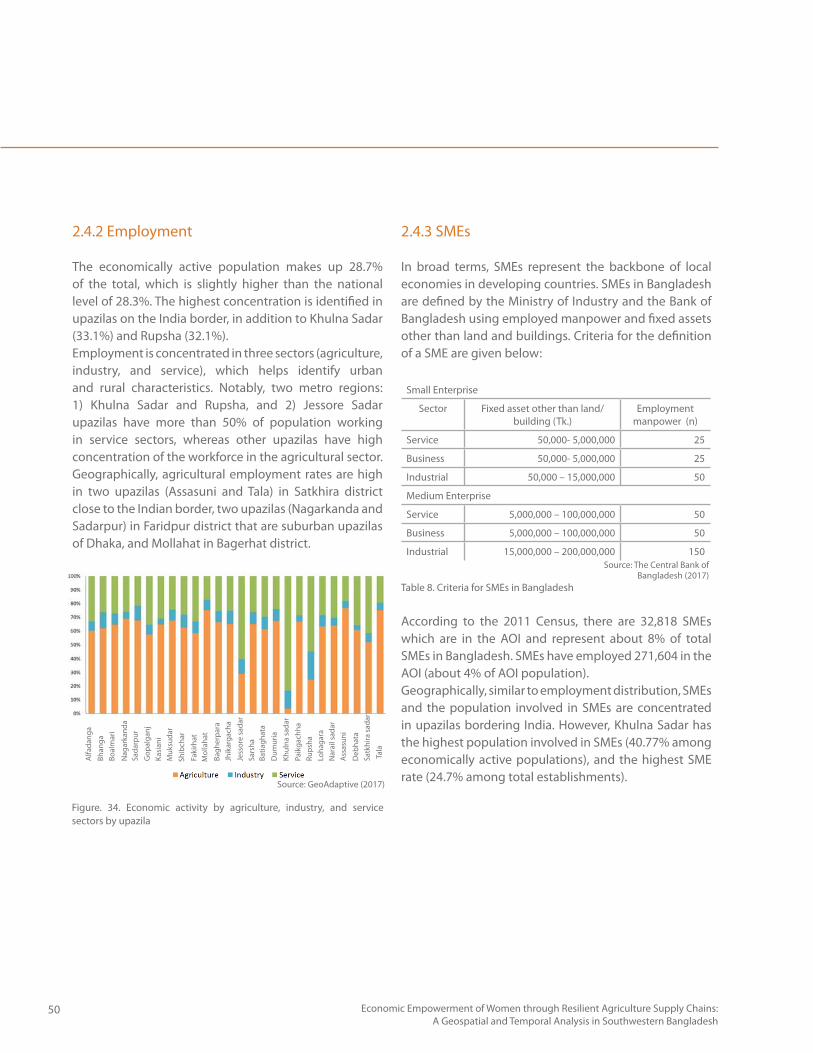
50 Economic Empowerment of Women through Resilient Agriculture Supply Chains: A Geospatial and Temporal Analysis in Southwestern Bangladesh
2.4.2 Employment
The economically active population makes up 28.7% of the total, which is slightly higher than the national level of 28.3%. The highest concentration is identified in upazilas on the India border, in addition to Khulna Sadar (33.1%) and Rupsha (32.1%). Employment is concentrated in three sectors (agriculture, industry, and service), which helps identify urban and rural characteristics. Notably, two metro regions: 1) Khulna Sadar and Rupsha, and 2) Jessore Sadar upazilas have more than 50% of population working in service sectors, whereas other upazilas have high concentration of the workforce in the agricultural sector. Geographically, agricultural employment rates are high in two upazilas (Assasuni and Tala) in Satkhira district close to the Indian border, two upazilas (Nagarkanda and Sadarpur) in Faridpur district that are suburban upazilas of Dhaka, and Mollahat in Bagerhat district.
2.4.3 SMEs
In broad terms, SMEs represent the backbone of local economies in developing countries. SMEs in Bangladesh are defined by the Ministry of Industry and the Bank of Bangladesh using employed manpower and fixed assets other than land and buildings. Criteria for the definition of a SME are given below:
Small Enterprise
Sector Fixed asset other than land/building (Tk.)
Employment manpower (n)
Service 50,000- 5,000,000 25
Business 50,000- 5,000,000 25
Industrial 50,000 – 15,000,000 50
Medium Enterprise
Service 5,000,000 – 100,000,000 50
Business 5,000,000 – 100,000,000 50
Industrial 15,000,000 – 200,000,000 150
Table 8. Criteria for SMEs in Bangladesh
According to the 2011 Census, there are 32,818 SMEs which are in the AOI and represent about 8% of total SMEs in Bangladesh. SMEs have employed 271,604 in the AOI (about 4% of AOI population). Geographically, similar to employment distribution, SMEs and the population involved in SMEs are concentrated in upazilas bordering India. However, Khulna Sadar has the highest population involved in SMEs (40.77% among economically active populations), and the highest SME rate (24.7% among total establishments).
Figure. 34. Economic activity by agriculture, industry, and service sectors by upazila
Alfa
dang
aBh
anga
Boal
mar
i
Nag
arka
nda
Sada
rpur
Gop
alga
njKa
sian
iM
uksu
dar
Shib
char
Faki
rhat
Mol
laha
t
Bagh
erpa
raJh
ikar
gach
aJe
ssor
e sa
dar
Sars
haBa
tiagh
ata
Dum
uria
Khul
na s
adar
Paik
gach
haRu
psha
Loha
gara
Nar
ail s
adar
Ass
asun
i
Deb
hata
Satk
hira
sada
rTa
la
Source: The Central Bank of Bangladesh (2017)
Source: GeoAdaptive (2017)
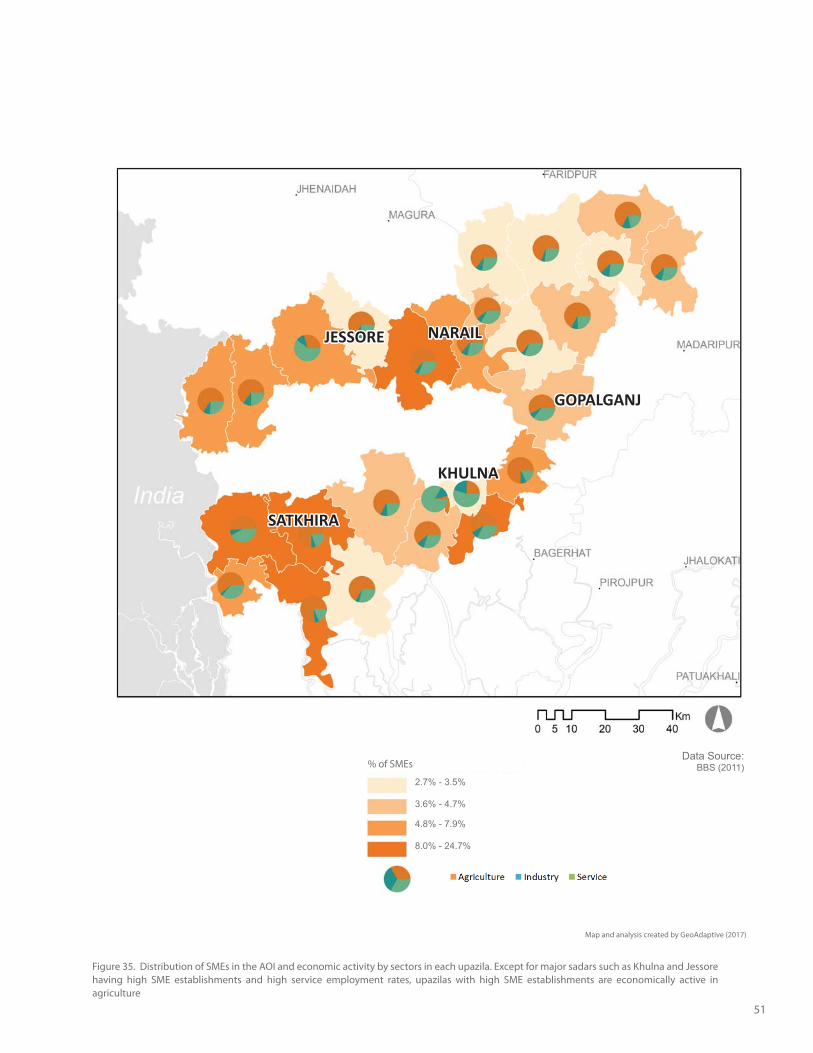
51
Figure 35. Distribution of SMEs in the AOI and economic activity by sectors in each upazila. Except for major sadars such as Khulna and Jessore having high SME establishments and high service employment rates, upazilas with high SME establishments are economically active in agriculture
% of SMEs
JESSORE NARAIL
GOPALGANJ
KHULNA
SATKHIRA
Map and analysis created by GeoAdaptive (2017)
Data Source:BBS (2011)
2.7% - 3.5%
3.6% - 4.7%
4.8% - 7.9%
8.0% - 24.7%
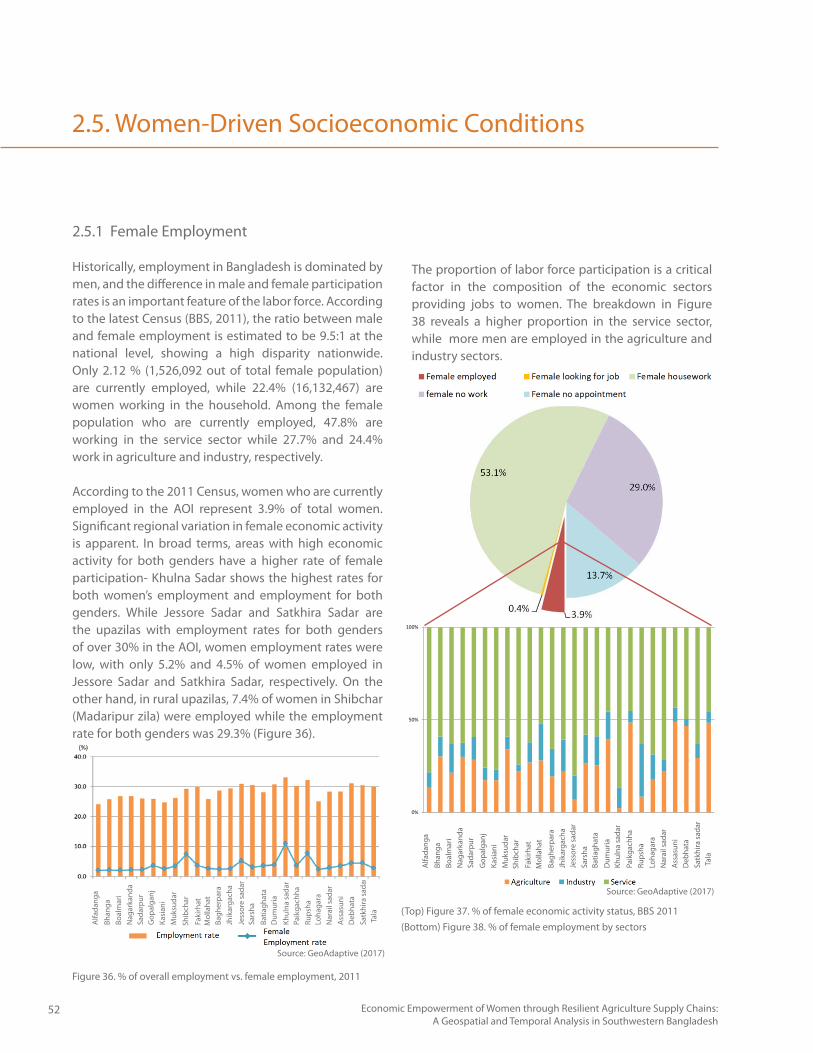
52 Economic Empowerment of Women through Resilient Agriculture Supply Chains: A Geospatial and Temporal Analysis in Southwestern Bangladesh
2.5. Women-Driven Socioeconomic Conditions
2.5.1 Female Employment
Historically, employment in Bangladesh is dominated by men, and the difference in male and female participation rates is an important feature of the labor force. According to the latest Census (BBS, 2011), the ratio between male and female employment is estimated to be 9.5:1 at the national level, showing a high disparity nationwide. Only 2.12 % (1,526,092 out of total female population) are currently employed, while 22.4% (16,132,467) are women working in the household. Among the female population who are currently employed, 47.8% are working in the service sector while 27.7% and 24.4% work in agriculture and industry, respectively.
According to the 2011 Census, women who are currently employed in the AOI represent 3.9% of total women. Significant regional variation in female economic activity is apparent. In broad terms, areas with high economic activity for both genders have a higher rate of female participation- Khulna Sadar shows the highest rates for both women’s employment and employment for both genders. While Jessore Sadar and Satkhira Sadar are the upazilas with employment rates for both genders of over 30% in the AOI, women employment rates were low, with only 5.2% and 4.5% of women employed in Jessore Sadar and Satkhira Sadar, respectively. On the other hand, in rural upazilas, 7.4% of women in Shibchar (Madaripur zila) were employed while the employment rate for both genders was 29.3% (Figure 36).
Figure 36. % of overall employment vs. female employment, 2011
(Bottom) Figure 38. % of female employment by sectors(Top) Figure 37. % of female economic activity status, BBS 2011
Alfa
dang
aBh
anga
Boal
mar
iN
agar
kand
aSa
darp
urG
opal
ganj
Kasi
ani
Muk
suda
rSh
ibch
ar
Faki
rhat
Mol
laha
t
Bagh
erpa
raJh
ikar
gach
aJe
ssor
e sa
dar
Sars
haBa
tiagh
ata
Dum
uria
Khul
na s
adar
Paik
gach
haRu
psha
Loha
gara
Nar
ail s
adar
Ass
asun
iD
ebha
taSa
tkhi
ra sa
dar
Tala
0%
50%
100%
Alfa
dang
aBh
anga
Boal
mar
iN
agar
kand
aSa
darp
urG
opal
ganj
Kasi
ani
Muk
suda
rSh
ibch
ar
Faki
rhat
Mol
laha
tBa
gher
para
Jhik
arga
cha
Jess
ore
sada
rSa
rsha
Batia
ghat
aD
umur
iaKh
ulna
sad
arPa
ikga
chha
Rups
haLo
haga
raN
arai
l sad
arA
ssas
uni
Deb
hata
Satk
hira
sada
rTa
la
The proportion of labor force participation is a critical factor in the composition of the economic sectors providing jobs to women. The breakdown in Figure 38 reveals a higher proportion in the service sector, while more men are employed in the agriculture and industry sectors.
Source: GeoAdaptive (2017)
Source: GeoAdaptive (2017)
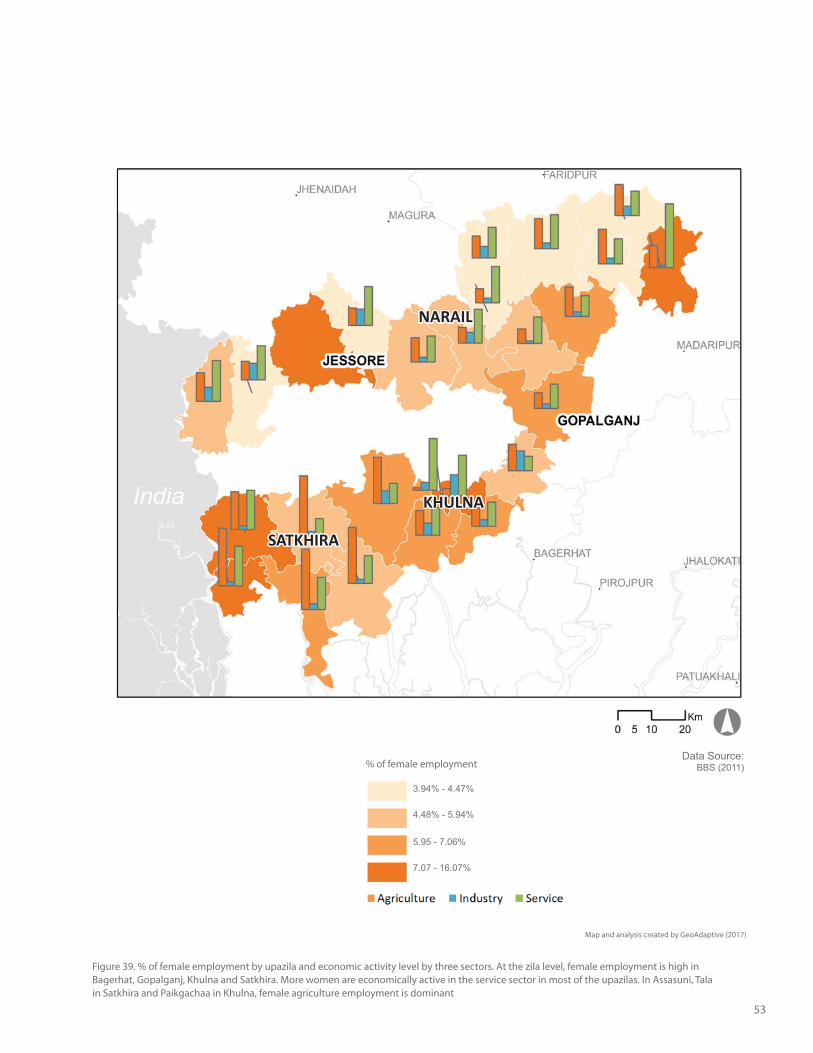
53
Figure 39. % of female employment by upazila and economic activity level by three sectors. At the zila level, female employment is high in Bagerhat, Gopalganj, Khulna and Satkhira. More women are economically active in the service sector in most of the upazilas. In Assasuni, Tala in Satkhira and Paikgachaa in Khulna, female agriculture employment is dominant
NARAIL
KHULNA
SATKHIRA
Map and analysis created by GeoAdaptive (2017)
Data Source:BBS (2011)% of female employment
3.94% - 4.47%
4.48% - 5.94%
5.95 - 7.06%
7.07 - 16.07%
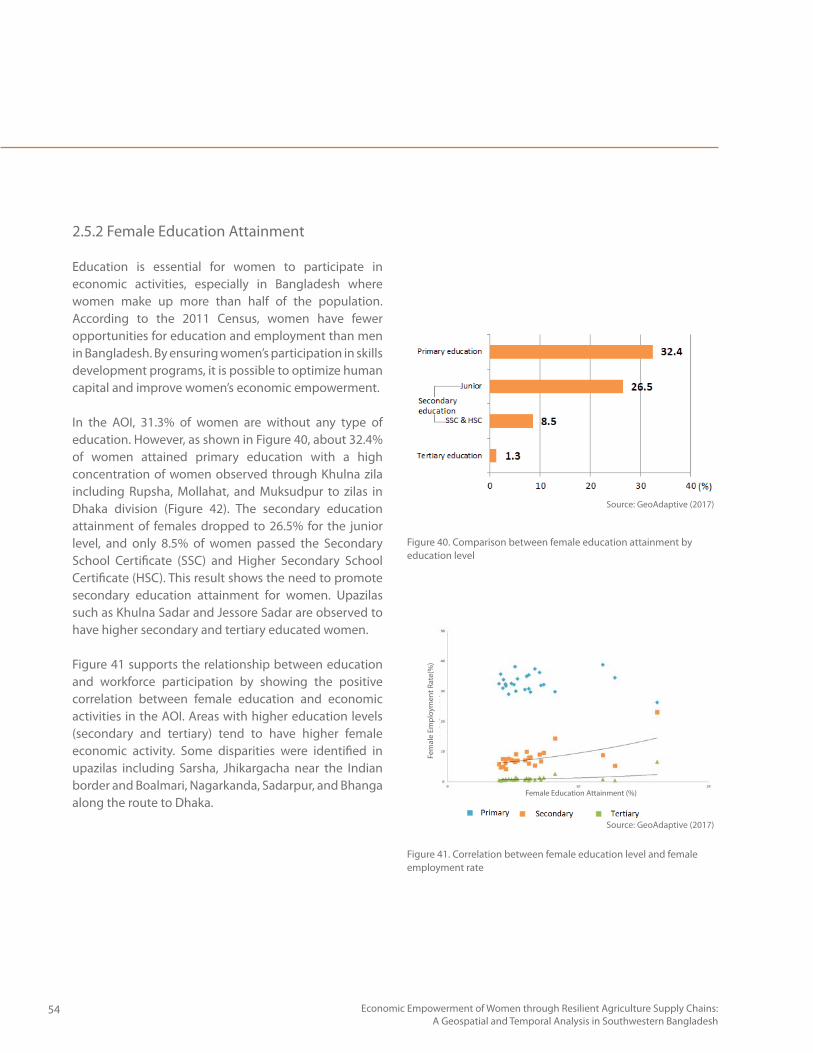
54 Economic Empowerment of Women through Resilient Agriculture Supply Chains: A Geospatial and Temporal Analysis in Southwestern Bangladesh
2.5.2 Female Education Attainment
Education is essential for women to participate in economic activities, especially in Bangladesh where women make up more than half of the population. According to the 2011 Census, women have fewer opportunities for education and employment than men in Bangladesh. By ensuring women’s participation in skills development programs, it is possible to optimize human capital and improve women’s economic empowerment.
In the AOI, 31.3% of women are without any type of education. However, as shown in Figure 40, about 32.4% of women attained primary education with a high concentration of women observed through Khulna zila including Rupsha, Mollahat, and Muksudpur to zilas in Dhaka division (Figure 42). The secondary education attainment of females dropped to 26.5% for the junior level, and only 8.5% of women passed the Secondary School Certificate (SSC) and Higher Secondary School Certificate (HSC). This result shows the need to promote secondary education attainment for women. Upazilas such as Khulna Sadar and Jessore Sadar are observed to have higher secondary and tertiary educated women.
Figure 41 supports the relationship between education and workforce participation by showing the positive correlation between female education and economic activities in the AOI. Areas with higher education levels (secondary and tertiary) tend to have higher female economic activity. Some disparities were identified in upazilas including Sarsha, Jhikargacha near the Indian border and Boalmari, Nagarkanda, Sadarpur, and Bhanga along the route to Dhaka.
Figure 40. Comparison between female education attainment by education level
Figure 41. Correlation between female education level and female employment rate
Female Education Attainment (%)
Fem
ale
Empl
oym
ent R
ate(
%)
Source: GeoAdaptive (2017)
Source: GeoAdaptive (2017)
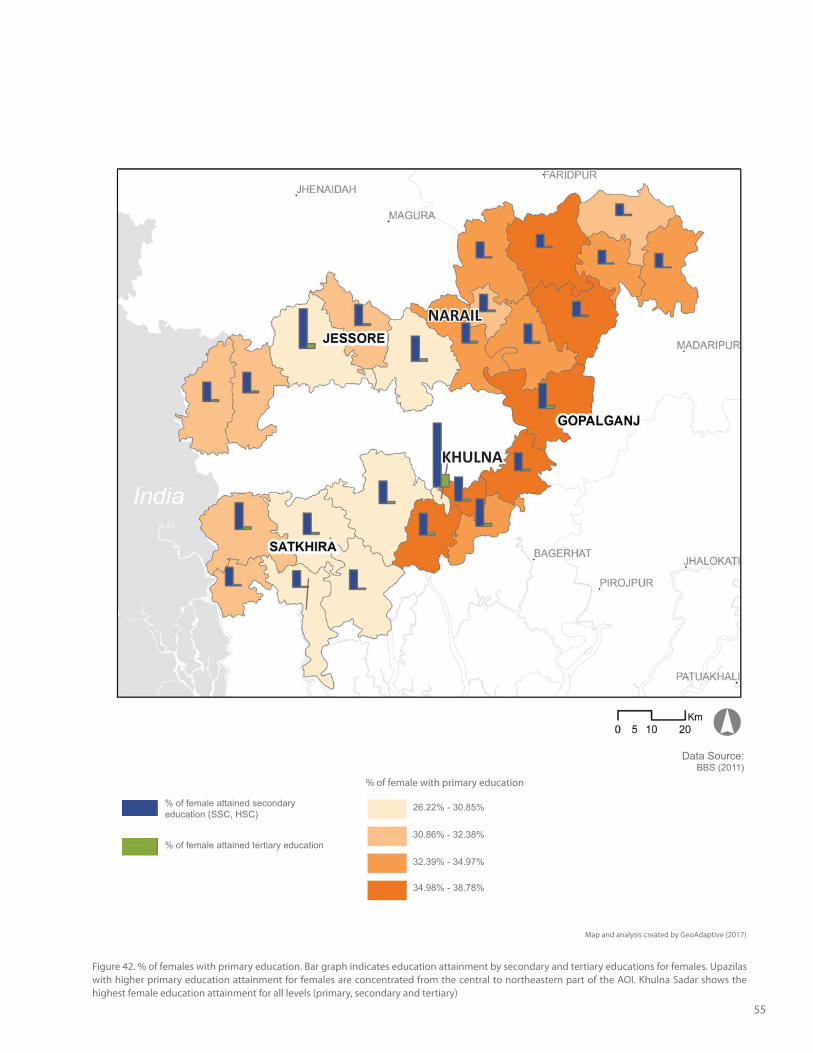
55
Figure 42. % of females with primary education. Bar graph indicates education attainment by secondary and tertiary educations for females. Upazilas with higher primary education attainment for females are concentrated from the central to northeastern part of the AOI. Khulna Sadar shows the highest female education attainment for all levels (primary, secondary and tertiary)
% of female attained secondary education (SSC, HSC)
% of female attained tertiary education
NARAIL
KHULNA
Map and analysis created by GeoAdaptive (2017)
Data Source:BBS (2011)
% of female with primary education
26.22% - 30.85%
30.86% - 32.38%
32.39% - 34.97%
34.98% - 38.78%
56 Economic Empowerment of Women through Resilient Agriculture Supply Chains: A Geospatial and Temporal Analysis in Southwestern Bangladesh
Multisectoral Assessment
Image by GeoAdaptive
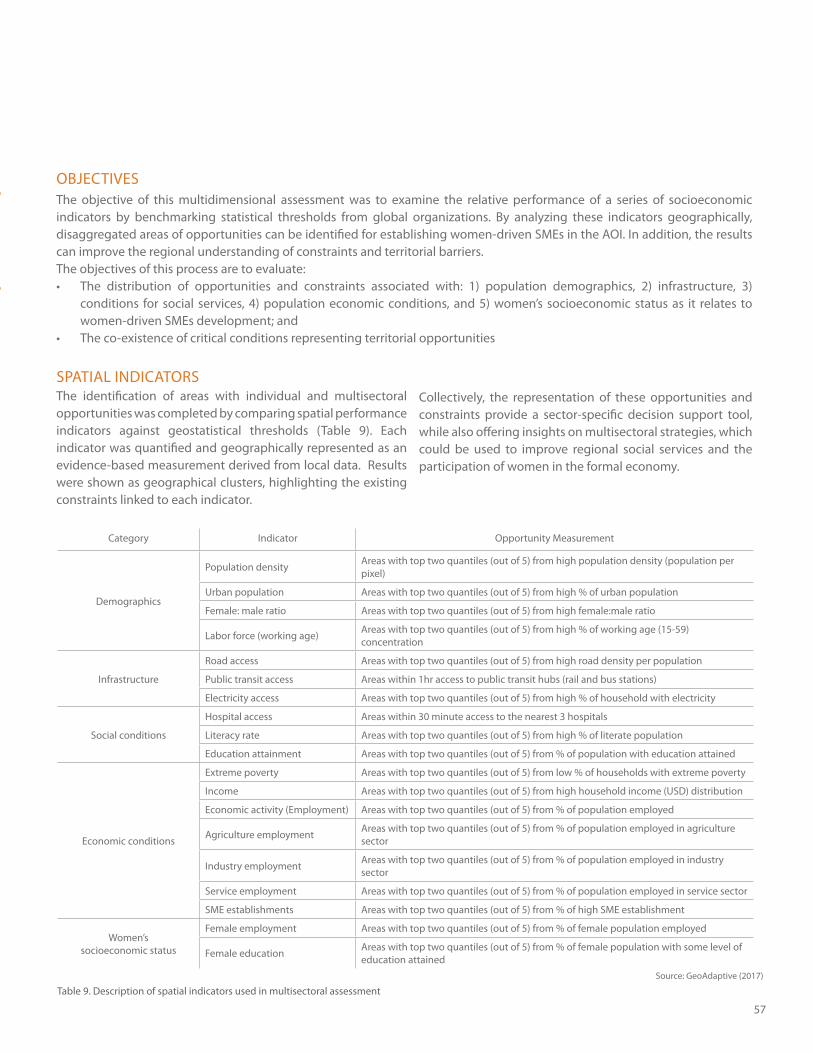
57
Category Indicator Opportunity Measurement
Demographics
Population density Areas with top two quantiles (out of 5) from high population density (population per pixel)
Urban population Areas with top two quantiles (out of 5) from high % of urban population
Female: male ratio Areas with top two quantiles (out of 5) from high female:male ratio
Labor force (working age) Areas with top two quantiles (out of 5) from high % of working age (15-59) concentration
Infrastructure
Road access Areas with top two quantiles (out of 5) from high road density per population
Public transit access Areas within 1hr access to public transit hubs (rail and bus stations)
Electricity access Areas with top two quantiles (out of 5) from high % of household with electricity
Social conditions
Hospital access Areas within 30 minute access to the nearest 3 hospitals
Literacy rate Areas with top two quantiles (out of 5) from high % of literate population
Education attainment Areas with top two quantiles (out of 5) from % of population with education attained
Economic conditions
Extreme poverty Areas with top two quantiles (out of 5) from low % of households with extreme poverty
Income Areas with top two quantiles (out of 5) from high household income (USD) distribution
Economic activity (Employment) Areas with top two quantiles (out of 5) from % of population employed
Agriculture employment Areas with top two quantiles (out of 5) from % of population employed in agriculture sector
Industry employment Areas with top two quantiles (out of 5) from % of population employed in industry sector
Service employment Areas with top two quantiles (out of 5) from % of population employed in service sector
SME establishments Areas with top two quantiles (out of 5) from % of high SME establishment
Women’s socioeconomic status
Female employment Areas with top two quantiles (out of 5) from % of female population employed
Female education Areas with top two quantiles (out of 5) from % of female population with some level of education attained
Table 9. Description of spatial indicators used in multisectoral assessment
The objective of this multidimensional assessment was to examine the relative performance of a series of socioeconomic indicators by benchmarking statistical thresholds from global organizations. By analyzing these indicators geographically, disaggregated areas of opportunities can be identified for establishing women-driven SMEs in the AOI. In addition, the results can improve the regional understanding of constraints and territorial barriers. The objectives of this process are to evaluate:
The distribution of opportunities and constraints associated with: 1) population demographics, 2) infrastructure, 3) conditions for social services, 4) population economic conditions, and 5) women’s socioeconomic status as it relates to women-driven SMEs development; andThe co-existence of critical conditions representing territorial opportunities
OBJECTIVES
SPATIAL INDICATORSThe identification of areas with individual and multisectoral opportunities was completed by comparing spatial performance indicators against geostatistical thresholds (Table 9). Each indicator was quantified and geographically represented as an evidence-based measurement derived from local data. Results were shown as geographical clusters, highlighting the existing constraints linked to each indicator.
Collectively, the representation of these opportunities and constraints provide a sector-specific decision support tool, while also offering insights on multisectoral strategies, which could be used to improve regional social services and the participation of women in the formal economy.
Source: GeoAdaptive (2017)
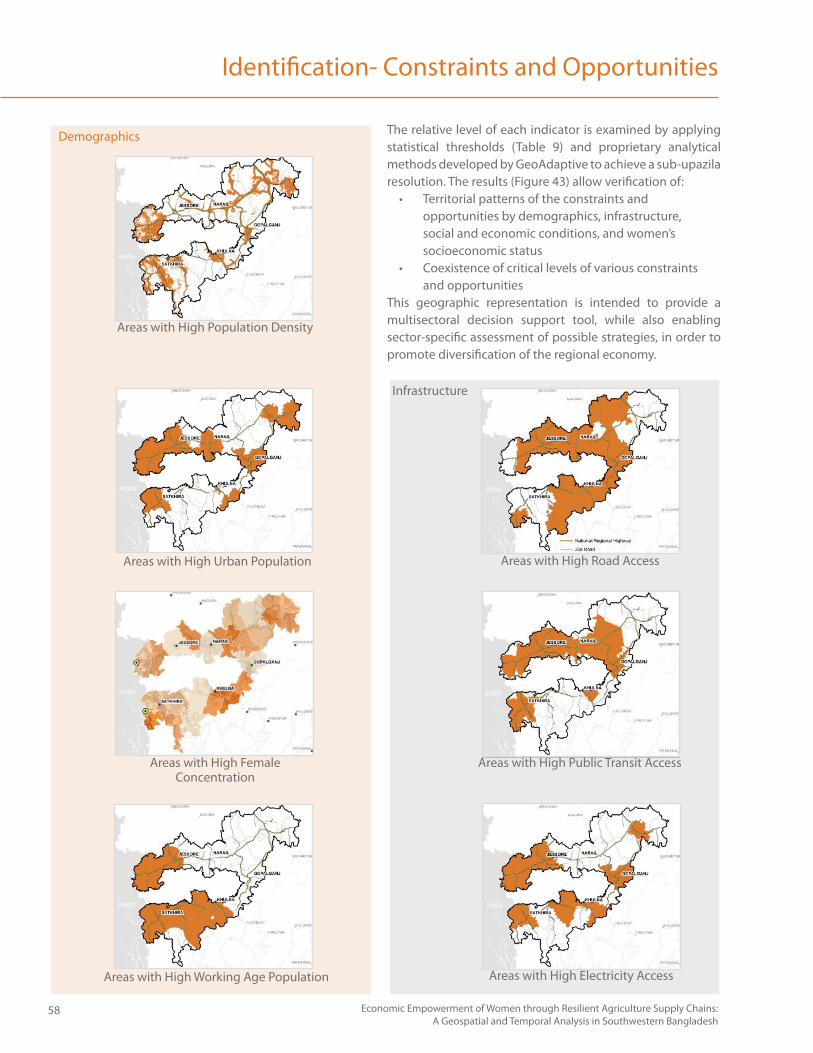
58 Economic Empowerment of Women through Resilient Agriculture Supply Chains: A Geospatial and Temporal Analysis in Southwestern Bangladesh
Identification- Constraints and Opportunities
The relative level of each indicator is examined by applying statistical thresholds (Table 9) and proprietary analytical methods developed by GeoAdaptive to achieve a sub-upazila resolution. The results (Figure 43) allow verification of:
Territorial patterns of the constraints and opportunities by demographics, infrastructure, social and economic conditions, and women’s socioeconomic status Coexistence of critical levels of various constraints and opportunities
This geographic representation is intended to provide a multisectoral decision support tool, while also enabling sector-specific assessment of possible strategies, in order to promote diversification of the regional economy.
Areas with High Population Density
Areas with High Urban Population Areas with High Road Access
Areas with High Female Concentration
Areas with High Public Transit Access
Areas with High Electricity AccessAreas with High Working Age Population
Demographics
Infrastructure
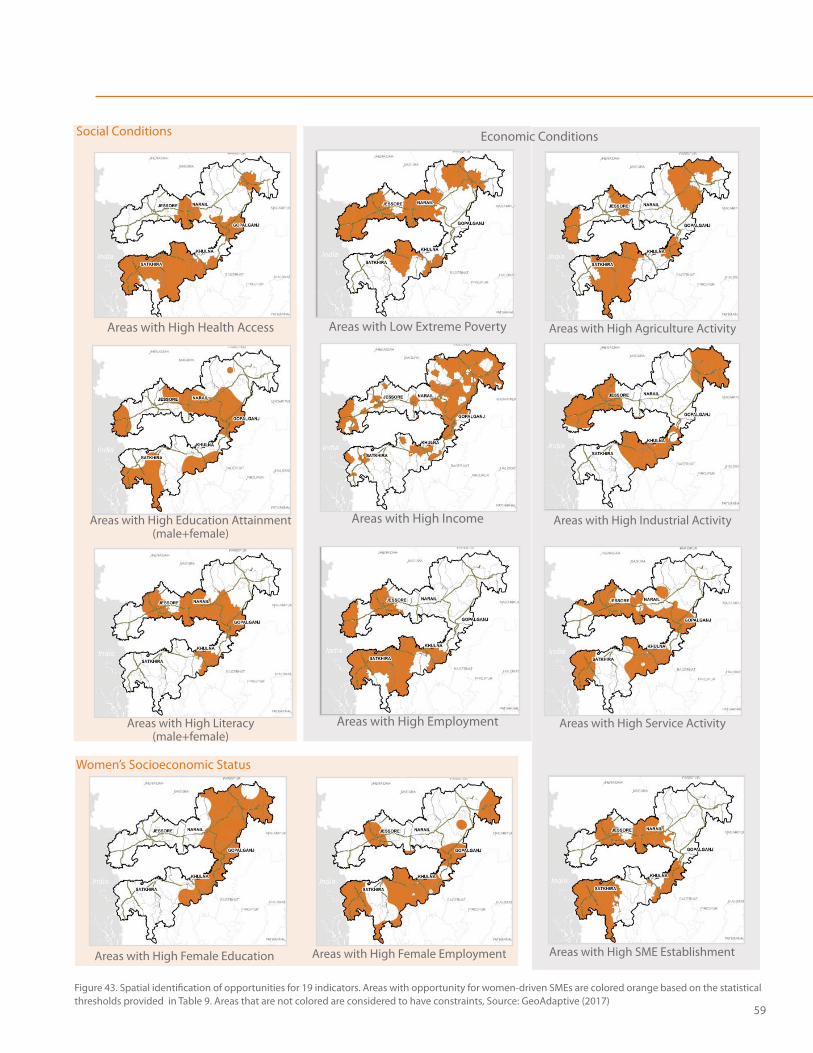
59
Figure 43. Spatial identification of opportunities for 19 indicators. Areas with opportunity for women-driven SMEs are colored orange based on the statistical thresholds provided in Table 9. Areas that are not colored are considered to have constraints, Source: GeoAdaptive (2017)
Areas with High Health Access Areas with Low Extreme Poverty Areas with High Agriculture Activity
Areas with High Education Attainment(male+female)
Areas with High Income Areas with High Industrial Activity
Areas with High Literacy (male+female)
Areas with High Employment Areas with High Service Activity
Areas with High SME EstablishmentAreas with High Female EmploymentAreas with High Female Education
Economic Conditions
Women’s Socioeconomic Status
Social Conditions
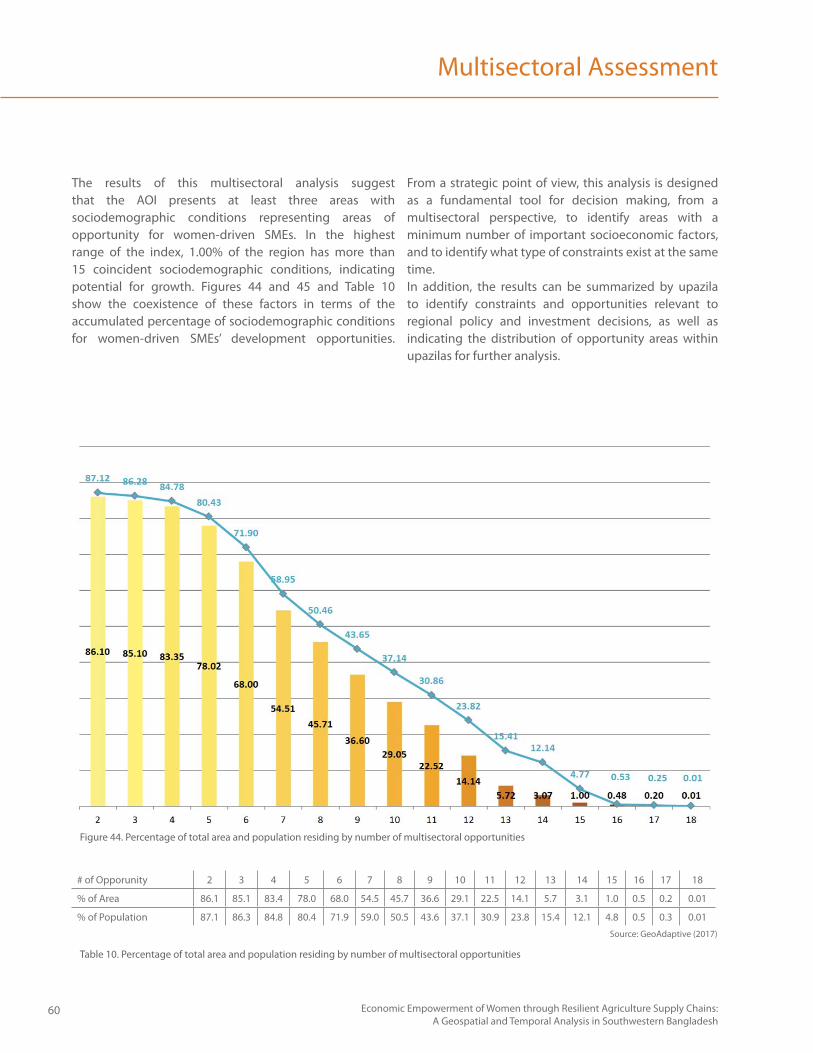
60 Economic Empowerment of Women through Resilient Agriculture Supply Chains: A Geospatial and Temporal Analysis in Southwestern Bangladesh
Multisectoral Assessment
The results of this multisectoral analysis suggest that the AOI presents at least three areas with sociodemographic conditions representing areas of opportunity for women-driven SMEs. In the highest range of the index, 1.00% of the region has more than 15 coincident sociodemographic conditions, indicating potential for growth. Figures 44 and 45 and Table 10 show the coexistence of these factors in terms of the accumulated percentage of sociodemographic conditions for women-driven SMEs’ development opportunities.
From a strategic point of view, this analysis is designed as a fundamental tool for decision making, from a multisectoral perspective, to identify areas with a minimum number of important socioeconomic factors, and to identify what type of constraints exist at the same time. In addition, the results can be summarized by upazila to identify constraints and opportunities relevant to regional policy and investment decisions, as well as indicating the distribution of opportunity areas within upazilas for further analysis.
Figure 44. Percentage of total area and population residing by number of multisectoral opportunities
# of Opporunity 2 3 4 5 6 7 8 9 10 11 12 13 14 15 16 17 18
% of Area 86.1 85.1 83.4 78.0 68.0 54.5 45.7 36.6 29.1 22.5 14.1 5.7 3.1 1.0 0.5 0.2 0.01
% of Population 87.1 86.3 84.8 80.4 71.9 59.0 50.5 43.6 37.1 30.9 23.8 15.4 12.1 4.8 0.5 0.3 0.01
Table 10. Percentage of total area and population residing by number of multisectoral opportunities
Source: GeoAdaptive (2017)
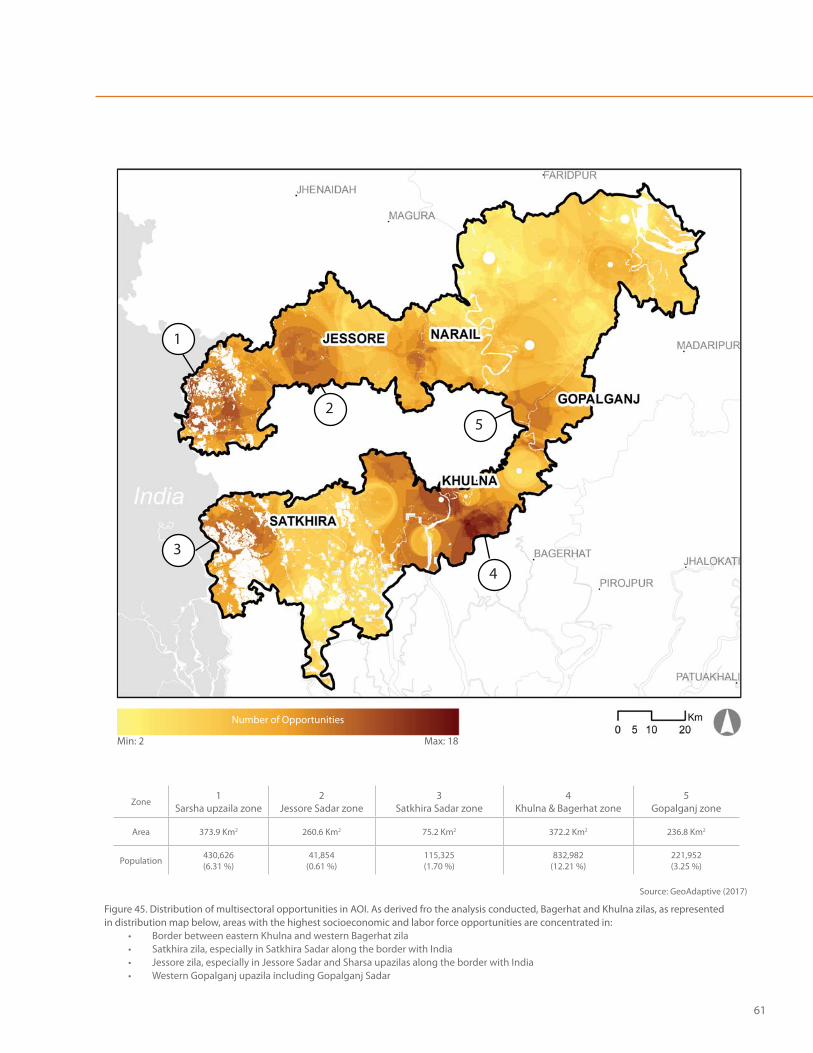
61
Figure 45. Distribution of multisectoral opportunities in AOI. As derived fro the analysis conducted, Bagerhat and Khulna zilas, as represented in distribution map below, areas with the highest socioeconomic and labor force opportunities are concentrated in:
Border between eastern Khulna and western Bagerhat zilaSatkhira zila, especially in Satkhira Sadar along the border with IndiaJessore zila, especially in Jessore Sadar and Sharsa upazilas along the border with IndiaWestern Gopalganj upazila including Gopalganj Sadar
Number of Opportunities
Min: 2 Max: 18
2
3
4
5
1
Zone1
Sarsha upzaila zone2
Jessore Sadar zone3
Satkhira Sadar zone4
Khulna & Bagerhat zone5
Gopalganj zone
Area 373.9 Km2 260.6 Km2 75.2 Km2 372.2 Km2 236.8 Km2
Population 430,626(6.31 %)
41,854(0.61 %)
115,325(1.70 %)
832,982(12.21 %)
221,952(3.25 %)
Source: GeoAdaptive (2017)
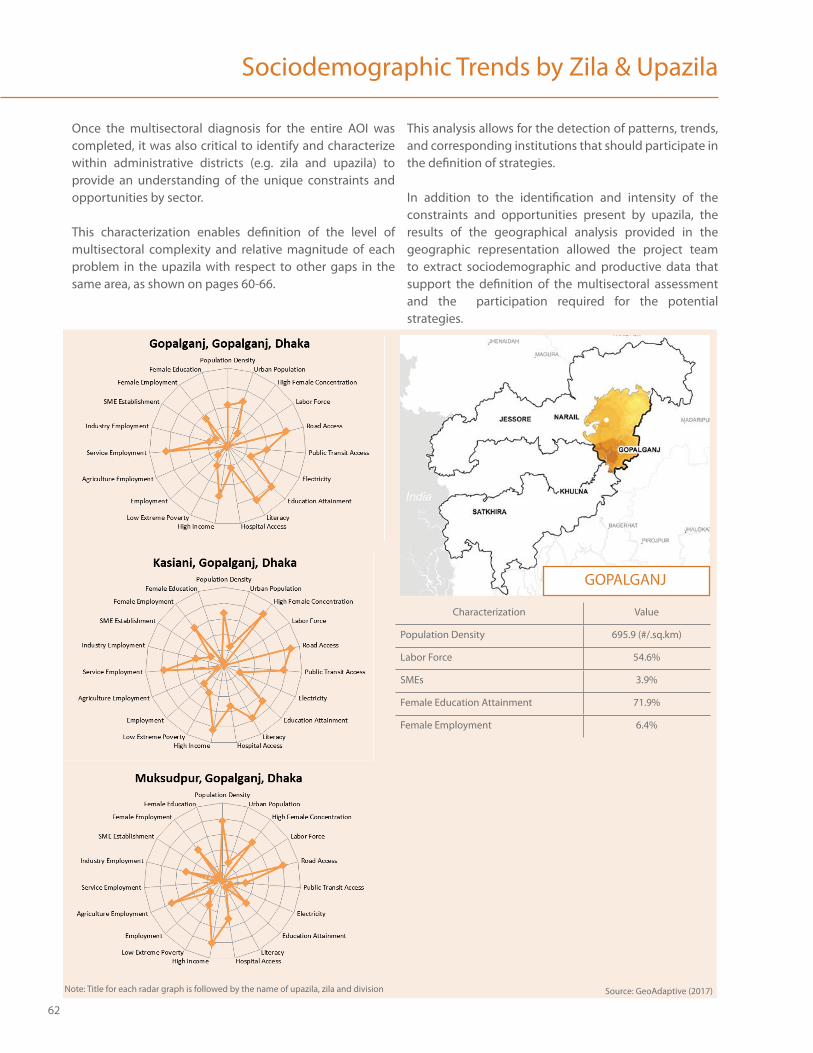
62
Sociodemographic Trends by Zila & Upazila
Once the multisectoral diagnosis for the entire AOI was completed, it was also critical to identify and characterize within administrative districts (e.g. zila and upazila) to provide an understanding of the unique constraints and opportunities by sector.
This characterization enables definition of the level of multisectoral complexity and relative magnitude of each problem in the upazila with respect to other gaps in the same area, as shown on pages 60-66.
This analysis allows for the detection of patterns, trends, and corresponding institutions that should participate in the definition of strategies.
In addition to the identification and intensity of the constraints and opportunities present by upazila, the results of the geographical analysis provided in the geographic representation allowed the project team to extract sociodemographic and productive data that support the definition of the multisectoral assessment and the participation required for the potential strategies.
Characterization Value
Population Density 695.9 (#/.sq.km)
Labor Force 54.6%
SMEs 3.9%
Female Education Attainment 71.9%
Female Employment 6.4%
GOPALGANJ
Note: Title for each radar graph is followed by the name of upazila, zila and division Source: GeoAdaptive (2017)
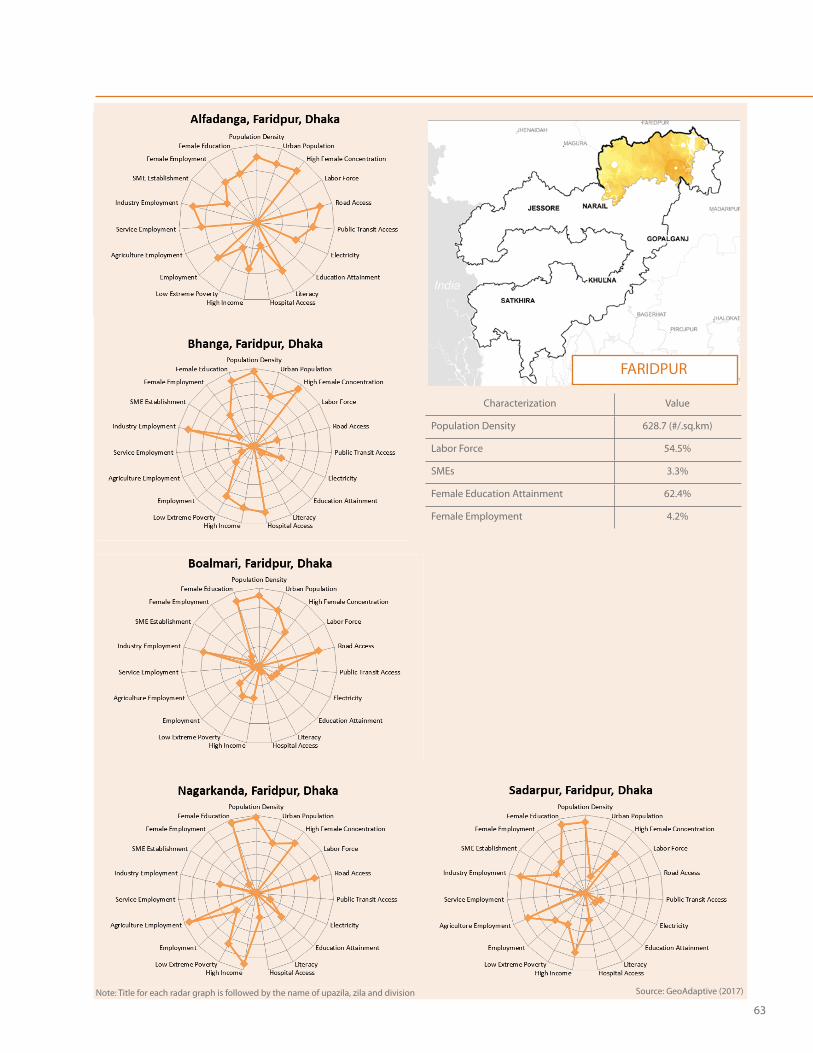
63
Characterization Value
Population Density 628.7 (#/.sq.km)
Labor Force 54.5%
SMEs 3.3%
Female Education Attainment 62.4%
Female Employment 4.2%
FARIDPUR
Note: Title for each radar graph is followed by the name of upazila, zila and division Source: GeoAdaptive (2017)
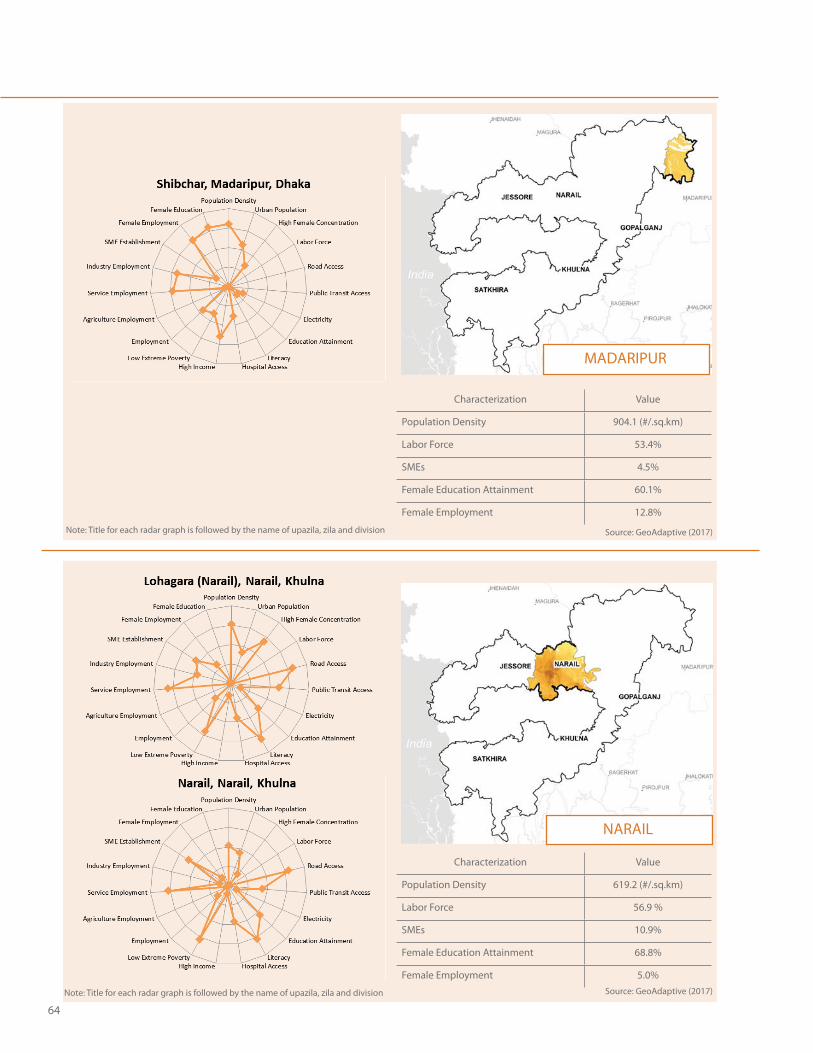
64
Characterization Value
Population Density 619.2 (#/.sq.km)
Labor Force 56.9 %
SMEs 10.9%
Female Education Attainment 68.8%
Female Employment 5.0%
Characterization Value
Population Density 904.1 (#/.sq.km)
Labor Force 53.4%
SMEs 4.5%
Female Education Attainment 60.1%
Female Employment 12.8%
MADARIPUR
NARAIL
Note: Title for each radar graph is followed by the name of upazila, zila and division
Note: Title for each radar graph is followed by the name of upazila, zila and division Source: GeoAdaptive (2017)
Source: GeoAdaptive (2017)
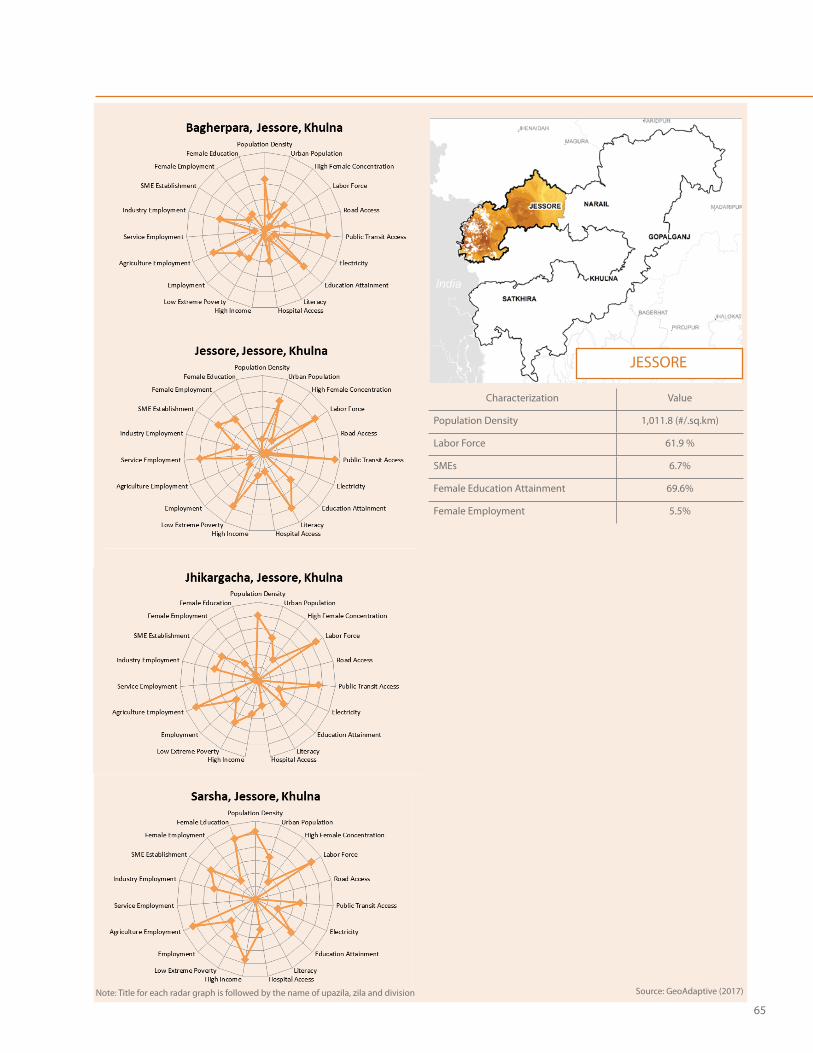
65
JESSORE
Characterization Value
Population Density 1,011.8 (#/.sq.km)
Labor Force 61.9 %
SMEs 6.7%
Female Education Attainment 69.6%
Female Employment 5.5%
Note: Title for each radar graph is followed by the name of upazila, zila and division Source: GeoAdaptive (2017)
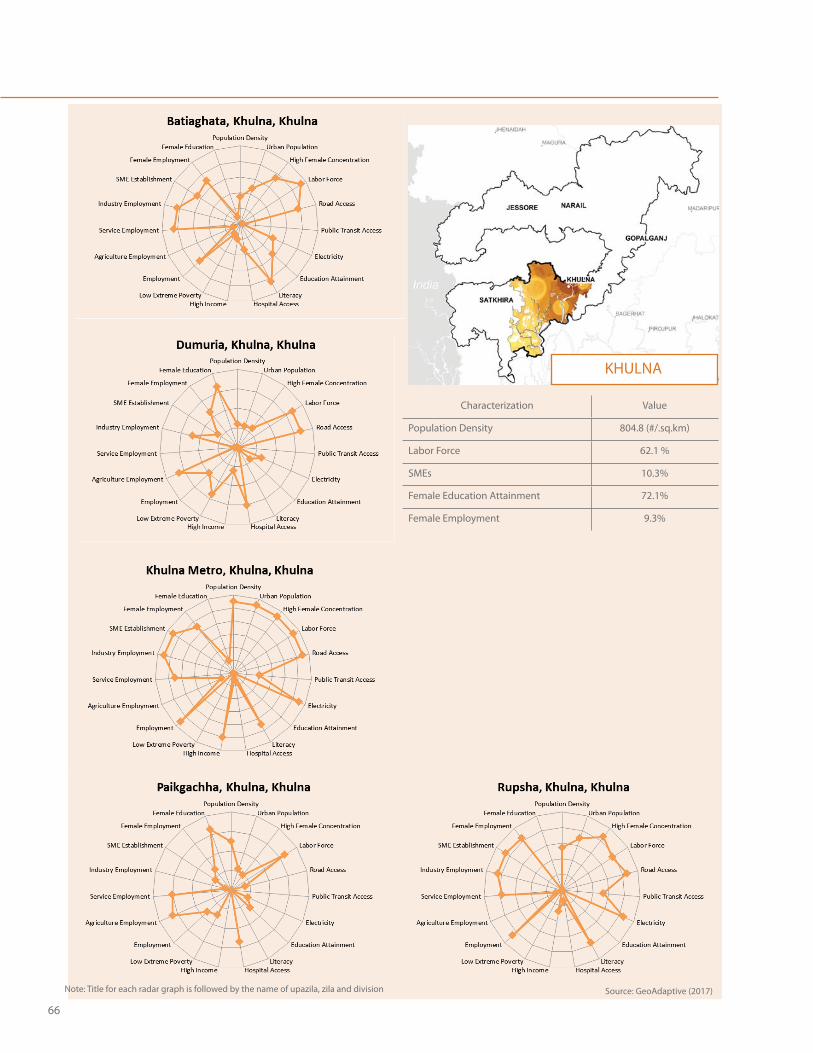
66
Characterization Value
Population Density 804.8 (#/.sq.km)
Labor Force 62.1 %
SMEs 10.3%
Female Education Attainment 72.1%
Female Employment 9.3%
KHULNA
Note: Title for each radar graph is followed by the name of upazila, zila and division Source: GeoAdaptive (2017)
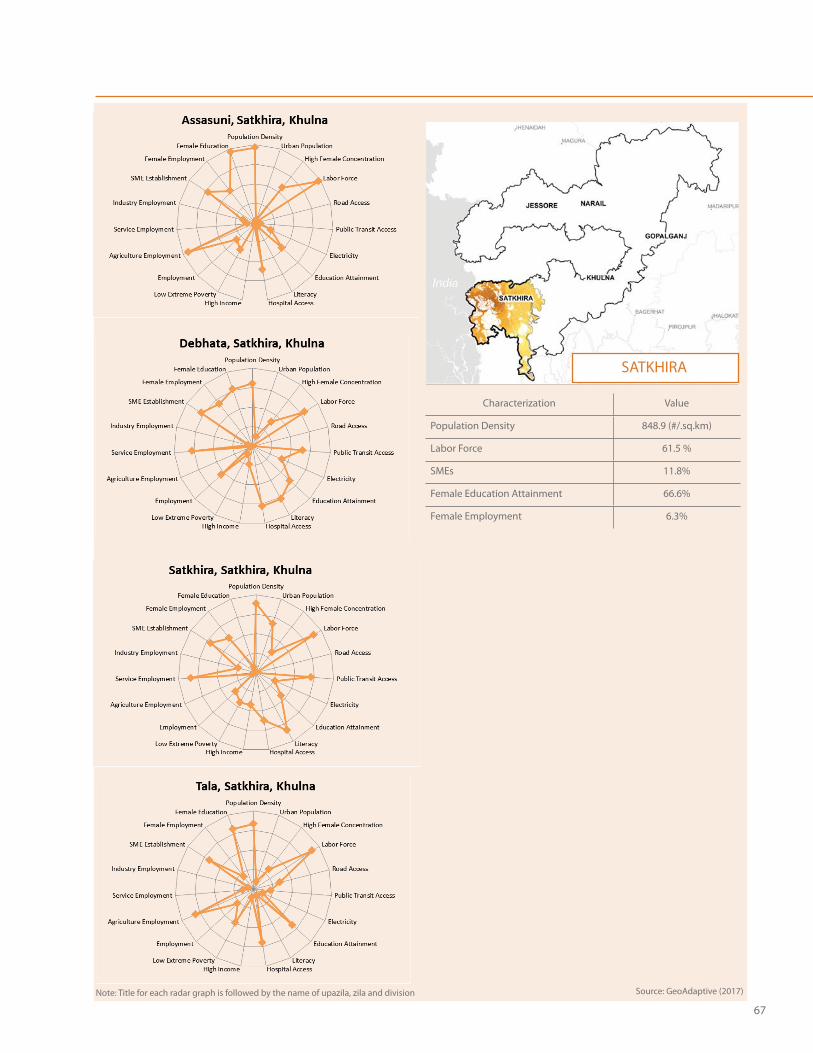
67
Characterization Value
Population Density 848.9 (#/.sq.km)
Labor Force 61.5 %
SMEs 11.8%
Female Education Attainment 66.6%
Female Employment 6.3%
SATKHIRA
Note: Title for each radar graph is followed by the name of upazila, zila and division Source: GeoAdaptive (2017)
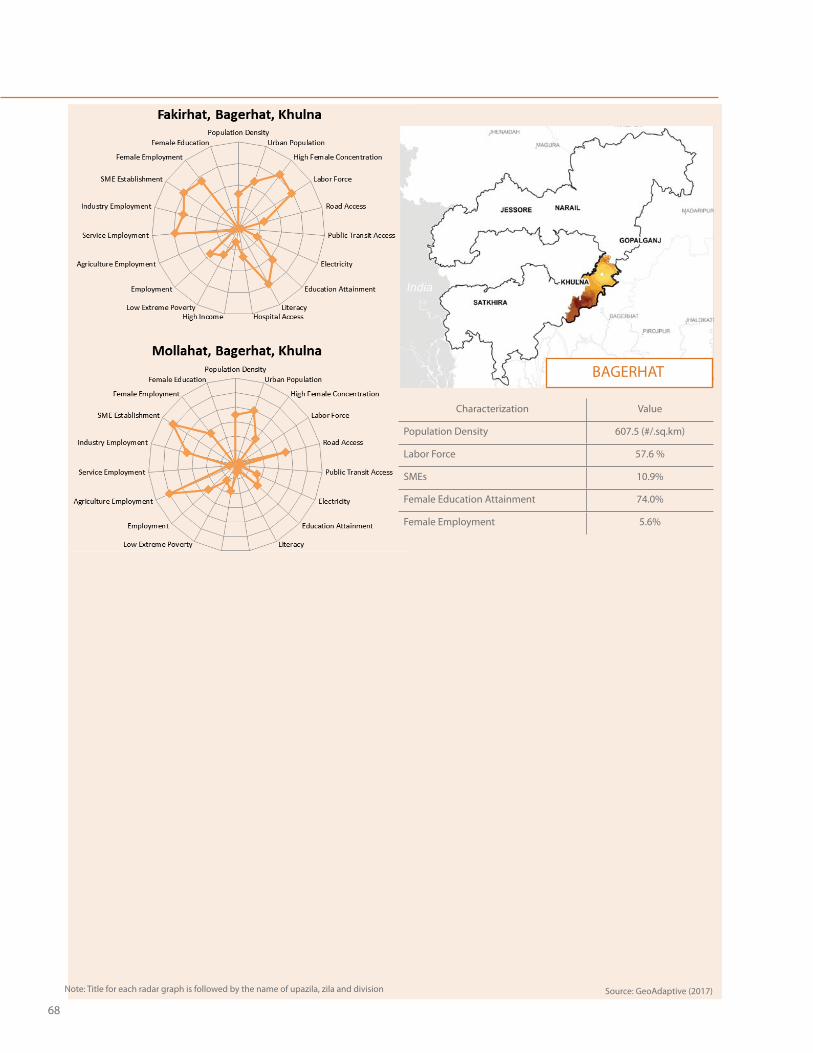
68
Characterization Value
Population Density 607.5 (#/.sq.km)
Labor Force 57.6 %
SMEs 10.9%
Female Education Attainment 74.0%
Female Employment 5.6%
BAGERHAT
Note: Title for each radar graph is followed by the name of upazila, zila and division Source: GeoAdaptive (2017)
InsightLinking economic products and
socioeconomic assessment
69

70 Economic Empowerment of Women through Resilient Agriculture Supply Chains: A Geospatial and Temporal Analysis in Southwestern Bangladesh
70
71 Economic Empowerment of Women through Resilient Agriculture Supply Chains: A Geospatial and Temporal Analysis in Southwestern Bangladesh
OVERVIEW
Separately, chapters 1 and 2 present the methodological underpinnings and results of the product selection and socioeconomic and infrastructure analyses. Together, they can be thought of as diagnostic tools whose aim is to derive vital statistics on the people, infrastructure and the entrepreneurial activity of women in the SME sector in Bangladesh.
As a whole, chapters 1 and 2 begin to inform a deep and intuitive understanding of the AOI and provide the necessary research base that allows for this first set of insights into the structural and economic barriers that women face in integrating themselves into existing value chains as well as identifying opportunities that could improve the business environment for value chains representative of women-driven SMEs.
The preliminary insights derived from chapter 1 and chapter 2 can be applicable to understand:
Considerations that affect the basic living conditions of the workforceConsiderations that improve the business environment of products that are representative of women-driven SMEs
The first of these considerations identifies insights that revolve around the identification of gaps and opportunities as they relate to improvements in social service delivery and public infrastructure access, in order to increase productivity through greater development of human capital and greater population mobility. The second consideration identifies insights that improve the business environment for products that are representative of women entrepreneurs, which includes general insights of possible backward and forward linkages that could lead to greater participation of women and women entrepreneurs in multiple links of the dairy, floriculture and fishery value chains.
72 Economic Empowerment of Women through Resilient Agriculture Supply Chains: A Geospatial and Temporal Analysis in Southwestern Bangladesh
Education Increase education options in the AOI as investment in education service delivery increases the development of human capital:
Expand education facilities in Dhaka division of AOI to increase educational opportunities for the populationImprove educational programs in areas such as Jessore Sadar, Rupsha and Dumuria where large portions of the population are uneducated, even though many education facilities existAdvance female attainment of primary education in zilas such as Bagerhat, Narail, Jessore, and Khulna
Health
Increase health options that support human capital and community health:
Emphasize the need of comprehensive health service facilities in Boalmari and Bagerhat upazilas where there is no single hospital, while family welfare centers are available in other upazilas in the AOIImprove access time to hospitals in Khulna Sadar, the most densely populated urban area in the AOI
1 Preliminary Insights on Social Service Delivery
2 Preliminary Insights on Public Infrastructure Accessibility
Promote transportation mobility by upgrading the road network:
Provide a paved road network in Jessore and Satkhira to improve mobility among dairy, fisheries, and floriculture production sites
Increase public transportation facilities to improve accessibility:
Provide transit hubs especially for railways at the peripheries of Khulna Sadar (e.g., Bariaghata, Dumuria) to increase connectivity between production sites and metropolitan centersExtend railways and transportation services to Dhaka
Expand electricity service in Satkhira zila
Rural upazilas in Satkhira, the zila that borders India (e.g. Assasuni, Debhata, and Tala) are experiencing the highest inequality in terms of accessibility to electricity. Less than 30% of zilas report having access to electricity
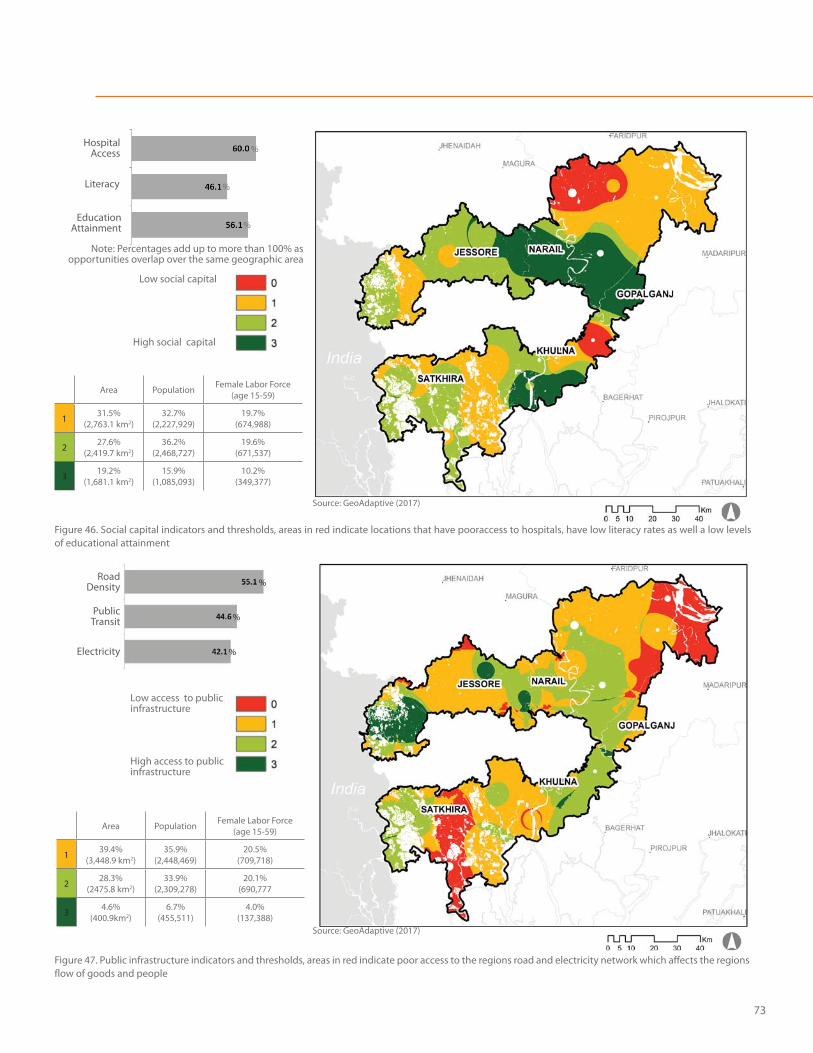
73
High social capital
Low social capital
High access to public infrastructure
Low access to public infrastructure
HospitalAccess
Literacy
Note: Percentages add up to more than 100% as opportunities overlap over the same geographic area
Education Attainment
RoadDensity
Public Transit
Electricity
Figure 46. Social capital indicators and thresholds, areas in red indicate locations that have pooraccess to hospitals, have low literacy rates as well a low levels of educational attainment
Figure 47. Public infrastructure indicators and thresholds, areas in red indicate poor access to the regions road and electricity network which affects the regions flow of goods and people
Area Population Female Labor Force (age 15-59)
1 31.5%(2,763.1 km2)
32.7%(2,227,929)
19.7%(674,988)
2 27.6%(2,419.7 km2)
36.2%(2,468,727)
19.6%(671,537)
3 19.2%(1,681.1 km2)
15.9%(1,085,093)
10.2%(349,377)
%
%
%
Area Population Female Labor Force (age 15-59)
1 39.4%(3,448.9 km2)
35.9%(2,448,469)
20.5%(709,718)
2 28.3%(2475.8 km2)
33.9%(2,309,278)
20.1%(690,777
3 4.6%(400.9km2)
6.7%(455,511)
4.0%(137,388)
%
%
%
Source: GeoAdaptive (2017)
Source: GeoAdaptive (2017)
74 Economic Empowerment of Women through Resilient Agriculture Supply Chains: A Geospatial and Temporal Analysis in Southwestern Bangladesh
To build a well-balanced and stable economic base in the AOI to alleviate poverty and provide employment opportunities, it would make sense to:
Create and maintain a business environment in areas such as Gopalganj zila, which has a low employment rate and a high percentage of population in extreme poverty
To encourage specialization for SME establishments, it would make sense to:
Expand agriculture-related SMEs in upazilas such as Assasuni, Tala in Satkhira zila, and Narail Sadar, which has the highest SME population/establishment involved and highest percentage of economic activities in agricultureExpand service-related SMEs in Khulna Sadar, which has the highest SME population/establishment involved and highest percentage of economic activities in services
To promote and integrate gender-responsive education offers and economic opportunities, it would make sense to:
Advance women’s primary education in zilas such as Bagerhat, Narail, Jessore, and Khulna
3 Preliminary Insights on the Economic and Business Environment for Women-Driven SMEs
The study’s AOI presents a challenge in the sense that it spans 8 different districts or zilas, each zila differs in its comparative advantage in the production of products and agricultural goods. In these zilas, there are over 20 products in which one of the 8 zilas produces competitively relative to the rest of the country. The question then becomes not only which products are representative of women-driven SME’ but also which products can provide benefits to the majority of the zilas in the area of interest, given that some zilas have a comparative advantage in the production of some goods over others.
After evaluating the spatial of distribution of agricultural productivity for the 8 zilas, the products selected derive benefits or have the potential to derive benefits to all the zilas in the AOI.
Floriculture and fisheries demonstrate high comparative advantages relative to the rest of country and the other zilas in the AOI.
As Figures 48 and 49 show, cut flowers and fishery production are concentrated in Jessore and Bagerhat, therefore investments relative to these sectors in these zilas are likely to produce much larger returns. In an effort to avoid spatial inequalities, dairy value chain development will likely benefit and engage women and women entrepreneurs in multiple links of the value chain. Therefore, while cut flowers and fishery products provide benefits to 4 out of the 8 zilas, dairy is more equitably distributed in terms of production in the region, allowing a more equitable distribution of benefits given investment in these value chains.
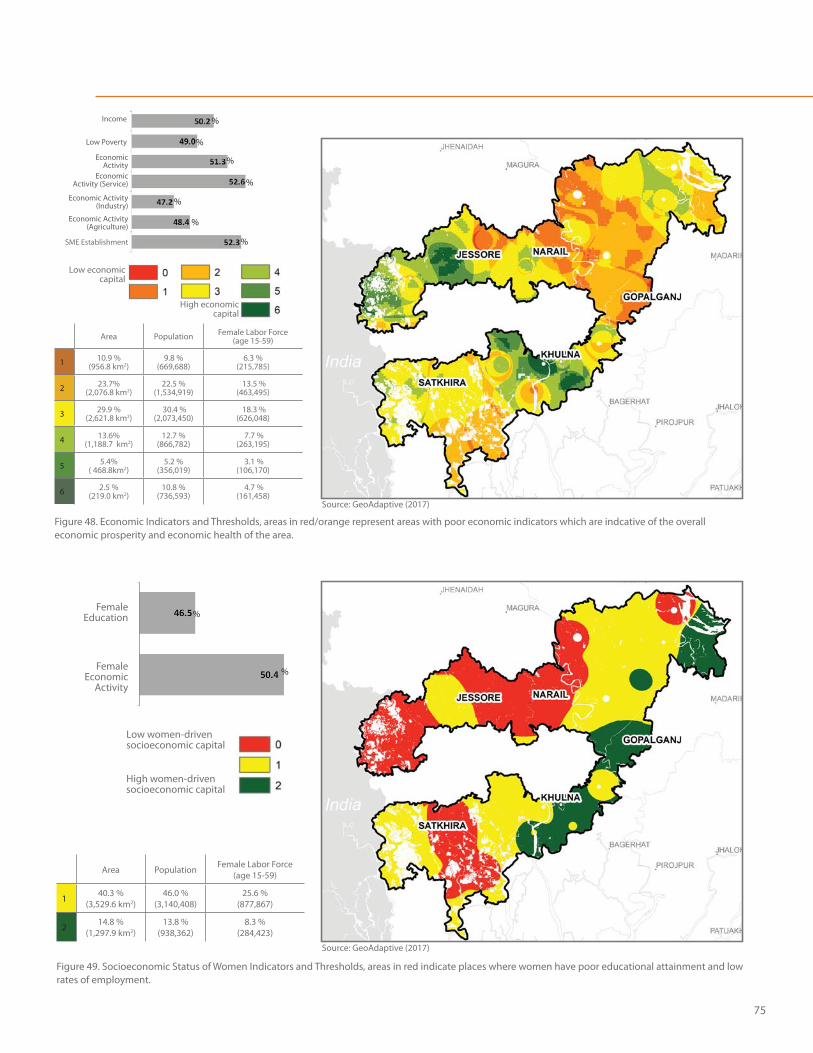
75
Low economic capital
Low women-driven socioeconomic capital
High women-driven socioeconomic capital
Income
Economic Activity
Low Poverty
Economic Activity (Service)
Economic Activity (Industry)
Economic Activity (Agriculture)
SME Establishment
FemaleEducation
FemaleEconomic
Activity
Figure 49. Socioeconomic Status of Women Indicators and Thresholds, areas in red indicate places where women have poor educational attainment and low rates of employment.
Figure 48. Economic Indicators and Thresholds, areas in red/orange represent areas with poor economic indicators which are indcative of the overall economic prosperity and economic health of the area.
Area Population Female Labor Force (age 15-59)
1 10.9 %(956.8 km2)
9.8 %(669,688)
6.3 %(215,785)
2 23.7%(2,076.8 km2)
22.5 %(1,534,919)
13.5 %(463,495)
3 29.9 %(2,621.8 km2)
30.4 %(2,073,450)
18.3 %(626,048)
4 13.6%(1,188.7 km2)
12.7 %(866,782)
7.7 %(263,195)
5 5.4%( 468.8km2)
5.2 %(356,019)
3.1 %(106,170)
6 2.5 %(219.0 km2)
10.8 %(736,593)
4.7 %(161,458)
Area Population Female Labor Force (age 15-59)
1 40.3 %(3,529.6 km2)
46.0 %(3,140,408)
25.6 %(877,867)
2 14.8 %(1,297.9 km2)
13.8 %(938,362)
8.3 %(284,423)
High economic capital
%
%
%
%
%
%
%
%
%
Source: GeoAdaptive (2017)
Source: GeoAdaptive (2017)
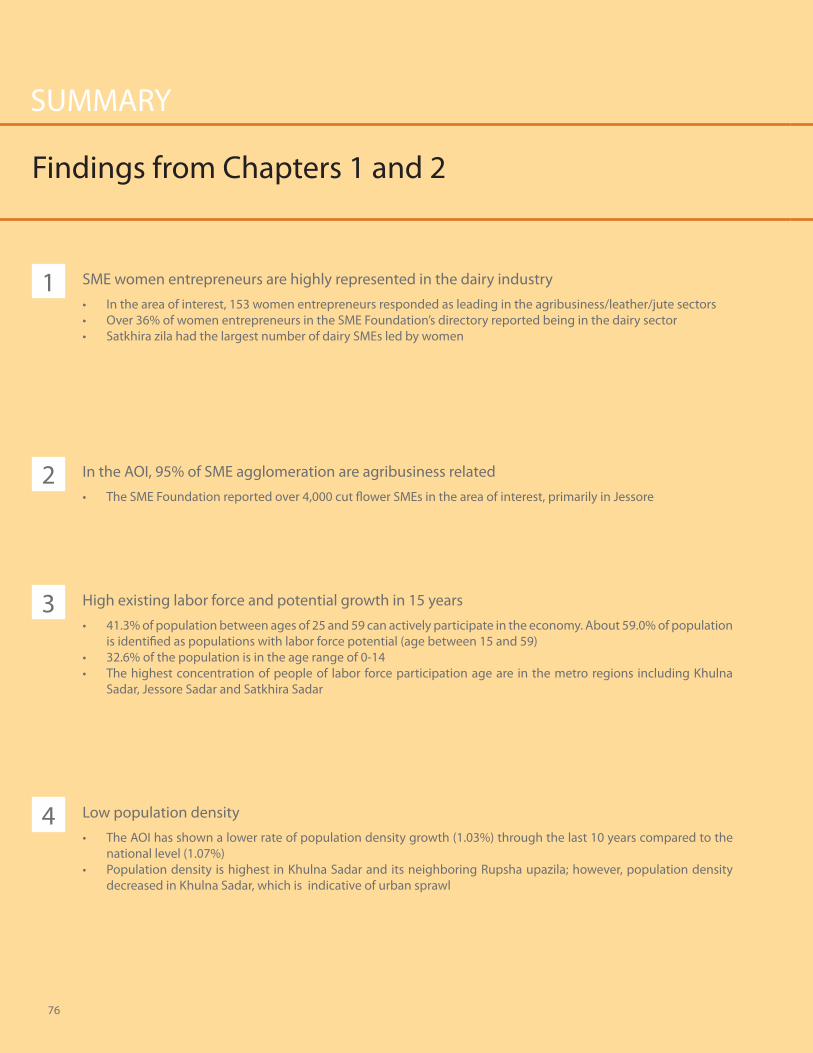
Findings from Chapters 1 and 2
1
2
3
4
76
SME women entrepreneurs are highly represented in the dairy industry
In the area of interest, 153 women entrepreneurs responded as leading in the agribusiness/leather/jute sectorsOver 36% of women entrepreneurs in the SME Foundation’s directory reported being in the dairy sectorSatkhira zila had the largest number of dairy SMEs led by women
In the AOI, 95% of SME agglomeration are agribusiness related
The SME Foundation reported over 4,000 cut flower SMEs in the area of interest, primarily in Jessore
High existing labor force and potential growth in 15 years
41.3% of population between ages of 25 and 59 can actively participate in the economy. About 59.0% of population is identified as populations with labor force potential (age between 15 and 59)32.6% of the population is in the age range of 0-14The highest concentration of people of labor force participation age are in the metro regions including Khulna Sadar, Jessore Sadar and Satkhira Sadar
Low population density
The AOI has shown a lower rate of population density growth (1.03%) through the last 10 years compared to the national level (1.07%)Population density is highest in Khulna Sadar and its neighboring Rupsha upazila; however, population density decreased in Khulna Sadar, which is indicative of urban sprawl
SUMMARY
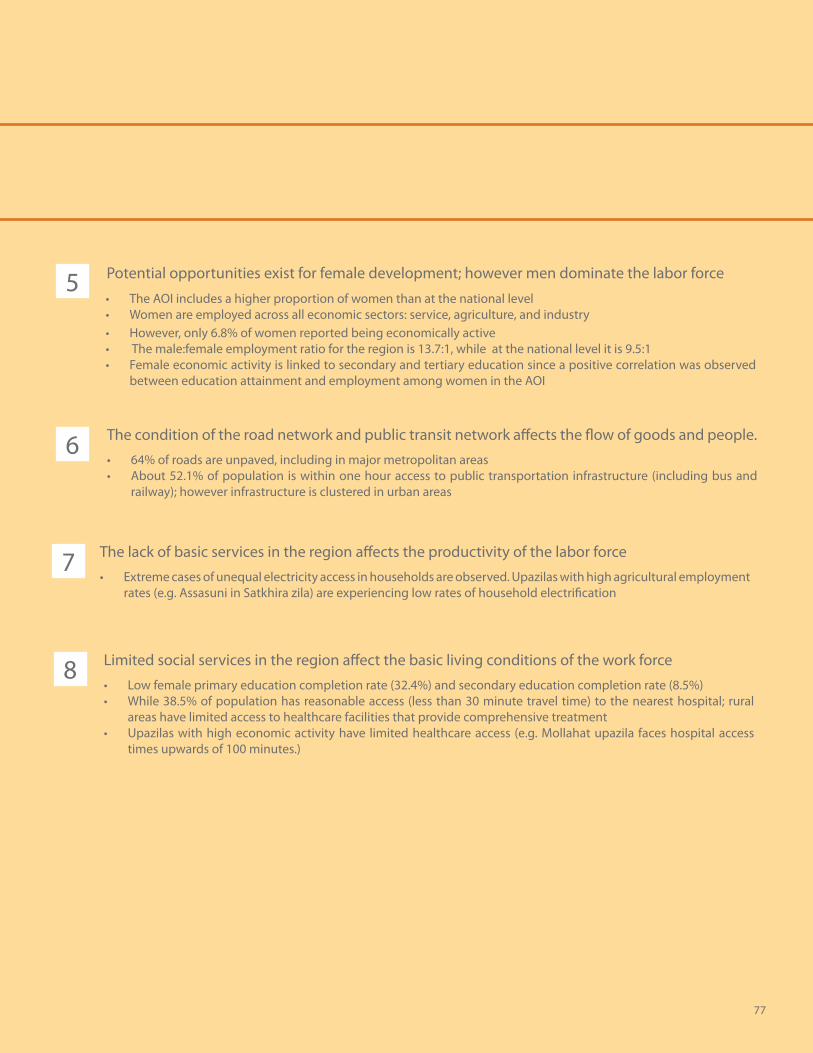
5
6
7
8
77
Potential opportunities exist for female development; however men dominate the labor force
The AOI includes a higher proportion of women than at the national levelWomen are employed across all economic sectors: service, agriculture, and industryHowever, only 6.8% of women reported being economically active The male:female employment ratio for the region is 13.7:1, while at the national level it is 9.5:1Female economic activity is linked to secondary and tertiary education since a positive correlation was observed between education attainment and employment among women in the AOI
The condition of the road network and public transit network affects the flow of goods and people.
64% of roads are unpaved, including in major metropolitan areasAbout 52.1% of population is within one hour access to public transportation infrastructure (including bus and railway); however infrastructure is clustered in urban areas
The lack of basic services in the region affects the productivity of the labor force
Extreme cases of unequal electricity access in households are observed. Upazilas with high agricultural employment rates (e.g. Assasuni in Satkhira zila) are experiencing low rates of household electrification
Limited social services in the region affect the basic living conditions of the work force
Low female primary education completion rate (32.4%) and secondary education completion rate (8.5%)While 38.5% of population has reasonable access (less than 30 minute travel time) to the nearest hospital; rural areas have limited access to healthcare facilities that provide comprehensive treatmentUpazilas with high economic activity have limited healthcare access (e.g. Mollahat upazila faces hospital access times upwards of 100 minutes.)

78 Economic Empowerment of Women through Resilient Agriculture Supply Chains: A Geospatial and Temporal Analysis in Southwestern Bangladesh

Chapter 3Spatial Economic Structure Analysis
79
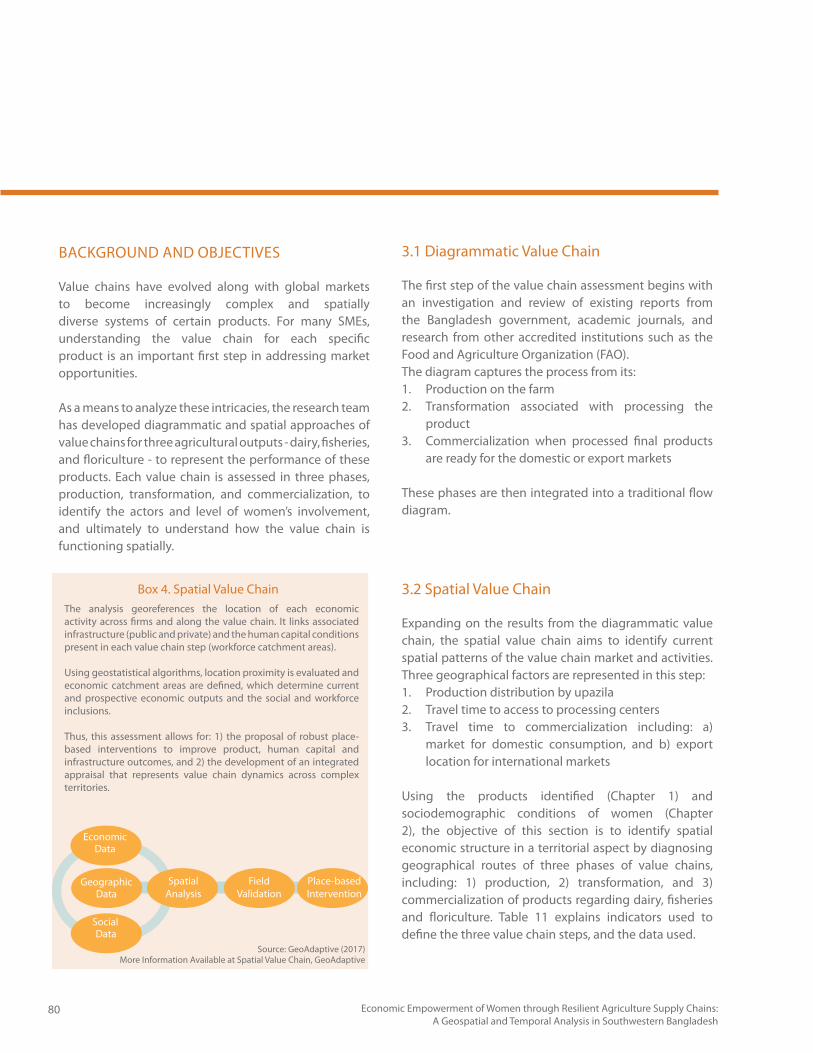
80 Economic Empowerment of Women through Resilient Agriculture Supply Chains: A Geospatial and Temporal Analysis in Southwestern Bangladesh
3.1 Diagrammatic Value Chain
The first step of the value chain assessment begins with an investigation and review of existing reports from the Bangladesh government, academic journals, and research from other accredited institutions such as the Food and Agriculture Organization (FAO). The diagram captures the process from its: 1. Production on the farm2. Transformation associated with processing the
product3. Commercialization when processed final products
are ready for the domestic or export markets
These phases are then integrated into a traditional flow diagram.
3.2 Spatial Value Chain
Expanding on the results from the diagrammatic value chain, the spatial value chain aims to identify current spatial patterns of the value chain market and activities. Three geographical factors are represented in this step: 1. Production distribution by upazila2. Travel time to access to processing centers3. Travel time to commercialization including: a)
market for domestic consumption, and b) export location for international markets
Using the products identified (Chapter 1) and sociodemographic conditions of women (Chapter 2), the objective of this section is to identify spatial economic structure in a territorial aspect by diagnosing geographical routes of three phases of value chains, including: 1) production, 2) transformation, and 3) commercialization of products regarding dairy, fisheries and floriculture. Table 11 explains indicators used to define the three value chain steps, and the data used.
BACKGROUND AND OBJECTIVES
Value chains have evolved along with global markets to become increasingly complex and spatially diverse systems of certain products. For many SMEs, understanding the value chain for each specific product is an important first step in addressing market opportunities.
As a means to analyze these intricacies, the research team has developed diagrammatic and spatial approaches of value chains for three agricultural outputs - dairy, fisheries, and floriculture - to represent the performance of these products. Each value chain is assessed in three phases, production, transformation, and commercialization, to identify the actors and level of women’s involvement, and ultimately to understand how the value chain is functioning spatially.
Box 4. Spatial Value ChainThe analysis georeferences the location of each economic activity across firms and along the value chain. It links associated infrastructure (public and private) and the human capital conditions present in each value chain step (workforce catchment areas).
Using geostatistical algorithms, location proximity is evaluated and economic catchment areas are defined, which determine current and prospective economic outputs and the social and workforce inclusions.
Thus, this assessment allows for: 1) the proposal of robust place-based interventions to improve product, human capital and infrastructure outcomes, and 2) the development of an integrated appraisal that represents value chain dynamics across complex territories.
Economic Data
Geographic Data
Social Data
Place-basedIntervention
FieldValidation
SpatialAnalysis
Source: GeoAdaptive (2017)More Information Available at Spatial Value Chain, GeoAdaptive
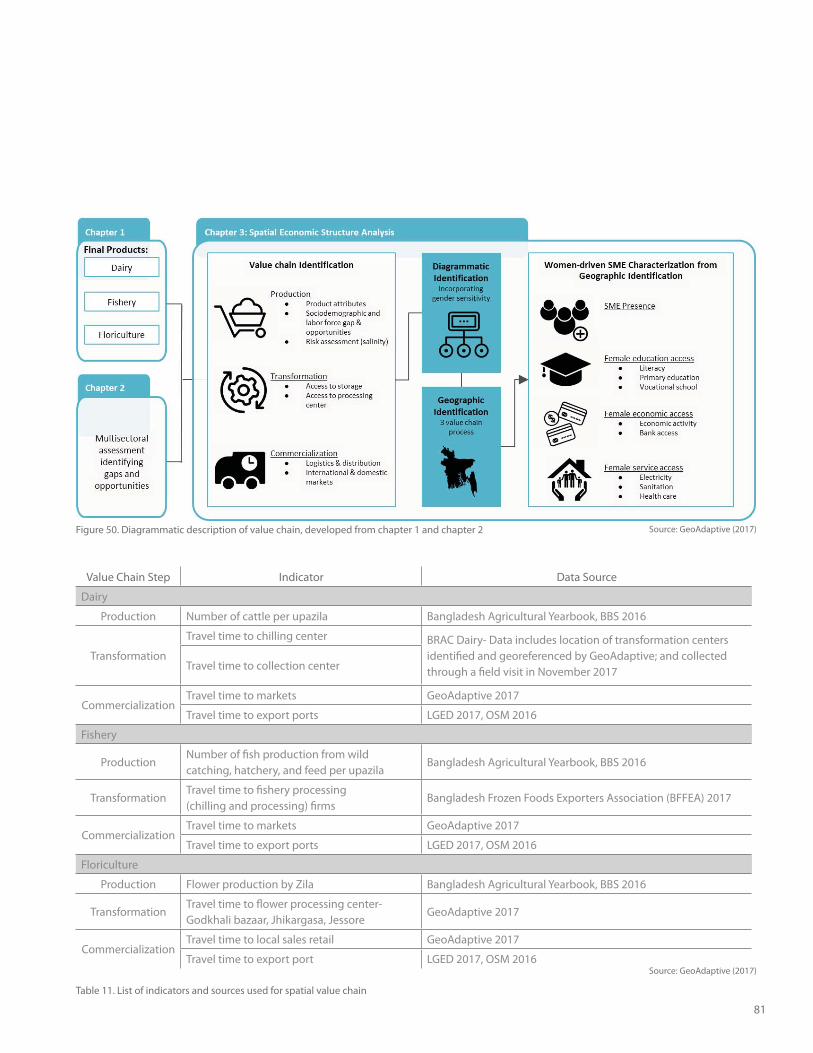
81
Value Chain Step Indicator Data Source
Dairy
Production Number of cattle per upazila Bangladesh Agricultural Yearbook, BBS 2016
Transformation
Travel time to chilling center BRAC Dairy- Data includes location of transformation centers identified and georeferenced by GeoAdaptive; and collected through a field visit in November 2017Travel time to collection center
CommercializationTravel time to markets GeoAdaptive 2017
Travel time to export ports LGED 2017, OSM 2016
Fishery
Production Number of fish production from wild catching, hatchery, and feed per upazila
Bangladesh Agricultural Yearbook, BBS 2016
Transformation Travel time to fishery processing (chilling and processing) firms
Bangladesh Frozen Foods Exporters Association (BFFEA) 2017
Commercialization Travel time to markets GeoAdaptive 2017
Travel time to export ports LGED 2017, OSM 2016
Floriculture
Production Flower production by Zila Bangladesh Agricultural Yearbook, BBS 2016
Transformation Travel time to flower processing center- Godkhali bazaar, Jhikargasa, Jessore
GeoAdaptive 2017
Commercialization Travel time to local sales retail GeoAdaptive 2017
Travel time to export port LGED 2017, OSM 2016
Figure 50. Diagrammatic description of value chain, developed from chapter 1 and chapter 2
Table 11. List of indicators and sources used for spatial value chain
Source: GeoAdaptive (2017)
Source: GeoAdaptive (2017)
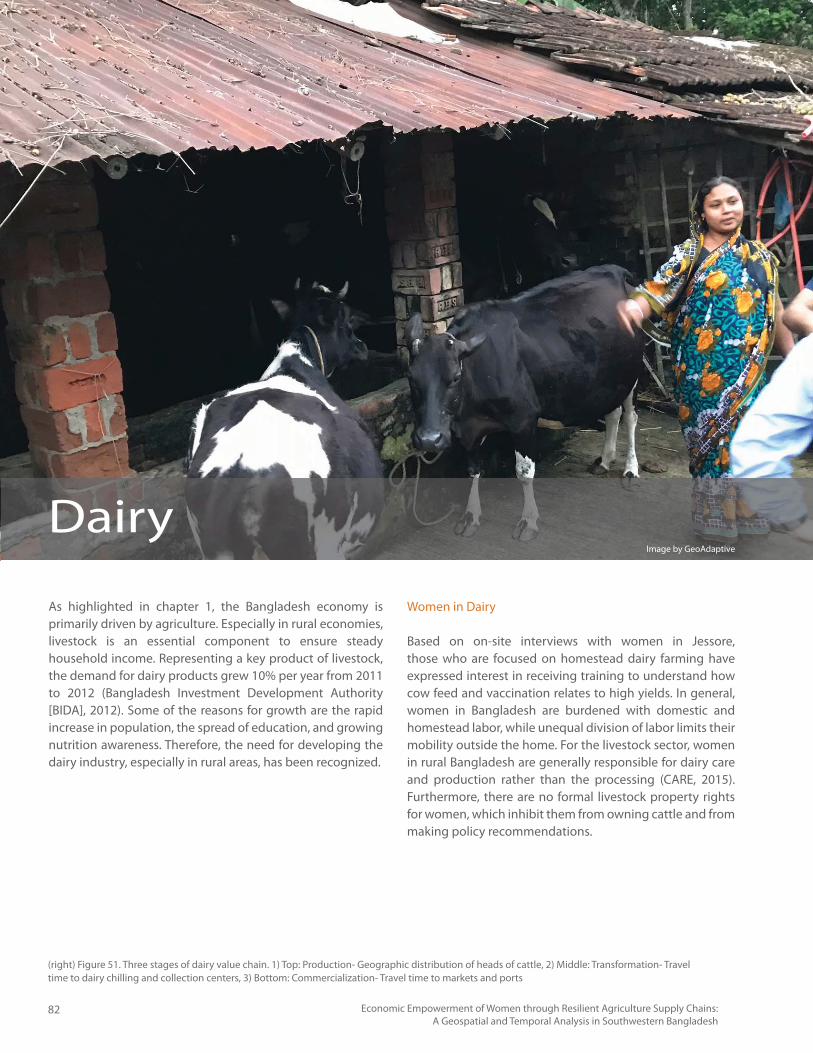
82 Economic Empowerment of Women through Resilient Agriculture Supply Chains: A Geospatial and Temporal Analysis in Southwestern Bangladesh
As highlighted in chapter 1, the Bangladesh economy is primarily driven by agriculture. Especially in rural economies, livestock is an essential component to ensure steady household income. Representing a key product of livestock, the demand for dairy products grew 10% per year from 2011 to 2012 (Bangladesh Investment Development Authority [BIDA], 2012). Some of the reasons for growth are the rapid increase in population, the spread of education, and growing nutrition awareness. Therefore, the need for developing the dairy industry, especially in rural areas, has been recognized.
Women in Dairy
Based on on-site interviews with women in Jessore, those who are focused on homestead dairy farming have expressed interest in receiving training to understand how cow feed and vaccination relates to high yields. In general, women in Bangladesh are burdened with domestic and homestead labor, while unequal division of labor limits their mobility outside the home. For the livestock sector, women in rural Bangladesh are generally responsible for dairy care and production rather than the processing (CARE, 2015). Furthermore, there are no formal livestock property rights for women, which inhibit them from owning cattle and from making policy recommendations.
Dairy
(right) Figure 51. Three stages of dairy value chain. 1) Top: Production- Geographic distribution of heads of cattle, 2) Middle: Transformation- Travel time to dairy chilling and collection centers, 3) Bottom: Commercialization- Travel time to markets and ports
Image by GeoAdaptive
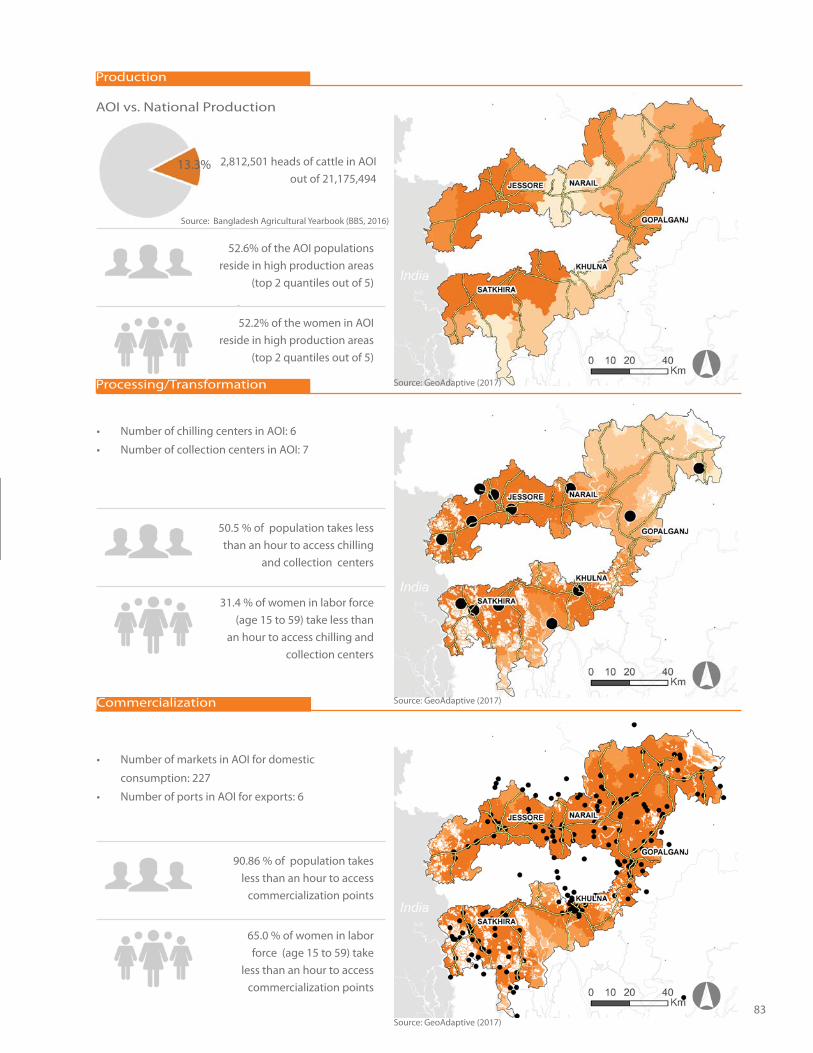
83
Production
Processing/Transformation
Commercialization
AOI vs. National Production
13.3% 2,812,501 heads of cattle in AOI out of 21,175,494
Source: Bangladesh Agricultural Yearbook (BBS, 2016)
52.6% of the AOI populations reside in high production areas
(top 2 quantiles out of 5)
Number of chilling centers in AOI: 6
Number of collection centers in AOI: 7
52.2% of the women in AOI reside in high production areas
(top 2 quantiles out of 5)
50.5 % of population takes less than an hour to access chilling
and collection centers
31.4 % of women in labor force (age 15 to 59) take less than
an hour to access chilling and collection centers
Number of markets in AOI for domestic
consumption: 227
Number of ports in AOI for exports: 6
90.86 % of population takes less than an hour to access
commercialization points
65.0 % of women in labor force (age 15 to 59) take
less than an hour to access commercialization points
Source: GeoAdaptive (2017)
Source: GeoAdaptive (2017)
Source: GeoAdaptive (2017)
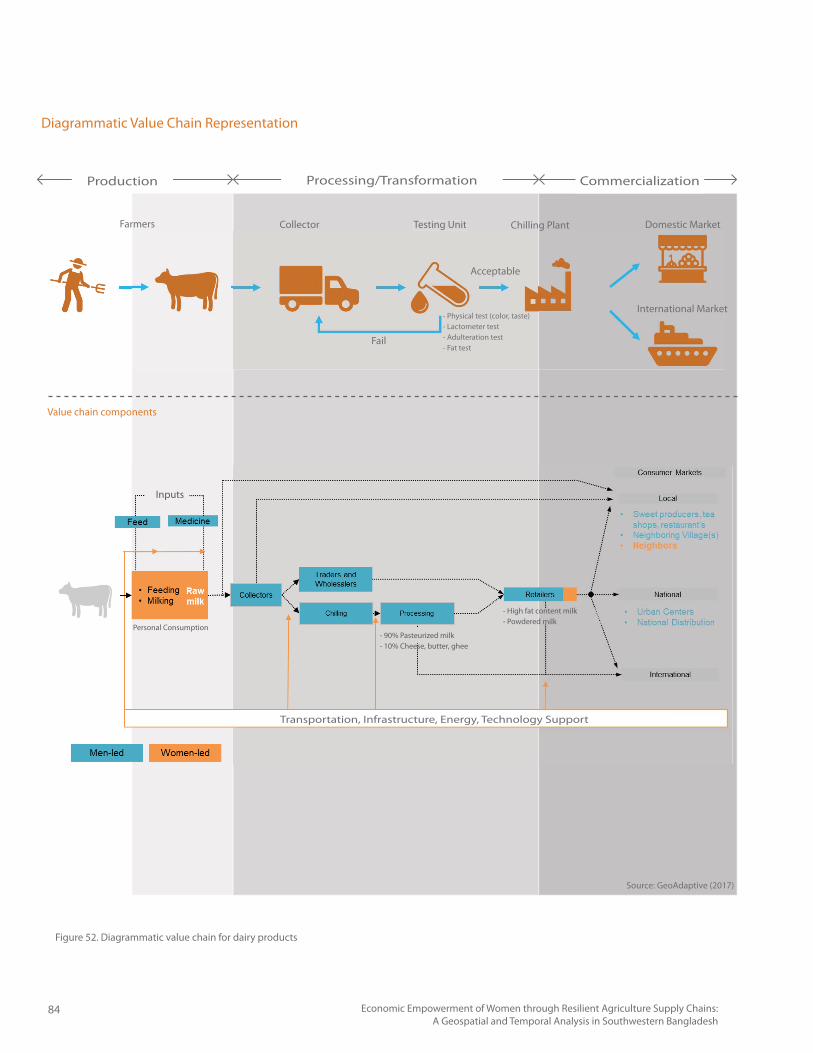
84 Economic Empowerment of Women through Resilient Agriculture Supply Chains: A Geospatial and Temporal Analysis in Southwestern Bangladesh
Diagrammatic Value Chain Representation
Figure 52. Diagrammatic value chain for dairy products
Value chain components
Production Processing/Transformation Commercialization
Transportation, Infrastructure, Energy, Technology Support
Inputs
Personal Consumption- 90% Pasteurized milk- 10% Cheese, butter, ghee
- High fat content milk- Powdered milk
Farmers Collector Testing Unit Chilling Plant Domestic Market
International Market- Physical test (color, taste)- Lactometer test- Adulteration test- Fat test
Acceptable
Fail
Source: GeoAdaptive (2017)
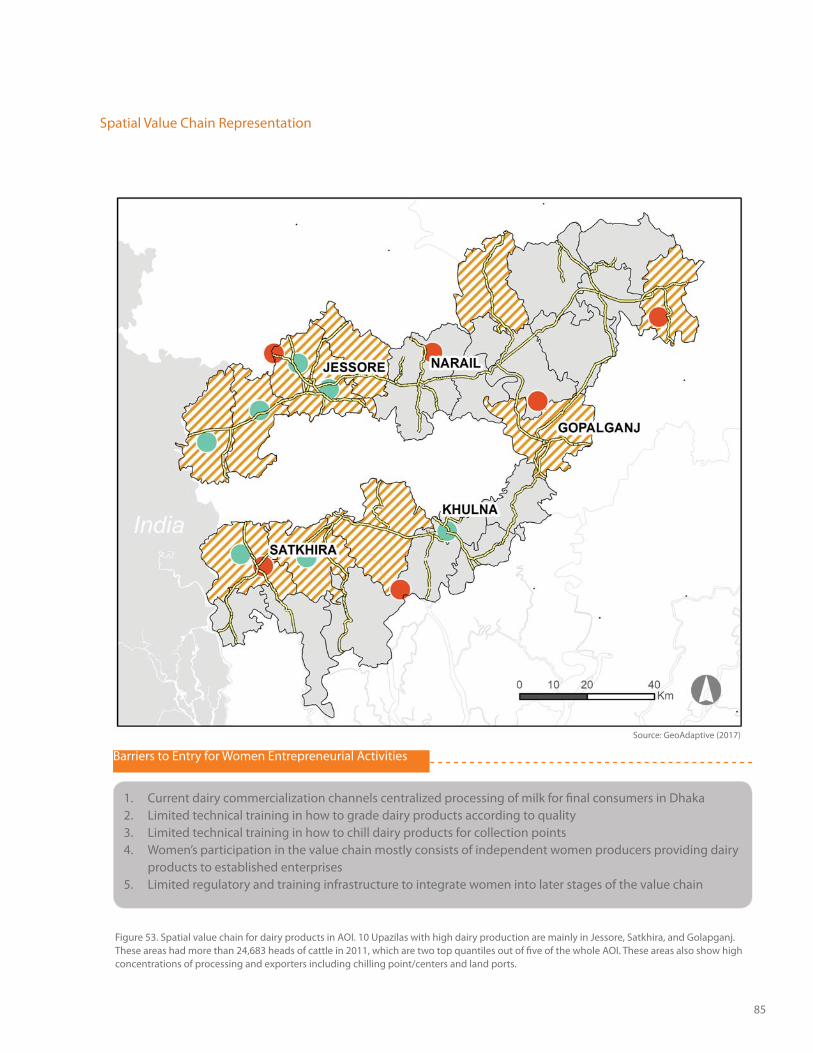
85
Spatial Value Chain Representation
1. Current dairy commercialization channels centralized processing of milk for final consumers in Dhaka2. Limited technical training in how to grade dairy products according to quality3. Limited technical training in how to chill dairy products for collection points4. Women’s participation in the value chain mostly consists of independent women producers providing dairy
products to established enterprises5. Limited regulatory and training infrastructure to integrate women into later stages of the value chain
Barriers to Entry for Women Entrepreneurial Activities
Figure 53. Spatial value chain for dairy products in AOI. 10 Upazilas with high dairy production are mainly in Jessore, Satkhira, and Golapganj. These areas had more than 24,683 heads of cattle in 2011, which are two top quantiles out of five of the whole AOI. These areas also show high concentrations of processing and exporters including chilling point/centers and land ports.
Source: GeoAdaptive (2017)
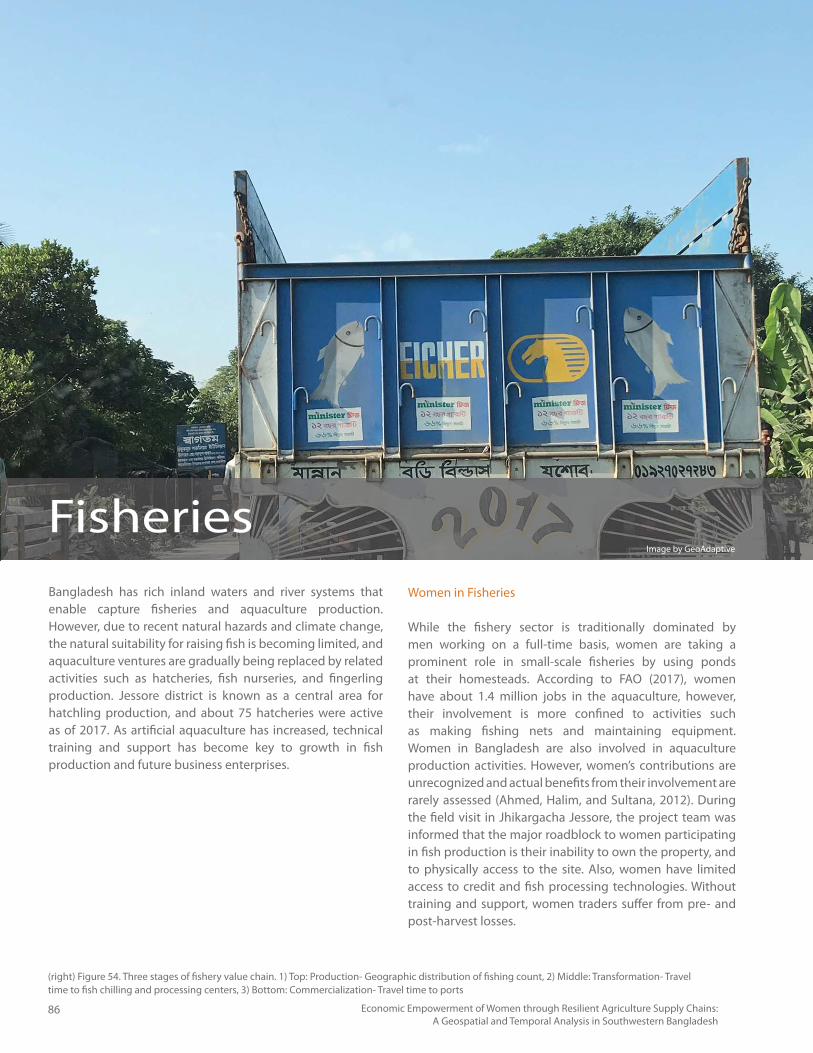
86 Economic Empowerment of Women through Resilient Agriculture Supply Chains: A Geospatial and Temporal Analysis in Southwestern Bangladesh
FisheriesBangladesh has rich inland waters and river systems that enable capture fisheries and aquaculture production. However, due to recent natural hazards and climate change, the natural suitability for raising fish is becoming limited, and aquaculture ventures are gradually being replaced by related activities such as hatcheries, fish nurseries, and fingerling production. Jessore district is known as a central area for hatchling production, and about 75 hatcheries were active as of 2017. As artificial aquaculture has increased, technical training and support has become key to growth in fish production and future business enterprises.
Women in Fisheries
While the fishery sector is traditionally dominated by men working on a full-time basis, women are taking a prominent role in small-scale fisheries by using ponds at their homesteads. According to FAO (2017), women have about 1.4 million jobs in the aquaculture, however, their involvement is more confined to activities such as making fishing nets and maintaining equipment. Women in Bangladesh are also involved in aquaculture production activities. However, women’s contributions are unrecognized and actual benefits from their involvement are rarely assessed (Ahmed, Halim, and Sultana, 2012). During the field visit in Jhikargacha Jessore, the project team was informed that the major roadblock to women participating in fish production is their inability to own the property, and to physically access to the site. Also, women have limited access to credit and fish processing technologies. Without training and support, women traders suffer from pre- and post-harvest losses.
(right) Figure 54. Three stages of fishery value chain. 1) Top: Production- Geographic distribution of fishing count, 2) Middle: Transformation- Travel time to fish chilling and processing centers, 3) Bottom: Commercialization- Travel time to ports
Image by GeoAdaptive
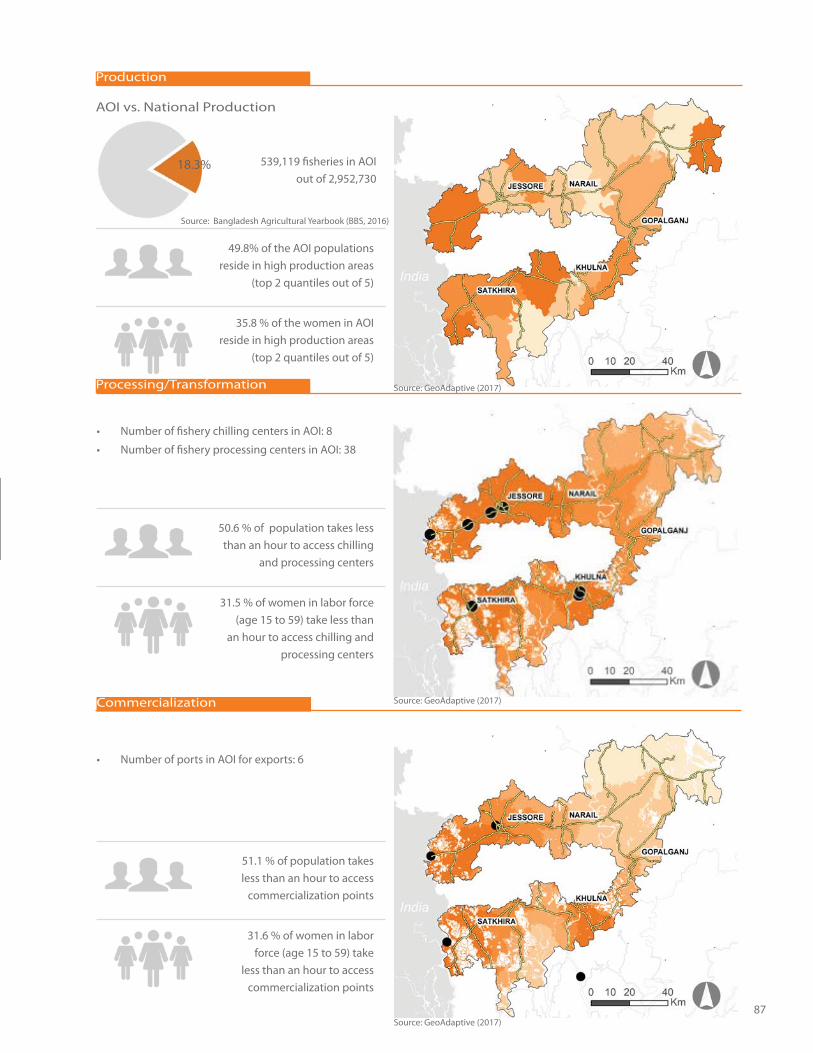
87
Production
Processing/Transformation
Commercialization
AOI vs. National Production
18.3% 539,119 fisheries in AOI out of 2,952,730
Source: Bangladesh Agricultural Yearbook (BBS, 2016)
49.8% of the AOI populations reside in high production areas
(top 2 quantiles out of 5)
35.8 % of the women in AOI reside in high production areas
(top 2 quantiles out of 5)
Number of fishery chilling centers in AOI: 8
Number of fishery processing centers in AOI: 38
50.6 % of population takes less than an hour to access chilling
and processing centers
31.5 % of women in labor force (age 15 to 59) take less than
an hour to access chilling and processing centers
Number of ports in AOI for exports: 6
51.1 % of population takes less than an hour to access
commercialization points
31.6 % of women in labor force (age 15 to 59) take
less than an hour to access commercialization points
Source: GeoAdaptive (2017)
Source: GeoAdaptive (2017)
Source: GeoAdaptive (2017)
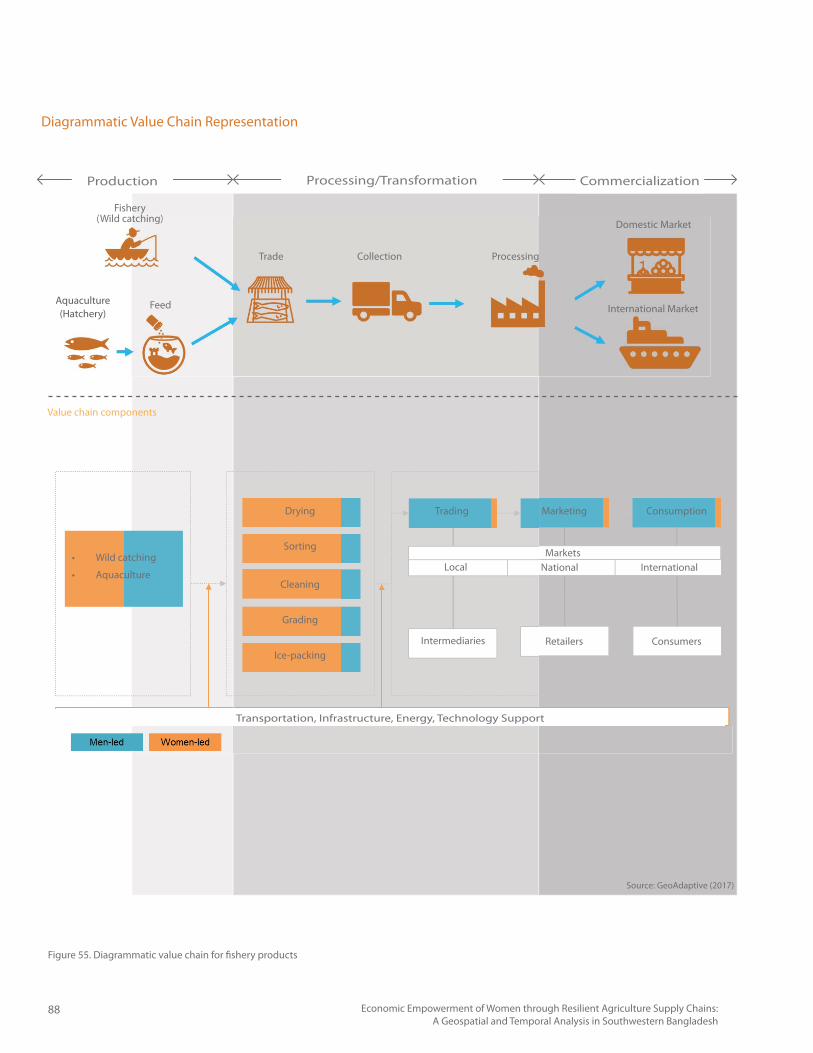
88 Economic Empowerment of Women through Resilient Agriculture Supply Chains: A Geospatial and Temporal Analysis in Southwestern Bangladesh
Diagrammatic Value Chain Representation
Figure 55. Diagrammatic value chain for fishery products
Value chain components
Production Processing/Transformation Commercialization
Fishery (Wild catching) Domestic Market
International Market
Wild catching
Aquaculture
Drying
Sorting
Cleaning
Grading
Ice-packing
Trading Marketing Consumption
MarketsLocal National International
Intermediaries Retailers Consumers
Transportation, Infrastructure, Energy, Technology Support
(Wild catching)t Domestic Market
International MarketAquaculture(Hatchery)
Trade
Feed
Collection Processing
Source: GeoAdaptive (2017)
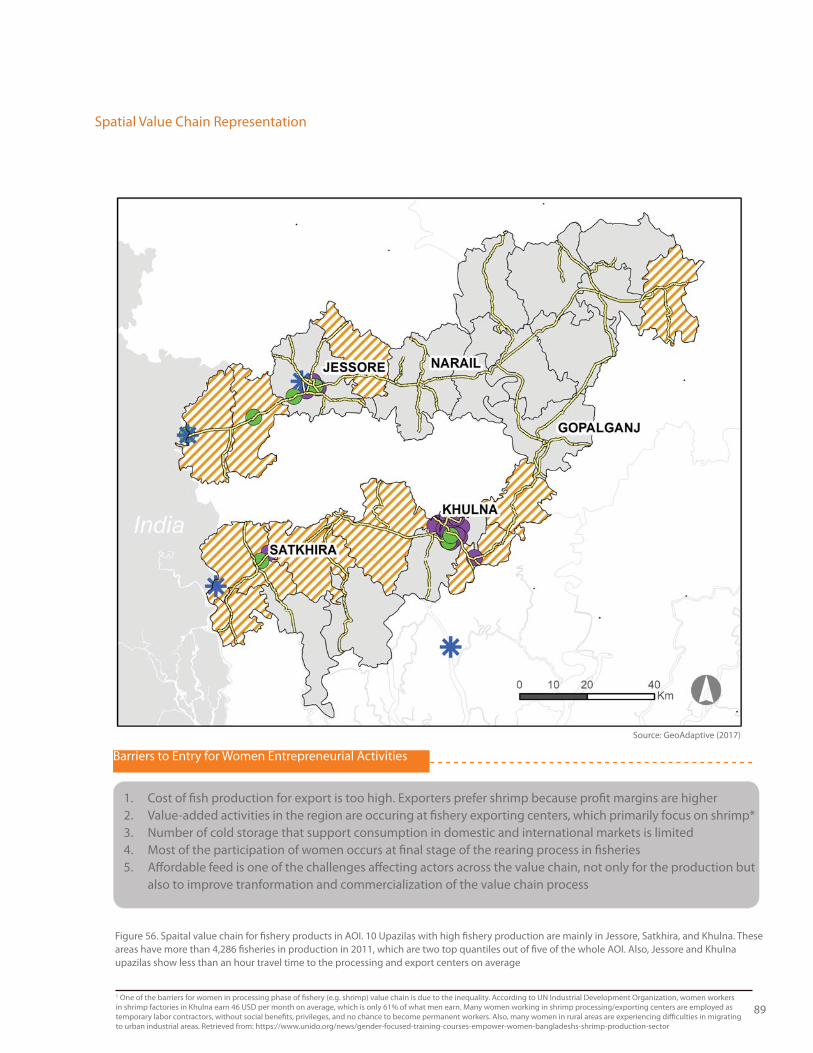
89
Spatial Value Chain Representation
1. Cost of fish production for export is too high. Exporters prefer shrimp because profit margins are higher2. Value-added activities in the region are occuring at fishery exporting centers, which primarily focus on shrimp*3. Number of cold storage that support consumption in domestic and international markets is limited4. Most of the participation of women occurs at final stage of the rearing process in fisheries5. Affordable feed is one of the challenges affecting actors across the value chain, not only for the production but
also to improve tranformation and commercialization of the value chain process
Barriers to Entry for Women Entrepreneurial Activities
Figure 56. Spaital value chain for fishery products in AOI. 10 Upazilas with high fishery production are mainly in Jessore, Satkhira, and Khulna. These areas have more than 4,286 fisheries in production in 2011, which are two top quantiles out of five of the whole AOI. Also, Jessore and Khulna upazilas show less than an hour travel time to the processing and export centers on average
1 One of the barriers for women in processing phase of fishery (e.g. shrimp) value chain is due to the inequality. According to UN Industrial Development Organization, women workers in shrimp factories in Khulna earn 46 USD per month on average, which is only 61% of what men earn. Many women working in shrimp processing/exporting centers are employed as temporary labor contractors, without social benefits, privileges, and no chance to become permanent workers. Also, many women in rural areas are experiencing difficulties in migrating to urban industrial areas. Retrieved from: https://www.unido.org/news/gender-focused-training-courses-empower-women-bangladeshs-shrimp-production-sector
Source: GeoAdaptive (2017)
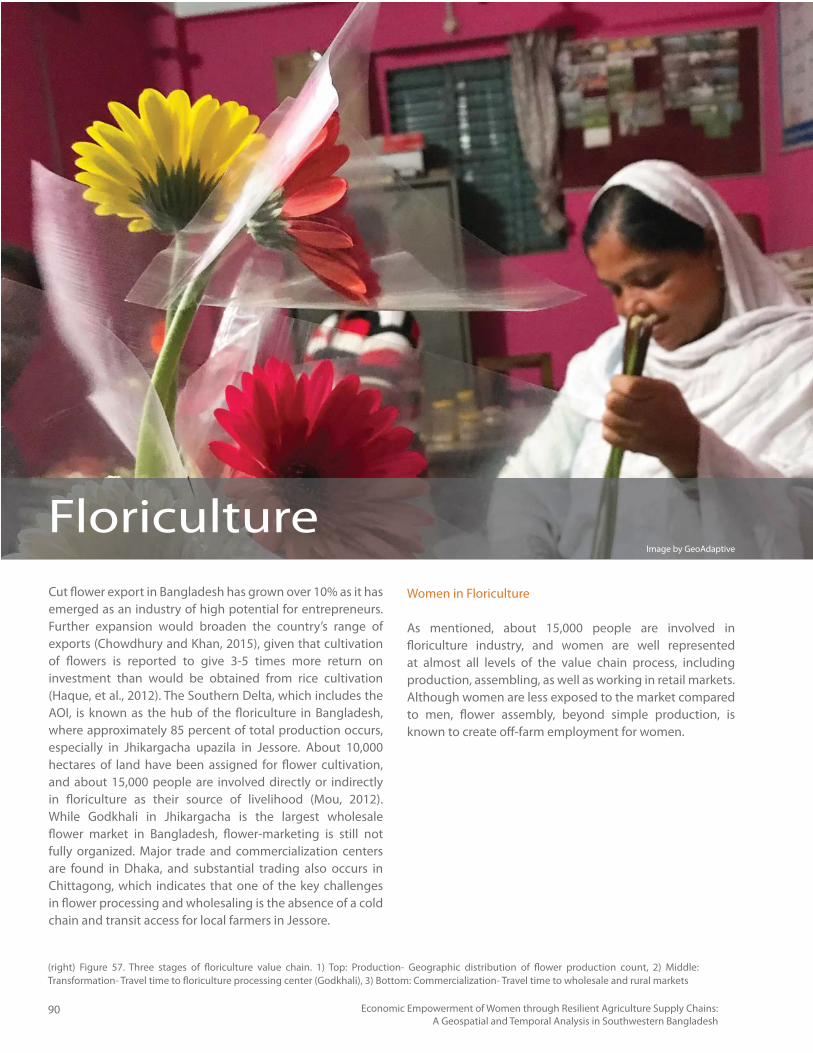
90 Economic Empowerment of Women through Resilient Agriculture Supply Chains: A Geospatial and Temporal Analysis in Southwestern Bangladesh
FloricultureCut flower export in Bangladesh has grown over 10% as it has emerged as an industry of high potential for entrepreneurs. Further expansion would broaden the country’s range of exports (Chowdhury and Khan, 2015), given that cultivation of flowers is reported to give 3-5 times more return on investment than would be obtained from rice cultivation (Haque, et al., 2012). The Southern Delta, which includes the AOI, is known as the hub of the floriculture in Bangladesh, where approximately 85 percent of total production occurs, especially in Jhikargacha upazila in Jessore. About 10,000 hectares of land have been assigned for flower cultivation, and about 15,000 people are involved directly or indirectly in floriculture as their source of livelihood (Mou, 2012). While Godkhali in Jhikargacha is the largest wholesale flower market in Bangladesh, flower-marketing is still not fully organized. Major trade and commercialization centers are found in Dhaka, and substantial trading also occurs in Chittagong, which indicates that one of the key challenges in flower processing and wholesaling is the absence of a cold chain and transit access for local farmers in Jessore.
Women in Floriculture
As mentioned, about 15,000 people are involved in floriculture industry, and women are well represented at almost all levels of the value chain process, including production, assembling, as well as working in retail markets. Although women are less exposed to the market compared to men, flower assembly, beyond simple production, is known to create off-farm employment for women.
(right) Figure 57. Three stages of floriculture value chain. 1) Top: Production- Geographic distribution of flower production count, 2) Middle: Transformation- Travel time to floriculture processing center (Godkhali), 3) Bottom: Commercialization- Travel time to wholesale and rural markets
Image by GeoAdaptive
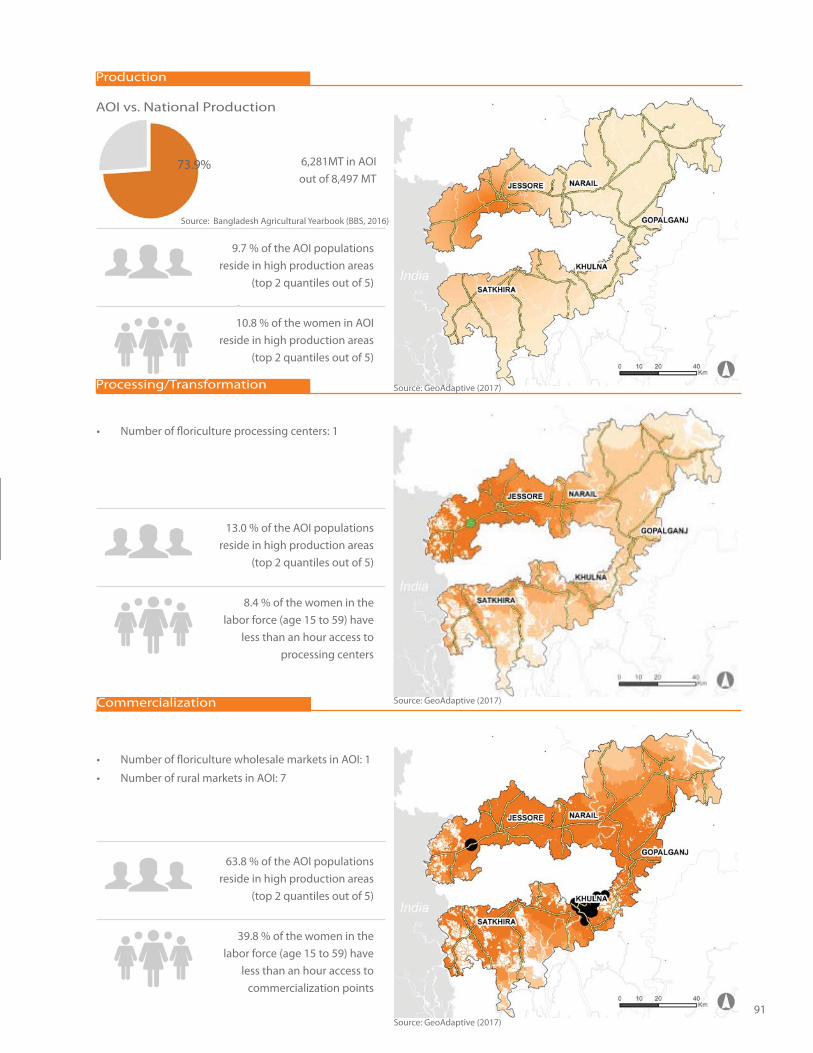
91
Production
Processing/Transformation
Commercialization
AOI vs. National Production
73.9% 6,281MT in AOI out of 8,497 MT
Source: Bangladesh Agricultural Yearbook (BBS, 2016)
9.7 % of the AOI populations reside in high production areas
(top 2 quantiles out of 5)
10.8 % of the women in AOI reside in high production areas
(top 2 quantiles out of 5)
Number of floriculture processing centers: 1
13.0 % of the AOI populations reside in high production areas
(top 2 quantiles out of 5)
8.4 % of the women in the labor force (age 15 to 59) have
less than an hour access to processing centers
63.8 % of the AOI populations reside in high production areas
(top 2 quantiles out of 5)
39.8 % of the women in the labor force (age 15 to 59) have
less than an hour access to commercialization points
Number of floriculture wholesale markets in AOI: 1
Number of rural markets in AOI: 7
Source: GeoAdaptive (2017)
Source: GeoAdaptive (2017)
Source: GeoAdaptive (2017)
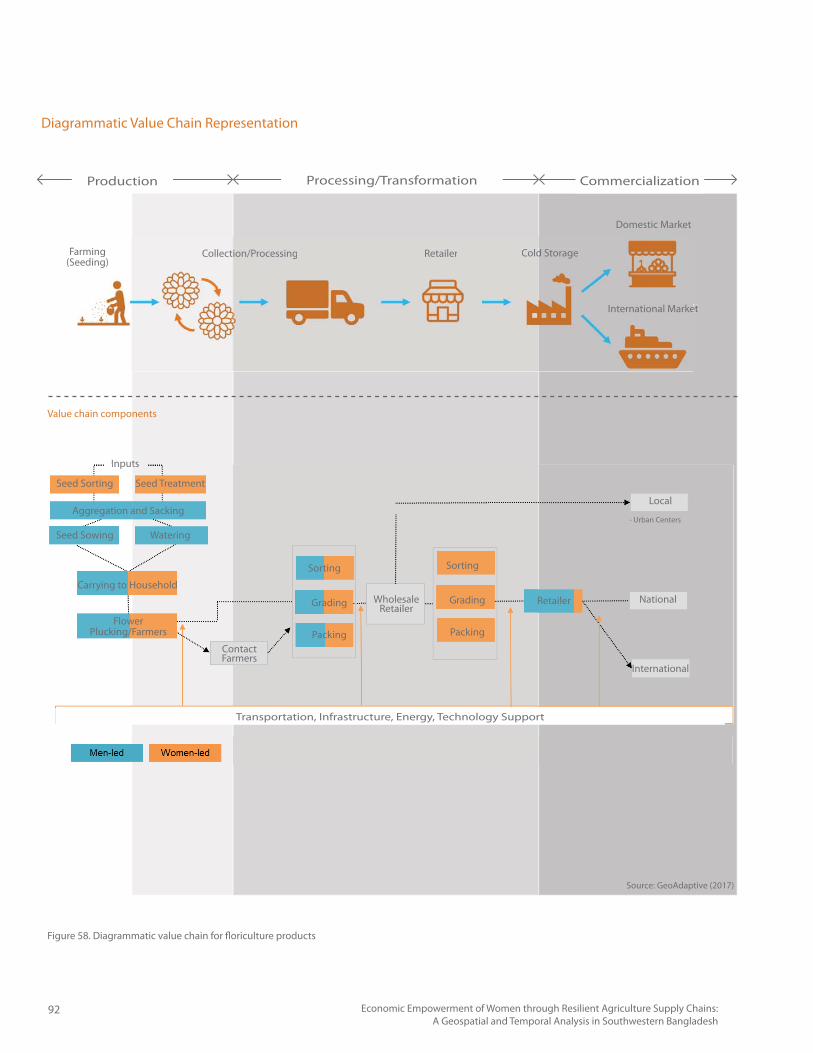
92 Economic Empowerment of Women through Resilient Agriculture Supply Chains: A Geospatial and Temporal Analysis in Southwestern Bangladesh
Diagrammatic Value Chain Representation
Figure 58. Diagrammatic value chain for floriculture products
Value chain components
Production Processing/Transformation Commercialization
Farming(Seeding)
Domestic Market
Inputs
Collection/Processing Retailer Cold Storage
Inputtst
Transportation, Infrastructure, Energy, Technology Support
Seed Sorting Seed Treatment
Aggregation and Sacking
Seed Sowing Watering
Carrying to Household
FlowerPlucking/Farmers
ContactFarmers
Sorting
Grading
Packing
Sorting
Grading
Packing
WholesaleRetailer
Retailer National
Local
International
- Urban Centers
International Market
Farming(Seeding)
Collection/Processingi Retailer Colddd Storaged
International Marke
Source: GeoAdaptive (2017)
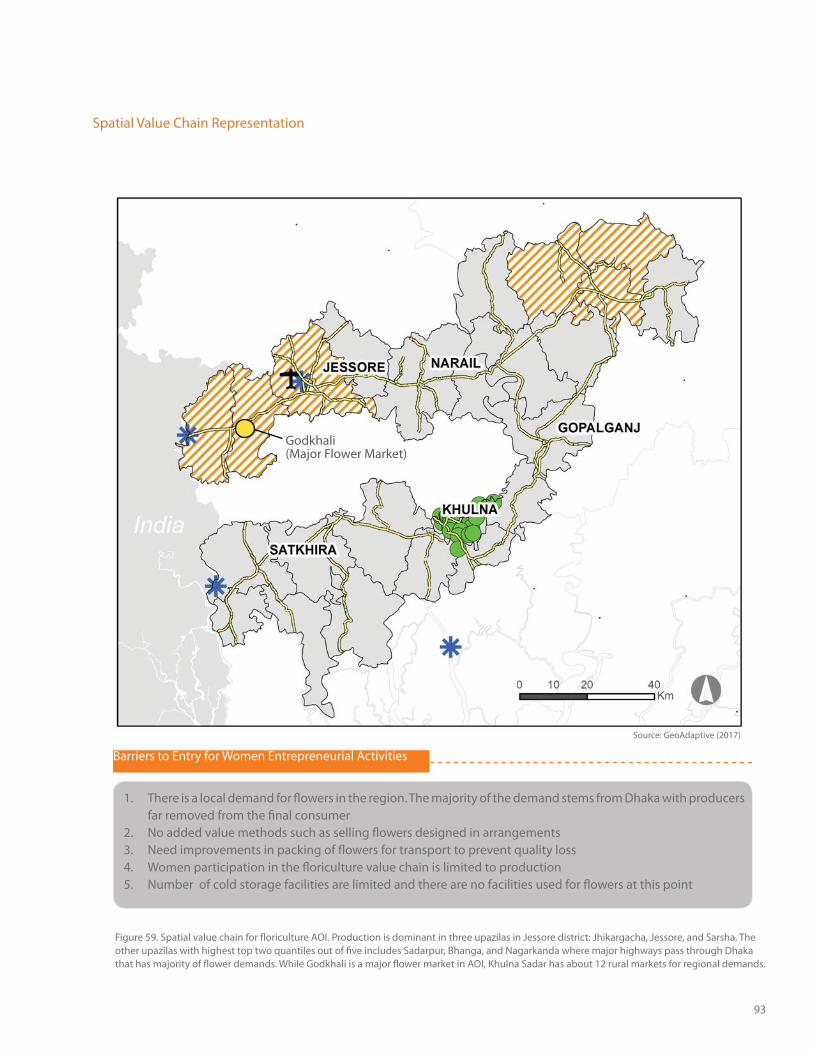
93
Spatial Value Chain Representation
1. There is a local demand for flowers in the region. The majority of the demand stems from Dhaka with producers far removed from the final consumer
2. No added value methods such as selling flowers designed in arrangements3. Need improvements in packing of flowers for transport to prevent quality loss4. Women participation in the floriculture value chain is limited to production5. Number of cold storage facilities are limited and there are no facilities used for flowers at this point
Barriers to Entry for Women Entrepreneurial Activities
Godkhali(Major Flower Market)
Figure 59. Spatial value chain for floriculture AOI. Production is dominant in three upazilas in Jessore district: Jhikargacha, Jessore, and Sarsha. The other upazilas with highest top two quantiles out of five includes Sadarpur, Bhanga, and Nagarkanda where major highways pass through Dhaka that has majority of flower demands. While Godkhali is a major flower market in AOI, Khulna Sadar has about 12 rural markets for regional demands.
Source: GeoAdaptive (2017)
94 Economic Empowerment of Women through Resilient Agriculture Supply Chains: A Geospatial and Temporal Analysis in Southwestern Bangladesh
OVERVIEW
The natural environment of southwestern Bangladesh is subject to multiple drivers of change, both seasonally and over longer time scales. Due to the region’s location in the Ganges River delta, as well as to the influence of the annual monsoon, changes in water quantity and salinity are among the most pressing concerns. The balance of fresh and salt water is constantly fluctuating, from daily tide cycles to seasonal influx of Himalayan meltwater and monsoon rains, with long term geologic and climate processes also causing sea-level rise, which threatens to submerge low-lying countries like Bangladesh.
Human activity has also significantly contributed to environmental changes and promoted resilient agriculture against environmental changes in southwestern Bangladesh. Transboundary water management has resulted in more extreme changes in river flow, primarily due to the Farakka Barrage, which diverts a significant proportion of water during the dry season, causing rivers such as the Gorai to dry up and higher salinity water to migrate further inland (Mahmuduzzaman et al., 2014). Pumping of groundwater has also impacted shallow aquifers, which have become more saline due to agricultural activity, requiring deeper wells for crop irrigation. The issue of polders is also becoming more urgent, as these protected low-lying areas are critical to ensuring the viability of rice production and aquaculture, yet deferred maintenance of the infrastructure and poorly-coordinated water management have reduced the functionality of these resources.
This combination of natural and human influence has accelerated the degradation of natural resources in the study region, and exacerbated food and water insecurity. The growing threat of sea-level rise and other climate-induced changes to seasonal weather patterns threatens to further impact the population and productive sectors of southwestern Bangladesh. Additional adaptation measures will be necessary to ensure the sustainability of livelihoods and reduce human and economic risk over the coming decades.
Box 5. Environmental Challenges
ENVIRONMENTAL MONITORING
Monitoring of environmental change has been essential to tracking the magnitude and rate of changes in water and land resources. Precipitation, surface water, and groundwater are measured throughout the year by the Bangladesh Water Development Board and other entities, using a network of monitoring stations. Salinity measurements are also collected at points throughout the country’s coastal zone, and organizations, such as the Institute of Water Modelling, use these readings to represent the distribution of the salinity gradient, both under current conditions and considering climate change projections (CSIRO, 2014).
Sea-level rise is another urgent issue that is monitored by the Climate Change Cell (CCC) of the Bangladesh Department of Environment. According to their “Assessment of Sea Level Rise on Bangladesh Coast through Trend Analysis” (CCC 2016), tide gauges and satellite altimetry are being used to track long-term trends. Over the past 20 years, stations in the Ganges tidal floodplain have recorded a range of sea-level change from -19 mm/year (decreasing) to 37 mm/year (increasing). Surges from tropical storms are another source of temporary influx of saline water in the coastal region, which can linger long after the storm has dissipated. Coupled with rising sea level, the impact of storm surge is anticipated to become more severe in the future (Mahmuduzzaman et al., 2014).
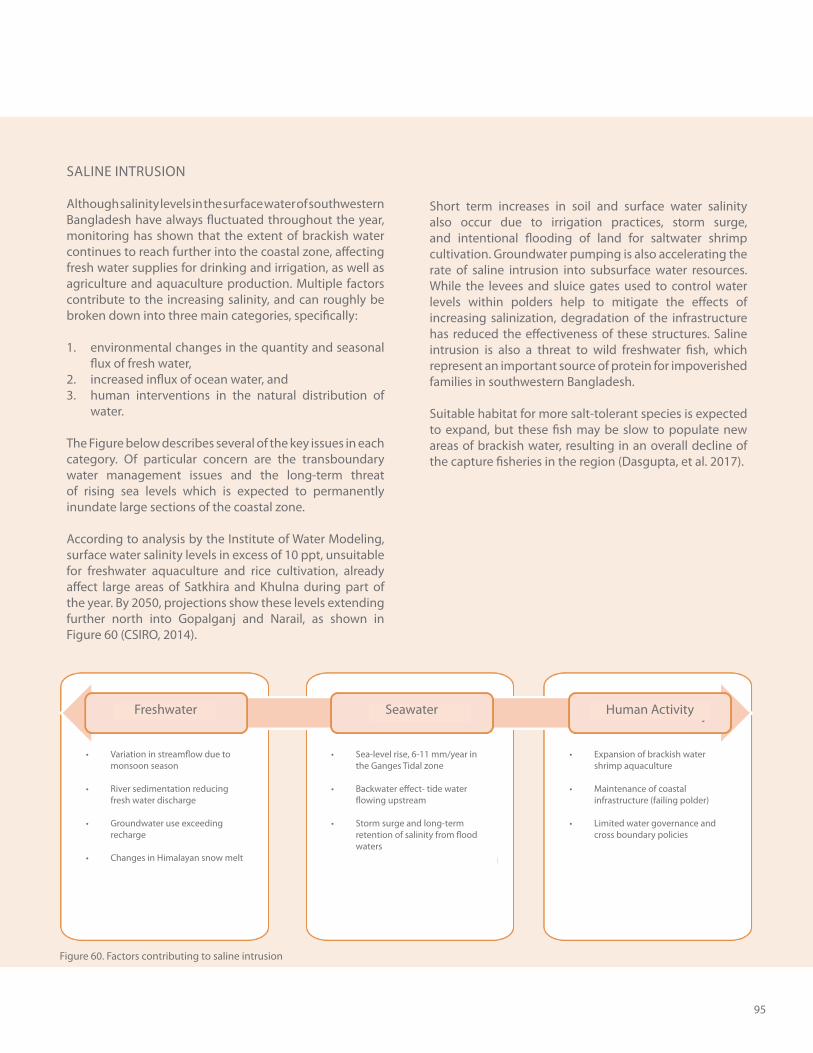
95
SALINE INTRUSION
Although salinity levels in the surface water of southwestern Bangladesh have always fluctuated throughout the year, monitoring has shown that the extent of brackish water continues to reach further into the coastal zone, affecting fresh water supplies for drinking and irrigation, as well as agriculture and aquaculture production. Multiple factors contribute to the increasing salinity, and can roughly be broken down into three main categories, specifically:
1. environmental changes in the quantity and seasonal flux of fresh water,
2. increased influx of ocean water, and 3. human interventions in the natural distribution of
water.
The Figure below describes several of the key issues in each category. Of particular concern are the transboundary water management issues and the long-term threat of rising sea levels which is expected to permanently inundate large sections of the coastal zone.
According to analysis by the Institute of Water Modeling, surface water salinity levels in excess of 10 ppt, unsuitable for freshwater aquaculture and rice cultivation, already affect large areas of Satkhira and Khulna during part of the year. By 2050, projections show these levels extending further north into Gopalganj and Narail, as shown in Figure 60 (CSIRO, 2014).
Figure 60. Factors contributing to saline intrusion
Freshwater Seawater Human Activity
Variation in streamflow due to monsoon season
River sedimentation reducing fresh water discharge
Groundwater use exceeding recharge
Changes in Himalayan snow melt
Sea-level rise, 6-11 mm/year in the Ganges Tidal zone
Backwater effect- tide water flowing upstream
Storm surge and long-term retention of salinity from flood waters
Expansion of brackish water shrimp aquaculture
Maintenance of coastal infrastructure (failing polder)
Limited water governance and cross boundary policies
Short term increases in soil and surface water salinity also occur due to irrigation practices, storm surge, and intentional flooding of land for saltwater shrimp cultivation. Groundwater pumping is also accelerating the rate of saline intrusion into subsurface water resources. While the levees and sluice gates used to control water levels within polders help to mitigate the effects of increasing salinization, degradation of the infrastructure has reduced the effectiveness of these structures. Saline intrusion is also a threat to wild freshwater fish, which represent an important source of protein for impoverished families in southwestern Bangladesh.
Suitable habitat for more salt-tolerant species is expected to expand, but these fish may be slow to populate new areas of brackish water, resulting in an overall decline of the capture fisheries in the region (Dasgupta, et al. 2017).
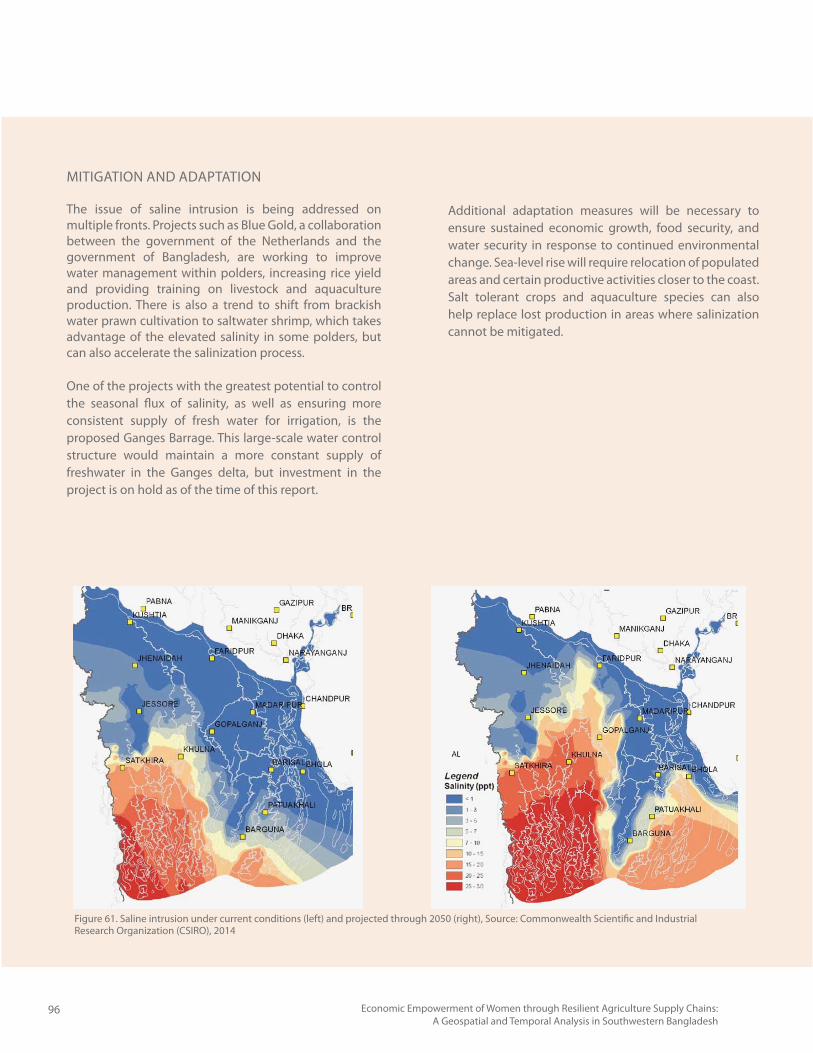
96 Economic Empowerment of Women through Resilient Agriculture Supply Chains: A Geospatial and Temporal Analysis in Southwestern Bangladesh
MITIGATION AND ADAPTATION
The issue of saline intrusion is being addressed on multiple fronts. Projects such as Blue Gold, a collaboration between the government of the Netherlands and the government of Bangladesh, are working to improve water management within polders, increasing rice yield and providing training on livestock and aquaculture production. There is also a trend to shift from brackish water prawn cultivation to saltwater shrimp, which takes advantage of the elevated salinity in some polders, but can also accelerate the salinization process.
One of the projects with the greatest potential to control the seasonal flux of salinity, as well as ensuring more consistent supply of fresh water for irrigation, is the proposed Ganges Barrage. This large-scale water control structure would maintain a more constant supply of freshwater in the Ganges delta, but investment in the project is on hold as of the time of this report.
Figure 61. Saline intrusion under current conditions (left) and projected through 2050 (right), Source: Commonwealth Scientific and Industrial Research Organization (CSIRO), 2014
Additional adaptation measures will be necessary to ensure sustained economic growth, food security, and water security in response to continued environmental change. Sea-level rise will require relocation of populated areas and certain productive activities closer to the coast. Salt tolerant crops and aquaculture species can also help replace lost production in areas where salinization cannot be mitigated.
Chapter 4Enterprise and Focal Zones Identification
97
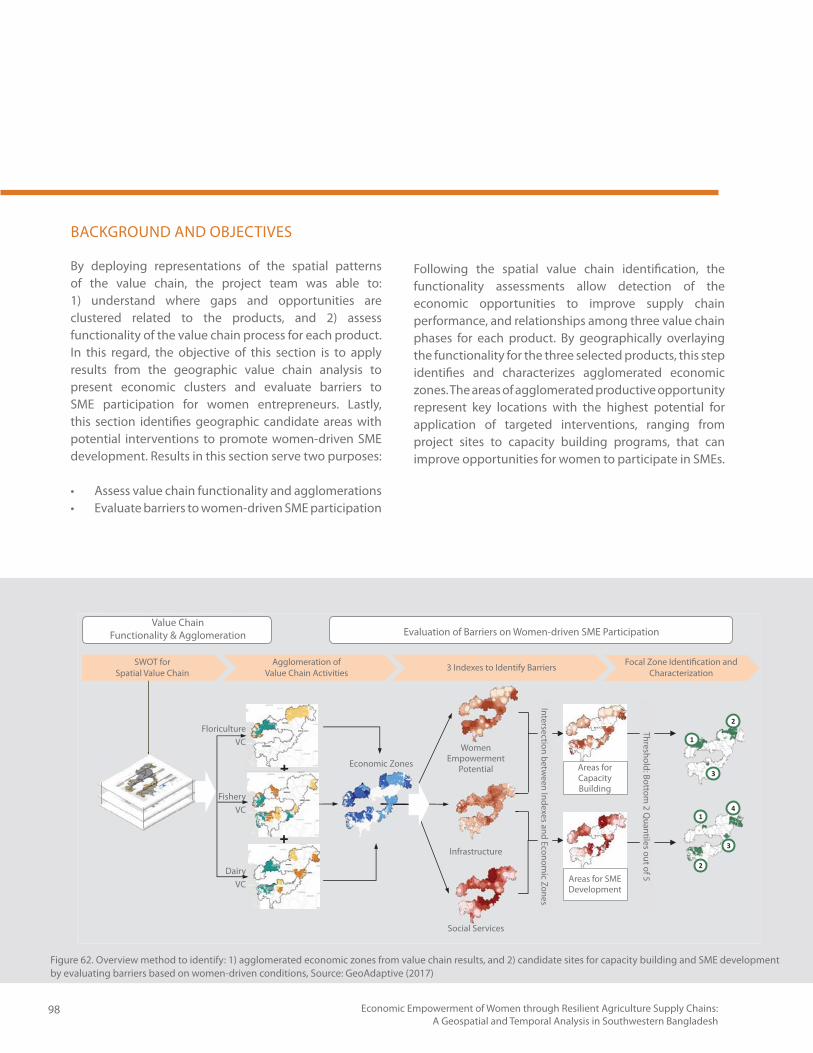
98 Economic Empowerment of Women through Resilient Agriculture Supply Chains: A Geospatial and Temporal Analysis in Southwestern Bangladesh
BACKGROUND AND OBJECTIVES
By deploying representations of the spatial patterns of the value chain, the project team was able to: 1) understand where gaps and opportunities are clustered related to the products, and 2) assess functionality of the value chain process for each product. In this regard, the objective of this section is to apply results from the geographic value chain analysis to present economic clusters and evaluate barriers to SME participation for women entrepreneurs. Lastly, this section identifies geographic candidate areas with potential interventions to promote women-driven SME development. Results in this section serve two purposes:
Assess value chain functionality and agglomerationsEvaluate barriers to women-driven SME participation
Figure 62. Overview method to identify: 1) agglomerated economic zones from value chain results, and 2) candidate sites for capacity building and SME development by evaluating barriers based on women-driven conditions, Source: GeoAdaptive (2017)
Following the spatial value chain identification, the functionality assessments allow detection of the economic opportunities to improve supply chain performance, and relationships among three value chain phases for each product. By geographically overlaying the functionality for the three selected products, this step identifies and characterizes agglomerated economic zones. The areas of agglomerated productive opportunity represent key locations with the highest potential for application of targeted interventions, ranging from project sites to capacity building programs, that can improve opportunities for women to participate in SMEs.
Conceptual Roadmap
��
��
��
��
��
��
��
��
��
Value Chain Functionality & Agglomeration Evaluation of Barriers on Women-driven SME Participation
SWOT forSpatial Value Chain
Agglomeration ofValue Chain Activities 3 Indexes to Identify Barriers Focal Zone Identification and
Characterization
FloricultureVC
FisheryVC
DairyVC
Economic Zones
Women Empowerment
Potential
Infrastructure
Social Services
Areas for Capacity Building
Areas for SME Development
Intersection between Indexes and Econom
ic Zones
Threshold: Bottom 2 Q
uantiles out of 5
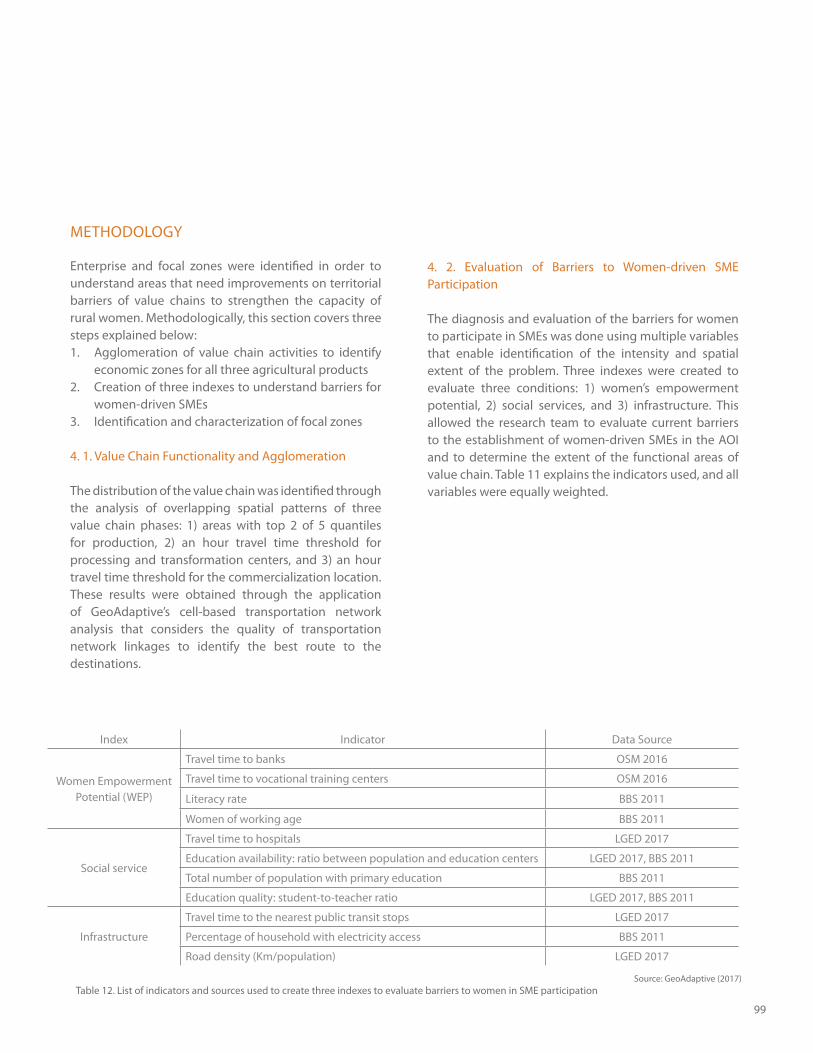
99
METHODOLOGY
Enterprise and focal zones were identified in order to understand areas that need improvements on territorial barriers of value chains to strengthen the capacity of rural women. Methodologically, this section covers three steps explained below:1. Agglomeration of value chain activities to identify
economic zones for all three agricultural products2. Creation of three indexes to understand barriers for
women-driven SMEs3. Identification and characterization of focal zones
4. 1. Value Chain Functionality and Agglomeration
The distribution of the value chain was identified through the analysis of overlapping spatial patterns of three value chain phases: 1) areas with top 2 of 5 quantiles for production, 2) an hour travel time threshold for processing and transformation centers, and 3) an hour travel time threshold for the commercialization location. These results were obtained through the application of GeoAdaptive’s cell-based transportation network analysis that considers the quality of transportation network linkages to identify the best route to the destinations.
Index Indicator Data Source
Women Empowerment Potential (WEP)
Travel time to banks OSM 2016
Travel time to vocational training centers OSM 2016
Literacy rate BBS 2011
Women of working age BBS 2011
Social service
Travel time to hospitals LGED 2017
Education availability: ratio between population and education centers LGED 2017, BBS 2011
Total number of population with primary education BBS 2011
Education quality: student-to-teacher ratio LGED 2017, BBS 2011
Infrastructure
Travel time to the nearest public transit stops LGED 2017
Percentage of household with electricity access BBS 2011
Road density (Km/population) LGED 2017
Table 12. List of indicators and sources used to create three indexes to evaluate barriers to women in SME participation
4. 2. Evaluation of Barriers to Women-driven SME Participation
The diagnosis and evaluation of the barriers for women to participate in SMEs was done using multiple variables that enable identification of the intensity and spatial extent of the problem. Three indexes were created to evaluate three conditions: 1) women’s empowerment potential, 2) social services, and 3) infrastructure. This allowed the research team to evaluate current barriers to the establishment of women-driven SMEs in the AOI and to determine the extent of the functional areas of value chain. Table 11 explains the indicators used, and all variables were equally weighted.
Source: GeoAdaptive (2017)
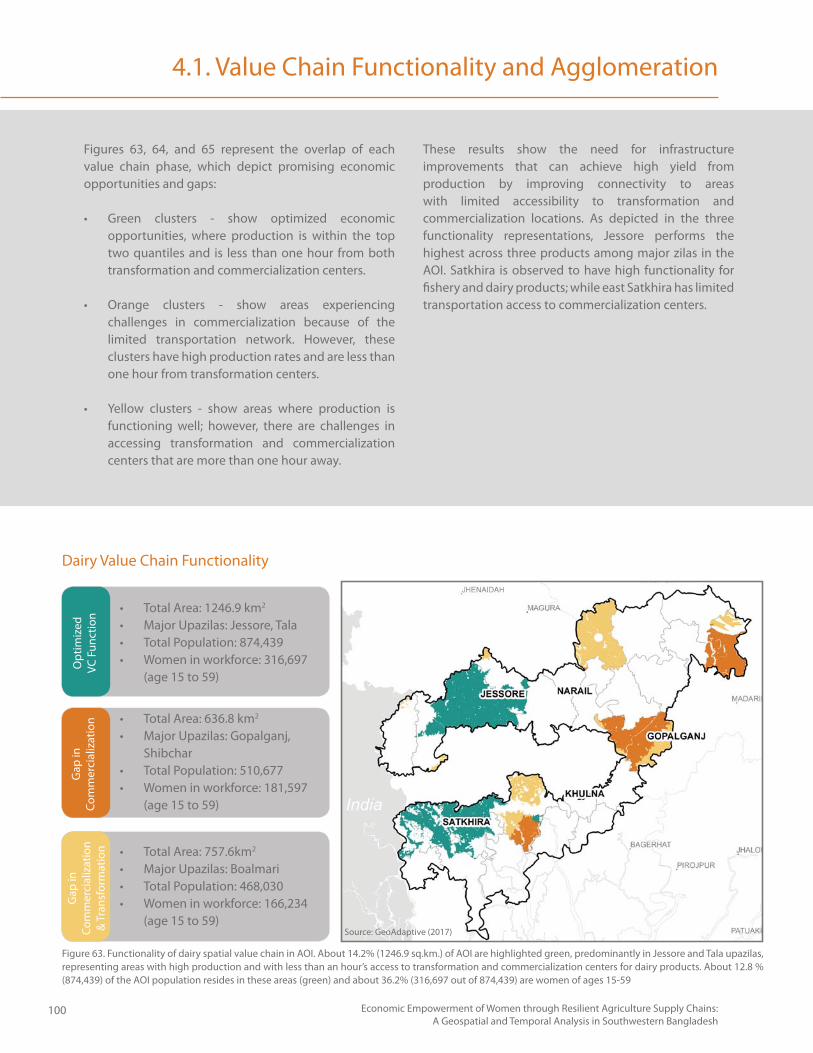
100 Economic Empowerment of Women through Resilient Agriculture Supply Chains: A Geospatial and Temporal Analysis in Southwestern Bangladesh
4.1. Value Chain Functionality and Agglomeration
Figures 63, 64, and 65 represent the overlap of each value chain phase, which depict promising economic opportunities and gaps:
Green clusters - show optimized economic opportunities, where production is within the top two quantiles and is less than one hour from both transformation and commercialization centers.
Orange clusters - show areas experiencing challenges in commercialization because of the limited transportation network. However, these clusters have high production rates and are less than one hour from transformation centers.
Yellow clusters - show areas where production is functioning well; however, there are challenges in accessing transformation and commercialization centers that are more than one hour away.
These results show the need for infrastructure improvements that can achieve high yield from production by improving connectivity to areas with limited accessibility to transformation and commercialization locations. As depicted in the three functionality representations, Jessore performs the highest across three products among major zilas in the AOI. Satkhira is observed to have high functionality for fishery and dairy products; while east Satkhira has limited transportation access to commercialization centers.
Opt
imiz
ed
VC F
unct
ion
Gap
in
Com
mer
cial
izat
ion
Gap
in
Com
mer
cial
izat
ion
& T
rans
form
atio
n
Total Area: 1246.9 km2
Major Upazilas: Jessore, TalaTotal Population: 874,439Women in workforce: 316,697 (age 15 to 59)
Total Area: 636.8 km2
Major Upazilas: Gopalganj, ShibcharTotal Population: 510,677Women in workforce: 181,597 (age 15 to 59)
Total Area: 757.6km2
Major Upazilas: BoalmariTotal Population: 468,030Women in workforce: 166,234 (age 15 to 59)
Figure 63. Functionality of dairy spatial value chain in AOI. About 14.2% (1246.9 sq.km.) of AOI are highlighted green, predominantly in Jessore and Tala upazilas, representing areas with high production and with less than an hour’s access to transformation and commercialization centers for dairy products. About 12.8 % (874,439) of the AOI population resides in these areas (green) and about 36.2% (316,697 out of 874,439) are women of ages 15-59
Dairy Value Chain Functionality
Source: GeoAdaptive (2017)
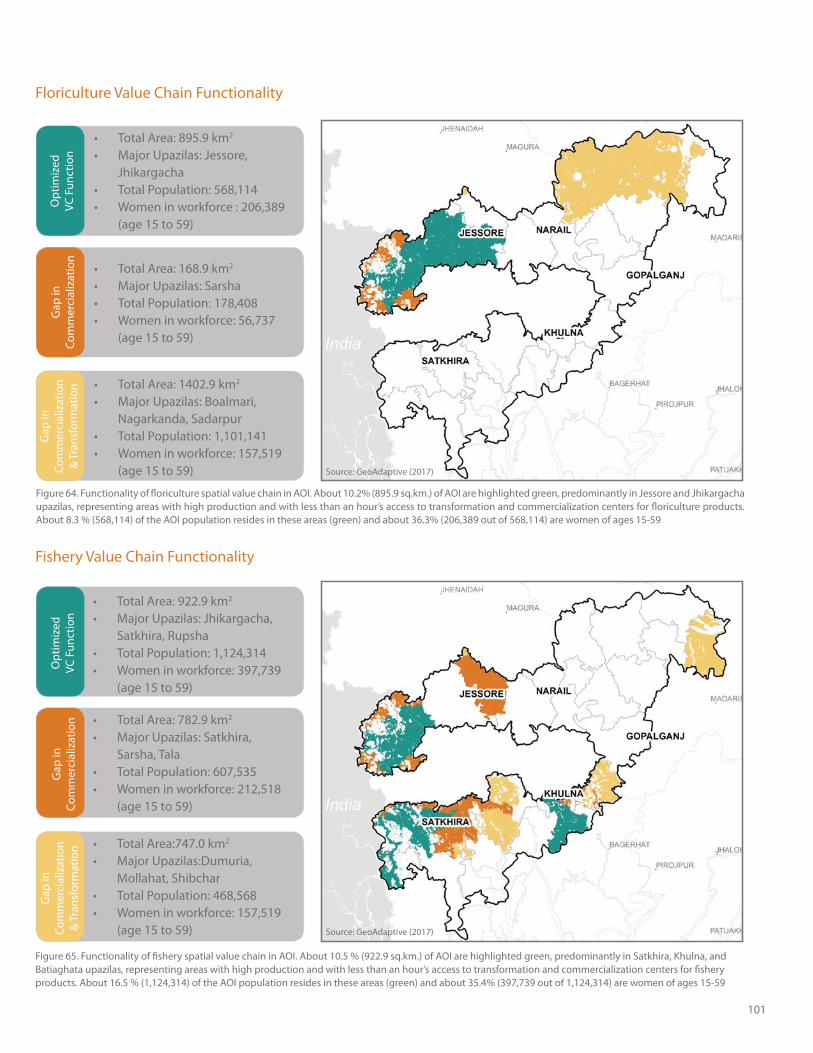
101
Opt
imiz
ed
VC F
unct
ion
Gap
in
Com
mer
cial
izat
ion
Gap
in
Com
mer
cial
izat
ion
& T
rans
form
atio
n
Opt
imiz
ed
VC F
unct
ion
Gap
in
Com
mer
cial
izat
ion
Gap
in
Com
mer
cial
izat
ion
& T
rans
form
atio
n
Total Area: 922.9 km2
Major Upazilas: Jhikargacha, Satkhira, RupshaTotal Population: 1,124,314Women in workforce: 397,739 (age 15 to 59)
Total Area: 782.9 km2
Major Upazilas: Satkhira, Sarsha, TalaTotal Population: 607,535Women in workforce: 212,518 (age 15 to 59)
Total Area:747.0 km2
Major Upazilas:Dumuria, Mollahat, ShibcharTotal Population: 468,568Women in workforce: 157,519 (age 15 to 59)
Total Area: 895.9 km2
Major Upazilas: Jessore, JhikargachaTotal Population: 568,114Women in workforce : 206,389 (age 15 to 59)
Total Area: 168.9 km2
Major Upazilas: SarshaTotal Population: 178,408Women in workforce: 56,737 (age 15 to 59)
Total Area: 1402.9 km2
Major Upazilas: Boalmari, Nagarkanda, SadarpurTotal Population: 1,101,141Women in workforce: 157,519 (age 15 to 59)
Figure 65. Functionality of fishery spatial value chain in AOI. About 10.5 % (922.9 sq.km.) of AOI are highlighted green, predominantly in Satkhira, Khulna, and Batiaghata upazilas, representing areas with high production and with less than an hour’s access to transformation and commercialization centers for fishery products. About 16.5 % (1,124,314) of the AOI population resides in these areas (green) and about 35.4% (397,739 out of 1,124,314) are women of ages 15-59
Figure 64. Functionality of floriculture spatial value chain in AOI. About 10.2% (895.9 sq.km.) of AOI are highlighted green, predominantly in Jessore and Jhikargacha upazilas, representing areas with high production and with less than an hour’s access to transformation and commercialization centers for floriculture products. About 8.3 % (568,114) of the AOI population resides in these areas (green) and about 36.3% (206,389 out of 568,114) are women of ages 15-59
Fishery Value Chain Functionality
Floriculture Value Chain Functionality
Source: GeoAdaptive (2017)
Source: GeoAdaptive (2017)
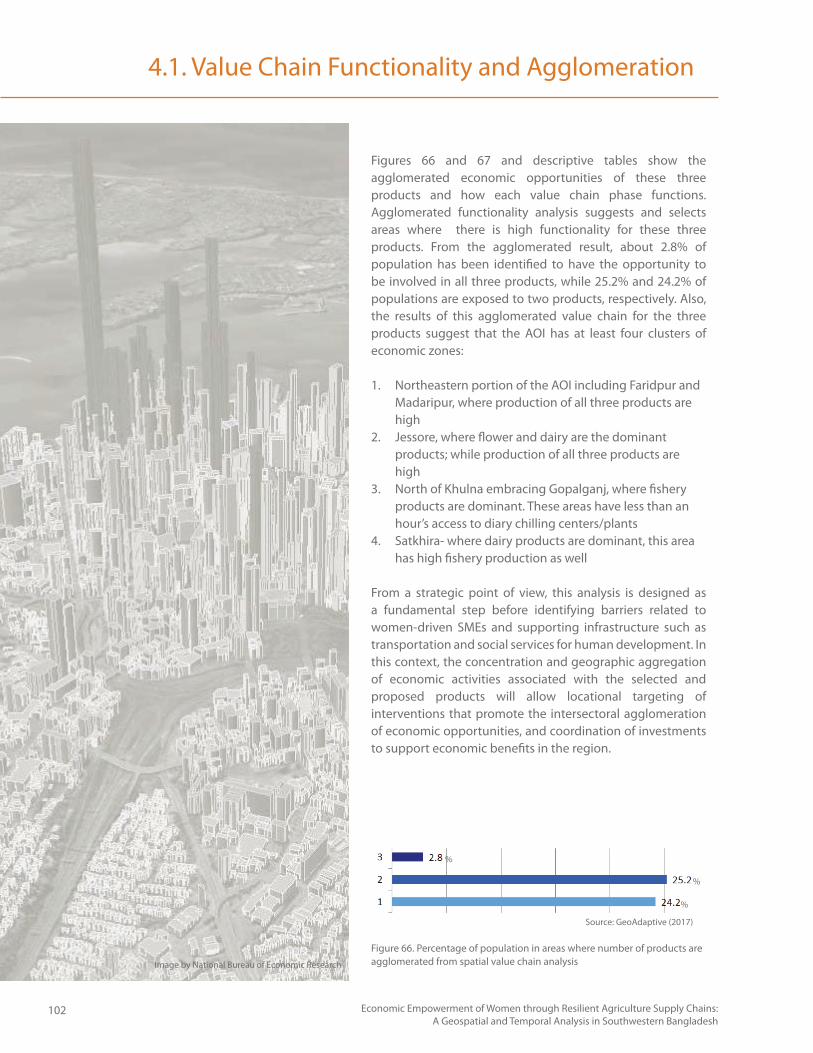
102 Economic Empowerment of Women through Resilient Agriculture Supply Chains: A Geospatial and Temporal Analysis in Southwestern Bangladesh
4.1. Value Chain Functionality and Agglomeration
Figures 66 and 67 and descriptive tables show the agglomerated economic opportunities of these three products and how each value chain phase functions. Agglomerated functionality analysis suggests and selects areas where there is high functionality for these three products. From the agglomerated result, about 2.8% of population has been identified to have the opportunity to be involved in all three products, while 25.2% and 24.2% of populations are exposed to two products, respectively. Also, the results of this agglomerated value chain for the three products suggest that the AOI has at least four clusters of economic zones:
1. Northeastern portion of the AOI including Faridpur and Madaripur, where production of all three products are high
2. Jessore, where flower and dairy are the dominant products; while production of all three products are high
3. North of Khulna embracing Gopalganj, where fishery products are dominant. These areas have less than an hour’s access to diary chilling centers/plants
4. Satkhira- where dairy products are dominant, this area has high fishery production as well
From a strategic point of view, this analysis is designed as a fundamental step before identifying barriers related to women-driven SMEs and supporting infrastructure such as transportation and social services for human development. In this context, the concentration and geographic aggregation of economic activities associated with the selected and proposed products will allow locational targeting of interventions that promote the intersectoral agglomeration of economic opportunities, and coordination of investments to support economic benefits in the region.
Figure 66. Percentage of population in areas where number of products are agglomerated from spatial value chain analysis
%
%
%
Source: GeoAdaptive (2017)
Image by National Bureau of Economic Research
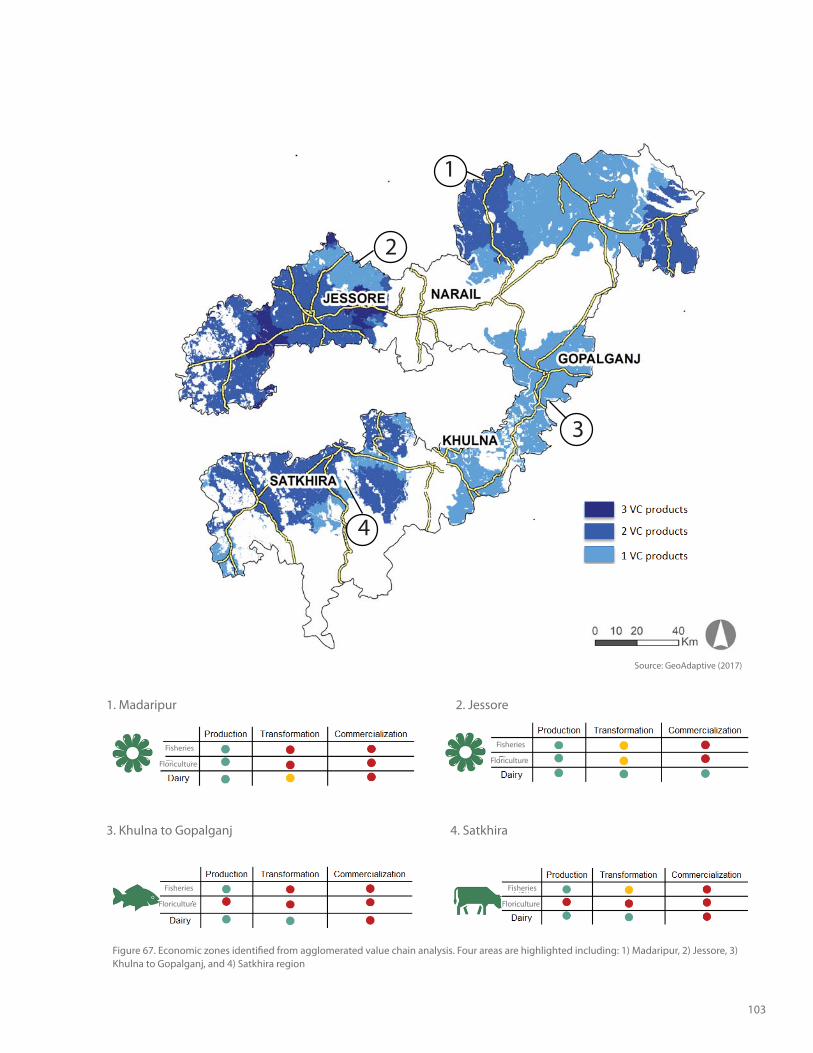
103
1
3
4
2
1. Madaripur 2. Jessore
3. Khulna to Gopalganj 4. Satkhira
Figure 67. Economic zones identified from agglomerated value chain analysis. Four areas are highlighted including: 1) Madaripur, 2) Jessore, 3) Khulna to Gopalganj, and 4) Satkhira region
Fisheries
Floriculture
Fisheries
Floriculture
Fisheries
Floriculture
Fisheries
Floriculture
Source: GeoAdaptive (2017)
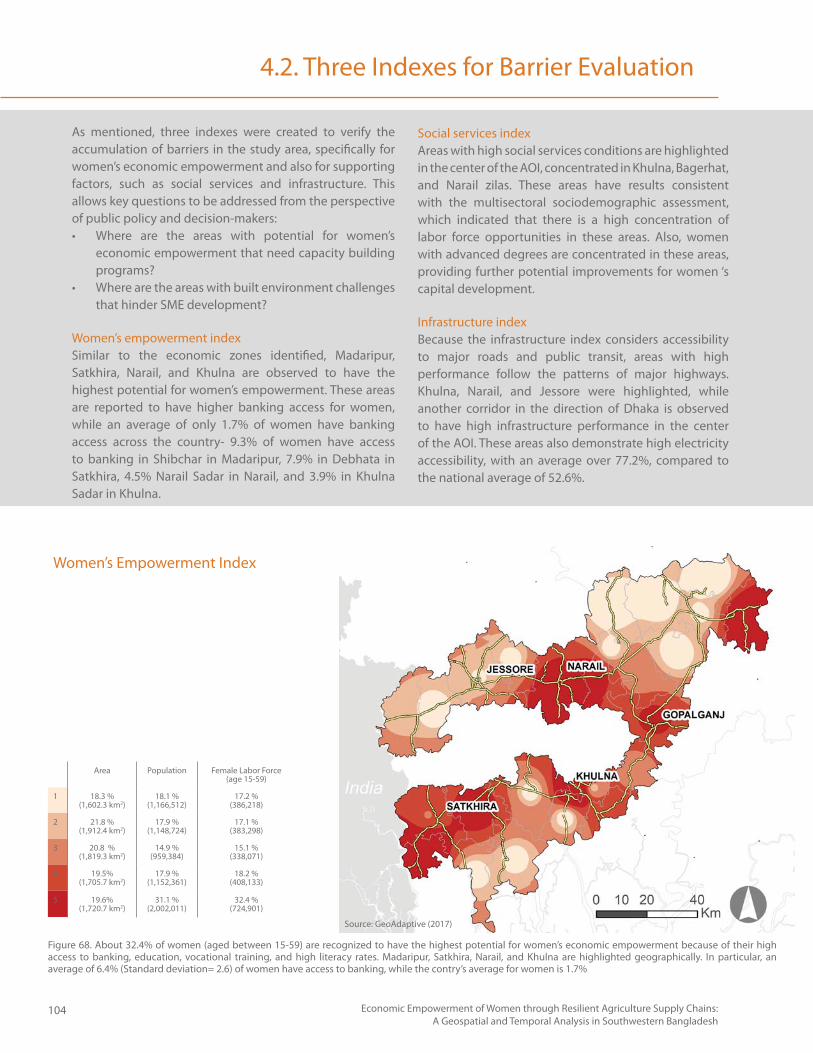
104 Economic Empowerment of Women through Resilient Agriculture Supply Chains: A Geospatial and Temporal Analysis in Southwestern Bangladesh
4.2. Three Indexes for Barrier Evaluation
As mentioned, three indexes were created to verify the accumulation of barriers in the study area, specifically for women’s economic empowerment and also for supporting factors, such as social services and infrastructure. This allows key questions to be addressed from the perspective of public policy and decision-makers:
Where are the areas with potential for women’s economic empowerment that need capacity building programs?Where are the areas with built environment challenges that hinder SME development?
Women’s empowerment indexSimilar to the economic zones identified, Madaripur, Satkhira, Narail, and Khulna are observed to have the highest potential for women’s empowerment. These areas are reported to have higher banking access for women, while an average of only 1.7% of women have banking access across the country- 9.3% of women have access to banking in Shibchar in Madaripur, 7.9% in Debhata in Satkhira, 4.5% Narail Sadar in Narail, and 3.9% in Khulna Sadar in Khulna.
Social services indexAreas with high social services conditions are highlighted in the center of the AOI, concentrated in Khulna, Bagerhat, and Narail zilas. These areas have results consistent with the multisectoral sociodemographic assessment, which indicated that there is a high concentration of labor force opportunities in these areas. Also, women with advanced degrees are concentrated in these areas, providing further potential improvements for women ‘s capital development.
Infrastructure index Because the infrastructure index considers accessibility to major roads and public transit, areas with high performance follow the patterns of major highways. Khulna, Narail, and Jessore were highlighted, while another corridor in the direction of Dhaka is observed to have high infrastructure performance in the center of the AOI. These areas also demonstrate high electricity accessibility, with an average over 77.2%, compared to the national average of 52.6%.
Area Population Female Labor Force (age 15-59)
1 18.3 %(1,602.3 km2)
18.1 %(1,166,512)
17.2 %(386,218)
2 21.8 %(1,912.4 km2)
17.9 %(1,148,724)
17.1 %(383,298)
3 20.8 %(1,819.3 km2)
14.9 %(959,384)
15.1 %(338,071)
4 19.5%(1,705.7 km2)
17.9 %(1,152,361)
18.2 %(408,133)
5 19.6%(1,720.7 km2)
31.1 %(2,002,011)
32.4 %(724,901)
Figure 68. About 32.4% of women (aged between 15-59) are recognized to have the highest potential for women’s economic empowerment because of their high access to banking, education, vocational training, and high literacy rates. Madaripur, Satkhira, Narail, and Khulna are highlighted geographically. In particular, an average of 6.4% (Standard deviation= 2.6) of women have access to banking, while the contry’s average for women is 1.7%
Women’s Empowerment Index
Source: GeoAdaptive (2017)
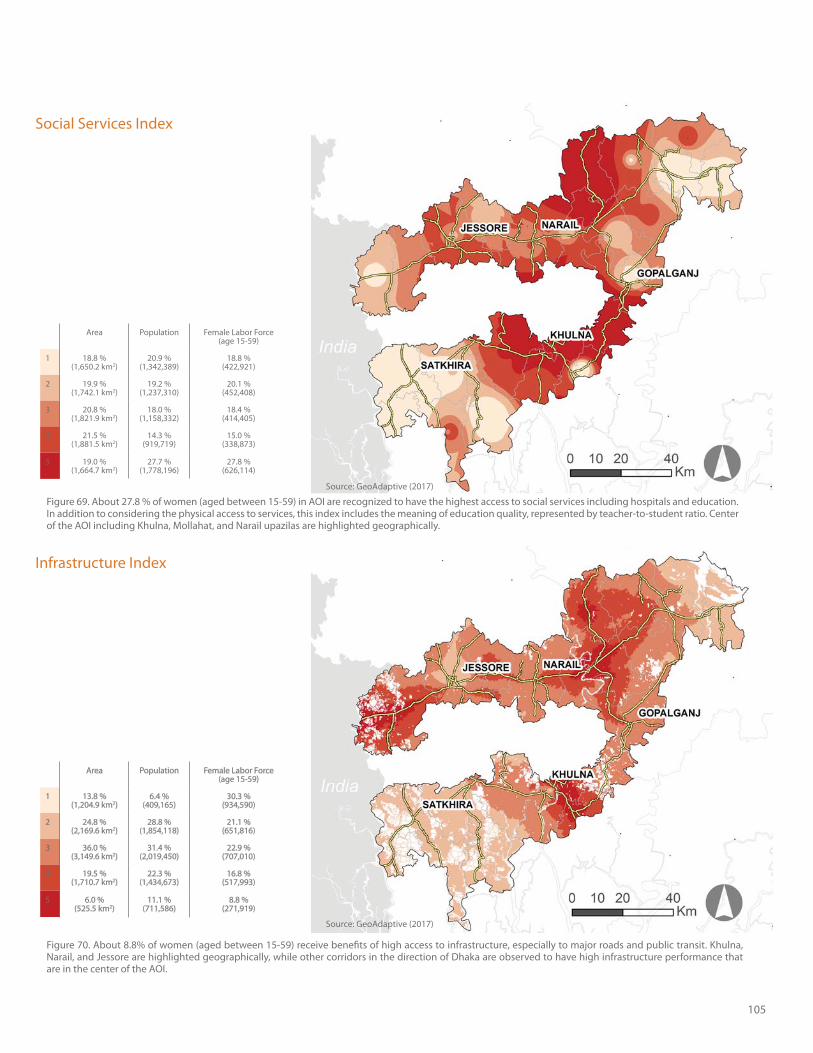
105
Figure 70. About 8.8% of women (aged between 15-59) receive benefits of high access to infrastructure, especially to major roads and public transit. Khulna, Narail, and Jessore are highlighted geographically, while other corridors in the direction of Dhaka are observed to have high infrastructure performance that are in the center of the AOI.
Figure 69. About 27.8 % of women (aged between 15-59) in AOI are recognized to have the highest access to social services including hospitals and education. In addition to considering the physical access to services, this index includes the meaning of education quality, represented by teacher-to-student ratio. Center of the AOI including Khulna, Mollahat, and Narail upazilas are highlighted geographically.
Area Population Female Labor Force (age 15-59)
1 13.8 %(1,204.9 km2)
6.4 %(409,165)
30.3 %(934,590)
2 24.8 %(2,169.6 km2)
28.8 %(1,854,118)
21.1 %(651,816)
3 36.0 %(3,149.6 km2)
31.4 %(2,019,450)
22.9 %(707,010)
4 19.5 %(1,710.7 km2)
22.3 %(1,434,673)
16.8 %(517,993)
5 6.0 %(525.5 km2)
11.1 %(711,586)
8.8 %(271,919)
Area Population Female Labor Force (age 15-59)
1 18.8 %(1,650.2 km2)
20.9 %(1,342,389)
18.8 %(422,921)
2 19.9 %(1,742.1 km2)
19.2 %(1,237,310)
20.1 %(452,408)
3 20.8 %(1,821.9 km2)
18.0 %(1,158,332)
18.4 %(414,405)
4 21.5 %(1,881.5 km2)
14.3 %(919,719)
15.0 %(338,873)
5 19.0 %(1,664.7 km2)
27.7 %(1,778,196)
27.8 %(626,114)
Infrastructure Index
Social Services Index
Source: GeoAdaptive (2017)
Source: GeoAdaptive (2017)

106 Economic Empowerment of Women through Resilient Agriculture Supply Chains: A Geospatial and Temporal Analysis in Southwestern Bangladesh
107
DiscussionWomen-driven SMEs Value Chains
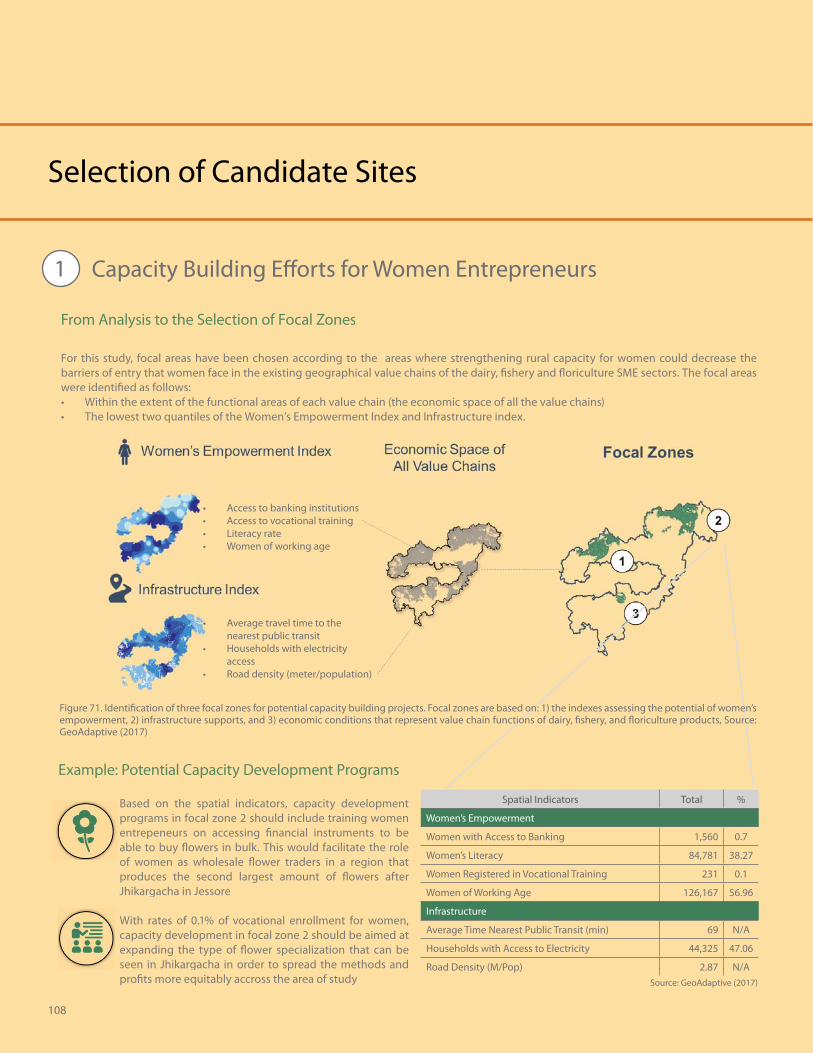
Selection of Candidate Sites
1 Capacity Building Efforts for Women Entrepreneurs
From Analysis to the Selection of Focal Zones
For this study, focal areas have been chosen according to the areas where strengthening rural capacity for women could decrease the barriers of entry that women face in the existing geographical value chains of the dairy, fishery and floriculture SME sectors. The focal areas were identified as follows:
Within the extent of the functional areas of each value chain (the economic space of all the value chains)The lowest two quantiles of the Women’s Empowerment Index and Infrastructure index.
Spatial Indicators Total %
Women’s Empowerment
Women with Access to Banking 1,560 0.7
Women’s Literacy 84,781 38.27
Women Registered in Vocational Training 231 0.1
Women of Working Age 126,167 56.96
Infrastructure
Average Time Nearest Public Transit (min) 69 N/A
Households with Access to Electricity 44,325 47.06
Road Density (M/Pop) 2.87 N/A
Example: Potential Capacity Development Programs
Based on the spatial indicators, capacity development programs in focal zone 2 should include training women entrepeneurs on accessing financial instruments to beable to buy flowers in bulk. This would facilitate the role of women as wholesale flower traders in a region thatproduces the second largest amount of flowers afterJhikargacha in Jessore
With rates of 0.1% of vocational enrollment for women,capacity development in focal zone 2 should be aimed atexpanding the type of flower specialization that can beseen in Jhikargacha in order to spread the methods andprofits more equitably accross the area of study
108
Figure 71. Identification of three focal zones for potential capacity building projects. Focal zones are based on: 1) the indexes assessing the potential of women’s empowerment, 2) infrastructure supports, and 3) economic conditions that represent value chain functions of dairy, fishery, and floriculture products, Source: GeoAdaptive (2017)
Source: GeoAdaptive (2017)
Access to banking institutionsAccess to vocational trainingLiteracy rateWomen of working age
Average travel time to the nearest public transitHouseholds with electricity accessRoad density (meter/population)
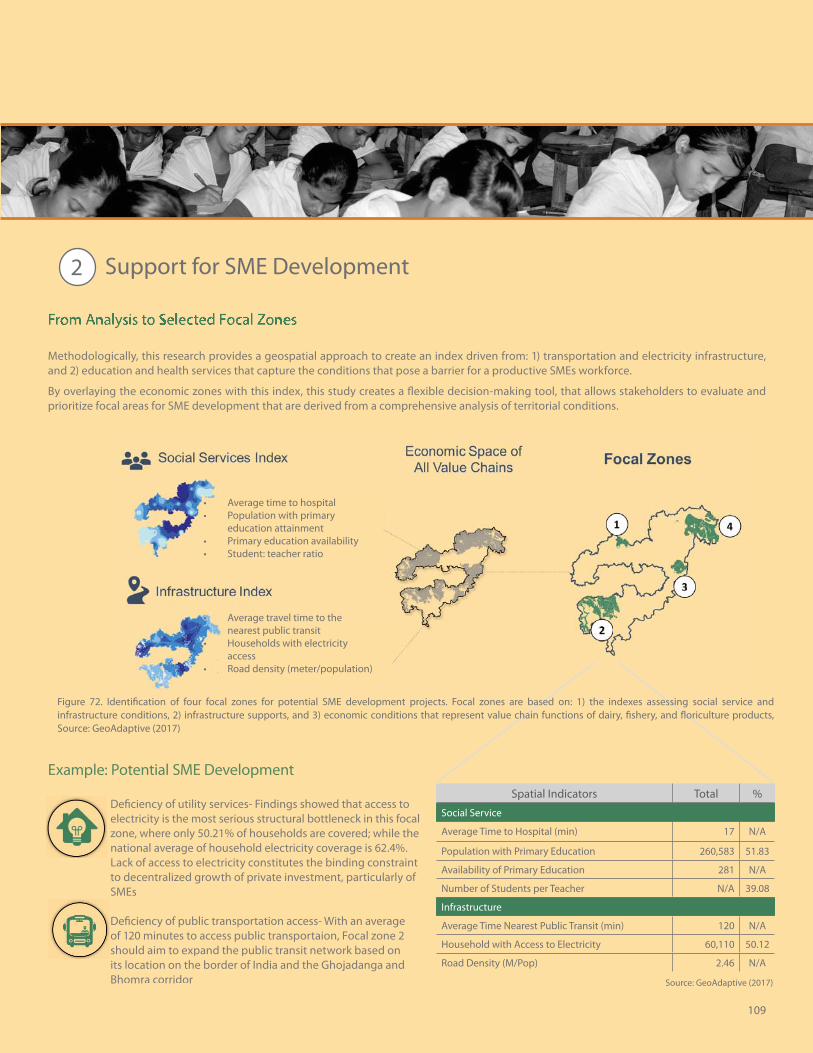
2 Support for SME Development
Methodologically, this research provides a geospatial approach to create an index driven from: 1) transportation and electricity infrastructure,and 2) education and health services that capture the conditions that pose a barrier for a productive SMEs workforce.
By overlaying the economic zones with this index, this study creates a flexible decision-making tool, that allows stakeholders to evaluate and prioritize focal areas for SME development that are derived from a comprehensive analysis of territorial conditions.
Spatial Indicators Total %
Social Service
Average Time to Hospital (min) 17 N/A
Population with Primary Education 260,583 51.83
Availability of Primary Education 281 N/A
Number of Students per Teacher N/A 39.08
Infrastructure
Average Time Nearest Public Transit (min) 120 N/A
Household with Access to Electricity 60,110 50.12
Road Density (M/Pop) 2.46 N/A
Deficiency of utility services- Findings showed that access toelectricity is the most serious structural bottleneck in this focalzone, where only 50.21% of households are covered; while thenational average of household electricity coverage is 62.4%.Lack of access to electricity constitutes the binding constraint to decentralized growth of private investment, particularly of SMEs
Deficiency of public transportation access- With an averageof 120 minutes to access public transportaion, Focal zone 2should aim to expand the public transit network based on its location on the border of India and the Ghojadanga and Bhomra corridor
109
Figure 72. Identification of four focal zones for potential SME development projects. Focal zones are based on: 1) the indexes assessing social service and infrastructure conditions, 2) infrastructure supports, and 3) economic conditions that represent value chain functions of dairy, fishery, and floriculture products, Source: GeoAdaptive (2017)
Example: Potential SME Development
From Analysis to Selected Focal ZonesFrom Analysis to Selected Focal ZonesFrom Analysis to Selected Focal ZonesFrom Analysis to Selected Focal Zones
Source: GeoAdaptive (2017)
Average time to hospital Population with primary education attainmentPrimary education availability Student: teacher ratio
Average travel time to the nearest public transitHouseholds with electricity accessRoad density (meter/population)
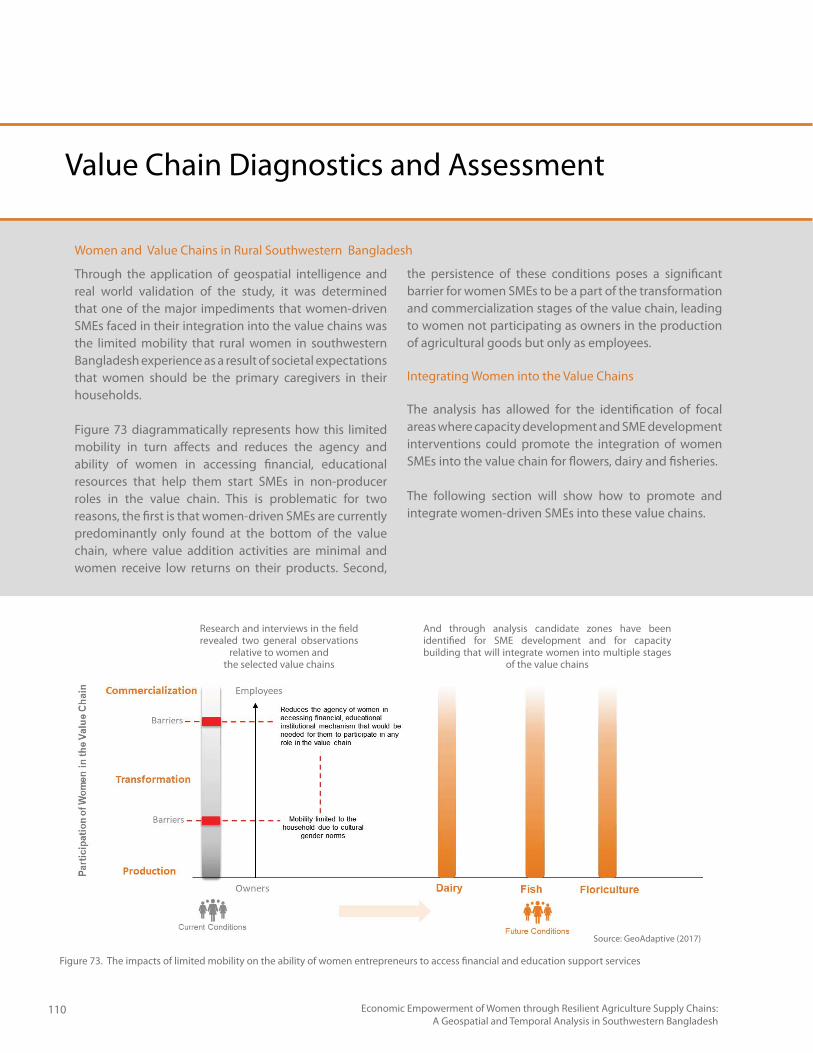
110 Economic Empowerment of Women through Resilient Agriculture Supply Chains: A Geospatial and Temporal Analysis in Southwestern Bangladesh
Through the application of geospatial intelligence and real world validation of the study, it was determined that one of the major impediments that women-driven SMEs faced in their integration into the value chains was the limited mobility that rural women in southwestern Bangladesh experience as a result of societal expectations that women should be the primary caregivers in their households.
Figure 73 diagrammatically represents how this limited mobility in turn affects and reduces the agency and ability of women in accessing financial, educational resources that help them start SMEs in non-producer roles in the value chain. This is problematic for two reasons, the first is that women-driven SMEs are currently predominantly only found at the bottom of the value chain, where value addition activities are minimal and women receive low returns on their products. Second,
Value Chain Diagnostics and Assessment
the persistence of these conditions poses a significant barrier for women SMEs to be a part of the transformation and commercialization stages of the value chain, leading to women not participating as owners in the production of agricultural goods but only as employees.
Integrating Women into the Value Chains
The analysis has allowed for the identification of focal areas where capacity development and SME development interventions could promote the integration of women SMEs into the value chain for flowers, dairy and fisheries.
The following section will show how to promote and integrate women-driven SMEs into these value chains.
Figure 73. The impacts of limited mobility on the ability of women entrepreneurs to access financial and education support services
Women and Value Chains in Rural Southwestern Bangladesh
Source: GeoAdaptive (2017)
And through analysis candidate zones have been identified for SME development and for capacity building that will integrate women into multiple stages
of the value chains
Research and interviews in the field revealed two general observations
relative to women and the selected value chains
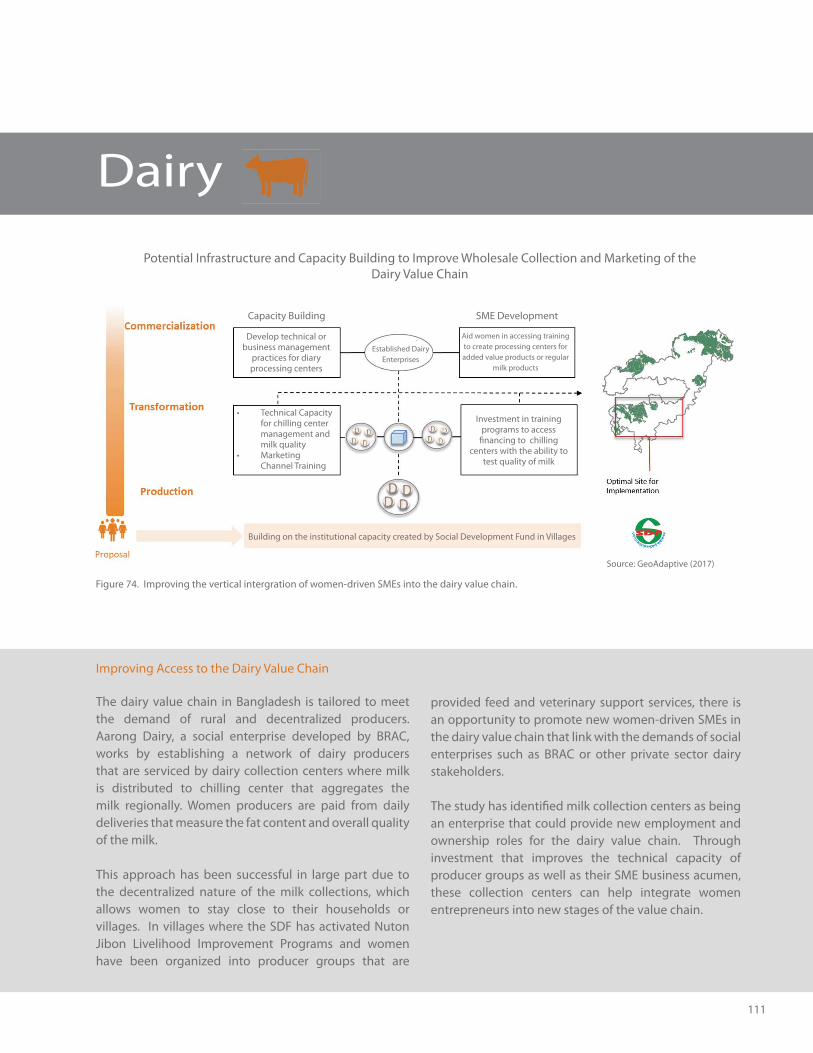
111
Dairy
Improving Access to the Dairy Value Chain
The dairy value chain in Bangladesh is tailored to meet the demand of rural and decentralized producers. Aarong Dairy, a social enterprise developed by BRAC, works by establishing a network of dairy producers that are serviced by dairy collection centers where milk is distributed to chilling center that aggregates the milk regionally. Women producers are paid from daily deliveries that measure the fat content and overall quality of the milk.
This approach has been successful in large part due to the decentralized nature of the milk collections, which allows women to stay close to their households or villages. In villages where the SDF has activated Nuton Jibon Livelihood Improvement Programs and women have been organized into producer groups that are
provided feed and veterinary support services, there is an opportunity to promote new women-driven SMEs in the dairy value chain that link with the demands of social enterprises such as BRAC or other private sector dairy stakeholders.
The study has identified milk collection centers as being an enterprise that could provide new employment and ownership roles for the dairy value chain. Through investment that improves the technical capacity of producer groups as well as their SME business acumen, these collection centers can help integrate women entrepreneurs into new stages of the value chain.
Figure 74. Improving the vertical intergration of women-driven SMEs into the dairy value chain.
Potential Infrastructure and Capacity Building to Improve Wholesale Collection and Marketing of the Dairy Value Chain
Source: GeoAdaptive (2017)
Develop technical or business management
practices for diary processing centers
Aid women in accessing training to create processing centers for added value products or regular
milk products
Technical Capacity for chilling center management and milk quality Marketing Channel Training
Investment in training programs to access
financing to chilling centers with the ability to
test quality of milk
Building on the institutional capacity created by Social Development Fund in Villages
Established Dairy Enterprises
Capacity Building SME Development
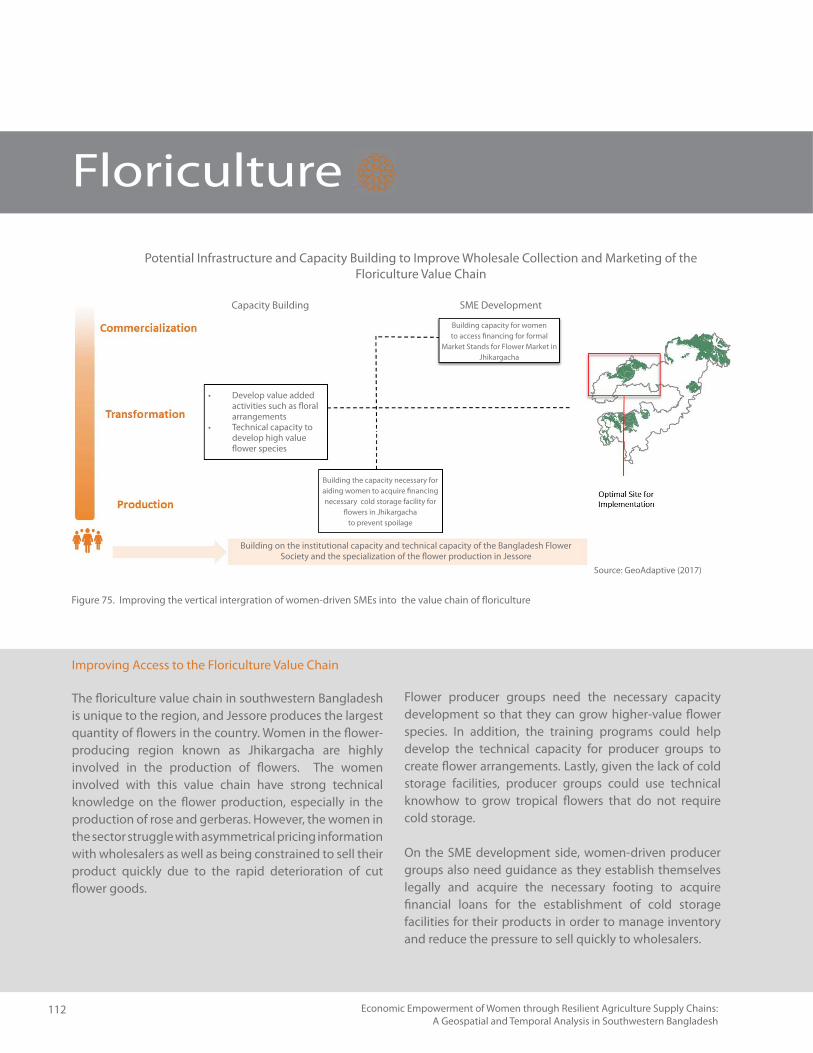
112 Economic Empowerment of Women through Resilient Agriculture Supply Chains: A Geospatial and Temporal Analysis in Southwestern Bangladesh
Floriculture
Improving Access to the Floriculture Value Chain
The floriculture value chain in southwestern Bangladesh is unique to the region, and Jessore produces the largest quantity of flowers in the country. Women in the flower-producing region known as Jhikargacha are highly involved in the production of flowers. The women involved with this value chain have strong technical knowledge on the flower production, especially in the production of rose and gerberas. However, the women in the sector struggle with asymmetrical pricing information with wholesalers as well as being constrained to sell their product quickly due to the rapid deterioration of cut flower goods.
Flower producer groups need the necessary capacity development so that they can grow higher-value flower species. In addition, the training programs could help develop the technical capacity for producer groups to create flower arrangements. Lastly, given the lack of cold storage facilities, producer groups could use technical knowhow to grow tropical flowers that do not require cold storage.
On the SME development side, women-driven producer groups also need guidance as they establish themselves legally and acquire the necessary footing to acquire financial loans for the establishment of cold storage facilities for their products in order to manage inventory and reduce the pressure to sell quickly to wholesalers.
Figure 75. Improving the vertical intergration of women-driven SMEs into the value chain of floriculture
Potential Infrastructure and Capacity Building to Improve Wholesale Collection and Marketing of the Floriculture Value Chain
Source: GeoAdaptive (2017)
Develop value added activities such as floral arrangements Technical capacity to develop high value flower species
Building capacity for women to access financing for formal
Market Stands for Flower Market in Jhikargacha
Capacity Building SME Development
Building the capacity necessary for aiding women to acquire financing necessary cold storage facility for
flowers in Jhikargacha to prevent spoilage
Building on the institutional capacity and technical capacity of the Bangladesh Flower Society and the specialization of the flower production in Jessore
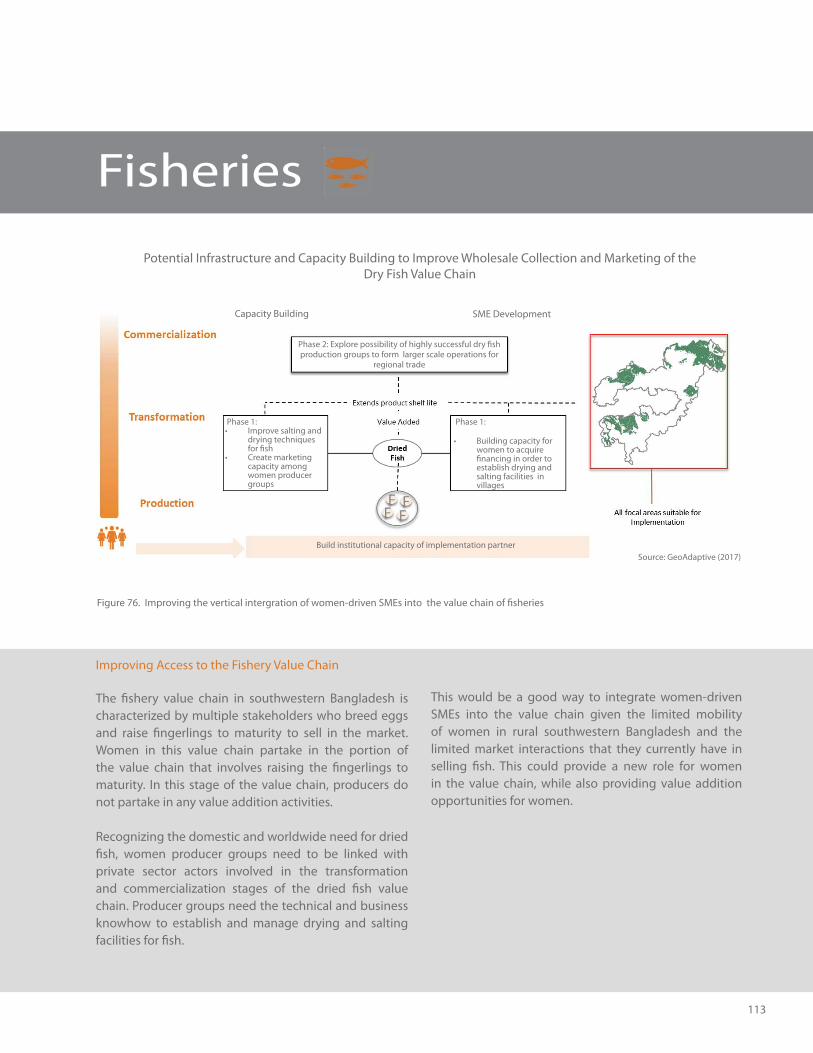
113
Fisheries
Improving Access to the Fishery Value Chain
The fishery value chain in southwestern Bangladesh is characterized by multiple stakeholders who breed eggs and raise fingerlings to maturity to sell in the market. Women in this value chain partake in the portion of the value chain that involves raising the fingerlings to maturity. In this stage of the value chain, producers do not partake in any value addition activities.
Recognizing the domestic and worldwide need for dried fish, women producer groups need to be linked with private sector actors involved in the transformation and commercialization stages of the dried fish value chain. Producer groups need the technical and business knowhow to establish and manage drying and salting facilities for fish.
This would be a good way to integrate women-driven SMEs into the value chain given the limited mobility of women in rural southwestern Bangladesh and the limited market interactions that they currently have in selling fish. This could provide a new role for women in the value chain, while also providing value addition opportunities for women.
Figure 76. Improving the vertical intergration of women-driven SMEs into the value chain of fisheries
Potential Infrastructure and Capacity Building to Improve Wholesale Collection and Marketing of the Dry Fish Value Chain
Source: GeoAdaptive (2017)Source: GeoAdaptive (2017
Capacity Building SME Development
Phase 2: Explore possibility of highly successful dry fish production groups to form larger scale operations for
regional trade
Build institutional capacity of implementation partner
Phase 1: Improve salting and drying techniques for fishCreate marketing capacity among women producer groups
Phase 1:
Building capacity for women to acquire financing in order to establish drying and salting facilities in villages
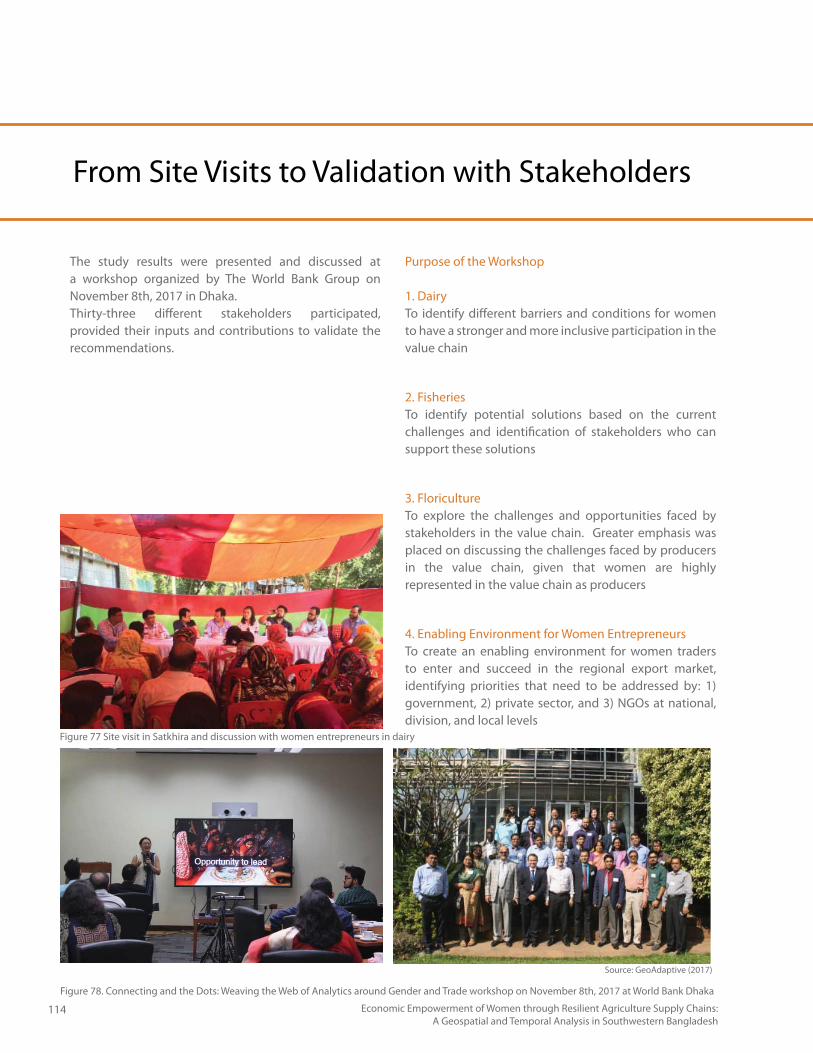
114 Economic Empowerment of Women through Resilient Agriculture Supply Chains: A Geospatial and Temporal Analysis in Southwestern Bangladesh
From Site Visits to Validation with Stakeholders
Figure 78. Connecting and the Dots: Weaving the Web of Analytics around Gender and Trade workshop on November 8th, 2017 at World Bank Dhaka
The study results were presented and discussed at a workshop organized by The World Bank Group on November 8th, 2017 in Dhaka. Thirty-three different stakeholders participated, provided their inputs and contributions to validate the recommendations.
Purpose of the Workshop
1. DairyTo identify different barriers and conditions for women to have a stronger and more inclusive participation in the value chain
2. FisheriesTo identify potential solutions based on the current challenges and identification of stakeholders who can support these solutions
3. FloricultureTo explore the challenges and opportunities faced by stakeholders in the value chain. Greater emphasis was placed on discussing the challenges faced by producers in the value chain, given that women are highly represented in the value chain as producers
4. Enabling Environment for Women EntrepreneursTo create an enabling environment for women traders to enter and succeed in the regional export market, identifying priorities that need to be addressed by: 1) government, 2) private sector, and 3) NGOs at national, division, and local levels
Figure 77 Site visit in Satkhira and discussion with women entrepreneurs in dairy
Source: GeoAdaptive (2017)
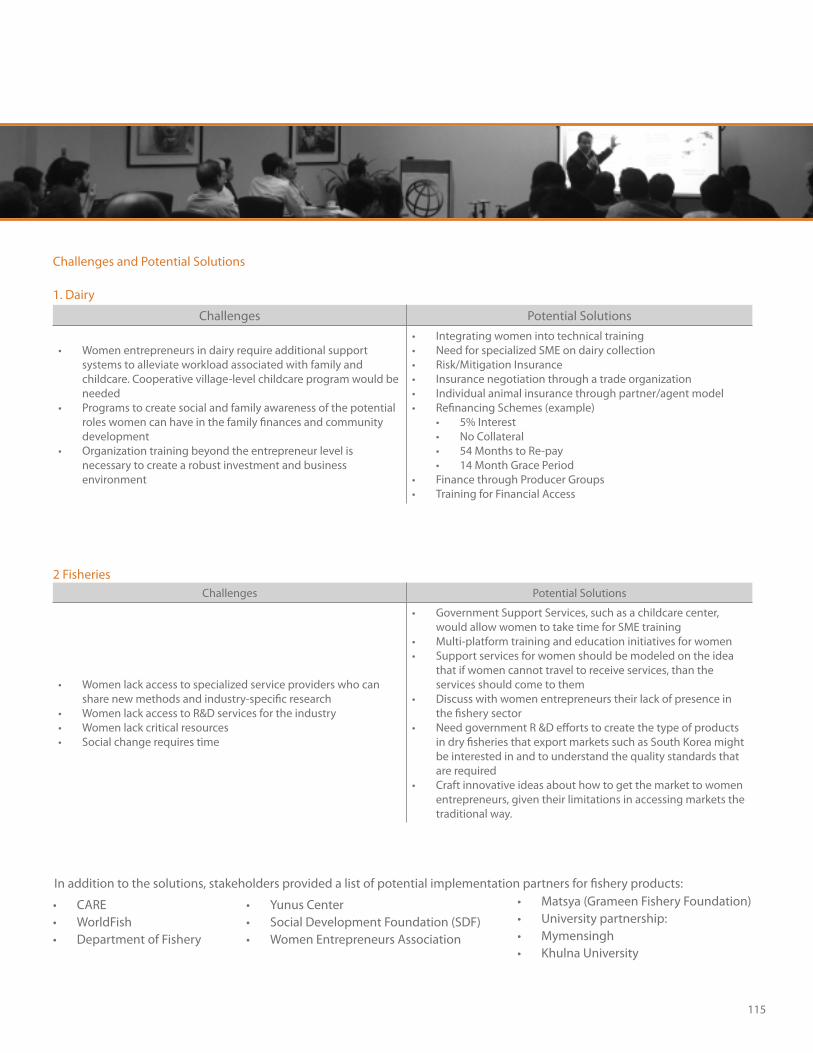
115
Challenges Potential Solutions
Women entrepreneurs in dairy require additional support systems to alleviate workload associated with family and childcare. Cooperative village-level childcare program would be neededPrograms to create social and family awareness of the potential roles women can have in the family finances and community development Organization training beyond the entrepreneur level is necessary to create a robust investment and business environment
Integrating women into technical training Need for specialized SME on dairy collectionRisk/Mitigation InsuranceInsurance negotiation through a trade organization Individual animal insurance through partner/agent modelRefinancing Schemes (example)
5% InterestNo Collateral54 Months to Re-pay14 Month Grace Period
Finance through Producer Groups Training for Financial Access
Challenges and Potential Solutions
1. Dairy
2 FisheriesChallenges Potential Solutions
Women lack access to specialized service providers who can share new methods and industry-specific researchWomen lack access to R&D services for the industryWomen lack critical resourcesSocial change requires time
Government Support Services, such as a childcare center, would allow women to take time for SME training Multi-platform training and education initiatives for womenSupport services for women should be modeled on the idea that if women cannot travel to receive services, than the services should come to themDiscuss with women entrepreneurs their lack of presence in the fishery sectorNeed government R &D efforts to create the type of products in dry fisheries that export markets such as South Korea might be interested in and to understand the quality standards that are requiredCraft innovative ideas about how to get the market to women entrepreneurs, given their limitations in accessing markets the traditional way.
In addition to the solutions, stakeholders provided a list of potential implementation partners for fishery products:
CAREWorldFishDepartment of Fishery
Yunus Center Social Development Foundation (SDF)Women Entrepreneurs Association
Matsya (Grameen Fishery Foundation)University partnership:Mymensingh Khulna University
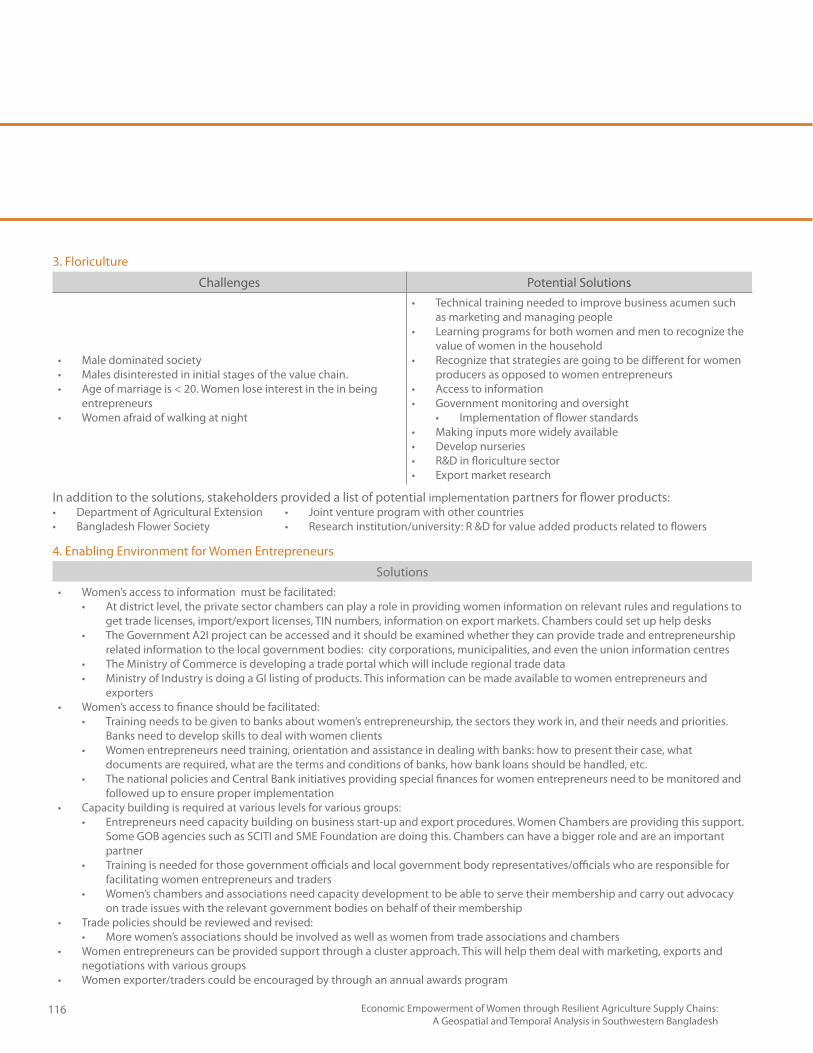
116 Economic Empowerment of Women through Resilient Agriculture Supply Chains: A Geospatial and Temporal Analysis in Southwestern Bangladesh
Challenges Potential Solutions
Male dominated societyMales disinterested in initial stages of the value chain.Age of marriage is < 20. Women lose interest in the in being entrepreneursWomen afraid of walking at night
Technical training needed to improve business acumen such as marketing and managing peopleLearning programs for both women and men to recognize the value of women in the householdRecognize that strategies are going to be different for women producers as opposed to women entrepreneursAccess to information Government monitoring and oversight
Implementation of flower standardsMaking inputs more widely available Develop nurseries R&D in floriculture sectorExport market research
3. Floriculture
4. Enabling Environment for Women Entrepreneurs
SolutionsWomen’s access to information must be facilitated:
At district level, the private sector chambers can play a role in providing women information on relevant rules and regulations to get trade licenses, import/export licenses, TIN numbers, information on export markets. Chambers could set up help desksThe Government A2I project can be accessed and it should be examined whether they can provide trade and entrepreneurship related information to the local government bodies: city corporations, municipalities, and even the union information centresThe Ministry of Commerce is developing a trade portal which will include regional trade dataMinistry of Industry is doing a GI listing of products. This information can be made available to women entrepreneurs and exporters
Women’s access to finance should be facilitated: Training needs to be given to banks about women’s entrepreneurship, the sectors they work in, and their needs and priorities. Banks need to develop skills to deal with women clientsWomen entrepreneurs need training, orientation and assistance in dealing with banks: how to present their case, what documents are required, what are the terms and conditions of banks, how bank loans should be handled, etc. The national policies and Central Bank initiatives providing special finances for women entrepreneurs need to be monitored and followed up to ensure proper implementation
Capacity building is required at various levels for various groups:Entrepreneurs need capacity building on business start-up and export procedures. Women Chambers are providing this support. Some GOB agencies such as SCITI and SME Foundation are doing this. Chambers can have a bigger role and are an important partnerTraining is needed for those government officials and local government body representatives/officials who are responsible for facilitating women entrepreneurs and traders Women’s chambers and associations need capacity development to be able to serve their membership and carry out advocacy on trade issues with the relevant government bodies on behalf of their membership
Trade policies should be reviewed and revised:More women’s associations should be involved as well as women from trade associations and chambers
Women entrepreneurs can be provided support through a cluster approach. This will help them deal with marketing, exports and negotiations with various groupsWomen exporter/traders could be encouraged by through an annual awards program
In addition to the solutions, stakeholders provided a list of potential implementation partners for flower products:Department of Agricultural ExtensionBangladesh Flower Society
Joint venture program with other countriesResearch institution/university: R &D for value added products related to flowers
Annexes
117
A. Field Visit Insights
B. Technical Details
C. Data Catalog- Geospatial
D. Data Catalog- Trade Export
E. References
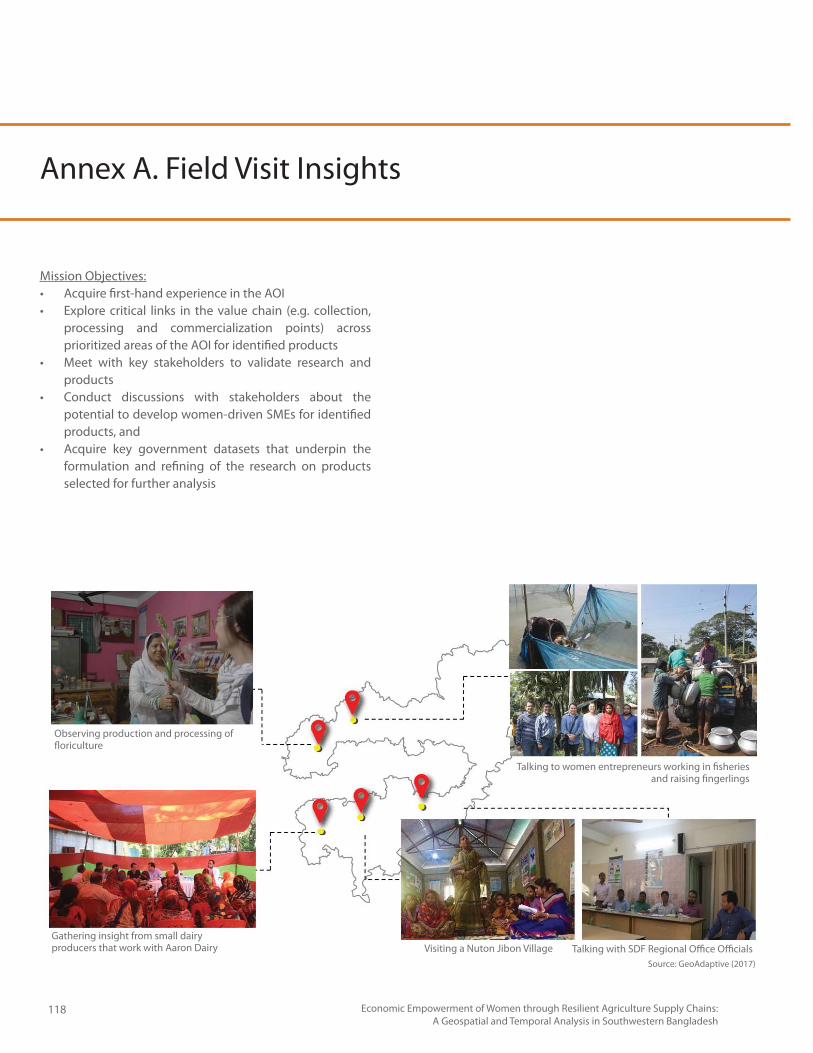
118 Economic Empowerment of Women through Resilient Agriculture Supply Chains: A Geospatial and Temporal Analysis in Southwestern Bangladesh
Annex A. Field Visit Insights
Mission Objectives:Acquire first-hand experience in the AOIExplore critical links in the value chain (e.g. collection, processing and commercialization points) across prioritized areas of the AOI for identified productsMeet with key stakeholders to validate research and productsConduct discussions with stakeholders about the potential to develop women-driven SMEs for identified products, andAcquire key government datasets that underpin the formulation and refining of the research on products selected for further analysis
Talking to women entrepreneurs working in fisheries and raising fingerlings
Visiting a Nuton Jibon Village Talking with SDF Regional Office OfficialsGathering insight from small dairy producers that work with Aaron Dairy
Observing production and processing of floriculture
Source: GeoAdaptive (2017)
119
Nuton Jibon/ Social Development Foundation (SDF)
Meeting Location(s)Discussion at Dhaka
Field Visit- Jessore, Satkhira, and Khulna
Meeting with Social Development Foundation (SDF)
Objectives
Learn about the success of Notun Jibon project in rural communities in Bangladesh Visit rural beneficiary communities in Jessore and Satkhira to learn about the short- and long-term needs for women-driven SMEsCollect insights and data about the type of capacity building programs developed through Nuton Jibon project
Lessons learned:
A beneficiary village the team visited in Satkhira conducts a bi-weekly meeting to: 1) check-on yields and revenues of the products (e.g. dairy), 2) identify needs of construction and maintenance of the infrastructure in the community, and 3) provide and train women on access to finance. Women are major labor forces in the community, contributing in production of agricultural crops and dairy; while men are involved in processing and selling products. Women who focus on homestead dairy farming have expressed interest in receiving training to understand how cow feed and vaccination relates to high yields
Lessons Learned from Mission and Local Stakeholders:
BRAC
Meeting Location(s)Discussion at Dhaka
Field Visit- Satkhira
Meeting with BRAC Dairy
Objectives
Collect location of chilling centers and BRAC programs that benefited women at national level and in southwestern region of Bangladesh Visit rural beneficiary communities in Satkhira, especially those have milk chilling and processing centers, and meet women producers
Lessons learned:
About 3,000 households in Satkhira are producing milk and about 10,000 cattle (6,000 cows) contribute to milk production There are 8 milk collection centers; and 7 collection points across Satkhira (Figure A.3). Milk collection center technicians perform quality control of the product About 12,000 liters of qualified milk are produced and collected from both collection centers and points; then reported to BRAC dairy
120 Economic Empowerment of Women through Resilient Agriculture Supply Chains: A Geospatial and Temporal Analysis in Southwestern Bangladesh
World FishBangladesh Frozen Foods Exporters Association (BFFEA) & Department of Fishery
Atlas Sea Food Industry Ltd.
Meeting Location (s) Field Visit- Jessore, and Khulna
Meeting with:WorldFishDepartment of Fishery, KhulnaBangladesh Frozen Foods Exporters Association (BFFEA)
Objectives
Observe fishery production, including SMEs business owners- 1) fingerling, 2) carp hatchery, 3) tilapia fry production system and brood rearing, and 4) a women entrepreneur Hear experience of BFFEA and Department of Fishery on existing production/processing system and status of the export
Lessons learned:
In order to reduce poverty, USAID started the Aquaculture for Income and Nutrition (AIN) program that was implemented by WorldFish. The main objective is to emphasize technology development for improved fish strains, and capacity building in hatcheries and nurseries for wider dissemination and uptake among small and medium scale household and commercial producersThe program covers 68 Upazilas in four (4) zilas- Khulna, Jessore, Faridpor, Barisal, and Chittagong, and the main location is KhulnaFrom AIN, high quality and accessible seed is identified as the most important factor for sustainable production in aquacultureFishery industry is maintained using various types of productions, including feed mills, ice plants, hatcheries, and culturingShrimp culture is of central importance to the fishery sector in Bangladesh particularly in the context of export earnings- it also provides direct employment to over 1 million people who, in turn, support well over 3.5 million dependentsMajor export destinations are Belgium, UK, and Netherlands by order in FY 2014-15Among fish, Pangasius is available in all major rivers of the middle and southern parts of the country
Lessons Learned from Mission and Local Stakeholders:
Bangladesh Flower Society (BFS)
Meeting Location (s) Field visit- Jessore (Godkhila)
Meeting with:The Bangladesh Flower Society (BFS)About 30 women floriculture producers in Godkhila
Objectives Visit the largest floriculture production location across the country and to understand the floriculture process to a value-added productMeet women floriculture producers to understand their constraints
Lessons learned:
While floriculture in Bangladesh is in an early stage; about 50,000 MT lands are used for floriculture productionRoses are the main production in floriculture in Godkhila; and demand has increased in the inland markets and internally such as to IndiaWomen are involved in all three phases of value chain, however, the general market chain is operated through middle men Financial and technical support for flower production is still limited but comes from different government, agencies, NGOs, and private banks
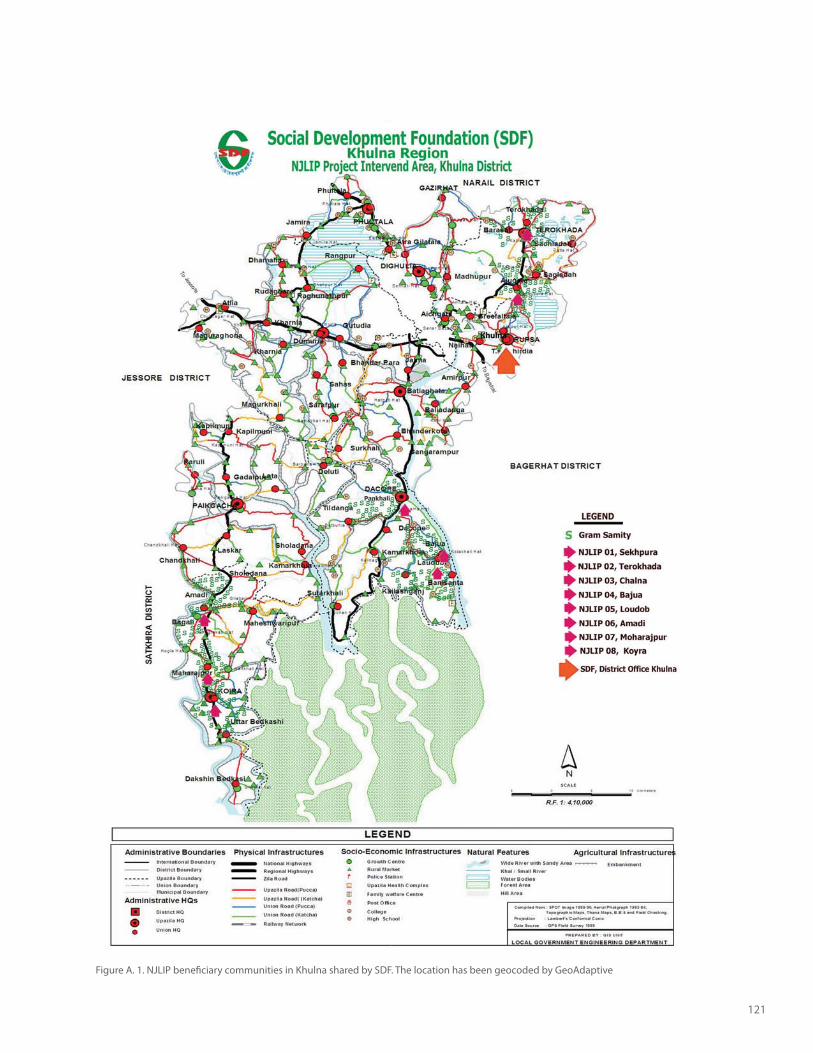
121
Figure A. 1. NJLIP beneficiary communities in Khulna shared by SDF. The location has been geocoded by GeoAdaptive
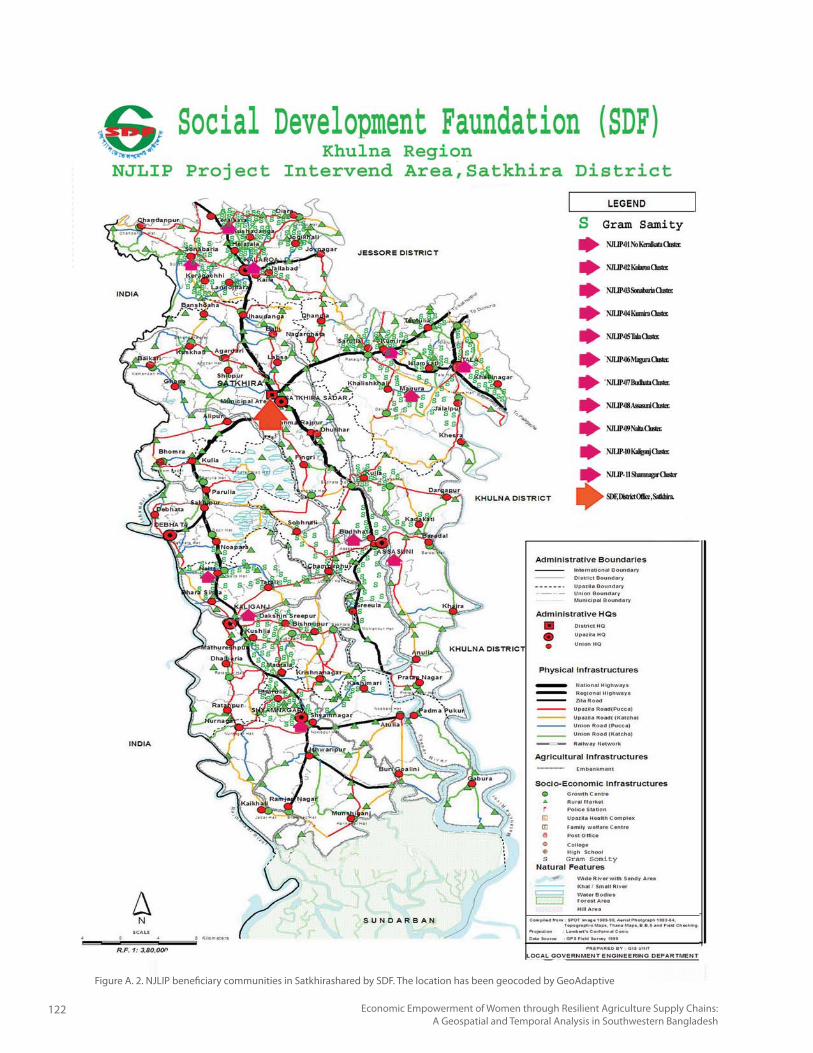
122 Economic Empowerment of Women through Resilient Agriculture Supply Chains: A Geospatial and Temporal Analysis in Southwestern Bangladesh
Figure A. 2. NJLIP beneficiary communities in Satkhirashared by SDF. The location has been geocoded by GeoAdaptive
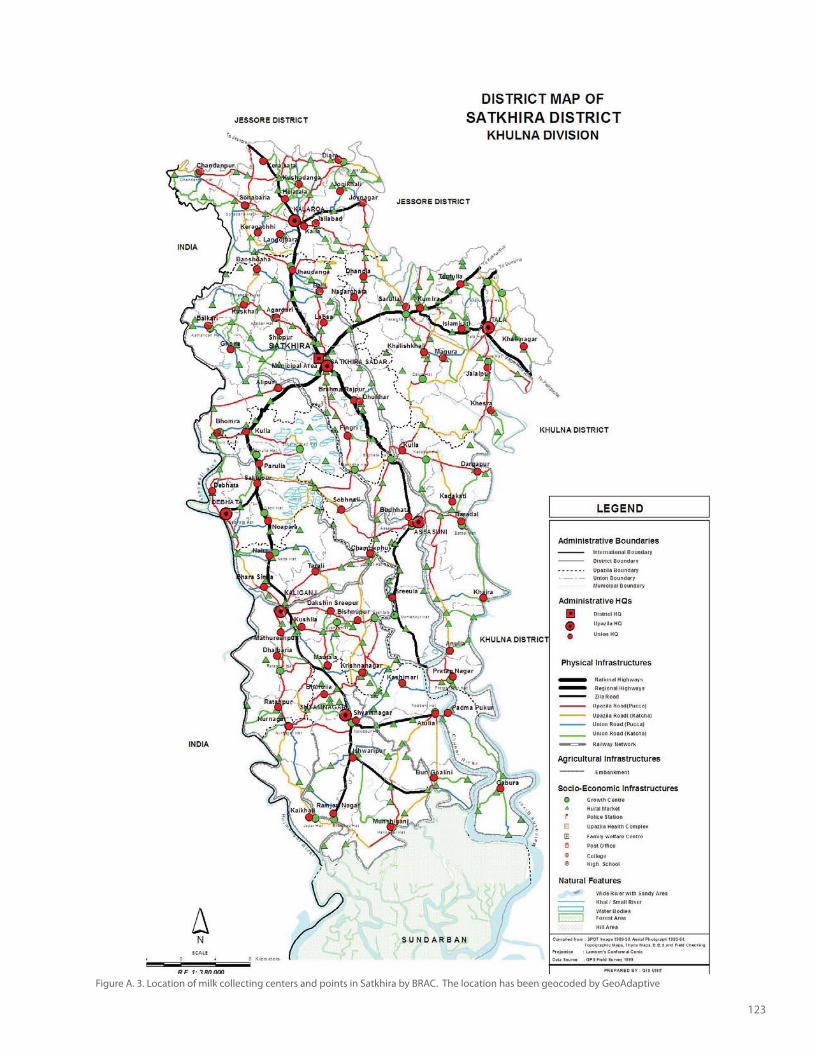
123
Figure A. 3. Location of milk collecting centers and points in Satkhira by BRAC. The location has been geocoded by GeoAdaptive
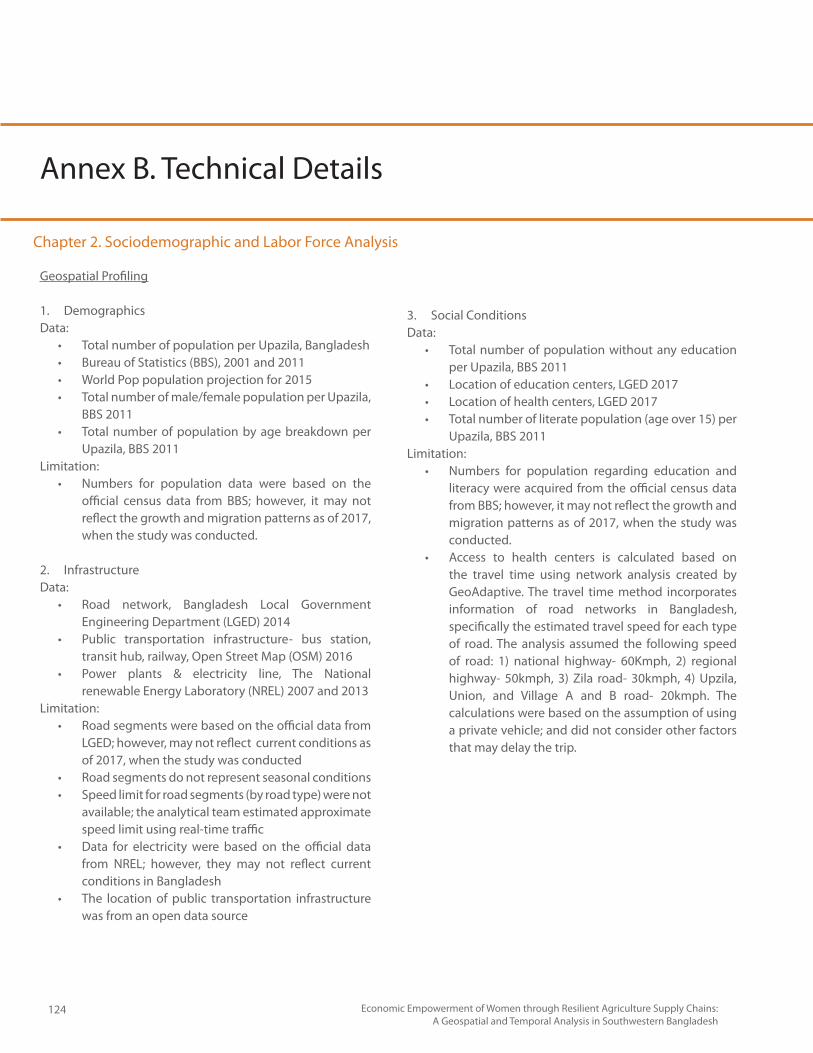
124 Economic Empowerment of Women through Resilient Agriculture Supply Chains: A Geospatial and Temporal Analysis in Southwestern Bangladesh
Annex B. Technical Details
Geospatial Profiling
1. Demographics Data:
Total number of population per Upazila, Bangladesh Bureau of Statistics (BBS), 2001 and 2011World Pop population projection for 2015Total number of male/female population per Upazila, BBS 2011Total number of population by age breakdown per Upazila, BBS 2011
Limitation:Numbers for population data were based on the official census data from BBS; however, it may not reflect the growth and migration patterns as of 2017, when the study was conducted.
2. InfrastructureData:
Road network, Bangladesh Local Government Engineering Department (LGED) 2014Public transportation infrastructure- bus station, transit hub, railway, Open Street Map (OSM) 2016Power plants & electricity line, The National renewable Energy Laboratory (NREL) 2007 and 2013
Limitation:Road segments were based on the official data from LGED; however, may not reflect current conditions as of 2017, when the study was conductedRoad segments do not represent seasonal conditions Speed limit for road segments (by road type) were not available; the analytical team estimated approximate speed limit using real-time trafficData for electricity were based on the official data from NREL; however, they may not reflect current conditions in Bangladesh The location of public transportation infrastructure was from an open data source
3. Social ConditionsData:
Total number of population without any education per Upazila, BBS 2011Location of education centers, LGED 2017Location of health centers, LGED 2017Total number of literate population (age over 15) per Upazila, BBS 2011
Limitation:Numbers for population regarding education and literacy were acquired from the official census data from BBS; however, it may not reflect the growth and migration patterns as of 2017, when the study was conducted. Access to health centers is calculated based on the travel time using network analysis created by GeoAdaptive. The travel time method incorporates information of road networks in Bangladesh, specifically the estimated travel speed for each type of road. The analysis assumed the following speed of road: 1) national highway- 60Kmph, 2) regional highway- 50kmph, 3) Zila road- 30kmph, 4) Upzila, Union, and Village A and B road- 20kmph. The calculations were based on the assumption of using a private vehicle; and did not consider other factors that may delay the trip.
Chapter 2. Sociodemographic and Labor Force Analysis
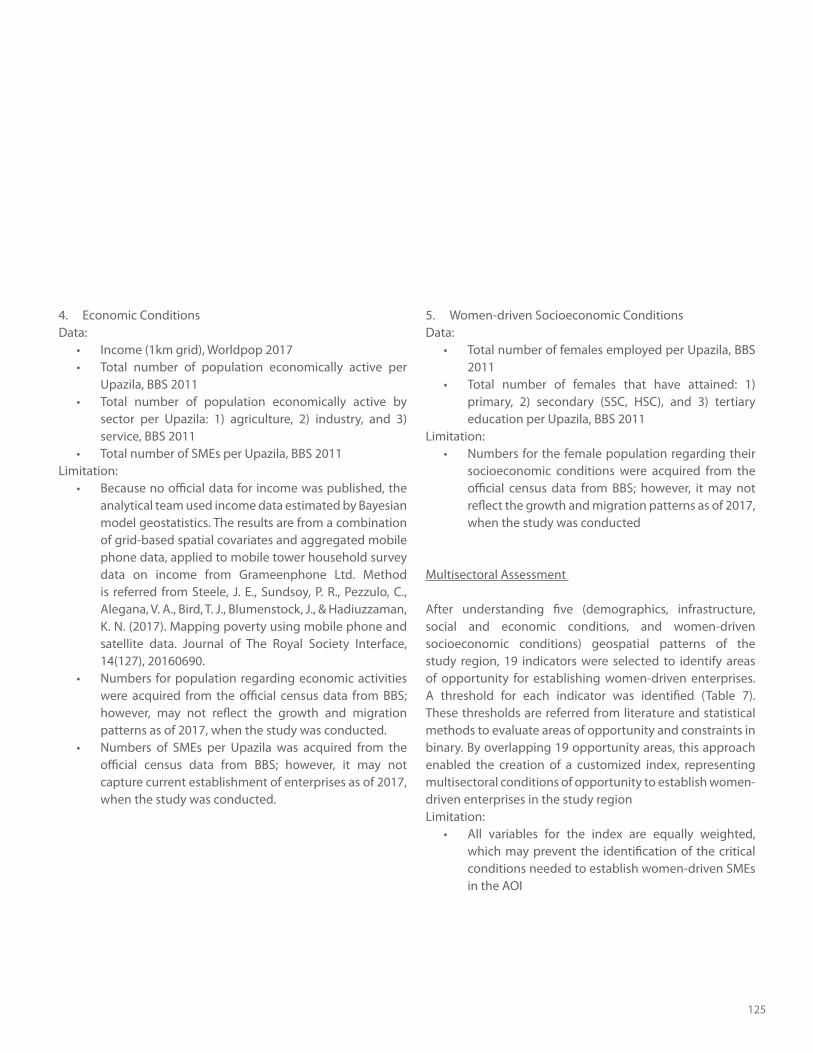
125
4. Economic ConditionsData:
Income (1km grid), Worldpop 2017Total number of population economically active per Upazila, BBS 2011Total number of population economically active by sector per Upazila: 1) agriculture, 2) industry, and 3) service, BBS 2011Total number of SMEs per Upazila, BBS 2011
Limitation:Because no official data for income was published, the analytical team used income data estimated by Bayesian model geostatistics. The results are from a combination of grid-based spatial covariates and aggregated mobile phone data, applied to mobile tower household survey data on income from Grameenphone Ltd. Method is referred from Steele, J. E., Sundsoy, P. R., Pezzulo, C., Alegana, V. A., Bird, T. J., Blumenstock, J., & Hadiuzzaman, K. N. (2017). Mapping poverty using mobile phone and satellite data. Journal of The Royal Society Interface, 14(127), 20160690.Numbers for population regarding economic activities were acquired from the official census data from BBS; however, may not reflect the growth and migration patterns as of 2017, when the study was conducted. Numbers of SMEs per Upazila was acquired from the official census data from BBS; however, it may not capture current establishment of enterprises as of 2017, when the study was conducted.
5. Women-driven Socioeconomic ConditionsData:
Total number of females employed per Upazila, BBS 2011Total number of females that have attained: 1) primary, 2) secondary (SSC, HSC), and 3) tertiary education per Upazila, BBS 2011
Limitation:Numbers for the female population regarding their socioeconomic conditions were acquired from the official census data from BBS; however, it may not reflect the growth and migration patterns as of 2017, when the study was conducted
Multisectoral Assessment
After understanding five (demographics, infrastructure, social and economic conditions, and women-driven socioeconomic conditions) geospatial patterns of the study region, 19 indicators were selected to identify areas of opportunity for establishing women-driven enterprises. A threshold for each indicator was identified (Table 7). These thresholds are referred from literature and statistical methods to evaluate areas of opportunity and constraints in binary. By overlapping 19 opportunity areas, this approach enabled the creation of a customized index, representing multisectoral conditions of opportunity to establish women-driven enterprises in the study regionLimitation:
All variables for the index are equally weighted, which may prevent the identification of the critical conditions needed to establish women-driven SMEs in the AOI
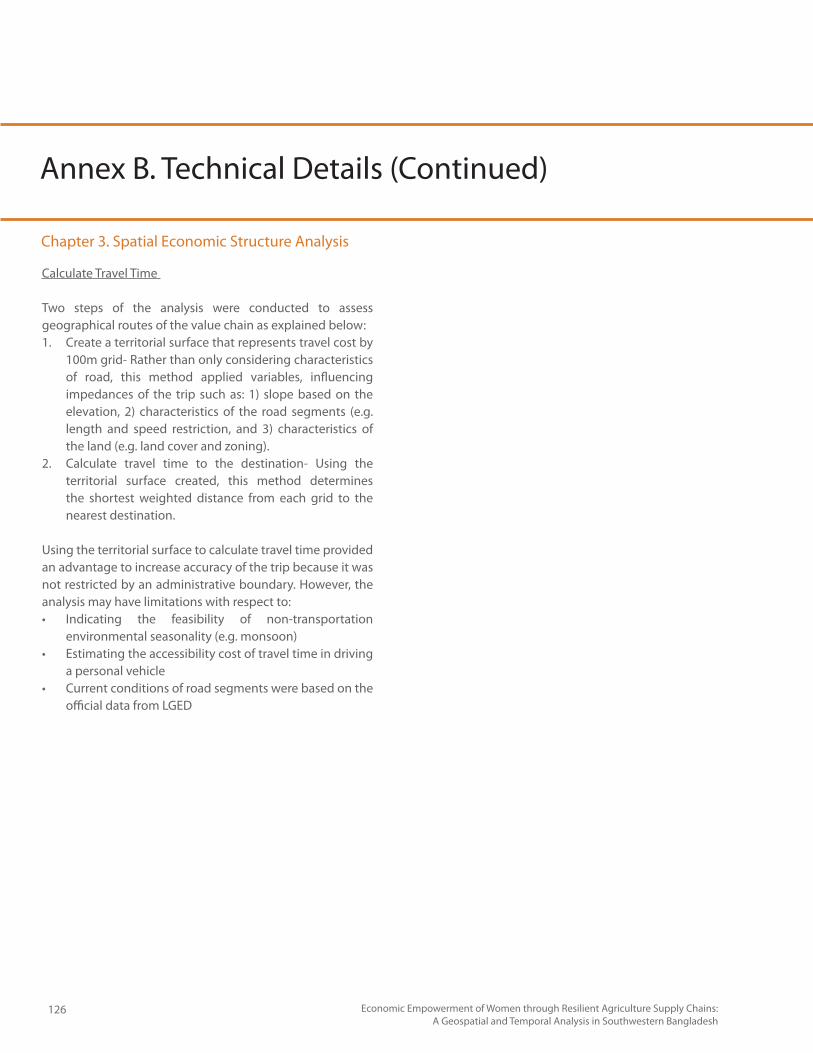
126 Economic Empowerment of Women through Resilient Agriculture Supply Chains: A Geospatial and Temporal Analysis in Southwestern Bangladesh
Calculate Travel Time
Two steps of the analysis were conducted to assess geographical routes of the value chain as explained below:1. Create a territorial surface that represents travel cost by
100m grid- Rather than only considering characteristics of road, this method applied variables, influencing impedances of the trip such as: 1) slope based on the elevation, 2) characteristics of the road segments (e.g. length and speed restriction, and 3) characteristics of the land (e.g. land cover and zoning).
2. Calculate travel time to the destination- Using the territorial surface created, this method determines the shortest weighted distance from each grid to the nearest destination.
Using the territorial surface to calculate travel time provided an advantage to increase accuracy of the trip because it was not restricted by an administrative boundary. However, the analysis may have limitations with respect to:
Indicating the feasibility of non-transportation environmental seasonality (e.g. monsoon)Estimating the accessibility cost of travel time in driving a personal vehicleCurrent conditions of road segments were based on the official data from LGED
Chapter 3. Spatial Economic Structure Analysis
Annex B. Technical Details (Continued)

127
This page is intentionally left blank
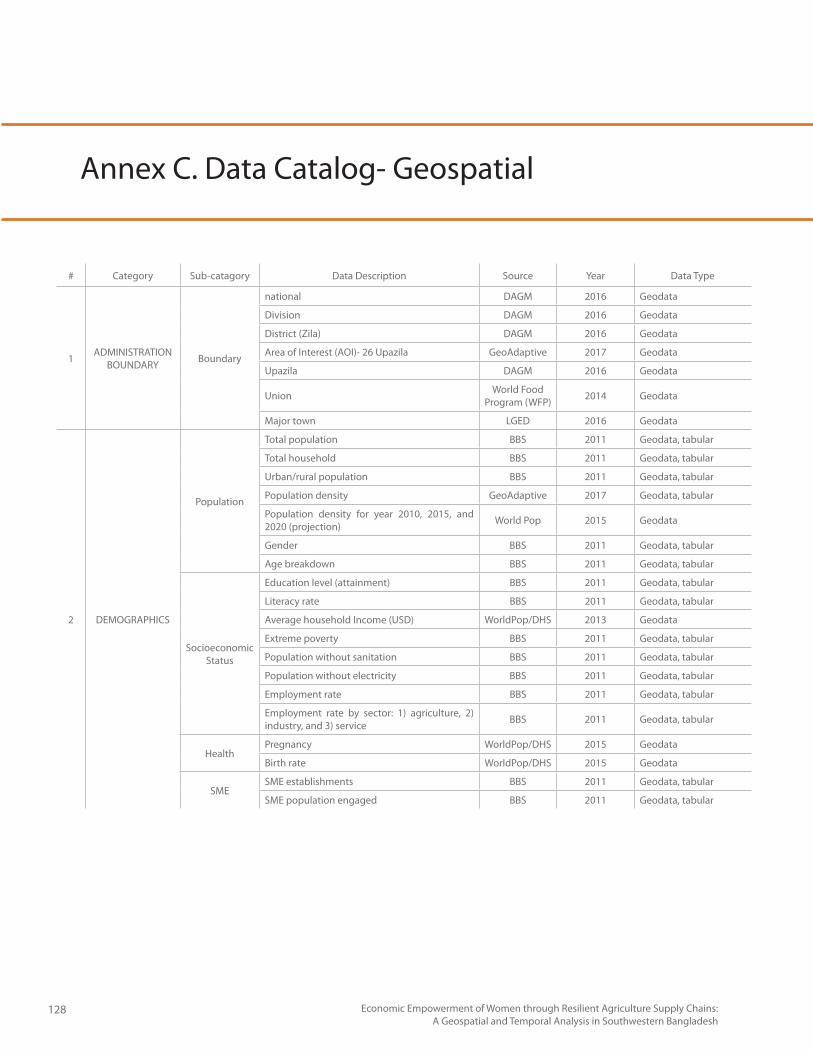
128 Economic Empowerment of Women through Resilient Agriculture Supply Chains: A Geospatial and Temporal Analysis in Southwestern Bangladesh
Annex C. Data Catalog- Geospatial
# Category Sub-catagory Data Description Source Year Data Type
1 ADMINISTRATION BOUNDARY Boundary
national DAGM 2016 Geodata
Division DAGM 2016 Geodata
District (Zila) DAGM 2016 Geodata
Area of Interest (AOI)- 26 Upazila GeoAdaptive 2017 Geodata
Upazila DAGM 2016 Geodata
Union World Food Program (WFP) 2014 Geodata
Major town LGED 2016 Geodata
2 DEMOGRAPHICS
Population
Total population BBS 2011 Geodata, tabular
Total household BBS 2011 Geodata, tabular
Urban/rural population BBS 2011 Geodata, tabular
Population density GeoAdaptive 2017 Geodata, tabular
Population density for year 2010, 2015, and 2020 (projection) World Pop 2015 Geodata
Gender BBS 2011 Geodata, tabular
Age breakdown BBS 2011 Geodata, tabular
Socioeconomic Status
Education level (attainment) BBS 2011 Geodata, tabular
Literacy rate BBS 2011 Geodata, tabular
Average household Income (USD) WorldPop/DHS 2013 Geodata
Extreme poverty BBS 2011 Geodata, tabular
Population without sanitation BBS 2011 Geodata, tabular
Population without electricity BBS 2011 Geodata, tabular
Employment rate BBS 2011 Geodata, tabular
Employment rate by sector: 1) agriculture, 2) industry, and 3) service BBS 2011 Geodata, tabular
HealthPregnancy WorldPop/DHS 2015 Geodata
Birth rate WorldPop/DHS 2015 Geodata
SMESME establishments BBS 2011 Geodata, tabular
SME population engaged BBS 2011 Geodata, tabular
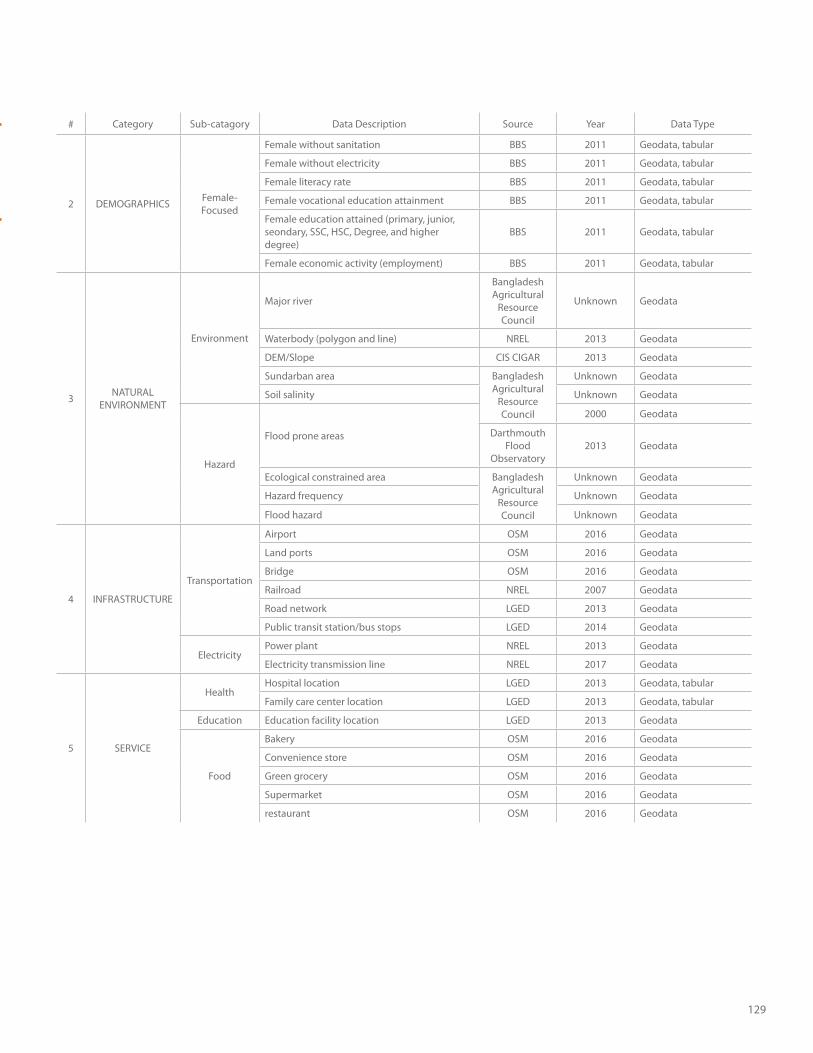
129
# Category Sub-catagory Data Description Source Year Data Type
2 DEMOGRAPHICS Female-Focused
Female without sanitation BBS 2011 Geodata, tabular
Female without electricity BBS 2011 Geodata, tabular
Female literacy rate BBS 2011 Geodata, tabular
Female vocational education attainment BBS 2011 Geodata, tabular
Female education attained (primary, junior, seondary, SSC, HSC, Degree, and higher degree)
BBS 2011 Geodata, tabular
Female economic activity (employment) BBS 2011 Geodata, tabular
3 NATURAL ENVIRONMENT
Environment
Major river
Bangladesh Agricultural
Resource Council
Unknown Geodata
Waterbody (polygon and line) NREL 2013 Geodata
DEM/Slope CIS CIGAR 2013 Geodata
Sundarban area Bangladesh Agricultural
Resource Council
Unknown Geodata
Soil salinity Unknown Geodata
Hazard
Flood prone areas
2000 Geodata
Darthmouth Flood
Observatory2013 Geodata
Ecological constrained area Bangladesh Agricultural
Resource Council
Unknown Geodata
Hazard frequency Unknown Geodata
Flood hazard Unknown Geodata
4 INFRASTRUCTURE
Transportation
Airport OSM 2016 Geodata
Land ports OSM 2016 Geodata
Bridge OSM 2016 Geodata
Railroad NREL 2007 Geodata
Road network LGED 2013 Geodata
Public transit station/bus stops LGED 2014 Geodata
ElectricityPower plant NREL 2013 Geodata
Electricity transmission line NREL 2017 Geodata
5 SERVICE
HealthHospital location LGED 2013 Geodata, tabular
Family care center location LGED 2013 Geodata, tabular
Education Education facility location LGED 2013 Geodata
Food
Bakery OSM 2016 Geodata
Convenience store OSM 2016 Geodata
Green grocery OSM 2016 Geodata
Supermarket OSM 2016 Geodata
restaurant OSM 2016 Geodata
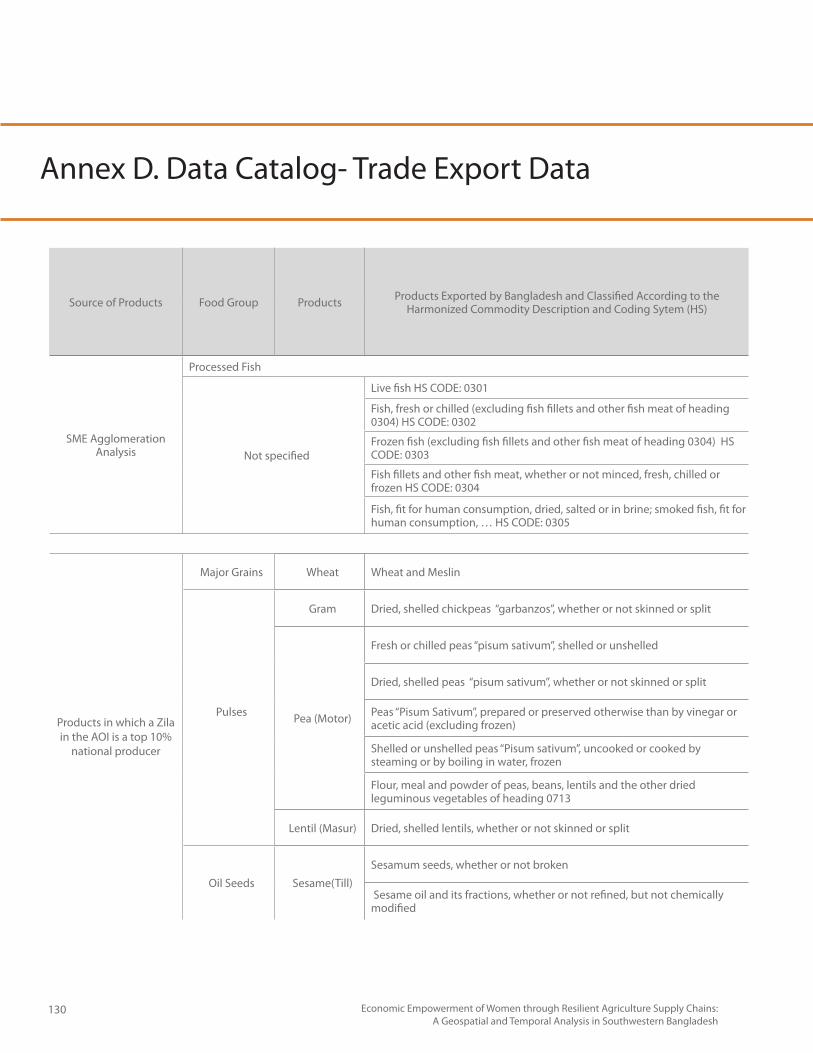
130 Economic Empowerment of Women through Resilient Agriculture Supply Chains: A Geospatial and Temporal Analysis in Southwestern Bangladesh
Source of Products Food Group Products Products Exported by Bangladesh and Classified According to the Harmonized Commodity Description and Coding Sytem (HS)
SME AgglomerationAnalysis
Processed Fish
Not specified
Live fish HS CODE: 0301
Fish, fresh or chilled (excluding fish fillets and other fish meat of heading 0304) HS CODE: 0302
Frozen fish (excluding fish fillets and other fish meat of heading 0304) HS CODE: 0303
Fish fillets and other fish meat, whether or not minced, fresh, chilled or frozen HS CODE: 0304
Fish, fit for human consumption, dried, salted or in brine; smoked fish, fit for human consumption, … HS CODE: 0305
Products in which a Zila in the AOI is a top 10%
national producer
Major Grains Wheat Wheat and Meslin
Pulses
Gram Dried, shelled chickpeas “garbanzos”, whether or not skinned or split
Pea (Motor)
Fresh or chilled peas “pisum sativum”, shelled or unshelled
Dried, shelled peas “pisum sativum”, whether or not skinned or split
Peas “Pisum Sativum”, prepared or preserved otherwise than by vinegar or acetic acid (excluding frozen)
Shelled or unshelled peas “Pisum sativum”, uncooked or cooked by steaming or by boiling in water, frozen
Flour, meal and powder of peas, beans, lentils and the other dried leguminous vegetables of heading 0713
Lentil (Masur) Dried, shelled lentils, whether or not skinned or split
Oil Seeds Sesame(Till)
Sesamum seeds, whether or not broken
Sesame oil and its fractions, whether or not refined, but not chemically modified
Annex D. Data Catalog- Trade Export Data
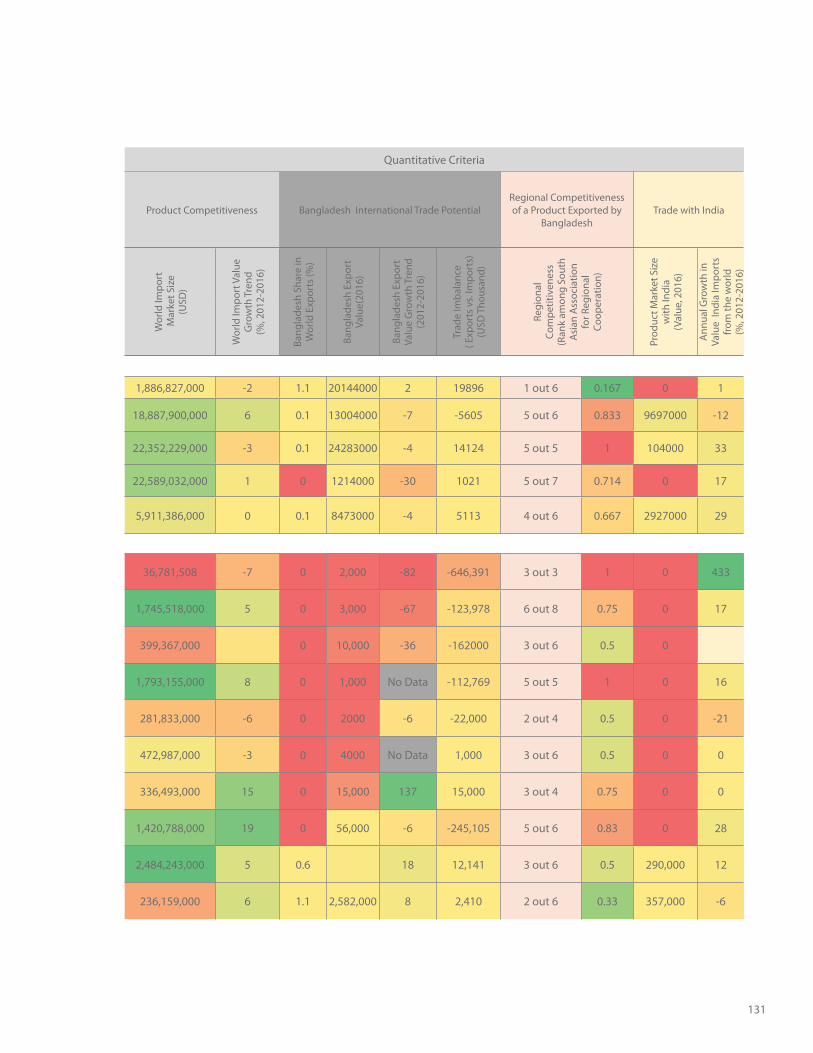
131
Quantitative Criteria
Product Competitiveness Bangladesh International Trade PotentialRegional Competitiveness of a Product Exported by
BangladeshTrade with India
Wor
ld Im
port
Mar
ket S
ize
(USD
)
Wor
ld Im
port
Val
ue
Gro
wth
Tre
nd(%
, 201
2-20
16)
Bang
lade
sh S
hare
in
Wor
ld E
xpor
ts (%
)
Bang
lade
sh E
xpor
t Va
lue(
2016
)
Bang
lade
sh E
xpor
t Va
lue
Gro
wth
Tre
nd(2
012-
2016
)
Trad
e Im
bala
nce
( Exp
orts
vs.
Impo
rts)
(U
SD T
hous
and)
Regi
onal
Co
mpe
titiv
enes
s (R
ank
amon
g So
uth
Asi
an A
ssoc
iatio
n fo
r Reg
iona
l Co
oper
atio
n)
Prod
uct M
arke
t Siz
e w
ith In
dia
(Val
ue, 2
016)
Ann
ual G
row
th in
Va
lue
Indi
a Im
port
s fr
om th
e w
orld
(%
, 201
2-20
16)
1,886,827,000 -2 1.1 20144000 2 19896 1 out 6 0.167 0 1
18,887,900,000 6 0.1 13004000 -7 -5605 5 out 6 0.833 9697000 -12
22,352,229,000 -3 0.1 24283000 -4 14124 5 out 5 1 104000 33
22,589,032,000 1 0 1214000 -30 1021 5 out 7 0.714 0 17
5,911,386,000 0 0.1 8473000 -4 5113 4 out 6 0.667 2927000 29
36,781,508 -7 0 2,000 -82 -646,391 3 out 3 1 0 433
1,745,518,000 5 0 3,000 -67 -123,978 6 out 8 0.75 0 17
399,367,000 0 10,000 -36 -162000 3 out 6 0.5 0
1,793,155,000 8 0 1,000 No Data -112,769 5 out 5 1 0 16
281,833,000 -6 0 2000 -6 -22,000 2 out 4 0.5 0 -21
472,987,000 -3 0 4000 No Data 1,000 3 out 6 0.5 0 0
336,493,000 15 0 15,000 137 15,000 3 out 4 0.75 0 0
1,420,788,000 19 0 56,000 -6 -245,105 5 out 6 0.83 0 28
2,484,243,000 5 0.6 18 12,141 3 out 6 0.5 290,000 12
236,159,000 6 1.1 2,582,000 8 2,410 2 out 6 0.33 357,000 -6
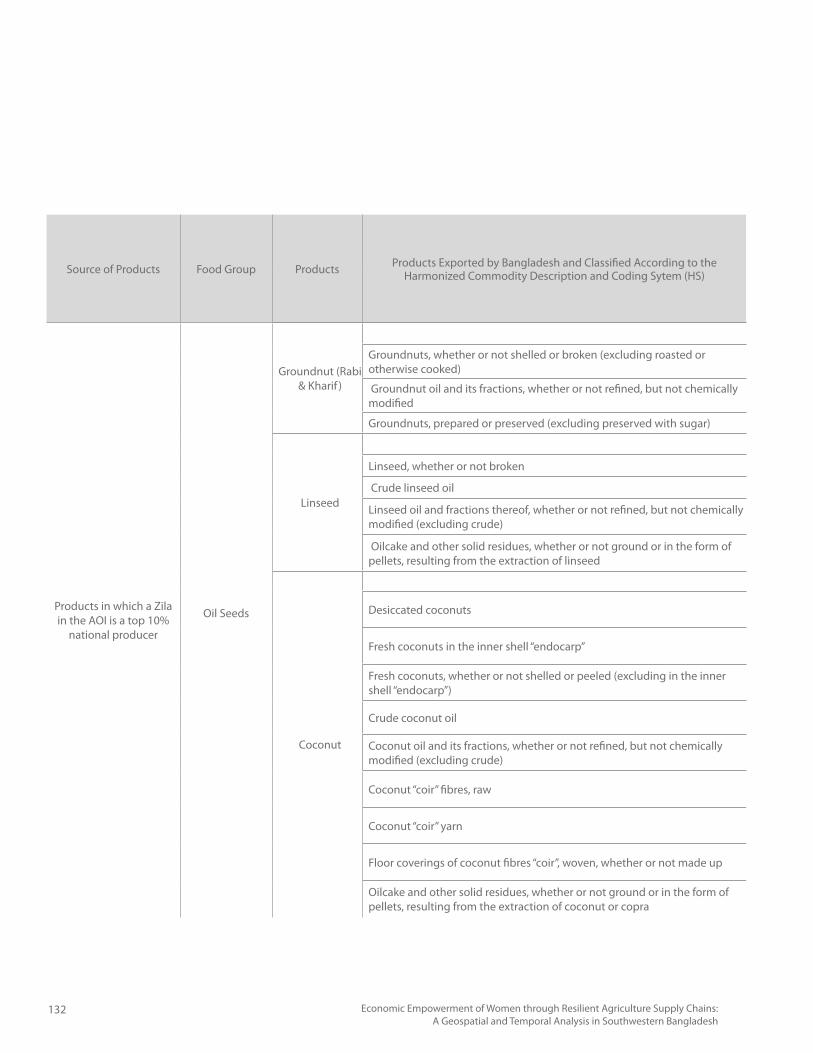
132 Economic Empowerment of Women through Resilient Agriculture Supply Chains: A Geospatial and Temporal Analysis in Southwestern Bangladesh
Source of Products Food Group Products Products Exported by Bangladesh and Classified According to the Harmonized Commodity Description and Coding Sytem (HS)
Products in which a Zila in the AOI is a top 10%
national producer
Oil Seeds
Groundnut (Rabi & Kharif )
Groundnuts, whether or not shelled or broken (excluding roasted or otherwise cooked)
Groundnut oil and its fractions, whether or not refined, but not chemically modified
Groundnuts, prepared or preserved (excluding preserved with sugar)
Linseed
Linseed, whether or not broken
Crude linseed oil
Linseed oil and fractions thereof, whether or not refined, but not chemically modified (excluding crude)
Oilcake and other solid residues, whether or not ground or in the form of pellets, resulting from the extraction of linseed
Coconut
Desiccated coconuts
Fresh coconuts in the inner shell “endocarp”
Fresh coconuts, whether or not shelled or peeled (excluding in the inner shell “endocarp”)
Crude coconut oil
Coconut oil and its fractions, whether or not refined, but not chemically modified (excluding crude)
Coconut “coir” fibres, raw
Coconut “coir” yarn
Floor coverings of coconut fibres “coir”, woven, whether or not made up
Oilcake and other solid residues, whether or not ground or in the form of pellets, resulting from the extraction of coconut or copra
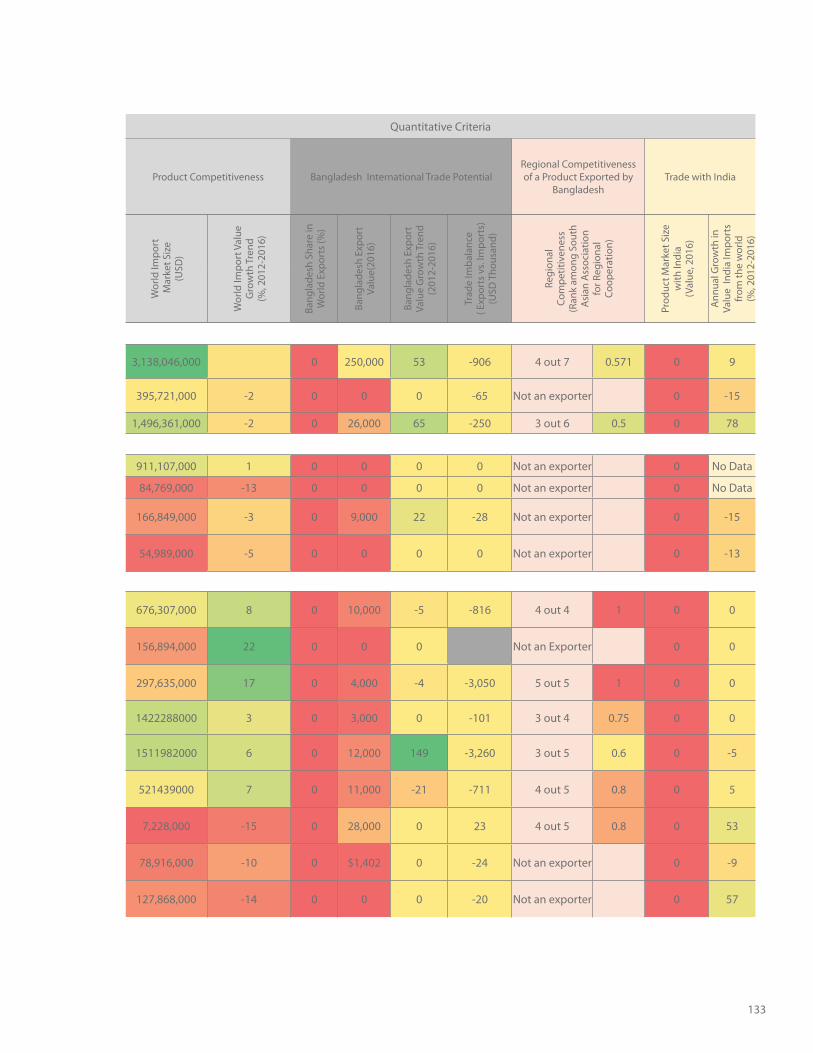
133
Quantitative Criteria
Product Competitiveness Bangladesh International Trade PotentialRegional Competitiveness of a Product Exported by
BangladeshTrade with India
Wor
ld Im
port
Mar
ket S
ize
(USD
)
Wor
ld Im
port
Val
ue
Gro
wth
Tre
nd(%
, 201
2-20
16)
Bang
lade
sh S
hare
in
Wor
ld E
xpor
ts (%
)
Bang
lade
sh E
xpor
t Va
lue(
2016
)
Bang
lade
sh E
xpor
t Va
lue
Gro
wth
Tre
nd(2
012-
2016
)
Trad
e Im
bala
nce
( Exp
orts
vs.
Impo
rts)
(U
SD T
hous
and)
Regi
onal
Co
mpe
titiv
enes
s (R
ank
amon
g So
uth
Asi
an A
ssoc
iatio
n fo
r Reg
iona
l Co
oper
atio
n)
Prod
uct M
arke
t Siz
e w
ith In
dia
(Val
ue, 2
016)
Ann
ual G
row
th in
Va
lue
Indi
a Im
port
s fr
om th
e w
orld
(%
, 201
2-20
16)
3,138,046,000 0 250,000 53 -906 4 out 7 0.571 0 9
395,721,000 -2 0 0 0 -65 Not an exporter 0 -15
1,496,361,000 -2 0 26,000 65 -250 3 out 6 0.5 0 78
911,107,000 1 0 0 0 0 Not an exporter 0 No Data
84,769,000 -13 0 0 0 0 Not an exporter 0 No Data
166,849,000 -3 0 9,000 22 -28 Not an exporter 0 -15
54,989,000 -5 0 0 0 0 Not an exporter 0 -13
676,307,000 8 0 10,000 -5 -816 4 out 4 1 0 0
156,894,000 22 0 0 0 Not an Exporter 0 0
297,635,000 17 0 4,000 -4 -3,050 5 out 5 1 0 0
1422288000 3 0 3,000 0 -101 3 out 4 0.75 0 0
1511982000 6 0 12,000 149 -3,260 3 out 5 0.6 0 -5
521439000 7 0 11,000 -21 -711 4 out 5 0.8 0 5
7,228,000 -15 0 28,000 0 23 4 out 5 0.8 0 53
78,916,000 -10 0 $1,402 0 -24 Not an exporter 0 -9
127,868,000 -14 0 0 0 -20 Not an exporter 0 57
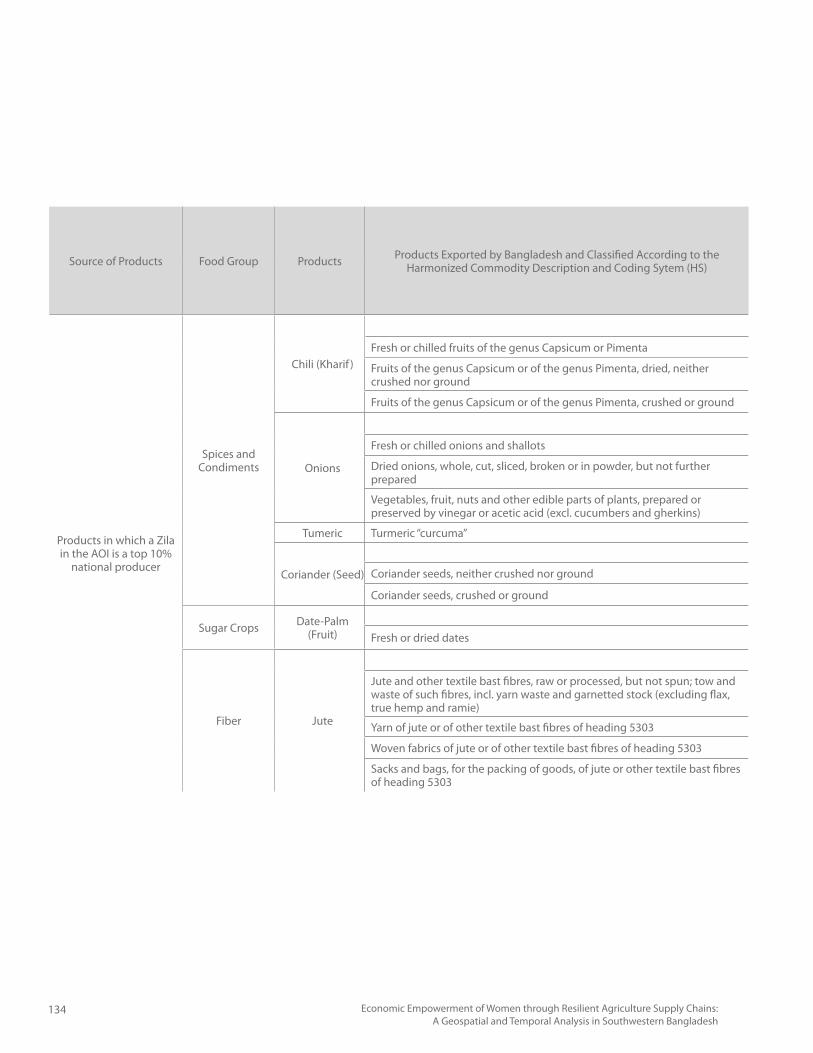
134 Economic Empowerment of Women through Resilient Agriculture Supply Chains: A Geospatial and Temporal Analysis in Southwestern Bangladesh
Source of Products Food Group Products Products Exported by Bangladesh and Classified According to the Harmonized Commodity Description and Coding Sytem (HS)
Products in which a Zila in the AOI is a top 10%
national producer
Spices and Condiments
Chili (Kharif )Fresh or chilled fruits of the genus Capsicum or Pimenta
Fruits of the genus Capsicum or of the genus Pimenta, dried, neither crushed nor ground
Fruits of the genus Capsicum or of the genus Pimenta, crushed or ground
Onions
Fresh or chilled onions and shallots
Dried onions, whole, cut, sliced, broken or in powder, but not further prepared
Vegetables, fruit, nuts and other edible parts of plants, prepared or preserved by vinegar or acetic acid (excl. cucumbers and gherkins)
Tumeric Turmeric “curcuma”
Coriander (Seed) Coriander seeds, neither crushed nor ground
Coriander seeds, crushed or ground
Sugar Crops Date-Palm (Fruit) Fresh or dried dates
Fiber Jute
Jute and other textile bast fibres, raw or processed, but not spun; tow and waste of such fibres, incl. yarn waste and garnetted stock (excluding flax, true hemp and ramie)
Yarn of jute or of other textile bast fibres of heading 5303
Woven fabrics of jute or of other textile bast fibres of heading 5303
Sacks and bags, for the packing of goods, of jute or other textile bast fibres of heading 5303
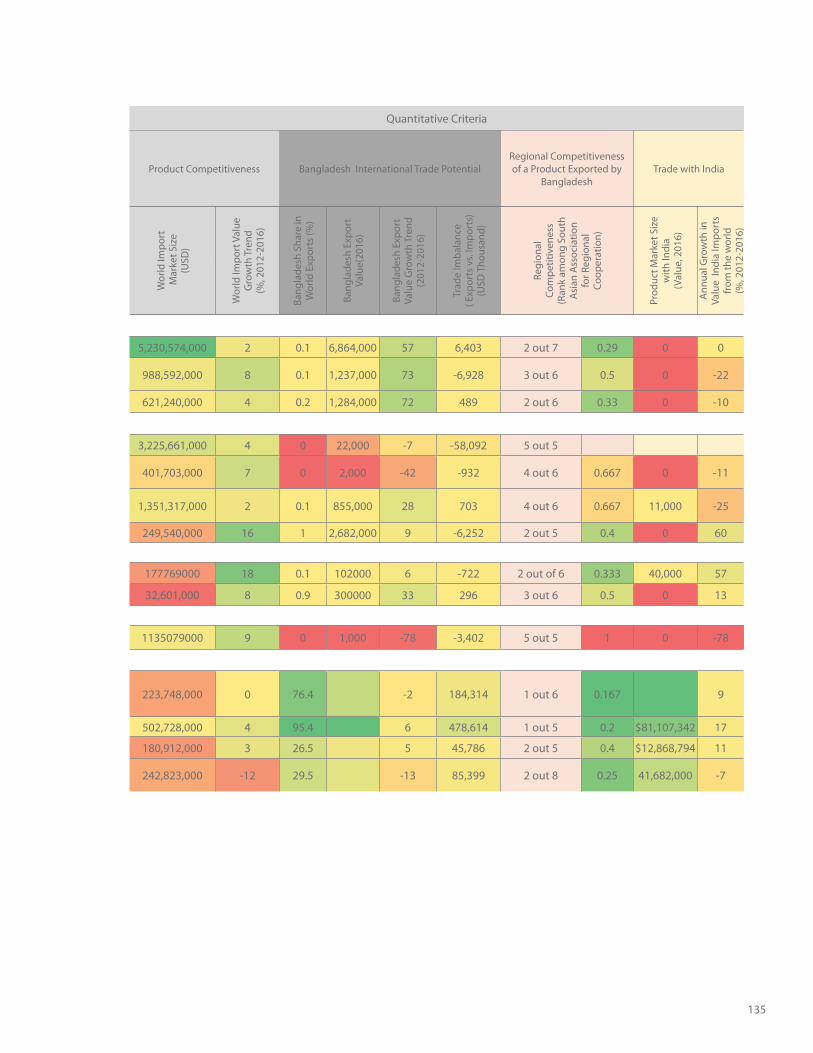
135
Quantitative Criteria
Product Competitiveness Bangladesh International Trade PotentialRegional Competitiveness of a Product Exported by
BangladeshTrade with India
Wor
ld Im
port
Mar
ket S
ize
(USD
)
Wor
ld Im
port
Val
ue
Gro
wth
Tre
nd(%
, 201
2-20
16)
Bang
lade
sh S
hare
in
Wor
ld E
xpor
ts (%
)
Bang
lade
sh E
xpor
t Va
lue(
2016
)
Bang
lade
sh E
xpor
t Va
lue
Gro
wth
Tre
nd(2
012-
2016
)
Trad
e Im
bala
nce
( Exp
orts
vs.
Impo
rts)
(U
SD T
hous
and)
Regi
onal
Co
mpe
titiv
enes
s (R
ank
amon
g So
uth
Asi
an A
ssoc
iatio
n fo
r Reg
iona
l Co
oper
atio
n)
Prod
uct M
arke
t Siz
e w
ith In
dia
(Val
ue, 2
016)
Ann
ual G
row
th in
Va
lue
Indi
a Im
port
s fr
om th
e w
orld
(%
, 201
2-20
16)
5,230,574,000 2 0.1 6,864,000 57 6,403 2 out 7 0.29 0 0
988,592,000 8 0.1 1,237,000 73 -6,928 3 out 6 0.5 0 -22
621,240,000 4 0.2 1,284,000 72 489 2 out 6 0.33 0 -10
3,225,661,000 4 0 22,000 -7 -58,092 5 out 5
401,703,000 7 0 2,000 -42 -932 4 out 6 0.667 0 -11
1,351,317,000 2 0.1 855,000 28 703 4 out 6 0.667 11,000 -25
249,540,000 16 1 2,682,000 9 -6,252 2 out 5 0.4 0 60
177769000 18 0.1 102000 6 -722 2 out of 6 0.333 40,000 57
32,601,000 8 0.9 300000 33 296 3 out 6 0.5 0 13
1135079000 9 0 1,000 -78 -3,402 5 out 5 1 0 -78
223,748,000 0 76.4 -2 184,314 1 out 6 0.167 9
502,728,000 4 95.4 6 478,614 1 out 5 0.2 $81,107,342 17
180,912,000 3 26.5 5 45,786 2 out 5 0.4 $12,868,794 11
242,823,000 -12 29.5 -13 85,399 2 out 8 0.25 41,682,000 -7
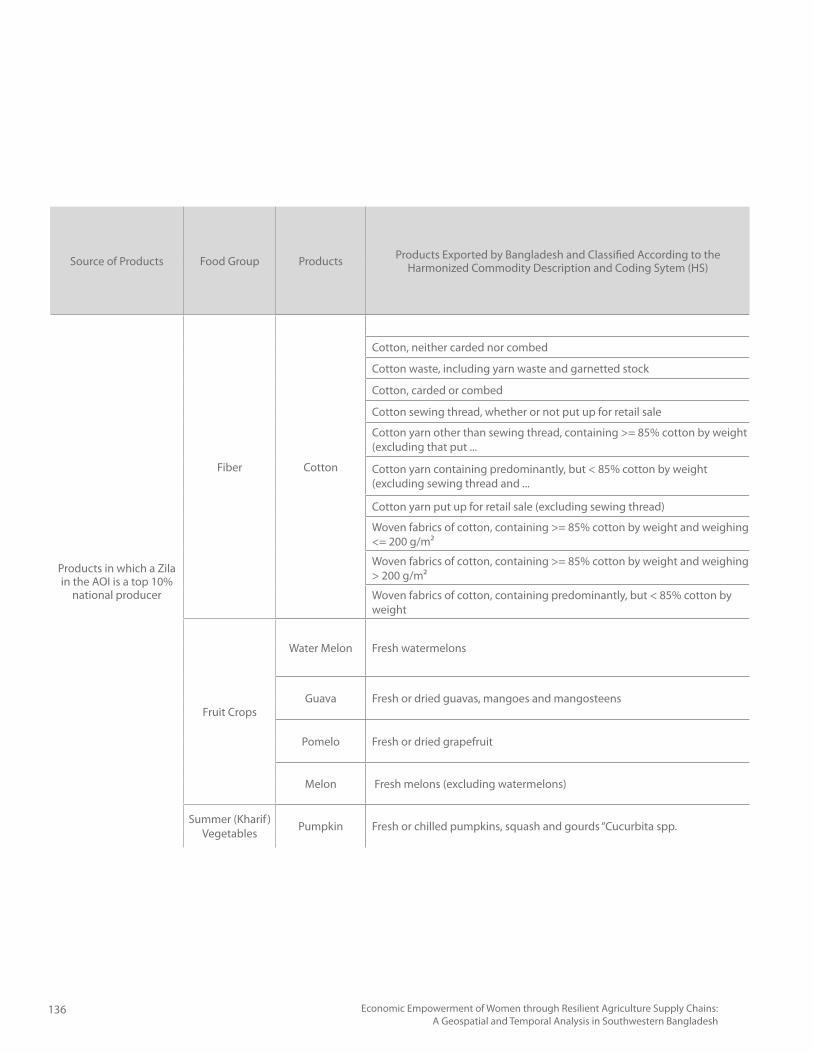
136 Economic Empowerment of Women through Resilient Agriculture Supply Chains: A Geospatial and Temporal Analysis in Southwestern Bangladesh
Source of Products Food Group Products Products Exported by Bangladesh and Classified According to the Harmonized Commodity Description and Coding Sytem (HS)
Products in which a Zila in the AOI is a top 10%
national producer
Fiber Cotton
Cotton, neither carded nor combed
Cotton waste, including yarn waste and garnetted stock
Cotton, carded or combed
Cotton sewing thread, whether or not put up for retail sale
Cotton yarn other than sewing thread, containing >= 85% cotton by weight (excluding that put ...
Cotton yarn containing predominantly, but < 85% cotton by weight (excluding sewing thread and ...
Cotton yarn put up for retail sale (excluding sewing thread)
Woven fabrics of cotton, containing >= 85% cotton by weight and weighing <= 200 g/m²
Woven fabrics of cotton, containing >= 85% cotton by weight and weighing > 200 g/m²
Woven fabrics of cotton, containing predominantly, but < 85% cotton by weight
Fruit Crops
Water Melon Fresh watermelons
Guava Fresh or dried guavas, mangoes and mangosteens
Pomelo Fresh or dried grapefruit
Melon Fresh melons (excluding watermelons)
Summer (Kharif ) Vegetables Pumpkin Fresh or chilled pumpkins, squash and gourds “Cucurbita spp.
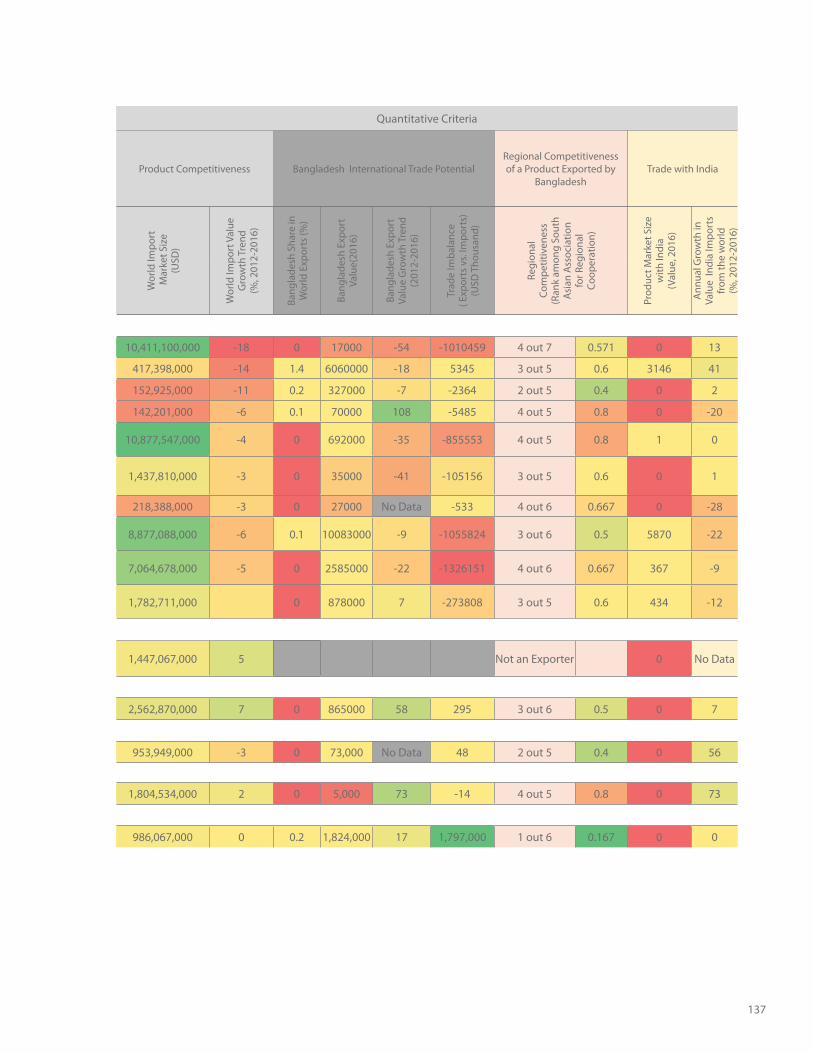
137
Quantitative Criteria
Product Competitiveness Bangladesh International Trade PotentialRegional Competitiveness of a Product Exported by
BangladeshTrade with India
Wor
ld Im
port
Mar
ket S
ize
(USD
)
Wor
ld Im
port
Val
ue
Gro
wth
Tre
nd(%
, 201
2-20
16)
Bang
lade
sh S
hare
in
Wor
ld E
xpor
ts (%
)
Bang
lade
sh E
xpor
t Va
lue(
2016
)
Bang
lade
sh E
xpor
t Va
lue
Gro
wth
Tre
nd(2
012-
2016
)
Trad
e Im
bala
nce
( Exp
orts
vs.
Impo
rts)
(U
SD T
hous
and)
Regi
onal
Co
mpe
titiv
enes
s (R
ank
amon
g So
uth
Asi
an A
ssoc
iatio
n fo
r Reg
iona
l Co
oper
atio
n)
Prod
uct M
arke
t Siz
e w
ith In
dia
(Val
ue, 2
016)
Ann
ual G
row
th in
Va
lue
Indi
a Im
port
s fr
om th
e w
orld
(%
, 201
2-20
16)
10,411,100,000 -18 0 17000 -54 -1010459 4 out 7 0.571 0 13
417,398,000 -14 1.4 6060000 -18 5345 3 out 5 0.6 3146 41
152,925,000 -11 0.2 327000 -7 -2364 2 out 5 0.4 0 2
142,201,000 -6 0.1 70000 108 -5485 4 out 5 0.8 0 -20
10,877,547,000 -4 0 692000 -35 -855553 4 out 5 0.8 1 0
1,437,810,000 -3 0 35000 -41 -105156 3 out 5 0.6 0 1
218,388,000 -3 0 27000 No Data -533 4 out 6 0.667 0 -28
8,877,088,000 -6 0.1 10083000 -9 -1055824 3 out 6 0.5 5870 -22
7,064,678,000 -5 0 2585000 -22 -1326151 4 out 6 0.667 367 -9
1,782,711,000 0 878000 7 -273808 3 out 5 0.6 434 -12
1,447,067,000 5 Not an Exporter 0 No Data
2,562,870,000 7 0 865000 58 295 3 out 6 0.5 0 7
953,949,000 -3 0 73,000 No Data 48 2 out 5 0.4 0 56
1,804,534,000 2 0 5,000 73 -14 4 out 5 0.8 0 73
986,067,000 0 0.2 1,824,000 17 1,797,000 1 out 6 0.167 0 0
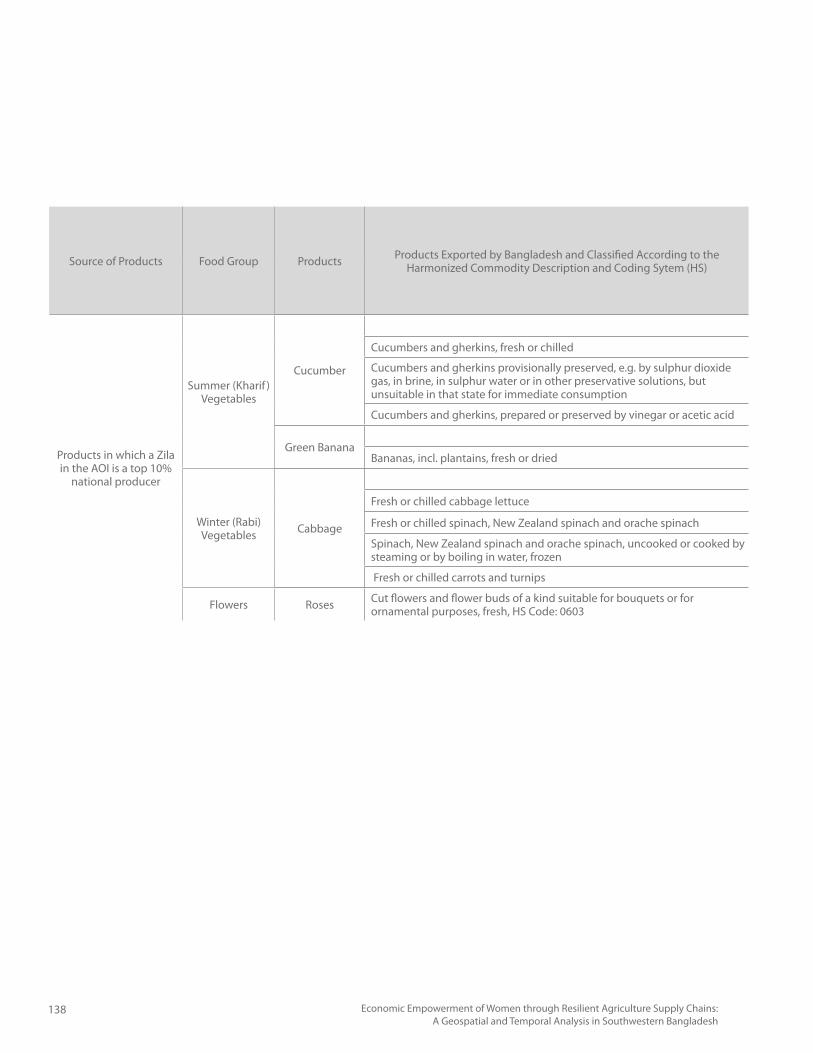
138 Economic Empowerment of Women through Resilient Agriculture Supply Chains: A Geospatial and Temporal Analysis in Southwestern Bangladesh
Source of Products Food Group Products Products Exported by Bangladesh and Classified According to the Harmonized Commodity Description and Coding Sytem (HS)
Products in which a Zila in the AOI is a top 10%
national producer
Summer (Kharif ) Vegetables
Cucumber
Cucumbers and gherkins, fresh or chilled
Cucumbers and gherkins provisionally preserved, e.g. by sulphur dioxide gas, in brine, in sulphur water or in other preservative solutions, but unsuitable in that state for immediate consumption
Cucumbers and gherkins, prepared or preserved by vinegar or acetic acid
Green BananaBananas, incl. plantains, fresh or dried
Winter (Rabi) Vegetables Cabbage
Fresh or chilled cabbage lettuce
Fresh or chilled spinach, New Zealand spinach and orache spinach
Spinach, New Zealand spinach and orache spinach, uncooked or cooked by steaming or by boiling in water, frozen
Fresh or chilled carrots and turnips
Flowers Roses Cut flowers and flower buds of a kind suitable for bouquets or for ornamental purposes, fresh, HS Code: 0603
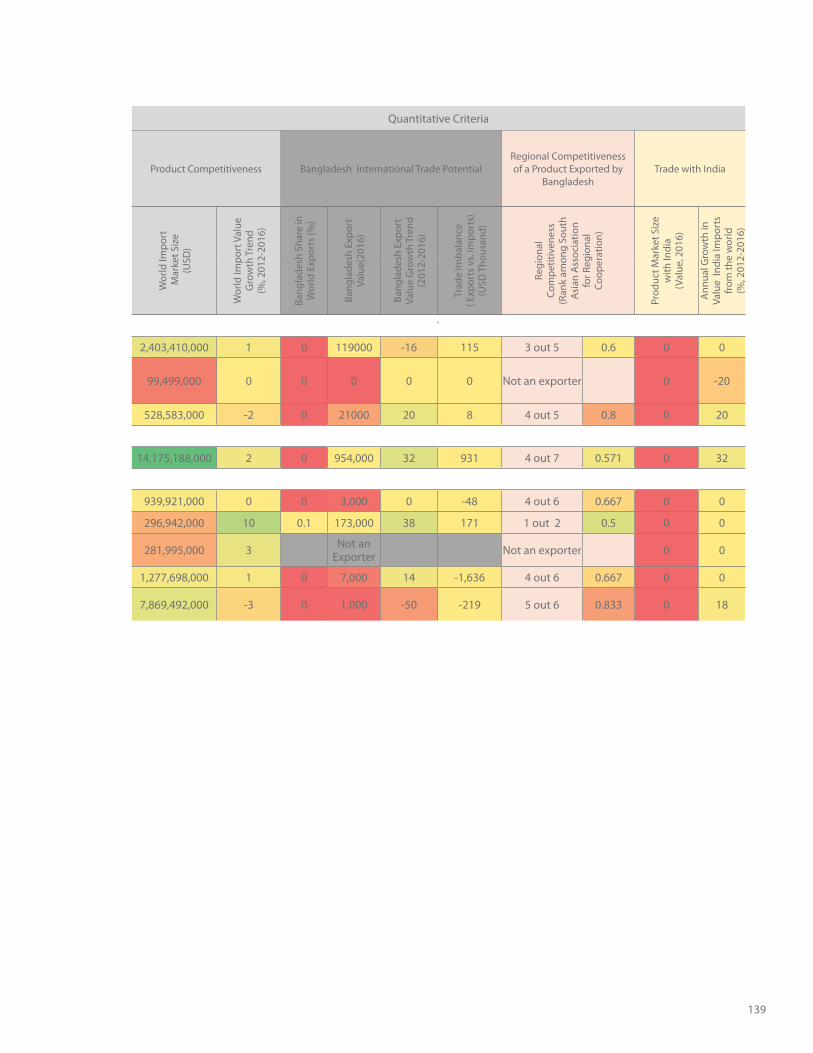
139
Quantitative Criteria
Product Competitiveness Bangladesh International Trade PotentialRegional Competitiveness of a Product Exported by
BangladeshTrade with India
Wor
ld Im
port
Mar
ket S
ize
(USD
)
Wor
ld Im
port
Val
ue
Gro
wth
Tre
nd(%
, 201
2-20
16)
Bang
lade
sh S
hare
in
Wor
ld E
xpor
ts (%
)
Bang
lade
sh E
xpor
t Va
lue(
2016
)
Bang
lade
sh E
xpor
t Va
lue
Gro
wth
Tre
nd(2
012-
2016
)
Trad
e Im
bala
nce
( Exp
orts
vs.
Impo
rts)
(U
SD T
hous
and)
Regi
onal
Co
mpe
titiv
enes
s (R
ank
amon
g So
uth
Asi
an A
ssoc
iatio
n fo
r Reg
iona
l Co
oper
atio
n)
Prod
uct M
arke
t Siz
e w
ith In
dia
(Val
ue, 2
016)
Ann
ual G
row
th in
Va
lue
Indi
a Im
port
s fr
om th
e w
orld
(%
, 201
2-20
16)
`
2,403,410,000 1 0 119000 -16 115 3 out 5 0.6 0 0
99,499,000 0 0 0 0 0 Not an exporter 0 -20
528,583,000 -2 0 21000 20 8 4 out 5 0.8 0 20
14,175,188,000 2 0 954,000 32 931 4 out 7 0.571 0 32
939,921,000 0 0 3,000 0 -48 4 out 6 0.667 0 0
296,942,000 10 0.1 173,000 38 171 1 out 2 0.5 0 0
281,995,000 3 Not an Exporter Not an exporter 0 0
1,277,698,000 1 0 7,000 14 -1,636 4 out 6 0.667 0 0
7,869,492,000 -3 0 1,000 -50 -219 5 out 6 0.833 0 18
140 Economic Empowerment of Women through Resilient Agriculture Supply Chains: A Geospatial and Temporal Analysis in Southwestern Bangladesh
Annex E. References
Ahmed, M. K., Halim, S., & Sultana, S. (2012). Participation of women in aquaculture in three coastal districts of Bangladesh: Approaches toward sustainable livelihood. World Journal of Agricultural Sciences, 8(3), 253-268.Asian Development Bank. (2010). Environmental Assessment Report. BAN: Padma Multipurpose Bridge Project. Retrieved from https://www.adb.org/sites/default/files/linked-documents/35049-01-ban-eiaab.pdf Asian Development Bank. (2016). Strategic master plan for Chittagong port. Retrieved from https://www.adb.org/sites/default/files/project-document/183636/45078-001-tacr-01-part-1.pdf Bangladesh Bureau of Statistics. (2011). Occupation, 2011, Bangladesh Population & Housing Census 2011. Bangladesh Bureau of Statistics. (2011). Age, 2011, Bangladesh Population & Housing Census 2011. Bangladesh Bureau of Statistics. (2017). The Yearbook of Agriculture Statistics- 2016. Retrieved from http://bbs.portal.gov.bd/sites/default/files/files/bbs.portal.gov.bd/page/1b1eb817_9325_4354_a756_3d18412203e2/Yearbook-2016-Final-19-06-2017.pdf CARE Bangladesh. (2015). Women’s engagement contributing to women’s empowerment in the Dairy Value Chain in Rural Bangladesh. Retrieved from http://www.care.org/sites/default/files/documents/sdvc_womens_empowerment.pdf Chowdhury, A. R., and Khan, F. (2015). Cut flower export from Bangadesh: Prospects, challenges, and propositions. Manarat International University Studies, 5(1), 11-21. Retrieved from http://miurs.manarat.ac.bd/download/Issue-05/02.pdf
Dasgupta, S., Huq, M., Mustafa, M. G., Sobhan, M. I., & Wheeler, D. (2017). The impact of aquatic salinization on fish habitats and poor communities in a changing climate: evidence from southwest coastal Bangladesh. Ecological economics, 139, 128-139.Elster, J. (1989). Social norms and economic theory. Journal of economic perspectives, 3(4), 99-117.Food and Agriculture Organization of the United Nation. (2017). Women’s empowerment in aquaculture in Bangladesh and Indonesia: Insights from four case studies. Retrieved from http://www.fao.org/3/a-i7113e.pdf Haque, M. A., Miah, M. M., Hossain, S., & Sharifuzzaman, S. M. (2012). Agro-economic analysis of tuberose cultivation in selected areas of Bangladesh. Bangladesh Journal of Agricultural Research, 37(3), 457-464.Mahmuduzzaman, M., Ahmed, Z. U., Nuruzzaman, A. K. M., & Ahmed, F. R. S. (2014). Causes of salinity intrusion in coastal belt of Bangladesh. International Journal of Plant Research, 4(4A), 8-13.Mckinsey & Company. (2011). Bangladesh’s ready-made garments landscape: The challenge of growth. Retrieved from http://www.wiwiss.fu-berlin.de/forschung/Garments/Medien/2011_McKinsey_Bangladesh_Case_Study.pdf Mou, H. N. (2012) Profitability of flower production and marketing system of Bangladesh. Bangladesh Journal of agricultural Research, 37 (1), 77-95. Retrieved from https://www.banglajol.info/index.php/BJAR/article/download/11179/8166 Porter, M. (1985). The value chain. The Value Chain and Competitive advantage: creating and sustaining superior performance.
141
SME Foundation, Ministry of Industries, Government of the People’s Republic of Bangladesh. (2015). SME Women Entrepreneurs Directory. Retrieved from http://www.smef.org.bd/v2/index.php/publication/2015-01-12-05-40-06SME Foundation, Ministry of Industries, Government of the People’s Republic of Bangladesh. (2013). SME Clusters in Bangladesh. Retrieved from http://www.smef.org.bd/media/publication/sme_cluster_bd_smef.pdfThe Observatory of Economic Complexity [OEC]. (2017). Retrieved from https://atlas.media.mit.edu/en/profile/country/bgd/ The World Bank Data Bank. (2018). Labor force participation rate, female (% of female population ages 15-64) (modeled ILO estimate). Retrieved from https://data.worldbank.org/indicator/SL.TLF.ACTI.FE.ZS?end=2017&locations=BD&start=2005 The World Bank Data Bank. (2018). Labor force participation rate, male (% of female population ages 15-64) (modeled ILO estimate). Retrieved from https://data.worldbank.org/indicator/SL.TLF.ACTI.MA.ZS?locations=BD World Economic Forum. (2017). The Global Gender Gap Report. Retrieved from http://www3.weforum.org/docs/WEF_GGGR_2017.pdf
Economic Empowerment of Women through Resilient Agriculture Supply Chains:A Geospatial and Temporal Analysis in Southwestern Bangladesh