economic development strategy, openness and rural poverty
TRANSCRIPT

econstor www.econstor.eu
Der Open-Access-Publikationsserver der ZBW – Leibniz-Informationszentrum WirtschaftThe Open Access Publication Server of the ZBW – Leibniz Information Centre for Economics
Nutzungsbedingungen:Die ZBW räumt Ihnen als Nutzerin/Nutzer das unentgeltliche,räumlich unbeschränkte und zeitlich auf die Dauer des Schutzrechtsbeschränkte einfache Recht ein, das ausgewählte Werk im Rahmender unter→ http://www.econstor.eu/dspace/Nutzungsbedingungennachzulesenden vollständigen Nutzungsbedingungen zuvervielfältigen, mit denen die Nutzerin/der Nutzer sich durch dieerste Nutzung einverstanden erklärt.
Terms of use:The ZBW grants you, the user, the non-exclusive right to usethe selected work free of charge, territorially unrestricted andwithin the time limit of the term of the property rights accordingto the terms specified at→ http://www.econstor.eu/dspace/NutzungsbedingungenBy the first use of the selected work the user agrees anddeclares to comply with these terms of use.
zbw Leibniz-Informationszentrum WirtschaftLeibniz Information Centre for Economics
Lin, Justin Yifu; Liu, Peilin
Working Paper
Economic development strategy, openness and ruralpoverty: A framework and China's experiences
Research Paper, UNU-WIDER, United Nations University (UNU), No. 2006/43
Provided in Cooperation with:United Nations University (UNU), World Institute for DevelopmentEconomics Research (WIDER)
Suggested Citation: Lin, Justin Yifu; Liu, Peilin (2006) : Economic development strategy,openness and rural poverty: A framework and China's experiences, Research Paper, UNU-WIDER, United Nations University (UNU), No. 2006/43, ISBN 9291908118
This Version is available at:http://hdl.handle.net/10419/63241

Copyright © UNU-WIDER 2006 1 Peking University, email: [email protected]; 2 Development Research Center of the State Council, email: [email protected]
This is a revised version of a paper originally prepared for the UNU-WIDER project conference on The Impact of Globalization on the World’s Poor, directed by Professors Machiko Nissanke and Erik Thorbecke, and organized in collaboration with the Japanese International Cooperation Agency (JICA) in Tokyo, 25-26 April 2005.
UNU-WIDER acknowledges the financial contributions to its research programme by the governments of Denmark (Royal Ministry of Foreign Affairs), Finland (Ministry for Foreign Affairs), Norway (Royal Ministry of Foreign Affairs), Sweden (Swedish International Development Cooperation Agency—Sida) and the United Kingdom (Department for International Development).
ISSN 1810-2611 ISBN 92-9190-811-8 (internet version)
Research Paper No. 2006/43
Economic Development Strategy, Openness and Rural Poverty
A Framework and China’s Experiences
Justin Yifu Lin1 and Peilin Liu2 April 2006
Abstract
This paper argues that both openness and poverty in a country are endogenously determined by the country’s long-term economic development strategy. Development strategies can be broadly divided into two mutually exclusive groups: (i) the comparative advantage-defying (CAD) strategy, which attempts to encourage firms to deviate from the economy’s existing comparative advantages in their entry into an industry or choice of technology; and (ii) the comparative advantage-following (CAF) strategy, which attempts to facilitate the firms’ entry into an industry or choice of technology according to the economy’s existing comparative advantages.
To carry out a CAD strategy, many governments of LDCs subsidize the firms in priority sectors by distorting capital prices, foreign exchange, and other inputs; and use administrative methods to allocate price-distorted inputs to the firms. The functions of
…/.Keywords: economic development strategy, income distribution, globalization, poverty JEL classification: O14, O20, O33, N65

The World Institute for Development Economics Research (WIDER) was established by the United Nations University (UNU) as its first research and training centre and started work in Helsinki, Finland in 1985. The Institute undertakes applied research and policy analysis on structural changes affecting the developing and transitional economies, provides a forum for the advocacy of policies leading to robust, equitable and environmentally sustainable growth, and promotes capacity strengthening and training in the field of economic and social policy making. Work is carried out by staff researchers and visiting scholars in Helsinki and through networks of collaborating scholars and institutions around the world.
www.wider.unu.edu [email protected]
UNU World Institute for Development Economics Research (UNU-WIDER) Katajanokanlaituri 6 B, 00160 Helsinki, Finland Camera-ready typescript prepared by Liisa Roponen at UNU-WIDER The views expressed in this publication are those of the author(s). Publication does not imply endorsement by the Institute or the United Nations University, nor by the programme/project sponsors, of any of the views expressed.
market will be suppressed. Rent-seeking will be widespread. As a result, economic performance will be poor and the income distribution issue will worsen. Foreign trade will also be retarded.
Only if governments of less-developed countries make following their economy’s comparative advantage the basic principle for promoting the economy’s industrial development, will the economy have an open and well functioning market, maintain a high rate of capital accumulation, upgrade its endowment structure quickly, and see a more equitable distribution of income and fewer poor.
Acronyms
ADB Asian Development Bank CAD comparative advantage-defying strategy CAF comparative advantage-following strategy EXIM export and import dependent ratio FDI foreign direct investment LDCs least developed countries NSB National Statistical Bureau of China SOEs state-owned enterprises TCI technological choice index

1
1 Introduction
With disintegration of the colonial system in the 1950s, many newly independent countries have been striving to develop their economies and alleviate poverty. However, thus far, except for a few countries in East Asia, most have not realized these goals. Living standards in most of these countries have not improved substantially and for those in areas like Sub-Saharan Africa there has been almost no change.
The trend of globalization in the last decades of the twentieth century has provided many opportunities and challenges for countries in the developing world. Though there is a great amount of interest in the relationship between globalization and poverty, a satisfactory analytical framework is lacking. Also, there is no consensus on the impact of globalization on poverty from the perspective of cross-country empirical studies. As Nissanke and Thorbecke (2005: 4) point out:
Cross-country studies would require precise measurements and definition of the two key concepts: globalization and poverty. Yet, both concepts are multidimensional, and not easily captured in a composite index to be used in a meaningful manner in cross-country, comparative studies. Indeed, only detailed case studies are able to delineate the role of path dependence of multiple factors such as resource endowments, trade and production structures, policies, and institutions. Such research, if carefully conducted, should yield high dividends in identifying appropriate policy responses to globalization in relation to the overriding policy objective of poverty reduction.
However, China’s experience1 after implementing reform and the open-door policy in 1978 is an interesting case in the study of globalization and poverty. The average annual growth rate of GDP and trade reached 9.4 per cent and 16.0 per cent in 1979-2003, respectively (NSB 2004).2 According to current prices, the proportions of primary industry, secondary industry and tertiary industry as part of GDP, respectively, changed from 28.1 per cent, 48.2 per cent and 23.7 per cent in 1978 to 14.6 per cent, 52.2 per cent and 33.2 per cent in 2003. Similarly, the make-up of the employment structure in the same industries changed from 70.5 per cent, 17.3 per cent and 12.2 per cent in 1978 to 49.1 per cent, 21.6 per cent and 29.3 per cent in 2003 (NSB 2004).3 The life expectancy of Chinese people also increased from 66.8 years in 1980 to 70.7 years in
1 China mentioned in this paper refers only to the Chinese mainland, and does not include Hong Kong,
Macao and Taiwan.
2 Annual growth rate here refers to annual compound growth rate.
3 Many people argue that share of tertiary industry is underestimated, but that of secondary industry is over-estimated.

2
2002 (World Bank 2004),4 while the rate of illiteracy decreased from 22.81 per cent in 1982 to 6.72 per cent in 2000. In addition, the proportion of people with education above the high school level grew from 7.39 per cent in 1982 to 14.76 per cent in 2000 (NSB 2004).
In the study of globalization and poverty, the Chinese experience deserves special attention: with an average annual growth rate of 16.0 per cent, China’s foreign trade dependency ratio has increased dramatically since 1978; and China has also attracted a large amount of foreign direct investment (Tables 1 and 2). Poverty has been decreasing significantly. According to Ravallion and Chen (2004), in terms of both the official Chinese poverty line5 and the new poverty line established by the National Statistical Bureau (NSB),6 there is a significant reduction in the headcount index, poverty gap index, squared poverty gap index of rural areas, urban areas and the country as a whole (Table 3). The world development index (Table 4) also indicates that China has achieved great success in poverty reduction. However, despite these achievements, China has begun to face increasing income disparity and new kinds of poverty in recent years. It is important that a systematic analysis of China’s experiences in opening-up and poverty reduction be done, as well as lessons be drawn from its achievements and shortfalls.
Table 1
China’s foreign trade dependence ratio
Commodities export Commodities import
in billion US$ to GDP (%) in billion US$ to GDP (%) Trade dependent
ratio (%)
(1) (2) (3) (4) (5)=(2)+(4) 1978 9.75 4.62 10.89 5.17 9.79 1980 18.12 6.00 20.02 6.61 12.61 1985 27.35 9.02 42.25 14.03 23.05 1990 62.09 16.10 53.35 13.88 29.98 1995 148.78 21.29 132.08 18.89 40.18 2000 249.20 23.06 225.09 20.83 43.89 2003 438.228 30.95 412.76 29.16 60.11
Source: NSB (China Statistical Yearbook, various years).
4 Life expectancy in 2000 as reported by NSB (2004) was 71.4 years, higher than reported in the World
Bank’s report. But generally speaking, it is a fact that the life expectancy of the Chinese people has increased greatly.
5 The Chinese official poverty line is 300 yuan per person per year for rural areas based on 1990 prices; comparable poverty line for urban areas is not available.
6 Based on 2002 prices, the new poverty line is 850 yuan per person per year for rural areas and 1200 yuan for urban areas. Consumption bundle at this poverty line can guarantee the people’s daily need of 2100 calorie.

3
Table 2
FDI and China’s investment
FDI (US$ trillion) FDI/total investment in fixed assets* (%)
Exchange rate (RMB/100$)
1985 1.658 1.91 293.66 1990 3.487 3.69 478.32 1995 37.521 15.65 835.10 2000 40.715 10.24 827.84 2003 53.505 7.97 827.70
Note: * Gross capital formation, which includes changes in inventories, is derived from Expenditure-Approach National Accounting.
Source: NSB (China Statistic Yearbook, various years).
Table 3
Poverty in China (%), 1981-2001
Earlier poverty line New poverty line
1981 1986 1991 1996 2001 1981 1986 1991 1996 2001Rural Headcount index 28.62 9.85 11.66 4.20 4.75 64.67 23.50 29.72 13.82 12.49Poverty gap index 6.84 1.92 2.84 1.13 0.81 19.99 5.99 8.52 3.55 3.32Squared poverty gap index 2.35 0.52 1.17 0.58 0.19 8.44 2.16 3.43 1.50 1.21
Urban Headcount index 0.82 0.22 0.00 0.18 0.00 6.01 3.23 1.66 0.61 0.50Poverty gap index 0.22 0.00 0.00 0.07 0.00 1.01 0.46 0.53 0.16 0.16Squared poverty gap index 0.14 0.00 0.00 0.06 0.00 0.35 0.09 0.38 0.09 0.11
National Headcount index 23.02 7.49 8.52 2.97 2.96 52.84 18.53 22.16 9.79 7.97Poverty gap index 5.51 1.45 2.08 0.81 0.51 16.17 4.63 6.37 2.52 2.13Squared poverty gap index 1.90 0.40 0.85 0.42 0.12 6.81 1.65 2.61 1.07 0.80
Source: Ravallion and Chen (2004).
Table 4
Headcount index of Chinese poverty, 1996-2001
Index 1996 1998 2001
Poverty gap index at $1 per day (%) – – 3.94 Poverty gap index at $2 per day (%) – – 18.44 Headcount index, national (% of population) 6.00 4.60 – Headcount index, rural (% of population) 7.90 4.60 – Headcount index, urban (% of population) 2.00 2.00 –
Source: World Bank (2004).

4
On the basis of previous studies (Lin, Cai and Li 1996; Lin 2003), this paper develops a general framework to analyse openness and poverty in developing countries7, followed by an empirical analysis of China’s experience.
Our main arguments are as follows. The volume and structure of international trade, income distribution and poverty of a country are all endogenously determined by its economic development strategy. Countries adopting a comparative advantage-following (CAF) strategy will be more open, achieve rapid economic growth, and create more jobs for low-income groups, who rely mainly on physical labour for their livelihood. As a consequence, income distribution in these countries will be kept relatively even and poverty can be alleviated gradually. On the contrary, countries adopting a comparative advantage-defying (CAD) strategy to promote capital-intensive industries will inevitably see the opposite happen. This is because investment in the priority sectors of a CAD strategy creates limited job opportunities, excluding most poor labourers from formal labourmarkets. Moreover, firms in the priority sectors are nonviable in open, competitive markets. The survival of such firms depends on government subsidies and protection from international competition, and as a result, the economy becomes closed. As investment in priority sectors requires large amounts of capital, only the rich or those with good government connections have the ability to make the investments. The burden of providing subsidies to nonviable firms will ultimately be carried by those with less wealth and power. It will inevitably further distort income distribution and make it difficult to alleviate poverty.
The structure of this paper is as follows: the following section 2 is a brief literature review. Section 3 provides a general framework for analysing the relationship between economic development strategy, openness and poverty. Section 4 discusses briefly China’s experience, while section 5 tests the hypothesis with China’s panel data. Section 6 concludes.
2 Literature review
2.1 Globalization and poverty: theoretical and cross-country empirical studies
The history of studies on globalization, economic development, income distribution and poverty is as long as that of economics itself. There is a huge amount of literature on these topics. Nissanke and Thorbecke (2005) have conducted an extensive literature review. According to their paper, economists have yet to reach a consensus on the relationship between openness, globalization and poverty. Economic growth and
7 Obviously, poverty problems exist not only in the developing countries, but also in the developed
countries. But there is a big difference in the living conditions of the poverty-poor in the developing countries and developed countries. This paper focuses on globalization and poverty problems in the developing countries.

5
improving income distribution are essential steps toward alleviating poverty. At present, there are two opposing views on the impact of openness and trade on economic development and income distribution. Some economists believe that market opening and participation in globalization will contribute to economic development and improve income distribution, while other economists take the opposite position.
The most recent empirical works fail to reach a conclusion on this issue. Milanovic (2002) and Easterly (2003) argue that the relationship between globalization and income distribution (then poverty) can be expressed as an inverted U curve. These conclusions may be useful in describing past phenomena, but have no implications for applicable policy on poverty reduction in the future. For instance, we can hardly make a suggestion on policy from Milanovic (2002), who states that economies with low-income should keep themselves away from openness in order to reduce poverty. Nor can we make the following policy suggestions according to the result of Easterly (2003), who suggests that economies with relative low openness should avoid further openness to prevent inequality in income distribution.
Obviously, openness and trade are treated as exogenous variables in these analyses. But in our opinion, openness, income distribution and poverty are endogenous to a country’s development strategy, which is discussed in section 3. The effects of openness and globalization on poverty are determined by the following two factors: (i) the intrinsic characteristics of an economic structure before openness and (ii) a country’s approach to openness and globalization. For instance, should a country invest a large amount on the newest technologies or just purchase technologies that are suitable for its current economic needs? Will it develop necessary basic infrastructure or engage in risky R&D that requires a large number of foreign loans? Will it export products produced using relatively abundant domestic resources, or products produced using far scarcer resources that can only be obtained through government subsidies?
2.2 Literature on poverty in China
There have been many studies concerning China’s openness and poverty individually and in conjunction. Anderson, Huang and Ianchovichina (2004) analyse China’s rural economy and rural poverty after its accession to the WTO with a GTAP model and finds that cutting down agricultural import protections and removing agricultural subsidies will worsen the situation of rural residents who rely on an agriculture-based income, compared with that of urban residents. But if the Chinese government reduces the negative nominal protection rate of rice, meat, vegetables and fruit to zero after accession to the WTO, the decrease in wages for rural residents would be less. His analysis, on the other hand, emphasizes that the reduction of agricultural protections in developed countries would contribute to the reduction of rural poverty in China. The analysis divides rural households into three categories: category A includes households whose proportion of non-farm income was 0 per cent; categories B and C include households for whom the proportions were 30 per cent and 60 per cent, respectively. After accession to the WTO, the income of households in categories A and B decreased,

6
while for those in category C it increased. Of course, the elimination of negative agricultural protection would improve the situation of households in categories A and B.
Chen (2004) finds that accession to the WTO would have little impact on average household income, household income inequity, and poverty in China, but the impact varies greatly among households with different characteristics. Generally speaking, the study finds that rural households would be harmed in the process, while urban households could benefit from it. The most vulnerable households are those who relied heavily on income from agriculture. Hertel, Zhai and Wang (2004) prove that after accession to the WTO if labour could move freely between the agricultural and non-agricultural sectors, both rural households and urban households in the long run would benefit, though rural households would benefit less. However, in the short run, rural households would experience a small loss because of the restriction of labour mobility.
Xue (2004) and Li (2004) analyse recent urban poverty problems in China and find that increasing numbers of laid-off and unemployed individuals, a result of enterprise reform, have increased urban poverty; the influx of migrants from rural areas is an important element of urban poverty; and poverty is also related to level of education and the health of residents. They suggest that increasing employment is a way to solve the problem of urban poverty.
Li and Knight (2004) develop a new classification of poverty, based on the permanent income hypothesis. According to an individual’s current levels of income and consumption, poverty can be divided into three categories: permanent poverty, selective poverty and temporary poverty. Permanent poverty includes individuals whose current income and consumption are both below the poverty line. Temporary poverty refers to those whose current income is below the poverty line, but whose consumption level is above the poverty line because their permanent income is higher than their current income. Their current consumption is financed either by past savings or by new loans. Selective poverty refers to those people, whose current income is above the poverty line but consumption level is below the poverty line. Their choice to lower consumption is because they are either making up for past overconsumption or have expectations of making large expenditures in the future. According to their 1999 survey, Li and Knight (2004) discover that the overall urban poverty rate was 9.4 per cent in China, of which 29 per cent could be categorized as permanent poverty, 20 per cent as temporary poverty, and the remaining 50 per cent as selective poverty.8 The propensity for high savings rates and low rates of expenditure of families categorized within selective-poverty was because most of these families did not have members who were ill or children who were still in school, so their current expenditures were very low.
Studies conducted by Ravallion and Chen (2004) can be taken as an authoritative analysis of Chinese poverty. They not only evaluate the change in the rate and extent of 8 When applying just the income standard or consumption standard, the poverty rate was 4.6 per cent
and 7.5 per cent, respectively.

7
poverty since 1978, but also provide a theoretical explanation for it. According to the poverty line defined in their analysis, in the 20 years since 1981, the proportion of the Chinese population in a state of poverty decreased from 53 per cent to 8 per cent, but the speed of this decrease has slowed since the end of the 1990s. At the same time, the degree of inequity in China was found to be increasing, which the analysis pointed out has become a common focus in the study of economic development and poverty reduction.
What’s more, another important finding of the study was that ‘the approach to economic development can affect poverty reduction’. Although we agree with this finding, we have reservations about their explanation for it, which is based in the idea that ‘if the overall growth rate of each industry9 remains constant since 1981, it will take 10 years rather than 20 years for incidences of poverty to decrease to 8 per cent’.10 The reason for our objection is simple: if the growth rate of secondary industry and tertiary industry remained at 1981 levels over the past 20 years (the growth of per capita income), then the demand for agricultural products would not have been as high as the actual levels that we have seen. In the extreme situation of a closed economy, since the demand elasticity of agricultural products with regard to both income and price is very low, an increase in agricultural production may result in a decrease, rather than increase, in farmers’ income. Although this paper correctly concludes that past reductions in China’s rural poverty was mainly due to agricultural growth, this can hardly be useful to suggest future policies for the reduction of rural poverty. Given the current endowment structure of population and land, depending on growth in agricultural output alone is hardly a sustainable method for reducing poverty.
Although the views of the above literature may be different, they are all based on detailed econometric analysis and simulation. This paper does not intend to judge where a reasonable poverty line should be set or which measurement of poverty is more precise. What concerns us most is the construction of a general framework for analysing the relationship between poverty and openness. The literature on Chinese poverty mentioned above has thus far failed to do so.
9 The industries mentioned here refer to primary industry, secondary industry and tertiary industry.
10 There is a methodology issue here. Just as Solow (2001: 283) points out when talking about cross-country regressions of economic convergence, ‘the causality issue points to a deeper question: Do cross-country regressions define a meaningful surface along which countries can move back and forth at will?’

8
3 Economic development strategy, openness and poverty: a framework11
Not including the instances of poverty that result from a loss of ability to work due to illness or natural or man-made disasters, the majority of instances of low income in developing countries are the result of the interaction of economic growth and income distribution. Obviously, if the increase in per capita income of an economy is so slow that it remains under the poverty line, most people will live in poverty no matter how equally income is distributed. The analysis of Dollar and Kraay (2000) using data from 80 countries over about 40 years shows that ‘the income of the poor rises one-for-one with overall growth’. Similarly, if income disparity in an economy is increasing along with its per capita income, the problem of poverty will also worsen. Thus the combination of economic growth and improved income distribution is a basic and sustainable way for solving the problem of poverty. Therefore, it is imperative to find a mode of development that can promote economic growth and improve income distribution simultaneously.
Economists have long strived for such an approach to development. Many suggestions have been put forward in different periods of history and in different contexts. However, economists have become less confident in making new suggestions. In a paper entitled ‘Growth Strategy’ prepared for the Handbook of Economic Growth, Rodrik (2004) cites two paragraphs by Harberger, one in 1985 and another in 2003. The first highly praised the power of economic principles in influencing development policies, but the second one lost almost all confidence in the economic principles that it had previously praised. Rodrik ends his article as follows, ‘rule-of-thumb economics, which has long dominated thinking on growth policies, can be safely discarded’. This remark reflects the frustration of economists in facing the many problems of development in today’s world.
We believe that the key to understanding the relationship between openness, growth and poverty is the government’s economic development strategy. According to Lin (2003), a country’s development strategy can be broadly divided into two mutually exclusive groups: (i) a comparative advantage-defying (CAD) strategy, which attempts to encourage the firms to deviate from the economy’s existing comparative advantages in their entry into an industry or choice of technology; and (ii) the comparative advantage-following (CAF) strategy, which attempts to facilitate the firms’ entry into an industry or choice of technology according to the economy’s existing comparative advantages.12
11 This section draws heavily on Lin (2003).
12 The concept of comparative advantage is most often used in trade theories. But the term we use here is not restricted to its conventional meaning. Even in a closed economy, an enterprise’s cost-minimizing input structure will be determined by the economy’s given factor endowment structure and market demand. If the relative intensity of the scarce resource used in the government’s prioritized industry exceeds its optimal cost-minimizing level, then the government’s development strategy is also a CAD strategy (Lin 2003).

9
When development economics started to take shape in the mid twentieth century, the dominant view among development economists w as to advise governments in the least developed countries (LDCs) to ignore their own comparative advantages and to adopt an inward-looking variant of the CAD strategy, telling them to focus on developing heavy-industry or import substitution. The endowment structure of most LDCs is characterized by a relative abundance of labour and lack of capital, whereas the projects supported by a CAD strategy are capital intensive and are not consistent with the comparative advantage of most LDCs. As a result, firms in government-selected priority sectors are not viable in an open and competitive market. Therefore, the governments must support these firms by intervening in the natural function of the market. Specific measures used include (but are not limited to) the following variants: interest rate suppression in order to lower investment and operation costs for heavy-industry projects, an overvalued domestic currency that makes importing equipment for heavy industry projects cheaper, and the creation of legal monopolies that allow firms to charge high prices in order to ensure high enough profits (Lin, Cai and Li 1996)
Unlike many other developing countries, Japan, Korea, Singapore, Hong Kong and Taiwan followed a development approach that was closer to a CAF strategy rather than a CAD strategy. After the Second World War, they upgraded their industries in accordance with the changes in their comparative advantages at each stage of development. They have achieved much better performance than their counterparts who adopted a CAD strategy. Lin (2003) argues that a country’s economic development strategy matters; and an economy’s growth, trade structure, income distribution and poverty are endogenous to its choice of development strategy.
3.1 Development strategy and growth
The most important sources of per capita income growth are per capita capital accumulation and technological progress. Capital accumulation depends on the size of economic surpluses and the rate of savings in the economy. When firms enter the industries in which an economy has comparative advantages and adopt cost-minimizing technology in their production, the firms will be competitive, the economy’s products will maximize their share in domestic and international markets, and the economy will maximize its possible surplus. Meanwhile, capital will have the highest possible rate of return when it is invested in industries in which the economy has comparative advantages. The incentive to save will also be maximized. Moreover, the government will not need to distort the prices of inputs and outputs, nor will it need to use administrative methods to create legal monopolies and provide subsidies in order to protect firms. Therefore, there will be no space for wasteful rent-seeking activities. The firms will have hard budget constraints and will need to earn profits by improving management practices and their competitiveness in the market. A CAD strategy will result in just the opposite effect with regard to competitiveness, the rate of return to capital, rent-seeking activities, and the softness of budget constraints for firms in

10
priority industries. Therefore, the accumulation of capital under a CAF strategy will be faster than under a CAD strategy.
The accumulation of per capita capital will provide a basis for upgrading the industrial/technological structure of the economy (Basu and Weil 1998). Despite possibly being borrowed from developed countries (DCs), these upgraded industries/technologies will be new to the firms of an LDC. The learning costs will be lower under a CAF strategy because the distance between the new industry/technology and existing industry/technology is smaller (Barro and Sala-i-Martin 1997). Moreover, the patent protections of many targeted technologies under a CAF strategy are likely to have expired; and even if they are still under patent protection, the licensing fee will be lower for technologies needed under the CAF strategy because ceteris paribus, most of the targeted technologies will be older than those needed under a CAD strategy. In some cases, firms under a CAD strategy will not be able to obtain necessary technology from DCs and will need to ‘reinvent the wheel’ on their own through investment in costly and risky R&D. Therefore, the acquisition cost of technology will be lower under a CAF strategy than under a CAD strategy.
So by following CAF strategy, the speed of endowment structure (capital-labour ratio) upgrading and technological progress will be faster than under a CAD strategy. We have tested these hypotheses, using cross-country data and provincial data within China, and the results are consistent with the above predictions (Lin 2003; Lin and Liu 2003).
3.2 Development strategy and openness
A country adopting a CAF strategy will import products for which it does not have comparative advantages and export products for which it has comparative advantages. For this country, the degree of openness (the value of imports and exports as a percentage of GDP) is endogenous to the country’s comparative advantages.
If the government of an LDC adopts a CAD strategy and attempts to substitute the importation of capital-intensive goods with domestic production, not only will the country’s import volume be reduced but its exports will also fall. The latter is the result of resources being redirected to priority industries from the industries in which the economy has a comparative advantage in addition to the exchange rate possibly being overvalued to facilitate the import of technology/equipment for the development of priority industries. Both will hamper the development of exports. The economies that followed the model include the socialist countries, India, Latin American countries and many other developing countries. The performance of these countries had been miserable compared with the East Asian economies that adopted a CAF strategy. The government of an LDC may adopt a CAD strategy while at the same time encouraging firms in its priority sector capital-intensive industries to export. In this case, even though a large proportion of the firms’ products may be sent to foreign markets and may see fast technological improvement, the products exported will not be profitable. These firms’ survival relies on government protection via preferential loans and other policy

11
supports. As a result of these policies, the country will have poor external accounts, accumulate massive foreign debt, and be sensitive to external shock.
It may be better for an LDC to adopt a CAD strategy that encourages exports rather than a CAD strategy that encourages import substitution. However, the overall economic performance of a country that adopts a strategy encouraging exports will still be worse than that of a country that adopts a CAF strategy. Since the optimal level of openness of an economy is endogenously determined by its comparative advantages, it is not true that emphasis on external trade is a better policy for promoting economic growth in an LDC.
3.3 Development strategy, income distribution and poverty
To reduce poverty and distribute the income more equally, the economic situation of low-income groups has to be improved. Low-income individuals, unlike the wealthy, have little in the way of land, capital, higher education, personal relations or social networks that may help them generate income. The major source of income for the poor is the physical labour that they can provide. Therefore, to continuously increase the income of these individuals both absolutely and relatively, it is essential for creating employment opportunities and for increasing wages for them as much as possible. This is the only feasible and sustainable way to improve the economic situation of low-income individuals in LDCs. If a CAF strategy is adopted and labour-intensive industries are developed, these people will have sufficient job opportunities. Moreover, the strategy will accelerate the accumulation of capital, which will in turn cause initially relatively abundant labour to become more and more scarce. In this process, industry and technology become increasingly capital intensive and the marginal productivity of labour increases, as do wages. With sufficient employment and an increase in wages, poverty can be eliminated. Meanwhile, as capital becomes increasingly abundant, the return to capital declines. The relative gap in income of people originally with an advantage in capital and those who could only depend on physical labour will be narrowed. Therefore, income will become more equally distributed. It is by adopting a CAF strategy that efficiency and equity can be achieved simultaneously in LDCs.
On the contrary, if an LDC adopts a CAD strategy, and gives priorities to capital-intensive industries, it will fail to create a large number of jobs. Most labourers will remain in the agricultural sector, where marginal productivity is low and their wages remain low (Lin et al. 1996). Meanwhile, only the rich and the powerful who have easy access to subsidized loans from banks will have the financial resources to invest in prioritized capital-intensive industries. However, firms in the priority industries will not be viable. Their investment and survival rely on government protection and subsidies, which must ultimately come from the pockets of the poor and powerless. Therefore, inequality in income distribution will be exacerbated.
The CAD strategy will also reduce social transfers to groups in relatively weak positions such as the poor, jobless, disabled, and elderly. These groups are universally

12
acknowledged as the ones in need of social protection, either through social security networks or relief funds or through assistance from other family members. However, the resources that could be allocated to support these groups depend on overall economic growth. Under a CAD strategy, low economic performance reduces the total amount of resources that can be used to help these people. Sometimes, the government may even divert resources, which would have been allocated to the social security system, to subsidize prioritized sectors. This will lead to deterioration in the standard of living for disadvantaged people.
4 Openness and poverty in China after reform
Before reform started in 1978, China adopted a typical CAD strategy, which resulted in poor economic performance. Ever since reform started, China’s economic development has moved gradually toward that of a CAF strategy.
The reform started with the replacement of collective farming with the household responsibility system in rural areas at the end of 1978. The institutional change greatly increased agricultural productivity (Lin 1992). Along with agricultural reform, the government also increased the autonomy of state-owned enterprises (SOEs) and allowed them to share the profits through a profit retention system, later on a contract system and recently the modern corporation system. Meanwhile, township and village enterprises and other private enterprises began to emerge and grow. These new enterprises were faced with a hard budget constraint, as they were not entitled to government protection and subsidies, leaving them to fight for survival among fierce competition.
The entry of new enterprises also increases the pressure on SOEs to face competition and forces them to improve performance. Since the mid-1990s, most small- and medium-size SOEs and collectively-owned enterprises have been privatized. With the progress of reform, the government reduced its direct interference on resource allocation and prices. Except for the financial market, most other markets have been liberalized. The reduction of the government’s interventions has shifted China’s development away from the CAD strategy to a CAF strategy.
With the progress of reform and the change in development strategy, China has turned from being an inward-oriented economy to integrating more and more with the world economy. By establishing special economic zones, attracting foreign direct investment (FDI) and liberalizing trade, the link between the Chinese economy and the global economy has become closer, especially after China’s accession to the WTO in 2001. China’s trade dependent ratio (the percentage of total imports and exports as a percentage of GDP) increased from 9.79 per cent in 1978 to 60.11 per cent in 2003 (Table 1). Among the largest economies in the world, China has become the most open economy, as measured by the trade dependent ratio. At the same time, FDI in China increased from almost nothing in the early 1980s to US$53.5 billion in 2003, the largest recipient of FDI in the world that year. The share of FDI in China’s fixed asset

13
investment increased from 1.9 per cent in 1985 to 17 per cent in 1994 and remained at around 10 per cent from the late 1990s into the early 2000s (Table 2). The composition of China’s trade also experienced a big change, with a significant increase in the proportion of manufactured products in imports and exports (Figures 1 and 2).
Figure 1
China’s export structure, 1980-2003
0102030405060708090
100
1980
1985
1989
1990
1991
1992
1993
1994
1995
1996
1997
1998
1999
2000
2001
2002
2003
%
Primary goodsManufactured goodsMachinery and transport equipment
Source: NSB (China Statistical Yearbook, various years).
Figure 2
China’s import structure, 1980-2003
0102030405060708090
100
1980
1985
1989
1990
1991
1992
1993
1994
1995
1996
1997
1998
1999
2000
2001
2002
2003
%
Primary goodsManufactured goodsMachinery and transport equipment
Source: NSB (China Statistical Yearbook, various years).

14
Figure 3
The regional distribution of FDI (US$10,000)
0
1000
00
2000
00
3000
00
4000
00
5000
00
6000
00
7000
00
8000
00
9000
00
1000
000
1100
000
1200
000
Bei j i ng Ti anj i n Hebei Shanxi I nner Mongol i a Li aoni ng J i l i n Hei l ongj i ang Shanghai J i angsu Zhej i ang Anhui Fuj i an J i angxi Shandong Henan Hubei Hunan Guangdong Guangxi Hai nan Chongqi ng Si chuan Gui zhou Yunnan Ti bet Shaanxi Gansu Qi nghai Ni ngxi a Xi nj i ang
1995 19972000 2003
Source: NSB (China Statistical Yearbook, various years).

15
Figure 4
Commodity exports according to location of origin in China (US$10,000)
010
0000
020
0000
030
0000
040
0000
050
0000
060
0000
070
0000
080
0000
090
0000
010
0000
0011
0000
0012
0000
0013
0000
0014
0000
0015
0000
0016
0000
00
Bei j i ng Ti anj i n Hebei Shanxi I nner Mongol i a Li aoni ng Ji l i n Hei l ongj i ang Shanghai Ji angsu Zhej i ang Anhui Fuj i an Ji angxi Shandong Henan Hubei Hunan Guangdong Guangxi Hai nan Chongqi ng Si chuan Gui zhou Yunnan Ti bet Shaanxi Gansu Qi nghai Ni ngxi a Xi nj i ang
1993199520002003
Source: NSB (China Statistical Yearbook, various years).
However, integration with the world economy is not even throughout all the provinces and regions in China. As shown in Figures 3 to 5, the coastal provinces, especially Guangdong, received significantly more FDI and their imports and exports comprise a much higher proportion of their total value-added than provinces in the central and western regions.

16
Foreign enterprises in China have provided many jobs and account for a large portion of China’s imports and exports. At the same time, foreign enterprises have also contributed to China’s change in development strategy. Foreign enterprises face a hard budget constraint, and to minimize costs they must follow the comparative advantage in their chosen industry and technology. Moreover, by listing in the equity markets abroad or forming joint ventures, some large SOEs are able to gain access to foreign capital and remove the constraint of China’s relative capital scarcity on their viability (Lin and Tan 1999).
Figure 5
Commodity imports according to destination in China (US$10,000)
0
1000
000
2000
000
3000
000
4000
000
5000
000
6000
000
7000
000
8000
000
9000
000
1000
0000
1100
0000
1200
0000
1300
0000
1400
0000
Bei j i ng Ti anj i n Hebei Shanxi I nner Mongol i a Li aoni ng Ji l i n Hei l ongj i ang Shanghai Ji angsu Zhej i ang Anhui Fuj i an Ji angxi Shandong Henan Hubei Hunan Guangdong Guangxi Hai nan Chongqi ng Si chuan Gui zhou Yunnan Ti bet Shaanxi Gansu Qi nghai Ni ngxi a Xi nj i ang
1993199520002003
Source: NSB (China Statistic Yearbook, various years).

17
However, China’s transition to an economy totally observing the CAF strategy is far from complete. First, reform in some key areas is not finished. For instance, interest rates have not been liberalized; and the banking system still bears the burden of subsidizing large SOEs. Second, the degrees to which various regions deviated from their comparative advantage differed before reform, and their degrees of shifts to a CAF strategy also vary across regions. Third, after reform, all levels of government, especially local government, often use administrative measures (such as deliberately keeping land prices low, reducing local taxes, lowering environment protection standards, creating entry barriers for products produced in other provinces, etc.) to encourage firms to ignore the region’s specific comparative advantages in their choice of industries or technologies. Evidence from productivity differences between agricultural and non-agricultural sectors clearly indicates that the change in China’s development strategy is still incomplete.
Figure 6
Labour productivity of agricultural sector (10,000 yuan/per worker)
0
500
1000
1500
2000
2500
3000
3500
4000
4500
5000
1978
1980
1985
1989
1990
1991
1992
1993
1994
1995
1996
1997
1998
1999
2000
2001
2002
Source: NSB (China Statistical Yearbook, various years).
In an open, competitive market, the marginal return of a factor of production in various sectors will be equalized. Figure 6 shows that the agricultural sector’s labour productivity is increasing. If the differences of the agricultural sector’s labour productivity to those of manufacturing and other industries are narrowing, we can conclude that the marginal productivity gaps between agriculture and other industries are diminishing. Otherwise we can reach the opposite conclusion.13 Figure 7 shows the relative labour productivity of non-agricultural sectors to that of agriculture. We see that before the 1990s, the differences in productivity between agriculture and other sectors were decreasing;
13 The long-term trend of labour productivity is consistent with that of marginal productivity of labour.

18
however, from the first half of the 1990s, the differences have grown and for several sectors have exceeded those at the beginning of reform.14
Figure 7
Relative labour productivity of non-agricultural to agricultural sectors
0
1
2
3
4
5
6
7
8
9
10
11
1978
1980
1985
1989
1990
1991
1992
1993
1994
1995
1996
1997
1998
1999
2000
2001
2002
National econom yIndustryConstructionTransport, post & telecommunication servicesW holesale, retail trade & catering servicesOther sectors of tertiary industry
Source: NSB (China Statistical Yearbook, various years).
Another proxy is the incremental output-labour ratio, the results of which are shown in Table 5.15 We see that after reform, the incremental output-labour ratios in the national economy, primary, secondary and tertiary industries all show an upward trend, especially in the first half of the 1990s and after 1999, a fact which indicates an increase in marginal labour productivity in all sectors. But compared with other industrial sectors and the national economy as a whole, the increase in the incremental output-labour ratio of primary industries is much slower. That is to say, the increase of marginal labour productivity in agricultural sectors is much lower than non-agricultural sectors.
14 It can be seen from Figure 7 that a large productivity gap exists not only between agriculture and other
industries, but also among other non-agriculture industries. What specifically needs to be mentioned here is that relative productivity of the other tertiary industries is, in fact, underestimated because the value-added of tertiary industry is underestimated.
15 The results in Table 5 are calculated with current prices.

19
Table 5
Incremental output-labour ratio, 1978-2003
Nat
iona
l ec
onom
y
Prim
ary
indu
stry
Sec
onda
ry
indu
stry
Man
ufac
tur
-ing
Con
stru
c-tio
n
Terti
ary
Tran
spor
t, po
st &
te
leco
m-
mun
icat
ion
W
hole
sale
, re
tail
trade
, &
cat
erin
g se
rvic
es
1978–79 0.47 0.76 0.63 0.79 0.09 0.02 0.34 -0.49 1979–80 0.36 0.21 0.56 0.55 0.67 0.29 0.99 -0.05 1980–81 0.25 0.28 0.21 0.20 0.33 0.23 0.16 0.33 1981–82 0.28 0.20 0.37 0.50 0.12 0.61 0.75 -0.67 1982–83 0.56 0.68 0.79 1.11 0.36 0.34 0.49 0.21 1983–84 0.70 -1.18 0.50 0.78 0.12 0.39 0.33 0.69 1984–85 1.07 0.94 0.96 1.57 0.27 1.27 0.51 1.49 1985–86 0.88 1.79 0.75 0.82 0.54 0.86 0.71 0.61 1986–87 1.17 1.08 1.49 1.71 0.95 0.96 0.90 1.33 1987–88 1.91 1.07 3.14 3.73 1.35 1.85 1.71 2.75 1988–89 1.99 0.41 -3.93 -7.68 0.19 4.63 125.0 2.56 1989–90 0.17 0.14 0.23 0.25 0.18 0.22 1.37 -0.57 1990–91 4.14 1.48 8.71 9.38 5.57 3.54 7.03 4.68 1991–92 7.60 -1.28 7.64 12.64 2.41 2.66 6.65 3.35 1992–93 12.19 -1.06 7.75 19.48 2.11 2.05 36.57 1.31 1993–94 18.74 -2.45 17.13 22.93 6.09 2.67 3.29 2.08 1994–95 19.21 -2.31 17.98 25.98 5.90 2.21 2.84 1.75 1995–96 10.63 -2.61 9.26 13.15 3.29 2.37 3.18 1.67 1996–97 7.56 18.35 10.49 18.76 1.68 5.15 38.86 2.81 1997–98 4.75 1.01 26.35 -3.28 1.20 5.01 -9.41 -4.83 1998–99 4.92 -0.14 -10.83 -5.57 1.90 5.40 5.54 1.61 1999-2000 10.71 0.57 -21.67 -12.09 3.32 4.64 -221.9 -3.89 2000-01 8.35 1.67 58.69 -56.67 3.94 8.02 46.69 9.23 2001-02 10.46 1.98 -9.51 -8.84 -18.94 2.30 5.30 1.13 2002-03 17.50 -3.01 25.56 4.93
Notes: Negative figures (indicated in bold italics) refer to situations in which output increased but employ-ment decreased. These can be viewed as a very large positive number. The boxed negative figures xxx refer to situations in which output decreased but employment increased, indicating that marginal labour productivity is very low.
Source: NSB (China Statistical Yearbook, various years).
Of course, even in ideal conditions, labour productivity in different sectors cannot be exactly the same because of differences in technologies, transaction costs and other reasons. However, if the productivity gap between agriculture and other industries continues to increase, the difference in income distribution between the rural agricultural population and those in the urban sectors will become greater. As long as most of the poor rely on agriculture for their livelihood, poverty will not be eliminated.
20
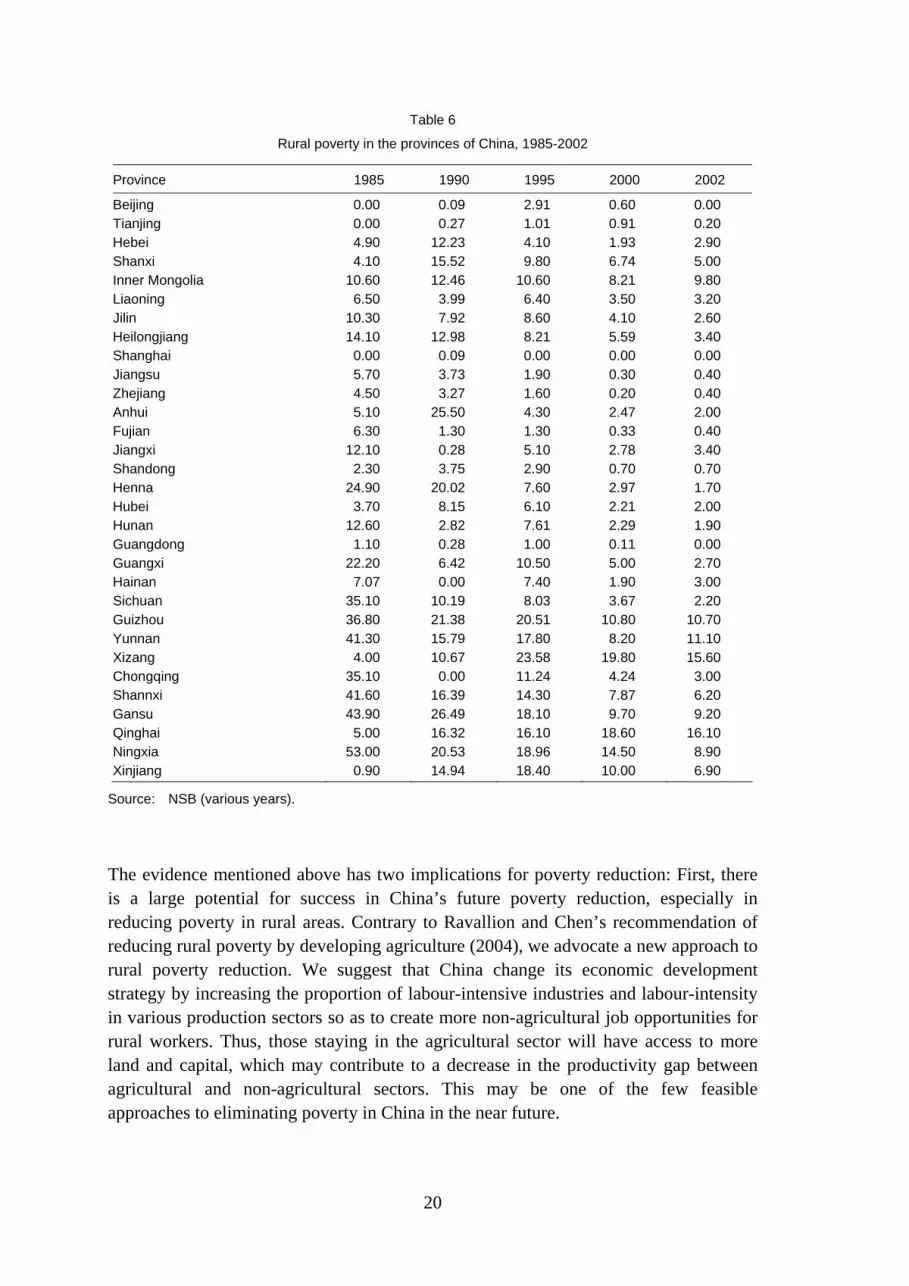
Table 6
Rural poverty in the provinces of China, 1985-2002
Province 1985 1990 1995 2000 2002
Beijing 0.00 0.09 2.91 0.60 0.00 Tianjing 0.00 0.27 1.01 0.91 0.20 Hebei 4.90 12.23 4.10 1.93 2.90 Shanxi 4.10 15.52 9.80 6.74 5.00 Inner Mongolia 10.60 12.46 10.60 8.21 9.80 Liaoning 6.50 3.99 6.40 3.50 3.20 Jilin 10.30 7.92 8.60 4.10 2.60 Heilongjiang 14.10 12.98 8.21 5.59 3.40 Shanghai 0.00 0.09 0.00 0.00 0.00 Jiangsu 5.70 3.73 1.90 0.30 0.40 Zhejiang 4.50 3.27 1.60 0.20 0.40 Anhui 5.10 25.50 4.30 2.47 2.00 Fujian 6.30 1.30 1.30 0.33 0.40 Jiangxi 12.10 0.28 5.10 2.78 3.40 Shandong 2.30 3.75 2.90 0.70 0.70 Henna 24.90 20.02 7.60 2.97 1.70 Hubei 3.70 8.15 6.10 2.21 2.00 Hunan 12.60 2.82 7.61 2.29 1.90 Guangdong 1.10 0.28 1.00 0.11 0.00 Guangxi 22.20 6.42 10.50 5.00 2.70 Hainan 7.07 0.00 7.40 1.90 3.00 Sichuan 35.10 10.19 8.03 3.67 2.20 Guizhou 36.80 21.38 20.51 10.80 10.70 Yunnan 41.30 15.79 17.80 8.20 11.10 Xizang 4.00 10.67 23.58 19.80 15.60 Chongqing 35.10 0.00 11.24 4.24 3.00 Shannxi 41.60 16.39 14.30 7.87 6.20 Gansu 43.90 26.49 18.10 9.70 9.20 Qinghai 5.00 16.32 16.10 18.60 16.10 Ningxia 53.00 20.53 18.96 14.50 8.90 Xinjiang 0.90 14.94 18.40 10.00 6.90
Source: NSB (various years).
The evidence mentioned above has two implications for poverty reduction: First, there is a large potential for success in China’s future poverty reduction, especially in reducing poverty in rural areas. Contrary to Ravallion and Chen’s recommendation of reducing rural poverty by developing agriculture (2004), we advocate a new approach to rural poverty reduction. We suggest that China change its economic development strategy by increasing the proportion of labour-intensive industries and labour-intensity in various production sectors so as to create more non-agricultural job opportunities for rural workers. Thus, those staying in the agricultural sector will have access to more land and capital, which may contribute to a decrease in the productivity gap between agricultural and non-agricultural sectors. This may be one of the few feasible approaches to eliminating poverty in China in the near future.

21
Table 7
Urban poverty in China,1998
Province
Poverty line (yuan/person/per
annum)
Total population with income below the poverty
line (1,000 people) Poverty rate (%)
Poverty rate (%) if poverty line is
increased by 15%
Beijing 3118 54 0.73 1.45 Tianjing 2993 360 6.77 10.71 Hebei 2509 651 5.20 9.15 Shanxi 1616 596 7.17 11.07 Inner Mongolia 1824 510 6.40 10.03 Liaoning 2203 1150 6.13 11.63 Jilin 1831 853 7.54 11.05 Heilongjiang 1878 1154 6.92 11.54 Shanghai 3636 314 3.24 4.98 Jiangsu 2228 244 1.20 3.09 Zhejiang 2989 153 1.62 3.06 Anhui 2138 348 2.89 6.57 Fujian 2416 145 2.18 4.24 Jiangxi 1809 310 3.42 7.49 Shandong 2566 1172 5.05 10.24 Henna 1904 1410 8.39 12.97 Hubei 2283 934 5.67 10.37 Hunan 2146 462 3.61 7.37 Guangdong 3061 154 0.68 1.07 Guangxi 2507 246 3.01 7.53 Hainan 2465 150 7.94 14.15 Sichuan 2004 711 4.72 6.75 Guizhou 2137 260 5.00 8.08 Yunnan 2359 225 3.69 6.44 Xizang 2237 39 11.31 13.99 Chongqing 2214 260 4.09 6.99 Shannxi 2014 932 11.95 17.66 Gansu 1819 304 6.44 12.16 Qinghai 1484 76 5.63 8.15 Ningxia 2093 210 13.51 20.35 Xinjiang 1772 383 6.16 7.04 National 2310 14770 4.73 8.17
Source: ADB (2003).
The second implication is that situations vary greatly between provinces and regions. The evidence cited above is not exactly the same for all provinces. Due to the different pace at which changes in development strategy are implemented, there are different degrees to which poverty reduction has been achieved. According to China’s official data, incidence rates of rural poverty vary greatly among different provinces (Table 6). Tibet, Qinghai, Guizhou, Yunnan, Inner Mongolia, Jiangxi and Anhui have relatively higher rates of poverty, while these values were relatively low for the big cities and the coastal provinces. One study on Chinese urban poverty conducted by ADB (2003) shows that incidence rates of urban poverty also vary greatly across provinces (Table 7).

22
In 1998, Guangdong had the lowest urban poverty rate, which was only 0.68 per cent, while Ningxia had the highest urban poverty incidence rate at 13.51 per cent.16
5 Hypothesis testing
In this section we use provincial panel data to test the effect of openness and development strategy on the incidence of rural poverty in China.
5.1 Proxies for openness and development strategy
In order to assess the impacts of globalization and development strategy on the incidence of rural poverty in each province in China, we need to have proxies for openness and the development strategy. For openness, we use the export and import dependent ratio (EXIM), which is defined as the sum of provincial imports (excluding imports from other provinces) and provincial exports (excluding exports to other provinces) divided by the provincial value-added each year.
Lin (2003) constructs a technological choice index (TCI) to measure the proxy for the development strategy. Given the endowment structure of a province, the nature of its development strategy is mainly characterized by all the capital-intensity as well as manufacturing industries of the province. When the province follows a CAF strategy, the optimum capital-labour ratio in manufacturing industries is endogenously determined by the province’s capital-labour ratio. That is, the optimum capital-labour ratio in manufacturing industries is a function of the economy’s capital-labour ratio, as shown in equation (1).
*, ,
, ,..i t i t
i t i t
K KfL L
⎛ ⎞⎛ ⎞ = ⎜ ⎟⎜ ⎟⎝ ⎠ ⎝ ⎠
(1)
The left-hand side of equation (1) refers to the optimum capital-labour ratio in the
manufacturing industry of the ith province at time t; , ,i t i tK L refers to the overall
capital-labour ratio in the ith province at time t. In order to measure the deviation between the adopted development strategy and the CAF strategy in a province, a technological choice index (TCI) is constructed. It is the quotient between the actual capital-labour ratio in the manufacturing industry of a province and the endowed capital-labour ratio of the province , i.e.
16 Urban poverty lines are not the same in the various provinces. For instance, in Guangdong province,
the urban poverty line is 3061 yuan/per person per annum, while in Ningxia it is 2093 yuan .

23
, ,,
, ,
( / )( / )
i t i ti t
i t i t
K LTCIK L
= (2)
Previous analysis shows that the provincial government’s development strategy will affect the value of the TCI in that province.
We then define the optimal technology choice index, TCIi,t*, for the ith province at time t. From the first-order Taylor expansion of equation (1) at the origin and omitting the higher order terms, we obtain
*, ,
, ,
i t i t
i t i t
K KL L
ω⎛ ⎞⎛ ⎞ = ⋅⎜ ⎟⎜ ⎟
⎝ ⎠ ⎝ ⎠ (3)
where ω is a positive constant. The optimal technological choice index TCI* is defined, accordingly, as follows:17
*, ,*
,, ,
( / ) ..( / )
i t i ti t
i t i t
K LTCIK L
ω= = (4)
It should be pointed out that what we assume to be a positive constant, ω , is a province’s optimal technological choice index TCIi,t
*, rather than the optimal capital-labour ratio of the province’s manufacturing industry (Ki,t/Li,t)*. Indeed, when capital is relatively abundant in a province, the optimum capital-labour ratio in the manufacturing industry of the province will be higher than that in a province where capital is relatively scarce. In other words, the higher the capital-labour ratio in a province’s endowments (the denominator of TCIi,t
*), the higher the optimum capital-labour ratio in its manufacturing industry (the numerator of TCIi,t
*). To be more specific, what we assume to be a positive constant,ω , is TCIi,t
* rather than the numerate of TCIi,t*.
Given the definition of TCIi,t*, a deviation from the CAF strategy in the ith province at
time t can then be indirectly measured as follows:
*, , , , .i t i t i t i tDS TCI TCI TCI ω= − = − (5)
If a CAF strategy is adopted in the ith province at time t, DSi.t=0. When the actual TCIi,t is higher (lower) than optimal level, DSi,t>0(<0). The absolute value of DSi,t measures the deviation between the adopted strategy and the CAF strategy in the ith province at time t.
17 TCI*is also affected by the level of economic development and the richness of natural resources in the
economy. We will not address these issues in this paper.

24
There are two types of CAD, i.e. DSi,t>0 or DSi,t<0. According to our observations, all provincial governments in China have the intention to develop capital-intensive and technology-intensive projects that are inconsistent with the comparative advantages at their present stage of development, probably due to the legacy of development concepts inherited from the old strategy before reform. The characteristic of development strategies in China’s provinces is that of DSi,t>0. Given this fact, the deviation of adopted strategy from the CAF in the ith province at time t can be measured as:
DSi,t = TCIi,t –ω
5.2 The specification of functional form
In our empirical analysis, we hope to examine the effects of development strategies on openness and rural poverty. The econometric models are constructed as follows:
, 0 1 , .i t i tEXIM DS Xα α υ= + + +α (6)
1 20, , ,i t i t i tPI DS EXIM Yβ β β ε= + + + +β (7)
In the above equations, ,i tEXIM refers to the trade dependent ratio of province i at time
t, PIi,t refers to the incidence rate of rural poverty of province i at time t; α 0 and ß0 are constant; DSi,t is the outcome of (5´), which represents the deviation from a CAF strategy in province i at time t. According to previous analysis, we expect that the larger the deviation, the lower the trade dependent ratio and the higher rural poverty incidence rate. This means α 1 is negative and ß1 is positive. X and Y represent all other
explanatory variables; α and β are the coefficient vectors. υ and ε are the error terms.
Since there is no observation for ω, DSi,t of (5´) cannot be calculated directly. However, since ω is assumed to be a positive constant, equations (6) and (7) can be transformed into (6´) and (7´):
, 0 1 ,' ..i t i tEXIM TCI Xα α υ= + + +α (6´)
1 20, , ,'i t i t i tPI TCI EXIM Yβ β β ε= + + + +β (7´)
where 0'α =α 0-α 1ω and 0'β = β 0- β 1ω. The TCIi,t in (6´) and (7´) is the quotient of
the actual capital-labour ratio in the manufacturing industry and the endowed capital-labour ratio of province i in the year t.

25
5.3 Variables and data
Provincial rural poverty incidence rates have been obtained from the National Statistics Bureau. The TCI index and other data used in the regression analyses are taken from Liu and Zhang (2005). TCIi,t is calculated through the following steps: (i) calculating the real capital (Ki,t) of the manufacturing industries of a province by devaluing the total value of fixed asset investments according to the fixed asset investment price index of that province; (ii) calculating the actual capital-labour ratio in the manufacturing industries, i.e. Ki,t/Li,t; (iii) based on the national accounting system for each province,
calculating the capital stock( tiK , ) of all provinces using the perpetual-stock method;
(iv) calculating the endowed capital-labour ratio, i.e. titi LK ,, / ; (v) TCIi,t is that of the
actual capital-labour ratio in the manufacturing industries divided by this province’s
one-year-legged endowed capital-labour ratio, i.e., )//()/( 1,1,,, −− titititi LKLK .18 The
dataset for TCIi,t is listed in the appendix.
There are 31 provinces in mainland China, but as the data for Tibet and Hainan are incomplete, we have eliminated these two provinces from the regressions. Also, as Chongqing became a provincial-rank municipality only in 1997, we have combined the data for Chongqing and Sichuan after 1997 for comparability with past datasets. Therefore, we have data for 28 provinces from 1985 to 2002.
Provincial rural poverty may also be affected by other variables. Other things being equal, the higher agriculture productivity is, the larger its contribution to the reduction of rural poverty will be. Therefore, we introduced a variable for agriculture productivity (AGR-PROD) to control for its effect on rural poverty. The variable is defined as agricultural value-added according to current prices divided by total rural employment.19 As the NSB revised its employment statistics from being based on local government reports to sampling surveys, there is considerable deviation in employment data before and after 1990. To ensure data comparability, we have restricted our use of
18 It is worthwhile to note that the capital endowment in each province is calculated from the fixed asset
investments in each province’s manufacturing industries. Therefore, the measurement has already captured the effects of FDI and the cross-province capital flow on each province’s capital endowment. In addition, even though the movement of labour across provincial borders is easier today than in the past, there are still many hidden barriers. Therefore, we assume that the labour mobility does not significantly change the labour endowment of each province.
19 Of course, we can use agricultural productivity calculated by constant prices. But our econometric analysis shows that productivities calculated at current price and constant price have similar behaviour in all the regressions. Another reason for us to use current price is that productivity in current price can reflect the impact of the price of agriculture products. Rural poverty incidence rate used as a dependent variable was also determined on the basis of poverty line adjusted by current price.

26
employment data to post-1990, which decreases the sample size for regressions including agriculture productivity as an explanatory variable from 420 to 196.
Infrastructure, especially transportation, has a significant influence on rural poverty through labour mobility and agriculture-products market. thus indices of regional road density (ROAD) and railway density (RAILWAY) are introduced as well.
The trade dependent ratio, EXIM, is endogenous to the development strategy of the government. In the estimation of its impact on rural poverty in equation (7´), we need to use the fitted value EXIM in equation (6´) in the regression of equation (7´) in order to obtain consistent estimates of the coefficients in equation (7´). The explanatory variables used in the regression of equation (6´) include TCI, AGR-PROD, ROAD, RAILWAY, and a COAST dummy to indicate whether the province is located in a coastal area. Coastal provinces are usually more open than inland provinces because of easier access to international markets. The dummy COAST is treated as an instrument variable in equation (6) in order to obtain the fitted value of EXIM for the second stage estimation of equation (7´).
5.4 Econometric results
We used the cross-sectional time-series FGLS regression in Stata v8.0 to conduct estimation under assumption that the error structure across the panels is heteroscedastic but uncorrelated; and the form of autocorrelation is AR (1). The results for EXIM and PI are shown respectively in Tables 8 and 9.
Table 8
The effect of the development strategy on openness
Cons 13.62 *** 1.32
TCI -0.64*** 0.19
AGR_PROD 0.36 1.92
ROAD -17.51*** 3.58
RAILWAY 110.85*** 17.32
COAST 19.37*** 1.10
Number of obs 196 Log likelihood -748.8619 Prob > chi2 0.0000
Note: *** indicates significance at 0.1 per cent level; the numbers below each coefficient are standard
errors.

27
The estimation results in Table 8 show that TCI has a negative and highly significant effect on EXIM. That is, as the previous sections suggest, the greater a province’s deviation from the CAF strategy, the less open that province will be. The results also show that AGR-PRO does not have a significant effect on EXIM, whereas the other three explanatory variables are all highly significant. However, the negative sign for the ROAD value is unexpected.
Table 9 shows the results of fitting equation (7´) with a two-stage approach where EXIM in the second stage is the fitted value from the first stage regression as shown in Table 8. From the results, we can see that the development strategy followed in a province has a significant effect on rural poverty in that province. The greater the deviation from a CAF strategy in a province, the higher the incidence of rural poverty in that province will be.
The estimation results of EXIM are negative and highly significant. That is, the more open a province, the less rural poverty there will be in that province. The negative effect of openness on rural poverty is likely to arise from the fact that most exports from China are labour-intensive manufactured goods. The increase in exports will increase demand for importing of intermediate inputs, while providing at the same time more job opportunities for rural migrants. As argued previously, the migration of the rural labourforce from the countryside to non-agricultural production is one of the most important ways to reduce rural poverty.
Table 9
The effect of the development strategy on rural poverty
I II III
Cons 0.0674*** 0.0080
0.0974*** 0.0115
0.1381*** 0.0119
TCI 0.0047*** 0.0014
0.0037* 0.0019
0.0039* 0.0021
EXIM1 -0.0023*** 0.0003
-0.0031*** 0.0003
AGR-PROD -0.0366*** 0.0097
ROAD -0.0914*** 0.164
RAILWAY 0.3499*** 0.0540
Number of obs 364 196 196 Log likelihood 883.6 527.7 301.4 Prob > chi2 0.0011 0.0000 0.0000
Notes: EXIM is the fitted value from equation (6); * Indicates significance at 5% level; ** Indicates significance at 1% level; *** Indicates significance at 0.1% level;
The numbers below each coefficient are the standard errors.

28
The results also show that the increase in agricultural productivity (AGR-PRO) will significantly reduce rural poverty in that particular province and an increase in its road density will have an effect similar to that of an increase in agricultural productivity. However, the effect of railroad density on the appearance of poverty in a province (RAILWAY) is puzzling. In model III, its coefficient is positive and highly significant. This question deserves further investigation.
6 Concluding remarks
Even though China has achieved great success in poverty reduction since reform started in 1978, there is still a long way to go before the country can claim victory in the war against poverty. First, if the international standard for poverty of one dollar a day according to purchasing power parity is used instead of the domestic standard, the incidence of poverty in China, based on the estimations reported by ADB for 2000, will increase dramatically from less than 2 per cent in urban areas and 3.5 per cent in rural areas to 16.1 per cent, as shown in Table 10. Moreover, the pattern of poverty will change over time. It is expected that the severity of urban poverty and poverty among migrants from rural areas will increase in the future with the progress of industrialization and urbanization.
Table 10
Headcount index of Chinese poverty, (%)
National poverty line 1$(PPP) a day
Urban Rural
2000 < 2.0 3.5 16.1
Source: ADB (2000).
A more serious challenge is that while the Chinese economy achieves dynamic growth, income disparities are also increasing. This means that the distribution of benefits from economic growth is growing increasingly unequally. It will not only worsen the poverty problem but also slow down, or even block, the pace of solving extreme poverty. As we have pointed out above, the increasing productivity gap between agricultural and non-agricultural sectors means that the dual nature of the Chinese economy is still a serious issue.
It is obvious from the theoretical analysis in section 3 and empirical results in section 5 that for poverty reduction in both urban and rural areas, one important and sustainable approach is to adopt a CAF development strategy and to promote the growth of labour-intensive industries during China’s current stage of economic development. With this development strategy, the economy will grow dynamically, open to international trade, and will be able to reduce poverty. This is an important experience that China can provide to other developing countries.

29
Reference
Anderson, K., J. Huang, and E. Ianchovichina (2004). ‘The Impacts of WTO Accession on Chinese Agriculture and Rural Poverty’, in D. Bhattasali, S. Li and W. Martin (eds), China and the WTO: Accession, Policy Reform, and Poverty Reduction Strategies. New York: Oxford University Press for the World Bank.
Asian Development Bank (ADB) (2000). Poverty and Development Indicators. Available at: www.adb.org/Statistics/pov_dev_indicators.asp
Asian Development Bank (ADB) (2003). Urban Poverty: New Challenges of China’s Development. Technical Assistant Programme PRC33448 of Asian Development Bank. Beijing: Economic Science Publishing House.
Barro, R. J., and X. Sala-i-Martin (1997). ‘Technological Diffusion, Convergence, and Growth’. Journal of Economic Growth, 2 (1): 1-26.
Basu, S., and D. N. Weil (1998). ‘Appropriate Technology and Growth’. Quarterly Journal of Economics, 113 (4): 1025-54.
Chen, S., and M. Ravallion (2004). ‘Welfare Impacts of China’s Accession to the WTO’, in D. Bhattasali, S. Li and W. Martin (eds), China and the WTO: Accession, Policy Reform, and Poverty Reduction Strategies. New York: Oxford University Press for the World Bank.
Dollar, D., and A. Kraay (2000). ‘Growth is Good for the Poor’. WB Working Paper. Washington, DC: World Bank. Reprinted in A. Shorrocks and R. van der Hoeven (eds) (2005), Growth Inequality and Poverty. Oxford: Oxford University Press for UNU-WIDER.
Easterly, W. (2003). ‘A Tale of Two Kuznets Curves: Inequality in the Old and New Globalizations’. Paper presented at NBER Pre-Conference on Globalization and Inequality, 24-25 October, Cambridge.
Harberger, A. C. (1978). ‘Perspective on Capital and Technology in Less Developed Countries’, in M. J. Artis and A. R. Nobay (eds), Contemporary Economic Analysis. London: Croom Helm, 15-42.
Harberger, A. C. (1985). ‘Economic Policy and Economic Growth’. San Francisco: International Center for Economic Growth, Institute for Contemporary Studies.
Harberger, A. C. (2003). ‘Interview with Arnold Harberger: Sound Polices Can Free Up Natural Forces of Growth’. IMF Survey, 14 July: 213-16.
Hertel, T., F. Zhai, and Z. Wang (2004). ‘Implications of WTO Accession for Poverty in China’, , in D. Bhattasali, S. Li and W. Martin (eds), China and the WTO: Accession, Policy Reform, and Poverty Reduction Strategies. New York: Oxford University Press for the World Bank.
Krueger, A. O. (1997). ‘Trade Policy and Economic Development: How We Learn’. American Economic Review, 87 (1): 1-22.

30
Li, S. (2004). ‘Deterioration of Urban Poverty in China and its Reasons in Late 1990s’, in S. Li and H. Sato (eds), Price of Transitional Economy – Empirical Analysis on Urban Unemployment, Poverty and Income Difference. Tenghong: China Fiscal Economic Publishing House.
Li, S., and J. Knight (2004). ‘Three Urban Poverty Categories in China’, in S. Li andH. Sato (eds), Price of Transitional Economy – Empirical Analysis on Urban Unemployment, Poverty and Income Difference. Tenghong: China Fiscal Economic Publishing House.
Lin, J. Y. (1992). ‘Rural Reforms and Agricultural Growth in China’. American Economic Review, 82 (1): 34-51.
Lin, J. Y. (2003). ‘Development Strategy, Viability, and Economic Convergence’. Economic Development and Cultural Change, 51 (3): 277-308.
Lin, J. Y., and P. Liu (2003). Impact of Economic Development on Capital Accumulation per Capita and Technology Upgrade: Empirical Test on Chinese Experience’. China Social Science, 4.
Lin, J. Y., F. Cai, and Z. Li (1996). The China Miracle: Development Strategy and Economics Reform. Hong Kong: Chinese University Press.
Liu, M., and Q. Zhang (2005). China’s Economic Growth Data: 1970-2002. Available at: www.fed.org.cn/.
Milanovic, B. (2002). ‘Can We Discern the Effect of Globalization on Income Distribution? Evidence for Household Budget Surveys’. WB Policy Research Working Paper No. 2876. Washington, DC: World Bank.
National Statistical Bureau (NSB) of China (2004). China Yearbook 2004.
Nissanke, M., and E. Thorbecke (2005). ‘Channels and Policy Debate in the Globalization-Inequality-Poverty Nexus’. WIDER Discussion Paper No. 2005/08. Helsinki: UNU-WIDER.
Ravallion, M., and S. Chen (2004). ‘China’s (Uneven) Progress Against Poverty’. WB Working Paper No. 3408. Washington, DC: World Bank.
Rodrik, D. (2004). Growth Strategies. Available at: www.ksg.harvard.edu/rodrik/.
Solow, R. (2001). ‘Applying Growth Theory Across Countries’. The World Bank Economic Review, 15 (2): 283-8.
World Bank (2002). Transition: The First Ten Years-Analysis and Lessons for Eastern Europe and the Former Soviet Union. Washington, DC: World Bank.
World Bank (2004). World Development Indicators 2004. Washington, DC: World Bank.
Xue, J., and Z. Wei (2004). ‘Urban Unemployment, Poverty and Income Difference’, in D. Bhattasali, S. Li and W. Martin (eds), China and the WTO: Accession, Policy Reform, and Poverty Reduction Strategies. New York: Oxford University Press for the World Bank.

Appendix Table Dataset for the technological choice index (TCI), 1984-99
Provinces 1984 1985 1986 1987 1988 1989 1990 1991 1992 1993 1994 1995 1996 1997 1998 1999
Beijing 2.9233 2.6197 2.2788 2.0686 1.8127 1.5738 1.4727 1.5499 1.6060 2.1215 1.5655 1.8659 1.6941 1.6602 1.8863 1.7084 Tianjin 2.0554 1.9007 1.7694 1.7218 1.7334 1.7251 1.6290 1.6482 1.6859 1.4929 1.6680 1.8908 1.7359 1.8082 2.4158 2.4957 Hebei 4.2771 3.3175 3.1557 3.1729 2.7331 3.1860 3.2930 3.6719 3.5402 3.3047 3.1246 2.8578 2.6911 2.5634 2.4950 2.4936 Shanxi 3.5230 3.7246 3.2928 2.8583 2.5605 2.4858 2.6892 2.6657 2.5396 4.0745 3.5068 3.9725 3.9904 4.0484 4.3705 4.0576 Inner Mongolia 6.0964 5.5199 4.7417 4.5526 4.2238 3.8756 4.1244 4.1717 3.8834 3.5234 3.5019 3.6616 3.5880 3.7228 4.6463 5.3463 Liaoning 4.1518 3.5660 3.2696 2.9316 2.6367 2.6696 2.5989 2.4596 2.4203 2.2379 2.1899 2.4587 2.6529 2.7347 3.5608 3.9971 Jilin 4.4789 4.0039 3.6249 3.6994 3.4045 3.0923 3.3966 3.7360 3.4757 3.6154 3.1261 3.3135 3.5348 3.6970 4.8241 5.0209 Heilongjiang 4.0382 3.5971 2.9867 2.7587 2.5513 2.3188 2.3646 2.2386 2.1431 2.0747 1.9359 2.0023 2.0333 2.2129 3.0246 2.8291 Shanghai 1.7720 1.5492 1.6088 1.4912 1.2952 1.1683 1.1510 1.2301 1.2642 1.2066 1.5825 1.3869 1.3041 1.3375 1.7169 1.7349 Jiangsu 3.0187 2.4365 2.3924 2.0957 1.8480 2.0721 2.1463 2.3183 2.1264 1.7823 1.7039 1.8747 1.8758 1.9378 2.1138 2.1915 Zhejiang 2.6047 2.6528 2.3732 2.1495 1.8273 1.9085 2.0444 2.0804 2.0453 1.8050 1.6543 1.7123 1.6197 1.6265 1.7505 1.7013 Anhui 8.9673 5.9713 5.2317 4.5488 3.7602 4.0962 4.3593 2.9422 2.6488 2.7690 3.1870 3.2917 3.4339 3.5320 3.7922 4.1014 Fujian 4.6001 3.7330 3.3514 2.9930 2.4262 2.4187 2.1877 2.0924 1.8812 1.9191 2.0757 2.4568 2.2745 2.2092 2.1183 2.0863 Jiangxi 5.5994 4.1956 4.7257 3.5288 2.5992 4.0119 3.8089 3.7576 3.7061 3.6693 3.9245 4.2954 4.2652 4.1597 4.6064 4.4884 Shandong 5.4818 3.6290 3.1805 2.9635 2.8114 2.9873 2.8166 2.6848 2.8155 3.2075 3.0970 3.1249 3.0136 3.5286 3.6292 3.4692 Henan 6.7153 4.5765 4.3598 3.7267 4.1520 4.2924 4.0632 4.2318 4.1502 3.7448 3.6115 3.7931 3.6199 3.4957 3.8693 3.9945 Hubei 6.5163 5.1297 4.5403 4.3889 3.9001 4.6918 4.1675 4.3696 4.1709 4.0572 3.6310 3.5334 3.4489 3.3062 3.8013 3.8084 Hunan 7.7157 7.6332 4.0008 6.0198 5.4578 5.7110 3.8479 3.6199 3.7137 3.4933 3.5170 3.8642 3.7057 3.9054 4.0319 4.1232 Guangdong 2.9197 2.4636 2.4504 2.4236 2.3076 2.5591 2.6282 3.3500 2.7349 2.8652 3.2138 2.9565 2.8298 2.8549 3.2599 3.0145 Guangxi 7.8751 7.0936 6.2782 5.6637 3.7559 4.7666 4.6499 4.5802 4.3286 6.8514 5.8289 7.4256 7.1732 6.9178 6.9291 7.0563 Guizhou 11.8961 9.2204 4.8355 5.5494 5.6977 5.1887 5.3582 5.2010 4.9324 5.1977 5.4170 5.4462 5.5529 5.4341 5.8933 6.0140 Yunnan 5.9259 5.0976 5.1607 5.5636 5.5440 5.6084 6.7829 6.4728 6.2375 5.5120 5.3752 6.0250 6.0494 6.0527 6.3665 6.4052 Shaanxi 6.6929 5.5195 5.9485 3.9648 3.9998 3.5117 3.1000 2.9693 3.2637 2.4638 2.5283 3.1672 3.1833 3.1534 3.7410 4.3313 Gansu 10.7659 10.0962 8.9586 8.6226 7.4697 7.2679 6.7679 6.6970 7.0460 8.0497 8.4045 10.0032 9.9807 11.0896 12.6249 11.8209 Qinghai 4.3398 3.5244 3.1782 4.2608 4.2425 5.2795 5.5843 4.5968 4.2157 4.4709 4.9769 5.5640 5.5155 7.0630 7.8109 10.3356 Ningxia 3.7827 3.6426 3.5156 3.1614 2.7374 2.4670 2.5486 2.6143 2.8955 3.2178 3.1264 3.3287 3.2440 3.5906 4.4157 4.6909 Xinjiang 4.9841 4.7845 4.1736 3.6316 3.3622 3.1868 4.1468 3.8556 3.6780 3.7459 3.1233 3.1453 3.4587 3.5053 4.0281 4.1671 Chongqing&Sichuan 5.7334 4.2287 3.9741 3.7920 3.0882 2.9308 2.9194 3.0369 3.2218 3.3174 3.0734 3.4390 3.2440 3.5333 3.8864 4.2215 Source: Liu and Zhang (2005).
31
APPE
ND
IX