economic crisis and global supply chains
TRANSCRIPT

Electronic copy available at: http://ssrn.com/abstract=1588946
No 2009 – 15 July
DO
CU
ME
NT
DE
TR
AV
AIL
Economic Crisis and Global Supply Chains _____________
Agnès Bénassy-Quéré, Yvan Decreux, Lionel Fontagné & David Khoudour-Casteras
Support from the CIREM is gratefully acknowledged

Electronic copy available at: http://ssrn.com/abstract=1588946
CEPII, WP No 2009-15 Economic Crisis and Global Supply Chains
2
TABLE OF CONTENTS
Non-technical summary ........................................................................................................... 3
Abstract .................................................................................................................................... 4
Résumé non technique ............................................................................................................. 6
Résumé court ............................................................................................................................ 7
Introduction .............................................................................................................................. 9
1. Trade multiplier and the supply chain .......................................................................... 12
2. Simulations in general equilibrium with inter-industry relations ................................. 16
2.1. MIRAGE in a nutshell ................................................................................................... 17
2.2. Assumptions on GDP.................................................................................................... 18
2.3. Calibration of the demand shift .................................................................................... 20
2.4. Assumptions on energy prices ...................................................................................... 21
2.5. Globalisation trend ........................................................................................................ 21
2.6. Choice of the deflator ................................................................................................... 22
3. Results ........................................................................................................................... 22
3.1. World exports ............................................................................................................... 23
3.2. Regional impacts ........................................................................................................... 24
4. Robustness analysis ...................................................................................................... 27
4.1. The role of the halt in the globalisation trend ............................................................... 27
4.2. The role of the oil price ................................................................................................. 28
Conclusion .............................................................................................................................. 29
Appendix ................................................................................................................................ 31
References .............................................................................................................................. 33
List of working papers released by CEPII ............................................................................. 35

CEPII, WP No 2009-15 Economic Crisis and Global Supply Chains
3
ECONOMIC CRISIS AND GLOBAL SUPPLY CHAINS
NON-TECHNICAL SUMMARY
The global crisis that originated in the U.S. subprime mortgage market in August 2007 has spread across the world and resulted in an abrupt fall in exports all over the world. During the last quarter of 2008, the value of exports decreased by 18 percent in Germany, 20 percent in the United States, 25 percent in France up to 32 percent in China. For the full year of 2009, world trade is expected to fall significantly. Forecasts vary from -9 percent (WTO forecast of March 2009) to -16.0 percent (OECD forecast of June 2009) whereas world output is expected to decline by “only” 1.3 (IMF, April 2009), or 2.2 percent (OECD, June 2009). Trade is hence expected to fall by more than GDP.
Four sets of explanations for this larger fall of trade compared to GDP have been proposed: i) credit restrictions and the rise in perceived risks (that are detrimental to “risky” activities such as international trade); ii) the rise of protectionism; iii) transmission channels in the real economy (a synchronised drop in activity in the OECD and a significant drop in the relative price of traded goods, especially oil); iv) new patterns of the international division of labour characterised by global supply chains.
According to the latter explanation, production in many sectors involves the same component being exchanged several times – and thus registered as ‘trade’ several times – before it is incorporated into the final product. A relatively low drop in world GDP could therefore be consistent with a much larger reduction in world trade. This argument based on a multiplier effect is challenged in this paper.
Through simple accounting, we firstly show that fragmented supply chains are consistent with world trade reacting proportionally to a fall in world GDP, under simplifying assumptions. In order to generalise this result, a fully consistent framework taking into account actual inter-industrial relations within and across countries is needed, and we mobilise a multi-country, multi-sectoral computable general equilibrium model (MIRAGE). There are considerable advantages to such approach. The trade-growth nexus very much depends on the respective openness and specialisation of the various regions in the world – two key features of such models. Interestingly, all simplifying assumptions of our simple accounting can then be relaxed. In particular, the model fully takes into account inter-industry relations between 25 sectors and 18 regions of the world economy, using the specific inter-industrial relations observed in each modelled country. Interestingly, we not only take into account inter-industry imports (e.g. the car industry importing glass); we also account for own-imports of each industry (e.g. the car industry importing car components).

CEPII, WP No 2009-15 Economic Crisis and Global Supply Chains
4
We introduce in MIRAGE the April 2009, IMF forecasts for the GDP and the oil price over 2009-2012. We also simulate a shift in demand away from capital goods, based on the shifts observed during the past business cycles. Lastly, we impose a halt to the long-run trend of declining trade costs, although we do not introduce a rise in tariff and non-tariff barriers.
Our simulation firstly stresses the role of relative prices in the apparent over-reaction of trade to GDP. When correcting nominal trade with GDP prices, we find that trade largely overshoots GDP during the crisis: in 2009, trade declines by 8.9 percent, for a 1.3 percent drop in world GDP. However, the fall in the oil price accounts for roughly 5 percentage points of this total. On the contrary, deflating each trade flow by its specific price leads to a much smaller falls in world trade (–2.4%). The remaining gap disappears if, like trade flows, GDPs are aggregated using current exchange rates rather than purchasing power parities: our 2.4% drop in world trade is now similar to the 2.6% drop in world GDP. All in all, and this is our main result, trade no longer overshoots GDP when the trade and growth nexus is properly modelled using a general equilibrium framework accounting for all input-output relations.
To obtain the double-digit figures recorded in the last quarter of 2008 and first quarter of 2009, one firstly has to factor in short-run effects such as inventory contraction, the reversal of expectations or the shortage of trade and consumption finance. Also, the shift in demand away from durable goods is certainly steeper than during the previous business cycles due to the credit crisis in general. Finally, the collapse of the car industry, already suffered from overcapacities before the crisis and its collapse has played a major role in global trade contraction.
ABSTRACT
Much attention has been paid to the sharp fall in world trade associated with the economic crisis during the last quarter of 2008 and the first quarter of 2009. Alarming forecasts have been published for the whole year of 2009 and several explanations have been offered. In particular, beyond the credit crunch and the global drop in demand, it has been argued that, due to globalisation and the fragmentation of supply chains, world trade will inevitably overshoot the shock in world GDP. We contest this view using both simple accounting calculations and a simulation of the multi-region, multi-sector Computable General Equilibrium (CGE) model, which explicitly models input-output relations within and between sectors. Using the CGE MIRAGE, we ask whether the most recent forecasts of GDP change, together with a twist in the composition of demand (to the detriment of capital goods), a halt in the trend towards the reduction in trade costs and a collapse in the oil price can replicate a very similar multiplier effect on world trade to that currently being experienced. Firstly, we find that, when trade flows are deflated by the price of the world GDP, the order of magnitude for trade decline in 2009 is 8.9 percent in our exercise. However, when trade flows are deflated by the sector-specific trade prices computed by the model, the drop in world trade is much more limited (-2.4 percent). Hence a large part of the fall in trade predicted by the model comes from a relative price effect. Secondly, while this fall is still more than the –1.3%

CEPII, WP No 2009-15 Economic Crisis and Global Supply Chains
5
drop in world GDP forecast by the IMF in April 2009, even this magnification effect disappears when GDPs are aggregated using current exchange rates, which is the appropriate reference, rather than PPP weights. Thirdly, while our paper does not support the hypothesis of a systematic over-shooting of trade due to globalisation and the fragmentation of supply chains, it seems likely that additional factors such as the credit shortage must have played a role in the short run to explain the sharp fall in world trade.
JEL Classification: F17, F43 Key Words: International trade, global crisis, global supply chains, CGE modelling

CEPII, WP No 2009-15 Economic Crisis and Global Supply Chains
6
CRISE ÉCONOMIQUE ET MONDIALISATION DES CHAÎNES DE VALEUR
RÉSUMÉ NON TECHNIQUE
La crise qui a débuté en 2007 sur le marché américain du crédit subprime a finalement touché le monde entier et s’est traduite par une chute brutale du commerce mondial. Pendant le dernier trimestre de 2008, les exportations allemandes ont reculé de 18% en valeur, les exportations américaines de 20%, les exportations françaises et chinoises respectivement de 25% et 32%. En année pleine, pour 2009, le commerce mondial pourrait décroître de 9% (prévisions OMC de mars 2009) et jusqu’à 16% (prévisions OCDE de juin 2009), chiffres à comparer avec un recul du PIB mondial de “seulement” 1,3% ou 2,2% selon le FMI (avril 2009) ou l’OCDE (juin 2009). Le commerce mondial devrait ainsi chuter dans une proportion bien supérieure au PIB mondial.
Plusieurs explications ont été avancées à cet effondrement du commerce mondial plus important que le recul de l’activité: 1) des restrictions de crédit et une plus grande aversion au risque, qui pénalisent les activités internationales, jugées plus risquées ; 2) des tensions protectionnistes ; 3) le recul simultané de l’activité dans les différents pays de l’OCDE et une baisse significative des prix des biens échangés, au premier rang desquels le pétrole); 4) le nouveau visage de la division internationale du travail, marqué par le fractionnement des chaînes de valeur.
Selon cette dernière explication, la production dans de nombreux secteurs impose que le même composant franchisse plusieurs frontières – et soit du coup enregistré plusieurs fois en tant que commerce – avant d’être incorporé dans le produit final. Une baisse du PIB mondial pourrait alors se traduire par une baisse plus que proportionnelle du commerce mondial. C’est cette idée d’un effet multiplicateur qui est examiné avec attention dans cet article.
Nous montrons tout d’abord, à l’aide d’un calcul simple, que le fractionnement des processus de production ne devrait pas empêcher le commerce de réagir proportionnellement aux variations du PIB. Afin de généraliser ce résultat et de prendre en compte explicitement les relations entre industries et entre pays, nous utilisons une modélisation en équilibre général calculable, multi-pays et multi-secteurs, permettant de relâcher nos hypothèses d’étape. Il y a des avantages considérables à utiliser un tel type de modèle (ici le modèle MIRAGE). La relation entre commerce et conjoncture dépend en effet beaucoup des degrés d’ouverture et de la nature des spécialisations des pays, qui y sont explicitement représentés. Nous prenons en compte ces relations inter-industrielles entre 25 secteurs et 18 régions de l’économie mondiale, en utilisant les données réelles relatives à ces échanges inter-industriels : cela concerne les échanges entre industries (par exemple la consommation intermédiaire de verre importé par l’industrie automobile), mais aussi les échanges à l’intérieur des industries (par exemple l’industrie automobile important des composants automobiles).

CEPII, WP No 2009-15 Economic Crisis and Global Supply Chains
7
Nous introduisons dans MIRAGE les prévisions du FMI relatives aux PIB et au prix du pétrole pour la période 2009-2012. Nous simulons également une modification de la structure de la demande globale en défaveur des biens d’équipement, en nous fondant sur les réactions observées lors des cycles économiques précédents. Enfin, nous faisons l’hypothèse d’une pause dans la tendance à la mondialisation croissante de la production résultant, sans toutefois supposer un relèvement de la protection tarifaire ou non tarifaire.
Notre simulation souligne en premier lieu la responsabilité des mouvements des prix relatifs dans l’apparente sur-réaction du commerce au PIB mondial. Lorsque l’on corrige la valeur des flux commerciaux par les prix du PIB, on trouve une forte sur-réaction des échanges : en 2009, le commerce recule de 8,9%, pour une baisse du PIB mondial de 1,3%. Mais la baisse du prix du pétrole contribue à hauteur de 5 points de pourcentage à cette baisse. Si au contraire on déflate la valeur du commerce de chaque secteur par les prix des biens mondiaux dans ce secteur, on obtient une baisse beaucoup plus limitée (-2,4%) du commerce mondial. Le reste de la différence entre baisse du commerce et baisse du PIB disparaît si l’on agrège le PIB mondial, comme le commerce, aux taux de change courants plutôt qu’aux taux de change à parité de pouvoir d’achat : le PIB baisse alors de 2,6%, chiffre comparable) la baisse du commerce de 2,4%. Finalement, et c’est le principal résultat de notre travail, le commerce n’a pas de raison de sur-réagir par rapport au PIB lorsque la relation entre commerce et conjoncture est modélisée dans un cadre prenant explicitement en compte les relations inter-industrielles.
Pour expliquer les baisses du commerce mondial à deux chiffres observées en fin d’année 2008 et au début de l’année 2009, d’autres facteurs doivent donc être introduits dans l’analyse, comme la réduction des stocks, un renversement des anticipations, ou encore les contraintes apparues sur le financement des exportations. De même, le recul de la demande de biens d’équipement est probablement plus violent que dans les crises passées, en raison de la crise générale du crédit. Enfin, l’effondrement de l’industrie automobile, préalablement en surcapacité chronique, a joué un rôle important dans le recul récent du commerce mondial.
RÉSUMÉ COURT
Le fort recul du commerce mondial au dernier trimestre 2008 et au premier trimestre 2009 a marqué les esprits. Des prévisions alarmistes ont été publiées pour l’ensemble de l’année 2009 et plusieurs explications ont été avancées. En particulier, au-delà des restrictions de crédit et de la chute de la demande mondiale, il a été suggéré que, en raison de la mondialisation des chaînes de valeur, le commerce mondial devait inévitablement sur-réagir à la chute du PIB mondial. Nous remettons en cause ce point de vue à travers quelques calculs simples, puis par la simulation d’un modèle multi-régional et multi-sectoriel d’équilibre général calculable, qui prend en compte explicitement les chaînes d’approvisionnement au inter et intra-sectorielles. A partir du modèle MIRAGE, on étudie si les prévisions de croissance d’avril 2009 c, conjuguées à une déformation de la demande au détriment des biens d’investissement et à un arrêt du processus de réduction des coûts du commerce, est

CEPII, WP No 2009-15 Economic Crisis and Global Supply Chains
8
cohérente avec un sur-ajustement du commerce par rapport au PIB mondial. Lorsque les flux de commerce sont corrigés par le prix du PIB mondial, le commerce mondial baisse de 8,9% en 2009 selon le modèle, contre une baisse de « seulement » 1,3% pour le PIB mondial. Cependant, si le commerce est corrigé par le prix spécifique de chaque catégorie de biens échangés, la chute du commerce mondial est bien plus limitée (-2.4 percent). Ainsi, une part importante de la baisse du commerce prédite par le modèle provient en fait d’une baisse du prix relatif des biens échangés. L’écart résiduel de 1,3 point entre baisse du PIB et baisse du commerce se résorbe complètement lorsque le PIB mondial est calculé à partir des PIB régionaux agrégés aux taux de change courant et non plus aux parités de pouvoirs d’achat. Finalement, nos résultats ne confirment pas l’existence d’une sur-réaction systématique du commerce par rapport au PIB mondial liée à la mondialisation des chaînes de valeur. Il faut alors rechercher dans les contraintes de crédit ou la contraction des stocks l’explication à la forte baisse observée au plus fort de la crise.
Classification JEL : F17, F43 Mots-clefs : Commerce international, crise mondiale, mondialisation des chaînes de
valeur, modèle d’équilibre général calculable

CEPII, WP No 2009-15 Economic Crisis and Global Supply Chains
9
ECONOMIC CRISIS AND GLOBAL SUPPLY CHAINS
Agnès Bénassy-Quéré*, Yvan Decreux*, Lionel Fontagné#* and David Khoudour-Castéras*
INTRODUCTION1
The global crisis that originated in the U.S. subprime mortgage market in August 2007 has spread across the world in two distinct phases. During the first phase (from August 2007 to October 2008), banks suffered from the collapse of the interbank market, and then from large losses stemming from crises in the markets for both asset-backed security products and conventional assets. As a consequence, they started to reduce their risk exposure by deleveraging and cutting credit to the real economy. This first phase mostly concerned advanced economies, banks in emerging countries being less exposed to the crisis. In the second phase, the emerging world was hugely affected by the crisis through the channel of the real-economy. As credit to the corporate sector in advanced economies became scarce and/or costly, investment plans were suddenly cut and firms started to reduce their stocks. This led to an abrupt fall in exports all over the world. During the last quarter of 2008, the value of exports decreased by 18 percent in Germany, 20 percent in the United States, 25 percent in France up to 32 percent in China.
For the full year of 2009, world trade is expected to fall significantly. Forecasts vary from 9 percent (World Trade Organization forecast of March 2009) to 9.7 percent (World Bank forecast of June 2009), 11 percent (International Monetary Fund forecast of April 2009) up to 16.0 percent (OECD forecast of June 2009) whereas world output is expected to decline by “only” 1.3 (IMF, April 2009), 1.7 percent (World Bank, June 2009) or 2.2 percent (OECD, June 2009, see Table 1). Trade is hence expected to fall by more than GDP.2
# Paris School of Economics, Université Paris I.
* CEPII.
This research program has received financial support from European Commission, DG Trade, under contract No. SI2.528.018. Support from the CIREM is gratefully acknowledged. We are indebted to Louise Curran, Joe Francois, Franck van Tongeren and to the participants in the Paris, July 2 2009 workshop, for helpful remarks on a previous draft. The usual disclaimer applies.
1 Excellent research assistance by Sadibou Fall is gratefully acknowledged. 2 Note however that world GDP growth is obtained by aggregating GDPs at PPP exchange rates whereas world trade
is a sum of flows at current exchange rates. According to the World Bank, aggregating GDPs at current exchange rates yields a 2.9 percent fall of world GDP in 2009 instead of a 1.7 percent fall at PPP rates.

CEPII, WP No 2009-15 Economic Crisis and Global Supply Chains
10
Table 1: Growth projections for 2009 (in percent)
WTO (March 2009)
IMF (April 2009)
World Bank (June 2009)
OECD (June 2009)
World GDP - -1.3 -1.7 -2.2
World trade -9.0 -11.0 -9.7 -16.0
Developed countries -10.0 -13.5 - -
Emerging and developing countries -3.0 to -2.0 -6.4 - -
Note: Annual percent change at constant price.
Sources: World Trade Organization (2009), International Monetary Fund (2009c), World Bank (2009), OECD (2009-b).
Several explanations have been proposed for the collapse of trade that has been, according to Baldwin and Evenett (2009) “sudden, severe, synchronised”. A first group of explanations relates to credit restrictions and the rise in perceived risks. The impact of economic crises on trade finance was already observed during the Asian crisis of 1997. Despite large exchange-rate depreciation, countries like Thailand saw their exports fall in the short run. In 2008, there is some evidence that firms, especially in developing countries, have suffered a fall in trade finance (see Auboin, 2009). Additionally, the rise in exchange-rate volatility may have been detrimental to trade.
A second group of explanations hinges on the rise of protectionism (Gamberoni and Newfarmer, 2009). What is at issue here is the use of trade measures that are not forbidden in the multilateral arena but hint of a growing trend towards “murky protectionism” (Baldwin and Evenett, 2009). This includes the use of consolidation margins by some emerging countries, but also nationalist support to domestic industries (state aid, the Buy America Act, Chinese public procurement directives). Although government support falls heavily on non-traded goods sectors (e.g. retail banking, construction), it may have impacted trade through distorting prices and thus the allocation of final demand. Emerging protectionism is unlikely to have contributed to the collapse of world trade observed at the end of year 2008, but it may have sizeable impact in 2009 and 2010, when the social consequences of the crisis in the real economy crisis will be felt and subsequent demands for protection can be expected. So far, it must be said that the monitoring process performed by the WTO seems to have kept such risks under tight control.
A third group of explanations points to transmission channels in the real economy. There is a direct link between the decline in activity and in trade: when considering the global economy (as opposed to the sole U.S. one), it can be observed that both industrial production and trade dived faster in 2008–2009 than during the Great depression (see the “Tale of Two Depressions” by Eichengreen and O’Rourke, 2009). The argument here is that as internal demand and production collapsed, and so did trade. This is particularly true for those sectors most exposed to recession and credit shortage: capital goods and vehicles (Francois and Woerz, 2009). Importantly, this drop has been synchronised in the OECD, leading to a sharp

CEPII, WP No 2009-15 Economic Crisis and Global Supply Chains
11
drop in world trade. Similar drops have been observed in the past for individual countries, but for the first time the globalised economy has recorded a synchronised fall in trade (Araujo and Oliveira-Martins, 2009). The argument also underlines the fact that tradable sectors are more affected by the current crisis than non-tradable ones. Indeed, corporate investment is made up of goods that on average are more traded than other tradable goods, while fiscal stimulus packages tend to be strongly oriented towards construction and infrastructure, which are non tradable. In addition, a significant drop in the relative price of traded goods, especially oil, compared to non-traded ones, could explain part of the global trade collapse, at least in nominal terms.
Finally, and this argument is of utmost importance for the following analysis, the new patterns of the international division of labour may also have played a big role. Global supply chains, which characterise many sectors, often involve the same component being exchanged several times (and thus registered as ‘trade’ several times) before it is incorporated into the final product. Since GDP is recorded as a sum of value added, whereas exports are recorded as a sum of product values, a relatively low drop in world GDP could therefore be consistent with a much larger reduction in world trade (Tanaka, 2009; Yi, 2009). This is the argument which we seek to challenge in this paper.
Through simple accounting, we firstly show that fragmented supply chains are consistent with world trade reacting proportionally to a fall in world GDP, when relative prices are held constant. In order to generalise this result, a fully consistent framework taking into account actual inter-industrial relations within and across countries is needed. This is where a multi-country, multi-sectoral computable general equilibrium (CGE) model like MIRAGE is a useful tool. As a second step, we introduce in MIRAGE an exogenous scenario for GDP, investment and the oil price changes and we simulate the impact of this scenario on trade over 2009-2012. We do not explicitly simulate an increase in protectionist tensions such as a return to bound tariff rates for importers in position to do so, or any non-tariff protection elsewhere, but we impose a halt to the long-run trend of declining trade costs (possibly including the cost of trade finance).
Our first conclusion is a warning that care should be taken in the use of nominal figures. Relative prices are essential to understanding the over-reaction of trade to GDP. Indeed, when using the same deflator for trade as for world GDP, we find that trade largely overshoots GDP during the crisis: in 2009, trade declines by –8.9 percent compared to the 2008 figure, for a 1.3 percent drop in world GDP. However, the fall in the oil price accounts for roughly 5 percentage points of this total.3 More generally, the percentage drop in the volume of world trade very much depends on the deflator used. Deflating each trade flow by its specific price (rather than by the same world GDP deflator) leads to smaller falls in world trade (–2.4%),
3 The oil price is assumed to almost halve in 2009. Considering that oil represents 10% of world trade, the oil-price
decline accounts for 0.5×10 = 5 percentage points of the fall in nominal trade. Deflating this figure by an almost stable GDP deflator does not change the picture.

CEPII, WP No 2009-15 Economic Crisis and Global Supply Chains
12
since most of the observed decline in value is explained by the drop in prices.4 The remaining gap between falls in GDP and trade can then be accounted for by aggregating country GDP growth rates at current exchange rates rather than those based on purchasing power parity (the convention used by the IMF). This gap indeed disappears when, like trade flows, GDPs are aggregated using current exchange rates: our 2.4% drop in world trade is similar to the 2.6% drop in world GDP (instead of 1.3% using the PPP aggregator).
The bottom line of this exercise is that a proper modelling of the fragmentation of supply chains hardly leads to any multiplier effect of trade over GDP. To obtain the double-digit figures recorded in 2008Q4 and 2009Q1, one firstly has to factor in short-run effects such as inventory contraction, the reversal of expectations or the shortage of trade and consumption finance. These factors will weigh on trade figures for the whole of 2009. Secondly, our simulations may underestimate the shift in demand away from durable goods. Our accelerator calibrated on past business cycles fails to reproduce the observed drop in investment. For instance, the calibrated 2009 drop in private investment in the US and Japan respectively, that we introduce in MIRAGE are –17% and –16%, while the observed drops are –37% and –27% on a yearly basis at the end of the first quarter of 2009 (World Bank, 2009). Finally, our figures do not reproduce the collapse of the car industry, which was already suffered from overcapacities before the crisis and whose collapse has played a major role in global trade contraction.5
The remainder of the paper is organized as follows. Section 2 presents some simple accounting showing that the fragmentation of supply chains does not automatically imply that world trade will overshoot world GDP fluctuations. In Section 3, we detail the methodology used to simulate the impact of the crisis on trade, relying on the CGE model MIRAGE. Section 4 discusses results. In Section 5, some robustness tests are presented. Section 6 concludes.
1. TRADE MULTIPLIER AND THE SUPPLY CHAIN
It has been argued that, due to the fragmentation of the supply chain internationally, world trade should fall by more than 1% whenever world GDP falls by 1%.6 Such intuition derives from observing the trend of exports to GDP at the world level over time. The ratio of world exports of goods and services to world GDP increased from 12% in 1960 to 28% in 2006 (Figure 1). One convincing explanation of this trend is the fragmentation of supply chains: the same component being traded several times before being included in the final product.7 Since GDP figures are recorded based on value added whereas export figures are recorded based on production values, it follows that exports grow more rapidly than GDP. Large scale CGE
4 Such finding at the world level is in line with the fact that nearly half of the decrease in nominal US imports over
February 2008 to February 2009 was in industrial supplies and thus mainly driven by prices (Francois and Woerz, 2009).
5 See Francois and Woerz (2009). 6 See Tanaka (2009), Yi (2009). 7 See Hummels et al. (1999) and Athukorala and Yamashita (2008).

CEPII, WP No 2009-15 Economic Crisis and Global Supply Chains
13
models are able to simulate the impact of a shock on the sectoral level, while taking into account their supply chains. Such models take into account input-output relations at the domestic as well as international level, with a complete description of the world economy. However, even integrating refinements of trade theory such as imperfect competition, economies of scale and substitution, they fail to fully reproduce the globalization trend summarized in Figure 1. These additional trends relate to a sustained fall in trade costs and to a shift in industrial organization engineered by new information technologies. An autonomous trend of globalization has to be introduced into the model to capture these factors. We will come back below to this issue.
Figure 1
The point we make here is that this stylized fact does not imply that world trade will necessarily over-react to any shock on world GDP. This can be illustrated with a very simple accounting. What we find is that world trade reacts proportionally to changes in GDP growth, provided (i) imported inputs remain a fixed proportion of output; (ii) exported final products remain a fixed proportion of foreign income; and (iii) relative prices remain constant. Our argument is systematizing the “Barbie doll” example used by O’Rourke (2009): the actual value of world trade is a multiple of world production as a result of fragmentation, but the change in trade is proportional to the change in production: only a composition effect, where changes in trade marginally fall on the more fragmented sectors can generate a more than proportional reaction of trade to a drop in GDP. We will explore the second part of the argument in the next section and focus on the first part of it now.
Let us denote by Xi and QiX the value of exports of final and intermediate goods respectively
by country i. Similarly, we denote by Mi and ZiM the value of imports of final and

CEPII, WP No 2009-15 Economic Crisis and Global Supply Chains
14
intermediate goods for this country. Denoting value added, production and intermediate inputs by Yi, Qi and Zi, respectively, we have:
Yi = Qi – Zi (1)
The question is whether the growth rates of total exports (Xi + QiX) and total imports (Mi +
ZiM) can differ from that of GDP (Yi). We proceed in three steps by examining successively (i)
trade in intermediate goods, (ii) trade in final goods, and (iii) total trade. In the following, we always assume fixed relative prices.
We first consider whether trade in intermediate goods necessarily overshoots changes in GDP. In the short term, imported and domestic inputs can be assumed to be complements rather than substitutes, and intermediate inputs can also be viewed as complements to labor and capital. Hence, we can assume a Leontief technology:
Mi
i
Mi z
ZZ
= ;
ii
i zQZ
= (2)
Substituting (2) into (1) yields:
Mi
iMi
ii Z
zzz
Y−
=1
(3)
Using the usual Jones’ notations, it follows that iMi YZ ˆˆ = : the growth rate of imports of
intermediate goods is the same as that of domestic GDP. This reasoning however falls short of considering the situation where trade in intermediate goods should react to a change in foreign – not domestic – activity. To address this issue, let us now consider that exports of intermediate goods of country i are directed to a second country j:
QiX = Zj
M ;Xi = Mj ;Yj = Qj – Zj (4)
Assume constant technical coefficients in country j:
Mj
j
Mj z
ZZ
= ;
jj
j zQZ
= (5)
We then have:
Xi
jMj
jMj
jMj
jj Q
zzz
Zzzz
Y−
=−
=11
(6)

CEPII, WP No 2009-15 Economic Crisis and Global Supply Chains
15
It follows that j
Xi YQ ˆˆ = : the growth rate of exports of intermediate goods is equal to GDP
growth in the partner country. It could be argued however that the fall in trade does not derive from intermediate goods, but from final goods. This is what we now examine.
Exports of final goods are generally considered to be a function of foreign income. Assuming constant relative prices, we have:
( ) jjjji YMX γη== (7)
where ηj, γj are positive parameters. When the trend of globalization is correctly accounted for, the income elasticity of imports, γj, is generally estimated close to unity. It follows that
jji YMX ˆˆˆ == . Symmetrically, we have: iji YXM ˆˆˆ == . Hence, the growth rate of exports of final goods is equal to that of foreign GDP; and the growth rate of imports of final goods is equal to that of domestic GDP. We now need to add-up the various building blocks of this reasoning and consider total trade.
Total exports of country i are TiX such that:
TiX = Xi + Qi
X (8)
Since both Xi and QiX grow at the same rate as foreign GDP, we have:
jX
i YT ˆˆ = (9)
Similarly, total imports of country i are:
TiM = Mi + Zi
M (10)
Since both Mi and ZiM grow at the same rate as domestic GDP, we have:
iM
i YT ˆˆ = (11)
As a first approximation we can finally assume that GDP growth is the same in both countries ( YYY ji
ˆˆˆ == ). We finally have:
YTTTT Mj
Xj
Mi
Xi
ˆˆˆˆˆ ==== (12)
The growth rate of world trade is equal to the growth rate of world GDP. Note that this result relies on three assumptions: (i) constant technical coefficients; (ii) a unitary income elasticity of imports; and (iii) constant relative prices.
In the absence of further opening up of the economies, the volume of world trade must grow at the same rate as the volume of world GDP. For a given country, the growth rates of exports

CEPII, WP No 2009-15 Economic Crisis and Global Supply Chains
16
and imports can differ depending on the relative growth of domestic and foreign GDP, but during a world depression, this difference is of second order. Actually, technologies are not Leontief, the short-term income elasticity of imports is not exactly equal to unity and relative prices change. But only a very peculiar combination of these elements would put our reasoning at risk.
In order to check whether the argument based on such simple accounting remains accurate when the three simplifying hypotheses (fixed technical coefficients, final exports proportional to foreign income, fixed relative prices) are abandoned, and when more than two countries trade, we subsequently simulate the CGE model MIRAGE.8 The advantage of such approach will be to fully take into account inter-industry relations in a consistent way.
2. SIMULATIONS IN GENERAL EQUILIBRIUM WITH INTER-INDUSTRY RELATIONS
Here we study the multiplier effect hypothesis of trade over GDP growth for the 2009–2012 period, within the world CGE model developed by the CEPII – MIRAGE. There are considerable advantages to such approach. The trade-growth nexus very much depends on the respective openness and specialisation of the various regions in the world – two key features of a CGE. Also, the ability of the model to compute the actual prices of traded goods is key to our reasoning. We fully take into account inter-industry relations between 25 sectors and 18 regions of the world economy, using the specific input-output tables for each modelled country.9 Interestingly, we not only take into account inter-industry imports (e.g. the car industry importing glass); we also account for imports on the diagonal of the input-output table (e.g. the car industry importing car components), thanks to the Armington specification that allows intra-industry trade. Thus, all simplifying assumptions of the previous section are now relaxed, with the exception of the Leontief technology between intermediate goods and primary factors. Relative prices vary, which leads to substitution of inputs and possibly of countries of origin for intermediate consumption, and the income elasticity of imports is calibrated based on observed values.
Lastly and importantly, we are now in a position to address the second part of the argument suggested by O’Rourke – as to whether the drop in trade induced by the fall in GDP falls on sectors with the highest vertical disintegration of production. The ratio of value added to exports indeed varies a lot across sectors: it is high in primary products and agricultural products, and lower in manufacturing (Johnson and Noguera, 2009). According to Miroudot and Ragoussis (2008), fragmentation is highest in motor vehicles, radio, TV and communication equipment, and office machinery and computers. Hence, we may expect that a drop in trade falling mostly on manufactured products and OECD countries should be a multiple of the fall in GDP. Here again, using a CGE model is useful, since the differences in fragmentation across sectors are documented in the baseline, while the demand shock is disseminated in the economy according to input-output relations. Accordingly, the composition effect suggested by O’Rourke is fully taken into account in our CGE approach. 8 Modelling International Relationships in Applied General Equilibrium (Decreux and Valin, 2007). 9 A region can comprise a single country.

CEPII, WP No 2009-15 Economic Crisis and Global Supply Chains
17
Incidentally, the data we use (GTAP 7) is an update of the data used by Johnson and Noguera (2009) and thus is calibrated on 2004 instead of 2001. It is also more disaggregated: the world economy is decomposed into 57 sectors and 113 regions.
In order to conduct our exercise, three variables are made exogenous in the model for a partition of the world in 18 countries or zones: GDP growth, oil prices and investment. The first two variables are based on the IMF forecasts of April 2009. The third variable, which captures a shift in demand away from capital goods, is calibrated on past business cycles, as detailed below. In addition, the calibrated trend of globalisation that is included in the model to account for trade growing faster than GDP over the past is halted in our simulation after 2008. The objective is to check whether the demand shock (both global and in terms of composition), combined with a sharp decline in the price of energy and a pause in globalization, suffices to generate a multiplier effect of trade (in volume) over GDP when all interactions in the world economy – including, in particular, global supply chains – are properly modelled.
Some important determinants, such as trade finance, inventory adjustments or expectations, are missing in a real-economy model like MIRAGE. In particular, the estimated income elasticities used are long-term elasticities, while in the short term, demand may react weakly to relative-price changes in some sectors. Similarly, the micro-economic foundations of the model do not account for expectations, thus it fails to account for ‘bubbles’ and short-term over-adjustments. Lastly, we do not account for the over-capacity in the car industry that has been revealed by the crisis but pre-dated it. The lack of consumer finance may have also played a role in the drop of world car demand.
We would accordingly expect to only partially replicate the double-digit drops in trade recorded in 2008Q4 and 2009Q1, which will have lasting effects on 2009 figures. However, our objective is rather to measure the role of global supply chains in the observed “over-shooting” of trade compared to GDP, within a consistent framework.
2.1. MIRAGE in a nutshell
In the MIRAGE model, the demand side is modelled in each region through a representative agent. Domestic products are assumed to benefit from a specific status for consumers, making them less substitutable for foreign products than foreign products are between each other. Secondly, manufactured products originated in developing and developed countries are assumed to belong to different price or quality ranges. Hence, the competition between products of different qualities is less intense than between products of similar quality. As regards the supply side of the model, producers use five factors: capital, skilled and unskilled labour, land, and natural resources. The structure of value-added is intended to take into account the well-documented relative complementarity of skill-capital. The production function assumes perfect complementarity between value-added and intermediate consumption (like the accounting of Section 2), but domestic and imported intermediate inputs are substitutes (unlike in Section 2). The sectoral composition of the intermediate

CEPII, WP No 2009-15 Economic Crisis and Global Supply Chains
18
consumption aggregate stems from a nested CES function. Constant returns to scale and perfect competition are assumed to prevail in agricultural sectors. In contrast, firms are assumed to face increasing returns to scale in industry and services. In those sectors, competition is imperfect and exports of final goods depend on relative prices (unlike in Section 2 where relative prices are set constant).
Capital is accumulated every year as the result of investments in the most profitable sectors, but it cannot change its sector affectation. The pace of regional (or country) investment is set exogenously here, while returns to capital determine the allocation of investment across sectors. The current account balance is assumed to be exogenous (and equal to its initial value in percentage of the world GDP), while real exchange rates are endogenous. This approach has a specific consequence when it comes to the simulated changes in exports and imports of individual countries. Depending on the initial surplus or deficit in the current account, the percentage change of exports and imports must be different in order to keep the imposed constraint on the current account. The real exchange rate appreciates or depreciates accordingly.
Natural resources are considered to be perfectly immobile and may not be accumulated. Oil resources, as detailed below, are calibrated such that prices in MIRAGE match IMF forecasts. Both high and low-skilled labours are assumed to be perfectly mobile across sectors, whereas imperfect land mobility is modelled with a constant elasticity of transformation function. Production factors are assumed to be fully employed. All production factors are immobile internationally.
While interested in medium-term effects, this paper however relies on the most recent aggregated trade figures for all countries for which monthly or (at worst) quarterly data was available up to December 2008. The model, calibrated on 2004 data, comprises a dynamic baseline reproducing the evolution of the overall economy from 2004 to the end of 2008. From 2009 on, the model simulates the changes in trade flows that are compatible with the forecasted recession, the drop in investment and a halt in the reduction of trade costs. The demography is given, investment is exogenous (see Section 3.3) and the oil price is constrained to the most recent forecasts.
2.2. Assumptions on GDP
Our first driver of the decline in world trade is the drop in GDP. As already stressed, we are interested in exploring whether the potential impact of this downturn can lead to a multiplier effect of world trade as a result of industrial fragmentation. The MIRAGE model relies on the GTAP-7 database that uses 2004 data. From 2005 to 2008, IMF and ITC databases are used to update GDPs, investment and trade flows.10 Total factor productivity as well as savings rates
10 Trade data between 2004 and 2008 comes from TradeMap, ITC (Geneva). For 2008, the most recent data is used,
including monthly series when available. Then, we simulate trade flows from 2009 onwards.

CEPII, WP No 2009-15 Economic Crisis and Global Supply Chains
19
are recovered endogenously. From 2009, our scenario is implemented: IMF forecasts for GDP are introduced exogenously, and TFP is again assumed to be endogenous.11
Most macroeconomic forecasters were surprised by the severity of the crisis and had to revise their forecast downwards several times during 2008 and 2009. As an illustration, Table 2 shows the projections of GDP growth rates for 2009 made by the IMF between May 2008 and April 2009 in its World Economic Outlook. Differences are striking. Such huge variations show that great care must be taken when forecasting in a situation of such uncertainty and complexity.
Table 2: IMF projections of GDP growth rates for 2009
Date of projections May 2008 Oct 2008 Jan 2009 March 2009 April 2009
World output 3.8 3.0 0.5 -1.0 to -0.5 -1.3
Advanced economies 1.3 0.5 -2.0 -3.5 to -3.0 -3.8
United States 0.6 0.1 -1.6 -2.6 -2.8
Euro area 1.2 0.2 -2.0 -3.2 -4.2
Japan 1.5 0.5 -2.6 -5.8 -6.2 Emerging and developing economies 6.6 6.1 3.3 1.5 to 2.5 1.6
Note: Annual percent change at constant price.
Sources: World Economic Outlook database; IMF (2009a, 2009b, 2009c).
The calibration of GDP growth rates in the model from 2008 onwards is based on the World Economic Outlook database, updated in April (IMF, 2009c), and on Freedman et al. (2009). For 2009 and 2010, we take the April figures (IMF, 2009c) summarised in last column of Table 2. For 2011 and 2012, we rely on Freedman et al. (2009), who analyse the combined effects of fiscal stimuli on world economic performance. Most importantly, they provide growth projections for the United States, the Euro area, Japan and the world as a whole up to 2015. We extrapolate their results to other regions (which make up 30% of the world economy). Our GDP assumptions are presented in Table 3, using a decomposition of the world economy in 18 countries or regions. Note that world GDP growth rates are a PPP-weighted average of regional growth rates, which implies that the world GDP growth rate is sustained by the resilience of countries with undervalued currencies (e.g. China) to the crisis.
11 A drop in TFP can be interpreted as a drop in the utilisation rate of production capacity. An alternative approach is
to compute the drop in primary factors (at constant TFP) that would lead to the imposed GDP growth. Such method has been used by Willenbockel and Robinson (2009).

CEPII, WP No 2009-15 Economic Crisis and Global Supply Chains
20
Table 3: GDP growth by region
2007 2008 2009 2010 2011 2012
Forecasts Australia/New Zealand 4.0 1.9 -1.5 0.6 3.8 3.0
China 13.0 9.0 6.5 7.5 11.1 10.3 India 9.3 7.3 4.5 5.6 8.6 7.9 Japan 2.4 -0.6 -6.2 0.5 2.8 3.4 Korea/Taiwan 5.2 1.5 -5.1 1.0 4.4 3.6 Rest of Asia 6.3 4.9 0.0 2.3 6.0 5.3 Canada 2.7 0.5 -2.5 1.2 3.2 2.4 USA 2.0 1.1 -2.8 0.0 2.0 3.0 European Union 3.1 1.1 -4.0 -0.3 1.5 1.8 Rest of Europe/Turkey 4.4 1.8 -3.7 0.5 4.0 3.2
Russia 8.1 5.6 -6.0 0.5 6.0 5.2 Brazil 5.7 5.1 -1.3 2.2 4.5 3.8 Mexico 3.2 1.3 -3.7 1.0 3.2 2.5 Other Latin America 5.7 4.2 -1.5 1.6 4.6 3.9 Middle East 6.4 5.9 2.5 3.5 6.6 5.8 North Africa 5.2 5.3 3.2 3.7 6.0 5.3 South Africa 5.1 3.1 -0.3 1.9 4.9 4.2 Rest of Africa 6.9 5.5 1.7 3.8 6.9 6.1
Note: Annual percent change at constant price.
Source: IMF (2009c) and Freedman et al. (2009).
2.3. Calibration of the demand shift
Our second channel of trade attrition is a sharp decline in investment. To model this mechanism, we consider that investment follows an exogenous path in our simulations. Investment growth rates in the various economies are calibrated based on an investment accelerator. Using the investment growth rate series between 1980 and 2007 (WEO database), we calibrate the investment accelerator (α) by region that minimizes squared errors (εt
2) in:
tt
t
t
t
t
t
t
t
YY
YY
II
II εα +⎟⎟
⎠
⎞⎜⎜⎝
⎛ ∆−
∆+
∆=
∆
−
−
−
−
1
1
1
1 (13)
Where It and Yt correspond, respectively, to investment and GDP in year t, and ∆ is the variation from one year to the next.

CEPII, WP No 2009-15 Economic Crisis and Global Supply Chains
21
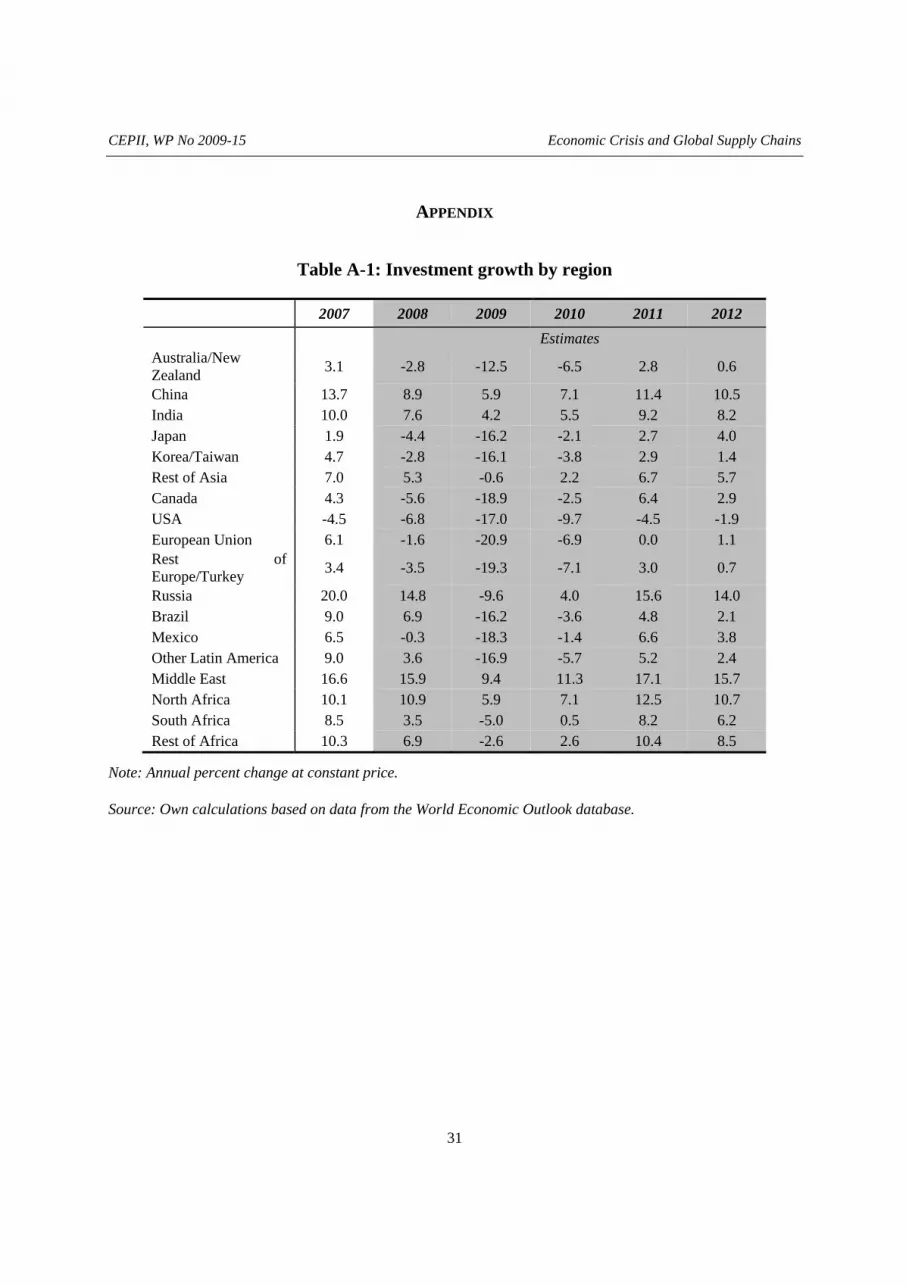
Table 4 shows the investment accelerator by region. This represents the ratio of changes in investment compared to changes in GDP. We use these figures to define investment growth rates by region over the period 2009-2012. They are presented in appendix (Table A-1). Exogenous investment growth rates are imposed in the simulations; to do so, savings rates become an endogenous variable.
Table 4: Investment accelerator by region
Australia/New Zealand 2.9 Canada 4.5 Mexico 3.6
China 1.2 USA 2.6 Other Latin America 3.6
India 1.2 European Union 3.8 Middle East 1.9
Japan 2.1 Rest of Europe/Turkey 2.9 North Africa 2.3
Korea/Taiwan 2.0 Russia 2.1 South Africa 2.5
Rest of Asia 1.2 Brazil 3.6 Rest of Africa 2.5
Source: Own calculations based on data from the World Economic Outlook database.
2.4. Assumptions on energy prices
The third channel of trade attrition is the price of oil. Accordingly, the third exogenous variable introduced in the model is the oil price. It is assumed to follow an exogenous path from 2004 to 2010. In 2007 and 2008, the annual percentage change in the oil price is respectively +10.7% and +36.4% according to IMF (2009c). For 2009, a sharp drop (–46.4%) was forecasted in April 2009 by the IMF, before a recovery in 2010 (+20.2%). Stocks of natural resources adjust proportionally in all producing country to be consistent with such price path.
2.5. Globalisation trend
In order for MIRAGE to reproduce the observed growth rates of trade over the period 2004–2008, an iceberg cost of exporting has been introduced at the country level (on the top of the already present transport cost).12 Since exports grew faster than GDPs from 2004 to 2008, this additional cost progressively diminishes during this period, mimicking the globalisation of the world economy (e.g. the development of supply chains referred to above). It seems reasonable to assume a halt to this trend during times of crisis. This approach does not roll back liberalisation and could therefore be seen as rather conservative, since some commentators have claimed that there is a trend towards a “de-globalisation process” (e.g. The Economist, 2009). Although there is some anecdotal evidence of ‘murky protectionism’ arising from the crisis (Baldwin and Evenett, 2009), firm evidence of a trend towards protectionism is limited. What does appear to be a realistic assumption, however, is a freezing of trade liberalisation as
12 According to the iceberg-cost formulation, part of a good « melts down » when shipped internationally.

CEPII, WP No 2009-15 Economic Crisis and Global Supply Chains
22
national governments focus on their domestic economic imperatives. Accordingly, in the simulation we impose a halt to the decline in trade costs in 2009 to mimic this halt in globalisation.
2.6. Choice of the deflator
Finally, the measurement of changes in prices of world trade is an important issue. In its standard version, MIRAGE reports evolutions in real terms (i.e. corrected for inflation) and uses the world GDP deflator. Consequently, all nominal variables introduced as exogenous inputs in the model (trade flows over 2004-2008 and the oil price over 2004-2010) have been deflated by a world GDP deflator computed as an average between US and EU deflators, in dollars.13
When it comes to reporting trade impacts, the model can compute trade either as values deflated by world inflation, or as actual volumes, at constant prices. The first, standard approach may well be ill-suited to a context where the price of a commodity which accounts for some 10 percent of world trade (oil), is almost halved. Indeed, aggregate prices (the GDP deflator) will vary much less than the price of oil. Using the GDP deflator runs the risk of massively overstating the fall in oil export volumes, and by implication, magnifying the fall in total world trade. Accordingly, two systems of deflators are successively used to recover trade volumes:
- A uniform world GDP deflator (like in Section 2);
- A system of sector-specific trade prices (unlike in Section 2).
Not all unit values of trade are observable: for very recent periods, unit values are unavailable. Guesstimates on prices have to be made.14 However, using sector-specific trade prices yields interesting results in terms of interpreting how dramatic the impact of the crisis on actual trade flows really is. Notice that relying on such prices is only possible when a complete model of the world economy, such as MIRAGE, is used, although such CGE models are devoted to simulation rather than forecast.
3. RESULTS
Here we present the simulation results for the world as a whole and for our 18 countries or regions, using the two systems of deflators successively.
13 In the simulation, the world deflator is generated by the model based on GDP deflators in the 18 countries or zones
under scrutiny. 14 For instance, the WTO Secretariat acknowledges that it relies on estimates when necessary.

CEPII, WP No 2009-15 Economic Crisis and Global Supply Chains
23
3.1. World exports
Projections for the annual growth of world exports from 2009 onwards are presented in Table 5 using the two alternative deflators. According to our simulations, world exports, at constant world GDP price, would be expected to fall by 8.9 percent in 2009. In contrast, at constant trade prices, in other words taking into account changes in the true price of traded goods, the decline appears to be much more limited: –2.4 percent. Accordingly, the comparison of trade flows using the two alternative deflators shows that a large part of the world trade collapse seems to be due to a marked fall in the relative price of traded goods compared to non-traded ones, with a large share of that fall coming from oil. This fall in trade still represents a 1.1 percentage point “overshooting” over the GDP decline forecast by the IMF (–1.3 percent). However when the world GDP decline is computed using the current exchange rates instead of the PPP weights, the 2009 decline introduced in MIRAGE is computed at –2.6%. Thus when appropriate benchmarks are used (trade and GDP aggregated at the world level using the same weights), there is no longer any multiplier effect on trade.
Table 5: World export growth, 2007-2012
2007 2008 2009 2010 2011 2012
Estimates
Constant world GDP price 6.0 7.2 -8.9 2.1 4.1 4.4
Constant trade prices 6.6 5.3 -2.4 0.7 3.7 3.7
Note: Annual percent change.
Source: MIRAGE simulations.
In 2010, the model anticipates an increase in world trade of 2.1 percent (0.7 percent at constant trade prices). Trade is forecast to pick up in 2011 and 2012, when exports are expected to increase by roughly 4 percent.
Such orders of magnitude suggest that our favoured channel of trade attrition, namely the collapse of investment, combined with a halt to the globalisation process, fails to replicate the observed steep drop in the volume of world trade flows, which substantially exceeded that of GDP during the last quarter of 2008 and the first quarter of 2009. Instead, the model finds a similar rate of contraction in trade and GDP when trade flows are deflated by actual prices and GDP figures are aggregated in the same way as trade flows. On the basis of this analysis, the over-shooting observed in late 2008 and early 2009 may be explained by credit restrictions or short term expectations or inventories, all of which are not modelled by MIRAGE.

CEPII, WP No 2009-15 Economic Crisis and Global Supply Chains
24
3.2. Regional impacts
Table 6 details the evolution of exports by countries or regions using the constant world-GDP deflator. The results for imports are reported in Appendix (Table A-2). Note that, when an initial current account imbalance (deficit or surplus) is observed, the percentage changes in exports and imports may be different, in order to maintain that imbalance (relative to world GDP).15
European exports are forecast to fall by 8.6 percent in 2009, almost as much as world exports (–8.9 percent), whereas GDP would decline by 4.0 percent in the EU, compared to only 1.3 percent for the world economy.16 In the United States, in contrast to the EU, exports in 2009 are forecast to fall by more than the world average (–9.5 percent). Oil exporting countries (Middle East, Russia…) are even more strongly affected by the decrease in global demand in 2009, with a drop in exports of 19.3 percent for Russia and 23.1 percent for the Middle Eastern countries. In a similar way, Asian countries are particularly hit by the dramatic decline in global demand for advanced manufacturing products, such as motor vehicles, information technology and capital goods (Sommer, 2009). As a result, exports in Japan, Korea and Taiwan are found to fall by roughly 9 percent in 2009. China suffers smaller export losses than most other countries (–1.7 percent in 2009), although this represents a 10.9 p.p. fall between export growth levels in 2008 (+9.2 percent) and 2009 (-1.7 percent). This 10.9 p.p. drop in the growth rate of Chinese exports is more limited than the world average (–16.1 p.p.), because China suffers less from the decline in its export prices than exporters of primary or agricultural products.
From 2010 onwards, trade recovery appears widespread, thanks to a rapid recovery in non-OECD countries, in particular Brazil, China and India (OECD, 2009). However, the increase in exports in 2011 and 2012 remains below the 2007–2008 figures, most probably because of the slow recovery of several major economies, coupled with the halt in globalization.
We now turn to the results obtained when trade flows are deflated by the prices of traded products (Table 7). As expected, accounting for the drop in the price of oil yields a much milder fall in the export volumes of oil-exporting regions (Russia, Middle East, North Africa). In fact, we even observe an increase in the volume of exported oil, as an endogenous response to the (exogenous) fall in its price. This (logical) response of the model is almost certainly too optimistic, given that it relies on long-term elasticities that do not take into account the limited short-term response of demand to falling prices.
In contrast, for advanced countries, which mainly export manufactured products and services where prices do not vary to the same extent, the difference between results based on the two deflators is limited. In the Korean case, both approaches produce the same change in exports. 15 Denoting by X, M and Y the volume of country’s exports, country’s imports and world GDP (all deflated by the
world GDP deflator), we have: ⎟⎠⎞
⎜⎝⎛ −
−=−⇒=
−X
dXYdY
MMX
MdM
XdXcst
YMX
. 16 Note that intra-EU trade, which represents roughly 60% of European trade, is excluded from these calculations.

CEPII, WP No 2009-15 Economic Crisis and Global Supply Chains
25
For Japan and the United States, there is at most a one percentage point difference. For the EU, the difference is also limited: –7.2% using sectoral trade prices, versus –8.6% using the GDP deflator. Finally, for developing economies exporting agricultural products or manufactured products, the outcome is more mixed. For China, the drop in exports (–11.4 p.p.) is much larger than the world average (–7.7 p.p.) due to the sharp contraction in most of its markets. For India, the price adjustment effect comes on top of a sharp decline in volumes. For Brazil, Mexico and Turkey, the price adjustment effect is very large and is a major determinant of changes in exports.
Table 6: Export growth by region at constant world GDP price
2007 2008 2009 2010 2011 2012 Estimates Australia/New Zealand 5.9 22.3 -6.5 1.6 4.3 4.0 China 11.9 9.2 -1.7 4.9 7.9 7.8 India 7.6 7.3 -8.2 7.2 8.4 8.3 Japan 2.7 2.7 -9.2 1.6 4.0 4.6 Korea/Taiwan 2.5 7.1 -8.7 1.9 4.9 4.7 Rest of Asia 4.5 7.0 -7.3 3.0 5.4 5.4 Canada 0.6 5.0 -8.3 0.9 3.2 3.0 USA 4.2 5.0 -9.5 0.6 2.6 3.4 European Union 7.0 6.7 -8.6 1.6 3.6 3.8 Rest of Europe/Turkey 9.7 6.8 -12.2 2.0 4.2 4.0 Russia 8.6 7.3 -19.3 4.5 6.0 6.4 Brazil 8.4 15.7 -9.7 2.8 4.1 4.1 Mexico 1.1 11.5 -11.3 0.7 2.4 2.7 Other Latin America 9.5 10.3 -12.3 3.0 4.1 4.2 Middle East 1.6 9.9 -23.1 9.1 6.9 7.4 North Africa 0.7 7.5 -16.0 7.3 6.1 6.5 South Africa 12.0 7.3 -7.3 2.4 4.8 4.7 Rest of Africa -42.5 7.6 -23.0 8.7 7.1 7.7
Note: Annual percentage change.
Source: MIRAGE simulations.

CEPII, WP No 2009-15 Economic Crisis and Global Supply Chains
26
Table 7: Exports growth by region at constant trade prices
2007 2008 2009 2010 2011 2012
Estimates Australia/New Zealand 5.9 23,9 ‐1,8 ‐0,1 3,7 2,8 China 11.9 12,0 0,6 6,5 9,5 9,2 India 7.6 8,2 ‐5,8 8,2 9,7 9,3 Japan 2.7 3,9 ‐10,1 2,0 3,7 4,4 Korea/Taiwan 2.5 8,6 ‐8,5 1,8 4,6 4,3 Rest of Asia 4.5 6,0 ‐0,7 2,3 5,8 5,3 Canada 0.6 2,6 ‐0,9 ‐0,8 2,6 1,9 USA 4.2 5,2 ‐8,6 0,0 2,1 3,0 European Union 7.0 7,3 ‐7,2 1,1 3,1 3,3 Rest of Europe/Turkey 9.7 1,8 ‐1,3 ‐1,0 3,3 2,5 Russia 8.6 ‐8,8 16,6 ‐4,2 4,1 3,0 Brazil 8.4 15,0 ‐2,7 1,4 4,0 3,4 Mexico 1.1 9,1 ‐0,5 ‐1,4 2,0 1,6 Other Latin America 9.5 3,1 4,7 ‐1,0 3,4 2,5 Middle East 1.6 ‐11,3 25,9 ‐3,2 4,0 2,6 North Africa 0.7 ‐8,3 20,8 ‐1,2 4,4 3,1 South Africa 12.0 7,7 ‐3,7 2,2 5,1 4,5 Rest of Africa ‐42.5 ‐12,4 21,7 ‐3,1 4,2 2,8
Note: Annual percentage change. Source: MIRAGE simulations.
Distinguishing between industry and services, we find that, at the world level, both types of exports are almost equivalently affected, with a 3.8% drop for industry and a 3.6% for services, at constant trade prices (Table 8). This can be explained by the fact that our assumption of a drop in world-wide investment concerns both categories of investment: equipment goods and construction services. The latter are less traded than the former but in our simulation those that are traded experience a similar fall. However, Table 8 shows that the picture can vary significantly between countries, with the sharp drops in industrial exports for certain OECD countries such as Japan (–9.3%) or the US (–8.8%) contrasting to the relative resilience of developing countries exports (e.g. China).
Table 8: Exports growth by region at constant trade prices for selected sectors and countries, 2009
World USA Japan EU China India Brazil
Industry -3.8 -8.8 -9.3 -6.7 1.9 -2.1 -5.6
Services -3.6 -9.1 -16.1 -9.0 -6.7 -16.1 -3.1
Note: Annual percent change.
Source: MIRAGE simulations.

CEPII, WP No 2009-15 Economic Crisis and Global Supply Chains
27
4. ROBUSTNESS ANALYSIS
The results presented in the previous section suggest that the observed and simulated sharp drop in world trade is partly explained by the decline in the relative price of traded goods compared to non-traded ones. When modelled in such a way that trade flows are deflated by sector-specific trade prices and world GDP is aggregated at current exchange rates, instead of PPPs, world trade no longer overshoots world GDP for 2009. However, our assumption of a halt to the globalization process may appear too conservative. As it is difficult to calibrate a ‘de-globalization’ process, in this section we simply seek to measure the contribution of this assumption to the results, by re-running the same exercise while prolonging the trend of globalisation from 2009 onwards.
A second issue which we seek to explore is the contribution of our expected fall in the oil price to the results, which is crucial in the finding of a large fall in world trade in 2009. The oil price is introduced as an exogenous variable and its evolution may reflect short-run factors such as ‘fire sales’ of oil derivatives. We accordingly re-run the simulation with an endogenous oil price, keeping the resource constant.
Finally, we compare our result to an exercise performed by Willenbockel and Robinson (2009) who have studied the impact of the recession on developing countries’ exports.
4.1. The role of the halt in the globalisation trend
Let us start with the important assumption in our simulations regarding the halt imposed on the trend of globalisation. Note that globalisation has been modelled here as a downward trend in trade costs, that we assume to be interrupted in 2009. Given the claims of de-globalisation from certain commentators (The Economist, 2009), it is interesting to explore how much the assumption contributes to the overall drop in trade simulated within MIRAGE. To capture this, we reproduce the previous scenarios while extrapolating (rather than halting) the decline in trade costs after 2008. Although such a trend seems an unlikely prospect in the current economic climate, it helps us to better understand the exercise.
The results are presented in the second row of Table 9 and must be compared with the first row which replicates the first row of Table . In 2009, extrapolating the globalisation trend limits the drop in world trade to –6.8% at world GDP prices. Therefore our assumption of a halt to the globalisation trend is found to account for 2.1 percentage points (roughly 25%) of the simulated decline in world trade at GDP prices. Hence, the fact that the general trend towards integration and market opening of recent years does not continue in the model has, in itself, an important impact on trade. Conversely, assuming linearity as a first approximation, a reversal of the trend (‘de-globalization’) could add some 2 percentage points to the fall in world trade.

CEPII, WP No 2009-15 Economic Crisis and Global Supply Chains
28
Table 9: World export growth, 2007-2012 at constant GDP price, under different sets of
assumptions
2007 2008 2009 2010 2011 2012
Estimates
Reference scenario 6.0 7.2 -8.9 2.1 4.1 4.4
Prolonged trend in globalisation 6.0 7.2 -6.8 4.5 6.7 7.1
Oil price endogenous 6.0 7.2 -2.8 1.6 4.4 4.9
Note: Annual percent change.
Source: MIRAGE simulation.
4.2. The role of the oil price
The price of energy in our simulation is exogenous. We accordingly made the resource endogenous in order to reflect the IMF’s forecasts. Since the price of energy has been seen to profoundly impact the results, it is worth comparing them with a simulation where the oil price is determined by the model (and resources are set exogenously). The results of this exercise are shown in the third row of Table 9. They point to a much reduced fall in trade in 2009 due to the more limited fall in the oil price. Hence, the short term deviation of the oil price from its long term equilibrium level accounts for a large part of the simulated decrease of world trade in 2009. As soon as the oil price converges toward its equilibrium long term price, differences between the two scenarios disappear, as illustrated by the comparison of the first and third lines in Table 9.
Is there a ‘trade multiplier’ after all?
We performed additional simulations, not reported here, in order to estimate the elasticity of world exports to world GDP, ceteris paribus, and found an elasticity of 0.98. This outcome is not specific to MIRAGE. Willenbockel and Robinson (2009) use a static CGE of the world economy, GLOBE, to assess the impact of the global depression on developing countries’ exports. Since these authors are not interested in reproducing WTO or IMF forecasts, they do not take into account actual GDP forecasts. Instead, they rely on an assumption of a 5 percent drop of GDP in the OECD. This reduction is imposed to the world economy as it was in 2004. This is a much sharper drop than the one modelled in our own exercise (recall that we assume a 1.3 percent drop for the world GDP in 2009, with –6.2 percent for Japan and –4.0 percent for the EU, but only –2.8 percent for the U.S.). With a 5 percent drop in the OECD’s GDP, the OECD’s exports drop by 4.7 to 5.6 percent depending on the region, while developing countries’ exports at worst suffer a drop of 2 percent. These results are computed as changes in volumes, at constant trade prices. They do not indicate the presence of any trade multiplier.

CEPII, WP No 2009-15 Economic Crisis and Global Supply Chains
29
CONCLUSION
Since the amplification of the global crisis in the fall of 2008, there has been a great concern about the sharp drop in world trade and about its implications for export-oriented economies, especially developing ones. Beyond the correlated sharp decline in activity world-wide – a consequence of a global economy – there are several potential explanations for the fall in world trade. The most popular include the fact that investment has dried up; that tradable sectors are relatively more affected by the crisis; that a scarcity of trade finance has constrained imports; that the increase in exchange-rate volatility has impeded trade; that there has been a rise in protectionism. But on top of all these explanations, a specific role has been attributed to the impact of the fragmentation of the production process and the related multiplier effect of trade over GDP.
In this paper we firstly present simple accounting calculations showing that the supply-chain argument does not automatically lead world trade to overshoot a drop in world GDP. We then use a multi-region, multi-sector CGE model to explicitly take into account inter-industry relations at the sectoral level to assess whether the GDP forecasts for 2009 and 2010, together with a change in the composition of demand detrimental to investment and a halt in the trend towards a reduction in trade costs, can together account for the sharp drop in world trade.
The model is adapted to reproduce the observed path of the world economy over the period 2004–2008. The most recent trade figures, notably monthly figures, are mobilised here for the maximum number of countries. Trends in investment at the country level are calibrated on the basis of observed behaviour during past business cycles. The evolution of the oil price is derived from independent estimates by the IMF. Lastly, the model is structured to reproduce the most recent GDP forecasts available at the country or regional level.
The order of magnitude for trade decline in 2009 simulated by the model is 8.9 percent when trade flows are deflated by the price of the world GDP, compared with the 1.3 percent fall in world GDP. However, the simulated drop in the volume of world trade very much depends on the deflator used. To some extent, results are driven by the assumptions made about the price of oil, in line with observed changes and forecast prices. Using actual trade price instead of GDP prices, the drop in the volume of world trade is only –2.4 percent. Accordingly, the large drop forecast by international organizations for the whole year of 2009 partly covers a relative price effect, i.e. a fall in the price of traded goods (especially energy) compared to non-traded ones. Lastly, it is important to use the right GDP benchmark to assess impacts: the drop in world GDP is –1.3% in 2009 according to IMF forecasts, but –2.6% when aggregated using current exchange rates. Accordingly, our paper does not support the hypothesis of a systematic over-shooting of trade due to the fragmentation of supply chains.
In sum, the double-digit drop in global trade that has been observed in the last quarter of 2008 and first quarter of 2009 seems likely to be explained by other factors than the fragmentation of supply chains: changes in inventory levels, consumer expectations and trade finance or the

CEPII, WP No 2009-15 Economic Crisis and Global Supply Chains
30
collapse of the car industry appear to be good candidates.17 Such factors are typically not modelled in a world multi-sectoral CGE such as MIRAGE, which is mostly focused on longer term adjustments. The short-term nature of some of these determinants should prevent a durable drop in trade such as that observed in the 1930s, unless a similarly significant rise in protectionism to that observed in the latter period emerges. In spite of anecdotal evidence of ‘murky protectionism’ this still looks an unlikely prospect.
17 Regarding trade finance, the OECD estimates that it explains up to a third of the drop in trade over 2008Q4 and
2009Q1 (cf. OECD (2009-b), Box 1.2).
CEPII, WP No 2009-15 Economic Crisis and Global Supply Chains
31
APPENDIX
Table A-1: Investment growth by region
2007 2008 2009 2010 2011 2012 Estimates Australia/New Zealand 3.1 -2.8 -12.5 -6.5 2.8 0.6
China 13.7 8.9 5.9 7.1 11.4 10.5 India 10.0 7.6 4.2 5.5 9.2 8.2 Japan 1.9 -4.4 -16.2 -2.1 2.7 4.0 Korea/Taiwan 4.7 -2.8 -16.1 -3.8 2.9 1.4 Rest of Asia 7.0 5.3 -0.6 2.2 6.7 5.7 Canada 4.3 -5.6 -18.9 -2.5 6.4 2.9 USA -4.5 -6.8 -17.0 -9.7 -4.5 -1.9 European Union 6.1 -1.6 -20.9 -6.9 0.0 1.1 Rest of Europe/Turkey 3.4 -3.5 -19.3 -7.1 3.0 0.7
Russia 20.0 14.8 -9.6 4.0 15.6 14.0 Brazil 9.0 6.9 -16.2 -3.6 4.8 2.1 Mexico 6.5 -0.3 -18.3 -1.4 6.6 3.8 Other Latin America 9.0 3.6 -16.9 -5.7 5.2 2.4 Middle East 16.6 15.9 9.4 11.3 17.1 15.7 North Africa 10.1 10.9 5.9 7.1 12.5 10.7 South Africa 8.5 3.5 -5.0 0.5 8.2 6.2 Rest of Africa 10.3 6.9 -2.6 2.6 10.4 8.5
Note: Annual percent change at constant price.
Source: Own calculations based on data from the World Economic Outlook database.

CEPII, WP No 2009-15 Economic Crisis and Global Supply Chains
32
Table A-2: Import growth by region at constant world GDP price
2007 2008 2009 2010 2011 2012 Estimates Australia/New Zealand 5.7 20.0 -6.1 1.5 4.3 4.0
China 12.8 10.1 -1.9 5.4 8.3 8.1 India 7.0 6.5 -7.4 6.2 7.6 7.7 Japan 2.8 3.5 -10.9 2.0 4.3 4.9 Korea/Taiwan 2.5 8.4 -10.1 2.2 5.2 5.0 Rest of Asia 4.7 7.8 -8.1 3.2 5.7 5.6 Canada 0.6 5.2 -8.6 1.0 3.2 3.0 USA 4.1 4.0 -7.1 0.6 2.9 3.4 European Union 6.7 6.7 -8.3 1.7 3.8 4.0 Rest of Europe/Turkey 9.8 7.2 -12.5 2.1 4.3 4.2 Russia 10.2 9.2 -24.4 6.0 7.1 7.4 Brazil 9.8 19.6 -11.6 3.4 4.3 4.3 Mexico 1.1 11.6 -11.4 0.7 2.4 2.7 Other Latin America 9.9 11.0 -13.2 3.2 4.2 4.3 Middle East 1.5 11.4 -26.0 10.5 7.4 8.0 North Africa 0.7 8.1 -16.9 7.8 6.3 6.7 South Africa 12.8 7.7 -7.7 2.5 5.0 4.8 Rest of Africa -42.4 7.9 -23.3 8.9 7.2 7.8
Note: Annual percent change.
Source: See the text.

CEPII, WP No 2009-15 Economic Crisis and Global Supply Chains
33
REFERENCES
Araujo, S., Oliveira-Martins J. (2009). The Great Synchronisation: What do high-frequency statistics tell us about the trade collapse? Vox, 8 July.
Athukorala P. And N.Yamashita (2009). Patterns and determinants of production fragmentation in world manufacturing trade. In di Mauro et al. (eds.) Globalisation, Regionalisation and Economic Interdependence. Cambridge University Press.
Auboin, M. (2009). Trade finance: G20 and follow-up. Vox, 5 June.
Baldwin Richard, Evenett Simon (2009), The collapse of global trade, murky protectionism, and the crisis: Recommendations for the G20, CEPR, London.
Decreux Yvan, Valin Hugo (2007), MIRAGE, Working Paper CEPII.
Eichengreen, Barry, O’Rourke Kevin H. (2009). A Tale of Two Depressions. Vox, 6 April
Francois Joseph; Woerz Julia (2009). The Big Drop: Trade and the Great Recession. Vox, 2 May.
Freedman, Charles, Michael Kumhof, Douglas Laxton and Jaewoo Lee (2009). The Case for Global Fiscal Stimulus. IMF Staff Position Note 09/03, March 6.
Gamberoni, Elisa and Richard Newfarmer (2009). Trade protection: Incipient but worrisome trends. Trade Note 37, World Bank, March 2.
Hummels David, Ishii Jung and Kei-Mu Yi (1999), The Nature and Growth of Vertical Specialization in World Trade.
International Monetary Fund (2009c). World Economic Outlook: Crisis and Recovery. Washington, DC: IMF, April.
International Monetary Fund (2009b). Global Economic Policies and Prospects. Note by the Staff of the IMF, Group of Twenty: Meeting of the Ministers and Central Bank Governors, March 13-14.
International Monetary Fund (2009a). Global Economic Slump Challenges Policies. World Economic Outlook Update, January 28.
Johnson R.C., Noguera G. (2009). Accounting for Intermediates: Production Sharing and Trade in Value Added. Mimeo, Princeton and UC Berkeley.

CEPII, WP No 2009-15 Economic Crisis and Global Supply Chains
34
Miroudot S., Ragoussis A. (2008). Vertical Trade, Trade Costs and FDI. OECD Trade Policy Working Paper (89).
Organisation for Economic Co-operation and Development (2009-a). OECD Economic Outlook Interim Report. Paris: OECD, March 31.
Organisation for Economic Co-operation and Development (2009-b). OECD Economic Outlook Report (85). Paris: OECD, June 17.
O’Rourke K. (2009). Collapsing trade in Barbie world. http://www.irisheconomy.ie/index.php/2009/06/18/collapsing-trade-in-a-barbie-world/
Sommer, Martin (2009). Why Has Japan Been Hit So Hard by the Global Recession? IMF Staff Position Note 09/05, March 18.
Tanaka, Kiyoyasu (2009). Trade collapse and vertical foreign direct investment, Vox, 7 May.
The Economist (2009). Turning their backs on the world, February 12. Online at: http://www.economist.com/research/articlesBySubject/displaystory.cfm?subjectid=423172&story_id=13145370
Willenbockel, Dirk, Robinson, Sherman (2009). The Global Financial Crisis, LDC Exports and Welfare: Analysis with a World Trade Model. Paper presented at the GTAP conference, Santiago de Chile, June.
World Bank (2009), “Prospects for the global economy”, June 22.
World Trade Organization (2009). WTO sees 9% global trade decline in 2009 as recession strikes. Press Release, March 24.
Yi, Kei-Mu (2009). The collapse of global trade: the role of vertical specialization, in Baldwin and Evenett (eds), The collapse of global trade, murky protectionism, and the crisis: Recommendations for the G20, Ed. Vox, CEPR, London.
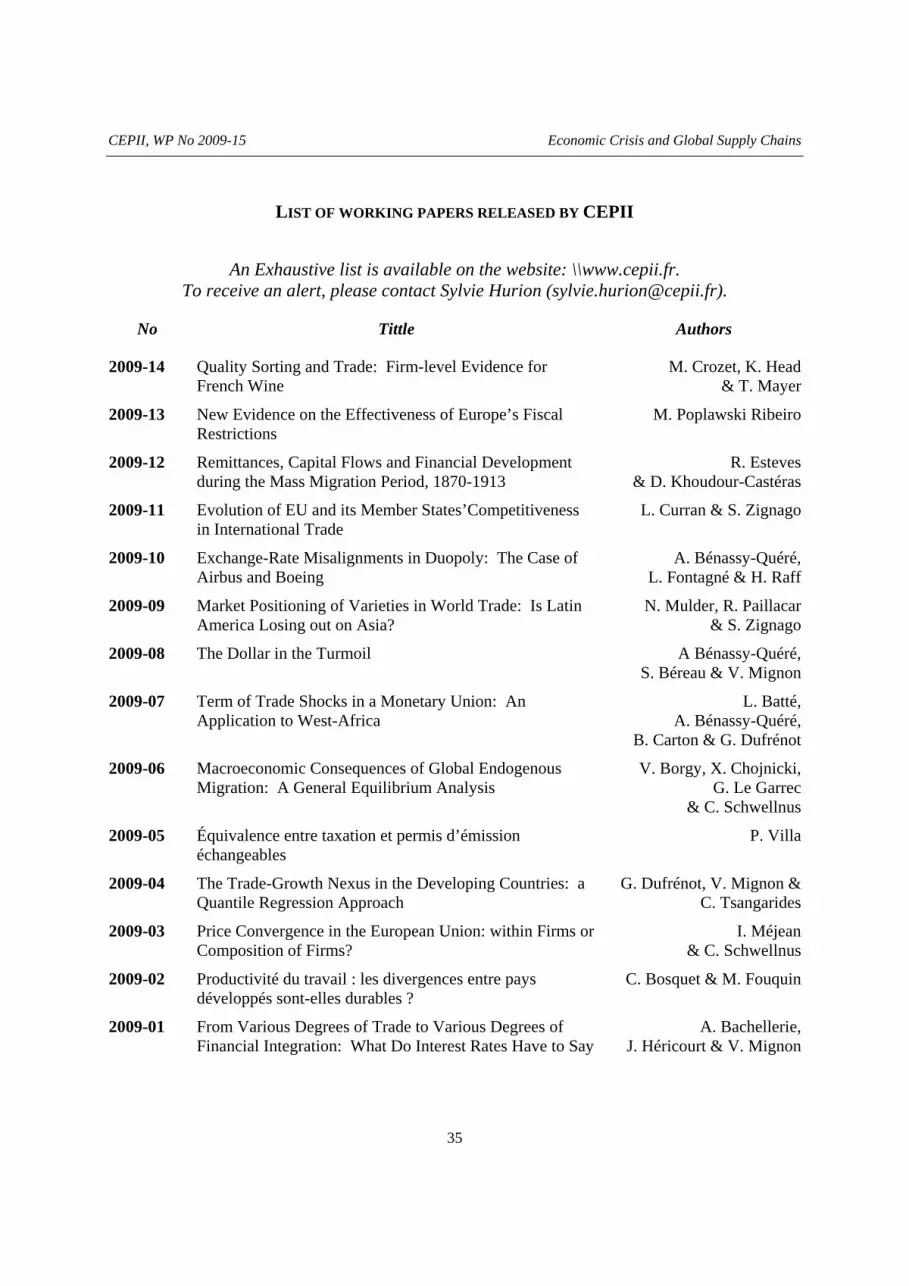
CEPII, WP No 2009-15 Economic Crisis and Global Supply Chains
35
LIST OF WORKING PAPERS RELEASED BY CEPII
An Exhaustive list is available on the website: \\www.cepii.fr. To receive an alert, please contact Sylvie Hurion ([email protected]).
No Tittle Authors
2009-14 Quality Sorting and Trade: Firm-level Evidence for French Wine
M. Crozet, K. Head& T. Mayer
2009-13 New Evidence on the Effectiveness of Europe’s Fiscal Restrictions
M. Poplawski Ribeiro
2009-12 Remittances, Capital Flows and Financial Development during the Mass Migration Period, 1870-1913
R. Esteves& D. Khoudour-Castéras
2009-11 Evolution of EU and its Member States’Competitiveness in International Trade
L. Curran & S. Zignago
2009-10 Exchange-Rate Misalignments in Duopoly: The Case of Airbus and Boeing
A. Bénassy-Quéré,L. Fontagné & H. Raff
2009-09 Market Positioning of Varieties in World Trade: Is Latin America Losing out on Asia?
N. Mulder, R. Paillacar& S. Zignago
2009-08 The Dollar in the Turmoil A Bénassy-Quéré,S. Béreau & V. Mignon
2009-07 Term of Trade Shocks in a Monetary Union: An Application to West-Africa
L. Batté,A. Bénassy-Quéré,
B. Carton & G. Dufrénot
2009-06 Macroeconomic Consequences of Global Endogenous Migration: A General Equilibrium Analysis
V. Borgy, X. Chojnicki, G. Le Garrec
& C. Schwellnus
2009-05 Équivalence entre taxation et permis d’émission échangeables
P. Villa
2009-04 The Trade-Growth Nexus in the Developing Countries: a Quantile Regression Approach
G. Dufrénot, V. Mignon & C. Tsangarides
2009-03 Price Convergence in the European Union: within Firms or Composition of Firms?
I. Méjean& C. Schwellnus
2009-02 Productivité du travail : les divergences entre pays développés sont-elles durables ?
C. Bosquet & M. Fouquin
2009-01 From Various Degrees of Trade to Various Degrees of Financial Integration: What Do Interest Rates Have to Say
A. Bachellerie,J. Héricourt & V. Mignon

CEPII, WP No 2009-15 Economic Crisis and Global Supply Chains
36
No Tittle Authors
2008-32 Do Terms of Trade Drive Real Exchange Rates? Comparing Oil and Commodity Currencies
V. Coudert, C. Couharde& V. Mignon
2008-31 Vietnam’s Accession to the WTO: Ex-Post Evaluation in a Dynamic Perspective
H. Boumellassa& H. Valin
2008-30 Structural Gravity Equations with Intensive and Extensive Margins
M. Crozet & P. Koenig
2008-29 Trade Prices and the Euro J. Martin & I. Méjean
2008-28 Commerce international et transports : tendances du passé et prospective 2020
C. Gouel, N. Kousnetzoff& H. Salman
2008-27 The Erosion of Colonial Trade Linkages after Independence
T. Mayer, K. Head& J. Ries
2008-26 Plus grandes, plus fortes, plus loin… Performances relatives des firmes exportatrices françaises
M. Crozet, I. Méjean& S. Zignago
2008-25 A General Equilibrium Evaluation of the Sustainability of the New Pension Reforms in Italy
R. Magnani
2008-24 The Location of Japanese MNC Affiliates: Agglomeration, Spillovers and Firm Heterogeneity
T. Inui, T. Matsuura& S. Poncet
2008-23 Non Linear Adjustment of the Real Exchange Rate Towards its Equilibrium Values
S. Béreau,A. Lopez Villavicencio
& V. Mignon
2008-22 Demographic Uncertainty in Europe – Implications on Macro Economic Trends and Pension Reforms – An Investigation with the INGENUE2 Model
M. Aglietta & V. Borgy
2008-21 The Euro Effects on the Firm and Product-Level Trade Margins: Evidence from France
A. Berthou & L. Fontagné
2008-20 The Impact of Economic Geography on Wages: Disentangling the Channels of Influence
L. Hering & S. Poncet
2008-19 Do Corporate Taxes Reduce Productivity and Investment at the Firm Level? Cross-Country Evidence from the Amadeus Dataset
J. Arnold& C. Schwellnus
2008-18 Choosing Sensitive Agricultural Products in Trade Negotiations
S. Jean, D. Laborde& W. Martin
2008-17 Government Consumption Volatility and Country Size D. Furceri& M. Poplawski Ribeiro
2008-16 Inherited or Earned? Performance of Foreign Banks in Central and Eastern Europe
O. Havrylchyk& E. Jurzyk
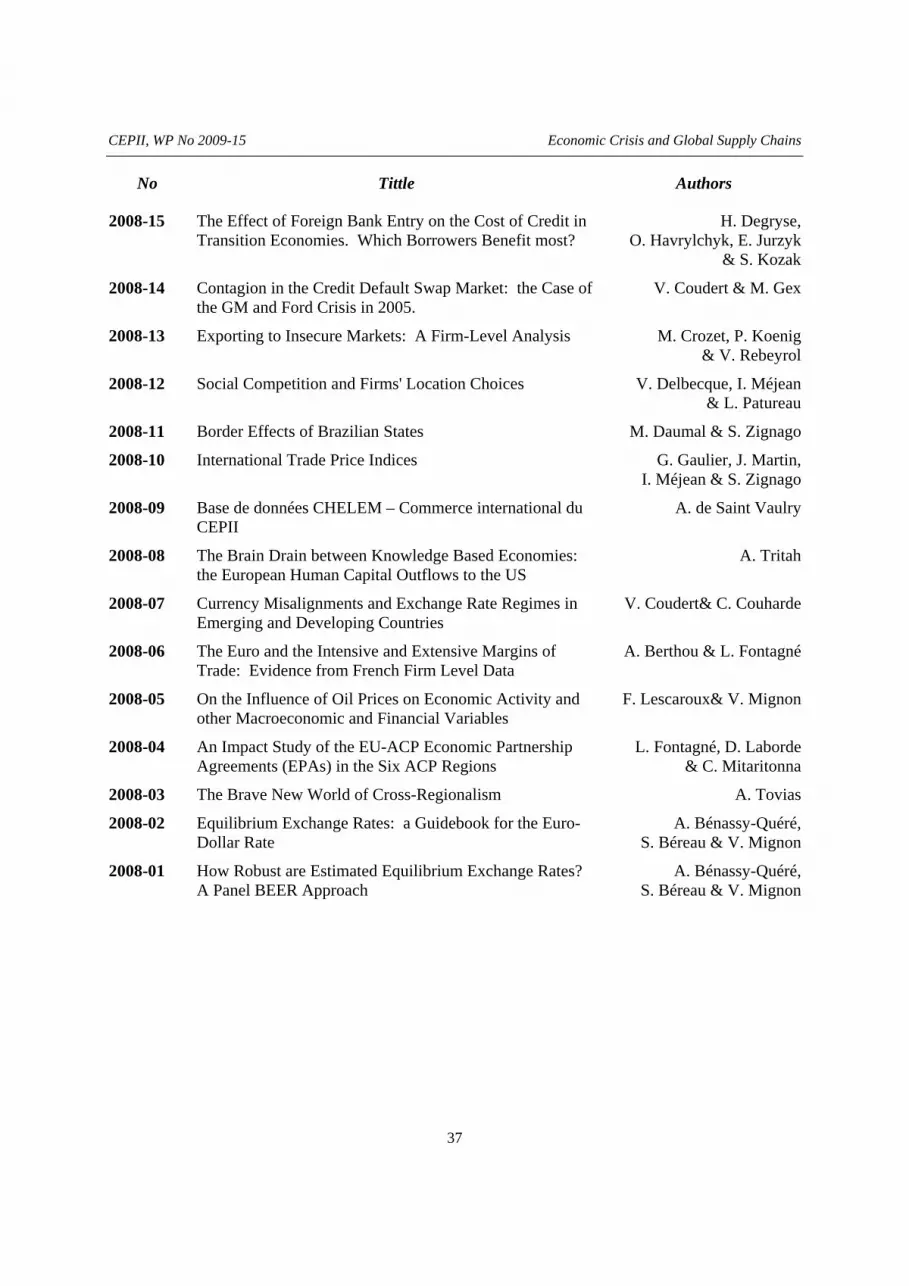
CEPII, WP No 2009-15 Economic Crisis and Global Supply Chains
37
No Tittle Authors
2008-15 The Effect of Foreign Bank Entry on the Cost of Credit in Transition Economies. Which Borrowers Benefit most?
H. Degryse,O. Havrylchyk, E. Jurzyk
& S. Kozak
2008-14 Contagion in the Credit Default Swap Market: the Case of the GM and Ford Crisis in 2005.
V. Coudert & M. Gex
2008-13 Exporting to Insecure Markets: A Firm-Level Analysis M. Crozet, P. Koenig& V. Rebeyrol
2008-12 Social Competition and Firms' Location Choices V. Delbecque, I. Méjean& L. Patureau
2008-11 Border Effects of Brazilian States M. Daumal & S. Zignago
2008-10 International Trade Price Indices G. Gaulier, J. Martin,I. Méjean & S. Zignago
2008-09 Base de données CHELEM – Commerce international du CEPII
A. de Saint Vaulry
2008-08 The Brain Drain between Knowledge Based Economies: the European Human Capital Outflows to the US
A. Tritah
2008-07 Currency Misalignments and Exchange Rate Regimes in Emerging and Developing Countries
V. Coudert& C. Couharde
2008-06 The Euro and the Intensive and Extensive Margins of Trade: Evidence from French Firm Level Data
A. Berthou & L. Fontagné
2008-05 On the Influence of Oil Prices on Economic Activity and other Macroeconomic and Financial Variables
F. Lescaroux& V. Mignon
2008-04 An Impact Study of the EU-ACP Economic Partnership Agreements (EPAs) in the Six ACP Regions
L. Fontagné, D. Laborde& C. Mitaritonna
2008-03 The Brave New World of Cross-Regionalism A. Tovias
2008-02 Equilibrium Exchange Rates: a Guidebook for the Euro-Dollar Rate
A. Bénassy-Quéré, S. Béreau & V. Mignon
2008-01 How Robust are Estimated Equilibrium Exchange Rates? A Panel BEER Approach
A. Bénassy-Quéré, S. Béreau & V. Mignon

Organisme public d’étude et de recherche en économie internationale, le CEPII est placé auprès du Centre d’Analyse Stratégique. Son programme de travail est fixé par un conseil composé de responsables de l’administration et de personnalités issues des entreprises, des organisations syndicales et de l’Université.
Les documents de travail du CEPII mettent à disposition du public professionnel des travaux effectués au CEPII, dans leur phase d’élaboration et de discussion avant publication définitive. Les documents de travail sont publiés sous la responsabilité de la direction du CEPII et n’engagent ni le conseil du Centre, ni le Centre d’Analyse Stratégique. Les opinions qui y sont exprimées sont celles des auteurs.
Les documents de travail du CEPII sont disponibles sur le site : http//www.cepii.fr.
CEPII 9, RUE GEORGES PITARD, 75740 PARIS CEDEX 15
SYLVIE HURION – PUBLICATIONS TÉL : 01 53 68 55 14 - FAX : 01 53 68 55 04
ISSN : 1293-2574