ecological niche conservatism and pleistocene refugia in the thrush-like mourner, schiffornis sp.,...
TRANSCRIPT

ORIGINAL ARTICLE
doi:10.1111/j.1558-5646.2007.00258.x
ECOLOGICAL NICHE CONSERVATISM ANDPLEISTOCENE REFUGIA IN THE THRUSH-LIKEMOURNER, SCHIFFORNIS SP., IN THENEOTROPICSA. Townsend Peterson1,2 and Arpad S. Nyari1
1Natural History Museum and Biodiversity Research Center, The University of Kansas, Lawrence, Kansas 660452E-mail: [email protected]
Received March 21, 2007
Accepted August 13, 2007
Recent studies have increasingly implicated deep (pre-Pleistocene) events as key in the vertebrate speciation, downplaying the
importance of more recent (Pleistocene) climatic shifts. This work, however, has been based almost exclusively on evidence from
molecular clock inferences of splitting dates. We present an independent perspective on this question, using ecological niche model
reconstructions of Pleistocene Last Glacial Maximum (LGM) potential distributions for the Thrush-like Mourner (Schiffornis turdina)
complex in the neotropics. LGM distributional patterns reconstructed from the niche models relate significantly to phylogroups
identified in previous molecular systematic analyses. As such, patterns of differentiation and speciation in this complex are con-
sistent with Pleistocene climate and geography, although further testing will be necessary to establish dates of origin firmly and
unambiguously.
KEY WORDS: Climate, ecological niche, Last Glacial Maximum, Pleistocene, speciation.
The age and timing of vertebrate speciation events have been the
subject of extensive debate and analysis in the literature, with re-
cent opinions indicating that most speciation took place prior to
the Pleistocene, and thus suggesting rather old (e.g., >106 years)
speciation events (Klicka and Zink 1997; Drovetski and Ronquist
2003), although some opinions to the contrary have been expressed
(Johnson and Cicero 2004; Weir and Schluter 2004). These con-
clusions, however, have been based exclusively on dating splitting
events via molecular clocks—such time estimates are complicated
by nonuniformity of molecular evolutionary rates and by poor or
scarce calibration of clocks (see, e.g., Britton 2005; Linder et al.
2005; Thorpe et al. 2005; Welch and Bromham 2005; Elango
et al. 2006; Ho and Larson 2006; Peterson 2007). As such, a ma-
jor conclusion in evolutionary biology is approaching the status
of dogma—a strong assertion based on little evidence, in this case
a single source of evidence that has seen considerable debate and
doubt (Ho et al. 2005; Peterson 2007).
The emerging field of ecological niche modeling (ENM) of-
fers an independent perspective on these questions. In particular,
an early pair of papers documented conservative aspects of ecolog-
ical niches across evolutionary time periods (Huntley et al. 1989;
Ricklefs and Latham 1992); detailed, quantitative tests of the hy-
pothesis and numerous applications and explorations (Peterson
et al. 1999; Martınez-Meyer 2002; Graham et al. 2004b; Martınez-
Meyer et al. 2004; Knouft et al. 2006; Martınez-Meyer and Peter-
son 2006; Ruegg et al. 2006; Yesson and Culham 2006) have now
been developed. The result has been the overall picture that ecolog-
ical niche conservatism is common, but far from universal—when
it is tested and confirmed (Peterson et al. 1999; Martınez-Meyer
et al. 2004; Martınez-Meyer and Peterson 2006), however, it offers
considerable potential for prediction and forecasting of biodiver-
sity phenomena (Peterson 2003a; Peterson et al. 2005b; Wiens and
Graham 2005b). Of particular relevance to the question at hand,
ENM can be applied in tandem with paleoclimatic reconstructions
173C© 2007 The Author(s). Journal compilation C© 2007 The Society for the Study of Evolution.Evolution 62-1: 173–183

A. T. PETERSON AND A. S. NYARI
to “retrodict” potential geographic distributions at points in the
past (Hugall et al. 2002; Peterson et al. 2004; Bonaccorso et al.
2006).
Here, we integrate the Pleistocene speciation question with
niche conservatism ideas to develop a novel hypothesis regarding
the Pleistocene speciation question. We use as a test-bed the Schif-
fornis turdina complex, which has been analyzed recently in terms
of molecular phylogeography by one of us (Nyari 2007). This
neotropical frugivorous bird constitutes a complex, long treated as
one overly inclusive species taxon, shows concordant variation in
qualitative vocal (note structure, number of notes, note frequency
range) and mitochondrial molecular characters (ND2, COI, and
cyt b genes), suggesting that six to seven well-supported (i.e.,
high bootstrap support under various manipulations) species can
be recognized within the complex. The molecular studies provide
detailed geographic information on the occurrence of each molec-
ular phylogroup (Nyari 2007). Here, our goals are to (1) examine
the extent of ecological niche conservatism in the group as a whole
(at least in spatial dimensions) using spatial stratification meth-
ods presented previously (Peterson and Holt 2003); (2) integrate
current-climate ENMs with new, fine-scale Last Glacial Maxi-
mum (LGM) Pleistocene climate summaries to estimate a LGM
potential range for the complex; and (3) test the consistency of
molecular phylogroups with Pleistocene refugial distributions—
that is, whether the spatial distribution of Pleistocene refugia has
explanatory power regarding historical patterns of speciation, as
reflected in molecular differences, providing a novel perspective
on the question of vertebrate speciation in the Pleistocene.
MethodsINPUT DATASETS
Occurrence data for the S. turdina group were drawn from
data associated with natural history museum specimens (see
Acknowledgments), for a total of 227 unique occurrences
across the geographic range of the complex, covering all named
forms and all molecular phylogroups. We assigned geographic
coordinates to textual locality descriptions by means of reference
to online gazetteer databases (Alexandria Digital Library Project,
http://middleware.alexandria.ucsb.edu/client/gaz/adl/index.jsp),
achieving a spatial precision of ∼0.1′ of latitude and longitude.
Of these sites, we identified 38 localities that correspond to
samples for which molecular sequence data were included in the
recent molecular analysis (Nyari 2007), which form the basis
of our testing for agreement between molecular and ecological
datasets (see below).
Climate data for the present day (1960–1990) were drawn
from the WorldClim climate archive (Hijmans et al. 2005a). In
particular, in view of the broad latitudinal range of the complex
under analysis and concerns regarding the effects of opposite tim-
ing of seasonality in Northern and Southern hemispheres, we used
a subset of the “bioclimatic” coverages: annual mean temperature,
mean diurnal range, maximum temperature of warmest month,
minimum temperature of coldest month, annual total precipita-
tion, precipitation of wettest month, and precipitation of driest
month. Although some workers preselect a very small suite of
variables prior to analysis (Huntley et al. 1995), we prefer to in-
clude more dimensions, and allow the evolutionary computing
algorithm to seek out important variables and sets of variables for
a given model. All analyses were developed at a spatial resolu-
tion of 0.04◦ to match the approximate spatial accuracy of our
georeferencing.
To summarize Pleistocene LGM climates at 0.04◦ spatial
resolution, we used a new, fine-resolution climate dataset devel-
oped by R. J. Hijmans, as follows. Current climate data from
the WorldClim database were used [http://www.worldclim.org;
(Hijmans et al. 2005b)] as a basis for LGM climate data de-
velopment. For past climates, we obtained general circulation
model (GCM) simulations from two climate models: the Commu-
nity Climate System Model [CCSM, http://www.ccsm.ucar.edu/,
(Kiehl and Gent 2004)] and the Model for Interdisciplinary Re-
search on Climate [MIROC, ver. 3.2; http://www.ccsr.u-tokyo.
ac.jp/∼hasumi/MIROC/]. The original GCM data were down-
loaded from the PMIP2 website (http://www.pmip2.cnrs-gif.fr/).
The GCM data had a spatial resolution of 2.8◦, or roughly
300 × 300 km. Surfaces were created at 0.04◦ spatial resolution
via the following procedure. First, the difference between the
GCM output for LGM and recent, preindustrial, conditions was
calculated. These differences were then interpolated to the 0.04◦
resolution grid using the spline function in ArcInfo (ESRI, Red-
lands, CA) with the tension option. Finally, the interpolated differ-
ences were added to the high-resolution current climate datasets
from WorldClim and LGM bioclimatic coverages created. This
procedure has the dual advantage of producing data at a resolution
that is relevant to the spatial scale of analysis and of calibrating the
simulated climate change data to the actual observed climate data.
ECOLOGICAL NICHE MODELING
We used the Genetic Algorithm for Rule-Set Prediction (GARP)
for generating ecological niche models (Stockwell and Peters
1999); we also generated models for present-day distributions us-
ing Maxent (Phillips et al. 2004, 2006), and results were closely
similar. Given that the behavior of GARP is well-documented in
extrapolative exercises is well known (Peterson 2003a, b; Peter-
son et al. 2005a), whereas that of Maxent has not been explored
sufficiently (Phillips et al. 2006; Peterson et al. 2007), for all sub-
sequent analyses, we used GARP, in its desktop version 1.1.3
(Scachetti-Pereira 2001).
GARP is an evolutionary-computing method that builds eco-
logical niche models based on nonrandom associations between
174 EVOLUTION JANUARY 2008
ECOLOGICAL NICHE CONSERVATISM AND PLEISTOCENE REFUGIA
known occurrence points for species and sets of GIS coverages
describing the ecological landscape. Occurrence data are used by
GARP as follows: 50% of occurrence datapoints are set aside
for an independent test of model quality (extrinsic testing data),
25% are used for developing models (training data), and 25% are
used for tests of model quality internal to GARP (intrinsic test-
ing data). Distributional data are converted to raster layers, and
by random sampling from areas of known presence (training and
intrinsic test data) and areas of “pseudoabsence” (areas lacking
known presences), two datasets are created, each of 1250 points;
these datasets are used for rule generation and model testing, re-
spectively (Stockwell and Peters 1999).
The first rule is created by applying a method chosen ran-
domly from a set of inferential tools (e.g., logistic regression,
bioclimatic rules). The genetic algorithm consists of specially de-
fined operators (e.g., crossover, mutation) that modify the initial
rules, and thus the result are models that have “evolved”—after
each modification, the quality of the rule is tested (to maximize
both significance and predictive accuracy) and a size-limited set
of best rules is retained. Because rules are tested based on inde-
pendent data (intrinsic test data), performance values reflect the
expected performance of the rule, an independent verification that
gives a more reliable estimate of true rule performance. The fi-
nal result is a set of rules that can be projected onto a map to
produce a potential geographic distribution for the species under
investigation.
Following recent best-practices recommendations (Anderson
et al. 2003), we developed 100 replicate random-walk GARP mod-
els, and filtered out 90% based on consideration of error statistics,
as follows. The “best subsets” methodology consists of an initial
filter removing models that omit (omission error = predicting ab-
sence in areas of known presence) heavily based on the extrinsic
testing data, and a second filter based on an index of commis-
sion error (= predicting presence in areas of known absence),
in which models predicting very large and very small areas are
removed from consideration. Specifically, we used a soft omis-
sion threshold of 20%, and a 50% retention based on commission
considerations; the result was 10 “best subsets” models (binary
raster data layers) that were summed to produce a best estimate
of geographic prediction.
ECOLOGICAL NICHE CONSERVATISM
We developed two sets of tests of ecological niche conservatism
across the range of the group using spatial stratification methods—
one, presented elsewhere (Peterson and Holt 2003), splits avail-
able occurrence data simply by their distribution across space,
whereas the other splits occurrence data by their lineage mem-
bership (Nyari 2007). Specifically, in the first tests, we divided
the values of latitude for the 227 unique occurrence points into
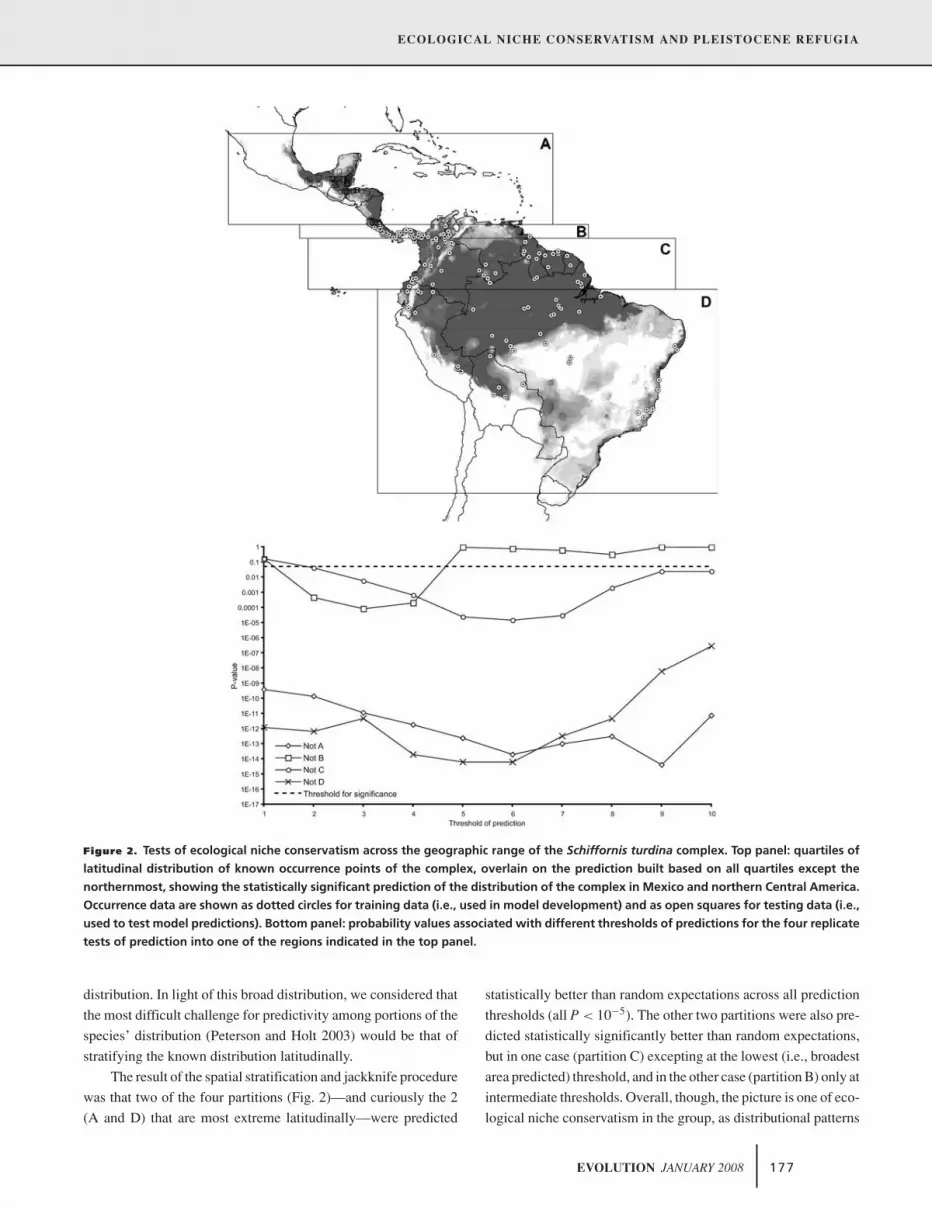
quartiles (“bins”; Fig. 2), and tested for predictivity among suites
of points corresponding to these regions. As such, we conducted
an N − 1 jackknife of the four bins, and used each possible set of
three bins to predict the distribution of the species in the fourth
bin, and tested for predictivity better than that expected at ran-
dom in that region. These tests were developed exclusively in the
present-day climate context without inclusion of phylogeographic
information, and so test only the idea that the distinct lineages that
make up the complex occur under a consistent ecological regime
across their range in the neotropics.
Details of the tests of predictive ability and spatial consis-
tency of ecological niches are as follows. Within the test area,
we calculated the proportion of the quartile area predicted present
at each threshold of the GARP model. We also assessed success
in predicting each independent test point at each threshold. We
then calculated a one-tailed cumulative binomial probability as-
sociated with that level of predictive success at that proportional
area predicted present (Anderson et al. 2003). We did not em-
ploy more complex approaches to model validation, such as the
receiver operating characteristic (Fielding and Bell 1997) owing
to concerns regarding emphases of such approaches that do not
necessarily focus on prediction of the entire distributional area
(Anderson et al. 2003). Under the assumption that niche stability
across space will be indicative of potential niche conservatism in
the lineage through time, ecological niche models that passed this
test of predictive ability across broad, unsampled regions in the
present day were then explored further as to their implications in
the Pleistocene LGM.
Second, using information on lineage membership of par-
ticular populations, we developed a similar test of niche con-
servatism. Seven lineages were recovered in detailed molecular
phylogeographic studies of S. turdina (Nyari 2007). We divided
occurrence points based on their respective phylogeographic af-
filiations (see Fig. 1); because only a relatively small number of
localities were genotyped in the molecular studies, we grouped
the remaining occurrence localities based on known morpholog-
ical and plumage breaks corresponding to subspecies boundaries
(Peters 1979; Snow 2004). These seven subsets of the available
occurrence data ranged in sample size 6-76 sites.
We developed GARP models based on all seven possible
sets of six phylogroups, and tested the ability of each repli-
cate model to anticipate the geographic distribution of the sev-
enth phylogroup. In light of the historically limited distribu-
tions of particular lineages, we circumscribed testing areas based
on a buffer around the known occurrences of the testing phy-
logroup with a radius equal to the longest axis of the distribu-
tion of that phylogroup. Within this testing area, we repeated
our calculations of the proportion of area predicted present at
each threshold of the GARP model and success in predict-
ing each independent test point at each threshold, as described
above.
EVOLUTION JANUARY 2008 175

A. T. PETERSON AND A. S. NYARI
1 2
3
4 5
7
6
71
34562
*
**
**
*
**
*
Guyanan Shield
Mexico to Western Panama
Western Ecuador lowlands
cis-Andean foothills
Amazon Basin headwaters
SE Amazon and Atlantic Forest
Eastern Panama
Figure 1. Map showing the geographic distributions, phylogeographic patterns, and phylogenetic tree reconstructed in recent molecular
systematic studies of the Schiffornis turdina complex (adapted from Nyari 2007). ∗on the tree indicates strong nodal support values of
1.0 in Bayesian posterior probability and >95% in maximum-likelihood bootstrap.
RETRODICTION OF LGM DISTRIBUTIONS
Once predictivity was confirmed in the present day, we devel-
oped an overall model for the present-day distribution and ecol-
ogy of the complex based on the full complement of occurrence
points available for the complex. We used the same protocols for
ENM development as described above, but projected the resulting
best-subsets models onto the LGM climatic coverages described
above. The result was a picture of areas at LGM matching habit-
able present-day climates, or effectively a picture of Pleistocene
refugia for the complex, from the point of view of the present-day
ecological requirements of the species (Rice et al. 2003).
We tested the consistency of geographic extents of molecular
phylogroups with those of Pleistocene refugial distributions. That
is, we asked (statistically) whether the geographic position and
continuity of areas of adequate climate conditions had explana-
tory power above and beyond that expected by chance regarding
distributions of molecular phylogroups. We used a statistical test
that was designed explicitly to consider that the numbers of geo-
referenced and genotyped occurrence points would be relatively
small compared to the overall pool of occurrence data. Specif-
ically, (1) we identified the 38 occurrence points for which the
phylogroup was known, which were the geographic coordinates
of samples included in the earlier molecular study (Nyari 2007).
(2) We reduced that set to the 11 points that occurred within re-
constructed Pleistocene LGM refugia, under the assumption that
a population presently occurring in a Pleistocene LGM refugium
is the same lineage as that which occurred there at LGM; we
here ignore those points not falling into Pleistocene LGM refu-
gia, as they represent putative subsequent expansion and cannot
unambiguously be identified with a particular refugium. (3) We
connected phylogroups and refugia for each sample in linked pairs
(e.g., phylogroup 1 – refugium a), counting the number of such
pairs as an observed value of coincidence. (4) To understand co-
incidence that would be expected were no phylogroup-refugium
association to be present, we randomized refugia with respect to
phylogroups to generate a distribution of 100 null coincidence
values; we then compared the observed value from (3) to this
distribution to obtain a probability value for the comparison.
VISUALIZATION OF LGM BARRIERS TO DISPERSAL
The field of phylogeography has placed considerable weight on
detection of interruptions of gene flow (i.e., barriers) (Avise and
Walker 1998), but has not often been able to characterize those
barriers ecologically. Here, we explore the possibility of visualiz-
ing barriers to gene flow by means of inspection of associations
between LGM climate data and LGM projections of present-day
ENMs. Specifically, as an example, we focused on a disjunction
that apparently formed at LGM between the eastern and western
portions of the Amazon Basin, which was noted in our earlier
analyses of diverse forest taxa (Bonaccorso et al. 2006), as well
as in our present analyses of Schiffornis. Within a transect linking
putative refugia on either side of this barrier, we combined the
ENM prediction with the LGM climate data; the resulting output
grid summarizes all unique combinations of input raster values.
Then, we used simple bivariate plots to visualize environmental
features across this LGM barrier, comparing areas predicted po-
tentially present by all replicate ENMs with areas predicted either
absent or at low levels of suitability (i.e., < 3 of 10 replicate ENMs
predicting present).
ResultsWe first established that the S. turdina assemblage is conservative
in its ecological niche characteristics across its broad geographic
176 EVOLUTION JANUARY 2008
ECOLOGICAL NICHE CONSERVATISM AND PLEISTOCENE REFUGIA
Figure 2. Tests of ecological niche conservatism across the geographic range of the Schiffornis turdina complex. Top panel: quartiles of
latitudinal distribution of known occurrence points of the complex, overlain on the prediction built based on all quartiles except the
northernmost, showing the statistically significant prediction of the distribution of the complex in Mexico and northern Central America.
Occurrence data are shown as dotted circles for training data (i.e., used in model development) and as open squares for testing data (i.e.,
used to test model predictions). Bottom panel: probability values associated with different thresholds of predictions for the four replicate
tests of prediction into one of the regions indicated in the top panel.
distribution. In light of this broad distribution, we considered that
the most difficult challenge for predictivity among portions of the
species’ distribution (Peterson and Holt 2003) would be that of
stratifying the known distribution latitudinally.
The result of the spatial stratification and jackknife procedure
was that two of the four partitions (Fig. 2)—and curiously the 2
(A and D) that are most extreme latitudinally—were predicted
statistically better than random expectations across all prediction
thresholds (all P < 10−5). The other two partitions were also pre-
dicted statistically significantly better than random expectations,
but in one case (partition C) excepting at the lowest (i.e., broadest
area predicted) threshold, and in the other case (partition B) only at
intermediate thresholds. Overall, though, the picture is one of eco-
logical niche conservatism in the group, as distributional patterns
EVOLUTION JANUARY 2008 177

A. T. PETERSON AND A. S. NYARI
of even the extreme northern and extreme southern populations
are predicted well by the ecological niche characteristics of the
remainder of the species’ distributional area.
Partitioning occurrence data by lineage showed similar re-
sults. Two of the seven lineages (clades 3 and 4 in Fig. 1) had
very small sample sizes (<10 points) of occurrence data, and so
were omitted from analyses. However, of the remaining five lin-
eages, three showed predictivity statistically better than random
expectations at all thresholds (clades 1, 5, and 6; all P < 0.05);
one showed predictivity statistically better than random expecta-
Figure 3. Ecological niche model estimates of present-day and Last Glacial Maximum potential distributional areas, the latter under two
different general circulation model estimates. Also shown are sample points for niche model development (Xs), and sampling localities
for genetic data (squares, with different colors indicating distinct molecular phylogroups).
tions 9 of 10 thresholds (clade 7; P < 0.05); and predictions for
clade 2 were statistically significant (P < 0.05) only for 2 of 10
thresholds. Hence, the predictions resulting from spatial stratifi-
cation by lineage membership showed almost universal predictive
ability, confirming the earlier results of ecological niche stability
across this clade.
We then explored the projection of present-day ENMs to
LGM climates under both the CCSM and MIROC GCM climate
models (Fig. 3). Here, we see that the overall reconstructed dis-
tributional limits of the complex were not dramatically different
178 EVOLUTION JANUARY 2008

ECOLOGICAL NICHE CONSERVATISM AND PLEISTOCENE REFUGIA
at LGM, but that habitable areas were more fragmented and dis-
continuous than at present. In particular, we observed reduced
continuity of the species’ potential distributional area across the
Amazon Basin, with eastern and western sectors of the species’
distribution being isolated by a northwest-to-southeast swath of
less-suitable conditions.
Spatial coincidence of samples belonging to particular molec-
ular phylogroups with particular putative Pleistocene refugia was
close (Fig. 4). For example, among the 11 test points available,
the four samples that were part of the molecular phylogroup
that corresponds to the Guyanan Shield all fell within the one
LGM refugium in that region. Indeed, of the 11 test points avail-
able, in one case a particular refugium included sample local-
ities from two phylogroups, and in one case localities for a
particular phylogroup fell into two distinct refugia. Comparing
this degree of correspondence between phylogroup membership
and refugium against correspondences in 50 randomizations of
refugium with respect to phylogroup, the correspondence between
phylogroup membership and refugium placement is better than
random, so it appears that climate-reconstructed refugia indeed
have significant predictive power regarding phylogroup structure
(P < 0.02).
Finally, we characterized the climatic characteristics of one
LGM barrier between refugia in the eastern and western portions
of the Amazon Basin (Fig. 5). Highly suitable habitats can be ob-
served to be most related to high precipitation through the year,
avoiding coldest minimum temperatures, and avoiding areas that
dry out significantly in any part of the year. These features gen-
0
5
10
15
20
25
5 6 7 8 9 10 Number of categories
Randomized replicates
Observed coincidence
Freq
uen
cy
Phylogroup Refugium
Mexico to WestenPanama (N = 3)
Mexico
Northern Central America
cis-Andean foothills(N = 1)
Western Amazon
Amazon Basin headwaters (N = 3)
Guyanan Shield(N = 4)
Guyanan Shield
Figure 4. Randomization tests assessing correspondence between occurrence points corresponding to samples included in molecular
studies and the phylogroups in which they were placed and ecological niche model reconstructions of putative Pleistocene Last Glacial
Maximum refugia. The diagram inset shows patterns of matching and mismatching of phylogroups and refugia; the histogram shows
numbers of phylogroup–refugium pairs in randomized replicates as compared with the observed value.
erally coincide with the characteristics of the evergreen lowland
rainforest in which this complex is distributed.
DiscussionBy integrating ecological niche characteristics drawn from the en-
vironmental characteristics of known occurrences of the complex
with phylogeographic and phylogenetic information from molec-
ular genetic studies, we can derive a more refined image of driving
forces that led to the distributions and discontinuities among extant
taxa. In this study, we documented significant niche conservatism
over the entire present-day distribution of the complex (Fig. 2),
and showed that, at LGM, the distributional area of the complex
fragmented into several areas corresponding to presumptive Pleis-
tocene refugia (Fig. 3). These areas are separated by less-suitable
areas, with environments that can be identified and characterized
as barriers to gene flow (Fig. 5).
LIMITATIONS
This study is not without its limitations. In particular, here, we bat-
tle with issues of spatial resolution—very narrow barriers (e.g.,
rivers in the Amazon Basin) may simply not be “visible” in our
analyses, even though they may be important to the biogeogra-
phy of the group under question. Recent long-term ecological
studies of Amazonian avifaunas have demonstrated clearly the
effects of habitat fragmentation, even on quite-fine scales, on
the population biology of species such as those analyzed here
(Ferraz et al. 2003). As such, the effects of the coarse resolution
EVOLUTION JANUARY 2008 179

A. T. PETERSON AND A. S. NYARI
Figure 5. Visualization of ecological and environmental variation across one Pleistocene Last Glacial Maximum barrier as reconstructed
from ecological niche models. The upper left panel shows the area within which visualizations were developed, where the rectangle
encompasses two distinct refugia. The remaining three panels show comparisons of suitable (predictive threshold of 10 of 10 models
predicting presence) versus unsuitable (predictive threshold of < 3 of 10 models predicting presence) in six environmental dimensions.
“Availability” shows conditions of intermediate levels of prediction.
of our LGM projections must be borne in mind in interpretating
results.
An additional complication arises due to the appearance of
nonanalogous climate conditions when ENMs are projected across
major climatic changes. That is, if ENMs are trained in the present,
but climatic conditions in the LGM include sets of conditions
not manifested at present, then modeling approaches will have
unknown or unpredictable behavior in predicting into those ar-
eas (Pearson et al. 2006). Still, given that topographic features
surrounding the Amazon Basin and adjacent to the Mesoamer-
ican portions of the distribution of the S. turdina complex pro-
vide cooler conditions than the complex’s lowland distribution,
these problems are probably of less concern here than for for-
ward projections to still-warmer climates that are likely to appear
over the next century (Pearson and Dawson 2003; Araujo et al.
2005).
Finally, in interpreting these model results, it must be borne
in mind that they provide only static pictures of environmental
suitability across landscapes (Soberon and Peterson 2005). As
such, LGM “refugia” are hypothetical only—if dispersal limita-
tions are sufficient, certain refugia may have been inaccessible to
a species (Araujo and Pearson 2005), effectively leading to dis-
cords between potential and actual distributional areas (Peterson
2003a; Soberon and Peterson 2005). Such complications require
care and thought in interpretation what would appear to be error
in the form of overly broad predicted areas.
NICHE CONSERVATISM
This study adds to a growing body of literature documenting
conservatism of ecological niche characteristics across short-to-
medium periods of evolutionary time (Peterson et al. 1999; An-
dreas et al. 2001; Peterson 2003a), although several examples of
180 EVOLUTION JANUARY 2008

ECOLOGICAL NICHE CONSERVATISM AND PLEISTOCENE REFUGIA
nonconservative ecological niche evolution have also been doc-
umented (Peterson and Holt 2003; Graham et al. 2004a; Knouft
et al. 2006). We do caution, however, based on extensive expe-
rience, about the effects of developing ENMs in overly dimen-
sional environmental spaces and the degree to which this overfit-
ting can produce the appearance of nonconservatism (Fitzpatrick
et al. 2006; Broennimann et al. 2007): regardless of conservatism,
if dimensionality of the environmental space so far outstrips the
sample sizes used to train the ENM, models are unlikely to be able
to predict accurately among areas or across time periods. Regard-
less, niche conservatism has many important implications, and
can provide a key tool in understanding historical biogeography
(Wiens 2004; Wiens and Graham 2005a; Peterson 2006).
PLEISTOCENE SPECIATION
The references cited in the Introduction reflect a strong cur-
rent in beliefs about vertebrate speciation—that Pleistocene cli-
matic fluctuations were not major generators of current vertebrate
species diversity. Rather, most authors argue for pre-Pleistocene
origins for most species (Klicka and Zink 1997; Drovetski and
Ronquist 2003), perhaps owing to broad use of poorly calibrated
molecular clocks in many molecular studies (Ho et al. 2005; Pe-
terson 2007). Although the few molecular dating efforts not based
on such molecular clocks and rather based on coalescent analyses
have indicated younger—Pleistocene—speciation events (Gris-
wold and Baker 2002; Carstens et al. 2005; Jennings and Edwards
2005), this point has not been addressed broadly with independent
sets of evidence, and as such we address it herein.
We present here a very simple test that only begins to shed
light on this question. We identify Pleistocene potential climatic
refugia for species taxa in the S. turdina complex, and show that
they have significant explanatory power regarding what is known
about the spatial distributions of phylogroups within the complex.
Although we do not as yet have data regarding climate patterns
prior to LGM, and as such cannot develop more detailed tests of the
timing of diversification of Schiffornis within the Pleistocene, our
results do show that Pleistocene climate patterns are at least rele-
vant to the question. That is, if Pleistocene fragmentation events
can explain much of the geography of species’ distributions, why
is it necessary to appeal to older climate phenomena, ignoring the
massive, global climate phenomena that characterized the Pleis-
tocene?
Pleistocene climatic fluctuations are known to have occurred
in repeated hot–cold cycles that approached a binary condition,
with extremely short transitions between the two (Dansgaard et al.
1993). As such, our use of LGM climate data quite simply re-
flects the availability of LGM simulations—to our knowledge, no
continent-wide simulations have been developed that allow direct
comparisons among glaciation events within the Pleistocene. Al-
ready, a Last Interglacial (135,000 years before present) dataset is
in preparation (R. J. Hijmans, pers. comm.) for addition to these
analyses, but considerable additional climatic information will be
necessary before we can use niche modeling tools to pin down
dates more precisely than what we have achieved in this article.
Clearly, this question will require much more in the way of
experimentation and exploration, but this analysis can be taken as
a first step toward a more general, broadly based answer. Finally,
here, we explore techniques for visualization of LGM barriers to
gene flow. The ENM approaches allow reconstruction not just of
the pattern of fragmentation of ranges, but also of the ecologi-
cal correlates of range restriction and distributional barriers. This
ecological interpretation of vicariant patterns opens doors to new
insights and new questions that have generally been out of the
realm of possibilities.
ACKNOWLEDGMENTSWe thank M. Papes for her continual help with technical GIS problems,E. Bonaccorso for helpful reflections and insights, and R. Guralnick andE. Waltari for comments on the manuscript. R. J. Hijmans kindly devel-oped and made available the LGM climate datasets. We are grateful tothe following institutions for providing locality data from specimens un-der their care: Louisiana State University Museum of Natural Science;Academy of Natural Sciences, Philadelphia; Field Museum of NaturalHistory; American Museum of Natural History; Museo de Zoologıa, Fac-ultad de Ciencias, Universidad Nacional Autonoma de Mexico; U. S.National Museum of Natural History; and University of Kansas NaturalHistory Museum. Marina Anciaes kindly provided additional georefer-enced localities from the National Museum of Brazil. We acknowledgethe PMIP2/MOTIF data providers and the Laboratoire des Sciences duClimat et de l’Environnement for providing access to the GCM data (datadownloaded on 1 March 2006).
LITERATURE CITEDAnderson, R. P., D. Lew, and A. T. Peterson. 2003. Evaluating predictive
models of species’ distributions: criteria for selecting optimal models.Ecol. Modell. 162:211–232.
Andreas, P., D. Walter, K. Stefan, and B. Roland. 2001. The niche of higherplants: evidence for phylogenetic conservatism. Proc. R. Soc. Lond. B268:2383–2389.
Araujo, M. B., and R. G. Pearson. 2005. Equilibrium of species’ distributionswith climate. Ecography 28:693–695.
Araujo, M. B., R. G. Pearson, W. Thuiller, and M. Erhard. 2005. Validationof species-climate impact models under climate change. Global ChangeBiol. 11:1504–1513.
Avise, J. C., and D. Walker. 1998. Pleistocene phylogeographic effects onavian populations and the speciation process. Proc. R. Soc. Lond. B265:457–463.
Bonaccorso, E., I. Koch, and A. T. Peterson. 2006. Pleistocene fragmentationof Amazon species’ ranges. Divers. Distrib. 12:157–164.
Britton, T. 2005. Estimating divergence times in phylogenetic trees without amolecular clock. Syst. Biol. 54:500–507.
Broennimann, O., U. A. Treier, H. Muller-Scharer, W. Thuiller, A. T. Peterson,and A. Guisan. 2007. Evidence of climatic niche shift during biologicalinvasion. Ecol. Lett. 10:701–709.
Carstens, B. C., J. D. Degenhardt, A. L. Stevenson, and J. Sullivan.2005. Accounting for coalescent stochasticity in testing phylogeo-graphical hypotheses: modelling Pleistocene population structure in the
EVOLUTION JANUARY 2008 181

A. T. PETERSON AND A. S. NYARI
Idaho giant salamander Dicamptodon aterrimus. Mol. Ecol. 14:255–265.
Dansgaard, W., S. J. Johnsen, H. B. Clausen, D. Dahl-Jensen, N. S. Gundestrup,C. U. Hammer, C. S. Hvidberg, J. P. Steffensen, A. E. Sveinbjornsdottir,J. Jouzel, and G. C. Bond. 1993. Evidence for general instability of pastclimate from a 250 kyr ice-core record. Nature 264:218–220.
Drovetski, S. V., and F. Ronquist. 2003. Plio-Pleistocene climatic oscillations,Holarctic biogeography and speciation in an avian subfamily. J. Bio-geogr. 30:1173–1181.
Elango, N., J. W. Thomas, and S. V. Yi. 2006. Variable molecular clocks inhominoids. Proc. Natl. Acad. Sci. USA 103:1370–1375.
Ferraz, G., G. J. Russell, P. C. Stouffer, R. O. Bierregaard, Jr., S. L. Pimm,and T. E. Lovejoy. 2003. Rates of species loss from Amazonian forestfragments. Proc. Natl. Acad. Sci. USA 100:14069–14073.
Fielding, A. H., and J. F. Bell. 1997. A review of methods for the assessmentof prediction errors in conservation presence/absence models. Environ.Conserv. 24:38–49.
Fitzpatrick, M. C., J. F. Weltzin, N. J. Sanders, and R. R. Dunn. 2006. Thebiogeography of prediction error: why doesn’t the introduced rangeof the fire ant predict its native range or vice versa? Global Ecol.Biogeogr. 16:24–33.
Graham, C., S. Ron, J. Santos, C. Schneider, and C. Moritz. 2004a. Integratingphylogenetics and environmental niche models to explore speciationmechanisms in dendrobatid frogs. Evolution 58:1781–1793.
Graham, C. H., S. R. Ron, J. C. Santos, C. J. Schneider, and C. Moritz.2004b. Integrating phylogenetics and environmental niche models to ex-plore speciation mechanisms in dendrobatid frogs. Evolution 58:1781–1793.
Griswold, C., and A. Baker. 2002. Time to the most recent common ancestorand divergence times of populations of Common Chaffinches (Fringillacoelebs) in Europe and North Africa: insights into Pleistocene refugiaand current levels of migration. Evolution 56:143–153.
Hijmans, R. J., S. Cameron, and J. Parra. 2005a. WorldClim, Version 1.3,http://biogeo.berkeley.edu/worldclim/worldclim.htm. Univ. of Califor-nia, Berkeley, CA.
Hijmans, R. J., S. E. Cameron, J. L. Parra, P. G. Jones, and A. Jarvis. 2005b.Very high resolution interpolated climate surfaces for global land areas.Int. J. Climatol. 25:1965–1978.
Ho, S. Y. W., and G. Larson. 2006. Molecular clocks: when times are a-changin’. Trends Genet. 22:79–83.
Ho, S. Y. W., M. J. Phillips, A. Cooper, and A. J. Drummond. 2005. Timedependency of molecular rate estimates and systematic overestimationof recent divergence times. Mol. Biol. Evol. 22:1561–1568.
Hugall, A., C. Moritz, A. Moussalli, and J. Stanisic. 2002. Reconciling pale-odistribution models and comparative phylogeography in the Wet Trop-ics rainforest land snail Gnarosophia bellendenkerensis (Brazier 1875).Proc. Natl. Acad. Sci. USA 99:6112–6117.
Huntley, B., P. J. Bartlein, and I. C. Prentice. 1989. Climatic control of thedistribution and abundance of Beech (Fagus L.) in Europe and NorthAmerica. J. Biogeogr. 16:551–560.
Huntley, B., P. M. Berry, W. Cramer, and A. P. McDonald. 1995. Modellingpresent and potential future ranges of some European higher plants usingclimate response surfaces. J. Biogeogr. 22:967–1001.
Jennings, W. B., and S. V. Edwards. 2005. Speciational history of Aus-tralian grass finches (Poephila) inferred from thirty gene trees. Evolution59:2033–2047.
Johnson, N. K., and C. Cicero. 2004. New mitochondrial DNA data affirm theimportance of Pleistocene speciation in North American birds. Evolution58:1122–1130.
Kiehl, J. T., and P. R. Gent. 2004. The community climate system model,version 2. J. Climate 17:3666–3682.
Klicka, J., and R. M. Zink. 1997. The importance of recent ice ages in speci-ation: a failed paradigm. Science 277:1666–1669.
Knouft, J. H., J. B. Losos, R. E. Glor, and J. J. Kolbe. 2006. Phylogeneticanalysis of the evolution of the niche in lizards of the Anolis sagreigroup. Ecology 87:S29–S38.
Linder, H. P., C. R. Hardy, and F. Rutschmann. 2005. Taxon sampling effectsin molecular clock dating: an example from the African Restionaceae.Mol. Phylogenet. Evol. 35:569–582.
Martınez-Meyer, E. 2002. Evolutionary trends in ecological niches of species.PhD Thesis, Department of Geography, Univ. of Kansas, Lawrence, KS.
Martınez-Meyer, E., and A. T. Peterson. 2006. Conservatism of ecolog-ical niche characteristics in North American plant species over thePleistocene-to-Recent transition. J. Biogeogr. 33:1779–1789.
Martınez-Meyer, E., A. T. Peterson, and W. W. Hargrove. 2004. Ecologicalniches as stable distributional constraints on mammal species, with im-plications for Pleistocene extinctions and climate change projections forbiodiversity. Global Ecol. Biogeogr. 13:305–314.
Nyari, A. S. 2007. Phylogeographic patterns, molecular and vocal differenti-ation, and species limits in Schiffornis turdina (Aves). Mol. Phylogenet.Evol. 44:154–164.
Pearson, R. G., and T. P. Dawson. 2003. Predicting the impacts of climatechange on the distribution of species: are bioclimate envelope modelsuseful? Global Ecology Biogeogr. 12:361–371.
Pearson, R. G., W. Thuiller, M. B. Araujo, E. Martinez-Meyer, L. Brotons,C. McClean, L. Miles, P. Segurado, T. P. Dawson, and D. C. Lees.2006. Model-based uncertainty in species range prediction. J. Biogeogr.33:1704–1711.
Peters, J. L. 1979. Check-list of birds of the World, Vol. 8. Museum of Com-parative Zoology, Cambridge, MA.
Peterson, A. T. 2003a. Predicting the geography of species’ invasions viaecological niche modeling. Q. Rev. Biol. 78:419–433.
———. 2003b. Projected climate change effects on Rocky Mountain and GreatPlains birds: generalities of biodiversity consequences. Global ChangeBiol. 9:647–655.
———. 2006. Uses and requirements of ecological niche models and relateddistributional models. Biodivers. Informatics 3:59–72.
———. 2007. Application of molecular clocks in ornithology revisited. J.Avian Biol. 37:541–544.
Peterson, A. T., and R. D. Holt. 2003. Niche differentiation in Mexicanbirds: using point occurrences to detect ecological innovation. Ecol. Lett.6:774–782.
Peterson, A. T., J. Soberon, and V. Sanchez-Cordero. 1999. Conservatism ofecological niches in evolutionary time. Science 285:1265–1267.
Peterson, A. T., E. Martınez-Meyer, and C. Gonzalez-Salazar. 2004. Recon-structing the Pleistocene geography of the Aphelocoma jays (Corvidae).Divers. Distrib. 10:237–246.
Peterson, A. T., C. Martınez-Campos, Y. Nakazawa, and E. Martınez-Meyer.2005a. Time-specific ecological niche modeling predicts spatial dynam-ics of vector insects and human dengue cases. Trans. R. Soc. Trop. Med.Hygiene 99:647–655.
Peterson, A. T., H. Tian, E. Martınez-Meyer, J. Soberon, V. Sanchez-Cordero,and B. Huntley. 2005b. Modeling distributional shifts of individualspecies and biomes. Pp. 211-228 in T. E. Lovejoy and L. Hannah,eds. Climate change and biodiversity. Yale Univ. Press, New Haven,CT.
Peterson, A. T., M. Papes, and M. Eaton. 2007. Transferability and modelevaluation in ecological niche modeling: a comparison of GARP andMaxent. Ecography. 50:550–560.
Phillips, S. J., M. Dudik, and R. E. Schapire. 2004. A maximum entropyapproach to species distribution modeling. Proceedings of the 21st In-ternational Conference on Machine Learning. 69:83–90.
182 EVOLUTION JANUARY 2008
ECOLOGICAL NICHE CONSERVATISM AND PLEISTOCENE REFUGIA
Phillips, S. J., R. P. Anderson, and R. E. Schapire. 2006. Maximum entropymodeling of species geographic distributions. Ecol. Modell. 190:231–259.
Rice, N. H., E. Martınez-Meyer, and A. T. Peterson. 2003. Ecological nichedifferentiation in the Aphelocoma jays: a phylogenetic perspective. Biol.J. Linn. Soc. 80:369–383.
Ricklefs, R. E., and R. E. Latham. 1992. Intercontinental correlation of ge-ographical ranges suggests stasis in ecological traits of relict genera oftemperate perennial herbs. Am. Nat. 139:1305–1321.
Ruegg, K. C., R. J. Hijmans, and C. Moritz. 2006. Climate change and the ori-gin of migratory pathways in the Swainson’s Thrush, Catharus ustulatus.J. Biogeogr. 33:1172–1182.
Scachetti-Pereira, R. 2001. Desktop GARP. http://www.lifemapper.org/desktopgarp/; access date 23 July 2003.
Snow, D. W. 2004. Family Pipridae (Manakins). Pp. 110-169 in J. lde Hoyo,A. Elliot and D. A. Christie, eds. Handbook of the birds of the World,Vol. 9. Cotingas to Pipits and Wagtails. Lynx Edicions, Barcelona,Spain.
Soberon, J., and A. T. Peterson. 2005. Interpretation of models of fundamentalecological niches and species’ distributional areas. Biodivers. Informat-ics 2:1–10.
Stockwell, D. R. B., and D. P. Peters. 1999. The GARP modelling system:
problems and solutions to automated spatial prediction. Int. J. Geograph.Information Sci. 13:143–158.
Thorpe, R. S., D. L. Leadbeater, and C. E. Pook. 2005. Molecular clocks andgeological dates: cytochrome b of Anolis extremus substantially contra-dicts dating of Barbados emergence. Mol. Ecol. 14:2087–2096.
Weir, J. T., and D. Schluter. 2004. Ice sheets promote speciation in borealbirds. Proc. R. Soc. Lond. B 271:1881–1887.
Welch, J. J., and L. Bromham. 2005. Molecular dating when rates vary. TrendsEcol. Evol. 20:320–327.
Wiens, J. J. 2004. Speciation and ecology revisited: phylogenetic niche con-servatism and the origin of species. Evolution 58:193–197.
Wiens, J., and C. Graham. 2005a. Niche conservatism: integrating evolution,ecology, and conservation biology. Annu. Rev. Ecol. Evol. Syst. 36:519–539.
Wiens, J. J., and C. H. Graham. 2005b. Niche conservatism: integrating evolu-tion, ecology, and conservation biology. Annu. Rev. Ecol. Syst. 36:519–539.
Yesson, C., and A. Culham. 2006. A phyloclimatic study of Cyclamen. BMCEvol. Biol. 6:doi:10.1186/1471-2148-6-72.
Associate Editor: K. Crandall
EVOLUTION JANUARY 2008 183