ecodesign preparatory study on mobile phones, smartphones
TRANSCRIPT
Written by Fraunhofer IZM, Fraunhofer ISI, VITO October – 2020
Ecodesign preparatory study on mobile phones,
smartphones and tablets
Draft Task 4 Report
Technologies
2
Authors:
Karsten Schischke (Fraunhofer IZM) Christian Clemm (Fraunhofer IZM) Anton Berwald (Fraunhofer IZM) Marina Proske (Fraunhofer IZM) Gergana Dimitrova (Fraunhofer IZM) Julia Reinhold (Fraunhofer IZM) Carolin Prewitz (Fraunhofer IZM) Christoph Neef (Fraunhofer ISI) Contributors: Antoine Durand (Quality control, Fraunhofer ISI) Clemens Rohde (Quality control, Fraunhofer ISI) Simon Hirzel (Quality control, Fraunhofer ISI) Mihaela Thuring (Quality control, contract management, VITO)
Study website: https://www.ecosmartphones.info
EUROPEAN COMMISSION
Directorate-General for Internal Market, Industry, Entrepreneurship and SMEs Directorate C — Sustainable Industry and Mobility DDG1.C.1 — Circular Economy and Construction
Contact: Davide Polverini
E-mail: [email protected]
European Commission B-1049 Brussels

4
Ecodesign preparatory study on mobile phones,
smartphones and tablets Draft Task 4 Report
Technologies
EUROPEAN COMMISSION
Directorate-General for Internal Market, Industry, Entrepreneurship and SMEs
2020
LEGAL NOTICE
This document has been prepared for the European Commission however it reflects the views only of the authors, and the Commission cannot be held responsible for any use which may be made of the information contained therein.
More information on the European Union is available on the Internet (http://www.europa.eu).
Luxembourg: Publications Office of the European Union, 2020
ISBN number doi:number
© European Union, 2020 Reproduction is authorised provided the source is acknowledged.
Printed in Belgium
Images © Fraunhofer IZM, 2020 (unless otherwise specified)
Europe Direct is a service to help you find answers to your questions about the European Union.
Freephone number (*):
00 800 6 7 8 9 10 11
(*) The information given is free, as are most calls (though some operators, phone boxes or hotels may charge you).
6
CONTENT
1. INTRODUCTION ................................................................................................... 13
2. SUBTASK 4.1 – TECHNICAL PRODUCT DESCRIPTION ................................................ 13
2.1. Average Technology: Products .......................................................... 13 2.1.1. Mobile phones ................................................................................... 13 2.1.2. Tablets ............................................................................................... 39 2.1.3. Cordless phones ................................................................................. 52
2.2. Average Technology: Components ..................................................... 60 2.2.1. Frame and back cover ........................................................................ 60 2.2.2. Display assembly ............................................................................... 60 2.2.3. Batteries ............................................................................................. 61 2.2.4. Semiconductors ................................................................................. 68 2.2.5. Camera ............................................................................................... 74 2.2.6. Connections ....................................................................................... 74 2.2.7. Other functional parts ........................................................................ 75 2.2.8. Software ............................................................................................. 75 2.2.9. Chargers ............................................................................................. 78 2.2.10. Accessories ........................................................................................ 78
2.3. BAT – Best Available Technology at product level ................................ 80 2.3.1. Mobile phones ................................................................................... 80 2.3.2. Tablet ................................................................................................. 86 2.3.3. Cordless phones ................................................................................. 92
2.4. BAT – Best Available Technology at component level ............................ 92 2.4.1. Battery ............................................................................................... 93 2.4.2. Cover and backside glass ................................................................... 93 2.4.3. Parts with recycled or bio-based materials ........................................ 94 2.4.4. Semiconductors ................................................................................. 94
2.5. BNAT – Best Not Available Technology ............................................... 94 2.5.1. Housing with 100% recycled plastics ................................................ 94 2.5.2. Universal compatibility ..................................................................... 94 2.5.3. Product modularity ............................................................................ 95 2.5.4. Modular RAM and modular SSD ...................................................... 95 2.5.5. Display cover glass ............................................................................ 95 2.5.6. Solid state batteries (SSB) ................................................................. 95 2.5.7. Technology Outlook .......................................................................... 96
3. SUBTASK 4.2 – PRODUCTION, DISTRIBUTION AND END-OF-LIFE ............................. 101
3.1. Product weight and Bills‐of‐Materials (BOMs) ..................................... 102 3.2. Assessment of the primary scrap production during sheet metal
manufacturing ............................................................................... 102
Ecodesign preparatory study on mobile phones, smartphones and tablets
7
3.3. Packaging materials ....................................................................... 103 3.4. Volume and weight of the packaged product ..................................... 103 3.5. Actual means of transport employed in shipment of components, sub‐
assemblies and finished products ..................................................... 104 3.6. Technical product life ..................................................................... 104 3.7. Materials flow and collection effort at end‐of‐life ................................ 105
4. PUBLICATION BIBLIOGRAPHY .............................................................................. 106
5. ANNEX .............................................................................................................. 113
5.1. Tested DECT phones ...................................................................... 113
8
FIGURES
FIGURE 1: TEARDOWN OF A SMARTPHONE (SAMSUNG GALAXY S5) .................................. 14
FIGURE 1: DEVELOPMENT OF THE AMOUNT OF RAM AND INTERNAL STORAGE EMPLOYED IN SMARTPHONES BETWEEN 2010 AND 2019 (CLEMM ET AL. 2020) ........................... 17
FIGURE 2: DEVELOPMENT OF THE AMOUNT OF RAM AND INTERNAL STORAGE EMPLOYED IN MOBILE PHONES BETWEEN 2000 AND 2020 PER PRICE CATEGORY (PROSKE ET AL. 2020A) ......................................................................................................... 17
FIGURE 3: DEVELOPMENT OF INTERNAL STORAGE EMPLOYED IN SMARTPHONES, 2017-2020, MARKET SHARE (DATA PROVIDED BY AN ANONYMOUS OEM) ........................... 18
FIGURE 4: DEVELOPMENT OF THE DISPLAY SIZE AND SCREEN-TO-BODY RATION IN SMARTPHONES BETWEEN 2010 AND 2019 (CLEMM ET AL. 2020) ............................... 18
FIGURE 5: DEVELOPMENT OF THE DISPLAY SIZE AND SCREEN-TO-BODY RATION IN MOBILE PHONES BETWEEN 2005 AND 2020 PER PRICE SEGMENT (PROSKE ET AL. 2020A) ................................................................................................................ 19
FIGURE 6: DEVELOPMENT OF WEIGHT AND WEIGHT PER DISPLAY SIZE IN MOBILE PHONES BETWEEN 2000 AND 2020 PER PRICE SEGMENT (PROSKE ET AL. 2020A) ....... 19
FIGURE 7: SMARTPHONE DISPLAY DESIGNS – MARKET SHARE, 2019, EUROPE ................... 20
FIGURE 9: DISPLAY TYPE AND RESOLUTION OF MOBILE PHONES BETWEEN 2000 AND 2020 (PROSKE ET AL. 2020A) ................................................................................ 20
FIGURE 12: MOBILE NETWORK GENERATION TECHNOLOGY IN MOBILE PHONES BETWEEN 2000 AND 2020 (PROSKE ET AL. 2020A) .................................................. 21
FIGURE 13: SMARTPHONES - 5G MARKET PENETRATION FORECAST (DATA PROVIDED BY AN ANONYMOUS OEM) .......................................................................................... 21
FIGURE 14: EVOLUTION OF SMARTPHONE CASE JOINING TECHNIQUES APPLIED TO THE BEST-SELLING SMARTPHONES IN EUROPE (BASED ON MARKET DATA FROM COUNTERPOINT RESEARCH; MARKET COVERAGE DENOTED ON TOP OF DATA COLUMNS)........................................................................................................... 22
FIGURE 15: TREND TOWARDS THE USE OF ADHESIVES TO FIX THE BATTERY WITHIN SMARTPHONES AMONG THE BEST-SELLING SMARTPHONES IN EUROPE (BASED ON MARKET DATA FROM COUNTERPOINT RESEARCH; MARKET COVERAGE DENOTED ON TOP OF DATA COLUMNS) ................................................................................. 22
FIGURE 8: DEVELOPMENT OF THE BATTERY CAPACITY IN SMARTPHONES BETWEEN 2010 AND 2019 (CLEMM ET AL. 2020) ............................................................................ 23
FIGURE 9: DEVELOPMENT OF THE BATTERY CAPACITY IN MOBILE PHONES BETWEEN 2000 AND 2020 PER PRICE SEGMENT (PROSKE ET AL. 2020A) .................................. 23
FIGURE 10: SHARE OF REMOVABLE AND NON-REMOVABLE BATTERIES IN MOBILE PHONES BETWEEN 2000 AND 2020 (PROSKE ET AL. 2020A) ...................................... 24
FIGURE 16 : COEVOLUTION OF THE SMARTPHONE DESIGN TRENDS EMBEDDED BATTERY, GLASS BACK COVER, IP RATING AND WIRELESS CHARGING (CLEMM ET AL. 2020) ............................................................................................................ 24
FIGURE 17: DEVELOPMENT OF BACKSIDE AND FRAME MATERIAL IN MOBILE PHONES BETWEEN 2010 AND 2020 (PROSKE ET AL. 2020A) .................................................. 25
FIGURE 18: MOTOROLA RAZR ....................................................................................... 25
FIGURE 19: SAMSUNG GALAXY Z FLIP ............................................................................ 25
FIGURE 20 : TANTALUM CAPACITOR, TOP-VIEW AND CROSS-SECTION, TANTALUM CONTAINING PARTS HIGHLIGHTED ........................................................................ 27
FIGURE 21 : DISASSEMBLED VIBRATION MOTOR OF A 2012 SMARTPHONE MODEL, TUNGSTEN PART MARKED IN RED .......................................................................... 28
Ecodesign preparatory study on mobile phones, smartphones and tablets
9
FIGURE 22: WLAN MODULE WITH GAAS AND SILICON CHIPS IN ONE PACKAGE (QUAD FLAT NO-LEAD PACKAGE; TOP-VIEW X-RAY, LEFT, AND SCHEMATIC DRAWING, RIGHT) ............................................................................................................... 28
FIGURE 23 : MATERIAL CONTENT OF SELECTED METALS IN CONVENTIONAL MOBILE PHONES AND SMARTPHONES (DATA SOURCE: BOOKHAGEN ET AL.) .......................... 29
FIGURE 24 : FEATURE PHONES – MAJOR PARTS, MATERIALS AND WEIGHTS ...................... 33
FIGURE 25 : SMARTPHONES – POWER CONSUMPTION IN VARIOUS MODES (NOTEBOOKCHECK 2020) ...................................................................................... 34
FIGURE 26 : SMARTPHONES – BATTERY ENDURANCE TESTING RESULTS (GSMARENA 2020) ................................................................................................................. 35
FIGURE 27 : SMARTPHONES – BATTERY ENDURANCE CORRELATED WITH BATTERY CAPACITY (GSMARENA 2020) ................................................................................ 35
FIGURE 28 : MOBILE PHONES – END OF LIFE ROUTES IN BELGIUM (VAN DER VOORT 2013) ................................................................................................................. 38
FIGURE 29: END OF LIFE OF CHARGERS (IPSOS, TRINOMICS, FRAUNHOFER FOKUS, ECONOMISTI ASSOCIATI 2019) ............................................................................. 39
FIGURE 33 : TABLET COMPUTERS, BATTERY CAPACITY AND NUMBER OF MODELS (2020) .......................................................................................................................... 40
FIGURE 34: DEVELOPMENT OF THE AMOUNT OF RAM AND INTERNAL STORAGE EMPLOYED IN TABLETS BETWEEN 2008 AND 2020 ................................................... 41
FIGURE 35: DEVELOPMENT OF SCREEN SIZE AND SCREEN-TO-BODY RATIO OF TABLETS BETWEEN 2008 AND 2020 ..................................................................................... 41
FIGURE 36: DEVELOPMENT OF BATTERY CAPACITY OF TABLETS BETWEEN 2008 AND 2020 ................................................................................................................... 42
FIGURE 37: DISPLAY TYPE AND RESOLUTION OF TABLETS BETWEEN 2008 AND 2020 ......... 42
FIGURE 38: REMOVABILITY OF BATTERIES IN TABLETS BETWEEN 2008 AND 2020 .............. 42
FIGURE 39: BACKSIDE AND FRAME MATERIAL OF TABLETS BETWEEN 2013 AND 2020 ........ 43
FIGURE 41: MOBILE NETWORK GENERATION TECHNOLOGY IN TABLETS BETWEEN 2008 AND 2020 ............................................................................................................ 43
FIGURE 30: RADIO-FREQUENCY PART OF TABLET MAINBOARD, GA MARKED AS FOUND BY µRFA .............................................................................................................. 44
FIGURE 31 : TABLET COMPUTERS, WEIGHT CORRELATED WITH DISPLAY SIZES (2020) ....... 46
FIGURE 32 : TABLET COMPUTERS, MATERIAL COMPOSITION, HUAWEI (2016-2018) ............ 46
FIGURE 40: WEIGHT OF TABLETS BETWEEN 2008 AND 2020 ............................................ 47
FIGURE 42 : TABLETS – POWER CONSUMPTION IN VARIOUS MODES (NOTEBOOKCHECK 2020) ................................................................................................................. 50
FIGURE 43 : FEATURES DECT PHONES (DATA BY STIFTUNG WARENTEST, COMPILATION BY FRAUNHOFER IZM) .......................................................................................... 53
FIGURE 44 : WEIGHT, DECT PHONES (DATA BY STIFTUNG WARENTEST, COMPILATION BY FRAUNHOFER IZM) .......................................................................................... 53
FIGURE 45 : CORDLESS PHONE HANDSET TEARDOWN – FRONTSIDE, BATTERIES, BATTERY COVER................................................................................................... 55
FIGURE 46 : CORDLESS PHONE HANDSET TEARDOWN – FRONTSIDE COVER, KEY PAD, DISPLAY AND MAINBOARD, BACKSIDE COVER ......................................................... 55
FIGURE 47 : CORDLESS PHONE HANDSET TEARDOWN – FRONTSIDE COVER INSIDE VIEW, KEY PAD BACKSIDE, MAINBOARD REVERSE SIDE, DISPLAY UNIT BACKSIDE VIEW, LOUDSPEAKER, BACKSIDE COVER ................................................................ 56
FIGURE 48 : CORDLESS PHONE HANDSET TEARDOWN – MAINBOARD ................................ 56
FIGURE 49 : CORDLESS PHONE BASE STATION TEARDOWN – OVERVIEW .......................... 57
10
FIGURE 50 : CORDLESS PHONE BASE STATION TEARDOWN – COVER (RIGHT) REMOVED .......................................................................................................................... 57
FIGURE 51 : CORDLESS PHONE BASE STATION TEARDOWN – PRINTED CIRCUIT BOARD, KEY PAD, LOUDSPEAKER ....................................................................................... 58
FIGURE 52 : CORDLESS PHONE BASE STATION TEARDOWN – PRINTED CIRCUIT BOARD DOWNSIDE .......................................................................................................... 58
FIGURE 53 : STANDBY POWER CONSUMPTION, DECT PHONES / CHARGING CRADLE / BASE STATION (DATA BY STIFTUNG WARENTEST, COMPILATION BY FRAUNHOFER IZM) ................................................................................................................... 59
FIGURE 54 : PHONE CALL TIMES WITH FULLY CHARGED BATTERIES AND CHARGING TIMES, DECT PHONES (DATA BY STIFTUNG WARENTEST, COMPILATION BY FRAUNHOFER IZM) ............................................................................................... 59
FIGURE 55 : STANDBY DURATION IN STANDARD AND ECO MODE, DECT PHONES (DATA BY STIFTUNG WARENTEST, COMPILATION BY FRAUNHOFER IZM) .............................. 60
FIGURE 56 : LEFT: IPHONE XS AND XS MAX L-BATTERY PACKS IN 1S1P AND 1S2P CONFIGURATION. RIGHT: MICROSOFT SURFACE PRO BATTERY PACK IN 2S2P CONFIGURATION. ................................................................................................. 62
FIGURE 57 : DEVELOPMENT OF LIB MARKETS FOR CELLULAR PHONES AND TABLETS. DATA TAKEN FROM (PILLOT 2017; B3 CORP.; B3 CORP.) .......................................... 64
FIGURE 58 : STATE OF HEALTH (SOH) OF SMARTPHONE BATTERIES, CLUSTERED INTO INTERVALS OF BATTERY AGE IN YEARS, OVER THE COURSE OF 1.000 CHARGING CYCLES (CLEMM ET AL. 2016B). ............................................................................. 66
FIGURE 59 : STATE OF HEALTH (SOH) OF TABLET BATTERIES, CLUSTERED INTO INTERVALS OF BATTERY AGE IN YEARS, OVER THE COURSE OF 500 CHARGING CYCLES. THE STATISTICS BELOW PRESENT THE SHARE OF DATA POINTS IN EACH INTERVAL THAT HAVE RETAINED AT LEAST 80 % AND 60 % SOH (CLEMM ET AL. 2016B). ............................................................................................................... 67
FIGURE 60: TABLET BATTERY CAPACITY DETERIORATION OVER LOAD CYCLES (SOURCE: FRAUNHOFER IZM) ............................................................................................... 68
FIGURE 61 : CROSS-SECTION OF A TABLET PROCESSOR (A6X) MOUNTED ON THE MAINBOARD ........................................................................................................ 71
FIGURE 62 : DRAM MEMORY DENSITY IN GB PER MM² CHIP AREA ..................................... 73
FIGURE 63 : FLASH MEMORY DENSITY IN GB PER MM² CHIP AREA .................................... 74
FIGURE 64 : ACCESSORIES IN A SMARTPHONE PACKAGING ............................................. 79
FIGURE 65 : SAMSUNG GALAXY S5, BACKSIDE COVER REMOVED ...................................... 82
FIGURE 66 : BATTERY WITH PULL-TAB ADHESIVE STRIPS ................................................ 83
FIGURE 67 : COMPLIANCE OF EPEAT-REGISTERED MOBILE PHONES WITH OPTIONAL CRITERIA (ACTIVE PRODUCTS AS OF JUNE 17, 2020) ............................................... 86
FIGURE 68 : WOODEN PARTS OF THE D4R IAMECO TABLET, KAPPA PROTOTYPE (MAHER ET AL. 2018) ........................................................................................................ 88
FIGURE 69 : COMPLIANCE OF EPEAT-REGISTERED TABLETS / SLATES WITH OPTIONAL CRITERIA (ACTIVE PRODUCTS AS OF JUNE 17, 2020) ............................................... 91
Ecodesign preparatory study on mobile phones, smartphones and tablets
11
TABLES
TABLE 1 : SMARTPHONE'S FUNCTIONS AND RELATED CHARACTERISTICS (CORDELLA ET AL. 2020) ............................................................................................................ 14
TABLE 2 : SMARTPHONE MARKET SEGMENTS (TYPICAL SPECIFICATIONS) .......................... 16
TABLE 3 : (SELECTED) MATERIAL CONTENT SMARTPHONE, FEATURE PHONE ...................... 30
TABLE 4 : ENERGY CONSUMPTION FOR SMARTPHONES (KEMNA ET AL. 2020) .................... 36
TABLE 5 : USE PHASE POWER CONSUMPTION OF EXEMPLARY MOBILE PHONES (APPLE 2020; GOOGLE 2020B) ......................................................................................... 37
TABLE 6 : ICT ELECTRICITY CONSUMPTION, EU27 (KEMNA ET AL. 2020) ........................... 37
TABLE 7 : COLLECTION RATES (SANDER ET AL. 2019) ..................................................... 38
TABLE 8: TABLET COMPUTER AVERAGE CONFIGURATION ................................................. 40
TABLE 9: TABLETS, COMPOSITION (2013) ...................................................................... 44
TABLE 10 : MATERIAL CONTENT TABLETS ....................................................................... 45
TABLE 11 : MATERIAL COMPOSITION GOOGLE PIXEL SLATE ............................................. 47
TABLE 12 : AVERAGE POWER CONSUMPTION DATA FOR SLATE/TABLET COMPUTERS, 2017 DATA .......................................................................................................... 48
TABLE 13 : USE PHASE POWER CONSUMPTION OF EXEMPLARY TABLETS............................ 49
TABLE 14 : ENERGY EFFICIENCY METRIC FOR TABLETS (KEMNA ET AL. 2020) .................... 50
TABLE 15 : TABLETS, EOL SCENARIOS (ARDUIN ET AL. 2017) .......................................... 52
TABLE 16 : MATERIAL CONTENT LANDLINE PHONES ........................................................ 54
TABLE 17 : INTEGRATED CIRCUITS IN AN EXEMPLARY SMARTPHONE, COMPILATION BASED ON (ELECTRONICPRODUCTS 2016) .............................................................. 69
TABLE 18 : AGGREGATED SEMICONDUCTOR PARAMETERS FOR AN EXEMPLARY SMARTPHONE ...................................................................................................... 70
TABLE 19 : SELECTED MOBILE PHONE AND TABLET PROCESSORS ..................................... 72
TABLE 20 : USB GENERATIONS AND TERMINOLOGIES (SOSNOWSKY 2020) ....................... 75
TABLE 21 : AVAILABILITY OF OPERATING SYSTEM SECURITY UPDATES, ADAPTED FROM (MOBILE & SECURITYLAB 2019) ............................................................................. 76
TABLE 22 : COMPARISON OF CHARGER SPECIFICATIONS FOR TABLETS AND SMARTPHONES (IPSOS, TRINOMICS, FRAUNHOFER FOKUS, ECONOMISTI ASSOCIATI 2019) ................................................................................................. 78
TABLE 23 : RECYCLED MATERIAL IN SMARTPHONES (APPLE INC. 2020; GOOGLE 2020A; SAMSUNG 2020; FAIRPHONE 2020; UMICORE 2020; FAIRPHONE 2018) ..................... 81
TABLE 24 : BIOBASED MATERIAL IN SMARTPHONES (APPLE INC. 2020; GOOGLE 2020A; SAMSUNG 2020; FAIRPHONE 2020; UMICORE 2020; FAIRPHONE 2018) ..................... 81
TABLE 25 : REPARABILITY ASSESSMENT OF BEST SCORING SMARTPHONES BY IFIXIT ........ 84
TABLE 26 : RECYCLED MATERIAL IN TABLETS (APPLE INC. 2020; GOOGLE 2020A; SAMSUNG 2020; FAIRPHONE 2020; UMICORE 2020; FAIRPHONE 2018) ..................... 87
TABLE 27 : REPARABILITY ASSESSMENT OF BEST SCORING TABLETS BY IFIXIT ................. 89
TABLE 28 : DECT PHONE BAT VALUES ............................................................................ 92
TABLE 29 : SPECIFICATION OF CORNING GLASS GENERATIONS 5, 6, AND 7 (CORNING 2020B, 2020A, 2020C) .......................................................................................... 93
TABLE 30 : SELECTION OF RECENT PATENTS ON MOBILE DEVICES WITH PARTICULAR RELEVANCY FOR ECODESIGN ................................................................................. 96
TABLE 31 : BILL OF MATERIALS STRUCTURE FOR BASE CASES AND APPROXIMATE PRODUCT WEIGHTS (EXCLUDING ACCESSORIES AND PACKAGING) ......................... 102
12
TABLE 32 : BASE CASES – PACKAGING MATERIALS WEIGHTS ......................................... 103
TABLE 33 : PACKAGE DIMENSION OF EXEMPLARY SMARTPHONES (ANALYSIS BY FRAUNHOFER IZM) ............................................................................................. 103
TABLE 34 : BASE CASES - PACKAGE DIMENSIONS ......................................................... 104
TABLE 35 : BASE CASES – ACTIVE USE LIFETIME .......................................................... 104
TABLE 36 : BASE CASES – END-OF-LIFE SCENARIOS ..................................................... 105
Ecodesign preparatory study on mobile phones, smartphones and tablets
13
1. INTRODUCTION 1
Preparatory studies aim to assess and specify generic or specific ecodesign measures 2 for improving the environmental performance of a defined product group, sometimes 3 in combination with energy label criteria. The ecodesign preparatory studies therefore 4 provide the scientific foundation for defining these generic and/or specific ecodesign 5 requirements as well as energy labelling criteria. The overall objective is to clearly 6 define the product scope, analyse the current environmental impacts of these products 7 and related systems (extended product scope) and assess the existing improvement 8 potential of any measures. The central element of the MEErP (Kemna 2011; Mudgal et 9 al. 2013), being the underlying assessment methodology, is to prioritise today’s 10 possible improvement options from a Least Life Cycle Cost (LLCC) perspective. 11 Identification of the improvement options are based on possible design innovations, 12 Best Available Technologies (BAT) for the short term and Best Not yet Available 13 Technologies (BNAT) for long term, that can help in mitigating the impacts of these 14 products. Policy options are assessed through a scenario analysis and the different 15 outcomes have to be evaluated from the perspective of the EU targets, taking into 16 account potential impacts on the competitiveness of enterprises in the EU and on the 17 consumers. 18
Task 4 covers the assessment of current and future product technologies in the EU 19 market at different life cycle stages, i.e. production, distribution and end-of-life. This 20 information is used to establish “base-cases” for average products in the established 21 product categories in Task 5. Also Best Available and Best Not yet Available 22 Technologies (BAT, BNAT) are identified which will be the basis for modelling in Task 23 6. Most of the environmental and life cycle cost analyses throughout the rest of the 24 study are built on base-cases and the technology analysis serves as the point-of-25 reference for Tasks 5, 6, and 7. 26
27
2. SUBTASK 4.1 – TECHNICAL PRODUCT DESCRIPTION 28
The objective of this subtask is the technical description of the product, the typical 29 specifications of the hardware elements and the functional spectrum provided by 30 application software. First, an analysis on the product level then on the component 31 level is provided. There are overlaps between both views as the components have to 32 interact with and are embedded in the whole system. 33
2.1. Average Technology: Products 34
2.1.1. Mobile phones 35
Due to some major design differences the technology of smartphones and feature 36 phones are explained in separate sub-chapters. The market segment of smartphones 37 is characterised by significantly faster technology changes compared to feature 38 phones. 39
2.1.1.1. Smartphones 40
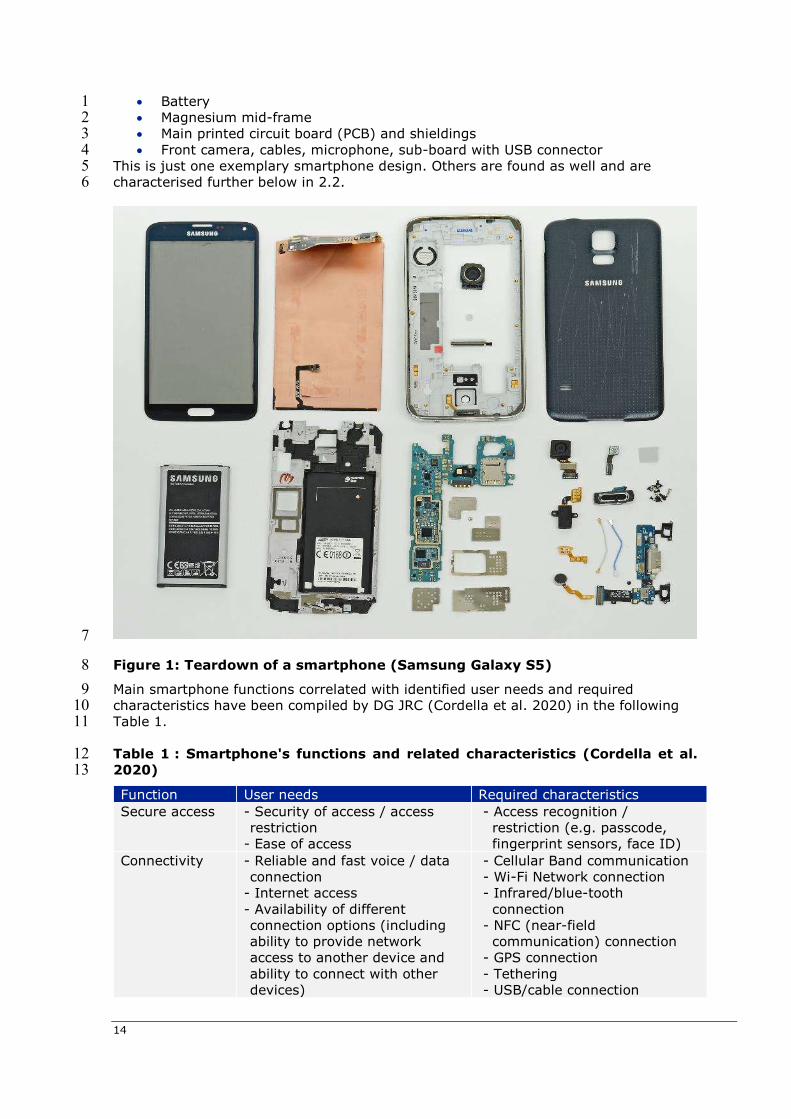
The overall composition of an exemplary smartphone is depicted in Figure 1, with 41 main sub-assemblies as follows (from top left to down right): 42
Cover glass 43 Display panel (backside view with shielding and display PCB) 44 Plastic frame and rear camera 45 Backside cover 46
14
Battery 1 Magnesium mid-frame 2 Main printed circuit board (PCB) and shieldings 3 Front camera, cables, microphone, sub-board with USB connector 4
This is just one exemplary smartphone design. Others are found as well and are 5 characterised further below in 2.2. 6
7
Figure 1: Teardown of a smartphone (Samsung Galaxy S5) 8
Main smartphone functions correlated with identified user needs and required 9 characteristics have been compiled by DG JRC (Cordella et al. 2020) in the following 10 Table 1. 11
Table 1 : Smartphone's functions and related characteristics (Cordella et al. 12 2020) 13
Function User needs Required characteristics Secure access - Security of access / access
restriction - Ease of access
- Access recognition / restriction (e.g. passcode, fingerprint sensors, face ID)
Connectivity - Reliable and fast voice / data connection
- Internet access - Availability of different connection options (including ability to provide network access to another device and ability to connect with other devices)
- Cellular Band communication - Wi-Fi Network connection - Infrared/blue-tooth connection
- NFC (near-field communication) connection
- GPS connection - Tethering - USB/cable connection
Ecodesign preparatory study on mobile phones, smartphones and tablets
15
Function User needs Required characteristics Communication, user interface and multimedia reproduction
- Ability to communicate (send and receive information) via audio, photo and video, and keyboard / touch
- Ability to receive/provide notifications via screen / audio / vibration
- Ability to take quality photo/video in a wide range of lighting conditions
- Ability to support communication apps (such as for video calling, messaging, email)
- Ability to adapt display / touchscreen for different phone orientations
- Microphone - Speaker - Audio jack - Keyboard and/or touch-screen - Functional display and touch screen (size, resolution, color and luminance)
- Integrated photo and video-camera (rear and front)
- Vibration motor - Accelerometer / gyroscope / proximity sensor
Data storage and processing
- Adequate capacities for storage and processing of data (including media)
- RAM and HD capacities
Portable operability
- Ability to connect to mains for charging
- Ability to connect to other devices for charging and data transfer (e.g. laptop)
- Battery that holds charge for a certain time
- Rechargeable battery - External power supply unit - Connector(s) - Duration cycle of the battery
Longevity - Software that is freely updated and maintained for security updates
- O/S that supports users’ applications
- Product that is reliable (electronics) and resistant to typical stresses (e.g. scratches, drops)
- Battery that is functional (measured as capacity) over time and replaceable
- Product that can be easily repaired and upgraded
- Updatable operating system and software
- Resistance to stresses - Longevity of battery - Ease of repair and upgrade
1
(a) Technical characteristics and market segments 2
Smartphones entering the market are often classified into flagship devices, mid-range 3 devices, and entry-level devices. These terms are useful to differentiate market 4 segments, however, the classes are not differentiated using clearly defined criteria. 5 The sales price on market entry is often used as one criterion, and while the price 6 range does approximate the specifications, it is also influenced by the OEMs individual 7 marketing strategy, and other factors separate from the device itself. The other 8 criteria are commonly the technical specifications. Flagship / premium / high-end 9 devices commonly feature the latest System-on-Chip (SoC), a relatively large amount 10 of Random-Access Memory (RAM) and internal storagy, higher resolutions displays. 11 Build quality and materials are also used as criteria. Further, those devices commonly 12
16
feature the latest feature on the market, such as curved displays, best cameras, latest 1 software, etc. 2
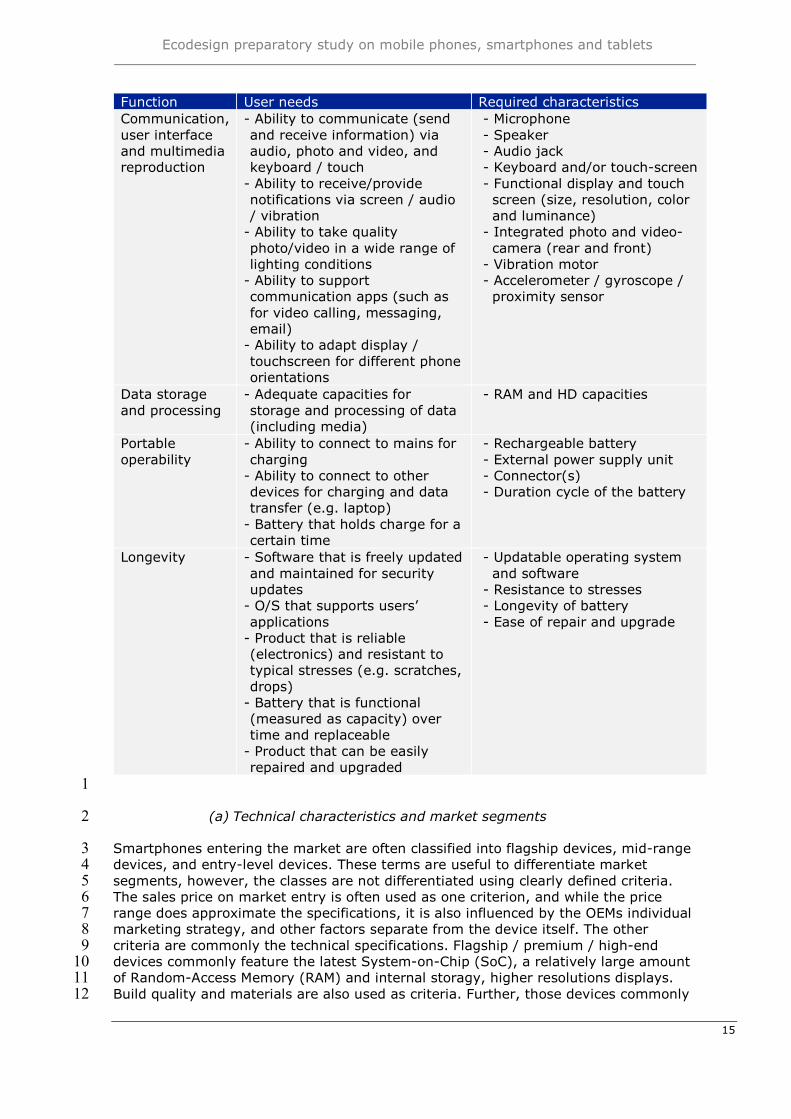
Table 2 : Smartphone market segments (typical specifications) 3
Classification / Criteria
Entry-level, low-end Mid-range Flagship, Premium, High-end
Price range Low (e.g. < 200€) Medium (e.g. 200-600€)
High (e.g. > 600€)
SOC Lower no. of cores, speed
Medium no. of cores, speed
High no. of cores, speed, latest features (e.g. 5G support)
RAM Low (e.g. 2-6 GB) Medium (e.g. 4-8 GB)
High (e.g. > 8 GB)
Storage Low (e.g. ≤ 32 GB) Medium (e.g. 64 GB)
High (e.g. ≥ 128 GB)
Display size Up to 5” 5 – 6” Larger than 6” Display resolution
Low (e.g. < 1080 px)
Medium (e.g. < 1440 px)
High (e.g. 2k, 4k)
Display refresh rate
Low (e.g. 60 Hz) Medium (e.g. 60-90 Hz)
High (e.g. > 90 Hz)
Body materials Plastic Metals, glass, plastic
Metals, glass
“Latest features”
Fewer features Only subset of features
Wireless charging, IP rating, better cameras, more cameras, longer software support
4
An analysis of the development of technical specifications and smartphone design 5 features over the past decade has been performed in the framework of the PROMPT 6 project (Clemm et al. 2020). The analyses are based on market data from 7 Counterpoint Research that list the market share and sales volumes of the best-selling 8 smartphone models for each year in wider Europe. This data was complemented with 9 technical specifications and design features for each listed model and weighed with the 10 market data to illustrate the features of smartphones entering the market over the 11 course of the past ten years. This data can be used to better understand the evolution 12 of the product group smartphones and may serve as a starting point to forecast 13 developments in the future. The data covers between 41 % and 72 % of the total 14 smartphone market in Europe. 15
This is complemented by a similar analysis based on a different data set. In the 16 framework of the German research project MoDeSt a data set of 9,600 smartphone 17 models and their technical specification was analysed (Proske et al. 2020a) . Different 18 from the numbers from (Clemm et al. 2020), these data does not take into account 19 market shares and sales figures, but is analysed per model. 20
Storage / memory 21
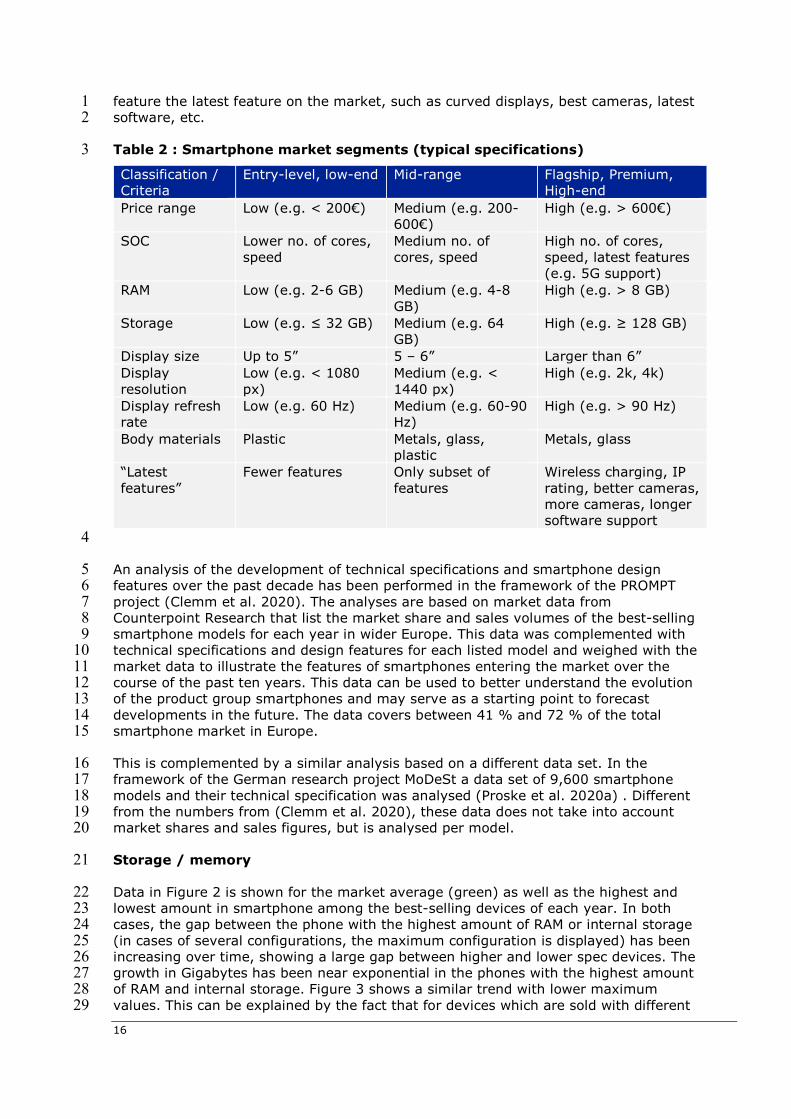
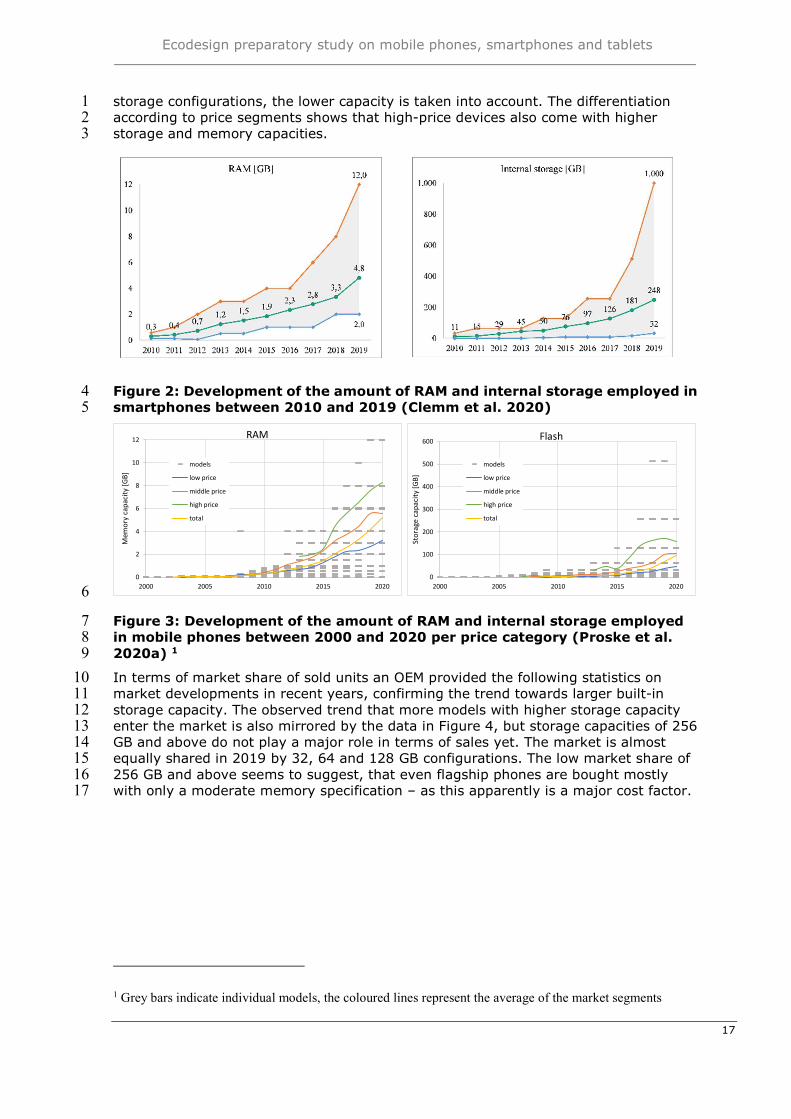
Data in Figure 2 is shown for the market average (green) as well as the highest and 22 lowest amount in smartphone among the best-selling devices of each year. In both 23 cases, the gap between the phone with the highest amount of RAM or internal storage 24 (in cases of several configurations, the maximum configuration is displayed) has been 25 increasing over time, showing a large gap between higher and lower spec devices. The 26 growth in Gigabytes has been near exponential in the phones with the highest amount 27 of RAM and internal storage. Figure 3 shows a similar trend with lower maximum 28 values. This can be explained by the fact that for devices which are sold with different 29
Ecodesign preparatory study on mobile phones, smartphones and tablets
17
storage configurations, the lower capacity is taken into account. The differentiation 1 according to price segments shows that high-price devices also come with higher 2 storage and memory capacities. 3
Figure 2: Development of the amount of RAM and internal storage employed in 4 smartphones between 2010 and 2019 (Clemm et al. 2020) 5
6
Figure 3: Development of the amount of RAM and internal storage employed 7 in mobile phones between 2000 and 2020 per price category (Proske et al. 8 2020a) 1 9
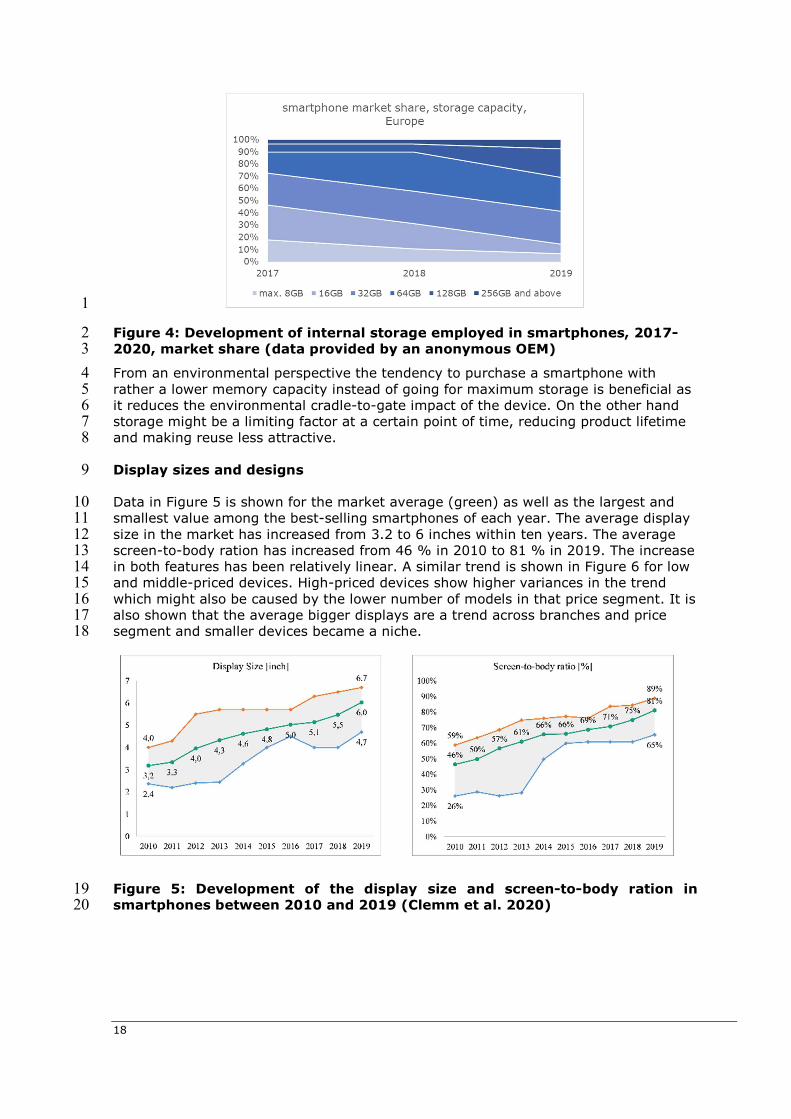
In terms of market share of sold units an OEM provided the following statistics on 10 market developments in recent years, confirming the trend towards larger built-in 11 storage capacity. The observed trend that more models with higher storage capacity 12 enter the market is also mirrored by the data in Figure 4, but storage capacities of 256 13 GB and above do not play a major role in terms of sales yet. The market is almost 14 equally shared in 2019 by 32, 64 and 128 GB configurations. The low market share of 15 256 GB and above seems to suggest, that even flagship phones are bought mostly 16 with only a moderate memory specification – as this apparently is a major cost factor. 17
1 Grey bars indicate individual models, the coloured lines represent the average of the market segments
0
2
4
6
8
10
12
2000 2005 2010 2015 2020
Mem
ory
capa
city
[GB]
RAM
models
low price
middle price
high price
total
0
100
200
300
400
500
600
2000 2005 2010 2015 2020
Stor
age
capa
city
[GB]
Flash
models
low price
middle price
high price
total
18
1
Figure 4: Development of internal storage employed in smartphones, 2017-2 2020, market share (data provided by an anonymous OEM) 3
From an environmental perspective the tendency to purchase a smartphone with 4 rather a lower memory capacity instead of going for maximum storage is beneficial as 5 it reduces the environmental cradle-to-gate impact of the device. On the other hand 6 storage might be a limiting factor at a certain point of time, reducing product lifetime 7 and making reuse less attractive. 8
Display sizes and designs 9
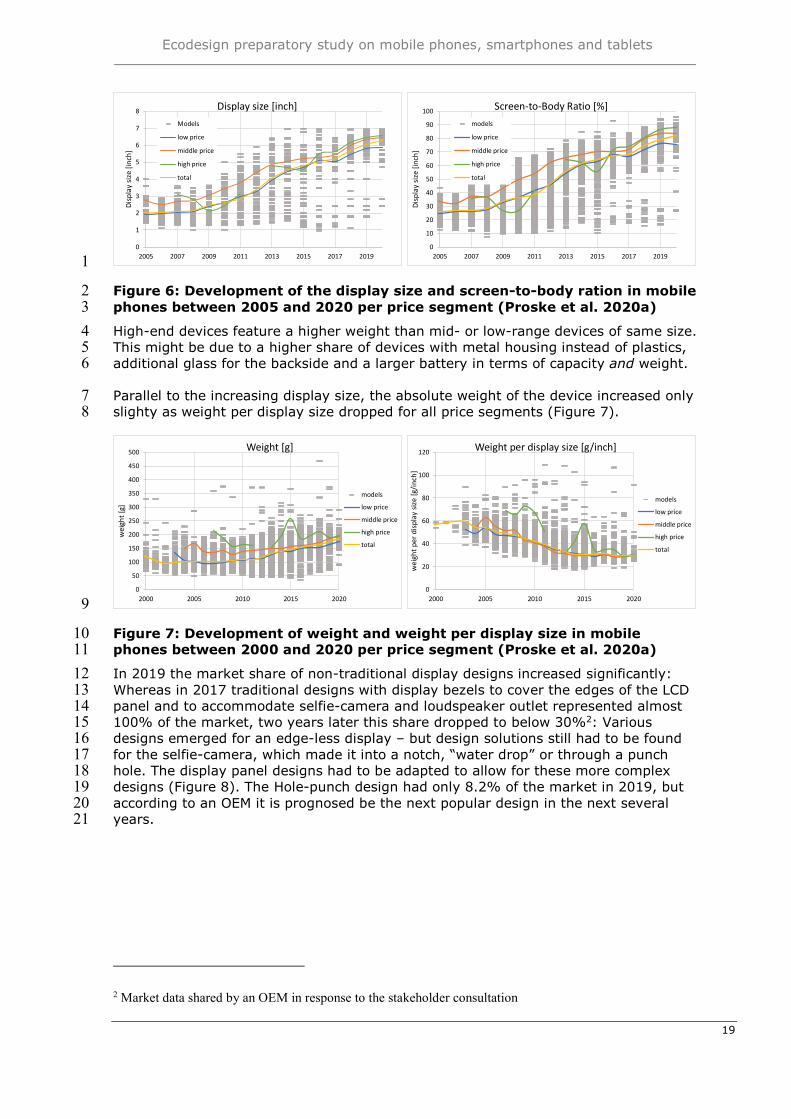
Data in Figure 5 is shown for the market average (green) as well as the largest and 10 smallest value among the best-selling smartphones of each year. The average display 11 size in the market has increased from 3.2 to 6 inches within ten years. The average 12 screen-to-body ration has increased from 46 % in 2010 to 81 % in 2019. The increase 13 in both features has been relatively linear. A similar trend is shown in Figure 6 for low 14 and middle-priced devices. High-priced devices show higher variances in the trend 15 which might also be caused by the lower number of models in that price segment. It is 16 also shown that the average bigger displays are a trend across branches and price 17 segment and smaller devices became a niche. 18
Figure 5: Development of the display size and screen-to-body ration in 19 smartphones between 2010 and 2019 (Clemm et al. 2020) 20
Ecodesign preparatory study on mobile phones, smartphones and tablets
19
1
Figure 6: Development of the display size and screen-to-body ration in mobile 2 phones between 2005 and 2020 per price segment (Proske et al. 2020a) 3
High-end devices feature a higher weight than mid- or low-range devices of same size. 4 This might be due to a higher share of devices with metal housing instead of plastics, 5 additional glass for the backside and a larger battery in terms of capacity and weight. 6
Parallel to the increasing display size, the absolute weight of the device increased only 7 slighty as weight per display size dropped for all price segments (Figure 7). 8
9
Figure 7: Development of weight and weight per display size in mobile 10 phones between 2000 and 2020 per price segment (Proske et al. 2020a) 11
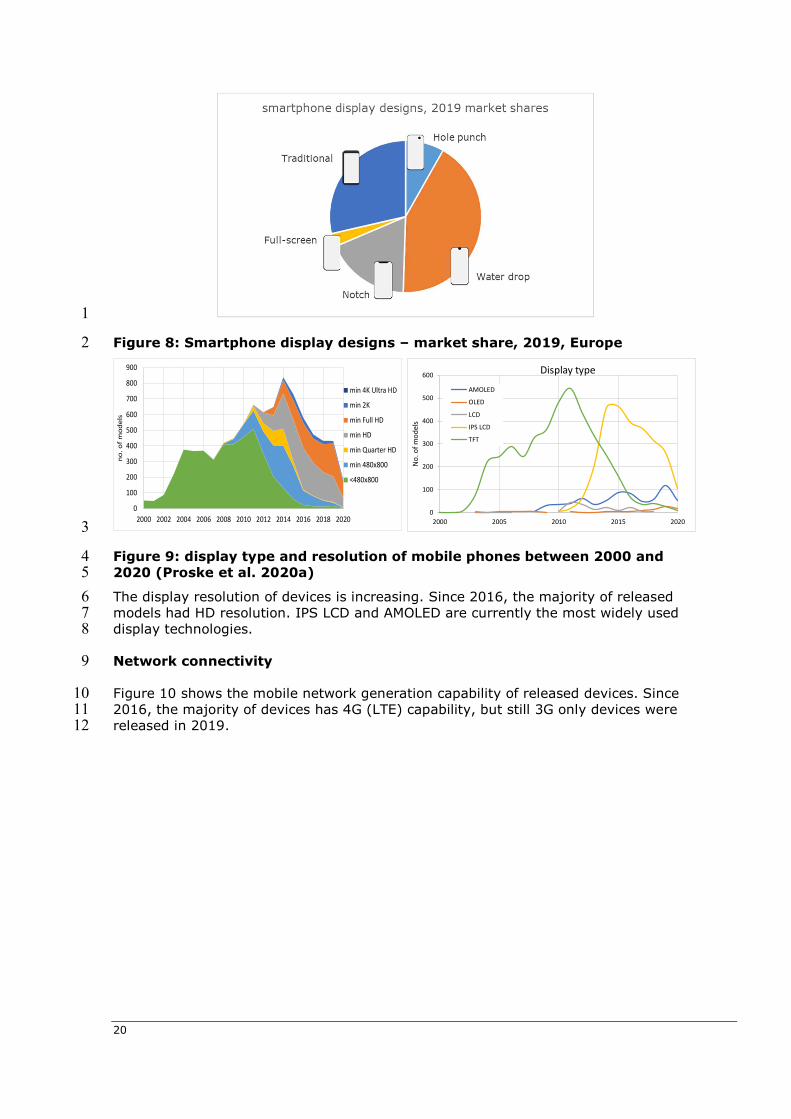
In 2019 the market share of non-traditional display designs increased significantly: 12 Whereas in 2017 traditional designs with display bezels to cover the edges of the LCD 13 panel and to accommodate selfie-camera and loudspeaker outlet represented almost 14 100% of the market, two years later this share dropped to below 30%2: Various 15 designs emerged for an edge-less display – but design solutions still had to be found 16 for the selfie-camera, which made it into a notch, “water drop” or through a punch 17 hole. The display panel designs had to be adapted to allow for these more complex 18 designs (Figure 8). The Hole-punch design had only 8.2% of the market in 2019, but 19 according to an OEM it is prognosed be the next popular design in the next several 20 years. 21
2 Market data shared by an OEM in response to the stakeholder consultation
0
1
2
3
4
5
6
7
8
2005 2007 2009 2011 2013 2015 2017 2019
Disp
lay
size
[inc
h]
Display size [inch]Models
low price
middle price
high price
total
0
10
20
30
40
50
60
70
80
90
100
2005 2007 2009 2011 2013 2015 2017 2019
Disp
lay
size
[inc
h]
Screen-to-Body Ratio [%]models
low price
middle price
high price
total
0
50
100
150
200
250
300
350
400
450
500
2000 2005 2010 2015 2020
wei
ght [
g]
Weight [g]
models
low price
middle price
high price
total
0
20
40
60
80
100
120
2000 2005 2010 2015 2020
wei
ght p
er d
ispl
ay s
ize
[g/i
nch]
Weight per display size [g/inch]
models
low price
middle price
high price
total
20
1
Figure 8: Smartphone display designs – market share, 2019, Europe 2
3
Figure 9: display type and resolution of mobile phones between 2000 and 4 2020 (Proske et al. 2020a) 5
The display resolution of devices is increasing. Since 2016, the majority of released 6 models had HD resolution. IPS LCD and AMOLED are currently the most widely used 7 display technologies. 8
Network connectivity 9
Figure 10 shows the mobile network generation capability of released devices. Since 10 2016, the majority of devices has 4G (LTE) capability, but still 3G only devices were 11 released in 2019. 12
0
100
200
300
400
500
600
700
800
900
2000 2002 2004 2006 2008 2010 2012 2014 2016 2018 2020
no. o
f m
odel
s
min 4K Ultra HD
min 2K
min Full HD
min HD
min Quarter HD
min 480x800
<480x800
0
100
200
300
400
500
600
2000 2005 2010 2015 2020
No.
of m
odel
s
Display type
AMOLED
OLED
LCD
IPS LCD
TFT
Ecodesign preparatory study on mobile phones, smartphones and tablets
21
1
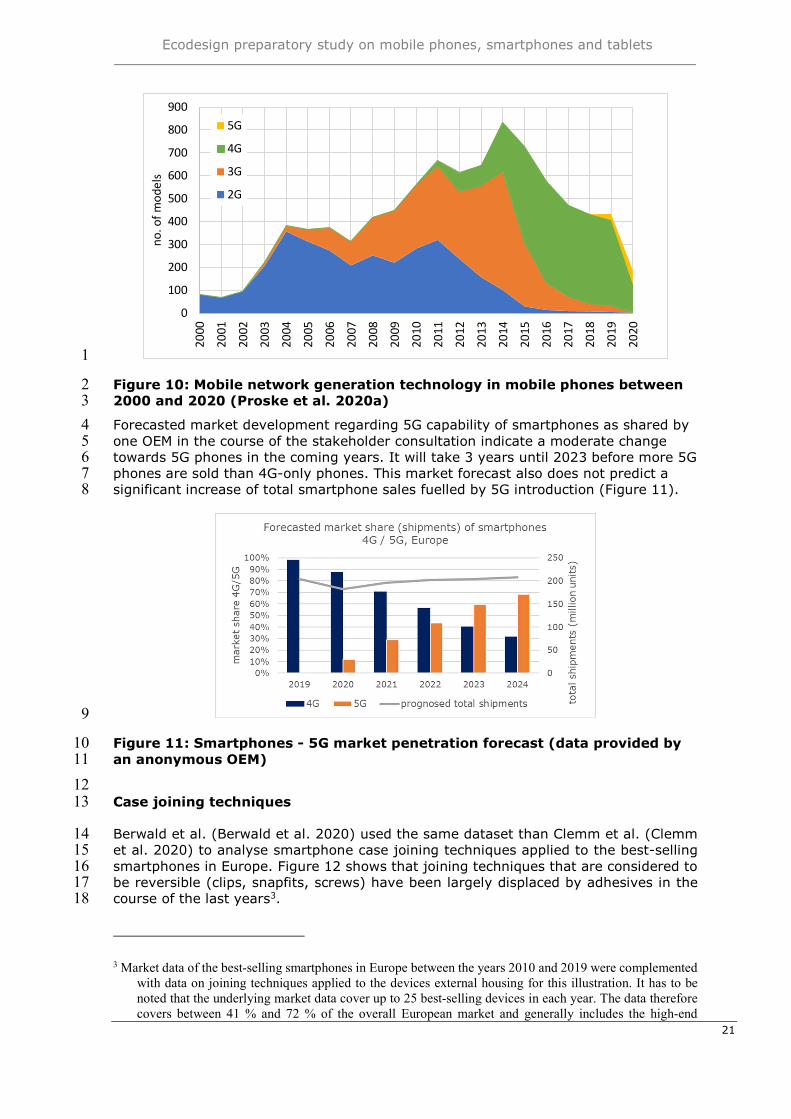
Figure 10: Mobile network generation technology in mobile phones between 2 2000 and 2020 (Proske et al. 2020a) 3
Forecasted market development regarding 5G capability of smartphones as shared by 4 one OEM in the course of the stakeholder consultation indicate a moderate change 5 towards 5G phones in the coming years. It will take 3 years until 2023 before more 5G 6 phones are sold than 4G-only phones. This market forecast also does not predict a 7 significant increase of total smartphone sales fuelled by 5G introduction (Figure 11). 8
9
Figure 11: Smartphones - 5G market penetration forecast (data provided by 10 an anonymous OEM) 11
12 Case joining techniques 13
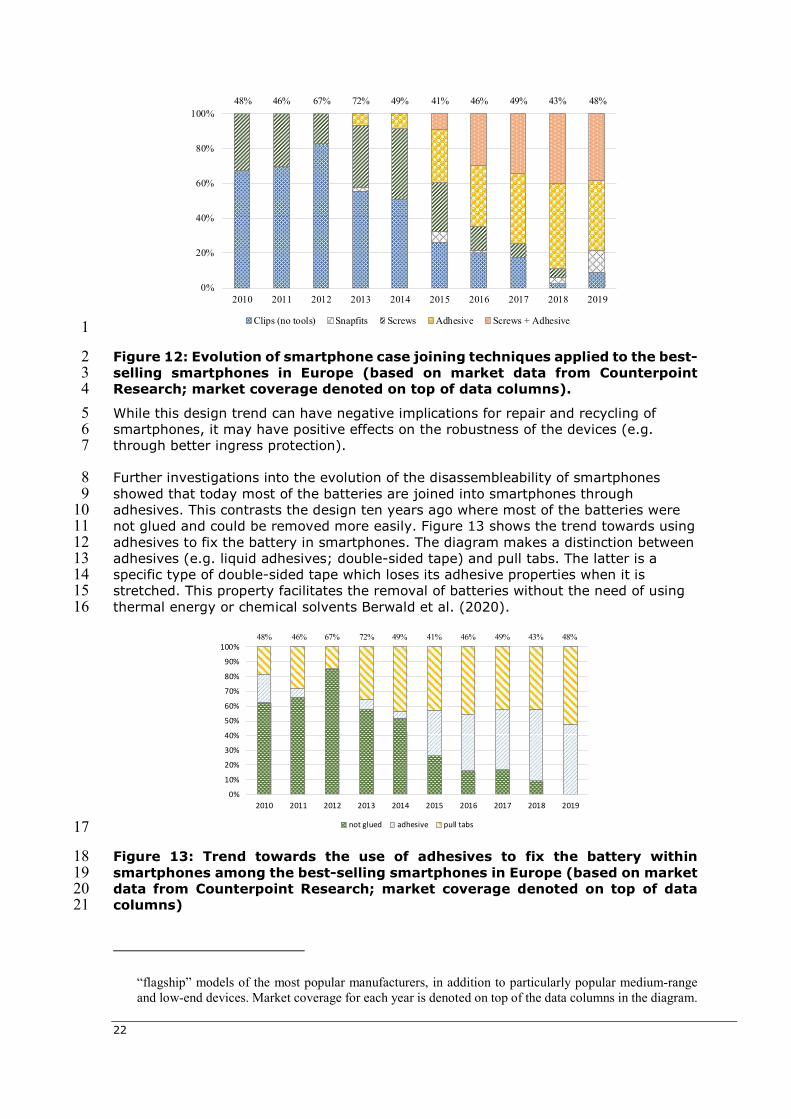
Berwald et al. (Berwald et al. 2020) used the same dataset than Clemm et al. (Clemm 14 et al. 2020) to analyse smartphone case joining techniques applied to the best-selling 15 smartphones in Europe. Figure 12 shows that joining techniques that are considered to 16 be reversible (clips, snapfits, screws) have been largely displaced by adhesives in the 17 course of the last years3. 18
3 Market data of the best-selling smartphones in Europe between the years 2010 and 2019 were complemented with data on joining techniques applied to the devices external housing for this illustration. It has to be noted that the underlying market data cover up to 25 best-selling devices in each year. The data therefore covers between 41 % and 72 % of the overall European market and generally includes the high-end
0
100
200
300
400
500
600
700
800
900
2000
2001
2002
2003
2004
2005
2006
2007
2008
2009
2010
2011
2012
2013
2014
2015
2016
2017
2018
2019
2020
no. o
f mod
els
5G
4G
3G
2G
22
1
Figure 12: Evolution of smartphone case joining techniques applied to the best-2 selling smartphones in Europe (based on market data from Counterpoint 3 Research; market coverage denoted on top of data columns). 4
While this design trend can have negative implications for repair and recycling of 5 smartphones, it may have positive effects on the robustness of the devices (e.g. 6 through better ingress protection). 7
Further investigations into the evolution of the disassembleability of smartphones 8 showed that today most of the batteries are joined into smartphones through 9 adhesives. This contrasts the design ten years ago where most of the batteries were 10 not glued and could be removed more easily. Figure 13 shows the trend towards using 11 adhesives to fix the battery in smartphones. The diagram makes a distinction between 12 adhesives (e.g. liquid adhesives; double-sided tape) and pull tabs. The latter is a 13 specific type of double-sided tape which loses its adhesive properties when it is 14 stretched. This property facilitates the removal of batteries without the need of using 15 thermal energy or chemical solvents Berwald et al. (2020). 16
17
Figure 13: Trend towards the use of adhesives to fix the battery within 18 smartphones among the best-selling smartphones in Europe (based on market 19 data from Counterpoint Research; market coverage denoted on top of data 20 columns) 21
“flagship” models of the most popular manufacturers, in addition to particularly popular medium-range and low-end devices. Market coverage for each year is denoted on top of the data columns in the diagram.
0%
20%
40%
60%
80%
100%
2010 2011 2012 2013 2014 2015 2016 2017 2018 2019
Clips (no tools) Snapfits Screws Adhesive Screws + Adhesive
48% 46% 67% 72% 49% 41% 46% 49% 43% 48%
0%
10%
20%
30%
40%
50%
60%
70%
80%
90%
100%
2010 2011 2012 2013 2014 2015 2016 2017 2018 2019
not glued adhesive pull tabs
48% 46% 67% 72% 49% 41% 46% 49% 43% 48%
Ecodesign preparatory study on mobile phones, smartphones and tablets
23
Again, this practice may have negative implications for repair and recycling of 1 smartphones, as batteries are more difficult to remove. On the other hand, using 2 adhesives might increase the robustness of the devices, since the batteries are firmly 3 held in place and might thereby be better protected from shocks and vibration. 4
Battery capacity and integration 5
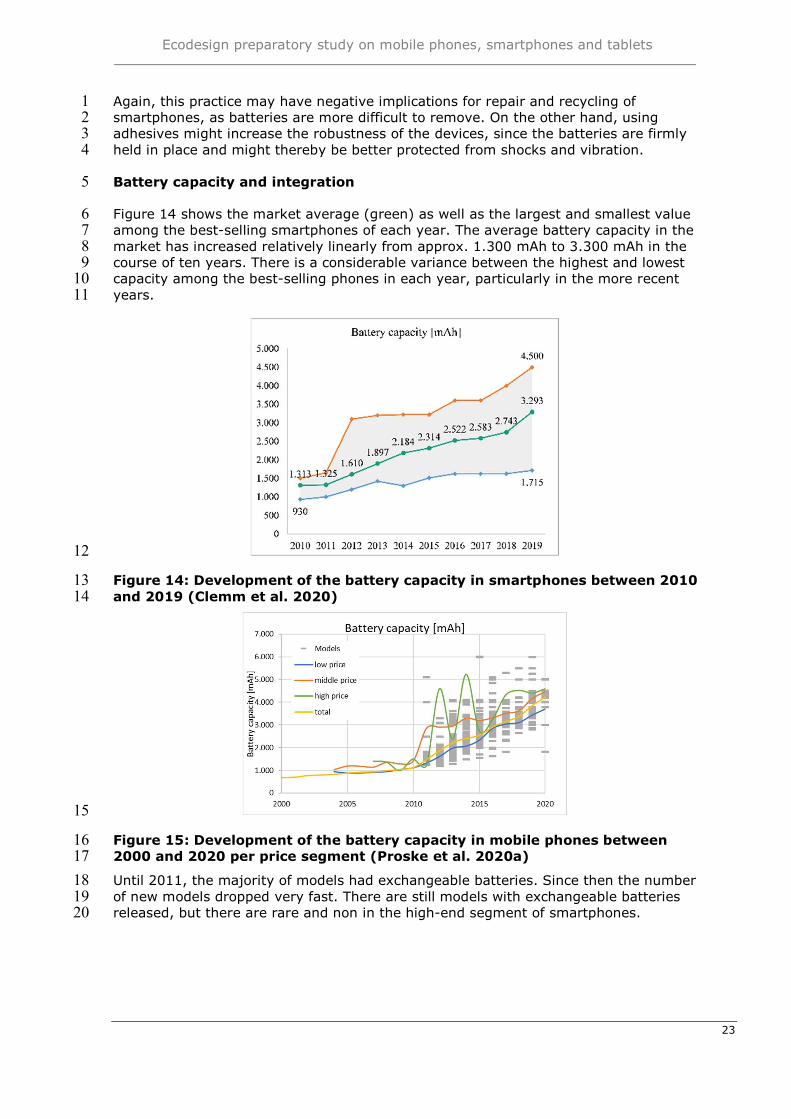
Figure 14 shows the market average (green) as well as the largest and smallest value 6 among the best-selling smartphones of each year. The average battery capacity in the 7 market has increased relatively linearly from approx. 1.300 mAh to 3.300 mAh in the 8 course of ten years. There is a considerable variance between the highest and lowest 9 capacity among the best-selling phones in each year, particularly in the more recent 10 years. 11
12
Figure 14: Development of the battery capacity in smartphones between 2010 13 and 2019 (Clemm et al. 2020) 14
15
Figure 15: Development of the battery capacity in mobile phones between 16 2000 and 2020 per price segment (Proske et al. 2020a) 17
Until 2011, the majority of models had exchangeable batteries. Since then the number 18 of new models dropped very fast. There are still models with exchangeable batteries 19 released, but there are rare and non in the high-end segment of smartphones. 20
24
1
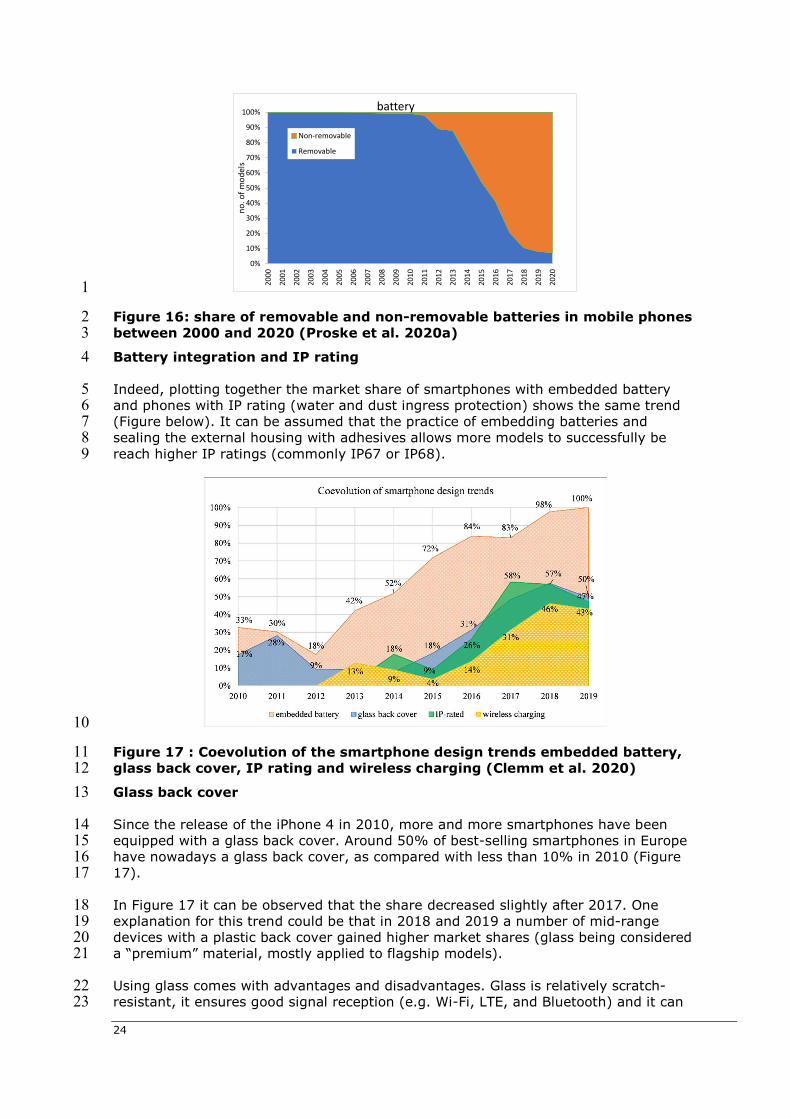
Figure 16: share of removable and non-removable batteries in mobile phones 2 between 2000 and 2020 (Proske et al. 2020a) 3
Battery integration and IP rating 4
Indeed, plotting together the market share of smartphones with embedded battery 5 and phones with IP rating (water and dust ingress protection) shows the same trend 6 (Figure below). It can be assumed that the practice of embedding batteries and 7 sealing the external housing with adhesives allows more models to successfully be 8 reach higher IP ratings (commonly IP67 or IP68). 9
10
Figure 17 : Coevolution of the smartphone design trends embedded battery, 11 glass back cover, IP rating and wireless charging (Clemm et al. 2020) 12
Glass back cover 13
Since the release of the iPhone 4 in 2010, more and more smartphones have been 14 equipped with a glass back cover. Around 50% of best-selling smartphones in Europe 15 have nowadays a glass back cover, as compared with less than 10% in 2010 (Figure 16 17). 17
In Figure 17 it can be observed that the share decreased slightly after 2017. One 18 explanation for this trend could be that in 2018 and 2019 a number of mid-range 19 devices with a plastic back cover gained higher market shares (glass being considered 20 a “premium” material, mostly applied to flagship models). 21
Using glass comes with advantages and disadvantages. Glass is relatively scratch-22 resistant, it ensures good signal reception (e.g. Wi-Fi, LTE, and Bluetooth) and it can 23
0%
10%
20%
30%
40%
50%
60%
70%
80%
90%
100%
2000
2001
2002
2003
2004
2005
2006
2007
2008
2009
2010
2011
2012
2013
2014
2015
2016
2017
2018
2019
2020
no. o
f mod
els
battery
Non-removable
Removable
Ecodesign preparatory study on mobile phones, smartphones and tablets
25
be used with wireless charging. On the other hand it is a relatively fragile material and 1 can break when an overload is induced (e.g. through a drop). Glass can be chemically 2 strengthened through an ion-exchange process. Major producers are Gorilla, Sapphire 3 and Dragontrail. According to Corning, smartphones with a Gorilla Glass 6 can survive 4 at least 15 drops on a rough surfaces from a height of one metre (Corning 2020b). 5
6
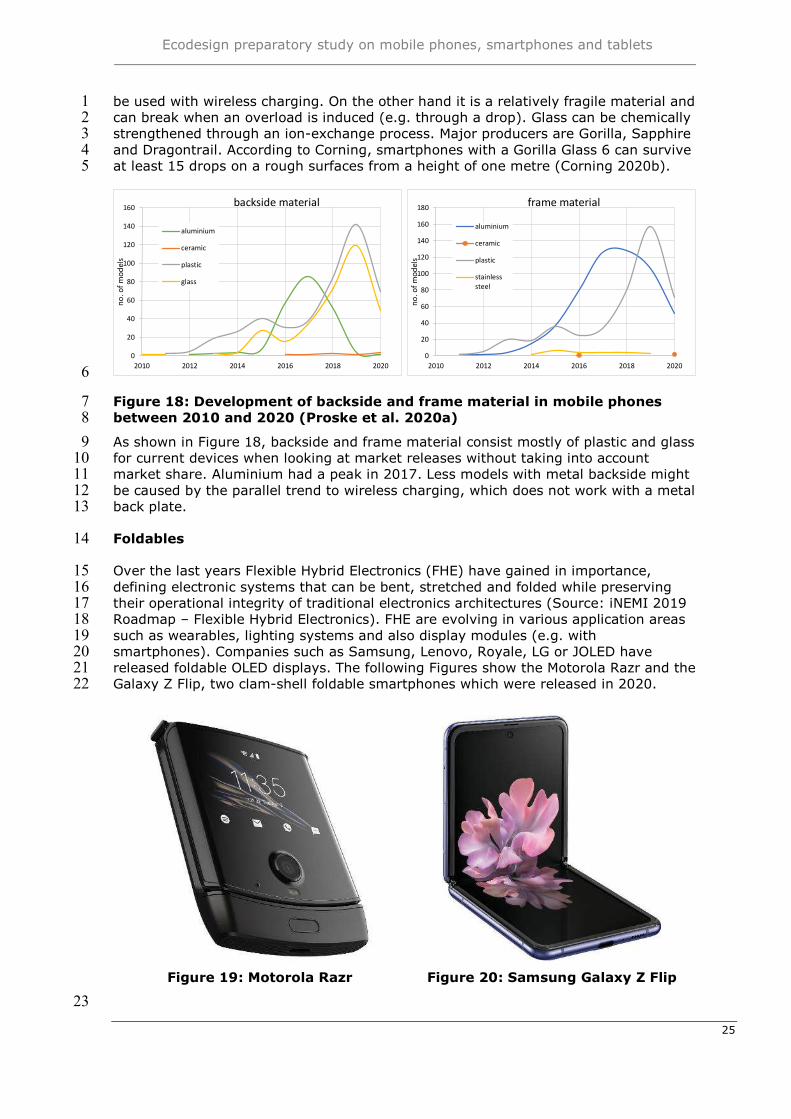
Figure 18: Development of backside and frame material in mobile phones 7 between 2010 and 2020 (Proske et al. 2020a) 8
As shown in Figure 18, backside and frame material consist mostly of plastic and glass 9 for current devices when looking at market releases without taking into account 10 market share. Aluminium had a peak in 2017. Less models with metal backside might 11 be caused by the parallel trend to wireless charging, which does not work with a metal 12 back plate. 13
Foldables 14
Over the last years Flexible Hybrid Electronics (FHE) have gained in importance, 15 defining electronic systems that can be bent, stretched and folded while preserving 16 their operational integrity of traditional electronics architectures (Source: iNEMI 2019 17 Roadmap – Flexible Hybrid Electronics). FHE are evolving in various application areas 18 such as wearables, lighting systems and also display modules (e.g. with 19 smartphones). Companies such as Samsung, Lenovo, Royale, LG or JOLED have 20 released foldable OLED displays. The following Figures show the Motorola Razr and the 21 Galaxy Z Flip, two clam-shell foldable smartphones which were released in 2020. 22
Figure 19: Motorola Razr
Figure 20: Samsung Galaxy Z Flip
23
0
20
40
60
80
100
120
140
160
2010 2012 2014 2016 2018 2020
no. o
f mod
els
backside material
aluminium
ceramic
plastic
glass
0
20
40
60
80
100
120
140
160
180
2010 2012 2014 2016 2018 2020
no. o
f mod
els
frame material
aluminium
ceramic
plastic
stainlesssteel
26
Since these devices are relatively new on the market, their durability has not been 1 comprehensively assessed in published literature at this point in time. Usually, 2 foldable smartphones come with two non-replaceable batteries. Particular concerns 3 can be related to the longevity of the flexible panels, the hinges and the material 4 covering the screen. First tests conducted by consumer organisations show that while 5 the hinge withstands more than 30,000 opening / closing cycles, it performs less good 6 in drop tests (UFC QC 2020). Furthermore, display scratch tests show damages at 7 relatively low levels that do not occur with strengthened glass (Nelson 2020). 8
When it comes to the reparability of folded devices, iFixit gave the Motorola Razr a 9 reparability score of 1/10, calling it the “most complicated phone-based contraption 10 we've ever taken apart” (iFixit 2020). Likewise, the Galaxy Z Fold has received a 11 relatively low iFixit reparability score of 2/10 (iFixit 2019). 12
(b) Material composition 13
DG JRC (Cordella et al. 2020) already researched comprehensively material 14 composition data with the following findings4: Data available for 32 models of 15 smartphones produced by Huawei (as of January 2019) shows a range in weight from 16 142.4 g to 232 g. The battery represents around 25-30% of the product weight and 17 together with glass and ceramic materials5 represent more than 50% of the 18 smartphone mass. 19
Weight of 15 models of smartphones produced by Apple (as of January 2019) ranges 20 from 112 g to 208 g, with an apparently higher weight for newer models. The relative 21 weight of batteries has passed from about 25% for older models to about 40% for the 22 newest ones6. Stainless steel is reported to be used more than aluminum and plastics. 23 However, a variation in the use of different materials over time can be observed. 24
The weights of smartphone models from Fairphone (170 g for a size of 75.5 cm²) and 25 Samsung are also included in the range described above. 26
Based on the available data, the weight of a smartphone could be estimated 27 approximately as 29 g per display size inch (+/- 15%). 28
The mass of a smartphone in general consists of metals (mainly aluminum, copper 29 and iron/steel alloys, but also minor quantities of other elements used for specific 30 applications because of their properties, including rare earth elements and conflict 31 minerals), glass and ceramics, plastics, and other materials. 32
Screens are manufactured mainly from aluminosilicate glass, a mixture of aluminum 33 oxide and silicon dioxide, which is then placed in a hot bath of molten salt. These are 34 pressed together when the glass cools, producing a layer of compressive stress on the 35 glass and increasing its strength and resistance to mechanical damage. A thin, 36 transparent, conductive layer of indium tin oxide is deposited on the glass in order to 37 allow it to function as a touch screen. 38
The vast majority of smartphones use lithium ion or lithium polymer batteries. These 39 batteries tend to use lithium cobalt oxide as the positive electrode in the battery 40
4 analysis has been updated and revised where appropriate with own insights 5 Ceramics are used in minor amounts only, mainly in capacitors, and can be considered a technically important,
but minor constituent of smartphones 6 With growing device sizes internal components do not need to be larger, so additional volume is typically
then allocated to increase battery capacity
Ecodesign preparatory study on mobile phones, smartphones and tablets
27
(though other transition metals are sometimes used in place of cobalt), whilst the 1 negative electrode is formed from carbon in the form of graphite. For further details 2 see 2.2.3. 3
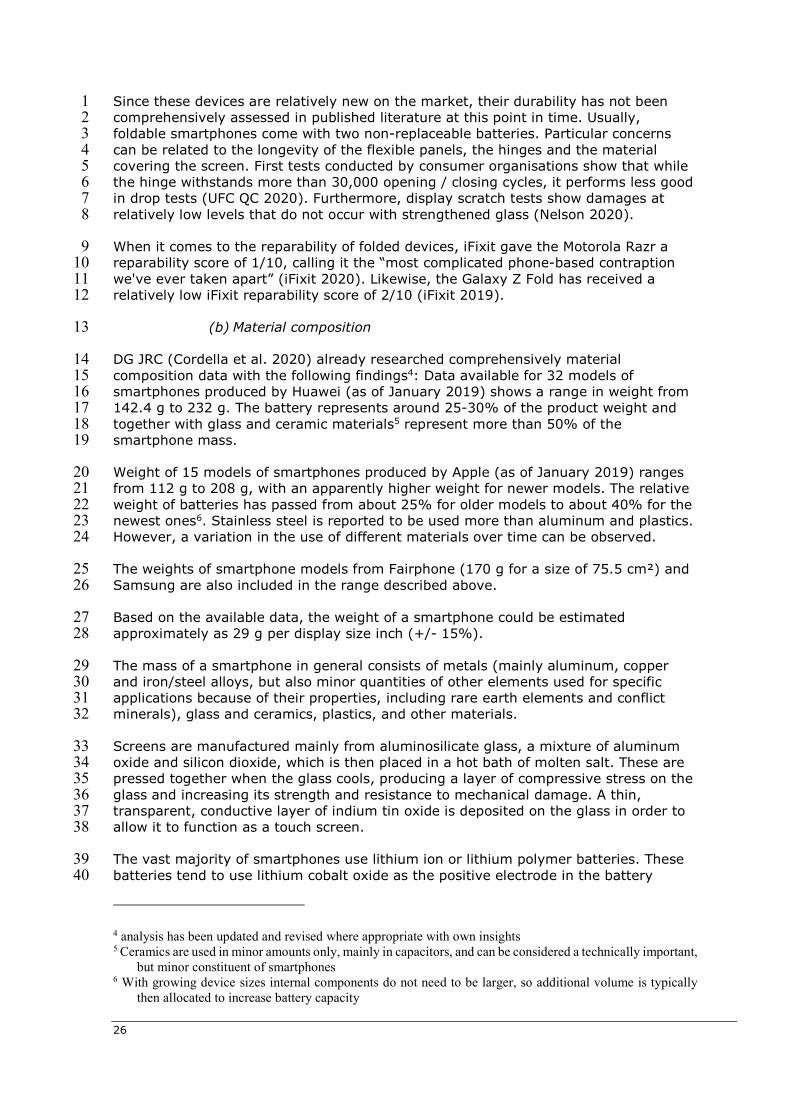
A wide range of elements and compounds are used in the electronics of a phone. The 4 main processor of the phone is made from pure silicon, which is then exposed to 5 oxygen and heat in order to produce a film of silicon dioxide on its surface. Parts of 6 this silicon dioxide layer are then removed where current is required to flow. Silicon 7 does not conduct electricity without being doped with other elements; this process 8 involves the silicon being bombarded with a variety of different elements, which can 9 include phosphorus, antimony, arsenic, boron, indium or gallium. Different types of 10 semiconductor (P or N) are produced depending on the element used, with boron 11 being the most common type of P-type dopant. The micro-electrical components and 12 wiring in the phone are composed mainly of copper, gold, and silver. Tantalum is also 13 used, being the main component of some capacitors (Figure 21). Contrary to other 14 passive components tantalum capacitors remained largely of the same size in past 15 years as the production technology is different than for, e.g. multi-layer ceramic 16 capacitors (MLCCs), which are cut from a substrate. The number of tantalum 17 capacitors per phone is varying, but typically in the range of 2 – 7, but with tantalum 18 capacitors ranging from 13 in the Fairphone 2 to none in the current Fairphone 3 and 19 several other smartphone models. 20
21
Figure 21 : Tantalum capacitor, top-view and cross-section, tantalum 22 containing parts highlighted 23
A range of other elements, including platinum and palladium are also used. Solder is 24 used to join electrical components together. Solder alloys with tin as main constituent, 25 silver and copper are in use. 26
28
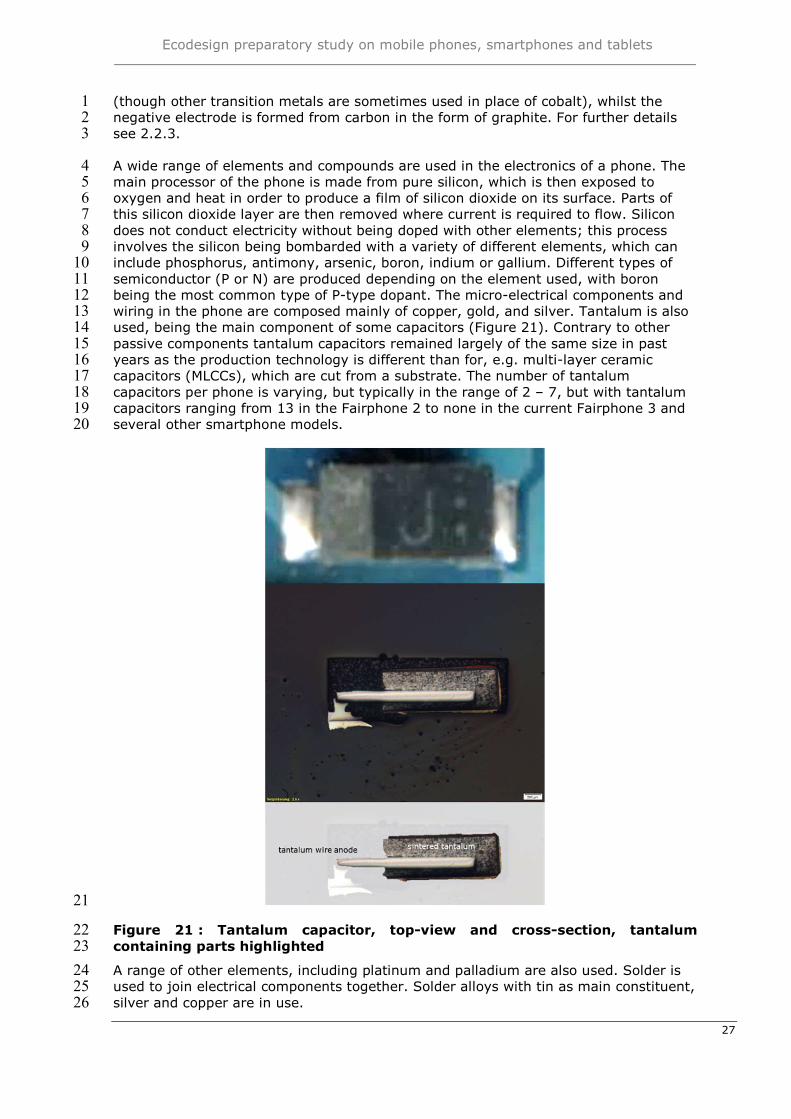
Besides tantalum, gold and tin another metal in smartphones, cordless phones and 1 tablets potentially originating from conflict minerals is tungsten, which is used in very 2 minor amounts in semiconductors and in more significant amounts in the vibration 3 alert modules. However, overall use of tungsten in mobile devices is only a marginal 4 share of the global total tungsten metal use. Most commercially available smartphones 5 contain coin-shaped linear resonant actuators (LRAs). The tungsten-containing 6 component, the tungsten ring, is mounted on other components inside a metal 7 housing. Figure 22 below shows a disassembled linear actuator and all the 8 components it contains: The metal housing, the tungsten ring, a wave spring, the 9 NdFeB magnet as well as a copper coil and the adhesive foil. The tungsten content 10 based on an analysis of models from 2012 – 2016 ranges between 0,35 g and 1,2 g 11 per smartphone (Nissen et al. 2019). 12
13 Figure 22 : Disassembled vibration motor of a 2012 smartphone model, 14 tungsten part marked in red 15
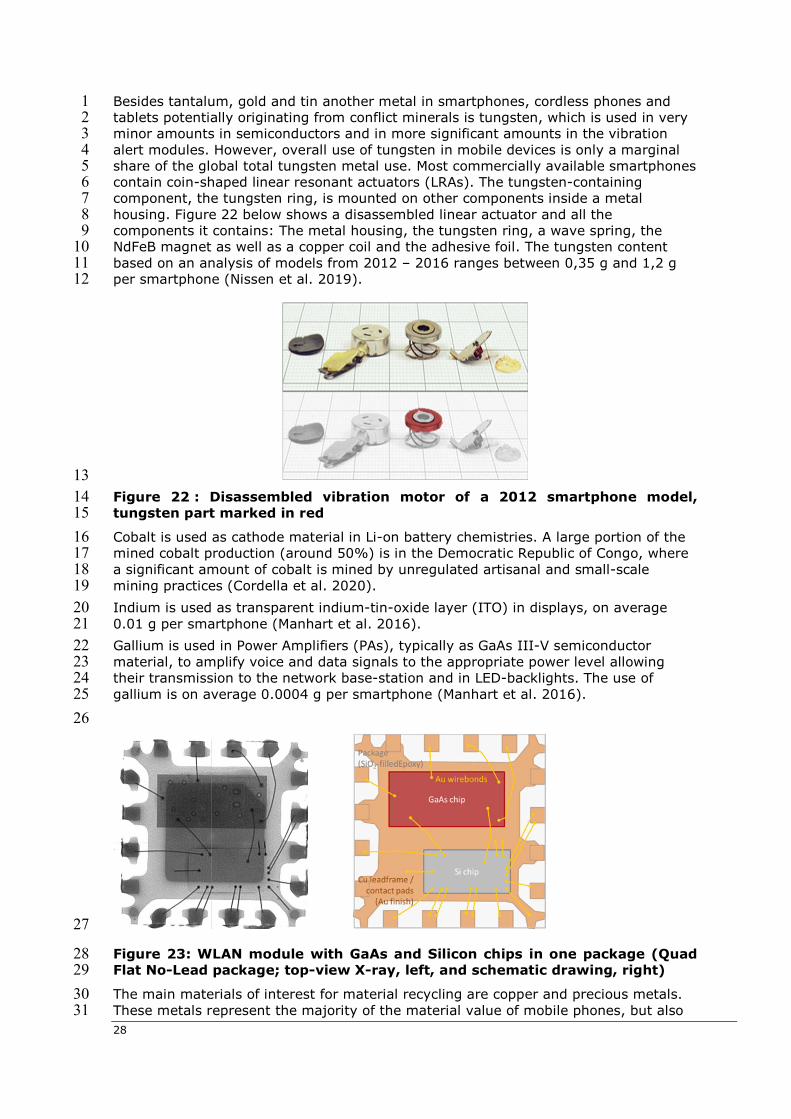
Cobalt is used as cathode material in Li-on battery chemistries. A large portion of the 16 mined cobalt production (around 50%) is in the Democratic Republic of Congo, where 17 a significant amount of cobalt is mined by unregulated artisanal and small-scale 18 mining practices (Cordella et al. 2020). 19 Indium is used as transparent indium-tin-oxide layer (ITO) in displays, on average 20 0.01 g per smartphone (Manhart et al. 2016). 21 Gallium is used in Power Amplifiers (PAs), typically as GaAs III-V semiconductor 22 material, to amplify voice and data signals to the appropriate power level allowing 23 their transmission to the network base-station and in LED-backlights. The use of 24 gallium is on average 0.0004 g per smartphone (Manhart et al. 2016). 25
26
27
Figure 23: WLAN module with GaAs and Silicon chips in one package (Quad 28 Flat No-Lead package; top-view X-ray, left, and schematic drawing, right) 29
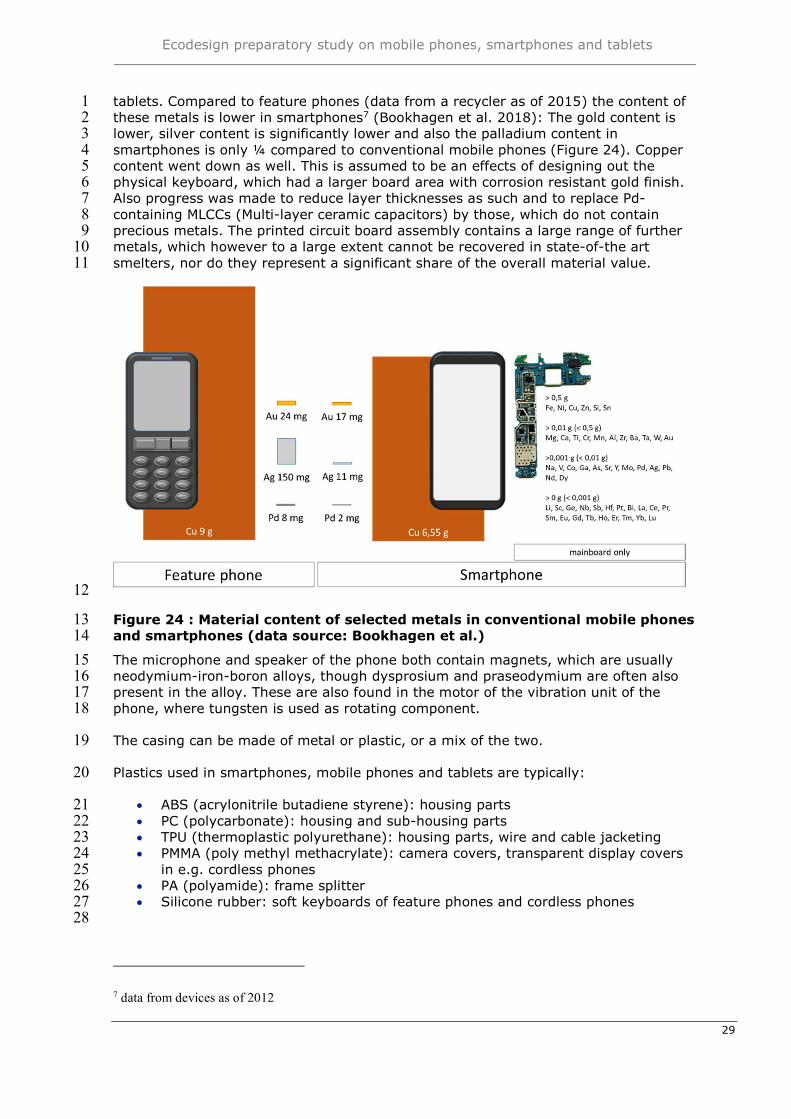
The main materials of interest for material recycling are copper and precious metals. 30 These metals represent the majority of the material value of mobile phones, but also 31
Ecodesign preparatory study on mobile phones, smartphones and tablets
29
tablets. Compared to feature phones (data from a recycler as of 2015) the content of 1 these metals is lower in smartphones7 (Bookhagen et al. 2018): The gold content is 2 lower, silver content is significantly lower and also the palladium content in 3 smartphones is only ¼ compared to conventional mobile phones (Figure 24). Copper 4 content went down as well. This is assumed to be an effects of designing out the 5 physical keyboard, which had a larger board area with corrosion resistant gold finish. 6 Also progress was made to reduce layer thicknesses as such and to replace Pd-7 containing MLCCs (Multi-layer ceramic capacitors) by those, which do not contain 8 precious metals. The printed circuit board assembly contains a large range of further 9 metals, which however to a large extent cannot be recovered in state-of-the art 10 smelters, nor do they represent a significant share of the overall material value. 11
12
Figure 24 : Material content of selected metals in conventional mobile phones 13 and smartphones (data source: Bookhagen et al.) 14
The microphone and speaker of the phone both contain magnets, which are usually 15 neodymium-iron-boron alloys, though dysprosium and praseodymium are often also 16 present in the alloy. These are also found in the motor of the vibration unit of the 17 phone, where tungsten is used as rotating component. 18
The casing can be made of metal or plastic, or a mix of the two. 19
Plastics used in smartphones, mobile phones and tablets are typically: 20
ABS (acrylonitrile butadiene styrene): housing parts 21 PC (polycarbonate): housing and sub-housing parts 22 TPU (thermoplastic polyurethane): housing parts, wire and cable jacketing 23 PMMA (poly methyl methacrylate): camera covers, transparent display covers 24
in e.g. cordless phones 25 PA (polyamide): frame splitter 26 Silicone rubber: soft keyboards of feature phones and cordless phones 27
28
7 data from devices as of 2012
30
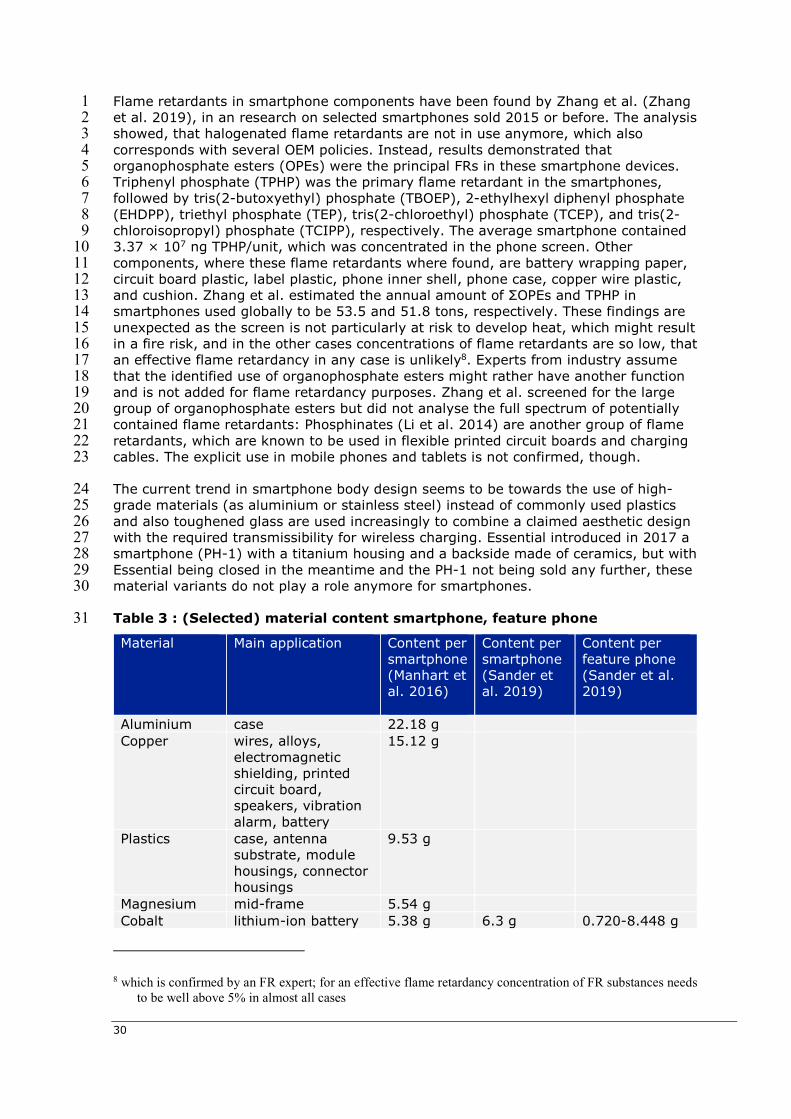
Flame retardants in smartphone components have been found by Zhang et al. (Zhang 1 et al. 2019), in an research on selected smartphones sold 2015 or before. The analysis 2 showed, that halogenated flame retardants are not in use anymore, which also 3 corresponds with several OEM policies. Instead, results demonstrated that 4 organophosphate esters (OPEs) were the principal FRs in these smartphone devices. 5 Triphenyl phosphate (TPHP) was the primary flame retardant in the smartphones, 6 followed by tris(2-butoxyethyl) phosphate (TBOEP), 2-ethylhexyl diphenyl phosphate 7 (EHDPP), triethyl phosphate (TEP), tris(2-chloroethyl) phosphate (TCEP), and tris(2-8 chloroisopropyl) phosphate (TCIPP), respectively. The average smartphone contained 9 3.37 × 10⁷ ng TPHP/unit, which was concentrated in the phone screen. Other 10 components, where these flame retardants where found, are battery wrapping paper, 11 circuit board plastic, label plastic, phone inner shell, phone case, copper wire plastic, 12 and cushion. Zhang et al. estimated the annual amount of ΣOPEs and TPHP in 13 smartphones used globally to be 53.5 and 51.8 tons, respectively. These findings are 14 unexpected as the screen is not particularly at risk to develop heat, which might result 15 in a fire risk, and in the other cases concentrations of flame retardants are so low, that 16 an effective flame retardancy in any case is unlikely8. Experts from industry assume 17 that the identified use of organophosphate esters might rather have another function 18 and is not added for flame retardancy purposes. Zhang et al. screened for the large 19 group of organophosphate esters but did not analyse the full spectrum of potentially 20 contained flame retardants: Phosphinates (Li et al. 2014) are another group of flame 21 retardants, which are known to be used in flexible printed circuit boards and charging 22 cables. The explicit use in mobile phones and tablets is not confirmed, though. 23
The current trend in smartphone body design seems to be towards the use of high-24 grade materials (as aluminium or stainless steel) instead of commonly used plastics 25 and also toughened glass are used increasingly to combine a claimed aesthetic design 26 with the required transmissibility for wireless charging. Essential introduced in 2017 a 27 smartphone (PH-1) with a titanium housing and a backside made of ceramics, but with 28 Essential being closed in the meantime and the PH-1 not being sold any further, these 29 material variants do not play a role anymore for smartphones. 30
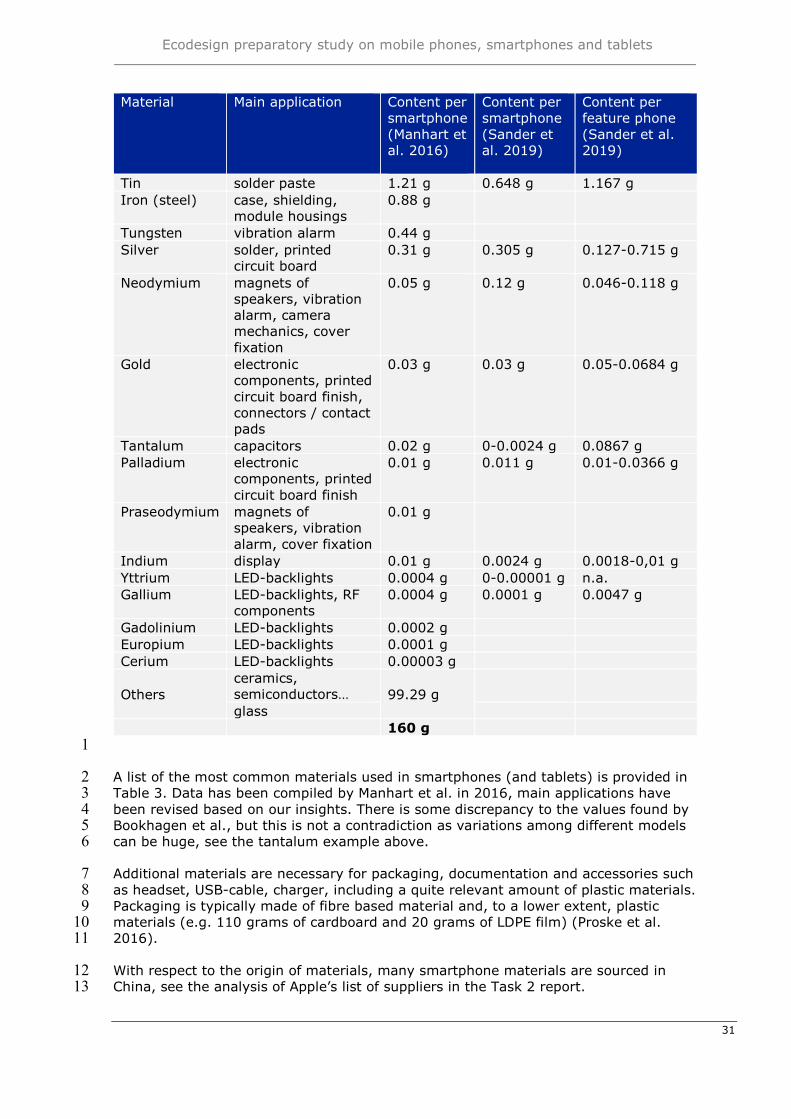
Table 3 : (Selected) material content smartphone, feature phone 31
Material Main application Content per smartphone (Manhart et al. 2016)
Content per smartphone (Sander et al. 2019)
Content per feature phone (Sander et al. 2019)
Aluminium case 22.18 g Copper wires, alloys,
electromagnetic shielding, printed circuit board, speakers, vibration alarm, battery
15.12 g
Plastics case, antenna substrate, module housings, connector housings
9.53 g
Magnesium mid-frame 5.54 g Cobalt lithium-ion battery 5.38 g 6.3 g 0.720-8.448 g
8 which is confirmed by an FR expert; for an effective flame retardancy concentration of FR substances needs to be well above 5% in almost all cases
Ecodesign preparatory study on mobile phones, smartphones and tablets
31
Material Main application Content per smartphone (Manhart et al. 2016)
Content per smartphone (Sander et al. 2019)
Content per feature phone (Sander et al. 2019)
Tin solder paste 1.21 g 0.648 g 1.167 g Iron (steel) case, shielding,
module housings 0.88 g
Tungsten vibration alarm 0.44 g Silver solder, printed
circuit board 0.31 g 0.305 g 0.127-0.715 g
Neodymium magnets of speakers, vibration alarm, camera mechanics, cover fixation
0.05 g 0.12 g 0.046-0.118 g
Gold electronic components, printed circuit board finish, connectors / contact pads
0.03 g 0.03 g 0.05-0.0684 g
Tantalum capacitors 0.02 g 0-0.0024 g 0.0867 g Palladium electronic
components, printed circuit board finish
0.01 g 0.011 g 0.01-0.0366 g
Praseodymium magnets of speakers, vibration alarm, cover fixation
0.01 g
Indium display 0.01 g 0.0024 g 0.0018-0,01 g Yttrium LED-backlights 0.0004 g 0-0.00001 g n.a. Gallium LED-backlights, RF
components 0.0004 g 0.0001 g 0.0047 g
Gadolinium LED-backlights 0.0002 g Europium LED-backlights 0.0001 g Cerium LED-backlights 0.00003 g
Others ceramics, semiconductors… 99.29 g
glass 160 g
1
A list of the most common materials used in smartphones (and tablets) is provided in 2 Table 3. Data has been compiled by Manhart et al. in 2016, main applications have 3 been revised based on our insights. There is some discrepancy to the values found by 4 Bookhagen et al., but this is not a contradiction as variations among different models 5 can be huge, see the tantalum example above. 6
Additional materials are necessary for packaging, documentation and accessories such 7 as headset, USB-cable, charger, including a quite relevant amount of plastic materials. 8 Packaging is typically made of fibre based material and, to a lower extent, plastic 9 materials (e.g. 110 grams of cardboard and 20 grams of LDPE film) (Proske et al. 10 2016). 11
With respect to the origin of materials, many smartphone materials are sourced in 12 China, see the analysis of Apple’s list of suppliers in the Task 2 report. 13
32
Both the type and the processing of materials used in smartphones are key factors for 1 determining the environmental impacts of devices. For example, it has been reported 2 that the impact on climate change of primary aluminum is about 20 kg CO2eq per kg 3 of materials when produced from coal-based electricity, and this drops to about 5 kg 4 CO2,eq per kg of materials when produced using hydro-based electricity. Recycled 5 aluminium has an even lower impact on climate change. The carbon footprint of most 6 plastics is instead about 4-5 kg CO2eq per kg of material (Cordella et al. 2020). 7
Regarding the use of certain substances, which are under discussion due to potential 8 environmental and health risks under certain conditions the analysis by JRC is still 9 accurate, that manufacturers increasingly phase out such substances (Cordella et al. 10 2020; Jardim 2017): 11
PVC: Due to possible formation of hazardous substances from the incineration 12 of this type of plastic, some manufacturers already a while ago communicated 13 the phase-out of PVC from their products, which anyway never has been 14 relevant for mobile phones except for power cables. 15
Beryllium: Beryllium copper is used in electronic and electrical connectors. 16 Beryllium is used as an alloying element in copper to improve its mechanical 17 properties without impairing the electric conductivity. Some manufacturers 18 claim to have phased-out beryllium. Modular designs might make increased use 19 of beryllium copper for springs and connectors (Schischke et al. 2019). 20
Antimony: this element is alloyed with lead or other metals to improve their 21 hardness and strength and is used in the electronics industry to make some 22 semiconductor devices, such as infrared detectors and diodes. Antimony 23 trioxide is moreover used for flame retardancy in combination with halogenated 24 flame retardants. Several manufacturers have eliminated the use of Antimony. 25
Arsenic compounds: Arsenic compounds have been used in glass of LCDs or 26 other glass parts, but OEMs and display suppliers switched to substitutes a 27 while ago. As III-V semiconductor GaAs is in rather increasing use in mobile 28 devices for RF chips (see gallium above). 29
30
2.1.1.2. Feature phones 31
In contrast to smartphones the technical characteristics of feature phones are less 32 sophisticated: The dimensions are typically smaller with regards to height and width, 33 but devices are thicker, typically. The weight is lower than that of average 34 smartphones. The screen is smaller (and not necessarily touch-sensitive), i.e. typically 35 2,4” or similar, and physical keys are provided. 36
Processors in feature phones are less sophisticated as they are mainly defined by the 37 telecom network generation they support. Many feature phones still rely on 2G 38 technology. Similarly RAM is rather small and the same is the case for internal 39 storage. Replaceable batteries and a clipped back cover to access the battery and the 40 SIM slot are common among feature phones. 41
The housing is made of plastics and only occasionally of metal. Whereas for 42 smartphones an internal frame or the back cover to which major components are 43 attached provides the needed stability, with feature phones the printed circuit board 44 frequently is a mechanically stabilizing element for the whole device and therefore is 45 of a size close to the internal dimensions of the handset (roughly 50 cm²) and 46 significantly larger than needed for the electronics functionality only. As such, it is 47 populated with SMD components only in some areas and complexity is assumed to be 48 2- or 4-layers. In sophisticated smartphones the mainboard is found side-by-side with 49 the battery and other components and does not fill the full area of the device; in 50 feature phones the mainboard is placed beneath the battery. 51
Ecodesign preparatory study on mobile phones, smartphones and tablets
33
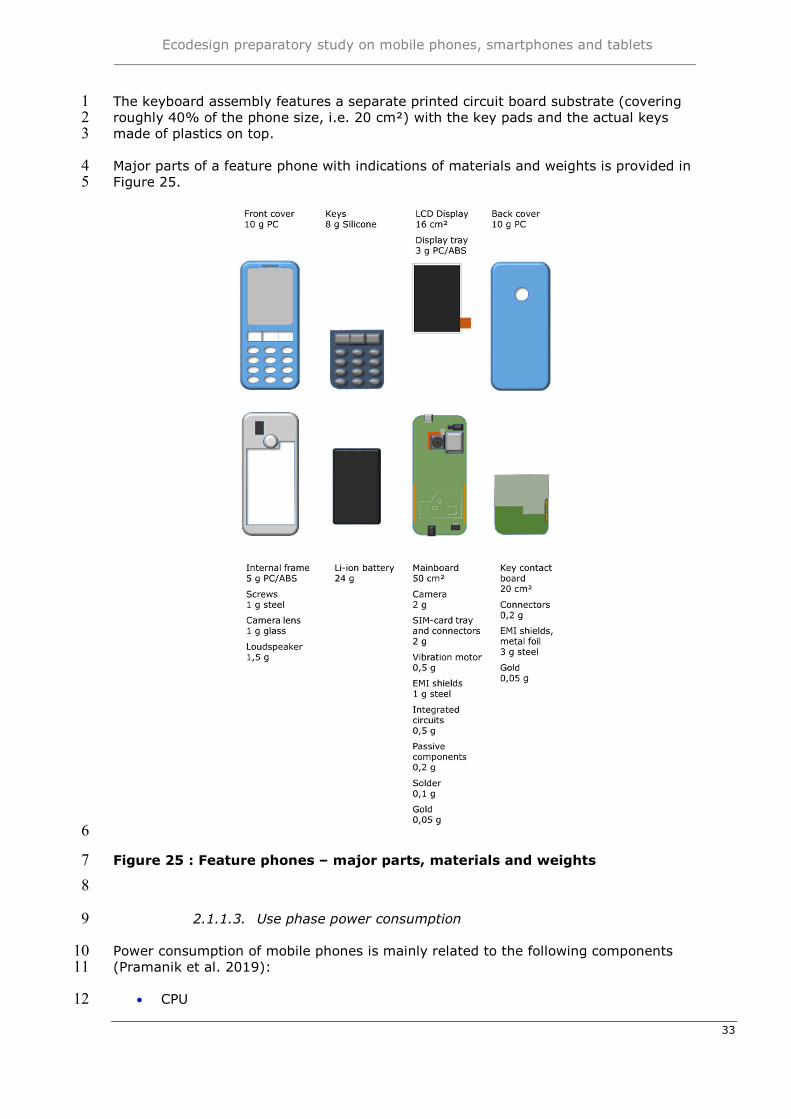
The keyboard assembly features a separate printed circuit board substrate (covering 1 roughly 40% of the phone size, i.e. 20 cm²) with the key pads and the actual keys 2 made of plastics on top. 3
Major parts of a feature phone with indications of materials and weights is provided in 4 Figure 25. 5
6
Figure 25 : Feature phones – major parts, materials and weights 7
8
2.1.1.3. Use phase power consumption 9
Power consumption of mobile phones is mainly related to the following components 10 (Pramanik et al. 2019): 11
CPU 12
34
Video / image / graphics processing 1 RF modems / interfaces: Bluetooth, WiFi, 3G / 4G / 5G, and GPS 2 Display / backlight 3
4
The relevant modes are: 5
Active battery charge 6 Maintenance or trickle-charge (mobile phone is connected to the external 7
power supply, but battery is fully charged) 8 Power adapter no-load (external power supply is plugged in, but disconnected 9
from mobile phone) 10 The power adapter no-load mode is already fully covered by the external power supply 11 regulation (see Task 1), and referenced and considered here only for completeness. 12
The web portal Notebookcheck reviews extensively the performance of smartphones, 13 including power measurements. These measurements are undertaken when the device 14 is connected to the grid, and the battery is fully charged: 15
Off: smartphone connected, but switched off 16 Standby: smartphone connected, but inactive 17 Idle average: smartphone is idle, maximum brightness, additional modules off 18 Load average: smartphone runs with maximum brightness, all modules on, 19
Android devices tested with the app "Stability Test" Classic, iOS and Windows 20 10 mobile devices tested with app Asphalt 8 21
With this stationary power measurement setting these mode definitions are not 22 suitable to define a typical mobile use scenario, but the power values as such provide 23 important orientation regarding device power consumption. 24
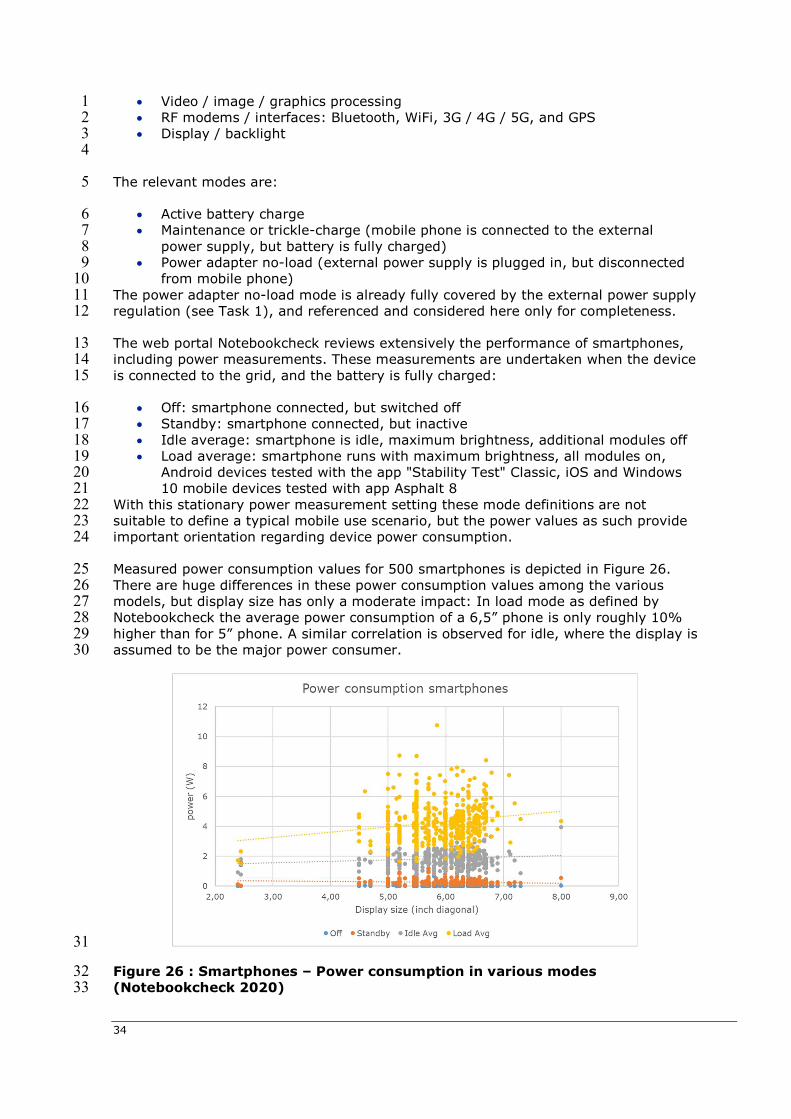
Measured power consumption values for 500 smartphones is depicted in Figure 26. 25 There are huge differences in these power consumption values among the various 26 models, but display size has only a moderate impact: In load mode as defined by 27 Notebookcheck the average power consumption of a 6,5” phone is only roughly 10% 28 higher than for 5” phone. A similar correlation is observed for idle, where the display is 29 assumed to be the major power consumer. 30
31
Figure 26 : Smartphones – Power consumption in various modes 32 (Notebookcheck 2020) 33
Ecodesign preparatory study on mobile phones, smartphones and tablets
35
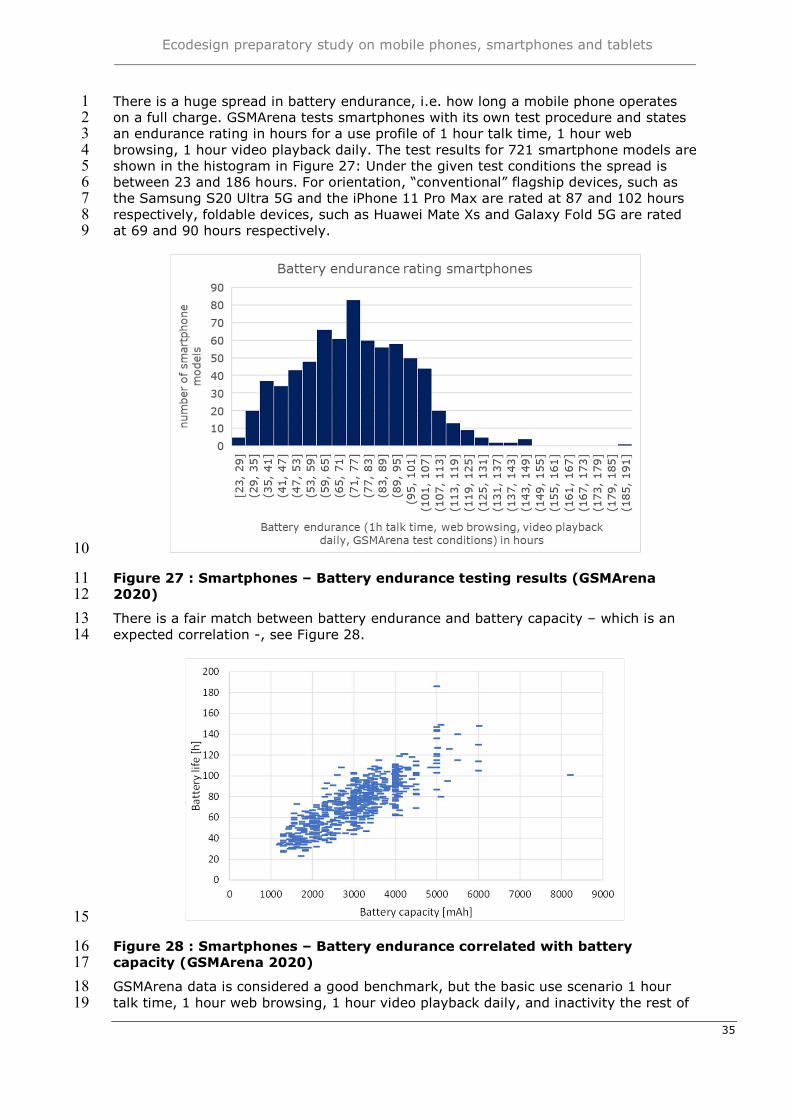
There is a huge spread in battery endurance, i.e. how long a mobile phone operates 1 on a full charge. GSMArena tests smartphones with its own test procedure and states 2 an endurance rating in hours for a use profile of 1 hour talk time, 1 hour web 3 browsing, 1 hour video playback daily. The test results for 721 smartphone models are 4 shown in the histogram in Figure 27: Under the given test conditions the spread is 5 between 23 and 186 hours. For orientation, “conventional” flagship devices, such as 6 the Samsung S20 Ultra 5G and the iPhone 11 Pro Max are rated at 87 and 102 hours 7 respectively, foldable devices, such as Huawei Mate Xs and Galaxy Fold 5G are rated 8 at 69 and 90 hours respectively. 9
10
Figure 27 : Smartphones – Battery endurance testing results (GSMArena 11 2020) 12
There is a fair match between battery endurance and battery capacity – which is an 13 expected correlation -, see Figure 28. 14
15
Figure 28 : Smartphones – Battery endurance correlated with battery 16 capacity (GSMArena 2020) 17
GSMArena data is considered a good benchmark, but the basic use scenario 1 hour 18 talk time, 1 hour web browsing, 1 hour video playback daily, and inactivity the rest of 19
36
the time leads to the conclusion, that the lowest rated devices have to be fully 1 charged once a day and above-average smartphones every 3 to 5 days, which does 2 not fully correspond with the analysis in Task 3, which indicates a more frequent 3 charging. Reasons might be running applications in the background or similar power 4 draining issues, which are not considered in the GSMArena test protocol. 5
Battery endurance as such is not only crucial for user convenience and less so for 6 energy consumption, but also for battery lifetime: The more often a battery has to be 7 charged the shorter the overall lifetime will be, which might result in a shorter overall 8 product lifetime. 9
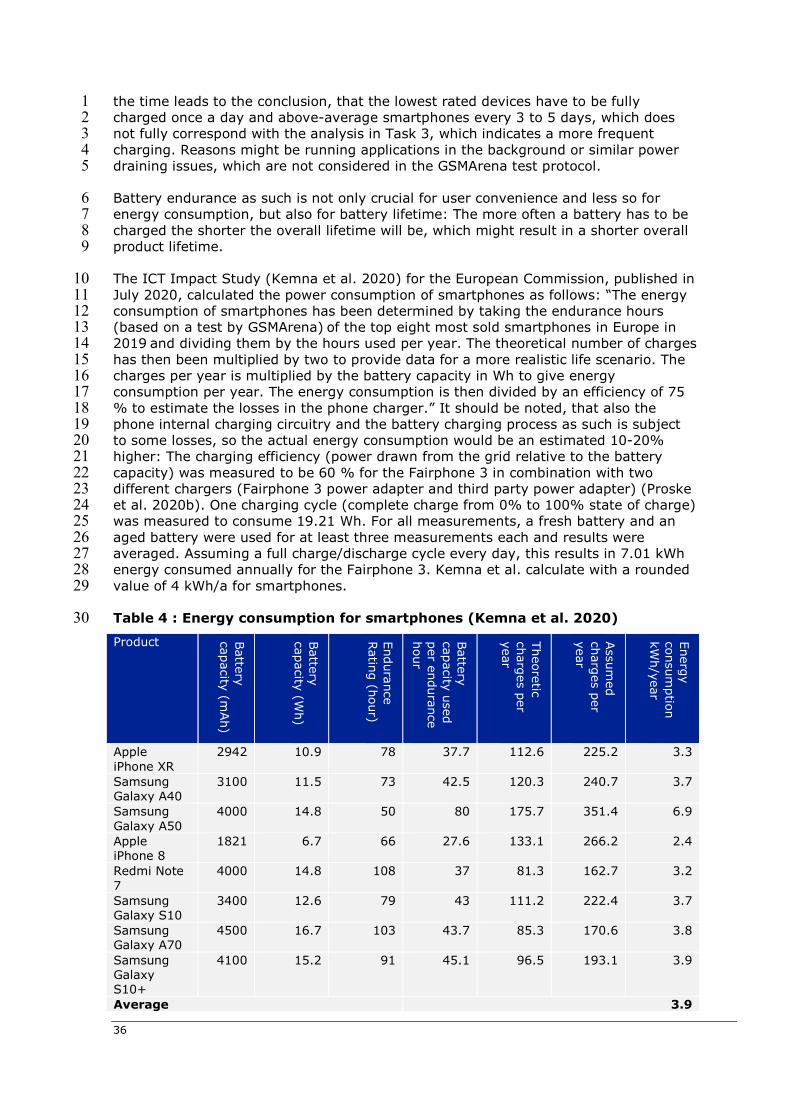
The ICT Impact Study (Kemna et al. 2020) for the European Commission, published in 10 July 2020, calculated the power consumption of smartphones as follows: “The energy 11 consumption of smartphones has been determined by taking the endurance hours 12 (based on a test by GSMArena) of the top eight most sold smartphones in Europe in 13 2019 and dividing them by the hours used per year. The theoretical number of charges 14 has then been multiplied by two to provide data for a more realistic life scenario. The 15 charges per year is multiplied by the battery capacity in Wh to give energy 16 consumption per year. The energy consumption is then divided by an efficiency of 75 17 % to estimate the losses in the phone charger.” It should be noted, that also the 18 phone internal charging circuitry and the battery charging process as such is subject 19 to some losses, so the actual energy consumption would be an estimated 10-20% 20 higher: The charging efficiency (power drawn from the grid relative to the battery 21 capacity) was measured to be 60 % for the Fairphone 3 in combination with two 22 different chargers (Fairphone 3 power adapter and third party power adapter) (Proske 23 et al. 2020b). One charging cycle (complete charge from 0% to 100% state of charge) 24 was measured to consume 19.21 Wh. For all measurements, a fresh battery and an 25 aged battery were used for at least three measurements each and results were 26 averaged. Assuming a full charge/discharge cycle every day, this results in 7.01 kWh 27 energy consumed annually for the Fairphone 3. Kemna et al. calculate with a rounded 28 value of 4 kWh/a for smartphones. 29
Table 4 : Energy consumption for smartphones (Kemna et al. 2020) 30
Product Battery
capacity (m
Ah)
Battery
capacity (W
h)
Endura
nce
Ratin
g (h
our)
Battery
capacity u
sed
per en
duran
ce hour
Theo
retic ch
arges p
er year
Assu
med
ch
arges p
er year
Energ
y co
nsu
mptio
n
kWh/year
Apple iPhone XR
2942 10.9 78 37.7 112.6 225.2 3.3
Samsung Galaxy A40
3100 11.5 73 42.5 120.3 240.7 3.7
Samsung Galaxy A50
4000 14.8 50 80 175.7 351.4 6.9
Apple iPhone 8
1821 6.7 66 27.6 133.1 266.2 2.4
Redmi Note 7
4000 14.8 108 37 81.3 162.7 3.2
Samsung Galaxy S10
3400 12.6 79 43 111.2 222.4 3.7
Samsung Galaxy A70
4500 16.7 103 43.7 85.3 170.6 3.8
Samsung Galaxy S10+
4100 15.2 91 45.1 96.5 193.1 3.9
Average 3.9
Ecodesign preparatory study on mobile phones, smartphones and tablets
37
1
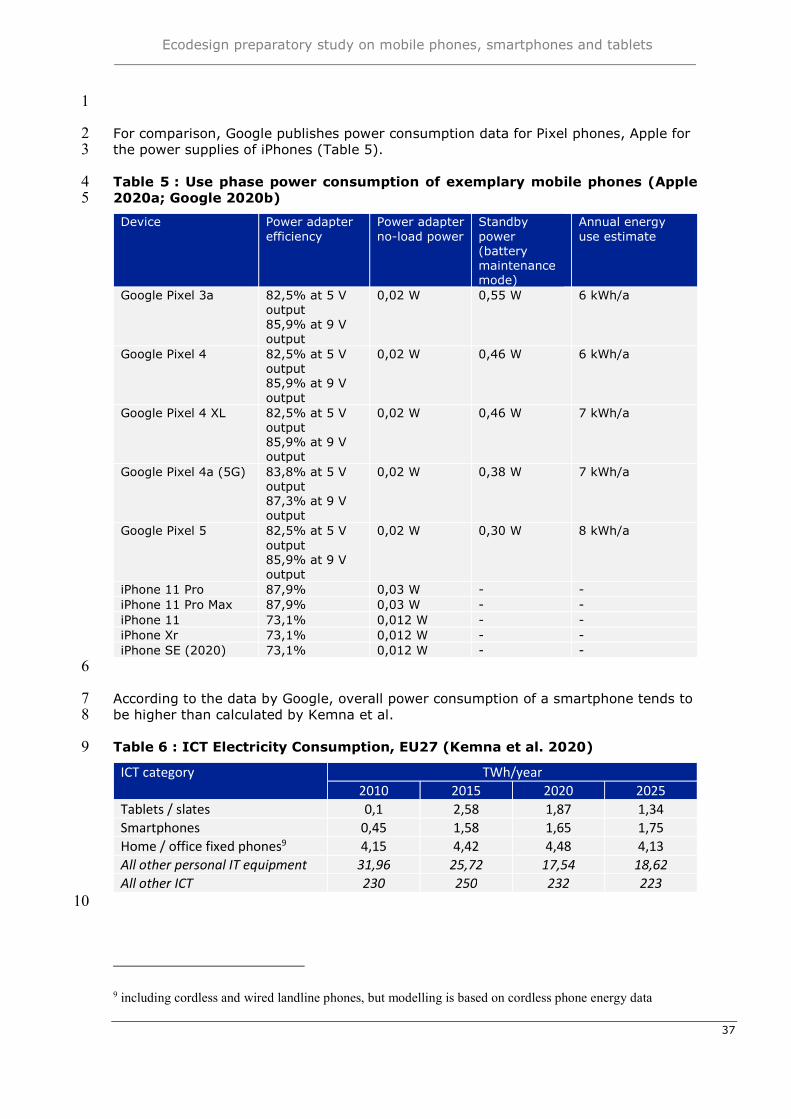
For comparison, Google publishes power consumption data for Pixel phones, Apple for 2 the power supplies of iPhones (Table 5). 3
Table 5 : Use phase power consumption of exemplary mobile phones (Apple 4 2020a; Google 2020b) 5
Device Power adapter efficiency
Power adapter no-load power
Standby power (battery maintenance mode)
Annual energy use estimate
Google Pixel 3a 82,5% at 5 V output 85,9% at 9 V output
0,02 W 0,55 W 6 kWh/a
Google Pixel 4 82,5% at 5 V output 85,9% at 9 V output
0,02 W 0,46 W 6 kWh/a
Google Pixel 4 XL 82,5% at 5 V output 85,9% at 9 V output
0,02 W 0,46 W 7 kWh/a
Google Pixel 4a (5G) 83,8% at 5 V output 87,3% at 9 V output
0,02 W 0,38 W 7 kWh/a
Google Pixel 5 82,5% at 5 V output 85,9% at 9 V output
0,02 W 0,30 W 8 kWh/a
iPhone 11 Pro 87,9% 0,03 W - - iPhone 11 Pro Max 87,9% 0,03 W - - iPhone 11 73,1% 0,012 W - - iPhone Xr 73,1% 0,012 W - - iPhone SE (2020) 73,1% 0,012 W - -
6
According to the data by Google, overall power consumption of a smartphone tends to 7 be higher than calculated by Kemna et al. 8
Table 6 : ICT Electricity Consumption, EU27 (Kemna et al. 2020) 9
ICT category TWh/year 2010 2015 2020 2025
Tablets / slates 0,1 2,58 1,87 1,34 Smartphones 0,45 1,58 1,65 1,75 Home / office fixed phones9 4,15 4,42 4,48 4,13 All other personal IT equipment 31,96 25,72 17,54 18,62 All other ICT 230 250 232 223
10
9 including cordless and wired landline phones, but modelling is based on cordless phone energy data
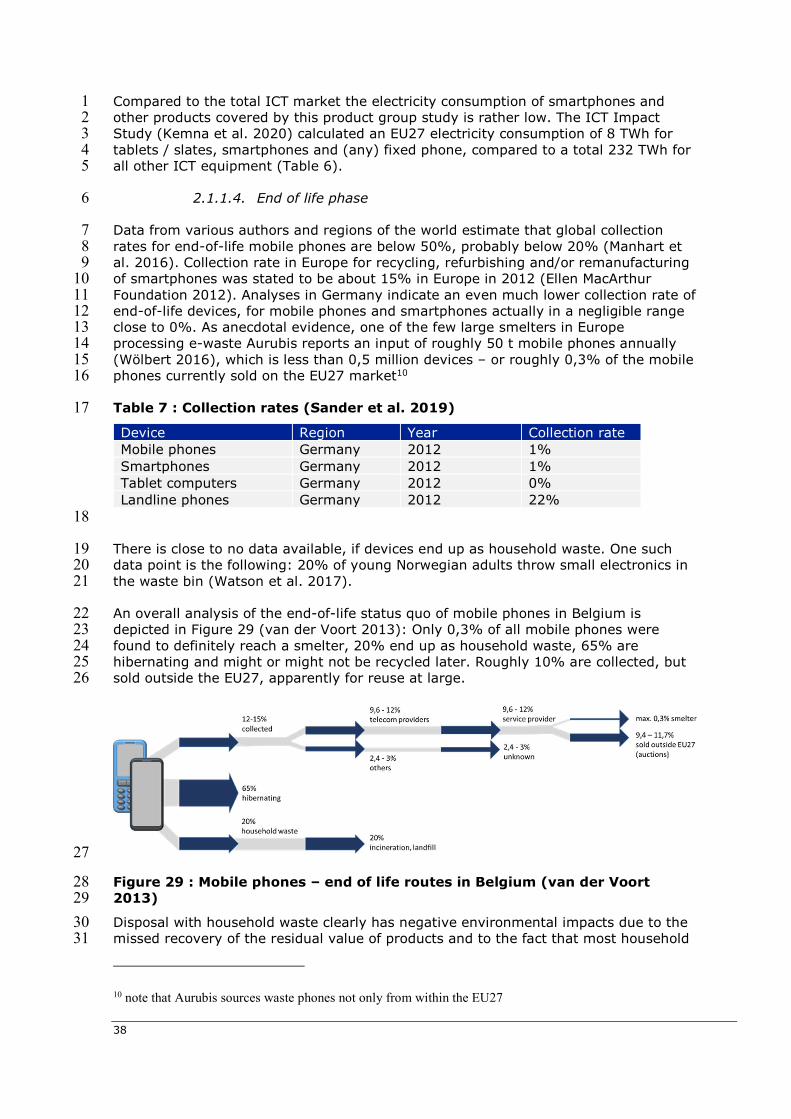
38
Compared to the total ICT market the electricity consumption of smartphones and 1 other products covered by this product group study is rather low. The ICT Impact 2 Study (Kemna et al. 2020) calculated an EU27 electricity consumption of 8 TWh for 3 tablets / slates, smartphones and (any) fixed phone, compared to a total 232 TWh for 4 all other ICT equipment (Table 6). 5
2.1.1.4. End of life phase 6
Data from various authors and regions of the world estimate that global collection 7 rates for end-of-life mobile phones are below 50%, probably below 20% (Manhart et 8 al. 2016). Collection rate in Europe for recycling, refurbishing and/or remanufacturing 9 of smartphones was stated to be about 15% in Europe in 2012 (Ellen MacArthur 10 Foundation 2012). Analyses in Germany indicate an even much lower collection rate of 11 end-of-life devices, for mobile phones and smartphones actually in a negligible range 12 close to 0%. As anecdotal evidence, one of the few large smelters in Europe 13 processing e-waste Aurubis reports an input of roughly 50 t mobile phones annually 14 (Wölbert 2016), which is less than 0,5 million devices – or roughly 0,3% of the mobile 15 phones currently sold on the EU27 market10 16
Table 7 : Collection rates (Sander et al. 2019) 17
Device Region Year Collection rate Mobile phones Germany 2012 1% Smartphones Germany 2012 1% Tablet computers Germany 2012 0% Landline phones Germany 2012 22%
18
There is close to no data available, if devices end up as household waste. One such 19 data point is the following: 20% of young Norwegian adults throw small electronics in 20 the waste bin (Watson et al. 2017). 21
An overall analysis of the end-of-life status quo of mobile phones in Belgium is 22 depicted in Figure 29 (van der Voort 2013): Only 0,3% of all mobile phones were 23 found to definitely reach a smelter, 20% end up as household waste, 65% are 24 hibernating and might or might not be recycled later. Roughly 10% are collected, but 25 sold outside the EU27, apparently for reuse at large. 26
27
Figure 29 : Mobile phones – end of life routes in Belgium (van der Voort 28 2013) 29
Disposal with household waste clearly has negative environmental impacts due to the 30 missed recovery of the residual value of products and to the fact that most household 31
10 note that Aurubis sources waste phones not only from within the EU27
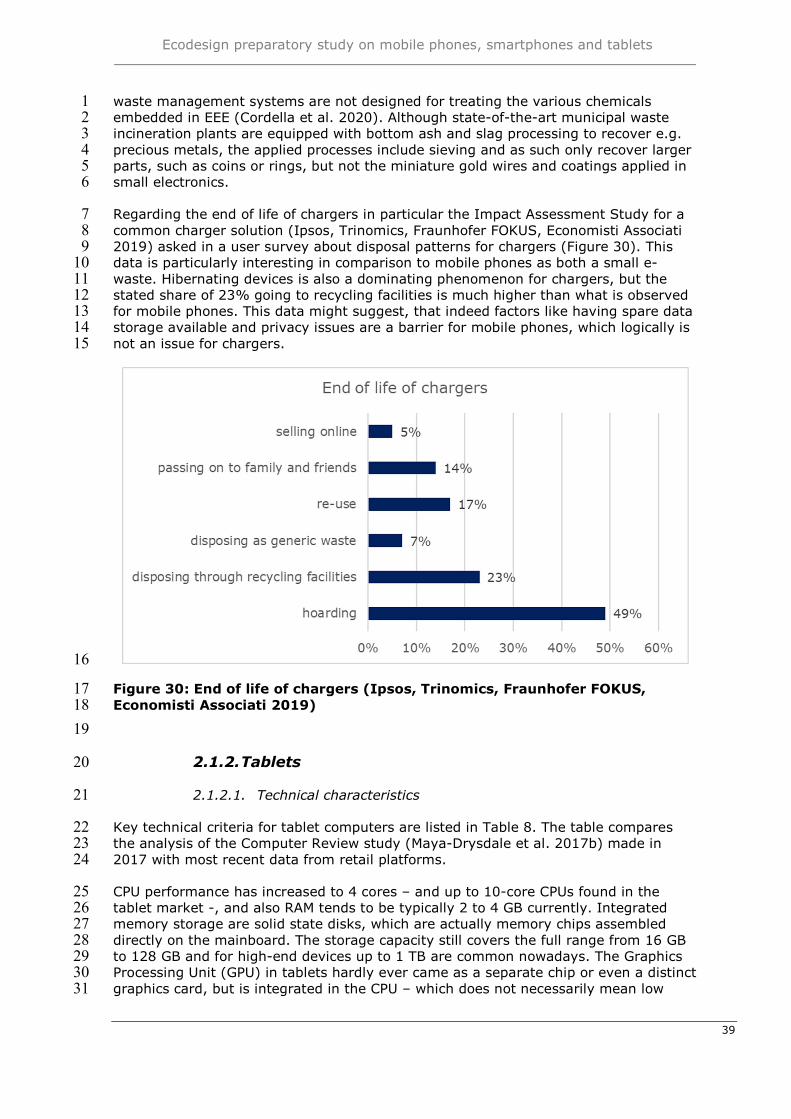
Ecodesign preparatory study on mobile phones, smartphones and tablets
39
waste management systems are not designed for treating the various chemicals 1 embedded in EEE (Cordella et al. 2020). Although state-of-the-art municipal waste 2 incineration plants are equipped with bottom ash and slag processing to recover e.g. 3 precious metals, the applied processes include sieving and as such only recover larger 4 parts, such as coins or rings, but not the miniature gold wires and coatings applied in 5 small electronics. 6
Regarding the end of life of chargers in particular the Impact Assessment Study for a 7 common charger solution (Ipsos, Trinomics, Fraunhofer FOKUS, Economisti Associati 8 2019) asked in a user survey about disposal patterns for chargers (Figure 30). This 9 data is particularly interesting in comparison to mobile phones as both a small e-10 waste. Hibernating devices is also a dominating phenomenon for chargers, but the 11 stated share of 23% going to recycling facilities is much higher than what is observed 12 for mobile phones. This data might suggest, that indeed factors like having spare data 13 storage available and privacy issues are a barrier for mobile phones, which logically is 14 not an issue for chargers. 15
16
Figure 30: End of life of chargers (Ipsos, Trinomics, Fraunhofer FOKUS, 17 Economisti Associati 2019) 18
19
2.1.2. Tablets 20
2.1.2.1. Technical characteristics 21
Key technical criteria for tablet computers are listed in Table 8. The table compares 22 the analysis of the Computer Review study (Maya-Drysdale et al. 2017b) made in 23 2017 with most recent data from retail platforms. 24
CPU performance has increased to 4 cores – and up to 10-core CPUs found in the 25 tablet market -, and also RAM tends to be typically 2 to 4 GB currently. Integrated 26 memory storage are solid state disks, which are actually memory chips assembled 27 directly on the mainboard. The storage capacity still covers the full range from 16 GB 28 to 128 GB and for high-end devices up to 1 TB are common nowadays. The Graphics 29 Processing Unit (GPU) in tablets hardly ever came as a separate chip or even a distinct 30 graphics card, but is integrated in the CPU – which does not necessarily mean low 31
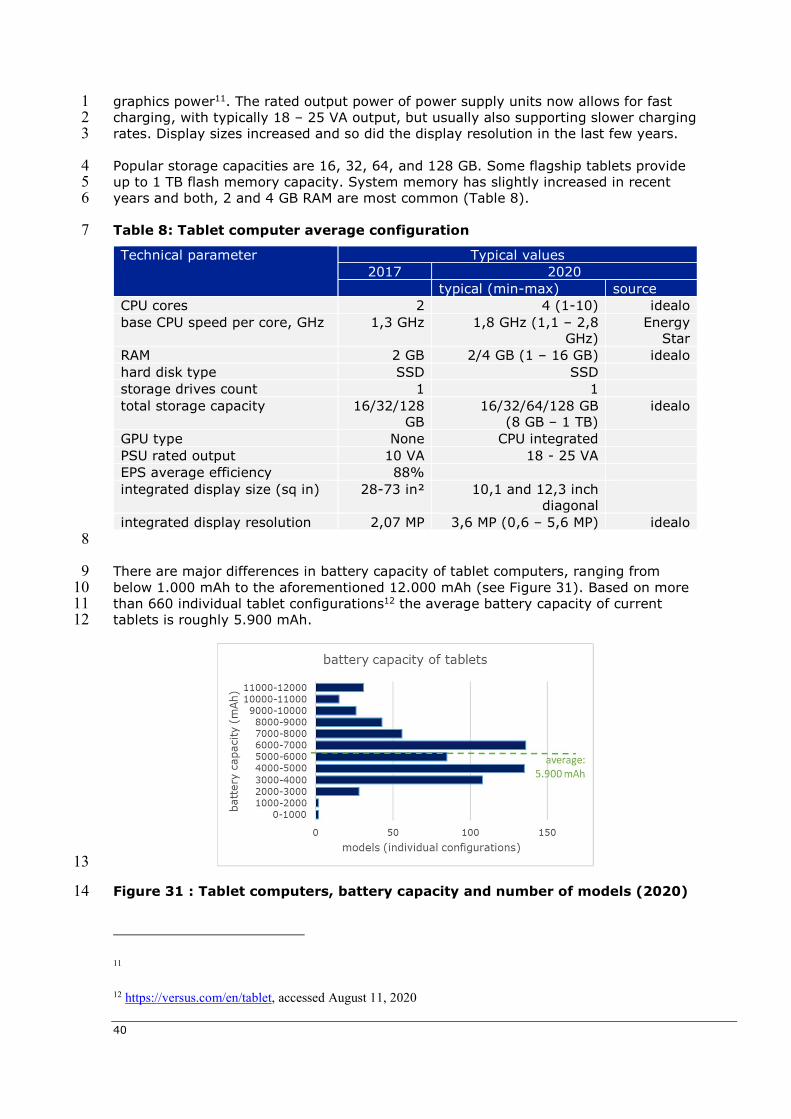
40
graphics power11. The rated output power of power supply units now allows for fast 1 charging, with typically 18 – 25 VA output, but usually also supporting slower charging 2 rates. Display sizes increased and so did the display resolution in the last few years. 3
Popular storage capacities are 16, 32, 64, and 128 GB. Some flagship tablets provide 4 up to 1 TB flash memory capacity. System memory has slightly increased in recent 5 years and both, 2 and 4 GB RAM are most common (Table 8). 6
Table 8: Tablet computer average configuration 7
Technical parameter Typical values 2017 2020
typical (min-max) source CPU cores 2 4 (1-10) idealo base CPU speed per core, GHz 1,3 GHz 1,8 GHz (1,1 – 2,8
GHz) Energy
Star RAM 2 GB 2/4 GB (1 – 16 GB) idealo hard disk type SSD SSD storage drives count 1 1 total storage capacity 16/32/128
GB 16/32/64/128 GB
(8 GB – 1 TB) idealo
GPU type None CPU integrated PSU rated output 10 VA 18 - 25 VA EPS average efficiency 88% integrated display size (sq in) 28-73 in² 10,1 and 12,3 inch
diagonal
integrated display resolution 2,07 MP 3,6 MP (0,6 – 5,6 MP) idealo 8
There are major differences in battery capacity of tablet computers, ranging from 9 below 1.000 mAh to the aforementioned 12.000 mAh (see Figure 31). Based on more 10 than 660 individual tablet configurations12 the average battery capacity of current 11 tablets is roughly 5.900 mAh. 12
13
Figure 31 : Tablet computers, battery capacity and number of models (2020) 14
11
12 https://versus.com/en/tablet, accessed August 11, 2020
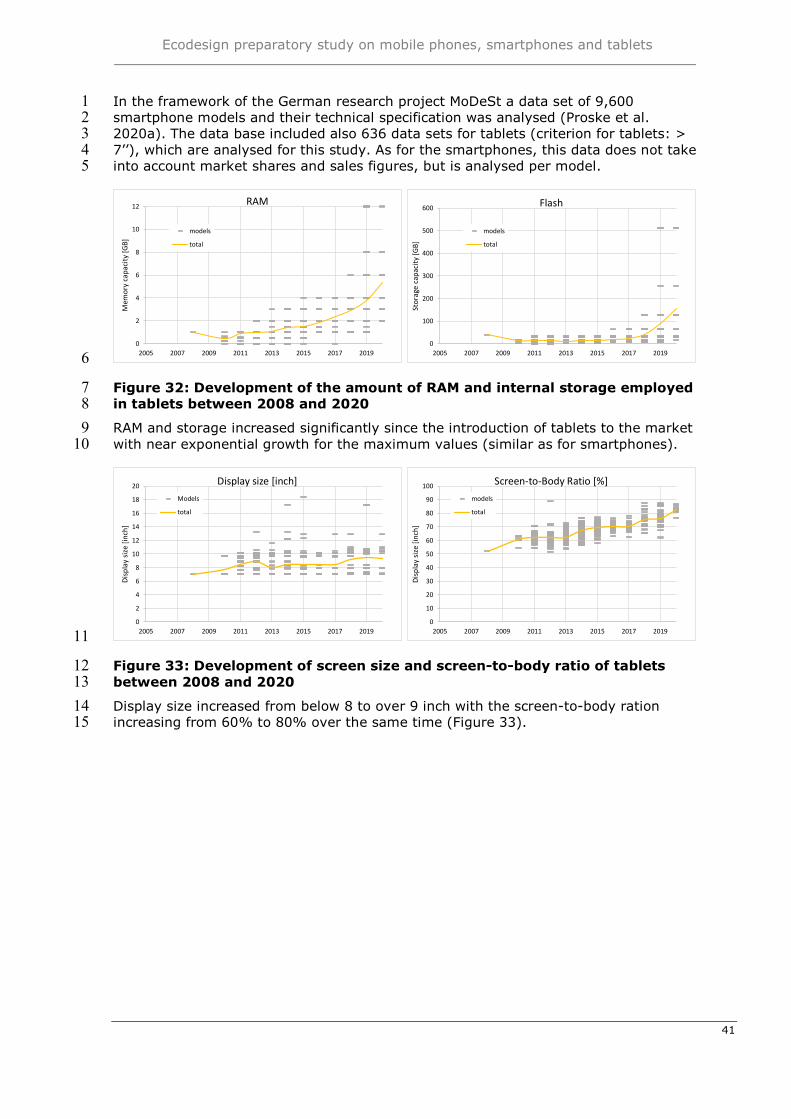
Ecodesign preparatory study on mobile phones, smartphones and tablets
41
In the framework of the German research project MoDeSt a data set of 9,600 1 smartphone models and their technical specification was analysed (Proske et al. 2 2020a). The data base included also 636 data sets for tablets (criterion for tablets: > 3 7’’), which are analysed for this study. As for the smartphones, this data does not take 4 into account market shares and sales figures, but is analysed per model. 5
6
Figure 32: Development of the amount of RAM and internal storage employed 7 in tablets between 2008 and 2020 8
RAM and storage increased significantly since the introduction of tablets to the market 9 with near exponential growth for the maximum values (similar as for smartphones). 10
11
Figure 33: Development of screen size and screen-to-body ratio of tablets 12 between 2008 and 2020 13
Display size increased from below 8 to over 9 inch with the screen-to-body ration 14 increasing from 60% to 80% over the same time (Figure 33). 15
0
2
4
6
8
10
12
2005 2007 2009 2011 2013 2015 2017 2019
Mem
ory
capa
city
[GB]
RAM
models
total
0
100
200
300
400
500
600
2005 2007 2009 2011 2013 2015 2017 2019
Stor
age
capa
city
[GB]
Flash
models
total
0
2
4
6
8
10
12
14
16
18
20
2005 2007 2009 2011 2013 2015 2017 2019
Disp
lay
size
[inc
h]
Display size [inch]Models
total
0
10
20
30
40
50
60
70
80
90
100
2005 2007 2009 2011 2013 2015 2017 2019
Disp
lay
size
[inc
h]
Screen-to-Body Ratio [%]models
total
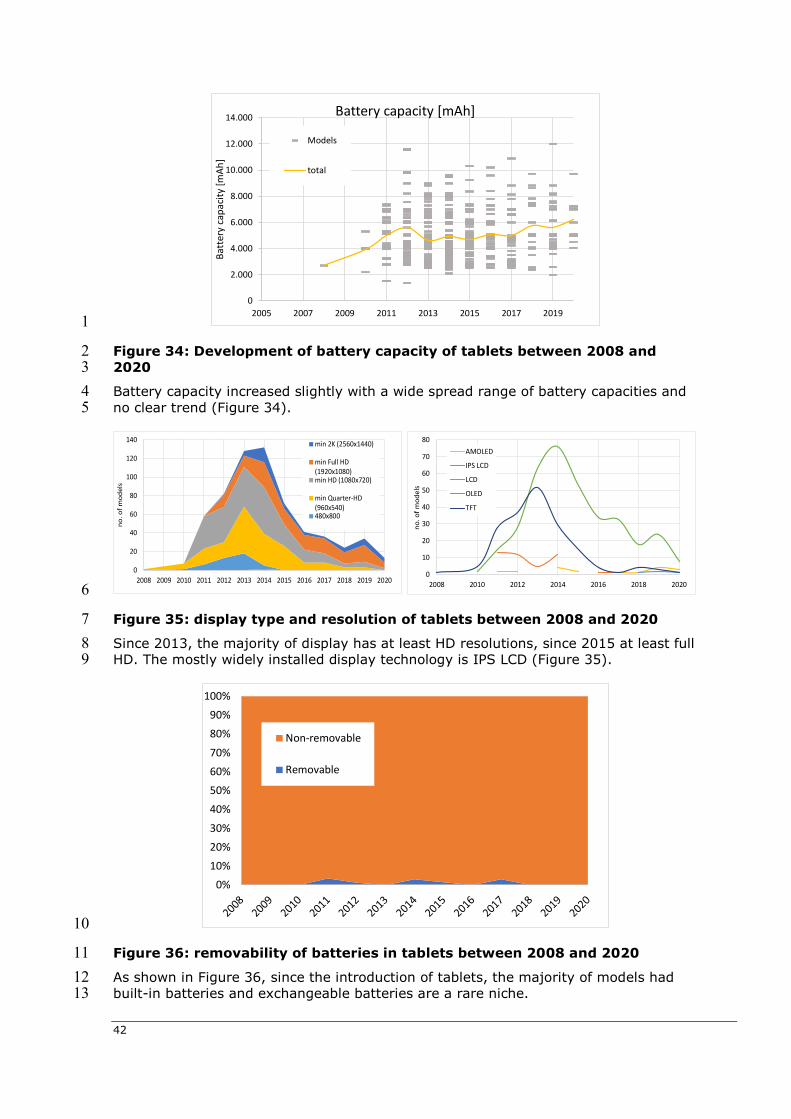
42
1
Figure 34: Development of battery capacity of tablets between 2008 and 2 2020 3
Battery capacity increased slightly with a wide spread range of battery capacities and 4 no clear trend (Figure 34). 5
6
Figure 35: display type and resolution of tablets between 2008 and 2020 7
Since 2013, the majority of display has at least HD resolutions, since 2015 at least full 8 HD. The mostly widely installed display technology is IPS LCD (Figure 35). 9
10
Figure 36: removability of batteries in tablets between 2008 and 2020 11
As shown in Figure 36, since the introduction of tablets, the majority of models had 12 built-in batteries and exchangeable batteries are a rare niche. 13
0
2.000
4.000
6.000
8.000
10.000
12.000
14.000
2005 2007 2009 2011 2013 2015 2017 2019
Batt
ery
capa
city
[mAh
]
Battery capacity [mAh]
Models
total
0
20
40
60
80
100
120
140
2008 2009 2010 2011 2012 2013 2014 2015 2016 2017 2018 2019 2020
no. o
f mod
els
min 2K (2560x1440)
min Full HD(1920x1080)min HD (1080x720)
min Quarter-HD(960x540)480x800
0
10
20
30
40
50
60
70
80
2008 2010 2012 2014 2016 2018 2020
no. o
f mod
els
AMOLED
IPS LCD
LCD
OLED
TFT
0%
10%
20%
30%
40%
50%
60%
70%
80%
90%
100%
Non-removable
Removable
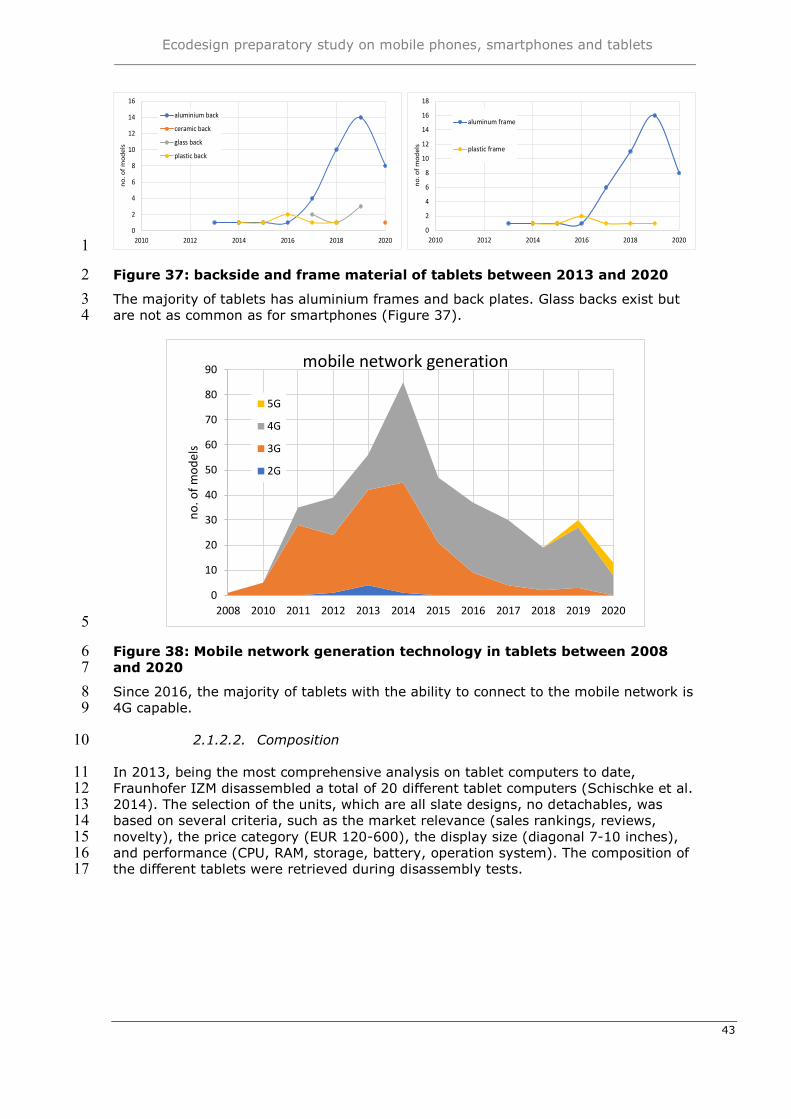
Ecodesign preparatory study on mobile phones, smartphones and tablets
43
1
Figure 37: backside and frame material of tablets between 2013 and 2020 2
The majority of tablets has aluminium frames and back plates. Glass backs exist but 3 are not as common as for smartphones (Figure 37). 4
5
Figure 38: Mobile network generation technology in tablets between 2008 6 and 2020 7
Since 2016, the majority of tablets with the ability to connect to the mobile network is 8 4G capable. 9
2.1.2.2. Composition 10
In 2013, being the most comprehensive analysis on tablet computers to date, 11 Fraunhofer IZM disassembled a total of 20 different tablet computers (Schischke et al. 12 2014). The selection of the units, which are all slate designs, no detachables, was 13 based on several criteria, such as the market relevance (sales rankings, reviews, 14 novelty), the price category (EUR 120-600), the display size (diagonal 7-10 inches), 15 and performance (CPU, RAM, storage, battery, operation system). The composition of 16 the different tablets were retrieved during disassembly tests. 17
0
2
4
6
8
10
12
14
16
2010 2012 2014 2016 2018 2020
no. o
f mod
els
aluminium back
ceramic back
glass back
plastic back
0
2
4
6
8
10
12
14
16
18
2010 2012 2014 2016 2018 2020
no. o
f mod
els
aluminum frame
plastic frame
0
10
20
30
40
50
60
70
80
90
2008 2010 2011 2012 2013 2014 2015 2016 2017 2018 2019 2020
no. o
f mod
els
mobile network generation
5G
4G
3G
2G
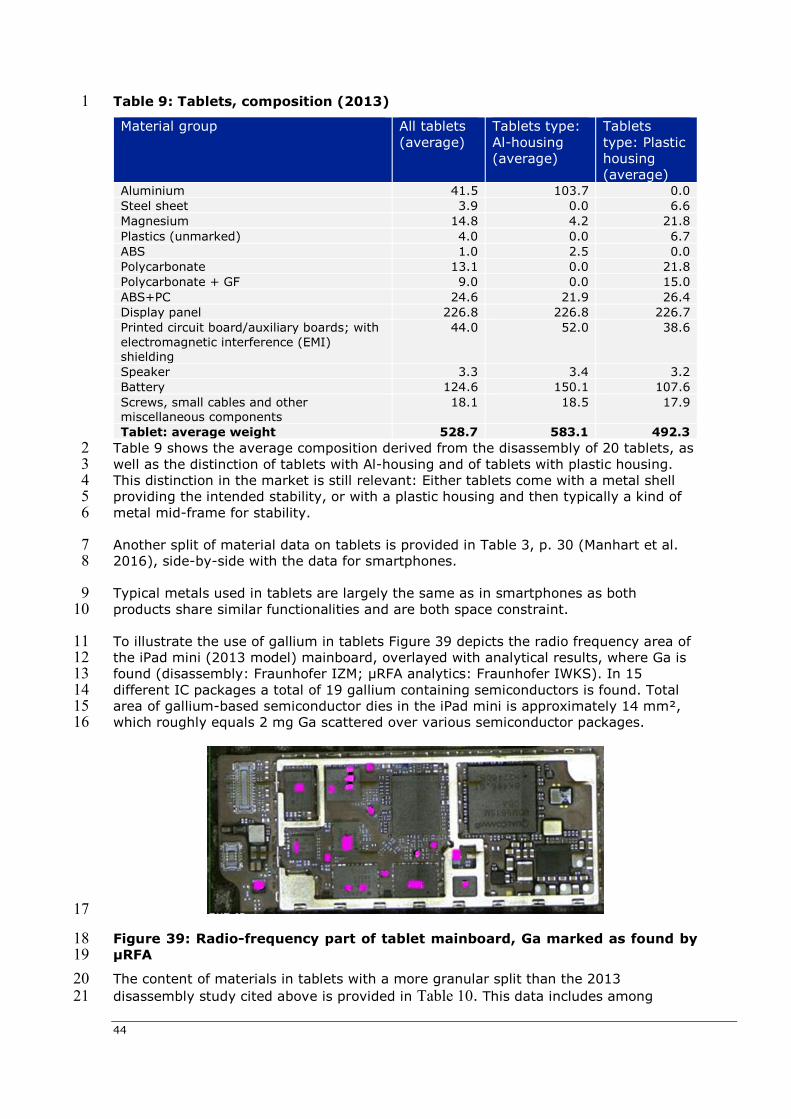
44
Table 9: Tablets, composition (2013) 1
Material group All tablets (average)
Tablets type: Al-housing (average)
Tablets type: Plastic housing (average)
Aluminium 41.5 103.7 0.0 Steel sheet 3.9 0.0 6.6 Magnesium 14.8 4.2 21.8 Plastics (unmarked) 4.0 0.0 6.7 ABS 1.0 2.5 0.0 Polycarbonate 13.1 0.0 21.8 Polycarbonate + GF 9.0 0.0 15.0 ABS+PC 24.6 21.9 26.4 Display panel 226.8 226.8 226.7 Printed circuit board/auxiliary boards; with electromagnetic interference (EMI) shielding
44.0 52.0 38.6
Speaker 3.3 3.4 3.2 Battery 124.6 150.1 107.6 Screws, small cables and other miscellaneous components
18.1 18.5 17.9
Tablet: average weight 528.7 583.1 492.3 Table 9 shows the average composition derived from the disassembly of 20 tablets, as 2 well as the distinction of tablets with Al-housing and of tablets with plastic housing. 3 This distinction in the market is still relevant: Either tablets come with a metal shell 4 providing the intended stability, or with a plastic housing and then typically a kind of 5 metal mid-frame for stability. 6
Another split of material data on tablets is provided in Table 3, p. 30 (Manhart et al. 7 2016), side-by-side with the data for smartphones. 8
Typical metals used in tablets are largely the same as in smartphones as both 9 products share similar functionalities and are both space constraint. 10
To illustrate the use of gallium in tablets Figure 39 depicts the radio frequency area of 11 the iPad mini (2013 model) mainboard, overlayed with analytical results, where Ga is 12 found (disassembly: Fraunhofer IZM; µRFA analytics: Fraunhofer IWKS). In 15 13 different IC packages a total of 19 gallium containing semiconductors is found. Total 14 area of gallium-based semiconductor dies in the iPad mini is approximately 14 mm², 15 which roughly equals 2 mg Ga scattered over various semiconductor packages. 16
17
Figure 39: Radio-frequency part of tablet mainboard, Ga marked as found by 18 µRFA 19
The content of materials in tablets with a more granular split than the 2013 20 disassembly study cited above is provided in Table 10. This data includes among 21
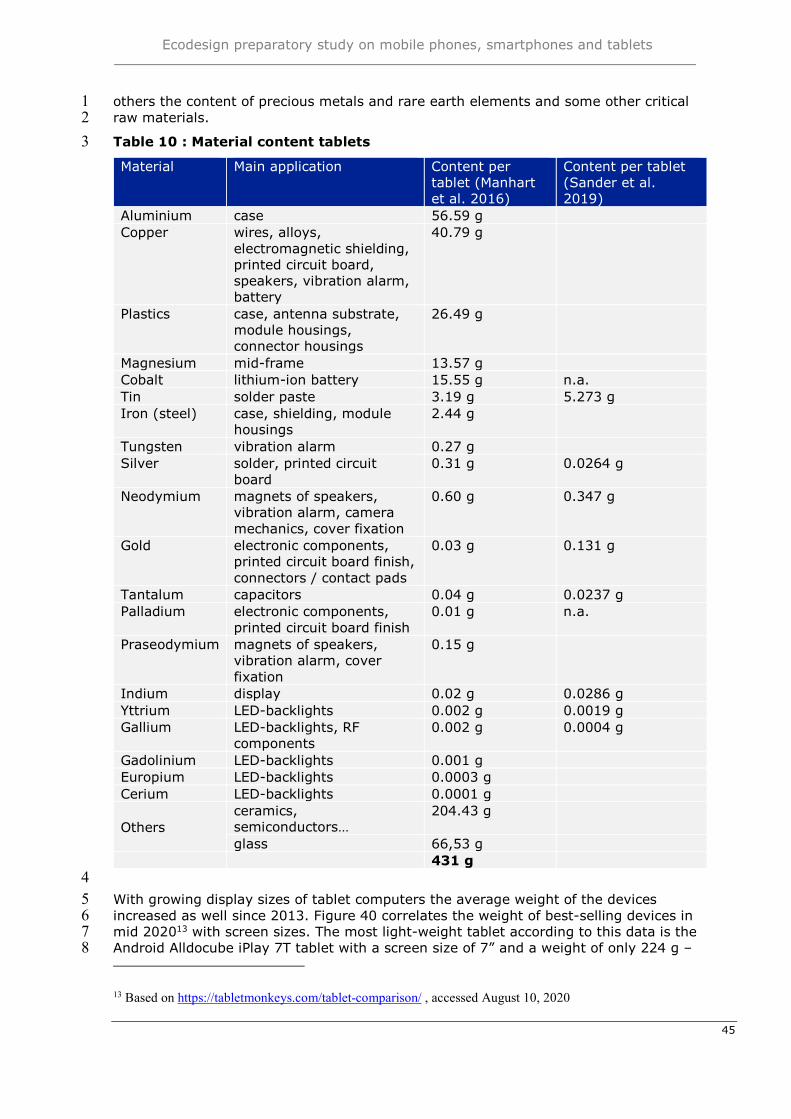
Ecodesign preparatory study on mobile phones, smartphones and tablets
45
others the content of precious metals and rare earth elements and some other critical 1 raw materials. 2
Table 10 : Material content tablets 3
Material Main application Content per tablet (Manhart et al. 2016)
Content per tablet (Sander et al. 2019)
Aluminium case 56.59 g Copper wires, alloys,
electromagnetic shielding, printed circuit board, speakers, vibration alarm, battery
40.79 g
Plastics case, antenna substrate, module housings, connector housings
26.49 g
Magnesium mid-frame 13.57 g Cobalt lithium-ion battery 15.55 g n.a. Tin solder paste 3.19 g 5.273 g Iron (steel) case, shielding, module
housings 2.44 g
Tungsten vibration alarm 0.27 g Silver solder, printed circuit
board 0.31 g 0.0264 g
Neodymium magnets of speakers, vibration alarm, camera mechanics, cover fixation
0.60 g 0.347 g
Gold electronic components, printed circuit board finish, connectors / contact pads
0.03 g 0.131 g
Tantalum capacitors 0.04 g 0.0237 g Palladium electronic components,
printed circuit board finish 0.01 g n.a.
Praseodymium magnets of speakers, vibration alarm, cover fixation
0.15 g
Indium display 0.02 g 0.0286 g Yttrium LED-backlights 0.002 g 0.0019 g Gallium LED-backlights, RF
components 0.002 g 0.0004 g
Gadolinium LED-backlights 0.001 g Europium LED-backlights 0.0003 g Cerium LED-backlights 0.0001 g
Others ceramics, semiconductors…
204.43 g
glass 66,53 g 431 g
4 With growing display sizes of tablet computers the average weight of the devices 5 increased as well since 2013. Figure 40 correlates the weight of best-selling devices in 6 mid 202013 with screen sizes. The most light-weight tablet according to this data is the 7 Android Alldocube iPlay 7T tablet with a screen size of 7” and a weight of only 224 g – 8
13 Based on https://tabletmonkeys.com/tablet-comparison/ , accessed August 10, 2020
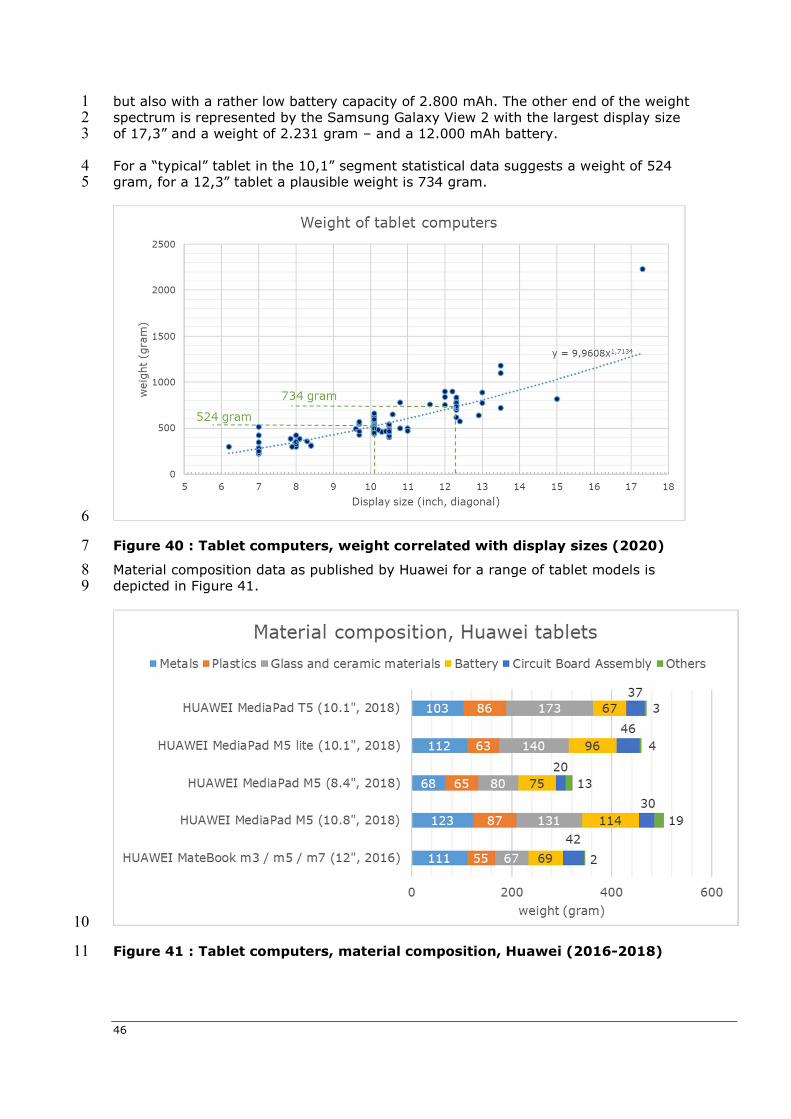
46
but also with a rather low battery capacity of 2.800 mAh. The other end of the weight 1 spectrum is represented by the Samsung Galaxy View 2 with the largest display size 2 of 17,3” and a weight of 2.231 gram – and a 12.000 mAh battery. 3
For a “typical” tablet in the 10,1” segment statistical data suggests a weight of 524 4 gram, for a 12,3” tablet a plausible weight is 734 gram. 5
6
Figure 40 : Tablet computers, weight correlated with display sizes (2020) 7
Material composition data as published by Huawei for a range of tablet models is 8 depicted in Figure 41. 9
10
Figure 41 : Tablet computers, material composition, Huawei (2016-2018) 11
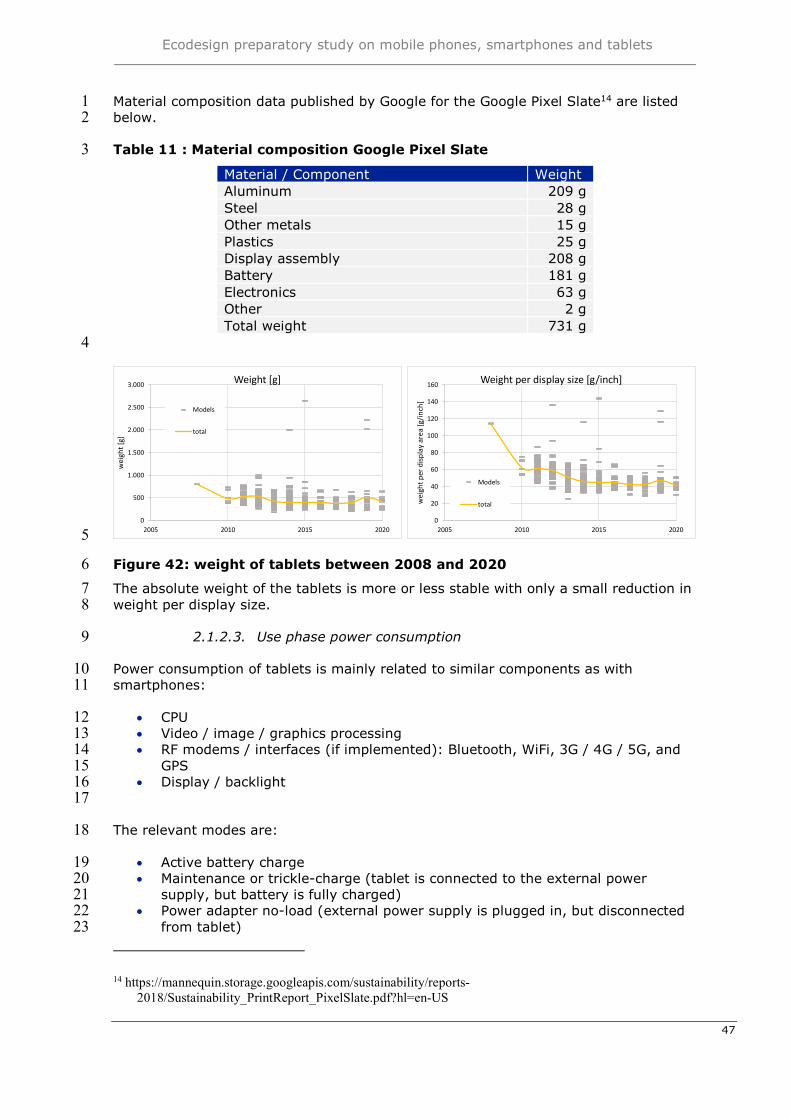
Ecodesign preparatory study on mobile phones, smartphones and tablets
47
Material composition data published by Google for the Google Pixel Slate14 are listed 1 below. 2
Table 11 : Material composition Google Pixel Slate 3
Material / Component Weight Aluminum 209 g Steel 28 g Other metals 15 g Plastics 25 g Display assembly 208 g Battery 181 g Electronics 63 g Other 2 g Total weight 731 g
4
5
Figure 42: weight of tablets between 2008 and 2020 6
The absolute weight of the tablets is more or less stable with only a small reduction in 7 weight per display size. 8
2.1.2.3. Use phase power consumption 9
Power consumption of tablets is mainly related to similar components as with 10 smartphones: 11
CPU 12 Video / image / graphics processing 13 RF modems / interfaces (if implemented): Bluetooth, WiFi, 3G / 4G / 5G, and 14
GPS 15 Display / backlight 16
17
The relevant modes are: 18
Active battery charge 19 Maintenance or trickle-charge (tablet is connected to the external power 20
supply, but battery is fully charged) 21 Power adapter no-load (external power supply is plugged in, but disconnected 22
from tablet) 23
14 https://mannequin.storage.googleapis.com/sustainability/reports-2018/Sustainability_PrintReport_PixelSlate.pdf?hl=en-US
0
500
1.000
1.500
2.000
2.500
3.000
2005 2010 2015 2020
wei
ght [
g]
Weight [g]
Models
total
0
20
40
60
80
100
120
140
160
2005 2010 2015 2020
wei
ght p
er d
ispl
ay a
rea
[g/i
nch[
Weight per display size [g/inch]
Models
total
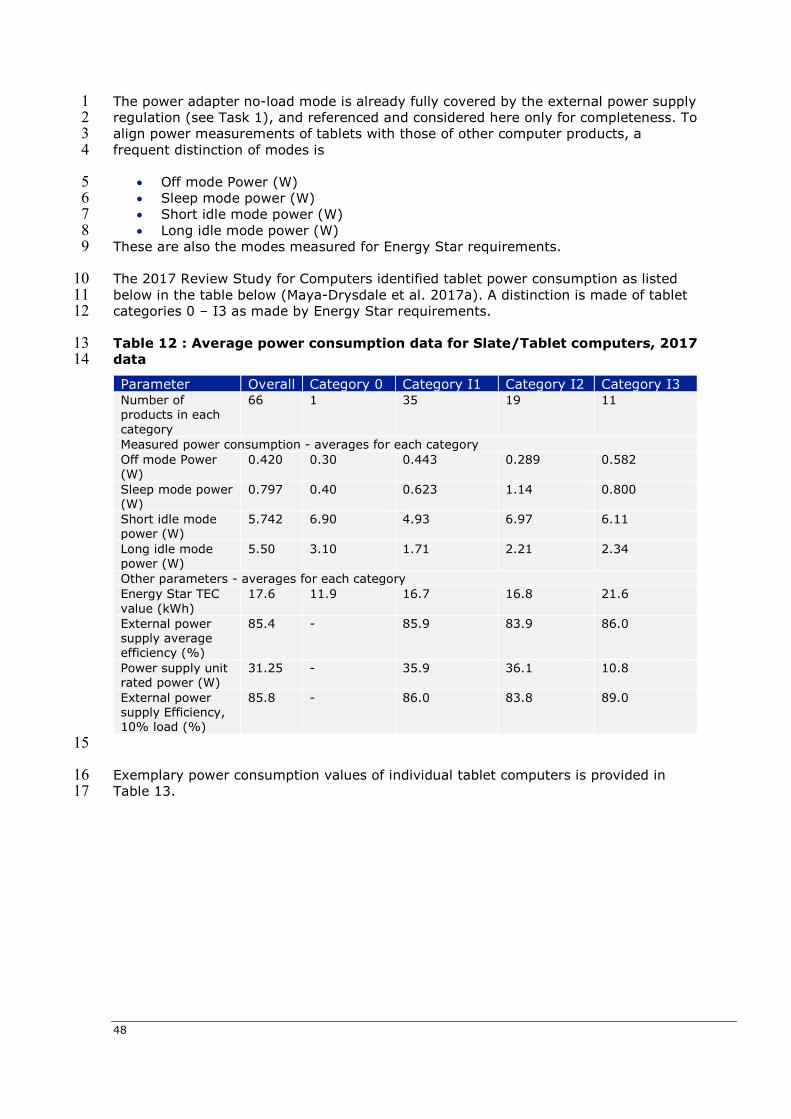
48
The power adapter no-load mode is already fully covered by the external power supply 1 regulation (see Task 1), and referenced and considered here only for completeness. To 2 align power measurements of tablets with those of other computer products, a 3 frequent distinction of modes is 4
Off mode Power (W) 5 Sleep mode power (W) 6 Short idle mode power (W) 7 Long idle mode power (W) 8
These are also the modes measured for Energy Star requirements. 9
The 2017 Review Study for Computers identified tablet power consumption as listed 10 below in the table below (Maya-Drysdale et al. 2017a). A distinction is made of tablet 11 categories 0 – I3 as made by Energy Star requirements. 12
Table 12 : Average power consumption data for Slate/Tablet computers, 2017 13 data 14
Parameter Overall Category 0 Category I1 Category I2 Category I3 Number of products in each category
66 1 35 19 11
Measured power consumption - averages for each category Off mode Power (W)
0.420 0.30 0.443 0.289 0.582
Sleep mode power (W)
0.797 0.40 0.623 1.14 0.800
Short idle mode power (W)
5.742 6.90 4.93 6.97 6.11
Long idle mode power (W)
5.50 3.10 1.71 2.21 2.34
Other parameters - averages for each category Energy Star TEC value (kWh)
17.6 11.9 16.7 16.8 21.6
External power supply average efficiency (%)
85.4 - 85.9 83.9 86.0
Power supply unit rated power (W)
31.25 - 35.9 36.1 10.8
External power supply Efficiency, 10% load (%)
85.8 - 86.0 83.8 89.0
15
Exemplary power consumption values of individual tablet computers is provided in 16 Table 13. 17
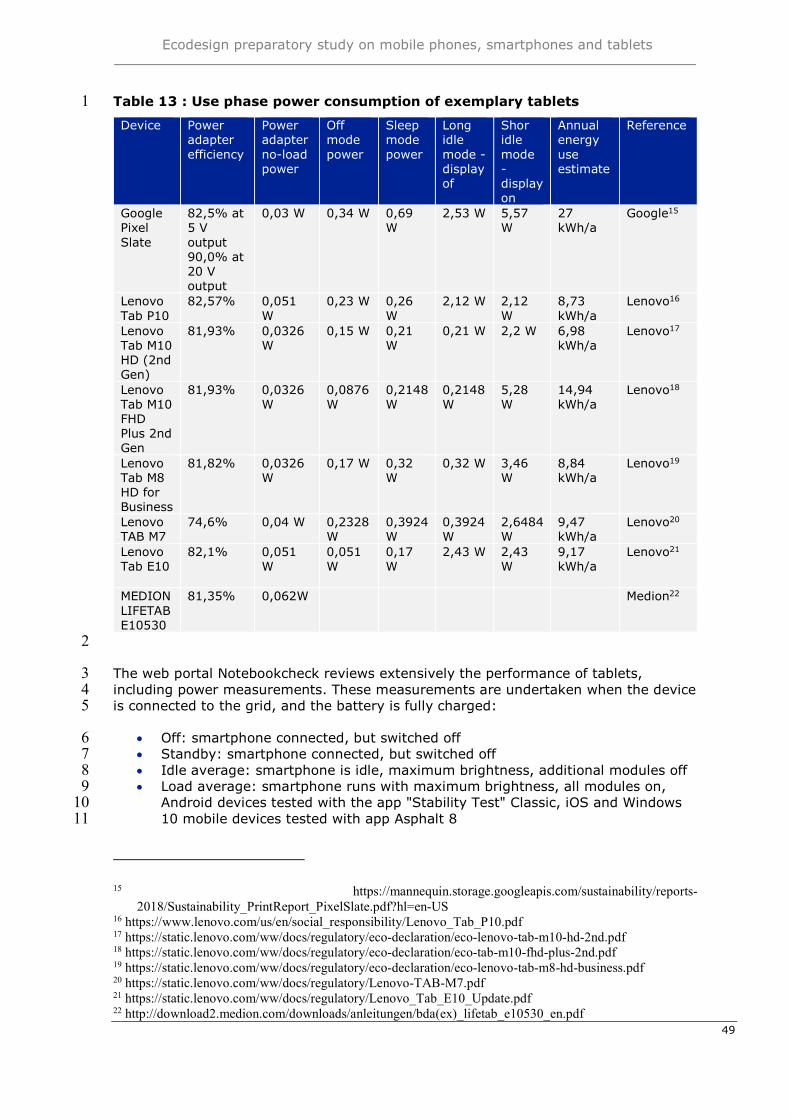
Ecodesign preparatory study on mobile phones, smartphones and tablets
49
Table 13 : Use phase power consumption of exemplary tablets 1
Device Power adapter efficiency
Power adapter no-load power
Off mode power
Sleep mode power
Long idle mode - display of
Shor idle mode - display on
Annual energy use estimate
Reference
Google Pixel Slate
82,5% at 5 V output 90,0% at 20 V output
0,03 W 0,34 W 0,69 W
2,53 W 5,57 W
27 kWh/a
Google15
Lenovo Tab P10
82,57% 0,051 W
0,23 W 0,26 W
2,12 W 2,12 W
8,73 kWh/a
Lenovo16
Lenovo Tab M10 HD (2nd Gen)
81,93% 0,0326 W
0,15 W 0,21 W
0,21 W 2,2 W 6,98 kWh/a
Lenovo17
Lenovo Tab M10 FHD Plus 2nd Gen
81,93% 0,0326 W
0,0876 W
0,2148 W
0,2148 W
5,28 W
14,94 kWh/a
Lenovo18
Lenovo Tab M8 HD for Business
81,82% 0,0326 W
0,17 W 0,32 W
0,32 W 3,46 W
8,84 kWh/a
Lenovo19
Lenovo TAB M7
74,6% 0,04 W 0,2328 W
0,3924 W
0,3924 W
2,6484 W
9,47 kWh/a
Lenovo20
Lenovo Tab E10
82,1% 0,051 W
0,051 W
0,17 W
2,43 W 2,43 W
9,17 kWh/a
Lenovo21
MEDION LIFETAB E10530
81,35% 0,062W Medion22
2
The web portal Notebookcheck reviews extensively the performance of tablets, 3 including power measurements. These measurements are undertaken when the device 4 is connected to the grid, and the battery is fully charged: 5
Off: smartphone connected, but switched off 6 Standby: smartphone connected, but switched off 7 Idle average: smartphone is idle, maximum brightness, additional modules off 8 Load average: smartphone runs with maximum brightness, all modules on, 9
Android devices tested with the app "Stability Test" Classic, iOS and Windows 10 10 mobile devices tested with app Asphalt 8 11
15 https://mannequin.storage.googleapis.com/sustainability/reports-2018/Sustainability_PrintReport_PixelSlate.pdf?hl=en-US
16 https://www.lenovo.com/us/en/social_responsibility/Lenovo_Tab_P10.pdf 17 https://static.lenovo.com/ww/docs/regulatory/eco-declaration/eco-lenovo-tab-m10-hd-2nd.pdf 18 https://static.lenovo.com/ww/docs/regulatory/eco-declaration/eco-tab-m10-fhd-plus-2nd.pdf 19 https://static.lenovo.com/ww/docs/regulatory/eco-declaration/eco-lenovo-tab-m8-hd-business.pdf 20 https://static.lenovo.com/ww/docs/regulatory/Lenovo-TAB-M7.pdf 21 https://static.lenovo.com/ww/docs/regulatory/Lenovo_Tab_E10_Update.pdf 22 http://download2.medion.com/downloads/anleitungen/bda(ex)_lifetab_e10530_en.pdf
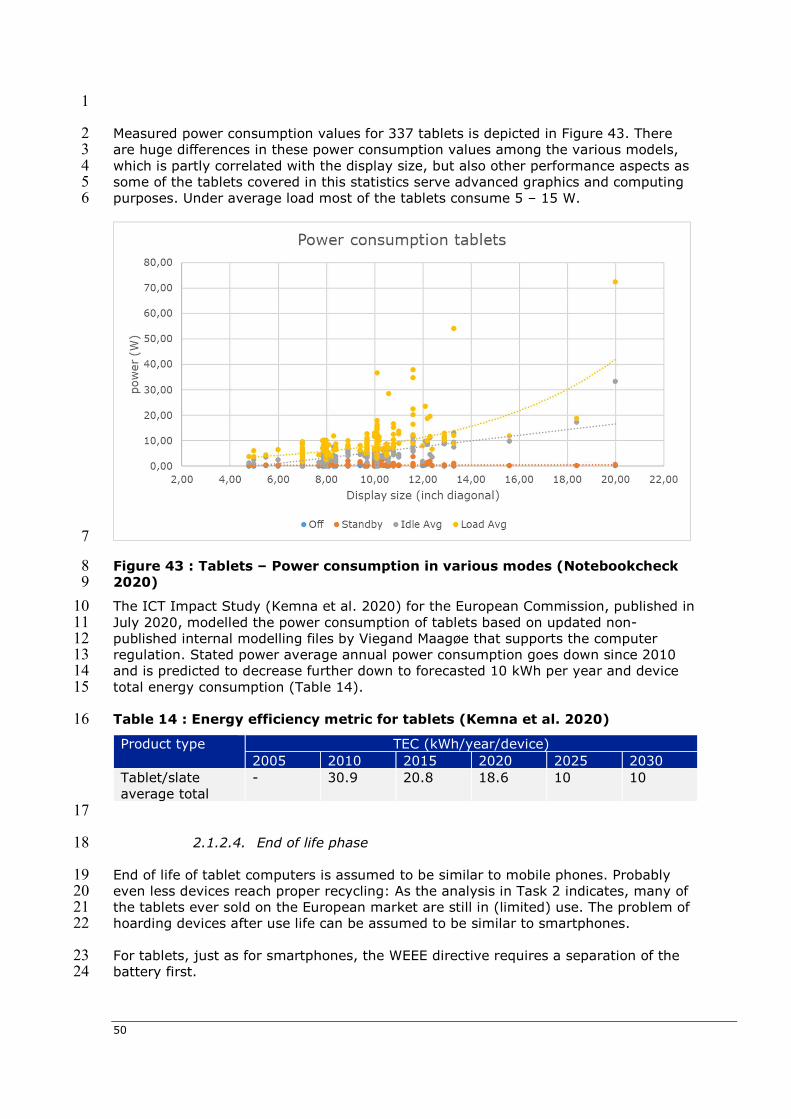
50
1
Measured power consumption values for 337 tablets is depicted in Figure 43. There 2 are huge differences in these power consumption values among the various models, 3 which is partly correlated with the display size, but also other performance aspects as 4 some of the tablets covered in this statistics serve advanced graphics and computing 5 purposes. Under average load most of the tablets consume 5 – 15 W. 6
7
Figure 43 : Tablets – Power consumption in various modes (Notebookcheck 8 2020) 9
The ICT Impact Study (Kemna et al. 2020) for the European Commission, published in 10 July 2020, modelled the power consumption of tablets based on updated non-11 published internal modelling files by Viegand Maagøe that supports the computer 12 regulation. Stated power average annual power consumption goes down since 2010 13 and is predicted to decrease further down to forecasted 10 kWh per year and device 14 total energy consumption (Table 14). 15
Table 14 : Energy efficiency metric for tablets (Kemna et al. 2020) 16
Product type TEC (kWh/year/device) 2005 2010 2015 2020 2025 2030
Tablet/slate average total
- 30.9 20.8 18.6 10 10
17
2.1.2.4. End of life phase 18
End of life of tablet computers is assumed to be similar to mobile phones. Probably 19 even less devices reach proper recycling: As the analysis in Task 2 indicates, many of 20 the tablets ever sold on the European market are still in (limited) use. The problem of 21 hoarding devices after use life can be assumed to be similar to smartphones. 22
For tablets, just as for smartphones, the WEEE directive requires a separation of the 23 battery first. 24
Ecodesign preparatory study on mobile phones, smartphones and tablets
51
After battery removal, three possible pre-processing approaches are relevant 1 according to the JRC study “Analysis of material efficiency aspects of personal 2 computers product group” (Tecchio et al. 2018), depending on the facility and taking 3 into account economic considerations. 4
Scenario 1: shredding of the whole device via cross-flow shredder. 5 Scenario 2: deep-level manual dismantling of the subassemblies (such as 6
aluminium or plastic housing, mainboard, LCD, magnesium frame if present), 7 using predominantly screw drivers (battery powered and hydraulic). 8
Scenario 3: direct treatment in copper smelter after removal of the battery. 9 10 The representativeness of the second scenario is limited, since the likelihood that the 11 labour cost for manual dismantling is not covered by the value of material 12 disassembled for recycling is very high. For deep-level manual dismantling, the 13 following materials and components were identified by the 2018 JRC study as 14 potentially relevant: 15
Plastics: In general, plastics can be separated according to their colour: white 16 (including light grey), black, and mixed colours. White plastics have a 17 significantly higher value compared to black plastics. Black plastics contain 18 carbon black, which complicates the proper identification and subsequent 19 separation. 20
Aluminium: Aluminium housing is of high interest for material recycling and it 21 can justify a slightly increased disassembly effort. Magnets (or other metal 22 parts such as copper) attached to the aluminium housing can reduce the 23 recovery value via mechanical processing. 24
Magnesium: Magnesium frames are frequently found in tablets with plastic 25 back-covers. Currently, magnesium frames are not dismantled into separate 26 fractions, but are rather processed together with the aluminium fraction, if 27 being seperated at all. For high-quality magnesium recycling, it is necessary to 28 achieve a high purity magnesium fraction, which is difficult via mechanical 29 separation due to the similar physical properties of Al and Mg. 30
Display panels: Display panels contain minuscule quantities of indium and REE 31 as well as gold in minor amounts, which is used for interconnects and 32 connectors of light-emitting diodes (LEDs) and for controlling ICs. However, 33 except for the gold, recycling systems are not yet adjusted to recover them 34 efficiently. The time needed to separate the display panel from the rest of the 35 device is critical. According to recyclers, the display panel would be separated 36 manually under the condition that it is easily accessed and removed. If the 37 front glass is not fused to the rest of the LCD unit, it would be separated. 38 However, as tablets do not contain mercury containing backlights, separation of 39 the display panels has a lower priority compared to e.g. the pre-processing of 40 display panels from older notebooks and electronic displays. 41
Printed Circuit Boards: Tablet mainboards are considered high-grade. After 42 tablet opening, the PCB can be easily removed and sorted. No removal of 43 electromagnetic interference (EMI) shields from PCBs is provided for as the 44 amount of material is not worth the effort. 45
46
End of life recycling scenarios have also been analysed by Arduin et al. (2017) and are 47 summarised in Table 15. Based on our insights, we tend to consider a hybrid scenario 48 of the conservative and pessimistic scenario to be the most realistic one: Extracting 49 the battery followed by shredding the remaining parts mixed with small equipment, 50 metal recycling and PCB recycling in a smelter, i.e. roughly corresponding to Tecchio’s 51 scenario 3 further above. 52
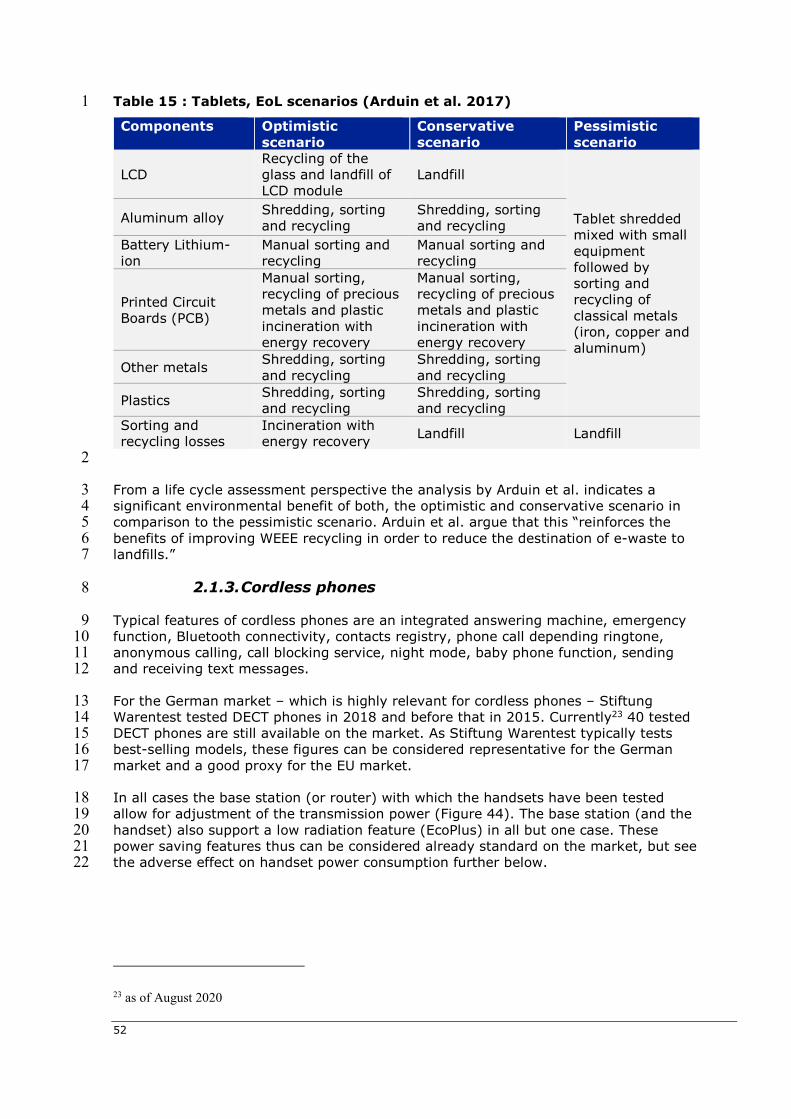
52
Table 15 : Tablets, EoL scenarios (Arduin et al. 2017) 1
Components Optimistic scenario
Conservative scenario
Pessimistic scenario
LCD Recycling of the glass and landfill of LCD module
Landfill
Tablet shredded mixed with small equipment followed by sorting and recycling of classical metals (iron, copper and aluminum)
Aluminum alloy Shredding, sorting and recycling
Shredding, sorting and recycling
Battery Lithium-ion
Manual sorting and recycling
Manual sorting and recycling
Printed Circuit Boards (PCB)
Manual sorting, recycling of precious metals and plastic incineration with energy recovery
Manual sorting, recycling of precious metals and plastic incineration with energy recovery
Other metals Shredding, sorting and recycling
Shredding, sorting and recycling
Plastics Shredding, sorting and recycling
Shredding, sorting and recycling
Sorting and recycling losses
Incineration with energy recovery Landfill Landfill
2
From a life cycle assessment perspective the analysis by Arduin et al. indicates a 3 significant environmental benefit of both, the optimistic and conservative scenario in 4 comparison to the pessimistic scenario. Arduin et al. argue that this “reinforces the 5 benefits of improving WEEE recycling in order to reduce the destination of e-waste to 6 landfills.” 7
2.1.3. Cordless phones 8
Typical features of cordless phones are an integrated answering machine, emergency 9 function, Bluetooth connectivity, contacts registry, phone call depending ringtone, 10 anonymous calling, call blocking service, night mode, baby phone function, sending 11 and receiving text messages. 12
For the German market – which is highly relevant for cordless phones – Stiftung 13 Warentest tested DECT phones in 2018 and before that in 2015. Currently23 40 tested 14 DECT phones are still available on the market. As Stiftung Warentest typically tests 15 best-selling models, these figures can be considered representative for the German 16 market and a good proxy for the EU market. 17
In all cases the base station (or router) with which the handsets have been tested 18 allow for adjustment of the transmission power (Figure 44). The base station (and the 19 handset) also support a low radiation feature (EcoPlus) in all but one case. These 20 power saving features thus can be considered already standard on the market, but see 21 the adverse effect on handset power consumption further below. 22
23 as of August 2020
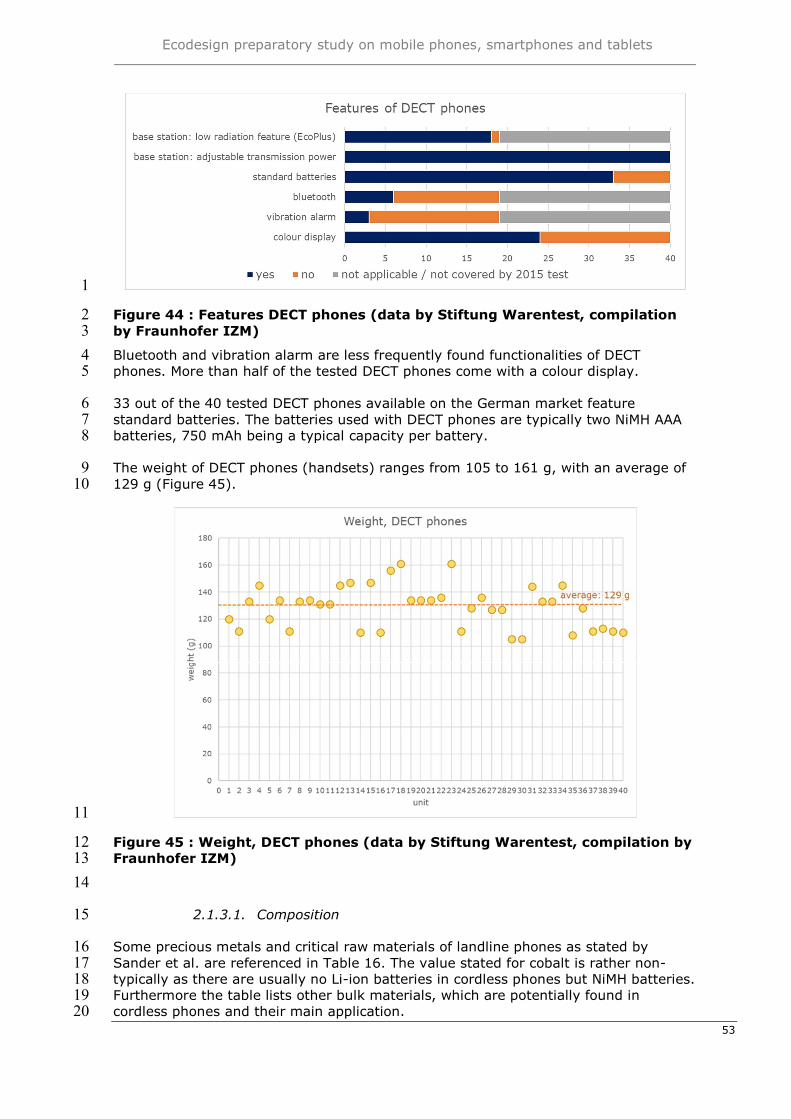
Ecodesign preparatory study on mobile phones, smartphones and tablets
53
1
Figure 44 : Features DECT phones (data by Stiftung Warentest, compilation 2 by Fraunhofer IZM) 3
Bluetooth and vibration alarm are less frequently found functionalities of DECT 4 phones. More than half of the tested DECT phones come with a colour display. 5
33 out of the 40 tested DECT phones available on the German market feature 6 standard batteries. The batteries used with DECT phones are typically two NiMH AAA 7 batteries, 750 mAh being a typical capacity per battery. 8
The weight of DECT phones (handsets) ranges from 105 to 161 g, with an average of 9 129 g (Figure 45). 10
11
Figure 45 : Weight, DECT phones (data by Stiftung Warentest, compilation by 12 Fraunhofer IZM) 13
14
2.1.3.1. Composition 15
Some precious metals and critical raw materials of landline phones as stated by 16 Sander et al. are referenced in Table 16. The value stated for cobalt is rather non-17 typically as there are usually no Li-ion batteries in cordless phones but NiMH batteries. 18 Furthermore the table lists other bulk materials, which are potentially found in 19 cordless phones and their main application. 20
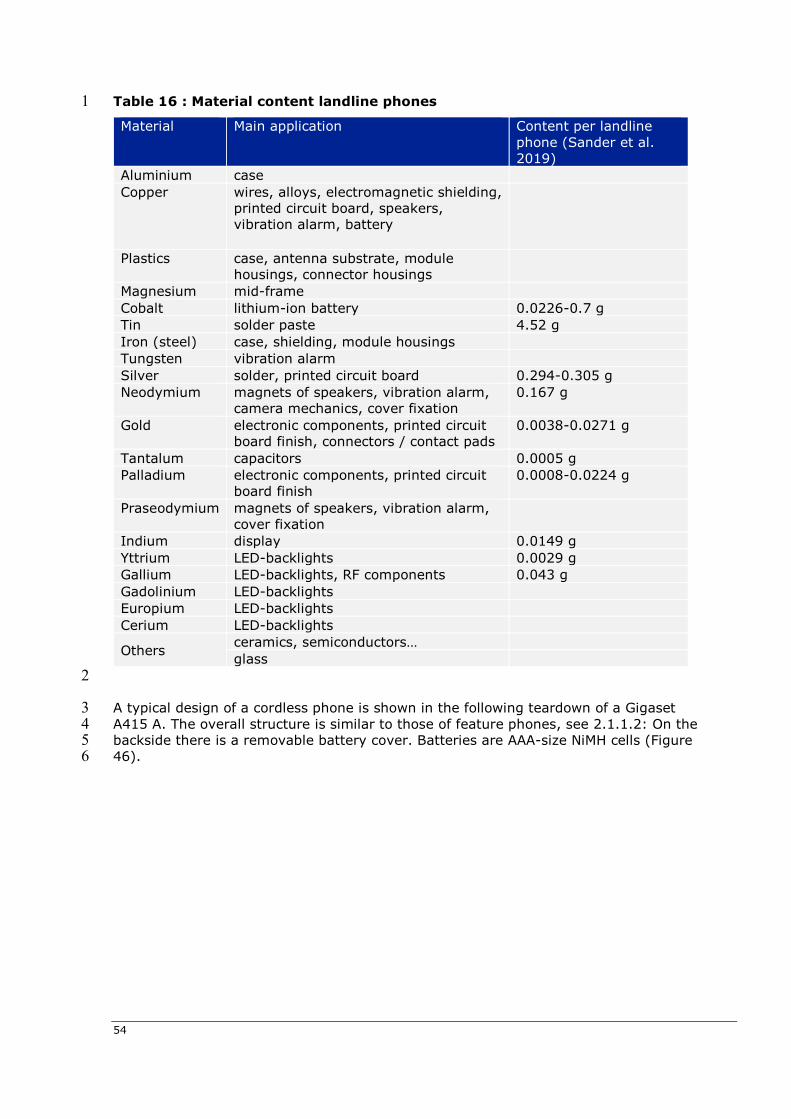
54
Table 16 : Material content landline phones 1
Material Main application Content per landline phone (Sander et al. 2019)
Aluminium case Copper wires, alloys, electromagnetic shielding,
printed circuit board, speakers, vibration alarm, battery
Plastics case, antenna substrate, module housings, connector housings
Magnesium mid-frame Cobalt lithium-ion battery 0.0226-0.7 g Tin solder paste 4.52 g Iron (steel) case, shielding, module housings Tungsten vibration alarm Silver solder, printed circuit board 0.294-0.305 g Neodymium magnets of speakers, vibration alarm,
camera mechanics, cover fixation 0.167 g
Gold electronic components, printed circuit board finish, connectors / contact pads
0.0038-0.0271 g
Tantalum capacitors 0.0005 g Palladium electronic components, printed circuit
board finish 0.0008-0.0224 g
Praseodymium magnets of speakers, vibration alarm, cover fixation
Indium display 0.0149 g Yttrium LED-backlights 0.0029 g Gallium LED-backlights, RF components 0.043 g Gadolinium LED-backlights Europium LED-backlights Cerium LED-backlights
Others ceramics, semiconductors… glass
2
A typical design of a cordless phone is shown in the following teardown of a Gigaset 3 A415 A. The overall structure is similar to those of feature phones, see 2.1.1.2: On the 4 backside there is a removable battery cover. Batteries are AAA-size NiMH cells (Figure 5 46). 6
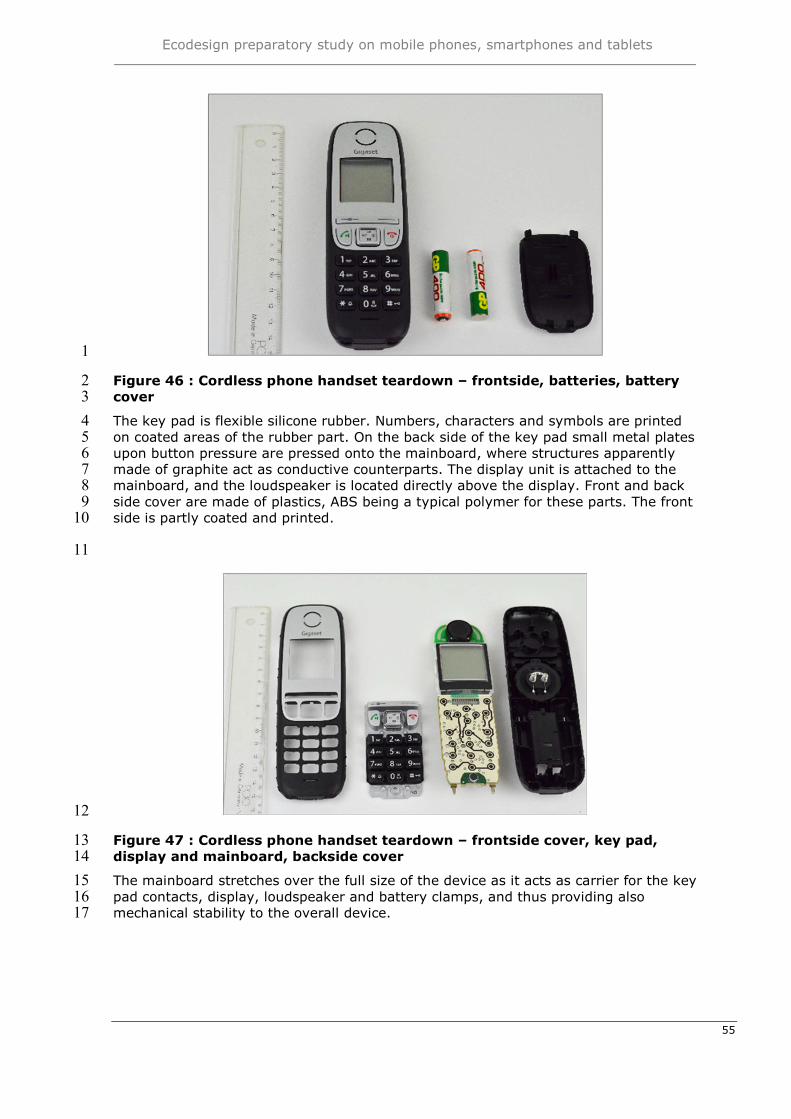
Ecodesign preparatory study on mobile phones, smartphones and tablets
55
1
Figure 46 : Cordless phone handset teardown – frontside, batteries, battery 2 cover 3
The key pad is flexible silicone rubber. Numbers, characters and symbols are printed 4 on coated areas of the rubber part. On the back side of the key pad small metal plates 5 upon button pressure are pressed onto the mainboard, where structures apparently 6 made of graphite act as conductive counterparts. The display unit is attached to the 7 mainboard, and the loudspeaker is located directly above the display. Front and back 8 side cover are made of plastics, ABS being a typical polymer for these parts. The front 9 side is partly coated and printed. 10
11
12
Figure 47 : Cordless phone handset teardown – frontside cover, key pad, 13 display and mainboard, backside cover 14
The mainboard stretches over the full size of the device as it acts as carrier for the key 15 pad contacts, display, loudspeaker and battery clamps, and thus providing also 16 mechanical stability to the overall device. 17
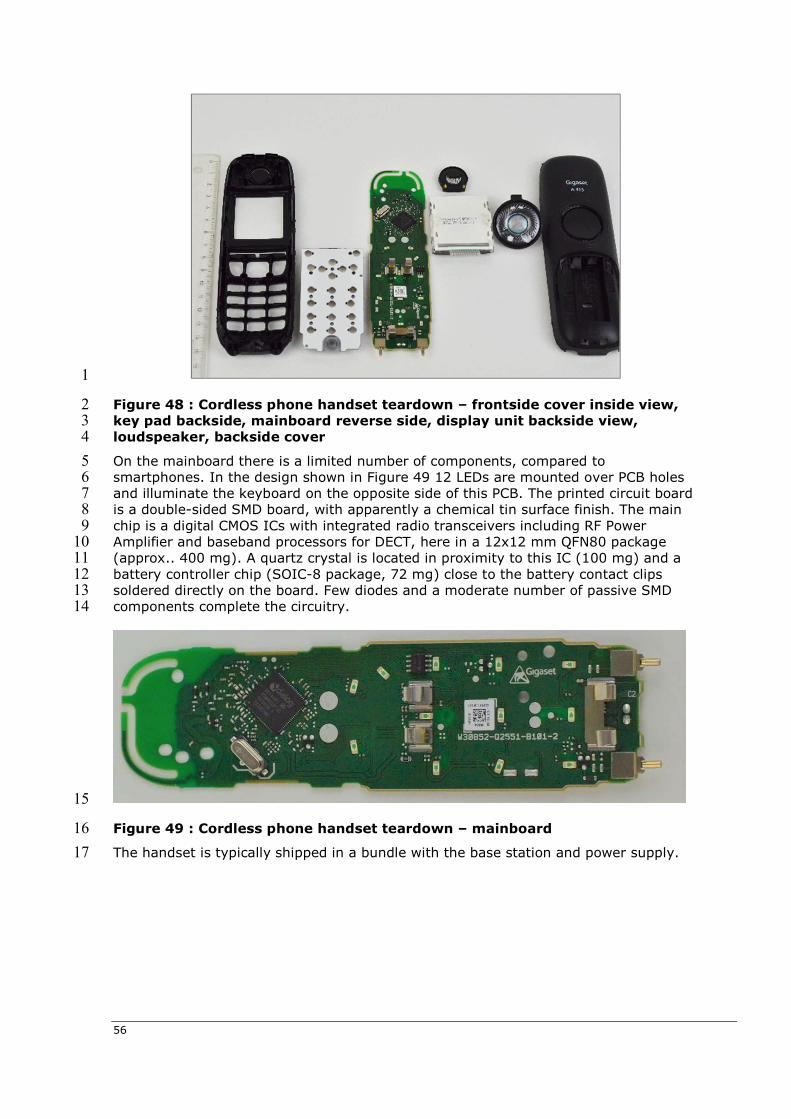
56
1
Figure 48 : Cordless phone handset teardown – frontside cover inside view, 2 key pad backside, mainboard reverse side, display unit backside view, 3 loudspeaker, backside cover 4
On the mainboard there is a limited number of components, compared to 5 smartphones. In the design shown in Figure 49 12 LEDs are mounted over PCB holes 6 and illuminate the keyboard on the opposite side of this PCB. The printed circuit board 7 is a double-sided SMD board, with apparently a chemical tin surface finish. The main 8 chip is a digital CMOS ICs with integrated radio transceivers including RF Power 9 Amplifier and baseband processors for DECT, here in a 12x12 mm QFN80 package 10 (approx.. 400 mg). A quartz crystal is located in proximity to this IC (100 mg) and a 11 battery controller chip (SOIC-8 package, 72 mg) close to the battery contact clips 12 soldered directly on the board. Few diodes and a moderate number of passive SMD 13 components complete the circuitry. 14
15
Figure 49 : Cordless phone handset teardown – mainboard 16
The handset is typically shipped in a bundle with the base station and power supply. 17
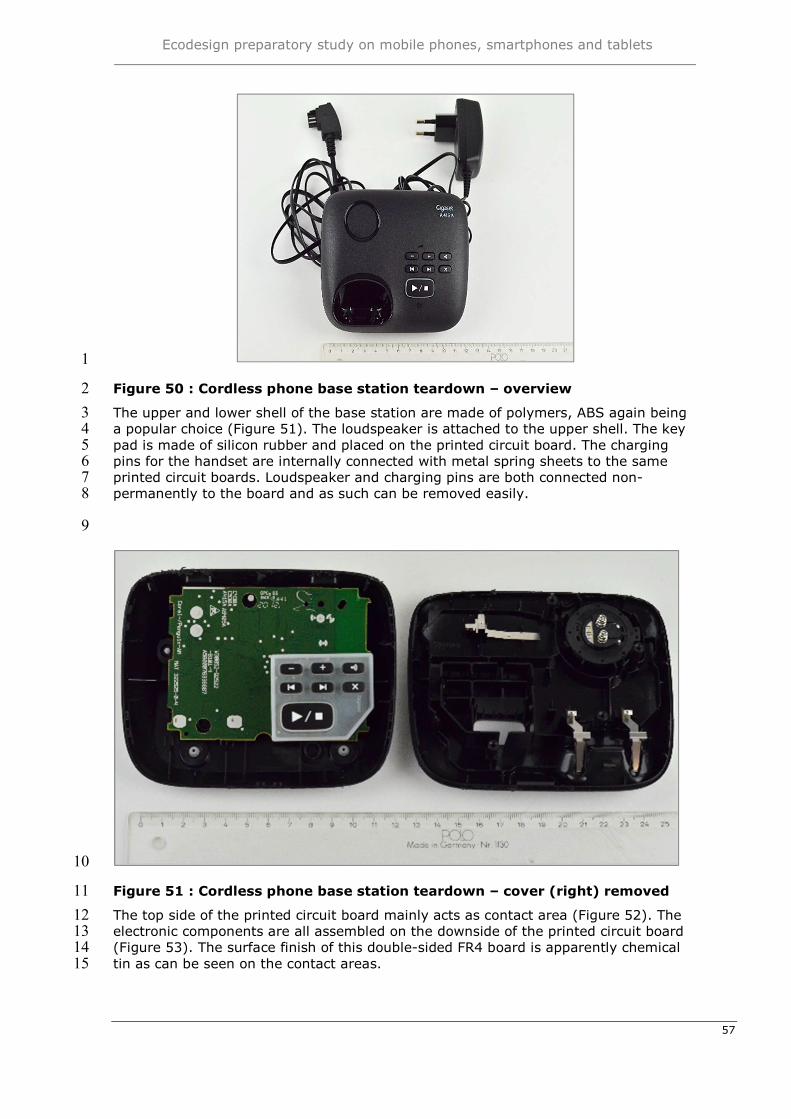
Ecodesign preparatory study on mobile phones, smartphones and tablets
57
1
Figure 50 : Cordless phone base station teardown – overview 2
The upper and lower shell of the base station are made of polymers, ABS again being 3 a popular choice (Figure 51). The loudspeaker is attached to the upper shell. The key 4 pad is made of silicon rubber and placed on the printed circuit board. The charging 5 pins for the handset are internally connected with metal spring sheets to the same 6 printed circuit boards. Loudspeaker and charging pins are both connected non-7 permanently to the board and as such can be removed easily. 8
9
10
Figure 51 : Cordless phone base station teardown – cover (right) removed 11
The top side of the printed circuit board mainly acts as contact area (Figure 52). The 12 electronic components are all assembled on the downside of the printed circuit board 13 (Figure 53). The surface finish of this double-sided FR4 board is apparently chemical 14 tin as can be seen on the contact areas. 15
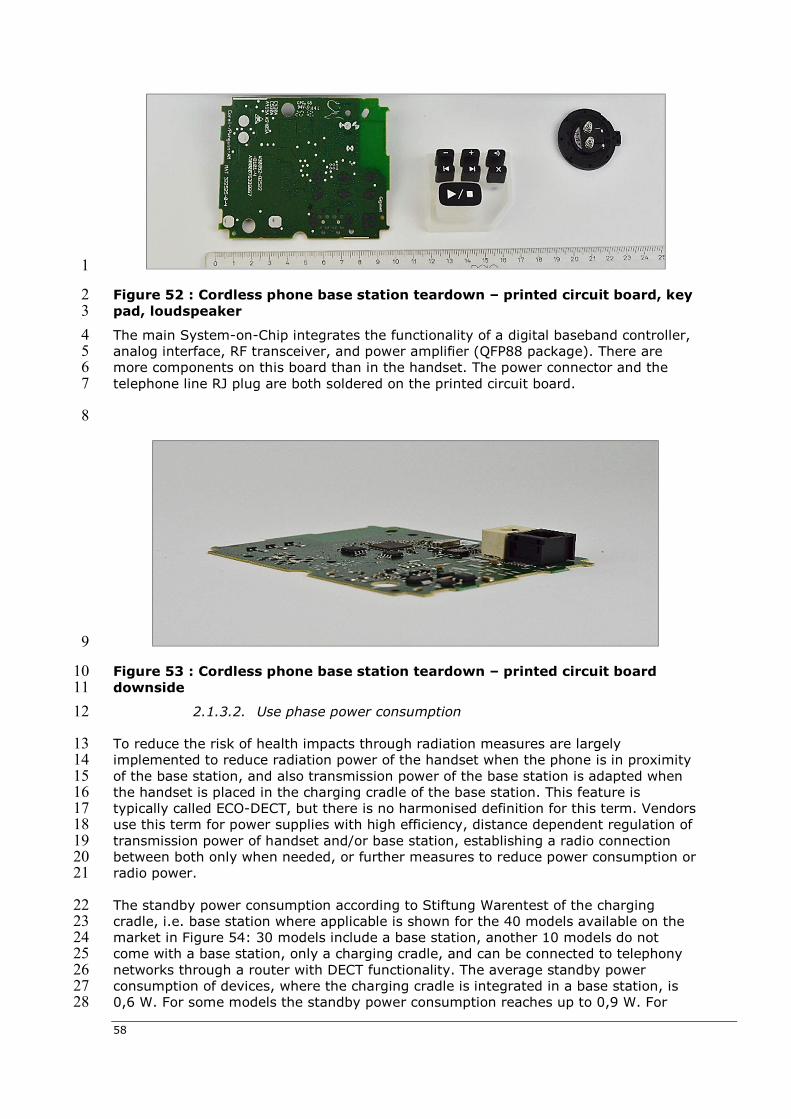
58
1
Figure 52 : Cordless phone base station teardown – printed circuit board, key 2 pad, loudspeaker 3
The main System-on-Chip integrates the functionality of a digital baseband controller, 4 analog interface, RF transceiver, and power amplifier (QFP88 package). There are 5 more components on this board than in the handset. The power connector and the 6 telephone line RJ plug are both soldered on the printed circuit board. 7
8
9
Figure 53 : Cordless phone base station teardown – printed circuit board 10 downside 11
2.1.3.2. Use phase power consumption 12
To reduce the risk of health impacts through radiation measures are largely 13 implemented to reduce radiation power of the handset when the phone is in proximity 14 of the base station, and also transmission power of the base station is adapted when 15 the handset is placed in the charging cradle of the base station. This feature is 16 typically called ECO-DECT, but there is no harmonised definition for this term. Vendors 17 use this term for power supplies with high efficiency, distance dependent regulation of 18 transmission power of handset and/or base station, establishing a radio connection 19 between both only when needed, or further measures to reduce power consumption or 20 radio power. 21
The standby power consumption according to Stiftung Warentest of the charging 22 cradle, i.e. base station where applicable is shown for the 40 models available on the 23 market in Figure 54: 30 models include a base station, another 10 models do not 24 come with a base station, only a charging cradle, and can be connected to telephony 25 networks through a router with DECT functionality. The average standby power 26 consumption of devices, where the charging cradle is integrated in a base station, is 27 0,6 W. For some models the standby power consumption reaches up to 0,9 W. For 28
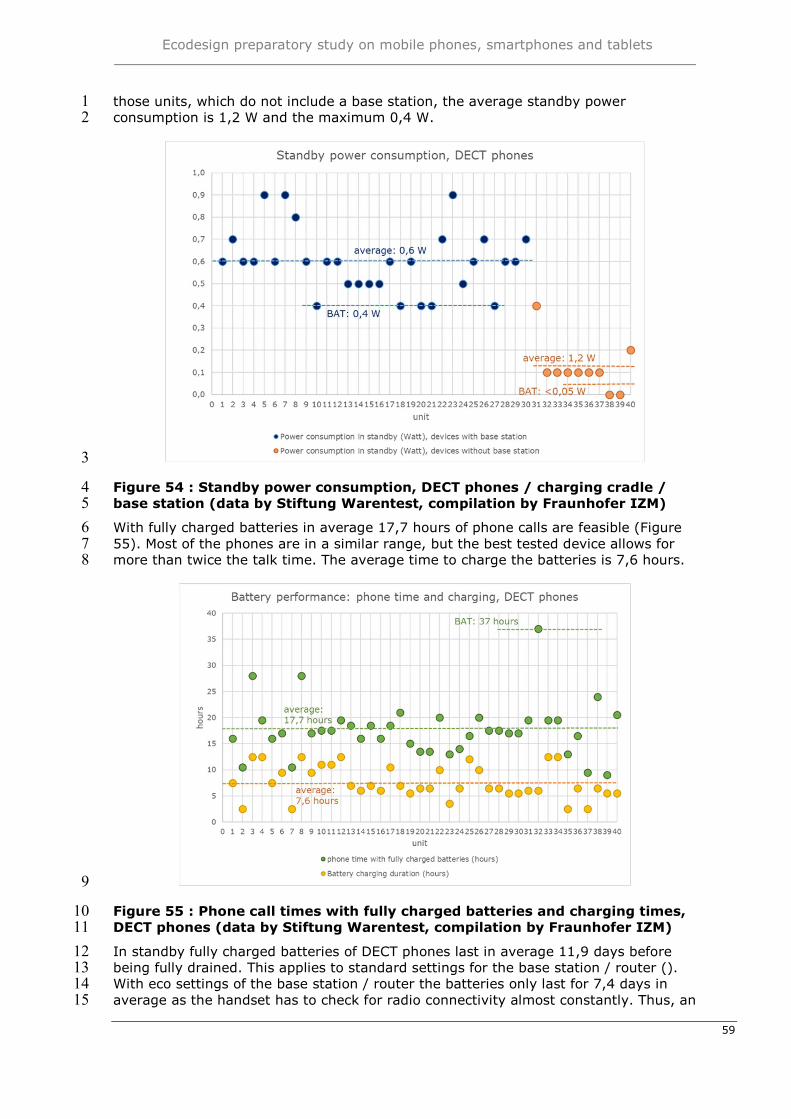
Ecodesign preparatory study on mobile phones, smartphones and tablets
59
those units, which do not include a base station, the average standby power 1 consumption is 1,2 W and the maximum 0,4 W. 2
3
Figure 54 : Standby power consumption, DECT phones / charging cradle / 4 base station (data by Stiftung Warentest, compilation by Fraunhofer IZM) 5
With fully charged batteries in average 17,7 hours of phone calls are feasible (Figure 6 55). Most of the phones are in a similar range, but the best tested device allows for 7 more than twice the talk time. The average time to charge the batteries is 7,6 hours. 8
9
Figure 55 : Phone call times with fully charged batteries and charging times, 10 DECT phones (data by Stiftung Warentest, compilation by Fraunhofer IZM) 11
In standby fully charged batteries of DECT phones last in average 11,9 days before 12 being fully drained. This applies to standard settings for the base station / router (). 13 With eco settings of the base station / router the batteries only last for 7,4 days in 14 average as the handset has to check for radio connectivity almost constantly. Thus, an 15
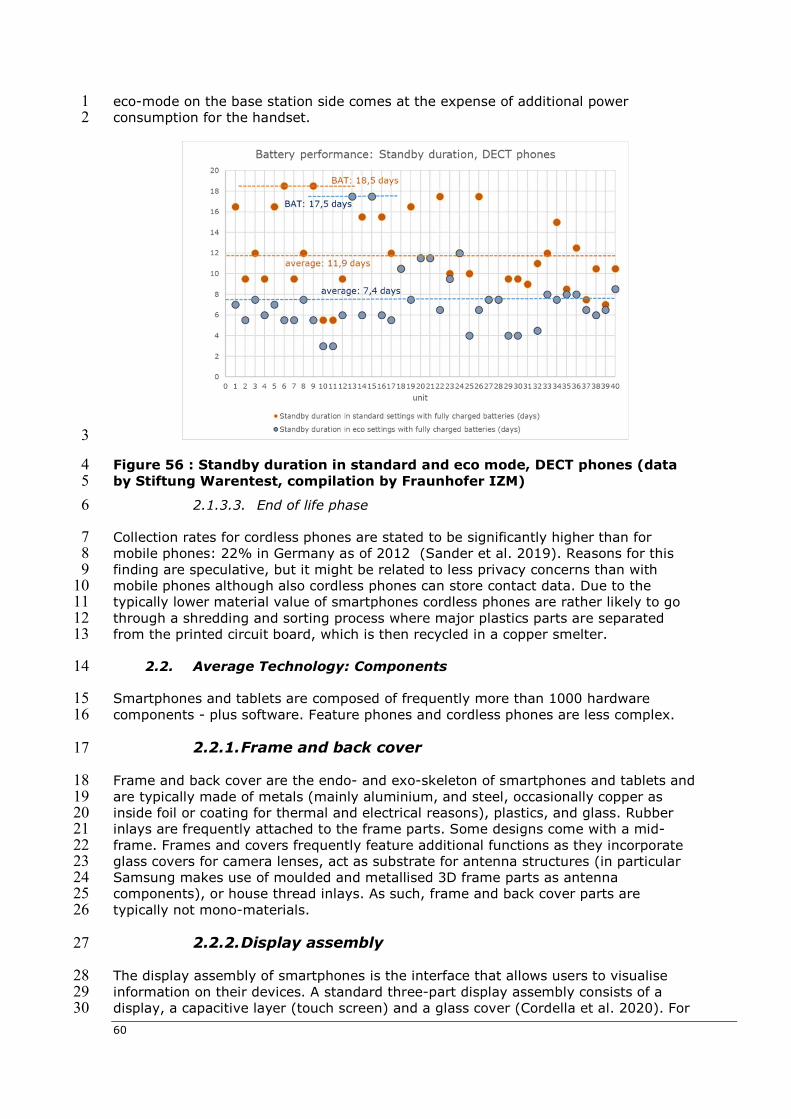
60
eco-mode on the base station side comes at the expense of additional power 1 consumption for the handset. 2
3
Figure 56 : Standby duration in standard and eco mode, DECT phones (data 4 by Stiftung Warentest, compilation by Fraunhofer IZM) 5
2.1.3.3. End of life phase 6
Collection rates for cordless phones are stated to be significantly higher than for 7 mobile phones: 22% in Germany as of 2012 (Sander et al. 2019). Reasons for this 8 finding are speculative, but it might be related to less privacy concerns than with 9 mobile phones although also cordless phones can store contact data. Due to the 10 typically lower material value of smartphones cordless phones are rather likely to go 11 through a shredding and sorting process where major plastics parts are separated 12 from the printed circuit board, which is then recycled in a copper smelter. 13
2.2. Average Technology: Components 14
Smartphones and tablets are composed of frequently more than 1000 hardware 15 components - plus software. Feature phones and cordless phones are less complex. 16
2.2.1. Frame and back cover 17
Frame and back cover are the endo- and exo-skeleton of smartphones and tablets and 18 are typically made of metals (mainly aluminium, and steel, occasionally copper as 19 inside foil or coating for thermal and electrical reasons), plastics, and glass. Rubber 20 inlays are frequently attached to the frame parts. Some designs come with a mid-21 frame. Frames and covers frequently feature additional functions as they incorporate 22 glass covers for camera lenses, act as substrate for antenna structures (in particular 23 Samsung makes use of moulded and metallised 3D frame parts as antenna 24 components), or house thread inlays. As such, frame and back cover parts are 25 typically not mono-materials. 26
2.2.2. Display assembly 27
The display assembly of smartphones is the interface that allows users to visualise 28 information on their devices. A standard three-part display assembly consists of a 29 display, a capacitive layer (touch screen) and a glass cover (Cordella et al. 2020). For 30
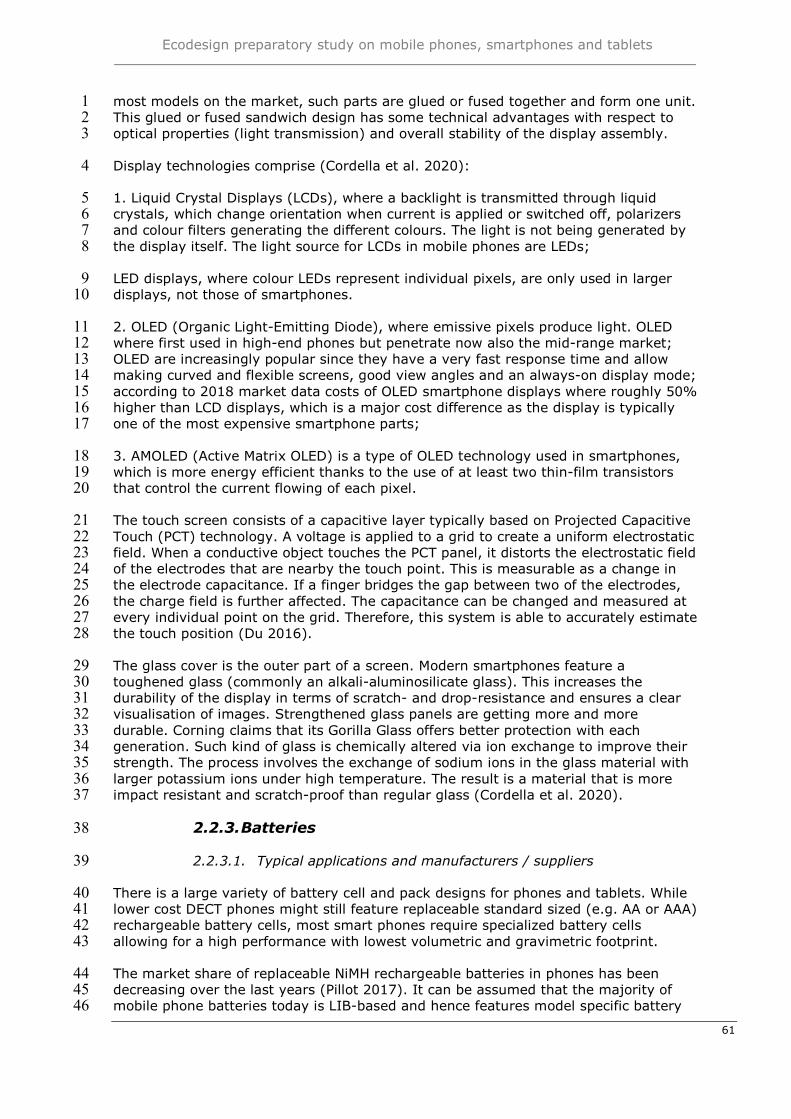
Ecodesign preparatory study on mobile phones, smartphones and tablets
61
most models on the market, such parts are glued or fused together and form one unit. 1 This glued or fused sandwich design has some technical advantages with respect to 2 optical properties (light transmission) and overall stability of the display assembly. 3
Display technologies comprise (Cordella et al. 2020): 4
1. Liquid Crystal Displays (LCDs), where a backlight is transmitted through liquid 5 crystals, which change orientation when current is applied or switched off, polarizers 6 and colour filters generating the different colours. The light is not being generated by 7 the display itself. The light source for LCDs in mobile phones are LEDs; 8
LED displays, where colour LEDs represent individual pixels, are only used in larger 9 displays, not those of smartphones. 10
2. OLED (Organic Light-Emitting Diode), where emissive pixels produce light. OLED 11 where first used in high-end phones but penetrate now also the mid-range market; 12 OLED are increasingly popular since they have a very fast response time and allow 13 making curved and flexible screens, good view angles and an always-on display mode; 14 according to 2018 market data costs of OLED smartphone displays where roughly 50% 15 higher than LCD displays, which is a major cost difference as the display is typically 16 one of the most expensive smartphone parts; 17
3. AMOLED (Active Matrix OLED) is a type of OLED technology used in smartphones, 18 which is more energy efficient thanks to the use of at least two thin-film transistors 19 that control the current flowing of each pixel. 20
The touch screen consists of a capacitive layer typically based on Projected Capacitive 21 Touch (PCT) technology. A voltage is applied to a grid to create a uniform electrostatic 22 field. When a conductive object touches the PCT panel, it distorts the electrostatic field 23 of the electrodes that are nearby the touch point. This is measurable as a change in 24 the electrode capacitance. If a finger bridges the gap between two of the electrodes, 25 the charge field is further affected. The capacitance can be changed and measured at 26 every individual point on the grid. Therefore, this system is able to accurately estimate 27 the touch position (Du 2016). 28
The glass cover is the outer part of a screen. Modern smartphones feature a 29 toughened glass (commonly an alkali-aluminosilicate glass). This increases the 30 durability of the display in terms of scratch- and drop-resistance and ensures a clear 31 visualisation of images. Strengthened glass panels are getting more and more 32 durable. Corning claims that its Gorilla Glass offers better protection with each 33 generation. Such kind of glass is chemically altered via ion exchange to improve their 34 strength. The process involves the exchange of sodium ions in the glass material with 35 larger potassium ions under high temperature. The result is a material that is more 36 impact resistant and scratch-proof than regular glass (Cordella et al. 2020). 37
2.2.3. Batteries 38
2.2.3.1. Typical applications and manufacturers / suppliers 39
There is a large variety of battery cell and pack designs for phones and tablets. While 40 lower cost DECT phones might still feature replaceable standard sized (e.g. AA or AAA) 41 rechargeable battery cells, most smart phones require specialized battery cells 42 allowing for a high performance with lowest volumetric and gravimetric footprint. 43
The market share of replaceable NiMH rechargeable batteries in phones has been 44 decreasing over the last years (Pillot 2017). It can be assumed that the majority of 45 mobile phone batteries today is LIB-based and hence features model specific battery 46
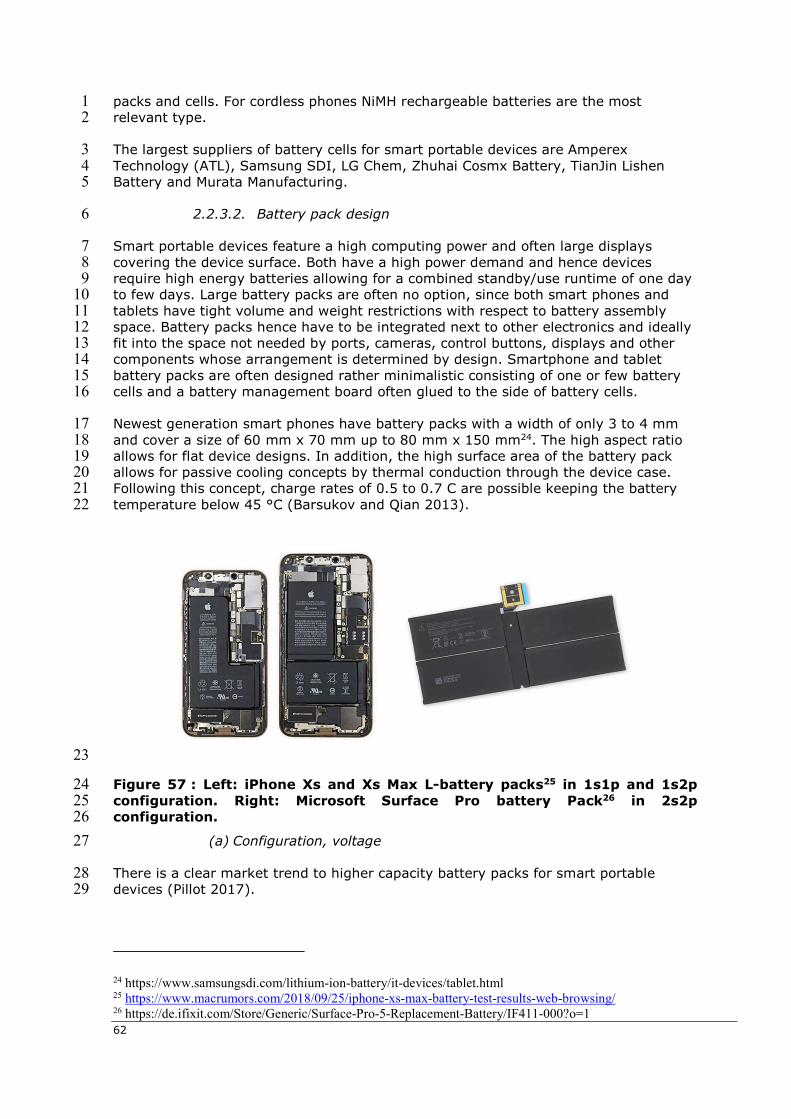
62
packs and cells. For cordless phones NiMH rechargeable batteries are the most 1 relevant type. 2
The largest suppliers of battery cells for smart portable devices are Amperex 3 Technology (ATL), Samsung SDI, LG Chem, Zhuhai Cosmx Battery, TianJin Lishen 4 Battery and Murata Manufacturing. 5
2.2.3.2. Battery pack design 6
Smart portable devices feature a high computing power and often large displays 7 covering the device surface. Both have a high power demand and hence devices 8 require high energy batteries allowing for a combined standby/use runtime of one day 9 to few days. Large battery packs are often no option, since both smart phones and 10 tablets have tight volume and weight restrictions with respect to battery assembly 11 space. Battery packs hence have to be integrated next to other electronics and ideally 12 fit into the space not needed by ports, cameras, control buttons, displays and other 13 components whose arrangement is determined by design. Smartphone and tablet 14 battery packs are often designed rather minimalistic consisting of one or few battery 15 cells and a battery management board often glued to the side of battery cells. 16
Newest generation smart phones have battery packs with a width of only 3 to 4 mm 17 and cover a size of 60 mm x 70 mm up to 80 mm x 150 mm24. The high aspect ratio 18 allows for flat device designs. In addition, the high surface area of the battery pack 19 allows for passive cooling concepts by thermal conduction through the device case. 20 Following this concept, charge rates of 0.5 to 0.7 C are possible keeping the battery 21 temperature below 45 °C (Barsukov and Qian 2013). 22
23
Figure 57 : Left: iPhone Xs and Xs Max L-battery packs25 in 1s1p and 1s2p 24 configuration. Right: Microsoft Surface Pro battery Pack26 in 2s2p 25 configuration. 26
(a) Configuration, voltage 27
There is a clear market trend to higher capacity battery packs for smart portable 28 devices (Pillot 2017). 29
24 https://www.samsungsdi.com/lithium-ion-battery/it-devices/tablet.html 25 https://www.macrumors.com/2018/09/25/iphone-xs-max-battery-test-results-web-browsing/ 26 https://de.ifixit.com/Store/Generic/Surface-Pro-5-Replacement-Battery/IF411-000?o=1
Ecodesign preparatory study on mobile phones, smartphones and tablets
63
Depending on display size, smart phones feature battery packs of 2500 (e.g. iPhone 1 X) to more than 4000 mAh (e.g. Huawei P30 Pro) capacity. Typically, smart phone 2 battery packs consist of one single Lithium-ion battery (LIB)-cell (1s1p27, Samsung, 3 Apple, Huawei). In some cases, parallel configurations are used, often to realize more 4 complex battery pack formats (e.g. iPhone X and Xs, see Figure 57). Series 5 connections of battery cells are not reported for smart phones, since all devices are 6 designed for charging via USB ports with a voltage of 5 V. Smart phone battery pack 7 voltage hence is around 3.7 V to 3.8 V. 8
A broader variety of battery configurations can be observed for tablets. Single cell 9 packs (1s1p) with a capacity of 5 to 7 Ah are utilized for smaller tablets below a 10 display size of 10 inches. For increased battery run time or due to format flexibility, a 11 number of tablets have parallel connections of two or three LIB- cells thereby realizing 12 battery capacities of up to 10 Ah (e.g. Google Nexus, Galaxy Tab / Galaxy Note, iPad, 13 iPad Air, iPad Pro). This configuration also allows for charging via USB. 14
A number of high end or heavy duty tablets utilize series connections of battery cells 15 thereby realizing higher pack voltages of 7.5 V to 7.8 V in 2s1p or 2s2p configuration 16 (e.g. Microsoft Surface Pro). While these concepts require special charging equipment, 17 the higher pack voltage can allow for higher energy efficiency, e.g. of the display 18 lighting and other electronic components. 19
(b) Battery Management Systems 20
Smart batteries make use of battery management systems (BMS) composed of 21 dedicated integrated circuits (IC) to track and report lifetime data in addition to 22 carrying out safety and performance-related tasks such as monitoring battery voltage, 23 current, and temperature. Due to space constraints, printed circuit boards (PCB) 24 embedded in smartphone batteries tend to be minimalistic. Most smartphones only 25 employ simple BMS that provide the essential safety features to prevent overcharge 26 overdischarge and other harmful events, communicate with the power adapter for 27 charging and report the state of charge and battery temperature to the operating 28 system. Some manufacturers employ more complex BMS that include a so-called fuel 29 gauge IC that track and report more elaborate data on the status of the battery. 30 Smart batteries equipped with such BMS commonly store basic information about the 31 battery, such as a unique ID, the manufacturing date, and the design capacity. They 32 also estimate the state of health (SOH), indicating the remaining capacity of an ageing 33 battery relative to the initial capacity the battery was designed for. These smart 34 battery BMS are more often found in premium smartphones. 35
The advantage of more complex BMS that estimate the SOH is that users are provided 36 with an indicator of the status of their battery, including age, number of 37 charge/discharge cycles, and state of health. This type of data may be useful to 38 determine whether a battery is fit for continued use. It also enables a reuse market 39 where concrete statements on the battery status can be made to ensure transparent 40 transactions. 41
2.2.3.3. Battery cell design and chemistry 42 (a) Design 43
With respect to cell formats, there is a clear trend towards Pouch-type LIB-cells in 44 smartphones and tablets. Due to their robust exterior, prismatic hard case cells 45
27 XsYp means a configuration of X battery cells in series connection and Y of these series strings in parallel connection OR Y battery cells in parallel connection and X of these parallel strings in series connection.
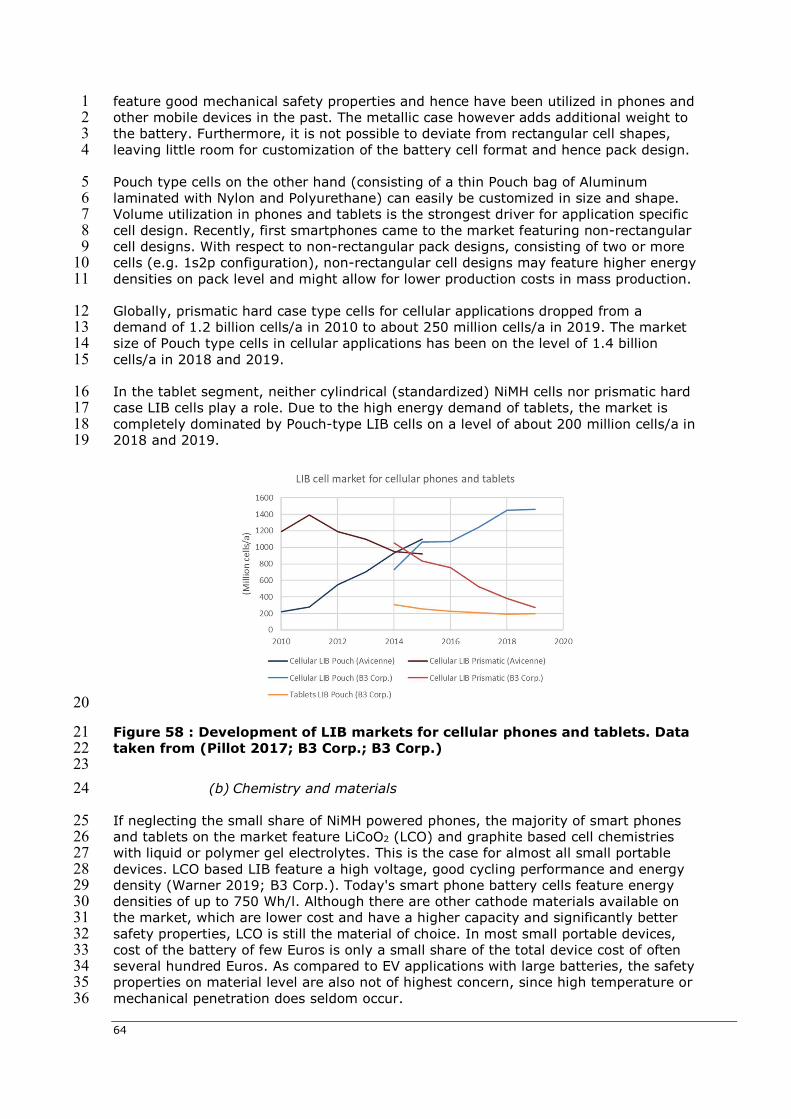
64
feature good mechanical safety properties and hence have been utilized in phones and 1 other mobile devices in the past. The metallic case however adds additional weight to 2 the battery. Furthermore, it is not possible to deviate from rectangular cell shapes, 3 leaving little room for customization of the battery cell format and hence pack design. 4
Pouch type cells on the other hand (consisting of a thin Pouch bag of Aluminum 5 laminated with Nylon and Polyurethane) can easily be customized in size and shape. 6 Volume utilization in phones and tablets is the strongest driver for application specific 7 cell design. Recently, first smartphones came to the market featuring non-rectangular 8 cell designs. With respect to non-rectangular pack designs, consisting of two or more 9 cells (e.g. 1s2p configuration), non-rectangular cell designs may feature higher energy 10 densities on pack level and might allow for lower production costs in mass production. 11
Globally, prismatic hard case type cells for cellular applications dropped from a 12 demand of 1.2 billion cells/a in 2010 to about 250 million cells/a in 2019. The market 13 size of Pouch type cells in cellular applications has been on the level of 1.4 billion 14 cells/a in 2018 and 2019. 15
In the tablet segment, neither cylindrical (standardized) NiMH cells nor prismatic hard 16 case LIB cells play a role. Due to the high energy demand of tablets, the market is 17 completely dominated by Pouch-type LIB cells on a level of about 200 million cells/a in 18 2018 and 2019. 19
20
Figure 58 : Development of LIB markets for cellular phones and tablets. Data 21 taken from (Pillot 2017; B3 Corp.; B3 Corp.) 22 23
(b) Chemistry and materials 24
If neglecting the small share of NiMH powered phones, the majority of smart phones 25 and tablets on the market feature LiCoO2 (LCO) and graphite based cell chemistries 26 with liquid or polymer gel electrolytes. This is the case for almost all small portable 27 devices. LCO based LIB feature a high voltage, good cycling performance and energy 28 density (Warner 2019; B3 Corp.). Today's smart phone battery cells feature energy 29 densities of up to 750 Wh/l. Although there are other cathode materials available on 30 the market, which are lower cost and have a higher capacity and significantly better 31 safety properties, LCO is still the material of choice. In most small portable devices, 32 cost of the battery of few Euros is only a small share of the total device cost of often 33 several hundred Euros. As compared to EV applications with large batteries, the safety 34 properties on material level are also not of highest concern, since high temperature or 35 mechanical penetration does seldom occur. 36
Ecodesign preparatory study on mobile phones, smartphones and tablets
65
On the other hand, LIB cell manufacturers are very experienced with the production of 1 LCO based batteries and continuous improvements have lead to LCO smartphone 2 batteries still featuring one of the highest energy densities of all LIB cells. 3
When considering the electrode level, the high energy densities are often not 4 introduced by utilization of a high specific capacity which is only in the range of 160 to 5 170 mAh/g for LCO. Active material particle densities in smartphone batteries however 6 are often significantly higher as compared to EV batteries. Low porosities are achieved 7 by tailored particle size distributions and high compression during calendaring of the 8 electrodes. 9
Similarly important, there has been a trend towards higher charge cut-off voltages for 10 smartphone batteries (Kalluri et al. 2017; Zhang et al. 2018).Typically, LIB feature a 11 cut-off voltage of 4.2 V and a respective average discharge voltage of 3.7 V. Newest 12 generation smart phone batteries have a cut-off voltage of 4.35 V and an average 13 discharge voltage of 3.81 V. This is realized by surface modification of LCO particles 14 resulting in higher stability at high charging voltages. 15
In terms of energy density, the voltage increase translates into an improvement of 16 3%. The higher cell voltage might however reduce losses in the device electronics and 17 hence have benefits for the runtime of the device. It can be expected that the trend 18 towards higher capacity utilization of LCO and higher voltage will continue in the next 19 years. 20
For a significant improvement of energy density it is likely that graphite / silicon or 21 graphite / silicon oxide anodes will be utilized in the next generation of portable device 22 LIB cells. Today, artificial or natural graphite still seems the material of choice. 23 However, for the realization of energy densities of 800 Wh/l or more, the transition 24 towards Si-alloying anodes is likely (Thielmann 2017). 25
2.2.3.4. Battery durability 26
The capacity of LIB inevitably decreases over time and with use. Battery durability is 27 usually described by a battery’s specific cycle life and calendar life. Cycle life denotes 28 the number of charge/discharge cycles (amount of charge equivalent to the battery’s 29 initial capacity) the battery can withstand before its capacity decreases below a certain 30 level (e.g. 80 % or 60 % of the initial capacity). Calendar life denotes the capacity 31 fade that occurs even as the battery is not in active use (e.g. while in storage). Many 32 studies have examined the underlying aging mechanisms associated with capacity 33 fade in lithium-ion batteries. The causes are chemical and physical processes taking 34 place inside the battery cell, which are influenced by a number of factors. Among the 35 dominant ageing mechanisms are loss of active and accessible electrode material and 36 active lithium-ions, loss of conductivity in the electrodes or the electrolyte, and 37 decomposition of the electrolyte. Factors with a considerable potential to accelerate 38 capacity fade include high and low temperatures, high state of charge (SOC), high 39 depth of discharge (DOD), high use intensity (high number of charge/discharge 40 cycles), and abusive use such as overcharge and overdischarge (both of which are 41 commonly prevented by batteries’ safety circuitry). 42
The durability of batteries is commonly stated in charging cycles before the initially 43 available capacity or the design capacity drops below a defined threshold. The 44 threshold is often defined at 80 % or 60 % state of health (SOH). This cycle withstand 45 or cycle stability can be measured under laboratory conditions using standards such as 46 EN 61960. Smartphone and tablet cells are frequently able to withstand 500, 1.000 47 and more charging cycles under such controlled conditions. However, the use patterns 48 and influencing factors that occur under real use conditions in the field can be 49 accounted for in laboratory testing only to a limited degree. 50
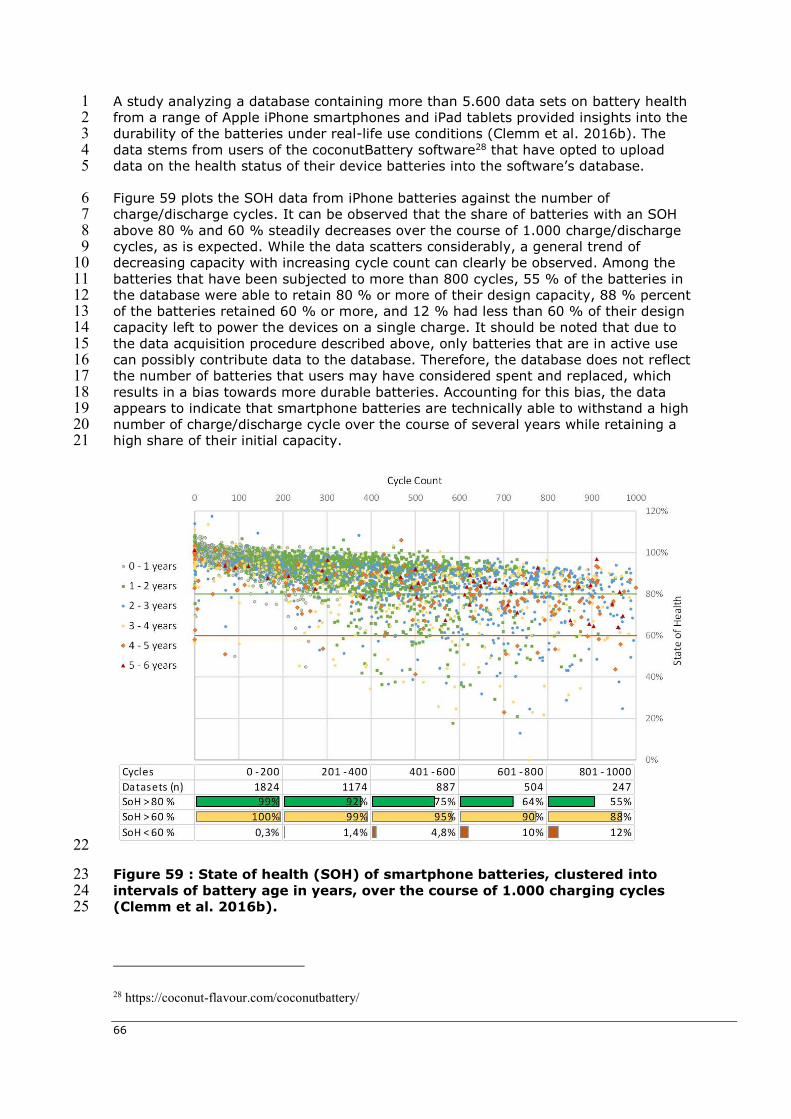
66
A study analyzing a database containing more than 5.600 data sets on battery health 1 from a range of Apple iPhone smartphones and iPad tablets provided insights into the 2 durability of the batteries under real-life use conditions (Clemm et al. 2016b). The 3 data stems from users of the coconutBattery software28 that have opted to upload 4 data on the health status of their device batteries into the software’s database. 5
Figure 59 plots the SOH data from iPhone batteries against the number of 6 charge/discharge cycles. It can be observed that the share of batteries with an SOH 7 above 80 % and 60 % steadily decreases over the course of 1.000 charge/discharge 8 cycles, as is expected. While the data scatters considerably, a general trend of 9 decreasing capacity with increasing cycle count can clearly be observed. Among the 10 batteries that have been subjected to more than 800 cycles, 55 % of the batteries in 11 the database were able to retain 80 % or more of their design capacity, 88 % percent 12 of the batteries retained 60 % or more, and 12 % had less than 60 % of their design 13 capacity left to power the devices on a single charge. It should be noted that due to 14 the data acquisition procedure described above, only batteries that are in active use 15 can possibly contribute data to the database. Therefore, the database does not reflect 16 the number of batteries that users may have considered spent and replaced, which 17 results in a bias towards more durable batteries. Accounting for this bias, the data 18 appears to indicate that smartphone batteries are technically able to withstand a high 19 number of charge/discharge cycle over the course of several years while retaining a 20 high share of their initial capacity. 21
22
Figure 59 : State of health (SOH) of smartphone batteries, clustered into 23 intervals of battery age in years, over the course of 1.000 charging cycles 24 (Clemm et al. 2016b). 25
28 https://coconut-flavour.com/coconutbattery/
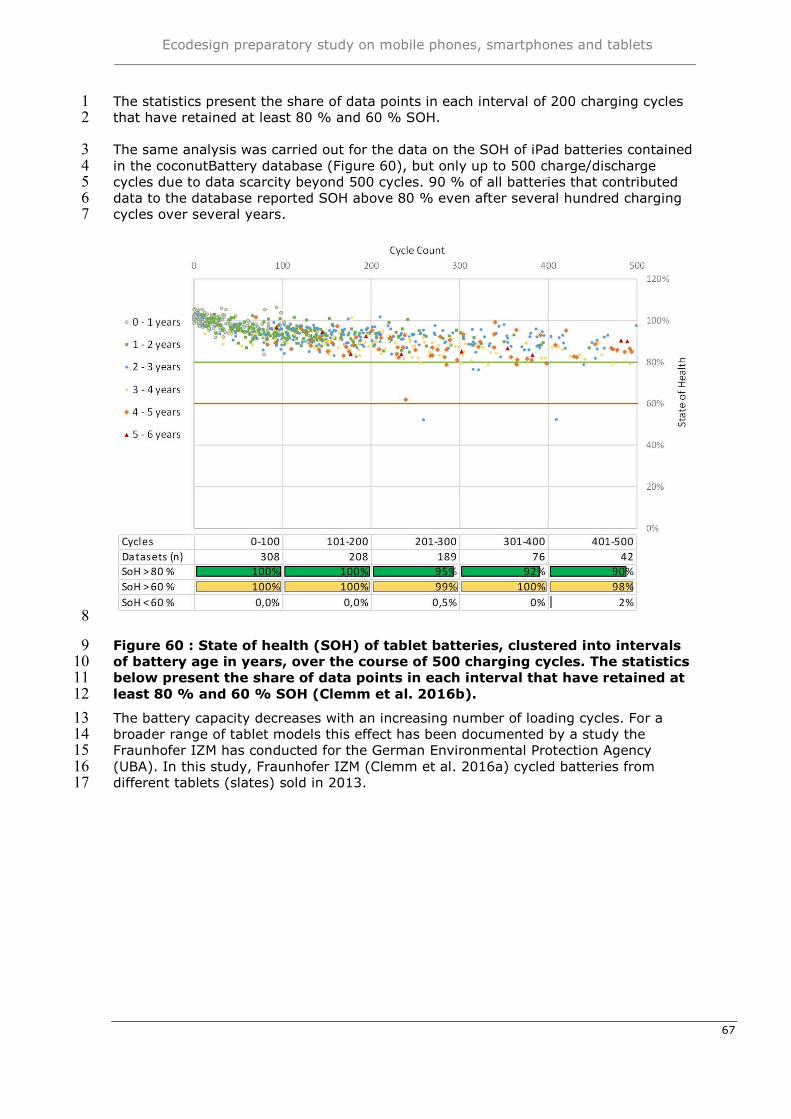
Ecodesign preparatory study on mobile phones, smartphones and tablets
67
The statistics present the share of data points in each interval of 200 charging cycles 1 that have retained at least 80 % and 60 % SOH. 2
The same analysis was carried out for the data on the SOH of iPad batteries contained 3 in the coconutBattery database (Figure 60), but only up to 500 charge/discharge 4 cycles due to data scarcity beyond 500 cycles. 90 % of all batteries that contributed 5 data to the database reported SOH above 80 % even after several hundred charging 6 cycles over several years. 7
8
Figure 60 : State of health (SOH) of tablet batteries, clustered into intervals 9 of battery age in years, over the course of 500 charging cycles. The statistics 10 below present the share of data points in each interval that have retained at 11 least 80 % and 60 % SOH (Clemm et al. 2016b). 12
The battery capacity decreases with an increasing number of loading cycles. For a 13 broader range of tablet models this effect has been documented by a study the 14 Fraunhofer IZM has conducted for the German Environmental Protection Agency 15 (UBA). In this study, Fraunhofer IZM (Clemm et al. 2016a) cycled batteries from 16 different tablets (slates) sold in 2013. 17
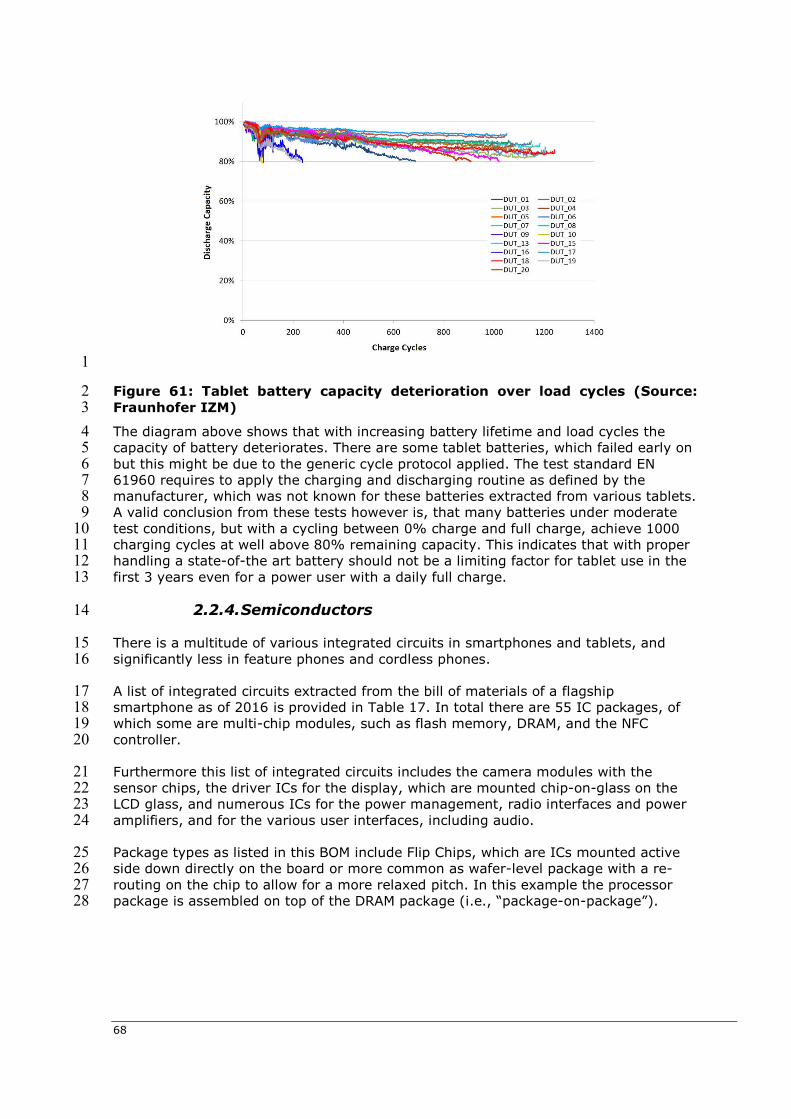
68
1
Figure 61: Tablet battery capacity deterioration over load cycles (Source: 2 Fraunhofer IZM) 3
The diagram above shows that with increasing battery lifetime and load cycles the 4 capacity of battery deteriorates. There are some tablet batteries, which failed early on 5 but this might be due to the generic cycle protocol applied. The test standard EN 6 61960 requires to apply the charging and discharging routine as defined by the 7 manufacturer, which was not known for these batteries extracted from various tablets. 8 A valid conclusion from these tests however is, that many batteries under moderate 9 test conditions, but with a cycling between 0% charge and full charge, achieve 1000 10 charging cycles at well above 80% remaining capacity. This indicates that with proper 11 handling a state-of-the art battery should not be a limiting factor for tablet use in the 12 first 3 years even for a power user with a daily full charge. 13
2.2.4. Semiconductors 14
There is a multitude of various integrated circuits in smartphones and tablets, and 15 significantly less in feature phones and cordless phones. 16
A list of integrated circuits extracted from the bill of materials of a flagship 17 smartphone as of 2016 is provided in Table 17. In total there are 55 IC packages, of 18 which some are multi-chip modules, such as flash memory, DRAM, and the NFC 19 controller. 20
Furthermore this list of integrated circuits includes the camera modules with the 21 sensor chips, the driver ICs for the display, which are mounted chip-on-glass on the 22 LCD glass, and numerous ICs for the power management, radio interfaces and power 23 amplifiers, and for the various user interfaces, including audio. 24
Package types as listed in this BOM include Flip Chips, which are ICs mounted active 25 side down directly on the board or more common as wafer-level package with a re-26 routing on the chip to allow for a more relaxed pitch. In this example the processor 27 package is assembled on top of the DRAM package (i.e., “package-on-package”). 28
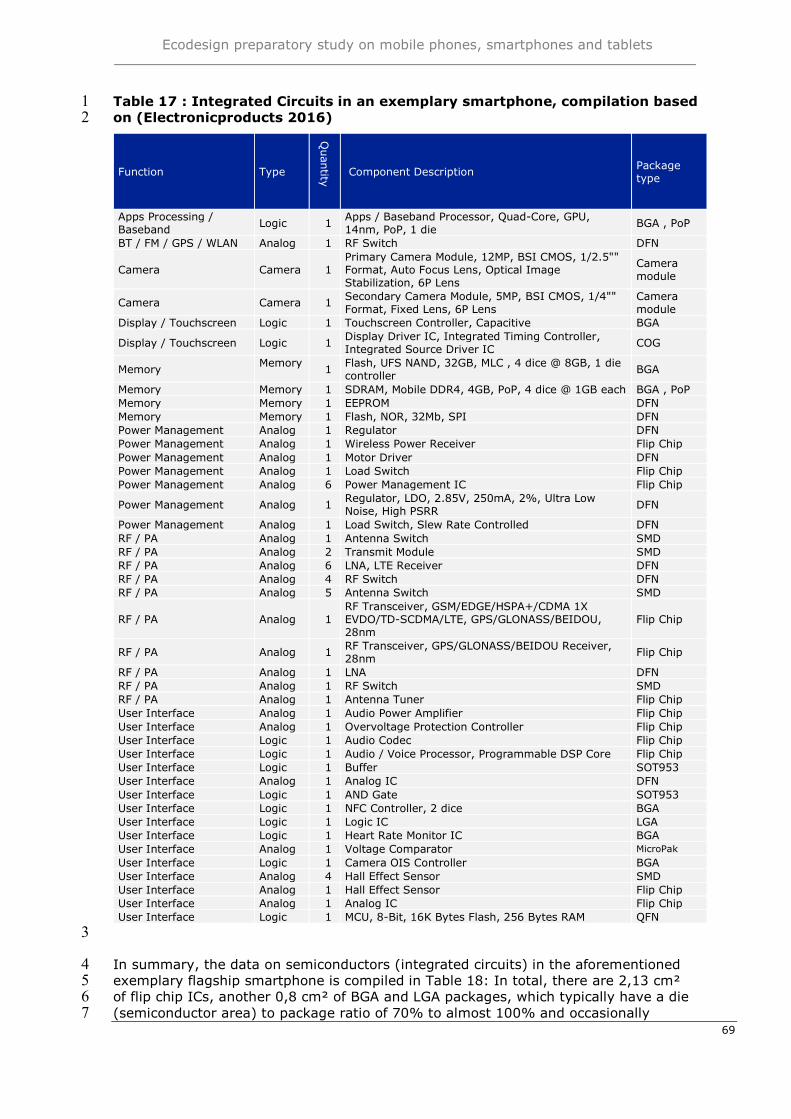
Ecodesign preparatory study on mobile phones, smartphones and tablets
69
Table 17 : Integrated Circuits in an exemplary smartphone, compilation based 1 on (Electronicproducts 2016) 2
Function Type
Quan
tity
Component Description Package type
Apps Processing / Baseband Logic 1
Apps / Baseband Processor, Quad-Core, GPU, 14nm, PoP, 1 die BGA , PoP
BT / FM / GPS / WLAN Analog 1 RF Switch DFN
Camera Camera 1 Primary Camera Module, 12MP, BSI CMOS, 1/2.5"" Format, Auto Focus Lens, Optical Image Stabilization, 6P Lens
Camera module
Camera Camera 1 Secondary Camera Module, 5MP, BSI CMOS, 1/4"" Format, Fixed Lens, 6P Lens
Camera module
Display / Touchscreen Logic 1 Touchscreen Controller, Capacitive BGA
Display / Touchscreen Logic 1 Display Driver IC, Integrated Timing Controller, Integrated Source Driver IC COG
Memory Memory 1
Flash, UFS NAND, 32GB, MLC , 4 dice @ 8GB, 1 die controller BGA
Memory Memory 1 SDRAM, Mobile DDR4, 4GB, PoP, 4 dice @ 1GB each BGA , PoP Memory Memory 1 EEPROM DFN Memory Memory 1 Flash, NOR, 32Mb, SPI DFN Power Management Analog 1 Regulator DFN Power Management Analog 1 Wireless Power Receiver Flip Chip Power Management Analog 1 Motor Driver DFN Power Management Analog 1 Load Switch Flip Chip Power Management Analog 6 Power Management IC Flip Chip
Power Management Analog 1 Regulator, LDO, 2.85V, 250mA, 2%, Ultra Low Noise, High PSRR DFN
Power Management Analog 1 Load Switch, Slew Rate Controlled DFN RF / PA Analog 1 Antenna Switch SMD RF / PA Analog 2 Transmit Module SMD RF / PA Analog 6 LNA, LTE Receiver DFN RF / PA Analog 4 RF Switch DFN RF / PA Analog 5 Antenna Switch SMD
RF / PA Analog 1 RF Transceiver, GSM/EDGE/HSPA+/CDMA 1X EVDO/TD-SCDMA/LTE, GPS/GLONASS/BEIDOU, 28nm
Flip Chip
RF / PA Analog 1 RF Transceiver, GPS/GLONASS/BEIDOU Receiver, 28nm
Flip Chip
RF / PA Analog 1 LNA DFN RF / PA Analog 1 RF Switch SMD RF / PA Analog 1 Antenna Tuner Flip Chip User Interface Analog 1 Audio Power Amplifier Flip Chip User Interface Analog 1 Overvoltage Protection Controller Flip Chip User Interface Logic 1 Audio Codec Flip Chip User Interface Logic 1 Audio / Voice Processor, Programmable DSP Core Flip Chip User Interface Logic 1 Buffer SOT953 User Interface Analog 1 Analog IC DFN User Interface Logic 1 AND Gate SOT953 User Interface Logic 1 NFC Controller, 2 dice BGA User Interface Logic 1 Logic IC LGA User Interface Logic 1 Heart Rate Monitor IC BGA User Interface Analog 1 Voltage Comparator MicroPak User Interface Logic 1 Camera OIS Controller BGA User Interface Analog 4 Hall Effect Sensor SMD User Interface Analog 1 Hall Effect Sensor Flip Chip User Interface Analog 1 Analog IC Flip Chip User Interface Logic 1 MCU, 8-Bit, 16K Bytes Flash, 256 Bytes RAM QFN
3
In summary, the data on semiconductors (integrated circuits) in the aforementioned 4 exemplary flagship smartphone is compiled in Table 18: In total, there are 2,13 cm² 5 of flip chip ICs, another 0,8 cm² of BGA and LGA packages, which typically have a die 6 (semiconductor area) to package ratio of 70% to almost 100% and occasionally 7
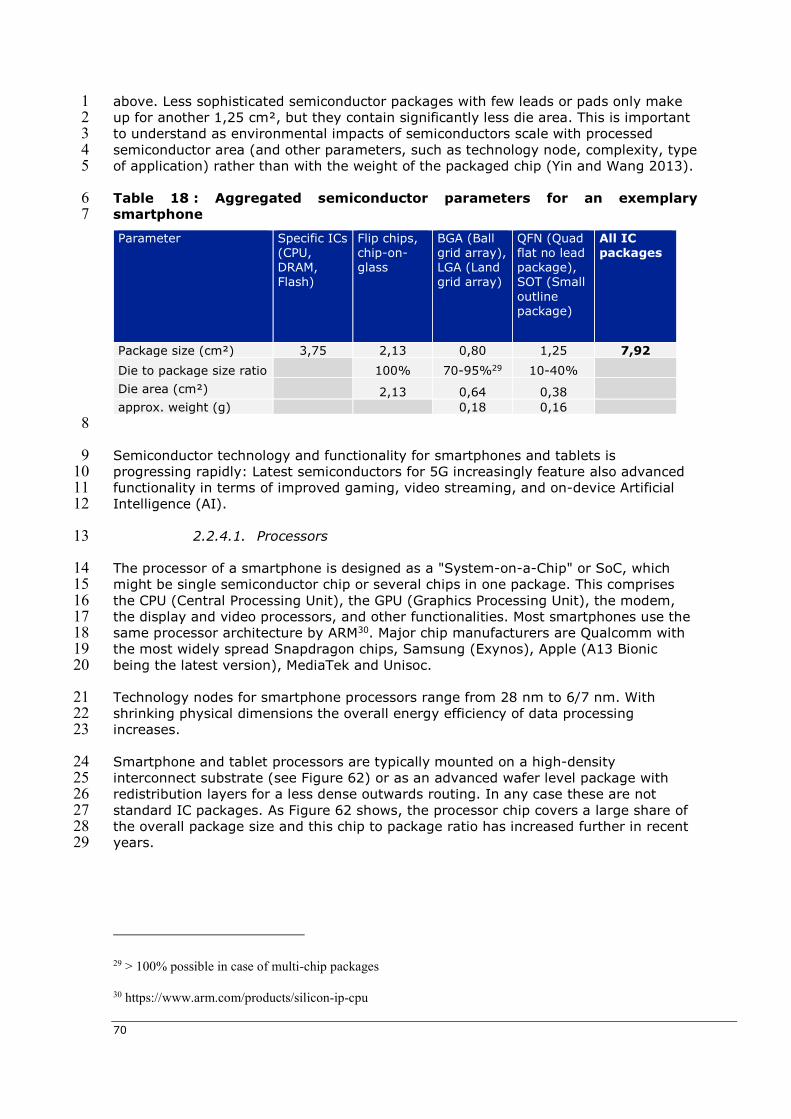
70
above. Less sophisticated semiconductor packages with few leads or pads only make 1 up for another 1,25 cm², but they contain significantly less die area. This is important 2 to understand as environmental impacts of semiconductors scale with processed 3 semiconductor area (and other parameters, such as technology node, complexity, type 4 of application) rather than with the weight of the packaged chip (Yin and Wang 2013). 5
Table 18 : Aggregated semiconductor parameters for an exemplary 6 smartphone 7
Parameter Specific ICs (CPU, DRAM, Flash)
Flip chips, chip-on-glass
BGA (Ball grid array), LGA (Land grid array)
QFN (Quad flat no lead package), SOT (Small outline package)
All IC packages
Package size (cm²) 3,75 2,13 0,80 1,25 7,92
Die to package size ratio 100% 70-95%29 10-40%
Die area (cm²) 2,13 0,64 0,38 approx. weight (g) 0,18 0,16
8
Semiconductor technology and functionality for smartphones and tablets is 9 progressing rapidly: Latest semiconductors for 5G increasingly feature also advanced 10 functionality in terms of improved gaming, video streaming, and on-device Artificial 11 Intelligence (AI). 12
2.2.4.1. Processors 13
The processor of a smartphone is designed as a "System-on-a-Chip" or SoC, which 14 might be single semiconductor chip or several chips in one package. This comprises 15 the CPU (Central Processing Unit), the GPU (Graphics Processing Unit), the modem, 16 the display and video processors, and other functionalities. Most smartphones use the 17 same processor architecture by ARM30. Major chip manufacturers are Qualcomm with 18 the most widely spread Snapdragon chips, Samsung (Exynos), Apple (A13 Bionic 19 being the latest version), MediaTek and Unisoc. 20
Technology nodes for smartphone processors range from 28 nm to 6/7 nm. With 21 shrinking physical dimensions the overall energy efficiency of data processing 22 increases. 23
Smartphone and tablet processors are typically mounted on a high-density 24 interconnect substrate (see Figure 62) or as an advanced wafer level package with 25 redistribution layers for a less dense outwards routing. In any case these are not 26 standard IC packages. As Figure 62 shows, the processor chip covers a large share of 27 the overall package size and this chip to package ratio has increased further in recent 28 years. 29
29 > 100% possible in case of multi-chip packages
30 https://www.arm.com/products/silicon-ip-cpu
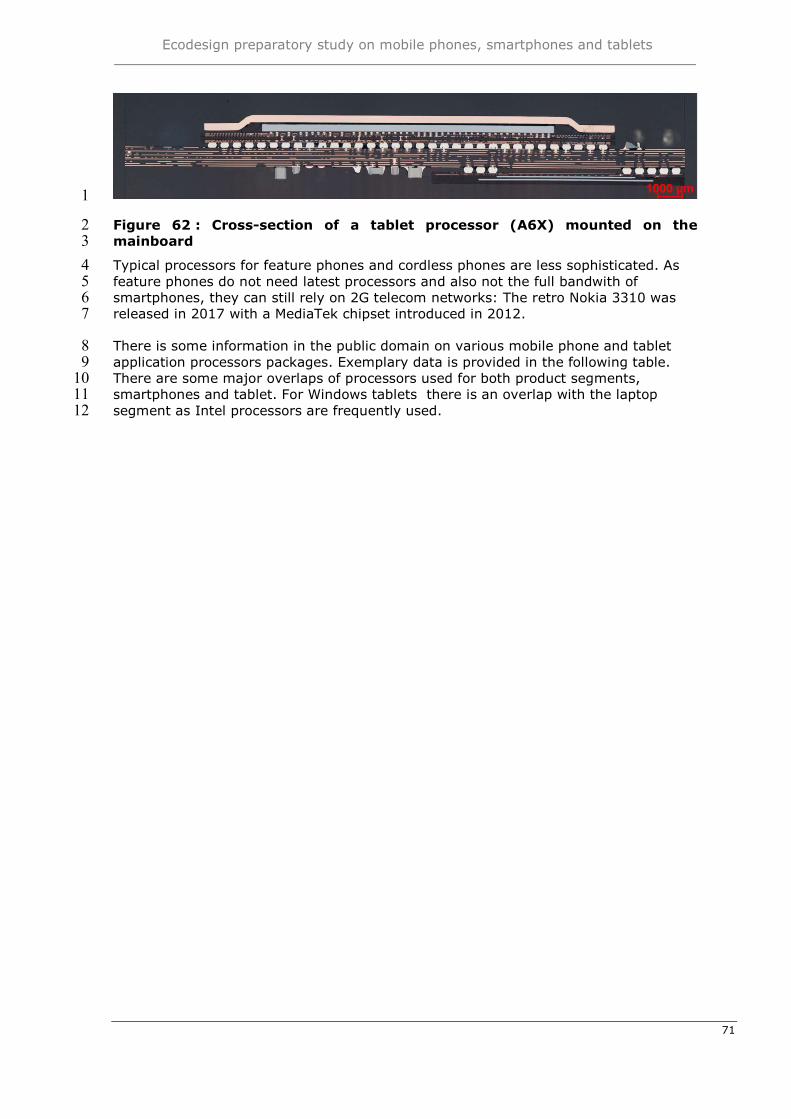
Ecodesign preparatory study on mobile phones, smartphones and tablets
71
1
Figure 62 : Cross-section of a tablet processor (A6X) mounted on the 2 mainboard 3
Typical processors for feature phones and cordless phones are less sophisticated. As 4 feature phones do not need latest processors and also not the full bandwith of 5 smartphones, they can still rely on 2G telecom networks: The retro Nokia 3310 was 6 released in 2017 with a MediaTek chipset introduced in 2012. 7
There is some information in the public domain on various mobile phone and tablet 8 application processors packages. Exemplary data is provided in the following table. 9 There are some major overlaps of processors used for both product segments, 10 smartphones and tablet. For Windows tablets there is an overlap with the laptop 11 segment as Intel processors are frequently used.12
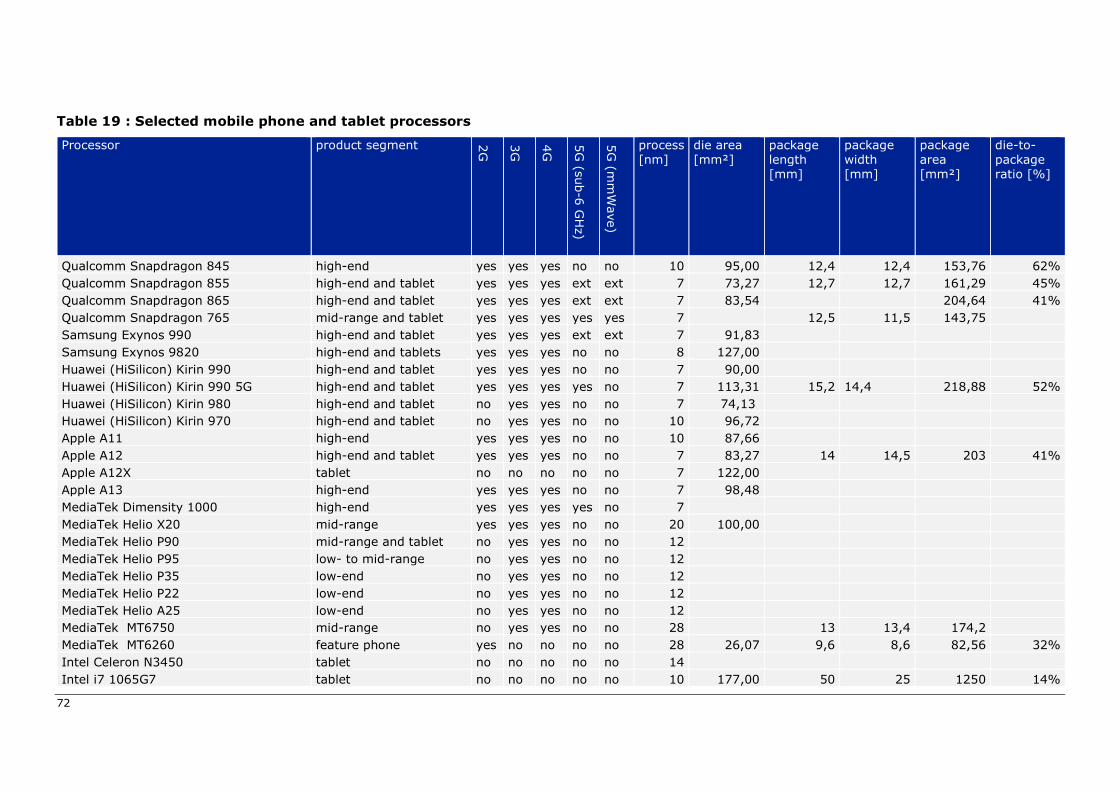
72
Table 19 : Selected mobile phone and tablet processors
Processor product segment 2G
3G
4G
5G
(sub-6
GH
z)
5G
(mm
Wave)
process [nm]
die area [mm²]
package length [mm]
package width [mm]
package area [mm²]
die-to-package ratio [%]
Qualcomm Snapdragon 845 high-end yes yes yes no no 10 95,00 12,4 12,4 153,76 62% Qualcomm Snapdragon 855 high-end and tablet yes yes yes ext ext 7 73,27 12,7 12,7 161,29 45% Qualcomm Snapdragon 865 high-end and tablet yes yes yes ext ext 7 83,54 204,64 41% Qualcomm Snapdragon 765 mid-range and tablet yes yes yes yes yes 7 12,5 11,5 143,75 Samsung Exynos 990 high-end and tablet yes yes yes ext ext 7 91,83 Samsung Exynos 9820 high-end and tablets yes yes yes no no 8 127,00 Huawei (HiSilicon) Kirin 990 high-end and tablet yes yes yes no no 7 90,00 Huawei (HiSilicon) Kirin 990 5G high-end and tablet yes yes yes yes no 7 113,31 15,2 14,4 218,88 52% Huawei (HiSilicon) Kirin 980 high-end and tablet no yes yes no no 7 74,13 Huawei (HiSilicon) Kirin 970 high-end and tablet no yes yes no no 10 96,72 Apple A11 high-end yes yes yes no no 10 87,66 Apple A12 high-end and tablet yes yes yes no no 7 83,27 14 14,5 203 41% Apple A12X tablet no no no no no 7 122,00 Apple A13 high-end yes yes yes no no 7 98,48 MediaTek Dimensity 1000 high-end yes yes yes yes no 7 MediaTek Helio X20 mid-range yes yes yes no no 20 100,00 MediaTek Helio P90 mid-range and tablet no yes yes no no 12 MediaTek Helio P95 low- to mid-range no yes yes no no 12 MediaTek Helio P35 low-end no yes yes no no 12 MediaTek Helio P22 low-end no yes yes no no 12 MediaTek Helio A25 low-end no yes yes no no 12 MediaTek MT6750 mid-range no yes yes no no 28 13 13,4 174,2 MediaTek MT6260 feature phone yes no no no no 28 26,07 9,6 8,6 82,56 32% Intel Celeron N3450 tablet no no no no no 14 Intel i7 1065G7 tablet no no no no no 10 177,00 50 25 1250 14%
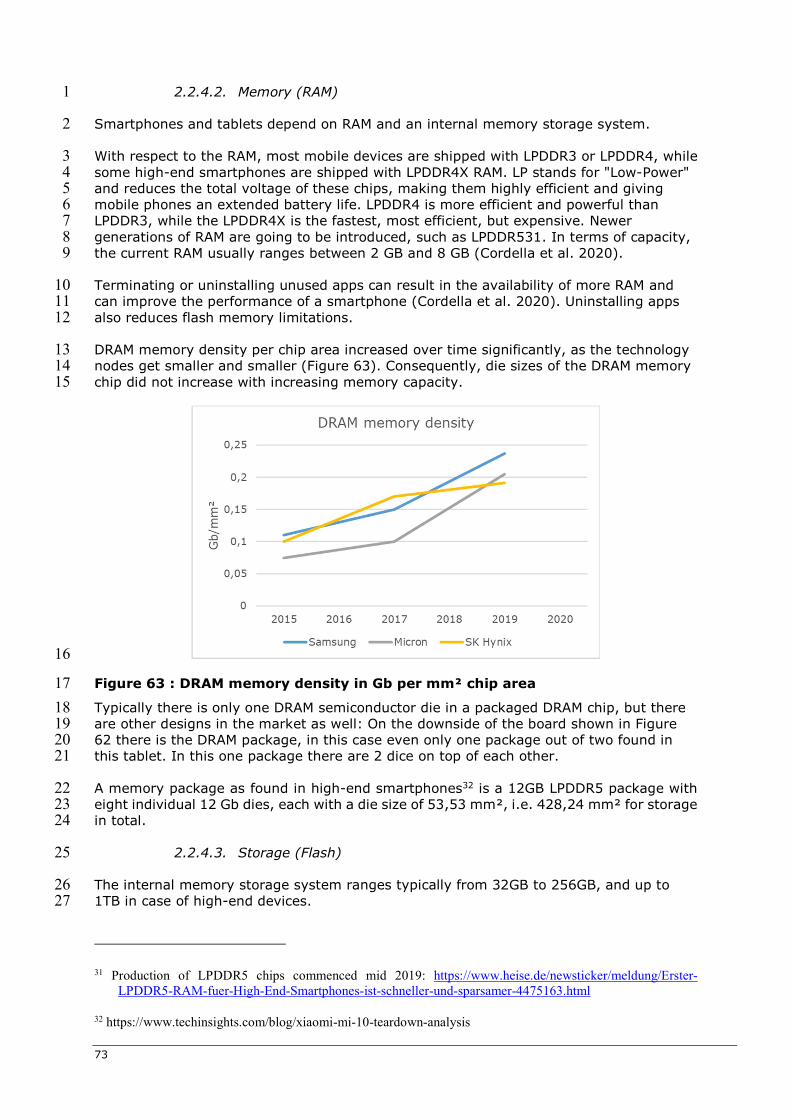
73
2.2.4.2. Memory (RAM) 1
Smartphones and tablets depend on RAM and an internal memory storage system. 2
With respect to the RAM, most mobile devices are shipped with LPDDR3 or LPDDR4, while 3 some high-end smartphones are shipped with LPDDR4X RAM. LP stands for "Low-Power" 4 and reduces the total voltage of these chips, making them highly efficient and giving 5 mobile phones an extended battery life. LPDDR4 is more efficient and powerful than 6 LPDDR3, while the LPDDR4X is the fastest, most efficient, but expensive. Newer 7 generations of RAM are going to be introduced, such as LPDDR531. In terms of capacity, 8 the current RAM usually ranges between 2 GB and 8 GB (Cordella et al. 2020). 9
Terminating or uninstalling unused apps can result in the availability of more RAM and 10 can improve the performance of a smartphone (Cordella et al. 2020). Uninstalling apps 11 also reduces flash memory limitations. 12
DRAM memory density per chip area increased over time significantly, as the technology 13 nodes get smaller and smaller (Figure 63). Consequently, die sizes of the DRAM memory 14 chip did not increase with increasing memory capacity. 15
16
Figure 63 : DRAM memory density in Gb per mm² chip area 17
Typically there is only one DRAM semiconductor die in a packaged DRAM chip, but there 18 are other designs in the market as well: On the downside of the board shown in Figure 19 62 there is the DRAM package, in this case even only one package out of two found in 20 this tablet. In this one package there are 2 dice on top of each other. 21
A memory package as found in high-end smartphones32 is a 12GB LPDDR5 package with 22 eight individual 12 Gb dies, each with a die size of 53,53 mm², i.e. 428,24 mm² for storage 23 in total. 24
2.2.4.3. Storage (Flash) 25
The internal memory storage system ranges typically from 32GB to 256GB, and up to 26 1TB in case of high-end devices. 27
31 Production of LPDDR5 chips commenced mid 2019: https://www.heise.de/newsticker/meldung/Erster-LPDDR5-RAM-fuer-High-End-Smartphones-ist-schneller-und-sparsamer-4475163.html
32 https://www.techinsights.com/blog/xiaomi-mi-10-teardown-analysis
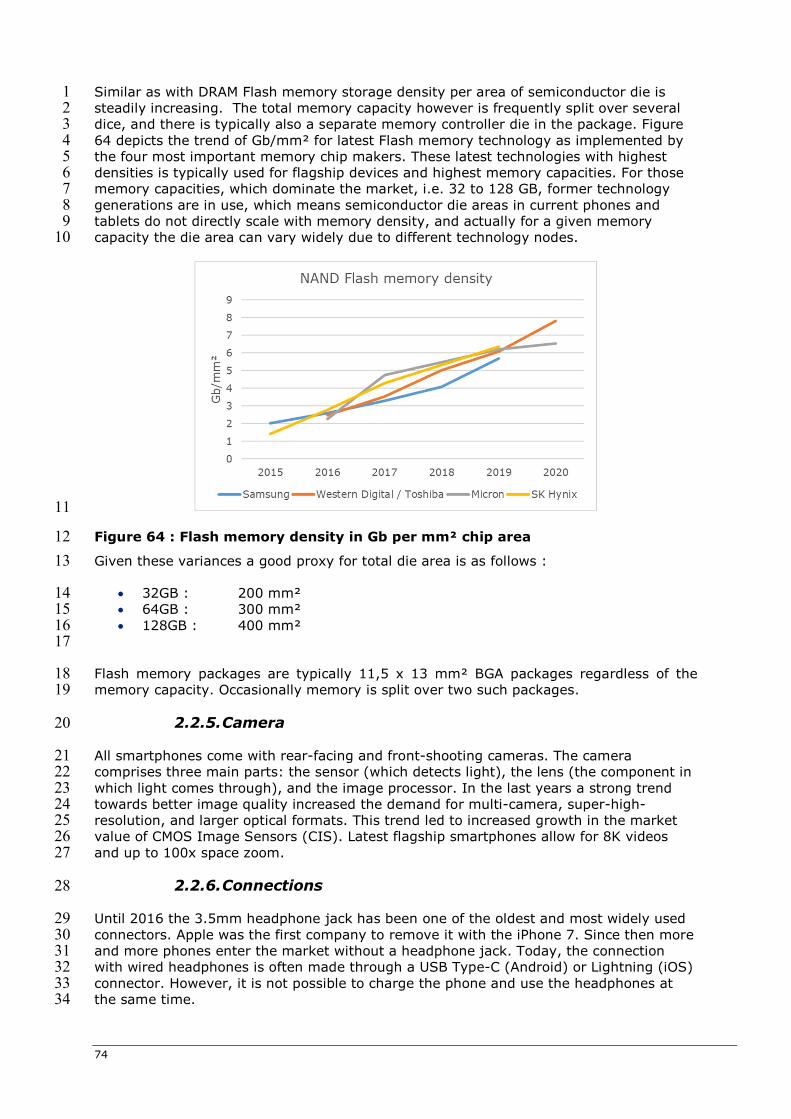
74
Similar as with DRAM Flash memory storage density per area of semiconductor die is 1 steadily increasing. The total memory capacity however is frequently split over several 2 dice, and there is typically also a separate memory controller die in the package. Figure 3 64 depicts the trend of Gb/mm² for latest Flash memory technology as implemented by 4 the four most important memory chip makers. These latest technologies with highest 5 densities is typically used for flagship devices and highest memory capacities. For those 6 memory capacities, which dominate the market, i.e. 32 to 128 GB, former technology 7 generations are in use, which means semiconductor die areas in current phones and 8 tablets do not directly scale with memory density, and actually for a given memory 9 capacity the die area can vary widely due to different technology nodes. 10
11
Figure 64 : Flash memory density in Gb per mm² chip area 12
Given these variances a good proxy for total die area is as follows : 13
32GB : 200 mm² 14 64GB : 300 mm² 15 128GB : 400 mm² 16
17
Flash memory packages are typically 11,5 x 13 mm² BGA packages regardless of the 18 memory capacity. Occasionally memory is split over two such packages. 19
2.2.5. Camera 20
All smartphones come with rear-facing and front-shooting cameras. The camera 21 comprises three main parts: the sensor (which detects light), the lens (the component in 22 which light comes through), and the image processor. In the last years a strong trend 23 towards better image quality increased the demand for multi-camera, super-high-24 resolution, and larger optical formats. This trend led to increased growth in the market 25 value of CMOS Image Sensors (CIS). Latest flagship smartphones allow for 8K videos 26 and up to 100x space zoom. 27
2.2.6. Connections 28
Until 2016 the 3.5mm headphone jack has been one of the oldest and most widely used 29 connectors. Apple was the first company to remove it with the iPhone 7. Since then more 30 and more phones enter the market without a headphone jack. Today, the connection 31 with wired headphones is often made through a USB Type-C (Android) or Lightning (iOS) 32 connector. However, it is not possible to charge the phone and use the headphones at 33 the same time. 34
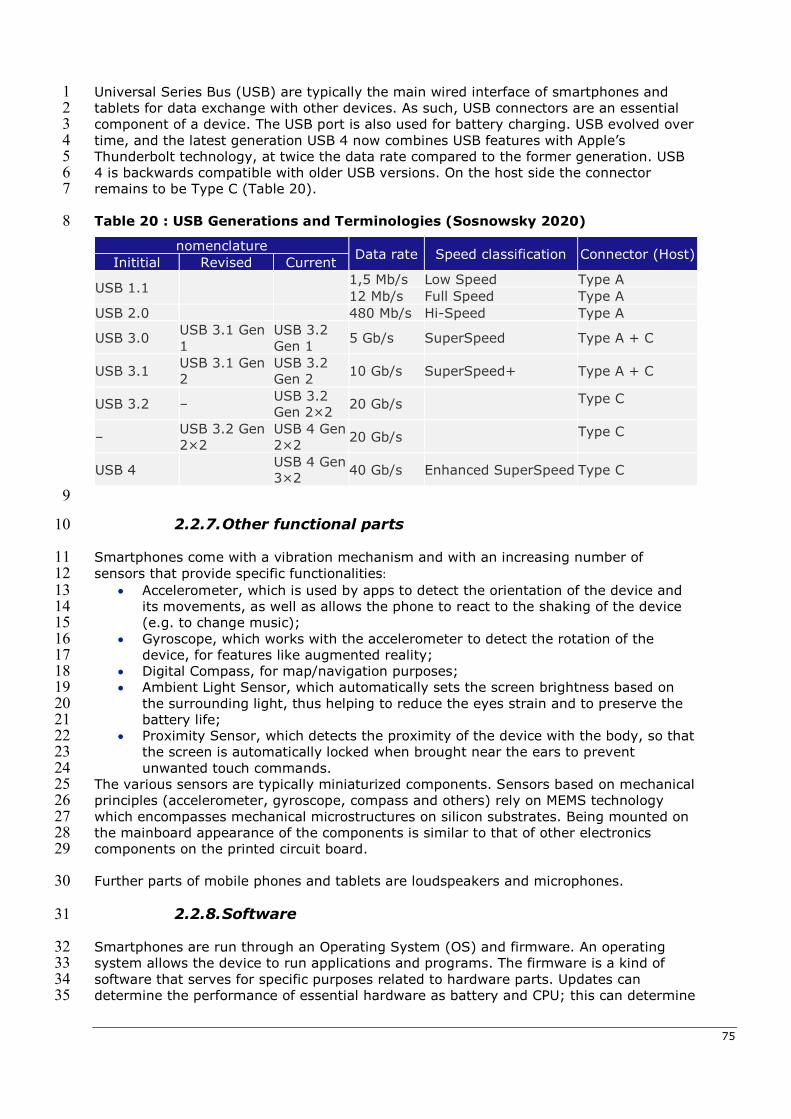
75
Universal Series Bus (USB) are typically the main wired interface of smartphones and 1 tablets for data exchange with other devices. As such, USB connectors are an essential 2 component of a device. The USB port is also used for battery charging. USB evolved over 3 time, and the latest generation USB 4 now combines USB features with Apple’s 4 Thunderbolt technology, at twice the data rate compared to the former generation. USB 5 4 is backwards compatible with older USB versions. On the host side the connector 6 remains to be Type C (Table 20). 7
Table 20 : USB Generations and Terminologies (Sosnowsky 2020) 8
9
2.2.7. Other functional parts 10
Smartphones come with a vibration mechanism and with an increasing number of 11 sensors that provide specific functionalities: 12
Accelerometer, which is used by apps to detect the orientation of the device and 13 its movements, as well as allows the phone to react to the shaking of the device 14 (e.g. to change music); 15
Gyroscope, which works with the accelerometer to detect the rotation of the 16 device, for features like augmented reality; 17
Digital Compass, for map/navigation purposes; 18 Ambient Light Sensor, which automatically sets the screen brightness based on 19
the surrounding light, thus helping to reduce the eyes strain and to preserve the 20 battery life; 21
Proximity Sensor, which detects the proximity of the device with the body, so that 22 the screen is automatically locked when brought near the ears to prevent 23 unwanted touch commands. 24
The various sensors are typically miniaturized components. Sensors based on mechanical 25 principles (accelerometer, gyroscope, compass and others) rely on MEMS technology 26 which encompasses mechanical microstructures on silicon substrates. Being mounted on 27 the mainboard appearance of the components is similar to that of other electronics 28 components on the printed circuit board. 29
Further parts of mobile phones and tablets are loudspeakers and microphones. 30
2.2.8. Software 31
Smartphones are run through an Operating System (OS) and firmware. An operating 32 system allows the device to run applications and programs. The firmware is a kind of 33 software that serves for specific purposes related to hardware parts. Updates can 34 determine the performance of essential hardware as battery and CPU; this can determine 35
nomenclature Data rate Speed classification Connector (Host)
Inititial Revised Current
USB 1.1 1,5 Mb/s Low Speed Type A 12 Mb/s Full Speed Type A
USB 2.0 480 Mb/s Hi-Speed Type A
USB 3.0 USB 3.1 Gen 1
USB 3.2 Gen 1
5 Gb/s SuperSpeed Type A + C
USB 3.1 USB 3.1 Gen 2
USB 3.2 Gen 2 10 Gb/s SuperSpeed+ Type A + C
USB 3.2 – USB 3.2 Gen 2×2
20 Gb/s Type C
– USB 3.2 Gen 2×2
USB 4 Gen 2×2
20 Gb/s Type C
USB 4 USB 4 Gen 3×2 40 Gb/s Enhanced SuperSpeed Type C
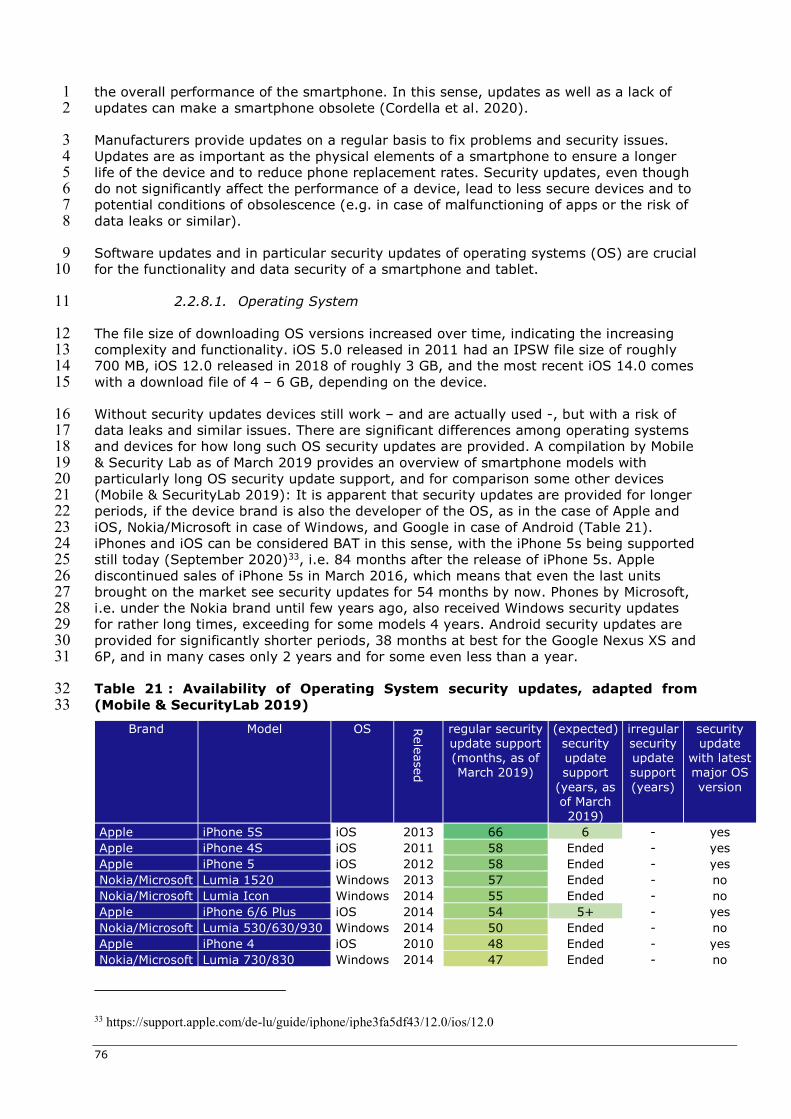
76
the overall performance of the smartphone. In this sense, updates as well as a lack of 1 updates can make a smartphone obsolete (Cordella et al. 2020). 2
Manufacturers provide updates on a regular basis to fix problems and security issues. 3 Updates are as important as the physical elements of a smartphone to ensure a longer 4 life of the device and to reduce phone replacement rates. Security updates, even though 5 do not significantly affect the performance of a device, lead to less secure devices and to 6 potential conditions of obsolescence (e.g. in case of malfunctioning of apps or the risk of 7 data leaks or similar). 8
Software updates and in particular security updates of operating systems (OS) are crucial 9 for the functionality and data security of a smartphone and tablet. 10
2.2.8.1. Operating System 11
The file size of downloading OS versions increased over time, indicating the increasing 12 complexity and functionality. iOS 5.0 released in 2011 had an IPSW file size of roughly 13 700 MB, iOS 12.0 released in 2018 of roughly 3 GB, and the most recent iOS 14.0 comes 14 with a download file of 4 – 6 GB, depending on the device. 15
Without security updates devices still work – and are actually used -, but with a risk of 16 data leaks and similar issues. There are significant differences among operating systems 17 and devices for how long such OS security updates are provided. A compilation by Mobile 18 & Security Lab as of March 2019 provides an overview of smartphone models with 19 particularly long OS security update support, and for comparison some other devices 20 (Mobile & SecurityLab 2019): It is apparent that security updates are provided for longer 21 periods, if the device brand is also the developer of the OS, as in the case of Apple and 22 iOS, Nokia/Microsoft in case of Windows, and Google in case of Android (Table 21). 23 iPhones and iOS can be considered BAT in this sense, with the iPhone 5s being supported 24 still today (September 2020)33, i.e. 84 months after the release of iPhone 5s. Apple 25 discontinued sales of iPhone 5s in March 2016, which means that even the last units 26 brought on the market see security updates for 54 months by now. Phones by Microsoft, 27 i.e. under the Nokia brand until few years ago, also received Windows security updates 28 for rather long times, exceeding for some models 4 years. Android security updates are 29 provided for significantly shorter periods, 38 months at best for the Google Nexus XS and 30 6P, and in many cases only 2 years and for some even less than a year. 31
Table 21 : Availability of Operating System security updates, adapted from 32 (Mobile & SecurityLab 2019) 33
Brand Model OS Released
regular security update support (months, as of March 2019)
(expected) security update support
(years, as of March 2019)
irregular security update support (years)
security update
with latest major OS version
Apple iPhone 5S iOS 2013 66 6 - yes Apple iPhone 4S iOS 2011 58 Ended - yes Apple iPhone 5 iOS 2012 58 Ended - yes Nokia/Microsoft Lumia 1520 Windows 2013 57 Ended - no Nokia/Microsoft Lumia Icon Windows 2014 55 Ended - no Apple iPhone 6/6 Plus iOS 2014 54 5+ - yes Nokia/Microsoft Lumia 530/630/930 Windows 2014 50 Ended - no Apple iPhone 4 iOS 2010 48 Ended - yes Nokia/Microsoft Lumia 730/830 Windows 2014 47 Ended - no
33 https://support.apple.com/de-lu/guide/iphone/iphe3fa5df43/12.0/ios/12.0
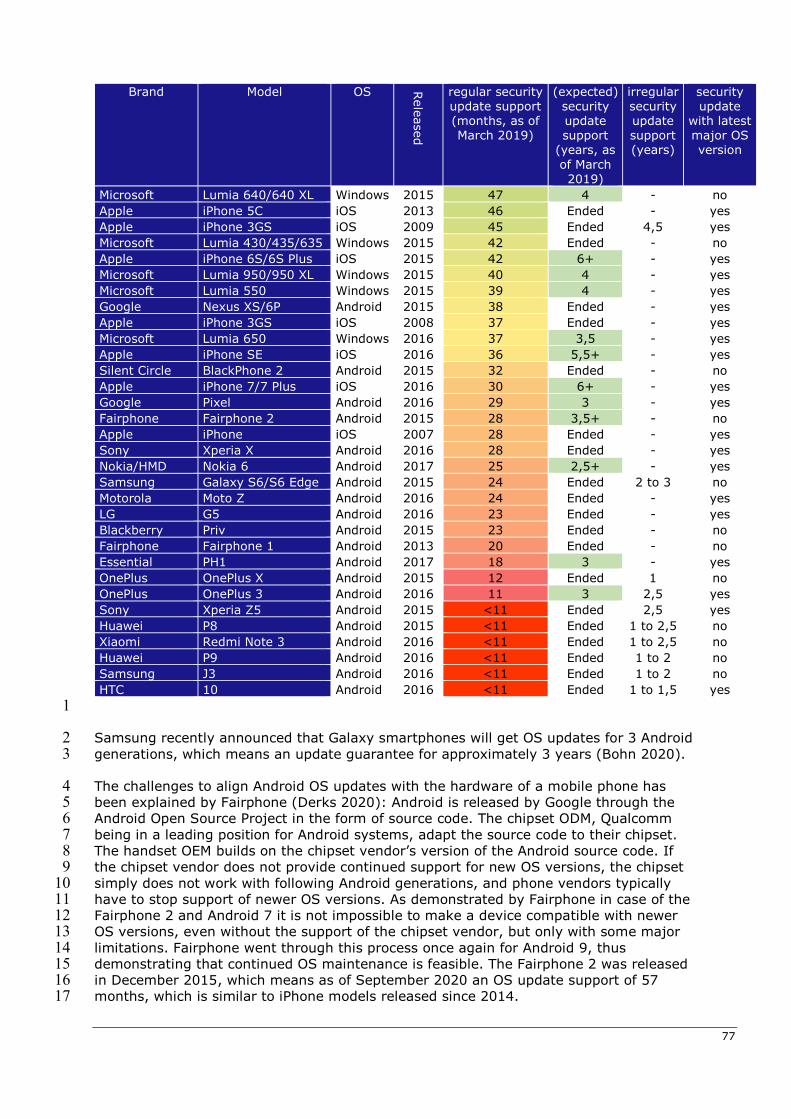
77
Brand Model OS Released
regular security update support (months, as of March 2019)
(expected) security update support
(years, as of March 2019)
irregular security update support (years)
security update
with latest major OS version
Microsoft Lumia 640/640 XL Windows 2015 47 4 - no Apple iPhone 5C iOS 2013 46 Ended - yes Apple iPhone 3GS iOS 2009 45 Ended 4,5 yes Microsoft Lumia 430/435/635 Windows 2015 42 Ended - no Apple iPhone 6S/6S Plus iOS 2015 42 6+ - yes Microsoft Lumia 950/950 XL Windows 2015 40 4 - yes Microsoft Lumia 550 Windows 2015 39 4 - yes Google Nexus XS/6P Android 2015 38 Ended - yes Apple iPhone 3GS iOS 2008 37 Ended - yes Microsoft Lumia 650 Windows 2016 37 3,5 - yes Apple iPhone SE iOS 2016 36 5,5+ - yes Silent Circle BlackPhone 2 Android 2015 32 Ended - no Apple iPhone 7/7 Plus iOS 2016 30 6+ - yes Google Pixel Android 2016 29 3 - yes Fairphone Fairphone 2 Android 2015 28 3,5+ - no Apple iPhone iOS 2007 28 Ended - yes Sony Xperia X Android 2016 28 Ended - yes Nokia/HMD Nokia 6 Android 2017 25 2,5+ - yes Samsung Galaxy S6/S6 Edge Android 2015 24 Ended 2 to 3 no Motorola Moto Z Android 2016 24 Ended - yes LG G5 Android 2016 23 Ended - yes Blackberry Priv Android 2015 23 Ended - no Fairphone Fairphone 1 Android 2013 20 Ended - no Essential PH1 Android 2017 18 3 - yes OnePlus OnePlus X Android 2015 12 Ended 1 no OnePlus OnePlus 3 Android 2016 11 3 2,5 yes Sony Xperia Z5 Android 2015 <11 Ended 2,5 yes Huawei P8 Android 2015 <11 Ended 1 to 2,5 no Xiaomi Redmi Note 3 Android 2016 <11 Ended 1 to 2,5 no Huawei P9 Android 2016 <11 Ended 1 to 2 no Samsung J3 Android 2016 <11 Ended 1 to 2 no HTC 10 Android 2016 <11 Ended 1 to 1,5 yes
1
Samsung recently announced that Galaxy smartphones will get OS updates for 3 Android 2 generations, which means an update guarantee for approximately 3 years (Bohn 2020). 3
The challenges to align Android OS updates with the hardware of a mobile phone has 4 been explained by Fairphone (Derks 2020): Android is released by Google through the 5 Android Open Source Project in the form of source code. The chipset ODM, Qualcomm 6 being in a leading position for Android systems, adapt the source code to their chipset. 7 The handset OEM builds on the chipset vendor’s version of the Android source code. If 8 the chipset vendor does not provide continued support for new OS versions, the chipset 9 simply does not work with following Android generations, and phone vendors typically 10 have to stop support of newer OS versions. As demonstrated by Fairphone in case of the 11 Fairphone 2 and Android 7 it is not impossible to make a device compatible with newer 12 OS versions, even without the support of the chipset vendor, but only with some major 13 limitations. Fairphone went through this process once again for Android 9, thus 14 demonstrating that continued OS maintenance is feasible. The Fairphone 2 was released 15 in December 2015, which means as of September 2020 an OS update support of 57 16 months, which is similar to iPhone models released since 2014. 17
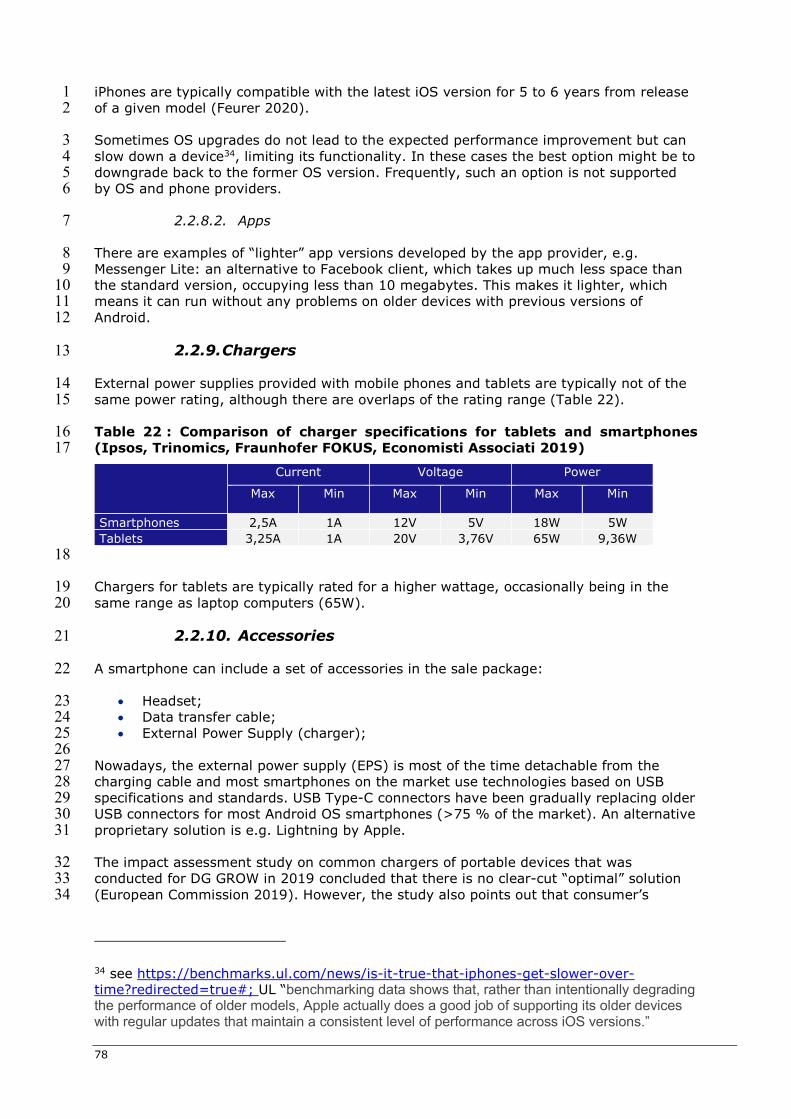
78
iPhones are typically compatible with the latest iOS version for 5 to 6 years from release 1 of a given model (Feurer 2020). 2
Sometimes OS upgrades do not lead to the expected performance improvement but can 3 slow down a device34, limiting its functionality. In these cases the best option might be to 4 downgrade back to the former OS version. Frequently, such an option is not supported 5 by OS and phone providers. 6
2.2.8.2. Apps 7
There are examples of “lighter” app versions developed by the app provider, e.g. 8 Messenger Lite: an alternative to Facebook client, which takes up much less space than 9 the standard version, occupying less than 10 megabytes. This makes it lighter, which 10 means it can run without any problems on older devices with previous versions of 11 Android. 12
2.2.9. Chargers 13
External power supplies provided with mobile phones and tablets are typically not of the 14 same power rating, although there are overlaps of the rating range (Table 22). 15
Table 22 : Comparison of charger specifications for tablets and smartphones 16 (Ipsos, Trinomics, Fraunhofer FOKUS, Economisti Associati 2019) 17
Current Voltage Power
Max Min Max Min Max Min
Smartphones 2,5A 1A 12V 5V 18W 5W Tablets 3,25A 1A 20V 3,76V 65W 9,36W
18
Chargers for tablets are typically rated for a higher wattage, occasionally being in the 19 same range as laptop computers (65W). 20
2.2.10. Accessories 21
A smartphone can include a set of accessories in the sale package: 22
Headset; 23 Data transfer cable; 24 External Power Supply (charger); 25
26 Nowadays, the external power supply (EPS) is most of the time detachable from the 27 charging cable and most smartphones on the market use technologies based on USB 28 specifications and standards. USB Type-C connectors have been gradually replacing older 29 USB connectors for most Android OS smartphones (>75 % of the market). An alternative 30 proprietary solution is e.g. Lightning by Apple. 31
The impact assessment study on common chargers of portable devices that was 32 conducted for DG GROW in 2019 concluded that there is no clear-cut “optimal” solution 33 (European Commission 2019). However, the study also points out that consumer’s 34
34 see https://benchmarks.ul.com/news/is-it-true-that-iphones-get-slower-over-time?redirected=true#; UL “benchmarking data shows that, rather than intentionally degrading the performance of older models, Apple actually does a good job of supporting its older devices with regular updates that maintain a consistent level of performance across iOS versions.”
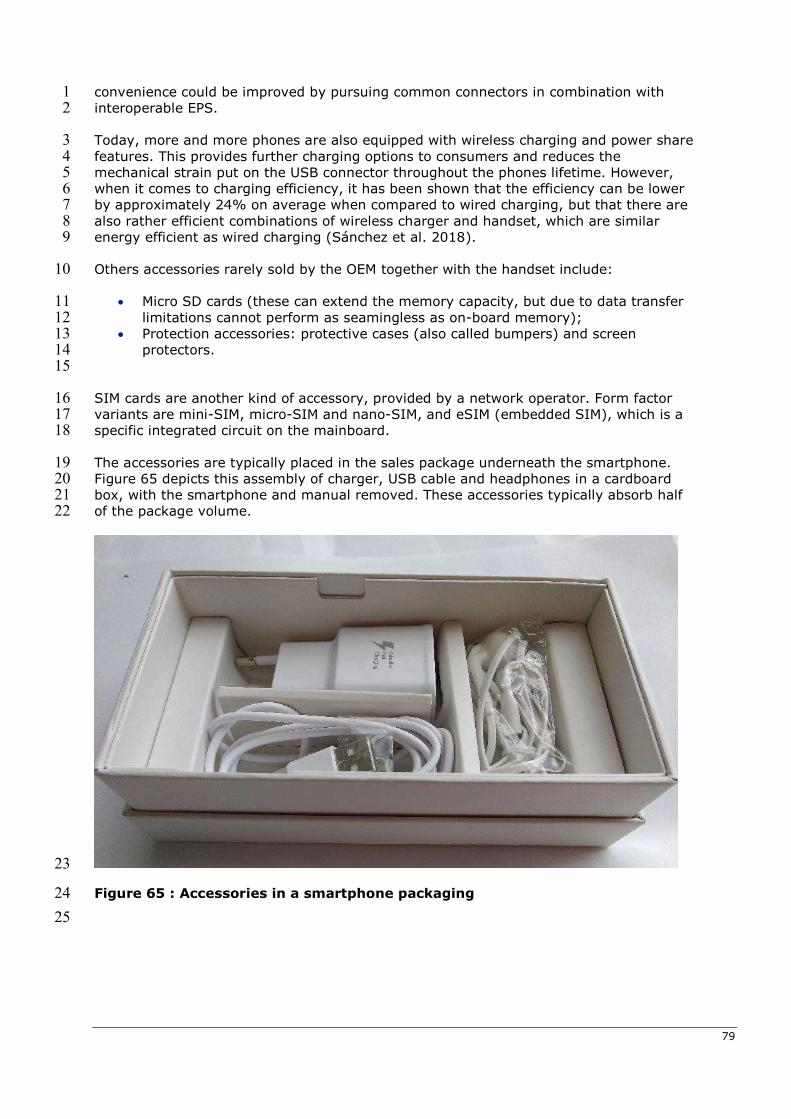
79
convenience could be improved by pursuing common connectors in combination with 1 interoperable EPS. 2
Today, more and more phones are also equipped with wireless charging and power share 3 features. This provides further charging options to consumers and reduces the 4 mechanical strain put on the USB connector throughout the phones lifetime. However, 5 when it comes to charging efficiency, it has been shown that the efficiency can be lower 6 by approximately 24% on average when compared to wired charging, but that there are 7 also rather efficient combinations of wireless charger and handset, which are similar 8 energy efficient as wired charging (Sánchez et al. 2018). 9
Others accessories rarely sold by the OEM together with the handset include: 10
Micro SD cards (these can extend the memory capacity, but due to data transfer 11 limitations cannot perform as seamingless as on-board memory); 12
Protection accessories: protective cases (also called bumpers) and screen 13 protectors. 14
15
SIM cards are another kind of accessory, provided by a network operator. Form factor 16 variants are mini-SIM, micro-SIM and nano-SIM, and eSIM (embedded SIM), which is a 17 specific integrated circuit on the mainboard. 18
The accessories are typically placed in the sales package underneath the smartphone. 19 Figure 65 depicts this assembly of charger, USB cable and headphones in a cardboard 20 box, with the smartphone and manual removed. These accessories typically absorb half 21 of the package volume. 22
23
Figure 65 : Accessories in a smartphone packaging 24
25
80
2.3. BAT – Best Available Technology at product level 1
2.3.1. Mobile phones 2
2.3.1.1. Energy efficiency 3
Energy consumption of mobile phones is a very complex issue as it relates to hardware 4 and software. As such, reducing energy consumption is essential for mobile phone 5 developers to increase battery lifetime in terms of hours in standby or active 6 (benchmark) use, which is a major performance feature for mobile phones and also 7 tablet computers. 8
Technical measures to increase energy efficiency are manifold and listed in detail by 9 Pramanik. Some of these measures, which can partly be assumed to be implemented 10 already (BAT), and partly originate from ongoing research (BNAT) are (Pramanik et al. 11 2019): 12
various power management options, 13 data compression for faster data exchange, 14 adapted WiFi sensing, 15 frame rate adjustment to use patterns, 16 sharing of location-sensing data across applications, 17 parallelism across multi-core processors, 18 dynamic setting of voltage, CPU frequency and memory bandwidth 19 brightness adaptation 20 energy-optimised design of applications, though being rather a third party issue 21
22
The smartphone with the by far best battery endurance rating, indicating a particular 23 good energy efficiency, by GSMArena is the low-end device Realme 6i with an above-24 average 5000 mAh battery. Further specifications of this device are a Mediatek Helio G80 25 (12 nm, Octa-core) CPU, 6,5” LCD with 1.600 x 720 pixel, 2G / 3G / 4G connectivity, WiFi, 26 Bluetooth. This devices is tested with a battery endurance of 35 hours talk time, 30 27 hours web browsing, or 21 hours video playback, or 186 hours with 1 hour talk time, web 28 browsing, video playback each per day35. 29
2.3.1.2. Overall weight 30
In terms of minimum weight, i.e. material use, the Zanco Tiny T1 with only 13 g, and a 31 size of 47 by 21 millimetres36, is Best Available Technology for mobile voice 32 communication, but with a very limited user experience. Hence, this mobile phone cannot 33 be considered as BAT for the mobile phone market as such, and rather serves as an 34 illustration, how much material is needed at best for the mobile voice communication 35 functionality. 36
2.3.1.3. Use of recycled material 37
The use of recycled material in mobile phones has increased in past years. Whereas 38 several metals sourced on the global market typically are a mix of primary and secondary 39 material anyway, such as copper, ferro metals, and precious metals, there are other 40
35 Test conditions : https://www.gsmarena.com/gsmarena_lab_tests-review-751p6.php
36 https://www.telecom-handel.de/distribution/h-o-t-phone/hotphone-bringt-bonsai-handy-deutschland-1657765.html
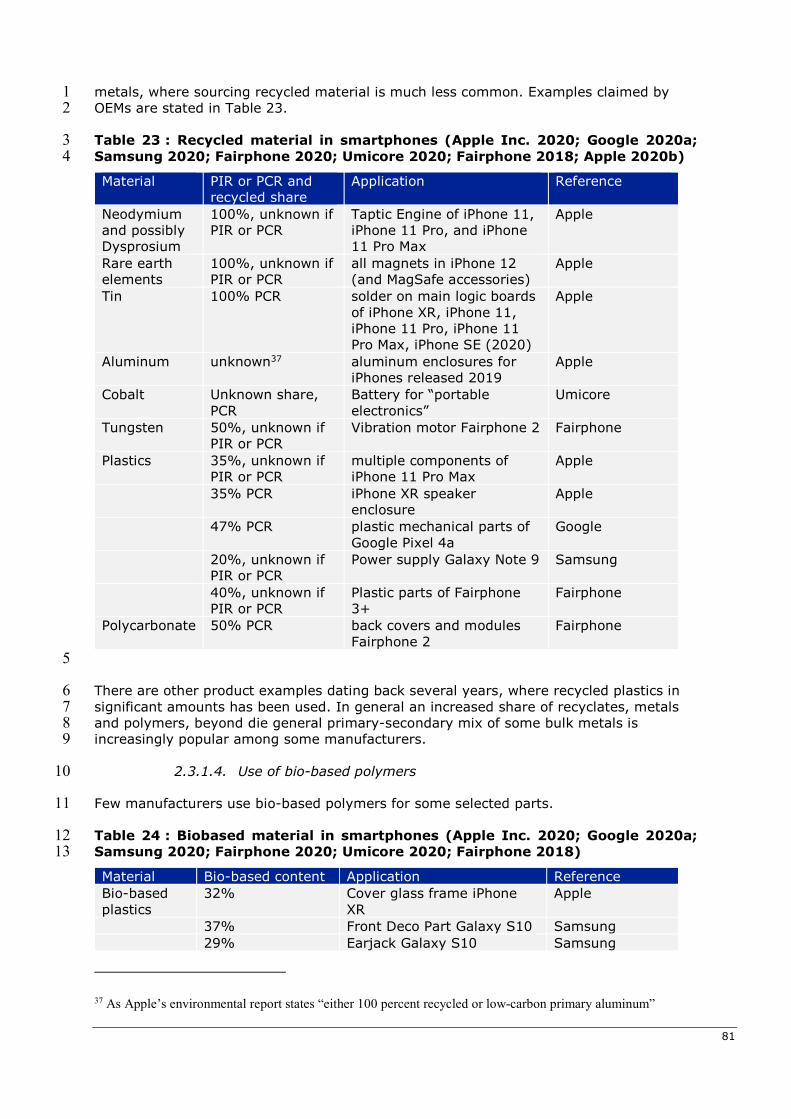
81
metals, where sourcing recycled material is much less common. Examples claimed by 1 OEMs are stated in Table 23. 2
Table 23 : Recycled material in smartphones (Apple Inc. 2020; Google 2020a; 3 Samsung 2020; Fairphone 2020; Umicore 2020; Fairphone 2018; Apple 2020b) 4
Material PIR or PCR and recycled share
Application Reference
Neodymium and possibly Dysprosium
100%, unknown if PIR or PCR
Taptic Engine of iPhone 11, iPhone 11 Pro, and iPhone 11 Pro Max
Apple
Rare earth elements
100%, unknown if PIR or PCR
all magnets in iPhone 12 (and MagSafe accessories)
Apple
Tin 100% PCR solder on main logic boards of iPhone XR, iPhone 11, iPhone 11 Pro, iPhone 11 Pro Max, iPhone SE (2020)
Apple
Aluminum unknown37 aluminum enclosures for iPhones released 2019
Apple
Cobalt Unknown share, PCR
Battery for “portable electronics”
Umicore
Tungsten 50%, unknown if PIR or PCR
Vibration motor Fairphone 2 Fairphone
Plastics 35%, unknown if PIR or PCR
multiple components of iPhone 11 Pro Max
Apple
35% PCR iPhone XR speaker enclosure
Apple
47% PCR plastic mechanical parts of Google Pixel 4a
20%, unknown if PIR or PCR
Power supply Galaxy Note 9 Samsung
40%, unknown if PIR or PCR
Plastic parts of Fairphone 3+
Fairphone
Polycarbonate 50% PCR back covers and modules Fairphone 2
Fairphone
5
There are other product examples dating back several years, where recycled plastics in 6 significant amounts has been used. In general an increased share of recyclates, metals 7 and polymers, beyond die general primary-secondary mix of some bulk metals is 8 increasingly popular among some manufacturers. 9
2.3.1.4. Use of bio-based polymers 10
Few manufacturers use bio-based polymers for some selected parts. 11
Table 24 : Biobased material in smartphones (Apple Inc. 2020; Google 2020a; 12 Samsung 2020; Fairphone 2020; Umicore 2020; Fairphone 2018) 13
Material Bio-based content Application Reference Bio-based plastics
32% Cover glass frame iPhone XR
Apple
37% Front Deco Part Galaxy S10 Samsung 29% Earjack Galaxy S10 Samsung
37 As Apple’s environmental report states “either 100 percent recycled or low-carbon primary aluminum”
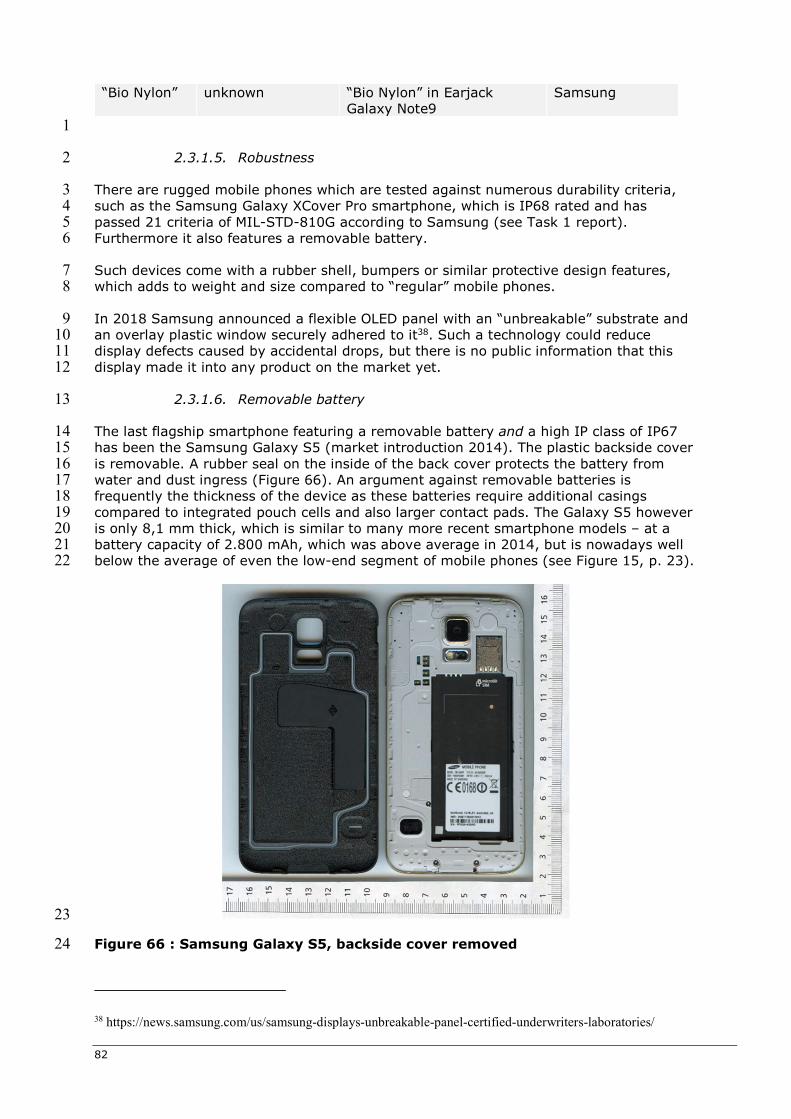
82
“Bio Nylon” unknown “Bio Nylon” in Earjack Galaxy Note9
Samsung
1
2.3.1.5. Robustness 2
There are rugged mobile phones which are tested against numerous durability criteria, 3 such as the Samsung Galaxy XCover Pro smartphone, which is IP68 rated and has 4 passed 21 criteria of MIL-STD-810G according to Samsung (see Task 1 report). 5 Furthermore it also features a removable battery. 6
Such devices come with a rubber shell, bumpers or similar protective design features, 7 which adds to weight and size compared to “regular” mobile phones. 8
In 2018 Samsung announced a flexible OLED panel with an “unbreakable” substrate and 9 an overlay plastic window securely adhered to it38. Such a technology could reduce 10 display defects caused by accidental drops, but there is no public information that this 11 display made it into any product on the market yet. 12
2.3.1.6. Removable battery 13
The last flagship smartphone featuring a removable battery and a high IP class of IP67 14 has been the Samsung Galaxy S5 (market introduction 2014). The plastic backside cover 15 is removable. A rubber seal on the inside of the back cover protects the battery from 16 water and dust ingress (Figure 66). An argument against removable batteries is 17 frequently the thickness of the device as these batteries require additional casings 18 compared to integrated pouch cells and also larger contact pads. The Galaxy S5 however 19 is only 8,1 mm thick, which is similar to many more recent smartphone models – at a 20 battery capacity of 2.800 mAh, which was above average in 2014, but is nowadays well 21 below the average of even the low-end segment of mobile phones (see Figure 15, p. 23). 22
23
Figure 66 : Samsung Galaxy S5, backside cover removed 24
38 https://news.samsung.com/us/samsung-displays-unbreakable-panel-certified-underwriters-laboratories/
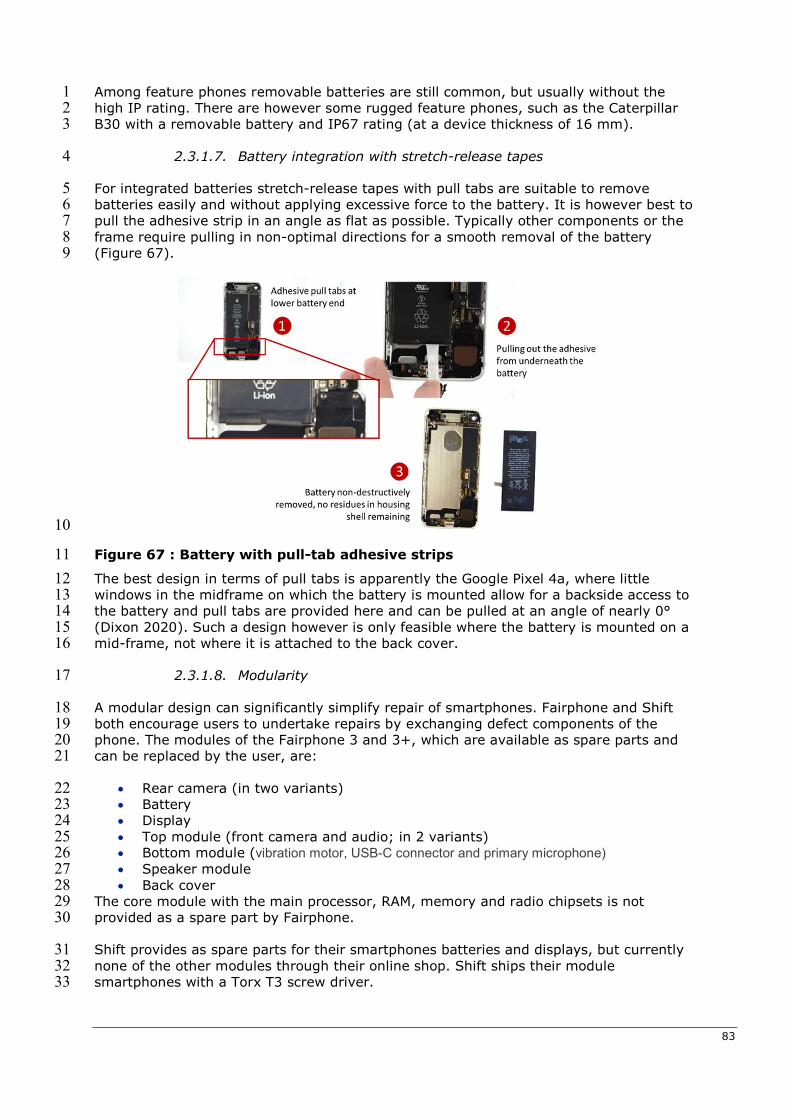
83
Among feature phones removable batteries are still common, but usually without the 1 high IP rating. There are however some rugged feature phones, such as the Caterpillar 2 B30 with a removable battery and IP67 rating (at a device thickness of 16 mm). 3
2.3.1.7. Battery integration with stretch-release tapes 4
For integrated batteries stretch-release tapes with pull tabs are suitable to remove 5 batteries easily and without applying excessive force to the battery. It is however best to 6 pull the adhesive strip in an angle as flat as possible. Typically other components or the 7 frame require pulling in non-optimal directions for a smooth removal of the battery 8 (Figure 67). 9
10
Figure 67 : Battery with pull-tab adhesive strips 11
The best design in terms of pull tabs is apparently the Google Pixel 4a, where little 12 windows in the midframe on which the battery is mounted allow for a backside access to 13 the battery and pull tabs are provided here and can be pulled at an angle of nearly 0° 14 (Dixon 2020). Such a design however is only feasible where the battery is mounted on a 15 mid-frame, not where it is attached to the back cover. 16
2.3.1.8. Modularity 17
A modular design can significantly simplify repair of smartphones. Fairphone and Shift 18 both encourage users to undertake repairs by exchanging defect components of the 19 phone. The modules of the Fairphone 3 and 3+, which are available as spare parts and 20 can be replaced by the user, are: 21
Rear camera (in two variants) 22 Battery 23 Display 24 Top module (front camera and audio; in 2 variants) 25 Bottom module (vibration motor, USB-C connector and primary microphone) 26 Speaker module 27 Back cover 28
The core module with the main processor, RAM, memory and radio chipsets is not 29 provided as a spare part by Fairphone. 30
Shift provides as spare parts for their smartphones batteries and displays, but currently 31 none of the other modules through their online shop. Shift ships their module 32 smartphones with a Torx T3 screw driver. 33
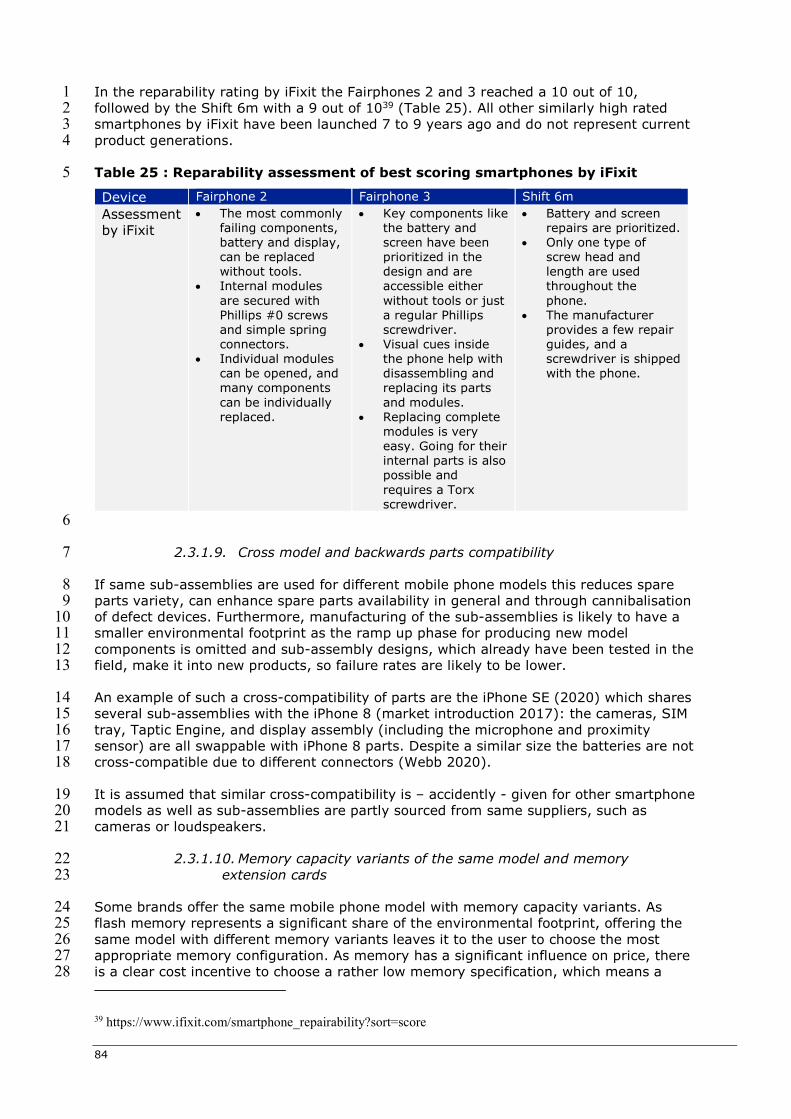
84
In the reparability rating by iFixit the Fairphones 2 and 3 reached a 10 out of 10, 1 followed by the Shift 6m with a 9 out of 1039 (Table 25). All other similarly high rated 2 smartphones by iFixit have been launched 7 to 9 years ago and do not represent current 3 product generations. 4
Table 25 : Reparability assessment of best scoring smartphones by iFixit 5
Device Fairphone 2 Fairphone 3 Shift 6m
Assessment by iFixit
The most commonly failing components, battery and display, can be replaced without tools.
Internal modules are secured with Phillips #0 screws and simple spring connectors.
Individual modules can be opened, and many components can be individually replaced.
Key components like the battery and screen have been prioritized in the design and are accessible either without tools or just a regular Phillips screwdriver.
Visual cues inside the phone help with disassembling and replacing its parts and modules.
Replacing complete modules is very easy. Going for their internal parts is also possible and requires a Torx screwdriver.
Battery and screen repairs are prioritized.
Only one type of screw head and length are used throughout the phone.
The manufacturer provides a few repair guides, and a screwdriver is shipped with the phone.
6
2.3.1.9. Cross model and backwards parts compatibility 7
If same sub-assemblies are used for different mobile phone models this reduces spare 8 parts variety, can enhance spare parts availability in general and through cannibalisation 9 of defect devices. Furthermore, manufacturing of the sub-assemblies is likely to have a 10 smaller environmental footprint as the ramp up phase for producing new model 11 components is omitted and sub-assembly designs, which already have been tested in the 12 field, make it into new products, so failure rates are likely to be lower. 13
An example of such a cross-compatibility of parts are the iPhone SE (2020) which shares 14 several sub-assemblies with the iPhone 8 (market introduction 2017): the cameras, SIM 15 tray, Taptic Engine, and display assembly (including the microphone and proximity 16 sensor) are all swappable with iPhone 8 parts. Despite a similar size the batteries are not 17 cross-compatible due to different connectors (Webb 2020). 18
It is assumed that similar cross-compatibility is – accidently - given for other smartphone 19 models as well as sub-assemblies are partly sourced from same suppliers, such as 20 cameras or loudspeakers. 21
2.3.1.10. Memory capacity variants of the same model and memory 22 extension cards 23
Some brands offer the same mobile phone model with memory capacity variants. As 24 flash memory represents a significant share of the environmental footprint, offering the 25 same model with different memory variants leaves it to the user to choose the most 26 appropriate memory configuration. As memory has a significant influence on price, there 27 is a clear cost incentive to choose a rather low memory specification, which means a 28
39 https://www.ifixit.com/smartphone_repairability?sort=score
85
smaller environmental footprint of the device. This product policy might also have the 1 adverse effect, that users underestimate the need of memory capacity and exchange 2 devices more rapidly – but this might be the case for only one given memory 3 configuration as well. 4
Several manufacturers implemented such a product policy to offer more than one 5 memory configuration for a given model. This is the case at least for all Apple iPhones, 6 OnePlus, Xiaomi, Realme, and some Huawei phones. 7
Low-end phones usually do not come with memory capacity variants, but allow for 8 memory extension through microSD, microSDHC, or microSDXC memory cards, which is 9 also the case for some flagship phones, which do not otherwise provide memory capacity 10 variants, such as the Samsung Galaxy S20 with a memory extension of up to 1 TB. The 11 advantage of a memory card extension is the simple use of this card to following 12 smartphones, given the same card format is supported. 13
2.3.1.11. Unbundling 14
Very few mobile phones can be ordered without a power supply unit. Examples are the 15 Fairphone 3 / Fairphone 3+ and SHIFT5me and SHIFT6m. Existing compatible power 16 supplies can be used further with these smartphones. 17
In October 2020 Apple announced to ship iPhones without charger and headset 18 (“EarPods”), and just to keep the USB‐C to Lightning cable in the shipping box. This 19 measure allows Apple also to reduce the package size, and Apple claims now to ship 70% 20 more phones on a pallet and correlates this with massive carbon savings (Apple 2020b). 21
2.3.1.12. EPEAT rating 22
Statistics of EPEAT criteria (see Task 1 report) met by mobile phones indicate, which 23 product related features are broadly implemented already and which ones are apparently 24 more challenging. The analysis provided in Figure 68 shows that for none of the 25 registered products a removable battery is claimed. Next “most challenging” criteria, 26 which are however met by several models include: 27
Substitutions assessment 28 Receiving substance inventory 29 Post-consumer recycled plastic and biobased plastic content in the mobile phone 30 Post-consumer recycled plastic and biobased plastic content in accessories 31 Improve packaging efficiency 32 Product LCA third-party verification or making LCA publicly available 33 Reduce fluorinated gas emissions from flat panel display manufacturing 34
35
The highest EPEAT score is currently reached by the iPhone Xr, with 103 points out of 36 119. 37
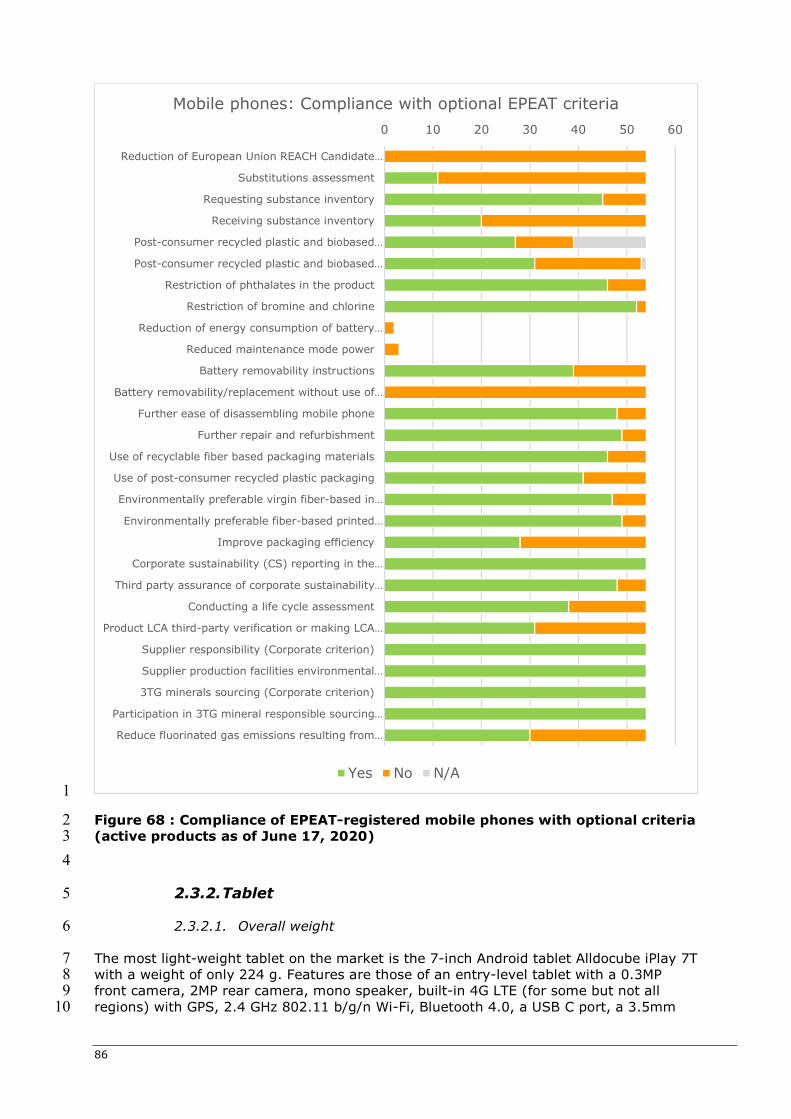
86
1
Figure 68 : Compliance of EPEAT-registered mobile phones with optional criteria 2 (active products as of June 17, 2020) 3
4
2.3.2. Tablet 5
2.3.2.1. Overall weight 6
The most light-weight tablet on the market is the 7-inch Android tablet Alldocube iPlay 7T 7 with a weight of only 224 g. Features are those of an entry-level tablet with a 0.3MP 8 front camera, 2MP rear camera, mono speaker, built-in 4G LTE (for some but not all 9 regions) with GPS, 2.4 GHz 802.11 b/g/n Wi-Fi, Bluetooth 4.0, a USB C port, a 3.5mm 10
0 10 20 30 40 50 60
Reduction of European Union REACH Candidate…
Substitutions assessment
Requesting substance inventory
Receiving substance inventory
Post-consumer recycled plastic and biobased…
Post-consumer recycled plastic and biobased…
Restriction of phthalates in the product
Restriction of bromine and chlorine
Reduction of energy consumption of battery…
Reduced maintenance mode power
Battery removability instructions
Battery removability/replacement without use of…
Further ease of disassembling mobile phone
Further repair and refurbishment
Use of recyclable fiber based packaging materials
Use of post-consumer recycled plastic packaging
Environmentally preferable virgin fiber-based in…
Environmentally preferable fiber-based printed…
Improve packaging efficiency
Corporate sustainability (CS) reporting in the…
Third party assurance of corporate sustainability…
Conducting a life cycle assessment
Product LCA third-party verification or making LCA…
Supplier responsibility (Corporate criterion)
Supplier production facilities environmental…
3TG minerals sourcing (Corporate criterion)
Participation in 3TG mineral responsible sourcing…
Reduce fluorinated gas emissions resulting from…
Mobile phones: Compliance with optional EPEAT criteria
Yes No N/A
87
audio combo jack, and a 2800 mAh battery40. This example serves as an illustration, how 1 much material is needed at best for general tablet functionality. 2
2.3.2.2. Use of recycled material 3
Examples of recycled materials used in tablets and claimed by OEMs are stated in Table 4 26. In general, recycled materials stated for smartphones in 2.3.1.3 are also an option 5 and might be in use already for tablets. In particular the use of recycled plastics is a 6 mandatory and an optional criteria of EPEAT which is claimed for some tablets, but 7 without giving any further details, which parts and polymers this might refer to. 8
Table 26 : Recycled material in tablets (Apple Inc. 2020; Google 2020a; Samsung 9 2020; Fairphone 2020; Umicore 2020; Fairphone 2018) 10
Material PIR or PCR and recycled share
Application Reference
Neodymium and possibly Dysprosium
100%, unknown if PIR or PCR
loudspeakers of iPad Air (2020)41
Apple
Tin 100% PCR solder on main logic boards of iPad (7th generation)
Apple
Aluminum unknown42 aluminum enclosures for iPads released 2019
Apple
100%, unknown if PIR or PCR
aluminum enclosure for iPad Air 2020
Apple
Cobalt Unknown share, PCR
Battery for “portable electronics”
Umicore
11
2.3.2.3. Use of bio-based materials 12
There is no known use of bio-based plastics for tablet computers. Applications of bio-13 based plastics for smartphone parts as listed in 2.3.1.4 indicate the feasibility of bio-14 based polymers for mobile devices. 15
MicroPro Computers developed a fully functional Windows tablet computer with a wooden 16 housing, demonstrating the feasibility of using wood for tablets (backcover with cavities 17 for various subassemblies, battery cover, and buttons) (Ospina et al. 2019). 18
40 https://tabletmonkeys.com/7-inch-android-9-0-tablet-alldocube-iplay-7t-launch/ 41 Apple Event, September 15, 2020, at 10 a.m. PDT, Apple Park, and https://www.apple.com/ipad-air/ (accessed
September 15, 2020) 42 As Apple’s environmental report states “either 100 percent recycled or low-carbon primary aluminum”
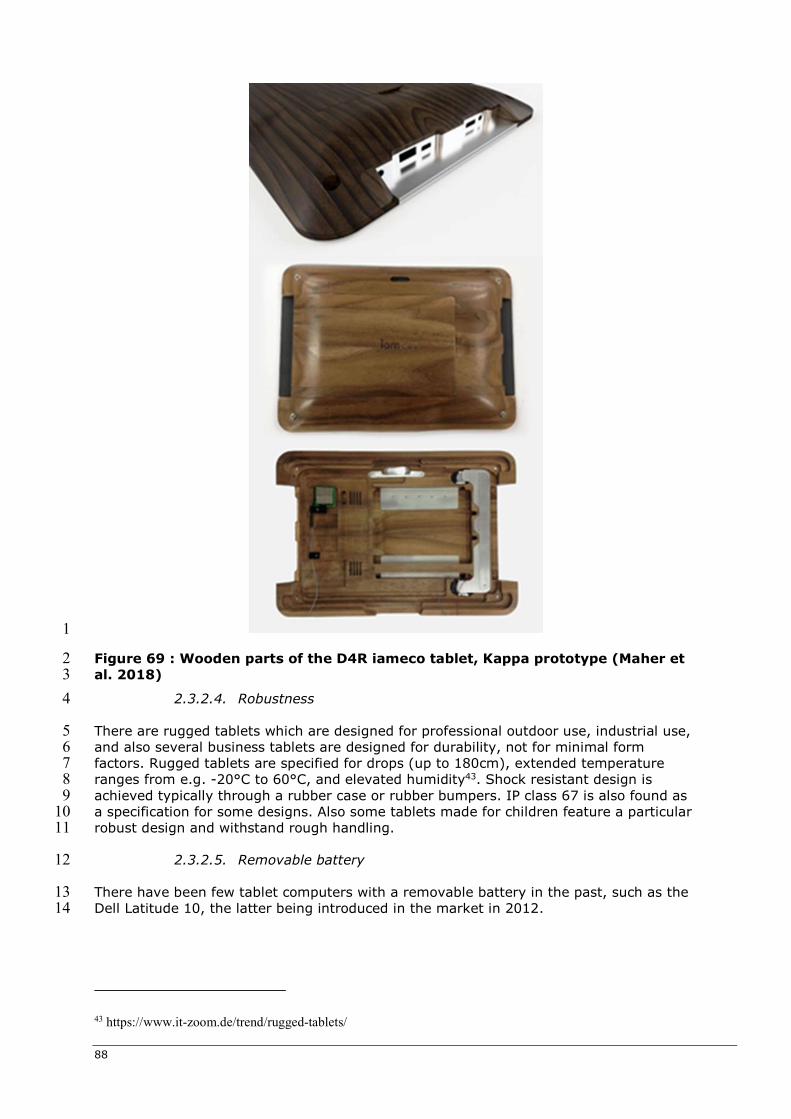
88
1
Figure 69 : Wooden parts of the D4R iameco tablet, Kappa prototype (Maher et 2 al. 2018) 3
2.3.2.4. Robustness 4
There are rugged tablets which are designed for professional outdoor use, industrial use, 5 and also several business tablets are designed for durability, not for minimal form 6 factors. Rugged tablets are specified for drops (up to 180cm), extended temperature 7 ranges from e.g. -20°C to 60°C, and elevated humidity43. Shock resistant design is 8 achieved typically through a rubber case or rubber bumpers. IP class 67 is also found as 9 a specification for some designs. Also some tablets made for children feature a particular 10 robust design and withstand rough handling. 11
2.3.2.5. Removable battery 12
There have been few tablet computers with a removable battery in the past, such as the 13 Dell Latitude 10, the latter being introduced in the market in 2012. 14
43 https://www.it-zoom.de/trend/rugged-tablets/
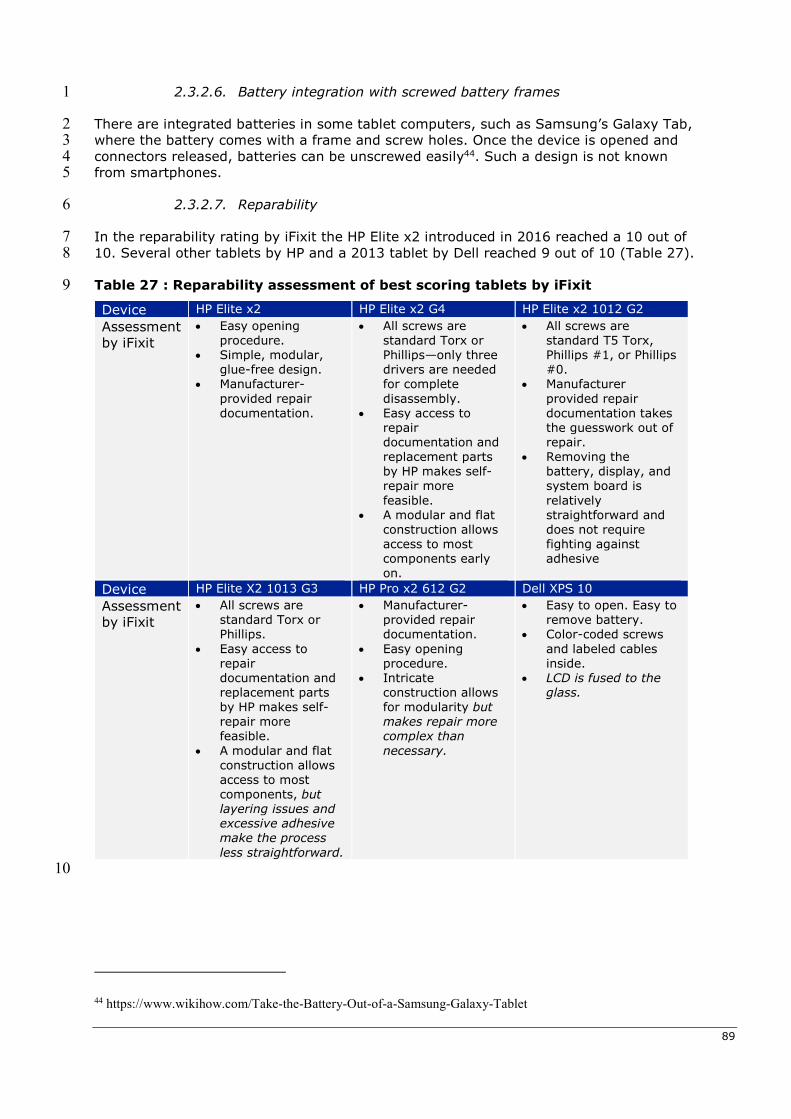
89
2.3.2.6. Battery integration with screwed battery frames 1
There are integrated batteries in some tablet computers, such as Samsung’s Galaxy Tab, 2 where the battery comes with a frame and screw holes. Once the device is opened and 3 connectors released, batteries can be unscrewed easily44. Such a design is not known 4 from smartphones. 5
2.3.2.7. Reparability 6
In the reparability rating by iFixit the HP Elite x2 introduced in 2016 reached a 10 out of 7 10. Several other tablets by HP and a 2013 tablet by Dell reached 9 out of 10 (Table 27). 8
Table 27 : Reparability assessment of best scoring tablets by iFixit 9
Device HP Elite x2 HP Elite x2 G4 HP Elite x2 1012 G2
Assessment by iFixit
Easy opening procedure.
Simple, modular, glue-free design.
Manufacturer-provided repair documentation.
All screws are standard Torx or Phillips—only three drivers are needed for complete disassembly.
Easy access to repair documentation and replacement parts by HP makes self-repair more feasible.
A modular and flat construction allows access to most components early on.
All screws are standard T5 Torx, Phillips #1, or Phillips #0.
Manufacturer provided repair documentation takes the guesswork out of repair.
Removing the battery, display, and system board is relatively straightforward and does not require fighting against adhesive
Device HP Elite X2 1013 G3 HP Pro x2 612 G2 Dell XPS 10 Assessment by iFixit
All screws are standard Torx or Phillips.
Easy access to repair documentation and replacement parts by HP makes self-repair more feasible.
A modular and flat construction allows access to most components, but layering issues and excessive adhesive make the process less straightforward.
Manufacturer-provided repair documentation.
Easy opening procedure.
Intricate construction allows for modularity but makes repair more complex than necessary.
Easy to open. Easy to remove battery.
Color-coded screws and labeled cables inside.
LCD is fused to the glass.
10
44 https://www.wikihow.com/Take-the-Battery-Out-of-a-Samsung-Galaxy-Tablet
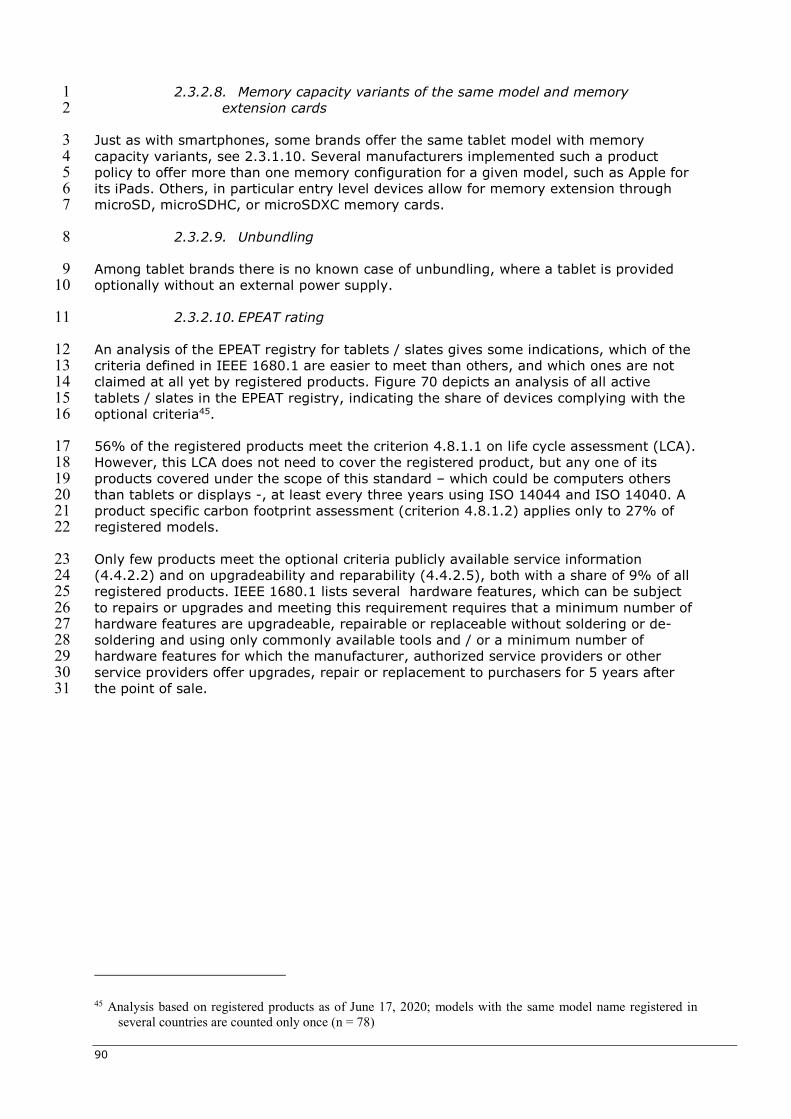
90
2.3.2.8. Memory capacity variants of the same model and memory 1 extension cards 2
Just as with smartphones, some brands offer the same tablet model with memory 3 capacity variants, see 2.3.1.10. Several manufacturers implemented such a product 4 policy to offer more than one memory configuration for a given model, such as Apple for 5 its iPads. Others, in particular entry level devices allow for memory extension through 6 microSD, microSDHC, or microSDXC memory cards. 7
2.3.2.9. Unbundling 8
Among tablet brands there is no known case of unbundling, where a tablet is provided 9 optionally without an external power supply. 10
2.3.2.10. EPEAT rating 11
An analysis of the EPEAT registry for tablets / slates gives some indications, which of the 12 criteria defined in IEEE 1680.1 are easier to meet than others, and which ones are not 13 claimed at all yet by registered products. Figure 70 depicts an analysis of all active 14 tablets / slates in the EPEAT registry, indicating the share of devices complying with the 15 optional criteria45. 16
56% of the registered products meet the criterion 4.8.1.1 on life cycle assessment (LCA). 17 However, this LCA does not need to cover the registered product, but any one of its 18 products covered under the scope of this standard – which could be computers others 19 than tablets or displays -, at least every three years using ISO 14044 and ISO 14040. A 20 product specific carbon footprint assessment (criterion 4.8.1.2) applies only to 27% of 21 registered models. 22
Only few products meet the optional criteria publicly available service information 23 (4.4.2.2) and on upgradeability and reparability (4.4.2.5), both with a share of 9% of all 24 registered products. IEEE 1680.1 lists several hardware features, which can be subject 25 to repairs or upgrades and meeting this requirement requires that a minimum number of 26 hardware features are upgradeable, repairable or replaceable without soldering or de-27 soldering and using only commonly available tools and / or a minimum number of 28 hardware features for which the manufacturer, authorized service providers or other 29 service providers offer upgrades, repair or replacement to purchasers for 5 years after 30 the point of sale. 31
45 Analysis based on registered products as of June 17, 2020; models with the same model name registered in several countries are counted only once (n = 78)
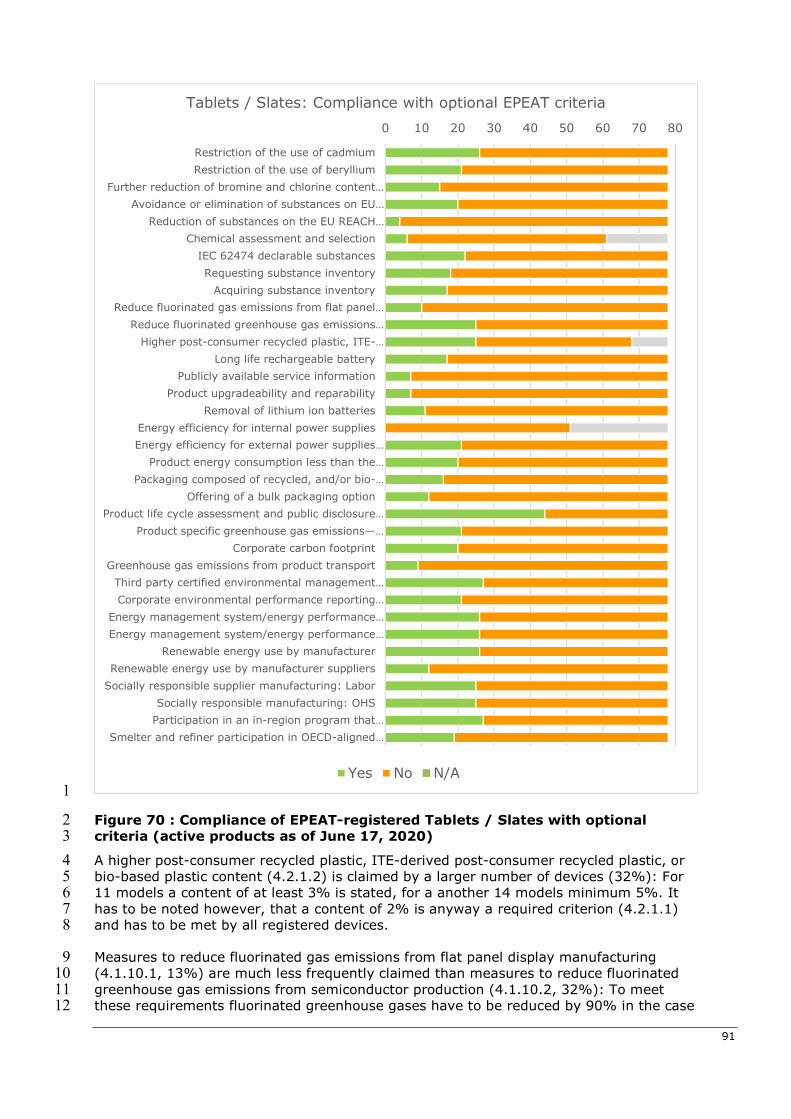
91
1
Figure 70 : Compliance of EPEAT-registered Tablets / Slates with optional 2 criteria (active products as of June 17, 2020) 3
A higher post-consumer recycled plastic, ITE-derived post-consumer recycled plastic, or 4 bio-based plastic content (4.2.1.2) is claimed by a larger number of devices (32%): For 5 11 models a content of at least 3% is stated, for a another 14 models minimum 5%. It 6 has to be noted however, that a content of 2% is anyway a required criterion (4.2.1.1) 7 and has to be met by all registered devices. 8
Measures to reduce fluorinated gas emissions from flat panel display manufacturing 9 (4.1.10.1, 13%) are much less frequently claimed than measures to reduce fluorinated 10 greenhouse gas emissions from semiconductor production (4.1.10.2, 32%): To meet 11 these requirements fluorinated greenhouse gases have to be reduced by 90% in the case 12
0 10 20 30 40 50 60 70 80
Restriction of the use of cadmium
Restriction of the use of beryllium
Further reduction of bromine and chlorine content…
Avoidance or elimination of substances on EU…
Reduction of substances on the EU REACH…
Chemical assessment and selection
IEC 62474 declarable substances
Requesting substance inventory
Acquiring substance inventory
Reduce fluorinated gas emissions from flat panel…
Reduce fluorinated greenhouse gas emissions…
Higher post-consumer recycled plastic, ITE-…
Long life rechargeable battery
Publicly available service information
Product upgradeability and reparability
Removal of lithium ion batteries
Energy efficiency for internal power supplies
Energy efficiency for external power supplies…
Product energy consumption less than the…
Packaging composed of recycled, and/or bio-…
Offering of a bulk packaging option
Product life cycle assessment and public disclosure…
Product specific greenhouse gas emissions—…
Corporate carbon footprint
Greenhouse gas emissions from product transport
Third party certified environmental management…
Corporate environmental performance reporting…
Energy management system/energy performance …
Energy management system/energy performance…
Renewable energy use by manufacturer
Renewable energy use by manufacturer suppliers
Socially responsible supplier manufacturing: Labor
Socially responsible manufacturing: OHS
Participation in an in-region program that…
Smelter and refiner participation in OECD-aligned…
Tablets / Slates: Compliance with optional EPEAT criteria
Yes No N/A
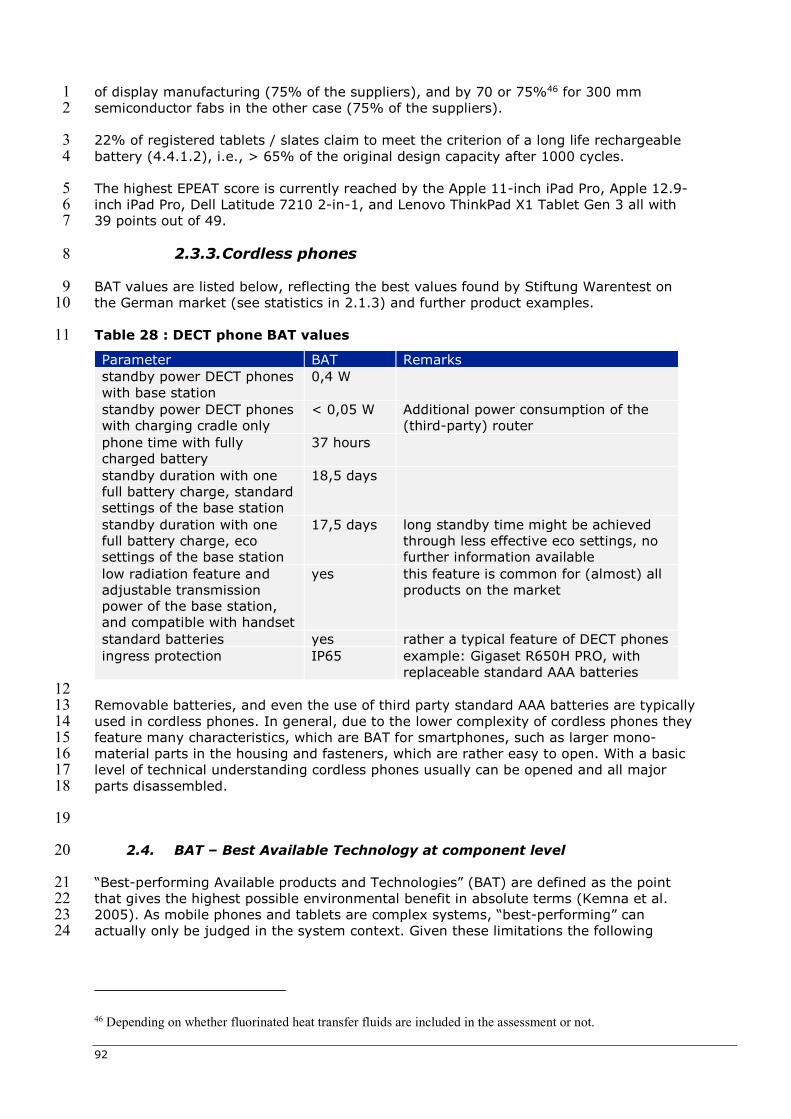
92
of display manufacturing (75% of the suppliers), and by 70 or 75%46 for 300 mm 1 semiconductor fabs in the other case (75% of the suppliers). 2
22% of registered tablets / slates claim to meet the criterion of a long life rechargeable 3 battery (4.4.1.2), i.e., > 65% of the original design capacity after 1000 cycles. 4
The highest EPEAT score is currently reached by the Apple 11-inch iPad Pro, Apple 12.9-5 inch iPad Pro, Dell Latitude 7210 2-in-1, and Lenovo ThinkPad X1 Tablet Gen 3 all with 6 39 points out of 49. 7
2.3.3. Cordless phones 8
BAT values are listed below, reflecting the best values found by Stiftung Warentest on 9 the German market (see statistics in 2.1.3) and further product examples. 10
Table 28 : DECT phone BAT values 11
Parameter BAT Remarks standby power DECT phones with base station
0,4 W
standby power DECT phones with charging cradle only
< 0,05 W Additional power consumption of the (third-party) router
phone time with fully charged battery
37 hours
standby duration with one full battery charge, standard settings of the base station
18,5 days
standby duration with one full battery charge, eco settings of the base station
17,5 days long standby time might be achieved through less effective eco settings, no further information available
low radiation feature and adjustable transmission power of the base station, and compatible with handset
yes this feature is common for (almost) all products on the market
standard batteries yes rather a typical feature of DECT phones ingress protection IP65 example: Gigaset R650H PRO, with
replaceable standard AAA batteries 12 Removable batteries, and even the use of third party standard AAA batteries are typically 13 used in cordless phones. In general, due to the lower complexity of cordless phones they 14 feature many characteristics, which are BAT for smartphones, such as larger mono-15 material parts in the housing and fasteners, which are rather easy to open. With a basic 16 level of technical understanding cordless phones usually can be opened and all major 17 parts disassembled. 18
19
2.4. BAT – Best Available Technology at component level 20
“Best-performing Available products and Technologies” (BAT) are defined as the point 21 that gives the highest possible environmental benefit in absolute terms (Kemna et al. 22 2005). As mobile phones and tablets are complex systems, “best-performing” can 23 actually only be judged in the system context. Given these limitations the following 24
46 Depending on whether fluorinated heat transfer fluids are included in the assessment or not.
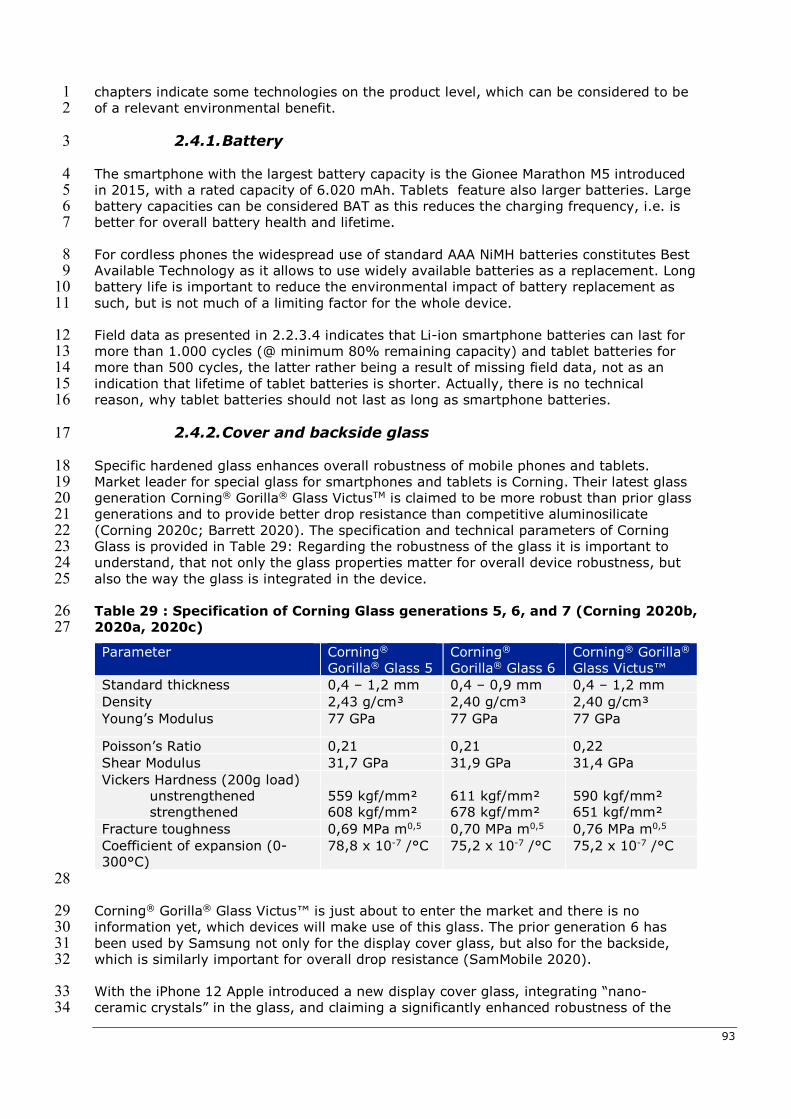
93
chapters indicate some technologies on the product level, which can be considered to be 1 of a relevant environmental benefit. 2
2.4.1. Battery 3
The smartphone with the largest battery capacity is the Gionee Marathon M5 introduced 4 in 2015, with a rated capacity of 6.020 mAh. Tablets feature also larger batteries. Large 5 battery capacities can be considered BAT as this reduces the charging frequency, i.e. is 6 better for overall battery health and lifetime. 7
For cordless phones the widespread use of standard AAA NiMH batteries constitutes Best 8 Available Technology as it allows to use widely available batteries as a replacement. Long 9 battery life is important to reduce the environmental impact of battery replacement as 10 such, but is not much of a limiting factor for the whole device. 11
Field data as presented in 2.2.3.4 indicates that Li-ion smartphone batteries can last for 12 more than 1.000 cycles (@ minimum 80% remaining capacity) and tablet batteries for 13 more than 500 cycles, the latter rather being a result of missing field data, not as an 14 indication that lifetime of tablet batteries is shorter. Actually, there is no technical 15 reason, why tablet batteries should not last as long as smartphone batteries. 16
2.4.2. Cover and backside glass 17
Specific hardened glass enhances overall robustness of mobile phones and tablets. 18 Market leader for special glass for smartphones and tablets is Corning. Their latest glass 19 generation Corning® Gorilla® Glass VictusTM is claimed to be more robust than prior glass 20 generations and to provide better drop resistance than competitive aluminosilicate 21 (Corning 2020c; Barrett 2020). The specification and technical parameters of Corning 22 Glass is provided in Table 29: Regarding the robustness of the glass it is important to 23 understand, that not only the glass properties matter for overall device robustness, but 24 also the way the glass is integrated in the device. 25
Table 29 : Specification of Corning Glass generations 5, 6, and 7 (Corning 2020b, 26 2020a, 2020c) 27
Parameter Corning® Gorilla® Glass 5
Corning® Gorilla® Glass 6
Corning® Gorilla® Glass Victus™
Standard thickness 0,4 – 1,2 mm 0,4 – 0,9 mm 0,4 – 1,2 mm Density 2,43 g/cm³ 2,40 g/cm³ 2,40 g/cm³ Young’s Modulus 77 GPa 77 GPa 77 GPa
Poisson’s Ratio 0,21 0,21 0,22 Shear Modulus 31,7 GPa 31,9 GPa 31,4 GPa Vickers Hardness (200g load)
unstrengthened 559 kgf/mm² 611 kgf/mm² 590 kgf/mm² strengthened 608 kgf/mm² 678 kgf/mm² 651 kgf/mm²
Fracture toughness 0,69 MPa m0,5 0,70 MPa m0,5 0,76 MPa m0,5 Coefficient of expansion (0-300°C)
78,8 x 10⁻⁷ /°C 75,2 x 10⁻⁷ /°C 75,2 x 10⁻⁷ /°C
28
Corning® Gorilla® Glass Victus™ is just about to enter the market and there is no 29 information yet, which devices will make use of this glass. The prior generation 6 has 30 been used by Samsung not only for the display cover glass, but also for the backside, 31 which is similarly important for overall drop resistance (SamMobile 2020). 32
With the iPhone 12 Apple introduced a new display cover glass, integrating “nano-33 ceramic crystals” in the glass, and claiming a significantly enhanced robustness of the 34
94
glass47, but without providing any further material data. The glass is produced by Corning 1 (Vincent 2020). 2
2.4.3. Parts with recycled or bio-based materials 3
Individual components made with recycled or bio-based materials are already listed in 4 chapters 2.3.1.3, 2.3.1.4, 2.3.2.2, and 2.3.2.3, including housing plastic parts, housing 5 aluminum parts, magnets, and solder. 6
2.4.4. Semiconductors 7
Semiconductor components get more efficient per operation with each technology 8 generation, just as the shrinking dimensions require less energy. In this sense 7nm 9 technology can be considered BAT, but this efficiency gain is compensated by increasing 10 computing performance and advanced features – such as embedded artificial intelligence 11 -, which does not necessarily reduce overall energy consumption of integrated circuits. 12 The increasing implementation of thermal management measures in high-end 13 smartphones and tablets, such as heatpipes, is an indicator of this kind of rebound: 14 Although processors are increasingly energy efficient, power losses result in thermal 15 challenges for the devices. In case of flash memory the advancement in technology 16 nodes also results in efficiency gains, but is turned into increasingly higher storage 17 capacity of high-end phones and tablets, which also means a higher environmental 18 footprint of producing the storage components. 19
20
2.5. BNAT – Best Not Available Technology 21
BNAT indicates long-term possibilities and helps to define the exact scope and definition 22 of possible measures (Kemna et al. 2005). This analysis is partly speculative as the 23 impact and actually also the later market introduction of not yet available technology is 24 highly uncertain. 25
2.5.1. Housing with 100% recycled plastics 26
On the example of a DECT phone the feasibility of using 100% recycled Acrylonitrile 27 Butadiene Styrene (rABS) in the caseworks has been demonstrated (Ford and Fisher 28 2019): “Materials testing on the rABS demonstrated that 100% recycled ABS has similar 29 properties to virgin ABS and can be substituted for virgin ABS as long as the product 30 design allows for the slightly stiffer nature of the rABS and addresses issues of surface 31 finish and ability to colour.” Colouring was achieved by adding a 3% master batch – 32 which actually means, recycled content in the end is slightly below 100%. The surface 33 finish was not as good in these trials as for virgin material and a mate surface instead of 34 a gloss finish is strongly recommended. Redesign of clips was implemented in a 35 prototype to account for slightly different material properties of the recycled ABS and to 36 avoid introduction of additional composite parts. 37
2.5.2. Universal compatibility 38
Company SHIFT announced the development of a product ecosystem, where a 39 smartphone can act as the computing unit of a tablet once being attached to a display, 40 and the display-smartphone-combo jointly with a (detachable) keyboard and a hub 41 device can work as a kind of laptop computer48. Such kind of All-in-one device reduces 42
47 https://www.apple.com/iphone-12/
48 https://www.shiftphones.com/en/shiftmu/
95
potentially of up to three devices in parallel, thus saves the environmental impacts of 1 redundant parts. This concept has been presented in 2018 and market introduction is 2 announced for 2021. A main challenge apparently is the operating system: For the 3 smartphone Android is intended to be the OS, but Windows shall be fully supported as 4 well for the laptop functionality. 5
2.5.3. Product modularity 6
Besides the modular smartphones referenced in the BAT chapter 2.3.1.8 there are 7 several more, which have been developed to a certain prototype level, but have not been 8 introduced to the market (yet), such as the Google ARA project (see the related patent in 9 2.5.7) and PuzzlePhone (Hankammer et al. 2018; Schischke et al. 2019). These two 10 modularity approaches, which would open up the module development to third parties 11 would come with environmental pros and cons. The drawbacks being the additional 12 hardware for module interfaces and in case of the Google ARA a major risk of a rebound 13 effect when smartphone features can be upgraded too easily. Likely positive effects can 14 be expected through upgrades, if this is embraced by consumers in a moderate way and 15 module upgrade is the alternative to a device new-buy. Easy replacement of defect 16 modules, a removable battery and the possibility to configure a smartphone exactly for 17 own needs – no over dimensioning of features – are further arguments, which lead to the 18 notion, that these concepts can be considered BNAT, if implemented with the 19 aforementioned drawbacks in mind. 20
2.5.4. Modular RAM and modular SSD 21
Modular RAM is an option for personal computers and occasionally also for convertible 22 tablets, but there is no known product in scope of the definition of this study with 23 modular RAM. This is apparently due to the fact, that the main computing parts of 24 convertible tablets are in the keyboard part, where the typical thickness allows for 25 modular RAM and related slots on the mainboard, whereas in detachable tablets and all 26 other “slate design” tablets a modular RAM would lead to a less slim design. 27
A modular M.2 SSD board (flash memory) is however found in the iameco D4R tablet, 28 which is in the prototype stage (Maher et al. 2018). 29
In smartphones and tablets RAM and flash memory are soldered on the mainboard. 30
2.5.5. Display cover glass 31
A new type of glass that can heal itself from cracks and breaks has been developed by a 32 group of Japanese researchers (Yanagisawa et al. 2018). This is made from a low weight 33 polymer called "polyether-thioureas" and can heal breaks when pressed together by hand 34 without the need for high heat to melt the material. 35
2.5.6. Solid state batteries (SSB) 36
Solid state batteries replace the highly-flammable electrolyte fluid (or gel) with a 37 ceramics-based solid. While this considerably increases the safety aspects of the 38 batteries, the primary driver behind the commercialization of SSB is to enable the use of 39 lithium metal as the anode, as opposed to the currently used carbon anode, which would 40 result in an estimated 20 % energy density improvement (Ulvestad 2018). Four potential 41 advantages to SSBs have been reported: (1) improved safety (2) higher energy density 42 (3) faster-charging times (i.e. higher power density) and (4) longer life (Gifford and 43 Brown 2020). The development of solid-state batteries that can be manufactured at a 44 large scale is one of the most important challenges in the battery industry today. 45
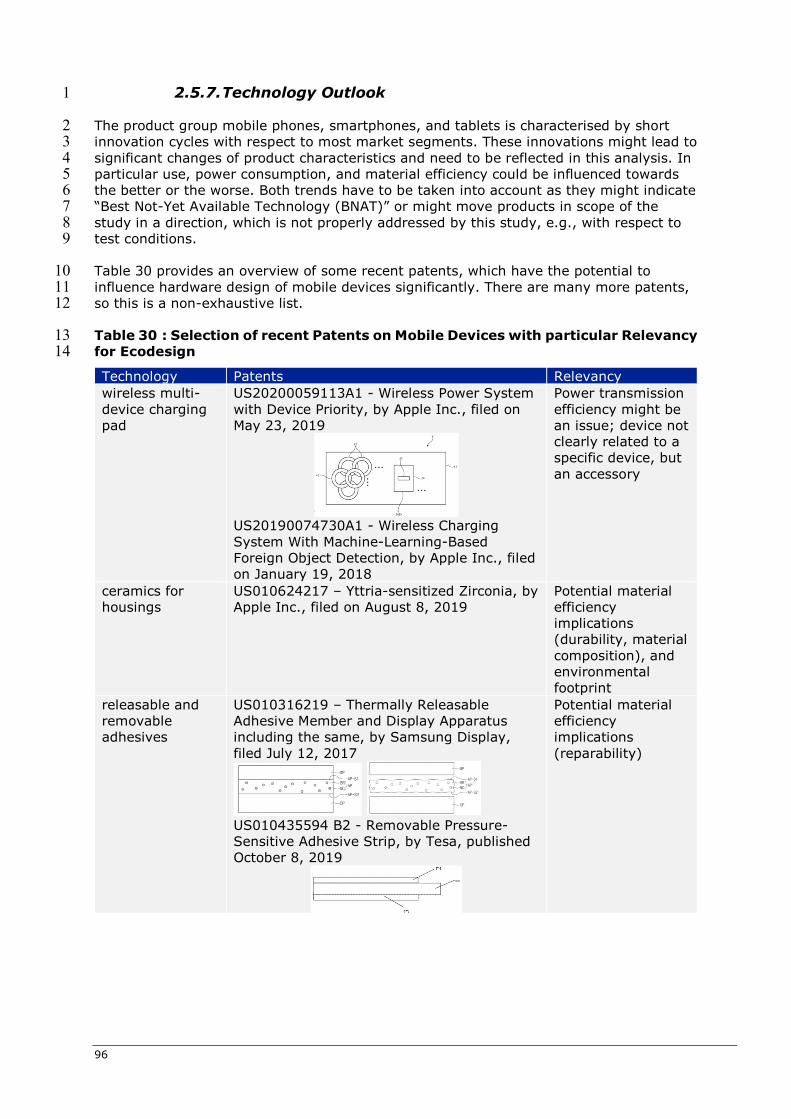
96
2.5.7. Technology Outlook 1
The product group mobile phones, smartphones, and tablets is characterised by short 2 innovation cycles with respect to most market segments. These innovations might lead to 3 significant changes of product characteristics and need to be reflected in this analysis. In 4 particular use, power consumption, and material efficiency could be influenced towards 5 the better or the worse. Both trends have to be taken into account as they might indicate 6 “Best Not-Yet Available Technology (BNAT)” or might move products in scope of the 7 study in a direction, which is not properly addressed by this study, e.g., with respect to 8 test conditions. 9
Table 30 provides an overview of some recent patents, which have the potential to 10 influence hardware design of mobile devices significantly. There are many more patents, 11 so this is a non-exhaustive list. 12
Table 30 : Selection of recent Patents on Mobile Devices with particular Relevancy 13 for Ecodesign 14
Technology Patents Relevancy wireless multi-device charging pad
US20200059113A1 - Wireless Power System with Device Priority, by Apple Inc., filed on May 23, 2019
US20190074730A1 - Wireless Charging System With Machine-Learning-Based Foreign Object Detection, by Apple Inc., filed on January 19, 2018
Power transmission efficiency might be an issue; device not clearly related to a specific device, but an accessory
ceramics for housings
US010624217 – Yttria-sensitized Zirconia, by Apple Inc., filed on August 8, 2019
Potential material efficiency implications (durability, material composition), and environmental footprint
releasable and removable adhesives
US010316219 – Thermally Releasable Adhesive Member and Display Apparatus including the same, by Samsung Display, filed July 12, 2017
US010435594 B2 - Removable Pressure-Sensitive Adhesive Strip, by Tesa, published October 8, 2019
Potential material efficiency implications (reparability)
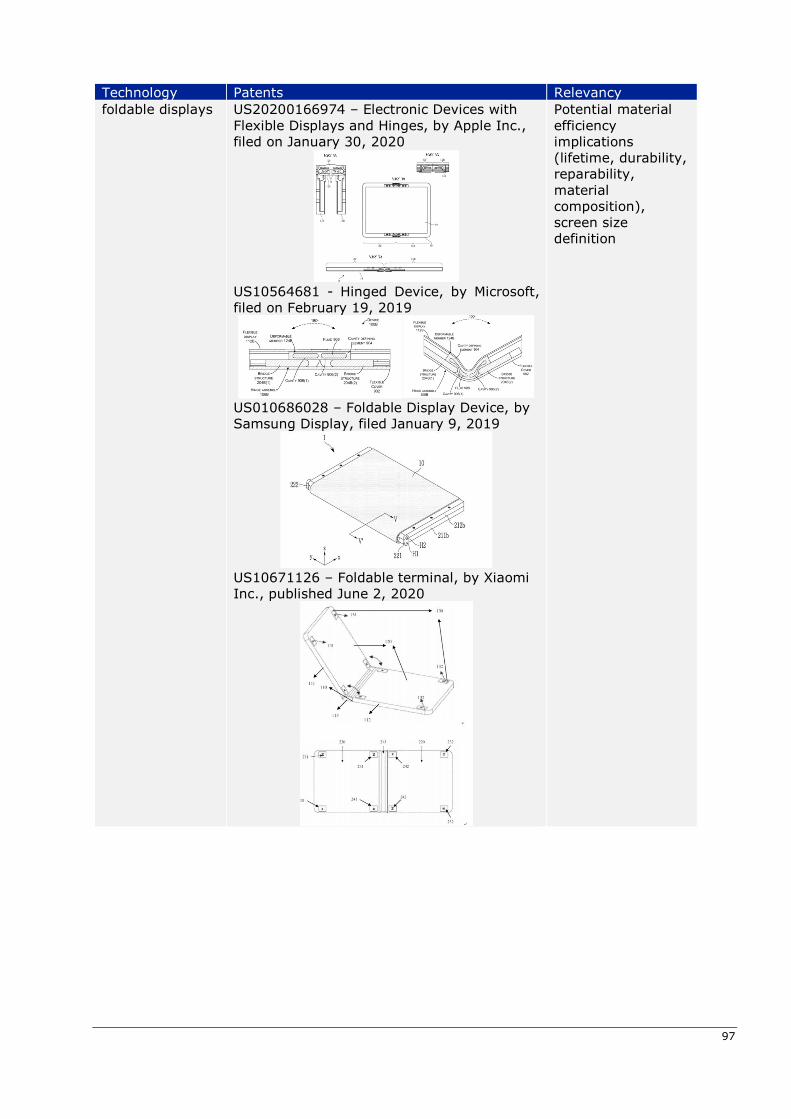
97
Technology Patents Relevancy foldable displays US20200166974 – Electronic Devices with
Flexible Displays and Hinges, by Apple Inc., filed on January 30, 2020
US10564681 - Hinged Device, by Microsoft, filed on February 19, 2019
US010686028 – Foldable Display Device, by Samsung Display, filed January 9, 2019
US10671126 – Foldable terminal, by Xiaomi Inc., published June 2, 2020
Potential material efficiency implications (lifetime, durability, reparability, material composition), screen size definition
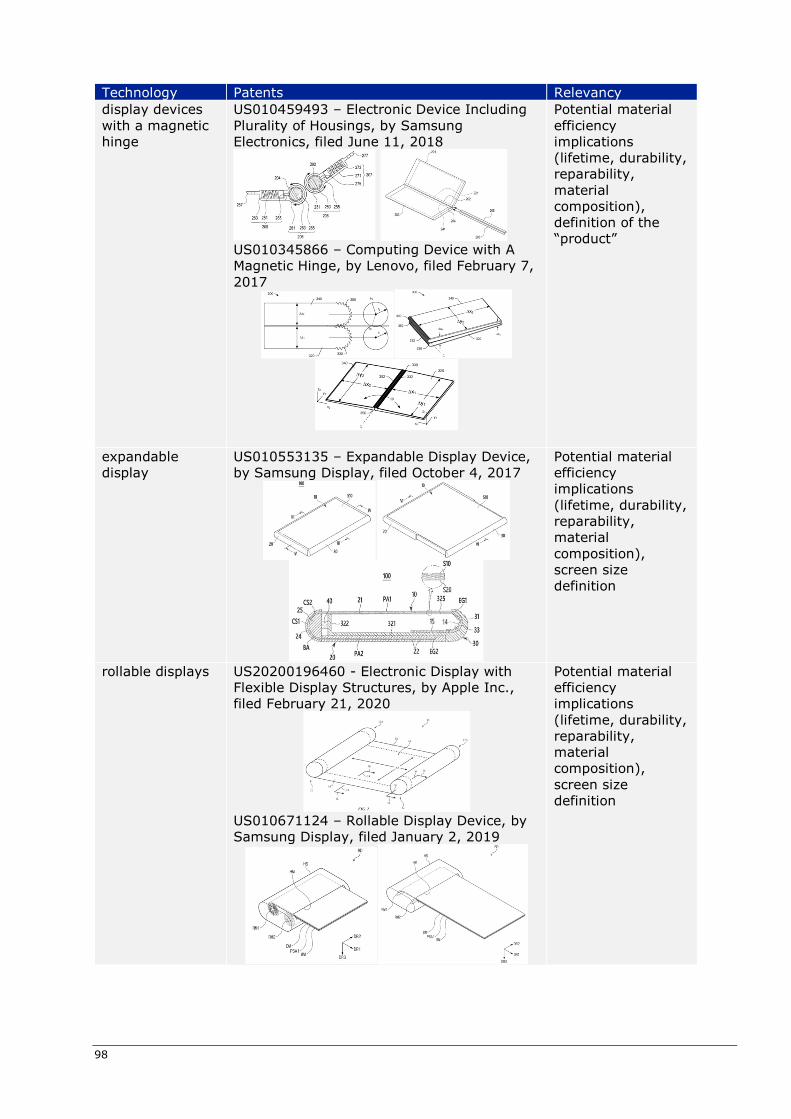
98
Technology Patents Relevancy display devices with a magnetic hinge
US010459493 – Electronic Device Including Plurality of Housings, by Samsung Electronics, filed June 11, 2018
US010345866 – Computing Device with A Magnetic Hinge, by Lenovo, filed February 7, 2017
Potential material efficiency implications (lifetime, durability, reparability, material composition), definition of the “product”
expandable display
US010553135 – Expandable Display Device, by Samsung Display, filed October 4, 2017
Potential material efficiency implications (lifetime, durability, reparability, material composition), screen size definition
rollable displays US20200196460 - Electronic Display with Flexible Display Structures, by Apple Inc., filed February 21, 2020
US010671124 – Rollable Display Device, by Samsung Display, filed January 2, 2019
Potential material efficiency implications (lifetime, durability, reparability, material composition), screen size definition
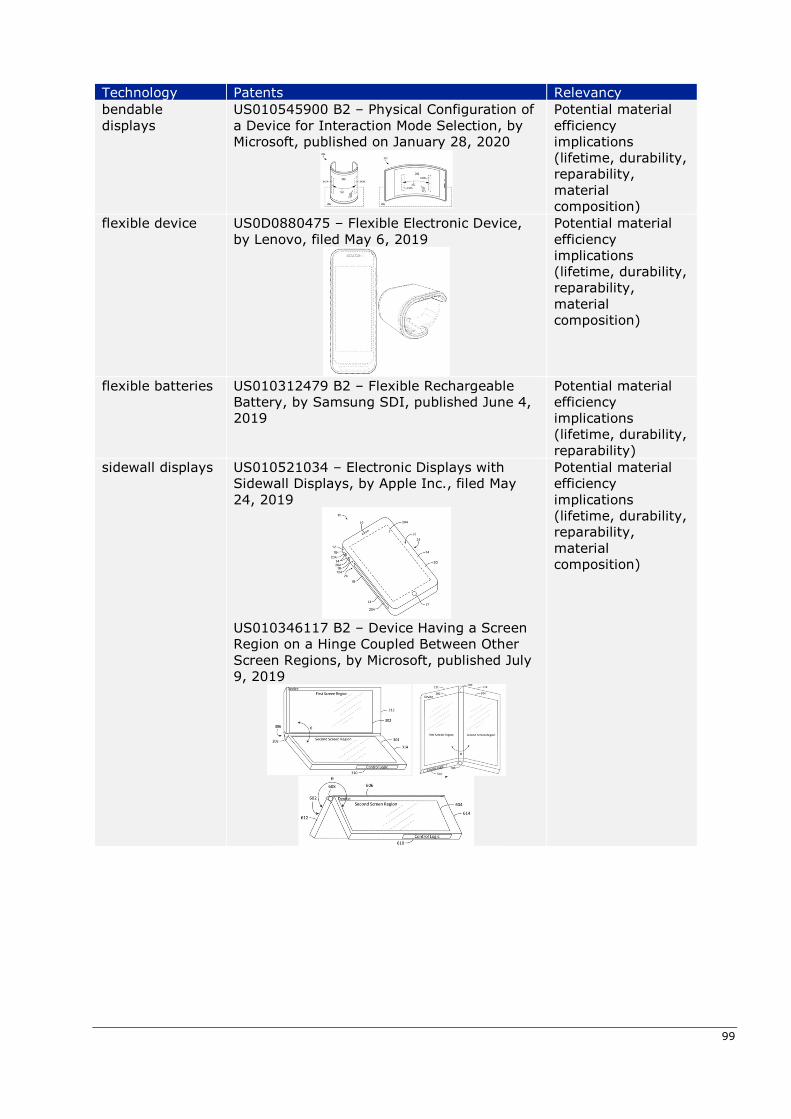
99
Technology Patents Relevancy bendable displays
US010545900 B2 – Physical Configuration of a Device for Interaction Mode Selection, by Microsoft, published on January 28, 2020
Potential material efficiency implications (lifetime, durability, reparability, material composition)
flexible device US0D0880475 – Flexible Electronic Device, by Lenovo, filed May 6, 2019
Potential material efficiency implications (lifetime, durability, reparability, material composition)
flexible batteries US010312479 B2 – Flexible Rechargeable Battery, by Samsung SDI, published June 4, 2019
Potential material efficiency implications (lifetime, durability, reparability)
sidewall displays US010521034 – Electronic Displays with Sidewall Displays, by Apple Inc., filed May 24, 2019
US010346117 B2 – Device Having a Screen Region on a Hinge Coupled Between Other Screen Regions, by Microsoft, published July 9, 2019
Potential material efficiency implications (lifetime, durability, reparability, material composition)
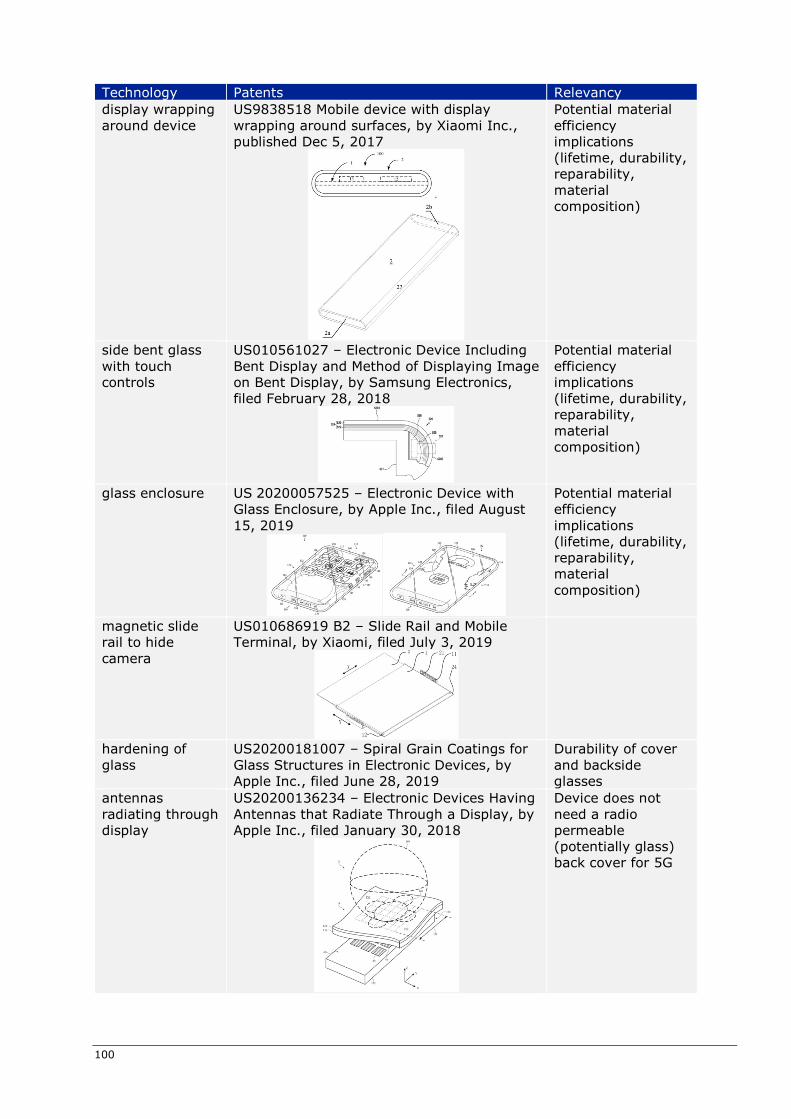
100
Technology Patents Relevancy display wrapping around device
US9838518 Mobile device with display wrapping around surfaces, by Xiaomi Inc., published Dec 5, 2017
Potential material efficiency implications (lifetime, durability, reparability, material composition)
side bent glass with touch controls
US010561027 – Electronic Device Including Bent Display and Method of Displaying Image on Bent Display, by Samsung Electronics, filed February 28, 2018
Potential material efficiency implications (lifetime, durability, reparability, material composition)
glass enclosure US 20200057525 – Electronic Device with Glass Enclosure, by Apple Inc., filed August 15, 2019
Potential material efficiency implications (lifetime, durability, reparability, material composition)
magnetic slide rail to hide camera
US010686919 B2 – Slide Rail and Mobile Terminal, by Xiaomi, filed July 3, 2019
hardening of glass
US20200181007 – Spiral Grain Coatings for Glass Structures in Electronic Devices, by Apple Inc., filed June 28, 2019
Durability of cover and backside glasses
antennas radiating through display
US20200136234 – Electronic Devices Having Antennas that Radiate Through a Display, by Apple Inc., filed January 30, 2018
Device does not need a radio permeable (potentially glass) back cover for 5G
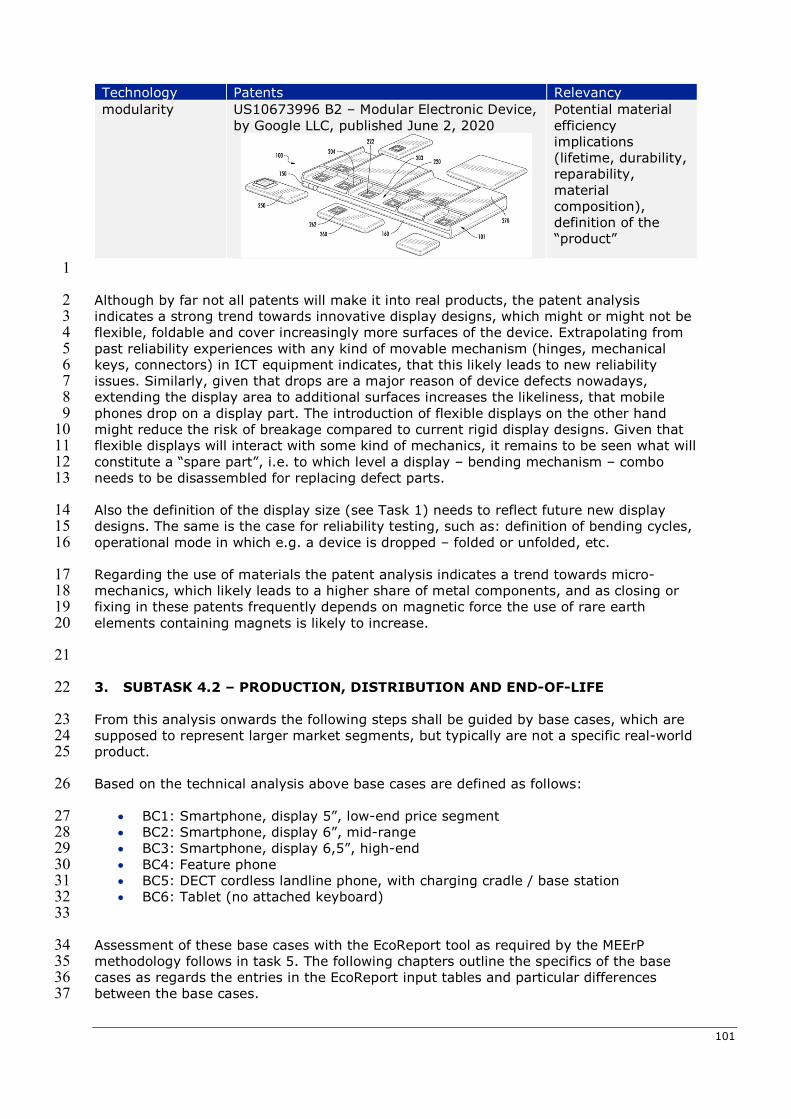
101
Technology Patents Relevancy modularity US10673996 B2 – Modular Electronic Device,
by Google LLC, published June 2, 2020
Potential material efficiency implications (lifetime, durability, reparability, material composition), definition of the “product”
1
Although by far not all patents will make it into real products, the patent analysis 2 indicates a strong trend towards innovative display designs, which might or might not be 3 flexible, foldable and cover increasingly more surfaces of the device. Extrapolating from 4 past reliability experiences with any kind of movable mechanism (hinges, mechanical 5 keys, connectors) in ICT equipment indicates, that this likely leads to new reliability 6 issues. Similarly, given that drops are a major reason of device defects nowadays, 7 extending the display area to additional surfaces increases the likeliness, that mobile 8 phones drop on a display part. The introduction of flexible displays on the other hand 9 might reduce the risk of breakage compared to current rigid display designs. Given that 10 flexible displays will interact with some kind of mechanics, it remains to be seen what will 11 constitute a “spare part”, i.e. to which level a display – bending mechanism – combo 12 needs to be disassembled for replacing defect parts. 13
Also the definition of the display size (see Task 1) needs to reflect future new display 14 designs. The same is the case for reliability testing, such as: definition of bending cycles, 15 operational mode in which e.g. a device is dropped – folded or unfolded, etc. 16
Regarding the use of materials the patent analysis indicates a trend towards micro-17 mechanics, which likely leads to a higher share of metal components, and as closing or 18 fixing in these patents frequently depends on magnetic force the use of rare earth 19 elements containing magnets is likely to increase. 20
21
3. SUBTASK 4.2 – PRODUCTION, DISTRIBUTION AND END-OF-LIFE 22
From this analysis onwards the following steps shall be guided by base cases, which are 23 supposed to represent larger market segments, but typically are not a specific real-world 24 product. 25
Based on the technical analysis above base cases are defined as follows: 26
BC1: Smartphone, display 5”, low-end price segment 27 BC2: Smartphone, display 6”, mid-range 28 BC3: Smartphone, display 6,5”, high-end 29 BC4: Feature phone 30 BC5: DECT cordless landline phone, with charging cradle / base station 31 BC6: Tablet (no attached keyboard) 32
33
Assessment of these base cases with the EcoReport tool as required by the MEErP 34 methodology follows in task 5. The following chapters outline the specifics of the base 35 cases as regards the entries in the EcoReport input tables and particular differences 36 between the base cases. 37
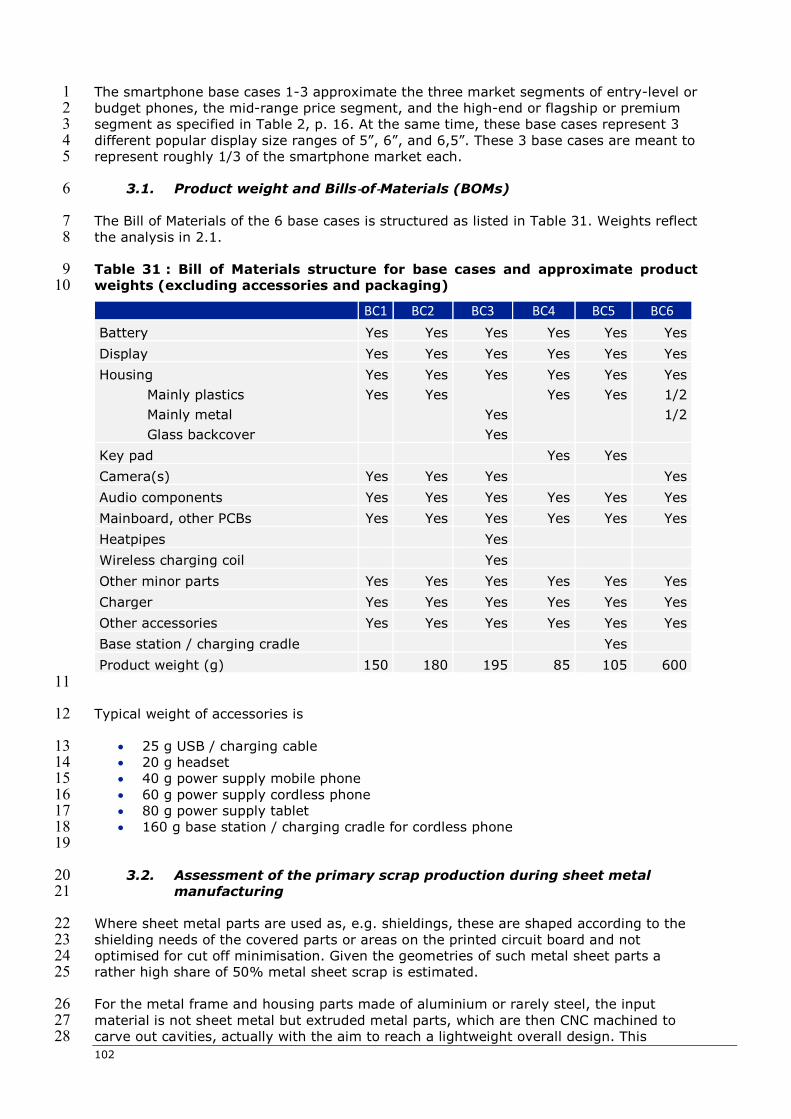
102
The smartphone base cases 1-3 approximate the three market segments of entry-level or 1 budget phones, the mid-range price segment, and the high-end or flagship or premium 2 segment as specified in Table 2, p. 16. At the same time, these base cases represent 3 3 different popular display size ranges of 5”, 6”, and 6,5”. These 3 base cases are meant to 4 represent roughly 1/3 of the smartphone market each. 5
3.1. Product weight and Bills‐of‐Materials (BOMs) 6
The Bill of Materials of the 6 base cases is structured as listed in Table 31. Weights reflect 7 the analysis in 2.1. 8
Table 31 : Bill of Materials structure for base cases and approximate product 9 weights (excluding accessories and packaging) 10
BC1 BC2 BC3 BC4 BC5 BC6 Battery Yes Yes Yes Yes Yes Yes
Display Yes Yes Yes Yes Yes Yes
Housing Yes Yes Yes Yes Yes Yes Mainly plastics Yes Yes Yes Yes 1/2 Mainly metal Yes 1/2 Glass backcover Yes
Key pad Yes Yes
Camera(s) Yes Yes Yes Yes
Audio components Yes Yes Yes Yes Yes Yes
Mainboard, other PCBs Yes Yes Yes Yes Yes Yes
Heatpipes Yes
Wireless charging coil Yes
Other minor parts Yes Yes Yes Yes Yes Yes
Charger Yes Yes Yes Yes Yes Yes
Other accessories Yes Yes Yes Yes Yes Yes
Base station / charging cradle Yes
Product weight (g) 150 180 195 85 105 600 11
Typical weight of accessories is 12
25 g USB / charging cable 13 20 g headset 14 40 g power supply mobile phone 15 60 g power supply cordless phone 16 80 g power supply tablet 17 160 g base station / charging cradle for cordless phone 18
19
3.2. Assessment of the primary scrap production during sheet metal 20 manufacturing 21
Where sheet metal parts are used as, e.g. shieldings, these are shaped according to the 22 shielding needs of the covered parts or areas on the printed circuit board and not 23 optimised for cut off minimisation. Given the geometries of such metal sheet parts a 24 rather high share of 50% metal sheet scrap is estimated. 25
For the metal frame and housing parts made of aluminium or rarely steel, the input 26 material is not sheet metal but extruded metal parts, which are then CNC machined to 27 carve out cavities, actually with the aim to reach a lightweight overall design. This 28
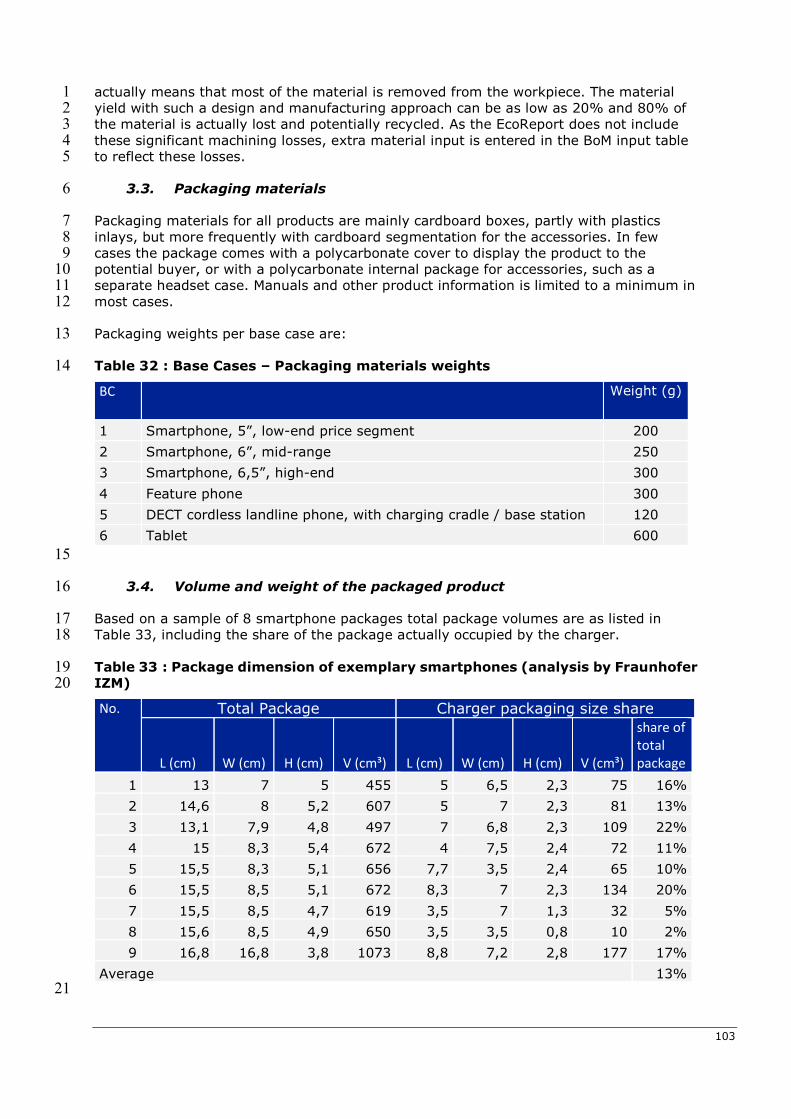
103
actually means that most of the material is removed from the workpiece. The material 1 yield with such a design and manufacturing approach can be as low as 20% and 80% of 2 the material is actually lost and potentially recycled. As the EcoReport does not include 3 these significant machining losses, extra material input is entered in the BoM input table 4 to reflect these losses. 5
3.3. Packaging materials 6
Packaging materials for all products are mainly cardboard boxes, partly with plastics 7 inlays, but more frequently with cardboard segmentation for the accessories. In few 8 cases the package comes with a polycarbonate cover to display the product to the 9 potential buyer, or with a polycarbonate internal package for accessories, such as a 10 separate headset case. Manuals and other product information is limited to a minimum in 11 most cases. 12
Packaging weights per base case are: 13
Table 32 : Base Cases – Packaging materials weights 14
BC Weight (g)
1 Smartphone, 5”, low-end price segment 200
2 Smartphone, 6”, mid-range 250
3 Smartphone, 6,5”, high-end 300
4 Feature phone 300
5 DECT cordless landline phone, with charging cradle / base station 120
6 Tablet 600 15
3.4. Volume and weight of the packaged product 16
Based on a sample of 8 smartphone packages total package volumes are as listed in 17 Table 33, including the share of the package actually occupied by the charger. 18
Table 33 : Package dimension of exemplary smartphones (analysis by Fraunhofer 19 IZM) 20
No. Total Package Charger packaging size share
L (cm) W (cm) H (cm) V (cm³) L (cm) W (cm) H (cm) V (cm³)
share of total package
1 13 7 5 455 5 6,5 2,3 75 16%
2 14,6 8 5,2 607 5 7 2,3 81 13%
3 13,1 7,9 4,8 497 7 6,8 2,3 109 22%
4 15 8,3 5,4 672 4 7,5 2,4 72 11%
5 15,5 8,3 5,1 656 7,7 3,5 2,4 65 10%
6 15,5 8,5 5,1 672 8,3 7 2,3 134 20%
7 15,5 8,5 4,7 619 3,5 7 1,3 32 5%
8 15,6 8,5 4,9 650 3,5 3,5 0,8 10 2%
9 16,8 16,8 3,8 1073 8,8 7,2 2,8 177 17%
Average 13% 21
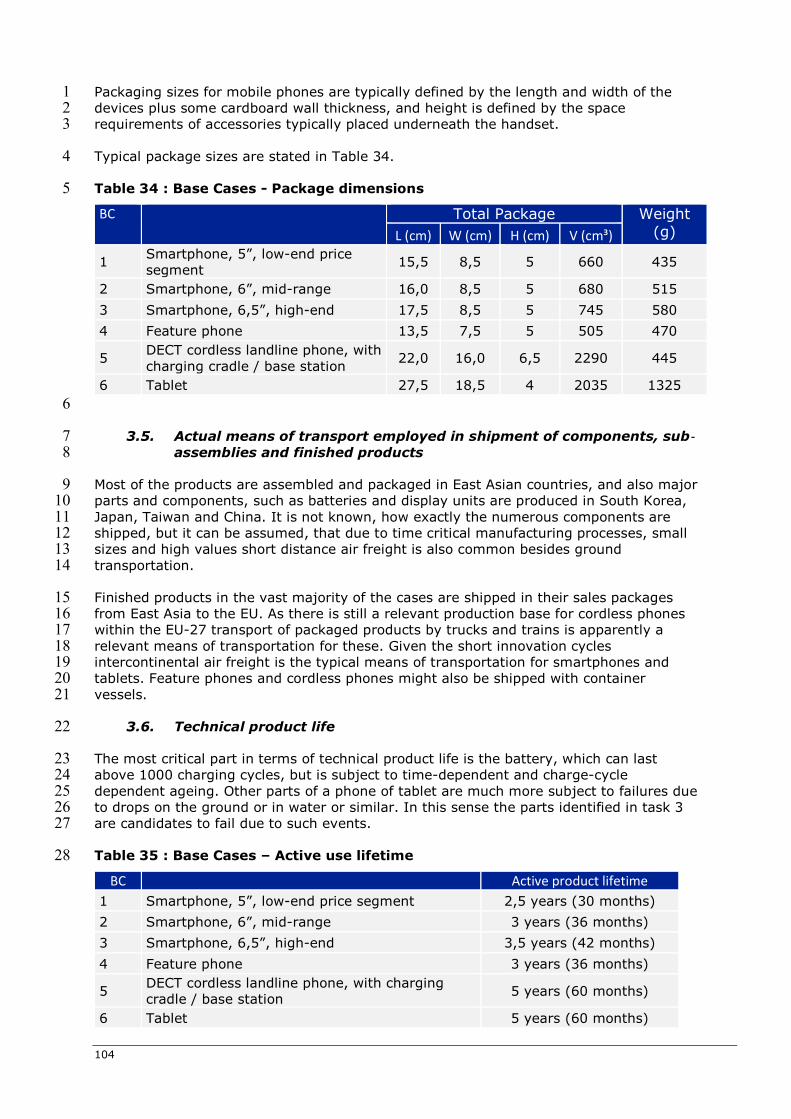
104
Packaging sizes for mobile phones are typically defined by the length and width of the 1 devices plus some cardboard wall thickness, and height is defined by the space 2 requirements of accessories typically placed underneath the handset. 3
Typical package sizes are stated in Table 34. 4
Table 34 : Base Cases - Package dimensions 5
BC Total Package Weight (g) L (cm) W (cm) H (cm) V (cm³)
1 Smartphone, 5”, low-end price segment
15,5 8,5 5 660 435
2 Smartphone, 6”, mid-range 16,0 8,5 5 680 515
3 Smartphone, 6,5”, high-end 17,5 8,5 5 745 580
4 Feature phone 13,5 7,5 5 505 470
5 DECT cordless landline phone, with charging cradle / base station
22,0 16,0 6,5 2290 445
6 Tablet 27,5 18,5 4 2035 1325 6
3.5. Actual means of transport employed in shipment of components, sub‐7 assemblies and finished products 8
Most of the products are assembled and packaged in East Asian countries, and also major 9 parts and components, such as batteries and display units are produced in South Korea, 10 Japan, Taiwan and China. It is not known, how exactly the numerous components are 11 shipped, but it can be assumed, that due to time critical manufacturing processes, small 12 sizes and high values short distance air freight is also common besides ground 13 transportation. 14
Finished products in the vast majority of the cases are shipped in their sales packages 15 from East Asia to the EU. As there is still a relevant production base for cordless phones 16 within the EU-27 transport of packaged products by trucks and trains is apparently a 17 relevant means of transportation for these. Given the short innovation cycles 18 intercontinental air freight is the typical means of transportation for smartphones and 19 tablets. Feature phones and cordless phones might also be shipped with container 20 vessels. 21
3.6. Technical product life 22
The most critical part in terms of technical product life is the battery, which can last 23 above 1000 charging cycles, but is subject to time-dependent and charge-cycle 24 dependent ageing. Other parts of a phone of tablet are much more subject to failures due 25 to drops on the ground or in water or similar. In this sense the parts identified in task 3 26 are candidates to fail due to such events. 27
Table 35 : Base Cases – Active use lifetime 28
BC Active product lifetime 1 Smartphone, 5”, low-end price segment 2,5 years (30 months)
2 Smartphone, 6”, mid-range 3 years (36 months)
3 Smartphone, 6,5”, high-end 3,5 years (42 months)
4 Feature phone 3 years (36 months)
5 DECT cordless landline phone, with charging cradle / base station 5 years (60 months)
6 Tablet 5 years (60 months)
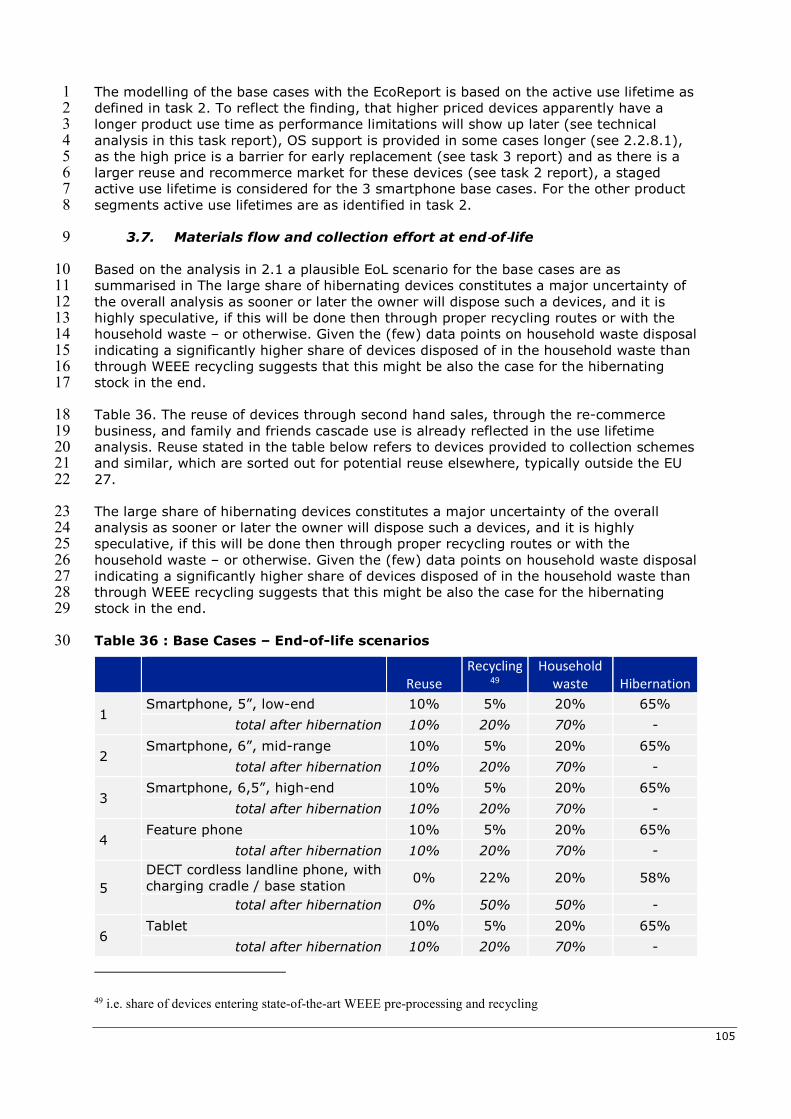
105
The modelling of the base cases with the EcoReport is based on the active use lifetime as 1 defined in task 2. To reflect the finding, that higher priced devices apparently have a 2 longer product use time as performance limitations will show up later (see technical 3 analysis in this task report), OS support is provided in some cases longer (see 2.2.8.1), 4 as the high price is a barrier for early replacement (see task 3 report) and as there is a 5 larger reuse and recommerce market for these devices (see task 2 report), a staged 6 active use lifetime is considered for the 3 smartphone base cases. For the other product 7 segments active use lifetimes are as identified in task 2. 8
3.7. Materials flow and collection effort at end‐of‐life 9
Based on the analysis in 2.1 a plausible EoL scenario for the base cases are as 10 summarised in The large share of hibernating devices constitutes a major uncertainty of 11 the overall analysis as sooner or later the owner will dispose such a devices, and it is 12 highly speculative, if this will be done then through proper recycling routes or with the 13 household waste – or otherwise. Given the (few) data points on household waste disposal 14 indicating a significantly higher share of devices disposed of in the household waste than 15 through WEEE recycling suggests that this might be also the case for the hibernating 16 stock in the end. 17
Table 36. The reuse of devices through second hand sales, through the re-commerce 18 business, and family and friends cascade use is already reflected in the use lifetime 19 analysis. Reuse stated in the table below refers to devices provided to collection schemes 20 and similar, which are sorted out for potential reuse elsewhere, typically outside the EU 21 27. 22
The large share of hibernating devices constitutes a major uncertainty of the overall 23 analysis as sooner or later the owner will dispose such a devices, and it is highly 24 speculative, if this will be done then through proper recycling routes or with the 25 household waste – or otherwise. Given the (few) data points on household waste disposal 26 indicating a significantly higher share of devices disposed of in the household waste than 27 through WEEE recycling suggests that this might be also the case for the hibernating 28 stock in the end. 29
Table 36 : Base Cases – End-of-life scenarios 30
Reuse Recycling
49 Household
waste Hibernation
1 Smartphone, 5”, low-end 10% 5% 20% 65%
total after hibernation 10% 20% 70% -
2 Smartphone, 6”, mid-range 10% 5% 20% 65%
total after hibernation 10% 20% 70% -
3 Smartphone, 6,5”, high-end 10% 5% 20% 65%
total after hibernation 10% 20% 70% -
4 Feature phone 10% 5% 20% 65%
total after hibernation 10% 20% 70% -
5 DECT cordless landline phone, with charging cradle / base station
0% 22% 20% 58%
total after hibernation 0% 50% 50% -
6 Tablet 10% 5% 20% 65%
total after hibernation 10% 20% 70% -
49 i.e. share of devices entering state-of-the-art WEEE pre-processing and recycling
106
4. PUBLICATION BIBLIOGRAPHY 1
Apple (2020a): Environment. Available online at 2 https://www.apple.com/environment/, updated on 10/6/2020, checked on 3 10/6/2020. 4
Apple (2020b): Apple Events - October 2020. Available online at 5 https://www.apple.com/apple-events/october-2020/, updated on 6 10/20/2020, checked on 10/20/2020. 7
Apple Inc. (2020): Environmental Progress Report. Covering fiscal year 8 2019. Available online at 9 https://www.apple.com/environment/pdf/Apple_Environmental_Progress_10 Report_2020.pdf. 11
Arduin, R. H.; Charbuillet, C.; Berthoud, F.; Perry, N. (2017): Life Cycle 12 Assessment of End-of-Life Scenarios: Tablet Case Study. In Proceedings 13 Sardinia 2017 / Sixteenth International Waste Management and Landfill 14 Symposium. 15
B3 Corp.: E16Q3 LIB Market Bulletin chapter 4. 16
B3 Corp.: E19Q1 LIB materials markets. 17
B3 Corp.: E19Q3 LIB market chapter 4. 18
Barrett, Brian (2020): Your Next Smartphone Will Be a Lot Harder to 19 Scratch. Available online at https://www.wired.com/story/gorilla-glass-20 victus/, updated on 10/7/2020, checked on 10/7/2020. 21
Barsukov, Yevgen; Qian, Jinrong (2013): Battery power management for 22 portable devices. Boston: Artech House (Artech House power engineering 23 series). 24
Berwald, Anton; Clemm, Christian; Prewitz, Carolin (2020): Environmental 25 evaluation of current and future design rules. Deliverable no. 2.5 of the EU 26 H2020 PROMPT project. Available online at https://prompt-project.eu/. 27
Bohn, Dieter (2020): Samsung guarantees three ‘generations’ of Android 28 OS updates for some Galaxy phones. There are some caveats for A-series 29 phones. Edited by The Verge. Available online at 30 https://www.theverge.com/2020/8/5/21355777/samsung-android-os-31 update-promise-galaxy-phones-3-generations, updated on 8/5/2020, 32 checked on 9/29/2020. 33
Bookhagen, Britta; Dorner, Ulrike; Damm, Sophie; Bergholtz, Jana; 34 Opper, Christine; Irrgeher, Johanna et al. (2018): Rohstoffverbrauch von 35 Smartphones. In Recycling und Rohstoffe Band 11, pp. 519–532. Available 36 online at https://www.vivis.de/wp-37 content/uploads/RuR11/2018_RuR_519-532_Bookhagen. 38
Clemm, Christian; Berwald, Anton; Prewitz, Carolin (2020): Evolution of 39 Smartphone Design and Implications for Material Efficiency. In Electronics 40 Goes Green 2020+. 41
Clemm, Christian; Mählitz, Paul; Schlösser, Alexander; Rotter, Vera 42 Susanne; Lang, Klaus-Dieter (2016a): Umweltwirkungen von 43
107
wiederaufladbaren Lithium-Batterien für den Einsatz in mobilen 1 Endgeräten der Informations- und Kommunikationstechnik (IKT). Edited 2 by Umweltbundesamt. Dessau, Germany (Texte, 52/2016). Available 3 online at 4 https://www.umweltbundesamt.de/publikationen/umweltwirkungen-von-5 wiederaufladbaren-lithium. 6
Clemm, Christian; Sinai, C.; Ferkinghoff, C.; Dethlefs, N.; Nissen, N. F.; 7 Lang, K.-D. (2016b): Durability and cycle frequency of smartphone and 8 tablet lithium-ion batteries in the field. In : 2016 Electronics Goes Green 9 2016+ (EGG). 2016 Electronics Goes Green 2016+ (EGG), pp. 1–7. 10
Cordella, Mauro; Alfieri, Felice; Sanfelix, Javier (2020): Guidance for the 11 Assessment of Material Efficiency: Application to Smartphones. Edited by 12 Publications Office of the European Union. Luxembourg (JRC116106). 13
Corning (2020a): CORNING® GORILLA® GLASS 5. Available online at 14 https://www.corning.com/microsites/csm/gorillaglass/PI_Sheets/2020/Cor15 ning%20Gorilla%20Glass%205_PI%20Sheet.pdf, checked on 7/10/2020. 16
Corning (2020b): CORNING® GORILLA® GLASS 6. Available online at 17 https://www.corning.com/gorillaglass/worldwide/en/glass-types/gorilla-18 glass-6.html. 19
Corning (2020c): Corning® Gorilla® Glass Victus™. Available online at 20 https://www.corning.com/microsites/csm/gorillaglass/PI_Sheets/2020/Cor21 ning%20Gorilla%20Glass%20Victus_PI%20Sheet.pdf, checked on 22 7/10/2020. 23
Derks, Maarten (2020): Building a breakthrough for Fairphone 2. Edited 24 by Fairphone. Available online at 25 https://www.fairphone.com/en/2020/06/18/fairphone-2-gets-android-9/, 26 updated on 6/30/2020, checked on 9/29/2020. 27
Dixon, Taylor (2020): The Pixel 4a Is Actually New and Interesting, Once 28 You Open It - iFixit. Available online at 29 https://de.ifixit.com/News/43537/the-pixel-4a-is-actually-new-and-30 interesting-once-you-open-it, updated on 9/22/2020, checked on 31 9/22/2020. 32
Du, Li (2016): Du, L. “An Overview of Mobile Capacitive Touch An 33 Overview of Mobile Capacitive Touch Technologies Trends. In ArXiv 34 abs/1612.08227. 35
Electronicproducts (2016): What's inside? Product teardowns. Available 36 online at http://www.electronicproducts.com, checked on 1/15/2017. 37
Ellen MacArthur Foundation (2012): In-depth - Mobile Phones. Available 38 online at https://www.ellenmacarthurfoundation.org/news/in-depth-39 mobile-phones, updated on 9/16/2020, checked on 9/16/2020. 40
European Commission (2019): Impact assessment study on common 41 chargers of portable devices. Available online at 42 https://op.europa.eu/en/web/eu-law-and-publications/publication-detail/-43 /publication/c6fadfea-4641-11ea-b81b-01aa75ed71a1. 44
108
Fairphone (2018): Digging into the recycled material chains - Fairphone. 1 Available online at https://www.fairphone.com/de/2018/04/26/digging-2 into-the-recycled-material-chains/, updated on 7/25/2018, checked on 3 9/16/2020. 4
Fairphone (2020): A new milestone in fairer electronics: Introducing 5 Fairphone 3+ - Fairphone. Available online at 6 https://www.fairphone.com/de/2020/08/27/introducing-fairphone-3-plus/, 7 updated on 8/27/2020, checked on 9/10/2020. 8
Feurer, Sebastian (2020): iOS 14: Diese iPhones bekommen das Update. 9 Edited by chip. Available online at https://www.chip.de/news/iOS-14-10 Diese-iPhones-bekommen-das-Update_182551984.html, updated on 11 9/29/2020, checked on 9/29/2020. 12
Ford, Peter; Fisher, Jill (2019): Designing consumer electronic products 13 for the circular economy using recycled Acrylonitrile Butadiene Styrene 14 (ABS): A case study. In Journal of Cleaner Production 236, p. 117490. 15 DOI: 10.1016/j.jclepro.2019.06.321. 16
Gifford, Stephen; Brown, Zachary (2020): Solid-State Batteries: The 17 Technology of the 2030s but the Research Challenge of the 2020s. 18 Available online at https://faraday.ac.uk/wp-19 content/uploads/2020/04/Faraday-Insights-5_Updated.pdf, checked on 20 5/10/2020. 21
Google (2020a): Pixel 4a. Product environmental report. Available online 22 at https://www.gstatic.com/gumdrop/sustainability/pixel4a-product-23 environment-report.pdf. 24
Google (2020b): Reports | Google Sustainability. Available online at 25 https://sustainability.google/reports/, updated on 10/6/2020, checked on 26 10/6/2020. 27
GSMArena (2020): Battery life tests results. Available online at 28 https://www.gsmarena.com/battery-test.php3, updated on 10/6/2020, 29 checked on 10/6/2020. 30
Hankammer, Stephan; Jiang, Ruth; Kleer, Robin; Schymanietz, Martin 31 (2018): Are modular and customizable smartphones the future, or 32 doomed to fail? A case study on the introduction of sustainable consumer 33 electronics. In CIRP Journal of Manufacturing Science and Technology 23, 34 pp. 146–155. DOI: 10.1016/j.cirpj.2017.11.001. 35
iFixit (2019): Samsung Galaxy Fold tear down. Available online at 36 https://fr.ifixit.com/Tutoriel/Vue+%C3%A9clat%C3%A9e+du+Samsung+37 Galaxy+Fold/122600. 38
iFixit (2020): Motorola Razr tear down. Available online at 39 https://fr.ifixit.com/Tutoriel/Vue+%C3%A9clat%C3%A9e+du+Motorola+40 Razr/130414. 41
Ipsos, Trinomics, Fraunhofer FOKUS, Economisti Associati (2019): Impact 42 Assessment Study on Common Chargers of Portable Devices. Edited by 43 Publications Office of the European Union. European Commission. 44 Luxembourg. 45
109
Jardim, Elizabeth (2017): From Smart to Senseless. The Global Impact of 1 10 Years of Smartphones. Available online at 2 http://www.greenpeace.org/usa/wp-content/uploads/2017/03/FINAL-3 10YearsSmartphones-Report-Design-230217-Digital.pdf, checked on 4 9/16/2020. 5
Kalluri, Sujith; Yoon, Moonsu; Jo, Minki; Park, Suhyeon; Myeong, 6 Seungjun; Kim, Junhyeok et al. (2017): Surface Engineering Strategies of 7 Layered LiCoO 2 Cathode Material to Realize High-Energy and High-8 Voltage Li-Ion Cells. Advanced Energy Materials, 7(1), 1601507. In Adv. 9 Energy Mater. 7 (1), p. 1601507. DOI: 10.1002/AENM.201601507. 10
Kemna, René (2011): Methodology for Ecodesign of Energy‐related 11 Products - MEErP 2011. Methodology Report. Part 1: Methods. With 12 assistance of Nelly Azaïs, Martijn van Elburg, Maaike van der Voort, 13 William Li. Brussels / Delft. 14
Kemna, René; van Elburg, Martijn; Li, William; van Holsteijn (2005): 15 Methodology Study Eco-design of Energy-using Products. Final Report, 16 MEEUP Methodoilogy Report. Edited by European Commission. Delft, The 17 Netherlands, Brussels, Belgium. 18
Kemna, René; Wierda, Leo; Li, William; van den Boorn, Roy; van Elburg, 19 Martijn; Viegand, Jan; Wu, Anson (2020): ICT Impact study. Technical 20 Assistance, Final Report. 21
Li, Hongxia; Ning, Nanying; Zhang, Liqun; Wang, Yanxiang; Liang, Wenli; 22 Tian, Ming (2014): Different flame retardancy effects and mechanisms of 23 aluminium phosphinate in PPO, TPU and PP. In Polymer Degradation and 24 Stability 105, pp. 86–95. DOI: 10.1016/j.polymdegradstab.2014.03.032. 25
Maher, Paul; Ospina, Jose; Galligan, Anne; Schischke, Karsten; Gallagher, 26 John; Madden, Jeremy; O'Donovan, Dermot (2018): D4R tablet: Concept 27 and technology validation. Deliverable 1.3. Project Sustainable Smart 28 Mobile Devices Lifecycles through Advanced Re-design, Reliability, and Re-29 use and Remanufacturing Technologies. Available online at 30 https://www.sustainably-smart.eu/app/download/9094792682/D4R-31 tablet-kappa.pdf?t=1574689220. 32
Manhart, Andreas; Blepp, Markus; Fischer, Corinna; Graulich, Kathrin 33 (2016): Resource Efficiency in the ICT Sector. Available online at 34 https://www.greenpeace.de/sites/www.greenpeace.de/files/publications/235 0161109_oeko_resource_efficency_final_full-report.pdf, checked on 36 7/9/2020. 37
Maya-Drysdale, Larisa; Peled, Michelle; Wood, Jonathan; Rames, Mette; 38 Viegand, Jan (2017a): Preparatory study on the Review of Regulation 39 617/2013 (Lot 3) Computers and Computer Servers. Simplified tasks 5 & 40 6 report Base cases and Design options. Brussels, Belgium. Available 41 online at https://www.semanticscholar.org/paper/An-Overview-of-Mobile-42 Capacitive-Touch-Technologies-43 Du/98b52004fe8a3cb4b961c6fa52068699b3fa7264. 44
110
Maya-Drysdale, Larisa; Peled, Michelle; Wood, Jonathan; Rames, Mette; 1 Viegand, Jan (2017b): Preparatory study on the Review of Regulation 2 617/2013 (Lot 3) Computers and Computer Servers. Task 4 report - 3 Technologies. Brussels, Belgium. Available online at 4 https://www.semanticscholar.org/paper/An-Overview-of-Mobile-5 Capacitive-Touch-Technologies-6 Du/98b52004fe8a3cb4b961c6fa52068699b3fa7264. 7
Mobile & SecurityLab (2019): Smartphones with the best security updates, 8 comparison with other main smartphones. twitter. Available online at 9 https://twitter.com/SecX13, checked on 9/28/2020. 10
Mudgal, Shailendra; Tinetti, Benoît; Prado Trigo, Alvaro de; Faninger, 11 Thibault; Schischke, Karsten; Proske, Marina et al. (2013): Material-12 efficiency ecodesign report and module to the methodology for the 13 ecodesign of energy-related products (MEErP). Part 1, material efficiency 14 for ecodesign - Study. Brussels. 15
Nelson (2020): 2020 Moto RAZR Durability Test! - Will the Folding Icon 16 Survive!? Available online at 17 https://www.youtube.com/watch?v=Eokt7DWljtU. 18
Nissen, Nils F.; Reinhold, Julia; Schischke, Karsten; Lang, Klaus-Dieter 19 (2019): Recyclability of Tungsten, Tantalum and Neodymium from 20 Smartphones. In EcoDesign 2019 Proc. 21
Notebookcheck (2020): Benchmarks and Test Results. Available online at 22 https://www.notebookcheck.net/Benchmarks-and-Test-23 Results.142793.0.html?&type=model&model_class=10&max_results=50024 &archive=1&or=0&showBars=1&test_current_current_off=1&test_current25 _current_standby=1&test_current_current_idle_avg=1&test_current_curr26 ent_load_avg=1&model=1&cpu_name=1&screen_size=1, updated on 27 10/6/2020, checked on 10/6/2020. 28
Ospina, Jose; Maher, Paul; Galligan, Anne; Gallagher, John; O'Donovan, 29 Dermot; Knorr, Stefan; Schischke, Karsten (2019): Design and 30 Manufacture of the iameco D4R Tablet in a Fab Lab Environment. In Proc. 31 Prouduct Lifecycles and the Environment - PLATE 2019. 32
Pillot, Christophe (2017): The Rechargeable Battery Market and Main 33 Trends 2016-2025. In The Battery Show, North America 2017. Available 34 online at 35 http://www.avicenne.com/pdf/The%20Rechargeable%20Battery%20Mark36 et%20and%20Main%20Trends%202016-37 2025_C%20Pillot_M%20Sanders_September%202017.pdf, checked on 38 5/10/2020. 39
Pramanik, Pijush Kanti Dutta; Sinhababu, Nilanjan; Mukherjee, Bulbul; 40 Padmanaban, Sanjeevikumar; Maity, Aranyak; Upadhyaya, Bijoy Kumar et 41 al. (2019): Power Consumption Analysis, Measurement, Management, and 42 Issues: A State-of-the-Art Review of Smartphone Battery and Energy 43 Usage. IEEE Access, 7, 182113-182172. In IEEE Access 7, pp. 182113–44 182172. DOI: 10.1109/ACCESS.2019.2958684. 45
111
Proske, Marina; Baur, Sarah-Jane; Rückschloss, Jana; Teusch, Christoph; 1 Krause, Thomas; Poppe, Erik (2020a): Bestandsaufnahme Smartphones. 2 Übersicht Modellhistorie und modulare Konzepte. Projektbericht MoDeSt. 3
Proske, Marina; Clemm, Christian; Richter, Nikolai (2016): Life Cycle 4 Assessment of the Fairphone 2. Final Report. Berlin. Available online at 5 https://www.fairphone.com/wp-6 content/uploads/2016/11/Fairphone_2_LCA_Final_20161122.pdf. 7
Proske, Marina; Sánchez, David; Clemm, Christian; Baur, Sarah-Jane 8 (2020b): Life Cycle Assessment of the Fairphone 3. Fraunhofer IZM. 9 Amsterdam, The Netherlands. Available online at 10 https://www.fairphone.com/wp-11 content/uploads/2020/07/Fairphone_3_LCA.pdf, checked on 9/27/2020. 12
Requirements for Computers. 13
SamMobile (2020): Galaxy S20 Ultra has Gorilla Glass 6 on the front and 14 back. Available online at https://www.sammobile.com/news/galaxy-s20-15 ultra-has-gorilla-glass-6-on-the-front-and-back/, updated on 10/7/2020, 16 checked on 10/7/2020. 17
Samsung (2020): Umweltbewusste Produkte | Umwelt | Nachhaltigkeit | 18 Samsung DE. Available online at 19 https://www.samsung.com/de/aboutsamsung/sustainability/environment/20 eco-conscious-products/, updated on 9/10/2020, checked on 9/10/2020. 21
Sánchez et al. (2018): Technology assessment of wireless charging using 22 life cycle tools. Presentation at the CARE conference. Available online at 23 http://ci2018.care-electronics.net/. 24
Sander, Knut; Marscheider-Weidemann, Frank; Wilts, Henning; Hobohm, 25 Julia; Hartfeil, Thorsten; Schöps, Dirk; Heymann, René (2019): 26 Abfallwirtschaftliche Produktverantwortung unter 27 Ressourcenschutzaspekten (RePro). Dessau, Germany (Texte | 52/2019). 28
Schischke, Karsten; Nissen, Nils F.; Stobbe, Lutz; Oerter, Markus; 29 Scheiber, Sascha; Schlösser, Alexander et al. (2014): Ansätze zur 30 stofflichen Verwertung von Tablets aus Sicht des Produktdesigns. In 31 Recycling und Rohstoffe Band 7. Available online at 32 http://www.vivis.de/fachbuecher/recycling-und-rohstoffe/184-rur7. 33
Schischke, Karsten; Proske, Marina; Nissen, Nils F.; Schneider-Ramelow, 34 Martin (2019): Impact of modularity as a circular design strategy on 35 materials use for smart mobile devices. In MRS Energy & Sustainability 6 36 (E16). DOI: 10.1557/mre.2019.17. 37
Sosnowsky, Rudolf (2020): Peripherie: 1, 2, 3, 4 – USB kann wieder 38 mehr. Available online at https://www.elektroniknet.de/design-39 elektronik/embedded/1-2-3-4-usb-kann-wieder-mehr-178135.html, 40 updated on 10/5/2020, checked on 10/5/2020. 41
Tecchio, Paolo; Ardente, Fulvio; Marwede, Max; Clemm, Christian; 42 Dimitrova, Gergana; Mathieux, Fabrice (2018): Analysis of material 43
112
efficiency aspects of personal computers product group. Luxembourg: 1 Publications Office (EUR. Scientific and technical research series, 28394). 2
Thielmann, A. et al. (2017): 2017 Energiespeicher-Roadmap (update 3 2017) – Hochenergie Batterien 2030+ und Perspektiven zukünftiger 4 Batterietechnologien. Edited by Fraunhofer Institute for Systems and 5 Innovation Research ISI. Karlsruhe, Germany. 6
UFC QC (2020): Test des Samsung Galaxy S20+ et S20 Ultra Des 7 smartphones trop fragiles ! Available online at 8 https://www.quechoisir.org/actualite-test-des-samsung-galaxy-s20-et-9 s20-ultra-des-smartphones-trop-fragiles-n78307/. 10
Ulvestad, Andrew (2018): A Brief Review of Current Lithium Ion Battery 11 Technology andPotentialSolid State Battery Technologies. Available online 12 at https://arxiv.org/ftp/arxiv/papers/1803/1803.04317.pdf, checked on 13 5/10/2020. 14
Umicore (2020): Closing the loop for cobalt in consumer devices’ batteries 15 (2018) | Annual report 2019. Available online at 16 https://annualreport.umicore.com/stories/closing-the-loop-for-cobalt-in-17 consumer-devices-batteries/, updated on 9/16/2020, checked on 18 9/16/2020. 19
van der Voort, Darell (2013): From Mobile Phone to Urban Mine. An 20 analysis of the potentials and process of mobile phone recycling in 21 Belgium. Available online at https://edepot.wur.nl/305511. 22
Vincent, James (2020): Apple’s new iPhone 12 line-up comes with a 23 ceramic-hardened display. In The Verge, 10/13/2020. Available online at 24 https://www.theverge.com/2020/10/13/21509008/apple-iphone-12-pro-25 max-mini-displays-ceramic-hardened, checked on 10/20/2020. 26
Warner, John T. (2019): Lithium-ion battery chemistries. A primer / John 27 T. Warner. Amsterdam: Elsevier. 28
Watson, David; Tojo, Naoko; Bauer, Bjørn; Milios, Leonidas; Gylling, Anja 29 Charlotte; Throne-Holst, Harald (2017): Circular Business Models in the 30 Mobile Phone Industry: Nordic Council of Ministers. 31
Webb, Olivia (2020): Here Are the Parts You Can Swap Between the New 32 iPhone SE and iPhone 8 - iFixit. Available online at 33 https://de.ifixit.com/News/41123/here-are-the-parts-you-can-swap-34 between-the-new-iphone-se-and-iphone-8, updated on 9/22/2020, 35 checked on 9/22/2020. 36
Wölbert, Christian (2016): Sammeln, schreddern, schmelzen. Wie 37 Elektronik recycelt wird. Edited by Heise Magazine. Available online at 38 https://www.heise.de/select/ct/2016/5/1456989946257904, updated on 39 9/30/2020, checked on 9/30/2020. 40
Yanagisawa, Yu; Nan, Yiling; Okuro, Kou; Aida, Takuzo (2018): 41 Mechanically robust, readily repairable polymers via tailored noncovalent 42 cross-linking. In Science (New York, N.Y.) 359 (6371), pp. 72–76. DOI: 43 10.1126/science.aam7588. 44
113
Yin, Jessica; Wang, Ting-Hsin (2013): A Process-based and Simplified 1 Carbon Footprint Model for Customized Semiconductor Products | SESHA. 2 Long Beach, CA, USA (SESHA 35th Annual Symposium), updated on 3 10/9/2020, checked on 10/9/2020. 4
Zhang, Jie-Nan; Li, Qinghao; Wang, Yi; Zheng, Jieyun; Yu, Xiqian; Li, 5 Hong (2018): Dynamic evolution of cathode electrolyte interphase (CEI) 6 on high voltage LiCoO2 cathode and its interaction with Li anode. Energy 7 Storage Materials, 14, 1-7. In Energy Storage Materials 14, pp. 1–7. DOI: 8 10.1016/J.ENSM.2018.02.016. 9
Zhang, Yayun; Su, Huijun; Ya, Miaolei; Li, Jianhua; Ho, Shih-Hsin; Zhao, 10 Luming et al. (2019): Distribution of flame retardants in smartphones and 11 identification of current-use organic chemicals including three novel aryl 12 organophosphate esters. In The Science of the total environment 693, 13 p. 133654. DOI: 10.1016/j.scitotenv.2019.133654. 14 15
5. ANNEX 16
5.1. Tested DECT phones 17
Following DECT phones have been tested in 2015 and 2018 by Stiftung Warentest and 18 are still available on the German market. Numbers correspond to those used in 19
Figure 54 : Standby power consumption, DECT phones / charging cradle / base 20 station (data by Stiftung Warentest, compilation by Fraunhofer IZM), p. 59 21
Figure 55 : Phone call times with fully charged batteries and charging times, DECT 22 phones (data by Stiftung Warentest, compilation by Fraunhofer IZM), p. 59 23
Figure 56 : Standby duration in standard and eco mode, DECT phones (data by 24 Stiftung Warentest, compilation by Fraunhofer IZM), p. 60 25 26
No. Model (1) Gigaset: CL660 (2) Gigaset: SL450 (3) Telekom: Speedphone 11 with base station (4) Telekom: Speedphone 51 with base station (5) Gigaset: CL660A (6) Gigaset: E560 (7) Gigaset: SL450A Go2 (8) Telekom: Speedphone 11 with base station and answering machine (9) Gigaset: E560A (10) Telekom: Sinus 207 (11) Telekom: Sinus A 207 (12) Telekom: Speedphone 51 with base station and answering machine (13) Panasonic: KX-TGE210 (14) Gigaset: C430 (15) Panasonic: KX-TGE220 (16) Gigaset: C430A (17) Telekom: Sinus A 206 Comfort (18) Panasonic: KX-TGK320 (19) Gigaset: E630 (20) Panasonic: KX-TG8051 (21) Panasonic: KX-TG8061 (22) Telekom: Sinus 206 (23) Gigaset: SL910
114
No. Model (24) Panasonic: KX-TGH220 (25) Telekom: Sinus 606 (26) Telekom: Sinus A 206 (27) Panasonic: KX-TG6811 (28) Panasonic: KX-TG6821 (29) Gigaset: A415 (30) Gigaset: A415A (31) Panasonic: KX-TGK220 (32) Panasonic: KX-TGQ2003 (33) Telekom: Speedphone 114 (34) Telekom: Speedphone 514 (35) AVM: FRITZ!Fon C53 (36) Panasonic: KX-TGQ4003 (37) Gigaset: SL450 HX3 (38) Gigaset: A540 CAT (39) AVM: Fritz!Fon C4 (40) AVM: Fritz!Fon M2
1
2
3
4
5
6
7
8
9
10
11
12
13
HOW TO OBTAIN EU PUBLICATIONS 14
Free publications: 15
• one copy: 16 via EU Bookshop (http://bookshop.europa.eu); 17
• more than one copy or posters/maps: 18 from the European Union’s representations (http://ec.europa.eu/represent_en.htm); 19 from the delegations in non-EU countries 20 (http://eeas.europa.eu/delegations/index_en.htm); 21 by contacting the Europe Direct service (http://europa.eu/europedirect/index_en.htm) 22 or calling 00 800 6 7 8 9 10 11 (freephone number from anywhere in the EU) (*). 23 24 (*) The information given is free, as are most calls (though some operators, phone boxes or hotels may 25 charge you). 26
115
Priced publications: 1
• via EU Bookshop (http://bookshop.europa.eu). 2
Priced subscriptions: 3
• via one of the sales agents of the Publications Office of the European Union 4 (http://publications.europa.eu/others/agents/index_en.htm). 5

doi:number