eco-information and its effect on consumer values for environmentally certified forest products
TRANSCRIPT

www.elsevier.de/jfeJournal of Forest Economics 10 (2004) 75–96
Eco-information and its effect on consumer values for
environmentally certified forest products$
Kelly A. O’Briena, Mario F. Teislb,*aKleinschmidt Associates, 75 Main Street, Pittsfield, ME 04967, USAbDepartment of Resource Economics and Policy at the University of Maine,
5782 Winslow Hall Orono, ME 04469, USA
Received 21 December 2003; accepted 8 March 2004
Abstract
Some sectors of the forest products industry have adopted environmental certification and
labeling as a business strategy. Typically, the designation of these products is through the use
of eco-seals (environmental ‘seals-of-approval’). For these programs to be effective, consumers
must first care about the disclosed information. We find consumers are willing to pay for these
products but changes in labeling policy affects their willingness to pay. Thus, there appears to
be a demand for environmentally certified forest products, however, the current use of eco-
seals may preclude the collection of an actual premium.
r 2004 Elsevier GmbH. All rights reserved.
JEL classification: Q510; Q230
Keywords: Consumer preferences; Environmental certification; Eco-labeling; Valuation
ARTICLE IN PRESS
$This project was financed in part by an US Department of Agriculture—National Research Initiative
Grant (x99-35400-7851), and the Maine Agricultural and Forest Experiment Station. Although the
research described in this article has been funded in part by the USDA, it has not been subject to the
Agency’s required peer and policy review and therefore does not necessarily reflect the views of USDA and
no official endorsement should be inferred. All errors and omissions are the sole responsibility of the
authors. Maine Agricultural and Forest Experiment Station Publication No. 2706.
*Corresponding author. Tel.: +1-207-581-3162.
E-mail address: [email protected] (M.F. Teisl).
1104-6899/$ - see front matter r 2004 Elsevier GmbH. All rights reserved.
doi:10.1016/j.jfe.2004.05.001

Introduction
The public’s apparent willingness to use its purchasing power as a means toprotect the environment, as evidenced by the sale and purchase of such products asdolphin-safe tuna (Teisl et al., 2002a, b) and organic foods (Dimitri and Greene,2002), may provide an opportunity for forest product manufacturers andenvironmentally concerned consumers to benefit. Although some sectors haveadopted environmental certification and labeling of their products as a businessstrategy to take advantage of specialized product markets and potential productpremiums,1 many in the forest products industry have been skeptical about thetouted environmental and economic benefits of these approaches (e.g., see Waffle,1994; Baharuddin and Simula, 1994; Irland, 2002; Auld et al., 2001).2
Given that forest and forest product certification is not costless (Plantinga et al.,2000), certification and labeling programs may not achieve their objectives unlessconsumers are willing to pay for the underlying improvements in forest managementpractices specified by the program. Currently, there are several studies (Anderson,2003; Donovan and Nicholls, 2003; Vlosky et al., 1999a, b; Ozanne and Vlosky,1997, 2003) that indicate there is a sizable portion of consumers willing to pay apremium for certified forest products or that have empirically measured the size ofthe WTP premium. However, it is unclear from these studies whether consumers arewilling to pay for changes to specific forest management practices or whetherconsumers are satisfied with a general assurance of the environmental quality of theproduct because these studies have presented respondents with only a vaguedescription of the forest management practices associated with certification. No onehas presented an analysis of the forest management attributes that are most likely toinfluence consumers’ willingness to pay (WTP) for certified forest products.In addition to being willing to pay for certified and labeled products, consumers
must understand and believe the information presented to them by the forest productmanufacturer.3 Currently, environmental certification of forest products is primarilyprovided through the non-profit Forest Stewardship Council (FSC) or the AmericanForest and Paper Association (AFPA)4 in the form of eco-seals (Fig. 1). Eco-sealsare essentially ‘‘seals-of-approval’’ that convey little information regarding theenvironmental attributes of a product. However, recent research indicates that forestproduct consumers prefer labels that provide more detail about how specific forestmanagement practices have been altered (Teisl, 2003).
ARTICLE IN PRESS
1There is a broad range of environmentally certified forest products currently on the market; e.g., stud-
grade lumber, wooden patio furniture, birdhouses, cutting boards, and copier paper.2There are two levels of environmental certification in the forest products industry; forest certification,
involves an assessment of forest management practices against specified social, ecological, and economic
standards. Forest product certification requires a chain-of-custody audit to confirm that wood from
certified forests is used in product lines.3Recent work has illustrated some of the factors that influence the understandability and credibility of a
product’s eco-label (Teisl et al., 2002a, b).4The AFPA is a trade association of the US and Canadian forest products industry.
K.A. O’Brien, M.F. Teisl / Journal of Forest Economics 10 (2004) 75–9676

This desire for information about changes in specific forest management practicesimplies consumers’ WTP may differ across various management practices. Previousresearch with forestland users indicates the public is able to distinguish betweendifferent forest management practices and their associated attributes (e.g., seeBrown, 1987; Hull and Buhyoff, 1986, Rudis et al., 1988; Mattsson and Li, 1994;Schroeder and Daniel, 1981; Ribe, 1990; Rosenberger and Smith, 1997). However,no research has examined if consumers of forest products hold different preferencesfor the various forest management practices used in certification schemes. Further,no research has explored whether changes in labeling policy, or other eco-marketingstrategies, may affect how these preferences are elicited in the market.For eco-labeling schemes to be effective in altering consumer behavior, firms (and
other stakeholders) need to understand the preferences of consumers for improve-ments in specific forest management practices and how best to inform consumers ofthe existence of these changes. The goals of this study are to measure consumers’WTP for improvements in the environmental quality of forest products and todetermine the influences that different informational factors may have onconsumers’ values for these improvements.
Literature review
Values for forest management practices
Until recently, there has been little economic research investigating the valuesindividuals may have for different forest management practices. However, in thefield of forestry there has been a large body of work conducted on public preferencesfor forest landscapes and forest conditions. The majority of these studies measureaesthetic preferences using scenic beauty estimation methods where participants areshown photographs and then administered surveys to determine preferences forspecific forest attributes. This research has highlighted that people have differentpreferences for different forest management attributes—e.g., tree height, tree density,
ARTICLE IN PRESS
Fig. 1. Examples of current forestry certification labels; (a) American Forest and Paper
Association, (b) Forest Stewardship Council and (c) Rainforest Alliance.
K.A. O’Brien, M.F. Teisl / Journal of Forest Economics 10 (2004) 75–96 77

slash disposal (Brown, 1987; Hull and Buhyoff, 1986; Rudis et al., 1988; Mattssonand Li, 1994; Schroeder and Daniel, 1981; Ribe, 1990; Rosenberger and Smith,1997).Other studies have used stated preference approaches to investigate individuals’
WTP for alterations in specific forest management practices. These studies alsosupport the notion that individuals’ preferences may differ across various forestmanagement practices—e.g., tree height, tree type, diversity of species and ageclasses, presence of more dead and dying trees, amount of clear-cutting, use ofartificial regeneration, protection of wildlife habitat, road density, and size of harvestopening (Hanley and Ruffell, 1993; Garrod and Willis, 1996; Mattsson and Li, 1994;Lippke and Bare, 1999; Cooksey and Howard, 1995; Boyle and Teisl, 1999).
Demand for environmentally certified forest products
Although several supply side studies have been conducted on the value andviability of environmental certification programs, studies on the demand forenvironmentally certified forest products is relatively limited. According to severalauthors, about half of US consumers are willing to pay a premium for certified woodproducts (34 percent—Ozanne and Smith (1998), 50 percent—Ozanne and Vlosky(1998), 60 percent—Ozanne and Vlosky (2003) and Anderson (2003)). In addition,two studies report similar results regarding the amount individuals are willing to pay.Vlosky et al. (1999a, b) report that, on average, US residents were willing to pay apremium of 12.5 percent for environmentally certified forest products while Ozanneand Vlosky (2003) indicates that this percent had dropped to 11.7 percent.As mentioned earlier it is unclear from these studies whether consumers demand
changes to specific forest management practices or whether consumers are satisfiedwith a general assurance of the environmental quality of the product because thesestudies presented respondents with only a vague description of the forest manage-ment practices associated with certification.
Eco-labeling and information effects
The success of labeling programs for environmentally preferred forest productsand the ability of market transactions to correctly reflect underlying WTP is partiallycontingent upon the perceived credibility of the information. One factor that caninfluence the label’s credibility is the level of information detail; i.e. more detailedenvironmental labels are more credible (Teisl, 2003). However, even labels thatdisclose detailed attribute information may be limited in the information they conveywhen each attribute descriptor acts as summary of a more complex underlying vectorof forest management practices. If consumers understand the meaning of theattribute description, or hold an underlying prior in line with what the attributedescription attempts to convey, then the label information is not likely to mislead theconsumer. However, if this does not occur, then labeling will not allow consumers tomake choices match their personal preferences nor will labeling allows firms that use
ARTICLE IN PRESSK.A. O’Brien, M.F. Teisl / Journal of Forest Economics 10 (2004) 75–9678

particular techniques to gain market share and maximize value-added rents.Currently, there is no research studying this issue.Another factor influencing the label’s credibility is who provides the information.
Vlosky and Ozanne (1998a) and Ozanne and Vlosky (2003) indicate that consumersview environmental organizations as the most credible. However, Teisl et al.(2001a, b) find that when survey respondents are presented a list of organizationsthat could potentially administer and enforce an eco-labeling program for forestproducts, most respondents choose a federal agency, followed by environmentalgroups, independent certifiers and finally, industry groups. Recently, Teisl (2003)finds consumers’ ratings of the credibility of label information and the perceived‘environmental friendliness’ of a product is significantly influenced by theorganization certifying the information.Finally, additional information may be placed on a label that could alter the
importance of environmental attributes. In general, valuation studies have indicatedthe importance of location in valuing natural resources; individuals place highervalues on improvements to environmental resources as they become more proximal(e.g., see Loomis, 1996a, b; Sutherland and Walsh, 1985; Pate and Loomis, 1997; Binand Polasky, 2002; Rubin et al., 1991). Presumably, providing location informationon an environmental label may affect the price premium that consumers are WTP foran improvement in an environmental attribute. Although our study does not test theeffect of proximity directly on consumer choice, labels may, purposefully orunintentionally, convey forest location. For example, forestry certification labelscould purposefully mention the location of the forest where the wood was originallyobtained or the certification organization may unintentionally (possibility inappro-priately) signal a forest location area.
Theoretical model
To provide a modeling framework to measure changes in consumer choicebehavior and welfare due to changes in forest management practices, one first needsto know how perceptions of environmental quality enter an individual’s utilityfunction (here defined in terms of a purchase occasion or decision). The utilityevaluation can be represented by the indirect utility function5
V ¼ nfE; p;M;Dg; ð1Þ
where E denotes a vector of perceived environmentally related assessments for m
products (i.e., E ¼ ½ES1 ;y;ESm�), p is a corresponding vector of prices and M denotesincome. D denotes a vector of individual characteristics (such as age, education andthe individual’s level of exposure/use of forest attributes) that explain differences inutility functions across individuals. V is increasing in E and M; decreasing in p.The technology that extracts and translates environmental information into an
assessment of a product’s environmental impact can be viewed as a ‘household
ARTICLE IN PRESS
5This model is similar to those used by Teisl et al. (2001a, b) and Teisl et al. (2002a, b).
K.A. O’Brien, M.F. Teisl / Journal of Forest Economics 10 (2004) 75–96 79
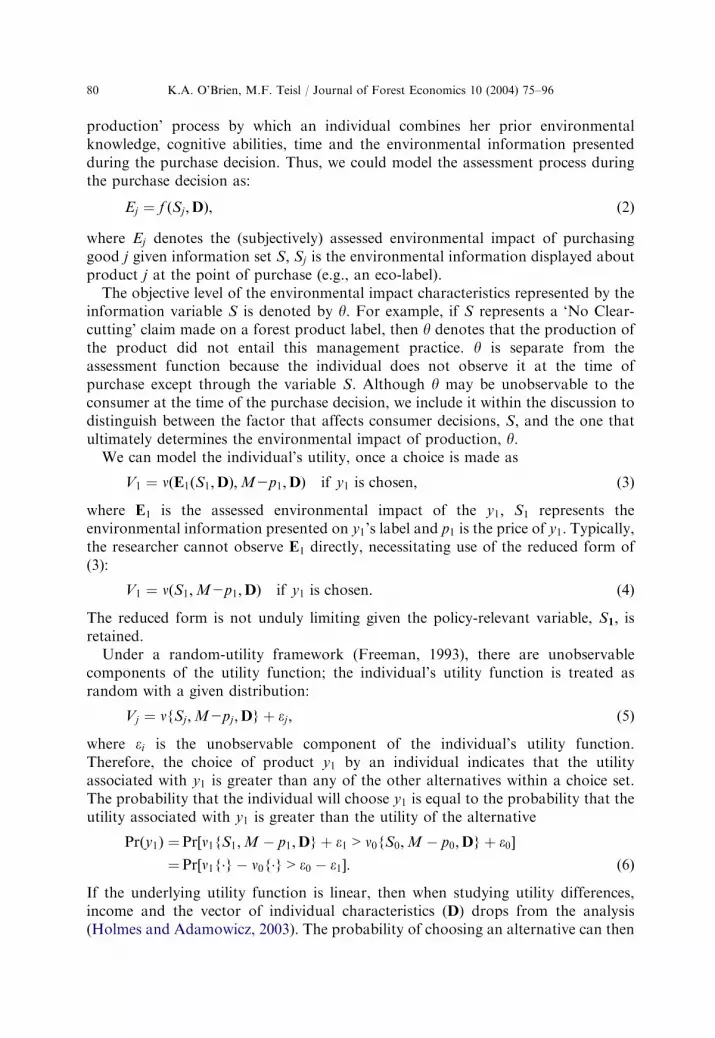
production’ process by which an individual combines her prior environmentalknowledge, cognitive abilities, time and the environmental information presentedduring the purchase decision. Thus, we could model the assessment process duringthe purchase decision as:
Ej ¼ f ðSj ;DÞ; ð2Þ
where Ej denotes the (subjectively) assessed environmental impact of purchasinggood j given information set S; Sj is the environmental information displayed aboutproduct j at the point of purchase (e.g., an eco-label).The objective level of the environmental impact characteristics represented by the
information variable S is denoted by y: For example, if S represents a ‘No Clear-cutting’ claim made on a forest product label, then y denotes that the production ofthe product did not entail this management practice. y is separate from theassessment function because the individual does not observe it at the time ofpurchase except through the variable S: Although y may be unobservable to theconsumer at the time of the purchase decision, we include it within the discussion todistinguish between the factor that affects consumer decisions, S; and the one thatultimately determines the environmental impact of production, y:We can model the individual’s utility, once a choice is made as
V1 ¼ nðE1ðS1;DÞ;M2p1;DÞ if y1 is chosen; ð3Þ
where E1 is the assessed environmental impact of the y1; S1 represents theenvironmental information presented on y1’s label and p1 is the price of y1: Typically,the researcher cannot observe E1 directly, necessitating use of the reduced form of(3):
V1 ¼ nðS1;M2p1;DÞ if y1 is chosen: ð4Þ
The reduced form is not unduly limiting given the policy-relevant variable, S1; isretained.Under a random-utility framework (Freeman, 1993), there are unobservable
components of the utility function; the individual’s utility function is treated asrandom with a given distribution:
Vj ¼ nfSj ;M2pj ;Dg þ ej ; ð5Þ
where ei is the unobservable component of the individual’s utility function.Therefore, the choice of product y1 by an individual indicates that the utilityassociated with y1 is greater than any of the other alternatives within a choice set.The probability that the individual will choose y1 is equal to the probability that theutility associated with y1 is greater than the utility of the alternative
Prðy1Þ ¼Pr½n1fS1;M p1;Dg þ e1 > n0fS0;M p0;Dg þ e0�
¼Pr½n1fg n0fg > e0 e1�: ð6Þ
If the underlying utility function is linear, then when studying utility differences,income and the vector of individual characteristics (D) drops from the analysis(Holmes and Adamowicz, 2003). The probability of choosing an alternative can then
ARTICLE IN PRESSK.A. O’Brien, M.F. Teisl / Journal of Forest Economics 10 (2004) 75–9680

be estimated using a multinomial logit:
Prðy1Þ ¼ exp1mn=Si
Nexpimn; ð7Þ
where N is the number of alternatives in the choice set and m is a scale parameterusually assumed to be equal to one.Compensating variation (CV) measures the change in individual welfare when the
qualities of a good changes (denoted as a move from y ¼ y0 to y1) along with acorresponding change in information about the quality change (S ¼ 0–1).6 When thechange in quality is positive, then CVX0. Here CV measures the maximum amountof money an individual is willing to pay to gain a higher quality good. Alternatively,if the change in quality is negative then CVp0; which denotes the maximum amountof money an individual must be given to accept a poorer quality good. Using theabove formulation, these welfare changes can be calculated directly:
nfS1;p1 CVg ¼ nfS0;p0g; ð8Þ
where CV is the amount of money the individual would require making him/her indifferent between the preferred alternative, y1; and the lesser-desired alter-native, y0:
Methods
To gather data to measure consumers’ WTP for improvements in theenvironmental quality of certified forest products and to evaluate the informationalfactors that may influence these values we administered a mail survey that containedchoice experiments specifically designed to elicit respondent reactions to variouscertified forest products under alternative labeling approaches.
Sampling
We obtained a sample of 3290 pre-recruited US adult (18 years old or older)residents from International Communications Research of Media, Pennsylvania.They conducted a telephone screening survey, using random-digit dialing (RDD),during the spring of 2000 to identify potential mail survey respondents. The sampledesign consisted of a nationally representative sample of 2929 US (non-Maine andnon-New England) adult residents with an additional over-sample of New England7
(n ¼ 138) and Maine (n ¼ 223) adult residents. Except for the over-sampling, therandomness of the dialing process should produce a sample similar to one drawnthrough the use of probability sampling if there is no telephone non-coverage bias inthe area under study and there is no non-response bias. However, one should note
ARTICLE IN PRESS
6When S does not accurately reflect y then CV is not the appropriate measure—for a more completediscussion of some alternate measures see Foster and Just (1989) and Teisl et al. (2001a, b).7New England is defined here as Connecticut, Massachusetts, New Hampshire, Rhode Island and
Vermont.
K.A. O’Brien, M.F. Teisl / Journal of Forest Economics 10 (2004) 75–96 81

that the screening procedure might have identified a sample that is more tolerant ofanswering surveys and sifting through information.
Survey administration
During the summer of 2000 we conducted a mail survey of the pre-recruitedrespondents. The survey was administered in three waves; a five-dollar incentive(paid when individuals returned their survey) was provided to increase response. Intotal 1948 individuals responded to the mail survey and 36 were returned asundeliverable for an overall response rate of 60 percent (1948/(3290–36)).8 Of thereturns, 154 were from Maine residents, 73 from New England residents and 1721from ‘other’ (non-Maine, non-New England) US residents for group response ratesof 70, 53 and 59 percent, respectively.We did not perform a follow-up survey effort of non-respondents thus we were
unable to provide a direct test for non-response bias. However, we did check if therewere any systematic differences in survey responses across the three waves of surveyreturns. Of the 78 possible response variables there was only one instance of asystematic difference; individuals responding to the latter waves of the survey weremore likely to have lower education levels. Although this is not a strong test for non-response bias, the relatively high response rate and absence of many differencesacross survey waves would suggest non-response bias may be minimal, if at allpresent.For all analyses, the data are weighted to adjust for over-sampling; responses for
each state are weighted such that the proportion of respondents from that state isreflective of the state’s proportion of the US adult population (as measured by the2000 US Census) while maintaining the overall sample size. Specifically, weights aredetermined by the formula:
State weight ¼state adult population=US adult population
number of state respondents=total number of respondents:
In general our survey respondents are relatively representative of the characteristicsof the US adult population (Table 1).
Survey design
The mail survey instrument consisted of 25 questions in six sections.9 Section Ielicited respondents’ general perceptions of forest management practices, Section IIfocused on obtaining respondent reactions to different environmental labels on
ARTICLE IN PRESS
8The surveys were mailed under a non-profit organization permit and thus we were not supposed to
receive undeliverable returns (unlike a first class mailing). As a result, the count of 36 undeliverables is
likely to be a gross underestimate of the actual number of undeliverables. Other mail surveys administered
by the authors using similar sampling techniques but with first-class postage have led to undeliverable rates
of about 10 percent. Thus our response rates are probably an underestimate of the true response rate.9Questions and experimental treatments used in the survey instrument are partially based upon the
results of earlier focus group research. See Teisl et al. (2000).
K.A. O’Brien, M.F. Teisl / Journal of Forest Economics 10 (2004) 75–9682

forest products and in Section III, respondents were asked questions to documentthe frequency and dollar value of purchases for various forest products. In SectionIV, respondents were asked to choose among three brands of a forest product thatdiffered in terms of price and whether it displayed an environmental certificationlabel; the labels also differed in terms of the amount of information and who acted asthe certification organization. The last section of the survey, Section VI, wasdedicated to socio-economic questions.Section V and discussion is the basis of this paper. In this section, respondents
were asked to respond to three separate product choice scenarios. In each scenario(Fig. 2), respondents viewed information about three representative brands of one ofthe products (a six-pack of paper towels, a birdhouse, or a wooden chair).10 Thebrands for each choice scenario differed in terms of the price and the environmentalinformation displayed. Respondents were told to assume that the products wereexactly the same except for their prices and the information presented on the labels.Respondents were asked to assume that they were shopping for each of the productsand indicate which of the three brands they would choose.Although each respondent was provided with three choice scenarios, we only
analyze and discuss one of them, paper towels, for two reasons. First, we found thatfocus group participants stated they would be most responsive to environmentallabels on paper products rather than on other forest products (Teisl et al., 2000). Thereason for this response hinges on the idea that most forest products are purchasedrelatively infrequently; participants felt that buying environmentally ‘‘better’’ paperwould make a greater individual impact. Second, the ‘in-market’ assumption seemsmost reasonable for the paper product. For example, of the 10 percent ofrespondents who chose not to ‘purchase’ a six-pack of paper towels, 96 percent hadpurchased paper products at least once in the past year. However, maintaining thisassumption seemed unreasonable for the birdhouse and wooden chair choicescenarios since most of the respondents who chose not to purchase had notpurchased a similar product in the past year.The five forest management attributes displayed on the labels were chosen based
on previous focus group research indicating that these attributes were the most
ARTICLE IN PRESS
Table 1. Socio-economic characteristics of survey respondents and of US adult population
Survey respondents US adultsa
Gender (percent male) 48 48
Average age 46 44
Race (percent white) 84 80
Average education 14.2 years 12.9 years
Average household income $54,400 $54,800
aDerived from 2000 US Census data.
10The order of presenting the choice scenarios was varied across individuals to counter any ordering
effects.
K.A. O’Brien, M.F. Teisl / Journal of Forest Economics 10 (2004) 75–96 83
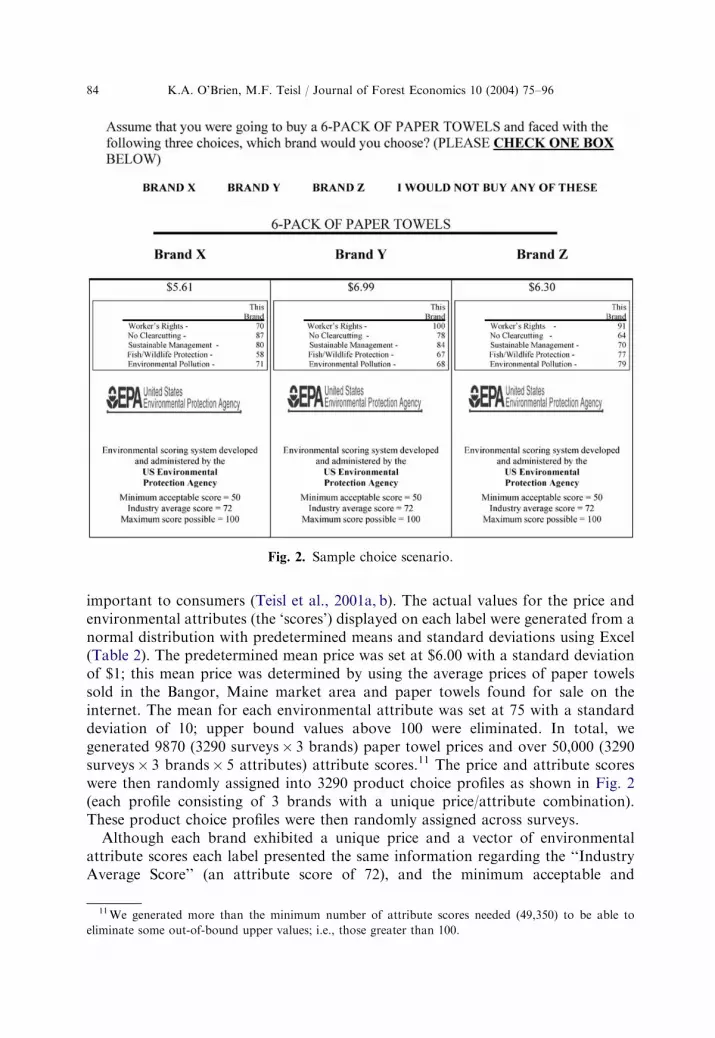
important to consumers (Teisl et al., 2001a, b). The actual values for the price andenvironmental attributes (the ‘scores’) displayed on each label were generated from anormal distribution with predetermined means and standard deviations using Excel(Table 2). The predetermined mean price was set at $6.00 with a standard deviationof $1; this mean price was determined by using the average prices of paper towelssold in the Bangor, Maine market area and paper towels found for sale on theinternet. The mean for each environmental attribute was set at 75 with a standarddeviation of 10; upper bound values above 100 were eliminated. In total, wegenerated 9870 (3290 surveys� 3 brands) paper towel prices and over 50,000 (3290surveys� 3 brands� 5 attributes) attribute scores.11 The price and attribute scoreswere then randomly assigned into 3290 product choice profiles as shown in Fig. 2(each profile consisting of 3 brands with a unique price/attribute combination).These product choice profiles were then randomly assigned across surveys.Although each brand exhibited a unique price and a vector of environmental
attribute scores each label presented the same information regarding the ‘‘IndustryAverage Score’’ (an attribute score of 72), and the minimum acceptable and
ARTICLE IN PRESS
Fig. 2. Sample choice scenario.
11We generated more than the minimum number of attribute scores needed (49,350) to be able to
eliminate some out-of-bound upper values; i.e., those greater than 100.
K.A. O’Brien, M.F. Teisl / Journal of Forest Economics 10 (2004) 75–9684

maximum possible scores (50 and 100, respectively). This was done to provide astatus quo option from which to measure differences in WTP for improvements inattribute values.We wanted to determine whether respondent choices and their resulting WTP for
environmental attributes would be affected by who is seen as providing theinformation. In response, we varied the certification agency displayed on the label(Environmental Protection Agency, Forest Stewardship Council, and ForestStewardship Council with an additional Made in Maine logo). Because theenvironmental attribute scores are a condensation of a vector of more complexenvironmental management issues, additional information was provided to somerespondents to determine if additional information affected choice decisions and theresulting valuation estimates (Fig. 3). If this additional information affects choice,then the implication is that the attribute descriptors on the label were inadequate inconveying the underlying forest management attributes. The aforementionedinformation treatments were randomly assigned to survey respondents.12
The goals of this study are to estimate respondents’ WTP for perceivedimprovements in the environmental quality of forest products and to determinethe influence that different informational factors may have on respondents’ valuesfor these improvements. Given the available data we operationalize the theoreticalmodel (Eq. (6)) as
Cik ¼ a1PRICEik þ Sja2jðlog½Aijk�Þ þ Sja3jðFME� AjkÞ þ Sja4jðEPA� AjkÞ
þ Sja5jðVECTORi � AjkÞ; ð9Þ
where Cik is a dummy variable denoting individual i’s choice of the kth brand ofpaper towels; 1 denotes the brand was chosen, 0 otherwise. PRICE is the price of thekth brand. Ajk is a vector of environmental certification scores presented on the kth’sproduct label (j ¼ 1 [Worker’s Rights], 2 [No Clearcutting], 3 [SustainableManagement], 4 [Fish and Wildlife Protection], or 5 [Environmental Pollution]);the attribute values are in natural log-form because we anticipate consumerresponses will be a non-linear reaction to changes in the attributes. Specifically, we
ARTICLE IN PRESS
Table 2. Product attribute and price information
Mean Minimum Maximum
Price $6.00 $2.87 $9.22
A1—Worker’s rights 75 39 100
A2—No clearcutting 75 38 100
A3—Sustainable management 75 42 100
A4—Fish & wildlife protection 75 35 100
A5—Environmental pollution 75 37 100
12The random assignment allows us to ignore differences in values across individuals. Including
individual characteristics within the analysis would lead to a rapid increase in the number of parameters to
be estimated and increase the likelihood of multicollinearity problems.
K.A. O’Brien, M.F. Teisl / Journal of Forest Economics 10 (2004) 75–96 85

hypothesize that consumer reactions to, and the WTP for, changes in attributes willbe decreasing (at the margin) as the baseline of the attribute gets larger. That is, wehypothesize that a consumer will have a relatively smaller WTP for a one-pointincrease in an attribute when the attribute score moves from 95 to 96 than when theattribute score moves from 75 to 76. FME denotes Forest Stewardship Councilcertification with the additional Made-in-Maine logo; EPA denotes EnvironmentalProtection Agency certification (the above coding makes the FSC label part of thebaseline scenario); VECTOR denotes the presence of the additional information(Fig. 3). Given that each individual is choosing one product from a choice set ofthree products we estimate the model using LIMDEP’s discrete choice logitprocedure.We hypothesize that a1; the respondents’ reaction to price, will be negative. Given
the presence of the interaction variables the a2j ’s provide information of howrespondents choices, and WTP for specific forest management attributes, changewith a one-point change in an attribute when the label is ‘‘FSC-certified’’ and there isno background information. Importantly, the significance of the a2j’s indicatewhether the attribute is important in the decision process for this baseline scenario(note: all significance tests are two-tailed tests using an alpha of 0.10). Further, weare not only interested in whether a particular attribute is significant in the
ARTICLE IN PRESS
Fig. 3. Attribute descriptor information.
K.A. O’Brien, M.F. Teisl / Journal of Forest Economics 10 (2004) 75–9686
respondent choice decision, but also whether the importance of the attributes aredifferent from one another (i.e., we test whether a2m ¼ a2n for all man and m; n ¼ 1;2, 3, 4, 5).The a3j’s provide information of how respondent reactions change when a Made-
in-Maine label is added to the FSC base label (i.e., if the a3ja0; then the Made-in-Maine label altered consumer behavior relative to the baseline; a FSC-certified labelwith no background information). The a4j’s provide information of how respondentreactions change when the EPA instead of the FSC certifies the label. Finally, thea5j’s provide information of how respondent reactions change when additionalbackground information about the attributes is provided to the respondent (i.e.,these parameters measure the impact of adding this definitional information).As explained above, the a3j ; a4j and a5j indicate how changing the information
changes respondent choices relative to the baseline behavior when the label is FSCcertified and there is no background information. To determine whether the impactsof these non-baseline labels are significantly different from zero, we perform jointtests of significance. For example, to determine if worker’s rights are an importantattribute when the label is EPA certified we perform the joint test: a21 logðA1Þ þa41A1 ¼ 0: Further, within each information treatment we test whether theimportance of the attributes is different from one another (i.e., we test whethera2m logðAmÞ þ a4mAm ¼ a2nlogðAnÞ þ a4nAn for all man).Because of the difficulty in directly relating equation parameters to changes in the
dependent variables (i.e., the coefficients in a discrete choice model do not representmarginal probabilities13), we use the estimated equations with appropriate variablecoding to provide estimates of the effect of a one-point change in an attribute scoreon the probability of choosing the product. We perform these calculations for eachinformation treatment. Specifically, if we define the right-hand side of (9) as Xa, thenmarginal effects are calculated as
Effects ¼ fexpðX1aÞ=Sj expðX1aÞg fexpðX0aÞ=Sj expðX0aÞg; ð10Þ
where X1 denotes the vector of attribute values after the change (e.g., 76, 86 or 96)and X0 denotes the vector of attribute values before the change (e.g., 75, 85 or 95).Estimates of compensating variation are derived from the discrete choice model as
follows and calculated as changes from the baseline:
WTP ¼ ðX�a�Þ=a1; ð11Þ
where a� and X� denote the vector of parameter estimates and the vector ofvariables from (9) with the exception of the parameter estimate on price. If CV ispositive and significant then this indicates that, on average, individuals view anincrease in a particular attribute as an improvement in the good’s quality and arewilling to pay to gain this improvement. We construct numerous WTP measures by
ARTICLE IN PRESS
13Marginal effects calculated by software programs usually calculate marginal effects by holding all
other variables in the equation at their means. In our case, since many of our variables are dummy-
interaction variables, it would be inappropriate to hold all these other variables at their means.
K.A. O’Brien, M.F. Teisl / Journal of Forest Economics 10 (2004) 75–96 87

increasing attribute scores by one-point from several baseline scores (75, 85 or 95)and across the various information treatments.
Results and discussion
As expected, price is negative and significant (Table 3). For the baseline scenario(FSC-certified label and no background information), all of the attributes aresignificant to the purchase decision (with an associated willingness to pay) at the 10percent level. The lack of significance of most of the information treatment variablesindicates that respondent choice was not significantly different than those in the
ARTICLE IN PRESS
Table 3. Regression results
Parameter Standard error
Price 1.1703 0.3107
Baseline
A1—Worker’s rights 3.1841 1.0680
A2—No clearcutting 2.6578 1.0691
A3—Sustainable management 2.5421 1.0698
A4—Fish&wildlife protection 1.8793 1.0742
a5—Environmental pollution 2.1548 1.0552
Baseline with ‘Made in Maine’ logo
A1—Worker’s rights 0.0128 0.0095
A2—No clearcutting 0.0004 0.0094
A3—Sustainable management 0.0061 0.0093
A4—Fish & wildlife protection 0.0020 0.0096
A5—Environmental pollution 0.0177 0.0092
Baseline label certified by the environmental protection agency
A1—Worker’s rights 0.0058 0.0082
A2—No clearcutting 0.0112 0.0080
A3—Sustainable management 0.0001 0.0081
A4—Fish & wildlife protection 0.0066 0.0080
A5—Environmental pollution 0.0096 0.0078
Baseline with added information
A1—Worker’s rights 0.0027 0.0082
A2—No clearcutting 0.0094 0.0081
A3—Sustainable management 0.0044 0.0081
A4—Fish & wildlife protection 0.0222 0.0081
A5—Environmental pollution 0.0093 0.0077
Baseline: no added information and label certified by the Forest Stewardship Council. Bold indicates
significant at the 10 percent level.
K.A. O’Brien, M.F. Teisl / Journal of Forest Economics 10 (2004) 75–9688
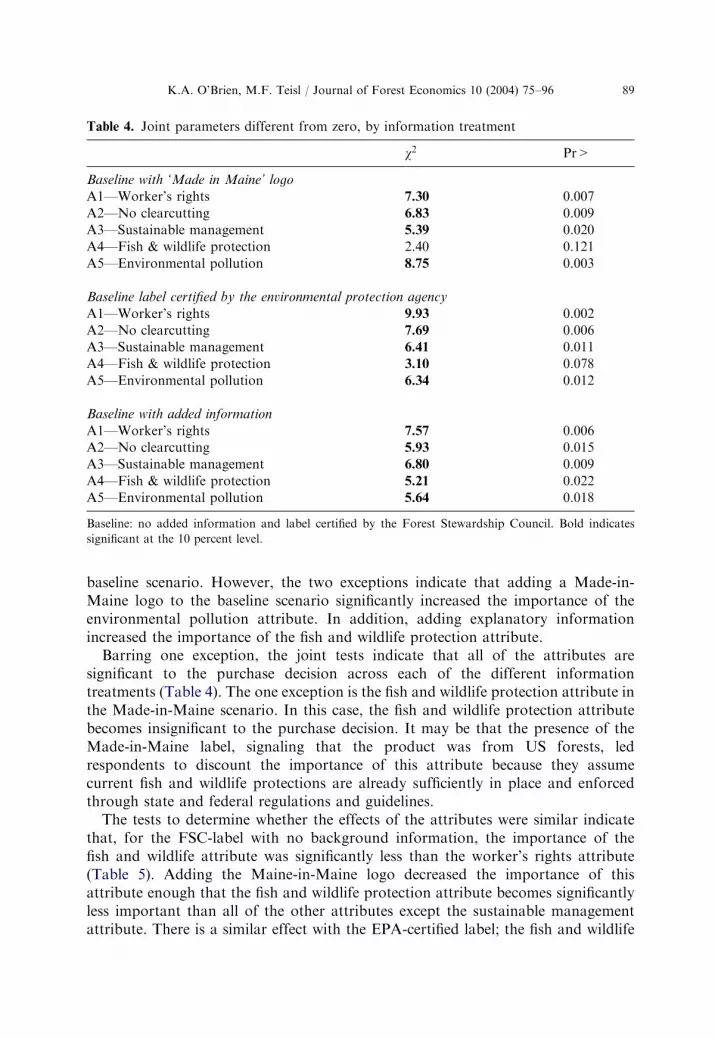
baseline scenario. However, the two exceptions indicate that adding a Made-in-Maine logo to the baseline scenario significantly increased the importance of theenvironmental pollution attribute. In addition, adding explanatory informationincreased the importance of the fish and wildlife protection attribute.Barring one exception, the joint tests indicate that all of the attributes are
significant to the purchase decision across each of the different informationtreatments (Table 4). The one exception is the fish and wildlife protection attribute inthe Made-in-Maine scenario. In this case, the fish and wildlife protection attributebecomes insignificant to the purchase decision. It may be that the presence of theMade-in-Maine label, signaling that the product was from US forests, ledrespondents to discount the importance of this attribute because they assumecurrent fish and wildlife protections are already sufficiently in place and enforcedthrough state and federal regulations and guidelines.The tests to determine whether the effects of the attributes were similar indicate
that, for the FSC-label with no background information, the importance of thefish and wildlife attribute was significantly less than the worker’s rights attribute(Table 5). Adding the Maine-in-Maine logo decreased the importance of thisattribute enough that the fish and wildlife protection attribute becomes significantlyless important than all of the other attributes except the sustainable managementattribute. There is a similar effect with the EPA-certified label; the fish and wildlife
ARTICLE IN PRESS
Table 4. Joint parameters different from zero, by information treatment
w2 Pr>
Baseline with ‘Made in Maine’ logo
A1—Worker’s rights 7.30 0.007
A2—No clearcutting 6.83 0.009
A3—Sustainable management 5.39 0.020
A4—Fish & wildlife protection 2.40 0.121
A5—Environmental pollution 8.75 0.003
Baseline label certified by the environmental protection agency
A1—Worker’s rights 9.93 0.002
A2—No clearcutting 7.69 0.006
A3—Sustainable management 6.41 0.011
A4—Fish & wildlife protection 3.10 0.078
A5—Environmental pollution 6.34 0.012
Baseline with added information
A1—Worker’s rights 7.57 0.006
A2—No clearcutting 5.93 0.015
A3—Sustainable management 6.80 0.009
A4—Fish & wildlife protection 5.21 0.022
A5—Environmental pollution 5.64 0.018
Baseline: no added information and label certified by the Forest Stewardship Council. Bold indicates
significant at the 10 percent level.
K.A. O’Brien, M.F. Teisl / Journal of Forest Economics 10 (2004) 75–96 89

attribute becomes significantly less important than the worker’s rights and noclearcutting attributes. Conversely, the provision of the additional (definitional)information increases the importance of the ‘‘Fish and Wildlife Protection’’attribute. This effect is strong enough that in this scenario the fish and wildlifeprotection attribute is similar to all the other attributes in terms of its importance tothe choice decision.The calculated marginal effects (Table 6) and the WTPs (Table 7) demonstrate the
relative importance of the different attributes. Interestingly, a non-environmentalattribute (worker’s rights) is the most important attribute. In general, the marginaleffects are less than one, indicating that a one-point increase in a product attribute isassociated with less than a one-percent change in the likelihood of choosing theproduct. The WTP for a one-point change in an attribute ranges from a high ofabout $0.041 to a low of $0.015. The size of the marginal effect, and associatedWTPs, decline as the baseline score for the attribute increases.
ARTICLE IN PRESS
Table 5. Equivalence of attribute parameters, by information treatment
A1 different A2 different A3 different A4 different
w2 Pr> w2 Pr> w2 Pr> w2 Pr>
Baseline
A2—No clearcutting 0.54 0.46
A3—Sustainable management 0.79 0.37 0.03 0.87
A4—Fish & wildlife protection 3.20 0.07 1.24 0.26 1.02 0.31
A5—Environmental pollution 2.23 0.13 0.52 0.47 0.33 0.57 0.16 0.69
Baseline with ‘Made in Maine’ logo
A2—No clearcutting 0.00 0.99
A3—Sustainable management 0.59 0.47 0.63 0.43
A4—Fish &wildlife protection 3.13 0.08 3.43 0.06 1.15 0.28
A5—Environmental pollution 0.15 0.78 0.14 0.70 1.36 0.24 4.66 0.03
Baseline label certified by the environmental protection agency
A2—No clearcutting 0.25 0.62
A3—Sustainable management 1.96 0.16 0.84 0.36
A4—Fish & wildlife protection 4.16 0.04 2.92 0.08 0.50 0.48
A5—Environmental pollution 2.22 0.14 0.97 0.32 0.00 0.98 0.15 0.70
Baseline with added information
A2—No clearcutting 1.91 0.17
A3—Sustainable management 0.38 0.54 0.59 0.44
A4—Fish & wildlife protection 0.28 0.60 0.65 0.42 0.01 0.93
A5—Environmental pollution 0.90 0.34 0.18 0.67 0.12 0.73 0.17 0.68
Baseline: no added information and label certified by the Forest Stewardship Council. Bold indicates
significant at the 10 percent level.
K.A. O’Brien, M.F. Teisl / Journal of Forest Economics 10 (2004) 75–9690

Conclusions
Contrary to the reported views of some stakeholders in the forest productsindustry, there not only appears to be a demand for environmentally certified forestproducts, but, in fact, consumers are willing to pay a premium for these products.This supports other demand-side research that indicates a potential mainstreammarket for environmentally certified forest products (Forsyth et al., 1999; Ozanneand Vlosky, 1997, 1998) and, hence, a derived demand for certification services andaltered forestry practices. This finding is significant in that additional premiums for
ARTICLE IN PRESS
Table 6. Marginal effects of a one-point increase in an attribute, across information
treatments and selected attribute scores
Scenarios Starting from a score of
75 85 95
Baseline
A1—Worker’s rights 0.94 0.83 0.74
A2—No clearcutting 0.79 0.69 0.62
A3—Sustainable management 0.75 0.66 0.59
A4—Fish & wildlife protection 0.55 0.49 0.44
A5—Environmental pollution 0.64 0.56 0.50
Baseline with ‘Made in Maine’ logo
A1—Worker’s rights 0.66 0.55 0.46
A2—No clearcutting 0.80 0.70 0.63
A3—Sustainable management 0.61 0.52 0.45
A4—Fish & wildlife protection 0.51 0.45 0.40
A5—Environmental pollution 1.03 0.95 0.89
Baseline label is certified by the environmental protection agency
A1—Worker’s rights 1.06 0.95 0.86
A2—No clearcutting 1.04 0.94 0.87
A3—Sustainable management 0.75 0.66 0.59
A4—Fish & wildlife protection 0.70 0.64 0.59
A5—Environmental pollution 0.86 0.78 0.72
Baseline with added information
A1—Worker’s rights 0.88 0.77 0.68
A2—No clearcutting 0.58 0.48 0.41
A3—Sustainable management 0.84 0.75 0.68
A4—Fish & wildlife protection 1.04 0.98 0.93
A5—Environmental pollution 0.84 0.76 0.70
Baseline: no added information and label certified by the Forest Stewardship Council.
K.A. O’Brien, M.F. Teisl / Journal of Forest Economics 10 (2004) 75–96 91
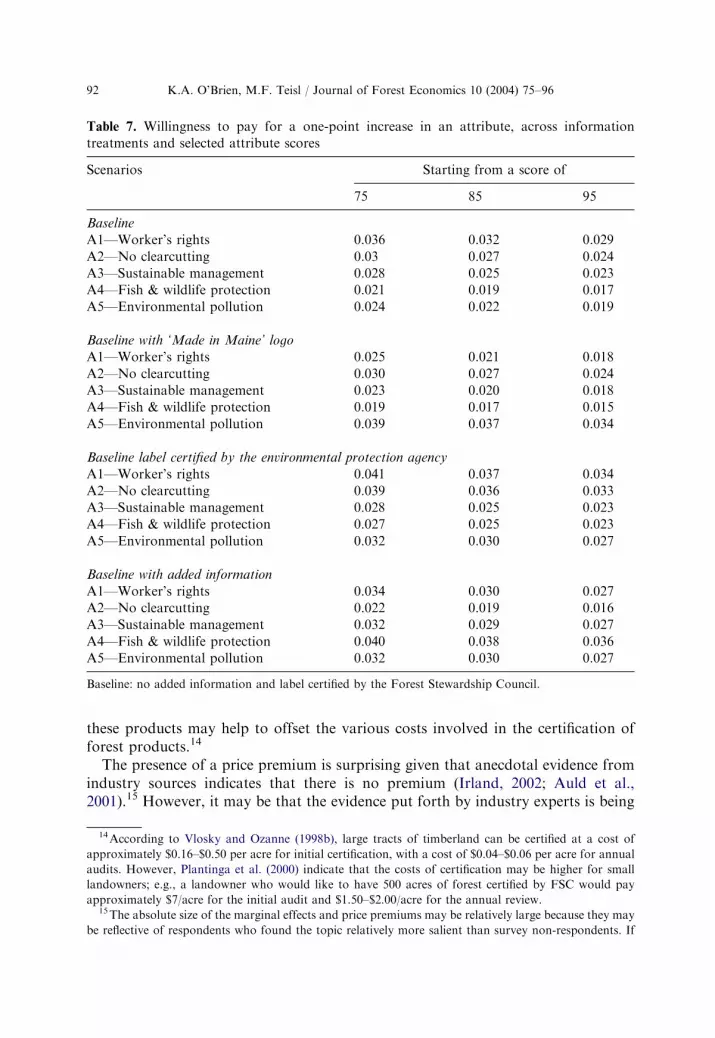
these products may help to offset the various costs involved in the certification offorest products.14
The presence of a price premium is surprising given that anecdotal evidence fromindustry sources indicates that there is no premium (Irland, 2002; Auld et al.,2001).15 However, it may be that the evidence put forth by industry experts is being
ARTICLE IN PRESS
Table 7. Willingness to pay for a one-point increase in an attribute, across information
treatments and selected attribute scores
Scenarios Starting from a score of
75 85 95
Baseline
A1—Worker’s rights 0.036 0.032 0.029
A2—No clearcutting 0.03 0.027 0.024
A3—Sustainable management 0.028 0.025 0.023
A4—Fish & wildlife protection 0.021 0.019 0.017
A5—Environmental pollution 0.024 0.022 0.019
Baseline with ‘Made in Maine’ logo
A1—Worker’s rights 0.025 0.021 0.018
A2—No clearcutting 0.030 0.027 0.024
A3—Sustainable management 0.023 0.020 0.018
A4—Fish & wildlife protection 0.019 0.017 0.015
A5—Environmental pollution 0.039 0.037 0.034
Baseline label certified by the environmental protection agency
A1—Worker’s rights 0.041 0.037 0.034
A2—No clearcutting 0.039 0.036 0.033
A3—Sustainable management 0.028 0.025 0.023
A4—Fish & wildlife protection 0.027 0.025 0.023
A5—Environmental pollution 0.032 0.030 0.027
Baseline with added information
A1—Worker’s rights 0.034 0.030 0.027
A2—No clearcutting 0.022 0.019 0.016
A3—Sustainable management 0.032 0.029 0.027
A4—Fish & wildlife protection 0.040 0.038 0.036
A5—Environmental pollution 0.032 0.030 0.027
Baseline: no added information and label certified by the Forest Stewardship Council.
14According to Vlosky and Ozanne (1998b), large tracts of timberland can be certified at a cost of
approximately $0.16–$0.50 per acre for initial certification, with a cost of $0.04–$0.06 per acre for annual
audits. However, Plantinga et al. (2000) indicate that the costs of certification may be higher for small
landowners; e.g., a landowner who would like to have 500 acres of forest certified by FSC would pay
approximately $7/acre for the initial audit and $1.50–$2.00/acre for the annual review.15The absolute size of the marginal effects and price premiums may be relatively large because they may
be reflective of respondents who found the topic relatively more salient than survey non-respondents. If
K.A. O’Brien, M.F. Teisl / Journal of Forest Economics 10 (2004) 75–9692
incorrectly interpreted. That is, it may be that a price premium is not being seen inthe market due to the nature of current eco-labeling strategies. Currently, thestrategy has focused on voluntary displays of eco-seals from a variety oforganizations, typically on higher-end, less-frequently purchased products. How-ever, other research indicates that (1) simple eco-seal type labels16 are notparticularly effective (Teisl et al., 2002a, b); (2) few individuals are familiar withany of the current certifying groups or with the criteria they use in awarding thecertification (Teisl et al., 2000); and (3) consumers may be more willing to weighenvironmental factors into their purchasing decisions for more frequently purchasedproducts (Teisl et al., 2000). As a result, the current situation may preclude thecollection of an actual premium.The research has significant implications for several sectors concerned with
advancing a pro-environmental or social agenda. One significant finding is theelicitation of the forest management attributes of most concern to consumers.Another is the major role that the information plays in altering the elicitation ofthese concerns. For example, the most important environmental attribute changesacross the four information treatments. Interestingly, no clear-cutting was not themost important attribute when definitional information was presented; yetenvironmental groups often use this attribute as the ‘rallying point’ behind anti-logging referenda. Somewhat surprising is the relative importance of the workersrights attribute; although this attribute is not currently a focus of eco-labelingprograms (although it is one of the focuses of forest certification programs) it is theprimary focus of anti-sweatshop and the so-called ‘clean clothes’ campaigns.Comparing consumer reactions across the certifier treatments (FSC and EPA)
indicates that respondents placed relatively more importance on four of the fiveattributes when they viewed them on an EPA certified label. However, thesedifferences were not significant. The lack of significance seems to support earlierresearch (Teisl, 2003) which points out the importance of presenting detailedinformation on an environmental label. In this earlier research, less detailed labelscertified by more familiar organizations (like the EPA) performed significantly betterthan similar labels certified by less familiar organizations (like the FSC). However,these differences were reduced or eliminated when more detailed information wasincluded on the label.Respondent reactions were quite different between the FSC baseline scenario and
the similar scenario that added a Made-in-Maine label. Adding the Made-in-Mainelabel decreased the importance of the worker’s rights attribute, eliminated theimportance of the fish and wildlife protection attribute and significantly increasedthe importance of the environmental pollution attribute. It may be that the presenceof the Made-in-Maine label, signaling that the product was from US forests, led
ARTICLE IN PRESS
(footnote continued)
non-respondents have a zero WTP for the improvements studied here, then the effects should be adjusted
accordingly. However, preliminary analysis does not indicate the presence of non-response bias.16 Interestingly, one group (Scientific Certification Systems, an independent testing and certification
organization) does use a more detailed environmental label, however, few forest products currently display
this label type.
K.A. O’Brien, M.F. Teisl / Journal of Forest Economics 10 (2004) 75–96 93

respondents to discount the importance of the first two attributes because theyassume current protections are already sufficiently in place and enforced throughstate and federal regulations and guidelines. A converse effect may be occurring withthe latter attribute; respondents may feel that current pollution regulations are notadequate.Providing additional information about the criteria used in the certification can
substantially alter the importance consumers place on these attributes. Here, addingdefinitional information significantly increased the importance of the fish andwildlife attribute, so much so that this attribute went from being the least importantto being the most important. Conversely, the no-clearcutting attribute went frombeing the most important to the least important environmental attribute. Theimplication is that in a similar market situation, consumers would makeinappropriate product choices and would be worse off due to ignorance about thisattribute’s meaning. Further, producers providing products scoring relatively highon this attribute would not obtain the appropriate level of market share or pricepremium. Because the environmental attribute ‘titles’ displayed on a label canactually encompass a broad range of management practices and because some ofthese titles may appear unclear or ambiguous to consumers, it may be beneficial toforest products manufacturers and retailers to incorporate various media andmarketing techniques in an effort to provide sufficient background information tothe purchasing public.
References
Anderson, R., 2003. Do forest certification ecolabels impact consumer behavior? Presented atCINTRAFOR’S (Center for International Trade in Forest Products) 20th Annual InternationalForest Products Markets Conference, October 16–17, Seattle, WA.
Auld, G., Cashore, B., Newsom, D., 2001. A look at forest certification through the eyes of United Stateswood and paper producers presented at the global initiatives and public policies. First InternationalConference on Private Forestry in the 21st Century, March 25–27, Atlanta, GA.
Baharuddin, H.J., Simula, M., 1994. Certification Schemes for all Timber and Timber Products.International Tropical Timber Organization, Yokohama, Japan.
Bin, O., Polasky, S., 2002. Valuing coastal wetlands: a hedonic property price approach. Department ofEconomics, East Carolina University, Greenville, NC.
Boyle, K.J., Teisl, M.F., 1999. Public perceptions for timber harvesting on private forest land purchasedfor public ownership in Maine. Maine Agriculture and Forest Experiment Station, MiscellaneousReport 414.
Brown, T., 1987. Production and cost of scenic beauty: examples for a Ponderosa Pine Forest. ForestScience 33, 394–410.
Cooksey, R.A., Howard, T.E., 1995. Willingness to pay to protect forest benefits with conservationeasements. Presented at the IUFRO (International Union of Forestry Research Organizations) WorldCongress. August 6–12, Tampere, Finland.
Dimitri, C., Greene, C., 2002. Organic Food Industry Taps Growing American Market AgriculturalOutlook Economic Research Service, US Department of Agriculture. AGO-295, October.
Donovan, G.H., Nicholls, D.L., 2003. Estimating Consumer Willingness to Pay a Price Premium forAlaska Secondary Wood Products. US Department of Agriculture, Forest Service, Pacific NorthwestResearch Station Research Paper PNW-RP-553, October.
Forsyth, K., Haley, D., Kozak, R., 1999. Will consumers pay more for certified wood products? Journal ofForestry 97 (2), 18–22.
ARTICLE IN PRESSK.A. O’Brien, M.F. Teisl / Journal of Forest Economics 10 (2004) 75–9694

Foster, W., Just, R.E., 1989. Measuring welfare effects of product contamination with consumeruncertainty. Journal of Environmental Economics and Management 17, 266–283.
Garrod, G.D., Willis, K.G., 1996. The non-use benefits of enhancing forest biodiversity: A contingentrank study. Ecological Economics 21, 45–61.
Hanley, N.D., Ruffell, R.J., 1993. The contingent valuation of forest characteristics: Two experiments.Journal of Agricultural Economics 44, 218–229.
Holmes, T., Adamowicz, V., 2003. Attribute-based methods. In: Champ, P., Boyle, K.J., Brown, T. (Eds.),A Primer on Non-Market Valuation. Kluwer Academic Publishers, Netherlands.
Hull, B., Buhyoff, G., 1986. The scenic beauty temporal distribution method: an attempt to make scenicbeauty assessment compatible with forest planning efforts. Forest Science 32, 271–286.
Irland, L.C., 2002. The Elusive Green Premium Presented at the Sustainable Wood Supply throughMarket-Based Incentives Workshop, Orono, ME, May 17.
Lippke, B., Bare, B., 1999. Cost and Compromise: Determining the Public’s Willingness to Pay for ValuesReceived from Forests. Center for International Trade in Forest Products. College of ForestResources, University of Washington.
Loomis, J., 1996a. Measuring the economic benefits of removing dams and restoring the Elwha River:results of a contingent valuation survey. Water Resources Research 32 (2), 441–447.
Loomis, J., 1996b. How large is the extent of the market for public goods: evidence from a nationwidecontingent valuation survey. Applied Economics 28, 779–782.
Mattsson, L., Li, C.Z., 1994. How do different forest management practices affect the non-timber value offorests? An economic analysis. Journal of Environmental Management 41, 79–88.
Ozanne, L.K., Smith, P.M., 1998. Segmenting the market for environmentally certified wood products.Forest Science 44 (3), 379–389.
Ozanne, L.K., Vlosky, R.P., 1997. Willingness to pay for environmentally certified wood products: theconsumer perspective. Forest Products Journal 47 (6), 1–8.
Ozanne, L.K., Vlosky, R.P., 1998. Environmental certification of wood products. Women in NaturalResources 19 (3), 4–48.
Ozanne, L.K., Vlosky, R.P., 2003. Certification from the US consumer perspective: a comparison of 1995and 2000. Forest Products Journal 53 (3), 13–21.
Pate J., Loomis, J., 1997. The effect of distance on willingness to pay values: a case study of wetlands andsalmon in California. Ecological Economics 20, 199–207.
Plantinga, A.J., Teisl, M.F., Allen, T.G., Field, D., 2000. Developing a Tax/Subsidy Program toEncourage Environmentally Based Forest Certification. Report to the Maine Watch Institute,Augusta, ME.
Ribe, R., 1990. A general model for understanding the perception of scenic beauty in northern Hardwoodforests. Landscape Journal 9 (2), 86–101.
Rosenberger, R.S., Smith, E.L., 1997. Non market Economic Impacts of Forest Insect Pests: A Review ofthe Literature. General Technical Report. Pacific Southwest Research Station (Albany CA). USDAForest Service.
Rubin, J., Helfand, G., Loomis, J., 1991. A benefit cost analysis of the northern spotted Owl. Journal ofForestry, 25–30.
Rudis, V., Gramann, J., Ruddell, E., Westphal, L., 1988. Forest inventory and management-based visualpreference models of Southern Pine stands. Forest Science 34, 846–863.
Schroeder, H., Daniel, T., 1981. Progress in predicting the perceived scenic beauty of forest landscapes.Forest Science 27, 71–80.
Sutherland, R.J., Walsh, R.G., 1985. Effect of distance on the preservation of ware. Quality LandEconomics 61 (3), 281–291.
Teisl, M., 2003. What we may have is a failure to communicate: labeling environmentally certified forestproducts. Forest Science 49 (5), 13.
Teisl, M., Newman, F., Buono, J., Hermann, M., 2000. Designing Effective Environmental Labels forForest Products: Results of Focus Group Research. Maine Agricultural Experiment StationMiscellaneous Report 420.
Teisl, M., O’Brien, K., Peavey, S., 2001. Environmental labeling of wood products: what do consumerswant to see? Proceedings of the National Association of Environmental Professionals 26th AnnualConference.
Teisl, M., Roe, B., Levy, A.S., 2002a. Eco-labeling: what does consumer science tell us about whichstrategies work? Proceedings of the Tufts Conference on Eco-labeling, Boston.
Teisl, M., Roe, B., Hicks, R.L., 2002b. Can eco-labels tune a market? Evidence from dolphin-safe labeling.Journal of Environmental Economics and Management 43, 339–359.
ARTICLE IN PRESSK.A. O’Brien, M.F. Teisl / Journal of Forest Economics 10 (2004) 75–96 95

Teisl, M.F., Bockstael, N.E., Levy, A.S., 2001b. Measuring the welfare effects of nutrition information.American Journal of Agricultural Economics 83 (1), 133–149.
Vlosky, R., Ozanne, L., 1998a. The value-chain for environmentally certified wood products: perceptionsand attitudes of manufacturers, home center retailers, building contractors, architects and consumers.Proceedings Paper from Wood Technology Clinic and Show, pp. 1–5.
Vlosky, R., Ozanne, L., 1998b. Eco-marketing: can certified products help expand your sales? ProceedingsPaper from Wood Technology Clinic and Show, pp. 1–5.
Vlosky, R.P., Ozanne, L.K., Fontenot, R., 1999a. A conceptual model of US consumer willingness-to-payfor environmentally certified wood products. Journal of Consumer Marketing 16 (2), 122–140.
Vlosky, R., Ozanne, L., Bigsby, H., 1999b. A Comparison of Consumer Wood Product CertificationPerceptions and Attitudes—New Zealand and the United States. Working Paper x36. Louisiana ForestProducts Laboratory Publication, LSU Agricultural Center.
Waffle, R., 1994. Forest certification: who profits?: green certification in not needed for sustained forestry.Wood and Wood Products, 97–101.
ARTICLE IN PRESSK.A. O’Brien, M.F. Teisl / Journal of Forest Economics 10 (2004) 75–9696