ec3320 2016-2017 michael spagat lecture 13. we continue
TRANSCRIPT
1
EC3320
2016-2017
Michael Spagat
Lecture 13.
We continue our discussion of the economic causes of conflict, but now we work with detailed data
on a single conflict.
The units of analysis for Collier-Hoefller-Fearon-Laitin are country-time periods. Hopefully, you
recall that we were not able to draw very many robust conclusions from this cross-country
analysis.
Now we will focus on a single country (Colombia) so we need new units of analysis.

2
To get anywhere with empirical research you need to have a reasonably large number of data
points. (This is a basic fact about empirical analysis that many students beginning research
projects overlook)
So we need to ask ourselves – where are all of these data points going to come from?
There are two possible dimensions – time and space, i.e., we can divide a country into
geographical areas and we can observe these areas at different points in time.
3
Dube and Vargas do both of these things in their paper “Commodity Price Shocks and Civil
Conflict: Evidence From Colombia.”
They divide space into more than 950 municipalities and then divide time into the years between
1988 and 2005.
In doing this they make a key assumption that in each year a municipality is a coherent functioning
unit both in terms of the economy and in terms of the conflict.
4
Before starting you need some minimal background on the conflict during the period of analysis.
The “guerrillas” are left-wing rebels who are trying to overthrow the government of Colombia.
They are also involved in a lot of criminal money-raising activities including the drug trade (mainly
coca), kidnapping and extortion.
5
The “paramilitaries” are illegal right-wing groups that are trying to stop the guerrillas from
overthrowing the government and are also involved in a wide range of criminal activities.
In fact, the paramilitaries are generally more involved in these activities than the guerrillas are.
One last thing to be aware of is that the paramilitaries were a pretty minor presence until around
1997 or so – after 1997 they expanded dramatically.
Therefore, we would not really expect paramilitary activity to respond much to economic factors
before 1997 because there was very little such activity back then.
6
Dube and Vargas want to know whether economic factors cause conflict, or at least increase
conflict intensity, in Colombia.
Their ideas about the possible relationship between conflict and the economy are more
sophisticated than the ideas we encountered in lectures 11 and 12.
In those lectures we were really just investigating whether bad economic conditions cause conflict
and good economic conditions prevent conflict.

7
In contrast, Dube and Vargas look for two possible effects:
1. An opportunity cost effect according to which higher wages should reduce conflict.
The idea is that when wages are low then illegal armed groups can lure people into joining up by
offering modest economic benefits to joiners.
With higher wages it becomes harder for illegal armed groups to tempt people to join. Wages
might rise in coffee growing areas when the international price of coffee goes up.
8
2. A rapacity effect according to which better economic conditions can create pools of wealth that
armed groups can expropriate.
For example, some revenue from oil production flows into municipalities that have the oil. Armed
groups can then target those municipalities by, for example, kidnapping mayors and demanding
payment.
To the extent that the rapacity effect operates we will observe a positive relationship between
conflict and economic performance, e.g., more oil production means more money to steal, leading
to more fighting.

9
The main idea behind the Dube and Vargas paper is to take advantage of the fact that changes in
international commodity prices will play out differently in different regions.
In particular we would expect that an increase in international coffee prices will increase wages in
coffee-growing municipalities and have no effect on wages in non-coffee-growing municipalities –
the more coffee-focused the municipality the bigger we would expect this effect to be.
Continuing this logic we would expect that in big coffee regions increases in coffee prices should
be associated with decreases in conflict intensity as armed groups struggle to sign up and retain
fighters when wages are high - as wages will be when coffee prices are high.
The prediction is that conflict intensity is not related to international coffee prices in regions where
there is no coffee growing.
10
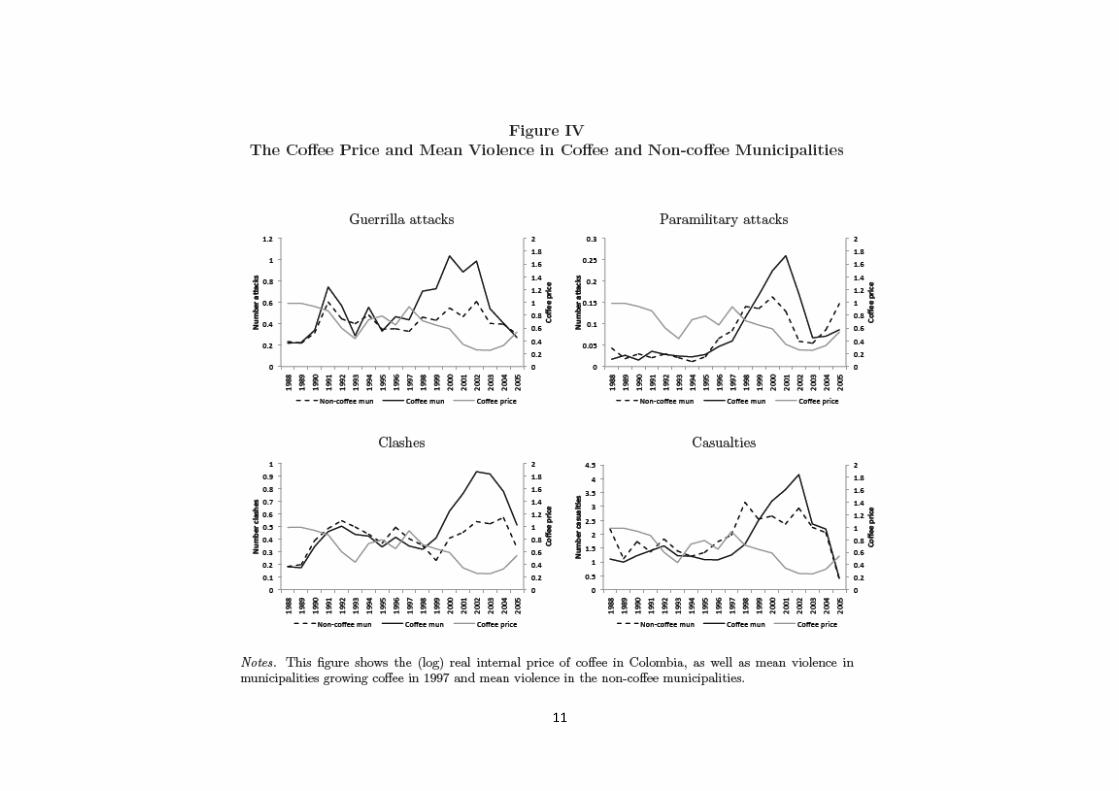
The pictures on slide 11 divide municipalities into coffee and non-coffee ones and suggest that
something along the lines of the above predictions might really be happening.
Notice, in particular, how the gap between conflict activities in coffee regions versus non-coffee
regions increases during 1997 and 2003, a period during which international coffee prices fell by
around 68%.
There is a smaller dip in coffee prices between 1989 and 1993 which, maybe, is associated with a
bit of a separation in guerrilla activity between coffee and non-coffee areas although this is a bit of
a stretch.
There is no such effect for paramilitaries for this time period, as we would expect since
paramilitaries were not very active back then.
11
12
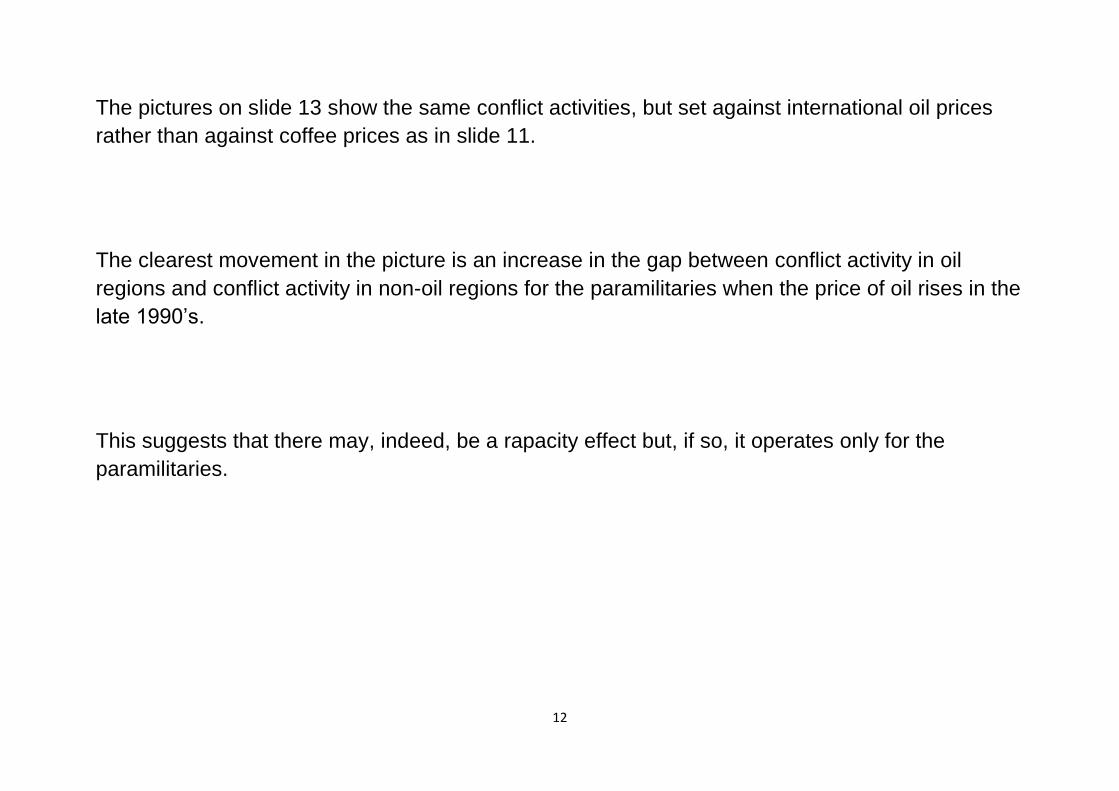
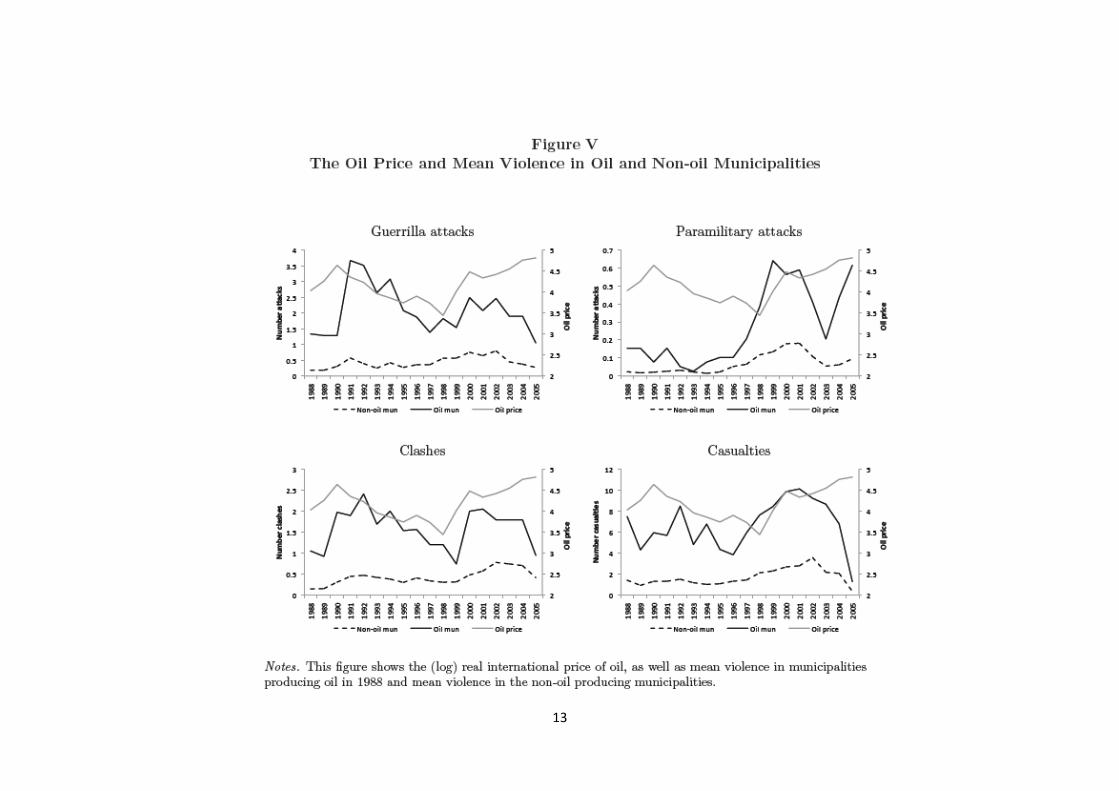
The pictures on slide 13 show the same conflict activities, but set against international oil prices
rather than against coffee prices as in slide 11.
The clearest movement in the picture is an increase in the gap between conflict activity in oil
regions and conflict activity in non-oil regions for the paramilitaries when the price of oil rises in the
late 1990’s.
This suggests that there may, indeed, be a rapacity effect but, if so, it operates only for the
paramilitaries.
13

14
The above pictures show just two-way relationships between either coffee prices and conflict
activities or oil prices and conflict activities.
The next step is to use regression analysis to control for various things so that we can have more
confidence in the findings than we can get from two-way comparisons alone.
The results on slide 15 include the following controls: log of population, year dummies, region
dummies and an indicator for whether or not the municipality is a coca producer which is
interacted with the year dummy.
The essence of the estimation can be taken from equation 1 of the Dube and Vargas paper (slide
15). Note that this is a difference in difference (“diff in diff”) design (lecture 8).
15
16
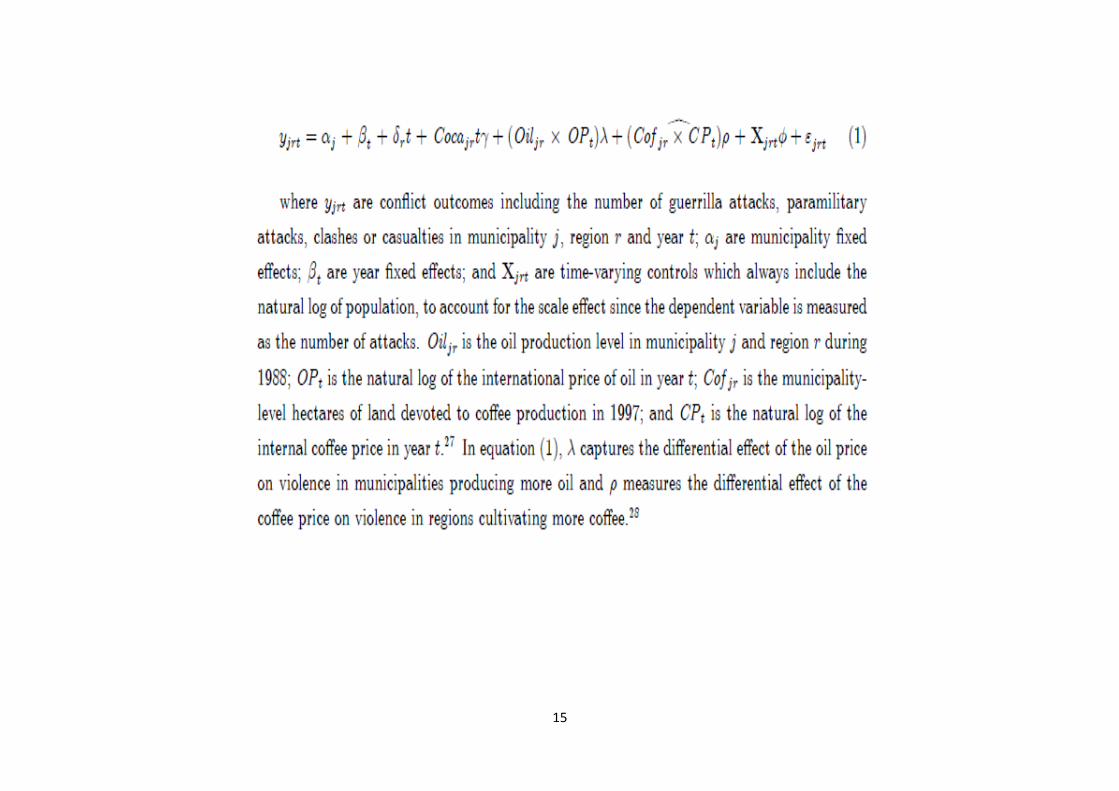
We are interested in the oil terms and the coffee terms in Dube and Vagas’ equation 1.
jrOil is a measure of the oil intensity of municipality j in region r and jrCof is a measure of the coffee
intensity of municipality j in region r .
Multiply these by the prices of oil and coffee, tOP and tCP respectively, and you get a measure of
the quantity of oil money and coffee money present in each municipality at each point in time.
The coefficient λ tells us how oil money translates into conflict and the ρ coefficient tells us how
coffee money translates into conflict.

17
The following table gives the main results of the paper:
18
The row labelled “Coffee int. X log coffee price” gives evidence for the opportunity cost effect.
You can see significant and negative effects for all the conflict measures, suggesting that higher
coffee prices are associated with less conflict.
Dube and Vargas calculate that the fall in coffee prices between 1997 and 2003 translates into an
additional 1013 deaths in coffee growing areas that would not have happened without these price
drops – so the opportunity cost effect appears to be quantitatively large in addition to being
statistically significant.

19
The row labelled “Oil production X log oil price” gives evidence for the rapacity effect which seems
to apply only to the paramilitaries, judging from the fact that only the coefficient in the equation for
paramilitary attacks comes out statistically significant.
The higher oil price is associated with more attacks for the paramilitaries, although it is not clear
that these effects are very large at all.
20
Dube and Vargas also extend their results to cover other commodities besides coffee and oil.
The key generalizable characteristic of coffee for this analysis is that coffee is labour intensive.
The authors find similar patterns for other labour-intensive goods such as sugar, bananas, tobacco
and palm.
That is, increases in the prices of labour-intensive commodities reduce conflict and vice versa.
21
Coal and gold are natural resources that have impacts on municipal budgets similar to the impact
of oil.
And, reassuringly, the impacts of coal and gold prices on conflict intensity turn out to be similar to
the impact oil prices on conflict intensity: higher prices cause more conflict and vice versa.
22
The table back on slide 17 showed a negative relationship between coffee and conflict but it does
not show that wages behave in a manner consistent with the opportunity cost effect.
Similarly, the relationship between oil and conflict on slide 17 does not imply that higher oil prices
lead to pools of money that can be stolen by the paramilitaries.
In other words, we have established statistical relations for coffee, oil and conflict that are
consistent with the opportunity cost and rapacity effect stories but we have not yet seen evidence
for the intermediate wage-based steps in the mechanisms that have been proposed to support
these stories.
23
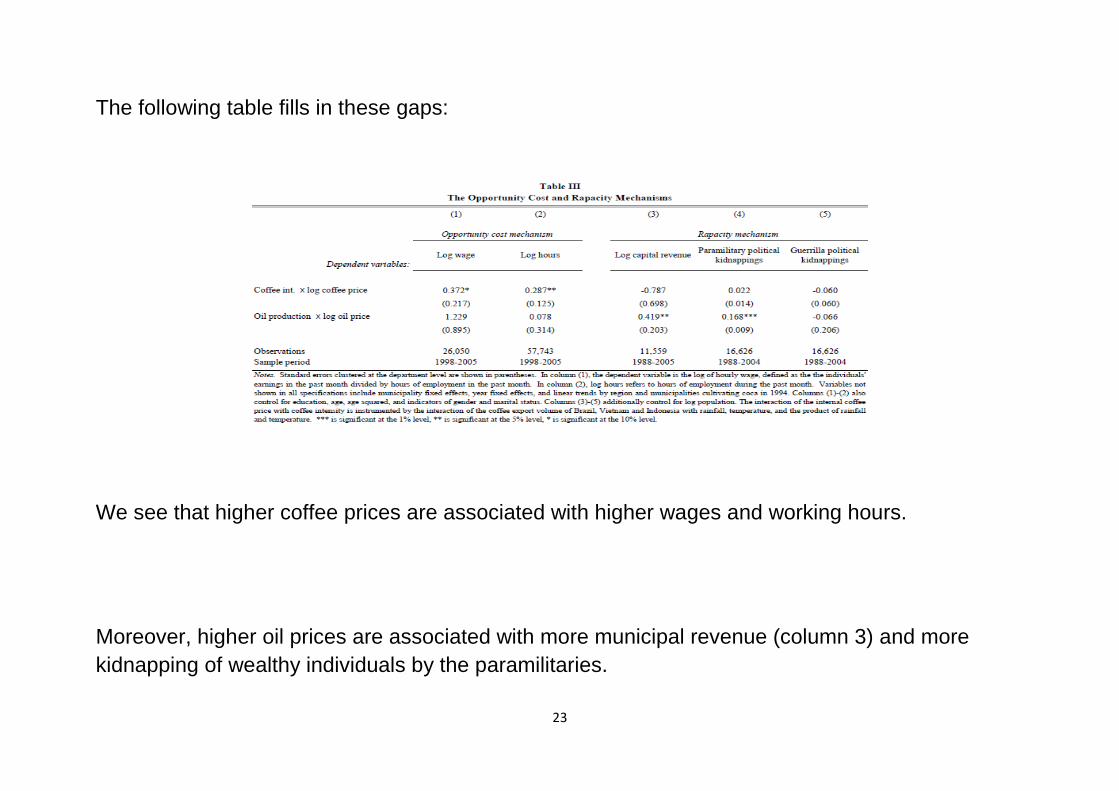
The following table fills in these gaps:
We see that higher coffee prices are associated with higher wages and working hours.
Moreover, higher oil prices are associated with more municipal revenue (column 3) and more
kidnapping of wealthy individuals by the paramilitaries.

24
The Dube and Vargas paper is a nice step forward for research on how the economy affects
armed conflict.
However, we have to bear in mind that it is only about one country….we do not know the extent to
which it might apply elsewhere.
25
The Bazzi and Blattman paper returns to the cross-country approach of Fearon-Laitin-Collier-
Hoeffler but is still similar to the Dube and Vargas paper because it uses changes in commodity
prices to analyse the impact of income on armed conflict.
The paper also clarifies some conceptual issues on the economics of armed conflict so let’s take a
look at this material before plunging into the empirical work.
26
Bazzi and Blattman distinguish between three main channels through which the economy could
affect conflict:
1. Opportunity cost – In a weak economy people have poor opportunities to earn money in the
legal economy so joining a rebel group may look like their best economic opportunity. If this is an
important channel then poor economies should suffer more conflict than rich ones do.
2. State capacity – In a weak economy the State cannot raise much tax revenue so it is unable to
do a good job of fighting against a rebellion. Again, weak economies suffer more conflict than
strong ones do but for a different reason than the opportunity cost theory suggests.
3. State prize – Here the idea is that when the State is poor there is no incentive to rebel to
overthrow the State because you receive a very small “prize” if you succeed since the State is so
poor. This mechanism suggests that economic strength is associated with rebellion.
27
Another interesting thing that Blazzi and Blattman do is to distinguish between different kinds of
conflict measurements.
1. Conflict onset
2. Conflict ending (sometimes known as “offset”)
3. Conflict intensity, i.e., the number of battle deaths
Many people mix these things together so this attention to detail is welcome.
28
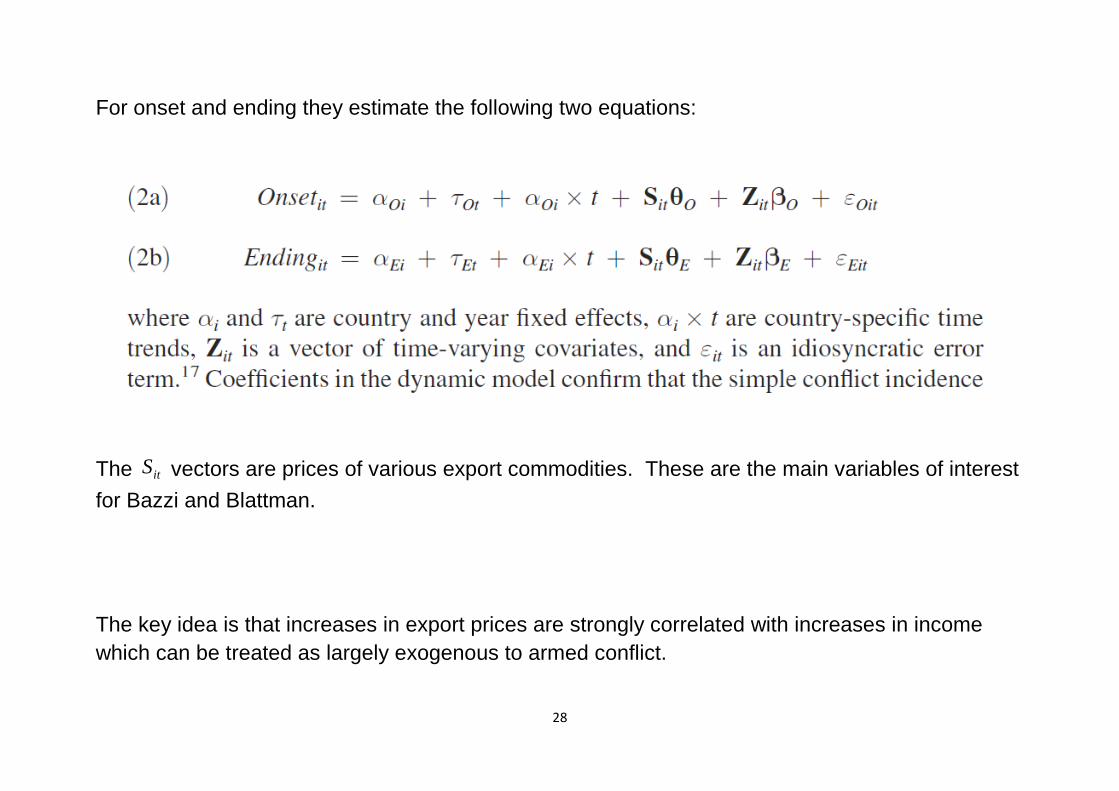
For onset and ending they estimate the following two equations:
The itS vectors are prices of various export commodities. These are the main variables of interest
for Bazzi and Blattman.
The key idea is that increases in export prices are strongly correlated with increases in income
which can be treated as largely exogenous to armed conflict.

29
The mass of insignificant coefficients on price shocks in the following table of results suggests that
there is no connection between price shocks to exports and the onset of armed conflict (or coups):
30
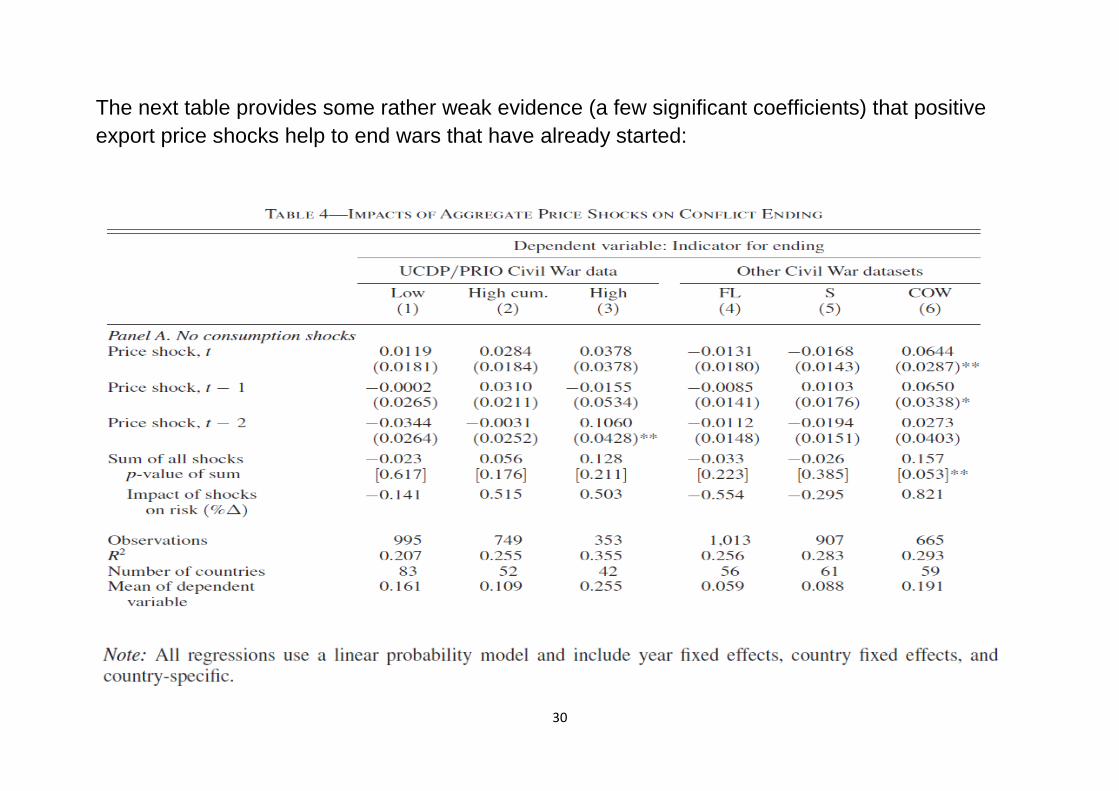
The next table provides some rather weak evidence (a few significant coefficients) that positive
export price shocks help to end wars that have already started:
31
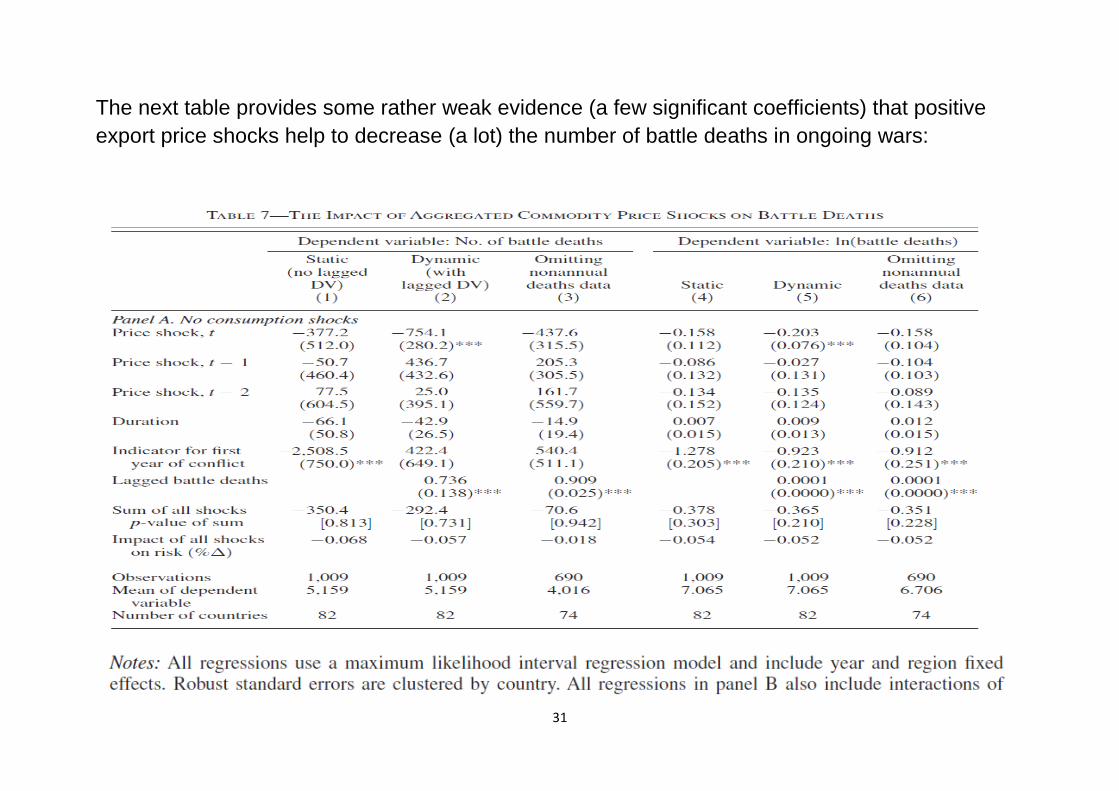
The next table provides some rather weak evidence (a few significant coefficients) that positive
export price shocks help to decrease (a lot) the number of battle deaths in ongoing wars:
32
Bazzi and Blattman repeat the analysis for oil and mineral price shocks, again finding that positive
shocks are associated with wars having fewer battle deaths and ending sooner but with
coefficients that are often not significant at standard levels.
Thinking back to the mechanisms on slide 26 the authors draw some general conclusions:
1. The state prize idea gets no support at all.
2. The opportunity cost and state capacity ideas do get some support.