early production and scavenging of hydrogen peroxide in the apoplast of sunflower plants exposed to...
TRANSCRIPT
DOI: 10.1093/jxb/erg270
RESEARCH PAPER
Early production and scavenging of hydrogen peroxide inthe apoplast of sun¯ower plants exposed to ozone
A. Ranieri1,*, A. Castagna1, J. Pacini1, B. Baldan2, A. Mensuali Sodi3 and G. F. Soldatini1
1 Department of Agricultural Chemistry and Biotechnology, University of Pisa, Via del Borghetto 80, I-56124 Pisa,Italy2 Department of Biology, University of Padova, Padova, I-35131, Italy3 Sant'Anna School of University Studies and Doctoral Research, Pisa, I-56124, Italy
Received 11 February 2003; Accepted 17 July 2003
Abstract
The present work set out to de®ne the processes
involved in the early O3-induced H2O2 accumulation in
sun¯ower plants exposed to a single pulse of 150 ppb
of O3 for 4 h. Hydrogen peroxide accumulation only
occurred in the apoplast and this temporally coin-
cided with the fumigation period. The inhibitor experi-
ments suggested that both the plasma membrane-
bound NAD(P)H oxidase complex and cell-wall
NAD(P)H PODs contributed to H2O2 generation. To
investigate the mechanisms responsible for O3-
induced H2O2 accumulation further, both production
and scavenging of H2O2 were investigated in the
extracellular matrix after subcellular fractionation. The
results indicated that H2O2 accumulation is a complex
and highly regulated event requiring the time-depend-
ent stimulation and down-regulation of differently
located enzymes, some of which are involved in H2O2
generation and degradation, not only during the fumi-
gation period but also in the subsequent recovery per-
iod in non-polluted air. Owing to the possible
interplay between H2O2 and ethylene, the time-course
of ethylene emission was analysed too. Ethylene was
rapidly emitted following O3 exposure, but it declined
to control values as early as after 4 h of exposure. The
early contemporaneous detection of increased ethy-
lene and H2O2 levels after 30 min of exposure does
not allow a clear temporal relationship between these
two signalling molecules to be established.
Key words: Ascorbate peroxidase, ethylene, hydrogen
peroxide, NAD(P)H oxidase, ozone, peroxidases, reactive
oxygen species, signal transduction, sun¯ower (Helianthus
annuus L.).
Introduction
Among the major gaseous pollutants studied to date,tropospheric ozone (O3) causes more damage to bothnatural and cultivated plants in industrialized nations thanany other pollutant (Heagle, 1989; Kley et al., 1999; Krupaand Kickert, 1989).
O3 toxicity was previously believed to be mainly due tothe loss of membrane integrity and the formation of toxicand oxidative products by O3 degradation (Heath, 1994).Recently, however, the similarities between O3-inducedresponses and the hypersensitive responses found inincompatible plant±pathogen interaction have led to thesuggestion that O3 could act as an abiotic elicitor ofphytopathological and antioxidant responses (Sandermannet al., 1998; Schraudner et al., 1998; Sharma and Davis,1997). The similarity between O3 and pathogen attacks ismost probably related to the occurrence of reactive oxygenspecies (ROS) such as the superoxide anion radical O.
2±
and hydrogen peroxide (H2O2) in the apoplast, the so-called `oxidative burst'. In fact, once having penetrated theleaf apoplast, O3 is rapidly converted to ROS. In additionto this rapid spontaneous ROS generation from O3
decomposition and/or from reaction with components of
* To whom correspondence should be addressed. Fax: +39 50 598614. E-mail: [email protected]: APX, ascorbate peroxidase; CAB, Na-cacodylate buffer; CB, cell wall covalently-bound fraction; DPI, diphenylene iodonium; DTT,dithiothreitol; HEPES, N-2-hydroxyethylpiperazine-N¢-2-ethanesulphonic acid; IB, cell wall ionically-bound fraction; IWF, intercellular washing ¯uid; MOPS,3-(N-morpholino)propanesulphonic acid; NAD(P)H PODs, H2O2 producing NAD(P)H-oxidizing peroxidases; PM, plasma membrane; PODs, peroxidases;pCMB, p-chloromercuribenzoate; ROS, reactive oxygen species; Syr-PODs, H2O2 scavenging syringaldazine-reducing peroxidases; TBARS, thiobarbituricacid reactive substances.
Journal of Experimental Botany, Vol. 54, No. 392, ã Society for Experimental Biology 2003; all rights reserved
Journal of Experimental Botany, Vol. 54, No. 392, pp. 2529±2540, November 2003
by guest on October 29, 2013
http://jxb.oxfordjournals.org/D
ownloaded from
by guest on O
ctober 29, 2013http://jxb.oxfordjournals.org/
Dow
nloaded from
by guest on October 29, 2013
http://jxb.oxfordjournals.org/D
ownloaded from
by guest on O
ctober 29, 2013http://jxb.oxfordjournals.org/
Dow
nloaded from
by guest on October 29, 2013
http://jxb.oxfordjournals.org/D
ownloaded from
by guest on O
ctober 29, 2013http://jxb.oxfordjournals.org/
Dow
nloaded from
by guest on October 29, 2013
http://jxb.oxfordjournals.org/D
ownloaded from
by guest on O
ctober 29, 2013http://jxb.oxfordjournals.org/
Dow
nloaded from
by guest on October 29, 2013
http://jxb.oxfordjournals.org/D
ownloaded from
by guest on O
ctober 29, 2013http://jxb.oxfordjournals.org/
Dow
nloaded from
by guest on October 29, 2013
http://jxb.oxfordjournals.org/D
ownloaded from
by guest on O
ctober 29, 2013http://jxb.oxfordjournals.org/
Dow
nloaded from
the plasma membrane and cell wall (Laisk et al., 1989;Salter and Hewitt, 1992), an active endogenous ROSproduction by cell enzymatic systems, such as the PM-bound neutrophil-like NAD(P)H oxidase complex, mayoccur (Bolwell and Wojtaszek, 1997). Peroxidases(PODs), which are important components of plantresponses to different kinds of stresses, may also regulatethe level of ROS. In fact, besides their role in the H2O2-dependent polymerization of lignin precursors and thecross-linking between cell-wall proteins and polysacchar-ides (Christensen et al., 1998; Otter and Polle, 1997; Penelet al., 2000; Polle et al., 1994), PODs are also capable ofH2O2 generation through the oxidation of various mole-cules, including NAD(P)H (Bolwell and Wojtaszek, 1997).
Among the different ROS, directly or indirectly gener-ated following O3 exposure, H2O2 is receiving increasingattention because of its dual role as a signal molecule andas a toxic-compound mediator of oxidative damage. Infact, due to its relatively long life and capability to crossthe membranes, H2O2 can diffuse into the cell and/or moveto the neighbouring cells, thus acting as a short-distancesignal or it can react with cell-wall and membranecomponents, thus generating other compounds which, inturn, can act as extra- or intracellular messengers (Raoet al., 2000). However, since H2O2 is rapidly removed byantioxidant enzymes and metabolites, it is unlikely thatincreased production of H2O2 alone is suf®cient toorchestrate the complex response to O3 at the wholeplant level. Additional signal molecules, such as ethylene,salicylic and jasmonic acid, are believed to be required toact in concert with H2O2 to trigger the plant defenceresponses (Rao et al., 2000).
On the other hand, although it is scarcely toxic by itselfunless at very high concentrations, H2O2 can damagemembranes particularly following the reduction to theextremely reactive hydroxyl radicals by transition metals(Fenton reaction). To avoid the oxidative damage, H2O2
levels are kept under control by both enzymatic and nonenzymatic scavenging mechanisms present in the apoplast,among which ascorbate peroxidase (APX) is very import-ant (Foyer et al., 1994; Ranieri et al., 1996).
Although extensive studies have been performedaimed at de®ning the processes involved in O3-inducedROS accumulation (Pellinen et al., 1999; Schraudneret al., 1998; Wohlgemuth et al., 2002), they mainlyfocused on H2O2 sources and relied on histochemicaldetection and inhibitor methods. In addition, most ofthese studies relied on plants showing visible signs ofO3-induced injuries. In the present paper, both thegeneration and degradation of H2O2 in the extracellularmatrix of O3-treated sun¯ower leaves are taken intoaccount by a dual approach which incorporates enzymeactivities and subcellular fractionation in addition tostaining and inhibitor studies. For this purpose, sun-¯ower (Helianthus annus L., cv. Hor) plants were
exposed to a single pulse of 150 ppb of O3 for 4 h. Thecomplex interaction among the different extracellularenzymes involved in H2O2 production and scavengingwas studied at different time points during fumigation aswell as during the recovery period in non-polluted air.The time-course of ethylene emission is also reportedbecause of the possible interplay between H2O2 andethylene.
Materials and methods
Plant material
Sterilized sun¯ower seeds (Heliantus annuus L., cv. Hor) weregerminated, in the dark, in Petri dishes for 3 d and the seedlings weregrown in perlite for a week. The seedlings were then transplantedand grown for 4 weeks in a greenhouse at 17/25 °C, night/day, RH60±80%, a 14 h photoperiod, and a photosynthetic photon ¯uxdensity of 530 mmol m±2 s±1 (photosynthetic active radiation:400±700 nm)
Only uniform plants with eight fully-expanded leaves wereselected (about 35 d after sowing). All biochemical analyses werecarried out on fully-expanded middle-aged leaves from both thecontrol and treated plants.
Fumigation treatment
O3 fumigation was performed in air-conditioned chambers (0.48m3). The temperature was maintained at 2061 °C and RH at8565%. A photon ¯ux density at plant height of 530 mmol m±2 s±1
was provided by incandescent lamps. O3 was generated by electricdisharge passing pure oxygen through a Fisher ozone generator 500(Fisher Labor und Verfahrenstechnik, Meckenheim, Germany).Ozone concentration in the fumigation chambers was continuouslymonitored with a Monitor Labs Analyzer mod. 8810 (Monitor Labs,San Diego, CA) operating on the principle of UV absorption andinterfaced with a personal computer. Plants were pre-adapted to thechamber conditions for 48 h and then exposed to an acute fumigationwith 150 ppb O3 for 4 h. Leaves were collected before (0 h), during(0.5, 1, 2, and 4 h) and after (5, 7, 24, and 48 h) the exposure to thepollutant. Times of measurement refer to hours after the onset offumigation. Untreated plants were kept in charcoal-®ltered airchambers under the same conditions and used as controls.
Ion leakage
Cell damage was assessed by measuring ion leakage from leaf discs.Ten discs of known area (1.13 cm2) were incubated by shaking in5 ml of distilled water for 3 h at room temperature. The conductivityof the incubation medium was recorded by a JENWAY 4010conductivity meter (JENWAY, Dunmow, Essex, England). Theresults are expressed as a percentage of the total conductivity,measured after overnight incubation of the discs frozen in liquid N2.
Lipid peroxidation
The extent of lipid peroxidation was evaluated by the thiobarbituricacid reaction. Leaf tissue was homogenized in 0.1% trichloroaceticacid (1:10, w:v) and centrifuged at 10 000 g for 5 min. 1.0 ml of thesupernatant was incubated with 4 ml of 0.5% thiobarbituric acid in20% trichloroacetic acid at 95 °C for 30 min and then cooled in anice bath. After centrifugation at 10 000 g for 10 min, the absorbanceof the supernatant was read at 532 nm and corrected for the non-speci®c absorbance recorded at 600 nm. The concentration ofthiobarbituric acid reactive substances (TBARS) was calculated asmalondialdehyde equivalents using the extinction coef®cient of155 mM±1 cm±1 for malondialdehyde (Ranieri et al., 1996).
2530 Ranieri et al.
Preparation of the apoplastic ¯uid
Freshly harvested intact leaves (10 g) were rinsed with distilledwater and vacuum in®ltrated (±65 kPa, three cycles of 30 s each) in50 ml of 66 mM K-phosphate buffer (pH 7) and 100 mM KCl.Having been wiped, the leaves were centrifuged at 1500 g for 10 minat 4 °C to obtain the intercellular washing ¯uid (IWF) which, afterdialysis against diluted in®ltration buffer, was immediately used forbiochemical analyses (Ranieri et al., 1996). For APX assay, Na-ascorbate (5 mM) was added to the in®ltration and the dialysisbuffers. To check the purity of the IWF fraction, the cytoplasmaticand chloroplastic enzyme markers, glucose-6-P dehydrogenase(G6PDH) and glyceraldehyde-3-P dehydrogenase (GAPDH), weremeasured in both the IWF and the residual cell material (RCM) aspreviously reported (Ranieri et al., 2000).
Cell-wall fractions
The cell wall ionically- (IB) and covalently-bound (CB) fractionswere separated as reported in Ranieri et al. (2001). Freshly-harvestedleaves were homogenized at 4 °C with 66 mM Na-phosphate buffer(pH 6.1) and centrifuged at 800 g for 5 min. The pellet was washedtwice with phosphate buffer, twice with water and, after 1 hincubation in 2% Triton X-100 at 4 °C with continuous shaking, itwas again rinsed 53 with water. The pellet was then incubated with1 M CaCl2 for 1 h and centrifuged at 800 g for 10 min at 4 °C. Theresulting supernatant was the IB fraction. The pellet was washedseveral times with water and then incubated for 16 h at roomtemperature with 0.3% cellulase, 0.3% macerase and 0.3%cellulolysin in 50 mM Na-acetate buffer, pH 5.5, to obtain the CBfraction, after centrifugation at 800 g for 10 min. The residual pelletwas dried at 80 °C and weighed.
Plasma membrane extraction
Plasma membrane (PM) vescicles were extracted according toLarsson et al. (1987) with some modi®cations. Freshly-harvestedleaves were homogenized at 4 °C with 50 mM N-2-hydroxyethylpi-perazine-N¢-2-ethanesulphonic acid (HEPES)-KOH (pH 7.5),330 mM sucrose, 5 mM EDTA, 5 mM dithiothreitol (DTT), 1 mgml±1 BSA, 2 mg ml±1 PMSF, ®ltered through four layers of gauze andcentrifuged at 13 000 g for 15 min. The recovered supernatant wascentrifuged at 80 000 g for a further 30 min and an aliquot of theresulting membrane pellet (microsomal fraction) was resuspended in5 mM K-phosphate buffer (pH 7.8), 330 mM sucrose, 5 mM KCl,1 mM DTT, and 0.1 mM EDTA. Plasma membrane vesicles wereprepared using a 9 g aqueous two-phase partitioning system.Resuspended microsomal fractions were mixed with 6.5% (w/w)Polyethylene Glycol 3350 (PEG), 6.5% (w/w) Dextran T500, 5 mMK-phosphate buffer (pH 7.8), 330 mM sucrose, 5 mM KCl, 1 mMDTT, and 0.1 mM EDTA. After mixing, the phases were separatedby centrifuging at 4000 g for 5 min. The upper phase, enriched in PMvesicles, was repartitioned twice with fresh lower phase withoutPEG and, after dilution with 50 mM HEPES-KOH (pH 7.5), 330 mMsucrose, the PM vesicles were collected by centrifuging at 40 000 gfor 45 min.
The sensitivity of ATPase activity to vanadate (0.1 mM), NaN3
(1 mM) and KNO3 (120 mM) was used as marker of PM,mitochondria and tonoplast activities, respectively (Hodges andLeonard, 1974).
Enzyme activity assay
APX activity was determined following the decrease in absorbanceat 290 nm due to the oxidation of ascorbic acid in the ®rst 30 s fromthe start of the reaction, using the extinction coef®cient of 2.8 mM±1
cm±1 for ascorbate. The reaction medium contained 0.5 mM Na-ascorbate, 0.1 mM H2O2, 1 mM EDTA, and 0.1 M HEPES-KOHbuffer (pH 7.8) (Ranieri et al., 1996). One enzymatic unit is
equivalent to 1 mmol of ascorbic acid oxidized min±1 cm±1. Todiscriminate between APX and POD activities, 50 mMp-chloromercuribenzoate (pCMB), known to inactivate APX, wasadded to the enzymatic reaction mixture (Miyake and Asada, 1992).
The activity of POD involved in the ligni®cation process wastested using syringaldazine, a synthetic substrate analogue to thesyringilic residue of lignin, as the reducing substrate. The activity ofSyr-POD was determined by measuring the increase in absorbance at530 nm of the reaction mixture containing 100 mM Na-K phosphatebuffer pH 6.0, 2.5 mM H2O2, 2 mM syringaldazine, and the proteinextract (Pandol®ni et al., 1992).
The rate of NAD(P)H oxidation was measured by following thedecrease in absorbance at 340 nm of a reaction medium containing40 mM Na-acetate (pH 5.5), 250 mM sucrose, 1 mM MnCl2, 100 mMsalicylhydroxamic acid, 100 mM NADH, and the extract aliquot(Vianello et al., 1997). The activity was calculated using theextinction coef®cient of 6.22 mM±1 cm±1 for NADH. To discriminatebetween the activity of NAD(P)H oxidase complex and NAD(P)HPODs, 15 mM diphenylene iodonium (DPI) or 50 mM KCN, speci®cinhibitors of NAD(P)H oxidase and POD, respectively, were addedto the reaction medium (Bolwell and Wojtaszek, 1997).
The protein content of the extracts was measured spectro-photometrically at 595 nm according to Bradford (1976), usingBSA as standard.
Ethylene determination
Fifteen minutes after excision, leaves were incubated within sealedcontainers at room temperature and, after 1 h, 2 ml samples werewithdrawn with a hypodermic syringe. Ethylene evolution wasmeasured by injecting samples into a gas chromatograph equippedwith a dual ¯ame ionization detector and a metal column(15030.4 cm id) packed with alumina (70±230 mesh). The columnand detector temperatures were 70 °C and 350 °C, respectively. N2
was used as a carrier at a ¯ow rate of 40 ml min±1 (Mensuali Sodiet al., 1992).
In situ localization of H2O2 accumulation
Hydrogen peroxide production was assessed cytochemically viadetermination of cerium perhydroxide formation after the reaction ofCeCl3 with endogenous H2O2 (Bestwick et al., 1997). Freshlyharvested leaves were cut into slices (1±2 mm2) which wereincubated for 1 h in 5 mM CeCl3 in 50 mM 3-(N-morpholino)pro-panesulphonic acid (MOPS) pH 7.2, ®xed in 1.25% glutaraldehyde,1.25% paraformaldehyde in 50 mM Na-cacodylate buffer (CAB) pH7.2 for 1 h, and washed twice in CAB buffer for 10 min (Bestwicket al., 1997). After post-®xation for 2 h in 1% osmium tetroxide in50 mM Na-cacodylate buffer, pH 7.2, samples were washed twice inthe same buffer, dehydrated in a graded ethanol series (25, 50, 75,90, and 100%), transferred into propylene oxide, and graduallyembedded in Epon-Araldite. Thin sections of embedded tissues wereobtained on a Reichert-Ultracut microtome, mounted on uncoatedcopper grids and observed using a transmission electron microscope(Hitachi 300, Tokyo, Japan) at 75kV.
For the treatment with inhibitors, the leaf slices were pre-incubated for 30 min in 50 mM MOPS pH 7.2 containing either3 mM KCN (to inhibit POD), 8 mM DPI (to inhibit NAD(P)Hoxidase complex) or 25 mg ml±1 bovine liver catalase (to decomposeH2O2) (Bestwick et al., 1997). The leaf slices were then incubatedfor 1 h in CeCl3 solutions supplemented with inhibitors at theconcentrations reported above and treated as described above.
Statistical analysis
A minimum of 12 plants per treatment were used in all theexperiments. Values shown in the ®gures are the means of sixdeterminations 6standard error, except for ethylene (n=3).
Extracellular O3-induced H2O2 production and scavenging in sun¯ower leaves 2531
Comparison between means was evaluated by t-test and the P=0.05level of error.
Results
With the aim of studying the mechanisms involved in theO3-induced oxidative burst, sun¯ower plants were exposedto a single pulse of 150 ppb of O3 for 4 h and left to recoverin pollutant-free air up to 48 h. Measurements wereperformed before (0 h), during (0.5, 1, 2, and 4 h) and after(5, 7, 24, and 48 h) the exposure to the pollutant. Times ofmeasurement refer to hours after the beginning of the O3
exposure.At the end of the O3 fumigation period, sun¯ower plants
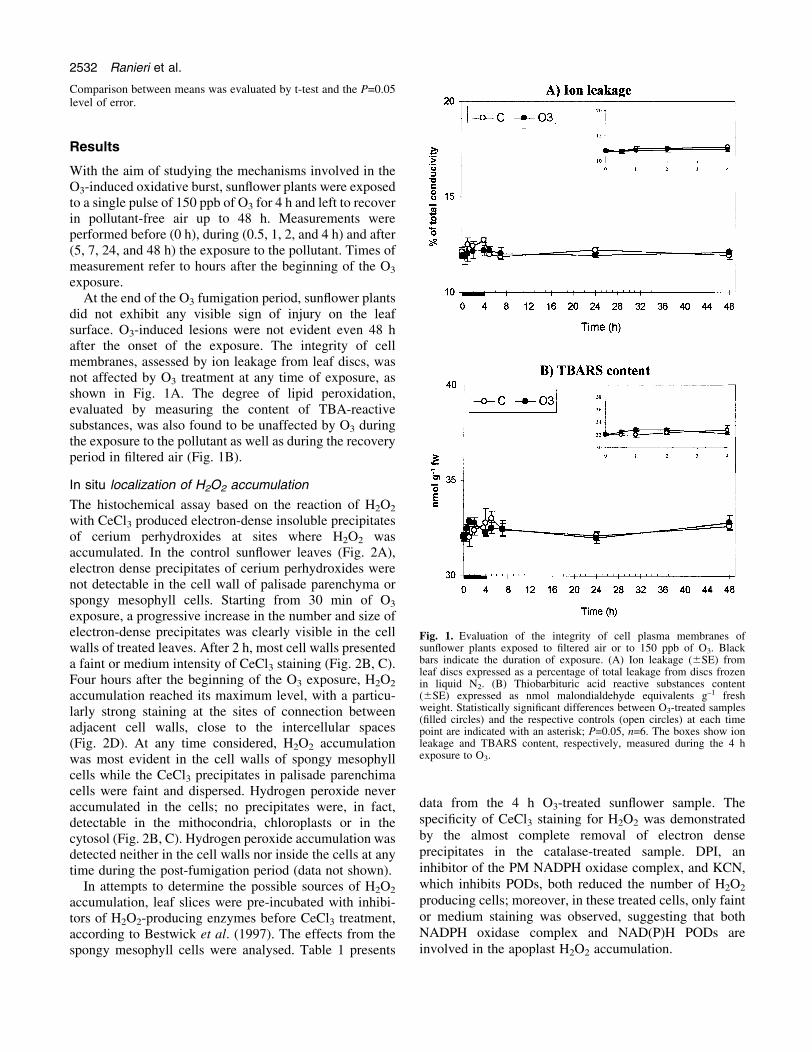
did not exhibit any visible sign of injury on the leafsurface. O3-induced lesions were not evident even 48 hafter the onset of the exposure. The integrity of cellmembranes, assessed by ion leakage from leaf discs, wasnot affected by O3 treatment at any time of exposure, asshown in Fig. 1A. The degree of lipid peroxidation,evaluated by measuring the content of TBA-reactivesubstances, was also found to be unaffected by O3 duringthe exposure to the pollutant as well as during the recoveryperiod in ®ltered air (Fig. 1B).
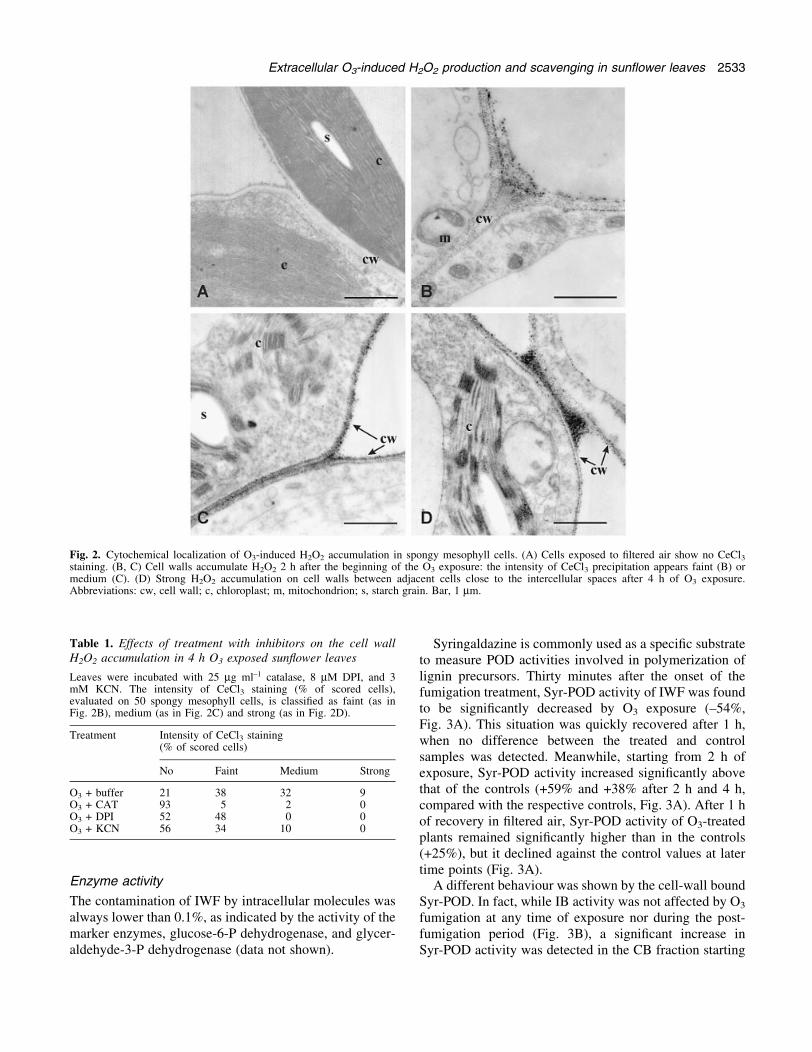
In situ localization of H2O2 accumulation
The histochemical assay based on the reaction of H2O2
with CeCl3 produced electron-dense insoluble precipitatesof cerium perhydroxides at sites where H2O2 wasaccumulated. In the control sun¯ower leaves (Fig. 2A),electron dense precipitates of cerium perhydroxides werenot detectable in the cell wall of palisade parenchyma orspongy mesophyll cells. Starting from 30 min of O3
exposure, a progressive increase in the number and size ofelectron-dense precipitates was clearly visible in the cellwalls of treated leaves. After 2 h, most cell walls presenteda faint or medium intensity of CeCl3 staining (Fig. 2B, C).Four hours after the beginning of the O3 exposure, H2O2
accumulation reached its maximum level, with a particu-larly strong staining at the sites of connection betweenadjacent cell walls, close to the intercellular spaces(Fig. 2D). At any time considered, H2O2 accumulationwas most evident in the cell walls of spongy mesophyllcells while the CeCl3 precipitates in palisade parenchimacells were faint and dispersed. Hydrogen peroxide neveraccumulated in the cells; no precipitates were, in fact,detectable in the mithocondria, chloroplasts or in thecytosol (Fig. 2B, C). Hydrogen peroxide accumulation wasdetected neither in the cell walls nor inside the cells at anytime during the post-fumigation period (data not shown).
In attempts to determine the possible sources of H2O2
accumulation, leaf slices were pre-incubated with inhibi-tors of H2O2-producing enzymes before CeCl3 treatment,according to Bestwick et al. (1997). The effects from thespongy mesophyll cells were analysed. Table 1 presents
data from the 4 h O3-treated sun¯ower sample. Thespeci®city of CeCl3 staining for H2O2 was demonstratedby the almost complete removal of electron denseprecipitates in the catalase-treated sample. DPI, aninhibitor of the PM NADPH oxidase complex, and KCN,which inhibits PODs, both reduced the number of H2O2
producing cells; moreover, in these treated cells, only faintor medium staining was observed, suggesting that bothNADPH oxidase complex and NAD(P)H PODs areinvolved in the apoplast H2O2 accumulation.
Fig. 1. Evaluation of the integrity of cell plasma membranes ofsun¯ower plants exposed to ®ltered air or to 150 ppb of O3. Blackbars indicate the duration of exposure. (A) Ion leakage (6SE) fromleaf discs expressed as a percentage of total leakage from discs frozenin liquid N2. (B) Thiobarbituric acid reactive substances content(6SE) expressed as nmol malondialdehyde equivalents g±1 freshweight. Statistically signi®cant differences between O3-treated samples(®lled circles) and the respective controls (open circles) at each timepoint are indicated with an asterisk; P=0.05, n=6. The boxes show ionleakage and TBARS content, respectively, measured during the 4 hexposure to O3.
2532 Ranieri et al.
Enzyme activity
The contamination of IWF by intracellular molecules wasalways lower than 0.1%, as indicated by the activity of themarker enzymes, glucose-6-P dehydrogenase, and glycer-aldehyde-3-P dehydrogenase (data not shown).
Syringaldazine is commonly used as a speci®c substrateto measure POD activities involved in polymerization oflignin precursors. Thirty minutes after the onset of thefumigation treatment, Syr-POD activity of IWF was foundto be signi®cantly decreased by O3 exposure (±54%,Fig. 3A). This situation was quickly recovered after 1 h,when no difference between the treated and controlsamples was detected. Meanwhile, starting from 2 h ofexposure, Syr-POD activity increased signi®cantly abovethat of the controls (+59% and +38% after 2 h and 4 h,compared with the respective controls, Fig. 3A). After 1 hof recovery in ®ltered air, Syr-POD activity of O3-treatedplants remained signi®cantly higher than in the controls(+25%), but it declined against the control values at latertime points (Fig. 3A).
A different behaviour was shown by the cell-wall boundSyr-POD. In fact, while IB activity was not affected by O3
fumigation at any time of exposure nor during the post-fumigation period (Fig. 3B), a signi®cant increase inSyr-POD activity was detected in the CB fraction starting
Fig. 2. Cytochemical localization of O3-induced H2O2 accumulation in spongy mesophyll cells. (A) Cells exposed to ®ltered air show no CeCl3staining. (B, C) Cell walls accumulate H2O2 2 h after the beginning of the O3 exposure: the intensity of CeCl3 precipitation appears faint (B) ormedium (C). (D) Strong H2O2 accumulation on cell walls between adjacent cells close to the intercellular spaces after 4 h of O3 exposure.Abbreviations: cw, cell wall; c, chloroplast; m, mitochondrion; s, starch grain. Bar, 1 mm.
Table 1. Effects of treatment with inhibitors on the cell wallH2O2 accumulation in 4 h O3 exposed sun¯ower leaves
Leaves were incubated with 25 mg ml±1 catalase, 8 mM DPI, and 3mM KCN. The intensity of CeCl3 staining (% of scored cells),evaluated on 50 spongy mesophyll cells, is classi®ed as faint (as inFig. 2B), medium (as in Fig. 2C) and strong (as in Fig. 2D).
Treatment Intensity of CeCl3 staining(% of scored cells)
No Faint Medium Strong
O3 + buffer 21 38 32 9O3 + CAT 93 5 2 0O3 + DPI 52 48 0 0O3 + KCN 56 34 10 0
Extracellular O3-induced H2O2 production and scavenging in sun¯ower leaves 2533
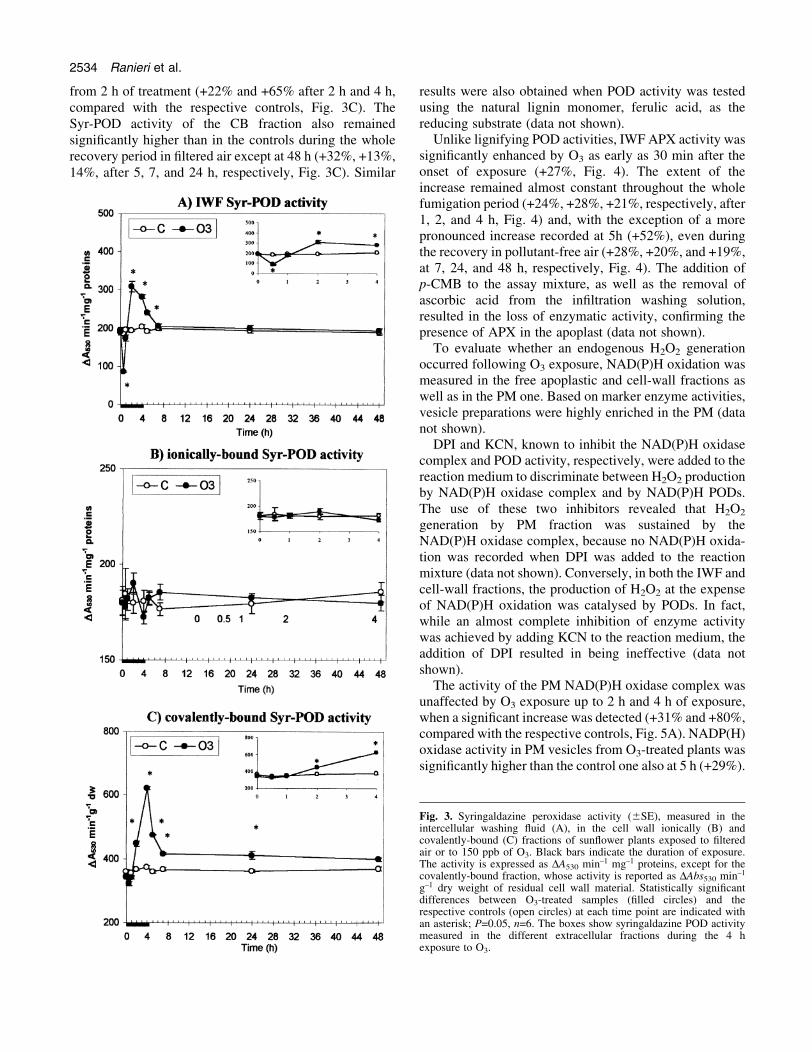
from 2 h of treatment (+22% and +65% after 2 h and 4 h,compared with the respective controls, Fig. 3C). TheSyr-POD activity of the CB fraction also remainedsigni®cantly higher than in the controls during the wholerecovery period in ®ltered air except at 48 h (+32%, +13%,14%, after 5, 7, and 24 h, respectively, Fig. 3C). Similar
results were also obtained when POD activity was testedusing the natural lignin monomer, ferulic acid, as thereducing substrate (data not shown).
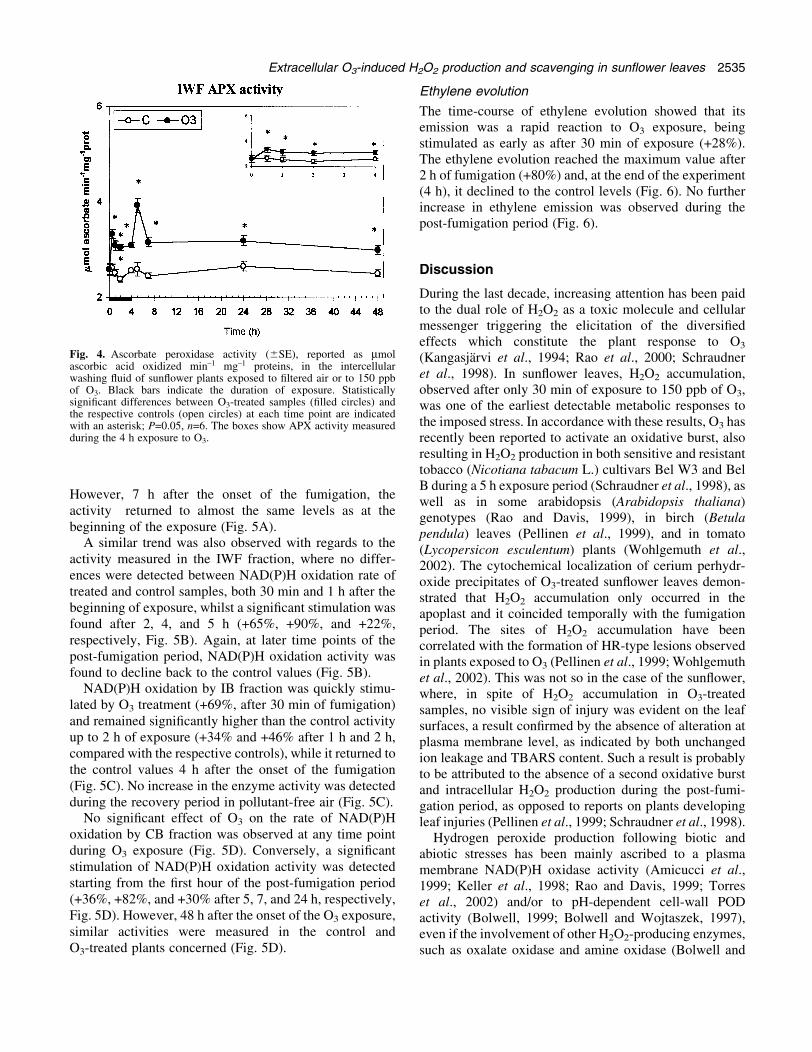
Unlike lignifying POD activities, IWF APX activity wassigni®cantly enhanced by O3 as early as 30 min after theonset of exposure (+27%, Fig. 4). The extent of theincrease remained almost constant throughout the wholefumigation period (+24%, +28%, +21%, respectively, after1, 2, and 4 h, Fig. 4) and, with the exception of a morepronounced increase recorded at 5h (+52%), even duringthe recovery in pollutant-free air (+28%, +20%, and +19%,at 7, 24, and 48 h, respectively, Fig. 4). The addition ofp-CMB to the assay mixture, as well as the removal ofascorbic acid from the in®ltration washing solution,resulted in the loss of enzymatic activity, con®rming thepresence of APX in the apoplast (data not shown).
To evaluate whether an endogenous H2O2 generationoccurred following O3 exposure, NAD(P)H oxidation wasmeasured in the free apoplastic and cell-wall fractions aswell as in the PM one. Based on marker enzyme activities,vesicle preparations were highly enriched in the PM (datanot shown).
DPI and KCN, known to inhibit the NAD(P)H oxidasecomplex and POD activity, respectively, were added to thereaction medium to discriminate between H2O2 productionby NAD(P)H oxidase complex and by NAD(P)H PODs.The use of these two inhibitors revealed that H2O2
generation by PM fraction was sustained by theNAD(P)H oxidase complex, because no NAD(P)H oxida-tion was recorded when DPI was added to the reactionmixture (data not shown). Conversely, in both the IWF andcell-wall fractions, the production of H2O2 at the expenseof NAD(P)H oxidation was catalysed by PODs. In fact,while an almost complete inhibition of enzyme activitywas achieved by adding KCN to the reaction medium, theaddition of DPI resulted in being ineffective (data notshown).
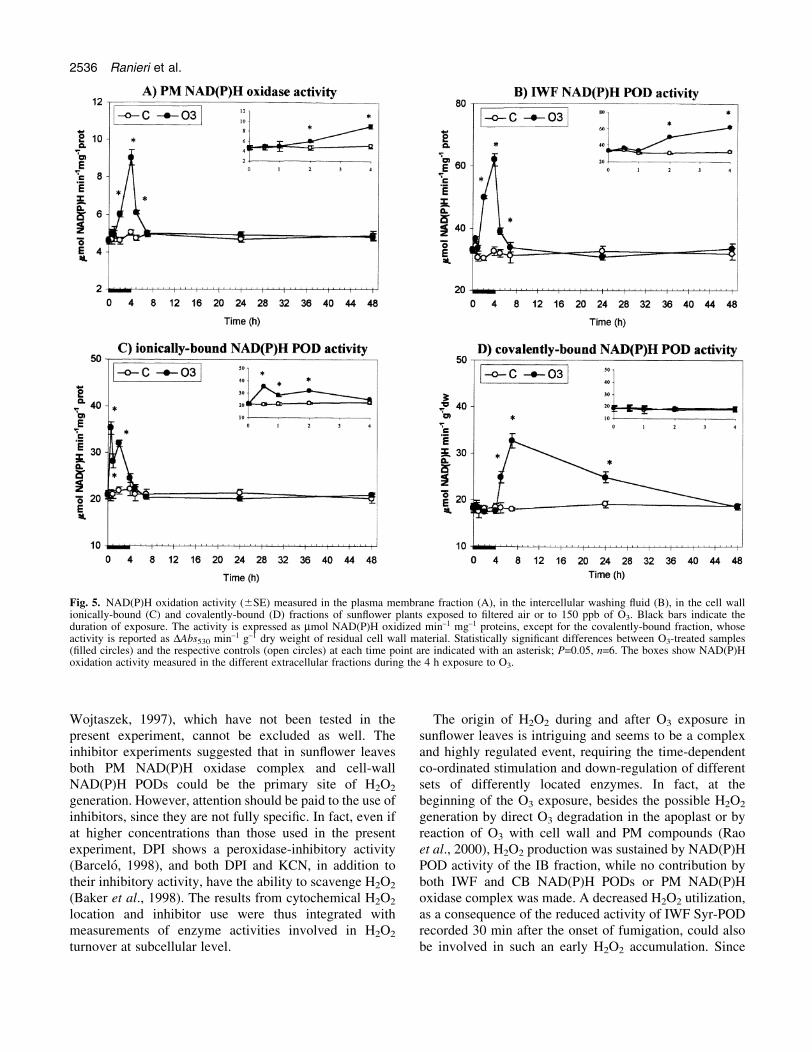
The activity of the PM NAD(P)H oxidase complex wasunaffected by O3 exposure up to 2 h and 4 h of exposure,when a signi®cant increase was detected (+31% and +80%,compared with the respective controls, Fig. 5A). NADP(H)oxidase activity in PM vesicles from O3-treated plants wassigni®cantly higher than the control one also at 5 h (+29%).
Fig. 3. Syringaldazine peroxidase activity (6SE), measured in theintercellular washing ¯uid (A), in the cell wall ionically (B) andcovalently-bound (C) fractions of sun¯ower plants exposed to ®lteredair or to 150 ppb of O3. Black bars indicate the duration of exposure.The activity is expressed as DA530 min±1 mg±1 proteins, except for thecovalently-bound fraction, whose activity is reported as DAbs530 min±1
g±1 dry weight of residual cell wall material. Statistically signi®cantdifferences between O3-treated samples (®lled circles) and therespective controls (open circles) at each time point are indicated withan asterisk; P=0.05, n=6. The boxes show syringaldazine POD activitymeasured in the different extracellular fractions during the 4 hexposure to O3.
2534 Ranieri et al.
However, 7 h after the onset of the fumigation, theactivity returned to almost the same levels as at thebeginning of the exposure (Fig. 5A).
A similar trend was also observed with regards to theactivity measured in the IWF fraction, where no differ-ences were detected between NAD(P)H oxidation rate oftreated and control samples, both 30 min and 1 h after thebeginning of exposure, whilst a signi®cant stimulation wasfound after 2, 4, and 5 h (+65%, +90%, and +22%,respectively, Fig. 5B). Again, at later time points of thepost-fumigation period, NAD(P)H oxidation activity wasfound to decline back to the control values (Fig. 5B).
NAD(P)H oxidation by IB fraction was quickly stimu-lated by O3 treatment (+69%, after 30 min of fumigation)and remained signi®cantly higher than the control activityup to 2 h of exposure (+34% and +46% after 1 h and 2 h,compared with the respective controls), while it returned tothe control values 4 h after the onset of the fumigation(Fig. 5C). No increase in the enzyme activity was detectedduring the recovery period in pollutant-free air (Fig. 5C).
No signi®cant effect of O3 on the rate of NAD(P)Hoxidation by CB fraction was observed at any time pointduring O3 exposure (Fig. 5D). Conversely, a signi®cantstimulation of NAD(P)H oxidation activity was detectedstarting from the ®rst hour of the post-fumigation period(+36%, +82%, and +30% after 5, 7, and 24 h, respectively,Fig. 5D). However, 48 h after the onset of the O3 exposure,similar activities were measured in the control andO3-treated plants concerned (Fig. 5D).
Ethylene evolution
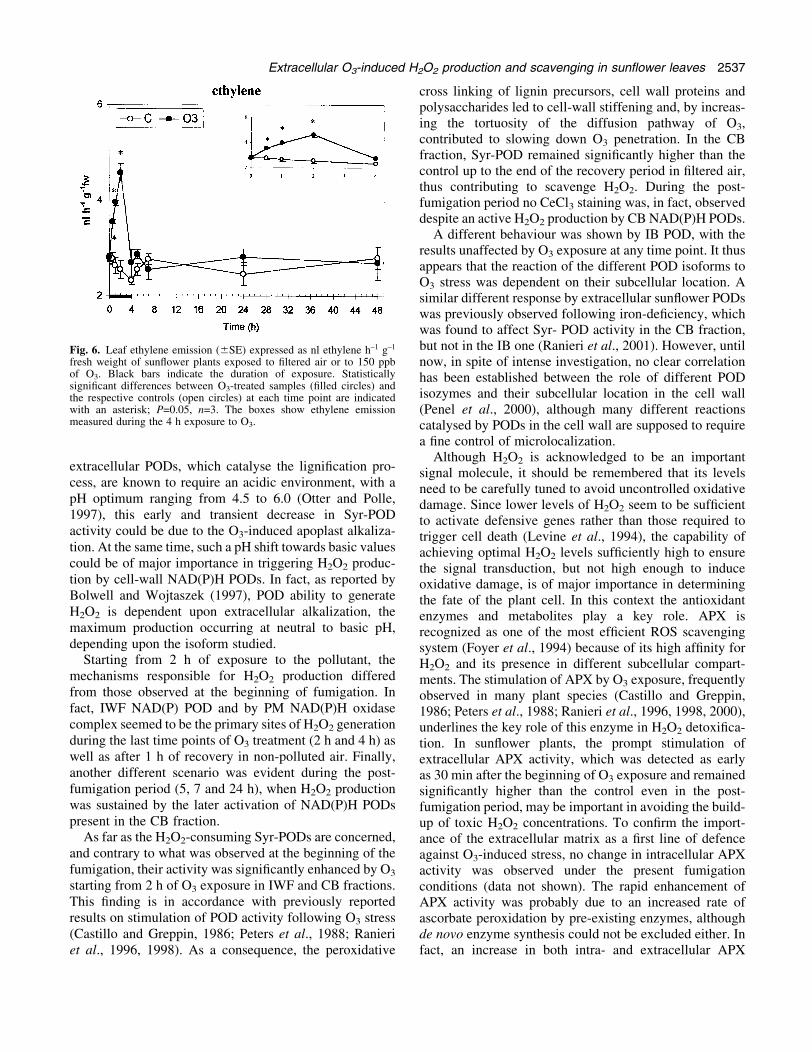
The time-course of ethylene evolution showed that itsemission was a rapid reaction to O3 exposure, beingstimulated as early as after 30 min of exposure (+28%).The ethylene evolution reached the maximum value after2 h of fumigation (+80%) and, at the end of the experiment(4 h), it declined to the control levels (Fig. 6). No furtherincrease in ethylene emission was observed during thepost-fumigation period (Fig. 6).
Discussion
During the last decade, increasing attention has been paidto the dual role of H2O2 as a toxic molecule and cellularmessenger triggering the elicitation of the diversi®edeffects which constitute the plant response to O3
(KangasjaÈrvi et al., 1994; Rao et al., 2000; Schraudneret al., 1998). In sun¯ower leaves, H2O2 accumulation,observed after only 30 min of exposure to 150 ppb of O3,was one of the earliest detectable metabolic responses tothe imposed stress. In accordance with these results, O3 hasrecently been reported to activate an oxidative burst, alsoresulting in H2O2 production in both sensitive and resistanttobacco (Nicotiana tabacum L.) cultivars Bel W3 and BelB during a 5 h exposure period (Schraudner et al., 1998), aswell as in some arabidopsis (Arabidopsis thaliana)genotypes (Rao and Davis, 1999), in birch (Betulapendula) leaves (Pellinen et al., 1999), and in tomato(Lycopersicon esculentum) plants (Wohlgemuth et al.,2002). The cytochemical localization of cerium perhydr-oxide precipitates of O3-treated sun¯ower leaves demon-strated that H2O2 accumulation only occurred in theapoplast and it coincided temporally with the fumigationperiod. The sites of H2O2 accumulation have beencorrelated with the formation of HR-type lesions observedin plants exposed to O3 (Pellinen et al., 1999; Wohlgemuthet al., 2002). This was not so in the case of the sun¯ower,where, in spite of H2O2 accumulation in O3-treatedsamples, no visible sign of injury was evident on the leafsurfaces, a result con®rmed by the absence of alteration atplasma membrane level, as indicated by both unchangedion leakage and TBARS content. Such a result is probablyto be attributed to the absence of a second oxidative burstand intracellular H2O2 production during the post-fumi-gation period, as opposed to reports on plants developingleaf injuries (Pellinen et al., 1999; Schraudner et al., 1998).
Hydrogen peroxide production following biotic andabiotic stresses has been mainly ascribed to a plasmamembrane NAD(P)H oxidase activity (Amicucci et al.,1999; Keller et al., 1998; Rao and Davis, 1999; Torreset al., 2002) and/or to pH-dependent cell-wall PODactivity (Bolwell, 1999; Bolwell and Wojtaszek, 1997),even if the involvement of other H2O2-producing enzymes,such as oxalate oxidase and amine oxidase (Bolwell and
Fig. 4. Ascorbate peroxidase activity (6SE), reported as mmolascorbic acid oxidized min±1 mg±1 proteins, in the intercellularwashing ¯uid of sun¯ower plants exposed to ®ltered air or to 150 ppbof O3. Black bars indicate the duration of exposure. Statisticallysigni®cant differences between O3-treated samples (®lled circles) andthe respective controls (open circles) at each time point are indicatedwith an asterisk; P=0.05, n=6. The boxes show APX activity measuredduring the 4 h exposure to O3.
Extracellular O3-induced H2O2 production and scavenging in sun¯ower leaves 2535
Wojtaszek, 1997), which have not been tested in thepresent experiment, cannot be excluded as well. Theinhibitor experiments suggested that in sun¯ower leavesboth PM NAD(P)H oxidase complex and cell-wallNAD(P)H PODs could be the primary site of H2O2
generation. However, attention should be paid to the use ofinhibitors, since they are not fully speci®c. In fact, even ifat higher concentrations than those used in the presentexperiment, DPI shows a peroxidase-inhibitory activity(BarceloÂ, 1998), and both DPI and KCN, in addition totheir inhibitory activity, have the ability to scavenge H2O2
(Baker et al., 1998). The results from cytochemical H2O2
location and inhibitor use were thus integrated withmeasurements of enzyme activities involved in H2O2
turnover at subcellular level.
The origin of H2O2 during and after O3 exposure insun¯ower leaves is intriguing and seems to be a complexand highly regulated event, requiring the time-dependentco-ordinated stimulation and down-regulation of differentsets of differently located enzymes. In fact, at thebeginning of the O3 exposure, besides the possible H2O2
generation by direct O3 degradation in the apoplast or byreaction of O3 with cell wall and PM compounds (Raoet al., 2000), H2O2 production was sustained by NAD(P)HPOD activity of the IB fraction, while no contribution byboth IWF and CB NAD(P)H PODs or PM NAD(P)Hoxidase complex was made. A decreased H2O2 utilization,as a consequence of the reduced activity of IWF Syr-PODrecorded 30 min after the onset of fumigation, could alsobe involved in such an early H2O2 accumulation. Since
Fig. 5. NAD(P)H oxidation activity (6SE) measured in the plasma membrane fraction (A), in the intercellular washing ¯uid (B), in the cell wallionically-bound (C) and covalently-bound (D) fractions of sun¯ower plants exposed to ®ltered air or to 150 ppb of O3. Black bars indicate theduration of exposure. The activity is expressed as mmol NAD(P)H oxidized min±1 mg±1 proteins, except for the covalently-bound fraction, whoseactivity is reported as DAbs530 min±1 g±1 dry weight of residual cell wall material. Statistically signi®cant differences between O3-treated samples(®lled circles) and the respective controls (open circles) at each time point are indicated with an asterisk; P=0.05, n=6. The boxes show NAD(P)Hoxidation activity measured in the different extracellular fractions during the 4 h exposure to O3.
2536 Ranieri et al.
extracellular PODs, which catalyse the ligni®cation pro-cess, are known to require an acidic environment, with apH optimum ranging from 4.5 to 6.0 (Otter and Polle,1997), this early and transient decrease in Syr-PODactivity could be due to the O3-induced apoplast alkaliza-tion. At the same time, such a pH shift towards basic valuescould be of major importance in triggering H2O2 produc-tion by cell-wall NAD(P)H PODs. In fact, as reported byBolwell and Wojtaszek (1997), POD ability to generateH2O2 is dependent upon extracellular alkalization, themaximum production occurring at neutral to basic pH,depending upon the isoform studied.
Starting from 2 h of exposure to the pollutant, themechanisms responsible for H2O2 production differedfrom those observed at the beginning of fumigation. Infact, IWF NAD(P) POD and by PM NAD(P)H oxidasecomplex seemed to be the primary sites of H2O2 generationduring the last time points of O3 treatment (2 h and 4 h) aswell as after 1 h of recovery in non-polluted air. Finally,another different scenario was evident during the post-fumigation period (5, 7 and 24 h), when H2O2 productionwas sustained by the later activation of NAD(P)H PODspresent in the CB fraction.
As far as the H2O2-consuming Syr-PODs are concerned,and contrary to what was observed at the beginning of thefumigation, their activity was signi®cantly enhanced by O3
starting from 2 h of O3 exposure in IWF and CB fractions.This ®nding is in accordance with previously reportedresults on stimulation of POD activity following O3 stress(Castillo and Greppin, 1986; Peters et al., 1988; Ranieriet al., 1996, 1998). As a consequence, the peroxidative
cross linking of lignin precursors, cell wall proteins andpolysaccharides led to cell-wall stiffening and, by increas-ing the tortuosity of the diffusion pathway of O3,contributed to slowing down O3 penetration. In the CBfraction, Syr-POD remained signi®cantly higher than thecontrol up to the end of the recovery period in ®ltered air,thus contributing to scavenge H2O2. During the post-fumigation period no CeCl3 staining was, in fact, observeddespite an active H2O2 production by CB NAD(P)H PODs.
A different behaviour was shown by IB POD, with theresults unaffected by O3 exposure at any time point. It thusappears that the reaction of the different POD isoforms toO3 stress was dependent on their subcellular location. Asimilar different response by extracellular sun¯ower PODswas previously observed following iron-de®ciency, whichwas found to affect Syr- POD activity in the CB fraction,but not in the IB one (Ranieri et al., 2001). However, untilnow, in spite of intense investigation, no clear correlationhas been established between the role of different PODisozymes and their subcellular location in the cell wall(Penel et al., 2000), although many different reactionscatalysed by PODs in the cell wall are supposed to requirea ®ne control of microlocalization.
Although H2O2 is acknowledged to be an importantsignal molecule, it should be remembered that its levelsneed to be carefully tuned to avoid uncontrolled oxidativedamage. Since lower levels of H2O2 seem to be suf®cientto activate defensive genes rather than those required totrigger cell death (Levine et al., 1994), the capability ofachieving optimal H2O2 levels suf®ciently high to ensurethe signal transduction, but not high enough to induceoxidative damage, is of major importance in determiningthe fate of the plant cell. In this context the antioxidantenzymes and metabolites play a key role. APX isrecognized as one of the most ef®cient ROS scavengingsystem (Foyer et al., 1994) because of its high af®nity forH2O2 and its presence in different subcellular compart-ments. The stimulation of APX by O3 exposure, frequentlyobserved in many plant species (Castillo and Greppin,1986; Peters et al., 1988; Ranieri et al., 1996, 1998, 2000),underlines the key role of this enzyme in H2O2 detoxi®ca-tion. In sun¯ower plants, the prompt stimulation ofextracellular APX activity, which was detected as earlyas 30 min after the beginning of O3 exposure and remainedsigni®cantly higher than the control even in the post-fumigation period, may be important in avoiding the build-up of toxic H2O2 concentrations. To con®rm the import-ance of the extracellular matrix as a ®rst line of defenceagainst O3-induced stress, no change in intracellular APXactivity was observed under the present fumigationconditions (data not shown). The rapid enhancement ofAPX activity was probably due to an increased rate ofascorbate peroxidation by pre-existing enzymes, althoughde novo enzyme synthesis could not be excluded either. Infact, an increase in both intra- and extracellular APX
Fig. 6. Leaf ethylene emission (6SE) expressed as nl ethylene h±1 g±1
fresh weight of sun¯ower plants exposed to ®ltered air or to 150 ppbof O3. Black bars indicate the duration of exposure. Statisticallysigni®cant differences between O3-treated samples (®lled circles) andthe respective controls (open circles) at each time point are indicatedwith an asterisk; P=0.05, n=3. The boxes show ethylene emissionmeasured during the 4 h exposure to O3.
Extracellular O3-induced H2O2 production and scavenging in sun¯ower leaves 2537
protein content was previously detected in sun¯ower plantsafter 4 d (4 h d±1) of exposure to 150 ppb of O3 (Ranieriet al., 2000). Similarly, analysis of APX mRNA levels inarabidopsis treated with 100±150 ppb of O3 revealedenhanced cytosolic mRNA levels within 3±4 h (Kubo et al.,1995), while exposure to 300 ppb of O3 lead to increasedtranscript levels of a cytosolic APX starting from 30 min oftreatment (Rao and Davis, 1999).
Increased ethylene production was one of the earliestevents observed in both herbaceous and tree species inresponse to O3 treatment (Langebartels et al., 1991;Overmeyer et al., 2000; Sandermann, 1996; Wellburnand Wellburn, 1996). An interplay between ethylene andROS was recently suggested by Moeder and co-workers(2002), who proposed that ethylene synthesis and percep-tion were required for active H2O2 production in O3-exposed tomato. On the other hand, the ®nding thattransgenic tobacco lines retaining a very low catalaseactivity (CAT1AS) showed a dramatic, transient increasein ethylene production 2±3 h after exposure to high light,which followed H2O2 accumulation, suggesting that H2O2
could act as a signal upstream of ethylene (Chamnongpolet al., 1998). Based on the result of the present experiment,a clear temporal correlation could not be establishedbetween these two signalling molecules. In fact, insun¯ower leaves, both H2O2 and ethylene levels increasedat a very early stage of the treatment, i.e. 30 min after theonset of the fumigation, although, in accordance with the®nding of Moeder et al. (2002), the peak of ethyleneemission, detected after 2 h of O3-exposure, preceded themaximum H2O2 accumulation, observed at the end of thefumigation. Treatments with inhibitors of ethylene bio-synthesis or perception are in progress to clarify thepossible role of ethylene in inducing H2O2-mediatedoxidative burst.
Ethylene emission by O3-exposed plants was correlatedto O3 sensitivity and the appearance of leaf injuries(KangasjaÈrvi et al., 1994; Sandermann et al., 1998). Celldamage has been initially ascribed to a chemical reactionbetween ethylene and O3, yielding a radical generationthat, in turn, would lead to lipid peroxidation and tissueinjury (Elstner et al., 1985; Mehlhorn and Wellburn,1987). More recently, however, some authors (Moederet al., 2002; Overmeyer et al., 2000; Sandermann et al.,1998; Tuomainen et al., 1997) have reported evidence ofethylene playing an active role in lesion development as acomponent of the signal transduction pathway leading toprogrammed cell death, so that both a highly regulatedincrease in ethylene emission and functional ethyleneperception and signalling are required. However, by con-trast with the commonly reported evidence, ethyleneevolution by O3-treated sun¯ower leaves was accompan-ied by neither increased lipid peroxidation nor leaf damage,suggesting the existence of threshold levels below whichethylene is ineffective and/or the involvement of factors
other than ethylene in inducing lesion formation. It shouldbe remembered that the ®nal response to O3 depends on thecross-talking between the different signalling routes,involving not only ROS and ethylene, but also jasmonic(JA) and salicylic acid (SA), which interact with each otherin a synergetic or antagonistic manner (Overmeyer et al.,2000; Rao et al., 2000). In this context SA is known toinduce H2O2 accumulation by inhibiting catalase activitythrough speci®c binding to the enzyme (Chen et al., 1993)or by inducing H2O2 formation by peroxidases (Kawanoand Muto, 2000), while JA is believed to desensitize theO3-induced oxidative burst and the SA-mediated ampli®-cation loop which results in the production of excess ROS(Overmeyer et al., 2000; Rao et al., 2000).
In conclusion, the early H2O2 accumulation in sun¯owerplants seems to be the result of a highly regulated time-dependent stimulation and down-regulation of differentlylocated enzymes which produce or scavenge H2O2. Asummary of the mechanisms involved is illustrated inTable 2. Further experiments aimed at investigating thebehaviour of other extracellular enzymes and metabolitesinvolved in H2O2 turn over, as well as studies directed tounravel the cross-talking among H2O2, ethylene and othersignalling molecules, are required.
Acknowledgements
This research was supported by a grant from MURST (NationalProject) Rome, Italy and by funds from the University of Pisa.
Table 2. Schematic representation of the interplay betweenH2O2 producing and scavenging mechanisms in sun¯owerplants exposed to 150 ppb of O3 for 4 h
Times of measurement refer to h after the onset of fumigation duringboth the exposure to the pollutant (0.5, 1, 2, and 4 h) and therecovery in non-polluted air (5, 7, 24, and 48 h). The symbols and¯ preceding the name of enzymes refer to the detected enhanced ordiminished activities, respectively.
Time Mechanisms contributing toincrease H2O2 content
Mechanisms contributingto decrease H2O2 content
0.5 h ¯ IWF syr-POD IWF APX IB NAD(P)H POD
1 h IB NAD(P)H POD IWF APX2 h IB NAD(P)H POD IWF APX
IWF NAD(P)H POD IWF Syr-POD PM NAD(P)H oxidase CB Syr-POD
4 h IWF NAD(P)H POD IWF APX PM NAD(P)H oxidase IWF Syr-POD
CB Syr-POD5 h IWF NAD(P)H POD IWF APX
PM NAD(P)H oxidase IWF Syr-POD CB NAD(P)H POD CB Syr-POD
7 h CB NAD(P)H POD IWF APX CB Syr-POD
24 h CB NAD(P)H POD IWF APX CB Syr-POD
48 h ± IWF APX
2538 Ranieri et al.
References
Amicucci E, Gaschler K, Ward JM. 1999. NADPH oxidase genesfrom tomato (Lycopersicon esculentum) and curly-leaf pond weed(Potamogeton crispus). Plant Biology 1, 524±528.
Baker CJ, Deahl K, Domek J, Orlandi EW. 1998. Oxygenmetabolism in plant/bacteria interactions: effect of DPI on thepseudo-NAD(P)H oxidase activity of peroxidase. Biochemicaland Biophysical Research Communication 252, 461±464.
Barcelo AR. 1998. Use and misuse of peroxidase inhibitors. Trendsin Plant Science 3, 418.
Bestwick CS, Brown IR, Bennet MHR, Mans®eld JW. 1997.Localization of hydrogen peroxide accumulation during thehypersensitive reaction of lettuce cells to Pseudomonassyringae pv phaseolicola. The Plant Cell 9, 209±211.
Bolwell GP. 1999. Role of active oxygen species and nitric oxide inplant defense responses. Current Opinion in Plant Biology 2,287±294.
Bolwell GP, Wojtaszek P. 1997. Mechanisms for the generation ofreactive oxygen species in plant defence ± a broad perspective.Physiological and Molecular Plant Pathology 51, 347±366.
Bradford MM. 1976. A rapid and sensitive method for thequantitation of microgram quantities of protein utilizing theprinciple of protein±dye binding. Analytical Biochemistry 72,248±254.
Castillo FJ, Greppin H. 1986. Balance between anionic andcationic extracellular peroxidase activities in Sedum album leavesafter ozone exposure: analysis by high-performance liquidchromatography. Physiologia Plantarum 68, 201±208.
Chamnongpol S, Willekens H, Moeder W, Langebartels C,Sandermann Jr H, Van Montagu M, Inze D, Van Camp W.1998. Defense activation and enhanced pathogen toleranceinduced by H2O2 in transgenic tobacco. Proceedings of theNational Academy of Sciences, USA 95, 5818±5823.
Chen Z, Silva H, Klessig DF. 1993. Active oxygen species in theinduction of plant systemic acquired resistance induced bysalicylic acid. Science 262, 1883±1886.
Christensen JH, Bauw G, Welinder KG, Van Montagu M,Boerjan W. 1998. Puri®cation and characterization ofperoxidases correlated with ligni®cation in poplar xylem. PlantPhysiology 118, 125±135.
Elstner EF, Osswald W, Youngman RJ. 1985. Basic mechanismsof pigment bleaching and loss of structural resistance in spruce(Picea abies) needles: advances in phytomedical diagnostics.Experientia 41, 591±597.
Foyer CH, Lelandais M, Kunert KJ. 1994. Photooxidative stressin plants. Plant Physiology 92, 696±717.
Heagle AS. 1989. Ozone and crop yield. Annual Review ofPhytopathology 27, 397±423.
Heath RL. 1994. Possible mechanisms for inhibition ofphotosynthesis by oxone. Photosynthesis Research 39, 439±451.
Hodges TK, Leonard RT. 1974. Puri®cation of a plasmamembrane-bound adenosine triphosphatase from plant roots.Methods in Enzymology 32, 392±406.
KangasjaÈrvi J, Talvinen J, Ultriainen M, Karjalainen R. 1994.Plant defense systems induced by ozone. Plant, Cell andEnvironment 17, 783±794.
Kawano T, Muto S. 2000. Mechanism of peroxidase actions forsalicylic acid-induced generation of active oxygen species and anincrease in cytosolic calcium in tobacco cell suspension culture.Journal of Experimental Botany 51, 685±693.
Keller T, Damude HG, Werner D, Doerner P, Dixon RA, LambC. 1998. A plant homolog of the neutrophil NADPH oxidasegp91phox subunit gene encodes a plasma membrane protein withCa2+ binding motifs. The Plant Cell 10, 255±266.
Kley D, Kleinmann M, Sanderman H, Krupa S. 1999.
Photochemical oxidants: state of the science. EnvironmentalPollution 100, 19±42.
Krupa SV, Kickert RN. 1989. The greenhouse effect: the impactof carbon dioxide CO2, ultraviolet-B UV-B radiation and ozoneO3 on vegetation. Environmental Pollution 61, 263±293.
Kubo A, Saji H, Tanaka K, Kondo N. 1995. Expression ofArabidopsis cytosolic ascorbate peroxidase gene in response toozone or sulfur dioxide. Plant Molecular Biology 29, 479±489.
Laisk A, Kull O, Moldau H. 1989. Ozone concentration in leafintercellular air spaces is close to zero. Plant Physiology 90,1163±1167.
Langebartels C, Kerner K, Leonardi S, Schraudner M, TrostM, Heller W, Sandermann H. 1991. Biochemical plantresponses to ozone. 1. Differential induction of polyamine andethylene biosynthesis in tobacco. Plant Physiology 95, 882±889.
Larsson C, Widell S, Kjellbom P. 1987. Preparation of high-purityplasma membranes. Methods in Enzymology 148, 558±568.
Levine A, Tenhaken R, Dixon R, Lamb C. 1994. H2O2 from theoxidative burst orchestrates the plant hypersensitive diseaseresistance response. Cell 79, 583±593.
Mehlhorn H, Wellburn AR. 1987. Stress ethylene formationdetermines plant sensitivity to ozone. Nature 327, 417±418.
Mensuali Sodi A, Panizza M, Tognoni F. 1992. Quanti®cation ofethylene losses in different container-seal systems andcomparison of biotic and abiotic contributions to ethyleneaccumulation in cultured tissues. Physiologia Plantarum 84,472±476.
Miyake C, Asada K. 1992. Thylakoid-bound ascorbate peroxidasein spinach chloroplasts and photoreduction of its primaryoxidation product monodehydroascorbate radicals in thylakoids.Plant Cell Physiology 33, 541±553.
Moeder W, Barry CS, Tauriainen AA, Betz C, Tuomainen J,Utriainen M, Grierson D, Sandermann H, Langebartels C,KangasjaÈrvi J. 2002. Ethylene synthesis regulated by biphasicinduction of 1-aminocyclopropane-1-carboxylic acid synthaseand 1-aminocyclopropane-1-carboxylic acid oxidase genes isrequired for hydrogen peroxide accumulation and cell death inozone-exposed tomato. Plant Physiology 130, 1918±1926.
Otter T, Polle A. 1997. Characterization of acidic and basicapoplastic peroxidases from needles of Norway spruce (Piceaabies L. Karsten) with respect to lignifying substrates. Plant CellPhysiology 38, 595±602.
Overmeyer K, Tuominen H, Kettunen R, Betz C, LangebartelsC, Sandermann HJ, Kangasjarvi J. 2000. Ozone-sensitivearabidopsis rcd1 mutant reveals opposite roles for ethylene andjasmonate signaling pathways in regulating superoxide-dependentcell death. The Plant Cell 12, 1849±1862.
Pandol®ni T, Gabbrielli R, Comparini C. 1992. Nickel toxicityand peroxidase activity in seedlings of Triticum aestivum L.Plant, Cell and Environment 15, 719±725.
Pellinen R, Palva T, KangasjaÈrvi J. 1999. Subcellular localizationof ozone-induced hydrogen peroxide production in birch (Betulapendula) leaf cells. The Plant Journal 20, 349±356.
Penel C, Carpin S, Crevecoeur M, Simon P, Greppin H. 2000.Binding of peroxidases to Ca2+-pectate: possible signi®cance forperoxidase function in cell wall. Plant Peroxidase Newsletter 14,33±40.
Peters JL, Castillo FJ, Heath RL. 1988. Alteration of extracellularenzymes in pinto bean leaves upon exposure to air pollutants,ozone and sulfur dioxide. Plant Physiology 89, 159±164.
Polle A, Otter T, Seifert F. 1994. Apoplastic peroxidases andligni®cation in needles of Norway spruce (Picea abies L.). PlantPhysiology 106, 53±60.
Ranieri A, Castagna A, Amoroso S, Nali C, Lorenzini G,Soldatini GF. 1998. Ascorbate levels and ascorbate peroxidaseactivation in two differently sensitive poplar clones as a result of
Extracellular O3-induced H2O2 production and scavenging in sun¯ower leaves 2539
ozone fumigation. In: De Kok LJ, Stulen I, eds. Responses ofplant metabolism to air pollution and global change. Leiden, TheNetherlands: Backhuys Publishers, 435±438.
Ranieri A, Castagna A, Soldatini GF. 2000. Differentialstimulation of ascorbate peroxidase isoforms by ozone exposurein sun¯ower plants. Journal of Plant Physiology 156, 266±271.
Ranieri A, Castagna A, Baldan B, Soldatini GF. 2001. Ironde®ciency differently affects peroxidase isoforms in sun¯ower.Journal of Experimental Botany 354, 25±35.
Ranieri A, D'Urso G, Nali C, Lorenzini G, Soldatini GF. 1996.Ozone stimulates apoplastic systems in pumkin leaves.Physiologia Plantarum 97, 381±387.
Rao MV, Davis KR. 1999. Ozone-induced cell death occurs viatwo distinct mechanisms. The role of salicylic acid. The PlantJournal 10, 1017±1026.
Rao MV, Koch JR, Davis KR. 2000. Ozone: a tool for probingprogrammed cell death in plants. Plant Molecular Biology 44,345±358.
Salter L, Hewitt CN. 1992. Ozone±hydrocarbon interactions inplants. Phytochemistry 31, 4045±4050.
Sandermann Jr H. 1996. Ozone and plant health. Annual Reviewof Phytopathology 34, 347±366.
Sandermann Jr H, Ernst D, Heller W, Langebartels C. 1998.Ozone: an abiotic elicitor of plant defense reactions. Trends inPlant Science 3, 47±50.
Schraudner M, Moeder W, Wiese C, Van Camp W, Inze D,Langebartels C, Sandermann Jr H. 1998. Ozone-induced
oxidative burst in the ozone biomonitor plant, tobacco Bel W3.The Plant Journal 16, 235±245.
Sharma YK, Davis KR. 1997. The effects of ozone on anti-oxidantresponses in plants. Free Radical Biology and Medicine 23, 480±488.
Torres MA, Dangl JL, Jones JDG. 2002. Arabidopsis gp91phoxhomologues AtrbohD and AtrbohF are required for accumulationof reactive oxygen intermediates in the plant defence responseProceedings of the National Academy of Sciences, USA 99, 523±528.
Tuomainen J, Betz C, KangasjaÈrvi J, Ernst D, Yin ZH,Langebartels C, Sandermann Jr H. 1997. Ozone induction ofethylene emission in tomato plants: Regulation by differentialtranscript accumulation for the biosynthetic enzymes. The PlantJournal 12, 1151±1162.
Vianello A, Zancani M, Nagy G, MacrõÁ F. 1997. Guaiacolperoxidase associated to soybean root plasma membrane oxidizesascorbate. Journal of Plant Physiology 150, 573±577.
Wellburn FAM, Wellburn AR. 1996. Variable patterns ofantioxidant protection but similar ethene emission differences inseveral ozone-sensitive and ozone-tolerant plant selections. Plant,Cell and Environment 19, 754±760.
Wohlgemuth H, Mittelstrass K, Kschieschan S, Bender J,Weigel HJ, Overmyer K, KangasjaÈrvi J, Sandermann H,Langebartels C. 2002. Activation of an oxidative burst is ageneral feature of sensitive plants exposed to the air pollutantozone. Plant, Cell and Environment 25, 717±726.
2540 Ranieri et al.