dynamic of vistula river channel deformations downstream of
TRANSCRIPT
1
Dynamic of Vistula River channel deformations
downstream of Włocławek Reservoir
Michal Habel
2
Contents
1. Introduction…………………………………………………………….…………..…3
2. Aim of work, scope and research methods…………………………….…………..…5
3. General characteristics of the Vistula valley floor……………………………..……11
3.1. Geomorphology and geological structure……………………..………...…11
3.2. Selected features of the hydrologic system ………………...…….......……16
3.3. The Włocławek dam……………………………………………………….19
4. Morphology of Vistula channel………………………………………..…...…..……22
4.1. Channel type………………………………………………………....…….23
4.2. Channel mesoforms………………………………………………..………30
4.3. Selected factors modifying channel morphology……………...………......37
4.3.1. Natural factors………………………………………………..…....37
4.3.2. Artificial factors……………………………………………..….....42
5. Changes in hydrological regime after damming………………………………..49
5.1. Changes in mean annual water stages……………………….………….….50
5.2. Changes in daily and hourly water stages………………………..……...…52
5.3. Maximum impact range of the dam ………………………………….……55
6. Changes in bed load transport and its lithological characteristics……………...…....62
7. Functioning of Włocławek reservoir and its morphological consequences .……..…74
7.1. Channel deformations………………………………………..………….....74
7.1.1. Changes in the longitudinal and cross-sectional profile……...….74
7.1.2. Dynamics of bed load layer thickness changes …………...……..84
7.1.3. Change in water surface slopes…………………………..…...….87
7.2. Flood plain development …………………………………………….…....92
8. Summary……………………………………………………………………….…….98
9. References……………………………………………………………..…………...102
*This paper was prepared under the project no. N N306 2178 3 financed by Narodowe Centrum Nauki –
Morphodynamics of Vistula valley floor below Włocławek reservoir
3
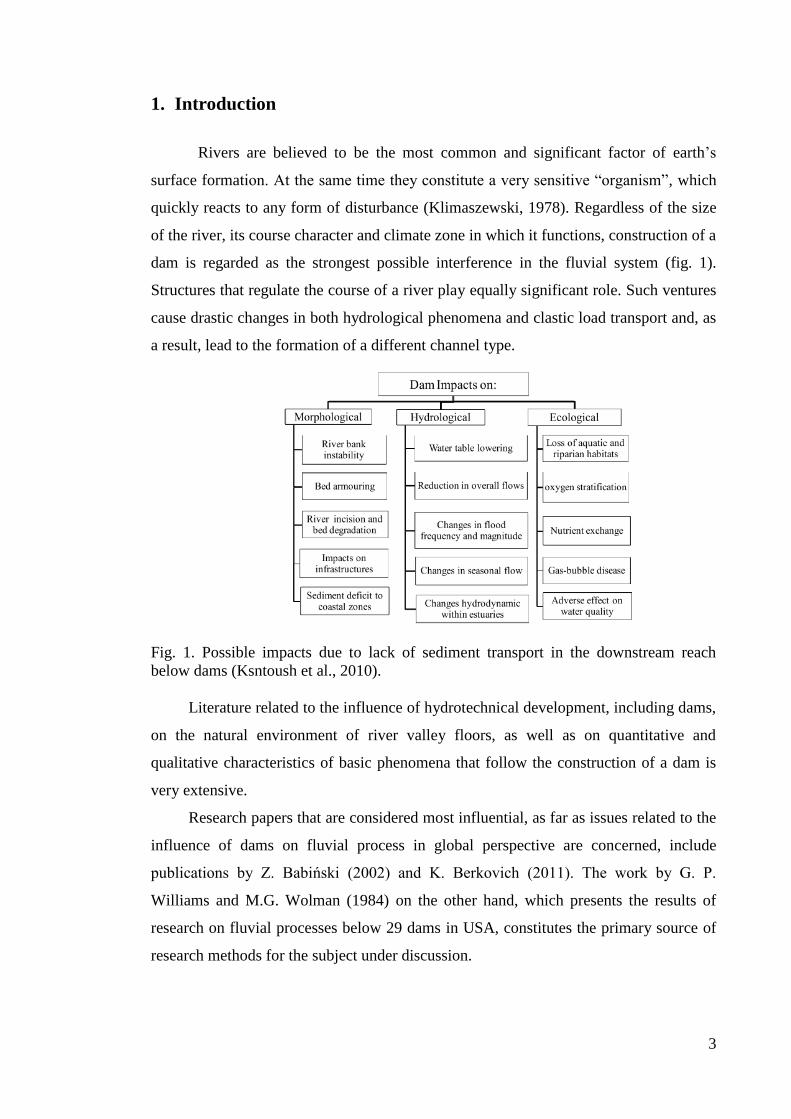
1. Introduction
Rivers are believed to be the most common and significant factor of earth’s
surface formation. At the same time they constitute a very sensitive “organism”, which
quickly reacts to any form of disturbance (Klimaszewski, 1978). Regardless of the size
of the river, its course character and climate zone in which it functions, construction of a
dam is regarded as the strongest possible interference in the fluvial system (fig. 1).
Structures that regulate the course of a river play equally significant role. Such ventures
cause drastic changes in both hydrological phenomena and clastic load transport and, as
a result, lead to the formation of a different channel type.
Fig. 1. Possible impacts due to lack of sediment transport in the downstream reach
below dams (Ksntoush et al., 2010).
Literature related to the influence of hydrotechnical development, including dams,
on the natural environment of river valley floors, as well as on quantitative and
qualitative characteristics of basic phenomena that follow the construction of a dam is
very extensive.
Research papers that are considered most influential, as far as issues related to the
influence of dams on fluvial process in global perspective are concerned, include
publications by Z. Babiński (2002) and K. Berkovich (2011). The work by G. P.
Williams and M.G. Wolman (1984) on the other hand, which presents the results of
research on fluvial processes below 29 dams in USA, constitutes the primary source of
research methods for the subject under discussion.

4
Individual issues related to dams operation, including the processes below their
reservoirs, was touched upon in numerous scientific articles. Research on changes in the
morphology of river channels and hydrological conditions were conducted by, among
others: N. I. Makkaveev (1957) – below Rybinski reservoir on the Volga river and
Dnieper reservoir on the Dnieper river; R. S. Chalov et al. (2001) – the Ob river, below
the Novosibirsk Dam; B. V. Belys et al. (2000) – on the Yenisei river, below the
Sayano-Shushenskaya Dam; E. D. Andrews (1986) – below Flaming Gorge reservoir,
on the Green river; M. Kondolf (1997) – below Keshweek reservoir, on the Sacramento
river; N. Zdankus and G. Sabas (2006) – below the hydro power plant in Kaunas, on the
Neman river. X. X. Lu and R. Y. Siew (2006) – below Manwan reservoir, on the
Mekong river. Trends in the development of flood plains adjacent to dammed rivers
were discussed by: Ch. Chiwei (1990), who conducted research on the Huang He river,
below Sanmenxia reservoir; S. N. Ruleva, L. V. Zlotina and K. Berkovich (2002), who
investigated the area of the upper Ob valley, below Novosibirsk reservoir.
Polish literature features numerous scientific articles that include results of
research dealing with the impact of artificial reservoirs on the environment: I.
Dynowska (1984) – on the San river; J. Punzet (1972) – on the San river; M. Kosicki
and J. Krężel (1977) – on the Oder; Z. Babiński and D. Szumińska (2006) – on the Wda
river; A. Bartczak (2007) on the Zgłowiączka river– all of the above-mentioned works
discussed the changes in runoff regime below dams. J. Cyberski (1984), on the other
hand, attempted to outline the problems related to the exploitation of artificial
reservoirs. A. T. Jankowski (1995), as well as A. T. Jankowski and M. Rzętała (1997)
conducted research in the Upper Silesia region. The works of W. Machalewski et al.
(1974), W. Śliwiński (1975), L. Bagiński (2010) and Z. Brenda (1998) focused on the
problems related to the functioning of Włocławek reservoir on the Vistula. Issues
related to erosion below dams, and below the Włocławek dam in particular, are touched
upon in numerous research papers by Z. Babiński (1982, 1992, 1997, 2002). B.
Przedwojski and J. Wicher (1999), on the other hand, studied erosion processes below
Jeziorsko reservoir on the Warta river. R. Głowski and K. Parzonka (2007), as well as
K. Parzonka and R. Kosterba (2010) carried out research on the Oder river, below Brzeg
Dolny reservoir, while R. Malarz (2004) dealt with channel deformations on the Soła
river below minor dams.

5
2. Aim of work, scope and research methods
The aims of this work are contained in the answer to the following question:
What was the role of the Włocławek dam in the process of shaping the valley floor
below in the last forty years of its operation. It is a fact that damming a channel greatly
contributes to radical changes in fluvial processes. Most importantly, it disrupts the
continuity of bed load transport and its renewal below dams and, furthermore, it leads to
the formation of a new hydrologic regime. Thus, an attempt was made to answer a
number of component questions: Did the dynamics of channel processes increased or
decreased due to the changes in the operation regime of the hydro power plant? Did the
identified erosion and deposition zones alter their location? Did the channel types
undergo transformation in consequence of dam’s activity? How did the course of
hydrological and morphodynamic phenomena relate to the channel bed, flood plain and
bed load changes in time and space?
The aims were primarily focused on: (a) analysing the course of hydrological
phenomena in the longitudinal profile below the dam (influence range of the hydro
power plant and weirs on water stages fluctuation, i.e. flows), (b) identifying changes in
channel’s cross-sections and the longitudinal profile of the channel bed in reference to
the factor that modifies these characteristics – geological structure, (c) analysing
changeability of conditions for channel sedimentation (bed load).
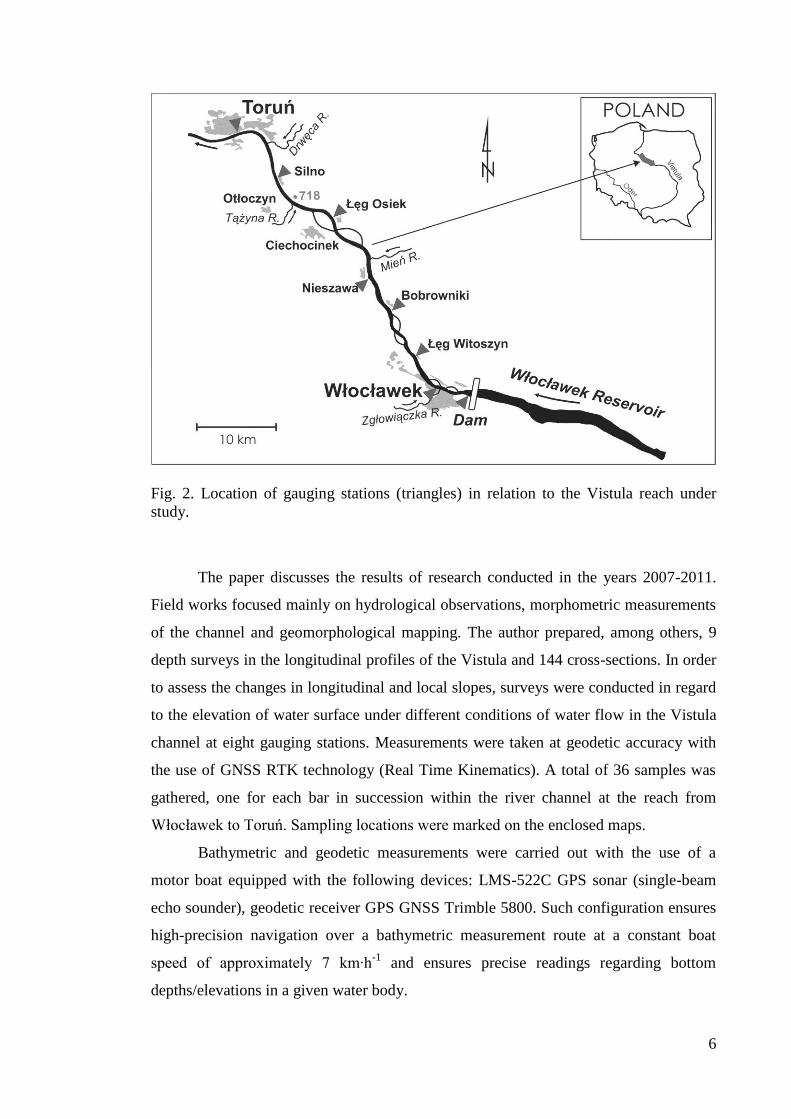
The research covered the Vistula valley floor fragment (its channel in particular)
stretching from the dam profile in Włocławek (river km 674.85) to the gauging station
profile in Toruń (734.7 km) (fig. 2). The reach under discussion is located entirely
within the boundaries of Kujawsko-Pomorskie voievodeship (central Poland). In terms
of physical and geographical division of Poland proposed by J. Kondracki (2002), the
area under discussion is located in the North European Plain, cuts through Płock Basin
and Toruń Basin (mesoregions of Toruń-Eberswalde ice-marginal valley). According to
the geographical division, the Vistula valley fragment from Płock to Bydgoszcz-Fordon
is referred to as Kuyavia Vistula (Falkowski, 1982). W. Pożaryski (1965) indicates that
the river flows along the hidden anticlinorium of Kujawy and it developed its valley in
the zone of coastal synclinorium, being parallel to the tectonic line which divides the
plate of Eastern Europe from the fold of Western Europe.
6
Fig. 2. Location of gauging stations (triangles) in relation to the Vistula reach under
study.
The paper discusses the results of research conducted in the years 2007-2011.
Field works focused mainly on hydrological observations, morphometric measurements
of the channel and geomorphological mapping. The author prepared, among others, 9
depth surveys in the longitudinal profiles of the Vistula and 144 cross-sections. In order
to assess the changes in longitudinal and local slopes, surveys were conducted in regard
to the elevation of water surface under different conditions of water flow in the Vistula
channel at eight gauging stations. Measurements were taken at geodetic accuracy with
the use of GNSS RTK technology (Real Time Kinematics). A total of 36 samples was
gathered, one for each bar in succession within the river channel at the reach from
Włocławek to Toruń. Sampling locations were marked on the enclosed maps.
Bathymetric and geodetic measurements were carried out with the use of a
motor boat equipped with the following devices: LMS-522C GPS sonar (single-beam
echo sounder), geodetic receiver GPS GNSS Trimble 5800. Such configuration ensures
high-precision navigation over a bathymetric measurement route at a constant boat
speed of approximately 7 km∙h-1
and ensures precise readings regarding bottom
depths/elevations in a given water body.

7
During the research on the development of the flood plain located 5 km below
the dam, a set of geomorphological maps was prepared for the flood deposition forms
within the new right-bank flood plain. In particular, morphometric measurements were
taken in relation to the natural levees and backswamps. A shallow geological sounding
was carried out to determine the character of sediments that constitute the new flood
level. Also, measurements of thickness were carried out for the overbank deposits found
on top of the flood plain. The natural levees were exposed and their structure was
analysed.
Hydrological observations involved an experiment aimed at defining the influence
range of the Włocławek dam on water stages fluctuation on the lower Vistula.
Observations were carried out every hour at ten gauging stations located at a 230 km
long reach of the Vistula below the Włocławek dam (the area under analysis was
beyond the scope of this paper). Staff gage were temporarily installed at four of the
stations. Apart from the author, a group of 20 observers participated in the experiment.
An aerial reconnaissance over the Vistula channel and the flood plain was
carried out twice: during low water stages and during the passage of a flood wave peak
through the reach under study in May 2010. A total of approximately 1500 high-
resolution photographs were taken, which were later used for typological analysis of the
channel.
By courtesy of numerous institutions, the author obtained archival source
materials, mostly hydrological data, as well as archival cross- and longitudinal sections
of the Vistula channel, which were then used to supplement the data collected during
field works. Hydrological data concerning water inflow to Włocławek reservoir in the
years 1970-2010 and the parameters of 46 flood waves that were allowed to go through
the Włocławek dam were made available by, among others, Hydro Power Plant in
Włocławek (Elektrownia Wodna in Włocławek) of ENERGA SA Capital Group. Data
on hourly water stages from the years 1996-2010 were acquired from the Włocławek
department of the Regional Water Management Authority in Warsaw. The said data
were obtained from a digital limnigraph located at the lower floodgate of the
Włocławek dam. The data related to hourly flows and water stages at Toruń and
Włocławek gauging stations were collected from the IMGW website –
www.pogodynka.pl. Additionally, the work incorporates the information included in the
permit required by Water Law Act for lifting waters in the Vistula river, as well as the
intake and discharge of water by the Włocławek dam and Włocławek hydro power

8
plant. The Regional Water Management Authority in Gdańsk, department in Toruń,
provided archival data concerning the morphology of the Vistula channel from the years
1976-1995. Based on this information, 25 longitudinal profiles of the channel within the
river reach under study were prepared. Hydroprojekt DHV company, department in
Włocławek, granted access to the Vistula channel cross-sections from the years 1969
and 1994.
Own data collected during field works supplemented with archival data allowed
for, among others, determining the dynamics of changes, both in time and space, in the
parameters related to the geometry of valley floor elements, including: channel and
flood plain width, hydraulic mean channel depthand maximum channel depth, wetted
perimeter of the channel. The value of hydraulic mean channel depth and maximum
depth was related to the mean annual water stages on the Vistula in the years 2005-2010
(166 cm at the water gauge in Włocławek and 298 cm in Toruń). Additionally, the
author proposed an index of channel cross-section shape kshp, which constitutes a
quantitative criterion to be used in the analysis of channel’s geometry. The index
represents the ratio of wetted perimeter length to channel width in a cross-section. If
channel bed is flat, devoid of microform and macroforms, the index value tends to be
low, for example close to 1. On the other hand, when channel bed in a cross section
features numerous pools and riffles, the value of the index increases.
The dynamics of changes in the longitudinal profile of the Vistula channel was
investigated by comparing 24 depth soundings on the navigation waterway (in the
thalweg zone) of the Vistula reach under study. 25 of them constitute archival data,
while the remaining 9 were carried out by the author of this work. With the use of
archival cross-sections of the Vistula – from the years 1969 and 1994 – as well as own
measurements taken in 2009, it was possible to compare changes which occurred in the
cross-sections of the channel after 40 years of the Włocławek dam operation. The
morphological analyses were conducted on digital terrain model (DTM) based on the
data collected in field with the use of single-beam sonar and GPS RTK receiver. The
process of preparing DTM in the form of a raster image was discussed by A.
Magnuszewski (1999). In order to compare the morphological changes that occurred in
the longitudinal and cross-sectional profiles of the channel, we related them to multi-
annual mean water stages from the period preceding the construction of the dam in
Włocławek (1954-1970), i.e. 348 cm at Włocławek, 418 cm at Nieszawa, 311 cm at
Silno, 347 cm at Toruń.

9
One of the advantages of surveying channel cross sections with the use of a
single-beam sonar converter LMS-522i is that it provides a digital image of bed
lithology (fig. 3). The converter of the sonar is capable of distinguishing strong and
weak signals, which allows for identification of bed sediments (Smith, Lazar 2003).
Fig. 3. Hydroacoustic image of the Vistula bottom in its cross-sectional profiles of
November 2009. Explanation: A – profile on 677.4 km), bottom with diverse relief,
devoid of alluvia, material in-situ remained (boulders, tills, moraine clay and its
residues); B – profile on 680.05 km, flat bottom devoid of alluvia; C – 706.8 km,
alluvial bottom (sand, gravel).
The analysis of sediment thickness and quartz grain roundness was conducted in
the Laboratory of the Institute of Geography at Kazimierz Wielki University.
Granulometric analysis of sand sediments was conducted on a set of sieves with a
mechanic shaker. The formula proposed by L. Folk and W. C. Ward (1957) was used to
characterize grain-size distribution, as well as lithodynamic features of the deposition
environment. Values for the following basic grain-size distribution indexes were
defined: average grain diameter (Mz), skewness asymmetry (SkG), standard deviation
(δ1) – a measure of sediment sorting. Furthermore, an analysis of quartz grain roundness

10
was conducted with the use of the method proposed by W. C. Krumbein (Mycielska-
Dowgiałło, 2007). Quartz grains of fractions 1.0-0.8 mm and 0.8-0.5 mm were analysed
using the method of visual comparison with the matrix. Upon distinguishing 100 quartz
grains of a given fraction, a stereoscopic microscope OPTA-TECH SL-T equipped with
fibre-optic illuminator was used to visually divide the grains into 10 classes of
roundness according to W. C. Krumbein (Mycielska-Dowgiałło, 2007) (fig. 4).
Consequently, a percentage share was calculated for well and very well rounded grains
(roundness class from 0.7 to 0.9 according to W. C. Krumbein). The author realizes that
visual methods of comparison may be subject to personal errors, however, as E.
Mycielska-Dowgiałło (2007) claims, values obtained by means of, among others,
Krumbein's method tend to be more precise than the ones obtained with the use of
Krygowski Geniformameter – a device for analysing the roundness of grains.
Fig. 4. Matrix for the visual assessment of grain roundness according to W. C.
Krumbein (as cited in Mycielska-Dowgiałło, 2007).
11
3. General characteristics of the Vistula valley floor
3.1. Geomorphology and geological structure
Geomorphological research within the lower Vistula valley first began in the
interwar period. The first scientist to engage the problem was R. Galon (1934), who
described the main stages of river development. Later on his research was continued by
W. Mrózek (1958), A. Tomczak (1971) and W. Niewarowski (1987). A summary of
research conducted up to date was offered by E. Wiśniewski (1976, 1987), whose
dissertations discussed geological characteristics and geomorphological evolution of a
valley – from the moment of ice sheet occurrence to the contemporary times. Similarly,
E. Falkowski along with his team (1987), based on detailed geological surveys,
attempted to explain the genesis of the lower Vistula valley floor.
The lower Vistula valley features a complex of river terraces and is
characterized by a sequence of narrowings and widenings (Wisniewski, 1976;
Drozdowski, 1982). Within its entire low-land reach, from the mouth of the Narew river
near Warsaw to Tczew (initial part of the estuary reach), the valley features six
widenings – basins: Warszawa, Płock, Toruń, Unisław, Świecie and Grudziądz,
separated one from another with narrower parts. The alternating character of the
widenings and narrowings (gorges) in the lower Vistula valley was primarily
conditioned by the impact of the last glaciation and the geological structure of the valley
itself. Płock Basin, a 20 km wide basing that stretches over a distance of 60 km, extends
into a 7 km wide gorge and further shifts into Toruń Basin (90 km long and approx. 20
km wide) (fig. 5).
Within the Vistula valley section under discussion, the prevailing
geomorphological units include: Dobrzyń Moraine Plateau and Kujawy Moraine
Plateau along with the gorge that separates them (fig. 5). The Vistula river flows on the
right side of Płock Basin, intensively undercutting the slope of Dobrzyń Moraine
Plateau in Włocławek. The river then runs more to the north and passes through the 25
km long gorge separating Płock Basin and Toruń Basin. Eventually, at Nieszawa town,
before entering Toruń Basin, it draws closer to the slopes of Kujawy Moraine Plateau
(fig. 5).
According to E. Wiśniewski (1976), the Vistula valley fragment under study
emerged from the material left during the transgression of the last glacier. Such
occurrence was a result of meltwater activity during the retreat of the glacier. The

12
process was later continued by the river waters. Varied strength and amount of flowing
waters was recorded in the form of erosion levels and terraces of different origins. The
eleven-stage system of terraces presented by R. Galon (1953) in relation to the outwash
plain (sandur) and the valley of the Brda river, and by W. Niewiarkowski (1968) in
reference to the ice-marginal valley and the Drwęca river valley, was later transferred
onto the Vistula valley by E. Wiśniewski (1976). During the cold and arid periods, on
top of the tall, vast and devoid of vegetation terraces of the Vistula, aeolian processes
tended to develop (Roszko, 1982). In consequence, dunes emerged and forest took hold
of the terrains that had undergone the aeolian transformations, stabilizing the
development of these formations in the process (Mrózek, 1958).
Fig. 5. Fragment of the lower Vistula valley in comparison to the geomorphological
outline (Roszko, 1982). Explanation: A – fragment of Płock Basin; B – gorge section of
the valley; C – Toruń Basin; 1 - ground moraines, 2- end moraines, 3 – dunes, 4 – edge
of valleys and terraces.

13
Elevation of the Dobrzyń Moraine Plateau near the Vistula valley ranges on
average from 95 to 100 m a.s.l. The hill located in the Szpetal district of Włocławek
(133 m a.s.l.) constitutes the highest peak of its western part – a pushed moraine
(Głodek et al. 1967) with a glaciotectonically deformed Neogene core (Froehlich,
1970). The Kujawy Moraine Plateau, on the other hand, is lower and its elevation
amounts to 90-95 m a.s.l. The Dobrzyń Moraine Plateau in comparison to the Kujawy
Moraine Plateau located west of the Vistula valley appears to be more diverse in terms
of glacial relief.
The eastern edge of the Kujawy Moraine Plateau located near Nieszawa town, is
particularly well defined in terms of its geological structure. At one of the exposed
fragments of a gravel pit one may observe that the series of sand, gravel and ice-
marginal sediments (series of river sediments) is covered with two layers of boulder
clay. They are separated with a one meter thick layer of fine sands. The series of sand
sediments, identified as river-derived, with its upper part reaching the elevation of 60-66
m a.s.l., locally rests on top of moraine clay and may serve as an evidence of multiple
glaciations. The near-edge zone of the Dobrzyń Moraine Plateau displays similar
geological structure. Deep drillings indicated that the geological structure mainly
involves three layers of moraine clay separated with series of sand formations or
Pliocene clays.
Geological mapping of the channel along with its banks in Włocławek
performed in October 1986 by the team of E. Falkowski (1987) revealed numerous
exposures of soils classified as erosion-resilient – silt and clay, as well as fluvioglacial
formations with interlayers of gravel and pebbles, which form boulder pavement. They
tend to occur in abundance along the left bank and boulevards, and below the mouth of
the Zgłowiączka river. The Vistula valley in Włocławek, due to its geological structure,
features high morphodynamics within the bank zone and the edge zone. Over the
Tertiary formations of the Miocene, and Pliocene in particular, numerous landslides and
weathering wastes creeping can be found (Falkowski, et al., 1987). The landslides on
the right bank, from the wintering harbour in Dolny Szpetal (not operating at present) to
the Zawiśle district, descend in the form of numerous tongues to a very narrow lath-
shaped fragment of the flood plain. The mass movements of the left-bank slope affected
only a minor fragment – near the road bridge, below the mouth of the Zgłowiączka river
(currently a build-up area). As one can conclude from the geological cross-section

14
prepared by B. Fąferek (1960), the Miocene formations in the vicinity of the dam in
Włocławek enter into a direct contact with the Quaternary sediments. The channel itself
is currently established in Pliocene clays and, partially, sand formations. The profile of
the Włocławek dam features a particularly specific distribution of geological strata. For
instance, Miocene sediments (sand with lignite) and Pliocene clays are deposited many
meters above the Pleistocene layers (sand and boulder clay). Grodzka Island in
Włocławek is located on top of a pedestal composed of variegated clay and gravel along
with numerous pebbles, which, in its upper part, form boulder pavement.(photo 1). The
upper layer of these formations lies above the average level of water surface –
approximately 40-41 m a.s.l. (Habel, 2007). E. Falkowski et al. (1987) identified it as a
threshold that took on the form of an islet capable of withstanding erosion processes
that extended over the entire Holocene.
Fig. 6. Geological cross-section in the profile of the Włocławek dam according to B.
Fąferek (1960 – generalized and supplemented with the maximum incision of the
channel bed). Explanation: 1 – sand and gravel, 2 – clay, 3 – Pliocene clay, 4 – fine
sand, 5 – water surface, 6 – line indicating the course of the cross-sectional profile prior
to dam construction, 7 – line indicating the course of the cross-sectional profile 500 m
below the dam in 2009.

15
According to E. Wiśniewski (1976), the surface of the sub-Quaternary
formations is usually composed of sediments of the Pliocene formations (variegated
clay interlayered with silts or fine sands). The upper layer of the Tertiary stratum within
the Vistula valley fragment under study is deposited at the depth of 20-35 m a.s.l. In the
vicinity of Ciechocinek town, on the other hand, geological drillings indicated a lack of
Pliocene formations. Moreover, the Quaternary series is deposited directly on top of
Miocene sediments (fine sands, clayey silts or brown coal), or over the Jurassic-
Cretaceous surface fractured with faults.
Photo 1. Exposed fragments of the bed in the right-bank zone of the Vistula channel in
Włocławek (river km 681.0). In the foreground: boulder pavement remaining from the
erosion of moraine clay – fragment of an out-washed threshold at the right bank of the
channel and also the proximal part of the new flood plain (photography taken in
December 2007).
Another important issue to be considered in relation to the area under study, both
in terms of geomorphology and geology, involves the genesis of the fluvioglacial
sediments that form the terraces – lath-shaped forms along the Vistula channel.
According to E. Falkowski et al. (1987), the development of the valley within the gorge
section of the river is related to the meltdown of dead-ice blocks. In his view, the place
where dead-ice was deposited the longest coincided with the line of the current Vistula
channel. Thus, rainwater and meltwater from the glacier had to flow adjacent to the
dead-ice blocks and the emerging moraine plateaus (present edge of the Dobrzyń and

16
Kujawy Moraine Plateau). This way, oblong covers of fluvioglacial sediments or lath-
shaped glacial alluvia genetically unrelated to the Vistula’s terraces were formed on the
slopes and in the post-glacial areas (lower in terms of hypsometry than the moraine
plateaus). The analysis of the material accumulated in those areas showed that it cannot
be related to the Vistula, as it contains large quantities of coarser gravel and pebbles,
transport of which is rendered impossible due to the gradient of the river, both in its
present and ancient form commonly referred to as “Pra-Wisła” (Falkowski et al., 1987).
Fig. 7. Course of river terraces within the fragment of the lower Vistula plain section
under study between Płock Basin and Toruń Basin (Wiśniewski, 1976).
Explanation: 1 – moraine plateau; 2 – subglacial channels; 3 – glaciofluvial strata; 4 –
erosive meltwater plains; 5 – meltwater valleys; 6 – late-glacial erosive terraces; 7 –
deposition terraces; 8 – dunes; 9 – escarpments of: a – moraine plateaus, b and c –
terrace; 10 – altitude points; 11 – terraces and strata were assigned to numbers from I to
IX.

17
Fig. 8. Fragment of the Vistula valley's gorge section near Bobrowniki, including the
course of terraces and strata according to E. Wiśniewski (1976) – aerial photography
was taken from the altitude of 1000 m during the flood of May 23rd
, 2010, during water
flows of approx. 5750 m3∙s
-1.
Photo 2. Near-bank zone of the Vistula channel exposed during low water stages along
with the channel bank – edge of terrace IV (51-52 m a.s.l.) in Łęg Witoszyn village (km
685). Boulders and pebbles, residues after the erosion of moraine clay, occur both in the
channel bed and at the edge of the terrace (photography taken in June 2007).

18
3.2. Selected features of the hydrologic system.
The basin of the Vistula river covers an area of 194 424 km2. The river stretches
over a distance of 1092 km. The average elevation of the basin amounts to 270 m a.s.l,
and the highest located point of the drainage area in the Tatra mountains reaches the
elevation of 2655 m a.s.l. (Mikulski, 1963). The average slope of the drainage basin
amounts to 1.04‰ and clearly decreases down the river (Soja, Mrózek, 1990).
However, as much as 75% of the river course displays slope lower than 0.3‰ (Starkel,
2001). There are three artificial reservoirs on the Vistula river course. Two are
constructed on upper part on the river in Czerniańsk and Goczałkowice and one on the
lower reach in Włocławek.
While summer floods appear to prevail in the drainage basin of the upper
Vistula, lowlands feature a tendency for meltwater floods. Total annual precipitation
within the river basin in the Carpathian Mountains oscillates between 1000 and 1300
mm. It reaches up to 550 mm in the vicinity of Warsaw and tends to be even lower in
Toruń – as little as 450 mm (Soja, Mrózek, 1990; Sobolewski, 2000). Due to the
prevalence of summer rainfalls, the river is considered to feature a snow/rain-fed system
of supply (Dynowska, 1991).
The mean annual flows on the Vistula tend to increase down the river. If the
flows amount to 6.23 m3∙
s-1
in Skoczewo, then in Zawichost they reach 450 m3∙
s-1
, and
1090 m3∙
s-1
in Tczew. The maximum flows increase from 648 m3∙
s-1
in Skoczewo to
7500 m3∙
s-1
in Zawichost and 7849 m3∙
s-1
in Tczew. Individual parts of the river basin of
the Vistula display a clear difference in the irregularity of flows (Qmax and Qmin), which
indicates varied capacity for retention and water circulation (Soja, Mrózek, 1990). The
lower reach features particular capacity for water to drain into alluvia (Starkel, 2001). In
the river basin of the upper Vistula runoff tends to be slightly higher in the summer
half-year. The lower parts of the drainage basin, on the other hand, feature much higher
runoff in the winter half-year, which for instance in Warsaw amounts to 67% (Starkel,
2001).
The lower Vistula holds about 65% of Vistula's entire water capacity and
represents approx. 30% of Poland's hydro-energetic resources. It displays features of a
transit river with complex hydrologic system. Its water regime is basically defined in
the upper and, albeit to lesser degree, middle part of the river basin. The lower course of

19
the Vistula constitutes nearly 18% of the entire river basin surface. Lowland inflows
ensure moderately stabile discharges (Rusak, 1982).
The surface area of Vistula's subcatchment at the reach under study, between the
profiles of the gauging stations in Włocławek and Toruń, amounts to 8644.2 km2
(approx. 4.4% of the entire river basin). From Włocławek to Toruń there are 29
tributaries, 5 intakes and 11 outfalls, 23 of which constitute minor unnamed streams.
The largest tributaries include: Drwęca (mean annual discharge of 33.15 m3∙
s-1
),
Zgłowiączka (5.05 m3∙
s-1
), Tążyna (1.53 m3∙
s-1
), Mień (1.36 m3∙
s-1
) (Kubiak–Wójcicka,
2006). The volume of water supplied by these streams (on average 43 m3.
s-1
) constitutes
less than 5% of total flows within this reach of the Vistula.
Table 1. Gauging stations on the Vistula within the river reach under study.
Item
no.
Name of station River
kilometre
Gauge datum
(m a.s.l.)
Current technical condition
1 Dam 674.85 - Staff gage and digital limnigraph
2 Włocławek 679.7
41.17 (newly
installed in
2004) (used to
be 42.17)
Staff gage and digital limnigraph
3 Łęg Witoszyn 685.3 42.50 No staff gage since spring 2010
4 Bobrowniki 695.8 40.92 No staff gage since approx. 1995
5 Nieszawa 702.4 38.23 No staff gage since approx. 2000
6 Łęg Osiek 713.5 38.69 No staff gage since approx. 1995
7 Silno 719.8 34.42 No staff gagesince approx. 2008
8 Toruń 734.7 31.96 Staff gageand digital limnigraph
Water stages at the river reach under study are recorded at two gauging stations
belonging to the Institute of Meteorology and Water Management - National Research
Institute, in Włocławek and in Toruń, and additionally at one station owned by the
Regional Water Management Boards of Warsaw, located below the Włocławek dam
(river km 679.85). Until recently it was possible to conduct observation at several more
gauging stations of the Regional Water Management Board (table 1).
High water stages on the lower Vistula occur in March and April and, albeit not
as frequently, in late spring and summer. The former are related to the early-spring

20
meltwater flow, often intensified with the movement of slush and floating ice. The
latter, on the other hand, usually short-term, result from continuous rains. In both cases
the occurring flood waves reach a relative elevation of 3-5 m (Babiński, 1992), the
maximum being 8 m. Lower water stages are most frequent at the turn of autumn and
winter (September-November). While water stages are predominantly shaped by flows,
water level fluctuation may st times result from slush and slush-ice jams (Babiński,
1992). The maximum flow on the lower Vistula was recorded in March 1924. It
amounted to 8620 m3∙
s-1
in Płock and 8305 m3.
s-1
in Włocławek. Such flows have never
again been recorded.
In the years 1970-2005, the river featured mean annual river flows of 895 m3.
s-1
in Włocławek and 1004 m3.
s-1
in Toruń. In humid years (1971, 1974-1975, 1977-1982,
1998-2002) they ranged from 945 to 1342 m3.s
-1 (fig. 9). In arid years (1972, 1984-
1987, 1990-1992, 2003-2004) they oscillated between 580 and 790 m3.s
-1. The
maximum water flow amounted to 5972 m3.
s-1
(on March 30th
, 1979), and the minimum
– 158 m3.
s-1
(in September 1992). Available records related to the maximum flows
during the flood of spring 2010 appear to be contradictory. According to the Regional
Water Management Board in Warsaw, on May 23rd
, there was a temporary discharge at
the Włocławek dam which amounted to 6350 m3.
s-1
(Bagiński, 2010). However, data
provided by the Institute of Meteorology and Water Management - National Research
Institute indicate that the said discharge was no higher than 5765 m3.
s-1
(Walczykiewicz,
2011). Records for the Vistula reach under study mention 46 flood waves in the last 40
years (1970-2010).
The operation of the dam clearly interferes with the natural regime of flows
below Włocławek. Since 1970 it has been lifting and retaining waters of the Vistula in
the adjacent reservoir, total capacity of which amounts to 270 million m3 (Glazik,
Grześ, 1999). While the reservoir does poorly at attenuating flood waves on the Vistula
below the dam, it does, to great extent, limit low water stages. The average time of
water retention in the reservoir in the years 1972-2000 amounted to only 5.2 days
(Gierszewski, 2006).
In the past, floods on the lower Vistula may have also resulted from ice and
slush-ice jams. The average time span of ice phenomena (slush, ice cover) on the lower
Vistula amounts to 60-65 days (Glazik, Grześ, 1999). The most frequently occurring
forms of icing include movement of slush and ice floats released by the dam in
Włocławek. In Toruń, in the years 1970-2000, ice cover occurred once in five years. It

21
is thus less frequent than in the previous years (Pawłowski, 2003). Ice phenomena on
the lower Vistula usually commence in mid November and tend to disperse by the end
of March (Grześ, 1991).
Fig. 9. Flows regime on the Vistula in Włocławek in the hydrological years 1970-2005
(data compilation based on: Elektrownia..., 2010).
Explanation: Q – mean annual flow, Qmax – maximum observed flow, Qmin –
minimum observed flow, F – number of days when flood plain was inundated, Qfb -
discharge above which flood plain becomes inundated (full bank).
3.3. Water barrage in Wloclawek
Most intensive hydrotechnical works at the river reach under study took place
in the 50s and the 60s of the 20th
century and were related to the implementation of
"Programme of complex development of the Vistula river water system", also referred
to as "the Vistula programme". It assumed, among others, that about thirty dams would
be constructed on the Vistula river (Makowski, 1998), about eight/nine of which were
supposed to be erected on the lower Vistula alone. Eventually, the dam in Włocławek
was the only project completed.
Preparations for the construction were commenced in May 1962. Surplus of
channel material was deposited on the left bank, which in result formed an artificial
river bank fragment. The channel was dammed on October 13th
, 1968. The dam was
commissioned on January 17th
, 1970 – upon filling the reservoir.
The Włocławek dam is located at river kilometre 674.85 km (photo 3).
Initially the dam lifted water to the level of 11.3 m. At present it is 14.1 m (Zdulski,
2001). Thus, the largest storage reservoir in Poland was formed, with surface area of 70

22
km2, length of 55 km, average width of 1.2 km and average depth of 5.5 m. It is also the
second largest reservoir in terms of capacity – approx. 270 million m3
of water. The face
dam is 670 m long and its crest is 12 m wide. Its base width at the deepest amounts to
150 m. The dam consists of the following elements:
1. Nine weirs locked with sluice gates, weight of which amounts to 93 tons each.
When normal level of impoundment (57.3 m a.s.l.) is maintained, their discharge
capacity amounts to 7500 m3∙s-
1. Over a stretch of 100 m, the bottom below
weirs is secured with concrete slabs and riprap.
2. A hydro power plant with an installed rating of 160.2 MW. It is equipped with
six Kaplan hydro-units with turbine runners of 8.0 m in diameter. In the years
1971-2000, the power plant annually produced from 550 GWh to 1043 GWh of
electric energy. The maximum flow capacity of the power plant amounts to 2100
m3s
-1 (Zdulski, 2001).
3. A navigation lock with chamber dimensions of 115x12 m.
4. A fish ladder - currently not operating (a new one is designed to be set on the
left bank).
5. A check dam stabilizing waters below the weirs and the power plant (new
element introduced in 1998 – photo 4).
The dam is administrated by the Regional Water Management Authority in Warsaw
- dapartment in Włocławek.
Due to the increasing concern for the safety of the dam, efforts were made to
stabilize the surface of lower water at the level of 44.5 m a.s.l. – the said value is
considered to be boundary for maintaining stability and integrity of the dam and proper
operation of the hydro power plant. For this purpose, in the years 1997-2000, 506 m
below the weir and the power plant, a threshold was constructed (photo 3 and 4), which
temporarily ensures proper conditions for the functioning of the said elements (Polak,
Rosicki, 2007). The threshold constitutes a structure made of riprap with an addition of
gabion on the crest and concrete tetrapods in the body of the threshold (photo 4). The
structure features the following dimensions: total length – 660 m, maximum height –
7.1 m, crest width at the frontal part – 7.0 m, maximum width at the base – 54 m.

23
Photo 3. Dam in Włocławek (photography taken on July 8th
, 2008). Explanation: 1 –
earth dam, 2 – weirs, 3 – power plant, 4 – navigation dock, 5 – fish ladder, 6 – check
dam stabilizing the lower part of the dam.
Photo 4. Renovation of the check dam in Włocławek during a complete cessation of
water flow (photography taken by St. Krzyżelewski on June 6th
, 2007).

24
For most part of the year, the threshold operates in adverse conditions –
particularly when ice goes through at low flows, between 400 and 1000 m3s
-1. When
only a thin layer of water flows over the threshold, the structure is being damaged by
moving blocks of ice. The flow of water over the threshold results in the formation of
higher deep pools at its lower part. The bottom at the lower part of the threshold at the
reach below the weir is relatively stable (higher deep pools range between 1.0 and 1.5 m
in depth). At the hydro power plant, on the other hand, it tends to be unstable (sand
Tertiary formations) and the higher deep pools reach depths of 10-14 m (fig. 6).
Proper maintenance of the dam in the last forty years required great financial
outlays. All repairs carried out so far cost PLN 152 million in total (Bagiński, 2010).

25
4. Morphology of Vistula channel
River channel, by M. Pardẻ (1957) referred to as channel proper, understood as
space contained between banks which holds average waters, arises from a more or less
ideal attempt at natural or artificial adaptation. A river-bed (channel along with flood
plain) may overlap with channel proper if the banks of the latter, at times of highest
floods, are higher than the current water level (e.g. Grand Canyon in USA, Dunayec
River Gorge in Poland). In such a case, the flood plain may be nonexistent. M. Pardẻ
(1957) also distinguishes a low water channel, which often coincides with channel
proper due to river slope being minor within a given reach, or in consequence of near-
bank structures, such as water-lifting weirs. This paper follows the claim made by J. R.
L. Allen (1965), that the range of a channel is limited by the course of bankline at water
surface level no higher than average high water. It tends to occurs at water surface level
corresponding to average water.
Morphology of river channels depends on many factors considered changeable
in time and space. According to D. Montogomery and J. Buffington (1997), river
channel's development predominantly depends on the following factors: debris supply
(its volume, frequency and size), river's transport capacity (frequency and volume of
flows) and – directly and indirectly – vegetation (e.g. it's impact on stability of banks).
W. Jarocki (1957) additionally distinguishes relief of the river basin and climate.
According to F. Falkowski (1978), channel's morphology is a resultant of requirements
imposed by high and low flows.
One might add one more factor to the above-mentioned list, namely the direct
influence of human activity, such as hydrotechnical infrastructure and extraction of
debris. Channel formation is most effective when it is entirely filled with water, at the
so called bankfull stage (Makkaveev, 1957). As water overflows channel banks, during
floods, the rate of water flow decreases and so does its erosive capacity (Klimaszewski,
1978).
The main parameters characterizing channe's morphology involve: its width,
depth, bed slope, size of grains composing the bed, channel formations, type of channel
(Montogmery, Buffington, 1997).

26
4.1. Channel type
The typological analysis of the Vistula river reach under study employed the
classification systems proposed by L.B. Leopold and M.G. Wolman (1957), as well as J.
L. Allen (1965). The authors identified, among others, straight, meandering and braided
rivers. Another criterion of classification involved the view in plan. According to J. C.
Brice (1975), one can distinguish single-thread rivers; straight, sinuous, meandering,
braided and island-braided, and the analysis of channel pattern should be conducted
with the use of topographic maps and aerial photographs. Research of L. B. Leopold
and M. G. Wolman (1957) shows that the occurrence of a meandering or braided
channel type at a given river reach depends mainly on the ratio of channel slope to river
flow value. S. A. Schumm (1981) relates the development of each particular channel
type to the size of bed load transport, texture of the bottom and debris, and the energy of
a river. Moreover, in his view, each channel type represents certain degree of stability.
Russian scientist R. S. Chalov (2001) proposed a classification system of channel types
based on morphodynamic criteria related to rivers that function in different conditions
of geological structure (fig. 10). The typological analysis introduced by D. Rosgen
(1994, 1996), on the other hand, is based on the measurable features of channel
geometry, plan view and channel bed-forming material (fig. 4). Initially, D. Rosgen
(1994) grouped rivers into categories, assigning them letters from A to G in relation to
characteristic parameters: slope value of water surface, shape of cross-section, channel
pattern in plan view, sinuosity, parameter defining the ratio of river valley floor width to
channel width, or width-depth ratio. Consequently, he distinguished another set of
categories, assigning them numbers from 1 to 6, which he related to the prevailing
fraction of transported sediment in a channel – d50 (fig. 4). Employing the classification
proposed by D. Rosgen (1996) allows us to assign an alpha-numeric code to a given
river reach under study. Moreover, since each category represents a strictly defined
range of values referring to particular geometrical parameters, it is possible to
effectively compare reaches selected from different rivers.

27
Fig. 10. Morphodynamic types of channels functioning in different geological and
geomorphological conditions – according to R. S. Chalov (2001). Explanation: A –
incised, confined; B – adapted; C – with wide flood valley; I – relatively straight, non-
branching; II – meandering; III – anabranching; a – Yug river channel; b – Panoy r.
channel; c – Sukhona r. channel; d – Don r. channel; e – Gauja r. channel; f – northern
Dvina r. channel; g – Oka r. channel; h – Żizdra r. channel; i – Pechora r. channel.
Fig. 4. River classification by D. Rosgen (1996), including measurable geometrical
parameters of a channel and type of sediments in which a channel was developed. W –
channel width, D – average depth.

28
Most of the approaches presented above are based exclusively on office works.
There is, however, a number of researchers who attempt to establish a typology of river
channels by supplementing theoretical considerations with field works: M.
Kamykowska et al. (1975), or L. Kaszowski and K. Krzemień (1999), among others,
seek to characterize rivers using code systems and field notes. Thus, channel typology is
defined based on gathered geometrical parameters of a channel, channel forms and
debris, as well as calculated indicators. For the analysis of a given channel system, one
tends to select features which directly or indirectly provide information on channel's
dynamics, in other words, on processes that tend to form and transform it (Krzemień,
2006). This kind of mode of research and proposed channel typology, which focuses on
identifying morphostatic and morphodynamic channel sections, tends to be employed
for mountain channel systems. However, it might be applied more extensively and for
other types of systems. The above-mentioned typological characteristic of channels
served as a basis for the analysis of changes in the Vistula channel below the
Włocławek dam.
A number of different channel formations were distinguished within the river
reach under study. For the purpose of identifying and classifying channel formations
within the Vistula reach under study, the author of this work consulted available
literature on the subject under discussion. M. Klimaszewski (1978) argues that in
consequence of bed erosion, shoals (riffles) and river pools tend to form. The
occurrence of riffles and pools in an interchangeable manner is considered a
characteristic feature of rivers that reach an equilibrium curve. According to J. L. Allen
(1965), under specific hydraulic conditions, bed load transport in a river flowing over a
sand bed results in the emergence of various bed formations. W. Florek et al. (2008)
expresses a similar opinion, claiming that bed formations reflect the hydrodynamic
condition of a channel at a given time. L. Van Rijn (1984) divided bed formations in
alluvial rivers in terms of discharge conditions into: formations of low flows regime
(flat bed, ripple marks or dunes), formations of transition flows regime, formations of
high flows regime (flat bed, antidunes).
Z. Babiński (1982, 1992, 2002), in his research on the lower Vistula, within the
macroformation here understood as the channel along with the flood plain,
distinguished channel meso- and micro-formations. Channel mesoformations include
those, which emerged in consequence of accumulation (islands, bars – positive
formations) and erosion formations (river pools – negative formations). Channel

29
microformations are defined as a dynamic surface layer of channel mesofromations. The
author of this paper took the liberty to extend the group to include thresholds, which
constitute outcrops of erosion-resilient formations. According to Z. Babiński (1992),
each type of a channel corresponds to a different channel bar type and their
classification should not only account for their emerged fragments, but also their
underwater parts. Z. Babiński (1992) also prepared a summary of terminology for all
positive channel sand mesoforms in world literature (gathered from 74 reference items
in English and 23 in Russian). Bearing this in mind, he proposed a schematic system of
channel mesoformations (fig. 12) along with channel types they correspond to.
Fig. 12. Schematic system of channel mesoforms on rivers with a gravelly-sand bottom
(Babiński, 1992).
I – Transversal pattern – straight river: 1 – transversal bars; 2 – transversal bars with
"horns"; a – stage of development; 3 –transversal mouth bars (in regard to inflow).
II – Diagonal pattern – straight-meandering river: 1 – oblique-alternate bars; 2 – oblique
bars.
III – Lateral pattern – meandering river: 1 – lateral bars; 2 – point bars; c – riffles.
IV – Medial-longitudinal pattern – braided river: 1 – Longitudinal bars – longitudinal
bars with lunate bars; 2 – middle-central bars, emerged fragments of middle-central
bars; 3 – middle-transversal bars.
V – Diverse pattern – braided river: 1 –braided river bars, 2 – sand levees (bars) -
linguoid bars, large-scale dunes; 3 – island and near-island bars.
In order to assign the Vistula reach under study to one of the channel types
falling into the classification proposed by R. S. Chalov (2001) or D. Rosgen (1996), the
30
river must be divided into several fragments. For the purpose of typological analysis,
the river reach under study was divided into three parts, taking into consideration
geomorphological, geological and geometric factors. The following attempt to classify
the types of channel is to be considered preliminary and shall be continued in the
summary of this paper.
Reach I. The Vistula river within the first reach under analysis, stretching
between the dam in Włocławek (river km 675) and Bobrowniki village (km 696) (fig.
2), displays features of a young river, restricted by hydrotechnical structures and diverse
in terms of bed's resilience to erosion (Falkowski et al., 1987). It runs between two
moraine plateaus (fig. 5) and takes on the form of a gorge (Wiśniewski, 1976). In plan
view, channel's course is straight, both during low and average water flows, and its
width fluctuate, ranging from 380 to 800 m (fig. 13 - c). The regulated reach of the
river, set out by the irregularly located groynes, is of changeable width, ranging from
280 to 450 m. The zone between the groynes is at present partially filled with sediments
(photo 5). Currently, flood plain’s width at this place ranges from 700 to 1200 m, half of
which is occupied by a channel of diverse width – sediments accumulated here undergo
redeposition (fig. 13 - a).
A number of islands strengthened by vegetation can be found along the entire
length of the overbank zone. Channels located behind the islands (side channels) are
currently sealed off by the regulatory structures. During floods, lateral channels behind
islands are filled with water, and the river may then resemble a multithreaded
anastomosing channel (fig. 8). During average flows, both bed and water surface slope
tend to increase with the distance from the dam in Włocławek towards the Bobrowniki
village. Water surface slope values, which amount to 0.06‰ at average and 0.156‰ at
low water stages, are predominantly shaped by the naturally occurring river thresholds
(fig. 13 – i; photo 1 and 6). The average depth in cross-sectional profiles of the channel
at reach I, at average flows, ranges from 2.8 to 5.9 m – an average of 3.8 m (fig. 13 – f).
The maximum depths in the cross-sectional profiles along the river also tend to vary.
Their values range from 3.3 to 8.9 m (fig. 13 - g). This particular reach of the Vistula
displays one more characteristic feature, as there is a tendency for thresholds (outcrop
for erosion-resilient formations) to appear where the difference between the maximum
and average depth in a cross-section drops to approximately 1.0 m. Both depth-defining
parameters decrease in value with the distance from the dam in Włocławek towards
Bobrowniki (fig. 13 – f, g).

31
Fig. 13. Selected geometrical parameters of Vistula's valley floor in the years 2007-2010 and their values in longitudinal profile at the reach between Włocławek and Toruń.
Explanation: a – width of flood prone area (flood plain, islands and channel); b – width of islands; c – active channel width; d – channel bed slope; e – water surface slope at average flows; f – pentad values
(moving average for five pieces of data) in the cross-sectional profiles of mean channel depths; g –maximum depth; h – shape index of cross-sectional profile (kshp) expressed as a ratio of wetted perimeter to
active channel width; i – location of thresholds at channel's bottom.

32
Photo 5. Intensive channel sedimentation in the basins formed between groynes of the
Vistula at reach I, approximately at river km 688 (right bank). Accelerated process of
channel incision and excessive length of groynes constitute favourable conditions for
sediment deposition. Explanation: 1 – filled groyne field, 2 – flood plain, 3 – groyne
(photo – September 2007).
Photo 6. "Wildered" fragment of the Vistula channel at reach I – km 686.2. Channel bed
restricted by groynes – diverse in terms of resilience to erosion. Explanation: 1 –
threshold, an outcrop of erosion-resilient formations; 2 – inter-groyne bars; 3 – remains
of an island; 4 – course of regulatory route; 5 – groynes; 6 – main directions of water
flows (photography taken on July 8th
, 2008).

33
At the reaches where thresholds occur, thalweg tends to migrate to the side –
river gradually becomes "wild" – which results in lateral erosion that "cuts off" groynes
from the channel banks and opens up channels behind islands to low and average flows
(photo 6). A criterion which facilitates the analysis of channel geometry is the use of
cross-section shape index kshp, which is the ratio of the length of wetted perimeter to
channel's width (fig. 13 - h). The value of the index tends to vary within the entire reach
under discussion – from 1.1 (flat bottom devoid of bed formations) to 3.1 (diversified
bottom with numerous pools and riffles, e.g. bellow the road bridge at river kilometre
680), which certainly contributes to the high changeability of hydrodynamic conditions
in the channel (fig. 3- A). On average the kshp index amounts to 1.8, which allows us to
draw a conclusion that the length of bed's wetted perimeter is by 80% higher than its
width.
The reach I at average water stages, according to the classification proposed by
R. S. Chalov (2001), displays features of a "constrained" incised river, and its channel is
relatively straight and non-branching – type A-1 (fig. 10). The fact arises from
anthropogenic transformations, including channel's location below the dam. However,
during flood flows it bears features of an adjusted river, branching into several channels
– type B-III (fig. 10, fig. 8). On the other hand, according to the classification of D.
Rosgen (1996), relating the reach under study to a specific type may prove to be
difficult due to transformations of river's natural geometrical attributes and the fact that
the parameters defining particular river types are fixed (fig. 4). It might be reasonable to
assume that reach I falls into type D3, D4, D5 or D6, as the width-depth ratio (W/D)
amounts to 128, slope is lower than 0.4‰, and its bed is mostly composed of clay,
boulder pavement and silt (fig. 3 - A and B). Additionally, type B2 may also be taken
into consideration (fig. 4).
Reach II. The second Vistula reach under analysis (river km 696-719.8), from
Bobrowniki to the mouth of the Tążyna river and the town of Silno (fig. 2), resembles a
braided-anastomosed river, with partially preserved islands and lateral channels, as well
as channel sand mesoforms (bars). Especially during floods, the channel in plan view
appears to be multi-branch (fig. 8, photo 7). In terms of geology and geomorphology,
the reach constitutes a transition zone between the gorge fragment of the valley and
wide Torun Basin (fig. 5). The channel has nearly constant width (from 500 to 650 m –
fig. 13 - c), and the regulatory structures (groynes) occur sporadically in the vicinity of
river kilometre 700 and at the reach from km 713 to 719.8. Large islands constitute a

34
major part of the cross-section of river valley floor. The only reach where they do not
occur stretches between river kilometre 696 and 700. Here, the width of the flood plain
is small (fig. 13 - b). The lateral branches behind the existing islands tend to function,
albeit partially, even at mean and low flows, unlike at the higher located reach I.
Channel slopes are diverse – perhaps due to the large quantity and size of accumulated
channel mesoforms (bars). Water surface slopes are nearly equal at average and low
flows, and do not correlate with channel's slope (fig. 13 - d, e). Hoever, they are
influenced by the channel sand mesofroms. Mean depths of the channel in its cross
sections are comparable and on average amount to 2.9 m (fig. 13 – f). The maximum
channel depths in cross sections range from 3.7 to 7.0 m (fig. 13 - g). The cross-
sectional profiles with highest depths are concentrated within a short reach located blow
the dam, at river kilometre 706. Kshp for this particular reach amounts to 1.6 and tends to
decrease down the river (fig. 13 – h).
Photo 7. Fragments of reach II. The channel resembles a braided-anastomosed river
with partially preserved island and sand mesoforms. Explanation: 1 – remaining
fragment of Ptasia Island at river kilometre 697, 2 – newly-formed flood plain, 3 –
Zielona Island at river kilometre 708-711 km (photography was taken during low flows
in June 2008).

35
According to the classification proposed by R.S. Chalov (2001), reach II
functions similarly to rivers that are adapted to their valleys, anabranching – type B-III
(fig. 10). According to D. Rosgen's (1996) classification, on the other hand, we may
tentatively assume that it belongs to type C5. W/D ratio amounts to 200, slope is lower
than 0.4‰, and the bed is mostely composed of sands (fig. 3 - C). Other variants that
may be taken into consideration include type D5 and DA5 (fig. 4).
Reach III. The third reach under analysis, between river kilometre 719.8 and 735, i.e.
between the towns of Silno and Toruń (fig. 2), constitutes a regulated channel with a
number of transverse-riffle sand bars – alternate. At low and average water stages, the
channel is straight, with forced erosion and limited meandering due to groynes (photo
10). There is a large concentration of hydrotechnical structures, due to which the course
of mainstream at times of low and average flows is winding, nearly sinusoidal. During
floods one can notice the consequence of regulatory works being carried out –
straightening of the channel. The Vistula channel in the central part of the valley floor is
regulated and of constant width (photo 8, fig. 13 - c). The adjacent flood plain is up to
approx. 2000 m wide and at present consists of former islands and lateral threads filled
with accumulated debris (fig. 13 – a, fig. 14). Currently, the flood plain, which is higher
than the one in reach I and II, is cultivated. Majority of tree stands and bush patches
were cleared, which accelerates runoff during floods. Channel bed slope is by 5 cm
(0.05‰) steeper than water surface slope (fig. 13 – d and e). Average depths in the
cross-sectional profiles of this river section amount to 3.8 m, meaning they are similar
to reach I. However, the course of depths in the longitudinal profile appears to be more
even, with a tendency to decrease down the river (fig. 13 - f). Numerous groynes and
three road bridges appear to exert strong influence on the course of maximum depths in
cross-sectional profiles, which, at this particular river reach, range from 4.0 to 8.8 m.
While the shape index of channel's cross sections kshp for the entire reach amounts to the
average of 1.9, longitudinal profile displays greater diversity – from 1.1 to 3.0 (fig. 13 -
h). Channel bed relief is particularly diverse in the vicinity of a highway bridge (river
km 725.5), which is considered to be a result of impact exerted by hydrotechnical
structures (groynes and the bridge), as well as numerous sand bars (fig. 13 – h).

36
Photo 8. Flooded Vistula valley floor near Toruń – reach III, in the vicinity of the
highway bridge during the culmination of the flood wave of May 2010; flow of approx.
5750 m3.
s.1
(photography taken on May 25th
, 2010 from an altitude of approx. 1000 m).
According to the classification proposed by R.S. Chalov (2001), reach III
functions similarly to rivers adapted, incised and constrained, in this case, by the
regulatory structures – type B-1 (fig. 10). During floods, water that pours into the flood
plain flows in between former islands. In such cases, the river displays features of an
anabranching stream – type B-III (fig. 11, photo 8). According to D. Rosgen's (1996)
classification, on the other hand, we may assume that it represents type C5. W/D ratio
amounts to 200, slope is lower than 0.4‰, and the bed is mostly composed of sands.
Other variants that may be taken into consideration include type D5 and DA5 (fig. 11).
TORUŃ

37
Fig. 14. Channel type changes in the vicinity of Toruń (Broza Toruńska) resulting from
the regulatory works in the last 130 years. 1876 – braided-anastomosed channel with the
width of up to 2 km; 1888 – channel soon after regulation, with a 350 m wide regulatory
route; 1943 – regulated channel, straight, with forced bed erosion and alternating
transverse-riffle sand bars (according to L. Koc (1972) – supplemented by Z. Babiński,
1992). Explanation: 1 – flood plain and islands; 2 – near-island bars; 3 – transverse-
riffle sand bars; 4 – flood plain’s edge; 5 – steep edges of islands; 6 – transverse and
longitudinal groynes; 7 – course of regulatory route.
4.2. Channel mesoforms
Islands are the largest mesoforms occurring within the reach under study. This
paper follows the definition given by Z. Babiński (1982), who defined them as
formations that vary in shape and are usually covered with willows, sporadically with
older tree stands. Initially they represented various kinds of sand bars or cut-off parts of
flood plain. If a river bar achieves an appropriate relative height, which prevents it from
being flooded and provides favourable conditions for vegetation, it may transform into
an island (Babiński, 1982). Changes concerning islands are often limited to their bank
zones. Within the Vistula reach under study, islands typically do not constitute
individual compact formations, but merge into groups of islands separated with lateral

38
channels. We can distinguish ten formations of this kind between Włocławek and
Toruń, although some of them are currently in residual form.
At present there are two islands in Włocławek (river km 678-682): Włocławska
Island, which in 2008 was once again separated from the flood plain in consequence of
dredging (Śliwiński, 2003), and Grodzka Island, merged with the flood plain. Moreover,
between river kilometre 682 and 700, there is Krzywogórska Island and Korabnicka
Island (currently devoid of lateral branches), complex of Rachocin and Bógpomóż
Islands (fig. 8), separated with partially obstructed channels, and a small remaining
fragment of Ptasia Island approximately at river kilometre 697. Two more islands are
located between river kilometre 700 and 719, Zielona Island and Dzikowska Island,
separated from the flood plain by lateral channels (photo 9). Changes in the shorelines
of islands in the last 40 years can be traced on the maps enclosed.
According to Z. Babiński (1982), islands located at the reach under study can be
divided into central and lateral. The first are genetically linked to large central bars
formed in the Holocene. Morphological analyses clearly indicate that both Zielona
Island (photo 9) and Dzikowska Island near Ciechocinek share such genesis. W.
Juśkiewicz (2006), upon analysis of historical maps and sketches dating to the Middle
Ages, claims that Dzikowska Island reached its current shape after the construction of
flood embankments in 1872, which protect Ciechocińska Lowland. Before that, the
island was dismembered.
Islands surface slope at the reach stretching from Włocławek to Toruń ranges
from 1.0 to 2.4‰ and is considerably higher than water surface slope in the main
channel. According to Z. Babiński (1982), islands with higher surface slope are less
dismembered, for instance Zielona Island and Dzikowska Island. On the other hand,
islands with lower slopes are highly dismembered and divided into small rhomboidal
islets. This feature is displayed by Grodzka Island, Rachocin Island, Bógpomóż Island.
Relief of these formations is diverse, which is a result of frequent inundation of their
surfaces. Height differences across these formations reach several metres, for instance
on Dzikowska Island (up to 7 m).
Within the Vistula reach under study one may distinguish positive, accumulation
channel sand mesoforms, sizes of which tend to be proportional to channel's width.
Their emerged surface usually attains the level of annual mean water stages. They tend
to be highly stable and inert. They may remain in an unchanged form and at the same

39
river reach even for many seasons (Babiński, 1992). In 2008, within the reach under
study we distinguished 36 river bars – either temporal or permanent.
Photo 9. Zielona Island at river kilometre 708-712 during a flood at water flow of
approx. 6350 m3.
s.1
. Explanation: 1 – lower part of floodplain forest 2 – elevated
fragment of the island, 3 – lateral channel artificially sealed with a groyne (photography
taken on May 23rd
, 2010 from an altitude of approx. 1000 m).
Natural thresholds – outcrops for erosion-resilient formations detected in the
channel zone – constitute a separate group of mesoforms. Hydrotechnicians sometimes
refer to them as "reefs" (Polak, 1996). This appears evident from the presence of
thresholds within the river reach. They tend to have considerable sizes, comparable to
river sand bars, and their boundaries can be distinguished with the use of bathymetric
maps or aerial photographs. Their highest fragments tend to emerge during low water
stages (photo 6 and 10). E. Falkowski (1990) and T. Falkowski (2004) described similar
formations on the middle Vistula, referring to them as "culminations of alluvial
basement". The author distinguished five mesoforms of this type within the river reach
under study (fig. 13 – i). They attained their present form through "uncovering" the
upper part of an erosive (fossil) valley. The said formations consist mainly of
Pleistocene sediments, such as boulder clay and compressed coarse grains of

40
fluvioglacial sediments, and their upper parts are often covered with boulders (photo 1,
5, 19). According to E. Falkowski et al. (1987), irregular distribution of the outcrops for
the alluvial bed sediments exerts strong influence on the pattern of the mainstream in
the river channel reach, as well as the course of its erosion and deposition processes.
The authors argue that random distribution of erosion-resilient sediment outcrops
underneath alluvia is conditioned by glaciotectonic deformations of Miocene, Pliocene
and older Pleistocene layers. M. Klimaszewski (1978) describes the occurrence of
"sulay" formations in the rivers of tropical and subtropical regions. The said formations
represent rocky bends and ridges, similar in terms of morphology and development of
fluvial processes to the thresholds on the lower Vistula. Sulay formations can be found
in a wide valley floor of an anastomosing river, or one that rapidly transforms its
channel. They tend to emerge where weathering of rocks proceeds slower than within
the adjacent reaches (selective erosion). Rivers incising into a weathered bed display
low slope and even profile. Similar in the form are "parohy" – stone outcrops
(Słownik..., 1881) found on the Dnieper and Dniester rivers.
The main determinants conditioning the configuration of channel mesoforms
within the river reach under study include: geometrical parameters of river valley,
hydrotechnical structures and diverse lithology of channel bed. The analysis of channel
mesoforms was conducted in relation to three Vistula reaches distinctively different in
terms of dynamics.

41
Photo 10. The emerged fragment of the threshold located at the right bank of the Vistula
channel at river kilometre 685.5 km (approx. 10 km below the dam). The upper layer of
the formation composed of moraine clay is covered with boulders, maximum diameters
of which range between 80 and 90 cm. The photography was taken on June 25th
, 2007.
It shows a groyne field located 150 m off the right bank during temporarily lowered
flows (to 350 m3.
s-1
) at the Włocławek dam.
Reach I – (between river kilometre 675 and 696) currently devoid of channel
sand mesoforms (bars). Lithological structure of the bed indicates large diversity of
sediments in terms of resilience to erosion. However, one can distinguish five erosion
formations within the reach – thresholds. M. Klimaszewski (1978) argues that
thresholds occurring at the bottom of river channels can be one-sided, two-sided,
transverse or diagonal in relation to the river course. In this particular case, four of them
are one-sided and all of them are located closer to the right bank (photo 1, 2 and 10).
One of them displays a well developed pattern in plan view and additionally diagonally
dams 90% of channel's width (fig. 15). Two thresholds took on the form of islets
capable of withstanding erosion in the channel. One of them is located at river kilometre
686 (photo 6), and the second at river kilometre 690 (fig. 16).

42
Fig. 15. Bathymetric plan of the Vistula channel near Włocławek (river kilometre
682.5-684) of November 2009 illustrating the arrangement of bed formations and depths
during low water flows. Explanation: 1 – channel's reach before 1970; 2 – islands before
1970; 3 – river kilometres; 4 –threshold's range; 5 – groynes; 6 – direction of water
flow.
Fig. 16. Bathymetric plan of November 2009, made on a considerably narrowed reach
of the Vistula channel near Gąbinek (river km 690), showing the morphology of a
positive channel mesoform, a threshold, composed of erosion-resilient formations. The

43
arrangement of bed formations and depths was established during low water flows.
Explanation: 1 – channel's reach before 1970; 2 – islands before 1970; 3 – river
kilometres; 4 – threshold's range; 5 – groynes; 6 – direction of water flow.
Thresholds, similarly to river bars, tend to limit the area of channel's cross-
section, yet seem more stable than bars. According to R. Sołtysik (2000), the occurrence
of thresholds may locally lead to the development of a multi-channel valley floor. These
formations often act as erosive bases, which stabilize the vertical arrangement of the
channel (Falkowski et al. 1987; Habel, 2010b).
As demonstrated in the study by K. Polak (1996), thresholds tend to undergo
gradual erosion. In consequence, some of the formations currently classified as one-
sided used to function as transversal thresholds which dammed the Vistula channel – an
example here being the threshold near Grodzka Island (photo 1). The author, during his
research on the river reach under discussion conducted 15 years earlier, did not identify
as many thresholds as there are at present. This may indicate intensively progressing
erosion of the alluvia within the river reach, which results in revealing new fragments of
fossil valley’s bottom
Reach II – between river kilometre 696 and 719.8. The first channel sand
mesoforms below the dam can be found at Bobrowniki and are typical of a braided river
(photo 7, fig. 17). The genesis of the middle-central and longitudinal bars (a group of
central bars – fig. 12, set IV and V), which are considered to be the most numerous
formations at this reach, is related to river's excessive bed load and its accumulation in
the axis of the channel (Leopold, Wolman, 1957). It should be noted that central bars
tend to form during floods. Water flowing around them at low water stages tends to
underwash channel banks, which in turn leads to lengthening the bars and widening the
two surrounding channels (Leopold et al., 1964).

44
Fig. 17. Middle-central bar (1) on a braided Vistula reach between Bobrowniki and
Nieszawa during low water stages (type IV-2 – fig. 12). The emerged formation is
accompanied by submerged linguoid bars (2) (photomap of September 2005).
In September 2009, during low water stages (195 cm at the gauging station in
Toruń), a detailed survey of an exemplary formation was conducted – an emerged
fragment of one of the central bars located at river kilometre 713.5. The analysis
enabled us to characterize the selected morphological parameters of the formation.
Moreover, the emerged fragment served as an object for conducting elevation
measurements and compiling a digital terrain model. Additionally, an emerged fragment
of a linguoid horn-shaped bar was found below the front of the main formation (fig.
18). The front of the mesoform was positioned transversally to the river course and the
surface area of its emerged part at the time amounted to 1.89 ha. The difference between
relative heights amounted to 0.95 m, with a culmination in the frontal part at an
elevation of 38.44 m a.s.l. The maximum depth amounted to 131 m, and the length was
estimated to144 m. The inclination angle of the central bar was contrary to the direction
of the river course (fig. 18 – profile A-B) and its longitudinal slope amounted to 20‰.
The fragment of the linguoid bar, on the other hand, was 96 m long and 30 m wide. Its
slope amounted to 4.54‰ and was in line with the direction of the river course. (fig. 18
– profile A-B). Cubic capacity of the emerged formation, calculated from its base equal
to water level in the channel, was estimated to approximately 4 924 m3.

45
Fig. 18. Digital terrain model for the emerged fragment of the central bar at river
kilometre 713.5 along with its longitudinal (A-B) and cross-sectional (C-D) profile.
Arrows indicate the direction of water flow in the channel. Grid dimensions – 20 x 20
m,
At the wider sections of the braided channel as well as in the lower parts of the
bends, due to favourable conditions for bed load accumulation during low water stages,
the mainstream was observed to meander and new formations emerged – lateral bars.
The largest formation of this type was observed in the vicinity of Ciechocinek, near the
left bank (fig. 19, fig. 12, set III). The highest fragments of this mesoform, for most of
the year, rose above the water surface – as evident from the fact that vegetation was able
to take hold on top of it. After floods of May and June 2010, the surface of the bar
transformed. In the years 1951-1972 Z. Babiński (1982) observed lateral bars to appear
on the Vistula near Włocławek. He claims that the said formations emerged behind
obstacles such as river groynes, in perifluvial zones. At the end part of reach II, in the
vicinity of Silno, due to the drop of water surface in a cross-sectional profile caused by
a rapid decrease in regulated channel's width by approx. 30% (fig. 13 - c), intensive
deposition of bed load took place and numerous longitudinal bars along with linguoid
bars were formed (fig. 20).

46
Fig. 19. Vistula reach at Ciechocinek (river km 707-710) during low water flows,
featuring numerous bars. 1 – middle-central bars; 2 – lateral bar, 3 – Zielona Island, 4 –
lateral channel behind the island. Arrows indicate the direction of water flow (photomap
of September 2005).
Fig. 20. Boundary in terms of hydrotechnical development Vistula reach near the mouth
of the Tążyna river (km 717-720). Channel features the following formations: 1 –
middle-central bar with numerous surrounding linguoid bars; 2 – boundary line dividing
reaches of different channel types (former boundary between Russia and Prusia back in
the 19th
century). Arrows indicate the direction of water flow (photomap of September
2005).

47
Sand mesoforms occurring within this reach of the Vistula correspond in terms
of their arrangement to a braided channel and constitute central bars with numerous
individual linguoid bars. Field surveys showed that the groynes within this particular
river reach do not operate properly. They are cut off from the banks, thus hampering the
development of lateral bars and sedimentation in the basins between groynes.
Reach III – stretches between river kilometre 719.8 and 735. Its channel is regulated to
nearly constant width (fig. 13- c). There are numerous groynes at both banks of the
channel (fig. 21). At the initial fragment of the Vistula reach under discussion, between
river kilometre 791.8 and 725, no bars were observed to emerge in the year 2007-2010,
which may be a result of progressive narrowing of the channel, as well as the decrease
in the amount of bed load within the reaches located above. From river kilometre
725 km (from the highway bridge A1 in Lubicz), transverse-riffle sand bars are formed
(fig. 12 - set II 1). According to Z. Babiński (1992), the shape of the bars resemble
oblong tongues, yet they do not constitute typical linguoid bars. They tend to occupy
over 50% of channel's width (fig. 21). They do not connect with channel's banks, as
they are separated by lateral channels ranging in width from 30 to 150 m. The fronts of
the bars, which at the same time constitute their highest fragments, tend to reach the
level of average low water stages and may, albeit seldom, reach average water stages.
During low-water periods, the surfaces of the bars emerge and tend to be washed away
by flowing water. Consequently, the eroded material may form linguoid bars (Babiński,
1992). The transverse-riffle bars observed at the river reaches under study do not
occupy central part of the channel, but tend to shift towards its left or right bank (fig.
21). Additionally, if low-water periods hold for extended time, transversal bars with
"horns" may occur. Also, a point bar tends to form at the meandering river section in
Toruń (km 729-730 km), which Z. Babiński (1992) refers to as a pseudo point bar, It is
considered different, as it tends to transform during low water stages, shifting its course
from nearly central to longitudinal, with a lateral thread at the convex part.

48
Fig. 21. Regulated Vistula reach at Toruń (river km approx. 746-748). Formations found
in the channel: (1) transverse-riffle bars, (2) linguoid bars, (3) river pools. Arrows
indicate the direction of water flow (photomap of September 2005).
Transverse-riffle bars tend to accompany river pools, average depth of which
ranges from 4 to 6 m in relation to average water stages (Babiński, 1992). Within the
said erosion formations, by hydrotechnicians referred to as potholes, one may find pools
reaching depths of up to 12 m. The said pools arise due to the influence of local
obstacles, such as groynes' heads. River pools display lengths that are comparable to
transverse-riffle bars, however, their widths are lower, ranging from 100 to 150 m.
These formations are interconnected with 1-3 m deep passages (in relation to average
water stages), due to which the river displays a sinuous course during low-water periods
(Babiński, 1982, 1992). River pools at the Toruń section are generally deeper than those
at reach II.
49
4.3. Selected factors modifying channel's morphology
4.3.1. Natural factors
1) Ice phenomena
Ice phenomena on rivers cause various changes in the morphology of river
channels and flood plains (Grześ, 1991; Pawłowski, 2008). The said transformations
include, among others, pattern of thalweg in a river, shape of cross section, impact of
ice on channel's banks. As ice cover begins to form, hydraulic conditions related to
flows tend to change in consequence of a decrease in the active surface of channel's
cross section. When a channel is filled with a considerable amount of ice, the course of
thalweg tends to shift and, if possible, water runs off through a flood relief channel (or a
lateral channel, if there are island – Pawłowski, 2003). The change in the course of
thalweg also tends to occur as the ice cover decomposes. For instance, in January 1974,
on the Vistula reach at Polska Island, an ice jam occurred and the dammed-up waters
flowed across the cultivated flood plain, damaging a flood embankment in the process
(Śliwiński, 1975). P. Gierszewski (1991) described a similar situation. In 1924 an ice
jam occurred near Starzewo and Ciechocinek. His morphometric analysis of Vistula's
left-bank food plain showed that a vast erosion formation occurred – a 900 m long, 20-
50 m wide and up to 2.5 m deep two-branch through.
Instances were recorded when ice filled up to 88% of channel's total capacity
(river profile in Płock, winter 2006). At certain points ice reached all the way to the
bottom of the channel (Pawłowski, 2008). In such cases, the concentration of water flow
in a cross section of the channel leads to the occurrence of local pools (Grześ, 1999; Sui
et al., 2006). According to M. Grześ (1999), bed erosion in a 150 m wide pool may
reach up to 2 m. At the same time, eroded material accumulates at the banks.
Marked daily water stages fluctuation along with short-term changes in water
flow velocity below dams significantly hamper the process of ice cover formation
within these reaches (Hayse et al., 2000). At the Vistula reach under study, the process
of ice cover formation appears to be spatially diverse due to the Włocławek dam
operation (daily water stages fluctuation) and the influence of warmer waters from
Włocławek reservoir. In fact, up to the distance of 25 kilometres below the dam, the ice
cover does virtually not form at all. Thus, the dominant form of icing in the vicinity of
Włocławek is stranded ice on top of the banks. It is only from Ciechocinek (40 km
below the dam) onwards that morphological conditions within the channel and

50
physiochemical conditions of water become stable enough for slush-ice jams to form,
which may then gradually transform into a solid ice cover that triggers bed deformations
(Grześ, 1991). Slush-ice jams at Ciechocinek reach proved to be particularly threatening
at the time when an accumulation zone continued to exist, that is in the 80s and 90s of
the last century. Currently such threats do not occur.
b) Natural flood waves
In the last 40 years (1970-2010), a total of 46 flood waves was recorded at the
Vistula reach under study. Water flows exceeding 2400 m3.
s-1
(referred to as acceptable
flows corresponding to bankfull stages) were agreed upon as a limit value for the river
to burst its banks and flood the plains stretching between Włocławek and Toruń
(Instrukcja..., 2006). The value of bankfull discharge for the Vistula reach below the
dam in Włocławek corresponds to the results of many-year observations conducted by
S. Siebauer (1947), whose estimation amounted to 2320 m3.
s-1
.
The analysed flood waves occurred up to four times per year and lasted from 2
to 36 days – 8 days on average (fig. 22). The flood waves featured volumes ranging
from 0.42 to 13.7 million m3 (on average 2 million m
3, which is five times the capacity
of Włocławek reservoir). The maximum discharge of flood waves ranged from 2420
m3.
s-1
to 5972 m3.s
-1 (on average 2999 m
3.s
-1).
The largest flood wave in terms of duration, volume and culmination discharge
occurred in spring 1979 (fig. 22). It came with intensive thawing of snow and ice, as
winter at the end of 1978 and the beginning of 1979 was frosty and snowy. The second
largest wave in terms of duration (27 days) was the one of autumn 1974. It was caused
by intensive precipitation in the south of Poland. The third longest wave (26 days), and
the second in terms of volume (9.4 million m3) and mean discharge (4203 m
3.s
-1) was
the one of June 2010 (fig. 22). The floods in the hydrological years of 1979 and 1980
displayed the highest percentage share in annual runoff – 35 and 18% respectively –
with an average of 7,8% (Elektrownia..., 2010).
In the period under analysis, the highest frequency of floods was observed in
spring (53.3%). It tended to be lower in summer (24.5%), considerably lower in winter
(15.6%), and the lowest in autumn (6.7% – fig. 22). The waves of winter half-year were
higher in terms of volume (on average 2.2 million m3; 1.8 million m
3 in summer) and
duration (on average 7.9 days; 6.5 days in summer). The waves of summer half-year, on

51
the other hand, displayed higher discharge culminations (one third of the waves with a
peak discharge exceeding 4 000 m3.
s-1
).
Fig. 22. Flood waves on the Vistula at Włocławek-Toruń reach in the years 1970-2010
(compilation based on the data: Elektrownia..., 2010).
A – duration of floods in days, B – parameters of flood waves: V – wave volume in
million m3, Qmax – highest observed discharge during a flood in m
3.s
-1, Q2 – average
discharge during a flood in m3.
s-1
,
c) Geological structure of the valley floor
The development of channel processes depends on, among others, bed's
resilience to erosion (Klimaszewski, 1978). If the lithological structure is diverse,
sediments may be eroded selectively. According to W. Jarocki (1957), durability of a
channel depends on the compactness of bed formations. The impact of geological
structure on the morphology of alluvial river channels was thoroughly discussed in the
works by E. Falkowski (1978, 1980), and further explored by T. Falkowski (2004,
2005). River valleys lined with alluvia display a double bed: the first one being erosive,
incised in rock, and the second being alluvial, made up of river sediments, which
covered the former valley formation (Klimaszewski, 1978).

52
Research by E. Falkowski (1978, 1980) and T. Falkowski (2004) demonstrated
that thickness diversity of alluvia, as well as the distribution of culminations of alluvial
basement stand out as the decisive morphogenetic factors to shape the contemporary
Vistula channel and other lowland rivers in Poland.
Detailed study of the Vistula reach between the Włocławek dam and Toruń
resulted in a visualisation of channel bed lithology in a longitudinal profile (fig. 23),
which was compiled based on, among others, data gathered from 144 cross sections
supplemented with hydroacoustic images of the bed (fig. 3). It was thus possible to
distinguish three consecutive channel reaches that exhibit characteristic morphological
and lithological features.
Reach I – river kilometre 675-696 (from Włocławek to the Bobrowniki village). This
section displays diverse bed relief and is mostly devoid of alluvia. Only material in-situ
remained (boulders, moraine clay and its residues, silts) (fig. 3 – A and B, fig. 23).
Underneath the erosion-resilient formations (Quaternary and Pliocene in genesis) of
varied thickness, one can find Miocene formations (fine sands, silt sands and brown
coal) (Fąferek, 1960). According to Z. Babiński (1997), in 1995 the range of the river
reach amounted to 12 km. At present it is approximately 20 km.
Reach II – between river kilometre 696 and 710 (from the Bobroniki village to the city
of Ciechocinek). It features a "shifting" bottom composed of sandy sediments deposited
on top of an erosion-resilient bed, locally exposed in the form of thresholds – similarly
to the reach between river kilometre 705 and 707 (fig. 23, fig. 3 – C).
Reach III – river kilometre 710-735 (from the city of Ciechocinek to Toruń), featuring
alluvial bed composed of sand and gravel of considerable thickness (fig. 23).
As far as the reach between the dam and Ciechocinek is concerned, river
thresholds are attributed the dominant morphogenetic role. The morphometric analyses
based on figure 15, 16 and 23 indicate that pools of considerable sizes tend to form
below these formations, undercutting the thresholds and causing headward erosion,
which in turn may eventually level out the river profile at this particular reach. Where
the channel bed is less resilient, deep longitudinal incisions tend to form. Apart from the
vertical changes in the channel, one may also observe gradual deterioration of
hydrotechnical structures – their continuity is disrupted and the groynes are being "cut
off" from the banks (photo 6). The fact that the near-bank zone of the channel is highly
"constrained" by the hydrotechnical structures bears no impact on the occurrence of the
phenomenon. It is believed to be a consequence of river's drive to migrate laterally.

53
Fig. 23. Lithology sketch of Vistula channel's surface formations in relation to the
longitudinal profile of the bed. Explanation: 1 – boulders left after clay erosion; 2 – clay
and silt; 3 – sand-gravel formations; blue line marks the course of the longitudinal slope
of water surface, established at low flows between Włocławek and Toruń (compilation
based on: Detailed Geologic Map of Poland (SMGP) – sheets for Włocławek,
Bobrowniki, Ciechocinek and Toruń – as well as own hydroacoustic surveys, shallow
drills and geological exposures).
The presence of these positive erosion formations may not only influence the
changes within the channel, but also within the entire flood plain. According to M.
Grześ (1991), thresholds on the lower Vistula cause slush-ice jams to occur, which in
turn may result in jam-floods that reshape the surface of the valley floor. Another
evidence of the morphogenetic role of these formations arises from the attempt to
correlate the development of multi-branching reaches (with islands) with the occurrence
of thresholds. E. Falkowski (1990) indicates that Włocławska Island and Grodzka Island
are situated on top of an erosion-resilient pedestal. Perhaps in the past, as a result of
progressive development of the channel (incising), the said pedestals constituted
thresholds. In consequence of lateral migration, a change in the course of thalweg took
place and the threshold began to emerge. The material, which at present constitutes the
island, accumulated on its surface and in its shadow.
The locally occurring residua of fluvioglacial formations deposited on top of
variegated clay and boulder clay proved to be particularly resilient. Such formations can
be found, for instance, at Grodzka Island. On the other hand, the least resilient, apart
from the contemporary alluvia, are marginal formations, here developed into fine sands,

54
silty sands and interlayered dusts, for example at river kilometre 696 (Bobrowniki
village).
The channel along with the Vistula flood plain commonly interact with the non-
alluvial terraces (fig. 7, photo 2), which tends to influence the morphology of the near-
bank zones in the channel, as well as its capability for horizontal changes. The
typological analysis of the dynamics of lower Vistula's banks compiled by M. Banach
(1998) shows that, within the river reach under study (60 km), the banks, at a 9.5 km
long left-side section and 9 km long right-side section, are composed of Quaternary
sediments (clay, sand, silt), Pliocene deposits (dust and clay), as well as anthropogenic
elements (embankments, concrete boulevards, groynes). The remaining parts of the
banks are mostly composed of formations resulting from channel and flood deposition.
4.3.2. Artificial factors
a) Operation of the dam
In consequence of damming a channel, a reservoir is formed, in the backwater of
which the flow of water decreases to a value that is critical for bed load transport.
Consequently, the material is discharged in the form resembling a delta (fig. 24 - Ab). In
the lower basin of the reservoir, the conditions tend to be favourable for at least partial
decantation of the transported suspension (Babiński, 2002). The shortage in clastic load
transport is consequently replenished below the dam in the course of bed erosion and,
frequently, lateral erosion (i.a.: Z. Babiński 1982, 1992, 2002; A. B. Veksler and V. M.
Donenberg, 1983; G. P. Williams and M. G. Wolman, 1984; E. D. Andrews, 1986; B.
Belyj et al., 2000; K. Juracek, 2002; M. Kondolf, 2004; Z. Wang, Ch. Hu, 2004; N.
Zdankus, G. Sabas, 2006; B. Przedwojski, M. Wierzbicki, 2007; W. Parzonka, R.
Kosierb, 2010; K. Bierkovich, 2011) (fig. 24 - E). Just below the front of the erosion
zone, an accumulation reach tends to emerge (fig. 24 – Ab), which displays features of a
braided channel (Babiński, 1992; Babiński, Habel, 2009).
Intensive morphological changes in the channel below a dam tend to occur
already at the stage of its construction. According to Z. Babiński (1982, 2002), due to
the shift of thalweg in the line of dams, in other words, redirecting the energy of water
towards the banks in the initial phase of dam operation, intensive lateral erosion takes
place. In the case of the Vistula, prior to the construction of the dam in Włocławek,

55
thalweg ran near the right bank. However, after the dam was commissioned, it shifted to
the left and, in consequence, the bank of Włocławska Island retracted.
Fig. 24. Model of channel processes in an alluvial/lowland river under the influence of a
dam (Babiński, 2002): Ab – bed load deposition zone, As – suspended load deposition
zone, E – erosion zone; vectors indicate the directions of channel processes
development.
Bed erosion below dams is most notable in the direct vicinity of the structure.
For instance, bed erosion below the Hoover dam in a cross-sectional profile amounts to
an average of 7.5 m (Williams, Wolman, 1984), while below Kuybyshev Reservoir on
the Volga it may reach up to 31 m (Raynov et al., 1986). The zone of intensive bed
erosion below dams occurs at a certain reach and moves at various rates as time goes
on. The movement rate of the front of this zone is closely connected with the dynamics
of waters flowing out of the reservoir, topography and the geological structure of a
given channel bed (Kondolf, 1997). As far as the movement rate of the front of an
erosion zone is concerned, the process of erosion is limited before reaching a proper
erosion base (sea level, lake level etc., tributary of a larger river) or an erosion-resilient
bed.
According to the data gathered by Z. Babiński (2002), movement rate of the
fronts of erosion zones on alluvial rivers tends to oscillate between 0.4 and 8 km per
year. However, in the initial period of dam operation, it may even exceed 42 km a year.
The shift in channel type that accompanies the erosion reach is related to the
two-direction character of channel processes development, namely, incision of the
thalweg zone and, at the same time, covering the areas outside thalweg, lateral channels
and groyne fields in particular (Babiński, 2002). Thus, accumulation forms tend to be
left out of channel process on increasingly longer reaches, transforming into a new flood
level (fig. 25). Forms such as mid-channel bars and central bars merge into a new level

56
and are consequently replaced by point bars and lateral bars (Babiński, 2002). The
following stage in the process of stabilizing the formations allows vegetation to take
hold on their surfaces.
Certain reaches of English rivers constitute interesting examples of typological
changes in channels below dams. As a result of the attenuation of the flood wave peak
and, most importantly, reduction of discharge, which in 40-60% of cases was related to
water intake for the purpose of agriculture, the parameters of the channels, such as
width, depth and surface area of cross sections, decreased by half (Babiński, 2002).
Channel erosion below a dam is virtually impossible to stop. Hence, a number of
adverse consequences, both natural and economic, are to be expected. These may
include damaging hydrotechnical infrastructure over long channel reaches or hindrance
to navigation. Solutions are implemented to prevent and/or limit erosion processes. One
of the most promising concepts involves replenishing bed load below dams with
material transported from the upper part of a reservoir where accumulation occurs. Such
ventures were undertaken, among others, on the Danube river, below the Freudenau
Dam near Vienna (Wedam et al., 2004) and on the Sacramento river, below the
Keswick Dam (Kondolf, 1997). Another possible solution, frequently applied on
lowland rivers, involves constructing check dams transversely to the river course.
Examples of such structures include four check dams made of fascine and stone on the
Warta river, below Jeziorsko reservoir (Przedwojski, Wierzbicki, 2007), and a single
check dam made of stone and concrete below the dam in Włocławek (Polak, Rosicki,
2007).
The process of bed erosion below dams contributes to the replenishment of bed
load (and part of suspension) accumulated in the upper basin of the reservoir (fig. 24).
Frequently – albeit not always, as one can conclude from the available literature
(Babiński, 2002) – a shallower aggradation reach may emerge. The appearance of an
aggradation reach tends to coincide with a partial discharge of debris below a very
dynamic and intensively developing erosion zone. The fact that the maximum riffle of a
channel tends to occur directly at the front of an erosion zone appears to support the
claim. The said phenomenon follows the rule that transport capacity of a river tends to
break at formations of different elevation (e.g. thalweg – flood plain), or in a zone
where the river became "overloaded" with clastic load. Furthermore, American
researchers argue that the occurrence of an aggradation reach frequently results from

57
widening the channel and the appearance of new formations that are considered typical
of braided rivers, for instance mid-channel bars, central bars etc. (Babiński, 1992).
Fig. 25. Horizontal channel deformations on alluvial rivers at the reaches below dams –
from braided-anastomosing to straight. Yellow colour indicates areas of a new, lower
flood plain. According to: A – R. C. Chalov et al. (2001); B – Ch. Chiwei (1990); C – Z.
Babiński (2002).
In the case of the river reach below the Włocławek dam, upon reaching the
average annual value of bed load transport, that is approximately 0.7 million m3, which
is considered to be a threshold value for the transport capacity on the lower Vistula
(Babiński, 1992), the river "drops" it, forming a channel reach of forced accumulation.
In consequence, the Vistula river in the years 1980-1990, at the Nieszawa-Ciechocinek
reach (20-40 km below the dam), displayed features typical of a braided river –
including central and lateral bars. As indicated by Z. Babiński (1992), the surfaces of
these bars emerged to the level of up to 0.2 m above the average water stages, or – albeit
sporadically – even up to 0.4 m upon the transit of a high flood wave. Thus, during
average – and even more so at low – water stages, they may serve as a visual indicator
of the appearance of an accumulation zone below the dam.

58
b ) Channel-regulating structures
Regulating a channel of low, average and high water results in changes in the
hydromorphological features of a river valley floor. In consequence of constructing
groynes – lengths of which range from several to several hundred metres and which are
perpendicular to the banks – hydrodynamical conditions in the channel undergo
considerable changes. The said changes include straightening, shortening and narrowing
the channel (Korpak et al., 2009). The changes in the course of thalweg and river
currents cause the channel process to shift towards erosion and accumulation (Babiński,
1985). An increase in the slope and water discharge energy occurring in this type of a
'canal' causes the channel to deepen at the reach along and above the structures. The
eroded material is then usually deposited below the regulated reach (Korpak et al.,
2009), within groyne fields, or at the wider sections of the channel. According to A. K.
Teiseeyre (1991), fragmentation of thalweg, particularly during low water stages, and
consequent braidening of the river, constitute a forced mechanism of river adaptation to
the new flow conditions and increased bed load transport. Thus, the initial channel
pattern transforms into a transitional one, such as a meandering-braided channel, often
referred to as pseudo-braided (Teiseeyre, 1991) or a forced-meandering channel
(Babiński, 1985; Falkowski, 1975).
Research on the regulated channel of the upper (Łajczak, 1995; Czajka, 2005),
and middle Vistula (Warowna, 2003) appear to support the claim that the highest rate of
sediment accumulation occurs within groyne fields. Rapid sedimentation tends to
proceed until it reaches the level indicated by the peak surfaces of groynes, which
causes individual basins to merge and sets out a technical route that runs adjacent to the
main channel (similar to the situation in photo 5). Moreover, as argued by L. Starkel
(2001), Z. Babiński (1985) and B. Wyżga (1999), eventually a new level is formed,
which, given time, becomes a new flood plain. According to Z. Babiński (1992), the
reason for sediments to accumulate in between consecutive groynes arises from the
tendency of river currents to break on the heads of groynes, and of bed load to be
deposited in their "shadow". In between groynes (in groyne fields), a rotary current
tends to form, which is of vertical axis and markedly lower velocity than in the main
channel (fig. 26, photo 5). The tangential velocities of a water stream are lowest in its
centre (Babiński, 1992).
The local erosion zones which emerge in the vicinity of groynes are particularly
noticeable near the head of a groyne, as it is subjected to the strongest "attacks" from
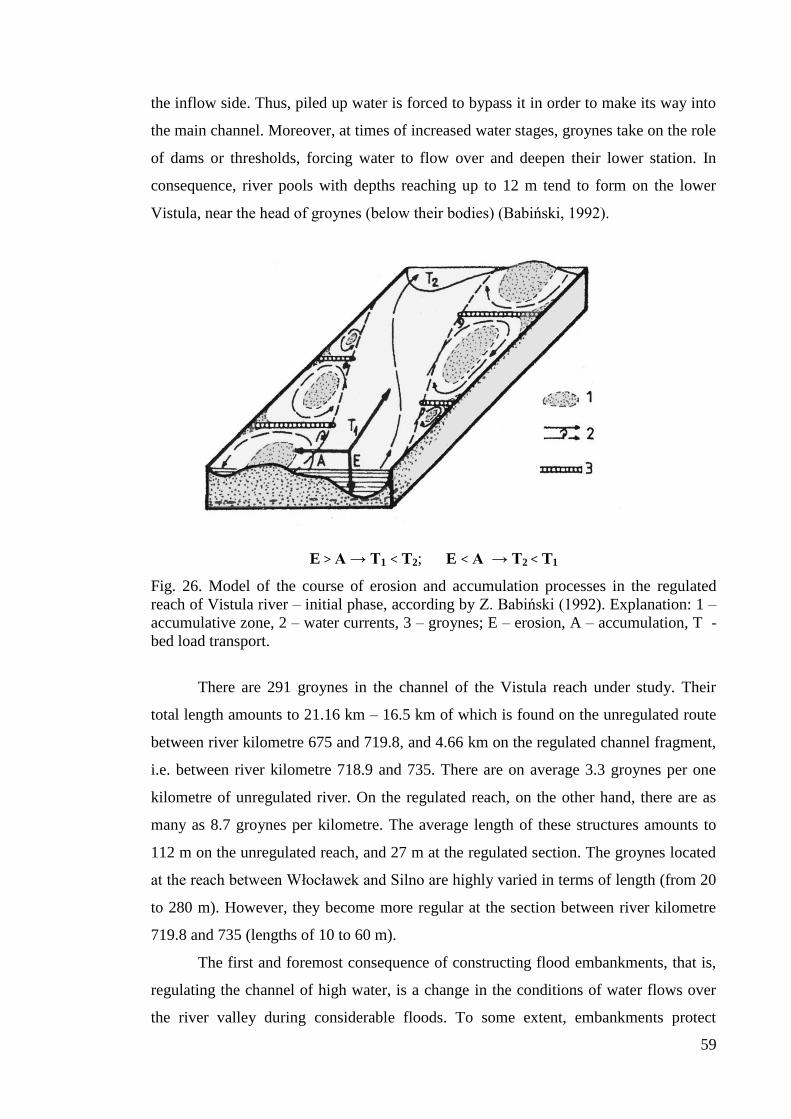
59
the inflow side. Thus, piled up water is forced to bypass it in order to make its way into
the main channel. Moreover, at times of increased water stages, groynes take on the role
of dams or thresholds, forcing water to flow over and deepen their lower station. In
consequence, river pools with depths reaching up to 12 m tend to form on the lower
Vistula, near the head of groynes (below their bodies) (Babiński, 1992).
E > A → T1 < T2; E < A → T2 < T1
Fig. 26. Model of the course of erosion and accumulation processes in the regulated
reach of Vistula river – initial phase, according by Z. Babiński (1992). Explanation: 1 –
accumulative zone, 2 – water currents, 3 – groynes; E – erosion, A – accumulation, T -
bed load transport.
There are 291 groynes in the channel of the Vistula reach under study. Their
total length amounts to 21.16 km – 16.5 km of which is found on the unregulated route
between river kilometre 675 and 719.8, and 4.66 km on the regulated channel fragment,
i.e. between river kilometre 718.9 and 735. There are on average 3.3 groynes per one
kilometre of unregulated river. On the regulated reach, on the other hand, there are as
many as 8.7 groynes per kilometre. The average length of these structures amounts to
112 m on the unregulated reach, and 27 m at the regulated section. The groynes located
at the reach between Włocławek and Silno are highly varied in terms of length (from 20
to 280 m). However, they become more regular at the section between river kilometre
719.8 and 735 (lengths of 10 to 60 m).
The first and foremost consequence of constructing flood embankments, that is,
regulating the channel of high water, is a change in the conditions of water flows over
the river valley during considerable floods. To some extent, embankments protect

60
adjacent terrains but, on the other hand, as a result of the decrease in valley retention,
flood waves tend to be higher and their course is accelerated ( Łapuszek, Witkowska,
2006). According to K. Klimek (2008), In consequence of erecting embankments to
withstand high waters, a zone is set out at the bottom of the valley where
geomorphological changes tend to be most dynamic. There are approximately 32 km of
embankments along the river reach under study. The lines of embankments are marked
on the maps enclosed.
As indicated in the research by A. Tomczak (1987) and W. Juśkiewicz (2006),
which involved analysing historical maps, construction of flood embankments at the end
of the 19th
century on Ciechocińska Lowland caused changes in the morphology of
islands within the Vistula channel. In particular, it contributed to the vertical
deformations of the river valley – an increase in bed erosion and thickness of sediments
being accumulated during floods within the flood valley and on the surface of islands.
This vertical direction of fluvial processes allowed for, among others, stabilization of
sand islands in the channel, which at times are flooded and undergo transformations
exclusively during high floods.
There is a total of 22 km of flood embankments at the Vistula valley floor
fragment under discussion – 17 km on the left side of the flood valley (river km 683.4-
689.8, 708-718), and 5 km on the right side (river km 679-680, 711-713).
5. Changes in hydrologic phenomena on the Vistula river after
damming
Appearance of a threshold (dam) in the course of a channel, which prevents
uninterrupted gravitational flow of water, results in changes of hydrological regime both
above and below the obstacle. In the case of an artificial form of obstruction, a dam, a
number of hydrological phenomena undergo changes. The most frequently occurring
ones involve:
– a decrease in annual amplitude of water stages fluctuation both within the reservoir
and in the river channel (Wiliams, Wolmman, 1984; Dynowska, 1984; Lu, Siew, 2006,
Bierkovich, 2011),
– an occurrence of daily water stages fluctuation below the dam related to the hydro
power plant operation (Makkaveev, 1957; Williams and Wolman, 1984; Andrews,

61
1986; Babiński, 1992, 2002; Chalov et al., 2001; Juracek, 2002; Wang and Hu, 2004;
Lu and Siew, 2006; Zdankus and Sabas, 2006; Babiński, Szumińska, 2006; Bartczak,
2007).
The most anticipated consequence of dam construction is attenuation of flood
waves. Investigation on 29 American dams located on rivers with alluvial channels
shows that the average annual peak of floods decreased by 3 to 91%, 39% on average
(Wiliams, Wolnman, 1984). In the case of certain Russian dams (for instance below
Rybinsk and Sayano–Shushenskaya reservoirs), hydrological regime was reversed. In
those locations flood waves were observed to transform into low-water periods (Belyj et
al., 2000). A classic example of dam operation influence on the course of flood regime
on the river Nile is the Aswan Low Dam. Before the dam was erected, there had been a
single life-giving flood per year. However, after the dam was commissioned, the floods
attenuated to the level below the bankfull stage. The lack of floods on the Nile adversely
affected the shape and form of the cultivated flood plain. The Peace River may serve as
a similar example. The waters of this stream, upon eliminating flood waves through the
construction of the W.A.C. Bennett Dam, no longer reached the Anthabasca lake
located below, which in consequence had its water stages permanently lowered by 0.6
m (Babiński, 2002).
The natural hydrologic regime of the lower Vistula is disturbed by the dam in
Włocławek, which operates since September 1968. It is most noticeable in the direct
vicinity of the dam, however, its influence appears to extent over the entire lower reach
of the river. The following part of the chapter discusses changes in hydrological
phenomena on the Vistula which occurred after the construction of the Włocławek dam.
5.1. Changes of mean annual water stages
The interference caused by the Włocławek dam is most apparent in view of the
changes of water surface level in the channel below the dam, which are one of the
indicators for the channel incision rate. Access to a full record of hydrological data from
the years 1956-2010 gathered at two gauging stations located at the extreme points of
the river reach under study allowed for the comparison analysis of the course of mean
annual water stages in the profiles of Włocławek and Toruń (Fig. 27-A).

62
Fig. 27. Changes in the course of water stages on the Vistula river before and after
commissioning the dam: A – course of mean annual water stages in Włocławek and
Toruń profiles; B – differences between Włocławek and Toruń: 1 – including the
change in 'zero' on the water gauge in Włocławek; 2 – excluding the change in 'staff
gage zero' on the water gauge in Włocławek; 3 – water stages in Toruń ((Babiński, 1997
– supplemented with the data from the Institute of Meteorology and Water Management
National Research Institute – Internet 1).
Prior to the construction of the dam in Włocławek (1961-1965), water stages
measured at both sites had had similar values – higher by 12 cm in Włocławek (fig. 27 -
B). From 1968 to 1990 water stages in Włocławek were continuously decreasing in
comparison to the readings at the gauging station in Toruń (fig. 27 - B). After 12 years
since the construction of the dam, the difference between these two points amounted to
1.0 m, reached 1.71 m in 1995 and 1.74 m in 1999 (fig. 27 - B). The effects of changes
in water stages were most apparent in Włocławek, where certain hydrotechnical
structures ceased to fulfil their functions, including the boulevard, water intakes for
industrial establishments, port, sluice gate on the dam (photo 11).
Detailed analysis of differences in the mean annual water stages in Włocławek
and Toruń showed, apart from steady increase, certain deviations in the following years:
1969, 1972, 1992, 1993, 1994 and 2004 (fig. 27 - B). Z. Babiński (1997) claims that in
1969 (the first year of dam operation) the 34 cm increase in the mean annual water
stages in Włocławek was related to the preliminary phase of erosion in the direct
vicinity of the dam (incision of the channel). At the time, 4.6 km down the river,
material deposition and shallowing of the channel occurred in the gauging station
63
profile. In 1972 bed erosion in this section of the alluvial channel reached the maximum
depth. The later decrease in water stages was related to the movement of the erosion
zone down the river (incision the channel below Włocławek). The situation changes in
the years 1992-1994, when waters in the channel were lifted due to the emergence of
two natural thresholds. The occurrence of these forms may be interpreted as the possible
outcome of the Vistula channel alluvia erosion. K. Polak (1996) identified two
thresholds located below the dam at river kilometre 680 and 686, axes of which at that
time ran crosswise to the channel (fig. 13). After 1994 both these thresholds were
partially washed out. This further increased the difference in the mean annual water
stages between Włocławek and Toruń (fig. 27 - B). Over time, the bed erosion zone
propagating down the river revealed more thresholds, among others, at river kilometre
683 (fig. 28). Since the year 2000, this particular form has exerted marked influence on
mean annual water stages in Włocławek. The said difference between Włocławek and
Toruń decreased from -1.74 m in 1999 to -0.94 in 2004 (fig. 27 - B). The analysis of the
archival orthophotomaps and aerial photographs show that the threshold at river
kilometre 683 became active after the year 2000. The investigation of water surface
slopes appear to confirm that the threshold stabilizes water surface above the water
gauge, located approximately 3 km up the river. Changes in the bed and banks of the
channel in the vicinity of this erosion mesoform caused, among others, further decrease
in mean annual water stages in Włocławek, from -1.18 m 2005 to -1.40 m in 2010 (fig.
27 - B).
Due to incision of the Vistula channel in Włocławek and, in consequence,
lowering the mean level of water surface, in November 2004 a new reference elevation
was agreed upon for reading water stages off the water gauge in Włocławek. it was
assumed that the so called "water gauge zero" would from that point on be located at
41.12 m.a.s.l

64
Photo 11. Vistula waters "shift back" from the boulevard in Włocławek – result of
progressing deep erosion and lowering of mean water surface elevation in the channel
(photography taken by Z. Babiński – May 1995).
Fig. 28. One of several thresholds which diagonally dam the Vistula channel at river
kilometre 683 (bathymetric map – fig. 15). A-B line indicates the course of channel
depth in the crosswise profile of May 2008. At the right bank one may observe emerged
fragments of the bed, which constitute forms that are highly resilient to washing out
(Habel, 2010b).

65
5.2. Changes in daily and hourly water stages
The operation regime of the dam in Włocławek in the last 40 years can be
divided into three characteristic systems of operation:
Period I - from January 1970 to February 2002 the power plant operated at
peak-capacity - intervention mode. Such a mode of operation contributed to drastic
hourly changes in flow rate (daily water stages fluctuation) below the dam (fig. 29 - A).
Peak demand for electric energy usually occurred twice a day, between 7 a.m and 1 p.m,
as well as in the evening, between 6 p.m and 9 p.m. There were typically five cycles of
power plant operation every 24 hours. Two of them involved peak-capacity operation
(temporary max. flow of approx. 1600 m3.
s-1
), while the remaining three corresponded
to the so called baseline, which relates to the ecological flow, that is approx. 450 m3.s
-1
(fig. 29 - A). In consequence of changeable flows, water stages fluctuation occurred
below the dam, daily amplitude of which ranged from 2.0 to 3.0 m (Babiński, 1982).
Observations by Z. Babiński (1992) indicate that the maximum daily amplitudes of
water stages fluctuation occurred in the zone of increased flows, approximately 710
m3.
s-1
(water stages/mean flows zone). According to Z. Brenda (1998), flow rates in
such a range occurred at that time approximately 70% of the year. Daily fluctuation of
water stages in that period was noticeable within the entire reach down to the town of
Chełmno (125 km away from the dam). In the Fordon profile (100 km away from the
dam) the amplitudes of water stages fluctuation reached up to 50 cm (Machalewski et
al., 1974). There were additional water discharges during low-water periods for the
purpose of navigation (Babiński, 2002).
Period II - it was assumed that from February 2002 the power plant would work
exclusively in constant-flow mode, i.e. the supply of water to Włocławek reservoir was
meant to be equal to the discharge from the dam (fig. 29 - B) and the minimum
acceptable flow was to be maintained at 350 m3.s-1 (Decyzja..., 2001). However, the
provisions stipulated in the new decision were in effect only for half a year.
Period III - from September 2002 intervention-flow system had to be implemented.
For approximately 6 hours a day water discharges from the reservoir ceased entirely, i.e.
maintenance of biological flow stipulated in the permit required by Water Law Act from
2001 was breached (fig. 29 - C). The said actions were taken on workdays, usually

66
between 8 a.m and 1 p.m, excluding periods when Włocławek reservoir was fed with
large amounts of water (Komunikat..., 2007; Komunikat..., 2010).
Fig. 29. Hydrograms of the course of hourly water stages below the dam in Włocławek,
illustrating three different operation regimes of the dam:
A – peak-capacity–intervention mode; B – constant flow mode; C – repair-intervention
mode; C1 – e.g. of water supply to the lower reach of the Vistula channel by the
alimentation wave for the purpose of navigation (compilation based on the data obtained
from a digital limnigraph of Regional Water Management Authority in Warsaw -
Inspectorate in Włocławek); Q – water level corresponding to the average mean water
flows; Qbiol. - water level corresponding to the minimum acceptable flow of 350 m3.s
-1
(Decyzja..., 2001).
Such mode of operation was implemented in order to carry out maintenance works,
which included repairs of spillway, sheathing of the check dam that stabilizes the
surface of water below the weirs and the power plant, as well as filling the 12-17 m-

67
deep pools (spot incisions) that occur after flood wave flows through, directly below the
stabilizing check dam (photo 3 and 4).
The analysis of hydrotechnical data from the digital limnigraph belonging
toRegional Water Management Authority in Warsaw , which is set to constantly collect
data at the lower outer port of the Włocławek dam navigation sluice, allowed for the
estimation of daily amplitudes of water stages fluctuation on the Vistula (fig. 30). The
study involved data gathered below the dam on hourly basis in the (hydrological) years
1997-2009. The results showed that, in consequence of the peak-capacity - intervention
mode, daily amplitudes of water surface fluctuation ranged from 0.5 m to 2.0 m for 70%
of a year (in the hydrological years of 1997-2001), and from 0 to 0.5 m for 18.1% of a
year. On the remaining days the amplitudes amounted to more than 2.0 m, to the
maximum of 3.4 m. Such system of dam operation was most apparent in close vicinity
of the dam. The highest rate of amplitude in the range from 0.5 to 2.0 m occurred in the
channel up to 30 km away from the dam. Farther away fluctuation gradually minimized.
Furthermore, due to short breaks between water discharges, waves tended to overlap
and made the impact of the dam appear more perceptible at shorter distances.
From February to September 2002, as a result of constant flows, the daily
amplitudes of water stages fluctuation amounted to, on average, 0.2 m and did not
exceed 0.5 m (fig. 29 - B, fig. 30 - b). Such operation regime of the power plant was
close to the natural one. From September to October 2009, due to the implementation of
intervention-flow system of work, the daily amplitudes of fluctuation exceeded 3.0 m
(fig. 29 -C, fig. 30 - c). Over 80% of days in a year displayed amplitudes ranging from 0
m to 1.0 m, and approximately 3% - over 2.0 m. Observations showed that operation of
the dam during the repairs conducted at the lower station of the dam, which involved
limiting water discharge from Włocławek reservoir for approximately 6 hours, resulted
in occurrence of water surface fluctuation at the station in Fordon (100 km below) with
an amplitude reaching approximately 0.5 m. In such situations, at the gauging station in
Nieszawa (approx. 25 km below the dam), a several-hour long decrease in water surface
level occurred, ranging from 0.4 to 0.6 m, with a delay of approximately 5 hours in
reference to Włocławek. In Toruń, on the other hand, decreased flows were noticeable
after approximately 10 hours and caused amplitudes ranging from 0.6 to 1.2 m. The
intervention mode of dam operation during low flows exerted a particularly adverse
impact on the water environment of the Vistula, since water flow tended to be lower
than natural over a long reach of the river. At the time, considerable fragments of river

68
bed started to emerge within the bank zone (photo 1 and 2) and at the entire width of
channels located behind islands
Fig. 30. Distribution of daily water stages fluctuation on the Vistula in Włocławek,
reflecting three types of dam operation regimes in the hydrological years 1997-2009.
Explanation: a – peak-capacity – intervention mode; b – constant flow mode; c –
intervention-flow mode (compiled with the use of data obtained from the digital
limnigraph of Regional Water Management Authority in Warsaw - department in
Włocławek).
From September 2002 to the beginning of 2010 over 30 intervention discharges
of water from the reservoir were performed to increase the depth in the navigation route
for the large-size load transport on the Vistula (fig. 29 – C and C1). At the reach
between Włocławek and Silno (distance of approximately 45 km) navigation with large
vessels at the discharges lower than 800 m3.
s-1
is rendered impossible (due to bed
thresholds uncovered by erosion – fig. 15, 28, photo 6). "Water management instruction
for the dam in Włocławek" from 2006 stipulates that such large discharges may be
performed only when water flow through the hydro power plant is maintained at the rate
of 1170 m3.
s-1
, and the discharge may last no longer than 12 hours. The volume of water
discharged (an artificial small flood wave) in such situations shall amount to
approximately 30 million m3 (7.4% of total capacity or 56.6% of reservoir's useful
capacity). Before the scheduled discharge, water in the reservoir is meant to be retained
for the period of 2 to 7 days.

69
5.3. Maximum impact range of the dam
Previous researches on the Vistula related to the impact range of the dam in
Włocławek on water stages fluctuation are, in view of the author, insufficient, as they
tend to focus exclusively on a short river reach below the dam (Glazik 1978; Babiński
1982, 2002; Brenda 1998). So far a claim has been maintained that at the beginning of
the dam operation, the daily fluctuation of water stages caused by the operation of
Włocławek power plant occurred on a 200 km-long reach down the river (Machalewski
i in., 1974). Such a statement has been made in all publications dealing with the subject
of hydrology of the lower Vistula thus far.
In June 2007, during an intervention discharge of water performed to allow for
the transport of a tanker from the river shipyard in Płock to Gdańsk, an experiment was
conducted to identify the range of hourly water stages fluctuation occurrence in the
channel. Detailed research results concerning this subject were included in author's prior
publication (Habel, 2010a). This paper will discuss only the most significant issues
presented more thoroughly in the publication, as the scope of the observations extended
beyond the river reach under study and covered 12 stations on the lower Vistula – from
the dam to Tczew (fig. 32 and 33) – a 234 km-long reach of the river.
The influence range of the dam on hydrological conditions in the channel was
discussed in relation to the analysis of stage discharge curve of annual water stages. Due
to the fact that an individual supply wave may resemble a flood wave, a method
proposed by A. Ciepielowski (1987) was employed, which involves graphic analysis of
stage discharge curve of a single flood. Based on this, the following parameters of the
wave under study were characterized: wave elevation, understood as the difference
between the crest and the base of the curve; mean velocity of wave movement (in w
km∙h-1
) and supply wave crest, i.e. maximum discharge (Qmax); duration of the entire
supply (T) (in hours), defined as total time in the phase of increase (Ti) and decrease
(Td) of the wave; time ratio of wave decrease phase (Td) to wave increase phase (Ti):
maximum and mean values of hourly water stages fluctuation in the phase of wave
increase and decrease (in cm∙h-1
); total wave volume (V) (in million m3), understood as
a sum of volumes of the increase phase (Vi) and decrease phase (Vd) (fig. 31); extreme
values of average water surface slopes (Imax, Imin) (in ‰), as well as of irregularity
degree of average slopes W = Imax/Imin; mean velocity of wave movement, as well as

70
flood crest velocity (w km∙h-1
) – with the use of the simplified Kuskov formula (1) for
shallow rivers (Arkuszewski et al., 1971).
Fig. 31. Model of flood wave (Lambor, 1962 – altered). Explanation: 1 – increase curve,
2 – decrease curve, Qmax – wave crest/maximum discharge, Ti – duration of increase
phase, Td – duration of decrease phase, Vi – wave volume during the increase phase, Vd
– wave volume during the decrease phase.
v = α √g Hśr [1]
where:
Hśr – mean height of a wave in cross-section (cm),
g – gravitational acceleration, 9.81 (m/s),
α – Kuskov coefficient which takes into account channel morphology (assumed value of 0,53
for
channel roughness coefficient n ≈ 0.0325);
Values of peak flows were obtained from current discharge rate curves for the
period under study. Consumption curves were prepared based on the data of IMGW
published on www.pogodynka.pl. Wave volume was determined by means of a graphic
method that involves measurements of areas between the curve of increase, decrease
and the base of the flood wave (Lambor, 1962). Data related to total volume of water
discharge and temporary flows in the dam profile were obtained from the Regional
Water Management Authority in Warsaw - department in Włocławek.
Data analysis showed that elevation of the supply wave (the height of the wave)
did not exceed bankfull stage at any of the stations and ranged from the maximum of
183 cm in Włocławek to the minimum of 77 cm in Grudziądz (160.1 km below the
dam). In Tczew, 234 km below the dam, the culmination amounted to 91 cm (fig. 33 -

71
A). Local modifying factors clearly influenced the course and shape of the wave. The
said factors include (among others): capacity of the channel and valley to retain water,
hydrotechnical structures (in particularly groynes), channel sand mesoforms. For that
reason elevation of the wave, which should decrease downstream, increased in the
measurement profile of Silno, Korzeniewo and Tczew in comparison to the higher
located reaches (fig. 33 - A). It is result of reducing hydraulic capacity of the channel,
in particularly at the reach near Silno. The wave movement rate within the Vistula reach
under study amounted to, on average, 5.03 km∙h-1
. The highest values were observed in
the profile of Silno – 5.8 km∙h-1
, then directly below the dam – 5.7 km∙h-1
, and in
Włocławek – 5.6 km∙h-1
. At the reach between Chełmno and Tczew, wave velocity
stabilized at the level of 4.2-4.4 km∙h-1
. Results bearing great significance for defining
changes in the hydrological phenomena on the Vistula were obtained from the analysis
of movement rate of wave front along the river course. It decrease with the distance
away from the source of water discharge. The peak of the wave reached the maximum
speed (8.8-11.25 km∙h-1
) in the reach between the dam and the profile of Nieszawa.
From the profile of Silno, the movement rate of wave front halved, reaching the value of
4,9 km∙h- 1
.
As the waved lowered, the culmination flow decreased from 1170 m3.
s- 1
in Włocławek to 720 m3.s
- 1 in Tczew (fig. 32). Total time of wave run between the
profiles of Włocławek and Tczew amounted to 44 hours. The entire channel-supplying
wave proved to be shortest in Włocławek – 26 hours, and longest in Tczew – nearly 56
hours (fig. 32).
Time of concentration (growth) of a wave (counted from the moment of flow
increase to flow culmination in a stream) in the dam profile, Włocławek and Łęg
Witoszyn amounted to 10 hours, which corresponds to the duration of water discharge
from the reservoir. From water gauge profile in Silno, growth time started to lengthen:
Silno – 11 hours, Toruń – 12 hours, Solec Kujawski and Fordon-Bydgoszcz – 15 hours,
Grudziądz – 17 hours, Tczew – 34 hours. Additionally, the wave decrease time curve
tends to elongate with the river course.

72
Fig. 32. Propagation of the alimentation wave caused by the intervention water
discharge from Włocławek reservoir in June 2007 (prepared with the use of own field
observations as well as data from the limnigraph of Regional Water Management
Authority in Warsaw at the dam in Włocławek and at the port in Korzeniewo).

73
Fig. 33. Course of the selected parameters of a channel-supplying wave in the
longitudinal profile of the lower Vistula (June 25th
- 28th
, 2007). A - elevation height of
the wave in cm, B - maximum value of water level fluctuation in cm∙h-1
.
The maximum and mean values of hourly water stages fluctuation during wave
concentration (growth) were higher than at the time of wave decrease. The average
increase of water stages during the growth phase in the dam profile amounted to 16.6
cm cm∙h-1
. It was lower in Toruń – 12.0 cm∙h-1
. Similar value to the one in the dam
profile was recorded at the station in Silno – 16.1 cm∙h-1
, despite considerable distance
between these two stations. The growth rate in the Fordon-Bydgoszcz profile amounted
to 8.1 cm∙h-1
, and 3.5 cm∙h-1
in Tczew.
The maximum recorded hourly fluctuation of water level in the phase of increase
amounted to 49 cm∙h-1
in the dam profile and 48 cm∙h-1
in Włocławek. It decreased to 21
cm∙h-1
in Niszawa. Then further increased to 30 cm∙h- 1
in Silno and dropped to 20 cm∙h-
1 in Toruń. Farther downstream the value did not exceed 20 cm∙h
- 1 and amounted to
only 5 cm∙h-1
in Tczew (fig. 33-B).
Changes of hourly water stages occurred at considerably lower rate in the phase of
decrease and amounted to an average of 11.6 11,6 cm∙h-1
: at the dam – 7.2 cm∙h-1
, in
Silno - 6.6 cm∙h-1
, in Toruń - 2.8 cm∙h-1
. The highest values of the maximum drop rates
of water stages in the dam profile and at the water gauge in Włocławek amounted to,

74
respectively: 30 and 29 cm∙h-1
; in Nieszawa – 14 cm∙h-1
; Silno – 12 cm∙h-1
; Toruń – 9;
in Tczew – 4 cm∙h-1
.
This part of the analysis indicates that the supply wave in the measuring profile in
Silno, at the distance of approximately 45 km away from the dam, while constituting the
beginning of an unregulated reach, exemplifies similar dynamics to the dam profile (fig.
32, 33 - A). In the Nieszawa profile, fluctuation of water stages attenuated and the wave
was flattened. Such course of a wave at this reach is related to better conditions for
water retention in the channel (larger width) and the river valley. In the vicinity of
Nieszawa and Ciechocinek, the Vistula river flows into Toruń Basin, where the channel
is composed exclusively of sand formations (fig. 23).
Observation of the consecutive three supply waves, which occurred in 2007 on
July 22nd
, September 23rd
and October 14
, showed that propagation of waves, and the
value of hourly water stages fluctuation in particular was considerably influenced by the
initial filling ratio of the Vistula channel (immediately before the water discharge from
Włocławek Reservoir). (fig. 34).
Figure 34 shows that the higher were the water stages in the channel prior to the
discharge, the lower was the wave and its duration was shorter. On the other hand,
movement rate of a wave front increased. The said relationship becomes apparent when
comparing the course of waves of June and July 2007, which were preceded by low
water flow (approx. 450 m3.s
-1), and the wave that occurred in November, the same
year, with initial water flow that did not exceed the average values (approx. 950 m3.
s-1
).
Observation of four different waves allowed to formulate a conclusion that the impact
range of the power plant operation on the hydrologic conditions depends on the extent
to which the channel is filled with water. The higher are the water stages, the shorter is
the distance at which fluctuation occurs (fig. 34).
While assessing the influence of the dam in Włocławek on the water stages
regime of the Vistula river one may assume that during low discharges the largest
hourly fluctuation of water stages occur within the reach between the dam and Toruń
(distance of 60 km) and range from 49 to 20 cm∙h-1
. Taking into consideration that
water stages fluctuation in a large river displaying a natural course does not exceed 10
cm∙h-1
(Zdankus, Sabas, 2006), it can be assumed that fluctuation lower than the said
value is observable only further down the river, in Korzeniewo and Tczew (i.e. over 160
km below the dam). The maximum hourly fluctuation at these stations amounted to
respectively: 7 and 5 cm∙h-1
. However, at the farthest located station (Tczew), daily

75
fluctuation of water stages reached over 80 cm, while elevation of the alimentation
wave amounted to 91 cm Thus one may assume that the impact of dam operation in
Włocławek on the course of hydrologic conditions, such as hourly fluctuation of water
stages, extends to over 160 km reach downstream, while its range of influence on daily
changes reaches over 230 km downstream. So far a claim has been maintained that the
distance does not exceed 200 km (Machalewskim et al., 1974).
The research conducted on the Vistula reach near Płock by A. Magnuszewski
(2002) show that, in relation to this particular river, the maximum range of flood waves
influence on groundwater stages may reach up to 1000 m. Thus, it appears that water
stages fluctuation below the Włocławek dam also influences ground waters in the
Vistula valley over a 230 km-long reach.
Fig. 34. Hydrographs of hourly water stages at the selected gauging stations during the
passage of four channel-supplying waves, at various channel filling ratios, preceding
water discharge from Włocławek reservoir. June 1st-24
th, 2007; July 2
nd-22
nd, 2007;
September 3rd
-23rd
, 2007; November 4th
-14th
, 2007 (Bydgoszcz-Fordon – own
observations; Włocławek – data obtained from the Regional Water Management
Authority in Warsaw; Tczew – data obtained from the Institute of Meteorology and
Water Management National Research Institute in Warsaw).

76
In May 2007 the new repair-intervention regime of operation of the Włocławek
dam caused ecological catastrophe on the lower Vistula (photo 12). After supplying the
channel for the purpose of navigation it took an hour to close the deficiency of useful
capacity in Włocławek reservoir. In order to achieve it, water level below the dam was
lowered to the value of biological flow. Additionally, discharge was entirely ceased for
approximately six hours (due to the planned maintenance works at the lower station of
the dam). Overlapping of these two factors caused considerable lowering of water
stages at the reach between Włocławek and Grudziądz, which lasted approximately 10
hours. All aspects combined resulted in great fish and mollusca mortality (Chełmiak
2007).
Photo 12. Employee of a company extracting gravel from the river in Fordon -
Bydgoszcz helping molluscs which remained on shoals return to water – result of
lowering water flows at the Włocławek dam to the value below the biological flow.
May 2007 (photo taken from the archive of Nowości Toruńskie).

77
6. Changes in bed load transport and its lithological characteristics
River's capacity for bed load transport plays a significant role in shaping their
morphodynamics and channel morphology (Allen, 1965; Dębski, 1970). The lower
Vistula currently does not comprise a homogeneous fluvial system. Due to human
activity, its channel lacks typological continuity. Study showed that different channel
types display different conditions for bed load transport in terms of its size, type of
material, as well as mode of transport.
Changes in the relationship between the components of fluvial transport are best
illustrated by the process that typically takes place in flow-through dammed reservoirs.
Such reservoirs display a tendency for retaining clastic load, including entire bed load
and a considerable amount of suspension. Damming the Vistula in Włocławek caused
complete cesation of bed load transport. It was assumed that the reservoir intercepts
approximately 42% of suspension (Babiński, 2005). However, in the years 1971-1995 it
was found to intercept as much as 88% of Vistula's clastic load (Babiński, 2002).
Disruption of river load movement continuity due to the existence of an artificial
reservoir results in increased bottom erosion below the dam, and thus, river tends to
replenish the material transported (fig. 24).
The process of redeposition of sediments from the channel bottom and banks
does not fully meet the transport capacity of the fluvial system. According to the
available literature, no dammed river has ever reached the same value of bed load
transport to its mouth, as it had had before the dam was erected (Babiński, 2002). As
mentioned before, the waters of the lower Vistula may, in a humid year, transport the
maximum of 4 million tons of bed load within the reach above Włocławek reservoir
(braided-anastomosing channel - in the profile of Kępa Polska) and over 1.5 million
tons within the regulated reach in the profile of Toruń. The minima in an arid year
amounted to, respectively, nearly 1.0 and 0.5 tons. The above-mentioned data indicate a
disproportion in the amount of bed load transported and show that the smallest
differences in bed load transport between the reaches take place in arid years (2 times),
while the most considerable ones occur during humid periods (2.7 times). The reason
for this disproportion is limiting river's capacity for bed load redeposition below the
dam as a result of bed erosion (Babiński, 1994).
In order to characterise bed load, which typically consists of grains of various
sizes (Skibiński, 1976), certain indexes must be introduced, for instance: average size of

78
grain (so called graphic arithmetic average) – Mz, median value d50, as well as indexes
of sorting, kurtosis and quartz grain roundness. Acording to M. Ludwikowska-Kędzia
and E. Smolska (2007), the analysis of relationship between the basic indexes of grain
size constitutes a source of information related to the environment of deposition and its
dynamics. J. Szmańda (2010), on the other hand, claims that based on grain size of the
alluvia one may conduct indirect assessment of the rate of rank flows: shear stress
(erosion) and deposition velocity. Bottom material and the ways it reacts constitute an
integral part of river mechanism, while mechanical composition of bed sediments
transforms in time in relation to the conditions of water flow in a channel (Kaniecki,
1976).
Detailed analysis of bed load grain-size distribution in the Vistula reach under
study was conducted with the use of 36 samples collected from the fronts of sandbars
found in the channel.
Prior studies regarding grain size of bed-load material in the lower Vistula reach
were subject of PIHM analysis under the supervisory of K. Dębski (Materiały..., 1954)
and were later continued by A. Born (1958). Research on the material obtained from the
fronts of sandbars was initiated by Z. Babiński (1992). As a result of his considerations
in this field, methodology of gathering representative samples for the bed load of the
Vistula was established, which was later employed by D. Giriat (2003), who analysed
selected textural features of bed load samples obtained on the lower Vistula in order to
define the extent of influence of the Włocławek dam on sediments. However, due to the
fact that samples were collected at random only from 8 out of total 30 sandbars
occurring at the time in the river reach under study, D Giriat (2003) did not obtain
satisfactory results. A. Kaniecki (1976) and Z. Babiński (1992) emphasize the necessity
of relating the places of sampling to channel geometry and flow conditions.
River sediments collected from 36 sandbar fronts were subject of detailed
analysis focused on textural features of grain size (average diameter of a grain,
skewness, sorting). Due to the fact that the river reach under study was diverse in terms
of channel and mesoforms typology, the sediment material obtained was divided into
two groups:
I – 28 samples collected in a braided reach of the river, unregulated, highly transformed,
where sand mesoforms prevail, such as central and lateral bars, stretching between
Bobrowniki (river km 694.25), where first sand bars occur below the dam and
Ciechocinek (river km 718.5);

79
II – 10 samples collected at the regulated reach, where channel is straightened and
narrowed to a constant width, featuring numerous alternate transverse-riffle bars, which
stretches from Silno (river km 721) to Toruń (river km 735).
Both in the first (unregulated – braided) and the second reach (regulated –
straightened), sediments consists mainly of sand fraction. Its average percentage share
in the samples under study amounts to, respectively, 99.3% and 99.6%. Gravels
constitute the remaining fraction, 0.6% and 0.3% respectively. Large homogeneity of
sediments under study appears to find confirmation in the indexes of grain size.
The values of grain mean diameter (Mz) indicate differences in the dynamics
of bed load transport. For the first group of samples (reach I) Mz indexes range from
0.335 to 0.556 mm (from 1.58 to 0.84 phi), 0.401 mm (1.32 phi) on average, while in
the case of the samples collected in reach II the indexes are higher and range from 0.404
to 0.622 mm (from 1.31 to 0.68 phi), 0.477 mm on average (1.07 phi). The above
analyses indicate that in the case of both groups an average grain represents middle-
grained sands with the exception of sample 18 in reach I and three samples in reach II
(no. 28, 30-31), where Mz was of coarse sands (fig. 35 A, appx. no. 2). Grain mean
diameter in reach I amounts to 0.513 mm (0.96 phi), thus, it is 1.25 times bigger than in
the case of those found in 2008. It can be assumed that the decrease in bed load
diameters is related to the changes in water environment's energy, arising from different
geometric parameters of the channel. As far as the regulated reach (II) is concerned, the
Mz index in 1988 amounted to 0.478 mm (1.06 phi), which means it was nearly
identical to the value calculated for the samples collected in 2008. Z. Babiński (1992)
points out that at the time of his research, one particular factor tended to exert marked
influence on the development of sedimentation process. Namely, the operation of the
dam in Włocławek, which conditioned the presence of erosion and deposition zones
below the dam and, consequently, triggered changes in the average diameters of a grain
in the longitudinal profile.
J. Skibiński (1976) also indicates that in the case of the lower Vistula river, the
genetic conditions for the formation of material in which the river forms its channel (i.e.
glaciofluvial sediments) may impact the differences between the values of bed load
diameter in the longitudinal profiles.
Detailed analysis of the Mz index in the longitudinal profile of the Vistula
indicates a clear pattern – a given type of bars arises under different environment's

80
energy. And so, one may divide all 36 bars into 4 types of identified forms: braided,
lateral, central and transverse-riffle bars.
Fig. 35. Line diagram of grain-size distribution (A-C) and roundness (D) of sediments
collected from the fronts of bars in the longitudinal profile of the Vistula in June 2008.
Explanation: Mz – distribution of mean diameter of sediment grains (a) in 2008 and (b)
1988 (Babiński, 1992); SkG – asymmetry of grain-size distribution (skewness
distribution); δ1 – distribution of sorting (standard deviation); Ro – distribution of
percentage content of rounded and well round grains in a sample, according to W.C.
Krumbein's model (Mycielska-Dowgiałło, 2007).
The first two are characterised by lower mean diameter of grains that form their fronts
(in the range 0.33-0.45 mm – sample 1-5, 8-17, 21-26, 36) in comparison to central and
transverse-riffle bars (Mz in the range of 0.42-0.62 mm – samples 6 and 7, 18-20, 27-
35) (fig. 35-A). This is why the course of Mz value in 1988 and 2008 could be so
diverse at reach I. The Mz values at reach II appear to be comparable with those from
the 80s' of the last century since the channel type remained unchanged at the time of the
dam being operational.

81
The course of the Mz index in the longitudinal profile of the river in 1998 and
2008 did not reflect the typical tendency for grains to become smaller with the distance
from a dam (Williams, Wolman, 1984; Kondolf, 1997; Juracek, 2002). It is assumed
that as the river bed becomes lower below a dam, an increase in the diameter of bed
forms occurs, and that there is a nearly direct relationship between them. This means
that reduction of deep erosion in time and space is related to the formation of a bottom
that is more resilient to the process and vice versa – an increase in bed material diameter
impedes the rate of river bed lowering.
At the reach under study, in the initial phase of the dam operation, alluvia were
redeposited selectively (replenishing missing bed load) to the point when their resources
within the channel were completely depleted (fig. 3 and 23). Alluvial material
redeposited at the reach below the dam (from 0 to 20 km below) participated in the
transport. Its features are known to reflect environment’s energetic It is often argued
that the bigger the energy of water flow, the thicker on average are the elements in the
sediments. Finer subfractions tend to be more common in the environments that display
lower dynamics, while in the enviroments of greater dinamics, the characteristic
fractions usually feature larger share of coarser subfractions (Racinowski et al., 2001).
Fine sands in reach I constituted on average 4.9% of the sample. In the regulated
reach (II) – merely 1.9%. The laegest share of such sands in reach I (between 8% and
15.5%) was found in the samples that had been collected directly below the reaches of
intensive lateral erosion (samples no. 5, 12) and from the fronts of lateral and braid bars
at the terminal part of the unregulated reach (samples 22, 25). The largest share of fine
sands in reach II (3.3% and 5.1%) occurred in samples no. 35 and 36, which were
collected in Toruń, within the impact zone of bridges.
The sediment samples were also analysed for sedimentation environment
dynamics diversity index (SkG) – skewness asymmetry of grain size distribution (fig.
35-B). Negative values of SkG index indicate material enrichment in thinner fractions
and elimination of finer ones, while positive values of the index point at the enrichment
of the material in finer fractions and reduction of coarser ones.
Sediments of bar fronts at reach I display mainly negative values in the
symmetric intervals and fine skewness of the distribution (fig. 35 - B), which means
that sediment under analysis is enriched in fractions coarser than the average. This may
suggest that debris is currently in the phase of erosion or there are tendencies for bed
material to be redeposited (Racinowski et al., 2001). Positive values of the SkG index,

82
exclusively in the intervals of symmetrical or slightly coarse skewness, were found in
several samples (no. 5, 8, 9, 12, 14, 15, 16, 23 – fig. 35 - B, appx 2), which may
suggest an occurrence of conditions that are favourable for debris deposition
(prevalence of periods featuring lower dynamics of deposition environment) within a
short reach of the river, between Bobrowniki and Nieszawa (river km 698.5), as well as
in the vicinity of Siarzewo and Ciechocinek (Kozia and Zielona Islands – river km 705-
709). Slightly positive (coarse) skewness of grain size distribution and negative (fine)
skewness of the remaining samples constitute a background which allows us to
conclude that river debris is currently in the phase of massive transit (Racinowski et al.,
2001).
Sediments in reach II (regulated) show negative values of the SkG index,
particularly in the interval of symmetrical grain size distribution. Exception here being
three samples displaying positive values and belonging to the positive interval of the
distribution. First of the samples (no. 28) was collected approximately 500 m above the
highway bridge near Toruń (river km 725.5), which may indicate a favourable influence
of a hydrotechnical structure – bridge – on the deposition of debris. The remaining two
samples (no. 30 and 31 – fig. 35 - B), which show enrichment of material in finer
fractions, were collected at the reach of marked influence of a point bar in Toruń (by Z.
Babiński (1992) referred to as a pseudo point bar). According to L.B Leopold (1982), in
the upper part of the meander, conditions tend to be favourable for material deposition
due to, among others, sudden drop in water discharge rate, which triggers grains that
move in saltation or their precipitation from the suspension.
Another factor that characterizes transport and deposition dynamics is
standard deviation (δ1), which is to be understood as a measure of sediment sorting
(Mycielska-Dowgiałło, 2007), that is spread of elements in a given grain size
distribution, which shows whether sediment, in terms of grain size, is highly or poorly
concentrated in relation to the mean value (Racinowski et al., 2001). According to the
theory of A. Shields (Barnik, 1998), the level of sediment sorting affect the conditions
under which grain movement may commence. It is assumed that the better is sediment
sorted, the lower is the energetic diversity of flow regime where sediment is formed. In
other words, the lower is the rate of sedimentation, hence higher selective velocity of
currents, the better sorted is the population.
Great majority of sediment samples is moderately and well sorted (fig. 35 - C).
Sediment sorting is more diverse in reach I than in reach II, which may indicate more

83
variable morphodynamic conditions (erosion, transport and accumulation) within the
reach. The unregulated reach (I) is also highly diverse in terms of geometry and
lithology of the channel (fig. 45 and 23), which further strengthens the effects of the
dam operation, in particular the dynamics of hourly fluctuation of water stages (fig. 32,
33). One of the morphological effects of frequent surges and drops of water stages in a
channel is a progressive erosion of the emerged surfaces of bars. In time they become
lower and, consequently, bed load transport forms tend to appear on their surfaces,
representing different degrees of bed load transport intensity (photo 13).
Photo 13. Large ripplemarks on the surface of one of the bars in the vicinity of
Ciechocinek (river km 712) after a several-hour long continuous flow of water over its
surface – the result of the Włocławek dam operation. The photograph was taken in
September 2001 during low flows. Arrows indicate the direction of water flow
(photograph by M. Hojan).
Sediments collected from the bars located in the vicinity of Kozia Island and
Ciechocinek were found to be best sorted, as the spread of elements in the population of
samples in grain size distribution oscillated around the boundary value for very well and
moderately sorted sediments (fig. 35 - C). According to R. Racinowski et al. (2001),
good and very good sorting may be related to the fact that bed load in this particular
place is either in transit or in the phase of deposition. As hydrological research showed,

84
the river reach under discussion is predisposed to reduce water stages fluctuation rate
caused by the dam operation, and thus, sediment here tends to be best sorted.
Moderately sorted sediments may occur within this reach due to intensive redeposition,
hence, considerable supply of bed load as a result of lateral erosion of Kozia and Ziolna
Islands (process of bed load differentiation does not keep up with the supply), as well as
the influence of a threshold on variable dynamics of flow rates within the reach.
Most poorly sorted (moderately at most) is the population of samples collected
at the terminal part of the unregulated reach in the vicinity of Otłoczyn (fig. 35 - C),
which may by a consequence of considerable changeability of environment energy
within this section of the river. The said fact is considered a result of water lifting
caused by the narrowed reach of the regulated channel located below (fig. 13). Due to
variable flow rate dynamics, central and lateral bars are being fragmented into smaller,
oblong, emerged forms and numerous submerged fragments - linguoid bars (photo 13).
It is possible to reconstruct transport dynamics and the deposition process in the
longitudinal profile of the Vistula reach under study with the use of a method suggested
by E. Mycielska-Dowgiałło (2007), the analysis of sedimentation trends in fluvial
environment. It provides means to interpret the distribution of population in samples
under analysis by referring them to a diagram of interrelationship between mean
diameter of a grain (Mz) and sorting ((δ1), covering three tendencies of the system (fig.
36):
System 1 – sorting diminishes with the increase in grain mean diameter. The
configuration registers the occurrences of temporary increases in the transporting energy
of the.
System 2 – trend opposite to system 1. Sorting diminishes with the decrease in
grain mean diameter. It accompanies the decrease in environment’s energy.
System 3 – constant sorting, regardless of changes in grain mean diameter,
typical of environments poor dynamics and low changeability of transporting energy.
The diagram depicting relationships between Mz and δ1 in subsequent sediment
samples (fig. 36) shows that the sedimentation environment in reach I (unregulated) is
dominated by the conditions of frequent disruption of sediment sorting caused by the
increase in flow competence and the presence of deposition of mainly coarse-grained
bed load (deterioration of sorting with the increase in grain mean diameter). This
appears evident form the increase in the share of coarse-grained sand subfraction and
fine-grained gravel in the following subsequent samples under analysis: no. 1-2, 4-5, 8-

85
9, 14-15, 17-18, 19-20, 26-27). Variability of current environment dynamics may in this
case be caused by the Włocławek dam operation and, in consequence, the occurrence of
hourly water stages fluctuation within a long reach below the dam (up to 30 cm∙h-1
in
Silno and 20 cm∙h-1
in Toruń). In such conditions sediments undergo resuspension,
which often leads to deterioration in sorting of sediment being redeposited. Conditions
in which a drop in environment's energy was observed, that is deterioration in sediment
sorting with the increase of finer-grained content, were indicated in five sediment
samples (no. 6-7, 9-10, 11-12, 15-16, 23-24), in which deposition affects mainly fine-
grained debris (increase in fine-grained sand subfraction). This may point at a relatively
short transport of material triggered from the bottom at the time of greater environment
dynamics (Gierszewski, Habel, 2011).
Fig. 36. Analysis of sedimentation trends in the Vistula at the reach between
Bobrowniki and Toruń according to the model suggested by E. Mycielska-Dowgiałło
(2007) in comparison to the diagram of interrelationship between grain mean diameter
(Mz) and sorting (δ1). The analysis involved 36 sediment samples collected from the bar
fronts located on the unregulated (a) and regulated (b) river reaches. Explanation: 1 –
trend towards the occurrence of increases in transporting energy in sedimentation
environment; 2 – trend towards frequent drops in transporting energy; 3 – trend towards
stabilization of conditions – typical of an environment featuring poor dynamics.
The second trend appears to prevail in reach II, hence, there is a decrease in
competence of deposition environment and, in consequence, deposition of fine-grained
debris. This tendency is reflected in three groups of samples: 28-29, 30-31, 33-34 (fig.
36). However, sediment samples collected from the bars at a short reach of the channel

86
indicate clear record of impact exerted by the bridges located in Toruń – increases in
transport energy in sedimentation environment (trend 1) for the groups of samples no.
34-35, 35-36 (fig. 36).
Another index under analysis, which allows for the reconstruction of
sedimentation environments, dynamics and length of sediment transport at the
investigated river reach is quartz grain roundness in collected samples. The shape of
grains in sediment, regardless of their diameter and surface features, depends on many
factors, namely: initial shape of a grain, its physical and chemical features, time of
processing, character and transport energy in sedimentation environment (Mycielska-
Dowgiałło, 2007). In a river, quartz grains are not subject to further processing
(Mycielska-Dowgiałło, Woronko, 1998) but, depending on the dynamics of flows, may
undergo segregation based on their roundness (Młynarczyk, 1985).
The author visually divided grains into 9 classes of roundness according to W.C.
Krumbein (Mycielska-Dowgiałło, 2007; fig. 4). The analysis focused exclusively on the
percentage share of rounded and well-rounded grains, i.e. of roundness class ranging
from 0.9 to 0.7 (fig. 4). The results were presented in a line diagram juxtaposing 36
samples in the longitudinal profile of the river for two selected fraction ranges: 0.5-0.8
mm and 0.8-1.0 mm (fig. 35 - D). A complete disruption of bed load movement
continuity occurred, as well as replenishment of its deficiency at the reach below the
dam by means of intensive redeposition of older alluvial sediments. The material that at
present participates in fluvial transport, sediment samples with the lowest numbers in
particular (samples 1-7), can be assumed to be source sediment.
The percentage share of rounded and well-rounded grains ranges from 3% to
43% and appears to be locally diverse, especially in the unregulated reach (reach II). In
reach I, rounded and well-rounded grains constitute 18% of sediment fraction in the
range of 0.5-0.8 mm and 13% in the range 0.8-1.0m, while in reach II – 20% and 23%
respectively. This means that finer grains are likely to be more rounded in reach I, while
in reach II it is coarser grains that tend to be of greater roundness. Which brings us to a
conclusion that sediments may have been transported in different ways. This
observation allowed us to reconstruct the prevailing hydrodynamic conditions for the
deposition of sediments on the bar fronts within the river reach under discussion. It
appears that the unregulated reach provides better conditions for the selection of finer
grains (fraction of 0.5-0.8 mm). The regulated reach, on the other hand, shows tendency
for triggering and transporting coarser fractions (0.8-1.0 mm) – greater environment

87
energy. In the upper part of reach I (samples no. 1-8), there is a clear difference between
the fractions of 0.5-0.8 mm and 0.8-1.0 mm (fig. 35-D). Finer fractions are clearly better
rounded (fig. 35 - D), which may arise from the fact that they are poorly sorted – impact
of the dam operation (water stages fluctuation – water flow rates). On the other hand,
the fact that finer fractions tend to be more rounded in the terminal part of reach I may
be related to the decrease in river's transport capacity caused by water lifting (fig. 35 -
D). Considerable diversity in term of quartz grain roundness in the river reach near
Ciechocinek may result from stabilization of environment's energetics and increased
sediment deposition (slow grain selection, great degree of roundness and sorting –
samples no. 11, 15), as well as from the fact that river transport there tends to be
supplied with the material from channel banks (deterioration in roundness and sorting of
sediment – samples no. 10, 12, 16). In reach II, on the other hand, roundness of quartz
grains tend to improve linearly along the river course – due to the fact that sediments
remain in transit (long-term sediment transport) over a presumably long distance
(samples no. 26-30), until they reach the meander section, where sediment accumulation
tends to be intensified (samples 31-33; fig. 35 - D). Thus, it can be assumed that, as far
as the reach under discussion is concerned, roundness degree of quartz grain tends to
increase with the distance from the Włocławek dam (moving away from the source of
sediment material being transported).

88
7. Functioning of Włocławek reservoir and its morphological
consequences
7.1. Channel deformations
7.1.1. Changes in the longitudinal and cross-sectional profile
The basic aspects of bed erosion development below dams include: rate of
channel bed incision and movement of erosion zone front downriver (Williams,
Wolman, 1984). Most frequently, the phenomena of erosion and deposition are studied
in relation to the observations of changes in the longitudinal and cross sections of a river
channel. Comparison analysis of their morphometric parameters recorded at various
periods allows for determining changes in the morphology of a channel. As K. Klimek
(1983) emphasizes, study of changes in cross sections can provide reliable results.
However, they need to be based on several decade-long periods of observation. River
cross-sections in gauging profiles are most frequently monitored (fig. 37). K. Krzemień
(2008) claims that monitoring changes in longitudinal profiles allows for distinguishing
morphostatic and morphodynamic sections of a river. Cross-sectional profiles, on the
other hand, help identify morphodynamic zones.
Fig. 37. Changes in cross section of the Vistula channel in the gauging profile in
Włocławek in the year 1966-2009 (river-km 679.7 – #9). Source: 1966, 1969 – cross
sections obtained from Hydroprojekt, department in Włocławek; 1994 – Śliwiński,
Polak, 1995; 2009 – own measurements.
Comparison analysis of changes in hydraulic mean depth of the Vistula channel
in the cross-sections prepared prior to the construction of the dam (1969), as well as 25

89
and 40 year later (1994 and 2009), shows a steady trend – incision of the channel (fig.
37 and 38). The differences in depths tend to decrease downstream from the dam, which
seems to confirm a general tendency in bed erosion processes below dams (Wiliams,
Wolman, 1984; Chalov et al., 2001; Juracek, 2002; Wang, Hu, 2004; Berkovich, 2011).
Comparison of mean depths, calculated for the cross sections of 1969 and 2009, indicate
that in the direct vicinity of the dam (up to approx. 10 km below) the mean depth of the
channel increased on average by 3.5 m (fig. 38), At the lowest located reach, 10-20 km
away from the dam, the difference in mean depths increased on average by 2.1 m (fig.
38). Comparison of changes in relation to the reach further down the river, below
Bobrowniki, is possible only for the period of 1994-2009, as no data is available for the
preceding years. At the reach from 20 to 30 km below the dam, the channel incision on
average by approximately 0.6 m (fig. 38).
Fig. 38. Changes in time of hydraulic mean channel depths (points), measured in cross
sectional profiles of the Vistula reach under study in relation to mean water stages in
the years 1956-1970 (continuous lines denote moving average). Source: 1969 – cross
sections of Hydroprojekt, department in Włocławek; 1994 – Śliwiński, Polak, 1995;
2009 – prepared by the author.
Detailed analysis of mean depths marked on cross sections allows for the
assessment of vertical erosion below Włocławek reservoir. With the use of data from
three different periods: 1969-1994, 1994-2009 and 1969-2009 (tab. 2), it was possible to
estimate the annual rate of mean channel depth increase (later referred to as channel
incision rate).
During the 40 years of dam operation (1969-2009), the mean rate of channel
incision in its direct vicinity (reach from 0 to 5 km below) was estimated to 8.6 cm∙year-

90
1 (tab. 2). To give a sense of scale, based on the analysis of data gathered on the Oder
river below Brzeg Dolny reservoir over the period of 31 year, the said value was
estimated to 6.2 cm∙year-1
(Głowski, Parzonka,2007). On the other hand, at the initial
stage of the Włocławek dam operation, between 1969 and 1994, the incision rate
amounted to 9.2 cm∙year-1
, and in the years 1994-2009 it dropped slightly to
7.5 cm∙year-1
. At the reach further down the river, approximately between river
kilometre 680 and 685 (Włocławek – Łęg Witoszyn), in the years 1994-2009, the value
amounted to 11.1 cm∙year-1
, thus, process of erosion intensified in comparison to the
initial stage of water dam operation (tab. 2). It is often assumed that bed erosion below
dams tends to diminish in time (Wiliams, Wolmman, 1984). In this case, however, at
the reach between Włocławek and the gauging station in Łęg Witoszyn, channel
incision clearly intensified in the last 15 years (tab. 2, fig. 38). Such occurrence may
arise from the geological structure of the channel, which favourable conditions for
selective erosion (numerous one-side thresholds).
Table 2. Mean annual rate of channel incision on the Vistula at the 45 km-long reach
below the Włocławek dam in the years 1969-2009. Source: 1969 – cross sections of
Hydroprojekt, department in Włocławek; 1994 – Śliwiński, Polak, 1995; 2009 – own
measurements.
River kilometre
River reach
Distance
from the dam
in km
Increase rate of mean depths observed in given
periods (in cm∙year-1
)
1969-1994 1994-2009 1969-2009
675-680
Dam - Włocławek city
0 to 5 9.2 7.5 8.6
680–685
Włocławek - Łęg Witoszyn
5 to 10 8.2 11.1 8.6
685-696
Łęg Witoszyn - Bobrowniki
10 to 21 4.4 5.7 5.3
696-702
Bobrowniki - Nieszawa
21 to 27 - 4.0 -
702-713
Nieszawa - Łęg Osiek
27 to 38 - 1.5 -
713-720
Łęg Osiek - Silno
38 to 45 - 2.3 -

91
fig. 23). However, in the opinion of the author, it is the consequence of channel
becoming narrower due to increased incision of the midstream zone and bed load
deposition between the channel regulating structures. The said phenomenon was
particularly intensive in the 80s of the last century. As illustrated with figure 37, within
the 5 km-long reach under discussion, channel lost over 40% of its active width (fig.
38). The reach located below, for instance, between river kilometre 685 and 696 (Łęg
Witoszyn–Bobrowniki reach), features lower rate of channel incision in spite of large
number of groynes (tab. 2, fig. 38). This is possibly due to two island of considerable
size, lateral channels of which relieve the main water flow zone during floods (fig. 8).
Thus, horizontal changes within this reach of the channel are lower (fig. 39,).
Fig. 39. Changes in channel width, measured in cross-sectional profiles of medium
water channel within the Vistula reach under study (continuous line indicates moving
average). Sources: 1968 – topographic map in the scale of 1:10 000; 1995 –
orthophotomap of the Polish Geodetic and Cartographic Documentation Centre
(CODGiK); 2009 – photomap of ODGK in Lublin 2005 – supplemented with mapping
conducted by the author in 2009.
The above mentioned analyses of mean depths in cross-sectional profiles show
that in 1994 the erosion zone below the Włocławek dam extended over a 20 km-long
river reach below the dam. This seems to confirm the results of research conducted by
Z. Babiński (1997, 2002), who indicated that after 25 years, the erosion zone covered a
reach of 26 km. Z. Babiński (2002) also calculated the mean rate of erosion zone
movement to 1.1 km∙year-1
(based on: 1 – channel changes in cross sections, 2 – channel
changes in longitudinal profiles). According to the author, erosion zone in 2009 already
crossed the boundary between the regulated and unregulated reach, meaning, it

92
extended over a distance of 40 km downstream from the dam (fig. 38, tab. 2). The
results obtained appear to be convergent with the results of research conducted at the
same reach by Z. Babiński (1997, 2002). One may also draw a conclusion that the
annual rate of channel incision is locally diverse, and is highest at the reaches where
considerable horizontal changes occurred in the channel (narrowing its active width).
Due to limited data (cross sections) from the year 1969 and 1994, it is impossible to
precisely indicate when the incision of the regulated channel at the reach from Silno to
Toruń commenced.
As vertical changes progress in a channel below a dam, the river adapts to new
hydrodynamic conditions. Observation conducted below the Włocławek dam showed
that the erosion and deposition zones movement was followed by horizontal changes in
the shape of channel cross sections, which resulted from the processes of both sediment
erosion and deposition.
Figure 39 presents the dynamics of channel width changes in the longitudinal
profile of the Vistula reach under study in the following three periods: 1969, 1994,
2009. During the initial stage of the Włocławek dam operation (1968-1995), the
horizontal changes mainly involved a decrease in channel's active width (fig. 39, tab. 3).
In the periods of increased water stages, intensive deposition of sediments occurred
between the groynes and in the channels located behind the islands. At that time, a
decrease in channel width was observed at the river reach under study by approximately
16%. Most significant changes affected the reach between Włocławek and Łęg
Witoszyn (fig. 39, tab. 3), where channel width decreased on average by 212 m. Thus,
the rate of channel narrowing amounted to mean 8.5 m∙year-1
.
In the later years (1995-2009) changes in the Vistula channel width were not as
rapid. However, at the time, process of channel widening commenced in consequence of
lateral erosion. As Z. Babiński (2002) suggests, such phenomenon tends to occur only
later on during water dam operation. While the banks at the river reach under study tend
to erode over short channel sections, the mean rate of width changes calculated for the
entire river reach under study showed that the active flow zone in the channel actually
continued to narrow (by 0.2 m∙year-1
) (tab. 3). Most intensive broadening of the channel
in that period occurred at the reach between Bobrowniki and Nieszawa, particularly
from river kilometre 694 to 699, where both the old and the new level of the flood plain
were subject to lateral erosion. As Z. Babiński (1982, 1992) indicates, transformation of
channel morphology below the Włocławek dam triggers changes in the course of

93
thalweg, which in turn results in lateral erosion of the channel. The process tends to be
most intensive within the erosion section of the channel, upon the formation of erosion-
resilient bed and uncovering river thresholds. In the region where mesoforms occur, the
banks of the flood plain and islands are exposed to intensive undercutting (photo 14).
The process proved to be particularly strong at the following reaches: between river
kilometre 683 and 684 (fig. 28), at river kilometre 686 km (photo 6), between river
kilometre 690 and 696, between river kilometre 705 and 706.
Table 3. Mean annual rate of width changes in the Vistula channel active cross section
at the reach from the dam in Włocławek to Toruń in the years 1968-2009. Sources: 1968
– topographic map in the scale of 1:10 000; 1995 – CODGiK orthophotomap; 2009 –
photomap of ODGK in Lublin 2005 – supplemented with mapping conducted by the
author in 2009.
The analysis of banks retreat rate shows that degradation, in the case of most
reaches at least, is related to undercutting and washing out caused by flowing water,
which is a consequence of forced relocation of the midstream of the river (fig. 28).
According to the research conducted by Z. Babiński (1982), the process of erosion in
the years 1973-1976 greatly affected the banks of Włocławska Island (within the reach
River kilometre
River reach
Distance
from the dam
in km
Rate of channel width changes in given periods (in
m∙year-1
)
1968-1995 1995-2009 1968-2009
675-680
dam
0 to 5 -3.7 -0.5 -4.2
680-685
Włocławek - Łęg Witoszyn
5 to 10 -8.5 -0.3 -8.8
685-696
Łęg Witoszyn - Bobrowniki
10 to 21 -2.7 -0.4 -3.1
696-702
Bobrowniki - Nieszawa
21to 27 -2.2 +0.1 -2.1
702-713
Nieszawa - Łęg Osiek
27 to 38 -1.5 -0.3 -1.8
713-720
Łęg Osiek - Silno
38 to 45 -0.1 -0.8 -0.9

94
from river kilometre 677.5 to 678), and progressed at the rate of 1.75 m ∙year-1
.
Research carried out by the author in the years 1995-2010 indicate that the banks
erosion rate of Kozia Island amounted to 2.0∙year-1
. Furthermore, recent observation of
changes in river banks between Bobrowniki and Nieszawashowed that, within the reach
between river kilometre 697 and 699, from September 2005 to November 2009, the left
bank of the channel retreated by up to 125 m (annual rate of 25 m∙year-1
). Moreover,
one of the islands, Ptasia Island, lost considerable part of its surface. The right bank is
also exposed to erosion – a fragment of the new low flood plain at river kilometre 698
in particular.
Photo 14. Left erosion bank of the Vistula channel near the threshold at river kilometre
683. Undercutting of the new low flood level, which emerged in the years 1980-1995
(photography taken in September 2007)
Another aspect that needs to be taken into account in the study of the Vistula
valley floor morphodynamics below Włocławek reservoir is the course of channel’s
longitudinal profile. Analysis of its changes in time allows for the assessment of erosion
zone and debris deposition zone movement rate below the dam (Babiński, 2002). A
series of 28 measurements of bed elevation in channel's longitudinal profiles was

95
conducted in the years 1978-2010, serving as the starting point and basic material for
the analysis.
Incision of the channel in the thalweg zone illustrates a general tendency in
fluvial processes within the Vistula reach under study. The said trend can be traced in
figure 40, which presents river longitudinal profiles and indicates extreme dates of
surveying: 1978 and 2009. The scale of the phenomenon appears to decrease
progressively with the distance from the dam (fig. 40). River bed in the thalweg was
incision the most (on average by 1.62 m) at the reach between Łęg Witoszyn, located 10
km away from the dam, and Bobrowniki (21 km from the dam). The least incision
section (on average by 0.52 m) was found at the terminal part of the river reach under
study, between Silno and Toruń (45-60 km below the dam). Changes in five separate
reaches can be analysed in the last column of table 4.
Fig. 40. Changes in river bed elevation in the longitudinal profile of Vistula's thalweg
zone between Włocławek and Toruń against the background of the moving average of
water surface profiles between the gauging stations in Włocławek, Silno and Toruń.
Propagation dynamics of the erosion and deposition zones below the dam in
Włocławek can be traced by analysing changes in the mutual position of lines in the
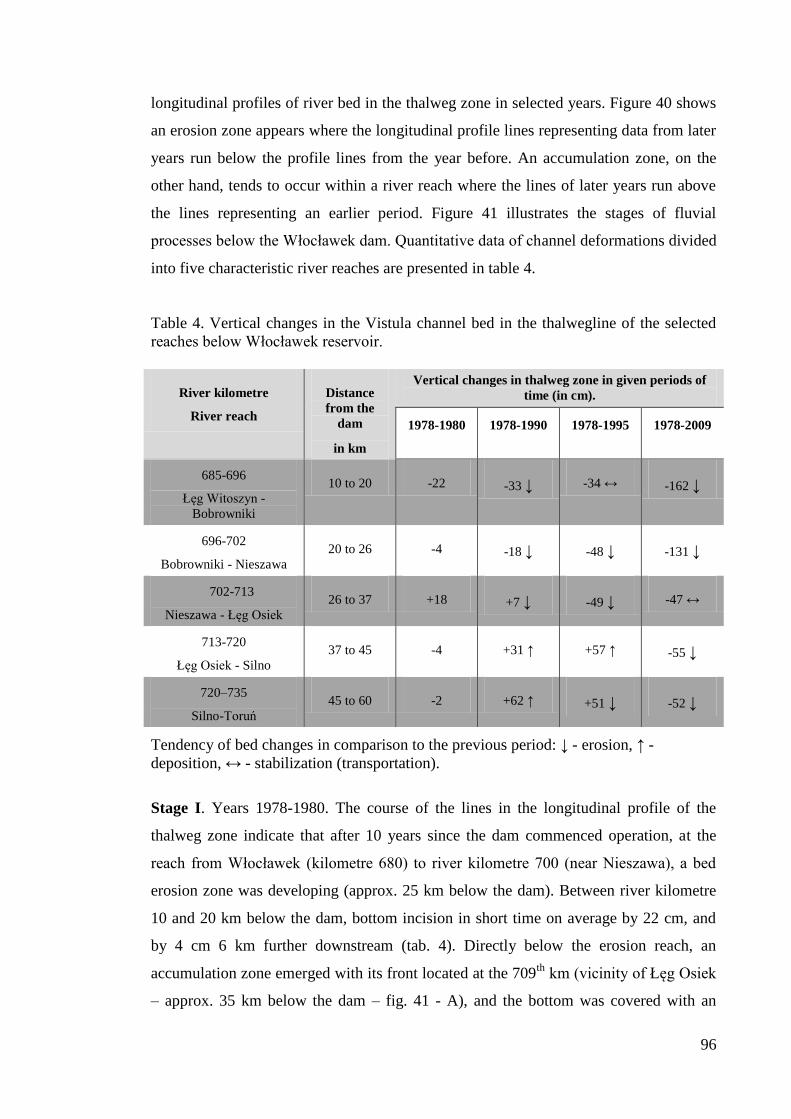
96
longitudinal profiles of river bed in the thalweg zone in selected years. Figure 40 shows
an erosion zone appears where the longitudinal profile lines representing data from later
years run below the profile lines from the year before. An accumulation zone, on the
other hand, tends to occur within a river reach where the lines of later years run above
the lines representing an earlier period. Figure 41 illustrates the stages of fluvial
processes below the Włocławek dam. Quantitative data of channel deformations divided
into five characteristic river reaches are presented in table 4.
Table 4. Vertical changes in the Vistula channel bed in the thalwegline of the selected
reaches below Włocławek reservoir.
Tendency of bed changes in comparison to the previous period: ↓ - erosion, ↑ -
deposition, ↔ - stabilization (transportation).
Stage I. Years 1978-1980. The course of the lines in the longitudinal profile of the
thalweg zone indicate that after 10 years since the dam commenced operation, at the
reach from Włocławek (kilometre 680) to river kilometre 700 (near Nieszawa), a bed
erosion zone was developing (approx. 25 km below the dam). Between river kilometre
10 and 20 km below the dam, bottom incision in short time on average by 22 cm, and
by 4 cm 6 km further downstream (tab. 4). Directly below the erosion reach, an
accumulation zone emerged with its front located at the 709th
km (vicinity of Łęg Osiek
– approx. 35 km below the dam – fig. 41 - A), and the bottom was covered with an
River kilometre
River reach
Distance
from the
dam
in km
Vertical changes in thalweg zone in given periods of
time (in cm).
1978-1980 1978-1990 1978-1995 1978-2009
685-696
Łęg Witoszyn -
Bobrowniki
10 to 20 -22 -33 ↓ -34 ↔ -162 ↓
696-702
Bobrowniki - Nieszawa
20 to 26 -4 -18 ↓ -48 ↓ -131 ↓
702-713
Nieszawa - Łęg Osiek
26 to 37 +18 +7 ↓ -49 ↓ -47 ↔
713-720
Łęg Osiek - Silno
37 to 45 -4 +31 ↑ +57 ↑ -55 ↓
720–735
Silno-Toruń
45 to 60 -2 +62 ↑ +51 ↓ -52 ↓

97
approximately 20 centimetre-thick layer of sediment (tab. 4). Farther reach, from Łęg
Osiek to Toruń, exemplifies vertical changes of the bottom that are typical of or close to
natural course of fluvial processes. In other words, alternating sections of minor erosion
and deposition occurred (fig. 41 - A).
Stage II. Years 1980-1990. After 20 years since Włocławek reservoir was filled, the
difference between bed elevations clearly indicate the progressive development of an
erosion zone, front of which moved 7 km downstream, near Łęg Osiek (approx. 32 km
below the dam – fig. 41 - B). The erosion zone movement rate was estimated to an
average of 0.7 km∙year-1
. From river kilometre 710 downstream, over a 25 km-long
reach, a rapidly developing deposition zone emerged, almost reaching Toruń (fig. 41 -
B), and the bottom at the reach between Silno and Toruń was covered with a 60
centimetre-thick layer of sediment (tab. 4). The zone movement rate was estimated to an
average of 2.5 km∙year-1
. Within the erosion reach, in the vicinity of Bobrowniki, a
short deposition fragment occurred (fig. 41 - B). However, the amount of deposition in
this part of the channel did not lift the bottom above the level from 1978.
Stage III. Years 1990-1995. Further development of channel bed erosion was observed.
At the reach from Silno to Toruń, sediment of the deposition zone from the years 1980-
1990 was subject to erosion (fig. 41 - C). This may serve as a premise to claim that the
erosion zone front entered the regulated reach, where five years before the front of
deposition zone occurred (approx. 58 km below the dam) (fig. 41 - C). Data in table 4
indicate that at the reach between Silno and Toruń, within thalweg zone, channel
incision by an average of 10 cm. At the reach between Łęg Osiek and Silno, a zone of
increased bed load deposition was found (fig. 41 - C), which led to the occurrence of
numerous bars that are typical of a braided river. Deposition at the terminal section of
the unregulated channel reach resulted from the fact that bed load supplied by the
erosion zone located upstream exceed river’s transport capacity (fig. 20). Assuming that
the erosion zone reached river kilometre 733 (vicinity of Toruń), its movement rate
amounted to 5.2 km∙year-1
, and, upon entering the regulated reach, increased several-
fold in comparison to the unregulated reach.
Stage IV. Years 1995-2009. The data presented clearly indicate that the erosion zone
below the dam covered the entire Vistula reach under study (fig. 41 - D). If that the
movement rate of this zone at the regulated reach amounted to 5.2 km∙year-1
, in the
period of 14 years under discussion, the front of the erosion zone would have reached as

98
far as 72 km downstream. However, it is currently located in the vicinity of Fordon (100
km below the dam) – or perhaps even further down the river.
Fig. 41. Dynamics of longitudinal profile changes of the Vistula channel below
Włocławek reservoir in the following periods: A – 1978-1980; B – 1980-1990; C –
1990-1995; D – 1995-2009. Numbers next to vectors indicate the maximum value of
vertical channel deformation in a given period.
Based on the analysis of dynamics changes in the longitudinal profiles of the
channel over a period of 40 years of the Włocławek dam operation, one can assume that
the most intensive development of the deposition zone, both in its length and the
thickness of the bed load layer covering the bottom in thalweg, occurred in the period

99
between 1980-1990 (tab. 4). The erosion zone, on the other hand, covered the entire
Vistula reach under study. The diversity of erosion and deposition zones movement
rates was not only related to the geometric features of the channel and the geologic
structure of the bottom, but also to the water flow conditions prevailing in the period
under discussion (arid years – humid years, size and frequency of floods).
The analysis of changes in channel morphology within a short, two kilometre-
long reach under observation for multiple years, allows for determining erosion-
deposition tendencies for the entire river. Comparison of changes in mean depths,
calculated from the bathygraphic curves for the selected reaches of the Vistula, allows
for, among others, tracing individual stages of the deposition zone entrance, which
continuously developed below the reach of intensive bed erosion (Babiński, Habel,
2009). The analysis includes the results of research for two Vistula channel fragments –
below Nieszawa and at Toruń.
The first investigated channel reach is located at Nieszawa, between river
kilometre 700 and 702. The first bathymetric measurements were taken by Z. Babiński
in the 80s of the last century. The author continued to survey the channel in the years
2007-2011. The publication by Z. Babiński (1992) shows that the average depth of the
channel at the reach between Włocławek and Silno, prior to the construction of the dam,
amounted to 2.2 m. The analysis of a sequence of eight depth surveys and bathymetric
plans allowed for preparing a graphic illustration of differences in bottom morphology
within the river reach under discussion (fig. 42). The results of morphometric analyses
were presented in the form of bathygraphic curves and tabulation (fig. 43).
Measurements taken in the years 1984-1985 indicate that mean depths of the
channel within this reach oscillated between 2.34 and 2.24 m. In 1987 the channel
became shallower – its average depth amounted to 1.93 m (fig. 43). This indicated
aggradation caused by the river. Figure 41 - B shows that, from 1978, a deposition zone
emerged in the vicinity of Nieszawa, below the erosion reach. Thus, it can be assumed
that the shallowing of the channel, which was observed in May 1987, was related to the
deposition of bed load directly below the front of the erosion zone.

100
Fig. 42. Bathymetric maps of the Vistula channel in the vicinity of Nieszawa. Depth of
the channel is presented in reference to water level – 418 cm at the gauging station in
Nieszawa (it is 24.41 m a.s.l.). Data from the years 1987 and 1995 – Z. Babiński, 1992;
2008 – survey prepared by the author.
Since May 1988 to July 2008, channel was progressively incision (fig. 42),
which indicates the presence and development of an erosion zone within this river reach
(fig. 41 B, C, D). Data concerning the differences between mean depths show that the
channel in Nieszawa, in the years 1988-2008, incision by an average of 1.1 m (fig. 43 -
B). Thus, the mean rate of channel incision amounted to 7 cm∙year-1
.
This particular example clearly indicates that the process of channel incision
may not always take on characteristics of a linear function. Surveys conducted in May
2008 and June 2011 showed that there was a slight decrease in mean depths at the
Vistula reach under study – by 20 cm (fig. 43 - B). This phenomenon is interpreted as

101
an effect of sediment build-up at the channel bottom during three floods that occurred in
May and June 2010 (fig. 22). Field observations allowed us to draw a conclusion that,
after 2010, the Vistula channel below Nieszawa undergone widening due to lateral
erosion. The material eroded in the process transformed into sand mesofroms that
occurred within the discussed reach in Nieszawa.
Fig. 43. The course of changes in mean depths of the Vistula channel near Nieszawa
(river km 700 to 702) presented on bathygraphic curves (A) and in the form of
tabulation for the selected morphometric parameters (B) (Babiński, Habel, 2009 –
supplemented with the data from 2011).
The second reach under analysis is located near Toruń, between river kilometre
730.5 and 732.5, and includes the regulated section of the Vistula. Three surveys were
conducted in the 80s of the last century (Babiński, 1992) and one in 2011. The
comparison of the course of bathygraphic curves and calculated mean depths of the
channel allows us to assume that mean depths of the channel were similar in the years
1985-1988, ranging from 3.02 to 3.11 m (fig. 44 - B). On the other hand, bathymetric
measurements taken in July 2011 gave the result of 3.54 m. Thus, in comparison to the
depth in 1988, the channel incision by approx. 0.5 m. (fig. 44). The course of the
bathygraphic curve of 2011 clearly indicates that depths are increasing within the range

102
of 4.5 - 9.0 metres (fig. 44 - A). The capacity of the channel, in comparison to the data
from 1988, increased by over 6%.
Fig. 44. The course of changes in relation to the bathygraphic curves (A) and the
selected morphometric parameters (B) of the Vistula channel in the vicinity of Toruń
(km 730.5-732.5). Data from the years 1985-1988 – Z. Babiński (1992); 2011 – study
by the author.
Taking into consideration the typical feature of regulated rivers, namely their
tendency to continuously lower their bottom (Babiński, 1985; Wyżga, 1993; Łajczak,
1995, Korpak et al., 2008), the average incision value of the Vistula in Toruń by appro.
0.5 m (assuming that erosion process at this reach commenced after 1995) exceeds the
effect of regulation by approx 60% (fig. 41 - D, tab. 4). Such stipulation arises from the
research conducted by Z. Babiński (1985), who argues that the development rate of
erosion processes at the regulated reach near Toruń amounts to an average of 1.05
cm∙year-1
(according to the data from the years 1888-1985).

103
7.1.2. Dynamics of bed load layer thickness changes
The channel reach under study is characterized by high dynamics of sediment
movement within the bottom zone, which was demonstrated in the analysis of bed load
layer thickness changes in longitudinal and cross-sectional profile. The said
phenomenon results from the operation of the water dam in Włocławek and arises from
the need for replenishing bed load below dams (Williams, Wolman, 1984). Erosion of
bed material ceases upon reaching silt-loam sediments, which are resilient to washing
out. Where such resilient forms do not occur, the process proceeds until the bottom of
the channel reaches appropriate gradient (Babiński, 2002).
The dynamics of vertical deformation of the alluvial channel bed are presented
in figure 45. It includes results of morphometric measurements of the channel
conducted in three consecutive periods: 1976-1980 (average value calculated from 14
measurements at various dates), 1985-1990 (average value from 12 measurements),
2007–2010 (average value from 9 measurements) (fig. 45 – B1 and B3). Each period is
presented in the form of a band chart of specific width. The above mentioned data is
demonstrated against the background of general thickness of alluvia found at the Vistula
reach under study (fig. 45 - A), interpreted as a zone between the extreme minimum and
maximum bottom elevations, measured at a given kilometre of the river in the years
1976-2010.
Alluvial rivers' capability to process sediments is highest during floods
(Rotnicki, Młynarczyk, 1989). According to E. Falkowski (1978), channels gain their
prevailing morphologic contour in the course of high, short floods, during which alluvia
are deeply processed and numerous moving pools occur. However, shallow erosion-
resilient forms, which constitute the upper parts of the fossil valley, may hinder their
free vertical movement. Thus, the highest depths in the Vistula channel are lined with
the lowest layers of alluvia, while the lowest depths coincide with the maximum riffles
(fig. 45 - A). Research by E. Wiśniewski (1976), E. Falkowski et al. (1987), as well as
the analyses of geological cross-sections of the Detailed Geological Map of Poland in
the scale of 1:50 000, show that the alluvia of the Vistula valley floor, in the
longitudinal profile of the area under study, may constitute covers varying in thickness.
In Włocławek, which is located at the initial section of the gorge fragment of the Vistula
valley (fig. 5), the channel is incised into Pliocene forms, and the fossil valley of the
Vistula is filled with sand-gravel sediment, thickness which can reach up to 20 m (fig.

104
6). A. Tomczak (1987) estimated the depth of alluvia in Toruń Basin to an average of
10-12 m, while E. Wiśniewski (1976) claims that the bottom layer of alluvia in the
vicinity of Ciechocinek can be 17 metres deep.
In view of author's research, thickness of the contemporary alluvia in the
longitudinal profile of the Vistula reach under study vary greatly, ranging from 4.8 to
10.7 m in the gorge section of the river, and from 6.0 to 9.8 m in Toruń Basin (fig. 45 -
A). The average thickness of alluvia at Toruń Basin is higher by 1.5 m in comparison to
the gorge section.
The longitudinal profile of the studied reach, for the period of 34 years under
discussion, displays a tendency of the river to process deeper alluvia both at the gorge
section of the valley and within Toruń Basin (fig. 45 – B1 and B3). Such occurrence
indicates that the channel below the dam in Włocławek is progressively shifting its
pattern and is becoming straightened. At the same time, sediments are being processed
within layers of decreasing thickness – difference between the minimum and maximum
values in this period (fig. 45 e.g. B3). Situation such as this may arise from the bed load
deficit (fig. 23). In the years 1976-1980, at the reach between Włocławek and
Ciechocinek (gorge section of the valley), the alluvia were being processed within the
layer of thickness ranging from 2.4 to 2.7 m (fig. 45 - B). In the years 2007-2010,
however, the process occurred only in the range of 1.7 to 2.3 m (fig. 45 - B3). Thus,
within 30 years, the capacity of the river to vertically transform alluvia decreased by
22%. On the other hand, at the reach between Ciechocinek and Toruń (Toruń Basin), in
the first period under discussion, the layer where alluvia were being processed displayed
thickness ranging from 2.5 to 3.9 m, and in the recent years – from 2.2 to 4.1 m, with a
general tendency to narrow the range of sediment processing by 5%. Sediment thickness
up to which alluvia were being processed in Toruń increased slightly in the years 2007-
2010 in comparison to the previous period (fig. 45 - B3).
The conducted analysis appears to support the claim that erosion and deposition
zones below the water dam in Włocławek exist and tend to change their location. The
evidence is to be found in the changes in the location of the layer where alluvia were
processed in the years 1985-1990 (B2) against the background of data from the years
1976-1980 (B1) and 2007-2010 (B3) (fig. 45). Comparison with the earlier period (B2
and B1) shows slight incision and decrease in thickness of the layer where sediments are
processed (entrance of erosion zone) at the reach from Włocławek to Nieszawa, while at
the reach from Łęg Osiek to Toruń one may observe an increase in level, within which

105

106
the river transformed its bottom (deposition zone) (fig. 45). Here, the erosion zone
appears to be convergent with the situations presented in figure 40 and 41, as well as
with the data in table 4.
The above-mentioned analysis appears to support the claim that the Vistula
channel at its george section (Włocławek-Ciechocinek) reached the erosion floor of the
Vistula valley. In other words, the alluvial cover once formed by the river waters was
removed (fig. 23). Comparison between the course of bottom elevation lines marked out
during depth surveying in November 2009 and the course of bottom layers of alluvia
shows that channel bed is covered with material displaying thickness ranging from 0.1
to 2.5 m (fig. 45). Alluvial resources within the reach between Ciechocinek and Toruń,
on the other hand, show even greater thickness, hence alluvia are processed at greater
depths.
Moreover, the analysis of thickness diversity of alluvia allows for determining a
precise borderline between the distinguished geomorphological units, i.e. between the
gorge section of the valley and Toruń Basin (fig. 5). On the other hand, identifying
lithological structure of the Vistula channel (fig. 23), along with the analysis of the
dynamics of vertical changes in processing its alluvial sediments (fig. 45), allow for
making prognosis in relation to the course of fluvial process for a few years to come.
7.1.3. Change in water surface slope
Water surface slope tends to transform when changes in flows (water stages)
occur in a river. Channel bed morphology is believed to be a decisive factor determining
its shape (Dunne, Leopold, 1978). When water stages are low, it draws close to the
channel bed slope and is more diverse. At high water stages it corresponds to an average
river gradient. During floods it may even resemble valley slope. Changes in gradients
tend to occur when there is lack of balance between the energy of flowing water and the
resistance of debris particles that form channel bed and river banks (Pasławski, 1973).
In the last 40 years, the diversity of longitudinal gradients of water surface in the
longitudinal profile of the Vistula reach under study was related to the course of erosion
and deposition processes. After only four years of Włocławek reservoir filling, within a
five metre long erosion reach, water surface gradient during average flows decreased
from 0.196‰ to 0.109‰. After over 25 years, surveys indicated a decrease to 0.077‰

107
(Babiński, 1997). Measurements taken by the author in November 2009 returned an
even lower value – 0.06‰ (table 5). As the channel depth increased in the thalweg zone
in the vicinity of Włocławek by approximately 1.62 m (after 40 years), the average
water stages decreased by a similar value (fig. 27). In consequence, the value of
longitudinal water surface gradient decreased within the entire reach under study (fig.
40). The said tendency for water surface gradient to decrease within the reach located
directly below dams is typical and proceeds in a similar way below other hydrotechnical
objects of this type in the world (Williams, Wolman, 1984, Berkovich, 2011).
The diversity of water surface gradient in the longitudinal profile of the river
reach under study is to be considered in two separate analyses. The former aims to
discuss the changes of values in longitudinal gradients during steady flow within
characteristic river segments (fig. 46 - A), the latter seeks to compare changes in the
longitudinal profile of water surface slope, measured in the thalweg of the river, in two
situations displaying different water flow values (fig. 46 - B). The following results of
the research were presented in author's earlier publication (Habel, 2010b)
Analysis I. Focuses on the values of longitudinal slopes within seven characteristic
river reaches, located between gauging stations listed in table 5. The slopes are defined
by values obtained during low water stages (560 m3.s
-1) – survey of May 19
th, 2009;
during average water stages (850 m3.
s-1
) – survey of November 3rd
, 2009; and during
flows corresponding to the bankfull water stage – survey of March 31st, 2010 (2300
m3.
s-1
). For the purpose of comparison, the chart includes data obtained from
measurements carried out by Z. Babiński (1997) in September 1995.
Data from the years 2009 and 2010 show that the lowest gradients occurred
within the reach located directly below the dam (km 674.9-679.4), and their values,
regardless of changes in the rate of flow, were close to 0.06‰. As the distance from the
dam increases downstream, the values of longitudinal slopes gradually increases,
reaching the maximum of 0.221‰ during low water stages at the reach between Łęg
Osiek and Silno (fig. 46 - A, table 5). The highest gradient value was recorded during
average water stages (950 m3.
s-1
) at the reach between Nieszawa and Łęg Osiek
(0.192‰). During bankfull stage (2300 m3.
s-1
), the river reaches the highest gradient at
the regulated reach (between Silno and Toruń) – 0.173‰, and between Nieszawa and
Łęg Osiek – 0.170‰ (fig. 46 - A, table 5).

108
On the Vistula between Silno and Toruń, regardless of water stages, longitudinal
gradients tend to be very stable and reach similar value – from 0.165‰ to 0.176‰ (fig.
25 - A). The said values are close to the ones, which occur within the entire regulated
Vistula reach (e.g. from Fordon to Grudziądz – 100 to 160 kilometres below the dam).
As the discharge of water changes in the channel, at the reach from Łęg Osiek to
Silno, a considerable shift in gradient occurs. While at low water stages it amounts to
0.221‰, during bankfull stage it decreases to 0.128‰ (fig. 46 - A). This indicates
diverse morphology of this particular river reach and, most importantly, constitutes an
evidence of accumulation of a large quantity of channel forms (fig. 20).
Table 5. Differences of water surface slope in space and time, and when changes in
flows (water stages). The values of flow relates to Toruń gauging station.
Characteristic
segments of the
river and river
kilometers
Distance
between
stations in
km
The values of the measured water surface slopes in ‰
21.09.1995
Q830 m3∙s-1
(according
Babiński, 1997)
12.08.2009
Q=520 m3∙s-1
19.05.2009
Q=560 m3∙s-1
03.11.2009
Q=950 m3∙s-1
27.11.20
09
Q=1400 m3∙s-1
31.03.201
0
Q=2300 m3∙s-1
23.05.2010
Q=6350
m3∙s-1
Zapora –
Włocławek
674,9 - 679,4
4,5
0,077
0,071
0,061
0,06
0,069
-
0,155
Włocławek – Łęg
Witoszyn
679,4 - 685,3
5,9
0,108
0,102
0,093
0,107
0,098
0,127
0,157
Łęg Witoszyn –
Bobrowniki
685,3 – 695,8
10,5
0,168
0,141
0,145
0,156
0, 158
0,159
0,142
Bobrowniki –
Nieszawa
695,8 – 702,4
6,6
0,093
0,168
0,154
0,155
0,154
0,152
0,135
Nieszawa - Łęg
Osiek
702,4 - 713,5
11,1
0,194
0,181
0,199
0,192
0, 166
0,170
0,137
Łęg Osiek – Silno
713,5 – 719,8
6,3
0,129
0,222
0,221
0,164
0,192
0,128
0,130
Silno – Toruń
719,8 – 734,7
14,9
0,165
0,164
0,165
0,176
0,164
0,173
1,91

109
110
The comparison of gradients in the years 1995 (orange dashed line in figure 46 -
A) and 2009 (red line in figure 46 - A) shows that in most cases the changes were
inconsiderable. However, two fragments represent a marked gradient increase. Within
the reach from Bobrowniki to Nieszawa it increased from 0.093‰ to 0.155‰, which
was mostly caused by marked loss of alluvia in this section. The average channel depth
increased there in the last 15 years by approx. 60 cm (tab. 2, fig. 38). Furthermore,
lateral erosion of the channel intensified (tab. 3). On the other hand, at the reach from
Łęg Osiek to Silno, the slope decreased from 0.129‰ to 0.164‰, and mean depth
increased by nearly 35 cm (tab. 2, fig. 38). At the reach from the dam to Bobrowniki,
the slope either remained unchanged or decreased slightly, which is a direct result of
stabilizing water surface by numerous exposed thresholds located at the bottom (fig. 23
and fig. 15, 16).
Analysis II. Geodetic surveys of water surface elevation (station pole every 20 m) in
the thalweg of the river, allowed for preparing a visual model of shape diversity
displayed by the longitudinal profile of water surface in the Vistula reach under study,
including the assessment of local slopes. Figure 46 - B demonstrates data from two
surveys. The former was conducted on May 19th
, 2009 at low water stages (560 m3.
s-1
),
the latter on November 3rd
, 2009 during average water stages (850 m3.
s-1
). The largest
channel mesoforms are partially emerged above water surface during low water stages
(flows), and usually become entirely submerged at average water stages. Thus, the
shape of the profile tends to be diverse during low water stages as the presence of
channel mesoforms is revealed. The profile appears more levelled out during average
water stages, although the influence of river bed on its shape is still apparent. The data
allowed for indicating five types of longitudinal profiles in relation to the reach under
study (Houghtale et al., 1996). Measurements taken during low water flows show that
the profile directly below the dam is mild, and at times even entirely flat (river km 683,
690, 696). For instance, the threshold at river kilometre 683 stabilizes water level in low
water channel within a nearly five kilometre-long reach (fig. 46 - B). While the distal
part of the largest channel mesoforms tend to feature steep profiles, short reaches
display profiles are critical, with slopes ranging from 0.54‰ to 0.60‰. In such cases
water movement tends to be rapid (fig. 46 - B, river km 684, 691, 701, 705, 709). Large
inclination of water surface at low channel depth causes triggering material in its bed
(Leopold, 1982). In consequence, the thalweg of the river cuts off channel mesoforms..
On the other hand, profiles that display shape reverse to water surface slope occur

111
below the biggest channel mesoforms (thresholds and bars). Thus, below the threshold
at river kilometre 683, over approx. 200 metre long reach, water surface is temporarily
inclined at 0.064‰ in the direction opposite to the course of the river. Below a bar of
considerable size, at river kilometre 698, the reverse-shape profile extends over a nearly
500 metre-long reach. (fig. 46 - B).
With a sudden increase and decrease of water stages in the Vistula below the dam
in Włocławek, considerable temporal surges in water surface gradients occur. It
influences, among the others, the intensity of erosion-deposition processes in a river
channel (Babiński, 1992). According to the results of research conducted by J. Skibiński
(1976) on the Vistula in Warsaw, observing water surface slopes in a river channel
simultaneously in its various profiles at times of increases or decreases in the values of
flows, allows for establishing channel morphology between subsequent measuring
profiles.
Similar experiment was carried out on June 27th
, 2007 at the Vistula reach under
study. Observation of changing water stages was carried out for 30-35 hours at six
gauging stations – dam, Włocławek, Łęg Witoszyn, Nieszawa, Silno, Toruń – during a
single channel-supplying wave discharged for the purpose of navigation (for further
discussion see subchapters 5.2 and 5.3). The results of calculations for longitudinal
slopes between these gauging stations, as well as relationships between gradients and
water stages are presented in the form of a scatter diagram (fig. 47). Each measurement
taken at hour intervals is marked in the diagram as a dot.
Analysis of the data indicates (fig. 47) that, within the reaches under study, the
amplitude of changes in water surface slope during a water rise amounted to 0.09‰ at
the dam-Włocławek and Nieszawa-Silno reaches, and was lower by nearly half at the
remaining sections. The highest gradients, among all the reaches, were found during the
initial phase of water rise (fig. 47). On the other hand, in the terminal phase of water
stages increase, during the culmination phase of a supply wave, the slopes tended to
reach their initial value. With the exception of the reaches between the dam and
Włocławek (values higher than initial), and between Nieszawa and Silno (lower than the
initial). As the supply wave waters began to fall, gradient decreased and reached a value
lower than the initial. The exception being the reach between the dam and Włocławek,
where the relationship between the slopes and water stages was affected by the sudden
cessation of water discharge from Włocławek reservoir (fig. 47). The most rapid surges
in water surface slopes, observable even when water level rose by merely 20 cm,

112
occurred at the reaches between Łęg Witoszyn and Nieszawa, and between Nieszawa
and Silno. Thus, a conclusion can be drawn that in consequence of releasing even minor
amounts of water from Włocławek reservoir, short-term yet intensive bed erosion of
alluvia is triggered at the discussed reaches of the Vistula. Z. Babiński (2008) points out
that the moment of maximum bed load traction rate during floods coincides with the
occurrence of maximum water surface slopes. Increase in the size of erosion, on the
other hand, depends on flow rate, which in turn is related to the mass of water and
channel slope (Klimaszewski, 1978). Assuming that the higher is the slope and water
mass, the larger is the intensity of erosion, one may conclude that within the 60
kilometre-long reach of the Vistula, the fragment most exposed to erosion would be the
one located in the direct vicinity of the dam (dam-Włocławek) (fig. 47). The said
relationship is less apparent at the Vistula reaches between Łęg Witoszyn and Nieszawa
(impact of thresholds), and between Nieszawa and Silno (influence of bars and good
conditions for increased channel retention). Between Nieszawa and Silno, despite the
increase in water mass, a drop in gradient occurred. This results in an increase of flows
caused by the occurrence of numerous sand bars, irregular hydrotechnical development
and existence of lateral channels behind Zielona Island and Dzikowska Island. In
consequence of decreased water flow rate, accumulation of transported river load
occurs. Moreover, earlier morphometric analyses indicated that Ciechocinek reach
displays best conditions for sediment deposition (fig. 13, 40).

113
Fig. 47. Dependency of water surface slopes (i) (in ‰) from water stages (H) (in
metres) in the Vistula channel within five characteristic river reaches. Explanation: A –
water rise stage, B – fall stage. Data of June 24th
, 2007 – obtained during intervention
discharge for the purpose of navigation.

114
8.2. Flood plain development
The flood plain of the lower Vistula reflects a tree-step development of a valley
floor in the Holocene: a braided river transforms into a meandering one, just to go back
to its braided pattern during the last centuries (Falkowski, 1978, Andrzejewski, 1994).
According to the research by E. Wiśniewski (1976), the accumulation phase in the
Vistula valley, during which the fossil terrace was filled and the older level of the flood
plain was formed, took place either during the Subboreal period (6000-2500 BP), or in
the first half of the Subatlantic period (2500-1250 BP).
The flood plain constituted the lowest level in the system of river terraces
proposed by E. Wiśniewski (1976). During the last 200 years, due to increased
anthropopression, its morphology and area coverage changed considerably. Within the
reach under study, it is discontinuous, on one or both sides of the gorge section
(Włocławek-Ciechocinek reach), and becomes continuous within Toruń Basin (fig. 13 -
a, photo 8).
At present, within the reach from Włocławek to Bobrowniki, the Holocene flood
plain constitutes the older, higher level. Its right-bank fragment in Włocławek is 250
metres wide and runs approximately 7 km downstream from Włocławek (fig. 7 – level
I). Its structure is composed of overbank deposits, as well as peat and fen soil. Structural
drilling conducted up to the depth of 4 m revealed their presence at the depth of 2-3 m
below the surface (Wiśniewski, 1976). Level I can also be found below Włocławek, in
the vicinity of Korabniki and Gąbinek villages, where it reaches 4-5 m above the
average level of the Vistula (approx. between river km 685 and 686) and is located at
the elevation 47 m a.s.l. (fig. 7). The youngest flood sediments formations can be found
at the depth of 2-4 m. The diameter of grains increases with depth. Moraine clay is
deposited at the depth of 21 m (Wiśniewski, 1976). The next fragment of the flood plain
is found in the vicinity of Bógpomóż, Bobrowniki and the mouth of the Mienia river.
From the place where the Vistula flows into Toruń Basin (Otłoczyn-Silno), the older
flood plain, which accompanies the river continuously and which can be up to 2000 m
wide (photo 7 and 8). The largest number of drills within the flood plain was performed
in the vicinity of Ciechocinek. Flood formations occur, namely fen soils, silts and fine
sands, occur up to the depth of 4-5 m. Geological structure frequently includes
organogenic sediments (Wiśniewski, 1976). The said formations are either deposited on
the surface, or covered with a layer of flood sediment. According to E. Wiśniewski
115
(1976), deposition of fossil organogenic and marginal formations indicates the presence
of Vistula fossil valley terraces. Most probably, these sediments were formed within the
old cut-off river channels. The flood plain in Toruń (approx. 735 km) is composed of
5.0-7.0 metre-thick complex of fine and silty sands. Underneath, within the entire width
of the plain, a layer of cobblestones is deposited, and further below one can fine
Pliocene clays and clayey formations (Grobelska, 2002).
Flood plains, unlike river channels, are subjected to the influence of flood waters
only for short time (Babiński, 1990). However, it is enough to change their surface. Due
to the operation of the dam in Włocławek, a new anthropogenic flood plain level
emerged (fig. 48), referred to by Z. Babiński (1992) as the new, lower flood plain.
L. Starkel (2001) and B. Wyżga (1999), among others, studied the low flood plain of
Carpathian tributaries of the Vistula river, which emerged in consequence of sediments
deposition in between groynes and was further stabilized by vegetation. Nevertheless,
the rate of development of the new Vistula flood plain directly below the dam in
Włocławek appears to be higher than in the case of the regulated Carpathian rivers
discussed by those authors.
Already after a year since the dam had been commissioned, material eroded
from the channel bed within the thalweg zone was found to accumulate in lateral
channels, behind islands and in between regulatory structures. As the erosion zone
moved down the river, sediment was found to accumulate in the near-channel zone.
According to Z. Babiński (1992), after 20 years of dam being operational, a new level of
flood plain was formed at the Vistula reach in Włocławek. (fig. 25). Currently, this
process occurs up to river kilometre 698, in other words, within a 23 kilometre-long
reach below the dam. The former flood plain in this river fragment transformed into a
floodplain terrace. The subject of flood plain development on dammed rivers has been
discussed in numerous research papers. (Chiwei, 1990; Kondolf, 1997; Wyżga, 1999;
Juracek, 2002; Ruleva, Zlotina, Berkovich, 2002; Starkel, 2001).
During the Włocławek dam operation flood waves entered the surface of flood
plain for an average of 7.3 days a year (fig. 9). In the years 1983-1992, inundation lasted
merely 6 days, which prevented, among others, entrance of vegetation and stabilization
of forms on its surface. The best developed section of the new low flood plain is located
below the dam (from the dam to Łęg Witoszyn). It was emerging in the conditions of
peak-intervention mode of hydro power plant operation (from 1970 to 2002) – currently
it operates in the intervention-flow mode.

116
Fig. 48. Formation of the new Vistula flood plain level in Włocławek at the reach
between river kilometre 681 and 683. Explanation: a and b – fragments of
Krzywogórska Island, 1-6 – river groynes (photo: 1988 – Z. Babiński; 2008 – author).
The first regime – peak-intervention – featured large frequency of water stages
fluctuation occurrence in the range of 1.5-2.0 m and 2.0-2.5 m (fig. 30 – a and 31 – A),
which resulted in frequent, short-term inundation of areas that currently belong to the
new flood plain. Z. Babiński (1982) points out that, especially in the first years of the
dam operation, the number of days when the flood plain was inundated quadrupled. B.
Wyżga (1993), during his research on changes in the regulated bottom of the Raba river
valley (tributary of the upper Vistula), observed that a decrease in the mean annual and,

117
in consequence, maximum water stages in relation to the height of river banks limited
the frequency of flooding. Morevoer, B. Wyżga (1993) noted that, as the channel
became deeper, given water stages were reached at increasingly larger and less frequent
flows. Similarly, this particular observation can be related to the Vistula reach under
study, where one can note a drastic change in mean water stages at Włocławek (fig. 27).
For instance, water level of 230 m (mean value estimated from the years 1969-2000), in
the period preceding the construction of the dam, was observed at the flows ranging
from 320 to 380 m3∙s
- 1. In recent years, however, the same water level tended to occur
at flows exceeding 1200 m3∙s
- 1 (three times larger channel capacity of the Vistula in
Włocławek). In consequence, the new flood plains becomes inundated at flows
exceeding 1400 m3∙s
- 1.
The newly formed flood plain at the right bank of the Vistula, width of which
ranges from 120 to 300 m, reaches 0.1-0.3 m above the average water table elevation
(depending on local conditions), and tends to be lower by 1.0-2.0 m than the surface of
the old flood plain. It developed into lath-shaped forms on both sides of the channel in
Włocławek and surrounds the following islands: Włocławska, Grodzka, Krzywogórska,
Korabnicka, Rachocin and Bógpomóż.
Field research showed that the new level is composed mainly of sedimentary
channel facies, thickness of which is diverse and ranges from 0.1 to 3.0 m (fig. 48,
photo 14). The surface, on the other hand, is covered with a 0.3-0.8 metre-thick layer of
flood sediments. In the lower parts of the channel embankments and post-flood basins
one may encounter channel sediment, tills and Pliocene clays, often covered with
boulder pavement. (fig. 49, photo 1). At a number of reaches, the emerged bottom of the
Vistula constitutes the proximal zone of flood level.
The decrease in frequency of water occurrence on the surface of the new flood
plain contributed to strengthening of vegetation and preservation of accumulated flood
sediments in the form of several grass-covered levees, height of which ranges from 0.5
to 0.8 m (fig. 49, fig. 50). They are located at the distance of 120 m away from the
current edge of the active channel. The said levees are likely to mark consecutive
episodes of the Vistula channel incision, thus contributing to the process of widening
the new flood plain (fig. 49). Studying their sedimentary structure allowed for
determining qualitative and quantitative changes in transported debris. According to K.
Teisseyre (1988), morphology and lithological structure of near-channel levees reflect

118
river's hydrologic regime, in particular, the frequency of high and low floods, as well as
concentration of suspension and grain size of suspended material carried by the floods.
Sediments of the grass-covered levees (formation type identified by K.
Teisseyre, 1988) form a characteristic set of laminate with alternating layers of fine
sands, silts and clayey silts (fig. 50). Also, minor longitudinal natural levees and
willow-covered levees tend to occur in the direct vicinity of the channel. However,
these formations are not as enduring as near-channel levees and are being washed out
during higher water stages.
Fig. 49. Morphologic outline of a right-bank fragment at the new flood plain in
Włocławek (river kilometre 679-681). Explanation: 1 – grass and willow-covered old
natural levees and their sediments (fig. 50); 2 – near-channel young natural levees and
their sediments; 3 – boulder pavement on the surface; 4 – backswamp and their
sediments; 5 – crevasse channels of backswamps; 6 – distal part of the new plain; 7 –
groynes; 8 – flood embankment; 9 – floodplain terrace; 10 – higher terrace beyond the
reach of flood waters.

119
Fig. 50. Natural levee (A) at the distal part of the new flood plain in Włocławek
(approx. 80 meters away from the Vistula channel) with lithological cross-section (B)
with structure of sediments that form them and lithofacial profile (C). Explanation: 1 –
levee, 2 – proximal part flood plain, 3 – distal part of flood plain, C – organic matter,
Fm – massive mud lithofacie, SFm – massive sandy silt lithofacie, Sm – massive sand
lithofacie, Gm – massive gravel.
120
8. Summary
Geomorphologic, hydrologic and sedimentologic research conducted of the
Vistula valley floor below Włocławek reservoir indicated that after 40 years since the
dam was commissioned, it has undergone considerable transformations. The changes in
the valley floor are very anthropogenic and included, among others:
– increased diversity of channel typology,
– noticeable changes in the hydrologic regime of the river on over 230 km-long
reach,
– prevalence of erosion over river debris aggradation within a 60 km-long reach
below the dam.
The maximum range of impact of the dam operation is impossible to define, as
the direct influence of the dam on the character of sedimentation structure of river bed
sediments is markedly modified by factors that may locally occur within the river
channel.
One may add that in the period from 1969 to 2011, at the reach under study, no
works were conducted to obtain aggregate from the channel, nor dredging Thus, the
results of morphologic research conducted by the author may be regarded as highly
credible.
I. The operation of the Włocławek dam is believed to disturb the natural
hydrologic regime of the lower Vistula, which finds its reflection in daily and hourly
water stages fluctuation. The largest hourly water stages fluctuation is observed within
the 60 km-long reach below the dam (i.e. down to Toruń). In the direct vicinity of the
dam (up to 5 km below) their maxima amount to 49 cm∙h-1
and 20 cm∙h-1
in Toruń. At
the gauging station in Tczew, which is located 230 km away from the dam, they reach
the maximum of 5 cm∙h-1
. The maximum daily water stages amplitudes, on the other
hand, amount to approximately 200 cm in Włocławek, 130 cm in Toruń, and 90 cm in
Tczew – that is 200 km away from the dam. Based on this premise one may assume
that the actual influence range of the dam on the course of hydrologic conditions
stretches 230 km downriver, and it is highly probable that it extends to the very mouth
of the Vistula, i.e. 260 km below the dam.

121
II. The analyses of movement rate of erosion and deposition sections within the
contemporary channel (in terms of depth changes both in cross sections and in
longitudinal profiles) show that after 20 years, the erosion zone stretches over an
approximately 30 km-long reach below the dam, and its mean rate of movement was
estimated to 1.1 km∙year-1
(Babiński, 1992). Upon reaching the regulated reach of the
Vistula, narrowed to a constant width, the propagation rate of the erosion zone increased
nearly fivefold (to 5.2 km∙year-1
). In the years 1980-1990, an intensive aggradation of
debris was observed between Ciechocinek and Toruń (40-60 km below the dam), which
was related to the intensive development of debris erosion processes in the higher-
located reach. Movement rate of the deposition zone downriver in the years 1970-1990
amounted to mean 2.5 km∙year-1
. For instance, debris aggradation in the reach between
Silno and Toruń was so intensive that the bottom in thalweg was on average covered
with a 60 cm-thick layer of sediments. At present, the erosion zone was found to mark
its presence as far as below Toruń, that is over 60 km away from the dam.
III. In the years 1970-1995 the development of Vistula's valley floor was observed to
progress in two directions. On the one hand, the active channel incision (at the rate of
approx. 8.7 cm∙year-1
within a 10 km-long reach below the dam). On the other hand,
debris was deposited in the overbank zone (in lateral channels and in between groynes,
as well as on the flood plain). Currently, the development appears to be unidirectional,
as the active channel zone tends to deepen further down the river (at an annual rate of
5.7 cm∙year-1
, for example at the reach between km 10 and 20 below the dam) and
simultaneously reduces its width (by 0.4 m∙year-1
). In the last 40 years, the Vistula
channel in Włocławek lost 40% of its width, that is an average of 221 m. After over 40
years, the average channel depth in a cross-section increased on average by 3.5 m at the
reach stretching up to 10 km away from the dam, by 2.1 m at the reach between 10 and
20 km below, by 1.6 m at the reach from 20 to 30 km further down the river and
approximately by 0.5 m in Toruń, that is 55-60 km below the dam.
IV. In the initial period of dam operation, at the reach located in the gorge section of the
Vistula valley (from Włocławek to Nieszawa), the channel incision to the point of
reaching the erosion-resilient upper part of the fossil valley. At that time, the zone
outside the active channel was being overlain with sediments, which resulted in the

122
formation of a new flood plain. Currently, the process of bed erosion further progresses.
In addition, the material deposited within the overbank zone also undergoes erosion.
V. The river section under study, prior to the construction of the Włocławek dam, was
divided into two types of channels: 1 – braided-anastomosing and 2 – regulated,
straight. After more than 40 years of functioning of the reservoir, the river reach under
discussion became even more diverse in terms of typology. At present we can
distinguish three types of channels: 1 – from the dam to Bobrowniki (20 km-long reach)
– straightened channel, confined vertically by the river bed that varies in terms of
resilience to erosion and vertically, by chaotically occurring hydrotechnical structures
(groynes); 2 – from Bobrowniki to Silno (20 to 45 km away from the dam) – braided
channel, which becomes braided-anastomosing during high water stages; 3 – from Silno
to Toruń (45 to 60 km below the dam) regulated channel, straight, with sinusoidal
course of midstream during low water flows.
VI. As demonstrated in the research, the deficiency of bed load in total debris transport
below the dam bears an adverse effect on the hydrotechnical structures located within
the erosive reach from Włocławek to Toruń. The development of erosion may prove to
be threatening, as one may conclude from, among others, destabilization of the devices
located at the lower station of the dam, i.e. more intensive flow of infiltration water
through the earthen face dam, scoured road bridge span in Włocławek, or uncovering
the crown of the PERN pipelines and the Yamal–Europe natural gas pipeline now
buried below the river bed. In December 2007, a PERN oil pipeline was unsealed,
which led to an ecological catastrophe on the Lower Vistula. Further development of
bed erosion may severely damage devices located on the valley floor below the dam
(electric wires, oil pipeline and gas pipelines, as well as regulatory structures –
groynes).
VII. Analysing the present and forecast course of erosion-deposition processes on the
Vistula river below Włocławek reservoir, one may conclude that in fifteen or so years,
current deposition zone in Solec Kujawski, which lies 72 km away from the dam, will
cease its development, giving way to erosion processes. Aggradation of the river bed is
bound to continue its progress 100 km away from the dam. One may also expect that
thresholds, constituting the culmination of the alluvial bed, will play the decisive role in

123
shaping vertical and horizontal changes in the Vistula valley floor. Thus, the most
considerable changes in the Vistula channel are expected to occur up to 10 km below
the dam. Such situation will coincide with lateral migration of the Vistula channel at
river kilometre 683 – current location of a threshold that transversally dams the channel.
At present the said threshold lifts water in the reach that stretches 10 km below the dam.
.9. References
Allen J. R. L., 1965. A review of origin and characteristic of recent alluvial sediments,
Sediment.-Else., Publish Company, Amsterdam.
Andrews E. D., 1986. Downstream effects of Flaming Gorge Reservoir on the Green River,
Colorado and Utah. Geol. Soc. Am. Bull.
Andrzejewski L., 1994. Ewolucja systemu fluwialnego doliny dolnej Wisły w późnym glacjale
i holocenie na podstawie wybranych dolin jej dopływów, Rozprawy UMK, Toruń.
Arkuszewski A., Przyłącki W., Symonowicz A., Żylicz A., 1971. Eksploatacja dróg wodnych,
Arkady, Warszawa.
Babiński Z., 1982. Procesy korytowe Wisły poniżej zapory wodnej we Włocławku,
Dokumentacja. Geograficzna., z.1-2.
Babiński Z., 1985. Hydromorfologiczne konsekwencje regulacji dolnej Wisły, Przegląd
Geograficzny, LVII, 4.
Babiński Z., 1990. Charakterystyka równiny zalewowej dolnej Wisły, Przegląd Geograficzny, t.
LXII, z. 1-2.
Babiński Z., 1992. Współczesne procesy korytowe dolnej Wisły, Prace Geograficzne nr 157.
Babiński Z., 1994. Transport rumowiska unoszonego i wleczonego dolnej Wisły w okresie
eksploatacji stopnia wodnego Włocławek, Przegląd Geologiczny, T. LXVI, z. 3-4.
Babiński Z. 1997. Procesy erozyjno-akumulacyjne poniżej stopnia wodnego Włocławek, ich
konsekwencje i wpływ na morfodynamikę planowanego Zbiornika Nieszawa. IGiPZ PAN,
Toruń.
Babiński Z., 2002. Wpływ zapór na procesy korytowe rzek aluwialnych, Akademia Bydgoska
im. Kazimierza Wielkiego.
Babiński Z., 2005. The relationship between suspended and bed load transport in river channels,
(in:) Walling D.E., Horowitz A.J. (ed.:) Sediment Budgets 1, IAHS Publication, 291
Proceedings of symposium S1 held during the Seventh IAHS Scientific Assembly at Foz do
Iguacu,Brasil).
Babiński Z., Habel M., 2009. Dynamika strefy akumulacyjnej poniżej czoła strefy erozyjnej
Zbiornika Włocławskiego, [w:] A.T. Jankowski, D. Absalon, R. Machowski, M. Ruman (red.),

124
Przeobrażenia stosunków wodnych w warunkach zmieniającego się środowiska, WNoZ UŚ,
PTG oddz. Katowice, RZGW Gliwice, Sosnowiec.
Babiński Z., Szumińska D., 2006. Human impact on the hydrological regimen and fluvial
processes of the River Wda, [w:] R.S. Chalov, M. Kamykowska, K. Krzemień (red.), Channel
processes in the rivers of mountains, foothills and plains, Prace Geogr. 116, UJ Kraków.
Bagiński L., 2010. 40 lat stopnia Włocławek – główne problemy eksploatacyjne, Referat
podczas konferencji pt. 40-lecie Stopnia Wodnego we Włocławku, 22.09.2010 r., KZGW,
ENERGA S.A., Warszawa.
Banach M., 1998. Dynamika brzegów dolnej Wisły. Dok. Geogr., nr 9, IGiPZ PAN Warszawa.
Bartczak A., 2007. Wahania stanów wody (przepływów) rzeki Zgłowiączki wywołane pracą
małej elektrowni wodnej (MEW) w Nowym Młynie, Przyroda, Nauka, Technologie, t. 1, z. 2.
Bartnik W. 1998. Określenie warunków obrukowania dna w potokach górskich podstawą
przeprowadzenia regulacji bliskiej natury, Wyd. Instytut Meteorologii i Gospodarki Wodnej,
Konferencja - Bliskie naturze kształtowanie rzek i potoków górskich, Zakopane.
Belyj B. V., Vinogradova I. I., Ivanov V. V., Nikitina Ł. N., Chalov R. S., Chernov A.V. 2000.
Morfologia i deformacja rusla Verchnego Jeniseja, meżdu Sajano-Szuszenskoj GES i
Krasnojarskim Vodochraniliszczem, [w:] R. S. Chalov (red.) Erozja poczv i ruslovyje processy,
12, Moskwa.
Berkovich K.M., 2011. Rusłowyje procesy na rjekach w sfere wlijanja wodochraniliści, MSU,
Moskwa.
Born A., 1958. Wleczenie materiału w korytach rzek i potoków, Wiad. Sł. Hydrol. Met. PIHM,
Warszawa.
Brenda Z., 1998. Główne czynniki antropogeniczne kształtujące układ stosunków wodnych na
obszarze województwa włocławskiego, maszynopis pracy doktorskiej, IGiPZ PAN.
Brice J.C., 1975. Air photo interpretation in the form and behavior of alluvial river. Final Report
for US Army Research Office.
Chalov R. C., 2001. Słożno pazbitjeljennyje rusła rawninnych rjek: usłownja formirowanja,
morfologia I deformacja. Wodnyje resursy, t. 28, nr 2.
Chalov R. C., Pleskjebin Е. М., Bauł В.А., 2001, Rusłowyje procesy i wodnyje puti na rjekach
obskogo bassjena, Nowosybirsk.
Chełmiak M., 2007. Remont progu zabija życie w Wiśle, Nowości, 12.05.2007 wyd. Express
Media Sp. z o.o. (artykuł prasy lokalnej).
Chiwei Ch., 1990. The fluvial processes of the Lower Yellow River post Sanmenxia Reservoir,
Institute of Hydraulic Research, Yellow River Conservancy Commission, Zheng Zhou, China
Ciepielowski A., 1987. Badania związków pomiędzy podstawowymi parametrami fal
wezbraniowych w wybranych profilach rzek, Wyd. SGGW-AR, Warszawa.
Cyberski J., 1984. Zjawiska akumulacyjno-erozyjne w rzekach objętych oddziaływaniem
budowli piętrzących, Czasopismo Geograficzne, t. LV, z. 3

125
Czajka A., 2005. Sedymentacja osadów przykorytowych rzek uregulowanych na przykładzie
górnej Odry i górnej Wisły, [w:] A. Kotarba, K. Krzemień, J. Święchowicz (red.), Współczesna
ewolucja rzeźby Polski, IGiGP UJ, Kraków.
Decyzja nr OŚ OW 6811-6/01 – pozwolenie wodno-prawne na piętrzenie wód rzeki Wisły oraz
na pobór i zrzut wody przez stopień wodny „Włocławek” i elektrownię wodną „Włocławek”,
14.12.2001.
Dębski K., 1970. Hydrologia, Arkady, Warszawa.
Drozdowski E., 1982. The evolution of the Lower Vistula River valley between the Chelmno
Basin and Grudziadz Basin, [w:] L. Starkel (red.) Evolution of the Vistula River valley during
the last 15000 years, Part I, Geogr. Studies, Spec. Iss.
Dunne S., Leopold L. 1978. Water in environmental planning, San Francisco. W.H. Freeman
Co., San Francisco.
Dynowska I., 1984. Zmiana reżimu odpływu w wyniku oddziaływania zbiorników
retencyjnych, Czasopismo Geograficzne, LV, 3.
Dynowska I., 1991. Główne kierunki ochrony zasobów wodnych w dorzeczu górnej Wisły, [w:]
I. Dynowska, M. Maciejewski (red.), Dorzecze górnej Wisły, cz. I, PWN, Warszawa-Kraków.
Elektrownia Wodna we Włocławku – dopływy wody do Zbiornika Włocławskiego w okresie
1970 – 2006 (dane cyfrowe, niepublikowane) oraz opracowanie dotyczące wpływu Zbiornika
Włocławskiego na bezpieczeństwo powodziowe Torunia, 2010.
Falkowski E., 1978. Typy morfogenetyczne odcinków rzek nizinnych Polski oraz schematy
rozwinięć koryta rzecznego w aspekcie potrzeb hydrotechnicznych, Metody dokumentacji
geologiczno - inżynierskiej obszarów dolin rzecznych, Geoprojekt Wrocław.
Falkowski E., 1982. Wisła w geografii Polski – przyroda rzeki, [w:] A. Piskozub, Wisła.
Monografia rzeki. Wyd. Komunikacji i Łączności.
Falkowski E. 1990. Morphogenetic classification of river valleys developing in formerly
glaciated areas for needs of mathematical and practical modeling in hydro technical projects.
Geogr. Polon., 58.
Falkowski E., Kraużlis K., Granacki W., Falkowski T., Hoffman E., Falkowski J., Bieganowski
R., 1987. Geologiczna morfogeneza koryta Wisły na dolnym stanowisku stopnia wodnego
Włocławek – etap II., Hydroprojekt Warszawa.
Falkowski T. 2004. Związek morfologii koryta i charakteru współczesnych osadów rzecznych z
ukształtowaniem powierzchni i litologią podłoża aluwiów Wisły Środkowej. [w:] A.
Kostrzewski (red.), Geneza, litologia i stratygrafia utworów czwartorzędowych, Seria Geografia
nr 68, t. IV, Wyd. Naukowe UAM.
Falkowski T., 2005. Wpływ morfologii podłoża aluwiów na stabilność układu koryta środkowej
Wisły, Przegl. Geol., vol. 53, nr 7.
Fąferek B., 1960. Inżynierskie badania geologiczne dla stopnia wodnego we Włocławku,
Przegląd Geologiczny, nr 2. Warszawa.
Florek W., Majewski M., Machajewski H., Gałka M., Pajewska J., 2008. Ewolucja doliny
Darżyńskiej Strugi jako efekt procesów naturalnychi antropogenicznych, Landform Analysis,
vol. 7.

126
Folk R.L, Ward W.C., 1957. Brazos River bar: a study in the significance of grain size
parameters, Journal of Sedimentology and Petrology, vol. 27.
Fotomapa koryta Wisły, wyk. przez ODGK w Lublinie we wrześniu 2005, własność RZGW
Gdańsk.
Froehlich W., 1970. Geneza wzgórza nad doliną Wisły w Szpetalu koło Włocławka, Przegląd
Geologiczny, t. 42, z. 4, Warszawa.
Galon R., 1934. Dolina dolnej Wisły, jej kształt i rozwój na tle budowy dolnego Powiśla,
Badania Geograficzne nad Polską Płn. – Zach. 12-13, Poznań,
Galon R., 1953. Morfologia doliny i sandru Brdy, Stud. Soc. Sc. Torun., ser. C, 1., nr 6, sec. C,
Toruń.
Gierszewski P., 1991. Zatorowe deformacje poziomu zalewowego Wisły w rejonie
Ciechocinka, Przegląd Geograficzny, nr 63, t. 1-2.
Gierszewski P., 2006. Intensywność wymiany wody w zbiorniku włocławskim, Dok. Geogr.,
32, s. 64-69.
Gierszewski P., Habel M., 2011. Cechy litologiczne osadów dennych Kanału Bydgoskiego,
Materiała Mieżdunarodnoj Konferencji – Problemy Wodnogo Transporta, St. Petersburg, Rosja.
Giriat D., 2003. Wpływ stopnia wodnego we Włocławku na wybrane cechy teksturalne osadów
korytowych, UW (maszynopis pracy doktorskiej).
Glazik R., 1978. Wpływ zbiornika wodnego na Wiśle we Włocławku na zmiany stosunków
wodnych w dolinie, Dok. Geogr., 2/3.
Glazik R., Grześ M., 1999. Stopień wodny „Włocławek” – wybrane zagadnienia badawcze i
eksploatacyjne, [w:] Konferencja naukowo-techniczna pt. „Eksploatacja i oddziaływanie dużych
zbiorników nizinnych na przykładzie zbiornika wodnego Jeziorsko”, Uniejów, 20-21 maja
1999, Stowarzyszenie Inżynierów i Techników Wodnych Melioracji, ODGW i Wydział
Melioracji i Inżynierii Środowiska Akademii Rolniczej w Poznaniu.
Głodek J., Kęsik A., Kolago C., Mojski J. E., Starkel L., 1967. Z biegiem Wisły. Przewodnik
geologiczno-krajoznawczy, WG Warszawa.
Głowski R., Parzonka K., 2007. Eksploatacja i oddziaływanie Zbiornika Brzeg Dolny na rzece
Odrze, Przyroda, Nauka, Technologie, t. 1, z. 2.
Gradziński R., 1973. Wyróżnianie i klasyfikacja kopalnych osadów rzecznych, Podstawy Nauk
Geologicznych, nr 5, Wyd. Geologiczne – Warszawa.
Grobelska H., 2002. Budowa geologiczna równiny zalewowej i dna koryta Wisły, Zeszyty
naukowe WSHE we Włocławku, T. X, seria E.
Grześ M., 1991. Zatory i powodzie zatorowe na dolnej Wiśle. Mechanizmy i warunki, IGiPZ
PAN, Warszawa.
Grześ M., 1999. Rola zjawisk lodowych w kształtowaniu koryta dolnej Wisły, Acta
Universitatis Nicolai Copernici, Geografia XXIX, UMK Toruń, z. 103.
127
Habel M., 2007. Fluvial processes below the Wloclawek dam, Proceedings of the 10th
International Symposium on River Sedimentation. August 1-4, Moscow, Russia, vol. 2.
Habel M., 2010a. Zasięg oddziaływania stopnia wodnego we Włocławku na wahania stanów
wód dolnej Wisły, Monografie Komitetu Inżynierii Środowiska PAN, vol. 68.
Habel M., 2010b. Zróżnicowanie podłużnego spadku zwierciadła wody w korycie Wisły poniżej
Zbiornika Włocławskiego, Seria Studia Geograficzne i Geologiczne UAM, tom 3.
Houghtalen R., Akan A., Hawang N., 1996. Fundamentals of Hydraulic Engineering Systems.
Pearson Education Ltd., London.
Hayse J., Daly S., Tuthill A., Valdez R., Cowdell B., Burton G.,2000. Effect of daily fluctuation
from Flaming Gorge Dam, Upper Colorado River Recovery Program Project no. 83, U.S. Dep.
of Energy.
Instrukcja gospodarowania wodą na stopniu wodnym Włocławek, 2006, RZGW Warszawa
(mat. niepubl.).
Internet 1 – www.pogodynka.pl (serwis informacyjny IMGW).
Internet 2 – www.nac.pl (Narodowe Archiwum Cyfrowe, sygnatura zdjęcia 1-G-4572-S).
Internet 3 – www.nac.pl (Narodowe Archiwum Cyfrowe, sygnatura zdjęcia 1-G-4569).
Internet 4 - www.most.torun.pl (Urząd Miasta Toruń).
Jankowski A.T., 1995. Z badań nad antropogenicznymi zbiornikami wodnymi na obszarze
górnośląskim, [w:] Wybrane zagadnienia geograficzne. Pamięci geografów Uniwersytetu
Śląskiego Józefa Szaflarskiego i Piotra Modrzejewskiego, WNoZ UŚ, PTG w Katowicach,
Sosnowiec.
Jankowski A.T., Rzętała M.,1997. Problemy wykorzystania retencji zbiornikowej w warunkach
silnej antropopresji, [w:] Wpływ antropopresji na jeziora, (red.) A. Choiński, UAM, Poznań –
Bydgoszcz.
Jarocki W., 1957. Ruch rumowiska w ciekach, Wyd. Morskie, Gdynia.
Juśkiewicz W., 2006. Rekonstrukcja procesów fluwialnych kształtujących Kępę Dzikowską na
Wiśle w rejonie Ciechocinka, Dok. Geogr., 32.
Juracek M., 2002. Channel-Bed Elevation Changes Downstream From Large Reservoirs in
Kansas, Water – Resources Investigations Report, USGS.
Kamykowska M., Kaszowski L., Krzemień K., Niemirowski M., 1975. Instrukcja do kartowania
koryt rzecznych. Kraków, maszynopis.
Kaniecki A., 1976. Dynamika rzeki w świetle osadów trzech wybranych odcinków Prosny,
Prace Kom. Geogr.- Geol., t. 17, Poznań.
Kantoush A. S., Sumi T., Kubota A.,, Suzuki T., 2010. Impacts of sediment replenishment
below dams on flow and bed morphology of river, First International Conference on Coastal
Zone Management of River Deltas and Low Land Coastlines, Alexandria, Egypt
Karolyi Z., 1949 Mesures se rapportant au dẻbit solide de haut Danube hongrois. Grenoble,
IAHR.
128
Kaszowski L., Krzemień K., 1999. Mountain river channel classification systems [w:] River
channels – pattern, structure and dynamics, K. Krzemień (red.), Prace Geogr., UJ, 104.
Klimaszewski M., 1978. Geomorfologia, PWN, Warszawa.
Klimek K., 1983. Erozja wgłębna dopływów Wisły na przedpolu Karpat, [w:] Z. Kajak (red.),
Ekologiczne podstawy zagospodarowania Wisły i jej dorzecza, PWN, Warszawa-Łódź.
Klimek K., 2008. Współczesne procesy rzeczne w strefie staro glacjalnej, [w:] Współczesne
przemiany rzeźby Polski, red. Starkel L., Kostrzewski A., Kotarba A., Krzemień K. wyd. IGiGP
UJ, Kraków.
Koc. L., 1972. Zmiany koryta Wisły w XIX i XX wieku między Płockiem a Toruniem, Przegl.
Geogr., 44, 4.
Kola R., 2001. Historia mostu pod Opaleniem. Świat Kolei, nr 8, EMI-PRESS.
Kola R., 2002. Most kolejowy w Toruniu. Świat Kolei, nr 4, EMI-PRESS.
Komunikat RZGW Warszawa, 2007. Komunikat o przerwach w przepływie wody przez stopień
wodny we Włocławku z 27.04.2007 r., Kierownik Inspektoratu RZGW we Włocławku (mat.
niepubl.)
Komunikat RZGW Warszawa, 2010. Komunikat o ograniczeniu przepływu wody przez stopień
wodny we Włocławku z 15.10.2010 r., Kierownik Inspektoratu RZGW we Włocławku (mat.
niepubl.)
Kondolf M., 1997. Hungry water: Effects of dams and gravel mining on river channel,
Enviromental Management,Vol. 21, No. 4.
Kondracki J., 2002. Geografia regionalna Polski. PWN, Warszawa.
Korpak J., Krzemień K., Radecki-Pawlik A., 2008. Wpływ czynników antropogenicznych na
zmiany koryt cieków karpackich, Infrastruktura i Ekologia Terenów Wiejskich, 4, Komisja
Technicznej Infrastruktury Wsi, PAN, Kraków.
Korpak J., Krzemień K., Radecki-Pawlik A., 2009. Wpływ działalności człowieka na
funkcjonowanie górskich systemów fluwialnych, Architektura – czasopismo techniczne, z. 10.
Kosicki M., Krężęl J., 1977. Wpływ zasilania ze zbiorników retencyjnych na głębokości w
Odrze Środkowej, Gosp. Wod., nr 9.
Kowalczyk K., 2011. Ocena przydatności pomiaru punktów niedostępnych metodą GPS RTK
z uwzględnieniem błędów punktów bazowych. Przegląd Geodezyjny, nr 10.
Krzemień K., 2006. Badania struktury i dynamiki koryt rzecznych, Infrastruktura i Ekologia
Terenów Wiejskich, 4. Komisja Technicznej Infrastruktury Wsi, PAN, Kraków.
Kubiak-Wójcicka K., 2006. Zmiany hydrograficzne i hydrologiczne w dolinie Wisły pomiędzy
Włocławkiem a Bydgoszczą. UMK Toruń (maszynopis pracy doktorskiej).
Lambor J., 1962. Metody prognoz hydrologicznych. Wyd. Komunik. i Łącz., Warszawa.
Leopold L. B. 1982. Water surface topography in river channels and implications for meander
development, Gravel-bed Rivers, Wiley and Sond Ltd.
129
Leopold L.B., Wolman M.G., 1957. River channel patterns: Braided, meandring and streight,
Geol. Surv. Prof. Paper, 282-B, Washington.
Leopold, Luna B., Wolman, M.G., and Miller, J.P., 1964. Fluvial Processes in Geomorphology,
San Francisco, W.H. Freeman and Company.
Lu X.X., Siew R.Y., 2006. Water discharge and sediment flux changes in the Lower Mekong
River: possible impacts of Chinese dams. Hydrology and Earth System Sciences 10.
Ludwikowska-Kędzia M., Smolska E., 2007. Wskaźnikowe cechy uziarnienia aluwiów i ich
znaczenie we wnioskowaniu o dynamice procesu, Przegląd Geologiczny, vol. 55, nr 3.
Łajczak A., 1995. The impact of River regulation, 1850-1990, on the channel and floodplain of
Upper Vistula River, [in:] River Geomorphology edited by E. Hickin, Wiley and Son Ltd.
Łapuszek M., Witkowska H., 2006. Wpływ zwiększenia rozstawu wałów na poprawę
warunków ekologicznych oraz ochronę przeciwpowodziową, Infrastruktura i Ekologia Terenów
Wiejskich, 4, Komisja Technicznej Infrastruktury Wsi, PAN, Kraków.
Machalewski W., Miełkowski M., Rozwadowski J., 1974, Wpływ stopnia wodnego we
Włocławku na warunki żeglugowe Wisły dolnej, Gospodarka Wodna, nr 3.
Magnuszewski A., 1999. GIS w geografii fizycznej, PWN, Warszawa.
Magnuszewski A., 2002. Systemy geoinformacyjne w badaniach ekohydrologicznych,
Wydawnictwa UW, Warszawa.
Makowski J., 1998. Dolna Wisła i jej obwałowania. Historyczne kształtowanie, obecny stan
i zachowanie w czasie znacznych wezbrań, cz. 2, Biblioteka Naukowa Technika nr 27, IBW
PAN Gdańsk.
Makkaveev N. I. 1957. Woprosy wolnowjego i ruslowjego rezimow na zaregulirowannych
rjekach i wodochraniliściach (Вoпросы волновего и руслового режимов na
зарегулированныx ржекаx и wodochraniliśцяx), MGU, Moskwa.
Malarz R., 2004. Geomorfologiczne skutki działania zapór wodnych w okresach powodziowych
w dolinie Soły, Folia Geographica, vol. XXXV-XXXVI.
Materiał wleczony i unoszony w korycie Wisły, 1954. Prace PIHM, Wyd. Komunikacyjne,
Warszawa, 33.
Mikulski Z., 1963. Zarys hydrografii Polski, PWN, Warszawa.
Młynarczyk Z., 1985. Rola wielkości i kształtu ziarna w transporcie fluwialnym,PTPN, 21,
Wyd. Geologiczne, Warszawa.
Montgomery, D. R., Buffington J. M., 1997. Channel-reach morphology in mountain drainage
basins, Geological Society of America Bulletin, 109.
Most czeka, 2004. Gazeta Wyborcza, 22 sierpnia 2004, Toruń (autor: hoł).
Mrózek W., 1958. Wydmy Kotliny Toruńsko-Bydgoskiej, w: R. Galon (red.), Wydmy
śródlądowe Polski, PTG Warszawa.

130
Mycielska-Dowgiałło E., Woronko B., 1998, Analiza obtoczenia i zmatowienia powierzchni
ziarn kwarcowych frakcji piaszczystej i jej wartość interpretacyjna, Przegląd Geologiczny, 46,
12.
Mycielska-Dowgiałło E., 2007, Metody badań cech teksturalnych osadów klastycznych i
wartość interpretacyjna wyników. (W:) E. Mycielska-Dowgiałło, J. Rutkowski (red.), Badania
cech teksturalnych osadów czwartorzędowych i wybrane metody oznaczania ich wieku. Wyd.
Szkoły Wyższej Przymierza Rodzin, Warszawa
Niewiarowski W., 1968. Morfologia i rozwój pradoliny i doliny dolnej Drwęcy, Stud. Soc. Sc.
Torun., ser. C, 6.
Niewiarowski W., 1987, Evolution of the Lower Vistula valley in the Unisław Basin and at the
river gap to the north of Bydgoszcz-Fordon, (w:) L. Starkel (red.) Evolution of the Vistula River
valley during the last 15000 years, Part II, Geogr. Studies, Spec. Iss., 4.
Ortofotomapa w skali 1:10 000, wyd. przez Centralny Ośrodek Dokumentacji Geodezyjnej
i Kartograficznej, 1995 r.
Ozga-Zielińska M., Brzeźiński J., 1994. Hydrologia stosowana, PWN, Warszawa.
Pardẻ M., 1957. Rzeki, org. tytuł: Fleuves et rivẻres, tłum. i uzupełnienie K. Dębski, PWN,
Warszawa.
Parzonka W., Kosierb R., 2010. Assessment of riverbed erosion process of middle Odra River
on Malczyce-Ścinawa section, Studia Geotechnica et Mechanica, vol. XXXII, no. 1.
Pasławski Z., 1973. Metody hydrometrii rzecznej, Wyd. Komunikacji i Łączności, Warszawa.
Pawłowski B., 2003. Piętrzenia zatorowe na dolnej Wiśle w świetle blizn lodowych na
drzewach poziomu zalewowego, UMK Toruń (maszynopis pracy doktorskiej).
Pawłowski B. 2008. Zmienność geometrii koryta dolnej Wisły w okresie zlodzenia rzeki,
Gospodarka Wodna, nr 7.
Polak K. 1996. Przyczyny postępującej erozji w dolnym stanowisku stopnia wodnego
„Włocławek” na tle oceny przebiegu procesów erozyjnych koryta w latach 1988/1994. Kaskada,
nr 96/3.
Polak K., Rosicki A., 2007. Zagrożenie stateczności stopnia wodnego we Włocławku,
XII Międzynarodowa Konferencja Technicznej Kontroli Zapór – Stare Jabłonki, 19-22 czerwca
2007.
Popek Z., 2008. Zmienność natężenia ruchu rumowiska wleczonego w czasie wezbrania na
małej rzece nizinnej, Przegląd Naukowy Inżynieria i Kształtowanie Środowiska, z. 2 (40).
Pożaryski W., 1965. Budowa geologiczna doliny Wisły środkowej między Sandomierzem i
Puławami. Geologiczne problemy zagospodarowania Wisły środkowej, Katowice.
Program ochrony przeciwpowodziowej województwa kujawsko-pomorskiego, 2005.
Wojewódzki Zarząd Melioracji i Urządzeń Wodnych, Włocławek.
Przedwojski B., Wicher J., 1999. Erozja koryta Warty poniżej zapory czołowej Zbiornika
Jeziorsko, [w:] Konferencja naukowo-techniczna pt. „Eksploatacja i oddziaływanie dużych
zbiorników nizinnych na przykładzie zbiornika wodnego Jeziorsko”, Uniejów, 20-21 maja
131
1999, Stowarzyszenie Inżynierów i Techników Wodnych Melioracji, ODGW i Wydział
Melioracji i Inżynierii Środowiska Akademii Rolniczej w Poznaniu.
Przedwojski B., Wierzbicki M., 2007. Skutki działania progów stabilizujących w korycie Warty
poniżej zbiornika Jeziorsko. Nauka Przyr. Technol. 1, 2, nr 30.
Przekroje poprzeczne koryta Wisły w odcinku 674,85 – 696 km z lat 1967 – 1972, Hydroprojekt
- Oddział we Włocławku, (mat. niepubl.).
Punzet J., 1972. Badania ruchu fal wypuszczanych ze zbiornika wodnego w Myczkowcach,
Gosp. Wod., nr 8.
Racinowski R., Szczypek T., Wach J., 2001. Prezentacja i interpretacja wyników badań
uziarnienia osadów czwartorzędowych, Wyd. Uniwersytetu Śląskiego, Katowice.
Raynov S., Pechinov D., Kopaliani Z., 1986. River response to hydraulic structures,
International Hydrological Programme, UNESCO, Paris.
Robakiewicz M., 2006. Rola ostróg w regulacji rzek. Infrastruktura i ekologia terenów
wiejskich, nr 4/2, KTIW PAN, Kraków.
Rosgen D., 1994. A classification of natural rivers, Catena, vol. 22.
Rosgen D., 1996. Applied River Morphology, Wildland Hydrology Books, Pagosa Springs.
Roszko L., 1982. Wisła Kujawska, [w:] A. Piskozub, Wisła. Monografia rzeki. Wyd.
Komunikacji i Łączności, Warszawa.
Rotnicki K., Młynarczyk Z., 1986. Późnovistuliańskie i holoceńskie formy i osady koryta
środkowej Prosny i ich paleohydrologiczna interpretacja, Geografia, 43, wyd. UAM Poznań.
Rusak M., 1982. Wisła dolna, w: A. Piskozub, Wisła. Monografia rzeki, Wyd. Komunikacji i
Łączności, Warszawa.
Ruleva S.N., Zlotina L.V., Berkovich K.M., 2002. Transformacja koryta i równiny zalewowej
rzeki Ob poniżej stopnia wodnego Nowosybirsk na podstawie długoterminowych obserwacji,
Zeszyty naukowe WSHE we Włocławku, T. X, seria E.
Schumm S.A., 1981. Evolution of response of the fluvial system sedimentology implications,
SEPM, Special Publ., 31.
Siebauer S., 1947. Charakterystyczne stany wody i objętości przepływu w przekrojach
wodowskazowych rzeki Wisły, Wiadomości Służby hydrologicznej i Meteorologicznej, 1.1.
Skibiński J., 1976. Próba ilościowej oceny intensywności transportu rumowiska wleczonego
w rzekach środkowej Polski. Rozprawy Naukowe, 74, Zeszyty Naukowe SGGW – AR w
Warszawie.
Słownik geograficzny Królestwa Polskiego i innych krajów słowiańskich, 1881. tom II –
wydanie internetowe: http://www.geo.uw.edu.pl/ZASOBY/GEOIMAGE/RIVER/dnepr.htm
SMGP (Szczegółowa Mapa Geologiczna Polski), skala 1:50 000, wyd. PIG, arkusze:
Włocławek, Bobrowniki, Ciechocinek, Toruń.
Smith G., Lazar K., 2003. Kigoma Bay bathymetry, sediment distribution, and acoustic
mapping. Case Studies and Modern Analogs, Maiami.

132
Sobolewski, W., 2000. Wyznaczanie działów wodnych w dorzeczu Wisły metodą analizy
wysokościowego modelu numerycznego, Gospodarka Wodna, nr 10.
Soja R., Mrózek T.,1990. Historical characteristic of the Vistula River, w: L. Starkel (red.)
Evolution of the Vistula River Valley during the last 15000 years, Geographical Studies, Issue
no. 5, Ossolineum Wrocław.
Sołtysik R., 2000. Współczesna aktywność tektoniczna starszego podłoża a holoceńskie
przekształcenie dolin rzek świętokrzyskich w odcinkach przedprzełomowych. [w:] K. Klimek,
K. Kocel (red.), Sympozjum "Transformacja dolin plejstoceńskich w holocenie. Strefowość i
piętrowość zjawiska", 13-14 kwietnia 2000. Kom. Bad. Czwart. PAN, Sosnowiec.
Starkel L., 2001. Historia doliny Wisły od ostatniego zlodowacenia do dziś, Monografie IGiPZ
PAN, 1, Warszawa.
Sui J., Hicks F., Menounos B., 2006. Observations of riverbed scour under a developing
hanging ice dam, Canadian Jour., Civil Eng., 33.
Szmańda J., 2010. Litodynamiczna interpretacja środowiska fluwialnego na podstawie
wskaźników uziarnienia, Landform Analysis, vol. 12.
Śliwiński W., 1975. Zagrożenia zatorowe na Wiśle powyżej Zbiornika Włocławskiego,
Informator Projektanta CBSiPBW Hydroprojekt, nr 3.
Śliwiński W., 2003. Udrożnienie koryta bocznego za Kepą Suchą we Włocławku dla poprawy
warunków przepływu wody w profilu mostu drogowego, maszynopis opracowania Biura Usług
Projektowych – A. Śliwińska we Włocławku.
Śliwiński W., Polak K., 1995. Prace pomiarowe w km 684 – 718, [w:] Ocena procesów
erozyjnych w dolnym stanowisku stopnia wodnego Włocławek w latach 1986 – 1994,
Hydroprojekt Warszawa Sp. z o.o. (maszynopis).
Teisseyre A. K., 1988. Mady dolin sudeckich, cz. II, Wybrane zagadnienia metodyczne,
Geologia Sudetica 23, 1.
Teisseyre A. K., 1991. Klasyfikacja rzek w świetle analizy systemu fluwialnego i geometrii
hydraulicznej, Prace Geologiczno-Mineralogiczne 22. Wyd. UW, Wrocław.
Tomczak A., 1971. Kępa Bazarowa na Wiśle w Toruniu w świetle badań geomorfologicznych
oraz archiwalnych materiałów kartograficznych, Stud. Soc. Sc. Torun., ser. C, 6., vol VII, nr 6,
sec. C, Toruń.
Tomczak A., 1987. Evolution oft he Vistula Valley in the Toruń Basin in the late glacial and
holocene, (w:) L. Starkel (red.) Evolution of the Vistula River valley during the last 15000
years, Part II, Geogr. Studies, Spec. Iss., 4.
Wang Z., Hu Ch., 2004. Interactis between fluvial systems and large scale hydro-projects, Ninth
International Symposium on River Sedimentation October 18 – 21, 2004, Yichang, China.
Walczykiewicz T., 2011. Monografia powodzi – Wisła maj-czerwiec 2010, referat wygłoszony
na Seminarium Stowarzyszenia Hydrologów Polskich, 20.04.2011, Politechnika Warszawska.
Warowna J., 2003. Wpływ zabudowy hydrotechnicznej na warunki sedymentacji w korycie
powodziowym Wisły na odcinku Zawichost – Puław. Wyd. UMCS, Lublin,

133
Wedam G., Kellner R., Braunshofer R., 2004. Innovative hydropower development in an urban
environment, Proceedings of 19th World Energy Congress – Sydney (Australia), paper no. 232.
Williams G. P., Wolman M. G. 1984. Downstream effects of dams on alluvial rivers,
Geol.Survey Profes. Paper, 1286, Washington.
Wiśniewski E., 1976. Rozwój geomorfologiczny doliny Wisły pomiędzy Kotliną Płocką a
Kotliną Toruńską, Prace Geogr. 119.
Wiśniewski E., 1987. The evolution of the Vistula river valley between Warsaw and Płock
Basins during the last 15 000 years, (w:) L. Starkel (red.) Evolution of the Vistula River valley
during the last 15000 years, Part II, Geogr. Studies, Spec. Iss., 4.
Wyżga B., 1993. Funkcjonowanie systemu rzecznego środkowej i dolnej Raby w ostatnich 200
latach, Dok. Geogr., z. 1.
Wyżga B., 1999. Wpływ pogłębiania się koryt karpackich dopływów Wisły na zmiany
warunków sedymentacji pozakorytowej, [w:] M. Kucharczyk (red.), Problemy ochrony i
renaturyzacji dolin dużych rzek Europy.
Van Rijn L., 1984. Van Rijn, L.C., Sediment Transport, Part III: Bed forms and alluvial
roughness, Journal of Hydraulic Engineering, ASCE, vol. 110, no. 12.
Veksler A. B., Donenberg V. M. 1983. Pereformirovanie rusla v niżnich befach krupnych
gidroelektrostancij, Energoatomizdat, Moskva.
Zdankus N., Sabas G., 2006. The impact of hydropower Plant on downstream river reach,
Environmental research, engineering and menagement, no. 4(38).
Zdulski W., 2001. Środowiskowe efekty działania elektrowni wodnej we Włocławku. Kaskada,
nr 1-2, Włocławek.
Ziółkowski B., 2001. Zarys dziejów Ciechocinka, [w:] Ciechocinek. Dzieje uzdrowiska. S.
Kubiak (red.), Włocławek.