dynamic multi-bed fdg pet imaging: feasibility and optimization
TRANSCRIPT
Dynamic Multi-Bed FDG PET Imaging: Feasibilityand Optimization
Nicolas A. Karakatsanis1, Member, IEEE, , Martin A. Lodge1, Yun Zhou1, Joyce Mhlanga1,Muhammad A. Chaudhry1, Abdel K. Tahari1, William P. Segars2, Richard L. Wahl1,
Arman Rahmim1,3, Member, IEEE
Abstract—Multi-Bed FDG PET/CT as applied to oncologicimaging is currently widely and routinely used for assessment oflocalized and metastatic disease involvement. In the past, basedon conventional (single-bed) dynamic PET imaging, standardtracer kinetic modeling techniques have been developed toestimate the FDG uptake rate Ki. However, routine clinicalmulti-bed FDG PET imaging commonly involves a single timeframe per bed, i.e. static imaging, and the standardized uptakevalue (SUV), a surrogate of metabolic activity, is employed toestimate the uptake rate Ki. The accuracy depends on twoconditions:(i) in the voxel or region of interest, contribution ofnon-phosphorylated FDG is negligible relative to phosphorylatedFDG, and (ii) time integral of plasma FDG concentration isproportional to injected dose divided by lean body mass, whichcan fail in clinical FDG PET imaging and pose problems indifferentiating malignant from benign tumors. The objective ofthe proposed work is to facilitate, for the fist time, a transitionfrom static to dynamic multi-bed FDG PET/CT imaging inclinically feasible times where, given the challenge of sparse tem-poral sampling at each bed, novel dynamic acquisition schemesshould be employed to yield quantitative whole-body imagingof FDG uptake. Thus, a set of novel dynamic multi-bed PETimage acquisition schemes have been modeled, using Monte Carlosimulations, to quantitatively evaluate the clinical feasibility of themethod and optimize the number of passes per bed and the totalstudy duration. It has been determined that a data acquisitionscheme consisting of 6 whole-body passes and constant timeframes of 45sec produces parametric images with the optimalnoise vs. bias performance. Finally, clinical whole-body patientdata have been acquired dynamically and results demonstratethe potential of the proposed method in enhancing treatmentresponse monitoring capabilities of clinical PET studies.
I. INTRODUCTION
The management of a wide variety of serious life-riskingdiseases including lung, lymphoma, head and neck,
melanoma and colorectal cancer has been considerably en-hanced due to the powerful modality of PET/CT using theradiotracer FDG (fluoro-deoxy-glucose) [1]–[3], a marker ofglucose metabolism. Nowadays, routine FDG PET/CT imag-ing involves scanning the patient over multiple bed positions toachieve whole-body imaging, which is especially important for
Manuscript received November 15, 2011. This work was supported in partby the NIH grant 1S10RR023623.
1 N.A. Karakatsanis (e-mail: [email protected]), M.A. Lodge, Y.Zhou, J. Mhlanga, M. Chaudhry, A.K. Tahari, R.L. Wahl and A. Rahmimare with the Department of Radiology, School of Medicine, Johns HopkinsUniversity, Baltimore, MD, USA
2 W. P. Segars is with the Department of Radiology, School of Medicine,Duke University, Durham, NC, USA
3 A. Rahmim is also with the Department of Electrical & ComputerEngineering, Johns Hopkins University, Baltimore, MD, USA.
evaluation of metastatic cancer. However, whole-body PET/CTis currently involving static data acquisition, i.e. employs onlya single temporal frame per bed position to measure the FDGconcentration; thus, the scanner passes over each bed positiononce (single-pass) [4]–[7]. The standardized uptake value orSUV, a semi-quantitative surrogate of metabolic activity, isused for this purpose.
SUV can be considered as a simple estimate of the FDGuptake rate constant Ki, but the accuracy in the estimationdepends on two conditions: (i) in the voxel or region ofinterest, contribution of non-phosphorylated FDG is negligiblerelative to phosphorylated FDG, and (ii) time integral ofplasma FDG concentration is proportional to injected dosedivided by body weight, lean body mass or body surfacearea, which can induce inaccuracies in clinical FDG PETimaging and potentially pose problems in quantifying follow-up PET studies [2]. Alternatively, in the research setting,dynamic single-bed FDG PET imaging has been performed toquantitatively measure the rate Ki over different time framesfor a given bed position [8]–[10].
We are proposing a novel shift of the two previous dataacquisition schemes into the dynamic multi-bed domain, wherethe benefits of both multi-bed acquisition and truly quantitativeimaging can potentially be combined. PET dynamic whole-body acquisition involves the scanner performing sequen-tial whole-body acquisitions over time. Therefore, each bedposition is scanned at multiple passes (multi-pass) but notcontinuously in time, as in the case of single bed dynamicacquisition. The series of PET measurements collected foreach bed position over time are later employed for the deriva-tion of a number of parameters quantifying physiological orbiochemical processes, such as the rate of glucose metabolism.Furthermore, the estimation of these parameters across all bedpositions, at the voxel level, can lead to parametric whole-bodyPET imaging, which allows for truly quantitative analysis ofserial PET images of the same subject, obtained on differentoccasions (e.g. prior to and following treatment). This isparticularly crucial in the whole-body domain, where the timeprogress of a large variety of metastatic cancer diseases, asspread across multiple bed positions, is determined over largeperiods of treatment. Thus, multi-bed dynamic imaging canallow for truly quantitative whole-body PET imaging and,therefore, potentially enhance treatment response monitoringcapabilities.
The objective of this study is to facilitate, for the fist time,a transition from conventional static SUV towards dynamic
multi-bed FDG PET/CT imaging by demonstrating clinicalfeasibility as well as by optimizing the associated data acquisi-tion protocol, given the challenge of sparse temporal sampling(non-continuous kinetic data) at each bed position.
II. METHODS AND MATERIALS
In the proposed work a set of novel dynamic multi-bed PETacquisition schemes is designed by carefully selecting differentnumber of passes per bed position and total study durationsand, also, by ensuring that a clinically acceptable total time of50min post injection is not exceeded. Subsequently, a seriesof Monte Carlo (MC) simulations is performed to model theselected data acquisition schemes and generate PET projectiondata, which are later reconstructed to produce a set of dynamicPET images. Afterwards, Patlak graphical analysis method isapplied to estimate the Ki parameter on a voxel basis andderive the parametric images. Furthermore, the Ki imagesare analyzed in terms of noise and bias performance inorder to quantitatively evaluate the clinical feasibility of theexamined acquisition protocols and optimize the number ofpasses per bed position as well as the total study duration.Moreover, patient clinical data are acquired, based on theoptimal acquisition scheme determined above, to validate oursimulated results. Finally, the clinical whole-body Ki imagesare compared with respective SUV images obtained 60minpost injection.
A. Estimation of FDG uptake rate constant Ki using kineticmodeling
The SUV metric employed in static imaging is defined as:
SUV =C(t)
Dose/LBM(1)
where, C(t) is the FDG concentration, decay corrected withrespect to the tracer injection time, Dose is the amount ofinjected activity and LBM is the lean body mass. Due tothe simplicity of its calculation, SUV is widely used inconventional static (single-pass) whole body clinical FDGstudies. However, in reality, the SUV measure: (i) cannotdifferentiate between non-metabolized and metabolized FDGconcentrations, and (ii) does not take into account the plasmaFDG dynamics [1], [8], [11]–[13].
As a result, the SUV can be considered a semi-quantitativesurrogate of the metabolic rate in certain cases in clinical FDGPET imaging [14]–[16]. For instance, if a patient is undergoingchemo- or hormone-therapy, and has impaired renal function,the clearance of plasma FDG could be significantly reducedand, therefore, the total amount of FDG in blood plasmaavailable for absorption could be larger than what would bepredicted from the injected dose and lean body mass alone(Eq.1). In such a case, SUV will overestimate the metabolicrate of glucose in tumor [16]–[19]. Thus, the therapy responsemay not be accurately reflected by the change in SUV.Consequently, assessments of treatment response, based solelyon SUV as obtained in static PET imaging, can potentiallybe erroneous and, therefore, lead to mistakes in treatmentplanning, for certain cases.
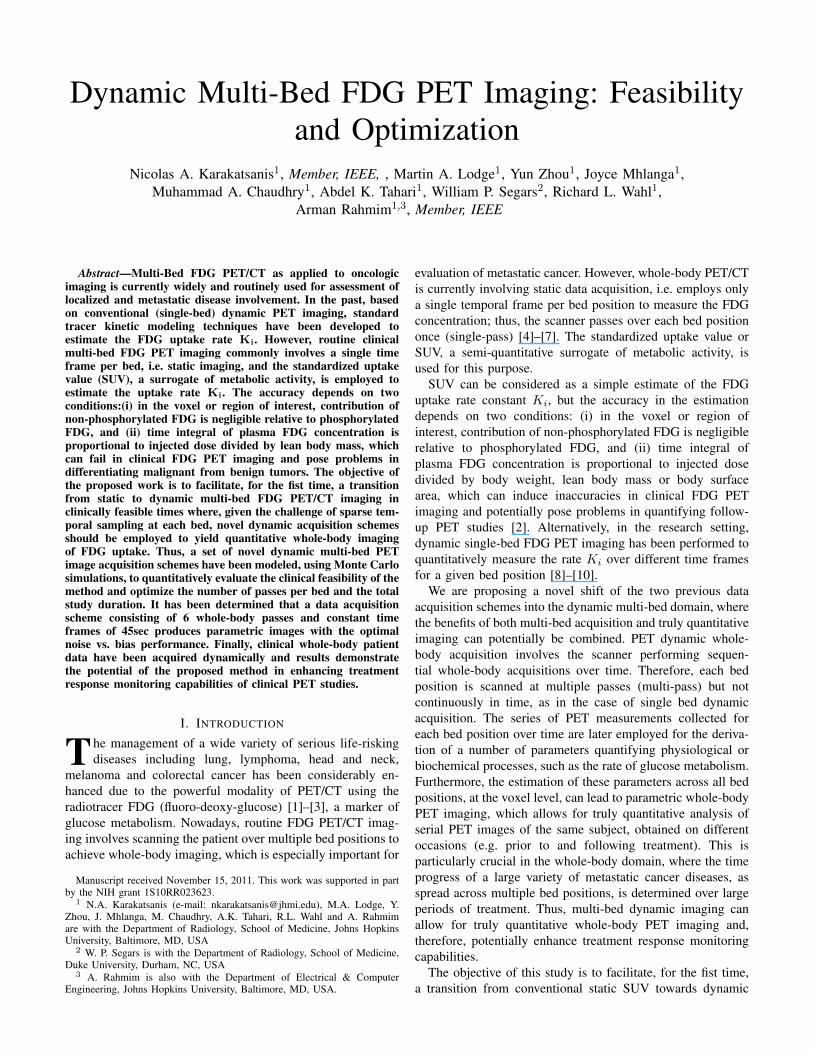
Fig. 1. Illustration of the compartment model of 18F-FDG tracer uptake.Cp(t), C1(t) and C2(t) are the tracer concentration in plasma, free (re-versible) and metabolized (irreversible, k4 = 0) compartments respectively.
On the contrary, quantitative parametric imaging may beachieved based on a series of PET measurements over time(dynamic acquisition) and applying kinetic modeling tech-niques. The standard 2-compartment 4-parameters kineticmodel with an irreversible compartment (k4 = 0) has beenemployed, (Fig. 1), to describe the FDG kinetics between theblood plasma, the free and the metabolized compartments forthe tissues examined in this study.
The tracer activity concentration in both the blood plasma,Cp(t) or input function, and the tissue of interest, C(t), aremeasured over a sequence of time frames (time-activity curves,TACs) and, subsequently, the tracer metabolic rate is estimatedby applying simple linear regression methods to the Patlaklinear equation (Eq. 2), for t ≥ t∗ (t∗ is defined as thetime after which relative equilibrium is attained between thevascular space and reversible compartments in tissue) [20]–[22]:
C(t)
Cp(t)= Ki
∫ t
0Cp(τ) dτ
Cp(t)+ V, t ≥ t∗ (2)
The parameter Ki is the slope of linear regression andrepresents the tracer uptake rate constant in the tissue. Ki isconsidered a macro-parameter as it can be expressed in termsof the kinetic micro-parameters K1, k2, k3 and k4 of the 2-compartment tracer kinetic model as follows:
Ki =K1k3k2 + k3
, k4 = 0, t ≥ t∗ (3)
If Vp is the effective plasma volume in the tissue region,such that VpCp is the exchangeable amount of tracer in theblood, f is the fraction of the amount of tracer in the reversiblecompartment C1(t) that goes back into the blood and leavesthe system and Ve is the steady-state volume of the reversiblecompartment C1(t), then the intercept of the regression, V , isexpressed by eq. (4) [20], [23]:
V = fVe + Vp, t ≥ t∗ (4)
The tracer concentration in the tissue, C(t), as measured byPET, is given by eq. 5:
C(t) = (1− Vp)C1(t) + C2(t) + VpCp(t) (5)
The Patlak plot is a fast graphical analysis method, whichcan be employed to estimate the Ki and V parameters on avoxel basis and, thus, produce a powerful image of glucosemetabolism uptake rates and blood volume fraction acrossall bed positions. By comparing equations (1) and (2), itis concluded that Ki measures the metabolic rate of tracerconcentration normalized with respect to the time-course of
tracer concentration in the plasma, while SUV-based metricsdoes not take the plasma FDG dynamics into account.
Micro-parameter k4 of the kinetic model is assumed tobe equal to zero when deriving Patlak equation (2). It hasbeen shown that if it is erroneously assumed that k4 = 0,while in reality k4 6= 0, then k3 and, therefore, Ki, areunderestimated from eq. (2) and (3) [24]. For certain organsand tracers, such as the FDG in normal liver, high levelsof glucose-6-phosphatase produce much higher values of k4in normal tissues than in tumors. Consequently, uncorrectedPatlak graphical analysis underestimates Ki in normal liverresulting in enhancement of the contrast between tumor andbackground in the parametric Ki images. [24].
The time activity curves used as an input to MC simulationsare derived from actual FDG kinetic micro-parameter andeffective plasma blood volume values reported in literature(Table I.) [25]–[33].
TABLE IFDG KINETIC MICRO-PARAMETERS
Regions K1 k2 k3 k4 VpNormal Liver 0.331 0.44 0.017 0.018 -Liver Tumor 0.242 0.388 0.061 0.022 -Normal Lung 0.108 0.735 0.016 0.013 0.017Lung Tumor 0.301 0.864 0.047 0.001 0.066Myocardium 0.6 1.2 0.1 0.001 -
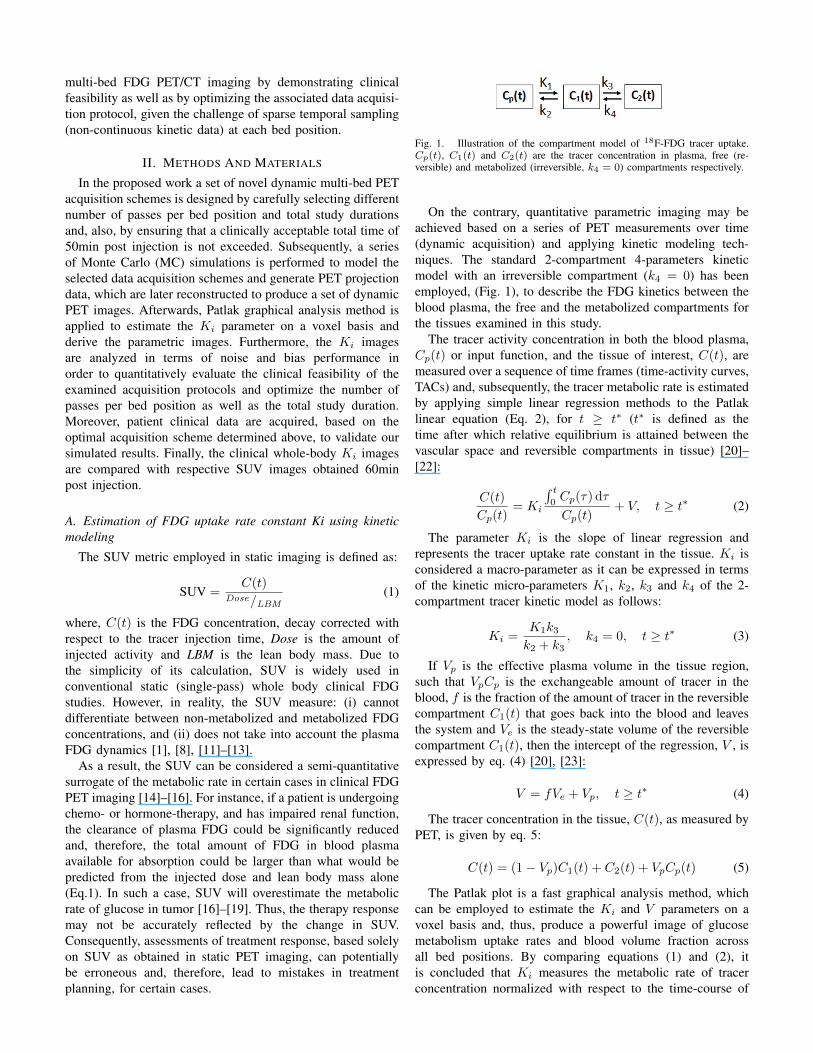
Fig. 2(a) depicts the noise-free samples and the fitted curvesfor the modeled input function Cp(t) and TACs of the regionsof Table I. Later, these sampled values are assigned to eachvoxel to produce the time series of the activity maps that, sub-sequently, serve as an input to MC simulations. Moreover, therespective Patlak points, as derived from the modeled samples,and the Patlak curves for each region, after performing linearregression, are plotted in Fig 2(b). This process is repeatedbelow for the noisy PET measurements, as generated by MCsimulations.
B. Design of dynamic multi-bed acquisition scheme
The transition from single-bed to multi-bed PET kineticmodeling techniques poses new significant challenges for thedata acquisition including the limited total scan duration andthe non-continuous sampling of the imaged subject at each bedposition. In this study we are examining a set of novel acquisi-tion schemes that can efficiently address these challenges whilesatisfying restrictions imposed by scanner specifications andclinical routine protocols regarding total study time. DynamicPET multi-bed acquisition has been realized in this study bydefining two separate time phases. During the first phase, a6-min dynamic acquisition is performed over the heart bedposition, immediately after the injection of FDG tracer to thesubject, in order to derive the time-course of the FDG activityconcentration at the blood plasma, or input function. First, 12frames of 10sec each are acquired, followed by 12 frames of20sec each. The GE Discovery RX LYSO PET/CT scanner,located at Johns Hopkins PET center, has been utilized for thisstudy.
Subsequently, in the second phase a series of conventionalwhole-body acquisitions, each consisting of 7 bed positions,
(a)
(b)
Fig. 2. (a) Modeled noise-free input function and TACs for different activityregions, utilized as an input to MC simulations and (b) Patlak analysis plots forvoxels belonging to 3 different regions of the XCAT phantom for validationof the noise-free data.
are repeated sequentially over time. Each repeated whole-bodyacquisition is noted as a pass. The time frames acquired foreach bed position are equal over all bed positions and passes.The scan direction of all passes is the same (craniocaudaldirection). As a result, each bed position is scanned for thesame number of passes, non-continuously and with equalsampling frequency.
In the case of single-bed dynamic acquisiton, the countsof all slices of a bed at each time frame i are assigned thesame time point tmid
i , which is the average of the start timetstarti and end time tendi of the particular frame. However,in the whole-body acquisition protocol the adjacent beds areoverlapping and, therefore, 11 slices from each side of theintermediate beds, out of the total 47 slices contained in eachbed, as well as 11 slices from the edge beds are scanned twiceat each pass. In these slices, a portion of the counts wereacquired at current time frame i corresponding to the currentbed, while the remaining portion at time frame i + 1, whichrefers to the next bed. Therefore, an intermediate time pointtmidi+1/2
is assigned to all counts of these slices for each pass,as derived by eq. (6):
tmidi+1/2
=tmidi + tmid
i+1
2(6)
where tmidi = (tstarti + tendi )/2 and tmid
i+1 = (tstarti+1 + tendi+1)/2are the average (middle) time points of frames i and i+ 1.
Currently we are proposing acquisition schemes that can beperformed during the first 50min post injection, followed by aconventional SUV scan 60min post injection. Our quantitativecriteria to optimize the data acquisition protocol is the noisevs. bias performance of the derived parametric Ki images, asthe number of OSEM iterations of the original PET dynamicimages increases. Our optimization strategy consists of twosteps:
Initially, we utilize all available clinical time between initialinjection and final SUV scan, which is usually not lessthan 50min. Therefore, we determine the optimal acquisitionscheme, assuming availability of a 50min total study time,by attempting different number of passes and different timeframes per bed. We start by examining only 2 passes per bedand time frames of 165sec each. In order to limit the total studytime to 50min, as the number of passes increases, the durationof the time frames is reduced. The scheme that produces thebest parametric images, in terms of noise vs. bias performance,is considered the optimal.
Subsequently, we select the optimal protocol derived aboveand consider for the second step its associated global timeframe length as a constant. Then we repeat the acquisition byomitting the last frame every time until we reach the case ofonly 2 passes per bed, which is the minimum acceptable num-ber of passes required for Patlak parameter estimation method.Our purpose is to determine how the gradual subtraction of thelast pass from all bed positions and, therefore, the reductionof the total study time, affects the noise vs. bias performanceof the parametric images in an attempt to demonstrate thatshorter total acquisition times are possible without significantdegradation of the quality of Ki images.
The acquisition schemes selected along with the rangeof optimization parameter values examined are listed in Ta-ble II. The protocols have been assigned names in the formatNPx TFy, where x and y stand for number of passes per bed,or NP, and time frame length in sec, or TF, respectively. Thefirst 4 columns describe the specifications of the protocolsevaluated during the first phase of the optimization process,while the last 4 columns are referring to the set of protocolscompared in the second phase. Also the total study time TTfor each protocol is presented.
TABLE IIACQUISITION SCHEMES FOR DYNAMIC MULTI-BED PET
Protocol NP TF(s) TT(m) Protocol NP TF(s) TT(m)NP8 TF31 8 31 48 NP6 TF45 6 45 48NP7 TF38 7 38 48 NP5 TF45 5 45 40NP6 TF45 6 45 48 NP4 TF45 4 45 33NP5 TF58 5 58 48 NP3 TF45 3 45 26NP4 TF76 4 76 48 NP2 TF45 2 45 19NP3 TF106 3 106 48NP2 TF165 2 165 48
C. Production of simulated data
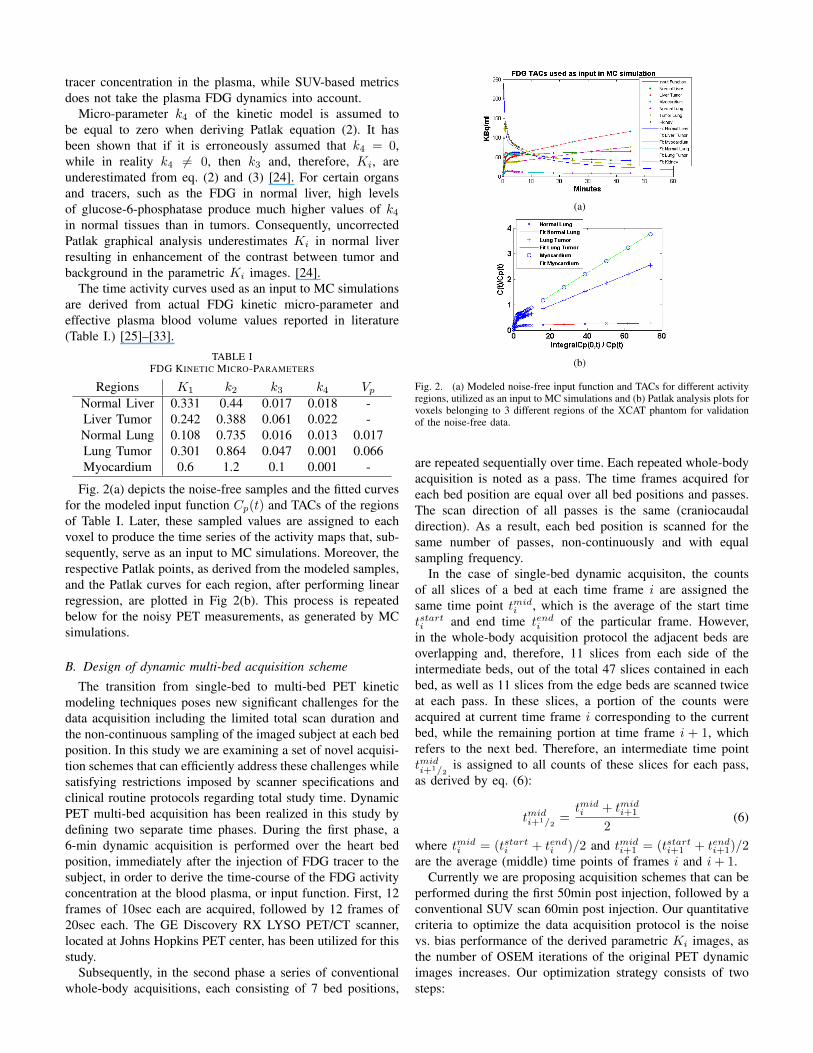
We employed Geant4 Application for Tomography Emis-sion (GATE), a well-validated MC simulation package, tomodel the GE Discovery RX LYSO PET/CT scanner. Wechose GATE, among many other competing candidates, be-cause both its ability to simulate time-dependent phenomenaas well as its accurate description of all physics processesunderlying emission tomography, inherited by Geant4 pack-age, makes it an ideal solution for our proposed study [34].Furthermore, the realistic XCAT human torso phantom wasutilized to model the attenuation as well as the time-dependentactivity maps for specific tissues and tumors commonly exam-ined in oncology whole-body PET studies [35]. Fig. 3 depictscharacteristic examples of whole-body activity and attenuationXCAT maps. Both GATE and XCAT are state-of-the-art soft-
(a) (b)
Fig. 3. An example of a 4D XCAT phantom activity map (left) andattenuation map (right) for whole-body applications
ware packages capable of producing, when combined, realisticsimulated PET data.
After the completion of the MC simulations, the generatedlist mode PET data are binned into 3D sinograms, accord-ing to the time frame sequence specified by each proposedacquisition scheme and, later, reconstructed using OS-MAP-OSL algorithm, which is a 3D OSEM One-Step-Late MAPreconstruction algorithm. It is implemented in STIR2.1, anopen-source software toolkit customized for emission tomog-raphy image reconstruction [36]. All dynamic PET frames arereconstructed using 21 subsets and for all number of iterationsranging between 1 and 15. Furthermore, the simulated data arecorrected for normalization, scatter, randoms and attenuationand the correction factors are incorporated into the sensitivityimage of the OSEM algorithm.
Subsequently, the input function Cp(t) is measured fromROIs drawn in the left ventricle (LV) blood pool region ofthe initial 24 dynamic cardiac frames at the first 6min andthe subsequent frames over the heart. Alternatively the inputfunction Cp(t) can be derived by arterial blood sampling attime points corresponding to the acquisition frames. Then,Cp(t) data are combined with the PET measurements C(t)for each voxel at each bed, according to Patlak eq. 2. In thisparticular simulation study we assume arterial blood samplingand, therefore, the true noise-free input function data are usedin the Patlak equation, instead of the ROI-based measurements.Thus, if we express eq. (2) in the form y = Kix+ V , a datapoint (x, y) can be plotted for each frame, as defined in eq.(7):
(x, y) =
(∫ t
0Cp(τ) dτ
Cp(t),C(t)
Cp(t)
)t ≥ t∗ (7)
Then simple linear regression is employed only to Patlakpoints where t ≥ t∗ to estimate Ki and V parameters ofinterest. The proposed kinetic parameter estimation algorithmacross all bed positions is performing at the voxel level,resulting in whole-body parametric images.
D. Quantitative optimization criteria
The determination of the optimal acqusition protocol isbased on the quantitative criteria of the normalized meansquare error (NMSE) and the normalized standard deviation(NSD), which are utilized to quantitate the bias and the
noise in the derived parametric Ki image from each protocol.Initially, a set of ROIs are drawn in the parametric images,based on the true activity maps, and the NMSE and NSDvalues are calculated for each ROI. Then, using the size ofeach ROI as a weight, the weighted average of NMSE andNSD value over all ROIs is calculated, as a metric of theoverall bias and noise of the parametric images.
The NMSE is calculated for each ROI according to eq. 8:
NMSE =1
R
R∑r=1
(|fr − µ|
µ
)(8)
where fr = 1n
∑ni=1 f
ri and µ = 1
n
∑ni=1 µi;fri denote the
ith voxel value from rth noise realization and µ denote thereference true activity value; n is the number of voxels inthe ROI and R is the number of noise realizations. Thus,first a normalized bias is calculated over all voxels of an ROIfor each noise realization. Then, all bias values are averagedover the different noise realizations to determine a singleNMSE value. By first adapting a spatial calculation of thebias over an ROI and, subsequently, averaging over differentnoise realizations, we believe to aleviate the negative effect tothe bias calculation, induced by the relatively high noise thatcharacterizes the individual voxels of a parametric image.
Similarly, for the calculation of the NSD, first the spatialstandard deviation over the ROI was calculated, followed byan averaging over the different noise realizations employed,as defined in eq. 9:
NSD =1
R
R∑r=1
√1
n−1
∑ni=1 (fri − fr)
2
fr(9)
These quantitative calculations are repeated for parametricimages derived from all examined protocols and for differentnumber of OSEM iterations of the original dynamic PETimages. Finally, the NSD is plotted against NMSE for allparametric images of each protocol, i.e. for all iterations. Thus,a single noise vs. bias curve is generated for each protocol.Finally, the curves from different protocols are plotted togetherfor comparative evaluation. The protocol which producesparametric images with curves closer to the origin of the axesis considered as the optimal acquisition scheme in this study.
III. RESULTS
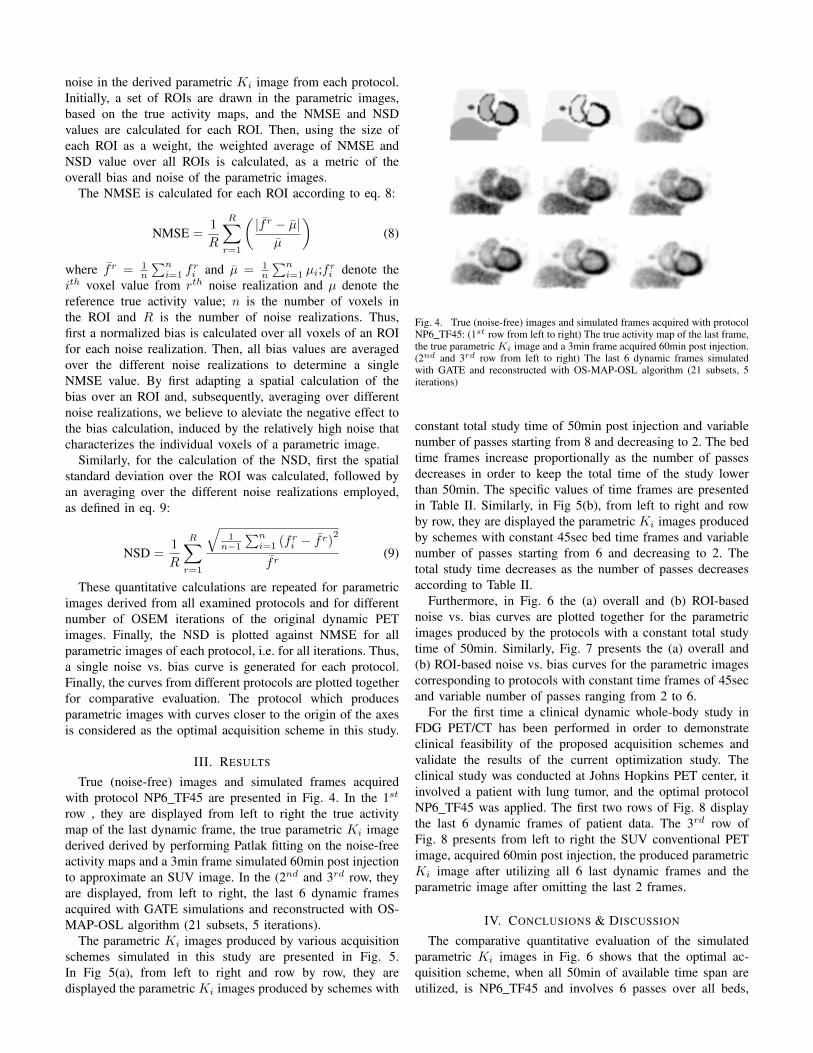
True (noise-free) images and simulated frames acquiredwith protocol NP6 TF45 are presented in Fig. 4. In the 1st
row , they are displayed from left to right the true activitymap of the last dynamic frame, the true parametric Ki imagederived derived by performing Patlak fitting on the noise-freeactivity maps and a 3min frame simulated 60min post injectionto approximate an SUV image. In the (2nd and 3rd row, theyare displayed, from left to right, the last 6 dynamic framesacquired with GATE simulations and reconstructed with OS-MAP-OSL algorithm (21 subsets, 5 iterations).
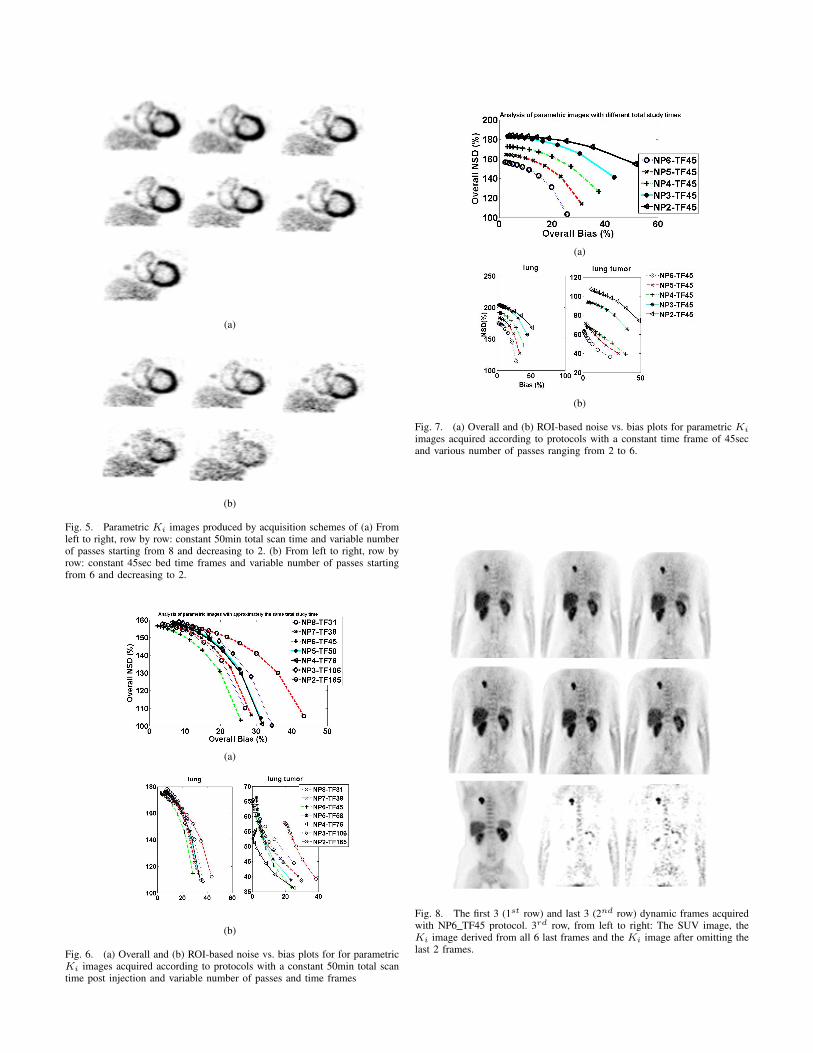
The parametric Ki images produced by various acquisitionschemes simulated in this study are presented in Fig. 5.In Fig 5(a), from left to right and row by row, they aredisplayed the parametric Ki images produced by schemes with
Fig. 4. True (noise-free) images and simulated frames acquired with protocolNP6 TF45: (1st row from left to right) The true activity map of the last frame,the true parametric Ki image and a 3min frame acquired 60min post injection.(2nd and 3rd row from left to right) The last 6 dynamic frames simulatedwith GATE and reconstructed with OS-MAP-OSL algorithm (21 subsets, 5iterations)
constant total study time of 50min post injection and variablenumber of passes starting from 8 and decreasing to 2. The bedtime frames increase proportionally as the number of passesdecreases in order to keep the total time of the study lowerthan 50min. The specific values of time frames are presentedin Table II. Similarly, in Fig 5(b), from left to right and rowby row, they are displayed the parametric Ki images producedby schemes with constant 45sec bed time frames and variablenumber of passes starting from 6 and decreasing to 2. Thetotal study time decreases as the number of passes decreasesaccording to Table II.
Furthermore, in Fig. 6 the (a) overall and (b) ROI-basednoise vs. bias curves are plotted together for the parametricimages produced by the protocols with a constant total studytime of 50min. Similarly, Fig. 7 presents the (a) overall and(b) ROI-based noise vs. bias curves for the parametric imagescorresponding to protocols with constant time frames of 45secand variable number of passes ranging from 2 to 6.
For the first time a clinical dynamic whole-body study inFDG PET/CT has been performed in order to demonstrateclinical feasibility of the proposed acquisition schemes andvalidate the results of the current optimization study. Theclinical study was conducted at Johns Hopkins PET center, itinvolved a patient with lung tumor, and the optimal protocolNP6 TF45 was applied. The first two rows of Fig. 8 displaythe last 6 dynamic frames of patient data. The 3rd row ofFig. 8 presents from left to right the SUV conventional PETimage, acquired 60min post injection, the produced parametricKi image after utilizing all 6 last dynamic frames and theparametric image after omitting the last 2 frames.
IV. CONCLUSIONS & DISCUSSION
The comparative quantitative evaluation of the simulatedparametric Ki images in Fig. 6 shows that the optimal ac-quisition scheme, when all 50min of available time span areutilized, is NP6 TF45 and involves 6 passes over all beds,
(a)
(b)
Fig. 5. Parametric Ki images produced by acquisition schemes of (a) Fromleft to right, row by row: constant 50min total scan time and variable numberof passes starting from 8 and decreasing to 2. (b) From left to right, row byrow: constant 45sec bed time frames and variable number of passes startingfrom 6 and decreasing to 2.
(a)
(b)
Fig. 6. (a) Overall and (b) ROI-based noise vs. bias plots for for parametricKi images acquired according to protocols with a constant 50min total scantime post injection and variable number of passes and time frames
(a)
(b)
Fig. 7. (a) Overall and (b) ROI-based noise vs. bias plots for parametric Ki
images acquired according to protocols with a constant time frame of 45secand various number of passes ranging from 2 to 6.
Fig. 8. The first 3 (1st row) and last 3 (2nd row) dynamic frames acquiredwith NP6 TF45 protocol. 3rd row, from left to right: The SUV image, theKi image derived from all 6 last frames and the Ki image after omitting thelast 2 frames.
while each bed frame lasts for 45sec. On the other hand, it isobserved that the quality of parametric images is deterioratedwhen employing a protocol with more than 6 passes per bed,for which the time frames are shorter than 45sec to keep thetotal study time below 50min. However, the discrepancies innoise and bias in all cases with total study time of 50minare not dramatic and therefore qualitatively it is difficult toobserve their effect in the parametric images of Fig. 5(a).
Moreover, Fig. 7 demonstrates the effect of gradual sub-traction of the last frames to the noise and bias of theparametric images for the optimal case of 6 passes per bed.The deterioration of bias is tolerable even if we omit the last2 frames and reduce the total study duration to 33min. This isconfirmed by the qualitative evalation of the parametric imagesof Fig 5(b). However, the noise in all parametric Ki images issignificantly high for all studied protocols, as observed in Fig6(b) and confirmed by the noise vs bias plots of Fig. 6 and 7.
Our first clinical demonstration of dynamic whole-bodyFDG PET imaging, as illustrated in Fig. 8, shows the clinicalfeasibility of the proposed method and suggests enhancedtumor-to-background contrast of the resulting parametric im-ages with respect to conventional SUV images. Currently,the present work is aiming to initiate a shift of whole-bodyPET imaging to a novel dynamic domain, potentially allowingfor quantitative whole-body assessment of patient response totreatments over short and long time periods.
Therefore, for future plans we are planning to implementadvanced techniques for the measurement of the input functionby utilizing more data from multiple bed positions, whichare now available. Furthermore, we are going to expand ourparameter estimation methods to the direct 4D domain andapply spatial constraints to efficiently address the challengesof temporal sparse sampling per bed and high noise per voxelin parametric images.
REFERENCES
[1] R. Wahl and J. Buchanan, Principles and practice of positron emissiontomography. Lippincott Williams & Wilkins, 2002.
[2] F. Castell and G. Cook, “Quantitative techniques in 18-FDG PETscanning in oncology,” British Journal of Cancer, vol. 98, no. 10, pp.1597–1601, 2008.
[3] K. Facey, I. Bradbury, G. Laking, and E. Payne, Overview of the clinicaleffectiveness of positron emission tomography imaging in selected can-cers. Gray on behalf of the National Coordinating Centre for HealthTechnology Assessment, 2007.
[4] M. Dahlbom, E. Hoffman, C. Hoh, C. Schiepers, G. Rosenqvist,R. Hawkins, M. Phelps et al., “Whole-body positron emission tomog-raphy: Part i. methods and performance characteristics.” Journal ofNuclear Medicine, vol. 33, no. 6, p. 1191, 1992.
[5] R. Hustinx, F. Benard, and A. Alavi, “Whole-body FDG-PET imagingin the management of patients with cancer*,” in Seminars in nuclearmedicine, vol. 32, no. 1. Elsevier, 2002, pp. 35–46.
[6] K. Kubota, M. Itoh, K. Ozaki, S. Ono, M. Tashiro, K. Yamaguchi,T. Akaizawa, K. Yamada, and H. Fukuda, “Advantage of delayed whole-body FDG-PET imaging for tumour detection,” European Journal ofNuclear Medicine and Molecular Imaging, vol. 28, no. 6, pp. 696–703,2001.
[7] D. Townsend, “Positron emission tomography/computed tomography,”in Seminars in nuclear medicine, vol. 38, no. 3. Elsevier, 2008, pp.152–166.
[8] N. Sadato, T. Tsuchida, S. Nakaumra, A. Waki, H. Uematsu, N. Taka-hashi, N. Hayashi, Y. Yonekura, and Y. Ishii, “Non-invasive estimationof the net influx constant using the standardized uptake value forquantification of FDG uptake of tumours,” European Journal of NuclearMedicine and Molecular Imaging, vol. 25, no. 6, pp. 559–564, 1998.
[9] W. Wong and K. Hicks, “A clinically practical method to acquireparametric images of unidirectional metabolic rates and blood spaces.”Journal of Nuclear Medicine, vol. 35, no. 7, p. 1206, 1994.
[10] A. Dimitrakopoulou-Strauss, L. Strauss, M. Schwarzbach, C. Burger,T. Heichel, F. Willeke, G. Mechtersheimer, and T. Lehnert, “DynamicPET 18F-FDG studies in patients with primary and recurrent soft-tissuesarcomas: impact on diagnosis and correlation with grading,” Journal ofNuclear Medicine, vol. 42, no. 5, pp. 713–720, 2001.
[11] K. Zasadny and R. Wahl, “Standardized uptake values of normal tissuesat PET with 2-[fluorine-18]-fluoro-2-deoxy-D-glucose: variations withbody weight and a method for correction.” Radiology, vol. 189, no. 3,p. 847, 1993.
[12] C. Kim, N. Gupta et al., “Dependency of standardized uptake values offluorine-18 fluorodeoxyglucose on body size: comparison of body sur-face area correction and lean body mass correction.” Nuclear medicinecommunications, vol. 17, no. 10, p. 890, 1996.
[13] C. Kim, N. Gupta, B. Chandramouli, A. Alavi et al., “Standardizeduptake values of FDG: body surface area correction is preferable tobody weight correction.” Journal of Nuclear Medicine, vol. 35, no. 1,p. 164, 1994.
[14] L. Hamberg, G. Hunter, N. Alpert, N. Choi, J. Babich, and A. Fischman,“The dose uptake ratio as an index of glucose metabolism: Usefulparameter or oversimplification?” Journal of Nuclear Medicine, vol. 35,no. 8, p. 1308, 1994.
[15] J. Keyes Jr et al., “SUV: Standard uptake or silly useless value?” Journalof Nuclear Medicine, vol. 36, no. 10, p. 1836, 1995.
[16] S. Huang, “Anatomy of SUV,” Nuclear Medicine and Biology, vol. 27,no. 7, pp. 643–646, 2000.
[17] M. Adams, T. Turkington, J. Wilson, and T. Wong, “A systematic reviewof the factors affecting accuracy of SUV measurements,” AmericanJournal of Roentgenology, vol. 195, no. 2, pp. 310–320, 2010.
[18] W. Weber, S. Ziegler, R. Thodtmann, A. Hanauske, M. Schwaiger et al.,“Reproducibility of metabolic measurements in malignant tumors usingFDG PET.” Journal of Nuclear Medicine, vol. 40, no. 11, p. 1771, 1999.
[19] S. Leskinen-Kallio, K. Nagren, P. Lehikoinen, U. Ruotsalainen,M. Teras, H. Joensuu et al., “Carbon-11-methionine and PET is aneffective method to image head and neck cancer.” Journal of NuclearMedicine, vol. 33, no. 5, p. 691, 1992.
[20] C. Patlak, R. Blasberg, J. Fenstermacher et al., “Graphical evaluationof blood-to-brain transfer constants from multiple-time uptake data,” JCereb Blood Flow Metab, vol. 3, no. 1, pp. 1–7, 1983.
[21] A. Gjedde, “High-and low-affinity transport of D-glucose from blood tobrain,” Journal of Neurochemistry, vol. 36, no. 4, pp. 1463–1471, 1981.
[22] Y. Zhou, W. Ye, J. Brasic, and D. Wong, “Multi-graphical analysis ofdynamic PET,” Neuroimage, vol. 49, no. 4, pp. 2947–2957, 2010.
[23] C. Patlak and R. Blasberg, “Graphical evaluation of blood-to-brain trans-fer constants from multiple-time uptake data. generalizations,” Journalof Cerebral Blood Flow & Metabolism, vol. 5, no. 4, pp. 584–590, 1985.
[24] C. Messa, Y. Choi, C. Hoh, E. Jacobs, J. Glaspy, S. Rege, E. Nitzsche,S. Huang, M. Phelps, R. Hawkins et al., “Quantification of glucoseutilization in liver metastases: parametric imaging of FDG uptake withpet.” Journal of Computer Assisted Tomography, vol. 16, no. 5, p. 684,1992.
[25] A. Dimitrakopoulou-Strauss, V. Georgoulias, M. Eisenhut, F. Herth,S. Koukouraki, H. Macke, U. Haberkorn, and L. Strauss, “Quantitativeassessment of SSTR2 expression in patients with non-small cell lungcancer using 68 Ga-DOTATOC PET and comparison with 18 F-FDGPET,” European journal of nuclear medicine and molecular imaging,vol. 33, no. 7, pp. 823–830, 2006.
[26] S. Okazumi, A. Dimitrakopoulou-Strauss, M. Schwarzbach, andL. Strauss, “Quantitative, dynamic 18F-FDG-PET for the evaluation ofsoft tissue sarcomas: relation to differential diagnosis, tumor grading andprediction of prognosis.” Hellenic journal of Nuclear Medicine, vol. 12,no. 3, p. 223, 2009.
[27] T. Torizuka, N. Tamaki, T. Inokuma, Y. Magata, S. Sasayama,Y. Yonekura, A. Tanaka, Y. Yamaoka, K. Yamamoto, J. Konishi et al.,“In vivo assessment of glucose metabolism in hepatocellular carcinomawith FDG-PET.” Journal of Nuclear Medicine, vol. 36, no. 10, p. 1811,1995.
[28] Y. Sugawara, K. Zasadny, H. Grossman, I. Francis, M. Clarke, andR. Wahl, “Germ cell tumor: Differentiation of viable tumor, matureteratoma, and necrotic tissue with FDG PET and kinetic modeling,”Radiology, vol. 211, no. 1, pp. 249–256, 1999.
[29] A. Dimitrakopoulou-Strauss, L. Strauss, and C. Burger, “QuantitativePET studies in pretreated melanoma patients: a comparison of 6-[18F]fluoro-L-dopa with 18F-FDG and 15O-water using compartment and
noncompartment analysis,” Journal of Nuclear Medicine, vol. 42, no. 2,pp. 248–256, 2001.
[30] A. Dimitrakopoulou-Strauss, L. Strauss, C. Burger, A. Ruhl, G. Irn-gartinger, W. Stremmel, and J. Rudi, “Prognostic aspects of 18F-FDGPET kinetics in patients with metastatic colorectal carcinoma receivingFOLFOX chemotherapy,” Journal of Nuclear Medicine, vol. 45, no. 9,pp. 1480–1487, 2004.
[31] L. Strauss, D. Koczan, S. Klippel, L. Pan, C. Cheng, S. Willis,U. Haberkorn, and A. Dimitrakopoulou-Strauss, “Impact ofangiogenesis-related gene expression on the tracer kinetics of 18F-FDGin colorectal tumors,” Journal of Nuclear Medicine, vol. 49, no. 8, pp.1238–1244, 2008.
[32] L. Strauss, S. Klippel, L. Pan, K. Schonleben, U. Haberkorn, andA. Dimitrakopoulou-Strauss, “Assessment of quantitative FDG PET datain primary colorectal tumours: which parameters are important withrespect to tumour detection?” European journal of nuclear medicineand molecular imaging, vol. 34, no. 6, pp. 868–877, 2007.
[33] H. Qiao, J. Bai, Y. Chen, and J. Tian, “Kidney modelling for FDGexcretion with PET,” International Journal of Biomedical Imaging, vol.2007, pp. 632–634, 2007.
[34] S. Jan, D. Benoit, E. Becheva, T. Carlier, F. Cassol, P. Descourt, T. Fris-son, L. Grevillot, L. Guigues, L. Maigne et al., “GATE V6: a majorenhancement of the GATE simulation platform enabling modelling ofct and radiotherapy,” Physics in Medicine and Biology, vol. 56, p. 881,2011.
[35] W. Segars, G. Sturgeon, S. Mendonca, J. Grimes, and B. Tsui, “4DXCAT phantom for multimodality imaging research,” Medical physics,vol. 37, p. 4902, 2010.
[36] K. Thielemans, S. Mustafovic, and C. Tsoumpas, “STIR: softwarefor tomographic image reconstruction release 2,” in Nuclear ScienceSymposium Conference Record, 2006. IEEE, vol. 4. IEEE, 2006, pp.2174–2176.