dunning, j. and zhang, f. 2008. foreign direct investment and the locational competitiveness of...
TRANSCRIPT
Foreign direct investment and the locational competitiveness of
countries
John H. Dunning and Feng Zhang*
The paper first examines the current state of thinking on the role of resources, capabilities and markets (RCM) and institutions (I) as the main ingredients of the competitiveness of national economies. The paper then empirically investigates how the extent, content and quality of each are associated with the level of foreign direct investment (FDI) to and from the country. Data are primarily drawn from the World Investment Report (UNCTAD) and the Global Competitiveness Report (World Economic Forum). We find that the level of competitiveness does, in general, encourage both inward and outward FDI. Moreover, the I of a country has stronger positive effects on FDI than its RCM. Further investigation shows that the effects of I are particularly strong in countries at the advanced stage of development. The findings of the paper suggest that more detailed future work focusing on countries’ institutional advantages promises to yield dividends in terms of insight into the determinants of national competitiveness and FDI.
Keywords: FDI, Institutions, Country Competitiveness, Economic Development
1. IntroductionOne of the several research interests the first author shared with Sanjaya
Lall was on the determinants of the competitiveness of countries. In 2001, Sanjaya wrote a trenchant criticism of the quality and relevance of some of the indices used to identify and assess the competitiveness of developing countries by the Global Competitiveness Report (GCR)1. While endorsing many of his concerns, we believe that, in one respect at least, the GCR does help us to better
* John H. Dunning is Emeritus Professor of International Business at the University of Reading, United Kingdom, and Rutgers University, United States. Feng Zhang is a PhD student at Rutgers University.
The final version of this article benefitted from significant comments and suggestions from Jeremy Clegg, Professor of International Business, University of Leeds, United Kingdom.
1 The 2005 edition of the annual publication of the World Economic Forum, which sets out 142 separate indices for 117 countries.
appreciate the role played by two distinctive, yet interrelated, components of competitiveness, which are often treated as one in the literature.
These are first, the resources, capabilities and markets (RCM) which make up the physical2 environment in which firms and other organizations create economic well-being; and second, the institutions (together with the values and belief systems underpinning them) (I) which provide the incentive structures to make up the human environment, and which set the rules of the game for, and determine the cognition and motivation of, firms and other wealth creating entities.
All too frequently in the past, in assessing national competitiveness, the RCM and I determinants of economic activity have been treated separately. Partly this reflects the different disciplinary and methodological approaches to evaluating each. While mainstream economists, borrowing from the causal and functional analytical tools of the physical and/or biological sciences have favoured the “if-then” approach to measuring competitiveness, other social scientists, notably sociologists, have focused more on the intentionality of human decision takers, and on the institutional and other elements determining the motivation and conduct of individuals.
This dichotomy is now starting to change. The first bridges were made by institutional scholars from a variety of disciplines in the 1930s and 1940s. Perhaps the most influential of these were John Commons and Herbert Simon. Later, the contributions of Oliver Williamson, Harold Demsetz and Douglass North helped bring the subject centre stage among economists and organizational theorists. Each, in their particular ways, has attempted to unite the RCM (or physical) with the I (or human) approach to understanding the strategy of firms and the policies of governments in the wealth creating process. However, from an International Business perspective, notwithstanding the work of the internalization school (Buckley and Casson, 1976, 1985; Hennart, 1982), institutions have been incorporated into mainstream theory only very recently.3
Outside International Business, an understanding of institutions has traditionally been the domain of sociologists, whose interest in this subject dates back to the writings of Emile Durkheim in the
2 We use these terms as does Douglass North in his various writings. See, for example, North (2005).
3 See e.g. the works of Oliver (1997), Henisz (2000, 2003), Mudambi and Navarra (2002), Peng (2003), Peng, Lee and Wang (2005), and Lu (2006).
2 Transnational Corporations, Vol. 17, No. 3 (December2008)
mid-nineteenth century; while, latterly, organizational, international relations and legal scholars have contributed to the debate.4 And once one trespasses into the arena of values, cognitive science and belief systems, social psychologists, anthropologists and theologians have their contribution to make, while a branch of economics called “neuro economics” is beginning to link these behavioural elements together (Katz, 2005).
The purpose of this contribution is to examine the present state of thinking on the role of RCM and I as the main ingredients of the competitiveness of national economies; and, more particularly, of how the extent, content and quality of each are associated with the value of inward foreign direct investment (FDI) by foreign companies and the outward FDI of their own transnational corporations (TNCs). In doing so, data constraints force us to take a cross sectional approach, although, ideally, we would like to have established how the respective contributions of RCM and I may have changed over time, and at different stages of economic development. As a proxy for this, we will attempt to classify the 117 national economies (about which GCR provides data) into three main groups according to their GDP per head. We will also offer further breakdowns according to the economic structure and degree of openness of the economy. In particular, we shall abstract some primary product developing countries from the 117 countries, as we believe that much of FDI into these economies has little to do with their overall competitiveness. Further details about our methodology of approach and data sources are set out in section 3 of this paper.
The following section sets out the theoretical justification for RCM and I as competitive influencing variables comprising the Global Competitiveness Index (GCI) identified by GCR.5 Here, we would simply observe that although some commentators have argued that the competitiveness (as opposed to the comparative advantages) of countries is a meaningless concept (Krugman, 1994), we believe that when evaluated from the viewpoint of investing or potentially investing firms, it is by no means so.6 TNCs, in particular, regularly compare the relative location specific (competitive) advantages of particular countries and of the indigenous firms in those countries, when deciding where to site their various value-adding activities. In this sense, firms do consider
4 See e.g. several essays in Ghoshal and Westney (1993), and Williamson (2000)5 To quote from the 2005/6 report The Global CI aims to measure the set of
institutions, policies and factors that set current and medium term levels of economic prosperity, (WEF 2005, p.22).
6 See, for example, my riposte to Krugman (Dunning 1995)
Transnational Corporations, Vol. 17, No. 3 (December 2008) 3
countries (and/or regions in countries) in terms of their ability to offer the RCMs and Is that they need to make their investments (or other forms of economic involvement) worthwhile.
2. Resources, capabilities and markets (RCM)
Both traditional economic theory and management related studies primarily focus their attention on the availability and quality of RCMs as the key determinant of economic welfare. The resource based theory of the firm (Wernerfelt, 1984; Barney, 1991), Michael Porter’s diamond of competitive advantage (Porter, 1990) and most Western based textbooks on economics dwell almost exclusively on the physical environment in which firms operate7, and on their technical efficiency in converting scarce resources into more valued goods and services, as dictated, by the market or other means. Such received wisdom has generally played down the role of the human environment and the intentionality of its constituents in the wealth creating process, and of its institutions, which help fashion such intentionality. Or, perhaps, it would be more accurate to describe the incentive structures assumed by neoclassical economists as being static and single dimensional, – the maximization of profits (in the case of firms), of utility (in the case of consumers) and of GDP or GDP per head of the community (in the case of governments).
Although, as we have said, in the last two or more decades, as the global economic arena has become more uncertain, volatile and complex, and as more players from widely different cultures have entered the world economic stage, the acceptance of multiple and changing intentions, and that of non-ergodic uncertainty (North, 2005) has gained scholarly credence. Most theories of competitiveness and economic well being, however, still remain firmly entrenched in the RCM tradition. Nowhere is this better illustrated than on the focus of knowledge as the competitive enhancing asset of the late twentieth and early twenty-first century.8
In table 1, we summarize the main components of RCM, which, it is generally agreed, firms consider when making their locational
7 One exception is Christine Oliver’s incorporation of institutional elements into the resource based theory (Oliver, 1997).
8 Having replaced first land, then machines, and then financial capital as the main ingredient of economic growth and competitiveness.
4 Transnational Corporations, Vol. 17, No. 3 (December2008)
choices. Clearly the importance of these “inputs” to competitiveness will be context specific. In particular, they will vary according to the purpose of the FDI – be it inward or outward. Technology-seeking TNCs are
likely to place particular value on accessing scientific manpower and R&D facilities. Firms seeking to offshore service call centres will be most strongly influenced by labour costs, and the efficiency of cross-border communication systems. Natural resource-based assets seekers will most obviously be attracted by the availability and quality of the primary products sought. Firms which need to be in close proximity to a range of suppliers, to common inputs or to their competitors will seek out locations which favour a clustering of the related activities.
Another possible way of classifying RCM of countries (as viewed by firms) is between those owned by them and those which they may tap into, e.g. via alliances and subcontracting ventures. In their internal deployment, much will depend on the functions performed. In the case of foreign affiliates, these might vary from simple assembling to highly complex innovatory activities. This also applies to gaining access to the RCM of other firms; e.g. buying into specialized high value-adding activities (e.g. R&D) at the one end of the value chain (UNCTAD, 2005) and call centres services at the other (UNCTAD, 2004).
Finally, given the desire of companies to access or own particular RCMs, the preferred mode of entry (greenfield v merger and acquisition) might both be influenced by, and influence, their locational choice. This particularly applies in the case of asset augmenting investment, where the country specific competitiveness sought by the investing TNC may already be internalized by a domestic firm (or another foreign affiliate). In other cases, as we have already indicated, the search for complementary technologies, managerial and organizational capabilities and market opportunities, might best be accomplished by the conclusion of alliances or by participating in networks.
In our empirical study, we shall seek to classify some of the more significant RCMs identified by GCR, (and other sources)9 into a number of groups, and to examine how far inbound and outbound FDI appear to be influenced by their values. In both cases, our purpose is to identify the kind of RCMs from the optimum location which will best promote
9 For example, UNDP (2004) and World Bank (2004).
Transnational Corporations, Vol. 17, No. 3 (December 2008) 5
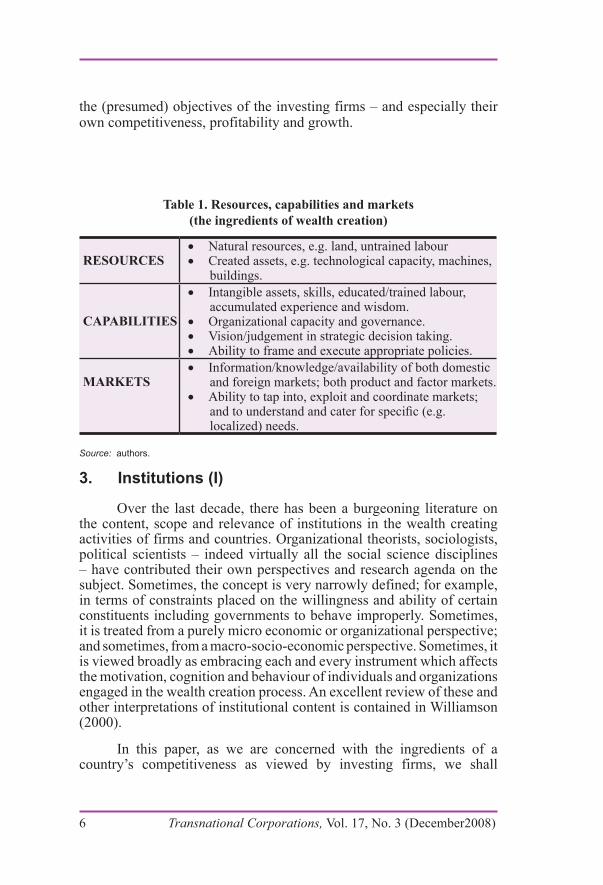
the (presumed) objectives of the investing firms – and especially their own competitiveness, profitability and growth.
Table 1. Resources, capabilities and markets(the ingredients of wealth creation)
RESOURCESNatural resources, e.g. land, untrained labour•Created assets, e.g. technological capacity, machines, •buildings.
CAPABILITIES
Intangible assets, skills, educated/trained labour, •accumulated experience and wisdom.Organizational capacity and governance.•Vision/judgement in strategic decision taking.•Ability to frame and execute appropriate policies.•
MARKETSInformation/knowledge/availability of both domestic •and foreign markets; both product and factor markets.Ability to tap into, exploit and coordinate markets; •and to understand and cater for specific (e.g. localized) needs.
Source: authors.
3. Institutions (I)
Over the last decade, there has been a burgeoning literature on the content, scope and relevance of institutions in the wealth creating activities of firms and countries. Organizational theorists, sociologists, political scientists – indeed virtually all the social science disciplines – have contributed their own perspectives and research agenda on the subject. Sometimes, the concept is very narrowly defined; for example, in terms of constraints placed on the willingness and ability of certain constituents including governments to behave improperly. Sometimes, it is treated from a purely micro economic or organizational perspective; and sometimes, from a macro-socio-economic perspective. Sometimes, it is viewed broadly as embracing each and every instrument which affects the motivation, cognition and behaviour of individuals and organizations engaged in the wealth creation process. An excellent review of these and other interpretations of institutional content is contained in Williamson (2000).
In this paper, as we are concerned with the ingredients of a country’s competitiveness as viewed by investing firms, we shall
6 Transnational Corporations, Vol. 17, No. 3 (December2008)
embrace the broad interpretation of institutions, which, we believe, is best articulated by Douglass North in his various writings (North, 1990, 1995, 2005). It is also the one that which most international business scholars have tended to adopt (albeit with modifications).10
Like RCM, I comprises a galaxy of ingredients. Some of these are reproduced in table 2. The left hand column of the table sets out some different governance structures. These range from coercive and top down laws and regulations, to spontaneous and bottom up behavioural norms or customs (Dunning. 2003). In the right hand column, we identify some of the economic and social functions which, depending on their institutional content and form, might affect the cognition, motivation and behaviour of firms in their decisions on whether and how to create and efficiently utilize the RCM owned, leased or accessed by them.
Once again, the likely drawing power of such institutions to inward foreign investors, and/or their influence in determining the willingness and ability of domestic firms to engage in outward FDI is likely to be highly contextual. For example, the content and quality of domestic innovatory systems and the protection of intellectual property rights is likely to be particularly relevant for (knowledge augmenting) FDI: while fiscal incentive might tip the balance of countries seeking to attract efficiency-seeking FDI. Within a developing region, the quality and content of indigenous social capital and the extent of crime and corruption and social disfunction might be one of the decisive influences on locational choice. Institutions affecting M&A strategies and/or the performance constraints placed on foreign affiliates might also be expected to have a major influence on the ownership strategies of foreign TNCs.
Analogous to the influences exerted by RCM on the location-specific attractiveness of countries, we shall group the I variables into a number of broad categories. These are described in section 5. Our main objective is, we repeat, to identify the relative importance of these largely immobile characteristics of countries in influencing the location decisions of firms.
We would make one final point at this stage of our analysis. That concerns the distinction between the institutions and policies of national governments, and the institutions and strategies of firms. We define policies as decisions taken by governments to pursue particular courses
10 See particularly Mudambi and Navarra (2002), Maitland and Nicholas (2003), Heinisz (2000), Oliver, (1997), Dunning (2005, 2006) and Dunning and Lundan (2006).
Transnational Corporations, Vol. 17, No. 3 (December 2008) 7
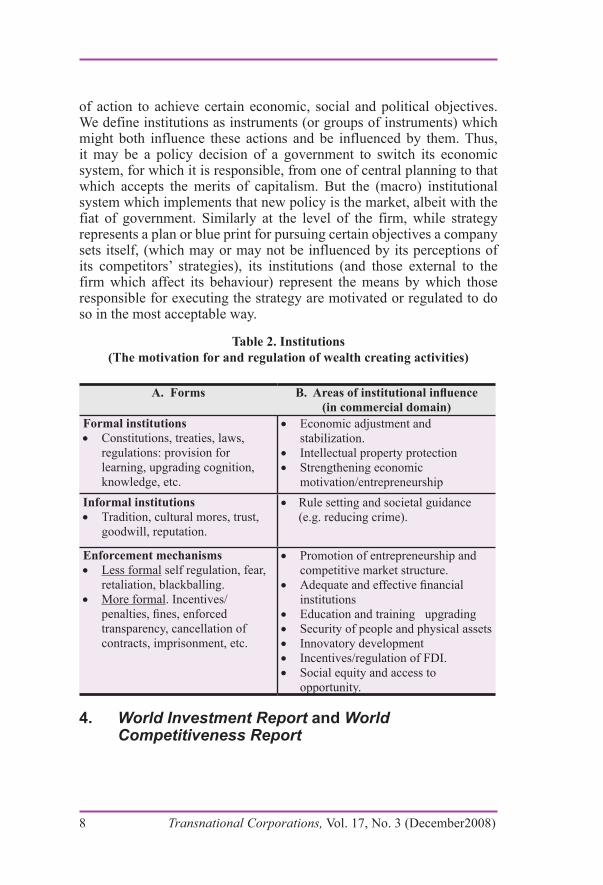
of action to achieve certain economic, social and political objectives. We define institutions as instruments (or groups of instruments) which might both influence these actions and be influenced by them. Thus, it may be a policy decision of a government to switch its economic system, for which it is responsible, from one of central planning to that which accepts the merits of capitalism. But the (macro) institutional system which implements that new policy is the market, albeit with the fiat of government. Similarly at the level of the firm, while strategy represents a plan or blue print for pursuing certain objectives a company sets itself, (which may or may not be influenced by its perceptions of its competitors’ strategies), its institutions (and those external to the firm which affect its behaviour) represent the means by which those responsible for executing the strategy are motivated or regulated to do so in the most acceptable way.
Table 2. Institutions(The motivation for and regulation of wealth creating activities)
A. Forms B. Areas of institutional influence (in commercial domain)
Formal institutionsConstitutions, treaties, laws, •regulations: provision for learning, upgrading cognition, knowledge, etc.
Economic adjustment and •stabilization.Intellectual property protection•Strengthening economic •motivation/entrepreneurship
Informal institutionsTradition, cultural mores, trust, •goodwill, reputation.
Rule setting and societal guidance •(e.g. reducing crime).
Enforcement mechanismsLess formal• self regulation, fear, retaliation, blackballing.More formal• . Incentives/penalties, fines, enforced transparency, cancellation of contracts, imprisonment, etc.
Promotion of entrepreneurship and •competitive market structure.Adequate and effective financial •institutionsEducation and training upgrading•Security of people and physical assets•Innovatory development•Incentives/regulation of FDI.•Social equity and access to •opportunity.
4. World Investment Report and World Competitiveness Report
8 Transnational Corporations, Vol. 17, No. 3 (December2008)
We have used two main sources of data in our empirical research. The first is UNCTAD’s annual World Investment Report which provides information on both outward and inward FDI stocks and/or accumulated flows11 for several years dating back to 1980. These data are mainly those provided by national authorities.12 However, except in a few cases, inward FDI flows or stocks are not classified by country of origin; neither is outward FDI delineated by country of destination. All values are expressed in United States dollars and converted (usually at the end of the calendar year) at current exchange rates. Our basic propositions of this paper are fourfold.
Proposition 1: the more pronounced the locational attractions or competitive advantages of a country are, the greater its share of the world FDI stock will be.
Proposition 2: the content and quality of the institutions of a country are an important influence on the extent of its inward FDI.
Proposition 3: the competitive advantages of firms in countries (but possibly different to those of the first kind) will be positively associated with the extent of outward FDI.
Proposition 4: I advantages are an important, and possibly an increasingly important, determinant of the extent of outward FDI.
As far as the explanatory variables are concerned, the data on RCM and I, and most of their ingredients, were obtained from GCR (World Economic Forum, 2005). The 2005/6 version of this publication provides data on 142 separate performance indicators, 90 of which are grouped into nine pillars of competitiveness.13 Data on these are provided for some 117 countries. Some of these indices were derived directly from national statistics (e.g. expenditure on R&D, interest rates, labour costs). Others came from the opinions of a group of some 10,993 executives from these countries14, who were asked to rank on a Likert scale of 1-7 how far they believed in the validity of particular statements,
11 Where FDI stocks are not available.12 Though the definition of FDI is broadly the same (viz. an investment of 10% by
one company in that of another, but in a different country).13 These pillars are respectively institutions, infrastructure, macro economy, health
and primary education, higher education and training, market efficiency, labour markets and technological readiness, business sophistication and innovation. See Chapter 1.1 of World Economic Forum (2005, pp. 22−24).
14 These countries cover 78.2% of the world’s GDP between them. Details of the respondents are given in chapter 4.1 of World Economic Forum (2005).
Transnational Corporations, Vol. 17, No. 3 (December 2008) 9
and/or of how important they perceived a particular locational variable might be. All the data were collected or provided for the years between 2003 and 2005.
In our exercise, and taking our definitions of RCM and I, we reclassified some of the individual performance indicators to form two main groups – an RCM group comprising 72 indices, and an I group made up of 70 indices. We further divided these two groups into three further subgroups. Market characteristics (Mc), technological capacity (T), and infrastructure and support services (Is) made up the RCM group; institutions (Ip), market efficiency (Me), and innovation Systems (In) constituted the I group.
5. The models
5.1 Inward FDI
In our empirical study, we distinguished between two alternative variants of Proposition 115 on the likely impact of locational competitiveness on inward FDI. The first is that such competitiveness should attract the exploitation or augmentation of the ownership specific advantages of the investing firms (i.e. by adding further value). The second is that since such competitiveness, at least partly, reflects the ownership advantages of established firms – both domestically and foreign owned, − it could be that the unique ownership advantages of foreign TNCs do not match up to those of the domestic sector, and thus there would be less FDI. Such, for example, was very much the case in the 1950s and 1960s, when there was little FDI in the United States because, among other reasons, the locational competitiveness of the country reflected the superior competitive advantages of its indigenous firms, and its institutions, vis-à-vis those of foreign competitors.16
When considering the relative locational attractions of RCM and I (and/or the individual components of each), which is the more likely to act as a deterrent in the second scenario described above? It
15 These alternatives propositions are: alternative 1 – locational competitiveness attracts inward FDI by adding to the O specific advantages of investing firms; alternative 2 – locational competitiveness reflects the O specific advantage of established domestic firms, and so deters inward FDI.
16 In the language of the eclectic paradigm, if the competitiveness of RCM and I reflects the L advantages of countries rather than the O advantages of firms located in that country they will attract inward FDI. If, however, such advantages are specific indigenous firms, then they may deter (competitive) inward FDI.
10 Transnational Corporations, Vol. 17, No. 3 (December2008)
is our proposition that, within a particular location, I is less likely to be O specific than is RCM; in other words, that the components of I (e.g. market efficiency, incentive structures and innovation systems) are likely to have a broadly similar affect on the competitive prowess of both foreign owned and domestic firms. Therefore, of the two, I is less likely to deter inward FDI.
Finally, we would reiterate an earlier point, viz. that other factors – notably the quality, availability and price of indigenous primary products – e.g. oil, hard minerals and agricultural goods – are less likely to be shown up in competitive indices than their counterparts in the secondary or tertiary sectors.17 We then have two alternative hypotheses to test. The first is a generalized hypothesis which examines the significance of each host country, relative to all other countries of the two groups of variables. This suggests a positive relationship between the dependent and explanatory variables (see proposition 1).18 Therefore we postulate the following relationship:
IFDI = f1 (RCM, I), (1.1)
where IFDI denotes inward FDI. The second attempts to assess the significance of the components of RCM and I viz. for each country relative to that of all other countries (see proposition 2). Thus, we have:
IFDI = f2 (Mc,T,Is) (Ip,Me,In), (1.2)
where Mc denotes market characteristics; T denotes technological capacity; and IS denotes infrastructure and support services; Ip denotes extra market public and private institutions; Me denotes market efficiency; and In denotes quality of (macro) innovation systems. As already indicated, we acknowledge that these variables do not embrace all the possible determinants of inward FDI. Several plausible factors, such as the strategies of competing firms and the FDI policies of home governments, are excluded. We also accept that inward FDI might be deterred by the competitiveness of indigenous firms, while outward FDI of an asset augmenting kind might reflect a weakness rather of a strength of the investing firms. However, the data for those variables included
17 In fact there are no indices of the significance of (exportable) primary produces in the GCI.
18 Though we accept that in some circumstances and in the case of RCM the relationship could be a negative one.
Transnational Corporations, Vol. 17, No. 3 (December 2008) 11
are obtained from the same source, and their method of calculation is reasonably well standardized.
In testing the relationship 1.1, we have added three “other” country specific variables, not covered by the global competitiveness index, as control variables. These are: (1) population (P) to represent the size of country; (2) the proportion of exports accounted for by primary products (Ep) to represent the endowments of natural resources; and (3) the ratio between the value of privatization and inbound FDI (Pr) as a proxy for the drawing power of such schemes particularly in transition economies. We hypothesize each of these variables to be positively related to inward FDI (propositions 1 and 2). For P, we take data for 2004 from GCR. For Ep, our data source is UNDP (2004); and for Pr we assign a dummy variable of 0−5. The full specification of equation 1.1, which again hypothesizes that each of the independent variables positively affects inward FDI, then becomes:
IFDI = f3 (RCM, I, P, Ep, Pr). (1.3)
5.2 Outward FDI
The received international business literature suggests that firms will engage in outward FDI when (a) their unique competitive, or O specific, advantages make it possible for them to effectively compete with indigenous firms in the markets they are intending to serve; (b) that it is better to locate at least some of their value added activities in these markets (or elsewhere outside the home country) rather than export to the country in question and (c) that the ownership of the foreign productive facilities is preferred to selling (e.g. by licensing or other contractual means) the rights to exploit the O advantages to a foreign based firm.
More recently (since the early 1990s), an alternative explanation of outward FDI has been increasingly emphasized. In contrast to the objective of more effectively exploiting their existing ownership advantages (via market, natural resource and efficiency seeking FDI), some firms may wish to engage in FDI in order to augment their ownership advantages; and to do so by acquiring or tapping into foreign based RCM and Is. As with inward FDI, the competitiveness of home based TNCs and their countries of origin might be seen as either a
12 Transnational Corporations, Vol. 17, No. 3 (December2008)
strength or a weakness for going abroad.19 Again, the question arises as to whether such FDI is likely to be of an RCM or an I kind, and whether the ownership advantages (or disadvantages) of the investing firms are common among the firms in their home country (or in the countries in which they operate) or they are specific to a particular firm or group of firms.20
This having been said, the content of the variables explaining outward FDI are postulated to be similar to those explaining inward FDI viz. for each home country, relative to all other countries competing for the same investment. So the relevant equations used to test propositions 3 and 4 set out on page 12 are:
OFDI = g1 (RCM, I), (2.1)
for the generalized proposition and
OFDI = g2 (Mc, T, Is) (Ip, Me, In), (2.2)
for the components for RCM and I, where OFDI denote outward FDI. As in the case of 1.1, we also include the three control variables. Thus, the complete equation for 2.1 becomes:
OFDI = g3 (RCM, I, P, Ep, Pr). (2.3)
6. The data
We define the dependent variables in each set of equations as the ratio between a country’s share of global FDI stock and its share in global gross domestic product (GDP) (as measured in dollars at the current exchange rate in 2006). We normalize for size of country as is also done for each of the independent variables. We use FDI stock (accumulated flows) figures. We believe the stock data better reflects the long term intentions of foreign investors, and their response to L specific attractions than FDI flows because over the last decade, the annual flow data have been greatly influenced by the volatility of M&As and privatization deals. For the independent and competitive related variables, we use the rankings of the 117 countries contained in GCR. For the control variables we extract data from World Economic Forum (2005), UNIDO (2004) and WIR (2002).
19 And, indeed in many cases, a combination of the two.20 In Alan Rugman’s terminology is it likely to be countries or firm specific
(Rugman, 2006)
Transnational Corporations, Vol. 17, No. 3 (December 2008) 13
In some cases, our rankings are based on hard data, e.g. most market-based and several technology-related variables. In others, they reflect the ranking (on a scale 1−7) assigned by 10,993 business executives from the 117 countries.21 The survey was conducted by the World Economic Forum between January and May 2005.
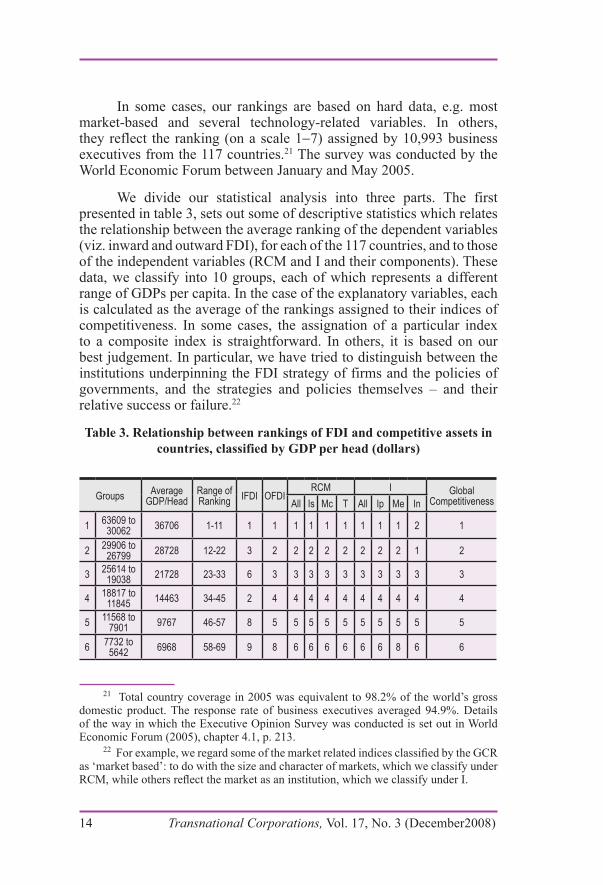
We divide our statistical analysis into three parts. The first presented in table 3, sets out some of descriptive statistics which relates the relationship between the average ranking of the dependent variables (viz. inward and outward FDI), for each of the 117 countries, and to those of the independent variables (RCM and I and their components). These data, we classify into 10 groups, each of which represents a different range of GDPs per capita. In the case of the explanatory variables, each is calculated as the average of the rankings assigned to their indices of competitiveness. In some cases, the assignation of a particular index to a composite index is straightforward. In others, it is based on our best judgement. In particular, we have tried to distinguish between the institutions underpinning the FDI strategy of firms and the policies of governments, and the strategies and policies themselves – and their relative success or failure.22
Table 3. Relationship between rankings of FDI and competitive assets in countries, classified by GDP per head (dollars)
Groups Average GDP/Head
Range of Ranking IFDI OFDI
RCM I Global CompetitivenessAll Is Mc T All Ip Me In
1 63609 to 30062 36706 1-11 1 1 1 1 1 1 1 1 1 2 1
2 29906 to 26799 28728 12-22 3 2 2 2 2 2 2 2 2 1 2
3 25614 to 19038 21728 23-33 6 3 3 3 3 3 3 3 3 3 3
4 18817 to 11845 14463 34-45 2 4 4 4 4 4 4 4 4 4 4
5 11568 to 7901 9767 46-57 8 5 5 5 5 5 5 5 5 5 5
6 7732 to 5642 6968 58-69 9 8 6 6 6 6 6 6 8 6 6
21 Total country coverage in 2005 was equivalent to 98.2% of the world’s gross domestic product. The response rate of business executives averaged 94.9%. Details of the way in which the Executive Opinion Survey was conducted is set out in World Economic Forum (2005), chapter 4.1, p. 213.
22 For example, we regard some of the market related indices classified by the GCR as ‘market based’: to do with the size and character of markets, which we classify under RCM, while others reflect the market as an institution, which we classify under I.
14 Transnational Corporations, Vol. 17, No. 3 (December2008)
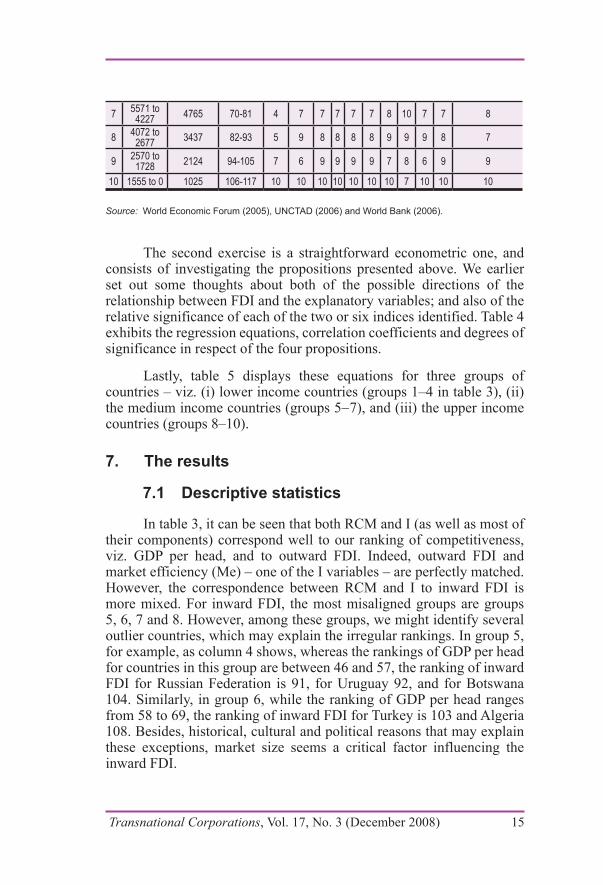
7 5571 to 4227 4765 70-81 4 7 7 7 7 7 8 10 7 7 8
8 4072 to 2677 3437 82-93 5 9 8 8 8 8 9 9 9 8 7
9 2570 to 1728 2124 94-105 7 6 9 9 9 9 7 8 6 9 9
10 1555 to 0 1025 106-117 10 10 10 10 10 10 10 7 10 10 10
Source: World Economic Forum (2005), UNCTAD (2006) and World Bank (2006).
The second exercise is a straightforward econometric one, and consists of investigating the propositions presented above. We earlier set out some thoughts about both of the possible directions of the relationship between FDI and the explanatory variables; and also of the relative significance of each of the two or six indices identified. Table 4 exhibits the regression equations, correlation coefficients and degrees of significance in respect of the four propositions.
Lastly, table 5 displays these equations for three groups of countries – viz. (i) lower income countries (groups 1–4 in table 3), (ii) the medium income countries (groups 5−7), and (iii) the upper income countries (groups 8–10).
7. The results
7.1 Descriptive statistics
In table 3, it can be seen that both RCM and I (as well as most of their components) correspond well to our ranking of competitiveness, viz. GDP per head, and to outward FDI. Indeed, outward FDI and market efficiency (Me) – one of the I variables – are perfectly matched. However, the correspondence between RCM and I to inward FDI is more mixed. For inward FDI, the most misaligned groups are groups 5, 6, 7 and 8. However, among these groups, we might identify several outlier countries, which may explain the irregular rankings. In group 5, for example, as column 4 shows, whereas the rankings of GDP per head for countries in this group are between 46 and 57, the ranking of inward FDI for Russian Federation is 91, for Uruguay 92, and for Botswana 104. Similarly, in group 6, while the ranking of GDP per head ranges from 58 to 69, the ranking of inward FDI for Turkey is 103 and Algeria 108. Besides, historical, cultural and political reasons that may explain these exceptions, market size seems a critical factor influencing the inward FDI.
Transnational Corporations, Vol. 17, No. 3 (December 2008) 15
While groups 5 and 6 have competitive indices which tend to lag inward FDI, exceptions in groups 7 and 8 suggest an opposite phenomenon. In group 7, column 4 shows whereas the ranking of GDP per head in this group is between 70 and 81, the ranking of inward FDI for Guyana, Jamaica, Morocco and Jordan are 5, 13, 31 and 36, respectively. Each of these countries displays a relatively high inward FDI compared to their GDP per head. Similarly, Azerbaijan, Nicaragua, Bolivia, Ecuador, Georgia and Honduras in group 8 reveal above average rankings in respect of their inward FDI stock compared with their GDP per head. It can be seen that most of the exceptions in groups 7 and 8 are from Latin America and Africa. Here, we may speculate that FDI directed to resource-seeking (either natural resource or labour) activities explains most of the apparently irregular patterns.
In general, the rankings of our RCM and I variables, as well as their components, correspond relatively well to those of inward and outward FDI, and competitiveness. Therefore, we (tentatively) conclude our first proposition (set out on page 12) viz. – the more pronounced the competitive advantages of a country, the more its share of the world inward & outward FDI stock – is supported.
7.2 Econometric tests
The results presented in table 4 confirm proposition 3 and give some support to propositions 2 and 4; they also suggest that inward FDI is mainly market oriented (the highly significant variable Me). We also find that outward FDI is influenced by the quality of home country institutions (the highly significant I variable). In other words, the O advantages of the outward investing firms strongly reflect the institutional environment of their home country.
Table 4 reports the coefficients for the aggregate RCM and I variables, and for the breakdown of these aggregate variables into their component variables. Table 4(a) presents the complete set of results for the equations run to determine the IFDI and OFDI variables, and those relevant to Proposition 1. For ease of discussion, tables 4(b) and 4(c) group results selected from table 4(a) according to their relevance to propositions 3, 2 and 4, respectively.23
23 In preliminary regressions it transpired that several of our variables benefited from transformation into logarithmic form.
16 Transnational Corporations, Vol. 17, No. 3 (December2008)
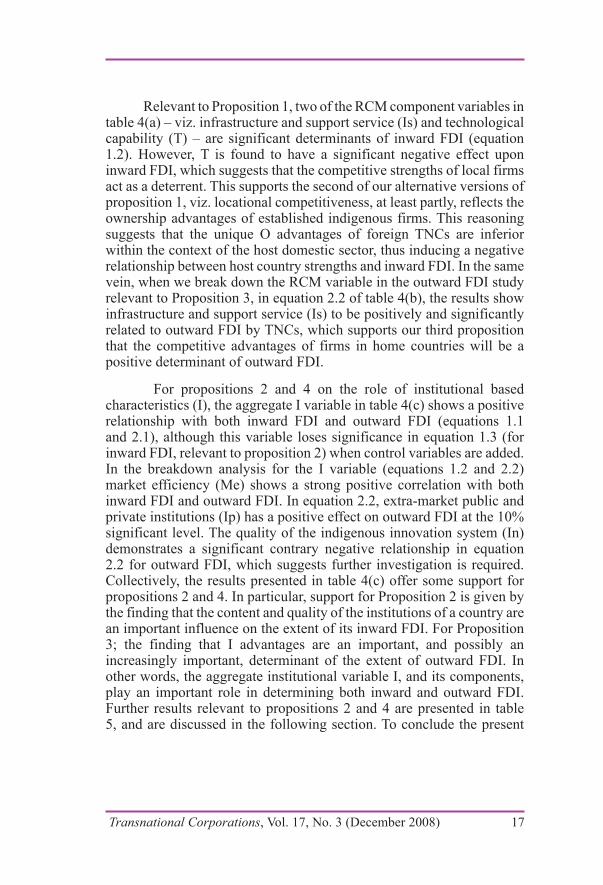
Relevant to Proposition 1, two of the RCM component variables in table 4(a) – viz. infrastructure and support service (Is) and technological capability (T) – are significant determinants of inward FDI (equation 1.2). However, T is found to have a significant negative effect upon inward FDI, which suggests that the competitive strengths of local firms act as a deterrent. This supports the second of our alternative versions of proposition 1, viz. locational competitiveness, at least partly, reflects the ownership advantages of established indigenous firms. This reasoning suggests that the unique O advantages of foreign TNCs are inferior within the context of the host domestic sector, thus inducing a negative relationship between host country strengths and inward FDI. In the same vein, when we break down the RCM variable in the outward FDI study relevant to Proposition 3, in equation 2.2 of table 4(b), the results show infrastructure and support service (Is) to be positively and significantly related to outward FDI by TNCs, which supports our third proposition that the competitive advantages of firms in home countries will be a positive determinant of outward FDI.
For propositions 2 and 4 on the role of institutional based characteristics (I), the aggregate I variable in table 4(c) shows a positive relationship with both inward FDI and outward FDI (equations 1.1 and 2.1), although this variable loses significance in equation 1.3 (for inward FDI, relevant to proposition 2) when control variables are added. In the breakdown analysis for the I variable (equations 1.2 and 2.2) market efficiency (Me) shows a strong positive correlation with both inward FDI and outward FDI. In equation 2.2, extra-market public and private institutions (Ip) has a positive effect on outward FDI at the 10% significant level. The quality of the indigenous innovation system (In) demonstrates a significant contrary negative relationship in equation 2.2 for outward FDI, which suggests further investigation is required. Collectively, the results presented in table 4(c) offer some support for propositions 2 and 4. In particular, support for Proposition 2 is given by the finding that the content and quality of the institutions of a country are an important influence on the extent of its inward FDI. For Proposition 3; the finding that I advantages are an important, and possibly an increasingly important, determinant of the extent of outward FDI. In other words, the aggregate institutional variable I, and its components, play an important role in determining both inward and outward FDI. Further results relevant to propositions 2 and 4 are presented in table 5, and are discussed in the following section. To conclude the present
Transnational Corporations, Vol. 17, No. 3 (December 2008) 17
section we briefly discuss the control variables and report the results of a supplementary stepwise regression procedure.
Of the control variables, privatization schemes (Pr), when run with the RCM variable, appears to be significantly associated with outward FDI. The role of this variable is to control for the fact that privatization encourages the development of entrepreneurship. However, population (P) is negatively related to inward FDI, in table 4, which is controlling effectively for the fact that global FDI is predominantly directed towards the less populous industrialized countries.
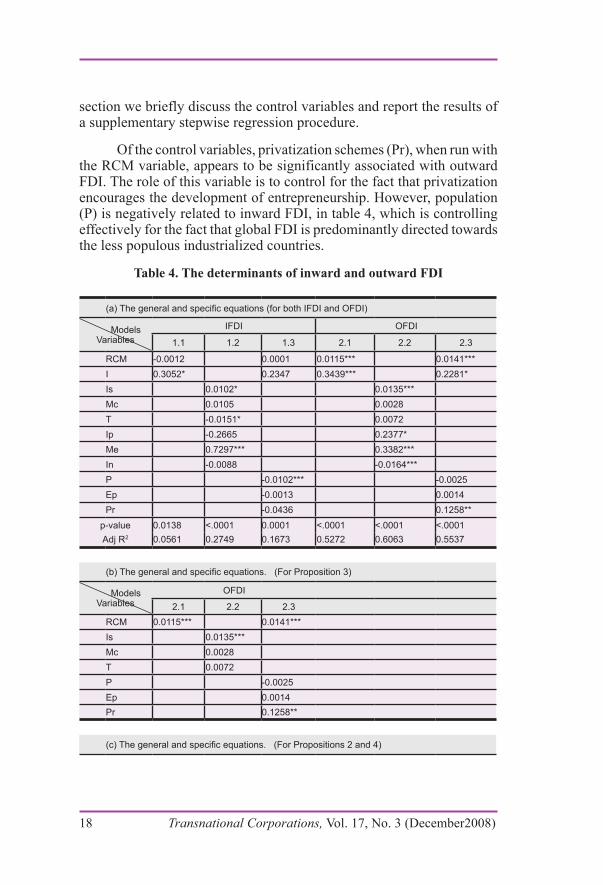
Table 4. The determinants of inward and outward FDI
(a) The general and specific equations (for both IFDI and OFDI)
Models Variables
IFDI OFDI
1.1 1.2 1.3 2.1 2.2 2.3
RCM -0.0012 0.0001 0.0115*** 0.0141*** I 0.3052* 0.2347 0.3439*** 0.2281* Is 0.0102* 0.0135*** Mc 0.0105 0.0028 T -0.0151* 0.0072 Ip -0.2665 0.2377* Me 0.7297*** 0.3382*** In -0.0088 -0.0164*** P -0.0102*** -0.0025 Ep -0.0013 0.0014 Pr -0.0436 0.1258**
p-value 0.0138 <.0001 0.0001 <.0001 <.0001 <.0001Adj R2 0.0561 0.2749 0.1673 0.5272 0.6063 0.5537
(b) The general and specific equations. (For Proposition 3)
Models Variables
OFDI
2.1 2.2 2.3 RCM 0.0115*** 0.0141*** Is 0.0135*** Mc 0.0028 T 0.0072 P -0.0025 Ep 0.0014 Pr 0.1258**
(c) The general and specific equations. (For Propositions 2 and 4)
18 Transnational Corporations, Vol. 17, No. 3 (December2008)
Models Variables
IFDI OFDI
1.1 1.2 1.3 2.1 2.2 2.3
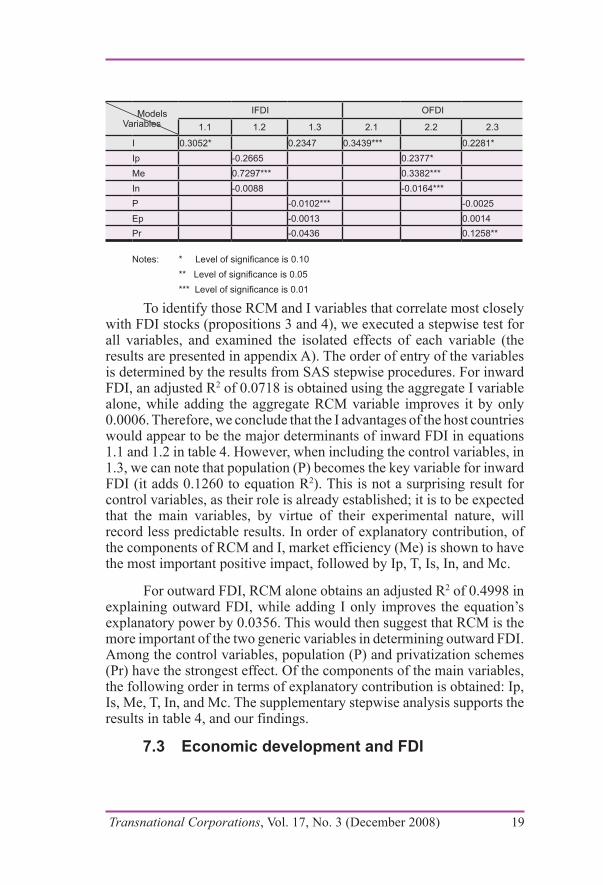
I 0.3052* 0.2347 0.3439*** 0.2281* Ip -0.2665 0.2377* Me 0.7297*** 0.3382*** In -0.0088 -0.0164*** P -0.0102*** -0.0025 Ep -0.0013 0.0014 Pr -0.0436 0.1258**
Notes: * Level of significance is 0.10 ** Level of significance is 0.05 *** Level of significance is 0.01
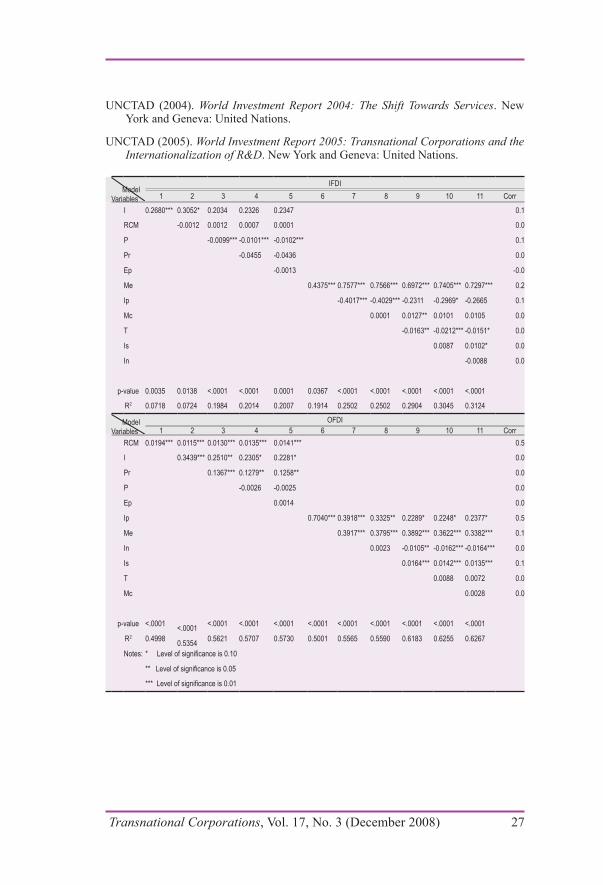
To identify those RCM and I variables that correlate most closely with FDI stocks (propositions 3 and 4), we executed a stepwise test for all variables, and examined the isolated effects of each variable (the results are presented in appendix A). The order of entry of the variables is determined by the results from SAS stepwise procedures. For inward FDI, an adjusted R2 of 0.0718 is obtained using the aggregate I variable alone, while adding the aggregate RCM variable improves it by only 0.0006. Therefore, we conclude that the I advantages of the host countries would appear to be the major determinants of inward FDI in equations 1.1 and 1.2 in table 4. However, when including the control variables, in 1.3, we can note that population (P) becomes the key variable for inward FDI (it adds 0.1260 to equation R2). This is not a surprising result for control variables, as their role is already established; it is to be expected that the main variables, by virtue of their experimental nature, will record less predictable results. In order of explanatory contribution, of the components of RCM and I, market efficiency (Me) is shown to have the most important positive impact, followed by Ip, T, Is, In, and Mc.
For outward FDI, RCM alone obtains an adjusted R2 of 0.4998 in explaining outward FDI, while adding I only improves the equation’s explanatory power by 0.0356. This would then suggest that RCM is the more important of the two generic variables in determining outward FDI. Among the control variables, population (P) and privatization schemes (Pr) have the strongest effect. Of the components of the main variables, the following order in terms of explanatory contribution is obtained: Ip, Is, Me, T, In, and Mc. The supplementary stepwise analysis supports the results in table 4, and our findings.
7.3 Economic development and FDI
Transnational Corporations, Vol. 17, No. 3 (December 2008) 19
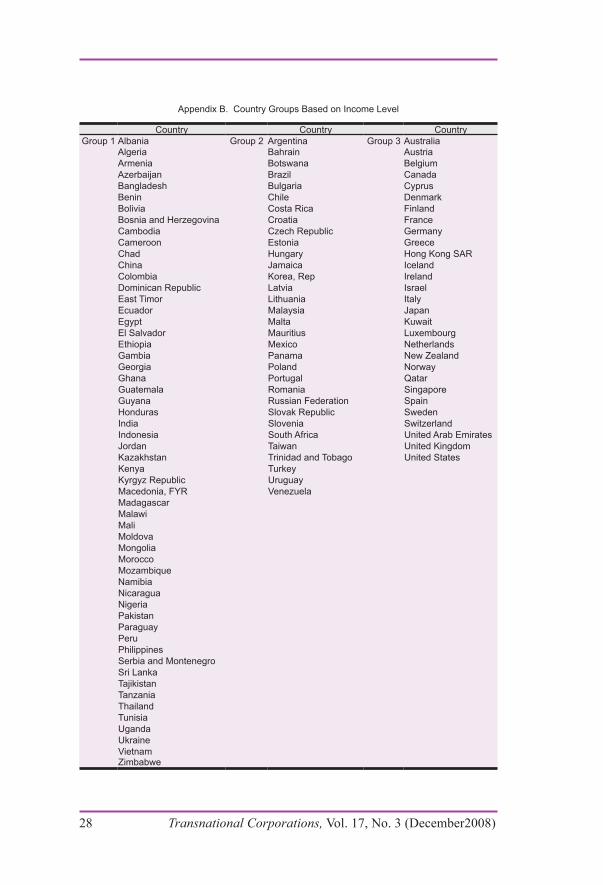
We now turn to consider the possibility that the results so far described might be related to the stage of development of a country. To test the relationship between the stage of economic development of a country and the interaction between its competitiveness & RCM/I and FDI, we divided the 117 countries identified by the GCR into three groups, based on their GDP per head, with Group 1 being the lowest income group (for details, see Appendix B). The results are set out in table 5. In the third (high income) group, which includes all the richest countries around the world, RCM is significantly correlated with outward FDI, and supports Proposition 3 (see table 5 (b)). But contrary to expectations, the variable I in this group is not significant in determining inward FDI and outward FDI (see table 5 (c)); indeed it appears to be negatively associated with both inward FDI (when run in conjunction with the control variables) and outward FDI. Again we can invoke the deterrent effects of strong firms within advanced host economies to explain the negative relationship between I and inward FDI. To account for the negative relation between I and outward FDI it is possible to argue that a reduced incentive to invest abroad might apply when the institutional environment at home is superior to foreign locations. We should also bear in mind that a large proportion the inward and outward FDI associated with advanced economies results from intra-Triad M&As; and these are primarily explained by firm- or industry-specific variables not captured in our research design. For income groups 2 and 3, neither RCM nor I are significantly related to inward FDI in the first two stages. The fact that the adjusted R2 of most equations are low is an indication that the use of aggregate variables, while intended to capture determinants that are general to all countries, may suffer from theoretical limitations. In other words, the approach is still too much influenced by the experience of the highest income countries of the world.
The incorporation of the component variables provides deeper insights into relationships between FDI and level of development. For inward FDI, at low development levels, extra market public and private institutions (Ip) and technological capacity (T) are positively and significantly related to inward FDI, while T has a negative coefficient. In middle development group, Ip records a significant negative relationship with inward FDI, while market efficiency (Me) becomes the most important positive determinant of inward FDI. In the third (high income) group, along with the similar effects of Ip and Me to those in group 2, infrastructure and support services (Is) become one of the major elements effecting inward FDI. This is clearly one of the most important locational attractions of developed countries.
20 Transnational Corporations, Vol. 17, No. 3 (December2008)
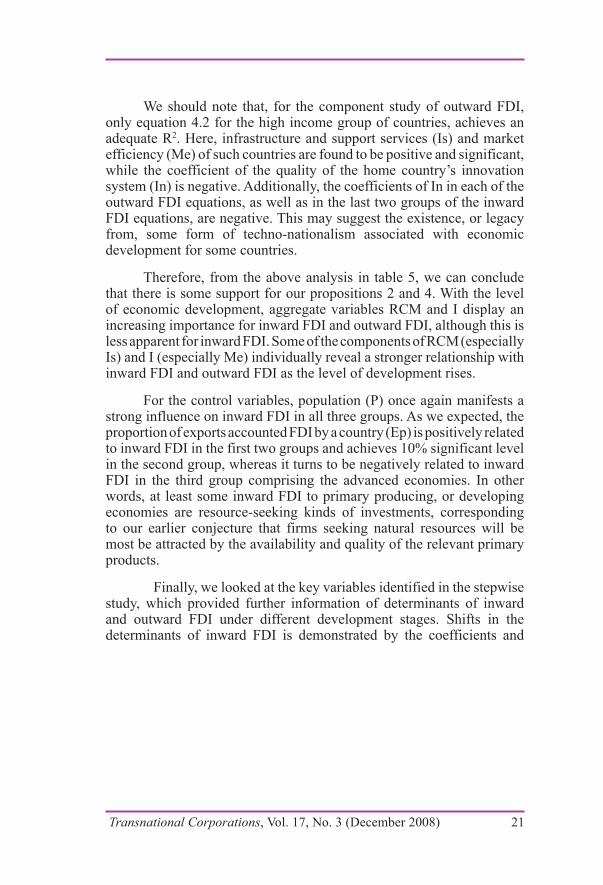
We should note that, for the component study of outward FDI, only equation 4.2 for the high income group of countries, achieves an adequate R2. Here, infrastructure and support services (Is) and market efficiency (Me) of such countries are found to be positive and significant, while the coefficient of the quality of the home country’s innovation system (In) is negative. Additionally, the coefficients of In in each of the outward FDI equations, as well as in the last two groups of the inward FDI equations, are negative. This may suggest the existence, or legacy from, some form of techno-nationalism associated with economic development for some countries.
Therefore, from the above analysis in table 5, we can conclude that there is some support for our propositions 2 and 4. With the level of economic development, aggregate variables RCM and I display an increasing importance for inward FDI and outward FDI, although this is less apparent for inward FDI. Some of the components of RCM (especially Is) and I (especially Me) individually reveal a stronger relationship with inward FDI and outward FDI as the level of development rises.
For the control variables, population (P) once again manifests a strong influence on inward FDI in all three groups. As we expected, the proportion of exports accounted FDI by a country (Ep) is positively related to inward FDI in the first two groups and achieves 10% significant level in the second group, whereas it turns to be negatively related to inward FDI in the third group comprising the advanced economies. In other words, at least some inward FDI to primary producing, or developing economies are resource-seeking kinds of investments, corresponding to our earlier conjecture that firms seeking natural resources will be most be attracted by the availability and quality of the relevant primary products.
Finally, we looked at the key variables identified in the stepwise study, which provided further information of determinants of inward and outward FDI under different development stages. Shifts in the determinants of inward FDI is demonstrated by the coefficients and
Transnational Corporations, Vol. 17, No. 3 (December 2008) 21
the significance levels of variables. This follows an order, from Ip in the low income group, to Me in the more developed levels (the second and third groups). As Ip and Me are both institutional variables, this progression corresponds with the results in table 4 and supports our Proposition 2. Furthermore, for outward FDI, RCM component (Is) and I component (Me) become significant in the third group, which not only demonstrates a balancing of the determinants among RCM and I factors, but also indicates the increasingly important role played by institutional advantages in determining outward FDI, along with the economic development of countries (as suggested by Proposition 4).
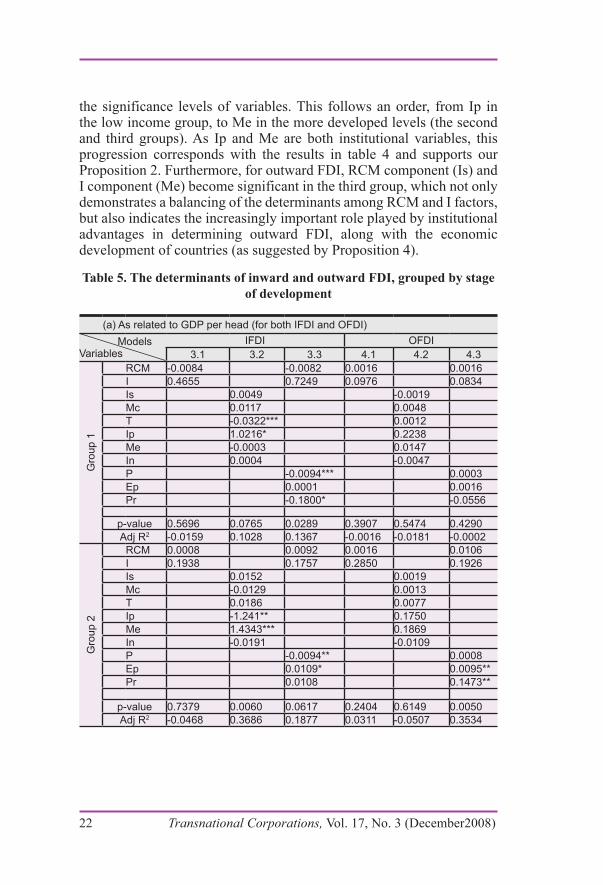
Table 5. The determinants of inward and outward FDI, grouped by stage of development
(a) As related to GDP per head (for both IFDI and OFDI) Models Variables
IFDI OFDI3.1 3.2 3.3 4.1 4.2 4.3
Gro
up 1
RCM -0.0084 -0.0082 0.0016 0.0016
I 0.4655 0.7249 0.0976 0.0834
Is 0.0049 -0.0019
Mc 0.0117 0.0048
T -0.0322*** 0.0012
Ip 1.0216* 0.2238
Me -0.0003 0.0147
In 0.0004 -0.0047
P -0.0094*** 0.0003
Ep 0.0001 0.0016
Pr -0.1800* -0.0556
p-value 0.5696 0.0765 0.0289 0.3907 0.5474 0.4290Adj R2 -0.0159 0.1028 0.1367 -0.0016 -0.0181 -0.0002
Gro
up 2
RCM 0.0008 0.0092 0.0016 0.0106
I 0.1938 0.1757 0.2850 0.1926
Is 0.0152 0.0019
Mc -0.0129 0.0013
T 0.0186 0.0077
Ip -1.241** 0.1750
Me 1.4343*** 0.1869
In -0.0191 -0.0109
P -0.0094** 0.0008
Ep 0.0109* 0.0095**
Pr 0.0108 0.1473**
p-value 0.7379 0.0060 0.0617 0.2404 0.6149 0.0050Adj R2 -0.0468 0.3686 0.1877 0.0311 -0.0507 0.3534
22 Transnational Corporations, Vol. 17, No. 3 (December2008)
Gro
up 3
RCM 0.0284 0.0275 0.0441** 0.0546**
I 0.1107 -0.0881 -0.0520 -0.2324
Is 0.0800** 0.0862*** Mc 0.0225 0.0162
T -0.0250 -0.0107
Ip -0.5619* -0.1142
Me 0.9516*** 0.5280**
In -0.0329 -0.0426*
P -0.0235*** -0.0132**
Ep -0.0206** -0.0061
Pr -0.0735 0.1037
p-value 0.2180 0.0015 0.0169 0.0164 0.0005 0.0183Adj R2 0.0422 0.4826 0.3089 0.2151 0.5394 0.3032
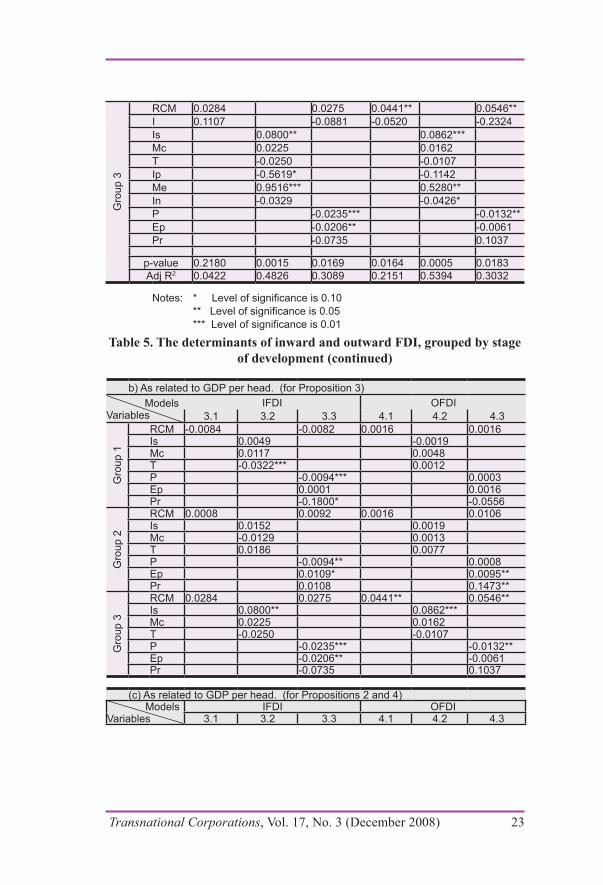
Notes: * Level of significance is 0.10 ** Level of significance is 0.05 *** Level of significance is 0.01
Table 5. The determinants of inward and outward FDI, grouped by stage of development (continued)
b) As related to GDP per head. (for Proposition 3) Models Variables
IFDI OFDI3.1 3.2 3.3 4.1 4.2 4.3
Gro
up 1
RCM -0.0084 -0.0082 0.0016 0.0016
Is 0.0049 -0.0019
Mc 0.0117 0.0048
T -0.0322*** 0.0012
P -0.0094*** 0.0003
Ep 0.0001 0.0016
Pr -0.1800* -0.0556
Gro
up 2
RCM 0.0008 0.0092 0.0016 0.0106
Is 0.0152 0.0019
Mc -0.0129 0.0013
T 0.0186 0.0077
P -0.0094** 0.0008
Ep 0.0109* 0.0095**
Pr 0.0108 0.1473**
Gro
up 3
RCM 0.0284 0.0275 0.0441** 0.0546**
Is 0.0800** 0.0862***
Mc 0.0225 0.0162
T -0.0250 -0.0107
P -0.0235*** -0.0132**
Ep -0.0206** -0.0061
Pr -0.0735 0.1037 (c) As related to GDP per head. (for Propositions 2 and 4) Models Variables
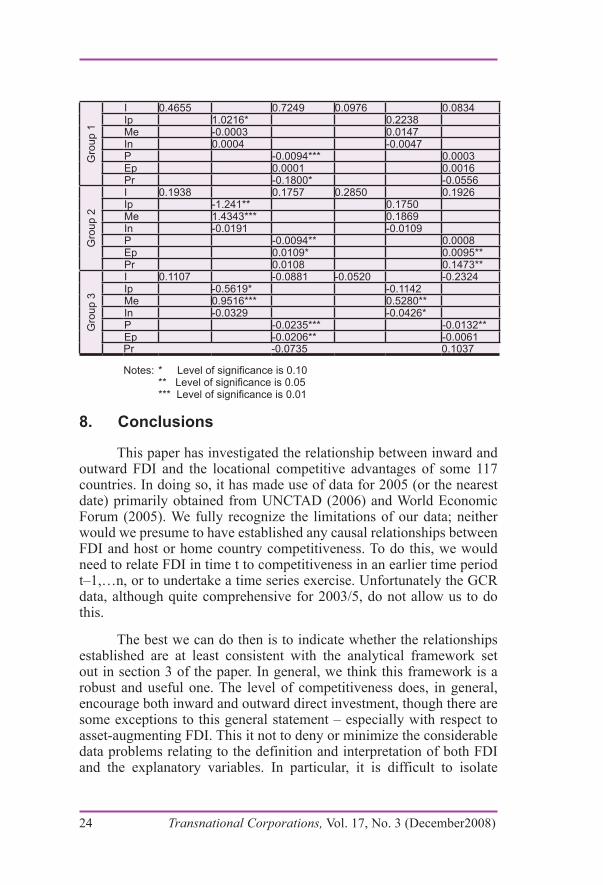
IFDI OFDI3.1 3.2 3.3 4.1 4.2 4.3
Transnational Corporations, Vol. 17, No. 3 (December 2008) 23
Gro
up 1
I 0.4655 0.7249 0.0976 0.0834 Ip 1.0216* 0.2238
Me -0.0003 0.0147
In 0.0004 -0.0047
P -0.0094*** 0.0003
Ep 0.0001 0.0016
Pr -0.1800* -0.0556
Gro
up 2
I 0.1938 0.1757 0.2850 0.1926
Ip -1.241** 0.1750
Me 1.4343*** 0.1869
In -0.0191 -0.0109
P -0.0094** 0.0008
Ep 0.0109* 0.0095**
Pr 0.0108 0.1473**
Gro
up 3
I 0.1107 -0.0881 -0.0520 -0.2324
Ip -0.5619* -0.1142
Me 0.9516*** 0.5280**
In -0.0329 -0.0426*
P -0.0235*** -0.0132**
Ep -0.0206** -0.0061
Pr -0.0735 0.1037
Notes: * Level of significance is 0.10 ** Level of significance is 0.05 *** Level of significance is 0.01
8. Conclusions
This paper has investigated the relationship between inward and outward FDI and the locational competitive advantages of some 117 countries. In doing so, it has made use of data for 2005 (or the nearest date) primarily obtained from UNCTAD (2006) and World Economic Forum (2005). We fully recognize the limitations of our data; neither would we presume to have established any causal relationships between FDI and host or home country competitiveness. To do this, we would need to relate FDI in time t to competitiveness in an earlier time period t–1,…n, or to undertake a time series exercise. Unfortunately the GCR data, although quite comprehensive for 2003/5, do not allow us to do this.
The best we can do then is to indicate whether the relationships established are at least consistent with the analytical framework set out in section 3 of the paper. In general, we think this framework is a robust and useful one. The level of competitiveness does, in general, encourage both inward and outward direct investment, though there are some exceptions to this general statement – especially with respect to asset-augmenting FDI. This it not to deny or minimize the considerable data problems relating to the definition and interpretation of both FDI and the explanatory variables. In particular, it is difficult to isolate
24 Transnational Corporations, Vol. 17, No. 3 (December2008)
the impact of the locational attractions of countries that are available to indigenous firms and foreign investors on an equal basis, and those which are largely “internalized” – i.e. primarily taken advantage of by indigenous firms – to separate the competitiveness of related variables from the other determinants of inward and outward FDI. A third challenge is to distinguish between the ways in which asset-augmenting and asset-exploiting FDI respond to different kinds of country specific competitiveness.
But, at the very least, we hope this contribution takes the debate on competitiveness and FDI – a topic so dear to Sanjaya’s heart – a stage further.
ReferencesBuckley, P.J. and M.C. Casson (1975). The Economic Theory of the Multinational
Enterprise. London: Macmillan.
Buckley, P.J. and M.C. Casson (1976). The Future of the Multinational Enterprise. London: Macmillan.
Dunning, J.H. (1995). “Think again Professor Krugman: competitiveness does matter”, International Executive, 37(4), pp. 315−24.
Dunning, J.H. (2003). Making Globalization Good. Oxford, Oxford University Press.
Dunning, J.H. (2005). “Institutional reform, foreign direct investment and European transition economies”, in R. Gross (ed.), International Business and Government Relations in the 21st Century, Cambridge: Cambridge University Press.
Dunning, J.H. (2006). “Towards a new paradigm of development”, Transnational Corporations, 15(1), pp. 173−227
Dunning, J.H. and S. Lundan (2006). “The MNE as a Creator, Fashioner and Respondent to Institutional change”, Reading and Rutgers Universities, mimeo.
Ghoshal, S. and D.E. Westney (eds.) (1993) Organisation theory and the multinational corporation. London: MacMillan.
Glaeser, E.L., R. La Porta, F. Lopez-de-Silanes and A. Schorfer (2004). “Do institutions cause growth?”, National Bureau of Economic Research Working Paper, No.10468. Cambridge, MA: NBER.
Henisz, W.J. (2000). “The institutional environment for multinational investment”, Journal of Law, Economics, and Organization, 16(2), pp. 334−364.
Henisz, W. J. (2003). “The power of the Buckley and Casson thesis: the ability to manage institutional idiosyncrasies”, Journal of International Business Studies, 34(2), pp. 173–184.
Transnational Corporations, Vol. 17, No. 3 (December 2008) 25
Hennart, J. (1982). A Theory of the Multinational Enterprise. Ann Arbor, MI: University of Michigan Press.
Krugman, P. (1994). “Competitiveness. a dangerous obsession”, Foreign Affairs, March/April.
Lall, S. (2001). “Competitiveness indices and developing countries. An economic evaluation of the global competitiveness report”, World Development, 29(9), pp. 1501−1525.
Lall, S. (2002). “Linking FDI and technology development for capacity building and strategic competitiveness”, Transnational Corporations, 11(3), pp. 40–88.
Lu, Z. (2006). “Institutional related new strategic assets and performance variation of diversification strategy”, Peking University, mimeo.
Maitland, E. and S. Nicholas (2003). “New institutional economics: an organising framework for OLI”, in J.C. Cantwell and R. Narula (eds.), International Business and the Eclectic Paradigm. London and New York: Routledge.
Mudambi, R and P. Navarra (2002). “Institutions and international business: a theoretical overview”, International Business Review, 11(6), pp. 635−646.
North, D.C. (1990). Institutions, Institutional Change and Economic Performance. Cambridge: Cambridge University Press.
North, D.C. (1994). “Economic performance through time”, American Economic Review, 84(3), pp. 359−368.
North, D.C. (2005). Understanding the Process of Economic Change. Princeton, NJ: Princeton University Press.
Oliver, C. (1997). “Sustainable competitive advantage: combining institutional and resource based views”, Strategic Management Journal, 18(9), pp. 697−713.
Peng, M.W. (2003). “Institutional transitions and strategic choices”, Academy of Management Review, 28, pp. 275–296.
Peng, M.W., S. Lee and D. Wang (2005). “What determines the scope of the firm over time? A focus on institutional relatedness”, Academy of Management Review, 30(3), pp. 622−633.
Rondinelli, D.A. (2005). “Assessing government policies for business competitiveness in emerging market economies; an institutional approach” in R. Gross (ed.), International Business and Government Relations in 21st Century. Cambridge: Cambridge University Press.
Rugman, A.M. (2006). “Multinational enterprise strategy for developing countries”, in Subhash C. Jain and Sushil Vachani (eds.), Multinational Corporations and Global Poverty. Cheltenham: Edward Elgar.
UNCTAD (2000). World Investment Report 2000: Cross-Border Mergers, Acquisitions and Development. New York and Geneva: United Nations.
26 Transnational Corporations, Vol. 17, No. 3 (December2008)
UNCTAD (2004). World Investment Report 2004: The Shift Towards Services. New York and Geneva: United Nations.
UNCTAD (2005). World Investment Report 2005: Transnational Corporations and the Internationalization of R&D. New York and Geneva: United Nations.
Model Variables
IFDI1 2 3 4 5 6 7 8 9 10 11 Corr
I 0.2680*** 0.3052* 0.2034 0.2326 0.2347 0.1
RCM -0.0012 0.0012 0.0007 0.0001 0.0
P -0.0099*** -0.0101*** -0.0102*** 0.1
Pr -0.0455 -0.0436 0.0
Ep -0.0013 -0.0
Me 0.4375*** 0.7577*** 0.7566*** 0.6972*** 0.7405*** 0.7297*** 0.2
Ip -0.4017*** -0.4029*** -0.2311 -0.2969* -0.2665 0.1
Mc 0.0001 0.0127** 0.0101 0.0105 0.0
T -0.0163** -0.0212*** -0.0151* 0.0
Is 0.0087 0.0102* 0.0
In -0.0088 0.0
p-value 0.0035 0.0138 <.0001 <.0001 0.0001 0.0367 <.0001 <.0001 <.0001 <.0001 <.0001
R2 0.0718 0.0724 0.1984 0.2014 0.2007 0.1914 0.2502 0.2502 0.2904 0.3045 0.3124
Model Variables
OFDI1 2 3 4 5 6 7 8 9 10 11 Corr
RCM 0.0194*** 0.0115*** 0.0130*** 0.0135*** 0.0141*** 0.5
I 0.3439*** 0.2510** 0.2305* 0.2281* 0.0
Pr 0.1367*** 0.1279** 0.1258** 0.0
P -0.0026 -0.0025 0.0
Ep 0.0014 0.0
Ip 0.7040*** 0.3918*** 0.3325** 0.2289* 0.2248* 0.2377* 0.5
Me 0.3917*** 0.3795*** 0.3892*** 0.3622*** 0.3382*** 0.1
In 0.0023 -0.0105** -0.0162*** -0.0164*** 0.0
Is 0.0164*** 0.0142*** 0.0135*** 0.1
T 0.0088 0.0072 0.0
Mc 0.0028 0.0
p-value <.0001 <.0001 <.0001 <.0001 <.0001 <.0001 <.0001 <.0001 <.0001 <.0001 <.0001
R2 0.4998 0.5354 0.5621 0.5707 0.5730 0.5001 0.5565 0.5590 0.6183 0.6255 0.6267
Notes: * Level of significance is 0.10
** Level of significance is 0.05
*** Level of significance is 0.01
Transnational Corporations, Vol. 17, No. 3 (December 2008) 27
Appendix B. Country Groups Based on Income Level
Country Country CountryGroup 1 Albania Group 2 Argentina Group 3 Australia
Algeria Bahrain AustriaArmenia Botswana BelgiumAzerbaijan Brazil CanadaBangladesh Bulgaria CyprusBenin Chile DenmarkBolivia Costa Rica FinlandBosnia and Herzegovina Croatia FranceCambodia Czech Republic GermanyCameroon Estonia GreeceChad Hungary Hong Kong SARChina Jamaica IcelandColombia Korea, Rep IrelandDominican Republic Latvia IsraelEast Timor Lithuania ItalyEcuador Malaysia JapanEgypt Malta KuwaitEl Salvador Mauritius LuxembourgEthiopia Mexico NetherlandsGambia Panama New ZealandGeorgia Poland NorwayGhana Portugal QatarGuatemala Romania SingaporeGuyana Russian Federation SpainHonduras Slovak Republic SwedenIndia Slovenia SwitzerlandIndonesia South Africa United Arab EmiratesJordan Taiwan United KingdomKazakhstan Trinidad and Tobago United StatesKenya TurkeyKyrgyz Republic UruguayMacedonia, FYR VenezuelaMadagascarMalawi MaliMoldovaMongoliaMoroccoMozambiqueNamibiaNicaraguaNigeriaPakistanParaguayPeruPhilippinesSerbia and MontenegroSri LankaTajikistanTanzaniaThailandTunisiaUgandaUkraineVietnamZimbabwe
28 Transnational Corporations, Vol. 17, No. 3 (December2008)
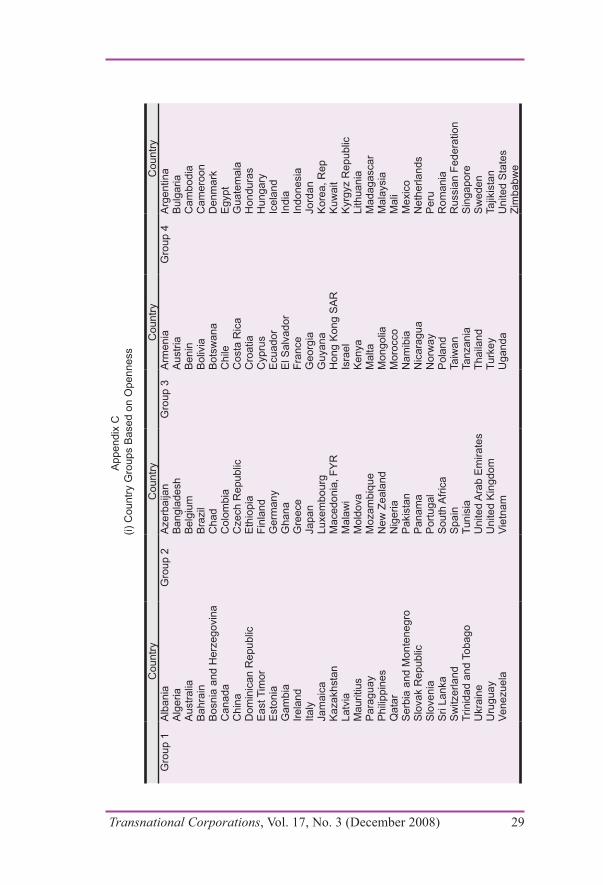
App
endi
x C
(i) C
ount
ry G
roup
s B
ased
on
Ope
nnes
s
Cou
ntry
Cou
ntry
Cou
ntry
Cou
ntry
Gro
up 1
Alb
ania
Gro
up 2
Aze
rbai
jan
Gro
up 3
Arm
enia
Gro
up 4
Arg
entin
aA
lger
iaB
angl
ades
hA
ustri
aB
ulga
riaA
ustra
liaB
elgi
umB
enin
Cam
bodi
aB
ahra
inB
razi
lB
oliv
iaC
amer
oon
Bos
nia
and
Her
zego
vina
Cha
dB
otsw
ana
Den
mar
kC
anad
aC
olom
bia
Chi
leE
gypt
Chi
naC
zech
Rep
ublic
Cos
ta R
ica
Gua
tem
ala
Dom
inic
an R
epub
licE
thio
pia
Cro
atia
Hon
dura
sE
ast T
imor
Finl
and
Cyp
rus
Hun
gary
Est
onia
Ger
man
yE
cuad
orIc
elan
dG
ambi
aG
hana
El S
alva
dor
Indi
aIre
land
Gre
ece
Fran
ceIn
done
sia
Italy
Japa
nG
eorg
iaJo
rdan
Jam
aica
Luxe
mbo
urg
Guy
ana
Kor
ea, R
epK
azak
hsta
nM
aced
onia
, FY
RH
ong
Kon
g S
AR
Kuw
ait
Latv
iaM
alaw
i Is
rael
Kyr
gyz
Rep
ublic
Mau
ritiu
sM
oldo
vaK
enya
Lith
uani
aP
arag
uay
Moz
ambi
que
Mal
taM
adag
asca
rP
hilip
pine
sN
ew Z
eala
ndM
ongo
liaM
alay
sia
Qat
arN
iger
iaM
oroc
coM
ali
Ser
bia
and
Mon
tene
gro
Pak
ista
nN
amib
iaM
exic
oS
lova
k R
epub
licP
anam
aN
icar
agua
Net
herla
nds
Slo
veni
aP
ortu
gal
Nor
way
Per
uS
ri La
nka
Sou
th A
frica
Pol
and
Rom
ania
Sw
itzer
land
Spa
inTa
iwan
Rus
sian
Fed
erat
ion
Trin
idad
and
Tob
ago
Tuni
sia
Tanz
ania
Sin
gapo
reU
krai
neU
nite
d A
rab
Em
irate
sTh
aila
ndS
wed
enU
rugu
ayU
nite
d K
ingd
omTu
rkey
Tajik
ista
nVe
nezu
ela
Viet
nam
Uga
nda
Uni
ted
Sta
tes
Zim
babw
e
Transnational Corporations, Vol. 17, No. 3 (December 2008) 29
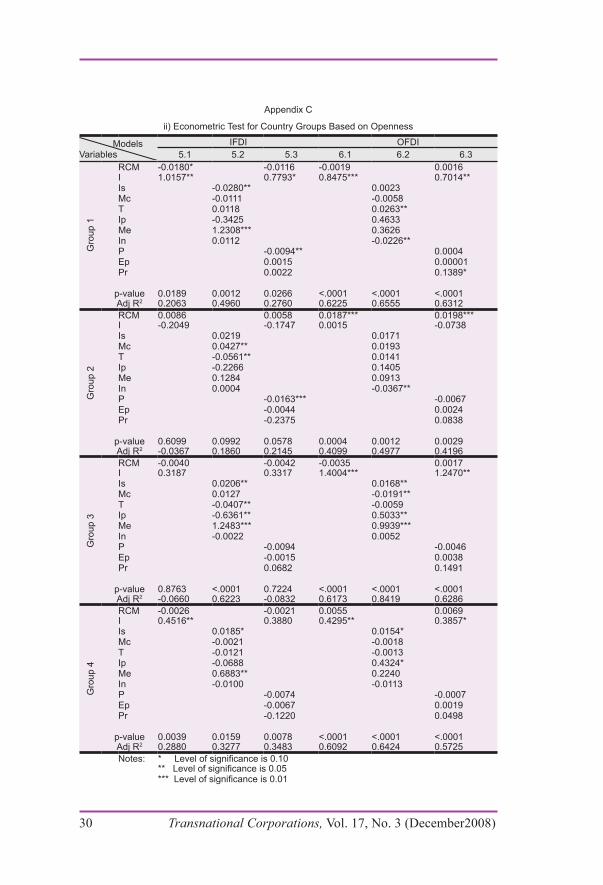
Appendix C
ii) Econometric Test for Country Groups Based on Openness
Models Variables
IFDI OFDI5.1 5.2 5.3 6.1 6.2 6.3
Gro
up 1
RCM -0.0180* -0.0116 -0.0019 0.0016I 1.0157** 0.7793* 0.8475*** 0.7014**Is -0.0280** 0.0023Mc -0.0111 -0.0058T 0.0118 0.0263**Ip -0.3425 0.4633Me 1.2308*** 0.3626In 0.0112 -0.0226**P -0.0094** 0.0004Ep 0.0015 0.00001Pr 0.0022 0.1389*
p-value 0.0189 0.0012 0.0266 <.0001 <.0001 <.0001Adj R2 0.2063 0.4960 0.2760 0.6225 0.6555 0.6312
Gro
up 2
RCM 0.0086 0.0058 0.0187*** 0.0198***I -0.2049 -0.1747 0.0015 -0.0738Is 0.0219 0.0171Mc 0.0427** 0.0193T -0.0561** 0.0141Ip -0.2266 0.1405Me 0.1284 0.0913In 0.0004 -0.0367**P -0.0163*** -0.0067Ep -0.0044 0.0024Pr -0.2375 0.0838
p-value 0.6099 0.0992 0.0578 0.0004 0.0012 0.0029Adj R2 -0.0367 0.1860 0.2145 0.4099 0.4977 0.4196
Gro
up 3
RCM -0.0040 -0.0042 -0.0035 0.0017I 0.3187 0.3317 1.4004*** 1.2470**Is 0.0206** 0.0168**Mc 0.0127 -0.0191**T -0.0407** -0.0059Ip -0.6361** 0.5033**Me 1.2483*** 0.9939***In -0.0022 0.0052P -0.0094 -0.0046Ep -0.0015 0.0038Pr 0.0682 0.1491
p-value 0.8763 <.0001 0.7224 <.0001 <.0001 <.0001Adj R2 -0.0660 0.6223 -0.0832 0.6173 0.8419 0.6286
Gro
up 4
RCM -0.0026 -0.0021 0.0055 0.0069I 0.4516** 0.3880 0.4295** 0.3857*Is 0.0185* 0.0154*Mc -0.0021 -0.0018T -0.0121 -0.0013Ip -0.0688 0.4324*Me 0.6883** 0.2240In -0.0100 -0.0113P -0.0074 -0.0007Ep -0.0067 0.0019Pr -0.1220 0.0498
p-value 0.0039 0.0159 0.0078 <.0001 <.0001 <.0001Adj R2 0.2880 0.3277 0.3483 0.6092 0.6424 0.5725Notes: * Level of significance is 0.10
** Level of significance is 0.05*** Level of significance is 0.01
30 Transnational Corporations, Vol. 17, No. 3 (December2008)