dual enrollment in ohio: participation, performance
TRANSCRIPT

Dual Enrollment in Ohio: Participation, Performance, Perceptions, and Potential
A dissertation presented to
the faculty of
The Patton College of Education of Ohio University
In partial fulfillment
of the requirements for the degree
Doctor of Philosophy
Larisa L. Harper
May 2015
© 2015 Larisa L. Harper. All Rights Reserved.

2
This dissertation titled
Dual Enrollment in Ohio: Participation, Performance, Perceptions, and Potential
by
LARISA L. HARPER
has been approved for
the Department of Counseling and Higher Education
and The Patton College of Education by
Valerie Martin Conley
Professor of Counseling and Higher Education
Renée A. Middleton
Dean, The Patton College of Education

3
Abstract
HARPER, LARISA L., Ph.D., May 2015, Higher Education
Dual Enrollment in Ohio: Participation, Performance, Perceptions, and Potential
Director of Dissertation: Valerie Martin Conley
As Ohio and the nation seek economic recovery, research indicates a need for
more individuals to earn college degrees. While personal benefits of college education
are important as well for individuals, the increase of degree earners benefits society. One
strategy is dual enrollment, Ohio’s Post-Secondary Enrollment Options (PSEO), which
will become College Credit Plus programming. Dual enrollment provides access but has
been under scrutiny and little information is available. When policy makers consider
changes, decisions are made with insufficient information.
The purpose of the study is to bridge the information gap. The present study uses
quantitative secondary data from state agencies. A cohort examination of education,
employment, wages, and participation in PSEO by sex, race, and poverty levels is
included. The research adds a qualitative exploration of secondary and postsecondary
personnel perceptions. This research used the economic based framework of St. John
(2003) who described funding decisions related to higher education access. To expand
access, consideration needs to be given to how education strategies are funded and
expanded.
During the years of 2005–2006 to 2010–2011, the descriptive data results indicate
that two-thirds of all PSEO participants were female and 80% are White. Over 70,000
students enrolled in 123,005 courses, averaged 1.75 courses each, and earned 11.7 credit

4 hours. Students enrolled most often in English courses. GPA per term was 3.21 in 2005–
2006 and 3.24 in 2010–2011. PSEO students enrolled primarily at two-year colleges.
The cohort of 7,577 students was identified enrolled in 12,057 courses in 2005,
averaging 1.59 courses. The average credit hour load was 12.22. Students earned an
average GPA of 3.22. Over 3,400 cohort students completed a certificate or degree. The
cohort increased average wages between fourth quarter 2006 of $1,440.27 to fourth
quarter 2011 of $6,181.30, primarily at “food services and drinking places.” In examining
PSEO participation by race, sex, and poverty related variables, 65.2% of the students
were female, 86.4% were White, and 40.99% were students from high poverty areas,
nearly half.
The qualitative interview themes included high schools and colleges losing
money, restricting access, and preparing students for college level coursework.

5
Dedication
Dedicated to my parents … in loving honor of Mom and in loving memory of Dad

6
Acknowledgements
“Two roads diverged in a wood, and I—I took the one less traveled by, And that
has made all the difference” (Frost, 1920, p. 1). This journey to a doctorate has been both
challenging and rewarding. Along the way, I have counted on the support of many people
beginning with my dissertation committee chair, Dr. Valerie Martin Conley. She has
provided help, guidance, and mentorship since I met her in January 2010. The guidance
and assistance of Drs. Gordon Brooks, Gregory Foley, David Horton, and Gary Moden
has been appreciated throughout this process. I am grateful for the assistance and support
of Dr. Lisa Neilson and the Ohio Education Research Center (OERC) for providing the
secondary data utilized within this dissertation.
Special thanks to Cohort XI! So many friends added to my life: I truly learned
more during each class session by listening to each of you. The three people I have
counted on the most are my writing group friends, Rebecca Butler, Maureen Doyle
Scharff, and Danny Twilley. Your encouragement has meant the world to me, and I
cannot wait to see you graduate soon also.
Thanks to my co-workers at Zane State College: There are so many who have
been so helpful, I’m sure I will overlook someone. Drs. Paul Brown and Chad Brown,
thank you for the opportunity to pursue my dreams. Dr. Robin Menschenfreund, though
distance has separated us, your encouragement was so important to me from the very
beginning. Dr. Dotty Welch, you believed in me long before I did, and your reassurance
that I could do this meant so much. Thank you to my many friends and current or past co-
workers at the College who provided support and encouragement: Dr. Beth Fischer, Jenn

7 Folden, Dr. Terry Herman, George Hicks, Dr. Jason Jolicoeur, Saylor Kelly, Dr. James
Kemper, Pam Kirst, Elizabeth Kline, Dr. Tricia Leggett, Julie MacLaine, Heather
Shepherd, Nick Welch, Phil Wentworth, and Mike Whitson. A special thanks to Brenda
Elswick for her proofreading skills and APA mastery.
I cannot thank my wonderful family enough. My mother has always been an
inspiration to me. She and Dad raised a large family and created this loving bond among
all nine of the siblings. You have believed in and supported me all of my life. I hope to be
the same type of inspiration for my children someday. I wish Dad were with me too to
enjoy this accomplishment. My siblings—all of my life—I have admired all of you. I
wanted to be like each of you when I grew up. Thank you all for loving me and having
my back! Thanks for the support of my Harper family members, the spouses of my
brothers and sisters, and my nieces and nephews, for which I’m grateful.
To my husband and children: I could not have done this without you. All the
many hours that I spent locked in my office, the many long hours at the office, and the
many weekends away, you patiently encouraged me to keep going. Aaron, even though
we didn’t expect this journey to take so long, thank you for sticking by me the entire time
and enduring the stress that came with pursuing my degree. You are so good to me. AJ,
your dedication to your education shows me that you understand that hard work will pay
off in the long run. I cannot wait to see you accomplish your goals too. Cassie, your
awesome laughter, sarcastic wit, and hugs have lifted me up on bad days. I love that you
want to be a Bobcat too, and I can’t wait to see that dream come true for you. Jordee, you
are a soulful, sensitive, and caring young lady. These long days and even longer years

8 have been hard on you, and I love that you still supported me even when you just wanted
me to be your mom. I promise that now is the time for me to become an even better
mother to you and your siblings. I love all of you.
After five years of stress, learning, fun, and hard work, I am sure I am
overlooking someone! In my prayers, I thank God for each of you and hope that you
pursue your dreams and goals like I have done. My blessings are too numerous to count
and that includes so many friends who inspire me daily.

9
Table of Contents
Page
Abstract ................................................................................................................................3
Acknowledgements ..............................................................................................................6
List of Tables .....................................................................................................................14
List of Figures ....................................................................................................................16
Chapter 1: Introduction ......................................................................................................17
Statement of Problem .....................................................................................................20
Theoretical Framework ..................................................................................................22
Purpose of the Study ......................................................................................................23
Significance of the Study ...............................................................................................26
Research Questions ........................................................................................................26
Definition of Terms ........................................................................................................28
Delimitations ..................................................................................................................35
Limitations .....................................................................................................................37
Organization of the Study ..............................................................................................42
Chapter 2: Review of Literature ........................................................................................44
Dual Enrollment Background.........................................................................................45
Creating Legislative Policies for Dual Enrollment ........................................................46
Socio-Economic Indicators ............................................................................................51
National Level ................................................................................................................52
Programming. .............................................................................................................52

10
Funding. ......................................................................................................................56
State Level ......................................................................................................................59
Dual Enrollment in Ohio ................................................................................................62
Programming. .............................................................................................................62
Ohio data reports. .......................................................................................................66
Ohio funding. ..............................................................................................................68
Theoretical Perspectives .................................................................................................74
Socialization and intervention. ...................................................................................74
Economics, sociology, and political science framework. ...........................................74
Assumptions of St. John’s framework. .......................................................................75
Overview of St. John’s influences. .............................................................................79
Rawls’ social justice: Political science. ......................................................................80
Becker’s human capital: Economic theory. ................................................................81
Bourdieu’s cultural capital: Sociology. ......................................................................84
Practical Application of St. John’s Framework .............................................................85
National economic recovery. ......................................................................................85
Ohio’s economic recovery. .........................................................................................87
Summary ........................................................................................................................89
Chapter 3: Method .............................................................................................................90
Research Design .............................................................................................................90
Quantitative Data Collection ..........................................................................................94
Identification of the population and cohort. ...............................................................94
11
Quantitative variables. ..............................................................................................100
Missing values. .........................................................................................................102
Quantitative Data Analysis...........................................................................................103
Longitudinal design. .................................................................................................104
Descriptive statistics. ................................................................................................105
Qualitative Data............................................................................................................112
Qualitative data collection. .......................................................................................114
Qualitative Data Analysis.............................................................................................115
Reliability and Validity ................................................................................................115
Summary ......................................................................................................................116
Chapter 4: Results ............................................................................................................117
Quantitative Results .....................................................................................................117
Student participant characteristics. ...........................................................................117
Student enrollment and performance. .......................................................................120
Location information. ...............................................................................................123
Cohort educational and employment outcomes........................................................127
Cohort equitable participation examination. ............................................................135
Qualitative Results .......................................................................................................143
Institution profiles.....................................................................................................144
Thematic results. .......................................................................................................149
Case results. ..............................................................................................................162
Summary ......................................................................................................................164
12 Chapter 5: Summary ........................................................................................................166
Research Findings ........................................................................................................166
Recommendations for Research ...................................................................................177
Recommendations for Practice.....................................................................................181
Summary ......................................................................................................................183
References ........................................................................................................................185
Appendix A: Ohio Revised Code Excerpts Related to PSEO and Dual Enrollment .......198
Appendix B: Variables and Descriptions for Present Study ............................................201
Appendix C: Ohio University Consent Form ..................................................................202
Appendix D: Interview Protocol ......................................................................................204
Appendix E: PSEO Student Participation Total, Sex of Students, and Race of Students by
Academic Year.................................................................................................................205
Appendix F: Number and Percentage of Students’ Residence by County and Academic
Year ..................................................................................................................................207
Appendix G: Cohort Students’ Earned Degree or Certificates, Cross Tabulated by Year
with Average Wages ........................................................................................................213
Appendix H: Number and Percent of Students Employed by Employer Types, Quarter
and Year ...........................................................................................................................217
Appendix I: Number and Percentage of Students Living Below Poverty Level Using ACS
Data of Zip Codes in Alphabetical Order by City ...........................................................221
Appendix J: Number and Percentage of Students Living Below Poverty Level Using ACS
Data of Cities with Multiple Zip Codes in Alphabetical Order by City ..........................236

13 Appendix K: Number and Percentage of Students Living Below NAR Data of Average
Home Prices in Alphabetical Order by City ....................................................................237
14
List of Tables Page Table 1. Process for Calculating GPA, Steps 2 and 3, using Excel with Cumulative Grade Point Average Hours Earned and Cumulative Grade Point Average Points .............. 108 Table 2. Process for Calculating GPA, Steps 5 and 6, using Excel with Total Credit Hours and Total Points ......................................................................................................... 109 Table 3. PSEO Student Participation by Sex of Student and by Academic Year ...... 118 Table 4. PSEO Student Participation by Race of Student and by Academic Year ..... 119 Table 5. Total Student Enrollment, Total Courses Enrolled, and Average Number of Courses by Academic Year ......................................................................................... 120 Table 6. Course Category Frequencies, Number of Enrollees and Percentage of Population by Academic Year .................................................................................... 121
Table 7. Average Credit Hours and Average GPAs for PSEO Participants by Academic Year ............................................................................................................................. 123 Table 8. PSEO Participation at Two-Year or Four-Year Institutions by Academic Year ..................................................................................................................................... 124 Table 9. Specific Institution Names with PSEO Enrollment by Academic Year ..................................................................................................................................... 125 Table 10. Effect Sizes for Cohort for Number of Courses, Credit Hours, and GPA ..................................................................................................................................... 128 Table 11. Cohort Course Categories, Institutions, and Counties by Year, Number of Enrollees and Percentage for Autumn 2005 ............................................................... 129 Table 12. Number of Cohort Students Earning Multiple Certificates and Degrees ..................................................................................................................................... 130 Table 13. Number of Cohort Students Earning Degree or Certificate by Academic Year ..................................................................................................................................... 131 Table 14. Number and Percentage of Cohort Students with Wages Reported, by Mean, Median, Minimum, and Maximum and by Quarter and Year .................................... 133 Table 15. Summary of Number and Percentage of ZIP Codes Available for Cohort Students for Autumn 2005 .......................................................................................... 136

15 Table 16. Indicators for ZIP Code Poverty Information by Description, Appendix, Data Available, and Number of Cohort Student Records ................................................... 138 Table 17. Number and Percentage of Cohort Students from ZIP Codes with Poverty Levels above Ohio’s Average .................................................................................... 139 Table 18. Number and Percentage of Cohort Students using ZIP Codes by ACS Poverty Levels .......................................................................................................................... 140 Table 19. Number and Percentage of Cohort Students using ZIP Codes by ACS Poverty Levels in Cities with Multiple ZIP Codes................................................................... 140 Table 20. Number and Percentage of Cohort Students using ZIP Codes and NAR Average Home Prices Compared to Ohio’s Average Home Price ............................. 142 Table 21. Communities of PSEO Cohort Students with Less than Ohio Average Home Price ............................................................................................................................ 142 Table 22. Institution Profiles of Interviewees ............................................................. 149 Table 23. Race Comparisons of Blanco et al. and Present Study .............................. 172 Table 24. Percentage of Cohort above State Average Poverty Level ......................... 173 Table 25. Summary of Students’ Poverty Levels using Multiple Indicators .............. 174

16
List of Figures
Page
Figure 1. Graphical Depiction of Theoretical Framework.................................................23
Figure 2. Flow Chart of PSEO Paperwork Process for Funding of Student Enrollment ...71
Figure 3. Depiction of Data Collection and Analysis ........................................................94
Figure 4. Participation by County with Ranges Indicated by Color Coding ...................127
Figure 5. Number of Cohort Members by Sex for Autumn 2005 ....................................135

17
Chapter 1: Introduction
The United States lags behind in postsecondary degree completion globally,
currently fourth behind Canada, Russia, and Israel (Lee & Rawls, 2010). Educational
attainment has a significant impact on economic development and recovery for the
nation. The U.S. Department of the Treasury (2012) reported, “American companies and
businesses require a highly skilled workforce to meet the demands of today’s increasingly
competitive global economy” (p.1). The U.S. Census Bureau (2012) estimated 28.5% of
adults (25 years and over) in the United States hold a bachelor’s degree or higher, while
24.7% of Ohioans have the same credentials. President Barack Obama addressed this
attainment gap between the United States and other nations early in his presidency when
he “challenged every American to commit to at least one year of higher education or
post-secondary training” (The White House, n.d., p. 1).
The Ohio Board of Regents (2012a) reported that “every one percent increase in
the total number of bachelor’s degrees translates into an estimated $2.5 billion in
increased economic activity per year and every year thereafter” (p. 4). Ohio currently
ranks 38 out of the 50 states in bachelor’s degree attainment (U.S. Census Bureau, 2012).
Policymakers, legislators, and higher education leaders point to the need to increase
educational attainment among citizens in order to improve the economic health of the
state: “For our economy to thrive and grow, we must provide businesses with a continual
pipeline of highly-skilled workers” (Ohio Board of Regents, 2012a, p. 7). The Board of
Regents’ Complete College Ohio Task Force (2012b) found that “the vast majority of
Ohio’s projected job openings and new jobs in the future—nearly 60% by 2020—will
18 require some form of credential from education and training beyond high school” (p. 7).
Without increasing the number of degree completers in Ohio, the Regents predicted,
“Ohio will be left behind in the fierce competition for investment and jobs” (p. 8). The
road to economic recovery will be a dead end.
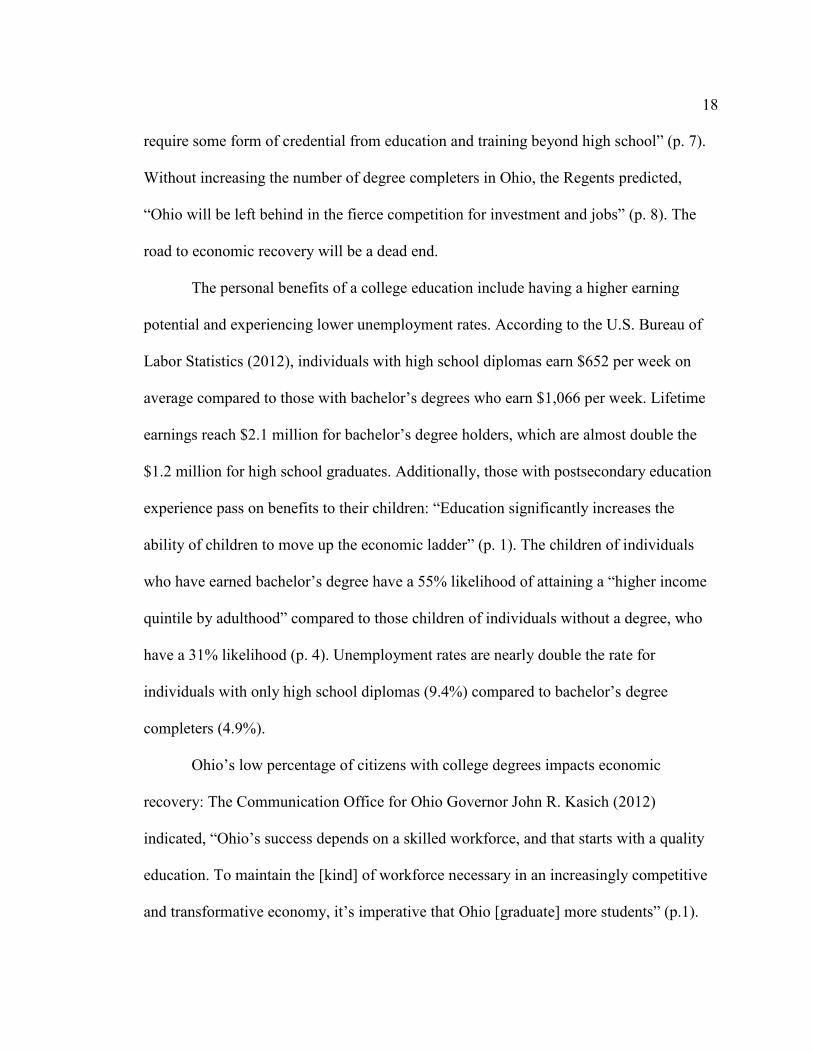
The personal benefits of a college education include having a higher earning
potential and experiencing lower unemployment rates. According to the U.S. Bureau of
Labor Statistics (2012), individuals with high school diplomas earn $652 per week on
average compared to those with bachelor’s degrees who earn $1,066 per week. Lifetime
earnings reach $2.1 million for bachelor’s degree holders, which are almost double the
$1.2 million for high school graduates. Additionally, those with postsecondary education
experience pass on benefits to their children: “Education significantly increases the
ability of children to move up the economic ladder” (p. 1). The children of individuals
who have earned bachelor’s degree have a 55% likelihood of attaining a “higher income
quintile by adulthood” compared to those children of individuals without a degree, who
have a 31% likelihood (p. 4). Unemployment rates are nearly double the rate for
individuals with only high school diplomas (9.4%) compared to bachelor’s degree
completers (4.9%).
Ohio’s low percentage of citizens with college degrees impacts economic
recovery: The Communication Office for Ohio Governor John R. Kasich (2012)
indicated, “Ohio’s success depends on a skilled workforce, and that starts with a quality
education. To maintain the [kind] of workforce necessary in an increasingly competitive
and transformative economy, it’s imperative that Ohio [graduate] more students” (p.1).

19 One strategy to increase the number of Ohioans with college degrees is to encourage
students to earn college credit at an earlier age through dual enrollment programs such as
Ohio’s Post-Secondary Enrollment Option (PSEO) program. This specific initiative
allows high school students to enroll in college courses. Though dual enrollment has
existed for decades across the United States, legislative policies concerning dual
enrollment have only existed since the 1980s (Johnson & Brophy, 2006). According to
Zinth for the Education Commission of the States (2013), 47 states have statewide
policies overseeing dual enrollment programming; while three states have policies
administered at the local or institutional level. Ohio is one of five states, along with
Alabama, Arkansas, Maine, and South Dakota, which has a dual enrollment policy that
allows students in grades 9 through 12 to participate in a dual enrollment program (Karp,
Bailey, Hughes, & Fermin, 2004). Ohio’s PSEO legislation was enacted in 1989 and is
defined in Ohio Revised Code (ORC) Section 3365, part 02, as the program “under which
a secondary grade student who is a resident of this state may enroll at a college … and
complete nonsectarian courses for high school and college credit” (Ohio Revised Code,
2007b, para. 1).
From the beginning of PSEO in 1989 until 1998, no data are available and no
research reports can be found. Not until Blanco, Prescott, and Taylor (2007) published
descriptive data for the 1998 to 2004 PSEO participants did the body of literature include
data for the program. Blanco et al. concluded this dual enrollment program “offers a 21st
century approach to learning that is essential for our state to compete globally and to
prepare a society of constant learners, ready to meet the challenges of a new century” (p.

20 48). In addition to the Blanco et al. report, the Ohio Board of Regents (2002) reported
overall student participation numbers in PSEO. Also, a narrative description was written
about PSEO processes at Columbus State Community College in Columbus, Ohio
(Jordan, 2001). However, no other research has focused on PSEO statistics in Ohio. As
previously noted, Blanco et al. (2007) have published a report about PSEO student
participation and performance. The Ohio Board of Regents (2002) has provided raw data
about overall student participation. The data ends in 2005 students in the program. Since
2005, no other research or data are publicly available. This lack of information lends one
to believe that decision makers may be making policy changes about dual enrollment
without adequate evidence.
Statement of Problem
Policymakers are facing two important issues related to understanding PSEO in
Ohio: information gaps and funding losses. With regard to information gaps, no
information has been published focusing on the success and effectiveness of PSEO since
the Blanco et al. (2007) publication of data up to the academic year of 2004–2005. Data
provided by Blanco et al. included overall number of PSEO participants; participation by
subject area; frequent course enrollments; credit hours attempted; participation by county,
campus type, race, and gender; first-to-second-year persistence in enrollment; attainment
of degrees; amount of time to degree completion; median years to completion; and
remedial coursework completion. With only one published research paper focusing on
PSEO student participation and performance and additional overall student enrollment
data on the Ohio Board of Regents website since 2005, leaders are facing significant

21 information gaps within the decade since 2004. Given that St. John’s (2003) framework
cited the need for up-to-date data, legislative changes may be influenced without enough
information to be effective.
Funding losses related to PSEO are important at the local and state levels. At each
postsecondary institution, the costs associated with PSEO include expenses incurred by
students for college tuition, fees, and textbooks. The current funding process for PSEO is
the redirection of state subsidy funds away from high schools to the postsecondary
institutions. The loss of funding creates a financial dilemma for high schools as they
struggle to balance their budgets from year to year. The other partners in PSEO—the
colleges and universities—receive the redirected funds; however, the funds received are
not complete reimbursements equaling exact costs of tuition, books, and fees. Ohio’s
Council of Chief Academic Affairs Officers (2005) have indicated that the
reimbursement is generally between 70 and 85% of actual costs. These important funding
losses create financial stress on the districts and colleges while also creating an
adversarial environment surrounding PSEO.
Ohio legislators and secondary and postsecondary leaders must examine ways to
overcome the problems of information gaps and funding losses. From a broad
perspective, leaders could benefit from applying the economic-based framework of St.
John (2003) to fill the gaps and examine funding more closely. The following section will
provide an overview of St. John’s framework. St. John described how funding decisions
are important to obtain access in higher education and ultimately to the state’s economic
recovery.

22 Theoretical Framework
The theoretical framework used in this study is based on the work of St. John
(2003). In his 2003 study, St. John examined the effect of public policy changes on
access to higher education for students. St. John indicated that legislators sometimes
make policy decisions and cut public support for education based on taxpayer concerns,
rather than considering the negative effects of shifting the costs. St. John indicated that
access for lower income students would be significantly decreased with a reduction in
financial assistance. By further limiting access to a portion of the citizenry, college
degree attainment would therefore be impacted: “Thus, to expand access further, we need
to reconsider how government funds education, whether funding is adequate, and how
financial strategies should be changed to expand access and equalize opportunity” (p. 1).
St. John pointed out the critical need to provide—not impede—access for college-ready
students: “It is crucial to ensure financial access for students who are prepared for college
and plan to attend. Only this minimum threshold of financial access can promote
economic productivity within states” (pp. 1–2).
St. John (2003) created a framework that connects the fields of sociology,
political science, and economics, built on the foundations of cultural capital (Bourdieu,
1977, 1990), human capital (Becker, 1993), and social justice (Rawls, 1971). As shown
in Figure 1, the framework can be used “to illuminate the social justice issues that
underlie the debates about public finance [Rawls’ social justice] and access to higher
education [Bourdieu’s cultural capital]” (St. John, 2003, p. 2). Further, St. John indicated

23 that the “economics of education [Becker’s human capital] provide a foundation” for his
research into the investments the public taxpayers make in education (p. 2).
Figure 1. Graphical depiction of theoretical framework
Created in Publisher with template using information from St. John (2003)
Purpose of the Study
The purpose of the study was to bridge the gap between the data of academic year
2004-2005 within the Blanco et al. study (2007) and academic year 2010–2011. Blanco et
al. stated that future research of PSEO should include “a thorough analysis of who is
participating and … whether participants are more likely to enroll in college and earn a
degree” (p. 16). The researchers indicated that a review of equity should be included to
determine if “PSEO is available to all students on an equal basis and whether the benefits
of PSEO participation are shared equally by all” (p. 16). Blanco et al. encouraged
additional research about PSEO, so that “the knowledge generated would inform
•“to illuminate the social justice issues that underlie the debates about public finance …
Rawls: Social Justice
•…and access to higher education …
Bourdieu: Cultural Capital •… “economics of
education provide a foundation” for research (St. John, 2003, p. 2)
Becker: Human Capital
24 policymakers and the education community about ways in which the PSEO policy might
be improved” (p. 16).
The quantitative data presented within this study utilized existing PSEO data from
the Ohio Board of Regents and the Ohio Department of Job and Family Services. These
data identified the population of students who participated in PSEO, in what types of
courses students enrolled, how many credit hours students earned, and at what institutions
students participated during the years of 2005 to 2011.
The research included an examination of longitudinal data for a cohort of PSEO
participants starting with the 2005–2006 academic year through 2010–2011. The cohort
members were identified as students who participated in PSEO in 2005–2006 and were
high school seniors that year. The longitudinal data included cohort grade point averages,
course enrollment, counties of residence, completion of certificates and degrees, and
completion of credit hours. Also, the study reviewed cohort students’ quarterly wages and
employer types by using data from the Ohio Department of Job and Family Services.
Blanco et al. (2007) encouraged a review of equity to be included in future
research to determine if “PSEO is available to all students on an equal basis and whether
the benefits of PSEO participation are shared equally by all” (p. 16). St. John (2003)
stated that one of the “three dimensions of social justice in college finance” is the “equal
opportunity to enroll” (p. 25). The cohort data included PSEO participation by the
variables of race and sex in order to examine equitable participation.
St. John (2003) indicated the need to review equal opportunity through income
groups. This study used proxy indicators to determine levels of poverty because no
25 existing data from the HEI system of the Ohio Board of Regents is available for PSEO
students to indicate their poverty statuses or income levels. Zone Improve Program (ZIP)
codes of PSEO participants were used to match to the percentages of families living
below the federal poverty level within the American Community Survey (ACS) (2012) of
the U.S. Census Bureau.
The addition of a theoretical framework itself was an expansion of the Blanco et
al. (2007) report. Creswell (2009) suggested that the “intersection of philosophy,
strategies of inquiry, and specific methods” should be included in research design (p. 5).
While the Blanco et al. report included the “strategy of inquiry” (i.e., quantitative) and
“specific methods” (i.e., “questions, data collection, analysis, interpretation, and
description”), the “philosophy” portion, missing from the Blanco et al. study, was added
with the examination of St. John’s (2003) framework (p. 5).
Not included in the Blanco et al. (2007) study, the present research included a
qualitative exploratory component to identify the perceptions of PSEO by secondary and
postsecondary personnel related to access and funding. By supplementing the quantitative
data with rich descriptive themes that emerge during interviews, perceptions about the
benefits and challenges of PSEO policies and funding will be enhanced. Blanco et al. did
not provide a qualitative perspective, and, therefore, the themes from the conducted
qualitative interviews for the present study provide a broader view of participation and
perceptions.

26 Significance of the Study
The significance of the study to the field of higher education is positioned in the
critical balance for legislators to consider public funding for higher education and the
economic health of Ohio and of the nation. Blanco et al. (2007) indicated that their study
was an attempt at knowing whether the PSEO program “makes a difference in the lives of
Ohio’s students” and whether the costs associated with this program are justified by its
impact on the creation of a skilled workforce (p. 3). Researchers (e.g., Andrews, 2001)
have noted the importance of ca continued research and focus on dual enrollment
programs. Andrews (2001) indicated the need “to document the successes and impact of
dual-credit programs on their students” (p. 9). By bridging the gap between Blanco et
al.’s data collected up to 2004 and this study’s data, the history of PSEO participants
related to access and success since the time of the earlier study was documented and
enhanced with perspectives of educational leaders on PSEO.
Research Questions
This study sought to review the Blanco et al. (2007) data analysis from academic
year 2004–2005 and continue the collection and analysis of PSEO data from academic
year 2005–2006 through 2010–2011. Secondary data from the existing database of the
Higher Education Information system of the Ohio Board of Regents were used in this
research to capture the PSEO student enrollment and performance data. For a cohort
group, students enrolled in PSEO during their senior year of high school enrollment to
employment were examined for a longitudinal analysis of student progression from high
school to employment. The present study examined PSEO participation by sex, race and

27 ethnicity, and community poverty levels to see if the program is equitably accessed by
students. Existing secondary data from the Ohio Department of Job and Family Services
were used in this research to examine employment and wage information for the cohort
students during and after PSEO participation. Additionally, emerging themes gathered
from interviews of secondary and postsecondary personnel provided richer analysis of the
PSEO program.
The research questions for the present study were designed to continue an
examination of participation and performance data similar to the Blanco et al. study, to
look at the data with economic and access lenses based on the framework of St. John
(2003), and to explore perspectives from secondary and postsecondary personnel.
1. For the Post-Secondary Enrollment Options (PSEO) in Ohio, what were the
enrollment types, performance rates, and locations of students from 2005–2006
through 2010–2011?
a) What are the demographic and background characteristics of those that
participated in PSEO during the academic years of 2005–2006 through 2010–
2011?
b) What were the types of courses in which PSEO students enrolled, the number of
credit hours earned, and the cumulative GPAs of students who participated in
PSEO?
c) Where were students participating in PSEO during the years of 2005–2006
through 2010–2011?

28 2. What were the educational and employment outcomes of the 2005–2006 PSEO
cohort? What were the participation levels by race, sex, and income level?
3. What were the perceptions of PSEO for secondary and postsecondary institutions?
Definition of Terms
Throughout this study, specific terms are utilized frequently and are defined to
enhance understanding:
Cohort: Part of longitudinal analysis is the study of a cohort; Glenn (2005)
indicated that a cohort “consists of people who share a common experience during a
specified period of time. Most often, the term cohort alone refers to a human birth
cohort” (p. v). Sharing a birth year can “expose individuals in a cohort to similar social
changes” (p. v). Glenn further defined cohorts within quantitative research as a group of
people “who experienced a particular event during a specified period of time” (p. 2). The
events are wide ranging for a cohort, and Glenn cited several possibilities including
marriage, beginning a university graduate program, or parenthood. In this case, the event
was participating in the PSEO program in Ohio during the 2005–2006 academic year
while seniors in high school.
In this study, the cohort was a human birth cohort defined as students who were
born in 1987 or 1988 and were high school seniors while participating in PSEO during
the 2005–2006 academic year, specifically Autumn 2005, Winter 2006, and Spring 2006.
Summer was not included because the students would have graduated from high school
during Spring 2006.

29
Because high school seniors are not identified by the actual high school grade
year in the Ohio Board of Regents’ HEI database, the students were instead identified in
this study based on birth year. In order to determine the birth year that would identify
seniors, the researcher examined the Ohio Department of Education’s (n.d.) report of
kindergarten entrance dates for the counties within this study. Ohio requires students to
be five years old by either August 1 or September 30 of the kindergarten year. Therefore,
by the twelfth grade year, seniors would be 17 or 18 years old. For the 2005–2006 school
year, high school seniors in this study would have been born in 1987 or 1988.
College Credit Plus: Ohio’s House Bill 59 required the Ohio Board of Regents’
Chancellor to create recommendations for College Credit Plus, a program that would
redefine dual enrollment in Ohio and restructure the funding of all types of dual
enrollment (130th General Assembly, 2013). The Ohio Board of Regents’ (2013b)
Chancellor John Carey submitted recommendations for College Credit Plus to the Ohio
General Assembly after consulting with various groups from secondary and
postsecondary education. The recommendations included policy changes to “program
participation requirements; funding, student and parent communication requirements;
coursework quality requirements; and data collection” (p. 3). The Chancellor indicated
that the College Credit Plus changes are needed to establish “a quality dual credit
program” and provide “reliable pathways that produce more college- and career-ready
citizens” (p. 3).

30
Course Completion: To examine the status of students’ enrollment in college-
level courses, the definition of “officially earned credit for this course enrollment” is
when a student completes the course requirements (Ohio Board of Regents, n.d., p. 12).
Cumulative Grade Point Average: Course performance for this study indicated by
cumulative grade point averages. The Ohio Board of Regents (n.d.) indicates grade point
averages (GPA) are calculated based on a division of the cumulative GPA quality points
by the cumulative GPA credit hours. Cumulative GPA quality points are defined as “the
total number of quality points that are earned in the courses” and the cumulative GPA
credit hours are defined as “the cumulative hours attempted but not the courses that do
not affect the cumulative GPA such as course withdrawal, audit, pass/no-pass” (p. 25).
Degree Types: A variety of degrees is available through Ohio’s colleges and
universities. Within the Ohio Board of Regents’ Higher Education Information system
documentation (n.d.), “Degree Type” referred to certificates (i.e., less than one-year and
one-year), associate, bachelor, master, and doctoral degrees. For much of this study,
given the timeframe starting with the PSEO participants enrolled from 2005–2006
through 2010–2011, students will have had up to six years to earn college credentials.
The primary credentials in this study are certificates, associate degrees, and bachelor
degrees.
Dual Enrollment: Dual enrollment has been referenced within research and
scholarly articles with many descriptors: dual credit, accelerated learning, early college,
and concurrent enrollment. Using a compilation of several articles, this study identified
common characteristics of dual enrollment within the definitions used in National Center

31 for Education Statistics reports. For this study, the definition has been created as the
enrollment of high school students in college courses to earn college credits through a
postsecondary institution (Blanco et al., 2007; Kleiner & Lewis, 2005; Lowe, 2010;
Waits, Setzer, & Lewis, 2005).
Economic Recovery: A question within this study’s interviews of PSEO personnel
at secondary and postsecondary institutions inquired about how educational institutions
can affect economic recovery. Definitions for economic recovery may include increased
job opportunities, decreased poverty, decreased unemployment, or increased personal
wealth. The Ohio Board of Regents (2012a) reported that “every one percent increase in
the total number of bachelor’s degrees translates into an estimated $2.5 billion in
increased economic activity per year and every year thereafter” (p. 4). Further, the Ohio
Board of Regents published the statement that “if Ohio’s economy is to thrive and grow,
we must provide business with a continual pipeline of highly skilled workers” (p. 6). For
this study, economic recovery refers to the Ohio Board of Regents’ indication that
increased postsecondary education and training will increase Ohio’s economic activity.
North American Industry Classification System (NAICS): The NAICS codes
identify the type of “primary economic activity” for an employer (Ohio Department of
Job and Family Services, n.d., p. 23). The NAICS codes will categorize the types of
industries in which PSEO cohort members have become employed after their PSEO
participation.
Postsecondary Education: Postsecondary education is a phrase often used
interchangeably with higher education, college, and university. The term has been
32 defined for the National Center for Education Statistics as “an academic, vocational,
technical, home study, business, professional, or other school, college or university …
(primarily to persons who have completed or terminated their secondary education or
who are beyond the age of compulsory school attendance) for attainment of educational,
professional, or vocational objectives” (Putnam, 1981, p. 3). Smith (1991) indicated that
postsecondary education includes over 3,500 institutions in the United States, including
1,551 public and 1,953 private institutions (p. 109). The Ohio Board of Regents and its
Chancellor oversee the University System of Ohio, which includes all 14 universities, 24
branch campuses, 23 community colleges, and over 120 adult education programs in the
State (Ohio Board of Regents, n.d., p.1). Additionally, the Ohio Board of Regents
mentioned, “Ohio is also home to numerous private colleges and universities” (p. 2).
Post-Secondary Enrollment Options (PSEO): In Ohio, the dual enrollment
program identified within the Ohio Revised Code (2007b) and the Blanco et al. (2007)
study is Post-Secondary Enrollment Options (PSEO). The Ohio Revised Code Section
3325 outlines legislatively identified policies and procedures for PSEO, which must be
followed by participating secondary and postsecondary institutions, and allows for
consistency throughout Ohio.
Poverty: The U.S. Census Bureau (2014) defined poverty as “a set of money
income thresholds that vary by family size and composition to determine who is in
poverty” (p. 2). This study utilized the 2012 American Community Survey to identify
poverty levels within the state of Ohio and communities identified by ZIP codes.

33
This study identified proxy indicators to represent poverty levels. A proxy
indicator “can employ an alternative definition and/or data source” (European
Communities, 2014, p. 3). No single identifier for socio-economic status or levels of
poverty was available through the existing data from the Ohio Board of Regents’ Higher
Education Information system for PSEO students; therefore, this study identified poverty
indicators through examination of participating students’ residences. Information from
the American Community Survey (ACS) of the U.S. Census Bureau (2012) was available
for the poverty level of almost all Ohio ZIP codes. When poverty level was not available
for a ZIP code from the ACS, additional indicators of poverty were provided for
informational purposes to supplement the study. These include average home prices and
estimated median value of houses and condominiums from other sources.
PSEO Participants: Through the Ohio Board of Regents database, students who
are participating in PSEO at a public college or university are reported into the Higher
Education Information (HEI) system utilizing the special population status codes for
PSEO. Each student is identified by Social Security Number and entered into HEI by the
enrolling postsecondary institution.
Race and Ethnicity: Students self-identify their races and ethnicities on college
applications as a single category. Categories are “Black, non-Hispanic; American Indian
or Alaskan Native; Asian or Pacific Islander; Hispanic; White, non-Hispanic; and
Nonresident Alien” (Ohio Board of Regents, n.d., p. 77).
Secondary education: The U.S. Department of Education (2004), outlined from
Title IX legislation, the definition of secondary education as a nonprofit institution which

34 “provides secondary education, as determined under State law, except that the term does
not include any education beyond grade 12” (p. 2). Ohio Revised Code 3301 (2010),
entitled “Department of Education,” included multiple subsections that encompass the
work of the Ohio Department of Education and local school districts. Subsection 3301-35
outlined the responsibilities and “standards for kindergarten through twelfth grade” (p. 1).
Further, subsection 3301-35-01 indicated that “the purpose for adopting operating
standards for Ohio school districts and elementary and secondary schools is to assure that
all students are provided a general education of high quality” (p. 1).
Transfer Assurance Guide (TAG) courses: The Ohio Board of Regents (2010),
based on legislative requirements, developed “The Ohio Articulation and Transfer
Policy” and described the “discipline-specific guides” (p. 6). Within the guides, “selected
courses from the existing transfer module, major, and pre-major requirements … are
guaranteed to transfer and be applied to degree/program requirements” at Ohio public
institutions of higher education (p. 6).
Unemployment Insurance (UI) Account ID for Employer: Each employer
submitting wage and employment data to the Ohio Department of Job and Family
Services is assigned an identification number which “should be consistent from quarter to
quarter to allow identification of the same unit over time” (Ohio Department of Job and
Family Services, n.d., p. 47).
Wages Paid: The Ohio Department of Job and Family Services received wage
data from employers for each individual working in Ohio by quarter each year. The wage

35 data for PSEO cohort members was included from the end of the fourth quarter
(December) of 2006 through the end of the fourth quarter (December) of 2011.
Workforce Development: Within the Ohio Revised Code 6301.01 (2013b),
workforce development activity is defined as “a program, grant, or other function, the
primary goal of which is to do one or more of the following: (1) help individuals
maximize their employment opportunities; (2) help employers gain access to skilled
workers; (3) help employers retain skilled workers; (4) help develop or enhance the skills
of incumbent workers; (5) improve the quality of the state’s workforce; (6) enhance the
productivity and competitiveness of the state’s economy” (pp. 1-2).
Delimitations
The focus of the present study is on one strategy to increase college enrollment
and degree attainment, PSEO. Many ways to attempt to increase college completion exist
in Ohio and across the nation; however, the strategy of dual enrollment will be the focus
of this study. PSEO is a single program identified in Ohio law with consistent reporting
and processes. The use of only PSEO in this study allowed for specificity across the
entire state among all public two-year and four-year institutions. Existing student-level
data was utilized from the Ohio Board of Regents.
Further, while many important purposes of education exist, the present study is
focused on how education can be a strategy to increase college completion and thereby
aid in economic development and recovery for the United States. Looking through the
economic lens of the framework of St. John (2003), which captured the significance of
social justice, cultural capital, and human capital, this research is focused on the
36 economic benefits of college participation, certificate and degree completion,
employment and wage gains through the program of PSEO.
Focusing on a specific time period, academic years 2005–2006 through 2010–
2011, allowed for a follow-up to the Blanco et al. (2007) study, which focused on data
from 1998–1999 through 2004–2005. The time period for this study was intentionally
selected in order to be consistent with the U.S. Department of Education, National Center
for Education Statistics (NCES) (2014) and guidelines for calculating graduation rates.
The Department of Education and NCES use criteria for these rates as outlined in the
Student Right to Know Act of 1990, which required postsecondary institutions to report
the percentage of students that complete their program within 150 percent of the normal
time for completion, which is within 6 years for students pursuing a bachelor’s degree”
(p. 1).
The six-year window of time also provided an opportunity to longitudinally study
a specific cohort of 2005–2006 PSEO students. As seniors in high school, the cohort
would have the entire high school year and the five years following graduation to earn a
baccalaureate if the students enrolled directly after high school and made continuous
progress toward degree. This longitudinal study provided a chance to examine the
students’ path of starting the program, continuing after high school, earning credentials,
and gaining employment.
To gain perspectives of secondary and postsecondary personnel about PSEO
programming and funding, interviews were conducted with a select number of informed
personnel. The selected individuals held roles such has college or university president,

37 superintendent, treasurer, chief financial officer, admissions officer, high school
principal, and guidance counselor. While valuable information have been gleaned from
interviews with students, parents, and others, the focus was on the perspective of high
school and college administrators. Therefore, selected individuals have the broadest
perspective and information about PSEO. Additionally, this study’s exploratory nature of
the qualitative research strategy lent itself to focus on the in-depth nature of interviewing
a smaller number of individuals. Patton (2002) indicated that spotlighting a small
interview group “can be very valuable, especially if the cases are information rich”
(2002, p. 244).
The data sources within this study were institutions of higher education that report
to the Ohio Board of Regents (OBR). Primarily, Ohio public colleges and universities
report student enrollment data to OBR; however, private institutions report limited
information. The data source for this research was OBR’s existing database, the Higher
Education Information (HEI) system. Additionally, students who attend college after high
school at institutions in other states were not included as part of this study, as only Ohio
colleges and universities report data to OBR.
Limitations
This study utilized existing secondary day from the Ohio Board of Regents and
the Ohio Department of Job and Family Services. Because only Ohio public institutions
are required to report extensive data to the Ohio Board of Regents, a limitation of the
study is that Ohio private colleges and universities do not submit the same types of data.
Therefore, if a student matriculates to a private institution or one outside of Ohio, the
38 OBR may not capture that information within the Higher Education Information (HEI)
system database. This limitation prevents the researcher from tracking longitudinally
enrollment after high school if a student is not in a public institution in Ohio.
Even though the Ohio Board of Regents’ HEI system is a robust system for public
institution data, many types of data are not collected that would be useful for this study.
For example, OBR does not require postsecondary institutions to identify the grade level
of a PSEO high school student. A resolution to the lack of grade level information could
be the connection of data systems between the Ohio Department of Education, which
does know the students’ grade levels, and the Ohio Board of Regents. This is a limitation
because the researcher had to use an alternative way of determining grade levels. For the
cohort, the researcher identified birth year as an approximation of which students would
have been seniors in 2005-2006.
These data issues led to an even greater concern with student tracking
information. Ohio’s data systems for students in secondary schools (Ohio Department of
Education’s Enrollment Management Information System (EMIS) and in postsecondary
institutions (Ohio Board of Regents’ Higher Education Information (HEI) system) do not
currently connect and share information about students from kindergarten to postgraduate
enrollment. A student reported in EMIS has a unique identifier in grades kindergarten
through twelfth grade, while that same student is provided a new and unique identifier
when the student’s data enters the college data system of HEI whether as a PSEO student
or as a high school graduate. Efforts are underway to connect the two data systems by
restructuring the student identifier within both systems in order to have one unique code
39 throughout lifetime educational enrollment. The longitudinal student database is currently
being established through the Ohio Education Research Center at the Center for Human
Resource Research at The Ohio State University; however, the completion of connecting
the two systems is at least two years from the present study date (L. Neilson, personal
communication, November 4, 2013).
A limitation in the secondary data was the fact that grade point averages (GPA)
are not included in the HEI system. In order to determine student grade point averages
(GPA), the researcher was required to calculate GPA for each student. The two variables
that are included in the data that were used to calculate this information were “cumulative
grade point average hours earned” and “cumulative grade point average points.” The
method for using those variables and calculating GPAs is described in Chapter 3.
Additionally, socio-economic status is not collected in the HEI system. College
students can be identified as low income when institutions report the students as federal
financial aid recipients; however, PSEO students are not eligible for federal grants. A
student cannot apply for federal financial aid until after high school graduation. Other
data points that are provided to HEI include student high schools. If high schools were to
be used for the PSEO students, this study could look at information about each high
school in Ohio such as the percentage of students eligible for the federal program of free
and reduced lunches. Free and reduced lunch percentages are used in several education
studies to connect students with community socio-economic status (Bevel & Mitchell,
2012; Hart, Soden, Johnson, Schatschneider, & Taylor, 2013; Ransdell, 2012; Wiley,
Siperstein, Forness, & Brigham, 2009). However, the submission of high school
40 information for PSEO students was very limited during the years of this study.
Specifically, of the cohort identified, only nine high schools were reported to HEI. As the
study later will reveal, nine high schools represent less than 1% of the entire cohort. Also
considered for this study’s examination of poverty was the county of residence for PSEO
students. Again, submission of county data was limited; however, 70% of the cohort’s
counties were reported to HEI. Still, an examination of counties may have provided
important information, but the limits of looking at counties with so many different
communities within one county may have caused generalizability concerns.
Studies such as Misra and Deberline (2007), Quinn (2007), and Peng and
Thibodeau (2013) also associated ZIP codes with poverty within their research. Quinn
examined one ZIP code in Wisconsin with relation to housing loans, prison recidivism,
family income, federal subsidy supports, among many other indicators of poverty and
socio-economic status. Misra and Deberline focused on socio-economic and demographic
factors related to rural and urban youth poverty in Kentucky by ZIP codes. The authors
chose ZIP code level since it is “one of the smallest geographic units to measure poverty”
instead of county or census-level, larger units (p. 3). Peng and Thibodeau examined 99
ZIP codes in Denver, Colorado, to provide research on house pricing changes within and
across neighborhoods especially and what impacts on the changes exist for low-income
households.
The studies of Poston et al. (2010); Keene, Prokos, and Held (2012); and Sasson
and Sakamoto (2012) utilized ACS data for communities and poverty levels. Poston et al.
examined areas within Arkansas, Louisiana, Mississippi, and Texas by using multilevel

41 regression models to predict the odds of households in poverty. Characteristics of the
household used in the study were head of household and family size from within the ACS
data. Keene, Prokos, and Held examined race and marital status differences on the
“likelihood of poverty among grandfathers who have primary responsibility for co-
resident grandchildren” (p. 49). Sasson and Sakamoto related the ACS data of non-poor
communities to the growth of population due to immigration of individuals from other
nations with fewer skills than native citizens did.
The ZIP codes of PSEO students’ permanent residences were utilized and
compared to poverty levels within Ohio using the U.S. Census Bureau’s American
Community Survey (2012). Other proxy indicators such as home values are provided for
informational purposes only.
Self-reported data are challenging for the system of PSEO. Information such as
race, sex, and income level are gathered based on student provided details on college
application forms or secondary school forms for enrollment. These data, when not
provided, cannot be reported to the EMIS or HEI system. For example, “race and
ethnicity” is typically an optional field to complete on college and university
applications. Therefore, students who do not provide that information will be submitted
by the institution as students with “unknown” races. Another field that may be submitted
by colleges as “unknown” is county of residence.
Similar to unknown race and county, some data are not submitted by colleges
based on lack of student submission or based on the procedures associated with data
submission. Missing data in the category of “institutions” at which students enrolled may

42 be attributed to a change that occurred in the submission of PSEO data. Prior to 2007,
colleges and universities submitted data but were not required to match “institution” with
the student record within the special status (i.e., PSEO participants). Instructions from the
Ohio Board of Regents (2007) for the “Edit and Load Specifications” of special
populations indicate the change occurred October 1, 2007. Therefore, many records of
“institution” for 2005, 2006, and early 2007 were not reported and are listed as missing.
At the time of the study by Blanco et al. (2007), only 5% of high school students
participated in PSEO. Comparisons that might be made among student groups would
result in unequal sample sizes. For example, if a researcher would want to know a true
comparison of PSEO participants and non-participants, the statistical phenomenon would
be impacted by the small number of PSEO participants. Further, examining subgroups
within the populations such as by race would result in even smaller sample sizes for
comparisons. Therefore, this study focused on the entire population of PSEO participants
and examined data within the population. The study did examine a cohort from within the
population which was an entire grade level of students, rather than a sample which may
have created unequal comparisons among all college-going students.
Organization of the Study
The information within this study is organized into five chapters. Chapter One is
an introduction to the research questions and background information about the study.
Chapter Two is a review of the research related to dual enrollment and the theoretical
framework of the study. Chapter Three is an explanation of the research method and
description of the Ohio databases used in the study. Chapter Four is a review of the

43 findings of the database and the research method employed. Chapter Five is a discussion
about the findings, suggestions of how to further help the subject of the study, and
recommendations for further study.
44
Chapter 2: Review of Literature
This chapter will review the existing literature on the subject of dual enrollment
overall in the nation and within specific states. A limited amount of literature is focused
on Ohio’s dual enrollment programming, funding, and students. With the wide gap of
information of Ohio’s dual enrollment efforts, information within this study will serve to
provide the context surrounding Ohio’s Post-Secondary Enrollment Options (PSEO) dual
enrollment program.
This chapter will review the scholarly literature on dual enrollment, examine
national and Ohio efforts related to dual enrollment programming and funding, review
the theoretical framework of St. John (2003), and examine dual enrollment as a practical
application of the framework. The chapter will provide a review of the literature that
informed the research questions presented in this study:
1. For the Post-Secondary Enrollment Options (PSEO) in Ohio, what were the
enrollment types, performance rates, and locations of students from 2005–2006
through 2010–2011?
a) What are the demographic and background characteristics of those that
participated in PSEO during the academic years of 2005–2006 through 2010–
2011?
b) What were the types of courses in which PSEO students enrolled, the number of
credit hours earned, and the cumulative GPAs of students who participated in
PSEO?

45
c) Where were students participating in PSEO during the years of 2005–2006
through 2010–2011?
2. What were the educational and employment outcomes of the 2005–2006 PSEO
cohort? What were the participation levels by race, sex, and income level?
3. What were the perceptions of PSEO for secondary and postsecondary institutions?
Dual Enrollment Background
One strategy leading to an increase of individuals earning degree credentials is
suggested as dual enrollment. The literature and research of dual enrollment participation
and performance are relatively new phenomena. Most data and research articles have
been published within the last twelve years. Dual enrollment, in a variety of formats, has
been in place to some extent for since the 1970s (Bailey, Hughes, & Karp, 2002). The
research that does exist has focused on specific aspects of dual enrollment such as
programming and course delivery types; policies among the states; student participation,
persistence, and performance; and demographics of student participants such as
minorities, low-income, academically underprepared, and urban/rural students. Given the
evolving nature of this research, the topic of dual enrollment is ripe for researchers to
begin the library of resources for years to come.
As dual enrollment programming has developed, postsecondary and secondary
schools have created their own dual enrollment partnerships. While most states have
policies about dual enrollment structure and funding arrangements, much has been
flexible and dynamic while in development. Though many definitions have been used by
researchers, commonly used phrases include “enrolling high school students,” “college-
level courses,” “for credit,” “concurrent enrollment,” and “dual credit” (Hoffman,

46 Vargas, & Santos, 2009; Johnson & Brophy, 2006; Karp et al., 2007). Additional
attributes in the literature include descriptions of the delivery of the courses such as high
school teachers teaching college course at high schools or college faculty traveling to
teach at high schools (Hughes, 2010; Karp et al., 2007). The decision to grant college and
high school credit for these courses is decision for the institutions to make but may be
governed by state policies. Hoffman et al. (2009) described an umbrella of dual
enrollment descriptors such as “dual credit, concurrent enrollment, college in the high
school, and joint enrollment” (p. 45).
Creating Legislative Policies for Dual Enrollment
For legislators to become more aware of dual enrollment practices or model
programs, Callan, Ewell, Finney, and Jones (2007) provided a guide for “state leaders
with promising new ideas about how to create improvement while limiting costs” (p. 2).
The authors identified three strategies for increasing educational attainment. The first,
college preparation, focused on providing opportunities for “acceleration” which included
dual enrollment, but focused on Advanced Placement (AP), International Baccalaureate
(IB), and College Level Examination Program (CLEP). The second strategy described
redesigning policies in order to help educational productivity. The focus for this strategy
was on academic curricular changes or redesigns to improve efficiencies of moving
students through the system. The final strategy focused on using and expanding facilities,
which focused on developing more teachers and increasing collaboration among colleges
and universities.
47 A second guide for policymakers continued with additional model practices in
educational strategies (Brenneman, Callan, Ewell, Finney, Jones, & Zis, 2010). These
authors provided overviews of “strategies, programs, and practices that can raise
educational productivity” (p. iv). Brenneman et al. used information from the National
Center for Higher Education Management Systems (NCHEMS) and the National Center
for Public Policy and Higher Education (NCPPHE) in part one of this volume to identify
three primary paths leading to increased productivity. The first path was preparing high
school students for college education to expand the educational pipeline. An example of
effective practices included “increasing the rigor of high school curriculum” and by
utilizing “dual enrollment” (p. 3). The second path was improving educational
productivity by critically reviewing and modifying the policies and processes involved
with curriculum design. An example included learning communities, three-year
bachelor’s degrees, and online learning. The third path was ensuring systems are effective
in areas such as facilities usage, educational delivery, and collaboration. Examples
included Ohio’s Advisory Committee on Efficiency that “examined public colleges and
universities’ business practices, identifying potential improvements, and promoting the
adoption of best practices” (p. 21). In the second part, Brenneman et al. described
“strategies that state policymakers can use … to influence innovation and improvement”
(p. v). The authors focused on five key policy levers: “A) planning and leadership; B)
finance; C) accountability; D) regulatory policies; and E) governance” (p. 23). All of the
five are considered integral to the development of policy framework when effectively
aligned.

48
Kinnick (2012) reviewed the financial impact on one institution, Kennesaw State
University (KSU) in Georgia, which was intended to determine answers to the questions
of “what are the payoffs and trade-offs that colleges thinking about establishing or
expanding dual enrollment programs should consider?” and “does dual enrollment
strengthen colleges and universities, or does it sap their increasingly limited resources?”
(p. 39). KSU enrolled 23,000 students overall and 200 dual enrollment students in 2011–
2012. The dual enrollment program at KSU is an honors program targeting students with
a 3.0 GPA and “a combined score of 1100 on Critical Reading and Math portions of the
SAT” (p. 41). The funding for the honors program (and all other dual enrollment
programs in Georgia) comes from two state programs, the Accel Program and the Move
on When Ready (MOWR) program.
Kinnick (2012) reported that of the dual enrollment participants, one-third
continue at their respective universities after high school graduation. Faculty, 86%,
reported that dual enrollment students “more capable than typical first-year students” (p.
43). Faculty are satisfied with teaching courses for dual enrollment students, with 93%
indicating high or extremely high satisfaction levels. Of those students who return to
KSU after high school graduation, Kinnick found that they earned higher GPAs, 3.4
versus 3.2 for other students in the same college entry year. Dual enrollment students are
more likely to graduate in four years, 64% versus 12% of other students, and are more
likely to enroll in and complete master’s degrees at KSU, 5% versus 0.2% of other
students. Kinnick’s data indicated positive results of dual enrollment programs, but the
49 author also cited issues with parking, facility space, and classroom capacity as deterrents
to dual enrollment.
Describing their qualitative study, Burns and Lewis (2000) surveyed students to
identify the “actual and perceived impact of the facility on the instructional benefits” of
dual enrollment courses (p. 3). The authors indicated that the school climate
(“atmosphere and morale”) greatly influenced learning (p. 3). Based on these influences,
the authors suggested that when choosing a facility for dual enrollment courses,
institutions should carefully consider the location. Six students were interviewed by
Burns and Lewis: three dual enrolled at the high school and three at the college campus.
The results of the interviews were organized into three categories. The first category was
about satisfaction with dual enrollment. All indicated positive satisfaction; however,
Burns and Lewis found students on the high school campus were less satisfied overall.
The second category was about academic and physical independence: Students expressed
feelings of physical independence related to being at a campus, being on their own, and
being academically challenged in a new environment. The third category was about the
continuation of college education: All six students planned to continue and were satisfied
with dual enrollment completion regardless of the location. Burns and Lewis’ study
provided the student-perspective for administrators to consider when determining
location of programming.
Studying the College Now partnership between the City University of New York
(CUNY) and New York City Department of Education (NYCDOE), Kim (2012)
described a dual enrollment program serving 20,000 students annually. Kim indicated
50 that the key to the success of College Now lies in the data-sharing agreement between
CUNY and NYCDOE. Sample data reports include “Where Are They Now” publications
produced by NYCDOE, which gives high school administrators information about
student preparation for college and performance at CUNY. Other data tracked are
accountability metrics that “measure the percentage of a high school’s on-time graduates
who successfully completed a college or career-ready benchmark” (p. 50). Data analysts
from CUNY Collaborative Programs produced reports with College Now data and
campus program leaders provided annual reports with benchmarks, goals, and outcomes.
Kim (2012) studied the student population participation based on the residency
within the New York boroughs in 2007–2008. The data indicated that College Now
enrollment “showed proportionately uneven number of students being served by College
Now citywide” (p. 53). One example included 21.1% of all students attended a school in
Manhattan but these students represented only 12% of College Now enrollment. Another
example, “24.2% attended school in the borough of Queens, but 33.4% of the total
College Now enrollment was from this borough” (p. 53). In response to these disparities,
administrators in the school district worked to enroll a more representative population by
reallocating resources throughout the district. The data have also indicated a need to
focus on “recruiting and retaining minority males” and having worked on this, the “most
recent data indicate a 27% increase in college-credit enrollments for Black and Hispanic
male students from high schools” in the boroughs of the Bronx and Manhattan (p. 53).

51 Socio-Economic Indicators
An (2012) studied socio-economic status related to dual enrollment and found that
participants in dual enrollment increased their first year grade point average in general
and that students of lower and higher socio-economic statuses benefited from dual
enrollment participation equally. An used data from the Beginning Postsecondary
Students Longitudinal Study (BPS:04/09) and the 2009 Postsecondary Education
Transcript Collections (PETS:09) to study dual enrollment and influence on academic
performance and college readiness. An found that dual enrollment students’ GPAs were
0.23 points higher than non-dual enrollment students. Also, dual enrollment students in
An’s study were 13% less likely to need remedial coursework. When examining socio-
economic status, dual enrollment first generation students (i.e., whose parents did not
attend college) earned GPAs that were 0.09 points higher than first generation students
with no dual enrollment coursework.
An (2013) continued to study dual enrollment and focused on low SES students.
He indicated that an “alarming” trend is the SES “disparity in educational attainment
where high SES students are more likely to attain a college degree than low-SES
students” (p. 57). An found that dual enrollment is a way for educational leaders and
policymakers to bridge the gap because dual enrollment provides a free or inexpensive
way to earn college credits. An’s research found that dual enrollment participation
“increases the probability of attaining any postsecondary degree and a bachelor’s degree
by eight percentage points and seven percentage points, respectively” (p. 62). An
compared SES to parental education and indicated that this “exerts the largest influence

52 on selection to dual enrollment and college degree attainment” (p. 64). He found that first
generation students obtain any postsecondary degree eight-percentage points higher if
they participated in dual enrollment.
An (2013) also determined that if students earn six credits in dual enrollment, this
increased students’ likelihood to attain a bachelor’s degree by 12 percentage points. An
also examined Advanced Placement participation compared to dual enrollment. He found
that “there is little difference in the effect of these [Advanced Placement] programs on
degree attainment” compared to dual enrollment (p. 68).
National Level
The literature focusing on programming and funding at the national level has
provided a perspective of progress in dual enrollment over the years. The national data
reviewed overall participation, types of programs, and sources of funds.
Programming.
Adelman (2004) examined data from three National Center for Education
Statistics (NCES) studies: National Longitudinal Study of 1972, High School and Beyond
(1980–1992), and National Education Longitudinal Study of 1988. The author focused on
three cohorts of students and defined the parameter of the cohorts as twelfth grade
students in classes of 1972, 1982, and 1992. Adelman described “major features of the
postsecondary academic experience and attainment” including a finding of 10% of
bachelor’s degree recipients in the class of 1992 earned the degree in a state other than
the one in which they began their degree (p. 111). The amount of time to complete a
bachelor’s degree for 1992 graduates was 4.56 years, 4.45 years for 1982 graduates, and

53 4.34 years for 1972 graduates. Of those students who began at community colleges, 36%
of the 1992 class transferred, 27% of the 1982 class transferred, and 28% of the 1972
class transferred. Nineteen percent of the 1992 class earned college credit while in high
school. Those with “accelerated credit” earned bachelor’s degrees in 4.25 years whereas
those without earned the degree in 4.56 years (p. 111).
Within the NCES report, Adelman (2004) indicated that “students in the highest
quintile of high school academic coursework are more likely to earn credits by means
other than post-matriculation course enrollment” such as dual enrollment, Advanced
Placement (AP), or College Level Examination Program (CLEP) (p. 55). Of the students
who earned graduate degrees, 25% of them had earned nine or more college credits while
in high school.
Waits, Setzer, and Lewis (2005) studied results from the National Center for
Education Statistics (NCES) Fast Response Survey System’s 2003 survey entitled “Dual
Credit and Exam Based Courses.” The survey sampled 1,499 public secondary schools on
questions focused on the availability of dual enrollment, Advanced Placement, and
International Baccalaureate courses at their schools; on dual enrollment policies; and on
types of dual enrollment courses. The responding high schools indicated that 71% offered
courses for dual credit, while 67% offered Advanced Placement courses, and 2% offered
International Baccalaureate courses. Characteristics of the participating schools showed
that schools in rural and urban areas were less likely to offer dual credit courses than
schools in towns or suburbs. Schools with the highest minority enrollment were less
54 likely to offer dual credit courses in comparison to schools with lower minority
enrollment with a rate of 58% to 72-78%.
Kleiner and Lewis (2005) studied the results of a Postsecondary Education Quick
Information System (PEQIS) survey entitled “Dual Enrollment Programs and Courses for
High School Students” in 2004 conducted by NCES. The survey respondents, U.S.
postsecondary institutions, answered questions about college courses taken by high
school students during the 2002–03 school year. Overall, 57% of the institutions reported
high school students taking college credit courses. By sector, 98% of public two-year
colleges had high school students taking college credit courses, compared to 77% of
public four-year colleges, 40% of private four-year, and 17% of private two-year
institutions.
Using a variety of national data such as the 2009 Postsecondary Education
Transcript Study (PETS:09); Beginning Postsecondary Longitudinal Study (BPS:04/09);
High School and Beyond Longitudinal Study of 1980 (HS&B/So:80–92); NCES’s
PEQIS “Dual Enrollment Programs and Courses for High School Students (2005);
National Education Longitudinal Study of 1988 (NELS:88/2000); and National
Longitudinal Study of High School Class of 1972 (NLS:72), a variety of researchers
reported national performance measures. With regard to participation, Kleiner & Lewis
(2005) found that nationwide, there were 680,000 participants, who represented 4% of all
high school students that year. Swanson (2008) studied persistence of students, and
reported that dual enrollment participants are 12% more likely to enter college after high
school graduation. Swanson also indicated that dual enrollment participants who

55 completed more than twenty credit hours in the first year of college enrollment were 28%
more likely to persist through the second year. An (2012) found that dual enrollment
participants earned a GPA that is 0.23 percentage points higher than non-dual enrollment
participants and that dual enrollment first generation students “earned a GPA that is 0.09
points higher” than non-dual enrollment first generation students (p. 421). Swanson
(2008) and Adelman (2004) reported on the time to complete degrees. Swanson found
that dual enrollment participants who earned twenty or more credits in the first year
improved their likelihood to earn a degree in 4.56 years by 38%. Adelman indicated that
dual enrollment participants in general will complete bachelor’s degrees within 4.25
years, while non-dual enrollment participants will complete in 4.65 years. An (2013)
indicated that dual enrollment participants increased their probability of attaining a
bachelor’s degree by 7%. Those dual enrollment participants who had earned six or more
college credits increased the likelihood to earn a bachelor’s degree by 12%.
Hoffman and Vargas (2010) studied the Early College High Schools (ECHS)
initiative, “a network of over 200 early colleges in 24 states enrolling more than 50,000
students” (p. 5). The initiative was designed as a “school-wide strategy,” often on a
college campus but that could be located within a high school (p. 2). The stated goal of
the ECHS effort is supporting “low-income high school students who, without significant
assistance, may lack the skills and knowledge to enter and persist through college” (p. 2).
Jobs for the Future, the leading organization of the ECHS initiative, has indicated a vision
of helping all students earn at least 12 college credit hours before high school graduation,
ensuring that all colleges will accept college credits earned in ECHS as transfer credit,

56 strengthening student skills to ensure decreasing remedial course needs, and redirecting
funds toward early college opportunities and away from remediation efforts.
Berger et al. (2013) focused on whether ECHS students were more likely to have
better performance outcomes such as graduation, college enrollment, and degree
attainment. The results of studying eight ECHS schools with a survey sample of 1,294
students included a comparison of ECHS students against non-ECHS students (students
who were enrolled in a district with ECHS as a part of the curriculum but were not
chosen in a “lottery” style admissions process). ECHS students graduated from high
school at a rate of 86% versus non-ECHS students at 81%; 80% of ECHS students
enrolled in college compared to 71% of non-ECHS students; and 22% of ECHS students
earned college degrees compared to 2% of non-ECHS students. In addition to these rates,
20% of ECHS students earned college degrees while in high school. Berger et al. (2013)
also studied gender, race, and income subgroups. From those data, they found that ECHS
had a strong impact on degree attainment for female students, minority students, and
lower income students.
Funding.
Funding for dual enrollment programs at the national level is as varied as the
programming for dual enrollment throughout the United States. Many studies have been
conducted over the years, but the information is dynamic as state policies and local
funding arrangements change regularly. A common theme among studies is that dual
enrollment can be a method for saving costs—for students, states, taxpayers, and
institutions. Barnett and Stamm (2010) indicated that overall savings is based on
57 “increasing the efficiency of the education system” and “reducing time in college” (p.
12). By providing students the option to take one course that covers both high school and
college credits, the efficiency of time and money has been improved. Of course, as
students complete college courses early, time spent after high school in college can be
reduced as credits earned earlier can help speed up degree attainment. This also reduces
taxpayer dollars as students who may have requested financial aid for tuition can
decrease that request based on a faster degree completion time. Barnett and Stamm also
reiterated that by “increasing the number of students who enter, and succeed in, post-
secondary education … graduates are more likely to contribute to the public good (paying
taxes, voting)” (p. 9). This also leads to benefits for employers who will find an increased
“level of preparation of employees” while “ensuring an appropriately skilled workforce
for the 21st century globalized economy” (p. 9).
Kinnick (2012) studied dual enrollment programming and funding and described
a common need for institutions to justify the expense of dual enrollment since “the
recession has squeezed state budgets for higher education” (p. 39). Often the funds are
reallocated from the high school districts to the colleges to offset the cost. This can create
an adversarial atmosphere as “public high schools have several disincentives to
participate in dual enrollment, as they lose FTE funds for dual-enrolled students and lose
enrollment” (p. 45).
Contributing to the social justice argument of St. John’s (2003) framework,
Barnett and Stamm (2010) found important justifications of dual enrollment expenses.
First, the researchers indicated that dual enrollment could be justified by “increasing the

58 efficiency of the education system” (p. 12). If students can earn high school and college
credit for a single course (two for the price of one), time and money have been saved.
Second, dual enrollment is justified by “reducing time in college” (p. 12). By completing
college courses early, students have reduced the amount of time to degree completion.
When attempting to identify specific sources of funding, a number of studies have
provided data available in public records as well as by reviewing national surveys from
the National Center for Education Statistics. For instance, Kleiner and Lewis (2005)
examined PEQIS survey results and found funding sources of parents (i.e., 64% of
institutions reported parents and students paid for tuition), postsecondary institutions (i.e.,
38% of institutions provided actual contributions toward tuition and tuition waivers), high
schools (i.e, 37% of the institutions indicated secondary schools paid tuition), and states
(i.e., 26% indicated state funds paid tuition).
The Education Commission of the States (2008) reported funding information
from 44 states. Parents pay for tuition in 22 states, postsecondary institutions pay or
waive tuition in 3 states, high schools pay or lose reallocated funds in 6 states, states
support tuition in 3 states, other sources provided funds in 4 states, and no funding
sources were specified in 6 states.
More recently, Barnett and Stamm (2010) identified specific descriptions of
funding sources from their research including the State of Georgia, which provided
scholarship funds with state lottery funds for which students may apply. In addition, the
California Community Colleges’ Board of Governors approved a tuition waiver that
allows students to enroll in dual enrollment at no cost. The City University of New York
59 system established a partnership with the New York Department of Education to waive
dual enrollment tuition. Barnett and Stamm referred to Ohio’s system when they
described that the costs of tuition, fees, and books are paid for by allocating a portion of
secondary school funds to colleges for the “Post Secondary Options Program” [sic] (pp.
14-15).
State Level
Initiated in 2008, the Concurrent Courses Initiative in California consists of eight
partnerships between high schools and colleges (Edwards, Hughes, & Weisberg, 2011).
Funded by the James Irvine Foundation for three years, this dual enrollment program has
been qualitatively studied by surveying the 1,757 participants and program staff in 2010.
Edward et al. collected student and staff opinions of program features. An example
included program location; this student is referring to taking a course at the Long Beach
City College: “‘If I can make it through a college course, I can make it through college,
and that inspires me more to go to college’” (p. 13). When discussing instructors and
pedagogy, this student appreciated the different way college faculty set expectations of
students: “‘There are not a lot of rules in the class. You have to show up and do the work.
The college teacher expects you to do it. If you don’t do it, you don’t’” (p. 15). Another
feature is student mix, which varies among the school partnerships. Some keep all high
school students apart from the general college populations while others mix. A student
comment about the mixed class was, “‘When you’re in a class with adults, it’s more of a
college-level environment. You feel more professional’” (p. 19). No reports of follow-up
studies were conducted after high school graduation.

60
Karp, Calcagno, Hughes, Jeong, and Bailey (2007) reported on Florida and New
York City’s dual enrollment students, specifically examining career-technical education
(CTE) students who participated. Karp et al. compared dual enrollment and the career-
technical education student subset and found that 4.3% of all dual enrollment students
were more likely to earn high school diplomas compared to non-dual enrollment students,
while 1% of the CTE dual enrollment subset was more likely to earn diplomas.
Additionally, all dual enrollment students had a higher grade point averages of 0.21
points and CTE students earned a higher grade point average of 0.26 points.
Karp et al. (2007) reviewed statistics of the 2001 and 2002 City University of
New York (CUNY) dual enrollment program, which included over 2,303 student records.
The researchers found that dual enrollment students were “more likely than their peers to
pursue a bachelor’s degree” and that dual enrollment students earned grade point
averages that were 0.133 points higher than non-dual enrollment students (p. 6). Finally,
Karp et al. found that dual enrollment students were “3.5 percent more likely to enroll
full-time” in college after high school graduation (p. 6).
Speroni (2011) provided descriptive statistics of dual enrollment participants of
Florida students also from the years 2000–2001 and 2001–2002. For example, 62.4% of
dual enrollment participants were females and 77.7% were White. Outcomes included
98.1% of dual enrollment students earned high school diplomas compared to 89.3% of
non-dual enrollment students. Of dual enrollment students, 88.3% enrolled at a college
after high school graduation while only 57.4% of non-participants enrolled. Speroni
found that 32% of dual enrollment students and 18.8% of non-participants earned

61 associate degrees. Finally, 42.6% of dual enrollment participants and 18.2% of non-
participants earned bachelor’s degrees.
An additional study focusing on New York City’s City University of New York
dual enrollment partnerships, Allen and Dadgar (2012) studied the “impact of dual
enrollment on students’ college credit, cumulative GPA, and retention” (p. 13). The
authors included students from the 2009 school year. The results of their study found that
students completing one or more dual enrollment courses “is associated with positive and
substantial gains including earning more credits during the first semester and a higher
college GPA” (p. 15). Students earned one more credit and GPAs averaging 0.l6 points
higher compared to non-dual enrollment students. Dual enrollment students also were
five percentage points more likely to enroll in the second year.
Georgia Perimeter College (GPC) (2008) reported their dual enrollment program
results from the fall of 2008. GPC stated that in the fall of 2007, 2,732 students
participated in dual enrollment in the University System of Georgia with 906 of those
students attending GPC. GPC indicated that 42.3% of the 2007–2008 students earned an
A and 91.6% earned a C or better in their courses. GPC found that two-thirds of the
students continued their education at baccalaureate institutions.
While studying the University of Texas-Pan American students’ dual enrollment
participation, Hinojosa and Salinas (2012) found that dual enrollment students were
retained from first year to second year at a greater rate, 80.3%, compared to non-dual
enrollment, 62.2%. Dual enrollment students’ average GPAs were higher at 2.74,
compared to 1.99 for non-dual enrollment students. The degree completion data also

62 showed that dual enrollment students finish sooner: The four-year graduate rate of dual
enrollment students was 26.5% compared to 2.7%; the five-year rate, 44.8% for dual
enrollment versus 14.3% for non-dual enrollment; and six-year rate, 54.0% versus 24.1%
respectively.
After reviewing the data of 3,000 students who graduated from the first set of 64
early colleges, Hoffman and Vargas (2010) found that students had earned an average of
20 or more credits, 25% had earned associate degrees, and 86% had enrolled after high
school at institutions of higher education. One specific effort highlighted by Hoffman and
Vargas included Hidalgo Independent School District in Texas. Hidalgo is on the Texas-
Mexico border, and has a 99.5% Hispanic American student population. Limited in
English proficiency and struggling with low-income, over 95% of the class of 2010
graduated with college hours. This number has grown from the class of 2008 from which
only 48% graduated with dual enrollment hours.
Dual Enrollment in Ohio
This section provides an overview of literature of dual enrollment in Ohio.
Programming, funding, and data are reviewed. Also included is a description of the
program of interest for this study, PSEO.
Programming.
Specifically referring to Ohio’s Post-Secondary Enrollment Options (PSEO)
program is Chapter 3365.02 of the Ohio Revised Code, which provided the legal
definition of PSEO in Ohio (Ohio Revised Code, 2007b). The definition confirmed that
Ohio high school students can “enroll at a college, on a full- or part-time basis, and
63 complete nonsectarian courses for high school and college credit” (p.1). Various
procedural requirements are outlined within the complete Chapter 3365 including the
notification of the Ohio Department of Education regarding participation; the funding
restrictions and counseling requirements; understanding enrollment options; and
furnishing supplies. The original PSEO legislation in 1989 prescribed participants to be
students in the eleventh and twelfth grades. In 1994, the legislation was amended to
include ninth and tenth grade students (Ohio Department of Education, 2002).
While PSEO is one dual enrollment opportunity in Ohio, the Ohio Revised Code
(ORC) has identified multiple opportunities for establishing dual enrollment programs
and funding plans between individual schools and postsecondary institutions. All ORC
references to PSEO and dual enrollment are outlined in Appendix A; however, a few
notable laws for PSEO include two, 3313.6013 and 3365.02. The first, 3313.6013 (Ohio
Revised Code, 2012), defined dual enrollment as a means for students to earn college
credit while in high school that perhaps can be applied to an academic degree if the
student has satisfactorily completed the minimum requirements for the coursework. All
public school districts are required to offer at least one of the three dual enrollment types:
1) PSEO, 2) Advanced Placement, and 3) similar agreement to PSEO bilaterally
determined between a school district and a college or university. The second, 3365.02
(Ohio Revised Code, 2007b), established the PSEO program and provided definitions and
requirements associated with the program. The Code indicated that the PSEO program
allowed Ohio high school students to enroll in higher education and earn academic
standing for high school and college credit simultaneously.
64
In recent years, the state of Ohio has attempted multiple strategies for increasing
participation in dual enrollment programs. Through state legislation and associated
grants, Ohio has supported PSEO in addition to components included in House Bill 115
in 2006, in House Bill 119 in 2007, and the Seniors to Sophomores initiative in 2008.
Each attempted to improve funding for dual enrollment, student eligibility requirements,
and rigorous instruction. While grant money was available, each program was sustained,
but none is still widely active in the state.
House Bill 115 provided $3.6 million in grant funds to “increase the number of
high school students earning college or dual credit in the high school setting and to build
statewide capacity to deliver high quality coursework and instruction in mathematics,
science, and foreign language” (Ohio Department of Education, 2006, p. 1). House Bill
115 encouraged a regional approach of Ohio counties to work as partners with
educational service centers, high schools, and colleges or universities. Each region could
submit a grant application to support personnel for coordinating and promoting the
program, teacher graduate level education (i.e., to earn credits for college teaching
credentials), meetings to develop regional funding agreements, etc. House Bill 119 was a
continuation of the work identified in House Bill 115 as it encouraged dual enrollment
agreements at a regional level (Ohio Department of Education, 2007).
Seniors to Sophomores was the most recent mention in the ORC, Chapter 3365.15
(2009i) as a dual enrollment program, but the legislation does not provide details about
the program. Budgeted at $5.675 million, the Seniors to Sophomores program was
created under former Ohio Governor Ted Strickland and former Ohio Board of Regents’

65 Chancellor Eric Fingerhut to provide high school seniors an opportunity to take college
level courses full-time during the senior year in order to earn credit toward college
graduation, skipping the college freshman year (Ohio Board of Regents, 2008b). Seniors
to Sophomores was also an attempt to create program-wide student eligibility
requirements. While PSEO admission requirements are left to the discretion of colleges
and universities, the Seniors to Sophomores program required each college and university
accept students who had passed “all parts of the Ohio Graduation Test,” completed
“Algebra II or the equivalent with a grade of “C” or better,” completed “three years of
high school English with a grade of “C” or better,” and scored remediation-free on the
college’s or university’s placement assessment (Ohio Board of Regents, 2008b, p. 1).
Former Ohio Governor Ted Strickland announced a grant opportunity for school
districts to apply for a Seniors to Sophomores “Early Adopter” school status (Ohio
Democratic Party, 2008). The grant provided up to $100,000 to help districts pay for
expenses including personnel to coordinate and promote the program, tuition, textbooks,
placement examinations, meeting expenses, conferences, and marketing materials (Ohio
Board of Regents, 2008a). During the Early Adopter grant phase, school districts,
colleges, and universities were charged with creating a local system of payment of tuition
and other expenses for the future of the program.
A more recent initiative encouraged by the Ohio Board of Regents (2012) was the
“Three-Year Degree” (p. 1). Legislatively addressed in the Ohio Revised Code 3333.43
(2011a), “Universities are required to develop a plan for a three-year baccalaureate
degree which can include courses that are completed through PSEO” (p. 1). Three-year
66 degrees are developed by Ohio’s colleges and universities to provide paths for students to
begin college education during their high school years and hence complete a bachelor’s
degree in three years (Ohio Board of Regents, 2012a). The Board of Regents described
the pathways as PSEO, Advanced Placement (AP) courses, Career-Technical Credit
Transfer, or Early College High Schools. AP classes are offered at high schools in
specific subjects at the end of which an AP exam is administered for a fee. Students who
earn a 3, 4, or 5 on the exam score will be guaranteed college credit at Ohio’s public
higher education institutions. Career-Technical Credit Transfer (CT2): Students who
participate in Ohio’s high school and adult career-technical programs can earn CT2
credits, which are transferable to colleges and universities with similar programs. Early
College High Schools (ECHS): A national initiative, ECHS enroll high school students
on a college campus to earn both a high school diploma and credits toward a college
degree.
Ohio data reports.
Two public reports about Ohio’s PSEO program have been published that focused
on student participation, performance, and funding. The first report, from the Ohio Board
of Regents (2002), offered limited information about student performance and was
focused more on participation information. The report indicated that in fall of 2000, over
7,000 high school students enrolled in Ohio’s public institutions. Those participants may
have been high school seniors, but also “may have been high school students with other
class ranks as well” (p. 1). Beyond the participant numbers, the Ohio Board of Regents
indicated that the school district types represented by participating students were “all
67 types … although they were least frequently coming from major city school districts with
extremely high poverty rates” (p. 1). Additional information included a 5% representation
of students from rural high poverty districts, 5% from suburban and urban with very high
socio-economic status (SES), 3% from suburban with very high SES, and 5% from small
town with very high poverty, among other types.
The other report of publicly available PSEO information was written by Blanco et
al. (2007) and examined PSEO data with most attention on academic year 2004–2005.
Blanco et al. provided overall number of participants; participation by subject area; top
course enrollments; credit hours attempted; participation by county, campus type, race,
and gender; first to second year persistence in enrollment; attainment of degrees; amount
of time to degree completion; median years to completion; and remedial coursework
completion. For the 2004–2005 academic year, Blanco et al. reported that 12,635 or 5%
of Ohio high school students participated in PSEO. Most participants were located in the
northern part of state, with lower numbers of participants in Cincinnati, Columbus, and
rural areas. Participant race was notably 90% White, non-Hispanic and 6.5% Black, non-
Hispanic. Most participants, 70%, were in grade 12. Students primarily were enrolled in
arts and humanities courses, 37%, and were enrolled in more than one course, 1.89
average courses. Two-year colleges dominated the participation with 83% of participants.
Nearly 71% of students who graduated high school in 2003 enrolled in Ohio public
colleges, compared to 58.7% of all Ohio graduates in 2002. PSEO students continued
their enrollment for a second year at two-year colleges at a rate of 85% compared to 63%
of general population. Of those students who enrolled at four-year institutions for PSEO,

68 93% were retained at four-year institutions, compared to 80% of general population.
Three years after high school graduation, 27% of PSEO participants had earned associate
degrees and 51% continued in college as compared to 11% of general population earning
associate degrees and 47% continuing in college. Six years after high school graduation,
70% of PSEO students had earned a bachelor's degree or higher, compared to 53% of all
students. Students who participated in PSEO were more likely to complete a college
degree: PSEO students earned associate degrees in 2.7 years compared to all students
who completed in 3.8 years; and earned bachelor's degrees in 3.8 years compared to non-
PSEO students who completed in 4.3 years.
Blanco et al. (2007) indicated that only 5% of students participated in the 2004-
2005 school year; students in the program were primarily in the northern part of Ohio;
and diversity was low with 90% White and 6.5% Black student participants. While PSEO
has been found as the “only statewide policy that offers all students the opportunity to
gain early college access and encourages schooling beyond high school,” and Ohio can
“no longer afford to offer early college access to a select few” (p. 5).
Ohio funding.
The PSEO funding formula, coordinated by the Ohio Department of Education,
specifically determines the amount of state foundation funding that will be diverted from
the public schools to the colleges and universities as reimbursements for student
enrollment (Ohio Revised Code, 3365.07, 2009e). Blanco et al. (2007) described the
funding as a reimbursement because the colleges “initially bear the cost of tuition, books,
and fees” on the colleges’ fiscal accounting systems and receive the funds in the

69 following academic year (p.11). Blanco et al. further described the reimbursement as the
“amount subtracted from district’s state funds and paid to postsecondary institution” (p.
11). Because the foundation is “taken away” from school districts and given to the
colleges, Blanco et al. warned that “the current method for funding PSEO is often
perceived as an undue burden on participating high schools/K-12 districts, whose leaders
may object to the loss of state funds when students take PSEO courses” (p. 46). Hence,
one of the primary issues with PSEO: school districts lose significant funds that would
originally have been provided to their budgets but instead are given to the colleges for
PSEO program expenses.
Blanco et al. (2007) indicated, “An opportunity is before our state to forge a
model for dual enrollment that bridges old education boundaries and increases access and
preparedness for all students” (p. 48). Lawmakers and Ohio’s educational leaders are
carefully examining the current funding model of PSEO as well as the return on
investment based on participation numbers. Blanco et al. reported that Ohio spent over
$12 million in the 2004–2005 academic year. While this amount is substantial, colleges
and school districts lose funds with the PSEO program: the student support funding is
transferred from the high schools to the colleges, but the amount of money colleges
receive is less than the costs that are actually incurred. The average amount of
reimbursement received for student tuition, fees, and books “is generally thought to be
somewhere between 70 and 85% for most students” (Ohio Association for Community
Colleges, 2011, p. 7).

70
The process is complicated and manually completed by high school, college, and
Ohio Department of Education (ODE) employees; illustrated in Figure 2:

71
Figure 2. Flow chart of PSEO paperwork process for funding of student enrollment.
As noted in the final portion of Figure 2, the “maximum amount available to the
post-secondary institution” is also the same funding described by Blanco et al. (2007) as
Students enroll at colleges/universities. Colleges and high schools complete and submit reports to the Ohio Department of Education (ODE).
Each high school must complete a “Student Worksheet” form for each participating student from the district. The worksheet includes identifying information about each student along with a step-by-step calculation of the formula for PSEO payments (Ohio Department of Education, 2008).
Colleges and universities complete Form SF-PS-140B to indicate the “total cost of participating public and nonpublic pupils attending post-secondary institutions” (Ohio Department of Education, 2008). Each participating student is identified by the colleges.
ODE personnel manually compare all worksheets to match students with
institutions
ODE confirms the match of student to institution and authorizes payment of the “maximum amount available to the post-secondary institution” (Ohio Department of Education, 2008).

72 the “amount subtracted from district’s state funds and paid to postsecondary institution”
(p. 11).This maximum amount is one of the primary concerns with PSEO: school districts
lose significant funds to the PSEO program. “The current method for funding PSEO is
often perceived as an undue burden on participating high schools/K-12 districts, whose
leaders may object to the loss of state funds when students take PSEO courses” (p. 46).
Blanco et al. (2007) also pointed out that PSEO participation is considered low in
comparison to the large amount of taxpayer funds invested in the program. Blanco et al.
reported more than 55,000 students participated in PSEO between 1998 and 2004. In one
year alone (2004–2005), only 10,819 students participated in PSEO courses and the state
of Ohio allocated $17.8 million for public school students from local school districts to
public postsecondary institutions and another $1.5 million for non-public school students
to public postsecondary institutions. However, while colleges and universities received
the combined $19.3 million, these institutions have indicated an overall loss of funds
because actual costs were $28.6 million for tuition and books, leaving a gap of $9.3
million.
On behalf of the Ohio Association of Community Colleges (2011), the Chief
Executive Officers and the Ohio Council of Chief Academic Officers (2005) declared
their concerns for an equitable dual enrollment cost solution in order to maintain the
existing programs. The Ohio Student Education Policy Institute (2011) suggested that “to
enable all Ohio high school students to access dual enrollment courses, full funding for
student enrollment/attendance needs to be provided to both institutions of higher
education and local school districts. Funding based on the principles of no cost to

73 students and no harm to educational institutions benefits high schools, colleges, and
students” (p. 15).
While the PSEO funding model and process described to this point was current in
Ohio and was followed during the time of the data within this study (2005-2011), a new
model has been identified under state legislation, House Bill 59, within Ohio’s biennium
budget for fiscal years 2014 and 2015 (130th General Assembly of the State of Ohio,
2013). The legislation replaced the terms “Post-Secondary Enrollment Options” with
“College Credit Plus” and “dual enrollment” with “advanced standing.” Most
significantly, the changes affect the funding formula for College Credit Plus. More recent
recommendations for the funding model, released by the Ohio Board of Regents’
Chancellor (2013b), included “ceiling” and “floor” amounts. When students participate in
college courses on a college campus, postsecondary institutions would receive the
“ceiling” amount or maximum of $160 per credit hour per student. When students
participate in college courses at a high school with a credentialed high school teacher,
postsecondary institutions would receive the “floor” amount or a minimum of $40 per
credit hour per student participating.
While research and scholarly literature are increasingly becoming available on
dual enrollment, much is left to learn on programming and funding to ensure
effectiveness and efficiencies. Additionally, in the next section, the research of the
theoretical framework of this study provides a context for understanding the balance
between decision making on funding and the implications on student access to higher
education.
74 Theoretical Perspectives
Socialization and intervention.
Karp (2012) identified a theoretical framework with a focus on socialization in the
college environment. Karp’s framework was an attempt to “help focus our expectations
and articulate to policymakers why this intervention [dual enrollment] is an important
strategy for increasing college success rates” (p. 21). The framework described dual
enrollment as a social intervention during which students learn about college
expectations, interactions, and behaviors. The “role” of college student allows dual
enrollment students to gain “early exposure and practice, coming to feel comfortable in a
college environment” (p. 23). Dual enrollment students get to experience college life
before making the final transition out of high school. This creates a strategy that helps
students matriculate and succeed in postsecondary education.
Karp (2012) used this framework in an actual dual enrollment setting by
conducting interviews with 26 high school students in New York City at two community
colleges. After interviewing these students, Karp’s findings included that the high school
students could accurately describe the role of a college student. Students reported a need
to take responsibility and to show initiative in their dual enrollment courses. Karp
emphasized that these students were not told what roles of college students were; rather,
they experienced the roles and defined by themselves.
Economics, sociology, and political science framework.
While Karp’s theoretical framework would be useful for studying students who
are not typically considered college-ready, this study selected a theoretical framework

75 that broadly included economic, educational, and equity issues surrounding dual
enrollment. St. John’s framework can be used to evaluate education and financial burdens
on taxpayers and students. The framework was built on the foundation of three theories
informed by others: 1) Social Justice, by Rawls (1971); 2) Human Capital, by Becker
(1993); and 3) Cultural Capital, by Bourdieu (1977 and 1990). St. John’s framework
connects these areas within the fields of sociology, political science, and economics to
the financial implications of education. For purposes of this study, the framework
provided a unique look at dual enrollment.
Assumptions of St. John’s framework.
St. John (2003) suggested that as policy makers consider the use of taxpayer funds
to support educational programs, they must take into account six cultural assumptions as
the foundation for making legislative changes, which may affect higher education
opportunity. St. John was most concerned about the availability of financial assistance for
students to increase higher education access either directly (e.g., student financial aid) or
indirectly (e.g., programming such as dual enrollment).
The first assumption of St. John (2003) was that “the concept of social justice
provides a way to think about crucial indicators for assessing the efficacy of financial aid:
access to postsecondary education, equity of participation across diverse groups, and
efficient use of tax dollars” (p. 51). St. John introduced social justice by indicating that all
students, regardless of family income, should have opportunities to become part of an
educated society without the barrier of finances. Social justice reminds policy makers that
equal access provides a sense of fairness for all citizens. St. John suggested that social

76 justice “indicators provide a basis for assessing whether access and equity are being
provided at a reasonable cost to taxpayers” (p. 51).
St. John’s (2003) second assumption was that “in addition to providing the
conceptual basis for need-based student financial aid, economics has provided a rationale
for appeals for funding of higher education and student aid (human capital) and a
framework for evaluating the effects of student aid” (p. 51). St. John introduced
economic theory as a “basis for assessing need and allocating resources to need-based
financial aid” (p. 51). St. John indicated that policy makers seem to understand the
importance of increasing human capital related to providing more funds for student aid;
however, policy makers fail to avoid political games when student aid funds are debated.
Instead of making decisions based on the value of educating more individuals for positive
economic outcomes, legislators get lost in the “appeals for funding” and focus more on
political alliances (p. 51).
The third assumption, “the tension between social reproduction and cross-
generation uplift can inhibit efforts to improve postsecondary access through school
reform, postsecondary encouragement, and financial aid,” was based in the political
science field (St. John, 2003, p. 52). St. John emphasized the theory of social justice as it
relates to the importance of ensuring postsecondary access for all citizens. Social
reproduction, or the cultural and familial history, specifies that an individual’s decisions
and choices are rooted in family history. This determination of a person’s future based on
history is in contrast to cross-generation uplift, which is the concept that the success or
achievement of the current generation is assisted and encouraged by previous generations

77 (p.43). The very social context in which an individual learns family values and
characteristics may create a conflict in the individual’s future educational choices. The
tension between pursuing postsecondary education when the family does not have a
strong educational background is a hindrance. Beyond the individual, the current
generation must also consider supporting future students with educational investments
(i.e., taxes). Depending on the history of the generation, the support for investment may
instead provide obstacles for policy and educational reform.
St. John’s (2003) fourth assumption was that “the shifts in focus of educational
reform—from equal access to quality education and improvement in outcomes—
complicate efforts to assess the role of academic preparation in promoting postsecondary
access” (p. 52). Policy, which focuses solely on academic preparation by way of
educational reforms implemented in the classroom, may overlook the importance of
ensuring equal access. As policy makers restrict decisions made specifically on whether
the educational system is preparing students for postsecondary education, they may miss
the importance of ensuring that students have the assistance of financial aid and that the
reforms are “addressing the learning needs of diverse populations” (p. 52). St. John
indicated that policy makers tend to focus on making change recommendations so
intently that they lose sight of ensuring that the changes are actually helping: “They
seldom ask whether the reforms they advocate have actually helped improve academic
preparation and college access” (p. 52).
The fifth assumption of St. John (2003) introduced sociology’s cultural capital:
“Postsecondary choices are made in situated contexts—prior family experiences and

78 educational choices—that both constrain and enable educational attainment processes”
(p. 53). Cultural capital influences student choices of access and persistence. The life in
which a student has been raised, both within a family and within a secondary school,
influences the next steps of the student in his educational journey. Thinking about college
as an option, let alone planning for it, may be negatively or positively swayed depending
on the cultural capital a family has created for the student. A student can be “constrained”
by the history of the family when making choices about postsecondary institutions, when
preparing for college education, and when determining sources of funding. In contrast, a
student can also be enabled by the same history by determinedly wanting to change the
future. However, policy makers must consider whether educational reforms and available
financial aid strain those decisions even further. If an individual is constrained by family
history, the lack of financial assistance or the lack of reforms to aid all learners will
hinder the individual even further. Persistence is impacted when a student is faced with
expensive educational choices each year. Again, will legislative action enable or
constrain the forward momentum of a student’s educational progress?
The sixth assumption of St. John (2003) is that “policy formulation is a political
process that can be informed by rational arguments and research evidence” (p. 53). St.
John’s final assumption is that policies are based on a combination of evidence and
politics. However, St. John indicated that decisions are not based often enough on
research evidence: “There have been times when research evidence has been used to
inform policy, but most decisions about federal student aid and state financing of colleges
and students remain essentially political” (p. 53). In fact, St. John accused policy makers
79 of looking for specific research that supports their decisions, rather than using research to
inform their decisions: “to filter through research evidence to find studies that support
their positions” (p. 53).
As precautionary advice, St. John’s (2003) assumptions remind educational
leaders, legislators, and tax-paying citizens to avoid succumbing to the mistakes previous
leaders have made. Educational reforms and legislative amendments may be made with
the best of intentions, but history has taught that falling victim to the assumptions will
lead to backsliding instead of progressing forward with higher educational opportunities.
By completely understanding the data with a broad vision of all the issues instead of
narrow gains, carefully weighing the options of change with an eye toward human and
social capital theories, and understanding how familial influence and capital culture can
hinder rather than help will allow leaders and legislators to fully base the intended
educational reform in the foundation and perspective that St. John’s framework was
intended.
Overview of St. John’s influences.
As noted, St. John (2003) based his framework on three distinct areas with three
fields of study: 1) Social Justice and Sociology, influenced by the writings of Rawls
(1971); 2) Human Capital and Economic Theory, based on Becker’s teachings (1993);
and 3) Cultural Capital and Political Science inspired by the works of Bourdieu (1977
and 1990). The following information summarizes each theorist’s points in relation to St.
John’s framework.

80 Rawls’ social justice: Political science.
John Rawls’ (1971) work began with descriptions intended to help the reader
understand the concept of social justice. He described that society and the establishments
within must work to “distribute fundamental rights and duties” in order to develop social
justice (p. 7). Within society, “social cooperation” is the basic understanding of rules
within the society that keep the peace and clarify the consequences for those that do not.
Social justice focuses on equality of individuals, specifically “in the assignment of rights
and duties.” Inequalities may exist in a just society, such as prosperity and power among
individuals, but “wealth and authority … are just only if they result in compensating
benefits for everyone, and in particular for the least advantaged members of society” (pp.
14-15).
Also concerned about social justice in the future, Rawls (1971) indicated that
decisions made in the present must be focused on how future generations will be
impacted. “Savings” and investments, as described by Rawls, should be sought by
society—one cutting costs and the other using wealth to invest in societal needs, but
neither should be at the cost of hurting future generations: “Each generation must not
only preserve the gains of culture and civilization, and maintain intact those just
institutions that have been established, but it must also put aside in each period of time a
suitable amount of real capital accumulation” (p. 285). While savings and investments
can come in the form of investing in “machinery” or other tangible items, education is
also an investment that Rawls encourages (p. 285).

81
Rawls’ (1971) theory of social justice focused on the ideas that 1) all individuals
should “have an equal right to the most extensive liberty,” 2) where inequalities exist,
these must be “reasonably expected to be to everyone’s advantage and attached to
positions and offices open to all,” and 3) “distribution of wealth and income … must be
to everyone’s advantage” (pp. 60-61). By considering all three principles for the purpose
of decision-making, Rawls cautioned policy makers to think about the consequences of
neglecting one or more of these when discussing educational reform and financial aid.
Although making decisions related to expanding access for as many citizens as possible
may seem positive for all, when considering educational reform, lawmakers should
determine if the reform benefits or expands opportunity for selected groups. When
considering justice for taxpayers, Rawls stressed the importance of understanding the
burden of additional costs to the taxpayers.
Based on Rawls’ (1971) theory, St. John (2003) stressed that society and
legislators must be concerned with the “three dimensions of social justice in college
finance: 1. access for the majority … 2. equal opportunity to enroll … 3. justice for
taxpayers” (p. 17). St. John emphasized each by stressing “a need to balance the interests
of three groups—the majority of students, who are mostly middle-class; low-income
students, disproportionately represented in African American and Hispanic populations;
and taxpayers—as we develop and test new financing strategies” (p. 30).
Becker’s human capital: Economic theory.
Economic theory with regard to higher education is important to understand when
politicians and economists announce the need for more Americans to earn college
82 credentials to affect the nation’s economy. St. John (2003) indicated that “economic
theory is important not only because it provides a rationale for public funding but also
because it provides the underlying rationale for using need-based financial subsidies to
equalize educational opportunity” (p. 40). Tying decisions about economic development
to educational opportunities is based on the idea of creating human capital—investments
made in education and in individuals seeking to accumulate additional educational
qualifications.
Becker’s (1993) economic theory of human capital indicated that investments in
people for educational purposes have specific costs and benefits associated. As legislators
decide on financial aid policies, they have direct impact on access and completion of
postsecondary education. While placing a “price” on individuals may seem harsh, Becker
indicated that humans are capital “in the sense that they [expenditures for schooling]
improve health, raise earnings, or add to a person’s appreciation of literature” (pp. 15-
16). Therefore, Becker confirmed that “expenditures on education, training, medical care,
etc., are investments in capital” (p. 16). Becker described this as a necessity because
“education and training are the most important investments in human capital” (p. 17).
The impact on a nation of human capital is also evident as Becker found that “the
earnings of more educated people are almost always well above average” (p. 17). Becker
cited studies from the 1980s which indicated that “talk about overeducated Americans
has vanished, and it has been replaced by concern once more about whether the United
States provides adequate quality and quantity of education and other training” (p. 17).
Recent studies are continuing to indicate that Americans are not overeducated. Carnevale

83 and Rose (2013) confirmed, “The United States has been underproducing college-going
workers since 1980” (p. 1). Human capital will continue to decline if the lower college-
going rate remains on the same trend: “Without enough talent to meet demand, we are
losing out on the productivity that more postsecondary-educated workers contribute to
our economy” (p. 8).
Also part of the human capital equation is the impact of families. The preparation
of a child for education begins in the family context: “Even small differences among
children in their preparation provided by their families are frequently multiplied over
time into large differences when they are teenagers” (Becker, 1993, p. 21). Becker
described the impact of familial income on educational pursuits. “Richer families” can
support the education and training of their children without concern for the costs at the
present time. Becker indicated that poorer families may wish to support their children but
have determined the risk of investing in their children’s future is outweighed by the loss
of money in the present. With this in mind, Becker confirmed, “one solution is for
governments to lend money to students when their parents are unable or unwilling to
finance the training” (p. 22). However, Becker found that “the program has serious flaws,
including low caps on the maximum amounts that can be borrowed, misplaced and
excessive subsidies, and shockingly high default rates” (p. 22).
Becker’s (1993) theory also pointed out the need for the nation to be concerned
about human capital for the health of the economy. The economic relationship between
input and output factors creates the wealth of a business, and in this case, of the nation.
Thus, what we put into it has a positive relation to what we get out of it: “The systematic

84 application of scientific knowledge to production of goods has greatly increased the value
of education, technical school, and on-the-job training as the growth of knowledge has
become embodied in people—in scientists, scholars, technicians, managers, and other
contributors to output” (p. 24).
Bourdieu’s cultural capital: Sociology.
St. John (2003) examined Bourdieu’s (1977) sociological theory that imparted
that individuals can be hindered from attaining higher education based on the habitus in
which an individual lives. In a later publication, Bourdieu (1990) indicated that the
habitus comprises an individual’s history and familial demands placed on the individual.
Habitus can also be considered as history within the family that has created future family
members’ nature. This is much more than family tradition; rather, it is “socially
constituted and constantly reinforced by individual or collective sanction” and
“consciously maintained loyalty” (p. 291).
The habitus influences the social reproduction for individuals and families: The
“immanent law, lex insita, laid down in each agent by his earliest upbringing” (Bourdieu,
1990, p. 81). St. John (2003) indicated that social reproduction “is a major inhibiting
force in educational attainment” (p. 44). St. John described Bourdieu’s theory as an
analogy: “Education is to cultural capital what money is to economic capital” (p. 44).
Bourdieu (1990) confirmed that just as money and “economic wealth” has no real
worth as capital until it is used within “an economic field,” cultural capital means little
until it is placed into a situation that values it such as “the relationship between the
educational system and the family” (p. 124). An individual must have education to

85 accumulate cultural capital, much as individuals must have money for economic capital.
However, similar to money, “educational qualifications … have a conventional, fixed
value, which is freed from local limitations” and by adding qualifications to an
individual’s cache, the habitus can be reformed for future generations. Bourdieu (1977)
indicated, “The habitus acquired in the family underlies the structuring of school
experiences … and the habitus transformed by schooling … in turn underlies the
structuring of all subsequent experiences” (p. 87). Unfortunately, Vargas (2004) also
pointed out that access to “college knowledge” which helps lead individuals to gain
cultural capital is limited. The individuals “who have the greatest need” such as “low-
income, minority, and first generation” have the least likely chance to gain college
knowledge and, therefore, may not seek college education, further perpetuating their
habitus (pp. 5–7).
Because the existing habitus may impede an individual’s accumulation of
education due to constraints and expectations of family, individuals must choose new
opportunities to overcome the family’s norm in order to restructure the family’s habitus
for the future.
Practical Application of St. John’s Framework
National economic recovery.
St. John’s (2003) framework can be used in a practical manner by applying the
three tenets of social justice, human capital, and cultural capital to dual enrollment and
economic recovery. By examining and utilizing the framework in a pragmatic manner,
the nation and Ohio’s interest in economic recovery could be aided by encouraging more

86 students to participate in PSEO. Further evidence of needing to apply the framework of
St. John (2003) is the current legislative and administrative discourse about the nation’s
economic recovery from the recession. Resolutions proposed to help with the recovery
include an increased number of American citizens who could earn college credentials.
The rhetoric surrounding the link between educational attainment and economic
development can be found in a variety of published accounts: from daily newspapers, to
online blogs to government reports to publications within respected journals. The concern
about the shortcoming of citizens with college degrees is not merely to be the “best” in
the world; rather, evidence points to significant economic development and growth
(Berger et al., 2013). The U.S. Department of the Treasury (2012) confirmed, “American
companies and businesses require a highly skilled workforce to meet the demands of
today’s increasingly competitive global economy” (p. 1). The Treasury reported benefits
of college education including the statistics of earning more and having a lower chance of
enduring unemployment. Unemployment rates are more than double the rate for
individuals with high school diplomas, 9.4%, compared to bachelor’s degrees completers,
4.9%. Barnett and Stamm (2010) reported that employers have a need for more
thoroughly prepared employees with an increased level of preparation for a variety of
jobs in the “21st century globalized economy” (p. 9). The National Commission on the
High School Senior Year (2001) indicated that the issue of degree attainment goes
beyond the economic recovery, rather “if democracy is to prosper … all Americans must
possess the high levels of literacy and logic and the capacity to think critically” (p. 9).
The national perspective of degree attainment is summed up by Day and Newburger

87 (2002) for the U.S. Census Bureau, which described the “compelling reason” for
Americans to attain college degrees is to support the “future economic success” of the
United States (p. 1).
Additionally, Day and Newburger (2002) reported that those with additional
education benefit their children: “Education significantly increases the ability of children
to move up the economic ladder” (p. 1). Children of individuals who have earned
bachelor’s degrees “will attain a higher income quintile by adulthood” with a likelihood
of 55% while those without a degree have a much lower, 31%, chance (p.4). This is
further supported by research of Georgetown University’s Center on Education and the
Workforce by Carnevale and Rose (2013) which pointed out that “economic growth in
the United States has been tied to technological change” and “it is no coincidence that the
expansion of American higher education occurred as the nation was enjoying economic
growth and global economic domination. Education was a primary driver of that growth”
(pp. 12-13).
Ohio’s economic recovery.
Within Ohio, the Ohio Board of Regents (2012a) declared that “every one percent
increase in the total number of bachelor’s degrees translates into an estimated $2.5 billion
in increased economic activity per year and every year thereafter” (p. 4). Policy makers,
legislators, and institutions point to the need to increase educational attainment among
citizens in order to improve the economic health of the state: “If Ohio’s economy is to
thrive and grow, we must provide business with a continual pipeline of highly skilled
workers” (p. 6). The Ohio Board of Regents’ (OBR) Strategic Plan (2008c) for 2008

88 through 2017 indicated the State’s higher education institutions should create
opportunities for more citizens to seek education with a variety of initiatives and policy
changes. The Strategic Plan was in response to former Ohio Governor Strickland’s 2008
call for Ohio’s higher education institutions to raise the college going and degree-
attainment rates. The Governor’s goal was to enroll 230,000 more students by the year
2017 and graduate an additional 20%. The OBR predicted that “if the State of Ohio is to
grow and prosper, it must raise the educational level of its population” (p. 9). At the time,
Ohio’s degree attainment rate was deteriorating, and OBR indicated, “Knowledge is the
currency of the global economy, and our currency is getting weaker. The per capita
income of Ohioans has been slipping relative to the rest of the nation for some time …
The only way to reverse this negative trend is to raise the overall educational attainment
level of the state” (p. 15).
The Board of Regents’ University System of Ohio Complete College Ohio Task
Force (2012a) found that “the vast majority of Ohio’s projected job openings and new
jobs in the future—nearly 60% by 2020—will require some form of credential from
education and training beyond high school” (p. 7). A recent publication by the National
Center for Education Statistics written by Hussar and Bailey (2013) pointed out that
while the number of degree attainers in the United States has grown since 2003, Ohio’s
degree attainers are actually decreasing and are projected to continue the decline through
2022. Multiple reasons for this decline have been summarized within the Secretary of the
U.S. Department of Education’s (2006) report from the Commission on the Future of
Higher Education. These include high schools that do not see preparing students for

89 college education as imperative or their responsibility, the lack of college information,
the scare of rising costs, and a “confusing financial aid system that spends too little on
those who need help the most” (p. vii). Without increasing the number of degree
completers in Ohio, the Regents (2012c) predicted, “Ohio will be left behind in the fierce
competition for investment and jobs” (p. 8). The road to economic recovery will be a
dead end.
Summary
By fully examining the literature in which existing dual enrollment programming,
funding, and student performance are discussed and the foundations of St. John’s (2003)
theoretical framework for educational access, lawmakers, and educational leaders can be
more fully informed about strategies for economic recovery. The literature from the
national perspective on dual enrollment indicated that dual enrollment could be a
successful path for creating educational opportunities for students and thereby potentially
affecting economic recovery and growth. Ohio’s research also indicated a solid
improvement of educational access and attainment using PSEO; however, gaps in
research that exist compel researchers to avoid making the assumptions listed by St. John
including ensuring that existing evidence is broadly understood before making reforms
that could negatively impact forward momentum. Having a true picture of Ohio’s
programming and funding will provide legislators with rich data for decision-making.

90
Chapter 3: Method
This chapter includes the description of the methods utilized within the present
study to examine access to Ohio’s PSEO program, student performance, and student
employment outcomes. Utilizing secondary and primary data within quantitative
databases and qualitative interviews, a multiple methods approach was utilized for this
research. This chapter includes an overview of the data collection procedures for the
study, a description of the population, and summary of the data analysis procedures.
Research Design
To understand PSEO in Ohio, the present study looked at the program through the
lens of St. John’s (2003) framework. To examine this legislative policy for students, the
financial implications for Ohioans, and the demographics of participants, this study
attempted to expand the knowledge first derived from the 2004–2005 data reported by
Blanco et al. (2007). This study utilized existing student data from state databases from
2005 through 2011. The method expanded what Blanco et al. started, which was a
quantitative review of PSEO participation and student performance data. This study
reviewed the same types of data for the entire population of PSEO participants from
2005–2006 through 2010–2011. Additionally, the study isolated the data of a cohort of
students to review participation and performance, degree and certificate attainment, and
employment and earned wages. Finally, qualitative data were added from interviews of
secondary and postsecondary personnel.
The present study built on Blanco et al.’s (2007) work by answering the following
research questions:
91 1. For the Post-Secondary Enrollment Options (PSEO) in Ohio, what were the
enrollment types, performance rates, and locations of students from 2005–2006
through 2010–2011?
a) What are the demographic and background characteristics of those that participated
in PSEO during the academic years of 2005–2006 through 2010–2011?
b) What were the types of courses in which PSEO students enrolled, the number of
credit hours earned, and the cumulative GPAs of students who participated in PSEO?
c) Where were students participating in PSEO during the years of 2005–2006 through
2010–2011?
2. What were the educational and employment outcomes of the 2005–2006 PSEO
cohort? What were the participation levels by race, sex, and income level?
3. What were the perceptions of PSEO for secondary and postsecondary institutions?
Two types of data analysis assisted in exploring and answering these questions.
First, using quantitative methods, the source of data for this study was existing secondary
data from the Ohio Board of Regents’ Higher Education Information (HEI) system,
obtained through a research partnership with the Ohio Education Research Center
(OERC). Initially, a broad look at all PSEO participants from the academic years of
2005–2006 through 2010–2011 was conducted, and was similar to Blanco et al.’s (2007)
descriptive data. Keeping in mind the framework of St. John, the study examined the
breadth of the enrollment within the program (e.g., participation, course enrollment),
equitable participation within the program (e.g., race, sex, poverty), and the performance
of students (e.g., GPA, degree completion). With all PSEO participant data, information

92 about student participation in PSEO and continued college enrollment was reviewed such
as course enrollment, GPAs, and degree completion.
Also continuing with quantitative methods, and extracted from the full PSEO
population, a human birth cohort of PSEO participants was identified: 2005–2006
academic year participants who were born in 1987 or 1988. The cohort’s data were
examined longitudinally in areas such as course enrollment, GPAs, degree completion,
employment, and wage information. Cohort race and ethnicity, gender, and poverty levels
were examined to provide context within the framework of equitable within educational
opportunities.
To extend the review of PSEO policy, the second type of data collection and
analysis involved qualitative interviews. High school and postsecondary personnel who
are familiar with PSEO were interviewed in order to identify perspectives about PSEO
funding and programming. The personnel interviewed had roles in which they were
responsible for or oversee PSEO at their high schools or higher education institutions.
The institutions selected were based on those that have the greatest and fewest PSEO
participants in a cluster of schools in both rural and urban types of communities. The
design, utilizing extreme case sampling, was best for this study because the greatest and
lowest participation numbers can provide the context of an exploratory approach to
understanding PSEO programming. Patton (2002) described extreme case sampling as
the strategy that “involves selecting cases that are information rich because they are
unusual or special in some way” (pp. 230-231). Further, Patton indicated, “the logic of
extreme case sampling is that lessons may be learned about unusual conditions or
93 extreme outcomes that are relevant to improving more typical programs” (p. 232). Thus,
by learning from institutions with high and low participation numbers, all of Ohio’s
institutions can benefit from these case studies.
The main focus of this study was on quantitative data analysis and a minor focus
on qualitative data. Patton (2002) indicated, “Because qualitative and quantitative
methods involve differing strengths and weaknesses, they constitute alternative, but not
mutually exclusive, strategies for research” (p. 14). With this research, the intention was
to use both forms of research methods to merge the information at the end, which
Creswell (2009) described as “a primary aim to collect one form of data (say quantitative)
and have the other form of data (say qualitative) provide supportive information” (p.
208).
Combining methods also allowed for triangulation of data, which helps the
research avoid becoming “overreliant on a single research method” and allows for “more
than one measurement procedure when investigating a research problem” (Bryman, n.d.,
p 1). Adding qualitative research to a primarily quantitative focused study allows “a way
to discuss directly the issues under investigation and tap into participants’ perspectives
and meanings” (Johnson & Onwuegbuzie, 2004, p. 19). This research used concurrent
embedded strategy triangulation which, described by Creswell (2009), as the strategy in
which data collection occurs concurrently but “has a primary method that guides the
project and a secondary database that provides a supporting role in the procedures” (p.
214).

94
The “dominant status” of the research was quantitative and is visually depicted by
Johnson and Onwuegbuzie (2004) as “QUAN” whereas the exploratory qualitative part
of the study can be represented as “qual” (p. 22).
Figure 3 provides a visual representation of the multiple methods for this study.
Figure 3. Depiction of data collection and analysis process
Quantitative Data Collection
Identification of the population and cohort.
Existing secondary data were accessed from the Ohio Board of Regents’ Higher
Education Information (HEI) system via the Ohio Education Research Center (OERC).
The population for this study was the entire population of PSEO participants from
academic years 2005–2006 through 2010–2011. This population was chosen to add to the
timeline continuum available after the Blanco et al. (2007) report. Utilizing all student
Data Collection & Analysis
95 information allowed for an overall perspective of student participation and performance
in college courses.
In addition to an overall examination of all PSEO participants, this study
examined longitudinal data for a cohort of PSEO participants. A cohort was studied to
further utilize St. John’s (2003) framework of equitable participation. The cohort data
were extracted directly from the full population of PSEO participants’ data and the
individuals were identified as part of the cohort based on the birth years of 1987 and
1988. The descriptive data obtained included course enrollment, credit hours, GPA,
degree completion, and economic factors such as employment and wages, gender, race,
and poverty level. Information identified for the cohort included GPAs, cumulative credit
hour averages, certificate or degree completion from the Ohio Board of Regents database.
Data from the Ohio Department of Job and Family Services via the OERC were accessed
to inform the study about the cohort of students’ employment and wage information.
The data of the cohort were examined to compare characteristics of sex, race and
ethnicity, and poverty levels. These comparisons of differences helped to determine if
participation in the PSEO program is equitable among Ohio’s students as part of
exploring the St. John (2003) framework.
Race and ethnicity are captured as one variable within the Ohio Board of Regents’
Higher Education Information (HEI) system. To examine equitable participation in the
program, the “race/ethnicity” variable was used to determine if students of all races in
Ohio are participating.

96
This study also reviewed equitable participation based on poverty level. No single
identifier for socio-economic status or levels of poverty was available through the
existing data from the Ohio Board of Regents’ Higher Education Information system;
therefore, this study identified poverty indicators by using ZIP codes of students’
permanent residences. Utilizing the data within the American Community Survey (ACS)
of the U.S. Census Bureau (2012), percentages of individuals living below the poverty
level within ZIP codes of Ohio were associated with PSEO participants.
While many of the ZIP codes are contained within ACS, not all were represented.
When poverty level was not available for a ZIP code, other indicators were used for
informational purposes only. These indicators provided real estate home values and
household income measures. One such indicator was real estate values using data from
the National Association of Realtors’ (NAR) website. With over one million members,
the NAR is America’s largest association (2014) whose members are residential and
commercial realtors. The NAR provided information such as average home price and
median household income within communities throughout the United States.
One final indicator for income, for the small number of ZIP codes that are not
included within the NAR database, was estimated median value of houses and
condominiums provided by Advameg, Inc.’s website. Advameg, Inc. (2014) has fifty
informational websites and utilizes information from “a variety of reputable sources”
which is “accurate, high-quality and easily understandable information” (p. 1). Advameg,
Inc. indicated that the source of information for “recent home sales, price trends, and
home value evaluator” was Onboard Informatics. Onboard Informatics (2014) is a
97 consulting company that provides information to clients, such as Advameg, Inc., about a
variety of topics. Onboard Informatics used “hundreds of data sources from national
sources like the Census, FBI and Bureau of Labor Statistics to local Assessor, Clerk, and
Chambers of Commerce” (Onboard Informatics, 2014, p. 1).
These indicators are provided for the small number of ZIP codes that were not
covered by the ACS. While interesting and informative, the other indicators were to
provide community information only. To use these other indicators in any other way was
not supported by any scholarly literature. For that reason, the only credible source to use
as a proxy indicator for this study was the ACS.
Existing secondary data were obtained from the Higher Education Information
(HEI) system of the Ohio Board of Regents (OBR) and the Unemployment Insurance
(UI) Wages dataset of the Ohio Department of Job and Family Services (ODJFS). The
data were utilized to generate descriptive statistics with the Statistical Package for Social
Sciences (SPSS) software. SPSS is a widely used software that allows the researcher to
input individual data records, identify multiple variables for each record, perform data
analysis procedures, and visually represent data with graphics (IBM Corporation, 2012).
From the SPSS generated reports, the data were examined within Microsoft Excel to
produce tables and figures.
The secondary data from OBR and ODJFS were obtained via a formal request
process through the Ohio Education Research Center (OERC). The OERC developed the
Ohio Longitudinal Data Archive (OLDA) beginning in 2011 as part of a grant award to
ODJFS under the federal Workforce Data Quality Initiative (Neilson, 2013). The OLDA
98 “provides centralized access to cross-matched, longitudinal data to support the education
and workforce research priorities of the Ohio Education Research Center and Ohio’s
public agencies” (p. 1). The OERC (2012), based at The Ohio State University, is
comprised of “six universities and four research organizations that connect research,
education, and policy for Ohio’s schools” (p. 1). The OLDA initiative is managed by The
Ohio State University’s Center for Human Resource Research (CHRR).
The OERC has established procedures for obtaining the restricted student-level
data in order to protect the privacy of the records within the OLDA system. In order to
request the data, the “OLDA Research Request for Data” form must be completed and
provided to the CHRR. The form requires information about the researcher, the research
questions and data usage, the research design, Institutional Review Board (IRB)
confirmation of review, project timeline, and secure data access plan. The “Ohio
Workforce Data Quality Initiative (OWDQI) Database Data Sharing Agreement” form is
the contract between the researcher and The Ohio State University detailing the “legal
terms of the agreement” (Neilson, 2013, p. 1).
Following submission of those documents, CHRR personnel reviewed the
proposal and determined if eligible for approval. The CHRR personnel routed the request
to the appropriate state agencies from which the data originated. After approval of the
proposal, the CHRR prepared the data for the researcher’s use. The researcher was
required to complete the Collaborative Institutional Training Initiative human subjects
training for The Ohio State University. Prior to publication of the data, the state agencies

99 received a copy of the research findings for a 21-day review period. A research brief was
submitted describing the research and key findings for publication on OERC’s website.
The OERC obtains student archived data from the Ohio Board of Regents. Ohio
public colleges and universities capture course enrollment, student enrollment, student
entrance, and degree completion data within student information systems at various times
during each semester. These data are exported and uploaded to the Ohio Board of
Regents’ Higher Education Information (HEI) system. HEI is a “comprehensive
relational database that includes student enrollment, course financial aid, personnel,
facilities, and finance data” (Ohio Board of Regents, 2012e).
OERC receives information about Ohio employers, employees, and wages from
the Ohio Department of Job and Family Services (ODJFS). ODJFS obtains this
information through a legislatively required process, Ohio Revised Code 4141, also
known as Ohio Unemployment Compensation Law (ODJFS, 2011). The law requires all
Ohio employers to register with ODJFS to pay unemployment compensation taxes
(unemployment insurance) and to report wages paid to employees on a quarterly basis.
The data obtained from ODJFS included employer industry type and quarterly wages
earned for the cohort of students who participated in PSEO in the year 2005–2006.
Employers are identified by NAICS industry codes and wage data are captured monthly
and quarterly for “workers covered by State unemployment insurance (UI) laws and for
civilian workers covered by the program of Unemployment Compensation for Federal
Employees (UCFE)” (Center for Transportation Research and Education, n.d., p. 1).

100 Quantitative variables.
Student-level data provided the basis of the quantitative portion of this study.
Institutions report student enrollment to the Ohio Board of Regents’ Higher Education
Information system with a string of codes for each student including a unique student
identifier, most often the Social Security Number. Also included in the string of codes is
a special status code for participants in the PSEO program (Ohio Board of Regents, n.d.).
These students were the entire PSEO population for this study for each of the academic
years of 2005–2006 through 2010–2011.
For each PSEO participant, variables identify the college enrollment,
demographics, and employment information needed for this study. For this study, the
data obtained through the Ohio Education Research Center (OERC) from the sources of
the Ohio Board of Regents and the Ohio Department of Job and Family Services are
identified by codes and datasets. The complete list of 14 variables for the study is
included in Appendix B.
Fourteen variables within the Ohio Board of Regents database were acquired. The
“Key_ID” variable is the unique student identification number linked to education and
workforce data for that individual. The “HEI_RanID” is used in place of the “Key_ID” if
it could not be generated. The “Special Status” variable identifies whether the student is
enrolled at the institution for PSEO coursework.
The “Student Year of Birth” is the four-digit code based on the year the student
was born. The “Race/Ethnicity of Student” variable has values that are based on a
student’s self-reported race and ethnicity. The “Sex of Student” variable indicates the

101 biological sex or gender of the student. The “Student County of Residence” is based on
the student’s reported permanent residence, and is a two-digit code based on alphabetic
order of Ohio counties. The “Student Zip Code” is the five-digit ZIP code as reported by
the student for their permanent residences.
The “Institution Code-First Institution” is the variable for each of Ohio’s public
institutions. Each has a four-character abbreviation, and “first institution” indicates that
this is the first college or university of the student’s enrollment. The “Course Inventory
Subject Code” denotes the type of course subjects and are assigned values by alphabetical
order. Student records may have multiple course subjects within each individual record.
The “Credit Hours for Course Enrollment” variable is based on the value of credit
hours for which a student is enrolled. The “Cumulative Grade Point Average Hours
Earned” is assigned by the institution and is rounded to hundredths. The “Degree
Certificate Level” is a code representing the type of certificate or degree earned by a
student. The “Year Degree Certificate was Earned” is the calendar year of the term
during which a student earns a degree or certificate.
The four variables from the Ohio Department of Job and Family Services are
distinguished based on the year and quarter during which the information was submitted.
The “Worker ID” variable links with the Ohio Board of Regents’ “Key_ID” variable,
which is the unique student identification number linked to education and workforce data
for that individual. The “UI Account ID, Employer1” variable is the employer which is
associated with the employee for that quarter and year. The “Wages1” variable identifies
the wages paid to the employee for that quarter and year. The “Three Digit NAICS Code”

102 links the employee to the main type of industry for the employer. Over the period of 2006
through 2011, four quarters for each year are associated with each student record.
Missing values.
Institutions upload the data required by the Ohio Board of Regents for various
reports to the HEI system; however, some data for variables are reported as “unknown”
or are left blank within the report submission. These missing data were noted within
tables throughout this study. Many of the missing data are those that are “self-reported”
by students. Information such as race, sex, and county are gathered based on student
provided details on college application forms. These data, when not provided, cannot be
reported to the Ohio Board of Regent’s HEI system. For example, “race and ethnicity” is
typically an optional field to complete on college and university applications. Therefore,
students who do not provide that information will be submitted by the institution as
“unknown” race or will be left blank upon submission. Missing data in the category of
“institutions” at which students enrolled may be attributed to a change that occurred in
the submission of PSEO data. Prior to 2007, colleges and universities submitted data but
were not required to match “institution” with the student record within the special status
(i.e., PSEO participants). Instructions from the Ohio Board of Regents (2007) for the
“Edit and Load Specifications” of special populations indicate the change occurred
October 1, 2007. Therefore, many records of “institution” for 2005, 2006, and early 2007
were not reported and are listed as missing.

103 Quantitative Data Analysis
Blanco et al. (2007) provided descriptive statistics from their study of PSEO
participants from 1999 to 2004. Expanded in this study with information from 2005 to
2011, these statistics included information such as enrollment during the PSEO program
and continued enrollment after high school, enrollment in courses by subject area,
number of credit hours completed during and after PSEO enrollment, types of campuses
at which students enrolled, and demographic information about PSEO students such as
race and ethnicity, sex, and county of residence. While this type of analysis is not
complex, the data provided demographic and enrollment information for PSEO in Ohio—
the overall enrollment, the types of courses students are taking, the students and their
demographic characteristics.
Descriptive data were also provided in a study by Karp et al. (2007) when they
studied dual enrollment in Florida and New York. They reviewed the large datasets of all
New York and Florida dual enrollment participants compared to non-dual enrollment
participants. They conducted descriptive analyses and reported “types of students
enrolled in dual enrollment compared to those who did not in terms of their preexisting
demographics (age, race/ethnicity, gender, limited English proficiency, citizens, SES) and
academic characteristic (high school grades, several test scores)” (p. 18).
This type of data analysis was similar to the National Center for Education
Statistics report by Kleiner and Lewis (2005), which studied dual enrollment students
during 2002–2003. The statistics provided in that report provided percentage distributions
of key elements of participant numbers as reported in the Postsecondary Education Quick

104 Information System (PEQIS) survey. This included the percentage distributions of “Title
IV degree-granting institutions with any high school students taking courses for college
credit,” of “high school students taking courses for college credit within our outside of
dual enrollment programs,” and of “high schools students taking courses for college
credit by institution type” among others within the report (pp. 6-8).
Longitudinal design.
Continuing the work of Blanco et al. (2007) provided the opportunity to review
student outcomes over a period of time that has not yet been studied. As Blanco et al.
ended within the 2004–2005 school year, this information within this study included the
full population of PSEO participants from 2005–2006 to 2010–2011. Further,
longitudinal analysis was completed for a cohort of PSEO participants’ senior year of
high school in the 2005–2006 academic year. The cohort data from 2005–2006 through
2010–2011 was studied to identify patterns of enrollment during and after high school
and to discover employment and wage information for the cohort.
The longitudinal approach to the study, indicated by Menard (2002), occurs when
“(a) data are collected for each item or variable for two or more distinct time periods; (b)
the subjects or cases analyzed are the same or at least comparable from one period to the
next; and (c) the analysis involves some comparison of data between or among periods”
(p. 2). This specific study is a retrospective panel design, as Menard defined it, “data
collected at a single period for several periods” because the data reflected fall term
enrollments each year over the 2005 to 2010 years (p. 2).

105
Very important for this study, longitudinal design allows the researcher to identify
“patterns of change” and a way to study “‘career’ patterns of behavior’” (Menard, 2002,
p. 12). Using longitudinal design fits well with Menard’s description of an “obvious
application” of the use in “the study of labor market careers” and “closely related to this
is the study of status attainment careers, which includes consideration of educational
attainment as well as occupational status and income” (p. 13). This was well suited for
this study, which included reviewing wage and employment data of the cohort of
students.
This study reviewed the longitudinal behaviors of the PSEO cohort over the six
year period, beginning while students were in high school. Educational and employment
patterns are reviewed for these students throughout the cohort study.
Descriptive statistics.
For Research Question 1a, What are the demographic and background
characteristics of those that participated in PSEO during the academic years of 2005–
2006 through 2010–2011?”:
Quantitative descriptive statistics were generated for the full population of PSEO
participants from academic years 2005–2006 through 2010–2011 by year. To review the
data of the full population for each year of the study, the student identifier was the first
data value to review and link with the variable of special status and confirmed the student
was a PSEO participant.
The variables of race and sex were used via SPSS to generate demographic
information.

106
For Research Question 1b, “What were the types of courses in which PSEO
students enroll, the number of credit hours earned, and the cumulative GPAs of students
who participated in PSEO?”:
The variable identifying the types of course subjects assessed the quantitative
frequency of types of courses for which students are enrolling using SPSS. The credit
hours for course enrollment determined the average number of credit hours in which
students were enrolled.
The variable of course inventory subject code was used to calculate the frequency
of course categories. Since GPA is not included in submission to the HEI system, the
variables (a) credit hours for course enrollment and (b) cumulative grade point average
hours earned were used in SPSS and Excel to generate GPA.
To calculate the GPA, a multi-step process was needed. 1) For each term, the
frequencies for average hours earned and average points earned were calculated in SPSS.
2) These data, copied into Excel, were summed to create the total average hours earned
and the total average points earned (e.g., frequency or student numbers multiplied by
hours and frequency multiplied by points). 3) The sums of those totals were used to
calculate average hours earned per student per quarter by dividing total credit hours by
number of students. 4) The total points were divided by number of students to calculate
the average points earned by students. 5) After each quarter’s information of hours and
points were calculated, the total credit hours and total points were copied into another
Excel spreadsheet and added together for the year. 6) To finish the calculation of GPA,
the average points earned per student was divided by the average hours earned per

107 student. The average GPA is the result. An example for one quarter is shown in Table 1
for a portion of sample student records within Excel (steps 2 through 4 above).
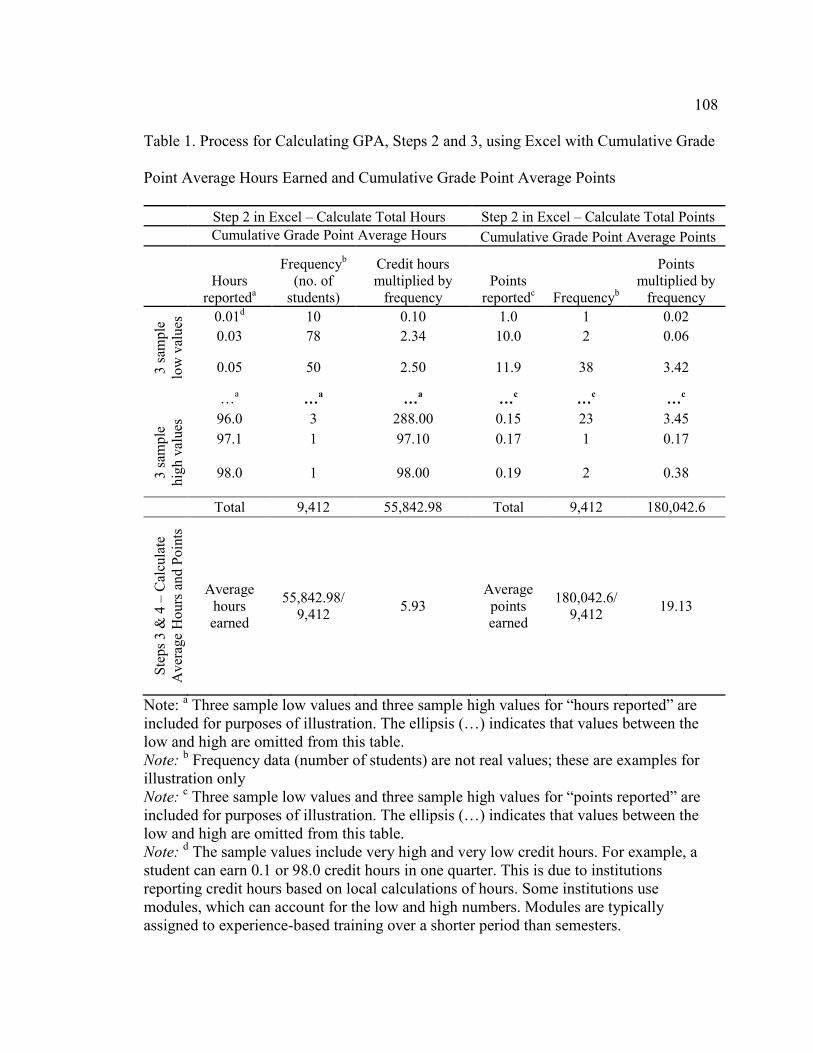
108 Table 1. Process for Calculating GPA, Steps 2 and 3, using Excel with Cumulative Grade
Point Average Hours Earned and Cumulative Grade Point Average Points
Step 2 in Excel – Calculate Total Hours Step 2 in Excel – Calculate Total Points Cumulative Grade Point Average Hours
Cumulative Grade Point Average Points
Hours reporteda
Frequencyb (no. of
students)
Credit hours multiplied by
frequency Points
reportedc Frequencyb
Points multiplied by
frequency
3 sa
mpl
e lo
w v
alue
s 0.01d 10 0.10 1.0 1 0.02 0.03 78 2.34 10.0 2 0.06
0.05 50 2.50 11.9 38 3.42
…a …a …a …c …c …c
3 sa
mpl
e hi
gh v
alue
s 96.0 3 288.00 0.15 23 3.45 97.1 1 97.10 0.17 1 0.17
98.0 1 98.00 0.19 2 0.38
Total 9,412 55,842.98 Total 9,412 180,042.6
Step
s 3 &
4 –
Cal
cula
te
Ave
rage
Hou
rs a
nd P
oint
s
Average hours earned
55,842.98/ 9,412 5.93
Average points earned
180,042.6/ 9,412 19.13
Note: a Three sample low values and three sample high values for “hours reported” are included for purposes of illustration. The ellipsis (…) indicates that values between the low and high are omitted from this table. Note: b Frequency data (number of students) are not real values; these are examples for illustration only Note: c Three sample low values and three sample high values for “points reported” are included for purposes of illustration. The ellipsis (…) indicates that values between the low and high are omitted from this table. Note: d The sample values include very high and very low credit hours. For example, a student can earn 0.1 or 98.0 credit hours in one quarter. This is due to institutions reporting credit hours based on local calculations of hours. Some institutions use modules, which can account for the low and high numbers. Modules are typically assigned to experience-based training over a shorter period than semesters.

109
After each quarter was calculated in steps 2 through 4, the total credit hours and
total points for the year were summed (i.e., step 5). To finish the calculation of GPA, the
“average points earned per student” is divided by the “average hours earned per student.”
The average GPA is the result (i.e., step 6). Table 2 is an example of the steps needed to
finish calculating the average GPA for the year in Excel is illustrated (steps 5 through 6).
Table 2. Process for Calculating GPA, Steps 5 and 6, using Excel with Total Credit Hours
and Total Points
Step 6 – Divide points by hours
for GPA
Term
Total credit hours
Total points Students
Average hours
earned per student
Average points earned
per student
Avg. GPA
Step
5 –
Add
cre
dit h
ours
and
po
ints
of e
ach
quar
ter t
oget
her f
or
com
plet
e ye
ar
Autumn 2010
55,842.98 180,042.62 9,412 5.93 19.13 3.22
Winter 2011
3,994.00 13,606.22 767 5.21 17.74 3.41
Spring 2011
5,554.08 18,385.30 1,163 4.78 15.81 3.31 Total 65,391.06 212,034.14 11,342 5.77 18.69 3.24
For Research Question 1c, “Where were students participating in PSEO during
the years of 2005–2006 through 2010–2011?”:

110
The variable of institution codes were linked to the student identifiers to examine
the quantitative frequency of where students were participating. The variable of county
codes established frequency data from which part of the state students were participating.
For Research Question 2, “What were the educational and employment outcomes
of the 2005–2006 PSEO cohort?”:
The cohort data from the PSEO participants were sorted by birth year, extracted
from the full population file, and saved in a new SPSS file. The student’s birth year
identified students for the cohort; for this study, students born in 1987 or 1988 would
have been 17 or 18 years of age in 2005–2006.
Using SPSS, quantitative descriptive statistics were generated for the entire cohort
for each of these variables. The data for the high school senior cohort were longitudinally
examined each year from 2005–2006 to 2010–2011 for college enrollment information
(i.e., after high school graduation).
Many of the same variables used for the population were used for descriptive
statistics of the cohort. The descriptive statistics procedures for only the cohort data
included the variables of types of course subjects, institutions, counties, credit hours, and
grade point average. The cohort data were examined starting with SPSS to extract the
data, and then using Excel to filter and sort to determine when degrees or certificates
were earned.
In addition to the descriptive statistics for the cohort, effect sizes were calculated
for the enrollment measures of number of courses in which the population and the cohort
enrolled during autumn 2005, average credit hours earned, and the grade point averages.

111 The differences between the two groups provided indications whether the differences are
“meaningful” as described by Salkind (2010, p. 231). Simply stated, the “effect size is a
measure of how different two groups are from one another” (Salkind, 2010, p. 231).
Although the cohort comes directly from the population, the importance of establishing
the scale of the difference is necessary for this study since only descriptive statistics are
used and these do not provide interpretive results.
With the addition of data from the Ohio Department of Job and Family Services,
industry type and wage frequencies for each student in the cohort were determined for
each year of the study. Descriptive statistics informed the study about student
employment and wages during and after PSEO participation. A cross tabulation of degree
or certificate attainment and average wages per year was prepared to review income
earnings before and after credential attainment.
For the second part of Research Question 2, “What were the participation levels
by race, sex, and income level?”:
The cohort data were examined quantitatively using the frequency of the variables
of sex and race. Participation by sex and race were reviewed with descriptive statistics
within SPSS. The researcher used the variable of ZIP codes to examine poverty levels
using SPSS frequencies of ZIP codes and comparing to the American Community Survey
from the U.S. Census Bureau, National Association of Realtors, and Advameg, Inc.
resources to provide poverty information.
112 Qualitative Data
To supplement the quantitative data, a set of qualitative interviews allowed for an
exploration of perspectives among high school and postsecondary personnel familiar with
PSEO programming and funding. Extreme cases were used and based on high schools
and higher education institutions which have the greatest and fewest PSEO participants
within a specific geographic area. The geographic area was a cluster of schools in both
rural and urban types of communities. The cases were selected based on publicly
available information of aggregated high and low PSEO participation (Ohio Department
of Education, 2013a and 2013b). This extreme case sampling provided information-rich
cases that allowed for learning from institutions with high and low participation numbers.
The institutions within two counties, one predominately rural and one urban, also
provided comparisons of two-year and four-year institutions. The four-year institutions
within these counties provided the perspectives of major universities within Ohio. The
two-year institutions are neighbors of the larger four-year institution counterparts. The
secondary schools within the counties provided the context of schools with larger and
smaller PSEO student participation.
By utilizing publicly available data, personnel from all of the institutions were
identified. When contacting the personnel, the individuals familiar with or responsible for
PSEO programming and funding were requested to participate in interviews. Interviews
were conducted to obtain data from postsecondary and secondary personnel. The
interviews were conducted by telephone or in person, whichever was more convenient for
the interviewee, and by using a standardized open-ended interview (Patton, 2002). Patton
113 indicated that this approach necessitates a careful structuring of each question. Open-
ended questions were used in order to “understand and capture the points of view of other
people without predetermining those points of view through prior selection of
questionnaire categories” (p. 21). Further, probes can be used but should be “placed in
the interview at appropriate places” (p. 346). Finally, standardized open-ended interviews
“make data analysis easier because it is possible to locate each respondent’s answer to the
same question rather quickly and to organize questions and answers that are similar” (p.
346).
The individuals who were interviewed were contacted initially by telephone and
then email, in order to describe the research and interview format and to provide the
“Consent Form” (Appendix C). Upon acceptance, a day and time was confirmed at the
convenience of the interviewee. The interview questions (Appendix D) were distributed
by email to the identified interviewee prior to the official interview.
Secondary and postsecondary personnel responsible for or oversee PSEO
programming and funding were interviewed. This study examined cases based on high
schools and higher education institutions that have the greatest and fewest PSEO
participants within in a specific geographic area. The geographic area of the cases was a
cluster of schools in both rural and urban Ohio counties. The institutions within two
counties, one predominately rural and one urban, provided comparisons of two-year and
four-year institutions. The four-year institutions within these counties provided the
perspectives of major universities within Ohio. The two-year institutions are geographic
neighbors of their larger four-year institution counterparts. The secondary schools within

114 the counties provided the context of schools with larger and smaller PSEO student
participation.
By utilizing publicly available data, personnel were identified. These personnel
were in positions of authority and were of administrative levels in their institutions. When
contacting the personnel, the researcher asked to speak with individuals who are familiar
with PSEO programming and funding.
Qualitative data collection.
For Research Question 3, “What were the perceptions of PSEO for secondary and
postsecondary institutions?”:
The qualitative interviews of secondary and postsecondary personnel provided an
exploration of perspectives about the benefits and challenges of PSEO in Ohio. The
nature of the qualitative study was an inductive analysis, which is “oriented toward
exploration, discovery, and inductive logic” (Patton, 2002, p. 55). Patton further
described this exploration as “begin[ning] with specific observations and build[ing]
toward general patterns” (p. 55).
While the Blanco et al. (2007) study was quantitative, qualitative interviews were
conducted for this study. The addition of qualitative data provided the perspective of
secondary and postsecondary personnel who are familiar with PSEO programming and
funding: “Adding qualitative interviews to experiments … as a way to discuss directly
the issues under investigation and tap into participants’ perspectives and meanings will
help avoid some potential problems with the experiment method” (Johnson &
Onwuegbuzie, 2004, pp. 18-19).

115 Qualitative Data Analysis
Emerging themes were identified following the completion of the interviews and
synthesis of interview notes. Interview responses were coded using line-by-line coding to
organize the interview details. According to Charmaz (2006), line-by-line coding is
helpful with detailed data and allows the researcher to “remain open to the data and to see
nuances in it” (p. 50). Following line-by-line coding, axial coding was used to create
categories and sub-categories as needed and provided an organization that helped “make
sense of the data” (p. 61). These categories led to acknowledging emerging themes from
the interviews and interview notes: “axial coding helps to clarify and to extend the
analytic power of your emerging ideas” (p. 63).
Reliability and Validity
By accessing the entire population of PSEO participants for the study, issues of
reliability and validity were minimized related to tests that rely on a sample for
generalizability or other issues when transferring conclusions from sample to population
do not apply to this research.
Specifically, for the qualitative portion of this study, reliability can be threatened
when conducting interviews. Changes to the setting of interview may affect
generalizability because interviews may take place in person or over the phone. With all
interviews occurring in different spaces and with different methods (e.g., phone or in
person), reliability could be a concern. Creswell (2009) indicated that while reliability
may be a threat for interviews, as long as the researcher’s approach is consistent among
all interviews—using the same interview protocol for instance, the reliability concerns

116 could be held to a minimum. Additionally, Creswell suggested that the researcher should
“check transcripts to make sure that they do not contain obvious mistakes during
transcription” (p. 190). The researcher audiotaped all interviews, transcribed the
conversations verbatim, and reviewed the audiotape and transcription to ensure the
recording was transcribed exactly.
For validity concerns in qualitative research, the researcher utilized triangulation
methods to minimize validity threats. For instance, Creswell (2009) recommended using
different data sources or a variety of interviews to “build a coherent justification for
themes” (p. 190). As part of the method, the researcher reviews the transcribed interviews
and themes emerge, validity issues can be overcome so long as the “themes are
established based on converging several sources of data or perspectives from participants,
then this process can be claimed as adding to the validity of the study” (p. 190).
Summary
This chapter described the method utilized within the present study in order to
bridge the gap between the 2004–2005 data within the Blanco et al. (2007) study and
2010–2011. The chapter described that the study utilized secondary and primary data for
a multiple methods approach. The research design, data collection, and data analysis
focused on quantitative procedures while an exploratory approach using qualitative
interviews will enhance the study. The chapter reviewed the stated purpose of the study
and the research questions. The chapter provided an overview of the data collection
procedures for the study, a description of the population, and summary of the data
analysis procedures.

117
Chapter 4: Results
To extend the research of the Blanco et al. (2007) through 2011 and into
additional areas of interest, such as employment and equitable participation, this study
has reviewed student-level data of enrollment and employment from fall semester 2005
through spring semester 2011. St. John’s (2003) framework of examination of policies
that have financial implications and equity concerns provided the lens through which to
look at the research. This chapter reviews participation and performance of students who
enrolled in college courses through the Post-Secondary Enrollment Options (PSEO)
program since fall term 2005.
Quantitative Results
Student participant characteristics.
Research Question 1a focused on student level data beginning with academic year
2005–2006 through 2010–2011. Table 3 illustrates enrollment for each year of the study,
ranging from a low of 9,827 to a high of 15,388 students (see Appendix E for full
details). This study found that approximately two-thirds of participants were consistently
female each year throughout the study as shown in Table 3.

118 Table 3. PSEO Student Participation by Sex of Student and by Academic Year
2005–2006 2006–2007 2007–2008 2008–2009 2009–2010 2010–2011 Sex N % N % N % N % N % N % Female 7,339 65 9,872 64 6,242 64 6,676 62 7,375 63 7,026 62 Male 3,926 35 5,515 36 3,585 36 4,147 38 4,416 37 4,316 38 Missing Data 0 1 0 0 0 0
Total Enrollment 11,265 15,388 9,827 10,823 11,791 11,342
With regard to race, the current study’s findings are illustrated in Table 4 (and
additional details in Appendix E). Predominately, PSEO participants are White students
with over 80% each year throughout the study. Black and Hispanic students were the next
groups of students with large enrollments; however, the category of “unknown” race had
nearly similar numbers as those groups.

119
Table 4. PSEO Student Participation by Race of Student and by Academic Year
2005–2006 2006–2007 2007–2008 2008–2009 2009–2010 2010–2011
Race N % N % N % N % N % N % American Indian 53 0.47 64 0.42 38 0.39 37 0.34 34 0.29 29 0.26 Asian, Pacific Islander 201 1.78 282 1.83 231 2.35 187 1.73 204 1.73 177 1.56 Black non-Hispanic 802 7.12 908 5.90 623 6.34 738 6.82 719 6.10 714 6.30 Hispanic and Hispanic, Puerto Ricana
278 2.47 304 1.97 225 2.29 248 2.30 296 2.51 261 2.30
Multiracial 10 0.09 30 0.19 28 0.28 43 0.40 78 0.66 157 1.38 Nonresident alien 23 0.20 29 0.19 19 0.19 14 0.13 14 0.12 n/ab n/a Unknown 566 5.02 696 4.52 485 4.94 654 6.04 727 6.17 784 6.91 White non-Hispanic 9,332 82.84 13,074 84.97 8,178 83.22 8,902 82.25 9,719 82.43 9,220 81.29 Missing 0 0 1 0 0 0 0 0 0 0 0 0 Total 11,265 15,388 9,827 10,823 11,791 11,342
Note: aThe racial categories of Hispanic, Puerto Rican and Hispanic have been collapsed into the category “Hispanic and Hispanic, Puerto Rican” in order to report cell sizes greater than 10. Note: bThe number of students who were reported as “Nonresident alien” for 2010–2011 has been combined with “Unknown” in order in order to report cell sizes greater than 10.

120 Student enrollment and performance.
For Research Question 1b, this study found that during the period of 2005–2006
through 2010–2011, 70,436 total students enrolled in 123,005 college courses (Table 5).
Since students can participate in PSEO during all four years of high school, the students
may have been counted in more than one year, and, as noted, more than one course. The
data within this study indicated that students enrolled in an average of 1.75 courses
during the six-year period. Table 5 also provides the average by year.
Table 5. Total Student Enrollment, Total Courses Enrolled, and Average Number of
Courses by Academic Year
Year Total students enrolled Total courses Average number of
courses 2005–2006 11,265 16,978 1.51 2006–2007 15,388 21,556 1.40 2007–2008 9,827 18,933 1.93 2008–2009 10,823 20,286 1.87 2009–2010 11,791 23,324 1.98 2010–2011 11,342 21,928 1.93 Total 70,436 123,005 1.75
Types of courses in which students enrolled were identified within the HEI data
by Classification of Instructional Programs (CIP) codes; actual course names are not
included in the HEI data. In Table 6, the course categories with the five highest
frequencies are identified with number and percentage of enrollees. English Language
and Literature/Letters was the course category with the highest proportion of enrollments
during all six years of the study, with over 25% of the share of courses each year. Of the

121 remaining 42 categories of courses, within Table 6, those categories with at least one
student enrolled in that course type and other categories with no enrollment are noted
within each year.
Table 6. Course Category Frequencies, Number of Enrollees and Percentage of
Population by Academic Year
Year Course Categories Number Percentage 2005–2006
English Language and Literature/Letters 5,865 34.54 Mathematics and Statistics 1,645 9.69
Physical Sciences 1,160 6.83
Social Sciences 1,038 6.11
Biological and Biomedical Sciences 1,033 6.08 All remaining categories with enrollment (33) 6,237 36.74 All remaining categories with no enrollment (9) 0 0 Total Courses 16,978 2006–2007
English Language and Literature/Letters 7,996 37.09 Mathematics and Statistics 2,098 9.73
Social Sciences 1,485 6.89
Physical Sciences 1,258 5.84
Biological and Biomedical Sciences 1,102 5.11 All remaining categories with enrollment (34) 7.617 35.34 All remaining categories with no enrollment (8) 0 0 Total Courses 21,556 2007–2008
English Language and Literature/Letters 4,834 25.53 Social Sciences 2,521 13.32
Psychology 2,105 11.12
Mathematics and Statistics 1,939 10.24
Physical Sciences 934 4.93 All remaining categories with enrollment (35) 6,600 34.86 All remaining categories with no enrollment (7) 0 0 Total Courses 18,933 2008–2009
English Language and Literature/Letters 5,409 26.66 Social Sciences 2,776 13.68
Psychology 2,151 10.60
Mathematics and Statistics 2,091 10.31
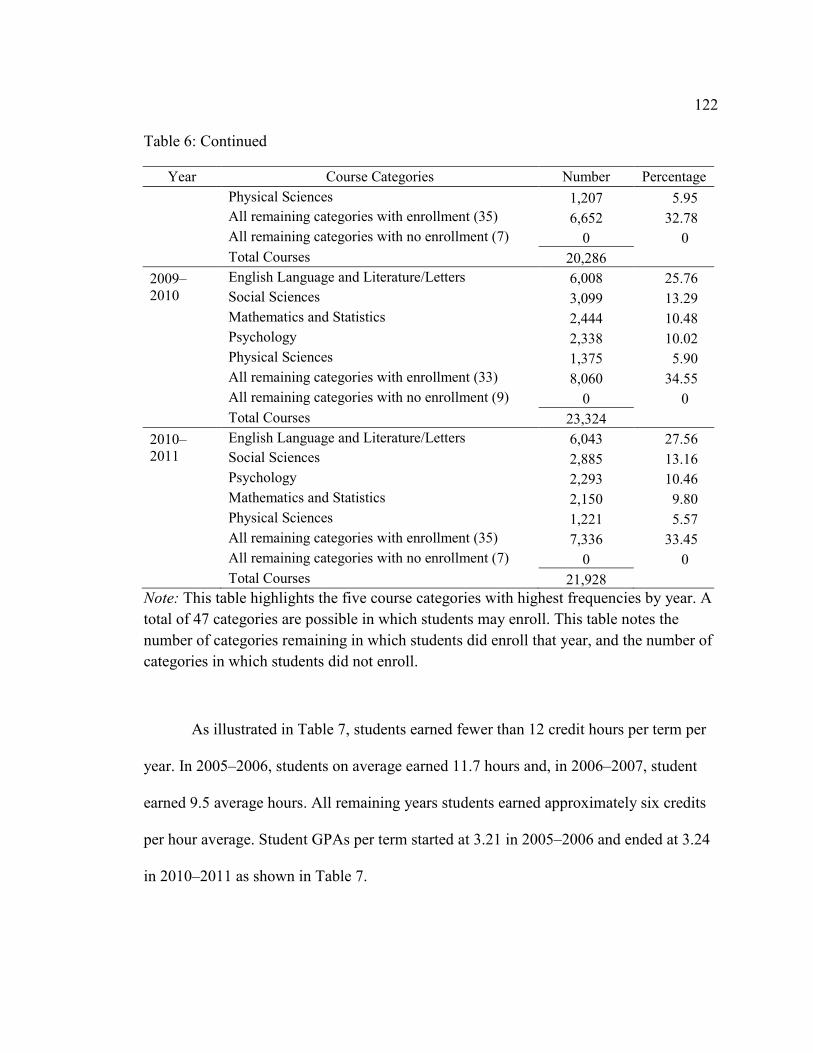
122 Table 6: Continued
Year Course Categories Number Percentage
Physical Sciences 1,207 5.95 All remaining categories with enrollment (35) 6,652 32.78 All remaining categories with no enrollment (7) 0 0 Total Courses 20,286 2009–2010
English Language and Literature/Letters 6,008 25.76 Social Sciences 3,099 13.29
Mathematics and Statistics 2,444 10.48
Psychology 2,338 10.02
Physical Sciences 1,375 5.90 All remaining categories with enrollment (33) 8,060 34.55 All remaining categories with no enrollment (9) 0 0 Total Courses 23,324 2010–2011
English Language and Literature/Letters 6,043 27.56 Social Sciences 2,885 13.16
Psychology 2,293 10.46
Mathematics and Statistics 2,150 9.80
Physical Sciences 1,221 5.57 All remaining categories with enrollment (35) 7,336 33.45 All remaining categories with no enrollment (7) 0 0 Total Courses 21,928
Note: This table highlights the five course categories with highest frequencies by year. A total of 47 categories are possible in which students may enroll. This table notes the number of categories remaining in which students did enroll that year, and the number of categories in which students did not enroll.
As illustrated in Table 7, students earned fewer than 12 credit hours per term per
year. In 2005–2006, students on average earned 11.7 hours and, in 2006–2007, student
earned 9.5 average hours. All remaining years students earned approximately six credits
per hour average. Student GPAs per term started at 3.21 in 2005–2006 and ended at 3.24
in 2010–2011 as shown in Table 7.

123 Table 7. Average Credit Hours and Average GPAs for PSEO Participants by Academic
Year
Year Average credit hours per student per term Average GPA 2005–2006 11.7 3.21 2006–2007 9.5 3.19 2007–2008 5.7 3.12 2008–2009 6.4 3.15 2009–2010 6.6 3.22 2010–2011 5.8 3.24
Note: HEI data do not include a designation of whether credit hours are semester or quarter based. The data within is strictly the numerical submission of colleges and universities.
Location information.
This study, for Research Question 1c, found that in academic year 2005–2006,
63.57% of PSEO students were enrolled at two-year colleges and 36.43% at four-year
colleges as noted in Table 8. Each year after that had similar percentages. Missing data in
the category of “institutions” at which students enrolled may be attributed to a change
that occurred in the submission of PSEO data. Prior to 2007, colleges and universities
submitted data but were not required to match “institution” with the student record within
the special status (i.e., PSEO participants). Instructions from the Ohio Board of Regents
(2007) for the “Edit and Load Specifications” of special populations indicate the change
occurred October 1, 2007. Therefore, many records of “institution” for 2005 and 2006
were not reported and are listed as missing.

124 Table 8. PSEO Participation at Two-Year or Four-Year Institutions by Academic Year
Two-year institutions Four-year institutions Missing data Percentage Year Total Percentage Total Percentage
2005–2006 5,613 49.83 3,217 28.56 2,435 21.62
2006–2007 7,633 49.60 4,800 31.19 2,955 19.20
2007–2008 6,377 64.89 3,448 35.09 2 0.02
2008–2009 7,244 66.93 3,541 32.72 38 0.35
2009–2010 8,241 69.89 3,549 30.10 1 0.01
2010–2011 8,112 71.52 3,227 28.45 3 0.03
Note: Enrollment data for four-year institutions include enrollment at regional campuses. The regional campuses are not separated in HEI submission for location.
With regard to specific institutions, Table 9 the institutions with the five highest
frequencies are identified with number and percentage of enrollees. Cuyahoga
Community College had the highest PSEO enrollment over all six years. Of the
remaining institutions, noted parenthetically within the table, those institutions with at
least one enrollment are noted within each year.

125 Table 9. Specific Institution Names with PSEO Enrollment by Academic Year
Year Institutions No. of students Percentage 2005–2006
Cuyahoga Community College 985 11.16 Lorain County Community College 598 6.77
Edison State Community College 580 6.57 Kent State University 572 6.48 University of Akron 486 5.50 All remaining institutions with enrollment (28) 5,609 63.52 Missing 2,435 Total 11,265 2006–2007
Cuyahoga Community College 1,313 10.56 Kent State University 1,057 8.50
Lorain County Community College 1,038 8.35
University of Akron 816 6.56
Edison State Community College 669 5.38
All remaining institutions with enrollment (31) 7,540 60.65 Missing 2,955 Total 15,388 2007–2008
Cuyahoga Community College 998 10.16 Lorain County Community College 971 9.88
Kent State University 869 8.84 Owens State Community College 593 6.04 University of Akron 553 5.63 All remaining institutions with enrollment (31) 5,841 76.99 Missing 2 Total 9,827 2008–2009
Cuyahoga Community College 943 8.74 Kent State University 892 8.27
Lorain County Community College 867 8.04 Stark State College of Technology 751 6.96 University of Akron 614 5.69 All remaining institutions with enrollment (31) 6,718 62.28 Missing 38 Total 10,823

126 Table 9: Continued
Year Institutions No. of students Percentage 2009–2010
Cuyahoga Community College 1,190 10.09 Lorain County Community College 1,144 9.70
Kent State University 784 6.65 Owens State Community College 783 6.64 University of Akron 659 5.59 All remaining institutions with enrollment (30) 7,230 61.32 Missing 1 Total 11,791 2010–2011
Cuyahoga Community College 1,162 10.25 Lorain County Community College 1,030 9.08
Owens State Community College 879 7.75 Kent State University 673 5.94 University of Akron 647 5.71 All remaining institutions with enrollment (31) 6,948 61.28 Missing 3 Total 11,342
Another aspect of location is the county in which students reside. Appendix F
provides the list of counties and the number and percentage of participating students each
year. Note that many data are missing for county of residence. Institutions do not report
this data piece consistently. Figure 4 illustrates the distribution for the 2010–2011
academic year of PSEO participants. The largest grouping of percentages is in the
northern part of Ohio, with the next largest in the central and southwest counties.

127
Figure 4. Participation by County with ranges indicated by color coding.
Map source: SmartDraw, LLC, free online software was utilized to create this map with data from population
Cohort educational and employment outcomes.
Research Question 2 focused on a cohort of students. After examining all students
who participated in PSEO during the academic year 2005–2006, a cohort of students
were extracted from the population file into a separate cohort file. Of the 11,265 students

128 enrolled in PSEO during autumn term 2005, 7,577 students were identified as cohort
students because their birth year was either 1987 or 1988 (i.e., age 17 or 18 as determined
by ODE’s kindergarten entrance age). Students who were not included in the cohort
would have been younger in age and in grades 9 through 11. The longitudinal
examination of the cohort included educational and employment data.
Educational data.
Enrollment patterns of the cohort were calculated with frequencies and averages
utilizing SPSS and Excel. Overall, the 7,577 cohort students enrolled in 12,057 courses in
Autumn 2005 for an average of 1.59 courses per student. On average, students enrolled in
12.22 credit hours. Students in the cohort earned an average 3.22 GPA for that term.
When comparing the two groups, the population and the cohort, of the students enrolled
in Autumn 2005 courses, the means, standard deviations, and Cohen’s d, have been
calculated and reported in Table 10.
Table 10. Effect Sizes for Cohort for Number of Courses, Credit Hours, and GPA
Enrollment factors
Population Mean
Population SD Cohort Mean
Cohort SD
Cohen’s d
Number of courses 1.55 1.26 1.59 1.26 -0.03
Credit hours 13.16 13.76 12.22 13.07 0.07 GPA 3.23 0.76 3.22 0.76 0.13

129
Table 11 is a compilation of the five highest frequencies of number and
percentage of the course categories, institutions at which they enrolled, and the counties
of residence for the cohort.
Table 11. Cohort Course Categories, Institutions, and Counties by Year, Number of
Enrollees and Percentage for Autumn 2005
Course Number Percent of cohort English Language and Literature/Letters 4,385 36.37 Mathematics and Statistics 1,219 10.11 Social Sciences 823 6.83 Biological and Biomedical Sciences 813 6.74 Physical Sciences 793 6.58 All remaining categories with enrollment (32) 4,024 33.37 All remaining categories with no enrollment (10) 0 Total Courses 12,057
Institutions Number Percent of cohort Cuyahoga Community College 573 7.56 Lorain County Community College 492 6.49 Kent State University 463 6.11 Edison State Community College 451 5.95 University of Akron 405 5.35 All remaining institutions with enrollment (27) 3,954 52.18 Missing 1,239 16.35 Total Institutions 7,577
County of Residence Number Percent of cohort Cuyahoga 441 5.82 Lorain 440 5.81 Franklin 282 3.72 Lucas 276 3.64 Stark 221 2.92 Additional counties 3,669 48.42 Missing 2,248 29.67 Total Counties 7,577
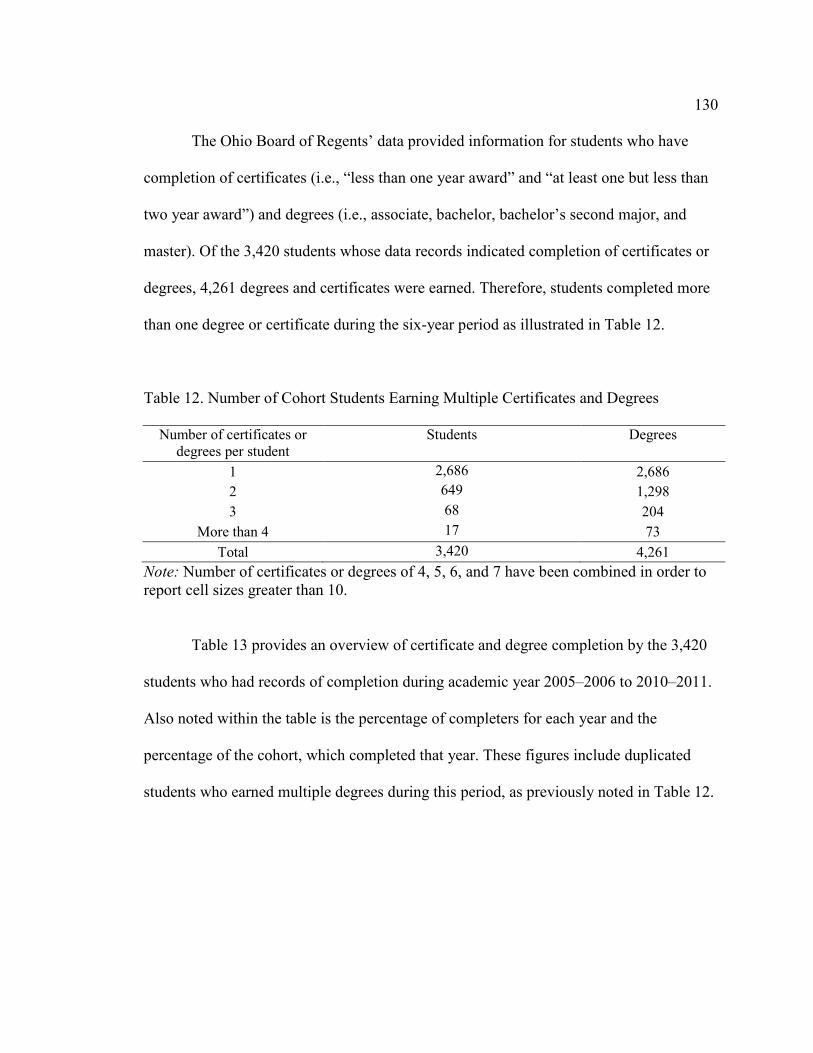
130
The Ohio Board of Regents’ data provided information for students who have
completion of certificates (i.e., “less than one year award” and “at least one but less than
two year award”) and degrees (i.e., associate, bachelor, bachelor’s second major, and
master). Of the 3,420 students whose data records indicated completion of certificates or
degrees, 4,261 degrees and certificates were earned. Therefore, students completed more
than one degree or certificate during the six-year period as illustrated in Table 12.
Table 12. Number of Cohort Students Earning Multiple Certificates and Degrees
Number of certificates or degrees per student
Students Degrees
1 2,686 2,686 2 649 1,298 3 68 204
More than 4 17 73 Total 3,420 4,261
Note: Number of certificates or degrees of 4, 5, 6, and 7 have been combined in order to report cell sizes greater than 10.
Table 13 provides an overview of certificate and degree completion by the 3,420
students who had records of completion during academic year 2005–2006 to 2010–2011.
Also noted within the table is the percentage of completers for each year and the
percentage of the cohort, which completed that year. These figures include duplicated
students who earned multiple degrees during this period, as previously noted in Table 12.
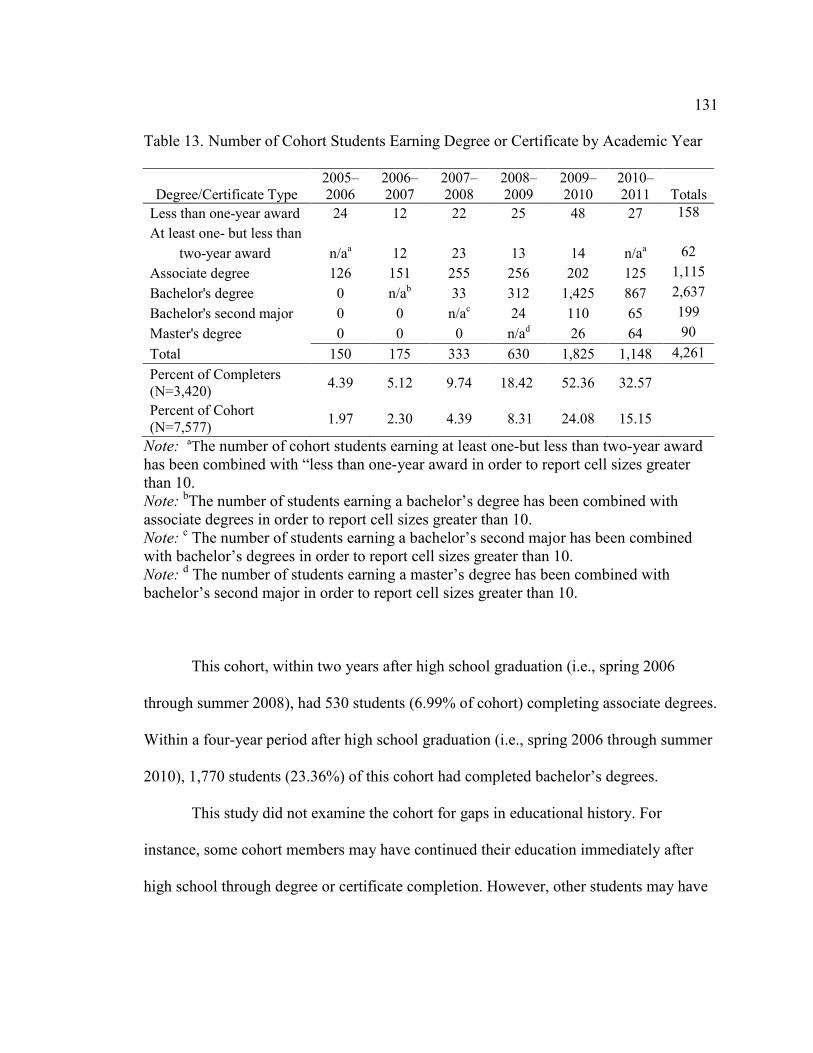
131 Table 13. Number of Cohort Students Earning Degree or Certificate by Academic Year
Degree/Certificate Type 2005– 2006
2006–2007
2007–2008
2008–2009
2009–2010
2010–2011 Totals
Less than one-year award 24 12 22 25 48 27 158 At least one- but less than
two-year award n/aa 12 23 13 14 n/aa 62 Associate degree 126 151 255 256 202 125 1,115 Bachelor's degree 0 n/ab 33 312 1,425 867 2,637 Bachelor's second major 0 0 n/ac 24 110 65 199 Master's degree 0 0 0 n/ad 26 64 90 Total 150 175 333 630 1,825 1,148 4,261 Percent of Completers (N=3,420) 4.39 5.12 9.74 18.42 52.36 32.57
Percent of Cohort (N=7,577) 1.97 2.30 4.39 8.31 24.08 15.15
Note: aThe number of cohort students earning at least one-but less than two-year award has been combined with “less than one-year award in order to report cell sizes greater than 10. Note: bThe number of students earning a bachelor’s degree has been combined with associate degrees in order to report cell sizes greater than 10. Note: c The number of students earning a bachelor’s second major has been combined with bachelor’s degrees in order to report cell sizes greater than 10. Note: d The number of students earning a master’s degree has been combined with bachelor’s second major in order to report cell sizes greater than 10.
This cohort, within two years after high school graduation (i.e., spring 2006
through summer 2008), had 530 students (6.99% of cohort) completing associate degrees.
Within a four-year period after high school graduation (i.e., spring 2006 through summer
2010), 1,770 students (23.36%) of this cohort had completed bachelor’s degrees.
This study did not examine the cohort for gaps in educational history. For
instance, some cohort members may have continued their education immediately after
high school through degree or certificate completion. However, other students may have

132 entered and exited postsecondary education over the period of five years after high
school.
Employment data.
The cohort of students was also examined by the amount of wages earned from
the fourth quarter (i.e., October, November, and December) of 2006 through fourth
quarter of 2011. Using Ohio Department of Job and Family Services data, the mean,
median, and range of quarterly wages earned by the cohort were calculated. Table 14
provides an overview of quarterly wages. The “N” in Table 14 is comprised of cohort
members reported by their employers to ODJFS.

133 Table 14. Number and Percentage of Cohort Students with Wages Reported, by Mean,
Median, Minimum, and Maximum and by Quarter and Year
Year Quarter N
Percent of
cohort
Wages
Mean Median Minimum Maximum 2006
Fourth Quarter 4,117 54 $1,440.27 $1,048.00 $2.00 $20,000.00 2007
First Quarter 4,118 54 $1,498.38 $1,149.50 $1.00 $22,879.00 Second Quarter 5,219 69 $1,673.61 $1,350.00 $4.00 $18,946.00 Third Quarter 5,477 72 $2,233.70 $1,959.00 $1.00 $34,160.00 Fourth Quarter 4,254 56 $1,970.38 $1,478.50 $3.00 $36,660.00
2008 First Quarter 4,229 56 $1,963.75 $1,477.00 $5.00 $31,020.00
Second Quarter 4,741 63 $2,175.49 $1,707.00 $1.00 $36,660.00 Third Quarter 5,020 66 $2,783.39 $2,407.50 $7.00 $36,660.00 Fourth Quarter 4,019 53 $2,507.88 $1,900.00 $1.00 $33,460.00
2009 First Quarter 3,928 52 $2,430.10 $1,831.50 $2.00 $31,262.00
Second Quarter 4,247 56 $2,575.75 $2,004.00 $7.00 $22,500.00 Third Quarter 4,469 59 $3,124.15 $2,665.00 $4.00 $21,956.00 Fourth Quarter 3,949 52 $3,247.21 $2,490.00 $2.00 $25,990.00
2010 First Quarter 3,949 52 $3,019.03 $2,355.00 $5.00 $31,116.00
Second Quarter 4,190 55 $3,370.77 $2,683.50 $2.00 $27,839.00 Third Quarter 4,449 59 $4,151.78 $3,519.00 $1.00 $48,218.00 Fourth Quarter 4,244 56 $4,760.70 $3,868.00 $1.00 $37,661.00
2011 First Quarter 4,243 56 $4,688.10 $3,864.00 $6.00 $37,975.00
Second Quarter 4,416 58 $5,081.28 $4,256.50 $1.00 $30,426.00 Third Quarter 4,470 59 $5,651.39 $4,850.50 $5.00 $27,064.00 Fourth Quarter 4,415 58 $6,181.30 $5,372.00 $5.00 $68,903.00
Note: One case was excluded from the data analysis due to an anomaly. The individual had been reported with a wage of $122,500 during second quarter 2010. A review of the individual’s record showed wages in previous quarters at $22,500. The wage within second quarter of 2010 appears to be a data entry error; therefore, the individual record was removed from analysis.

134
The mean and median increased over the years from fourth quarter 2006 of
$1,440.27 and $1,048 respectively to the final fourth quarter 2011 of $6,181.30 and
$5,372; therefore, within five years of participating in PSEO, the cohort members on
average more than quadrupled their earnings.
A cross tabulation of certificate and degree attainment with average annual
earnings provided information about income before and after credential attainment
(Appendix G). For most years, students who earned credentials typically experienced a
wage increase in subsequent years. For those years where “none reported” is indicated,
students who attained degrees or certificates may have had wages reported for at least one
quarter but not previous or subsequent quarters. If students earned additional credentials
in another quarter, those students’ subsequent wages would have been reported under the
new credential.
This study examined the types of employers with which the cohort are earning
these wages. The employer types with the five highest frequencies each year are included
in Appendix H for each quarter and year. The “food services and drinking places”
category is reported as the highest frequency during all quarters and years. In
comparison, in the fourth quarter of 2006, over 1,200 students were employed at “food
services and drinking places,” whereas in fourth quarter of 2011, that number is reduced
by over half or 527. The professional types of employers are gradually added to the list of
five highest frequencies each quarter.
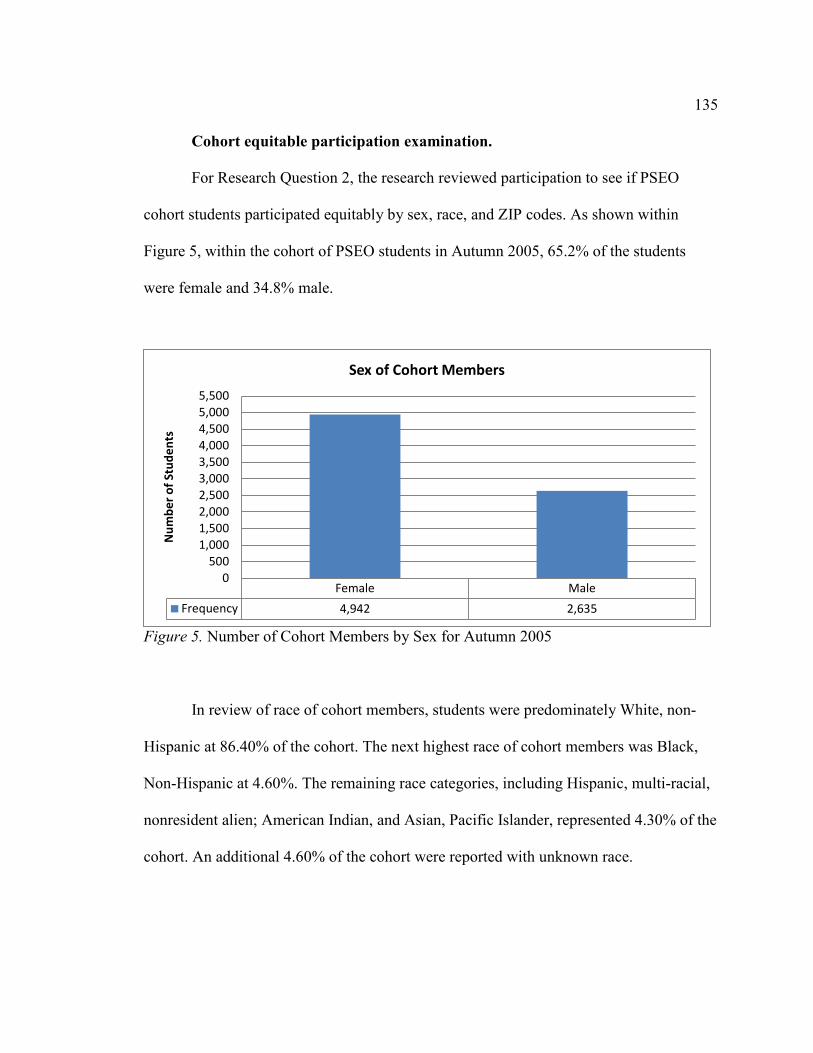
135 Cohort equitable participation examination.
For Research Question 2, the research reviewed participation to see if PSEO
cohort students participated equitably by sex, race, and ZIP codes. As shown within
Figure 5, within the cohort of PSEO students in Autumn 2005, 65.2% of the students
were female and 34.8% male.
Figure 5. Number of Cohort Members by Sex for Autumn 2005
In review of race of cohort members, students were predominately White, non-
Hispanic at 86.40% of the cohort. The next highest race of cohort members was Black,
Non-Hispanic at 4.60%. The remaining race categories, including Hispanic, multi-racial,
nonresident alien; American Indian, and Asian, Pacific Islander, represented 4.30% of the
cohort. An additional 4.60% of the cohort were reported with unknown race.
Female MaleFrequency 4,942 2,635
0500
1,0001,5002,0002,5003,0003,5004,0004,5005,0005,500
Num
ber o
f Stu
dent
s
Sex of Cohort Members

136
For poverty examination, ZIP codes were used to approximate a community’s
poverty level and therefore to determine if PSEO cohort students were participating from
both high and low socioeconomic statuses. Of the 7,577 cohort members, 5,624 students
have valid ZIP codes noted within their student records from Ohio Board of Regents data,
9 have invalid ZIP codes, and 1,944 have missing data, as noted within Table 15.
Table 15. Summary of Number and Percentage of ZIP Codes Available for Cohort
Students for Autumn 2005
Number of student records Percentage of available ZIP codes
Valid ZIP codes 5,624 99.84 Invalid ZIP codes (postal box only; non-residential) 2 0.04
Invalid ZIP codes (do not exist) 7 0.12
Total records with ZIP codes 5,633 100.00
Missing ZIP code records 1,944
Total 7,577
Using the ACS (2012) data of percentages of families below the poverty level, the
study identified 3,706 student records of ZIP codes for Ohio individual cities and are
listed in Appendix I. An additional 1,690 student records are matched with ACS poverty
level data for Ohio cities that have multiple ZIP codes and are identified in Appendix J.
Using these two ACS sets of data (i.e., individual cities and cities with multiple ZIP
codes), a total of 5,396 student records which is 96% of the total records (5,633)
available.

137
Of the remaining valid student records of ZIP codes, other poverty indicators are
matched for informational purposes only. Using the National Association of Realtor
(NAR) data, 217 student records of ZIP codes are matched with average home prices. An
additional 11 student records can be matched with median household incomes and
estimated median home and condominium values from Advameg, Inc.. The specific
details of those 11 records are combined and summarized within this study.
Table 16 describes all student records of ZIP codes from the study, the indicators,
and the respective appendices.

138 Table 16. Indicators for ZIP Code Poverty Information by Description, Appendix, Data
Available, and Number of Cohort Student Records
ZIP code description Appendix Indicator
Data provided
Number of student records
Cities in alphabetical order
I American Community Survey
% of families below poverty level 3,706
Cities with multiple ZIP codes in alphabetical
J American Community Survey
% of families below poverty level 1,690
Cities in alphabetical order
K National
Association of Realtors
Average home prices 217
Cities in alphabetical order
a
National Association of Realtors and
Advameg, Inc.
Median household incomes and house and condo values
11
Total 5,624 Note: a The specific cities are not identified in order to suppress information with values less than 10.
While sources such as the National Association of Realtors and Advameg, Inc.,
are available for informing the study, initially the findings of only the ACS (2012) is
reported in Table 17. Of the ACS’s percentages of families living below the poverty
level, 3,106 students or 41% of the cohort live in a community with a poverty indicator
greater than the Ohio average of 14.2% (noted in Table 17).

139 Table 17. Number and Percentage of Cohort Students from ZIP Codes with Poverty
Levels above Ohio’s Average
Source No. students % of cohort ZIP codes Poverty indicator ACS 1,582 20.88 209 greater than 14.2%
1,524 20.11 184 greater than 14.2% Total 3,106 40.99 393
This study reviewed detailed findings utilizing the ACS and other indicators (e.g.,
National Association of Realtors and Advameg).
Percentage of families below the poverty level.
First, the ACS (2012) poverty guidelines for each ZIP code were matched and
compared to Ohio’s average rate of 14.2% poverty rate. As noted within Appendix I, the
city, county, and PSEO participant number and percentage for each ZIP code are noted
with the ACS percentage of families living below the poverty level. Of the 3,706 PSEO
participants in the 502 ZIP codes, only two ZIP codes for the cities of Plymouth (Huron
County) and Uniontown (Summit County) have 0% of families living below the poverty
level. As illustrated in Table 18, these 2 cities account for 15 students, or 0.20% of the
cohort. Within 291 of the ZIP codes, 2,109 students (27.83% of cohort) are from
communities between 0.6% and 14.1% of families living below the poverty level. The
remaining 1,582 students, 20.88%, are from communities with greater than 14.2%
(Ohio’s average) of the families living in poverty.

140 Table 18. Number and Percentage of Cohort Students using ZIP Codes by ACS Poverty
Levels
Source Appendix No. students Percentage of Cohort ZIP codes
Percentage below poverty level
ACS I 15 0.20 2 0% 2,109 27.83 291 between 0.6% and 14.1% 1,582 20.88 209 greater than 14.2% Total 3,706 502
To highlight specific cities in Appendix I, Elyria in Lorain County has the largest
number of PSEO participants, 79, with a poverty level of 15.9%. The city of Athens in
Athens County has 23 participants in the cohort with the greatest percentage of 50.9% of
families living below the poverty level.
Appendix J indicates all cities with multiple ZIP codes and the respective poverty
levels. These urban cities account for 196 total ZIP codes and 1,690 students. Table 19
illustrates the number of students and their respective communities’ poverty levels.
Table 19. Number and Percentage of Cohort Students using ZIP Codes by ACS Poverty
Levels in Cities with Multiple ZIP Codes
Source Appendix No. Students Percentage of Cohort ZIP codes
Percentage below poverty level
ACS J 0 0.00 0 0% 166 36.70 12 between 2.9% and 6.5% 1,524 20.11 184 greater than 14.2% Total 1,690 196

141
Youngstown in Mahoning County with 6 ZIP codes was found to have 32.7% of
its families living below poverty level, accounting for 34 PSEO participants. With the
largest number of PSEO participants in this group, 233 students, 3.08% of the cohort,
Cleveland, Cuyahoga County, has 26 ZIP codes with 31.2% of its families living below
the poverty level. Only five cities (i.e., Oregon, Chagrin Falls, Westerville, Strongsville,
and Dublin) have less than 10% of their families living below the poverty level,
accounting for 146 PSEO students.
Because not all ZIP codes were available in ACS, a commonly used source of
poverty level data, this study reviewed poverty information using additional indicators
(e.g., National Association of Realtors and Advameg) to help inform the study on the
remaining ZIP codes.
Average home price. Without ACS data and for informational purposes only, the National Association
of Realtors (NAR) provided information to match ZIP codes to the indicator of average
home prices. Appendix K provides information for the communities of 217 PSEO
students. Ohio’s median home price from the NAR (2014) was $84,119. Using that as the
benchmark for the poverty level, ZIP codes were sorted by average home prices. Table 20
shows the number and percentage of ZIP codes above and below the Ohio average.

142 Table 20. Number and Percentage of Cohort Students using ZIP Codes and NAR
Average Home Prices Compared to Ohio’s Average Home Price
Source Appendix No. students Percentage of cohort ZIP codes Average home price
NAR K 202 2.67 72 greater than $84,119 15 0.20 9 less than $84,119 Total 217 81
Table 21 highlights the names of the cities and counties which have average home
prices less than the state average of $84,119. The total PSEO participants of 15 are not
provided with each individual city in order to suppress cell sizes less than 10.
Table 21. Communities of PSEO Cohort Students with Less than Ohio Average Home
Price
ZIP code City County Average home price
43720 Blue Rock Muskingum $83,100 45618 Cherry Fork Adams $75,000 45004 Collinsville Butler $15,000 43445 Martin Ottawa $35,775 45353 Pemberton Shelby $79,900 45361 Potsdam Miami $64,690 44272 Rootstown Portage $70,342 44881 Sulphur Springs Crawford $75,900 45388 Yorkshire Darke $39,000
Median household income and median house and condo value.
Eleven ZIP codes did not have average home prices available through the
National Association of Realtors. Of those 11, a small number could be aligned with
143 median household income reported in NAR and a small number with median house and
condominium values. All 11 were found to live within communities that are lower than
the Ohio median income and median home values. These have been combined without
providing details about the students’ cities to suppress data less than 10.
Qualitative Results
To address Research Question 3, a set of qualitative interviews were used to
explore perspectives among high school and postsecondary personnel familiar with
PSEO. Extreme case sampling was employed. The school districts’ and higher education
institutions’ personnel were chosen because their schools had the greatest and fewest
PSEO participants within in a specific geographic area. The geographic area was a cluster
of schools in both rural and urban counties. The institutions within two counties, one
predominately rural and one urban, provided a comparison of two-year and four-year
institutions. The four-year institutions within these counties provided the perspectives of
major universities within Ohio. The two-year institutions are neighbors of the larger four-
year institution counterparts.
Initially, the researcher reached out to four secondary schools’ administrators. Of
the initial four, one person did not return my email or call for participation in the
interview. Another secondary school within that same county with similar PSEO
participation data was selected and the administrator agreed to participate. The researcher
reached out to four postsecondary institutions. All four responded to my request, with
only one person referring me to another colleague within the institution who would be
better suited for the interview.
144 Institution profiles.
Of the eight institutions participating in interviews, two were public four-year
universities, two were public two-year colleges, and four were public secondary school
districts. The districts and colleges were located within one central Ohio county and one
southeastern Ohio county.
The participating four-year universities were residential institutions with multiple
regional campuses offering undergraduate and graduate degrees and were recognized as
leading institutions in the state and nation. The two-year institutions offered associate
degree and certificate programs focused on workforce development needs and career-
technical education. The secondary school districts were selected based on the number of
students who participated in PSEO from the Ohio Department of Education (2013a)
participation report. Within each county, one district with the larger number of
participants and one district with the smaller number of participants were selected.
Individuals at these districts and colleges were chosen to be interviewed based on website
information describing the individuals’ responsibilities associated with PSEO. To
maintain confidentiality, exact numbers of participation numbers have been rounded.
Institution A is a public two-year college located in a southeastern Ohio county.
The institution enrolled approximately 140 PSEO students in fiscal year 2012 according
to the Ohio Department of Education (ODE) (2013). The Integrated Postsecondary
Education Data System (IPEDS) Data Center (2012) information for this institution
indicated a total fall 2012 enrollment of over 4,500; therefore, the PSEO students
comprised approximately 3% of the total enrollment. For PSEO student eligibility,

145 students must have a 3.0 high school GPA and must maintain a 2.0 cumulative GPA to
continue annually. The researcher conducted a 20-minute, in-person interview with the
individual responsible for PSEO at the institution. Data and quotes from this institution
are noted as “Medium-Sized Community College” or “Adam.” Adam serves as the
coordinator of the PSEO program and provides one-on-one assistance to PSEO students.
Institution B is a public secondary school district in a southeastern Ohio county.
In FY2012, approximately 45 or 1.5% of the high school’s approximate 2,800 students
participated in PSEO at colleges and universities (ODE, 2013b). The researcher
conducted a 24-minute, in-person interview with an administrator of the district. Data and
quotes from this institution are noted as “Medium-Sized Secondary School” or “Bill.”
Bill is an administrator for the district with the responsibility of oversight of all
operations.
Institution C is a public secondary school district in a central Ohio county. From
an ODE (2013a) enrollment report, approximately 60 students out of the district’s over
14,000 students participated in PSEO, for a less than 1% participation rate (ODE, 2013d).
The district has three high schools and one administrator located within the county. The
researcher conducted an 18-minute telephone interview with the individual who
supervises the PSEO program for the district. Data and quotes from this institution are
noted as “Large Secondary School” or “Craig.” Craig has the role of developing
partnerships with universities and colleges and has experience working as a school
administrator.

146 Institution D is a public two-year college located in a central Ohio county. The
institution has multiple campuses throughout the county. The institution enrolled over
400 PSEO students in 2012 according to the Ohio Department of Education (2013b). The
IPEDS Data Center (2012) information for this institution indicated a fall 2012
enrollment of approximately 26,000; therefore, the PSEO students comprised
approximately 1.5% of the total enrollment. For PSEO student eligibility, students must
have a 3.0 high school GPA within the subject area in which a student enrolls or the
student must have scored above minimum testing results from a nationally normed
assessment such as the ACT, SAT, Compass, or Accuplacer exams. PSEO applicants
must complete written essays and submit letters of recommendation. The researcher
conducted a 21-minute telephone interview with the individual responsible for PSEO at
the institution. Data and quotes from this institution are noted as “Large Community
College” or “Danielle.” Danielle oversees the PSEO program with many years’
experience working with PSEO at other institutions.
Institution E is a public secondary school district in a southeastern Ohio county.
From the ODE (2013a) enrollment report, fewer than 10 students out of the district’s
almost 900 students participated in PSEO, for an approximate 1% participation rate
(ODE, 2013d). The researcher conducted a 16-minute telephone interview with a district
administrator. Data and quotes from this institution are noted as “Small Secondary
School” or “Elizabeth.” Elizabeth is an administrator for the district with the
responsibility of oversight of all operations, and has served the district in a teaching role
and coordinating special programs.

147 Institution F is a public four-year university in a southeastern Ohio county. The
institution has multiple campuses throughout the state, primarily in southeastern Ohio.
The institution enrolled approximately 300 PSEO students in FY 2012 according to the
Ohio Department of Education (2013b). The IPEDS Data Center (2012) information for
this institution indicated a total fall 2012 enrollment of approximately 27,000; therefore,
the PSEO students comprised about 1% of the total enrollment. For PSEO student
eligibility, students must have a 3.0 high school GPA and must have earned above the
minimum requirement on the ACT. To maintain eligibility within the PSEO program,
students must maintain a minimum 2.0 cumulative GPA. The researcher conducted a 26-
minute telephone interview with the individual responsible for PSEO at the institution.
Data and quotes from this institution are noted as “Large Four-Year University” or
“Frank.” Frank is an administrator who is responsible for overseeing all initiatives related
to PSEO.
Institution G is a secondary school district in a central Ohio county. From the
ODE (2013a) enrollment report, 200 students out of the district’s approximately 50,000
students participated in PSEO, for a less than 1% participation rate (ODE, 2013d). The
researcher conducted a 32-minute telephone interview with the individual responsible for
PSEO at the institution. Data and quotes from this institution are noted as “Large School
District” or “George.” George is a staff member with the responsibility of supervising
and overseeing the PSEO program for the district.
Institution H is a public four-year university in a central Ohio county. The
institution has multiple campuses throughout the state. The institution enrolled

148 approximately 300 PSEO students in FY 2012 according to the Ohio Department of
Education (2013b). The IPEDS Data Center (2012) information for this institution
indicated a total fall 2012 enrollment of over 50,000; therefore, the PSEO students
comprised less than 1% of the total enrollment. For PSEO student eligibility, students
must have a 3.7 minimum high school GPA, must be within the top 15% of their class,
and must have earned above the minimum requirement on the ACT, SAT, or other
assessment exams. The researcher conducted a 14-minute telephone interview with the
individual responsible for PSEO at the institution. Data and quotes from this institution
are noted as “Large Four-Year University” or “Heidi.” Heidi oversees the PSEO program
at the university.
The answers to Research Question 3 emerged from the qualitative interviews
conducted with secondary and postsecondary personnel. These interviews provided a
broad spectrum of perspectives regarding PSEO. The eight interviews were conducted by
phone or in person, audio taped, and transcribed. The following information includes the
themes and case results of the interviews.
Table 22 illustrates the characteristics of the institutions’ profiles.

149 Table 22. Institution Profiles of Interviewees
Institution
Description A B C D E F G H
Two-year college
X X
Four-year university
X X
Public school district
X X X X
Location South-eastern county
South-eastern county
Central county
Central county
South-eastern county
South-eastern county
Central county
Central county
Interviewee time in role 4 years 20 years 6
months 3 weeks 4 years 8 years 4 years 12 years
Thematic results.
By using line-by-line coding, key themes emerged regarding the benefits and
challenges of the program. From specific concerns about funding, or the lack thereof, to
obvious limitations placed on the number of participating students, to being described as
“the great equalizer,” PSEO is a program that all interview participants agree has both
benefits and challenges.
Funding.
The costs of PSEO dominated nearly every interview. The references to funding
often centered on the funding formula: When students participate in PSEO, the funding
from the Ohio Department of Education is re-directed from the secondary schools and
instead given to the colleges at which students enroll. Mentioned as one of the challenges,
Bill, from a Medium-Sized Secondary School, indicated that the cost for his district was a
major challenge:

150
Usually it’s whatever the cost of the course is minus what state share they
might get for that student, and then we get a balance bill plus books.
The “balance bill” reference did not seem to match the state of Ohio’s flow of funds as
described by other interviewees, but could be a reference to a specific local agreement
with higher education institutions. Bill described the only improvement for the PSEO
program would be for “someone else to pay for it other than us.” All secondary school
institutions withstand the brunt of this fiscal formula. Elizabeth, from a Small Secondary
School, described the financial calculation:
We receive maybe $5,700 per child for the year. If they take a class or
two, $2,800 of it can flow right out the door per child.
Continuing with that description, Elizabeth approximated the cost to the district had
increased in recent years:
Our spending for PSEO went from $8,000 to maybe $30,000. Because you
pay up to half of what you get from the state. And so what that might
mean is, say we school a child for six periods here, or even seven, but they
go take a class, you know at the end of the day, and just one class, there
goes half the money for the child. That’s a challenge.
Elizabeth appreciated that higher education institutions also need funding for
PSEO, but found the distribution of funds unbalanced:
Well, I think the funding piece really needs to be looked at. I know the
universities need funding as well, but again, the distribution of funding as
per the example I gave you previously. We have them for six-sevenths of

151
the day, and then how does that match, because they receive half the
money?
Craig, from a Large Secondary School, expressed concern about the funding and the way
tax dollars are being utilized:
I don’t feel that the school districts should be the ones that [pay] for it.
We’re responsible for our K through 12 education, and that’s our tax
dollars. I’m not so sure that our tax dollars should be going for college at
this point, because that’s not how we’re being funded from the state.
From the perspective of the other partners in PSEO, the colleges and universities
indicated concerns about the funding. Specifically, the concerns center on the idea that
the funds received are not sufficient to cover the actual costs incurred by student
enrollment. For instance, Adam, from the Medium-Sized Community College, indicated
that “obviously more is always better.” Because the colleges are not receiving the full
amount of funding, Adam indicated that colleges are covering more of the costs;
therefore, an improvement would be “the less that the colleges would have to put out of
their own monies, if the college courses were covered more.”
Frank, representing a Large Four-Year University, confirmed that colleges
sometimes lose funds with PSEO, and this loss actually can hamper access for more
students:
How do we pay for this and how do we provide more access to students? I
am not involved so much in the financial aspects of PSEO and fortunately
I don’t have to be involved in the billing of the program. What I do know

152
is that we’ve never made money on it. It’s not something we do because
we turn a profit. It’s something we’ve done because it’s a good thing, and
we might break even from time to time, and that’s it.
Heidi described what she believed was the “original thought behind” PSEO:
If there are open seats, let’s let a high school student take that, but I think
the number of students who participate is more than just, here’s an
occasional open seat.
She also confirmed that postsecondary institutions are well aware of the funding
challenges for secondary districts:
In terms of how the high schools lose some of their state funding to help
pay for these classes, but what the colleges receive does not reflect what
they might receive if the student was paying tuition.
In addition, colleges also bear the cost of support services such as advising the
students to ensure academic success. Heidi indicated that both sides find the
funding of PSEO a challenge:
Neither the high school nor the colleges [have] the funding to make this
easy. It’s still a very worthwhile program, but the challenge is that our
budgets are getting cut, left and right, it does make it a little bit more
difficult.
A different side of funding was mentioned as primary benefit for students: Since
the costs of tuition and books are taxpayer funded and distributed between the high
schools and colleges, the students and their families benefit from higher education
153 without a direct financial investment while in high school. Frank indicated that the
opportunities provided through PSEO allow not only for “cost savings” but also for
“degree attainment” for students who might not otherwise enroll in college:
I’m a first generation college kid. My opportunity to go to college was
based on a football scholarship. That’s about the only way we could have
afforded it. There’s got to be more we can do. As a state, a community of
higher education professionals, we need to provide educational
opportunities to these students, so they can get their degrees. PSEO is a
way to do that. It’s a way to provide coursework, you know, free of charge
for these students.
Access and equitable participation.
Cited as a concern in the Blanco et al. (2007) study and as a major principle
within St. John’s (2003) framework, the concept of equitable access to higher education
was mentioned many times in the interviews of this study. PSEO is an opportunity for
students to take college courses, but this opportunity may be lost if parents are unaware
of the program. Listed as a challenge for PSEO, Craig indicated this:
Another challenge would be getting the information to parents, who
themselves did not go to college or are not engaged in the school, to know
that that’s an option for their child.
The importance of having an engaged parent or supportive family was one of St. John’s
key elements of the family “habitus.” St. John utilized Bourdieu’s (1977) sociological
theory that individuals can be hindered from attaining higher education based on the
154 “habitus” in which an individual lives. Further, Vargas (2004) also pointed out that
access to “college knowledge” which helps lead individuals to gain cultural capital is
limited. The individuals “who have the greatest need” such as “low-income, minority,
and first generation” have the least likely chance to gain college knowledge and,
therefore, may not seek college education, further perpetuating their habitus (pp. 5-7).
Bill described the students:
The kids that go tend to be more high level kids. They usually have
parental support, or they have a fairly sound structure at home. The kids
that don’t go are the kids that come from a little bit more challenged
families.
Elizabeth also remarked that because PSEO opportunities exist on college campuses,
rather than high schools, the students must have transportation. Many families cannot
provide cars for students to transport themselves to the colleges’ campuses, and therefore,
another limit has been placed on the access of these students. Elizabeth indicated:
If you’re from a family that’s better off, you’re going to have more chance
to do PSEO than if you’re less fortunate.
Further, Bill confirmed that easy access to an institution is a challenge:
I don’t know about a lot of the other districts but you know in general, you
have Cleveland, Columbus, Cincinnati, and Dayton, maybe Youngstown.
The rest is pretty rural. We’re 100 miles from anywhere.

155 Bill did mention the university within the county; however, he indicated that access
beyond that institution was limited. Bill mentioned the option for online learning has
increased:
Technically a kid could sit … at their home and attend pretty much any
school in the country via electronic courses.
When asked about Internet access for students, he confirmed that this can be a problem in
the rural sections of the county, but “if you live in the city or close to the city, you’re
usually pretty good.”
Access is also limited purposefully by the secondary and postsecondary
institutions. Postsecondary institutions can place eligibility requirements for entry into
the PSEO program. These requirements vary by institution such as a minimum GPA,
class rank, or national assessment tests (e.g., SAT or ACT). In addition, some
postsecondary institutions limit the accessibility by designating a certain number of slots
in the program for high school students. Heidi, representing a four-year university,
confirmed that typically her institution would only admit between 300 and 350 students
total at all of their campuses. As noted previously, this represents less than 1% of the
institution’s entire enrollment. Similarly, Frank, also representing a four-year university,
indicated that this institution “only enrolls about 75 new students a year into PSEO,”
which totals the 300 enrolled in 2012 (ODE, 2013). With the larger universities limiting
enrollment, the growth of PSEO is stalled, whereas the interviewees from the two-year
institutions did not mention limited access at all.

156
The secondary schools place their own limits on PSEO. For instance, George,
from an urban school district, indicated that only 30 students per year could participate in
full-time enrollment for PSEO:
This does not include the students taking one or two courses through
PSEO, so there are a lot of students that are able to do that. But there are
more students that qualify for a full-time program than what we’re able to
accept.
Elizabeth indicated that her district has placed restrictions on the scheduling of PSEO
courses only after 10 a.m. to ensure that the district is complying with attendance
monitoring. This limit also was created to accommodate the high school schedule of
courses, which are required for students:
Some of them may have class that’s at 9:30, 9 a.m. … that [ruins] the
morning as far as getting their other classes in.
Positive aspects.
Many positive characteristics were cited for students participating in the PSEO
program. From early exposure to college environments to earning transferable college
credits to avoiding large student loan debts, the interviewees found many reasons to
support the program. Frank shared:
I think the number one [thing is] exposure to the college classroom. The
college experience is huge … those are all positive things. And then
obviously the cost savings involved. If we can take a term or two out of

157
the four years after graduation, we can decrease that time towards a
degree, we’re really helping the students out.
Opportunities for students to explore college courses at no cost are also a
benefit. Some high schools have cut back on their course electives due to budget
constraints, and PSEO allows students to take additional courses. Frank indicated
that this is a way to “supplement that high school curriculum … something that
might not be available at the high school level.”
George, from a large school district, indicated that PSEO is a way for
students “to put their toe in the water for a minute” which leads to this scenario of
having support:
I think another benefit is that participating in PSEO provides an extra layer
of support, an extra layer of structure around students who are ready
academically a year earlier or two years earlier, but might still need the
emotional and social support that the high school student needs.
The curricular exploration and built-in support systems may lead to boosting
student confidence as noted by George:
So just the fact that they had that jump-start on other students really does a
lot for student self-confidence. It really eases the transition, and it allows
them to, I think, believe in themselves that, ‘I can do this. I’ve been
supported through this. I’m ready for it now because I had this jump start.’

158 Being able to transfer college courses from one institution to another
provides financial benefits. By taking courses that are transferable and that satisfy
high school graduation credits, Adam indicated this process for advising students:
My first goal for the students when I do advise is, ‘what are the high
school graduation requirements, and then what do you want to do as your
career’ … and all the courses are transferable.
By utilizing these transferable college credits at another institution, or
continuing at that institution, students bear less of the financial burden of student
loans. Bill expressed great concerns of college costs for students:
Of course we all know that the cost of going to college, they rack up debt
that they can’t possibly pay back … it’s really a problem and a shame …
It’s a crisis in the country, everybody speaks of it, but it’s certainly not
getting any better.
Adam indicated that PSEO could be a resolution for student loan debt:
I think by getting students through school faster, the advantage of students
being able to take classes, essentially, I mean, for free, is reducing the
amount of student loan debt in the long run, so our students are not buried,
hopefully.
Economic impact.
When asked about the opportunities that secondary and postsecondary
institutions have on impacting economic recovery, most interviewees cited the

159 possibilities of students earning college degrees sooner when participating in
PSEO. Frank shared:
Obviously the downstream effect is degree attainment, and more education
for the workforce, which has the impact to the state when it comes to the
tax impact downstream. So these students are employed in higher wage
jobs, the intellectual fortitude of the population is increased, and you’ve
got [a] more productive workforce.
Heidi responded similarly, but included other skills that students must attain:
Education is the key to success in life. But I think it can’t be just a
superficial social path, just, you know, the credential is all that is needed. I
think that it really has to be that students are really gaining skills that help
them be successful in the workplace. You know, what we hear from
employers is that we really do need those really critical skills of
communication, of being able to understand math and data analysis, that
they’re constantly looking for students with those soft skills of being able
to get along with others.
Craig also indicated the need for training:
Well, certainly training of the next generation of workforce is important
and training them for the skills that are needed for those. When you look
at economic recovery, there’s oftentimes, a part of that is emphasis on
training, re-training, I should say.
160 However, not all interviewees agreed with the notion of impacting economic
recovery. Elizabeth shared:
I’m not sure about that … My personal opinion is the current
administration would like to link this … this program and the economic
recovery, but they must be seeing something I’m not seeing. What it does
to me is it puts … people into the job market more quickly. But I’m not
certain that worker availability is a … real problem. I think that’s what
they’re saying: Well wait, with more trained workers available, businesses
will be drawn to Ohio. I think there are a lot of unemployed, so that would
indicate to me that there really are available workers. I contend that
they’re really not appropriately trained.
Negative aspects.
As previously described, the financial burden of the PSEO program is difficult for
both secondary and postsecondary institutions. In addition, interviewees mentioned other
negative aspects about the program including the conflicting state laws of monitoring
attendance. Elizabeth shared:
Monitoring’s a concern because a lot of college classes, they don’t
monitor so closely. Education is standards-based, ‘you passed the test; you
did okay.’ But they don’t necessarily have to take attendance. Well, what
does that mean for us? We’re charged with taking attendance. We’ve had
children who say that they’re doing this or doing that, and it turns out that
they haven’t even been there for two or three weeks.

161 Elizabeth would suggest that colleges and high schools should agree to monitor
the students’ attendance records.
Ensuring students are ready for college-level courses can be a problem
even when placing restrictions on eligibility requirements for students. Frank
pointed out:
There are a lot of students who are academically ready to be in a college
course at the high school level …intellectually ready, but there are not a
lot of students who are mature enough to be in the college classroom, at
least at our institution… So I want to just be certain that we’re putting
these students in the right place to be successful.
Another issue of concern was also noted as a student benefit: course
transferability. While students taking courses in PSEO may have many of their credits
transfer to another institution, the credit is not guaranteed to transfer. Craig shared an
instance when this did not work for a student:
I wish that all courses could be what are called TAG courses. Courses that
are transferable… We had a student go to a local university at local level,
a course was held at one of our high schools. The [receiving] college
would not accept the credit.
The interviews shed light on a great number of benefits and challenges of
PSEO. The funding concerns, the limits of accepted students, and the flexibility of
credit transfer counter the positive benefits for students to earn college credit

162 while in high school and potentially decrease the time to earn a college degree,
which could influence the economic recovery of the state of Ohio.
Case results.
These institutions were selected as case studies to examine the PSEO challenges
and benefits because of their unique characteristic of being located within a county with
both two-year and four-year institutions and secondary schools with high and low PSEO
participation rates. The following information compares and contrasts the institutions
with regard to the type of institution (i.e., two-year and four-year, high school and
college) and location (i.e., urban and rural) and their responses to the interview questions.
County
With regard to counties, the primary characteristic to consider is that one county
is predominantly urban and one is rural. For the institutions within the mostly urban
central Ohio county, a similarity cited by the schools is a concern with transportation.
Both secondary schools and postsecondary schools indicated that students without
transportation have difficulty participating in PSEO as most courses in this program are
at the postsecondary campuses. One notable difference is that the representatives of
postsecondary institutions in the urban area cited concerns with parking for the students,
as it is limited within the city boundary of this institution. The rural county school
representative expressed that students may have difficulty accessing a car to get the
student to the campus.

163 Types of institutions.
For the most part, interviewees from high schools and colleges agreed on most
issues with PSEO. Interviewees expressed concern with the funding, although high
schools’ representatives protested about the funds redirected from their schools and the
colleges found that the funds they received were not enough. Secondary schools and
higher education institutions both recognized that PSEO is for students who are excelling
academically. Some interviewees referred to students as “gifted,” “bright,” or “advanced”
to indicate these are the types of students who institutions want to participate and are
drawn to the challenge of a college curriculum. Finally, representatives from both types
of institutions understand the importance of communicating with parents. Some high
schools will invite colleges to speak to their parents about PSEO in order to give families
an opportunity to be aware of the options. Parental support was a critical characteristic.
Students with parents who have not earned college degrees have less support than other
students. One rural secondary school representative indicated that although many
students within the district have parents who work at the nearby university, other students
have no family members with higher education experience.
One primary difference between the perspectives of representatives from high
schools and the colleges was the awareness of College Credit Plus, which was drafted by
the Ohio Board of Regents’ Chancellor Carey (2013b) as a requirement of Ohio House
Bill 59 and enacted into law July 2014. Only one of the secondary school administrators
mentioned the changes to PSEO when College Credit Plus is enacted. In comparison, all

164 four of the postsecondary institutions’ representatives were vocal about changes to
funding and programming because of College Credit Plus.
Two-year and four-year institutions.
Two-year institutions and four-year institutions both had admission criteria for
PSEO participation; however, the four-year universities were more restrictive and limited
the number of students who were accepted. Also similar, both types of institutions
recognized the need to communicate with high school counselors about admissions
procedures.
Both four-year institutions indicated that students were most often attracted to
their universities because of their institutional brand. They believed that students want to
attend their universities because the courses can more easily transfer and because the
students want to be associated with that institution.
Staffing of PSEO programs was an area of difference. Two-year institutions
typically have one person serving students on a day-to-day basis, whereas the four-year
institutions had more layers of administrative staff. Interestingly, a two-year college had
one person serving 400 students and both four-year universities had multiple personnel
serving 300.
Summary
This examination of the results of quantitative data from the Ohio Board of
Regents and the Ohio Department of Job and Family Services provided a broad analysis
of PSEO participants beginning with academic year 2005–2006 and ending with 2010–
2011. This analysis provided answers to the research questions posed for this study.
165 Beginning with the full PSEO population during the study’s academic years, student
demographics (e.g., sex, race, county of residence) and types of institutions of higher
education involved in PSEO were examined. Student performance was examined
including average number of courses completed, course categories, grade point averages,
and average hours earned. Drilling down to a cohort of students, high school seniors in
academic year 2004–2005, the research questions surrounding educational and
employment outcomes were explored using longitudinal data from 2005 through 2011.
The educational outcomes included course enrollment, GPAs, credit hours earned,
degrees and certificates attained; the employment outcomes included wages earned on a
quarterly basis and types of employers that had hired these students. Equitable access was
examined with an analysis of sex, race, and poverty. With the addition of qualitative
interviews, this study provided the perspectives of secondary and postsecondary
personnel responsible for PSEO at their respective institutions. The interviews provided
thematic results related to funding, access, and equity.

166
Chapter 5: Summary
This chapter addresses findings from the data analysis, conclusions that could be
drawn from the data, and recommendations for future research related to dual enrollment
in general and PSEO specifically. This research was focused on a strategy to overcome
the problem of Ohio’s low percentage of citizens with college degrees. The strategy, dual
enrollment of high school students taking college courses, was examined in this research.
Ohio’s Post-Secondary Enrollment Options (PSEO) is one type of dual enrollment
program. This study intended to extend the Blanco et al. (2007) research and expand into
additional data focusing on a cohort of students’ educational and employment outcomes
and exploring qualitative interviews to gain perspectives of secondary and postsecondary
personnel.
Research Findings
Over the period of 2005–2006 through 2010–2011, student participation
fluctuated. While there was one year of growth in academic year 2006–2007 to over
15,000 students, during most years of the study, participation stayed between 9,000 and
12,000 enrolled students. Blanco et al. (2007) reported over 12,000 students had
participated in 2004–2005. Due to the trend of relatively flat enrollment, this suggests
that the strategy of encouraging students to enroll in college courses, in the PSEO
program, while in high school is not gaining popularity; rather, the data seem to indicate
that either students are not interested or public schools and higher education are limiting
participation in the PSEO program. These quantitative data are supported by the
qualitative theme identified of district and college personnel indicating that the financial
167 implications are major concerns and, therefore, limits are placed on participation.
Limiting participation may serve to minimize the financial effects of losing school district
money and colleges not recuperating enough funding.
Female students continue to dominate the participation numbers. Nearly every
year of the study showed about two-thirds of the participants were females, consistent
with the findings of Blanco et al. (2007). Racial demographics have begun to shift.
Whereas Blanco et al. found that White, non-Hispanic students participated at a rate of
90% of the total participants in 2004; this study found that White students decreased in
proportion to 82.19% in 2011. Black participants decreased from 6.5% to 6.3%, and
Hispanic students increased from 1.8% to 2.30%. Equitable participation was not evident
with regard to race and sex.
Another noteworthy finding of the study is the location of participation. Eighty-
three percent of students in the Blanco et al. (2007) study had enrolled at two-year
colleges. While still the dominant location of PSEO attendees, the choice of two-year
colleges did decrease to 63.57% the year after the Blanco et al. study and continued to
fluctuate to 71.54% in 2010–2011. Students continued to participate in the northern
counties primarily.
Looking at trends over the years of this study, PSEO enrollment in most counties
stayed the same. However, a few counties have noteworthy trends such as Brown,
Clermont, Sandusky, Summit, and Warren Counties, which have experienced growth in
PSEO enrollment over the six years. Enrollment in Brown, Clermont, Sandusky, and
Warren Counties grew from under 1.0% to nearly 2.0%. Summit County, however, grew
168 from 1.95% to 3.05%. Cuyahoga County had the most enrollments: as of 2010–2011 at
11.08% of the PSEO participants. This county grew its PSEO enrollment from 8.72% in
2005–2006. Similarly, Lorain County experienced a major growth from 5.74% to 7.84%.
Stark County showed the most variation in growth and decline of enrollment. In 2005–
2006, 2.81% of the PSEO participants resided in Stark and then decreased to 1.89% the
next year. In 2007–2008, PSEO numbers increased to 3.39% and jumped to 6.07% in
2008–2009. From there, the participation rate has decreased: 2.26% in 2009–2010 and
finally to 0.55% in 2010–2011.
As cited by Kim (2012), New York’s College Now dual enrollment program
experienced a similar geography challenge. The data indicated that College Now
enrollment “showed proportionately uneven number of students being served by College
Now citywide” (p. 53). One example included 21.1% of all students attended a school in
Manhattan but these students represented only 12% of College Now enrollment. In
response to these disparities, administrators in the school district worked to enroll a more
representative population by reallocating resources throughout the district. Considering
the disparity of participants in Ohio’s southern counties and institutions and the similar
racial and gender patterns of participants, Ohio’s policymakers could consider
concentrated efforts to encourage participation in less represented locations and male
students of color.
The seniors averaged 1.59 courses compared to the entire group of 2005–2006
participants’ 1.75 courses. The average GPA was the same at 3.21, and the average credit
hour load was 13.16 compared to the PSEO population at 11.7 hours. The cohort of

169 students from the academic year 2005–2006 earned a large number of certificates and
degrees, but the percentage declined from previous years. A large number of students
earned an associate degree in the academic year 2005–2006. The cohort earned many
certificates and degrees including 24 certificates and 126 associate degrees during their
senior year. Obviously, the seniors had completed a significant number of credit hours
prior to their last year of high school. However, Blanco et al. (2007) found that 32% of
PSEO students had graduated with an associate degree within two years compared to the
cohort’s 6.99%. Students in this cohort earned more than one degree or certificates with
734 earning two or more credentials; this type of accomplishment was not addressed by
Blanco et al.
An important note for future research is the fact that this study did not examine
the cohort for gaps in educational history. For instance, some cohort members may have
continued their education immediately after high school through degree or certificate
completion. However, other students may have entered and exited postsecondary
education over the period of five years after high school. Future research should examine
the gaps. This information would prove very interesting to see if PSEO participants are
more apt to continue their education without stopping.
When calculating the effect size for comparison of groups, in this case, the
population and the cohort, the standard findings of Cohen’s d include a small effect size
ranging from 0.0 to 0.20, a medium size ranging from 0.20 to 0.50, and a large effect size
with values over 0.50 (Salkind, 2010). For the number of courses that students enrolled in
autumn 2005 from the population, the effect size (d = -0.03) suggests that a negative

170 effect size means that “the control group performed better than the experimental group
did” (Jacobs, 2005, p. 2). With a cohort mean of 1.59 and a population mean of 1.55, the
cohort did enroll in 0.04 courses more than the population.
The number of credit hours earned during autumn 2005 by the population and the
cohort have means of 13.16 and 12.22 respectively. For average credit hours earned,
Cohen’s d, d = 0.07, suggests a small effect size. Finally, the grade point averages earned
during autumn 2005 by the population and the cohort are 3.23 and 3.22 with a Cohen’s d
of d = 0.13, a small effect size.
The cohort of PSEO students from the academic year 2005–2006 earned a large
number of certificates and degrees, but the percentage declined from previous years. A
large number of students earned an associate degree in the academic year 2005–2006.
The cohort earned many certificates and degrees including 24 certificates and 126
associate degrees during their senior year. Obviously, the seniors had completed a
significant number of credit hours prior to their last year of high school. However, Blanco
et al. (2007) found that 32% of PSEO students had graduated with an associate degree
within two years compared to the cohort’s 7.65%. Students in this cohort earned more
than one degree or certificate with 734 earning two or more credentials; this type of
accomplishment was not addressed by Blanco et al.
Employment outcomes provided an interesting look at types of employers and
wages. During the fall after the cohort’s senior year of high school, students earned an
average of $1,440.27 per quarter. The wages steadily increased over the years with an
outcome of students earning $6,181.30 on average. This quadrupling of income within

171 five years indicated a significant impact on individuals’ economic growth during the
study. These students also progressively changed from retail and food service type jobs in
the beginning years of the study to professional and technical related employers at the
end.
St. John (2003) indicated that educational policies needed to reflect equitable
opportunities among all citizens in order to truly impact economic growth. Unfortunately,
the data within this study do not reflect an equitable participation in the cohort. Sixty-five
percent of students were female, and 84.2% were White for the entire population of
PSEO; likewise, within the cohort, 65.2% were female and 86.40% were White. Cohort
numbers were in proportion to the entire population of the PSEO participants. In one case
of differences, there were 4.60% Black students within the cohort which was a decrease
in comparison to Blanco et al.’s (2007) finding of 6.5% and the population range of
5.90% in 2007 up to 7.12% in 2006.
Blanco et al.’s (2007) percentages of race have been illustrated as the baseline
year in 2004–2005 in Table 23 compared with the current study’s population findings.
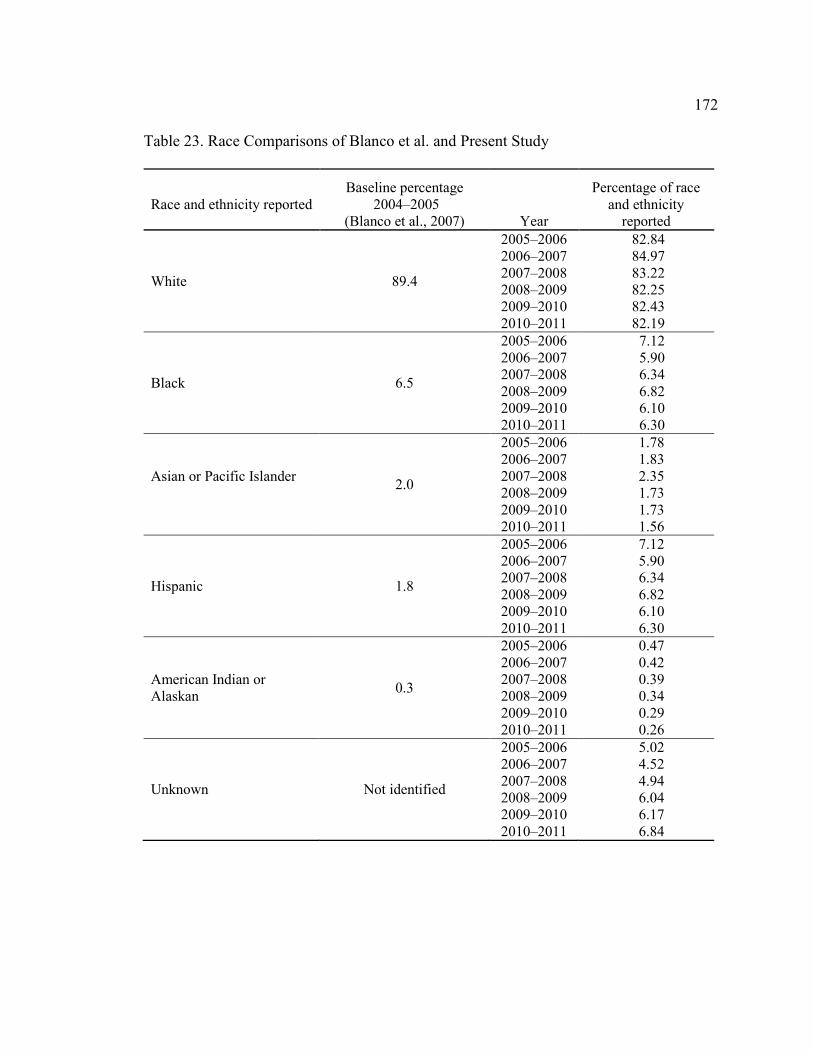
172 Table 23. Race Comparisons of Blanco et al. and Present Study
Race and ethnicity reported
Baseline percentage 2004–2005
(Blanco et al., 2007) Year
Percentage of race and ethnicity
reported
White 89.4
2005–2006 2006–2007 2007–2008 2008–2009 2009–2010 2010–2011
82.84 84.97 83.22 82.25 82.43 82.19
Black 6.5
2005–2006 2006–2007 2007–2008 2008–2009 2009–2010 2010–2011
7.12 5.90 6.34 6.82 6.10 6.30
Asian or Pacific Islander 2.0
2005–2006 2006–2007 2007–2008 2008–2009 2009–2010 2010–2011
1.78 1.83 2.35 1.73 1.73 1.56
Hispanic 1.8
2005–2006 2006–2007 2007–2008 2008–2009 2009–2010 2010–2011
7.12 5.90 6.34 6.82 6.10 6.30
American Indian or Alaskan 0.3
2005–2006 2006–2007 2007–2008 2008–2009 2009–2010 2010–2011
0.47 0.42 0.39 0.34 0.29 0.26
Unknown Not identified
2005–2006 2006–2007 2007–2008 2008–2009 2009–2010 2010–2011
5.02 4.52 4.94 6.04 6.17 6.84

173
The proportion of White student participation decreased in comparison to the
baseline, Black and American Indian student participation remained similar, and Hispanic
student participation increased. Blanco et al. (2007) did not address missing data of race,
while this study’s missing data or unidentified race accounted for nearly 7% in the last
year of the study. Nor did Blanco et al. identify proportions of participants within race
and ethnicities identified as Hispanic, Puerto Rican, Multiracial, and Nonresident Alien.
Using ZIP codes as the indicator for income, cohort participants come from a
variety of communities throughout Ohio. With approximately 41% or 3,106 students
living in communities with poverty levels greater than Ohio’s average, a large amount of
PSEO participants are in lower income areas (noted in Table 24). With 41% of the cohort
living in communities that have higher levels of poverty, this suggests that this
opportunity is spreading beyond those with financial means. In comparison to the study
by Blanco et al. (2007), which had access to limited Ohio Department of Education
income information, found that “only 5.4% were economically disadvantaged” (p. 27).
Table 24. Percentage of Cohort above State Average Poverty Level
Source No. students % of cohort ZIP codes Poverty indicator ACS 1,582 20.88 209 greater than 14.2%
1,524 20.11 184 greater than 14.2% Total 3,106 40.99 393

174
Considering a large number of student records did not include ZIP codes and
poverty levels from the U.S. Census Bureau were not available for all communities, these
data limits provide opportunities for additional research.
Sex and race of PSEO participants show differences within the categories, with
female and White students as the primary participants. With poverty levels, 41% of the
PSEO cohort students are economically disadvantaged. St. John (2003) indicated a
positive impact on society when one of the “three dimensions of social justice in college
finance” is the “equal opportunity to enroll” (p. 25). Further, St. John indicated that a
“way to measure equal opportunity is to compare enrollment rates for historically
underrepresented minorities (African Americans and Hispanics) with enrollment rates for
Whites” (p. 25).
Considering the variety of proxy indicators, determining equitable participation of
students in PSEO with a variety of socio-economic statuses is difficult. Table 25
combines all proxy information that indicates percentages of PSEO students living in
communities with some poverty associated.
Table 25. Summary of Students’ Poverty Levels using Multiple Indicators
Source No. students % of cohort ZIP codes Poverty indicator
ACS 1,582 20.88 209 greater than 14.2%
1,524 20.11 184 greater than 14.2%
NAR & Advameg 22 0.29 14 Less than state
average Total 3,128 41.28 407

175
When the ACS data are combined with the NAR and Advameg data, 41.28% of
PSEO cohort students are from communities with poverty levels that are greater than the
state average, have home prices lower than the state’s average, or earn income lower than
the state average.
The qualitative interviews provided a variety of themes about PSEO. Starting with
funding, both high school and college representatives indicated major problems with the
way Ohio is funding PSEO. Instead of a positive way to increase student participation,
funding is a challenge for the institutions. Secondary schools want to stop the loss of
funding from their revenue stream and postsecondary institutions find the funding
inadequate. Because of these funding issues, secondary and postsecondary personnel
struggle with supporting PSEO. In response, educational professionals look to legislators
to find solutions such as College Credit Plus. St. John (2003) indicated the need for
policy makers to create opportunities in building human capital. St. John described the
perception that policy makers seem to understand the importance of increasing human
capital related to providing more funds for education; however, policy makers fail to
avoid political games when student aid funds are debated. Instead of making decisions
based on the value of educating more individuals for positive economic outcomes,
legislators get lost in the “appeals for funding” and focus more on political alliances (p.
51).
Access to higher education, as a theme, provided the perspective of understanding
that PSEO provides a gateway to college that perhaps would not be otherwise available.
As a part of access, parental involvement is critical and often lacking according to those

176 interviewed. When parents are very involved, participation seemed to increase while
those who are marginally or not at all involved tend to have students who do not
participate. An (2013) compared SES to parental education and indicated that this “exerts
the largest influence on selection to dual enrollment and college degree attainment” (p.
64). He found that first generation students obtain any postsecondary degree eight-
percentage points higher if they participated in dual enrollment.
Related to parental involvement, interviewees also cited that PSEO is limited to
those students who can financially afford transportation. This translates to access to the
financial means needed to purchase and maintain a vehicle. As indicated by An (2013),
dual enrollment participation is beneficial for students of high and low socio-economic
statuses. He indicated that an “alarming” trend is the SES “disparity in educational
attainment where high-SES students are more likely to attain a college degree than low-
SES students” (p. 57). An found that dual enrollment is a way for educational leaders and
policymakers to bridge the gap because dual enrollment provides a free or inexpensive
way to earn college credits. In order to increase the number of low socio-economic
students participating in dual enrollment programs, financial barriers need to be examined
and solutions need to be created.
Access is purposely limited by some schools, both secondary and postsecondary.
Cited as a way to stem the outflow of funding, some secondary schools limit the number
of participants or the number of hours of participants, whereas some postsecondary
institutions limit the number of participants allowed on their campuses. These limits may
be a primary factor in the quantitative results of little growth in participation over the
177 years. If both secondary and postsecondary institutions are purposely limiting
participation, the impact of PSEO on economic growth will continue to be minimal. This
limitation is contrary to Rawls’s (1971) theory of social justice, which was incorporated
into St. John’s (2003) framework. St. John stressed that society and legislators must be
concerned with the “three dimensions of social justice in college finance: 1. access for the
majority … 2. equal opportunity to enroll … 3. justice for taxpayers” (p. 17). St. John
emphasized each by stressing “a need to balance the interests of three groups — the
majority of students, who are mostly middle-class; low-income students,
disproportionately represented in African American and Hispanic populations; and
taxpayers — as we develop and test new financing strategies” (p. 30).
Recommendations for Research
In general, dual enrollment research in Ohio and the nation is certainly ripe for
additional information gathering. Very little is published about dual enrollment programs,
policy, and funding in Ohio. With regard to continuation of this research, which was a
continuation of sorts of the Blanco et al. (2007) research, is also rich for additional work.
Dual enrollment programming nationwide has differed in many ways, one
significant difference was in the way programming was funded. As noted in the research
of the Education Commission of the States (2008) report, parents paid for dual enrollment
tuition in 22 states, postsecondary institutions paid or waived tuition in 3 states, high
schools paid or lost reallocated funds in 6 states, states supported tuition in 3 states, other
sources provided funds in 4 states, and no funding sources were specified in 6 states.
Further research could be conducted to compare student participation and performance

178 based on the source of funding. For instance, do students participate at a greater rate in
states in which dual enrollment is paid for by states, colleges, or high schools versus
those in which it is paid for by parents. What are the “other sources” noted by the
Education Commission of the States? Are these private sources that are supporting dual
enrollment for a specific reason? Further, funders may be asking questions about whether
dual enrollment is a good investment. Are students getting into college sooner? Are they
graduating sooner, and therefore obtaining employment and paying taxes at an earlier
rate. Many additional questions can be derived to learn more about how funding sources
influences dual enrollment.
To build on the existing results of this research, an expansion of looking at
specific aspects could be conducted. For instance, a researcher can more fully examine
the numbers of enrollment patterns. What happened in the years of growth and the years
of decrease in enrollment? Were there changes in Ohio’s postsecondary institutions
during those years? Did those institutions, which may have limited participation, allow
for more during the growth years, and did they limit participation again in the decreasing
years? Perhaps student enrollment patterns could be examined. For instance, did students
take one or more courses at specific institutions? As an additional look at the types of
courses, the researcher could look at the changes over the years. English courses were
always the most popular, but other courses declined or grew during those years. Did math
enrollment increase as a result of a policy change? Perhaps the cut-scores of the
assessment tools used by colleges and universities? Another important aspect of the
current research that could be further examined is race. Although White students
179 continued to take courses more than students of other races, the other races did have
changes in their percentages. Did those changes reflect any changes within the population
of Ohio? Did those students participate from specific urban or rural areas?
Further, this research reported on the demographics and background of the PSEO
population focused on percentages of the entire PSEO population rather than the
percentages of each population participating in PSEO. There may be some value in
examining sub-populations within the data such as among genders and among races. This
could also lead to examining groups with combinations of characteristics, such as White
females, Black males, or other sub-groups.
Another area of specific research is the comparison of state population and the
participation in PSEO. For example, counties were reviewed according to participation
numbers and percentages. A researcher could overlay the map of PSEO participants with
a map of county residents. Are PSEO participants primarily from counties with high
populations in Ohio? Alternatively, are there some counties with small populations but
high PSEO participation? Diving deeper into the data will produce even more rich data
for researchers as well as practitioners.
As to ways to continue with this research, one is to conduct additional qualitative
interviews with a variety of individuals to gain other perspectives. Students who are
currently enrolled in PSEO courses could be interviewed with questions focused on
choices of courses, institution, and future options of postsecondary. Students could be
asked about challenges such as transportation and opportunities such as saving time and
money. Students who participate in multiple types of dual enrollment could be asked to
180 compare and contrast the programming. In addition, those students who chose not to
participate could be asked about their decisions or barriers. Parents of participating and
non-participating students could be interviewed to again gain perspectives on benefits
and challenges.
Also, quantitative data could be gathered during the interviews by asking
questions to determine satisfaction levels of programming and communication among the
schools and families. College faculty could be interviewed to learn more about teaching
younger students in college classrooms. The focus could be on performance and
behavior: Are younger students performing and behaving any differently than non-high
school students? Finally, another audience to interview could be legislators: those who
were involved in the development of College Credit Plus, the newly approved legislation
that will change dual enrollment in Ohio. Other legislators could be interviewed with St.
John’s (2003) framework at the forefront. Are they aware of the assumptions that St. John
highlighted? Do they agree or disagree?
In light of the fact that some high schools and colleges limit the participants, the
interview could include questions about placing limits and the consequences of those
limits. Again, St. John’s (2003) framework could be discussed with the interviewees to
determine whether they might reconsider setting limits knowing that the limits are
contrary to the framework’s assumptions.
With multiple types of dual enrollment available, future research could attempt to
compare students who participate in PSEO and those who participate in other types of
dual enrollment. The difficulty lies in the data collection and the inconsistent coding
181 among institutions with regard to student classification. While all PSEO students are
entered into the HEI system using one “special status,” the information is unclear how
other dual enrollment students are entered. Perhaps some are incorrectly entered using the
PSEO special status. The assumption is that institutions use classification status of “high
school” for those students, but directions for entering the data are not specific.
Although the Ohio legislation addressing dual enrollment, College Credit Plus
provides a new formula for funding of dual enrollment programs, many of the rules and
procedures for the program are in the process of being finalized. When College Credit
Plus is fully implemented in the fall semester of 2015, research into the impact of the
changes on participation should occur. In addition to this current study and the Blanco et
al. (2007) study, additional data for the participants of 2011–2012 through 2014–2015
should be gathered. This will provide a complete “before” picture of PSEO to compare
with the “after”effects of College Credit Plus.
Recommendations for Practice
The following recommendations are suggested for practitioners in the fields of
higher education and secondary education. Based on the quantitative data analysis of
participation rates, a relatively flat enrollment over the years of this study indicated that
perhaps students were not encouraged to participate in PSEO. Since the results of the
PSEO population indicated students earned positive average GPAs, encouraging students
to participate in college courses can provide opportunities for students to get a head start
on their higher education careers. The framework of St. John (2003) encouraged
furthering students in higher education careers in order to increase human capital, thus,

182 supporting the growth of the nation’s economic condition. Recommendations, therefore,
include 1) secondary schools should encourage as many students to participate in dual
enrollment programs as possible, 2) postsecondary institutions should allow as many
students as possible to participate, and 3) legislators should provide as many support
systems for secondary and postsecondary institutions to alleviate financial losses related
to dual enrollment.
Based on the results of the qualitative interviews, practitioners in secondary and
postsecondary institutions must overcome the obstacles that they perceive as belaying
access for students. These include, but are not limited to, funding that both institutions
lose, monitoring of student attendance, and transportation for students. With upcoming
changes to dual enrollment in Ohio, College Credit Plus was supposed to help even the
playing field with regard to funding; however, initial assessment of this legislation is that
secondary schools will continue to lose funds at a far greater rate than in the past. Instead
of working as adversaries within dual enrollment, secondary and postsecondary
institutions must forge partnerships and find ways to overcome the barriers for this
program to work positively for students.
Practitioners in secondary and postsecondary institutions should be asking
questions of themselves and of policy makers, including: As public policy, do education
leaders and taxpayers want more students who are traditionally underserved students to
participate in programs like PSEO? During the qualitative interview with “Frank,” he
commented that opportunities provided through PSEO allow not only for “cost savings”
but also for “degree attainment” for students who might not otherwise enroll in college.

183 Also as part of public policy, is this program (or a similar one) providing access for only
the students who already have resources? In the qualitative interview with “Elizabeth,”
the comment of “If you’re a family that’s better off, you’re gonna have more chance to
do PSEO than if you’re less fortunate.” While the qualitative interviews seem to be
indicating that students with resources are more likely to participate and the quantitative
results of community poverty levels are showing equitable participation, a lot of more
detailed and careful research can be conducted to better understand the intention of public
policy related to underserved students.
Summary
This chapter addressed key findings within the data analysis, conclusions that
could be drawn from the data, and recommendations for future research related to dual
enrollment in general and PSEO specifically. A relatively flat participation rate may have
implications on the significance of the PSEO program in relation to helping students gain
time and save money by taking college courses during high school. Little has changed in
comparison to the Blanco et al. (2007) study in terms of sex and race. Females and White
students still dominate as the primary participants of PSEO. Additionally, students in the
northern part of Ohio participate far more often than other parts of the state. The cohort
of students performed well by earning multiple degrees or certificates, quadrupled their
earning power compared to their beginning wages, and began employment in
professional and technical fields. Poverty data within the cohort indicated that students
from all financial backgrounds were approaching an even distribution throughout the
state, which is in contrast to the Blanco et al. findings. Qualitative results indicated that

184 funding and access were major obstacles to PSEO participation, with purposeful
limitation sometimes employed on the part of both secondary and postsecondary schools.
185
References
Adelman, C. (2004). Principal indicators of student academic histories in postsecondary education, 1972–2000. U.S. Department of Education, Institute of Education Sciences. Retrieved from website: http://www.ed.gov/rschstat/research/pubs/prinindicat/index.html
Advameg, Inc. (2014). About Advameg, Inc. Retrieved from http://www.advameg.com/ Allen, D., & Dadgar, M. (2012). Does dual enrollment increase students’ success in
college? Evidence from a quasi-experimental analysis of dual enrollment in New York City. New Directions for Community Colleges, 158, 11–19. doi: 10.1002/he.20010
An, B. P. (2012). The influence of dual enrollment on academic performance and college
readiness: Differences by socioeconomic status. Research in Higher Education, 54(4), 407–432. doi:10.1007/s11162-012-9278-z
An, B. P. (2013). The impact of dual enrollment on college degree attainment: Do low-
SES students benefit? Educational Evaluation and Policy Analysis, 35(1), 57–75. doi:10.3102/0162373712461933
Andrews, H. A. (2001). The dual-credit phenomenon! Challenging secondary school
students across 50 states. Stillwater, OK: New Forums Press, Inc. Bailey, T. R., Hughes, K. L., & Karp, M. M. (2002).What role can dual enrollment
programs play in easing the transition between high school and postsecondary education? Retrieved from http://ccrc.tc.columbia.edu/media/k2/attachments/dual-enrollment-easing-transitions.pdf
Barnett, E., & Stamm, L. (2010). Dual enrollment: A strategy for educational
advancement of all students. Blackboard Institute, Washington, DC. Becker, G. (1993). Human capital: A theoretical and empirical analysis, with special
reference to education. (3rd ed.). Chicago: The University of Chicago Press (Original work published in 1964).
Berger, A., Turk-Bicakci, L., Garet, M., Song, M., Knudson, J., Haxton, C., Zeiser, K.,
Hoshen, G., Ford, J., Stephan, J., Keatin, K., & Cassidy, L. (2013). Early college, early success: Early College High School initiative impact study. Retrieved from American Institutes for Research website: http://www.air.org/files/AIR_ECHSI_Impact_Study_Report_Final.pdf

186 Bevel, R. K., & Mitchell, R. M. (2010). The effects of academic optimism on elementary
reading achievement. Journal of Educational Administration, 50(6), 773–787. doi: 10.1108/09578231211264685
Blanco, C., Prescott, B., & Taylor, N. (2007). The promise of dual enrollment: Assessing Ohio’s early college access policy. Western Interstate Commission for Higher Education. Retrieved from KnowledgeWorks Foundation website: http://knowledgeworks.org/sites/default/files/Promise%20of%20Dual%20Enrollment.pdf
Bourdieu, P. (1977). Outline of a theory of practice. Cambridge, United Kingdom:
Cambridge University Press. Original work published in 1972. Bourdieu, P. (1990). The logic of practice. Stanford, California: Stanford. Original work
published 1980. Brenneman, M. W., Callan, P. M., Ewell, P. T., Finney, J. E., Jones, D. P., & Zis, S.
(2010). Good policy, good practice II: Improving outcomes and productivity in higher education. National Center for Public Policy and Higher Education, National Center for Higher Education Management Systems.
Bryman, A. E. (n.d.). Multimethod research and measurement. Leicestershire, United
Kingdom, Loughborough University. Burns, H., & Lewis, B. (2000, January). Dual-enrolled students’ perception of the effect
of classroom environment on educational experience [31 paragraphs]. The Qualitative Report [On-line serial], 4(1/2). Available: http://www.nova.edu/ssss/QR/QR4-1/burns.html
Callan, P. M., Ewell, P. T., Finney, J. E., & Jones, D. P. National Center for Public Policy
and Higher Education, (2007). Good policy, good practice: Improving outcomes and productivity in higher education. National Center for Higher Education Management Systems.
Carnevale, A. P., & Rose, S. J. (2013). The undereducated American. (Georgetown
University) Retrieved from http://www9.georgetown.edu/grad/gppi/hpi/cew/pdfs/undereducatedamerican.pdf
Center for Transportation Research and Education. (n.d.). Covered employment and
wages (ES202 program). (Iowa State University) Retrieved from http://www.ctre.iastate.edu/research/bts_wb/cd_rom/employment/es202.htm
Charmaz, K. (2006). Constructing grounded theory: A practical guide through
qualitative analysis. London, United Kingdom: Sage.

187 Creswell, J. W. (2009). Research design: Qualitative, quantitative, and mixed methods
approaches. (3rd ed.). Thousand Oaks, CA: Sage. Day, J. C., & Newburger, E. C. U.S. Department of Commerce, U.S. Census Bureau.
(2002). The big payoff: Educational attainment and synthetic estimates of work-life earnings (P23–210). Retrieved from website: http://www.census.gov/prod/2002pubs/p23-210.pdf
Education Commission of the States. (2008).Dual enrollment. Retrieved from
http://mb2.ecs.org/reports/Report.aspx?id=950 Edwards, L., Hughes, K. L., & Weisberg, A. (2011).Different approaches to dual
enrollment: Understanding program features and their implications. San Francisco, CA: The James Irvine Foundation. Retrieved from http://ccrc.tc.columbia.edu/media/k2/attachments/dual-enrollment-program-features-implications.pdf
European Anti-Poverty Network. (2014). How is poverty measured? Retrieved from http://www.eapn.eu/en/what-is-poverty/how-is-poverty-measured
European Communities. European Evaluation Network for Rural Development, (2014). Defining proxy indicators for rural development programmes. Retrieved from European Communities website: http://ec.europa.eu/agriculture/cap-post-2013/monitoring-evaluation/documents/proxy-indicators-rdp_en.pdf
Frost, R. (1920). The road not taken. Retrieved from http://www.bartleby.com/119/1.html
Galster, G. C., Cutsinger, J. M., & Malega, R. (2008). Estimating the costs of concentrated poverty to American neighborhoods. Unpublished manuscript. Retrieved from http://www.maxwell.syr.edu/uploadedFiles/cpr/events/cpr_seminar_series/previous_seminars/Galster.pdf
Georgia Perimeter College. (2008). Dual enrollment, Advanced Placement, and
International Baccalaureate in Georgia: An unbalanced policy environment that short-changes student success. Retrieved from http://depts.gpc.edu/je/thecasefordualenrollment.pdf
Glenn, N. D. (2005). Cohort analysis. (2nd ed., Vol. 5). Thousand Oaks, CA: Sage.
Governor, State of Ohio, Communication Department. (2012).A new focus on results. Retrieved from website: http://www.governor.ohio.gov/MediaRoom/PressReleases.aspx

188 Hart, S. A., Soden, B., Johnson, W., Schatschneider, C., & Taylor, J. (2013). Expanding
the environment: gene x school-level SES interaction on reading comprehension. Journal of Child Psychology and Psychiatry, 54(10), 1047–1055. doi: 10.1111/jcpp.12083
Hinojosa, M., & Salinas, M. (2012). A review of prior college hours earned by entering freshmen at UTPA. Retrieved from http://richmedia.onset.freedom.com/monitortx/lzttv1-areviewofpriorcollegehours.pdf
Hoffman, N., & Vargas, J. (2010). A policymaker’s guide to early college designs:
Expanding a strategy for achieving college readiness for all. Washington, DC: Jobs for the Future. Retrieved from http://www.jff.org/sites/default/files/PolicymakersGuide_102010.pdf
Hoffman, N., Vargas, J., & Santos, J. (2009). New directions for dual enrollment:
Creating stronger pathways from high school through college. New Directions for Community Colleges, 145, 43–58. doi: 10.1002/cc.354
Hughes, K. L. (2010). Dual enrollment: Postsecondary/secondary partnerships to prepare
students. Journal of College Science Teaching, Retrieved from http://ccrc.tc.columbia.edu/Publication.asp?UID=791
Hussar, W., & Bailey, T. (2013) Projections of education statistics to 2021 (NCES 2013-
008). U.S. Department of Education, National Center for Education Statistics. Washington, DC: U.S. Government Printing Office.
IBM Corporation. (2012). IBM SPSS statistics. Retrieved from
http://public.dhe.ibm.com/common/ssi/ecm/en/ytd03123usen/YTD03123USEN.PDF
Integrated Postsecondary Education Data System. Institute of Education Sciences, (2012). Institution profile. Retrieved from National Center for Education Statistics website: http://nces.ed.gov/ipeds/datacenter/InstitutionProfile.aspx?unitId=adabadadadad
Jacobs, R. M. (2005). The concepts of statistical power and effect size. Educational Research, Villanova University, Villanova, PA. Retrieved from http://www83.homepage.villanova.edu/richard.jacobs/EDU 8603/lessons/stastical power.html
Johnson, R. B., & Onwuegbuzie, A. J. (2004). Mixed methods research: A research
paradigm whose time has come. Educational Researcher, 33(7), 14–26.
189 Johnson, T. E., & Brophy, M. (2006). Dual enrollment: Measuring factors for rural high
school student participation. The Rural Educator, (28-1), 25–31. Retrieved from http://www.ruraleducator.net/archive/28-1/28-1_Johnson.pdf
Jordan, T. (2001). Dual Enrollment Options: Columbus State Community College model for successful implementation. New Directions for Community Colleges, 2001(113), 73–80. doi:10.1002/cc.11
Karp, M. M. (2012), “I don’t know, I’ve never been to college!” Dual enrollment as a
college readiness strategy. New Directions for Higher Education, 2012: 21–28. doi: 10.1002/he.20011
Karp, M. M., Bailey, T. R., Hughes, K. L., & Fermin, B. J. (2004) State dual enrollment
policies: Addressing access and quality. U.S. Department of Education, Office of Vocational and Adult Education. Washington, DC: Education Publications Center.
Karp, M. M., Calcagno, J. C., Hughes, K. L., Jeong, D. W., & Bailey, T. R. (2007). The
postsecondary achievements in dual enrollment: An analysis of student outcomes in two states. (University of Minnesota) Retrieved from http://ccrc.tc.columbia.edu/media/k2/attachments/dual-enrollment-student-outcomes.pdf
Keene, J. R., Prokos, A. H., & Held, B. (2011). Grandfather caregivers: Race and ethnic differences in poverty. Sociological Inquiry, 82(1), 49–77. doi: 10.1111/j.1475-682X.2011.00398.x
Kim, J. (2012), Data-informed practices in an urban dual enrollment program. New Directions for Higher Education, 2012: 49–57. doi: 10.1002/he.20014
Kinnick, K. N. (2012). The impact of dual enrollment on the institution. New Directions
for Higher Education, 2012: 39–47. doi: 10.1002/he.20013 Kleiner, B., & Lewis, L. (2005). Dual enrollment of high school students at
postsecondary institutions: 2002–03 (NCES 2005–008). U.S. Department of Education. Washington, DC: National Center for Education Statistics.
Lee, J. M., & Rawls, A. (2010). The college completion agenda. Retrieved from College
Board website: http://advocacy.collegeboard.org/sites/default/files/Progress_Report_2010.pdf
Lowe, A. I. (2010). Promoting quality: State strategies for overseeing dual enrollment
programs. Retrieved from National Alliance of Concurrent Enrollment Partnerships website: http://nacep.org/wp-content/uploads/2010/10/NACEP_Promoting_Quality_Report_2010.pdf

190 Menard, S. (2002). Longitudinal research. (2nd ed.). Thousand Oaks, CA: Sage.
Misra, K., & Debertin, D. L. (2007, February). Determinants of youth poverty: A ZIP code analysis. Presented at the Southern Agricultural Economic Association Annual meeting, Mobile, AL. Retrieved from http://ageconsearch.umn.edu/bitstream/34899/1/sp07mi02.pdf
National Association of Realtors. (2014a). About NAR. Retrieved from http://www.realtor.org/about-nar
National Association of Realtors (2014b). Market overview & information. Retrieved from http://www.realtor.org
National Commission on the High School Senior Year. U.S. Department of Education, (2001). The lost opportunity of senior year: Finding a better way. Retrieved from: http://inpathways.net/lostopportunity.pdf
Neilson, L. (2013).Orientation to the Ohio Longitudinal Data Archive (OLDA). (The
Ohio State University). Ohio Association of Community Colleges. (2011). Dual enrollment financing
recommendations. Ohio’s Community College Presidents. Ohio Board of Regents. (n.d.). HEI file documentation: Primary data areas. Retrieved
from website: http://www.chrr.ohio-state.edu/content/surveys/olda/HEI%20User%20Guide.html
Ohio Board of Regents. (n.d.).Ohio’s campuses. Retrieved from
https://www.ohiohighered.org/campuses Ohio Board of Regents. (2002). Making the transition from high school to college in
Ohio. Retrieved from website: http://regents.ohio.gov/perfrpt/hs_2002
Ohio Board of Regents. (2007). Edit and load specifications. Retrieved from website: http://regents.ohio.gov/hei/enrollment/SP_edits.html
Ohio Board of Regents. (2008a). Request for applications – Seniors to Sophomores early adopters program.
Ohio Board of Regents. (2008b). Seniors to Sophomores Early Adopters: Frequently
asked questions. Ohio Board of Regents. (2008c). Strategic Plan for Higher Education: 2008–2017.
191 Ohio Board of Regents. (2010). The Ohio articulation and transfer policy. Retrieved
from website: https://www.ohiohighered.org/transfer/policy
Ohio Board of Regents. (2012a). Complete College Ohio. Retrieved from website: https://ohiohighered.org/sites/ohiohighered.org/files/uploads/completion/complete-college-ohio_071912(Final).pdf
Ohio Board of Regents. (2012b). Complete College Ohio: Task force report and
recommendations. Retrieved from website: https://www.ohiohighered.org/sites/ohiohighered.org/files/uploads/completion/CCO-task-force-report_FINAL.pdf
Ohio Board of Regents. (2012c). The 3-year degree. Retrieved from website:
http://www.ohiohigheredorg/3-year-degrees Ohio Board of Regents. (2012d). Headcount enrollment by student level and age: Fall
term 2001 to 2010. Retrieved from website: https://www.ohiohighered.org/files/uploads/data/statistical-profiles/enrollment/HC_by_Level_Age_Rpt_01-10.pdf
Ohio Board of Regents. (2012e). HEI enrollment data submissions. Retrieved from
website: http://regents.ohio.gov/hei/datasubdoc/enrollment/snfile.php Ohio Board of Regents. (2013a). College credit plus program funding model as proposed
(Sec. 3365.07). Ohio Board of Regents. (2013b). College credit plus: Chancellor John Carey’s
recommendations for Ohio’s dual credit program. Retrieved from website: https://www.ohiohighered.org/college_credit_plus
Ohio Council of Chief Academic Officers for Two-Year Colleges. (2005). Ohio
postsecondary enrollment options program – position and recommendations. Unpublished manuscript, Ohio Association of Community Colleges, Retrieved from http://www.ohio2yrcao.org/documents/PSEO-CAO%20Position%20Paper.pdf
Ohio Democratic Party. (2008). Strickland announces early adopter grants for seniors to
sophomores program. Retrieved from http://www.tedstrickland.com/2-28-08-strickland-announces-early-adopter-grants-for-seniors-to-sophomores-program/
Ohio Department of Education. (2002). Guidance resource booklet. Ohio Department of Education. (2006). HB 115 letter. Ohio Department of Education. (2007). Notification of award for FY2008.

192 Ohio Department of Education. (2008). Post-secondary Enrollment Options Program
worksheet for public high schools: Fiscal year 2008–2009.
Ohio Department of Education. (2013a). Public school students – 2012. Retrieved from website: http://education.ohio.gov/getattachment/Topics/School-Choice/Post-Secondary-Enrollment-Option-PSEO/Students-by-Public-School-2012.pdf.aspx
Ohio Department of Education. (2013b). Public school students by college – 2012. Retrieved from website: http://education.ohio.gov/getattachment/Topics/School-Choice/Post-Secondary-Enrollment-Option-PSEO/Public-School-Students-by-Post-Secondary-Institution.pdf.aspx
Ohio Department of Education. (n.d.). FY2011 kindergarten entrance date. Retrieved
from website: http://education.ohio.gov/getattachment/Topics/Early-Learning/Kindergarten/Guidance-About-Kindergarten/2011-Kindergarten-Entrance-Date.pdf.aspx
Ohio Department of Job and Family and Services, Office of Unemployment
Compensation. (2011).Important information about unemployment insurance tax audits (JFS 08018). Retrieved from website: http://www.odjfs.state.oh.us/forms/file.asp?id=1665&type=application/pdf
Ohio Department of Job and Family and Services, (n.d.).Appendix B – data element
definitions. Retrieved from website: http://www.chrr.ohio-state.edu/content/surveys/olda/AppendixB.htm
Ohio Education Research Center. (2012). Welcome to the Ohio Education Research
Center. Retrieved from http://www.oerc.osu.edu Ohio Revised Code. (1997a). Chapter 3365.021: Counseling provided to students and
parents of nonpublic school. Retrieved from website: http://codes.ohio.gov/orc/3365.021
Ohio Revised Code. (1997b). Chapter 3365.06: Restrictions on enrollment. Retrieved
from website: http://codes.ohio.gov/orc/3365.06 Ohio Revised Code. (1999). Chapter 3324.07: District plan for service of gifted students.
Retrieved from website: http://codes.ohio.gov/orc/3324.07 Ohio Revised Code. (2007a). Chapter 3345.06: Entrance requirements of high school
graduates – core curriculum. Retrieved from website: http://codes.ohio.gov/orc/3345.06

193 Ohio Revised Code. (2007b). Chapter 3365.02: Post-secondary enrollment options
program. Retrieved from website: http://codes.ohio.gov/orc/3365.02
Ohio Revised Code. (2007c). Chapter 3365.03: Student may apply for college enrollment. Retrieved from website: http://codes.ohio.gov/orc/3365.03
Ohio Revised Code. (2007d). Chapter 3365.05: Awarding high school credit. Retrieved
from website: http://codes.ohio.gov/orc/3365.05 Ohio Revised Code. (2007e). Chapter 3365.11: Reimbursement where student fails
course. Retrieved from website: http://codes.ohio.gov/orc/3365.11 Ohio Revised Code. (2008). Chapter 3333.86: Offering of course as dual enrollment
program. Retrieved from website: http://codes.ohio.gov/orc/3333.86 Ohio Revised Code. (2009a). Chapter 3333.35: Cooperative efforts with state board of
education and board of regents. Retrieved from website: http://codes.ohio.gov/orc/3333.35
Ohio Revised Code. (2009b). Chapter 3345.062: Internet offerings of college level
courses. Retrieved from website: http://codes.ohio.gov/orc/3345.062 Ohio Revised Code. (2009c). Chapter 3365.04: Enrollment options. Retrieved from
website: http://codes.ohio.gov/orc/3365.04
Ohio Revised Code. (2009d). Chapter 3365.041: Notice of expulsion of student. Retrieved from website: http://codes.ohio.gov/orc/3365.041
Ohio Revised Code. (2009e). Chapter 3365.07: Calculating average daily membership.
Retrieved from website: http://codes.ohio.gov/orc/3365.07 Ohio Revised Code. (2009f). Chapter 3365.09: Provisions not applicable to full-time
students. Retrieved from website: http://codes.ohio.gov/orc/3365.09 Ohio Revised Code. (2009g). Chapter 3365.10: Application by nonpublic school student.
Retrieved from website: http://codes.ohio.gov/orc/3365.10 Ohio Revised Code. (2009h). Chapter 3365.12: Adoption of rules regarding alternate
funding formulas. Retrieved from website: http://codes.ohio.gov/orc/3365.12 Ohio Revised Code. (2009i). Chapter 3365.15: Participation in Seniors to Sophomores
program. Retrieved from website: http://codes.ohio.gov/orc/3365.15 Ohio Revised Code. (2010a). Chapter 3301-35-01: Standards for kindergarten through
twelfth grade. Retrieved from website: http://codes.ohio.gov/orc/3301-35-01
194 Ohio Revised Code. (2010b). Chapter 3313.6016: Daily physical activity for students;
pilot program. Retrieved from website: http://codes.ohio.gov/orc/3313.6016 Ohio Revised Code. (2011a). Chapter 3333.43: Statements for three-year baccalaureate
degrees. Retrieved from website: http://codes.ohio.gov/orc/3333.43 Ohio Revised Code. (2011b). Chapter 3365.01: Post-secondary enrollment options
program definitions. Retrieved from website: http://codes.ohio.gov/orc/3365.01 Ohio Revised Code. (2011c). Chapter 3365.08: Participant furnished with all textbooks
and materials – financial aid ineligibility – transportation reimbursement. Retrieved from website: http://codes.ohio.gov/orc/3365.08
Ohio Revised Code. (2012). Chapter 3313.6013: Dual enrollment program for college
credit. Retrieved from website: http://codes.ohio.gov/orc/3313.6013 Ohio Revised Code. (2013a). Chapter 3302.03: Grading school districts. Retrieved from
website: http://codes.ohio.gov/orc/3302.03 Ohio Revised Code. (2013b). Chapter 6301.01. Retrieved from website:
http://codes.ohio.gov/orc/6301.01 Ohio Revised Code. (2013c). Ohio Revised Code home. Retrieved from website:
http://codes.ohio.gov Ohio Student Education Policy Institute. (2011). Standardizing and expanding dual
enrollment options in Ohio. Ohio University, Athens, Ohio.
Onboard Informatics. (2014). Our way. Retrieved from http://www.onboardinformatics.com/about/our-way/
130th General Assembly of the State of Ohio. (2013). H.B. No. 59 as introduced. Retrieved from website: http://www.legislature.state.oh.us/BillText130/130_HB_59_I_N.html
Patton, M. Q. (2002). Qualitative research and evaluation methods. (3rd ed.). Thousand
Oaks, California: Sage Publications, Inc.
Peng, L., & Thibodeau, T. (2013). Risk segmentation of American homes: Evidence from Denver. Real Estate Economics, 41(3), 569–599. doi: 10.1111/reec.12005
Poston, D. L., Singelmann, J., Siordia, C., Slack, T., Robertson, B. A., Saenz, R., & Fontenot, K. (2010). Spatial context and poverty: Area-level effects and micro-level effects on household poverty in the Texas borderland & lower Mississippi

195
delta. Applied Spatial Analysis and Policy, 3(2-3), 139–162. doi: 10.1007/s12061-010-9046-4
Putnam, J. F. (1981). Postsecondary student terminology: A handbook of terms and
definitions for describing students in postsecondary education. U.S. Department of Education, National Center for Education Statistics. Retrieved from website: http://nces.ed.gov/pubs79/79409.pdf
Quinn, L. M. (2007). New indicators of neighborhood need in ZIP code 53206. (University of Wisconsin-Milwaukee). Retrieved from http://www4.uwm.edu/eti/2007/53206N.pdf
Ransdell, S. (2012). There's still no free lunch: Poverty as a composite of SES predicts school-level reading comprehension. American Behavioral Scientist, 56(7), 908–925. doi: 10.1177/0002764211408878
Rawls, J. (1971). A theory of justice. Cambridge: The Belknap Press of Harvard University Press.
Salkind, N. (2010). Statistics for people who think they hate statistics. (2nd ed.). Thousand
Oaks, CA: SAGE Publications, Inc.
Sasson, I., & Sakamoto, A. (2012). Non-poor components of population growth and immigration in the U.S., 1990-2010. Social Indicators Research, 115(1), 183–201. doi: 10.1007/s11205-012-0214-6
Smith, D. G. (1991). Introduction. In J. Bess (Ed.), Foundations of American Higher Education (p. 109). Needham Heights: Ginn Press.
Speroni, C. (2011). High school dual enrollment programs: Are we fast-tracking students
too fast? New York, NY: Community College Research Center. Retrieved from http://ccrc.tc.columbia.edu/media/k2/attachments/dual-enrollment-fast-tracking-students-too-fast.pdf
St. John, E. P. (2003). Refinancing the college dream: Access, equal opportunity, and
justice. Baltimore, MD: Johns Hopkins Press. Swanson, J. (2008). An analysis of the impact of high school dual enrollment course
participation on post-secondary academic success, persistence and degree completion. Paper presented at the meeting of the National Association for Gifted Children, Tampa, FL and the National Alliance of Concurrent Enrollment Partnerships, Kansas City, MO.

196 U.S. Bureau of Labor Statistics, Current population survey. (2012). Earnings and
unemployment rates by educational attainment. Retrieved from website: http://www.bls.gov/emp/ep_chart_001.htm
U.S. Census Bureau, (2012). American Community Survey 1-year estimate (S1501).
Retrieved from website: http://factfinder2.census.gov/rest/dnldController/deliver?_ts=372418708120
U.S. Census Bureau, (2013). Ohio quickfacts from the US Census Bureau. Retrieved
from website: http://quickfacts.census.gov/qfd/states/39000.html
U.S. Census Bureau. (2014). Definitions. Retrieved from website: http://www.census.gov/hhes/www/poverty/methods/definitions.html
U.S. Department of Agriculture, Food and Nutrition Service. (2013). Child nutrition programs; income eligibility guidelines (FR Doc. C1-2013-06544 Filed 3-28-13). Retrieved from website: http://www.fns.usda.gov/cnd/governance/notices/iegs/IEG_Table-032913.pdf
U.S. Department of Education, (2004). Elementary & secondary education: Title IX –
general provisions. Retrieved from website: http://www2.ed.gov/policy/elsec/leg/esea02/pg107.html
U.S. Department of Education, (2006). A test of leadership: Charting the future of U.S.
higher education. Retrieved from ED Pubs, Education Publications Center website: http://www2.ed.gov/about/bdscomm/list/hiedfuture/reports/pre-pub-report.pdf
U.S. Department of Education, National Center for Education Statistics. (2014). The condition of education 2014 (NCES 2014-083). Retrieved from website: http://nces.ed.gov/programs/coe/indicator_cva.asp
U.S. Department of Labor, Bureau of Labor Statistics. (1997). BLS handbook of methods. Retrieved from website: http://stats.bls.gov/hom/homch5.pdf
U.S. Department of the Treasury, (2012). The economics of higher education. Retrieved from website: http://www.treasury.gov/connect/blog/Documents/20121212_Economics of Higher Ed_vFINAL.pdf
U.S. Postal Service. (2014). Look up a ZIP code. Retrieved from https://tools.usps.com/go/ZipLookupAction!input.action

197 Vargas, J. H. (2004). College knowledge: Addressing information barriers to college.
Boston, MA: The Education Resources Institute. DOI: www.teri.org/pdf/research-studies/CollegeKnowledge.pdf
Waits, T., Setzer, J.C., and Lewis, L. (2005). Dual credit and exam-based courses in U.S. public high schools: 2002–03 (NCES 2005–009). U.S. Department of Education. Washington, DC: National Center for Education Statistics.
The White House, (n.d.). Higher education. Retrieved from website:
http://www.whitehouse.gov/issues/education/higher-education
Wiley, A. L., Siperstein, G. N., Forness, S. R., & Brigham, F. J. (2009). School context and the problem behavior and social skills of students with emotional disturbance. Journal of Child and Family Studies, 19(4), 451–461. doi: 10.1007/s10826-009-9316-4
Zinth, J. (2013, December). Dual Enrollment - All State Profiles. Retrieved from http://ecs.force.com/mbdata/mbprofallRT?Rep=DE13A

198
Appendix A: Ohio Revised Code Excerpts Related to PSEO and Dual Enrollment
Code number Description
Program referenced
3302.03
By the 2013–14 school year, a report will be produced indicating the number of students who have earned at least three college credits. Also, a similar report will be generated in 2014–15. PSEO is referenced as a method for students to earn college credit.
PSEO
3313.6013
Dual Enrollment is defined as “a program that enables a student to earn credit toward a degree from an institution of higher education while enrolled in high school or that enables a student to complete coursework while enrolled in high school that may earn credit toward a degree from an institution of higher education upon the student’s attainment of a specified score on an examination covering the coursework.” All public school districts are required to offer at least one of the three dual enrollment types: 1) PSEO, 2) Advanced Placement, and 3) Similar agreement to PSEO bilaterally determined between a school district and a college/university.
Dual Enrollment in general; PSEO specifically; alternative plans developed locally
3313.6016 PSEO students are exempted from the daily physical activity program. PSEO
3324.07 School districts must develop a plan for gifted students that includes many options such as PSEO. PSEO
3333.35
The Ohio Board of Education and the Ohio Board of Regents must join in cooperative efforts to reduce the costs of college remediation coursework, enhance the PSEO program, and improve the alternative resident educator licensure program.
PSEO
3333.43 Universities are required to develop a plan for a three-year bachelor’s degree, which can include courses that are completed through PSEO.
PSEO
3333.86
The Chancellor of the OBR has the authority to determine which courses fall under the definition of a dual enrollment program, which courses can be offered to home schooled or nonpublic school students, and which courses can be offered outside of the normal school day.
Dual enrollment
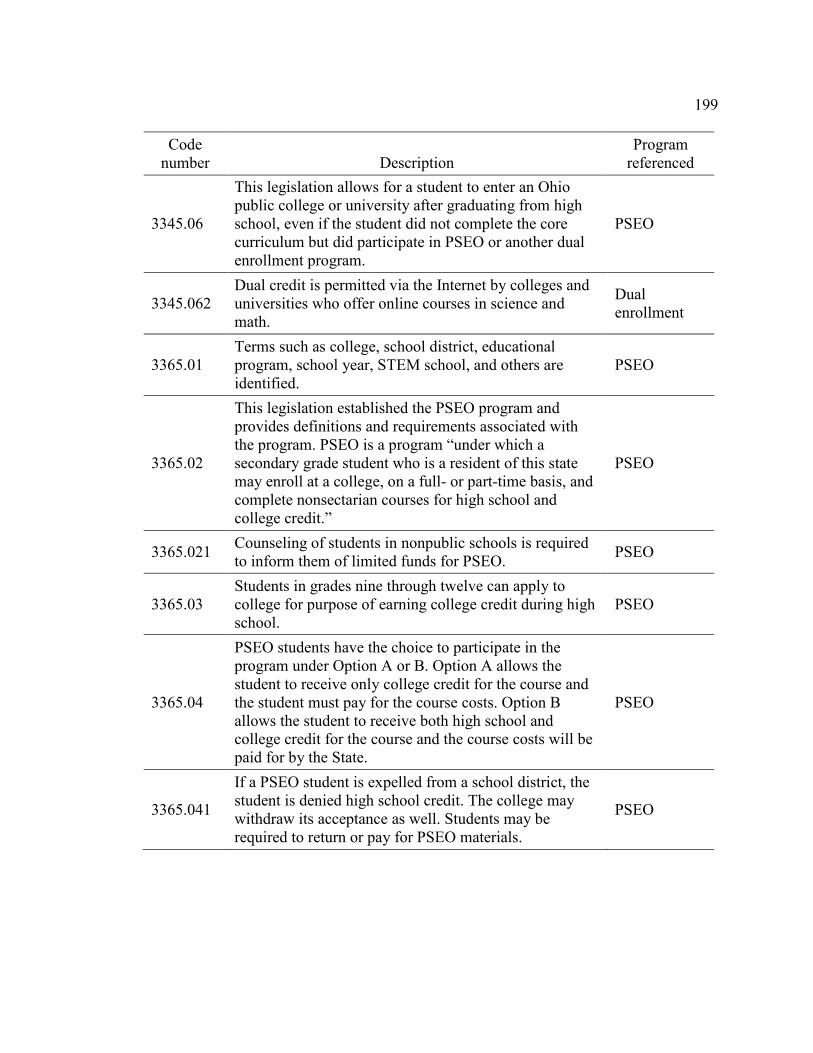
199
Code number Description
Program referenced
3345.06
This legislation allows for a student to enter an Ohio public college or university after graduating from high school, even if the student did not complete the core curriculum but did participate in PSEO or another dual enrollment program.
PSEO
3345.062 Dual credit is permitted via the Internet by colleges and universities who offer online courses in science and math.
Dual enrollment
3365.01 Terms such as college, school district, educational program, school year, STEM school, and others are identified.
PSEO
3365.02
This legislation established the PSEO program and provides definitions and requirements associated with the program. PSEO is a program “under which a secondary grade student who is a resident of this state may enroll at a college, on a full- or part-time basis, and complete nonsectarian courses for high school and college credit.”
PSEO
3365.021 Counseling of students in nonpublic schools is required to inform them of limited funds for PSEO. PSEO
3365.03 Students in grades nine through twelve can apply to college for purpose of earning college credit during high school.
PSEO
3365.04
PSEO students have the choice to participate in the program under Option A or B. Option A allows the student to receive only college credit for the course and the student must pay for the course costs. Option B allows the student to receive both high school and college credit for the course and the course costs will be paid for by the State.
PSEO
3365.041
If a PSEO student is expelled from a school district, the student is denied high school credit. The college may withdraw its acceptance as well. Students may be required to return or pay for PSEO materials.
PSEO
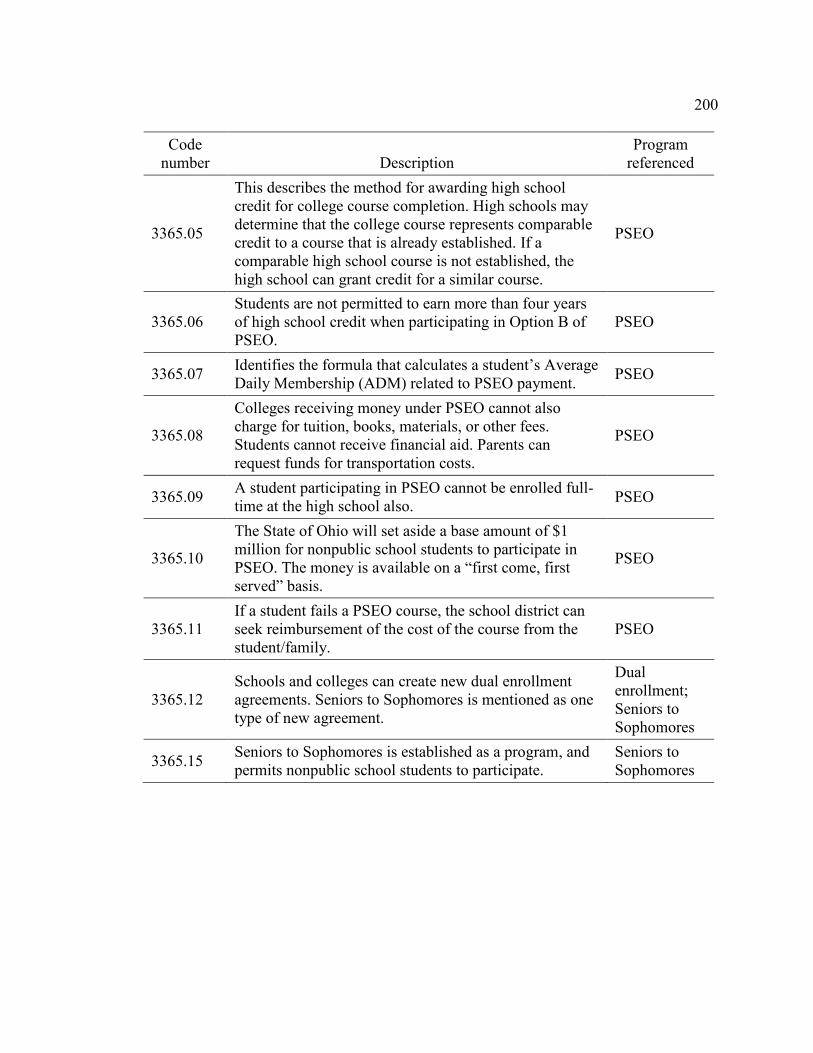
200
Code number Description
Program referenced
3365.05
This describes the method for awarding high school credit for college course completion. High schools may determine that the college course represents comparable credit to a course that is already established. If a comparable high school course is not established, the high school can grant credit for a similar course.
PSEO
3365.06 Students are not permitted to earn more than four years of high school credit when participating in Option B of PSEO.
PSEO
3365.07 Identifies the formula that calculates a student’s Average Daily Membership (ADM) related to PSEO payment. PSEO
3365.08
Colleges receiving money under PSEO cannot also charge for tuition, books, materials, or other fees. Students cannot receive financial aid. Parents can request funds for transportation costs.
PSEO
3365.09 A student participating in PSEO cannot be enrolled full-time at the high school also. PSEO
3365.10
The State of Ohio will set aside a base amount of $1 million for nonpublic school students to participate in PSEO. The money is available on a “first come, first served” basis.
PSEO
3365.11 If a student fails a PSEO course, the school district can seek reimbursement of the cost of the course from the student/family.
PSEO
3365.12 Schools and colleges can create new dual enrollment agreements. Seniors to Sophomores is mentioned as one type of new agreement.
Dual enrollment; Seniors to Sophomores
3365.15 Seniors to Sophomores is established as a program, and permits nonpublic school students to participate.
Seniors to Sophomores
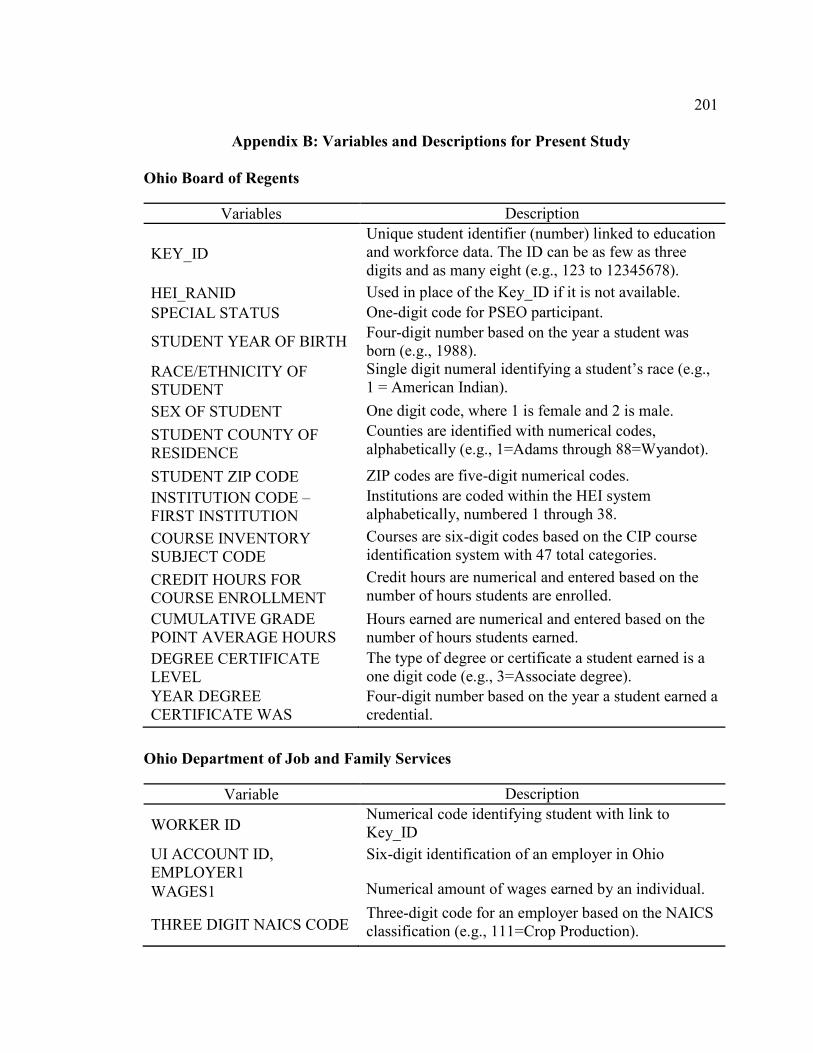
201
Appendix B: Variables and Descriptions for Present Study
Ohio Board of Regents
Variables Description
KEY_ID Unique student identifier (number) linked to education and workforce data. The ID can be as few as three digits and as many eight (e.g., 123 to 12345678).
HEI_RANID Used in place of the Key_ID if it is not available. SPECIAL STATUS One-digit code for PSEO participant.
STUDENT YEAR OF BIRTH Four-digit number based on the year a student was born (e.g., 1988).
RACE/ETHNICITY OF STUDENT
Single digit numeral identifying a student’s race (e.g., 1 = American Indian).
SEX OF STUDENT One digit code, where 1 is female and 2 is male. STUDENT COUNTY OF RESIDENCE
Counties are identified with numerical codes, alphabetically (e.g., 1=Adams through 88=Wyandot).
STUDENT ZIP CODE ZIP codes are five-digit numerical codes. INSTITUTION CODE – FIRST INSTITUTION
Institutions are coded within the HEI system alphabetically, numbered 1 through 38.
COURSE INVENTORY SUBJECT CODE
Courses are six-digit codes based on the CIP course identification system with 47 total categories.
CREDIT HOURS FOR COURSE ENROLLMENT
Credit hours are numerical and entered based on the number of hours students are enrolled.
CUMULATIVE GRADE POINT AVERAGE HOURS
Hours earned are numerical and entered based on the number of hours students earned. DEGREE CERTIFICATE
LEVEL The type of degree or certificate a student earned is a one digit code (e.g., 3=Associate degree).
YEAR DEGREE CERTIFICATE WAS
Four-digit number based on the year a student earned a credential.
Ohio Department of Job and Family Services
Variable Description
WORKER ID Numerical code identifying student with link to Key_ID
UI ACCOUNT ID, EMPLOYER1
Six-digit identification of an employer in Ohio
WAGES1 Numerical amount of wages earned by an individual.
THREE DIGIT NAICS CODE Three-digit code for an employer based on the NAICS classification (e.g., 111=Crop Production).

202
Appendix C: Ohio University Consent Form
Title of Research: Dual Enrollment in Ohio: Participation, Performance, Perceptions, and Potential Researcher: Larisa Harper You are being asked to participate in research. For you to be able to decide whether you want to participate in this project, you should understand what the project is about, as well as the possible risks and benefits in order to make an informed decision. This process is known as informed consent. This form describes the purpose, procedures, possible benefits, and risks. It also explains how your personal information will be used and protected. Once you have read this form and your questions about the study are answered, you will be asked to verify via email and/or spoken during the audiotaped interview that you agree to the consent items contained within this form. This will allow your participation in this study. Explanation of Study This study is being done because no current data exists about the participation and degree completion rates of students who participate in Ohio’s “Post-Secondary Enrollment Options” (PSEO) program. The most recent report utilizing data is from the academic year 2004–2005. The quantitative data presented within this study will examine data longitudinally starting with the 2005–2006 through the 2010–2011 academic years. The present study will attempt to determine whether Ohio’s PSEO students have increased in access and completion rates since 2005. The study will also examine a cohort of students who participated in PSEO as high school seniors during the 2005–2006 academic year by reviewing data longitudinally from 2005–2006 to 2010–2011. Finally, the study will provide qualitative data gained from interviews with secondary and postsecondary personnel about their perspectives on PSEO programming and funding. If you agree to participate, you will be asked to participate in an audiotaped telephone interview. Your participation in the study will last approximately 30 minutes during the recorded interview. Benefits The anticipated benefit to society is the contribution of data, which will inform legislators who are creating public policy related to use of taxpayer funds. Anticipated benefits for the interviewed individuals may include the satisfaction of contributing to the research of a strategy potentially leading to increased number of college-educated citizens in the state of Ohio.

203 Risks and Discomforts No risks or discomforts are anticipated. Confidentiality and Records Your study information will be kept confidential by Larisa Harper. Participant interviews will become part of a public dissertation. Interviews will be coded and labeled with names or aliases. If an alias is used, no document will be published that links the actual name with the alias. Only the researcher will know the true identity of participants. Additionally, while every effort will be made to keep your study-related information confidential, there may be circumstances where this information must be shared with:
• Federal agencies, for example the Office of Human Research Protections, whose responsibility is to protect human subjects in research;
• Representatives of Ohio University (OU), including the Institutional Review Board, a committee that oversees the research at OU;
• The Ohio Education Research Center at The Ohio State University, the Ohio Board of Regents, and the Ohio Department of Education.
Contact Information If you have any questions regarding this study, please contact Larisa Harper at [email protected] or (740) 588-4131; or Dr. Valerie Martin Conley at [email protected] or (740) 593-4442. If you have any questions regarding your rights as a research participant, please contact Jo Ellen Sherow, Director of Research Compliance, Ohio University at (740) 593-0664. By email or spoken during the audiotaped interview, you will be asked to confirm the following to which you are agreeing:
• you have read this consent form (or it has been read to you) and have been given the opportunity to ask questions and have them answered
• you have been informed of potential risks and they have been explained to your satisfaction.
• you understand Ohio University has no funds set aside for any injuries you might receive as a result of participating in this study
• you are 18 years of age or older • your participation in this research is completely voluntary • you may leave the study at any time. If you decide to stop participating in the
study, there will be no penalty to you and you will not lose any benefits to which you are otherwise entitled.
Signature *via email or spoken during audiotaped interview Date Version Date: [10/23/2013]

204
Appendix D: Interview Protocol
Standardized Open-Ended Interviews
Date of Interview:
Interviewee Name:
Title:
Secondary or Postsecondary Institution Name:
These questions are for dissertation research. The purpose of the interview is to identify the perspectives of secondary and postsecondary personnel about Ohio’s Post-Secondary Enrollment Options (PSEO) programming and funding. The interview will be recorded by placing the telephone on “speaker” mode and a recording device will be used throughout the session. Ask the interviewee to confirm that he or she has reviewed the Consent Form and agrees to the information within the Form. □ CHECK IF AGREE Questions: 1. How many years you have served in your role at your current institution? 2. In what capacity have you been involved or are aware of Ohio’s Post-Secondary
Enrollment Options program? 3. What are the benefits of PSEO for Ohio’s high school students? 4. What are the challenges of PSEO for Ohio’s educational institutions? 5. What improvements can be made to PSEO policies of programming and funding? 6. What opportunities do Ohio secondary and postsecondary institutions have on
impacting economic recovery? 7a. (For colleges/universities) Why do you believe students choose your institution over
another college? 7b. (For high schools) What efforts has your institution implemented to ensure all
students have access to PSEO and are encouraged to participate in PSEO? 8. Do you have any additional thoughts or comments about PSEO?

205
Appendix E: PSEO Student Participation Total, Sex of Students, and Race of
Students by Academic Year
PSEO Participant Demographics
Year Total Sex Number % Race Number %
2005
–200
6
11,265 Female 7,339 65 American Indian 53 0.47
Male 3,926 35 Asian or Pacific Islander 201 1.78
11,265 Black, Non-Hispanic 802 7.12
Hispanic 278 2.47
Multiracial 10 0.09
Nonresident Alien 23 0.20
Unknown 566 5.02
White, Non-Hispanic 9,332 82.84
Total 11,265
2006
–200
7
15,387 Female 9,872 64 American Indian 64 0.42
Male 5,515 36 Asian or Pacific Islander 282 1.83
15,387 Black, Non-Hispanic 908 5.90
Hispanic, Puerto Rican
and Hispanic 304 1.97
Multiracial 30 0.19
Nonresident Alien 29 0.19
Unknown 696 4.52
White, Non-Hispanic 13,074 84.97
Total 15,387
2007
–200
8
9,827 Female 6,242 64 American Indian 38 0.39
Male 3,585 36 Asian or Pacific Islander 231 2.35
9,827 Black, Non-Hispanic 623 6.34
Hispanic, Puerto Rican
and Hispanic 225 2.29
Multiracial 28 0.28
Nonresident Alien 19 0.19
Unknown 485 4.94
White, Non-Hispanic 8,178 83.22
Total 9,827
2008
–200
9
10,823 Female 6,676 62 American Indian 37 0.34
Male 4,147 38 Asian or Pacific Islander 187 1.73
Total 10,823 Black, Non-Hispanic 738 6.82
Hispanic, Puerto Rican
and Hispanic 248 2.30
Multiracial 43 0.40

206
PSEO Participant Demographics
Year Total Sex Number % Race Number %
Nonresident Alien 14 0.13
Unknown 654 6.04
White, Non-Hispanic 8,902 82.25
Total 10,823
2009
–201
0
11,791 Female 7,375 63 American Indian 34 0.29
Male 4,416 37 Asian or Pacific Islander 204 1.73
11,791 Black, Non-Hispanic 719 6.10
Hispanic, Puerto Rican 16 0.14
Hispanic 280 2.37
Multiracial 78 0.66
Nonresident Alien 14 0.12
Unknown 727 6.17
White, Non-Hispanic 9,719 82.43
Total 11,791
2010
–201
1
11,342 Female 7,026 62 American Indian 29 0.26
Male 4,316 38 Asian or Pacific Islander 177 1.56
Total 11,342 Black, Non-Hispanic 714 6.30
Hispanic, Puerto Rican 14 0.12
Hispanic 247 2.18
Multiracial 157 1.38
Unknown and
Nonresident Alien 784 6.91
White, Non-Hispanic 9,220 81.29
Total 11,342

207
Appendix F: Number and Percentage of Students’ Residence by County and Academic Year
2005–2006 2006–2007 2007–2008 2008–2009 2009–2010 2010–2011 Range for Map Figure County No. % No. % No. % No. % No. % No. %
Adams 39 0.35 46 0.30 48 0.49 128 1.18 95 0.81 97 0.86 >1.0%
Allen 95 0.84 87 0.57 92 0.94 102 0.94 120 1.02 130 1.15 1.0–1.9%
Ashland 14 0.12 18 0.12 29 0.30 29 0.27 41 0.35 31 0.27 >1.0% Ashtabula 72 0.64 66 0.43 61 0.62 76 0.70 80 0.68 77 0.68 >1.0% Athens 54 0.48 49 0.32 54 0.55 84 0.78 132 1.12 64 0.56 >1.0% Auglaize 63 0.56 57 0.37 48 0.49 52 0.48 58 0.49 37 0.33 >1.0% Belmont 32 0.28 32 0.21 25 0.25 29 0.27 16 0.14 14 0.12 >1.0%
Brown 32 0.28 33 0.21 53 0.54 39 0.36 85 0.72 139 1.23 1.0–1.9%
Butler 211 1.87 166 1.08 180 1.83 159 1.47 234 1.98 259 2.28 2.0–2.9%
Carroll 24 0.21 39 0.25 31 0.32 34 0.31 27 0.23 12 0.11 >1.0% Champaign 33 0.29 50 0.32 43 0.44 21 0.19 62 0.53 47 0.41 >1.0% Clark 126 1.12 120 0.78 103 1.05 72 0.67 100 0.85 91 0.80 >1.0%
Clermont 98 0.87 118 0.77 147 1.50 182 1.68 183 1.55 235 2.07 2.0–2.9%
Clinton 26 0.23 26 0.17 41 0.42 77 0.71 91 0.77 99 0.87 >1.0% Columbiana 85 0.75 118 0.77 82 0.83 142 1.31 157 1.33 78 0.69 >1.0% Coshocton 42 0.37 42 0.27 28 0.28 32 0.30 33 0.28 33 0.29 >1.0% Crawford 60 0.53 65 0.42 67 0.68 71 0.66 86 0.73 72 0.63 >1.0% Cuyahoga 982 8.72 1217 7.91 1259 12.81 1104 10.20 1383 11.73 1257 11.08 10% +

208
2005–2006 2006–2007 2007–2008 2008–2009 2009–2010 2010–2011 Range for Map Figure County No. % No. % No. % No. % No. % No. %
Darke 159 1.41 99 0.64 128 1.30 149 1.38 138 1.17 134 1.18 1.0–1.9%
Defiance 29 0.26 27 0.18 29 0.30 11 0.10 17 0.14 16 0.14 >1.0% Delaware 81 0.72 84 0.55 98 1.00 135 1.25 90 0.76 111 0.98 >1.0%
Erie 101 0.90 85 0.55 105 1.07 120 1.11 125 1.06 163 1.44 1.0–1.9%
Fairfield 111 0.99 120 0.78 128 1.30 141 1.30 184 1.56 153 1.35 1.0–1.9%
Fayette 22 0.20 12 0.08 30 0.31 52 0.48 59 0.50 65 0.57 >1.0%
Franklin 430 3.82 373 2.42 461 4.69 552 5.10 573 4.86 530 4.67 4.0–9.9%
Fulton 79 0.70 84 0.55 92 0.94 72 0.67 45 0.38 56 0.49 >1.0% Gallia n/a 0.07 32 0.21 22 0.22 18 0.17 16 0.14 16 0.14 >1.0%
Geauga 86 0.76 104 0.68 85 0.86 121 1.12 133 1.13 116 1.02 1.0–1.9%
Greene 135 1.20 142 0.92 131 1.33 128 1.18 102 0.87 103 0.91 >1.0% Guernsey 27 0.24 23 0.15 n/a 0.07 27 0.25 20 0.17 n/a 0.03 >1.0%
Hamilton 140 1.24 86 0.56 65 0.66 116 1.07 149 1.26 125 1.10 1.0–1.9%
Hancock 26 0.23 48 0.31 63 0.64 65 0.60 79 0.67 79 0.70 >1.0% Hardin 17 0.15 15 0.10 21 0.21 14 0.13 11 0.09 28 0.25 >1.0% Harrison n/a 0.04 12 0.08 13 0.13 12 0.11 n/a 0.07 n/a 0.07 >1.0% Henry 36 0.32 55 0.36 88 0.90 38 0.35 99 0.84 82 0.72 >1.0%
Highland 47 0.42 41 0.27 80 0.81 76 0.70 104 0.88 115 1.01 1.0–1.9%
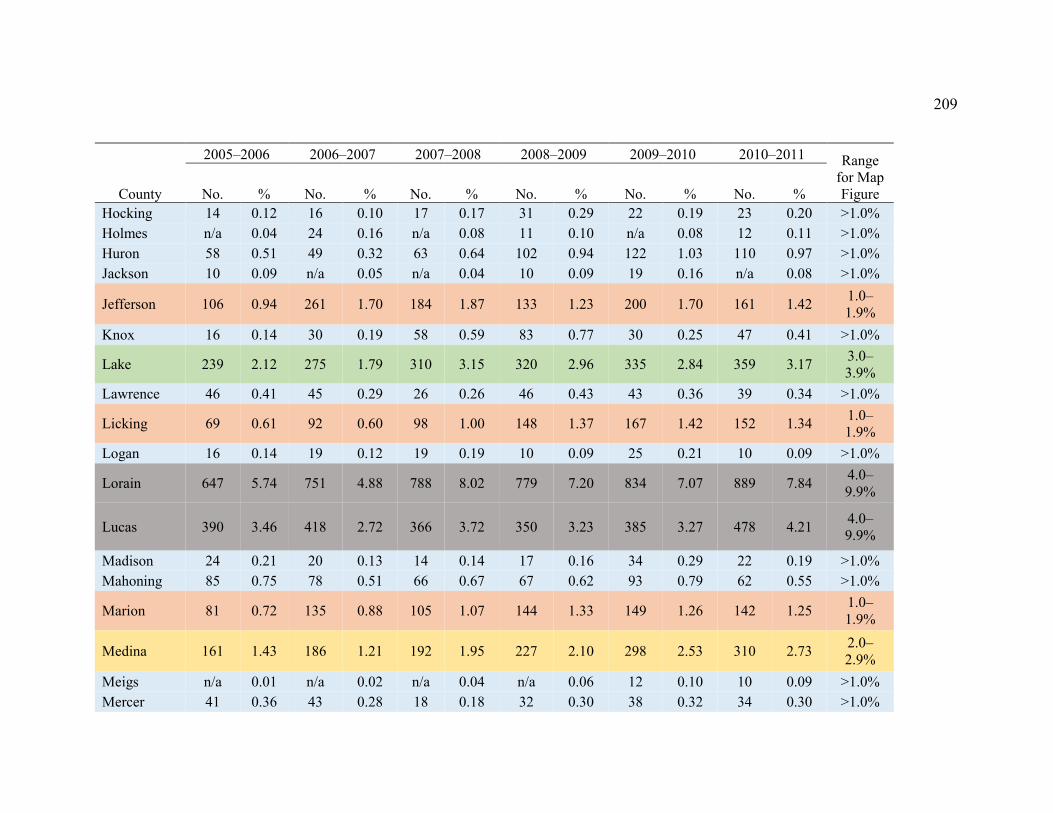
209
2005–2006 2006–2007 2007–2008 2008–2009 2009–2010 2010–2011 Range for Map Figure County No. % No. % No. % No. % No. % No. %
Hocking 14 0.12 16 0.10 17 0.17 31 0.29 22 0.19 23 0.20 >1.0% Holmes n/a 0.04 24 0.16 n/a 0.08 11 0.10 n/a 0.08 12 0.11 >1.0% Huron 58 0.51 49 0.32 63 0.64 102 0.94 122 1.03 110 0.97 >1.0% Jackson 10 0.09 n/a 0.05 n/a 0.04 10 0.09 19 0.16 n/a 0.08 >1.0%
Jefferson 106 0.94 261 1.70 184 1.87 133 1.23 200 1.70 161 1.42 1.0–1.9%
Knox 16 0.14 30 0.19 58 0.59 83 0.77 30 0.25 47 0.41 >1.0%
Lake 239 2.12 275 1.79 310 3.15 320 2.96 335 2.84 359 3.17 3.0–3.9%
Lawrence 46 0.41 45 0.29 26 0.26 46 0.43 43 0.36 39 0.34 >1.0%
Licking 69 0.61 92 0.60 98 1.00 148 1.37 167 1.42 152 1.34 1.0–1.9%
Logan 16 0.14 19 0.12 19 0.19 10 0.09 25 0.21 10 0.09 >1.0%
Lorain 647 5.74 751 4.88 788 8.02 779 7.20 834 7.07 889 7.84 4.0–9.9%
Lucas 390 3.46 418 2.72 366 3.72 350 3.23 385 3.27 478 4.21 4.0–9.9%
Madison 24 0.21 20 0.13 14 0.14 17 0.16 34 0.29 22 0.19 >1.0% Mahoning 85 0.75 78 0.51 66 0.67 67 0.62 93 0.79 62 0.55 >1.0%
Marion 81 0.72 135 0.88 105 1.07 144 1.33 149 1.26 142 1.25 1.0–1.9%
Medina 161 1.43 186 1.21 192 1.95 227 2.10 298 2.53 310 2.73 2.0–2.9%
Meigs n/a 0.01 n/a 0.02 n/a 0.04 n/a 0.06 12 0.10 10 0.09 >1.0% Mercer 41 0.36 43 0.28 18 0.18 32 0.30 38 0.32 34 0.30 >1.0%

210
2005–2006 2006–2007 2007–2008 2008–2009 2009–2010 2010–2011 Range for Map Figure County No. % No. % No. % No. % No. % No. %
Miami 236 2.09 201 1.31 213 2.17 164 1.52 187 1.59 170 1.50 1.0–1.9%
Monroe 11 0.10 n/a 0.05 n/a 0.05 n/a 0.06 n/a 0.04 n/a 0.05 >1.0%
Montgomery 244 2.17 264 1.72 237 2.41 217 2.00 81 0.69 225 1.98 1.0–1.9%
Morgan n/a 0.07 13 0.08 n/a 0.04 n/a 0.04 19 0.16 13 0.11 >1.0% Morrow 65 0.58 64 0.42 73 0.74 38 0.35 60 0.51 77 0.68 >1.0%
Muskingum 63 0.56 97 0.63 98 1.00 94 0.87 94 0.80 132 1.16 1.0–1.9%
Noble 13 0.12 n/a 0.05 n/a 0.05 13 0.12 n/a 0.07 13 0.11 >1.0%
Ottawa 70 0.62 61 0.40 98 1.00 116 1.07 147 1.25 141 1.24 1.0–1.9%
Paulding 15 0.13 10 0.06 n/a 0.09 n/a 0.06 n/a 0.02 46 0.41 >1.0% Perry 40 0.36 23 0.15 45 0.46 22 0.20 34 0.29 27 0.24 >1.0% Pickaway 21 0.19 28 0.18 29 0.30 19 0.18 51 0.43 34 0.30 >1.0% Pike 26 0.23 30 0.19 34 0.35 20 0.18 28 0.24 22 0.19 >1.0%
Portage 89 0.79 87 0.57 131 1.33 168 1.55 131 1.11 160 1.41 1.0–1.9%
Preble 20 0.18 24 0.16 18 0.18 22 0.20 15 0.13 20 0.18 >1.0%
Putnam 98 0.87 141 0.92 113 1.15 127 1.17 151 1.28 139 1.23 1.0–1.9%
Richland 65 0.58 87 0.57 96 0.98 117 1.08 166 1.41 149 1.31 1.0–1.9%
Ross 25 0.22 23 0.15 39 0.40 33 0.30 48 0.41 39 0.34 >1.0%

211
2005–2006 2006–2007 2007–2008 2008–2009 2009–2010 2010–2011 Range for Map Figure County No. % No. % No. % No. % No. % No. %
Sandusky 102 0.91 22 0.14 194 1.97 233 2.15 266 2.26 271 2.39 2.0–2.9%
Scioto 76 0.67 68 0.44 63 0.64 60 0.55 84 0.71 83 0.73 >1.0%
Seneca 40 0.36 18 0.12 89 0.91 110 1.02 120 1.02 124 1.09 1.0–1.9%
Shelby 116 1.03 88 0.57 70 0.71 102 0.94 74 0.63 82 0.72 >1.0% Stark 316 2.81 291 1.89 333 3.39 657 6.07 266 2.26 62 0.55 >1.0%
Summit 220 1.95 314 2.04 323 3.29 399 3.69 378 3.21 346 3.05 3.0–3.9%
Trumbull 54 0.48 50 0.32 84 0.85 62 0.57 49 0.42 67 0.59 >1.0% Tuscarawas 75 0.67 106 0.69 102 1.04 113 1.04 115 0.98 109 0.96 >1.0% Union 12 0.11 16 0.10 18 0.18 17 0.16 25 0.21 29 0.26 >1.0% Van Wert n/a 0.08 14 0.09 12 0.12 n/a 0.06 10 0.08 13 0.11 >1.0% Vinton n/a 0.03 n/a 0.01 0 0.00 n/a 0.03 n/a 0.03 n/a 0.04 >1.0%
Warren 54 0.48 59 0.38 66 0.67 72 0.67 71 0.60 195 1.72 1.0–1.9%
Washington 144 1.28 133 0.86 87 0.89 97 0.90 132 1.12 224 1.97 1.0–1.9%
Wayne 86 0.76 103 0.67 198 2.01 210 1.94 181 1.54 152 1.34 1.0–1.9%
Williams 34 0.30 20 0.13 30 0.31 22 0.20 22 0.19 27 0.24 >1.0%
Wood 172 1.53 199 1.29 211 2.15 199 1.84 214 1.81 311 2.74 2.0–2.9%
Wyandot 41 0.36 37 0.24 60 0.61 39 0.36 95 0.81 38 0.34 >1.0% Unknown 0 0.00 9 0.06 3 0.03 9 0.08 12 0.10 18 0.16

212
2005–2006 2006–2007 2007–2008 2008–2009 2009–2010 2010–2011 Range for Map Figure County No. % No. % No. % No. % No. % No. %
Missing 2,967 26.30 6,429 41.70 260 2.65 430 3.97 697 5.91 229 2.02 Total 11,265 100.00 15,388 100.00 9,827 100.00 10,823 100.00 11,791 100.00 11,342 100.00
Note: Range for map figure and colors of rows coordinate with Figure 4, Participation by County
When the cell size for number of students in a county is less than 10, the data have been suppressed.
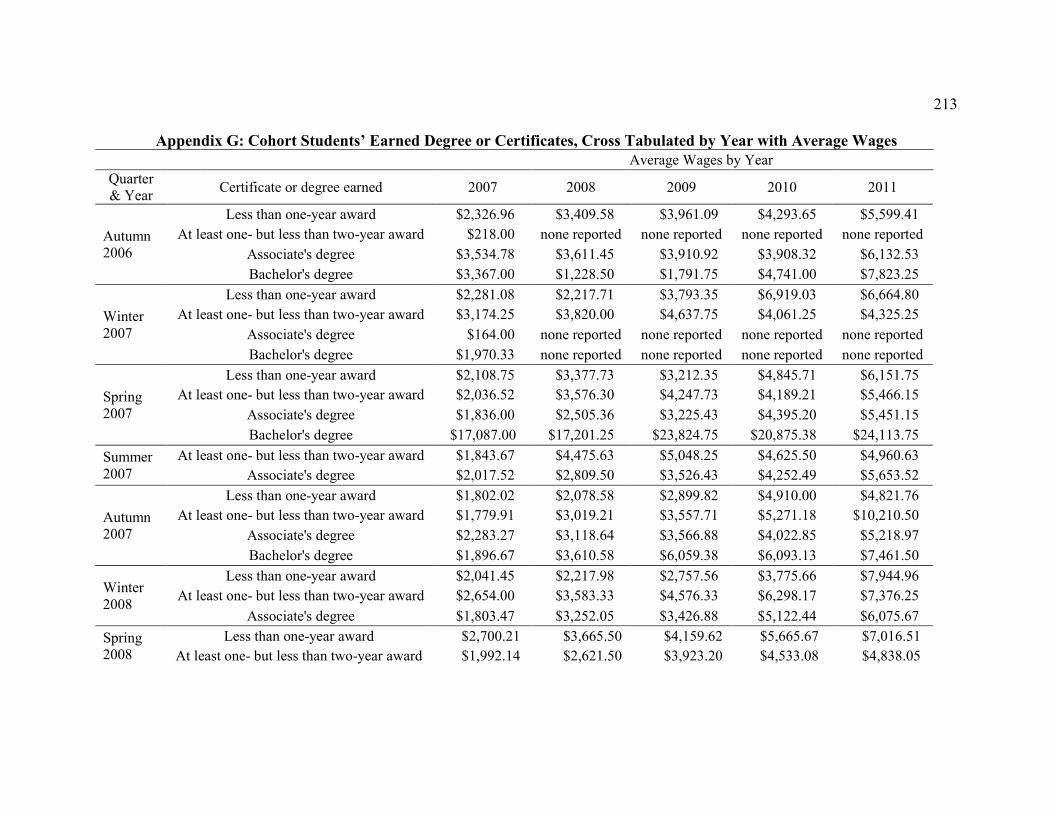
213
Appendix G: Cohort Students’ Earned Degree or Certificates, Cross Tabulated by Year with Average Wages Average Wages by Year
Quarter & Year Certificate or degree earned 2007 2008 2009 2010 2011
Autumn 2006
Less than one-year award $2,326.96 $3,409.58 $3,961.09 $4,293.65 $5,599.41 At least one- but less than two-year award $218.00 none reported none reported none reported none reported
Associate's degree $3,534.78 $3,611.45 $3,910.92 $3,908.32 $6,132.53 Bachelor's degree $3,367.00 $1,228.50 $1,791.75 $4,741.00 $7,823.25
Winter 2007
Less than one-year award $2,281.08 $2,217.71 $3,793.35 $6,919.03 $6,664.80 At least one- but less than two-year award $3,174.25 $3,820.00 $4,637.75 $4,061.25 $4,325.25
Associate's degree $164.00 none reported none reported none reported none reported Bachelor's degree $1,970.33 none reported none reported none reported none reported
Spring 2007
Less than one-year award $2,108.75 $3,377.73 $3,212.35 $4,845.71 $6,151.75 At least one- but less than two-year award $2,036.52 $3,576.30 $4,247.73 $4,189.21 $5,466.15
Associate's degree $1,836.00 $2,505.36 $3,225.43 $4,395.20 $5,451.15 Bachelor's degree $17,087.00 $17,201.25 $23,824.75 $20,875.38 $24,113.75
Summer 2007
At least one- but less than two-year award $1,843.67 $4,475.63 $5,048.25 $4,625.50 $4,960.63 Associate's degree $2,017.52 $2,809.50 $3,526.43 $4,252.49 $5,653.52
Autumn 2007
Less than one-year award $1,802.02 $2,078.58 $2,899.82 $4,910.00 $4,821.76 At least one- but less than two-year award $1,779.91 $3,019.21 $3,557.71 $5,271.18 $10,210.50
Associate's degree $2,283.27 $3,118.64 $3,566.88 $4,022.85 $5,218.97 Bachelor's degree $1,896.67 $3,610.58 $6,059.38 $6,093.13 $7,461.50
Winter 2008
Less than one-year award $2,041.45 $2,217.98 $2,757.56 $3,775.66 $7,944.96 At least one- but less than two-year award $2,654.00 $3,583.33 $4,576.33 $6,298.17 $7,376.25
Associate's degree $1,803.47 $3,252.05 $3,426.88 $5,122.44 $6,075.67 Spring 2008
Less than one-year award $2,700.21 $3,665.50 $4,159.62 $5,665.67 $7,016.51 At least one- but less than two-year award $1,992.14 $2,621.50 $3,923.20 $4,533.08 $4,838.05

214
Average Wages by Year Quarter & Year Certificate or degree earned 2007 2008 2009 2010 2011
Associate's degree $2,157.09 $3,315.45 $4,481.32 $4,740.50 $5,628.47 Bachelor's degree none reported $3,478.23 $7,008.47 $8,671.37 $8,200.45
A3 Second Associate's Major $2,035.67 $3,961.00 $3,774.50 $4,426.67 $3,944.00
Summer 2008
Less than one-year award $1,103.23 $1,734.75 $3,234.13 $4,399.38 $4,051.38 At least one- but less than two-year award $1,824.63 $1,964.08 $4,208.81 $4,798.56 $5,422.94
Associate's degree $2,128.67 $2,935.31 $3,877.92 $4,714.61 $5,984.62 Bachelor's degree $2,053.96 $1,231.90 $2,842.48 $3,783.19 $5,188.69
Autumn 2008
Less than one-year award $2,441.25 $3,567.36 $3,911.42 $5,980.33 $9,302.54 At least one- but less than two-year award $1,587.85 $1,777.71 $4,841.94 $6,925.14 $7,367.75
Associate's degree $2,384.74 $2,944.08 $4,053.60 $5,190.15 $5,933.65 Bachelor's degree $1,632.42 $2,149.67 $3,314.30 $5,074.19 $6,920.49 Master's degree $1,432.00 $5,068.00 $8,186.25 $8,096.50 $8,429.50
Winter 2009
Less than one-year award $1,381.88 $2,074.75 $5,452.25 $6,778.75 $5,920.13 At least one- but less than two-year award $3,362.38 $2,582.88 $3,001.50 $8,479.17 $5,373.63
Associate's degree $2,101.20 $2,850.93 $3,874.77 $5,692.92 $6,463.83 Bachelor's degree $1,825.75 $1,396.83 $3,508.77 $5,348.83 $5,162.17
Spring 2009
Less than one-year award $1,809.50 $2,246.92 $2,985.30 $4,672.70 $5,971.90 At least one- but less than two-year award $2,108.67 $3,989.46 $5,441.92 $6,080.50 $7,357.00
Associate's degree $2,188.03 $2,501.34 $3,470.82 $5,872.45 $6,691.07 Bachelor's degree $1,498.49 $1,848.79 $2,869.18 $5,407.82 $6,682.61
Summer 2009
Less than one-year award $1,589.88 $2,443.65 $3,023.93 $4,389.35 $4,023.45 At least one- but less than two-year award $2,009.88 $2,645.88 $1,453.63 $4,301.38 $3,353.13
Associate's degree $1,999.02 $2,633.53 $3,267.91 $4,494.10 $4,908.58 Bachelor's degree $1,667.28 $2,279.78 $2,849.61 $4,830.83 $6,342.84

215
Average Wages by Year Quarter & Year Certificate or degree earned 2007 2008 2009 2010 2011
Master's degree $899.00 none reported none reported none reported none reported
Autumn 2009
Less than one-year award $1,676.93 $2,736.19 $4,016.05 $5,447.30 $6,436.93 At least one- but less than two-year award $969.00 $819.00 $2,355.75 $4,371.00 $3,348.75
Associate's degree $2,346.26 $2,702.77 $3,056.59 $4,795.63 $6,530.13 Bachelor's degree $1,792.58 $2,322.90 $2,331.84 $4,598.08 $6,662.80
A5 Second Bachelor's Major $1,791.00 $1,554.63 $2,826.38 $8,121.25 $7,753.75
Winter 2010
Less than one-year award $2,433.53 $3,063.15 $3,444.53 $6,523.76 $9,674.96 At least one- but less than two-year award $670.88 $1,986.67 $2,313.50 $4,071.88 $5,998.63
Associate's degree $1,980.61 $2,420.68 $3,048.58 $4,873.80 $6,908.86 Bachelor's degree $1,353.28 $1,889.52 $2,132.75 $3,661.22 $5,840.70
Spring 2010
Less than one-year award $1,614.06 $2,066.29 $2,332.17 $3,195.37 $6,758.37 At least one- but less than two-year award $2,013.97 $2,558.69 $2,756.08 $3,807.29 $5,972.93
Associate's degree $2,044.43 $2,493.02 $2,614.22 $3,618.00 $6,295.77 Bachelor's degree $1,358.34 $1,686.98 $2,045.40 $3,356.62 $6,398.26 Master's degree $1,564.03 $2,010.85 $2,870.42 $6,128.34 $8,689.17
A5 Second Bachelor's` Major $1,974.95 $1,836.30 $2,010.33 $3,603.54 $6,068.70
Summer 2010
Less than one-year award $1,265.63 $1,826.79 $1,675.00 $2,172.79 $4,741.95 At least one- but less than two-year award $2,865.08 $3,112.71 $2,810.17 $3,608.56 $7,363.81
Associate's degree $2,282.60 $3,162.09 $3,069.09 $3,683.67 $5,628.39 Bachelor's degree $1,554.95 $1,786.48 $2,155.57 $3,122.93 $6,435.75
Post-baccalaureate certificate $1,245.00 $912.00 $2,468.00 $3,633.75 $7,033.75 Master's degree $1,404.05 $384.27 $2,907.29 $3,870.33 $8,011.59
A5 Second Bachelor's Major none reported none reported none reported none reported $138.00 Autumn Less than one-year award $1,533.90 $1,718.15 $2,789.20 $3,160.79 $5,053.13

216
Average Wages by Year Quarter & Year Certificate or degree earned 2007 2008 2009 2010 2011
2010 At least one- but less than two-year award $3,084.38 $3,194.75 $2,320.18 $3,940.75 $2,716.00 Associate's degree $2,264.43 $2,680.14 $2,770.61 $3,107.97 $5,114.54 Bachelor's degree $1,610.46 $1,984.08 $2,347.66 $2,594.74 $5,828.47 Master's degree $2,006.24 $2,225.46 $2,033.38 $3,274.79 $8,868.63
Winter 2011
Less than one-year award $1,810.95 $2,034.40 $2,921.27 $3,323.28 $3,268.80 At least one- but less than two-year award $1,162.00 $2,981.00 $1,083.03 $169.00 $432.00
Associate's degree $2,023.37 $2,674.66 $2,743.80 $3,323.28 $4,682.99 Bachelor's degree $1,688.75 $2,074.18 $2,033.31 $169.00 $4,423.60 Master's degree $1,811.33 none reported none reported none reported none reported
Spring 2011
Less than one-year award $1,150.51 $1,458.79 $1,289.76 $1,683.45 $2,643.99 At least one- but less than two-year award $2,253.60 $2,380.51 $1,728.75 $2,741.39 $3,514.08
Associate's degree $1,901.33 $2,517.58 $2,691.02 $3,118.76 $4,566.67 Bachelor's degree $1,446.09 $1,880.11 $2,318.29 $2,567.94 $4,122.04
Post-baccalaureate certificate $1,092.50 $276.00 $234.00 $195.00 none reported Master's degree $1,348.01 $1,804.96 $1,988.80 $2,204.00 $4,470.04
Note: For the calculation of average wages, the researcher used mean averages. In 2009, the method of reporting wages changed. Prior to 2009, wages were top coded; after 2009, wages are not. “There are generally higher mean wages in 2009 and later because outliers at the high end are high enough to elevate the mean” (personal communication, L. Neilson, February 25, 2015).

217
Appendix H: Number and Percent of Students Employed by Employer Types, Quarter and Year
Fourth Quarter 2006 Number Percent 1 Food Services and Drinking Places 1,203 16.5 2 General Merchandise Stores 267 3.7 3 Food and Beverage Stores 265 3.6 4 Clothing and Clothing Accessories Stores 225 3.1 5 Administrative and Support Services 180 2.5 First Quarter 2007 1 Food Services and Drinking Places 1,220 16.7 2 Clothing and Clothing Accessories Stores 280 3.8 3 Food and Beverage Stores 245 3.4 4 General Merchandise Stores 232 3.2 5 Administrative and Support Services 162 2.2 Second Quarter 2007 1 Food Services and Drinking Places 1,339 18.3 2 Administrative and Support Services 270 3.7 3 General Merchandise Stores 256 3.5 4 Food and Beverage Stores 249 3.4 5 Clothing and Clothing Accessories Stores 238 3.3 Third Quarter 2007 1 Food Services and Drinking Places 1,257 17.2 2 General Merchandise Stores 289 4.0 3 Administrative and Support Services 285 3.9 4 Food and Beverage Stores 255 3.5 5 Amusement, Gambling, and Recreational
d i 244 3.3
Fourth Quarter 2007 1 Food Services and Drinking Places 976 13.4 2 General Merchandise Stores 305 4.2 3 Clothing and Clothing Accessories Stores 279 3.8 4 Food and Beverage Stores 204 2.8 5 Administrative and Support Services 181 2.5 First Quarter 2008 1 Food Services and Drinking Places 1,018 13.9 2 General Merchandise Stores 290 4.0 3 Clothing and Clothing Accessories Stores 257 3.5 4 Food and Beverage Stores 207 2.8 5 Administrative and Support Services 198 2.7 Second Quarter 2008 Number Percent 1 Food Services and Drinking Places 1,064 14.6 2 Administrative and Support Services 302 4.1

218 3 General Merchandise Stores 266 3.6 4 Clothing and Clothing Accessories Stores 193 2.6 5 Professional, Scientific, and Technical Services 174 2.4 Third Quarter 2008 1 Food Services and Drinking Places 1,034 14.2 2 Administrative and Support Services 327 4.5 3 General Merchandise Stores 265 3.6 4 Food and Beverage Stores 203 2.8 5 Professional, Scientific, and Technical Services 194 2.7 Fourth Quarter 2008 1 Food Services and Drinking Places 868 11.9 2 General Merchandise Stores 238 3.3 3 Administrative and Support Services 202 2.8 4 Clothing and Clothing Accessories Stores 197 2.7 5 Food and Beverage Stores 192 2.6 First Quarter 2009 1 Food Services and Drinking Places 892 12.2 2 General Merchandise Stores 222 3.0 3 Clothing and Clothing Accessories Stores 185 2.5 4 Hospitals 185 2.5 5 Food and Beverage Stores 176 2.4 Second Quarter 2009 1 Food Services and Drinking Places 903 12.4 2 General Merchandise Stores 214 2.9 3 Professional, Scientific, and Technical Services 204 2.8 4 Administrative and Support Services 194 2.7 5 Hospitals 185 2.5 Third Quarter 2009 1 Food Services and Drinking Places 932 12.8 2 Hospitals 237 3.2 3 Administrative and Support Services 221 3.0 4 Professional, Scientific, and Technical Services 209 2.9 5 General Merchandise Stores 201 2.8 Fourth Quarter 2009 Number Percent 1 Food Services and Drinking Places 810 11.1 2 Hospitals 240 3.3 3 General Merchandise Stores 207 2.8 4 Administrative and Support Services 193 2.6 5 Clothing and Clothing Accessories Stores 177 2.4 First Quarter 2010 1 Food Services and Drinking Places 810 11.1

219 2 Hospitals 253 3.5 3 Education Services 247 3.4 4 Administrative and Support Services 201 2.8 5 Professional, Scientific, and Technical
194 2.7
Second Quarter 2010 1 Food Services and Drinking Places 810 11.1 2 Hospitals 284 3.9 3 Professional, Scientific, and Technical
245 3.4
4 Administrative and Support Services 231 3.2 5 Education Services 218 3.0 Third Quarter 2010 1 Food Services and Drinking Places 768 10.5 2 Hospitals 311 4.3 3 Professional, Scientific, and Technical
268 3.7
4 Administrative and Support Services 265 3.6 5 Education Services 266 3.6 Fourth Quarter 2010 1 Food Services and Drinking Places 691 9.5 2 Education Services 348 4.8 3 Hospitals 341 4.7 4 Professional, Scientific, and Technical
267 3.7
5 Administrative and Support Services 250 3.4 First Quarter 2011 1 Food Services and Drinking Places 683 9.4 2 Education Services 374 5.1 3 Hospitals 363 5.0 4 Professional, Scientific, and Technical
295 4.0
5 Administrative and Support Services 233 3.2 Second Quarter 2011 Number Percent 1 Food Services and Drinking Places 653 8.9 2 Education Services 402 5.5 3 Hospitals 359 4.9 4 Professional, Scientific, and Technical
323 4.4
5 Administrative and Support Services 284 3.9 Third Quarter 2011 1 Food Services and Drinking Places 609 8.3 2 Education Services 389 5.3 3 Professional, Scientific, and Technical
347 4.8
4 Hospitals 340 4.7 5 Administrative and Support Services 275 3.8 Fourth Quarter 2011

220 1 Food Services and Drinking Places 527 7.2 2 Education Services 448 6.1 3 Hospitals 425 5.8 4 Professional, Scientific, and Technical
354 4.8
5 Administrative and Support Services 247 3.4

221 Appendix I: Number and Percentage of Students Living Below Poverty Level Using
ACS Data of Zip Codes in Alphabetical Order by City
Community members living
below poverty level
ZIP code City County
PSEO no.
% of cohort ACS %
ACS Margin of error
Ohio 14.2 0.2 43001 Alexandria Licking n/a 0.01 12.9 13.7 45101 Aberdeen Brown n/a 0.01 26.6 7.5 45810 Ada Hardin n/a 0.01 26.1 5.8 45710 Albany Athens n/a 0.07 26.1 12.2 45812 Alger Hardin n/a 0.04 9.7 5.6 44601 Alliance Stark 19 0.25 19.2 3.1 45102 Amelia Clermont n/a 0.11 7.0 3.6 44001 Amherst Lorain 66 0.87 5.9 2.3 43903 Amsterdam Carroll n/a 0.01 30.1 17.7 44003 Andover Ashtabula n/a 0.04 14.4 7.4 45302 Anna Shelby n/a 0.04 9.7 6.6 45303 Ansonia Darke n/a 0.05 13.9 6.2 44606 Apple Creek Wayne n/a 0.01 7.8 5.4 44804 Arcadia Hancock n/a 0.01 10.1 11.2 45304 Arcanum Darke 24 0.32 11.2 5.3 43502 Archbold Fulton 16 0.21 14.4 5.3 45814 Arlington Hancock n/a 0.03 5.5 2.7 44805 Ashland Ashland n/a 0.12 15.4 3.1 43003 Ashley Delaware n/a 0.01 20.2 9.3 44004 Ashtabula Ashtabula 23 0.30 30.5 4.2 43103 Ashville Pickaway n/a 0.07 10.0 6.3 45701 Athens Athens 23 0.30 50.9 3.3 44807 Attica Seneca n/a 0.03 11.5 11.0 44201 Atwater Portage n/a 0.03 24.8 19.5 44202 Aurora Portage n/a 0.09 5.1 1.9 44010 Austinburg Ashtabula n/a 0.03 15.0 2.6 44011 Avon Lorain 22 0.29 6.2 2.0 44012 Avon Lake Lorain 22 0.29 4.6 1.7 45612 Bainbridge Ross n/a 0.01 17.3 8.4 43105 Baltimore Fairfield n/a 0.01 22.3 9.7 44203 Barberton Summit 25 0.33 20.6 2.6 43713 Barnesville Belmont n/a 0.05 14.9 5.7
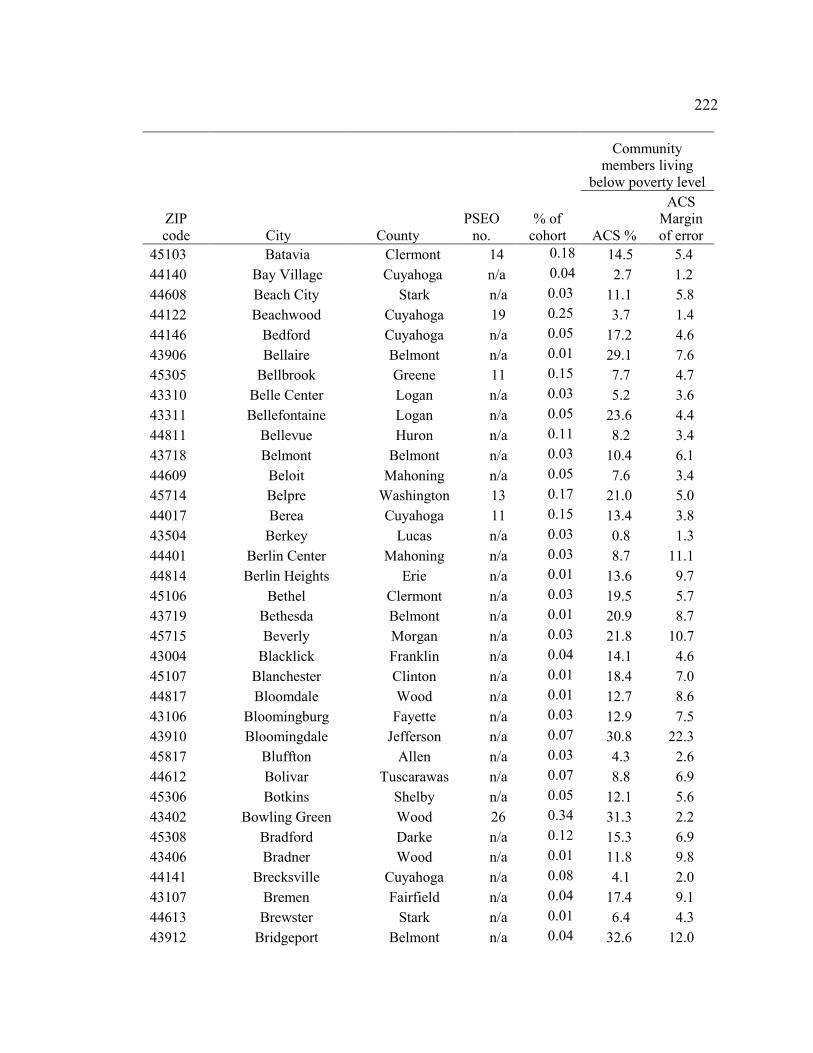
222
Community members living
below poverty level
ZIP code City County
PSEO no.
% of cohort ACS %
ACS Margin of error
45103 Batavia Clermont 14 0.18 14.5 5.4 44140 Bay Village Cuyahoga n/a 0.04 2.7 1.2 44608 Beach City Stark n/a 0.03 11.1 5.8 44122 Beachwood Cuyahoga 19 0.25 3.7 1.4 44146 Bedford Cuyahoga n/a 0.05 17.2 4.6 43906 Bellaire Belmont n/a 0.01 29.1 7.6 45305 Bellbrook Greene 11 0.15 7.7 4.7 43310 Belle Center Logan n/a 0.03 5.2 3.6 43311 Bellefontaine Logan n/a 0.05 23.6 4.4 44811 Bellevue Huron n/a 0.11 8.2 3.4 43718 Belmont Belmont n/a 0.03 10.4 6.1 44609 Beloit Mahoning n/a 0.05 7.6 3.4 45714 Belpre Washington 13 0.17 21.0 5.0 44017 Berea Cuyahoga 11 0.15 13.4 3.8 43504 Berkey Lucas n/a 0.03 0.8 1.3 44401 Berlin Center Mahoning n/a 0.03 8.7 11.1 44814 Berlin Heights Erie n/a 0.01 13.6 9.7 45106 Bethel Clermont n/a 0.03 19.5 5.7 43719 Bethesda Belmont n/a 0.01 20.9 8.7 45715 Beverly Morgan n/a 0.03 21.8 10.7 43004 Blacklick Franklin n/a 0.04 14.1 4.6 45107 Blanchester Clinton n/a 0.01 18.4 7.0 44817 Bloomdale Wood n/a 0.01 12.7 8.6 43106 Bloomingburg Fayette n/a 0.03 12.9 7.5 43910 Bloomingdale Jefferson n/a 0.07 30.8 22.3 45817 Bluffton Allen n/a 0.03 4.3 2.6 44612 Bolivar Tuscarawas n/a 0.07 8.8 6.9 45306 Botkins Shelby n/a 0.05 12.1 5.6 43402 Bowling Green Wood 26 0.34 31.3 2.2 45308 Bradford Darke n/a 0.12 15.3 6.9 43406 Bradner Wood n/a 0.01 11.8 9.8 44141 Brecksville Cuyahoga n/a 0.08 4.1 2.0 43107 Bremen Fairfield n/a 0.04 17.4 9.1 44613 Brewster Stark n/a 0.01 6.4 4.3 43912 Bridgeport Belmont n/a 0.04 32.6 12.0

223
Community members living
below poverty level
ZIP code City County
PSEO no.
% of cohort ACS %
ACS Margin of error
43913 Brilliant Jefferson n/a 0.01 19.6 11.9 44147 Broadview Heights Cuyahoga 10 0.13 4.9 1.8 44142 Brookpark Cuyahoga n/a 0.08 7.0 1.8 45309 Brookville Montgomery n/a 0.05 4.8 2.5 44212 Brunswick Medina 30 0.40 5.9 1.2 43506 Bryan Williams 10 0.13 14 4.6 44820 Bucyrus Crawford 25 0.33 13.3 2.5 43407 Burgoon Sandusky n/a 0.01 6.9 8.2 44021 Burton Geauga n/a 0.11 13.0 11.3 44822 Butler Richland n/a 0.01 6.4 4.4 43723 Byesville Guernsey n/a 0.03 21.2 5.6 43724 Caldwell Noble n/a 0.08 16.8 8.0 43314 Caledonia Marion n/a 0.03 5.9 6.6 43725 Cambridge Guernsey n/a 0.11 30.1 5.2 45311 Camden Preble n/a 0.09 22.2 7.2 44405 Campbell Mahoning n/a 0.01 21.1 4.8 44614 Canal Fulton Stark 15 0.20 7.8 4.9 43110 Canal Winchester Franklin 14 0.18 2.7 2.2 44406 Canfield Mahoning n/a 0.04 6.3 3.2 43315 Cardington Morrow n/a 0.04 22.6 10.1 43316 Carey Wyandot n/a 0.03 7.2 3.3 44615 Carrollton Carroll 13 0.17 16.5 9.4 45312 Casstown Miami n/a 0.08 15.0 14.7 44824 Castalia Erie n/a 0.03 10.8 6.6 45821 Cecil Paulding n/a 0.03 34.3 19.9 45314 Cedarville Greene n/a 0.03 24.7 9.1 45822 Celina Mercer 15 0.20 13.3 3.1 43011 Centerburg Knox n/a 0.05 20.9 8.8 44024 Chardon Geauga 14 0.18 6.8 2.9 44026 Chesterland Geauga n/a 0.08 3.4 2.0 45826 Chickasaw Mercer n/a 0.01 1.8 2.4 45601 Chillicothe Ross n/a 0.11 20.3 3.3 43113 Circleville Pickaway n/a 0.09 21.0 4.0 43115 Clarksburg Ross n/a 0.01 22.7 14.7 45113 Clarksville Clinton n/a 0.03 30.4 15.4

224
Community members living
below poverty level
ZIP code City County
PSEO no.
% of cohort ACS %
ACS Margin of error
45315 Clayton Montgomery n/a 0.04 6.7 2.1 45002 Cleves Hamilton n/a 0.01 11.7 5.2 44216 Clinton Summit n/a 0.08 7.6 3.7 45827 Cloverdale Putnam n/a 0.04 24.5 23.5 43410 Clyde Sandusky n/a 0.12 10.6 4.7 45621 Coalton Jackson n/a 0.01 23.9 16.1 45828 Coldwater Mercer n/a 0.09 7.2 3.7 44408 Columbiana Columbiana n/a 0.09 17.0 5.5 43116 Commercial Point Pickaway n/a 0.01 6.3 4.6 43811 Conesville Coshocton n/a 0.03 7.5 8.2 44030 Conneaut Ashtabula n/a 0.09 19.5 3.7 45832 Convoy Van Wert n/a 0.01 12.5 8.1 43730 Corning Perry n/a 0.03 31.8 13.9 44410 Cortland Trumbull n/a 0.07 8.6 3.2 43812 Coshocton Coshocton 20 0.26 20.0 3.5 45318 Covington Miami 11 0.15 15.1 5.8 44827 Crestline Crawford n/a 0.11 18.7 5.8 44217 Creston Wayne n/a 0.03 11.7 4.7 43731 Crooksville Morgan n/a 0.04 20.0 6.6 45623 Crown City Gallia n/a 0.03 15.5 7.4 43732 Cumberland Guernsey n/a 0.01 1.7 2.7 43412 Curtice Lucas n/a 0.07 0.8 1.4 43413 Cygnet Wood n/a 0.03 13.2 10.5 44618 Dalton Wayne n/a 0.11 5.1 4.9 43014 Danville Knox n/a 0.03 25.1 9.4 43512 Defiance Defiance 22 0.29 19.0 3.7 43015 Delaware Delaware 19 0.25 10.4 1.7 44620 Dellroy Carroll n/a 0.03 6.7 6.2 45833 Delphos Allen n/a 0.05 13.3 4.3 43515 Delta Fulton n/a 0.07 9.4 4.3 44621 Dennison Tuscarawas n/a 0.04 15.9 6.5 43516 Deshler Henry n/a 0.12 17.6 6.5 43917 Dillonvale Jefferson n/a 0.01 20.2 11.8 45319 Donnelsville Clark n/a 0.01 2.6 2.5 44622 Dover Tuscarawas 10 0.13 10.8 3.2
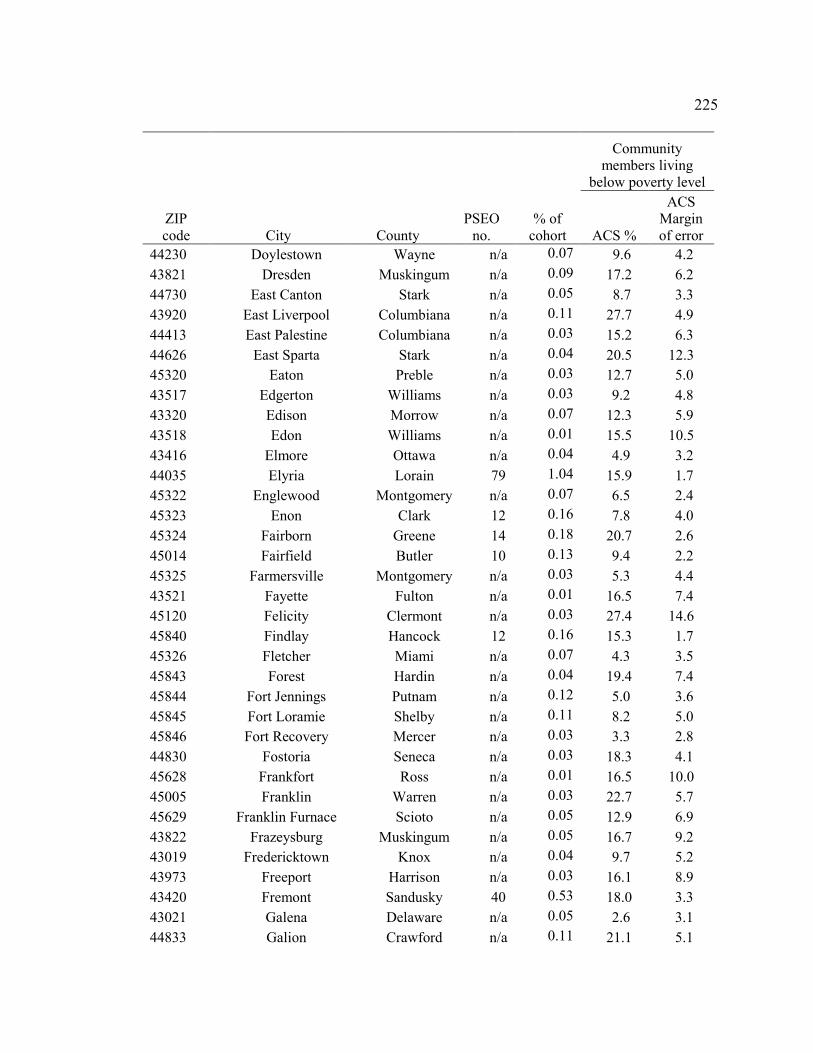
225
Community members living
below poverty level
ZIP code City County
PSEO no.
% of cohort ACS %
ACS Margin of error
44230 Doylestown Wayne n/a 0.07 9.6 4.2 43821 Dresden Muskingum n/a 0.09 17.2 6.2 44730 East Canton Stark n/a 0.05 8.7 3.3 43920 East Liverpool Columbiana n/a 0.11 27.7 4.9 44413 East Palestine Columbiana n/a 0.03 15.2 6.3 44626 East Sparta Stark n/a 0.04 20.5 12.3 45320 Eaton Preble n/a 0.03 12.7 5.0 43517 Edgerton Williams n/a 0.03 9.2 4.8 43320 Edison Morrow n/a 0.07 12.3 5.9 43518 Edon Williams n/a 0.01 15.5 10.5 43416 Elmore Ottawa n/a 0.04 4.9 3.2 44035 Elyria Lorain 79 1.04 15.9 1.7 45322 Englewood Montgomery n/a 0.07 6.5 2.4 45323 Enon Clark 12 0.16 7.8 4.0 45324 Fairborn Greene 14 0.18 20.7 2.6 45014 Fairfield Butler 10 0.13 9.4 2.2 45325 Farmersville Montgomery n/a 0.03 5.3 4.4 43521 Fayette Fulton n/a 0.01 16.5 7.4 45120 Felicity Clermont n/a 0.03 27.4 14.6 45840 Findlay Hancock 12 0.16 15.3 1.7 45326 Fletcher Miami n/a 0.07 4.3 3.5 45843 Forest Hardin n/a 0.04 19.4 7.4 45844 Fort Jennings Putnam n/a 0.12 5.0 3.6 45845 Fort Loramie Shelby n/a 0.11 8.2 5.0 45846 Fort Recovery Mercer n/a 0.03 3.3 2.8 44830 Fostoria Seneca n/a 0.03 18.3 4.1 45628 Frankfort Ross n/a 0.01 16.5 10.0 45005 Franklin Warren n/a 0.03 22.7 5.7 45629 Franklin Furnace Scioto n/a 0.05 12.9 6.9 43822 Frazeysburg Muskingum n/a 0.05 16.7 9.2 43019 Fredericktown Knox n/a 0.04 9.7 5.2 43973 Freeport Harrison n/a 0.03 16.1 8.9 43420 Fremont Sandusky 40 0.53 18.0 3.3 43021 Galena Delaware n/a 0.05 2.6 3.1 44833 Galion Crawford n/a 0.11 21.1 5.1

226
Community members living
below poverty level
ZIP code City County
PSEO no.
% of cohort ACS %
ACS Margin of error
44231 Garrettsville Portage n/a 0.01 11.0 7.7 44041 Geneva Ashtabula 12 0.16 15.6 5.8 43430 Genoa Ottawa n/a 0.08 8.5 4.1 45121 Georgetown Brown n/a 0.07 21.7 6.6 45327 Germantown Montgomery n/a 0.04 3.1 2.0 43431 Gibsonburg Sandusky n/a 0.12 8.5 3.9 44420 Girard Trumbull n/a 0.04 17.6 4.1 43739 Glenford Perry n/a 0.03 10.6 8.7 45732 Glouster Athens n/a 0.03 31.2 10.4 44629 Gnadenhutten Tuscarawas n/a 0.01 8.0 4.6 44044 Grafton Lorain 30 0.40 5.2 4.5 43522 Grand Rapids Lucas n/a 0.04 8.3 6.3 43023 Granville Licking n/a 0.04 4.6 2.6 44836 Green Springs Seneca n/a 0.01 10.9 6.8 45331 Greenville Darke 58 0.77 15.2 2.7 43123 Grove City Franklin 19 0.25 7.6 1.9 43125 Groveport Franklin n/a 0.05 7.8 4.2 45130 Hamersville Brown n/a 0.01 12.2 12.3 43524 Hamler Henry n/a 0.01 4.4 4.3 44423 Hanoverton Columbiana n/a 0.03 7.3 5.0 43323 Harpster Wyandot n/a 0.04 18 13.1 45030 Harrison Hamilton n/a 0.05 6.9 2.9 45850 Harrod Allen n/a 0.12 7.9 8.2 44632 Hartville Stark n/a 0.07 6.3 4.1 45851 Haviland Paulding n/a 0.01 13.8 8.8 43056 Heath Licking 14 0.18 14.2 3.9 43025 Hebron Licking n/a 0.01 10.8 5.7 43435 Helena Sandusky n/a 0.07 17.6 14.7 43526 Hicksville Defiance n/a 0.01 16.1 8.2 43026 Hilliard Franklin n/a 0.09 4.2 1.4 45133 Hillsboro Highland 20 0.26 25.5 4.9 44234 Hiram Portage n/a 0.03 3.9 4.0 43527 Holgate Henry n/a 0.03 22.4 10.8 43528 Holland Lucas n/a 0.12 4.9 3.1 45332 Hollansburg Darke n/a 0.03 13.6 10.8

227
Community members living
below poverty level
ZIP code City County
PSEO no.
% of cohort ACS %
ACS Margin of error
44634 Homeworth Columbiana n/a 0.03 15.0 21.7 44425 Hubbard Trumbull n/a 0.04 8.5 2.6 44236 Hudson Summit n/a 0.07 3.5 1.7 43324 Huntsville Logan n/a 0.01 7.1 6.6 44839 Huron Erie 17 0.22 5.0 2.9 44131 Independence Cuyahoga 14 0.18 3.5 2.6 43932 Irondale Jefferson n/a 0.01 39.0 19.3 45638 Ironton Lawrence 10 0.13 24.4 4.6 45640 Jackson Jackson n/a 0.01 14.9 5.2 45334 Jackson Center Shelby n/a 0.01 13.1 8.3 45335 Jamestown Greene n/a 0.01 10.8 4.7 44047 Jefferson Ashtabula n/a 0.05 13.2 7.9 43128 Jeffersonville Fayette n/a 0.01 33.9 9.5 43031 Johnstown Licking n/a 0.04 11.7 6.1 43748 Junction City Perry n/a 0.03 23.8 11.2 45853 Kalida Putnam 10 0.13 2.8 3.5 43438 Kelleys Island Erie n/a 0.01 1.5 2.6 44240 Kent Portage 14 0.18 34.0 3.4 43326 Kenton Hardin n/a 0.01 21.6 5.0 45644 Kingston Ross n/a 0.01 16.9 6.6 43332 La Rue Marion n/a 0.01 7.6 5.1 45854 Lafayette Allen n/a 0.01 14.3 14.9 44050 Lagrange Lorain n/a 0.08 3.9 2.4 43331 Lakeview Logan n/a 0.05 21.9 13.3 44107 Lakewood Cuyahoga 14 0.18 15.1 1.7 43130 Lancaster Fairfield 30 0.40 14.8 2.0 45337 Laura Miami n/a 0.04 8.0 6.7 43135 Laurelville Hocking n/a 0.01 17.1 9.6 45036 Lebanon Warren 17 0.22 10.4 2.6 45135 Leesburg Highland n/a 0.05 18.5 7.6 44431 Leetonia Columbiana n/a 0.04 17.7 7.0 45856 Leipsic Putnam n/a 0.07 5.8 3.7 45338 Lewisburg Preble n/a 0.04 10.2 3.9 43532 Liberty Center Henry n/a 0.04 15.0 6.6 44254 Lodi Medina n/a 0.03 11.4 8.1

228
Community members living
below poverty level
ZIP code City County
PSEO no.
% of cohort ACS %
ACS Margin of error
43138 Logan Hocking 15 0.20 24.8 6.0 43140 London Madison n/a 0.12 14.6 3.8 43755 Lore City Guernsey n/a 0.01 28.3 19.2 44641 Louisville Stark n/a 0.12 9.7 3.2 45140 Loveland Clermont 12 0.16 8.4 3.0 45744 Lowell Washington n/a 0.01 24.6 16.6 44436 Lowellville Mahoning n/a 0.01 10.6 5.1 44843 Lucas Richland n/a 0.05 17.3 14.5 45648 Lucasville Scioto 12 0.16 24.5 14.2 43443 Luckey Wood n/a 0.05 9.3 6.9 45339 Ludlow Falls Miami n/a 0.04 3.9 4.2 45142 Lynchburg Highland n/a 0.03 21.5 10.5 43533 Lyons Fulton n/a 0.01 12.6 9.6 44057 Madison Lake 18 0.24 11.1 7.8 44643 Magnolia Carroll n/a 0.05 6.0 4.1 45039 Maineville Warren n/a 0.04 5.6 4.6 43758 Malta Morgan n/a 0.03 28.2 12.9 45144 Manchester Adams n/a 0.01 34.8 8.4 44255 Mantua Portage n/a 0.05 7.6 6.9 44137 Maple Heights Cuyahoga n/a 0.05 16.4 3.0 43334 Marengo Morrow n/a 0.08 21.9 17.7 45750 Marietta Washington 37 0.49 24.0 3.6 43302 Marion Marion 59 0.78 24.3 2.4 44645 Marshallville Wayne n/a 0.07 8.2 4.5 43935 Martins Ferry Belmont n/a 0.05 21.2 4.6 43040 Marysville Union n/a 0.05 8.3 2.3 45040 Mason Warren n/a 0.03 4.2 1.1 43537 Maumee Lucas 22 0.29 7.5 2.7 44437 Mc Donald Trumbull n/a 0.01 10.8 5.8 43756 McConnelsville Morgan n/a 0.03 30.3 9.8 43044 Mechanicsburg Champaign n/a 0.04 17.6 5.2 44256 Medina Medina 42 0.55 11.1 2.0 44060 Mentor Lake 58 0.77 5.4 1.3 45342 Miamisburg Montgomery 10 0.13 8.3 2.5 44062 Middlefield Geauga n/a 0.04 6.2 2.8

229
Community members living
below poverty level
ZIP code City County
PSEO no.
% of cohort ACS %
ACS Margin of error
45760 Middleport Meigs n/a 0.01 26.4 7.6 44846 Milan Erie n/a 0.04 10.4 7.4 45150 Milford Clermont n/a 0.12 11.2 4.1 43447 Millbury Wood n/a 0.07 4.8 3.0 44654 Millersburg Holmes n/a 0.01 15.2 7.0 44656 Mineral City Tuscarawas n/a 0.03 6.1 4.9 44440 Mineral Ridge Trumbull n/a 0.01 9.2 3.9 44657 Minerva Stark n/a 0.03 13.1 4.6 43938 Mingo Junction Jefferson n/a 0.07 12.6 4.1 45865 Minster Auglaize n/a 0.11 2.9 2.4 44260 Mogadore Portage 11 0.15 9.4 5.7 45050 Monroe Butler n/a 0.08 5.2 1.9 44847 Monroeville Huron n/a 0.08 8.0 4.1 43543 Montpelier Williams n/a 0.05 24.4 8.4 43337 Morral Marion n/a 0.01 14.4 8.8 45153 Moscow Clermont n/a 0.01 6.6 5.7 45867 Mount Blanchard Hancock n/a 0.03 3.8 3.7 43338 Mount Gilead Morrow 16 0.21 9.4 8.2 45154 Mount Orab Brown n/a 0.04 16.6 4.9 43143 Mount Sterling Madison n/a 0.09 12.4 6.6 43340 Mount Victory Hardin n/a 0.01 10.1 6.1 43545 Napoleon Henry 10 0.13 14.2 3.9 44662 Navarre Stark n/a 0.07 8.8 3.6 43940 Neffs Belmont n/a 0.01 2.3 3.3 45764 Nelsonville Athens n/a 0.01 39.1 7.4 44849 Nevada Wyandot n/a 0.04 19.0 10.1 43054 New Albany Franklin n/a 0.12 1.8 1.1 45869 New Bremen Auglaize n/a 0.04 6.5 3.2 45344 New Carlisle Clark 13 0.17 16.1 7.2 43145 New Holland Pickaway n/a 0.03 14.1 7.5 45871 New Knoxville Auglaize n/a 0.04 5.9 4.5 45345 New Lebanon Montgomery n/a 0.05 16.2 7.5 43764 New Lexington Perry 15 0.20 31.1 9.4 44851 New London Huron n/a 0.03 18.1 8.2 45346 New Madison Darke n/a 0.09 13.9 8.5

230
Community members living
below poverty level
ZIP code City County
PSEO no.
% of cohort ACS %
ACS Margin of error
44442 New Middletown Mahoning n/a 0.01 8.7 4.1 45347 New Paris Preble n/a 0.04 17.9 5.6 44663 New Philadelphia Tuscarawas n/a 0.12 15.2 2.7 45157 New Richmond Clermont n/a 0.04 15.6 6.2 43766 New Straitsville Perry n/a 0.07 27.3 13.3 45159 New Vienna Clinton n/a 0.04 19.7 7.5 44854 New Washington Crawford n/a 0.01 7.5 3.6 44445 New Waterford Columbiana n/a 0.03 11.2 5.5 45348 New Weston Darke n/a 0.04 32.4 24.1 43055 Newark Licking 13 0.17 20.4 2.0 44444 Newton Falls Trumbull n/a 0.08 13.5 7.0 44446 Niles Trumbull n/a 0.03 18.0 3.4 45872 North Baltimore Wood n/a 0.04 9.8 6.1 45052 North Bend Hamilton n/a 0.03 18.9 18.1 44720 North Canton Stark 31 0.41 7.0 2.2 44855 North Fairfield Huron n/a 0.01 30.5 15.2 45349 North Hampton Clark n/a 0.01 4.5 5.1 43060 North Lewisburg Champaign n/a 0.01 12.9 5.7 44070 North Olmsted Cuyahoga 28 0.37 6.3 1.7 44039 North Ridgeville Lorain 37 0.49 5.1 1.3 44133 North Royalton Cuyahoga 29 0.38 4.9 1.5 43619 Northwood Wood n/a 0.07 5.9 3.6 44857 Norwalk Huron n/a 0.11 14.0 3.2 43449 Oak Harbor Ottawa n/a 0.05 8.1 5.5 45873 Oakwood Paulding n/a 0.03 21.1 12.8 44074 Oberlin Lorain 12 0.16 24.0 6.7 45874 Ohio City Van Wert n/a 0.01 10.4 6.0 44138 Olmsted Falls Cuyahoga 11 0.15 4.9 2.5 44667 Orrville Wayne 22 0.29 16.0 4.2 43061 Ostrander Delaware n/a 0.05 3.3 3.5 45875 Ottawa Putnam 41 0.54 15.1 5.8 45056 Oxford Butler 15 0.20 46.6 4.3 44077 Painesville Lake 33 0.44 26.4 3.5 45877 Pandora Putnam n/a 0.01 4.9 4.7 43062 Pataskala Licking n/a 0.07 9.2 2.7

231
Community members living
below poverty level
ZIP code City County
PSEO no.
% of cohort ACS %
ACS Margin of error
45879 Paulding Paulding n/a 0.03 12.4 4.2 45880 Payne Paulding n/a 0.04 11.2 4.9 45660 Peebles Adams n/a 0.08 33.4 8.6 43450 Pemberville Wood 11 0.15 5.7 2.7 44264 Peninsula Summit n/a 0.01 0.7 0.9 44081 Perry Lake n/a 0.08 7.1 4.3 43551 Perrysburg Wood 38 0.50 2.9 0.9 43771 Philo Muskingum n/a 0.01 13.7 8.8 43147 Pickerington Fairfield 31 0.41 3.6 1.4 45661 Piketon Pike n/a 0.08 26.3 7.6 43554 Pioneer Williams n/a 0.01 13.9 7.0 45356 Piqua Miami 36 0.48 13.7 2.8 45358 Pitsburg Darke n/a 0.01 0.9 1.5 43064 Plain City Union n/a 0.01 12.5 8.1 43772 Pleasant City Guernsey n/a 0.01 32.1 13.7 45359 Pleasant Hill Miami n/a 0.08 31.2 14.4 45162 Pleasant Plain Warren n/a 0.04 6.8 5.4 44865 Plymouth Huron n/a 0.01 0 19.8 43452 Port Clinton Ottawa 26 0.34 11.2 3.6 43451 Portage Wood n/a 0.03 12.0 5.6 45662 Portsmouth Scioto 14 0.18 32.2 3.4 43065 Powell Delaware 16 0.21 2.1 1.4 45669 Proctorville Lawrence n/a 0.09 31.1 17.0 43342 Prospect Marion n/a 0.08 3.2 2.7 43773 Quaker City Guernsey n/a 0.01 14.9 9.2 45671 Rarden Scioto n/a 0.01 18.3 19.1 44266 Ravenna Portage 11 0.15 19.2 4.8 45881 Rawson Hancock n/a 0.01 19.3 15.5 43943 Rayland Jefferson n/a 0.01 13.9 6.7 44867 Republic Seneca n/a 0.01 11.2 6.6 43068 Reynoldsburg Franklin 29 0.38 13.1 2.2 44286 Richfield Summit n/a 0.03 2.9 2.3 43944 Richmond Jefferson n/a 0.03 14.2 11.2 43344 Richwood Union n/a 0.01 12.0 6.7 45167 Ripley Brown n/a 0.05 16.4 5.4
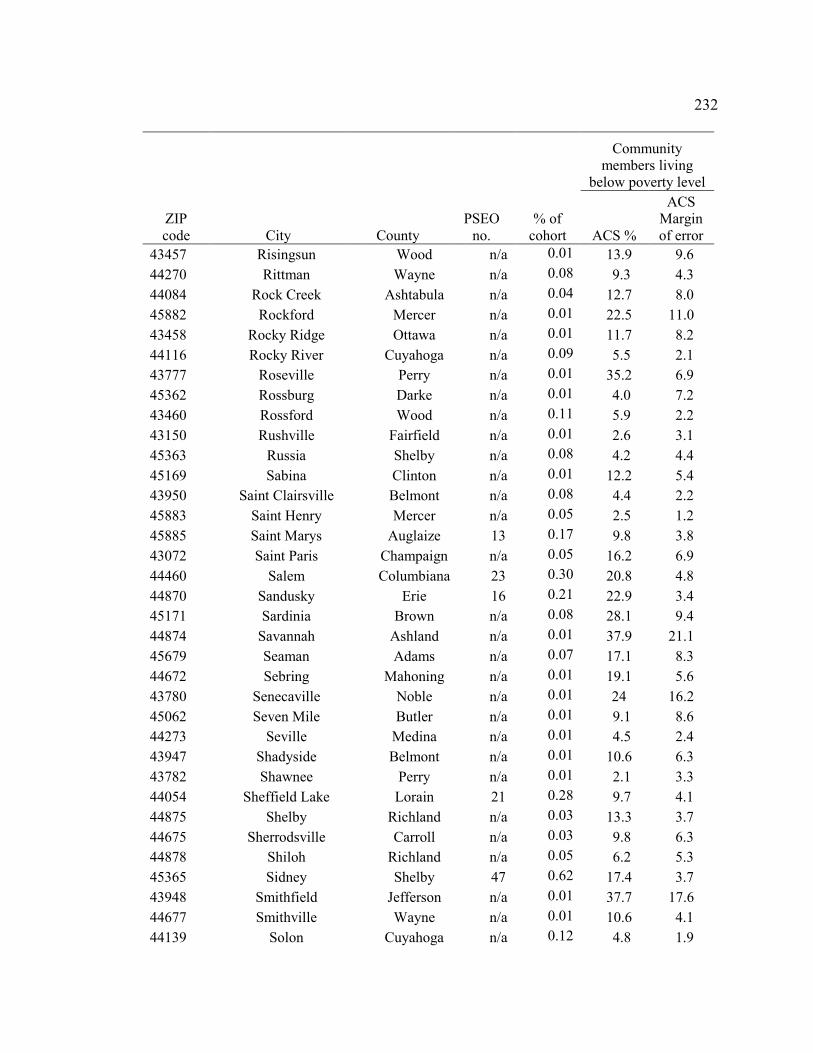
232
Community members living
below poverty level
ZIP code City County
PSEO no.
% of cohort ACS %
ACS Margin of error
43457 Risingsun Wood n/a 0.01 13.9 9.6 44270 Rittman Wayne n/a 0.08 9.3 4.3 44084 Rock Creek Ashtabula n/a 0.04 12.7 8.0 45882 Rockford Mercer n/a 0.01 22.5 11.0 43458 Rocky Ridge Ottawa n/a 0.01 11.7 8.2 44116 Rocky River Cuyahoga n/a 0.09 5.5 2.1 43777 Roseville Perry n/a 0.01 35.2 6.9 45362 Rossburg Darke n/a 0.01 4.0 7.2 43460 Rossford Wood n/a 0.11 5.9 2.2 43150 Rushville Fairfield n/a 0.01 2.6 3.1 45363 Russia Shelby n/a 0.08 4.2 4.4 45169 Sabina Clinton n/a 0.01 12.2 5.4 43950 Saint Clairsville Belmont n/a 0.08 4.4 2.2 45883 Saint Henry Mercer n/a 0.05 2.5 1.2 45885 Saint Marys Auglaize 13 0.17 9.8 3.8 43072 Saint Paris Champaign n/a 0.05 16.2 6.9 44460 Salem Columbiana 23 0.30 20.8 4.8 44870 Sandusky Erie 16 0.21 22.9 3.4 45171 Sardinia Brown n/a 0.08 28.1 9.4 44874 Savannah Ashland n/a 0.01 37.9 21.1 45679 Seaman Adams n/a 0.07 17.1 8.3 44672 Sebring Mahoning n/a 0.01 19.1 5.6 43780 Senecaville Noble n/a 0.01 24 16.2 45062 Seven Mile Butler n/a 0.01 9.1 8.6 44273 Seville Medina n/a 0.01 4.5 2.4 43947 Shadyside Belmont n/a 0.01 10.6 6.3 43782 Shawnee Perry n/a 0.01 2.1 3.3 44054 Sheffield Lake Lorain 21 0.28 9.7 4.1 44875 Shelby Richland n/a 0.03 13.3 3.7 44675 Sherrodsville Carroll n/a 0.03 9.8 6.3 44878 Shiloh Richland n/a 0.05 6.2 5.3 45365 Sidney Shelby 47 0.62 17.4 3.7 43948 Smithfield Jefferson n/a 0.01 37.7 17.6 44677 Smithville Wayne n/a 0.01 10.6 4.1 44139 Solon Cuyahoga n/a 0.12 4.8 1.9
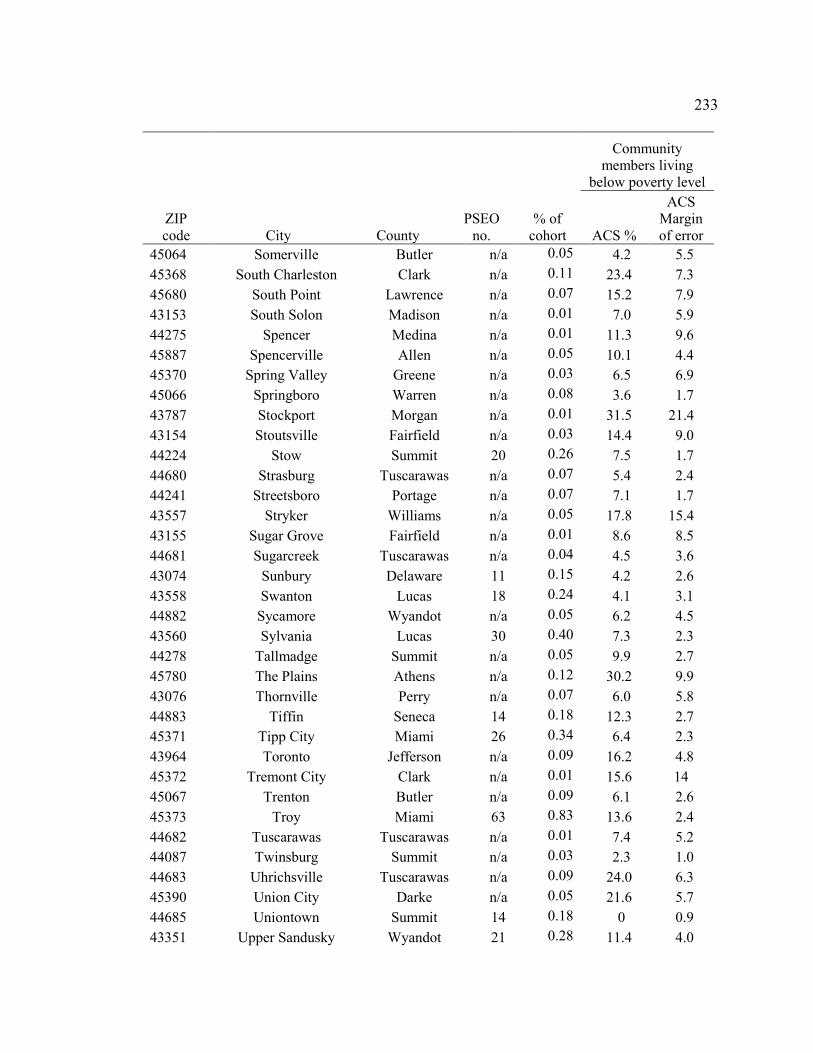
233
Community members living
below poverty level
ZIP code City County
PSEO no.
% of cohort ACS %
ACS Margin of error
45064 Somerville Butler n/a 0.05 4.2 5.5 45368 South Charleston Clark n/a 0.11 23.4 7.3 45680 South Point Lawrence n/a 0.07 15.2 7.9 43153 South Solon Madison n/a 0.01 7.0 5.9 44275 Spencer Medina n/a 0.01 11.3 9.6 45887 Spencerville Allen n/a 0.05 10.1 4.4 45370 Spring Valley Greene n/a 0.03 6.5 6.9 45066 Springboro Warren n/a 0.08 3.6 1.7 43787 Stockport Morgan n/a 0.01 31.5 21.4 43154 Stoutsville Fairfield n/a 0.03 14.4 9.0 44224 Stow Summit 20 0.26 7.5 1.7 44680 Strasburg Tuscarawas n/a 0.07 5.4 2.4 44241 Streetsboro Portage n/a 0.07 7.1 1.7 43557 Stryker Williams n/a 0.05 17.8 15.4 43155 Sugar Grove Fairfield n/a 0.01 8.6 8.5 44681 Sugarcreek Tuscarawas n/a 0.04 4.5 3.6 43074 Sunbury Delaware 11 0.15 4.2 2.6 43558 Swanton Lucas 18 0.24 4.1 3.1 44882 Sycamore Wyandot n/a 0.05 6.2 4.5 43560 Sylvania Lucas 30 0.40 7.3 2.3 44278 Tallmadge Summit n/a 0.05 9.9 2.7 45780 The Plains Athens n/a 0.12 30.2 9.9 43076 Thornville Perry n/a 0.07 6.0 5.8 44883 Tiffin Seneca 14 0.18 12.3 2.7 45371 Tipp City Miami 26 0.34 6.4 2.3 43964 Toronto Jefferson n/a 0.09 16.2 4.8 45372 Tremont City Clark n/a 0.01 15.6 14 45067 Trenton Butler n/a 0.09 6.1 2.6 45373 Troy Miami 63 0.83 13.6 2.4 44682 Tuscarawas Tuscarawas n/a 0.01 7.4 5.2 44087 Twinsburg Summit n/a 0.03 2.3 1.0 44683 Uhrichsville Tuscarawas n/a 0.09 24.0 6.3 45390 Union City Darke n/a 0.05 21.6 5.7 44685 Uniontown Summit 14 0.18 0 0.9 43351 Upper Sandusky Wyandot 21 0.28 11.4 4.0

234
Community members living
below poverty level
ZIP code City County
PSEO no.
% of cohort ACS %
ACS Margin of error
43078 Urbana Champaign 14 0.18 18.9 5.6 43080 Utica Licking n/a 0.01 10.0 5.1 45889 Van Buren Hancock n/a 0.01 0.6 1.1 45891 Van Wert Van Wert n/a 0.03 10.7 3.1 45377 Vandalia Montgomery n/a 0.01 10.1 2.5 44089 Vermilion Erie 13 0.17 6.3 2.1 45380 Versailles Darke n/a 0.03 4.7 3.1 44473 Vienna Trumbull n/a 0.01 13.5 12.6 44281 Wadsworth Medina 24 0.32 5.1 1.5 44889 Wakeman Huron n/a 0.03 7.0 4.8 43465 Walbridge Wood n/a 0.05 11.6 5.3 45895 Wapakoneta Auglaize 20 0.26 10.0 3.1 43844 Warsaw Coshocton n/a 0.05 19.1 11.9 43160 Washington Court
Fayette 10 0.13 19.7 3.7
43566 Waterville Lucas n/a 0.09 0.7 0.8 43567 Wauseon Fulton 13 0.17 20.6 6.2 45690 Waverly Pike n/a 0.09 22.3 7.6 44688 Waynesburg Stark n/a 0.01 3.8 3.3 45068 Waynesville Warren 13 0.17 5.1 2.9 44090 Wellington Lorain 17 0.22 10.5 4.6 43968 Wellsville Columbiana n/a 0.01 25.3 8.2 43162 West Jefferson Madison n/a 0.01 6.4 3.2 43845 West Lafayette Coshocton n/a 0.08 25.6 9.6 43357 West Liberty Logan n/a 0.03 5.9 3.8 45382 West Manchester Preble n/a 0.01 20.7 11.9 45383 West Milton Miami n/a 0.13 10.7 6.7 45663 West Portsmouth Scioto n/a 0.04 15.5 8.5 44287 West Salem Wayne n/a 0.03 21.9 6.7 45693 West Union Adams n/a 0.05 30.2 9.6 43570 West Unity Williams n/a 0.05 12.5 5.3 44145 Westlake Cuyahoga 16 0.21 4.3 1.0 43569 Weston Wood n/a 0.03 8.4 4.1 45694 Wheelersburg Scioto n/a 0.07 13.9 5.7 43571 Whitehouse Lucas 11 0.15 2.2 1.8 44092 Wickliffe Lake n/a 0.07 6.6 1.7
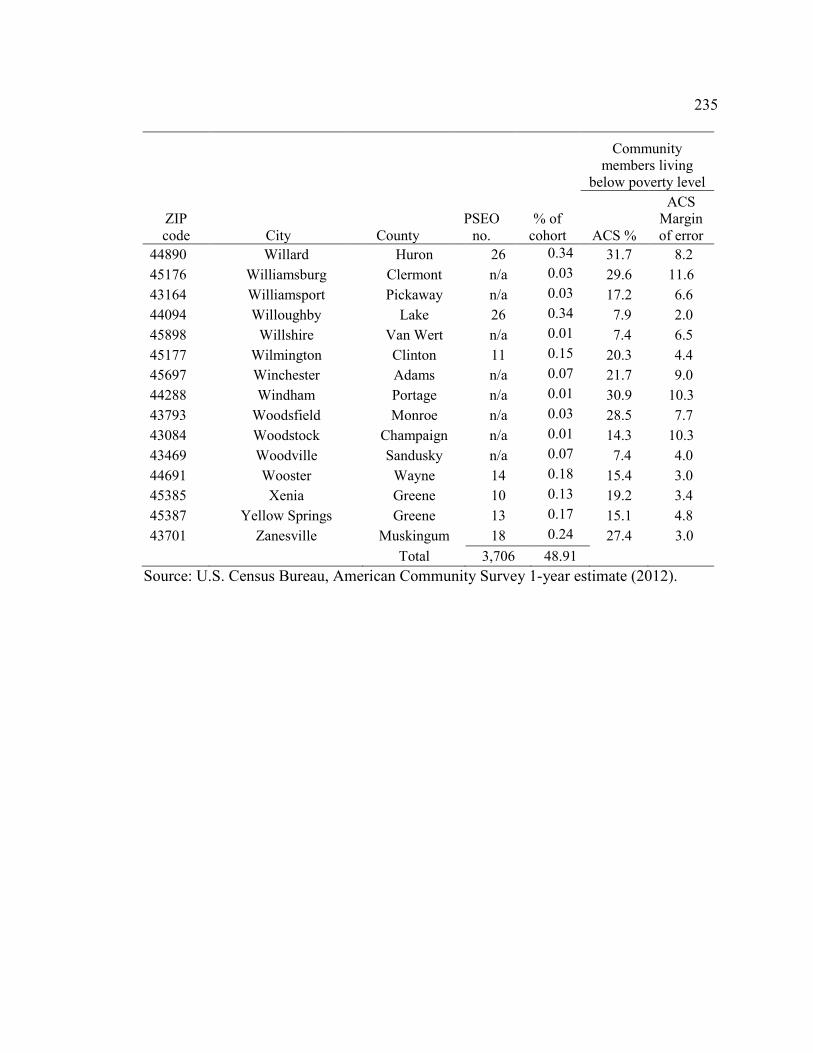
235
Community members living
below poverty level
ZIP code City County
PSEO no.
% of cohort ACS %
ACS Margin of error
44890 Willard Huron 26 0.34 31.7 8.2 45176 Williamsburg Clermont n/a 0.03 29.6 11.6 43164 Williamsport Pickaway n/a 0.03 17.2 6.6 44094 Willoughby Lake 26 0.34 7.9 2.0 45898 Willshire Van Wert n/a 0.01 7.4 6.5 45177 Wilmington Clinton 11 0.15 20.3 4.4 45697 Winchester Adams n/a 0.07 21.7 9.0 44288 Windham Portage n/a 0.01 30.9 10.3 43793 Woodsfield Monroe n/a 0.03 28.5 7.7 43084 Woodstock Champaign n/a 0.01 14.3 10.3 43469 Woodville Sandusky n/a 0.07 7.4 4.0 44691 Wooster Wayne 14 0.18 15.4 3.0 45385 Xenia Greene 10 0.13 19.2 3.4 45387 Yellow Springs Greene 13 0.17 15.1 4.8 43701 Zanesville Muskingum 18 0.24 27.4 3.0 Total 3,706 48.91
Source: U.S. Census Bureau, American Community Survey 1-year estimate (2012).

236 Appendix J: Number and Percentage of Students Living Below Poverty Level Using
ACS Data of Cities with Multiple Zip Codes in Alphabetical Order by City
Community members living
below poverty level
No. ZIP
codes City County PSEO
participation
% of cohort
ACS %
ACS Margin of error
13 Akron Summit 70 0.92 23.9 1.2 11 Canton Stark 85 1.12 27.1 1.9 2 Chagrin Falls Cuyahoga 23 0.30 6.3 2.9 31 Cincinnati Hamilton 72 0.95 27.2 1.1 26 Cleveland Cuyahoga 233 3.08 31.2 0.8 25 Columbus Franklin 187 2.47 21.4 0.6
2 Cuyahoga Falls Summit 20 0.26 10.2 1.3
26 Dayton Montgomery 206 2.72 31.0 1.6 2 Dublin Franklin 18 0.24 2.9 1.1 3 Euclid Cuyahoga 14 0.18 16.6 2.1 2 Hamilton Butler 49 0.65 22.0 2.2 5 Lima Allen 66 0.87 30.3 2.5 3 Lorain Lorain 111 1.46 27.9 2.1 5 Mansfield Richland 33 0.44 20.0 2.2 2 Massillon Stark 30 0.40 14.7 1.7 2 Middletown Butler 47 0.62 20.7 2.4 2 Oregon Lucas 23 0.30 6.5 1.7 5 Springfield Clark 54 0.71 25.8 2.3 2 Steubenville Jefferson 54 0.71 27.4 3.3 2 Strongsville Cuyahoga 43 0.57 4.7 1.1 14 Toledo Lucas 161 2.12 23.8 0.8 3 Warren Trumbull 18 0.24 29.6 2.7 2 Westerville Franklin 39 0.51 6.1 1.6 6 Youngstown Mahoning 34 0.45 32.7 2.1 Total 1,690 22.30
Sources: U.S. Census Bureau, American Community Survey 1-year estimate (2012); U.S. Postal Service (2014)

237
Appendix K: Number and Percentage of Students Living Below NAR Data of Average Home Prices in Alphabetical Order by City
ZIP code City County
PSEO participation
Percent of cohort
NAR Average
home price OHIO $84,119 43802 Adamsville Muskingum n/a 0.03 $373,850 45301 Alpha Greene n/a 0.01 $105,000 45614 Bidwell Gallia n/a 0.01 $161,575 45616 Blue Creek Adams n/a 0.01 $204,431 43720 Blue Rock Muskingum n/a 0.01 $83,100 44402 Bristolville Trumbull n/a 0.03 $115,367 44404 Burghill Trumbull n/a 0.01 $160,060 43009 Cable Champaign n/a 0.03 $170,686 43727 Chandlersville Muskingum n/a 0.01 $119,720 45618 Cherry Fork Adams n/a 0.01 $75,000 45004 Collinsville Butler n/a 0.01 $15,000 44028 Columbia Station Lorain 20 0.26 $256,010 45724 Cutler Washington n/a 0.01 $180,855 44412 Diamond Portage n/a 0.01 $109,152 43414 Dunbridge Wood n/a 0.01 $214,900 44624 Dundee Tuscarawas n/a 0.01 $169,985 44625 East Rochester Columbiana n/a 0.01 $214,000 44095 Eastlake Lake 10 0.13 $129,002 45729 Fleming Washington n/a 0.01 $168,876 44418 Fowler Trumbull n/a 0.01 $107,225 43824 Fresno Coshocton n/a 0.04 $269,467 43119 Galloway Franklin n/a 0.07 $159,031 45122 Goshen Clermont n/a 0.11 $184,534 45734 Graysville Monroe n/a 0.01 $99,450 44233 Hinckley Medina n/a 0.12 $318,029 44235 Homerville Medina n/a 0.03 $163,090 45333 Houston Shelby n/a 0.04 $152,425 43028 Howard Knox n/a 0.01 $97,240 44046 Huntsburg Geauga n/a 0.01 $96,981 43747 Jerusalem Monroe n/a 0.01 $169,900 44841 Kansas Seneca n/a 0.05 $224,475 43749 Kimbolton Guernsey n/a 0.03 $110,905 45645 Kitts Hill Lawrence n/a 0.01 $185,900 44429 Lake Milton Mahoning n/a 0.01 $150,812 43035 Lewis Center Delaware n/a 0.03 $294,531
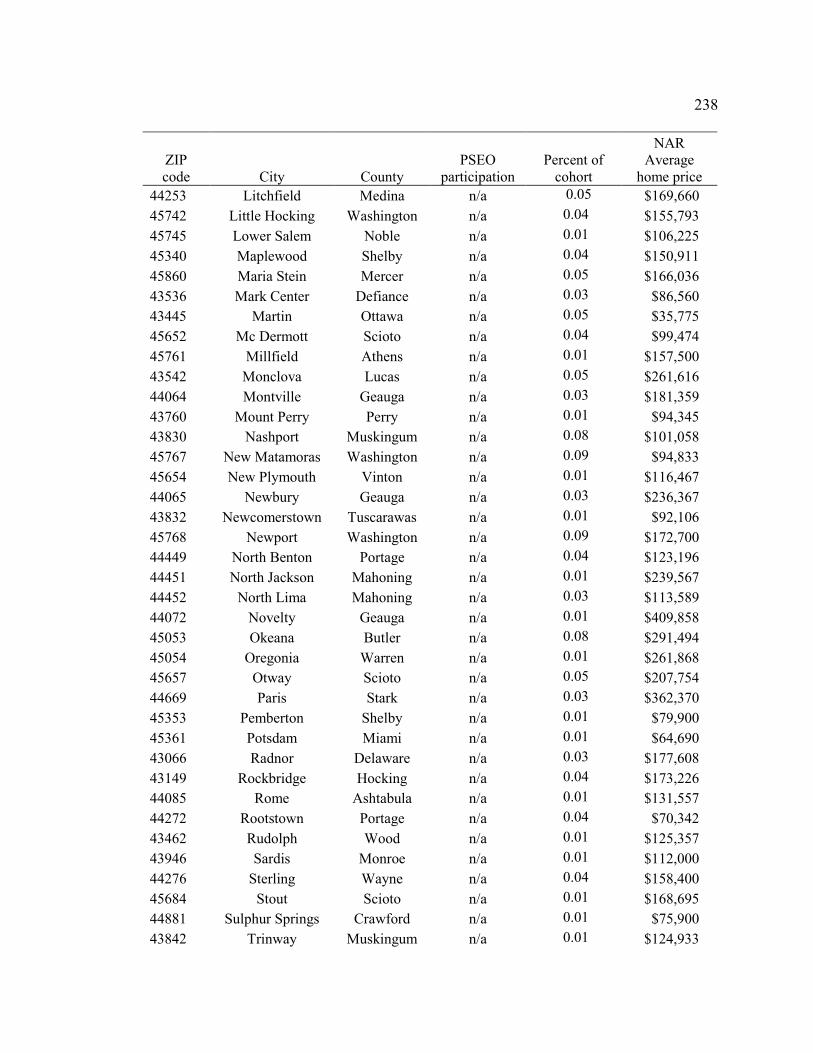
238
ZIP code City County
PSEO participation
Percent of cohort
NAR Average
home price 44253 Litchfield Medina n/a 0.05 $169,660 45742 Little Hocking Washington n/a 0.04 $155,793 45745 Lower Salem Noble n/a 0.01 $106,225 45340 Maplewood Shelby n/a 0.04 $150,911 45860 Maria Stein Mercer n/a 0.05 $166,036 43536 Mark Center Defiance n/a 0.03 $86,560 43445 Martin Ottawa n/a 0.05 $35,775 45652 Mc Dermott Scioto n/a 0.04 $99,474 45761 Millfield Athens n/a 0.01 $157,500 43542 Monclova Lucas n/a 0.05 $261,616 44064 Montville Geauga n/a 0.03 $181,359 43760 Mount Perry Perry n/a 0.01 $94,345 43830 Nashport Muskingum n/a 0.08 $101,058 45767 New Matamoras Washington n/a 0.09 $94,833 45654 New Plymouth Vinton n/a 0.01 $116,467 44065 Newbury Geauga n/a 0.03 $236,367 43832 Newcomerstown Tuscarawas n/a 0.01 $92,106 45768 Newport Washington n/a 0.09 $172,700 44449 North Benton Portage n/a 0.04 $123,196 44451 North Jackson Mahoning n/a 0.01 $239,567 44452 North Lima Mahoning n/a 0.03 $113,589 44072 Novelty Geauga n/a 0.01 $409,858 45053 Okeana Butler n/a 0.08 $291,494 45054 Oregonia Warren n/a 0.01 $261,868 45657 Otway Scioto n/a 0.05 $207,754 44669 Paris Stark n/a 0.03 $362,370 45353 Pemberton Shelby n/a 0.01 $79,900 45361 Potsdam Miami n/a 0.01 $64,690 43066 Radnor Delaware n/a 0.03 $177,608 43149 Rockbridge Hocking n/a 0.04 $173,226 44085 Rome Ashtabula n/a 0.01 $131,557 44272 Rootstown Portage n/a 0.04 $70,342 43462 Rudolph Wood n/a 0.01 $125,357 43946 Sardis Monroe n/a 0.01 $112,000 44276 Sterling Wayne n/a 0.04 $158,400 45684 Stout Scioto n/a 0.01 $168,695 44881 Sulphur Springs Crawford n/a 0.01 $75,900 43842 Trinway Muskingum n/a 0.01 $124,933
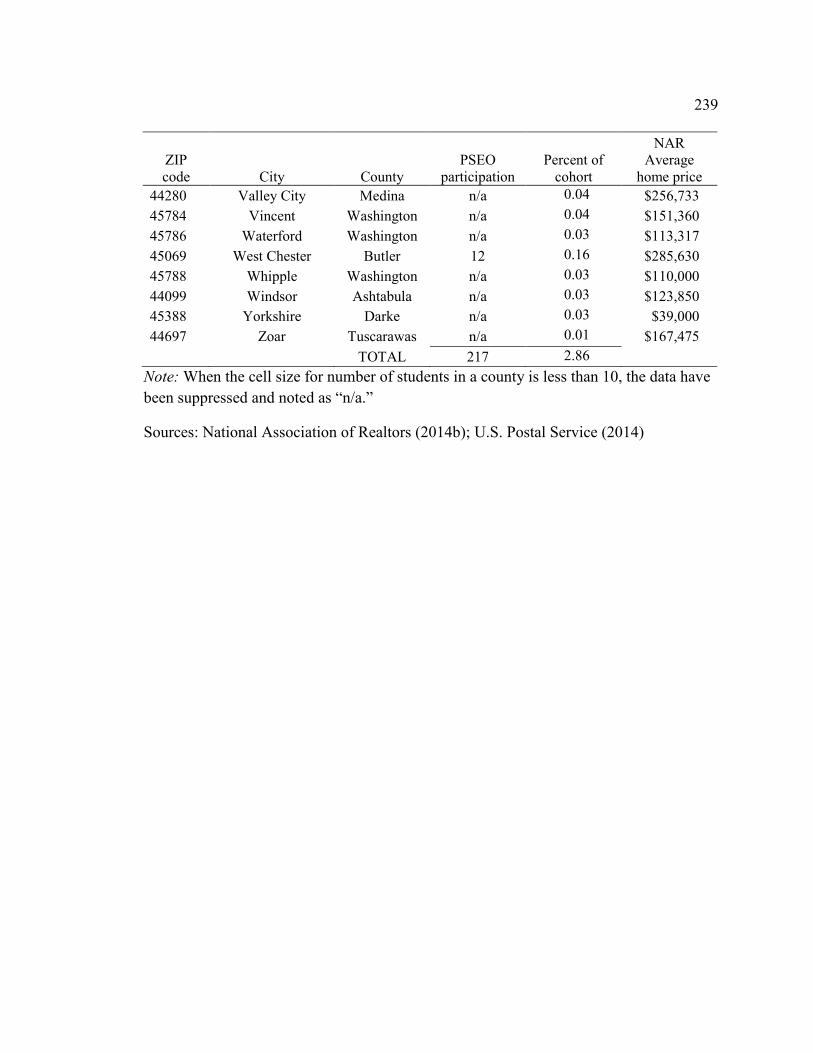
239
ZIP code City County
PSEO participation
Percent of cohort
NAR Average
home price 44280 Valley City Medina n/a 0.04 $256,733 45784 Vincent Washington n/a 0.04 $151,360 45786 Waterford Washington n/a 0.03 $113,317 45069 West Chester Butler 12 0.16 $285,630 45788 Whipple Washington n/a 0.03 $110,000 44099 Windsor Ashtabula n/a 0.03 $123,850 45388 Yorkshire Darke n/a 0.03 $39,000 44697 Zoar Tuscarawas n/a 0.01 $167,475 TOTAL 217 2.86
Note: When the cell size for number of students in a county is less than 10, the data have been suppressed and noted as “n/a.”
Sources: National Association of Realtors (2014b); U.S. Postal Service (2014)

!!!!!!!!!!!!!!!!!!!!!!!!!!!!!!!!!!!!!!!
!!
Thesis and Dissertation Services