drinking restraint: refinement of a construct and prediction of alcohol consumption
TRANSCRIPT
Cognitive Therapy and Research, Vol. 13, No. 5, 1989, pp. 423-440
Drinking Restraint: Refinement of a Construct and
Prediction of Alcohol Consumption I
R. Lorraine Col l ins 2 Research Institute on Alcoholism
Wil l iam H. George
State University of New York at Buffalo
Wil l iam M. Lapp Research Institute on Alcoholism
The Restrained Drinking Scale (RDS) was designed to measure an individu- al's preoccupation with controlling alcohol intake. Cluster analyses indicated that the original RDS couM be divided into four subscales. One o f the sub- scales measured frequency and occasions for heavy drinking, and was there- fore conceptually and statistically confounded with self-reported consump- tion. The remaining three subscales o f the differentiated RDS outperformed two undifferentiated (with and without the confounding items) versions o f the RDS in prediction o f drinking behavior. Negative experiences interacted with drinking restraint and contributed in their own right to prediction o f drinking. It was concluded that drinking restraint, as measured by the differentiated RDS, encompasses components that relate uniquely to drink- ing behavior.
KEY WORDS: drinking restraint; alcohol consumption; cluster analysis; negative consequences of alcohol use.
~This research was supported by National Institute on Alcohol Abuse and Alcoholism Grant R01-AA07595 awarded to R. Lorraine Collins. The authors wish to thank Lydia Breedlove for her assistance with data preparation, as wdl as Gerard Connors and four anonymous review- ers for helpful comments on an earlier draft of this manuscript . Port ions o f this research were presented at the annual meeting of the Association for Advancement of Behavior Therapy, Boston, November 1987.
~Address all correspondence to R. Lorraine Collins, Research Institute on Alcoholism, 1021 Main Street, Buffalo, New York 14203.
423
0147-5916/89/1000-0423506.00/0 © 1989 Plenum Publishing Corporation

424 Collins, George, and Lapp
Drinking restraint has recently gained attention as a cognitive construct that may enhance our understanding of drinking behavior, particularly episodic excessive (binge) drinking (Bensley, Kuna, & Steele, 1988; Curry, Southwick, & Steele, 1987; Ruderman & McKirnan, 1984; Southwick & Steele, 1987). Ruderman and McKirnan (1984) introduced and defined drinking restraint as "a cognitive dimension-preoccupation with control over drinking" (p. 371). Restrained drinkers are individuals who have inordinate interest in and/or pay attention to controlling alcohol consumption, a concern that may be ex- pressed by invoking rules and/or setting limits on alcohol consumption in order to regulate intake. For the restrained drinker, a self-imposed drinking limit may help to maintain a balance between the desire for alcohol and the regulation of intake. Cognizance of the violation of this drinking limit may precipitate the counterregulatory response of excessive alcohol consumption. Over time a cycle of restraint/regulation, violation, and counterregulation may be set in motion.
An analogous phenomenon, restrained eating, has been observed in the binge-eating episodes of normal weight and obese individuals (Heatherton, Herman, Polivy, King, & McGree, 1988; Herman & Polivy, 1980; Ruder- man, 1986; Ruderman & Wilson, 1979). In much of the research on eating restraint, restrained individuals have been shown to consume excessive amounts of a previously restricted food following the perceived violation of their limit. The parallels in the conceptualization of eating and drinking re- straint suggests that the restraint construct may be important in understand- ing processes that occur in a variety of addictive disorders.
Ruderman and McKirnan (1984) developed the Restrained Drinking Scale (RDS) to measure the preoccupation with controlling alcohol consump- tion, but the construct and scale were not thoroughly examined. Psychometric evaluation of the RDS was limited to the computation of a standard score and an adequate level of internal consistency (Cronbach alpha = .81). Although no assessment of the component structure of the RDS was under- taken, the high internal consistency of the RDS led Ruderman and McKirnan to conclude that drinking restraint as measured by the RDS "represents a unitary construct" (p. 366). Developments in the assessment of eating restraint suggest that this may not necessarily be true. The Restraint Scale (RS; Herman & Mack, 1975), a reliable and commonly used measure of restrained eating, has been found to have multiple components, indicative of conceptually meaningful aspects of the restraint construct (Blanchard & Frost, 1983; Heatherton et al., 1988; Johnson, Lake, & Mahan, 1983; Ruderman, 1983; Wardle, 1986). Wardle's (1986) conclusion that a total (eating) RS score "can no longer be taken as a pure measure of restraint" (p. 213) may also apply to the RDS.
)
The main purpose of the present study was to examine the possibility that the RDS might not represent a unitary measure of drinking restraint
Drinking Restraint and Alcohol Consumption 425
by probing its structure and psychometric properties. The first phase of the study was exploration of the RDS to identify potential subcomponents representative of the construct of drinking restraint. The identification of these components may serve to clarify the association between drinking re- straint and patterns of alcohol consumption.
In research to date, restraint has been positively related to measures of habitual/typical consumption (Curry et al., 1987; Ruderman & McKirnan, 1984; Southwick & Steele, 1987), but measures of typical drinking do not capture the drinking pattern of interest with regard to restraint: episodic heavy drinking that is predicted to occur as a result of counterregulation following the violation of a drinking limit. In the present study, both a measure of typical alcohol consumption (weekend drinking) and an indicator of episodic heavy drinking (maximum consumption on a single occasion) were employed. The weekend drinking variable offered a basis for comparison with previ- ous research, whereas maximum consumption offered a basis for testing one of the hypothesized connections between restraint and alcohol consumption.
The study was designed to investigate three questions about drinking restraint as measured by the RDS: (1) Does the RDS represent a unitary con- struct or does it contain meaningfully different components? (2) Does drink- ing restraint, in its unitary and/or differentiated forms, predict either of two measures of alcohol consumption? (3) Do negative experiences have an im- pact on the association between drinking restraint and alcohol consumption? The third question arises from previous research in which it was shown that individuals who had experienced negative consequences of alcohol use had significantly higher scores on a measure of drinking restraint and that high- ly restrained individuals tended to be heavier drinkers (Curry et al., 1987). These findings were expanded upon in the present study by assessing the rela- tionship between negative experiences and drinking behavior, both by itself and in combination with drinking restraint.
M E T H O D
Subjects
A sample of undergraduates, drawn from the same general population on which the RDS was developed, was employed in the study. Subjects were 110 men and 1 l0 women social drinkers, with a mean age of 18.65 years (SD = 2.38). The racial/ethnic composition of the sample was 94.1 07o white, 3.2°70 Asian, 1.8°/0 black, and 0.907o Hispanic. The majority of subjects (96.407o) were single. Participation in the study was voluntary and all subjects received course credit.

426 Collins, George, and Lapp
Measures and Procedure
All measures were administered in small groups of approximately 20 subjects. After providing informed consent, subjects completed a packet of questionnaires that included measures of drinking behavior, experience of negative consequences related to alcohol use, and level of preoccupation with controlling their alcohol consumption (Restrained Drinking Scale; Ruder- man & McKirnan, 1984). The questionnaires were presented in counter- balanced order and were completed in approximately 30 minutes.
Assessment o f Drinking Behavior. Drinking behavior was assessed using the Daily Drinking Questionnaire (DDQ), a commonly used modification of the Drinking Practices Questionnaire (Cahalan, Cisin, & Crossley, 1969), which measures the volume, quantity, and frequency of alcohol consump- tion. The version of the DDQ employed in the present study contained a calendar on which subjects were instructed to provide an estimate of the aver- age number of drinks (if any) they typically consumed on each of the 7 days of the week. The DDQ calendar formed the basis for the computation of a measure of typical alcohol consumption based on self-reports of actual num- ber of drinks consumed. The DDQ also included a measure of the maximum number of drinks consumed on any single occasion. Subjects selected one of 10 descriptions, ranging from "2 or less" drinks to "22 or more" drinks.
Assessment o f Negative Consequences of Alcohol Use. Subjects com- pleted a multipurpose general information questionnaire (GIQ), in which they provided information concerning demographic characteristics (e.g., gender, age, ethnic background) and their experience of negative consequences of alcohol use. Subjects indicated (yes/no) whether they had experienced each of six negative effects of alcohol (e.g., flushing, problems with the police). These responses were summed to form the negative experiences variable.
The Restrained Drinking Scale. Drinking restraint was assessed by using the RDS (Ruderman & McKirnan, 1984), a measure consisting of 233 items designed to assess preoccupation with control over alcohol consumption. Each item is rated on a 9-point Likert scale in which 1 indicates a lack of preoccu- pation with controlling consumption and 9 indicates a high degree of preoc- cupation.
3Ruderman and McKirnan (1984) presented a 23-item RDS. They removed 1 item (No. 9) be- cause of its low (.18) item-total correlation but retained another item (No. 23) with a similarly low (. 19) item-total correlation. In the present study all 23 items of the RDS were administered to subjects and were included in the assessment of the structure of the RDS.

Drinking Restraint and Alcohol Consumption
RESULTS
427
Drinking Patterns
The calendar portion of the DDQ showed that weekly consumption ranged from 0 to 56 drinks. The mean consumption of 9.51 drinks (SD = 9.41) per week suggests that this was a sample of moderate social drinkers. Most of the week's consumption took place on Friday (M = 4.10, SD = 3.85) and Saturday (M = 3.80, SD = 3.64), whereas the daily average num- ber of drinks consumed on Sunday through Thursday was less than 1. Given the strong positive relationship between consumption for the entire week and weekend consumption (r(219) = .98, p < .001), in conjunction with the concentration of drinking on the weekend, a variable for weekend drinking was formed based on the total number of drinks consumed on Friday, Satur- day, and Sunday (M = 8.32, SD = 7.72). Weekend drinking served as the measure of typical drinking.
Ratings of maximum number of drinks consumed on a single occasion spanned the full range of potential responses. The modal rating of maxi- mum consumption was 3 (representing a maximum of 5-6 drinks) and the median rating was 4 (7-8 drinks maximum). Maximum consumption on a single occasion (M/O) served as the measure of episodic heavy drinking (Greenfield, 1986).
Men and women differed with respect to both measures of drinking behavior. Specifically, men consumed a significantly greater number of drinks in a typical weekend (t(216) = 4.42, p < .001) and consumed a greater max- imum number of drinks on a single occasion (t(218) = 6.05, p < .001).
Negative Consequences o f Alcohol Use
The majority of subjects (61.4070) reported not having experienced any of six negative effects associated with alcohol use. The remainder of the sam- ple (38.6°70) had experienced between one and four negative consequences of alcohol use (M = 1.42). This subsample of subjects (n = 84) included 48 men and 36 women, and their average alcohol consumption was 10.78 drinks (SD = 8.51) per weekend (range = 0 to 50). The breakdown of per- centage of subjects reporting each of the negative experiences includes faint- ing = 15o70, flushing = 35070, psychological reactions = 40/0, DWI = 107o, non-DWI problems with the police = 11°7o, liver problems = 0070. There was no significant difference in the number of negative experiences reported by men and women.
428 Collins, George, and Lapp
Psychometric Refinement o f the Restrained Drinking Scale
A series of cluster analyses were performed to identify a set of relative- ly homogeneous, "natural" groups (Anderberg, 1973) of test items within the RDS. Cluster analysis sorts the collective items of a scale into subscales that exhibit greater stability and accuracy than sets of items derived through factor analysis, especially in the case of a small subject/item ratio (Revelle, 1979; Straw et al., 1984). Items are sorted into discrete, nonoverlapping sub- scales in which the items are maximally similar, and are as dissimilar to items in every other subscale as possible (Cliff, McCormick, Zatkin, Cudeck, & Collins, 1986).
Overview of the Cluster-Analytic Strategy. Cluster analysis is a well- known statistical method for sorting a target population into subgroups (cf. Berzins, Ross, & English, 1974; Lorr & Suziedelis, 1982; Shiffman, 1986). Classification of subgroups within a target population is, however, only one potential application of cluster analysis. A psychometric scale may be parti- tioned into internally consistent, nonoverlapping subscales by clustering the items of the scale (Cliff et al., 1986; Edelbrock, 1979; Revelle, 1979). 4
Single linkage was chosen as the primary clustering method in this study because the shape of the clusters was unknown, possibly serpentine (Ander- berg, 1973), and other methods may impose a spherical (or hyperspherical) structure where none exists (Anderberg, 1973; Blashfield, 1976; Everitt, 1974). The extreme ends of a single-linkage cluster solution, on the other hand, are sometimes quite different and are "chained" together by a string of inter- mediaries (Anderberg, 1973; Lorr, 1983). Therefore, a few conceptually anomalous items were deleted from the single-linkage solutions obtained in the present study when they were not represented in otherwise correspond- ing clusters found with the average linkage methods. Items that did not cluster with more than one other item were dropped from the analysis. Cluster so- lutions were highly consistent across the three cluster algorithms: the aver- age linkage within-group method coincided with the solutions reached with single linkage on 91 °70 of the items, and the average linkage between-groups solution coincided with the single-linkage solution on 92°7o of the items.
Clusters o f the RDS. A similarity matrix was precomputed 5 for the 23 items of the RDS using Pearson's product-moment correlation coefficient
4Cluster analysis of items has been applied to an obesity assessment device (Straw et al., 1984), classes of cognitive functions assessed by a short battery of psychodiagnostic tests for children (Zagar & Mead, 1983), an adult developmental analysis of the Wechsler memory scale (Zagar, Arbit, Stuckey, & Wengel, 1984), and the identification of a six-dimensional domain common to personality and vocational interests (Zagar, Arbit, Falconer, & Friedland, 1983).
5In order to cluster items of a scale, a similarity or dissimilarity matrix is precomputed to represent the association between the items. Correlational measures were found to be superior to the usual squared Euclidean metric in at least three extensive Monte Carlo studies of numerous cluster algorithms (Edelbrock, 1979; Edelbrock & McLaughlin, 1980; Scheibler & Schneider, 1985). The choice of similarity metric is not arbitrary, however, and the optimal choice de- pends on the nature of the data (Cliff et al., 1986).
Drinking Restraint and Alcohol Consumption
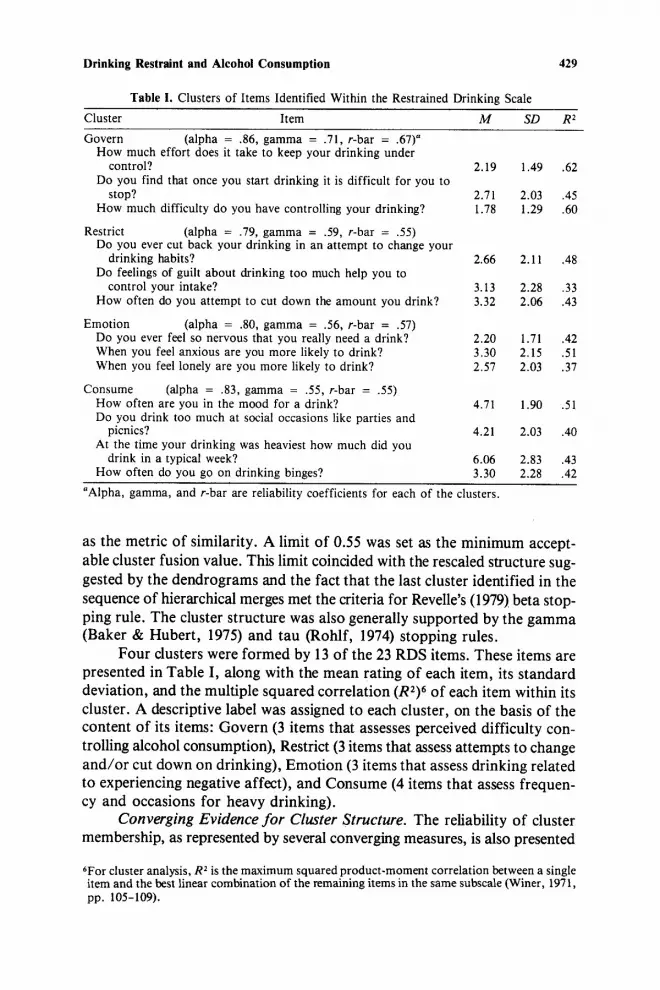
Table 1. Clusters of Items Identified Within the Restrained Drinking Scale
429
Cluster Item M SD R 2
Govern (alpha = .86, gamma = .71, r-bar = .67) a How much effort does it take to keep your drinking under
control? 2.19 1.49 .62 Do you find that once you start drinking it is difficult for you to
stop? 2.71 2.03 .45 How much difficulty do you have controlling your drinking? 1.78 1.29 .60
Restrict (alpha = .79, gamma = .59, r-bar = .55) Do you ever cut back your drinking in an attempt to change your
drinking habits? 2.66 2.11 .48 Do feelings of guilt about drinking too much help you to
control your intake? 3.13 2.28 .33 How often do you attempt to cut down the amount you drink? 3.32 2.06 .43
Emotion (alpha = .80, gamma = .56, r-bar = .57) Do you ever feel so nervous that you really need a drink? 2.20 1.71 .42 When you feel anxious are you more likely to drink? 3.30 2.15 .51 When you feel lonely are you more likely to drink? 2.57 2.03 .37
Consume (alpha = .83, gamma = .55, r-bar = .55) How often are you in the mood for a drink? 4.71 1.90 .51 Do you drink too much at social occasions like parties and
picnics? 4.21 2.03 .40 At the time your drinking was heaviest how much did you
drink in a typical week? 6.06 2.83 .43 How often do you go on drinking binges? 3.30 2.28 .42
"Alpha, gamma, and r-bar are reliability coefficients for each of the clusters.
as the metric of similarity. A limit of 0.55 was set as the minimum accept- able cluster fusion value. This limit coincided with the rescaled structure sug- gested by the dendrograms and the fact that the last cluster identified in the sequence of hierarchical merges met the criteria for Revelle's (1979) beta stop- ping rule. The cluster structure was also generally supported by the gamma (Baker & Hubert, 1975) and tau (Rohlf, 1974) stopping rules.
Four dusters were formed by 13 of the 23 RDS items. These items are presented in Table I, along with the mean rating of each item, its standard deviation, and the multiple squared correlation (R2) 6 of each item within its cluster. A descriptive label was assigned to each cluster, on the basis of the content of its items: Govern (3 items that assesses perceived difficulty con- trolling alcohol consumption), Restrict (3 items that assess attempts to change and/or cut down on drinking), Emotion (3 items that assess drinking related to experiencing negative affect), and Consume (4 items that assess frequen- cy and occasions for heavy drinking).
Converging Evidence for Cluster Structure. The reliability of cluster membership, as represented by several converging measures, is also presented
6For cluster analysis, R ~ is the maximum squared product-moment correlation between a single item and the best linear combination of the remaining items in the same subscale (Winer, 1971, pp. 105-109).

430 Collins, George, and Lapp
Table II. Correlations Among the Clusters of the Restrained Drinking Scale
Govern Restrict Emotion Govern Restrict .27 Emotion .55 .20 Consume .63 .06 .55
in Table I. The Cronbach (1951) alphas all exceeded the recommended .70 limit. Gamma coefficients, or upper-bound reliabilities, have been observed to be the best predictor of an accurate cluster solution (Milligan, 1981). The values achieved for the current set of clusters were substantial (.55 to .71). The average interitem correlation is reported as r-bar.
Cluster membership was also supported by VARCLUS, a nonhierar- chical SAS cluster procedure. In general, the items that merged into com- bined clusters in the hierarchical procedures fell into the same groups with theVARCLUS procedure. The R 2 within each duster was substantially higher for the items identified by the hierarchical procedures than for the other items contained in a given principle component cluster. In addition, the next best R 2 within a different cluster was consistently and substantially lower for the same set of items. The corresponding ratio of 1 - R 2 within own cluster/1 - R 2 within the next best cluster (see Sarle, 1985) was uniformly low for the items clustered by the hierarchical procedures. In summary, virtually the same set of items was assigned to identical clusters by the hierarchical and non- hierarchical procedures.
Correlations among the clusters were low to moderate (see Table II), as is to be expected given the common construct being measured. The two strongest correlations were between the Consume cluster and the Govern and Emotion clusters. However, the items of the Consume cluster seem to represent frequency and occasions for heavy drinking rather than the cogni- tive preoccupation with controlling alcohol consumption. Thus, the relation- ship of Consume to Govern and Emotion may represent the relationship of the latter two clusters to drinking behavior.
Alternative Conceptualizations and Scoring of Drinking Restraint
Identification of the clusters of the RDS suggested three different ap- proaches for conceptualizing and scoring drinking restraint in order to test its utility as a predictor of drinking behavior. One approach originates f rom our cluster-analytic findings that depict the RDS as a differentiated measure. This approach suggested the computation of four subscales based on the items
Drinking Restraint and Alcohol Consumption 431
contained in each cluster. However, our data indicated that one of the sub- scales, Consume, should be omitted because it reflected drinking behavior rather than the preoccupation with consumption. The Consume cluster represented a measure of frequency and occasions for heavy drinking, as evi- denced by its strong positive correlation to both measures of drinking be- havior. 7 The potential confound created by the relationship of Consume to the dependent variables provided statistical grounds for removing the Con- sume cluster from tests of whether or not drinking restraint predicts drink- ing behavior. Consequently, the differentiated version of the RDS consisted of the Govern, Restrict, and Emotion clusters identified in the initial analysis.
In addition to the differentiated version of the RDS, two other ap- proaches involved computing total scores that represented unitary measures of drinking restraint. The first involved adoption of Ruderman and McKir- nan's (1984) method of computing a total restraint score based on 22 items of the RDS. The second involved combining the two previous alternatives; drinking restraint was conceptualized as a unitary construct, but the items that measure drinking behavior (i.e., Consume cluster) were removed to avoid confounding the prediction of alcohol consumption. This option involved computing a restraint score based on Ruderman and McKirnan's 22-item RDS, but without the four items of the Consume cluster, resulting in an 18-item measure of drinking restraint.
A Multivariate Pretest
Separate measures of typical consumption (weekend drinking) and epi- sodic drinking (M/O) were collected. As expected, these two indicants of drinking behavior were highly correlated (r = .72, p < .001). Thus, before proceeding further, a multivariate multiple regression was performed to de- termine whether restraint and Negative Experiences (NE) had an effect on Maximum per occasion (episodic drinking) that was independent of their ef- fect on Weekend (typical drinking). The three clusters of the RDS, the NE variable, and the interaction of each RDS cluster with NE were entered simul- taneously. A significant mukivariate result was obtained for both M/O and Weekend taken together (F(16, 416) = 14.82, p < .001). Significant uni- variate results were obtained for M/O (F(8, 209) = 17.86, p < .001) and Weekend (F(8, 109) = 14.82, p < .001), considered separately. The Roy- Bargmann (1958) Stepdown F test indicated that restraint and NE had an
7The correlation between Consume and maximum per occasion was r(220) = .69, p < .001, and the correlation between Consume and weekend drinking was also substantial (r(219) = .72, p < .001).
432 Collins, George, and Lapp
effect on M/O after their effects on Weekend were partialed out of the anal- ysis (stepdown F(8,208) = 5.47, p < .001). Analogous results were obtained for the 18-item (stepdown F(1,212) = 21.14, p < .001) and 22-item (step- down F(4, 212) = 9.61, p < .001) total restraint scores in combination with the NE variable. Therefore, both M / O and Weekend were used as depen- dent variables in the hierarchical multiple regression equations that follow.
The Impact of Drinking Restraint and Negative Experiences on Alcohol Consumption
All three alternative approaches to scoring the RDS were tested in separate hierarchical multiple regression equations designed to assess the im- pact of drinking restraint and negative experiences on two patterns of alco- hol consumption: the maximum amount of alcohol consumed on a single occasion (episodic heavy drinking) and weekend drinking (typical consump- tion). In all six regression equations the alcohol consumption variable (max- imum/occasion or weekend drinking) was regressed on gender, drinking restraint (the three RDS clusters, the 22-item RDS total score, or the 18-item RDS), the negative experiences variable, and the product interaction terms of restraint × the negative experiences variable.
The regression equations were performed in four steps designed to take into account the variance attributable to the previously entered variable(s). Given a significant difference in the alcohol consumption of men and wom- en in the sample, gender was always entered in Step 1. Each of the three alternative representations of the RDS was entered as a main effect in Step 2. The impact of negative experiences related to alcohol consumption was assessed as a main effect in Step 3, and the interaction of drinking restraint and negative experiences was assessed in the final step of the regression equa- tion (see Cohen, 1968, 1978; Cohen & Cohen, 1983, for the statistical logic of this design).
A conservative interpretation of the hierarchical regression results re- quires that the significance levels be adjusted with respect to the number of test performed. The Bonferroni adjustment procedure (see Bray & Maxwell, 1985) was applied to the results of each regression equation. Only results that remained significant after application of this procedure are referred to in the text, but all of the results are presented in Tables III and IV.
Maximum Consumption per Occasion. As presented in Table III, 8 the results of all three regressions indicated that when gender was entered first,
8Application of the Bonferroni adjustment procedure (see Bray & Maxwell, 1985) indicated that those effects listed as significant at the p < .001 level in Tables III and IV are significant at the p < .01 level. All of the remaining effects were not significant at the p < .05 level with the exception of the Restrict cluster in predicting M/O (Table Ill) and the Negative Experiences variable in predicting Weekend Drinking (Table IV).

Drinking Restraint and Alcohol Consumption 433
Table III. Regression of Maximum Amount of Alcohol Consumed per Occasion on the RDS Clusters, the 22-Item RDS, and the 18-Item RDS a
Partial F Adjusted R 2 Delta R 2 F Beta
Gender 36.01 c .14 RDS clusters 17.08 c .30
Restrict Govern Emotion
Negative experiences (NE) 21.6V .36 Interaction terms 4.49 b .39
Restrict × NE Emotion × NE Govern × NE
22-item total RDS score 33.79 c .25 Negative experiences (NE) 20.26 c .31 22-item RDS × NE 6.28 b .33
18-item total RDS score 6.32 b .16 Negative experiences (NE) 30.77 ~ .26 18-item RDS × NE 6.05 b .28
.38 .17
7.30 b - .16 18.92 c .31 6.83 b .18
.06 .27
.04 10.79" - .42
1.46 - .20 0.37 .09
.12 .34
.06 .27
.02 - .58
.02 .16
.10 .34
.02 - .51
~Degrees of freedom for the F tests ranged from (1, 217) to (8, 210). bp < .05. cp < .001; after Bonferroni adjustment, p < .05 = n.s., p < .001 = .05.
it was a significant predictor of maximum consumption per occasion (M/O), R 2 = .14 and ([3 = .38). In the regression equation employing the differen- tiated RDS, the combination of the three RDS clusters was a significant predictor of M / O and accounted for 17°70 of the variance. Interestingly, the beta weights indicated positive relationships between Govern and M / O (/3 = .31) and Emotion and M / O (/3 = . 18) and an inverse relationship between Restrict and M / O (/3 = - . 16). The main effect for negative experiences (NEs) was a significant predictor, accounting for 6°70 of the variance, and was posi- tively related to M / O ([3 = .27). The entire regression equation accounted for 39°70 of the variance in M / O .
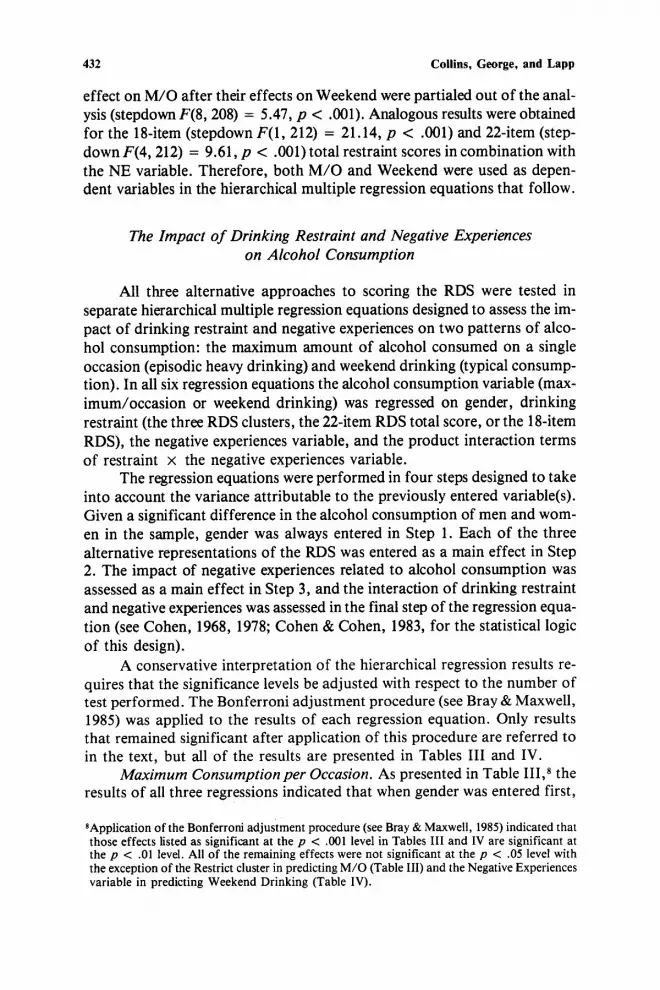
The interaction terms accounted for 4°70 of the variance in M / O , and Restrict × NE was the only term to reach significance (/3 = - .42). The in- verse relationship between Restrict and M / O was stronger for the individu- als who reported NEs than for subjects without NEs (see Figure 1). For subjects who reported NEs, M / O decreased as concern about cutting back on drinking increased, while for subjects who reported no NEs, M / O did not vary as a function of concern about cutting back on drinking.
In the regression equation for the 22-item RDS, the main effect for res- traint accounted for 12°70 of the variance and was positively related to M / O ([3 = .34). The main effect for NE accounted for 6070 of the variance and also was positvely related to M / O (/3 = .27). The regression equation for the 22-item RDS accounted for a total of 33°70 of the variance in M / O .
434 Collins, George, and Lapp
Table IV. Regression of Weekend Drinking on the RDS Clusters, the 22-Item RDS, and the 18-Item RDS a
Partial F Adjusted R 2 Delta R 2 F Beta
Gender 18.11 ~ .07 RDS clusters 19.04 c .26
Restrict Govern Emotion
Negative experiences (NE) 9.73 b .29 Interaction terms 6.30 c .34
Restrict × NE Emotion × NE Govern × NE
22-item total RDS score 26.91 c .17 Negative experiences (NE) 10.76 c .21 22-item RDS × NE 3.11 .22
18-item total RDS score 2.33 .08 Negative experiences (NE) 19.77 ~ .15 18-item RDS × NE 5.25 b .17
.28 .20
11.48 c - .21 35.08 c .43 0.57 .05
.03 9.73 b .27
.06 13.22 c - .48 4.21 b - .36 4.07 b .33
.10 .32
.04 .21
.01 - .44
.01 .10
.08 .29
.02 - .22
"Degrees of freedom for the F tests ranged from (1, 216) to (8, 209). bp < .05. Cp < .001; after Bonferroni adjustment, p < .05 = n.s., p < .001 = .05.
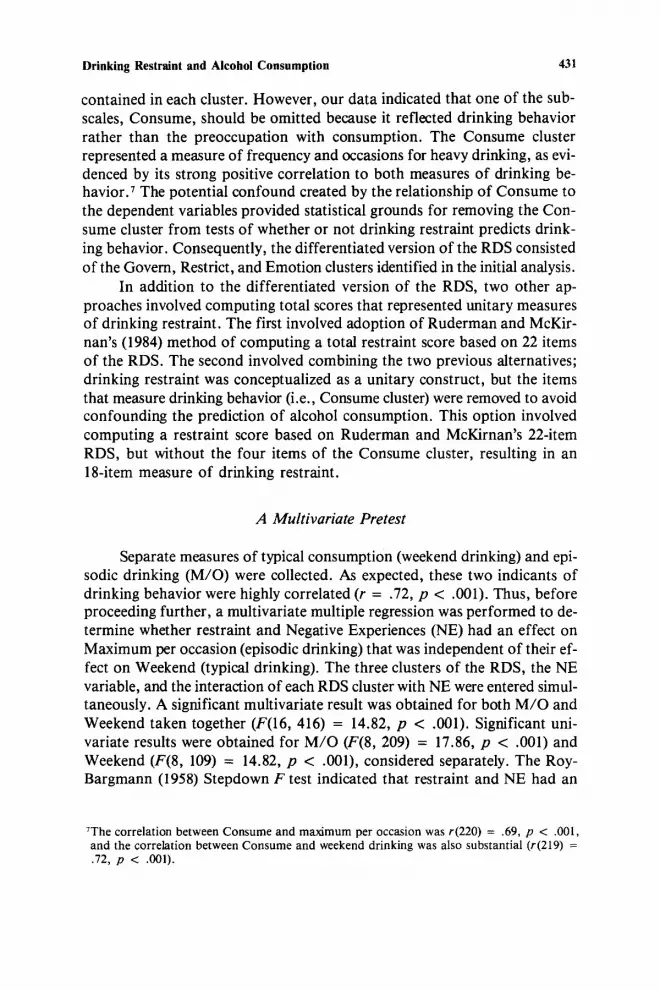
Once the confounding influence of the items contained in the Consume cluster were omitted f rom the 22-item total RDS score, the remaining un- differentiated 18-item RDS accounted for only 2% of the variance in M / O (/3 = . 16) and, given the Bonferroni adjustment, was not a significant predic- tor of M / O . It is evident that the items of the Consume cluster inflated the prediction of M / O when the 22-item RDS was used in the regression equa- tion. The removal of these items radically reduced the amount of variance accounted for, leaving an extremely small and nonsignificant effect of drink- ing restraint. The NE variables was the only significant predictor in the equa- tion, accounting for 10% of the variance, and was positively related to M / O (/3 = .34). The entire regression equation accounted for a total of 28% of the variance in M / O .
The separate contributions of each of the three RDS clusters to the prediction of M / O may explain why the amount of variance accounted for by the unconfounded 18-item RDS score was so small. The Restrict cluster was negatively related to M / O (/3 = - . 16), whereas the Emotion (/3 = . 18) and Govern (/~ = .31) clusters were positively related to M/O. These recipro- cal influences may have canceled each other when the RDS was summed to form a total score.
Weekend Drinking. Essentially the same pattern of results was obtained in the parallel series of hierarchical multiple regression equat ions generated for weekend drinking, with a few notable exceptions (see Table IVS). First,
Drinking Restraint and Alcohol Consumption 435
10
8 8
6
5 - 4 -
O 2
1
Fig.
No Negative Experiences . . . . . . . . One or More Negative Experiences
i i i | i i
0 5 10 15 20 25 30
Restrict Cluster of the RDS (Ratings)
1. Regression lines for ratings of maximum consumption per occasion plotted as a function of scores on the restrict cluster.
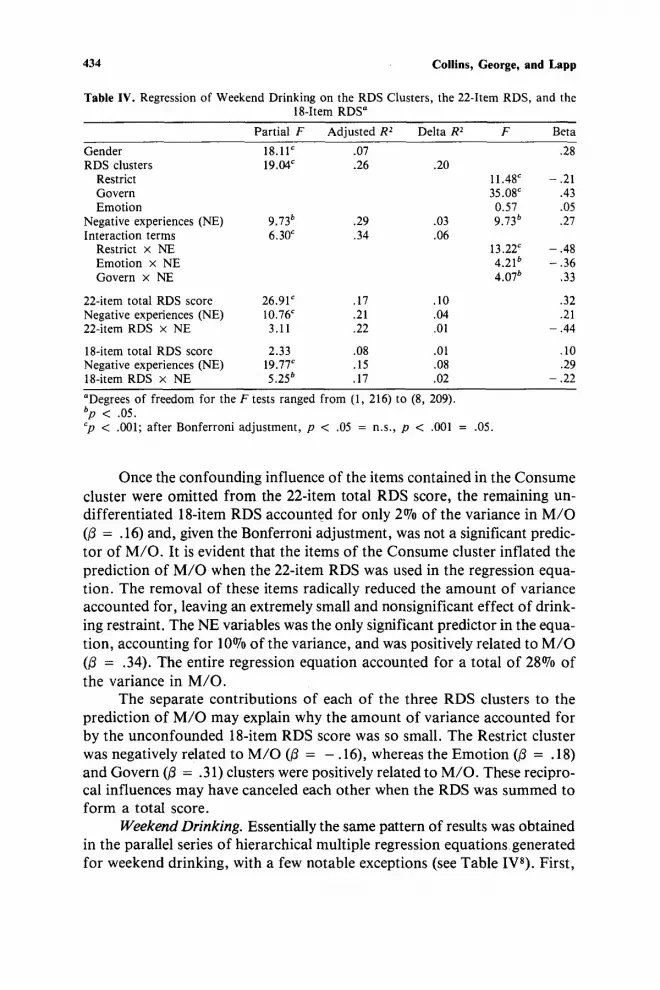
in all three equations gender accounted for only 7%o of the variance (/3 = .28) in weekend drinking. In the regression equation for the differentiated RDS, the main effect for the RDS clusters accounted for 20% of the vari- ance in weekend drinking, but only Restrict (/3 = - .21) and Govern (/3 -- .43) were significant predictors. The main effect for NE was a significant predictor, accounting for 3% of the variance, and was positively related (/3 = .27) to weekend drinking. The combination of the three interaction terms significantly predicted weekend drinking, accounting for 6% of the variance. However, the only significant interaction term was that for Restrict × NE. For this interaction, the inverse relationship to weekend drinking was stronger for subjects with NEs than for subjects with no NEs. As presented in Figure 2, for subjects who reported NEs, weekend drinking decreased as concern
50
ta 40
".~ 20
No Negative Experiences . . . . . . . . One or More Negative Experiences
. . . . . . . . . . . . . . . . . . . . . . . . . . . . . . . . . . . . . . . . . =.
! i i i i i
5 10 15 20 25 30
Restrict Cluster of the RDS (Ratings)
Fig. 2. Regression lines for number of drinks on the weekend plotted as a function of scores on the restrict cluster.

436 Collins, George, and Lapp
about cutting back on drinking increased. For those subjects who reported no NEs, weekend drinking did not vary as a function of concern about cut- ting back on drinking. The entire equation accounted for 34% of the vari- ance in weekend drinking.
The pattern of results for the 22-item RDS and the 18-item RDS were generally similar to each other, with the following specific differences. While the 22-item RDS was a significant predictor, accounting for 10% of the vari- ance in weekend drinking (/3 -- .32), the 18-item RDS was not a significant predictor. The NE variable was a significant predictor in both equations but accounted for less variance in the equation for the 22-item RDS (4%) than in the equation for the 18-item RDS (8°7o). In both cases the beta weight in- dicated a positive relationship between NE and weekend drinking (/3 = .21 for 22-item RDS and/~ = .29 for 18-item RDS). The restraint × NE inter- action term was not significant for either equation.
DISCUSSION
The Restrained Drinking Scale (RDS) was designed for the purpose of tapping "a cognitive dimension-preoccupation with control over drinking" and was said to represent a "unitary construct" (Ruderman & McKirnan, 1984). No suport was found in the present investigation for the idea that the RDS measures only a single construct. Instead, the RDS contains four components, one of which (Consume) is confounded with one of the usual criterion (dependent) variables of alcohol-related studies: self-reported al- cohol consumption. Partial support was found, however, for the idea that the RDS taps the cognitive dimension of preoccupation with control over drinking.
Our identification of components within the RDS is consistent with evaluations of the psychometric properties of the Restraint Scale (RS; Herman & Mack, 1975), a commonly used measure of eating restraint (Blanchard & Frost, 1983; Heatherton et al., 1988; Johnson et al., 1983; Ruderman, 1983; Wardle, 1986). As with the RS, the identification of the components of the RDS calls into question the results of studies in which the undifferentiated RDS was used as the basis for subject selection. For example, Ruderman and McKirnan (1984) reported that "restrained drinkers" (as measured by a total RDS score) drank more alcohol in their study 2 and elected to drink alcohol instead of soda in their study 3 than did "unrestrained drinkers," regardless of whether or not they had received an alcoholic preload (two glasses of wine). These unanticipated results may be attributable to the con- founding of self-reported drinking behavior (the Consume cluster) with ac- tual drinking in the laboratory. The results of the present study also suggest

Drinking Restraint and Alcohol Consumption 437
that there may have been untapped differences between between restrained and unrestrained drinkers that were not assessable by using the total RDS score: Only 2°7o of the variance in alcohol consumption was accounted for by a total RDS score that had the items of the consume cluster removed, whereas, 17°70 to 20°7o of the variance in alcohol cnsumption was predicted on the basis of the three RDS clusters when they were treated as separate predictors.
Preoccupation with Control over Drinking
Three of the four RDS clusters were related to the preoccupation with control over drinking, but the items of each cluster were not necessarily cog- nitive in nature and the direction fo their relation to alcohol consumption remains uncertain. Despite these limitations, the Restrict and Govern clusters contained information of relevance to the construct of restrained drinking, and they predicted alcohol consumption.
The Restrict cluster seems to represent a self-reported behavioral mea- sure of trying to limit alcohol intake. Subjects were apparently more or less successful in this enterprise, as evidenced by the negative relationship be- tween the Restrict cluster and both typical and episodic drinking. However, this cluster only taps a cognitive dimension insofar as behavioral attempts to limit alcohol intake are driven by or reflected in the mental (cognitive) preoccupation with control over drinking.
Perceived difficulty with controlling drinking, as measured by the Govern cluster, was positively associated with both typical and episodic drink- ing. Regardless of whether the perceived difficulty of controlling drinking represents a recollection of effort in previous attempts to control drinking or is arrived at on the basis of other information, the Govern cluster represents a cognitive-behavioral self-report measure of one aspect of drinking restraint. The Govern cluster is of theoretical interest because it seems to measure a subject's perceived competence in controling alcohol intake. Marlatt and Gor- don's (1980, 1985) notion that alcohol consumption will increase as perceived competence decreases (i.e., as our Govern scores increase) was observed for social drinkers in the present study.
The Impact of Negative Experiences
Curry et al. (1987) previously found an association between negative experiences with alcohol, heavy drinking, and drinking restraint. The main effect of negative experiences observed in the present study was associated with an increase in both episodic and typical drinking. The simplest expla-

438 Collins, George, and Lapp
nation of this relationship is that higher levels of alcohol consumption produced a greater likelihood of legal and physiological consequences (the constituents of the Negative Experinces variable) related to drinking. These consequence may serve to punish and thereby suppress the behavior of alco- hol consumption, negatively reinforce attempts to restrict alchol consump- tion, or lead to learned helplessness if the individual's perceived competence in controlling alcohol consumption is threatened (Abramson, Seligman, & Teasdale, 1978).
Interaction of Drinking Restraint and Negative Experiences
Negative experiences may foster or support drinking restraint in the short run but may produce counterregulatory behavior once the restraining factors are suspended or ignored. A reasonable way to examine the effects of drinking restraint on alcohol consumption, then, is to observe its interac- tion with negative experiences.
For both typical and episodic drinking, alcohol consumption was negligibly affected by attempted restriction for the subjects who reported no negative experiences, but was noticeably affected for the subjects who had one or more negative experiences. At low levels of alcohol restriction, subjects with negative experiences drank more than subjects who reported no negative experiences. As restriction increased, however, alcohol consump- tion decreased for those subjects who reported one or more negative ex- periences and was ultimately suppressed below the level of alcohol consumption reported by the subjects who did not have negative experiences. It might then be expected that when the restriction is suspended for whatever reason, alcohol consumption may not change for those subjects who had no negative experiences because it does not vary with restriction across such individuals in the first place. Conversely, there was a clear and evident sup- pression of drinking as restriction of alcohol consumption increased for those subjects who had one or more negative experiences, and alcohol consump- tion may increase when the restriction is suspended.
The present assessment of the psychometric properties of the RDS result- ed in refinement of the measure on both statistical and conceptual grounds. On statistical grounds, the method of deriving the clusters, their high levels of internal consistency, and their relative brevity suggest that they represent psychometrically rigorous components of drinking restraint as measured by the RDS. Conceptually, the partitioning of the RDS provides new insight into the multifaceted nature of the drinking restraint construct and creates the potential for discovering complex relationships between drinking restraint and alcohol consumption. However, efforts must be made to expand the RDS so that it directly taps the cognitive preoccupation with control over drink-

Drinking Restraint and Alcohol Consumption 439
ing, to supplement the three aspects o f res t ra ined dr ink ing tha t the RDS cur-
ren t ly measures : s e l f - r epor t ed behav io ra l a t t e m p t s to l imit a l coho l c o n s u m p t i o n , perce ived d i f f icu l ty wi th con t ro l l ing d r ink ing , and d r ink ing in response to negat ive emot iona l states.
Our f indings regard ing the role o f d r ink ing res t ra in t in d r ink ing be- hav io r are inconclus ive because cause / e f f ec t re la t ionships canno t be speci- f ied. Howeve r , even given l imi ta t ions re la ted to the use o f a college sample
and se l f - repor t measures , the presen t f indings indicate f ru i t fu l areas for fu- ture research. These findings are being pursued further in our current research on d r ink ing res t ra in t in a sample o f ind iv idua ls in t r ea tmen t for subs tance
abuse and in our l abora to ry-based research on the response to violating dr ink- ing l imits .
R E F E R E N C E S
Abramson, L. Y., Seligman, M. E. P., & Teasdale, J. D. (1978). Learned helplessness in hu- mans: Critique and reformulation. Journal of Abnormal Psychology, 87, 49-74.
Anderberg, M. R. (1973). Cluster analysis for applications. New York: Academic Press. Baker, F. B., & Hubert, L. J. (1975). Measuring the power of hierarchical cluster analysis. Journal
of the American Statistical Association, 70, 31-38. Bensley, L. S., Kuna, P. H., & Steele, C. M. (1988). The role of external responsiveness in
drinking restraint. Cognitive Therapy and Research, 12, 261-278. Berzins, J. I., Ross, W. F., & English, G. E. (1974). Subgroups among opiate addicts: A typo-
logical investigation. Journal of Abnormal Psychology, 83, 65-73. Blanchard, F. A., & Frost, R. O. (1983). Two factors of restraint: Concern for dieting and
weight fluctuation. Behaviour Research anad Therapy, 21, 259-267. Blashfield, R. K. (1976). Mixture model tests of cluster analysis: Accuracy of four agglomera-
tive hierarchical methods. Psychological Bulletin, 83, 377-388. Bray, J. H., & Maxwell, S. E. (1985). Multivariate analysis of variance. Beverly Hills: Sage. Cahalan, D., Cisin, I., & Crossley, H. (1969). American drinking practices. New Brunswick,
N J: Rutgers Center of Alcohol Studies. Cliff, N., McCormick, D. J., Zatkin, J. L., Cudeck, R. A., & Collins, L. M. (1986). BIN-
CLUS: Nonhierarchical clustering of binary data. Multivariate Behavioral Research, 21, 201-227.
Cohen, J. (1968). Multiple regression as a general data-analytic system. PsychologicaIBulletin, 70, 426-443.
Cohen, J. (1978). Partialed products are interactions: Partialed powers are curve components. Psychological Bulletin, 85, 858-866.
Cohen, J., & Cohen, P. (1983). Applied multiple regression~correlation analysis for the be- havioral sciences. Hillsdale, N J: Erlbaum.
Cronbach, L. J. (1951). Coefficient alpha and the internal structure of tests. Psychometrika, 16, 297-334.
Curry, S., Southwick, L., & Steele, C. (1987). Restrained drinking: Risk factor for problems with alcohol? Addictive Behaviors, 12, 73-77.
Edelbrock, C. (1979). Mixture model tests of hierarchical clustering algorithms: The problem of classifying everybody. Multivariate Behavioral Research, 14, 367-384.
Edelbrock, C., & McLaughlin, B. (1980). Hierarchical cluster analysis using interclass correla- tions: A mixture model study. Multivariate Behavioral Research, 15, 299-318.
Everitt, B. S. (1974). Cluster analysis. London: Halsted Press.
440 Collins, George, and Lapp
Greenfield, T. K. (1986). Quantity per occasion and consequences of drinking: A reconsidera- tion and recommendation. International Journal of the Addictions, 21, 1059-1079.
Heatherton, T. F., Herman, C. P., Polivy, J., King, G. A., & McGree, S. T. (1988). The (mis)measurement of restraint: An analysis of conceptual and psychometric issues. Journal of Abnormal Psychology, 97, 19-28.
Herman, C. P., & Mack, D. (1975). Restrained and unrestrained eating. Journal of Personali- ty, 43, 647-660.
Herman, C. P., & Polivy, J. (1980). Restrained eating. In A. J. Stunkard (Ed.), Obesity (pp. 208-225). Philadelphia: Saunders.
Johnson, W. G., Lake, L., & Mahan, L. M. (1983). Restrained eating: Measuring an elusive construct. Addictive Behaviors, 8, 413-418.
Lorr, M. (1983). Cluster analysis for social scientists: Techniques for analyzing and simplifying complex blocks of data. San Francisco: Jossey-Bass.
Lorr, M., & Suziedelis, A. (1982). A cluster analytic approach to MMPI profile types. Mul- tivariate Behavioral Research, 17, 287-299.
Marlatt, G. A., & Gordon, J. R. (1980). Determinants of relapse: Implications for the main- tenance of behavior change. In P. O. Davidson & S. M. Davidson (Eds.), Behavioral medicine: Changing health lifestyles (pp. 410-452). New York: Brunner/Mazel.
Marlatt, G. A., & Gordon, J. R. (Eds.). (1985). Relapse prevention. New York: Guilford. Milligan, G. W. (1981). A Monte Carlo study of thirty internal criterion measures for cluster
analysis. Psychometrika, 46, 187-199. Revelle, W. (1979). Hierarchical cluster analysis and the internal structure of tests. Multivari-
ate Behavioral Research, 14, 57-74. Rohlf, F. J. (1974). Methods for comparing classifications. Annual Reviews of Ecology and
Systematics, 5, 101-113. Roy, J., & Bargmann, R. E. (1958). Tests of multiple independence and the associated con-
fidence bounds. Annals of Mathematical Statistics, 29, 491-503. Ruderman, A. J. (1983). The Restraint Scale: A psychometric investigation. Behaviour Research
and Therapy, 21, 253-258. Ruderman, A. J. (1986). Dietary restraint: A theoretical and empirical review. Psychological
Bulletin, 99, 247-262. Ruderman, A. J., & McKirnan, D. (1984). The development of a restrained drinking scale: A
test of the abstinence violation effect among alcohol users. Addictive Behaviors, 9, 365-371. Ruderman, A. J., & Wilson, G. T. (1979). Weight, restraint, cognitions and counter regula-
tion. Behaviour Research and Therapy, 17, 581-590. Sarle, W. S. (1985). The VARCLUS procedure. In SAS user's guide: Statistics. Cary, NC: SAS
Institute. Scheibler, D., & Schneider, W. (1985). Monte Carlo tests of the accuracy of cluster analysis:
A comparison of hierarchical and nonhierarchical methods. Multivariate Behavioral Research, 20, 283-304.
Shiffman, S. (1986). A cluster-analytic classification of smoking relapse episodes. Addictive Behaviors, 11, 295-307.
Southwick, L., & Steele, C. M. (1987). Restrained drinking: Personality correlates of a control style. Journal of Drug lssues, 17, 349-358.
Straw, M. K., Straw, R. B., Mahoney, M. J., Rogers, T., Mahoney, B. K., Craighead, L. W., & Stunkard, A. J. (1984). The master questionnaire: Preliminary report on an obesity assessment device. Addictive Behaviors, 9, 1-10.
Wardle, J. (1986). The assessment of restrained eating. Behaviour Research and Therapy, 24, 213-215.
Winer, B. J. (1971). Statistical principles in experimental design (2nd ed.). New York: McGraw-Hill.
Zagar, R., Arbit, J., Falconer, J., & Friedland, J. (1983). Vocational interests and personality. Journal of Occupational Psychology, 56, 203-214.
Zagar, R., Arbit, J., Stuckey, M., & Wengel, W. W. (1984). Developmental analysis of the Wechsler Memory Scale. Journal of Clinical Psychology, 40, 1466-1473.
Zagar, R., & Mead, J. D. (1983). Analysis of a short test battery for children. Journal of Clini- cal Psychology, 39, 590-597.