drebrin a regulates dendritic spine plasticity and synaptic function in mature cultured hippocampal...
TRANSCRIPT

524 Research Article
IntroductionDendritic spines are the postsynaptic elements that receive themajority of excitatory glutamatergic inputs in the CNS (Harrisand Kater, 1994). These small protrusions emerging fromdendritic shafts are believed to constitute sites for thedevelopment of glutamatergic neuronal networks and might bea cellular substrate for synaptic plasticity (Yuste and Bonhoeffer,2001).
The actin filament (F-actin) is one of the major structuralelements of dendritic spines (Fifkova and Delay, 1982; Matus etal., 1982). These actin filaments are thought to be the key targetof molecular mechanisms regulating spine plasticity that has beenshown to be activity dependent (Matus, 2000). The adult isoformof drebrin, drebrin A (DA), a major neuron-specific F-actin-binding protein, emerges as a candidate protein that regulates theactin cytoskeleton of dendritic spines (Sekino et al., 2007). DAis specifically localized at dendritic spines of mature corticalneurons (Hayashi et al., 1996; Aoki et al., 2005) and is known toinhibit the actin-binding activity of tropomyosin, fascin and α-actinin (Ishikawa et al., 1994; Sasaki et al., 1996). In vitro, it alsoinhibits the interaction between actin and myosin (Hayashi et al.,1996; Ishikawa et al., 2007), suggesting that it modulates actinfilament contractility. Transfection of DA into fibroblasts inducedreorganization of actin filaments, leading to a change in cellmorphology (Shirao et al., 1994). Such transfection in neuronsresults in the elongation of dendritic spines of cortical neurons(Hayashi and Shirao, 1999). Furthermore, downregulation of DAexpression in developing hippocampal neurons suppresses the
accumulation of F-actin within dendritic spines (Takahashi et al.,2003).
In addition to its role in spine morphology, DA might beinvolved in spine functions. It has been recently shown that DA isinvolved in spinous clustering of the postsynaptic density (PSD)scaffold protein, PSD-95 (Takahashi et al., 2003), as well as in theactivity-dependent synaptic targeting of N-methyl-D-aspartate(NMDA) subtype of glutamate receptors (Takahashi et al., 2006).Consistent with this observation, the induction of long-termpotentiation (LTP) in the hippocampus is accompanied by theenhanced DA content within dendritic spines (Fukazawa et al.,2003). All these data support the hypothesis that DA expressed inspines can modulate synaptic activity.
To test this hypothesis, we investigated the effects of DA ondendritic spine morphology and its consequences on synapticactivity, in mature cultured hippocampal neurons. Our study led tothree main conclusions: (1) the actin-binding domain of DA isresponsible for dendritic spine plasticity, presumably via regulationof actin cytoskeleton remodeling and dynamics; (2) enhancedexpression of DA increases the density of glutamatergic but notGABAergic synapses and leads to alteration of the normalexcitatory-inhibitory balance in favour of excitation; (3)downregulation of DA results in the decrease of both glutamatergicand GABAergic synaptic transmissions without affecting the normalexcitatory-inhibitory balance. Thus, the present study provides thefirst evidence that an actin-binding protein such as DA modulatesboth glutamatergic and GABAergic synaptic transmission in maturehippocampal neurons.
Drebrin A, one of the most abundant neuron-specific F-actin-binding proteins, is found exclusively in dendrites and isparticularly concentrated in dendritic spines receiving excitatoryinputs. We investigated the role of drebrin A in synaptictransmission and found that overexpression of drebrin Aaugmented the glutamatergic synaptic transmission, probablythrough an increase of active synaptic site density. Interestingly,overexpression of drebrin A also affected the frequency, amplitudeand kinetics of miniature inhibitory postsynaptic currents(mIPSCs), despite the fact that GABAergic synapse density andtransmission efficacy were not modified. Downregulation ofdrebrin A led to a decrease of both glutamatergic and GABAergic
synaptic activity. In heterologous cells, drebrin A reorganized andstabilized F-actin and these effects were mediated by its actin-binding domain. Thus, drebrin A might regulate dendritic spinemorphology via regulation of actin cytoskeleton remodeling anddynamics. Our data demonstrate for the first time that drebrinA modulates glutamatergic and GABAergic synaptic activities.
Supplementary material available online athttp://jcs.biologists.org/cgi/content/full/122/4/524/DC1
Key words: Spine morphogenesis, F-actin, GABA, Glutamate,vGlut1, Gad-65, Bassoon
Summary
Drebrin A regulates dendritic spine plasticity andsynaptic function in mature cultured hippocampalneuronsAnton Ivanov1, Monique Esclapez2, Christophe Pellegrino1, Tomoaki Shirao3 and Lotfi Ferhat1,4,*1INMED/INSERM U29, Parc Scientifique de Luminy, 13273, Marseille, France2INSERM U 751, Université dʼAix-Marseille, Hôpital de la Timone, Marseille, France3Department of Neurobiology and Behavior, Gunma University Graduate School of Medicine, Maebashi, Gunma, Japan4CNRS UMR 6184, Neurobiologie des Interactions Cellulaires et Neurophysiopathologie (NICN), IFR Jean Roche, Marseille, F-13020, France*Author for correspondence (e-mail: [email protected])
Accepted 30 October 2008Journal of Cell Science 122, 524-534 Published by The Company of Biologists 2009doi:10.1242/jcs.033464
Jour
nal o
f Cel
l Sci
ence

525Drebrin A regulates synaptic transmission
ResultsPostsynaptic localization of endogenous DA in mixedhippocampal culturesThe developmental changes of DA localization in hippocampalneurons have been described in low-density culture from 7 to 21days in vitro (DIV) (Takahashi et al., 2003). In this study, we re-examined this issue in mixed high-density hippocampal cultures(supplementary material Fig. S1A,B). Our data confirmed thepostsynaptic localization of DA in mixed hippocampal neurons at21 DIV, because it colocalized with two specific markers for thepostsynaptic compartment, PSD-95 and F-actin, in most spines(supplementary material Fig. S1C-E).
The actin-binding domain of DA is responsible for spinemorphological changes induced by overexpression of DA-GFPin mature hippocampal neuronsIt has been shown that DA affects some morphological aspects ofcortical dendritic spines (Hayashi and Shirao, 1999). To analyzethe physiological consequences of morphological changes induced
by DA, we re-examined the effects of DA on spine morphologyin our mature and high-density hippocampal culture system. Asrevealed by cotransfected red fluorescent protein (RFP) neurons(Fig. 1A,B), both green fluorescent protein (GFP, used as a control)(Fig. 1A�) and DA-GFP (Fig. 1B�) were distributed withindendritic shafts, as well as in dendritic protrusions. With respectto DA-GFP, the green fluorescence in dendritic shafts was lighterthan in dendritic protrusions. Striking morphological changes wereobserved between dendritic protrusions of DA-GFP- (Fig. 1B�)and those of GFP neurons (Fig. 1A�). Indeed, the dendrites ofDA-GFP neurons displayed longer protrusions (Fig. 1B-B�,arrows) compared with those found in GFP neurons (Fig. 1A-A�).Some of these long protrusions reached over 5 μm (see asterisksin Fig. 1B-B�). All protrusions induced by DA-GFP includedheads, and thus differed in their morphology from dendriticfilopodia, which have no heads. These observations suggested thatthese long protrusions were spines and were more mature thanfilopodia, which are precursors of dendritic spines (Papa et al.,1995).
Fig. 1. Effects of DA-GFP overexpression on spinemorphology and network activity. Cultured neurons werecotransfected on DIV 21 with RFP (A) and GFP (A�), RFP(B) and DA-GFP (B�), RFP (C) and GFP-DAΔABS (C�),or RFP (D) and GFP-ABS (D�). At 23 DIV, neurons werefixed and then analyzed. RFP channel is shown in allpanels to outline dendritic morphology. (A�,B�,C� andD�) Merged images. Scale bar: 10 μm. (E-G) Quantificationof DA-GFP effects on protrusion plasticity. Histogramsshowing the average length (E), width (F) and density (G)of protrusions of GFP, DA-GFP, GFP-DAΔABS and GFP-ABS neurons. As with GFP spines (H-H�), the long spinesinduced by DA-GFP (I-I�) were associated with functionalexcitatory synaptic contacts. GFP (H) or DA-GFP (I)neurons immunostained for synaptophysin (H� and I�).(H� and I�) Merged images. Some synaptophysin clustersare not in close apposition to the spines of GFP or DA-GFPneurons because they are probably opposed to dendriticshafts or spines of nontransfected neurons. Scale bar:10 μm. *P<0.05, **P<0.01, ***P<0.001, Bonferroni’s test.(J) Examples of sPSCs recorded at –60 mV in GFP (blacktrace) and DA-GFP neurons (gray trace). (K) Histogramshowing the sPSCs charge transfer in all recorded GFP andDA-GFP neurons. All data in E-G and K are mean ± s.e.m.
Jour
nal o
f Cel
l Sci
ence

526
To investigate whether DA-GFP exerts its effects via itsinteraction with F-actin, we cotransfected mature hippocampalneurons with RFP (Fig. 1C) and GFP-DAΔABS (Fig. 1C�), a mutantof DA that lacks the actin-binding domain (Hayashi et al., 1999).As revealed by coexpressed RFP (Fig. 1C), GFP-DAΔABS (Fig.1C�) was detected in dendritic shafts as well as at dendriticprotrusions (Fig. 1C�). In contrast to DA-GFP, GFP-DAΔABS didnot induce elongation of dendritic protrusions (Fig. 1C-C�). Thesedata indicate that the elongation of dendritic protrusions inducedby DA-GFP requires its actin-binding domain.
We further determined whether the overexpression of the actin-binding domain of DA was sufficient to induce the elongation ofdendritic protrusions. For this purpose, we cotransfectedhippocampal neurons with RFP (Fig. 1D) and GFP-ABS (Fig. 1D�),a construct that contains only the actin-binding domain of DA(Hayashi et al., 1999). As visualized by cotransfected RFP (Fig.1D), GFP-ABS was found in dendritic shafts as well as in dendriticprotrusions (Fig. 1D�). Similarly to DA-GFP, GFP-ABS inducedmorphological changes in dendritic protrusions. Indeed, somedendritic protrusions of GFP-ABS neurons were markedly longer(Fig. 1D-D�, see arrows) than those observed in GFP neurons (Fig.1A-A�). In addition, GFP-ABS neurons displayed long protrusionswith heads, reminiscent of dendritic spines. Therefore, the actin-binding domain of DA is necessary and sufficient to induce an effecton dendritic spine elongation.
Quantitative analysis in both DA-GFP and GFP-ABS neuronsshowed that the average protrusion lengths were significantly longer(1.86±0.08 and 2.40±0.10 μm, respectively) than that in GFP(1.15±0.04 μm; n=10; P<0.001; Bonferroni’s test) (Fig. 1E) andGFP-DAΔABS neurons (1.15±0.04 and 1.21±0.04 μm, respectively;n=10; P<0.001; Bonferroni’s test) (Fig. 1E). However, the averageprotrusion length of GFP-DAΔABS neurons was not significantlydifferent from that of GFP neurons (P=0.38; Bonferroni’s test) (Fig.1E). Interestingly, the average protrusion of GFP-ABS wassignificantly longer than that in DA-GFP neurons (P<0.01;Bonferroni’s test) (Fig. 1E), presumably due to their differences inexpression levels. Indeed, western blot analyses on CHO-K1 cellsshowed higher expression levels of GFP-ABS compared with thoseof DA-GFP construct (data not shown).
In DA-GFP and GFP-ABS neurons, the average protrusion headwidth was significantly larger (0.88±0.02 and 0.91±0.01 μm,respectively) than that in GFP neurons (0.78±0.02 μm; n=10; P<0.05for DA-GFP and P<0.01 for GFP-ABS; Bonferroni’s test) (Fig. 1F).However, in GFP-DAΔABS neurons, the average protrusion headwidth (0.83±0.01 μm) was not different from that of GFP neurons(n=10; P=0.18; Bonferroni’s test) (Fig. 1F).
In DA-GFP and GFP-ABS neurons, the average protrusiondensities were significantly higher (3.28±0.23 and 3.32±0.39spines/10 μm, respectively) than that in GFP neurons (2.29±0.17spines/10 μm; n=10; P<0.05; Bonferroni’s test) (Fig. 1G), whereasthe average protrusion density of GFP-DAΔABS neurons(2.00±0.15 spines/10 μm) was not significantly different from thatof GFP neurons (n=10; P=0.26; Bonferroni’s test) (Fig. 1G).Therefore the actin-binding domain of DA was necessary andsufficient to induce an effect on spine morphology.
The molecular mechanisms by which DA-GFP causes elongationof dendritic spines was investigated. For this purpose, weoverexpressed either DA-GFP or its DA mutants (GFP-DAΔABSand GFP-ABS) in CHO-K1 cells and analyzed its effects on theorganization and stabilization of F-actin (supplementary materialFigs S2 and S3, respectively). CHO-K1 cells were used because,
Journal of Cell Science 122 (4)
in contrast to neurons, they provide a model of choice for visualizingthe cellular organization and stability of F-actin (Rami et al., 2006).Studies in heterologous cells revealed that DA reorganized F-actinand stabilized them and these effects were dependent upon its actin-binding domain (supplementary material Figs S2 and S3,respectively).
Effects of DA-GFP overexpression on synaptic functionOur confocal microscopy data revealed that as for spines labeledwith GFP (Fig. 1H-H�, see arrowheads), the long protrusionsinduced by DA-GFP (Fig. 1I) were associated with axon terminalssince a presynaptic marker such as synaptophysin (Fig. 1I�) wasfacing most of these dendritic protrusions (Fig. 1I�, arrowheads).The close apposition of the presynaptic marker to the long spinesinduced by overexpression of DA-GFP suggests the presence ofsynaptic excitatory contacts. We next investigated whether thesesynapses were functional. Whole-cell recordings of spontaneous andminiature synaptic currents were performed on mature culturedhippocampal neurons overexpressing either GFP (used as a control,supplementary material Fig. S4) or DA-GFP. Our data showed thatspontaneous activity was detected both in GFP or DA-GFP neurons(Fig. 1J), indicating that these neurons were alive and integrated inthe neuronal network. In addition, the neuronal network activitywas not affected by the overexpression of DA-GFP compared withthat of GFP neurons. Indeed, the average charge transfer ofspontaneous postsynaptic currents (sPSCs) was not significantlydifferent in both culture types (GFP, 100±11%; DA-GFP, 106±35%;n�5; P=0.8; U-test) (Fig. 1K).
Next, we investigated whether overexpression of DA-GFP wasalso associated with changes in the electrophysiological propertiesof excitatory glutamatergic synapses (Fig. 2A). In DA-GFP neurons,the cumulative probability plots of amplitude (Fig. 2B) andfrequency (Fig. 2C) of miniature excitatory postsynaptic currents(mEPSCs) were significantly shifted to higher values compared withthose of GFP neurons (n=8; P<0.01 for the amplitude and P<0.05for the frequency; K-S test). The average amplitude and frequencyof mEPSCs were increased in DA-GFP neurons (14.0±0.6 pA;3.7±0.5 Hz) when compared with those of GFP neurons (11.8±0.4pA, Fig. 2B, inset; 2.9±0.5 Hz, Fig. 2C, inset). However, the averagerise times (GFP: 1.28±0.26 mseconds; DA-GFP: 1.16±0.11mseconds; n=8; P=0.67; Student’s t-test) (Fig. 2D) and decay times(GFP, 6.04±0.90 mseconds; DA-GFP, 6.39±0.79 mseconds; n=8;P=0.14; Student’s t-test) (Fig. 2E) were comparable. As a result ofthe amplitude and frequency changes of mEPSCs in DA-GFPneurons, the average charge transfer of mEPSCs was significantlyincreased in DA-GFP neurons (334±93 vs 100±20%; n=8; P<0.01;U-test) (Fig. 2F).
The GABA miniature inhibitory postsynaptic currents (mIPSCs)were also recorded from the same GFP and DA-GFP neurons (Fig.3A) used for mEPSC recordings. Surprisingly, the effects of DA-GFP overexpression on GABA transmission were more severe thanthose on glutamate transmission. In neurons overexpressing DA-GFP, cumulative probability plots of mIPSC amplitude weresignificantly shifted to lower values compared with those of GFPneurons (n=8; P<0.01; K-S test) (Fig. 3B). The average amplitudeof mIPSCs was lower in DA-GFP neurons (24.0±0.9 pA) than inGFP neurons (34.3±1.8 pA) (Fig. 3B, inset). However, thecumulative probability plots of mIPSC frequency in DA-GFPneurons were significantly shifted to higher values compared withthose of GFP neurons (n=8; P<0.001; K-S test) (Fig. 3C). Theaverage frequency of mIPSCs was higher in neurons overexpressing
Jour
nal o
f Cel
l Sci
ence

527Drebrin A regulates synaptic transmission
DA-GFP (2.8±0.3 Hz) than in GFP neurons (1.3±0.2 Hz; n=8) (Fig.3C, inset). The average rise time of mIPSCs was significantlyincreased in DA-GFP neurons (4.28±0.64 mseconds) whencompared with that of GFP neurons (1.84±0.16 mseconds; n=8;P<0.05; Student’s t-test) (Fig. 3D), whereas the average decay timewas significantly decreased (18.93±1.46 vs 23.38±2.41 mseconds;n=8; P<0.05; Student’s t-test) (Fig. 3E). However, despite themIPSC properties changes described above, the average chargetransfer in neurons overexpressing DA-GFP (132±33%) was notsignificantly different from that of GFP neurons (100±3%; n=8;P=0.23; U-test) (Fig. 3F).
Thus, the overexpression of DA-GFP displayed differentialeffects on functional properties of excitatory and inhibitory synapses.Indeed, DA enhances the strength of excitatory synaptictransmission preferentially (Fig. 2F), without affecting the efficacyof inhibitory synaptic transmission (Fig. 3F). As a result, the averageinhibition to excitation charge transfer ratio was significantlyreduced in DA-GFP neurons (5.5±0.2) when compared with thatof GFP neurons (11.2±0.5; n=8; P<0.01; U-test) (Fig. 3G).
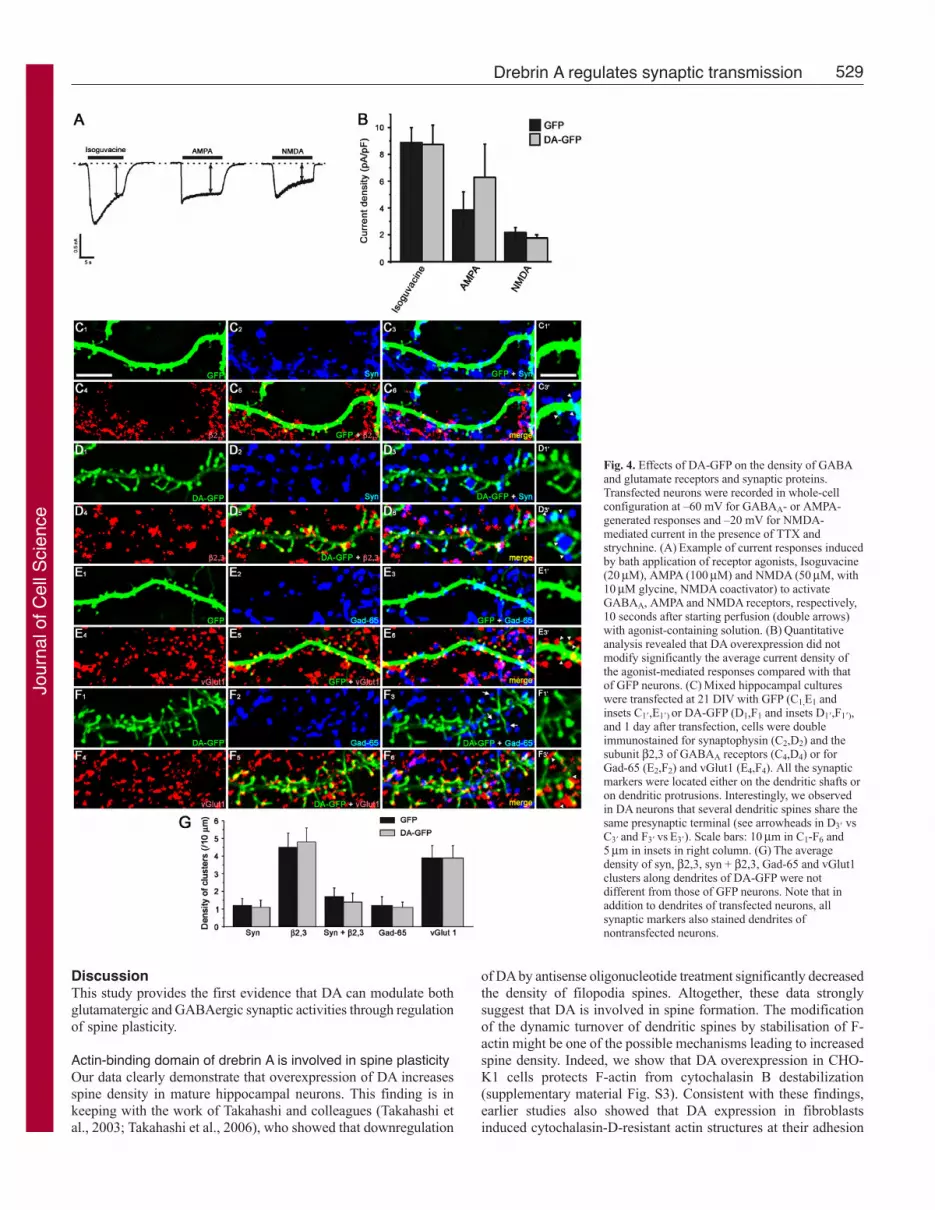
The effects of DA-GFP on synaptic proteinsThe changes in GABA and glutamate miniature postsynapticcurrent (mPSC) properties induced by DA-GFP prompted us toexamine whether the density of glutamate and GABA receptors wereaffected. The quantitative analysis revealed that DA overexpressiondid not modify significantly the average current density [amplitude(pA)/cell capacitance (pF)] of the agonist-mediated responsescompared with that of GFP neurons, which were used as a control(isoguvacine, 8.9±1.8 vs 8.7±2.2, P=0.93; AMPA, 3.9±2.1 vs6.3±3.7, P=0.39; NMDA, 2.2±0.6 vs 1.8±0.3; n�9; P=0.37;Student’s t-test) (Fig. 4B). These results suggested that the density
of GABAA, AMPA, and NMDA membrane receptorswere comparable in both GFP and DA-GFP neurons.
We therefore assessed whether postsynapticexpression of DA-GFP might affect the density ofglutamatergic and GABAergic presynaptic terminals(Fig. 4C). These terminals were identified withsynaptophysin (the general presynaptic marker) ortransmitter-specific markers of glutamatergic andGABAergic axons (vGlut1 and Gad-65, respectively).The average densities of synaptophysin and vGlut1clusters (clusters/10 μm) along dendrites (shafts and/orprotrusions) of DA-GFP were not different from thoseof GFP neurons (syn, 1.1±0.4 vs 1.2±0.4, P=0.7;vGlut1, 3.9±0.4 vs 3.9±0.4, P=0.87; n�32 dendrites;Student’s t-test) (Fig. 4J). However, in DA-GFPneurons, most protrusions (over 98%) were associatedwith clusters of synaptophysin or vGlut1, suggestingthat the majority of protrusions had a presynapticpartner, similar to spines of GFP neurons. Since DA-
GFP increased the dendritic spine density and the glutamatergicsynaptic activity, we concluded that the density of glutamatergicsynapses was increased in DA-GFP neurons.
The postsynaptic expression of DA-GFP did not affect the densityof GABA presynaptic terminals in DA-GFP versus GFP neurons(Gad-65, 1.1±0.3 vs 1.2±0.5 clusters/10 μm; n�32 dendrites;P=0.55; Student’s t-test) (Fig. 4J). We next assessed whether thedensity of GABA synapses was affected in DA-GFP neurons. Forthis purpose we used β2,3 subunits of the GABAA receptor as apostsynaptic marker because β2,3 is one of the most abundantsubunits of the GABAA receptors in the brain (McKernan andWhiting, 1996). Our data showed that the average density of clusters(clusters/10 μm) positive for β2,3 or for synaptophysin and β2,3in DA-GFP was not different from that of GFP neurons (β2,3,4.8±0.8 vs 4.5±0.8, P=0.51; β2,3 + syn, 1.4±0.5 vs 1.7±0.5,P=0.29; n≥32 dendrites; Student’s t-test) (Fig. 4J). Therefore thedensities of GABA terminals and synapses were similar in GFPand DA-GFP neurons. Taken together, these data indicated that theratio of glutamatergic to GABAergic synapses was increased in DA-GFP neurons.
One possible explanation of the absence of significant changesin the density of presynaptic terminals in the presence of suchmarked changes in the density and shape of postsynaptic spines isthat multiple spines can share the same terminal. If this is the case,multiple active zones should form, with a corresponding increaseof active zone-associated proteins, such as bassoon. To assess thishypothesis, we studied the effects of DA overexpression on bassoonclusters (Fig. 5A,B�). Our data showed that the average density ofbassoon clusters (clusters/10 μm) along dendrites (shafts and/orprotrusions) was increased in DA-GFP (28.2±1.9) compared withthat of GFP neurons (16.8±2.0; n�15 dendrites, P<0.0001; Student’s
Fig. 2. Effects of DA-GFP overexpression on glutamate function. Mixed hippocampalcultures were transfected at 21 DIV with GFP or DA-GFP, and 1 day later, the transfectedneurons were recorded. Electrophysiological recordings of GFP neurons used as controlswere compared with those of DA-GFP neurons. (A) Examples of mEPSCs recordingsfrom GFP (black trace) and DA-GFP neurons (gray trace). (B,C) Cumulative probabilityplots of amplitude and frequency of mEPSCs in GFP and DA-GFP neurons. The averageamplitude and frequency of mEPSCs in GFP and DA-GFP neurons are shown as insets.*P<0.05, **P<0.01, K-S test. (D-F) Histograms showing the average rise time, decaytime, and charge transfer of mEPSCs respectively in GFP and DA-GFP neurons. Traces inD and E show the rise and decay time, respectively, of the average mEPSCs. **P<0.01,U-test.
Jour
nal o
f Cel
l Sci
ence

528
t-test) (Fig. 5C). Moreover, the average number of bassoon clusterson spines was increased almost twofold in DA-GFP neurons(1.9±0.2 vs 1.0±0.1 clusters/spine; n�15 dendrites; P<0.0001;Student’s t-test) (Fig. 5D). From these data, we concluded thatindeed the increased number of spines was paralleled by an increasein the number of active zones.
Effects of downregulation of DA expression on synapticfunctionWestern blot analysis showed that treatment of mature mixedhippocampal cultures with DA antisense oligonucleotides (AS),whose specificity and efficiency have been described previously(Takahashi et al., 2003; Takahashi et al., 2006), reduced significantly
Journal of Cell Science 122 (4)
the expression of endogenous DA (AS, 11.87±3.47%) whencompared with untreated (Ctl, 100.00±14.77%; n=7; P<0.0001;Bonferroni’s test) or sense-treated neurons (S, 84.59±12.91%; n=7;P<0.001; Bonferroni’s test) (Fig. 6A,B, right panel). The expressionof another neuronal protein such as β3-tubulin was not altered byoligonucleotide treatments when compared with untreated or sense-treated cultures (Ctl, 100.00±1.15%; S, 100.17±1.84%; AS,100.21±1.68%; n=7; P=0.99; ANOVA) (Fig. 6A,B, left panel), inkeeping with previously reported data for β-actin (Takahashi et al.,2003; Takahashi et al., 2006).
Whole-cell recordings of spontaneous and miniature synapticcurrents were performed on mature cultured hippocampal neuronstreated with sense oligonucleotides (used as a control, for detailssee supplementary material Fig. S4) or antisense oligonucleotides.Both sense and antisense oligonucleotide-treated neurons showedspontaneous activity (Fig. 6C), suggesting that these neurons werealive and fully integrated in the neuronal network. In addition, theneuronal network activity was not affected by the treatment withantisense oligonucleotides compared with that of neurons treatedwith sense oligonucleotides. Indeed, the average charge transfer ofsPSCs was not significantly different in both culture types (S,100±15%; AS, 92±21%; n�6; P=0.8; U-test) (Fig. 6D).
The mEPSCs were recorded from S or AS neurons (Fig. 7A).In antisense-treated neurons, the cumulative probability plots ofamplitude and frequency of mEPSCs were significantly shiftedto lower values when compared to sense-treated neurons (n=6;P<0.05; K-S test) (Fig. 7B,C). The average amplitude andfrequency of mEPSCs were decreased in antisense-treated neurons(11.3±0.9 pA; 4.3±1.5 Hz) when compared with those of sense-treated neurons (12.3±1.0 pA; 6.7±2.1 Hz) (Fig. 7B,C, insets).However, the average rise times (S, 1.44±0.16; AS, 1.58±0.15;n=6; P=0.67; Student’s t-test) (Fig. 7D) and decay times (S,4.42±0.65; AS, 4.67±0.61; n=6; P=0.14; Student’s t-test) werecomparable (Fig. 7E). As a result of amplitude and frequencychanges of mEPSCs in antisense-treated neurons, the averagecharge transfer of mEPSCs was significantly reduced (56±3 vs100±15%; n=6; P<0.05; U-test) (Fig. 7F).
We recorded the GABA mIPSCs from the same oligonucleotide-treated neurons, where the mEPSCs were recorded (Fig. 8A). Inantisense-treated neurons, the cumulative probability plots ofamplitude and frequency of mIPSCs were significantly shifted tolower values as compared with those of sense-treated neurons (n=6;P<0.01 for the amplitude and P<0.05 for the frequency; K-S test)(Fig. 8B,C). The average amplitude and frequency of mIPSCs weredecreased in antisense-treated (15.9±1.6 pA; 2.3±0.7 Hz) whencompared to sense-treated neurons (23.2±2.0 pA; 3.1±0.7 Hz) (Fig.8B,C, insets). The average rise time and decay time of mIPSCswere not significantly modified in antisense-treated (3.52±0.44mseconds; 20.48±1.78 mseconds) when compared with those ofsense-treated neurons (2.74±0.31 mseconds; 22.25±3.30 mseconds;n=6; P=0.12 and 0.37 respectively; Student’s t-test) (Fig. 8D,E).Owing to the mIPSC property changes described above, the averagecharge transfer in antisense-treated neurons was significantlyreduced (78±11 vs 100±10%; n=6; P<0.05; U-test) (Fig. 8F). Thus,the reduction of DA expression affected both the functionalproperties of glutamatergic and GABAergic synapses. Despite thesechanges, the inhibition to excitation charge transfer ratio was notaltered by the reduction of DA expression (AS, 7.7±2.8; S, 5.1±1.5;n=6; P=0.9; U-test) (Fig. 8G). Thus, the functional balance betweenexcitation and inhibition was maintained while DA level wasreduced.
Fig. 3. Effects of DA-GFP overexpression on GABA function. Mixedhippocampal cultures were transfected at 21 DIV with GFP or DA-GFP, and 1day later, the transfected neurons were recorded. Electrophysiologicalrecordings of GFP neurons used as controls were compared with those of DA-GFP neurons. (A) Examples of mIPSCs recordings from GFP neurons (blacktrace) and DA-GFP neurons (gray trace). (B,C) Cumulative probability plots ofamplitude and frequency of mIPSCs in GFP and DA-GFP neurons. Theaverage amplitude (B) and frequency of mIPSCs (C) in GFP and DA-GFPneurons are shown in insets. **P<0.01, ***P<0.001, K-S test.(D-G) Histograms showing the average rise time, decay time, charge transferand inhibition to excitation transfer charge ratio of mEPSCs, respectively, inGFP and DA-GFP neurons. *P<0.05, t-test; **P<0.01, U-test.
Jour
nal o
f Cel
l Sci
ence
529Drebrin A regulates synaptic transmission
DiscussionThis study provides the first evidence that DA can modulate bothglutamatergic and GABAergic synaptic activities through regulationof spine plasticity.
Actin-binding domain of drebrin A is involved in spine plasticityOur data clearly demonstrate that overexpression of DA increasesspine density in mature hippocampal neurons. This finding is inkeeping with the work of Takahashi and colleagues (Takahashi etal., 2003; Takahashi et al., 2006), who showed that downregulation
of DA by antisense oligonucleotide treatment significantly decreasedthe density of filopodia spines. Altogether, these data stronglysuggest that DA is involved in spine formation. The modificationof the dynamic turnover of dendritic spines by stabilisation of F-actin might be one of the possible mechanisms leading to increasedspine density. Indeed, we show that DA overexpression in CHO-K1 cells protects F-actin from cytochalasin B destabilization(supplementary material Fig. S3). Consistent with these findings,earlier studies also showed that DA expression in fibroblastsinduced cytochalasin-D-resistant actin structures at their adhesion
Fig. 4. Effects of DA-GFP on the density of GABAand glutamate receptors and synaptic proteins.Transfected neurons were recorded in whole-cellconfiguration at –60 mV for GABAA- or AMPA-generated responses and –20 mV for NMDA-mediated current in the presence of TTX andstrychnine. (A) Example of current responses inducedby bath application of receptor agonists, Isoguvacine(20 μM), AMPA (100 μM) and NMDA (50 μM, with10 μM glycine, NMDA coactivator) to activateGABAA, AMPA and NMDA receptors, respectively,10 seconds after starting perfusion (double arrows)with agonist-containing solution. (B) Quantitativeanalysis revealed that DA overexpression did notmodify significantly the average current density ofthe agonist-mediated responses compared with thatof GFP neurons. (C) Mixed hippocampal cultureswere transfected at 21 DIV with GFP (C1,E1 andinsets C1�,E1�) or DA-GFP (D1,F1 and insets D1�,F1�),and 1 day after transfection, cells were doubleimmunostained for synaptophysin (C2,D2) and thesubunit β2,3 of GABAA receptors (C4,D4) or forGad-65 (E2,F2) and vGlut1 (E4,F4). All the synapticmarkers were located either on the dendritic shafts oron dendritic protrusions. Interestingly, we observedin DA neurons that several dendritic spines share thesame presynaptic terminal (see arrowheads in D3� vsC3� and F3� vs E3�). Scale bars: 10 μm in C1-F6 and5 μm in insets in right column. (G) The averagedensity of syn, β2,3, syn + β2,3, Gad-65 and vGlut1clusters along dendrites of DA-GFP were notdifferent from those of GFP neurons. Note that inaddition to dendrites of transfected neurons, allsynaptic markers also stained dendrites ofnontransfected neurons.
Jour
nal o
f Cel
l Sci
ence

530
plaques (Ikeda et al., 1996). It is thus possible that elevated DAlevels stabilize actin filaments in spines and alter their dynamicturnover (retraction). This inhibition of spine retraction by DA mightlead to the increase in spine density.
In addition, our data show that DA regulates spine shape andsize. Indeed, DA-GFP overexpression in mature culturedhippocampal neurons caused elongation of dendritic spines, whichwere similar to the spines observed in GFP-DA-expressing corticalneurons (Hayashi and Shirao, 1999). Furthermore, DA-GFPincreases spine head width. This finding is corroborated by studiesshowing that downregulation of DA significantly decreases thewidth of filopodia spines (Takahashi et al., 2006). Themorphological changes of dendritic spines induced by DA-GFP aremediated by its actin-binding domain as illustrated by our data (seeFig. 1A-G).
It has been reported that drebrin interacts directly with profilin(Mammoto et al., 1998), an actin-binding protein, known tostimulate actin polymerization (Carlsson et al., 1977; Buss et al.,1992; Rothkegel et al., 1996). One possible mechanism to inducemorphological changes of dendritic spines is that DA recruits profilinto stimulate actin polymerization, leading to the elongation andincrease in size of dendritic spines.
It has also been shown that DA reduced the movement of actinover a myosin-bound surface in the sliding actin motility assay, andinhibited the actin-based ATPase activity of myosin (Hayashi et al.,1996). The actomyosin-based machinery might thus be anothermechanism involved in the elongation of spines. Based on theseobservations, we suggest that elongation of spines induced by DA-GFP may result from the superimposition of two additive
Journal of Cell Science 122 (4)
mechanisms: polymerization of actin and inhibition of actomyosinactivity and that DA is a key protein in the plasticity of dendriticspines.
DA modulates glutamatergic and GABAergic synaptictransmissionOur data showed that the long protrusions induced by DA areassociated with presynaptic glutamatergic terminals. Despite theincreased spine density (by about 43%), the density of glutamatergicterminals is not modified. However, the average number of activezone-associated bassoon clusters on spines is increased twice. Sincebassoon is a component of the presynaptic apparatus of bothexcitatory glutamatergic and inhibitory GABAergic synapses(Richter et al., 1999), the increase of bassoon clusters suggests thatat least some of the dendritic spines share the same glutamatergicterminal. Consistent with this idea, a single glutamatergic terminalcould be contacted by two DA dendritic spines (see arrowheads inFig. 4). As a result, the density of glutamatergic synapses isincreased. Furthermore, our electrophysiological data demonstratethat these synapses are functional and more active. Indeed, anincrease in the frequency (~27%) and amplitude (~18%) of mEPSCswere observed in DA-GFP neurons. The frequency increase couldresult from the augmented number of functional excitatory synapses,whereas the amplitude increase could be due to spine head widening(~13%) and/or to simultaneous glutamate release at multiple activesites. Bath application of glutamatergic agonists showed that overalldensity of receptors is preserved in DA-GFP neurons. This methoddoes not permit us to distinguish the response mediated byextrasynaptic receptors from that mediated by synaptic receptors.
Fig. 5. Effects of DA-GFP overexpression on bassoon protein. Mixedhippocampal cultures were transfected at 21 DIV with GFP (A) or DA-GFP(B) and 1 day after transfection, cells were immunostained for bassoon(A�,B�). (A� and B�) Merge of panels A and A� and B and B�, respectively.(A� and B�) Composite of A� and B�, and drawings showing selected objectsobtained with ImageJ software from A� and B�, respectively. (C,D) Histogramsshowing the density of bassoon clusters (C) and their number per spine (D) inGFP and DA-GFP neurons. ***P<0.0001, Student’s t-test. Scale bar: 5 μm.
Fig. 6. Effects of DA downregulation on network activity. Mixed hippocampalcultures of 21 DIV treated for 2 days in the absence (untreated) or the presenceof 10 μM sense (S) or antisense (AS) oligonucleotides. Following treatment,the cells were either used for western blot analysis (A,B) or electrophysiologyrecordings (C,D). **P<0.001, Bonferroni’s test. (C) Using whole-cellrecordings, sPSCs were detected at –60 mV in sense- (black trace) andantisense-treated neurons (gray trace). (D) Histogram showing the sPSCaverage charge transfer in all recorded neurons.
Jour
nal o
f Cel
l Sci
ence

531Drebrin A regulates synaptic transmission
Therefore, these results show that overall density of glutamatergicmembrane receptors (extrasynaptic and synaptic) was comparablein both GFP and DA-GFP neurons. Thus, the increased amplitudeof mEPSCs could be explained by the spine head widening and theredistribution of glutamatergic extrasynaptic receptors to synapticsites. The fact that the mEPSC kinetics was comparable in GFPand DA-GFP neurons, suggests that the subunit composition ofglutamate receptors was not different in the newly formed and thealready established excitatory synapses of DA neurons.
Despite a 43% increase in the density of excitatory synapses inDA-GFP neurons, we did not observe an equivalent increase inmEPSC frequency. This could suggest that synapses on dendriticshafts move on newly formed spines and/or that some of the DA-GFP excitatory synapses are inactive. In both cases, DA-GFPoverexpression resulted in a significant increase in excitatorysynaptic activity. As a result of the amplitude and frequency changesof mEPSCs in DA-GFP neurons, the glutamatergic transmissionefficacy was significantly increased in DA-GFP compared with thatof GFP neurons.
Our data revealed that although the mIPSC properties change(frequency, amplitude, and kinetics), the GABAergic transmissionefficacy in DA-GFP neurons was not significantly different. Thepossible mechanisms that mediate the effect of DA on GABApostsynaptic activity are unknown. However it is interesting thatDA could interact with gephyrin, a GABAA receptor anchoringprotein (Kneussel and Loebrich, 2007), through profilin (Mammotoet al., 1998). Immunocytochemical data showed that the density ofGABA synapses was also similar in GFP and DA-GFP neurons. Asa result, the average inhibition to excitation charge transfer ratio issignificantly reduced in DA-GFP neurons. Altogether, theseobservations indicate that DA-GFP overexpression increases the
density of excitatory relative to inhibitory synapses,and enhances the excitation to inhibition ratio. Theexcitatory to inhibitory synapse ratio is believed to becrucial for normal neuronal computation and isgenerally kept constant by homeostatic mechanisms(Burrone et al., 2002; Hausser et al., 2000; Knott etal., 2002; Liu, 2004; Turrigiano and Nelson, 2004).Some of the factors that control the overall change inthe ratio of excitatory-inhibitory synapse number andactivity have only recently been discovered. Severalstudies have implicated the synaptic cell adhesionmolecules called neuroligin (NLG) proteins and thescaffolding postsynaptic density protein PSD-95(Prange et al., 2004; Chih et al., 2005; Levinson et al.,2005; Levinson and El Husseini, 2005a; Levinson andEl Husseini, 2005b). An alteration in the excitation-inhibition synaptic balance was also suggested to occurin several neurodevelopmental psychiatric disorders,including autism and some forms of mental retardation(Rubenstein and Merzenich, 2003; Levinson and ElHusseini, 2005a; Levinson and El Husseini, 2005b).
The importance of our findings is emphasized by the recent discoverythat the drebrin level is increased in the superior frontal cortex inneurological disorders accompanied by mild cognitive impairment(MCI) (Counts et al., 2006; Kojima and Shirao, 2007). It has beensuggested that this might be a compensatory reaction to the reducedsynaptic function in MCI.
Since overexpression of DA affected the glutamate and GABAsynaptic properties, we investigated the functional consequences ofa reduced DA expression. In DA-knockdown neurons, bothamplitude and frequency of mEPSCs were reduced. The decreasedamplitude of mEPSCs could be explained by the decreased in thewidth of filopodia spines observed in DA-knockdown neurons(Takahashi et al., 2006). The decreased frequency of mEPSCs inDA-knockdown neurons could be due to the decreased number offunctional excitatory synapses. This possibility is supported by thefact that DA-knockdown neurons displayed a significant decreasein the density of filopodia spines (Takahashi et al., 2003; Takahashiet al., 2006). Similarly to mEPSCs, the frequency and amplitudeof mIPSCs were also reduced in DA-knockdown neurons. Thesedecreases could be due to the loss of dendritic spines containingfunctional inhibitory synapses (see arrows in Fig. 4F). Spinesreceiving both an excitatory and inhibitory input were first describedby Jones and Powell (Jones and Powell, 1969) in the catsomatosensory cortex, and have since been implicated in inhibitorymechanisms by which the inhibitory synapses can reduce theexcitatory influence of other synapses (Dehay et al., 1991; Knottet al., 2002). The fact that the kinetics of mEPSCs and mIPSCswere not affected by DA knockdown, suggests that the subunitcomposition of the glutamate and GABA receptor channels werenot different in residual glutamatergic and GABAergic synapses,respectively, of DA-knockdown neurons. The parallel effects
Fig. 7. Effects of DA downregulation on glutamate function. Mixed hippocampal cultures of 21DIV treated for 2 days with 10μM sense or antisense oligonucleotides, followed byelectrophysiological recording. (A) Examples of mEPSCs recordings from DA sense (blacktrace) and antisense oligonucleotide-treated neurons (gray trace). (B,C) Cumulative probabilityplots of amplitude and frequency of mEPSCs in sense- and antisense-treated neurons. Theaverage amplitude and frequency of mEPSCs in sense and antisense oligonucleotide-treatedneurons are shown in insets. *P<0.05, K-S test. (D-F) Histograms showing the average risetime, decay time, and charge transfer of mEPSCs in oligonucleotide-treated neurons.***P<0.001, U-test.
Jour
nal o
f Cel
l Sci
ence

532
exerted by DA knockdown on mEPSCs and mIPSCs resulted inthe reduction of both glutamatergic and GABAergic transmissionefficacy. Despite these changes, the inhibition to excitation ratiowas not affected by the 73% reduction of DA expression. Combinedwith the data described above, these results indicated that theresidual DA was not sufficient to affect the functional balancebetween excitation and inhibition. One possible explanation of theeffects of DA on the inhibitory to excitatory ratio is that in the caseof overexpression of DA we affect only transfected postsynapticneurons, whereas in the case of underexpression of DA we alsoaffect the presynaptic neurons. Thus, the amounts of DA availablecan contribute to the homeostatic mechanism that maintains thestructural and functional balance between excitatory and inhibitorysynapses.
Journal of Cell Science 122 (4)
Interestingly, a decreased level in DA content is reportedin the superior temporal cortex in MCI and Alzheimerdisease (Counts et al., 2006; Kojima and Shirao, 2007).In addition, the level of postsynaptic DA has been shownto strongly correlate with the severity of cognitiveimpairment (Counts et al., 2006; Kojima and Shirao,2007). This indicated that a critical level of DA proteinmight be required for normal function. Therefore, wepropose a model in which improper expression of DAmight trigger either an imbalance in neuronal excitabilityor an alteration in synaptic transmission. In both cases,these alterations result in synaptic dysfunction reminiscentof that observed in the cognitive impairmentaccompanying normal aging and neurological disorders,including Alzheimer disease (Harigaya et al., 1996;Hatanpää et al., 1999; Counts et al., 2006; Kojima andShirao, 2007) and Down syndrome (Shim and Lubec,2002).
In conclusion, the identification of factors involved insynaptogenesis should enhance our understanding of themechanisms responsible for synaptic plasticity as well asthe cellular and molecular defects observed in neurologicaldisorders.
Materials and MethodscDNA constructsThe full-length drebrin A (DA, NCBI accession number NM-031024)fragment was amplified by PCR and inserted into pEGFP-N1 vector (BDBioscience Clontech, Palo Alto, CA). The DA-GFP construct wassubsequently fully sequenced. We also used GFP-ABS and GFP-DAΔABSconstructs (see Hayashi et al., 1999).
Cell lines, transfection and immunofluorescenceChinese Ovary (CHO-K1) cells were obtained from the American TypeTissue Culture Collection (ATCC, Molsheim, France). They were grownin F12 (Invitrogen, Cergy Pontoise, France), supplemented with 10% fetalbovine serum (FBS, Invitrogen), 2 mM glutamine (Invitrogen), 100 U/mlpenicillin and 100 mg/ml streptomycin (Sigma, Lyon, France). Cells wererinsed one time with serum-free medium (Opti-MEM, Invitrogen) andtransfections were performed according to the manufacturer’s protocol(Invitrogen). Briefly, cells were incubated in a solution containing 500μl Opti-MEM, 4 μl Plus reagent, 6 μl lipofectamine reagent (Invitrogen)and 1 μg of either the GFP, the DA-GFP, the GFP-ABS or the GFP-DA�ABS construct. After incubation for 4 hours at 37°C, the transfectionmixture was replaced by a fresh complete growth medium containing10% FBS. 24 hours after transfection, cells were fixed with 4%paraformaldehyde (PFA) in 0.12 M phosphate buffer (PB), pH 7.2-7.4for 20 minutes at room temperature (RT).
Quantitative analyses of the number of transfected cells were performedusing a fluorescence microscope with a �20 objective. Twenty fields percoverslip per experiment (n=3) were analyzed. Data were expressed asmean % of total cells per experiment ± s.e.m.
For the F-actin staining, the cells were incubated with 0.5% Triton X-100 and 1% blocking reagent (BR, Roche, Meylan, France) for 30 minutes and exposedfor 2 hours at RT to 0.5 U per coverslip of Texas-Red-labeled X phalloidin(Molecular Probes, Leiden, Netherlands), rinsed in PB and incubated with 0.5 μg/mlDNA intercalant Hoechst 33258 (Molecular Probes). Cells were rinsed in PB andthen mounted with Fluoromount G (Electron Microscopy, Fort Washington, PA).
In some experimental sets (n=3), the microfilament-depolymerizing drugcytochalasin B (Sigma, used at 10 μg/ml final concentration in 0.1%dimethylsulfoxide) was added into the medium to assess the stability of F-actin oftransfected cells. After incubation with cytochalasin B for 10 minutes, cells werefixed with PFA for 20 minutes, washed three times with PB, stained for F-actin asdescribed above, rinsed in PB, then incubated with Hoechst 33258, and mountedwith Fluoromount G.
Analysis was performed on a Leica (Mannheim, Germany) TCS SP2 confocalmicroscope using the 488 nm band of an Ar laser and the 543 nm band of aHe-Ne laser for excitation of GFP and Texas Red, respectively. Images wereacquired by sequential scanning using �63 1.32 oil-immersion lens (zoom 3) andprocessed with Adobe Photoshop. Results are shown in supplementary materialFigs S1-S4.
Fig. 8. Effects of DA downregulation on GABA function. Mixed hippocampal cultures of21 DIV treated for 2 days with 10 μM sense (S) or antisense (AS) DA oligonucleotides,followed by electrophysiological recording. (A) Examples of mIPSC recordings fromsense (black trace) and antisense neurons (gray trace). (B,C) Cumulative probability plotsof amplitude and frequency of mIPSCs in sense and antisense oligonucleotide-treatedneurons. The average amplitude and frequency of mIPSCs in oligonucleotide-treatedneurons are shown in insets. *P<0.05, **P<0.01, K-S test. (D-G) Histograms showing theaverage rise time, decay time, charge transfer and inhibition to excitation charge transferratio of mIPSCs in oligonucleotide-treated neurons. ***P<0.001, U-test.
Jour
nal o
f Cel
l Sci
ence

533Drebrin A regulates synaptic transmission
Primary cultures of rat hippocampal neurons and transfectionMixed hippocampal cultures were prepared from embryonic day 18 (E18) ratsaccording to Rami et al. (Rami et al., 2006). At 21 DIV, mixed hippocampal cultureswere transiently transfected using a Magnetofection Kit (OZ Biosciences, Marseille,France) and lipofectamine 2000 reagent according to the OZ Biosciences protocol.Following transfection, the cells were either used for electrophysiology recordingsor fixed with 4% PFA in 0.12 M phosphate buffer (PB), pH 7.2-7.4 for 20 minutesat RT for immunofluorescence. The transfection efficiency was less than 1%.
ImmunofluorescenceFor single immunolabeling of DA and double immunolabeling of DA/synaptophysinand DA/PSD-95, mixed hippocampal cultures of 21 DIV were incubated overnightat RT in DA antiserum (1:500) (Aoki et al., 2005) or a mixture of DA antiserum andeither synaptophysin (1:300, Chemicon, Temecula, CA), or PSD-95 (1:500, Upstate,Charlottesville, VA) monoclonal antibodies diluted in PB containing 1% BR. Afterseveral rinses in PB, coverslips were incubated in a mixture of Alexa 488-conjugatedgoat anti-rabbit IgG and Cy3-conjugated goat anti-mouse IgG (1:200, both fromJackson Immunoresearch, West Grove, PA) diluted in PB containing 1% BR.
For double labeling of DA/F-actin, cells were exposed for 2 hours at RT to 0.5 Uper coverslip of Texas-Red X phalloidin prepared in PB containing 1% BR.
Single immunolabeling of bassoon, double immunolabeling of synaptophysin/β2,3or Gad-65/vGlut1 were performed on hippocampal neurons transfected with GFP orDA-GFP. Cells were incubated with the following primary antibodies (most fromChemicon): polyclonal synaptophysin (1:500) and mouse monoclonal antibody againstGABAA receptor beta chain (β2,3, 1:500) or mouse monoclonal antibody againstGad 65 (one of the glutamic acid decarboxylase isoforms, 1:300) and guinea pigpolyclonal antiserum against vGlut1 (vesicular glutamate transporter 1, 1:5000) ormouse monoclonal antibody against bassoon (1:300, Assay designs, Ann Arbor, MI).After several rinses in PB, coverslips were incubated for 1 hour at RT in biotinylatedgoat- anti-rabbit IgG (1:200) or anti-mouse IgG (1:200), and then incubated in amixture of Cy5-conjugated streptavidin and Cy3-conjugated goat anti-mouse IgG orCy3-conjugated donkey anti-guinea pig IgG (1:200, all from JacksonImmunoresearch). Bassoon staining was revealed with Alexa Fluor 594-conjugatedgoat anti-mouse IgG (1:200, Molecular Probes) diluted in PB containing 1% BR. Inall cases, no labeling was detected when specific antibodies were replaced with normalrabbit, mouse, guinea pig serum or when primary antibodies were omitted.
Image acquisition and quantificationAll measurements were performed on spiny and pyramidal neurons that were visuallyidentified based on their morphology (Benson et al., 1994). Images were acquiredwith an Olympus fluoview-500 confocal microscope (Olympus, France) using an oilimmersion �60 1.4 lens (zoom 3). Dendritic protrusions were reconstructed from 7to 15 serial images of 0.5 μm thickness projected onto one plane. For morphometricanalysis, protrusion length, width and density were measured from projected imagesusing Neurolucida software as described previously (Rami et al., 2006).
Analysis of synaptic proteins was performed with an Olympus Fluoview-500confocal microscope using the 488, 543, 633 laser lines for excitation of GFP, Cy3and Cy5, respectively. For quantitation of synaptic protein clusters, pictures fromGFP and DA-GFP neurons were taken sequentially using �63 1.4 (zoom 3) with thesame exposure parameters. Then the projections of z-stacks were thresholded equallyto eliminate the background of dendritic staining and the remaining clusters werecounted based on their location either on dendritic shafts or on dendritic protrusionsusing Neurolucida or ImageJ softwares. Five to ten transfected neurons were chosenrandomly from three independent experiments for GFP and DA-GFP constructs andthe number of clusters was collected from at least three dendritic segments of 100μm per neuron. Then, the density of the synaptic protein clusters was determinedsimilarly to protrusion density.
Westerns blot analysisFor western blot analysis, cultures were homogenized in 50 mM Tris-HCl, pH 6.8,5% SDS, 6% 2-mercaptoethanol, 10% glycerol and 4 mM EDTA. Protein sampleswere boiled for 10 minutes, and equal amounts were loaded into each well, resolvedon 8% SDS-polyacrylamide gels and transferred onto Hybond-ECL nitrocellulosemembranes (Amersham Biosciences, Germany). Blots were then blocked,immunostained with appropriate antibodies and immunodetected using the enhancechemiluminescence system (ECL, Amersham Biosciences). Chemiluminescent signalswere projected on X-ray film and digitalized, and the signals were quantified usingImageJ.
Antisense experimentsTranslation of DA was suppressed by treatment of cultures with an antisensephosphorothioate-substituted DNA oligonucleotides (AS) (Takahashi et al., 2006).The sense phosphorothioate oligonucleotide (S) (Takahashi et al., 2006) was used asnegative control since the sense oligo treatment has no effect on the expression ofDA, β3-tubulin and synaptic activity compared with untreated cultures (supplementarymaterial Fig. S4). Therefore, we used sense oligo-treated neurons for the analysis ofthe control neuronal activity. At 21 DIV, cultures were treated for 2 days in the absence(untreated) or the presence of 10 μM sense or antisense oligonucleotides. Following
treatment, the cells were either used for western blot analysis or electrophysiologyrecordings.
Whole-cell recordingsPSCs or mPSCs were recorded from visually identified spiny and pyramidal neurons(Chudotvorova et al., 2005; Rami et al., 2006). The mEPSCs or mIPSCs were isolatedat –60 mV in the presence of TTX, D-AP5, strychnine and bicuculline/CNQX. Wetook into account for analysis, only neurons in which both mEPSCs and mIPSCswere recorded. To evaluate the change produced by DA-GFP overexpression or bytreatment with antisense oligonucleotides against DA on network activity and theoverall synaptic strength of a single neuron (Turrigiano et al., 1998; Burrone et al.,2002; Liu, 2004; Chih et al., 2005), the mean charge transfer was determined. Thisparameter depends simultaneously on the amplitude, frequency and kinetic ofpostsynaptic currents. Therefore, during spontaneous activity, charge transfer reflectsneuronal network activity. When this activity is blocked by TTX, the charge transferreflects the overall synaptic strength of a single neuron (Liu, 2004). Charge transfersfor sPSCs or mPSCs were calculated for each recorded neuron as the sPSCs or mPSCsarea (charge transferred by single postsynaptic current) multiplied on instantaneousfrequency value (instantaneous frequency=1/inter-event interval). In each experiment,the mean charge transfer values were normalized relative to the average mean controlvalue (expressed in %). To evaluate the effects of postsynaptic receptor agonists withindifferent cells, the current densities (amplitude/cell capacitance) were compared.Amplitudes of currents induced by bath application of agonists were measured 10seconds after starting perfusion with agonist containing solution (see Fig. 4A).
Statistical analysisAll experiments were repeated at least three times with different culture series.Morphological, immunostaining and western blot data were statistically analyzed byunpaired Student’s t-test for comparing two groups, or by ANOVA, with a post hocBonferroni’s t-test (Bonferroni test) for multiple comparison, as applicable.
Statistical analyses for frequency, amplitude, and area of mPSCs were performedwith the nonparametric Kolmogorov-Smirnov (K-S) test. Unpaired Student’s t-testwas used to examine the statistical significance of the differences between groups ofothers parameters (decay time, rise time, density of agonist induced current). All dataparameters were expressed as the mean ± s.e.m. To determine the difference betweengroups of charge transfer data, Kolmogorov-Smirnov as well as Mann-Whitney U(U-test) tests were used; the higher value of P was taken into account.
We thank Djaffar Boussa, Santiago Rivera, François Feron andMichel Khrestchatisky for critical reading of the manuscript. We alsothank Marie-Pierre Blanchard for her help with the Leica lasermicroscope. This work was supported by grants from the InstitutNational de la Santé et de la Recherche Médicale (INSERM) and theCentre National de la Recherche Scientifique (CNRS). This projectwas initiated in the INMED laboratory directed by Yezekiel Ben Ari.
ReferencesAoki, C., Sekino, Y., Hanamura, K., Fujisawa, S., Mahadomrongkul, V., Ren, Y. and
Shirao, T. (2005). Drebrin A is a postsynaptic protein that localizes in vivo to thesubmembranous surface of dendritic sites forming excitatory synapses. J. Comp. Neurol.483, 383-402.
Ballestrem, C., Wehrle-Haller, B. and Imhof, B. A. (1998). Actin dynamics in livingmammalian cells. J. Cell Sci. 111, 1649-1658.
Benson, D. L., Watkins, F. H., Steward, O. and Banker, G. (1994). Characterization ofGABAergic neurons in hippocampal cell cultures. J. Neurocytol. 23, 279-295.
Burrone, J., O’Byrne, M. and Murthy, V. N. (2002). Multiple forms of synaptic plasticitytriggered by selective suppression of activity in individual neurons. Nature 420, 414-418.
Buss, F., Temm-Grove, C., Henning, S. and Jockusch, B. M. (1992). Distribution ofprofilin in fibroblasts correlates with the presence of highly dynamic actin filaments.Cell Motil. Cytoskeleton 22, 51-61.
Carlsson, L., Nystrom, L. E., Sundkvist, I., Markey, F. and Lindberg, U. (1977). Actinpolymerizability is influenced by profilin, a low molecular weight protein in non-musclecells. J. Mol. Biol. 115, 465-483.
Chih, B., Engelman, H. and Scheiffele, P. (2005). Control of excitatory and inhibitorysynapse formation by neuroligins. Science 307, 1324-1328.
Chudotvorova, I., Ivanov, A., Rama, S., Hübner, C. A., Pellegrino, C., Ben-Ari, Y.and Medina, I. (2005). Early expression of KCC2 in rat hippocampal cultures augmentsexpression of functional GABA synapses. J. Physiol. 566, 671-679.
Cooper, J. A. (1987). Effects of cytochalasin and phalloidin on actin. J. Cell Biol. 105,1473-1478.
Counts, S. E., Nadeem, M., Lad, S. P., Wuu, J. and Mufson, E. J. (2006). Differentialexpression of synaptic proteins in the frontal and temporal cortex of elderly subjectswith mild cognitive impairment. J. Neuropathol. Exp. Neurol. 65, 592-601.
Dehay, C., Douglas, R. J., Martin, K. A. and Nelson, C. (1991). Excitation bygeniculocortical synapses is not ‘vetoed’ at the level of dendritic spines in cat visualcortex. J. Physiol. 440, 723-734.
Jour
nal o
f Cel
l Sci
ence

Edson, K., Weisshaar, B. and Matus, A. (1993). Actin depolymerisation induces processformation on MAP2-transfected non-neuronal cells. Development 117, 689-700.
Fifkova, E. and Delay, R. J. (1982). Cytoplasmic actin in neuronal processes as a possiblemediator of synaptic plasticity. J. Cell Biol. 95, 345-350.
Fukazawa, Y., Saitoh, Y., Ozawa, F., Ohta, Y., Mizuno, K. and Inokuchi, K. (2003).Hippocampal LTP is accompanied by enhanced F-actin content within the dendritic spinethat is essential for late LTP maintenance in vivo. Neuron 38, 447-460.
Harigaya, Y., Shoji, M., Shirao, T. and Hirai, S. (1996). Disappearance of actin-bindingprotein, drebrin, from hippocampal synapses in Alzheimer’s disease. J. Neurosci. Res.43, 87-92.
Harris, K. M. and Kater, S. B. (1994). Dendritic spines: cellular specializations impartingboth stability and flexibility to synaptic function. Annu. Rev. Neurosci. 17, 341-371.
Hatanpaa, K., Isaacs, K. R., Shirao, T., Brady, D. R. and Rapoport, S. I. (1999). Lossof proteins regulating synaptic plasticity in normal aging of the human brain and inAlzheimer disease. J. Neuropathol. Exp. Neurol. 58, 637-643.
Hausser, M., Spruston, N. and Stuart, G. J. (2000). Diversity and dynamics of dendriticsignaling. Science 290, 739-744.
Hayashi, K. and Shirao, T. (1999). Change in the shape of dendritic spines caused byoverexpression of drebrin in cultured cortical neurons. J. Neurosci. 19, 3918-3925.
Hayashi, K., Ishikawa, R., Ye, L. H., He, X. L., Takata, K., Kohama, K. and Shirao,T. (1996). Modulatory role of drebrin on the cytoskeleton within dendritic spines in therat cerebral cortex. J. Neurosci. 16, 7161-7170.
Hayashi, K., Ishikawa, R., Kawai-Hirai, R., Takagi, T., Taketomi, A. and Shirao, T.(1999). Domain analysis of the actin-binding and actin-remodeling activities of drebrin.Exp. Cell Res. 253, 673-680.
Ikeda, K., Kaub, P. A., Asada, H., Uyemura, K., Toya, S. and Shirao, T. (1996).Stabilization of adhesion plaques by the expression of drebrin A in fibroblasts. BrainRes. Dev. Brain Res. 91, 227-236.
Ishikawa, R., Hayashi, K., Shirao, T., Xue, Y., Takagi, T., Sasaki, Y. and Kohama, K.(1994). Drebrin, a development-associated brain protein from rat embryo, causes thedissociation of tropomyosin from actin filaments. J. Biol. Chem. 269, 29928-29933.
Ishikawa, R., Katoh, K., Takahashi, A., Xie, C., Oseki, K., Watanabe, M., Igarashi,M., Nakamura, A. and Kohama, K. (2007). Drebrin attenuates the interaction betweenactin and myosin-V. Biochem. Biophys. Res. Commun. 359, 398-401.
Jones, E. G. and Powell, T. P. (1969). Morphological variations in the dendritic spinesof the neocortex. J. Cell Sci. 5, 509-529.
Kneussel, M. and Loebrich, S. (2007). Trafficking and synaptic anchoring of ionotropicinhibitory neurotransmitter receptors. Biol. Cell 99, 297-309.
Knott, G. W., Quairiaux, C., Genoud, C. and Welker, E. (2002). Formation of dendriticspines with GABAergic synapses induced by whisker stimulation in adult mice. Neuron34, 265-273.
Kojima, N. and Shirao, T. (2007). Synaptic dysfunction and disruption of postsynapticdrebrin-actin complex: a study of neurological disorders accompanied by cognitivedeficits. Neurosci. Res. 58, 1-5.
Levinson, J. N. and El-Husseini, A. (2005a). Building excitatory and inhibitory synapses:balancing neuroligin partnerships. Neuron 48, 171-174.
Levinson, J. N. and El-Husseini, A. (2005b). New players tip the scales in the balancebetween excitatory and inhibitory synapses. Mol. Pain 1, 12.
Levinson, J. N., Chery, N., Huang, K., Wong, T. P., Gerrow, K., Kang, R., Prange,O., Wang, Y. T. and El-Husseini, A. (2005). Neuroligins mediate excitatory andinhibitory synapse formation: involvement of PSD-95 and neurexin-1beta in neuroligin-induced synaptic specificity. J. Biol. Chem. 280, 17312-17319.
Liu, G. (2004). Local structural balance and functional interaction of excitatory andinhibitory synapses in hippocampal dendrites. Nat. Neurosci. 7, 373-379.
Mammoto, A., Sasaki, T., Asakura, T., Hotta, I., Imamura, H., Takahashi, K.,Matsuura, Y., Shirao, T. and Takai, Y. (1998). Interactions of drebrin and gephyrinwith profilin. Biochem. Biophys. Res. Commun. 243, 86-89.
Matus, A. (2000). Actin-based plasticity in dendritic spines. Science 290, 754-758.Matus, A., Ackermann, M., Pehling, G., Byers, H. R. and Fujiwara, K. (1982). High
actin concentrations in brain dendritic spines and postsynaptic densities. Proc. Natl. Acad.Sci. USA 79, 7590-7594.
McKernan, R. M. and Whiting, P. J. (1996). Which GABAA-receptor subtypes reallyoccur in the brain? Trends Neurosci. 19, 139-143.
Papa, M., Bundman, M. C., Greenberger, V. and Segal, M. (1995). Morphologicalanalysis of dendritic spine development in primary cultures of hippocampal neurons. J.Neurosci. 15, 1-11.
Prange, O., Wong, T. P., Gerrow, K., Wang, Y. T. and El-Husseini, A. (2004). A balancebetween excitatory and inhibitory synapses is controlled by PSD-95 and neuroligin. Proc.Natl. Acad. Sci. USA 101, 13915-13920.
Rami, G., Caillard, O., Medina, I., Pellegrino, C., Fattoum, A., Ben-Ari, Y. and Ferhat,L. (2006). Change in the shape and density of dendritic spines caused by overexpressionof acidic calponin in cultured hippocampal neurons. Hippocampus 16, 183-197.
Richter, K., Langnaese, K., Kreutz, M. R., Olias, G., Zhai, R., Scheich, H., Garner,C. C. and Gundelfinger, E. D. (1999). Presynaptic cytomatrix protein bassoon islocalized at both excitatory and inhibitory synapses of rat brain. J. Comp. Neurol. 408,437-448.
Rothkegel, M., Mayboroda, O., Rohde, M., Wucherpfennig, C., Valenta, R. andJockusch, B. M. (1996). Plant and animal profilins are functionally equivalent andstabilize microfilaments in living animal cells. J. Cell Sci. 109, 83-90.
Rubenstein, J. L. and Merzenich, M. M. (2003). Model of autism: increased ratio ofexcitation/inhibition in key neural systems. Genes Brain Behav. 2, 255-267.
Sasaki, Y., Hayashi, K., Shirao, T., Ishikawa, R. and Kohama, K. (1996). Inhibitionby drebrin of the actin-bundling activity of brain fascin, a protein localized in filopodiaof growth cones. J. Neurochem. 66, 980-988.
Sekino, Y., Kojima, N. and Shirao, T. (2007). Role of actin cytoskeleton in dendriticspine morphogenesis. Neurochem. Int. 51, 92-104.
Shim, K. S. and Lubec, G. (2002). Drebrin, a dendritic spine protein, is manifold decreasedin brains of patients with Alzheimer’s disease and Down syndrome. Neurosci. Lett. 324,209-212.
Shirao, T., Hayashi, K., Ishikawa, R., Isa, K., Asada, H., Ikeda, K. and Uyemura, K.(1994). Formation of thick, curving bundles of actin by drebrin A expressed infibroblasts. Exp. Cell Res. 215, 145-153.
Takahashi, H., Sekino, Y., Tanaka, S., Mizui, T., Kishi, S. and Shirao, T. (2003). Drebrin-dependent actin clustering in dendritic filopodia governs synaptic targeting of postsynapticdensity-95 and dendritic spine morphogenesis. J. Neurosci. 23, 6586-6595.
Takahashi, H., Mizui, T. and Shirao, T. (2006). Down-regulation of drebrin A expressionsuppresses synaptic targeting of NMDA receptors in developing hippocampal neurones.J. Neurochem. 97 Suppl. 1, 110-115.
Turrigiano, G. G. and Nelson, S. B. (2004). Homeostatic plasticity in the developingnervous system. Nat. Rev Neurosci 5, 97-107.
Turrigiano, G. G., Leslie, K. R., Desai, N. S., Rutherford, L. C. and Nelson, S. B.(1998). Activity-dependent scaling of quantal amplitude in neocortical neurons. Nature391, 892-896.
Yahara, I., Harada, F., Sekita, S., Yoshihira, K. and Natori, S. (1982). Correlationbetween effects of 24 different cytochalasins on cellular structures and cellular eventsand those on actin in vitro. J. Cell Biol. 92, 69-78.
Yuste, R. and Bonhoeffer, T. (2001). Morphological changes in dendritic spines associatedwith long-term synaptic plasticity. Annu. Rev. Neurosci. 24, 1071-1089.
Journal of Cell Science 122 (4)534
Jour
nal o
f Cel
l Sci
ence