draft report - illinois.gov
TRANSCRIPT
Draft Report
Illinois Environmental Protection Agency Cahokia Canal/Horseshoe Lake Watershed Total Maximum Daily Load Stage Three Report January 2008

THIS PAGE INTENTIONALLY LEFT BLANK
DRAFT i
T:\GIS\STAGE3\CAHOKIA-HORSESHOE\STAGE3DRAFT\DRAFT\TOC-LOFT CAHOKIA CL - HORSESHOE L.DOC
Contents
Sections 1-6 Stage 1 Report .........................................................................Attachment 1
Section 7 Methodology Development for the Cahokia Canal/Horseshoe Lake Watershed
7.1 Methodology Overview ................................................................................... 7-1 7.1.1 QUAL2K Overview........................................................................... 7-1 7.1.2 Load-Duration Curve Overview ........................................................ 7-1 7.1.3 BATHTUB Overview........................................................................ 7-2
7.2 Methodology Development ............................................................................. 7-2 7.2.1 QUAL2K Model ................................................................................ 7-3
7.2.1.1 QUAL2K Inputs............................................................... 7-3 7.2.1.1.1 Stream Segmentation .................................... 7-3 7.2.1.1.2 Hydraulic Characteristics.............................. 7-3 7.2.1.1.3 Headwater Conditions .................................. 7-4 7.2.1.1.3.1 Cahokia Canal............................................... 7-4 7.2.1.1.3.2 Canteen Creek............................................... 7-4 7.2.1.1.4 Climate.......................................................... 7-5 7.2.1.1.5 Point Sources ................................................ 7-5
7.2.1.2 QUAL2K Calibration....................................................... 7-5 7.2.2 Load Duration Curve Development................................................... 7-6
7.2.2.1 Watershed Delineation and Flow Estimation .................. 7-6 7.2.2.2 Total Manganese Analysis for Canteen Creek Segment
JNA02 .............................................................................. 7-7 7.2.2.3 Fecal Coliform Analysis for Harding Ditch Segment
JMAC01........................................................................... 7-7 7.2.3 BATHTUB Development for Horseshoe Lake.................................. 7-8
7.2.3.1 Horseshoe Lake Operations and Watershed Delineation....................................................................... 7-8
7.2.3.2 Global Inputs.................................................................... 7-9 7.2.3.3 Reservoir Segment Inputs .............................................. 7-10 7.2.3.4 Tributary Inputs ............................................................. 7-10 7.2.3.5 Horseshoe Lake BATHTUB Confirmatory Analysis .... 7-12
7.2.4 BATHTUB Development for Frank Holten Lakes.......................... 7-13 7.2.4.1 Operation of Frank Holten Lakes and Watershed
Delineation..................................................................... 7-13 7.2.4.2 Global Inputs.................................................................. 7-13 7.2.4.3 Reservoir Segment Inputs .............................................. 7-14 7.2.4.4 Tributary Inputs ............................................................. 7-14 7.2.4.5 Frank Holten Lakes BATHTUB Confirmatory
Analysis.......................................................................... 7-15
Table of Contents Development of Total Maximum Daily Loads Cahokia Canal/Horseshoe Lake Watershed
ii DRAFT
T:\GIS\STAGE3\CAHOKIA-HORSESHOE\STAGE3DRAFT\DRAFT\TOC-LOFT CAHOKIA CL - HORSESHOE L.DOC
Section 8 Total Maximum Daily Loads for the Cahokia Canal/Horseshoe Lake Watershed
8.1 TMDL Endpoints ............................................................................................. 8-1 8.2 Pollutant Source and Linkage .......................................................................... 8-1 8.3 Allocation......................................................................................................... 8-2
8.3.1 Cahokia Canal DO TMDL................................................................. 8-2 8.3.1.1 Loading Capacity ............................................................. 8-2
8.3.2 Canteen Creek Manganese TMDL .................................................... 8-3 8.3.2.1 Loading Capacity ............................................................. 8-3 8.3.2.2 Seasonal Variation ........................................................... 8-3 8.3.2.3 Margin of Safety .............................................................. 8-3 8.3.2.4 Waste Load Allocation .................................................... 8-3 8.3.2.5 Load Allocation and TMDL Summary............................ 8-3
8.3.3 Harding Ditch Fecal Coliform TMDL............................................... 8-4 8.3.3.1 Loading Capacity ............................................................. 8-4 8.3.3.2 Seasonal Variation ........................................................... 8-4 8.3.3.3 Margin of Safety .............................................................. 8-4 8.3.3.4 Waste Load Allocation .................................................... 8-5 8.3.3.5 Load Allocation and TMDL Summary............................ 8-5
8.3.4 Horseshoe Lake Total Phosphorus TMDL ........................................ 8-5 8.3.4.1 Loading Capacity ............................................................. 8-5 8.3.4.2 Seasonal Variation ........................................................... 8-6 8.3.4.3 Margin of Safety .............................................................. 8-6 8.3.4.4 Waste Load Allocation .................................................... 8-7 8.3.4.5 Load Allocation and TMDL Summary............................ 8-7
8.3.5 Frank Holten Lakes Total Phosphorus TMDL .................................. 8-8 8.3.5.1 Loading Capacity ............................................................. 8-8 8.3.5.2 Seasonal Variation ........................................................... 8-8 8.3.5.3 Margin of Safety .............................................................. 8-8 8.3.5.4 Waste Load Allocation .................................................... 8-9 8.3.5.5 Load Allocation and TMDL Summary............................ 8-9
Table of Contents Development of Total Maximum Daily Loads Cahokia Canal/Horseshoe Lake Watershed
DRAFT iii
T:\GIS\Stage3\Cahokia-Horseshoe\Stage3Draft\DRAFT\TOC-LOFT Cahokia Cl - Horseshoe L.doc
Section 9 Implementation Plan for the Cahokia Canal/Horseshoe Lake Watershed 9.1 Adaptive Management ..................................................................................... 9-1 9.2 Implementation Actions and Management Measures for DO in the
Cahokia Canal.................................................................................................. 9-2 9.2.1 Point Sources of Oxygen-Demanding Materials ............................... 9-2
9.2.1.1 Stormwater Sources ......................................................... 9-2 9.2.1.2 Municipal/Industrial Sources ........................................... 9-3
9.2.2 Nonpoint Sources of Oxygen-Demanding Materials......................... 9-4 9.2.2.1 Filter Strips....................................................................... 9-4 9.2.2.2 Reaeration/Streambank Stabilization............................... 9-5
9.3 Implementation Actions and Management Measures for Manganese in Canteen Creek.................................................................................................. 9-6 9.3.1 Nonpoint Sources of Manganese ....................................................... 9-6
9.3.1.1 Filter Strips....................................................................... 9-6 9.3.1.2 Sediment Control Basins.................................................. 9-6 9.3.1.3 Streambank Stabilization/Erosion Control ...................... 9-7
9.4 Implementation Actions and Management Measures for Fecal Coliform in Harding Ditch................................................................................................... 9-7 9.4.1 Point Sources of Fecal Coliform........................................................ 9-8
9.4.1.1 Stormwater Sources ......................................................... 9-8 9.4.1.2 Municipal Wastewater Sources........................................ 9-8
9.4.2 Nonpoint Sources of Fecal Coliform ................................................. 9-8 9.4.2.1 Filter Strips....................................................................... 9-9 9.4.2.2 Private Septic System Inspection and Maintenance
Program............................................................................ 9-9 9.4.2.3 Restrict Livestock Access to Harding Ditch and
Tributaries ...................................................................... 9-10 9.5 Implementation Actions and Management Measures for Phosphorus in
Horseshoe Lake and the Frank Holten Lakes ................................................ 9-10 9.5.1 Point Sources of Phosphorus ........................................................... 9-10
9.5.1.1 Stormwater Sources ....................................................... 9-10 9.5.1.2 Industrial Sources........................................................... 9-11
9.5.2 Nonpoint Sources of Phosphorus..................................................... 9-11 9.5.2.1 Conservation Tillage Practices ...................................... 9-12 9.5.2.2 Filter Strips..................................................................... 9-12 9.5.2.3 Wetlands ........................................................................ 9-13 9.5.2.4 Nutrient Management .................................................... 9-13 9.5.2.5 Septic System Maintenance and Sanitary System ......... 9-14
9.5.3 In-Lake Phosphorus ......................................................................... 9-14 9.6 Reasonable Assurance ................................................................................... 9-15
9.6.1 Available Programs for Nonpoint Source Management .................. 9-15
Table of Contents Development of Total Maximum Daily Loads Cahokia Canal/Horseshoe Lake Watershed
iv DRAFT
T:\GIS\STAGE3\CAHOKIA-HORSESHOE\STAGE3DRAFT\DRAFT\TOC-LOFT CAHOKIA CL - HORSESHOE L.DOC
9.6.1.1 Illinois Department of Agriculture and Illinois EPA Nutrient Management Plan Project................................ 9-16
9.6.1.2 Conservation Reserve Program (CRP) .......................... 9-16 9.6.1.3 Clean Water Act Section 319 Grants ............................. 9-17 9.6.1.4 Wetlands Reserve Program (WRP) ............................... 9-17 9.6.1.5 Environmental Quality Incentive Program (EQIP)........ 9-18 9.6.1.6 Wildlife Habitat Incentives Program (WHIP) ............... 9-19 9.6.1.7 Streambank Stabilization and Restoration Practice ....... 9-19 9.6.1.8 Conservation Practices Cost-Share Program ................. 9-19 9.6.1.9 Local Program Information............................................ 9-20
9.6.2 Cost Estimates of BMPs .................................................................. 9-20 9.6.2.1 Wetlands ........................................................................ 9-20 9.6.2.2 Filter Strips and Riparian Buffers .................................. 9-20 9.6.2.3 Nutrient Management Plan - NRCS .............................. 9-20 9.6.2.4 Nutrient Management Plan - IDA and Illinois EPA ...... 9-20 9.6.2.5 Conservation Tillage...................................................... 9-21 9.6.2.6 Internal Cycling ............................................................. 9-21 9.6.2.7 Planning Level Cost Estimates for Implementation
Measures ........................................................................ 9-21 9.7 Monitoring Plan ............................................................................................. 9-22 9.8 Implementation Time Line ............................................................................ 9-23
Section 10 References Appendices Appendix E Cross Section Data for Cahokia Canal Appendix F QUAL2K Model Appendix G Canteen Creek Load Duration Curve Appendix H Harding Ditch Load Duration Curve Appendix I BATHTUB Analysis for Horseshoe Lake Appendix J BATHTUB Analysis for the Frank Holten Lakes
DRAFT v
T:\GIS\STAGE3\CAHOKIA-HORSESHOE\STAGE3DRAFT\DRAFT\TOC-LOFT CAHOKIA CL - HORSESHOE L.DOC
Figures
7-1 QUAL2K Segmentation Cahokia Creek 7-2 Canteen Creek Watershed Delineation 7-3 Harding Ditch Watershed Delineation 7-4 Manganese Load Duration Series for Canteen Creek 7-5 Fecal Coliform Load Duration Curve for Harding Ditch 7-6 Horseshoe Lake BATHTUB Schematic 7-7 Frank Holten Lakes BATHTUB Schematic 9-1 Potential Areas for Filter Strip Implementation

List of Figures Development of Total Maximum Daily Loads Cahokia Canal/Horseshoe Lake Watershed
vi
T:\GIS\STAGE3\CAHOKIA-HORSESHOE\STAGE3DRAFT\DRAFT\TOC-LOFT CAHOKIA CL - HORSESHOE L.DOC
THIS PAGE INTENTIONALLY LEFT BLANK

DRAFT vii
T:\GIS\STAGE3\CAHOKIA-HORSESHOE\STAGE3DRAFT\DRAFT\TOC-LOFT CAHOKIA CL - HORSESHOE L.DOC
Tables
7-1 Methodologies Used to Develop TMDLs in the Cahokia Canal/ Horseshoe Lake Watershed ............................................................................. 7-1
7-2 Q2K Data Inputs .............................................................................................. 7-3 7-3 Point Source Discharges within the Cahokia Canal Watershed ...................... 7-5 7-4 Horseshoe Lake Subbasin Characteristics ..................................................... 7-11 7-5 Summary of Horseshoe Lake Model Confirmatory Analyses....................... 7-12 7-6 Frank Holten Lakes Subbasin Characteristics ............................................... 7-14 7-7 Summary of Frank Holten Lakes Model Confirmatory Analyses ................. 7-16 8-1 TMDL Endpoints and Average Observed Concentrations for Impaired
Constituents in the Cahokia Canal/Horseshoe Lake Watershed...................... 8-1 8-2 Manganese Loading Capacity for Canteen Creek Segment JNA01 ................ 8-3 8-3 TMDL Summary for Manganese in Canteen Creek ........................................ 8-4 8-4 Fecal Coliform Loading Capacity of Harding Ditch Segment JMAC02......... 8-4 8-5 TMDL Summary for Fecal Coliform in Harding Ditch................................... 8-5 8-6 Current Estimated Percent Load Contribution by Source................................ 8-7 8-7 TMDL Summary for Total Phosphorus in Horseshoe Lake............................ 8-7 8-8 TMDL Summary for Total Phosphorus in Frank Holten Lakes - Dry
Season .............................................................................................................. 8-9 8-9 TMDL Summary for Total Phosphorus in Frank Holten Lakes - Wet
Season .............................................................................................................. 8-9 9-1 Current Estimated CBOD5 Load...................................................................... 9-3 9-2 Current Estimated Ammonia Load .................................................................. 9-3 9-3 Permit Expiration Dates for Point Source Discharges within the
Cahokia Canal Watershed................................................................................ 9-3 9-4 Filter Strip Flow Lengths Based on Land Slope.............................................. 9-5 9-5 Acres of Wetlands for Horseshoe Lake Watershed ....................................... 9-13 9-6 Costs for Enrollment Options of WRP Program............................................ 9-18 9-7 Local NRCS and FSA Contact Information .................................................. 9-20 9-8 Cost Estimate of Various BMP Measures in McLean County ...................... 9-21

List of Tables Development of Total Maximum Daily Loads Cahokia Canal/Horseshoe Lake Watershed
viii
T:\GIS\STAGE3\CAHOKIA-HORSESHOE\STAGE3DRAFT\DRAFT\TOC-LOFT CAHOKIA CL - HORSESHOE L.DOC
THIS PAGE INTENTIONALLY LEFT BLANK
DRAFT ix
T:\GIS\STAGE3\CAHOKIA-HORSESHOE\STAGE3DRAFT\DRAFT\TOC-LOFT CAHOKIA CL - HORSESHOE L.DOC
Acronyms
°F degrees Fahrenheit ALMP Ambient Lake Monitoring Program BMP best management practice BOD biochemical oxygen demand CBOD5 5-day carbonaceous biochemical oxygen demand cfs cubic feet per second CRP Conservation Reserve Program CWA Clean Water Act DEM Digital Elevation Model DMR Discharge Monitoring Reports DO dissolved oxygen DP dissolved phosphorus ft foot GIS geographic information system GWLF generalized watershed loading function HUC Hydrologic Unit Code IBI Index of Biotic Integrity ICLP Illinois Clean Lakes Program IDA Illinois Department of Agriculture IDNR Illinois Department of Natural Resources ILLCP Illinois Interagency Landscape Classification Project Illinois EPA Illinois Environmental Protection Agency IPCB Illinois Pollution Control Board ISWS Illinois State Water Survey LA load allocation LC loading capacity MBI Macroinvertebrate Biotic Index mg/L milligrams per liter MOS margin of safety NASS National Agricultural Statistics Service NCDC National Climatic Data Center NRCS National Resource Conservation Service PO4 phosphate SSURGO Soil Survey Geographic Database
List of Acronyms Development of Total Maximum Daily Loads Cahokia Canal/Horseshoe Lake Watershed
x
T:\GIS\STAGE3\CAHOKIA-HORSESHOE\STAGE3DRAFT\DRAFT\TOC-LOFT CAHOKIA CL - HORSESHOE L.DOC
STATSGO State Soil Geographic STORET Storage and Retrieval TMDL total maximum daily load TP total phosphorus TSS total suspended solids USEPA U.S. Environmental Protection Agency USGS U.S. Geological Survey WLA waste load allocation
DRAFT 7-1
T:\GIS\Stage3\Cahokia-Horseshoe\Stage3Draft\DRAFT\Sec 7 Cahokia Cl - Horseshoe L.doc
Schematic 1
Schematic 2
Section 7 Methodology Development for the Cahokia Canal/Horseshoe Lake Watershed 7.1 Methodology Overview Table 7-1 contains information on the methodologies selected and used to develop TMDLs for impaired segments within the Cahokia Canal/Horseshoe Lake watershed.
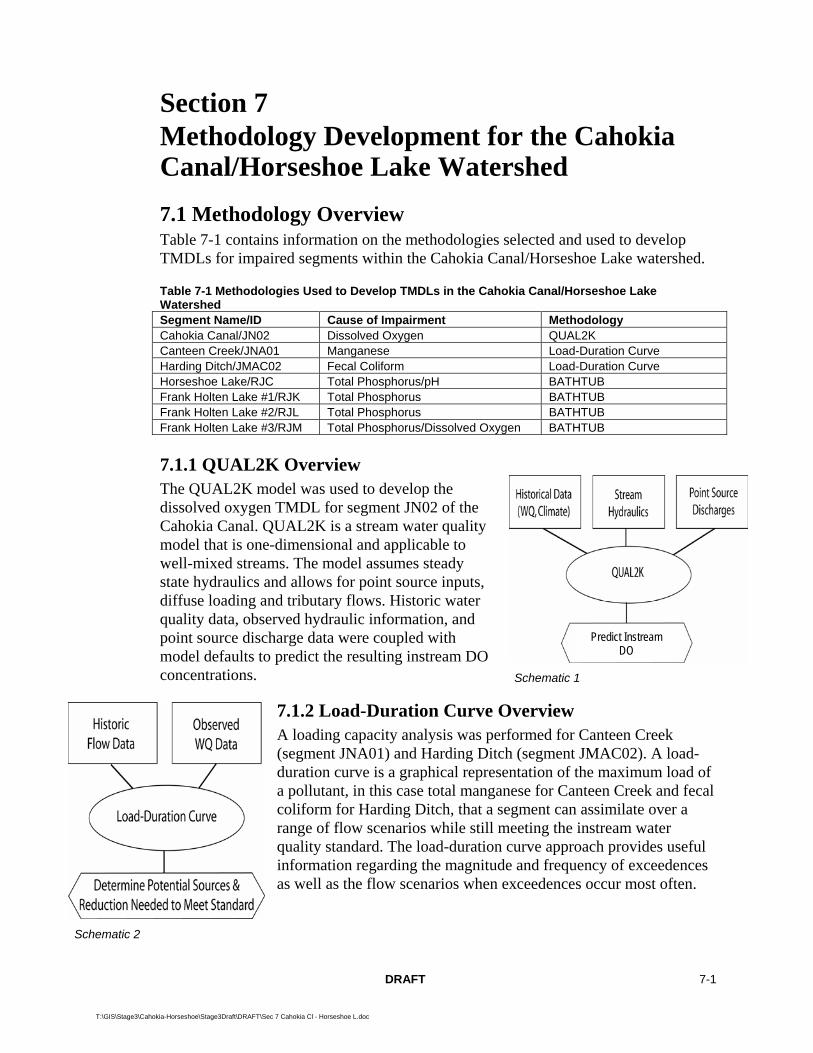
Table 7-1 Methodologies Used to Develop TMDLs in the Cahokia Canal/Horseshoe Lake Watershed Segment Name/ID Cause of Impairment Methodology Cahokia Canal/JN02 Dissolved Oxygen QUAL2K Canteen Creek/JNA01 Manganese Load-Duration Curve Harding Ditch/JMAC02 Fecal Coliform Load-Duration Curve Horseshoe Lake/RJC Total Phosphorus/pH BATHTUB Frank Holten Lake #1/RJK Total Phosphorus BATHTUB Frank Holten Lake #2/RJL Total Phosphorus BATHTUB Frank Holten Lake #3/RJM Total Phosphorus/Dissolved Oxygen BATHTUB 7.1.1 QUAL2K Overview The QUAL2K model was used to develop the dissolved oxygen TMDL for segment JN02 of the Cahokia Canal. QUAL2K is a stream water quality model that is one-dimensional and applicable to well-mixed streams. The model assumes steady state hydraulics and allows for point source inputs, diffuse loading and tributary flows. Historic water quality data, observed hydraulic information, and point source discharge data were coupled with model defaults to predict the resulting instream DO concentrations.
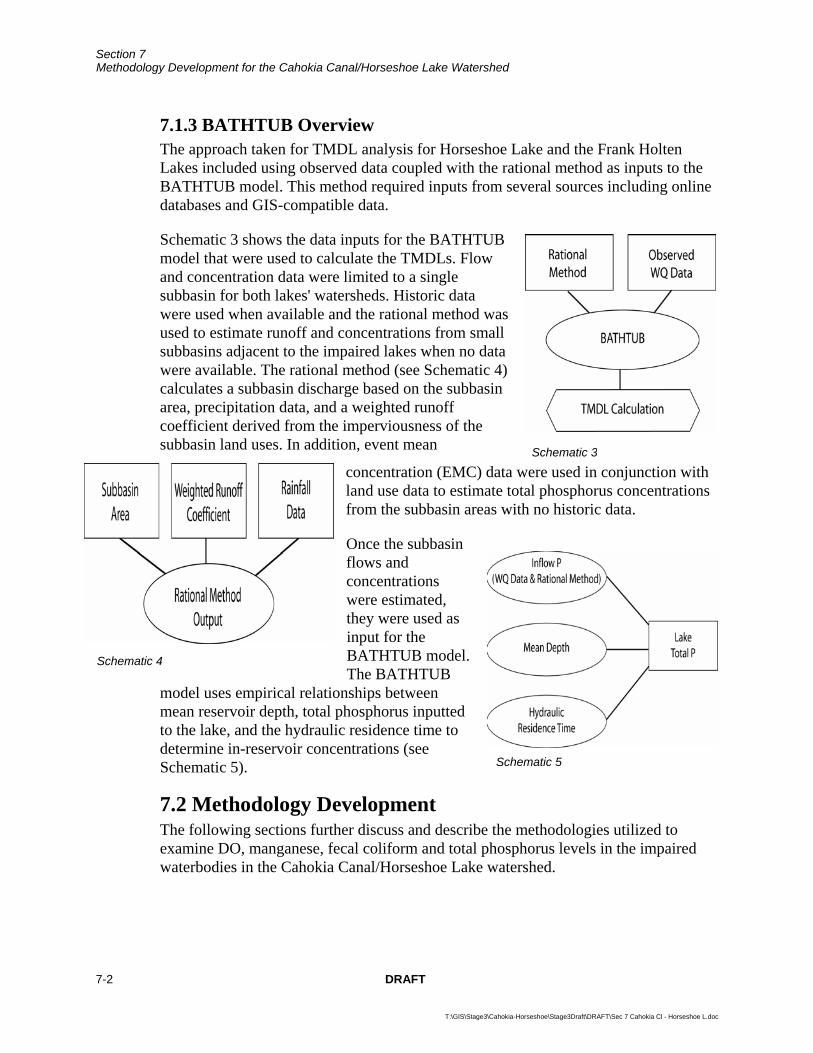
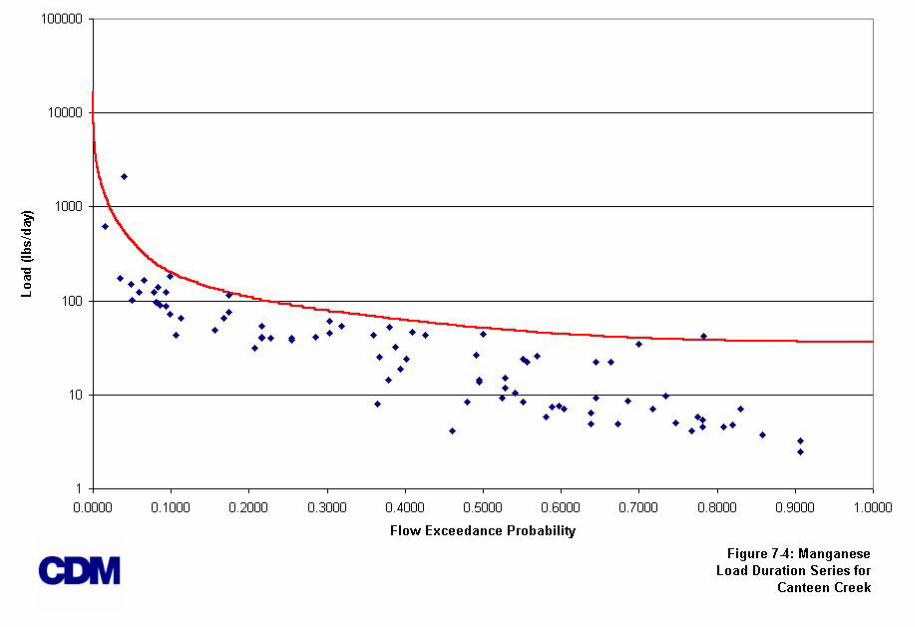
7.1.2 Load-Duration Curve Overview A loading capacity analysis was performed for Canteen Creek (segment JNA01) and Harding Ditch (segment JMAC02). A load-duration curve is a graphical representation of the maximum load of a pollutant, in this case total manganese for Canteen Creek and fecal coliform for Harding Ditch, that a segment can assimilate over a range of flow scenarios while still meeting the instream water quality standard. The load-duration curve approach provides useful information regarding the magnitude and frequency of exceedences as well as the flow scenarios when exceedences occur most often.
Predict Instream DO
Section 7 Methodology Development for the Cahokia Canal/Horseshoe Lake Watershed
7-2 DRAFT
T:\GIS\Stage3\Cahokia-Horseshoe\Stage3Draft\DRAFT\Sec 7 Cahokia Cl - Horseshoe L.doc
Schematic 3
Schematic 4
Schematic 5
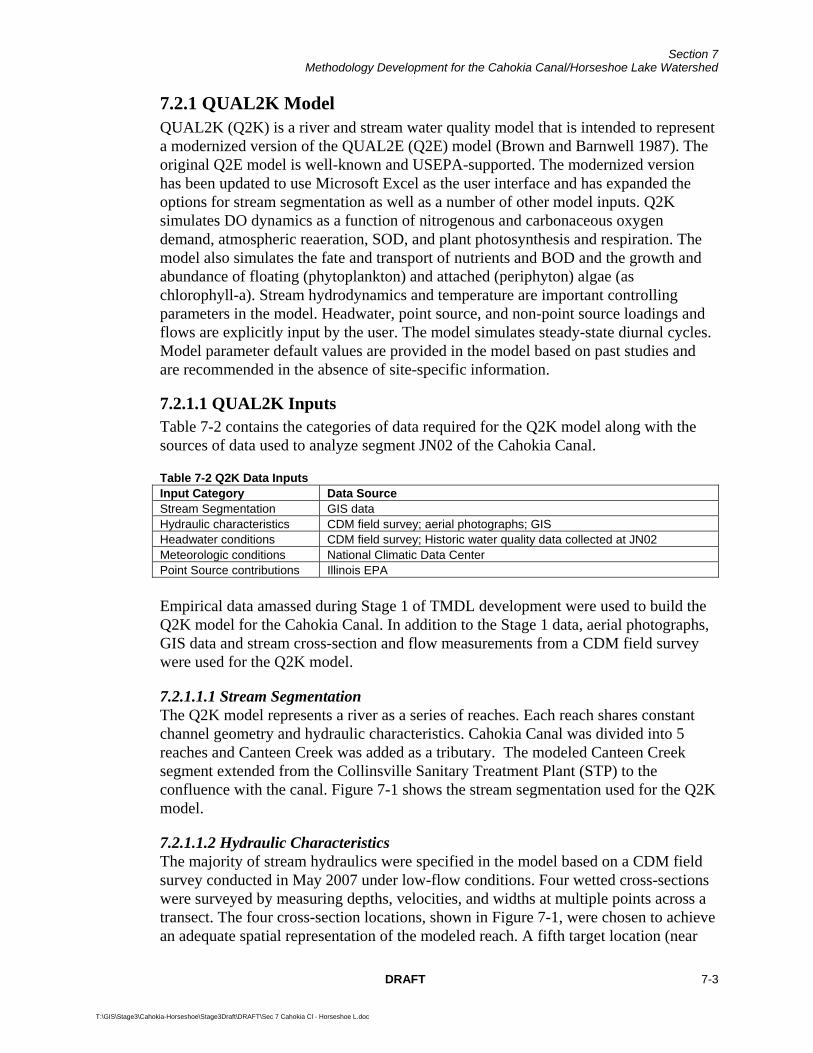
7.1.3 BATHTUB Overview The approach taken for TMDL analysis for Horseshoe Lake and the Frank Holten Lakes included using observed data coupled with the rational method as inputs to the BATHTUB model. This method required inputs from several sources including online databases and GIS-compatible data.
Schematic 3 shows the data inputs for the BATHTUB model that were used to calculate the TMDLs. Flow and concentration data were limited to a single subbasin for both lakes' watersheds. Historic data were used when available and the rational method was used to estimate runoff and concentrations from small subbasins adjacent to the impaired lakes when no data were available. The rational method (see Schematic 4) calculates a subbasin discharge based on the subbasin area, precipitation data, and a weighted runoff coefficient derived from the imperviousness of the subbasin land uses. In addition, event mean
concentration (EMC) data were used in conjunction with land use data to estimate total phosphorus concentrations from the subbasin areas with no historic data.
Once the subbasin flows and concentrations were estimated, they were used as input for the BATHTUB model. The BATHTUB
model uses empirical relationships between mean reservoir depth, total phosphorus inputted to the lake, and the hydraulic residence time to determine in-reservoir concentrations (see Schematic 5).
7.2 Methodology Development The following sections further discuss and describe the methodologies utilized to examine DO, manganese, fecal coliform and total phosphorus levels in the impaired waterbodies in the Cahokia Canal/Horseshoe Lake watershed.
Section 7 Methodology Development for the Cahokia Canal/Horseshoe Lake Watershed
DRAFT 7-3
T:\GIS\Stage3\Cahokia-Horseshoe\Stage3Draft\DRAFT\Sec 7 Cahokia Cl - Horseshoe L.doc
7.2.1 QUAL2K Model QUAL2K (Q2K) is a river and stream water quality model that is intended to represent a modernized version of the QUAL2E (Q2E) model (Brown and Barnwell 1987). The original Q2E model is well-known and USEPA-supported. The modernized version has been updated to use Microsoft Excel as the user interface and has expanded the options for stream segmentation as well as a number of other model inputs. Q2K simulates DO dynamics as a function of nitrogenous and carbonaceous oxygen demand, atmospheric reaeration, SOD, and plant photosynthesis and respiration. The model also simulates the fate and transport of nutrients and BOD and the growth and abundance of floating (phytoplankton) and attached (periphyton) algae (as chlorophyll-a). Stream hydrodynamics and temperature are important controlling parameters in the model. Headwater, point source, and non-point source loadings and flows are explicitly input by the user. The model simulates steady-state diurnal cycles. Model parameter default values are provided in the model based on past studies and are recommended in the absence of site-specific information.
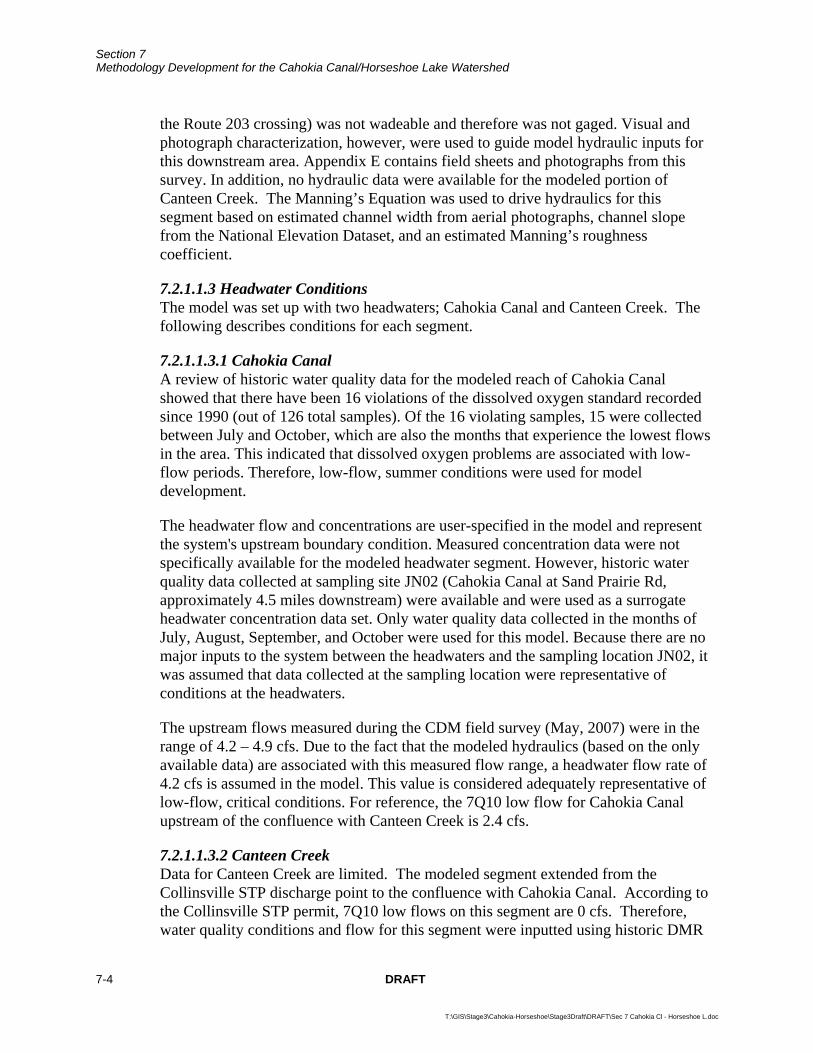
7.2.1.1 QUAL2K Inputs Table 7-2 contains the categories of data required for the Q2K model along with the sources of data used to analyze segment JN02 of the Cahokia Canal.
Table 7-2 Q2K Data Inputs Input Category Data Source Stream Segmentation GIS data Hydraulic characteristics CDM field survey; aerial photographs; GIS Headwater conditions CDM field survey; Historic water quality data collected at JN02 Meteorologic conditions National Climatic Data Center Point Source contributions Illinois EPA Empirical data amassed during Stage 1 of TMDL development were used to build the Q2K model for the Cahokia Canal. In addition to the Stage 1 data, aerial photographs, GIS data and stream cross-section and flow measurements from a CDM field survey were used for the Q2K model.
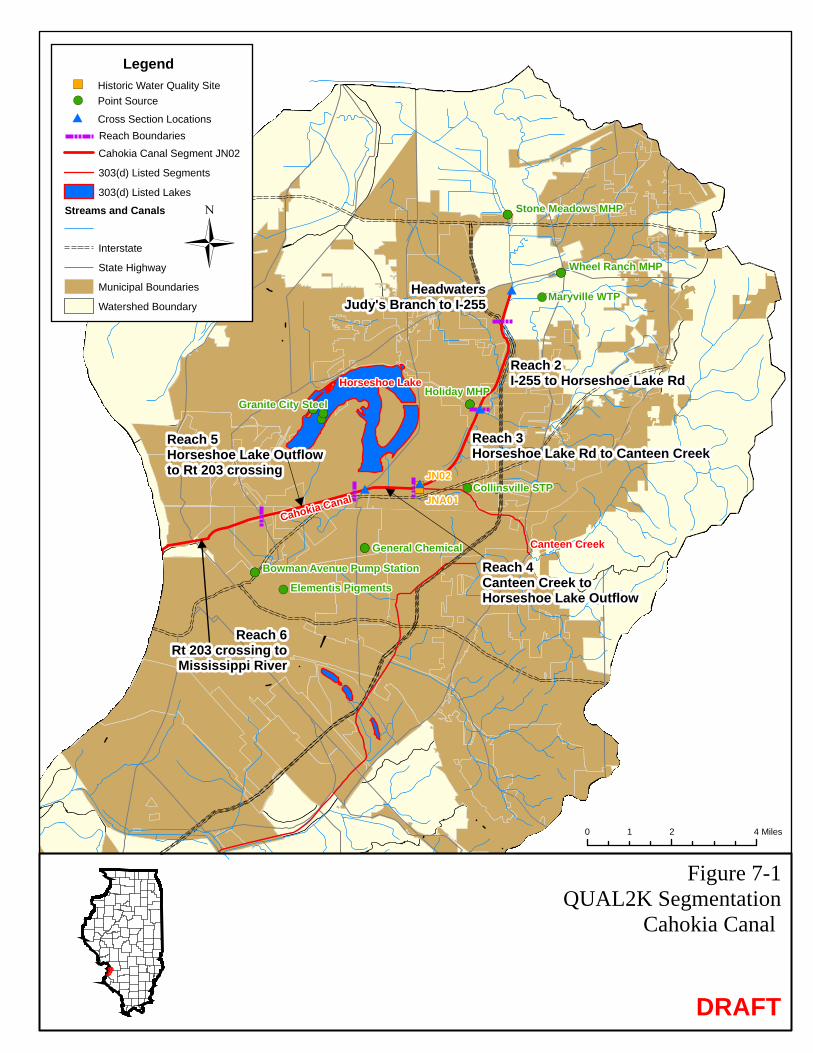
7.2.1.1.1 Stream Segmentation The Q2K model represents a river as a series of reaches. Each reach shares constant channel geometry and hydraulic characteristics. Cahokia Canal was divided into 5 reaches and Canteen Creek was added as a tributary. The modeled Canteen Creek segment extended from the Collinsville Sanitary Treatment Plant (STP) to the confluence with the canal. Figure 7-1 shows the stream segmentation used for the Q2K model.
7.2.1.1.2 Hydraulic Characteristics The majority of stream hydraulics were specified in the model based on a CDM field survey conducted in May 2007 under low-flow conditions. Four wetted cross-sections were surveyed by measuring depths, velocities, and widths at multiple points across a transect. The four cross-section locations, shown in Figure 7-1, were chosen to achieve an adequate spatial representation of the modeled reach. A fifth target location (near
Section 7 Methodology Development for the Cahokia Canal/Horseshoe Lake Watershed
7-4 DRAFT
T:\GIS\Stage3\Cahokia-Horseshoe\Stage3Draft\DRAFT\Sec 7 Cahokia Cl - Horseshoe L.doc
the Route 203 crossing) was not wadeable and therefore was not gaged. Visual and photograph characterization, however, were used to guide model hydraulic inputs for this downstream area. Appendix E contains field sheets and photographs from this survey. In addition, no hydraulic data were available for the modeled portion of Canteen Creek. The Manning’s Equation was used to drive hydraulics for this segment based on estimated channel width from aerial photographs, channel slope from the National Elevation Dataset, and an estimated Manning’s roughness coefficient.
7.2.1.1.3 Headwater Conditions The model was set up with two headwaters; Cahokia Canal and Canteen Creek. The following describes conditions for each segment.
7.2.1.1.3.1 Cahokia Canal A review of historic water quality data for the modeled reach of Cahokia Canal showed that there have been 16 violations of the dissolved oxygen standard recorded since 1990 (out of 126 total samples). Of the 16 violating samples, 15 were collected between July and October, which are also the months that experience the lowest flows in the area. This indicated that dissolved oxygen problems are associated with low-flow periods. Therefore, low-flow, summer conditions were used for model development.
The headwater flow and concentrations are user-specified in the model and represent the system's upstream boundary condition. Measured concentration data were not specifically available for the modeled headwater segment. However, historic water quality data collected at sampling site JN02 (Cahokia Canal at Sand Prairie Rd, approximately 4.5 miles downstream) were available and were used as a surrogate headwater concentration data set. Only water quality data collected in the months of July, August, September, and October were used for this model. Because there are no major inputs to the system between the headwaters and the sampling location JN02, it was assumed that data collected at the sampling location were representative of conditions at the headwaters.
The upstream flows measured during the CDM field survey (May, 2007) were in the range of 4.2 – 4.9 cfs. Due to the fact that the modeled hydraulics (based on the only available data) are associated with this measured flow range, a headwater flow rate of 4.2 cfs is assumed in the model. This value is considered adequately representative of low-flow, critical conditions. For reference, the 7Q10 low flow for Cahokia Canal upstream of the confluence with Canteen Creek is 2.4 cfs.
7.2.1.1.3.2 Canteen Creek Data for Canteen Creek are limited. The modeled segment extended from the Collinsville STP discharge point to the confluence with Cahokia Canal. According to the Collinsville STP permit, 7Q10 low flows on this segment are 0 cfs. Therefore, water quality conditions and flow for this segment were inputted using historic DMR
Section 7 Methodology Development for the Cahokia Canal/Horseshoe Lake Watershed
DRAFT 7-5
T:\GIS\Stage3\Cahokia-Horseshoe\Stage3Draft\DRAFT\Sec 7 Cahokia Cl - Horseshoe L.doc
records from the STP assuming that the facility’s effluent discharge rate and quality are representative of instream flows and water quality during critical low flow times.
Where historic DMR data were missing, concentration data were estimated using mean summer values from Canteen Creek water quality monitoring station JNA01.
7.2.1.1.4 Climate Q2K requires inputs for climate. Temperature and wind speed data from Lambert International Airport in St. Louis, Missouri were used for the model.
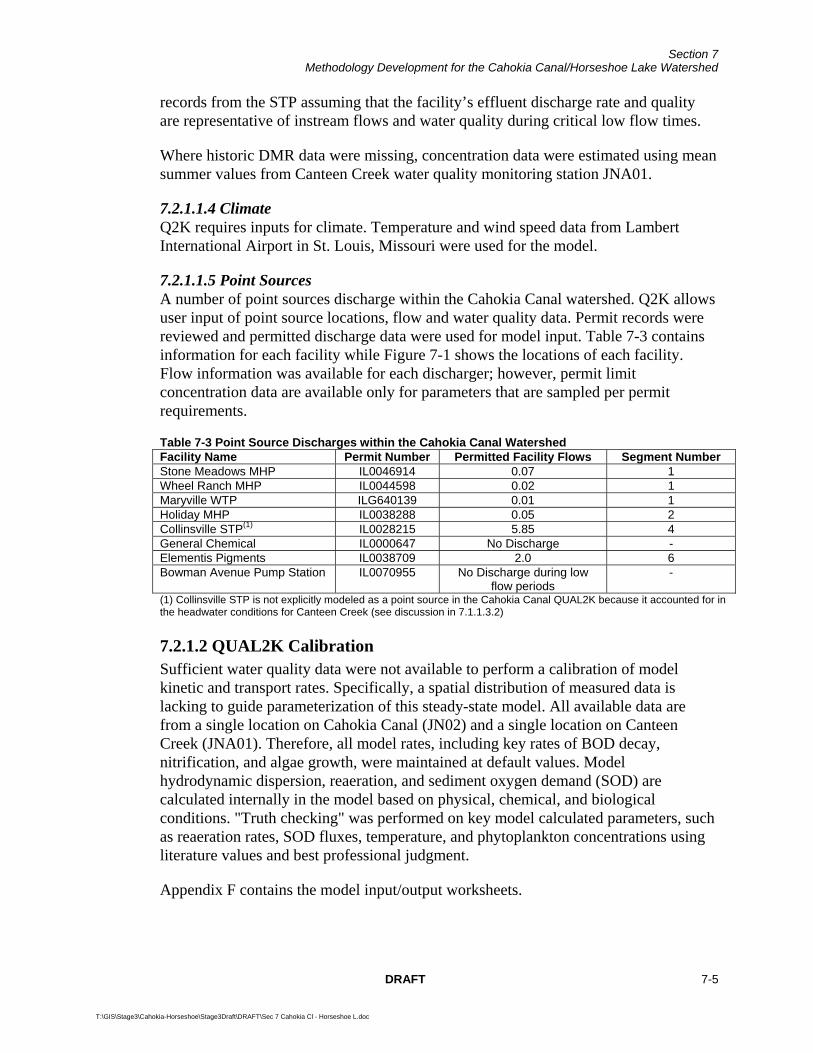
7.2.1.1.5 Point Sources A number of point sources discharge within the Cahokia Canal watershed. Q2K allows user input of point source locations, flow and water quality data. Permit records were reviewed and permitted discharge data were used for model input. Table 7-3 contains information for each facility while Figure 7-1 shows the locations of each facility. Flow information was available for each discharger; however, permit limit concentration data are available only for parameters that are sampled per permit requirements.
Table 7-3 Point Source Discharges within the Cahokia Canal Watershed Facility Name Permit Number Permitted Facility Flows Segment Number Stone Meadows MHP IL0046914 0.07 1 Wheel Ranch MHP IL0044598 0.02 1 Maryville WTP ILG640139 0.01 1 Holiday MHP IL0038288 0.05 2 Collinsville STP(1) IL0028215 5.85 4 General Chemical IL0000647 No Discharge - Elementis Pigments IL0038709 2.0 6 Bowman Avenue Pump Station IL0070955 No Discharge during low
flow periods -
(1) Collinsville STP is not explicitly modeled as a point source in the Cahokia Canal QUAL2K because it accounted for in the headwater conditions for Canteen Creek (see discussion in 7.1.1.3.2) 7.2.1.2 QUAL2K Calibration Sufficient water quality data were not available to perform a calibration of model kinetic and transport rates. Specifically, a spatial distribution of measured data is lacking to guide parameterization of this steady-state model. All available data are from a single location on Cahokia Canal (JN02) and a single location on Canteen Creek (JNA01). Therefore, all model rates, including key rates of BOD decay, nitrification, and algae growth, were maintained at default values. Model hydrodynamic dispersion, reaeration, and sediment oxygen demand (SOD) are calculated internally in the model based on physical, chemical, and biological conditions. "Truth checking" was performed on key model calculated parameters, such as reaeration rates, SOD fluxes, temperature, and phytoplankton concentrations using literature values and best professional judgment.
Appendix F contains the model input/output worksheets.
Section 7 Methodology Development for the Cahokia Canal/Horseshoe Lake Watershed
7-6 DRAFT
T:\GIS\Stage3\Cahokia-Horseshoe\Stage3Draft\DRAFT\Sec 7 Cahokia Cl - Horseshoe L.doc
7.2.2 Load Duration Curve Development Load duration curves are used to gain understanding of the range of loads allowable throughout the flow regime of a stream. This approach was used to characterize the current loading of fecal coliform in segment JMAC02 of Harding Ditch and total manganese in segment JNA01 of Canteen Creek.
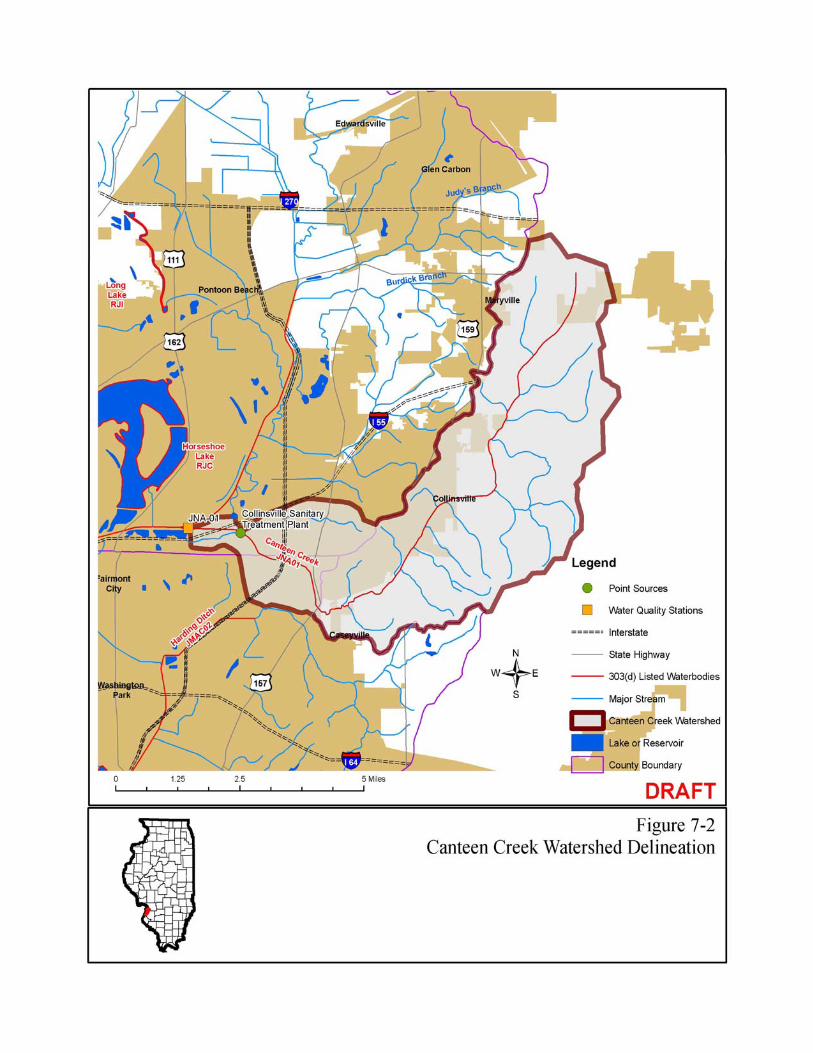
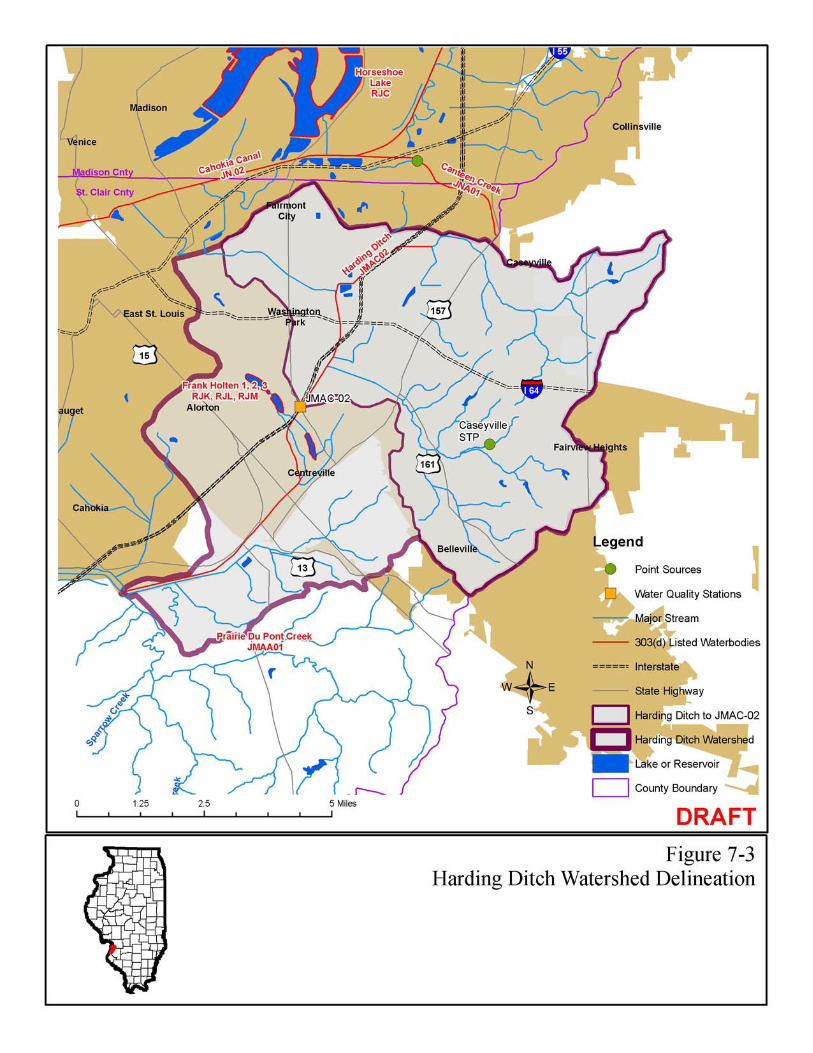
7.2.2.1 Watershed Delineation and Flow Estimation Watersheds for the areas contributing directly to Canteen Creek segment JNA01 and Harding Ditch segment JMAC02 were delineated with GIS analyses through use of the NED as discussed in Section 2.2. The delineation suggests that Canteen Creek segment JNA01 captures flows from a directly contributing watershed of approximately 27.2 square miles and Harding Ditch segment JMAC02 captures flows from a directly contributing watershed of approximately 56 square miles. Figures 7-2 and 7-3 at the end of this section show the location of the water quality stations on each segment as well as the boundary of the GIS-delineated watershed.
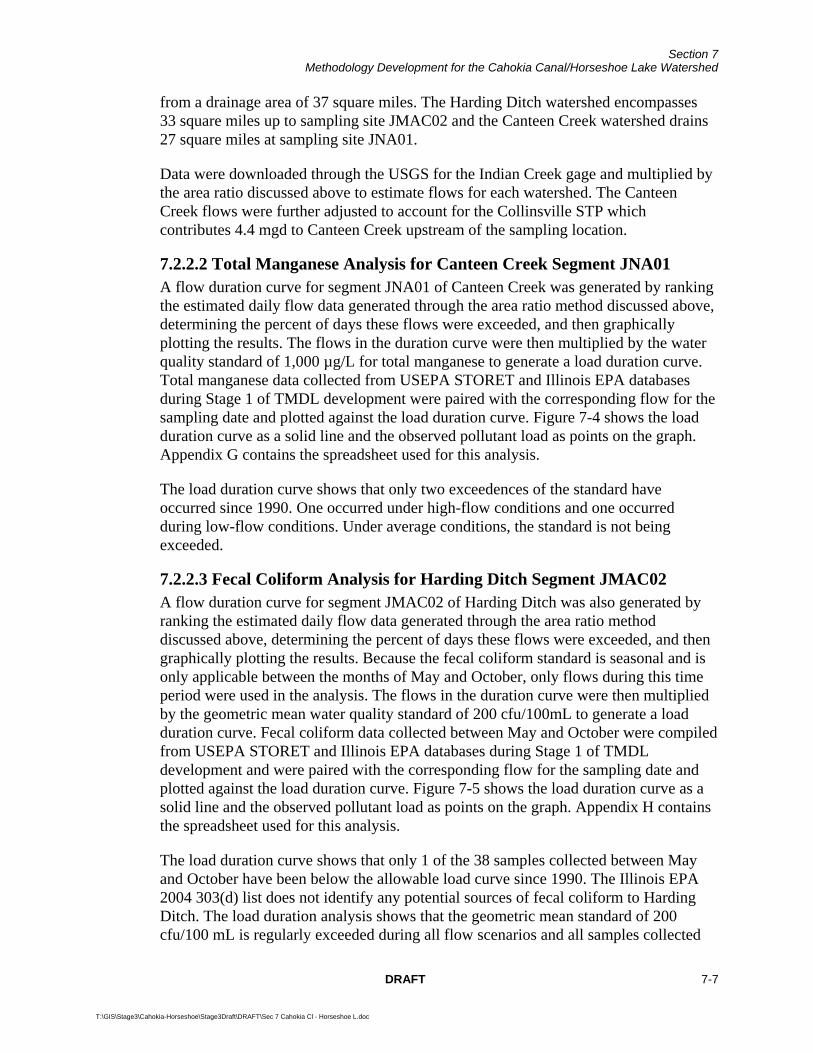
In order to create a load duration curve, it is necessary to obtain flow data corresponding to each water quality sample. As discussed in Section 2.6.2, there are no USGS stream gages within the watersheds that have current, or even recent, streamflow data. Therefore, the drainage area ratio method, represented by the following equation, was used to estimate flows.
ungagedgaged
ungagedgaged Q
AreaArea
Q =⎟⎟⎠
⎞⎜⎜⎝
⎛
where Qgaged = Streamflow of the gaged basin Qungaged = Streamflow of the ungaged basin Areagaged = Area of the gaged basin Areaungaged = Area of the ungaged basin
The assumption behind the equation is that the flow per unit area is equivalent in watersheds with similar characteristics. Therefore, the flow per unit area in the gaged watershed multiplied by the area of the ungaged watershed estimates the flow for the ungaged watershed.
USGS gage 05588000 (Indian Creek near Wanda, Illinois) was chosen as an appropriate gage from which to estimate flows in both Harding Ditch and Canteen Creek. The Indian Creek watershed is approximately 17 miles west northwest of Harding Ditch sampling site JMAC02 and 12 miles north of sampling site JNA01 on Canteen Creek. The gage drains an area that is a similar order of magnitude and receives comparable precipitation throughout the year. Gage 05588000 captures flow
Section 7 Methodology Development for the Cahokia Canal/Horseshoe Lake Watershed
DRAFT 7-7
T:\GIS\Stage3\Cahokia-Horseshoe\Stage3Draft\DRAFT\Sec 7 Cahokia Cl - Horseshoe L.doc
from a drainage area of 37 square miles. The Harding Ditch watershed encompasses 33 square miles up to sampling site JMAC02 and the Canteen Creek watershed drains 27 square miles at sampling site JNA01.
Data were downloaded through the USGS for the Indian Creek gage and multiplied by the area ratio discussed above to estimate flows for each watershed. The Canteen Creek flows were further adjusted to account for the Collinsville STP which contributes 4.4 mgd to Canteen Creek upstream of the sampling location.
7.2.2.2 Total Manganese Analysis for Canteen Creek Segment JNA01 A flow duration curve for segment JNA01 of Canteen Creek was generated by ranking the estimated daily flow data generated through the area ratio method discussed above, determining the percent of days these flows were exceeded, and then graphically plotting the results. The flows in the duration curve were then multiplied by the water quality standard of 1,000 µg/L for total manganese to generate a load duration curve. Total manganese data collected from USEPA STORET and Illinois EPA databases during Stage 1 of TMDL development were paired with the corresponding flow for the sampling date and plotted against the load duration curve. Figure 7-4 shows the load duration curve as a solid line and the observed pollutant load as points on the graph. Appendix G contains the spreadsheet used for this analysis.
The load duration curve shows that only two exceedences of the standard have occurred since 1990. One occurred under high-flow conditions and one occurred during low-flow conditions. Under average conditions, the standard is not being exceeded.
7.2.2.3 Fecal Coliform Analysis for Harding Ditch Segment JMAC02 A flow duration curve for segment JMAC02 of Harding Ditch was also generated by ranking the estimated daily flow data generated through the area ratio method discussed above, determining the percent of days these flows were exceeded, and then graphically plotting the results. Because the fecal coliform standard is seasonal and is only applicable between the months of May and October, only flows during this time period were used in the analysis. The flows in the duration curve were then multiplied by the geometric mean water quality standard of 200 cfu/100mL to generate a load duration curve. Fecal coliform data collected between May and October were compiled from USEPA STORET and Illinois EPA databases during Stage 1 of TMDL development and were paired with the corresponding flow for the sampling date and plotted against the load duration curve. Figure 7-5 shows the load duration curve as a solid line and the observed pollutant load as points on the graph. Appendix H contains the spreadsheet used for this analysis.
The load duration curve shows that only 1 of the 38 samples collected between May and October have been below the allowable load curve since 1990. The Illinois EPA 2004 303(d) list does not identify any potential sources of fecal coliform to Harding Ditch. The load duration analysis shows that the geometric mean standard of 200 cfu/100 mL is regularly exceeded during all flow scenarios and all samples collected
Section 7 Methodology Development for the Cahokia Canal/Horseshoe Lake Watershed
7-8 DRAFT
T:\GIS\Stage3\Cahokia-Horseshoe\Stage3Draft\DRAFT\Sec 7 Cahokia Cl - Horseshoe L.doc
during higher flow scenarios have exceeded the allowable levels. Exceedences during high flows are likely attributable to the fecal matter introduced to the stream via overland runoff and the resuspension of fecal material in the ditch sediment. Dry weather sources of fecal coliform likely include failing septic systems in the watershed and livestock with direct access to the ditch or its tributaries.
7.2.3 BATHTUB Development for Horseshoe Lake The BATHTUB model was used to develop the total phosphorus TMDL for Horseshoe Lake. The aquatic life use of the lake is impaired by high phosphorus levels as well as high pH. Fluctuations in pH can be correlated to photosynthesis from algae. Plants and algae use carbon dioxide (CO2) during photosynthesis, which causes pH levels to rise. The photosynthetic rate progressively decreases as the residual CO2 concentration declines and ceases completely with the extinction of light. During the night, reaeration and respiration replenish CO2 causing the pH levels to decrease overnight (Welch 1980). Chlorophyll "a" indicates presence of excessive algal or aquatic plant growth. Reducing total phosphorus is likely to reduce algal growth thus resulting in attainment of the pH standard. Therefore, the BATHTUB model was used to investigate total phosphorus levels in Horseshoe Lake.
BATHTUB has three primary input interfaces: global, reservoir segment(s), and watershed inputs. The individual inputs for each of these interfaces are described in the following sections along with watershed and operational information for the lake.
7.2.3.1 Horseshoe Lake Operations and Watershed Delineation Horseshoe Lake is an old oxbow lake of the Mississippi River located within Horseshoe Lake State Park, which is managed by the Illinois Department of Natural Resources (IDNR). Horseshoe Lake, as shown on Figure 7-6, has three "legs," the first leg to the west and the second and third to the east, respectively, which are separated by the land mass that is known as Walker's Island. At the southernmost tip of the east side of Horseshoe Lake, just south of the railroad, is Canteen Lake, which is privately owned. Siltation has occurred due to the diversion canal, which connects Canteen Lake (and effectively Horseshoe Lake) to the Cahokia Canal, and Walker's Island currently exists as a peninsula. There is a 180-acre portion of the lake (sub-impoundment) that is formed by this siltation and the causeway, the road that runs over the third, easternmost leg of the lake and connects to "Walker's Island." There is a valve located under the causeway that is closed under normal conditions and can be used to drain the sub-impoundment in the late summer.
Under normal conditions, Horseshoe Lake flows into Canteen Lake and then to the Cahokia Canal and ultimately to the Mississippi River by gravity. The outlet is located at the southern end of Canteen Lake, which consists of a 150-foot spillway at 437 feet of elevation, two 36-inch pipes at elevation 400.6 feet, and then the control structure, two 6-foot by 6-foot box culverts with sluice gates at elevation 399.0 feet. The lake pool elevation is maintained at an elevation of 403.8 feet. The gate is used to divert Cahokia Canal into Horseshoe Lake during wet weather. It is controlled by Metro East
Section 7 Methodology Development for the Cahokia Canal/Horseshoe Lake Watershed
DRAFT 7-9
T:\GIS\Stage3\Cahokia-Horseshoe\Stage3Draft\DRAFT\Sec 7 Cahokia Cl - Horseshoe L.doc
Sanitary District (MESD), and is left open under normal conditions. There is a gate at the MESD-owned North Pump Station that is located where the Cahokia Canal meets the Mississippi River levee, and it is also left open under normal conditions.
During wet weather, when the Mississippi River elevation reaches 399.44 feet, the gate at the North Pump Station is closed. When the Cahokia Canal elevation reaches 403.7 feet, flow goes over the spillway and into the diversion canal, which is located just east of Highway 111 and Interstate 55. Cahokia Canal thereby backflows into Canteen Lake and Horseshoe Lake. The largest flows that enter the lake during a storm event are from Cahokia Canal. The area drained by Cahokia Canal is approximately 48,540 acres.
In early July, the 180-acre sub-impoundment is drained to stimulate growth of natural vegetation to attract water fowl. Water is pumped out of the sub-impoundment north of the causeway. It takes approximately a week of 24 hour per day pumping to drain the lake. During this time, depending on the water elevations in the sub-impoundment and the remaining portions of the lake, pumping costs can be reduced by draining the sub-impoundment to the north. When the water level at the northern end of the sub-impoundment is higher than the second leg of Horseshoe Lake, the causeway valve is opened. During this time about six plant species grow up to three feet high. Water is pumped out of the sub-impoundment after rain events (when the Cahokia Canal is diverted into Horseshoe Lake). By late August, pumping is stopped and rain water gradually contributes to the lake. Around September the causeway valve is opened to let lake water gravity flow from the north into the sub-impoundment. These pumps are also used for maintenance throughout the year. The outlet gate at the southern end of Canteen Lake can also be closed to bring up lake levels when necessary.
The area drained by Horseshoe Lake (not including Cahokia Canal drainage) is 17,118 acres. There are three sources of inflows into Horseshoe Lake:
Stormwater runoff from surrounding residential and agricultural areas Granite City Steel treated point source discharge Wet weather diversion from Cahokia Canal
Stormwater runoff from Granite City discharges into Horseshoe Lake via three culverts. There is one culvert located at the north end of the lake, which discharges flow from Nameokie Ditch. There are two culverts at the northeast end of the lake, which flow from Elm Slough and Long Lake. There are nine culverts at the east end of the lake that discharge agricultural runoff into the lake. Granite City Steel uses intake water from the Mississippi River and is permitted to discharge 25mgd of treated water to Horseshoe Lake. This discharge is located on the west side of the lake. Runoff from the other areas adjacent to the lake also contributes to the lake.
7.2.3.2 Global Inputs The modeling approach for Horseshoe Lake is based on two distinct conditions; the portion of the year when flows from the Cahokia Canal are likely being diverted into the lake (March – May), and the remaining portion of the year which is dominated by
Section 7 Methodology Development for the Cahokia Canal/Horseshoe Lake Watershed
7-10 DRAFT
T:\GIS\Stage3\Cahokia-Horseshoe\Stage3Draft\DRAFT\Sec 7 Cahokia Cl - Horseshoe L.doc
“normal” operations. Two separate models have been developed, one for each condition. Normal operation is defined as June through February, during which contributions to the lake originate from direct runoff from the surrounding watershed following precipitation, internal loading and the point source discharge from Granite City Steel. The wet season includes March through May, the high flow portion of the year, when Cahokia Canal can backflow and be diverted into Horseshoe Lake.
Global inputs represent the averaging period, precipitation, evaporation, and atmospheric contribution of phosphorus. The averaging period for the Horseshoe Lake “normal” scenario is 9 months and the wet scenario is 3 months. Based on precipitation and evaporation rates discussed in the previous sections, the average annual precipitation received at Horseshoe Lake is approximately 39.2 inches. Through the ISWS website, pan evaporation data are available from nine locations across Illinois (ISWS 2000). The Belleville station was chosen to be representative of pan evaporation conditions for Horseshoe Lake. The average monthly pan evaporation at the Belleville station for the years 1980 to 2002 (data was available for May-September) yields an average annual pan evaporation of 27 inches. Actual evaporation is typically less than pan evaporation, so the average annual pan evaporation was multiplied by 0.75 to calculate an average annual evaporation of 18 inches (ISWS 2007).
Precipitation and evaporation data from the corresponding wet (March through May) and normal (June through February) time periods were used for model inputs. The default atmospheric phosphorus deposition rate suggested in the BATHTUB model was used in absence of site-specific data, which is a value of 30 kg/km2-yr (USACE 1999).
7.2.3.3 Reservoir Segment Inputs Reservoir segment inputs in BATHTUB are used for physical characterization of the reservoir. Horseshoe Lake was modeled with six segments. The segment boundaries are shown on Figure 7-6. Segmentation was established based on available water quality and lake morphologic data.
Segment inputs to the model include average depth, segment length, and depth to the metalimnion. The lake's depths were represented by the averaged data from the water quality stations. Depth data were presented in Section 5.2.1. Segment lengths were determined using GIS.
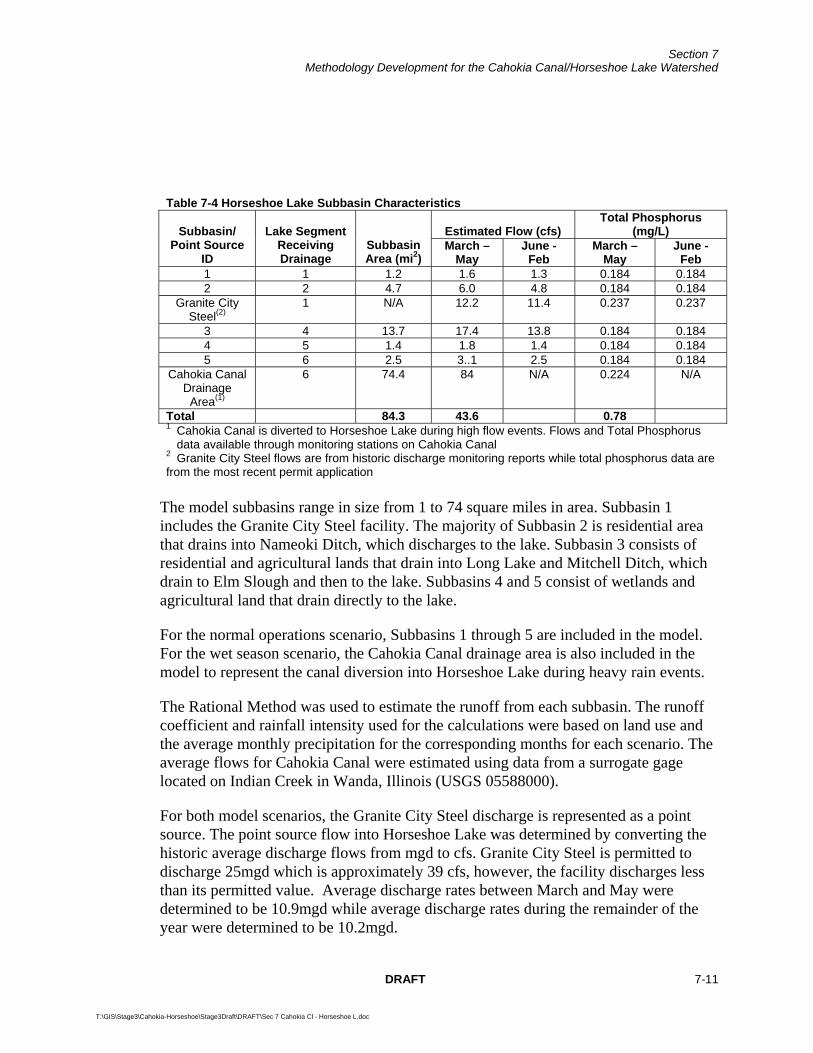
7.2.3.4 Tributary Inputs Tributary inputs to BATHTUB include drainage area, flow, and total phosphorus (dissolved and solid-phase) loading. The drainage area of each tributary is equivalent to the basin or subbasin it represents, which was determined by reviewing the operations of the lake (see Section 7.2.3.1), land use data, aerial photography and GIS analyses. Table 7-4 is a summary of the subbasin characteristics.
Section 7 Methodology Development for the Cahokia Canal/Horseshoe Lake Watershed
DRAFT 7-11
T:\GIS\Stage3\Cahokia-Horseshoe\Stage3Draft\DRAFT\Sec 7 Cahokia Cl - Horseshoe L.doc
Table 7-4 Horseshoe Lake Subbasin Characteristics
Estimated Flow (cfs) Total Phosphorus
(mg/L) Subbasin/ Point Source
ID
Lake Segment Receiving Drainage
Subbasin Area (mi2)
March – May
June - Feb
March – May
June - Feb
1 1 1.2 1.6 1.3 0.184 0.184 2 2 4.7 6.0 4.8 0.184 0.184
Granite City Steel(2)
1 N/A 12.2 11.4 0.237 0.237
3 4 13.7 17.4 13.8 0.184 0.184 4 5 1.4 1.8 1.4 0.184 0.184 5 6 2.5 3..1 2.5 0.184 0.184
Cahokia Canal Drainage
Area(1)
6 74.4 84 N/A 0.224 N/A
Total 84.3 43.6 0.78 1 Cahokia Canal is diverted to Horseshoe Lake during high flow events. Flows and Total Phosphorus
data available through monitoring stations on Cahokia Canal 2 Granite City Steel flows are from historic discharge monitoring reports while total phosphorus data are from the most recent permit application
The model subbasins range in size from 1 to 74 square miles in area. Subbasin 1 includes the Granite City Steel facility. The majority of Subbasin 2 is residential area that drains into Nameoki Ditch, which discharges to the lake. Subbasin 3 consists of residential and agricultural lands that drain into Long Lake and Mitchell Ditch, which drain to Elm Slough and then to the lake. Subbasins 4 and 5 consist of wetlands and agricultural land that drain directly to the lake.
For the normal operations scenario, Subbasins 1 through 5 are included in the model. For the wet season scenario, the Cahokia Canal drainage area is also included in the model to represent the canal diversion into Horseshoe Lake during heavy rain events.
The Rational Method was used to estimate the runoff from each subbasin. The runoff coefficient and rainfall intensity used for the calculations were based on land use and the average monthly precipitation for the corresponding months for each scenario. The average flows for Cahokia Canal were estimated using data from a surrogate gage located on Indian Creek in Wanda, Illinois (USGS 05588000).
For both model scenarios, the Granite City Steel discharge is represented as a point source. The point source flow into Horseshoe Lake was determined by converting the historic average discharge flows from mgd to cfs. Granite City Steel is permitted to discharge 25mgd which is approximately 39 cfs, however, the facility discharges less than its permitted value. Average discharge rates between March and May were determined to be 10.9mgd while average discharge rates during the remainder of the year were determined to be 10.2mgd.
Section 7 Methodology Development for the Cahokia Canal/Horseshoe Lake Watershed
7-12 DRAFT
T:\GIS\Stage3\Cahokia-Horseshoe\Stage3Draft\DRAFT\Sec 7 Cahokia Cl - Horseshoe L.doc
Based on depth and segment length information, the storage volume for Horseshoe Lake was determined to be 12,642 acre-feet (ac-ft). Using inflow data and storage volume, the lake residence time was estimated for both scenarios.
Because there was no available historic concentration data, phosphorus loads from the contributing watershed were estimated based on land use data and the median event mean concentrations (EMCs) for each land use. EMC data were based on values presented in the Results of the Nationwide Urban Runoff Program (NURP), 1983. The average wet season total phosphorus concentrations for Cahokia Canal, available from water quality station JN02, were also used in the model. Phosphorus sampling is not required by the Granite City Steel permit, however, effluent phosphorus concentration was reported in the most recent permit application for the facility at 0.237 mg/L. This value was used in the model to represent the point source contribution.
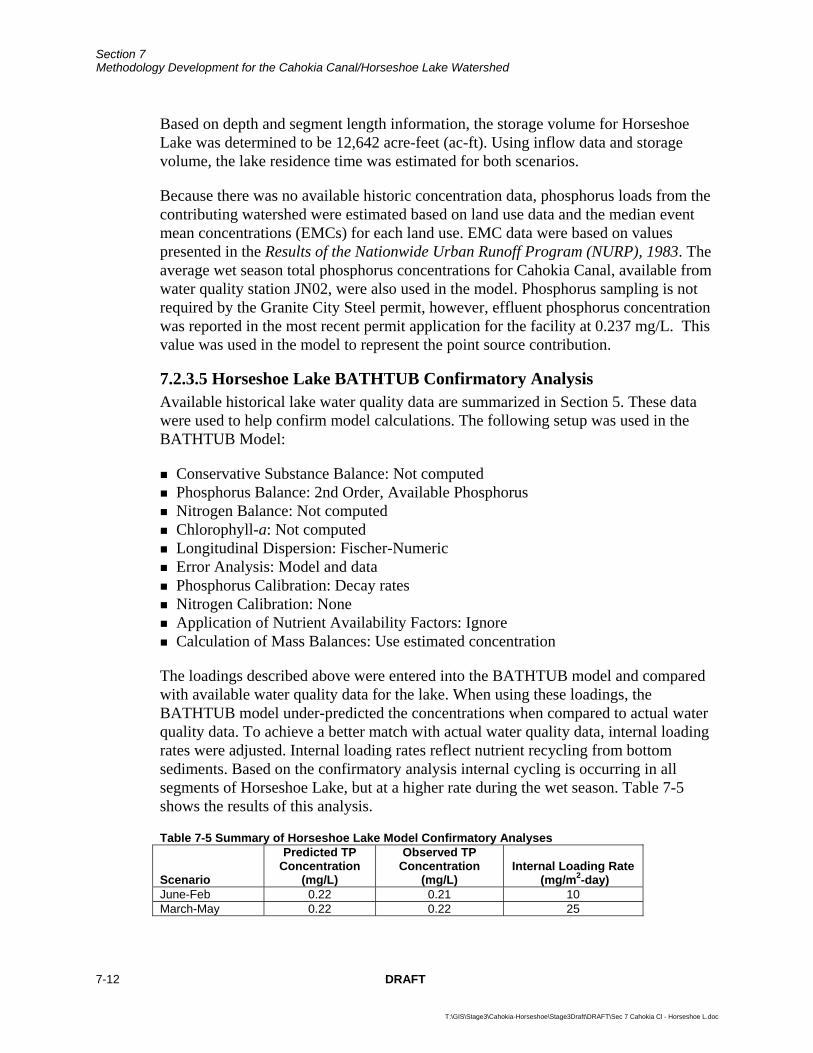
7.2.3.5 Horseshoe Lake BATHTUB Confirmatory Analysis Available historical lake water quality data are summarized in Section 5. These data were used to help confirm model calculations. The following setup was used in the BATHTUB Model:
Conservative Substance Balance: Not computed Phosphorus Balance: 2nd Order, Available Phosphorus Nitrogen Balance: Not computed Chlorophyll-a: Not computed Longitudinal Dispersion: Fischer-Numeric Error Analysis: Model and data Phosphorus Calibration: Decay rates Nitrogen Calibration: None Application of Nutrient Availability Factors: Ignore Calculation of Mass Balances: Use estimated concentration
The loadings described above were entered into the BATHTUB model and compared with available water quality data for the lake. When using these loadings, the BATHTUB model under-predicted the concentrations when compared to actual water quality data. To achieve a better match with actual water quality data, internal loading rates were adjusted. Internal loading rates reflect nutrient recycling from bottom sediments. Based on the confirmatory analysis internal cycling is occurring in all segments of Horseshoe Lake, but at a higher rate during the wet season. Table 7-5 shows the results of this analysis.
Table 7-5 Summary of Horseshoe Lake Model Confirmatory Analyses
Scenario
Predicted TP Concentration
(mg/L)
Observed TP Concentration
(mg/L) Internal Loading Rate
(mg/m2-day) June-Feb 0.22 0.21 10 March-May 0.22 0.22 25
Section 7 Methodology Development for the Cahokia Canal/Horseshoe Lake Watershed
DRAFT 7-13
T:\GIS\Stage3\Cahokia-Horseshoe\Stage3Draft\DRAFT\Sec 7 Cahokia Cl - Horseshoe L.doc
7.2.4 BATHTUB Development for Frank Holten Lakes The BATHTUB model was used to develop the total phosphorus TMDL for the Frank Holten Lakes. Frank Holten Lakes 1, 2, and 3 are connected and were modeled as three segments of a contiguous waterbody. All of the Frank Holten Lakes are listed on the 2004 303(d) list for impairments caused by total phosphorus. In addition, Frank Holten Lake 3 has had two dissolved oxygen samples collected that were below the 5.0 mg/L instantaneous minimum standard. There are no known sources of oxygen demanding materials to the lakes and it is therefore assumed that reducing total phosphorus will likely result in improved dissolved oxygen levels.
7.2.4.1 Operation of Frank Holten Lakes and Watershed Delineation Frank Holten State Park contains three small lakes, Frank Holten Lake 1, 2, and 3. These lakes are the remains of an old oxbow lake of the Mississippi River. Lakes 1 and 2 together are commonly known as Whispering Willow Lake and Lake 3 is known as Grand Marais Lake. The lakes and the park are managed by the Illinois Department of Conservation (IDOC).
The Frank Holten Lakes consists of three distinct lakes as shown on Figure 7-7. Under normal conditions, Lake 1 flows into Lake 2, Lake 2 flows into Lake 3 via a connection channel, and then Lake 3 drains to Harding Ditch. The only connection between the lakes and Harding Ditch is at the outlet at the southern end of Lake 3. The connection channel and Harding Ditch are directed through culverts beneath I-255. There is no water level control at the outlet, and therefore during wet weather, when the water level in Harding Ditch is rising, it flows freely into Lake 3. When the water level in Harding Ditch is falling, Lake 3 flows freely into Harding Ditch. The area drained by Harding Ditch is 23,755 acres.
The area drained directly by the Frank Holten Lakes is approximately 3,300 acres. There are two sources of inflows into the Frank Holten Lakes:
Stormwater runoff from surrounding residential sites Wet weather flows from Harding Ditch
Stormwater runoff from low-density residential areas and a high school discharges into Lake 1 via three drainage district culverts. Also, direct overland runoff from the other areas surrounding the lakes contributes flows to the lakes.
The modeling approach for the Frank Holten Lakes is based on two distinct "seasons"; a dry and a wet season. Two separate models have been developed, one for each season. The wet season includes March through May, the high flow portion of the year, when Harding Ditch can backflow into Lake 3. The dry season is defined as the other 9 months of the year, during which flows are lower.
7.2.4.2 Global Inputs Global inputs represent the averaging period, precipitation, evaporation, and atmospheric contribution of phosphorus. The averaging period for the Frank Holten
Section 7 Methodology Development for the Cahokia Canal/Horseshoe Lake Watershed
7-14 DRAFT
T:\GIS\Stage3\Cahokia-Horseshoe\Stage3Draft\DRAFT\Sec 7 Cahokia Cl - Horseshoe L.doc
Lakes dry scenario is 9 months and the wet scenario is 3 months. Based on precipitation and evaporation rates discussed in the previous sections, the average annual precipitation received at Frank Holten Lakes is approximately 39.2 inches. Through the ISWS website, pan evaporation data are available from nine locations across Illinois (ISWS 2000). The Belleville station was chosen to be representative of pan evaporation conditions for Horseshoe Lake. The average monthly pan evaporation at the Belleville station for the years 1980 to 2002 (data was available for May-September) yields an average annual pan evaporation of 27 inches. Actual evaporation is typically less than pan evaporation, so the average annual pan evaporation was multiplied by 0.75 to calculate an average annual evaporation of 18 inches (ISWS 2007).
Precipitation and evaporation data from the corresponding wet (March through May) and dry (June through February) time periods were used for model inputs. The default atmospheric phosphorus deposition rate suggested in the BATHTUB model was used in absence of site-specific data, which is a value of 30 kg/km2-yr (USACE 1999).
7.2.4.3 Reservoir Segment Inputs Reservoir segment inputs in BATHTUB are used for physical characterization of the reservoir. The Frank Holten Lakes were modeled in 4 segments. The segment boundaries are shown on Figure 7-7. Segmentation was established based on available water quality and lake morphologic data.
Segment inputs to the model include average depth, segment length, and depth to the metalimnion. The lakes' depths were represented by the averaged data from the water quality stations. Depth data were presented in Section 5.2.2. Segment lengths were determined using GIS.
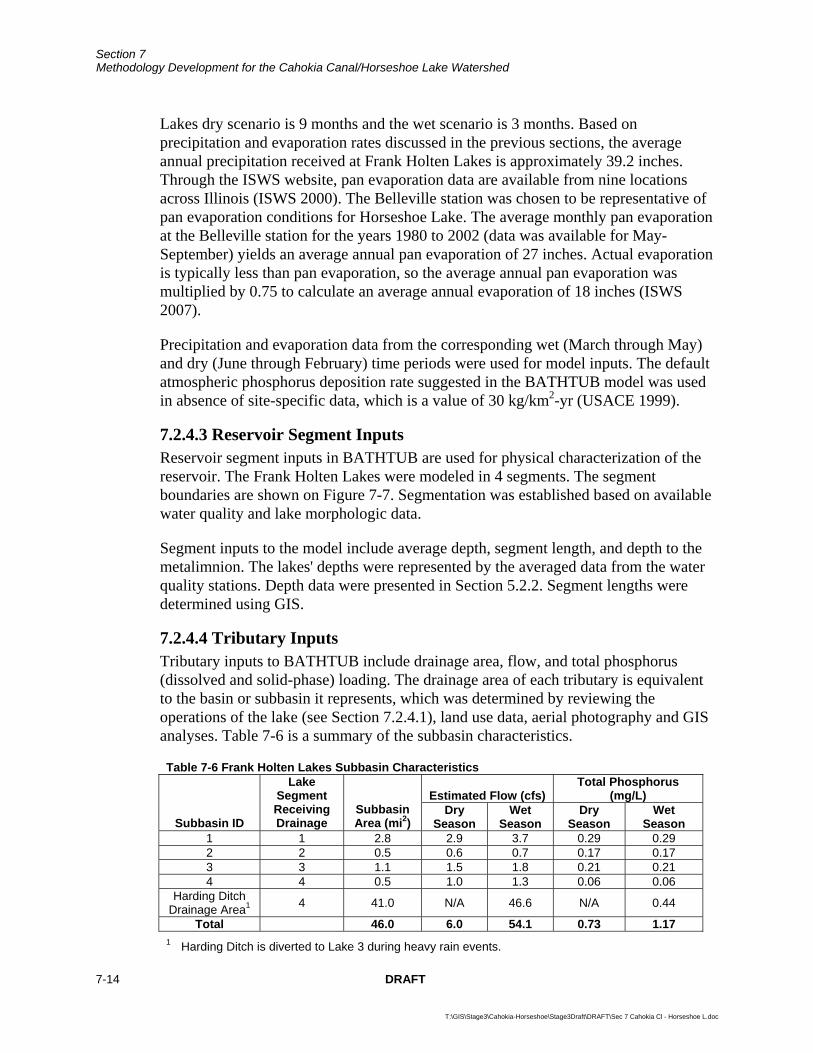
7.2.4.4 Tributary Inputs Tributary inputs to BATHTUB include drainage area, flow, and total phosphorus (dissolved and solid-phase) loading. The drainage area of each tributary is equivalent to the basin or subbasin it represents, which was determined by reviewing the operations of the lake (see Section 7.2.4.1), land use data, aerial photography and GIS analyses. Table 7-6 is a summary of the subbasin characteristics.
Table 7-6 Frank Holten Lakes Subbasin Characteristics
Estimated Flow (cfs) Total Phosphorus
(mg/L)
Subbasin ID
Lake Segment Receiving Drainage
Subbasin Area (mi2)
Dry Season
Wet Season
Dry Season
Wet Season
1 1 2.8 2.9 3.7 0.29 0.29 2 2 0.5 0.6 0.7 0.17 0.17 3 3 1.1 1.5 1.8 0.21 0.21 4 4 0.5 1.0 1.3 0.06 0.06
Harding Ditch Drainage Area1 4 41.0 N/A 46.6 N/A 0.44
Total 46.0 6.0 54.1 0.73 1.17 1 Harding Ditch is diverted to Lake 3 during heavy rain events.
Section 7 Methodology Development for the Cahokia Canal/Horseshoe Lake Watershed
DRAFT 7-15
T:\GIS\Stage3\Cahokia-Horseshoe\Stage3Draft\DRAFT\Sec 7 Cahokia Cl - Horseshoe L.doc
The model subbasins range in size from 0.5 to 41 square miles in area. The majority of Subbasin 1 is residential area, but it also includes a golf course adjacent to the Lake 1 and a high school to the north. Subbasin 2 is a mix of residential area, open space, and wetlands. The majority of Subbasin 3 is residential area. Subbasin 4 is mostly wetlands.
For the dry season scenario, Subbasins 1 through 4 are included in the model. For the wet season scenario, the Harding Ditch drainage area is also included in the model to represent the ditch backflow into Lake 3 during wet weather.
The Rational Method was used to estimate the runoff from each subbasin. The runoff coefficient and rainfall intensity used for the calculations were based on land use and the average monthly precipitation for the corresponding months for each season. The average wet and dry season flows for Harding Ditch were estimated were estimated using data from a surrogate gage located on Indian Creek in Wanda, Illinois (USGS 05588000). Based on depth and segment length information, the storage volume for Frank Holten Lakes was determined to be 1,783 ac-ft. Using inflow data and storage volume, the residence time was estimated for both scenarios.
Because no historic concentration data exist for Frank Holten Lakes' contributing subbasins, phosphorus loads from each subbasin in the lake were estimated based on land use data and the median event mean concentrations (EMCs) for each land use found in the Results of the Nationwide Urban Runoff Program (NURP), 1983 report. The average wet season total phosphorus concentrations for Harding Ditch, available from water quality station JMAC02, were used in the model.
7.2.4.5 Frank Holten Lakes BATHTUB Confirmatory Analysis Available historical lake water quality data are summarized in Section 5. These data were used to help confirm model calculations. The following setup was used in the BATHTUB Model:
Conservative Substance Balance: Not computed Phosphorus Balance: 2nd Order, Available Phosphorus Nitrogen Balance: Not computed Chlorophyll-a: Not computed Longitudinal Dispersion: Fischer-Numeric Error Analysis: Model and data Phosphorus Calibration: Decay rates Nitrogen Calibration: None Application of Nutrient Availability Factors: Ignore Calculation of Mass Balances: Use estimated concentration
The loadings described above were entered into the BATHTUB model and compared with available water quality data for the lake. When using these loadings, the BATHTUB model under-predicted the concentrations when compared to actual water quality data. To achieve a better match with actual water quality data, internal loading
Section 7 Methodology Development for the Cahokia Canal/Horseshoe Lake Watershed
7-16 DRAFT
T:\GIS\Stage3\Cahokia-Horseshoe\Stage3Draft\DRAFT\Sec 7 Cahokia Cl - Horseshoe L.doc
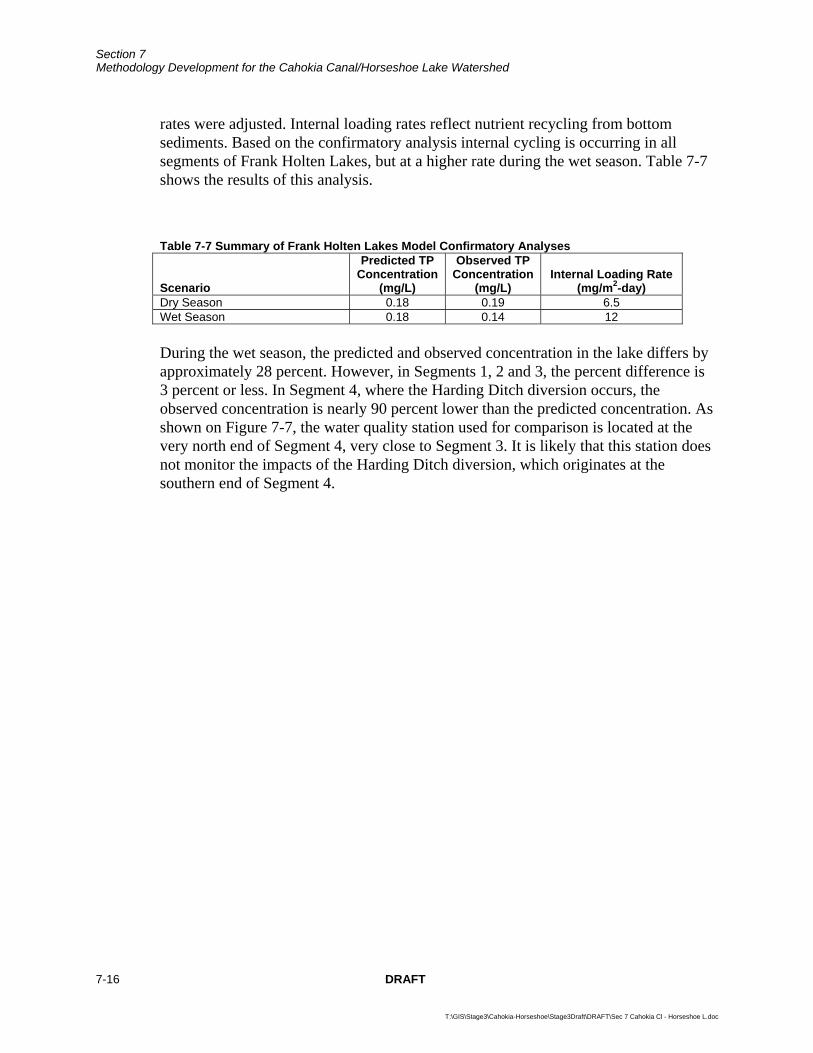
rates were adjusted. Internal loading rates reflect nutrient recycling from bottom sediments. Based on the confirmatory analysis internal cycling is occurring in all segments of Frank Holten Lakes, but at a higher rate during the wet season. Table 7-7 shows the results of this analysis.
Table 7-7 Summary of Frank Holten Lakes Model Confirmatory Analyses
Scenario
Predicted TP Concentration
(mg/L)
Observed TP Concentration
(mg/L) Internal Loading Rate
(mg/m2-day) Dry Season 0.18 0.19 6.5 Wet Season 0.18 0.14 12 During the wet season, the predicted and observed concentration in the lake differs by approximately 28 percent. However, in Segments 1, 2 and 3, the percent difference is 3 percent or less. In Segment 4, where the Harding Ditch diversion occurs, the observed concentration is nearly 90 percent lower than the predicted concentration. As shown on Figure 7-7, the water quality station used for comparison is located at the very north end of Segment 4, very close to Segment 3. It is likely that this station does not monitor the impacts of the Harding Ditch diversion, which originates at the southern end of Segment 4.
!(
!(!(!(!(!(
!(!(
!( !(!(
!(!(
!(
!(!(
!(!(
!(!(
")")
HeadwatersJudy's Branch to I-255
Reach 2I-255 to Horseshoe Lake Rd
Reach 3Horseshoe Lake Rd to Canteen Creek
Reach 4Canteen Creek toHorseshoe Lake Outflow
Reach 5Horseshoe Lake Outflowto Rt 203 crossing
Reach 6Rt 203 crossing toMississippi River
Granite City Steel
Stone Meadows MHP
Wheel Ranch MHP
Maryville WTP
Holiday MHP
Collinsville STP
General Chemical
Elementis Pigments
Bowman Avenue Pump Station
Horseshoe Lake
Cahokia Canal
JN02
JNA01
Canteen Creek
Figure 7-1QUAL2K Segmentation
Cahokia Canal
DRAFT
0 2 41 Miles
#
#
##
Legend")
!(
303(d) Listed Segments
303(d) Listed Lakes
Streams and Canals
Interstate
State Highway
Municipal Boundaries
Watershed Boundary
#
Cahokia Canal Segment JN02
Reach BoundariesCross Section Locations
Historic Water Quality SitePoint Source
Section 7 Methodology Development for the Cahokia Canal/Horseshoe Lake Watershed
7-18 DRAFT
T:\GIS\Stage3\Cahokia-Horseshoe\Stage3Draft\DRAFT\Sec 7 Cahokia Cl - Horseshoe L.doc
THIS PAGE INTENTIONALLY LEFT BLANK

Section 7 Methodology Development for the Cahokia Canal/Horseshoe Lake Watershed
7-20 DRAFT
T:\GIS\Stage3\Cahokia-Horseshoe\Stage3Draft\DRAFT\Sec 7 Cahokia Cl - Horseshoe L.doc
THIS PAGE INTENTIONALLY LEFT BLANK

Section 7 Methodology Development for the Cahokia Canal/Horseshoe Lake Watershed
7-22 DRAFT
T:\GIS\Stage3\Cahokia-Horseshoe\Stage3Draft\DRAFT\Sec 7 Cahokia Cl - Horseshoe L.doc
THIS PAGE INTENTIONALLY LEFT BLANK

Section 7 Methodology Development for the Cahokia Canal/Horseshoe Lake Watershed
7-24 DRAFT
T:\GIS\Stage3\Cahokia-Horseshoe\Stage3Draft\DRAFT\Sec 7 Cahokia Cl - Horseshoe L.doc
THIS PAGE INTENTIONALLY LEFT BLANK
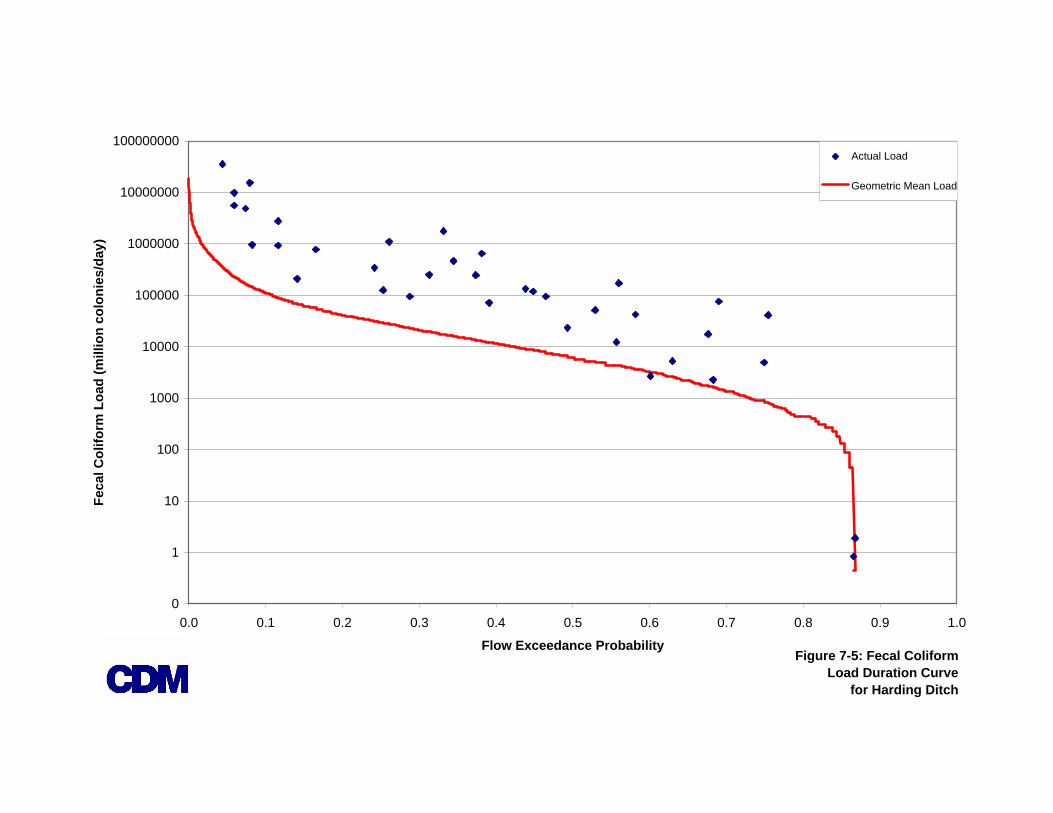
Figure 7-5: Fecal Coliform Load Duration Curve
for Harding Ditch
0
1
10
100
1000
10000
100000
1000000
10000000
100000000
0.0 0.1 0.2 0.3 0.4 0.5 0.6 0.7 0.8 0.9 1.0
Flow Exceedance Probability
Feca
l Col
iform
Loa
d (m
illio
n co
loni
es/d
ay)
Actual Load
Geometric Mean Load

Section 7 Methodology Development for the Cahokia Canal/Horseshoe Lake Watershed
7-26 DRAFT
T:\GIS\Stage3\Cahokia-Horseshoe\Stage3Draft\DRAFT\Sec 7 Cahokia Cl - Horseshoe L.doc
THIS PAGE INTENTIONALLY LEFT BLANK
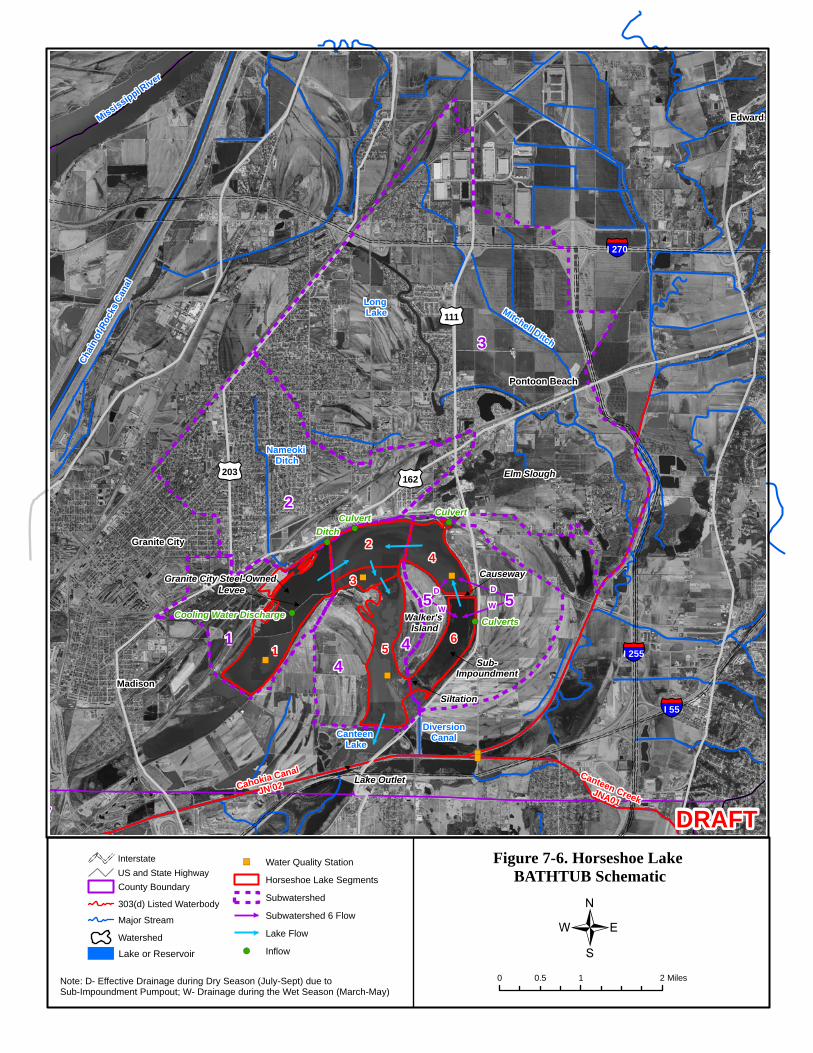
Figure 7-6. Horseshoe Lake BATHTUB Schematic
0 1 20.5 Miles
")")
") ")
")
")
!(
!(!(
!(
!(
tu203
tu111
tu162
§̈¦I 270
§̈¦I 55
y
Chai
n of
Roc
ks C
anal
Cahokia Canal
JN 02Canteen Creek
JNA01
Pontoon Beach
Edwards
Granite City
Madison
Mississippi River
Long Lake
§̈¦I 255
Nameoki Ditch
Walker's Island
Sub-Impoundment
Siltation
DiversionCanal
1
24
6
2
3
5
1 44
Canteen Lake
Granite City Steel-Owned
Mitchell Ditch
Elm Slough
Lake Outlet
Levee
Causeway3
5
D
WCooling Water Discharge
CulvertDitch
Culvert
Culverts
5D
W
") Water Quality Station
Horseshoe Lake Segments
Subwatershed
Subwatershed 6 Flow
Lake Flow
!( Inflow {
DRAFT
Lake or Reservoir
County Boundary
303(d) Listed Waterbody
Watershed
Major Stream
InterstateUS and State Highway
Note: D- Effective Drainage during Dry Season (July-Sept) due toSub-Impoundment Pumpout; W- Drainage during the Wet Season (March-May)

Section 7 Methodology Development for the Cahokia Canal/Horseshoe Lake Watershed
7-28 DRAFT
T:\GIS\Stage3\Cahokia-Horseshoe\Stage3Draft\DRAFT\Sec 7 Cahokia Cl - Horseshoe L.doc
THIS PAGE INTENTIONALLY LEFT BLANK

Figure 7-7. Frank Holten Lakes BATHTUB Schematic
0 1 20.5 Miles
")
")
")
")
")
")
!(!(
tu15
§̈¦I 64East St. Louis
tu111
§̈¦I 255
Frank Holten Lake 1
Frank Holten Lake 2
Frank Holten Lake 3
Lake Outlet
Interconnecting
Channel
Hard
ing
Ditc
hJM
AC02
Culvert
1
2
3
1
2
3
4
4
") Water Quality Station
Part of Lake 3
FrankHoltenLk_subws
Lake Flow
!( Inflow
Segmented_FrankHoltenLks_Prj{
DRAFT
Lake or Reservoir
County Boundary
303(d) Listed Waterbody
Watershed
Major Stream
InterstateUS and State Highway

Section 7 Methodology Development for the Cahokia Canal/Horseshoe Lake Watershed
7-30 DRAFT
T:\GIS\Stage3\Cahokia-Horseshoe\Stage3Draft\DRAFT\Sec 7 Cahokia Cl - Horseshoe L.doc
THIS PAGE INTENTIONALLY LEFT BLANK
DRAFT 8-1
T:\GIS\Stage3\Cahokia-Horseshoe\Stage3Draft\DRAFT\Sec 8 Cahokia Cl - Horseshoe L.doc
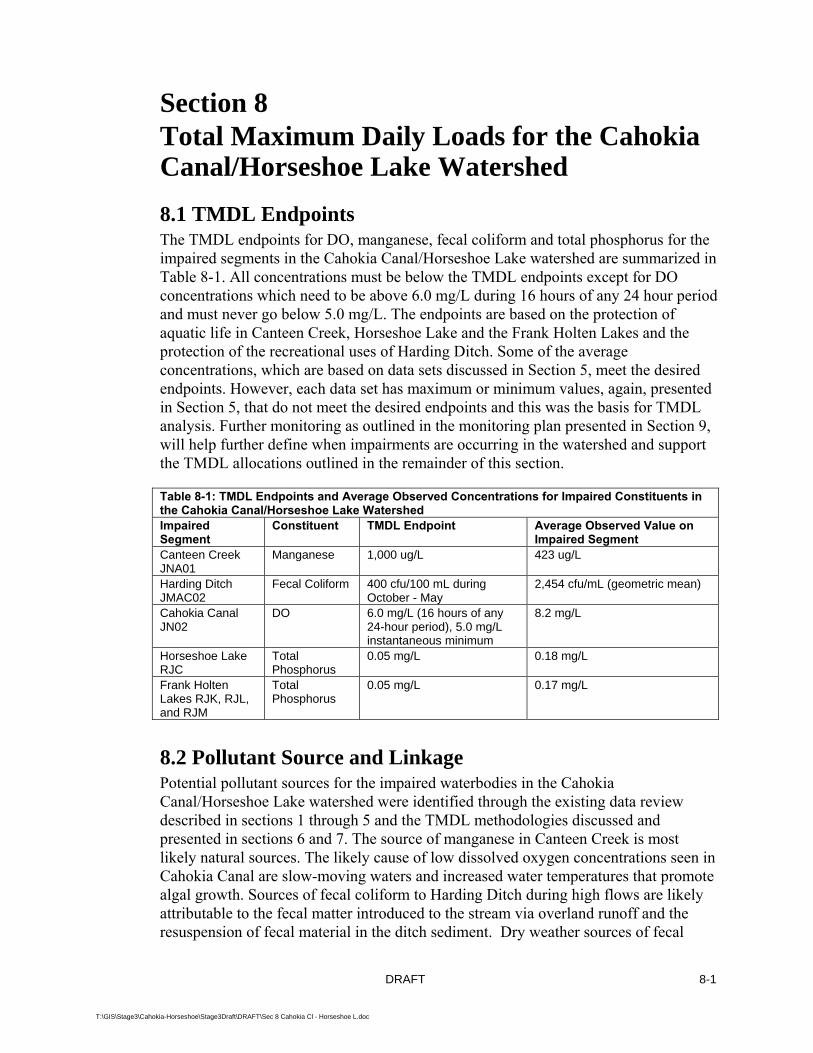
Section 8 Total Maximum Daily Loads for the Cahokia Canal/Horseshoe Lake Watershed 8.1 TMDL Endpoints The TMDL endpoints for DO, manganese, fecal coliform and total phosphorus for the impaired segments in the Cahokia Canal/Horseshoe Lake watershed are summarized in Table 8-1. All concentrations must be below the TMDL endpoints except for DO concentrations which need to be above 6.0 mg/L during 16 hours of any 24 hour period and must never go below 5.0 mg/L. The endpoints are based on the protection of aquatic life in Canteen Creek, Horseshoe Lake and the Frank Holten Lakes and the protection of the recreational uses of Harding Ditch. Some of the average concentrations, which are based on data sets discussed in Section 5, meet the desired endpoints. However, each data set has maximum or minimum values, again, presented in Section 5, that do not meet the desired endpoints and this was the basis for TMDL analysis. Further monitoring as outlined in the monitoring plan presented in Section 9, will help further define when impairments are occurring in the watershed and support the TMDL allocations outlined in the remainder of this section.
Table 8-1: TMDL Endpoints and Average Observed Concentrations for Impaired Constituents in the Cahokia Canal/Horseshoe Lake Watershed Impaired Segment
Constituent TMDL Endpoint Average Observed Value on Impaired Segment
Canteen Creek JNA01
Manganese 1,000 ug/L 423 ug/L
Harding Ditch JMAC02
Fecal Coliform 400 cfu/100 mL during October - May
2,454 cfu/mL (geometric mean)
Cahokia Canal JN02
DO 6.0 mg/L (16 hours of any 24-hour period), 5.0 mg/L instantaneous minimum
8.2 mg/L
Horseshoe Lake RJC
Total Phosphorus
0.05 mg/L 0.18 mg/L
Frank Holten Lakes RJK, RJL, and RJM
Total Phosphorus
0.05 mg/L 0.17 mg/L
8.2 Pollutant Source and Linkage Potential pollutant sources for the impaired waterbodies in the Cahokia Canal/Horseshoe Lake watershed were identified through the existing data review described in sections 1 through 5 and the TMDL methodologies discussed and presented in sections 6 and 7. The source of manganese in Canteen Creek is most likely natural sources. The likely cause of low dissolved oxygen concentrations seen in Cahokia Canal are slow-moving waters and increased water temperatures that promote algal growth. Sources of fecal coliform to Harding Ditch during high flows are likely attributable to the fecal matter introduced to the stream via overland runoff and the resuspension of fecal material in the ditch sediment. Dry weather sources of fecal
Section 8 Total Maximum Daily Loads for the Cahokia Canal/Horseshoe Lake Watershed
8-2 DRAFT
T:\GIS\Stage3\Cahokia-Horseshoe\Stage3Draft\DRAFT\Sec 8 Cahokia Cl - Horseshoe L.doc
coliform likely include failing septic systems in the watershed and livestock with direct access to the ditch or its tributaries. Nutrient sources to Horseshoe Lake and the Frank Holten Lakes are dominated by wet weather nonpoint sources.
8.3 Allocation As explained in Section 1, the TMDLs for the impaired segments in the Cahokia Canal/Horseshoe Lake watershed will address the following equation:
TMDL = LC = ΣWLA + ΣLA + MOS
where: LC = Maximum amount of pollutant loading a water body can receive without violating water quality standards
WLA = The portion of the TMDL allocated to existing or future point sources
LA = Portion of the TMDL allocated to existing or future nonpoint sources and natural background
MOS = An accounting of uncertainty about the relationship between pollutant loads and receiving water quality
Each of these elements will be discussed in this section as well as consideration of seasonal variation in the TMDL calculation. 8.3.1 Cahokia Canal DO TMDL 8.3.1.1 Loading Capacity The LC is the maximum amount of oxygen-demanding material that Cahokia Canal can receive and still maintain compliance with the water quality standards. The allowable loads of oxygen-demanding material that can be generated in the watershed and still maintain water quality standards were determined with the methodology discussed in Section 7.2.1.
In the absence of a reasonable measured calibration data set, model dissolved oxygen forcing variables were adjusted to achieve reasonable values based on limited site-specific data (e.g. hydraulics, water temperature) and literature/experience (e.g. SOD, benthic algae, phytoplankton). Model internal rates were maintained at default (recommended) values. Results show that re-aeration dominates over oxidation in the target reach for the assumed loading conditions and kinetic rates.
Based on model analysis, flow and reaeration would need to be increased during summer months. Because a TMDL can not be developed for reaeration, no TMDL will be developed at this time.
Further monitoring and implementation measures to increase aeration in the system are discussed in Section 9.
Section 8 Total Maximum Daily Loads for the Cahokia Canal/Horseshoe Lake Watershed
DRAFT 8-3
T:\GIS\Stage3\Cahokia-Horseshoe\Stage3Draft\DRAFT\Sec 8 Cahokia Cl - Horseshoe L.doc
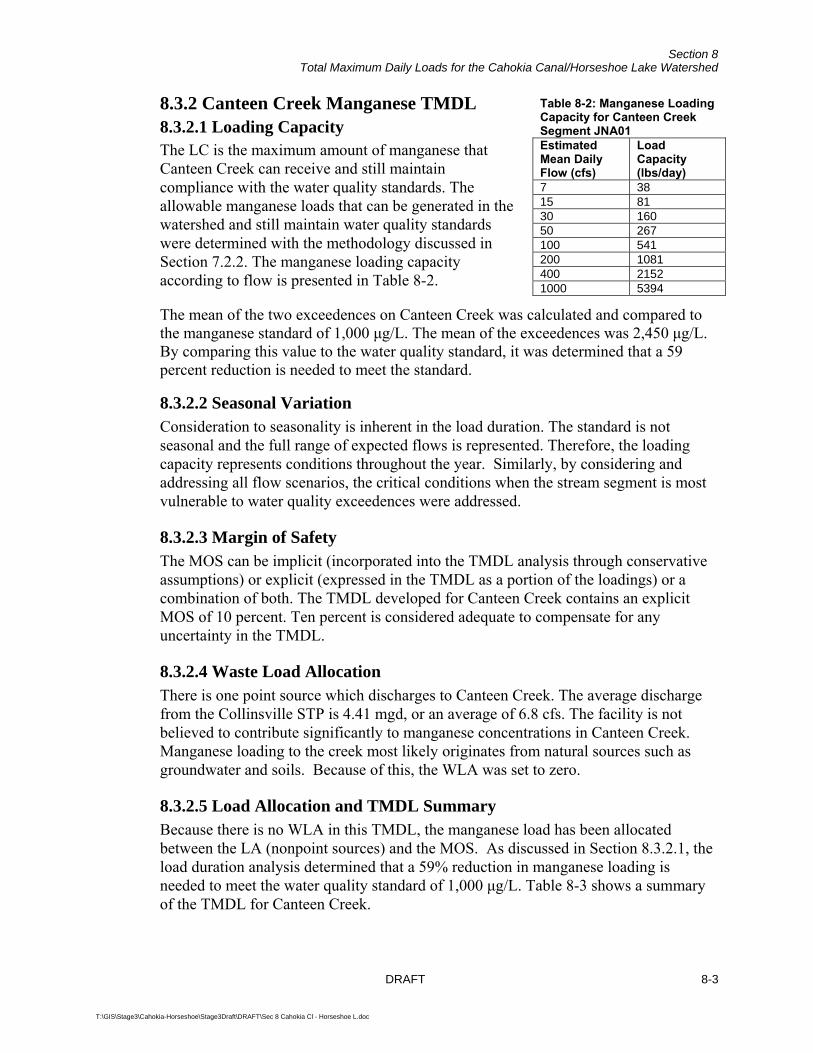
8.3.2 Canteen Creek Manganese TMDL 8.3.2.1 Loading Capacity The LC is the maximum amount of manganese that Canteen Creek can receive and still maintain compliance with the water quality standards. The allowable manganese loads that can be generated in the watershed and still maintain water quality standards were determined with the methodology discussed in Section 7.2.2. The manganese loading capacity according to flow is presented in Table 8-2.
The mean of the two exceedences on Canteen Creek was calculated and compared to the manganese standard of 1,000 μg/L. The mean of the exceedences was 2,450 μg/L. By comparing this value to the water quality standard, it was determined that a 59 percent reduction is needed to meet the standard.
8.3.2.2 Seasonal Variation Consideration to seasonality is inherent in the load duration. The standard is not seasonal and the full range of expected flows is represented. Therefore, the loading capacity represents conditions throughout the year. Similarly, by considering and addressing all flow scenarios, the critical conditions when the stream segment is most vulnerable to water quality exceedences were addressed.
8.3.2.3 Margin of Safety The MOS can be implicit (incorporated into the TMDL analysis through conservative assumptions) or explicit (expressed in the TMDL as a portion of the loadings) or a combination of both. The TMDL developed for Canteen Creek contains an explicit MOS of 10 percent. Ten percent is considered adequate to compensate for any uncertainty in the TMDL.
8.3.2.4 Waste Load Allocation There is one point source which discharges to Canteen Creek. The average discharge from the Collinsville STP is 4.41 mgd, or an average of 6.8 cfs. The facility is not believed to contribute significantly to manganese concentrations in Canteen Creek. Manganese loading to the creek most likely originates from natural sources such as groundwater and soils. Because of this, the WLA was set to zero.
8.3.2.5 Load Allocation and TMDL Summary Because there is no WLA in this TMDL, the manganese load has been allocated between the LA (nonpoint sources) and the MOS. As discussed in Section 8.3.2.1, the load duration analysis determined that a 59% reduction in manganese loading is needed to meet the water quality standard of 1,000 μg/L. Table 8-3 shows a summary of the TMDL for Canteen Creek.
Table 8-2: Manganese Loading Capacity for Canteen Creek Segment JNA01 Estimated Mean Daily Flow (cfs)
Load Capacity (lbs/day)
7 38 15 81 30 160 50 267 100 541 200 1081 400 2152 1000 5394
Section 8 Total Maximum Daily Loads for the Cahokia Canal/Horseshoe Lake Watershed
8-4 DRAFT
T:\GIS\Stage3\Cahokia-Horseshoe\Stage3Draft\DRAFT\Sec 8 Cahokia Cl - Horseshoe L.doc
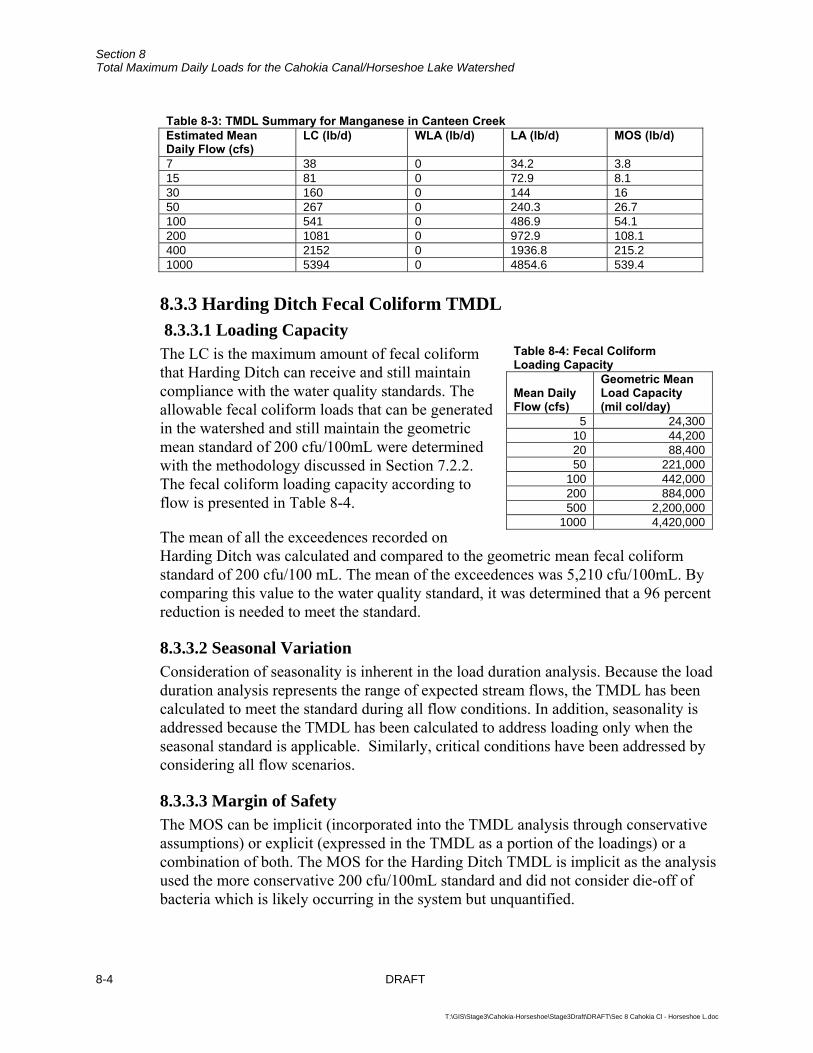
Table 8-3: TMDL Summary for Manganese in Canteen Creek Estimated Mean Daily Flow (cfs)
LC (lb/d) WLA (lb/d) LA (lb/d) MOS (lb/d)
7 38 0 34.2 3.8 15 81 0 72.9 8.1 30 160 0 144 16 50 267 0 240.3 26.7 100 541 0 486.9 54.1 200 1081 0 972.9 108.1 400 2152 0 1936.8 215.2 1000 5394 0 4854.6 539.4
8.3.3 Harding Ditch Fecal Coliform TMDL 8.3.3.1 Loading Capacity The LC is the maximum amount of fecal coliform that Harding Ditch can receive and still maintain compliance with the water quality standards. The allowable fecal coliform loads that can be generated in the watershed and still maintain the geometric mean standard of 200 cfu/100mL were determined with the methodology discussed in Section 7.2.2. The fecal coliform loading capacity according to flow is presented in Table 8-4.
The mean of all the exceedences recorded on Harding Ditch was calculated and compared to the geometric mean fecal coliform standard of 200 cfu/100 mL. The mean of the exceedences was 5,210 cfu/100mL. By comparing this value to the water quality standard, it was determined that a 96 percent reduction is needed to meet the standard.
8.3.3.2 Seasonal Variation Consideration of seasonality is inherent in the load duration analysis. Because the load duration analysis represents the range of expected stream flows, the TMDL has been calculated to meet the standard during all flow conditions. In addition, seasonality is addressed because the TMDL has been calculated to address loading only when the seasonal standard is applicable. Similarly, critical conditions have been addressed by considering all flow scenarios.
8.3.3.3 Margin of Safety The MOS can be implicit (incorporated into the TMDL analysis through conservative assumptions) or explicit (expressed in the TMDL as a portion of the loadings) or a combination of both. The MOS for the Harding Ditch TMDL is implicit as the analysis used the more conservative 200 cfu/100mL standard and did not consider die-off of bacteria which is likely occurring in the system but unquantified.
Table 8-4: Fecal Coliform Loading Capacity
Mean Daily Flow (cfs)
Geometric Mean Load Capacity (mil col/day)
5 24,300 10 44,200 20 88,400 50 221,000
100 442,000 200 884,000 500 2,200,000
1000 4,420,000
Section 8 Total Maximum Daily Loads for the Cahokia Canal/Horseshoe Lake Watershed
DRAFT 8-5
T:\GIS\Stage3\Cahokia-Horseshoe\Stage3Draft\DRAFT\Sec 8 Cahokia Cl - Horseshoe L.doc
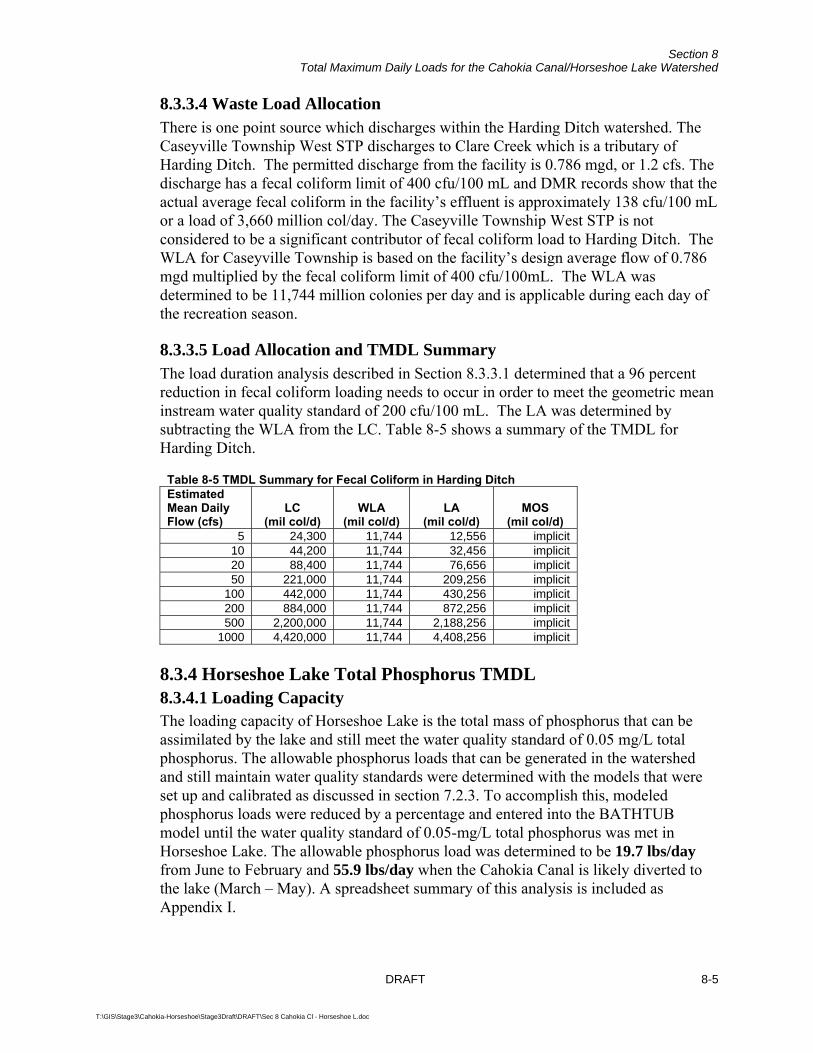
8.3.3.4 Waste Load Allocation There is one point source which discharges within the Harding Ditch watershed. The Caseyville Township West STP discharges to Clare Creek which is a tributary of Harding Ditch. The permitted discharge from the facility is 0.786 mgd, or 1.2 cfs. The discharge has a fecal coliform limit of 400 cfu/100 mL and DMR records show that the actual average fecal coliform in the facility’s effluent is approximately 138 cfu/100 mL or a load of 3,660 million col/day. The Caseyville Township West STP is not considered to be a significant contributor of fecal coliform load to Harding Ditch. The WLA for Caseyville Township is based on the facility’s design average flow of 0.786 mgd multiplied by the fecal coliform limit of 400 cfu/100mL. The WLA was determined to be 11,744 million colonies per day and is applicable during each day of the recreation season.
8.3.3.5 Load Allocation and TMDL Summary The load duration analysis described in Section 8.3.3.1 determined that a 96 percent reduction in fecal coliform loading needs to occur in order to meet the geometric mean instream water quality standard of 200 cfu/100 mL. The LA was determined by subtracting the WLA from the LC. Table 8-5 shows a summary of the TMDL for Harding Ditch.
Table 8-5 TMDL Summary for Fecal Coliform in Harding Ditch Estimated Mean Daily Flow (cfs)
LC (mil col/d)
WLA (mil col/d)
LA (mil col/d)
MOS (mil col/d)
5 24,300 11,744 12,556 implicit 10 44,200 11,744 32,456 implicit 20 88,400 11,744 76,656 implicit 50 221,000 11,744 209,256 implicit
100 442,000 11,744 430,256 implicit 200 884,000 11,744 872,256 implicit 500 2,200,000 11,744 2,188,256 implicit
1000 4,420,000 11,744 4,408,256 implicit 8.3.4 Horseshoe Lake Total Phosphorus TMDL 8.3.4.1 Loading Capacity The loading capacity of Horseshoe Lake is the total mass of phosphorus that can be assimilated by the lake and still meet the water quality standard of 0.05 mg/L total phosphorus. The allowable phosphorus loads that can be generated in the watershed and still maintain water quality standards were determined with the models that were set up and calibrated as discussed in section 7.2.3. To accomplish this, modeled phosphorus loads were reduced by a percentage and entered into the BATHTUB model until the water quality standard of 0.05-mg/L total phosphorus was met in Horseshoe Lake. The allowable phosphorus load was determined to be 19.7 lbs/day from June to February and 55.9 lbs/day when the Cahokia Canal is likely diverted to the lake (March – May). A spreadsheet summary of this analysis is included as Appendix I.
Section 8 Total Maximum Daily Loads for the Cahokia Canal/Horseshoe Lake Watershed
8-6 DRAFT
T:\GIS\Stage3\Cahokia-Horseshoe\Stage3Draft\DRAFT\Sec 8 Cahokia Cl - Horseshoe L.doc
8.3.4.2 Seasonal Variation Seasonal variation in lake water quality is captured in the Horseshoe Lake TMDL by simulating two different seasons: wet (March-May) and normal (remainder of the year). The wet scenario is characterized by higher loadings, higher dilution, and lower water temperatures. Loadings are higher in this wet season scenario due to increased runoff and an operational practice that diverts the Cahokia Canal to the lake during heavy rain events. The remainder of the year is characterized by normal operations where the lake is filled by rain and runoff from the surrounding watershed. The loadings for this TMDL are presented as daily amounts allowable during both operations. Because the TMDL includes loading during both scenarios, it is assumed that the critical condition is accounted for within the analysis.
8.3.4.3 Margin of Safety The MOS can be implicit (incorporated into the TMDL analysis through conservative assumptions) or explicit (expressed in the TMDL as a portion of the loadings) or a combination of both. The MOS for the Horseshoe Lake TMDL includes both. The analysis completed for Horseshoe Lake is implicitly conservative because of the following:
Default values were used in the BATHTUB model, which in absence of site-specific information are assumed conservative. Default model values, such as the phosphorus assimilation rate, are based on scientific data accumulated from a large survey of lakes. Because no site-specific data are available, default model rates are used which are based on error analysis calculations. The model used for this analysis uses estimates of second-order sedimentation coefficients which are generally accurate to within a factor of 2 for phosphorusn. This provides a conservation range of where the predictions could fall and provides confidence in the predicted values.
Because site-specific data were not available on internal cycling rates, conservative estimates were used based on available in-lake concentration data and predicted concentrations in the absence of internal loading. The model is set up to allow conservative estimates of internal loading which result in the model achieving a close estimate of in-lake concentration data for the average-loading conditions modeled in this scenario.
In the absence of site-specific data, an atmospheric loading rate of 30 mg/m2-yr total phosphorus (USACE 1999) was taken from literature values and assumed in the BATHTUB model. This is a conservative value because atmospheric loadings of phosphorus are attributed to erosion that becomes wind borne and because of the low agricultural activity in the watershed the atmospheric loading is most likely negligible.
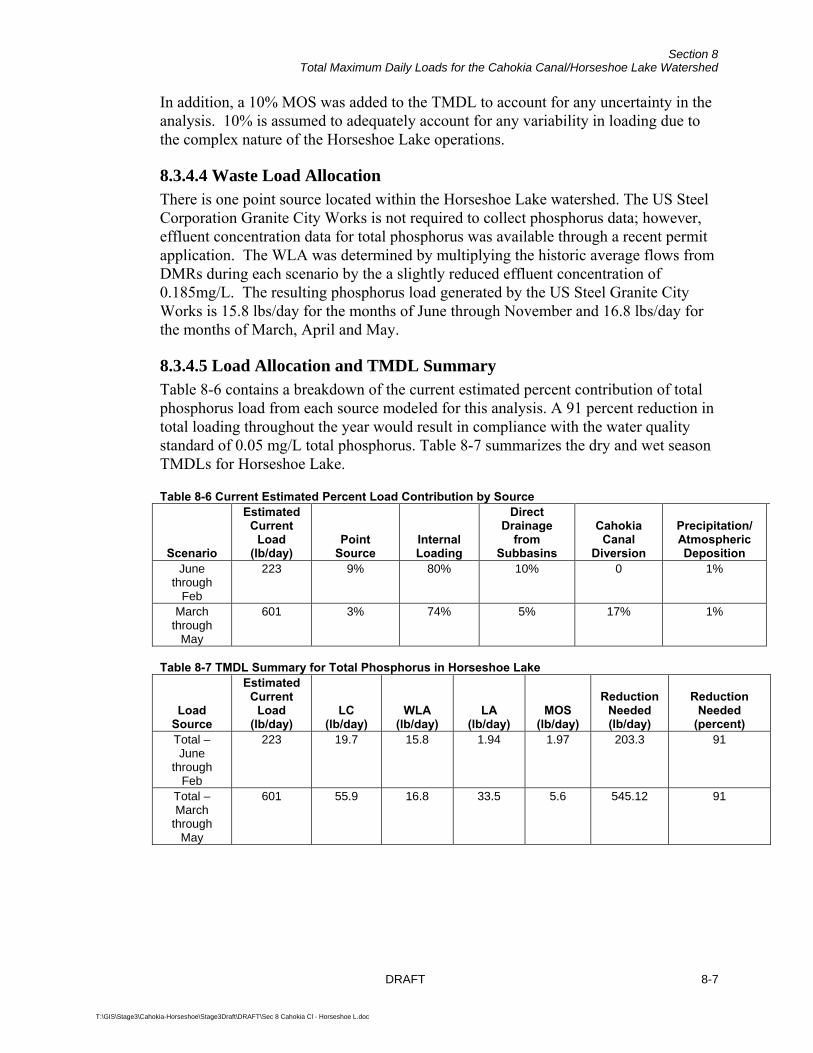
Section 8 Total Maximum Daily Loads for the Cahokia Canal/Horseshoe Lake Watershed
DRAFT 8-7
T:\GIS\Stage3\Cahokia-Horseshoe\Stage3Draft\DRAFT\Sec 8 Cahokia Cl - Horseshoe L.doc
In addition, a 10% MOS was added to the TMDL to account for any uncertainty in the analysis. 10% is assumed to adequately account for any variability in loading due to the complex nature of the Horseshoe Lake operations.
8.3.4.4 Waste Load Allocation There is one point source located within the Horseshoe Lake watershed. The US Steel Corporation Granite City Works is not required to collect phosphorus data; however, effluent concentration data for total phosphorus was available through a recent permit application. The WLA was determined by multiplying the historic average flows from DMRs during each scenario by the a slightly reduced effluent concentration of 0.185mg/L. The resulting phosphorus load generated by the US Steel Granite City Works is 15.8 lbs/day for the months of June through November and 16.8 lbs/day for the months of March, April and May.
8.3.4.5 Load Allocation and TMDL Summary Table 8-6 contains a breakdown of the current estimated percent contribution of total phosphorus load from each source modeled for this analysis. A 91 percent reduction in total loading throughout the year would result in compliance with the water quality standard of 0.05 mg/L total phosphorus. Table 8-7 summarizes the dry and wet season TMDLs for Horseshoe Lake.
Table 8-6 Current Estimated Percent Load Contribution by Source
Scenario
Estimated Current
Load (lb/day)
Point Source
Internal Loading
Direct Drainage
from Subbasins
Cahokia Canal
Diversion
Precipitation/ Atmospheric Deposition
June through
Feb
223 9% 80% 10% 0 1%
March through
May
601 3% 74% 5% 17% 1%
Table 8-7 TMDL Summary for Total Phosphorus in Horseshoe Lake
Load Source
Estimated Current
Load (lb/day)
LC (lb/day)
WLA (lb/day)
LA (lb/day)
MOS (lb/day)
Reduction Needed (lb/day)
Reduction Needed
(percent) Total – June
through Feb
223 19.7 15.8 1.94 1.97 203.3 91
Total – March
through May
601 55.9 16.8 33.5 5.6 545.12 91
Section 8 Total Maximum Daily Loads for the Cahokia Canal/Horseshoe Lake Watershed
8-8 DRAFT
T:\GIS\Stage3\Cahokia-Horseshoe\Stage3Draft\DRAFT\Sec 8 Cahokia Cl - Horseshoe L.doc
8.3.5 Frank Holten Lakes Total Phosphorus TMDL 8.3.5.1 Loading Capacity The loading capacity of the Frank Holten Lakes is the total mass of phosphorus that can be assimilated by the lake and still meet the water quality standard of 0.05 mg/L total phosphorus. The allowable phosphorus loads that can be generated in the watershed and still maintain water quality standards were determined with the models that were set up and calibrated as discussed in section 7.2.3. To accomplish this, modeled phosphorus loads were reduced by a percentage and entered into the BATHTUB model until the water quality standard of 0.05-mg/L total phosphorus was met in Horseshoe Lake. The allowable phosphorus load was determined to be 0.2 lbs/day during the dry season and 11.5 lbs/day during the wet season. A spreadsheet of this analysis is included as Appendix J.
8.3.5.2 Seasonal Variation Seasonal variation in lake water quality is captured in the Frank Holten Lakes TMDL by both wet and dry seasons. The wet scenario is characterized by higher loadings, higher dilution, and lower water temperatures. Loadings are higher in this wet season scenario due to increased runoff and the back flow of Harding Ditch into Frank Holten Lake #3. The summer scenario is characterized by higher water temperatures and lower dilution. The loadings for this TMDL are presented as daily amounts allowable during dry and wet seasons. Because the TMDL includes loading during both scenarios, it is assumed that the critical condition is accounted for within the analysis.
8.3.5.3 Margin of Safety The MOS can be implicit (incorporated into the TMDL analysis through conservative assumptions) or explicit (expressed in the TMDL as a portion of the loadings) or a combination of both. The MOS for the Frank Holten Lakes TMDL is implicit. The analysis completed for the lakes is conservative because of the following:
Default values were used in the BATHTUB model, which in absence of site-specific information are assumed conservative. Default model values, such as the phosphorus assimilation rate, are based on scientific data accumulated from a large survey of lakes. Because no site-specific data are available, default model rates are used which are based on error analysis calculations. The model used for this analysis uses estimates of second-order sedimentation coefficients which are generally accurate to within a factor of 2 for phosphorusn. This provides a conservation range of where the predictions could fall and provides confidence in the predicted values.
Because site-specific data were not available on internal cycling rates, conservative estimates were used based on available in-lake concentration data and predicted concentrations in the absence of internal loading. The model is set up to allow conservative estimates of internal loading which result in the model achieving a
Section 8 Total Maximum Daily Loads for the Cahokia Canal/Horseshoe Lake Watershed
DRAFT 8-9
T:\GIS\Stage3\Cahokia-Horseshoe\Stage3Draft\DRAFT\Sec 8 Cahokia Cl - Horseshoe L.doc
close estimate of in-lake concentration data for the average-loading conditions modeled in this scenario.
In the absence of site-specific data, an atmospheric loading rate of 30 mg/m2-yr total phosphorus (USACE 1999) was taken from literature values and assumed in the BATHTUB model. This is a conservative value because atmospheric loadings of phosphorus are attributed to erosion that becomes wind borne and because of the low agricultural activity in the watershed the atmospheric loading is most likely negligible.
8.3.5.4 Waste Load Allocation There are no point sources located within the Frank Holten Lakes watershed. There is one point source located in the Harding Ditch subbasin, however, it is located on a tributary to Harding Ditch and is significantly upstream of the lakes. Because point sources are not influencing nutrient levels in the lakes, the WLA is set to zero.
8.3.5.5 Load Allocation and TMDL Summary Tables 8-8 and 8-9 show a summary of the TMDLs for the Frank Holten Lakes. On average, a total reduction of total phosphorus loads to the lake of 92 percent during the dry season and 88 percent during the wet season would result in compliance with the water quality standard of 0.05 mg/L total phosphorus.
Table 8-8 TMDL Summary for Total Phosphorus in Frank Holten Lakes- Dry Season
Load Source
Estimated Current
Load (lb/day) LC
(lb/day) WLA
(lb/day) LA
(lb/day) MOS
(lb/day)
Reduction Needed (lb/day)
Reduction Needed
(percent) Total 2.4 0.2 0 0.2 0 2.2 92
Internal 2.3 0.1 0 0.1 0 2.2 96 External 0.1 0.1 0 0.1 0 0 0 Table 8-9 TMDL Summary for Total Phosphorus in Frank Holten Lakes- Wet Season
Load Source
Estimated Current
Load (lb/day) LC
(lb/day) WLA
(lb/day) LA
(lb/day) MOS
(lb/day)
Reduction Needed (lb/day)
Reduction Needed
(percent) Total 95.9 11.5 0 11.5 0 84.3 88
Internal 4.2 0.4 0 0.4 0 3.8 90 External 91.7 11.1 0 11.1 0 80.5 88
Section 8 Total Maximum Daily Loads for the Cahokia Canal/Horseshoe Lake Watershed
8-10 DRAFT
T:\GIS\Stage3\Cahokia-Horseshoe\Stage3Draft\DRAFT\Sec 8 Cahokia Cl - Horseshoe L.doc
THIS PAGE INTENTIONALLY LEFT BLANK
DRAFT 9-1
T:\GIS\Stage3\Cahokia-Horseshoe\Stage3Draft\DRAFT\Sec 9 Cahokia Cl - Horseshoe L.doc
Section 9 Implementation Plan for the Cahokia Canal/Horseshoe Lake Watershed 9.1 Adaptive Management An adaptive management or phased approach is recommended for the TMDLs developed for the Cahokia Canal/Horseshoe Lake watershed due to the limited amount of data available for the TMDL analysis. Adaptive management is a systematic process for continually improving management policies and practices through learning from the outcomes of operational programs. Some of the differentiating characteristics of adaptive management are:
Acknowledgement of uncertainty about what policy or practice is "best" for the particular management issue
Thoughtful selection of the policies or practices to be applied (the assessment and design stages of the cycle)
Careful implementation of a plan of action designed to reveal the critical knowledge that is currently lacking
Monitoring of key response indicators
Analysis of the management outcomes in consideration of the original objectives and incorporation of the results into future decisions (British Columbia Ministry of Forests 2000)
Implementation actions, point source controls, management measures, or BMPs are used to control the generation or distribution of pollutants. BMPs are either structural, such as wetlands, sediment basins, fencing, or filter strips; or managerial, such as conservation tillage, nutrient management plans, or crop rotation. Both types require good management to be effective in reducing pollutant loading to water resources (Osmond et al. 1995).
It is generally more effective to install a combination of point source controls and BMPs or a BMP system. A BMP system is a combination of two or more individual BMPs that are used to control a pollutant from the same critical source. In other words, if the watershed has more than one identified pollutant, but the transport mechanism is the same, then a BMP system that establishes controls for the transport mechanism can be employed (Osmond et al. 1995).
To assist in adaptive management, implementation actions, management measures, available assistance programs, and recommended continued monitoring are all discussed throughout the remainder of this section.
Section 9 Implementation Plan for the Cahokia Canal/Horseshoe Lake Watershed
9-2 DRAFT
T:\GIS\Stage3\Cahokia-Horseshoe\Stage3Draft\DRAFT\Sec 9 Cahokia Cl - Horseshoe L.doc
9.2 Implementation Actions and Management Measures for DO in the Cahokia Canal A number of potential sources of oxygen-demanding material were identified through Stages 1 and 3 of TMDL development. Modeling determined that low flows and high temperatures are driving the low levels of DO recorded on the segment. Oxygen-demanding materials in the canal sediments consume oxygen during these low flow times. Potential contributors to oxygen-demanding materials in the impaired segment include include nonpoint sources (crop fertilization, lawn fertilization, and streambank erosion) as well as point sources contributions in the watershed.
9.2.1 Point Sources of Oxygen-Demanding Materials A DO TMDL for Cahokia Canal was not developed, however, a review of potential contributors of oxygen-demanding materials was performed for this implementation plan so that information on all potential sources are available to the community for any future monitoring or remediation work performed within the watershed.
9.2.1.1 Stormwater Sources Portions of the Cahokia Canal watershed are dominated by urban land uses. Within the canal's watershed, the following municipalities have stormwater permits:
Edwardsville Glen Carbon Pontoon Beach Maryville Granite City Collinsville Madison Venice East St. Louis Caseyville
Illinois MS4 permits require that six minimum controls be implemented to reduce pollutants discharged. The minimum controls are:
Public Education/Outreach Public Participation/Involvement Illicit Discharge Detection/Elimination Construction Site Runoff Control Post Construction Runoff Control Pollution Prevention/Good Housekeeping
These six controls should result in stormwater quality that does not affect the loads of oxygen-demanding material to the canal. Future monitoring of stormwater outfalls will help determine the efficiency of the six minimum stormwater controls and will help to
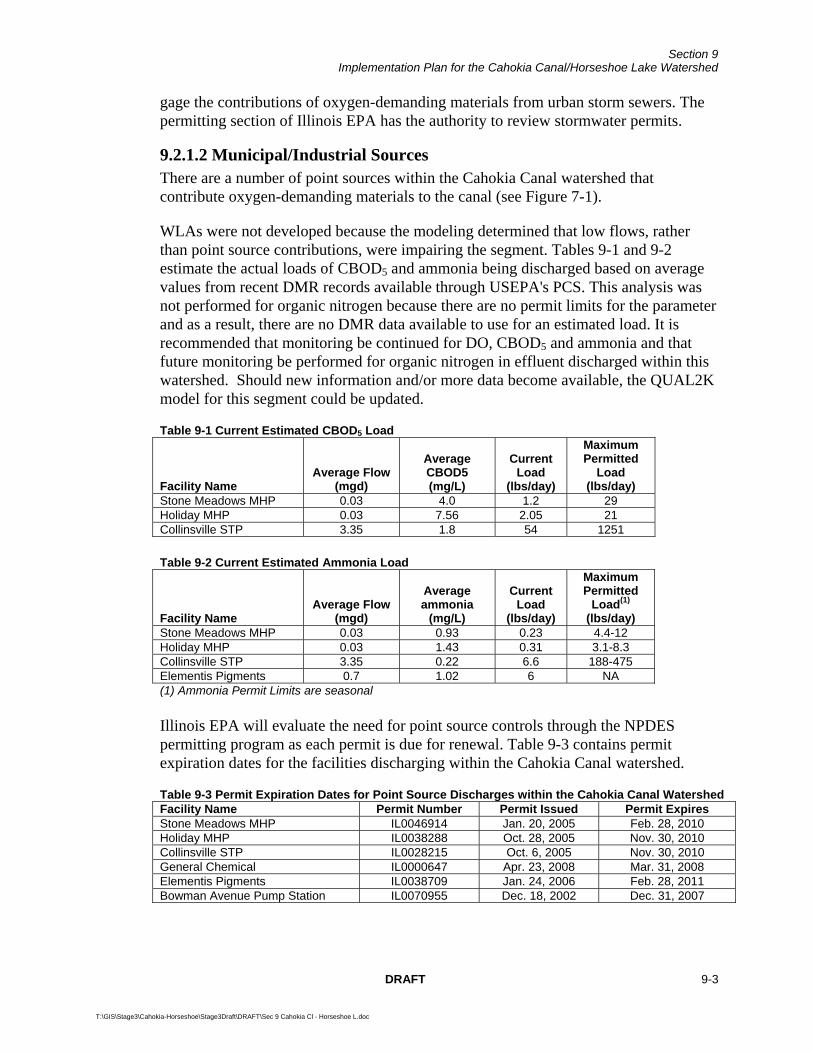
Section 9 Implementation Plan for the Cahokia Canal/Horseshoe Lake Watershed
DRAFT 9-3
T:\GIS\Stage3\Cahokia-Horseshoe\Stage3Draft\DRAFT\Sec 9 Cahokia Cl - Horseshoe L.doc
gage the contributions of oxygen-demanding materials from urban storm sewers. The permitting section of Illinois EPA has the authority to review stormwater permits.
9.2.1.2 Municipal/Industrial Sources There are a number of point sources within the Cahokia Canal watershed that contribute oxygen-demanding materials to the canal (see Figure 7-1).
WLAs were not developed because the modeling determined that low flows, rather than point source contributions, were impairing the segment. Tables 9-1 and 9-2 estimate the actual loads of CBOD5 and ammonia being discharged based on average values from recent DMR records available through USEPA's PCS. This analysis was not performed for organic nitrogen because there are no permit limits for the parameter and as a result, there are no DMR data available to use for an estimated load. It is recommended that monitoring be continued for DO, CBOD5 and ammonia and that future monitoring be performed for organic nitrogen in effluent discharged within this watershed. Should new information and/or more data become available, the QUAL2K model for this segment could be updated.
Table 9-1 Current Estimated CBOD5 Load
Facility Name Average Flow
(mgd)
Average CBOD5 (mg/L)
Current Load
(lbs/day)
Maximum Permitted
Load (lbs/day)
Stone Meadows MHP 0.03 4.0 1.2 29 Holiday MHP 0.03 7.56 2.05 21 Collinsville STP 3.35 1.8 54 1251 Table 9-2 Current Estimated Ammonia Load
Facility Name Average Flow
(mgd)
Average ammonia
(mg/L)
Current Load
(lbs/day)
Maximum Permitted
Load(1) (lbs/day)
Stone Meadows MHP 0.03 0.93 0.23 4.4-12 Holiday MHP 0.03 1.43 0.31 3.1-8.3 Collinsville STP 3.35 0.22 6.6 188-475 Elementis Pigments 0.7 1.02 6 NA (1) Ammonia Permit Limits are seasonal Illinois EPA will evaluate the need for point source controls through the NPDES permitting program as each permit is due for renewal. Table 9-3 contains permit expiration dates for the facilities discharging within the Cahokia Canal watershed.
Table 9-3 Permit Expiration Dates for Point Source Discharges within the Cahokia Canal Watershed Facility Name Permit Number Permit Issued Permit Expires Stone Meadows MHP IL0046914 Jan. 20, 2005 Feb. 28, 2010 Holiday MHP IL0038288 Oct. 28, 2005 Nov. 30, 2010 Collinsville STP IL0028215 Oct. 6, 2005 Nov. 30, 2010 General Chemical IL0000647 Apr. 23, 2008 Mar. 31, 2008 Elementis Pigments IL0038709 Jan. 24, 2006 Feb. 28, 2011 Bowman Avenue Pump Station IL0070955 Dec. 18, 2002 Dec. 31, 2007
Section 9 Implementation Plan for the Cahokia Canal/Horseshoe Lake Watershed
9-4 DRAFT
T:\GIS\Stage3\Cahokia-Horseshoe\Stage3Draft\DRAFT\Sec 9 Cahokia Cl - Horseshoe L.doc
9.2.2 Nonpoint Sources of Oxygen-Demanding Materials In addition to point sources of oxygen-demanding materials within the watershed, there are a number or potential nonpoint sources. The potential sources of nonpoint pollution to the Cahokia Canal include overfertilization, streambank erosion, low flows, and high temperatures. BMPs evaluated for treatment of these nonpoint sources are:
Filter strips Reaeration/Erosion Control/Streambank Stabilization
Organic and nutrient loads originating from cropland are most efficiently treated with a combination of riparian buffer or grass filter strips. Streambank stabilization and erosion control can limit the oxygen-demanding material entering the stream. Instream management measures for DO focus on reaeration techniques. The Q2K model used to develop the TMDL utilizes reaeration coefficients. Increasing the reaeration coefficient by physical means will increase DO in the Cahokia Canal.
9.2.2.1 Filter Strips Filter strips can be used as a control to reduce pollutant loads, including nutrients and sediment, to the Cahokia Canal. Filter strips implemented along stream segments slow and filter nutrients and sediment out of runoff, help reduce stream water temperatures thereby increasing the water body DO saturation level, and provide bank stabilization decreasing erosion and deposition. The following paragraphs focus on the implementation of filter strips in the Cahokia Canal watershed. Finally, design criteria and size selection of filter strips are detailed.
Organic debris in topsoil contributes to the CBOD5 load to water bodies (USEPA 1997). Increasing the length of stream bordered by grass and riparian buffer strips will decrease the amount of CBOD5 and nutrient load associated with sediment loads to the Cahokia Canal. Nutrient criteria, currently being developed and expected to be adopted in the near future by the Illinois EPA, will assess the instream nutrient concentrations required for the watershed. Excess nutrients in streams can cause excessive algal growth, which can deplete DO in streams. Adoption of nutrient criteria will potentially affect this DO TMDL and help control exceedences of DO water quality criteria in the Cahokia Canal.
Filter strips will help control CBOD5 levels by removing organic loads associated with sediment from runoff; however, no studies were identified as providing an estimate of removal efficiency. Grass filter strips can remove as much as 75 percent of sediment and 45 percent of total phosphorus from runoff, so it is assumed that the removal of CBOD5 falls within this range (NCSU 2000). Riparian buffer strips also help reduce water temperatures which can in turn increase the water body DO saturation level.
Riparian vegetation, specifically shade, plays a significant role in controlling stream temperature change. The shade provided will reduce solar radiation loading to the stream. Furthermore, riparian vegetation provides bank stability that reduces sediment
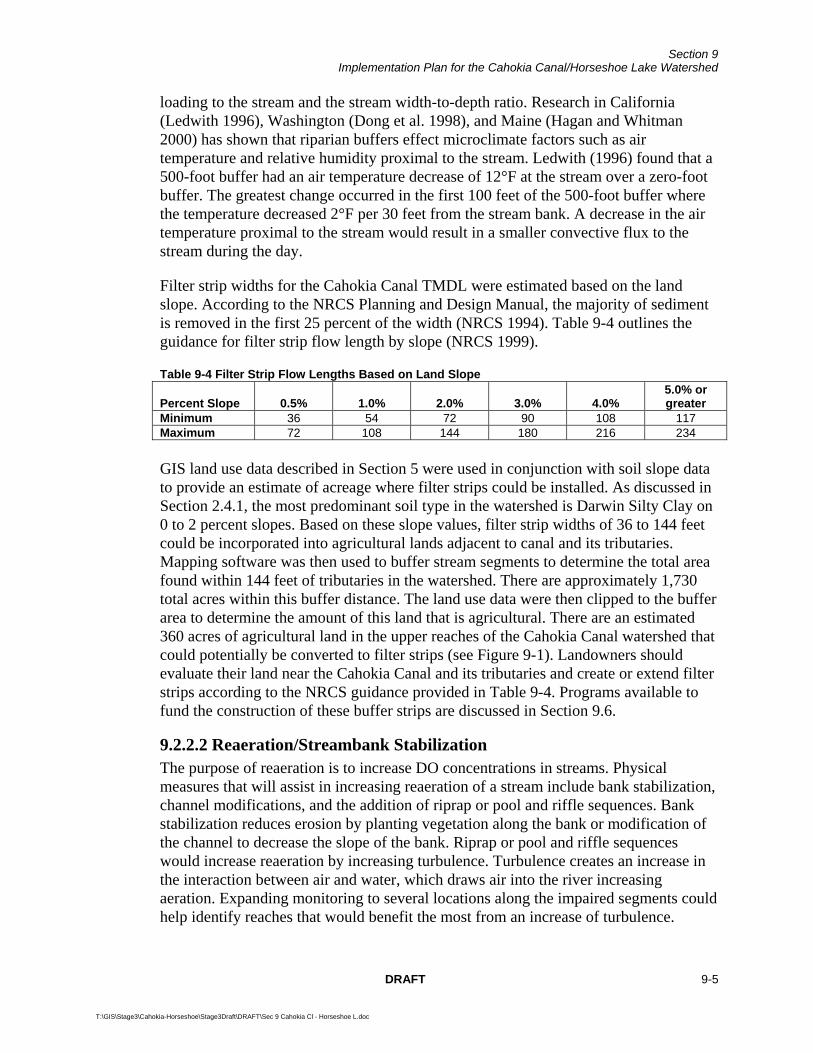
Section 9 Implementation Plan for the Cahokia Canal/Horseshoe Lake Watershed
DRAFT 9-5
T:\GIS\Stage3\Cahokia-Horseshoe\Stage3Draft\DRAFT\Sec 9 Cahokia Cl - Horseshoe L.doc
loading to the stream and the stream width-to-depth ratio. Research in California (Ledwith 1996), Washington (Dong et al. 1998), and Maine (Hagan and Whitman 2000) has shown that riparian buffers effect microclimate factors such as air temperature and relative humidity proximal to the stream. Ledwith (1996) found that a 500-foot buffer had an air temperature decrease of 12°F at the stream over a zero-foot buffer. The greatest change occurred in the first 100 feet of the 500-foot buffer where the temperature decreased 2°F per 30 feet from the stream bank. A decrease in the air temperature proximal to the stream would result in a smaller convective flux to the stream during the day.
Filter strip widths for the Cahokia Canal TMDL were estimated based on the land slope. According to the NRCS Planning and Design Manual, the majority of sediment is removed in the first 25 percent of the width (NRCS 1994). Table 9-4 outlines the guidance for filter strip flow length by slope (NRCS 1999).
Table 9-4 Filter Strip Flow Lengths Based on Land Slope
Percent Slope 0.5% 1.0% 2.0% 3.0% 4.0% 5.0% or greater
Minimum 36 54 72 90 108 117 Maximum 72 108 144 180 216 234 GIS land use data described in Section 5 were used in conjunction with soil slope data to provide an estimate of acreage where filter strips could be installed. As discussed in Section 2.4.1, the most predominant soil type in the watershed is Darwin Silty Clay on 0 to 2 percent slopes. Based on these slope values, filter strip widths of 36 to 144 feet could be incorporated into agricultural lands adjacent to canal and its tributaries. Mapping software was then used to buffer stream segments to determine the total area found within 144 feet of tributaries in the watershed. There are approximately 1,730 total acres within this buffer distance. The land use data were then clipped to the buffer area to determine the amount of this land that is agricultural. There are an estimated 360 acres of agricultural land in the upper reaches of the Cahokia Canal watershed that could potentially be converted to filter strips (see Figure 9-1). Landowners should evaluate their land near the Cahokia Canal and its tributaries and create or extend filter strips according to the NRCS guidance provided in Table 9-4. Programs available to fund the construction of these buffer strips are discussed in Section 9.6.
9.2.2.2 Reaeration/Streambank Stabilization The purpose of reaeration is to increase DO concentrations in streams. Physical measures that will assist in increasing reaeration of a stream include bank stabilization, channel modifications, and the addition of riprap or pool and riffle sequences. Bank stabilization reduces erosion by planting vegetation along the bank or modification of the channel to decrease the slope of the bank. Riprap or pool and riffle sequences would increase reaeration by increasing turbulence. Turbulence creates an increase in the interaction between air and water, which draws air into the river increasing aeration. Expanding monitoring to several locations along the impaired segments could help identify reaches that would benefit the most from an increase of turbulence.
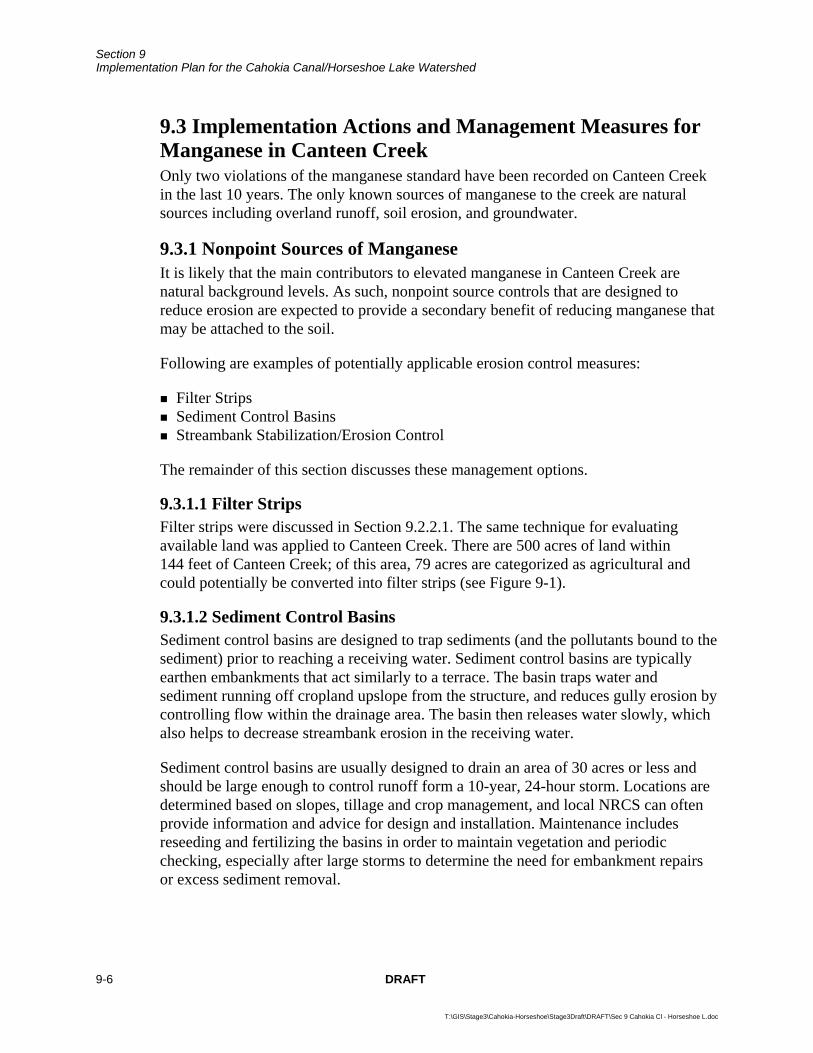
Section 9 Implementation Plan for the Cahokia Canal/Horseshoe Lake Watershed
9-6 DRAFT
T:\GIS\Stage3\Cahokia-Horseshoe\Stage3Draft\DRAFT\Sec 9 Cahokia Cl - Horseshoe L.doc
9.3 Implementation Actions and Management Measures for Manganese in Canteen Creek Only two violations of the manganese standard have been recorded on Canteen Creek in the last 10 years. The only known sources of manganese to the creek are natural sources including overland runoff, soil erosion, and groundwater.
9.3.1 Nonpoint Sources of Manganese It is likely that the main contributors to elevated manganese in Canteen Creek are natural background levels. As such, nonpoint source controls that are designed to reduce erosion are expected to provide a secondary benefit of reducing manganese that may be attached to the soil.
Following are examples of potentially applicable erosion control measures:
Filter Strips Sediment Control Basins Streambank Stabilization/Erosion Control
The remainder of this section discusses these management options.
9.3.1.1 Filter Strips Filter strips were discussed in Section 9.2.2.1. The same technique for evaluating available land was applied to Canteen Creek. There are 500 acres of land within 144 feet of Canteen Creek; of this area, 79 acres are categorized as agricultural and could potentially be converted into filter strips (see Figure 9-1).
9.3.1.2 Sediment Control Basins Sediment control basins are designed to trap sediments (and the pollutants bound to the sediment) prior to reaching a receiving water. Sediment control basins are typically earthen embankments that act similarly to a terrace. The basin traps water and sediment running off cropland upslope from the structure, and reduces gully erosion by controlling flow within the drainage area. The basin then releases water slowly, which also helps to decrease streambank erosion in the receiving water.
Sediment control basins are usually designed to drain an area of 30 acres or less and should be large enough to control runoff form a 10-year, 24-hour storm. Locations are determined based on slopes, tillage and crop management, and local NRCS can often provide information and advice for design and installation. Maintenance includes reseeding and fertilizing the basins in order to maintain vegetation and periodic checking, especially after large storms to determine the need for embankment repairs or excess sediment removal.
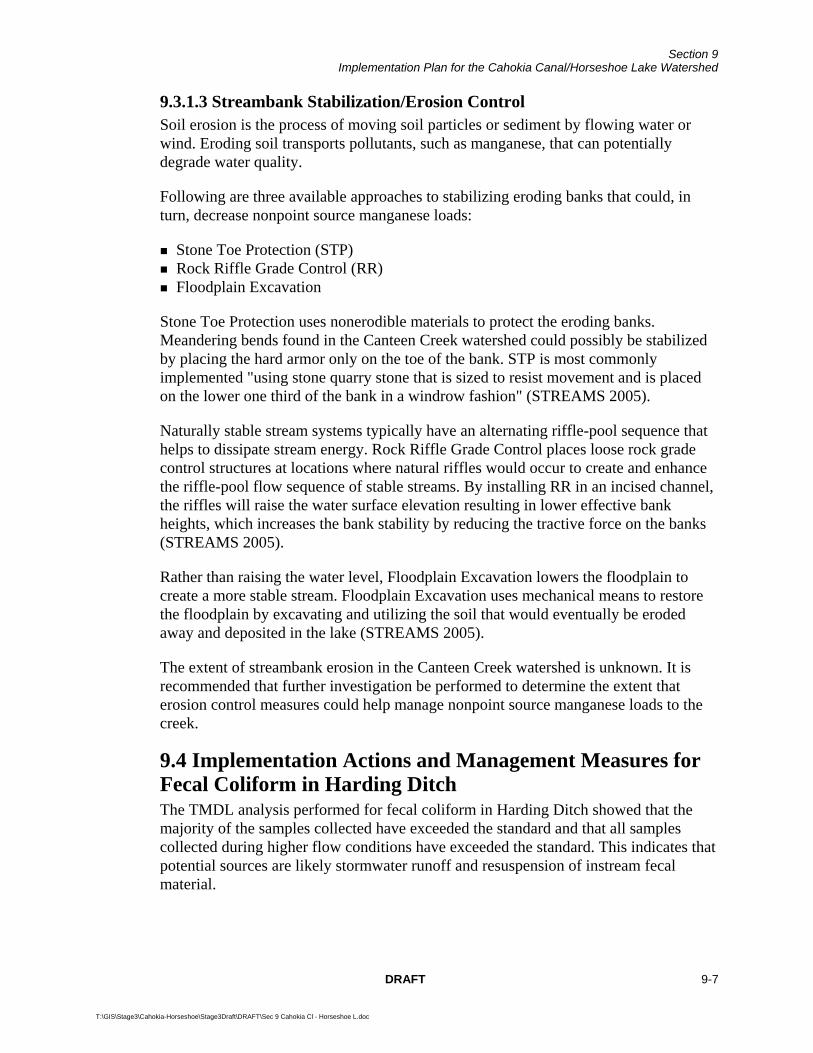
Section 9 Implementation Plan for the Cahokia Canal/Horseshoe Lake Watershed
DRAFT 9-7
T:\GIS\Stage3\Cahokia-Horseshoe\Stage3Draft\DRAFT\Sec 9 Cahokia Cl - Horseshoe L.doc
9.3.1.3 Streambank Stabilization/Erosion Control Soil erosion is the process of moving soil particles or sediment by flowing water or wind. Eroding soil transports pollutants, such as manganese, that can potentially degrade water quality.
Following are three available approaches to stabilizing eroding banks that could, in turn, decrease nonpoint source manganese loads:
Stone Toe Protection (STP) Rock Riffle Grade Control (RR) Floodplain Excavation
Stone Toe Protection uses nonerodible materials to protect the eroding banks. Meandering bends found in the Canteen Creek watershed could possibly be stabilized by placing the hard armor only on the toe of the bank. STP is most commonly implemented "using stone quarry stone that is sized to resist movement and is placed on the lower one third of the bank in a windrow fashion" (STREAMS 2005).
Naturally stable stream systems typically have an alternating riffle-pool sequence that helps to dissipate stream energy. Rock Riffle Grade Control places loose rock grade control structures at locations where natural riffles would occur to create and enhance the riffle-pool flow sequence of stable streams. By installing RR in an incised channel, the riffles will raise the water surface elevation resulting in lower effective bank heights, which increases the bank stability by reducing the tractive force on the banks (STREAMS 2005).
Rather than raising the water level, Floodplain Excavation lowers the floodplain to create a more stable stream. Floodplain Excavation uses mechanical means to restore the floodplain by excavating and utilizing the soil that would eventually be eroded away and deposited in the lake (STREAMS 2005).
The extent of streambank erosion in the Canteen Creek watershed is unknown. It is recommended that further investigation be performed to determine the extent that erosion control measures could help manage nonpoint source manganese loads to the creek.
9.4 Implementation Actions and Management Measures for Fecal Coliform in Harding Ditch The TMDL analysis performed for fecal coliform in Harding Ditch showed that the majority of the samples collected have exceeded the standard and that all samples collected during higher flow conditions have exceeded the standard. This indicates that potential sources are likely stormwater runoff and resuspension of instream fecal material.
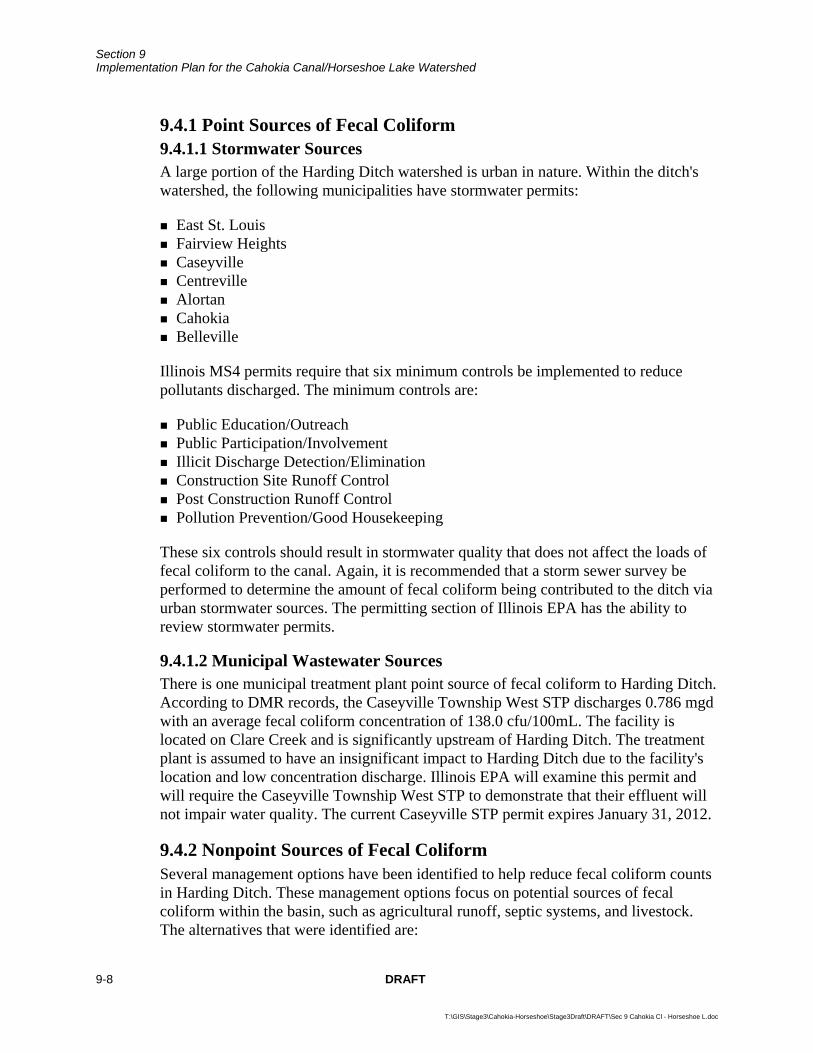
Section 9 Implementation Plan for the Cahokia Canal/Horseshoe Lake Watershed
9-8 DRAFT
T:\GIS\Stage3\Cahokia-Horseshoe\Stage3Draft\DRAFT\Sec 9 Cahokia Cl - Horseshoe L.doc
9.4.1 Point Sources of Fecal Coliform 9.4.1.1 Stormwater Sources A large portion of the Harding Ditch watershed is urban in nature. Within the ditch's watershed, the following municipalities have stormwater permits:
East St. Louis Fairview Heights Caseyville Centreville Alortan Cahokia Belleville
Illinois MS4 permits require that six minimum controls be implemented to reduce pollutants discharged. The minimum controls are:
Public Education/Outreach Public Participation/Involvement Illicit Discharge Detection/Elimination Construction Site Runoff Control Post Construction Runoff Control Pollution Prevention/Good Housekeeping
These six controls should result in stormwater quality that does not affect the loads of fecal coliform to the canal. Again, it is recommended that a storm sewer survey be performed to determine the amount of fecal coliform being contributed to the ditch via urban stormwater sources. The permitting section of Illinois EPA has the ability to review stormwater permits.
9.4.1.2 Municipal Wastewater Sources There is one municipal treatment plant point source of fecal coliform to Harding Ditch. According to DMR records, the Caseyville Township West STP discharges 0.786 mgd with an average fecal coliform concentration of 138.0 cfu/100mL. The facility is located on Clare Creek and is significantly upstream of Harding Ditch. The treatment plant is assumed to have an insignificant impact to Harding Ditch due to the facility's location and low concentration discharge. Illinois EPA will examine this permit and will require the Caseyville Township West STP to demonstrate that their effluent will not impair water quality. The current Caseyville STP permit expires January 31, 2012.
9.4.2 Nonpoint Sources of Fecal Coliform Several management options have been identified to help reduce fecal coliform counts in Harding Ditch. These management options focus on potential sources of fecal coliform within the basin, such as agricultural runoff, septic systems, and livestock. The alternatives that were identified are:
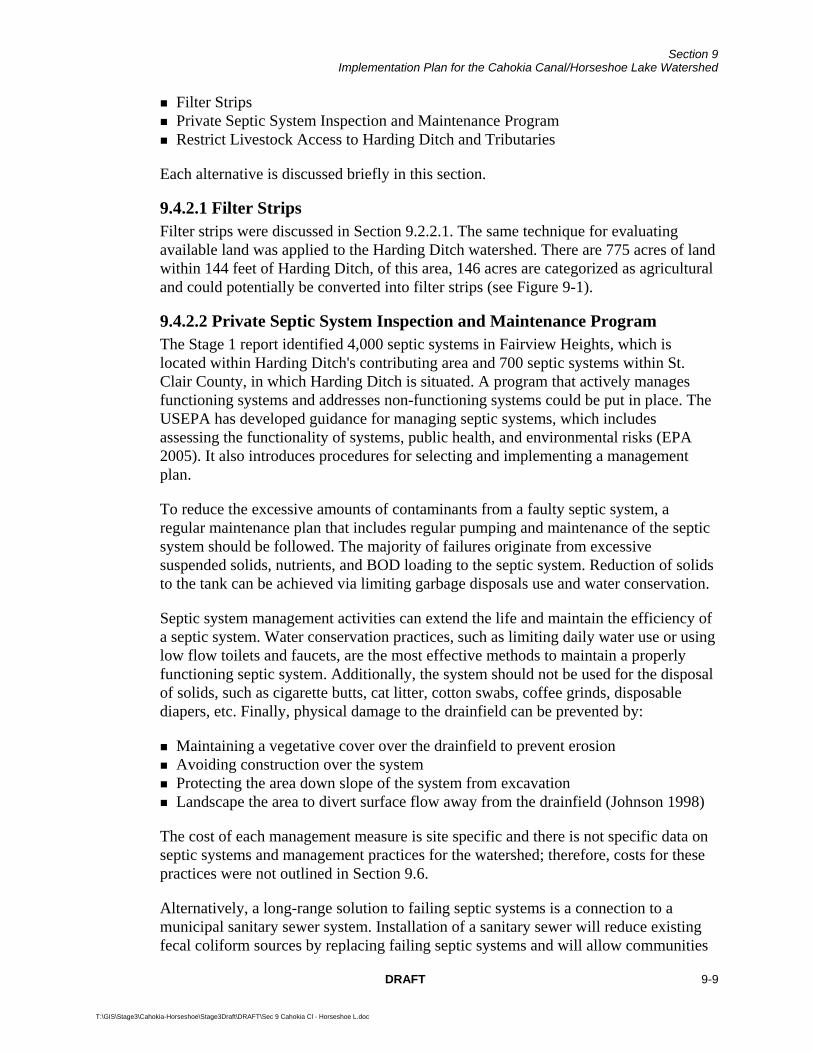
Section 9 Implementation Plan for the Cahokia Canal/Horseshoe Lake Watershed
DRAFT 9-9
T:\GIS\Stage3\Cahokia-Horseshoe\Stage3Draft\DRAFT\Sec 9 Cahokia Cl - Horseshoe L.doc
Filter Strips Private Septic System Inspection and Maintenance Program Restrict Livestock Access to Harding Ditch and Tributaries
Each alternative is discussed briefly in this section.
9.4.2.1 Filter Strips Filter strips were discussed in Section 9.2.2.1. The same technique for evaluating available land was applied to the Harding Ditch watershed. There are 775 acres of land within 144 feet of Harding Ditch, of this area, 146 acres are categorized as agricultural and could potentially be converted into filter strips (see Figure 9-1).
9.4.2.2 Private Septic System Inspection and Maintenance Program The Stage 1 report identified 4,000 septic systems in Fairview Heights, which is located within Harding Ditch's contributing area and 700 septic systems within St. Clair County, in which Harding Ditch is situated. A program that actively manages functioning systems and addresses non-functioning systems could be put in place. The USEPA has developed guidance for managing septic systems, which includes assessing the functionality of systems, public health, and environmental risks (EPA 2005). It also introduces procedures for selecting and implementing a management plan.
To reduce the excessive amounts of contaminants from a faulty septic system, a regular maintenance plan that includes regular pumping and maintenance of the septic system should be followed. The majority of failures originate from excessive suspended solids, nutrients, and BOD loading to the septic system. Reduction of solids to the tank can be achieved via limiting garbage disposals use and water conservation.
Septic system management activities can extend the life and maintain the efficiency of a septic system. Water conservation practices, such as limiting daily water use or using low flow toilets and faucets, are the most effective methods to maintain a properly functioning septic system. Additionally, the system should not be used for the disposal of solids, such as cigarette butts, cat litter, cotton swabs, coffee grinds, disposable diapers, etc. Finally, physical damage to the drainfield can be prevented by:
Maintaining a vegetative cover over the drainfield to prevent erosion Avoiding construction over the system Protecting the area down slope of the system from excavation Landscape the area to divert surface flow away from the drainfield (Johnson 1998)
The cost of each management measure is site specific and there is not specific data on septic systems and management practices for the watershed; therefore, costs for these practices were not outlined in Section 9.6.
Alternatively, a long-range solution to failing septic systems is a connection to a municipal sanitary sewer system. Installation of a sanitary sewer will reduce existing fecal coliform sources by replacing failing septic systems and will allow communities
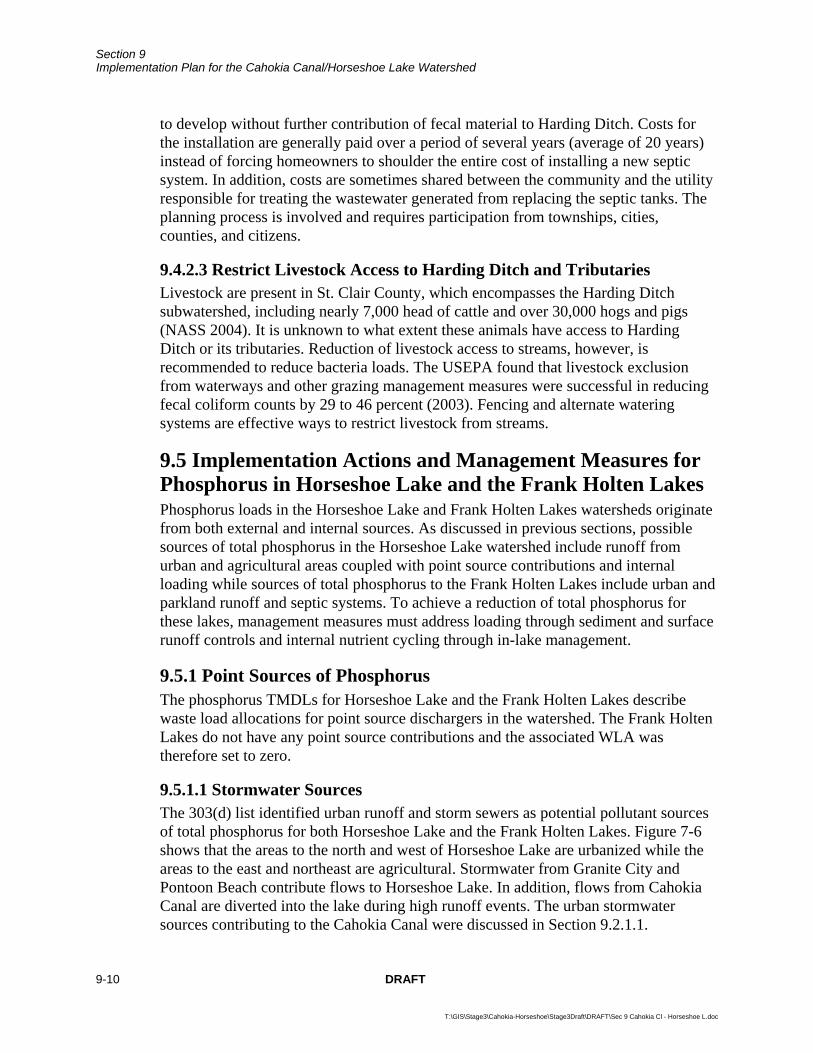
Section 9 Implementation Plan for the Cahokia Canal/Horseshoe Lake Watershed
9-10 DRAFT
T:\GIS\Stage3\Cahokia-Horseshoe\Stage3Draft\DRAFT\Sec 9 Cahokia Cl - Horseshoe L.doc
to develop without further contribution of fecal material to Harding Ditch. Costs for the installation are generally paid over a period of several years (average of 20 years) instead of forcing homeowners to shoulder the entire cost of installing a new septic system. In addition, costs are sometimes shared between the community and the utility responsible for treating the wastewater generated from replacing the septic tanks. The planning process is involved and requires participation from townships, cities, counties, and citizens.
9.4.2.3 Restrict Livestock Access to Harding Ditch and Tributaries Livestock are present in St. Clair County, which encompasses the Harding Ditch subwatershed, including nearly 7,000 head of cattle and over 30,000 hogs and pigs (NASS 2004). It is unknown to what extent these animals have access to Harding Ditch or its tributaries. Reduction of livestock access to streams, however, is recommended to reduce bacteria loads. The USEPA found that livestock exclusion from waterways and other grazing management measures were successful in reducing fecal coliform counts by 29 to 46 percent (2003). Fencing and alternate watering systems are effective ways to restrict livestock from streams.
9.5 Implementation Actions and Management Measures for Phosphorus in Horseshoe Lake and the Frank Holten Lakes Phosphorus loads in the Horseshoe Lake and Frank Holten Lakes watersheds originate from both external and internal sources. As discussed in previous sections, possible sources of total phosphorus in the Horseshoe Lake watershed include runoff from urban and agricultural areas coupled with point source contributions and internal loading while sources of total phosphorus to the Frank Holten Lakes include urban and parkland runoff and septic systems. To achieve a reduction of total phosphorus for these lakes, management measures must address loading through sediment and surface runoff controls and internal nutrient cycling through in-lake management.
9.5.1 Point Sources of Phosphorus The phosphorus TMDLs for Horseshoe Lake and the Frank Holten Lakes describe waste load allocations for point source dischargers in the watershed. The Frank Holten Lakes do not have any point source contributions and the associated WLA was therefore set to zero.
9.5.1.1 Stormwater Sources The 303(d) list identified urban runoff and storm sewers as potential pollutant sources of total phosphorus for both Horseshoe Lake and the Frank Holten Lakes. Figure 7-6 shows that the areas to the north and west of Horseshoe Lake are urbanized while the areas to the east and northeast are agricultural. Stormwater from Granite City and Pontoon Beach contribute flows to Horseshoe Lake. In addition, flows from Cahokia Canal are diverted into the lake during high runoff events. The urban stormwater sources contributing to the Cahokia Canal were discussed in Section 9.2.1.1.
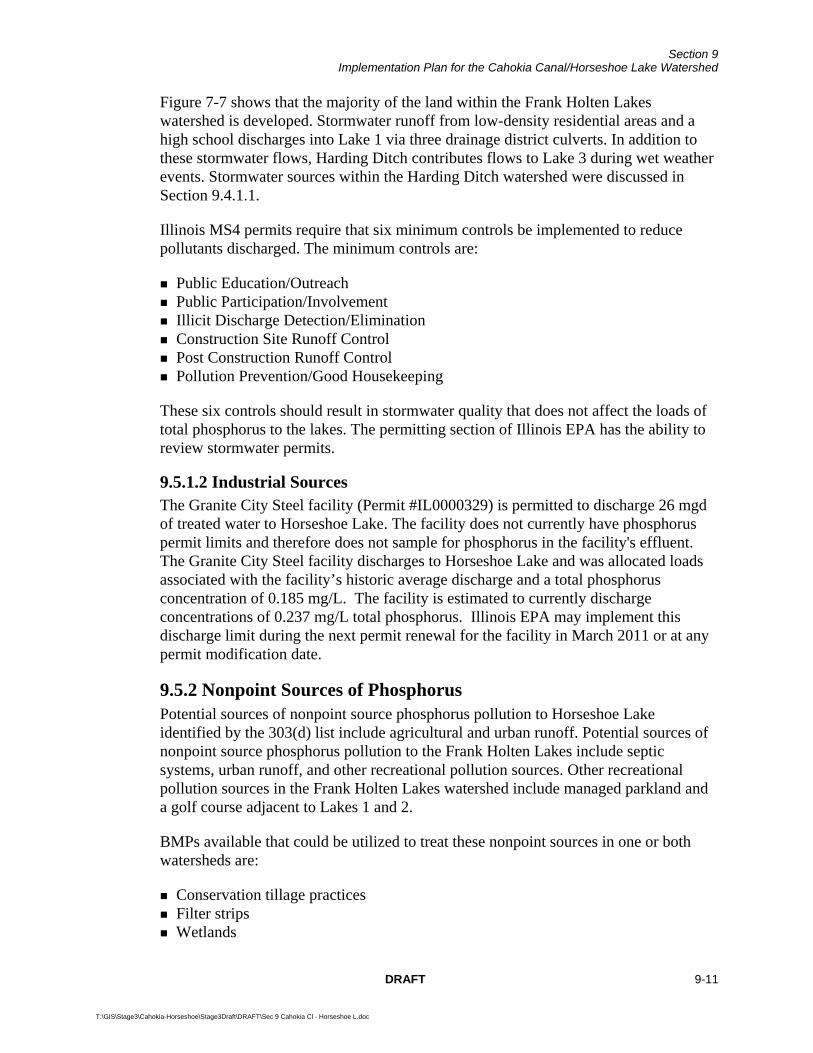
Section 9 Implementation Plan for the Cahokia Canal/Horseshoe Lake Watershed
DRAFT 9-11
T:\GIS\Stage3\Cahokia-Horseshoe\Stage3Draft\DRAFT\Sec 9 Cahokia Cl - Horseshoe L.doc
Figure 7-7 shows that the majority of the land within the Frank Holten Lakes watershed is developed. Stormwater runoff from low-density residential areas and a high school discharges into Lake 1 via three drainage district culverts. In addition to these stormwater flows, Harding Ditch contributes flows to Lake 3 during wet weather events. Stormwater sources within the Harding Ditch watershed were discussed in Section 9.4.1.1.
Illinois MS4 permits require that six minimum controls be implemented to reduce pollutants discharged. The minimum controls are:
Public Education/Outreach Public Participation/Involvement Illicit Discharge Detection/Elimination Construction Site Runoff Control Post Construction Runoff Control Pollution Prevention/Good Housekeeping
These six controls should result in stormwater quality that does not affect the loads of total phosphorus to the lakes. The permitting section of Illinois EPA has the ability to review stormwater permits.
9.5.1.2 Industrial Sources The Granite City Steel facility (Permit #IL0000329) is permitted to discharge 26 mgd of treated water to Horseshoe Lake. The facility does not currently have phosphorus permit limits and therefore does not sample for phosphorus in the facility's effluent. The Granite City Steel facility discharges to Horseshoe Lake and was allocated loads associated with the facility’s historic average discharge and a total phosphorus concentration of 0.185 mg/L. The facility is estimated to currently discharge concentrations of 0.237 mg/L total phosphorus. Illinois EPA may implement this discharge limit during the next permit renewal for the facility in March 2011 or at any permit modification date.
9.5.2 Nonpoint Sources of Phosphorus Potential sources of nonpoint source phosphorus pollution to Horseshoe Lake identified by the 303(d) list include agricultural and urban runoff. Potential sources of nonpoint source phosphorus pollution to the Frank Holten Lakes include septic systems, urban runoff, and other recreational pollution sources. Other recreational pollution sources in the Frank Holten Lakes watershed include managed parkland and a golf course adjacent to Lakes 1 and 2.
BMPs available that could be utilized to treat these nonpoint sources in one or both watersheds are:
Conservation tillage practices Filter strips Wetlands
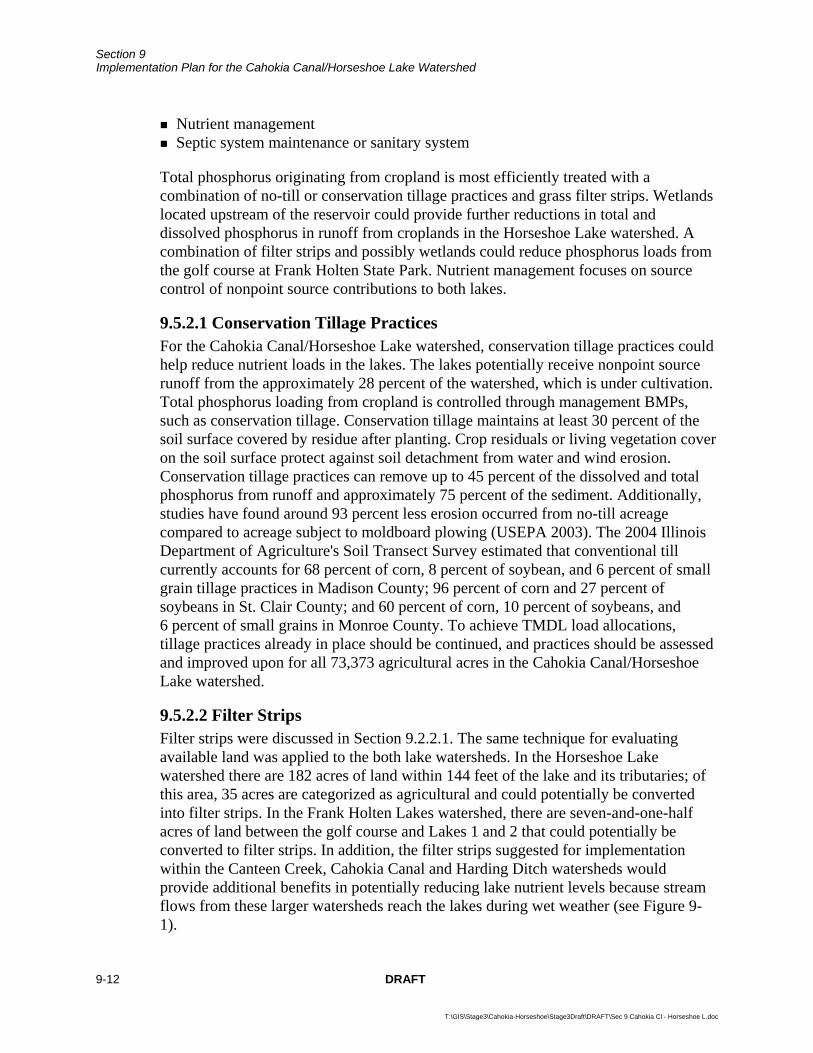
Section 9 Implementation Plan for the Cahokia Canal/Horseshoe Lake Watershed
9-12 DRAFT
T:\GIS\Stage3\Cahokia-Horseshoe\Stage3Draft\DRAFT\Sec 9 Cahokia Cl - Horseshoe L.doc
Nutrient management Septic system maintenance or sanitary system
Total phosphorus originating from cropland is most efficiently treated with a combination of no-till or conservation tillage practices and grass filter strips. Wetlands located upstream of the reservoir could provide further reductions in total and dissolved phosphorus in runoff from croplands in the Horseshoe Lake watershed. A combination of filter strips and possibly wetlands could reduce phosphorus loads from the golf course at Frank Holten State Park. Nutrient management focuses on source control of nonpoint source contributions to both lakes.
9.5.2.1 Conservation Tillage Practices For the Cahokia Canal/Horseshoe Lake watershed, conservation tillage practices could help reduce nutrient loads in the lakes. The lakes potentially receive nonpoint source runoff from the approximately 28 percent of the watershed, which is under cultivation. Total phosphorus loading from cropland is controlled through management BMPs, such as conservation tillage. Conservation tillage maintains at least 30 percent of the soil surface covered by residue after planting. Crop residuals or living vegetation cover on the soil surface protect against soil detachment from water and wind erosion. Conservation tillage practices can remove up to 45 percent of the dissolved and total phosphorus from runoff and approximately 75 percent of the sediment. Additionally, studies have found around 93 percent less erosion occurred from no-till acreage compared to acreage subject to moldboard plowing (USEPA 2003). The 2004 Illinois Department of Agriculture's Soil Transect Survey estimated that conventional till currently accounts for 68 percent of corn, 8 percent of soybean, and 6 percent of small grain tillage practices in Madison County; 96 percent of corn and 27 percent of soybeans in St. Clair County; and 60 percent of corn, 10 percent of soybeans, and 6 percent of small grains in Monroe County. To achieve TMDL load allocations, tillage practices already in place should be continued, and practices should be assessed and improved upon for all 73,373 agricultural acres in the Cahokia Canal/Horseshoe Lake watershed.
9.5.2.2 Filter Strips Filter strips were discussed in Section 9.2.2.1. The same technique for evaluating available land was applied to the both lake watersheds. In the Horseshoe Lake watershed there are 182 acres of land within 144 feet of the lake and its tributaries; of this area, 35 acres are categorized as agricultural and could potentially be converted into filter strips. In the Frank Holten Lakes watershed, there are seven-and-one-half acres of land between the golf course and Lakes 1 and 2 that could potentially be converted to filter strips. In addition, the filter strips suggested for implementation within the Canteen Creek, Cahokia Canal and Harding Ditch watersheds would provide additional benefits in potentially reducing lake nutrient levels because stream flows from these larger watersheds reach the lakes during wet weather (see Figure 9-1).
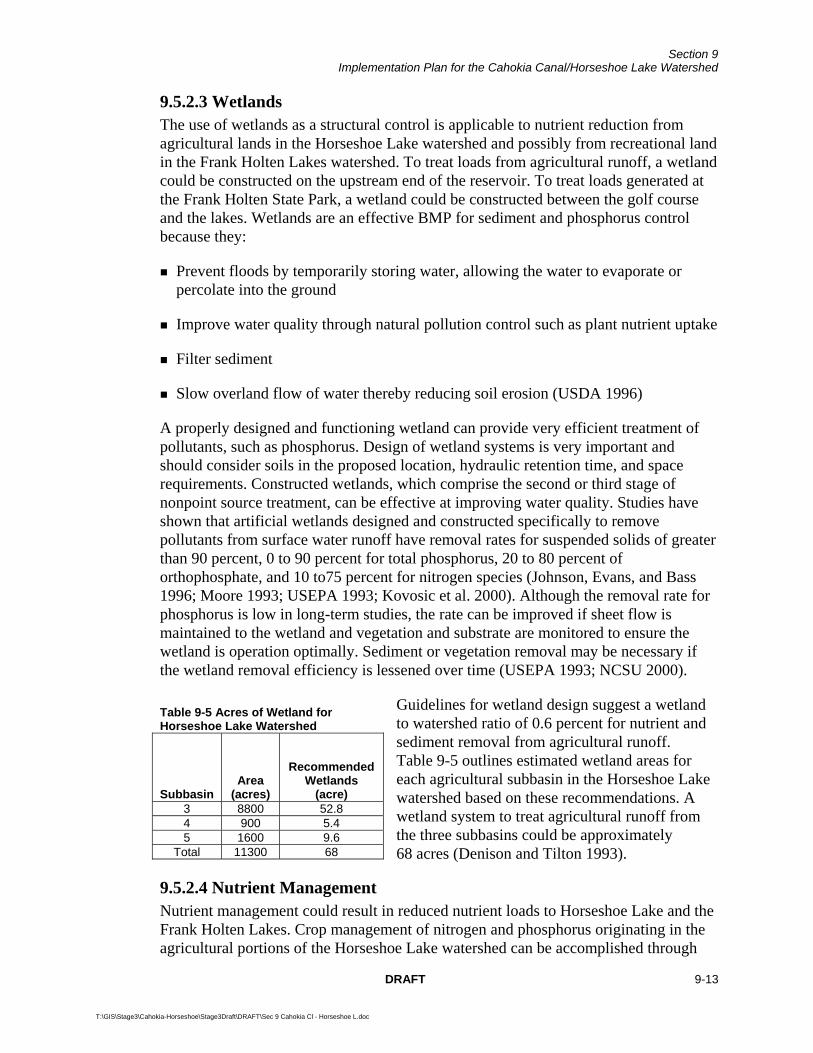
Section 9 Implementation Plan for the Cahokia Canal/Horseshoe Lake Watershed
DRAFT 9-13
T:\GIS\Stage3\Cahokia-Horseshoe\Stage3Draft\DRAFT\Sec 9 Cahokia Cl - Horseshoe L.doc
9.5.2.3 Wetlands The use of wetlands as a structural control is applicable to nutrient reduction from agricultural lands in the Horseshoe Lake watershed and possibly from recreational land in the Frank Holten Lakes watershed. To treat loads from agricultural runoff, a wetland could be constructed on the upstream end of the reservoir. To treat loads generated at the Frank Holten State Park, a wetland could be constructed between the golf course and the lakes. Wetlands are an effective BMP for sediment and phosphorus control because they:
Prevent floods by temporarily storing water, allowing the water to evaporate or percolate into the ground
Improve water quality through natural pollution control such as plant nutrient uptake
Filter sediment
Slow overland flow of water thereby reducing soil erosion (USDA 1996)
A properly designed and functioning wetland can provide very efficient treatment of pollutants, such as phosphorus. Design of wetland systems is very important and should consider soils in the proposed location, hydraulic retention time, and space requirements. Constructed wetlands, which comprise the second or third stage of nonpoint source treatment, can be effective at improving water quality. Studies have shown that artificial wetlands designed and constructed specifically to remove pollutants from surface water runoff have removal rates for suspended solids of greater than 90 percent, 0 to 90 percent for total phosphorus, 20 to 80 percent of orthophosphate, and 10 to75 percent for nitrogen species (Johnson, Evans, and Bass 1996; Moore 1993; USEPA 1993; Kovosic et al. 2000). Although the removal rate for phosphorus is low in long-term studies, the rate can be improved if sheet flow is maintained to the wetland and vegetation and substrate are monitored to ensure the wetland is operation optimally. Sediment or vegetation removal may be necessary if the wetland removal efficiency is lessened over time (USEPA 1993; NCSU 2000).
Guidelines for wetland design suggest a wetland to watershed ratio of 0.6 percent for nutrient and sediment removal from agricultural runoff. Table 9-5 outlines estimated wetland areas for each agricultural subbasin in the Horseshoe Lake watershed based on these recommendations. A wetland system to treat agricultural runoff from the three subbasins could be approximately 68 acres (Denison and Tilton 1993).
9.5.2.4 Nutrient Management Nutrient management could result in reduced nutrient loads to Horseshoe Lake and the Frank Holten Lakes. Crop management of nitrogen and phosphorus originating in the agricultural portions of the Horseshoe Lake watershed can be accomplished through
Table 9-5 Acres of Wetland for Horseshoe Lake Watershed
Subbasin Area
(acres)
Recommended Wetlands
(acre) 3 8800 52.8 4 900 5.4 5 1600 9.6
Total 11300 68
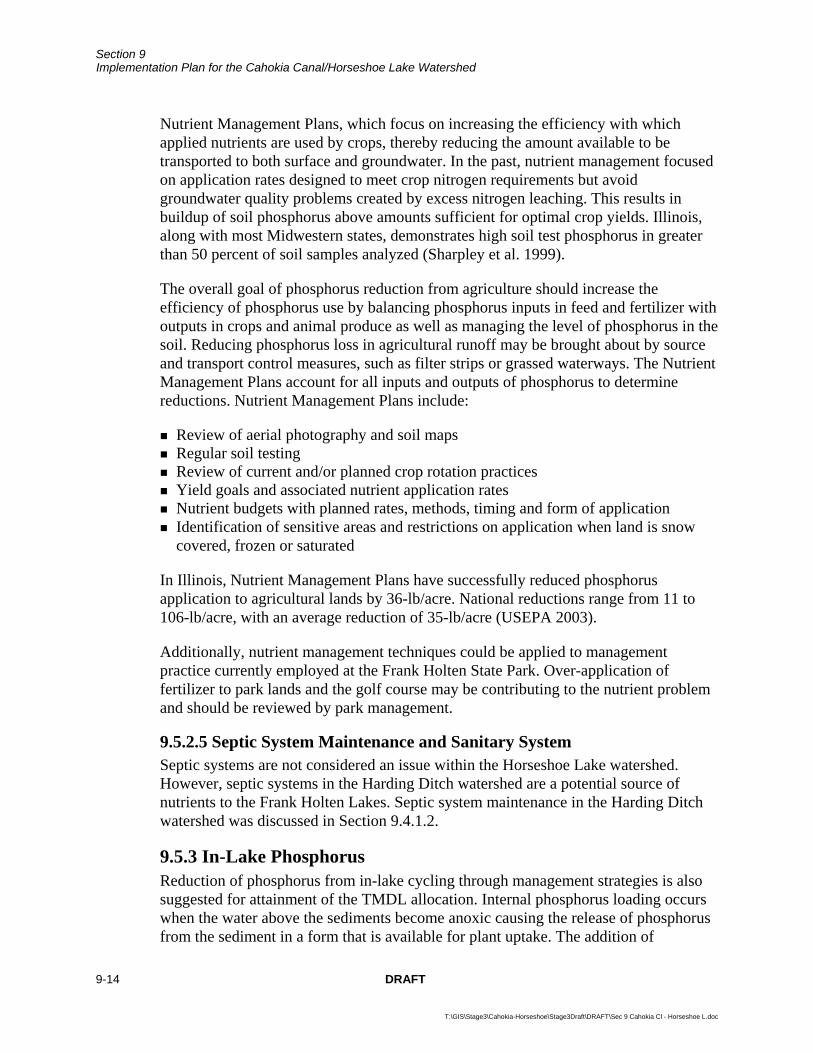
Section 9 Implementation Plan for the Cahokia Canal/Horseshoe Lake Watershed
9-14 DRAFT
T:\GIS\Stage3\Cahokia-Horseshoe\Stage3Draft\DRAFT\Sec 9 Cahokia Cl - Horseshoe L.doc
Nutrient Management Plans, which focus on increasing the efficiency with which applied nutrients are used by crops, thereby reducing the amount available to be transported to both surface and groundwater. In the past, nutrient management focused on application rates designed to meet crop nitrogen requirements but avoid groundwater quality problems created by excess nitrogen leaching. This results in buildup of soil phosphorus above amounts sufficient for optimal crop yields. Illinois, along with most Midwestern states, demonstrates high soil test phosphorus in greater than 50 percent of soil samples analyzed (Sharpley et al. 1999).
The overall goal of phosphorus reduction from agriculture should increase the efficiency of phosphorus use by balancing phosphorus inputs in feed and fertilizer with outputs in crops and animal produce as well as managing the level of phosphorus in the soil. Reducing phosphorus loss in agricultural runoff may be brought about by source and transport control measures, such as filter strips or grassed waterways. The Nutrient Management Plans account for all inputs and outputs of phosphorus to determine reductions. Nutrient Management Plans include:
Review of aerial photography and soil maps Regular soil testing Review of current and/or planned crop rotation practices Yield goals and associated nutrient application rates Nutrient budgets with planned rates, methods, timing and form of application Identification of sensitive areas and restrictions on application when land is snow
covered, frozen or saturated
In Illinois, Nutrient Management Plans have successfully reduced phosphorus application to agricultural lands by 36-lb/acre. National reductions range from 11 to 106-lb/acre, with an average reduction of 35-lb/acre (USEPA 2003).
Additionally, nutrient management techniques could be applied to management practice currently employed at the Frank Holten State Park. Over-application of fertilizer to park lands and the golf course may be contributing to the nutrient problem and should be reviewed by park management.
9.5.2.5 Septic System Maintenance and Sanitary System Septic systems are not considered an issue within the Horseshoe Lake watershed. However, septic systems in the Harding Ditch watershed are a potential source of nutrients to the Frank Holten Lakes. Septic system maintenance in the Harding Ditch watershed was discussed in Section 9.4.1.2.
9.5.3 In-Lake Phosphorus Reduction of phosphorus from in-lake cycling through management strategies is also suggested for attainment of the TMDL allocation. Internal phosphorus loading occurs when the water above the sediments become anoxic causing the release of phosphorus from the sediment in a form that is available for plant uptake. The addition of
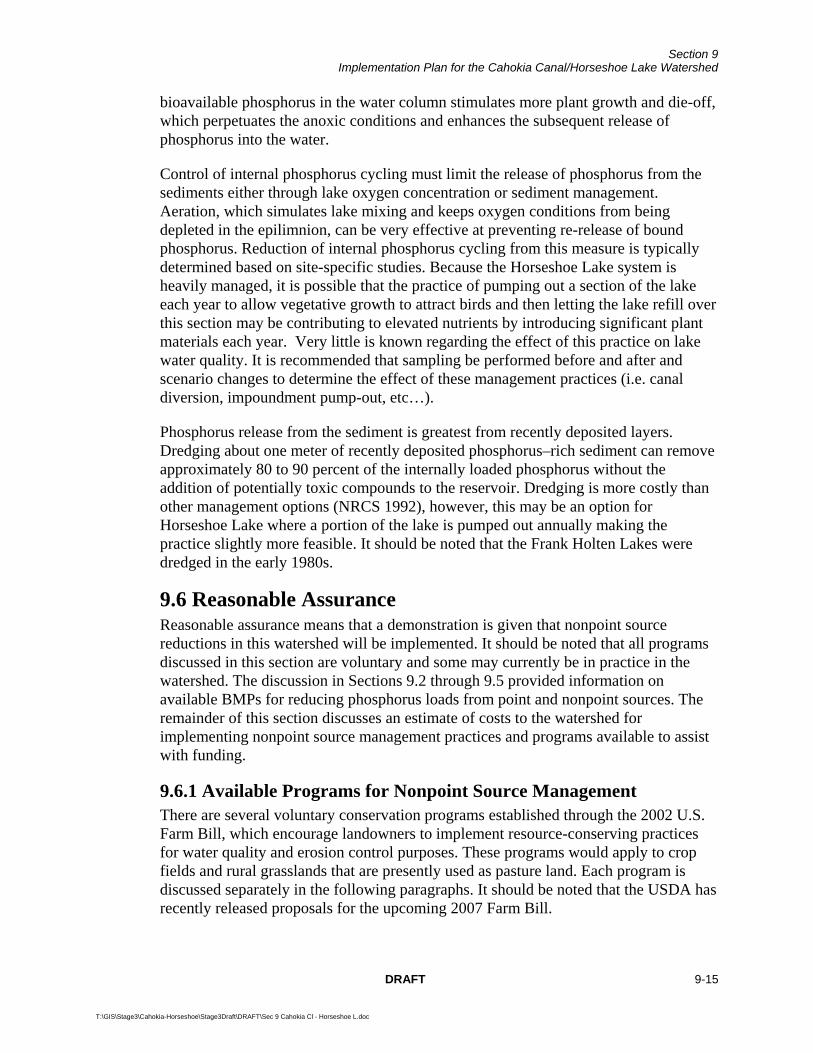
Section 9 Implementation Plan for the Cahokia Canal/Horseshoe Lake Watershed
DRAFT 9-15
T:\GIS\Stage3\Cahokia-Horseshoe\Stage3Draft\DRAFT\Sec 9 Cahokia Cl - Horseshoe L.doc
bioavailable phosphorus in the water column stimulates more plant growth and die-off, which perpetuates the anoxic conditions and enhances the subsequent release of phosphorus into the water.
Control of internal phosphorus cycling must limit the release of phosphorus from the sediments either through lake oxygen concentration or sediment management. Aeration, which simulates lake mixing and keeps oxygen conditions from being depleted in the epilimnion, can be very effective at preventing re-release of bound phosphorus. Reduction of internal phosphorus cycling from this measure is typically determined based on site-specific studies. Because the Horseshoe Lake system is heavily managed, it is possible that the practice of pumping out a section of the lake each year to allow vegetative growth to attract birds and then letting the lake refill over this section may be contributing to elevated nutrients by introducing significant plant materials each year. Very little is known regarding the effect of this practice on lake water quality. It is recommended that sampling be performed before and after and scenario changes to determine the effect of these management practices (i.e. canal diversion, impoundment pump-out, etc…).
Phosphorus release from the sediment is greatest from recently deposited layers. Dredging about one meter of recently deposited phosphorus–rich sediment can remove approximately 80 to 90 percent of the internally loaded phosphorus without the addition of potentially toxic compounds to the reservoir. Dredging is more costly than other management options (NRCS 1992), however, this may be an option for Horseshoe Lake where a portion of the lake is pumped out annually making the practice slightly more feasible. It should be noted that the Frank Holten Lakes were dredged in the early 1980s.
9.6 Reasonable Assurance Reasonable assurance means that a demonstration is given that nonpoint source reductions in this watershed will be implemented. It should be noted that all programs discussed in this section are voluntary and some may currently be in practice in the watershed. The discussion in Sections 9.2 through 9.5 provided information on available BMPs for reducing phosphorus loads from point and nonpoint sources. The remainder of this section discusses an estimate of costs to the watershed for implementing nonpoint source management practices and programs available to assist with funding.
9.6.1 Available Programs for Nonpoint Source Management There are several voluntary conservation programs established through the 2002 U.S. Farm Bill, which encourage landowners to implement resource-conserving practices for water quality and erosion control purposes. These programs would apply to crop fields and rural grasslands that are presently used as pasture land. Each program is discussed separately in the following paragraphs. It should be noted that the USDA has recently released proposals for the upcoming 2007 Farm Bill.
Section 9 Implementation Plan for the Cahokia Canal/Horseshoe Lake Watershed
9-16 DRAFT
T:\GIS\Stage3\Cahokia-Horseshoe\Stage3Draft\DRAFT\Sec 9 Cahokia Cl - Horseshoe L.doc
9.6.1.1 Illinois Department of Agriculture and Illinois EPA Nutrient Management Plan Project The IDA and Illinois EPA are presently co-sponsoring a cropland Nutrient Management Plan project in watersheds that have or are developing a TMDL. This voluntary project supplies incentive payments to producers to have Nutrient Management Plans developed and implemented. Additionally, watersheds that have sediments or phosphorus identified as a cause for impairment (as is the case in this watershed), are eligible for cost-share assistance in implementing traditional erosion control practices through the Nutrient Management Plan project.
9.6.1.2 Conservation Reserve Program (CRP) This voluntary program encourages landowners to plant long-term resource-conserving cover to improve soils, water, and wildlife resources. CRP is the USDA's single largest environmental improvement program and one of its most productive and cost-efficient. It is administered through the Farm Service Agency (FSA) by USDA's Commodity Credit Corporation (CCC). The program was initially established in the Food & Security Act of 1985. The duration of the contracts under CRP range from 10 to 15 years.
Eligible land must be one of the following:
1. Cropland that is planted or considered planted to an agricultural commodity two of the five most recent crop years (including field margins) and must be physically and legally capable of being planted in a normal manner to an agricultural commodity.
2. Certain marginal pastureland enrolled in the Water Bank Program.
The CCC bases rental rates on the relative productivity of soils within each county and the average of the past three years of local dry land cash rent or cash-rent equivalent. The maximum rental rate is calculated in advance of enrollment. Producers may offer land at the maximum rate or at a lower rental rate to increase likelihood of offer acceptance. In addition, the CCC provides cost-share assistance for up to 50 percent of the participant's costs in establishing approved conservation practices (USDA 2006).
Finally, CCC offers additional financial incentives of up to 20 percent of the annual payment for certain continuous sign-up practices (USDA 2006). Continuous sign-up provides management flexibility to farmers and ranchers to implement certain high-priority conservation practices on eligible land. The land must be determined by NRCS to be eligible and suitable for any of the following practices:
Riparian buffers Filter strips Grass waterways Shelter belts
Section 9 Implementation Plan for the Cahokia Canal/Horseshoe Lake Watershed
DRAFT 9-17
T:\GIS\Stage3\Cahokia-Horseshoe\Stage3Draft\DRAFT\Sec 9 Cahokia Cl - Horseshoe L.doc
Field windbreaks Living snow fences Contour grass strips Salt tolerant vegetation Shallow water areas for wildlife Eligible acreage within an EPA-designated wellhead protection area (FSA 1997)
The current extent of land enrolled in CRP within the Cahokia Canal/Horseshoe Lake watershed is unknown.
9.6.1.3 Clean Water Act Section 319 Grants Section 319 was added to the CWA to establish a national program to address nonpoint sources of water pollution. Through this program, each state is allocated Section 319 funds on an annual basis according to a national allocation formula based on the total annual appropriation for the Section 319 grant program. The total award consists of two categories of funding: incremental funds and base funds. A state is eligible to receive EPA 319(b) grants upon USEPA's approval of the state's Nonpoint Source Assessment Report and Nonpoint Source Management Program. States may reallocate funds through subawards (e.g., contracts, subgrants) to both public and private entities, including local governments, tribal authorities, cities, counties, regional development centers, local school systems, colleges and universities, local nonprofit organizations, state agencies, federal agencies, watershed groups, for-profit groups, and individuals.
USEPA designates incremental funds, a $100-million award, for the restoration of impaired water through the development and implementation of watershed-based plans and TMDLs for impaired waters. Base funds, funds other than incremental funds, are used to provide staffing and support to manage and implement the state Nonpoint Source Management Program. Section 319 funding can be used to implement activities that improve water quality, such as filter strips, streambank stabilization, etc. (USEPA 2003).
9.6.1.4 Wetlands Reserve Program (WRP) The Wetlands Reserve Program (WRP) is a voluntary program that provides technical and financial assistance to eligible landowners to restore, enhance, and protect wetlands. The goal of WRP is to achieve the greatest wetland functions and values, along with optimum wildlife habitat, on every acre enrolled in the program. At least 70 percent of each project area will be restored to the original natural condition, to the extent practicable. The remaining 30 percent of each area may be restored to other than natural conditions. Landowners have the option of enrolling eligible lands through permanent easements, 30-year easements, or 10-year restoration cost-share agreements. The program is offered on a continuous sign-up basis and is available nationwide. WRP offers landowners an opportunity to establish, at minimal cost, long-term conservation and wildlife habitat enhancement practices and protection. It is administered through the NRCS (2002b).
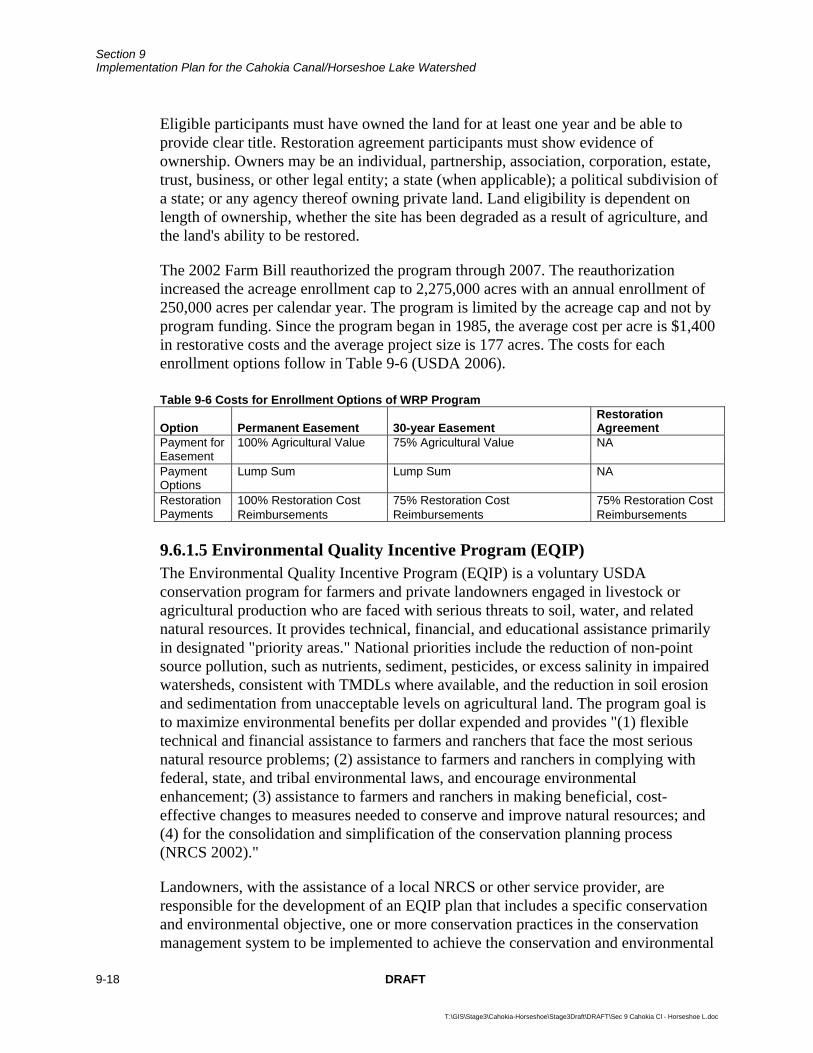
Section 9 Implementation Plan for the Cahokia Canal/Horseshoe Lake Watershed
9-18 DRAFT
T:\GIS\Stage3\Cahokia-Horseshoe\Stage3Draft\DRAFT\Sec 9 Cahokia Cl - Horseshoe L.doc
Eligible participants must have owned the land for at least one year and be able to provide clear title. Restoration agreement participants must show evidence of ownership. Owners may be an individual, partnership, association, corporation, estate, trust, business, or other legal entity; a state (when applicable); a political subdivision of a state; or any agency thereof owning private land. Land eligibility is dependent on length of ownership, whether the site has been degraded as a result of agriculture, and the land's ability to be restored.
The 2002 Farm Bill reauthorized the program through 2007. The reauthorization increased the acreage enrollment cap to 2,275,000 acres with an annual enrollment of 250,000 acres per calendar year. The program is limited by the acreage cap and not by program funding. Since the program began in 1985, the average cost per acre is $1,400 in restorative costs and the average project size is 177 acres. The costs for each enrollment options follow in Table 9-6 (USDA 2006).
9.6.1.5 Environmental Quality Incentive Program (EQIP) The Environmental Quality Incentive Program (EQIP) is a voluntary USDA conservation program for farmers and private landowners engaged in livestock or agricultural production who are faced with serious threats to soil, water, and related natural resources. It provides technical, financial, and educational assistance primarily in designated "priority areas." National priorities include the reduction of non-point source pollution, such as nutrients, sediment, pesticides, or excess salinity in impaired watersheds, consistent with TMDLs where available, and the reduction in soil erosion and sedimentation from unacceptable levels on agricultural land. The program goal is to maximize environmental benefits per dollar expended and provides "(1) flexible technical and financial assistance to farmers and ranchers that face the most serious natural resource problems; (2) assistance to farmers and ranchers in complying with federal, state, and tribal environmental laws, and encourage environmental enhancement; (3) assistance to farmers and ranchers in making beneficial, cost-effective changes to measures needed to conserve and improve natural resources; and (4) for the consolidation and simplification of the conservation planning process (NRCS 2002)."
Landowners, with the assistance of a local NRCS or other service provider, are responsible for the development of an EQIP plan that includes a specific conservation and environmental objective, one or more conservation practices in the conservation management system to be implemented to achieve the conservation and environmental
Table 9-6 Costs for Enrollment Options of WRP Program
Option Permanent Easement 30-year Easement Restoration Agreement
100% Agricultural Value 75% Agricultural Value NA Payment for Easement
Lump Sum Lump Sum NA Payment Options
100% Restoration Cost 75% Restoration Cost 75% Restoration Cost Restoration Payments Reimbursements Reimbursements Reimbursements

Section 9 Implementation Plan for the Cahokia Canal/Horseshoe Lake Watershed
DRAFT 9-19
T:\GIS\Stage3\Cahokia-Horseshoe\Stage3Draft\DRAFT\Sec 9 Cahokia Cl - Horseshoe L.doc
objectives, and the schedule for implementing the conservation practices. This plan becomes the basis of the cost-share agreement between NRCS and the participant. NRCS provides cost-share payments to landowners under these agreements that can be up to 10 years in duration.
Cost-share assistance may pay landowners up to 75 percent of the costs of conservation practices, such as grassed waterways, filter strips, manure management, capping abandoned wells, and other practices important to improving and maintaining the health of natural resources in the area. EQIP cost-share rates for limited resource producers and beginning farmers may be up to 90 percent. Total incentive and cost-share payments are limited to an aggregate of $450,000 (NRCS 2006).
9.6.1.6 Wildlife Habitat Incentives Program (WHIP) The Wildlife Habitat Incentives Program (WHIP) is a voluntary program that encourages the creation of high quality wildlife habitat of national, state, tribal, or local significance. WHIP is administered through NRCS, which provides technical and financial assistance to landowners for development of upland, riparian, and aquatic habitat areas on their property. NRCS works with the participant to develop a wildlife habitat development plan, which becomes the basis of the cost-share agreement between NRCS and the participant. Most contracts are five to 10 years in duration, depending upon the practices to be installed. However, longer term contracts of 15 years or greater may also funded. In addition, if the landowner agrees, cooperating state wildlife agencies and nonprofit or private organizations may provide expertise or additional funding to help complete a project.
9.6.1.7 Streambank Stabilization and Restoration Practice The Streambank Stabilization and Restoration Practice (SSRP) was established to address problems associated with streambank erosion, such as loss or damage to valuable farmland, wildlife habitat, and roads; stream capacity reduction through sediment deposition; and degraded water quality, fish, and wildlife habitat. The primary goals of the SSRP are to develop and demonstrate vegetative, stone structure, and other low cost bio-engineering techniques for stabilizing streambanks and to encourage the adoption of low-cost streambank stabilization practices by making available financial incentives, technical assistance, and educational information to landowners with critically eroding streambanks. A cost share of 75 percent is available for approved project components such as willow post installation, bendway weirs, rock riffles, stream barbs/rock, vanes, lunker structures, gabion baskets, and stone toe protection techniques. There is no limit on the total program payment for cost-share projects that a landowner can receive in a fiscal year. However, maximum cost per foot of bank treated is used to cap the payment assistance on a per foot basis and maintain the program's objectives of funding low-cost techniques (IDA 2000).
9.6.1.8 Conservation Practices Cost-Share Program The Conservation Practices Program (CPP) is a 10-year program. The practices consist of waterways, water and sediment control basins (WASCOBs), pasture/hayland establishment, critical area, terrace system, no-till system, diversions, and grade
Section 9 Implementation Plan for the Cahokia Canal/Horseshoe Lake Watershed
9-20 DRAFT
T:\GIS\Stage3\Cahokia-Horseshoe\Stage3Draft\DRAFT\Sec 9 Cahokia Cl - Horseshoe L.doc
stabilization structures. The CPP is state-funded through the Department of Agriculture. There is a project cap of $5,000 per landowner and costs per acre vary significantly from project to project.
9.6.1.9 Local Program Information The Farm Service Agency (FSA) administers the CRP. NRCS administers the EQIP, WRP, and WHIP. Local NRCS contact information in St. Clair and Madison County are listed in the Table 9-7 below.
Table 9-7 Local NRCS and FSA Contact Information Contact Address Phone Local NRCS Office Madison County 7205 Marine Road
Edwardsville, IL 62025 618.656.4710 ext. 3
St. Clair County 2031 Mascoutah Avenue Belleville, IL 62220
618.235.2500 ext. 3
9.6.2 Cost Estimates of BMPs Cost estimates for different BMPs and individual practice prices such as filter strip installation are detailed in the following sections. Finally, an estimate of the total order of magnitude costs for implementation measures in the Cahokia Canal/Horseshoe Lake watershed are presented in Section 9.6.2.8 and Table 9-8.
9.6.2.1 Wetlands The price to establish a wetland is very site specific. There are many different costs that could be incurred depending on wetland construction. Examples of costs associated with constructed wetlands include excavation costs. NRCS estimates excavation cost at $2/cubic foot. Establishment of vegetation in critical areas including seeding and fertilizing is estimated at $230/acre. It should be noted that the larger the wetland acreage to be established, the more cost-effective the project.
9.6.2.2 Filter Strips and Riparian Buffers In previous studies, the NRCS has estimated an average cost per acre to install and maintain a grass filter strip with a five-year life span at $54/acre for nonnative species and $188/acre for native species. This price quote accounts for seeding and mowing every other year to remove woody sprouts. A riparian buffer strip established with bare root stock has a life span of 10-years and an installation cost of $350/acre.
9.6.2.3 Nutrient Management Plan – NRCS A portion of the rural land in the Cahokia Canal/Horseshoe Lake watershed is comprised of cropland. The service for developing a nutrient management plan averages $5 to $15/acre.
9.6.2.4 Nutrient Management Plan – IDA and Illinois EPA The costs associated with development of Nutrient Management Plans co-sponsored by the IDA and the Illinois EPA is estimated as $10/acre paid to the producer and
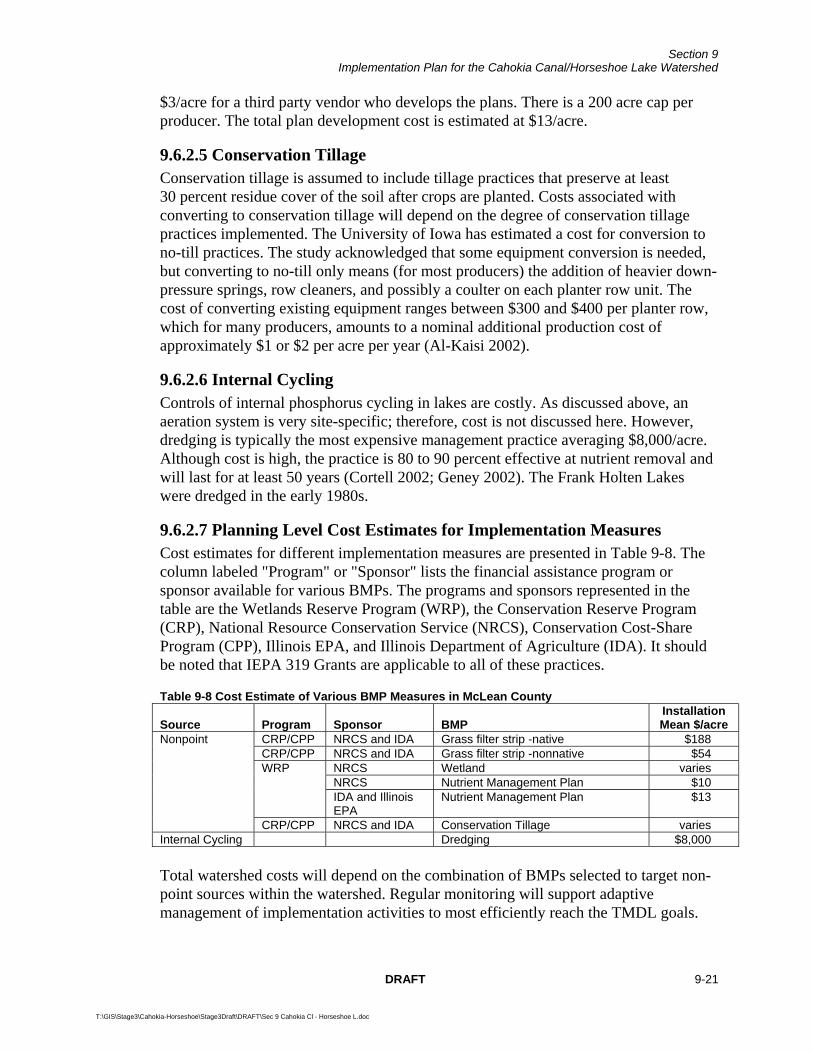
Section 9 Implementation Plan for the Cahokia Canal/Horseshoe Lake Watershed
DRAFT 9-21
T:\GIS\Stage3\Cahokia-Horseshoe\Stage3Draft\DRAFT\Sec 9 Cahokia Cl - Horseshoe L.doc
$3/acre for a third party vendor who develops the plans. There is a 200 acre cap per producer. The total plan development cost is estimated at $13/acre.
9.6.2.5 Conservation Tillage Conservation tillage is assumed to include tillage practices that preserve at least 30 percent residue cover of the soil after crops are planted. Costs associated with converting to conservation tillage will depend on the degree of conservation tillage practices implemented. The University of Iowa has estimated a cost for conversion to no-till practices. The study acknowledged that some equipment conversion is needed, but converting to no-till only means (for most producers) the addition of heavier down-pressure springs, row cleaners, and possibly a coulter on each planter row unit. The cost of converting existing equipment ranges between $300 and $400 per planter row, which for many producers, amounts to a nominal additional production cost of approximately $1 or $2 per acre per year (Al-Kaisi 2002).
9.6.2.6 Internal Cycling Controls of internal phosphorus cycling in lakes are costly. As discussed above, an aeration system is very site-specific; therefore, cost is not discussed here. However, dredging is typically the most expensive management practice averaging $8,000/acre. Although cost is high, the practice is 80 to 90 percent effective at nutrient removal and will last for at least 50 years (Cortell 2002; Geney 2002). The Frank Holten Lakes were dredged in the early 1980s.
9.6.2.7 Planning Level Cost Estimates for Implementation Measures Cost estimates for different implementation measures are presented in Table 9-8. The column labeled "Program" or "Sponsor" lists the financial assistance program or sponsor available for various BMPs. The programs and sponsors represented in the table are the Wetlands Reserve Program (WRP), the Conservation Reserve Program (CRP), National Resource Conservation Service (NRCS), Conservation Cost-Share Program (CPP), Illinois EPA, and Illinois Department of Agriculture (IDA). It should be noted that IEPA 319 Grants are applicable to all of these practices.
Table 9-8 Cost Estimate of Various BMP Measures in McLean County
Source Program Sponsor BMP Installation Mean $/acre
CRP/CPP NRCS and IDA Grass filter strip -native $188 CRP/CPP NRCS and IDA Grass filter strip -nonnative $54 WRP NRCS Wetland varies NRCS Nutrient Management Plan $10 IDA and Illinois
EPA Nutrient Management Plan $13
Nonpoint
CRP/CPP NRCS and IDA Conservation Tillage varies Internal Cycling Dredging $8,000 Total watershed costs will depend on the combination of BMPs selected to target non-point sources within the watershed. Regular monitoring will support adaptive management of implementation activities to most efficiently reach the TMDL goals.
Section 9 Implementation Plan for the Cahokia Canal/Horseshoe Lake Watershed
9-22 DRAFT
T:\GIS\Stage3\Cahokia-Horseshoe\Stage3Draft\DRAFT\Sec 9 Cahokia Cl - Horseshoe L.doc
9.7 Monitoring Plan The purpose of the monitoring plan for the Cahokia Canal/Horseshoe Lake watershed is to assess the overall implementation of management actions outlined in this section. This can be accomplished by conducting the following monitoring programs:
Track implementation of management measures in the watershed
Estimate effectiveness of management measures
Monitoring of point source discharges in the watershed
Continued ambient monitoring of all TMDL segments
Investigation of tile line flow and associated water quality from agricultural land
Further information gathering on area septic systems including locations and failure rates
Storm-based monitoring of high flow events
Tributary monitoring
Monitoring of pump out rates and diversion flows for Horseshoe Lake and Cahokia Canal
Storm Sewer surveys to monitor outfall concentration of parameters of concern
Tracking the implementation of management measures can be used to address the following goals:
Determine the extent to which management measures and practices have been implemented compared to action needed to meet TMDL endpoints
Establish a baseline from which decisions can be made regarding the need for additional incentives for implementation efforts
Measure the extent of voluntary implementation efforts
Further clarify the contributions from point sources
Support work-load and costing analysis for assistance or regulatory programs
Determine the extent to which management measures are properly maintained and operated
Estimating the effectiveness of the BMPs implemented in the watershed could be completed by monitoring before and after the BMP is incorporated into the watershed. Additional monitoring could be conducted on specific structural systems such as a constructed wetland. Inflow and outflow measurements could be conducted to determine site-specific removal efficiency. If aeration is used to control internal loading, site-specific data could be collected to assess the effectiveness of this management measure. In addition, sampling should be performed before and after
Section 9 Implementation Plan for the Cahokia Canal/Horseshoe Lake Watershed
DRAFT 9-23
T:\GIS\Stage3\Cahokia-Horseshoe\Stage3Draft\DRAFT\Sec 9 Cahokia Cl - Horseshoe L.doc
management operations employed within Horseshoe Lake to determine their effects on lake nutrient levels.
IEPA monitors lakes every three years and conducts Intensive Basin Surveys every five years. Additionally, ambient sites are monitored nine times a year. Continuation of this state monitoring program will assess lake and stream water quality as improvements in the watershed are completed. This data will also be used to assess whether water quality standards in the impaired segments are being attained.
Regular and more extensive monitoring of point sources in the watershed would confirm their collective contributions and add confidence to the modeled conclusion that low flows and not point sources are the driving factor behind low DO levels in the canal. As permits come up for renewal, Illinois EPA NPDES program should review the permits and decide if further management measures are required.
Stormwater outfall monitoring will also confirm stormwater contributions throughout the watershed. Urban stormwater is a potential pollutant source for each impaired waterbody segment in the watershed. Outfall monitoring for parameters of concern is suggested.
Continued tributary monitoring is needed to further assess the contribution of internal loading to the impaired watershed lakes. By having more knowledge on actual contributions from external loads a more precise estimate of internal loads could occur. Data on the different forms of phosphorus (dissolved, total, or orthophosphate) would also be beneficial to better assess reservoir responses to phosphorus loading.
9.8 Implementation Time Line Implementing the actions outlined in this section for the Cahokia Canal/Horseshoe Lake watershed should occur in phases and assessing effectiveness of the management actions as improvements are made. It is assumed that it may take up to five years to secure funding for actions needed in the watershed and five to seven years after funding to implement the measures. Once improvements are implemented, it may take impaired segments 10 years or more to reach their water quality standard targets. In summary, it may take up to 20 years for impaired segments to meet the applicable water quality standards.

Section 9 Implementation Plan for the Cahokia Canal/Horseshoe Lake Watershed
9-24 DRAFT
T:\GIS\Stage3\Cahokia-Horseshoe\Stage3Draft\DRAFT\Sec 9 Cahokia Cl - Horseshoe L.doc
THIS SECTION INTENTIONALLY LEFT BLANK
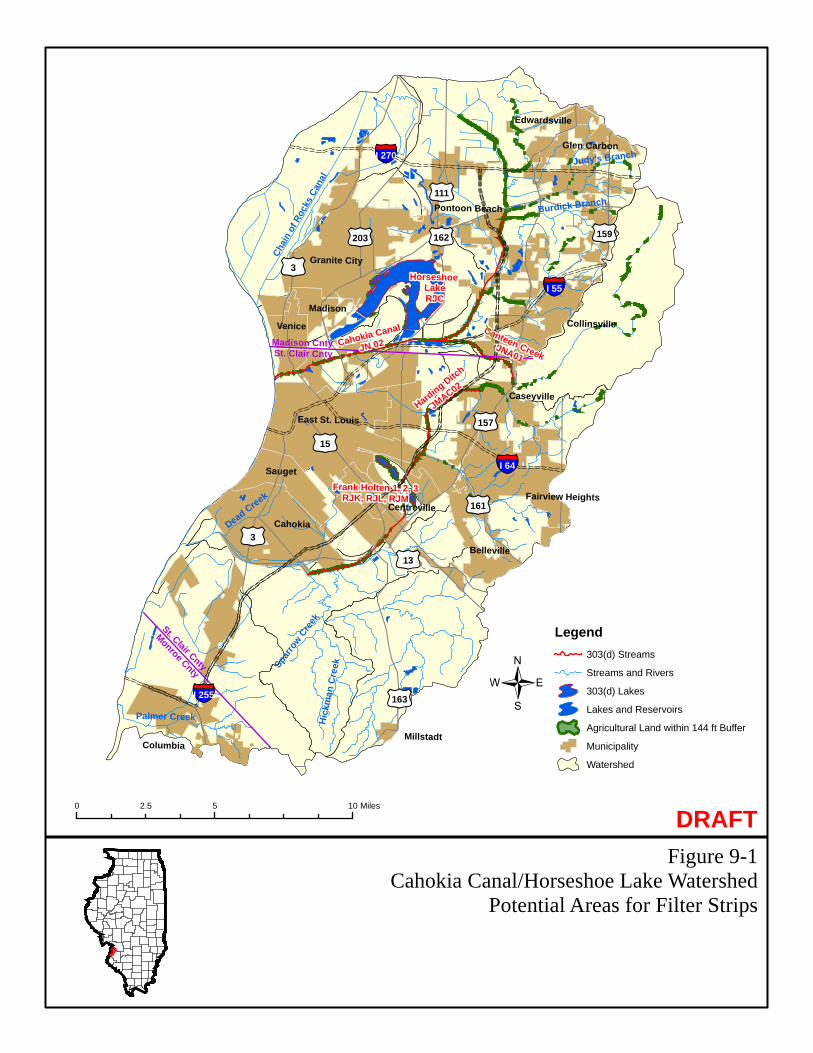
Figure 9-1Cahokia Canal/Horseshoe Lake Watershed
Potential Areas for Filter Strips
DRAFT
tu3
tu203
tu111
tu162
tu15
tu3
tu157
tu163
tu13
tu159
tu161
§̈¦I 270
§̈¦I 255
§̈¦I 64
§̈¦I 55
St. Clair Cnty
Monroe Cnty
Madison CntySt. Clair Cnty
Chai
n of
Roc
ks C
anal
Spar
row C
reek
Palmer Creek Hic
kman
Cre
ek
Dead Creek
Burdick Branch
Horseshoe LakeRJC
Cahokia Canal
JN 02Canteen Creek
JNA01
Harding Ditch
JMAC02
Frank Holten 1, 2, 3RJK, RJL, RJM
Columbia
Judy's Branch
Pontoon Beach
Centreville
Belleville
Collinsville
Edwardsville
Granite City
Glen Carbon
Millstadt
Venice
Madison
Cahokia
East St. Louis
Sauget
Fairview Heights
Caseyville
0 5 102.5 Miles
{Legend
303(d) Streams
Streams and Rivers
303(d) Lakes
Lakes and Reservoirs
Agricultural Land within 144 ft Buffer
Municipality
Watershed

Section 9 Implementation Plan for the Cahokia Canal/Horseshoe Lake Watershed
9-26 DRAFT
T:\GIS\Stage3\Cahokia-Horseshoe\Stage3Draft\DRAFT\Sec 9 Cahokia Cl - Horseshoe L.doc
THIS PAGE INTENTIONALLY LEFT BLANK
10-1
DRAFT REPORT
Section 10 References Al-Kaisi, M. 2002. Can Residue be Managed Successfully with No-Till? Integrated Crop Management. IC-496(11). May.
British Columbia Ministry of Forests. 2000. Definitions of Adaptive Management. (http://www.for.gov.bc.ca/hfp/amhome/Amdefs.htm)
Chapra, S.C., Pelletier, G.J. and Tao, H. 2005. QUAL2K: A Modeling Framework for Simulating River and Stream Water Quality, Version 2.04
Cortell, J. 2002. Personal communication regarding Marine Biochemists aeration systems. www.marinebiochemists.com.
Denison, D. and D. Tilton. 1993. Rouge River National Wet Weather Demonstration Program: Technical Memorandum. Rouge River Project: RPO-NPS-TM-12.01. August.
Dong, J., J. Chen, K.D. Brosofske, and R.J. Naiman. 1998. "Modelling Air Temperature Gradients Across Managed Small Streams in Western Washington." Journal of Environmental Management. 53:309-321.
FSA (Farm Service Agency). 1997. Conservation Reserve Program: Continuous Sign-Up for High Priority Conservation Practices. USDA. February.
Hagan, J.M. and A.A. Whitman, 2000. Microclimate changes across upland and riparian clearcut-forest boundaries in Maine. Mosaic Science Notes #2000-4. November 30. http://www.manometmaine.com/MSN2000-4.pdf
IILCP (Illinois Interagency Landscape Classification Project). 1999-2000: Land Cover of Illinois. http://www.agr.state.il.us/gis/landcover99-00.html
IDA (Illinois Department of Agriculture). 2006.http://www.agr.state.il.us/ Environment /conserv/ index.html
Illinois Department of Agriculture (IDA). 2004. 2004 Illinois Soil Conservation Transect Survey Summary.
Illinois Department of Natural Resources (IDNR), Illinois Natural History Survey (INHS), Illinois Department of Agriculture (IDA), United States Department of Agriculture (USDA) National Agricultural Statistics Survey (NASS)’s 1:1000,000 Scale Land Cover of Illinois 1999-2000. Raster Digital Data. Version 2.0, Sept 2003. http://www.inhs.uiuc.edu/cwe/gap/landcover.htm
Section 10 References
10-2
DRAFT REPORT
Illinois EPA (Illinois Environmental Protection Agency). 2005a. Point source discharge information, Illinois Environmental Protection Agency.
________.2005b. Water Quality Data.
________.2004a. Illinois Water Quality Report, 2004. IEPA/BOW/04-006.
________. 2004b. Clean Water Act Section 303(d) List -Illinois' Submittal for 2004. Illinois Natural Resources Geospatial Data Clearinghouse. 2005 Illinois Digital Orthophoto Quarter Quadrangle Data. http://www.isgs.uiuc.edu/nsdihome/webdocs/doq05/
ISWS (Illinois State Water Survey). 2007. Pan Evaporation in Illinois. Download: Pan Evaporation in Illinois. http://www.sws.uiuc.edu/atmos/statecli/Pan_Evap/Panevap.htm
Kinney, W. 2005. STREAMS (Stream Technical Resource Evaluation and Management Service): Watershed Evaluation – Evergreen Lake. May.
Kovacic, D.A., M.B. David, L.E. Gentry, K.M. Starks and R.A. Cooke. 2000 Effectiveness of constructed wetlands in reducing nitrogen and phosphorus export from agricultural tile drainage. J. Environ. Qual. 29:1262-1274. Ledwith, Tyler. 1996. Effects of Buffer Strip Width on Air Temperature and Relative Humidity in a Stream Riparian Zone. Watershed Management Council Networker; 6(4):6-7. http://www.watershed.org/news/sum_96/buffer.html
NCDC (National Climatic Data Center). 2007. Weather stations.
NCSU (North Carolina State University) Water Quality Group. 2000. National Management Measures to Control Nonpoint Source Pollution from Agriculture. United States Environmental Protection Agency: Contract # 68-C99-249.
NRC (National Research Council). 1992. “Restoration of Aquatic Ecosystems: Science, Technology, and Public Policy.” National Academy of Sciences. Washington, D.C.
NRCS (Natural Resources Conservation Service). 2006. EQIP Fact Sheet. http://www.nrcs.usda.gov/PROGRAMS/EQIP/
________. 2004. Wetland Reserves Program. http://www.nrcs.usda.gov/programs/ WRP/
Section 10 References
10-3
T:\GIS\STAGE3\CAHOKIA-HORSESHOE\STAGE3DRAFT\DRAFT\REFERENCES1.DOC DRAFT REPORT
________. 1999. Illinois Urban Manual: PRACTICE STANDARD -FILTER STRIP (acre) CODE 835. http://www.il.nrcs.usda.gov/technical/engineer/urban/standards/ urbst835.html Osmond, D.L., J. Spooner, and D.E. Line. 1995. Systems of Best Management Practices for Controlling Agricultural Nonpoint Source Pollution: The Rural Clean Water Program Experience. North Carolina State University Water Quality Control Group: brochure 6. March.
Raman, R.K. and W. Bogner. 1994. Frank Holten State Park Lakes: Phase III, Post-Restoration Monitoring. ISWS.CR564.c.1
Sharpley, A.N., T. Daniel, T. Sims, J. Lemunyon, R. Stevens, and R. Parry. 1999. Agricultural Phosphorus and Eutrophication. United States Department of Agriculture: ARS-149. July. http://www.ars.usda.gov/is/np/Phos&Eutro/phos%26eutro.pdf
USACE (United States Army Corps of Engineers) in cooperation with FEMA's National Dam Safety Program. 2005. National Inventory of Dams. http://www.tec.army.mil/nid ________. 1999. Simplified Procedures for Eutrophication and Assessment and Prediction: User Manual. William Walker. Instruction Report W-96-2. Waterways Experiment Station. USACE Headquarters.
USDA (United States Department of Agriculture). 2006. Farm Service Agency Online: Conservation Reserve Program Fact Sheet. http:/www.fsa.usda.gov/pas/publications/ facts/html/crp06.htm.October
________. 2002. National Agricultural Statistics Survey (NASS) 2002 Census of Agriculture. http://www.nass.usda.gov/census/census02/volume1/index2.htm
________. 1994. Natural Resource Conservation Service Online: Planning and Design Manual for the Control of Erosion, Sediment, and Stormwater. http://www.abe. msstate.edu/ Tools/csd/p-dm/index.html
USEPA (U.S. Environmental Protection Agency). 2007. Permit Compliance System Data. http://www.epa.gov/enviro/html/pcs/pcs_query_java.html
________. 2004a. BASINS - Better Assessment Science Integrating Point and Nonpoint Sources. Download: BASINS Data. http://www.epa.gov/OST/BASINS/
________. 2004b. STORET – Storage and Retrieval. Download: Water Quality Data. http://www.epa.gov/storet/
Section 10 References
10-4
DRAFT REPORT
________. 2003. Air Toxics and the Great Lakes: What Are We Doing About Air Deposition of Pollutants to the Great Lakes? March. http://www.epa.gov/region5/air/glakes/gl2.htm.
________. 1999. Draft Guidance for Water Quality-based Decisions: The TMDL Process (Second Edition). Office of Water. EPA 841/D/99/001.
________. 1997. Compendium of Tools for Watershed Assessment and TMDL Development. Office of Water. EPA/841/B/97/006.
________. Office of Water. 1983. Final Report of the Nationwide Urban Runoff Program. Washington, D.C.
US Fish and Wildlife Service. 2006. National Wetlands Inventory. http://www.fws.gov /nwi/
USGS (U.S. Geological Survey). 2006. Daily Streamflow. Download: Daily Flows for Stream Gage 05588000 (Indian Creek near Wanda, Illinois). http://waterdata.usgs.gov/nwis.
Wetzel, R. G. 1983. Limnology. Saunders College Publishing. Orlando, Florida. pp. 289–297.

Attachment 1: Stage 1 Report

THIS PAGE INTENTIONALLY LEFT BLANK

Final Report
Illinois Environmental Protection Agency Cahokia Canal/Horseshoe Lake Watershed Total Maximum Daily Load Stage One Report
October 2006

THIS PAGE INTENTIONALLY LEFT BLANK
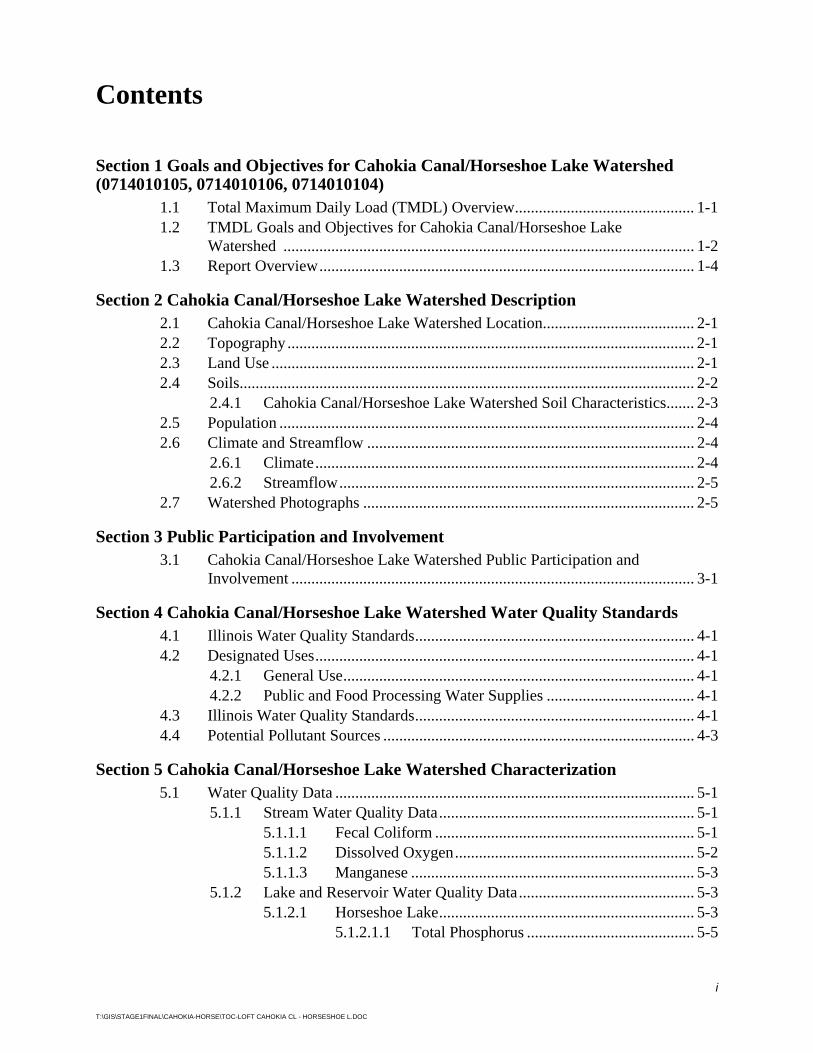
i
T:\GIS\STAGE1FINAL\CAHOKIA-HORSE\TOC-LOFT CAHOKIA CL - HORSESHOE L.DOC
Contents
Section 1 Goals and Objectives for Cahokia Canal/Horseshoe Lake Watershed (0714010105, 0714010106, 0714010104)
1.1 Total Maximum Daily Load (TMDL) Overview............................................. 1-1 1.2 TMDL Goals and Objectives for Cahokia Canal/Horseshoe Lake
Watershed ....................................................................................................... 1-2 1.3 Report Overview.............................................................................................. 1-4
Section 2 Cahokia Canal/Horseshoe Lake Watershed Description 2.1 Cahokia Canal/Horseshoe Lake Watershed Location...................................... 2-1 2.2 Topography...................................................................................................... 2-1 2.3 Land Use .......................................................................................................... 2-1 2.4 Soils.................................................................................................................. 2-2
2.4.1 Cahokia Canal/Horseshoe Lake Watershed Soil Characteristics....... 2-3 2.5 Population ........................................................................................................ 2-4 2.6 Climate and Streamflow .................................................................................. 2-4
2.6.1 Climate............................................................................................... 2-4 2.6.2 Streamflow......................................................................................... 2-5
2.7 Watershed Photographs ................................................................................... 2-5
Section 3 Public Participation and Involvement 3.1 Cahokia Canal/Horseshoe Lake Watershed Public Participation and
Involvement ..................................................................................................... 3-1
Section 4 Cahokia Canal/Horseshoe Lake Watershed Water Quality Standards 4.1 Illinois Water Quality Standards...................................................................... 4-1 4.2 Designated Uses............................................................................................... 4-1
4.2.1 General Use........................................................................................ 4-1 4.2.2 Public and Food Processing Water Supplies ..................................... 4-1
4.3 Illinois Water Quality Standards...................................................................... 4-1 4.4 Potential Pollutant Sources .............................................................................. 4-3
Section 5 Cahokia Canal/Horseshoe Lake Watershed Characterization 5.1 Water Quality Data .......................................................................................... 5-1
5.1.1 Stream Water Quality Data................................................................ 5-1 5.1.1.1 Fecal Coliform ................................................................. 5-1 5.1.1.2 Dissolved Oxygen............................................................ 5-2 5.1.1.3 Manganese ....................................................................... 5-3
5.1.2 Lake and Reservoir Water Quality Data............................................ 5-3 5.1.2.1 Horseshoe Lake................................................................ 5-3
5.1.2.1.1 Total Phosphorus .......................................... 5-5
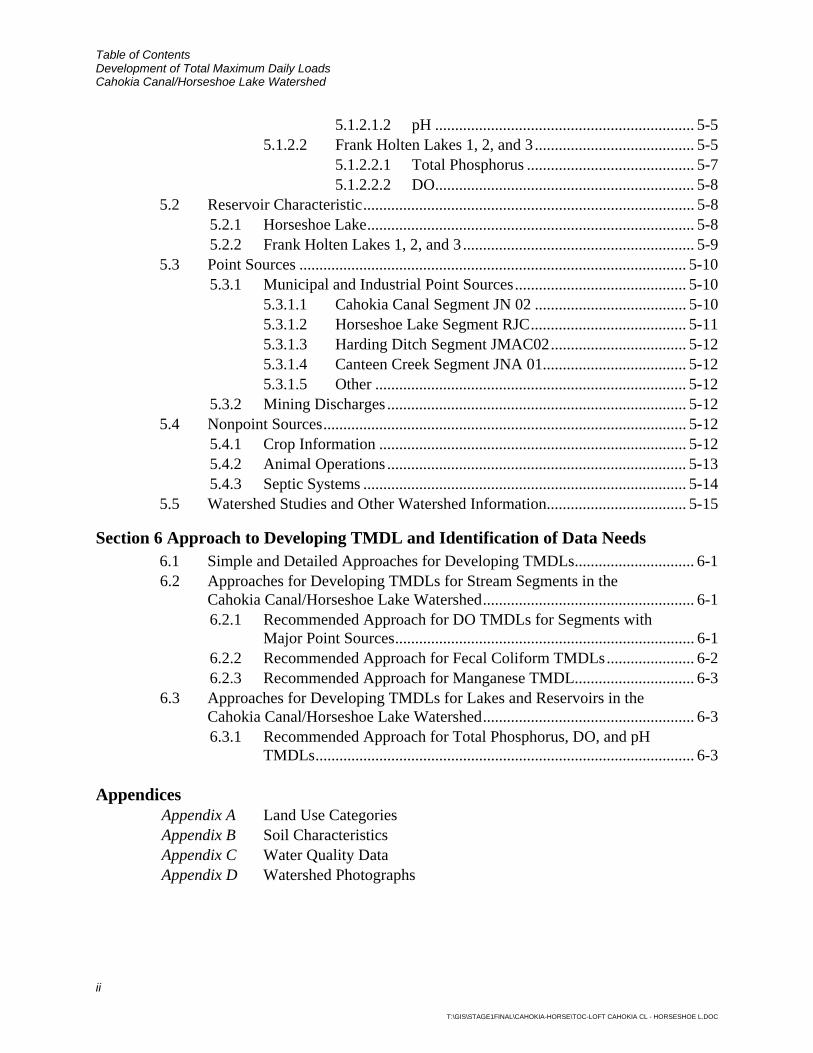
Table of Contents Development of Total Maximum Daily Loads Cahokia Canal/Horseshoe Lake Watershed
ii
T:\GIS\STAGE1FINAL\CAHOKIA-HORSE\TOC-LOFT CAHOKIA CL - HORSESHOE L.DOC
5.1.2.1.2 pH ................................................................. 5-5 5.1.2.2 Frank Holten Lakes 1, 2, and 3 ........................................ 5-5
5.1.2.2.1 Total Phosphorus .......................................... 5-7 5.1.2.2.2 DO................................................................. 5-8
5.2 Reservoir Characteristic................................................................................... 5-8 5.2.1 Horseshoe Lake.................................................................................. 5-8 5.2.2 Frank Holten Lakes 1, 2, and 3 .......................................................... 5-9
5.3 Point Sources ................................................................................................. 5-10 5.3.1 Municipal and Industrial Point Sources........................................... 5-10
5.3.1.1 Cahokia Canal Segment JN 02 ...................................... 5-10 5.3.1.2 Horseshoe Lake Segment RJC....................................... 5-11 5.3.1.3 Harding Ditch Segment JMAC02.................................. 5-12 5.3.1.4 Canteen Creek Segment JNA 01.................................... 5-12 5.3.1.5 Other .............................................................................. 5-12
5.3.2 Mining Discharges ........................................................................... 5-12 5.4 Nonpoint Sources........................................................................................... 5-12
5.4.1 Crop Information ............................................................................. 5-12 5.4.2 Animal Operations ........................................................................... 5-13 5.4.3 Septic Systems ................................................................................. 5-14
5.5 Watershed Studies and Other Watershed Information................................... 5-15
Section 6 Approach to Developing TMDL and Identification of Data Needs 6.1 Simple and Detailed Approaches for Developing TMDLs.............................. 6-1 6.2 Approaches for Developing TMDLs for Stream Segments in the
Cahokia Canal/Horseshoe Lake Watershed..................................................... 6-1 6.2.1 Recommended Approach for DO TMDLs for Segments with
Major Point Sources........................................................................... 6-1 6.2.2 Recommended Approach for Fecal Coliform TMDLs...................... 6-2 6.2.3 Recommended Approach for Manganese TMDL.............................. 6-3
6.3 Approaches for Developing TMDLs for Lakes and Reservoirs in the Cahokia Canal/Horseshoe Lake Watershed..................................................... 6-3 6.3.1 Recommended Approach for Total Phosphorus, DO, and pH
TMDLs............................................................................................... 6-3 Appendices Appendix A Land Use Categories Appendix B Soil Characteristics Appendix C Water Quality Data Appendix D Watershed Photographs
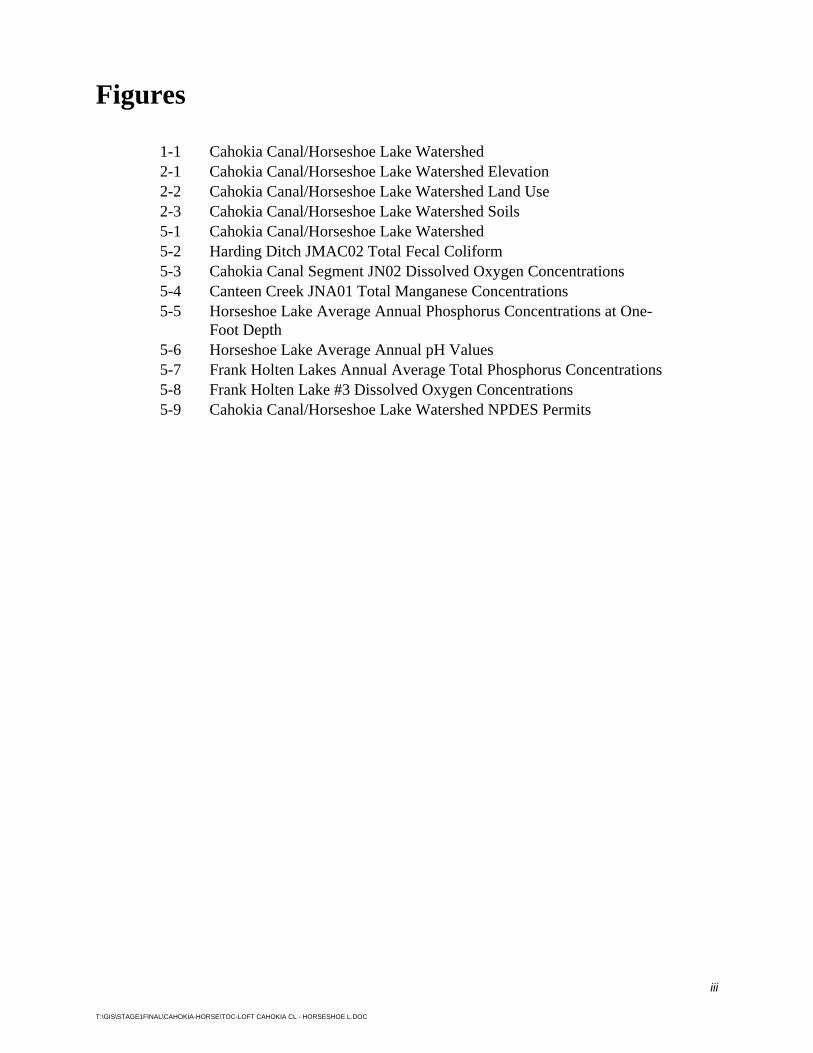
iii
T:\GIS\STAGE1FINAL\CAHOKIA-HORSE\TOC-LOFT CAHOKIA CL - HORSESHOE L.DOC
Figures
1-1 Cahokia Canal/Horseshoe Lake Watershed 2-1 Cahokia Canal/Horseshoe Lake Watershed Elevation 2-2 Cahokia Canal/Horseshoe Lake Watershed Land Use 2-3 Cahokia Canal/Horseshoe Lake Watershed Soils 5-1 Cahokia Canal/Horseshoe Lake Watershed 5-2 Harding Ditch JMAC02 Total Fecal Coliform 5-3 Cahokia Canal Segment JN02 Dissolved Oxygen Concentrations 5-4 Canteen Creek JNA01 Total Manganese Concentrations 5-5 Horseshoe Lake Average Annual Phosphorus Concentrations at One-
Foot Depth 5-6 Horseshoe Lake Average Annual pH Values 5-7 Frank Holten Lakes Annual Average Total Phosphorus Concentrations 5-8 Frank Holten Lake #3 Dissolved Oxygen Concentrations 5-9 Cahokia Canal/Horseshoe Lake Watershed NPDES Permits

List of Figures Development of Total Maximum Daily Loads Cahokia Canal/Horseshoe Lake Watershed
iv
T:\GIS\STAGE1FINAL\CAHOKIA-HORSE\TOC-LOFT CAHOKIA CL - HORSESHOE L.DOC
THIS PAGE INTENTIONALLY LEFT BLANK
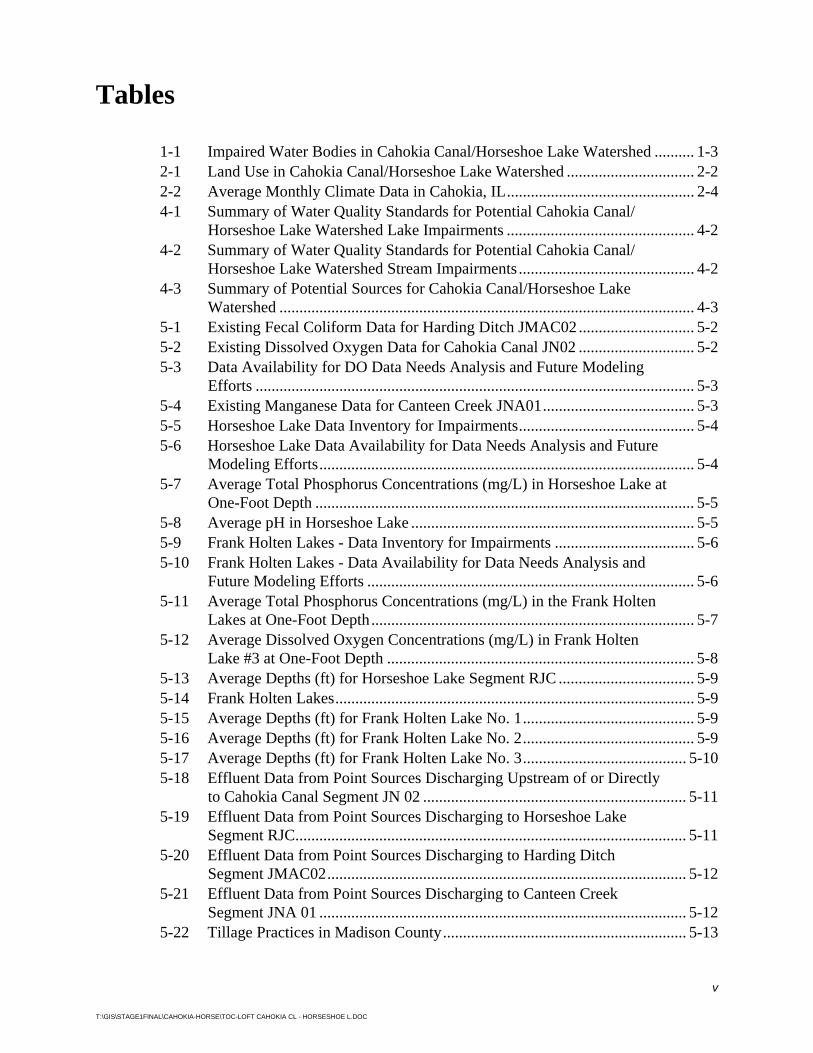
v
T:\GIS\STAGE1FINAL\CAHOKIA-HORSE\TOC-LOFT CAHOKIA CL - HORSESHOE L.DOC
Tables
1-1 Impaired Water Bodies in Cahokia Canal/Horseshoe Lake Watershed .......... 1-3 2-1 Land Use in Cahokia Canal/Horseshoe Lake Watershed ................................ 2-2 2-2 Average Monthly Climate Data in Cahokia, IL............................................... 2-4 4-1 Summary of Water Quality Standards for Potential Cahokia Canal/
Horseshoe Lake Watershed Lake Impairments ............................................... 4-2 4-2 Summary of Water Quality Standards for Potential Cahokia Canal/
Horseshoe Lake Watershed Stream Impairments ............................................ 4-2 4-3 Summary of Potential Sources for Cahokia Canal/Horseshoe Lake
Watershed ........................................................................................................ 4-3 5-1 Existing Fecal Coliform Data for Harding Ditch JMAC02............................. 5-2 5-2 Existing Dissolved Oxygen Data for Cahokia Canal JN02 ............................. 5-2 5-3 Data Availability for DO Data Needs Analysis and Future Modeling
Efforts .............................................................................................................. 5-3 5-4 Existing Manganese Data for Canteen Creek JNA01...................................... 5-3 5-5 Horseshoe Lake Data Inventory for Impairments............................................ 5-4 5-6 Horseshoe Lake Data Availability for Data Needs Analysis and Future
Modeling Efforts.............................................................................................. 5-4 5-7 Average Total Phosphorus Concentrations (mg/L) in Horseshoe Lake at
One-Foot Depth ............................................................................................... 5-5 5-8 Average pH in Horseshoe Lake ....................................................................... 5-5 5-9 Frank Holten Lakes - Data Inventory for Impairments ................................... 5-6 5-10 Frank Holten Lakes - Data Availability for Data Needs Analysis and
Future Modeling Efforts .................................................................................. 5-6 5-11 Average Total Phosphorus Concentrations (mg/L) in the Frank Holten
Lakes at One-Foot Depth................................................................................. 5-7 5-12 Average Dissolved Oxygen Concentrations (mg/L) in Frank Holten
Lake #3 at One-Foot Depth ............................................................................. 5-8 5-13 Average Depths (ft) for Horseshoe Lake Segment RJC .................................. 5-9 5-14 Frank Holten Lakes.......................................................................................... 5-9 5-15 Average Depths (ft) for Frank Holten Lake No. 1........................................... 5-9 5-16 Average Depths (ft) for Frank Holten Lake No. 2........................................... 5-9 5-17 Average Depths (ft) for Frank Holten Lake No. 3......................................... 5-10 5-18 Effluent Data from Point Sources Discharging Upstream of or Directly
to Cahokia Canal Segment JN 02 .................................................................. 5-11 5-19 Effluent Data from Point Sources Discharging to Horseshoe Lake
Segment RJC.................................................................................................. 5-11 5-20 Effluent Data from Point Sources Discharging to Harding Ditch
Segment JMAC02.......................................................................................... 5-12 5-21 Effluent Data from Point Sources Discharging to Canteen Creek
Segment JNA 01 ............................................................................................ 5-12 5-22 Tillage Practices in Madison County............................................................. 5-13
List of Tables Development of Total Maximum Daily Loads Cahokia Canal/Horseshoe Lake Watershed
vi
T:\GIS\STAGE1FINAL\CAHOKIA-HORSE\TOC-LOFT CAHOKIA CL - HORSESHOE L.DOC
5-23 Tillage Practices in St. Clair County.............................................................. 5-13 5-24 Tillage Practices in Monroe County .............................................................. 5-13 5-25 Madison County Animal Population ............................................................. 5-14 5-26 St. Clair County Animal Population .............................................................. 5-14 5-27 Monroe County Animal Population............................................................... 5-14 5-28 Estimated Septic Systems in the Cahokia Canal/Horseshoe Lake
Watershed ...................................................................................................... 5-15

vii
T:\GIS\STAGE1FINAL\CAHOKIA-HORSE\TOC-LOFT CAHOKIA CL - HORSESHOE L.DOC
Acronyms
°F degrees Fahrenheit ALMP Ambient Lake Monitoring Program BMP best management practice BOD biochemical oxygen demand CBOD5 5-day carbonaceous biochemical oxygen demand cfs cubic feet per second CRP Conservation Reserve Program CWA Clean Water Act DEM Digital Elevation Model DMR Discharge Monitoring Reports DO dissolved oxygen DP dissolved phosphorus ft foot GIS geographic information system GWLF generalized watershed loading function HUC Hydrologic Unit Code IBI Index of Biotic Integrity ICLP Illinois Clean Lakes Program IDA Illinois Department of Agriculture IDNR Illinois Department of Natural Resources ILLCP Illinois Interagency Landscape Classification Project Illinois EPA Illinois Environmental Protection Agency IPCB Illinois Pollution Control Board ISWS Illinois State Water Survey LA load allocation LC loading capacity MBI Macroinvertebrate Biotic Index mg/L milligrams per liter MOS margin of safety NASS National Agricultural Statistics Service NCDC National Climatic Data Center NRCS National Resource Conservation Service PO4 phosphate SSURGO Soil Survey Geographic Database
List of Acronyms Development of Total Maximum Daily Loads Cahokia Canal/Horseshoe Lake Watershed
viii
T:\GIS\STAGE1FINAL\CAHOKIA-HORSE\TOC-LOFT CAHOKIA CL - HORSESHOE L.DOC
STATSGO State Soil Geographic STORET Storage and Retrieval TMDL total maximum daily load TP total phosphorus TSS total suspended solids USEPA U.S. Environmental Protection Agency USGS U.S. Geological Survey WLA waste load allocation
1-1
T:\GIS\STAGE1FINAL\cahokia-horse\Sec 1 Cahokia Cl - Horseshoe L.doc
Section 1 Goals and Objectives for Cahokia Canal/ Horseshoe Lake Watershed (0714010105, 0714010106, 0714010104) 1.1 Total Maximum Daily Load (TMDL) Overview A Total Maximum Daily Load, or TMDL, is a calculation of the maximum amount of a pollutant that a water body can receive and still meet water quality standards. TMDLs are a requirement of Section 303(d) of the Clean Water Act (CWA). To meet this requirement, the Illinois Environmental Protection Agency (Illinois EPA) must identify water bodies not meeting water quality standards and then establish TMDLs for restoration of water quality. Illinois EPA lists water bodies not meeting water quality standards every two years. This list is called the 303(d) list and water bodies on the list are then targeted for TMDL development.
In general, a TMDL is a quantitative assessment of water quality problems, contributing sources, and pollution reductions needed to attain water quality standards. The TMDL specifies the amount of pollution or other stressor that needs to be reduced to meet water quality standards, allocates pollution control or management responsibilities among sources in a watershed, and provides a scientific and policy basis for taking actions needed to restore a water body.
Water quality standards are laws or regulations that states authorize to enhance water quality and protect public health and welfare. Water quality standards provide the foundation for accomplishing two of the principal goals of the CWA. These goals are:
Restore and maintain the chemical, physical, and biological integrity of the nation's waters
Where attainable, to achieve water quality that promotes protection and propagation of fish, shellfish, and wildlife, and provides for recreation in and on the water
Water quality standards consist of three elements:
The designated beneficial use or uses of a water body or segment of a water body
The water quality criteria necessary to protect the use or uses of that particular water body
An antidegradation policy
Examples of designated uses are recreation and protection of aquatic life. Water quality criteria describe the quality of water that will support a designated use. Water quality criteria can be expressed as numeric limits or as a narrative statement.
Section 1 Goals and Objectives for Cahokia Canal/Horseshoe Lake Watershed
1-2
T:\GIS\STAGE1FINAL\cahokia-horse\Sec 1 Cahokia Cl - Horseshoe L.doc
Antidegradation policies are adopted so that water quality improvements are conserved, maintained, and protected.
1.2 TMDL Goals and Objectives for Cahokia Canal/ Horseshoe Lake Watershed The Illinois EPA has a three-stage approach to TMDL development. The stages are:
Stage 1 – Watershed Characterization, Data Analysis, Methodology Selection
Stage 2 – Data Collection (optional)
Stage 3 – Model Calibration, TMDL Scenarios, Implementation Plan
This report addresses Stage 1 TMDL development for the Cahokia Canal/Horseshoe Lake watershed. Stage 2 and 3 will be conducted upon completion of Stage 1. Stage 2 is optional as data collection may not be necessary if additional data is not required to establish the TMDL.
Following this process, the TMDL goals and objectives for the Cahokia Canal/ Horseshoe Lake watershed will include developing TMDLs for all impaired water bodies within the watershed, describing all of the necessary elements of the TMDL, developing an implementation plan for each TMDL, and gaining public acceptance of the process. Following are the impaired water body segments in the Cahokia Canal/Horseshoe Lake watershed for which a TMDL will be developed:
Cahokia Canal (JN 02)
Horseshoe Lake (Madison) (RJC)
Prairie Du Pont Creek (JMAA01)
Harding Ditch (JMCA02)
Frank Holten Main Lake (RJK)
Frank Holten Lake #2 (RJL)
Frank Holten Lake #3 (RJM)
Canteen Creek (JNA 01)
These impaired water body segments are shown on Figure 1-1. There are eight impaired segments within the Cahokia Canal/Horseshoe Lake watershed. Table 1-1 lists the water body segment, water body size, and potential causes of impairment for the water body.
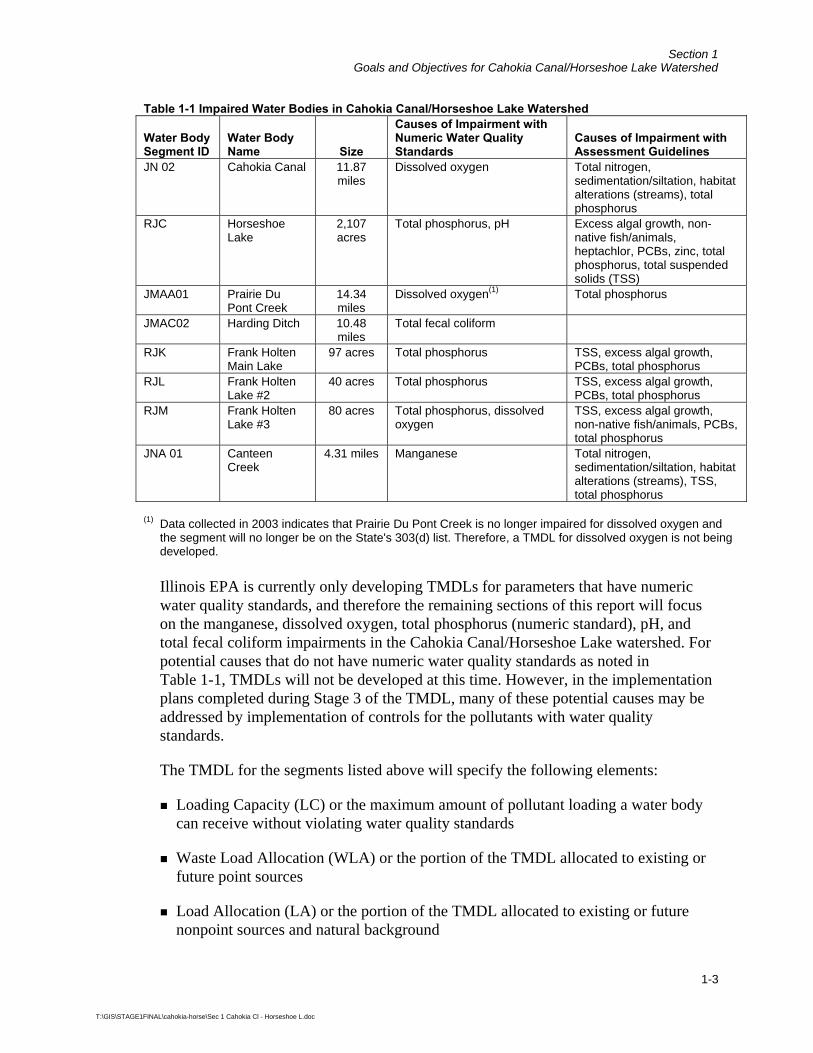
Section 1 Goals and Objectives for Cahokia Canal/Horseshoe Lake Watershed
1-3
T:\GIS\STAGE1FINAL\cahokia-horse\Sec 1 Cahokia Cl - Horseshoe L.doc
Table 1-1 Impaired Water Bodies in Cahokia Canal/Horseshoe Lake Watershed
Water Body Segment ID
Water Body Name Size
Causes of Impairment with Numeric Water Quality Standards
Causes of Impairment with Assessment Guidelines
JN 02 Cahokia Canal 11.87 miles
Dissolved oxygen Total nitrogen, sedimentation/siltation, habitat alterations (streams), total phosphorus
RJC Horseshoe Lake
2,107 acres
Total phosphorus, pH Excess algal growth, non-native fish/animals, heptachlor, PCBs, zinc, total phosphorus, total suspended solids (TSS)
JMAA01 Prairie Du Pont Creek
14.34 miles
Dissolved oxygen(1) Total phosphorus
JMAC02 Harding Ditch 10.48 miles
Total fecal coliform
RJK Frank Holten Main Lake
97 acres Total phosphorus TSS, excess algal growth, PCBs, total phosphorus
RJL Frank Holten Lake #2
40 acres Total phosphorus TSS, excess algal growth, PCBs, total phosphorus
RJM Frank Holten Lake #3
80 acres Total phosphorus, dissolved oxygen
TSS, excess algal growth, non-native fish/animals, PCBs, total phosphorus
JNA 01 Canteen Creek
4.31 miles Manganese Total nitrogen, sedimentation/siltation, habitat alterations (streams), TSS, total phosphorus
(1) Data collected in 2003 indicates that Prairie Du Pont Creek is no longer impaired for dissolved oxygen and the segment will no longer be on the State's 303(d) list. Therefore, a TMDL for dissolved oxygen is not being developed.
Illinois EPA is currently only developing TMDLs for parameters that have numeric water quality standards, and therefore the remaining sections of this report will focus on the manganese, dissolved oxygen, total phosphorus (numeric standard), pH, and total fecal coliform impairments in the Cahokia Canal/Horseshoe Lake watershed. For potential causes that do not have numeric water quality standards as noted in Table 1-1, TMDLs will not be developed at this time. However, in the implementation plans completed during Stage 3 of the TMDL, many of these potential causes may be addressed by implementation of controls for the pollutants with water quality standards.
The TMDL for the segments listed above will specify the following elements:
Loading Capacity (LC) or the maximum amount of pollutant loading a water body can receive without violating water quality standards
Waste Load Allocation (WLA) or the portion of the TMDL allocated to existing or future point sources
Load Allocation (LA) or the portion of the TMDL allocated to existing or future nonpoint sources and natural background
Section 1 Goals and Objectives for Cahokia Canal/Horseshoe Lake Watershed
1-4
T:\GIS\STAGE1FINAL\cahokia-horse\Sec 1 Cahokia Cl - Horseshoe L.doc
Margin of Safety (MOS) or an accounting of uncertainty about the relationship between pollutant loads and receiving water quality
These elements are combined into the following equation:
TMDL = LC = ΣWLA + ΣLA + MOS The TMDL developed must also take into account the seasonal variability of pollutant loads so that water quality standards are met during all seasons of the year. Also, reasonable assurance that the TMDL will be achieved will be described in the implementation plan. The implementation plan for the Cahokia Canal/Horseshoe Lake watershed will describe how water quality standards will be attained. This implementation plan will include recommendations for implementing best management practices (BMPs), cost estimates, institutional needs to implement BMPs and controls throughout the watershed, and timeframe for completion of implementation activities.
1.3 Report Overview The remaining sections of this report contain:
Section 2 Cahokia Canal/Horseshoe Lake Watershed Characteristics provides a description of the watershed's location, topography, geology, land use, soils, population, and hydrology.
Section 3 Public Participation and Involvement discusses public participation activities that occurred throughout the TMDL development.
Section 4 Cahokia Canal/Horseshoe Lake Watershed Water Quality Standards defines the water quality standards for the impaired water body.
Section 5 Cahokia Canal/Horseshoe Lake Watershed Characterization presents the available water quality data needed to develop TMDLs, discusses the characteristics of the impaired reservoirs in the watershed, and also describes the point and non-point sources with potential to contribute to the watershed load.
Section 6 Approach to Developing TMDL and Identification of Data Needs makes recommendations for the models and analysis that will be needed for TMDL development and also suggests segments for Stage 2 data collection.
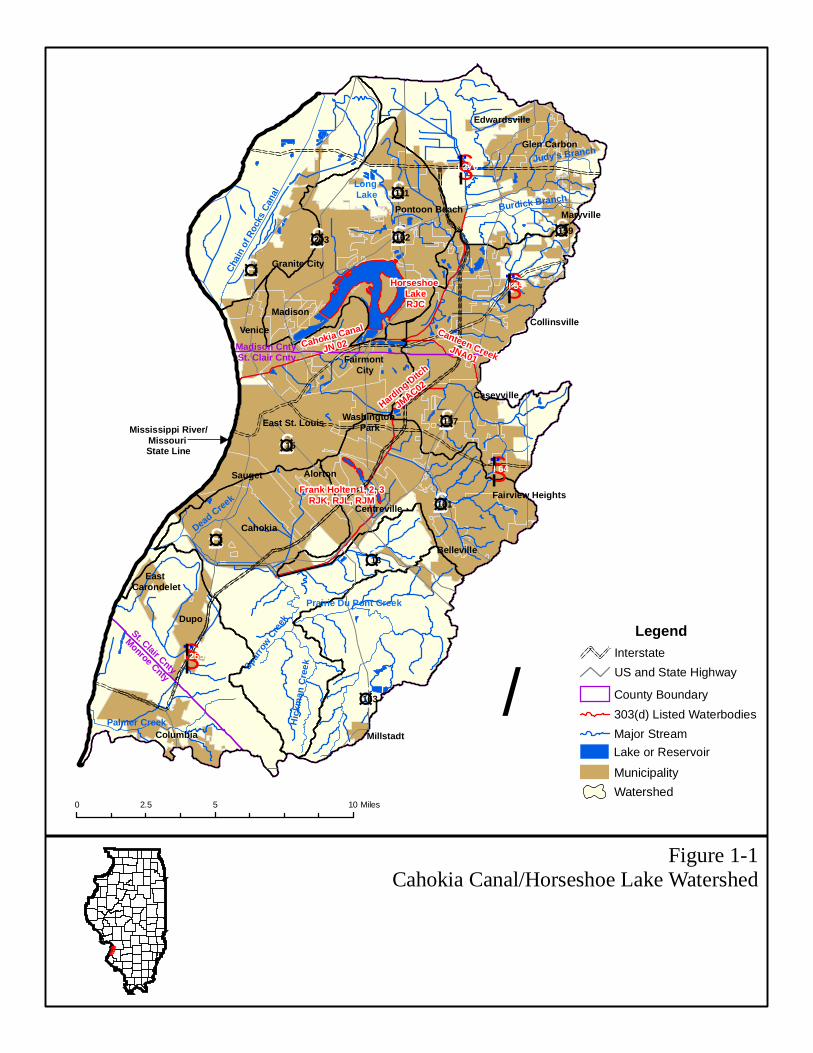
Figure 1-1Cahokia Canal/Horseshoe Lake Watershed
£¤3
£¤203
£¤111
£¤162
£¤15
£¤3
£¤157
£¤163
£¤13
£¤159
£¤161
§̈¦I 270
§̈¦I 255
§̈¦I 64
§̈¦I 55
St. Clair Cnty
Monroe Cnty
Madison CntySt. Clair Cnty
Mississippi River/Missouri State Line
Chai
n of
Roc
ks C
anal
Spar
row C
reek
Palmer Creek Hic
kman
Cre
ek
Dead Creek
Burdick Branch
Horseshoe LakeRJC
Cahokia Canal
JN 02Canteen Creek
JNA01
Harding Ditch
JMAC02
Frank Holten 1, 2, 3RJK, RJL, RJM
Prairie Du Pont Creek
Columbia
Judy's Branch
Pontoon Beach
Centreville
Belleville
Collinsville
Edwardsville
Granite City
Glen Carbon
Millstadt
Venice
Madison
Cahokia
East St. Louis
Sauget
Fairview Heights
Caseyville
Maryville
Fairmont City
Washington Park
Alorton
Dupo
East Carondelet
Long Lake
0 5 102.5 Miles
/
WatershedMunicipality
Lake or ReservoirMajor Stream303(d) Listed WaterbodiesCounty Boundary
LegendInterstateUS and State Highway
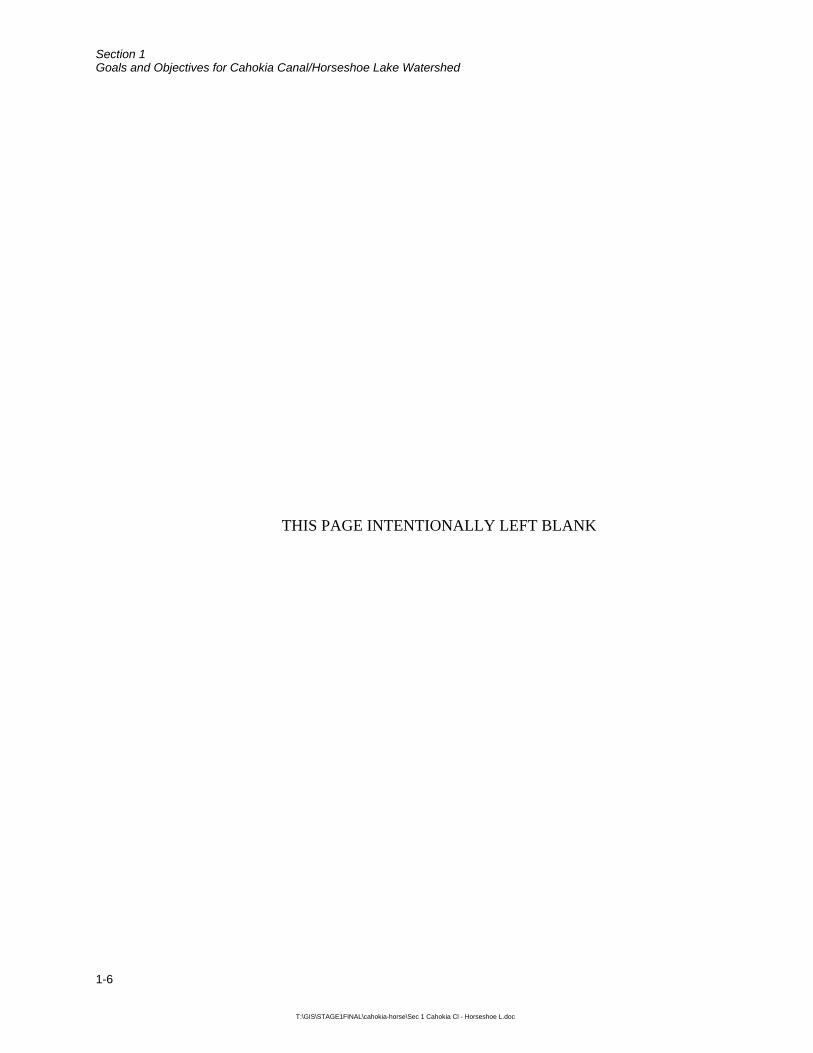
Section 1 Goals and Objectives for Cahokia Canal/Horseshoe Lake Watershed
1-6
T:\GIS\STAGE1FINAL\cahokia-horse\Sec 1 Cahokia Cl - Horseshoe L.doc
THIS PAGE INTENTIONALLY LEFT BLANK
2-1
T:\GIS\STAGE1FINAL\cahokia-horse\Sec 2 Cahokia Cl - Horseshoe L.doc
Section 2 Cahokia Canal/Horseshoe Lake Watershed Description 2.1 Cahokia Canal/Horseshoe Lake Watershed Location The Cahokia Canal/Horseshoe Lake watershed (Figure 1-1) is located in southern Illinois, flows in a southwesterly direction, and drains approximately 181,673 acres within the state of Illinois. Approximately 75,472 acres lie in southwestern Madison County, 97,427 acres lie in western St. Clair County, and 8,775 acres lie in northern Monroe County.
2.2 Topography Topography is an important factor in watershed management because stream types, precipitation, and soil types can vary dramatically by elevation. National Elevation Dataset (NED) coverages containing 30-meter grid resolution elevation data are available from the U.S. Geological Survey (USGS) for each 1:24,000-topographic quadrangle in the United States. Elevation data for the Cahokia Canal/Horseshoe Lake watershed was obtained by overlaying the NED grid onto the GIS-delineated watershed. Figure 2-1 shows the elevations found within the watershed.
Elevation in the Cahokia Canal/Horseshoe Lake watershed ranges from 702 feet above sea level in the headwaters of Cahokia Canal to 374 feet at its most downstream point at the Mississippi River. The absolute elevation change is 26 feet over the approximately 12-mile stream length of Cahokia Canal, which yields a stream gradient of approximately 2.2 feet per mile. Prairie DuPont Creek, located in the southern half of the watershed, yields an absolute elevation change of 262 feet over the approximately 20-mile stream length and a stream gradient of approximately 13.3 feet per mile.
2.3 Land Use Land use data for the Cahokia Canal/Horseshoe Lake watershed were extracted from the Illinois Gap Analysis Project (IL-GAP) Land Cover data layer. IL-GAP was started at the Illinois Natural History Survey (INHS) in 1996, and the land cover layer was the first component of the project. The IL-GAP Land Cover data layer is a product of the Illinois Interagency Landscape Classification Project (IILCP), an initiative to produce statewide land cover information on a recurring basis cooperatively managed by the United States Department of Agriculture National Agricultural Statistics Service (NASS), the Illinois Department of Agriculture (IDA), and the Illinois Department of Natural Resources (IDNR). The land cover data was generated using 30-meter grid resolution satellite imagery taken during 1999 and 2000. The IL-GAP Land Cover data layer contains 23 land cover categories, including detailed classification in the vegetated areas of Illinois. Appendix A contains a complete listing of land cover
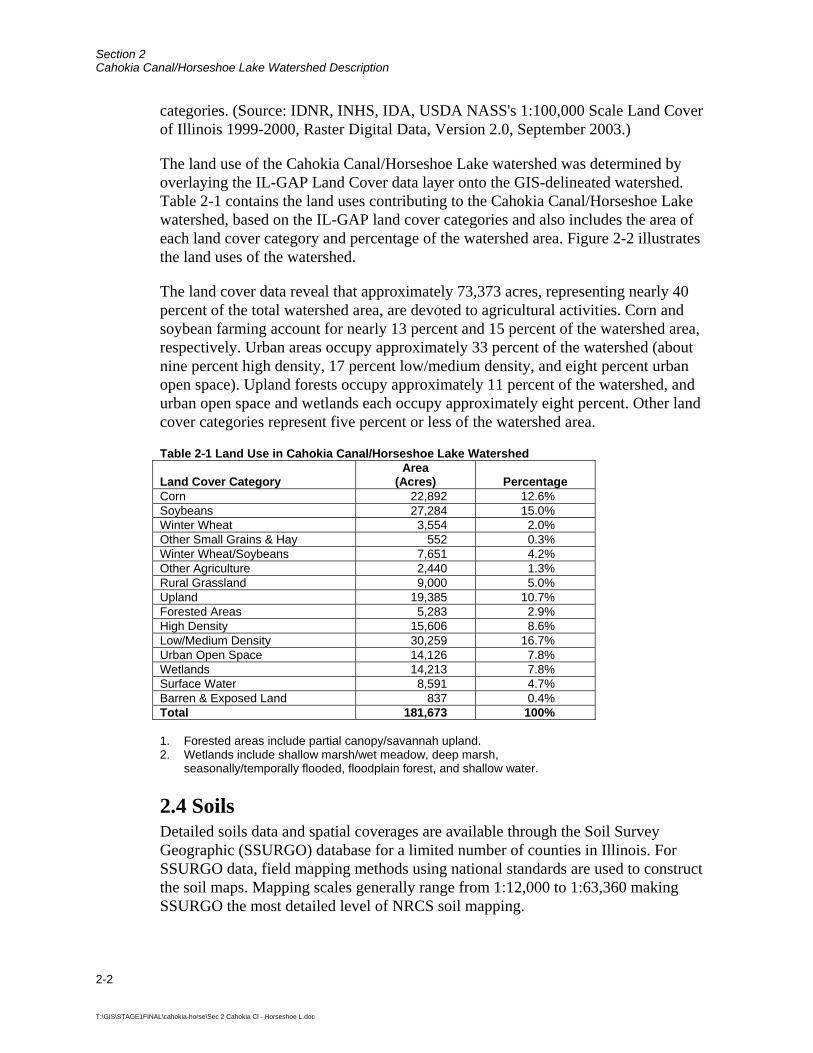
Section 2 Cahokia Canal/Horseshoe Lake Watershed Description
2-2
T:\GIS\STAGE1FINAL\cahokia-horse\Sec 2 Cahokia Cl - Horseshoe L.doc
categories. (Source: IDNR, INHS, IDA, USDA NASS's 1:100,000 Scale Land Cover of Illinois 1999-2000, Raster Digital Data, Version 2.0, September 2003.)
The land use of the Cahokia Canal/Horseshoe Lake watershed was determined by overlaying the IL-GAP Land Cover data layer onto the GIS-delineated watershed. Table 2-1 contains the land uses contributing to the Cahokia Canal/Horseshoe Lake watershed, based on the IL-GAP land cover categories and also includes the area of each land cover category and percentage of the watershed area. Figure 2-2 illustrates the land uses of the watershed.
The land cover data reveal that approximately 73,373 acres, representing nearly 40 percent of the total watershed area, are devoted to agricultural activities. Corn and soybean farming account for nearly 13 percent and 15 percent of the watershed area, respectively. Urban areas occupy approximately 33 percent of the watershed (about nine percent high density, 17 percent low/medium density, and eight percent urban open space). Upland forests occupy approximately 11 percent of the watershed, and urban open space and wetlands each occupy approximately eight percent. Other land cover categories represent five percent or less of the watershed area.
Table 2-1 Land Use in Cahokia Canal/Horseshoe Lake Watershed
Land Cover Category Area
(Acres) Percentage Corn 22,892 12.6% Soybeans 27,284 15.0% Winter Wheat 3,554 2.0% Other Small Grains & Hay 552 0.3% Winter Wheat/Soybeans 7,651 4.2% Other Agriculture 2,440 1.3% Rural Grassland 9,000 5.0% Upland 19,385 10.7% Forested Areas 5,283 2.9% High Density 15,606 8.6% Low/Medium Density 30,259 16.7% Urban Open Space 14,126 7.8% Wetlands 14,213 7.8% Surface Water 8,591 4.7% Barren & Exposed Land 837 0.4% Total 181,673 100% 1. Forested areas include partial canopy/savannah upland. 2. Wetlands include shallow marsh/wet meadow, deep marsh,
seasonally/temporally flooded, floodplain forest, and shallow water. 2.4 Soils Detailed soils data and spatial coverages are available through the Soil Survey Geographic (SSURGO) database for a limited number of counties in Illinois. For SSURGO data, field mapping methods using national standards are used to construct the soil maps. Mapping scales generally range from 1:12,000 to 1:63,360 making SSURGO the most detailed level of NRCS soil mapping.
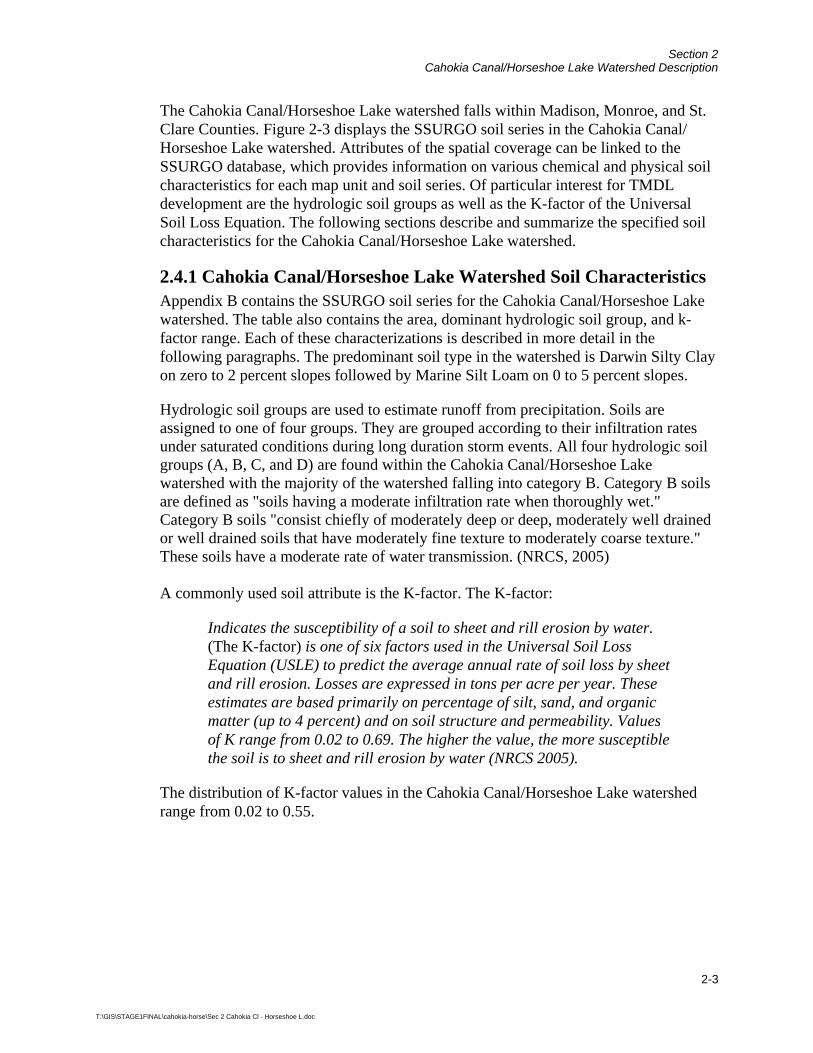
Section 2 Cahokia Canal/Horseshoe Lake Watershed Description
2-3
T:\GIS\STAGE1FINAL\cahokia-horse\Sec 2 Cahokia Cl - Horseshoe L.doc
The Cahokia Canal/Horseshoe Lake watershed falls within Madison, Monroe, and St. Clare Counties. Figure 2-3 displays the SSURGO soil series in the Cahokia Canal/ Horseshoe Lake watershed. Attributes of the spatial coverage can be linked to the SSURGO database, which provides information on various chemical and physical soil characteristics for each map unit and soil series. Of particular interest for TMDL development are the hydrologic soil groups as well as the K-factor of the Universal Soil Loss Equation. The following sections describe and summarize the specified soil characteristics for the Cahokia Canal/Horseshoe Lake watershed.
2.4.1 Cahokia Canal/Horseshoe Lake Watershed Soil Characteristics Appendix B contains the SSURGO soil series for the Cahokia Canal/Horseshoe Lake watershed. The table also contains the area, dominant hydrologic soil group, and k-factor range. Each of these characterizations is described in more detail in the following paragraphs. The predominant soil type in the watershed is Darwin Silty Clay on zero to 2 percent slopes followed by Marine Silt Loam on 0 to 5 percent slopes.
Hydrologic soil groups are used to estimate runoff from precipitation. Soils are assigned to one of four groups. They are grouped according to their infiltration rates under saturated conditions during long duration storm events. All four hydrologic soil groups (A, B, C, and D) are found within the Cahokia Canal/Horseshoe Lake watershed with the majority of the watershed falling into category B. Category B soils are defined as "soils having a moderate infiltration rate when thoroughly wet." Category B soils "consist chiefly of moderately deep or deep, moderately well drained or well drained soils that have moderately fine texture to moderately coarse texture." These soils have a moderate rate of water transmission. (NRCS, 2005) A commonly used soil attribute is the K-factor. The K-factor:
Indicates the susceptibility of a soil to sheet and rill erosion by water. (The K-factor) is one of six factors used in the Universal Soil Loss Equation (USLE) to predict the average annual rate of soil loss by sheet and rill erosion. Losses are expressed in tons per acre per year. These estimates are based primarily on percentage of silt, sand, and organic matter (up to 4 percent) and on soil structure and permeability. Values of K range from 0.02 to 0.69. The higher the value, the more susceptible the soil is to sheet and rill erosion by water (NRCS 2005).
The distribution of K-factor values in the Cahokia Canal/Horseshoe Lake watershed range from 0.02 to 0.55.
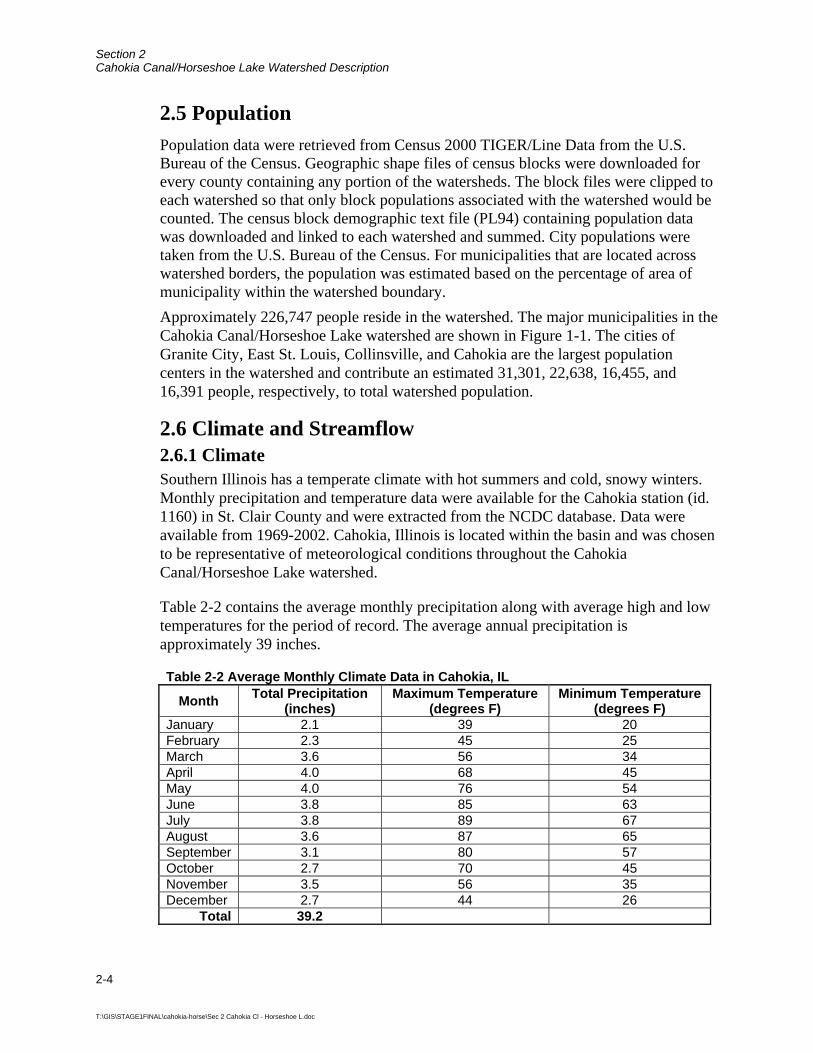
Section 2 Cahokia Canal/Horseshoe Lake Watershed Description
2-4
T:\GIS\STAGE1FINAL\cahokia-horse\Sec 2 Cahokia Cl - Horseshoe L.doc
2.5 Population Population data were retrieved from Census 2000 TIGER/Line Data from the U.S. Bureau of the Census. Geographic shape files of census blocks were downloaded for every county containing any portion of the watersheds. The block files were clipped to each watershed so that only block populations associated with the watershed would be counted. The census block demographic text file (PL94) containing population data was downloaded and linked to each watershed and summed. City populations were taken from the U.S. Bureau of the Census. For municipalities that are located across watershed borders, the population was estimated based on the percentage of area of municipality within the watershed boundary. Approximately 226,747 people reside in the watershed. The major municipalities in the Cahokia Canal/Horseshoe Lake watershed are shown in Figure 1-1. The cities of Granite City, East St. Louis, Collinsville, and Cahokia are the largest population centers in the watershed and contribute an estimated 31,301, 22,638, 16,455, and 16,391 people, respectively, to total watershed population.
2.6 Climate and Streamflow 2.6.1 Climate Southern Illinois has a temperate climate with hot summers and cold, snowy winters. Monthly precipitation and temperature data were available for the Cahokia station (id. 1160) in St. Clair County and were extracted from the NCDC database. Data were available from 1969-2002. Cahokia, Illinois is located within the basin and was chosen to be representative of meteorological conditions throughout the Cahokia Canal/Horseshoe Lake watershed.
Table 2-2 contains the average monthly precipitation along with average high and low temperatures for the period of record. The average annual precipitation is approximately 39 inches.
Table 2-2 Average Monthly Climate Data in Cahokia, IL
Month Total Precipitation (inches)
Maximum Temperature (degrees F)
Minimum Temperature (degrees F)
January 2.1 39 20 February 2.3 45 25 March 3.6 56 34 April 4.0 68 45 May 4.0 76 54 June 3.8 85 63 July 3.8 89 67 August 3.6 87 65 September 3.1 80 57 October 2.7 70 45 November 3.5 56 35 December 2.7 44 26
Total 39.2
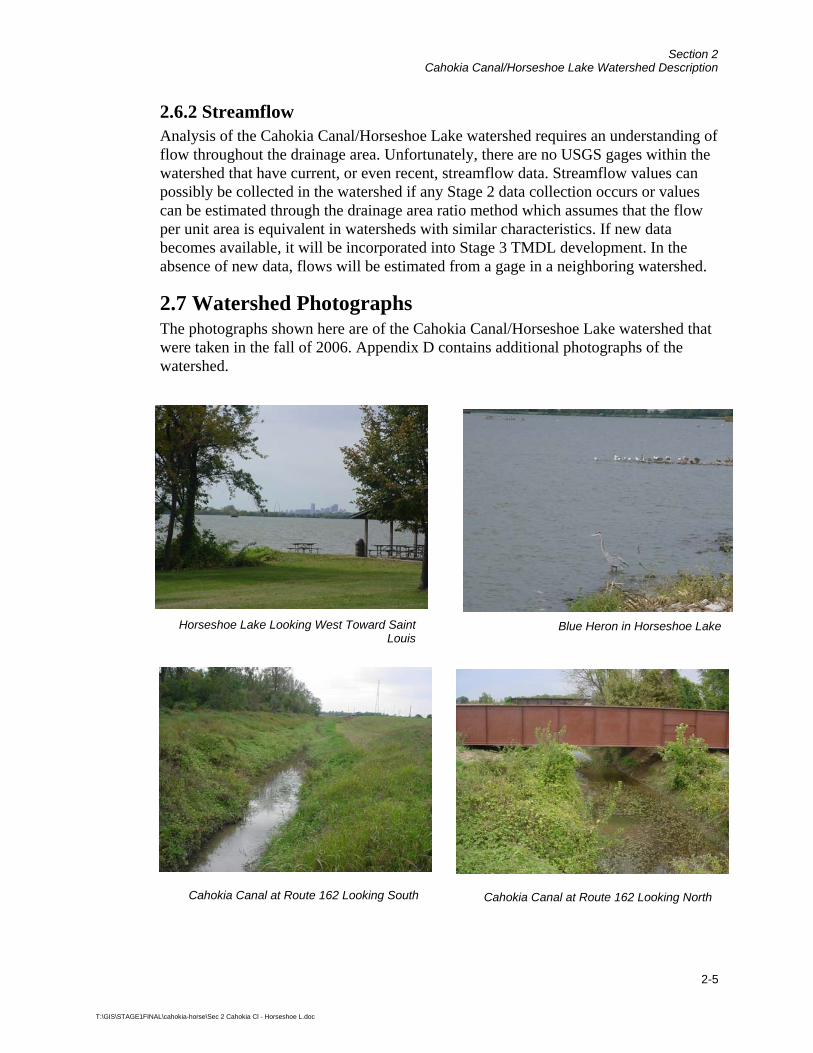
Section 2 Cahokia Canal/Horseshoe Lake Watershed Description
2-5
T:\GIS\STAGE1FINAL\cahokia-horse\Sec 2 Cahokia Cl - Horseshoe L.doc
2.6.2 Streamflow Analysis of the Cahokia Canal/Horseshoe Lake watershed requires an understanding of flow throughout the drainage area. Unfortunately, there are no USGS gages within the watershed that have current, or even recent, streamflow data. Streamflow values can possibly be collected in the watershed if any Stage 2 data collection occurs or values can be estimated through the drainage area ratio method which assumes that the flow per unit area is equivalent in watersheds with similar characteristics. If new data becomes available, it will be incorporated into Stage 3 TMDL development. In the absence of new data, flows will be estimated from a gage in a neighboring watershed.
2.7 Watershed Photographs The photographs shown here are of the Cahokia Canal/Horseshoe Lake watershed that were taken in the fall of 2006. Appendix D contains additional photographs of the watershed.
Horseshoe Lake Looking West Toward Saint Louis
Cahokia Canal at Route 162 Looking South Cahokia Canal at Route 162 Looking North
Blue Heron in Horseshoe Lake
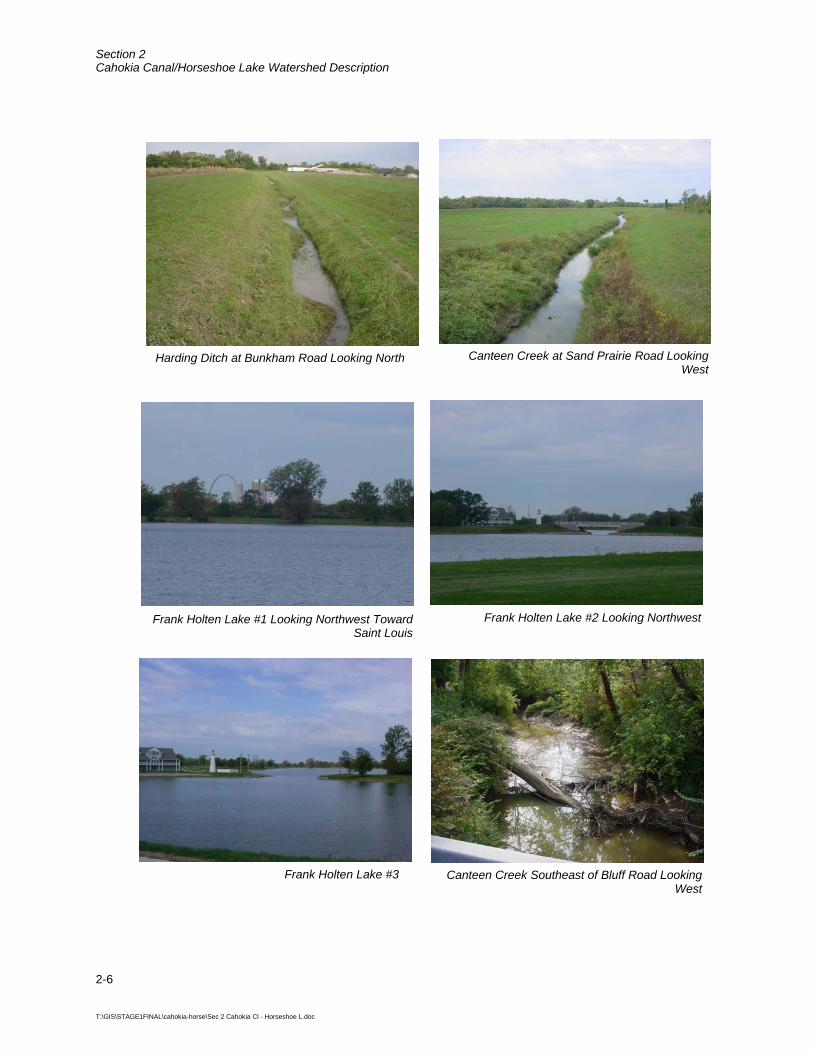
Section 2 Cahokia Canal/Horseshoe Lake Watershed Description
2-6
T:\GIS\STAGE1FINAL\cahokia-horse\Sec 2 Cahokia Cl - Horseshoe L.doc
Canteen Creek Southeast of Bluff Road Looking West
Harding Ditch at Bunkham Road Looking North
Frank Holten Lake #1 Looking Northwest Toward Saint Louis
Frank Holten Lake #3
Canteen Creek at Sand Prairie Road Looking West
Frank Holten Lake #2 Looking Northwest
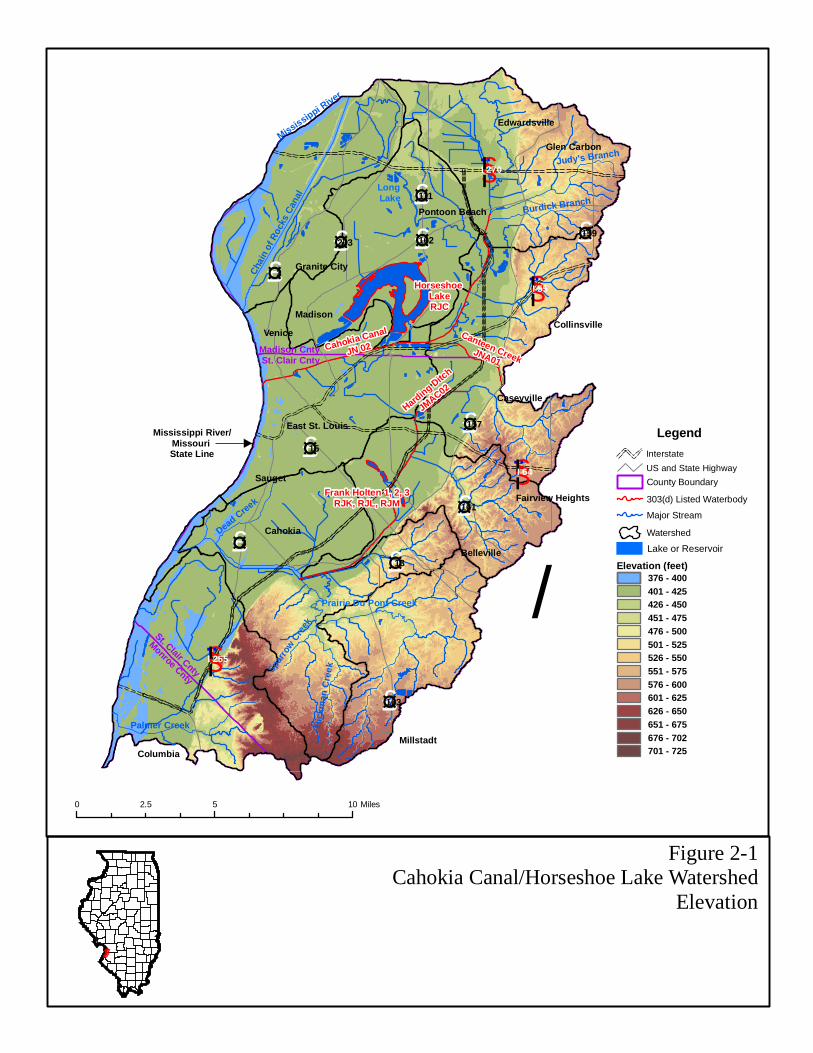
Figure 2-1Cahokia Canal/Horseshoe Lake Watershed
Elevation
0 5 102.5 Miles
£¤3
£¤203
£¤111
£¤162
£¤15
£¤3
£¤157
£¤163
£¤13
£¤159
£¤161
§̈¦I 270
§̈¦I 255
§̈¦I 64
§̈¦I 55
St. Clair Cnty
Monroe Cnty
Madison CntySt. Clair Cnty
Mississippi River/Missouri State Line
Chai
n of
Roc
ks C
anal
Spar
row C
reek
Palmer Creek Hic
kman
Cre
ek
Dead Creek
Burdick Branch
Horseshoe LakeRJC
Cahokia Canal
JN 02Canteen Creek
JNA01
Harding Ditch
JMAC02
Frank Holten 1, 2, 3RJK, RJL, RJM
Columbia
Judy's Branch
Pontoon Beach
Belleville
Collinsville
Edwardsville
Granite City
Glen Carbon
Millstadt
Venice
Madison
Cahokia
East St. Louis
Sauget
Fairview Heights
Caseyville
Mississippi River
Prairie Du Pont Creek
Long Lake
/Lake or Reservoir
Legend
County Boundary
303(d) Listed Waterbody
Watershed
Major Stream
InterstateUS and State Highway
Elevation (feet)376 - 400401 - 425426 - 450451 - 475476 - 500501 - 525526 - 550551 - 575576 - 600601 - 625626 - 650651 - 675676 - 702701 - 725

Section 2 Cahokia Canal/Horseshoe Lake Watershed Description
2-8
T:\GIS\STAGE1FINAL\cahokia-horse\Sec 2 Cahokia Cl - Horseshoe L.doc
THIS PAGE INTENTIONALLY LEFT BLANK
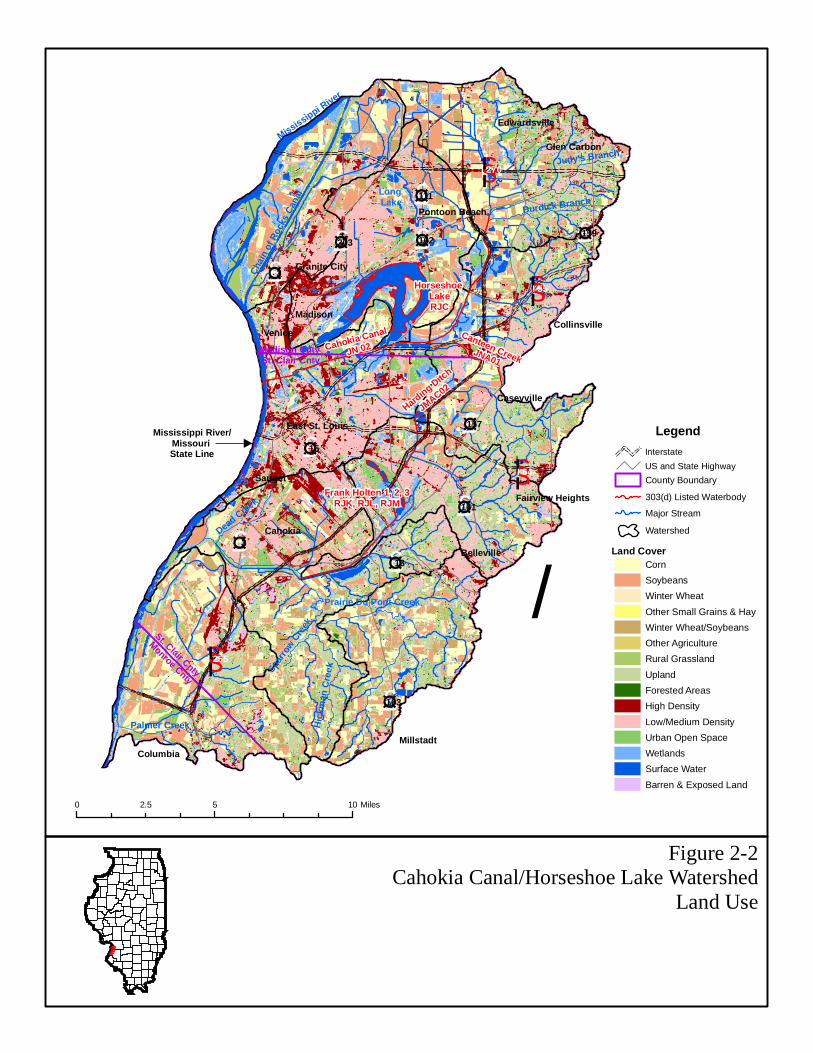
Figure 2-2Cahokia Canal/Horseshoe Lake Watershed
Land Use
0 5 102.5 Miles
£¤3
£¤203
£¤111
£¤162
£¤15
£¤3
£¤157
£¤163
£¤13
£¤159
£¤161
§̈¦I 270
§̈¦I 255
§̈¦I 64
§̈¦I 55
St. Clair Cnty
Monroe Cnty
Madison CntySt. Clair Cnty
Mississippi River/Missouri State Line
Chai
n of
Roc
ks C
anal
Spar
row C
reek
Palmer Creek Hic
kman
Cre
ek
Dead Creek
Burdick Branch
Horseshoe LakeRJC
Cahokia Canal
JN 02Canteen Creek
JNA01
Harding Ditch
JMAC02
Frank Holten 1, 2, 3RJK, RJL, RJM
Columbia
Judy's Branch
Pontoon Beach
Belleville
Collinsville
Edwardsville
Granite City
Glen Carbon
Millstadt
Venice
Madison
Cahokia
East St. Louis
Sauget
Fairview Heights
Caseyville
Mississippi River
Prairie Du Pont Creek
Long Lake
/
Legend
Land CoverCornSoybeansWinter Wheat
Other Small Grains & HayWinter Wheat/SoybeansOther AgricultureRural Grassland
UplandForested AreasHigh Density
Low/Medium DensityUrban Open SpaceWetlandsSurface Water
Barren & Exposed Land
County Boundary
303(d) Listed Waterbody
Watershed
Major Stream
InterstateUS and State Highway

Section 2 Cahokia Canal/Horseshoe Lake Watershed Description
2-10
T:\GIS\STAGE1FINAL\cahokia-horse\Sec 2 Cahokia Cl - Horseshoe L.doc
THIS PAGE INTENTIONALLY LEFT BLANK
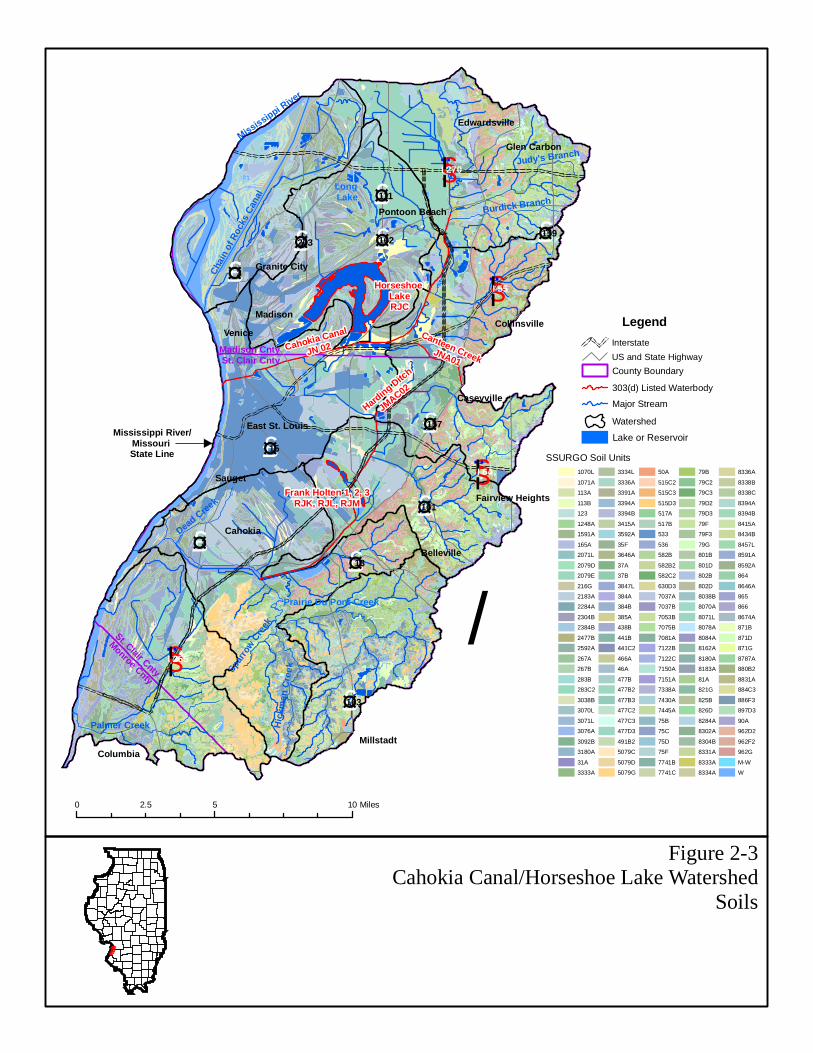
Figure 2-3Cahokia Canal/Horseshoe Lake Watershed
Soils
0 5 102.5 Miles
£¤3
£¤203
£¤111
£¤162
£¤15
£¤3
£¤157
£¤163
£¤13
£¤159
£¤161
§̈¦I 270
§̈¦I 255
§̈¦I 64
§̈¦I 55
St. Clair Cnty
Monroe Cnty
Madison CntySt. Clair Cnty
Mississippi River/Missouri State Line
Chai
n of
Roc
ks C
anal
Spar
row C
reek
Palmer Creek Hic
kman
Cre
ek
Dead Creek
Burdick Branch
Horseshoe LakeRJC
Cahokia Canal
JN 02Canteen Creek
JNA01
Harding Ditch
JMAC02
Frank Holten 1, 2, 3RJK, RJL, RJM
Columbia
Judy's Branch
Pontoon Beach
Belleville
Collinsville
Edwardsville
Granite City
Glen Carbon
Millstadt
Venice
Madison
Cahokia
East St. Louis
Sauget
Fairview Heights
Caseyville
Mississippi River
Prairie Du Pont Creek
Long Lake
1070L
1071A
113A
113B
123
1248A
1591A
165A
2071L
2079D
2079E
216G
2183A
2284A
2304B
2384B
2477B
2592A
267A
267B
283B
283C2
3038B
3070L
3071L
3076A
3092B
3180A
31A
3333A
3334L
3336A
3391A
3394A
3394B
3415A
3592A
35F
3646A
37A
37B
3847L
384A
384B
385A
438B
441B
441C2
466A
46A
477B
477B2
477B3
477C2
477C3
477D3
491B2
5079C
5079D
5079G
50A
515C2
515C3
515D3
517A
517B
533
536
582B
582B2
582C2
630D3
7037A
7037B
7053B
7075B
7081A
7122B
7122C
7150A
7151A
7338A
7430A
7445A
75B
75C
75D
75F
7741B
7741C
79B
79C2
79C3
79D2
79D3
79F
79F3
79G
801B
801D
802B
802D
8038B
8070A
8071L
8078A
8084A
8162A
8180A
8183A
81A
821G
825B
826D
8284A
8302A
8304B
8331A
8333A
8334A
8336A
8338B
8338C
8394A
8394B
8415A
8434B
8457L
8591A
8592A
864
8646A
865
866
8674A
871B
871D
871G
8787A
880B2
8831A
884C3
886F3
897D3
90A
962D2
962F2
962G
M-W
W
/
Lake or Reservoir
Legend
County Boundary
303(d) Listed Waterbody
Watershed
Major Stream
InterstateUS and State Highway
SSURGO Soil Units
Section 2 Cahokia Canal/Horseshoe Lake Watershed Description
2-12
T:\GIS\STAGE1FINAL\cahokia-horse\Sec 2 Cahokia Cl - Horseshoe L.doc
THIS PAGE INTENTIONALLY LEFT BLANK
3-1
T:\GIS\STAGE1FINAL\cahokia-horse\Sec 3 Cahokia Cl - Horseshoe L.doc
Section 3 Public Participation and Involvement 3.1 Cahokia Canal/Horseshoe Lake Watershed Public Participation and Involvement Public knowledge, acceptance, and follow through are necessary to implement a plan to meet recommended TMDLs. It is important to involve the public as early in the process as possible to achieve maximum cooperation and counter concerns as to the purpose of the process and the regulatory authority to implement any recommendations.
Illinois EPA, along with CDM, will hold up to four public meetings within the watershed throughout the course of the TMDL development. A public meeting was held on June 29, 2006 at IDOT District 8 Headquarters in Collinsville, Illinois to present Stage 1 of TMDL development for the Cahokia Canal/Horseshoe Lake watershed.
Section 3 Public Participation and Involvement
3-2
T:\GIS\STAGE1FINAL\cahokia-horse\Sec 3 Cahokia Cl - Horseshoe L.doc
THIS PAGE INTENTIONALLY LEFT BLANK
4-1
T:\GIS\STAGE1FINAL\cahokia-horse\Sec 4 Cahokia Cl - Horseshoe L.doc
Section 4 Cahokia Canal/Horseshoe Lake Watershed Water Quality Standards 4.1 Illinois Water Quality Standards Water quality standards are developed and enforced by the state to protect the "designated uses" of the state's waterways. In the state of Illinois, setting the water quality standards is the responsibility of the Illinois Pollution Control Board (IPCB). Illinois is required to update water quality standards every three years in accordance with the CWA. The standards requiring modifications are identified and prioritized by Illinois EPA, in conjunction with USEPA. New standards are then developed or revised during the three-year period.
Illinois EPA is also responsible for developing scientifically based water quality criteria and proposing them to the IPCB for adoption into state rules and regulations. The Illinois water quality standards are established in the Illinois Administrative Rules Title 35, Environmental Protection; Subtitle C, Water Pollution; Chapter I, Pollution Control Board; Part 302, Water Quality Standards.
4.2 Designated Uses The waters of Illinois are classified by designated uses, which include: General Use, Public and Food Processing Water Supplies, Lake Michigan, and Secondary Contact and Indigenous Aquatic Life Use (Illinois EPA 2005). The designated uses applicable to the Cahokia Canal/Horseshoe Lake watershed are the General Use and Public and Food Processing Water Supplies Use.
4.2.1 General Use The General Use classification is defined by IPCB as: The General Use standards will protect the state's water for aquatic life, wildlife, agricultural use, secondary contact use and most industrial uses and ensure the aesthetic quality of the state's aquatic environment. Primary contact uses are protected for all General Use waters whose physical configuration permits such use.
4.2.2 Public and Food Processing Water Supplies The Public and Food Processing Water Supplies Use is defined by IPCB as: These are cumulative with the general use standards of Subpart B and must be met in all waters designated in Part 303 at any point at which water is withdrawn for treatment and distribution as a potable supply or for food processing.
4.3 Illinois Water Quality Standards To make 303(d) listing determinations for aquatic life uses, Illinois EPA first collects biological data and if this data suggests that impairment to aquatic life is occurring, then a comparison of available water quality data with water quality standards occurs.
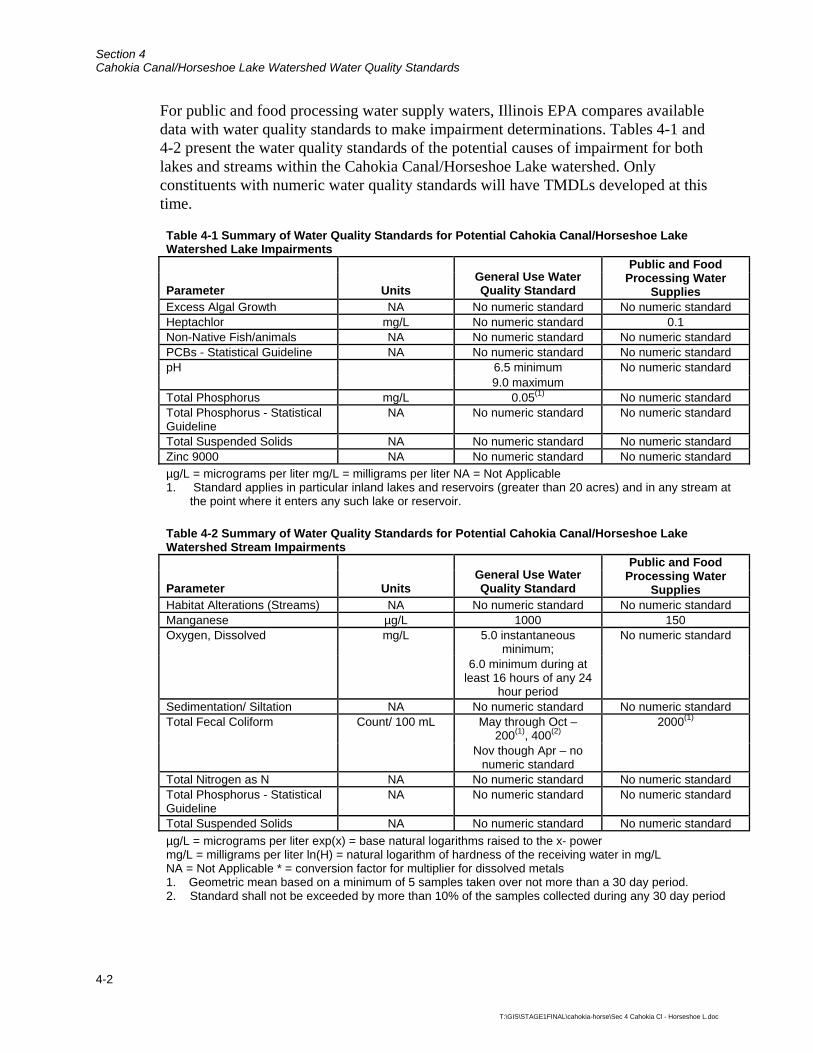
Section 4 Cahokia Canal/Horseshoe Lake Watershed Water Quality Standards
4-2
T:\GIS\STAGE1FINAL\cahokia-horse\Sec 4 Cahokia Cl - Horseshoe L.doc
For public and food processing water supply waters, Illinois EPA compares available data with water quality standards to make impairment determinations. Tables 4-1 and 4-2 present the water quality standards of the potential causes of impairment for both lakes and streams within the Cahokia Canal/Horseshoe Lake watershed. Only constituents with numeric water quality standards will have TMDLs developed at this time.
Table 4-1 Summary of Water Quality Standards for Potential Cahokia Canal/Horseshoe Lake Watershed Lake Impairments
Parameter Units General Use Water Quality Standard
Public and Food Processing Water
Supplies Excess Algal Growth NA No numeric standard No numeric standard Heptachlor mg/L No numeric standard 0.1 Non-Native Fish/animals NA No numeric standard No numeric standard PCBs - Statistical Guideline NA No numeric standard No numeric standard
6.5 minimum pH 9.0 maximum
No numeric standard
Total Phosphorus mg/L 0.05(1) No numeric standard Total Phosphorus - Statistical Guideline
NA No numeric standard No numeric standard
Total Suspended Solids NA No numeric standard No numeric standard Zinc 9000 NA No numeric standard No numeric standard µg/L = micrograms per liter mg/L = milligrams per liter NA = Not Applicable 1. Standard applies in particular inland lakes and reservoirs (greater than 20 acres) and in any stream at
the point where it enters any such lake or reservoir. Table 4-2 Summary of Water Quality Standards for Potential Cahokia Canal/Horseshoe Lake Watershed Stream Impairments
Parameter Units General Use Water Quality Standard
Public and Food Processing Water
Supplies Habitat Alterations (Streams) NA No numeric standard No numeric standard Manganese µg/L 1000 150
5.0 instantaneous minimum;
Oxygen, Dissolved mg/L
6.0 minimum during at least 16 hours of any 24
hour period
No numeric standard
Sedimentation/ Siltation NA No numeric standard No numeric standard May through Oct –
200(1), 400(2) Total Fecal Coliform Count/ 100 mL
Nov though Apr – no numeric standard
2000(1)
Total Nitrogen as N NA No numeric standard No numeric standard Total Phosphorus - Statistical Guideline
NA No numeric standard No numeric standard
Total Suspended Solids NA No numeric standard No numeric standard µg/L = micrograms per liter exp(x) = base natural logarithms raised to the x- power mg/L = milligrams per liter ln(H) = natural logarithm of hardness of the receiving water in mg/L NA = Not Applicable * = conversion factor for multiplier for dissolved metals 1. Geometric mean based on a minimum of 5 samples taken over not more than a 30 day period. 2. Standard shall not be exceeded by more than 10% of the samples collected during any 30 day period
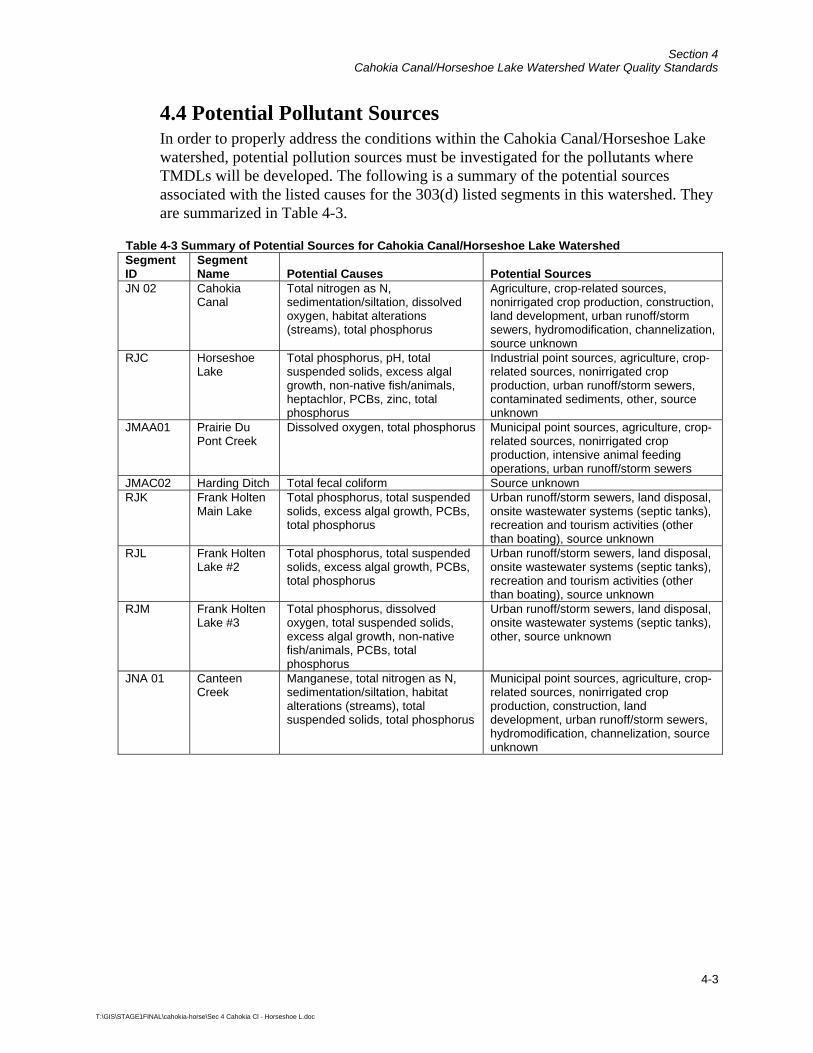
Section 4 Cahokia Canal/Horseshoe Lake Watershed Water Quality Standards
4-3
T:\GIS\STAGE1FINAL\cahokia-horse\Sec 4 Cahokia Cl - Horseshoe L.doc
4.4 Potential Pollutant Sources In order to properly address the conditions within the Cahokia Canal/Horseshoe Lake watershed, potential pollution sources must be investigated for the pollutants where TMDLs will be developed. The following is a summary of the potential sources associated with the listed causes for the 303(d) listed segments in this watershed. They are summarized in Table 4-3.
Table 4-3 Summary of Potential Sources for Cahokia Canal/Horseshoe Lake Watershed Segment ID
Segment Name Potential Causes Potential Sources
JN 02 Cahokia Canal
Total nitrogen as N, sedimentation/siltation, dissolved oxygen, habitat alterations (streams), total phosphorus
Agriculture, crop-related sources, nonirrigated crop production, construction, land development, urban runoff/storm sewers, hydromodification, channelization, source unknown
RJC Horseshoe Lake
Total phosphorus, pH, total suspended solids, excess algal growth, non-native fish/animals, heptachlor, PCBs, zinc, total phosphorus
Industrial point sources, agriculture, crop-related sources, nonirrigated crop production, urban runoff/storm sewers, contaminated sediments, other, source unknown
JMAA01 Prairie Du Pont Creek
Dissolved oxygen, total phosphorus Municipal point sources, agriculture, crop-related sources, nonirrigated crop production, intensive animal feeding operations, urban runoff/storm sewers
JMAC02 Harding Ditch Total fecal coliform Source unknown RJK Frank Holten
Main Lake Total phosphorus, total suspended solids, excess algal growth, PCBs, total phosphorus
Urban runoff/storm sewers, land disposal, onsite wastewater systems (septic tanks), recreation and tourism activities (other than boating), source unknown
RJL Frank Holten Lake #2
Total phosphorus, total suspended solids, excess algal growth, PCBs, total phosphorus
Urban runoff/storm sewers, land disposal, onsite wastewater systems (septic tanks), recreation and tourism activities (other than boating), source unknown
RJM Frank Holten Lake #3
Total phosphorus, dissolved oxygen, total suspended solids, excess algal growth, non-native fish/animals, PCBs, total phosphorus
Urban runoff/storm sewers, land disposal, onsite wastewater systems (septic tanks), other, source unknown
JNA 01 Canteen Creek
Manganese, total nitrogen as N, sedimentation/siltation, habitat alterations (streams), total suspended solids, total phosphorus
Municipal point sources, agriculture, crop-related sources, nonirrigated crop production, construction, land development, urban runoff/storm sewers, hydromodification, channelization, source unknown
Section 4 Cahokia Canal/Horseshoe Lake Watershed Water Quality Standards
4-4
T:\GIS\STAGE1FINAL\cahokia-horse\Sec 4 Cahokia Cl - Horseshoe L.doc
THIS PAGE INTENTIONALLY LEFT BLANK
5-1
T:\GIS\STAGE1FINAL\cahokia-horse\Sec 5 Cahokia Cl - Horseshoe L.doc
Section 5 Cahokia Canal/Horseshoe Lake Watershed Characterization Data was collected and reviewed from many sources in order to further characterize the Cahokia Canal/Horseshoe Lake Watershed. Data has been collected for water quality, reservoirs, and both point and nonpoint sources. This information is presented and discussed in further detail in the remainder of this section.
5.1 Water Quality Data There are 14 historic water quality stations within the Cahokia Canal/Horseshoe Lake watershed that were used for this report. Figure 5-1 shows the water quality data stations within the watershed that contain data relevant to the impaired segments.
The impaired water body segments in the Cahokia Canal/Horseshoe Lake watershed were presented in Section 1. Refer to Table 1-1 for impairment information specific to each segment. The following sections address both stream and lake impairments. Data is summarized by impairment and discussed in relation to the relevant Illinois numeric water quality standard. Data analysis is focused on all available data collected since 1990. The information presented in this section is a combination of USEPA Storage and Retrieval (STORET) database and Illinois EPA database data. STORET data is available for stations sampled prior to January 1, 1999 while Illinois EPA data (electronic and hard copy) are available for stations sampled after that date. The following sections will first discuss Cahokia Canal/Horseshoe Lake watershed stream data followed by Cahokia Canal/Horseshoe Lake watershed lake/reservoir data.
5.1.1 Stream Water Quality Data The Cahokia Canal/Horseshoe Lake watershed has four impaired streams within its drainage area that are addressed in this report. There are five active water quality stations on impaired segments (see Figure 5-1). The data summarized in this section include water quality data for impaired constituents as well as parameters that could be useful in future modeling and analysis efforts. All historic data is available in Appendix C.
5.1.1.1 Fecal Coliform Segment JMAC02 of Harding Ditch is listed as impaired for total fecal coliform. Table 5-1 summarizes available historic fecal coliform data on the segment. The general use water quality standard for fecal coliform states that the standard of 200 per 100 mL not be exceeded by the geometric mean of at least five samples, nor can 10 percent of the samples collected exceed 400 per 100 mL in protected waters, except as provided in 35 Ill. Adm. Code 302.209(b). Samples must be collected over a 30 day period or less during peak fecal coliform application periods (May through October).
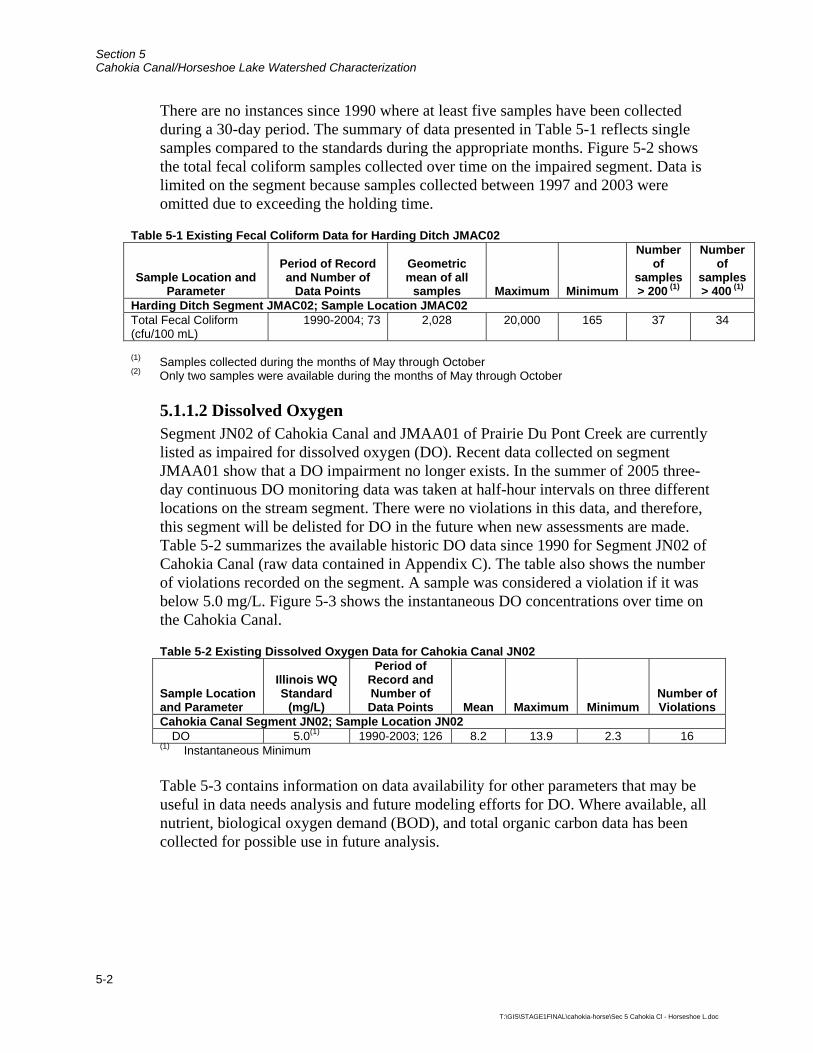
Section 5 Cahokia Canal/Horseshoe Lake Watershed Characterization
5-2
T:\GIS\STAGE1FINAL\cahokia-horse\Sec 5 Cahokia Cl - Horseshoe L.doc
There are no instances since 1990 where at least five samples have been collected during a 30-day period. The summary of data presented in Table 5-1 reflects single samples compared to the standards during the appropriate months. Figure 5-2 shows the total fecal coliform samples collected over time on the impaired segment. Data is limited on the segment because samples collected between 1997 and 2003 were omitted due to exceeding the holding time.
Table 5-1 Existing Fecal Coliform Data for Harding Ditch JMAC02
Sample Location and Parameter
Period of Record and Number of
Data Points
Geometric mean of all
samples Maximum Minimum
Number of
samples > 200 (1)
Number of
samples > 400 (1)
Harding Ditch Segment JMAC02; Sample Location JMAC02 Total Fecal Coliform (cfu/100 mL)
1990-2004; 73 2,028 20,000 165 37 34
(1) Samples collected during the months of May through October (2) Only two samples were available during the months of May through October
5.1.1.2 Dissolved Oxygen Segment JN02 of Cahokia Canal and JMAA01 of Prairie Du Pont Creek are currently listed as impaired for dissolved oxygen (DO). Recent data collected on segment JMAA01 show that a DO impairment no longer exists. In the summer of 2005 three-day continuous DO monitoring data was taken at half-hour intervals on three different locations on the stream segment. There were no violations in this data, and therefore, this segment will be delisted for DO in the future when new assessments are made. Table 5-2 summarizes the available historic DO data since 1990 for Segment JN02 of Cahokia Canal (raw data contained in Appendix C). The table also shows the number of violations recorded on the segment. A sample was considered a violation if it was below 5.0 mg/L. Figure 5-3 shows the instantaneous DO concentrations over time on the Cahokia Canal.
Table 5-2 Existing Dissolved Oxygen Data for Cahokia Canal JN02
Sample Location and Parameter
Illinois WQ Standard
(mg/L)
Period of Record and Number of Data Points Mean Maximum Minimum
Number of Violations
Cahokia Canal Segment JN02; Sample Location JN02 DO 5.0(1) 1990-2003; 126 8.2 13.9 2.3 16 (1) Instantaneous Minimum Table 5-3 contains information on data availability for other parameters that may be useful in data needs analysis and future modeling efforts for DO. Where available, all nutrient, biological oxygen demand (BOD), and total organic carbon data has been collected for possible use in future analysis.
Section 5 Cahokia Canal/Horseshoe Lake Watershed Characterization
5-3
T:\GIS\STAGE1FINAL\cahokia-horse\Sec 5 Cahokia Cl - Horseshoe L.doc
Table 5-3 Data Availability for DO Data Needs Analysis and Future Modeling Efforts
Sample Location and Parameter Available Period of Record Post 1990
Number of Samples
Cahokia Canal Segment JN02; Sample Location JN02 Ammonia, Unionized (Calc Fr Temp-pH-NH4) (mg/L) 1990-1998 82 Ammonia, Unionized (mg/L as N) 1990-1998 82 BOD, 5-Day, 20 Deg C (mg/L) 1990 1 Carbon, Total Organic (mg/L as C) 1998 2 COD, .025N K2CR2O7 (mg/L) 1990-1993 36 Nitrite plus Nitrate, Total 1 Det. (mg/L as N) 1990-2002 115 Nitrogen, Ammonia, Total (mg/L as N) 1990-2002 115 Nitrogen, Kjeldahl, Total (mg/L as N) 1998-2002 26 Phosphorus, Dissolved (mg/L as P) 1990-2002 115 Phosphorus, Total (mg/L as P) 1990-2002 115 5.1.1.3 Manganese Segment JNA01 of Canteen Creek is impaired for manganese. The applicable water quality standard is a maximum total manganese concentration of 1,000 µg/L. Table 5-4 summarizes the available historic manganese data since 1990 for the impaired stream. The table also shows the number of violations recorded on the segment. Figure 5-4 shows total manganese values recorded over time for Canteen Creek.
Table 5-4 Existing Manganese Data for Canteen Creek JNA01 Sample Location and Parameter
Illinois WQ Standard
(µg/L)
Period of Record and Number of Data Points Mean Maximum Minimum
Number of Violations
Canteen Creek Segment JNA01; Sample Locations JNA01 and JNA02 Total Manganese (µg/L)
General Use: 1000
1990-1998; 83 423 3,800 68 2
5.1.2 Lake and Reservoir Water Quality Data The Cahokia Canal/Horseshoe Lake watershed has four impaired lakes within its drainage area that are addressed in this report. There are nine active water quality stations on or tributary to the impaired water bodies (see Figure 5-1). The data summarized in this section include water quality data for impaired constituents as well as parameters that could be useful in future modeling and analysis efforts. All historic data is available in Appendix C.
5.1.2.1 Horseshoe Lake There are four active stations on Horseshoe Lake. The reservoir is impaired for total phosphorus and pH. An inventory of all available phosphorus and pH data at all depths is presented in Table 5-5.
Section 5 Cahokia Canal/Horseshoe Lake Watershed Characterization
5-4
T:\GIS\STAGE1FINAL\cahokia-horse\Sec 5 Cahokia Cl - Horseshoe L.doc
Table 5-5 Horseshoe Lake Data Inventory for Impairments Horseshoe Lake Segment RJC; Sample Locations RJC-1, RJC-2, RJC-3 and RJC-4 RJC-1 Period of Record Number of Samples Total Phosphorus 1993-2002 48 Dissolved Phosphorus 1993-1996 19 Total Phosphorus in Bottom Deposits 1993-1996 3 pH 1993-2002 37 RJC-2 Total Phosphorus 1993-2002 20 Dissolved Phosphorus 1993-1996 10 pH 1993-2002 19 RJC-3 Total Phosphorus 1993-2002 21 Dissolved Phosphorus 1993-1996 11 Total Phosphorus in Bottom Deposits 1993-1996 3 pH 1993-2002 20 RJC-4 Total Phosphorus 1993-2002 19 Dissolved Phosphorus 1993-1996 10 pH 1993-2002 19
Table 5-6 contains information on data availability for other parameters that may be useful in data needs analysis and future modeling efforts for total phosphorus. DO at varying depths as well as chlorophyll-a data has been collected where available.
Table 5-6 Horseshoe Lake Data Availability for Data Needs Analysis and Future Modeling Efforts Horseshoe Lake Segment RJC; Sample Locations RJC-1, RJC-2, RJC-3 and RJC-4 RJC-1 Period of Record Number of Samples Chlorophyll-a Corrected 1993-2002 28 Chlorophyll-a Uncorrected 1993-2002 28 Total Depth 1993-2002 679 Dissolved Oxygen 1993-2002 598 Temperature 1993-2002 598 RJC-2 Chlorophyll-a Corrected 1993-2002 18 Chlorophyll-a Uncorrected 1993-2002 18 Total Depth 1993-2002 120 Dissolved Oxygen 1993-2002 48 Temperature 1993-2002 19 RJC-3 Chlorophyll-a Corrected 1993-2002 18 Chlorophyll-a Uncorrected 1993-2002 18 Total Depth 1993-2002 135 Dissolved Oxygen 1993-2002 60 Temperature 1993-2002 20 RJC-4 Chlorophyll-a Corrected 1993-2002 18 Chlorophyll-a Uncorrected 1993-2002 18 Total Depth 1993-2005 114 Dissolved Oxygen 1993-2005 41 Temperature 1993-2002 19
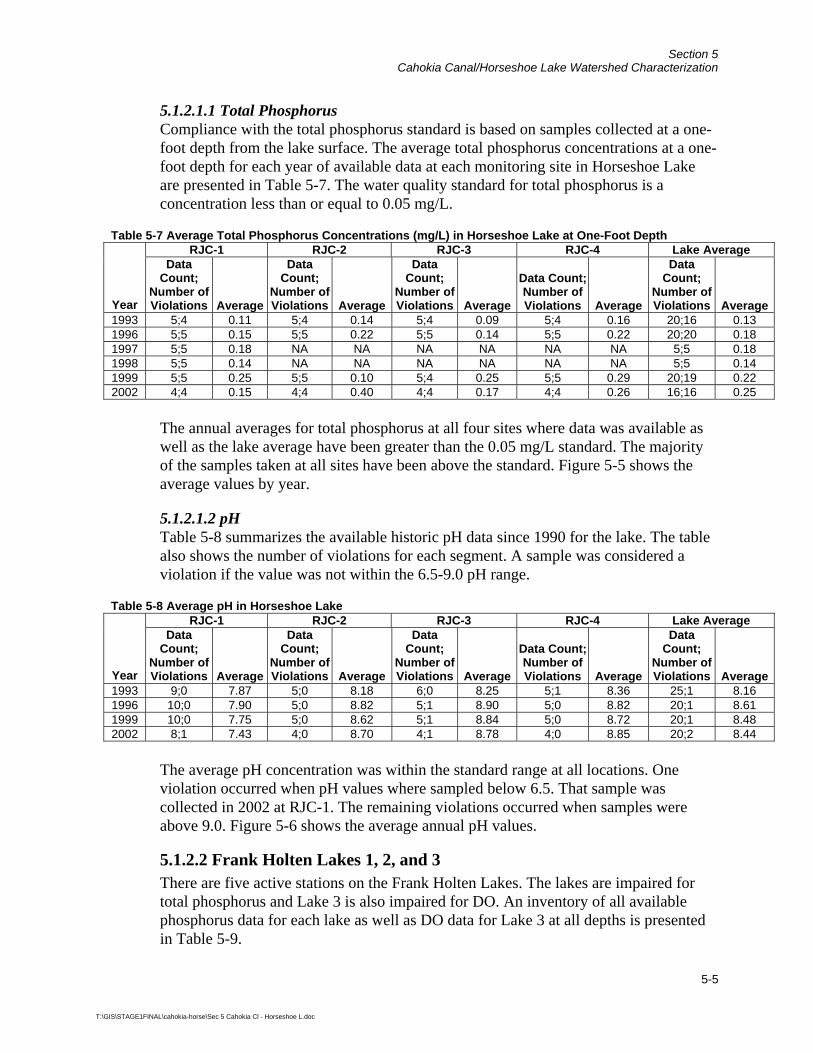
Section 5 Cahokia Canal/Horseshoe Lake Watershed Characterization
5-5
T:\GIS\STAGE1FINAL\cahokia-horse\Sec 5 Cahokia Cl - Horseshoe L.doc
5.1.2.1.1 Total Phosphorus Compliance with the total phosphorus standard is based on samples collected at a one-foot depth from the lake surface. The average total phosphorus concentrations at a one-foot depth for each year of available data at each monitoring site in Horseshoe Lake are presented in Table 5-7. The water quality standard for total phosphorus is a concentration less than or equal to 0.05 mg/L.
Table 5-7 Average Total Phosphorus Concentrations (mg/L) in Horseshoe Lake at One-Foot Depth RJC-1 RJC-2 RJC-3 RJC-4 Lake Average
Year
Data Count;
Number of Violations Average
Data Count;
Number of Violations Average
Data Count;
Number of Violations Average
Data Count; Number of Violations Average
Data Count;
Number of Violations Average
1993 5;4 0.11 5;4 0.14 5;4 0.09 5;4 0.16 20;16 0.13 1996 5;5 0.15 5;5 0.22 5;5 0.14 5;5 0.22 20;20 0.18 1997 5;5 0.18 NA NA NA NA NA NA 5;5 0.18 1998 5;5 0.14 NA NA NA NA NA NA 5;5 0.14 1999 5;5 0.25 5;5 0.10 5;4 0.25 5;5 0.29 20;19 0.22 2002 4;4 0.15 4;4 0.40 4;4 0.17 4;4 0.26 16;16 0.25
The annual averages for total phosphorus at all four sites where data was available as well as the lake average have been greater than the 0.05 mg/L standard. The majority of the samples taken at all sites have been above the standard. Figure 5-5 shows the average values by year.
5.1.2.1.2 pH Table 5-8 summarizes the available historic pH data since 1990 for the lake. The table also shows the number of violations for each segment. A sample was considered a violation if the value was not within the 6.5-9.0 pH range.
Table 5-8 Average pH in Horseshoe Lake RJC-1 RJC-2 RJC-3 RJC-4 Lake Average
Year
Data Count;
Number of Violations Average
Data Count;
Number of Violations Average
Data Count;
Number of Violations Average
Data Count; Number of Violations Average
Data Count;
Number of Violations Average
1993 9;0 7.87 5;0 8.18 6;0 8.25 5;1 8.36 25;1 8.16 1996 10;0 7.90 5;0 8.82 5;1 8.90 5;0 8.82 20;1 8.61 1999 10;0 7.75 5;0 8.62 5;1 8.84 5;0 8.72 20;1 8.48 2002 8;1 7.43 4;0 8.70 4;1 8.78 4;0 8.85 20;2 8.44
The average pH concentration was within the standard range at all locations. One violation occurred when pH values where sampled below 6.5. That sample was collected in 2002 at RJC-1. The remaining violations occurred when samples were above 9.0. Figure 5-6 shows the average annual pH values.
5.1.2.2 Frank Holten Lakes 1, 2, and 3 There are five active stations on the Frank Holten Lakes. The lakes are impaired for total phosphorus and Lake 3 is also impaired for DO. An inventory of all available phosphorus data for each lake as well as DO data for Lake 3 at all depths is presented in Table 5-9.
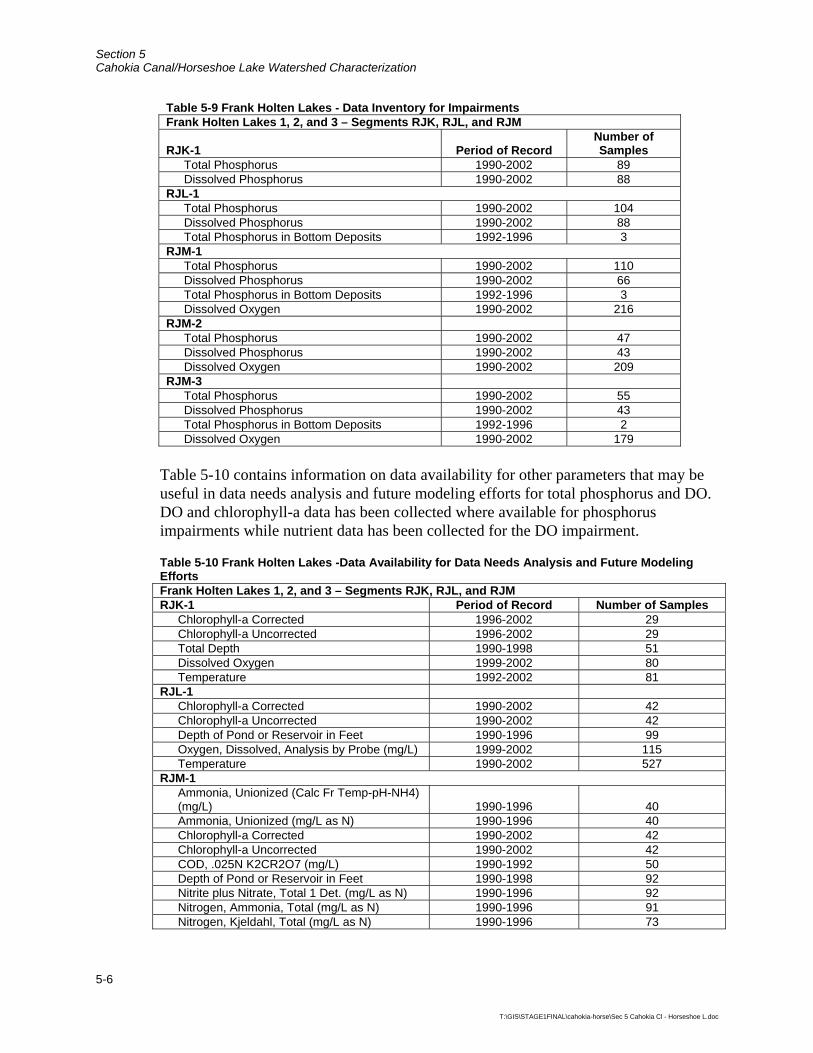
Section 5 Cahokia Canal/Horseshoe Lake Watershed Characterization
5-6
T:\GIS\STAGE1FINAL\cahokia-horse\Sec 5 Cahokia Cl - Horseshoe L.doc
Table 5-9 Frank Holten Lakes - Data Inventory for Impairments Frank Holten Lakes 1, 2, and 3 – Segments RJK, RJL, and RJM
RJK-1 Period of Record Number of Samples
Total Phosphorus 1990-2002 89 Dissolved Phosphorus 1990-2002 88 RJL-1 Total Phosphorus 1990-2002 104 Dissolved Phosphorus 1990-2002 88 Total Phosphorus in Bottom Deposits 1992-1996 3 RJM-1 Total Phosphorus 1990-2002 110 Dissolved Phosphorus 1990-2002 66 Total Phosphorus in Bottom Deposits 1992-1996 3 Dissolved Oxygen 1990-2002 216 RJM-2 Total Phosphorus 1990-2002 47 Dissolved Phosphorus 1990-2002 43 Dissolved Oxygen 1990-2002 209 RJM-3 Total Phosphorus 1990-2002 55 Dissolved Phosphorus 1990-2002 43 Total Phosphorus in Bottom Deposits 1992-1996 2 Dissolved Oxygen 1990-2002 179
Table 5-10 contains information on data availability for other parameters that may be useful in data needs analysis and future modeling efforts for total phosphorus and DO. DO and chlorophyll-a data has been collected where available for phosphorus impairments while nutrient data has been collected for the DO impairment.
Table 5-10 Frank Holten Lakes -Data Availability for Data Needs Analysis and Future Modeling Efforts Frank Holten Lakes 1, 2, and 3 – Segments RJK, RJL, and RJM RJK-1 Period of Record Number of Samples Chlorophyll-a Corrected 1996-2002 29 Chlorophyll-a Uncorrected 1996-2002 29 Total Depth 1990-1998 51 Dissolved Oxygen 1999-2002 80 Temperature 1992-2002 81 RJL-1 Chlorophyll-a Corrected 1990-2002 42 Chlorophyll-a Uncorrected 1990-2002 42 Depth of Pond or Reservoir in Feet 1990-1996 99 Oxygen, Dissolved, Analysis by Probe (mg/L) 1999-2002 115 Temperature 1990-2002 527 RJM-1
Ammonia, Unionized (Calc Fr Temp-pH-NH4) (mg/L) 1990-1996 40 Ammonia, Unionized (mg/L as N) 1990-1996 40 Chlorophyll-a Corrected 1990-2002 42 Chlorophyll-a Uncorrected 1990-2002 42 COD, .025N K2CR2O7 (mg/L) 1990-1992 50 Depth of Pond or Reservoir in Feet 1990-1998 92 Nitrite plus Nitrate, Total 1 Det. (mg/L as N) 1990-1996 92 Nitrogen, Ammonia, Total (mg/L as N) 1990-1996 91 Nitrogen, Kjeldahl, Total (mg/L as N) 1990-1996 73
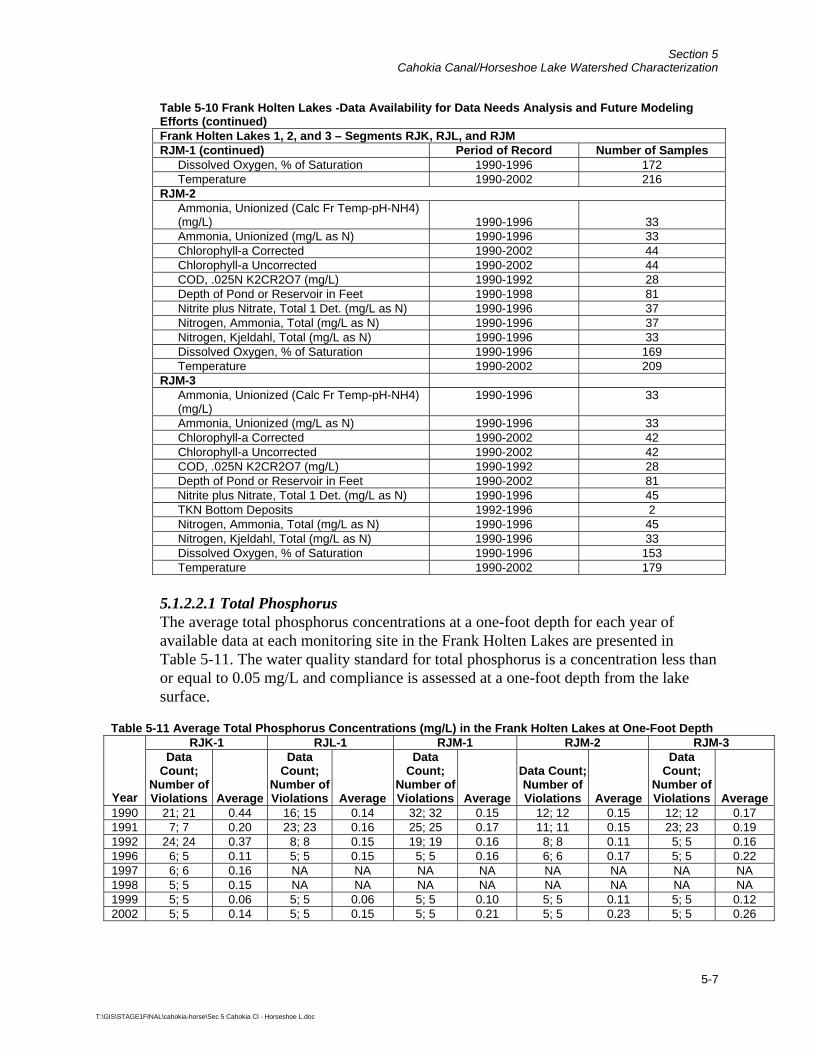
Section 5 Cahokia Canal/Horseshoe Lake Watershed Characterization
5-7
T:\GIS\STAGE1FINAL\cahokia-horse\Sec 5 Cahokia Cl - Horseshoe L.doc
Table 5-10 Frank Holten Lakes -Data Availability for Data Needs Analysis and Future Modeling Efforts (continued) Frank Holten Lakes 1, 2, and 3 – Segments RJK, RJL, and RJM RJM-1 (continued) Period of Record Number of Samples
Dissolved Oxygen, % of Saturation 1990-1996 172 Temperature 1990-2002 216
RJM-2 Ammonia, Unionized (Calc Fr Temp-pH-NH4) (mg/L) 1990-1996 33 Ammonia, Unionized (mg/L as N) 1990-1996 33 Chlorophyll-a Corrected 1990-2002 44 Chlorophyll-a Uncorrected 1990-2002 44 COD, .025N K2CR2O7 (mg/L) 1990-1992 28 Depth of Pond or Reservoir in Feet 1990-1998 81 Nitrite plus Nitrate, Total 1 Det. (mg/L as N) 1990-1996 37 Nitrogen, Ammonia, Total (mg/L as N) 1990-1996 37 Nitrogen, Kjeldahl, Total (mg/L as N) 1990-1996 33 Dissolved Oxygen, % of Saturation 1990-1996 169
Temperature 1990-2002 209 RJM-3 Ammonia, Unionized (Calc Fr Temp-pH-NH4)
(mg/L) 1990-1996 33
Ammonia, Unionized (mg/L as N) 1990-1996 33 Chlorophyll-a Corrected 1990-2002 42 Chlorophyll-a Uncorrected 1990-2002 42 COD, .025N K2CR2O7 (mg/L) 1990-1992 28 Depth of Pond or Reservoir in Feet 1990-2002 81 Nitrite plus Nitrate, Total 1 Det. (mg/L as N) 1990-1996 45 TKN Bottom Deposits 1992-1996 2 Nitrogen, Ammonia, Total (mg/L as N) 1990-1996 45 Nitrogen, Kjeldahl, Total (mg/L as N) 1990-1996 33
Dissolved Oxygen, % of Saturation 1990-1996 153 Temperature 1990-2002 179 5.1.2.2.1 Total Phosphorus The average total phosphorus concentrations at a one-foot depth for each year of available data at each monitoring site in the Frank Holten Lakes are presented in Table 5-11. The water quality standard for total phosphorus is a concentration less than or equal to 0.05 mg/L and compliance is assessed at a one-foot depth from the lake surface.
Table 5-11 Average Total Phosphorus Concentrations (mg/L) in the Frank Holten Lakes at One-Foot Depth RJK-1 RJL-1 RJM-1 RJM-2 RJM-3
Year
Data Count;
Number of Violations Average
Data Count;
Number of Violations Average
Data Count;
Number of Violations Average
Data Count; Number of Violations Average
Data Count;
Number of Violations Average
1990 21; 21 0.44 16; 15 0.14 32; 32 0.15 12; 12 0.15 12; 12 0.17 1991 7; 7 0.20 23; 23 0.16 25; 25 0.17 11; 11 0.15 23; 23 0.19 1992 24; 24 0.37 8; 8 0.15 19; 19 0.16 8; 8 0.11 5; 5 0.16 1996 6; 5 0.11 5; 5 0.15 5; 5 0.16 6; 6 0.17 5; 5 0.22 1997 6; 6 0.16 NA NA NA NA NA NA NA NA 1998 5; 5 0.15 NA NA NA NA NA NA NA NA 1999 5; 5 0.06 5; 5 0.06 5; 5 0.10 5; 5 0.11 5; 5 0.12 2002 5; 5 0.14 5; 5 0.15 5; 5 0.21 5; 5 0.23 5; 5 0.26
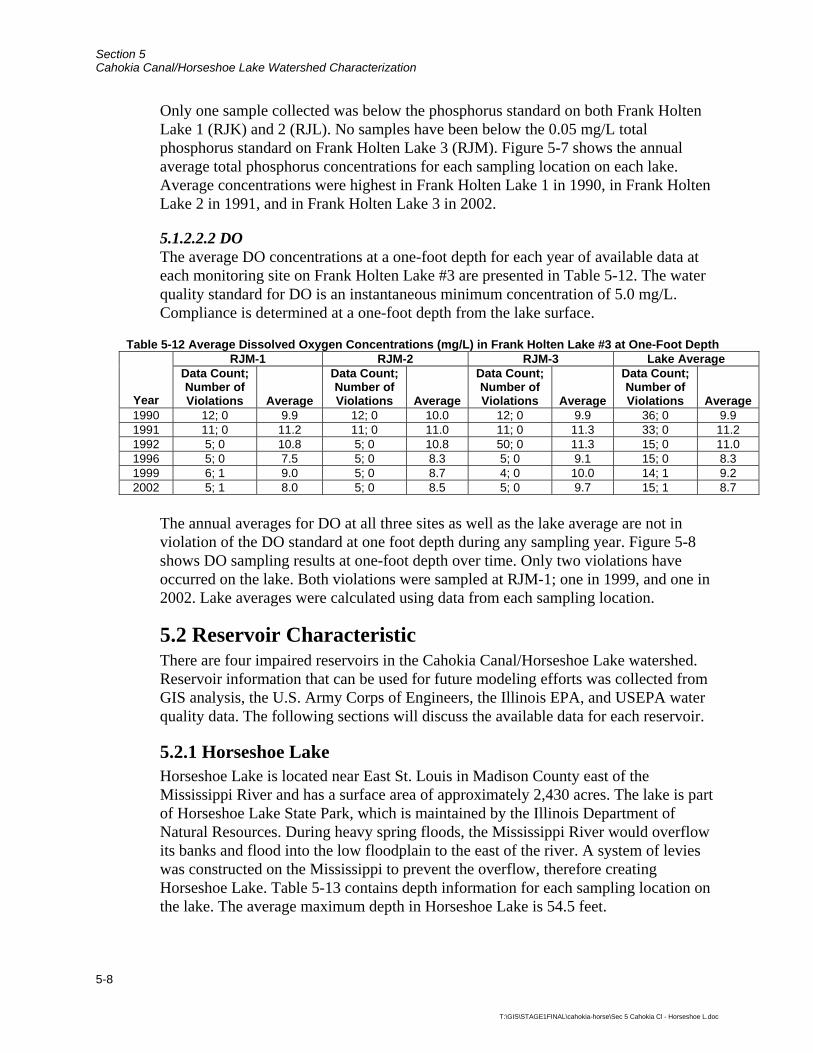
Section 5 Cahokia Canal/Horseshoe Lake Watershed Characterization
5-8
T:\GIS\STAGE1FINAL\cahokia-horse\Sec 5 Cahokia Cl - Horseshoe L.doc
Only one sample collected was below the phosphorus standard on both Frank Holten Lake 1 (RJK) and 2 (RJL). No samples have been below the 0.05 mg/L total phosphorus standard on Frank Holten Lake 3 (RJM). Figure 5-7 shows the annual average total phosphorus concentrations for each sampling location on each lake. Average concentrations were highest in Frank Holten Lake 1 in 1990, in Frank Holten Lake 2 in 1991, and in Frank Holten Lake 3 in 2002.
5.1.2.2.2 DO The average DO concentrations at a one-foot depth for each year of available data at each monitoring site on Frank Holten Lake #3 are presented in Table 5-12. The water quality standard for DO is an instantaneous minimum concentration of 5.0 mg/L. Compliance is determined at a one-foot depth from the lake surface.
Table 5-12 Average Dissolved Oxygen Concentrations (mg/L) in Frank Holten Lake #3 at One-Foot Depth RJM-1 RJM-2 RJM-3 Lake Average
Year
Data Count; Number of Violations Average
Data Count; Number of Violations Average
Data Count; Number of Violations Average
Data Count; Number of Violations Average
1990 12; 0 9.9 12; 0 10.0 12; 0 9.9 36; 0 9.9 1991 11; 0 11.2 11; 0 11.0 11; 0 11.3 33; 0 11.2 1992 5; 0 10.8 5; 0 10.8 50; 0 11.3 15; 0 11.0 1996 5; 0 7.5 5; 0 8.3 5; 0 9.1 15; 0 8.3 1999 6; 1 9.0 5; 0 8.7 4; 0 10.0 14; 1 9.2 2002 5; 1 8.0 5; 0 8.5 5; 0 9.7 15; 1 8.7
The annual averages for DO at all three sites as well as the lake average are not in violation of the DO standard at one foot depth during any sampling year. Figure 5-8 shows DO sampling results at one-foot depth over time. Only two violations have occurred on the lake. Both violations were sampled at RJM-1; one in 1999, and one in 2002. Lake averages were calculated using data from each sampling location.
5.2 Reservoir Characteristic There are four impaired reservoirs in the Cahokia Canal/Horseshoe Lake watershed. Reservoir information that can be used for future modeling efforts was collected from GIS analysis, the U.S. Army Corps of Engineers, the Illinois EPA, and USEPA water quality data. The following sections will discuss the available data for each reservoir.
5.2.1 Horseshoe Lake Horseshoe Lake is located near East St. Louis in Madison County east of the Mississippi River and has a surface area of approximately 2,430 acres. The lake is part of Horseshoe Lake State Park, which is maintained by the Illinois Department of Natural Resources. During heavy spring floods, the Mississippi River would overflow its banks and flood into the low floodplain to the east of the river. A system of levies was constructed on the Mississippi to prevent the overflow, therefore creating Horseshoe Lake. Table 5-13 contains depth information for each sampling location on the lake. The average maximum depth in Horseshoe Lake is 54.5 feet.
Section 5 Cahokia Canal/Horseshoe Lake Watershed Characterization
5-9
T:\GIS\STAGE1FINAL\cahokia-horse\Sec 5 Cahokia Cl - Horseshoe L.doc
Table 5-13 Average Depths (ft) for Horseshoe Lake Segment RJC (Illinois EPA 2002 and USEPA 2002a)
Year RJC-1 RJC-2 RJC-3 RJC-4 1993 54.5 3.8 9.4 2.1 1996 53.0 3.4 4.5 2.9 1997 10.9 3.5 3.6 8.1 1998 14.5 4.2 4.8 4.0 1999 60.0 3.5 4.0 2.5 2002 59.1 3.7 4.8 2.9 2005 – – – 2.0
Average 54.5 3.8 9.4 2.1 5.2.2 Frank Holten Lakes 1, 2, and 3 The Frank Holten Lakes are located in East St. Louis in St. Clair County. All three lakes are located within the Frank Holten State Park, which is maintained by the Illinois Department of Natural Resources. Table 5-14 contains lake information for each lake.
Table 5-14 Frank Holten Lakes Lake No. 1 Lake No. 2 Lake No. 3 Surface Area (acres) 97 40 80 Capacity (acre-feet) 500 NA 92.4 Shoreline (miles) 2.5 NA 2 Tables 5-15, -16, and -17 contain depth information for each sampling location on the lakes. The maximum water depths for Frank Holten Lakes No. 1, No. 2, and No. 3 are 13.0 feet, 21.1 feet, and 7.8 feet respectively.
Table 5-15 Average Depths (ft) for Frank Holten Lake No. 1 (Illinois EPA 2002 and USEPA 2002a)
Year RJK-1 1990 13.7 1991 15.5 1992 13.2 1996 11.3 1997 6.7 1998 8.6 1999 17.1 2002 17.5
Average 13.0 Table 5-16 Average Depths (ft) for Frank Holten Lake No. 2 (Illinois EPA 2002 and USEPA 2002a)
Year RJL-1 1990 23.5 1991 23.6 1992 23.1 1996 15.8 1999 19.7 2002 21.4
Average 21.2
Section 5 Cahokia Canal/Horseshoe Lake Watershed Characterization
5-10
T:\GIS\STAGE1FINAL\cahokia-horse\Sec 5 Cahokia Cl - Horseshoe L.doc
Table 5-17 Average Depths (ft) for Frank Holten Lake No. 3 (Illinois EPA 2002 and USEPA 2002a)
Year RJM-1 RJM-2 RJM-3 1990 9.3 9.3 8.0 1991 8.9 8.9 7.4 1992 9.0 8.9 8.0 1996 7.9 7.8 5.9 1997 5.9 7.0 5.7 1998 8.5 7.9 5.4 1999 6.6 6.3 4.1 2002 6.6 6.5 4.4
Average 7.8 7.8 6.1 5.3 Point Sources Point sources for the Cahokia Canal/Horseshoe Lake watershed have been separated into municipal/industrial sources and mining discharges. Available data has been summarized and presented in the following sections.
5.3.1 Municipal and Industrial Point Sources Permitted facilities must provide Discharge Monitoring Reports (DMRs) to Illinois EPA as part of their NPDES permit compliance. DMRs contain effluent discharge sampling results, which are then maintained in a database by the state. Figure 5-9 shows all permitted facilities whose discharge potentially reaches impaired segments. In order to assess point source contributions to the watershed, the data has been examined by receiving water and then by the downstream impaired segment that has the potential to receive the discharge. Receiving waters were determined through information contained in the USEPA Permit Compliance System (PCS) database. Maps were used to determine downstream impaired receiving water information when PCS data was not available. Many of the point sources in this watershed discharge directly to the Mississippi River. These point sources have not been used for watershed assessment. The impairments for each segment or downstream segment were considered when reviewing DMR data. Data has been summarized for any sampled parameter that is associated with a downstream impairment (i.e., all available nutrient and biological oxygen demand data was reviewed for segments that are impaired for dissolved oxygen). This will help in future model selection as well as source assessment and load allocation.
5.3.1.1 Cahokia Canal Segment JN 02 There are seven point sources with the potential to contribute discharge to Cahokia Canal Segment JN 02. Segment JN 02 is listed as impaired for dissolved oxygen. Table 5-18 contains a summary of available and pertinent DMR data for these point sources. Dissolved oxygen data is not required by all permits and was available for only three point sources.
Section 5 Cahokia Canal/Horseshoe Lake Watershed Characterization
5-11
T:\GIS\STAGE1FINAL\cahokia-horse\Sec 5 Cahokia Cl - Horseshoe L.doc
Table 5-18 Effluent Data from Point Sources Discharging Upstream of or Directly to Cahokia Canal Segment JN 02 (Illinois EPA 2005) Facility Name Period of Record Permit Number
Receiving Water/ Downstream Impaired Waterbody Constituent
Average Value
Average Loading
(lb/d) Average Daily Flow 0.655 mgd NA Elementis Pigments,
Inc. 1995-2005 IL0038709
Schoenberger Creek/Cahokia Canal Segment JN 02
Nitrogen, Ammonia 1.12 mg/L 5.64
General Chemical LLC 2003-2004 IL0000647
Rose Creek/Cahokia Canal Segment JN 02
Average Daily Flow 0.0037 mgd NA
Average Daily Flow 19 mgd NA Dot-Dist 8 Bowman Ave Pump Station 1997-2005 IL0070955
Cahokia Canal/Cahokia Canal Segment JN 02 Nitrogen, Ammonia 0.722 mg/L 83.1
Maryville WTP 1996-2003 ILG640139
NA/Cahokia Canal Segment JN 02
Average Daily Flow 0.01 mgd NA
Average Daily Flow 0.07 mgd NA BOD, 5-Day 157.9 mg/L CBOD, 5-Day 5.58 mg/L 2.05 Oxygen, Dissolved 7.2 mg/L
Stone Meadows MHP 1994-2004 IL0046914
Cahokia Canal/Cahokia Canal Segment JN 02
Nitrogen, Ammonia 1.23 mg/L 0.36 Average Daily Flow 0.015 mgd NA BOD, 5-Day 431.8 mg/L – CBOD, 5-Day 6.22 mg/L 0.258
Wheel Ranch MHP-Collinsville 1996-2003 IL0044598
NA/Cahokia Canal Segment JN 02
Nitrogen, Ammonia 2.94 mg/L 0.122 Average Daily Flow 0.05 mgd NA BOD, 5-Day 181.4 mg/L 71.9 CBOD, 5-Day 7.01 mg/L 1.99
Holiday MHP 1995-2004 IL0038288
Unnamed Tributary to Cahokia Canal/Cahokia Canal Segment JN 02
Nitrogen, Ammonia 2.69 mg/L 0.39 5.3.1.2 Horseshoe Lake Segment RJC There is one permitted facility that discharges to Horseshoe Lake Segment RJC. Horseshoe Lake is listed for total phosphorus and pH impairments. Table 5-19 contains a summary of available DMR data for this point source. DMR data reflects actual sampled values rather than permit maximums. As reported in the latest permit, the facility's maximum daily flow is 25 mgd, the three-day maximum flow is 21 mgd, and the long-term average flow is 16 mgd. Phosphorus sampling is not required by the US Steel-Granite City permit. However, it should be noted that in the facility's 2006 permit renewal application, a total phosphorous effluent concentration of 0.24 mg/L is recorded.
Table 5-19 Effluent Data from Point Sources Discharging to Horseshoe Lake Segment RJC (Illinois EPA 2005) Facility Name Period of Record Permit Number
Receiving Water/ Downstream Impaired Waterbody Constituent
Average Value
Average Loading
(lb/d) Average Daily Flow 26.3 mgd NA United States Steel-
Granite City 1989-2005 IL0000329
Horseshoe Lake/ Horseshoe Lake Segment RJC pH 7.80 su –
Section 5 Cahokia Canal/Horseshoe Lake Watershed Characterization
5-12
T:\GIS\STAGE1FINAL\cahokia-horse\Sec 5 Cahokia Cl - Horseshoe L.doc
5.3.1.3 Harding Ditch Segment JMAC02 There is one point source with the potential to contribute discharge to Harding Ditch Segment JMAC02. Segment JMAC02 is impaired for total fecal coliform. Table 5-20 contains a summary of available DMR data.
Table 5-20 Effluent Data from Point Sources Discharging to Harding Ditch Segment JMAC02 (Illinois EPA 2005) Facility Name Period of Record Permit Number
Receiving Water/ Downstream Impaired Waterbody Constituent
Average Value
Average Loading
(lb/d) Average Daily Flow 0.786 mgd NA Caseyville Township
West STP 1993-2004 IL0023043
Clare Creek/Harding Ditch Segment JMAC02 Total fecal coliform 138.0 mg/L –
5.3.1.4 Canteen Creek Segment JNA 01 There is one point source with the potential to contribute discharge to Canteen Creek Segment JNA 01. Segment JNA 01 is impaired for manganese. Table 5-21 contains a summary of available DMR data.
Table 5-21 Effluent Data from Point Sources Discharging to Canteen Creek Segment JNA 01 (Illinois EPA 2005) Facility Name Period of Record Permit Number
Receiving Water/ Downstream Impaired Waterbody Constituent
Average Value
Average Loading
(lb/d) Average Daily Flow 4.41 mgd NA Collinsville STP
1989-2005 IL0028215
Canteen Creek/Canteen Creek Segment JNA01 Manganese 0.017 mg/L –
5.3.1.5 Other There are no permitted facilities that discharge directly to any of the Frank Holten Lakes.
5.3.2 Mining Discharges There are no permitted mine sites or recently abandoned mines within the Cahokia Canal/Horseshoe Lake watershed. If additional information becomes available, it will be reviewed and considered during Stage 3 of TMDL development.
5.4 Nonpoint Sources There are many potential nonpoint sources of pollutant loading to the impaired segments in the Cahokia Canal/Horseshoe Lake watershed. This section will discuss site-specific cropping practices, animal operations, and area septic systems. Data was collected through communication with local NRCS, Soil and Water Conservation District (SWCD), Public Health Department, and County Tax Department officials.
5.4.1 Crop Information A portion of the land found within the Cahokia Canal/Horseshoe Lake watershed is devoted to crops. Corn and soybean farming account for approximately 13 percent and 15 percent of the watershed respectively. Tillage practices can be categorized as
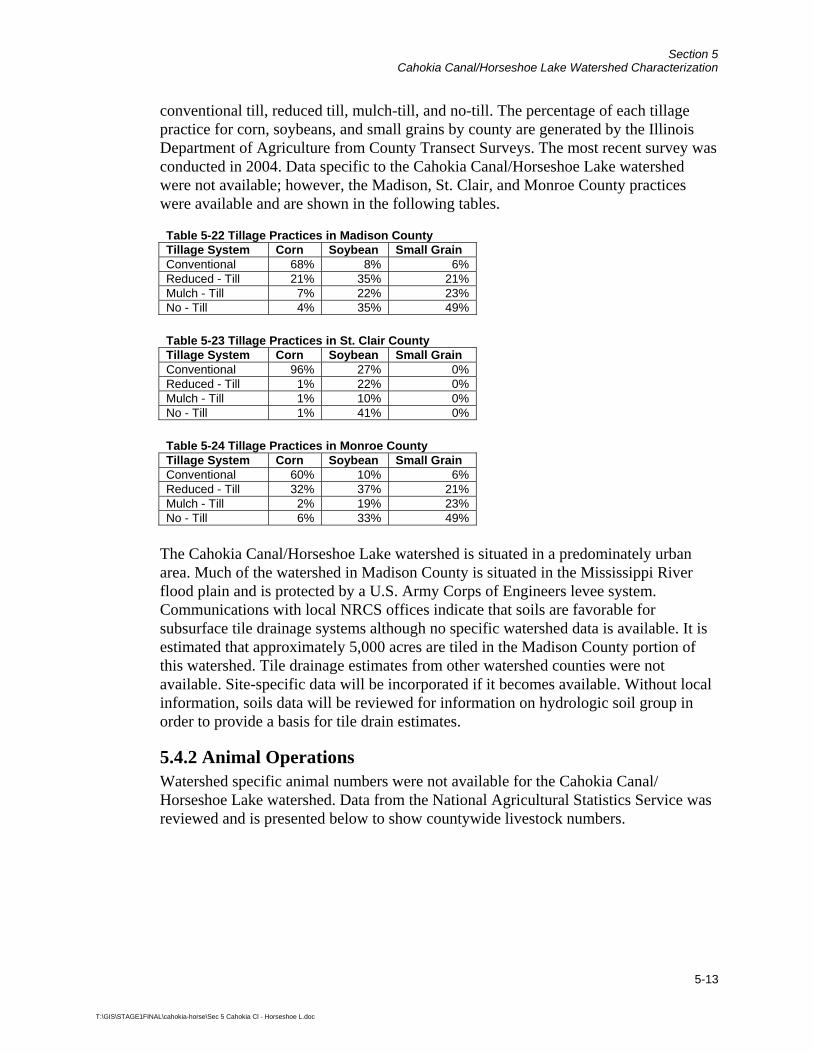
Section 5 Cahokia Canal/Horseshoe Lake Watershed Characterization
5-13
T:\GIS\STAGE1FINAL\cahokia-horse\Sec 5 Cahokia Cl - Horseshoe L.doc
conventional till, reduced till, mulch-till, and no-till. The percentage of each tillage practice for corn, soybeans, and small grains by county are generated by the Illinois Department of Agriculture from County Transect Surveys. The most recent survey was conducted in 2004. Data specific to the Cahokia Canal/Horseshoe Lake watershed were not available; however, the Madison, St. Clair, and Monroe County practices were available and are shown in the following tables.
Table 5-22 Tillage Practices in Madison County Tillage System Corn Soybean Small Grain Conventional 68% 8% 6% Reduced - Till 21% 35% 21% Mulch - Till 7% 22% 23% No - Till 4% 35% 49%
Table 5-23 Tillage Practices in St. Clair County Tillage System Corn Soybean Small Grain Conventional 96% 27% 0% Reduced - Till 1% 22% 0% Mulch - Till 1% 10% 0% No - Till 1% 41% 0%
Table 5-24 Tillage Practices in Monroe County Tillage System Corn Soybean Small Grain Conventional 60% 10% 6% Reduced - Till 32% 37% 21% Mulch - Till 2% 19% 23% No - Till 6% 33% 49%
The Cahokia Canal/Horseshoe Lake watershed is situated in a predominately urban area. Much of the watershed in Madison County is situated in the Mississippi River flood plain and is protected by a U.S. Army Corps of Engineers levee system. Communications with local NRCS offices indicate that soils are favorable for subsurface tile drainage systems although no specific watershed data is available. It is estimated that approximately 5,000 acres are tiled in the Madison County portion of this watershed. Tile drainage estimates from other watershed counties were not available. Site-specific data will be incorporated if it becomes available. Without local information, soils data will be reviewed for information on hydrologic soil group in order to provide a basis for tile drain estimates.
5.4.2 Animal Operations Watershed specific animal numbers were not available for the Cahokia Canal/ Horseshoe Lake watershed. Data from the National Agricultural Statistics Service was reviewed and is presented below to show countywide livestock numbers.
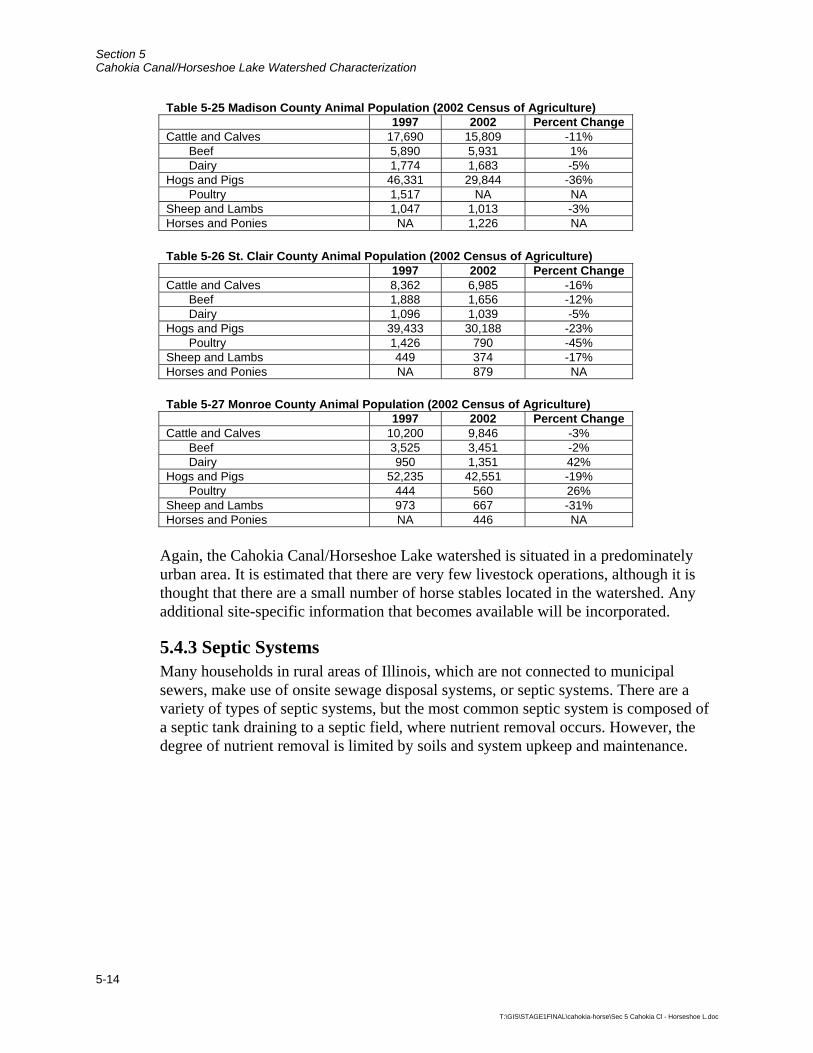
Section 5 Cahokia Canal/Horseshoe Lake Watershed Characterization
5-14
T:\GIS\STAGE1FINAL\cahokia-horse\Sec 5 Cahokia Cl - Horseshoe L.doc
Table 5-25 Madison County Animal Population (2002 Census of Agriculture) 1997 2002 Percent Change Cattle and Calves 17,690 15,809 -11% Beef 5,890 5,931 1% Dairy 1,774 1,683 -5% Hogs and Pigs 46,331 29,844 -36% Poultry 1,517 NA NA Sheep and Lambs 1,047 1,013 -3% Horses and Ponies NA 1,226 NA
Table 5-26 St. Clair County Animal Population (2002 Census of Agriculture) 1997 2002 Percent Change Cattle and Calves 8,362 6,985 -16% Beef 1,888 1,656 -12% Dairy 1,096 1,039 -5% Hogs and Pigs 39,433 30,188 -23% Poultry 1,426 790 -45% Sheep and Lambs 449 374 -17% Horses and Ponies NA 879 NA
Table 5-27 Monroe County Animal Population (2002 Census of Agriculture) 1997 2002 Percent Change Cattle and Calves 10,200 9,846 -3% Beef 3,525 3,451 -2% Dairy 950 1,351 42% Hogs and Pigs 52,235 42,551 -19% Poultry 444 560 26% Sheep and Lambs 973 667 -31% Horses and Ponies NA 446 NA
Again, the Cahokia Canal/Horseshoe Lake watershed is situated in a predominately urban area. It is estimated that there are very few livestock operations, although it is thought that there are a small number of horse stables located in the watershed. Any additional site-specific information that becomes available will be incorporated.
5.4.3 Septic Systems Many households in rural areas of Illinois, which are not connected to municipal sewers, make use of onsite sewage disposal systems, or septic systems. There are a variety of types of septic systems, but the most common septic system is composed of a septic tank draining to a septic field, where nutrient removal occurs. However, the degree of nutrient removal is limited by soils and system upkeep and maintenance.
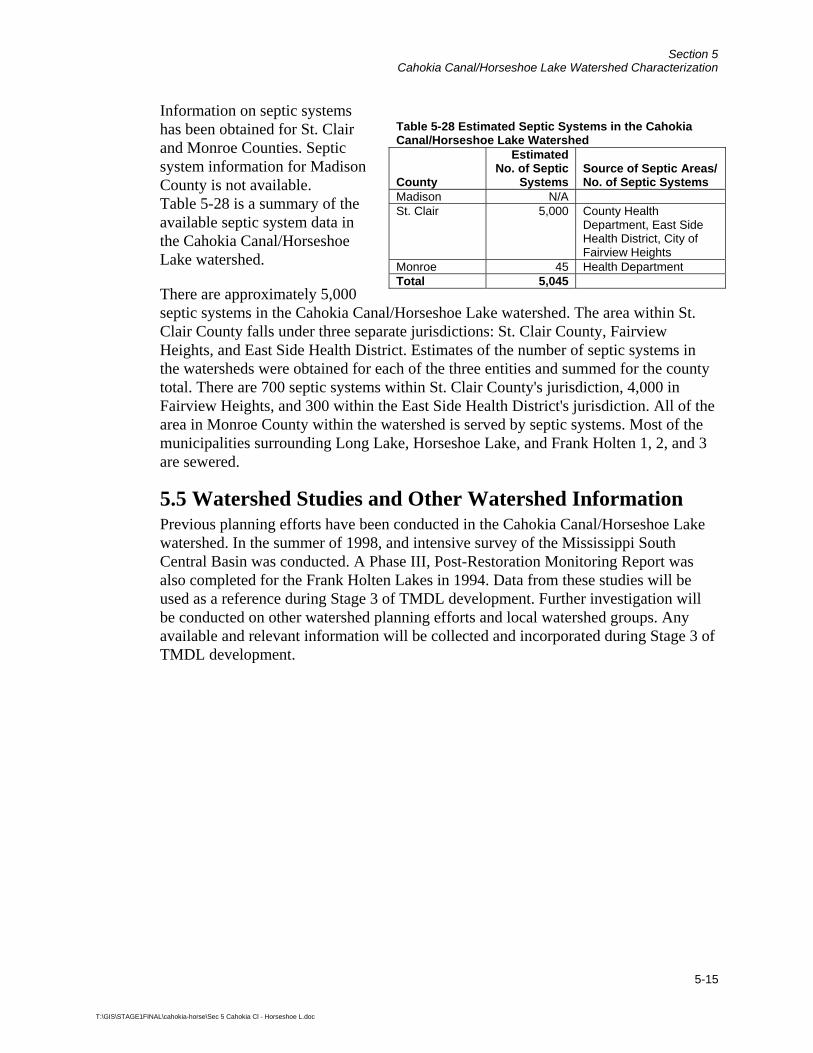
Section 5 Cahokia Canal/Horseshoe Lake Watershed Characterization
5-15
T:\GIS\STAGE1FINAL\cahokia-horse\Sec 5 Cahokia Cl - Horseshoe L.doc
Information on septic systems has been obtained for St. Clair and Monroe Counties. Septic system information for Madison County is not available. Table 5-28 is a summary of the available septic system data in the Cahokia Canal/Horseshoe Lake watershed.
There are approximately 5,000 septic systems in the Cahokia Canal/Horseshoe Lake watershed. The area within St. Clair County falls under three separate jurisdictions: St. Clair County, Fairview Heights, and East Side Health District. Estimates of the number of septic systems in the watersheds were obtained for each of the three entities and summed for the county total. There are 700 septic systems within St. Clair County's jurisdiction, 4,000 in Fairview Heights, and 300 within the East Side Health District's jurisdiction. All of the area in Monroe County within the watershed is served by septic systems. Most of the municipalities surrounding Long Lake, Horseshoe Lake, and Frank Holten 1, 2, and 3 are sewered.
5.5 Watershed Studies and Other Watershed Information Previous planning efforts have been conducted in the Cahokia Canal/Horseshoe Lake watershed. In the summer of 1998, and intensive survey of the Mississippi South Central Basin was conducted. A Phase III, Post-Restoration Monitoring Report was also completed for the Frank Holten Lakes in 1994. Data from these studies will be used as a reference during Stage 3 of TMDL development. Further investigation will be conducted on other watershed planning efforts and local watershed groups. Any available and relevant information will be collected and incorporated during Stage 3 of TMDL development.
Table 5-28 Estimated Septic Systems in the Cahokia Canal/Horseshoe Lake Watershed
County
Estimated No. of Septic
Systems Source of Septic Areas/ No. of Septic Systems
Madison N/A St. Clair 5,000 County Health
Department, East Side Health District, City of Fairview Heights
Monroe 45 Health Department Total 5,045
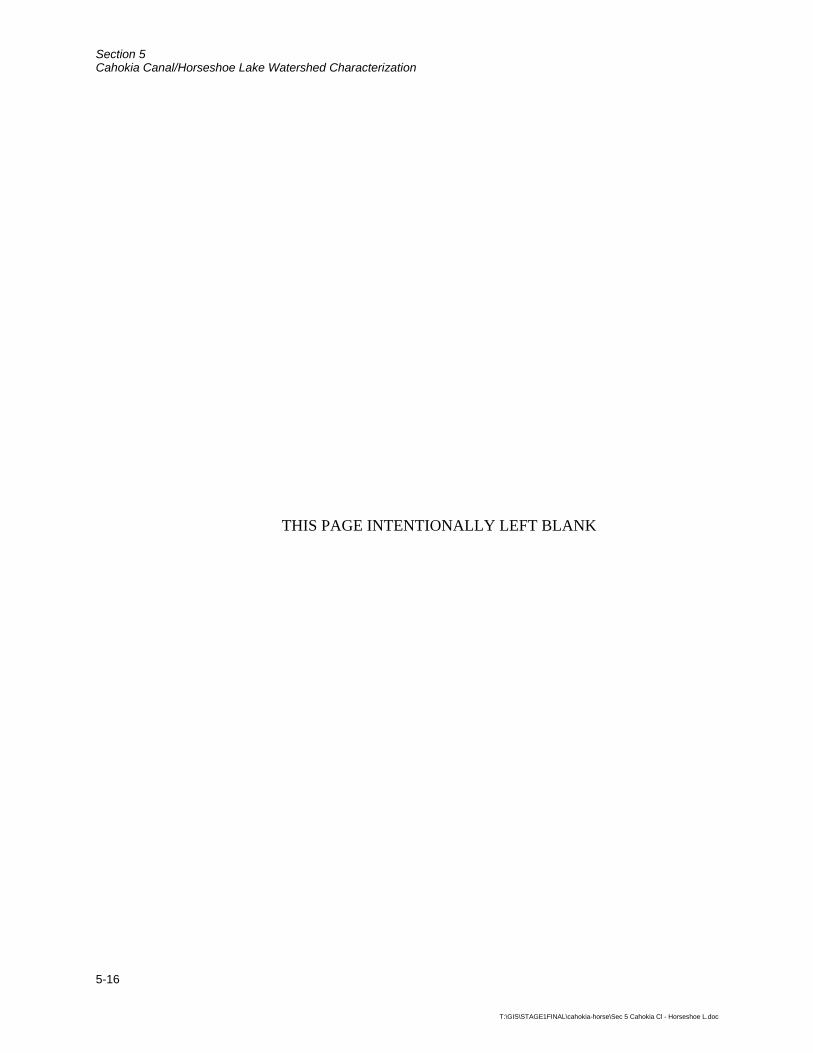
Section 5 Cahokia Canal/Horseshoe Lake Watershed Characterization
5-16
T:\GIS\STAGE1FINAL\cahokia-horse\Sec 5 Cahokia Cl - Horseshoe L.doc
THIS PAGE INTENTIONALLY LEFT BLANK
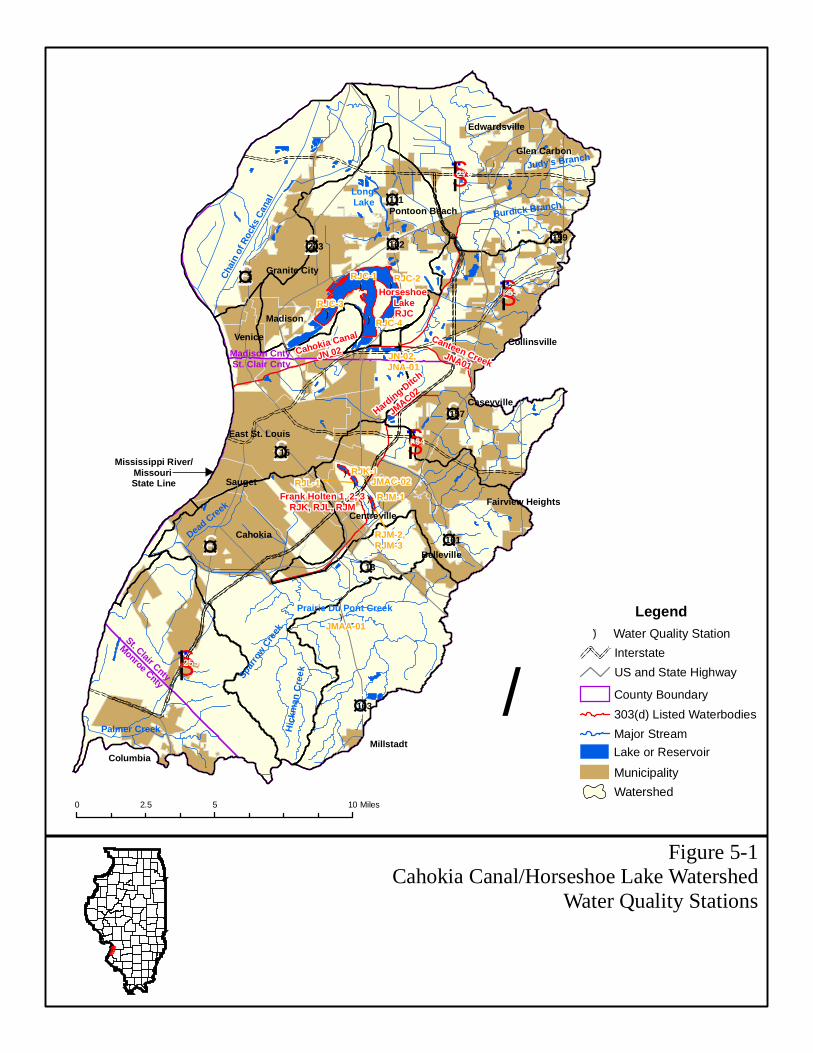
Figure 5-1Cahokia Canal/Horseshoe Lake Watershed
Water Quality Stations
")
")
")")
") ")
")")
")
")
")
")")
£¤3
£¤203
£¤111
£¤162
£¤15
£¤3
£¤157
£¤163
£¤13
£¤159
£¤161
§̈¦I 270
§̈¦I 255
§̈¦I 64
§̈¦I 55
St. Clair Cnty
Monroe Cnty
Madison CntySt. Clair Cnty
Chai
n of
Roc
ks C
anal
Spar
row C
reek
Palmer Creek Hic
kman
Cre
ek
Dead Creek
Burdick Branch
Horseshoe LakeRJC
Cahokia Canal
JN 02Canteen Creek
JNA01
Harding Ditch
JMAC02
Frank Holten 1, 2, 3RJK, RJL, RJM
Columbia
Judy's Branch
Pontoon Beach
Centreville
Belleville
Collinsville
Edwardsville
Granite City
Glen Carbon
Millstadt
Venice
Madison
Cahokia
East St. Louis
Sauget
Fairview Heights
Caseyville
JMAA-01
JMAC-02
RJM-2,RJM-3
RJK-1RJL-1
RJC-2RJC-1
RJC-3
RJC-4
JN-02, JNA-01
Mississippi River/Missouri State Line
RJM-1
Prairie Du Pont Creek
Long Lake
0 5 102.5 Miles
/
WatershedMunicipality
Lake or ReservoirMajor Stream303(d) Listed WaterbodiesCounty Boundary
Legend
InterstateUS and State Highway
") Water Quality Station

Section 5 Cahokia Canal/Horseshoe Lake Watershed Characterization
5-17
T:\GIS\STAGE1FINAL\cahokia-horse\Sec 5 Cahokia Cl - Horseshoe L.doc
THIS PAGE INTENTIONALLY LEFT BLANK
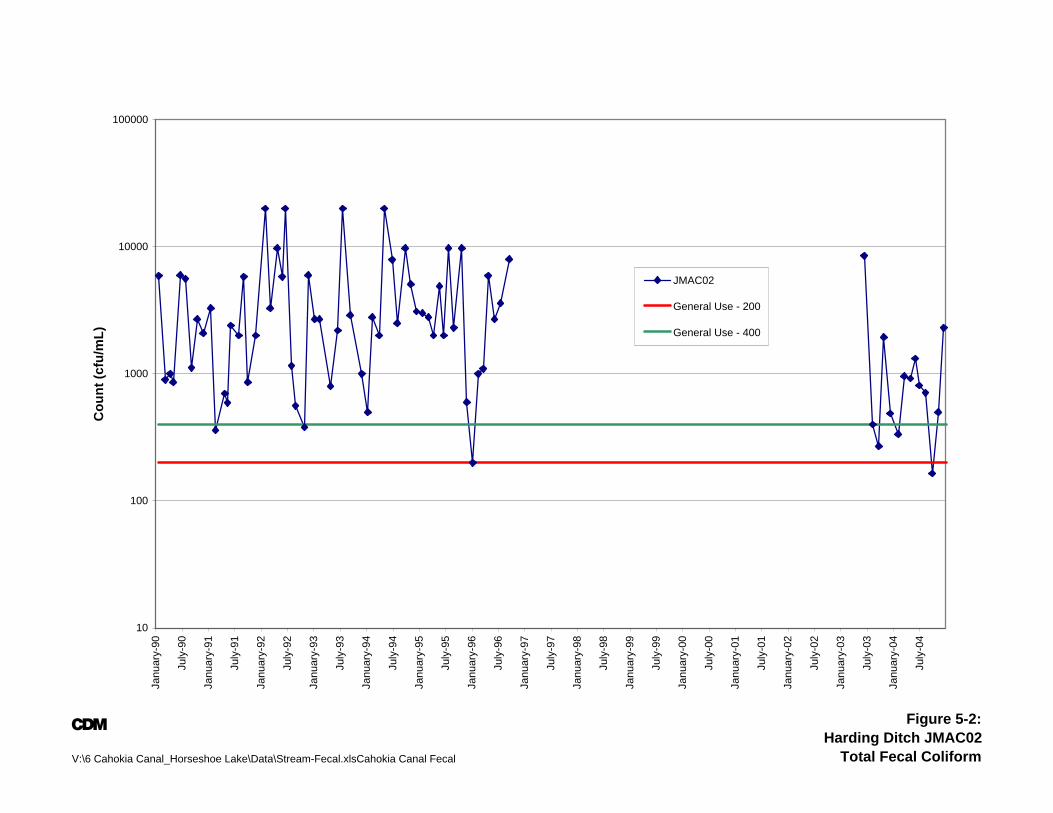
A
V:\6 Cahokia Canal_Horseshoe Lake\Data\Stream-Fecal.xlsCahokia Canal Fecal
Figure 5-2:Harding Ditch JMAC02
Total Fecal Coliform
10
100
1000
10000
100000
Janu
ary-
90
July
-90
Janu
ary-
91
July
-91
Janu
ary-
92
July
-92
Janu
ary-
93
July
-93
Janu
ary-
94
July
-94
Janu
ary-
95
July
-95
Janu
ary-
96
July
-96
Janu
ary-
97
July
-97
Janu
ary-
98
July
-98
Janu
ary-
99
July
-99
Janu
ary-
00
July
-00
Janu
ary-
01
July
-01
Janu
ary-
02
July
-02
Janu
ary-
03
July
-03
Janu
ary-
04
July
-04
Cou
nt (c
fu/m
L)
JMAC02
General Use - 200
General Use - 400

THIS PAGE INTENTIONALLY LEFT BLANK
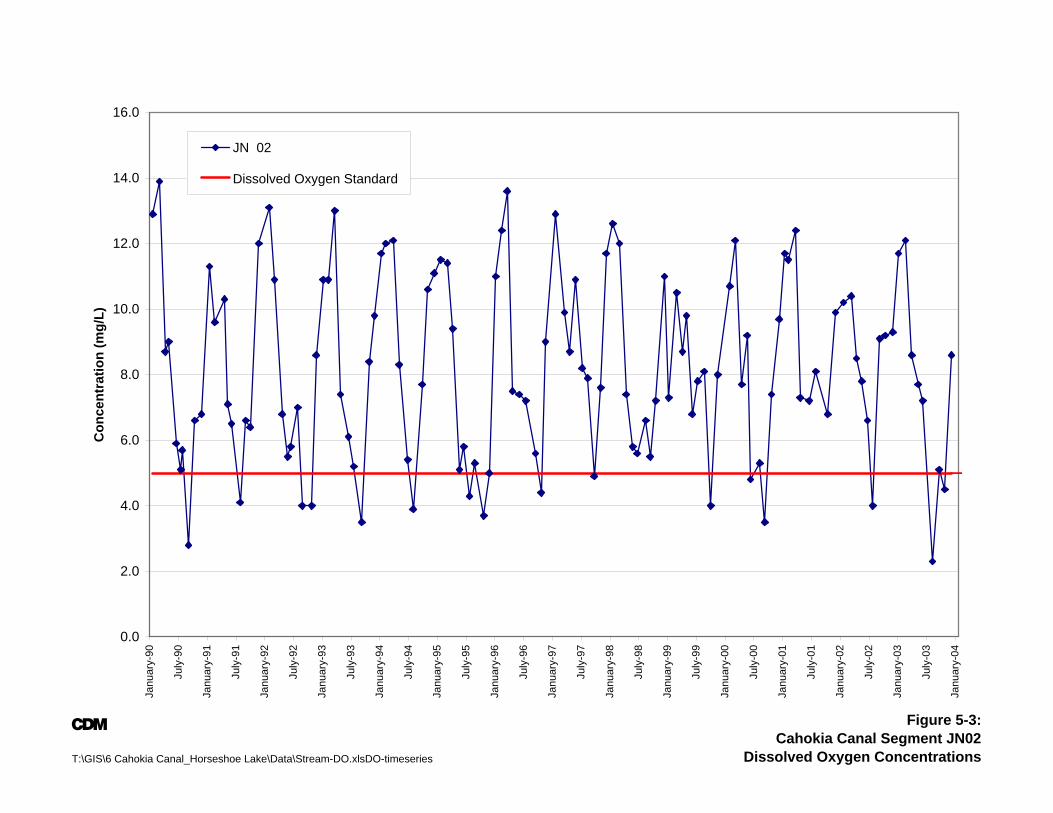
A
T:\GIS\6 Cahokia Canal_Horseshoe Lake\Data\Stream-DO.xlsDO-timeseries
Figure 5-3:Cahokia Canal Segment JN02
Dissolved Oxygen Concentrations
0.0
2.0
4.0
6.0
8.0
10.0
12.0
14.0
16.0
Janu
ary-
90
July
-90
Janu
ary-
91
July
-91
Janu
ary-
92
July
-92
Janu
ary-
93
July
-93
Janu
ary-
94
July
-94
Janu
ary-
95
July
-95
Janu
ary-
96
July
-96
Janu
ary-
97
July
-97
Janu
ary-
98
July
-98
Janu
ary-
99
July
-99
Janu
ary-
00
July
-00
Janu
ary-
01
July
-01
Janu
ary-
02
July
-02
Janu
ary-
03
July
-03
Janu
ary-
04
Con
cent
ratio
n (m
g/L)
JN 02
Dissolved Oxygen Standard

THIS PAGE INTENTIONALLY LEFT BLANK
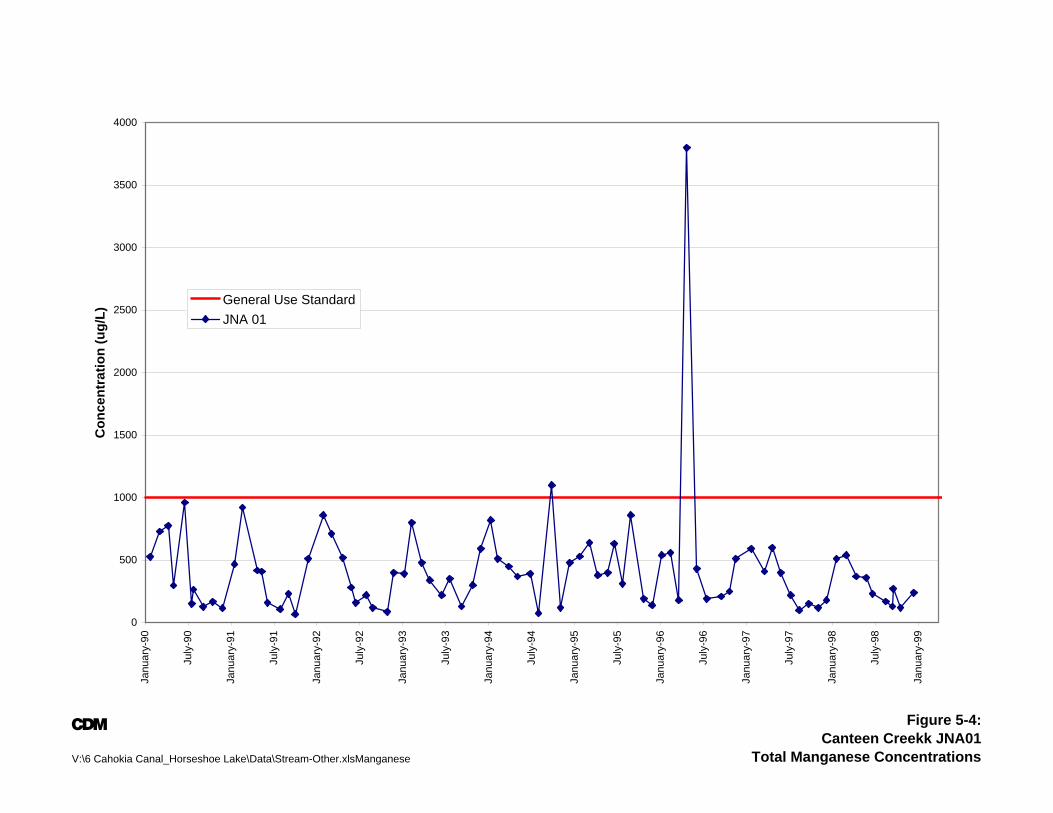
A
V:\6 Cahokia Canal_Horseshoe Lake\Data\Stream-Other.xlsManganese
Figure 5-4:Canteen Creekk JNA01
Total Manganese Concentrations
0
500
1000
1500
2000
2500
3000
3500
4000
Janu
ary-
90
July
-90
Janu
ary-
91
July
-91
Janu
ary-
92
July
-92
Janu
ary-
93
July
-93
Janu
ary-
94
July
-94
Janu
ary-
95
July
-95
Janu
ary-
96
July
-96
Janu
ary-
97
July
-97
Janu
ary-
98
July
-98
Janu
ary-
99
Con
cent
ratio
n (u
g/L)
General Use StandardJNA 01

THIS PAGE INTENTIONALLY LEFT BLANK
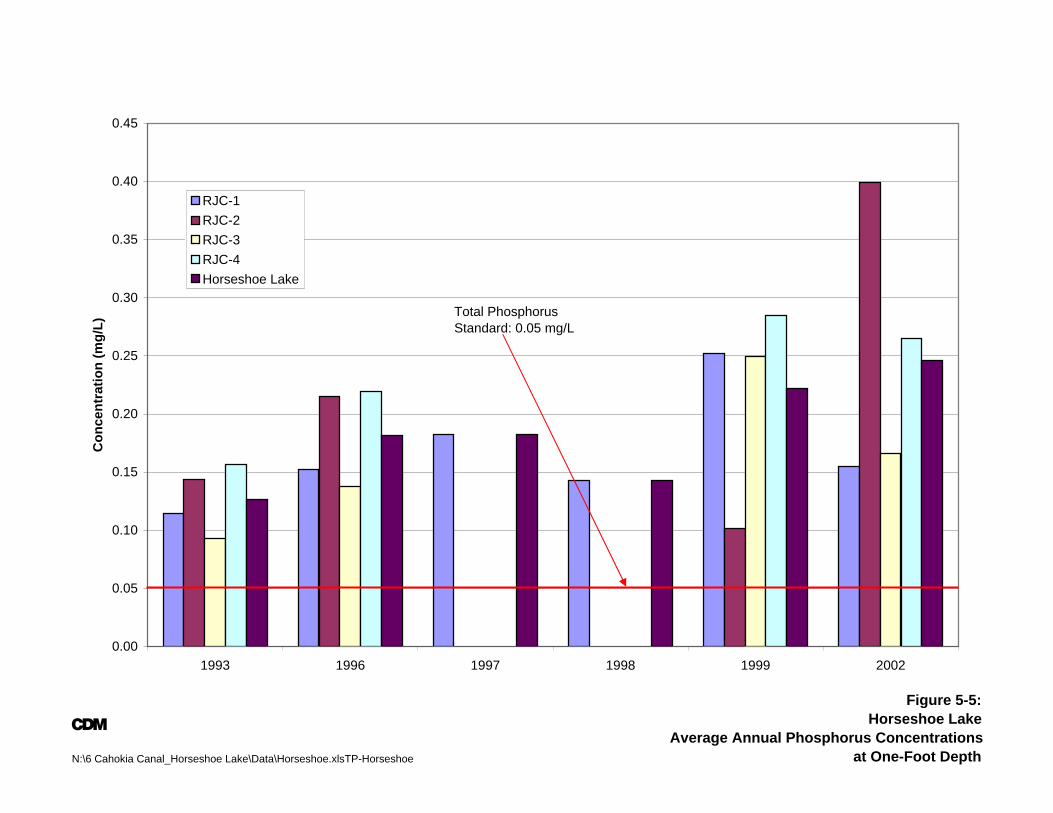
A
N:\6 Cahokia Canal_Horseshoe Lake\Data\Horseshoe.xlsTP-Horseshoe
Figure 5-5:Horseshoe Lake
Average Annual Phosphorus Concentrations at One-Foot Depth
0.00
0.05
0.10
0.15
0.20
0.25
0.30
0.35
0.40
0.45
1993 1996 1997 1998 1999 2002
Con
cent
ratio
n (m
g/L)
RJC-1RJC-2RJC-3RJC-4Horseshoe Lake
Total Phosphorus Standard: 0.05 mg/L

THIS PAGE INTENTIONALLY LEFT BLANK
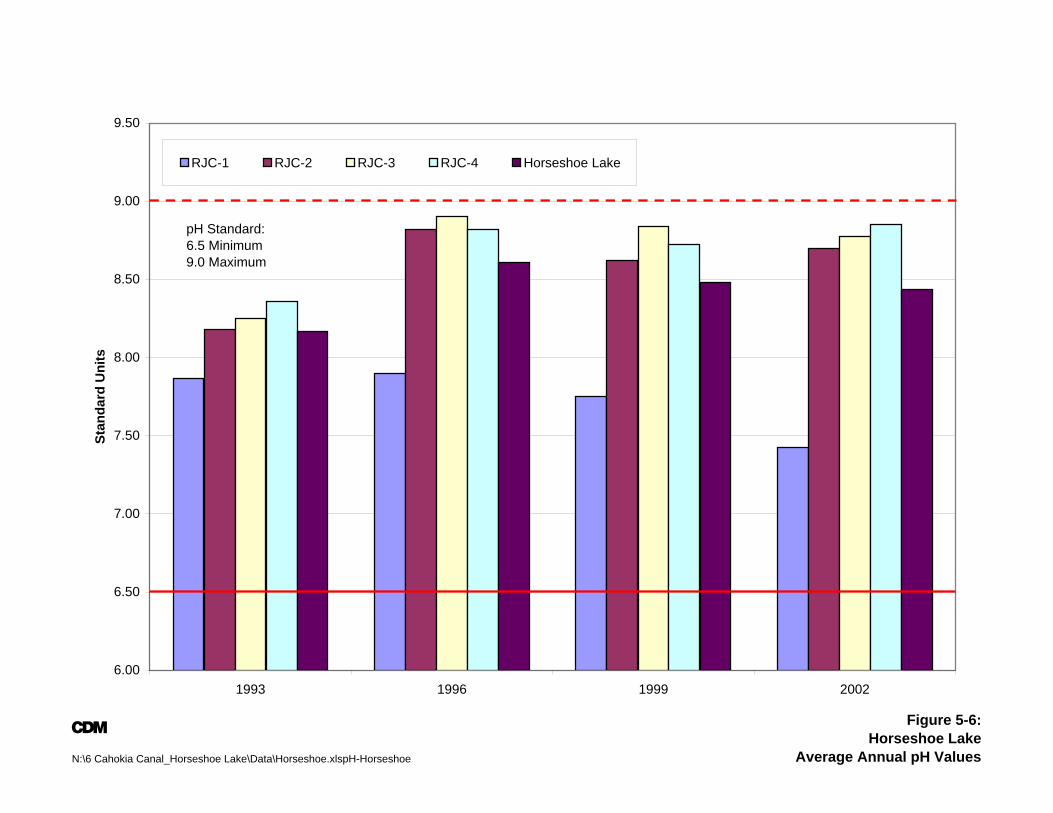
A
N:\6 Cahokia Canal_Horseshoe Lake\Data\Horseshoe.xlspH-Horseshoe
Figure 5-6:Horseshoe Lake
Average Annual pH Values
6.00
6.50
7.00
7.50
8.00
8.50
9.00
9.50
1993 1996 1999 2002
Stan
dard
Uni
ts
RJC-1 RJC-2 RJC-3 RJC-4 Horseshoe Lake
pH Standard:6.5 Minimum9.0 Maximum

THIS PAGE INTENTIONALLY LEFT BLANK
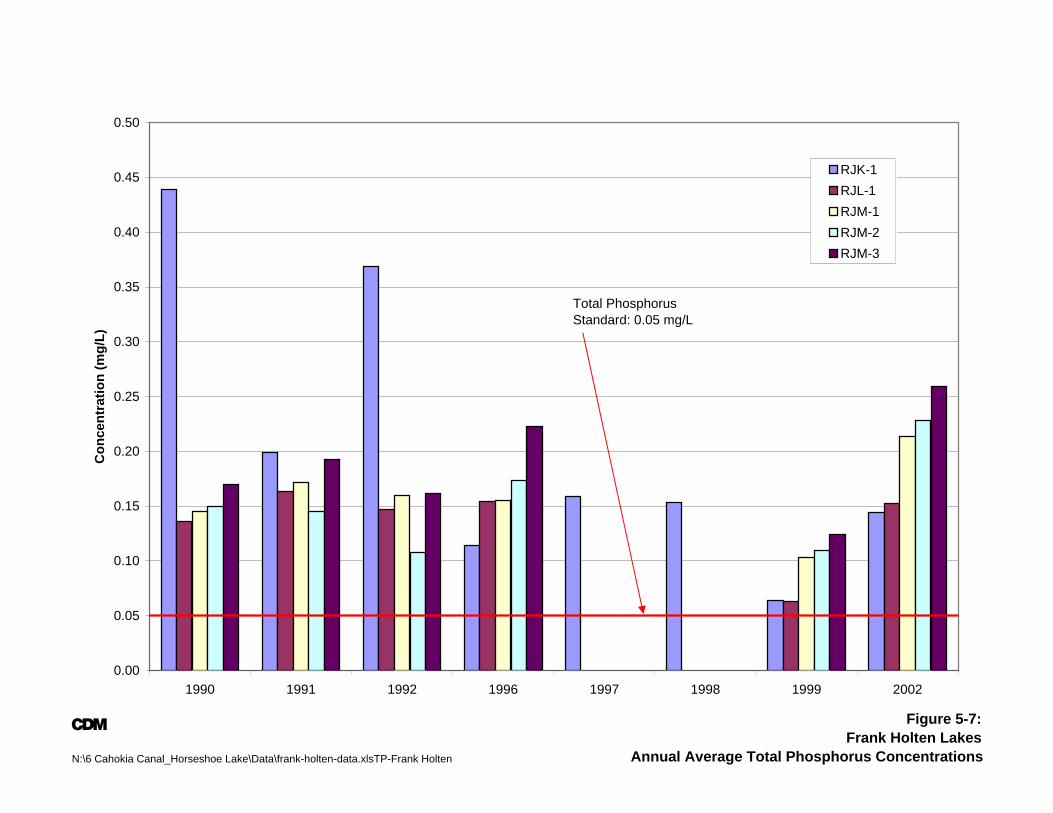
A
N:\6 Cahokia Canal_Horseshoe Lake\Data\frank-holten-data.xlsTP-Frank Holten
Figure 5-7:Frank Holten Lakes
Annual Average Total Phosphorus Concentrations
0.00
0.05
0.10
0.15
0.20
0.25
0.30
0.35
0.40
0.45
0.50
1990 1991 1992 1996 1997 1998 1999 2002
Con
cent
ratio
n (m
g/L)
RJK-1RJL-1RJM-1RJM-2RJM-3
Total Phosphorus Standard: 0.05 mg/L

THIS PAGE INTENTIONALLY LEFT BLANK
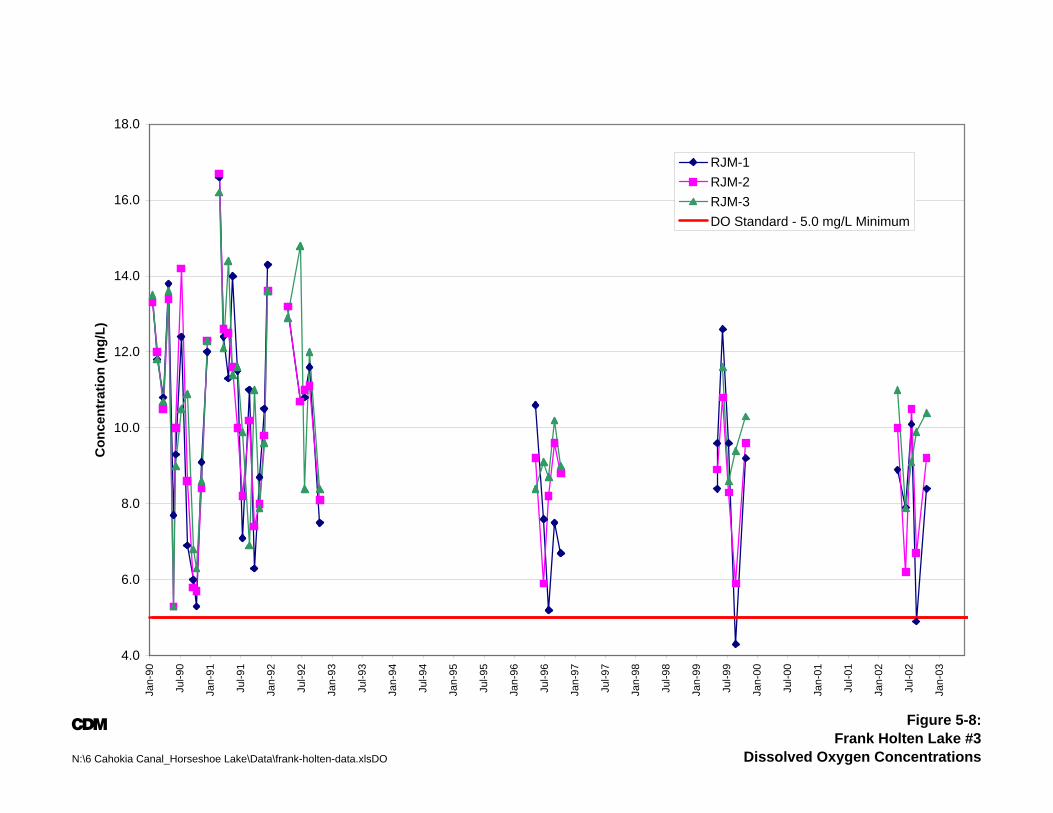
A
N:\6 Cahokia Canal_Horseshoe Lake\Data\frank-holten-data.xlsDO
Figure 5-8:Frank Holten Lake #3
Dissolved Oxygen Concentrations
4.0
6.0
8.0
10.0
12.0
14.0
16.0
18.0
Jan-
90
Jul-9
0
Jan-
91
Jul-9
1
Jan-
92
Jul-9
2
Jan-
93
Jul-9
3
Jan-
94
Jul-9
4
Jan-
95
Jul-9
5
Jan-
96
Jul-9
6
Jan-
97
Jul-9
7
Jan-
98
Jul-9
8
Jan-
99
Jul-9
9
Jan-
00
Jul-0
0
Jan-
01
Jul-0
1
Jan-
02
Jul-0
2
Jan-
03
Con
cent
ratio
n (m
g/L)
RJM-1RJM-2RJM-3DO Standard - 5.0 mg/L Minimum

THIS PAGE INTENTIONALLY LEFT BLANK
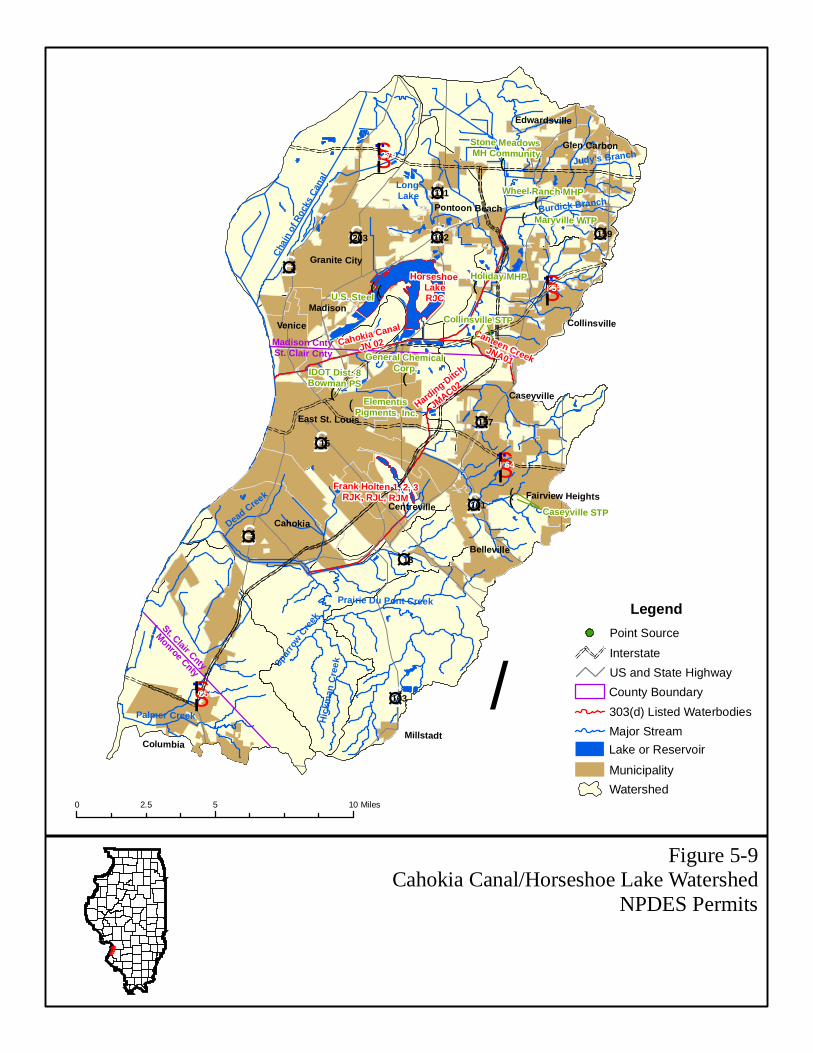
Figure 5-9Cahokia Canal/Horseshoe Lake Watershed
NPDES Permits
!(
!(!(!(!(!(
!(!(
!(!(!(
!( !(!(
!(!(
!(
!(!(
!(!(
!(!(
£¤3
£¤203
£¤111
£¤162
£¤15
£¤3
£¤157
£¤163
£¤13
£¤159
£¤161
§̈¦I 270
§̈¦I 255
§̈¦I 64
§̈¦I 55
St. Clair Cnty
Monroe Cnty
Madison CntySt. Clair Cnty
Chai
n of
Roc
ks C
anal
Spar
row C
reek
Palmer Creek Hic
kman
Cre
ek
Dead Creek
Burdick Branch
Horseshoe LakeRJC
Cahokia Canal
JN 02Canteen Creek
JNA01
Harding Ditch
JMAC02
Frank Holten 1, 2, 3RJK, RJL, RJM
Prairie Du Pont Creek
Columbia
Judy's Branch
Pontoon Beach
Centreville
Belleville
Collinsville
Edwardsville
Granite City
Glen Carbon
Millstadt
Venice
Madison
Cahokia
East St. Louis
Fairview Heights
Caseyville
U.S. Steel
Holiday MHP
IDOT Dist. 8Bowman PS
Elementis Pigments, Inc.
General Chemical Corp.
Collinsville STP
Maryville WTP
Caseyville STP
Wheel Ranch MHP
Stone Meadows MH Community
Long Lake
0 5 102.5 Miles
/
WatershedMunicipality
Lake or ReservoirMajor Stream303(d) Listed WaterbodiesCounty Boundary
Legend
InterstateUS and State Highway
Point Source
Section 5 Cahokia Canal/Horseshoe Lake Watershed Characterization
5-33
T:\GIS\STAGE1FINAL\cahokia-horse\Sec 5 Cahokia Cl - Horseshoe L.doc
THIS PAGE INTENTIONALLY LEFT BLANK
6-1
T:\GIS\STAGE1FINAL\cahokia-horse\Sec 6 Cahokia Cl - Horseshoe L.doc
Section 6 Approach to Developing TMDL and Identification of Data Needs Illinois EPA is currently developing TMDLs for pollutants that have numeric water quality standards. Of the pollutants impairing stream segments in the Cahokia Canal/ Horseshoe Lake watershed, manganese, DO, and fecal coliform are the parameters with numeric water quality standards. For the impaired lakes in the watershed, phosphorus, DO, and pH are the parameters with numeric water quality standards. Illinois EPA believes that addressing these impairments should lead to an overall improvement in water quality due to the interrelated nature of the other listed pollutants. Recommended technical approaches for developing TMDLs for streams and lakes are presented in this section. Additional data needs are also discussed.
6.1 Simple and Detailed Approaches for Developing TMDLs The range of analyses used for developing TMDLs varies from simple to complex. Examples of a simple approach include mass-balance, load-duration, and simple watershed and receiving water models. Detailed approaches incorporate the use of complex watershed and receiving water models. Simple approaches typically require less data than detailed approaches and therefore these are the analyses recommended for the Cahokia Canal/Horseshoe Lake watershed except for stream segments where major point sources whose NDPES permit may be affected by the TMDL's WLA. Establishing a link between pollutant loads and resulting water quality is one of the most important steps in developing a TMDL. As discussed above, this link can be established through a variety of techniques. The objective of the remainder of this section is to recommend approaches for establishing these links for the constituents of concern in the Cahokia Canal/Horseshoe Lake Watershed.
6.2 Approaches for Developing TMDLs for Stream Segments in the Cahokia Canal/Horseshoe Lake Watershed All of the impaired stream segments with the watershed have major point sources discharging to them. Approaches for developing TMDLs for parameters that are possibly affected by point sources as well as TMDLs for parameters not likely influenced by point sources are described below.
6.2.1 Recommended Approach for DO TMDLs for Segments with Major Point Sources Cahokia Canal Segment JN02 has point sources discharging directly to or upstream of it. For this segment a more complicated approach that would also incorporate the impacts of stream plant activity, and possibly sediment oxygen demand (SOD), and would require a more sophisticated numerical model and an adequate level of measured data to aide in model parameterization is recommended.
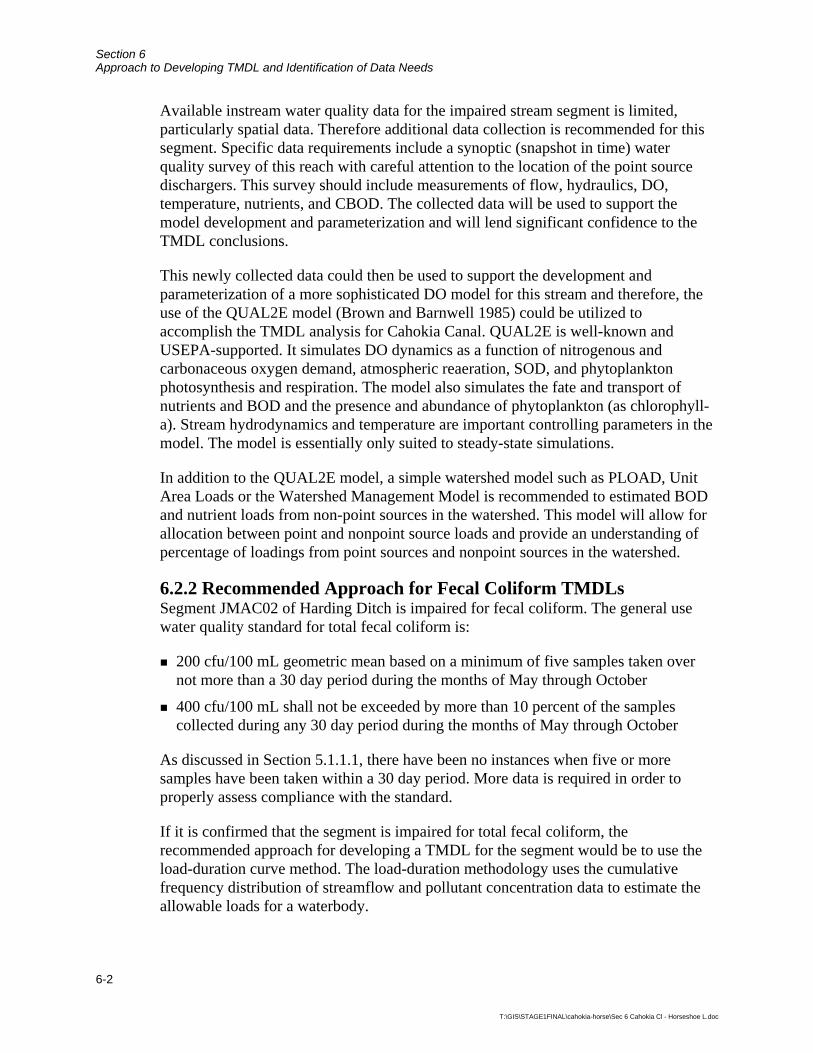
Section 6 Approach to Developing TMDL and Identification of Data Needs
6-2
T:\GIS\STAGE1FINAL\cahokia-horse\Sec 6 Cahokia Cl - Horseshoe L.doc
Available instream water quality data for the impaired stream segment is limited, particularly spatial data. Therefore additional data collection is recommended for this segment. Specific data requirements include a synoptic (snapshot in time) water quality survey of this reach with careful attention to the location of the point source dischargers. This survey should include measurements of flow, hydraulics, DO, temperature, nutrients, and CBOD. The collected data will be used to support the model development and parameterization and will lend significant confidence to the TMDL conclusions.
This newly collected data could then be used to support the development and parameterization of a more sophisticated DO model for this stream and therefore, the use of the QUAL2E model (Brown and Barnwell 1985) could be utilized to accomplish the TMDL analysis for Cahokia Canal. QUAL2E is well-known and USEPA-supported. It simulates DO dynamics as a function of nitrogenous and carbonaceous oxygen demand, atmospheric reaeration, SOD, and phytoplankton photosynthesis and respiration. The model also simulates the fate and transport of nutrients and BOD and the presence and abundance of phytoplankton (as chlorophyll-a). Stream hydrodynamics and temperature are important controlling parameters in the model. The model is essentially only suited to steady-state simulations.
In addition to the QUAL2E model, a simple watershed model such as PLOAD, Unit Area Loads or the Watershed Management Model is recommended to estimated BOD and nutrient loads from non-point sources in the watershed. This model will allow for allocation between point and nonpoint source loads and provide an understanding of percentage of loadings from point sources and nonpoint sources in the watershed.
6.2.2 Recommended Approach for Fecal Coliform TMDLs Segment JMAC02 of Harding Ditch is impaired for fecal coliform. The general use water quality standard for total fecal coliform is:
200 cfu/100 mL geometric mean based on a minimum of five samples taken over not more than a 30 day period during the months of May through October
400 cfu/100 mL shall not be exceeded by more than 10 percent of the samples collected during any 30 day period during the months of May through October
As discussed in Section 5.1.1.1, there have been no instances when five or more samples have been taken within a 30 day period. More data is required in order to properly assess compliance with the standard.
If it is confirmed that the segment is impaired for total fecal coliform, the recommended approach for developing a TMDL for the segment would be to use the load-duration curve method. The load-duration methodology uses the cumulative frequency distribution of streamflow and pollutant concentration data to estimate the allowable loads for a waterbody.
Section 6 Approach to Developing TMDL and Identification of Data Needs
6-3
T:\GIS\STAGE1FINAL\cahokia-horse\Sec 6 Cahokia Cl - Horseshoe L.doc
6.2.3 Recommended Approach for Manganese TMDL Segment JNA01 of Canteen Creek is impaired for manganese. No apparent source of manganese has been identified to date and therefore, an empirical loading and spreadsheet analysis will be utilized to calculate this TMDL.
6.3 Approaches for Developing TMDLs for Lakes and Reservoirs in the Cahokia Canal/Horseshoe Lake Watershed Recommended TMDL approaches for Horseshoe Lake and the Frank Holten Lakes will be discussed in this section. It is assumed that enough data exists to develop a simple model for use in TMDL development.
6.3.1 Recommended Approach for Total Phosphorus, DO, and pH TMDLs Horseshoe Lake and each of the Frank Holten Lakes are impaired for total phosphorus. Horseshoe Lake is also impaired for pH, while Frank Holten Lake #3 is additionally impaired for DO. The BATHTUB model is recommended for all lake phosphorus and DO assessments in this watershed. The BATHTUB model performs steady-state water and nutrient balance calculations in a spatially segmented hydraulic network that accounts for advective and diffusive transport, and nutrient sedimentation. The model relies on empirical relationships to predict lake trophic conditions and subsequent DO conditions as functions of total phosphorus and nitrogen loads, residence time, and mean depth (USEPA 1997). Oxygen conditions in the model are simulated as meta and hypolimnetic depletion rates, rather than explicit concentrations.
Watershed loadings to the lakes will be based on empirical data or tributary data available in the lake watersheds. In addition, pH will be addressed empirically. Most likely, control of phosphorus concentrations will address pH impairments within Horseshoe Lake.
Section 6 Approach to Developing TMDL and Identification of Data Needs
6-4
T:\GIS\STAGE1FINAL\cahokia-horse\Sec 6 Cahokia Cl - Horseshoe L.doc
THIS PAGE INTENTIONALLY LEFT BLANK

Appendix A Land Use Categories

THIS PAGE INTENTIONALLY LEFT BLANK
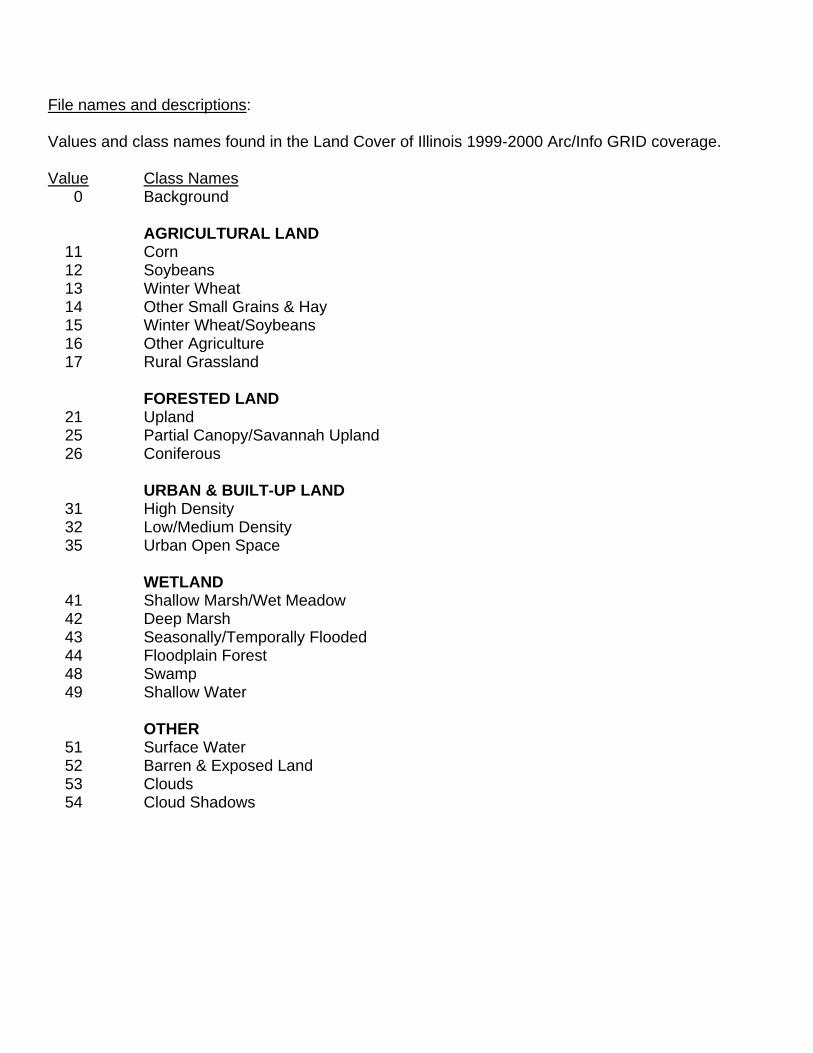
File names and descriptions: Values and class names found in the Land Cover of Illinois 1999-2000 Arc/Info GRID coverage. Value Class Names
0 Background
AGRICULTURAL LAND 11 Corn 12 Soybeans 13 Winter Wheat 14 Other Small Grains & Hay 15 Winter Wheat/Soybeans 16 Other Agriculture 17 Rural Grassland
FORESTED LAND
21 Upland 25 Partial Canopy/Savannah Upland 26 Coniferous
URBAN & BUILT-UP LAND
31 High Density 32 Low/Medium Density 35 Urban Open Space
WETLAND
41 Shallow Marsh/Wet Meadow 42 Deep Marsh 43 Seasonally/Temporally Flooded 44 Floodplain Forest 48 Swamp 49 Shallow Water
OTHER
51 Surface Water 52 Barren & Exposed Land 53 Clouds 54 Cloud Shadows

THIS PAGE INTENTIONALLY LEFT BLANK
Appendix B Soil Characteristics

THIS PAGE INTENTIONALLY LEFT BLANK
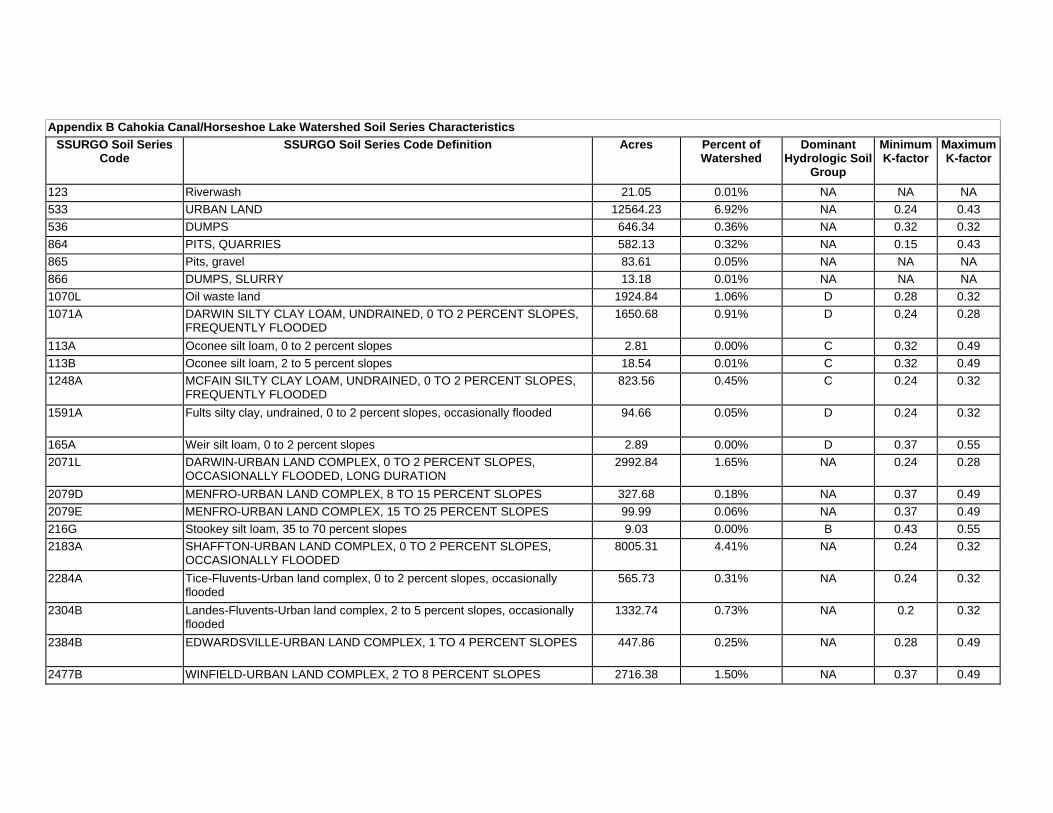
Appendix B Cahokia Canal/Horseshoe Lake Watershed Soil Series Characteristics SSURGO Soil Series
Code SSURGO Soil Series Code Definition Acres Percent of
Watershed Dominant
Hydrologic Soil Group
Minimum K-factor
Maximum K-factor
123 Riverwash 21.05 0.01% NA NA NA 533 URBAN LAND 12564.23 6.92% NA 0.24 0.43 536 DUMPS 646.34 0.36% NA 0.32 0.32 864 PITS, QUARRIES 582.13 0.32% NA 0.15 0.43 865 Pits, gravel 83.61 0.05% NA NA NA 866 DUMPS, SLURRY 13.18 0.01% NA NA NA 1070L Oil waste land 1924.84 1.06% D 0.28 0.32 1071A DARWIN SILTY CLAY LOAM, UNDRAINED, 0 TO 2 PERCENT SLOPES,
FREQUENTLY FLOODED 1650.68 0.91% D 0.24 0.28
113A Oconee silt loam, 0 to 2 percent slopes 2.81 0.00% C 0.32 0.49 113B Oconee silt loam, 2 to 5 percent slopes 18.54 0.01% C 0.32 0.49 1248A MCFAIN SILTY CLAY LOAM, UNDRAINED, 0 TO 2 PERCENT SLOPES,
FREQUENTLY FLOODED 823.56 0.45% C 0.24 0.32
1591A Fults silty clay, undrained, 0 to 2 percent slopes, occasionally flooded 94.66 0.05% D 0.24 0.32
165A Weir silt loam, 0 to 2 percent slopes 2.89 0.00% D 0.37 0.55 2071L DARWIN-URBAN LAND COMPLEX, 0 TO 2 PERCENT SLOPES,
OCCASIONALLY FLOODED, LONG DURATION 2992.84 1.65% NA 0.24 0.28
2079D MENFRO-URBAN LAND COMPLEX, 8 TO 15 PERCENT SLOPES 327.68 0.18% NA 0.37 0.49 2079E MENFRO-URBAN LAND COMPLEX, 15 TO 25 PERCENT SLOPES 99.99 0.06% NA 0.37 0.49 216G Stookey silt loam, 35 to 70 percent slopes 9.03 0.00% B 0.43 0.55 2183A SHAFFTON-URBAN LAND COMPLEX, 0 TO 2 PERCENT SLOPES,
OCCASIONALLY FLOODED 8005.31 4.41% NA 0.24 0.32
2284A Tice-Fluvents-Urban land complex, 0 to 2 percent slopes, occasionally flooded
565.73 0.31% NA 0.24 0.32
2304B Landes-Fluvents-Urban land complex, 2 to 5 percent slopes, occasionally flooded
1332.74 0.73% NA 0.2 0.32
2384B EDWARDSVILLE-URBAN LAND COMPLEX, 1 TO 4 PERCENT SLOPES 447.86 0.25% NA 0.28 0.49
2477B WINFIELD-URBAN LAND COMPLEX, 2 TO 8 PERCENT SLOPES 2716.38 1.50% NA 0.37 0.49
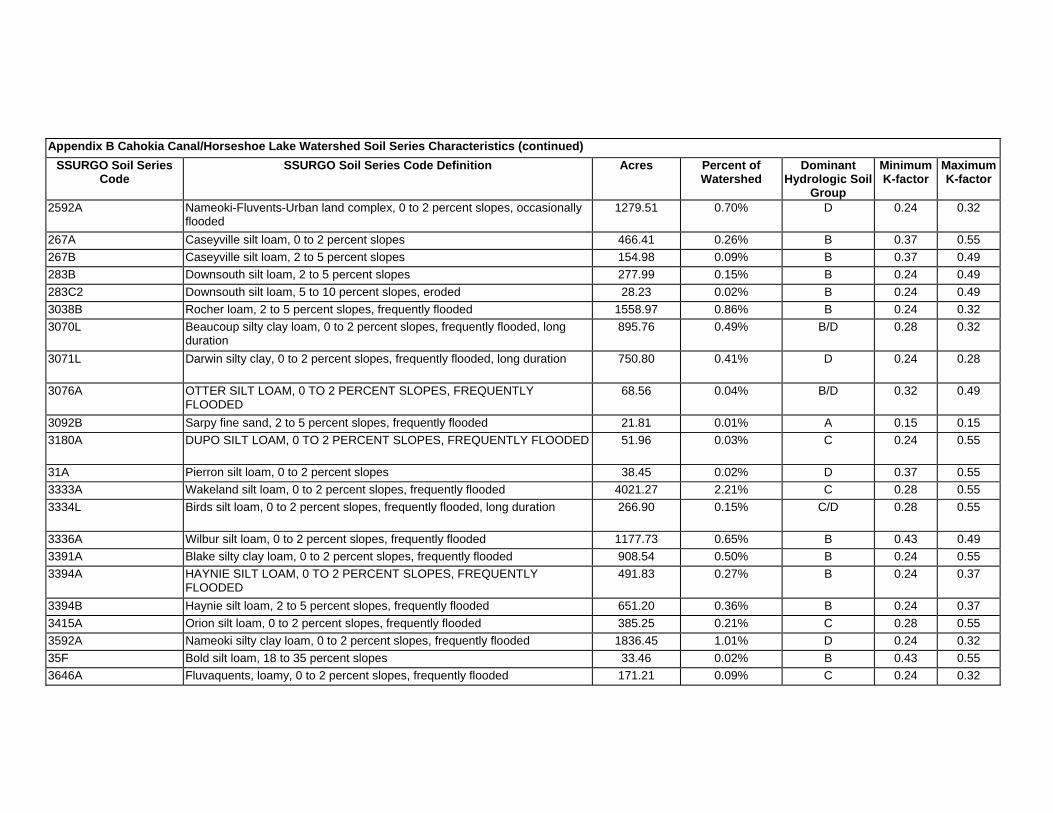
Appendix B Cahokia Canal/Horseshoe Lake Watershed Soil Series Characteristics (continued)
SSURGO Soil Series Code
SSURGO Soil Series Code Definition Acres Percent of Watershed
Dominant Hydrologic Soil
Group
Minimum K-factor
Maximum K-factor
2592A Nameoki-Fluvents-Urban land complex, 0 to 2 percent slopes, occasionally flooded
1279.51 0.70% D 0.24 0.32
267A Caseyville silt loam, 0 to 2 percent slopes 466.41 0.26% B 0.37 0.55 267B Caseyville silt loam, 2 to 5 percent slopes 154.98 0.09% B 0.37 0.49 283B Downsouth silt loam, 2 to 5 percent slopes 277.99 0.15% B 0.24 0.49 283C2 Downsouth silt loam, 5 to 10 percent slopes, eroded 28.23 0.02% B 0.24 0.49 3038B Rocher loam, 2 to 5 percent slopes, frequently flooded 1558.97 0.86% B 0.24 0.32 3070L Beaucoup silty clay loam, 0 to 2 percent slopes, frequently flooded, long
duration 895.76 0.49% B/D 0.28 0.32
3071L Darwin silty clay, 0 to 2 percent slopes, frequently flooded, long duration 750.80 0.41% D 0.24 0.28
3076A OTTER SILT LOAM, 0 TO 2 PERCENT SLOPES, FREQUENTLY FLOODED
68.56 0.04% B/D 0.32 0.49
3092B Sarpy fine sand, 2 to 5 percent slopes, frequently flooded 21.81 0.01% A 0.15 0.15 3180A DUPO SILT LOAM, 0 TO 2 PERCENT SLOPES, FREQUENTLY FLOODED 51.96 0.03% C 0.24 0.55
31A Pierron silt loam, 0 to 2 percent slopes 38.45 0.02% D 0.37 0.55 3333A Wakeland silt loam, 0 to 2 percent slopes, frequently flooded 4021.27 2.21% C 0.28 0.55 3334L Birds silt loam, 0 to 2 percent slopes, frequently flooded, long duration 266.90 0.15% C/D 0.28 0.55
3336A Wilbur silt loam, 0 to 2 percent slopes, frequently flooded 1177.73 0.65% B 0.43 0.49 3391A Blake silty clay loam, 0 to 2 percent slopes, frequently flooded 908.54 0.50% B 0.24 0.55 3394A HAYNIE SILT LOAM, 0 TO 2 PERCENT SLOPES, FREQUENTLY
FLOODED 491.83 0.27% B 0.24 0.37
3394B Haynie silt loam, 2 to 5 percent slopes, frequently flooded 651.20 0.36% B 0.24 0.37 3415A Orion silt loam, 0 to 2 percent slopes, frequently flooded 385.25 0.21% C 0.28 0.55 3592A Nameoki silty clay loam, 0 to 2 percent slopes, frequently flooded 1836.45 1.01% D 0.24 0.32 35F Bold silt loam, 18 to 35 percent slopes 33.46 0.02% B 0.43 0.55 3646A Fluvaquents, loamy, 0 to 2 percent slopes, frequently flooded 171.21 0.09% C 0.24 0.32
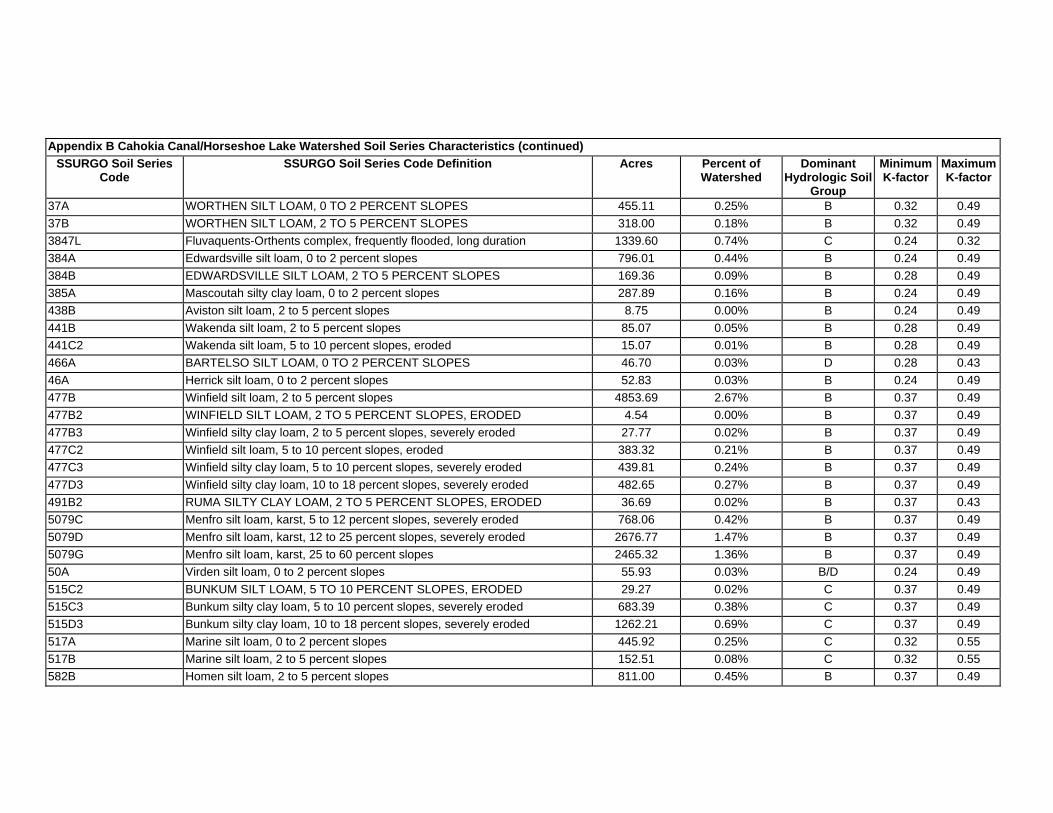
Appendix B Cahokia Canal/Horseshoe Lake Watershed Soil Series Characteristics (continued)
SSURGO Soil Series Code
SSURGO Soil Series Code Definition Acres Percent of Watershed
Dominant Hydrologic Soil
Group
Minimum K-factor
Maximum K-factor
37A WORTHEN SILT LOAM, 0 TO 2 PERCENT SLOPES 455.11 0.25% B 0.32 0.49 37B WORTHEN SILT LOAM, 2 TO 5 PERCENT SLOPES 318.00 0.18% B 0.32 0.49 3847L Fluvaquents-Orthents complex, frequently flooded, long duration 1339.60 0.74% C 0.24 0.32 384A Edwardsville silt loam, 0 to 2 percent slopes 796.01 0.44% B 0.24 0.49 384B EDWARDSVILLE SILT LOAM, 2 TO 5 PERCENT SLOPES 169.36 0.09% B 0.28 0.49 385A Mascoutah silty clay loam, 0 to 2 percent slopes 287.89 0.16% B 0.24 0.49 438B Aviston silt loam, 2 to 5 percent slopes 8.75 0.00% B 0.24 0.49 441B Wakenda silt loam, 2 to 5 percent slopes 85.07 0.05% B 0.28 0.49 441C2 Wakenda silt loam, 5 to 10 percent slopes, eroded 15.07 0.01% B 0.28 0.49 466A BARTELSO SILT LOAM, 0 TO 2 PERCENT SLOPES 46.70 0.03% D 0.28 0.43 46A Herrick silt loam, 0 to 2 percent slopes 52.83 0.03% B 0.24 0.49 477B Winfield silt loam, 2 to 5 percent slopes 4853.69 2.67% B 0.37 0.49 477B2 WINFIELD SILT LOAM, 2 TO 5 PERCENT SLOPES, ERODED 4.54 0.00% B 0.37 0.49 477B3 Winfield silty clay loam, 2 to 5 percent slopes, severely eroded 27.77 0.02% B 0.37 0.49 477C2 Winfield silt loam, 5 to 10 percent slopes, eroded 383.32 0.21% B 0.37 0.49 477C3 Winfield silty clay loam, 5 to 10 percent slopes, severely eroded 439.81 0.24% B 0.37 0.49 477D3 Winfield silty clay loam, 10 to 18 percent slopes, severely eroded 482.65 0.27% B 0.37 0.49 491B2 RUMA SILTY CLAY LOAM, 2 TO 5 PERCENT SLOPES, ERODED 36.69 0.02% B 0.37 0.43 5079C Menfro silt loam, karst, 5 to 12 percent slopes, severely eroded 768.06 0.42% B 0.37 0.49 5079D Menfro silt loam, karst, 12 to 25 percent slopes, severely eroded 2676.77 1.47% B 0.37 0.49 5079G Menfro silt loam, karst, 25 to 60 percent slopes 2465.32 1.36% B 0.37 0.49 50A Virden silt loam, 0 to 2 percent slopes 55.93 0.03% B/D 0.24 0.49 515C2 BUNKUM SILT LOAM, 5 TO 10 PERCENT SLOPES, ERODED 29.27 0.02% C 0.37 0.49 515C3 Bunkum silty clay loam, 5 to 10 percent slopes, severely eroded 683.39 0.38% C 0.37 0.49 515D3 Bunkum silty clay loam, 10 to 18 percent slopes, severely eroded 1262.21 0.69% C 0.37 0.49 517A Marine silt loam, 0 to 2 percent slopes 445.92 0.25% C 0.32 0.55 517B Marine silt loam, 2 to 5 percent slopes 152.51 0.08% C 0.32 0.55 582B Homen silt loam, 2 to 5 percent slopes 811.00 0.45% B 0.37 0.49
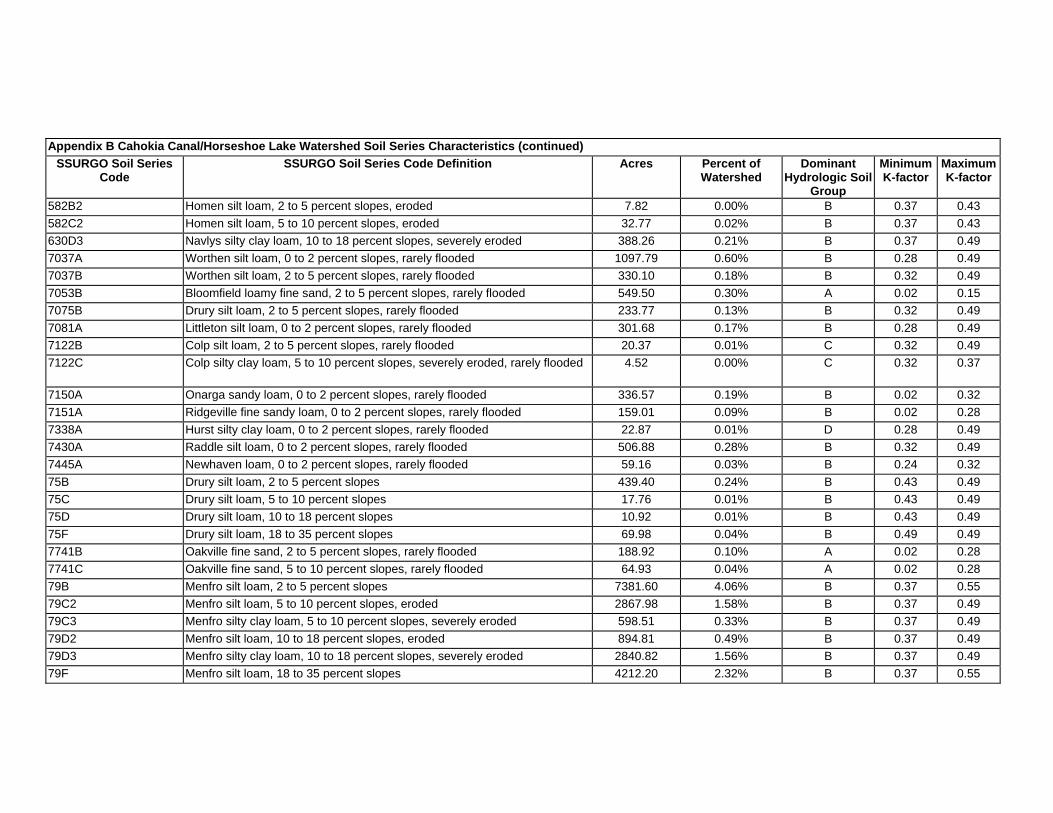
Appendix B Cahokia Canal/Horseshoe Lake Watershed Soil Series Characteristics (continued)
SSURGO Soil Series Code
SSURGO Soil Series Code Definition Acres Percent of Watershed
Dominant Hydrologic Soil
Group
Minimum K-factor
Maximum K-factor
582B2 Homen silt loam, 2 to 5 percent slopes, eroded 7.82 0.00% B 0.37 0.43 582C2 Homen silt loam, 5 to 10 percent slopes, eroded 32.77 0.02% B 0.37 0.43 630D3 Navlys silty clay loam, 10 to 18 percent slopes, severely eroded 388.26 0.21% B 0.37 0.49 7037A Worthen silt loam, 0 to 2 percent slopes, rarely flooded 1097.79 0.60% B 0.28 0.49 7037B Worthen silt loam, 2 to 5 percent slopes, rarely flooded 330.10 0.18% B 0.32 0.49 7053B Bloomfield loamy fine sand, 2 to 5 percent slopes, rarely flooded 549.50 0.30% A 0.02 0.15 7075B Drury silt loam, 2 to 5 percent slopes, rarely flooded 233.77 0.13% B 0.32 0.49 7081A Littleton silt loam, 0 to 2 percent slopes, rarely flooded 301.68 0.17% B 0.28 0.49 7122B Colp silt loam, 2 to 5 percent slopes, rarely flooded 20.37 0.01% C 0.32 0.49 7122C Colp silty clay loam, 5 to 10 percent slopes, severely eroded, rarely flooded 4.52 0.00% C 0.32 0.37
7150A Onarga sandy loam, 0 to 2 percent slopes, rarely flooded 336.57 0.19% B 0.02 0.32 7151A Ridgeville fine sandy loam, 0 to 2 percent slopes, rarely flooded 159.01 0.09% B 0.02 0.28 7338A Hurst silty clay loam, 0 to 2 percent slopes, rarely flooded 22.87 0.01% D 0.28 0.49 7430A Raddle silt loam, 0 to 2 percent slopes, rarely flooded 506.88 0.28% B 0.32 0.49 7445A Newhaven loam, 0 to 2 percent slopes, rarely flooded 59.16 0.03% B 0.24 0.32 75B Drury silt loam, 2 to 5 percent slopes 439.40 0.24% B 0.43 0.49 75C Drury silt loam, 5 to 10 percent slopes 17.76 0.01% B 0.43 0.49 75D Drury silt loam, 10 to 18 percent slopes 10.92 0.01% B 0.43 0.49 75F Drury silt loam, 18 to 35 percent slopes 69.98 0.04% B 0.49 0.49 7741B Oakville fine sand, 2 to 5 percent slopes, rarely flooded 188.92 0.10% A 0.02 0.28 7741C Oakville fine sand, 5 to 10 percent slopes, rarely flooded 64.93 0.04% A 0.02 0.28 79B Menfro silt loam, 2 to 5 percent slopes 7381.60 4.06% B 0.37 0.55 79C2 Menfro silt loam, 5 to 10 percent slopes, eroded 2867.98 1.58% B 0.37 0.49 79C3 Menfro silty clay loam, 5 to 10 percent slopes, severely eroded 598.51 0.33% B 0.37 0.49 79D2 Menfro silt loam, 10 to 18 percent slopes, eroded 894.81 0.49% B 0.37 0.49 79D3 Menfro silty clay loam, 10 to 18 percent slopes, severely eroded 2840.82 1.56% B 0.37 0.49 79F Menfro silt loam, 18 to 35 percent slopes 4212.20 2.32% B 0.37 0.55
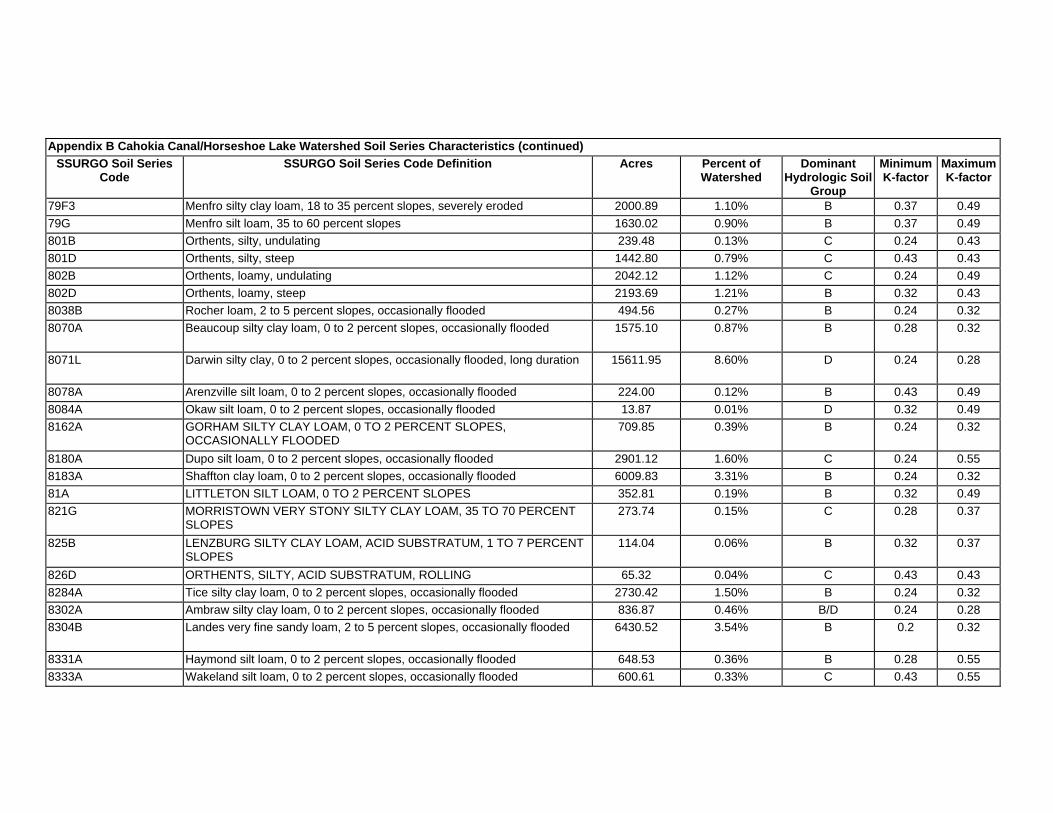
Appendix B Cahokia Canal/Horseshoe Lake Watershed Soil Series Characteristics (continued)
SSURGO Soil Series Code
SSURGO Soil Series Code Definition Acres Percent of Watershed
Dominant Hydrologic Soil
Group
Minimum K-factor
Maximum K-factor
79F3 Menfro silty clay loam, 18 to 35 percent slopes, severely eroded 2000.89 1.10% B 0.37 0.49 79G Menfro silt loam, 35 to 60 percent slopes 1630.02 0.90% B 0.37 0.49 801B Orthents, silty, undulating 239.48 0.13% C 0.24 0.43 801D Orthents, silty, steep 1442.80 0.79% C 0.43 0.43 802B Orthents, loamy, undulating 2042.12 1.12% C 0.24 0.49 802D Orthents, loamy, steep 2193.69 1.21% B 0.32 0.43 8038B Rocher loam, 2 to 5 percent slopes, occasionally flooded 494.56 0.27% B 0.24 0.32 8070A Beaucoup silty clay loam, 0 to 2 percent slopes, occasionally flooded 1575.10 0.87% B 0.28 0.32
8071L Darwin silty clay, 0 to 2 percent slopes, occasionally flooded, long duration 15611.95 8.60% D 0.24 0.28
8078A Arenzville silt loam, 0 to 2 percent slopes, occasionally flooded 224.00 0.12% B 0.43 0.49 8084A Okaw silt loam, 0 to 2 percent slopes, occasionally flooded 13.87 0.01% D 0.32 0.49 8162A GORHAM SILTY CLAY LOAM, 0 TO 2 PERCENT SLOPES,
OCCASIONALLY FLOODED 709.85 0.39% B 0.24 0.32
8180A Dupo silt loam, 0 to 2 percent slopes, occasionally flooded 2901.12 1.60% C 0.24 0.55 8183A Shaffton clay loam, 0 to 2 percent slopes, occasionally flooded 6009.83 3.31% B 0.24 0.32 81A LITTLETON SILT LOAM, 0 TO 2 PERCENT SLOPES 352.81 0.19% B 0.32 0.49 821G MORRISTOWN VERY STONY SILTY CLAY LOAM, 35 TO 70 PERCENT
SLOPES 273.74 0.15% C 0.28 0.37
825B LENZBURG SILTY CLAY LOAM, ACID SUBSTRATUM, 1 TO 7 PERCENT SLOPES
114.04 0.06% B 0.32 0.37
826D ORTHENTS, SILTY, ACID SUBSTRATUM, ROLLING 65.32 0.04% C 0.43 0.43 8284A Tice silty clay loam, 0 to 2 percent slopes, occasionally flooded 2730.42 1.50% B 0.24 0.32 8302A Ambraw silty clay loam, 0 to 2 percent slopes, occasionally flooded 836.87 0.46% B/D 0.24 0.28 8304B Landes very fine sandy loam, 2 to 5 percent slopes, occasionally flooded 6430.52 3.54% B 0.2 0.32
8331A Haymond silt loam, 0 to 2 percent slopes, occasionally flooded 648.53 0.36% B 0.28 0.55 8333A Wakeland silt loam, 0 to 2 percent slopes, occasionally flooded 600.61 0.33% C 0.43 0.55
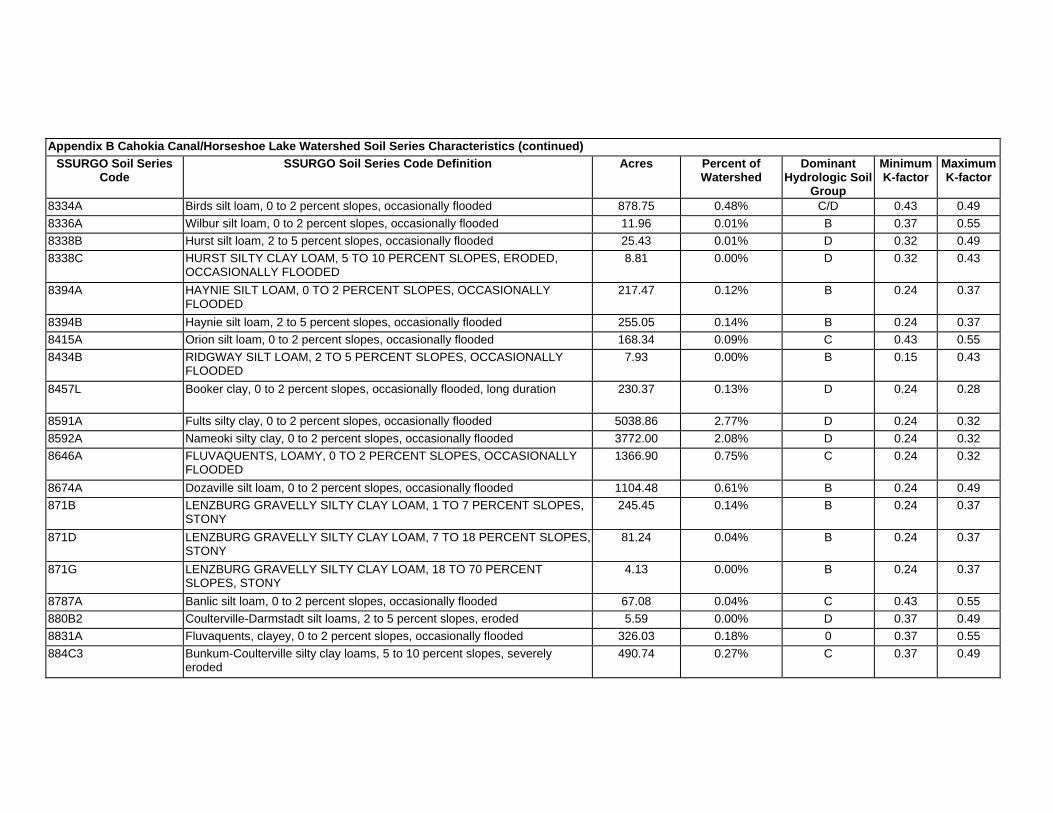
Appendix B Cahokia Canal/Horseshoe Lake Watershed Soil Series Characteristics (continued)
SSURGO Soil Series Code
SSURGO Soil Series Code Definition Acres Percent of Watershed
Dominant Hydrologic Soil
Group
Minimum K-factor
Maximum K-factor
8334A Birds silt loam, 0 to 2 percent slopes, occasionally flooded 878.75 0.48% C/D 0.43 0.49 8336A Wilbur silt loam, 0 to 2 percent slopes, occasionally flooded 11.96 0.01% B 0.37 0.55 8338B Hurst silt loam, 2 to 5 percent slopes, occasionally flooded 25.43 0.01% D 0.32 0.49 8338C HURST SILTY CLAY LOAM, 5 TO 10 PERCENT SLOPES, ERODED,
OCCASIONALLY FLOODED 8.81 0.00% D 0.32 0.43
8394A HAYNIE SILT LOAM, 0 TO 2 PERCENT SLOPES, OCCASIONALLY FLOODED
217.47 0.12% B 0.24 0.37
8394B Haynie silt loam, 2 to 5 percent slopes, occasionally flooded 255.05 0.14% B 0.24 0.37 8415A Orion silt loam, 0 to 2 percent slopes, occasionally flooded 168.34 0.09% C 0.43 0.55 8434B RIDGWAY SILT LOAM, 2 TO 5 PERCENT SLOPES, OCCASIONALLY
FLOODED 7.93 0.00% B 0.15 0.43
8457L Booker clay, 0 to 2 percent slopes, occasionally flooded, long duration 230.37 0.13% D 0.24 0.28
8591A Fults silty clay, 0 to 2 percent slopes, occasionally flooded 5038.86 2.77% D 0.24 0.32 8592A Nameoki silty clay, 0 to 2 percent slopes, occasionally flooded 3772.00 2.08% D 0.24 0.32 8646A FLUVAQUENTS, LOAMY, 0 TO 2 PERCENT SLOPES, OCCASIONALLY
FLOODED 1366.90 0.75% C 0.24 0.32
8674A Dozaville silt loam, 0 to 2 percent slopes, occasionally flooded 1104.48 0.61% B 0.24 0.49 871B LENZBURG GRAVELLY SILTY CLAY LOAM, 1 TO 7 PERCENT SLOPES,
STONY 245.45 0.14% B 0.24 0.37
871D LENZBURG GRAVELLY SILTY CLAY LOAM, 7 TO 18 PERCENT SLOPES, STONY
81.24 0.04% B 0.24 0.37
871G LENZBURG GRAVELLY SILTY CLAY LOAM, 18 TO 70 PERCENT SLOPES, STONY
4.13 0.00% B 0.24 0.37
8787A Banlic silt loam, 0 to 2 percent slopes, occasionally flooded 67.08 0.04% C 0.43 0.55 880B2 Coulterville-Darmstadt silt loams, 2 to 5 percent slopes, eroded 5.59 0.00% D 0.37 0.49 8831A Fluvaquents, clayey, 0 to 2 percent slopes, occasionally flooded 326.03 0.18% 0 0.37 0.55 884C3 Bunkum-Coulterville silty clay loams, 5 to 10 percent slopes, severely
eroded 490.74 0.27% C 0.37 0.49
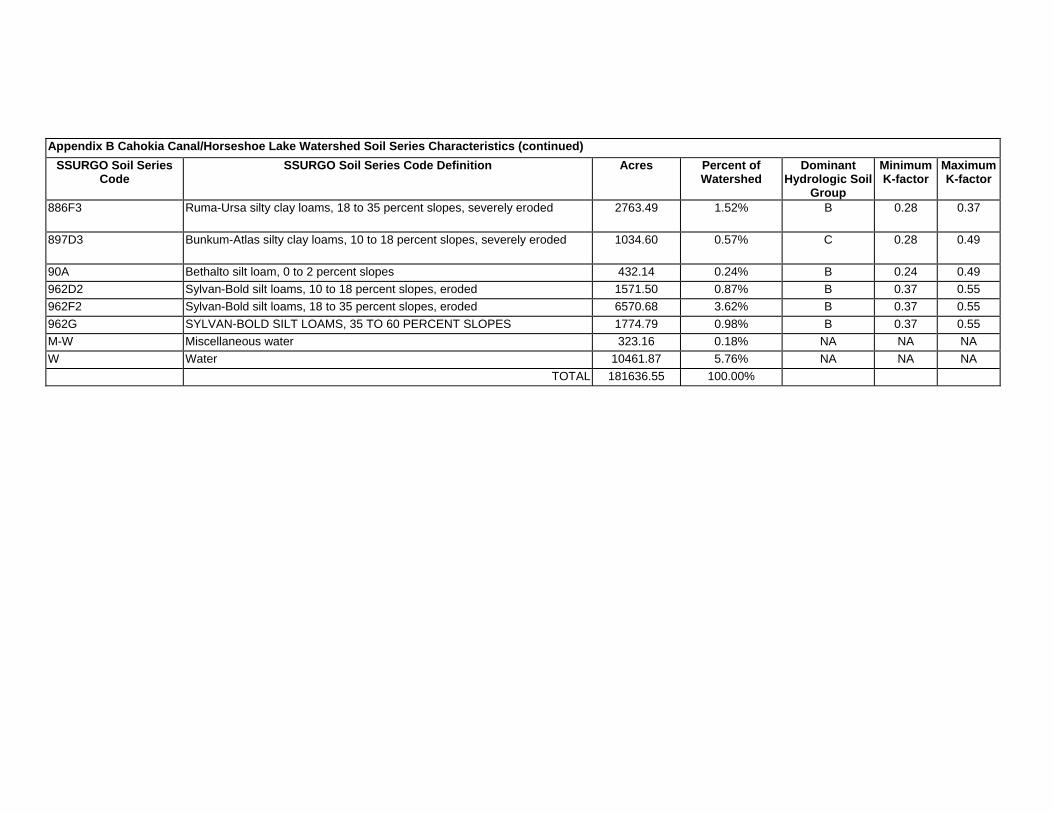
Appendix B Cahokia Canal/Horseshoe Lake Watershed Soil Series Characteristics (continued)
SSURGO Soil Series Code
SSURGO Soil Series Code Definition Acres Percent of Watershed
Dominant Hydrologic Soil
Group
Minimum K-factor
Maximum K-factor
886F3 Ruma-Ursa silty clay loams, 18 to 35 percent slopes, severely eroded 2763.49 1.52% B 0.28 0.37
897D3 Bunkum-Atlas silty clay loams, 10 to 18 percent slopes, severely eroded 1034.60 0.57% C 0.28 0.49
90A Bethalto silt loam, 0 to 2 percent slopes 432.14 0.24% B 0.24 0.49 962D2 Sylvan-Bold silt loams, 10 to 18 percent slopes, eroded 1571.50 0.87% B 0.37 0.55 962F2 Sylvan-Bold silt loams, 18 to 35 percent slopes, eroded 6570.68 3.62% B 0.37 0.55 962G SYLVAN-BOLD SILT LOAMS, 35 TO 60 PERCENT SLOPES 1774.79 0.98% B 0.37 0.55 M-W Miscellaneous water 323.16 0.18% NA NA NA W Water 10461.87 5.76% NA NA NA
TOTAL 181636.55 100.00%

THIS PAGE INTENTIONALLY LEFT BLANK

Appendix C Water Quality Data

THIS PAGE INTENTIONALLY LEFT BLANK
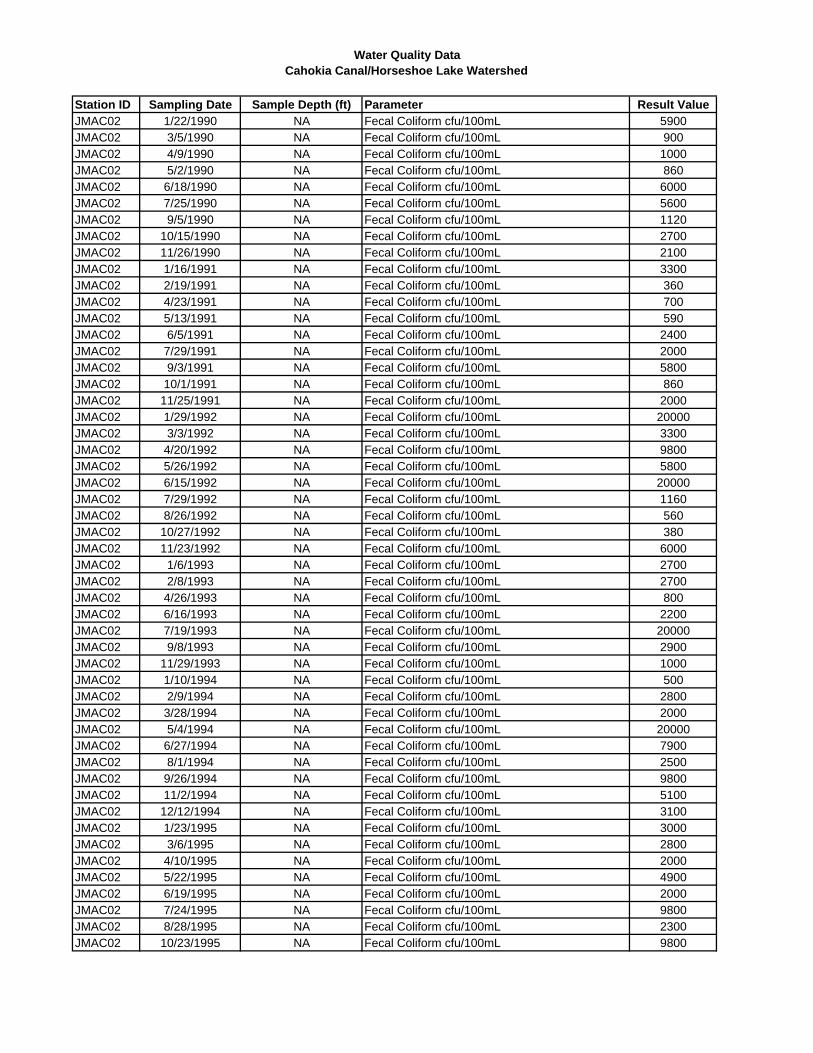
Water Quality DataCahokia Canal/Horseshoe Lake Watershed
Station ID Sampling Date Sample Depth (ft) Parameter Result ValueJMAC02 1/22/1990 NA Fecal Coliform cfu/100mL 5900JMAC02 3/5/1990 NA Fecal Coliform cfu/100mL 900JMAC02 4/9/1990 NA Fecal Coliform cfu/100mL 1000JMAC02 5/2/1990 NA Fecal Coliform cfu/100mL 860JMAC02 6/18/1990 NA Fecal Coliform cfu/100mL 6000JMAC02 7/25/1990 NA Fecal Coliform cfu/100mL 5600JMAC02 9/5/1990 NA Fecal Coliform cfu/100mL 1120JMAC02 10/15/1990 NA Fecal Coliform cfu/100mL 2700JMAC02 11/26/1990 NA Fecal Coliform cfu/100mL 2100JMAC02 1/16/1991 NA Fecal Coliform cfu/100mL 3300JMAC02 2/19/1991 NA Fecal Coliform cfu/100mL 360JMAC02 4/23/1991 NA Fecal Coliform cfu/100mL 700JMAC02 5/13/1991 NA Fecal Coliform cfu/100mL 590JMAC02 6/5/1991 NA Fecal Coliform cfu/100mL 2400JMAC02 7/29/1991 NA Fecal Coliform cfu/100mL 2000JMAC02 9/3/1991 NA Fecal Coliform cfu/100mL 5800JMAC02 10/1/1991 NA Fecal Coliform cfu/100mL 860JMAC02 11/25/1991 NA Fecal Coliform cfu/100mL 2000JMAC02 1/29/1992 NA Fecal Coliform cfu/100mL 20000JMAC02 3/3/1992 NA Fecal Coliform cfu/100mL 3300JMAC02 4/20/1992 NA Fecal Coliform cfu/100mL 9800JMAC02 5/26/1992 NA Fecal Coliform cfu/100mL 5800JMAC02 6/15/1992 NA Fecal Coliform cfu/100mL 20000JMAC02 7/29/1992 NA Fecal Coliform cfu/100mL 1160JMAC02 8/26/1992 NA Fecal Coliform cfu/100mL 560JMAC02 10/27/1992 NA Fecal Coliform cfu/100mL 380JMAC02 11/23/1992 NA Fecal Coliform cfu/100mL 6000JMAC02 1/6/1993 NA Fecal Coliform cfu/100mL 2700JMAC02 2/8/1993 NA Fecal Coliform cfu/100mL 2700JMAC02 4/26/1993 NA Fecal Coliform cfu/100mL 800JMAC02 6/16/1993 NA Fecal Coliform cfu/100mL 2200JMAC02 7/19/1993 NA Fecal Coliform cfu/100mL 20000JMAC02 9/8/1993 NA Fecal Coliform cfu/100mL 2900JMAC02 11/29/1993 NA Fecal Coliform cfu/100mL 1000JMAC02 1/10/1994 NA Fecal Coliform cfu/100mL 500JMAC02 2/9/1994 NA Fecal Coliform cfu/100mL 2800JMAC02 3/28/1994 NA Fecal Coliform cfu/100mL 2000JMAC02 5/4/1994 NA Fecal Coliform cfu/100mL 20000JMAC02 6/27/1994 NA Fecal Coliform cfu/100mL 7900JMAC02 8/1/1994 NA Fecal Coliform cfu/100mL 2500JMAC02 9/26/1994 NA Fecal Coliform cfu/100mL 9800JMAC02 11/2/1994 NA Fecal Coliform cfu/100mL 5100JMAC02 12/12/1994 NA Fecal Coliform cfu/100mL 3100JMAC02 1/23/1995 NA Fecal Coliform cfu/100mL 3000JMAC02 3/6/1995 NA Fecal Coliform cfu/100mL 2800JMAC02 4/10/1995 NA Fecal Coliform cfu/100mL 2000JMAC02 5/22/1995 NA Fecal Coliform cfu/100mL 4900JMAC02 6/19/1995 NA Fecal Coliform cfu/100mL 2000JMAC02 7/24/1995 NA Fecal Coliform cfu/100mL 9800JMAC02 8/28/1995 NA Fecal Coliform cfu/100mL 2300JMAC02 10/23/1995 NA Fecal Coliform cfu/100mL 9800
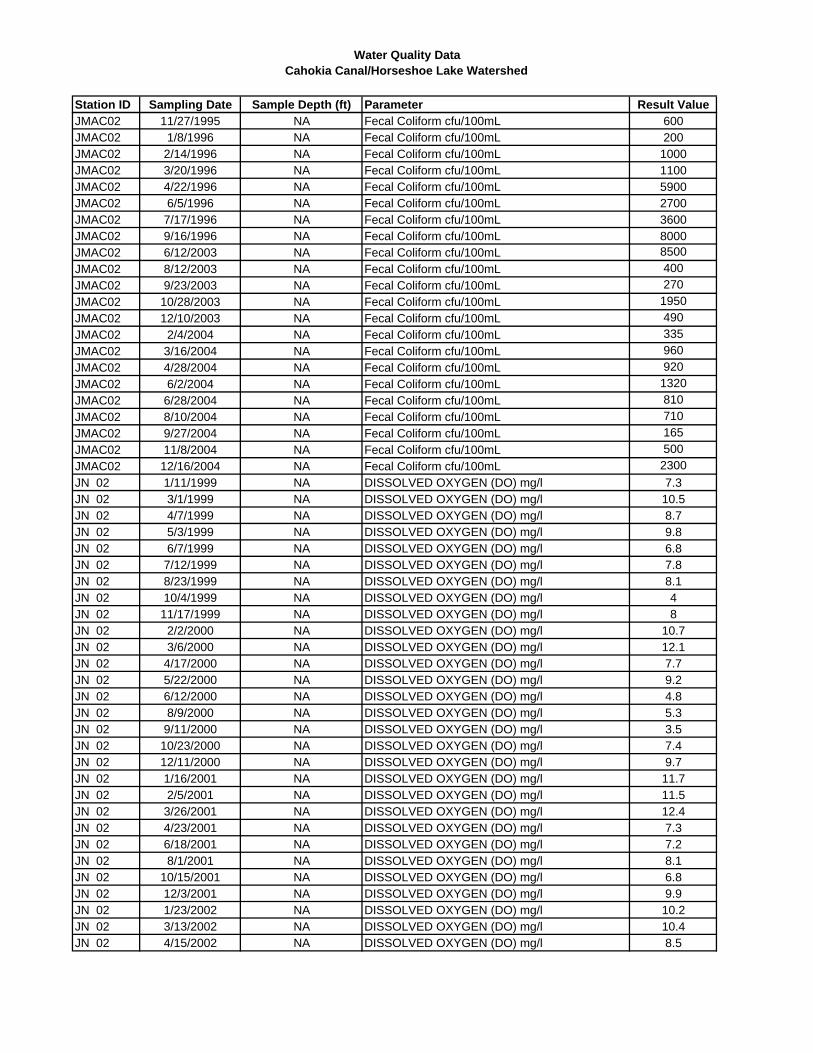
Water Quality DataCahokia Canal/Horseshoe Lake Watershed
Station ID Sampling Date Sample Depth (ft) Parameter Result ValueJMAC02 11/27/1995 NA Fecal Coliform cfu/100mL 600JMAC02 1/8/1996 NA Fecal Coliform cfu/100mL 200JMAC02 2/14/1996 NA Fecal Coliform cfu/100mL 1000JMAC02 3/20/1996 NA Fecal Coliform cfu/100mL 1100JMAC02 4/22/1996 NA Fecal Coliform cfu/100mL 5900JMAC02 6/5/1996 NA Fecal Coliform cfu/100mL 2700JMAC02 7/17/1996 NA Fecal Coliform cfu/100mL 3600JMAC02 9/16/1996 NA Fecal Coliform cfu/100mL 8000JMAC02 6/12/2003 NA Fecal Coliform cfu/100mL 8500JMAC02 8/12/2003 NA Fecal Coliform cfu/100mL 400JMAC02 9/23/2003 NA Fecal Coliform cfu/100mL 270JMAC02 10/28/2003 NA Fecal Coliform cfu/100mL 1950JMAC02 12/10/2003 NA Fecal Coliform cfu/100mL 490JMAC02 2/4/2004 NA Fecal Coliform cfu/100mL 335JMAC02 3/16/2004 NA Fecal Coliform cfu/100mL 960JMAC02 4/28/2004 NA Fecal Coliform cfu/100mL 920JMAC02 6/2/2004 NA Fecal Coliform cfu/100mL 1320JMAC02 6/28/2004 NA Fecal Coliform cfu/100mL 810JMAC02 8/10/2004 NA Fecal Coliform cfu/100mL 710JMAC02 9/27/2004 NA Fecal Coliform cfu/100mL 165JMAC02 11/8/2004 NA Fecal Coliform cfu/100mL 500JMAC02 12/16/2004 NA Fecal Coliform cfu/100mL 2300JN 02 1/11/1999 NA DISSOLVED OXYGEN (DO) mg/l 7.3JN 02 3/1/1999 NA DISSOLVED OXYGEN (DO) mg/l 10.5JN 02 4/7/1999 NA DISSOLVED OXYGEN (DO) mg/l 8.7JN 02 5/3/1999 NA DISSOLVED OXYGEN (DO) mg/l 9.8JN 02 6/7/1999 NA DISSOLVED OXYGEN (DO) mg/l 6.8JN 02 7/12/1999 NA DISSOLVED OXYGEN (DO) mg/l 7.8JN 02 8/23/1999 NA DISSOLVED OXYGEN (DO) mg/l 8.1JN 02 10/4/1999 NA DISSOLVED OXYGEN (DO) mg/l 4JN 02 11/17/1999 NA DISSOLVED OXYGEN (DO) mg/l 8JN 02 2/2/2000 NA DISSOLVED OXYGEN (DO) mg/l 10.7JN 02 3/6/2000 NA DISSOLVED OXYGEN (DO) mg/l 12.1JN 02 4/17/2000 NA DISSOLVED OXYGEN (DO) mg/l 7.7JN 02 5/22/2000 NA DISSOLVED OXYGEN (DO) mg/l 9.2JN 02 6/12/2000 NA DISSOLVED OXYGEN (DO) mg/l 4.8JN 02 8/9/2000 NA DISSOLVED OXYGEN (DO) mg/l 5.3JN 02 9/11/2000 NA DISSOLVED OXYGEN (DO) mg/l 3.5JN 02 10/23/2000 NA DISSOLVED OXYGEN (DO) mg/l 7.4JN 02 12/11/2000 NA DISSOLVED OXYGEN (DO) mg/l 9.7JN 02 1/16/2001 NA DISSOLVED OXYGEN (DO) mg/l 11.7JN 02 2/5/2001 NA DISSOLVED OXYGEN (DO) mg/l 11.5JN 02 3/26/2001 NA DISSOLVED OXYGEN (DO) mg/l 12.4JN 02 4/23/2001 NA DISSOLVED OXYGEN (DO) mg/l 7.3JN 02 6/18/2001 NA DISSOLVED OXYGEN (DO) mg/l 7.2JN 02 8/1/2001 NA DISSOLVED OXYGEN (DO) mg/l 8.1JN 02 10/15/2001 NA DISSOLVED OXYGEN (DO) mg/l 6.8JN 02 12/3/2001 NA DISSOLVED OXYGEN (DO) mg/l 9.9JN 02 1/23/2002 NA DISSOLVED OXYGEN (DO) mg/l 10.2JN 02 3/13/2002 NA DISSOLVED OXYGEN (DO) mg/l 10.4JN 02 4/15/2002 NA DISSOLVED OXYGEN (DO) mg/l 8.5
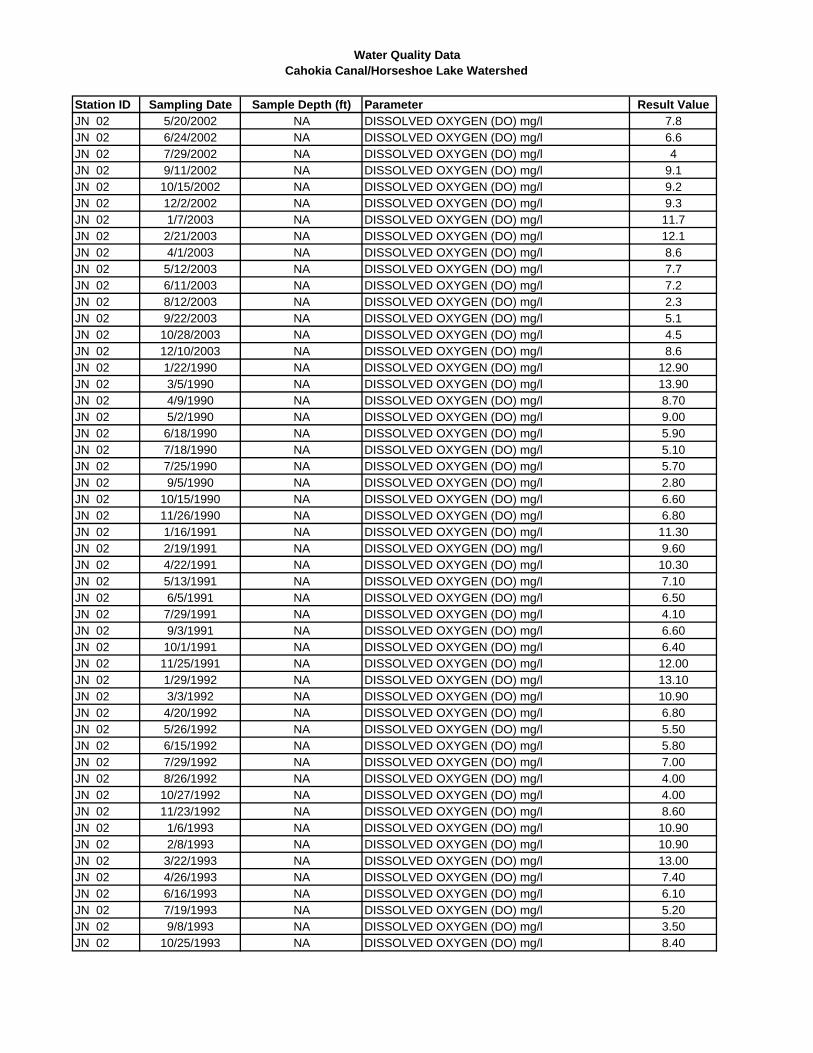
Water Quality DataCahokia Canal/Horseshoe Lake Watershed
Station ID Sampling Date Sample Depth (ft) Parameter Result ValueJN 02 5/20/2002 NA DISSOLVED OXYGEN (DO) mg/l 7.8JN 02 6/24/2002 NA DISSOLVED OXYGEN (DO) mg/l 6.6JN 02 7/29/2002 NA DISSOLVED OXYGEN (DO) mg/l 4JN 02 9/11/2002 NA DISSOLVED OXYGEN (DO) mg/l 9.1JN 02 10/15/2002 NA DISSOLVED OXYGEN (DO) mg/l 9.2JN 02 12/2/2002 NA DISSOLVED OXYGEN (DO) mg/l 9.3JN 02 1/7/2003 NA DISSOLVED OXYGEN (DO) mg/l 11.7JN 02 2/21/2003 NA DISSOLVED OXYGEN (DO) mg/l 12.1JN 02 4/1/2003 NA DISSOLVED OXYGEN (DO) mg/l 8.6JN 02 5/12/2003 NA DISSOLVED OXYGEN (DO) mg/l 7.7JN 02 6/11/2003 NA DISSOLVED OXYGEN (DO) mg/l 7.2JN 02 8/12/2003 NA DISSOLVED OXYGEN (DO) mg/l 2.3JN 02 9/22/2003 NA DISSOLVED OXYGEN (DO) mg/l 5.1JN 02 10/28/2003 NA DISSOLVED OXYGEN (DO) mg/l 4.5JN 02 12/10/2003 NA DISSOLVED OXYGEN (DO) mg/l 8.6JN 02 1/22/1990 NA DISSOLVED OXYGEN (DO) mg/l 12.90JN 02 3/5/1990 NA DISSOLVED OXYGEN (DO) mg/l 13.90JN 02 4/9/1990 NA DISSOLVED OXYGEN (DO) mg/l 8.70JN 02 5/2/1990 NA DISSOLVED OXYGEN (DO) mg/l 9.00JN 02 6/18/1990 NA DISSOLVED OXYGEN (DO) mg/l 5.90JN 02 7/18/1990 NA DISSOLVED OXYGEN (DO) mg/l 5.10JN 02 7/25/1990 NA DISSOLVED OXYGEN (DO) mg/l 5.70JN 02 9/5/1990 NA DISSOLVED OXYGEN (DO) mg/l 2.80JN 02 10/15/1990 NA DISSOLVED OXYGEN (DO) mg/l 6.60JN 02 11/26/1990 NA DISSOLVED OXYGEN (DO) mg/l 6.80JN 02 1/16/1991 NA DISSOLVED OXYGEN (DO) mg/l 11.30JN 02 2/19/1991 NA DISSOLVED OXYGEN (DO) mg/l 9.60JN 02 4/22/1991 NA DISSOLVED OXYGEN (DO) mg/l 10.30JN 02 5/13/1991 NA DISSOLVED OXYGEN (DO) mg/l 7.10JN 02 6/5/1991 NA DISSOLVED OXYGEN (DO) mg/l 6.50JN 02 7/29/1991 NA DISSOLVED OXYGEN (DO) mg/l 4.10JN 02 9/3/1991 NA DISSOLVED OXYGEN (DO) mg/l 6.60JN 02 10/1/1991 NA DISSOLVED OXYGEN (DO) mg/l 6.40JN 02 11/25/1991 NA DISSOLVED OXYGEN (DO) mg/l 12.00JN 02 1/29/1992 NA DISSOLVED OXYGEN (DO) mg/l 13.10JN 02 3/3/1992 NA DISSOLVED OXYGEN (DO) mg/l 10.90JN 02 4/20/1992 NA DISSOLVED OXYGEN (DO) mg/l 6.80JN 02 5/26/1992 NA DISSOLVED OXYGEN (DO) mg/l 5.50JN 02 6/15/1992 NA DISSOLVED OXYGEN (DO) mg/l 5.80JN 02 7/29/1992 NA DISSOLVED OXYGEN (DO) mg/l 7.00JN 02 8/26/1992 NA DISSOLVED OXYGEN (DO) mg/l 4.00JN 02 10/27/1992 NA DISSOLVED OXYGEN (DO) mg/l 4.00JN 02 11/23/1992 NA DISSOLVED OXYGEN (DO) mg/l 8.60JN 02 1/6/1993 NA DISSOLVED OXYGEN (DO) mg/l 10.90JN 02 2/8/1993 NA DISSOLVED OXYGEN (DO) mg/l 10.90JN 02 3/22/1993 NA DISSOLVED OXYGEN (DO) mg/l 13.00JN 02 4/26/1993 NA DISSOLVED OXYGEN (DO) mg/l 7.40JN 02 6/16/1993 NA DISSOLVED OXYGEN (DO) mg/l 6.10JN 02 7/19/1993 NA DISSOLVED OXYGEN (DO) mg/l 5.20JN 02 9/8/1993 NA DISSOLVED OXYGEN (DO) mg/l 3.50JN 02 10/25/1993 NA DISSOLVED OXYGEN (DO) mg/l 8.40
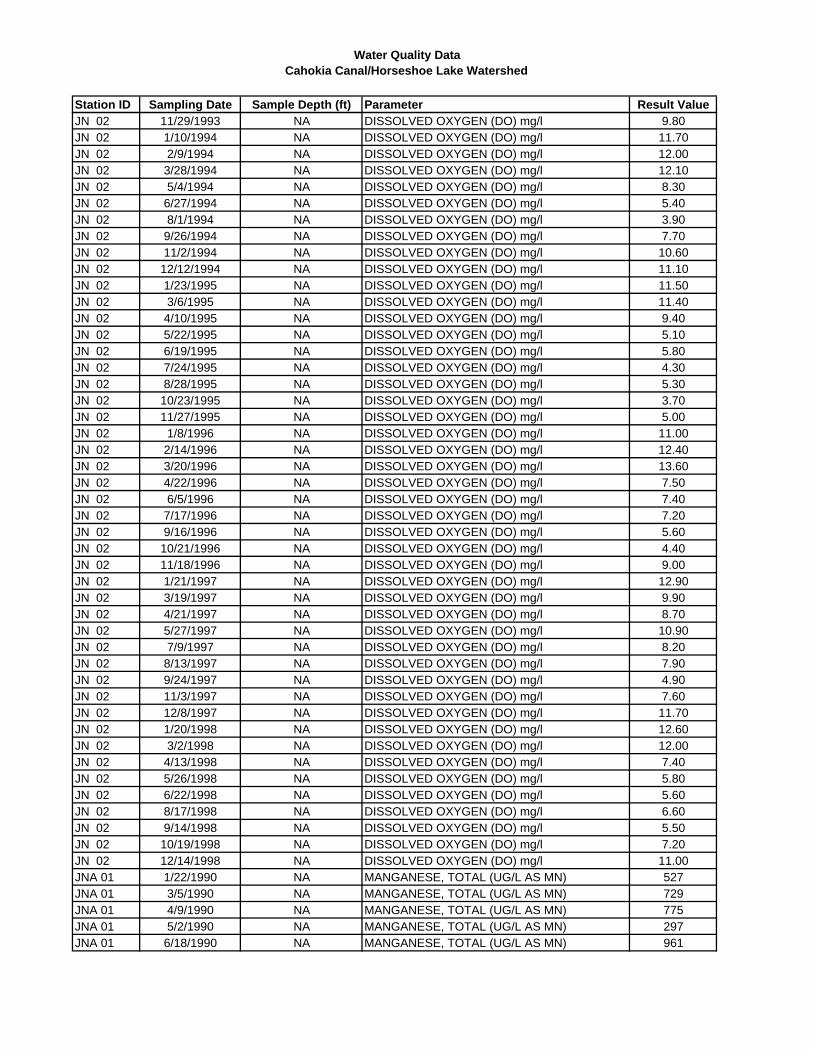
Water Quality DataCahokia Canal/Horseshoe Lake Watershed
Station ID Sampling Date Sample Depth (ft) Parameter Result ValueJN 02 11/29/1993 NA DISSOLVED OXYGEN (DO) mg/l 9.80JN 02 1/10/1994 NA DISSOLVED OXYGEN (DO) mg/l 11.70JN 02 2/9/1994 NA DISSOLVED OXYGEN (DO) mg/l 12.00JN 02 3/28/1994 NA DISSOLVED OXYGEN (DO) mg/l 12.10JN 02 5/4/1994 NA DISSOLVED OXYGEN (DO) mg/l 8.30JN 02 6/27/1994 NA DISSOLVED OXYGEN (DO) mg/l 5.40JN 02 8/1/1994 NA DISSOLVED OXYGEN (DO) mg/l 3.90JN 02 9/26/1994 NA DISSOLVED OXYGEN (DO) mg/l 7.70JN 02 11/2/1994 NA DISSOLVED OXYGEN (DO) mg/l 10.60JN 02 12/12/1994 NA DISSOLVED OXYGEN (DO) mg/l 11.10JN 02 1/23/1995 NA DISSOLVED OXYGEN (DO) mg/l 11.50JN 02 3/6/1995 NA DISSOLVED OXYGEN (DO) mg/l 11.40JN 02 4/10/1995 NA DISSOLVED OXYGEN (DO) mg/l 9.40JN 02 5/22/1995 NA DISSOLVED OXYGEN (DO) mg/l 5.10JN 02 6/19/1995 NA DISSOLVED OXYGEN (DO) mg/l 5.80JN 02 7/24/1995 NA DISSOLVED OXYGEN (DO) mg/l 4.30JN 02 8/28/1995 NA DISSOLVED OXYGEN (DO) mg/l 5.30JN 02 10/23/1995 NA DISSOLVED OXYGEN (DO) mg/l 3.70JN 02 11/27/1995 NA DISSOLVED OXYGEN (DO) mg/l 5.00JN 02 1/8/1996 NA DISSOLVED OXYGEN (DO) mg/l 11.00JN 02 2/14/1996 NA DISSOLVED OXYGEN (DO) mg/l 12.40JN 02 3/20/1996 NA DISSOLVED OXYGEN (DO) mg/l 13.60JN 02 4/22/1996 NA DISSOLVED OXYGEN (DO) mg/l 7.50JN 02 6/5/1996 NA DISSOLVED OXYGEN (DO) mg/l 7.40JN 02 7/17/1996 NA DISSOLVED OXYGEN (DO) mg/l 7.20JN 02 9/16/1996 NA DISSOLVED OXYGEN (DO) mg/l 5.60JN 02 10/21/1996 NA DISSOLVED OXYGEN (DO) mg/l 4.40JN 02 11/18/1996 NA DISSOLVED OXYGEN (DO) mg/l 9.00JN 02 1/21/1997 NA DISSOLVED OXYGEN (DO) mg/l 12.90JN 02 3/19/1997 NA DISSOLVED OXYGEN (DO) mg/l 9.90JN 02 4/21/1997 NA DISSOLVED OXYGEN (DO) mg/l 8.70JN 02 5/27/1997 NA DISSOLVED OXYGEN (DO) mg/l 10.90JN 02 7/9/1997 NA DISSOLVED OXYGEN (DO) mg/l 8.20JN 02 8/13/1997 NA DISSOLVED OXYGEN (DO) mg/l 7.90JN 02 9/24/1997 NA DISSOLVED OXYGEN (DO) mg/l 4.90JN 02 11/3/1997 NA DISSOLVED OXYGEN (DO) mg/l 7.60JN 02 12/8/1997 NA DISSOLVED OXYGEN (DO) mg/l 11.70JN 02 1/20/1998 NA DISSOLVED OXYGEN (DO) mg/l 12.60JN 02 3/2/1998 NA DISSOLVED OXYGEN (DO) mg/l 12.00JN 02 4/13/1998 NA DISSOLVED OXYGEN (DO) mg/l 7.40JN 02 5/26/1998 NA DISSOLVED OXYGEN (DO) mg/l 5.80JN 02 6/22/1998 NA DISSOLVED OXYGEN (DO) mg/l 5.60JN 02 8/17/1998 NA DISSOLVED OXYGEN (DO) mg/l 6.60JN 02 9/14/1998 NA DISSOLVED OXYGEN (DO) mg/l 5.50JN 02 10/19/1998 NA DISSOLVED OXYGEN (DO) mg/l 7.20JN 02 12/14/1998 NA DISSOLVED OXYGEN (DO) mg/l 11.00JNA 01 1/22/1990 NA MANGANESE, TOTAL (UG/L AS MN) 527JNA 01 3/5/1990 NA MANGANESE, TOTAL (UG/L AS MN) 729JNA 01 4/9/1990 NA MANGANESE, TOTAL (UG/L AS MN) 775JNA 01 5/2/1990 NA MANGANESE, TOTAL (UG/L AS MN) 297JNA 01 6/18/1990 NA MANGANESE, TOTAL (UG/L AS MN) 961
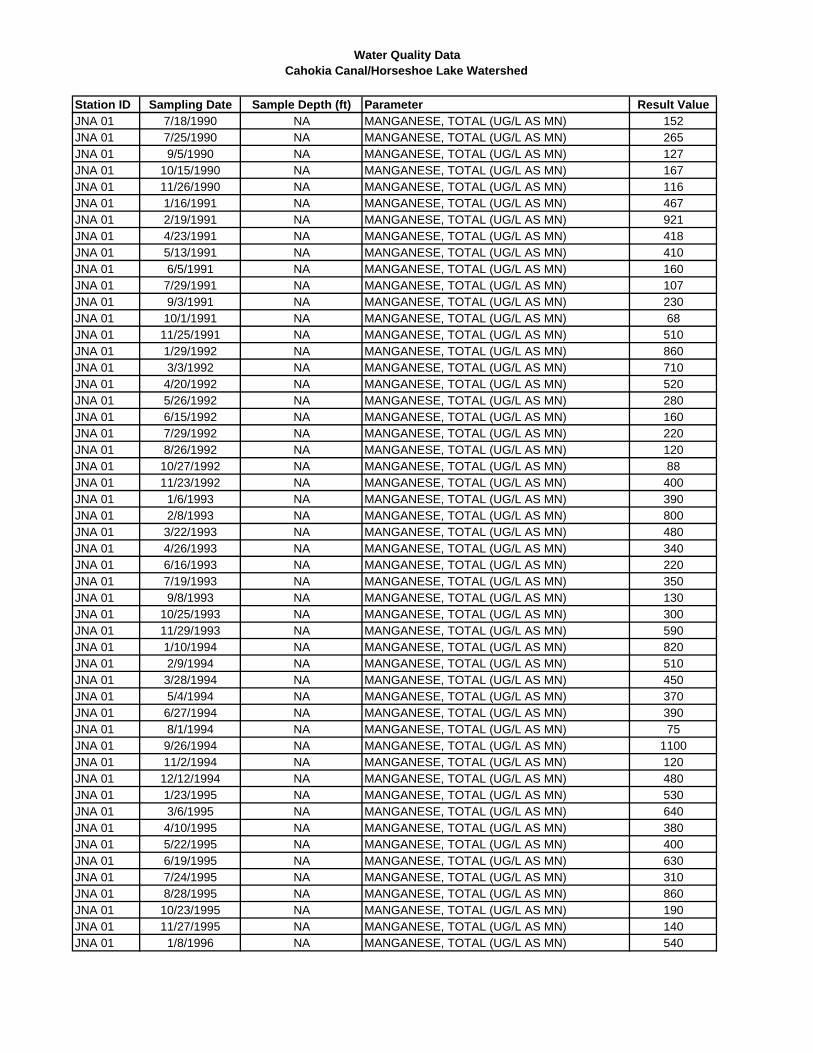
Water Quality DataCahokia Canal/Horseshoe Lake Watershed
Station ID Sampling Date Sample Depth (ft) Parameter Result ValueJNA 01 7/18/1990 NA MANGANESE, TOTAL (UG/L AS MN) 152JNA 01 7/25/1990 NA MANGANESE, TOTAL (UG/L AS MN) 265JNA 01 9/5/1990 NA MANGANESE, TOTAL (UG/L AS MN) 127JNA 01 10/15/1990 NA MANGANESE, TOTAL (UG/L AS MN) 167JNA 01 11/26/1990 NA MANGANESE, TOTAL (UG/L AS MN) 116JNA 01 1/16/1991 NA MANGANESE, TOTAL (UG/L AS MN) 467JNA 01 2/19/1991 NA MANGANESE, TOTAL (UG/L AS MN) 921JNA 01 4/23/1991 NA MANGANESE, TOTAL (UG/L AS MN) 418JNA 01 5/13/1991 NA MANGANESE, TOTAL (UG/L AS MN) 410JNA 01 6/5/1991 NA MANGANESE, TOTAL (UG/L AS MN) 160JNA 01 7/29/1991 NA MANGANESE, TOTAL (UG/L AS MN) 107JNA 01 9/3/1991 NA MANGANESE, TOTAL (UG/L AS MN) 230JNA 01 10/1/1991 NA MANGANESE, TOTAL (UG/L AS MN) 68JNA 01 11/25/1991 NA MANGANESE, TOTAL (UG/L AS MN) 510JNA 01 1/29/1992 NA MANGANESE, TOTAL (UG/L AS MN) 860JNA 01 3/3/1992 NA MANGANESE, TOTAL (UG/L AS MN) 710JNA 01 4/20/1992 NA MANGANESE, TOTAL (UG/L AS MN) 520JNA 01 5/26/1992 NA MANGANESE, TOTAL (UG/L AS MN) 280JNA 01 6/15/1992 NA MANGANESE, TOTAL (UG/L AS MN) 160JNA 01 7/29/1992 NA MANGANESE, TOTAL (UG/L AS MN) 220JNA 01 8/26/1992 NA MANGANESE, TOTAL (UG/L AS MN) 120JNA 01 10/27/1992 NA MANGANESE, TOTAL (UG/L AS MN) 88JNA 01 11/23/1992 NA MANGANESE, TOTAL (UG/L AS MN) 400JNA 01 1/6/1993 NA MANGANESE, TOTAL (UG/L AS MN) 390JNA 01 2/8/1993 NA MANGANESE, TOTAL (UG/L AS MN) 800JNA 01 3/22/1993 NA MANGANESE, TOTAL (UG/L AS MN) 480JNA 01 4/26/1993 NA MANGANESE, TOTAL (UG/L AS MN) 340JNA 01 6/16/1993 NA MANGANESE, TOTAL (UG/L AS MN) 220JNA 01 7/19/1993 NA MANGANESE, TOTAL (UG/L AS MN) 350JNA 01 9/8/1993 NA MANGANESE, TOTAL (UG/L AS MN) 130JNA 01 10/25/1993 NA MANGANESE, TOTAL (UG/L AS MN) 300JNA 01 11/29/1993 NA MANGANESE, TOTAL (UG/L AS MN) 590JNA 01 1/10/1994 NA MANGANESE, TOTAL (UG/L AS MN) 820JNA 01 2/9/1994 NA MANGANESE, TOTAL (UG/L AS MN) 510JNA 01 3/28/1994 NA MANGANESE, TOTAL (UG/L AS MN) 450JNA 01 5/4/1994 NA MANGANESE, TOTAL (UG/L AS MN) 370JNA 01 6/27/1994 NA MANGANESE, TOTAL (UG/L AS MN) 390JNA 01 8/1/1994 NA MANGANESE, TOTAL (UG/L AS MN) 75JNA 01 9/26/1994 NA MANGANESE, TOTAL (UG/L AS MN) 1100JNA 01 11/2/1994 NA MANGANESE, TOTAL (UG/L AS MN) 120JNA 01 12/12/1994 NA MANGANESE, TOTAL (UG/L AS MN) 480JNA 01 1/23/1995 NA MANGANESE, TOTAL (UG/L AS MN) 530JNA 01 3/6/1995 NA MANGANESE, TOTAL (UG/L AS MN) 640JNA 01 4/10/1995 NA MANGANESE, TOTAL (UG/L AS MN) 380JNA 01 5/22/1995 NA MANGANESE, TOTAL (UG/L AS MN) 400JNA 01 6/19/1995 NA MANGANESE, TOTAL (UG/L AS MN) 630JNA 01 7/24/1995 NA MANGANESE, TOTAL (UG/L AS MN) 310JNA 01 8/28/1995 NA MANGANESE, TOTAL (UG/L AS MN) 860JNA 01 10/23/1995 NA MANGANESE, TOTAL (UG/L AS MN) 190JNA 01 11/27/1995 NA MANGANESE, TOTAL (UG/L AS MN) 140JNA 01 1/8/1996 NA MANGANESE, TOTAL (UG/L AS MN) 540
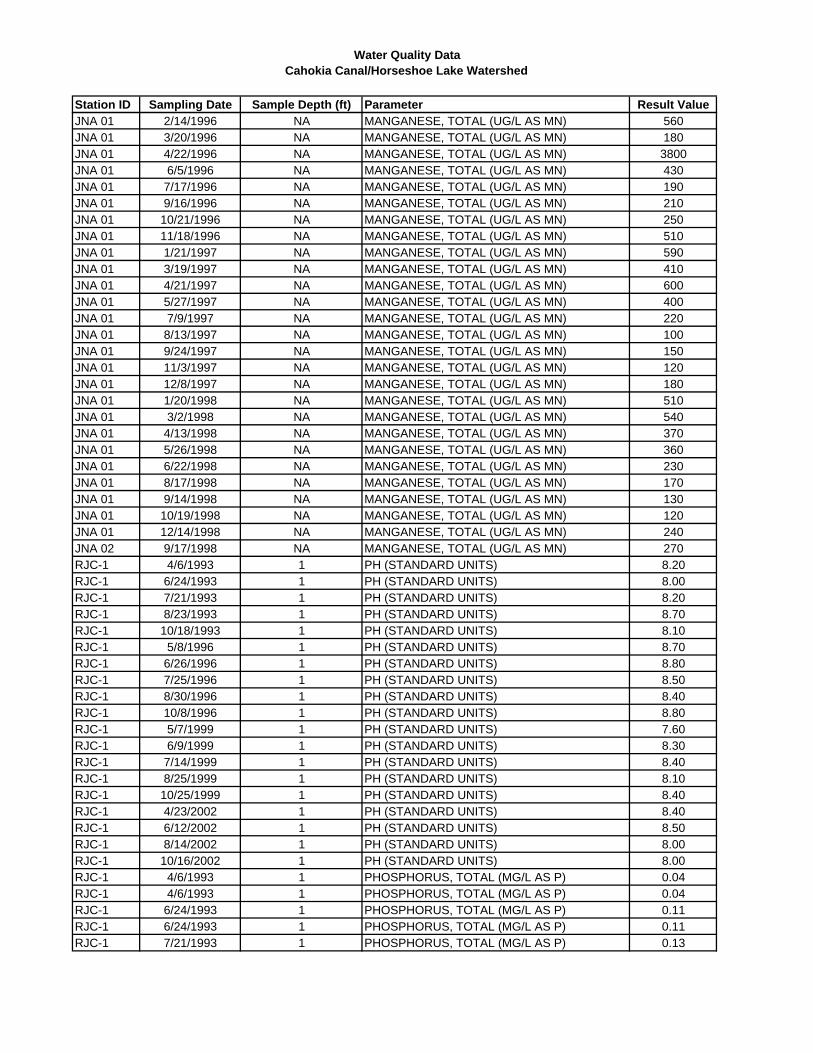
Water Quality DataCahokia Canal/Horseshoe Lake Watershed
Station ID Sampling Date Sample Depth (ft) Parameter Result ValueJNA 01 2/14/1996 NA MANGANESE, TOTAL (UG/L AS MN) 560JNA 01 3/20/1996 NA MANGANESE, TOTAL (UG/L AS MN) 180JNA 01 4/22/1996 NA MANGANESE, TOTAL (UG/L AS MN) 3800JNA 01 6/5/1996 NA MANGANESE, TOTAL (UG/L AS MN) 430JNA 01 7/17/1996 NA MANGANESE, TOTAL (UG/L AS MN) 190JNA 01 9/16/1996 NA MANGANESE, TOTAL (UG/L AS MN) 210JNA 01 10/21/1996 NA MANGANESE, TOTAL (UG/L AS MN) 250JNA 01 11/18/1996 NA MANGANESE, TOTAL (UG/L AS MN) 510JNA 01 1/21/1997 NA MANGANESE, TOTAL (UG/L AS MN) 590JNA 01 3/19/1997 NA MANGANESE, TOTAL (UG/L AS MN) 410JNA 01 4/21/1997 NA MANGANESE, TOTAL (UG/L AS MN) 600JNA 01 5/27/1997 NA MANGANESE, TOTAL (UG/L AS MN) 400JNA 01 7/9/1997 NA MANGANESE, TOTAL (UG/L AS MN) 220JNA 01 8/13/1997 NA MANGANESE, TOTAL (UG/L AS MN) 100JNA 01 9/24/1997 NA MANGANESE, TOTAL (UG/L AS MN) 150JNA 01 11/3/1997 NA MANGANESE, TOTAL (UG/L AS MN) 120JNA 01 12/8/1997 NA MANGANESE, TOTAL (UG/L AS MN) 180JNA 01 1/20/1998 NA MANGANESE, TOTAL (UG/L AS MN) 510JNA 01 3/2/1998 NA MANGANESE, TOTAL (UG/L AS MN) 540JNA 01 4/13/1998 NA MANGANESE, TOTAL (UG/L AS MN) 370JNA 01 5/26/1998 NA MANGANESE, TOTAL (UG/L AS MN) 360JNA 01 6/22/1998 NA MANGANESE, TOTAL (UG/L AS MN) 230JNA 01 8/17/1998 NA MANGANESE, TOTAL (UG/L AS MN) 170JNA 01 9/14/1998 NA MANGANESE, TOTAL (UG/L AS MN) 130JNA 01 10/19/1998 NA MANGANESE, TOTAL (UG/L AS MN) 120JNA 01 12/14/1998 NA MANGANESE, TOTAL (UG/L AS MN) 240JNA 02 9/17/1998 NA MANGANESE, TOTAL (UG/L AS MN) 270RJC-1 4/6/1993 1 PH (STANDARD UNITS) 8.20RJC-1 6/24/1993 1 PH (STANDARD UNITS) 8.00RJC-1 7/21/1993 1 PH (STANDARD UNITS) 8.20RJC-1 8/23/1993 1 PH (STANDARD UNITS) 8.70RJC-1 10/18/1993 1 PH (STANDARD UNITS) 8.10RJC-1 5/8/1996 1 PH (STANDARD UNITS) 8.70RJC-1 6/26/1996 1 PH (STANDARD UNITS) 8.80RJC-1 7/25/1996 1 PH (STANDARD UNITS) 8.50RJC-1 8/30/1996 1 PH (STANDARD UNITS) 8.40RJC-1 10/8/1996 1 PH (STANDARD UNITS) 8.80RJC-1 5/7/1999 1 PH (STANDARD UNITS) 7.60RJC-1 6/9/1999 1 PH (STANDARD UNITS) 8.30RJC-1 7/14/1999 1 PH (STANDARD UNITS) 8.40RJC-1 8/25/1999 1 PH (STANDARD UNITS) 8.10RJC-1 10/25/1999 1 PH (STANDARD UNITS) 8.40RJC-1 4/23/2002 1 PH (STANDARD UNITS) 8.40RJC-1 6/12/2002 1 PH (STANDARD UNITS) 8.50RJC-1 8/14/2002 1 PH (STANDARD UNITS) 8.00RJC-1 10/16/2002 1 PH (STANDARD UNITS) 8.00RJC-1 4/6/1993 1 PHOSPHORUS, TOTAL (MG/L AS P) 0.04RJC-1 4/6/1993 1 PHOSPHORUS, TOTAL (MG/L AS P) 0.04RJC-1 6/24/1993 1 PHOSPHORUS, TOTAL (MG/L AS P) 0.11RJC-1 6/24/1993 1 PHOSPHORUS, TOTAL (MG/L AS P) 0.11RJC-1 7/21/1993 1 PHOSPHORUS, TOTAL (MG/L AS P) 0.13
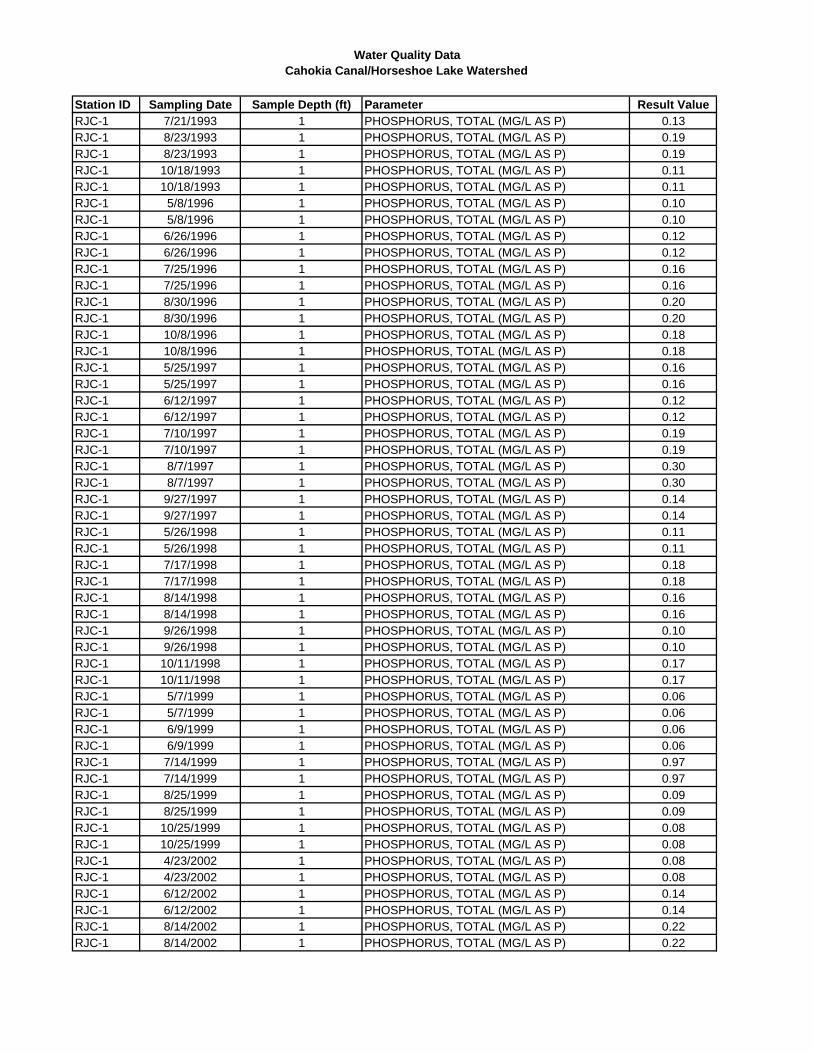
Water Quality DataCahokia Canal/Horseshoe Lake Watershed
Station ID Sampling Date Sample Depth (ft) Parameter Result ValueRJC-1 7/21/1993 1 PHOSPHORUS, TOTAL (MG/L AS P) 0.13RJC-1 8/23/1993 1 PHOSPHORUS, TOTAL (MG/L AS P) 0.19RJC-1 8/23/1993 1 PHOSPHORUS, TOTAL (MG/L AS P) 0.19RJC-1 10/18/1993 1 PHOSPHORUS, TOTAL (MG/L AS P) 0.11RJC-1 10/18/1993 1 PHOSPHORUS, TOTAL (MG/L AS P) 0.11RJC-1 5/8/1996 1 PHOSPHORUS, TOTAL (MG/L AS P) 0.10RJC-1 5/8/1996 1 PHOSPHORUS, TOTAL (MG/L AS P) 0.10RJC-1 6/26/1996 1 PHOSPHORUS, TOTAL (MG/L AS P) 0.12RJC-1 6/26/1996 1 PHOSPHORUS, TOTAL (MG/L AS P) 0.12RJC-1 7/25/1996 1 PHOSPHORUS, TOTAL (MG/L AS P) 0.16RJC-1 7/25/1996 1 PHOSPHORUS, TOTAL (MG/L AS P) 0.16RJC-1 8/30/1996 1 PHOSPHORUS, TOTAL (MG/L AS P) 0.20RJC-1 8/30/1996 1 PHOSPHORUS, TOTAL (MG/L AS P) 0.20RJC-1 10/8/1996 1 PHOSPHORUS, TOTAL (MG/L AS P) 0.18RJC-1 10/8/1996 1 PHOSPHORUS, TOTAL (MG/L AS P) 0.18RJC-1 5/25/1997 1 PHOSPHORUS, TOTAL (MG/L AS P) 0.16RJC-1 5/25/1997 1 PHOSPHORUS, TOTAL (MG/L AS P) 0.16RJC-1 6/12/1997 1 PHOSPHORUS, TOTAL (MG/L AS P) 0.12RJC-1 6/12/1997 1 PHOSPHORUS, TOTAL (MG/L AS P) 0.12RJC-1 7/10/1997 1 PHOSPHORUS, TOTAL (MG/L AS P) 0.19RJC-1 7/10/1997 1 PHOSPHORUS, TOTAL (MG/L AS P) 0.19RJC-1 8/7/1997 1 PHOSPHORUS, TOTAL (MG/L AS P) 0.30RJC-1 8/7/1997 1 PHOSPHORUS, TOTAL (MG/L AS P) 0.30RJC-1 9/27/1997 1 PHOSPHORUS, TOTAL (MG/L AS P) 0.14RJC-1 9/27/1997 1 PHOSPHORUS, TOTAL (MG/L AS P) 0.14RJC-1 5/26/1998 1 PHOSPHORUS, TOTAL (MG/L AS P) 0.11RJC-1 5/26/1998 1 PHOSPHORUS, TOTAL (MG/L AS P) 0.11RJC-1 7/17/1998 1 PHOSPHORUS, TOTAL (MG/L AS P) 0.18RJC-1 7/17/1998 1 PHOSPHORUS, TOTAL (MG/L AS P) 0.18RJC-1 8/14/1998 1 PHOSPHORUS, TOTAL (MG/L AS P) 0.16RJC-1 8/14/1998 1 PHOSPHORUS, TOTAL (MG/L AS P) 0.16RJC-1 9/26/1998 1 PHOSPHORUS, TOTAL (MG/L AS P) 0.10RJC-1 9/26/1998 1 PHOSPHORUS, TOTAL (MG/L AS P) 0.10RJC-1 10/11/1998 1 PHOSPHORUS, TOTAL (MG/L AS P) 0.17RJC-1 10/11/1998 1 PHOSPHORUS, TOTAL (MG/L AS P) 0.17RJC-1 5/7/1999 1 PHOSPHORUS, TOTAL (MG/L AS P) 0.06RJC-1 5/7/1999 1 PHOSPHORUS, TOTAL (MG/L AS P) 0.06RJC-1 6/9/1999 1 PHOSPHORUS, TOTAL (MG/L AS P) 0.06RJC-1 6/9/1999 1 PHOSPHORUS, TOTAL (MG/L AS P) 0.06RJC-1 7/14/1999 1 PHOSPHORUS, TOTAL (MG/L AS P) 0.97RJC-1 7/14/1999 1 PHOSPHORUS, TOTAL (MG/L AS P) 0.97RJC-1 8/25/1999 1 PHOSPHORUS, TOTAL (MG/L AS P) 0.09RJC-1 8/25/1999 1 PHOSPHORUS, TOTAL (MG/L AS P) 0.09RJC-1 10/25/1999 1 PHOSPHORUS, TOTAL (MG/L AS P) 0.08RJC-1 10/25/1999 1 PHOSPHORUS, TOTAL (MG/L AS P) 0.08RJC-1 4/23/2002 1 PHOSPHORUS, TOTAL (MG/L AS P) 0.08RJC-1 4/23/2002 1 PHOSPHORUS, TOTAL (MG/L AS P) 0.08RJC-1 6/12/2002 1 PHOSPHORUS, TOTAL (MG/L AS P) 0.14RJC-1 6/12/2002 1 PHOSPHORUS, TOTAL (MG/L AS P) 0.14RJC-1 8/14/2002 1 PHOSPHORUS, TOTAL (MG/L AS P) 0.22RJC-1 8/14/2002 1 PHOSPHORUS, TOTAL (MG/L AS P) 0.22
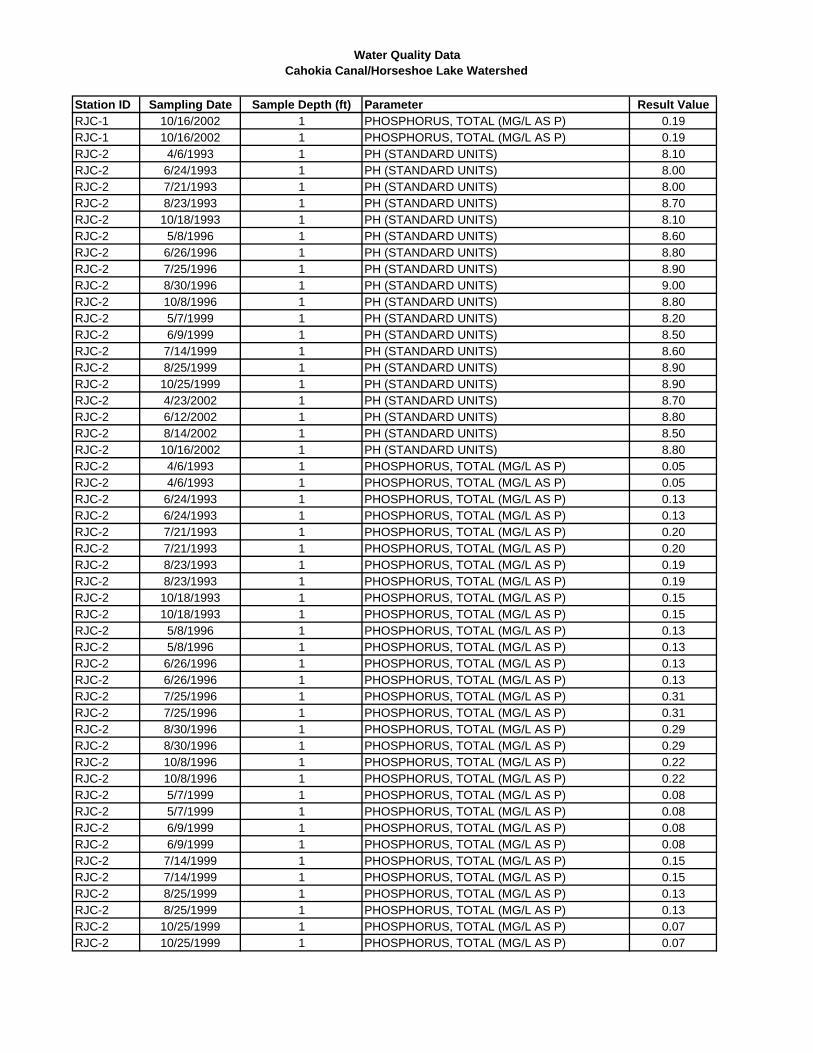
Water Quality DataCahokia Canal/Horseshoe Lake Watershed
Station ID Sampling Date Sample Depth (ft) Parameter Result ValueRJC-1 10/16/2002 1 PHOSPHORUS, TOTAL (MG/L AS P) 0.19RJC-1 10/16/2002 1 PHOSPHORUS, TOTAL (MG/L AS P) 0.19RJC-2 4/6/1993 1 PH (STANDARD UNITS) 8.10RJC-2 6/24/1993 1 PH (STANDARD UNITS) 8.00RJC-2 7/21/1993 1 PH (STANDARD UNITS) 8.00RJC-2 8/23/1993 1 PH (STANDARD UNITS) 8.70RJC-2 10/18/1993 1 PH (STANDARD UNITS) 8.10RJC-2 5/8/1996 1 PH (STANDARD UNITS) 8.60RJC-2 6/26/1996 1 PH (STANDARD UNITS) 8.80RJC-2 7/25/1996 1 PH (STANDARD UNITS) 8.90RJC-2 8/30/1996 1 PH (STANDARD UNITS) 9.00RJC-2 10/8/1996 1 PH (STANDARD UNITS) 8.80RJC-2 5/7/1999 1 PH (STANDARD UNITS) 8.20RJC-2 6/9/1999 1 PH (STANDARD UNITS) 8.50RJC-2 7/14/1999 1 PH (STANDARD UNITS) 8.60RJC-2 8/25/1999 1 PH (STANDARD UNITS) 8.90RJC-2 10/25/1999 1 PH (STANDARD UNITS) 8.90RJC-2 4/23/2002 1 PH (STANDARD UNITS) 8.70RJC-2 6/12/2002 1 PH (STANDARD UNITS) 8.80RJC-2 8/14/2002 1 PH (STANDARD UNITS) 8.50RJC-2 10/16/2002 1 PH (STANDARD UNITS) 8.80RJC-2 4/6/1993 1 PHOSPHORUS, TOTAL (MG/L AS P) 0.05RJC-2 4/6/1993 1 PHOSPHORUS, TOTAL (MG/L AS P) 0.05RJC-2 6/24/1993 1 PHOSPHORUS, TOTAL (MG/L AS P) 0.13RJC-2 6/24/1993 1 PHOSPHORUS, TOTAL (MG/L AS P) 0.13RJC-2 7/21/1993 1 PHOSPHORUS, TOTAL (MG/L AS P) 0.20RJC-2 7/21/1993 1 PHOSPHORUS, TOTAL (MG/L AS P) 0.20RJC-2 8/23/1993 1 PHOSPHORUS, TOTAL (MG/L AS P) 0.19RJC-2 8/23/1993 1 PHOSPHORUS, TOTAL (MG/L AS P) 0.19RJC-2 10/18/1993 1 PHOSPHORUS, TOTAL (MG/L AS P) 0.15RJC-2 10/18/1993 1 PHOSPHORUS, TOTAL (MG/L AS P) 0.15RJC-2 5/8/1996 1 PHOSPHORUS, TOTAL (MG/L AS P) 0.13RJC-2 5/8/1996 1 PHOSPHORUS, TOTAL (MG/L AS P) 0.13RJC-2 6/26/1996 1 PHOSPHORUS, TOTAL (MG/L AS P) 0.13RJC-2 6/26/1996 1 PHOSPHORUS, TOTAL (MG/L AS P) 0.13RJC-2 7/25/1996 1 PHOSPHORUS, TOTAL (MG/L AS P) 0.31RJC-2 7/25/1996 1 PHOSPHORUS, TOTAL (MG/L AS P) 0.31RJC-2 8/30/1996 1 PHOSPHORUS, TOTAL (MG/L AS P) 0.29RJC-2 8/30/1996 1 PHOSPHORUS, TOTAL (MG/L AS P) 0.29RJC-2 10/8/1996 1 PHOSPHORUS, TOTAL (MG/L AS P) 0.22RJC-2 10/8/1996 1 PHOSPHORUS, TOTAL (MG/L AS P) 0.22RJC-2 5/7/1999 1 PHOSPHORUS, TOTAL (MG/L AS P) 0.08RJC-2 5/7/1999 1 PHOSPHORUS, TOTAL (MG/L AS P) 0.08RJC-2 6/9/1999 1 PHOSPHORUS, TOTAL (MG/L AS P) 0.08RJC-2 6/9/1999 1 PHOSPHORUS, TOTAL (MG/L AS P) 0.08RJC-2 7/14/1999 1 PHOSPHORUS, TOTAL (MG/L AS P) 0.15RJC-2 7/14/1999 1 PHOSPHORUS, TOTAL (MG/L AS P) 0.15RJC-2 8/25/1999 1 PHOSPHORUS, TOTAL (MG/L AS P) 0.13RJC-2 8/25/1999 1 PHOSPHORUS, TOTAL (MG/L AS P) 0.13RJC-2 10/25/1999 1 PHOSPHORUS, TOTAL (MG/L AS P) 0.07RJC-2 10/25/1999 1 PHOSPHORUS, TOTAL (MG/L AS P) 0.07
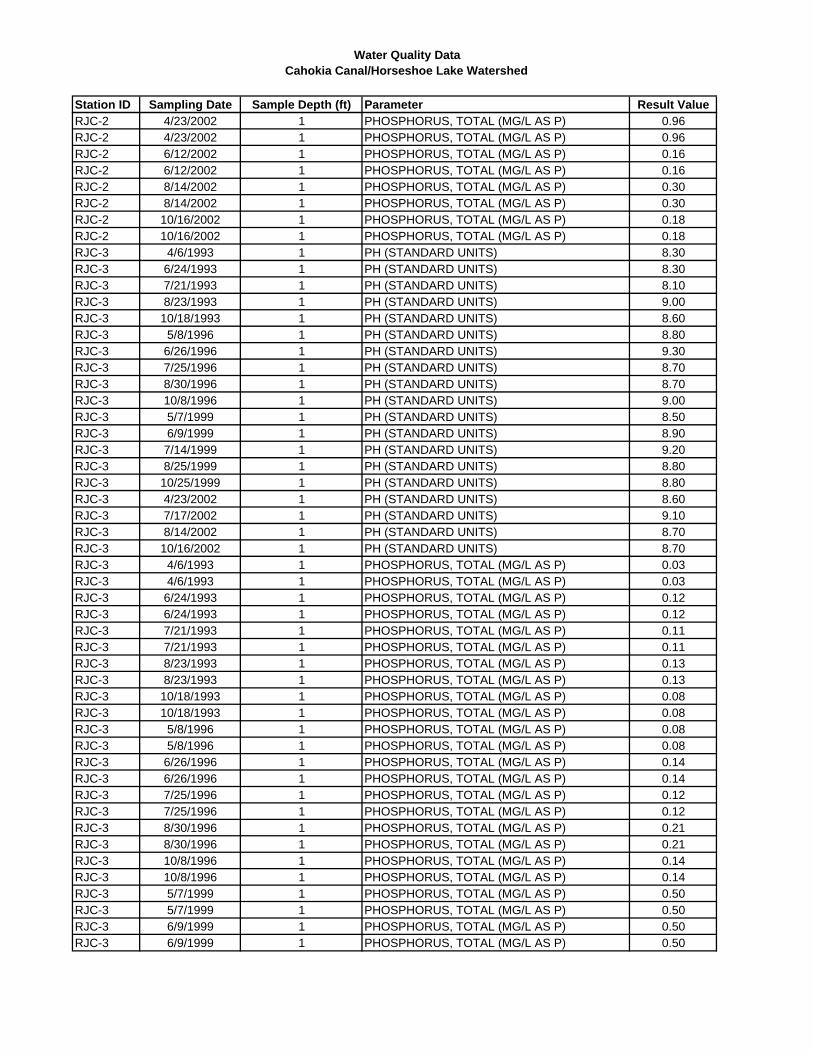
Water Quality DataCahokia Canal/Horseshoe Lake Watershed
Station ID Sampling Date Sample Depth (ft) Parameter Result ValueRJC-2 4/23/2002 1 PHOSPHORUS, TOTAL (MG/L AS P) 0.96RJC-2 4/23/2002 1 PHOSPHORUS, TOTAL (MG/L AS P) 0.96RJC-2 6/12/2002 1 PHOSPHORUS, TOTAL (MG/L AS P) 0.16RJC-2 6/12/2002 1 PHOSPHORUS, TOTAL (MG/L AS P) 0.16RJC-2 8/14/2002 1 PHOSPHORUS, TOTAL (MG/L AS P) 0.30RJC-2 8/14/2002 1 PHOSPHORUS, TOTAL (MG/L AS P) 0.30RJC-2 10/16/2002 1 PHOSPHORUS, TOTAL (MG/L AS P) 0.18RJC-2 10/16/2002 1 PHOSPHORUS, TOTAL (MG/L AS P) 0.18RJC-3 4/6/1993 1 PH (STANDARD UNITS) 8.30RJC-3 6/24/1993 1 PH (STANDARD UNITS) 8.30RJC-3 7/21/1993 1 PH (STANDARD UNITS) 8.10RJC-3 8/23/1993 1 PH (STANDARD UNITS) 9.00RJC-3 10/18/1993 1 PH (STANDARD UNITS) 8.60RJC-3 5/8/1996 1 PH (STANDARD UNITS) 8.80RJC-3 6/26/1996 1 PH (STANDARD UNITS) 9.30RJC-3 7/25/1996 1 PH (STANDARD UNITS) 8.70RJC-3 8/30/1996 1 PH (STANDARD UNITS) 8.70RJC-3 10/8/1996 1 PH (STANDARD UNITS) 9.00RJC-3 5/7/1999 1 PH (STANDARD UNITS) 8.50RJC-3 6/9/1999 1 PH (STANDARD UNITS) 8.90RJC-3 7/14/1999 1 PH (STANDARD UNITS) 9.20RJC-3 8/25/1999 1 PH (STANDARD UNITS) 8.80RJC-3 10/25/1999 1 PH (STANDARD UNITS) 8.80RJC-3 4/23/2002 1 PH (STANDARD UNITS) 8.60RJC-3 7/17/2002 1 PH (STANDARD UNITS) 9.10RJC-3 8/14/2002 1 PH (STANDARD UNITS) 8.70RJC-3 10/16/2002 1 PH (STANDARD UNITS) 8.70RJC-3 4/6/1993 1 PHOSPHORUS, TOTAL (MG/L AS P) 0.03RJC-3 4/6/1993 1 PHOSPHORUS, TOTAL (MG/L AS P) 0.03RJC-3 6/24/1993 1 PHOSPHORUS, TOTAL (MG/L AS P) 0.12RJC-3 6/24/1993 1 PHOSPHORUS, TOTAL (MG/L AS P) 0.12RJC-3 7/21/1993 1 PHOSPHORUS, TOTAL (MG/L AS P) 0.11RJC-3 7/21/1993 1 PHOSPHORUS, TOTAL (MG/L AS P) 0.11RJC-3 8/23/1993 1 PHOSPHORUS, TOTAL (MG/L AS P) 0.13RJC-3 8/23/1993 1 PHOSPHORUS, TOTAL (MG/L AS P) 0.13RJC-3 10/18/1993 1 PHOSPHORUS, TOTAL (MG/L AS P) 0.08RJC-3 10/18/1993 1 PHOSPHORUS, TOTAL (MG/L AS P) 0.08RJC-3 5/8/1996 1 PHOSPHORUS, TOTAL (MG/L AS P) 0.08RJC-3 5/8/1996 1 PHOSPHORUS, TOTAL (MG/L AS P) 0.08RJC-3 6/26/1996 1 PHOSPHORUS, TOTAL (MG/L AS P) 0.14RJC-3 6/26/1996 1 PHOSPHORUS, TOTAL (MG/L AS P) 0.14RJC-3 7/25/1996 1 PHOSPHORUS, TOTAL (MG/L AS P) 0.12RJC-3 7/25/1996 1 PHOSPHORUS, TOTAL (MG/L AS P) 0.12RJC-3 8/30/1996 1 PHOSPHORUS, TOTAL (MG/L AS P) 0.21RJC-3 8/30/1996 1 PHOSPHORUS, TOTAL (MG/L AS P) 0.21RJC-3 10/8/1996 1 PHOSPHORUS, TOTAL (MG/L AS P) 0.14RJC-3 10/8/1996 1 PHOSPHORUS, TOTAL (MG/L AS P) 0.14RJC-3 5/7/1999 1 PHOSPHORUS, TOTAL (MG/L AS P) 0.50RJC-3 5/7/1999 1 PHOSPHORUS, TOTAL (MG/L AS P) 0.50RJC-3 6/9/1999 1 PHOSPHORUS, TOTAL (MG/L AS P) 0.50RJC-3 6/9/1999 1 PHOSPHORUS, TOTAL (MG/L AS P) 0.50
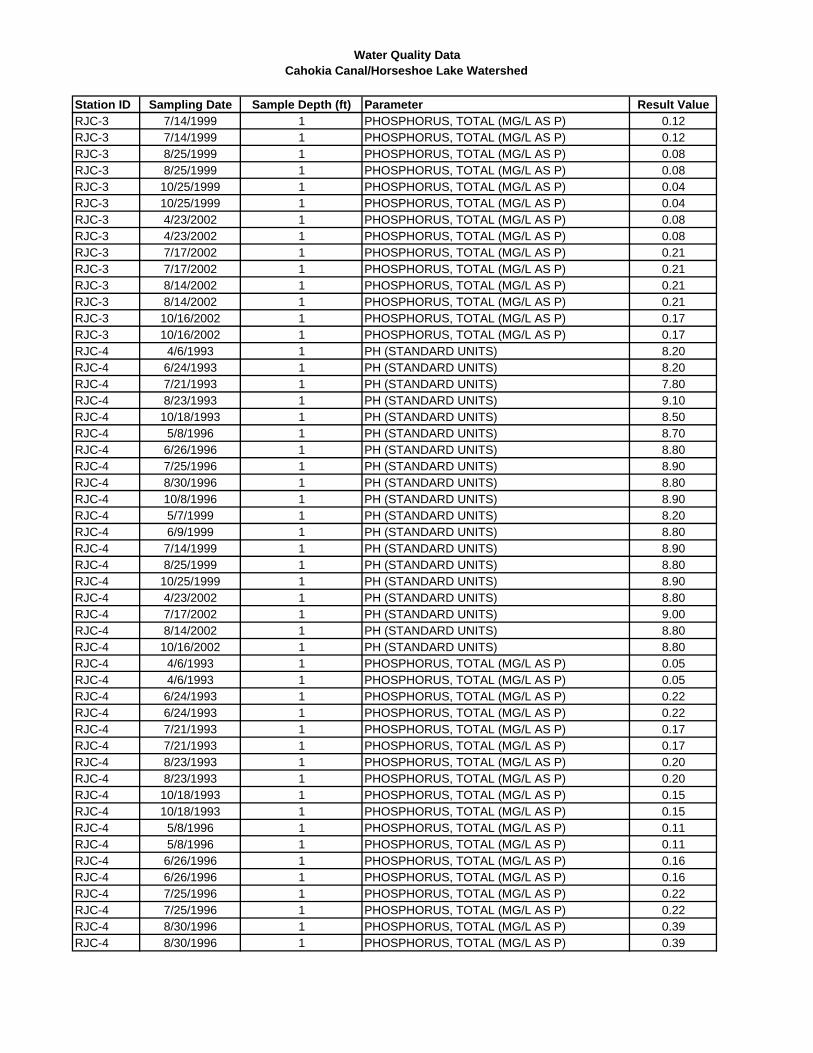
Water Quality DataCahokia Canal/Horseshoe Lake Watershed
Station ID Sampling Date Sample Depth (ft) Parameter Result ValueRJC-3 7/14/1999 1 PHOSPHORUS, TOTAL (MG/L AS P) 0.12RJC-3 7/14/1999 1 PHOSPHORUS, TOTAL (MG/L AS P) 0.12RJC-3 8/25/1999 1 PHOSPHORUS, TOTAL (MG/L AS P) 0.08RJC-3 8/25/1999 1 PHOSPHORUS, TOTAL (MG/L AS P) 0.08RJC-3 10/25/1999 1 PHOSPHORUS, TOTAL (MG/L AS P) 0.04RJC-3 10/25/1999 1 PHOSPHORUS, TOTAL (MG/L AS P) 0.04RJC-3 4/23/2002 1 PHOSPHORUS, TOTAL (MG/L AS P) 0.08RJC-3 4/23/2002 1 PHOSPHORUS, TOTAL (MG/L AS P) 0.08RJC-3 7/17/2002 1 PHOSPHORUS, TOTAL (MG/L AS P) 0.21RJC-3 7/17/2002 1 PHOSPHORUS, TOTAL (MG/L AS P) 0.21RJC-3 8/14/2002 1 PHOSPHORUS, TOTAL (MG/L AS P) 0.21RJC-3 8/14/2002 1 PHOSPHORUS, TOTAL (MG/L AS P) 0.21RJC-3 10/16/2002 1 PHOSPHORUS, TOTAL (MG/L AS P) 0.17RJC-3 10/16/2002 1 PHOSPHORUS, TOTAL (MG/L AS P) 0.17RJC-4 4/6/1993 1 PH (STANDARD UNITS) 8.20RJC-4 6/24/1993 1 PH (STANDARD UNITS) 8.20RJC-4 7/21/1993 1 PH (STANDARD UNITS) 7.80RJC-4 8/23/1993 1 PH (STANDARD UNITS) 9.10RJC-4 10/18/1993 1 PH (STANDARD UNITS) 8.50RJC-4 5/8/1996 1 PH (STANDARD UNITS) 8.70RJC-4 6/26/1996 1 PH (STANDARD UNITS) 8.80RJC-4 7/25/1996 1 PH (STANDARD UNITS) 8.90RJC-4 8/30/1996 1 PH (STANDARD UNITS) 8.80RJC-4 10/8/1996 1 PH (STANDARD UNITS) 8.90RJC-4 5/7/1999 1 PH (STANDARD UNITS) 8.20RJC-4 6/9/1999 1 PH (STANDARD UNITS) 8.80RJC-4 7/14/1999 1 PH (STANDARD UNITS) 8.90RJC-4 8/25/1999 1 PH (STANDARD UNITS) 8.80RJC-4 10/25/1999 1 PH (STANDARD UNITS) 8.90RJC-4 4/23/2002 1 PH (STANDARD UNITS) 8.80RJC-4 7/17/2002 1 PH (STANDARD UNITS) 9.00RJC-4 8/14/2002 1 PH (STANDARD UNITS) 8.80RJC-4 10/16/2002 1 PH (STANDARD UNITS) 8.80RJC-4 4/6/1993 1 PHOSPHORUS, TOTAL (MG/L AS P) 0.05RJC-4 4/6/1993 1 PHOSPHORUS, TOTAL (MG/L AS P) 0.05RJC-4 6/24/1993 1 PHOSPHORUS, TOTAL (MG/L AS P) 0.22RJC-4 6/24/1993 1 PHOSPHORUS, TOTAL (MG/L AS P) 0.22RJC-4 7/21/1993 1 PHOSPHORUS, TOTAL (MG/L AS P) 0.17RJC-4 7/21/1993 1 PHOSPHORUS, TOTAL (MG/L AS P) 0.17RJC-4 8/23/1993 1 PHOSPHORUS, TOTAL (MG/L AS P) 0.20RJC-4 8/23/1993 1 PHOSPHORUS, TOTAL (MG/L AS P) 0.20RJC-4 10/18/1993 1 PHOSPHORUS, TOTAL (MG/L AS P) 0.15RJC-4 10/18/1993 1 PHOSPHORUS, TOTAL (MG/L AS P) 0.15RJC-4 5/8/1996 1 PHOSPHORUS, TOTAL (MG/L AS P) 0.11RJC-4 5/8/1996 1 PHOSPHORUS, TOTAL (MG/L AS P) 0.11RJC-4 6/26/1996 1 PHOSPHORUS, TOTAL (MG/L AS P) 0.16RJC-4 6/26/1996 1 PHOSPHORUS, TOTAL (MG/L AS P) 0.16RJC-4 7/25/1996 1 PHOSPHORUS, TOTAL (MG/L AS P) 0.22RJC-4 7/25/1996 1 PHOSPHORUS, TOTAL (MG/L AS P) 0.22RJC-4 8/30/1996 1 PHOSPHORUS, TOTAL (MG/L AS P) 0.39RJC-4 8/30/1996 1 PHOSPHORUS, TOTAL (MG/L AS P) 0.39
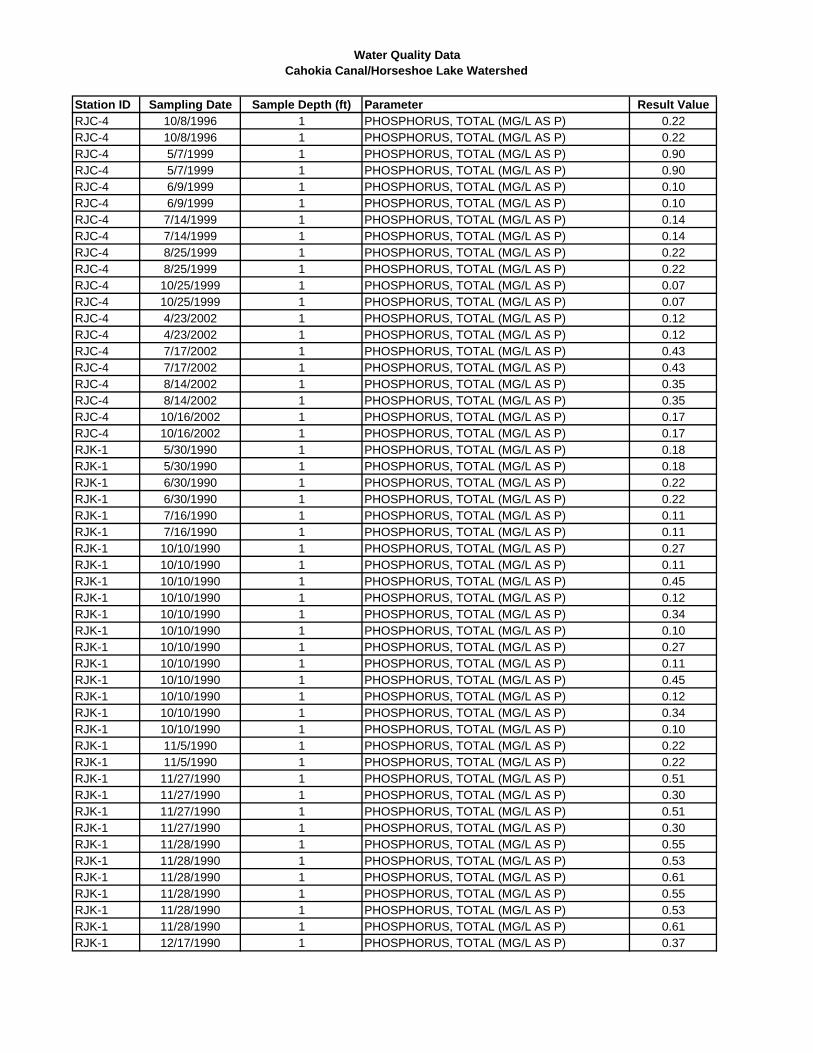
Water Quality DataCahokia Canal/Horseshoe Lake Watershed
Station ID Sampling Date Sample Depth (ft) Parameter Result ValueRJC-4 10/8/1996 1 PHOSPHORUS, TOTAL (MG/L AS P) 0.22RJC-4 10/8/1996 1 PHOSPHORUS, TOTAL (MG/L AS P) 0.22RJC-4 5/7/1999 1 PHOSPHORUS, TOTAL (MG/L AS P) 0.90RJC-4 5/7/1999 1 PHOSPHORUS, TOTAL (MG/L AS P) 0.90RJC-4 6/9/1999 1 PHOSPHORUS, TOTAL (MG/L AS P) 0.10RJC-4 6/9/1999 1 PHOSPHORUS, TOTAL (MG/L AS P) 0.10RJC-4 7/14/1999 1 PHOSPHORUS, TOTAL (MG/L AS P) 0.14RJC-4 7/14/1999 1 PHOSPHORUS, TOTAL (MG/L AS P) 0.14RJC-4 8/25/1999 1 PHOSPHORUS, TOTAL (MG/L AS P) 0.22RJC-4 8/25/1999 1 PHOSPHORUS, TOTAL (MG/L AS P) 0.22RJC-4 10/25/1999 1 PHOSPHORUS, TOTAL (MG/L AS P) 0.07RJC-4 10/25/1999 1 PHOSPHORUS, TOTAL (MG/L AS P) 0.07RJC-4 4/23/2002 1 PHOSPHORUS, TOTAL (MG/L AS P) 0.12RJC-4 4/23/2002 1 PHOSPHORUS, TOTAL (MG/L AS P) 0.12RJC-4 7/17/2002 1 PHOSPHORUS, TOTAL (MG/L AS P) 0.43RJC-4 7/17/2002 1 PHOSPHORUS, TOTAL (MG/L AS P) 0.43RJC-4 8/14/2002 1 PHOSPHORUS, TOTAL (MG/L AS P) 0.35RJC-4 8/14/2002 1 PHOSPHORUS, TOTAL (MG/L AS P) 0.35RJC-4 10/16/2002 1 PHOSPHORUS, TOTAL (MG/L AS P) 0.17RJC-4 10/16/2002 1 PHOSPHORUS, TOTAL (MG/L AS P) 0.17RJK-1 5/30/1990 1 PHOSPHORUS, TOTAL (MG/L AS P) 0.18RJK-1 5/30/1990 1 PHOSPHORUS, TOTAL (MG/L AS P) 0.18RJK-1 6/30/1990 1 PHOSPHORUS, TOTAL (MG/L AS P) 0.22RJK-1 6/30/1990 1 PHOSPHORUS, TOTAL (MG/L AS P) 0.22RJK-1 7/16/1990 1 PHOSPHORUS, TOTAL (MG/L AS P) 0.11RJK-1 7/16/1990 1 PHOSPHORUS, TOTAL (MG/L AS P) 0.11RJK-1 10/10/1990 1 PHOSPHORUS, TOTAL (MG/L AS P) 0.27RJK-1 10/10/1990 1 PHOSPHORUS, TOTAL (MG/L AS P) 0.11RJK-1 10/10/1990 1 PHOSPHORUS, TOTAL (MG/L AS P) 0.45RJK-1 10/10/1990 1 PHOSPHORUS, TOTAL (MG/L AS P) 0.12RJK-1 10/10/1990 1 PHOSPHORUS, TOTAL (MG/L AS P) 0.34RJK-1 10/10/1990 1 PHOSPHORUS, TOTAL (MG/L AS P) 0.10RJK-1 10/10/1990 1 PHOSPHORUS, TOTAL (MG/L AS P) 0.27RJK-1 10/10/1990 1 PHOSPHORUS, TOTAL (MG/L AS P) 0.11RJK-1 10/10/1990 1 PHOSPHORUS, TOTAL (MG/L AS P) 0.45RJK-1 10/10/1990 1 PHOSPHORUS, TOTAL (MG/L AS P) 0.12RJK-1 10/10/1990 1 PHOSPHORUS, TOTAL (MG/L AS P) 0.34RJK-1 10/10/1990 1 PHOSPHORUS, TOTAL (MG/L AS P) 0.10RJK-1 11/5/1990 1 PHOSPHORUS, TOTAL (MG/L AS P) 0.22RJK-1 11/5/1990 1 PHOSPHORUS, TOTAL (MG/L AS P) 0.22RJK-1 11/27/1990 1 PHOSPHORUS, TOTAL (MG/L AS P) 0.51RJK-1 11/27/1990 1 PHOSPHORUS, TOTAL (MG/L AS P) 0.30RJK-1 11/27/1990 1 PHOSPHORUS, TOTAL (MG/L AS P) 0.51RJK-1 11/27/1990 1 PHOSPHORUS, TOTAL (MG/L AS P) 0.30RJK-1 11/28/1990 1 PHOSPHORUS, TOTAL (MG/L AS P) 0.55RJK-1 11/28/1990 1 PHOSPHORUS, TOTAL (MG/L AS P) 0.53RJK-1 11/28/1990 1 PHOSPHORUS, TOTAL (MG/L AS P) 0.61RJK-1 11/28/1990 1 PHOSPHORUS, TOTAL (MG/L AS P) 0.55RJK-1 11/28/1990 1 PHOSPHORUS, TOTAL (MG/L AS P) 0.53RJK-1 11/28/1990 1 PHOSPHORUS, TOTAL (MG/L AS P) 0.61RJK-1 12/17/1990 1 PHOSPHORUS, TOTAL (MG/L AS P) 0.37
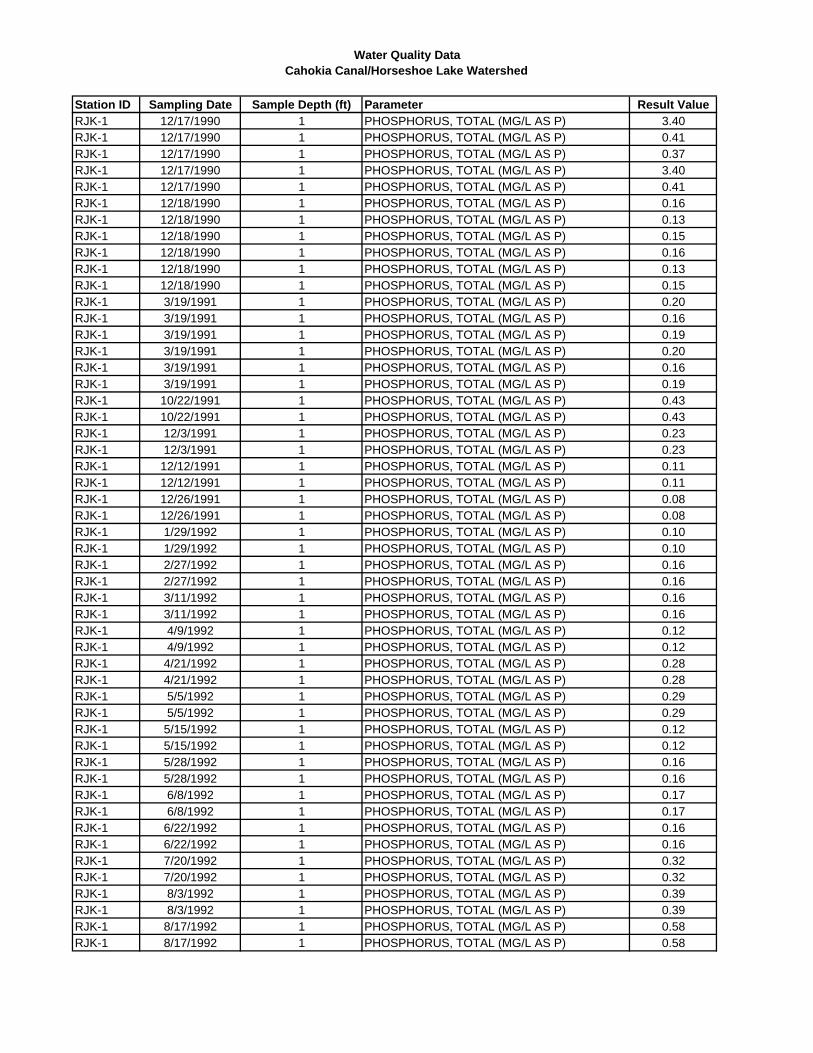
Water Quality DataCahokia Canal/Horseshoe Lake Watershed
Station ID Sampling Date Sample Depth (ft) Parameter Result ValueRJK-1 12/17/1990 1 PHOSPHORUS, TOTAL (MG/L AS P) 3.40RJK-1 12/17/1990 1 PHOSPHORUS, TOTAL (MG/L AS P) 0.41RJK-1 12/17/1990 1 PHOSPHORUS, TOTAL (MG/L AS P) 0.37RJK-1 12/17/1990 1 PHOSPHORUS, TOTAL (MG/L AS P) 3.40RJK-1 12/17/1990 1 PHOSPHORUS, TOTAL (MG/L AS P) 0.41RJK-1 12/18/1990 1 PHOSPHORUS, TOTAL (MG/L AS P) 0.16RJK-1 12/18/1990 1 PHOSPHORUS, TOTAL (MG/L AS P) 0.13RJK-1 12/18/1990 1 PHOSPHORUS, TOTAL (MG/L AS P) 0.15RJK-1 12/18/1990 1 PHOSPHORUS, TOTAL (MG/L AS P) 0.16RJK-1 12/18/1990 1 PHOSPHORUS, TOTAL (MG/L AS P) 0.13RJK-1 12/18/1990 1 PHOSPHORUS, TOTAL (MG/L AS P) 0.15RJK-1 3/19/1991 1 PHOSPHORUS, TOTAL (MG/L AS P) 0.20RJK-1 3/19/1991 1 PHOSPHORUS, TOTAL (MG/L AS P) 0.16RJK-1 3/19/1991 1 PHOSPHORUS, TOTAL (MG/L AS P) 0.19RJK-1 3/19/1991 1 PHOSPHORUS, TOTAL (MG/L AS P) 0.20RJK-1 3/19/1991 1 PHOSPHORUS, TOTAL (MG/L AS P) 0.16RJK-1 3/19/1991 1 PHOSPHORUS, TOTAL (MG/L AS P) 0.19RJK-1 10/22/1991 1 PHOSPHORUS, TOTAL (MG/L AS P) 0.43RJK-1 10/22/1991 1 PHOSPHORUS, TOTAL (MG/L AS P) 0.43RJK-1 12/3/1991 1 PHOSPHORUS, TOTAL (MG/L AS P) 0.23RJK-1 12/3/1991 1 PHOSPHORUS, TOTAL (MG/L AS P) 0.23RJK-1 12/12/1991 1 PHOSPHORUS, TOTAL (MG/L AS P) 0.11RJK-1 12/12/1991 1 PHOSPHORUS, TOTAL (MG/L AS P) 0.11RJK-1 12/26/1991 1 PHOSPHORUS, TOTAL (MG/L AS P) 0.08RJK-1 12/26/1991 1 PHOSPHORUS, TOTAL (MG/L AS P) 0.08RJK-1 1/29/1992 1 PHOSPHORUS, TOTAL (MG/L AS P) 0.10RJK-1 1/29/1992 1 PHOSPHORUS, TOTAL (MG/L AS P) 0.10RJK-1 2/27/1992 1 PHOSPHORUS, TOTAL (MG/L AS P) 0.16RJK-1 2/27/1992 1 PHOSPHORUS, TOTAL (MG/L AS P) 0.16RJK-1 3/11/1992 1 PHOSPHORUS, TOTAL (MG/L AS P) 0.16RJK-1 3/11/1992 1 PHOSPHORUS, TOTAL (MG/L AS P) 0.16RJK-1 4/9/1992 1 PHOSPHORUS, TOTAL (MG/L AS P) 0.12RJK-1 4/9/1992 1 PHOSPHORUS, TOTAL (MG/L AS P) 0.12RJK-1 4/21/1992 1 PHOSPHORUS, TOTAL (MG/L AS P) 0.28RJK-1 4/21/1992 1 PHOSPHORUS, TOTAL (MG/L AS P) 0.28RJK-1 5/5/1992 1 PHOSPHORUS, TOTAL (MG/L AS P) 0.29RJK-1 5/5/1992 1 PHOSPHORUS, TOTAL (MG/L AS P) 0.29RJK-1 5/15/1992 1 PHOSPHORUS, TOTAL (MG/L AS P) 0.12RJK-1 5/15/1992 1 PHOSPHORUS, TOTAL (MG/L AS P) 0.12RJK-1 5/28/1992 1 PHOSPHORUS, TOTAL (MG/L AS P) 0.16RJK-1 5/28/1992 1 PHOSPHORUS, TOTAL (MG/L AS P) 0.16RJK-1 6/8/1992 1 PHOSPHORUS, TOTAL (MG/L AS P) 0.17RJK-1 6/8/1992 1 PHOSPHORUS, TOTAL (MG/L AS P) 0.17RJK-1 6/22/1992 1 PHOSPHORUS, TOTAL (MG/L AS P) 0.16RJK-1 6/22/1992 1 PHOSPHORUS, TOTAL (MG/L AS P) 0.16RJK-1 7/20/1992 1 PHOSPHORUS, TOTAL (MG/L AS P) 0.32RJK-1 7/20/1992 1 PHOSPHORUS, TOTAL (MG/L AS P) 0.32RJK-1 8/3/1992 1 PHOSPHORUS, TOTAL (MG/L AS P) 0.39RJK-1 8/3/1992 1 PHOSPHORUS, TOTAL (MG/L AS P) 0.39RJK-1 8/17/1992 1 PHOSPHORUS, TOTAL (MG/L AS P) 0.58RJK-1 8/17/1992 1 PHOSPHORUS, TOTAL (MG/L AS P) 0.58
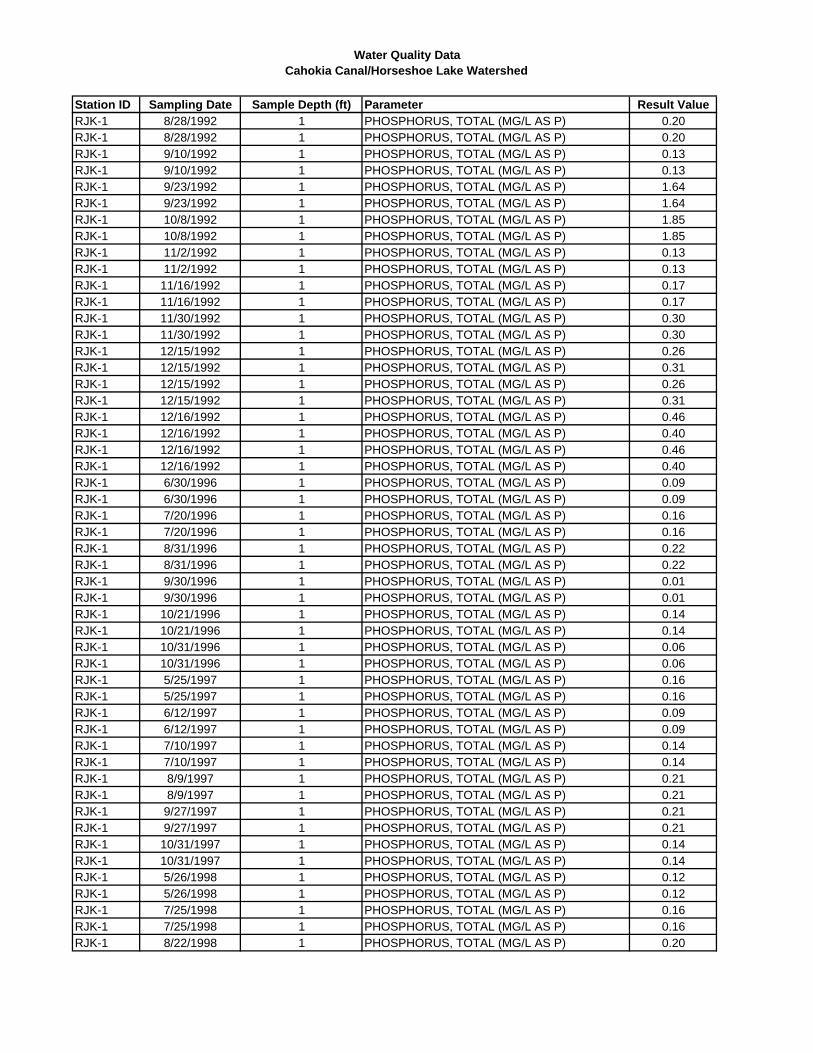
Water Quality DataCahokia Canal/Horseshoe Lake Watershed
Station ID Sampling Date Sample Depth (ft) Parameter Result ValueRJK-1 8/28/1992 1 PHOSPHORUS, TOTAL (MG/L AS P) 0.20RJK-1 8/28/1992 1 PHOSPHORUS, TOTAL (MG/L AS P) 0.20RJK-1 9/10/1992 1 PHOSPHORUS, TOTAL (MG/L AS P) 0.13RJK-1 9/10/1992 1 PHOSPHORUS, TOTAL (MG/L AS P) 0.13RJK-1 9/23/1992 1 PHOSPHORUS, TOTAL (MG/L AS P) 1.64RJK-1 9/23/1992 1 PHOSPHORUS, TOTAL (MG/L AS P) 1.64RJK-1 10/8/1992 1 PHOSPHORUS, TOTAL (MG/L AS P) 1.85RJK-1 10/8/1992 1 PHOSPHORUS, TOTAL (MG/L AS P) 1.85RJK-1 11/2/1992 1 PHOSPHORUS, TOTAL (MG/L AS P) 0.13RJK-1 11/2/1992 1 PHOSPHORUS, TOTAL (MG/L AS P) 0.13RJK-1 11/16/1992 1 PHOSPHORUS, TOTAL (MG/L AS P) 0.17RJK-1 11/16/1992 1 PHOSPHORUS, TOTAL (MG/L AS P) 0.17RJK-1 11/30/1992 1 PHOSPHORUS, TOTAL (MG/L AS P) 0.30RJK-1 11/30/1992 1 PHOSPHORUS, TOTAL (MG/L AS P) 0.30RJK-1 12/15/1992 1 PHOSPHORUS, TOTAL (MG/L AS P) 0.26RJK-1 12/15/1992 1 PHOSPHORUS, TOTAL (MG/L AS P) 0.31RJK-1 12/15/1992 1 PHOSPHORUS, TOTAL (MG/L AS P) 0.26RJK-1 12/15/1992 1 PHOSPHORUS, TOTAL (MG/L AS P) 0.31RJK-1 12/16/1992 1 PHOSPHORUS, TOTAL (MG/L AS P) 0.46RJK-1 12/16/1992 1 PHOSPHORUS, TOTAL (MG/L AS P) 0.40RJK-1 12/16/1992 1 PHOSPHORUS, TOTAL (MG/L AS P) 0.46RJK-1 12/16/1992 1 PHOSPHORUS, TOTAL (MG/L AS P) 0.40RJK-1 6/30/1996 1 PHOSPHORUS, TOTAL (MG/L AS P) 0.09RJK-1 6/30/1996 1 PHOSPHORUS, TOTAL (MG/L AS P) 0.09RJK-1 7/20/1996 1 PHOSPHORUS, TOTAL (MG/L AS P) 0.16RJK-1 7/20/1996 1 PHOSPHORUS, TOTAL (MG/L AS P) 0.16RJK-1 8/31/1996 1 PHOSPHORUS, TOTAL (MG/L AS P) 0.22RJK-1 8/31/1996 1 PHOSPHORUS, TOTAL (MG/L AS P) 0.22RJK-1 9/30/1996 1 PHOSPHORUS, TOTAL (MG/L AS P) 0.01RJK-1 9/30/1996 1 PHOSPHORUS, TOTAL (MG/L AS P) 0.01RJK-1 10/21/1996 1 PHOSPHORUS, TOTAL (MG/L AS P) 0.14RJK-1 10/21/1996 1 PHOSPHORUS, TOTAL (MG/L AS P) 0.14RJK-1 10/31/1996 1 PHOSPHORUS, TOTAL (MG/L AS P) 0.06RJK-1 10/31/1996 1 PHOSPHORUS, TOTAL (MG/L AS P) 0.06RJK-1 5/25/1997 1 PHOSPHORUS, TOTAL (MG/L AS P) 0.16RJK-1 5/25/1997 1 PHOSPHORUS, TOTAL (MG/L AS P) 0.16RJK-1 6/12/1997 1 PHOSPHORUS, TOTAL (MG/L AS P) 0.09RJK-1 6/12/1997 1 PHOSPHORUS, TOTAL (MG/L AS P) 0.09RJK-1 7/10/1997 1 PHOSPHORUS, TOTAL (MG/L AS P) 0.14RJK-1 7/10/1997 1 PHOSPHORUS, TOTAL (MG/L AS P) 0.14RJK-1 8/9/1997 1 PHOSPHORUS, TOTAL (MG/L AS P) 0.21RJK-1 8/9/1997 1 PHOSPHORUS, TOTAL (MG/L AS P) 0.21RJK-1 9/27/1997 1 PHOSPHORUS, TOTAL (MG/L AS P) 0.21RJK-1 9/27/1997 1 PHOSPHORUS, TOTAL (MG/L AS P) 0.21RJK-1 10/31/1997 1 PHOSPHORUS, TOTAL (MG/L AS P) 0.14RJK-1 10/31/1997 1 PHOSPHORUS, TOTAL (MG/L AS P) 0.14RJK-1 5/26/1998 1 PHOSPHORUS, TOTAL (MG/L AS P) 0.12RJK-1 5/26/1998 1 PHOSPHORUS, TOTAL (MG/L AS P) 0.12RJK-1 7/25/1998 1 PHOSPHORUS, TOTAL (MG/L AS P) 0.16RJK-1 7/25/1998 1 PHOSPHORUS, TOTAL (MG/L AS P) 0.16RJK-1 8/22/1998 1 PHOSPHORUS, TOTAL (MG/L AS P) 0.20
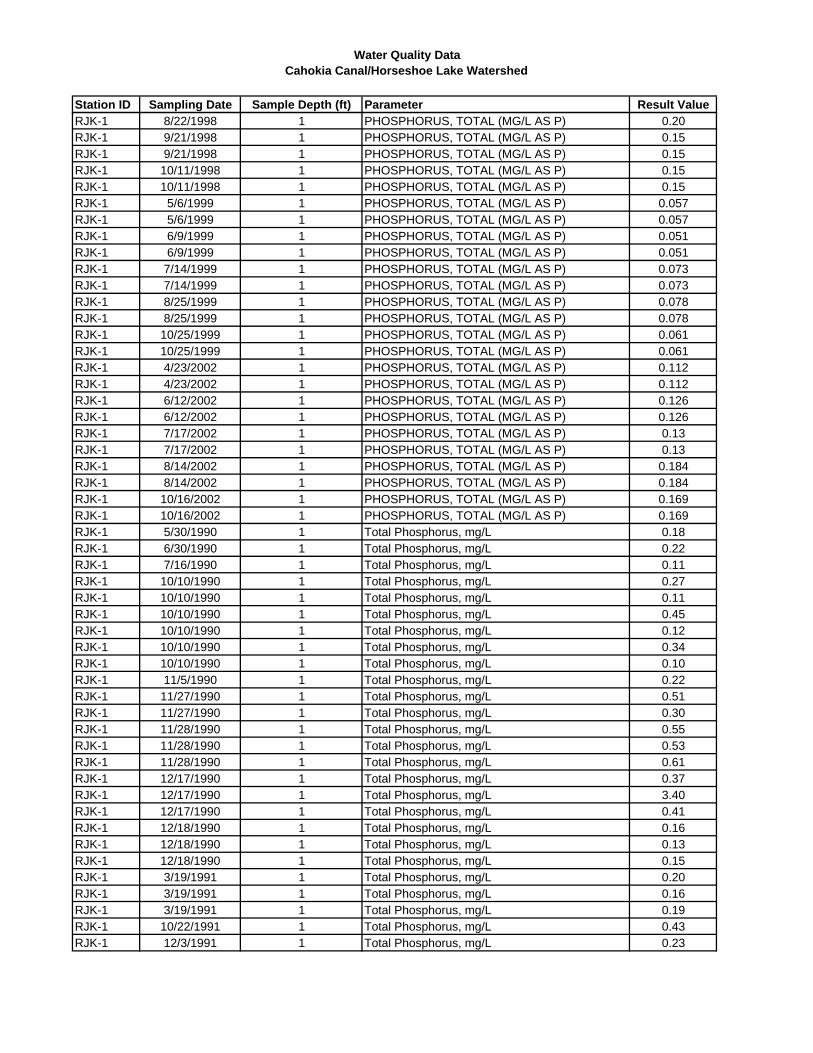
Water Quality DataCahokia Canal/Horseshoe Lake Watershed
Station ID Sampling Date Sample Depth (ft) Parameter Result ValueRJK-1 8/22/1998 1 PHOSPHORUS, TOTAL (MG/L AS P) 0.20RJK-1 9/21/1998 1 PHOSPHORUS, TOTAL (MG/L AS P) 0.15RJK-1 9/21/1998 1 PHOSPHORUS, TOTAL (MG/L AS P) 0.15RJK-1 10/11/1998 1 PHOSPHORUS, TOTAL (MG/L AS P) 0.15RJK-1 10/11/1998 1 PHOSPHORUS, TOTAL (MG/L AS P) 0.15RJK-1 5/6/1999 1 PHOSPHORUS, TOTAL (MG/L AS P) 0.057RJK-1 5/6/1999 1 PHOSPHORUS, TOTAL (MG/L AS P) 0.057RJK-1 6/9/1999 1 PHOSPHORUS, TOTAL (MG/L AS P) 0.051RJK-1 6/9/1999 1 PHOSPHORUS, TOTAL (MG/L AS P) 0.051RJK-1 7/14/1999 1 PHOSPHORUS, TOTAL (MG/L AS P) 0.073RJK-1 7/14/1999 1 PHOSPHORUS, TOTAL (MG/L AS P) 0.073RJK-1 8/25/1999 1 PHOSPHORUS, TOTAL (MG/L AS P) 0.078RJK-1 8/25/1999 1 PHOSPHORUS, TOTAL (MG/L AS P) 0.078RJK-1 10/25/1999 1 PHOSPHORUS, TOTAL (MG/L AS P) 0.061RJK-1 10/25/1999 1 PHOSPHORUS, TOTAL (MG/L AS P) 0.061RJK-1 4/23/2002 1 PHOSPHORUS, TOTAL (MG/L AS P) 0.112RJK-1 4/23/2002 1 PHOSPHORUS, TOTAL (MG/L AS P) 0.112RJK-1 6/12/2002 1 PHOSPHORUS, TOTAL (MG/L AS P) 0.126RJK-1 6/12/2002 1 PHOSPHORUS, TOTAL (MG/L AS P) 0.126RJK-1 7/17/2002 1 PHOSPHORUS, TOTAL (MG/L AS P) 0.13RJK-1 7/17/2002 1 PHOSPHORUS, TOTAL (MG/L AS P) 0.13RJK-1 8/14/2002 1 PHOSPHORUS, TOTAL (MG/L AS P) 0.184RJK-1 8/14/2002 1 PHOSPHORUS, TOTAL (MG/L AS P) 0.184RJK-1 10/16/2002 1 PHOSPHORUS, TOTAL (MG/L AS P) 0.169RJK-1 10/16/2002 1 PHOSPHORUS, TOTAL (MG/L AS P) 0.169RJK-1 5/30/1990 1 Total Phosphorus, mg/L 0.18RJK-1 6/30/1990 1 Total Phosphorus, mg/L 0.22RJK-1 7/16/1990 1 Total Phosphorus, mg/L 0.11RJK-1 10/10/1990 1 Total Phosphorus, mg/L 0.27RJK-1 10/10/1990 1 Total Phosphorus, mg/L 0.11RJK-1 10/10/1990 1 Total Phosphorus, mg/L 0.45RJK-1 10/10/1990 1 Total Phosphorus, mg/L 0.12RJK-1 10/10/1990 1 Total Phosphorus, mg/L 0.34RJK-1 10/10/1990 1 Total Phosphorus, mg/L 0.10RJK-1 11/5/1990 1 Total Phosphorus, mg/L 0.22RJK-1 11/27/1990 1 Total Phosphorus, mg/L 0.51RJK-1 11/27/1990 1 Total Phosphorus, mg/L 0.30RJK-1 11/28/1990 1 Total Phosphorus, mg/L 0.55RJK-1 11/28/1990 1 Total Phosphorus, mg/L 0.53RJK-1 11/28/1990 1 Total Phosphorus, mg/L 0.61RJK-1 12/17/1990 1 Total Phosphorus, mg/L 0.37RJK-1 12/17/1990 1 Total Phosphorus, mg/L 3.40RJK-1 12/17/1990 1 Total Phosphorus, mg/L 0.41RJK-1 12/18/1990 1 Total Phosphorus, mg/L 0.16RJK-1 12/18/1990 1 Total Phosphorus, mg/L 0.13RJK-1 12/18/1990 1 Total Phosphorus, mg/L 0.15RJK-1 3/19/1991 1 Total Phosphorus, mg/L 0.20RJK-1 3/19/1991 1 Total Phosphorus, mg/L 0.16RJK-1 3/19/1991 1 Total Phosphorus, mg/L 0.19RJK-1 10/22/1991 1 Total Phosphorus, mg/L 0.43RJK-1 12/3/1991 1 Total Phosphorus, mg/L 0.23
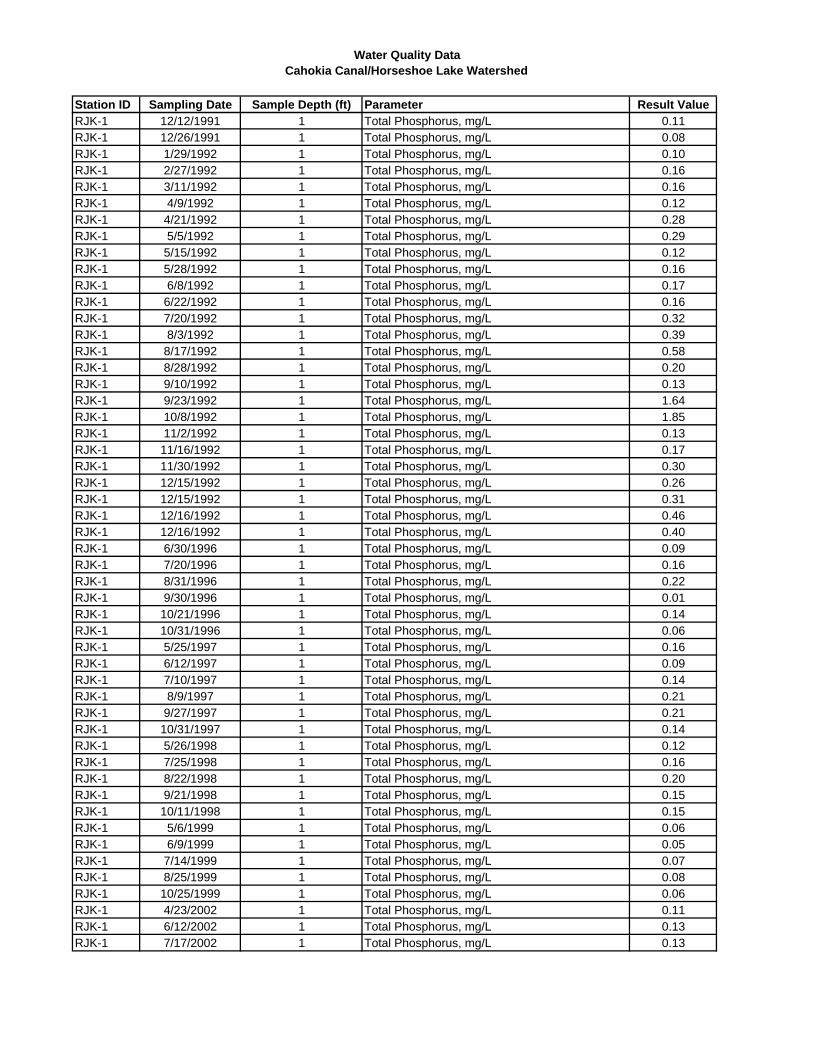
Water Quality DataCahokia Canal/Horseshoe Lake Watershed
Station ID Sampling Date Sample Depth (ft) Parameter Result ValueRJK-1 12/12/1991 1 Total Phosphorus, mg/L 0.11RJK-1 12/26/1991 1 Total Phosphorus, mg/L 0.08RJK-1 1/29/1992 1 Total Phosphorus, mg/L 0.10RJK-1 2/27/1992 1 Total Phosphorus, mg/L 0.16RJK-1 3/11/1992 1 Total Phosphorus, mg/L 0.16RJK-1 4/9/1992 1 Total Phosphorus, mg/L 0.12RJK-1 4/21/1992 1 Total Phosphorus, mg/L 0.28RJK-1 5/5/1992 1 Total Phosphorus, mg/L 0.29RJK-1 5/15/1992 1 Total Phosphorus, mg/L 0.12RJK-1 5/28/1992 1 Total Phosphorus, mg/L 0.16RJK-1 6/8/1992 1 Total Phosphorus, mg/L 0.17RJK-1 6/22/1992 1 Total Phosphorus, mg/L 0.16RJK-1 7/20/1992 1 Total Phosphorus, mg/L 0.32RJK-1 8/3/1992 1 Total Phosphorus, mg/L 0.39RJK-1 8/17/1992 1 Total Phosphorus, mg/L 0.58RJK-1 8/28/1992 1 Total Phosphorus, mg/L 0.20RJK-1 9/10/1992 1 Total Phosphorus, mg/L 0.13RJK-1 9/23/1992 1 Total Phosphorus, mg/L 1.64RJK-1 10/8/1992 1 Total Phosphorus, mg/L 1.85RJK-1 11/2/1992 1 Total Phosphorus, mg/L 0.13RJK-1 11/16/1992 1 Total Phosphorus, mg/L 0.17RJK-1 11/30/1992 1 Total Phosphorus, mg/L 0.30RJK-1 12/15/1992 1 Total Phosphorus, mg/L 0.26RJK-1 12/15/1992 1 Total Phosphorus, mg/L 0.31RJK-1 12/16/1992 1 Total Phosphorus, mg/L 0.46RJK-1 12/16/1992 1 Total Phosphorus, mg/L 0.40RJK-1 6/30/1996 1 Total Phosphorus, mg/L 0.09RJK-1 7/20/1996 1 Total Phosphorus, mg/L 0.16RJK-1 8/31/1996 1 Total Phosphorus, mg/L 0.22RJK-1 9/30/1996 1 Total Phosphorus, mg/L 0.01RJK-1 10/21/1996 1 Total Phosphorus, mg/L 0.14RJK-1 10/31/1996 1 Total Phosphorus, mg/L 0.06RJK-1 5/25/1997 1 Total Phosphorus, mg/L 0.16RJK-1 6/12/1997 1 Total Phosphorus, mg/L 0.09RJK-1 7/10/1997 1 Total Phosphorus, mg/L 0.14RJK-1 8/9/1997 1 Total Phosphorus, mg/L 0.21RJK-1 9/27/1997 1 Total Phosphorus, mg/L 0.21RJK-1 10/31/1997 1 Total Phosphorus, mg/L 0.14RJK-1 5/26/1998 1 Total Phosphorus, mg/L 0.12RJK-1 7/25/1998 1 Total Phosphorus, mg/L 0.16RJK-1 8/22/1998 1 Total Phosphorus, mg/L 0.20RJK-1 9/21/1998 1 Total Phosphorus, mg/L 0.15RJK-1 10/11/1998 1 Total Phosphorus, mg/L 0.15RJK-1 5/6/1999 1 Total Phosphorus, mg/L 0.06RJK-1 6/9/1999 1 Total Phosphorus, mg/L 0.05RJK-1 7/14/1999 1 Total Phosphorus, mg/L 0.07RJK-1 8/25/1999 1 Total Phosphorus, mg/L 0.08RJK-1 10/25/1999 1 Total Phosphorus, mg/L 0.06RJK-1 4/23/2002 1 Total Phosphorus, mg/L 0.11RJK-1 6/12/2002 1 Total Phosphorus, mg/L 0.13RJK-1 7/17/2002 1 Total Phosphorus, mg/L 0.13
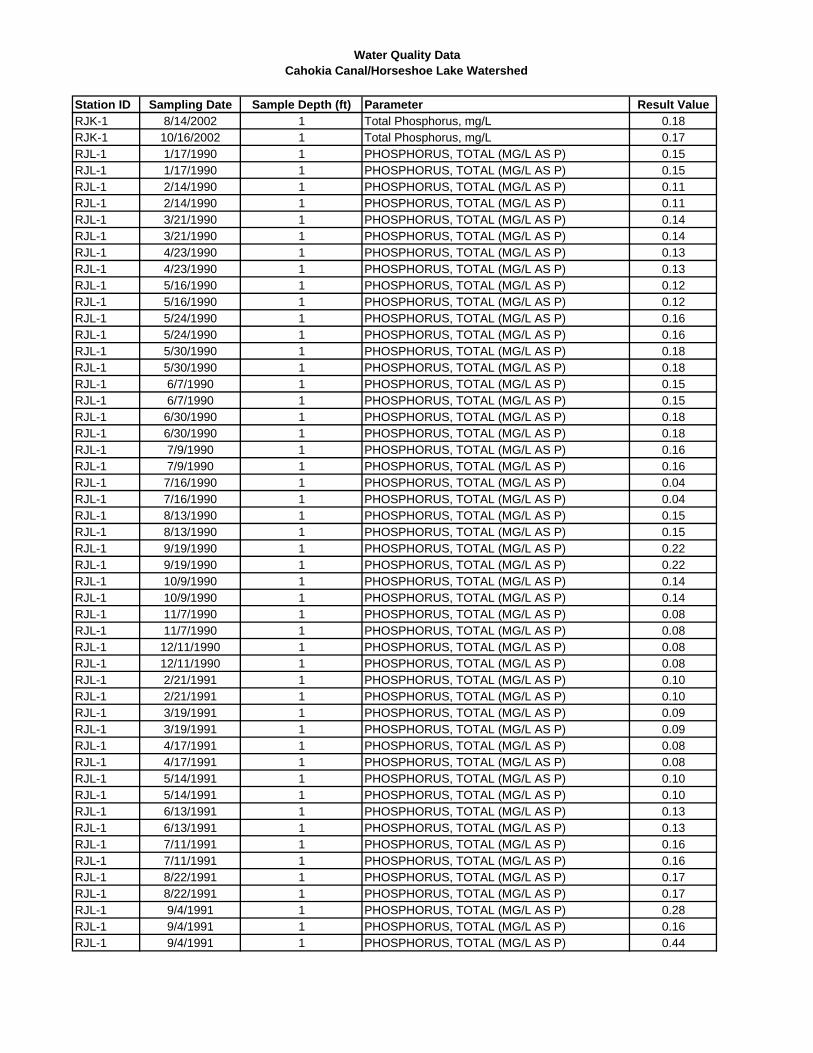
Water Quality DataCahokia Canal/Horseshoe Lake Watershed
Station ID Sampling Date Sample Depth (ft) Parameter Result ValueRJK-1 8/14/2002 1 Total Phosphorus, mg/L 0.18RJK-1 10/16/2002 1 Total Phosphorus, mg/L 0.17RJL-1 1/17/1990 1 PHOSPHORUS, TOTAL (MG/L AS P) 0.15RJL-1 1/17/1990 1 PHOSPHORUS, TOTAL (MG/L AS P) 0.15RJL-1 2/14/1990 1 PHOSPHORUS, TOTAL (MG/L AS P) 0.11RJL-1 2/14/1990 1 PHOSPHORUS, TOTAL (MG/L AS P) 0.11RJL-1 3/21/1990 1 PHOSPHORUS, TOTAL (MG/L AS P) 0.14RJL-1 3/21/1990 1 PHOSPHORUS, TOTAL (MG/L AS P) 0.14RJL-1 4/23/1990 1 PHOSPHORUS, TOTAL (MG/L AS P) 0.13RJL-1 4/23/1990 1 PHOSPHORUS, TOTAL (MG/L AS P) 0.13RJL-1 5/16/1990 1 PHOSPHORUS, TOTAL (MG/L AS P) 0.12RJL-1 5/16/1990 1 PHOSPHORUS, TOTAL (MG/L AS P) 0.12RJL-1 5/24/1990 1 PHOSPHORUS, TOTAL (MG/L AS P) 0.16RJL-1 5/24/1990 1 PHOSPHORUS, TOTAL (MG/L AS P) 0.16RJL-1 5/30/1990 1 PHOSPHORUS, TOTAL (MG/L AS P) 0.18RJL-1 5/30/1990 1 PHOSPHORUS, TOTAL (MG/L AS P) 0.18RJL-1 6/7/1990 1 PHOSPHORUS, TOTAL (MG/L AS P) 0.15RJL-1 6/7/1990 1 PHOSPHORUS, TOTAL (MG/L AS P) 0.15RJL-1 6/30/1990 1 PHOSPHORUS, TOTAL (MG/L AS P) 0.18RJL-1 6/30/1990 1 PHOSPHORUS, TOTAL (MG/L AS P) 0.18RJL-1 7/9/1990 1 PHOSPHORUS, TOTAL (MG/L AS P) 0.16RJL-1 7/9/1990 1 PHOSPHORUS, TOTAL (MG/L AS P) 0.16RJL-1 7/16/1990 1 PHOSPHORUS, TOTAL (MG/L AS P) 0.04RJL-1 7/16/1990 1 PHOSPHORUS, TOTAL (MG/L AS P) 0.04RJL-1 8/13/1990 1 PHOSPHORUS, TOTAL (MG/L AS P) 0.15RJL-1 8/13/1990 1 PHOSPHORUS, TOTAL (MG/L AS P) 0.15RJL-1 9/19/1990 1 PHOSPHORUS, TOTAL (MG/L AS P) 0.22RJL-1 9/19/1990 1 PHOSPHORUS, TOTAL (MG/L AS P) 0.22RJL-1 10/9/1990 1 PHOSPHORUS, TOTAL (MG/L AS P) 0.14RJL-1 10/9/1990 1 PHOSPHORUS, TOTAL (MG/L AS P) 0.14RJL-1 11/7/1990 1 PHOSPHORUS, TOTAL (MG/L AS P) 0.08RJL-1 11/7/1990 1 PHOSPHORUS, TOTAL (MG/L AS P) 0.08RJL-1 12/11/1990 1 PHOSPHORUS, TOTAL (MG/L AS P) 0.08RJL-1 12/11/1990 1 PHOSPHORUS, TOTAL (MG/L AS P) 0.08RJL-1 2/21/1991 1 PHOSPHORUS, TOTAL (MG/L AS P) 0.10RJL-1 2/21/1991 1 PHOSPHORUS, TOTAL (MG/L AS P) 0.10RJL-1 3/19/1991 1 PHOSPHORUS, TOTAL (MG/L AS P) 0.09RJL-1 3/19/1991 1 PHOSPHORUS, TOTAL (MG/L AS P) 0.09RJL-1 4/17/1991 1 PHOSPHORUS, TOTAL (MG/L AS P) 0.08RJL-1 4/17/1991 1 PHOSPHORUS, TOTAL (MG/L AS P) 0.08RJL-1 5/14/1991 1 PHOSPHORUS, TOTAL (MG/L AS P) 0.10RJL-1 5/14/1991 1 PHOSPHORUS, TOTAL (MG/L AS P) 0.10RJL-1 6/13/1991 1 PHOSPHORUS, TOTAL (MG/L AS P) 0.13RJL-1 6/13/1991 1 PHOSPHORUS, TOTAL (MG/L AS P) 0.13RJL-1 7/11/1991 1 PHOSPHORUS, TOTAL (MG/L AS P) 0.16RJL-1 7/11/1991 1 PHOSPHORUS, TOTAL (MG/L AS P) 0.16RJL-1 8/22/1991 1 PHOSPHORUS, TOTAL (MG/L AS P) 0.17RJL-1 8/22/1991 1 PHOSPHORUS, TOTAL (MG/L AS P) 0.17RJL-1 9/4/1991 1 PHOSPHORUS, TOTAL (MG/L AS P) 0.28RJL-1 9/4/1991 1 PHOSPHORUS, TOTAL (MG/L AS P) 0.16RJL-1 9/4/1991 1 PHOSPHORUS, TOTAL (MG/L AS P) 0.44

Water Quality DataCahokia Canal/Horseshoe Lake Watershed
Station ID Sampling Date Sample Depth (ft) Parameter Result ValueRJL-1 9/4/1991 1 PHOSPHORUS, TOTAL (MG/L AS P) 0.16RJL-1 9/4/1991 1 PHOSPHORUS, TOTAL (MG/L AS P) 0.16RJL-1 9/4/1991 1 PHOSPHORUS, TOTAL (MG/L AS P) 0.22RJL-1 9/4/1991 1 PHOSPHORUS, TOTAL (MG/L AS P) 0.28RJL-1 9/4/1991 1 PHOSPHORUS, TOTAL (MG/L AS P) 0.16RJL-1 9/4/1991 1 PHOSPHORUS, TOTAL (MG/L AS P) 0.44RJL-1 9/4/1991 1 PHOSPHORUS, TOTAL (MG/L AS P) 0.16RJL-1 9/4/1991 1 PHOSPHORUS, TOTAL (MG/L AS P) 0.16RJL-1 9/4/1991 1 PHOSPHORUS, TOTAL (MG/L AS P) 0.22RJL-1 9/18/1991 1 PHOSPHORUS, TOTAL (MG/L AS P) 0.19RJL-1 9/18/1991 1 PHOSPHORUS, TOTAL (MG/L AS P) 0.14RJL-1 9/18/1991 1 PHOSPHORUS, TOTAL (MG/L AS P) 0.14RJL-1 9/18/1991 1 PHOSPHORUS, TOTAL (MG/L AS P) 0.14RJL-1 9/18/1991 1 PHOSPHORUS, TOTAL (MG/L AS P) 0.15RJL-1 9/18/1991 1 PHOSPHORUS, TOTAL (MG/L AS P) 0.14RJL-1 9/18/1991 1 PHOSPHORUS, TOTAL (MG/L AS P) 0.19RJL-1 9/18/1991 1 PHOSPHORUS, TOTAL (MG/L AS P) 0.14RJL-1 9/18/1991 1 PHOSPHORUS, TOTAL (MG/L AS P) 0.14RJL-1 9/18/1991 1 PHOSPHORUS, TOTAL (MG/L AS P) 0.14RJL-1 9/18/1991 1 PHOSPHORUS, TOTAL (MG/L AS P) 0.15RJL-1 9/18/1991 1 PHOSPHORUS, TOTAL (MG/L AS P) 0.14RJL-1 9/20/1991 1 PHOSPHORUS, TOTAL (MG/L AS P) 0.32RJL-1 9/20/1991 1 PHOSPHORUS, TOTAL (MG/L AS P) 0.32RJL-1 10/22/1991 1 PHOSPHORUS, TOTAL (MG/L AS P) 0.16RJL-1 10/22/1991 1 PHOSPHORUS, TOTAL (MG/L AS P) 0.16RJL-1 11/19/1991 1 PHOSPHORUS, TOTAL (MG/L AS P) 0.08RJL-1 11/19/1991 1 PHOSPHORUS, TOTAL (MG/L AS P) 0.08RJL-1 12/12/1991 1 PHOSPHORUS, TOTAL (MG/L AS P) 0.08RJL-1 12/12/1991 1 PHOSPHORUS, TOTAL (MG/L AS P) 0.08RJL-1 4/9/1992 1 PHOSPHORUS, TOTAL (MG/L AS P) 0.11RJL-1 4/9/1992 1 PHOSPHORUS, TOTAL (MG/L AS P) 0.11RJL-1 6/22/1992 1 PHOSPHORUS, TOTAL (MG/L AS P) 0.14RJL-1 6/22/1992 1 PHOSPHORUS, TOTAL (MG/L AS P) 0.14RJL-1 7/15/1992 1 PHOSPHORUS, TOTAL (MG/L AS P) 0.14RJL-1 7/15/1992 1 PHOSPHORUS, TOTAL (MG/L AS P) 0.15RJL-1 7/15/1992 1 PHOSPHORUS, TOTAL (MG/L AS P) 0.13RJL-1 7/15/1992 1 PHOSPHORUS, TOTAL (MG/L AS P) 0.14RJL-1 7/15/1992 1 PHOSPHORUS, TOTAL (MG/L AS P) 0.15RJL-1 7/15/1992 1 PHOSPHORUS, TOTAL (MG/L AS P) 0.13RJL-1 7/20/1992 1 PHOSPHORUS, TOTAL (MG/L AS P) 0.16RJL-1 7/20/1992 1 PHOSPHORUS, TOTAL (MG/L AS P) 0.16RJL-1 8/17/1992 1 PHOSPHORUS, TOTAL (MG/L AS P) 0.20RJL-1 8/17/1992 1 PHOSPHORUS, TOTAL (MG/L AS P) 0.20RJL-1 10/19/1992 1 PHOSPHORUS, TOTAL (MG/L AS P) 0.16RJL-1 10/19/1992 1 PHOSPHORUS, TOTAL (MG/L AS P) 0.16RJL-1 5/8/1996 1 PHOSPHORUS, TOTAL (MG/L AS P) 0.15RJL-1 5/8/1996 1 PHOSPHORUS, TOTAL (MG/L AS P) 0.15RJL-1 6/26/1996 1 PHOSPHORUS, TOTAL (MG/L AS P) 0.11RJL-1 6/26/1996 1 PHOSPHORUS, TOTAL (MG/L AS P) 0.11RJL-1 7/26/1996 1 PHOSPHORUS, TOTAL (MG/L AS P) 0.18RJL-1 7/26/1996 1 PHOSPHORUS, TOTAL (MG/L AS P) 0.18
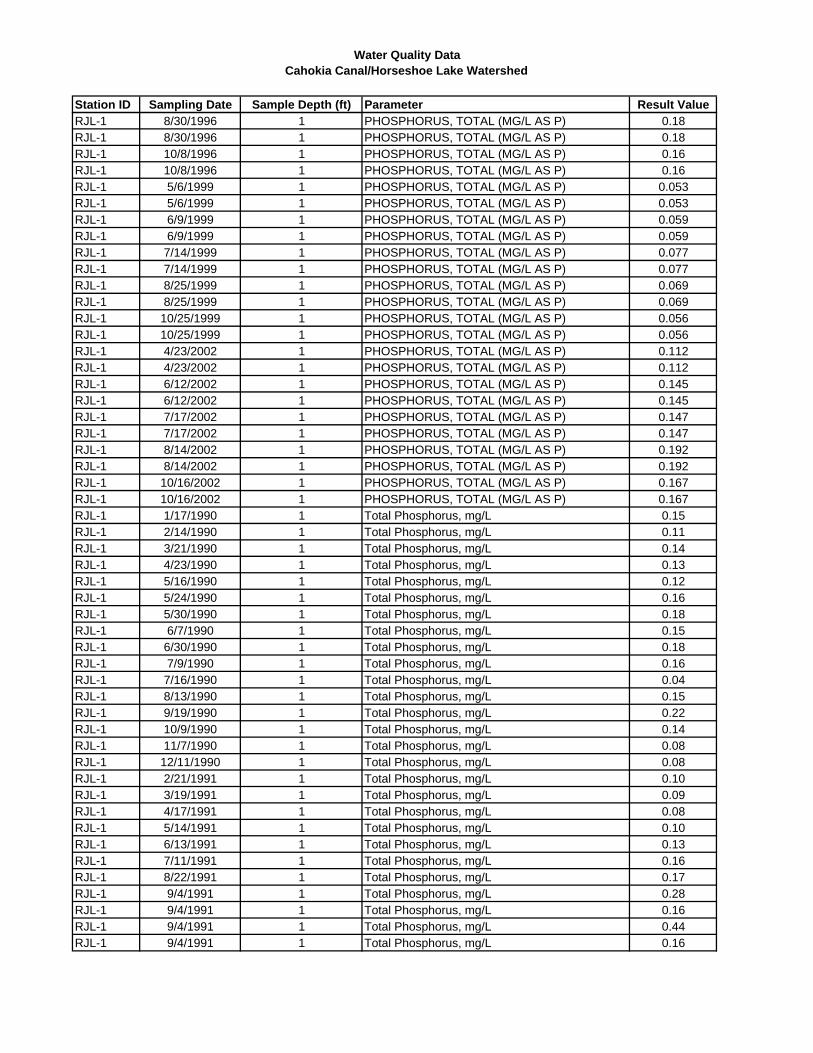
Water Quality DataCahokia Canal/Horseshoe Lake Watershed
Station ID Sampling Date Sample Depth (ft) Parameter Result ValueRJL-1 8/30/1996 1 PHOSPHORUS, TOTAL (MG/L AS P) 0.18RJL-1 8/30/1996 1 PHOSPHORUS, TOTAL (MG/L AS P) 0.18RJL-1 10/8/1996 1 PHOSPHORUS, TOTAL (MG/L AS P) 0.16RJL-1 10/8/1996 1 PHOSPHORUS, TOTAL (MG/L AS P) 0.16RJL-1 5/6/1999 1 PHOSPHORUS, TOTAL (MG/L AS P) 0.053RJL-1 5/6/1999 1 PHOSPHORUS, TOTAL (MG/L AS P) 0.053RJL-1 6/9/1999 1 PHOSPHORUS, TOTAL (MG/L AS P) 0.059RJL-1 6/9/1999 1 PHOSPHORUS, TOTAL (MG/L AS P) 0.059RJL-1 7/14/1999 1 PHOSPHORUS, TOTAL (MG/L AS P) 0.077RJL-1 7/14/1999 1 PHOSPHORUS, TOTAL (MG/L AS P) 0.077RJL-1 8/25/1999 1 PHOSPHORUS, TOTAL (MG/L AS P) 0.069RJL-1 8/25/1999 1 PHOSPHORUS, TOTAL (MG/L AS P) 0.069RJL-1 10/25/1999 1 PHOSPHORUS, TOTAL (MG/L AS P) 0.056RJL-1 10/25/1999 1 PHOSPHORUS, TOTAL (MG/L AS P) 0.056RJL-1 4/23/2002 1 PHOSPHORUS, TOTAL (MG/L AS P) 0.112RJL-1 4/23/2002 1 PHOSPHORUS, TOTAL (MG/L AS P) 0.112RJL-1 6/12/2002 1 PHOSPHORUS, TOTAL (MG/L AS P) 0.145RJL-1 6/12/2002 1 PHOSPHORUS, TOTAL (MG/L AS P) 0.145RJL-1 7/17/2002 1 PHOSPHORUS, TOTAL (MG/L AS P) 0.147RJL-1 7/17/2002 1 PHOSPHORUS, TOTAL (MG/L AS P) 0.147RJL-1 8/14/2002 1 PHOSPHORUS, TOTAL (MG/L AS P) 0.192RJL-1 8/14/2002 1 PHOSPHORUS, TOTAL (MG/L AS P) 0.192RJL-1 10/16/2002 1 PHOSPHORUS, TOTAL (MG/L AS P) 0.167RJL-1 10/16/2002 1 PHOSPHORUS, TOTAL (MG/L AS P) 0.167RJL-1 1/17/1990 1 Total Phosphorus, mg/L 0.15RJL-1 2/14/1990 1 Total Phosphorus, mg/L 0.11RJL-1 3/21/1990 1 Total Phosphorus, mg/L 0.14RJL-1 4/23/1990 1 Total Phosphorus, mg/L 0.13RJL-1 5/16/1990 1 Total Phosphorus, mg/L 0.12RJL-1 5/24/1990 1 Total Phosphorus, mg/L 0.16RJL-1 5/30/1990 1 Total Phosphorus, mg/L 0.18RJL-1 6/7/1990 1 Total Phosphorus, mg/L 0.15RJL-1 6/30/1990 1 Total Phosphorus, mg/L 0.18RJL-1 7/9/1990 1 Total Phosphorus, mg/L 0.16RJL-1 7/16/1990 1 Total Phosphorus, mg/L 0.04RJL-1 8/13/1990 1 Total Phosphorus, mg/L 0.15RJL-1 9/19/1990 1 Total Phosphorus, mg/L 0.22RJL-1 10/9/1990 1 Total Phosphorus, mg/L 0.14RJL-1 11/7/1990 1 Total Phosphorus, mg/L 0.08RJL-1 12/11/1990 1 Total Phosphorus, mg/L 0.08RJL-1 2/21/1991 1 Total Phosphorus, mg/L 0.10RJL-1 3/19/1991 1 Total Phosphorus, mg/L 0.09RJL-1 4/17/1991 1 Total Phosphorus, mg/L 0.08RJL-1 5/14/1991 1 Total Phosphorus, mg/L 0.10RJL-1 6/13/1991 1 Total Phosphorus, mg/L 0.13RJL-1 7/11/1991 1 Total Phosphorus, mg/L 0.16RJL-1 8/22/1991 1 Total Phosphorus, mg/L 0.17RJL-1 9/4/1991 1 Total Phosphorus, mg/L 0.28RJL-1 9/4/1991 1 Total Phosphorus, mg/L 0.16RJL-1 9/4/1991 1 Total Phosphorus, mg/L 0.44RJL-1 9/4/1991 1 Total Phosphorus, mg/L 0.16
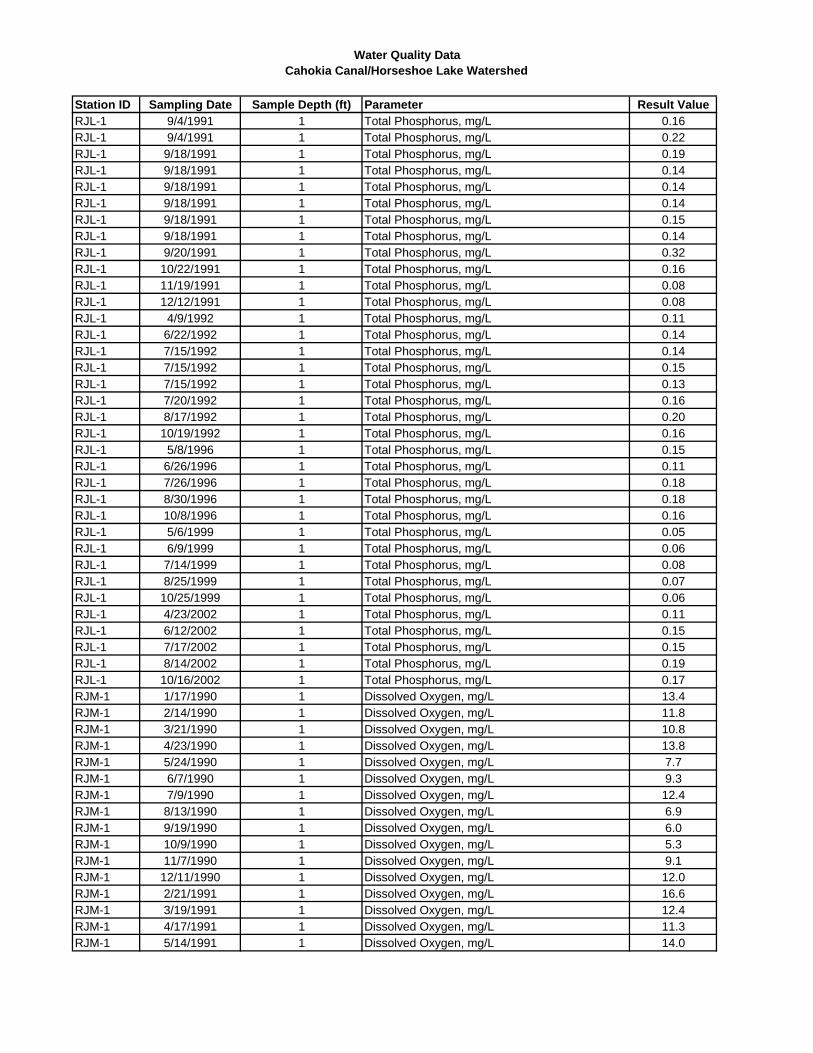
Water Quality DataCahokia Canal/Horseshoe Lake Watershed
Station ID Sampling Date Sample Depth (ft) Parameter Result ValueRJL-1 9/4/1991 1 Total Phosphorus, mg/L 0.16RJL-1 9/4/1991 1 Total Phosphorus, mg/L 0.22RJL-1 9/18/1991 1 Total Phosphorus, mg/L 0.19RJL-1 9/18/1991 1 Total Phosphorus, mg/L 0.14RJL-1 9/18/1991 1 Total Phosphorus, mg/L 0.14RJL-1 9/18/1991 1 Total Phosphorus, mg/L 0.14RJL-1 9/18/1991 1 Total Phosphorus, mg/L 0.15RJL-1 9/18/1991 1 Total Phosphorus, mg/L 0.14RJL-1 9/20/1991 1 Total Phosphorus, mg/L 0.32RJL-1 10/22/1991 1 Total Phosphorus, mg/L 0.16RJL-1 11/19/1991 1 Total Phosphorus, mg/L 0.08RJL-1 12/12/1991 1 Total Phosphorus, mg/L 0.08RJL-1 4/9/1992 1 Total Phosphorus, mg/L 0.11RJL-1 6/22/1992 1 Total Phosphorus, mg/L 0.14RJL-1 7/15/1992 1 Total Phosphorus, mg/L 0.14RJL-1 7/15/1992 1 Total Phosphorus, mg/L 0.15RJL-1 7/15/1992 1 Total Phosphorus, mg/L 0.13RJL-1 7/20/1992 1 Total Phosphorus, mg/L 0.16RJL-1 8/17/1992 1 Total Phosphorus, mg/L 0.20RJL-1 10/19/1992 1 Total Phosphorus, mg/L 0.16RJL-1 5/8/1996 1 Total Phosphorus, mg/L 0.15RJL-1 6/26/1996 1 Total Phosphorus, mg/L 0.11RJL-1 7/26/1996 1 Total Phosphorus, mg/L 0.18RJL-1 8/30/1996 1 Total Phosphorus, mg/L 0.18RJL-1 10/8/1996 1 Total Phosphorus, mg/L 0.16RJL-1 5/6/1999 1 Total Phosphorus, mg/L 0.05RJL-1 6/9/1999 1 Total Phosphorus, mg/L 0.06RJL-1 7/14/1999 1 Total Phosphorus, mg/L 0.08RJL-1 8/25/1999 1 Total Phosphorus, mg/L 0.07RJL-1 10/25/1999 1 Total Phosphorus, mg/L 0.06RJL-1 4/23/2002 1 Total Phosphorus, mg/L 0.11RJL-1 6/12/2002 1 Total Phosphorus, mg/L 0.15RJL-1 7/17/2002 1 Total Phosphorus, mg/L 0.15RJL-1 8/14/2002 1 Total Phosphorus, mg/L 0.19RJL-1 10/16/2002 1 Total Phosphorus, mg/L 0.17RJM-1 1/17/1990 1 Dissolved Oxygen, mg/L 13.4RJM-1 2/14/1990 1 Dissolved Oxygen, mg/L 11.8RJM-1 3/21/1990 1 Dissolved Oxygen, mg/L 10.8RJM-1 4/23/1990 1 Dissolved Oxygen, mg/L 13.8RJM-1 5/24/1990 1 Dissolved Oxygen, mg/L 7.7RJM-1 6/7/1990 1 Dissolved Oxygen, mg/L 9.3RJM-1 7/9/1990 1 Dissolved Oxygen, mg/L 12.4RJM-1 8/13/1990 1 Dissolved Oxygen, mg/L 6.9RJM-1 9/19/1990 1 Dissolved Oxygen, mg/L 6.0RJM-1 10/9/1990 1 Dissolved Oxygen, mg/L 5.3RJM-1 11/7/1990 1 Dissolved Oxygen, mg/L 9.1RJM-1 12/11/1990 1 Dissolved Oxygen, mg/L 12.0RJM-1 2/21/1991 1 Dissolved Oxygen, mg/L 16.6RJM-1 3/19/1991 1 Dissolved Oxygen, mg/L 12.4RJM-1 4/17/1991 1 Dissolved Oxygen, mg/L 11.3RJM-1 5/14/1991 1 Dissolved Oxygen, mg/L 14.0
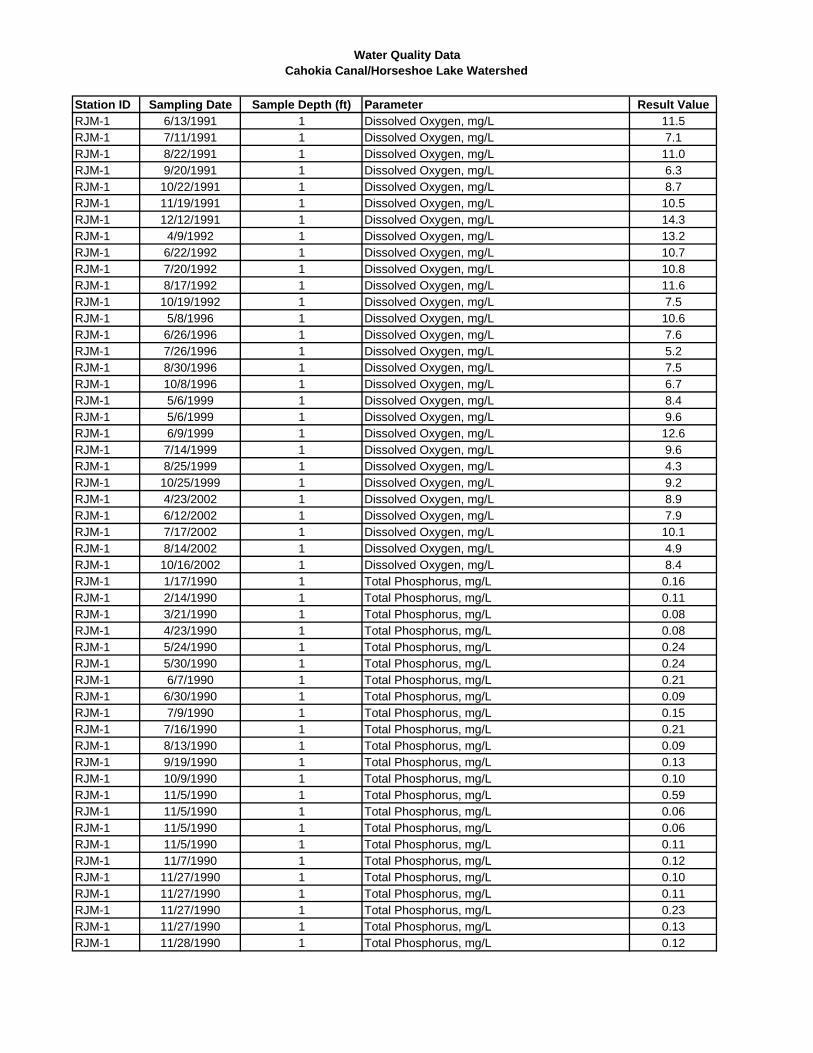
Water Quality DataCahokia Canal/Horseshoe Lake Watershed
Station ID Sampling Date Sample Depth (ft) Parameter Result ValueRJM-1 6/13/1991 1 Dissolved Oxygen, mg/L 11.5RJM-1 7/11/1991 1 Dissolved Oxygen, mg/L 7.1RJM-1 8/22/1991 1 Dissolved Oxygen, mg/L 11.0RJM-1 9/20/1991 1 Dissolved Oxygen, mg/L 6.3RJM-1 10/22/1991 1 Dissolved Oxygen, mg/L 8.7RJM-1 11/19/1991 1 Dissolved Oxygen, mg/L 10.5RJM-1 12/12/1991 1 Dissolved Oxygen, mg/L 14.3RJM-1 4/9/1992 1 Dissolved Oxygen, mg/L 13.2RJM-1 6/22/1992 1 Dissolved Oxygen, mg/L 10.7RJM-1 7/20/1992 1 Dissolved Oxygen, mg/L 10.8RJM-1 8/17/1992 1 Dissolved Oxygen, mg/L 11.6RJM-1 10/19/1992 1 Dissolved Oxygen, mg/L 7.5RJM-1 5/8/1996 1 Dissolved Oxygen, mg/L 10.6RJM-1 6/26/1996 1 Dissolved Oxygen, mg/L 7.6RJM-1 7/26/1996 1 Dissolved Oxygen, mg/L 5.2RJM-1 8/30/1996 1 Dissolved Oxygen, mg/L 7.5RJM-1 10/8/1996 1 Dissolved Oxygen, mg/L 6.7RJM-1 5/6/1999 1 Dissolved Oxygen, mg/L 8.4RJM-1 5/6/1999 1 Dissolved Oxygen, mg/L 9.6RJM-1 6/9/1999 1 Dissolved Oxygen, mg/L 12.6RJM-1 7/14/1999 1 Dissolved Oxygen, mg/L 9.6RJM-1 8/25/1999 1 Dissolved Oxygen, mg/L 4.3RJM-1 10/25/1999 1 Dissolved Oxygen, mg/L 9.2RJM-1 4/23/2002 1 Dissolved Oxygen, mg/L 8.9RJM-1 6/12/2002 1 Dissolved Oxygen, mg/L 7.9RJM-1 7/17/2002 1 Dissolved Oxygen, mg/L 10.1RJM-1 8/14/2002 1 Dissolved Oxygen, mg/L 4.9RJM-1 10/16/2002 1 Dissolved Oxygen, mg/L 8.4RJM-1 1/17/1990 1 Total Phosphorus, mg/L 0.16RJM-1 2/14/1990 1 Total Phosphorus, mg/L 0.11RJM-1 3/21/1990 1 Total Phosphorus, mg/L 0.08RJM-1 4/23/1990 1 Total Phosphorus, mg/L 0.08RJM-1 5/24/1990 1 Total Phosphorus, mg/L 0.24RJM-1 5/30/1990 1 Total Phosphorus, mg/L 0.24RJM-1 6/7/1990 1 Total Phosphorus, mg/L 0.21RJM-1 6/30/1990 1 Total Phosphorus, mg/L 0.09RJM-1 7/9/1990 1 Total Phosphorus, mg/L 0.15RJM-1 7/16/1990 1 Total Phosphorus, mg/L 0.21RJM-1 8/13/1990 1 Total Phosphorus, mg/L 0.09RJM-1 9/19/1990 1 Total Phosphorus, mg/L 0.13RJM-1 10/9/1990 1 Total Phosphorus, mg/L 0.10RJM-1 11/5/1990 1 Total Phosphorus, mg/L 0.59RJM-1 11/5/1990 1 Total Phosphorus, mg/L 0.06RJM-1 11/5/1990 1 Total Phosphorus, mg/L 0.06RJM-1 11/5/1990 1 Total Phosphorus, mg/L 0.11RJM-1 11/7/1990 1 Total Phosphorus, mg/L 0.12RJM-1 11/27/1990 1 Total Phosphorus, mg/L 0.10RJM-1 11/27/1990 1 Total Phosphorus, mg/L 0.11RJM-1 11/27/1990 1 Total Phosphorus, mg/L 0.23RJM-1 11/27/1990 1 Total Phosphorus, mg/L 0.13RJM-1 11/28/1990 1 Total Phosphorus, mg/L 0.12
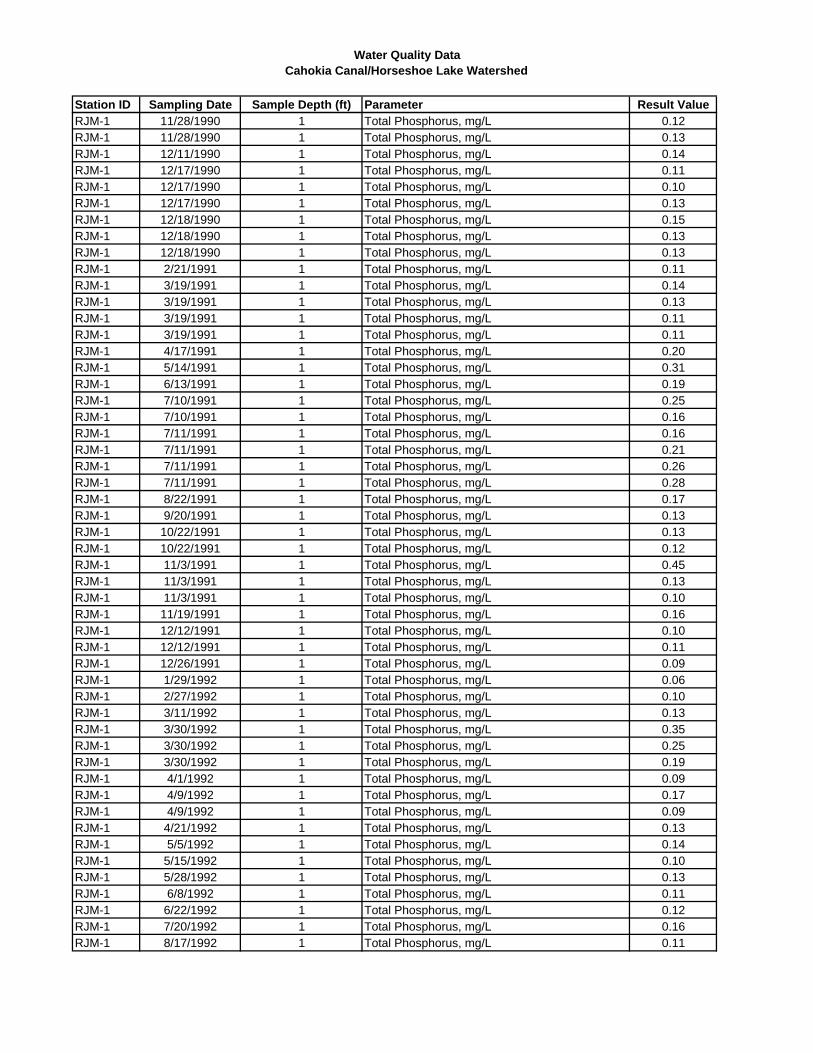
Water Quality DataCahokia Canal/Horseshoe Lake Watershed
Station ID Sampling Date Sample Depth (ft) Parameter Result ValueRJM-1 11/28/1990 1 Total Phosphorus, mg/L 0.12RJM-1 11/28/1990 1 Total Phosphorus, mg/L 0.13RJM-1 12/11/1990 1 Total Phosphorus, mg/L 0.14RJM-1 12/17/1990 1 Total Phosphorus, mg/L 0.11RJM-1 12/17/1990 1 Total Phosphorus, mg/L 0.10RJM-1 12/17/1990 1 Total Phosphorus, mg/L 0.13RJM-1 12/18/1990 1 Total Phosphorus, mg/L 0.15RJM-1 12/18/1990 1 Total Phosphorus, mg/L 0.13RJM-1 12/18/1990 1 Total Phosphorus, mg/L 0.13RJM-1 2/21/1991 1 Total Phosphorus, mg/L 0.11RJM-1 3/19/1991 1 Total Phosphorus, mg/L 0.14RJM-1 3/19/1991 1 Total Phosphorus, mg/L 0.13RJM-1 3/19/1991 1 Total Phosphorus, mg/L 0.11RJM-1 3/19/1991 1 Total Phosphorus, mg/L 0.11RJM-1 4/17/1991 1 Total Phosphorus, mg/L 0.20RJM-1 5/14/1991 1 Total Phosphorus, mg/L 0.31RJM-1 6/13/1991 1 Total Phosphorus, mg/L 0.19RJM-1 7/10/1991 1 Total Phosphorus, mg/L 0.25RJM-1 7/10/1991 1 Total Phosphorus, mg/L 0.16RJM-1 7/11/1991 1 Total Phosphorus, mg/L 0.16RJM-1 7/11/1991 1 Total Phosphorus, mg/L 0.21RJM-1 7/11/1991 1 Total Phosphorus, mg/L 0.26RJM-1 7/11/1991 1 Total Phosphorus, mg/L 0.28RJM-1 8/22/1991 1 Total Phosphorus, mg/L 0.17RJM-1 9/20/1991 1 Total Phosphorus, mg/L 0.13RJM-1 10/22/1991 1 Total Phosphorus, mg/L 0.13RJM-1 10/22/1991 1 Total Phosphorus, mg/L 0.12RJM-1 11/3/1991 1 Total Phosphorus, mg/L 0.45RJM-1 11/3/1991 1 Total Phosphorus, mg/L 0.13RJM-1 11/3/1991 1 Total Phosphorus, mg/L 0.10RJM-1 11/19/1991 1 Total Phosphorus, mg/L 0.16RJM-1 12/12/1991 1 Total Phosphorus, mg/L 0.10RJM-1 12/12/1991 1 Total Phosphorus, mg/L 0.11RJM-1 12/26/1991 1 Total Phosphorus, mg/L 0.09RJM-1 1/29/1992 1 Total Phosphorus, mg/L 0.06RJM-1 2/27/1992 1 Total Phosphorus, mg/L 0.10RJM-1 3/11/1992 1 Total Phosphorus, mg/L 0.13RJM-1 3/30/1992 1 Total Phosphorus, mg/L 0.35RJM-1 3/30/1992 1 Total Phosphorus, mg/L 0.25RJM-1 3/30/1992 1 Total Phosphorus, mg/L 0.19RJM-1 4/1/1992 1 Total Phosphorus, mg/L 0.09RJM-1 4/9/1992 1 Total Phosphorus, mg/L 0.17RJM-1 4/9/1992 1 Total Phosphorus, mg/L 0.09RJM-1 4/21/1992 1 Total Phosphorus, mg/L 0.13RJM-1 5/5/1992 1 Total Phosphorus, mg/L 0.14RJM-1 5/15/1992 1 Total Phosphorus, mg/L 0.10RJM-1 5/28/1992 1 Total Phosphorus, mg/L 0.13RJM-1 6/8/1992 1 Total Phosphorus, mg/L 0.11RJM-1 6/22/1992 1 Total Phosphorus, mg/L 0.12RJM-1 7/20/1992 1 Total Phosphorus, mg/L 0.16RJM-1 8/17/1992 1 Total Phosphorus, mg/L 0.11

Water Quality DataCahokia Canal/Horseshoe Lake Watershed
Station ID Sampling Date Sample Depth (ft) Parameter Result ValueRJM-1 8/28/1992 1 Total Phosphorus, mg/L 0.50RJM-1 10/19/1992 1 Total Phosphorus, mg/L 0.10RJM-1 5/8/1996 1 Total Phosphorus, mg/L 0.22RJM-1 6/26/1996 1 Total Phosphorus, mg/L 0.15RJM-1 7/26/1996 1 Total Phosphorus, mg/L 0.12RJM-1 8/30/1996 1 Total Phosphorus, mg/L 0.13RJM-1 10/8/1996 1 Total Phosphorus, mg/L 0.15RJM-1 5/6/1999 1 Total Phosphorus, mg/L 0.08RJM-1 6/9/1999 1 Total Phosphorus, mg/L 0.10RJM-1 7/14/1999 1 Total Phosphorus, mg/L 0.10RJM-1 8/25/1999 1 Total Phosphorus, mg/L 0.16RJM-1 10/25/1999 1 Total Phosphorus, mg/L 0.09RJM-1 4/23/2002 1 Total Phosphorus, mg/L 0.14RJM-1 6/12/2002 1 Total Phosphorus, mg/L 0.16RJM-1 7/17/2002 1 Total Phosphorus, mg/L 0.24RJM-1 8/14/2002 1 Total Phosphorus, mg/L 0.32RJM-1 10/16/2002 1 Total Phosphorus, mg/L 0.21RJM-2 1/17/1990 1 Dissolved Oxygen, mg/L 13.3RJM-2 2/14/1990 1 Dissolved Oxygen, mg/L 12.0RJM-2 3/21/1990 1 Dissolved Oxygen, mg/L 10.5RJM-2 4/23/1990 1 Dissolved Oxygen, mg/L 13.4RJM-2 5/24/1990 1 Dissolved Oxygen, mg/L 5.3RJM-2 6/7/1990 1 Dissolved Oxygen, mg/L 10.0RJM-2 7/9/1990 1 Dissolved Oxygen, mg/L 14.2RJM-2 8/13/1990 1 Dissolved Oxygen, mg/L 8.6RJM-2 9/19/1990 1 Dissolved Oxygen, mg/L 5.8RJM-2 10/9/1990 1 Dissolved Oxygen, mg/L 5.7RJM-2 11/7/1990 1 Dissolved Oxygen, mg/L 8.4RJM-2 12/11/1990 1 Dissolved Oxygen, mg/L 12.3RJM-2 2/21/1991 1 Dissolved Oxygen, mg/L 16.7RJM-2 3/19/1991 1 Dissolved Oxygen, mg/L 12.6RJM-2 4/17/1991 1 Dissolved Oxygen, mg/L 12.5RJM-2 5/14/1991 1 Dissolved Oxygen, mg/L 11.6RJM-2 6/13/1991 1 Dissolved Oxygen, mg/L 10.0RJM-2 7/11/1991 1 Dissolved Oxygen, mg/L 8.2RJM-2 8/22/1991 1 Dissolved Oxygen, mg/L 10.2RJM-2 9/20/1991 1 Dissolved Oxygen, mg/L 7.4RJM-2 10/22/1991 1 Dissolved Oxygen, mg/L 8.0RJM-2 11/19/1991 1 Dissolved Oxygen, mg/L 9.8RJM-2 12/12/1991 1 Dissolved Oxygen, mg/L 13.6RJM-2 4/9/1992 1 Dissolved Oxygen, mg/L 13.2RJM-2 6/22/1992 1 Dissolved Oxygen, mg/L 10.7RJM-2 7/20/1992 1 Dissolved Oxygen, mg/L 11.0RJM-2 8/17/1992 1 Dissolved Oxygen, mg/L 11.1RJM-2 10/19/1992 1 Dissolved Oxygen, mg/L 8.1RJM-2 5/8/1996 1 Dissolved Oxygen, mg/L 9.2RJM-2 6/26/1996 1 Dissolved Oxygen, mg/L 5.9RJM-2 7/26/1996 1 Dissolved Oxygen, mg/L 8.2RJM-2 8/30/1996 1 Dissolved Oxygen, mg/L 9.6RJM-2 10/8/1996 1 Dissolved Oxygen, mg/L 8.8RJM-2 5/6/1999 1 Dissolved Oxygen, mg/L 8.9

Water Quality DataCahokia Canal/Horseshoe Lake Watershed
Station ID Sampling Date Sample Depth (ft) Parameter Result ValueRJM-2 6/9/1999 1 Dissolved Oxygen, mg/L 10.8RJM-2 7/14/1999 1 Dissolved Oxygen, mg/L 8.3RJM-2 8/25/1999 1 Dissolved Oxygen, mg/L 5.9RJM-2 10/25/1999 1 Dissolved Oxygen, mg/L 9.6RJM-2 4/23/2002 1 Dissolved Oxygen, mg/L 10.0RJM-2 6/12/2002 1 Dissolved Oxygen, mg/L 6.2RJM-2 7/17/2002 1 Dissolved Oxygen, mg/L 10.5RJM-2 8/14/2002 1 Dissolved Oxygen, mg/L 6.7RJM-2 10/16/2002 1 Dissolved Oxygen, mg/L 9.2RJM-2 1/17/1990 1 Total Phosphorus, mg/L 0.20RJM-2 2/14/1990 1 Total Phosphorus, mg/L 0.11RJM-2 3/21/1990 1 Total Phosphorus, mg/L 0.09RJM-2 4/23/1990 1 Total Phosphorus, mg/L 0.10RJM-2 5/24/1990 1 Total Phosphorus, mg/L 0.28RJM-2 6/7/1990 1 Total Phosphorus, mg/L 0.22RJM-2 7/9/1990 1 Total Phosphorus, mg/L 0.16RJM-2 8/13/1990 1 Total Phosphorus, mg/L 0.09RJM-2 9/19/1990 1 Total Phosphorus, mg/L 0.14RJM-2 10/9/1990 1 Total Phosphorus, mg/L 0.15RJM-2 11/7/1990 1 Total Phosphorus, mg/L 0.12RJM-2 12/11/1990 1 Total Phosphorus, mg/L 0.15RJM-2 2/21/1991 1 Total Phosphorus, mg/L 0.10RJM-2 3/19/1991 1 Total Phosphorus, mg/L 0.09RJM-2 4/17/1991 1 Total Phosphorus, mg/L 0.16RJM-2 5/14/1991 1 Total Phosphorus, mg/L 0.13RJM-2 6/13/1991 1 Total Phosphorus, mg/L 0.15RJM-2 7/11/1991 1 Total Phosphorus, mg/L 0.26RJM-2 8/22/1991 1 Total Phosphorus, mg/L 0.16RJM-2 9/20/1991 1 Total Phosphorus, mg/L 0.15RJM-2 10/22/1991 1 Total Phosphorus, mg/L 0.13RJM-2 11/19/1991 1 Total Phosphorus, mg/L 0.17RJM-2 12/12/1991 1 Total Phosphorus, mg/L 0.10RJM-2 3/30/1992 1 Total Phosphorus, mg/L 0.10RJM-2 3/30/1992 1 Total Phosphorus, mg/L 0.10RJM-2 3/30/1992 1 Total Phosphorus, mg/L 0.10RJM-2 4/9/1992 1 Total Phosphorus, mg/L 0.09RJM-2 6/22/1992 1 Total Phosphorus, mg/L 0.11RJM-2 7/20/1992 1 Total Phosphorus, mg/L 0.15RJM-2 8/17/1992 1 Total Phosphorus, mg/L 0.13RJM-2 10/19/1992 1 Total Phosphorus, mg/L 0.09RJM-2 5/8/1996 1 Total Phosphorus, mg/L 0.21RJM-2 6/3/1996 1 Total Phosphorus, mg/L 0.18RJM-2 6/26/1996 1 Total Phosphorus, mg/L 0.18RJM-2 7/26/1996 1 Total Phosphorus, mg/L 0.16RJM-2 8/30/1996 1 Total Phosphorus, mg/L 0.14RJM-2 10/8/1996 1 Total Phosphorus, mg/L 0.18RJM-2 5/6/1999 1 Total Phosphorus, mg/L 0.07RJM-2 6/9/1999 1 Total Phosphorus, mg/L 0.10RJM-2 7/14/1999 1 Total Phosphorus, mg/L 0.12RJM-2 8/25/1999 1 Total Phosphorus, mg/L 0.17RJM-2 10/25/1999 1 Total Phosphorus, mg/L 0.09
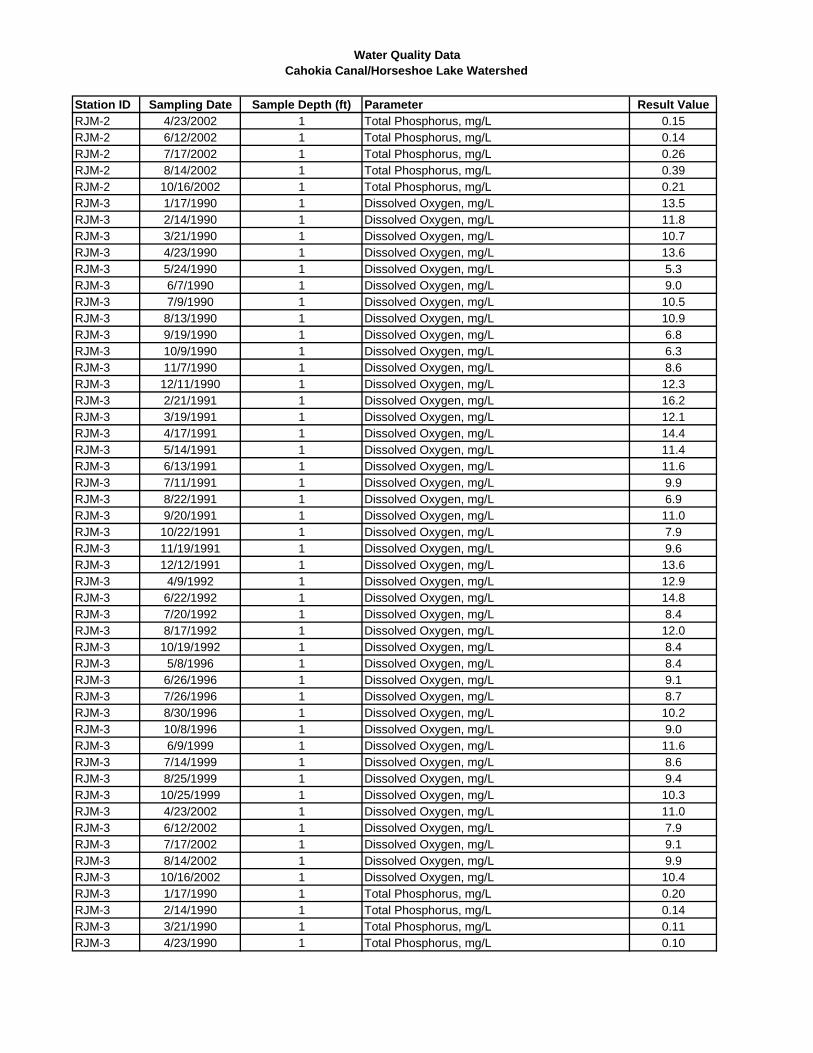
Water Quality DataCahokia Canal/Horseshoe Lake Watershed
Station ID Sampling Date Sample Depth (ft) Parameter Result ValueRJM-2 4/23/2002 1 Total Phosphorus, mg/L 0.15RJM-2 6/12/2002 1 Total Phosphorus, mg/L 0.14RJM-2 7/17/2002 1 Total Phosphorus, mg/L 0.26RJM-2 8/14/2002 1 Total Phosphorus, mg/L 0.39RJM-2 10/16/2002 1 Total Phosphorus, mg/L 0.21RJM-3 1/17/1990 1 Dissolved Oxygen, mg/L 13.5RJM-3 2/14/1990 1 Dissolved Oxygen, mg/L 11.8RJM-3 3/21/1990 1 Dissolved Oxygen, mg/L 10.7RJM-3 4/23/1990 1 Dissolved Oxygen, mg/L 13.6RJM-3 5/24/1990 1 Dissolved Oxygen, mg/L 5.3RJM-3 6/7/1990 1 Dissolved Oxygen, mg/L 9.0RJM-3 7/9/1990 1 Dissolved Oxygen, mg/L 10.5RJM-3 8/13/1990 1 Dissolved Oxygen, mg/L 10.9RJM-3 9/19/1990 1 Dissolved Oxygen, mg/L 6.8RJM-3 10/9/1990 1 Dissolved Oxygen, mg/L 6.3RJM-3 11/7/1990 1 Dissolved Oxygen, mg/L 8.6RJM-3 12/11/1990 1 Dissolved Oxygen, mg/L 12.3RJM-3 2/21/1991 1 Dissolved Oxygen, mg/L 16.2RJM-3 3/19/1991 1 Dissolved Oxygen, mg/L 12.1RJM-3 4/17/1991 1 Dissolved Oxygen, mg/L 14.4RJM-3 5/14/1991 1 Dissolved Oxygen, mg/L 11.4RJM-3 6/13/1991 1 Dissolved Oxygen, mg/L 11.6RJM-3 7/11/1991 1 Dissolved Oxygen, mg/L 9.9RJM-3 8/22/1991 1 Dissolved Oxygen, mg/L 6.9RJM-3 9/20/1991 1 Dissolved Oxygen, mg/L 11.0RJM-3 10/22/1991 1 Dissolved Oxygen, mg/L 7.9RJM-3 11/19/1991 1 Dissolved Oxygen, mg/L 9.6RJM-3 12/12/1991 1 Dissolved Oxygen, mg/L 13.6RJM-3 4/9/1992 1 Dissolved Oxygen, mg/L 12.9RJM-3 6/22/1992 1 Dissolved Oxygen, mg/L 14.8RJM-3 7/20/1992 1 Dissolved Oxygen, mg/L 8.4RJM-3 8/17/1992 1 Dissolved Oxygen, mg/L 12.0RJM-3 10/19/1992 1 Dissolved Oxygen, mg/L 8.4RJM-3 5/8/1996 1 Dissolved Oxygen, mg/L 8.4RJM-3 6/26/1996 1 Dissolved Oxygen, mg/L 9.1RJM-3 7/26/1996 1 Dissolved Oxygen, mg/L 8.7RJM-3 8/30/1996 1 Dissolved Oxygen, mg/L 10.2RJM-3 10/8/1996 1 Dissolved Oxygen, mg/L 9.0RJM-3 6/9/1999 1 Dissolved Oxygen, mg/L 11.6RJM-3 7/14/1999 1 Dissolved Oxygen, mg/L 8.6RJM-3 8/25/1999 1 Dissolved Oxygen, mg/L 9.4RJM-3 10/25/1999 1 Dissolved Oxygen, mg/L 10.3RJM-3 4/23/2002 1 Dissolved Oxygen, mg/L 11.0RJM-3 6/12/2002 1 Dissolved Oxygen, mg/L 7.9RJM-3 7/17/2002 1 Dissolved Oxygen, mg/L 9.1RJM-3 8/14/2002 1 Dissolved Oxygen, mg/L 9.9RJM-3 10/16/2002 1 Dissolved Oxygen, mg/L 10.4RJM-3 1/17/1990 1 Total Phosphorus, mg/L 0.20RJM-3 2/14/1990 1 Total Phosphorus, mg/L 0.14RJM-3 3/21/1990 1 Total Phosphorus, mg/L 0.11RJM-3 4/23/1990 1 Total Phosphorus, mg/L 0.10
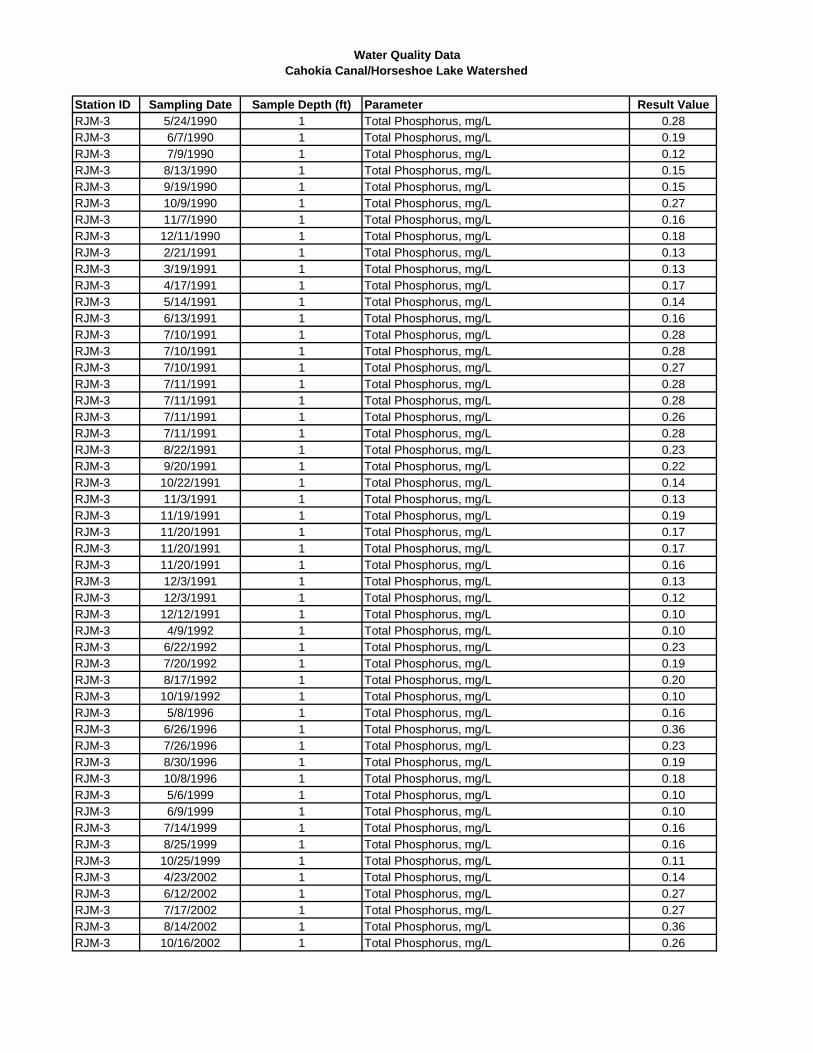
Water Quality DataCahokia Canal/Horseshoe Lake Watershed
Station ID Sampling Date Sample Depth (ft) Parameter Result ValueRJM-3 5/24/1990 1 Total Phosphorus, mg/L 0.28RJM-3 6/7/1990 1 Total Phosphorus, mg/L 0.19RJM-3 7/9/1990 1 Total Phosphorus, mg/L 0.12RJM-3 8/13/1990 1 Total Phosphorus, mg/L 0.15RJM-3 9/19/1990 1 Total Phosphorus, mg/L 0.15RJM-3 10/9/1990 1 Total Phosphorus, mg/L 0.27RJM-3 11/7/1990 1 Total Phosphorus, mg/L 0.16RJM-3 12/11/1990 1 Total Phosphorus, mg/L 0.18RJM-3 2/21/1991 1 Total Phosphorus, mg/L 0.13RJM-3 3/19/1991 1 Total Phosphorus, mg/L 0.13RJM-3 4/17/1991 1 Total Phosphorus, mg/L 0.17RJM-3 5/14/1991 1 Total Phosphorus, mg/L 0.14RJM-3 6/13/1991 1 Total Phosphorus, mg/L 0.16RJM-3 7/10/1991 1 Total Phosphorus, mg/L 0.28RJM-3 7/10/1991 1 Total Phosphorus, mg/L 0.28RJM-3 7/10/1991 1 Total Phosphorus, mg/L 0.27RJM-3 7/11/1991 1 Total Phosphorus, mg/L 0.28RJM-3 7/11/1991 1 Total Phosphorus, mg/L 0.28RJM-3 7/11/1991 1 Total Phosphorus, mg/L 0.26RJM-3 7/11/1991 1 Total Phosphorus, mg/L 0.28RJM-3 8/22/1991 1 Total Phosphorus, mg/L 0.23RJM-3 9/20/1991 1 Total Phosphorus, mg/L 0.22RJM-3 10/22/1991 1 Total Phosphorus, mg/L 0.14RJM-3 11/3/1991 1 Total Phosphorus, mg/L 0.13RJM-3 11/19/1991 1 Total Phosphorus, mg/L 0.19RJM-3 11/20/1991 1 Total Phosphorus, mg/L 0.17RJM-3 11/20/1991 1 Total Phosphorus, mg/L 0.17RJM-3 11/20/1991 1 Total Phosphorus, mg/L 0.16RJM-3 12/3/1991 1 Total Phosphorus, mg/L 0.13RJM-3 12/3/1991 1 Total Phosphorus, mg/L 0.12RJM-3 12/12/1991 1 Total Phosphorus, mg/L 0.10RJM-3 4/9/1992 1 Total Phosphorus, mg/L 0.10RJM-3 6/22/1992 1 Total Phosphorus, mg/L 0.23RJM-3 7/20/1992 1 Total Phosphorus, mg/L 0.19RJM-3 8/17/1992 1 Total Phosphorus, mg/L 0.20RJM-3 10/19/1992 1 Total Phosphorus, mg/L 0.10RJM-3 5/8/1996 1 Total Phosphorus, mg/L 0.16RJM-3 6/26/1996 1 Total Phosphorus, mg/L 0.36RJM-3 7/26/1996 1 Total Phosphorus, mg/L 0.23RJM-3 8/30/1996 1 Total Phosphorus, mg/L 0.19RJM-3 10/8/1996 1 Total Phosphorus, mg/L 0.18RJM-3 5/6/1999 1 Total Phosphorus, mg/L 0.10RJM-3 6/9/1999 1 Total Phosphorus, mg/L 0.10RJM-3 7/14/1999 1 Total Phosphorus, mg/L 0.16RJM-3 8/25/1999 1 Total Phosphorus, mg/L 0.16RJM-3 10/25/1999 1 Total Phosphorus, mg/L 0.11RJM-3 4/23/2002 1 Total Phosphorus, mg/L 0.14RJM-3 6/12/2002 1 Total Phosphorus, mg/L 0.27RJM-3 7/17/2002 1 Total Phosphorus, mg/L 0.27RJM-3 8/14/2002 1 Total Phosphorus, mg/L 0.36RJM-3 10/16/2002 1 Total Phosphorus, mg/L 0.26

Continuous Dissolved Oxygen DataCahokia Canal/Horseshoe Lake Watershed
Log File Name Sampling Date Sampling Time Sample Depth (ft) Parameter Result ValueJMAA-02-PO 7/25/2005 12:00:00 NA DISSOLVED OXYGEN (DO) mg/l 6.38JMAA-02-PO 7/25/2005 12:30:00 NA DISSOLVED OXYGEN (DO) mg/l 6.69JMAA-02-PO 7/25/2005 13:00:00 NA DISSOLVED OXYGEN (DO) mg/l 6.98JMAA-02-PO 7/25/2005 13:30:00 NA DISSOLVED OXYGEN (DO) mg/l 7.23JMAA-02-PO 7/25/2005 14:00:00 NA DISSOLVED OXYGEN (DO) mg/l 7.44JMAA-02-PO 7/25/2005 14:30:00 NA DISSOLVED OXYGEN (DO) mg/l 7.58JMAA-02-PO 7/25/2005 15:00:00 NA DISSOLVED OXYGEN (DO) mg/l 7.62JMAA-02-PO 7/25/2005 15:30:00 NA DISSOLVED OXYGEN (DO) mg/l 7.59JMAA-02-PO 7/25/2005 16:00:00 NA DISSOLVED OXYGEN (DO) mg/l 7.59JMAA-02-PO 7/25/2005 16:30:00 NA DISSOLVED OXYGEN (DO) mg/l 7.52JMAA-02-PO 7/25/2005 17:00:00 NA DISSOLVED OXYGEN (DO) mg/l 7.49JMAA-02-PO 7/25/2005 17:30:00 NA DISSOLVED OXYGEN (DO) mg/l 7.42JMAA-02-PO 7/25/2005 18:00:00 NA DISSOLVED OXYGEN (DO) mg/l 7.38JMAA-02-PO 7/25/2005 18:30:00 NA DISSOLVED OXYGEN (DO) mg/l 7.24JMAA-02-PO 7/25/2005 19:00:00 NA DISSOLVED OXYGEN (DO) mg/l 7.09JMAA-02-PO 7/25/2005 19:30:00 NA DISSOLVED OXYGEN (DO) mg/l 6.87JMAA-02-PO 7/25/2005 20:00:00 NA DISSOLVED OXYGEN (DO) mg/l 6.64JMAA-02-PO 7/25/2005 20:30:00 NA DISSOLVED OXYGEN (DO) mg/l 6.49JMAA-02-PO 7/25/2005 21:00:00 NA DISSOLVED OXYGEN (DO) mg/l 6.34JMAA-02-PO 7/25/2005 21:30:00 NA DISSOLVED OXYGEN (DO) mg/l 6.15JMAA-02-PO 7/25/2005 22:00:00 NA DISSOLVED OXYGEN (DO) mg/l 6JMAA-02-PO 7/25/2005 22:30:00 NA DISSOLVED OXYGEN (DO) mg/l 5.82JMAA-02-PO 7/25/2005 23:00:00 NA DISSOLVED OXYGEN (DO) mg/l 5.69JMAA-02-PO 7/25/2005 23:30:00 NA DISSOLVED OXYGEN (DO) mg/l 5.62JMAA-02-PO 7/26/2005 0:00:00 NA DISSOLVED OXYGEN (DO) mg/l 5.52JMAA-02-PO 7/26/2005 0:30:00 NA DISSOLVED OXYGEN (DO) mg/l 5.51JMAA-02-PO 7/26/2005 1:00:00 NA DISSOLVED OXYGEN (DO) mg/l 5.37JMAA-02-PO 7/26/2005 1:30:00 NA DISSOLVED OXYGEN (DO) mg/l 5.32JMAA-02-PO 7/26/2005 2:00:00 NA DISSOLVED OXYGEN (DO) mg/l 5.25JMAA-02-PO 7/26/2005 2:30:00 NA DISSOLVED OXYGEN (DO) mg/l 5.23JMAA-02-PO 7/26/2005 3:00:00 NA DISSOLVED OXYGEN (DO) mg/l 5.18JMAA-02-PO 7/26/2005 3:30:00 NA DISSOLVED OXYGEN (DO) mg/l 5.24JMAA-02-PO 7/26/2005 4:00:00 NA DISSOLVED OXYGEN (DO) mg/l 5.17JMAA-02-PO 7/26/2005 4:30:00 NA DISSOLVED OXYGEN (DO) mg/l 5.16JMAA-02-PO 7/26/2005 5:00:00 NA DISSOLVED OXYGEN (DO) mg/l 5.13JMAA-02-PO 7/26/2005 5:30:00 NA DISSOLVED OXYGEN (DO) mg/l 5.14JMAA-02-PO 7/26/2005 6:00:00 NA DISSOLVED OXYGEN (DO) mg/l 5.16JMAA-02-PO 7/26/2005 6:30:00 NA DISSOLVED OXYGEN (DO) mg/l 5.2JMAA-02-PO 7/26/2005 7:00:00 NA DISSOLVED OXYGEN (DO) mg/l 5.23JMAA-02-PO 7/26/2005 7:30:00 NA DISSOLVED OXYGEN (DO) mg/l 5.3JMAA-02-PO 7/26/2005 8:00:00 NA DISSOLVED OXYGEN (DO) mg/l 5.3JMAA-02-PO 7/26/2005 8:30:00 NA DISSOLVED OXYGEN (DO) mg/l 5.36JMAA-02-PO 7/26/2005 9:00:00 NA DISSOLVED OXYGEN (DO) mg/l 5.4JMAA-02-PO 7/26/2005 9:30:00 NA DISSOLVED OXYGEN (DO) mg/l 5.47JMAA-02-PO 7/26/2005 10:00:00 NA DISSOLVED OXYGEN (DO) mg/l 5.57JMAA-02-PO 7/26/2005 10:30:00 NA DISSOLVED OXYGEN (DO) mg/l 5.73JMAA-02-PO 7/26/2005 11:00:00 NA DISSOLVED OXYGEN (DO) mg/l 5.94JMAA-02-PO 7/26/2005 11:30:00 NA DISSOLVED OXYGEN (DO) mg/l 6.23JMAA-02-PO 7/26/2005 12:00:00 NA DISSOLVED OXYGEN (DO) mg/l 6.51JMAA-02-PO 7/26/2005 12:30:00 NA DISSOLVED OXYGEN (DO) mg/l 6.78JMAA-02-PO 7/26/2005 13:00:00 NA DISSOLVED OXYGEN (DO) mg/l 7.06JMAA-02-PO 7/26/2005 13:30:00 NA DISSOLVED OXYGEN (DO) mg/l 7.4JMAA-02-PO 7/26/2005 14:00:00 NA DISSOLVED OXYGEN (DO) mg/l 7.67JMAA-02-PO 7/26/2005 14:30:00 NA DISSOLVED OXYGEN (DO) mg/l 7.77
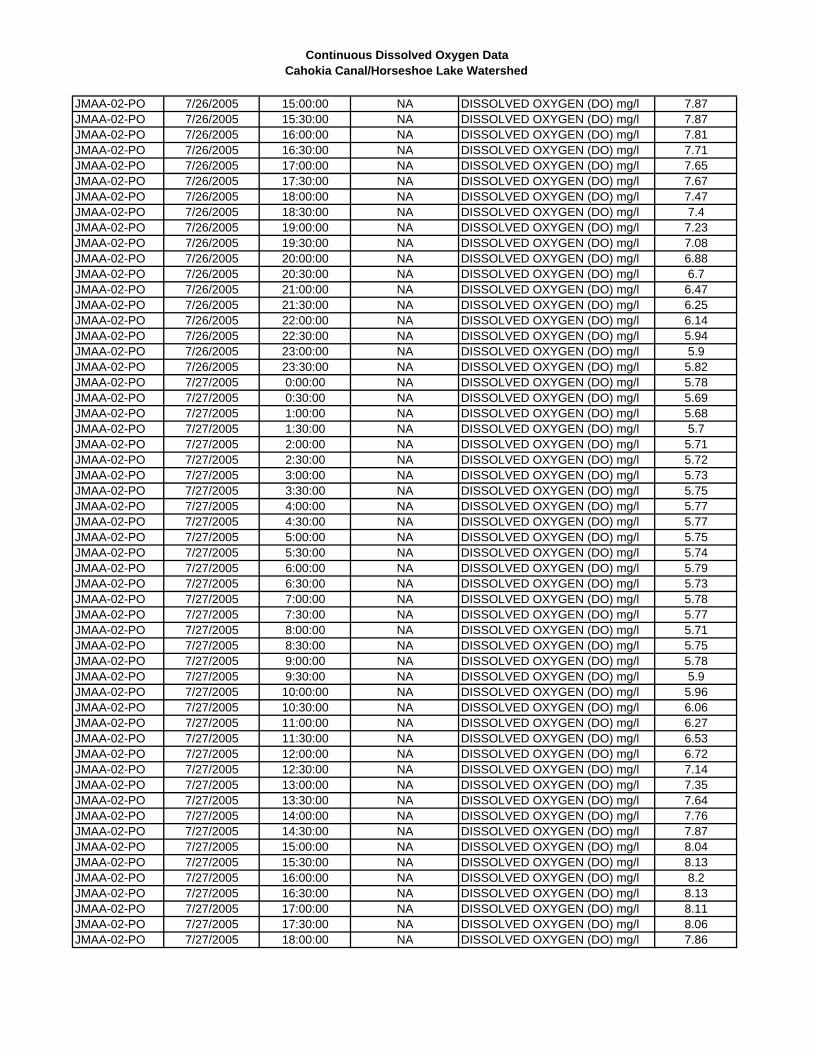
Continuous Dissolved Oxygen DataCahokia Canal/Horseshoe Lake Watershed
JMAA-02-PO 7/26/2005 15:00:00 NA DISSOLVED OXYGEN (DO) mg/l 7.87JMAA-02-PO 7/26/2005 15:30:00 NA DISSOLVED OXYGEN (DO) mg/l 7.87JMAA-02-PO 7/26/2005 16:00:00 NA DISSOLVED OXYGEN (DO) mg/l 7.81JMAA-02-PO 7/26/2005 16:30:00 NA DISSOLVED OXYGEN (DO) mg/l 7.71JMAA-02-PO 7/26/2005 17:00:00 NA DISSOLVED OXYGEN (DO) mg/l 7.65JMAA-02-PO 7/26/2005 17:30:00 NA DISSOLVED OXYGEN (DO) mg/l 7.67JMAA-02-PO 7/26/2005 18:00:00 NA DISSOLVED OXYGEN (DO) mg/l 7.47JMAA-02-PO 7/26/2005 18:30:00 NA DISSOLVED OXYGEN (DO) mg/l 7.4JMAA-02-PO 7/26/2005 19:00:00 NA DISSOLVED OXYGEN (DO) mg/l 7.23JMAA-02-PO 7/26/2005 19:30:00 NA DISSOLVED OXYGEN (DO) mg/l 7.08JMAA-02-PO 7/26/2005 20:00:00 NA DISSOLVED OXYGEN (DO) mg/l 6.88JMAA-02-PO 7/26/2005 20:30:00 NA DISSOLVED OXYGEN (DO) mg/l 6.7JMAA-02-PO 7/26/2005 21:00:00 NA DISSOLVED OXYGEN (DO) mg/l 6.47JMAA-02-PO 7/26/2005 21:30:00 NA DISSOLVED OXYGEN (DO) mg/l 6.25JMAA-02-PO 7/26/2005 22:00:00 NA DISSOLVED OXYGEN (DO) mg/l 6.14JMAA-02-PO 7/26/2005 22:30:00 NA DISSOLVED OXYGEN (DO) mg/l 5.94JMAA-02-PO 7/26/2005 23:00:00 NA DISSOLVED OXYGEN (DO) mg/l 5.9JMAA-02-PO 7/26/2005 23:30:00 NA DISSOLVED OXYGEN (DO) mg/l 5.82JMAA-02-PO 7/27/2005 0:00:00 NA DISSOLVED OXYGEN (DO) mg/l 5.78JMAA-02-PO 7/27/2005 0:30:00 NA DISSOLVED OXYGEN (DO) mg/l 5.69JMAA-02-PO 7/27/2005 1:00:00 NA DISSOLVED OXYGEN (DO) mg/l 5.68JMAA-02-PO 7/27/2005 1:30:00 NA DISSOLVED OXYGEN (DO) mg/l 5.7JMAA-02-PO 7/27/2005 2:00:00 NA DISSOLVED OXYGEN (DO) mg/l 5.71JMAA-02-PO 7/27/2005 2:30:00 NA DISSOLVED OXYGEN (DO) mg/l 5.72JMAA-02-PO 7/27/2005 3:00:00 NA DISSOLVED OXYGEN (DO) mg/l 5.73JMAA-02-PO 7/27/2005 3:30:00 NA DISSOLVED OXYGEN (DO) mg/l 5.75JMAA-02-PO 7/27/2005 4:00:00 NA DISSOLVED OXYGEN (DO) mg/l 5.77JMAA-02-PO 7/27/2005 4:30:00 NA DISSOLVED OXYGEN (DO) mg/l 5.77JMAA-02-PO 7/27/2005 5:00:00 NA DISSOLVED OXYGEN (DO) mg/l 5.75JMAA-02-PO 7/27/2005 5:30:00 NA DISSOLVED OXYGEN (DO) mg/l 5.74JMAA-02-PO 7/27/2005 6:00:00 NA DISSOLVED OXYGEN (DO) mg/l 5.79JMAA-02-PO 7/27/2005 6:30:00 NA DISSOLVED OXYGEN (DO) mg/l 5.73JMAA-02-PO 7/27/2005 7:00:00 NA DISSOLVED OXYGEN (DO) mg/l 5.78JMAA-02-PO 7/27/2005 7:30:00 NA DISSOLVED OXYGEN (DO) mg/l 5.77JMAA-02-PO 7/27/2005 8:00:00 NA DISSOLVED OXYGEN (DO) mg/l 5.71JMAA-02-PO 7/27/2005 8:30:00 NA DISSOLVED OXYGEN (DO) mg/l 5.75JMAA-02-PO 7/27/2005 9:00:00 NA DISSOLVED OXYGEN (DO) mg/l 5.78JMAA-02-PO 7/27/2005 9:30:00 NA DISSOLVED OXYGEN (DO) mg/l 5.9JMAA-02-PO 7/27/2005 10:00:00 NA DISSOLVED OXYGEN (DO) mg/l 5.96JMAA-02-PO 7/27/2005 10:30:00 NA DISSOLVED OXYGEN (DO) mg/l 6.06JMAA-02-PO 7/27/2005 11:00:00 NA DISSOLVED OXYGEN (DO) mg/l 6.27JMAA-02-PO 7/27/2005 11:30:00 NA DISSOLVED OXYGEN (DO) mg/l 6.53JMAA-02-PO 7/27/2005 12:00:00 NA DISSOLVED OXYGEN (DO) mg/l 6.72JMAA-02-PO 7/27/2005 12:30:00 NA DISSOLVED OXYGEN (DO) mg/l 7.14JMAA-02-PO 7/27/2005 13:00:00 NA DISSOLVED OXYGEN (DO) mg/l 7.35JMAA-02-PO 7/27/2005 13:30:00 NA DISSOLVED OXYGEN (DO) mg/l 7.64JMAA-02-PO 7/27/2005 14:00:00 NA DISSOLVED OXYGEN (DO) mg/l 7.76JMAA-02-PO 7/27/2005 14:30:00 NA DISSOLVED OXYGEN (DO) mg/l 7.87JMAA-02-PO 7/27/2005 15:00:00 NA DISSOLVED OXYGEN (DO) mg/l 8.04JMAA-02-PO 7/27/2005 15:30:00 NA DISSOLVED OXYGEN (DO) mg/l 8.13JMAA-02-PO 7/27/2005 16:00:00 NA DISSOLVED OXYGEN (DO) mg/l 8.2JMAA-02-PO 7/27/2005 16:30:00 NA DISSOLVED OXYGEN (DO) mg/l 8.13JMAA-02-PO 7/27/2005 17:00:00 NA DISSOLVED OXYGEN (DO) mg/l 8.11JMAA-02-PO 7/27/2005 17:30:00 NA DISSOLVED OXYGEN (DO) mg/l 8.06JMAA-02-PO 7/27/2005 18:00:00 NA DISSOLVED OXYGEN (DO) mg/l 7.86
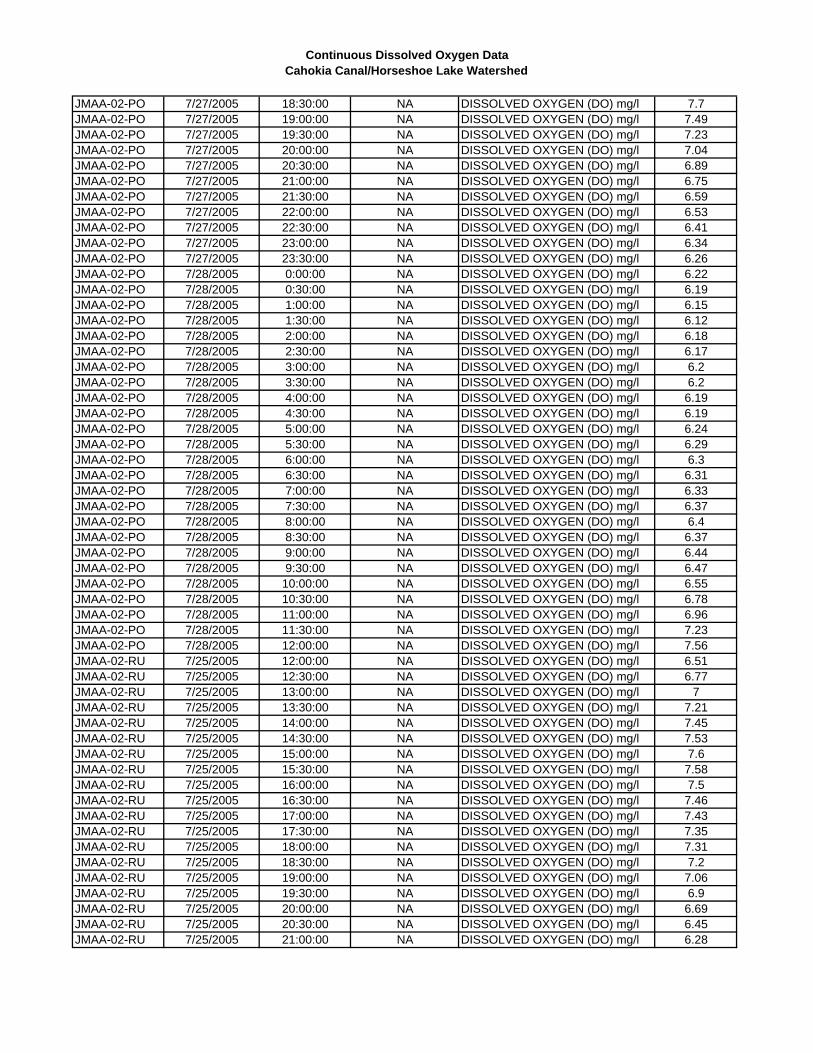
Continuous Dissolved Oxygen DataCahokia Canal/Horseshoe Lake Watershed
JMAA-02-PO 7/27/2005 18:30:00 NA DISSOLVED OXYGEN (DO) mg/l 7.7JMAA-02-PO 7/27/2005 19:00:00 NA DISSOLVED OXYGEN (DO) mg/l 7.49JMAA-02-PO 7/27/2005 19:30:00 NA DISSOLVED OXYGEN (DO) mg/l 7.23JMAA-02-PO 7/27/2005 20:00:00 NA DISSOLVED OXYGEN (DO) mg/l 7.04JMAA-02-PO 7/27/2005 20:30:00 NA DISSOLVED OXYGEN (DO) mg/l 6.89JMAA-02-PO 7/27/2005 21:00:00 NA DISSOLVED OXYGEN (DO) mg/l 6.75JMAA-02-PO 7/27/2005 21:30:00 NA DISSOLVED OXYGEN (DO) mg/l 6.59JMAA-02-PO 7/27/2005 22:00:00 NA DISSOLVED OXYGEN (DO) mg/l 6.53JMAA-02-PO 7/27/2005 22:30:00 NA DISSOLVED OXYGEN (DO) mg/l 6.41JMAA-02-PO 7/27/2005 23:00:00 NA DISSOLVED OXYGEN (DO) mg/l 6.34JMAA-02-PO 7/27/2005 23:30:00 NA DISSOLVED OXYGEN (DO) mg/l 6.26JMAA-02-PO 7/28/2005 0:00:00 NA DISSOLVED OXYGEN (DO) mg/l 6.22JMAA-02-PO 7/28/2005 0:30:00 NA DISSOLVED OXYGEN (DO) mg/l 6.19JMAA-02-PO 7/28/2005 1:00:00 NA DISSOLVED OXYGEN (DO) mg/l 6.15JMAA-02-PO 7/28/2005 1:30:00 NA DISSOLVED OXYGEN (DO) mg/l 6.12JMAA-02-PO 7/28/2005 2:00:00 NA DISSOLVED OXYGEN (DO) mg/l 6.18JMAA-02-PO 7/28/2005 2:30:00 NA DISSOLVED OXYGEN (DO) mg/l 6.17JMAA-02-PO 7/28/2005 3:00:00 NA DISSOLVED OXYGEN (DO) mg/l 6.2JMAA-02-PO 7/28/2005 3:30:00 NA DISSOLVED OXYGEN (DO) mg/l 6.2JMAA-02-PO 7/28/2005 4:00:00 NA DISSOLVED OXYGEN (DO) mg/l 6.19JMAA-02-PO 7/28/2005 4:30:00 NA DISSOLVED OXYGEN (DO) mg/l 6.19JMAA-02-PO 7/28/2005 5:00:00 NA DISSOLVED OXYGEN (DO) mg/l 6.24JMAA-02-PO 7/28/2005 5:30:00 NA DISSOLVED OXYGEN (DO) mg/l 6.29JMAA-02-PO 7/28/2005 6:00:00 NA DISSOLVED OXYGEN (DO) mg/l 6.3JMAA-02-PO 7/28/2005 6:30:00 NA DISSOLVED OXYGEN (DO) mg/l 6.31JMAA-02-PO 7/28/2005 7:00:00 NA DISSOLVED OXYGEN (DO) mg/l 6.33JMAA-02-PO 7/28/2005 7:30:00 NA DISSOLVED OXYGEN (DO) mg/l 6.37JMAA-02-PO 7/28/2005 8:00:00 NA DISSOLVED OXYGEN (DO) mg/l 6.4JMAA-02-PO 7/28/2005 8:30:00 NA DISSOLVED OXYGEN (DO) mg/l 6.37JMAA-02-PO 7/28/2005 9:00:00 NA DISSOLVED OXYGEN (DO) mg/l 6.44JMAA-02-PO 7/28/2005 9:30:00 NA DISSOLVED OXYGEN (DO) mg/l 6.47JMAA-02-PO 7/28/2005 10:00:00 NA DISSOLVED OXYGEN (DO) mg/l 6.55JMAA-02-PO 7/28/2005 10:30:00 NA DISSOLVED OXYGEN (DO) mg/l 6.78JMAA-02-PO 7/28/2005 11:00:00 NA DISSOLVED OXYGEN (DO) mg/l 6.96JMAA-02-PO 7/28/2005 11:30:00 NA DISSOLVED OXYGEN (DO) mg/l 7.23JMAA-02-PO 7/28/2005 12:00:00 NA DISSOLVED OXYGEN (DO) mg/l 7.56JMAA-02-RU 7/25/2005 12:00:00 NA DISSOLVED OXYGEN (DO) mg/l 6.51JMAA-02-RU 7/25/2005 12:30:00 NA DISSOLVED OXYGEN (DO) mg/l 6.77JMAA-02-RU 7/25/2005 13:00:00 NA DISSOLVED OXYGEN (DO) mg/l 7JMAA-02-RU 7/25/2005 13:30:00 NA DISSOLVED OXYGEN (DO) mg/l 7.21JMAA-02-RU 7/25/2005 14:00:00 NA DISSOLVED OXYGEN (DO) mg/l 7.45JMAA-02-RU 7/25/2005 14:30:00 NA DISSOLVED OXYGEN (DO) mg/l 7.53JMAA-02-RU 7/25/2005 15:00:00 NA DISSOLVED OXYGEN (DO) mg/l 7.6JMAA-02-RU 7/25/2005 15:30:00 NA DISSOLVED OXYGEN (DO) mg/l 7.58JMAA-02-RU 7/25/2005 16:00:00 NA DISSOLVED OXYGEN (DO) mg/l 7.5JMAA-02-RU 7/25/2005 16:30:00 NA DISSOLVED OXYGEN (DO) mg/l 7.46JMAA-02-RU 7/25/2005 17:00:00 NA DISSOLVED OXYGEN (DO) mg/l 7.43JMAA-02-RU 7/25/2005 17:30:00 NA DISSOLVED OXYGEN (DO) mg/l 7.35JMAA-02-RU 7/25/2005 18:00:00 NA DISSOLVED OXYGEN (DO) mg/l 7.31JMAA-02-RU 7/25/2005 18:30:00 NA DISSOLVED OXYGEN (DO) mg/l 7.2JMAA-02-RU 7/25/2005 19:00:00 NA DISSOLVED OXYGEN (DO) mg/l 7.06JMAA-02-RU 7/25/2005 19:30:00 NA DISSOLVED OXYGEN (DO) mg/l 6.9JMAA-02-RU 7/25/2005 20:00:00 NA DISSOLVED OXYGEN (DO) mg/l 6.69JMAA-02-RU 7/25/2005 20:30:00 NA DISSOLVED OXYGEN (DO) mg/l 6.45JMAA-02-RU 7/25/2005 21:00:00 NA DISSOLVED OXYGEN (DO) mg/l 6.28
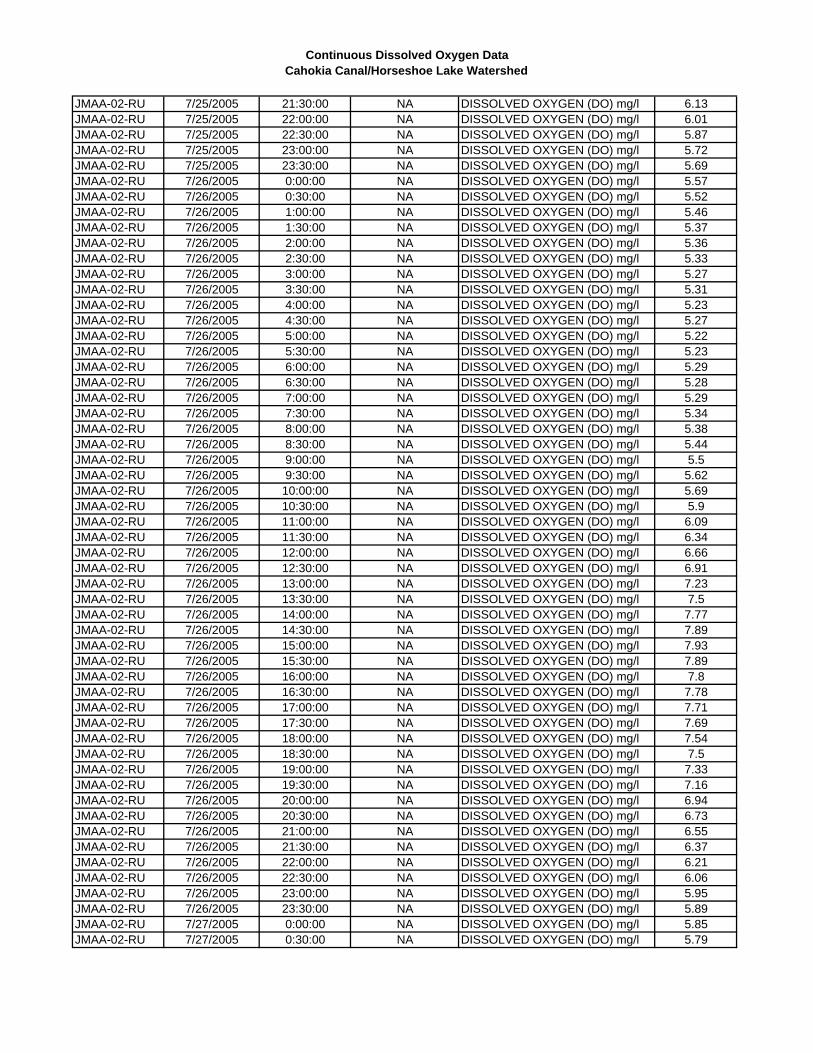
Continuous Dissolved Oxygen DataCahokia Canal/Horseshoe Lake Watershed
JMAA-02-RU 7/25/2005 21:30:00 NA DISSOLVED OXYGEN (DO) mg/l 6.13JMAA-02-RU 7/25/2005 22:00:00 NA DISSOLVED OXYGEN (DO) mg/l 6.01JMAA-02-RU 7/25/2005 22:30:00 NA DISSOLVED OXYGEN (DO) mg/l 5.87JMAA-02-RU 7/25/2005 23:00:00 NA DISSOLVED OXYGEN (DO) mg/l 5.72JMAA-02-RU 7/25/2005 23:30:00 NA DISSOLVED OXYGEN (DO) mg/l 5.69JMAA-02-RU 7/26/2005 0:00:00 NA DISSOLVED OXYGEN (DO) mg/l 5.57JMAA-02-RU 7/26/2005 0:30:00 NA DISSOLVED OXYGEN (DO) mg/l 5.52JMAA-02-RU 7/26/2005 1:00:00 NA DISSOLVED OXYGEN (DO) mg/l 5.46JMAA-02-RU 7/26/2005 1:30:00 NA DISSOLVED OXYGEN (DO) mg/l 5.37JMAA-02-RU 7/26/2005 2:00:00 NA DISSOLVED OXYGEN (DO) mg/l 5.36JMAA-02-RU 7/26/2005 2:30:00 NA DISSOLVED OXYGEN (DO) mg/l 5.33JMAA-02-RU 7/26/2005 3:00:00 NA DISSOLVED OXYGEN (DO) mg/l 5.27JMAA-02-RU 7/26/2005 3:30:00 NA DISSOLVED OXYGEN (DO) mg/l 5.31JMAA-02-RU 7/26/2005 4:00:00 NA DISSOLVED OXYGEN (DO) mg/l 5.23JMAA-02-RU 7/26/2005 4:30:00 NA DISSOLVED OXYGEN (DO) mg/l 5.27JMAA-02-RU 7/26/2005 5:00:00 NA DISSOLVED OXYGEN (DO) mg/l 5.22JMAA-02-RU 7/26/2005 5:30:00 NA DISSOLVED OXYGEN (DO) mg/l 5.23JMAA-02-RU 7/26/2005 6:00:00 NA DISSOLVED OXYGEN (DO) mg/l 5.29JMAA-02-RU 7/26/2005 6:30:00 NA DISSOLVED OXYGEN (DO) mg/l 5.28JMAA-02-RU 7/26/2005 7:00:00 NA DISSOLVED OXYGEN (DO) mg/l 5.29JMAA-02-RU 7/26/2005 7:30:00 NA DISSOLVED OXYGEN (DO) mg/l 5.34JMAA-02-RU 7/26/2005 8:00:00 NA DISSOLVED OXYGEN (DO) mg/l 5.38JMAA-02-RU 7/26/2005 8:30:00 NA DISSOLVED OXYGEN (DO) mg/l 5.44JMAA-02-RU 7/26/2005 9:00:00 NA DISSOLVED OXYGEN (DO) mg/l 5.5JMAA-02-RU 7/26/2005 9:30:00 NA DISSOLVED OXYGEN (DO) mg/l 5.62JMAA-02-RU 7/26/2005 10:00:00 NA DISSOLVED OXYGEN (DO) mg/l 5.69JMAA-02-RU 7/26/2005 10:30:00 NA DISSOLVED OXYGEN (DO) mg/l 5.9JMAA-02-RU 7/26/2005 11:00:00 NA DISSOLVED OXYGEN (DO) mg/l 6.09JMAA-02-RU 7/26/2005 11:30:00 NA DISSOLVED OXYGEN (DO) mg/l 6.34JMAA-02-RU 7/26/2005 12:00:00 NA DISSOLVED OXYGEN (DO) mg/l 6.66JMAA-02-RU 7/26/2005 12:30:00 NA DISSOLVED OXYGEN (DO) mg/l 6.91JMAA-02-RU 7/26/2005 13:00:00 NA DISSOLVED OXYGEN (DO) mg/l 7.23JMAA-02-RU 7/26/2005 13:30:00 NA DISSOLVED OXYGEN (DO) mg/l 7.5JMAA-02-RU 7/26/2005 14:00:00 NA DISSOLVED OXYGEN (DO) mg/l 7.77JMAA-02-RU 7/26/2005 14:30:00 NA DISSOLVED OXYGEN (DO) mg/l 7.89JMAA-02-RU 7/26/2005 15:00:00 NA DISSOLVED OXYGEN (DO) mg/l 7.93JMAA-02-RU 7/26/2005 15:30:00 NA DISSOLVED OXYGEN (DO) mg/l 7.89JMAA-02-RU 7/26/2005 16:00:00 NA DISSOLVED OXYGEN (DO) mg/l 7.8JMAA-02-RU 7/26/2005 16:30:00 NA DISSOLVED OXYGEN (DO) mg/l 7.78JMAA-02-RU 7/26/2005 17:00:00 NA DISSOLVED OXYGEN (DO) mg/l 7.71JMAA-02-RU 7/26/2005 17:30:00 NA DISSOLVED OXYGEN (DO) mg/l 7.69JMAA-02-RU 7/26/2005 18:00:00 NA DISSOLVED OXYGEN (DO) mg/l 7.54JMAA-02-RU 7/26/2005 18:30:00 NA DISSOLVED OXYGEN (DO) mg/l 7.5JMAA-02-RU 7/26/2005 19:00:00 NA DISSOLVED OXYGEN (DO) mg/l 7.33JMAA-02-RU 7/26/2005 19:30:00 NA DISSOLVED OXYGEN (DO) mg/l 7.16JMAA-02-RU 7/26/2005 20:00:00 NA DISSOLVED OXYGEN (DO) mg/l 6.94JMAA-02-RU 7/26/2005 20:30:00 NA DISSOLVED OXYGEN (DO) mg/l 6.73JMAA-02-RU 7/26/2005 21:00:00 NA DISSOLVED OXYGEN (DO) mg/l 6.55JMAA-02-RU 7/26/2005 21:30:00 NA DISSOLVED OXYGEN (DO) mg/l 6.37JMAA-02-RU 7/26/2005 22:00:00 NA DISSOLVED OXYGEN (DO) mg/l 6.21JMAA-02-RU 7/26/2005 22:30:00 NA DISSOLVED OXYGEN (DO) mg/l 6.06JMAA-02-RU 7/26/2005 23:00:00 NA DISSOLVED OXYGEN (DO) mg/l 5.95JMAA-02-RU 7/26/2005 23:30:00 NA DISSOLVED OXYGEN (DO) mg/l 5.89JMAA-02-RU 7/27/2005 0:00:00 NA DISSOLVED OXYGEN (DO) mg/l 5.85JMAA-02-RU 7/27/2005 0:30:00 NA DISSOLVED OXYGEN (DO) mg/l 5.79
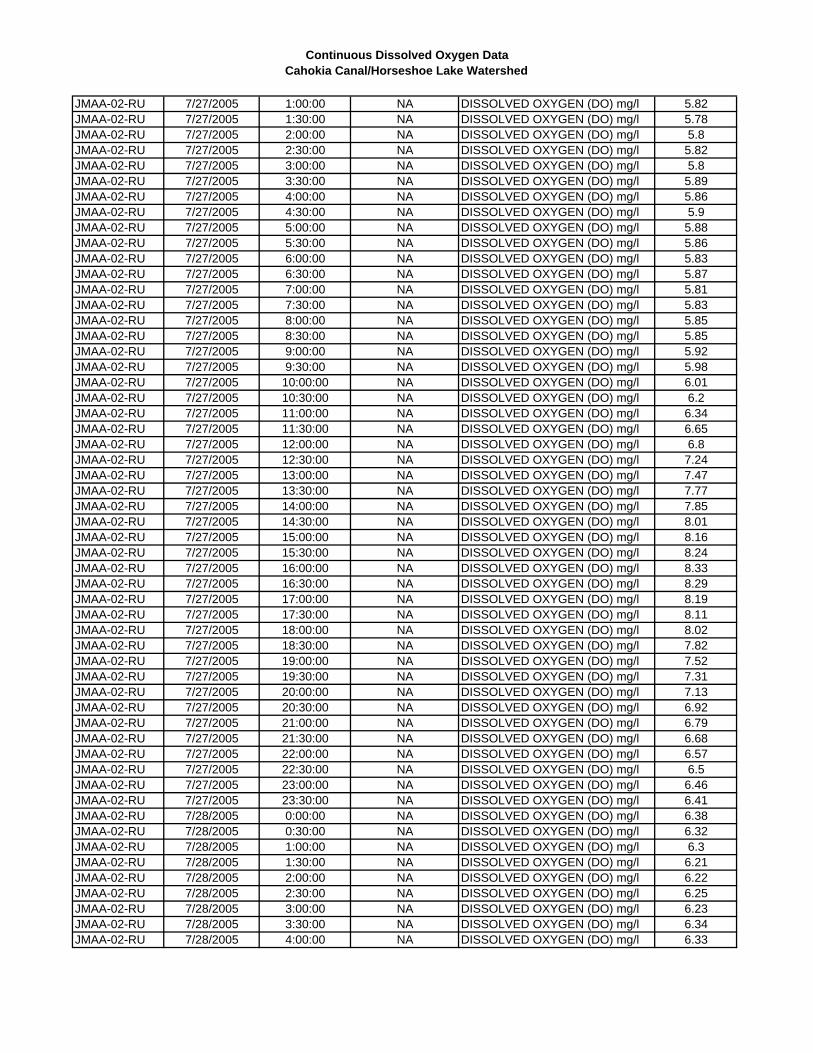
Continuous Dissolved Oxygen DataCahokia Canal/Horseshoe Lake Watershed
JMAA-02-RU 7/27/2005 1:00:00 NA DISSOLVED OXYGEN (DO) mg/l 5.82JMAA-02-RU 7/27/2005 1:30:00 NA DISSOLVED OXYGEN (DO) mg/l 5.78JMAA-02-RU 7/27/2005 2:00:00 NA DISSOLVED OXYGEN (DO) mg/l 5.8JMAA-02-RU 7/27/2005 2:30:00 NA DISSOLVED OXYGEN (DO) mg/l 5.82JMAA-02-RU 7/27/2005 3:00:00 NA DISSOLVED OXYGEN (DO) mg/l 5.8JMAA-02-RU 7/27/2005 3:30:00 NA DISSOLVED OXYGEN (DO) mg/l 5.89JMAA-02-RU 7/27/2005 4:00:00 NA DISSOLVED OXYGEN (DO) mg/l 5.86JMAA-02-RU 7/27/2005 4:30:00 NA DISSOLVED OXYGEN (DO) mg/l 5.9JMAA-02-RU 7/27/2005 5:00:00 NA DISSOLVED OXYGEN (DO) mg/l 5.88JMAA-02-RU 7/27/2005 5:30:00 NA DISSOLVED OXYGEN (DO) mg/l 5.86JMAA-02-RU 7/27/2005 6:00:00 NA DISSOLVED OXYGEN (DO) mg/l 5.83JMAA-02-RU 7/27/2005 6:30:00 NA DISSOLVED OXYGEN (DO) mg/l 5.87JMAA-02-RU 7/27/2005 7:00:00 NA DISSOLVED OXYGEN (DO) mg/l 5.81JMAA-02-RU 7/27/2005 7:30:00 NA DISSOLVED OXYGEN (DO) mg/l 5.83JMAA-02-RU 7/27/2005 8:00:00 NA DISSOLVED OXYGEN (DO) mg/l 5.85JMAA-02-RU 7/27/2005 8:30:00 NA DISSOLVED OXYGEN (DO) mg/l 5.85JMAA-02-RU 7/27/2005 9:00:00 NA DISSOLVED OXYGEN (DO) mg/l 5.92JMAA-02-RU 7/27/2005 9:30:00 NA DISSOLVED OXYGEN (DO) mg/l 5.98JMAA-02-RU 7/27/2005 10:00:00 NA DISSOLVED OXYGEN (DO) mg/l 6.01JMAA-02-RU 7/27/2005 10:30:00 NA DISSOLVED OXYGEN (DO) mg/l 6.2JMAA-02-RU 7/27/2005 11:00:00 NA DISSOLVED OXYGEN (DO) mg/l 6.34JMAA-02-RU 7/27/2005 11:30:00 NA DISSOLVED OXYGEN (DO) mg/l 6.65JMAA-02-RU 7/27/2005 12:00:00 NA DISSOLVED OXYGEN (DO) mg/l 6.8JMAA-02-RU 7/27/2005 12:30:00 NA DISSOLVED OXYGEN (DO) mg/l 7.24JMAA-02-RU 7/27/2005 13:00:00 NA DISSOLVED OXYGEN (DO) mg/l 7.47JMAA-02-RU 7/27/2005 13:30:00 NA DISSOLVED OXYGEN (DO) mg/l 7.77JMAA-02-RU 7/27/2005 14:00:00 NA DISSOLVED OXYGEN (DO) mg/l 7.85JMAA-02-RU 7/27/2005 14:30:00 NA DISSOLVED OXYGEN (DO) mg/l 8.01JMAA-02-RU 7/27/2005 15:00:00 NA DISSOLVED OXYGEN (DO) mg/l 8.16JMAA-02-RU 7/27/2005 15:30:00 NA DISSOLVED OXYGEN (DO) mg/l 8.24JMAA-02-RU 7/27/2005 16:00:00 NA DISSOLVED OXYGEN (DO) mg/l 8.33JMAA-02-RU 7/27/2005 16:30:00 NA DISSOLVED OXYGEN (DO) mg/l 8.29JMAA-02-RU 7/27/2005 17:00:00 NA DISSOLVED OXYGEN (DO) mg/l 8.19JMAA-02-RU 7/27/2005 17:30:00 NA DISSOLVED OXYGEN (DO) mg/l 8.11JMAA-02-RU 7/27/2005 18:00:00 NA DISSOLVED OXYGEN (DO) mg/l 8.02JMAA-02-RU 7/27/2005 18:30:00 NA DISSOLVED OXYGEN (DO) mg/l 7.82JMAA-02-RU 7/27/2005 19:00:00 NA DISSOLVED OXYGEN (DO) mg/l 7.52JMAA-02-RU 7/27/2005 19:30:00 NA DISSOLVED OXYGEN (DO) mg/l 7.31JMAA-02-RU 7/27/2005 20:00:00 NA DISSOLVED OXYGEN (DO) mg/l 7.13JMAA-02-RU 7/27/2005 20:30:00 NA DISSOLVED OXYGEN (DO) mg/l 6.92JMAA-02-RU 7/27/2005 21:00:00 NA DISSOLVED OXYGEN (DO) mg/l 6.79JMAA-02-RU 7/27/2005 21:30:00 NA DISSOLVED OXYGEN (DO) mg/l 6.68JMAA-02-RU 7/27/2005 22:00:00 NA DISSOLVED OXYGEN (DO) mg/l 6.57JMAA-02-RU 7/27/2005 22:30:00 NA DISSOLVED OXYGEN (DO) mg/l 6.5JMAA-02-RU 7/27/2005 23:00:00 NA DISSOLVED OXYGEN (DO) mg/l 6.46JMAA-02-RU 7/27/2005 23:30:00 NA DISSOLVED OXYGEN (DO) mg/l 6.41JMAA-02-RU 7/28/2005 0:00:00 NA DISSOLVED OXYGEN (DO) mg/l 6.38JMAA-02-RU 7/28/2005 0:30:00 NA DISSOLVED OXYGEN (DO) mg/l 6.32JMAA-02-RU 7/28/2005 1:00:00 NA DISSOLVED OXYGEN (DO) mg/l 6.3JMAA-02-RU 7/28/2005 1:30:00 NA DISSOLVED OXYGEN (DO) mg/l 6.21JMAA-02-RU 7/28/2005 2:00:00 NA DISSOLVED OXYGEN (DO) mg/l 6.22JMAA-02-RU 7/28/2005 2:30:00 NA DISSOLVED OXYGEN (DO) mg/l 6.25JMAA-02-RU 7/28/2005 3:00:00 NA DISSOLVED OXYGEN (DO) mg/l 6.23JMAA-02-RU 7/28/2005 3:30:00 NA DISSOLVED OXYGEN (DO) mg/l 6.34JMAA-02-RU 7/28/2005 4:00:00 NA DISSOLVED OXYGEN (DO) mg/l 6.33
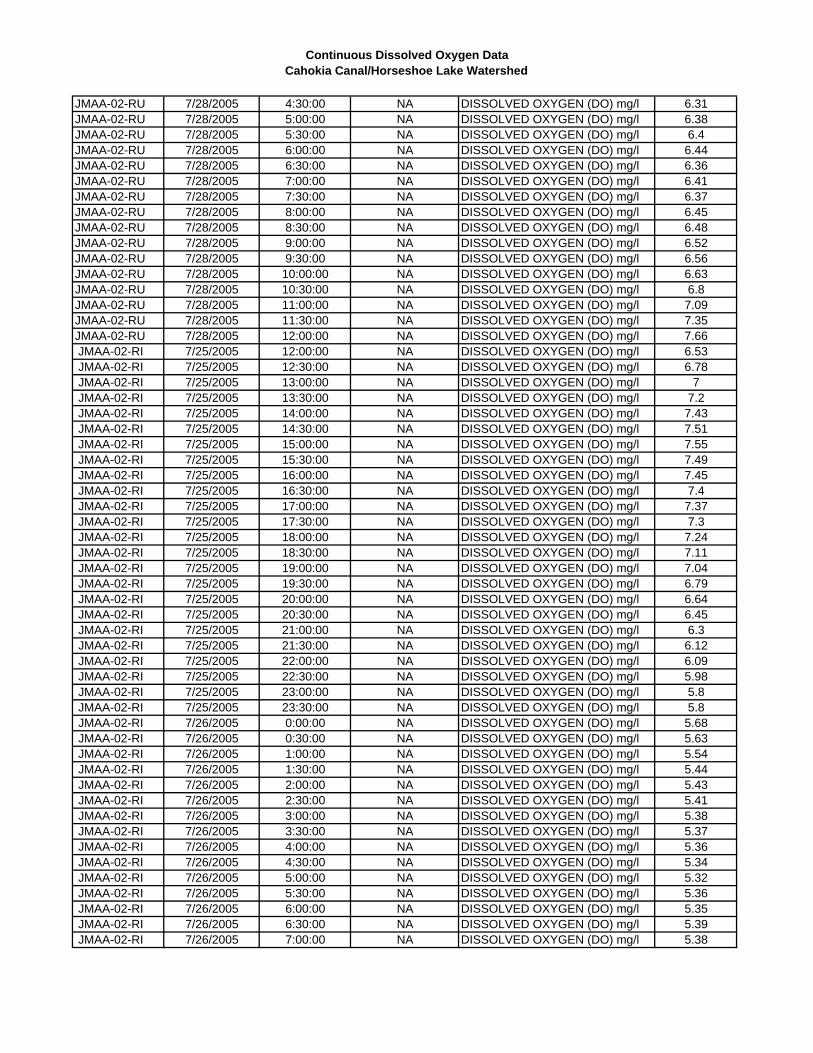
Continuous Dissolved Oxygen DataCahokia Canal/Horseshoe Lake Watershed
JMAA-02-RU 7/28/2005 4:30:00 NA DISSOLVED OXYGEN (DO) mg/l 6.31JMAA-02-RU 7/28/2005 5:00:00 NA DISSOLVED OXYGEN (DO) mg/l 6.38JMAA-02-RU 7/28/2005 5:30:00 NA DISSOLVED OXYGEN (DO) mg/l 6.4JMAA-02-RU 7/28/2005 6:00:00 NA DISSOLVED OXYGEN (DO) mg/l 6.44JMAA-02-RU 7/28/2005 6:30:00 NA DISSOLVED OXYGEN (DO) mg/l 6.36JMAA-02-RU 7/28/2005 7:00:00 NA DISSOLVED OXYGEN (DO) mg/l 6.41JMAA-02-RU 7/28/2005 7:30:00 NA DISSOLVED OXYGEN (DO) mg/l 6.37JMAA-02-RU 7/28/2005 8:00:00 NA DISSOLVED OXYGEN (DO) mg/l 6.45JMAA-02-RU 7/28/2005 8:30:00 NA DISSOLVED OXYGEN (DO) mg/l 6.48JMAA-02-RU 7/28/2005 9:00:00 NA DISSOLVED OXYGEN (DO) mg/l 6.52JMAA-02-RU 7/28/2005 9:30:00 NA DISSOLVED OXYGEN (DO) mg/l 6.56JMAA-02-RU 7/28/2005 10:00:00 NA DISSOLVED OXYGEN (DO) mg/l 6.63JMAA-02-RU 7/28/2005 10:30:00 NA DISSOLVED OXYGEN (DO) mg/l 6.8JMAA-02-RU 7/28/2005 11:00:00 NA DISSOLVED OXYGEN (DO) mg/l 7.09JMAA-02-RU 7/28/2005 11:30:00 NA DISSOLVED OXYGEN (DO) mg/l 7.35JMAA-02-RU 7/28/2005 12:00:00 NA DISSOLVED OXYGEN (DO) mg/l 7.66 JMAA-02-RI 7/25/2005 12:00:00 NA DISSOLVED OXYGEN (DO) mg/l 6.53 JMAA-02-RI 7/25/2005 12:30:00 NA DISSOLVED OXYGEN (DO) mg/l 6.78 JMAA-02-RI 7/25/2005 13:00:00 NA DISSOLVED OXYGEN (DO) mg/l 7 JMAA-02-RI 7/25/2005 13:30:00 NA DISSOLVED OXYGEN (DO) mg/l 7.2 JMAA-02-RI 7/25/2005 14:00:00 NA DISSOLVED OXYGEN (DO) mg/l 7.43 JMAA-02-RI 7/25/2005 14:30:00 NA DISSOLVED OXYGEN (DO) mg/l 7.51 JMAA-02-RI 7/25/2005 15:00:00 NA DISSOLVED OXYGEN (DO) mg/l 7.55 JMAA-02-RI 7/25/2005 15:30:00 NA DISSOLVED OXYGEN (DO) mg/l 7.49 JMAA-02-RI 7/25/2005 16:00:00 NA DISSOLVED OXYGEN (DO) mg/l 7.45 JMAA-02-RI 7/25/2005 16:30:00 NA DISSOLVED OXYGEN (DO) mg/l 7.4 JMAA-02-RI 7/25/2005 17:00:00 NA DISSOLVED OXYGEN (DO) mg/l 7.37 JMAA-02-RI 7/25/2005 17:30:00 NA DISSOLVED OXYGEN (DO) mg/l 7.3 JMAA-02-RI 7/25/2005 18:00:00 NA DISSOLVED OXYGEN (DO) mg/l 7.24 JMAA-02-RI 7/25/2005 18:30:00 NA DISSOLVED OXYGEN (DO) mg/l 7.11 JMAA-02-RI 7/25/2005 19:00:00 NA DISSOLVED OXYGEN (DO) mg/l 7.04 JMAA-02-RI 7/25/2005 19:30:00 NA DISSOLVED OXYGEN (DO) mg/l 6.79 JMAA-02-RI 7/25/2005 20:00:00 NA DISSOLVED OXYGEN (DO) mg/l 6.64 JMAA-02-RI 7/25/2005 20:30:00 NA DISSOLVED OXYGEN (DO) mg/l 6.45 JMAA-02-RI 7/25/2005 21:00:00 NA DISSOLVED OXYGEN (DO) mg/l 6.3 JMAA-02-RI 7/25/2005 21:30:00 NA DISSOLVED OXYGEN (DO) mg/l 6.12 JMAA-02-RI 7/25/2005 22:00:00 NA DISSOLVED OXYGEN (DO) mg/l 6.09 JMAA-02-RI 7/25/2005 22:30:00 NA DISSOLVED OXYGEN (DO) mg/l 5.98 JMAA-02-RI 7/25/2005 23:00:00 NA DISSOLVED OXYGEN (DO) mg/l 5.8 JMAA-02-RI 7/25/2005 23:30:00 NA DISSOLVED OXYGEN (DO) mg/l 5.8 JMAA-02-RI 7/26/2005 0:00:00 NA DISSOLVED OXYGEN (DO) mg/l 5.68 JMAA-02-RI 7/26/2005 0:30:00 NA DISSOLVED OXYGEN (DO) mg/l 5.63 JMAA-02-RI 7/26/2005 1:00:00 NA DISSOLVED OXYGEN (DO) mg/l 5.54 JMAA-02-RI 7/26/2005 1:30:00 NA DISSOLVED OXYGEN (DO) mg/l 5.44 JMAA-02-RI 7/26/2005 2:00:00 NA DISSOLVED OXYGEN (DO) mg/l 5.43 JMAA-02-RI 7/26/2005 2:30:00 NA DISSOLVED OXYGEN (DO) mg/l 5.41 JMAA-02-RI 7/26/2005 3:00:00 NA DISSOLVED OXYGEN (DO) mg/l 5.38 JMAA-02-RI 7/26/2005 3:30:00 NA DISSOLVED OXYGEN (DO) mg/l 5.37 JMAA-02-RI 7/26/2005 4:00:00 NA DISSOLVED OXYGEN (DO) mg/l 5.36 JMAA-02-RI 7/26/2005 4:30:00 NA DISSOLVED OXYGEN (DO) mg/l 5.34 JMAA-02-RI 7/26/2005 5:00:00 NA DISSOLVED OXYGEN (DO) mg/l 5.32 JMAA-02-RI 7/26/2005 5:30:00 NA DISSOLVED OXYGEN (DO) mg/l 5.36 JMAA-02-RI 7/26/2005 6:00:00 NA DISSOLVED OXYGEN (DO) mg/l 5.35 JMAA-02-RI 7/26/2005 6:30:00 NA DISSOLVED OXYGEN (DO) mg/l 5.39 JMAA-02-RI 7/26/2005 7:00:00 NA DISSOLVED OXYGEN (DO) mg/l 5.38
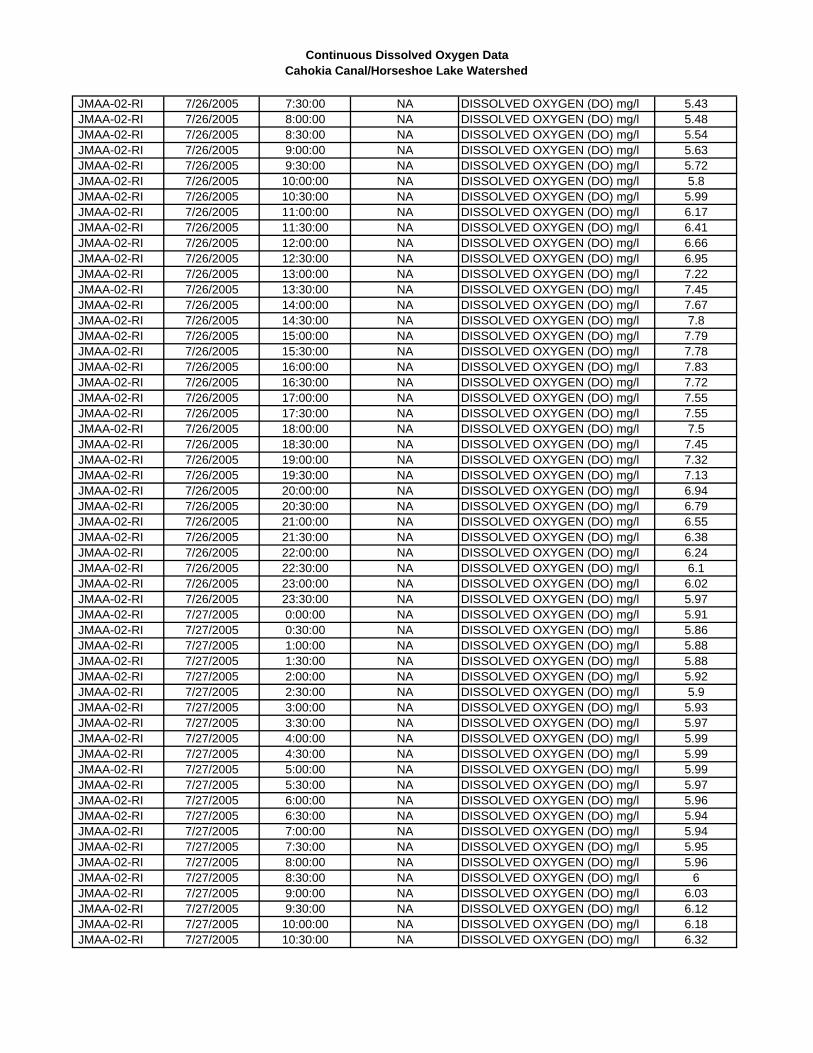
Continuous Dissolved Oxygen DataCahokia Canal/Horseshoe Lake Watershed
JMAA-02-RI 7/26/2005 7:30:00 NA DISSOLVED OXYGEN (DO) mg/l 5.43 JMAA-02-RI 7/26/2005 8:00:00 NA DISSOLVED OXYGEN (DO) mg/l 5.48 JMAA-02-RI 7/26/2005 8:30:00 NA DISSOLVED OXYGEN (DO) mg/l 5.54 JMAA-02-RI 7/26/2005 9:00:00 NA DISSOLVED OXYGEN (DO) mg/l 5.63 JMAA-02-RI 7/26/2005 9:30:00 NA DISSOLVED OXYGEN (DO) mg/l 5.72 JMAA-02-RI 7/26/2005 10:00:00 NA DISSOLVED OXYGEN (DO) mg/l 5.8 JMAA-02-RI 7/26/2005 10:30:00 NA DISSOLVED OXYGEN (DO) mg/l 5.99 JMAA-02-RI 7/26/2005 11:00:00 NA DISSOLVED OXYGEN (DO) mg/l 6.17 JMAA-02-RI 7/26/2005 11:30:00 NA DISSOLVED OXYGEN (DO) mg/l 6.41 JMAA-02-RI 7/26/2005 12:00:00 NA DISSOLVED OXYGEN (DO) mg/l 6.66 JMAA-02-RI 7/26/2005 12:30:00 NA DISSOLVED OXYGEN (DO) mg/l 6.95 JMAA-02-RI 7/26/2005 13:00:00 NA DISSOLVED OXYGEN (DO) mg/l 7.22 JMAA-02-RI 7/26/2005 13:30:00 NA DISSOLVED OXYGEN (DO) mg/l 7.45 JMAA-02-RI 7/26/2005 14:00:00 NA DISSOLVED OXYGEN (DO) mg/l 7.67 JMAA-02-RI 7/26/2005 14:30:00 NA DISSOLVED OXYGEN (DO) mg/l 7.8 JMAA-02-RI 7/26/2005 15:00:00 NA DISSOLVED OXYGEN (DO) mg/l 7.79 JMAA-02-RI 7/26/2005 15:30:00 NA DISSOLVED OXYGEN (DO) mg/l 7.78 JMAA-02-RI 7/26/2005 16:00:00 NA DISSOLVED OXYGEN (DO) mg/l 7.83 JMAA-02-RI 7/26/2005 16:30:00 NA DISSOLVED OXYGEN (DO) mg/l 7.72 JMAA-02-RI 7/26/2005 17:00:00 NA DISSOLVED OXYGEN (DO) mg/l 7.55 JMAA-02-RI 7/26/2005 17:30:00 NA DISSOLVED OXYGEN (DO) mg/l 7.55 JMAA-02-RI 7/26/2005 18:00:00 NA DISSOLVED OXYGEN (DO) mg/l 7.5 JMAA-02-RI 7/26/2005 18:30:00 NA DISSOLVED OXYGEN (DO) mg/l 7.45 JMAA-02-RI 7/26/2005 19:00:00 NA DISSOLVED OXYGEN (DO) mg/l 7.32 JMAA-02-RI 7/26/2005 19:30:00 NA DISSOLVED OXYGEN (DO) mg/l 7.13 JMAA-02-RI 7/26/2005 20:00:00 NA DISSOLVED OXYGEN (DO) mg/l 6.94 JMAA-02-RI 7/26/2005 20:30:00 NA DISSOLVED OXYGEN (DO) mg/l 6.79 JMAA-02-RI 7/26/2005 21:00:00 NA DISSOLVED OXYGEN (DO) mg/l 6.55 JMAA-02-RI 7/26/2005 21:30:00 NA DISSOLVED OXYGEN (DO) mg/l 6.38 JMAA-02-RI 7/26/2005 22:00:00 NA DISSOLVED OXYGEN (DO) mg/l 6.24 JMAA-02-RI 7/26/2005 22:30:00 NA DISSOLVED OXYGEN (DO) mg/l 6.1 JMAA-02-RI 7/26/2005 23:00:00 NA DISSOLVED OXYGEN (DO) mg/l 6.02 JMAA-02-RI 7/26/2005 23:30:00 NA DISSOLVED OXYGEN (DO) mg/l 5.97 JMAA-02-RI 7/27/2005 0:00:00 NA DISSOLVED OXYGEN (DO) mg/l 5.91 JMAA-02-RI 7/27/2005 0:30:00 NA DISSOLVED OXYGEN (DO) mg/l 5.86 JMAA-02-RI 7/27/2005 1:00:00 NA DISSOLVED OXYGEN (DO) mg/l 5.88 JMAA-02-RI 7/27/2005 1:30:00 NA DISSOLVED OXYGEN (DO) mg/l 5.88 JMAA-02-RI 7/27/2005 2:00:00 NA DISSOLVED OXYGEN (DO) mg/l 5.92 JMAA-02-RI 7/27/2005 2:30:00 NA DISSOLVED OXYGEN (DO) mg/l 5.9 JMAA-02-RI 7/27/2005 3:00:00 NA DISSOLVED OXYGEN (DO) mg/l 5.93 JMAA-02-RI 7/27/2005 3:30:00 NA DISSOLVED OXYGEN (DO) mg/l 5.97 JMAA-02-RI 7/27/2005 4:00:00 NA DISSOLVED OXYGEN (DO) mg/l 5.99 JMAA-02-RI 7/27/2005 4:30:00 NA DISSOLVED OXYGEN (DO) mg/l 5.99 JMAA-02-RI 7/27/2005 5:00:00 NA DISSOLVED OXYGEN (DO) mg/l 5.99 JMAA-02-RI 7/27/2005 5:30:00 NA DISSOLVED OXYGEN (DO) mg/l 5.97 JMAA-02-RI 7/27/2005 6:00:00 NA DISSOLVED OXYGEN (DO) mg/l 5.96 JMAA-02-RI 7/27/2005 6:30:00 NA DISSOLVED OXYGEN (DO) mg/l 5.94 JMAA-02-RI 7/27/2005 7:00:00 NA DISSOLVED OXYGEN (DO) mg/l 5.94 JMAA-02-RI 7/27/2005 7:30:00 NA DISSOLVED OXYGEN (DO) mg/l 5.95 JMAA-02-RI 7/27/2005 8:00:00 NA DISSOLVED OXYGEN (DO) mg/l 5.96 JMAA-02-RI 7/27/2005 8:30:00 NA DISSOLVED OXYGEN (DO) mg/l 6 JMAA-02-RI 7/27/2005 9:00:00 NA DISSOLVED OXYGEN (DO) mg/l 6.03 JMAA-02-RI 7/27/2005 9:30:00 NA DISSOLVED OXYGEN (DO) mg/l 6.12 JMAA-02-RI 7/27/2005 10:00:00 NA DISSOLVED OXYGEN (DO) mg/l 6.18 JMAA-02-RI 7/27/2005 10:30:00 NA DISSOLVED OXYGEN (DO) mg/l 6.32
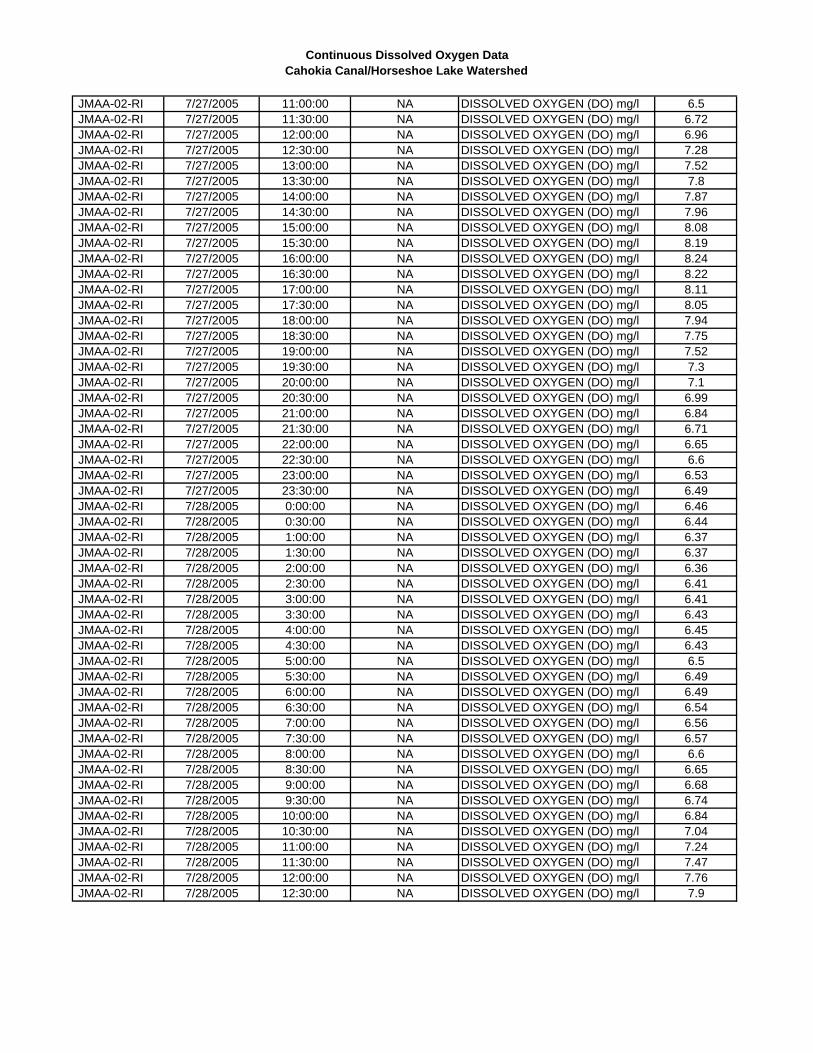
Continuous Dissolved Oxygen DataCahokia Canal/Horseshoe Lake Watershed
JMAA-02-RI 7/27/2005 11:00:00 NA DISSOLVED OXYGEN (DO) mg/l 6.5 JMAA-02-RI 7/27/2005 11:30:00 NA DISSOLVED OXYGEN (DO) mg/l 6.72 JMAA-02-RI 7/27/2005 12:00:00 NA DISSOLVED OXYGEN (DO) mg/l 6.96 JMAA-02-RI 7/27/2005 12:30:00 NA DISSOLVED OXYGEN (DO) mg/l 7.28 JMAA-02-RI 7/27/2005 13:00:00 NA DISSOLVED OXYGEN (DO) mg/l 7.52 JMAA-02-RI 7/27/2005 13:30:00 NA DISSOLVED OXYGEN (DO) mg/l 7.8 JMAA-02-RI 7/27/2005 14:00:00 NA DISSOLVED OXYGEN (DO) mg/l 7.87 JMAA-02-RI 7/27/2005 14:30:00 NA DISSOLVED OXYGEN (DO) mg/l 7.96 JMAA-02-RI 7/27/2005 15:00:00 NA DISSOLVED OXYGEN (DO) mg/l 8.08 JMAA-02-RI 7/27/2005 15:30:00 NA DISSOLVED OXYGEN (DO) mg/l 8.19 JMAA-02-RI 7/27/2005 16:00:00 NA DISSOLVED OXYGEN (DO) mg/l 8.24 JMAA-02-RI 7/27/2005 16:30:00 NA DISSOLVED OXYGEN (DO) mg/l 8.22 JMAA-02-RI 7/27/2005 17:00:00 NA DISSOLVED OXYGEN (DO) mg/l 8.11 JMAA-02-RI 7/27/2005 17:30:00 NA DISSOLVED OXYGEN (DO) mg/l 8.05 JMAA-02-RI 7/27/2005 18:00:00 NA DISSOLVED OXYGEN (DO) mg/l 7.94 JMAA-02-RI 7/27/2005 18:30:00 NA DISSOLVED OXYGEN (DO) mg/l 7.75 JMAA-02-RI 7/27/2005 19:00:00 NA DISSOLVED OXYGEN (DO) mg/l 7.52 JMAA-02-RI 7/27/2005 19:30:00 NA DISSOLVED OXYGEN (DO) mg/l 7.3 JMAA-02-RI 7/27/2005 20:00:00 NA DISSOLVED OXYGEN (DO) mg/l 7.1 JMAA-02-RI 7/27/2005 20:30:00 NA DISSOLVED OXYGEN (DO) mg/l 6.99 JMAA-02-RI 7/27/2005 21:00:00 NA DISSOLVED OXYGEN (DO) mg/l 6.84 JMAA-02-RI 7/27/2005 21:30:00 NA DISSOLVED OXYGEN (DO) mg/l 6.71 JMAA-02-RI 7/27/2005 22:00:00 NA DISSOLVED OXYGEN (DO) mg/l 6.65 JMAA-02-RI 7/27/2005 22:30:00 NA DISSOLVED OXYGEN (DO) mg/l 6.6 JMAA-02-RI 7/27/2005 23:00:00 NA DISSOLVED OXYGEN (DO) mg/l 6.53 JMAA-02-RI 7/27/2005 23:30:00 NA DISSOLVED OXYGEN (DO) mg/l 6.49 JMAA-02-RI 7/28/2005 0:00:00 NA DISSOLVED OXYGEN (DO) mg/l 6.46 JMAA-02-RI 7/28/2005 0:30:00 NA DISSOLVED OXYGEN (DO) mg/l 6.44 JMAA-02-RI 7/28/2005 1:00:00 NA DISSOLVED OXYGEN (DO) mg/l 6.37 JMAA-02-RI 7/28/2005 1:30:00 NA DISSOLVED OXYGEN (DO) mg/l 6.37 JMAA-02-RI 7/28/2005 2:00:00 NA DISSOLVED OXYGEN (DO) mg/l 6.36 JMAA-02-RI 7/28/2005 2:30:00 NA DISSOLVED OXYGEN (DO) mg/l 6.41 JMAA-02-RI 7/28/2005 3:00:00 NA DISSOLVED OXYGEN (DO) mg/l 6.41 JMAA-02-RI 7/28/2005 3:30:00 NA DISSOLVED OXYGEN (DO) mg/l 6.43 JMAA-02-RI 7/28/2005 4:00:00 NA DISSOLVED OXYGEN (DO) mg/l 6.45 JMAA-02-RI 7/28/2005 4:30:00 NA DISSOLVED OXYGEN (DO) mg/l 6.43 JMAA-02-RI 7/28/2005 5:00:00 NA DISSOLVED OXYGEN (DO) mg/l 6.5 JMAA-02-RI 7/28/2005 5:30:00 NA DISSOLVED OXYGEN (DO) mg/l 6.49 JMAA-02-RI 7/28/2005 6:00:00 NA DISSOLVED OXYGEN (DO) mg/l 6.49 JMAA-02-RI 7/28/2005 6:30:00 NA DISSOLVED OXYGEN (DO) mg/l 6.54 JMAA-02-RI 7/28/2005 7:00:00 NA DISSOLVED OXYGEN (DO) mg/l 6.56 JMAA-02-RI 7/28/2005 7:30:00 NA DISSOLVED OXYGEN (DO) mg/l 6.57 JMAA-02-RI 7/28/2005 8:00:00 NA DISSOLVED OXYGEN (DO) mg/l 6.6 JMAA-02-RI 7/28/2005 8:30:00 NA DISSOLVED OXYGEN (DO) mg/l 6.65 JMAA-02-RI 7/28/2005 9:00:00 NA DISSOLVED OXYGEN (DO) mg/l 6.68 JMAA-02-RI 7/28/2005 9:30:00 NA DISSOLVED OXYGEN (DO) mg/l 6.74 JMAA-02-RI 7/28/2005 10:00:00 NA DISSOLVED OXYGEN (DO) mg/l 6.84 JMAA-02-RI 7/28/2005 10:30:00 NA DISSOLVED OXYGEN (DO) mg/l 7.04 JMAA-02-RI 7/28/2005 11:00:00 NA DISSOLVED OXYGEN (DO) mg/l 7.24 JMAA-02-RI 7/28/2005 11:30:00 NA DISSOLVED OXYGEN (DO) mg/l 7.47 JMAA-02-RI 7/28/2005 12:00:00 NA DISSOLVED OXYGEN (DO) mg/l 7.76 JMAA-02-RI 7/28/2005 12:30:00 NA DISSOLVED OXYGEN (DO) mg/l 7.9

THIS PAGE INTENTIONALLY LEFT BLANK

Appendix D Watershed Photographs

THIS PAGE INTENTIONALLY LEFT BLANK
Canteen Creek Southeast of Bluff Road Looking West
Canteen Creek Southeast of Bluff Road Looking West
Harding Ditch at Bunkham Road Looking North
Harding Ditch at Bunkham Road Looking South
Harding Ditch Southwest of Lake BoulevardLooking North
Frank Holten Lake #1 Looking NorthwestToward Saint Louis
Frank Holten Lake #2 Looking Northwest Frank Holten Lake #3
Frank Holten Lake #3 Shoreline Frank Holten Golf Course
Frank Holten Lake #3 with Golf Course in Background
Canteen Creek at Sand Prairie Road Looking West
Canteen Creek at Sand Prairie Road Looking East
Canteen Creek at Sand Prairie Road Looking West
Blue Heron in Horseshoe Lake
Horseshoe Lake East of Lake Road Fisherman at Horseshoe Lake
Horseshoe Lake with U.S. Steel Facility in Background
Horseshoe Lake Looking West Toward Saint Louis
Cahokia Canal at Route 162 Looking South
Cahokia Canal at Route 162 Looking North Cahokia Canal at Route 162 Looking South(Construction Activity)

Appendix E: Cross Section Data and
Stream Photographs

THIS PAGE INTENTIONALLY LEFT BLANK
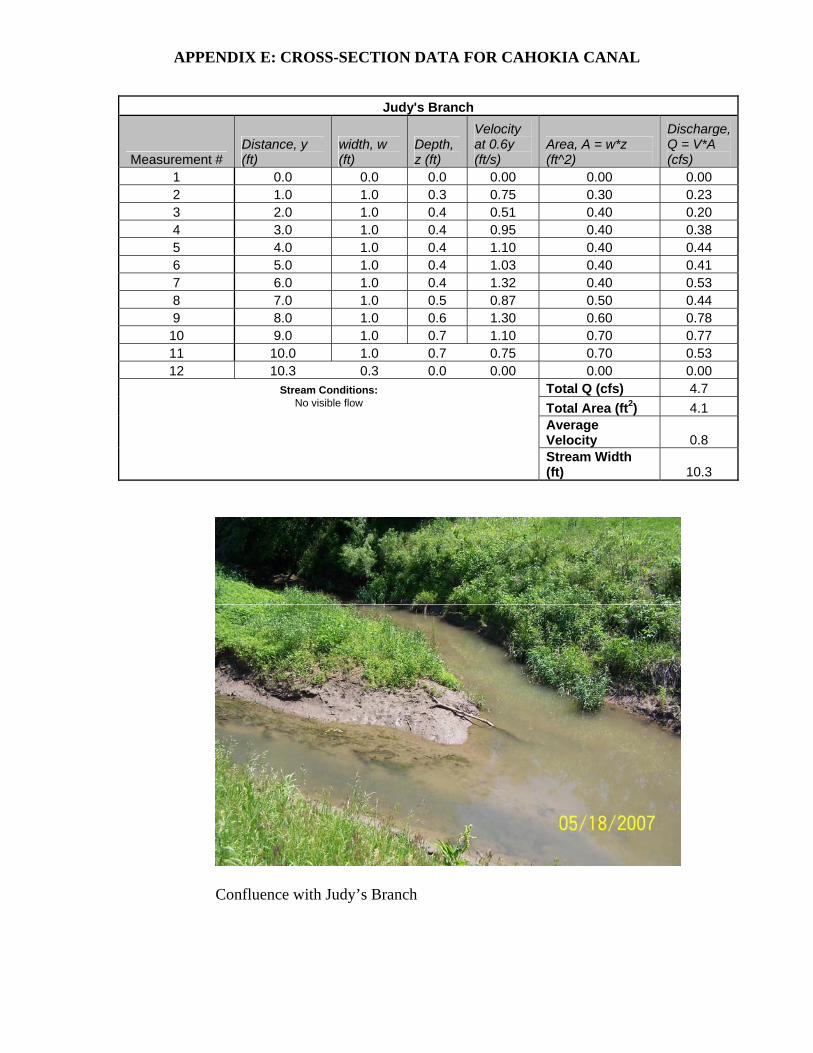
APPENDIX E: CROSS-SECTION DATA FOR CAHOKIA CANAL
Judy's Branch
Measurement # Distance, y (ft)
width, w (ft)
Depth, z (ft)
Velocity at 0.6y (ft/s)
Area, A = w*z (ft^2)
Discharge, Q = V*A (cfs)
1 0.0 0.0 0.0 0.00 0.00 0.00 2 1.0 1.0 0.3 0.75 0.30 0.23 3 2.0 1.0 0.4 0.51 0.40 0.20 4 3.0 1.0 0.4 0.95 0.40 0.38 5 4.0 1.0 0.4 1.10 0.40 0.44 6 5.0 1.0 0.4 1.03 0.40 0.41 7 6.0 1.0 0.4 1.32 0.40 0.53 8 7.0 1.0 0.5 0.87 0.50 0.44 9 8.0 1.0 0.6 1.30 0.60 0.78 10 9.0 1.0 0.7 1.10 0.70 0.77 11 10.0 1.0 0.7 0.75 0.70 0.53 12 10.3 0.3 0.0 0.00 0.00 0.00
Stream Conditions: Total Q (cfs) 4.7 Total Area (ft2) 4.1 Average Velocity 0.8
No visible flow
Stream Width (ft) 10.3
Confluence with Judy’s Branch
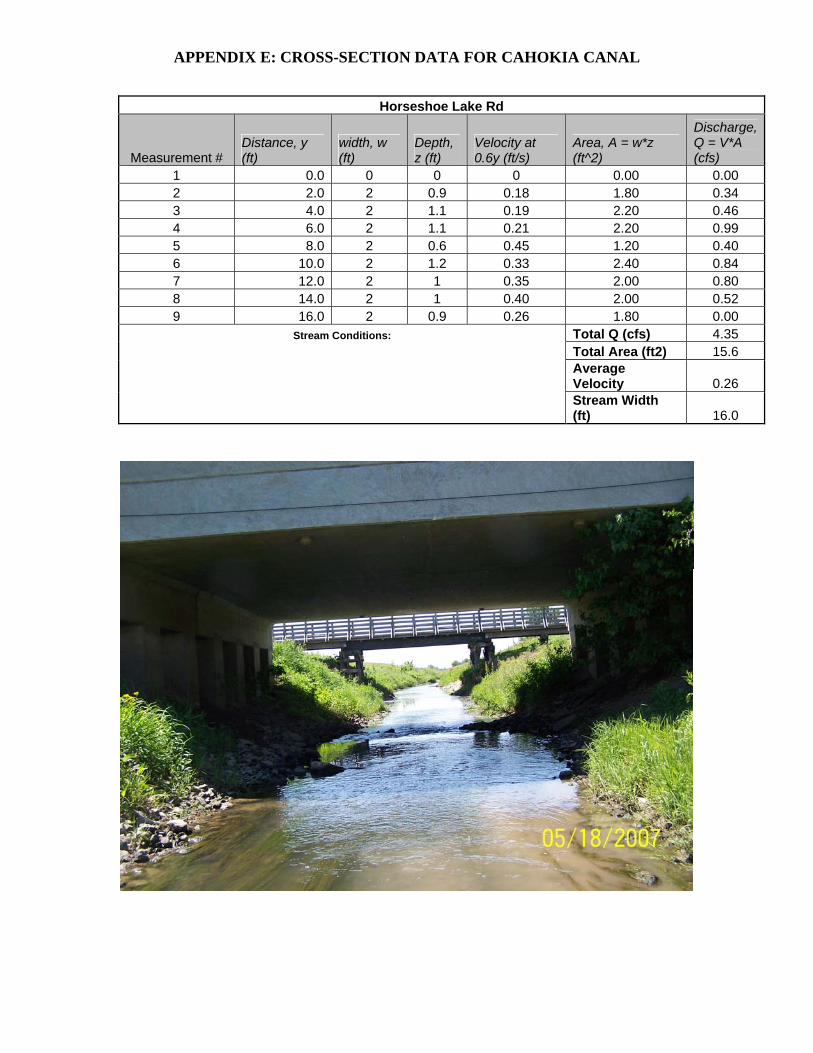
APPENDIX E: CROSS-SECTION DATA FOR CAHOKIA CANAL
Horseshoe Lake Rd
Measurement # Distance, y (ft)
width, w (ft)
Depth, z (ft)
Velocity at 0.6y (ft/s)
Area, A = w*z (ft^2)
Discharge, Q = V*A (cfs)
1 0.0 0 0 0 0.00 0.00 2 2.0 2 0.9 0.18 1.80 0.34 3 4.0 2 1.1 0.19 2.20 0.46 4 6.0 2 1.1 0.21 2.20 0.99 5 8.0 2 0.6 0.45 1.20 0.40 6 10.0 2 1.2 0.33 2.40 0.84 7 12.0 2 1 0.35 2.00 0.80 8 14.0 2 1 0.40 2.00 0.52 9 16.0 2 0.9 0.26 1.80 0.00
Stream Conditions: Total Q (cfs) 4.35 Total Area (ft2) 15.6 Average Velocity 0.26
Stream Width (ft) 16.0
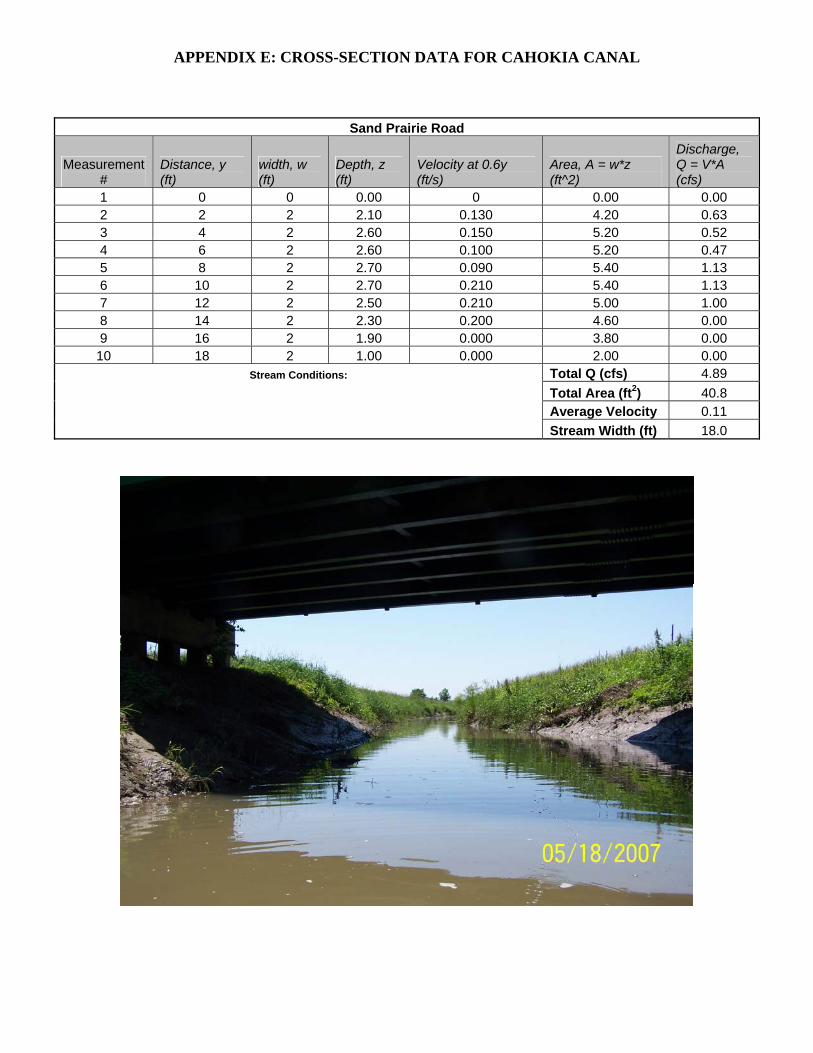
APPENDIX E: CROSS-SECTION DATA FOR CAHOKIA CANAL
Sand Prairie Road
Measurement #
Distance, y (ft)
width, w (ft)
Depth, z (ft)
Velocity at 0.6y (ft/s)
Area, A = w*z (ft^2)
Discharge, Q = V*A (cfs)
1 0 0 0.00 0 0.00 0.00 2 2 2 2.10 0.130 4.20 0.63 3 4 2 2.60 0.150 5.20 0.52 4 6 2 2.60 0.100 5.20 0.47 5 8 2 2.70 0.090 5.40 1.13 6 10 2 2.70 0.210 5.40 1.13 7 12 2 2.50 0.210 5.00 1.00 8 14 2 2.30 0.200 4.60 0.00 9 16 2 1.90 0.000 3.80 0.00
10 18 2 1.00 0.000 2.00 0.00 Stream Conditions: Total Q (cfs) 4.89
Total Area (ft2) 40.8 Average Velocity 0.11
Stream Width (ft) 18.0
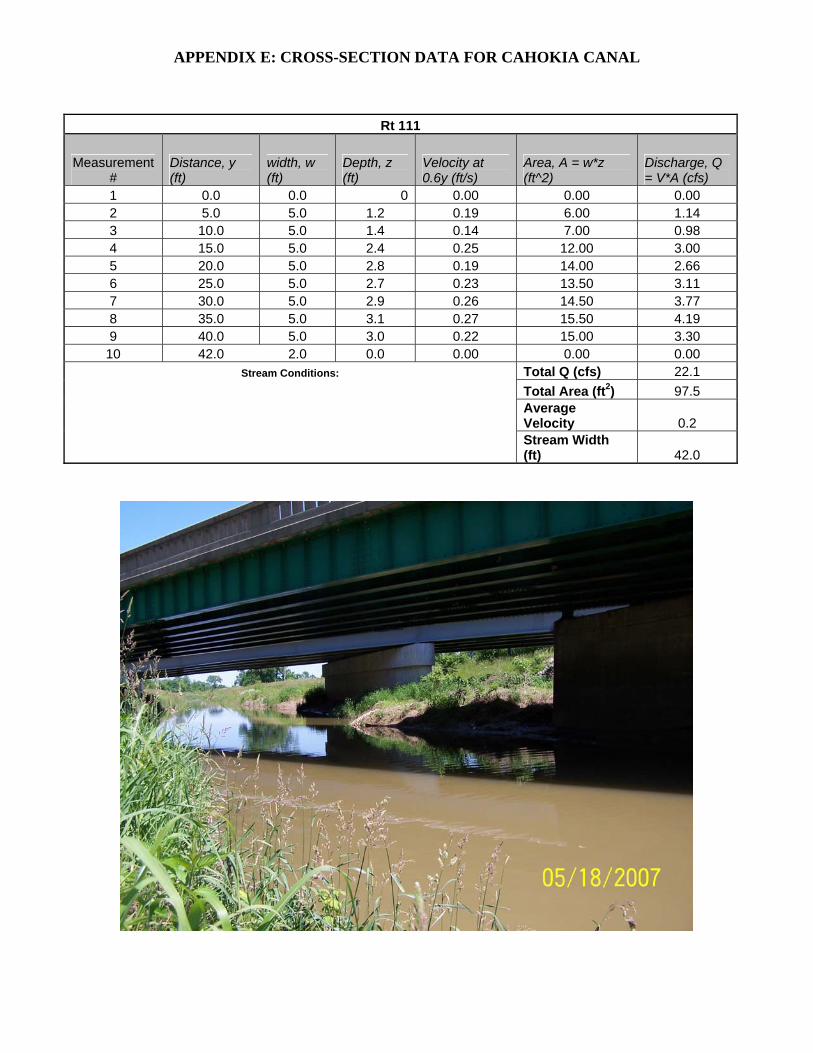
APPENDIX E: CROSS-SECTION DATA FOR CAHOKIA CANAL
Rt 111
Measurement #
Distance, y (ft)
width, w (ft)
Depth, z (ft)
Velocity at 0.6y (ft/s)
Area, A = w*z (ft^2)
Discharge, Q = V*A (cfs)
1 0.0 0.0 0 0.00 0.00 0.00 2 5.0 5.0 1.2 0.19 6.00 1.14 3 10.0 5.0 1.4 0.14 7.00 0.98 4 15.0 5.0 2.4 0.25 12.00 3.00 5 20.0 5.0 2.8 0.19 14.00 2.66 6 25.0 5.0 2.7 0.23 13.50 3.11 7 30.0 5.0 2.9 0.26 14.50 3.77 8 35.0 5.0 3.1 0.27 15.50 4.19 9 40.0 5.0 3.0 0.22 15.00 3.30
10 42.0 2.0 0.0 0.00 0.00 0.00 Stream Conditions: Total Q (cfs) 22.1
Total Area (ft2) 97.5 Average Velocity 0.2
Stream Width (ft) 42.0
Appendix F: QUAL2K Model
Cahokia Canal

THIS PAGE INTENTIONALLY LEFT BLANK
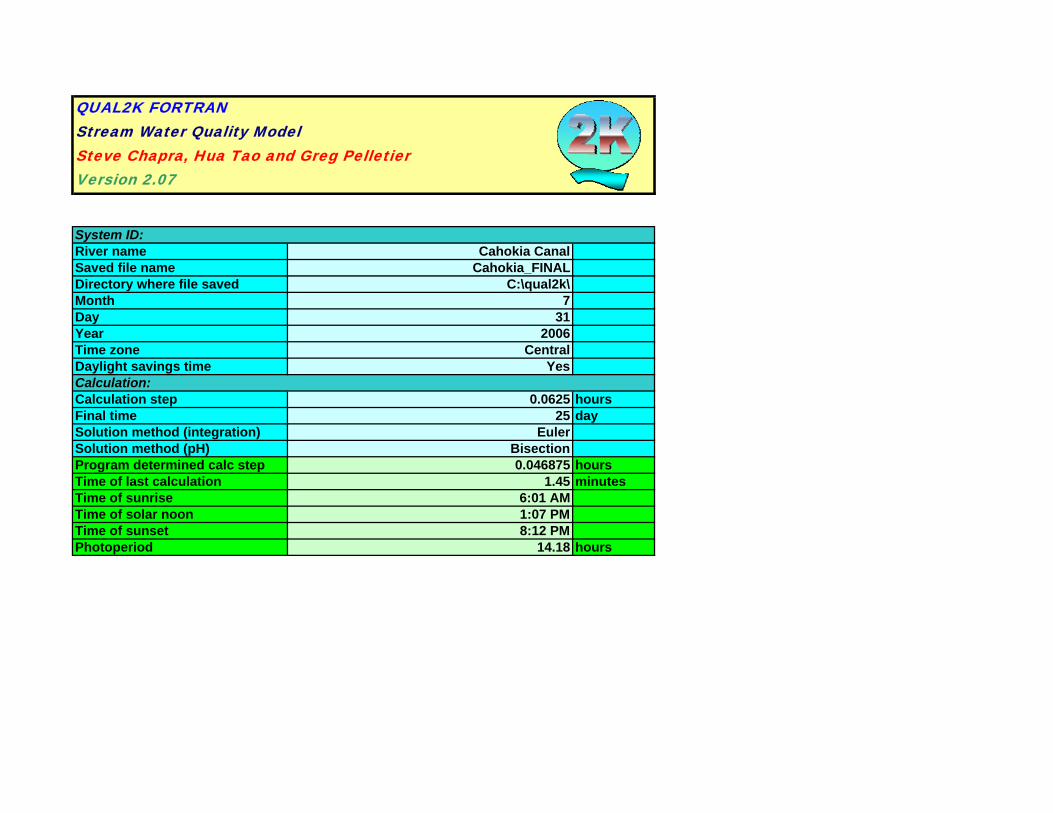
QUAL2K FORTRANStream Water Quality ModelSteve Chapra, Hua Tao and Greg PelletierVersion 2.07
System ID:River name Cahokia CanalSaved file name Cahokia_FINALDirectory where file saved C:\qual2k\Month 7Day 31Year 2006Time zone CentralDaylight savings time YesCalculation:Calculation step 0.0625 hoursFinal time 25 daySolution method (integration) EulerSolution method (pH) BisectionProgram determined calc step 0.046875 hoursTime of last calculation 1.45 minutesTime of sunrise 6:01 AMTime of solar noon 1:07 PMTime of sunset 8:12 PMPhotoperiod 14.18 hours
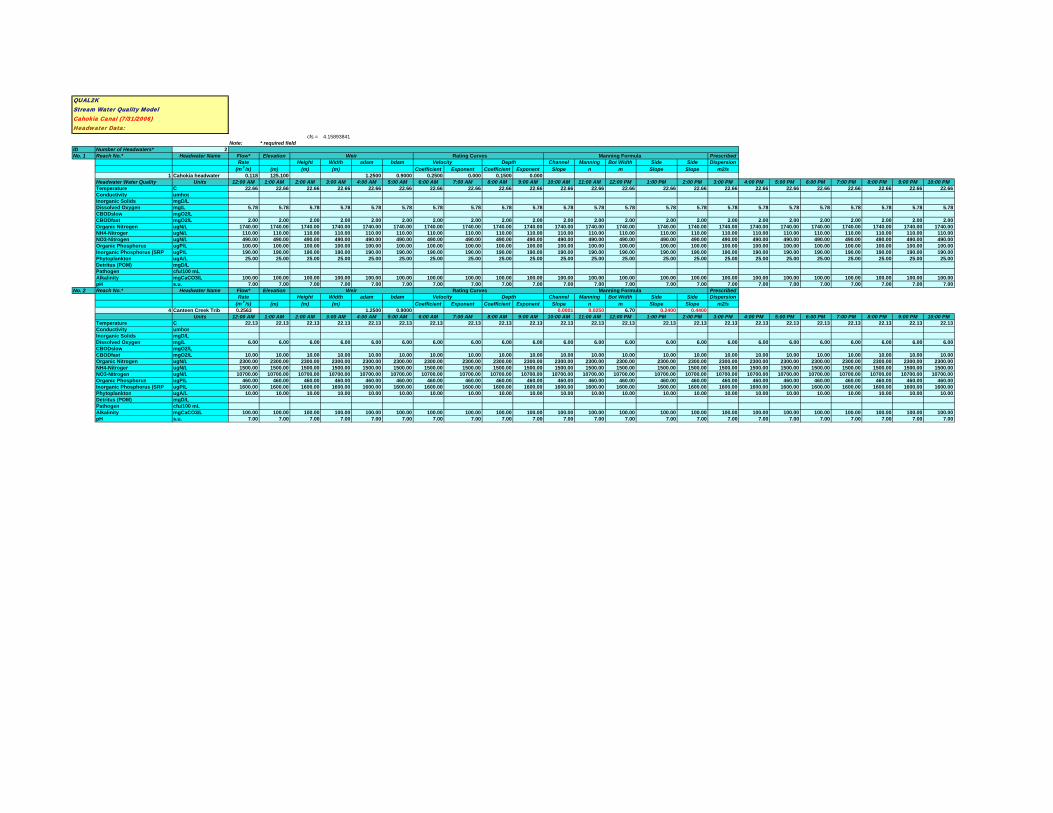
QUAL2KStream Water Quality ModelCahokia Canal (7/31/2006)Headwater Data:
cfs = 4.15893841Note: * required field
ID Number of Headwaters* 2No. 1 Reach No.* Headwater Name Flow* Elevation Rating Curves Manning Formula Prescribed
Rate Height Width adam bdam Velocity Depth Channel Manning Bot Width Side Side Dispersion(m 3 /s) (m) (m) (m) Coefficient Exponent Coefficient Exponent Slope n m Slope Slope m2/s
1 Cahokia headwater 0.118 125.100 1.2500 0.9000 0.2500 0.000 0.1500 0.000Headwater Water Quality Units 12:00 AM 1:00 AM 2:00 AM 3:00 AM 4:00 AM 5:00 AM 6:00 AM 7:00 AM 8:00 AM 9:00 AM 10:00 AM 11:00 AM 12:00 PM 1:00 PM 2:00 PM 3:00 PM 4:00 PM 5:00 PM 6:00 PM 7:00 PM 8:00 PM 9:00 PM 10:00 PMTemperature C 22.66 22.66 22.66 22.66 22.66 22.66 22.66 22.66 22.66 22.66 22.66 22.66 22.66 22.66 22.66 22.66 22.66 22.66 22.66 22.66 22.66 22.66 22.66Conductivity umhosInorganic Solids mgD/LDissolved Oxygen mg/L 5.78 5.78 5.78 5.78 5.78 5.78 5.78 5.78 5.78 5.78 5.78 5.78 5.78 5.78 5.78 5.78 5.78 5.78 5.78 5.78 5.78 5.78 5.78CBODslow mgO2/LCBODfast mgO2/L 2.00 2.00 2.00 2.00 2.00 2.00 2.00 2.00 2.00 2.00 2.00 2.00 2.00 2.00 2.00 2.00 2.00 2.00 2.00 2.00 2.00 2.00 2.00Organic Nitrogen ugN/L 1740.00 1740.00 1740.00 1740.00 1740.00 1740.00 1740.00 1740.00 1740.00 1740.00 1740.00 1740.00 1740.00 1740.00 1740.00 1740.00 1740.00 1740.00 1740.00 1740.00 1740.00 1740.00 1740.00NH4-Nitrogen ugN/L 110.00 110.00 110.00 110.00 110.00 110.00 110.00 110.00 110.00 110.00 110.00 110.00 110.00 110.00 110.00 110.00 110.00 110.00 110.00 110.00 110.00 110.00 110.00NO3-Nitrogen ugN/L 490.00 490.00 490.00 490.00 490.00 490.00 490.00 490.00 490.00 490.00 490.00 490.00 490.00 490.00 490.00 490.00 490.00 490.00 490.00 490.00 490.00 490.00 490.00Organic Phosphorus ugP/L 100.00 100.00 100.00 100.00 100.00 100.00 100.00 100.00 100.00 100.00 100.00 100.00 100.00 100.00 100.00 100.00 100.00 100.00 100.00 100.00 100.00 100.00 100.00Inorganic Phosphorus (SRP) ugP/L 190.00 190.00 190.00 190.00 190.00 190.00 190.00 190.00 190.00 190.00 190.00 190.00 190.00 190.00 190.00 190.00 190.00 190.00 190.00 190.00 190.00 190.00 190.00Phytoplankton ugA/L 25.00 25.00 25.00 25.00 25.00 25.00 25.00 25.00 25.00 25.00 25.00 25.00 25.00 25.00 25.00 25.00 25.00 25.00 25.00 25.00 25.00 25.00 25.00Detritus (POM) mgD/LPathogen cfu/100 mLAlkalinity mgCaCO3/L 100.00 100.00 100.00 100.00 100.00 100.00 100.00 100.00 100.00 100.00 100.00 100.00 100.00 100.00 100.00 100.00 100.00 100.00 100.00 100.00 100.00 100.00 100.00pH s.u. 7.00 7.00 7.00 7.00 7.00 7.00 7.00 7.00 7.00 7.00 7.00 7.00 7.00 7.00 7.00 7.00 7.00 7.00 7.00 7.00 7.00 7.00 7.00
No. 2 Reach No.* Headwater Name Flow* Elevation Rating Curves Manning Formula PrescribedRate Height Width adam bdam Velocity Depth Channel Manning Bot Width Side Side Dispersion
(m 3 /s) (m) (m) (m) Coefficient Exponent Coefficient Exponent Slope n m Slope Slope m2/s4 Canteen Creek Trib 0.2563 1.2500 0.9000 0.0001 0.0250 6.70 0.2400 0.4400
Units 12:00 AM 1:00 AM 2:00 AM 3:00 AM 4:00 AM 5:00 AM 6:00 AM 7:00 AM 8:00 AM 9:00 AM 10:00 AM 11:00 AM 12:00 PM 1:00 PM 2:00 PM 3:00 PM 4:00 PM 5:00 PM 6:00 PM 7:00 PM 8:00 PM 9:00 PM 10:00 PMTemperature C 22.13 22.13 22.13 22.13 22.13 22.13 22.13 22.13 22.13 22.13 22.13 22.13 22.13 22.13 22.13 22.13 22.13 22.13 22.13 22.13 22.13 22.13 22.13Conductivity umhosInorganic Solids mgD/LDissolved Oxygen mg/L 6.00 6.00 6.00 6.00 6.00 6.00 6.00 6.00 6.00 6.00 6.00 6.00 6.00 6.00 6.00 6.00 6.00 6.00 6.00 6.00 6.00 6.00 6.00CBODslow mgO2/LCBODfast mgO2/L 10.00 10.00 10.00 10.00 10.00 10.00 10.00 10.00 10.00 10.00 10.00 10.00 10.00 10.00 10.00 10.00 10.00 10.00 10.00 10.00 10.00 10.00 10.00Organic Nitrogen ugN/L 2300.00 2300.00 2300.00 2300.00 2300.00 2300.00 2300.00 2300.00 2300.00 2300.00 2300.00 2300.00 2300.00 2300.00 2300.00 2300.00 2300.00 2300.00 2300.00 2300.00 2300.00 2300.00 2300.00NH4-Nitrogen ugN/L 1500.00 1500.00 1500.00 1500.00 1500.00 1500.00 1500.00 1500.00 1500.00 1500.00 1500.00 1500.00 1500.00 1500.00 1500.00 1500.00 1500.00 1500.00 1500.00 1500.00 1500.00 1500.00 1500.00NO3-Nitrogen ugN/L 10700.00 10700.00 10700.00 10700.00 10700.00 10700.00 10700.00 10700.00 10700.00 10700.00 10700.00 10700.00 10700.00 10700.00 10700.00 10700.00 10700.00 10700.00 10700.00 10700.00 10700.00 10700.00 10700.00Organic Phosphorus ugP/L 460.00 460.00 460.00 460.00 460.00 460.00 460.00 460.00 460.00 460.00 460.00 460.00 460.00 460.00 460.00 460.00 460.00 460.00 460.00 460.00 460.00 460.00 460.00Inorganic Phosphorus (SRP) ugP/L 1600.00 1600.00 1600.00 1600.00 1600.00 1600.00 1600.00 1600.00 1600.00 1600.00 1600.00 1600.00 1600.00 1600.00 1600.00 1600.00 1600.00 1600.00 1600.00 1600.00 1600.00 1600.00 1600.00Phytoplankton ugA/L 10.00 10.00 10.00 10.00 10.00 10.00 10.00 10.00 10.00 10.00 10.00 10.00 10.00 10.00 10.00 10.00 10.00 10.00 10.00 10.00 10.00 10.00 10.00Detritus (POM) mgD/LPathogen cfu/100 mLAlkalinity mgCaCO3/L 100.00 100.00 100.00 100.00 100.00 100.00 100.00 100.00 100.00 100.00 100.00 100.00 100.00 100.00 100.00 100.00 100.00 100.00 100.00 100.00 100.00 100.00 100.00pH s.u. 7.00 7.00 7.00 7.00 7.00 7.00 7.00 7.00 7.00 7.00 7.00 7.00 7.00 7.00 7.00 7.00 7.00 7.00 7.00 7.00 7.00 7.00 7.00
Weir
Weir
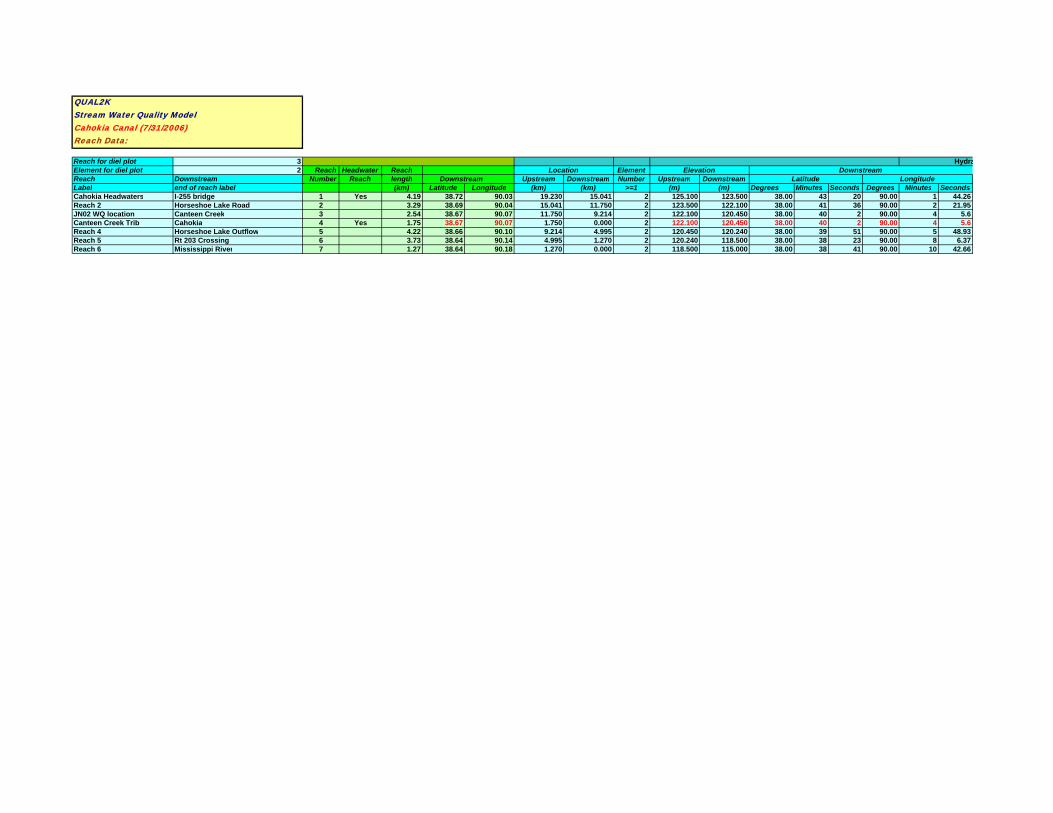
QUAL2KStream Water Quality ModelCahokia Canal (7/31/2006)Reach Data:
Reach for diel plot 3 HydraElement for diel plot 2 Reach Headwater Reach ElementReach Downstream Number Reach length Downstream Upstream Downstream Number Upstream DownstreamLabel end of reach label (km) Latitude Longitude (km) (km) >=1 (m) (m) Degrees Minutes Seconds Degrees Minutes SecondsCahokia Headwaters I-255 bridge 1 Yes 4.19 38.72 90.03 19.230 15.041 2 125.100 123.500 38.00 43 20 90.00 1 44.26Reach 2 Horseshoe Lake Road 2 3.29 38.69 90.04 15.041 11.750 2 123.500 122.100 38.00 41 36 90.00 2 21.95JN02 WQ location Canteen Creek 3 2.54 38.67 90.07 11.750 9.214 2 122.100 120.450 38.00 40 2 90.00 4 5.6Canteen Creek Trib Cahokia 4 Yes 1.75 38.67 90.07 1.750 0.000 2 122.100 120.450 38.00 40 2 90.00 4 5.6Reach 4 Horseshoe Lake Outflow 5 4.22 38.66 90.10 9.214 4.995 2 120.450 120.240 38.00 39 51 90.00 5 48.93Reach 5 Rt 203 Crossing 6 3.73 38.64 90.14 4.995 1.270 2 120.240 118.500 38.00 38 23 90.00 8 6.37Reach 6 Mississippi River 7 1.27 38.64 90.18 1.270 0.000 2 118.500 115.000 38.00 38 41 90.00 10 42.66
Latitude LongitudeLocation Elevation Downstream
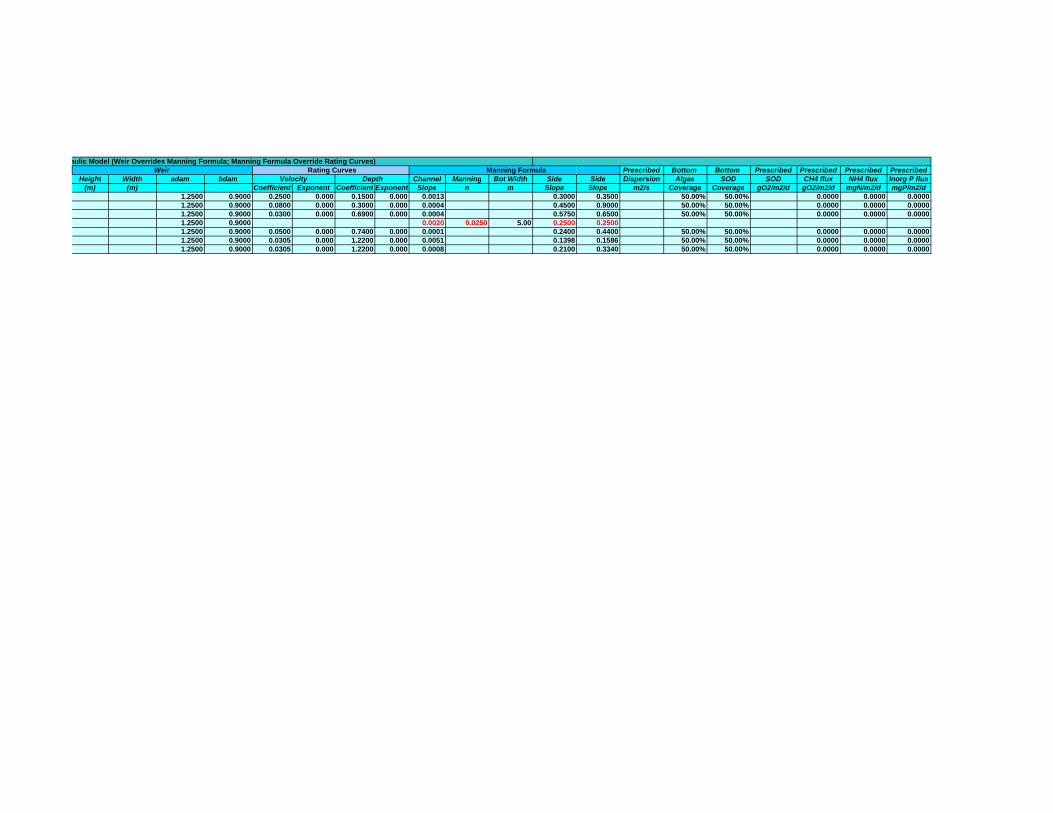
aulic Model (Weir Overrides Manning Formula; Manning Formula Override Rating Curves) Rating Curves Manning Formula Prescribed Bottom Bottom Prescribed Prescribed Prescribed Prescribed
Height Width adam bdam Velocity Depth Channel Manning Bot Width Side Side Dispersion Algae SOD SOD CH4 flux NH4 flux Inorg P flux(m) (m) Coefficient Exponent Coefficient Exponent Slope n m Slope Slope m2/s Coverage Coverage gO2/m2/d gO2/m2/d mgN/m2/d mgP/m2/d
1.2500 0.9000 0.2500 0.000 0.1500 0.000 0.0013 0.3000 0.3500 50.00% 50.00% 0.0000 0.0000 0.00001.2500 0.9000 0.0800 0.000 0.3000 0.000 0.0004 0.4500 0.9000 50.00% 50.00% 0.0000 0.0000 0.00001.2500 0.9000 0.0300 0.000 0.6900 0.000 0.0004 0.5750 0.6500 50.00% 50.00% 0.0000 0.0000 0.00001.2500 0.9000 0.0020 0.0250 5.00 0.2500 0.25001.2500 0.9000 0.0500 0.000 0.7400 0.000 0.0001 0.2400 0.4400 50.00% 50.00% 0.0000 0.0000 0.00001.2500 0.9000 0.0305 0.000 1.2200 0.000 0.0051 0.1398 0.1586 50.00% 50.00% 0.0000 0.0000 0.00001.2500 0.9000 0.0305 0.000 1.2200 0.000 0.0008 0.2100 0.3340 50.00% 50.00% 0.0000 0.0000 0.0000
Weir
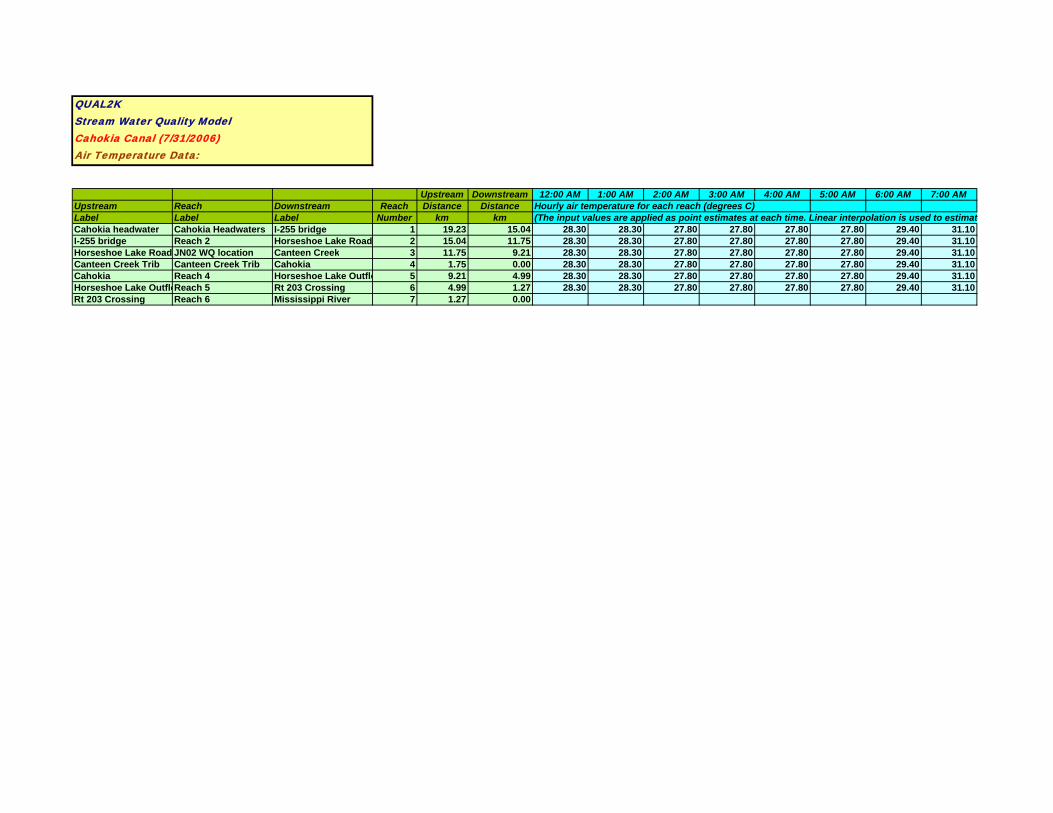
QUAL2KStream Water Quality ModelCahokia Canal (7/31/2006)Air Temperature Data:
Upstream Downstream 12:00 AM 1:00 AM 2:00 AM 3:00 AM 4:00 AM 5:00 AM 6:00 AM 7:00 AMUpstream Reach Downstream Reach Distance Distance Hourly air temperature for each reach (degrees C)Label Label Label Number km km (The input values are applied as point estimates at each time. Linear interpolation is used to estimateCahokia headwater Cahokia Headwaters I-255 bridge 1 19.23 15.04 28.30 28.30 27.80 27.80 27.80 27.80 29.40 31.10I-255 bridge Reach 2 Horseshoe Lake Road 2 15.04 11.75 28.30 28.30 27.80 27.80 27.80 27.80 29.40 31.10Horseshoe Lake Road JN02 WQ location Canteen Creek 3 11.75 9.21 28.30 28.30 27.80 27.80 27.80 27.80 29.40 31.10Canteen Creek Trib Canteen Creek Trib Cahokia 4 1.75 0.00 28.30 28.30 27.80 27.80 27.80 27.80 29.40 31.10Cahokia Reach 4 Horseshoe Lake Outflo 5 9.21 4.99 28.30 28.30 27.80 27.80 27.80 27.80 29.40 31.10Horseshoe Lake OutfloReach 5 Rt 203 Crossing 6 4.99 1.27 28.30 28.30 27.80 27.80 27.80 27.80 29.40 31.10Rt 203 Crossing Reach 6 Mississippi River 7 1.27 0.00
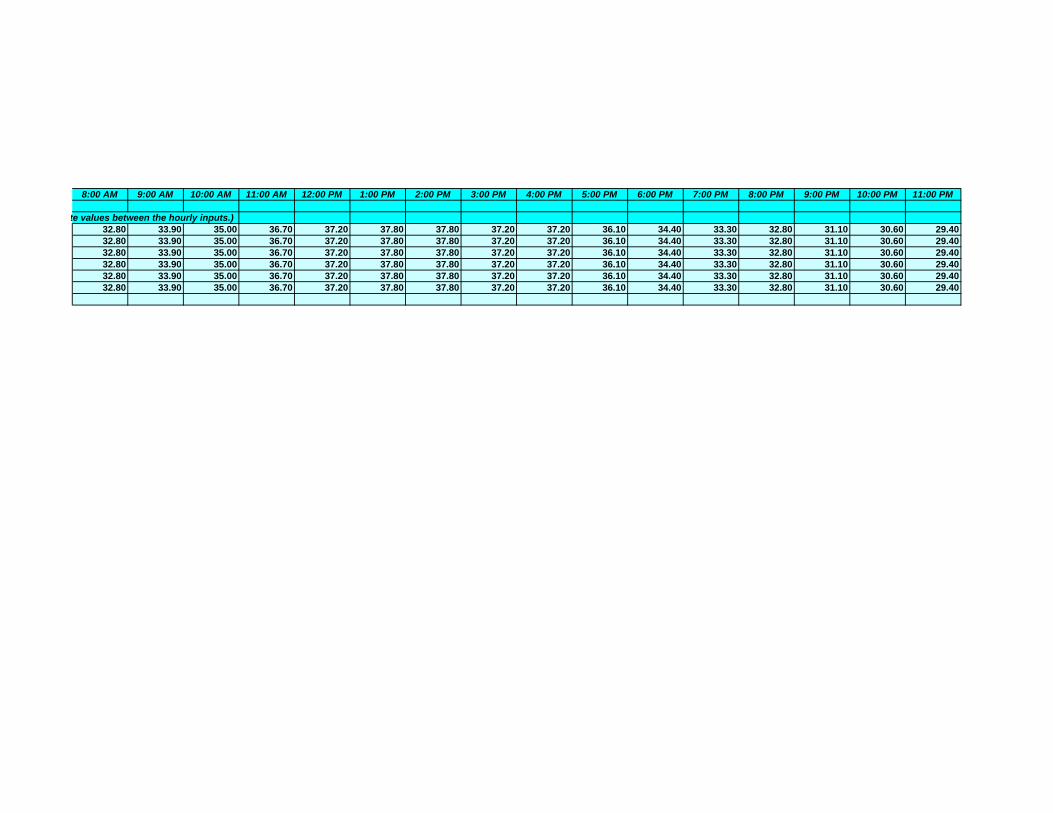
8:00 AM 9:00 AM 10:00 AM 11:00 AM 12:00 PM 1:00 PM 2:00 PM 3:00 PM 4:00 PM 5:00 PM 6:00 PM 7:00 PM 8:00 PM 9:00 PM 10:00 PM 11:00 PM
te values between the hourly inputs.)32.80 33.90 35.00 36.70 37.20 37.80 37.80 37.20 37.20 36.10 34.40 33.30 32.80 31.10 30.60 29.4032.80 33.90 35.00 36.70 37.20 37.80 37.80 37.20 37.20 36.10 34.40 33.30 32.80 31.10 30.60 29.4032.80 33.90 35.00 36.70 37.20 37.80 37.80 37.20 37.20 36.10 34.40 33.30 32.80 31.10 30.60 29.4032.80 33.90 35.00 36.70 37.20 37.80 37.80 37.20 37.20 36.10 34.40 33.30 32.80 31.10 30.60 29.4032.80 33.90 35.00 36.70 37.20 37.80 37.80 37.20 37.20 36.10 34.40 33.30 32.80 31.10 30.60 29.4032.80 33.90 35.00 36.70 37.20 37.80 37.80 37.20 37.20 36.10 34.40 33.30 32.80 31.10 30.60 29.40
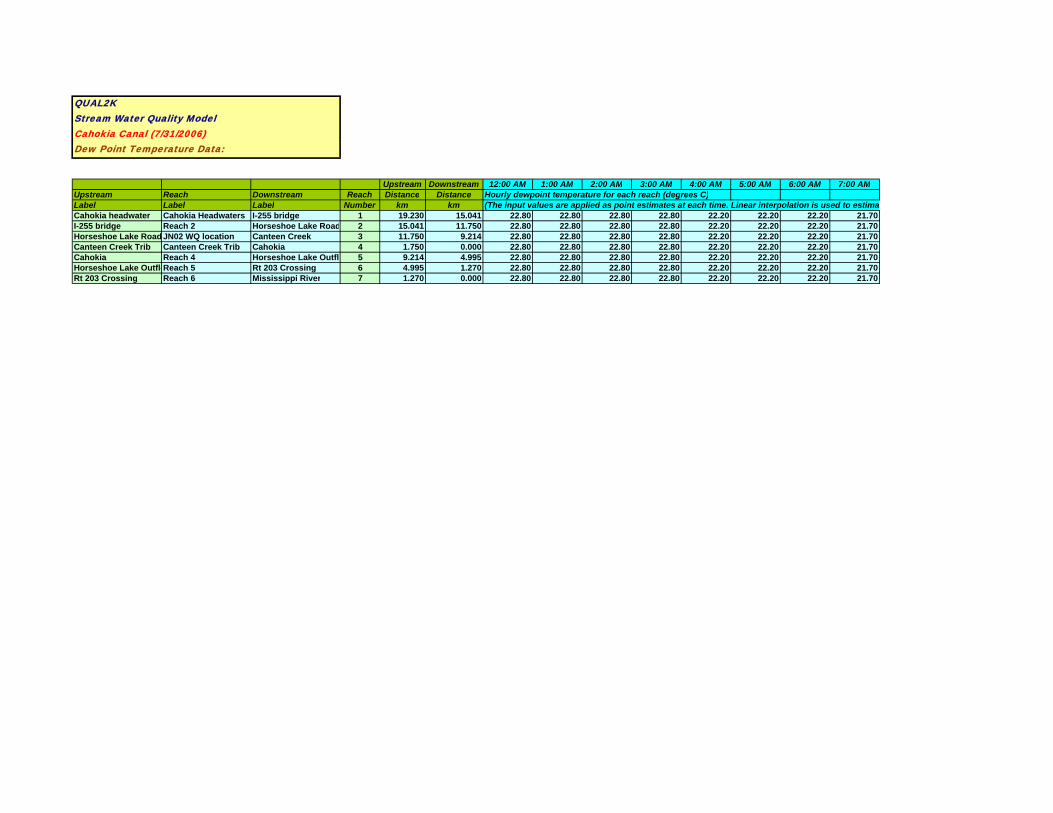
QUAL2KStream Water Quality ModelCahokia Canal (7/31/2006)Dew Point Temperature Data:
Upstream Downstream 12:00 AM 1:00 AM 2:00 AM 3:00 AM 4:00 AM 5:00 AM 6:00 AM 7:00 AMUpstream Reach Downstream Reach Distance Distance Hourly dewpoint temperature for each reach (degrees C)Label Label Label Number km km (The input values are applied as point estimates at each time. Linear interpolation is used to estimaCahokia headwater Cahokia Headwaters I-255 bridge 1 19.230 15.041 22.80 22.80 22.80 22.80 22.20 22.20 22.20 21.70I-255 bridge Reach 2 Horseshoe Lake Road 2 15.041 11.750 22.80 22.80 22.80 22.80 22.20 22.20 22.20 21.70Horseshoe Lake Road JN02 WQ location Canteen Creek 3 11.750 9.214 22.80 22.80 22.80 22.80 22.20 22.20 22.20 21.70Canteen Creek Trib Canteen Creek Trib Cahokia 4 1.750 0.000 22.80 22.80 22.80 22.80 22.20 22.20 22.20 21.70Cahokia Reach 4 Horseshoe Lake Outflo 5 9.214 4.995 22.80 22.80 22.80 22.80 22.20 22.20 22.20 21.70Horseshoe Lake OutfloReach 5 Rt 203 Crossing 6 4.995 1.270 22.80 22.80 22.80 22.80 22.20 22.20 22.20 21.70Rt 203 Crossing Reach 6 Mississippi River 7 1.270 0.000 22.80 22.80 22.80 22.80 22.20 22.20 22.20 21.70

8:00 AM 9:00 AM 10:00 AM 11:00 AM 12:00 PM 1:00 PM 2:00 PM 3:00 PM 4:00 PM 5:00 PM 6:00 PM 7:00 PM 8:00 PM 9:00 PM 10:00 PM 11:00 PM
te values between the hourly inputs.)21.70 21.70 21.10 21.10 20.00 20.60 19.40 20.00 20.60 19.40 20.00 20.60 20.60 21.70 22.80 22.8021.70 21.70 21.10 21.10 20.00 20.60 19.40 20.00 20.60 19.40 20.00 20.60 20.60 21.70 22.80 22.8021.70 21.70 21.10 21.10 20.00 20.60 19.40 20.00 20.60 19.40 20.00 20.60 20.60 21.70 22.80 22.8021.70 21.70 21.10 21.10 20.00 20.60 19.40 20.00 20.60 19.40 20.00 20.60 20.60 21.70 22.80 22.8021.70 21.70 21.10 21.10 20.00 20.60 19.40 20.00 20.60 19.40 20.00 20.60 20.60 21.70 22.80 22.8021.70 21.70 21.10 21.10 20.00 20.60 19.40 20.00 20.60 19.40 20.00 20.60 20.60 21.70 22.80 22.8021.70 21.70 21.10 21.10 20.00 20.60 19.40 20.00 20.60 19.40 20.00 20.60 20.60 21.70 22.80 22.80
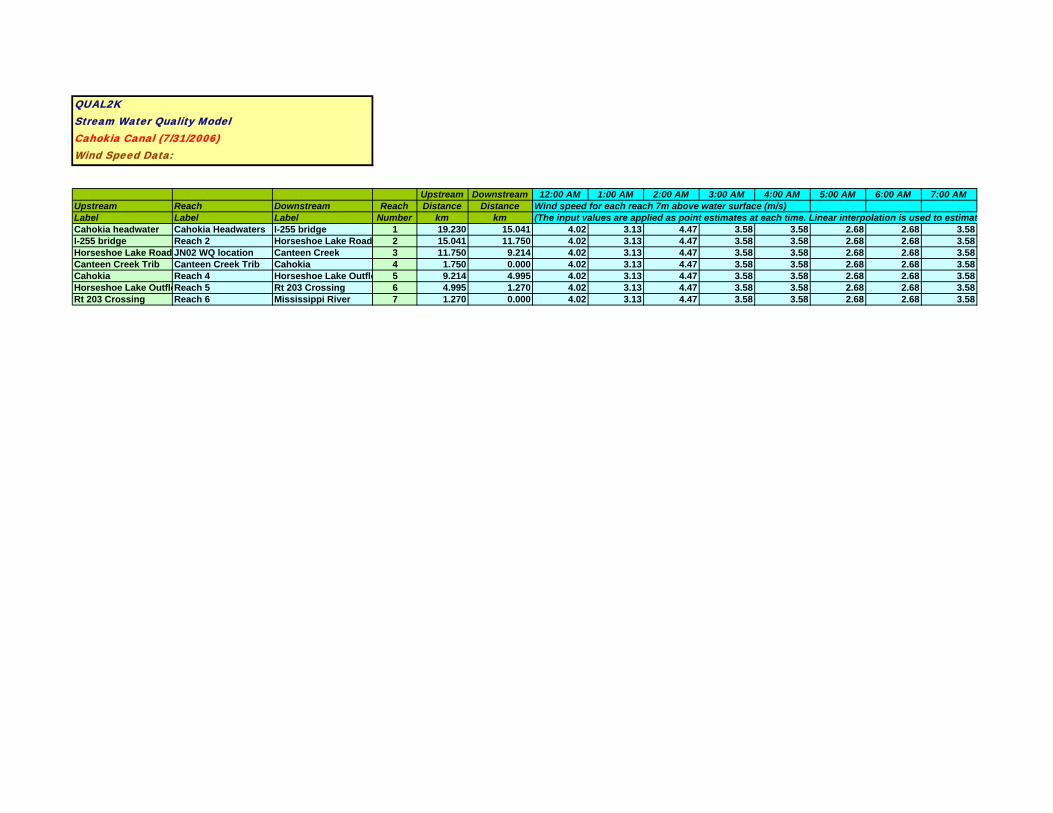
QUAL2KStream Water Quality ModelCahokia Canal (7/31/2006)Wind Speed Data:
Upstream Downstream 12:00 AM 1:00 AM 2:00 AM 3:00 AM 4:00 AM 5:00 AM 6:00 AM 7:00 AMUpstream Reach Downstream Reach Distance Distance Wind speed for each reach 7m above water surface (m/s)Label Label Label Number km km (The input values are applied as point estimates at each time. Linear interpolation is used to estimateCahokia headwater Cahokia Headwaters I-255 bridge 1 19.230 15.041 4.02 3.13 4.47 3.58 3.58 2.68 2.68 3.58I-255 bridge Reach 2 Horseshoe Lake Road 2 15.041 11.750 4.02 3.13 4.47 3.58 3.58 2.68 2.68 3.58Horseshoe Lake Road JN02 WQ location Canteen Creek 3 11.750 9.214 4.02 3.13 4.47 3.58 3.58 2.68 2.68 3.58Canteen Creek Trib Canteen Creek Trib Cahokia 4 1.750 0.000 4.02 3.13 4.47 3.58 3.58 2.68 2.68 3.58Cahokia Reach 4 Horseshoe Lake Outflo 5 9.214 4.995 4.02 3.13 4.47 3.58 3.58 2.68 2.68 3.58Horseshoe Lake OutfloReach 5 Rt 203 Crossing 6 4.995 1.270 4.02 3.13 4.47 3.58 3.58 2.68 2.68 3.58Rt 203 Crossing Reach 6 Mississippi River 7 1.270 0.000 4.02 3.13 4.47 3.58 3.58 2.68 2.68 3.58
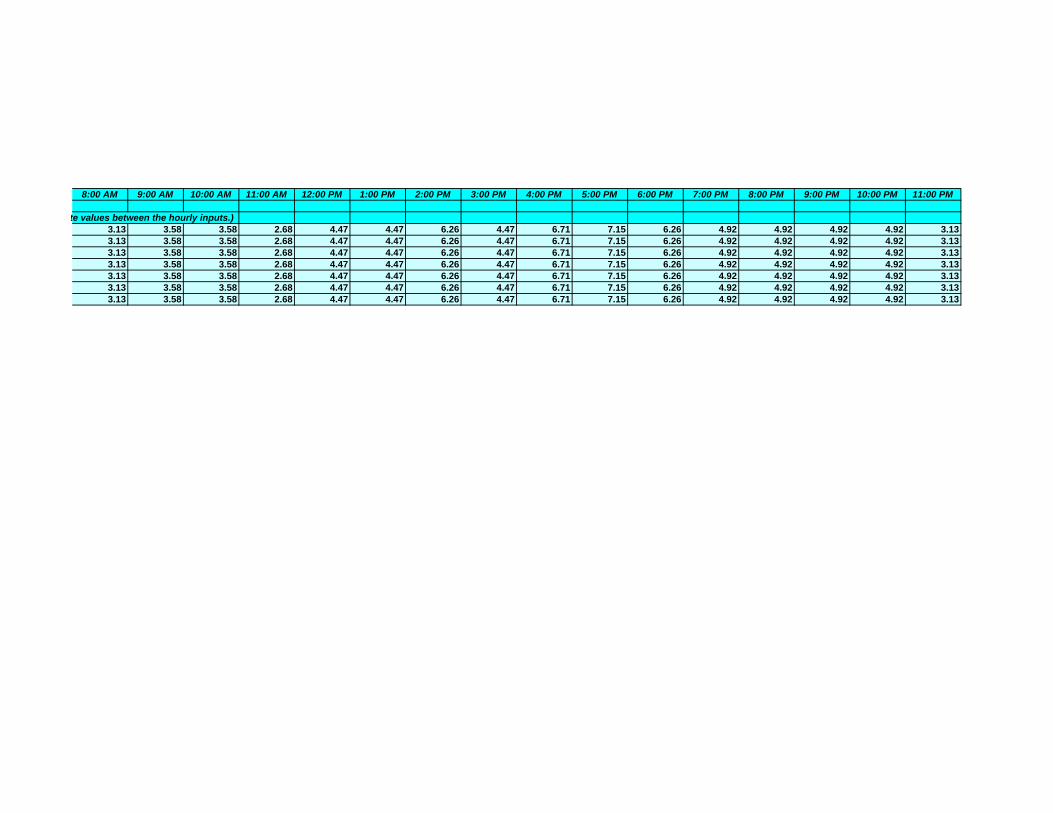
8:00 AM 9:00 AM 10:00 AM 11:00 AM 12:00 PM 1:00 PM 2:00 PM 3:00 PM 4:00 PM 5:00 PM 6:00 PM 7:00 PM 8:00 PM 9:00 PM 10:00 PM 11:00 PM
te values between the hourly inputs.)3.13 3.58 3.58 2.68 4.47 4.47 6.26 4.47 6.71 7.15 6.26 4.92 4.92 4.92 4.92 3.133.13 3.58 3.58 2.68 4.47 4.47 6.26 4.47 6.71 7.15 6.26 4.92 4.92 4.92 4.92 3.133.13 3.58 3.58 2.68 4.47 4.47 6.26 4.47 6.71 7.15 6.26 4.92 4.92 4.92 4.92 3.133.13 3.58 3.58 2.68 4.47 4.47 6.26 4.47 6.71 7.15 6.26 4.92 4.92 4.92 4.92 3.133.13 3.58 3.58 2.68 4.47 4.47 6.26 4.47 6.71 7.15 6.26 4.92 4.92 4.92 4.92 3.133.13 3.58 3.58 2.68 4.47 4.47 6.26 4.47 6.71 7.15 6.26 4.92 4.92 4.92 4.92 3.133.13 3.58 3.58 2.68 4.47 4.47 6.26 4.47 6.71 7.15 6.26 4.92 4.92 4.92 4.92 3.13

QUAL2KStream Water Quality ModelCahokia Canal (7/31/2006)Cloud Cover Data:
Upstream Downstream 12:00 AM 1:00 AM 2:00 AM 3:00 AM 4:00 AM 5:00 AM 6:00 AM 7:00 AMUpstream Reach Downstream Reach Distance Distance Hourly cloud cover shade for each reach (Percent)Label Label Label Number km km (Percent of sky that is covered by clouds. The input values are applied as point estimates at each timCahokia headwater Cahokia Headwaters I-255 bridge 1 19.230 15.041 25.0% 25.0% 25.0% 25.0% 25.0% 25.0% 25.0% 25.0%I-255 bridge Reach 2 Horseshoe Lake Road 2 15.041 11.750 25.0% 25.0% 25.0% 25.0% 25.0% 25.0% 25.0% 25.0%Horseshoe Lake Road JN02 WQ location Canteen Creek 3 11.750 9.214 25.0% 25.0% 25.0% 25.0% 25.0% 25.0% 25.0% 25.0%Canteen Creek Trib Canteen Creek Trib Cahokia 4 1.750 0.000 25.0% 25.0% 25.0% 25.0% 25.0% 25.0% 25.0% 25.0%Cahokia Reach 4 Horseshoe Lake Outflo 5 9.214 4.995 25.0% 25.0% 25.0% 25.0% 25.0% 25.0% 25.0% 25.0%Horseshoe Lake OutfloReach 5 Rt 203 Crossing 6 4.995 1.270 25.0% 25.0% 25.0% 25.0% 25.0% 25.0% 25.0% 25.0%Rt 203 Crossing Reach 6 Mississippi River 7 1.270 0.000 25.0% 25.0% 25.0% 25.0% 25.0% 25.0% 25.0% 25.0%
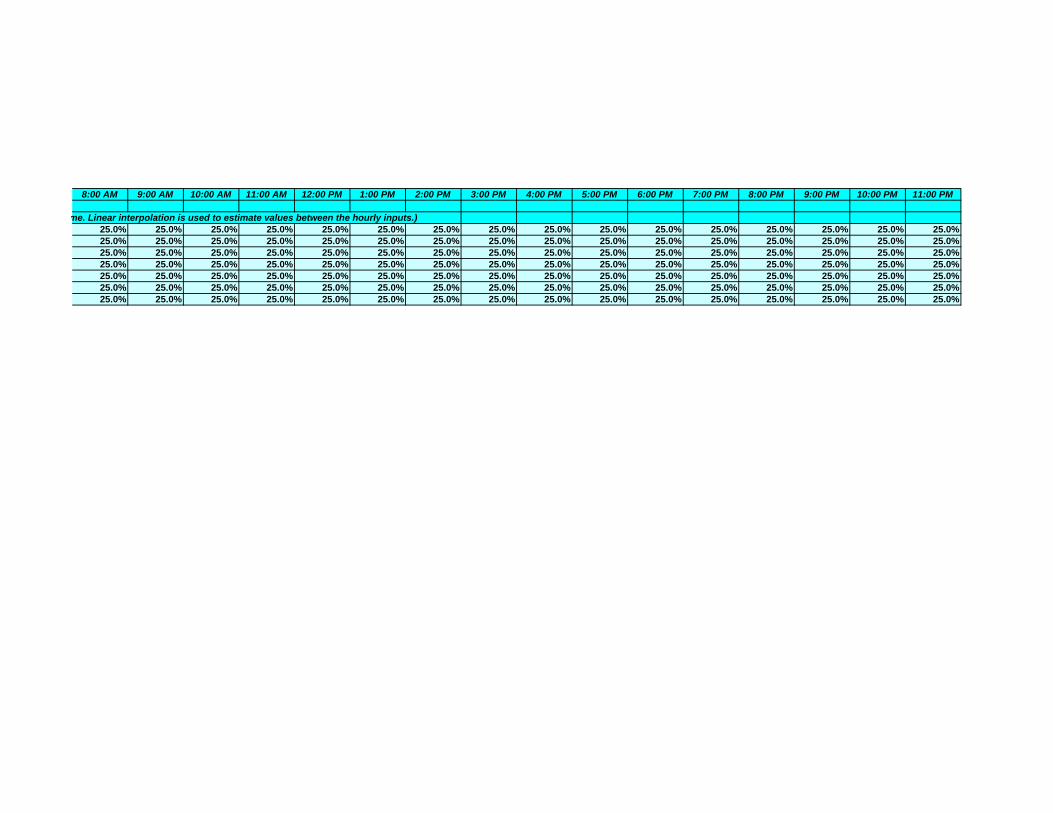
8:00 AM 9:00 AM 10:00 AM 11:00 AM 12:00 PM 1:00 PM 2:00 PM 3:00 PM 4:00 PM 5:00 PM 6:00 PM 7:00 PM 8:00 PM 9:00 PM 10:00 PM 11:00 PM
me. Linear interpolation is used to estimate values between the hourly inputs.)25.0% 25.0% 25.0% 25.0% 25.0% 25.0% 25.0% 25.0% 25.0% 25.0% 25.0% 25.0% 25.0% 25.0% 25.0% 25.0%25.0% 25.0% 25.0% 25.0% 25.0% 25.0% 25.0% 25.0% 25.0% 25.0% 25.0% 25.0% 25.0% 25.0% 25.0% 25.0%25.0% 25.0% 25.0% 25.0% 25.0% 25.0% 25.0% 25.0% 25.0% 25.0% 25.0% 25.0% 25.0% 25.0% 25.0% 25.0%25.0% 25.0% 25.0% 25.0% 25.0% 25.0% 25.0% 25.0% 25.0% 25.0% 25.0% 25.0% 25.0% 25.0% 25.0% 25.0%25.0% 25.0% 25.0% 25.0% 25.0% 25.0% 25.0% 25.0% 25.0% 25.0% 25.0% 25.0% 25.0% 25.0% 25.0% 25.0%25.0% 25.0% 25.0% 25.0% 25.0% 25.0% 25.0% 25.0% 25.0% 25.0% 25.0% 25.0% 25.0% 25.0% 25.0% 25.0%25.0% 25.0% 25.0% 25.0% 25.0% 25.0% 25.0% 25.0% 25.0% 25.0% 25.0% 25.0% 25.0% 25.0% 25.0% 25.0%
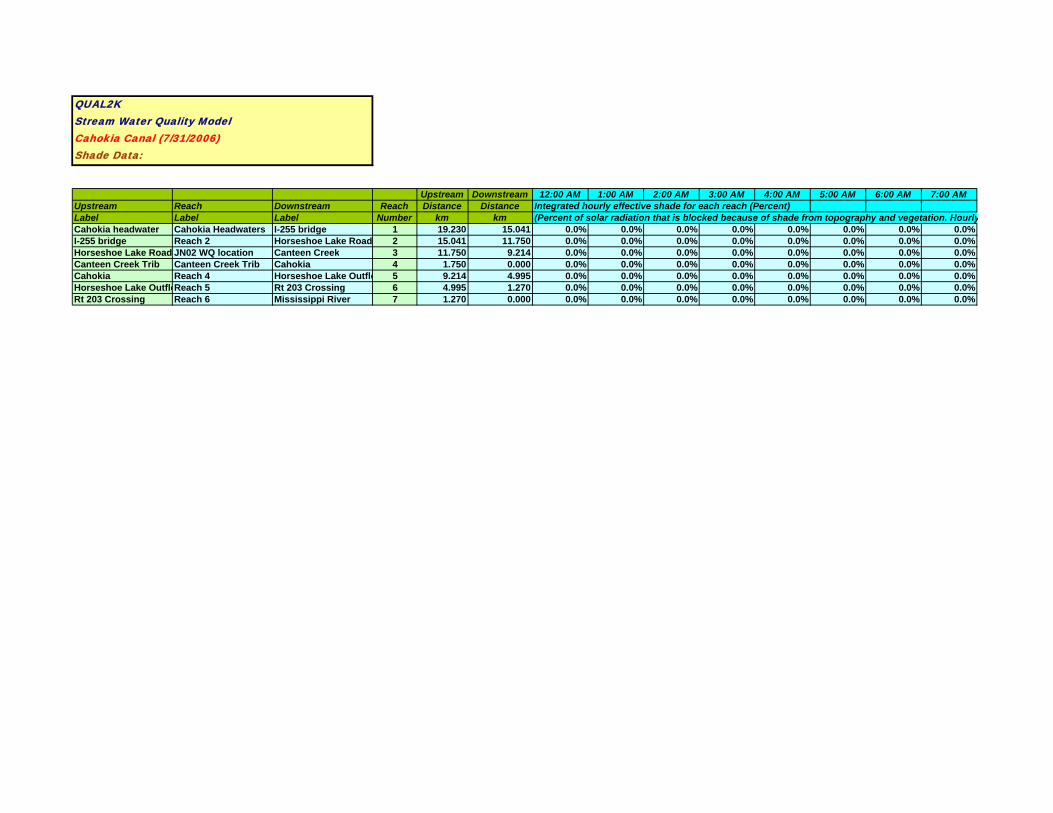
QUAL2KStream Water Quality ModelCahokia Canal (7/31/2006)Shade Data:
Upstream Downstream 12:00 AM 1:00 AM 2:00 AM 3:00 AM 4:00 AM 5:00 AM 6:00 AM 7:00 AMUpstream Reach Downstream Reach Distance Distance Integrated hourly effective shade for each reach (Percent)Label Label Label Number km km (Percent of solar radiation that is blocked because of shade from topography and vegetation. HourlyCahokia headwater Cahokia Headwaters I-255 bridge 1 19.230 15.041 0.0% 0.0% 0.0% 0.0% 0.0% 0.0% 0.0% 0.0%I-255 bridge Reach 2 Horseshoe Lake Road 2 15.041 11.750 0.0% 0.0% 0.0% 0.0% 0.0% 0.0% 0.0% 0.0%Horseshoe Lake Road JN02 WQ location Canteen Creek 3 11.750 9.214 0.0% 0.0% 0.0% 0.0% 0.0% 0.0% 0.0% 0.0%Canteen Creek Trib Canteen Creek Trib Cahokia 4 1.750 0.000 0.0% 0.0% 0.0% 0.0% 0.0% 0.0% 0.0% 0.0%Cahokia Reach 4 Horseshoe Lake Outflo 5 9.214 4.995 0.0% 0.0% 0.0% 0.0% 0.0% 0.0% 0.0% 0.0%Horseshoe Lake OutfloReach 5 Rt 203 Crossing 6 4.995 1.270 0.0% 0.0% 0.0% 0.0% 0.0% 0.0% 0.0% 0.0%Rt 203 Crossing Reach 6 Mississippi River 7 1.270 0.000 0.0% 0.0% 0.0% 0.0% 0.0% 0.0% 0.0% 0.0%
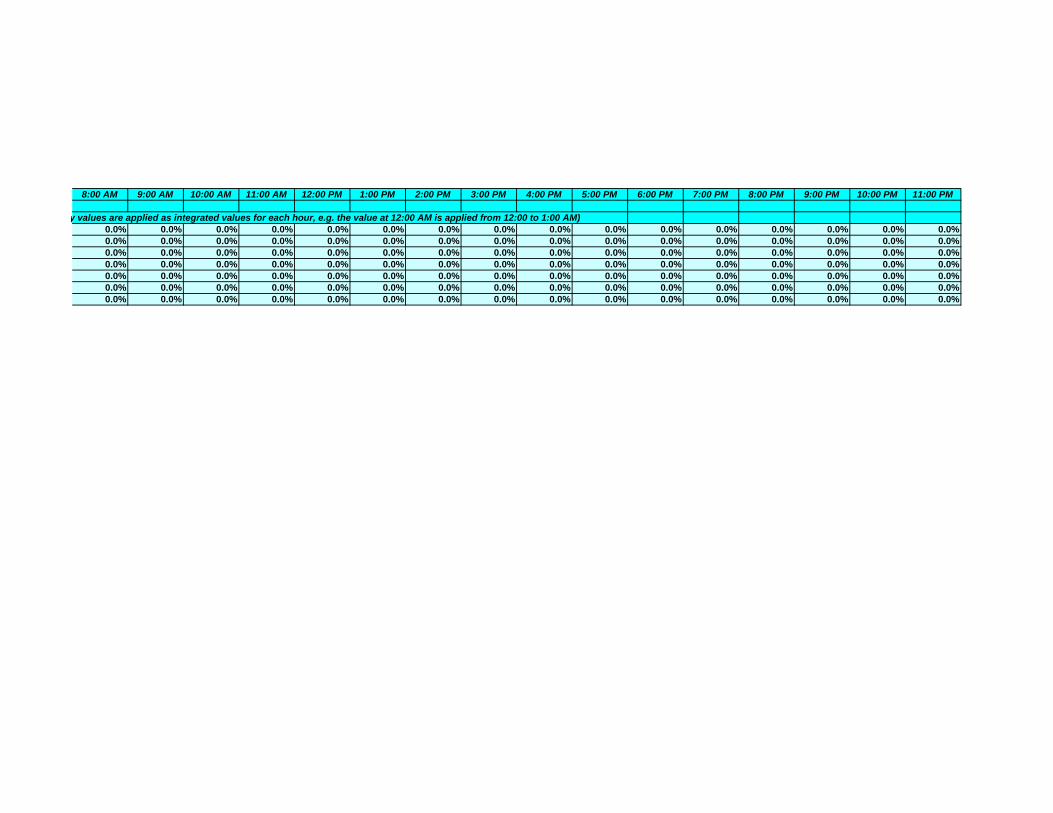
8:00 AM 9:00 AM 10:00 AM 11:00 AM 12:00 PM 1:00 PM 2:00 PM 3:00 PM 4:00 PM 5:00 PM 6:00 PM 7:00 PM 8:00 PM 9:00 PM 10:00 PM 11:00 PM
y values are applied as integrated values for each hour, e.g. the value at 12:00 AM is applied from 12:00 to 1:00 AM)0.0% 0.0% 0.0% 0.0% 0.0% 0.0% 0.0% 0.0% 0.0% 0.0% 0.0% 0.0% 0.0% 0.0% 0.0% 0.0%0.0% 0.0% 0.0% 0.0% 0.0% 0.0% 0.0% 0.0% 0.0% 0.0% 0.0% 0.0% 0.0% 0.0% 0.0% 0.0%0.0% 0.0% 0.0% 0.0% 0.0% 0.0% 0.0% 0.0% 0.0% 0.0% 0.0% 0.0% 0.0% 0.0% 0.0% 0.0%0.0% 0.0% 0.0% 0.0% 0.0% 0.0% 0.0% 0.0% 0.0% 0.0% 0.0% 0.0% 0.0% 0.0% 0.0% 0.0%0.0% 0.0% 0.0% 0.0% 0.0% 0.0% 0.0% 0.0% 0.0% 0.0% 0.0% 0.0% 0.0% 0.0% 0.0% 0.0%0.0% 0.0% 0.0% 0.0% 0.0% 0.0% 0.0% 0.0% 0.0% 0.0% 0.0% 0.0% 0.0% 0.0% 0.0% 0.0%0.0% 0.0% 0.0% 0.0% 0.0% 0.0% 0.0% 0.0% 0.0% 0.0% 0.0% 0.0% 0.0% 0.0% 0.0% 0.0%
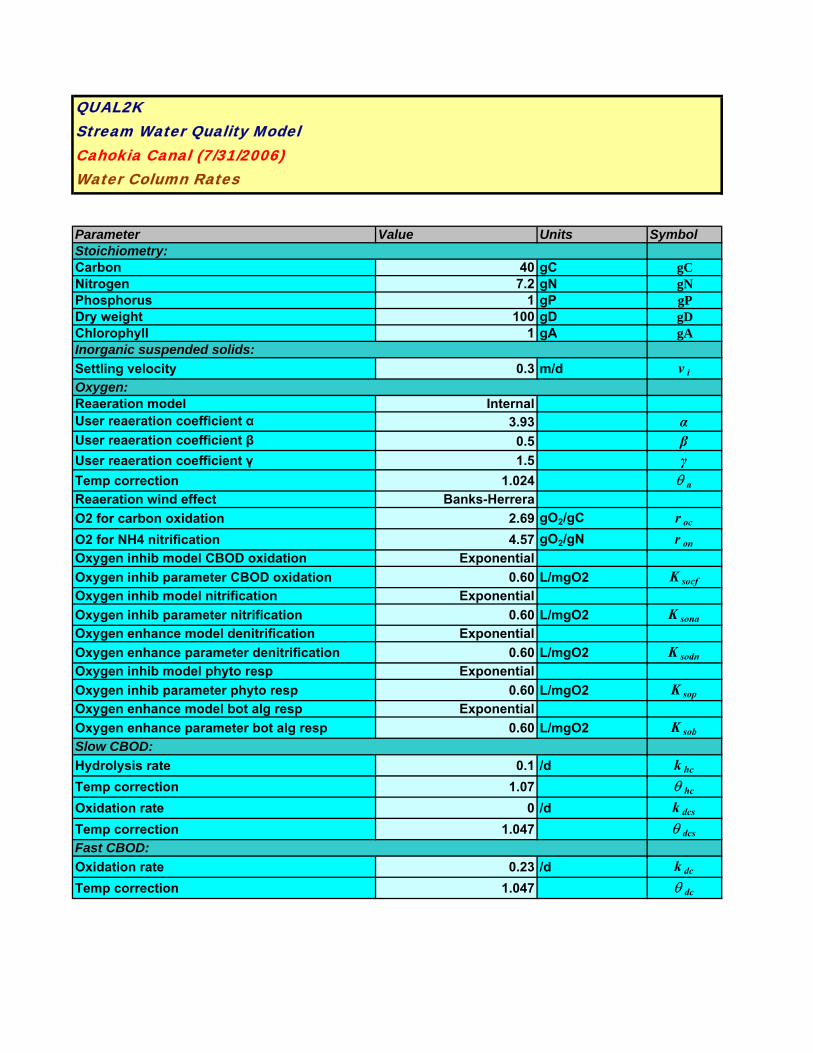
QUAL2KStream Water Quality ModelCahokia Canal (7/31/2006)Water Column Rates
Parameter Value Units SymbolStoichiometry:Carbon 40 gC gCNitrogen 7.2 gN gNPhosphorus 1 gP gPDry weight 100 gD gDChlorophyll 1 gA gAInorganic suspended solids:Settling velocity 0.3 m/d v iOxygen:Reaeration model InternalUser reaeration coefficient α 3.93 αUser reaeration coefficient β 0.5 βUser reaeration coefficient γ 1.5 γTemp correction 1.024 θ aReaeration wind effect Banks-HerreraO2 for carbon oxidation 2.69 gO2/gC r ocO2 for NH4 nitrification 4.57 gO2/gN r onOxygen inhib model CBOD oxidation ExponentialOxygen inhib parameter CBOD oxidation 0.60 L/mgO2 K socfOxygen inhib model nitrification ExponentialOxygen inhib parameter nitrification 0.60 L/mgO2 K sonaOxygen enhance model denitrification ExponentialOxygen enhance parameter denitrification 0.60 L/mgO2 K sodnOxygen inhib model phyto resp ExponentialOxygen inhib parameter phyto resp 0.60 L/mgO2 K sopOxygen enhance model bot alg resp ExponentialOxygen enhance parameter bot alg resp 0.60 L/mgO2 K sobSlow CBOD:Hydrolysis rate 0.1 /d k hcTemp correction 1.07 θ hcOxidation rate 0 /d k dcsTemp correction 1.047 θ dcsFast CBOD:Oxidation rate 0.23 /d k dcTemp correction 1.047 θ dc
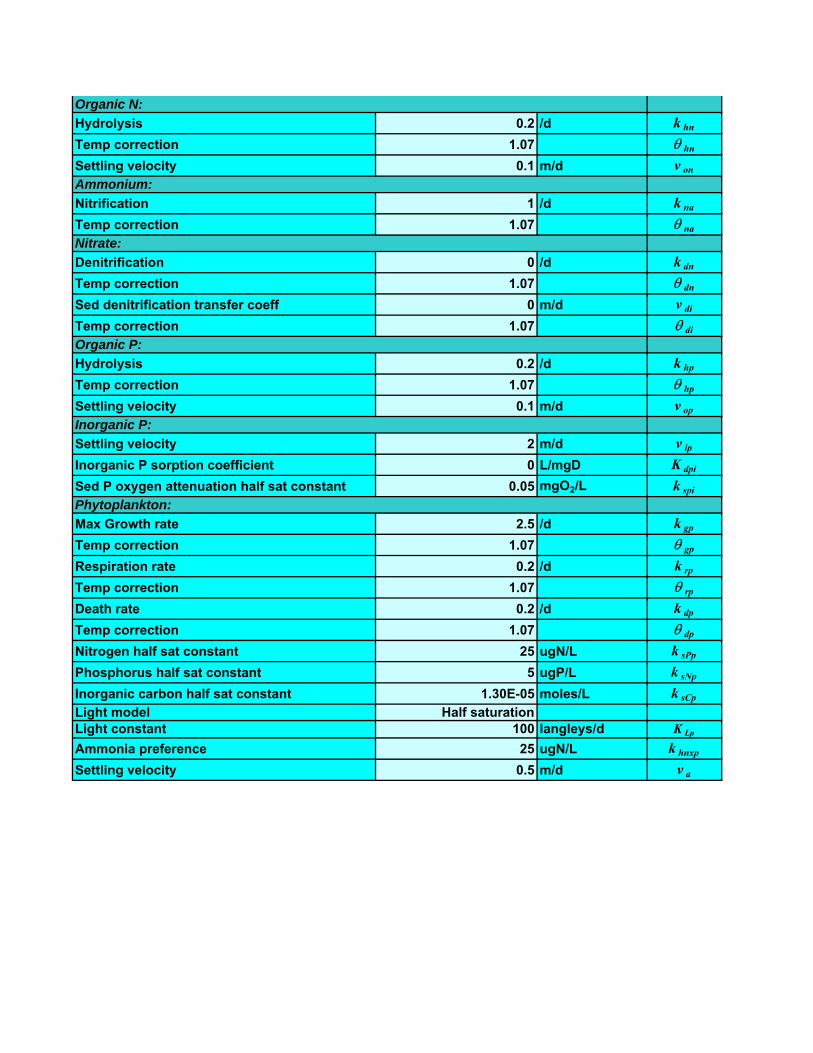
Organic N:Hydrolysis 0.2 /d k hnTemp correction 1.07 θ hnSettling velocity 0.1 m/d v onAmmonium:Nitrification 1 /d k naTemp correction 1.07 θ naNitrate:Denitrification 0 /d k dnTemp correction 1.07 θ dnSed denitrification transfer coeff 0 m/d v diTemp correction 1.07 θ diOrganic P:Hydrolysis 0.2 /d k hpTemp correction 1.07 θ hpSettling velocity 0.1 m/d v opInorganic P:Settling velocity 2 m/d v ipInorganic P sorption coefficient 0 L/mgD K dpiSed P oxygen attenuation half sat constant 0.05 mgO2/L k spiPhytoplankton:Max Growth rate 2.5 /d k gpTemp correction 1.07 θ gpRespiration rate 0.2 /d k rpTemp correction 1.07 θ rpDeath rate 0.2 /d k dpTemp correction 1.07 θ dpNitrogen half sat constant 25 ugN/L k sPpPhosphorus half sat constant 5 ugP/L k sNpInorganic carbon half sat constant 1.30E-05 moles/L k sCpLight model Half saturationLight constant 100 langleys/d K Lp
Ammonia preference 25 ugN/L k hnxpSettling velocity 0.5 m/d v a
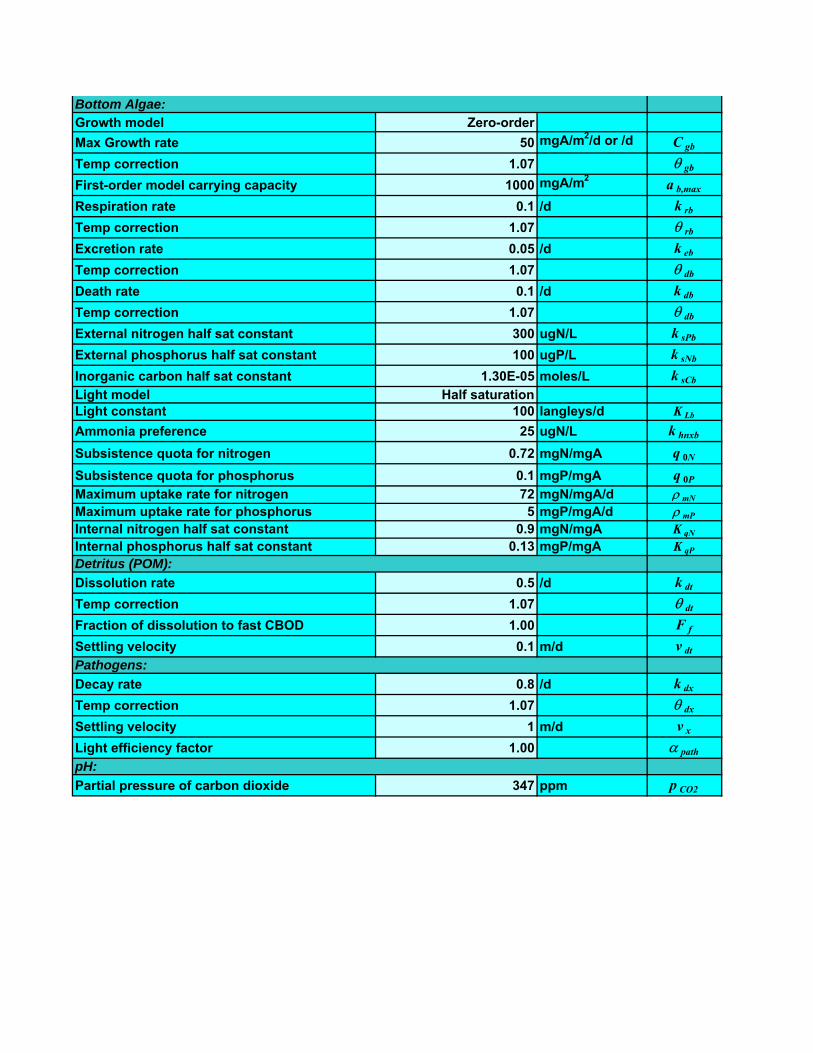
Bottom Algae:Growth model Zero-orderMax Growth rate 50 mgA/m2/d or /d C gbTemp correction 1.07 θ gbFirst-order model carrying capacity 1000 mgA/m2 a b,maxRespiration rate 0.1 /d k rbTemp correction 1.07 θ rbExcretion rate 0.05 /d k ebTemp correction 1.07 θ dbDeath rate 0.1 /d k dbTemp correction 1.07 θ dbExternal nitrogen half sat constant 300 ugN/L k sPbExternal phosphorus half sat constant 100 ugP/L k sNbInorganic carbon half sat constant 1.30E-05 moles/L k sCbLight model Half saturationLight constant 100 langleys/d K Lb
Ammonia preference 25 ugN/L k hnxbSubsistence quota for nitrogen 0.72 mgN/mgA q 0N
Subsistence quota for phosphorus 0.1 mgP/mgA q 0PMaximum uptake rate for nitrogen 72 mgN/mgA/d ρ mNMaximum uptake rate for phosphorus 5 mgP/mgA/d ρ mPInternal nitrogen half sat constant 0.9 mgN/mgA K qN
Internal phosphorus half sat constant 0.13 mgP/mgA K qP
Detritus (POM):Dissolution rate 0.5 /d k dtTemp correction 1.07 θ dtFraction of dissolution to fast CBOD 1.00 F fSettling velocity 0.1 m/d v dtPathogens:Decay rate 0.8 /d k dxTemp correction 1.07 θ dxSettling velocity 1 m/d v xLight efficiency factor 1.00 α pathpH:Partial pressure of carbon dioxide 347 ppm p CO2
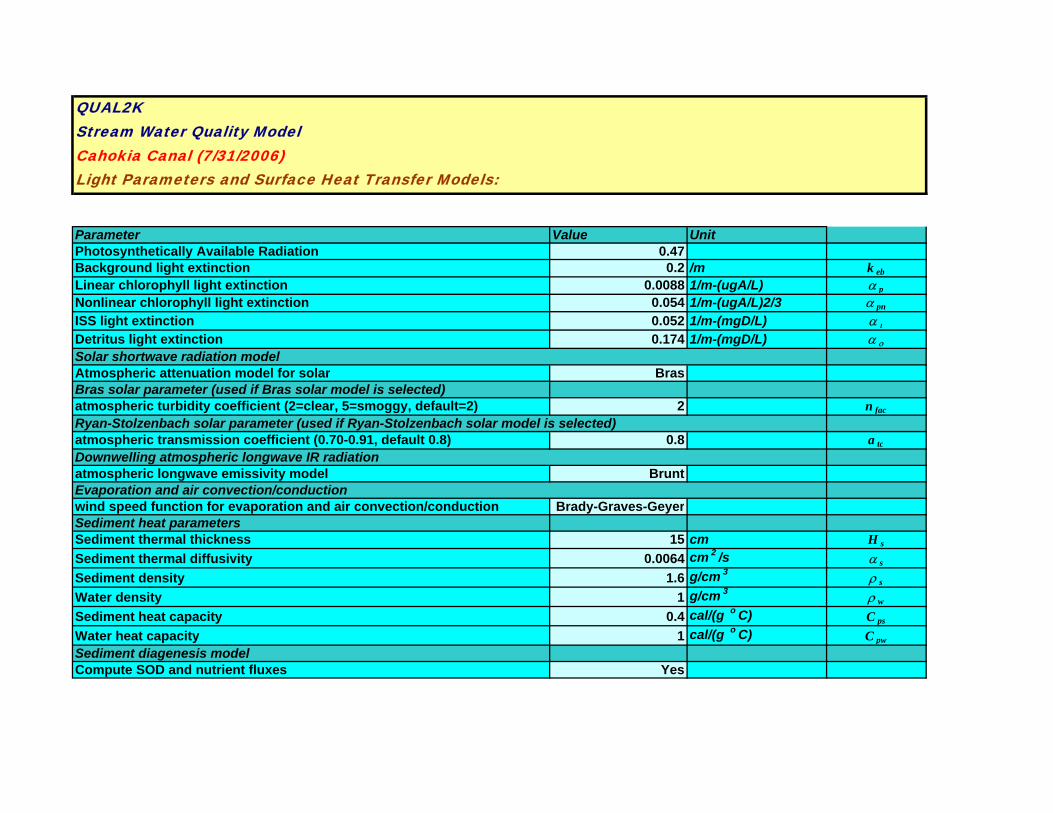
QUAL2KStream Water Quality ModelCahokia Canal (7/31/2006)Light Parameters and Surface Heat Transfer Models:
Parameter Value UnitPhotosynthetically Available Radiation 0.47Background light extinction 0.2 /m k eb
Linear chlorophyll light extinction 0.0088 1/m-(ugA/L) α p
Nonlinear chlorophyll light extinction 0.054 1/m-(ugA/L)2/3 α pn
ISS light extinction 0.052 1/m-(mgD/L) α ι
Detritus light extinction 0.174 1/m-(mgD/L) α ο
Solar shortwave radiation modelAtmospheric attenuation model for solar BrasBras solar parameter (used if Bras solar model is selected)atmospheric turbidity coefficient (2=clear, 5=smoggy, default=2) 2 n fac
Ryan-Stolzenbach solar parameter (used if Ryan-Stolzenbach solar model is selected)atmospheric transmission coefficient (0.70-0.91, default 0.8) 0.8 a tc
Downwelling atmospheric longwave IR radiationatmospheric longwave emissivity model BruntEvaporation and air convection/conductionwind speed function for evaporation and air convection/conduction Brady-Graves-GeyerSediment heat parametersSediment thermal thickness 15 cm H s
Sediment thermal diffusivity 0.0064 cm 2 /s α s
Sediment density 1.6 g/cm 3 ρ s
Water density 1 g/cm 3 ρ w
Sediment heat capacity 0.4 cal/(g o C) C ps
Water heat capacity 1 cal/(g o C) C pw
Sediment diagenesis modelCompute SOD and nutrient fluxes Yes
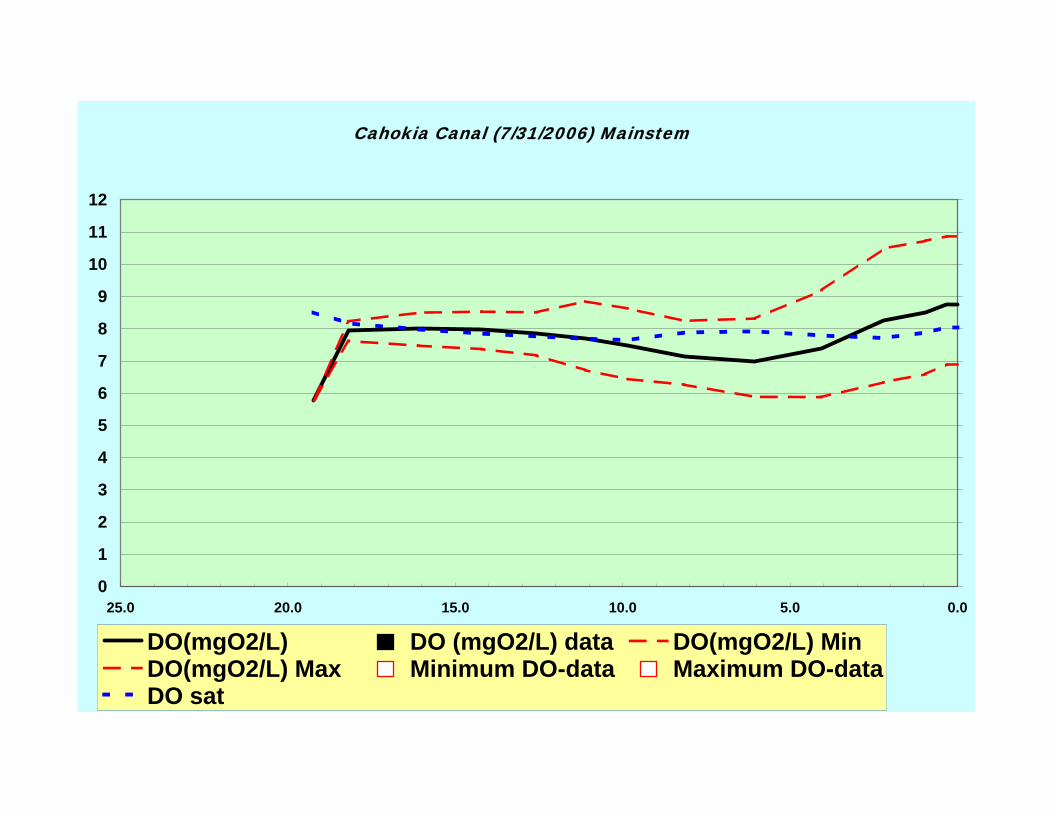
Cahokia Canal (7/31/2006) Mainstem
0
1
2
3
4
5
6
7
8
9
10
11
12
0.05.010.015.020.025.0
DO(mgO2/L) DO (mgO2/L) data DO(mgO2/L) MinDO(mgO2/L) Max Minimum DO-data Maximum DO-dataDO sat

THIS PAGE INTENTIONALLY LEFT BLANK
Appendix G: Load Duration Analysis
Canteen Creek

THIS PAGE INTENTIONALLY LEFT BLANK
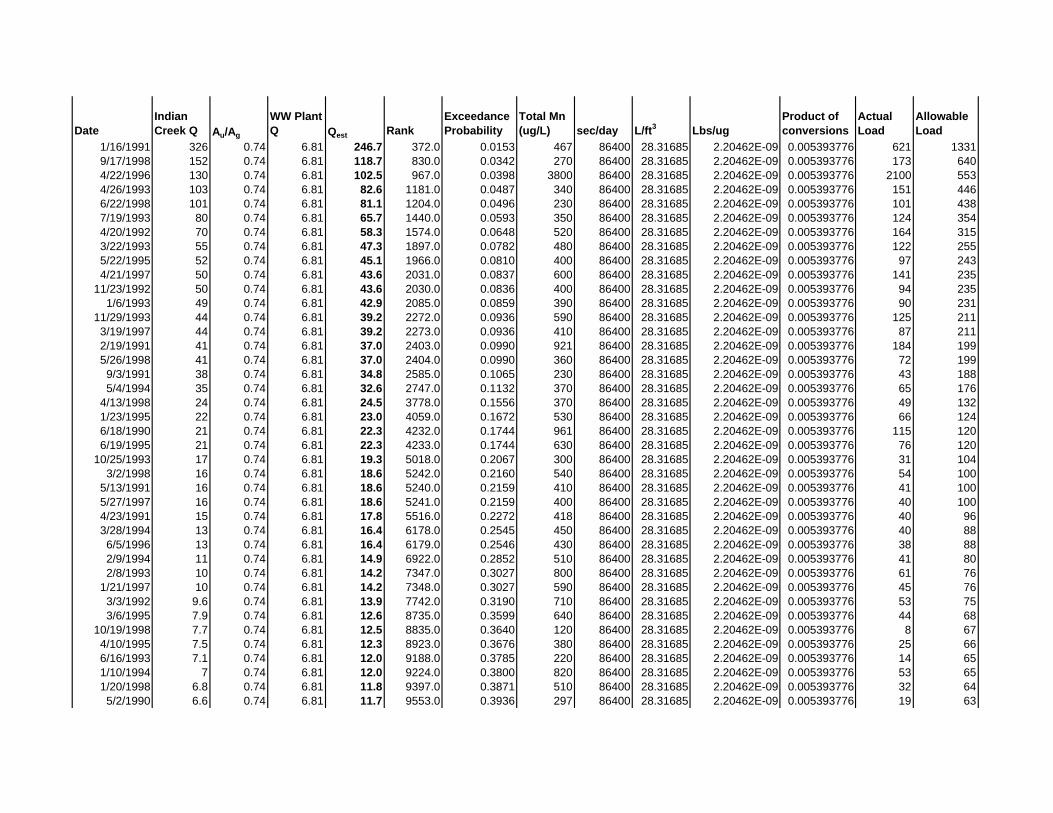
DateIndian Creek Q Au/Ag
WW Plant Q Qest Rank
Exceedance Probability
Total Mn (ug/L) sec/day L/ft3 Lbs/ug
Product of conversions
Actual Load
Allowable Load
1/16/1991 326 0.74 6.81 246.7 372.0 0.0153 467 86400 28.31685 2.20462E-09 0.005393776 621 13319/17/1998 152 0.74 6.81 118.7 830.0 0.0342 270 86400 28.31685 2.20462E-09 0.005393776 173 6404/22/1996 130 0.74 6.81 102.5 967.0 0.0398 3800 86400 28.31685 2.20462E-09 0.005393776 2100 5534/26/1993 103 0.74 6.81 82.6 1181.0 0.0487 340 86400 28.31685 2.20462E-09 0.005393776 151 4466/22/1998 101 0.74 6.81 81.1 1204.0 0.0496 230 86400 28.31685 2.20462E-09 0.005393776 101 4387/19/1993 80 0.74 6.81 65.7 1440.0 0.0593 350 86400 28.31685 2.20462E-09 0.005393776 124 3544/20/1992 70 0.74 6.81 58.3 1574.0 0.0648 520 86400 28.31685 2.20462E-09 0.005393776 164 3153/22/1993 55 0.74 6.81 47.3 1897.0 0.0782 480 86400 28.31685 2.20462E-09 0.005393776 122 2555/22/1995 52 0.74 6.81 45.1 1966.0 0.0810 400 86400 28.31685 2.20462E-09 0.005393776 97 2434/21/1997 50 0.74 6.81 43.6 2031.0 0.0837 600 86400 28.31685 2.20462E-09 0.005393776 141 235
11/23/1992 50 0.74 6.81 43.6 2030.0 0.0836 400 86400 28.31685 2.20462E-09 0.005393776 94 2351/6/1993 49 0.74 6.81 42.9 2085.0 0.0859 390 86400 28.31685 2.20462E-09 0.005393776 90 231
11/29/1993 44 0.74 6.81 39.2 2272.0 0.0936 590 86400 28.31685 2.20462E-09 0.005393776 125 2113/19/1997 44 0.74 6.81 39.2 2273.0 0.0936 410 86400 28.31685 2.20462E-09 0.005393776 87 2112/19/1991 41 0.74 6.81 37.0 2403.0 0.0990 921 86400 28.31685 2.20462E-09 0.005393776 184 1995/26/1998 41 0.74 6.81 37.0 2404.0 0.0990 360 86400 28.31685 2.20462E-09 0.005393776 72 1999/3/1991 38 0.74 6.81 34.8 2585.0 0.1065 230 86400 28.31685 2.20462E-09 0.005393776 43 1885/4/1994 35 0.74 6.81 32.6 2747.0 0.1132 370 86400 28.31685 2.20462E-09 0.005393776 65 176
4/13/1998 24 0.74 6.81 24.5 3778.0 0.1556 370 86400 28.31685 2.20462E-09 0.005393776 49 1321/23/1995 22 0.74 6.81 23.0 4059.0 0.1672 530 86400 28.31685 2.20462E-09 0.005393776 66 1246/18/1990 21 0.74 6.81 22.3 4232.0 0.1744 961 86400 28.31685 2.20462E-09 0.005393776 115 1206/19/1995 21 0.74 6.81 22.3 4233.0 0.1744 630 86400 28.31685 2.20462E-09 0.005393776 76 120
10/25/1993 17 0.74 6.81 19.3 5018.0 0.2067 300 86400 28.31685 2.20462E-09 0.005393776 31 1043/2/1998 16 0.74 6.81 18.6 5242.0 0.2160 540 86400 28.31685 2.20462E-09 0.005393776 54 100
5/13/1991 16 0.74 6.81 18.6 5240.0 0.2159 410 86400 28.31685 2.20462E-09 0.005393776 41 1005/27/1997 16 0.74 6.81 18.6 5241.0 0.2159 400 86400 28.31685 2.20462E-09 0.005393776 40 1004/23/1991 15 0.74 6.81 17.8 5516.0 0.2272 418 86400 28.31685 2.20462E-09 0.005393776 40 963/28/1994 13 0.74 6.81 16.4 6178.0 0.2545 450 86400 28.31685 2.20462E-09 0.005393776 40 886/5/1996 13 0.74 6.81 16.4 6179.0 0.2546 430 86400 28.31685 2.20462E-09 0.005393776 38 882/9/1994 11 0.74 6.81 14.9 6922.0 0.2852 510 86400 28.31685 2.20462E-09 0.005393776 41 802/8/1993 10 0.74 6.81 14.2 7347.0 0.3027 800 86400 28.31685 2.20462E-09 0.005393776 61 76
1/21/1997 10 0.74 6.81 14.2 7348.0 0.3027 590 86400 28.31685 2.20462E-09 0.005393776 45 763/3/1992 9.6 0.74 6.81 13.9 7742.0 0.3190 710 86400 28.31685 2.20462E-09 0.005393776 53 753/6/1995 7.9 0.74 6.81 12.6 8735.0 0.3599 640 86400 28.31685 2.20462E-09 0.005393776 44 68
10/19/1998 7.7 0.74 6.81 12.5 8835.0 0.3640 120 86400 28.31685 2.20462E-09 0.005393776 8 674/10/1995 7.5 0.74 6.81 12.3 8923.0 0.3676 380 86400 28.31685 2.20462E-09 0.005393776 25 666/16/1993 7.1 0.74 6.81 12.0 9188.0 0.3785 220 86400 28.31685 2.20462E-09 0.005393776 14 651/10/1994 7 0.74 6.81 12.0 9224.0 0.3800 820 86400 28.31685 2.20462E-09 0.005393776 53 651/20/1998 6.8 0.74 6.81 11.8 9397.0 0.3871 510 86400 28.31685 2.20462E-09 0.005393776 32 645/2/1990 6.6 0.74 6.81 11.7 9553.0 0.3936 297 86400 28.31685 2.20462E-09 0.005393776 19 63
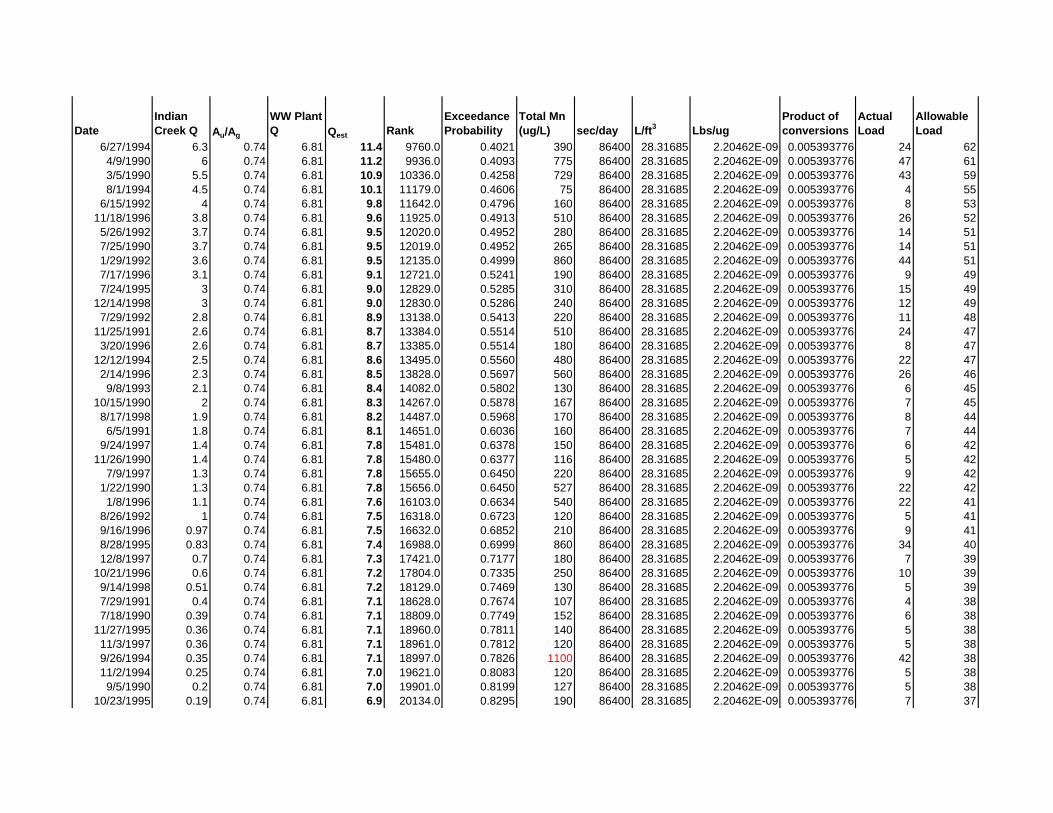
DateIndian Creek Q Au/Ag
WW Plant Q Qest Rank
Exceedance Probability
Total Mn (ug/L) sec/day L/ft3 Lbs/ug
Product of conversions
Actual Load
Allowable Load
6/27/1994 6.3 0.74 6.81 11.4 9760.0 0.4021 390 86400 28.31685 2.20462E-09 0.005393776 24 624/9/1990 6 0.74 6.81 11.2 9936.0 0.4093 775 86400 28.31685 2.20462E-09 0.005393776 47 613/5/1990 5.5 0.74 6.81 10.9 10336.0 0.4258 729 86400 28.31685 2.20462E-09 0.005393776 43 598/1/1994 4.5 0.74 6.81 10.1 11179.0 0.4606 75 86400 28.31685 2.20462E-09 0.005393776 4 55
6/15/1992 4 0.74 6.81 9.8 11642.0 0.4796 160 86400 28.31685 2.20462E-09 0.005393776 8 5311/18/1996 3.8 0.74 6.81 9.6 11925.0 0.4913 510 86400 28.31685 2.20462E-09 0.005393776 26 525/26/1992 3.7 0.74 6.81 9.5 12020.0 0.4952 280 86400 28.31685 2.20462E-09 0.005393776 14 517/25/1990 3.7 0.74 6.81 9.5 12019.0 0.4952 265 86400 28.31685 2.20462E-09 0.005393776 14 511/29/1992 3.6 0.74 6.81 9.5 12135.0 0.4999 860 86400 28.31685 2.20462E-09 0.005393776 44 517/17/1996 3.1 0.74 6.81 9.1 12721.0 0.5241 190 86400 28.31685 2.20462E-09 0.005393776 9 497/24/1995 3 0.74 6.81 9.0 12829.0 0.5285 310 86400 28.31685 2.20462E-09 0.005393776 15 49
12/14/1998 3 0.74 6.81 9.0 12830.0 0.5286 240 86400 28.31685 2.20462E-09 0.005393776 12 497/29/1992 2.8 0.74 6.81 8.9 13138.0 0.5413 220 86400 28.31685 2.20462E-09 0.005393776 11 48
11/25/1991 2.6 0.74 6.81 8.7 13384.0 0.5514 510 86400 28.31685 2.20462E-09 0.005393776 24 473/20/1996 2.6 0.74 6.81 8.7 13385.0 0.5514 180 86400 28.31685 2.20462E-09 0.005393776 8 47
12/12/1994 2.5 0.74 6.81 8.6 13495.0 0.5560 480 86400 28.31685 2.20462E-09 0.005393776 22 472/14/1996 2.3 0.74 6.81 8.5 13828.0 0.5697 560 86400 28.31685 2.20462E-09 0.005393776 26 469/8/1993 2.1 0.74 6.81 8.4 14082.0 0.5802 130 86400 28.31685 2.20462E-09 0.005393776 6 45
10/15/1990 2 0.74 6.81 8.3 14267.0 0.5878 167 86400 28.31685 2.20462E-09 0.005393776 7 458/17/1998 1.9 0.74 6.81 8.2 14487.0 0.5968 170 86400 28.31685 2.20462E-09 0.005393776 8 446/5/1991 1.8 0.74 6.81 8.1 14651.0 0.6036 160 86400 28.31685 2.20462E-09 0.005393776 7 44
9/24/1997 1.4 0.74 6.81 7.8 15481.0 0.6378 150 86400 28.31685 2.20462E-09 0.005393776 6 4211/26/1990 1.4 0.74 6.81 7.8 15480.0 0.6377 116 86400 28.31685 2.20462E-09 0.005393776 5 42
7/9/1997 1.3 0.74 6.81 7.8 15655.0 0.6450 220 86400 28.31685 2.20462E-09 0.005393776 9 421/22/1990 1.3 0.74 6.81 7.8 15656.0 0.6450 527 86400 28.31685 2.20462E-09 0.005393776 22 421/8/1996 1.1 0.74 6.81 7.6 16103.0 0.6634 540 86400 28.31685 2.20462E-09 0.005393776 22 41
8/26/1992 1 0.74 6.81 7.5 16318.0 0.6723 120 86400 28.31685 2.20462E-09 0.005393776 5 419/16/1996 0.97 0.74 6.81 7.5 16632.0 0.6852 210 86400 28.31685 2.20462E-09 0.005393776 9 418/28/1995 0.83 0.74 6.81 7.4 16988.0 0.6999 860 86400 28.31685 2.20462E-09 0.005393776 34 4012/8/1997 0.7 0.74 6.81 7.3 17421.0 0.7177 180 86400 28.31685 2.20462E-09 0.005393776 7 39
10/21/1996 0.6 0.74 6.81 7.2 17804.0 0.7335 250 86400 28.31685 2.20462E-09 0.005393776 10 399/14/1998 0.51 0.74 6.81 7.2 18129.0 0.7469 130 86400 28.31685 2.20462E-09 0.005393776 5 397/29/1991 0.4 0.74 6.81 7.1 18628.0 0.7674 107 86400 28.31685 2.20462E-09 0.005393776 4 387/18/1990 0.39 0.74 6.81 7.1 18809.0 0.7749 152 86400 28.31685 2.20462E-09 0.005393776 6 38
11/27/1995 0.36 0.74 6.81 7.1 18960.0 0.7811 140 86400 28.31685 2.20462E-09 0.005393776 5 3811/3/1997 0.36 0.74 6.81 7.1 18961.0 0.7812 120 86400 28.31685 2.20462E-09 0.005393776 5 389/26/1994 0.35 0.74 6.81 7.1 18997.0 0.7826 1100 86400 28.31685 2.20462E-09 0.005393776 42 3811/2/1994 0.25 0.74 6.81 7.0 19621.0 0.8083 120 86400 28.31685 2.20462E-09 0.005393776 5 389/5/1990 0.2 0.74 6.81 7.0 19901.0 0.8199 127 86400 28.31685 2.20462E-09 0.005393776 5 38
10/23/1995 0.19 0.74 6.81 6.9 20134.0 0.8295 190 86400 28.31685 2.20462E-09 0.005393776 7 37
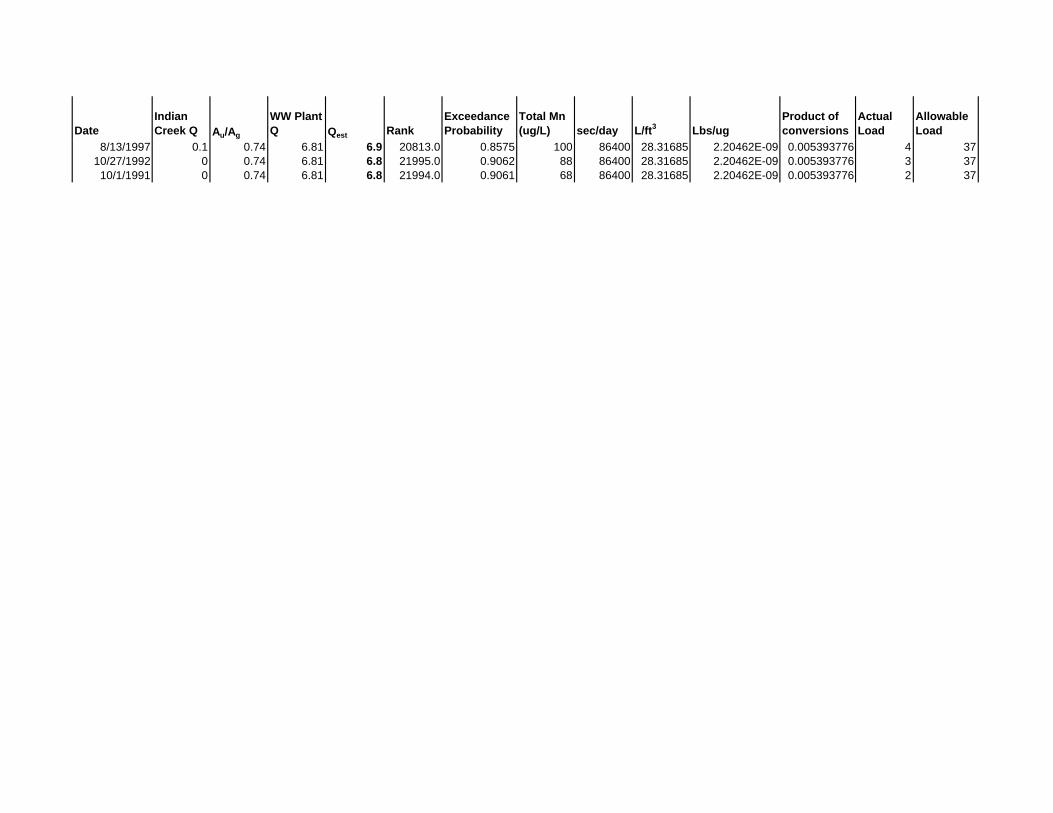
DateIndian Creek Q Au/Ag
WW Plant Q Qest Rank
Exceedance Probability
Total Mn (ug/L) sec/day L/ft3 Lbs/ug
Product of conversions
Actual Load
Allowable Load
8/13/1997 0.1 0.74 6.81 6.9 20813.0 0.8575 100 86400 28.31685 2.20462E-09 0.005393776 4 3710/27/1992 0 0.74 6.81 6.8 21995.0 0.9062 88 86400 28.31685 2.20462E-09 0.005393776 3 3710/1/1991 0 0.74 6.81 6.8 21994.0 0.9061 68 86400 28.31685 2.20462E-09 0.005393776 2 37

THIS PAGE INTENTIONALLY LEFT BLANK

Appendix H: Load Duration Analysis
Harding Ditch

THIS PAGE INTENTIONALLY LEFT BLANK
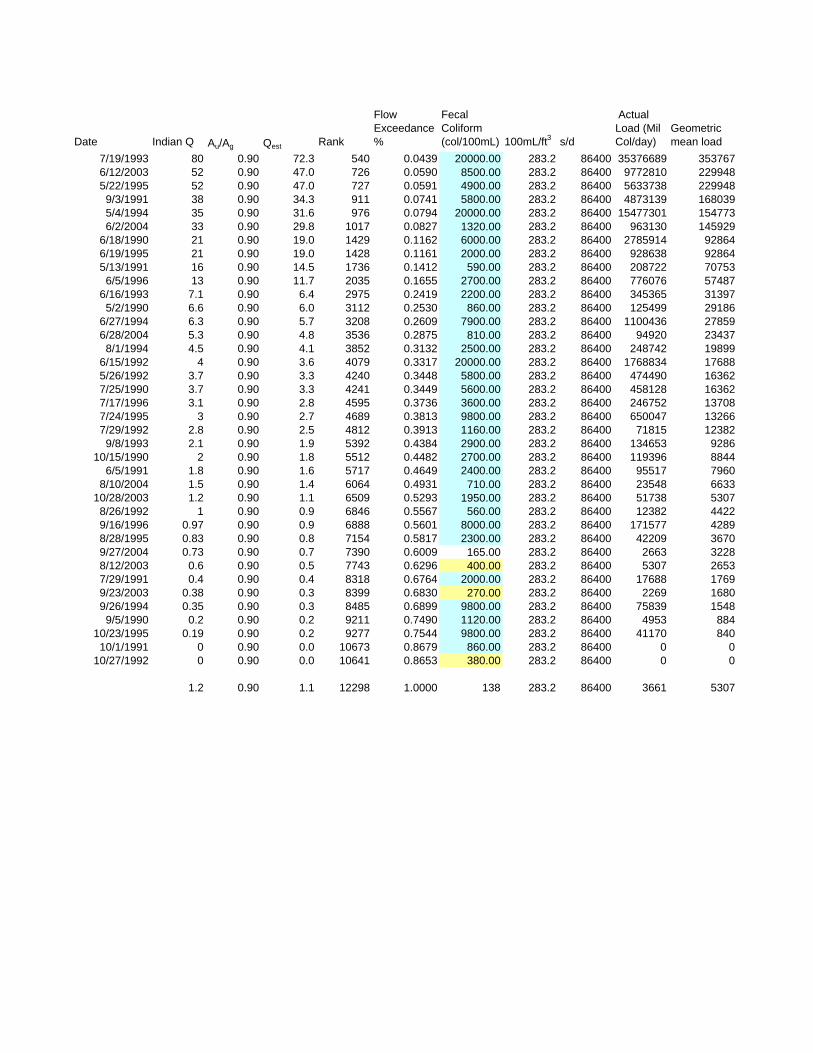
Date Indian Q Au/Ag Qest Rank
Flow Exceedance %
Fecal Coliform (col/100mL) 100mL/ft3 s/d
Actual Load (Mil Col/day)
Geometric mean load
7/19/1993 80 0.90 72.3 540 0.0439 20000.00 283.2 86400 35376689 3537676/12/2003 52 0.90 47.0 726 0.0590 8500.00 283.2 86400 9772810 2299485/22/1995 52 0.90 47.0 727 0.0591 4900.00 283.2 86400 5633738 2299489/3/1991 38 0.90 34.3 911 0.0741 5800.00 283.2 86400 4873139 1680395/4/1994 35 0.90 31.6 976 0.0794 20000.00 283.2 86400 15477301 1547736/2/2004 33 0.90 29.8 1017 0.0827 1320.00 283.2 86400 963130 145929
6/18/1990 21 0.90 19.0 1429 0.1162 6000.00 283.2 86400 2785914 928646/19/1995 21 0.90 19.0 1428 0.1161 2000.00 283.2 86400 928638 928645/13/1991 16 0.90 14.5 1736 0.1412 590.00 283.2 86400 208722 707536/5/1996 13 0.90 11.7 2035 0.1655 2700.00 283.2 86400 776076 57487
6/16/1993 7.1 0.90 6.4 2975 0.2419 2200.00 283.2 86400 345365 313975/2/1990 6.6 0.90 6.0 3112 0.2530 860.00 283.2 86400 125499 29186
6/27/1994 6.3 0.90 5.7 3208 0.2609 7900.00 283.2 86400 1100436 278596/28/2004 5.3 0.90 4.8 3536 0.2875 810.00 283.2 86400 94920 234378/1/1994 4.5 0.90 4.1 3852 0.3132 2500.00 283.2 86400 248742 19899
6/15/1992 4 0.90 3.6 4079 0.3317 20000.00 283.2 86400 1768834 176885/26/1992 3.7 0.90 3.3 4240 0.3448 5800.00 283.2 86400 474490 163627/25/1990 3.7 0.90 3.3 4241 0.3449 5600.00 283.2 86400 458128 163627/17/1996 3.1 0.90 2.8 4595 0.3736 3600.00 283.2 86400 246752 137087/24/1995 3 0.90 2.7 4689 0.3813 9800.00 283.2 86400 650047 132667/29/1992 2.8 0.90 2.5 4812 0.3913 1160.00 283.2 86400 71815 123829/8/1993 2.1 0.90 1.9 5392 0.4384 2900.00 283.2 86400 134653 9286
10/15/1990 2 0.90 1.8 5512 0.4482 2700.00 283.2 86400 119396 88446/5/1991 1.8 0.90 1.6 5717 0.4649 2400.00 283.2 86400 95517 7960
8/10/2004 1.5 0.90 1.4 6064 0.4931 710.00 283.2 86400 23548 663310/28/2003 1.2 0.90 1.1 6509 0.5293 1950.00 283.2 86400 51738 53078/26/1992 1 0.90 0.9 6846 0.5567 560.00 283.2 86400 12382 44229/16/1996 0.97 0.90 0.9 6888 0.5601 8000.00 283.2 86400 171577 42898/28/1995 0.83 0.90 0.8 7154 0.5817 2300.00 283.2 86400 42209 36709/27/2004 0.73 0.90 0.7 7390 0.6009 165.00 283.2 86400 2663 32288/12/2003 0.6 0.90 0.5 7743 0.6296 400.00 283.2 86400 5307 26537/29/1991 0.4 0.90 0.4 8318 0.6764 2000.00 283.2 86400 17688 17699/23/2003 0.38 0.90 0.3 8399 0.6830 270.00 283.2 86400 2269 16809/26/1994 0.35 0.90 0.3 8485 0.6899 9800.00 283.2 86400 75839 15489/5/1990 0.2 0.90 0.2 9211 0.7490 1120.00 283.2 86400 4953 884
10/23/1995 0.19 0.90 0.2 9277 0.7544 9800.00 283.2 86400 41170 84010/1/1991 0 0.90 0.0 10673 0.8679 860.00 283.2 86400 0 0
10/27/1992 0 0.90 0.0 10641 0.8653 380.00 283.2 86400 0 0
1.2 0.90 1.1 12298 1.0000 138 283.2 86400 3661 5307

THIS PAGE INTENTIONALLY LEFT BLANK

Appendix I: BATHTUB
Horseshoe Lake

THIS PAGE INTENTIONALLY LEFT BLANK

HORSESHOE LAKE: JUNE THROUGH FEBRUARY "NORMAL" SCENARIO
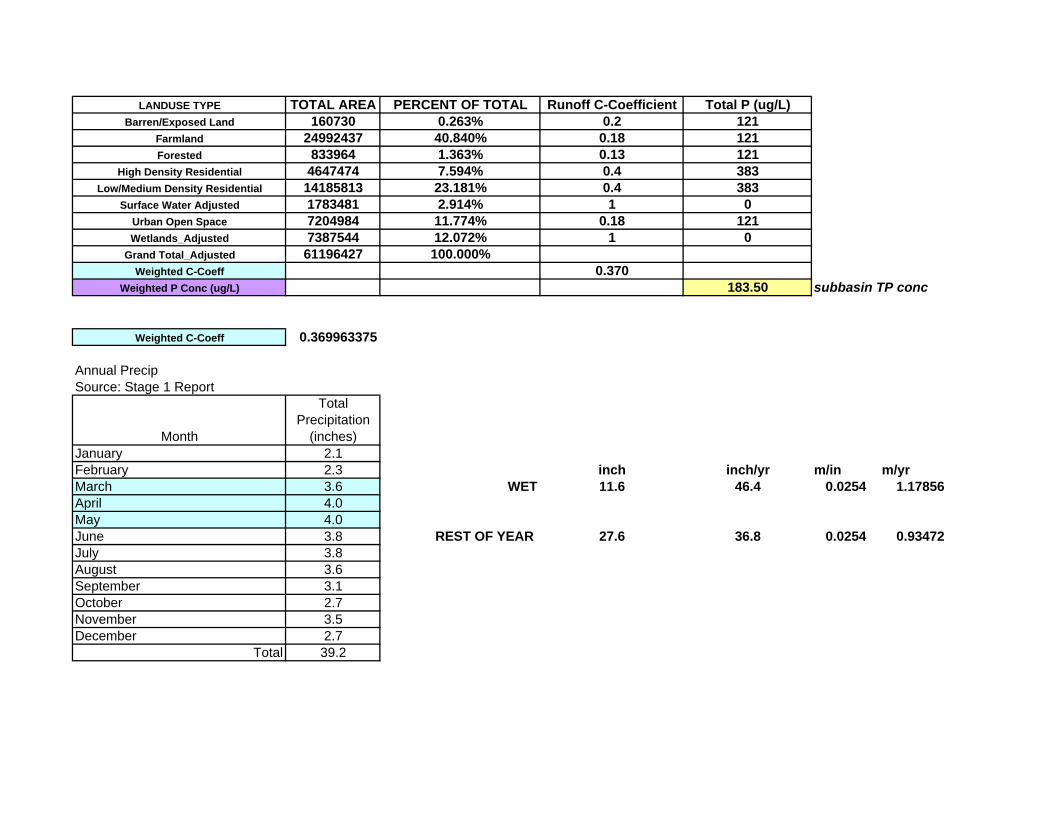
LANDUSE TYPE TOTAL AREA PERCENT OF TOTAL Runoff C-Coefficient Total P (ug/L)Barren/Exposed Land 160730 0.263% 0.2 121
Farmland 24992437 40.840% 0.18 121Forested 833964 1.363% 0.13 121
High Density Residential 4647474 7.594% 0.4 383Low/Medium Density Residential 14185813 23.181% 0.4 383
Surface Water Adjusted 1783481 2.914% 1 0Urban Open Space 7204984 11.774% 0.18 121Wetlands_Adjusted 7387544 12.072% 1 0
Grand Total_Adjusted 61196427 100.000%Weighted C-Coeff 0.370
Weighted P Conc (ug/L) 183.50 subbasin TP conc
Weighted C-Coeff 0.369963375
Annual PrecipSource: Stage 1 Report
Month
Total Precipitation
(inches)January 2.1February 2.3 inch inch/yr m/in m/yrMarch 3.6 WET 11.6 46.4 0.0254 1.17856April 4.0May 4.0June 3.8 REST OF YEAR 27.6 36.8 0.0254 0.93472July 3.8August 3.6September 3.1October 2.7November 3.5December 2.7
Total 39.2
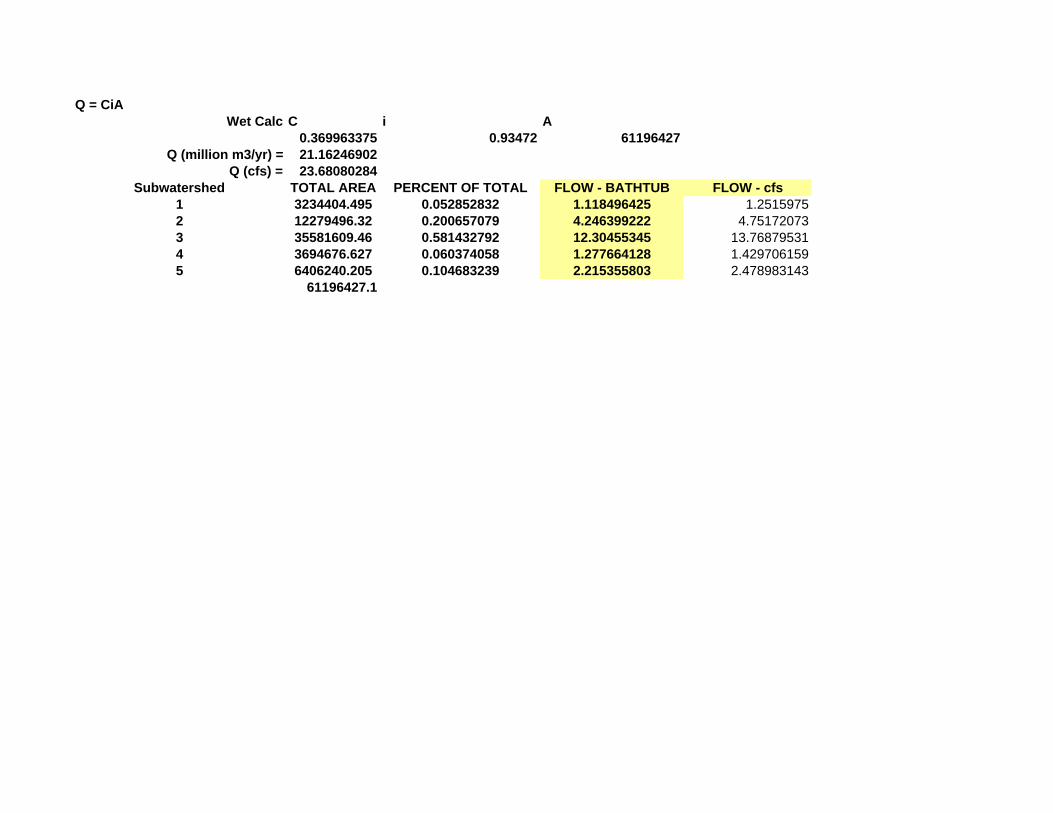
Q = CiAWet Calc C i A
0.369963375 0.93472 61196427Q (million m3/yr) = 21.16246902
Q (cfs) = 23.68080284Subwatershed TOTAL AREA PERCENT OF TOTAL FLOW - BATHTUB FLOW - cfs
1 3234404.495 0.052852832 1.118496425 1.25159752 12279496.32 0.200657079 4.246399222 4.751720733 35581609.46 0.581432792 12.30455345 13.768795314 3694676.627 0.060374058 1.277664128 1.4297061595 6406240.205 0.104683239 2.215355803 2.478983143
61196427.1
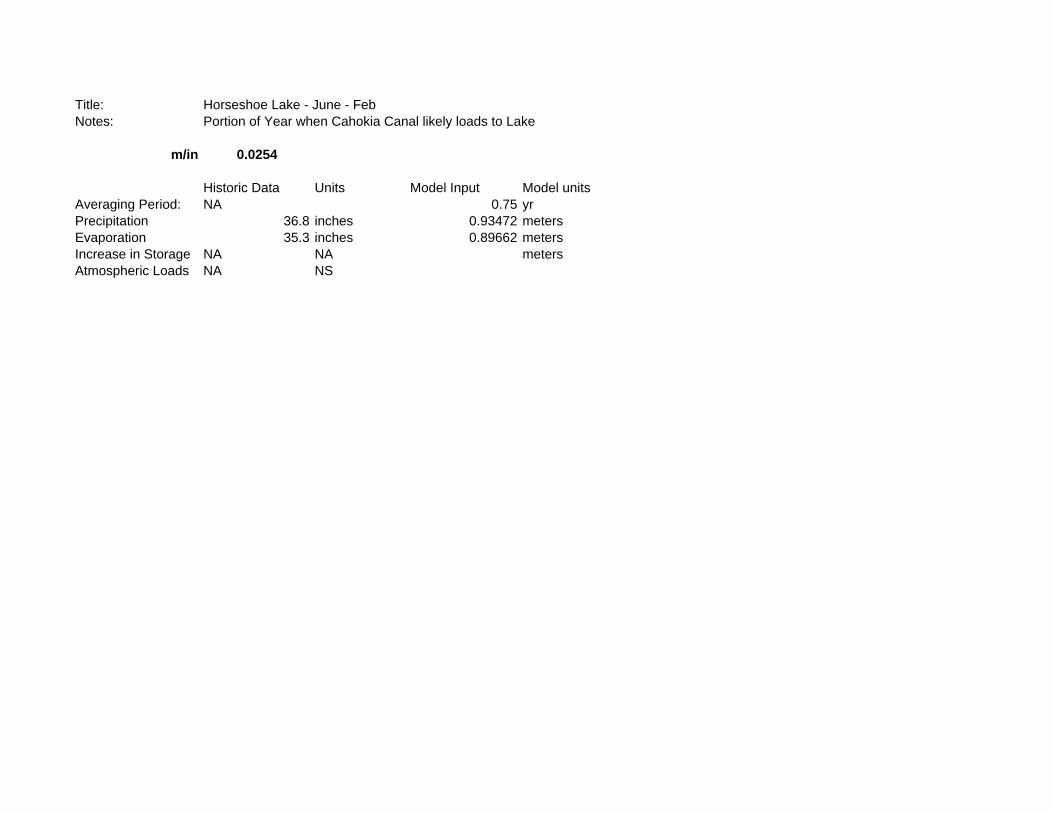
Title: Horseshoe Lake - June - FebNotes: Portion of Year when Cahokia Canal likely loads to Lake
m/in 0.0254
Historic Data Units Model Input Model unitsAveraging Period: NA 0.75 yrPrecipitation 36.8 inches 0.93472 metersEvaporation 35.3 inches 0.89662 metersIncrease in Storage NA NA metersAtmospheric Loads NA NS
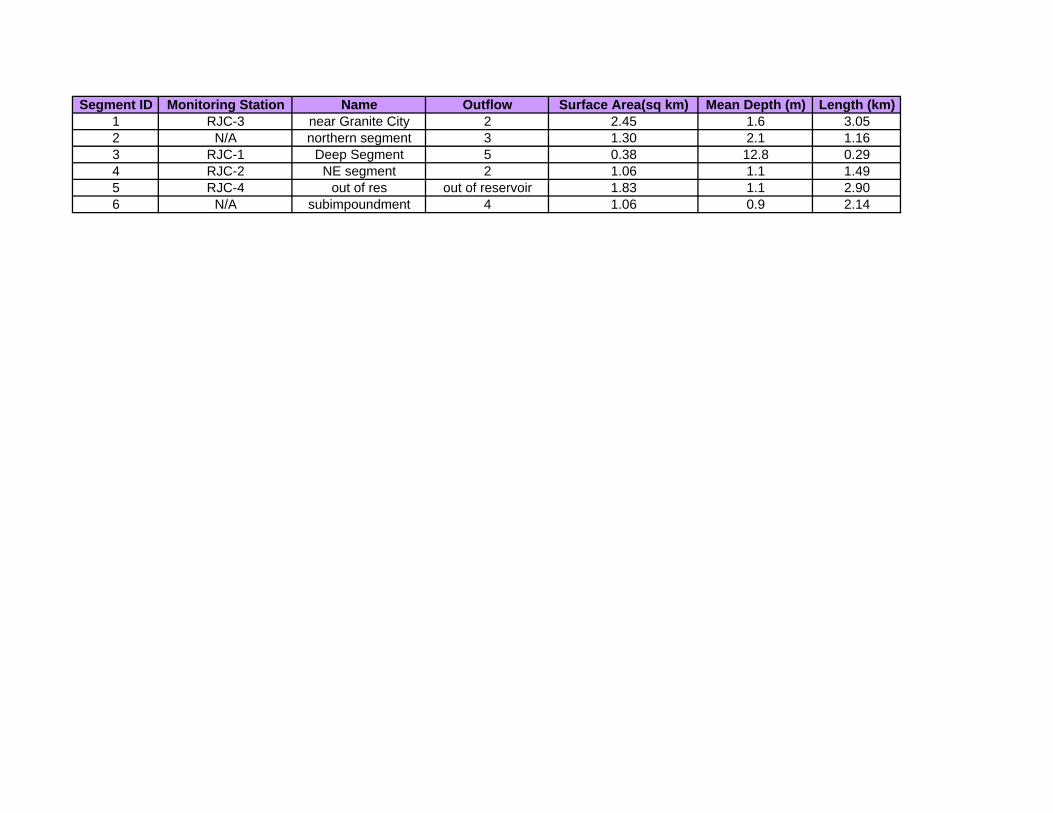
Segment ID Monitoring Station Name Outflow Surface Area(sq km) Mean Depth (m) Length (km)1 RJC-3 near Granite City 2 2.45 1.6 3.052 N/A northern segment 3 1.30 2.1 1.163 RJC-1 Deep Segment 5 0.38 12.8 0.294 RJC-2 NE segment 2 1.06 1.1 1.495 RJC-4 out of res out of reservoir 1.83 1.1 2.906 N/A subimpoundment 4 1.06 0.9 2.14
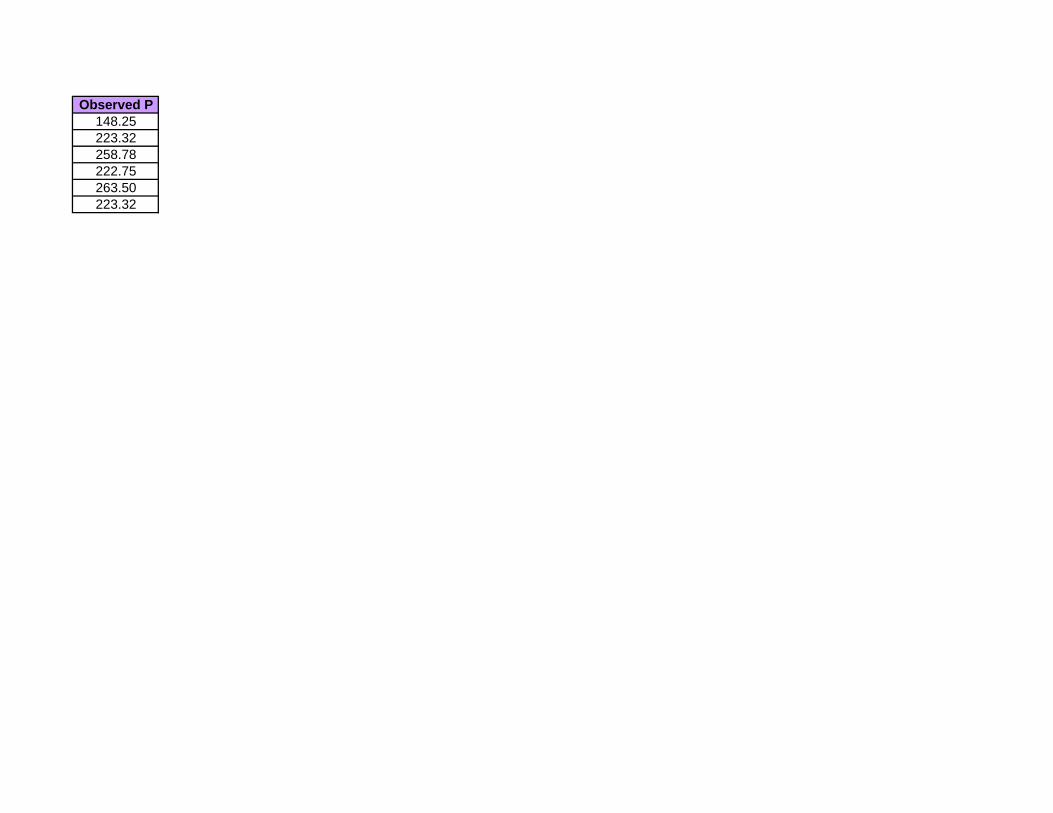
Observed P148.25223.32258.78222.75263.50223.32

Tributary To Segment Trib Type Area (km2) Flow Total P SOURCE1 Monitored Inflow 3.2 1.1185 183.50 Landuse Calc2 Monitored Inflow 12.3 4.2464 183.50 Landuse Calc3 Monitored Inflow 35.6 12.3046 183.50 Landuse Calc4 Monitored Inflow 3.7 1.2777 183.50 Landuse Calc5 Monitored Inflow 6 2.2154 183.50 Landuse Calc
Granite City Point Source NA 14.1200 237.00 Permit Application

Horseshoe Lake - Non-Wet Weather Loading ScenarioFile: C:\BATHTUB\HORSESHOE-notWET-BD-CAL.btbVariable: TOTAL P MG/M3
Predicted ObservedSegment Mean CV Mean CVRJC-3 214.4 0.19 148.3 0.00northern Segment 206.6 0.20 223.3 0.00RJC-1 204.5 0.20 258.8 0.00RJC-2 212.2 0.19 222.8 0.00RJC-4 205.8 0.20 263.5 0.00subimpoundment 253.7 0.19 223.3 0.00Area-Wtd Mean 215.6 0.19 211.3 0.00
Horseshoe Lake - Non-Wet Weather Loading ScenarioFile: C:\BATHTUB\HORSESHOE-notWET-BD-CAL.btb
Overall Water & Nutrient Balances
Overall Water Balance Averaging Period = 0.75 yearsArea Flow Variance CVRunoff
Trb Type Seg Name km2 hm3/yr (hm3/yr)2 - m/yr1 1 1 Granite City - Trib 1 3.2 1.1 0.00E+00 0.00 0.352 1 2 Nameoki Ditch - Trib 2 12.3 4.2 0.00E+00 0.00 0.353 1 4 Long Lake - Trib 3 35.6 12.3 0.00E+00 0.00 0.354 1 5 Agricultural Area - Trib 4 3.7 1.3 0.00E+00 0.00 0.355 1 6 Trib 5 6.0 2.2 0.00E+00 0.00 0.376 3 1 US Steel - Granite City NPDES 14.1 0.00E+00 0.00
PRECIPITATION 8.1 10.1 0.00E+00 0.00 1.25TRIBUTARY INFLOW 60.8 21.2 0.00E+00 0.00 0.35POINT-SOURCE INFLOW 14.1 0.00E+00 0.00***TOTAL INFLOW 68.9 45.4 0.00E+00 0.00 0.66ADVECTIVE OUTFLOW 68.9 35.7 0.00E+00 0.00 0.52***TOTAL OUTFLOW 68.9 35.7 0.00E+00 0.00 0.52***EVAPORATION 9.7 0.00E+00 0.00
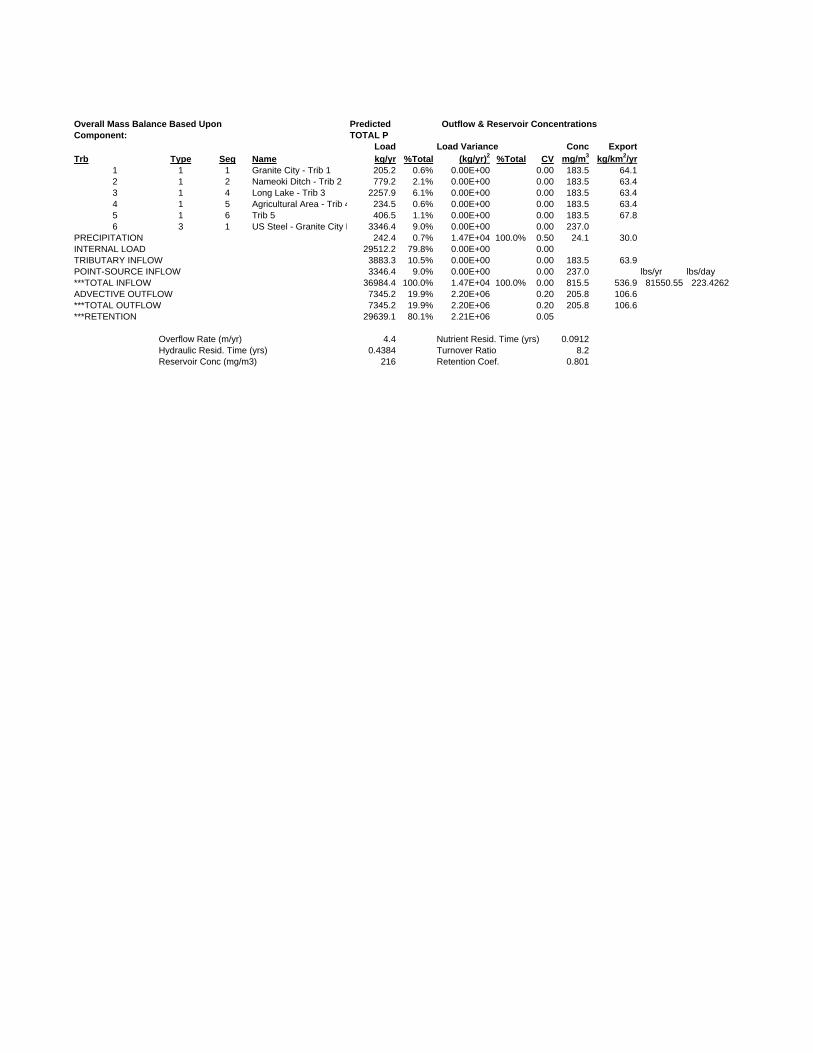
Overall Mass Balance Based Upon Predicted Outflow & Reservoir ConcentrationsComponent: TOTAL P
Load Load Variance Conc ExportTrb Type Seg Name kg/yr %Total (kg/yr)2 %Total CV mg/m3 kg/km2/yr
1 1 1 Granite City - Trib 1 205.2 0.6% 0.00E+00 0.00 183.5 64.12 1 2 Nameoki Ditch - Trib 2 779.2 2.1% 0.00E+00 0.00 183.5 63.43 1 4 Long Lake - Trib 3 2257.9 6.1% 0.00E+00 0.00 183.5 63.44 1 5 Agricultural Area - Trib 4 234.5 0.6% 0.00E+00 0.00 183.5 63.45 1 6 Trib 5 406.5 1.1% 0.00E+00 0.00 183.5 67.86 3 1 US Steel - Granite City N 3346.4 9.0% 0.00E+00 0.00 237.0
PRECIPITATION 242.4 0.7% 1.47E+04 100.0% 0.50 24.1 30.0INTERNAL LOAD 29512.2 79.8% 0.00E+00 0.00TRIBUTARY INFLOW 3883.3 10.5% 0.00E+00 0.00 183.5 63.9POINT-SOURCE INFLOW 3346.4 9.0% 0.00E+00 0.00 237.0 lbs/yr lbs/day***TOTAL INFLOW 36984.4 100.0% 1.47E+04 100.0% 0.00 815.5 536.9 81550.55 223.4262ADVECTIVE OUTFLOW 7345.2 19.9% 2.20E+06 0.20 205.8 106.6***TOTAL OUTFLOW 7345.2 19.9% 2.20E+06 0.20 205.8 106.6***RETENTION 29639.1 80.1% 2.21E+06 0.05
Overflow Rate (m/yr) 4.4 Nutrient Resid. Time (yrs) 0.0912Hydraulic Resid. Time (yrs) 0.4384 Turnover Ratio 8.2Reservoir Conc (mg/m3) 216 Retention Coef. 0.801
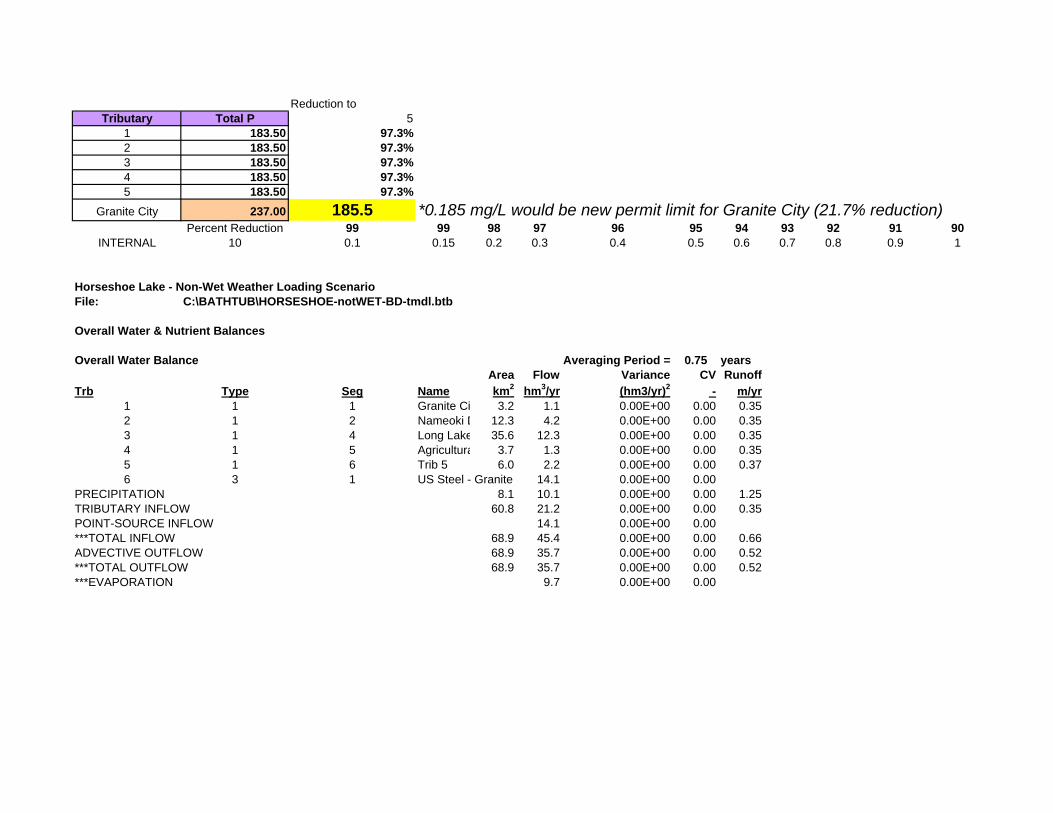
Reduction toTributary Total P 5
1 183.50 97.3%2 183.50 97.3%3 183.50 97.3%4 183.50 97.3%5 183.50 97.3%
Granite City 237.00 185.5 *0.185 mg/L would be new permit limit for Granite City (21.7% reduction)Percent Reduction 99 99 98 97 96 95 94 93 92 91 90
INTERNAL 10 0.1 0.15 0.2 0.3 0.4 0.5 0.6 0.7 0.8 0.9 1
Horseshoe Lake - Non-Wet Weather Loading ScenarioFile: C:\BATHTUB\HORSESHOE-notWET-BD-tmdl.btb
Overall Water & Nutrient Balances
Overall Water Balance Averaging Period = 0.75 yearsArea Flow Variance CV Runoff
Trb Type Seg Name km2 hm3/yr (hm3/yr)2 - m/yr1 1 1 Granite Ci 3.2 1.1 0.00E+00 0.00 0.352 1 2 Nameoki D 12.3 4.2 0.00E+00 0.00 0.353 1 4 Long Lake 35.6 12.3 0.00E+00 0.00 0.354 1 5 Agricultura 3.7 1.3 0.00E+00 0.00 0.355 1 6 Trib 5 6.0 2.2 0.00E+00 0.00 0.376 3 1 US Steel - Granite 14.1 0.00E+00 0.00
PRECIPITATION 8.1 10.1 0.00E+00 0.00 1.25TRIBUTARY INFLOW 60.8 21.2 0.00E+00 0.00 0.35POINT-SOURCE INFLOW 14.1 0.00E+00 0.00***TOTAL INFLOW 68.9 45.4 0.00E+00 0.00 0.66ADVECTIVE OUTFLOW 68.9 35.7 0.00E+00 0.00 0.52***TOTAL OUTFLOW 68.9 35.7 0.00E+00 0.00 0.52***EVAPORATION 9.7 0.00E+00 0.00
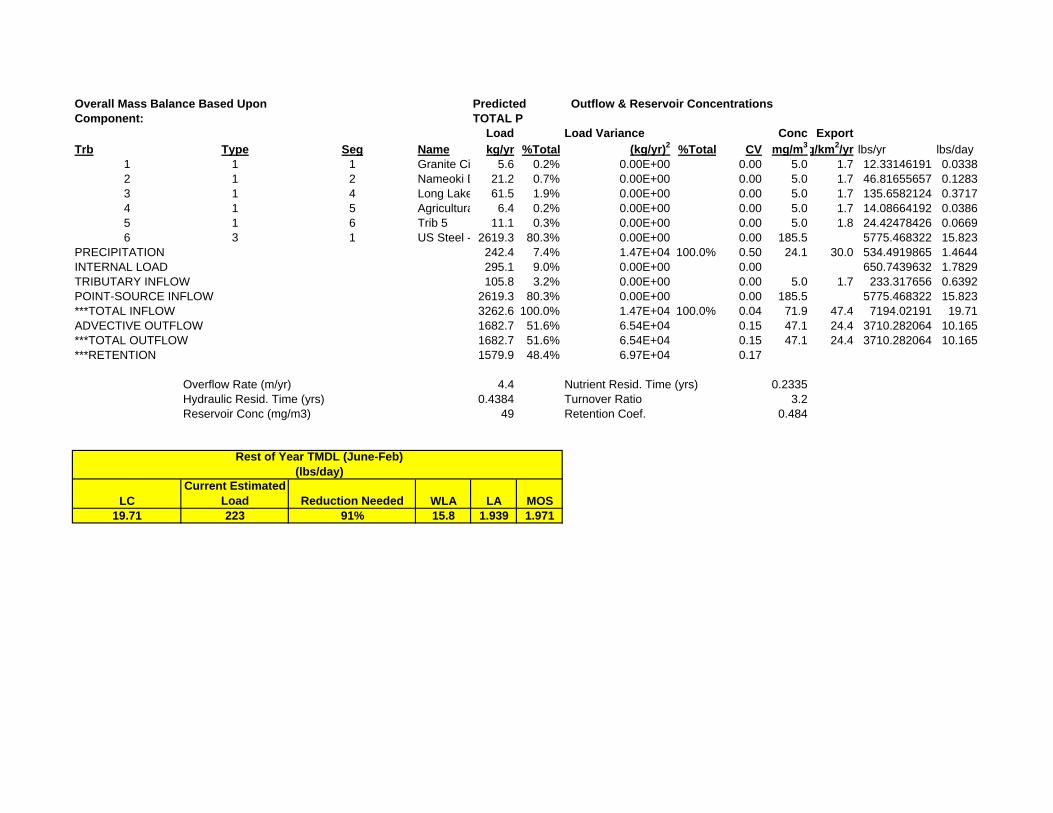
Overall Mass Balance Based Upon Predicted Outflow & Reservoir ConcentrationsComponent: TOTAL P
Load Load Variance Conc ExportTrb Type Seg Name kg/yr %Total (kg/yr)2 %Total CV mg/m3g/km2/yr lbs/yr lbs/day
1 1 1 Granite Ci 5.6 0.2% 0.00E+00 0.00 5.0 1.7 12.33146191 0.03382 1 2 Nameoki D 21.2 0.7% 0.00E+00 0.00 5.0 1.7 46.81655657 0.12833 1 4 Long Lake 61.5 1.9% 0.00E+00 0.00 5.0 1.7 135.6582124 0.37174 1 5 Agricultura 6.4 0.2% 0.00E+00 0.00 5.0 1.7 14.08664192 0.03865 1 6 Trib 5 11.1 0.3% 0.00E+00 0.00 5.0 1.8 24.42478426 0.06696 3 1 US Steel - 2619.3 80.3% 0.00E+00 0.00 185.5 5775.468322 15.823
PRECIPITATION 242.4 7.4% 1.47E+04 100.0% 0.50 24.1 30.0 534.4919865 1.4644INTERNAL LOAD 295.1 9.0% 0.00E+00 0.00 650.7439632 1.7829TRIBUTARY INFLOW 105.8 3.2% 0.00E+00 0.00 5.0 1.7 233.317656 0.6392POINT-SOURCE INFLOW 2619.3 80.3% 0.00E+00 0.00 185.5 5775.468322 15.823***TOTAL INFLOW 3262.6 100.0% 1.47E+04 100.0% 0.04 71.9 47.4 7194.02191 19.71ADVECTIVE OUTFLOW 1682.7 51.6% 6.54E+04 0.15 47.1 24.4 3710.282064 10.165***TOTAL OUTFLOW 1682.7 51.6% 6.54E+04 0.15 47.1 24.4 3710.282064 10.165***RETENTION 1579.9 48.4% 6.97E+04 0.17
Overflow Rate (m/yr) 4.4 Nutrient Resid. Time (yrs) 0.2335Hydraulic Resid. Time (yrs) 0.4384 Turnover Ratio 3.2Reservoir Conc (mg/m3) 49 Retention Coef. 0.484
LCCurrent Estimated
Load Reduction Needed WLA LA MOS19.71 223 91% 15.8 1.939 1.971
Rest of Year TMDL (June-Feb) (lbs/day)

THIS PAGE INTENTIONALLY LEFT BLANK

HORSESHOE LAKE: MARCH-MAY "WET" SCENARIO
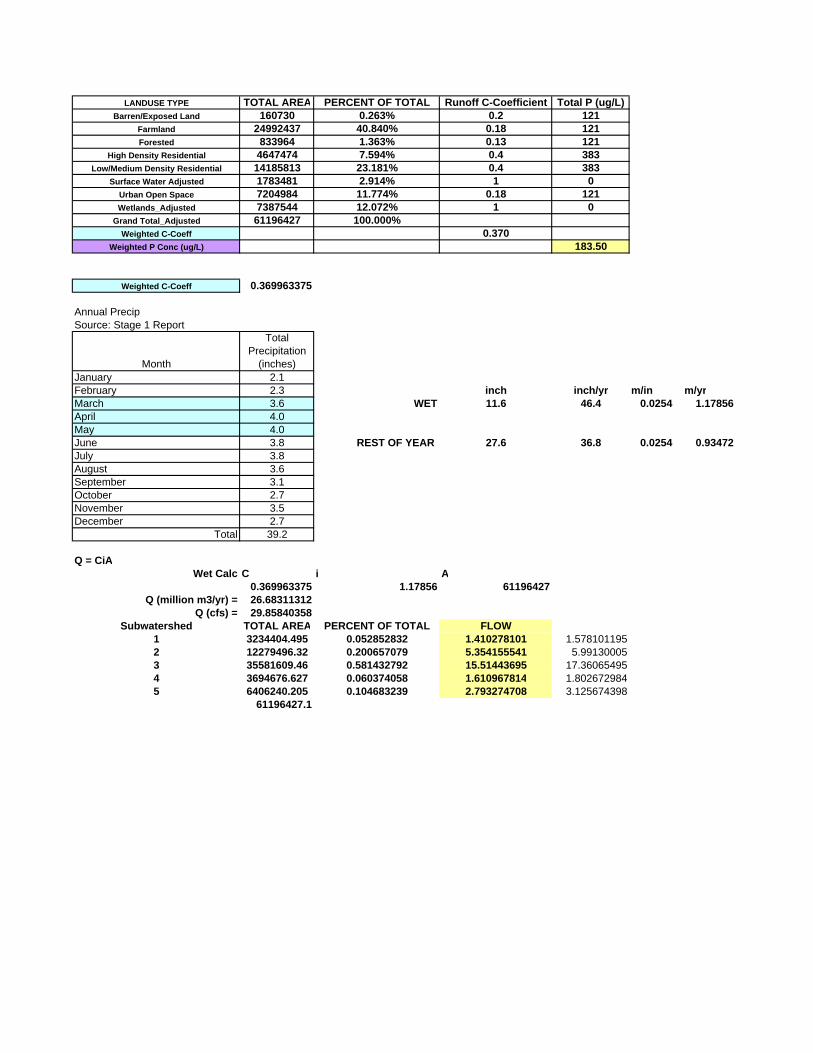
LANDUSE TYPE TOTAL AREA PERCENT OF TOTAL Runoff C-Coefficient Total P (ug/L)Barren/Exposed Land 160730 0.263% 0.2 121
Farmland 24992437 40.840% 0.18 121Forested 833964 1.363% 0.13 121
High Density Residential 4647474 7.594% 0.4 383Low/Medium Density Residential 14185813 23.181% 0.4 383
Surface Water Adjusted 1783481 2.914% 1 0Urban Open Space 7204984 11.774% 0.18 121Wetlands_Adjusted 7387544 12.072% 1 0
Grand Total_Adjusted 61196427 100.000%Weighted C-Coeff 0.370
Weighted P Conc (ug/L) 183.50
Weighted C-Coeff 0.369963375
Annual PrecipSource: Stage 1 Report
Month
Total Precipitation
(inches)January 2.1February 2.3 inch inch/yr m/in m/yrMarch 3.6 WET 11.6 46.4 0.0254 1.17856April 4.0May 4.0June 3.8 REST OF YEAR 27.6 36.8 0.0254 0.93472July 3.8August 3.6September 3.1October 2.7November 3.5December 2.7
Total 39.2
Q = CiAWet Calc C i A
0.369963375 1.17856 61196427Q (million m3/yr) = 26.68311312
Q (cfs) = 29.85840358Subwatershed TOTAL AREA PERCENT OF TOTAL FLOW
1 3234404.495 0.052852832 1.410278101 1.5781011952 12279496.32 0.200657079 5.354155541 5.991300053 35581609.46 0.581432792 15.51443695 17.360654954 3694676.627 0.060374058 1.610967814 1.8026729845 6406240.205 0.104683239 2.793274708 3.125674398
61196427.1
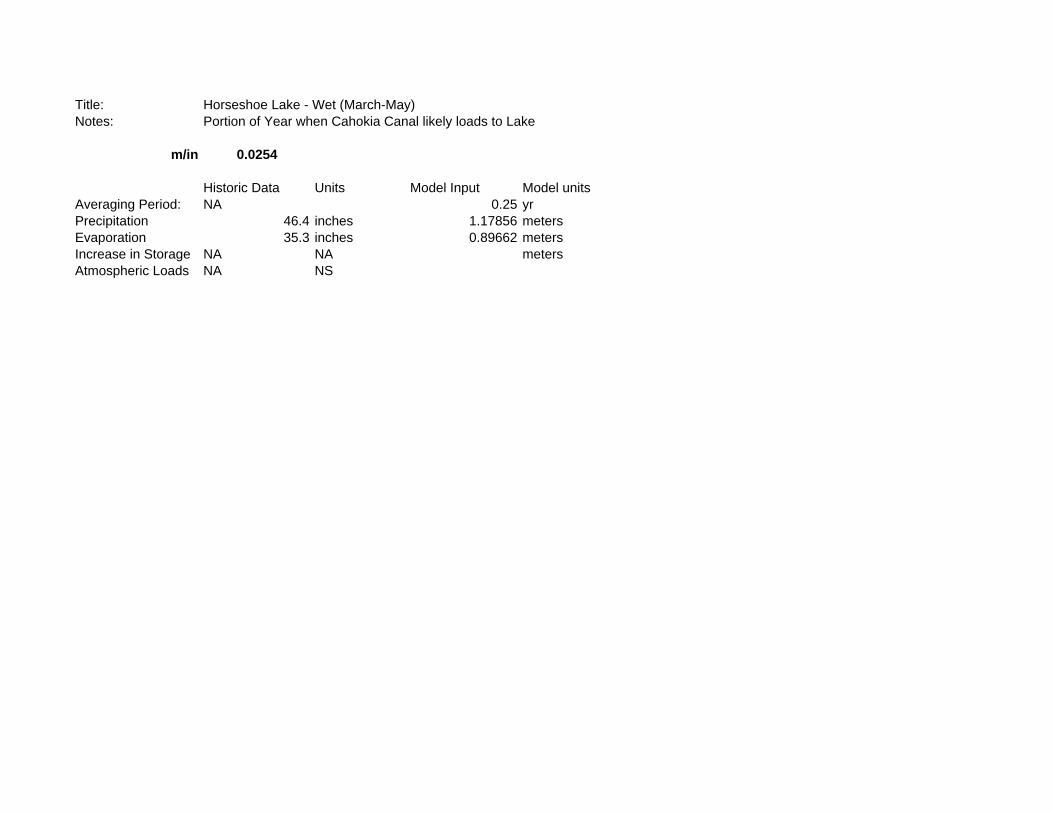
Title: Horseshoe Lake - Wet (March-May)Notes: Portion of Year when Cahokia Canal likely loads to Lake
m/in 0.0254
Historic Data Units Model Input Model unitsAveraging Period: NA 0.25 yrPrecipitation 46.4 inches 1.17856 metersEvaporation 35.3 inches 0.89662 metersIncrease in Storage NA NA metersAtmospheric Loads NA NS
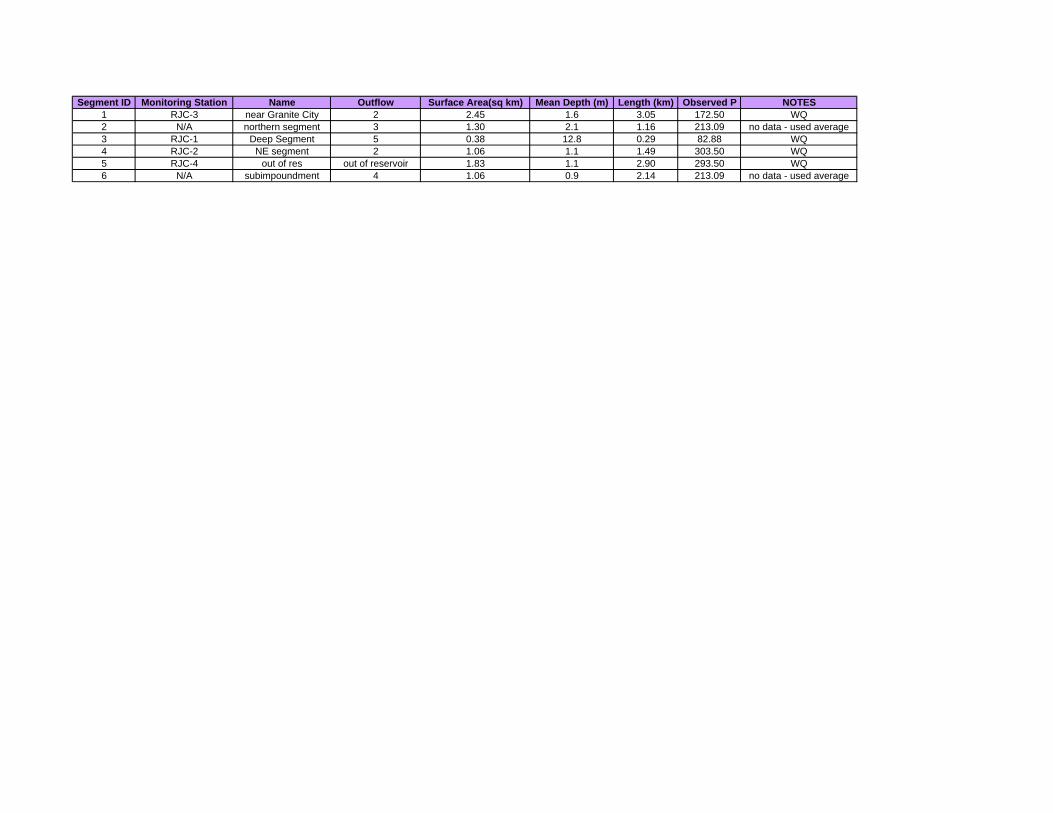
Segment ID Monitoring Station Name Outflow Surface Area(sq km) Mean Depth (m) Length (km) Observed P NOTES1 RJC-3 near Granite City 2 2.45 1.6 3.05 172.50 WQ2 N/A northern segment 3 1.30 2.1 1.16 213.09 no data - used average3 RJC-1 Deep Segment 5 0.38 12.8 0.29 82.88 WQ4 RJC-2 NE segment 2 1.06 1.1 1.49 303.50 WQ5 RJC-4 out of res out of reservoir 1.83 1.1 2.90 293.50 WQ6 N/A subimpoundment 4 1.06 0.9 2.14 213.09 no data - used average
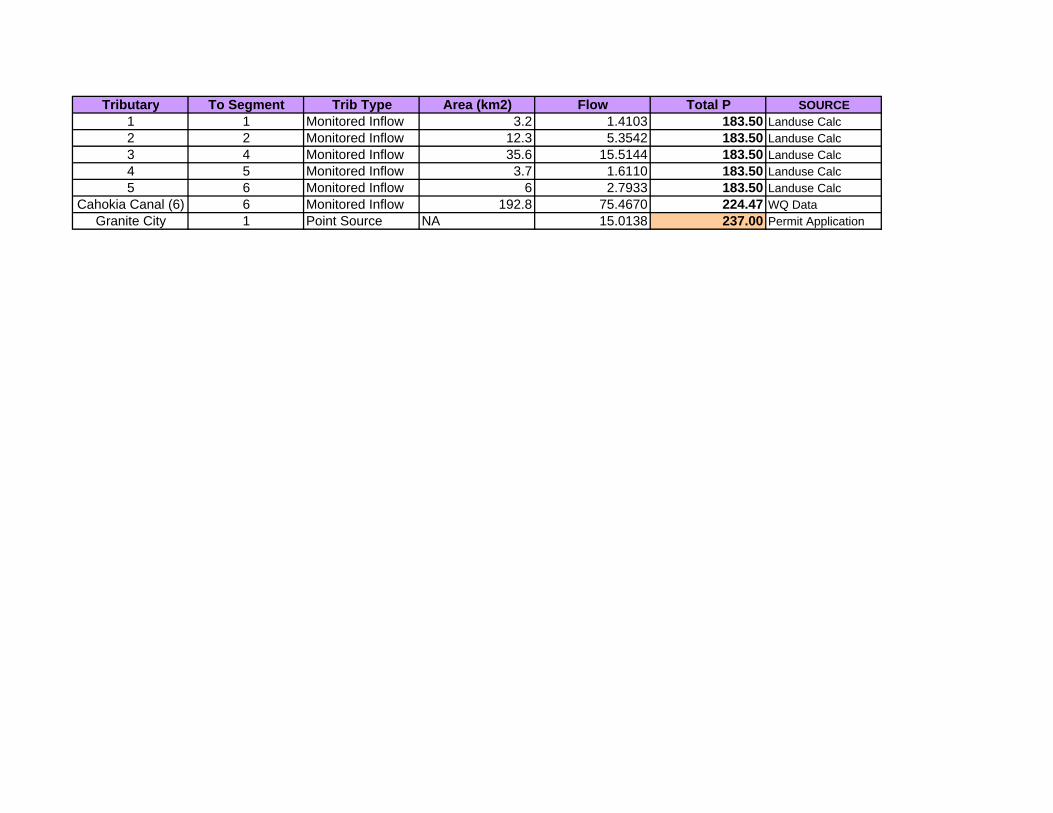
Tributary To Segment Trib Type Area (km2) Flow Total P SOURCE1 1 Monitored Inflow 3.2 1.4103 183.50 Landuse Calc2 2 Monitored Inflow 12.3 5.3542 183.50 Landuse Calc3 4 Monitored Inflow 35.6 15.5144 183.50 Landuse Calc4 5 Monitored Inflow 3.7 1.6110 183.50 Landuse Calc5 6 Monitored Inflow 6 2.7933 183.50 Landuse Calc
Cahokia Canal (6) 6 Monitored Inflow 192.8 75.4670 224.47 WQ DataGranite City 1 Point Source NA 15.0138 237.00 Permit Application
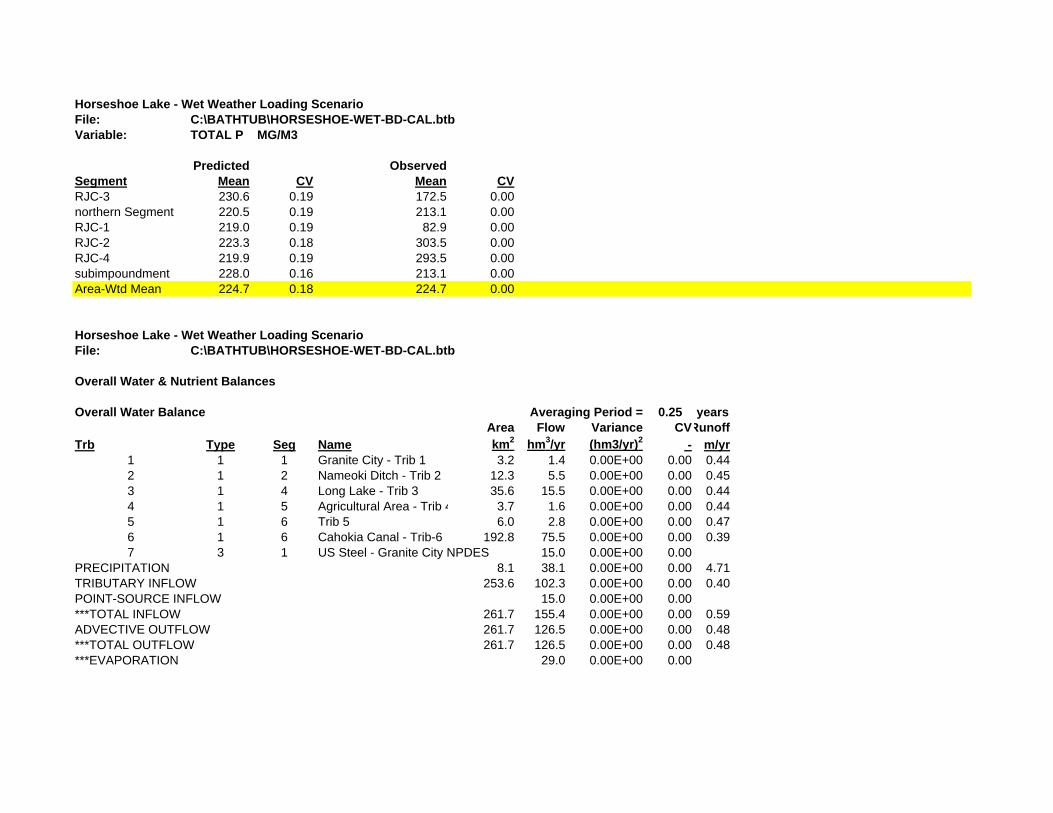
Horseshoe Lake - Wet Weather Loading ScenarioFile: C:\BATHTUB\HORSESHOE-WET-BD-CAL.btbVariable: TOTAL P MG/M3
Predicted ObservedSegment Mean CV Mean CVRJC-3 230.6 0.19 172.5 0.00northern Segment 220.5 0.19 213.1 0.00RJC-1 219.0 0.19 82.9 0.00RJC-2 223.3 0.18 303.5 0.00RJC-4 219.9 0.19 293.5 0.00subimpoundment 228.0 0.16 213.1 0.00Area-Wtd Mean 224.7 0.18 224.7 0.00
Horseshoe Lake - Wet Weather Loading ScenarioFile: C:\BATHTUB\HORSESHOE-WET-BD-CAL.btb
Overall Water & Nutrient Balances
Overall Water Balance Averaging Period = 0.25 yearsArea Flow Variance CVRunoff
Trb Type Seg Name km2 hm3/yr (hm3/yr)2 - m/yr1 1 1 Granite City - Trib 1 3.2 1.4 0.00E+00 0.00 0.442 1 2 Nameoki Ditch - Trib 2 12.3 5.5 0.00E+00 0.00 0.453 1 4 Long Lake - Trib 3 35.6 15.5 0.00E+00 0.00 0.444 1 5 Agricultural Area - Trib 4 3.7 1.6 0.00E+00 0.00 0.445 1 6 Trib 5 6.0 2.8 0.00E+00 0.00 0.476 1 6 Cahokia Canal - Trib-6 192.8 75.5 0.00E+00 0.00 0.397 3 1 US Steel - Granite City NPDES 15.0 0.00E+00 0.00
PRECIPITATION 8.1 38.1 0.00E+00 0.00 4.71TRIBUTARY INFLOW 253.6 102.3 0.00E+00 0.00 0.40POINT-SOURCE INFLOW 15.0 0.00E+00 0.00***TOTAL INFLOW 261.7 155.4 0.00E+00 0.00 0.59ADVECTIVE OUTFLOW 261.7 126.5 0.00E+00 0.00 0.48***TOTAL OUTFLOW 261.7 126.5 0.00E+00 0.00 0.48***EVAPORATION 29.0 0.00E+00 0.00
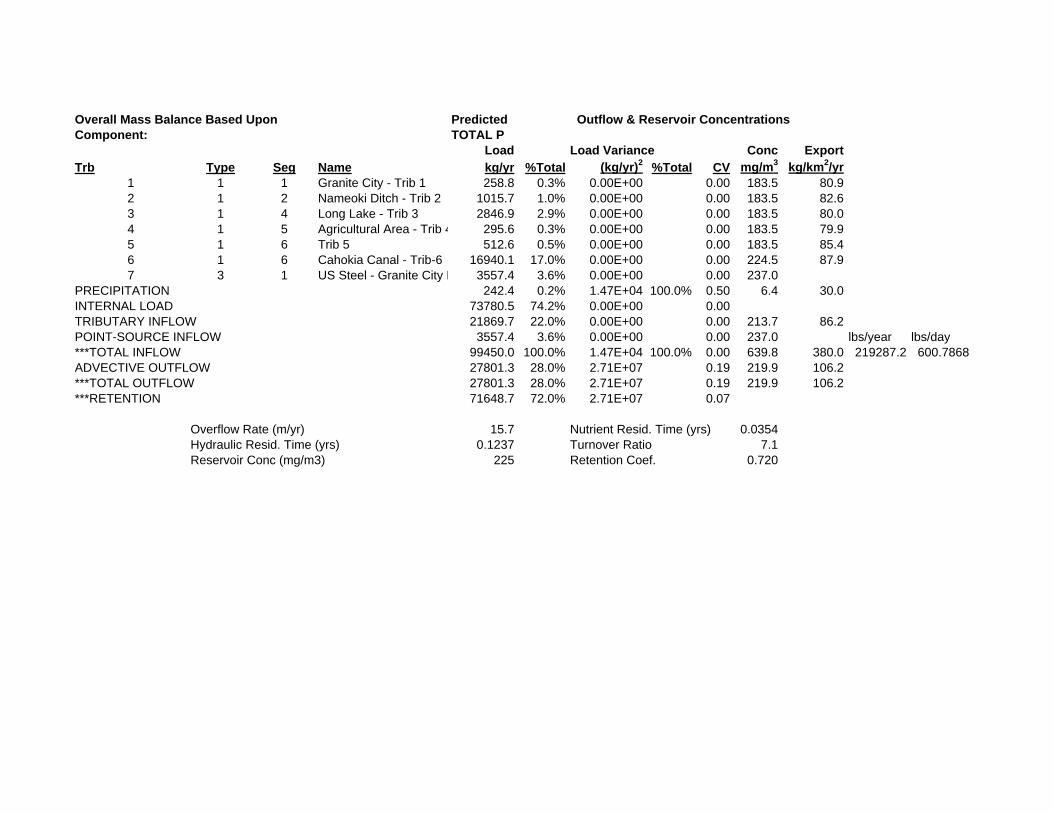
Overall Mass Balance Based Upon Predicted Outflow & Reservoir ConcentrationsComponent: TOTAL P
Load Load Variance Conc ExportTrb Type Seg Name kg/yr %Total (kg/yr)2 %Total CV mg/m3 kg/km2/yr
1 1 1 Granite City - Trib 1 258.8 0.3% 0.00E+00 0.00 183.5 80.92 1 2 Nameoki Ditch - Trib 2 1015.7 1.0% 0.00E+00 0.00 183.5 82.63 1 4 Long Lake - Trib 3 2846.9 2.9% 0.00E+00 0.00 183.5 80.04 1 5 Agricultural Area - Trib 4 295.6 0.3% 0.00E+00 0.00 183.5 79.95 1 6 Trib 5 512.6 0.5% 0.00E+00 0.00 183.5 85.46 1 6 Cahokia Canal - Trib-6 16940.1 17.0% 0.00E+00 0.00 224.5 87.97 3 1 US Steel - Granite City N 3557.4 3.6% 0.00E+00 0.00 237.0
PRECIPITATION 242.4 0.2% 1.47E+04 100.0% 0.50 6.4 30.0INTERNAL LOAD 73780.5 74.2% 0.00E+00 0.00TRIBUTARY INFLOW 21869.7 22.0% 0.00E+00 0.00 213.7 86.2POINT-SOURCE INFLOW 3557.4 3.6% 0.00E+00 0.00 237.0 lbs/year lbs/day***TOTAL INFLOW 99450.0 100.0% 1.47E+04 100.0% 0.00 639.8 380.0 219287.2 600.7868ADVECTIVE OUTFLOW 27801.3 28.0% 2.71E+07 0.19 219.9 106.2***TOTAL OUTFLOW 27801.3 28.0% 2.71E+07 0.19 219.9 106.2***RETENTION 71648.7 72.0% 2.71E+07 0.07
Overflow Rate (m/yr) 15.7 Nutrient Resid. Time (yrs) 0.0354Hydraulic Resid. Time (yrs) 0.1237 Turnover Ratio 7.1Reservoir Conc (mg/m3) 225 Retention Coef. 0.720
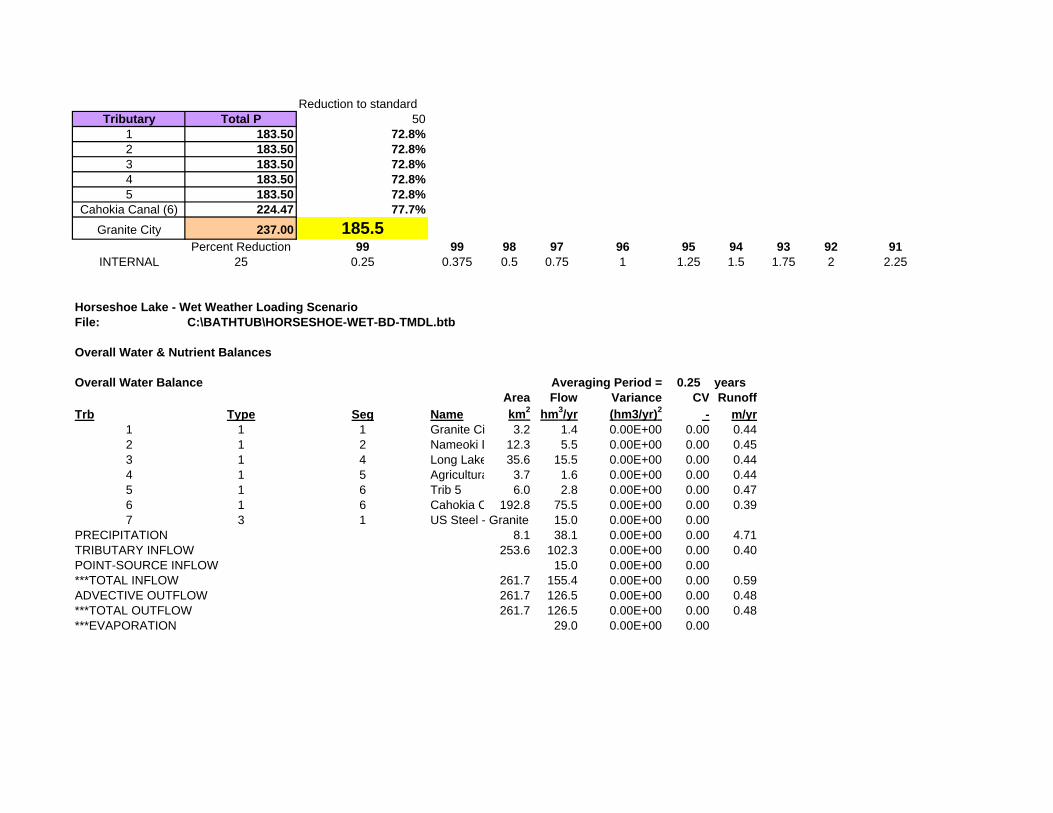
Reduction to standardTributary Total P 50
1 183.50 72.8%2 183.50 72.8%3 183.50 72.8%4 183.50 72.8%5 183.50 72.8%
Cahokia Canal (6) 224.47 77.7%Granite City 237.00 185.5
Percent Reduction 99 99 98 97 96 95 94 93 92 91INTERNAL 25 0.25 0.375 0.5 0.75 1 1.25 1.5 1.75 2 2.25
Horseshoe Lake - Wet Weather Loading ScenarioFile: C:\BATHTUB\HORSESHOE-WET-BD-TMDL.btb
Overall Water & Nutrient Balances
Overall Water Balance Averaging Period = 0.25 yearsArea Flow Variance CV Runoff
Trb Type Seg Name km2 hm3/yr (hm3/yr)2 - m/yr1 1 1 Granite Ci 3.2 1.4 0.00E+00 0.00 0.442 1 2 Nameoki D 12.3 5.5 0.00E+00 0.00 0.453 1 4 Long Lake 35.6 15.5 0.00E+00 0.00 0.444 1 5 Agricultura 3.7 1.6 0.00E+00 0.00 0.445 1 6 Trib 5 6.0 2.8 0.00E+00 0.00 0.476 1 6 Cahokia C 192.8 75.5 0.00E+00 0.00 0.397 3 1 US Steel - Granite 15.0 0.00E+00 0.00
PRECIPITATION 8.1 38.1 0.00E+00 0.00 4.71TRIBUTARY INFLOW 253.6 102.3 0.00E+00 0.00 0.40POINT-SOURCE INFLOW 15.0 0.00E+00 0.00***TOTAL INFLOW 261.7 155.4 0.00E+00 0.00 0.59ADVECTIVE OUTFLOW 261.7 126.5 0.00E+00 0.00 0.48***TOTAL OUTFLOW 261.7 126.5 0.00E+00 0.00 0.48***EVAPORATION 29.0 0.00E+00 0.00
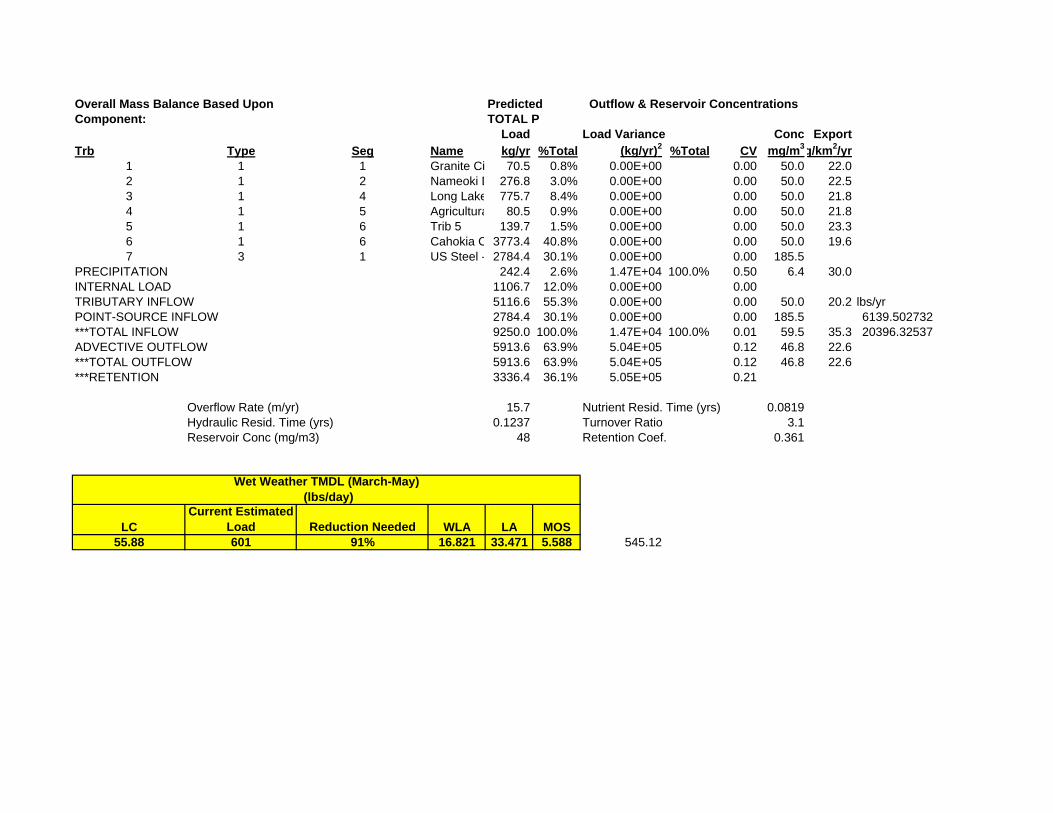
Overall Mass Balance Based Upon Predicted Outflow & Reservoir ConcentrationsComponent: TOTAL P
Load Load Variance Conc ExportTrb Type Seg Name kg/yr %Total (kg/yr)2 %Total CV mg/m3g/km2/yr
1 1 1 Granite Ci 70.5 0.8% 0.00E+00 0.00 50.0 22.02 1 2 Nameoki D 276.8 3.0% 0.00E+00 0.00 50.0 22.53 1 4 Long Lake 775.7 8.4% 0.00E+00 0.00 50.0 21.84 1 5 Agricultura 80.5 0.9% 0.00E+00 0.00 50.0 21.85 1 6 Trib 5 139.7 1.5% 0.00E+00 0.00 50.0 23.36 1 6 Cahokia C 3773.4 40.8% 0.00E+00 0.00 50.0 19.67 3 1 US Steel - 2784.4 30.1% 0.00E+00 0.00 185.5
PRECIPITATION 242.4 2.6% 1.47E+04 100.0% 0.50 6.4 30.0INTERNAL LOAD 1106.7 12.0% 0.00E+00 0.00TRIBUTARY INFLOW 5116.6 55.3% 0.00E+00 0.00 50.0 20.2 lbs/yrPOINT-SOURCE INFLOW 2784.4 30.1% 0.00E+00 0.00 185.5 6139.502732***TOTAL INFLOW 9250.0 100.0% 1.47E+04 100.0% 0.01 59.5 35.3 20396.32537ADVECTIVE OUTFLOW 5913.6 63.9% 5.04E+05 0.12 46.8 22.6***TOTAL OUTFLOW 5913.6 63.9% 5.04E+05 0.12 46.8 22.6***RETENTION 3336.4 36.1% 5.05E+05 0.21
Overflow Rate (m/yr) 15.7 Nutrient Resid. Time (yrs) 0.0819Hydraulic Resid. Time (yrs) 0.1237 Turnover Ratio 3.1Reservoir Conc (mg/m3) 48 Retention Coef. 0.361
LCCurrent Estimated
Load Reduction Needed WLA LA MOS55.88 601 91% 16.821 33.471 5.588 545.12
Wet Weather TMDL (March-May) (lbs/day)

THIS PAGE INTENTIONALLY LEFT BLANK

Appendix J: BATHTUB
Frank Holten Lakes

THIS PAGE INTENTIONALLY LEFT BLANK
Frank Holten Lakes BATHTUB Modeling Parameter Development
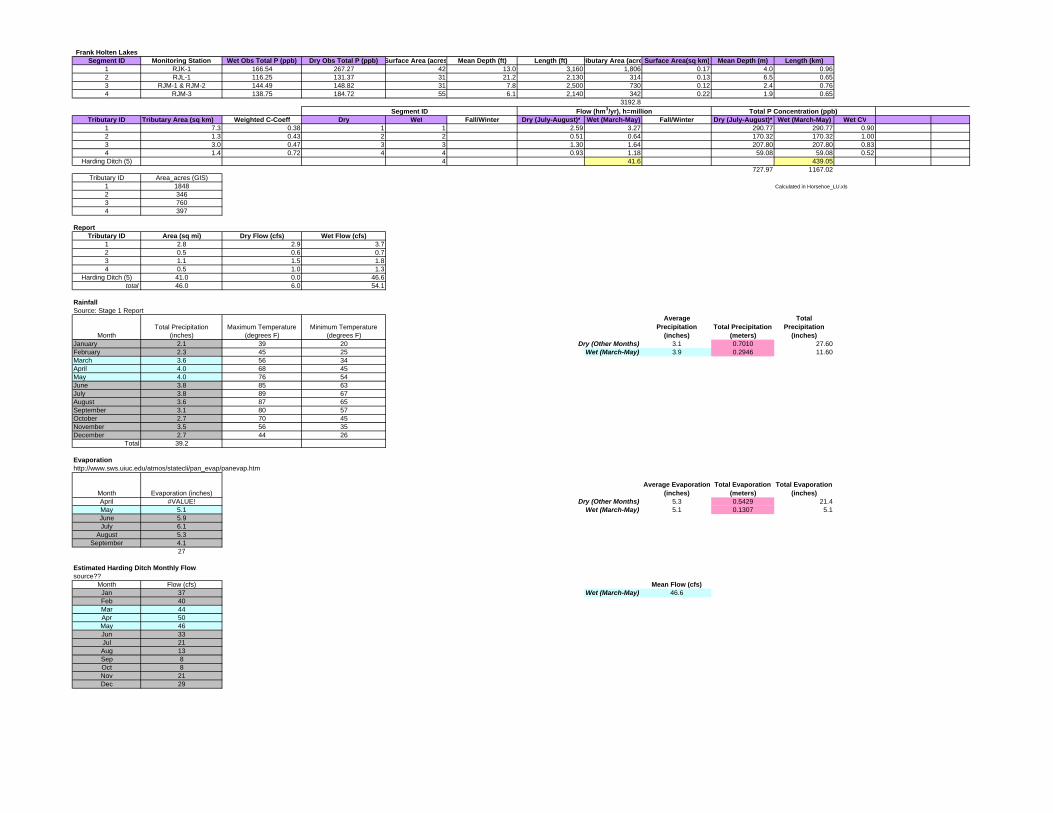
Frank Holten LakesSegment ID Monitoring Station Wet Obs Total P (ppb) Dry Obs Total P (ppb) Surface Area (acres Mean Depth (ft) Length (ft) ributary Area (acre Surface Area(sq km) Mean Depth (m) Length (km)
1 RJK-1 166.54 267.27 42 13.0 3,160 1,806 0.17 4.0 0.962 RJL-1 116.25 131.37 31 21.2 2,130 314 0.13 6.5 0.653 RJM-1 & RJM-2 144.49 148.82 31 7.8 2,500 730 0.12 2.4 0.764 RJM-3 138.75 184.72 55 6.1 2,140 342 0.22 1.9 0.65
3192.8
Tributary ID Tributary Area (sq km) Weighted C-Coeff Dry Wet Fall/Winter Dry (July-August)* Wet (March-May) Fall/Winter Dry (July-August)* Wet (March-May) Wet CV1 7.3 0.38 1 1 2.59 3.27 290.77 290.77 0.902 1.3 0.43 2 2 0.51 0.64 170.32 170.32 1.003 3.0 0.47 3 3 1.30 1.64 207.80 207.80 0.834 1.4 0.72 4 4 0.93 1.18 59.08 59.08 0.52
Harding Ditch (5) 4 41.6 439.05727.97 1167.02
Tributary ID Area_acres (GIS)1 1848 Calculated in Horsehoe_LU.xls2 3463 7604 397
ReportTributary ID Area (sq mi) Dry Flow (cfs) Wet Flow (cfs)
1 2.8 2.9 3.72 0.5 0.6 0.73 1.1 1.5 1.84 0.5 1.0 1.3
Harding Ditch (5) 41.0 0.0 46.6total 46.0 6.0 54.1
RainfallSource: Stage 1 Report
MonthTotal Precipitation
(inches)Maximum Temperature
(degrees F)Minimum Temperature
(degrees F)
Average Precipitation
(inches)Total Precipitation
(meters)
Total Precipitation
(inches)January 2.1 39 20 Dry (Other Months) 3.1 0.7010 27.60February 2.3 45 25 Wet (March-May) 3.9 0.2946 11.60March 3.6 56 34April 4.0 68 45May 4.0 76 54June 3.8 85 63July 3.8 89 67August 3.6 87 65September 3.1 80 57October 2.7 70 45November 3.5 56 35December 2.7 44 26
Total 39.2
Evaporationhttp://www.sws.uiuc.edu/atmos/statecli/pan_evap/panevap.htm
Month Evaporation (inches)Average Evaporation
(inches)Total Evaporation
(meters)Total Evaporation
(inches)April #VALUE! Dry (Other Months) 5.3 0.5429 21.4May 5.1 Wet (March-May) 5.1 0.1307 5.1June 5.9July 6.1
August 5.3September 4.1
27
Estimated Harding Ditch Monthly Flowsource??
Month Flow (cfs) Mean Flow (cfs)Jan 37 Wet (March-May) 46.6Feb 40 Mar 44 Apr 50 May 46 Jun 33 Jul 21 Aug 13 Sep 8 Oct 8 Nov 21 Dec 29
Segment ID Flow (hm3/yr), h=million Total P Concentration (ppb)
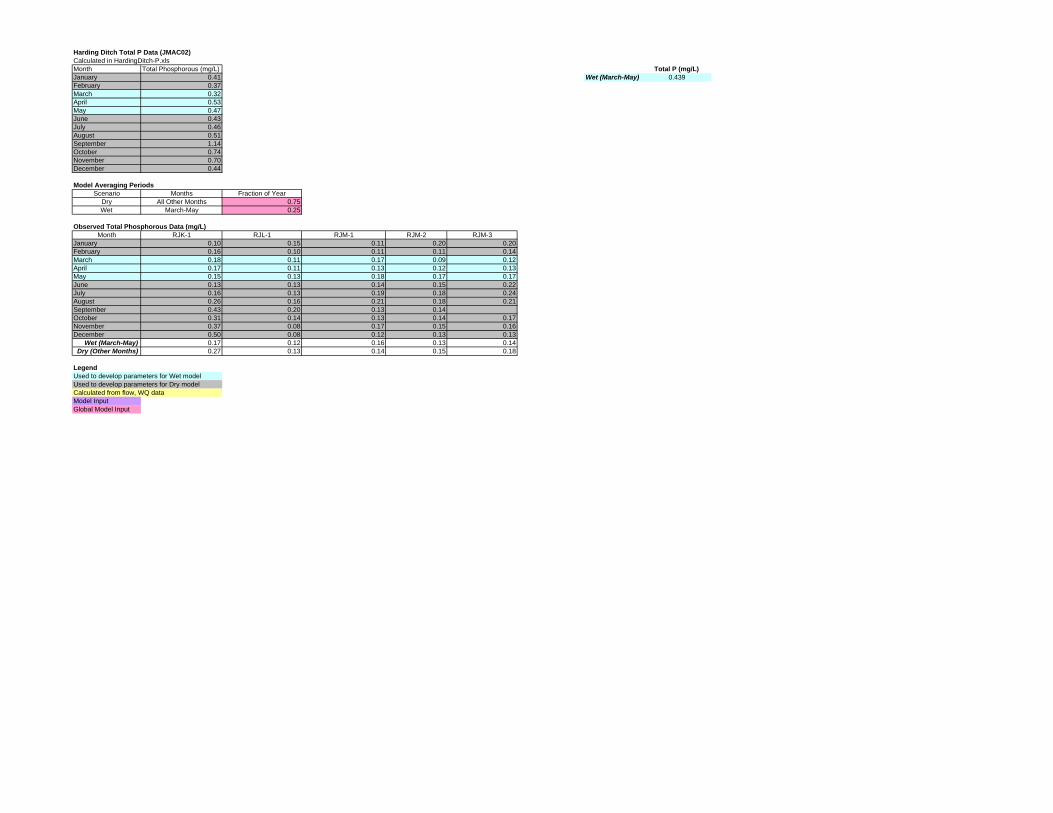
Harding Ditch Total P Data (JMAC02)Calculated in HardingDitch-P.xlsMonth Total Phosphorous (mg/L) Total P (mg/L)January 0.41 Wet (March-May) 0.439February 0.37March 0.32April 0.53May 0.47June 0.43July 0.46August 0.51September 1.14October 0.74November 0.70December 0.44
Model Averaging PeriodsScenario Months Fraction of Year
Dry All Other Months 0.75Wet March-May 0.25
Observed Total Phosphorous Data (mg/L)Month RJK-1 RJL-1 RJM-1 RJM-2 RJM-3
January 0.10 0.15 0.11 0.20 0.20February 0.16 0.10 0.11 0.11 0.14March 0.18 0.11 0.17 0.09 0.12April 0.17 0.11 0.13 0.12 0.13May 0.15 0.13 0.18 0.17 0.17June 0.13 0.13 0.14 0.15 0.22July 0.16 0.13 0.19 0.18 0.24August 0.26 0.16 0.21 0.18 0.21September 0.43 0.20 0.13 0.14October 0.31 0.14 0.13 0.14 0.17November 0.37 0.08 0.17 0.15 0.16December 0.50 0.08 0.12 0.13 0.13
Wet (March-May) 0.17 0.12 0.16 0.13 0.14Dry (Other Months) 0.27 0.13 0.14 0.15 0.18
LegendUsed to develop parameters for Wet modelUsed to develop parameters for Dry modelCalculated from flow, WQ dataModel InputGlobal Model Input
Frank Holten Lakes Dry Weather Scenario- Existing Conditions
BATHTUB Modeling Files
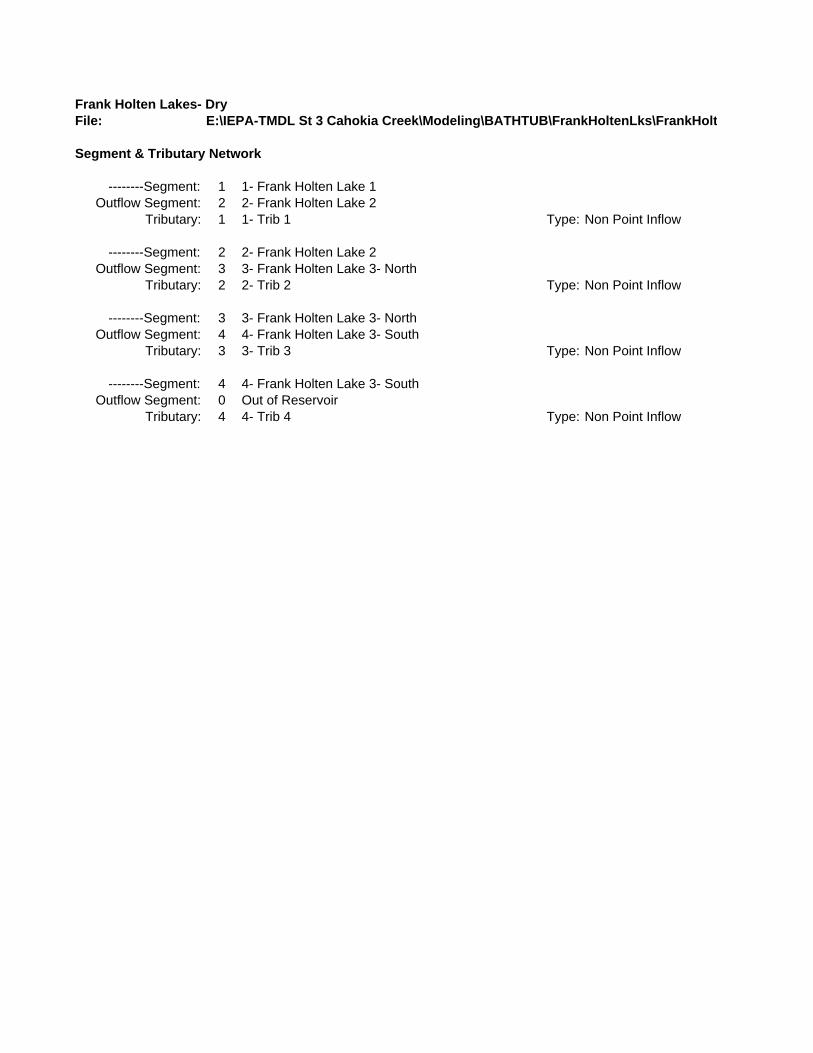
Frank Holten Lakes- DryFile: E:\IEPA-TMDL St 3 Cahokia Creek\Modeling\BATHTUB\FrankHoltenLks\FrankHolt
Segment & Tributary Network
--------Segment: 1 1- Frank Holten Lake 1Outflow Segment: 2 2- Frank Holten Lake 2
Tributary: 1 1- Trib 1 Type: Non Point Inflow
--------Segment: 2 2- Frank Holten Lake 2Outflow Segment: 3 3- Frank Holten Lake 3- North
Tributary: 2 2- Trib 2 Type: Non Point Inflow
--------Segment: 3 3- Frank Holten Lake 3- NorthOutflow Segment: 4 4- Frank Holten Lake 3- South
Tributary: 3 3- Trib 3 Type: Non Point Inflow
--------Segment: 4 4- Frank Holten Lake 3- SouthOutflow Segment: 0 Out of Reservoir
Tributary: 4 4- Trib 4 Type: Non Point Inflow
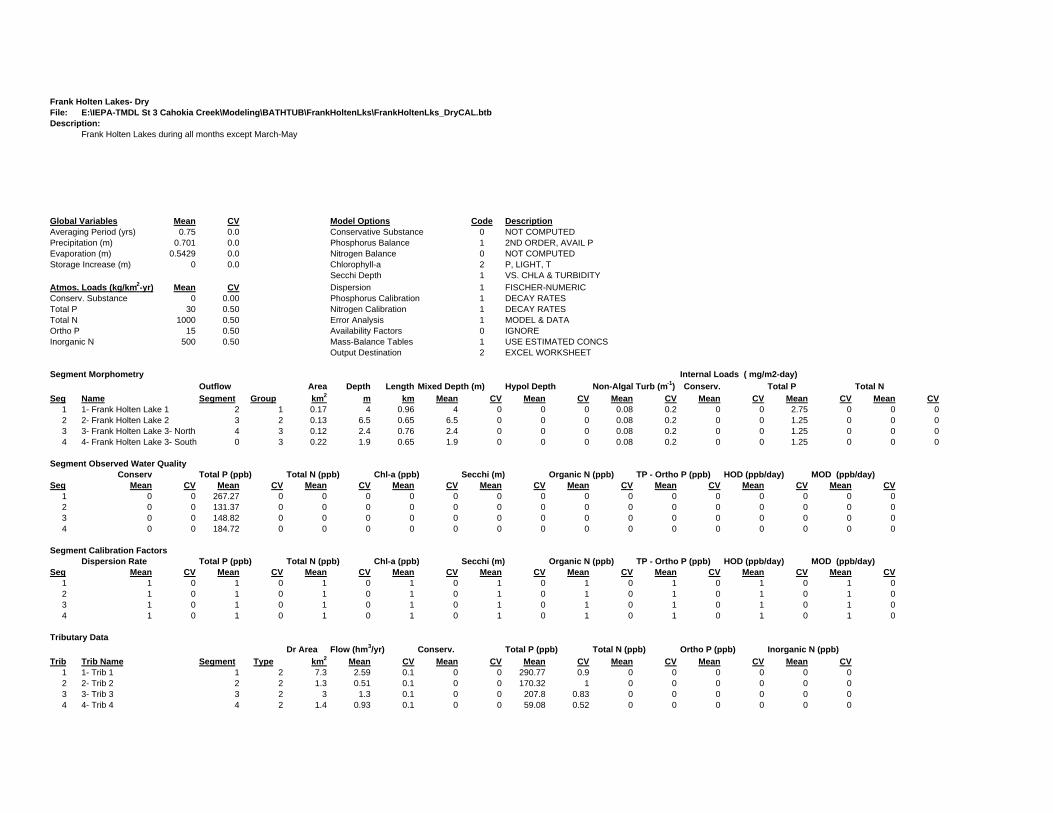
Frank Holten Lakes- DryFile: E:\IEPA-TMDL St 3 Cahokia Creek\Modeling\BATHTUB\FrankHoltenLks\FrankHoltenLks_DryCAL.btbDescription:
Frank Holten Lakes during all months except March-May
Global Variables Mean CV Model Options Code DescriptionAveraging Period (yrs) 0.75 0.0 Conservative Substance 0 NOT COMPUTEDPrecipitation (m) 0.701 0.0 Phosphorus Balance 1 2ND ORDER, AVAIL PEvaporation (m) 0.5429 0.0 Nitrogen Balance 0 NOT COMPUTEDStorage Increase (m) 0 0.0 Chlorophyll-a 2 P, LIGHT, T
Secchi Depth 1 VS. CHLA & TURBIDITYAtmos. Loads (kg/km2-yr) Mean CV Dispersion 1 FISCHER-NUMERICConserv. Substance 0 0.00 Phosphorus Calibration 1 DECAY RATESTotal P 30 0.50 Nitrogen Calibration 1 DECAY RATESTotal N 1000 0.50 Error Analysis 1 MODEL & DATAOrtho P 15 0.50 Availability Factors 0 IGNOREInorganic N 500 0.50 Mass-Balance Tables 1 USE ESTIMATED CONCS
Output Destination 2 EXCEL WORKSHEET
Segment Morphometry Internal Loads ( mg/m2-day)Outflow Area Depth Length Mixed Depth (m) Hypol Depth Non-Algal Turb (m-1) Conserv. Total P Total N
Seg Name Segment Group km2 m km Mean CV Mean CV Mean CV Mean CV Mean CV Mean CV1 1- Frank Holten Lake 1 2 1 0.17 4 0.96 4 0 0 0 0.08 0.2 0 0 2.75 0 0 02 2- Frank Holten Lake 2 3 2 0.13 6.5 0.65 6.5 0 0 0 0.08 0.2 0 0 1.25 0 0 03 3- Frank Holten Lake 3- North 4 3 0.12 2.4 0.76 2.4 0 0 0 0.08 0.2 0 0 1.25 0 0 04 4- Frank Holten Lake 3- South 0 3 0.22 1.9 0.65 1.9 0 0 0 0.08 0.2 0 0 1.25 0 0 0
Segment Observed Water QualityConserv Total P (ppb) Total N (ppb) Chl-a (ppb) Secchi (m) Organic N (ppb) TP - Ortho P (ppb) HOD (ppb/day) MOD (ppb/day)
Seg Mean CV Mean CV Mean CV Mean CV Mean CV Mean CV Mean CV Mean CV Mean CV1 0 0 267.27 0 0 0 0 0 0 0 0 0 0 0 0 0 0 02 0 0 131.37 0 0 0 0 0 0 0 0 0 0 0 0 0 0 03 0 0 148.82 0 0 0 0 0 0 0 0 0 0 0 0 0 0 04 0 0 184.72 0 0 0 0 0 0 0 0 0 0 0 0 0 0 0
Segment Calibration FactorsDispersion Rate Total P (ppb) Total N (ppb) Chl-a (ppb) Secchi (m) Organic N (ppb) TP - Ortho P (ppb) HOD (ppb/day) MOD (ppb/day)
Seg Mean CV Mean CV Mean CV Mean CV Mean CV Mean CV Mean CV Mean CV Mean CV1 1 0 1 0 1 0 1 0 1 0 1 0 1 0 1 0 1 02 1 0 1 0 1 0 1 0 1 0 1 0 1 0 1 0 1 03 1 0 1 0 1 0 1 0 1 0 1 0 1 0 1 0 1 04 1 0 1 0 1 0 1 0 1 0 1 0 1 0 1 0 1 0
Tributary DataDr Area Flow (hm3/yr) Conserv. Total P (ppb) Total N (ppb) Ortho P (ppb) Inorganic N (ppb)
Trib Trib Name Segment Type km2 Mean CV Mean CV Mean CV Mean CV Mean CV Mean CV1 1- Trib 1 1 2 7.3 2.59 0.1 0 0 290.77 0.9 0 0 0 0 0 02 2- Trib 2 2 2 1.3 0.51 0.1 0 0 170.32 1 0 0 0 0 0 03 3- Trib 3 3 2 3 1.3 0.1 0 0 207.8 0.83 0 0 0 0 0 04 4- Trib 4 4 2 1.4 0.93 0.1 0 0 59.08 0.52 0 0 0 0 0 0

Model Coefficients Mean CVDispersion Rate 1.000 0.70Total Phosphorus 1.000 0.45Total Nitrogen 1.000 0.55Chl-a Model 1.000 0.26Secchi Model 1.000 0.10Organic N Model 1.000 0.12TP-OP Model 1.000 0.15HODv Model 1.000 0.15MODv Model 1.000 0.22Secchi/Chla Slope (m2/mg) 0.025 0.00Minimum Qs (m/yr) 0.100 0.00Chl-a Flushing Term 1.000 0.00Chl-a Temporal CV 0.620 0Avail. Factor - Total P 0.330 0Avail. Factor - Ortho P 1.930 0Avail. Factor - Total N 0.590 0Avail. Factor - Inorganic N 0.790 0

Frank Holten Lakes- DryFile: E:\IEPA-TMDL St 3 Cahokia Creek\Modeling\BATHTUB\FrankHoltenLks\Fra
Predicted & Observed Values Ranked Against CE Model Development Dataset
Segment: 5 Area-Wtd Mean Predicted Values---> Observed Values--->
Variable Mean CV Rank Mean CV RankTOTAL P MG/M3 201.8 0.21 94.5% 189.1 93.6%CHL-A MG/M3 55.3 0.27 98.9%SECCHI M 0.8 0.26 34.1%ORGANIC N MG/M3 1423.7 0.27 98.4%TP-ORTHO-P MG/M3 96.2 0.31 89.0%ANTILOG PC-1 2109.2 0.51 95.0%ANTILOG PC-2 15.1 0.08 94.7%TURBIDITY 1/M 0.1 0.10 1.1% 0.1 0.10 1.1%ZMIX * TURBIDITY 0.3 0.11 0.1% 0.3 0.11 0.1%ZMIX / SECCHI 4.3 0.27 42.3%CHL-A * SECCHI 37.5 0.10 96.7%CHL-A / TOTAL P 0.3 0.30 70.7%FREQ(CHL-a>10) % 97.1 0.02 98.9%FREQ(CHL-a>20) % 83.9 0.10 98.9%FREQ(CHL-a>30) % 68.0 0.18 98.9%FREQ(CHL-a>40) % 53.7 0.25 98.9%FREQ(CHL-a>50) % 41.9 0.33 98.9%FREQ(CHL-a>60) % 32.7 0.40 98.9%CARLSON TSI-P 80.5 0.04 94.5% 79.2 93.6%CARLSON TSI-CHLA 69.2 0.04 98.9%CARLSON TSI-SEC 64.5 0.06 65.9%
Segment: 1 1- Frank Holten Lake 1 Predicted Values---> Observed Values--->
Variable Mean CV Rank Mean CV RankTOTAL P MG/M3 246.8 0.21 96.6% 267.3 97.2%CHL-A MG/M3 43.6 0.26 97.7%SECCHI M 0.9 0.26 37.9%ORGANIC N MG/M3 1158.1 0.26 96.0%TP-ORTHO-P MG/M3 75.5 0.31 83.4%ANTILOG PC-1 1242.5 0.49 89.2%ANTILOG PC-2 15.3 0.08 95.0%TURBIDITY 1/M 0.1 0.20 1.1% 0.1 0.20 1.1%ZMIX * TURBIDITY 0.3 0.20 0.2% 0.3 0.20 0.2%ZMIX / SECCHI 4.7 0.26 48.8%CHL-A * SECCHI 37.3 0.10 96.6%CHL-A / TOTAL P 0.2 0.31 43.6%FREQ(CHL-a>10) % 98.1 0.02 97.7%FREQ(CHL-a>20) % 82.9 0.13 97.7%FREQ(CHL-a>30) % 61.6 0.26 97.7%FREQ(CHL-a>40) % 43.3 0.38 97.7%FREQ(CHL-a>50) % 29.8 0.49 97.7%FREQ(CHL-a>60) % 20.5 0.59 97.7%
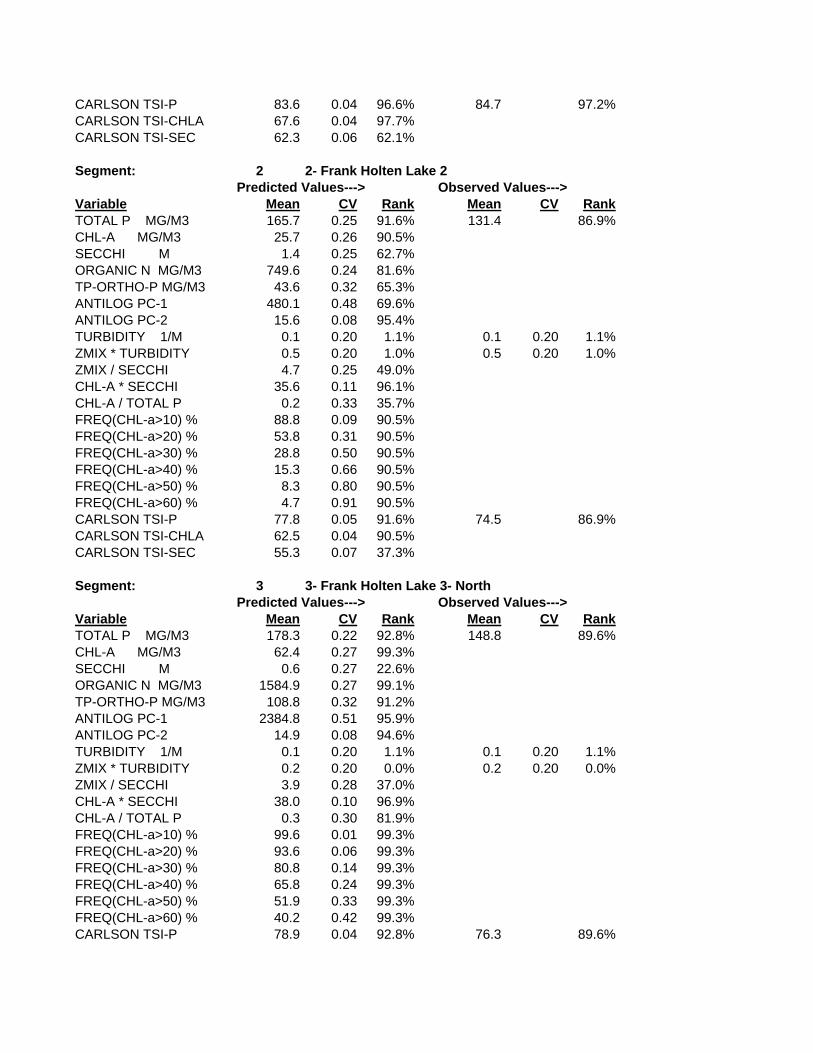
CARLSON TSI-P 83.6 0.04 96.6% 84.7 97.2%CARLSON TSI-CHLA 67.6 0.04 97.7%CARLSON TSI-SEC 62.3 0.06 62.1%
Segment: 2 2- Frank Holten Lake 2 Predicted Values---> Observed Values--->
Variable Mean CV Rank Mean CV RankTOTAL P MG/M3 165.7 0.25 91.6% 131.4 86.9%CHL-A MG/M3 25.7 0.26 90.5%SECCHI M 1.4 0.25 62.7%ORGANIC N MG/M3 749.6 0.24 81.6%TP-ORTHO-P MG/M3 43.6 0.32 65.3%ANTILOG PC-1 480.1 0.48 69.6%ANTILOG PC-2 15.6 0.08 95.4%TURBIDITY 1/M 0.1 0.20 1.1% 0.1 0.20 1.1%ZMIX * TURBIDITY 0.5 0.20 1.0% 0.5 0.20 1.0%ZMIX / SECCHI 4.7 0.25 49.0%CHL-A * SECCHI 35.6 0.11 96.1%CHL-A / TOTAL P 0.2 0.33 35.7%FREQ(CHL-a>10) % 88.8 0.09 90.5%FREQ(CHL-a>20) % 53.8 0.31 90.5%FREQ(CHL-a>30) % 28.8 0.50 90.5%FREQ(CHL-a>40) % 15.3 0.66 90.5%FREQ(CHL-a>50) % 8.3 0.80 90.5%FREQ(CHL-a>60) % 4.7 0.91 90.5%CARLSON TSI-P 77.8 0.05 91.6% 74.5 86.9%CARLSON TSI-CHLA 62.5 0.04 90.5%CARLSON TSI-SEC 55.3 0.07 37.3%
Segment: 3 3- Frank Holten Lake 3- North Predicted Values---> Observed Values--->
Variable Mean CV Rank Mean CV RankTOTAL P MG/M3 178.3 0.22 92.8% 148.8 89.6%CHL-A MG/M3 62.4 0.27 99.3%SECCHI M 0.6 0.27 22.6%ORGANIC N MG/M3 1584.9 0.27 99.1%TP-ORTHO-P MG/M3 108.8 0.32 91.2%ANTILOG PC-1 2384.8 0.51 95.9%ANTILOG PC-2 14.9 0.08 94.6%TURBIDITY 1/M 0.1 0.20 1.1% 0.1 0.20 1.1%ZMIX * TURBIDITY 0.2 0.20 0.0% 0.2 0.20 0.0%ZMIX / SECCHI 3.9 0.28 37.0%CHL-A * SECCHI 38.0 0.10 96.9%CHL-A / TOTAL P 0.3 0.30 81.9%FREQ(CHL-a>10) % 99.6 0.01 99.3%FREQ(CHL-a>20) % 93.6 0.06 99.3%FREQ(CHL-a>30) % 80.8 0.14 99.3%FREQ(CHL-a>40) % 65.8 0.24 99.3%FREQ(CHL-a>50) % 51.9 0.33 99.3%FREQ(CHL-a>60) % 40.2 0.42 99.3%CARLSON TSI-P 78.9 0.04 92.8% 76.3 89.6%
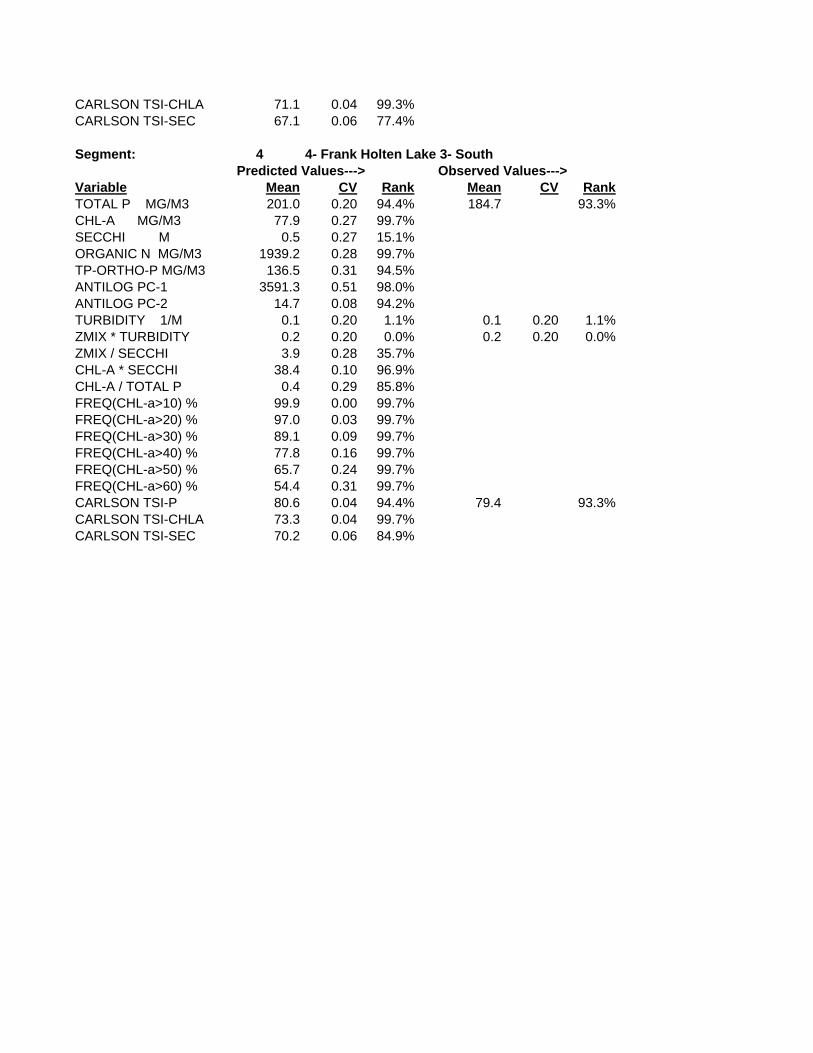
CARLSON TSI-CHLA 71.1 0.04 99.3%CARLSON TSI-SEC 67.1 0.06 77.4%
Segment: 4 4- Frank Holten Lake 3- South Predicted Values---> Observed Values--->
Variable Mean CV Rank Mean CV RankTOTAL P MG/M3 201.0 0.20 94.4% 184.7 93.3%CHL-A MG/M3 77.9 0.27 99.7%SECCHI M 0.5 0.27 15.1%ORGANIC N MG/M3 1939.2 0.28 99.7%TP-ORTHO-P MG/M3 136.5 0.31 94.5%ANTILOG PC-1 3591.3 0.51 98.0%ANTILOG PC-2 14.7 0.08 94.2%TURBIDITY 1/M 0.1 0.20 1.1% 0.1 0.20 1.1%ZMIX * TURBIDITY 0.2 0.20 0.0% 0.2 0.20 0.0%ZMIX / SECCHI 3.9 0.28 35.7%CHL-A * SECCHI 38.4 0.10 96.9%CHL-A / TOTAL P 0.4 0.29 85.8%FREQ(CHL-a>10) % 99.9 0.00 99.7%FREQ(CHL-a>20) % 97.0 0.03 99.7%FREQ(CHL-a>30) % 89.1 0.09 99.7%FREQ(CHL-a>40) % 77.8 0.16 99.7%FREQ(CHL-a>50) % 65.7 0.24 99.7%FREQ(CHL-a>60) % 54.4 0.31 99.7%CARLSON TSI-P 80.6 0.04 94.4% 79.4 93.3%CARLSON TSI-CHLA 73.3 0.04 99.7%CARLSON TSI-SEC 70.2 0.06 84.9%
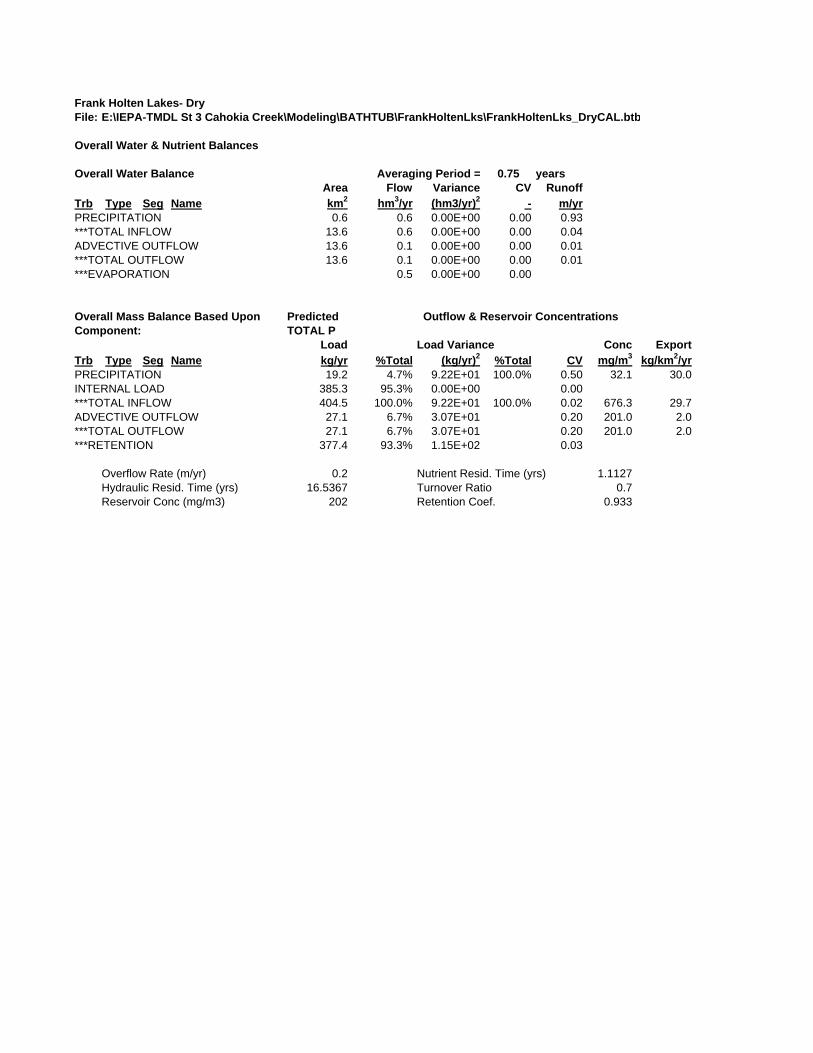
Frank Holten Lakes- DryFile: E:\IEPA-TMDL St 3 Cahokia Creek\Modeling\BATHTUB\FrankHoltenLks\FrankHoltenLks_DryCAL.btb
Overall Water & Nutrient Balances
Overall Water Balance Averaging Period = 0.75 yearsArea Flow Variance CV Runoff
Trb Type Seg Name km2 hm3/yr (hm3/yr)2 - m/yrPRECIPITATION 0.6 0.6 0.00E+00 0.00 0.93***TOTAL INFLOW 13.6 0.6 0.00E+00 0.00 0.04ADVECTIVE OUTFLOW 13.6 0.1 0.00E+00 0.00 0.01***TOTAL OUTFLOW 13.6 0.1 0.00E+00 0.00 0.01***EVAPORATION 0.5 0.00E+00 0.00
Overall Mass Balance Based Upon Predicted Outflow & Reservoir ConcentrationsComponent: TOTAL P
Load Load Variance Conc ExportTrb Type Seg Name kg/yr %Total (kg/yr)2 %Total CV mg/m3 kg/km2/yrPRECIPITATION 19.2 4.7% 9.22E+01 100.0% 0.50 32.1 30.0INTERNAL LOAD 385.3 95.3% 0.00E+00 0.00***TOTAL INFLOW 404.5 100.0% 9.22E+01 100.0% 0.02 676.3 29.7ADVECTIVE OUTFLOW 27.1 6.7% 3.07E+01 0.20 201.0 2.0***TOTAL OUTFLOW 27.1 6.7% 3.07E+01 0.20 201.0 2.0***RETENTION 377.4 93.3% 1.15E+02 0.03
Overflow Rate (m/yr) 0.2 Nutrient Resid. Time (yrs) 1.1127Hydraulic Resid. Time (yrs) 16.5367 Turnover Ratio 0.7Reservoir Conc (mg/m3) 202 Retention Coef. 0.933
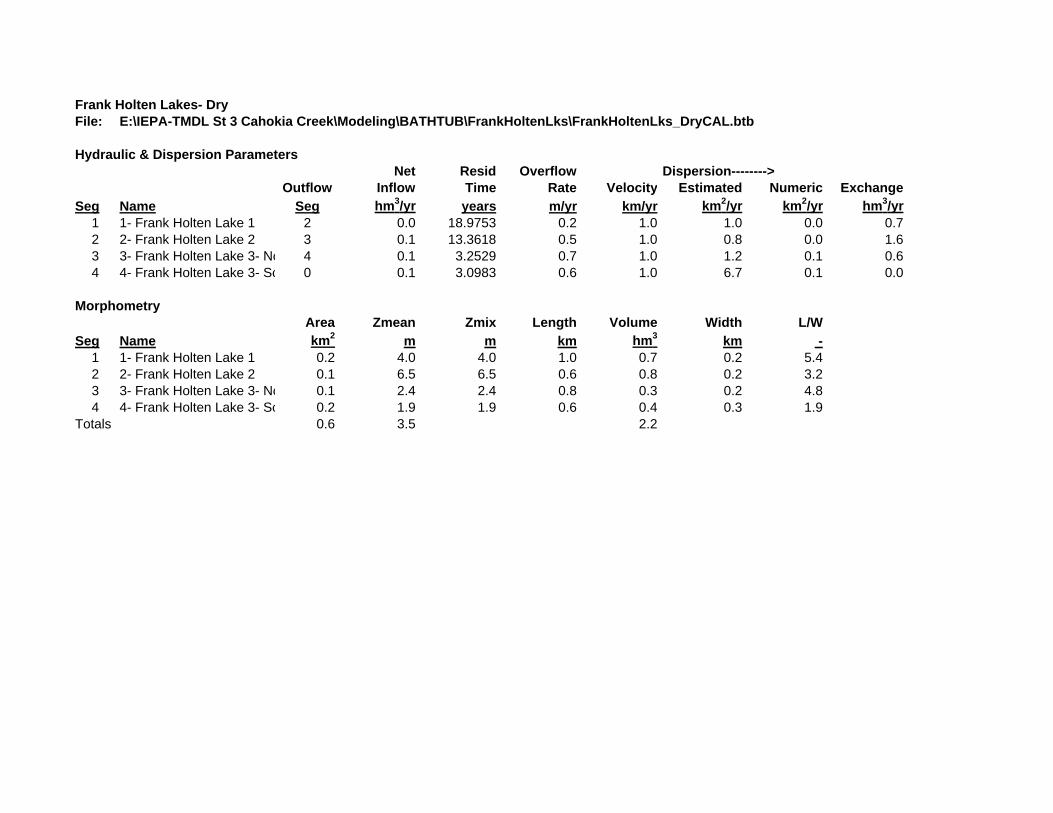
Frank Holten Lakes- DryFile: E:\IEPA-TMDL St 3 Cahokia Creek\Modeling\BATHTUB\FrankHoltenLks\FrankHoltenLks_DryCAL.btb
Hydraulic & Dispersion ParametersNet Resid Overflow Dispersion-------->
Outflow Inflow Time Rate Velocity Estimated Numeric ExchangeSeg Name Seg hm3/yr years m/yr km/yr km2/yr km2/yr hm3/yr
1 1- Frank Holten Lake 1 2 0.0 18.9753 0.2 1.0 1.0 0.0 0.72 2- Frank Holten Lake 2 3 0.1 13.3618 0.5 1.0 0.8 0.0 1.63 3- Frank Holten Lake 3- No 4 0.1 3.2529 0.7 1.0 1.2 0.1 0.64 4- Frank Holten Lake 3- So 0 0.1 3.0983 0.6 1.0 6.7 0.1 0.0
MorphometryArea Zmean Zmix Length Volume Width L/W
Seg Name km2 m m km hm3 km -1 1- Frank Holten Lake 1 0.2 4.0 4.0 1.0 0.7 0.2 5.42 2- Frank Holten Lake 2 0.1 6.5 6.5 0.6 0.8 0.2 3.23 3- Frank Holten Lake 3- No 0.1 2.4 2.4 0.8 0.3 0.2 4.84 4- Frank Holten Lake 3- So 0.2 1.9 1.9 0.6 0.4 0.3 1.9
Totals 0.6 3.5 2.2

Frank Holten Lakes- DryFile: E:\IEPA-TMDL St 3 Cahokia Creek\Modeling\BATHTUB\FrankHoltenLks\FraVariable: TOTAL P MG/M3
Predicted ObservedSegment Mean CV Mean CV1- Frank Holten Lake 1 246.8 0.21 267.3 0.002- Frank Holten Lake 2 165.7 0.25 131.4 0.003- Frank Holten Lake 3- Nor 178.3 0.22 148.8 0.004- Frank Holten Lake 3- Sou 201.0 0.20 184.7 0.00Area-Wtd Mean 201.8 0.21 189.1 0.00
0
50
100
150
200
250
300
350
1- F
rank
Hol
ten
Lake
1
2- F
rank
Hol
ten
Lake
2
3- F
rank
Hol
ten
Lake
3- N
orth
4- F
rank
Hol
ten
Lake
3- S
outh
Area
-Wtd
Mea
n
TOTA
L P
M
G/M
3
Observed Predicted
Frank Holten Lakes Dry Weather Scenario- Reduced Loading Conditions
BATHTUB Modeling Files
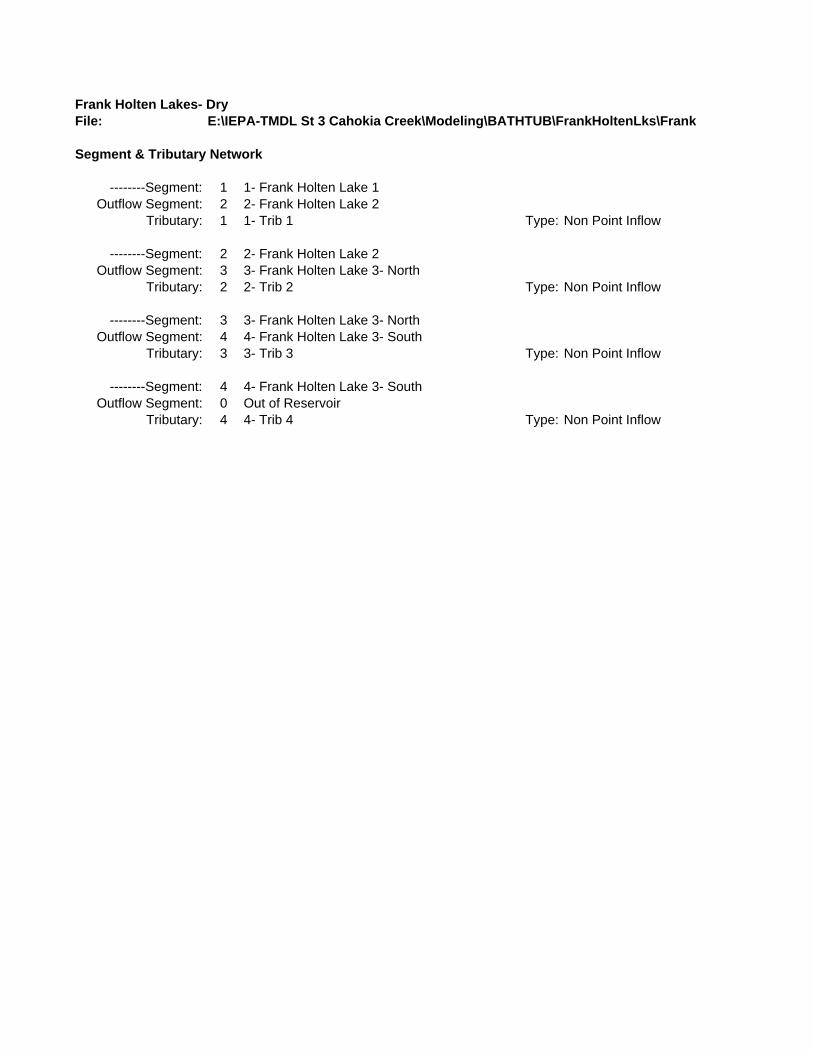
Frank Holten Lakes- DryFile: E:\IEPA-TMDL St 3 Cahokia Creek\Modeling\BATHTUB\FrankHoltenLks\FrankH
Segment & Tributary Network
--------Segment: 1 1- Frank Holten Lake 1Outflow Segment: 2 2- Frank Holten Lake 2
Tributary: 1 1- Trib 1 Type: Non Point Inflow
--------Segment: 2 2- Frank Holten Lake 2Outflow Segment: 3 3- Frank Holten Lake 3- North
Tributary: 2 2- Trib 2 Type: Non Point Inflow
--------Segment: 3 3- Frank Holten Lake 3- NorthOutflow Segment: 4 4- Frank Holten Lake 3- South
Tributary: 3 3- Trib 3 Type: Non Point Inflow
--------Segment: 4 4- Frank Holten Lake 3- SouthOutflow Segment: 0 Out of Reservoir
Tributary: 4 4- Trib 4 Type: Non Point Inflow
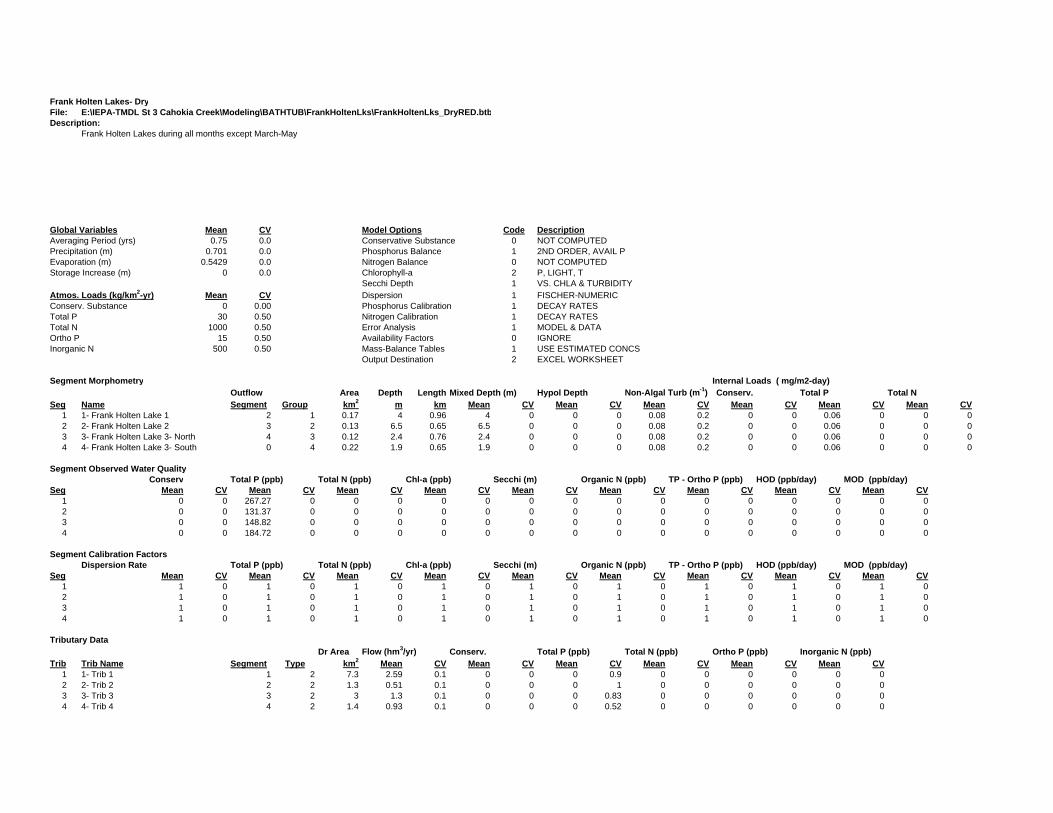
Frank Holten Lakes- DryFile: E:\IEPA-TMDL St 3 Cahokia Creek\Modeling\BATHTUB\FrankHoltenLks\FrankHoltenLks_DryRED.btbDescription:
Frank Holten Lakes during all months except March-May
Global Variables Mean CV Model Options Code DescriptionAveraging Period (yrs) 0.75 0.0 Conservative Substance 0 NOT COMPUTEDPrecipitation (m) 0.701 0.0 Phosphorus Balance 1 2ND ORDER, AVAIL PEvaporation (m) 0.5429 0.0 Nitrogen Balance 0 NOT COMPUTEDStorage Increase (m) 0 0.0 Chlorophyll-a 2 P, LIGHT, T
Secchi Depth 1 VS. CHLA & TURBIDITYAtmos. Loads (kg/km2-yr) Mean CV Dispersion 1 FISCHER-NUMERICConserv. Substance 0 0.00 Phosphorus Calibration 1 DECAY RATESTotal P 30 0.50 Nitrogen Calibration 1 DECAY RATESTotal N 1000 0.50 Error Analysis 1 MODEL & DATAOrtho P 15 0.50 Availability Factors 0 IGNOREInorganic N 500 0.50 Mass-Balance Tables 1 USE ESTIMATED CONCS
Output Destination 2 EXCEL WORKSHEET
Segment Morphometry Internal Loads ( mg/m2-day)Outflow Area Depth Length Mixed Depth (m) Hypol Depth Non-Algal Turb (m-1) Conserv. Total P Total N
Seg Name Segment Group km2 m km Mean CV Mean CV Mean CV Mean CV Mean CV Mean CV1 1- Frank Holten Lake 1 2 1 0.17 4 0.96 4 0 0 0 0.08 0.2 0 0 0.06 0 0 02 2- Frank Holten Lake 2 3 2 0.13 6.5 0.65 6.5 0 0 0 0.08 0.2 0 0 0.06 0 0 03 3- Frank Holten Lake 3- North 4 3 0.12 2.4 0.76 2.4 0 0 0 0.08 0.2 0 0 0.06 0 0 04 4- Frank Holten Lake 3- South 0 4 0.22 1.9 0.65 1.9 0 0 0 0.08 0.2 0 0 0.06 0 0 0
Segment Observed Water QualityConserv Total P (ppb) Total N (ppb) Chl-a (ppb) Secchi (m) Organic N (ppb) TP - Ortho P (ppb) HOD (ppb/day) MOD (ppb/day)
Seg Mean CV Mean CV Mean CV Mean CV Mean CV Mean CV Mean CV Mean CV Mean CV1 0 0 267.27 0 0 0 0 0 0 0 0 0 0 0 0 0 0 02 0 0 131.37 0 0 0 0 0 0 0 0 0 0 0 0 0 0 03 0 0 148.82 0 0 0 0 0 0 0 0 0 0 0 0 0 0 04 0 0 184.72 0 0 0 0 0 0 0 0 0 0 0 0 0 0 0
Segment Calibration FactorsDispersion Rate Total P (ppb) Total N (ppb) Chl-a (ppb) Secchi (m) Organic N (ppb) TP - Ortho P (ppb) HOD (ppb/day) MOD (ppb/day)
Seg Mean CV Mean CV Mean CV Mean CV Mean CV Mean CV Mean CV Mean CV Mean CV1 1 0 1 0 1 0 1 0 1 0 1 0 1 0 1 0 1 02 1 0 1 0 1 0 1 0 1 0 1 0 1 0 1 0 1 03 1 0 1 0 1 0 1 0 1 0 1 0 1 0 1 0 1 04 1 0 1 0 1 0 1 0 1 0 1 0 1 0 1 0 1 0
Tributary DataDr Area Flow (hm3/yr) Conserv. Total P (ppb) Total N (ppb) Ortho P (ppb) Inorganic N (ppb)
Trib Trib Name Segment Type km2 Mean CV Mean CV Mean CV Mean CV Mean CV Mean CV1 1- Trib 1 1 2 7.3 2.59 0.1 0 0 0 0.9 0 0 0 0 0 02 2- Trib 2 2 2 1.3 0.51 0.1 0 0 0 1 0 0 0 0 0 03 3- Trib 3 3 2 3 1.3 0.1 0 0 0 0.83 0 0 0 0 0 04 4- Trib 4 4 2 1.4 0.93 0.1 0 0 0 0.52 0 0 0 0 0 0

Model Coefficients Mean CVDispersion Rate 1.000 0.70Total Phosphorus 1.000 0.45Total Nitrogen 1.000 0.55Chl-a Model 1.000 0.26Secchi Model 1.000 0.10Organic N Model 1.000 0.12TP-OP Model 1.000 0.15HODv Model 1.000 0.15MODv Model 1.000 0.22Secchi/Chla Slope (m2/mg) 0.025 0.00Minimum Qs (m/yr) 0.100 0.00Chl-a Flushing Term 1.000 0.00Chl-a Temporal CV 0.620 0Avail. Factor - Total P 0.330 0Avail. Factor - Ortho P 1.930 0Avail. Factor - Total N 0.590 0Avail. Factor - Inorganic N 0.790 0

Frank Holten Lakes- DryFile: E:\IEPA-TMDL St 3 Cahokia Creek\Modeling\BATHTUB\FrankHoltenLks\Fra
Predicted & Observed Values Ranked Against CE Model Development Dataset
Segment: 5 Area-Wtd Mean Predicted Values---> Observed Values--->
Variable Mean CV Rank Mean CV RankTOTAL P MG/M3 46.9 0.25 49.1% 189.1 93.6%CHL-A MG/M3 23.8 0.34 88.7%SECCHI M 1.5 0.30 67.9%ORGANIC N MG/M3 706.6 0.29 78.3%TP-ORTHO-P MG/M3 40.2 0.39 62.1%ANTILOG PC-1 433.0 0.62 66.8%ANTILOG PC-2 15.6 0.08 95.4%TURBIDITY 1/M 0.1 0.10 1.1% 0.1 0.10 1.1%ZMIX * TURBIDITY 0.3 0.11 0.1% 0.3 0.11 0.1%ZMIX / SECCHI 2.1 0.30 8.5%CHL-A * SECCHI 35.1 0.11 95.9%CHL-A / TOTAL P 0.5 0.26 93.2%FREQ(CHL-a>10) % 83.8 0.14 88.7%FREQ(CHL-a>20) % 47.7 0.42 88.7%FREQ(CHL-a>30) % 25.1 0.66 88.7%FREQ(CHL-a>40) % 13.3 0.86 88.7%FREQ(CHL-a>50) % 7.3 1.03 88.7%FREQ(CHL-a>60) % 4.1 1.17 88.7%CARLSON TSI-P 59.6 0.06 49.1% 79.2 93.6%CARLSON TSI-CHLA 61.5 0.05 88.7%CARLSON TSI-SEC 54.1 0.08 32.1%
Segment: 1 1- Frank Holten Lake 1 Predicted Values---> Observed Values--->
Variable Mean CV Rank Mean CV RankTOTAL P MG/M3 48.4 0.25 50.5% 267.3 97.2%CHL-A MG/M3 21.9 0.32 86.4%SECCHI M 1.6 0.30 69.5%ORGANIC N MG/M3 662.6 0.27 74.4%TP-ORTHO-P MG/M3 36.8 0.37 58.5%ANTILOG PC-1 361.4 0.58 61.7%ANTILOG PC-2 15.6 0.08 95.4%TURBIDITY 1/M 0.1 0.20 1.1% 0.1 0.20 1.1%ZMIX * TURBIDITY 0.3 0.20 0.2% 0.3 0.20 0.2%ZMIX / SECCHI 2.5 0.30 13.5%CHL-A * SECCHI 34.9 0.11 95.9%CHL-A / TOTAL P 0.5 0.27 90.6%FREQ(CHL-a>10) % 83.0 0.16 86.4%FREQ(CHL-a>20) % 43.5 0.47 86.4%FREQ(CHL-a>30) % 20.7 0.72 86.4%FREQ(CHL-a>40) % 10.0 0.92 86.4%FREQ(CHL-a>50) % 5.0 1.09 86.4%FREQ(CHL-a>60) % 2.7 1.23 86.4%
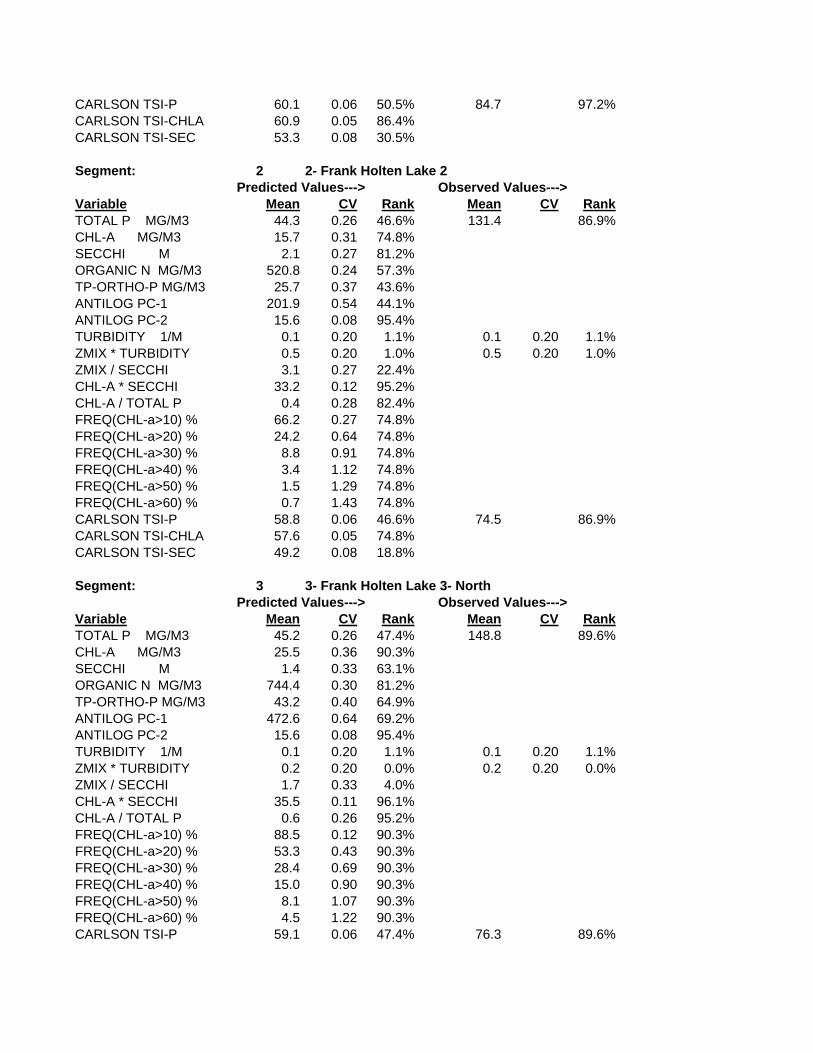
CARLSON TSI-P 60.1 0.06 50.5% 84.7 97.2%CARLSON TSI-CHLA 60.9 0.05 86.4%CARLSON TSI-SEC 53.3 0.08 30.5%
Segment: 2 2- Frank Holten Lake 2 Predicted Values---> Observed Values--->
Variable Mean CV Rank Mean CV RankTOTAL P MG/M3 44.3 0.26 46.6% 131.4 86.9%CHL-A MG/M3 15.7 0.31 74.8%SECCHI M 2.1 0.27 81.2%ORGANIC N MG/M3 520.8 0.24 57.3%TP-ORTHO-P MG/M3 25.7 0.37 43.6%ANTILOG PC-1 201.9 0.54 44.1%ANTILOG PC-2 15.6 0.08 95.4%TURBIDITY 1/M 0.1 0.20 1.1% 0.1 0.20 1.1%ZMIX * TURBIDITY 0.5 0.20 1.0% 0.5 0.20 1.0%ZMIX / SECCHI 3.1 0.27 22.4%CHL-A * SECCHI 33.2 0.12 95.2%CHL-A / TOTAL P 0.4 0.28 82.4%FREQ(CHL-a>10) % 66.2 0.27 74.8%FREQ(CHL-a>20) % 24.2 0.64 74.8%FREQ(CHL-a>30) % 8.8 0.91 74.8%FREQ(CHL-a>40) % 3.4 1.12 74.8%FREQ(CHL-a>50) % 1.5 1.29 74.8%FREQ(CHL-a>60) % 0.7 1.43 74.8%CARLSON TSI-P 58.8 0.06 46.6% 74.5 86.9%CARLSON TSI-CHLA 57.6 0.05 74.8%CARLSON TSI-SEC 49.2 0.08 18.8%
Segment: 3 3- Frank Holten Lake 3- North Predicted Values---> Observed Values--->
Variable Mean CV Rank Mean CV RankTOTAL P MG/M3 45.2 0.26 47.4% 148.8 89.6%CHL-A MG/M3 25.5 0.36 90.3%SECCHI M 1.4 0.33 63.1%ORGANIC N MG/M3 744.4 0.30 81.2%TP-ORTHO-P MG/M3 43.2 0.40 64.9%ANTILOG PC-1 472.6 0.64 69.2%ANTILOG PC-2 15.6 0.08 95.4%TURBIDITY 1/M 0.1 0.20 1.1% 0.1 0.20 1.1%ZMIX * TURBIDITY 0.2 0.20 0.0% 0.2 0.20 0.0%ZMIX / SECCHI 1.7 0.33 4.0%CHL-A * SECCHI 35.5 0.11 96.1%CHL-A / TOTAL P 0.6 0.26 95.2%FREQ(CHL-a>10) % 88.5 0.12 90.3%FREQ(CHL-a>20) % 53.3 0.43 90.3%FREQ(CHL-a>30) % 28.4 0.69 90.3%FREQ(CHL-a>40) % 15.0 0.90 90.3%FREQ(CHL-a>50) % 8.1 1.07 90.3%FREQ(CHL-a>60) % 4.5 1.22 90.3%CARLSON TSI-P 59.1 0.06 47.4% 76.3 89.6%

CARLSON TSI-CHLA 62.4 0.06 90.3%CARLSON TSI-SEC 55.2 0.09 36.9%
Segment: 4 4- Frank Holten Lake 3- South Predicted Values---> Observed Values--->
Variable Mean CV Rank Mean CV RankTOTAL P MG/M3 48.2 0.25 50.3% 184.7 93.3%CHL-A MG/M3 29.2 0.36 93.0%SECCHI M 1.2 0.34 56.9%ORGANIC N MG/M3 829.8 0.31 86.4%TP-ORTHO-P MG/M3 49.9 0.41 70.4%ANTILOG PC-1 603.4 0.66 75.4%ANTILOG PC-2 15.5 0.08 95.3%TURBIDITY 1/M 0.1 0.20 1.1% 0.1 0.20 1.1%ZMIX * TURBIDITY 0.2 0.20 0.0% 0.2 0.20 0.0%ZMIX / SECCHI 1.5 0.34 2.6%CHL-A * SECCHI 36.1 0.11 96.3%CHL-A / TOTAL P 0.6 0.26 96.2%FREQ(CHL-a>10) % 92.2 0.09 93.0%FREQ(CHL-a>20) % 61.9 0.35 93.0%FREQ(CHL-a>30) % 36.3 0.60 93.0%FREQ(CHL-a>40) % 20.7 0.80 93.0%FREQ(CHL-a>50) % 12.0 0.98 93.0%FREQ(CHL-a>60) % 7.1 1.12 93.0%CARLSON TSI-P 60.0 0.06 50.3% 79.4 93.3%CARLSON TSI-CHLA 63.7 0.06 93.0%CARLSON TSI-SEC 57.0 0.09 43.1%
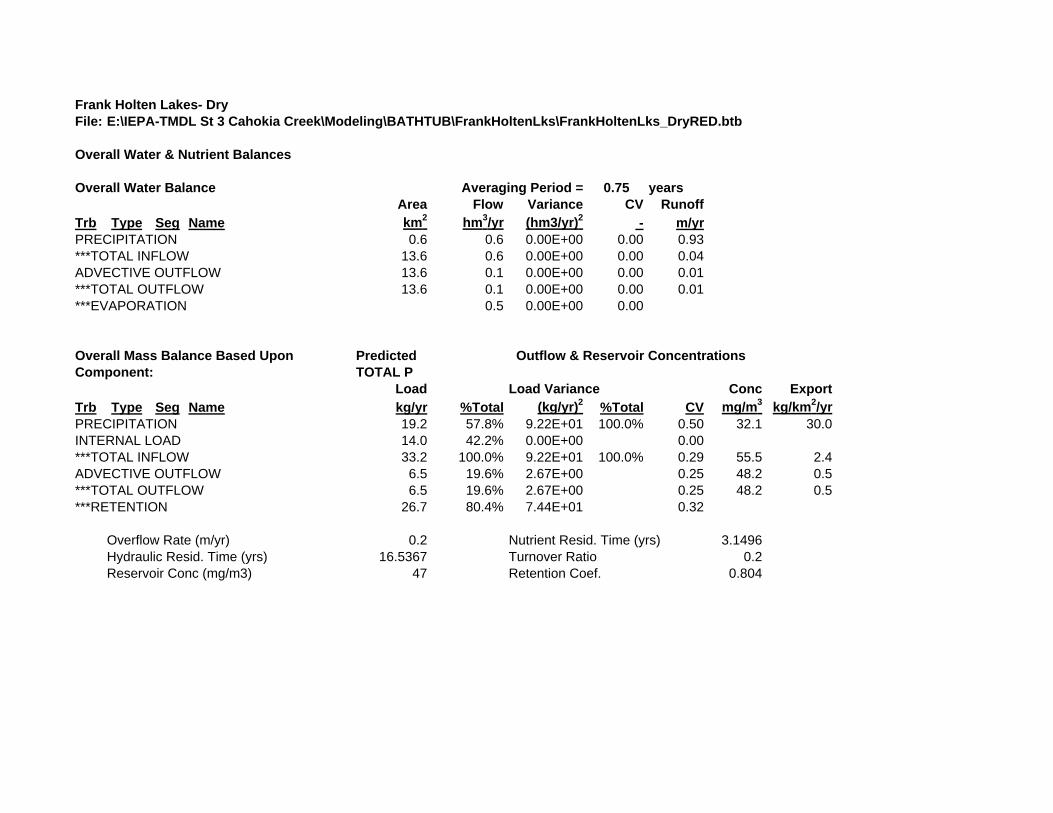
Frank Holten Lakes- DryFile: E:\IEPA-TMDL St 3 Cahokia Creek\Modeling\BATHTUB\FrankHoltenLks\FrankHoltenLks_DryRED.btb
Overall Water & Nutrient Balances
Overall Water Balance Averaging Period = 0.75 yearsArea Flow Variance CV Runoff
Trb Type Seg Name km2 hm3/yr (hm3/yr)2 - m/yrPRECIPITATION 0.6 0.6 0.00E+00 0.00 0.93***TOTAL INFLOW 13.6 0.6 0.00E+00 0.00 0.04ADVECTIVE OUTFLOW 13.6 0.1 0.00E+00 0.00 0.01***TOTAL OUTFLOW 13.6 0.1 0.00E+00 0.00 0.01***EVAPORATION 0.5 0.00E+00 0.00
Overall Mass Balance Based Upon Predicted Outflow & Reservoir ConcentrationsComponent: TOTAL P
Load Load Variance Conc ExportTrb Type Seg Name kg/yr %Total (kg/yr)2 %Total CV mg/m3 kg/km2/yrPRECIPITATION 19.2 57.8% 9.22E+01 100.0% 0.50 32.1 30.0INTERNAL LOAD 14.0 42.2% 0.00E+00 0.00***TOTAL INFLOW 33.2 100.0% 9.22E+01 100.0% 0.29 55.5 2.4ADVECTIVE OUTFLOW 6.5 19.6% 2.67E+00 0.25 48.2 0.5***TOTAL OUTFLOW 6.5 19.6% 2.67E+00 0.25 48.2 0.5***RETENTION 26.7 80.4% 7.44E+01 0.32
Overflow Rate (m/yr) 0.2 Nutrient Resid. Time (yrs) 3.1496Hydraulic Resid. Time (yrs) 16.5367 Turnover Ratio 0.2Reservoir Conc (mg/m3) 47 Retention Coef. 0.804
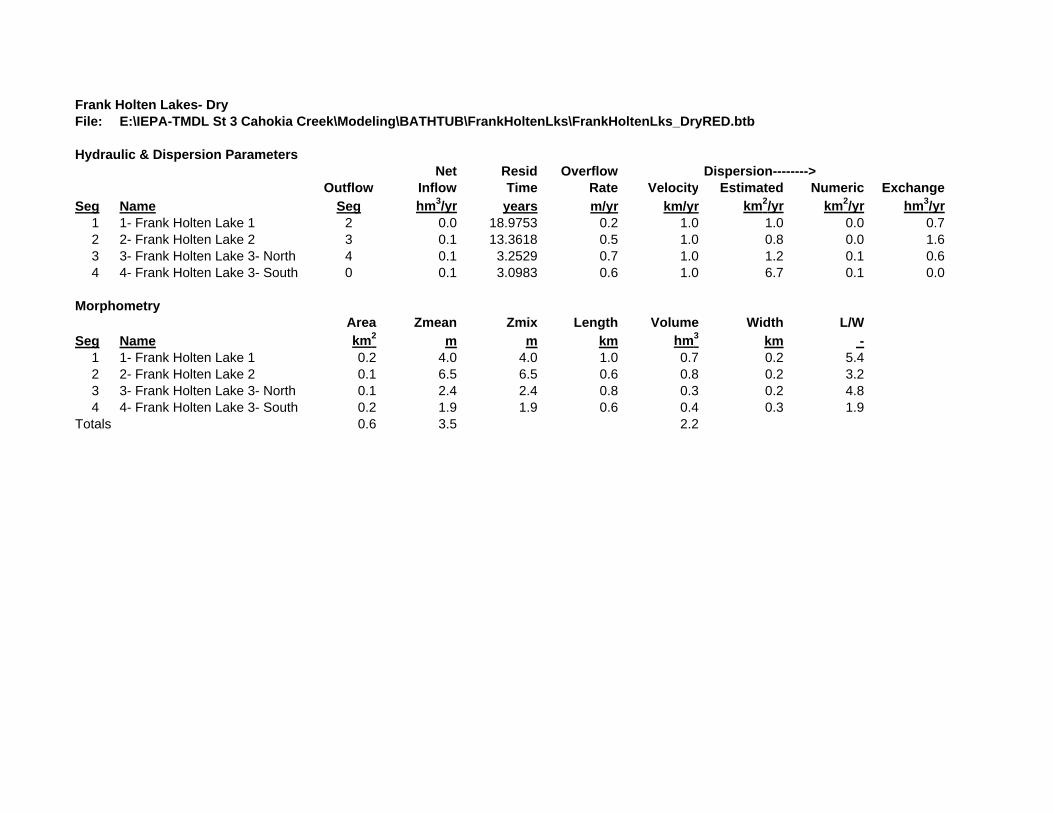
Frank Holten Lakes- DryFile: E:\IEPA-TMDL St 3 Cahokia Creek\Modeling\BATHTUB\FrankHoltenLks\FrankHoltenLks_DryRED.btb
Hydraulic & Dispersion ParametersNet Resid Overflow Dispersion-------->
Outflow Inflow Time Rate Velocity Estimated Numeric ExchangeSeg Name Seg hm3/yr years m/yr km/yr km2/yr km2/yr hm3/yr
1 1- Frank Holten Lake 1 2 0.0 18.9753 0.2 1.0 1.0 0.0 0.72 2- Frank Holten Lake 2 3 0.1 13.3618 0.5 1.0 0.8 0.0 1.63 3- Frank Holten Lake 3- North 4 0.1 3.2529 0.7 1.0 1.2 0.1 0.64 4- Frank Holten Lake 3- South 0 0.1 3.0983 0.6 1.0 6.7 0.1 0.0
MorphometryArea Zmean Zmix Length Volume Width L/W
Seg Name km2 m m km hm3 km -1 1- Frank Holten Lake 1 0.2 4.0 4.0 1.0 0.7 0.2 5.42 2- Frank Holten Lake 2 0.1 6.5 6.5 0.6 0.8 0.2 3.23 3- Frank Holten Lake 3- North 0.1 2.4 2.4 0.8 0.3 0.2 4.84 4- Frank Holten Lake 3- South 0.2 1.9 1.9 0.6 0.4 0.3 1.9
Totals 0.6 3.5 2.2
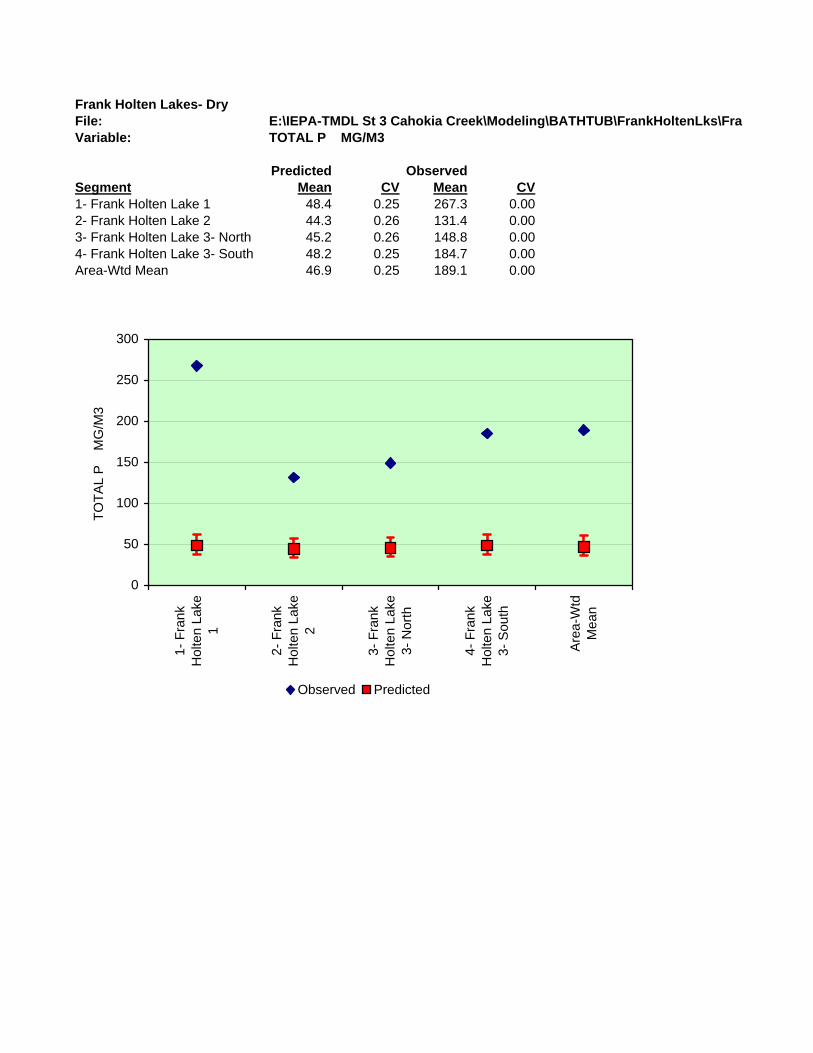
Frank Holten Lakes- DryFile: E:\IEPA-TMDL St 3 Cahokia Creek\Modeling\BATHTUB\FrankHoltenLks\FraVariable: TOTAL P MG/M3
Predicted ObservedSegment Mean CV Mean CV1- Frank Holten Lake 1 48.4 0.25 267.3 0.002- Frank Holten Lake 2 44.3 0.26 131.4 0.003- Frank Holten Lake 3- North 45.2 0.26 148.8 0.004- Frank Holten Lake 3- South 48.2 0.25 184.7 0.00Area-Wtd Mean 46.9 0.25 189.1 0.00
0
50
100
150
200
250
300
1- F
rank
Hol
ten
Lake
1
2- F
rank
Hol
ten
Lake
2
3- F
rank
Hol
ten
Lake
3- N
orth
4- F
rank
Hol
ten
Lake
3- S
outh
Are
a-W
tdM
ean
TOTA
L P
M
G/M
3
Observed Predicted
Frank Holten Lakes Wet Weather Scenario- Existing Conditions
BATHTUB Modeling Files
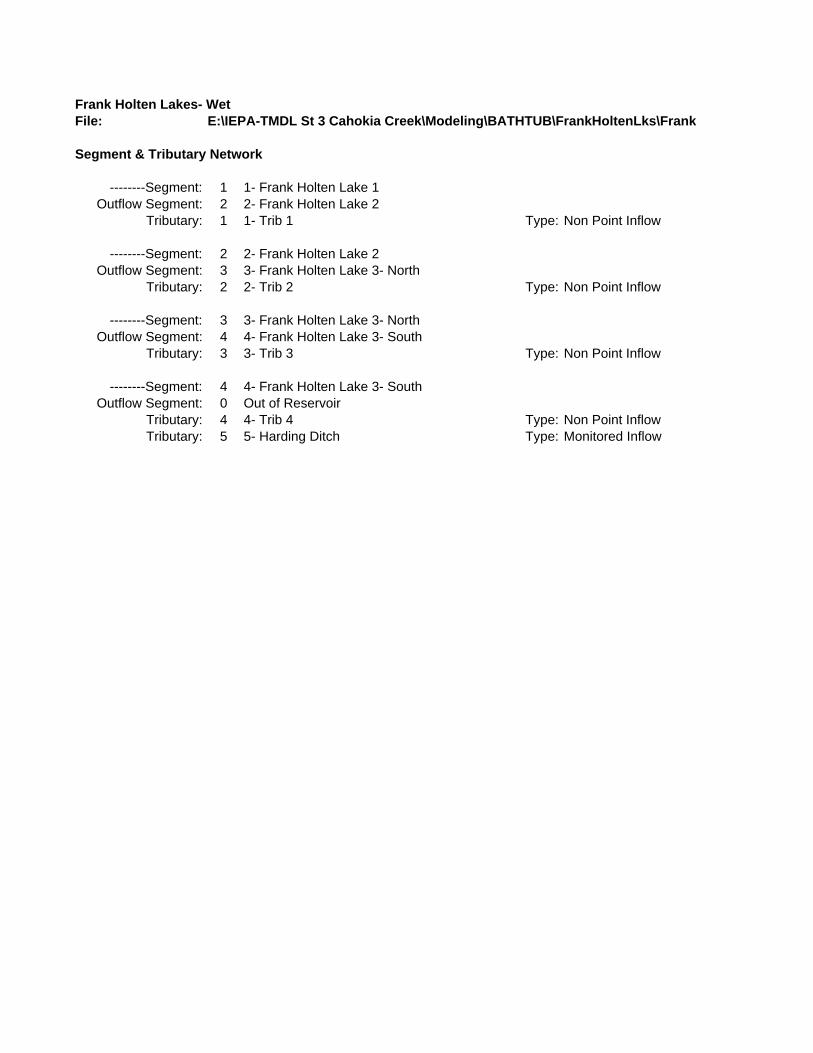
Frank Holten Lakes- WetFile: E:\IEPA-TMDL St 3 Cahokia Creek\Modeling\BATHTUB\FrankHoltenLks\FrankH
Segment & Tributary Network
--------Segment: 1 1- Frank Holten Lake 1Outflow Segment: 2 2- Frank Holten Lake 2
Tributary: 1 1- Trib 1 Type: Non Point Inflow
--------Segment: 2 2- Frank Holten Lake 2Outflow Segment: 3 3- Frank Holten Lake 3- North
Tributary: 2 2- Trib 2 Type: Non Point Inflow
--------Segment: 3 3- Frank Holten Lake 3- NorthOutflow Segment: 4 4- Frank Holten Lake 3- South
Tributary: 3 3- Trib 3 Type: Non Point Inflow
--------Segment: 4 4- Frank Holten Lake 3- SouthOutflow Segment: 0 Out of Reservoir
Tributary: 4 4- Trib 4 Type: Non Point InflowTributary: 5 5- Harding Ditch Type: Monitored Inflow

Frank Holten Lakes- WetFile: E:\IEPA-TMDL St 3 Cahokia Creek\Modeling\BATHTUB\FrankHoltenLks\FrankHoltenLks_WetCAL.btbDescription:
March-May
Global Variables Mean CV Model Options Code DescriptionAveraging Period (yrs) 0.25 0.0 Conservative Substance 0 NOT COMPUTEDPrecipitation (m) 0.2946 0.0 Phosphorus Balance 1 2ND ORDER, AVAIL PEvaporation (m) 0.1307 0.0 Nitrogen Balance 0 NOT COMPUTEDStorage Increase (m) 0 0.0 Chlorophyll-a 2 P, LIGHT, T
Secchi Depth 1 VS. CHLA & TURBIDITYAtmos. Loads (kg/km2-yr) Mean CV Dispersion 1 FISCHER-NUMERICConserv. Substance 0 0.00 Phosphorus Calibration 1 DECAY RATESTotal P 30 0.50 Nitrogen Calibration 1 DECAY RATESTotal N 1000 0.50 Error Analysis 1 MODEL & DATAOrtho P 15 0.50 Availability Factors 0 IGNOREInorganic N 500 0.50 Mass-Balance Tables 1 USE ESTIMATED CONCS
Output Destination 2 EXCEL WORKSHEET
Segment Morphometry Internal Loads ( mg/m2-day)Outflow Area Depth Length Mixed Depth (m) Hypol Depth Non-Algal Turb (m-1) Conserv. Total P Total N
Seg Name Segment Group km2 m km Mean CV Mean CV Mean CV Mean CV Mean CV Mean CV1 1- Frank Holten Lake 1 2 1 0.17 4 0.96 4 0 0 0 0.08 0.2 0 0 3 0 0 02 2- Frank Holten Lake 2 3 2 0.13 6.5 0.65 6.5 0 0 0 0.08 0.2 0 0 3 0 0 03 3- Frank Holten Lake 3- North 4 3 0.12 2.4 0.76 2.4 0 0 0 0.08 0.2 0 0 3 0 0 04 4- Frank Holten Lake 3- South 0 4 0.22 1.9 0.65 1.9 0 0 0 0.08 0.2 0 0 3 0 0 0
Segment Observed Water QualityConserv Total P (ppb) Total N (ppb) Chl-a (ppb) Secchi (m) Organic N (ppb) TP - Ortho P (ppb) HOD (ppb/day) MOD (ppb/day)
Seg Mean CV Mean CV Mean CV Mean CV Mean CV Mean CV Mean CV Mean CV Mean CV1 0 0 166.54 0 0 0 0 0 0 0 0 0 0 0 0 0 0 02 0 0 116.25 0 0 0 0 0 0 0 0 0 0 0 0 0 0 03 0 0 144.49 0 0 0 0 0 0 0 0 0 0 0 0 0 0 04 0 0 138.75 0 0 0 0 0 0 0 0 0 0 0 0 0 0 0
Segment Calibration FactorsDispersion Rate Total P (ppb) Total N (ppb) Chl-a (ppb) Secchi (m) Organic N (ppb) TP - Ortho P (ppb) HOD (ppb/day) MOD (ppb/day)
Seg Mean CV Mean CV Mean CV Mean CV Mean CV Mean CV Mean CV Mean CV Mean CV1 1 0 1 0 1 0 1 0 1 0 1 0 1 0 1 0 1 02 1 0 1 0 1 0 1 0 1 0 1 0 1 0 1 0 1 03 1 0 1 0 1 0 1 0 1 0 1 0 1 0 1 0 1 04 1 0 1 0 1 0 1 0 1 0 1 0 1 0 1 0 1 0
Tributary DataDr Area Flow (hm3/yr) Conserv. Total P (ppb) Total N (ppb) Ortho P (ppb) Inorganic N (ppb)
Trib Trib Name Segment Type km2 Mean CV Mean CV Mean CV Mean CV Mean CV Mean CV1 1- Trib 1 1 2 7.3 3.27 0 0 0 290.77 0.9 0 0 0 0 0 02 2- Trib 2 2 2 1.3 0.64 0 0 0 170.32 1 0 0 0 0 0 03 3- Trib 3 3 2 3 1.64 0 0 0 207.8 0.83 0 0 0 0 0 04 4- Trib 4 4 2 1.4 1.18 0 0 0 59.08 0.52 0 0 0 0 0 05 5- Harding Ditch 4 1 0 41.6 0 0 0 365.1 0 0 0 0 0 0 0

Model Coefficients Mean CVDispersion Rate 1.000 0.70Total Phosphorus 1.000 0.45Total Nitrogen 1.000 0.55Chl-a Model 1.000 0.26Secchi Model 1.000 0.10Organic N Model 1.000 0.12TP-OP Model 1.000 0.15HODv Model 1.000 0.15MODv Model 1.000 0.22Secchi/Chla Slope (m2/mg) 0.025 0.00Minimum Qs (m/yr) 0.100 0.00Chl-a Flushing Term 1.000 0.00Chl-a Temporal CV 0.620 0Avail. Factor - Total P 0.330 0Avail. Factor - Ortho P 1.930 0Avail. Factor - Total N 0.590 0Avail. Factor - Inorganic N 0.790 0
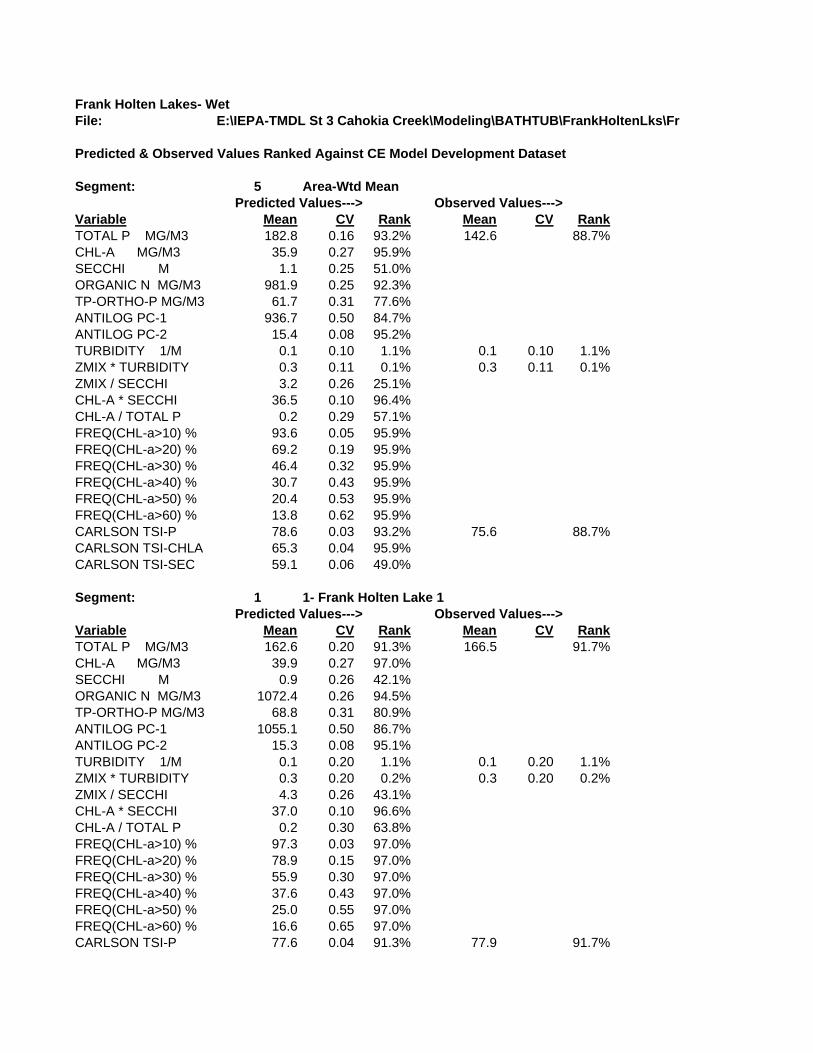
Frank Holten Lakes- WetFile: E:\IEPA-TMDL St 3 Cahokia Creek\Modeling\BATHTUB\FrankHoltenLks\Fra
Predicted & Observed Values Ranked Against CE Model Development Dataset
Segment: 5 Area-Wtd Mean Predicted Values---> Observed Values--->
Variable Mean CV Rank Mean CV RankTOTAL P MG/M3 182.8 0.16 93.2% 142.6 88.7%CHL-A MG/M3 35.9 0.27 95.9%SECCHI M 1.1 0.25 51.0%ORGANIC N MG/M3 981.9 0.25 92.3%TP-ORTHO-P MG/M3 61.7 0.31 77.6%ANTILOG PC-1 936.7 0.50 84.7%ANTILOG PC-2 15.4 0.08 95.2%TURBIDITY 1/M 0.1 0.10 1.1% 0.1 0.10 1.1%ZMIX * TURBIDITY 0.3 0.11 0.1% 0.3 0.11 0.1%ZMIX / SECCHI 3.2 0.26 25.1%CHL-A * SECCHI 36.5 0.10 96.4%CHL-A / TOTAL P 0.2 0.29 57.1%FREQ(CHL-a>10) % 93.6 0.05 95.9%FREQ(CHL-a>20) % 69.2 0.19 95.9%FREQ(CHL-a>30) % 46.4 0.32 95.9%FREQ(CHL-a>40) % 30.7 0.43 95.9%FREQ(CHL-a>50) % 20.4 0.53 95.9%FREQ(CHL-a>60) % 13.8 0.62 95.9%CARLSON TSI-P 78.6 0.03 93.2% 75.6 88.7%CARLSON TSI-CHLA 65.3 0.04 95.9%CARLSON TSI-SEC 59.1 0.06 49.0%
Segment: 1 1- Frank Holten Lake 1 Predicted Values---> Observed Values--->
Variable Mean CV Rank Mean CV RankTOTAL P MG/M3 162.6 0.20 91.3% 166.5 91.7%CHL-A MG/M3 39.9 0.27 97.0%SECCHI M 0.9 0.26 42.1%ORGANIC N MG/M3 1072.4 0.26 94.5%TP-ORTHO-P MG/M3 68.8 0.31 80.9%ANTILOG PC-1 1055.1 0.50 86.7%ANTILOG PC-2 15.3 0.08 95.1%TURBIDITY 1/M 0.1 0.20 1.1% 0.1 0.20 1.1%ZMIX * TURBIDITY 0.3 0.20 0.2% 0.3 0.20 0.2%ZMIX / SECCHI 4.3 0.26 43.1%CHL-A * SECCHI 37.0 0.10 96.6%CHL-A / TOTAL P 0.2 0.30 63.8%FREQ(CHL-a>10) % 97.3 0.03 97.0%FREQ(CHL-a>20) % 78.9 0.15 97.0%FREQ(CHL-a>30) % 55.9 0.30 97.0%FREQ(CHL-a>40) % 37.6 0.43 97.0%FREQ(CHL-a>50) % 25.0 0.55 97.0%FREQ(CHL-a>60) % 16.6 0.65 97.0%CARLSON TSI-P 77.6 0.04 91.3% 77.9 91.7%
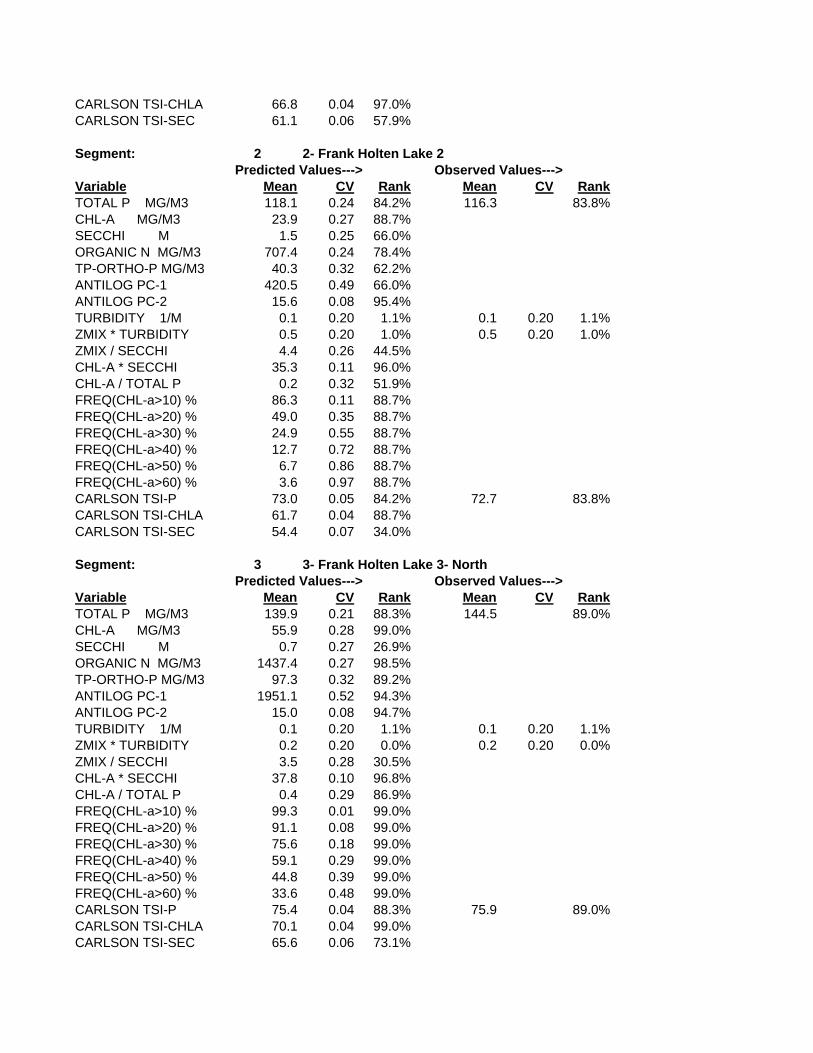
CARLSON TSI-CHLA 66.8 0.04 97.0%CARLSON TSI-SEC 61.1 0.06 57.9%
Segment: 2 2- Frank Holten Lake 2 Predicted Values---> Observed Values--->
Variable Mean CV Rank Mean CV RankTOTAL P MG/M3 118.1 0.24 84.2% 116.3 83.8%CHL-A MG/M3 23.9 0.27 88.7%SECCHI M 1.5 0.25 66.0%ORGANIC N MG/M3 707.4 0.24 78.4%TP-ORTHO-P MG/M3 40.3 0.32 62.2%ANTILOG PC-1 420.5 0.49 66.0%ANTILOG PC-2 15.6 0.08 95.4%TURBIDITY 1/M 0.1 0.20 1.1% 0.1 0.20 1.1%ZMIX * TURBIDITY 0.5 0.20 1.0% 0.5 0.20 1.0%ZMIX / SECCHI 4.4 0.26 44.5%CHL-A * SECCHI 35.3 0.11 96.0%CHL-A / TOTAL P 0.2 0.32 51.9%FREQ(CHL-a>10) % 86.3 0.11 88.7%FREQ(CHL-a>20) % 49.0 0.35 88.7%FREQ(CHL-a>30) % 24.9 0.55 88.7%FREQ(CHL-a>40) % 12.7 0.72 88.7%FREQ(CHL-a>50) % 6.7 0.86 88.7%FREQ(CHL-a>60) % 3.6 0.97 88.7%CARLSON TSI-P 73.0 0.05 84.2% 72.7 83.8%CARLSON TSI-CHLA 61.7 0.04 88.7%CARLSON TSI-SEC 54.4 0.07 34.0%
Segment: 3 3- Frank Holten Lake 3- North Predicted Values---> Observed Values--->
Variable Mean CV Rank Mean CV RankTOTAL P MG/M3 139.9 0.21 88.3% 144.5 89.0%CHL-A MG/M3 55.9 0.28 99.0%SECCHI M 0.7 0.27 26.9%ORGANIC N MG/M3 1437.4 0.27 98.5%TP-ORTHO-P MG/M3 97.3 0.32 89.2%ANTILOG PC-1 1951.1 0.52 94.3%ANTILOG PC-2 15.0 0.08 94.7%TURBIDITY 1/M 0.1 0.20 1.1% 0.1 0.20 1.1%ZMIX * TURBIDITY 0.2 0.20 0.0% 0.2 0.20 0.0%ZMIX / SECCHI 3.5 0.28 30.5%CHL-A * SECCHI 37.8 0.10 96.8%CHL-A / TOTAL P 0.4 0.29 86.9%FREQ(CHL-a>10) % 99.3 0.01 99.0%FREQ(CHL-a>20) % 91.1 0.08 99.0%FREQ(CHL-a>30) % 75.6 0.18 99.0%FREQ(CHL-a>40) % 59.1 0.29 99.0%FREQ(CHL-a>50) % 44.8 0.39 99.0%FREQ(CHL-a>60) % 33.6 0.48 99.0%CARLSON TSI-P 75.4 0.04 88.3% 75.9 89.0%CARLSON TSI-CHLA 70.1 0.04 99.0%CARLSON TSI-SEC 65.6 0.06 73.1%
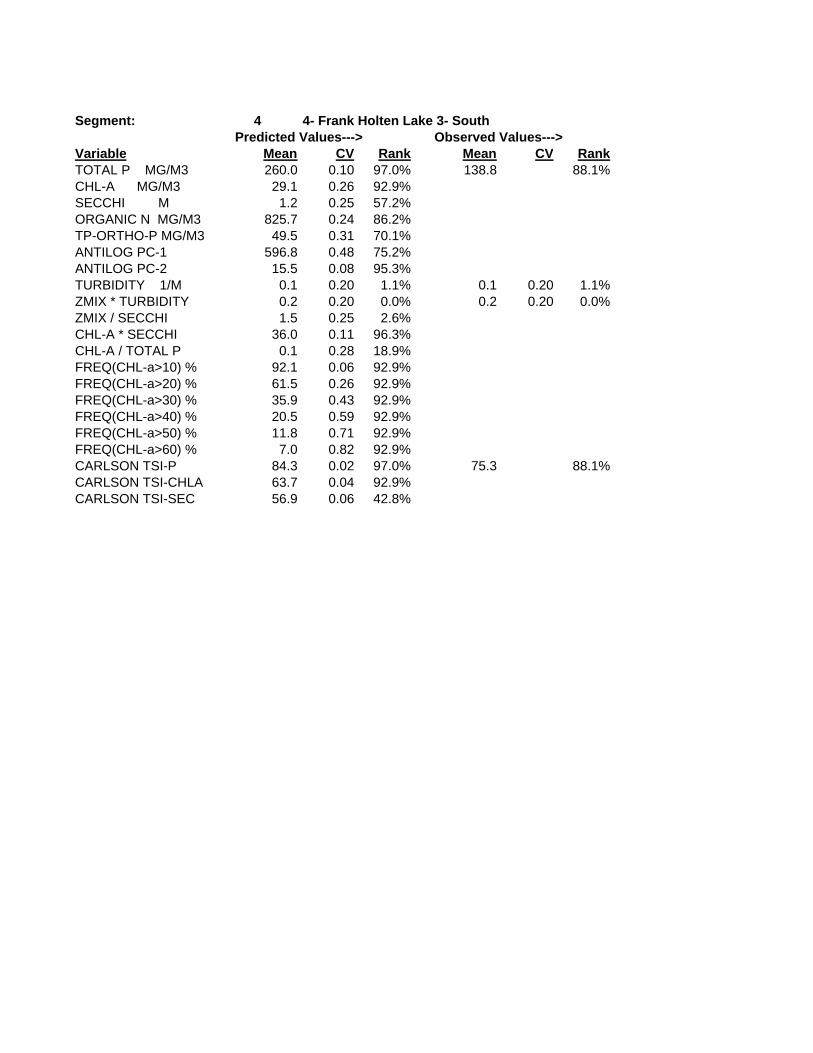
Segment: 4 4- Frank Holten Lake 3- South Predicted Values---> Observed Values--->
Variable Mean CV Rank Mean CV RankTOTAL P MG/M3 260.0 0.10 97.0% 138.8 88.1%CHL-A MG/M3 29.1 0.26 92.9%SECCHI M 1.2 0.25 57.2%ORGANIC N MG/M3 825.7 0.24 86.2%TP-ORTHO-P MG/M3 49.5 0.31 70.1%ANTILOG PC-1 596.8 0.48 75.2%ANTILOG PC-2 15.5 0.08 95.3%TURBIDITY 1/M 0.1 0.20 1.1% 0.1 0.20 1.1%ZMIX * TURBIDITY 0.2 0.20 0.0% 0.2 0.20 0.0%ZMIX / SECCHI 1.5 0.25 2.6%CHL-A * SECCHI 36.0 0.11 96.3%CHL-A / TOTAL P 0.1 0.28 18.9%FREQ(CHL-a>10) % 92.1 0.06 92.9%FREQ(CHL-a>20) % 61.5 0.26 92.9%FREQ(CHL-a>30) % 35.9 0.43 92.9%FREQ(CHL-a>40) % 20.5 0.59 92.9%FREQ(CHL-a>50) % 11.8 0.71 92.9%FREQ(CHL-a>60) % 7.0 0.82 92.9%CARLSON TSI-P 84.3 0.02 97.0% 75.3 88.1%CARLSON TSI-CHLA 63.7 0.04 92.9%CARLSON TSI-SEC 56.9 0.06 42.8%
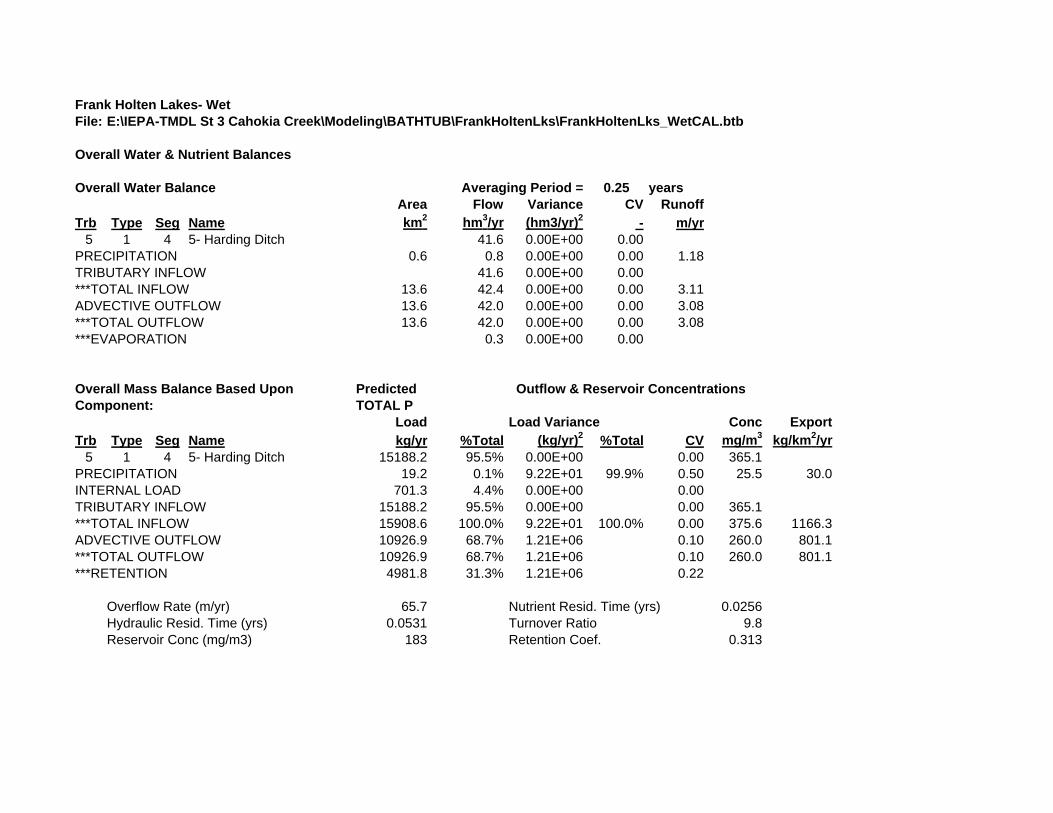
Frank Holten Lakes- WetFile: E:\IEPA-TMDL St 3 Cahokia Creek\Modeling\BATHTUB\FrankHoltenLks\FrankHoltenLks_WetCAL.btb
Overall Water & Nutrient Balances
Overall Water Balance Averaging Period = 0.25 yearsArea Flow Variance CV Runoff
Trb Type Seg Name km2 hm3/yr (hm3/yr)2 - m/yr5 1 4 5- Harding Ditch 41.6 0.00E+00 0.00
PRECIPITATION 0.6 0.8 0.00E+00 0.00 1.18TRIBUTARY INFLOW 41.6 0.00E+00 0.00***TOTAL INFLOW 13.6 42.4 0.00E+00 0.00 3.11ADVECTIVE OUTFLOW 13.6 42.0 0.00E+00 0.00 3.08***TOTAL OUTFLOW 13.6 42.0 0.00E+00 0.00 3.08***EVAPORATION 0.3 0.00E+00 0.00
Overall Mass Balance Based Upon Predicted Outflow & Reservoir ConcentrationsComponent: TOTAL P
Load Load Variance Conc ExportTrb Type Seg Name kg/yr %Total (kg/yr)2 %Total CV mg/m3 kg/km2/yr
5 1 4 5- Harding Ditch 15188.2 95.5% 0.00E+00 0.00 365.1PRECIPITATION 19.2 0.1% 9.22E+01 99.9% 0.50 25.5 30.0INTERNAL LOAD 701.3 4.4% 0.00E+00 0.00TRIBUTARY INFLOW 15188.2 95.5% 0.00E+00 0.00 365.1***TOTAL INFLOW 15908.6 100.0% 9.22E+01 100.0% 0.00 375.6 1166.3ADVECTIVE OUTFLOW 10926.9 68.7% 1.21E+06 0.10 260.0 801.1***TOTAL OUTFLOW 10926.9 68.7% 1.21E+06 0.10 260.0 801.1***RETENTION 4981.8 31.3% 1.21E+06 0.22
Overflow Rate (m/yr) 65.7 Nutrient Resid. Time (yrs) 0.0256Hydraulic Resid. Time (yrs) 0.0531 Turnover Ratio 9.8Reservoir Conc (mg/m3) 183 Retention Coef. 0.313
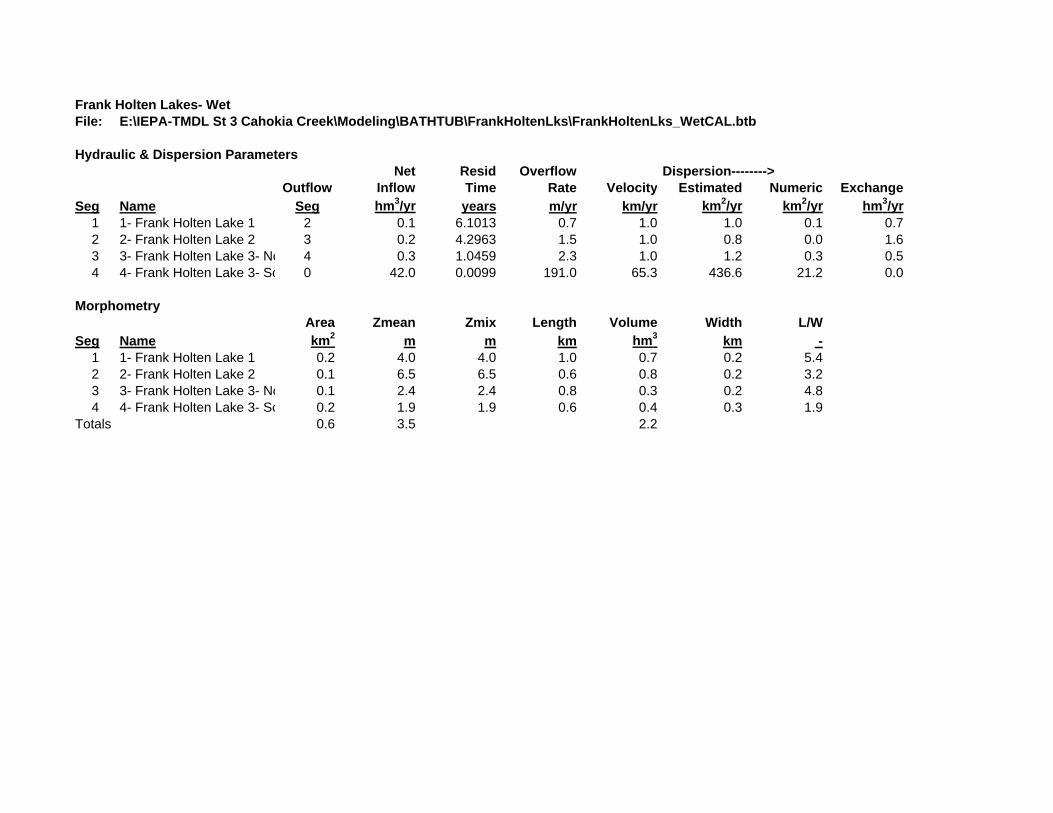
Frank Holten Lakes- WetFile: E:\IEPA-TMDL St 3 Cahokia Creek\Modeling\BATHTUB\FrankHoltenLks\FrankHoltenLks_WetCAL.btb
Hydraulic & Dispersion ParametersNet Resid Overflow Dispersion-------->
Outflow Inflow Time Rate Velocity Estimated Numeric ExchangeSeg Name Seg hm3/yr years m/yr km/yr km2/yr km2/yr hm3/yr
1 1- Frank Holten Lake 1 2 0.1 6.1013 0.7 1.0 1.0 0.1 0.72 2- Frank Holten Lake 2 3 0.2 4.2963 1.5 1.0 0.8 0.0 1.63 3- Frank Holten Lake 3- No 4 0.3 1.0459 2.3 1.0 1.2 0.3 0.54 4- Frank Holten Lake 3- So 0 42.0 0.0099 191.0 65.3 436.6 21.2 0.0
MorphometryArea Zmean Zmix Length Volume Width L/W
Seg Name km2 m m km hm3 km -1 1- Frank Holten Lake 1 0.2 4.0 4.0 1.0 0.7 0.2 5.42 2- Frank Holten Lake 2 0.1 6.5 6.5 0.6 0.8 0.2 3.23 3- Frank Holten Lake 3- No 0.1 2.4 2.4 0.8 0.3 0.2 4.84 4- Frank Holten Lake 3- So 0.2 1.9 1.9 0.6 0.4 0.3 1.9
Totals 0.6 3.5 2.2

Frank Holten Lakes- WetFile: E:\IEPA-TMDL St 3 Cahokia Creek\Modeling\BATHTUB\FrankHoltenLks\FraVariable: TOTAL P MG/M3
Predicted ObservedSegment Mean CV Mean CV1- Frank Holten Lake 1 162.6 0.20 166.5 0.002- Frank Holten Lake 2 118.1 0.24 116.3 0.003- Frank Holten Lake 3- Nor 139.9 0.21 144.5 0.004- Frank Holten Lake 3- Sou 260.0 0.10 138.8 0.00Area-Wtd Mean 182.8 0.16 142.6 0.00
0
50
100
150
200
250
300
350
1- F
rank
Hol
ten
Lake
1
2- F
rank
Hol
ten
Lake
2
3- F
rank
Hol
ten
Lake
3- N
orth
4- F
rank
Hol
ten
Lake
3- S
outh
Area
-Wtd
Mea
n
TOTA
L P
M
G/M
3
Observed Predicted
Frank Holten Lakes Wet Weather Scenario- Reduced Loading Conditions
BATHTUB Modeling Files

Frank Holten Lakes- WetFile: E:\IEPA-TMDL St 3 Cahokia Creek\Modeling\BATHTUB\FrankHoltenLks\FrankH
Segment & Tributary Network
--------Segment: 1 1- Frank Holten Lake 1Outflow Segment: 2 2- Frank Holten Lake 2
Tributary: 1 1- Trib 1 Type: Non Point Inflow
--------Segment: 2 2- Frank Holten Lake 2Outflow Segment: 3 3- Frank Holten Lake 3- North
Tributary: 2 2- Trib 2 Type: Non Point Inflow
--------Segment: 3 3- Frank Holten Lake 3- NorthOutflow Segment: 4 4- Frank Holten Lake 3- South
Tributary: 3 3- Trib 3 Type: Non Point Inflow
--------Segment: 4 4- Frank Holten Lake 3- SouthOutflow Segment: 0 Out of Reservoir
Tributary: 4 4- Trib 4 Type: Non Point InflowTributary: 5 5- Harding Ditch Type: Monitored Inflow
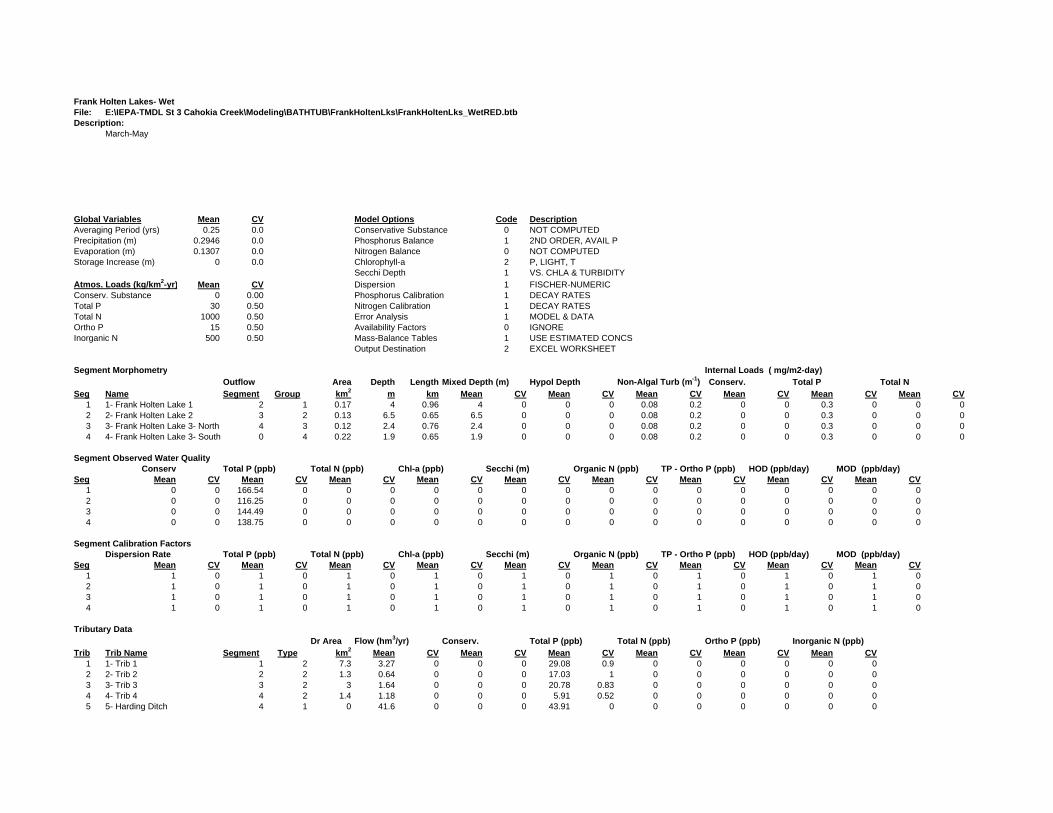
Frank Holten Lakes- WetFile: E:\IEPA-TMDL St 3 Cahokia Creek\Modeling\BATHTUB\FrankHoltenLks\FrankHoltenLks_WetRED.btbDescription:
March-May
Global Variables Mean CV Model Options Code DescriptionAveraging Period (yrs) 0.25 0.0 Conservative Substance 0 NOT COMPUTEDPrecipitation (m) 0.2946 0.0 Phosphorus Balance 1 2ND ORDER, AVAIL PEvaporation (m) 0.1307 0.0 Nitrogen Balance 0 NOT COMPUTEDStorage Increase (m) 0 0.0 Chlorophyll-a 2 P, LIGHT, T
Secchi Depth 1 VS. CHLA & TURBIDITYAtmos. Loads (kg/km2-yr) Mean CV Dispersion 1 FISCHER-NUMERICConserv. Substance 0 0.00 Phosphorus Calibration 1 DECAY RATESTotal P 30 0.50 Nitrogen Calibration 1 DECAY RATESTotal N 1000 0.50 Error Analysis 1 MODEL & DATAOrtho P 15 0.50 Availability Factors 0 IGNOREInorganic N 500 0.50 Mass-Balance Tables 1 USE ESTIMATED CONCS
Output Destination 2 EXCEL WORKSHEET
Segment Morphometry Internal Loads ( mg/m2-day)Outflow Area Depth Length Mixed Depth (m) Hypol Depth Non-Algal Turb (m-1) Conserv. Total P Total N
Seg Name Segment Group km2 m km Mean CV Mean CV Mean CV Mean CV Mean CV Mean CV1 1- Frank Holten Lake 1 2 1 0.17 4 0.96 4 0 0 0 0.08 0.2 0 0 0.3 0 0 02 2- Frank Holten Lake 2 3 2 0.13 6.5 0.65 6.5 0 0 0 0.08 0.2 0 0 0.3 0 0 03 3- Frank Holten Lake 3- North 4 3 0.12 2.4 0.76 2.4 0 0 0 0.08 0.2 0 0 0.3 0 0 04 4- Frank Holten Lake 3- South 0 4 0.22 1.9 0.65 1.9 0 0 0 0.08 0.2 0 0 0.3 0 0 0
Segment Observed Water QualityConserv Total P (ppb) Total N (ppb) Chl-a (ppb) Secchi (m) Organic N (ppb) TP - Ortho P (ppb) HOD (ppb/day) MOD (ppb/day)
Seg Mean CV Mean CV Mean CV Mean CV Mean CV Mean CV Mean CV Mean CV Mean CV1 0 0 166.54 0 0 0 0 0 0 0 0 0 0 0 0 0 0 02 0 0 116.25 0 0 0 0 0 0 0 0 0 0 0 0 0 0 03 0 0 144.49 0 0 0 0 0 0 0 0 0 0 0 0 0 0 04 0 0 138.75 0 0 0 0 0 0 0 0 0 0 0 0 0 0 0
Segment Calibration FactorsDispersion Rate Total P (ppb) Total N (ppb) Chl-a (ppb) Secchi (m) Organic N (ppb) TP - Ortho P (ppb) HOD (ppb/day) MOD (ppb/day)
Seg Mean CV Mean CV Mean CV Mean CV Mean CV Mean CV Mean CV Mean CV Mean CV1 1 0 1 0 1 0 1 0 1 0 1 0 1 0 1 0 1 02 1 0 1 0 1 0 1 0 1 0 1 0 1 0 1 0 1 03 1 0 1 0 1 0 1 0 1 0 1 0 1 0 1 0 1 04 1 0 1 0 1 0 1 0 1 0 1 0 1 0 1 0 1 0
Tributary DataDr Area Flow (hm3/yr) Conserv. Total P (ppb) Total N (ppb) Ortho P (ppb) Inorganic N (ppb)
Trib Trib Name Segment Type km2 Mean CV Mean CV Mean CV Mean CV Mean CV Mean CV1 1- Trib 1 1 2 7.3 3.27 0 0 0 29.08 0.9 0 0 0 0 0 02 2- Trib 2 2 2 1.3 0.64 0 0 0 17.03 1 0 0 0 0 0 03 3- Trib 3 3 2 3 1.64 0 0 0 20.78 0.83 0 0 0 0 0 04 4- Trib 4 4 2 1.4 1.18 0 0 0 5.91 0.52 0 0 0 0 0 05 5- Harding Ditch 4 1 0 41.6 0 0 0 43.91 0 0 0 0 0 0 0
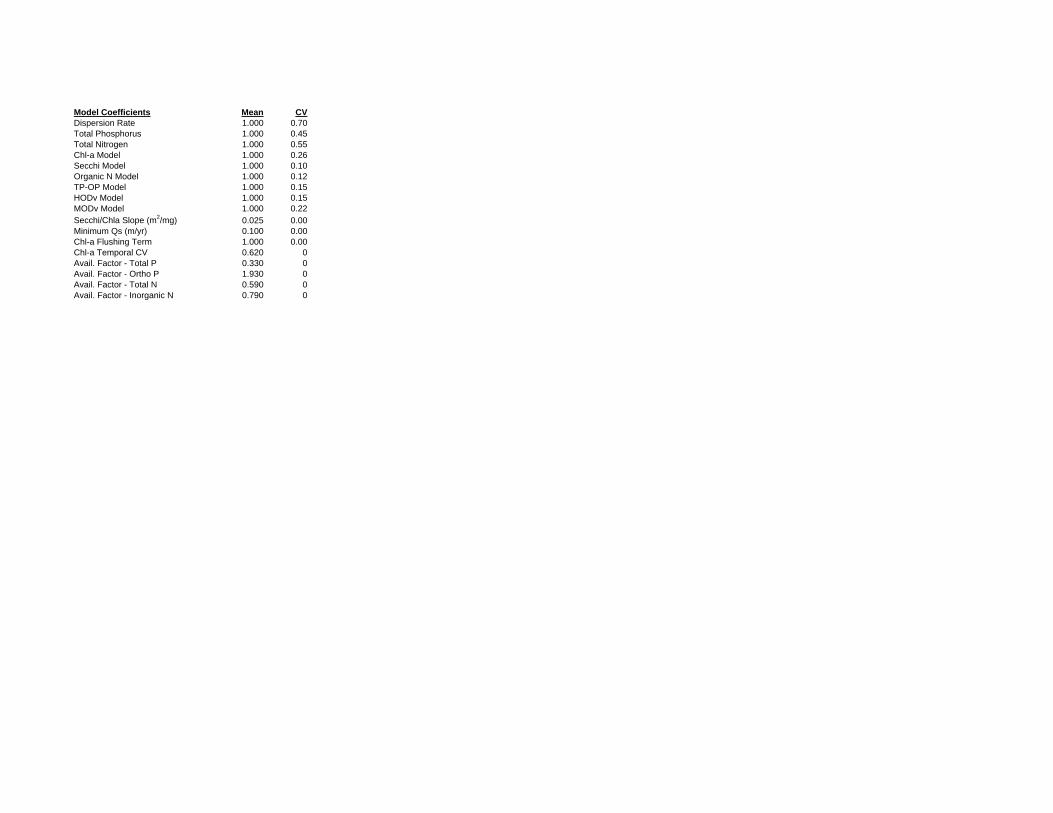
Model Coefficients Mean CVDispersion Rate 1.000 0.70Total Phosphorus 1.000 0.45Total Nitrogen 1.000 0.55Chl-a Model 1.000 0.26Secchi Model 1.000 0.10Organic N Model 1.000 0.12TP-OP Model 1.000 0.15HODv Model 1.000 0.15MODv Model 1.000 0.22Secchi/Chla Slope (m2/mg) 0.025 0.00Minimum Qs (m/yr) 0.100 0.00Chl-a Flushing Term 1.000 0.00Chl-a Temporal CV 0.620 0Avail. Factor - Total P 0.330 0Avail. Factor - Ortho P 1.930 0Avail. Factor - Total N 0.590 0Avail. Factor - Inorganic N 0.790 0
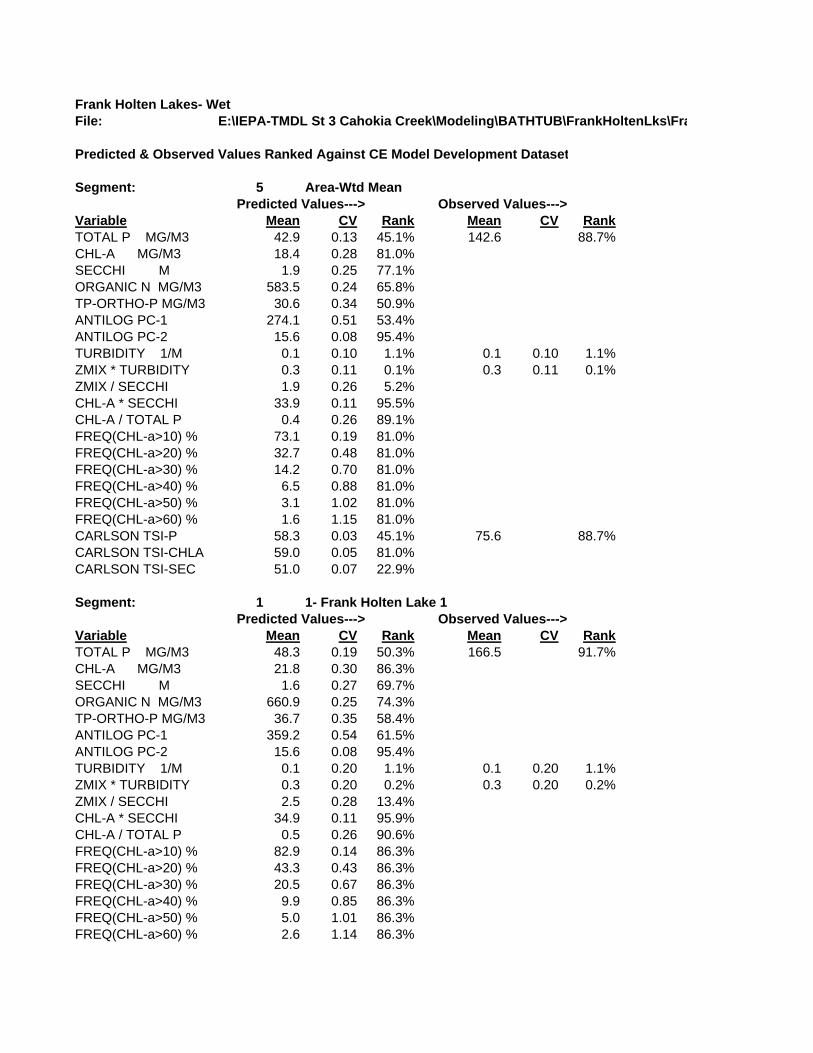
Frank Holten Lakes- WetFile: E:\IEPA-TMDL St 3 Cahokia Creek\Modeling\BATHTUB\FrankHoltenLks\Fra
Predicted & Observed Values Ranked Against CE Model Development Dataset
Segment: 5 Area-Wtd Mean Predicted Values---> Observed Values--->
Variable Mean CV Rank Mean CV RankTOTAL P MG/M3 42.9 0.13 45.1% 142.6 88.7%CHL-A MG/M3 18.4 0.28 81.0%SECCHI M 1.9 0.25 77.1%ORGANIC N MG/M3 583.5 0.24 65.8%TP-ORTHO-P MG/M3 30.6 0.34 50.9%ANTILOG PC-1 274.1 0.51 53.4%ANTILOG PC-2 15.6 0.08 95.4%TURBIDITY 1/M 0.1 0.10 1.1% 0.1 0.10 1.1%ZMIX * TURBIDITY 0.3 0.11 0.1% 0.3 0.11 0.1%ZMIX / SECCHI 1.9 0.26 5.2%CHL-A * SECCHI 33.9 0.11 95.5%CHL-A / TOTAL P 0.4 0.26 89.1%FREQ(CHL-a>10) % 73.1 0.19 81.0%FREQ(CHL-a>20) % 32.7 0.48 81.0%FREQ(CHL-a>30) % 14.2 0.70 81.0%FREQ(CHL-a>40) % 6.5 0.88 81.0%FREQ(CHL-a>50) % 3.1 1.02 81.0%FREQ(CHL-a>60) % 1.6 1.15 81.0%CARLSON TSI-P 58.3 0.03 45.1% 75.6 88.7%CARLSON TSI-CHLA 59.0 0.05 81.0%CARLSON TSI-SEC 51.0 0.07 22.9%
Segment: 1 1- Frank Holten Lake 1 Predicted Values---> Observed Values--->
Variable Mean CV Rank Mean CV RankTOTAL P MG/M3 48.3 0.19 50.3% 166.5 91.7%CHL-A MG/M3 21.8 0.30 86.3%SECCHI M 1.6 0.27 69.7%ORGANIC N MG/M3 660.9 0.25 74.3%TP-ORTHO-P MG/M3 36.7 0.35 58.4%ANTILOG PC-1 359.2 0.54 61.5%ANTILOG PC-2 15.6 0.08 95.4%TURBIDITY 1/M 0.1 0.20 1.1% 0.1 0.20 1.1%ZMIX * TURBIDITY 0.3 0.20 0.2% 0.3 0.20 0.2%ZMIX / SECCHI 2.5 0.28 13.4%CHL-A * SECCHI 34.9 0.11 95.9%CHL-A / TOTAL P 0.5 0.26 90.6%FREQ(CHL-a>10) % 82.9 0.14 86.3%FREQ(CHL-a>20) % 43.3 0.43 86.3%FREQ(CHL-a>30) % 20.5 0.67 86.3%FREQ(CHL-a>40) % 9.9 0.85 86.3%FREQ(CHL-a>50) % 5.0 1.01 86.3%FREQ(CHL-a>60) % 2.6 1.14 86.3%
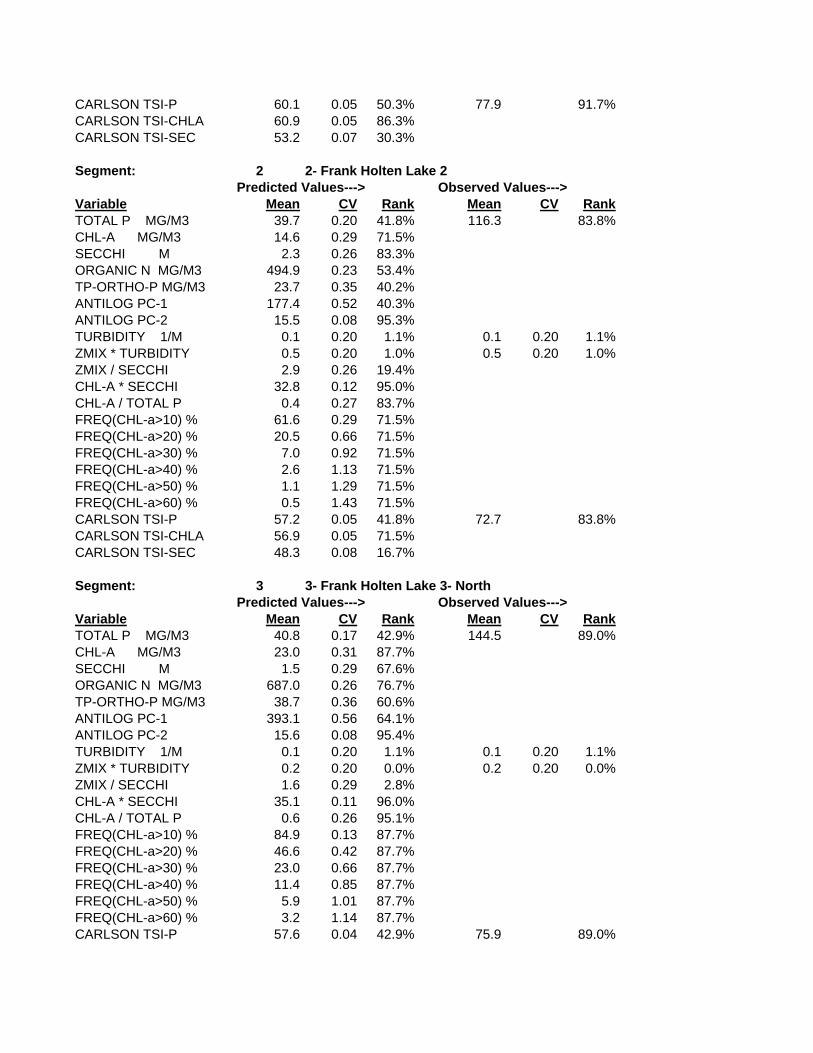
CARLSON TSI-P 60.1 0.05 50.3% 77.9 91.7%CARLSON TSI-CHLA 60.9 0.05 86.3%CARLSON TSI-SEC 53.2 0.07 30.3%
Segment: 2 2- Frank Holten Lake 2 Predicted Values---> Observed Values--->
Variable Mean CV Rank Mean CV RankTOTAL P MG/M3 39.7 0.20 41.8% 116.3 83.8%CHL-A MG/M3 14.6 0.29 71.5%SECCHI M 2.3 0.26 83.3%ORGANIC N MG/M3 494.9 0.23 53.4%TP-ORTHO-P MG/M3 23.7 0.35 40.2%ANTILOG PC-1 177.4 0.52 40.3%ANTILOG PC-2 15.5 0.08 95.3%TURBIDITY 1/M 0.1 0.20 1.1% 0.1 0.20 1.1%ZMIX * TURBIDITY 0.5 0.20 1.0% 0.5 0.20 1.0%ZMIX / SECCHI 2.9 0.26 19.4%CHL-A * SECCHI 32.8 0.12 95.0%CHL-A / TOTAL P 0.4 0.27 83.7%FREQ(CHL-a>10) % 61.6 0.29 71.5%FREQ(CHL-a>20) % 20.5 0.66 71.5%FREQ(CHL-a>30) % 7.0 0.92 71.5%FREQ(CHL-a>40) % 2.6 1.13 71.5%FREQ(CHL-a>50) % 1.1 1.29 71.5%FREQ(CHL-a>60) % 0.5 1.43 71.5%CARLSON TSI-P 57.2 0.05 41.8% 72.7 83.8%CARLSON TSI-CHLA 56.9 0.05 71.5%CARLSON TSI-SEC 48.3 0.08 16.7%
Segment: 3 3- Frank Holten Lake 3- North Predicted Values---> Observed Values--->
Variable Mean CV Rank Mean CV RankTOTAL P MG/M3 40.8 0.17 42.9% 144.5 89.0%CHL-A MG/M3 23.0 0.31 87.7%SECCHI M 1.5 0.29 67.6%ORGANIC N MG/M3 687.0 0.26 76.7%TP-ORTHO-P MG/M3 38.7 0.36 60.6%ANTILOG PC-1 393.1 0.56 64.1%ANTILOG PC-2 15.6 0.08 95.4%TURBIDITY 1/M 0.1 0.20 1.1% 0.1 0.20 1.1%ZMIX * TURBIDITY 0.2 0.20 0.0% 0.2 0.20 0.0%ZMIX / SECCHI 1.6 0.29 2.8%CHL-A * SECCHI 35.1 0.11 96.0%CHL-A / TOTAL P 0.6 0.26 95.1%FREQ(CHL-a>10) % 84.9 0.13 87.7%FREQ(CHL-a>20) % 46.6 0.42 87.7%FREQ(CHL-a>30) % 23.0 0.66 87.7%FREQ(CHL-a>40) % 11.4 0.85 87.7%FREQ(CHL-a>50) % 5.9 1.01 87.7%FREQ(CHL-a>60) % 3.2 1.14 87.7%CARLSON TSI-P 57.6 0.04 42.9% 75.9 89.0%

CARLSON TSI-CHLA 61.4 0.05 87.7%CARLSON TSI-SEC 53.9 0.08 32.4%
Segment: 4 4- Frank Holten Lake 3- South Predicted Values---> Observed Values--->
Variable Mean CV Rank Mean CV RankTOTAL P MG/M3 41.7 0.03 43.9% 138.8 88.1%CHL-A MG/M3 15.6 0.26 74.6%SECCHI M 2.1 0.23 81.3%ORGANIC N MG/M3 519.6 0.22 57.1%TP-ORTHO-P MG/M3 25.6 0.32 43.4%ANTILOG PC-1 200.7 0.46 43.9%ANTILOG PC-2 15.6 0.08 95.4%TURBIDITY 1/M 0.1 0.20 1.1% 0.1 0.20 1.1%ZMIX * TURBIDITY 0.2 0.20 0.0% 0.2 0.20 0.0%ZMIX / SECCHI 0.9 0.24 0.2%CHL-A * SECCHI 33.2 0.11 95.2%CHL-A / TOTAL P 0.4 0.26 84.6%FREQ(CHL-a>10) % 66.0 0.23 74.6%FREQ(CHL-a>20) % 24.0 0.55 74.6%FREQ(CHL-a>30) % 8.7 0.78 74.6%FREQ(CHL-a>40) % 3.4 0.96 74.6%FREQ(CHL-a>50) % 1.4 1.11 74.6%FREQ(CHL-a>60) % 0.7 1.23 74.6%CARLSON TSI-P 57.9 0.01 43.9% 75.3 88.1%CARLSON TSI-CHLA 57.6 0.04 74.6%CARLSON TSI-SEC 49.1 0.07 18.7%

Frank Holten Lakes- WetFile: E:\IEPA-TMDL St 3 Cahokia Creek\Modeling\BATHTUB\FrankHoltenLks\FrankHoltenLks_WetRED.btb
Overall Water & Nutrient Balances
Overall Water Balance Averaging Period = 0.25 yearsArea Flow Variance CV Runoff
Trb Type Seg Name km2 hm3/yr (hm3/yr)2 - m/yr5 1 4 5- Harding Ditch 41.6 0.00E+00 0.00
PRECIPITATION 0.6 0.8 0.00E+00 0.00 1.18TRIBUTARY INFLOW 41.6 0.00E+00 0.00***TOTAL INFLOW 13.6 42.4 0.00E+00 0.00 3.11ADVECTIVE OUTFLOW 13.6 42.0 0.00E+00 0.00 3.08***TOTAL OUTFLOW 13.6 42.0 0.00E+00 0.00 3.08***EVAPORATION 0.3 0.00E+00 0.00
Overall Mass Balance Based Upon Predicted Outflow & Reservoir ConcentrationsComponent: TOTAL P
Load Load Variance Conc ExportTrb Type Seg Name kg/yr %Total (kg/yr)2 %Total CV mg/m3 kg/km2/yr
5 1 4 5- Harding Ditch 1826.7 95.3% 0.00E+00 0.00 43.9PRECIPITATION 19.2 1.0% 9.22E+01 100.0% 0.50 25.5 30.0INTERNAL LOAD 70.1 3.7% 0.00E+00 0.00TRIBUTARY INFLOW 1826.7 95.3% 0.00E+00 0.00 43.9***TOTAL INFLOW 1916.0 100.0% 9.22E+01 100.0% 0.01 45.2 140.5ADVECTIVE OUTFLOW 1752.6 91.5% 2.47E+03 0.03 41.7 128.5***TOTAL OUTFLOW 1752.6 91.5% 2.47E+03 0.03 41.7 128.5***RETENTION 163.4 8.5% 2.49E+03 0.31
Overflow Rate (m/yr) 65.7 Nutrient Resid. Time (yrs) 0.0499Hydraulic Resid. Time (yrs) 0.0531 Turnover Ratio 5.0Reservoir Conc (mg/m3) 43 Retention Coef. 0.085
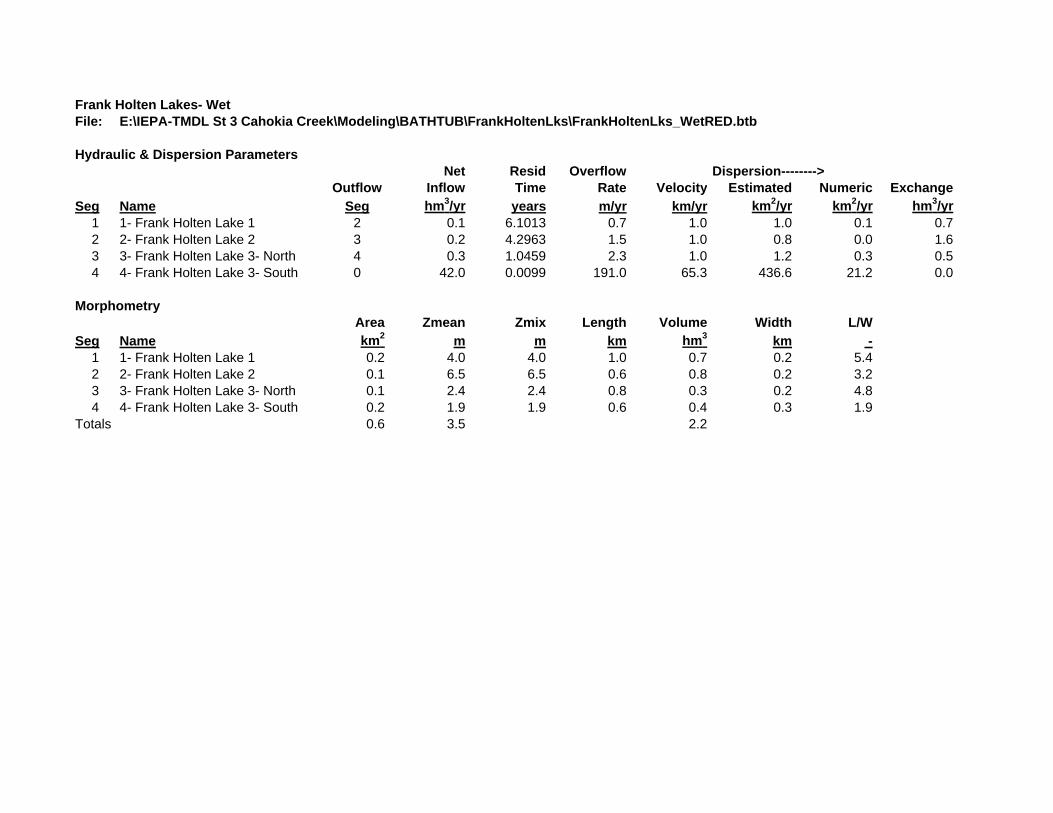
Frank Holten Lakes- WetFile: E:\IEPA-TMDL St 3 Cahokia Creek\Modeling\BATHTUB\FrankHoltenLks\FrankHoltenLks_WetRED.btb
Hydraulic & Dispersion ParametersNet Resid Overflow Dispersion-------->
Outflow Inflow Time Rate Velocity Estimated Numeric ExchangeSeg Name Seg hm3/yr years m/yr km/yr km2/yr km2/yr hm3/yr
1 1- Frank Holten Lake 1 2 0.1 6.1013 0.7 1.0 1.0 0.1 0.72 2- Frank Holten Lake 2 3 0.2 4.2963 1.5 1.0 0.8 0.0 1.63 3- Frank Holten Lake 3- North 4 0.3 1.0459 2.3 1.0 1.2 0.3 0.54 4- Frank Holten Lake 3- South 0 42.0 0.0099 191.0 65.3 436.6 21.2 0.0
MorphometryArea Zmean Zmix Length Volume Width L/W
Seg Name km2 m m km hm3 km -1 1- Frank Holten Lake 1 0.2 4.0 4.0 1.0 0.7 0.2 5.42 2- Frank Holten Lake 2 0.1 6.5 6.5 0.6 0.8 0.2 3.23 3- Frank Holten Lake 3- North 0.1 2.4 2.4 0.8 0.3 0.2 4.84 4- Frank Holten Lake 3- South 0.2 1.9 1.9 0.6 0.4 0.3 1.9
Totals 0.6 3.5 2.2
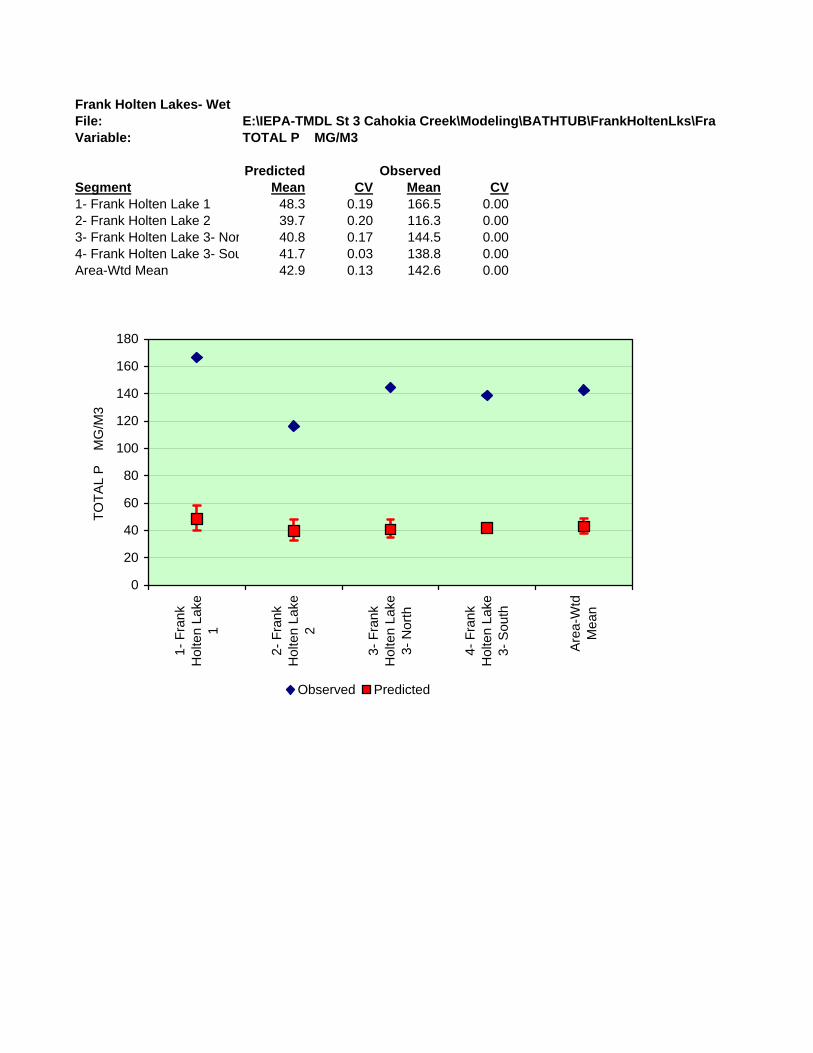
Frank Holten Lakes- WetFile: E:\IEPA-TMDL St 3 Cahokia Creek\Modeling\BATHTUB\FrankHoltenLks\FraVariable: TOTAL P MG/M3
Predicted ObservedSegment Mean CV Mean CV1- Frank Holten Lake 1 48.3 0.19 166.5 0.002- Frank Holten Lake 2 39.7 0.20 116.3 0.003- Frank Holten Lake 3- Nor 40.8 0.17 144.5 0.004- Frank Holten Lake 3- Sou 41.7 0.03 138.8 0.00Area-Wtd Mean 42.9 0.13 142.6 0.00
0
20
40
60
80
100
120
140
160
180
1- F
rank
Hol
ten
Lake
1
2- F
rank
Hol
ten
Lake
2
3- F
rank
Hol
ten
Lake
3- N
orth
4- F
rank
Hol
ten
Lake
3- S
outh
Are
a-W
tdM
ean
TOTA
L P
M
G/M
3
Observed Predicted

THIS PAGE INTENTIONALLY LEFT BLANK