dottorato di ricerca in - unical
TRANSCRIPT
UNIVERSITA’ DELLA CALABRIA
Dipartimento di Ingegneria per l'Ambiente e il Territorio e Ingegneria Chimica
Dottorato di Ricerca in
Ingegneria Chimica e dei Materiali
CICLO
XXVI
DEVELOPMENT OF MEMBRANE
BIOREACTOR (MBR) PROCESS APPLYING
NOVEL LOW FOULING MEMBRANES
Settore Scientifico Disciplinare CHIM/07 Fondamenti chimici delle
tecnologie
Coordinatore: Ch.mo Prof. Raffaele Molinari
Supervisori: Ch.mo Prof. Enrico Drioli
Dott. Alberto Figoli
Prof. Jan Hoinkis
Dottorando: Dott. Shamim Ahmed Deowan
S. A. Deowan : Development of Membrane Bioreactor (MBR) Process Applying Novel Low Fouling Membrane
Summary
Water is a part and parcel of human life. Water contaminated from industry and
agriculture with heavy metal ions, pesticides, organic compounds, endocrine
disruptive compounds, nutrients (phosphates, nitrates, nitrites) has to be effi-
ciently treated to protect humans from being intoxicated with these compounds
or with bacteria. Clean water as basis for health and good living conditions is
too far out of reach for the majority of the population in the world (Bionexgen,
2013). Water recycling is now widely accepted as a sustainable option to re-
spond to the general increase of the fresh water demand, water shortages and
for environmental protection. Water recycling is commonly seen as one of the
main options to provide remedy for water shortage caused by the increase of
the water demand and draughts as well as a response to some economical and
environmental drivers. The main options for wastewater recycling are industri-
al, irrigation, aquifer recharge and urban reuse (Pidou, M., 2006).
Among the industrial wastewaters, the textile industry is long regarded as a
water intensive sector, due to its high demand of water for all parts of its pro-
cedures. Accordingly, textile wastewater includes quite a large variety of con-
tents, chemicals, additives and different kinds of dyestuffs. The main environ-
mental concern with this waste water is about the quantity and quality of the
water discharged and the chemical load it carries. To illustrate, for each ton of
fabric products, 20 – 350 m3 of water are consumed, which differs from the
color and procedure used. The quality of the textile wastewater depends much
on the employed coloring matters, dyestuffs, accompanying chemicals, as well
as the process itself (Brik et al., 2006).
MBR technology is recognised as a promising technology to provide water
with reliable quality for reuse. It provides safely reuse water for non-potable
use. But the treated textile wastewater by MBR technology alone can’t comply
with the reuse or discharge standard in many countries due to its colouring
matters and dyestuffs remained in the effluent, if otherwise, MBR is associated
with other technology like NF, RO, other processes or the applied membrane is
modified or a novel MBR is applied. Fouling is another limiting factor for
worldwide application of MBR technology especially in high-strength industri-
al wastewater like textile wastewater. Moreover, membrane fouling is regarded
as the most important bottleneck for further development of MBR technology.
It is the main limitation for faster development of this process, particularly
when it leads to flux losses that cleaning cannot restore (Howell et al. 2004).
i
S. A. Deowan : Development of Membrane Bioreactor (MBR) Process Applying Novel Low Fouling Membrane
In this thesis work, a novel membrane bioreactor (MBR) process was devel-
oped by modifying a applied commercial PES UF membrane in MBR module
by nano-structured novel coating through polymerisable bicontinuous micro-
emulsion (PBM) process with the purpose of having higher hydrophilicity and
low fouling propensity. Before starting the MBR experiments, some characteri-
sation tests such as SEM, AFM images analysis, roughness measurements,
pore geometry, contact angel, standard salt rejections, model textile dye rejec-
tions were performed. In addition, fouling tests using two laboratory cross flow
testing units were conducted as well. To reach the ultimate goal of research, 6
sheets of novel coated membranes with size of 30 cm × 30 cm were prepared
and these were used to prepare a three-envelope MBR module of 25 cm × 25
cm in size (total membrane area 0.33 m2) similar to that of a commercially
available three-envelope PES UF MBR module. This novel MBR module was
tested in a submerged lab-scale MBR pilot plant (tank volume ca. 60 L) for
about 6 months using model textile dye wastewater (MTDW) as test media for
all experiments with the aim of having uniform compositions with respect to
time. The tests were done based on carefully selected operation conditions.
Prior to testing of the novel membrane module MBR, experiments were carried
out with a commercial PES UF MBR module using the same pilot plant set up
and the same selected operating conditions for about 10 months. After comple-
tion of trials with the novel coated MBR module, similar experiments were
carried out again with a commercial PES UF MBR module to check the simi-
larity of the biological sludge conditions and other operation conditions as
well. In short, the sequences of the experiments were as follows:
Commercial PES UF MBR (10 months) →novel membrane coated MBR (6
months)→PES UF MBR (1.5 months)
The ultimate goal of the experiments was to compare the results between the
commercial MBR and novel coated MBR module in order to demonstrate im-
provement regarding fouling propensity and permeate water quality.
The performance analysis shows that the novel coated MBR module compared
to the commercial MBR module has 7% points higher COD removal efficien-
cy, 20% points higher blue dye removal efficiency, high antifoul-
ing/antimicrobial properties, resulting in a very low-fluctuating and highly ro-
bust MBR process which looks promising with regard to economic viability.
Since the newly developed MBR module worked excellent on laboratory scale
it consequently should be deployed at an industrial site to be tested with real
ii
S. A. Deowan : Development of Membrane Bioreactor (MBR) Process Applying Novel Low Fouling Membrane
wastewater. Therefore, this novel three-envelope MBR module is on the way to
be tested with real wastewater in a textile factory in Tunisia. The findings of
these on-site pilot trials will serve as a basis for further improvement and even-
tually pilot trails with larger membrane area will be addressed.
References
BioNexGen, www.bionexgen.eu, accessed on September 6, 2013
Pidou, M., Hybrid membrane processes for water reuse, PhD thesis, 2006,
School of applied science, department of sustainable systems, centre for
water science, Cranfield University, UK
Brik, M., Schoeberl, P. Chamam, B., Braun, R., Fuchs, W., Advanced treat-
ment of textile wastewater towards reuse using a membrane bioreactor,
Process Biochemistry 41 (2006) 1751 – 1757 Howell, J.A., Chua, H.C., Arnot, T.C (2004), In situ manipulation of critical flux in a
submerged membrane bioreactor using variable aeration rates and effects of
membrane history, Journal of Membrane Science, Vol 242 (2004) 13-19
iii
S. A. Deowan : Development of Membrane Bioreactor (MBR) Process Applying Novel Low Fouling Membrane
Riassunto
Il riciclo dell’acqua è comunemente visto come una delle principali soluzioni al
problema della scarsità dell’acqua causata dall’aumento della sua richiesta e
come risposta a ragioni economiche ed ambientali (Pidou, M., 2006). Le acque
di scarico prodotte in processi industriali spesso contengono sostanze nocive
per la salute umana e per l’ambiente. Perciò al fine di poter riutilizzare tali
correnti, è necessario un loro trattamento. Tra i processi industriali, quello tes-
sile presenta la più alta intensità di utilizzo di acqua. Ad esempio, per ogni ton-
nellata di tessuto prodotto, sono consumati 20-350 m3 di acqua a seconda della
procedura utilizzata (Brik et al., 2006). Nel sistema produttivo, tali acque
vengono a contatto con una serie di sostanze inquinanti che vanno dai prodotti
chimici e additivi a differenti tipi di coloranti che rendono necessaria la loro
purificazione prima di essere scaricate nell’ambiente o riutilizzate.
La tecnologia MBR (bioreattori a membrana) è riconosciuta come una tra le
più promettenti per la produzione di acqua, potenzialmente riutilizzabile. Tut-
tavia, il trattamento delle acque di scarico tessili mediante tecnologia MBR non
può soddisfare da sola gli standard di riciclo o di scarico richiesti in molti pae-
si, a causa delle sostanze coloranti che rimangono nel filtrato. Perciò la tecno-
logia MBR viene di solito integrata con altre tecnologie come la nanofiltra-
zione (NF) o osmosi inversa (RO), ecc. Lo sporcamento (fouling) è un altro
fattore limitante della tecnologia MBR specialmente in acque di scarico diffi-
cili da trattare come quelle tessili. A causa dello sporcamento, si registra una
riduzione drastica delle prestazioni in termini di flusso difficilmente ripristina-
bili anche con trattamenti chimici (Howell et al. 2004).
Nel presente lavoro di tesi, il processo MBR è stato migliorato attraverso la
modifica, mediante un coating, ottenuto tramite polimerizzazione di micro-
emulsione bicontinua (PBM), di membrane commerciali da ultrafiltrazione in
PES, con lo scopo di produrre membrane altamente idrofiliche e con una bassa
tendenza allo sporcamento (innovative low fouling membrane). Le nuove
membrane prodotte sono state caratterizzate mediante analisi di immagini al
microscopio Eletrronico a Scansione (SEM), a Forza Atomica (AFM), misure
di rugosità della superficie, geometria dei pori, angolo di contatto, reiezione ai
sali, reiezione a coloranti modello. Inoltre, i test di sporcamento sono stati
eseguiti attraverso l’utilizzo di due celle a flusso tangenziale (cross-flow) da
ultrafiltrazione (UF) impiegando anche membrane commerciali in PES per 10
iv
S. A. Deowan : Development of Membrane Bioreactor (MBR) Process Applying Novel Low Fouling Membrane
mesi. Le nuove membrane in PBM sono state utilizzate per assemblare 3 mod-
uli MBR aventi una superfice di membrana pari a (0.33 m2).
I moduli MBR prodotti, contenenti membrane con e senza coating (PES com-
merciali), sono stati testati su scala di laboratorio per circa 6 e 1,5 mesi, rispet-
tivamente, utilizzando acque di scarico tessili modello (MTDW). I test sono
stati eseguiti mantenendo costanti le condizioni operative.
Test MBR con membrane commerciali in PES da UF (10 mesi) →MBR ibrido (6
mesi) → MBR PES UF (1,5 mesi)
Scopo ultimo degli esperimenti è stato quello di comparare i risultati MBR
ottenuti con le membrane commerciali con quelli ottenuti con le membrane
PBM.
Le analisi dei risultati mostrano che il modulo MBR preparato con le mem-
brane PBM, rispetto a quello con le membrane commerciali, ha un’efficienza
di rimozione dei COD (carbon oxygen demand) maggiore del 7%, una
rimozione del colorante blu maggiore del 20%, alte proprietà anti-sporcamento
e antimicrobiche. Il processo risulta essere inoltre più semplice e robusto e
maggiormente sostenibile economicamente (riduzione dei tempi di lavaggio e
sostituzione nuove membrane). L’insieme di tutti questi benefici ha permesso
di raggiungere gli obbiettivi prefigurati, ovvero lo sviluppo di un innovativo
processo MBR.
Il nuovo MBR realizzato e testato su scala di laboratorio può essere quindi
prontamente sviluppato su scala industriale per essere collaudato in condizioni
reali. A tal riguardo. in Tunisia, sono in corso esperimenti su più larga scala e
su acque reflue reali tessili.
References
BioNexGen, www.bionexgen.eu, accessed on September 6, 2013
Pidou, M., Hybrid membrane processes for water reuse, PhD thesis, 2006,
School of applied science, department of sustainable systems, centre for
water science, Cranfield University, UK
Brik, M., Schoeberl, P. Chamam, B., Braun, R., Fuchs, W., Advanced treat-
ment of textile wastewater towards reuse using a membrane bioreactor,
Process Biochemistry 41 (2006) 1751 – 1757 Howell, J.A., Chua, H.C., Arnot, T.C (2004), In situ manipulation of critical flux in a
submerged membrane bioreactor using variable aeration rates and effects of
membrane history, Journal of Membrane Science, Vol 242 (2004) 13-19
v
S. A. Deowan : Development of Membrane Bioreactor (MBR) Process Applying Novel Low Fouling Membrane
Zusammenfassung
Wasser ist ein wesentlicher Bestandteil des menschlichen Lebens. Die Abwäs-
ser aus der Industrie und Landwirtschaft, welche mit Schwermetallionen, Pes-
tiziden, organischen Verbindungen , endokrinen Verbindungen und Nährstof-
fen (Phosphate , Nitrate, Nitrite) belastet sein können, müssen effizient behan-
delt werden, um die Umwelt vor einer Verschmutzung zu schützen. Sauberes
Wasser, welches als Grundlage für die Gesundheit und das Wohlbefinden einer
Gesellschaft dient, ist für die Mehrheit der Weltbevölkerung nicht zugänglich
(BIONEXGEN, 2013). Die Aufbereitung und Wiederverwendung von Abwas-
ser wird heute als Antwort auf die zunehmende Wasserknappheit und steigende
Nachfrage nach Frischwasser als nachhaltige Möglichkeit zum Schutz der
Umwelt akzeptiert. Deshalb wird das Recycling von aufbereitetem Abwasser
allgemein als eine der wichtigsten Optionen zur Beseitigung von Wasserman-
gel - verursacht durch den starken Anstieg der Nachfrage und den damit ver-
bundenen steigenden Wasserpreisen - betrachtet. Die wichtigsten Bereiche für
Abwasser-Recycling sind Industrieanwendungen, Bewässerung , Grundwas-
serneubildung und urbane Wiederverwendung (Pidou, M. , 2006).
Die Textilindustrie ist im Bereich industrieller Abwässer traditionell ein was-
serintensiver Bereich und hat deshalb einen hohen Bedarf an Frischwasser für
alle Produktionsverfahren. Textilabwässer enthalten eine große Vielfalt von
Inhaltstoffen, wie Prozesschemikalien, Hilfsstoffe und verschiedene Arten von
Farbstoffen. Aus ökologischer und ökonomischer Sicht sind die Menge und
Qualität des Abwassers, d.h die chemischen Belastungen die es trägt, von gro-
ßer Bedeutung. So werden für die Herstellung jeder Tonne textiler Produkte 20
bis 350 m3 Wasser verbraucht, wobei sich die angewendeten Produktionsver-
fahren deutlich unterscheiden können und sich damit die Qualität der Abwässer
entsprechend ändern können (hinsichtlich verwendeter Farbstoffe, Hilfschemi-
kalien etc.) (Brik et al. , 2006).
Die Membranbioreaktor (MBR)-Technologie wird als eine vielversprechende
Technologie betrachtet, um Wasser mit hoher Qualität zur Wiederverwendung
in Bereichen bereitzustellen, in denen keine Trinkwasserqualität erforderlich
ist. Allerdings hat sich bei der Behandlung von Textilabwässern durch MBR-
Technologie gezeigt, dass sich die erforderlichen Wasserqualitätstandards für
eine Einleitung in Gewässer bzw. Wiederverwendung - insbesondere aufgrund
seiner Farbigkeit - nicht einhalten lassen, falls nicht zusätzliche Behandlungs-
verfahren zum Einsatz kommen (z.B. Umkehrosmose oder Nanofiltration).
vi
vi
S. A. Deowan : Development of Membrane Bioreactor (MBR) Process Applying Novel Low Fouling Membrane
Fouling ist ein weiterer limitierender Faktor für den weltweiten Einsatz von
MBR-Technologie vor allem in Industrieabwässern mit schwer abbaubaren
Inhaltsstoffen, wie Textilabwasser. Insbesondere wird Membranfouling als
entscheidender Engpass für die weitere Entwicklung der MBR-Technologie
betrachtet. Es ist die wichtigste Einschränkung für eine schnellere Verbreitung
dieser Technologie, insbesondere da Fouling häufig zu einer irreversiblen Re-
duktion des Wasserfluxes führt, der auch durch Reinigungsmaßnahmen nicht
behoben werden kann (Howell et al. 2004).
In dieser Arbeit wurde durch Verwendung einer neuartigen nanostrukturierten
Membran ein neuer Membran-Bioreaktor (MBR)-Prozess entwickelt. Diese
Membran wurde durch das Verfahren der Polymerisation von bikontinuierli-
chen Mikroemulsionen (PBM) durch Beschichtung von kommerziellen Ultrat-
filtrations- (UF) Flachmembranen (PES) hergestellt mit dem Ziel eine hydro-
phile Membran mit geringerem Foulingpotential zu erhalten. Vor Beginn der
eigentlichen MBR Versuche wurde die neuartige Membran mittels verschiede-
ner Verfahren untersucht und charakterisiert: SEM-, AFM-Aufnahmen, Rau-
higkeitsmessungen, Porengeometrie, Kontaktwinkel, Standard-Salzrückhaltung
und Rückhalt an Modellfarbstoffen. Darüber hinaus wurden Fouling-Tests un-
ter Verwendung von zwei Laborversuchsanlagen mit Querstrommembranmo-
dulen durchgeführt. Zur Untersuchung des Verhaltens in einem Labor-
Membranbioreaktor wurde aus sechs mittels PBM Verfahren beschichteten
Membranblättern (30 cm × 30 cm) ein kleines MBR-Modul mit drei Membran-
taschen hergestellt (25 cm × 25 cm, gesamte Membranfläche ca. 0,3 m2). Ein
Modul mit diesen Abmessungen war bereits als kommerzielles UF MBR-
Modul erhältlich.
Dieses MBR-Modul wurde als getauchte Membran in einer Labor-Pilotanlage
(Tankvolumen ca. 60 L) über einen Zeitraum von etwa 6 Monaten getestet. Für
diese Versuche wurde ein Modell-Textilabwasser unter sorgfältig ausgewähl-
ten Versuchsbedingungen eingesetzt, um über die gesamte Versuchsdauer eine
konstante Zusammensetzung im Zulauf und damit möglichst konstante Ver-
suchsbedingungen zu gewährleisten. Zum Vergleich wurden vor dem Test mit
dem neuartigen MBR-Modul Versuche mit einem kommerziellen PES UF
MBR-Modul mit der gleichen Pilotanlage und den gleichen Betriebsbedingun-
gen über eine Versuchsperiode von 10 Monate durchgeführt. Nach Abschluss
der Pilotversuche mit dem neuartigen MBR-Modul wurde die Versuchsreihe
wieder mit einem kommerziellen PES UF MBR-Modul unter gleichen Ver-
suchsbedingungen fortgeführt, um Einflüsse eventueller Veränderungen in der
Belebtschlammbiologie zu überprüfen. Damit war der Ablauf der Versuchsrei-
hen wie folgt :
vii
vi
S. A. Deowan : Development of Membrane Bioreactor (MBR) Process Applying Novel Low Fouling Membrane
Kommerzielles PES UF MBR-Modul (10 Monate) → Neuartiges MBR-Modul
(6 Monate) → Kommerzielles PES UF MBR-Modul (1.5 Monate)
Insgesamt war es das Ziel der Versuchsreihen die Ergebnisse zwischen dem
kommerziellen MBR und neuartigen MBR-Modul zu vergleichen, um eine
Verbesserung hinsichtlich Fouling-Neigung sowie Permeat-Wasserqualität
aufzuzeigen.
Die Auswertung der Versuchsreihen hat gezeigt, dass das neuartige, durch
PBM beschichtete, MBR-Modul im Vergleich zu dem kommerziellen Modul
eine um 7 %-Punkte höhere Effizienz des CSB-Abbaus und eine 20%-Punkte
höhere Effizienz beim Abbau des blauen Farbstoff aufweist. Außerdem weist
die neuartige Membran geringeres Fouling sowie auch nach Ende der Ver-
suchsreihe noch deutlich antimikrobielle Eigenschaften auf. Dadurch ergibt
sich im Vergleich mit dem kommerziellen Modul ein wesentlich stabilerer Pro-
zess mit geringeren Schwankungen in der Permeatqualität und damit lässt sich
auch eine Verbesserung der Wirtschaftlichkeit erwarten.
Der im Labormaßstab mit einem Modellwasser erfolgreich getestete MBR-
Prozess sollte nun an einem industriellen Standort mit realem Abwasser pilo-
tiert werden. Deshalb sind bereits erste Versuche mit dem Drei-
Membrantaschenmodul in einer Textilfabrik in Tunesien vorbereitet worden.
Die Ergebnisse dieser Pilotierung sollen dann als Grundlage für eine weitere
Verbesserung der neuartigen Membran dienen, um anschließend MBR-Module
mit größerer Membranfläche herzustellen und zu testen.
References
BioNexGen, www.bionexgen.eu, accessed on September 6, 2013
Pidou, M., Hybrid membrane processes for water reuse, PhD thesis, 2006,
School of applied science, department of sustainable systems, centre for
water science, Cranfield University, UK
Brik, M., Schoeberl, P. Chamam, B., Braun, R., Fuchs, W., Advanced treat-
ment of textile wastewater towards reuse using a membrane bioreactor,
Process Biochemistry 41 (2006) 1751 – 1757 Howell, J.A., Chua, H.C., Arnot, T.C (2004), In situ manipulation of critical flux in a
submerged membrane bioreactor using variable aeration rates and effects of
membrane history, Journal of Membrane Science, Vol 242 (2004) 13-19
viii
S. A. Deowan : Development of Membrane Bioreactor (MBR) Process Applying Novel Low Fouling Membrane
11
Contents
Summary i
Riassunto iv
Zusammenfassung vi
Contents ix
1. Chapter 1: Introduction 18
1.1 General Introduction 18
1.2 Research Objectives 21
1.3 Thesis outline 21
2. Chapter 2 : Literature Review 26
2.1 Section I: The State of the Art of Membrane Bioreactor (MBR) Technology 26
2.1.1 Basic aspects of Membrane Bioreactor 26
2.1.1.1 Definition of MBR 26
2.1.1.2 History of MBR development 27
2.1.1.3 MBR Configurations 28
2.1.1.4 Configurations of membrane module 31
2.1.1.4.1 Flat sheet membrane module 32
2.1.1.4.2 Tubular membrane module 33
2.1.1.5 Membrane materials and pore size 35
2.1.2 Filtration processes of MBRs 38
2.1.2.1 Membrane filtration process in general 38
2.1.2.2 Pressure driven membrane process 39
2.1.2.3 Parameters affecting membrane performances 44
2.1.2.3.1 Intrinsic resistance of the membrane 44
2.1.2.3.2 Transmembrane pressure (TMP) 44
2.1.2.3.3 Hydrodynamic regime 45
2.1.2.4 Hydraulic geometry of MBR 45
ix
S. A. Deowan : Development of Membrane Bioreactor (MBR) Process Applying Novel Low Fouling Membrane
12
2.1.2.4.1 Microbiological aspects of MBR 45
2.1.3 Resistance model 52
2.1.3.1 Membrane resistance 53
2.1.3.2 Membrane fouling 54
2.1.3.2.1 General considerations of fouling 54
2.1.3.2.2 Fouling mechanism 55
2.1.3.2.3 Factors affecting membrane fouling 58
2.1.3.2.3.1 Membrane properties 58
2.1.3.2.3.2 Solute properties 61
2.1.3.2.3.3 Operating parameters 63
2.1.3.2.4 Control of membrane fouling 64 2.2 Section II : Aerobic Submerged MBR in Textile Wastewater Treatment 71
2.2.1 Textile Wastewater 71
2.2.2 Conventional Methods in Textile Wastewater Treatment 72
2.2.2.1 Physical Method 74
2.2.2.2 Chemical Method 75
2.2.2.3 Biological Method 76
2.2.2.3.1 Biological Activated Sludge Process 76
2.2.2.3.2 Decolourisation by white - rot fungi 77
2.2.2.3.3 Decolourisation by mixed bacterial cultures 77
2.2.2.3.4 Bio-sorption by microbial biomass 78
2.2.2.3.5 Anaerobic textile-dye bioremediation systems 79
2.2.3 MBR in Textile Wastewater Treatment 79
2.2.3.1 Current Status 79
2.2.3.2 Future Approach 82
3. Chapter 3 : Materials and Methods 102
3.1 Materials for membrane preparation 102
3.2 Membrane preparation chamber 102
3.3 Instruments/chemicals used for membrane characterisation 104
3.4 Membrane bioreactor (MBR) 110
3.5 Model foulant humic acid (HA) 113
3.6 Preparation of model textile dye wastewater (MTDW) 114
3.7 Textile dyes in MTDW 115
3.8 DI water and auxiliary chemicals for model textile dye wastewater (MTDW) 117
S. A. Deowan : Development of Membrane Bioreactor (MBR) Process Applying Novel Low Fouling Membrane
13
3.9 MBR samples analyzers 118
4. Chapter 4 : Novel Membrane Preparation and Characterisation 131
4.1 Preparation of novel membrane 131
4.1.1 Microemulsions 132
4.1.2 Phase diagram 133
4.1.3 Membrane preparation protocol 134
4.1.4 Preparation of novel membrane 137
4.1.5 Prepared membranes at optimized conditions 139
4.2 Characterisation of novel membrane 141
4.2.1 Surface characteristics 141
4.2.2 Pore geometry 144
4.2.3 Contact angle 145
4.2.4 Molecular weight cut off (MWCO) 146
4.2.5 Standard salt rejection test 148
4.2.6 Water permeability test 149
4.2.7 Model fouling test 150
4.2.7.1 Model foulant rejection 150
4.2.7.2 Reversible and irreversible fouling 152
4.2.8 Model textile dye rejection test 155
4.2.9 Antimicrobial test 156
4.2.10 Lamination of PBM membranes for MBR applications 157
5. Chapter 5 : Membrane Bioreactor (MBR) Applying Commercial Membranes 162
5.1 Formulation of membrane bioreactor (MBR) 162
5.2 Start –up of the System and functionality test 162
5.3 Selection of test media 164
5.3.1 Characterisation of model textile dye wastewater (MTDW) 164
5.4 Selection of the optimum operation conditions 165
5.4.1 Transmembrane Pressure (TMP) 166
5.4.2 pH 166
5.4.3 Temperature 166
5.4.4 Aeration rate 167
5.4.5 Hydraulic residence time (HRT) 167
5.4.6 Mixed liquor suspended solids (MLSS) 168
5.4.7 Electrical conductivity 168
S. A. Deowan : Development of Membrane Bioreactor (MBR) Process Applying Novel Low Fouling Membrane
14
5.4.8 Critical flux (CF) 168
5.5 Continuous operation of the experiments 168
5.5.1 Sampling procedure 169
5.6 Results 170
5.6.1 Water production 170
5.6.1.1 Flux and TMP 170
5.6.1.2 Water permeability 172
5.6.2 Hydraulic Residence Time (HRT) 173
5.6.3 COD and TOC 174
5.6.3.1 Permeate COD and COD removal efficiency 174
5.6.3.2 Effect of HRT on COD removal efficiency 175
5.6.3.3 COD and TOC relation 176
5.6.3.4 COD and TOC removal efficiency 177
5.6.3.5 Permeate COD and reactor COD 178
5.6.4 Dye removal efficiency 179
5.6.4.1 Dyes in permeate 179
5.6.4.2 Dyes in reactor 181
5.6.5 N-Balance 182
5.6.6 O2 concentration and consumption 186
5.6.6.1 Aeration rate vs dissolved oxygen (DO) 186
5.6.6.2 Oxygen upate rate (OUR) vs dissolved oxygen (DO) 188
5.6.7 MLSS 190
5.6.7.1 MLSS in operation phases 190
5.6.7.2 Effect of MLSS on COD removal efficiency 191
5.6.8 F/M ratio 191
5.6.9 Chloride concentration and conductivity 192
5.6.10 Drying residue (DR) and Conductivity 193
5.6.11 pH and temperature 195
5.6.12 Critical flux 196
5.6.13 Membrane resistance model 198
6. Chapter 6 : Membrane Bioreactor (MBR) Applying Novel Membrane 205
6.1 Experiment part 205
6.2 Operation conditions 206
6.3 Results 206
S. A. Deowan : Development of Membrane Bioreactor (MBR) Process Applying Novel Low Fouling Membrane
15
6.3.1 Water production 207
6.3.1.1 Flux and TMP 207
6.3.1.2 Water permeability 208
6.3.2 Hydraulic Residence Time (HRT) 209
6.3.3 COD and TOC 210
6.3.3.1 Permeate COD and COD removal efficiency 210
6.3.3.2 Effect of HRT on COD removal efficiency 211
6.3.3.3 COD and TOC relation 212
6.3.3.4 TOC removal efficiency 213
6.3.3.5 Permeate COD and reactor COD 214
6.3.4 Dye removal efficiency 215
6.3.4.1 Dyes in permeate 215
6.3.4.2 Reactor dyes 216
6.3.5 N-Balance 217
6.3.6 O2 concentration and consumption 219
6.3.6.1 Aeration rate vs dissolved oxygen (DO) 219
6.3.6.2 O2 uptake rate (OUR) vs dissolved oxygen (DO) 220
6.3.7 MLSS 221
6.3.7.1 MLSS in operation trials 221
6.3.7.2 Effect of MLSS in COD removal efficiency 222
6.3.8 F/M ratio 223
6.3.9 Chloride (Cl-) concentration 224
6.3.10 Drying residue (DR) and Conductivity 225
6.3.11 pH and temperature 226
6.3.12 Critical flux 227
6.3.13 Membrane resistance model 229
7. Chapter 7 : Comparison of Performances between Commercial and Novel
Membranes 234
7.1 Results 235
7.1.1 Water production 235
7.1.1.1 Flux and TMP 235
7.1.1.2 Water permeability (WP) 236
7.1.2 Hydraulic Residence Time (HRT) 237
7.1.3 COD and TOC 238
S. A. Deowan : Development of Membrane Bioreactor (MBR) Process Applying Novel Low Fouling Membrane
16
7.1.3.1 COD removal efficiency 238
7.1.3.2 Effect of HRT on COD removal efficiency 239
7.1.3.3 COD and TOC relation 240
7.1.3.4 TOC removal efficiency 241
7.1.3.5 Permeate COD and reactor COD 242
7.1.4 Dye removal efficiency 243
7.1.4.1 Red dye in permeate 243
7.1.4.2 Blue dye in permeate 244
7.1.4.3 Red dye in reactor 245
7.1.4.4 Reactor blue dyes 246
7.1.5 N - Balance 247
7.1.6 O2 concentration and consumption 250
7.1.6.1 Aeration rate vs dissolved oxygen (DO) 250
7.1.6.2 Oxygen uptake rate (OUR) vs dissolved oxygen (DO) 251
7.1.7 MLSS 252
7.1.7.1 MLSS in operation phases 252
7.1.7.2 Effect of MLSS in COD removal efficiency 253
7.1.8 F/M ratio 254
7.1.9 Chloride (Cl-) content 255
7.1.10 Drying residue (DR) and electrical conductivity 256
7.1.11 pH and temperature 257
7.1.12 Critical flux (CF) 258
7.1.13 Membrane resistance model 260
7.2 Benefits of PBM membranes 262
7.2.1 Permeate quality 262
7.2.2 Low fouling properties 263
7.2.3 Antimicrobial properties 264
7.2.4 Process robustness 265
7.2.5 Energy consumption 267
7.2.6 Techno-Economical analysis of the applied processes 268
7.3 Outlook for PBM membrane preparation 270
8. Chapter 8 : Conclusion and Outlook 272
8.1 Conclusion 272
8.2 Outlook 273
S. A. Deowan : Development of Membrane Bioreactor (MBR) Process Applying Novel Low Fouling Membrane
17
Scientific activities of Shamim Ahmed Deowan 276
Acknowledgement 280
Abbreviations 282
Nomenclature 285
Appendices 286
Appendix A LabVIEW Control program 287
Appendix B Formula for standard deviation and coefficient of variation (accuracy) calculation 288
Chapter 1
Introduction
S. A. Deowan : Development of Membrane Bioreactor (MBR) Process Applying Novel Low Fouling Membrane
18
1. Chapter 1: Introduction
1.1 General Introduction
Water is another synonym of life. According to the World Health Organisation
(WHO), the most dangerous threat for health of mankind emerging within the
next years is polluted water. In under developed countries the shortage of clean
freshwater will be the most important cause of death for children under 5 years.
The low quantities of fresh water for industrial, agricultural and municipal us-
age have to be well preserved by efficient, sustainable and cost-effective tech-
nologies. Water contaminated from industry and agriculture with heavy metal
ions, pesticides, organic compounds, endocrine disruptive compounds, nutri-
ents (phosphates, nitrates, nitrites) has to be efficiently treated to protect hu-
mans from being intoxicated with these compounds or with bacteria. Further-
more, incidental sludge of industrial wastewater treatment facilities is com-
monly highly contaminated with toxic compounds (Bionexgen, 2013).
Clean water as basis for health and good living conditions is too far out of
reach for the majority of the population in the world. Thus neither sustainable
consumption nor reinforcement of governmental regulations are effective driv-
ers to force the industry to adopt sustainability policies. Though polluted water
and water shortages demand for a sustainable water usage and recycling of
waste water, the barriers are high to adopt these (Bionexgen, 2013).
Water recycling is now widely accepted as a sustainable option to respond to
the general increase of the fresh water demand, water shortages and for envi-
ronment protection. Water recycling is commonly seen as one of the main op-
tions to provide remedy for water shortage caused by the increase of the water
demand and draughts as well as a response to some economical and environ-
mental drivers. The main options for wastewater recycling are industrial, irriga-
tion, aquifer recharge and urban reuse (Pidou, M., 2006).
Among the industrial wastewaters, the textile industry is long regarded as a
water intensive sector, due to its high demand of water for all parts of its pro-
cedures. Accordingly, textile wastewater includes quite a large variety of con-
tents, chemicals, additives, different kinds of dyestuffs, and so on. The main
environmental concern with this waste water is about the quantity and quality
of the water discharged and the chemical loads it carries. To illustrate, for each
Introduction
S. A. Deowan : Development of Membrane Bioreactor (MBR) Process Applying Novel Low Fouling Membrane
19
Chapter1
ton of fabric products, 20 – 350 m3 of water are consumed, which differs from
the color and procedure used (Brik et al., 2006).
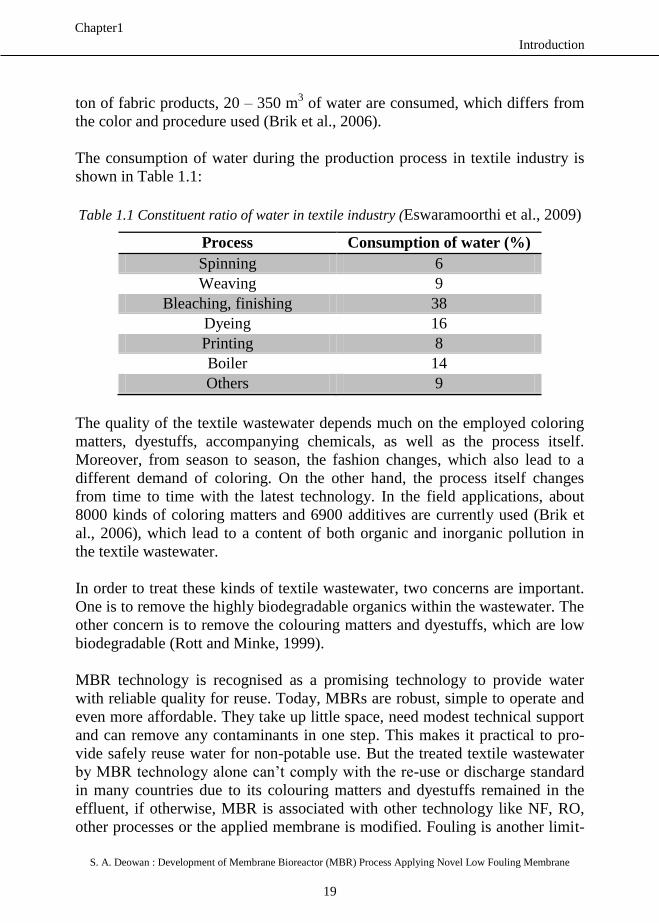
The consumption of water during the production process in textile industry is
shown in Table 1.1:
Table 1.1 Constituent ratio of water in textile industry (Eswaramoorthi et al., 2009)
Process Consumption of water (%)
Spinning 6
Weaving 9
Bleaching, finishing 38
Dyeing 16
Printing 8
Boiler 14
Others 9
The quality of the textile wastewater depends much on the employed coloring
matters, dyestuffs, accompanying chemicals, as well as the process itself.
Moreover, from season to season, the fashion changes, which also lead to a
different demand of coloring. On the other hand, the process itself changes
from time to time with the latest technology. In the field applications, about
8000 kinds of coloring matters and 6900 additives are currently used (Brik et
al., 2006), which lead to a content of both organic and inorganic pollution in
the textile wastewater.
In order to treat these kinds of textile wastewater, two concerns are important.
One is to remove the highly biodegradable organics within the wastewater. The
other concern is to remove the colouring matters and dyestuffs, which are low
biodegradable (Rott and Minke, 1999).
MBR technology is recognised as a promising technology to provide water
with reliable quality for reuse. Today, MBRs are robust, simple to operate and
even more affordable. They take up little space, need modest technical support
and can remove any contaminants in one step. This makes it practical to pro-
vide safely reuse water for non-potable use. But the treated textile wastewater
by MBR technology alone can’t comply with the re-use or discharge standard
in many countries due to its colouring matters and dyestuffs remained in the
effluent, if otherwise, MBR is associated with other technology like NF, RO,
other processes or the applied membrane is modified. Fouling is another limit-
Introduction
S. A. Deowan : Development of Membrane Bioreactor (MBR) Process Applying Novel Low Fouling Membrane
20
Chapter1
ing factor for worldwide application of MBR technology especially in high-
strength industrial wastewater like textile wastewater. However, membrane
fouling is regarded as the most important bottleneck for further development of
MBR technology. It is the main limitation for faster development of this pro-
cess, particularly when it leads to flux losses that cleaning cannot restore
(Howell et al. 2004).
The target of this thesis was to develop a membrane bioreactor focusing on
novel low fouling membrane towards developing upgraded or novel or hybrid
MBR process. Generally the term “hybrid” means the combination of two dif-
ferent things resulting in the development of a modified thing which has the
superior characteristics compared to its origin. In terms of MBR, hybrid or up-
graded MBR means improved or novel MBR process which has higher per-
formances like better permeate quality and lower fouling propensity compared
to conventional MBR process. Many researchers have developed novel MBR
process integrating conventional MBR with other technologies like NF, RO,
PAC, biofilm carriers, porous suspended carriers etc. (Mulder et al., 2007;
Ravindran et al., 2009; Liu et al., 2010 and Yang et al., 2009).
To develop the MBR process in this thesis work, commercial UF membrane
was modified by a nano-structured functionalised novel coating using polymer-
isable bicontinuous microemulsion (PBM) process. This modified novel coated
membrane is associated with anti-fouling properties through cationic surfac-
tant, acryloyloxyundecyltriethyl ammonium bromide (AUTEAB) used in the
preparation process. The surface smoothness and hydrophilicity of the novel
coated membrane was much higher than the unmodified commercial mem-
branes. Higher hydrophilicity and anti-fouling properties of the modified mem-
brane showed higher fouling resistant which was revealed from different tests
(physical and biological) with model foulant in cross-flow ultrafiltration testing
cells and biological sludge treatment in a lab scale – MBR plant carried
throughout this thesis work. This kind of low fouling novel coated modified
membrane applied in MBR application looks promising in terms of economic
viability of the process for textile wastewater treatment.
Introduction
S. A. Deowan : Development of Membrane Bioreactor (MBR) Process Applying Novel Low Fouling Membrane
21
Chapter1
1.2 Research Objectives
The aim of this PhD thesis is to develop a novel MBR process preparing nano-
structured functionalised novel MBR membranes with a focus on reducing
fouling propensities. The main objectives of the thesis workare as follows:
To prepare nano-structured functionalised novel coating by polymeris-
able bicontinuous microemulsion process onto commercial UF mem-
branes following the protocol developed by ITM-CNR, Italy
To characterise the prepared novel membranes in terms of pore geome-
try, hydrophilicity, surface smoothness, water permeablities, model
foulant tests, etc..
To define the antifouling effect (reversible and irreversible) of the pre-
pared novel membranes applying model foulant (humic acid) and tex-
tile dyestuffs (Remazol Brilliant Blue R and Acid Red 4) with ultrafil-
tration cross-flow testing cells
To carry out long term lab scale MBR experiment applying commer-
cial PES UF MBR module for benchmarking
To carry out long term lab scale MBR experiment applying novel coat-
ed PBM MBR module
To compare the results of PES UF MBR and PBM MBR modules and
illustrate the process benefits
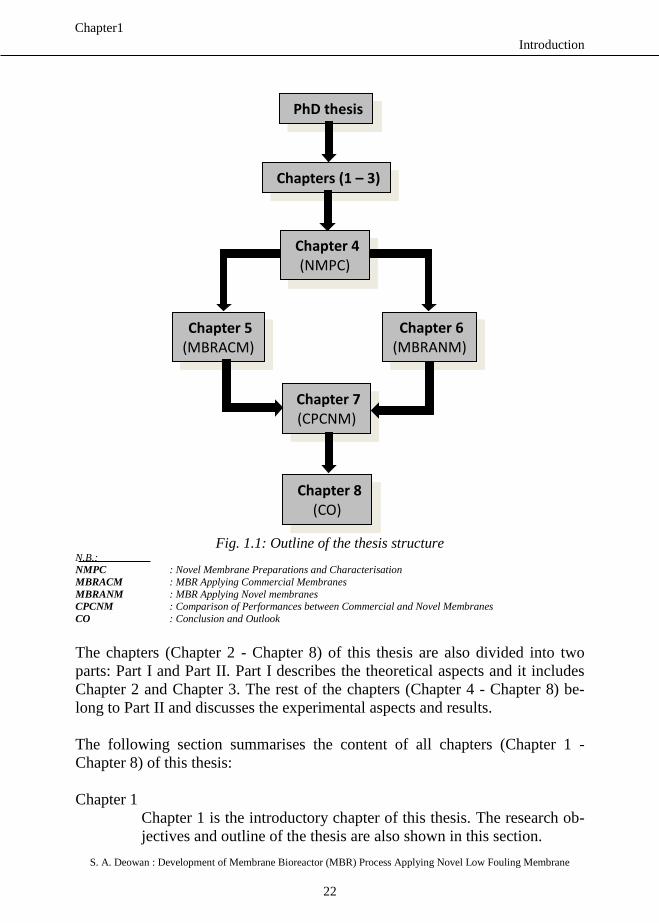
1.3 Thesis outline
This PhD thesis was formulated based on the development steps and is struc-
turized into 8 chapters which are shown in Fig.1.1.
Introduction
S. A. Deowan : Development of Membrane Bioreactor (MBR) Process Applying Novel Low Fouling Membrane
22
Chapter1
Fig. 1.1: Outline of the thesis structure
N.B.: NMPC : Novel Membrane Preparations and Characterisation
MBRACM : MBR Applying Commercial Membranes
MBRANM : MBR Applying Novel membranes CPCNM : Comparison of Performances between Commercial and Novel Membranes
CO : Conclusion and Outlook
The chapters (Chapter 2 - Chapter 8) of this thesis are also divided into two
parts: Part I and Part II. Part I describes the theoretical aspects and it includes
Chapter 2 and Chapter 3. The rest of the chapters (Chapter 4 - Chapter 8) be-
long to Part II and discusses the experimental aspects and results.
The following section summarises the content of all chapters (Chapter 1 -
Chapter 8) of this thesis:
Chapter 1
Chapter 1 is the introductory chapter of this thesis. The research ob-
jectives and outline of the thesis are also shown in this section.
Chapters (1 – 3)
Chapter 4
(NMPC)
Chapter 6
(MBRANM) Chapter 5
(MBRACM)
PhD thesis
Chapter 7
(CPCNM)
Chapter 8
(CO)
Introduction
S. A. Deowan : Development of Membrane Bioreactor (MBR) Process Applying Novel Low Fouling Membrane
23
Chapter1
Chapter 2
A literature review on membrane bioreactor (MBR) in general and
MBR for textile wastewater treatment is illustrated in Chapter 2. The
basic aspects of MBR, its configurations, filtration processes, biolog-
ical aspects, hydraulic geometry and fouling mechanisms were dis-
cussed in this section. An outline on how to control MBR fouling
was also provided. Different conventional technologies for
wastewater treatment are also discussed in this part. The emphasis is
given on MBR technology for textile wastewater treatment; its cur-
rent status and future prospects. It is also discussed on how the ob-
jectives of this thesis contributed in MBR technology for textile
wastewater treatment. Part of this chapter was the basis of a scien-
tific paper entitled as “Membrane Bioreactor (MBR) Technology –
A Promising Approach for Industrial Wastewater Reuse” published
in Journal of Procedia Engineering in 2012.
Chapter 3
In Chapter 3, materials and methods applied in this thesis are dis-
cussed. A short description of the applied materials and methods in-
cluding their operating ranges and accuracy are provided.
Chapter 4
The process of preparing novel membrane by polymerisable bicon-
tinuous microemulsion (PBM) and its characterisation in detail are
discussed in chapter 4. The antifouling/antimicrobial effects of the
PBM coated membranes under different test conditions in different
experimental set ups are also discussed in this chapter. The critical
operating conditions which are needed to be optimised for preparing
high performing PBM coated membrane are discussed in this chapter
as well.
Chapter 5
In Chaper 5, a MBR system incorporated with commercial MBR
module that was applied for textile wastewater treatment is dis-
cussed. The entire range of the applied MBR system starting from
start up until the final results obtained is covered by this part. The re-
sults obtained from chapter 5 are used as reference for Chapter 6.
Introduction
S. A. Deowan : Development of Membrane Bioreactor (MBR) Process Applying Novel Low Fouling Membrane
24
Chapter1
Chapter 6
In Chapter 6, the MBR system wherein PBM coated novel MBR mod-
ule was applied for textile wastewater treatment and the results have
been discussed. The test conditions of the experiments were similar to
that of chapter 5. The basis for this chapter is based on scientific publi-
cation entitled as “Submerged Membrane Bioreactor (SMBR) for
treatment of Textile Dye Wastewater towards Developing Nobel MBR
Process” published in journal of APCBEE Procedia in 2013 and a pa-
tent “BICONTINUOUS MICROEMULSION POLYMERIZED
COATING FOR WATER TREATMENT”, registration number IT
GE2013A000096, filed on 27.09.2013.
Chapter 7
In Chapter 7, the results obtained from commercial MBR and
PBM/novel coated MBR systems have been compared. The results
have been analysed based on product quality, organic stuff degrada-
tion/rejection, fouling properties, process robustness etc.. The tech-
no-economical analysis of the obtained results concludes that the ob-
jectives of the thesis have been achieved.
Chapter 8
In Chapter 8, overall conclusions are provided and the future pro-
spective of the developed MBR process is discussed in detail. In ad-
dition, some recommendations for process optimisations and real-
field application of the technology in an industrial site are presented.
References
BioNexGen, www.bionexgen.eu, accessed on September 6, 2013
Brik, M., Schoeberl, P. Chamam, B., Braun, R., Fuchs, W., Advanced treat-
ment of textile wastewater towards reuse using a membrane bioreactor,
Process Biochemistry 41 (2006) 1751 – 1757
Eswaramoorthi, S., Dhanapal, K. andChauhan, D.S., Textile Waste Water
Treatment With Membrane Bioreactor, 2009, environmental technology
awareness series, India. Howell, J.A., Chua, H.C., Arnot, T.C (2004), In situ manipulation of critical flux in a
submerged membrane bioreactor using variable aeration rates and effects of
membrane history, Journal of Membrane Science, Vol 242 (2004) 13-19 Jan Hoinkis, Shamim A. Deowan, Volker Panten, Alberto Figoli, Rong Rong
Huang and Enrico Drioli, Membrane Bioreactor (MBR) Technology –
Introduction
S. A. Deowan : Development of Membrane Bioreactor (MBR) Process Applying Novel Low Fouling Membrane
25
Chapter1
A Promising Approach for Industrial Wastewater Reuse, Procedia En-
gineering 33 (2012) 234-241
Liu, Q, Wang, X.C., Liu, Y, Yuan, H., Du, Y., Performance of a hybrid mem-
brane bioreactor in municipal wastewater treatment, Desalination 258
(2010) 143 - 147
Mulder, J. W., Braunersreuther, M., Schonewille, H., Jager, R. D. and Veraart,
A., Hybrid MBR for industrial reuse of domestic wastewater in the Ne-
derlands, 2007
Pidou, M., Hybrid membrane processes for water reuse, PhD thesis, 2006,
School of applied science, department of sustainable systems, centre for
water science, Cranfield University, UK.
Ravindran, V., Tsai, H.H., Williams, M.D., Pirbazari, M., Hybrid membrane
bioreactor technology for small water treatment utilities: Process evalu-
ation and primordial considerations, Journal of Membrane Science 244
(2009) 39 - 54
Rott, U. and Minke, R., Overview of wastewater treatment and recycling in the
textile processing industry, Water Sci. Technol. 1999, 40(1):137 - 144.
Shamim Ahmed Deowan, Francesco Galiano, Jan Hoinkis, Alberto Figoli, En-
rico Drioli, Submerged Membrane Bioreactor (SMBR) for Treatment
of Textile Dye Wastewater towards Developing Nobel MBR Process,
APCBEE Procedia 5 (2013) 259-264
Yang Q., Y., Yang, T., Wang, H., J. and Liu, K. Q., Filtration characteristics of
activated sludge in hybrid membrane bioreactor with porous suspended
carriers (HMBR), Desalination 249 (2009) 507 – 514
Chapter 2
Literature Review
S. A. Deowan : Development of Membrane Bioreactor (MBR) Process Applying Novel Low Fouling Membrane
26
2. Chapter 2 : Literature Review
2.1 Section I: The State of the Art of Membrane Bioreactor (MBR)
Technology
2.1.1 Basic aspects of Membrane Bioreactor
Basic aspects of membrane bioreactor (MBR) such as its definition, history, its
configuration, materials etc. are discussed in the following sections.
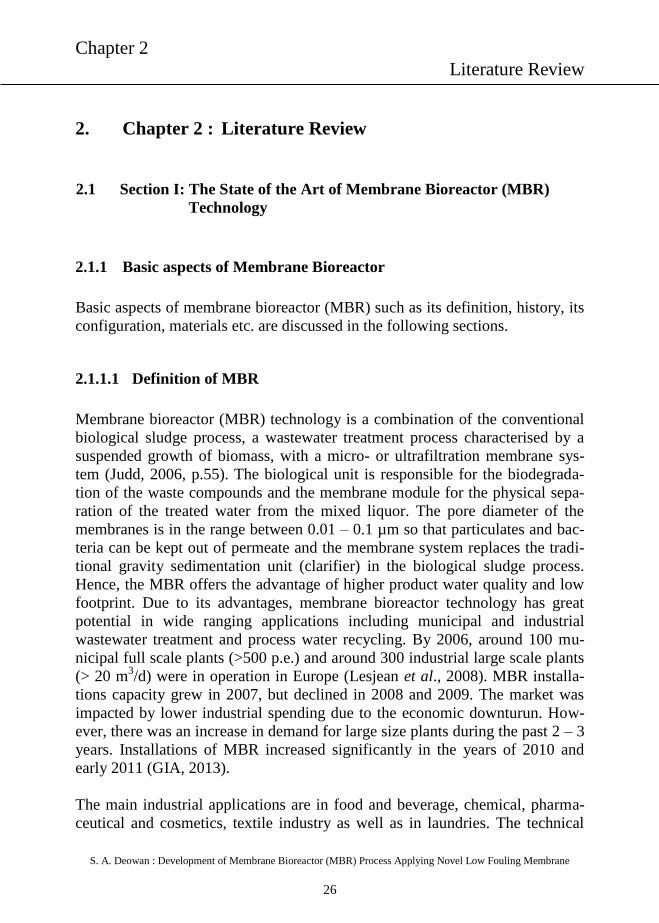
2.1.1.1 Definition of MBR
Membrane bioreactor (MBR) technology is a combination of the conventional
biological sludge process, a wastewater treatment process characterised by a
suspended growth of biomass, with a micro- or ultrafiltration membrane sys-
tem (Judd, 2006, p.55). The biological unit is responsible for the biodegrada-
tion of the waste compounds and the membrane module for the physical sepa-
ration of the treated water from the mixed liquor. The pore diameter of the
membranes is in the range between 0.01 – 0.1 µm so that particulates and bac-
teria can be kept out of permeate and the membrane system replaces the tradi-
tional gravity sedimentation unit (clarifier) in the biological sludge process.
Hence, the MBR offers the advantage of higher product water quality and low
footprint. Due to its advantages, membrane bioreactor technology has great
potential in wide ranging applications including municipal and industrial
wastewater treatment and process water recycling. By 2006, around 100 mu-
nicipal full scale plants (>500 p.e.) and around 300 industrial large scale plants
(> 20 m3/d) were in operation in Europe (Lesjean et al., 2008). MBR installa-
tions capacity grew in 2007, but declined in 2008 and 2009. The market was
impacted by lower industrial spending due to the economic downturun. How-
ever, there was an increase in demand for large size plants during the past 2 – 3
years. Installations of MBR increased significantly in the years of 2010 and
early 2011 (GIA, 2013).
The main industrial applications are in food and beverage, chemical, pharma-
ceutical and cosmetics, textile industry as well as in laundries. The technical
Literature Review
S. A. Deowan : Development of Membrane Bioreactor (MBR) Process Applying Novel Low Fouling Membrane
27
Chapter2
feasibility of this technology has been demonstrated through a large number of
small and large scale applications.
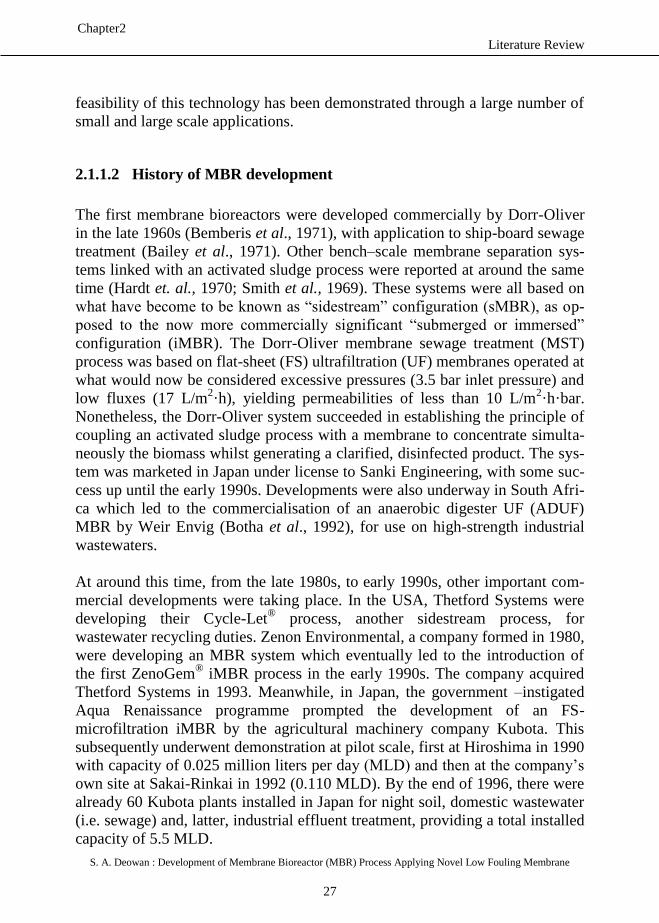
2.1.1.2 History of MBR development
The first membrane bioreactors were developed commercially by Dorr-Oliver
in the late 1960s (Bemberis et al., 1971), with application to ship-board sewage
treatment (Bailey et al., 1971). Other bench–scale membrane separation sys-
tems linked with an activated sludge process were reported at around the same
time (Hardt et. al., 1970; Smith et al., 1969). These systems were all based on
what have become to be known as “sidestream” configuration (sMBR), as op-
posed to the now more commercially significant “submerged or immersed”
configuration (iMBR). The Dorr-Oliver membrane sewage treatment (MST)
process was based on flat-sheet (FS) ultrafiltration (UF) membranes operated at
what would now be considered excessive pressures (3.5 bar inlet pressure) and
low fluxes (17 L/m2·h), yielding permeabilities of less than 10 L/m
2·h·bar.
Nonetheless, the Dorr-Oliver system succeeded in establishing the principle of
coupling an activated sludge process with a membrane to concentrate simulta-
neously the biomass whilst generating a clarified, disinfected product. The sys-
tem was marketed in Japan under license to Sanki Engineering, with some suc-
cess up until the early 1990s. Developments were also underway in South Afri-
ca which led to the commercialisation of an anaerobic digester UF (ADUF)
MBR by Weir Envig (Botha et al., 1992), for use on high-strength industrial
wastewaters.
At around this time, from the late 1980s, to early 1990s, other important com-
mercial developments were taking place. In the USA, Thetford Systems were
developing their Cycle-Let® process, another sidestream process, for
wastewater recycling duties. Zenon Environmental, a company formed in 1980,
were developing an MBR system which eventually led to the introduction of
the first ZenoGem® iMBR process in the early 1990s. The company acquired
Thetford Systems in 1993. Meanwhile, in Japan, the government –instigated
Aqua Renaissance programme prompted the development of an FS-
microfiltration iMBR by the agricultural machinery company Kubota. This
subsequently underwent demonstration at pilot scale, first at Hiroshima in 1990
with capacity of 0.025 million liters per day (MLD) and then at the company’s
own site at Sakai-Rinkai in 1992 (0.110 MLD). By the end of 1996, there were
already 60 Kubota plants installed in Japan for night soil, domestic wastewater
(i.e. sewage) and, latter, industrial effluent treatment, providing a total installed
capacity of 5.5 MLD.
Literature Review
S. A. Deowan : Development of Membrane Bioreactor (MBR) Process Applying Novel Low Fouling Membrane
28
Chapter2
In the early 1990s, only one Kubota plant for sewage treatment had been in-
stalled outside of Japan, this being the pilot plant at Kingston Seymour operat-
ed by Wesex Water in the UK. Within Japan, however, the Kubota process
dominated the market in the 1990s, effectively displacing the older side stream
systems, such as that of Rhodia-Orelis (now Novasep Orelis). To this day, Ku-
bota continues to dominate the Japanese membrane wastewater treatment mar-
ket and also provides the largest number of MBRs worldwide, although around
86% of these are for flows of less than 0.2 MLD.
In the late 1980s, development of a hollow fibre (HF) UF iMBR was taking
place both in Japan, with pioneering work by Kazuo Yamamoto and his co-
workers (1989), and also in the US. By the early 1990s, the ZenoGem®
process
had been patented (Tonelli and Behmann, 1996; Tonelli and Canning, 1993),
and the total installed capacity had reached 2.8 MLD from installations in
North America. Zenon introduced its first immersed HF ZeeWeeD® module in
1993, this being the ZW 145 (145 square feet), quickly followed by the ZW130
and 150 modules. These were in time superceded by the first of the ZW500
series in 1997. The company introduced the ZW500b, c and d modules in 1990,
2001 and 2003 respectively, the design changing to increase the overall process
efficiency and cyclic aeration in 2000. Over this period, Kubota also developed
products with improved overall energy efficiency, introducing a double decker
design in 2003.
The cumulative capacity of both Zenon and Kubota has increased exponential-
ly since the immersed products were first introduced. These two systems domi-
nate the MBR market today, with a very large number of small-scale Kubota
systems and the largest MBR systems tending to be Zenon. The largest MBR
worldwide is currently at Kaarst in Germany (50 MLD), though there is actual-
ly a larger membrane wastewater recycling facility in Kuwait (The Sulaibiya
plant), which has a design capacity of 375 MLD (Judd, 2006, p. 12).
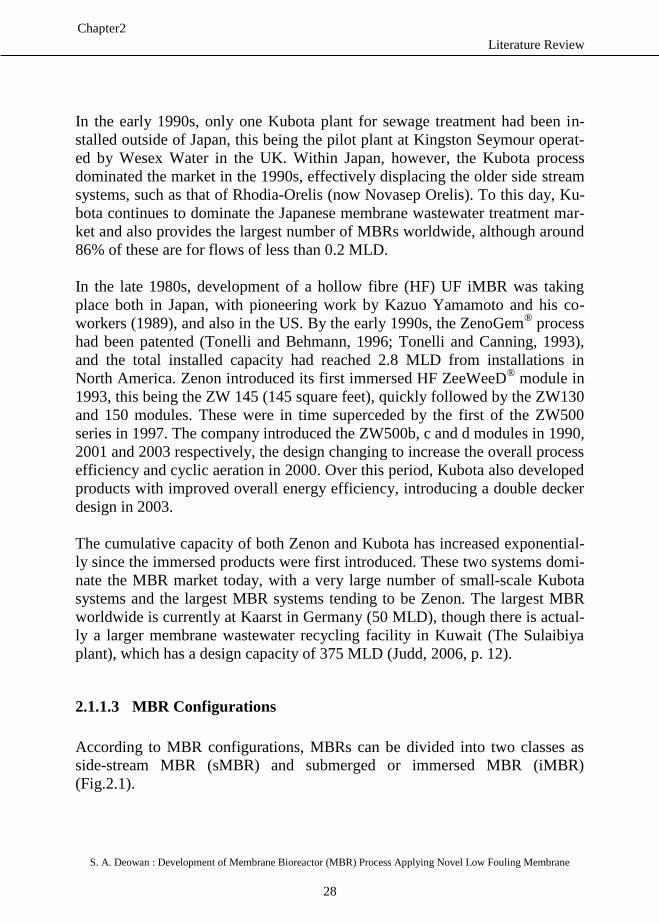
2.1.1.3 MBR Configurations
According to MBR configurations, MBRs can be divided into two classes as
side-stream MBR (sMBR) and submerged or immersed MBR (iMBR)
(Fig.2.1).
Literature Review
S. A. Deowan : Development of Membrane Bioreactor (MBR) Process Applying Novel Low Fouling Membrane
29
Chapter2
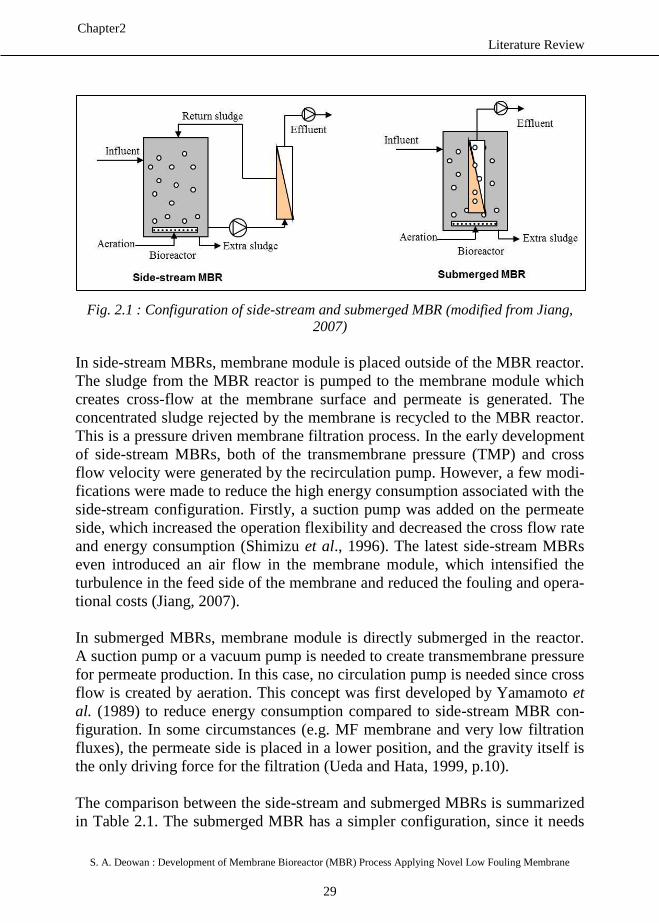
Fig. 2.1 : Configuration of side-stream and submerged MBR (modified from Jiang,
2007)
In side-stream MBRs, membrane module is placed outside of the MBR reactor.
The sludge from the MBR reactor is pumped to the membrane module which
creates cross-flow at the membrane surface and permeate is generated. The
concentrated sludge rejected by the membrane is recycled to the MBR reactor.
This is a pressure driven membrane filtration process. In the early development
of side-stream MBRs, both of the transmembrane pressure (TMP) and cross
flow velocity were generated by the recirculation pump. However, a few modi-
fications were made to reduce the high energy consumption associated with the
side-stream configuration. Firstly, a suction pump was added on the permeate
side, which increased the operation flexibility and decreased the cross flow rate
and energy consumption (Shimizu et al., 1996). The latest side-stream MBRs
even introduced an air flow in the membrane module, which intensified the
turbulence in the feed side of the membrane and reduced the fouling and opera-
tional costs (Jiang, 2007).
In submerged MBRs, membrane module is directly submerged in the reactor.
A suction pump or a vacuum pump is needed to create transmembrane pressure
for permeate production. In this case, no circulation pump is needed since cross
flow is created by aeration. This concept was first developed by Yamamoto et
al. (1989) to reduce energy consumption compared to side-stream MBR con-
figuration. In some circumstances (e.g. MF membrane and very low filtration
fluxes), the permeate side is placed in a lower position, and the gravity itself is
the only driving force for the filtration (Ueda and Hata, 1999, p.10).
The comparison between the side-stream and submerged MBRs is summarized
in Table 2.1. The submerged MBR has a simpler configuration, since it needs
Literature Review
S. A. Deowan : Development of Membrane Bioreactor (MBR) Process Applying Novel Low Fouling Membrane
30
Chapter2
less equipment. The coarse bubble aeration in the membrane tank is multifunc-
tional. In addition to the membrane fouling control, it also supplies oxygen to
the biological process (although the oxygen utilisation efficiency is low). The
biggest advantage of submerged over side-stream configuration is the energy
saving by using coarse bubble aeration, instead of high rate recirculation pump
in side-stream MBRs. The capillary and hollow fibre membranes used in many
submerged MBRs have very high packing density and low cost, which make it
feasible to use more membranes. However, typical tubular membranes used in
side-stream MBRs have low packing density and they are very expensive.
Gander et al. (2000) reviewed 4 side-stream and 4 submerged MBR systems
and concluded that the side-stream MBRs have a higher total energy cost, by
up to two orders of magnitude, mainly due to the high recycle flow velocity (1-
3 m/s) and head loss within the membrane module. In addition, the submerged
MBRs suffered fouling and could be cleaned easier than the side-stream MBRs
(Gander et at., 2000).
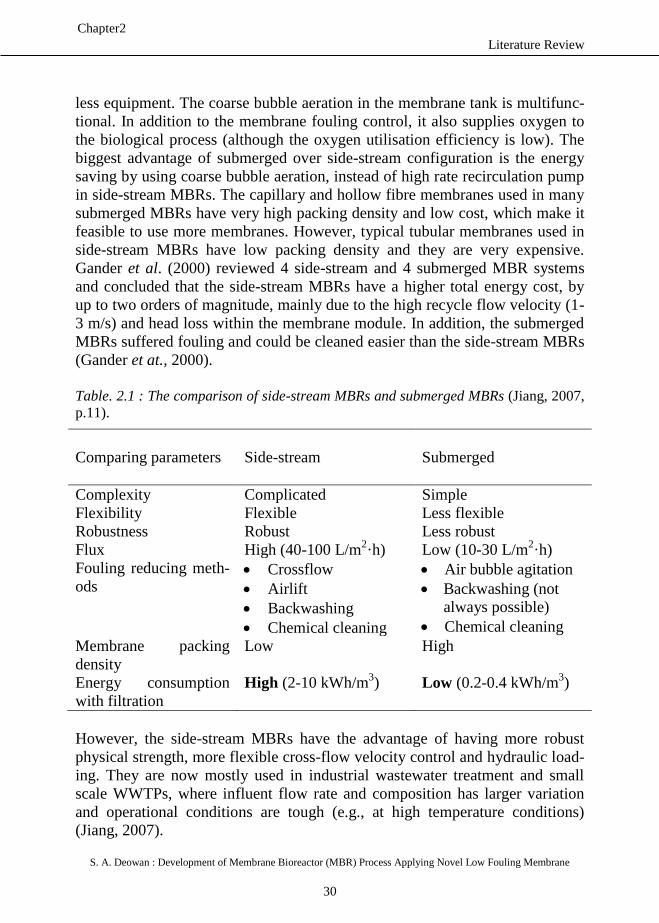
Table. 2.1 : The comparison of side-stream MBRs and submerged MBRs (Jiang, 2007,
p.11).
Comparing parameters
Side-stream
Submerged
Complexity Complicated Simple
Flexibility Flexible Less flexible
Robustness Robust Less robust
Flux High (40-100 L/m2·h) Low (10-30 L/m
2·h)
Fouling reducing meth-
ods Crossflow
Airlift
Backwashing
Chemical cleaning
Air bubble agitation
Backwashing (not
always possible)
Chemical cleaning
Membrane packing
density
Low High
Energy consumption
with filtration
High (2-10 kWh/m3) Low (0.2-0.4 kWh/m
3)
However, the side-stream MBRs have the advantage of having more robust
physical strength, more flexible cross-flow velocity control and hydraulic load-
ing. They are now mostly used in industrial wastewater treatment and small
scale WWTPs, where influent flow rate and composition has larger variation
and operational conditions are tough (e.g., at high temperature conditions)
(Jiang, 2007).
Literature Review
S. A. Deowan : Development of Membrane Bioreactor (MBR) Process Applying Novel Low Fouling Membrane
31
Chapter2
2.1.1.4 Configurations of membrane module
The configuration of the membrane, i.e. its geometry and the way it is mounted
and oriented in relation to the flow of water, is crucial in determining the over-
all process performance (Judd, 2006, p.26). Large membrane areas are normal-
ly required when membranes have to be applied on an industrial scale. The
smallest unit into which the membranes are packed is called module (Mulder,
1996, p.465). The practical considerations concern the way in which the mem-
brane elements, that is the individual discrete membrane units themselves, are
housed in “shells” to produce modules, the complete vessels through which the
water flows. Ideally, the membrane should be configured so as to have (Judd,
2006, p.26) :
(a) a high membrane area to module bulk volume ratio,
(b) a high degree of turbulence for mass transfer promotion on the
feed side,
(c) a low energy expenditure per unit product water volume,
(d) a low cost per unit membrane area,
(e) a design that facilitates cleaning,
(f) a design that permits modularisation
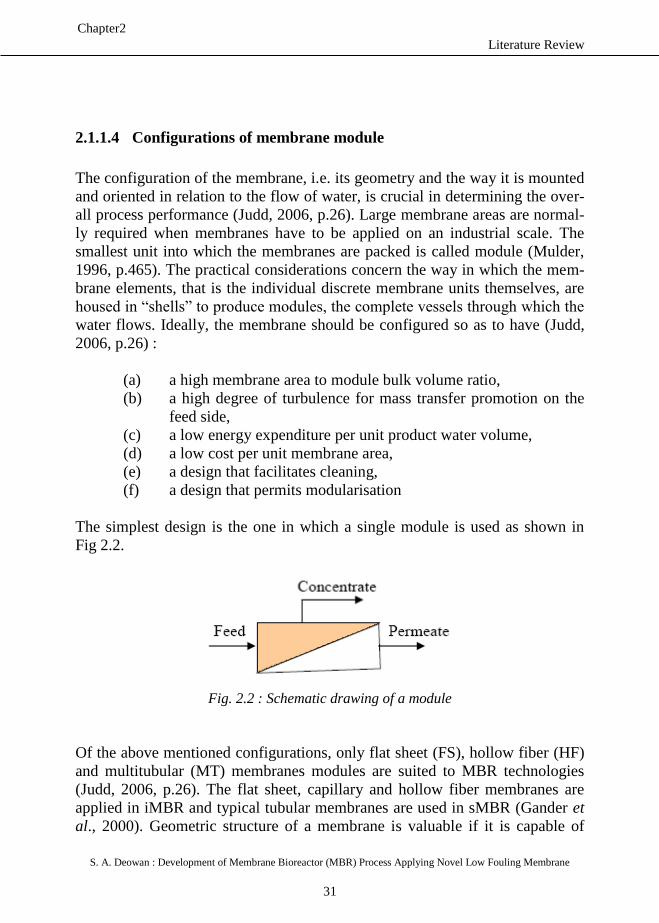
The simplest design is the one in which a single module is used as shown in
Fig 2.2.
Fig. 2.2 : Schematic drawing of a module
Of the above mentioned configurations, only flat sheet (FS), hollow fiber (HF)
and multitubular (MT) membranes modules are suited to MBR technologies
(Judd, 2006, p.26). The flat sheet, capillary and hollow fiber membranes are
applied in iMBR and typical tubular membranes are used in sMBR (Gander et
al., 2000). Geometric structure of a membrane is valuable if it is capable of
Literature Review
S. A. Deowan : Development of Membrane Bioreactor (MBR) Process Applying Novel Low Fouling Membrane
32
Chapter2
minimizing fouling during filtration process, and, contemporarily, of having a
good specific surface of the module, where, for “specific surface” the filtering
surface per unity of occupied volume is intended. Also structural simplicity,
management flexibility and modularity are important factors while deciding if
a membrane module is valuable. A very important parameter often taken into
account while considering the membrane filtration process is the molecular
weight of the compound that can be retained by the membrane. This is called
Molecular Weight Cut Off (MWCO); it refers to molecular cut off of the solute
at which 90% rejection takes place and it is expressed in Dalton (Manigas,
2008).
Since plate and frame membrane from flat sheet membrane module and hollow
fiber membrane from tubular membrane module are most suited to MBR tech-
nologies, these are described in sections 2.1.1.4.1 and 2.1.1.4.2 elaborately.
2.1.1.4.1 Flat sheet membrane module
Plate and frame membrane module
The plate-and-frame module is used on industrial scale for various membrane
separation processes such as ultrafiltration, reverse osmosis and gas separation.
Its design has its origin in the conventional filter press-concept. Membrane,
feed spacers, and product spacers are layered together between two end-plates
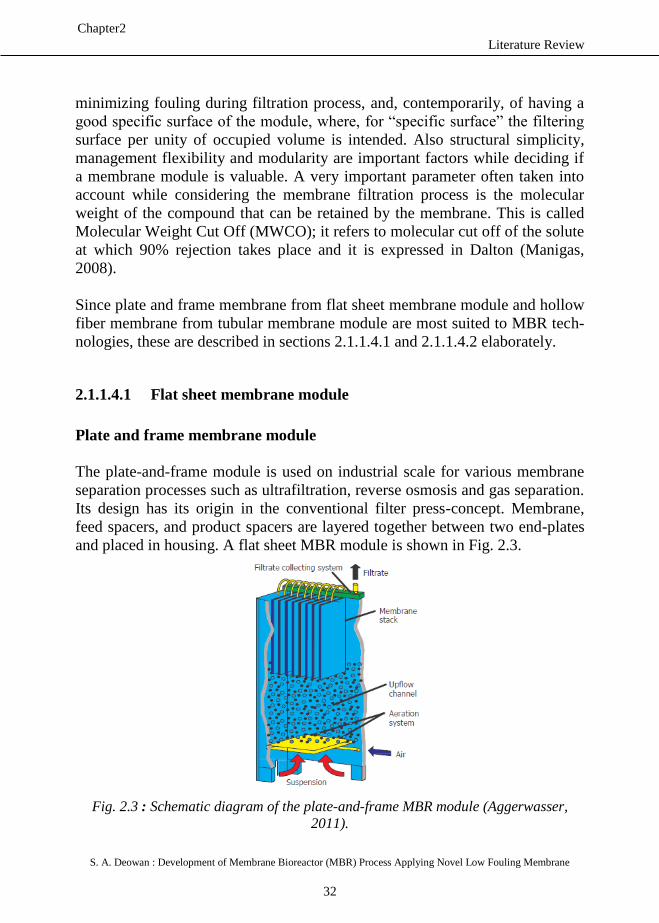
and placed in housing. A flat sheet MBR module is shown in Fig. 2.3.
Fig. 2.3 : Schematic diagram of the plate-and-frame MBR module (Aggerwasser,
2011).
Literature Review
S. A. Deowan : Development of Membrane Bioreactor (MBR) Process Applying Novel Low Fouling Membrane
33
Chapter2
Plate and frame membranes from flat sheet configuration are most suited to
submerged membrane bioreactor. An overview of different membrane configu-
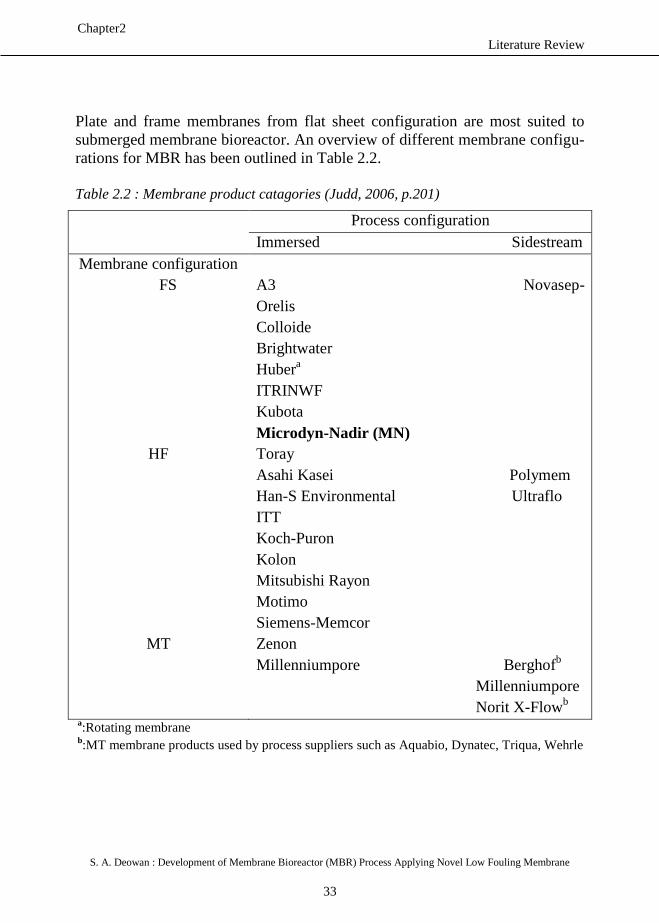
rations for MBR has been outlined in Table 2.2.
Table 2.2 : Membrane product catagories (Judd, 2006, p.201)
Process configuration
Immersed Sidestream
Membrane configuration
FS
HF
MT
A3 Novasep-
Orelis
Colloide
Brightwater
Hubera
ITRINWF
Kubota
Microdyn-Nadir (MN)
Toray
Asahi Kasei Polymem
Han-S Environmental Ultraflo
ITT
Koch-Puron
Kolon
Mitsubishi Rayon
Motimo
Siemens-Memcor
Zenon
Millenniumpore Berghofb
Millenniumpore
Norit X-Flowb
a:Rotating membrane
b:MT membrane products used by process suppliers such as Aquabio, Dynatec, Triqua, Wehrle
Literature Review
S. A. Deowan : Development of Membrane Bioreactor (MBR) Process Applying Novel Low Fouling Membrane
34
Chapter2
2.1.1.4.2 Tubular membrane module
Hollow fiber membrane module
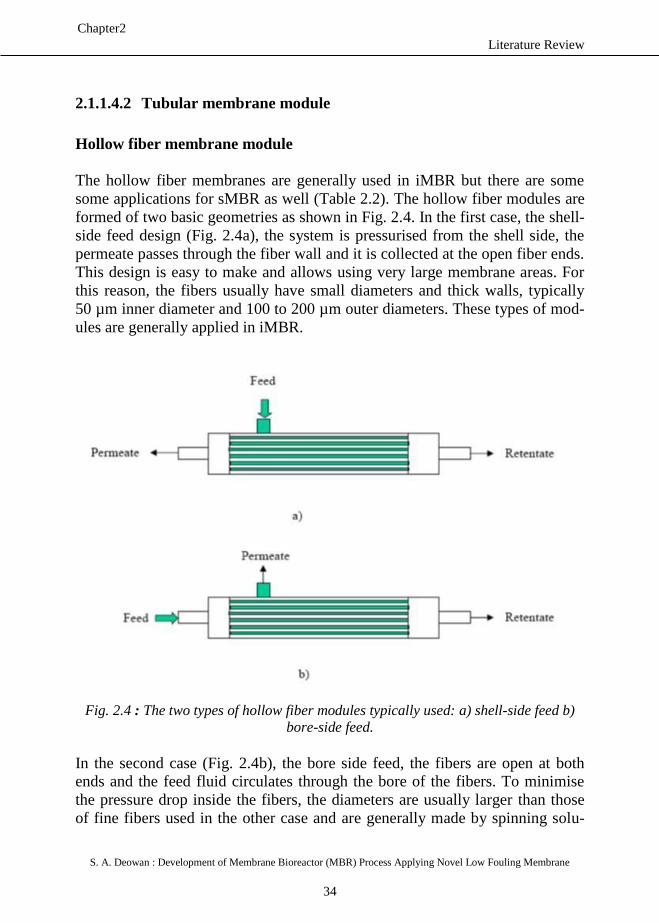
The hollow fiber membranes are generally used in iMBR but there are some
some applications for sMBR as well (Table 2.2). The hollow fiber modules are
formed of two basic geometries as shown in Fig. 2.4. In the first case, the shell-
side feed design (Fig. 2.4a), the system is pressurised from the shell side, the
permeate passes through the fiber wall and it is collected at the open fiber ends.
This design is easy to make and allows using very large membrane areas. For
this reason, the fibers usually have small diameters and thick walls, typically
50 µm inner diameter and 100 to 200 µm outer diameters. These types of mod-
ules are generally applied in iMBR.
Fig. 2.4 : The two types of hollow fiber modules typically used: a) shell-side feed b)
bore-side feed.
In the second case (Fig. 2.4b), the bore side feed, the fibers are open at both
ends and the feed fluid circulates through the bore of the fibers. To minimise
the pressure drop inside the fibers, the diameters are usually larger than those
of fine fibers used in the other case and are generally made by spinning solu-
Literature Review
S. A. Deowan : Development of Membrane Bioreactor (MBR) Process Applying Novel Low Fouling Membrane
35
Chapter2
tion. This type of module is mainly applied with tubular membranes in sMBR.
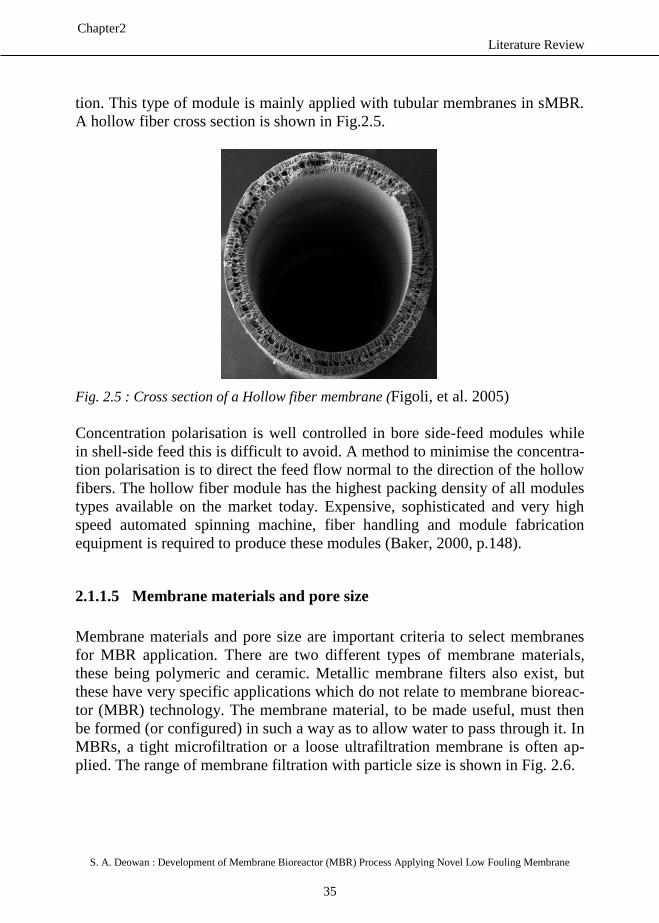
A hollow fiber cross section is shown in Fig.2.5.
Fig. 2.5 : Cross section of a Hollow fiber membrane (Figoli, et al. 2005)
Concentration polarisation is well controlled in bore side-feed modules while
in shell-side feed this is difficult to avoid. A method to minimise the concentra-
tion polarisation is to direct the feed flow normal to the direction of the hollow
fibers. The hollow fiber module has the highest packing density of all modules
types available on the market today. Expensive, sophisticated and very high
speed automated spinning machine, fiber handling and module fabrication
equipment is required to produce these modules (Baker, 2000, p.148).
2.1.1.5 Membrane materials and pore size
Membrane materials and pore size are important criteria to select membranes
for MBR application. There are two different types of membrane materials,
these being polymeric and ceramic. Metallic membrane filters also exist, but
these have very specific applications which do not relate to membrane bioreac-
tor (MBR) technology. The membrane material, to be made useful, must then
be formed (or configured) in such a way as to allow water to pass through it. In
MBRs, a tight microfiltration or a loose ultrafiltration membrane is often ap-
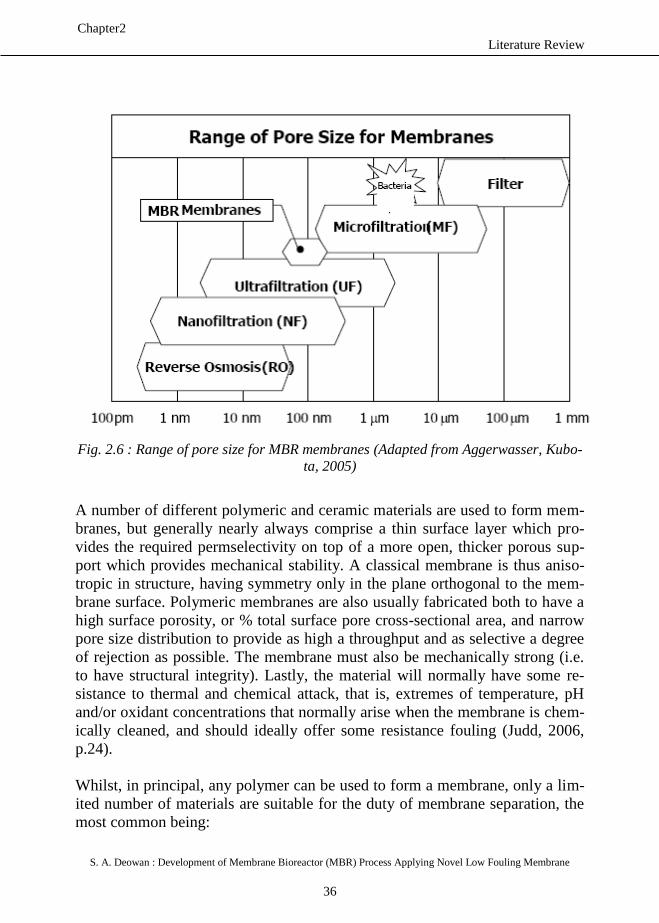
plied. The range of membrane filtration with particle size is shown in Fig. 2.6.
Literature Review
S. A. Deowan : Development of Membrane Bioreactor (MBR) Process Applying Novel Low Fouling Membrane
36
Chapter2
Fig. 2.6 : Range of pore size for MBR membranes (Adapted from Aggerwasser, Kubo-
ta, 2005)
A number of different polymeric and ceramic materials are used to form mem-
branes, but generally nearly always comprise a thin surface layer which pro-
vides the required permselectivity on top of a more open, thicker porous sup-
port which provides mechanical stability. A classical membrane is thus aniso-
tropic in structure, having symmetry only in the plane orthogonal to the mem-
brane surface. Polymeric membranes are also usually fabricated both to have a
high surface porosity, or % total surface pore cross-sectional area, and narrow
pore size distribution to provide as high a throughput and as selective a degree
of rejection as possible. The membrane must also be mechanically strong (i.e.
to have structural integrity). Lastly, the material will normally have some re-
sistance to thermal and chemical attack, that is, extremes of temperature, pH
and/or oxidant concentrations that normally arise when the membrane is chem-
ically cleaned, and should ideally offer some resistance fouling (Judd, 2006,
p.24).
Whilst, in principal, any polymer can be used to form a membrane, only a lim-
ited number of materials are suitable for the duty of membrane separation, the
most common being:
Literature Review
S. A. Deowan : Development of Membrane Bioreactor (MBR) Process Applying Novel Low Fouling Membrane
37
Chapter2
Polyvinylidene difluoride (PVDF)
Polyethylsulphone (PES)
Polyethylene (PE)
Polypropylene (PP)
Polysulfon (PS)
The most often used membrane materials in MBRs are organic polymers, e.g.,
PE, PP and PVDF membranes (Judd, 2006, p.25). Some of them are blended
with other materials to change their surface charge or hydrophobicity (Mulder,
1996, p.49). Nowadays ceramic materials have been shown suitable for MBR
technology due to their thermal, chemical and mechanical stability.
All the above polymers can be formed, through specific manufacturing tech-
niques, into membrane materials having desirable physical properties, and they
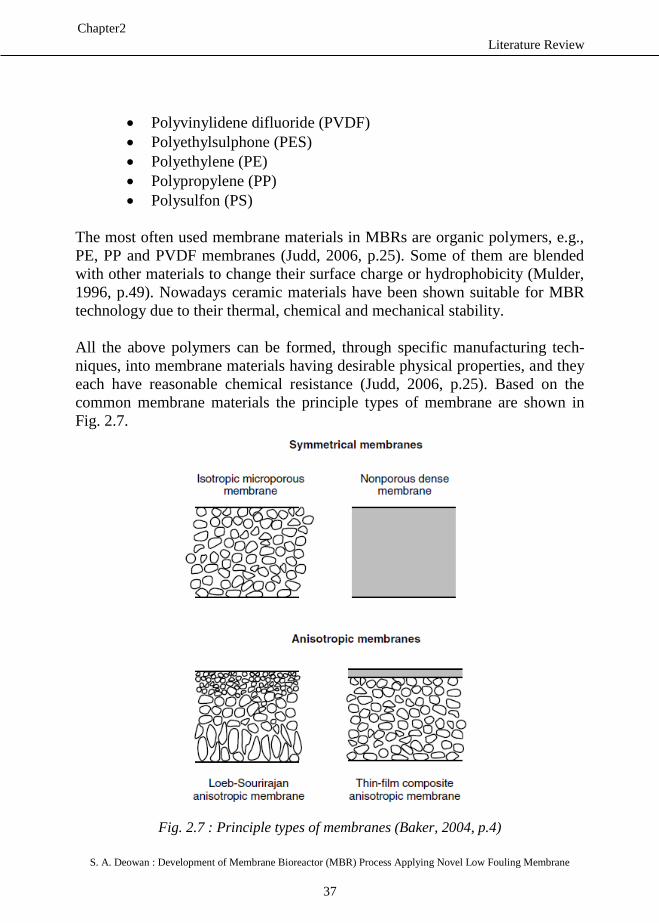
each have reasonable chemical resistance (Judd, 2006, p.25). Based on the
common membrane materials the principle types of membrane are shown in
Fig. 2.7.
Fig. 2.7 : Principle types of membranes (Baker, 2004, p.4)
Literature Review
S. A. Deowan : Development of Membrane Bioreactor (MBR) Process Applying Novel Low Fouling Membrane
38
Chapter2
Membrane hydrophobicity has shown in some studies to play a significant role
(Chang and Lee, 1998; Chang et al., 1999; Choo et al., 2000a; Stephenson et
al., 2000). Hydrophobic protein residues can form strong attachments to hy-
drophobic membranes resulting in strong fouling (Howell and Nystrom,1993;
Russotti et al., 2001). Indeed, surface modification of hydrophobic polymeric
membranes by chemical oxidation, chemical reaction, plasma treatment (Judd,
2006, p.25) or grafting more hydrophilic polymers can reduce fouling and im-
prove flux (Choo et al., 2000b; Russotti et al., 2001; Sainbayar et al., 2001).
Membrane materials may also determine the applicable fluxes. Kang et al.
(2002) compared the filtration characteristics of organic and inorganic mem-
branes, observing that flux was determined by internal fouling in inorganic
membranes and the formation of a cake layer over the organic membrane.
Ghyoot and Verstraete (1997) also achieved higher fluxes using a ceramic mi-
crofiltration membrane, in comparison with a polymeric ultrafiltration mem-
brane. However, these differences in membrane performances may also be the
result of structural differences between the membranes, like surface roughness.
(Bérubé et al., 2006).
Membrane pore sizes used in wastewater treatment applications are in the
range of 0.02-0.5 μm (Stephenson et al., 2000). Several authors have observed
the existence of an optimum membrane pore size (Choo and Lee, 1996;
Elmaleh and Abdelmoumni, 1997). This suggests that higher pore sizes may
foul more rapidly as a result of blocking by macrocolloids or cells, while those
smaller are expected to foul more readily as a result of clogging by micro-
colloids that can adsorb to the internal surface of the pores (Bérubé et al.,
2006). It should also be considered that membrane rejection properties are not
only defined by membrane pore size but also by the formation of a gel or cake
layer, which acts as a secondary dynamic membrane. This phenomenon has
been observed in both anaerobic and aerobic MBRs (Harada et al., 1994; Pillay
et al., 1994; Choi et al., 2005b). When long term operation is considered, the
formation of cake or gel layers may also reduce the influence of membrane
properties over filtration performance, since the membrane is not anymore in
direct contact with the suspension.
2.1.2 Filtration processes of MBRs
Literature Review
S. A. Deowan : Development of Membrane Bioreactor (MBR) Process Applying Novel Low Fouling Membrane
39
Chapter2
2.1.2.1 Membrane filtration process in general
A membrane is an interphase that restricts the passage of different components
in a specific manner and over a wide range of particle sizes and molecular
weights, from ions to macromolecules (Drioli, et al. 2005, p.8).
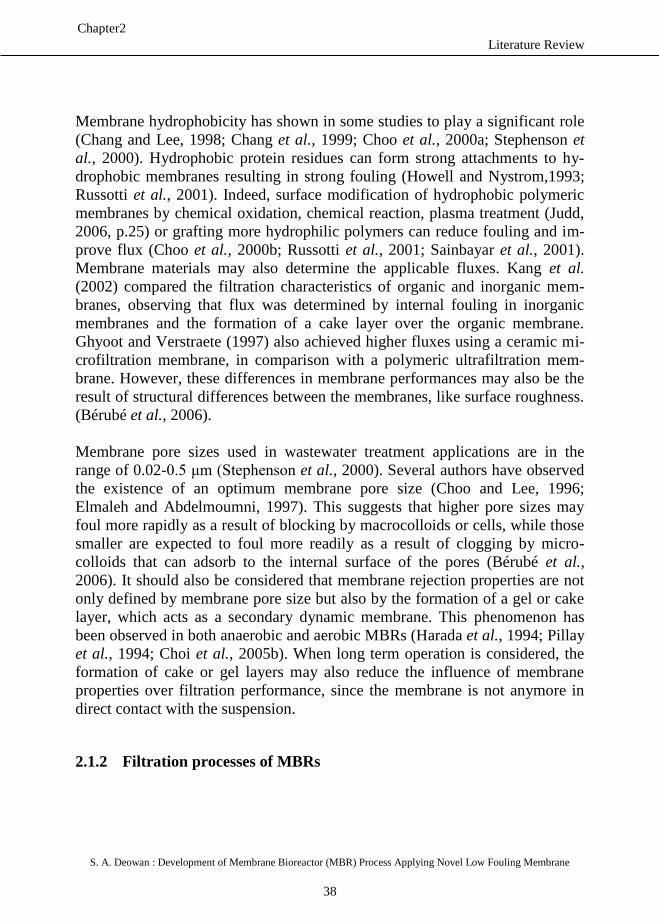
The influent to the membrane is called “feed” and the solvent passes through
the membrane is called “permeate”. It is measured as a flow rate per surface
unit. The liquid that is retained by the membrane and remained in the feed
stream is called “concentrate or retentate”. The basic principle of a membrane
operation is shown in Fig. 2.8.
Fig. 2.8 : Basic principle of membrane operation
The efficiency of a membrane basically is determined by two parameters: per-
meability (the rate at which a given component is transferred through the
membrane) and selectivity (the ability to separate in a specific way a given
component from others). The transport of different species through a mem-
brane is a non-equilibrium process, and the separation of the different compo-
nents results from difference in their transport rate. In a membrane separation
process, the transport rate of a component through the membrane is activated
by various driving forces such as gradients in concentration, pressure, tempera-
ture or electrical potential.
2.1.2.2 Pressure driven membrane process
In pressure driven membrane processes the solvent and solute molecules per-
meate through the membrane as a result of the applied pressure, whereas other
molecules or particles are rejected to various extents depending on the structure
of the membrane. If the pore size is considered for membranes from microfil-
tration to ultrafiltration, nanofiltration and reverse osmosis, the pore sizes in
Literature Review
S. A. Deowan : Development of Membrane Bioreactor (MBR) Process Applying Novel Low Fouling Membrane
40
Chapter2
the membrane diminishes and consequently becomes smaller the size (or mo-
lecular weight) of the particles or molecules separated. This implies that the
resistance of the membranes to mass transfer increases and hence the applied
pressure has to be increased to obtain the same flux (Table 2.3).
Table 2.3 : Typical pore size and driving force applied in pressure driven membrane
processe (IUPAC definition of pore diameter: Macropores: > 50 nm; Mesopores:
range 2 nm – 50 nm; Micropores: < 2 nm (Drioli, et al. 2005, p.9).
Membrane pro-
cess
Typical pore size Pressure ap-
plied Pore diameter IUPAC classifica-
tion
Microfiltration 50 – 10000 nm macropores <2 bar
Ultrafiltration 1 – 100 nm mesopores 1 – 10 bar
Nanofiltration < 2 nm micropores 10 – 25 bar
Reverse Osmosis < 2 nm micropores 15 – 80 bar
Filtration systems, which membranes belong to, can be divided primarily into
“depth filters”, in which all the depth of filtering element contributes to retain
the particles from the flow, and “screen filters”, in which particles whose di-
mensions are larger than pores are retained on a single side of the filter. Mem-
branes (e.g. MBR) belong to this last category, the one of screen filters (Mani-
gas, 2008).
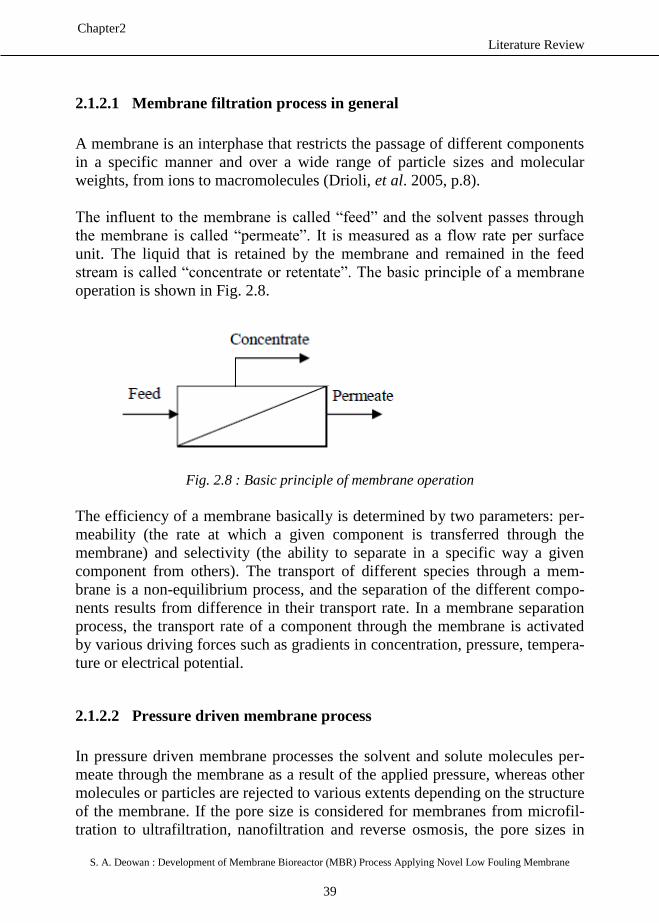
Microfiltration and ultrafiltration processes are mainly related to porous mem-
branes and are used in MBR technology. A large variety of pore geometries is
possible.
Fig. 2.9 : Simplified schematic pore geometries in porous membranes : a) cylindrical
b) spherical (UNSW, 2005, aaflowsystem, 2005, tu-freiburg, 2011) (a)
Literature Review
S. A. Deowan : Development of Membrane Bioreactor (MBR) Process Applying Novel Low Fouling Membrane
41
Chapter2
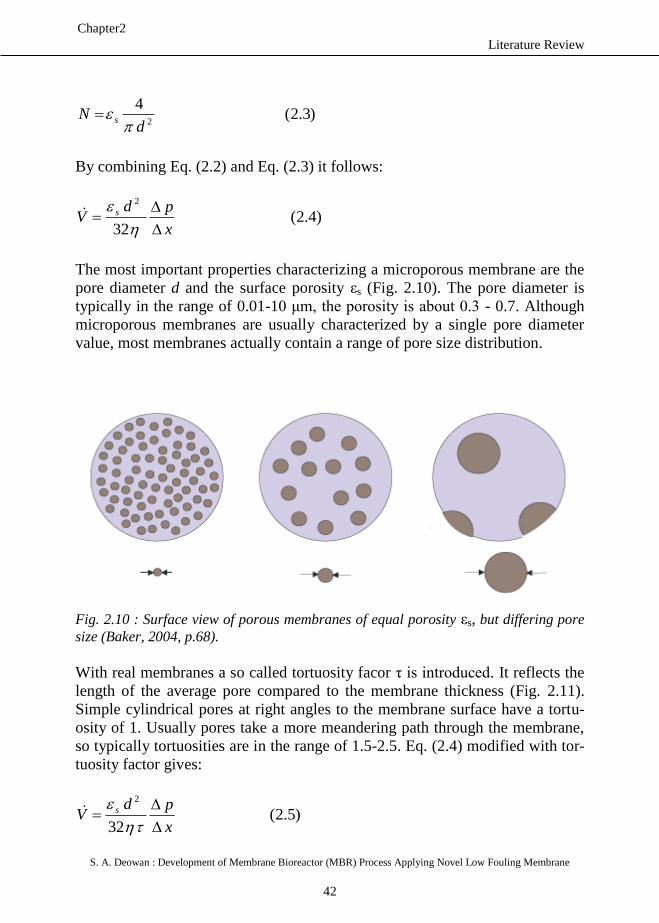
Fig. 2.9 gives two simplified schematic pore geometries found in porous mem-
branes. The existence of these pore geometries implies that different models
have been developed to describe mass transport adequately.
Since MBR technology represents microfiltration or ultrafiltration processes,
the models based on these processes have been taken into account. These
transport models indicate which structural parameters are important and how
membrane performance can be improved by variation of specific parameters.
There are mainly two basic models (Mulder, 1996, p.224):
Model A
Model B
These models are discussed in the following sections.
Model A
The simplest representation is one in which the membrane is considered as a
number of parallel cylindrical pores perpendicular to the membrane surface
(Fig. 2.9 a).
The length of each cylindrical pore is in simplest equal to membrane thickness.
The volume flux can be described by the Hagen-Poiseuille law. Assuming that
all pores have the same diameter the liquid flow through a pore is given by:
)1.2(128
4
x
pdq
Where Δp is the pressure difference across the pore length Δx, η is the liquid
viscosity and d is the diameter of the pore. The flux, or flow per unit membrane
area, is the sum of all flows through the individual pores and so given by:
)2.2(128
4
x
pdNV
Where N is the number of pores per square unit of membrane. For membranes
of equal pore area and surface porosity εs, the number of pores per square unit,
N is:
Literature Review
S. A. Deowan : Development of Membrane Bioreactor (MBR) Process Applying Novel Low Fouling Membrane
42
Chapter2
)3.2(4
2dN s
By combining Eq. (2.2) and Eq. (2.3) it follows:
)4.2(32
2
x
pdV s
The most important properties characterizing a microporous membrane are the
pore diameter d and the surface porosity εs (Fig. 2.10). The pore diameter is
typically in the range of 0.01-10 μm, the porosity is about 0.3 - 0.7. Although
microporous membranes are usually characterized by a single pore diameter
value, most membranes actually contain a range of pore size distribution.
Fig. 2.10 : Surface view of porous membranes of equal porosity εs, but differing pore
size (Baker, 2004, p.68).
With real membranes a so called tortuosity facor τ is introduced. It reflects the
length of the average pore compared to the membrane thickness (Fig. 2.11).
Simple cylindrical pores at right angles to the membrane surface have a tortu-
osity of 1. Usually pores take a more meandering path through the membrane,
so typically tortuosities are in the range of 1.5-2.5. Eq. (2.4) modified with tor-
tuosity factor gives:
)5.2(32
2
x
pdV s
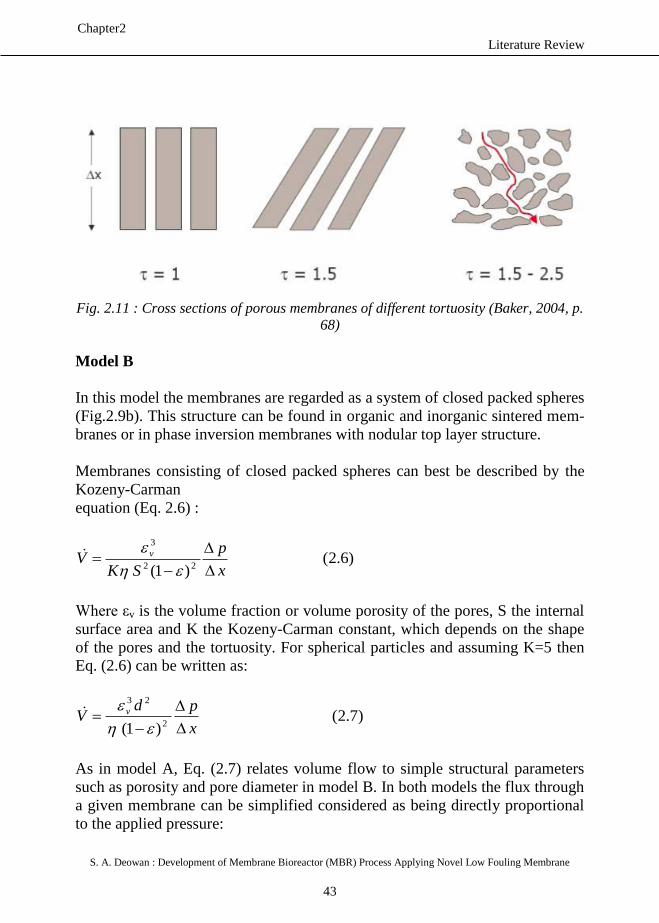
Literature Review
S. A. Deowan : Development of Membrane Bioreactor (MBR) Process Applying Novel Low Fouling Membrane
43
Chapter2
Fig. 2.11 : Cross sections of porous membranes of different tortuosity (Baker, 2004, p.
68)
Model B
In this model the membranes are regarded as a system of closed packed spheres
(Fig.2.9b). This structure can be found in organic and inorganic sintered mem-
branes or in phase inversion membranes with nodular top layer structure.
Membranes consisting of closed packed spheres can best be described by the
Kozeny-Carman
equation (Eq. 2.6) :
)6.2()1( 22
3
x
p
SKV v
Where εv is the volume fraction or volume porosity of the pores, S the internal
surface area and K the Kozeny-Carman constant, which depends on the shape
of the pores and the tortuosity. For spherical particles and assuming K=5 then
Eq. (2.6) can be written as:
)7.2()1( 2
23
x
pdV v
As in model A, Eq. (2.7) relates volume flow to simple structural parameters
such as porosity and pore diameter in model B. In both models the flux through
a given membrane can be simplified considered as being directly proportional
to the applied pressure:
Literature Review
S. A. Deowan : Development of Membrane Bioreactor (MBR) Process Applying Novel Low Fouling Membrane
44
Chapter2
)8.2(PAV
Where, the so called permeability constant A contains all structural factors.
2.1.2.3 Parameters affecting membrane performances
A pressure driven membrane filtration process (section 2.1.2.2) based on pres-
sure gradient is affected by the following factors:
Intrinsic resistance of the membrane
Transmembrane pressure (TMP)
Hydrodynamic regime at the interface between the membrane and the
solution to be filtered.
Concentration polarisation phenomenon
Fouling
2.1.2.3.1 Intrinsic resistance of the membrane
Intrinsic resistance of a membrane is the physical resistance opposed by the
clean membrane to the filtration of pure water. It is the function of pore dimen-
sion, of surface porosity of the membrane, of the ratio between surface and
volume of porous surface (m2·m
-3) and of membrane depth (Manigas, 2008).
This is denoted by A
1 as shown in Eq. (2.8).
2.1.2.3.2 Transmembrane pressure (TMP)
Transmembrane pressure (TMP) is denoted as the pressure difference applied
between upstream and downstream of the membrane in order to determine the
permeate crossing through the membrane (section 2.1.2.2). TMP is thus de-
fined as
TMP = Pfeed - Ppermeate
Where,
Literature Review
S. A. Deowan : Development of Membrane Bioreactor (MBR) Process Applying Novel Low Fouling Membrane
45
Chapter2
Pfeed = pressure on the side of the solution to be filtrated (bar)
Ppermeate = pressure on the side of the permeate (bar)
For submerged membranes, pressure in the upstream of the membrane is calcu-
lated as average hydrostatic charge between upper and lower extremity of the
module:
)9.2(2
.... lowup
feed
hghgP
Where,
ρ = feed density (kg/m3)
g = acceleration due to gravity (m/s2)
hup = immersion depth of the upper extreme of the filtering surface (m)
hlow = immersion depth of the lower extreme of the filtering surface (m) (Man-
igas, 2008).
2.1.2.3.3 Hydrodynamic regime
Usually, turbulence obtained by means of increase of feed flow rate can be
helpful in decreasing membrane fouling (details on fouling is described in sec-
tion 2.1.3.2). However, overcoming a certain feed flow rate can cause mem-
brane fouling, because while turbulence cleans away the bigger molecules from
the surface of the membrane, the small molecules enter into the pores of the
membrane causing its irreversible fouling.
A membrane system can be operated in two ways:
at constant TMP, with progressive flux decrease, caused by the gradual
membrane fouling;
at constant flux, with progressive increase of TMP, due to the gradual
membrane pores blocking.
2.1.2.4 Hydraulic geometry of MBR
Hydraulic geometry of MBR is a complex aspect. So many parameters and
geometries are involved in the hydraulic systems of MBR. Microbiology in the
reactor is one of them. The microbiological aspect is described in section
2.1.2.4.1 below.
Literature Review
S. A. Deowan : Development of Membrane Bioreactor (MBR) Process Applying Novel Low Fouling Membrane
46
Chapter2
2.1.2.4.1 Microbiological aspects of MBR
Microbiological species of MBR are influenced by several common parameters
such as:
Hydraulic residence time (HRT)
Mixed liquor suspended solids (MLSS)
Sludge retention time (SRT)
Sludge loading (SL) etc.
An overview of these common parameters have been outlined in the following
sections.
Hydraulic residence time (HRT)
Hydraulic residence time (HRT) indicates the time as long the feed solution
remains in the MBR reactor in hour before it gets processed as permeate by
membrane. The formula for HRT is
)10.2()/(
)()(
hLflowPermeate
LvolumeHydraulichHRT
From equation (2.10) it is clear that HRT depends on the hydraulic volume of
the reactor and the permeate flow. If HRT is very high, it is easier for bacteria
to acclimate the reactor conditions but very low HRT affects the conditions
inversely.
Mixed liquor suspended solids (MLSS)
Mixed liquor suspended solids (MLSS) is the concentration of suspended sol-
ids in mixed liquor, usually expressed in g/L (wateronline, 2011). Mixed liquor
is a mixture of raw or settled wastewater and activated sludge contained in an
aeration basin in the activated sludge process. The MLSS is used to control the
wastewater treatment plant in suspended growth process.
Sludge retention time (SRT)
Sludge retention time (SRT) indicates how frequently the sludge is taken away
from MBR reactor. In another way, it means the sludge age. According to
(Laera et al, 2007) a significant correlation between SRT and organic loading
rate has been observed. This study suggested that the biomass activity is weak-
Literature Review
S. A. Deowan : Development of Membrane Bioreactor (MBR) Process Applying Novel Low Fouling Membrane
47
Chapter2
ly affected by the sludge age. Membrane cleaning requirements also appear to
be scarcely dependent on SRT.
Sludge loading (SL)
The sludge loading or feed to microorganism (F/M) ratio is an important design
parameter for MBR process. Generally, the MBR process can operate at higher
F/M ratios when compared to an activated sludge plant (Robinsion, 2003). It is
defined by kg COD/kg MLSS·day.
Microbiological aspects:
In the biochemical stage of wastewater treatment, organic carbon and nutrients
are removed from wastewater by microbes. These microbes live and grow en-
meshed in Extra-cellular Polymeric Substances (EPS) that bind them into dis-
crete micro-colonies forming three-dimensional aggregated microbial struc-
tures called flocs. The ability of microorganisms to form flocs is vital for the
activated sludge treatment of wastewater. The floc structure enables not only
the adsorption of soluble substrates but also the adsorption of the colloidal mat-
ter and macromolecules additionally found in wastewaters (Michael et al.,
2002, Liwarska-Bizukojc et al., 2005). The diversity of microbial community
in activated sludge is very large, containing prokaryotes (bacteria), eukaryotes
(protozoa, nematodes, rotifers), and viruses. In this complex microsystem, bac-
teria dominate the microbial population and play a key role in the degradation
process (Michael et al., 2002).
MBR technology with biochemical and sludge-separation stage integrated into
one step implies a continuous generation of new sludge with the consumption
of feed organic materials, while some sludge mass is decayed by endogenous
respiration. Endogenous respiration involves consumption of cell-internal sub-
strate, which leads to a loss of activity and slightly reduced biomass. Endoge-
nous respiration implies all forms of biomass loss and energy requirements not
associated with growth by considering related respiration under aerobic condi-
tions: decay, maintenance, endogenous respiration, lyses, predation, and death.
It can be both aerobic and anoxic, though under anoxic conditions it is a lot
slower and especially protozoa are considerably less active under denitrifying
conditions (slower predation) (Gujer et al., 1999).
Endogenous respiration of a microbial community in MBR can be encouraged
by very high sludge age, i.e., high sludge concentration. The energy available
to microorganisms is determined by the supply of substrate. By increasing the
Literature Review
S. A. Deowan : Development of Membrane Bioreactor (MBR) Process Applying Novel Low Fouling Membrane
48
Chapter2
Sludge Retention Time (SRT), which increases biomass concentration, it
would be theoretically possible to reach a situation where the amount of energy
provided equals the maintenance demand. This concept was first introduced. by
Pirt (Pirt, S.J., 1965), where maintenance energy is defined as the amount of
biochemical energy strictly necessary for sludge endogenous respiration. Mi-
croorganisms satisfy their maintenance energy requirements in preference to
producing additional biomass. Therefore, under the conditions of decreased
nutrient supply, external substrate is used only for the upkeep of bacterial func-
tions, while the amount of bacteria is not changed. In various studies on appli-
cations of MBR in wastewater treatment, zero sludge production was estab-
lished at different F/M ratios, obviously depending on feed compositions which
determine the growth of microbial populations (Liu et al., 2005; Rosenberger
et al., 2000; Yoon et al., 2002).
However, there is an optimal biomass concentration (i.e., SRT) for a successful
operation of MBR. Biomass retention results in a slow-growing population
with high sludge ages, where cell dormancy and death reduce the viability of
population (Cicek et al., 2001; Macomber et al., 2005). An example of changes
in sludge yield and biomass concentration with sludge age are presented in Fig.
2.12 (HRT- hydraulic retention time, k-rate constant for endogenous metabo-
lism, kd-rate constant for biomass decay) (Howell et al., 2003).
Several explanations are suggested for this phenomenon. Since MBR sludge
acts as a non-Newtonian fluid, by increasing the mixed-liquor suspended solids
(MLSS) concentration, the viscosity of sludge increases exponentially. This
results in mass transfer limitations for both the oxygen and substrate, which
increases aeration costs as well as causing extensive membrane fouling (Wei,
Y., 2003). On the other side, at lower MLSS concentrations, more specific sur-
face area is available for the uptake of a substrate and enzyme production, and
the enzymatic activity is higher. Thus, when operating at low SRT, response of
the system in degradation of xenobiotic waste should be faster.
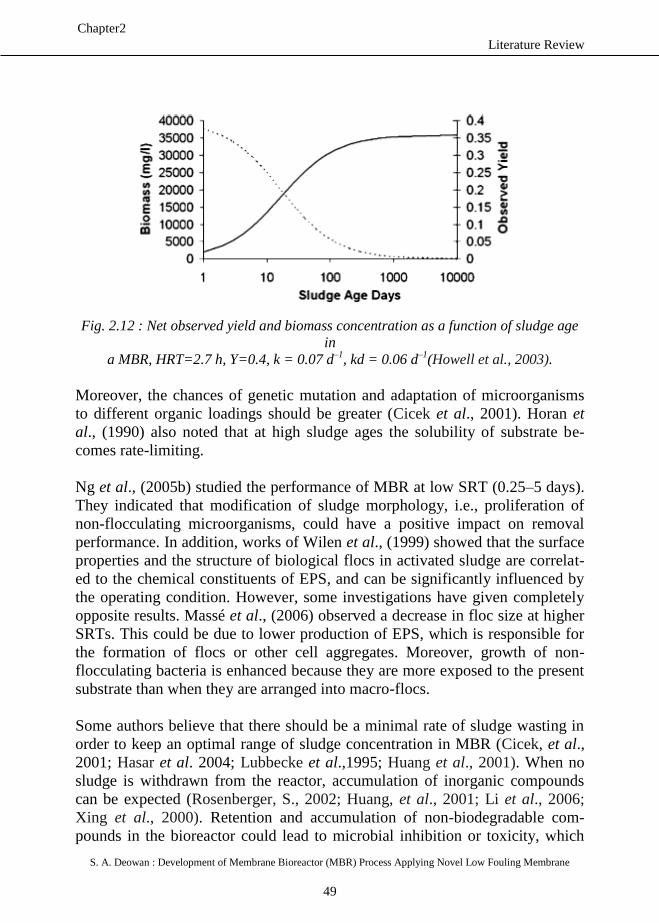
Literature Review
S. A. Deowan : Development of Membrane Bioreactor (MBR) Process Applying Novel Low Fouling Membrane
49
Chapter2
Fig. 2.12 : Net observed yield and biomass concentration as a function of sludge age
in
a MBR, HRT=2.7 h, Y=0.4, k = 0.07 d–1
, kd = 0.06 d–1
(Howell et al., 2003).
Moreover, the chances of genetic mutation and adaptation of microorganisms
to different organic loadings should be greater (Cicek et al., 2001). Horan et
al., (1990) also noted that at high sludge ages the solubility of substrate be-
comes rate-limiting.
Ng et al., (2005b) studied the performance of MBR at low SRT (0.25–5 days).
They indicated that modification of sludge morphology, i.e., proliferation of
non-flocculating microorganisms, could have a positive impact on removal
performance. In addition, works of Wilen et al., (1999) showed that the surface
properties and the structure of biological flocs in activated sludge are correlat-
ed to the chemical constituents of EPS, and can be significantly influenced by
the operating condition. However, some investigations have given completely
opposite results. Massé et al., (2006) observed a decrease in floc size at higher
SRTs. This could be due to lower production of EPS, which is responsible for
the formation of flocs or other cell aggregates. Moreover, growth of non-
flocculating bacteria is enhanced because they are more exposed to the present
substrate than when they are arranged into macro-flocs.
Some authors believe that there should be a minimal rate of sludge wasting in
order to keep an optimal range of sludge concentration in MBR (Cicek, et al.,
2001; Hasar et al. 2004; Lubbecke et al.,1995; Huang et al., 2001). When no
sludge is withdrawn from the reactor, accumulation of inorganic compounds
can be expected (Rosenberger, S., 2002; Huang, et al., 2001; Li et al., 2006;
Xing et al., 2000). Retention and accumulation of non-biodegradable com-
pounds in the bioreactor could lead to microbial inhibition or toxicity, which
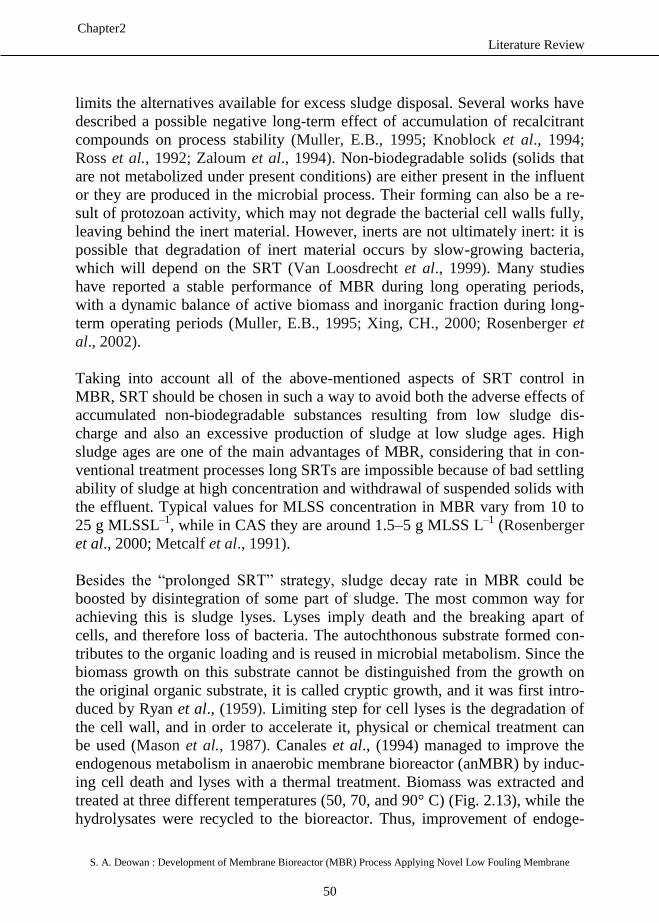
Literature Review
S. A. Deowan : Development of Membrane Bioreactor (MBR) Process Applying Novel Low Fouling Membrane
50
Chapter2
limits the alternatives available for excess sludge disposal. Several works have
described a possible negative long-term effect of accumulation of recalcitrant
compounds on process stability (Muller, E.B., 1995; Knoblock et al., 1994;
Ross et al., 1992; Zaloum et al., 1994). Non-biodegradable solids (solids that
are not metabolized under present conditions) are either present in the influent
or they are produced in the microbial process. Their forming can also be a re-
sult of protozoan activity, which may not degrade the bacterial cell walls fully,
leaving behind the inert material. However, inerts are not ultimately inert: it is
possible that degradation of inert material occurs by slow-growing bacteria,
which will depend on the SRT (Van Loosdrecht et al., 1999). Many studies
have reported a stable performance of MBR during long operating periods,
with a dynamic balance of active biomass and inorganic fraction during long-
term operating periods (Muller, E.B., 1995; Xing, CH., 2000; Rosenberger et
al., 2002).
Taking into account all of the above-mentioned aspects of SRT control in
MBR, SRT should be chosen in such a way to avoid both the adverse effects of
accumulated non-biodegradable substances resulting from low sludge dis-
charge and also an excessive production of sludge at low sludge ages. High
sludge ages are one of the main advantages of MBR, considering that in con-
ventional treatment processes long SRTs are impossible because of bad settling
ability of sludge at high concentration and withdrawal of suspended solids with
the effluent. Typical values for MLSS concentration in MBR vary from 10 to
25 g MLSSL–1
, while in CAS they are around 1.5–5 g MLSS L–1
(Rosenberger
et al., 2000; Metcalf et al., 1991).
Besides the “prolonged SRT” strategy, sludge decay rate in MBR could be
boosted by disintegration of some part of sludge. The most common way for
achieving this is sludge lyses. Lyses imply death and the breaking apart of
cells, and therefore loss of bacteria. The autochthonous substrate formed con-
tributes to the organic loading and is reused in microbial metabolism. Since the
biomass growth on this substrate cannot be distinguished from the growth on
the original organic substrate, it is called cryptic growth, and it was first intro-
duced by Ryan et al., (1959). Limiting step for cell lyses is the degradation of
the cell wall, and in order to accelerate it, physical or chemical treatment can
be used (Mason et al., 1987). Canales et al., (1994) managed to improve the
endogenous metabolism in anaerobic membrane bioreactor (anMBR) by induc-
ing cell death and lyses with a thermal treatment. Biomass was extracted and
treated at three different temperatures (50, 70, and 90° C) (Fig. 2.13), while the
hydrolysates were recycled to the bioreactor. Thus, improvement of endoge-
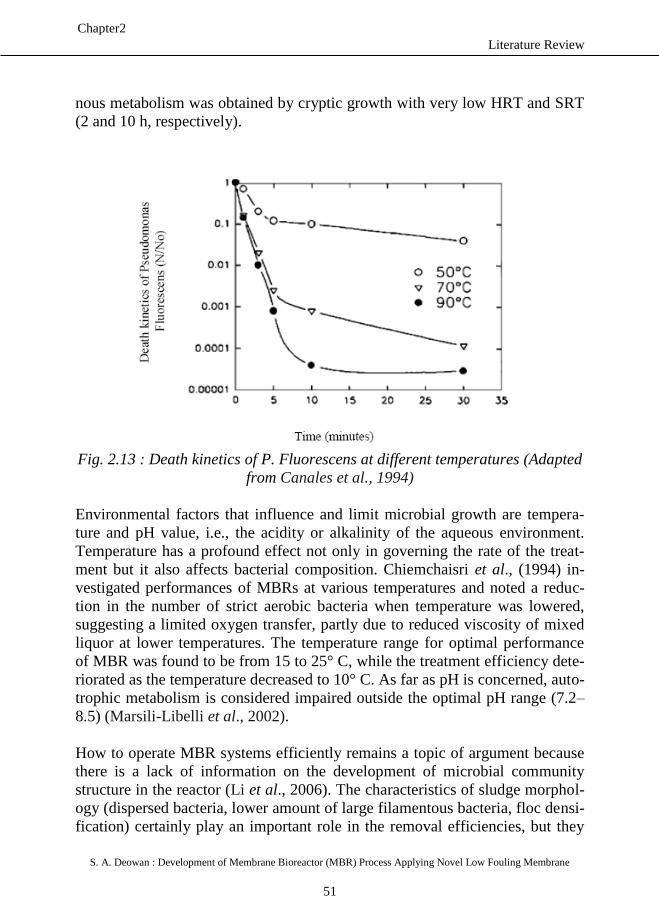
Literature Review
S. A. Deowan : Development of Membrane Bioreactor (MBR) Process Applying Novel Low Fouling Membrane
51
Chapter2
nous metabolism was obtained by cryptic growth with very low HRT and SRT
(2 and 10 h, respectively).
Fig. 2.13 : Death kinetics of P. Fluorescens at different temperatures (Adapted
from Canales et al., 1994)
Environmental factors that influence and limit microbial growth are tempera-
ture and pH value, i.e., the acidity or alkalinity of the aqueous environment.
Temperature has a profound effect not only in governing the rate of the treat-
ment but it also affects bacterial composition. Chiemchaisri et al., (1994) in-
vestigated performances of MBRs at various temperatures and noted a reduc-
tion in the number of strict aerobic bacteria when temperature was lowered,
suggesting a limited oxygen transfer, partly due to reduced viscosity of mixed
liquor at lower temperatures. The temperature range for optimal performance
of MBR was found to be from 15 to 25° C, while the treatment efficiency dete-
riorated as the temperature decreased to 10° C. As far as pH is concerned, auto-
trophic metabolism is considered impaired outside the optimal pH range (7.2–
8.5) (Marsili-Libelli et al., 2002).
How to operate MBR systems efficiently remains a topic of argument because
there is a lack of information on the development of microbial community
structure in the reactor (Li et al., 2006). The characteristics of sludge morphol-
ogy (dispersed bacteria, lower amount of large filamentous bacteria, floc densi-
fication) certainly play an important role in the removal efficiencies, but they
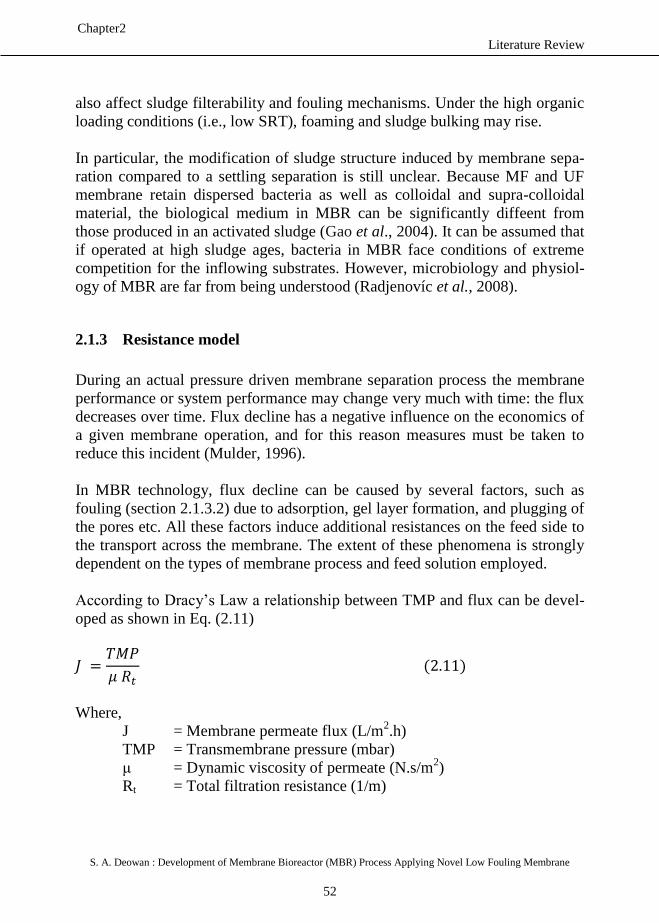
Literature Review
S. A. Deowan : Development of Membrane Bioreactor (MBR) Process Applying Novel Low Fouling Membrane
52
Chapter2
also affect sludge filterability and fouling mechanisms. Under the high organic
loading conditions (i.e., low SRT), foaming and sludge bulking may rise.
In particular, the modification of sludge structure induced by membrane sepa-
ration compared to a settling separation is still unclear. Because MF and UF
membrane retain dispersed bacteria as well as colloidal and supra-colloidal
material, the biological medium in MBR can be significantly diffeent from
those produced in an activated sludge (Gao et al., 2004). It can be assumed that
if operated at high sludge ages, bacteria in MBR face conditions of extreme
competition for the inflowing substrates. However, microbiology and physiol-
ogy of MBR are far from being understood (Radjenovíc et al., 2008).
2.1.3 Resistance model
During an actual pressure driven membrane separation process the membrane
performance or system performance may change very much with time: the flux
decreases over time. Flux decline has a negative influence on the economics of
a given membrane operation, and for this reason measures must be taken to
reduce this incident (Mulder, 1996).
In MBR technology, flux decline can be caused by several factors, such as
fouling (section 2.1.3.2) due to adsorption, gel layer formation, and plugging of
the pores etc. All these factors induce additional resistances on the feed side to
the transport across the membrane. The extent of these phenomena is strongly
dependent on the types of membrane process and feed solution employed.
According to Dracy’s Law a relationship between TMP and flux can be devel-
oped as shown in Eq. (2.11)
Where,
J = Membrane permeate flux (L/m2.h)
TMP = Transmembrane pressure (mbar)
μ = Dynamic viscosity of permeate (N.s/m2)
Rt = Total filtration resistance (1/m)
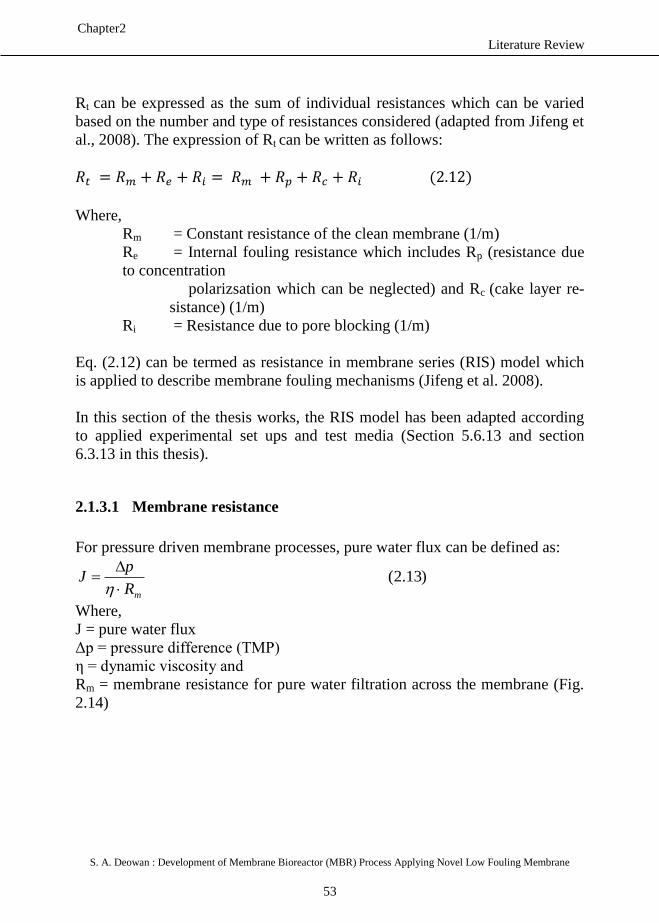
Literature Review
S. A. Deowan : Development of Membrane Bioreactor (MBR) Process Applying Novel Low Fouling Membrane
53
Chapter2
Rt can be expressed as the sum of individual resistances which can be varied
based on the number and type of resistances considered (adapted from Jifeng et
al., 2008). The expression of Rt can be written as follows:
Where,
Rm = Constant resistance of the clean membrane (1/m)
Re = Internal fouling resistance which includes Rp (resistance due
to concentration
polarizsation which can be neglected) and Rc (cake layer re-
sistance) (1/m)
Ri = Resistance due to pore blocking (1/m)
Eq. (2.12) can be termed as resistance in membrane series (RIS) model which
is applied to describe membrane fouling mechanisms (Jifeng et al. 2008).
In this section of the thesis works, the RIS model has been adapted according
to applied experimental set ups and test media (Section 5.6.13 and section
6.3.13 in this thesis).
2.1.3.1 Membrane resistance
For pressure driven membrane processes, pure water flux can be defined as:
)13.2(mR
pJ
Where,
J = pure water flux
Δp = pressure difference (TMP)
η = dynamic viscosity and
Rm = membrane resistance for pure water filtration across the membrane (Fig.
2.14)
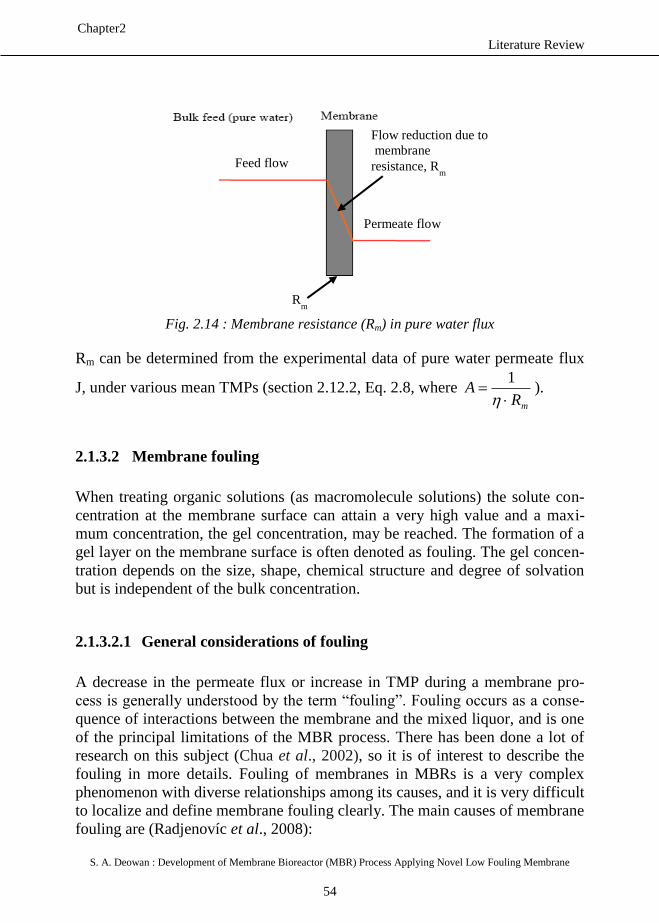
Literature Review
S. A. Deowan : Development of Membrane Bioreactor (MBR) Process Applying Novel Low Fouling Membrane
54
Chapter2
Fig. 2.14 : Membrane resistance (Rm) in pure water flux
Rm can be determined from the experimental data of pure water permeate flux
J, under various mean TMPs (section 2.12.2, Eq. 2.8, where mR
A
1).
2.1.3.2 Membrane fouling
When treating organic solutions (as macromolecule solutions) the solute con-
centration at the membrane surface can attain a very high value and a maxi-
mum concentration, the gel concentration, may be reached. The formation of a
gel layer on the membrane surface is often denoted as fouling. The gel concen-
tration depends on the size, shape, chemical structure and degree of solvation
but is independent of the bulk concentration.
2.1.3.2.1 General considerations of fouling
A decrease in the permeate flux or increase in TMP during a membrane pro-
cess is generally understood by the term “fouling”. Fouling occurs as a conse-
quence of interactions between the membrane and the mixed liquor, and is one
of the principal limitations of the MBR process. There has been done a lot of
research on this subject (Chua et al., 2002), so it is of interest to describe the
fouling in more details. Fouling of membranes in MBRs is a very complex
phenomenon with diverse relationships among its causes, and it is very difficult
to localize and define membrane fouling clearly. The main causes of membrane
fouling are (Radjenovíc et al., 2008):
Permeate flow
Feed flow
Flow reduction due to membrane
resistance, Rm
Rm
Literature Review
S. A. Deowan : Development of Membrane Bioreactor (MBR) Process Applying Novel Low Fouling Membrane
55
Chapter2
Adsorption of macromolecular and colloidal matter
Growth of biofilms on the membrane surface
Precipitation of inorganic matter
Aging of the membrane
The formation of a gel or cake layer is one cause for membrane fouling. Gel or
cake formation may be caused by a variety of materials including inorganic
precipitates such as CaSO4, Fe(OH)2 and other metal hydroxides, organic mate-
rials such as proteins, humic acids and other macromolecular materials, and
biological components such as micro-organisms and products of their metabo-
lism. The attachment of the substances to the membrane surface may be caused
by adsorption due to hydrophobic interactions, van der Waals force attractions
or electrostatic forces. The fouling layer itself may be rather porous and thus
permeable for aqueous solutions as some inorganic precipitants or highly im-
permeable as some films of mineral oils or hydrophobic surfactants (Cassano et
al., 2005, p.94).
2.1.3.2.2 Fouling mechanism
MBRs are normally operated under a constant flux. Since the fouling rate in-
creases roughly and exponentially with the flux, MBR plants are operated at
modest fluxes and preferably below the so-called critical flux. The critical flux
concept, firstly introduced by Field et al., (1995), assumes that in MF/UF pro-
cesses exists a flux below which a decline of permeability with time does not
occur, and above which fouling occurs. In MBR operations, critical flux is
normally defined as the highest flux under which a prolonged filtration with
constant permeability is possible.
Pollice et al., (2005) reviewed the sub-critical fouling phenomenon in MBR.
From the reviewed data it is evident that even sub-critical operation inevitably
leads to fouling. This fouling is often reported to follow a two-stage fouling
pattern (Brookes et al., 2004 and Wen et al., 2004) which includes slow TMP
increase over a long period of time, followed by a rapid increase after some
critical time period. In the work of Zhang et al., (2006), this pattern is extended
with an initial period of conditioning fouling (Radjenovíc et al., 2008).
Membrane fouling is regarded as the most important bottleneck for further de-
velopment of MBRs. It is the main limitation to faster development of this pro-
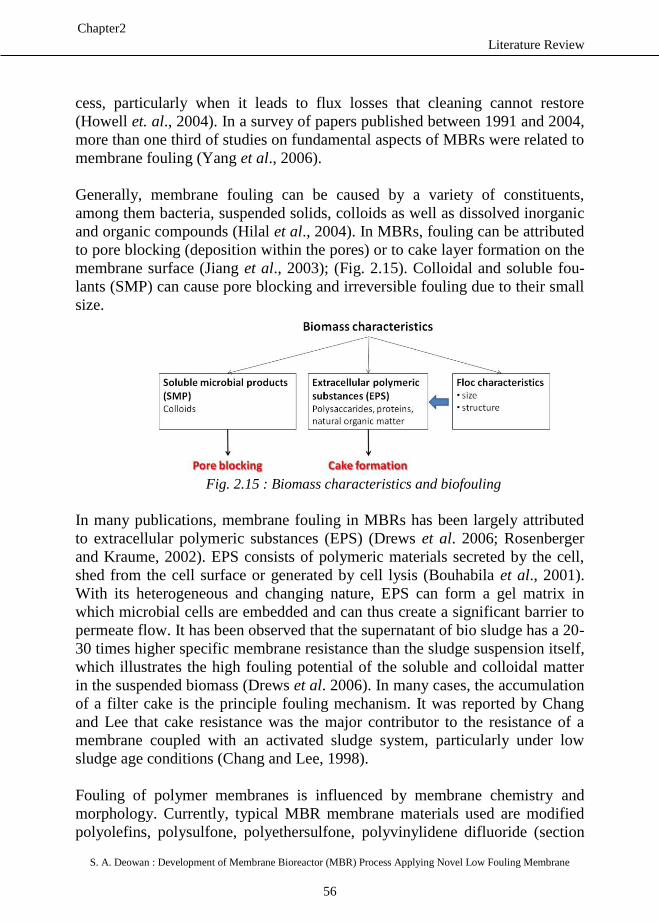
Literature Review
S. A. Deowan : Development of Membrane Bioreactor (MBR) Process Applying Novel Low Fouling Membrane
56
Chapter2
cess, particularly when it leads to flux losses that cleaning cannot restore
(Howell et. al., 2004). In a survey of papers published between 1991 and 2004,
more than one third of studies on fundamental aspects of MBRs were related to
membrane fouling (Yang et al., 2006).
Generally, membrane fouling can be caused by a variety of constituents,
among them bacteria, suspended solids, colloids as well as dissolved inorganic
and organic compounds (Hilal et al., 2004). In MBRs, fouling can be attributed
to pore blocking (deposition within the pores) or to cake layer formation on the
membrane surface (Jiang et al., 2003); (Fig. 2.15). Colloidal and soluble fou-
lants (SMP) can cause pore blocking and irreversible fouling due to their small
size.
Fig. 2.15 : Biomass characteristics and biofouling
In many publications, membrane fouling in MBRs has been largely attributed
to extracellular polymeric substances (EPS) (Drews et al. 2006; Rosenberger
and Kraume, 2002). EPS consists of polymeric materials secreted by the cell,
shed from the cell surface or generated by cell lysis (Bouhabila et al., 2001).
With its heterogeneous and changing nature, EPS can form a gel matrix in
which microbial cells are embedded and can thus create a significant barrier to
permeate flow. It has been observed that the supernatant of bio sludge has a 20-
30 times higher specific membrane resistance than the sludge suspension itself,
which illustrates the high fouling potential of the soluble and colloidal matter
in the suspended biomass (Drews et al. 2006). In many cases, the accumulation
of a filter cake is the principle fouling mechanism. It was reported by Chang
and Lee that cake resistance was the major contributor to the resistance of a
membrane coupled with an activated sludge system, particularly under low
sludge age conditions (Chang and Lee, 1998).
Fouling of polymer membranes is influenced by membrane chemistry and
morphology. Currently, typical MBR membrane materials used are modified
polyolefins, polysulfone, polyethersulfone, polyvinylidene difluoride (section
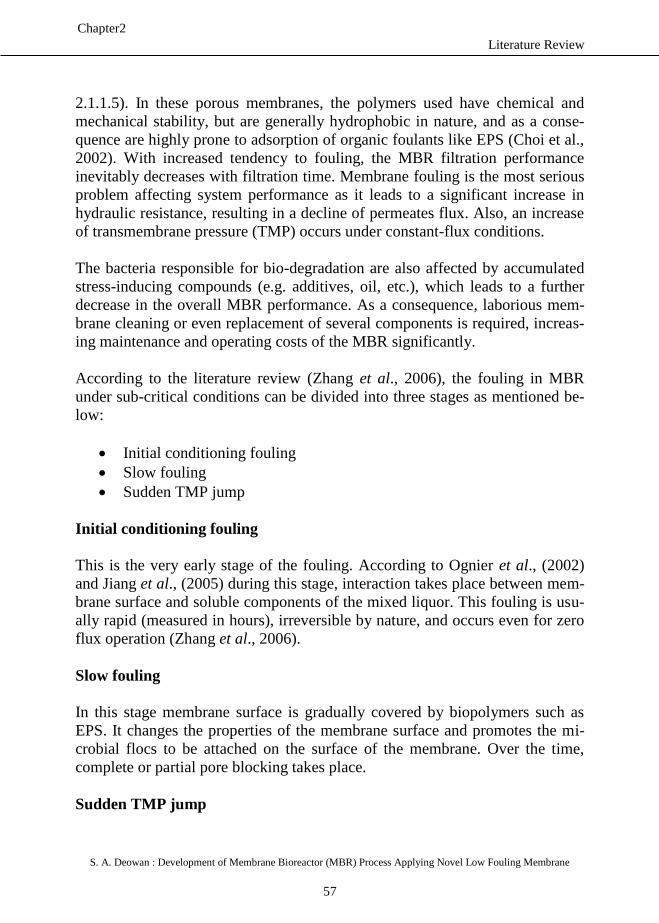
Literature Review
S. A. Deowan : Development of Membrane Bioreactor (MBR) Process Applying Novel Low Fouling Membrane
57
Chapter2
2.1.1.5). In these porous membranes, the polymers used have chemical and
mechanical stability, but are generally hydrophobic in nature, and as a conse-
quence are highly prone to adsorption of organic foulants like EPS (Choi et al.,
2002). With increased tendency to fouling, the MBR filtration performance
inevitably decreases with filtration time. Membrane fouling is the most serious
problem affecting system performance as it leads to a significant increase in
hydraulic resistance, resulting in a decline of permeates flux. Also, an increase
of transmembrane pressure (TMP) occurs under constant-flux conditions.
The bacteria responsible for bio-degradation are also affected by accumulated
stress-inducing compounds (e.g. additives, oil, etc.), which leads to a further
decrease in the overall MBR performance. As a consequence, laborious mem-
brane cleaning or even replacement of several components is required, increas-
ing maintenance and operating costs of the MBR significantly.
According to the literature review (Zhang et al., 2006), the fouling in MBR
under sub-critical conditions can be divided into three stages as mentioned be-
low:
Initial conditioning fouling
Slow fouling
Sudden TMP jump
Initial conditioning fouling
This is the very early stage of the fouling. According to Ognier et al., (2002)
and Jiang et al., (2005) during this stage, interaction takes place between mem-
brane surface and soluble components of the mixed liquor. This fouling is usu-
ally rapid (measured in hours), irreversible by nature, and occurs even for zero
flux operation (Zhang et al., 2006).
Slow fouling
In this stage membrane surface is gradually covered by biopolymers such as
EPS. It changes the properties of the membrane surface and promotes the mi-
crobial flocs to be attached on the surface of the membrane. Over the time,
complete or partial pore blocking takes place.
Sudden TMP jump
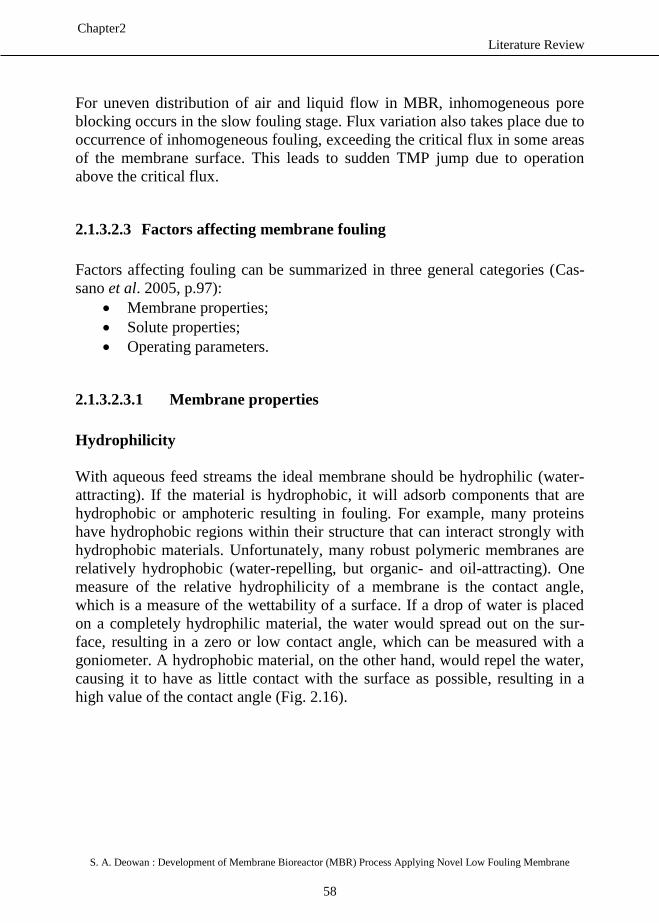
Literature Review
S. A. Deowan : Development of Membrane Bioreactor (MBR) Process Applying Novel Low Fouling Membrane
58
Chapter2
For uneven distribution of air and liquid flow in MBR, inhomogeneous pore
blocking occurs in the slow fouling stage. Flux variation also takes place due to
occurrence of inhomogeneous fouling, exceeding the critical flux in some areas
of the membrane surface. This leads to sudden TMP jump due to operation
above the critical flux.
2.1.3.2.3 Factors affecting membrane fouling
Factors affecting fouling can be summarized in three general categories (Cas-
sano et al. 2005, p.97):
Membrane properties;
Solute properties;
Operating parameters.
2.1.3.2.3.1 Membrane properties
Hydrophilicity
With aqueous feed streams the ideal membrane should be hydrophilic (water-
attracting). If the material is hydrophobic, it will adsorb components that are
hydrophobic or amphoteric resulting in fouling. For example, many proteins
have hydrophobic regions within their structure that can interact strongly with
hydrophobic materials. Unfortunately, many robust polymeric membranes are
relatively hydrophobic (water-repelling, but organic- and oil-attracting). One
measure of the relative hydrophilicity of a membrane is the contact angle,
which is a measure of the wettability of a surface. If a drop of water is placed
on a completely hydrophilic material, the water would spread out on the sur-
face, resulting in a zero or low contact angle, which can be measured with a
goniometer. A hydrophobic material, on the other hand, would repel the water,
causing it to have as little contact with the surface as possible, resulting in a
high value of the contact angle (Fig. 2.16).
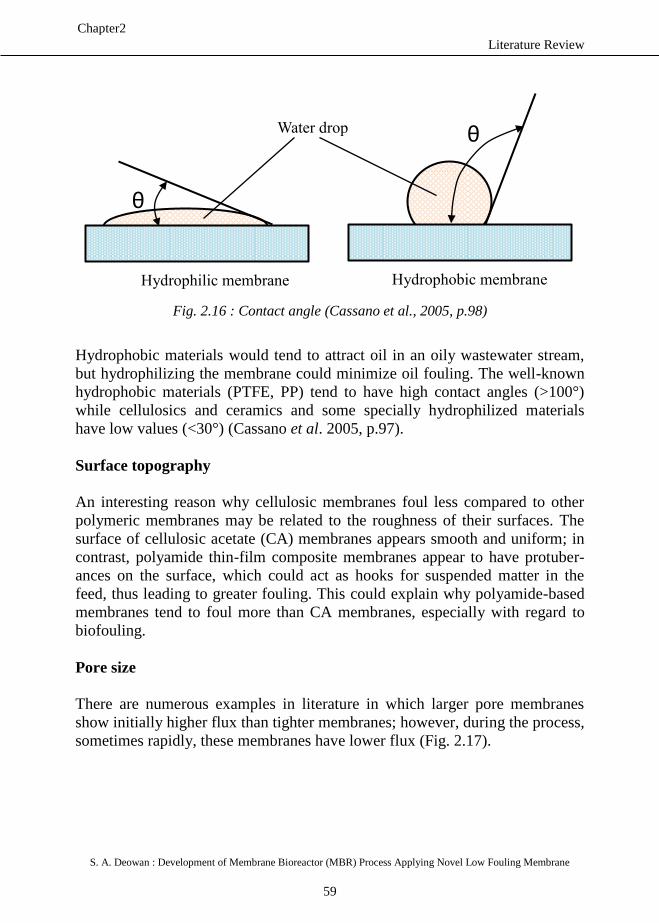
Literature Review
S. A. Deowan : Development of Membrane Bioreactor (MBR) Process Applying Novel Low Fouling Membrane
59
Chapter2
Fig. 2.16 : Contact angle (Cassano et al., 2005, p.98)
Hydrophobic materials would tend to attract oil in an oily wastewater stream,
but hydrophilizing the membrane could minimize oil fouling. The well-known
hydrophobic materials (PTFE, PP) tend to have high contact angles (>100°)
while cellulosics and ceramics and some specially hydrophilized materials
have low values (<30°) (Cassano et al. 2005, p.97).
Surface topography
An interesting reason why cellulosic membranes foul less compared to other
polymeric membranes may be related to the roughness of their surfaces. The
surface of cellulosic acetate (CA) membranes appears smooth and uniform; in
contrast, polyamide thin-film composite membranes appear to have protuber-
ances on the surface, which could act as hooks for suspended matter in the
feed, thus leading to greater fouling. This could explain why polyamide-based
membranes tend to foul more than CA membranes, especially with regard to
biofouling.
Pore size
There are numerous examples in literature in which larger pore membranes
show initially higher flux than tighter membranes; however, during the process,
sometimes rapidly, these membranes have lower flux (Fig. 2.17).
θ
θ
Water drop
Hydrophilic membrane Hydrophobic membrane
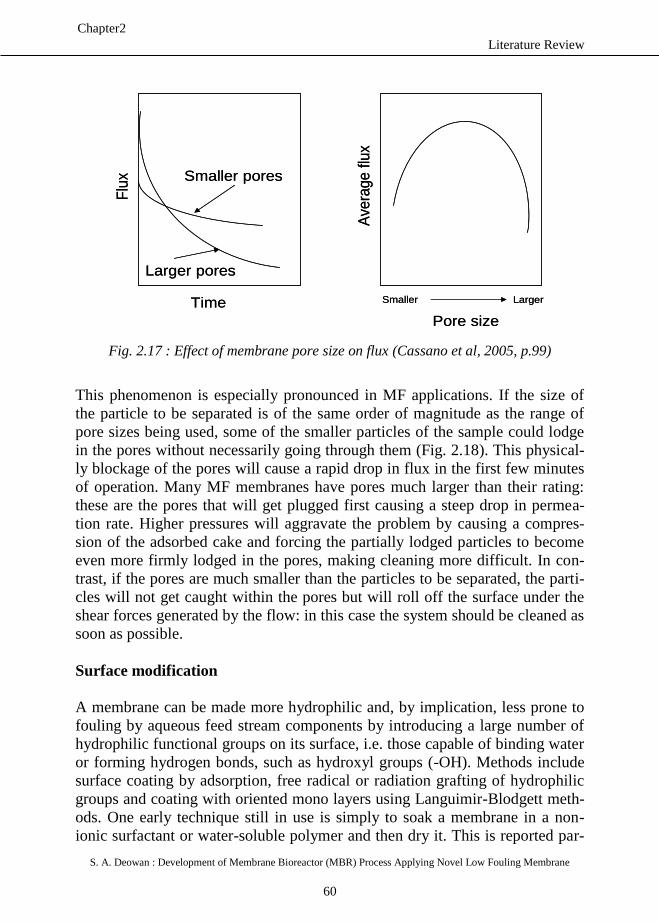
Literature Review
S. A. Deowan : Development of Membrane Bioreactor (MBR) Process Applying Novel Low Fouling Membrane
60
Chapter2
Fig. 2.17 : Effect of membrane pore size on flux (Cassano et al, 2005, p.99)
This phenomenon is especially pronounced in MF applications. If the size of
the particle to be separated is of the same order of magnitude as the range of
pore sizes being used, some of the smaller particles of the sample could lodge
in the pores without necessarily going through them (Fig. 2.18). This physical-
ly blockage of the pores will cause a rapid drop in flux in the first few minutes
of operation. Many MF membranes have pores much larger than their rating:
these are the pores that will get plugged first causing a steep drop in permea-
tion rate. Higher pressures will aggravate the problem by causing a compres-
sion of the adsorbed cake and forcing the partially lodged particles to become
even more firmly lodged in the pores, making cleaning more difficult. In con-
trast, if the pores are much smaller than the particles to be separated, the parti-
cles will not get caught within the pores but will roll off the surface under the
shear forces generated by the flow: in this case the system should be cleaned as
soon as possible.
Surface modification
A membrane can be made more hydrophilic and, by implication, less prone to
fouling by aqueous feed stream components by introducing a large number of
hydrophilic functional groups on its surface, i.e. those capable of binding water
or forming hydrogen bonds, such as hydroxyl groups (-OH). Methods include
surface coating by adsorption, free radical or radiation grafting of hydrophilic
groups and coating with oriented mono layers using Languimir-Blodgett meth-
ods. One early technique still in use is simply to soak a membrane in a non-
ionic surfactant or water-soluble polymer and then dry it. This is reported par-
Flu
x
Time
Smaller pores
Larger pores
Ave
rage
flux
Pore size
Smaller Larger
Flu
x
Time
Smaller pores
Larger pores
Ave
rage
flux
Pore size
Smaller Larger
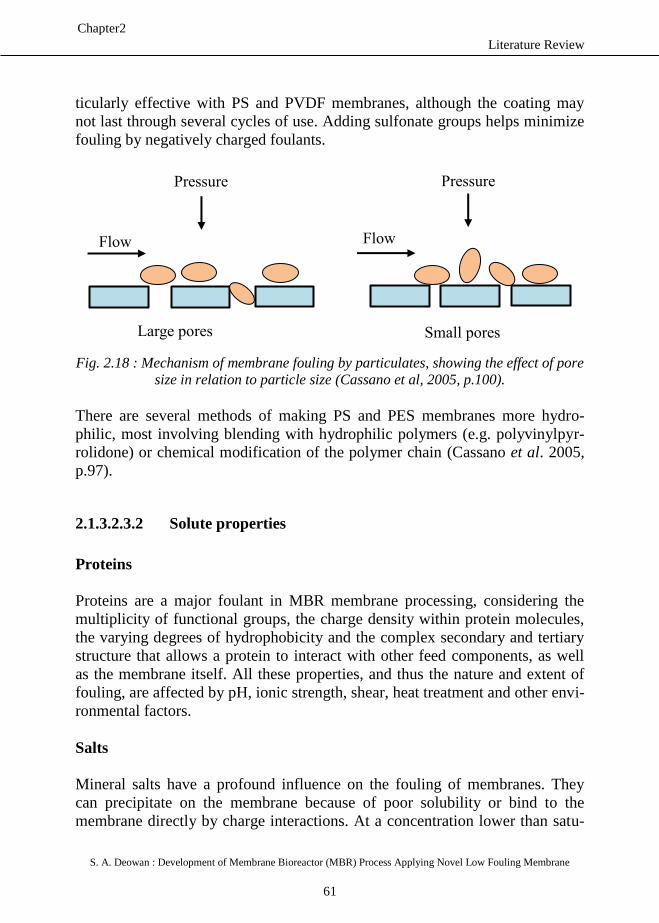
Literature Review
S. A. Deowan : Development of Membrane Bioreactor (MBR) Process Applying Novel Low Fouling Membrane
61
Chapter2
ticularly effective with PS and PVDF membranes, although the coating may
not last through several cycles of use. Adding sulfonate groups helps minimize
fouling by negatively charged foulants.
Fig. 2.18 : Mechanism of membrane fouling by particulates, showing the effect of pore
size in relation to particle size (Cassano et al, 2005, p.100).
There are several methods of making PS and PES membranes more hydro-
philic, most involving blending with hydrophilic polymers (e.g. polyvinylpyr-
rolidone) or chemical modification of the polymer chain (Cassano et al. 2005,
p.97).
2.1.3.2.3.2 Solute properties
Proteins
Proteins are a major foulant in MBR membrane processing, considering the
multiplicity of functional groups, the charge density within protein molecules,
the varying degrees of hydrophobicity and the complex secondary and tertiary
structure that allows a protein to interact with other feed components, as well
as the membrane itself. All these properties, and thus the nature and extent of
fouling, are affected by pH, ionic strength, shear, heat treatment and other envi-
ronmental factors.
Salts
Mineral salts have a profound influence on the fouling of membranes. They
can precipitate on the membrane because of poor solubility or bind to the
membrane directly by charge interactions. At a concentration lower than satu-
Large pores
Small pores
Pressure Pressure
Flow Flow
Literature Review
S. A. Deowan : Development of Membrane Bioreactor (MBR) Process Applying Novel Low Fouling Membrane
62
Chapter2
ration sodium chloride appears to have no effect by itself. In presence of pro-
teins, it appears to increase protein deposition and loss of flux. Sodium chloride
in the feed solution reduced fouling by polyphenols. Calcium has been identi-
fied as a major cause of fouling in dairy streams, not only due to precipitation
in the form of tricalcium phosphate, but also because it`s ionic form could act
as a salt bridge between the membrane and proteins, which will lead to faster
protein fouling.
pH
In general, flux is lowest at the isoelectric point of the protein and is higher as
the pH is moved away from the isoelectric point. Changes in pH affect solubili-
ty and conformation of feed components. The solubility of a protein is general-
ly lowest at the isoelectric point; it increases as the pH is adjusted away from
the isoelectric point, and this could explain the mentioned phenomenon. How-
ever, if there are salts that decrease in solubility and precipitate on the mem-
brane, then flux could decrease at higher pH. The removal of insoluble calcium
salts from cheese whey at pH 6.4-7 by filtration or centrifugation improved
flux significantly (Cassano et. al, 2005, p.100).
Lipids, fats and oils
The removal of lipids in whey by centrifugation or microfiltration has a benefi-
cial effect on UF flux. With oil-in-water mixtures, it should be remembered
that “like attracts like”; if hydrophobic membranes are used, free oils can coat
the membrane, resulting in poor flux. Oils have a structure similar to the func-
tional groups of membranes such as PVDF and PS, thus resulting in considera-
ble fouling. Hydrophilic membranes such as the modified PAN membranes
have functional groups more like water which gives it excellent hydrophilicity.
This preferentially attracts water rather than the oil, resulting in much higher
flux.
Antifoams
These are used to suppress foaming in evaporators and fermenters. Many
commercial antifoaming agents (e.g. polyoxyethylene, polyglycols, silicone
oils, etc.) severely foul hydrophobic membranes. Hydrophilic membranes are
fouled less by antifoams.
Humic substances
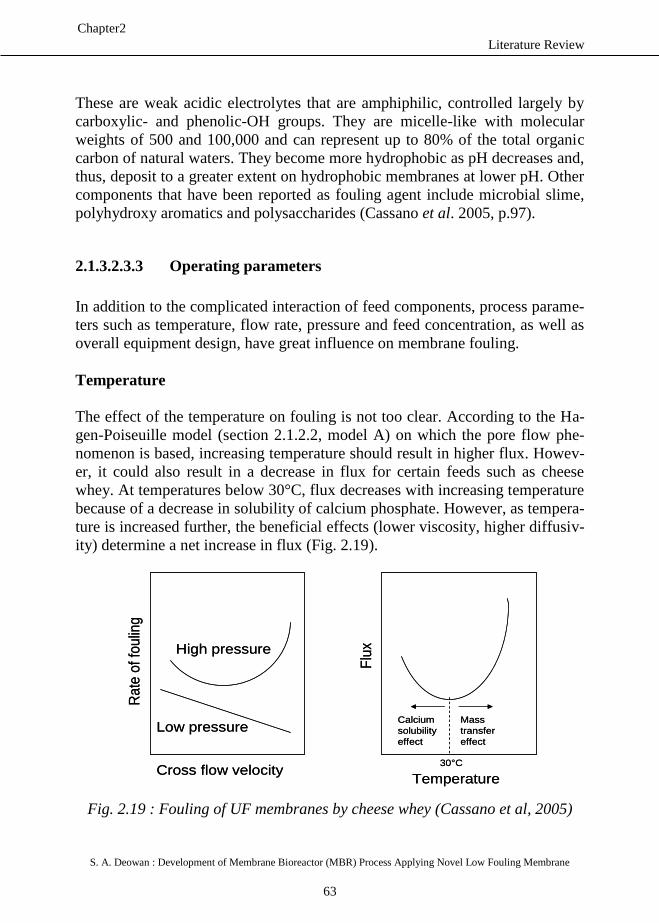
Literature Review
S. A. Deowan : Development of Membrane Bioreactor (MBR) Process Applying Novel Low Fouling Membrane
63
Chapter2
These are weak acidic electrolytes that are amphiphilic, controlled largely by
carboxylic- and phenolic-OH groups. They are micelle-like with molecular
weights of 500 and 100,000 and can represent up to 80% of the total organic
carbon of natural waters. They become more hydrophobic as pH decreases and,
thus, deposit to a greater extent on hydrophobic membranes at lower pH. Other
components that have been reported as fouling agent include microbial slime,
polyhydroxy aromatics and polysaccharides (Cassano et al. 2005, p.97).
2.1.3.2.3.3 Operating parameters
In addition to the complicated interaction of feed components, process parame-
ters such as temperature, flow rate, pressure and feed concentration, as well as
overall equipment design, have great influence on membrane fouling.
Temperature
The effect of the temperature on fouling is not too clear. According to the Ha-
gen-Poiseuille model (section 2.1.2.2, model A) on which the pore flow phe-
nomenon is based, increasing temperature should result in higher flux. Howev-
er, it could also result in a decrease in flux for certain feeds such as cheese
whey. At temperatures below 30°C, flux decreases with increasing temperature
because of a decrease in solubility of calcium phosphate. However, as tempera-
ture is increased further, the beneficial effects (lower viscosity, higher diffusiv-
ity) determine a net increase in flux (Fig. 2.19).
Fig. 2.19 : Fouling of UF membranes by cheese whey (Cassano et al, 2005)
Rate
of
foulin
g
Cross flow velocity
High pressure
Low pressure
Flu
x
Temperature
30°C
Calcium
solubility
effect
Mass
transfer
effect
Rate
of
foulin
g
Cross flow velocity
High pressure
Low pressure
Flu
x
Temperature
30°C
Calcium
solubility
effect
Mass
transfer
effect
Literature Review
S. A. Deowan : Development of Membrane Bioreactor (MBR) Process Applying Novel Low Fouling Membrane
64
Chapter2
For biological systems high temperatures will result in protein denaturation
which will result, other heat damage, in a lowering of the flux.
Flow rate and turbulence
High shear rates generated at the membrane surface tend to shear off deposited
materials and thus reduce the hydraulic resistance of the fouling layer in iMBR.
However, this may not always happen if the transmembrane pressure is high in
relation to the permeation velocity. Tubular modules (sMBR) have flow chan-
nels large enough (1.25 - 2.5 cm diameter) to allow most suspended matter to
flow easily. Since flow velocity are usually 1-4 m/sec, this results in fairly high
Reynolds numbers in the turbulent region, but pumping cost to maintain the
high flow velocity is also quite high (sometimes as much as 100 times more
energy per unit permeate volume removed than spirals or hollow fibers). At the
other extreme are the hollow fiber modules, with inside diameters of 0.5-1.1
mm, which operate in the laminar region but under high shear rates (4000-
14,000 sec-1
) in sMBR.
Pressure
When transmembrane pressure is in the pre-gel region, flux increases as pres-
sure increases, though usually not linearly for macromolecular feeds. As pres-
sure increases further, the concentration polarization layer reaches a limiting
concentration and the flux becomes independent of pressure and becomes mass
transfer-controlled. Any pressure increase beyond this point will only bring up
the flux momentarily, but as soon as the equilibrium is re-established between
the rate of transport of solute to and from the membrane surface, the flux re-
mains essentially unchanged. The situation changes, however, when fouling
layers are compressed under the high pressures. Increasing pressure above a
critical point may result in a lower flux. With MF and high flux UF mem-
branes, high pressures may cause severe fouling probably due to compaction of
the fouling layer. Sometimes it is more important to maintain a low flux rather
than low pressures to minimize fouling (Cassano et al., 2005, p.102).
2.1.3.2.4 Control of membrane fouling
Completely getting rid of fouling problem in membrane technology is impossi-
ble but it can be controlled. The control of fouling and clogging in practice is
generally limited to five main strategies (Judd, 2006, p.94):
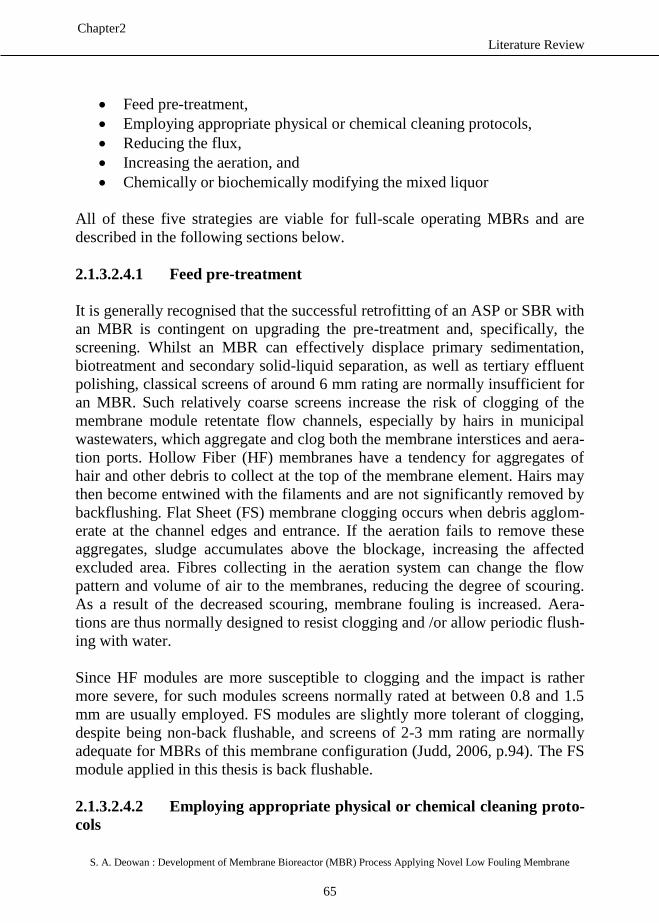
Literature Review
S. A. Deowan : Development of Membrane Bioreactor (MBR) Process Applying Novel Low Fouling Membrane
65
Chapter2
Feed pre-treatment,
Employing appropriate physical or chemical cleaning protocols,
Reducing the flux,
Increasing the aeration, and
Chemically or biochemically modifying the mixed liquor
All of these five strategies are viable for full-scale operating MBRs and are
described in the following sections below.
2.1.3.2.4.1 Feed pre-treatment
It is generally recognised that the successful retrofitting of an ASP or SBR with
an MBR is contingent on upgrading the pre-treatment and, specifically, the
screening. Whilst an MBR can effectively displace primary sedimentation,
biotreatment and secondary solid-liquid separation, as well as tertiary effluent
polishing, classical screens of around 6 mm rating are normally insufficient for
an MBR. Such relatively coarse screens increase the risk of clogging of the
membrane module retentate flow channels, especially by hairs in municipal
wastewaters, which aggregate and clog both the membrane interstices and aera-
tion ports. Hollow Fiber (HF) membranes have a tendency for aggregates of
hair and other debris to collect at the top of the membrane element. Hairs may
then become entwined with the filaments and are not significantly removed by
backflushing. Flat Sheet (FS) membrane clogging occurs when debris agglom-
erate at the channel edges and entrance. If the aeration fails to remove these
aggregates, sludge accumulates above the blockage, increasing the affected
excluded area. Fibres collecting in the aeration system can change the flow
pattern and volume of air to the membranes, reducing the degree of scouring.
As a result of the decreased scouring, membrane fouling is increased. Aera-
tions are thus normally designed to resist clogging and /or allow periodic flush-
ing with water.
Since HF modules are more susceptible to clogging and the impact is rather
more severe, for such modules screens normally rated at between 0.8 and 1.5
mm are usually employed. FS modules are slightly more tolerant of clogging,
despite being non-back flushable, and screens of 2-3 mm rating are normally
adequate for MBRs of this membrane configuration (Judd, 2006, p.94). The FS
module applied in this thesis is back flushable.
2.1.3.2.4.2 Employing appropriate physical or chemical cleaning proto-
cols
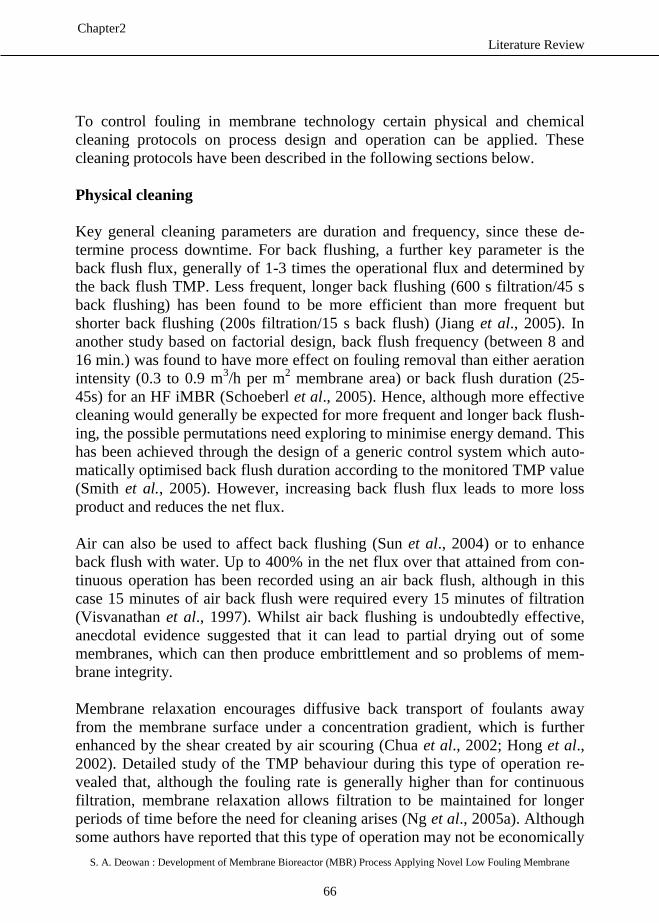
Literature Review
S. A. Deowan : Development of Membrane Bioreactor (MBR) Process Applying Novel Low Fouling Membrane
66
Chapter2
To control fouling in membrane technology certain physical and chemical
cleaning protocols on process design and operation can be applied. These
cleaning protocols have been described in the following sections below.
Physical cleaning
Key general cleaning parameters are duration and frequency, since these de-
termine process downtime. For back flushing, a further key parameter is the
back flush flux, generally of 1-3 times the operational flux and determined by
the back flush TMP. Less frequent, longer back flushing (600 s filtration/45 s
back flushing) has been found to be more efficient than more frequent but
shorter back flushing (200s filtration/15 s back flush) (Jiang et al., 2005). In
another study based on factorial design, back flush frequency (between 8 and
16 min.) was found to have more effect on fouling removal than either aeration
intensity (0.3 to 0.9 m3/h per m
2 membrane area) or back flush duration (25-
45s) for an HF iMBR (Schoeberl et al., 2005). Hence, although more effective
cleaning would generally be expected for more frequent and longer back flush-
ing, the possible permutations need exploring to minimise energy demand. This
has been achieved through the design of a generic control system which auto-
matically optimised back flush duration according to the monitored TMP value
(Smith et al., 2005). However, increasing back flush flux leads to more loss
product and reduces the net flux.
Air can also be used to affect back flushing (Sun et al., 2004) or to enhance
back flush with water. Up to 400% in the net flux over that attained from con-
tinuous operation has been recorded using an air back flush, although in this
case 15 minutes of air back flush were required every 15 minutes of filtration
(Visvanathan et al., 1997). Whilst air back flushing is undoubtedly effective,
anecdotal evidence suggested that it can lead to partial drying out of some
membranes, which can then produce embrittlement and so problems of mem-
brane integrity.
Membrane relaxation encourages diffusive back transport of foulants away
from the membrane surface under a concentration gradient, which is further
enhanced by the shear created by air scouring (Chua et al., 2002; Hong et al.,
2002). Detailed study of the TMP behaviour during this type of operation re-
vealed that, although the fouling rate is generally higher than for continuous
filtration, membrane relaxation allows filtration to be maintained for longer
periods of time before the need for cleaning arises (Ng et al., 2005a). Although
some authors have reported that this type of operation may not be economically
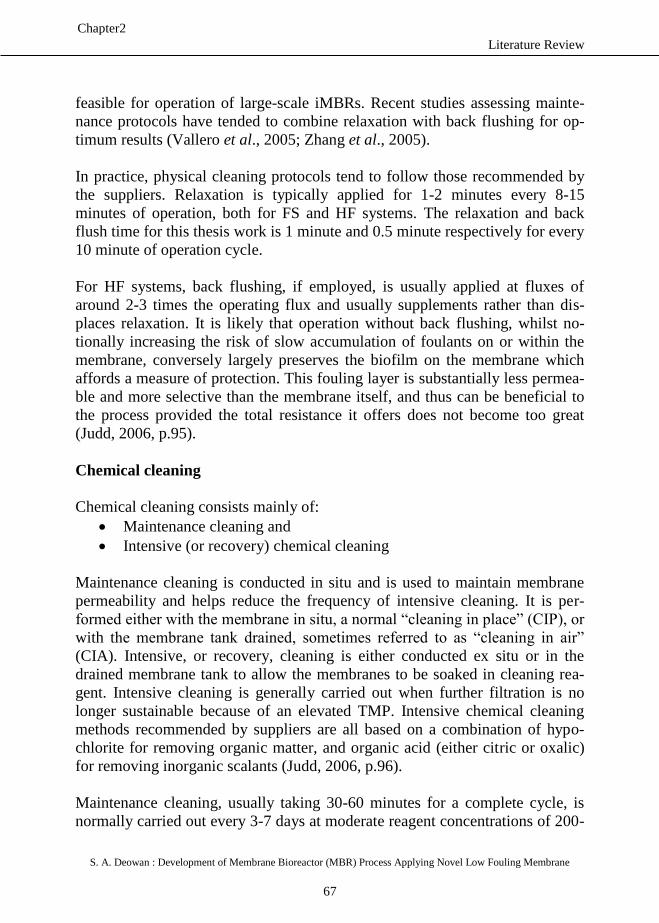
Literature Review
S. A. Deowan : Development of Membrane Bioreactor (MBR) Process Applying Novel Low Fouling Membrane
67
Chapter2
feasible for operation of large-scale iMBRs. Recent studies assessing mainte-
nance protocols have tended to combine relaxation with back flushing for op-
timum results (Vallero et al., 2005; Zhang et al., 2005).
In practice, physical cleaning protocols tend to follow those recommended by
the suppliers. Relaxation is typically applied for 1-2 minutes every 8-15
minutes of operation, both for FS and HF systems. The relaxation and back
flush time for this thesis work is 1 minute and 0.5 minute respectively for every
10 minute of operation cycle.
For HF systems, back flushing, if employed, is usually applied at fluxes of
around 2-3 times the operating flux and usually supplements rather than dis-
places relaxation. It is likely that operation without back flushing, whilst no-
tionally increasing the risk of slow accumulation of foulants on or within the
membrane, conversely largely preserves the biofilm on the membrane which
affords a measure of protection. This fouling layer is substantially less permea-
ble and more selective than the membrane itself, and thus can be beneficial to
the process provided the total resistance it offers does not become too great
(Judd, 2006, p.95).
Chemical cleaning
Chemical cleaning consists mainly of:
Maintenance cleaning and
Intensive (or recovery) chemical cleaning
Maintenance cleaning is conducted in situ and is used to maintain membrane
permeability and helps reduce the frequency of intensive cleaning. It is per-
formed either with the membrane in situ, a normal “cleaning in place” (CIP), or
with the membrane tank drained, sometimes referred to as “cleaning in air”
(CIA). Intensive, or recovery, cleaning is either conducted ex situ or in the
drained membrane tank to allow the membranes to be soaked in cleaning rea-
gent. Intensive cleaning is generally carried out when further filtration is no
longer sustainable because of an elevated TMP. Intensive chemical cleaning
methods recommended by suppliers are all based on a combination of hypo-
chlorite for removing organic matter, and organic acid (either citric or oxalic)
for removing inorganic scalants (Judd, 2006, p.96).
Maintenance cleaning, usually taking 30-60 minutes for a complete cycle, is
normally carried out every 3-7 days at moderate reagent concentrations of 200-
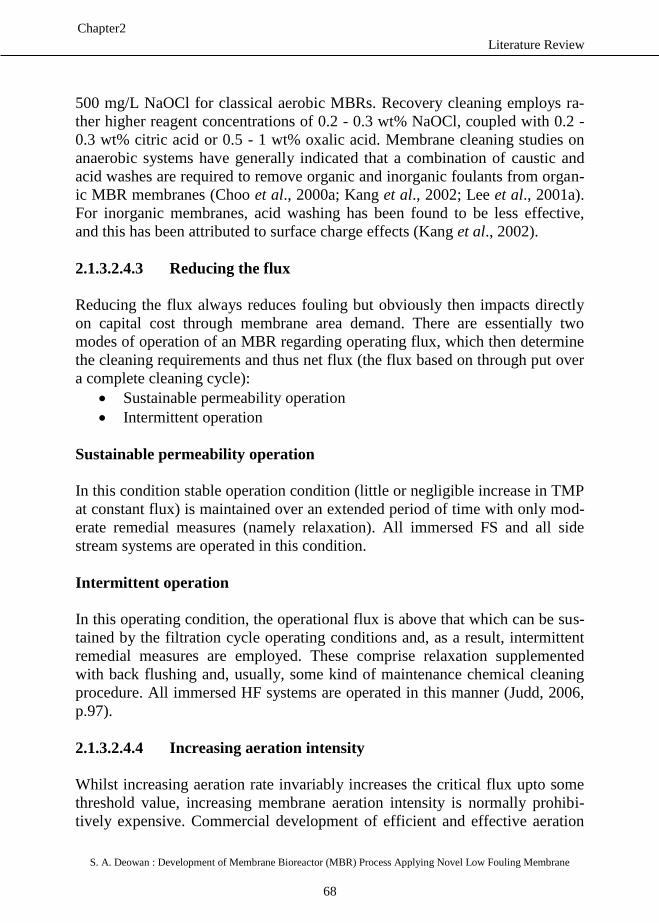
Literature Review
S. A. Deowan : Development of Membrane Bioreactor (MBR) Process Applying Novel Low Fouling Membrane
68
Chapter2
500 mg/L NaOCl for classical aerobic MBRs. Recovery cleaning employs ra-
ther higher reagent concentrations of 0.2 - 0.3 wt% NaOCl, coupled with 0.2 -
0.3 wt% citric acid or 0.5 - 1 wt% oxalic acid. Membrane cleaning studies on
anaerobic systems have generally indicated that a combination of caustic and
acid washes are required to remove organic and inorganic foulants from organ-
ic MBR membranes (Choo et al., 2000a; Kang et al., 2002; Lee et al., 2001a).
For inorganic membranes, acid washing has been found to be less effective,
and this has been attributed to surface charge effects (Kang et al., 2002).
2.1.3.2.4.3 Reducing the flux
Reducing the flux always reduces fouling but obviously then impacts directly
on capital cost through membrane area demand. There are essentially two
modes of operation of an MBR regarding operating flux, which then determine
the cleaning requirements and thus net flux (the flux based on through put over
a complete cleaning cycle):
Sustainable permeability operation
Intermittent operation
Sustainable permeability operation
In this condition stable operation condition (little or negligible increase in TMP
at constant flux) is maintained over an extended period of time with only mod-
erate remedial measures (namely relaxation). All immersed FS and all side
stream systems are operated in this condition.
Intermittent operation
In this operating condition, the operational flux is above that which can be sus-
tained by the filtration cycle operating conditions and, as a result, intermittent
remedial measures are employed. These comprise relaxation supplemented
with back flushing and, usually, some kind of maintenance chemical cleaning
procedure. All immersed HF systems are operated in this manner (Judd, 2006,
p.97).
2.1.3.2.4.4 Increasing aeration intensity
Whilst increasing aeration rate invariably increases the critical flux upto some
threshold value, increasing membrane aeration intensity is normally prohibi-
tively expensive. Commercial development of efficient and effective aeration
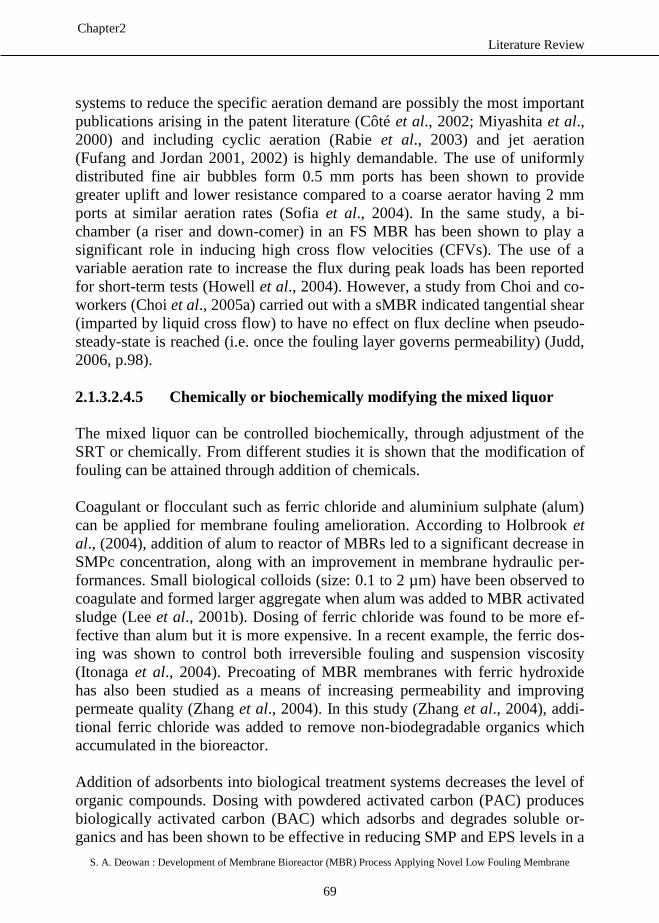
Literature Review
S. A. Deowan : Development of Membrane Bioreactor (MBR) Process Applying Novel Low Fouling Membrane
69
Chapter2
systems to reduce the specific aeration demand are possibly the most important
publications arising in the patent literature (Côté et al., 2002; Miyashita et al.,
2000) and including cyclic aeration (Rabie et al., 2003) and jet aeration
(Fufang and Jordan 2001, 2002) is highly demandable. The use of uniformly
distributed fine air bubbles form 0.5 mm ports has been shown to provide
greater uplift and lower resistance compared to a coarse aerator having 2 mm
ports at similar aeration rates (Sofia et al., 2004). In the same study, a bi-
chamber (a riser and down-comer) in an FS MBR has been shown to play a
significant role in inducing high cross flow velocities (CFVs). The use of a
variable aeration rate to increase the flux during peak loads has been reported
for short-term tests (Howell et al., 2004). However, a study from Choi and co-
workers (Choi et al., 2005a) carried out with a sMBR indicated tangential shear
(imparted by liquid cross flow) to have no effect on flux decline when pseudo-
steady-state is reached (i.e. once the fouling layer governs permeability) (Judd,
2006, p.98).
2.1.3.2.4.5 Chemically or biochemically modifying the mixed liquor
The mixed liquor can be controlled biochemically, through adjustment of the
SRT or chemically. From different studies it is shown that the modification of
fouling can be attained through addition of chemicals.
Coagulant or flocculant such as ferric chloride and aluminium sulphate (alum)
can be applied for membrane fouling amelioration. According to Holbrook et
al., (2004), addition of alum to reactor of MBRs led to a significant decrease in
SMPc concentration, along with an improvement in membrane hydraulic per-
formances. Small biological colloids (size: 0.1 to 2 µm) have been observed to
coagulate and formed larger aggregate when alum was added to MBR activated
sludge (Lee et al., 2001b). Dosing of ferric chloride was found to be more ef-
fective than alum but it is more expensive. In a recent example, the ferric dos-
ing was shown to control both irreversible fouling and suspension viscosity
(Itonaga et al., 2004). Precoating of MBR membranes with ferric hydroxide
has also been studied as a means of increasing permeability and improving
permeate quality (Zhang et al., 2004). In this study (Zhang et al., 2004), addi-
tional ferric chloride was added to remove non-biodegradable organics which
accumulated in the bioreactor.
Addition of adsorbents into biological treatment systems decreases the level of
organic compounds. Dosing with powdered activated carbon (PAC) produces
biologically activated carbon (BAC) which adsorbs and degrades soluble or-
ganics and has been shown to be effective in reducing SMP and EPS levels in a
Literature Review
S. A. Deowan : Development of Membrane Bioreactor (MBR) Process Applying Novel Low Fouling Membrane
70
Chapter2
comparative study of a side stream and immersed hybrid PAC-MBR (Kim and
Lee, 2003). Decreased membrane fouling has also been demonstrated in studies
of the effects of dosing MBR supernatant at up to 1 g/L PAC (Lesage et al.,
2005) and dosing activated sludge itself (Li et al., 2005a), for which an opti-
mum PAC concentration of 1.2 g/L was recorded. In the latter study, floc size
parameters were influenced, resulting in a reduced cake resistance, when PAC
was dosed into the bioreactor. Tests have been performed using zeolite (Lee et
al., 2001c) and aerobic granular sludge, with an average size around 1 mm (Li
et al., 2005b) to create granular flocs of lower specific resistance. Granular
sludge was found to increase membrane permeability by 50% but also lower
the permeability recovery from cleaning by 12%, which would be likely to lead
to unsustainable operation. Yoon et al., (2005) observed that addition of 1 g/L
of membrane performance enhancing agent (MPE50) directly to the bioreactor
led to the reduction of SMPc from 41 to 21 mg/L. The interaction between the
polymer and the soluble organics in general, and SMPc in particular, was iden-
tified as being the main mechanism responsible for the performance enhance-
ment (Judd, 2006, p.98).
Literature Review
S. A. Deowan : Development of Membrane Bioreactor (MBR) Process Applying Novel Low Fouling Membrane
71
Chapter2
2.2 Section II : Aerobic Submerged MBR in Textile Wastewater
Treatment
2.2.1 Textile Wastewater
Textile industries are one of the biggest users of water and complex chemicals
during textile processing at various processing stages. The unused materials
from the processes are discharged as wastewater that is high in colour, bio-
chemical oxygen demand (BOD), chemical oxygen demand (COD), pH, tem-
perature, turbidity and toxic chemicals. The direct discharge of this wastewater
into the water bodies like lakes, rivers etc. pollutes the water and affects the
flora and fauna. Effluent from textile industries contains different types of
dyes, which because of high molecular weight and complex structures, shows
very low biodegradability (Hsu and Chiang, 1997; Pala and Tokat, 2002; Kim
et al., 2004; Gao et al., 2007). Also, the direct discharge of this industrial efflu-
ent into sewage networks produces disturbances in biological treatment pro-
cesses. These effluents produce high concentrations of inorganic salts, acids
and bases in biological reactors leading to the increase of treatment costs
(Gholami et al., 2001; Babu et al., 2007). Some of the chemicals such as heavy
metals either in free form in effluents or adsorbed in the suspended solids are
either carcinogenic (Tamburlini et al., 2002; Bayramoglu and Arica, 2007) or
may cause harm to children even before birth while others may trigger allergic
reactions in some people.
There are more than 100,000 commercially available dyes with over 7×10⁵ ton
of dye-stuff produced annually (Meyer, 1981; Zollinger 1987). Many dyes are
difficult to decolourise due to their complex structure and synthetic origin.
There are many structural varieties, such as acidic, basic, disperse, azo, diazo,
anthroguinone based and metal complex dyes. Decolourisation of textile dye
effluent doesn’t occur when treated aerobically by municipal sewerage systems
(Willmott et al., 1998).
In addition, there are many structural varieties of dyes that fall into either the
cationic, non-ionic or anionic type. Anionic dyes are the direct, acid and reac-
tive dyes (Mishra and Tripathy, 1993). Brightly coloured, water soluble reac-
tive and acid dyes are the most problematic as they tend to pass through con-
ventional treatment systems unaffected (Willmott et al., 1998). Municipal aer-
Literature Review
S. A. Deowan : Development of Membrane Bioreactor (MBR) Process Applying Novel Low Fouling Membrane
72
Chapter2
obic systems, dependent on biological activity, were found to be inefficient in
the removal of these dyes (Moran et al., 1997).
Non-ionic dyes refer to disperse dyes because they do not ionise in an aqueous
medium. Concern arises, as many dyes are made from known carcinogens such
as benzidine and other aromatic compounds (Baughman and Perenich, 1988).
Weber and Wolfe (1987) demonstrated that azo- and nitro-compounds are re-
duced in sediments, and similarly Chung et al. (1978) illustrated their reduction
in the intestinal environment, resulting in the formation of toxic amines. An-
throquinone-based dyes are most resistant to degradation due to their fused
aromatic ring structure. The ability of some disperse dyes to bioaccumulate has
also been demonstrated (Baughman and Perenich, 1988).
Textile wastewater is a complex and highly variable mixture of many polluting
substances including dye (Robinson et al., 2001). Dyes are used in different
industrial sectors, among which the textile industries is one of the most signifi-
cant users. The manufacture of several textile products involves the use of nu-
merous different dyes and auxiliary chemicals (e.g. salts) in many different
industrial processes that causes the formation of wastewaters with complex and
very variable characteristics that makes their treatment particularly difficult.
The textile industry is also one of the most water consuming industrial sectors
(Correia et al., 1994; Delee et al., 1998; vandevivere et al., 1998; O’Neill et al.,
1999). According to Brik et al., (2006), it is illustrated that for each ton of fab-
ric products, 20 – 350 m3 of water are consumed, which differs from the color
and procedure used.
Textile dyeing industry demands large quantities of water which results in
large amounts of wastewater streams of complex contaminant matrix from dif-
ferent steps (dyeing, bleaching, printing, soaking and finishing) of textile in-
dustry process. The discharged wastewater which has strong colour, high value
of chemical oxidation demand (COD) and extremely low biochemical oxygen
demand (BOD) to COD ratio may exert a great impact on the environment and
therefore the related ecology (Kritikos et al., 2007).
2.2.2 Conventional Methods in Textile Wastewater Treatment
Conventional processes treating textile (dyeing and printing) wastewater in-
clude biological, physical and chemical methods such as oxidation, adsorption
or coagulation or iron salts (Vlyssides et al., 2000, Tratnyek, et al.,1994, Liu et
al. 2001, Sheng et al., 1994).
Literature Review
S. A. Deowan : Development of Membrane Bioreactor (MBR) Process Applying Novel Low Fouling Membrane
73
Chapter2
Virtually all the known physic-chemical and biological techniques have been
explored for treatment of extremely recalcitrant textile dye wastewater; none,
however has emerged as a panacea (Hai et al., 2007). Residual dyes along with
other auxiliary chemical reagents used for textile processing impose massive
load on wastewater treatment systems, eventually leading to poor color and
COD removal performances. The presence of even trace concentration of dyes
in effluent is highly visible and the release of such colored wastewater in the
ecosystem is a remarkable source of esthetic pollution eutrophication and per-
turbations (due to toxicity and persistence) in aquatic life (Robinson et al.,
2001).
Traditional methods for dealing with the textile wastewater consists of various
combinations of biological, physical and chemical methods (Hamza and Ham-
oda, 1980; Mckay, 1980; Brower and Reed, 1987; Paprowicz and Slodczyk,
1988). Because of large variability of the composition of textile wastewaters,
most of those traditional methods are becoming inadequate.
From different literature reviews it is revealed that a large number of well-
structured conventional deocolourisation methods involving physical, chemical
and biological processes, as well as some emerging techniques like sonochemi-
cal or advanced oxidation processes have been explored. However, there is no
single economically and technically viable method to solve this problem and
usually two or three methods have to be combined in order to achieve adequate
level of colour removal (Kang and Chen, 1997; Robinson et al., 2001). Re-
searches on chemical coagulation/flocculation, is observed as one of the most
practised technology. Regardless of the generation of considerable amount of
sludge, it is still used in developed and in developing countries. Because the
mechanism of coagulant applied to decolourise wastewater is still not absolute-
ly clear, colour removal by coagulation is found in some cases very effective,
in some cases however has failed completely (Verma et al., 2011).
Since small amount of dye in textile wastewater gives very bright appearance
and stays far below to the discharge limit, making the wastewater treatment
difficult, the conventional decolourisation methods have been focused in the
following section. Until today plenty of different methods (physical, chemical
and biological) have been investigated by various researchers and applied
throughout the world. A brief discussion on some of these methods are pre-
sented in the following sections.
Literature Review
S. A. Deowan : Development of Membrane Bioreactor (MBR) Process Applying Novel Low Fouling Membrane
74
Chapter2
2.2.2.1 Physical Method
One of the most commonly used physical methods is the ultrafiltration tech-
nology. Filtration methods such as ultrafiltration, nanofiltration and reverse
osmosis have been used for water reuse and the chemical recovery (Marcucci
et al., 2001; Fersi and Dhahbi 2008). In the textile industry, these filtration
methods can be used for both filtering and recycling of not only pigment rich
wastewaters, but also mercerising and bleaching wastewaters. The specific
temperature and chemical composition of the wastewaters determines the type
and porosity of the filter to be applied. Further, the utilisation of membrane
technology for dye removal from textile wastewaters is very effective as re-
ported by various researchers (Ledakowicz et al., 2001; Ahmad et al., 2002).
However the main drawbacks of membrane technology are the high cost, fre-
quent membrane fouling, requirement of different pretreatments depending
upon the type of influent wastewaters and production of concentrated dyebath
which further needs proper treatment before its safe disposal to the environ-
ment (Robinsion et al., 2001; Akbari et al., 2006). For membrane filtration,
proper pre-treatment units for removing suspended solids (SS) of the
wastewaters are almost mandatory to increase the life time of the membranes.
This makes the process more expensive and thereby limit the application of this
expensive technology for wastewater treatment.
Another popular method is adsorption technology. Adsorption method for col-
our removal is based on the affinity of various dyes for adsorbents. It is influ-
enced by physical and chemical factors such as dye adsorbent interactions, sur-
face area of adsorbent, particle size, temperature, pH and contact time (An-
janeyulu et al., 2005; Patel and Vashi, 2010). The main criteria for selection of
adsorbents are based on the characteristics like high affinity, capacity of target
compound and possibility of adsorbent generation (Karcher et al., 2002). Acti-
vated carbon is the most commonly used adsorbent and can be very effective
for many dyes (Walker and Weatherly, 1997; Pala and Tokat, 2002). However,
efficiency is directly dependent upon the type of carbon material used and
wastewater characteristics (Robinson et al., 2001). The limitations of this tech-
nology are the eco-friendly disposal of the spent adsorbents, excessive mainte-
nance costs, and pre-treatment of the wastewater to reduce the SS under ac-
ceptable range before it is fed into the adsorption column. Because of these
reasons, field scale application of adsorption technology is limited not only for
colour removal of textile wastewaters but also for other water and wastewater
treatment (Verma et al., 2011).
Literature Review
S. A. Deowan : Development of Membrane Bioreactor (MBR) Process Applying Novel Low Fouling Membrane
75
Chapter2
2.2.2.2 Chemical Method
Chemical methods mainly involve use of oxidising agents such as ozone (O3),
hydrogen peroxide (H2O2), permanganate (MnO4-) and Cl2 to change the chem-
ical composition of compounds or group of compounds, e.g. dyes (Metcalf and
Eddy, 2003). Among these oxidants, ozone is widely used because of its high
reactivity with dyes and good removal efficiencies (Alaton et al., 2002). How-
ever, it is also reported that ozone is not efficient in decolourising non-soluble
disperse and vat dyes which react slowly and take longer reaction time (Mar-
magne and Coste, 1996; Rajeswari, 2000). The decolourisation efficiency also
depends upon the pH. As the pH decreases, ozonation of hydrolysed dyes (Re-
active Yellow 84) decreases (Rein, 2001; Konsowa, 2003). It has also been
reported that O3/UV as the more effective method for decolourising of dyes
compared to oxidation by UV or ozonation alone. However, Perkowski and
Kos, (2003) has reported no significant differences between ozonation and
O3/UV in terms of colour removal. This may be due to the fact that production
of hydroxyl radical (HO•) during photodecomposition of ozone may improve
the degradation of organics. However, most of the UV light gets absorbed by
the dyes and hence very small amount of hydroxyl free radical can be produced
to decompose the dyes. Therefore, approximately same colour removal effi-
ciencies using O3 and O3/UV could be expected. In H2O2/UV process, HO•
radicals are formed when water containing H2O2 is exposed to UV light, nor-
mally in the range of 200 – 280 nm (Metcalf and Eddy, 2003). The H2O2 pho-
tolysis occurs as per the reaction shown in Eq. (2.14)
H2O2 + UV (λ = 200 – 280 nm) → HO• + HO• (2.14)
This process is widely used in Advanced Oxidation Process (AOP) technology
for the decompositon of chromophores present in the dyes (Ferroro, 2000;
Kurbus et al., 2002) and consequently relies on complete decolourisation. Fen-
ton reaction is also an example of AOP in which H2O2 is added in an acid solu-
tion (pH: 2 – 3) containing Fe2+
(Eq. 2.15)
Fe2+
+ H2O2 → Fe3+
+ HO• + HO- (2.15)
As compared to ozonation, this method is relatively cheap and also presents
high COD reduction and decolouisation efficiencies (Van der Zee, 2002). The
main drawback is high sludge generation due to the flocculation of reagents
and dye molecules (Robinson et al., 2001; Azbar et al., 2004). Most of the
AOP for textile wastewaters are highly expensive and its effectiveness varies
Literature Review
S. A. Deowan : Development of Membrane Bioreactor (MBR) Process Applying Novel Low Fouling Membrane
76
Chapter2
widely with the type of constituents present in the textile wastewaters. Also,
from the several reports it is observed that in cases, at certain conditions, these
technologies give very attractive results, however, in some other cases; their
application has been reported not worthy considering the cost and complexity
involved in these technologies.
Coagulation of dye-containing wastewaters has been used for many years as
main treatment or pre-treatment due to its low capital cost (Anjaneyulu at al,
2005; Golob et al., 2005). However, the major limitation of this process is the
generation of sludge and ineffective decolourisation of some soluble dyes (An-
janeyulu et al., 2005; Hai et al., 2007). Further, the sludge production can be
minimised if only a small volume of highly coloured effluent is treated directly
after the dyeing bath (Golob et al., 2005). The reasons could be the non-
availability of the other chemical additives except hydrolysing and fixing
agents in the effluent coming from dyeing bath. The chemical additives that are
normally present in the textile wastewaters provide hindrance to the colour
removal. If interfering chemical additives are absent in the textile wastewater
except colour causing dyes, then less coagulant dosage might be required
which in turns will reduce the sludge production (Verma et al., 2011).
The disadvantage of the advanced oxidation process are the high capital cost
and operation cost (Green Co., 2013)
The physical and chemical methods discussed in section 2.2.2.1 and 2.2.2.2 can
be also combined together such as physico-chemical method and can be ap-
plied as pre-treatment, post treatment or main process for textile wastewater
treatment worldwide.
2.2.2.3 Biological Method
2.2.2.3.1 Biological Activated Sludge Process
In recent years, textile wastewater is usually treated by the combination of ac-
tivated sludge process and coagulation-flocculation process. The activated
sludge process removes the part of organic compounds degraded by biological
microorganisms, and reduces treatment loading for the next process. The ar-
rangement in which the activated sludge process is in front of the coagulation-
flocculation process reduces the chemical cost and sludge treatment cost
(Green Co., 2013). An overview of a biological activated sludge process is
shown in Fig. 2.20.
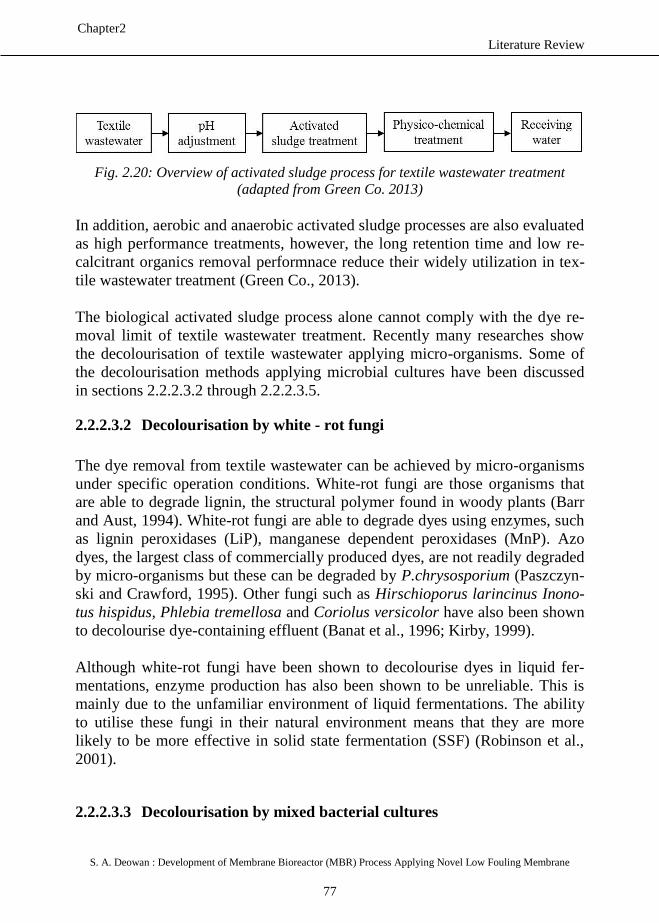
Literature Review
S. A. Deowan : Development of Membrane Bioreactor (MBR) Process Applying Novel Low Fouling Membrane
77
Chapter2
Fig. 2.20: Overview of activated sludge process for textile wastewater treatment
(adapted from Green Co. 2013)
In addition, aerobic and anaerobic activated sludge processes are also evaluated
as high performance treatments, however, the long retention time and low re-
calcitrant organics removal performnace reduce their widely utilization in tex-
tile wastewater treatment (Green Co., 2013).
The biological activated sludge process alone cannot comply with the dye re-
moval limit of textile wastewater treatment. Recently many researches show
the decolourisation of textile wastewater applying micro-organisms. Some of
the decolourisation methods applying microbial cultures have been discussed
in sections 2.2.2.3.2 through 2.2.2.3.5.
2.2.2.3.2 Decolourisation by white - rot fungi
The dye removal from textile wastewater can be achieved by micro-organisms
under specific operation conditions. White-rot fungi are those organisms that
are able to degrade lignin, the structural polymer found in woody plants (Barr
and Aust, 1994). White-rot fungi are able to degrade dyes using enzymes, such
as lignin peroxidases (LiP), manganese dependent peroxidases (MnP). Azo
dyes, the largest class of commercially produced dyes, are not readily degraded
by micro-organisms but these can be degraded by P.chrysosporium (Paszczyn-
ski and Crawford, 1995). Other fungi such as Hirschioporus larincinus Inono-
tus hispidus, Phlebia tremellosa and Coriolus versicolor have also been shown
to decolourise dye-containing effluent (Banat et al., 1996; Kirby, 1999).
Although white-rot fungi have been shown to decolourise dyes in liquid fer-
mentations, enzyme production has also been shown to be unreliable. This is
mainly due to the unfamiliar environment of liquid fermentations. The ability
to utilise these fungi in their natural environment means that they are more
likely to be more effective in solid state fermentation (SSF) (Robinson et al.,
2001).
2.2.2.3.3 Decolourisation by mixed bacterial cultures
Literature Review
S. A. Deowan : Development of Membrane Bioreactor (MBR) Process Applying Novel Low Fouling Membrane
78
Chapter2
It was found that mixed bacterial cultures are able to decolourise the dia-
zolinked chromophore of dye molecules in 15 days (Knapp and Newby, 1995).
Nigam and Marchant (1995) and Nigam et al. (1996) demonstrated that a mix-
ture of dyes were decolourised by anaerobic bacteria in 24-30 h, using free
growing cells or in the form of biofilms on various support materials. Ogawa
and Yatome (1990) also demonstrated the use of bacteria for azo dye degrada-
tion. These microbial systems have the drawback of requiring a fermentation
process, and are therefore unable to cope with larger volumes of textile efflu-
ents.
A number of research groups have investigated the ability of bacteria to de-
grade azo dyes. Under aerobic conditions azo dyes are not readily metabolised
although Kulla (1981), reported the ability of Pseudomonas strains to aerobi-
cally degrade certain azo dyes. However, the intermediates formed by these
degradative steps resulted in disruption of metabolic pathways and the dyes
were not actually mineralised. Under anaerobic conditions, such as anoxic sed-
iments, many bacteria gratuitously reduce azo dyes reportedly by the activity of
unspecific, soluble, cytoplasmic reductases. These enzymes are reported to
result in the production of colourless aromatic amines which may be toxic,
mutagenic and possibly carcinogenic to animals (Robinson et al., 2001).
2.2.2.3.4 Bio-sorption by microbial biomass
Textile dyes vary greatly in their chemistries, and therefore their interactions
with micro-organisms depend on the chemistry of a particular dye and the spe-
cific chemistry of the microbial biomass (Polman and Brekenridge, 1996). De-
pending on the dye and the species of micro-organism used different binding
rates and capacities can observed. It can be said that certain dyes have a partic-
ular affinity for binding with microbial species (Robinson et al., 2001).
Adsorption by biomass occurs by ion exchange. Hu (1992) demonstrated the
ability of bacterial cells to adsorb reactive dyes. Zhou and Zimmerman (1993)
used actinomyces as an adsorbent for decolourisation of effluents containing
anthroquinone, phalocyanine and azo dyes.
The simplest mechanism of colour removal by whole bacterial cells is that of
the adsorption of the dye onto the biomass (Bras et al., 2001). However, this
mechanism is similar to many other physical adsorption mechanisms for the
removal of colour and is not suitable for long term treatment. This is because,
Literature Review
S. A. Deowan : Development of Membrane Bioreactor (MBR) Process Applying Novel Low Fouling Membrane
79
Chapter2
during adsorption, the dye is concentrated with time, and the dye-adsorbent
composition must also be disposed of (Southern et al. 1995).
2.2.2.3.5 Anaerobic textile-dye bioremediation systems
Anaerobic bioremediation allows azo and other water-soluble dyes to be decol-
ourised. This decolourisation involves an oxidation-reduction reaction with
hydrogen rather than free molecular oxygen in aerobic systems. Typically, an-
aerobic breakdown yields methane and hydrogen sulphide (Carliell et al.,
1996).
Azo dye acts as an oxidising agent for the reduced flavin nucleotides of the
microbial electron chain and is reduced and decolourised concurrently with
reoxidation of the reduced flavin nucleotides. In order for this to occur, addi-
tional carbon is required for decolourisation to proceed at a vaiable rate. This
additional carbon is converted to methane and carbon doxide, releasing elec-
trons. These electrons cascade down the electron transport chain to a final elec-
tron acceptor, in this case the azo-reactive dye. The electrons react with the dye
reducing the azo bonds, and ultimately causing decolourisation (Carliell et al.,
1996).
Anaerobic degradation of textile dyes yields only azo reduction. Mineralisation
doesn’t occur. It has been shown that azo- and nitro-components are reduced in
the sediments and in the intestinal environment, resulting in the regeneration of
the parent toxic amines (Banat et al., 1996). Therefore, careful monitoring is
required before treated wastewater is released into waterways (Robinson et al.,
2001).
2.2.3 MBR in Textile Wastewater Treatment
2.2.3.1 Current Status
With respect to filtration of organic compounds, Membrane Bioreactors
(MBR) in combination with subsequent Nanofiltration (NF) or Reverse Os-
mosis (RO) membranes are well established, state of the art technology pref-
erably in industrial wastewater treatment, for example, textile wastewater
treatment (Fig. 2.21).
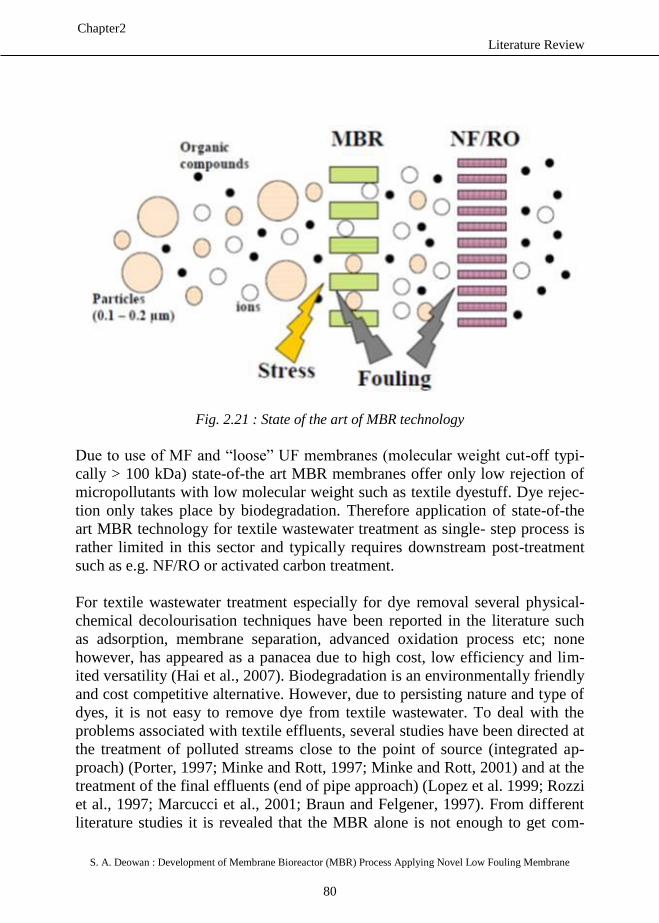
Literature Review
S. A. Deowan : Development of Membrane Bioreactor (MBR) Process Applying Novel Low Fouling Membrane
80
Chapter2
Fig. 2.21 : State of the art of MBR technology
Due to use of MF and “loose” UF membranes (molecular weight cut-off typi-
cally > 100 kDa) state-of-the art MBR membranes offer only low rejection of
micropollutants with low molecular weight such as textile dyestuff. Dye rejec-
tion only takes place by biodegradation. Therefore application of state-of-the
art MBR technology for textile wastewater treatment as single- step process is
rather limited in this sector and typically requires downstream post-treatment
such as e.g. NF/RO or activated carbon treatment.
For textile wastewater treatment especially for dye removal several physical-
chemical decolourisation techniques have been reported in the literature such
as adsorption, membrane separation, advanced oxidation process etc; none
however, has appeared as a panacea due to high cost, low efficiency and lim-
ited versatility (Hai et al., 2007). Biodegradation is an environmentally friendly
and cost competitive alternative. However, due to persisting nature and type of
dyes, it is not easy to remove dye from textile wastewater. To deal with the
problems associated with textile effluents, several studies have been directed at
the treatment of polluted streams close to the point of source (integrated ap-
proach) (Porter, 1997; Minke and Rott, 1997; Minke and Rott, 2001) and at the
treatment of the final effluents (end of pipe approach) (Lopez et al. 1999; Rozzi
et al., 1997; Marcucci et al., 2001; Braun and Felgener, 1997). From different
literature studies it is revealed that the MBR alone is not enough to get com-
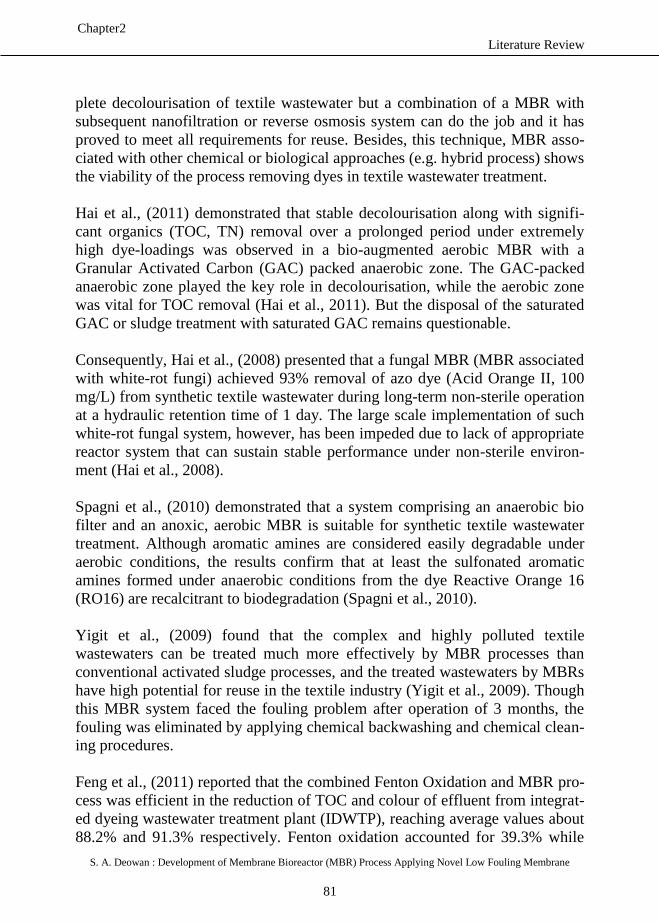
Literature Review
S. A. Deowan : Development of Membrane Bioreactor (MBR) Process Applying Novel Low Fouling Membrane
81
Chapter2
plete decolourisation of textile wastewater but a combination of a MBR with
subsequent nanofiltration or reverse osmosis system can do the job and it has
proved to meet all requirements for reuse. Besides, this technique, MBR asso-
ciated with other chemical or biological approaches (e.g. hybrid process) shows
the viability of the process removing dyes in textile wastewater treatment.
Hai et al., (2011) demonstrated that stable decolourisation along with signifi-
cant organics (TOC, TN) removal over a prolonged period under extremely
high dye-loadings was observed in a bio-augmented aerobic MBR with a
Granular Activated Carbon (GAC) packed anaerobic zone. The GAC-packed
anaerobic zone played the key role in decolourisation, while the aerobic zone
was vital for TOC removal (Hai et al., 2011). But the disposal of the saturated
GAC or sludge treatment with saturated GAC remains questionable.
Consequently, Hai et al., (2008) presented that a fungal MBR (MBR associated
with white-rot fungi) achieved 93% removal of azo dye (Acid Orange II, 100
mg/L) from synthetic textile wastewater during long-term non-sterile operation
at a hydraulic retention time of 1 day. The large scale implementation of such
white-rot fungal system, however, has been impeded due to lack of appropriate
reactor system that can sustain stable performance under non-sterile environ-
ment (Hai et al., 2008).
Spagni et al., (2010) demonstrated that a system comprising an anaerobic bio
filter and an anoxic, aerobic MBR is suitable for synthetic textile wastewater
treatment. Although aromatic amines are considered easily degradable under
aerobic conditions, the results confirm that at least the sulfonated aromatic
amines formed under anaerobic conditions from the dye Reactive Orange 16
(RO16) are recalcitrant to biodegradation (Spagni et al., 2010).
Yigit et al., (2009) found that the complex and highly polluted textile
wastewaters can be treated much more effectively by MBR processes than
conventional activated sludge processes, and the treated wastewaters by MBRs
have high potential for reuse in the textile industry (Yigit et al., 2009). Though
this MBR system faced the fouling problem after operation of 3 months, the
fouling was eliminated by applying chemical backwashing and chemical clean-
ing procedures.
Feng et al., (2011) reported that the combined Fenton Oxidation and MBR pro-
cess was efficient in the reduction of TOC and colour of effluent from integrat-
ed dyeing wastewater treatment plant (IDWTP), reaching average values about
88.2% and 91.3% respectively. Fenton oxidation accounted for 39.3% while
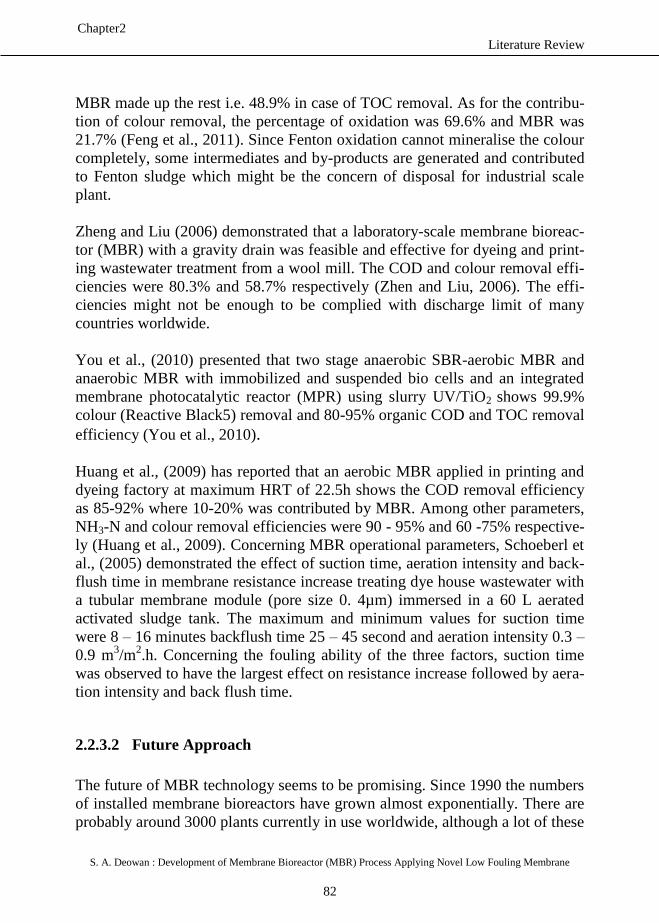
Literature Review
S. A. Deowan : Development of Membrane Bioreactor (MBR) Process Applying Novel Low Fouling Membrane
82
Chapter2
MBR made up the rest i.e. 48.9% in case of TOC removal. As for the contribu-
tion of colour removal, the percentage of oxidation was 69.6% and MBR was
21.7% (Feng et al., 2011). Since Fenton oxidation cannot mineralise the colour
completely, some intermediates and by-products are generated and contributed
to Fenton sludge which might be the concern of disposal for industrial scale
plant.
Zheng and Liu (2006) demonstrated that a laboratory-scale membrane bioreac-
tor (MBR) with a gravity drain was feasible and effective for dyeing and print-
ing wastewater treatment from a wool mill. The COD and colour removal effi-
ciencies were 80.3% and 58.7% respectively (Zhen and Liu, 2006). The effi-
ciencies might not be enough to be complied with discharge limit of many
countries worldwide.
You et al., (2010) presented that two stage anaerobic SBR-aerobic MBR and
anaerobic MBR with immobilized and suspended bio cells and an integrated
membrane photocatalytic reactor (MPR) using slurry UV/TiO2 shows 99.9%
colour (Reactive Black5) removal and 80-95% organic COD and TOC removal
efficiency (You et al., 2010).
Huang et al., (2009) has reported that an aerobic MBR applied in printing and
dyeing factory at maximum HRT of 22.5h shows the COD removal efficiency
as 85-92% where 10-20% was contributed by MBR. Among other parameters,
NH3-N and colour removal efficiencies were 90 - 95% and 60 -75% respective-
ly (Huang et al., 2009). Concerning MBR operational parameters, Schoeberl et
al., (2005) demonstrated the effect of suction time, aeration intensity and back-
flush time in membrane resistance increase treating dye house wastewater with
a tubular membrane module (pore size 0. 4µm) immersed in a 60 L aerated
activated sludge tank. The maximum and minimum values for suction time
were 8 – 16 minutes backflush time 25 – 45 second and aeration intensity 0.3 –
0.9 m3/m
2.h. Concerning the fouling ability of the three factors, suction time
was observed to have the largest effect on resistance increase followed by aera-
tion intensity and back flush time.
2.2.3.2 Future Approach
The future of MBR technology seems to be promising. Since 1990 the numbers
of installed membrane bioreactors have grown almost exponentially. There are
probably around 3000 plants currently in use worldwide, although a lot of these
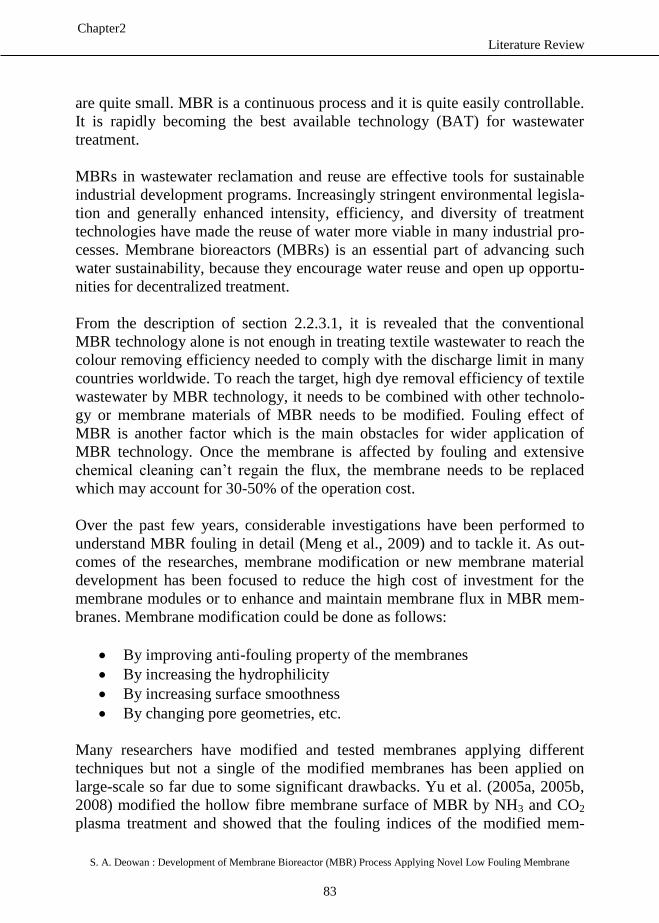
Literature Review
S. A. Deowan : Development of Membrane Bioreactor (MBR) Process Applying Novel Low Fouling Membrane
83
Chapter2
are quite small. MBR is a continuous process and it is quite easily controllable.
It is rapidly becoming the best available technology (BAT) for wastewater
treatment.
MBRs in wastewater reclamation and reuse are effective tools for sustainable
industrial development programs. Increasingly stringent environmental legisla-
tion and generally enhanced intensity, efficiency, and diversity of treatment
technologies have made the reuse of water more viable in many industrial pro-
cesses. Membrane bioreactors (MBRs) is an essential part of advancing such
water sustainability, because they encourage water reuse and open up opportu-
nities for decentralized treatment.
From the description of section 2.2.3.1, it is revealed that the conventional
MBR technology alone is not enough in treating textile wastewater to reach the
colour removing efficiency needed to comply with the discharge limit in many
countries worldwide. To reach the target, high dye removal efficiency of textile
wastewater by MBR technology, it needs to be combined with other technolo-
gy or membrane materials of MBR needs to be modified. Fouling effect of
MBR is another factor which is the main obstacles for wider application of
MBR technology. Once the membrane is affected by fouling and extensive
chemical cleaning can’t regain the flux, the membrane needs to be replaced
which may account for 30-50% of the operation cost.
Over the past few years, considerable investigations have been performed to
understand MBR fouling in detail (Meng et al., 2009) and to tackle it. As out-
comes of the researches, membrane modification or new membrane material
development has been focused to reduce the high cost of investment for the
membrane modules or to enhance and maintain membrane flux in MBR mem-
branes. Membrane modification could be done as follows:
By improving anti-fouling property of the membranes
By increasing the hydrophilicity
By increasing surface smoothness
By changing pore geometries, etc.
Many researchers have modified and tested membranes applying different
techniques but not a single of the modified membranes has been applied on
large-scale so far due to some significant drawbacks. Yu et al. (2005a, 2005b,
2008) modified the hollow fibre membrane surface of MBR by NH3 and CO2
plasma treatment and showed that the fouling indices of the modified mem-
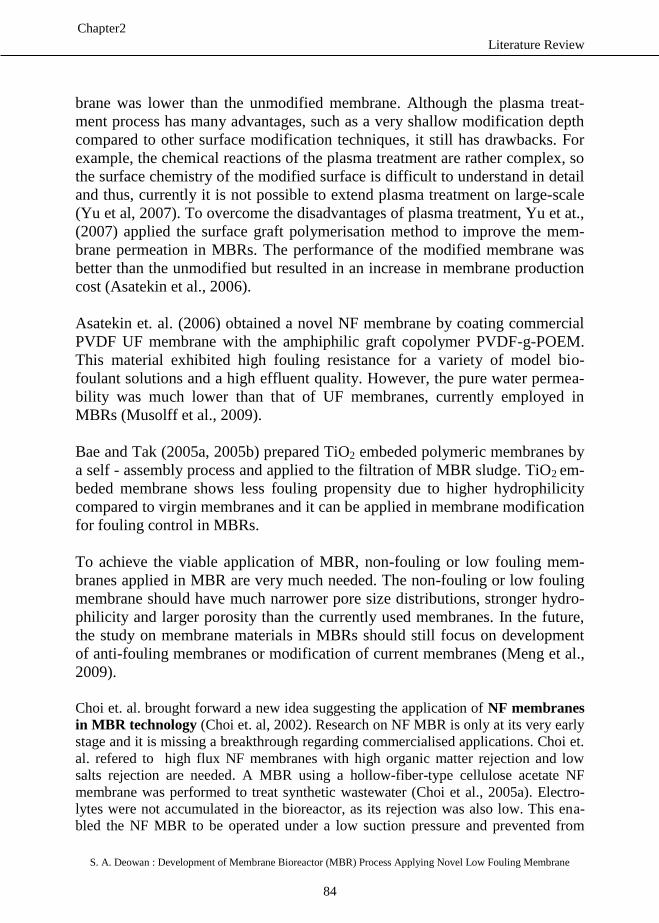
Literature Review
S. A. Deowan : Development of Membrane Bioreactor (MBR) Process Applying Novel Low Fouling Membrane
84
Chapter2
brane was lower than the unmodified membrane. Although the plasma treat-
ment process has many advantages, such as a very shallow modification depth
compared to other surface modification techniques, it still has drawbacks. For
example, the chemical reactions of the plasma treatment are rather complex, so
the surface chemistry of the modified surface is difficult to understand in detail
and thus, currently it is not possible to extend plasma treatment on large-scale
(Yu et al, 2007). To overcome the disadvantages of plasma treatment, Yu et at.,
(2007) applied the surface graft polymerisation method to improve the mem-
brane permeation in MBRs. The performance of the modified membrane was
better than the unmodified but resulted in an increase in membrane production
cost (Asatekin et al., 2006).
Asatekin et. al. (2006) obtained a novel NF membrane by coating commercial
PVDF UF membrane with the amphiphilic graft copolymer PVDF-g-POEM.
This material exhibited high fouling resistance for a variety of model bio-
foulant solutions and a high effluent quality. However, the pure water permea-
bility was much lower than that of UF membranes, currently employed in
MBRs (Musolff et al., 2009).
Bae and Tak (2005a, 2005b) prepared TiO2 embeded polymeric membranes by
a self - assembly process and applied to the filtration of MBR sludge. TiO2 em-
beded membrane shows less fouling propensity due to higher hydrophilicity
compared to virgin membranes and it can be applied in membrane modification
for fouling control in MBRs.
To achieve the viable application of MBR, non-fouling or low fouling mem-
branes applied in MBR are very much needed. The non-fouling or low fouling
membrane should have much narrower pore size distributions, stronger hydro-
philicity and larger porosity than the currently used membranes. In the future,
the study on membrane materials in MBRs should still focus on development
of anti-fouling membranes or modification of current membranes (Meng et al.,
2009).
Choi et. al. brought forward a new idea suggesting the application of NF membranes
in MBR technology (Choi et. al, 2002). Research on NF MBR is only at its very early
stage and it is missing a breakthrough regarding commercialised applications. Choi et.
al. refered to high flux NF membranes with high organic matter rejection and low
salts rejection are needed. A MBR using a hollow-fiber-type cellulose acetate NF
membrane was performed to treat synthetic wastewater (Choi et al., 2005a). Electro-
lytes were not accumulated in the bioreactor, as its rejection was also low. This ena-
bled the NF MBR to be operated under a low suction pressure and prevented from
Literature Review
S. A. Deowan : Development of Membrane Bioreactor (MBR) Process Applying Novel Low Fouling Membrane
85
Chapter2
inhibition against microorganisms, whose activity might be deteriorated by high salt
concentration (Choi et al., 2002). Choi et. al. operated a submerged NF MBR using
cellulose acetate membranes for 240 days to examine the performance in the domestic
wastewater treatment. However, they noticed a qualitative deterioration of the NF
membrane caused by the hydrolysis of cellulose acetate (Choi 2005a).
The new approach of MBR application could be osmotic MBR applying forward os-
mosis (FO) process. For textile dye removal purpose, MBR might be applied in com-
bination with anaerobic and aerobic MBR process.
Throughout this PhD thesis works, UF membrane for MBR application has
been modified applying nano-structured novel coating on it via polymerisable
bicontinuous microemulsion (PBM) process. The antifouling effect of the
membranes have been tested in short term tests with model foulant humic acid
and model textile dye wastewater (MTDW) in ultrafiltration cross-flow testing
cells and long term tests with model textile dye wastewater (MTDW) in a lab-
scale MBR plant for the duration of 6 months. The overall performances of the
modified membranes and their benefits have been discussed in chapter7 within
this thesis report.
References
aaflowsystem, www.aaflowsystem.com, accessed on May, 2011
Aggerwasser, Kubota; Info CD “Membrantechnik”, www.aggerwasser.de, ac-
cessed on May, 2011
Ahmad, A.L., Harris, W.A., SyafiieOoi, B.S. (2002), Removal of dye from
wastewater of textile industry using membrane technology. Universiti
Teknologi Malaysia Jurnal Teknologi 36 (F), 31 - 44.
Akbari, A., Desclaux, S., Rouch, J.C., Aptel, P., Remigy, J.C. (2006), New
UV-photografted nanofiltration membranes for the treatment of colored
textile dye effluents. Journal of Membrane Science 286 342 - 350.
Alaton, I.A., Balcioglu, I.A., Bahnemann, D.W. (2002), Advanced oxidation of
a reactive dye bath effluent: comparison of O3, H2O2/UV-C and
TiO2/UV-A processes. Water Research 36 1143 - 1154.
Anjaneyulu, Y., Chary, N.S., Raj, D.S.S. (2005), Decolourization of industrial
effluents available methods and emerging technologies-a review. Re-
views in Environmental Science and Biotechnology 4 245 - 273.
Asatekin, A., Menniti, A., Kang, S., Elimelech, M., Morgenroth, E., and
Mayes, A.M. (2006), Antifouling nanofiltration membranes for mem-
brane bioreactors from self-assembling graft copolymers, J. Membr.
Sci. 285, 81-89.
Literature Review
S. A. Deowan : Development of Membrane Bioreactor (MBR) Process Applying Novel Low Fouling Membrane
86
Chapter2
Azbar, N., Yonar, T., Kestioglu, K. (2004), Comparison of various advanced
oxidation processes and chemical treatment methods for COD and col-
our removal from a polyester and acetate fiber dying effluent. Chemo-
sphere 55 35 - 43.
Babu, B.R., Parande, A.K., Raghu, S., Kumar, T.P. (2007), Cotton textile pro-
cessing: waste generation and effluent treatment. Textile technology.
The Journal of Cotton Science 11 141 - 153.
Bae, T. – H., Tak, T. – M. (2005a), Effect of TiO2 nanoparticles on fouling
mitigation of ultrafiltration membranes for activated sludge filtration,
journal of membrane science, 249 (1-2). 1-8
Bae, T. – H., Tak, T. – M. (2005b), Preparation of TiO2 self-assebmled poly-
meric nanocomposite membranes and examination of their fouling mit-
igation effects in a membrane bioreactor system, journal of membrane
science 266 (1-2), 1-5
Bailey, J., Bemberis, I. and Presti, J. (1971), Phase I Final Report-Shipboard
sewage treatment system, General Dynamics Electric Boat Division,
November. 1971, NTIS.
Baker, R.W. (2000), Membrane Technology and Applications, Chapter 3,
ISBN 0-07-135440-9, McGraw-Hill.
Baker, R. W. (2004), Membrane Technology and Applications, John Wiley &
Sons Ltd, second edition.
Banat, I.M., Nigam, P., Singh, D., Marchant, R. (1996), Microbial decoloriza-
tion of textile-dye containing e.uents: a review. Bioresour. Technol. 58,
217 - 227.
Barr, D.P., Aust, S.D. (1994), Mechanisms white rot fungi use to degrade pol-
lutants. Environ. Sci. Technol. 28, 320 - 328.
Baughman, G.L., Perenich, T.A. (1988), Fate of dyes in aquatic systems: I Sol-
ubility and partitioning of some hydrophobic dyes and related com-
pounds. Environ. Toxicol. Chem. 7 183 - 199.
Bayramoglu, G., Arica, M.Y. (2007), Biosorption of benzidine based textile
dyes Direct Blue 1 and Direct Red 128 using native and heat-treated bi-
omass of Trametes versicolor. Journal of Hazardous Materials 143 (1 -
2), 135 - 143.
Bemberis, I., Hubbard, P.J. and Leonard, F.B. (1971), Membrane sewage
treatment systems-potential for complete wastewater treatment, Ameri-
can Society of Agricultural Engineers Winter Meeting, 71-878, 1-28.
Bérubé, P.R., Hall, E.R. and Sutton, P.M. (2006), Parameters governing per-
meate flux in an anaerobic membrane bioreactor treating low-strength
municipal wastewaters: A literature review. Water Environment Re-
search, 78(8), 887-896.
Literature Review
S. A. Deowan : Development of Membrane Bioreactor (MBR) Process Applying Novel Low Fouling Membrane
87
Chapter2
Botha, G.R., Sanderson, R.D. and Buckley, C.A. (1992), Brief historical re-
view of membrane development and membrane applications in
wastewater treatment in Southern Africa. Wat. Sci. technol., 25 (10), 1-
4.
Bouhabila, E.H., Aïm, R.B., Buisson, H. (2001), Fouling characterisation in
membrane bioreactors, Separation and Purification Technology Vol-
umes 22-23, 123-132.
Bras R, Ferra IA, Pinheiro HM, Goncalves IC. (2001), Batch tests for assessing
decolourisation of azo dyes by methanogenic and mixed cultures. Jour-
nal of Biothechnology 89, 155–62.
Braun, G. and. Felgener, O.W. (1997), Treatment of Wastewaters from Textile
Processing, TU-Berlin Schiftenreihe biologische A wasserreinigung,
Vol. 9, Berlin.
Brookes, A., Jefferson, B. and Judd, S. (2004), IWA 4th World Water Con-
gress, Marrakech, Marruecos.
Brik, M.; Schoeberl, P.; Chamam, B; Braun, R and Fuchs, W. (2006), Ad-
vanced treatment of textile wastewater towards reuse using a membrane
bioreactor, Process Biochemistry 41, 1751 - 1757
Brower, G. R. and Reed G. D. (1987), Economic pretreatment for color remov-
al from textile dye wastes. In Proc. 41st Purdue Ind. Waste Conf.,
Lafayette, Indiana.
Canales, A., Pareilleux, A., Rols, J. L., Goma, G. and Huyard, A. (1994), De-
creased Sludge Production Strategy for Domestic Wastewater Treat-
ment, Wat. Sci. Technol., 30, 97-106.
Cassano, A, Drioli, E., Figoli, A., Hoinkis, J., Deowan, S.A., Islam, M.A.,
Huang, R.R. (2005), Membrane Technology for Water Treatment,
Membrane Training Handbook, p.94, Jiangsu Polytechnic University,
China.
Carliell, C.M., Barclay, S.J., Buckley, C.A. (1996), Treatment of exhausted
reactive dye bath effluent using anaerobic digestion: laboratory and full
scale trials. Water S.A. 22, 225 - 233.
Chang, I.S. and Lee, C.H. (1998), Membrane filtration characteristics in mem-
brane-coupled activated sludge system - the effect of physiological
states of activated sludge on membrane fouling. Desalination 120(3),
221-233.
Chang, I.S., Lee, C.H. and Ahn, K.H. (1999), Membrane filtration characteris-
tics in membrane-coupled activated sludge system: The effect of floc
structure on membrane fouling. Separation Science and Technology
34(9), 1743-1758.
Literature Review
S. A. Deowan : Development of Membrane Bioreactor (MBR) Process Applying Novel Low Fouling Membrane
88
Chapter2
Chiemchaisri, C. and Yamamoto, K. (1994), Performance of membrane separa-
tion bioreactor at various temperatures for domestic wastewater treat-
ment. J. Memb. Sci., 87, 119-129.
Choi, J.H., Dockko, S., Fukushi, F., and Yamamoto, K. (2002), A novel appli-
cation of a submerged nanofiltration membrane bioreactor (NF MBR)
for wastewater treatment. Desalination 146, 413-420.
Choi, J.H., Fukushi, F. and Yamamoto, K. (2005a), Comparison of treatment
efficiency of submerged nanofiltration membrane bioreactors using cel-
lulose treated and polyamide membrane, Wa. Sci. Technol., 51 (6/7)
305-312.
Choi, H., Zhang, K., Dionysiou, D.D., Oerther, D.B. and Sorial, G.A. (2005b),
Effect of permeate flux and tangential flow on membrane fouling for
wastewater treatment. Desalination, 178, 219-225.
Chung, K.T., Fulk, G.E., Egan, M. (1978), reduction of azo dyes by intestinal
anaerobes, Appl. Environ. Microbiol., 35, 558 - 562
Choo, K.H., Kang, I.J., Yoon, S.H., Park, H., Kim, J.H., Adiya, S. and Lee,
C.H. (2000a), Approaches to membrane fouling control in anaerobic
membrane bioreactors. Wat. Sci. Technol., 41(10-11), 363-371.
Cicek, N., Macomber, J., Davel, J., Suidan, M. T., Audic, J. and Genestet, P.
(2001), Effect of solids retention time on the performance and biologi-
cal characteristics of a membrane bioreactor. Wat. Sci. Technol., 43
(11), 43-50.
Choo, K.H. and Lee, C.H. (1996), Effect of anaerobic digestion broth composi-
tion on membrane permeability. Wat. Sci. Technol., 34(9), 173-179.
Choo, K.H., Kang, I.J., Yoon, S.H., Park, H., Kim, J.H., Adlya, S. and Lee,
C.H. (2000b), Approaches to membrane fouling control in anaerobic
membrane bioreactor. Water Res., 32, 3387-3397
Chua, H.C., Arnot, T.C. and Howell, J.A. (2002), Controlling fouling in mem-
brane bioreactor operated with a variable throughput. Desalination, 90,
323-331.
Côté, P. (2002), Inverted air box aerator and aeration method for immersed
membrane, US Patent 6,863, 823.
Correia, V.M., Stephenson, T., Judd, S. (1994), Characterisation of textile
wastewaters - a review, Environmental Technology 15 917 - 929.
Drews, A., Lee, C.-H., Kraume, M. (2006), Membrane fouling - a review on
the role of EPS, Desalination Volume 200, Issues 1-3, 186-188
Drioli, E., Figoli, A., Cassano, A, Hoinkis, J., Deowan, S.A., Islam, M.A.,
Huang, R.R. (2005), Membrane Technology for Water Treatment,
Membrane Training Handbook, p.9, Jiangsu Polytechnic University,
China.
Literature Review
S. A. Deowan : Development of Membrane Bioreactor (MBR) Process Applying Novel Low Fouling Membrane
89
Chapter2
Delee, W., O’Neill, C., Hawkes, F.R., Pinheiro, H.M. (1998), Anaerobic treat-
ment of textile effluent: a review. Journal of Chemical Technology and
Biotechnology 73, 323 - 335.
Elmaleh, S. and Abdelmoumni, L. (1997), Cross-flow filtration of an anaerobic
methanogenic suspension. J. Membr. Sci., 131(1-2), 261-274.
Field, R.W., Wu, D., Howell, J.A. and Gupta, B.B (1995), Critical flux concept
for microfiltration fouling. J Membr Sci 100:259-272.
Figoli, A., Drioli, E., Cassano, A, Hoinkis, J., Deowan, S.A., Islam, M.A.,
Huang, R.R. (2005), Membrane Technology for Water Treatment,
Membrane Training Handbook, A. Figoli, Chapter 4, p.81, , Jiangsu
Polytechnic University, China.
Fraunhofer IGB (1997), press release, August, www-alt.igb.fraunhofer.de, ac-
cessed May, 2011
Fufang, Z., and Jordan, J. (2002), Apparatus and method for cleaning mem-
brane filtration modules US Patent 0075504.
Ferroro, F., (2000), Oxidative degradation of dyes and surfactant in the Fenton
and photo-Fenton treatment of dye house effluents. Coloration Tech-
nology 116 (5 - 6), 148 - 153.
Fersi, C., Dhahbi, M. (2008), Treatment of textile plant effluent by ultrafiltra-
tion and/ or nanofiltration for water reuse. Desalination 222, 263 - 271.
Feng, F., Xu, Z., Li, X., You, W. and Zhen, Y. (2010), Advanced treatment of
dyeing wastewater towards reuse by the combined Fenton oxidation and
membrane bioreactor process, Journal of Environmental Sciences
22(11), 1657 - 1665
Gander, M., Jefferson, B. and Judd, S. (2000), Aerobic MBRs for domestic
wastewater treatment: a review with cost considerations. Separation
and Purification Technology 18(2), 119-130.
Gao, M., Yang, M., Li, H., Yang, Q. and Zhang Y. (2004), Comparison be-
tween a submerged membrane bioreactor and a conventional activated
sludge system on treating ammonia-bearing inorganic wastewater.
Journal of Biotechnology, 108, 265 – 269.
Gao, B.Y., Yue, Q.Y., Wang, Y., Zhou, W.Z. (2007), Color removal from dye-
containing wastewater by magnesium chloride, Journal of Environmen-
tal Management 82 167 - 172.
Gholami, M., Nasseri, S., Fard, M.R.A., Mesdaghinia, A., Vaezi, F., Mahvi,
A., Naddaffi, K. (2001), Dye removal from effluents of textile indus-
tries by ISO9888 method and membrane technology. Iranian Journal of
Public Health 30, 73 - 80.
Ghyoot, W.R. and Verstraete, W.H. (1997), Coupling membrane filtration to
anaerobic primary sludge digestion. Environmental Technology 18(6),
569-580.
Literature Review
S. A. Deowan : Development of Membrane Bioreactor (MBR) Process Applying Novel Low Fouling Membrane
90
Chapter2
GIA, Global Industrial Analysts Inc., (2013),
http://www.prweb.com/releases/membrane_bioreactors/MBR/prweb897
3361.htm, accessed on November 22, 2013
Green Co. LTD., (2013), Treatment of textile wastewater treatment using bio-
logical activated sludge process combined with coagulation, 2013, Vi-
etnam (accessed on 24.03.2013)
Golob, V., Vinder, A., Simonic, M. (2005), Efficiency of coagula-
tion/flocculation method for treatment of dye bath effluents. Dyes and
Pigments 67, 93 - 97.
Gujer, W., Henze M., Mino T. and Van Loosdrecht, M. (1999), Activated
sludge model No. 3. Wat. Sci. Technol. 39:183-193.
Hai, F.I., Yamamoto, K., Nakajima, F. and Fukushi, K. (2011), Bioaugmented
membrane bioreactor (MBR) with a GAC-Packed zone for high rate
textile wastewater treatment, water research 45, 2199 - 2206
Hai, F.I., Yamamoto, K., Nakajima, F. and Fukushi, K. (2008), Factors govern-
ing performance of continuous fungal reactor during non-sterile opera-
tion – The case of a membrane bioreactor treating textile wastewater,
Chemosphere 74 810 – 817
Hai, F.I., Yamamoto, K., Fukushi, K. (2007), Hybrid treatment systems for dye
wastewater. Crit. Rev. Environ. Sci. Technol. 37, 1–64.
Hamza A. and Hamoda M. F. (1980),Multiprocess treatment of textile
wastewater. In Proc. 35th Purdue Ind. Waste Conf., Lafayette, Indiana
Harada, H., Momonoi, K., Yamazaki, S. and Takizawa, S. (1994), Application
of Anaerobic-UF Membrane Reactor for Treatment of A Waste-Water
Containing High-Strength Particulate Organics. Wat. Sci.Technol.,
30(12), 307-319.
Hardt, F.W., Clesceri, L.S., Nemerow, N.L. and Washington, D.R. (1970), Sol-
id separation by ultrafiltration for concentrated activated sludge. J.
Wat.Pollut. Con. Fed., 42, 2135-2148.
Hasar, H., Kinaci, C., Unlu, A., Toğrul, H., Ipek, U. (2004), Rheological prop-
erties of
activated sludge in a sMBR, Biochem Eng. J., 20(1): 1-6.
Hilal, N., Kochkodan, V., Al-Khatib, L., Levadna, T. (2004), Surface modified
polymeric membranes to reduce (bio) fouling: a microbiological study
using E. coli, Desalination Volume 167, 293–300.
Holbrook, R.D., Higgins, M.J., Murthy, S.N., Fonseca, A.D., Fleishcher, E.J.,
Daigger, G.T., Grizzard, T.J., Love, N.G., and Novak, J.T. (2004), Ef-
fect of alum addition on the performance of submerged membranes for
wastewater treatment. Water Env. Res., 76, 2699-2702.
Literature Review
S. A. Deowan : Development of Membrane Bioreactor (MBR) Process Applying Novel Low Fouling Membrane
91
Chapter2
Hong, S.P., Bae, T.H., Tak, T.M., Hong, S and Randball, A. (2002), Fouling
control in activated sludge submerged hollow fiber membrane bioreac-
tors. Desalination, 143, 219-228.
Horan, N. (1990), Biological Wastewater Treatment Systems: Theory and Op-
eration. Wiley, Chichester.
Howell, J.A. and Nystrom, M. (1993), Fouling Phenomena. in Membranes in
bioprocessing : theory and applications in: J. A. Howell, V. Sanchez
and R. W. Field. London, Chapman & Hall. First Edition: 203-244.
Howell, J.A., Arnot, T.C. and Liu, W. (2003), Membrane bioreactor for treat-
ing waste streams. Ann NY Ac Sci 984:411-9.
Howell, J.A., Chua, H.C. and Arnot, T.C. (2004), in situ manipulation of criti-
cal flux in a submerged membrane bioreactor using variable aeration
rates, and effects of membrane history. J. Membr. Sci., 242, 13-19.
Hsu, T.C., Chiang, C.S., (1997), Activated sludge treatment of dispersed dye
factory wastewater. Journal of Environmental Science and Health 32,
1921 - 1932.
Hu, T.L., (1992), Sorption of reactive dyes by Aeromonas biomass. Water Sci.
Technol. 26, 357 - 366.
Huang, X., Gui, P. and Qian, Y. (2001), Effect of sludge retention time on mi-
crobial behaviour in a submerged membrane bioreactor. Process Bio-
chem. 36, 1001-1006.
Huang, R.R., Hoinkis, J., Hu, Q. and Koch, F. (2009), Treatment of dyeing
wastewater by hollow fiber membrane biological reactor, Journal of de-
salination and water treatment, 11, 1 - 6
Itonaga, T., Kimura, K. and Watanabe, Y. (2004), Influence of suspension vis-
cosity and colloidal particles on permeability of membrane used in
membrane bioreactor (mbr). Wat. Sci. Technol., 50, 301-309.
Jifeng, G., Siqing, X., Rongchang, W., (2008), Study on Membrane Fouling of
Submerged Membrane Bioreactor in Treating Bathing Wastewater,
Journal of Environmental Sciences 20, 1158–1167
Jiang, T. (2007), Characterization and modelling of soluble microbial products
in membrane bioreactors, PhD thesis, Ghent University, Belgium, 241-
248.
Jiang, T., Kennedy, M.D., Guinzbourg, B.F., Vanrolleghem, P.A. and Schip-
pers, J.C. (2005), Optimising the operation of a mbr pilot plant by quan-
titative analysis of the membrane fouling mechanism. Water Sci. Tech-
nol., 51, 19-25.
Jiang, T., Kennedy, M.D., van der Meer, W.G.J., Vanrolleghem, P.A., Schip-
pers, J.C. (2003), The role of blocking and cake filtration in MBR foul-
ing,Desalination Volume 157, Issues 1-3, 1, 335-343
Literature Review
S. A. Deowan : Development of Membrane Bioreactor (MBR) Process Applying Novel Low Fouling Membrane
92
Chapter2
Judd, S. (2006), The MBR Book: Principles and Applications of Membrane
Bioreactors for Water and Wastewater Treatment, editor, Elsevier.
Kang, S.F., Chen, M.C. (1997), Coagulation of textile secondary effluents with
fenton’s reagent. Water Science and Technology 36 (12), 215 - 222.
Kang, I.J., Yoon, S.H. and Lee, C.H. (2002), Comparison of the filtration char-
acteristics of organic and inorganic membranes in a membrane-coupled
anaerobic bioreactor. Water Research 36(7), 1803-1813.
Karcher, S., Kornmuller, A. (2002), Jekel, M., Anion exchange resins for re-
moval of reactive dyes from textile wastewaters. Water Research 36,
4717 - 4724.
Kim, J.S. and Lee, C.H. (2003), Effect of powdered activated carbon on the
performance of an aerobic membrane bioreactor: comparison between
cross-flow and submerged membrane systems. Water Env. Res., 75,
300-307.
Kim, T.H., Park, C., Yang, J., Kim, S., (2004), Comparison of disperse and
reactive dye removals by chemical coagulation and fenton oxidation.
Journal of Hazardous Materials 112 (1-2), 95 - 103.
Kirby, N. (1999), Bioremediation of textile industry wastewater by white rot
fungi. DPhil Thesis, University of Ulster, Coleraine, UK.
Knoblock, MD., Sutton, PM., Mishra, P.N., Gupta, K., Janson, A. (1994),
Membrane bioreactor for industrial wastewater treatment : Applicability
and selection of optimal systems configuration. Water Environ Res.
66:133.
Kritikos D E, Xekoukoulotakis N P, Psillakis E, Mantzavinos D, (2007), Pho-
tocatalytic degradation of Reactive Black 5 in aqueous solution: Effect
of operating conditions and coupling with ultrasound irradiation. Water
Research, 41(10): 2236–2246.
Konsowa, A.H. (2003), Decolorization of wastewater containing direct dye by
ozonation in a batch bubble column reactor. Desalination 158, 233 -
240.
Kurbus, T., Slokar, Y.M., Marechal, A.M. (2002), The study of the effects of
the variables on H2O2/UV decolouration of vinylsulphone dye: Part II.
Dyes And Pigments 54, 67 -78.
Knapp, J.S., Newby, P.S. (1995), The microbiological decolorization of an
industrial e.uent contain ing a diazo-linked chromophore. Water Res. 7,
1807 - 1809.
Kulla, M.G. (1981), Aerobic bacterial degradation of azo dyes. Microbial deg-
radation of xerobiotics and recalcitrant compounds. In: Leisinger, T.,
Cook, A.M., Hutter, R., Nuesch, J. (Eds.), FEMS Symposium, 12. Aca-
demic Press, London, 387 - 399.
Literature Review
S. A. Deowan : Development of Membrane Bioreactor (MBR) Process Applying Novel Low Fouling Membrane
93
Chapter2
Laeraa, G., Polliceb, A., Saturnob, D., Giordanob, C., Sandullia, R. (2009),
Influence of sludge retention time on biomass characteristics and clean-
ing requirements in a membrane bioreactor for municipal wastewater
treatment, Desalination 236, 104–110
Ledakowicz, S., Solecka, M., Zylla, R. ( 2001), Biodegradation, decolourisa-
tion and detoxification of textile wastewater enhanced by advanced ox-
idation processes. Journal of Biotechnology 89, 175 - 184.
Lesage, N., Sperandio, M. and Cabassud, C. (2005), Performances of a hybrid
adsorption/submerged membrane biological process for toxic waste re-
moval. Wat. Sci. Technol., 51, 173-180.
Lesjean, B., and Huisjeslow, E.H. (2008), Survey of the European MBR mar-
ket: trends and perspectives, Desalination Volume 231, Issues 1-3, 71-
81.
Lee, S.M., Jung, J.Y. and Chung, Y.C. (2001a), Novel method for enhancing
permeate flux of submerged membrane system in two-phase anaerobic
reactor. Water Research., 35, 471-477.
Lee, J., Ahn, W.Y. and Lee, C.H. (2001b), Comparison of the filtration charac-
teristics between attached and suspended growth microorganisms in
submerged membrane bioreactor . Water Research 35(10), 2435-2445.
Lee, J.C., Kim, J, S., Kang, I.J., Cho, M.H., Park, P.K. and Lee, C.H. (2001c),
Potential and limitations of alum or zeolite addition to improve the per-
formance of a submerged membrane bioreactor. Water Res., 35, 2435-
2445.
Li H, Yang M, Zhang Y, Yu T and Kamagata, Y. (2006), Nitrification perfor-
mance and microbial community dynamics in a submerged membrane
bioreactor with complete sludge retention. J. Biotechnol., 123, 60-70.
Li, Y.Z., He, Y.L., Liu, Y.H., Yang, S.C. and Zhang, G.J. (2005a), Comparison
of the filtration characteristics between biological powdered activated
carbon sludge and activated sludge in submerged membrane bioreac-
tors. Desalination, 174, 305-314.
Li, X., Gao, F., Hua, Z., Du, G. and Chen, J. (2005b), Treatment of synthetic
wastewater by a novel mbr with granular sludge developed for control-
ling membrane fouling. Sep. Purif. Technol., 46, 19-25.
Liu, R. Huang, X., Xi, J. and Qian, Y. (2005), Microbial behavior in a mem-
brane bioreactor with complete sludge retention. Process Biochem. 40,
3165-3170
Liu, G., Lei, L.C. and Cen, P.L. (2001), Wet air oxidation of printing and dying
wastewater. J. Zhejiang University, 35(1) 37–40.
Liwarska-Bizukojć E. and Bizukojć M. (2005), Digital image analysis to esti-
mate the influence of sodium dodecyl sulphate on activated sludge
flocs. Process Biochemistry, 40, 2067-2072.
Literature Review
S. A. Deowan : Development of Membrane Bioreactor (MBR) Process Applying Novel Low Fouling Membrane
94
Chapter2
Lopez, A., Ricco, G., R. Ciannarella, Rozzi, A., Pinto, A.C. Di and Passino, R.
(1999), Textile wastewater reuse: Ozonation of membrane concentrated
secondary effluent. Water Sci. Tech., 40 99-105.
Lubbecke, S., Vogelpohl, A., Dewjanin, W. (1995), Wastewater treatment in a
biological high-performance system with high biomass concentration
Water Research. 29, 793-802.
Macomber J., Cicek N., Suidan M. T., Jan Davel, Ginestet P. and Audic J.M.
(2005), Biological kinetic data evaluation of an activated sludge system
coupled with an ultrafiltration membrane. ASCE Journal of Environ-
mental Engineering, 131-4, 579-586.
Manigas, L. (2008), Use of membrane bioreactor for the bioremediation of
groundwater polluted by chlorinated compounds, PhD thesis, Universi-
ty of Cagliari, Italy.
Marsili-Libelli, S. and Tabani, F. (2002), Accuracy analysis of a respirometer
for activated sludge dynamic modelling. Water Research 36, 1181-
1192.
Marcucci, M., Nosenzo, G., Capannelli, G., Ciabatti, I., Corrieri, D., Ciardelli,
G., (2001), Treatment and reuse of textile effluents based on new ultra-
filtration and other membrane technologies. Desalination 138, 75 - 82
Marmagne, O., Coste, C. (1996), Colour removal from textile plant effluents.
American
Dyestuff Reports 85, 15 - 21.
Mason C. A. and Hamer G. (1987), Cryptic growth in Klebsiellan pneumoniae.
Appl. Microbiol. Biotechnol. 25, 577-584.
McKay G. (1980), Color removal by adsorption. Am.Dyestuff Rept. 69, 38
Metcalf and Eddy, (2003), Wastewater Engineering Treatment and Reuse,
fourth ed.McGraw-Hill, New York,
Meng, F., Chae, S.R, Drews, A., Kraume, M. and Shind, H.S. (2009), Recent
advances in membrane bioreactors (MBRs): Membrane fouling and
membrane material, water research 43, 1489 - 1512
Metcalf and Eddy Inc (1991), Wastewater Engineering; Treatment, Disposal,
and
Reuse, 3rd edn. McGraw-Hill Inc, New York.
Meyer, U. (1981), Biodegradation of synthetic organic colorants. Microbial
degradation of xenobiotic and recalcitrant compounds. In: Leisinger, T.,
Cook, A.M., Hunter, R., Nuesch, J. (Eds.), FEMS Symposium 12, Aca-
demic Press, London, 371 - 385.
Michael, L.S and Fikret, K. (2002), Bioprocess Engineering: Basic Concepts,
2nd edn. Prentice-Hall International, Upper Saddle River, NJ, USA.
Mishra, G., Tripathy, M. (1993). A critical review of the treatments for decol-
ourization of textile effluent, Colourage 40, 35 – 38
Literature Review
S. A. Deowan : Development of Membrane Bioreactor (MBR) Process Applying Novel Low Fouling Membrane
95
Chapter2
Miyashita, S., Honjyo, K., Kato, O., Watari, K., Takashima, T., Itakura, M.,
Okzaki, H., Kinoshita, I. and Inoue, N. (2000), gas diffuser for aeration
vessel of membrane assembly, US Patent 6,328,886.
Minke, R. and Rott, U. (1997), Innerbetriebliche anaerobe Behandlung orga-
nisch hoehbelasteter und stark farbiger Teilstromabw~sser der Textil-
veredelungsindustrie [in German], in: Preprints, Colloquium Produkti-
onsintegrierte Wasser-/ Abwassertechnik, Naeh_haltige Entwicklung in
der Textilveredlung, Bremen.
Minke, R. and Rott, U. (2001), Pmzesswasserrttekgewinnung und Abwasser-
vorbehandlung bei der Garnve edelung [in German], in: Preprints, Col-
loquium Produktionsintegrierte Wasser-/Abwassertechnik, Nachhaltige
Entwickltmg in der Textilveredelung, Bremen.
Moran, C., Hall, M.E. (1997), Howell, R.C., Effects of sewage treatment on
textile effluent. J. Soc. Dyers. Colour. 113, 272 - 274.
Mulder, M. (1996), Basic Principles of Membrane Technology, second edition,
ISBN 0-7923-4248, Kluwer Academic Publishers.
Muller, E.B., Stouthamer, A.H., van Verseveld, H.W., and Eikelboom, D.H.
(1995), Aerobic domestic waster water treatment in a pilot plant with
complete sludge retention by cross-flow filtration. Water. Research.
29, 1179-1189
Musolff, A., Leschik, S., Möder, M., Strauch, G., Reinstorf, F. and Schirmer,
M. (2009), Temporal and spacial patterns of micropollutants in urban
receiving water, Environmental Pollution 157(11), 3069-3077.
Nigam, P., Armour, G., Banat, I.M., Singh, D., Marchant, R. (1996), Physical
removal of textile dyes and solid state fermentation of dyeadsorbed ag-
ricultural residues. Bioresour. Technol. 72, 219 - 226.
Nigam, P., Marchant, R. (1995), Selection of the substratum for composing
bioflm system of textile decolourizing bacteria. Biotechnol. Lett. 17,
993 - 996.
Ng, H.Y., and Hermanowicz, S.W. ( 2005a),. Membrane bioreactor operation
at short solids retention times:performance and biomass characteristics.
Water Research. 39, 981-992.
Ng, C.A., Sun, D., Zhang, J., Chua, H.C., Bing, W., Tay, S. and fane, A.
(2005b), Strategies to improve the sustainable operation of membrane
bioreactors, Proceedings of International Desalination Association
Conference, Singapore
Ognier, S., Wisniewski, C. and Grasmick, A. (2002), Membrane fouling during
constant flux filtration in membrane bioreactors. Membr. Technol. 147,
6–10.
Literature Review
S. A. Deowan : Development of Membrane Bioreactor (MBR) Process Applying Novel Low Fouling Membrane
96
Chapter2
Ogawa, T., Yatome, C. (1990), Biodegradation of azo dyes in multistage rotat-
ing biological contra tor immobilized by assimilating bacteria. Bull.
Environ. Contam. Toxicol. 44, 561 - 566.
O’Neill, C., Hawkes, F.R., Hawkes, D.L., Lourenco, N.D., Pinheiro, H.M.,
Delee, W. (1999). Colour in textile effluents e sources, measurement,
discharge consents and simulation: a review. Journal of Chemical
Technology and Biotechnology 74, 1009 – 1018
Pala, A., Tokat, E. (2002), Color removal from cotton textile industry
wastewater in an activated sludge system with various additives. Water
Research 36 (11), 2920 - 2925.
Paprowicz J. and Slodczyk S. (1988) Application of biologically activated
sorptive columns for textile wastewater treatment. Environ. Technol.
Lett. 9, 271.
Paszczynski, A., Crawford, R.C. (1995), Potential for bioremediation of xeno-
biotic compounds by the white-rot fungus Phanerochaete chrysospori-
um. Biotechnol. Progr. 11, 368 - 379.
Patel, H., Vashi, R.T. (2010), Treatment of textile wastewater by adsorption
and coagulation. E-Journal of Chemistry 7 (4), 1468 - 1476.
Perkowski, J., Kos, L. (2003), Decolouration of model dye house wastewater
with advanced oxidation processes. Fibres and Textiles in Eastern Eu-
rope 11, 67 - 71.
Pillay, V.L., Townsend, B. and Buckley, C.A. (1994), Improving the Perfor-
mance of Anaerobic Digesters at Waste-Water Treatment Works - the
Coupled Cross-Flow Microfiltration Digester Process. Wat. Sci. Tech-
nol. 30(12), 329-337.
Pirt, S.J. (1965), The maintenance energy of bacteria in growing cultures. Proc
R Soc Lond B Biol Sci 163:224.
Pollice A., Brookes A., Jefferson B. and Judd S. (2005), Sub-critical flux foul-
ing in membrane bioreactors - a review of recent literature. Desalina-
tion, 174 (3), 221-230.
Polman, A., Brekenridge, C.R. (1996), Biomass-mediated binding and recov-
ery of textile dyes from waste effluents. Tex. Chem. Colour.28, 31 - 35.
Porter, J. (1997), Wastewater treatment in the textile industry. In: Treatment of
Wastewaters from Textile Processing. TU-Berlin Schiftenreihe biolo-
gische Abwasserreinigung, Vol. 9, Berlin.
Rabie, H.R., Côté, P., Sing, M. and Janson, A. (2003), Cyclic aeration system
for submerged membrane modules, US Patent 6881,343.
Radjenovic, J., (2008), Membrane Bioreactor (MBR) as an advanced
Wastewater Treatment Technology, PhD thesis, Hdb Env Chem Vol. 5,
Part S/2 : 37-101.
Literature Review
S. A. Deowan : Development of Membrane Bioreactor (MBR) Process Applying Novel Low Fouling Membrane
97
Chapter2
Rajeswari, K.R. (2002), Ozonation treatment of textile dyes wastewater using
plasma ozoniser. Ph.D thesis, University Malaysia, Malaysia,.
Rein, M. (2001), Advanced oxidation processes-current status and prospects,
proc.
estonian acad. Science Chemistry 50, , 59 - 80.
Robinsion, T. (2003), The MBR for industrial effluent, CIWEM & Aqua Envi-
ro Conference, Wakefield, UK.
Robinson, T., McMullan, G., Marchant, R., Nigam, P. (2001), Remediation of
dyes in textile effluent: a critical review on current treatment technolo-
gies with a proposed alternative. Bioresource Technology 77 247 - 255.
Rosenberger, S., Krüger, U., Witzig, R., Manz, W., Szewzyk, U., Kraume, M.
(2002), Performance of a bioreactor with submerged membranes for
aerobic treatment of municipal wastewater. Water Research, 36, 413-
420.
Rosenberger, S., Witzig, R., Manz, W., Szewzyk, U., Kraume, M. (2000), Op-
eration of different membrane bioreactors: Experimental results and
physiological state of the microorganisms. Wat. Sci. Technol. 10-11
(41), 269-277.
Rosenberger, S. and Kraume M. (2002), Filterability of activated sludge in
membrane bioreactors. Desalination 151, 195-200.
Ross, WR., Barnard, JP., Strohwald, N.K.H., Grobler C.J. and Sanetra J
(1992), Practical application of the ADUF process to the full-scale
treatment of a maize-processing Effluent.Water Sci Technol 25, (10),
27-39.
Russotti, G., Goklen, K.E. and Wang, W.K. (2001), Crossflow membrane fil-
tration of fermentation broth. in Membrane Separations in Biotechnolo-
gy. New York, Marcel Dekker Inc. Second Edition 85.
Ryan, F.J (1959), Bacterial mutation in a stationary phase and the question of
cell turnover. J Gen Microbiol 21, 530–549.
Rozzi, A. Bianchi, R., Liessens, J., Lopez, A. and Verstraete, W. (1997),
Ozone, granular activated carbon and membrane treatment of secondary
textile effluents for direct reuse, in: Treatment of Wastewaters from
Textile Processing, TU-Berlin Sehiftenreihe biologisehe Abwasser-
reinigung, Vol. 9, Berlin.
Sainbayar, A., Kim, J.S., Jung, W.J., Lee, Y.S. and Lee, C.H. (2001), Applica-
tion of surface modified polypropylene membranes to an anaerobic
membrane bioreactor. Environmental Technology 22(9), 1035-1042.
Schoeberl, P., Brik, M., Bertoni, M., Braun, R. and Fuchs, W. (2005), Optimi-
zation of operational parameters for a submerged membrane bioreactor
treating dyehouse wastewater. Sep.Purif. Technol., 44, 61-68.
Literature Review
S. A. Deowan : Development of Membrane Bioreactor (MBR) Process Applying Novel Low Fouling Membrane
98
Chapter2
Shimizu, Y., Okuno, Y., Uryu, K., Ohtsubo, S and Watanabe, A. (1996), Filtra-
tion characteristics of hollow fiber microfiltration membranes used in
MBR for domestic wastewater treatment. Water Research 30 (10),
2385-2392.
Smith, C.V., Gregorio, D.O. and Talcott, R.M. (1969), The use of ultrafiltration
membranes for activated sludge separation, Proceedings of the 24th
In-
dustrial Waste Conference, Purdue University, Ann Arbor Science, Ann
Arbor, USA, 1300-1310
Smith, P.J., Vigneswaran, S., Ngo, H.H., Ben-Aim, R. and Nguyen, H. (2005),
Design of a generic control system for optimising back flush durations
in a submerged membrane hybrid reactor. J. Membr. Sci., 255, 99-106.
Sofia, A., Ng, W.J. and Ong, S.L. (2004), Engineering design approaches for
minimum fouling in submerged MBR. Desalination 160, 67-74.
Stephenson, T., Judd, S., Jefferson, B. and Brindle, K. (2000), Membrane Bio-
reactors for Wastewater Treatment, IWA Publishing, London, UK.
Sun, Y., Huang, X., Chen, F. and Wen, X. (2004), A dual functional filtra-
tion/aeration membrane bioreactor for domestic wastewater treatment,
Proceedings of water environment-Membrane Technology Conference,
Seoul, Korea.
Sheng, H and Peng, C.F. (1994), Treatment of textile wastewater by electro-
chemical method. Water Res., 28 277–282.
Southern TG. (1995), Technical solutions to the colour problem: a critical re-
view. In: Cooper P, editor. Colour in dyehouse effluent. Bradford: Soci-
ety of Dyers and Colourists;, p. 75.
Spagni, A., Grilli, S., Casu, S. and Mattioli, D. (2010), Treatment of a simulat-
ed textile wastewater containing the azo-dye reactive orange 16 in an
anaerobic-biofilm anoxiceaerobic membrane bioreactor, International
Biodeterioration & Biodegradation 64, 676 - 681
Tamburlini, G., Ehrenstein, O.V., Bertollini, R. (2002), Children’s health and
environment: a review of evidence. In: Environmental Issue, 129.
WHO/European Environment Agency, WHO, Geneva, 22 - 31.
Tonelli, F.A. and Behmann, H. (1996), Aerated membrane bioreactor process
for treating recalcitrant compounds, US Pat. No. 410730.
Tonelli, F.A. and Canning, R.P. (1993), Membrane bioreactor system for treat-
ing synthetic metal-working fluids and oil based products, USA Pat.
No. 5204001. USEPA (2006a),
www.epa.gov/region5/defs/html/ppa.htm.
Tratnyek, P.G., Michael, S.E. and Peter, C. (1994), Photoeffects of textile dye
wastewater: Sensitization of single oxy-gen formation, oxidation of
phenols and toxicity to bacteria. Environ. Toxicol. Chem., 13 27–33.
TU Freiburg, www.tu-freiburg.de, accessed on May, 2011
Literature Review
S. A. Deowan : Development of Membrane Bioreactor (MBR) Process Applying Novel Low Fouling Membrane
99
Chapter2
Ueda, T. and Hata, K. (1999), Domestic wastewater treatment by a submerged
membrane bioreactor with gravitational filtration. Water Research
33(12), 2888-2892.
Vallero, M.V.G., lettinga, G. and Lens, P.N.L. (2005), High rate sulfate reduc-
tion in a submerged anaerobic membrane bioreactor (SAMBaR) at high
salinity. J. Membr. Sci., 253, 217-232.
Van Loosdrecht, M.C.M. and Henze, M. (1999), Maintenance, endogenous
respiration, lysis, decay and predation. Wat. Sci. Technol., 39, 107-117
Vandevivere, P.C., Bianchi, R., Verstraete, W. (1998), Treatment and reuse of
wastewater from the textile wet-processing industry: review of emerg-
ing technologies. Journal of Chemical Technology and Biotechnology
72, 289 - 302.
Van der Zee, F.P. (2002), Anaerobic azo dye reduction. PhD Thesis. Wa-
geningen University, Wageningen, The Netherlands.
Verma, Akshaya Kumar, Rajesh Roshan Dash, Pupendu Bunia, (2012), A re-
view on chemical coagulation/flocculation technologies for removal of
colour from textile wastewaters, Journal of Environmenal Management,
93, 154-168
Visvanathan, C., Yang, B.S., Muttamara, S. and Mythanukhraw, R. (1997),
Application of air backflushing technique in membrane bioreactor. Wat.
Sci. Technol., 36, 259-266.
Vlyssides, A.G., Papaioannou, D., Loizidoy, M, Karlis, P.K. and Zorpas, A.A.
(2000), Testing an electr chemical method for treatment of textile dye
wastewater.Waste Management, 20, 569–574.
Walker, G.M., Weatherly, L.R. (1997), Adsorption of acid dyes on to granular
activated carbon in fixed beds. Water Research 31, 2093 - 2101
Wateronline, 2011; http://www.wateronline.com/article.mvc/Mixed-Liquor-
Suspended-Solids-In-Wastewater-0002, loggen on 23.02.11
Wei Y., Houten R. T. V., Borger A. R., Eikelboom, D. H. and Fan, Y. (2003),
Minimization of excess sludge production for biological wastewater
treatment. Water Research, 37, 4453-4467.
Weber, E., Wolfe, N.L. (1987), Kinetics studies of reduction of aromatic azo
compounds in anaerobic sediment/water systems. Environ. Toxicol.
Chem. 6, 911 - 920.
Wen, X., Bu, Q. and Huang, X. (2004), Water Environment-Membrane Tech-
nology Conference, Seoul, Korea.
Wilen, B.M. and Balmer, P. (1999), Effect of dissolved oxygen concentration
on the structure, size and size distribution of activated sludge flocs.
Doktorsavhandlingar vid Chalmers Tekniska Hogskola 1541, 391–400.
Willmott, N., Guthrie, J., Nelson, G. (1998), The biotechnology approach to
colour removal from textile effluent. JSDC 114, 38 - 41.
Literature Review
S. A. Deowan : Development of Membrane Bioreactor (MBR) Process Applying Novel Low Fouling Membrane
100
Chapter2
Xing, C.H., Tardieu, E., Qian, Y. and Wen, W.H. (2000), Ultrafiltration mem-
brane bioreactor for urban wastewater reclamation. J. Membr. Sci. 177,
73–82.
Yamamoto, K., Hiasa, M., Mahmood, T. and Matsuo, T. (1989), Direct Solid-
Liquid Separation Using Hollow Fiber Membrane in an Activated-
Sludge Aeration Tank. Wat. Sci. Technol. 21, 43-54.
Yang, W., Cicek, N., and Ilg, J. (2006), State-of-the-art of membrane bioreac-
tors: Worldwide research and commercial applications in North Ameri-
ca, Journal of Membrane Science, 270, (1-2), 201-211
Yoon, S.H, Kim, H.S. and Chung, Y.C. (2002), Effect of acidity consumption/
production on the pH of aeration tank during the biodegradation of ace-
tic acid/epichlorohydrin. Water Research, 36, 2695–2702.
Yoon, S.H., Collins, J.H., Musale, D., Sundararajan, S., Tsai, S.P., Hallsby,
G.A., Kong, J.F., Koppes, J. and Cachia, P. (2005), Effects of flux en-
hancing polymer on the characteristics of sludge in membrane bioreac-
tor process. Water Sci. Technol., 51, 151-157.
Yigit, N.O., Uzal, N., Koseoglu, H., Harman, I., Yukseler, H., Yetis, U., Civel-
ekoglu, G. and Kitis, M. (2009), Treatment of a denim producing textile
industry wastewater using pilot-scale membrane bioreactor, Desalina-
tion 240, 143 – 150
You, S.J, Damodara, R.A. and Hou S.C. (2010), Degradation of Reactive Black
5 dye using anaerobic/aerobic membrane bioreactor (MBR) and photo-
chemical membrane reactor, Journal of Hazardous Materials 177, 1112
- 1118
Yu, H.-Y., Hu, M.-X., Xu, Z.-K., Wang, J.-L., Wang, S.-Y. (2005a), Surface
modification of pol propylene microporous membranes to improve their
antifouling property in MBR: NH3 plasma treatment. Separation and
Purification Technology 45 (1), 8–15
Yu, H.-Y., Xie, Y.-J., Hu, M.-X., Wang, J.-L., Wang, S.-Y., Xu, Z.-K. (2005b),
Surface modification of polypropylene microporous membrane to im-
prove its antifouling property in MBR: CO2 plasma treatment. Journal
of Membrane Science 254 (1–2), 219 - 227.
Yu, H.-Y., Liu, L.-Q., Tang, Z.-Q., Yan, M.-G., Gu, J.-S., Wei, X.-W. (2008),
Mitigated membrane fouling in an SMBR by surface modification.
Journal of Membrane Science 310 (1–2), 409 - 417.
Yu, H.-Y., Xu, Z.-K., Lei, H., Hu, M.-X., Yang, Q. (2007), Photoinduced graft
polymerization of acrylamide on polypropylene microporous mem-
branes for the improvement of antifouling characteristics in a sub-
merged membrane-bioreactor. Separation and Purification Technology
53 (1), 119–125.
Literature Review
S. A. Deowan : Development of Membrane Bioreactor (MBR) Process Applying Novel Low Fouling Membrane
101
Chapter2
Zaloum, R., Lessard, S., Mourato, D., and Carriere, J. (1994), Membrane bio-
reactor treatment of oily wastes from a metal transformation mill. Wat.
Sci. Technol., 30, 21–27.
Zhang, Y., Bu, D., Liu, C.G., Luo, X. and Gu, P. (2004), Study on retarding
membrane fouling by ferric salts dosing in membrane bioreactors, Pro-
ceedings of Water Environment- Membrane Technology Conference,
Seoul, Korea.
Zhang, J., Chua, H.C., Zhou, J. and Fane, A.G. (2006), Factors affecting the
membrane performance in submerged membrane bioreactors. J Membr
Sci., 284, 54-66.
Zhang, S.T., Qu, Y.B., Liu, Y.H., Yang, F.L., Zhang, X.W., Furukawa, K. and
Yamada, Y. (2005), Experimental study of domestic sewage treatment
with a metal membrane bioreactor. Desalination, 177, 83-93.
Zollinger, H. (2006), Colour Chemistry-Synthesis, Properties of Organic Dyes
and Pigments. VC Publishers, New York, 92 - 100.
Zheng, X., and Lui, J. (2006), dyeing and printing wastewater treatment using
membrane bioreactor with gravity drain, Desalination, 190, 277 - 286
Zhou, W., Zimmerman, W. (1993), Decolorization of industrial effluents con-
taining reactive dyes by actinomyces. Microbiol. Lett. FEMS 107, 157 -
162.
Chapter 3
Materials and Methods
S. A. Deowan : Development of Membrane Bioreactor (MBR) Process Applying Novel Low Fouling Membranes
102
3. Chapter 3 : Materials and Methods
To fulfil the objectives of this thesis, lot of materials and methods were applied
under different operating conditions. This chapter reports on the applied mate-
rials and methods those were used in every step of the thesis ranging from
membrane preparation until the final experimental results obtained. Some of
the important materials and methods including their coefficient of variation (%
Cv) (which were calculated using equations described in appendix D) are illus-
trated very briefly in the following sections of this chapter.
3.1 Materials for membrane preparation
All the chemicals used for preparing microemulsions for PBM membranes
were bought from Sigma-Aldrich (Germany) with purity higher than 98% (ana-
lytical grade).
3.2 Membrane preparation chamber
For novel/PBM membrane preparation different kinds of chemicals were ap-
plied (Section 4.1). Finally a microemulsion was casted on commercial UF
PES membrane supplied by Microdyn – Nadir, in a casting chamber. The di-
mensions of the casting chamber were 40 cm × 40 cm × 42 cm (Fig. 3.1) and it
was made of plexyglass incorporated with 4 N2 gas inlet channels (one from
left side, one from right side and two from back side). N2 gas was needed as
inert gas required for polymerisation reaction of novel membrane casting. The
chamber was also equipped with temperature sensor, heating plate, power sup-
ply for the heating plate, thermo-couple, glass plate, commercial UF PES
membrane and casting knife. There was a Flapof the glass chamber for opening
or closing the chamber. The experimental set up of the device is shown in Fig.
3.2.
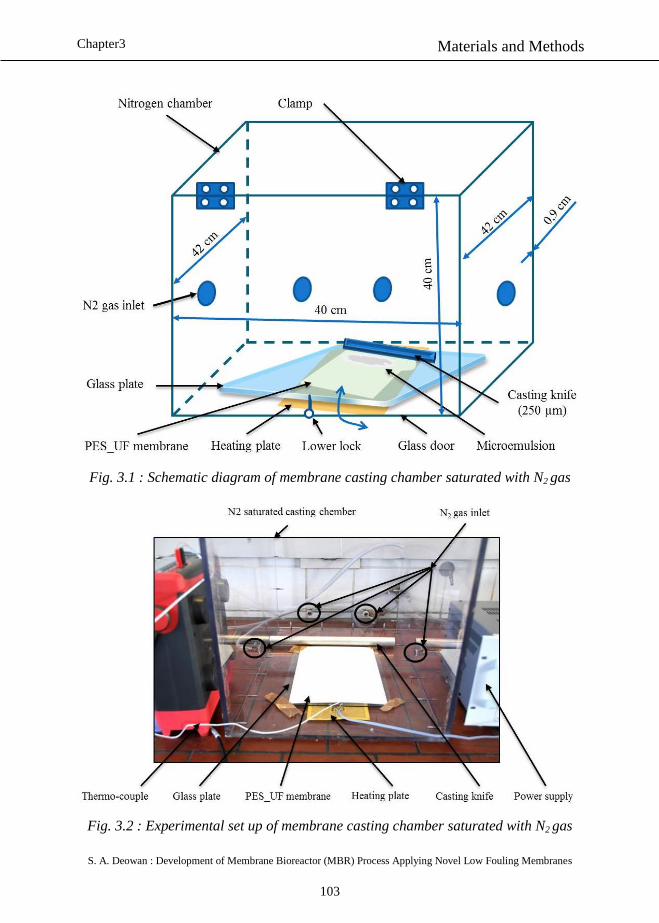
Materials and Methods
S. A. Deowan : Development of Membrane Bioreactor (MBR) Process Applying Novel Low Fouling Membranes
103
Chapter3
Fig. 3.1 : Schematic diagram of membrane casting chamber saturated with N2 gas
Fig. 3.2 : Experimental set up of membrane casting chamber saturated with N2 gas
Materials and Methods
S. A. Deowan : Development of Membrane Bioreactor (MBR) Process Applying Novel Low Fouling Membranes
104
Chapter3
To keep the casting chamber N2 gas saturated, N2 gas was supplied for 5
minutes at the rate of 1 bar gas pressure before casting any PBM membrane.
The gas flow was indirectly indicated by manually displayed pressure gauge.
This display might have ± 5% error. The temperature set for membrane prepa-
ration was varied at ± 1 °C due to process variation.
3.3 Instruments/chemicals used for membrane characterisation
The prepared membranes were characterised by membrane surface analysis
through scan electronic microscopy (SEM) and atomic force microscopy
(AFM), porosity measurement, contact angel measurement, molecular weight
cut off (MWCO), water permeabilities in two cross-flow testing cells, salt re-
jections, dyes rejections and model fouling test. The SEM and AFM analyses
were carried out by Dr. Daniel Johnson from Swansea University, England.
Scan Electron Microscopy (SEM)
The SEM applied in this case was Hitachi Field Emission SEM (model S-
4800). The resolution of the applied SEM was as follows:
Accelerating voltage 15 kV
Working distance = 4 mm -1.0 nm
Accelerating voltage 1 kV
Working distance = 1.5 mm -2.0 nm
This work was done in collaborating with Swansea University, UK.
Atomic Force Microscopy (AFM)
All AFM measurements were performed with a Multimode AFM with Nano-
scope IIIa controller (Veeco, USA) using manufacturer supplied software.
Tapping mode measurements in air were performed using TESP (nominal
spring constant 20-80 N/m) cantilevers (Bruker AXS). All other measurements
were performed using NP-S probes (long thick lever, nominal spring constant
0.12 N/m). Roughness values were obtained from topography scans using the
instrument software. The resolution of the most of the images created by AFM
instrument was in the form of 512× 512 pixels.This work was done in collabo-
rating with Swansea University, UK.
Porometer
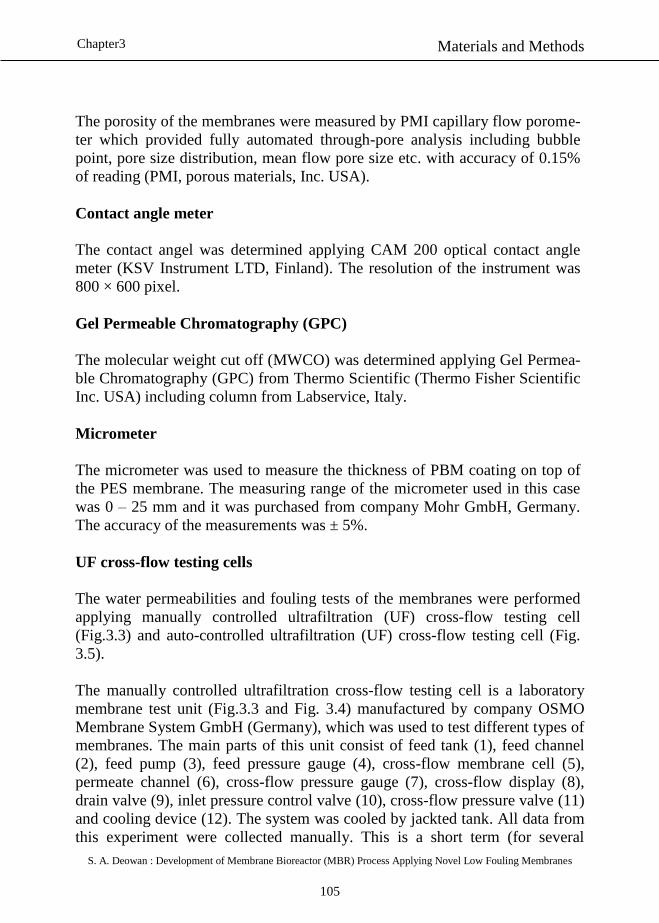
Materials and Methods
S. A. Deowan : Development of Membrane Bioreactor (MBR) Process Applying Novel Low Fouling Membranes
105
Chapter3
The porosity of the membranes were measured by PMI capillary flow porome-
ter which provided fully automated through-pore analysis including bubble
point, pore size distribution, mean flow pore size etc. with accuracy of 0.15%
of reading (PMI, porous materials, Inc. USA).
Contact angle meter
The contact angel was determined applying CAM 200 optical contact angle
meter (KSV Instrument LTD, Finland). The resolution of the instrument was
800 × 600 pixel.
Gel Permeable Chromatography (GPC)
The molecular weight cut off (MWCO) was determined applying Gel Permea-
ble Chromatography (GPC) from Thermo Scientific (Thermo Fisher Scientific
Inc. USA) including column from Labservice, Italy.
Micrometer
The micrometer was used to measure the thickness of PBM coating on top of
the PES membrane. The measuring range of the micrometer used in this case
was 0 – 25 mm and it was purchased from company Mohr GmbH, Germany.
The accuracy of the measurements was ± 5%.
UF cross-flow testing cells
The water permeabilities and fouling tests of the membranes were performed
applying manually controlled ultrafiltration (UF) cross-flow testing cell
(Fig.3.3) and auto-controlled ultrafiltration (UF) cross-flow testing cell (Fig.
3.5).
The manually controlled ultrafiltration cross-flow testing cell is a laboratory
membrane test unit (Fig.3.3 and Fig. 3.4) manufactured by company OSMO
Membrane System GmbH (Germany), which was used to test different types of
membranes. The main parts of this unit consist of feed tank (1), feed channel
(2), feed pump (3), feed pressure gauge (4), cross-flow membrane cell (5),
permeate channel (6), cross-flow pressure gauge (7), cross-flow display (8),
drain valve (9), inlet pressure control valve (10), cross-flow pressure valve (11)
and cooling device (12). The system was cooled by jackted tank. All data from
this experiment were collected manually. This is a short term (for several
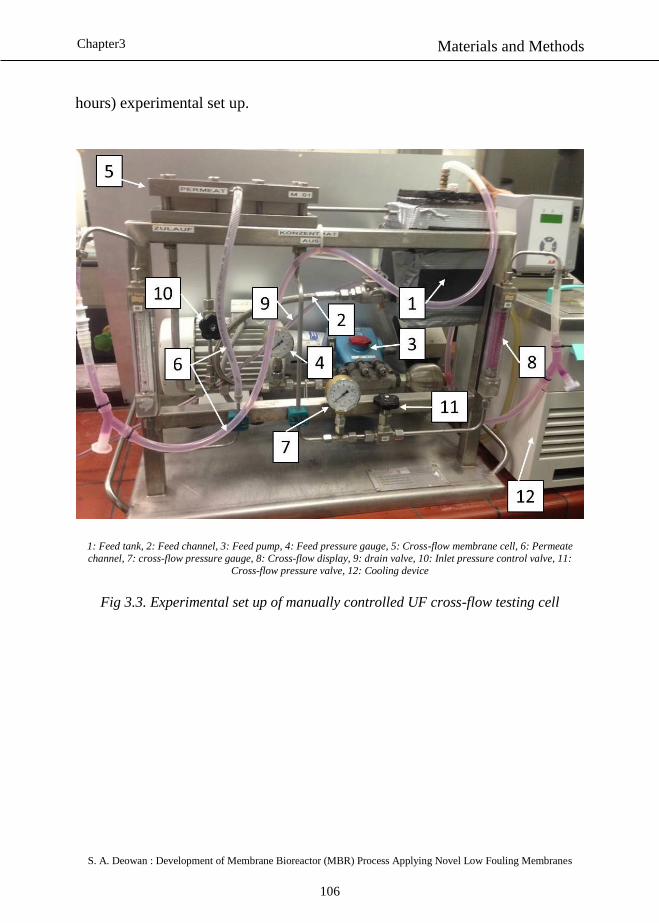
Materials and Methods
S. A. Deowan : Development of Membrane Bioreactor (MBR) Process Applying Novel Low Fouling Membranes
106
Chapter3
hours) experimental set up.
1: Feed tank, 2: Feed channel, 3: Feed pump, 4: Feed pressure gauge, 5: Cross-flow membrane cell, 6: Permeate
channel, 7: cross-flow pressure gauge, 8: Cross-flow display, 9: drain valve, 10: Inlet pressure control valve, 11:
Cross-flow pressure valve, 12: Cooling device
Fig 3.3. Experimental set up of manually controlled UF cross-flow testing cell
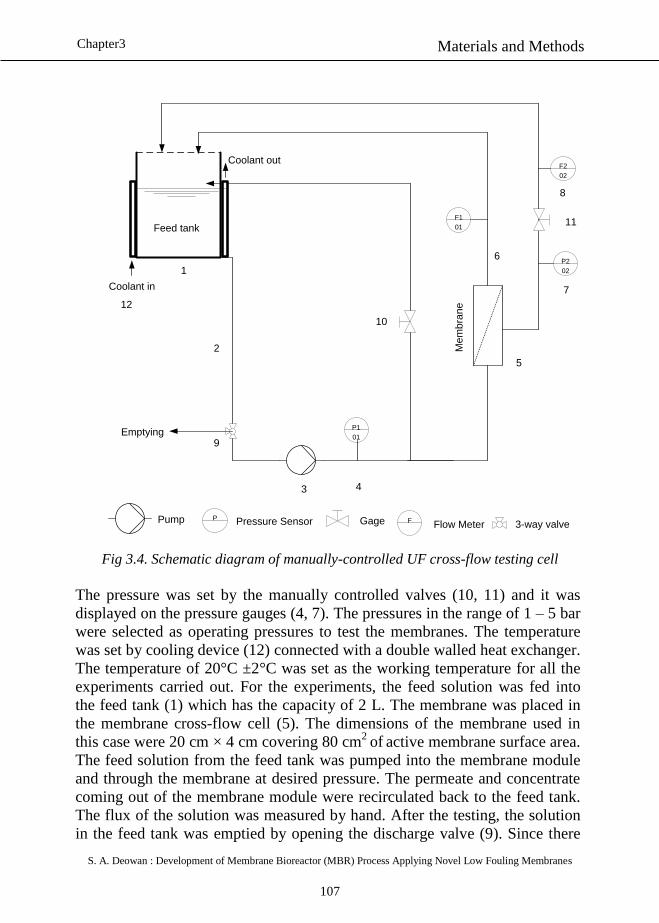
Materials and Methods
S. A. Deowan : Development of Membrane Bioreactor (MBR) Process Applying Novel Low Fouling Membranes
107
Chapter3
Pump Gage Flow MeterPressure Sensor
P1
01
P2
02
F1
01
F2
02
P F
Emptying
Coolant in
Coolant out
3-way valve
Feed tank
Me
mb
ran
e
1
2
3 4
5
6
7
8
9
10
11
12
Fig 3.4. Schematic diagram of manually-controlled UF cross-flow testing cell
The pressure was set by the manually controlled valves (10, 11) and it was
displayed on the pressure gauges (4, 7). The pressures in the range of 1 – 5 bar
were selected as operating pressures to test the membranes. The temperature
was set by cooling device (12) connected with a double walled heat exchanger.
The temperature of 20°C ±2°C was set as the working temperature for all the
experiments carried out. For the experiments, the feed solution was fed into
the feed tank (1) which has the capacity of 2 L. The membrane was placed in
the membrane cross-flow cell (5). The dimensions of the membrane used in
this case were 20 cm × 4 cm covering 80 cm2
of active membrane surface area.
The feed solution from the feed tank was pumped into the membrane module
and through the membrane at desired pressure. The permeate and concentrate
coming out of the membrane module were recirculated back to the feed tank.
The flux of the solution was measured by hand. After the testing, the solution
in the feed tank was emptied by opening the discharge valve (9). Since there
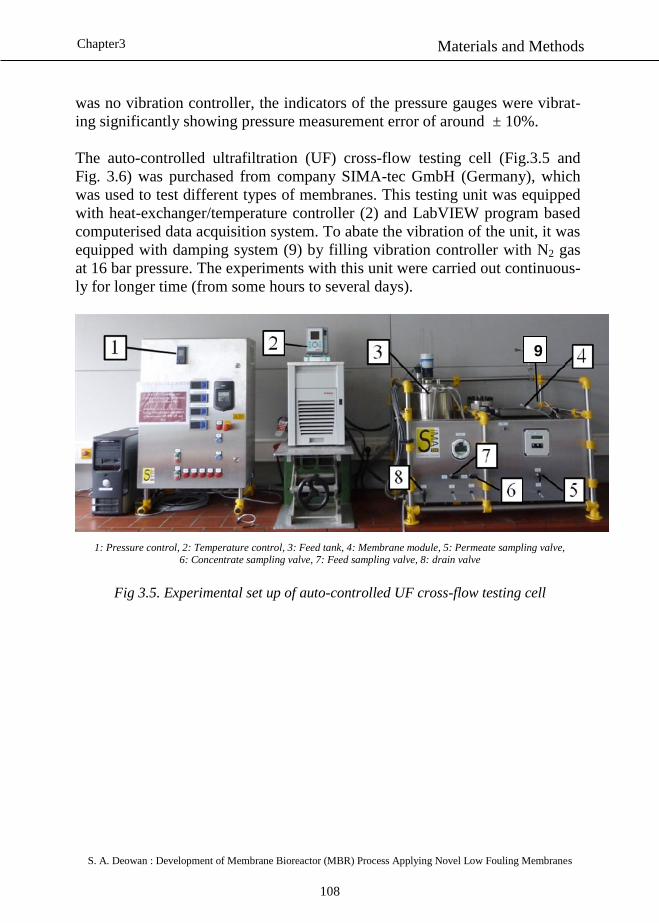
Materials and Methods
S. A. Deowan : Development of Membrane Bioreactor (MBR) Process Applying Novel Low Fouling Membranes
108
Chapter3
was no vibration controller, the indicators of the pressure gauges were vibrat-
ing significantly showing pressure measurement error of around ± 10%.
The auto-controlled ultrafiltration (UF) cross-flow testing cell (Fig.3.5 and
Fig. 3.6) was purchased from company SIMA-tec GmbH (Germany), which
was used to test different types of membranes. This testing unit was equipped
with heat-exchanger/temperature controller (2) and LabVIEW program based
computerised data acquisition system. To abate the vibration of the unit, it was
equipped with damping system (9) by filling vibration controller with N2 gas
at 16 bar pressure. The experiments with this unit were carried out continuous-
ly for longer time (from some hours to several days).
1: Pressure control, 2: Temperature control, 3: Feed tank, 4: Membrane module, 5: Permeate sampling valve, 6: Concentrate sampling valve, 7: Feed sampling valve, 8: drain valve
Fig 3.5. Experimental set up of auto-controlled UF cross-flow testing cell
9
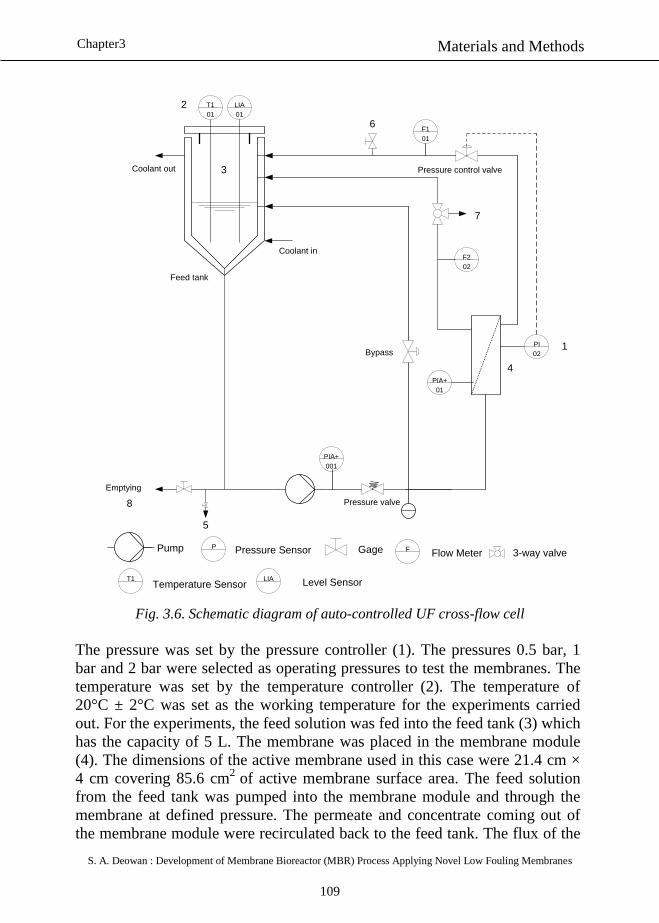
Materials and Methods
S. A. Deowan : Development of Membrane Bioreactor (MBR) Process Applying Novel Low Fouling Membranes
109
Chapter3
Pump Gage Flow MeterPressure Sensor
PIA+
001
F1
01
P F
Emptying
Coolant in
Coolant out
3-way valve
Feed tank
2
4
5
6
1
8
7
Bypass
PIA+
01
PI
02
F2
02
Pressure control valve
Pressure valve
T1
01
LIA
01
3
T1Temperature Sensor
LIA Level Sensor
Fig. 3.6. Schematic diagram of auto-controlled UF cross-flow cell
The pressure was set by the pressure controller (1). The pressures 0.5 bar, 1
bar and 2 bar were selected as operating pressures to test the membranes. The
temperature was set by the temperature controller (2). The temperature of
20°C ± 2°C was set as the working temperature for the experiments carried
out. For the experiments, the feed solution was fed into the feed tank (3) which
has the capacity of 5 L. The membrane was placed in the membrane module
(4). The dimensions of the active membrane used in this case were 21.4 cm ×
4 cm covering 85.6 cm2
of active membrane surface area. The feed solution
from the feed tank was pumped into the membrane module and through the
membrane at defined pressure. The permeate and concentrate coming out of
the membrane module were recirculated back to the feed tank. The flux of the
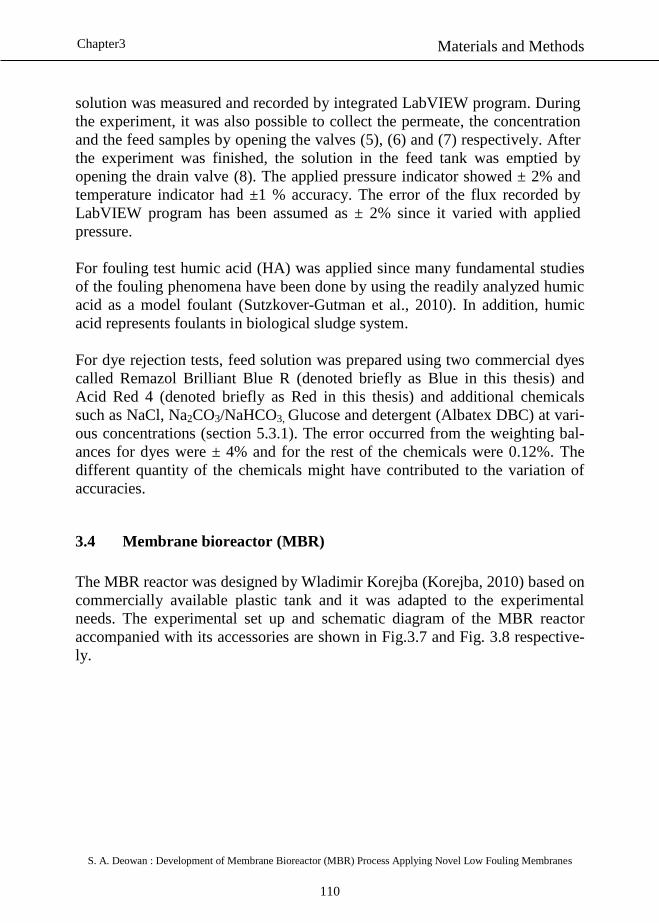
Materials and Methods
S. A. Deowan : Development of Membrane Bioreactor (MBR) Process Applying Novel Low Fouling Membranes
110
Chapter3
solution was measured and recorded by integrated LabVIEW program. During
the experiment, it was also possible to collect the permeate, the concentration
and the feed samples by opening the valves (5), (6) and (7) respectively. After
the experiment was finished, the solution in the feed tank was emptied by
opening the drain valve (8). The applied pressure indicator showed ± 2% and
temperature indicator had ±1 % accuracy. The error of the flux recorded by
LabVIEW program has been assumed as ± 2% since it varied with applied
pressure.
For fouling test humic acid (HA) was applied since many fundamental studies
of the fouling phenomena have been done by using the readily analyzed humic
acid as a model foulant (Sutzkover-Gutman et al., 2010). In addition, humic
acid represents foulants in biological sludge system.
For dye rejection tests, feed solution was prepared using two commercial dyes
called Remazol Brilliant Blue R (denoted briefly as Blue in this thesis) and
Acid Red 4 (denoted briefly as Red in this thesis) and additional chemicals
such as NaCl, Na2CO3/NaHCO3, Glucose and detergent (Albatex DBC) at vari-
ous concentrations (section 5.3.1). The error occurred from the weighting bal-
ances for dyes were ± 4% and for the rest of the chemicals were 0.12%. The
different quantity of the chemicals might have contributed to the variation of
accuracies.
3.4 Membrane bioreactor (MBR)
The MBR reactor was designed by Wladimir Korejba (Korejba, 2010) based on
commercially available plastic tank and it was adapted to the experimental
needs. The experimental set up and schematic diagram of the MBR reactor
accompanied with its accessories are shown in Fig.3.7 and Fig. 3.8 respective-
ly.
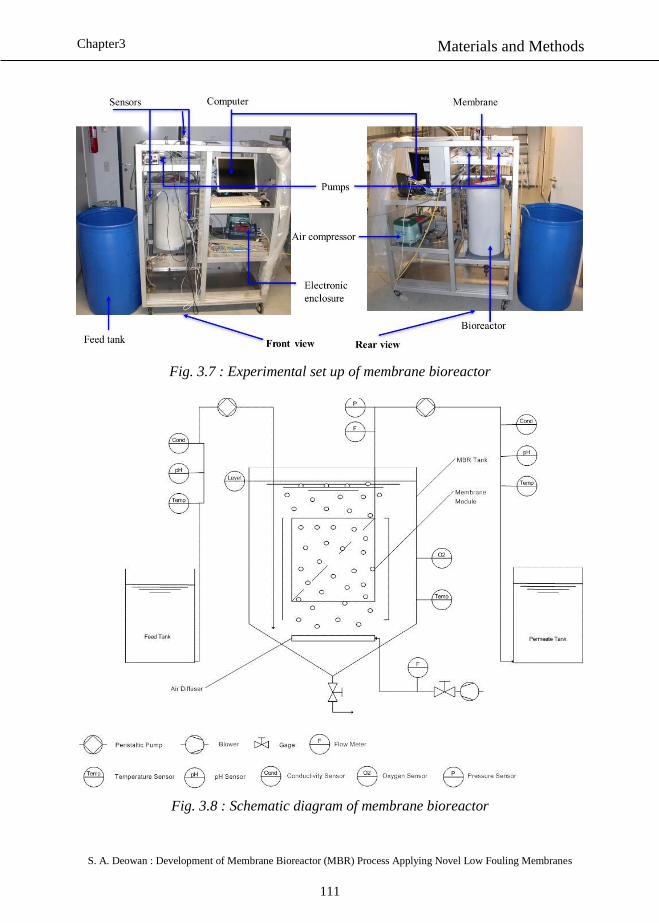
Materials and Methods
S. A. Deowan : Development of Membrane Bioreactor (MBR) Process Applying Novel Low Fouling Membranes
111
Chapter3
Fig. 3.7 : Experimental set up of membrane bioreactor
Fig. 3.8 : Schematic diagram of membrane bioreactor
Materials and Methods
S. A. Deowan : Development of Membrane Bioreactor (MBR) Process Applying Novel Low Fouling Membranes
112
Chapter3
The total volume of the reactor (tank) is around 60 L where hydraulic volume
(where MBR module is submerged) was around 57 L. The MBR reactor con-
sists of membrane module, air compressor, level sensor, differential pressure
sensor, feed pump, permeate pump, foam pump, foam sensor, flow sensor, pH
sensor, temperature sensor, conductivity sensor and air flow meter. The errors
of the measurements from different sensors applied in MBR process were as
like as the errors of the corresponding /measuring devices/applied sensors.
Selecting the MBR reactor size as shown in Fig. 3.9, the flat sheet membrane
module (UF PES membrane, pore size: 0.040 µm, dimensions: 25cm × 25cm)
from company Microdyn-Nadir, Germany (Microdyn – Nadir, 2013) was in-
stalled inside the reactor. The module consists of 3 flat sheets membrane each
of having 0.11 m2 of area giving total area of 0.33 m
2. The membrane module
was equipped with mechanical aerator at the bottom of the module and perme-
ate suction channel in the middle of the module cassette. Air was supplied by a
compressor. To avoid any movement of the module, it was fixed with the head
of the MBR reactor with the help of module holder. It was taken care that the
module was always submerged in the hydraulic volume ensured by level sen-
sor. The permeate suction channel of the module was connected to a differen-
tial pressure sensor to measure the transmembrane pressure (TMP) which was
created by a vacuum pump to produce permeate flow. Feed was supplied by a
feed pump. A foam sensor was incorporated at the top of the reactor to abate
excess foam. Some other sensors were installed to ascertain pH, conductivity,
temperature of feed and permeate. All the process parameters were monitored
and data were acquired by LabVIEW program controlled computer system.
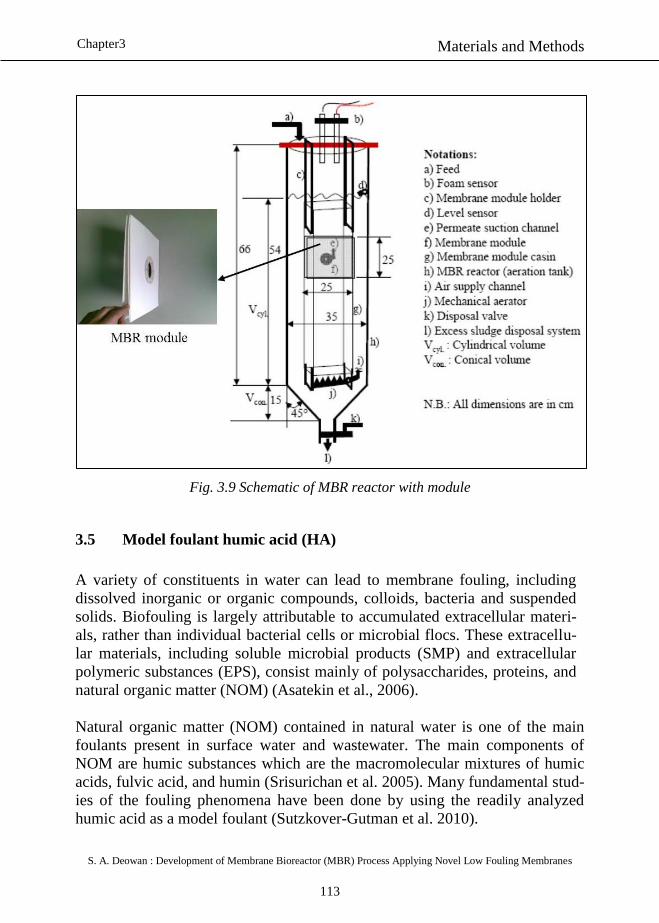
Materials and Methods
S. A. Deowan : Development of Membrane Bioreactor (MBR) Process Applying Novel Low Fouling Membranes
113
Chapter3
Fig. 3.9 Schematic of MBR reactor with module
3.5 Model foulant humic acid (HA)
A variety of constituents in water can lead to membrane fouling, including
dissolved inorganic or organic compounds, colloids, bacteria and suspended
solids. Biofouling is largely attributable to accumulated extracellular materi-
als, rather than individual bacterial cells or microbial flocs. These extracellu-
lar materials, including soluble microbial products (SMP) and extracellular
polymeric substances (EPS), consist mainly of polysaccharides, proteins, and
natural organic matter (NOM) (Asatekin et al., 2006).
Natural organic matter (NOM) contained in natural water is one of the main
foulants present in surface water and wastewater. The main components of
NOM are humic substances which are the macromolecular mixtures of humic
acids, fulvic acid, and humin (Srisurichan et al. 2005). Many fundamental stud-
ies of the fouling phenomena have been done by using the readily analyzed
humic acid as a model foulant (Sutzkover-Gutman et al. 2010).
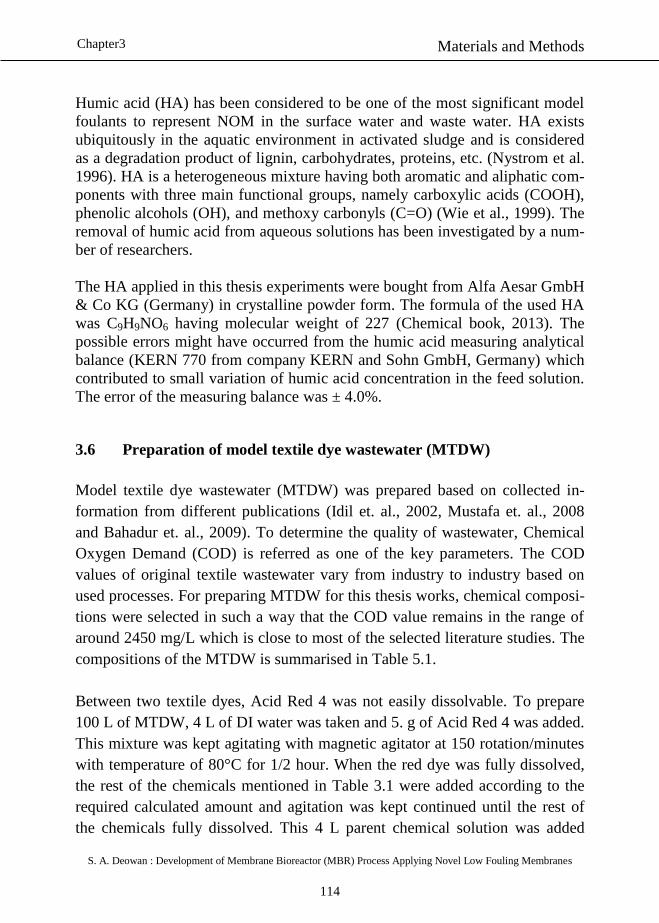
Materials and Methods
S. A. Deowan : Development of Membrane Bioreactor (MBR) Process Applying Novel Low Fouling Membranes
114
Chapter3
Humic acid (HA) has been considered to be one of the most significant model
foulants to represent NOM in the surface water and waste water. HA exists
ubiquitously in the aquatic environment in activated sludge and is considered
as a degradation product of lignin, carbohydrates, proteins, etc. (Nystrom et al.
1996). HA is a heterogeneous mixture having both aromatic and aliphatic com-
ponents with three main functional groups, namely carboxylic acids (COOH),
phenolic alcohols (OH), and methoxy carbonyls (C=O) (Wie et al., 1999). The
removal of humic acid from aqueous solutions has been investigated by a num-
ber of researchers.
The HA applied in this thesis experiments were bought from Alfa Aesar GmbH
& Co KG (Germany) in crystalline powder form. The formula of the used HA
was C9H9NO6 having molecular weight of 227 (Chemical book, 2013). The
possible errors might have occurred from the humic acid measuring analytical
balance (KERN 770 from company KERN and Sohn GmbH, Germany) which
contributed to small variation of humic acid concentration in the feed solution.
The error of the measuring balance was ± 4.0%.
3.6 Preparation of model textile dye wastewater (MTDW)
Model textile dye wastewater (MTDW) was prepared based on collected in-
formation from different publications (Idil et. al., 2002, Mustafa et. al., 2008
and Bahadur et. al., 2009). To determine the quality of wastewater, Chemical
Oxygen Demand (COD) is referred as one of the key parameters. The COD
values of original textile wastewater vary from industry to industry based on
used processes. For preparing MTDW for this thesis works, chemical composi-
tions were selected in such a way that the COD value remains in the range of
around 2450 mg/L which is close to most of the selected literature studies. The
compositions of the MTDW is summarised in Table 5.1.
Between two textile dyes, Acid Red 4 was not easily dissolvable. To prepare
100 L of MTDW, 4 L of DI water was taken and 5. g of Acid Red 4 was added.
This mixture was kept agitating with magnetic agitator at 150 rotation/minutes
with temperature of 80°C for 1/2 hour. When the red dye was fully dissolved,
the rest of the chemicals mentioned in Table 3.1 were added according to the
required calculated amount and agitation was kept continued until the rest of
the chemicals fully dissolved. This 4 L parent chemical solution was added
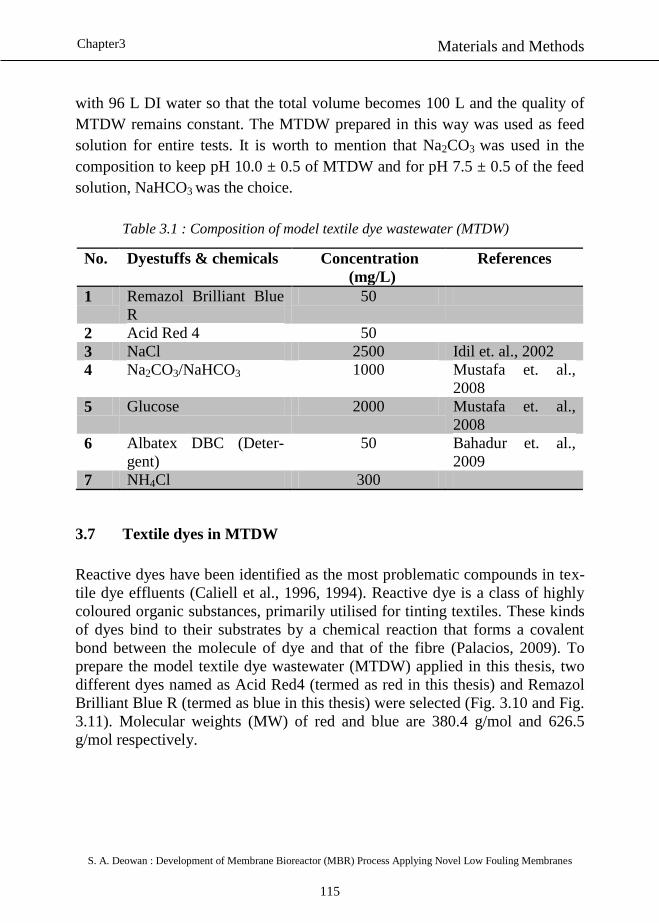
Materials and Methods
S. A. Deowan : Development of Membrane Bioreactor (MBR) Process Applying Novel Low Fouling Membranes
115
Chapter3
with 96 L DI water so that the total volume becomes 100 L and the quality of
MTDW remains constant. The MTDW prepared in this way was used as feed
solution for entire tests. It is worth to mention that Na2CO3 was used in the
composition to keep pH 10.0 ± 0.5 of MTDW and for pH 7.5 ± 0.5 of the feed
solution, NaHCO3 was the choice.
Table 3.1 : Composition of model textile dye wastewater (MTDW)
No. Dyestuffs & chemicals Concentration
(mg/L)
References
1 Remazol Brilliant Blue
R
50
2 Acid Red 4 50
3 NaCl 2500 Idil et. al., 2002
4 Na2CO3/NaHCO3 1000 Mustafa et. al.,
2008
5 Glucose 2000 Mustafa et. al.,
2008
6 Albatex DBC (Deter-
gent)
50 Bahadur et. al.,
2009
7 NH4Cl 300
3.7 Textile dyes in MTDW
Reactive dyes have been identified as the most problematic compounds in tex-
tile dye effluents (Caliell et al., 1996, 1994). Reactive dye is a class of highly
coloured organic substances, primarily utilised for tinting textiles. These kinds
of dyes bind to their substrates by a chemical reaction that forms a covalent
bond between the molecule of dye and that of the fibre (Palacios, 2009). To
prepare the model textile dye wastewater (MTDW) applied in this thesis, two
different dyes named as Acid Red4 (termed as red in this thesis) and Remazol
Brilliant Blue R (termed as blue in this thesis) were selected (Fig. 3.10 and Fig.
3.11). Molecular weights (MW) of red and blue are 380.4 g/mol and 626.5
g/mol respectively.
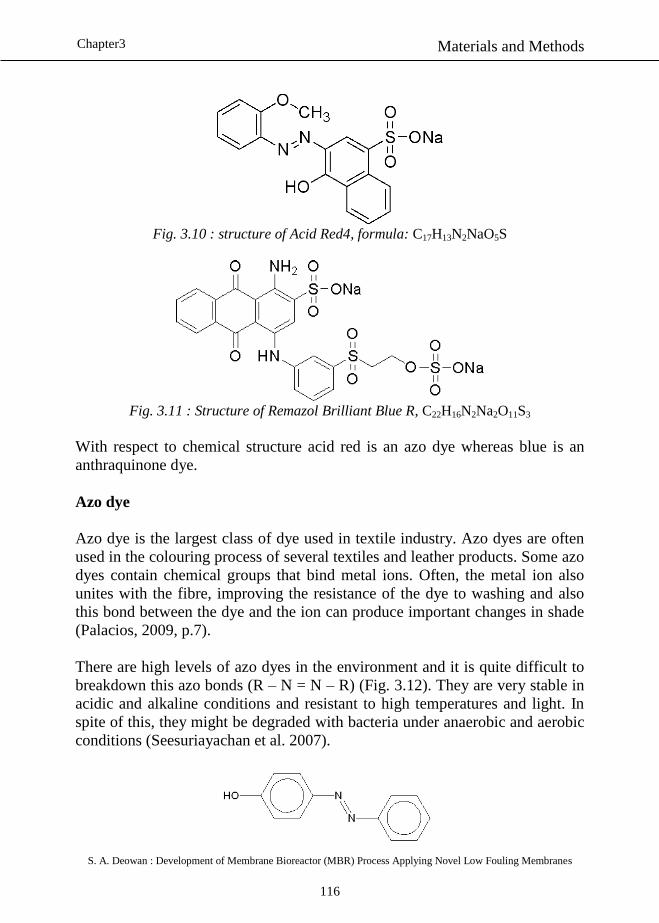
Materials and Methods
S. A. Deowan : Development of Membrane Bioreactor (MBR) Process Applying Novel Low Fouling Membranes
116
Chapter3
Fig. 3.10 : structure of Acid Red4, formula: C17H13N2NaO5S
Fig. 3.11 : Structure of Remazol Brilliant Blue R, C22H16N2Na2O11S3
With respect to chemical structure acid red is an azo dye whereas blue is an
anthraquinone dye.
Azo dye
Azo dye is the largest class of dye used in textile industry. Azo dyes are often
used in the colouring process of several textiles and leather products. Some azo
dyes contain chemical groups that bind metal ions. Often, the metal ion also
unites with the fibre, improving the resistance of the dye to washing and also
this bond between the dye and the ion can produce important changes in shade
(Palacios, 2009, p.7).
There are high levels of azo dyes in the environment and it is quite difficult to
breakdown this azo bonds (R – N = N – R) (Fig. 3.12). They are very stable in
acidic and alkaline conditions and resistant to high temperatures and light. In
spite of this, they might be degraded with bacteria under anaerobic and aerobic
conditions (Seesuriayachan et al. 2007).
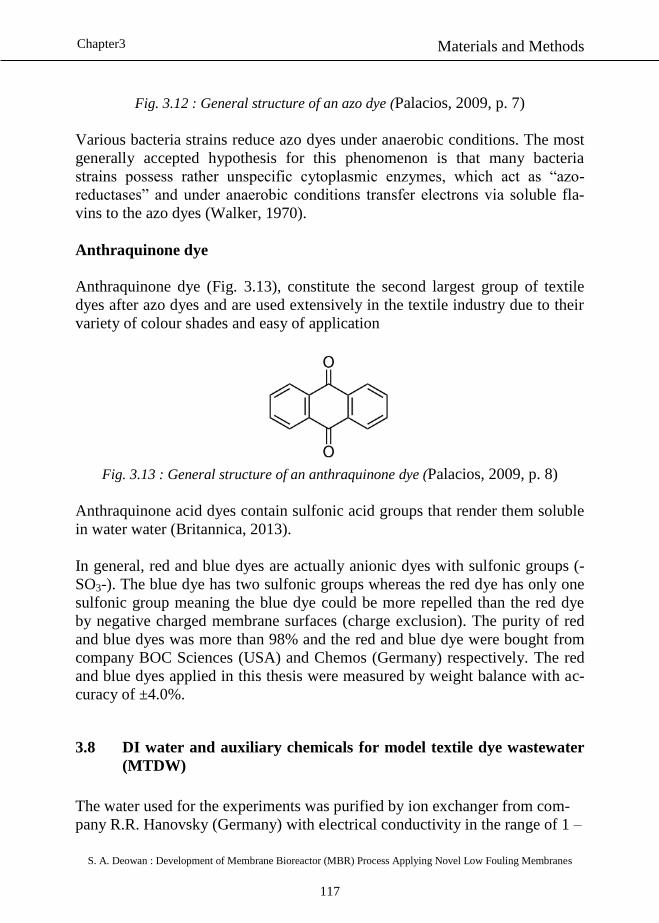
Materials and Methods
S. A. Deowan : Development of Membrane Bioreactor (MBR) Process Applying Novel Low Fouling Membranes
117
Chapter3
Fig. 3.12 : General structure of an azo dye (Palacios, 2009, p. 7)
Various bacteria strains reduce azo dyes under anaerobic conditions. The most
generally accepted hypothesis for this phenomenon is that many bacteria
strains possess rather unspecific cytoplasmic enzymes, which act as “azo-
reductases” and under anaerobic conditions transfer electrons via soluble fla-
vins to the azo dyes (Walker, 1970).
Anthraquinone dye
Anthraquinone dye (Fig. 3.13), constitute the second largest group of textile
dyes after azo dyes and are used extensively in the textile industry due to their
variety of colour shades and easy of application
Fig. 3.13 : General structure of an anthraquinone dye (Palacios, 2009, p. 8)
Anthraquinone acid dyes contain sulfonic acid groups that render them soluble
in water water (Britannica, 2013).
In general, red and blue dyes are actually anionic dyes with sulfonic groups (-
SO3-). The blue dye has two sulfonic groups whereas the red dye has only one
sulfonic group meaning the blue dye could be more repelled than the red dye
by negative charged membrane surfaces (charge exclusion). The purity of red
and blue dyes was more than 98% and the red and blue dye were bought from
company BOC Sciences (USA) and Chemos (Germany) respectively. The red
and blue dyes applied in this thesis were measured by weight balance with ac-
curacy of ±4.0%.
3.8 DI water and auxiliary chemicals for model textile dye wastewater
(MTDW)
The water used for the experiments was purified by ion exchanger from com-
pany R.R. Hanovsky (Germany) with electrical conductivity in the range of 1 –
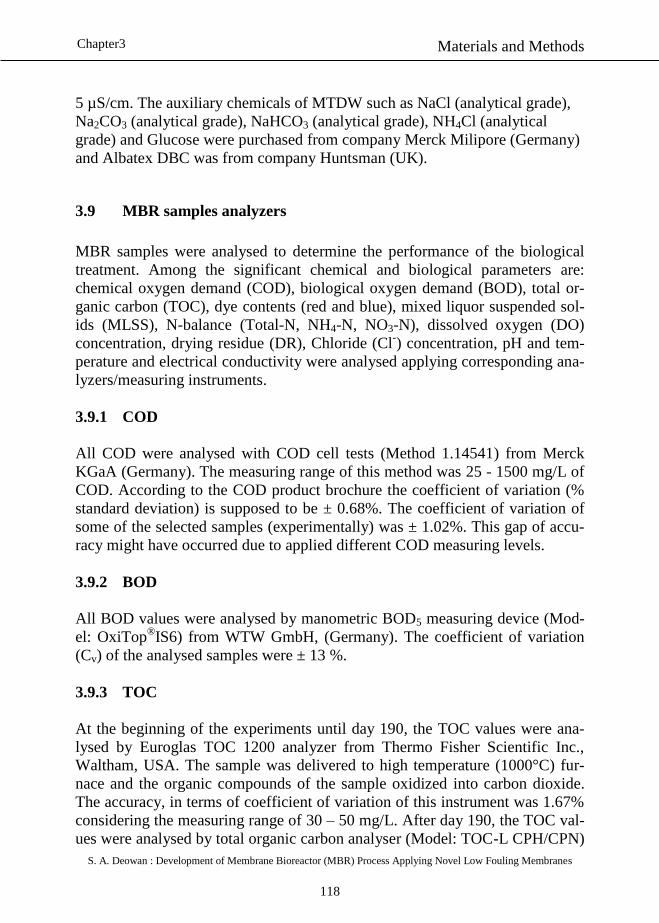
Materials and Methods
S. A. Deowan : Development of Membrane Bioreactor (MBR) Process Applying Novel Low Fouling Membranes
118
Chapter3
5 µS/cm. The auxiliary chemicals of MTDW such as NaCl (analytical grade),
Na2CO3 (analytical grade), NaHCO3 (analytical grade), NH4Cl (analytical
grade) and Glucose were purchased from company Merck Milipore (Germany)
and Albatex DBC was from company Huntsman (UK).
3.9 MBR samples analyzers
MBR samples were analysed to determine the performance of the biological
treatment. Among the significant chemical and biological parameters are:
chemical oxygen demand (COD), biological oxygen demand (BOD), total or-
ganic carbon (TOC), dye contents (red and blue), mixed liquor suspended sol-
ids (MLSS), N-balance (Total-N, NH4-N, NO3-N), dissolved oxygen (DO)
concentration, drying residue (DR), Chloride (Cl-) concentration, pH and tem-
perature and electrical conductivity were analysed applying corresponding ana-
lyzers/measuring instruments.
3.9.1 COD
All COD were analysed with COD cell tests (Method 1.14541) from Merck
KGaA (Germany). The measuring range of this method was 25 - 1500 mg/L of
COD. According to the COD product brochure the coefficient of variation (%
standard deviation) is supposed to be ± 0.68%. The coefficient of variation of
some of the selected samples (experimentally) was ± 1.02%. This gap of accu-
racy might have occurred due to applied different COD measuring levels.
3.9.2 BOD
All BOD values were analysed by manometric BOD5 measuring device (Mod-
el: OxiTop®
IS6) from WTW GmbH, (Germany). The coefficient of variation
(Cv) of the analysed samples were ± 13 %.
3.9.3 TOC
At the beginning of the experiments until day 190, the TOC values were ana-
lysed by Euroglas TOC 1200 analyzer from Thermo Fisher Scientific Inc.,
Waltham, USA. The sample was delivered to high temperature (1000°C) fur-
nace and the organic compounds of the sample oxidized into carbon dioxide.
The accuracy, in terms of coefficient of variation of this instrument was 1.67%
considering the measuring range of 30 – 50 mg/L. After day 190, the TOC val-
ues were analysed by total organic carbon analyser (Model: TOC-L CPH/CPN)
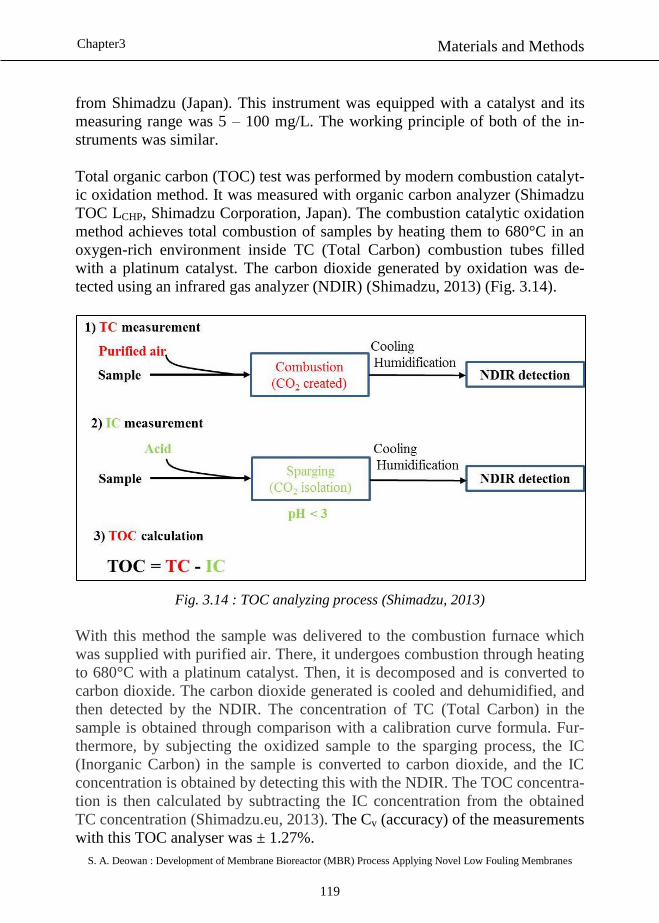
Materials and Methods
S. A. Deowan : Development of Membrane Bioreactor (MBR) Process Applying Novel Low Fouling Membranes
119
Chapter3
from Shimadzu (Japan). This instrument was equipped with a catalyst and its
measuring range was 5 – 100 mg/L. The working principle of both of the in-
struments was similar.
Total organic carbon (TOC) test was performed by modern combustion catalyt-
ic oxidation method. It was measured with organic carbon analyzer (Shimadzu
TOC LCHP, Shimadzu Corporation, Japan). The combustion catalytic oxidation
method achieves total combustion of samples by heating them to 680°C in an
oxygen-rich environment inside TC (Total Carbon) combustion tubes filled
with a platinum catalyst. The carbon dioxide generated by oxidation was de-
tected using an infrared gas analyzer (NDIR) (Shimadzu, 2013) (Fig. 3.14).
Fig. 3.14 : TOC analyzing process (Shimadzu, 2013)
With this method the sample was delivered to the combustion furnace which
was supplied with purified air. There, it undergoes combustion through heating
to 680°C with a platinum catalyst. Then, it is decomposed and is converted to
carbon dioxide. The carbon dioxide generated is cooled and dehumidified, and
then detected by the NDIR. The concentration of TC (Total Carbon) in the
sample is obtained through comparison with a calibration curve formula. Fur-
thermore, by subjecting the oxidized sample to the sparging process, the IC
(Inorganic Carbon) in the sample is converted to carbon dioxide, and the IC
concentration is obtained by detecting this with the NDIR. The TOC concentra-
tion is then calculated by subtracting the IC concentration from the obtained
TC concentration (Shimadzu.eu, 2013). The Cv (accuracy) of the measurements
with this TOC analyser was ± 1.27%.
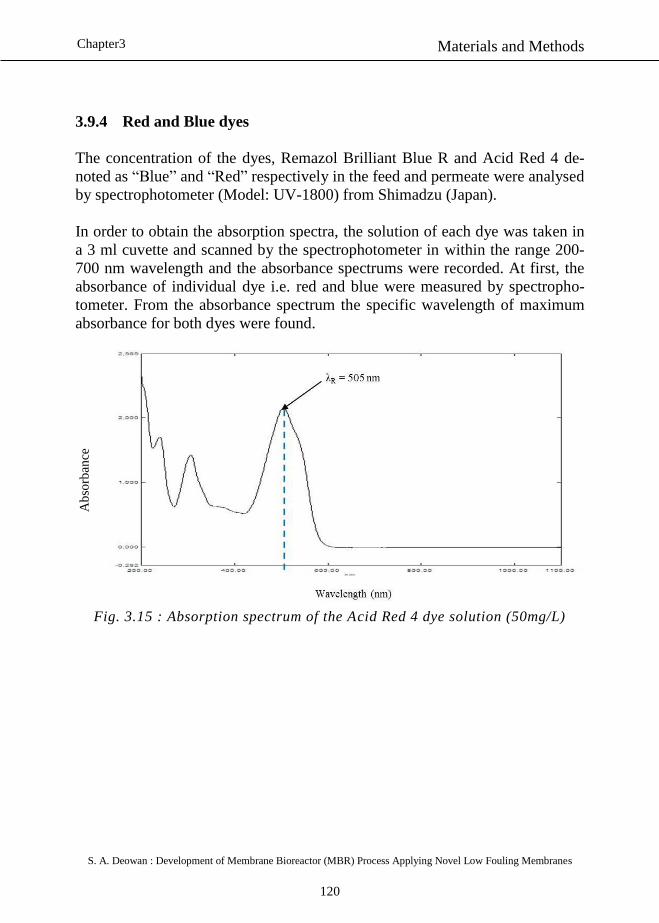
Materials and Methods
S. A. Deowan : Development of Membrane Bioreactor (MBR) Process Applying Novel Low Fouling Membranes
120
Chapter3
3.9.4 Red and Blue dyes
The concentration of the dyes, Remazol Brilliant Blue R and Acid Red 4 de-
noted as “Blue” and “Red” respectively in the feed and permeate were analysed
by spectrophotometer (Model: UV-1800) from Shimadzu (Japan).
In order to obtain the absorption spectra, the solution of each dye was taken in
a 3 ml cuvette and scanned by the spectrophotometer in within the range 200-
700 nm wavelength and the absorbance spectrums were recorded. At first, the
absorbance of individual dye i.e. red and blue were measured by spectropho-
tometer. From the absorbance spectrum the specific wavelength of maximum
absorbance for both dyes were found.
Fig. 3.15 : Absorption spectrum of the Acid Red 4 dye solution (50mg/L)
Ab
sorb
ance
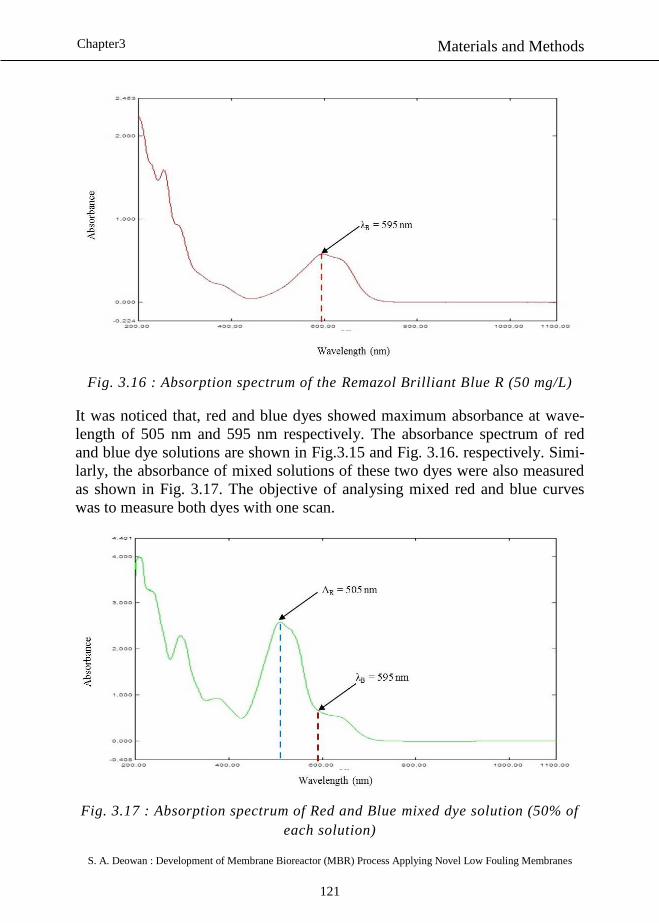
Materials and Methods
S. A. Deowan : Development of Membrane Bioreactor (MBR) Process Applying Novel Low Fouling Membranes
121
Chapter3
Fig. 3.16 : Absorption spectrum of the Remazol Brilliant Blue R (50 mg/L)
It was noticed that, red and blue dyes showed maximum absorbance at wave-
length of 505 nm and 595 nm respectively. The absorbance spectrum of red
and blue dye solutions are shown in Fig.3.15 and Fig. 3.16. respectively. Simi-
larly, the absorbance of mixed solutions of these two dyes were also measured
as shown in Fig. 3.17. The objective of analysing mixed red and blue curves
was to measure both dyes with one scan.
Fig. 3.17 : Absorption spectrum of Red and Blue mixed dye solution (50% of
each solution)
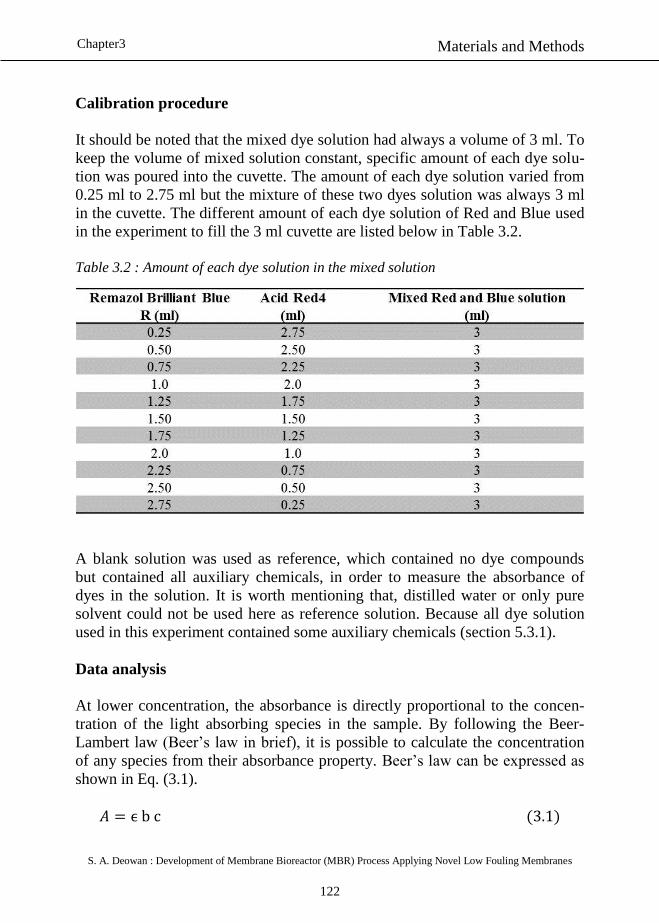
Materials and Methods
S. A. Deowan : Development of Membrane Bioreactor (MBR) Process Applying Novel Low Fouling Membranes
122
Chapter3
Calibration procedure
It should be noted that the mixed dye solution had always a volume of 3 ml. To
keep the volume of mixed solution constant, specific amount of each dye solu-
tion was poured into the cuvette. The amount of each dye solution varied from
0.25 ml to 2.75 ml but the mixture of these two dyes solution was always 3 ml
in the cuvette. The different amount of each dye solution of Red and Blue used
in the experiment to fill the 3 ml cuvette are listed below in Table 3.2.
Table 3.2 : Amount of each dye solution in the mixed solution
A blank solution was used as reference, which contained no dye compounds
but contained all auxiliary chemicals, in order to measure the absorbance of
dyes in the solution. It is worth mentioning that, distilled water or only pure
solvent could not be used here as reference solution. Because all dye solution
used in this experiment contained some auxiliary chemicals (section 5.3.1).
Data analysis
At lower concentration, the absorbance is directly proportional to the concen-
tration of the light absorbing species in the sample. By following the Beer-
Lambert law (Beer’s law in brief), it is possible to calculate the concentration
of any species from their absorbance property. Beer’s law can be expressed as
shown in Eq. (3.1).
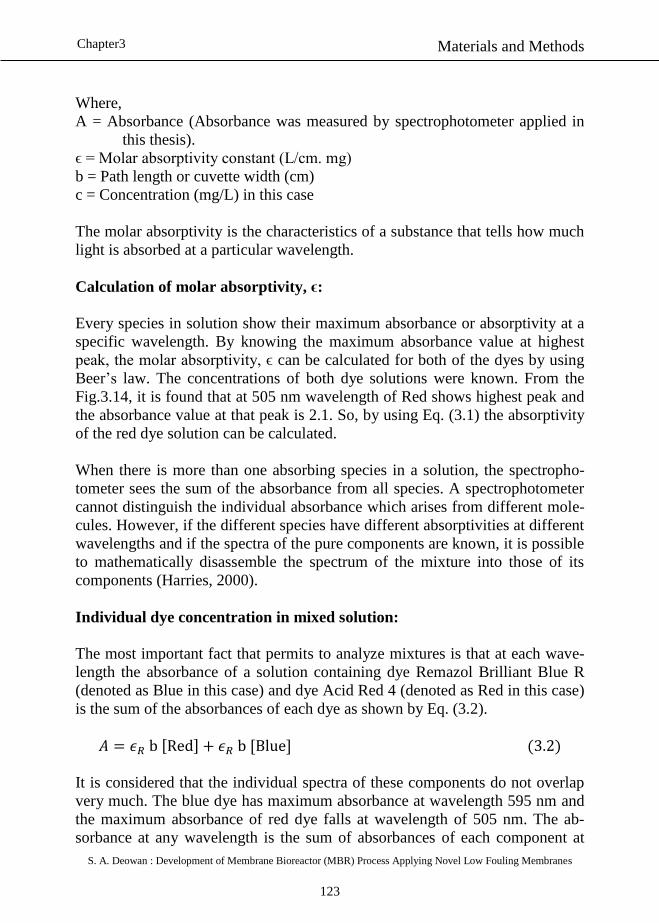
Materials and Methods
S. A. Deowan : Development of Membrane Bioreactor (MBR) Process Applying Novel Low Fouling Membranes
123
Chapter3
Where,
A = Absorbance (Absorbance was measured by spectrophotometer applied in
this thesis).
ϵ = Molar absorptivity constant (L/cm. mg)
b = Path length or cuvette width (cm)
c = Concentration (mg/L) in this case
The molar absorptivity is the characteristics of a substance that tells how much
light is absorbed at a particular wavelength.
Calculation of molar absorptivity, ϵ:
Every species in solution show their maximum absorbance or absorptivity at a
specific wavelength. By knowing the maximum absorbance value at highest
peak, the molar absorptivity, ϵ can be calculated for both of the dyes by using
Beer’s law. The concentrations of both dye solutions were known. From the
Fig.3.14, it is found that at 505 nm wavelength of Red shows highest peak and
the absorbance value at that peak is 2.1. So, by using Eq. (3.1) the absorptivity
of the red dye solution can be calculated.
When there is more than one absorbing species in a solution, the spectropho-
tometer sees the sum of the absorbance from all species. A spectrophotometer
cannot distinguish the individual absorbance which arises from different mole-
cules. However, if the different species have different absorptivities at different
wavelengths and if the spectra of the pure components are known, it is possible
to mathematically disassemble the spectrum of the mixture into those of its
components (Harries, 2000).
Individual dye concentration in mixed solution:
The most important fact that permits to analyze mixtures is that at each wave-
length the absorbance of a solution containing dye Remazol Brilliant Blue R
(denoted as Blue in this case) and dye Acid Red 4 (denoted as Red in this case)
is the sum of the absorbances of each dye as shown by Eq. (3.2).
[ ] [ ]
It is considered that the individual spectra of these components do not overlap
very much. The blue dye has maximum absorbance at wavelength 595 nm and
the maximum absorbance of red dye falls at wavelength of 505 nm. The ab-
sorbance at any wavelength is the sum of absorbances of each component at
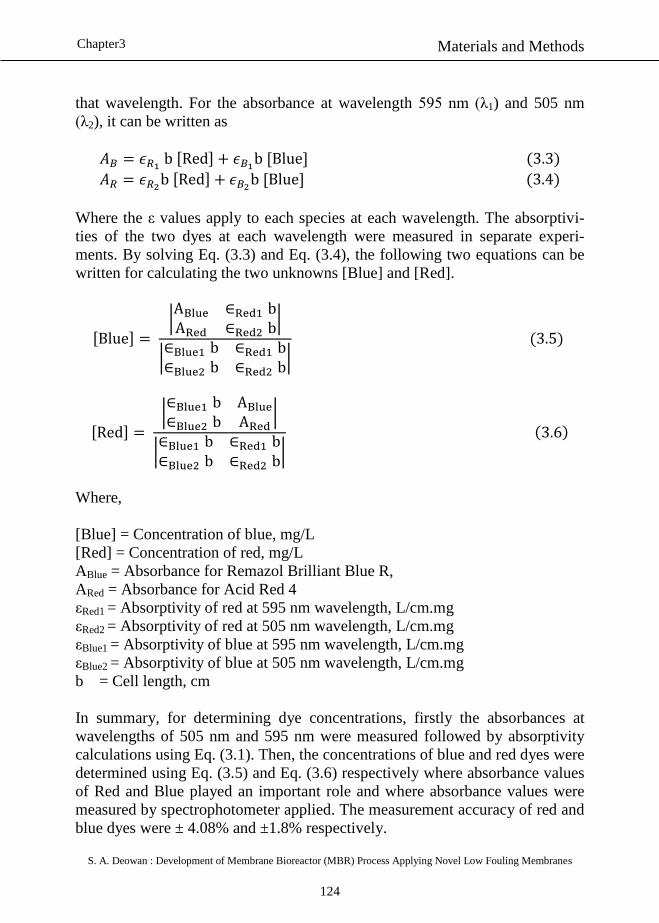
Materials and Methods
S. A. Deowan : Development of Membrane Bioreactor (MBR) Process Applying Novel Low Fouling Membranes
124
Chapter3
that wavelength. For the absorbance at wavelength 595 nm (λ1) and 505 nm
(λ2), it can be written as
[ ]
[ ]
[ ]
[ ]
Where the ε values apply to each species at each wavelength. The absorptivi-
ties of the two dyes at each wavelength were measured in separate experi-
ments. By solving Eq. (3.3) and Eq. (3.4), the following two equations can be
written for calculating the two unknowns [Blue] and [Red].
[ ] |
|
|
|
[ ] |
|
|
|
Where,
[Blue] = Concentration of blue, mg/L
[Red] = Concentration of red, mg/L
ABlue = Absorbance for Remazol Brilliant Blue R,
ARed = Absorbance for Acid Red 4
εRed1 = Absorptivity of red at 595 nm wavelength, L/cm.mg
εRed2 = Absorptivity of red at 505 nm wavelength, L/cm.mg
εBlue1 = Absorptivity of blue at 595 nm wavelength, L/cm.mg
εBlue2 = Absorptivity of blue at 505 nm wavelength, L/cm.mg
b = Cell length, cm
In summary, for determining dye concentrations, firstly the absorbances at
wavelengths of 505 nm and 595 nm were measured followed by absorptivity
calculations using Eq. (3.1). Then, the concentrations of blue and red dyes were
determined using Eq. (3.5) and Eq. (3.6) respectively where absorbance values
of Red and Blue played an important role and where absorbance values were
measured by spectrophotometer applied. The measurement accuracy of red and
blue dyes were ± 4.08% and ±1.8% respectively.
Materials and Methods
S. A. Deowan : Development of Membrane Bioreactor (MBR) Process Applying Novel Low Fouling Membranes
125
Chapter3
3.9.5 MBR reactor COD and reactor dyes
For analysing COD and dyes (red and blue) in the reactor, the collected sample
from the MBR reactor was sonicated for 10 minutes. Then, it was filtered by
microfiltration membrane (PS MF membrane 150 kDa from Microdyn-Nadir,
Germany) applying vacuum pressure close to the similar TMP value applied in
MBR experiment. Most of the time, the maximum volume of filtrate was
around 4 ml and it was diluted to 3 times equal to 12 ml adding DI water since
at least 12 ml sample was needed for COD and dye analysis. 3 ml of this vol-
ume was used for COD analysis and the rest of 9 ml was used for analysis of
dye concentrations following the analysing method described above. The dilu-
tion factor might have influence in accuracy of the analyses. The accuracy of
the measurements were ± 1.02%, ± 4.08% and ±1.8% for reactor COD, reactor
red dye and reactor blue dye respectively.
3.9.6 MLSS
MLSS values were analysed by classical analysing process at drying tempera-
ture of 103 °C – 105 °C.
The equipment used in this case were:
Dessicator
Dyring oven (operating temperature 103 – 105°C)
Analytical scale
Graduated porcelain crucible
Beaker
For each measurement, 40 ml sample from MBR reactor/permeate were taken
in ceramic crucible. The filled ceramic crucible was stored in a drying oven for
24 h. After 24 h of drying, the crucible was taken away from the oven and kept
in a dessicator at ambient temperature (20 ± 2°C) for half an hour. Subsequent-
ly, the sample was weighted and MLSS was calculated following Eq. (3.7).
{(
) (
)}
Where,
C1 = weight of ceramic crucible + dried residue of reactor sample, g
D1 = weight of empty ceramic crucible used for reactor sample, g
C2 = weight of ceramic crucible + dried residue of permeate sample, g
Materials and Methods
S. A. Deowan : Development of Membrane Bioreactor (MBR) Process Applying Novel Low Fouling Membranes
126
Chapter3
D2 = weight of empty ceramic crucible used for permeate sample, g
The Cv value of the analysis was ± 3.4% which might have occurred from
weighing the samples by the applied analytical balance.
3.9.7 N-Balance
The N-balance consists of Total-N, NH4-N and NO3-N.
Total-N
At the beginning of the experiment until day 190, the Total-N analyses were
conducted with cell tests (Model: 1.00613) from Merck KGaA (Germany). The
measuring range of this method was 0.5 – 15 mg/L. According to the product
brochure the Cv was ± 1.5% but in this experiment it was found as ± 4.24%.
After day190 onward, the Total-N was determined by TOC-L CHP/CPN ana-
lyser (Shimadzu, Japan) along with TOC since it was cheaper and simpler. The
accuracy of the results obtained were comparable to that of cell tests.
NH4-N
All NH4-N analyses were conducted with cell tests (Method: 1.14558) from
Merch KGaA (Germany). The measuring range of this method was 0.2 – 8
mg/L. The product brochure indicates the Cv as ± 1.0% but it was found as ±
6.85% experimentally in this thesis which could have occurred from fluctuat-
ing NH4-N values in the samples. The fewer number of samples (Number of
samples: 5) used in this case compared to the sample numbers of product bro-
chure (Number of samples: 39) might have also created this variation of accu-
racy.
NO3-N
All NO3-N analyses were conducted with cell tests (Method: 1.14542) from
Merck KGaA (Germany). The measuring range of this method was 0.5 – 18
mg/L. The product brochure indicates Cv as ±1.5% but experimentally it was
found as ± 7.9% which might have occurred from very low concentration of
NO3-N values in the samples. The fewer number of samples (Number of sam-
ples used: 5) used in this case compared to the sample numbers of product bro-
chure (Number of samples used: 27) might have created this variation of accu-
racy too.
Materials and Methods
S. A. Deowan : Development of Membrane Bioreactor (MBR) Process Applying Novel Low Fouling Membranes
127
Chapter3
3.9.8 Dissolved Oxygen (DO)
The DO concentrations were determined with an oxygen sensor (Model: Oxi
340i meter and CellOX® 325 O2 electrode) from WTW GmbH (Germany). The
Cv of the method according to the product brochure was ± 0.5% but experimen-
tally it was found as ± 3.2% considering 10 number of samples.
Oxygen uptake rate (OUR)
Oxgen uptake rate (OUR) was calculated as described below:
Firstly , roughly 100 ml sample from MBR reactor was taken and DO of this
sample was measured. After that the sample was kept on stirring for 10 minutes
in an ambient temperature without extra oxygen supply. After 10 minutes, DO
of this sample was measured and OUR was calculated in mg/Lmin.
3.9.9 Drying Residue (DR)
DR values were analysed with classical analysing process at operating tem-
perature of 103 – 105° C. The analysing procedure was similar to MLSS but
sample volume and sampling location was different.
The equipment used in this case were:
Dessicator
Dyring oven (operating temperature 103 – 105°C)
Analytical scale
Graduated porcelain cruvible
Beaker
For each measurement, 20 ml sample from feed/permeate were taken in ceram-
ic crucible. The filled ceramic crucible was stored in a drying oven for 24 h.
After 24 h of drying, the crucible was taken out of the oven and kept in a des-
sicator at ambient temperature (20 ± 2°C) for half an hour. Subsequently, the
sample was weighted and drying residue DR was calculated following Eq.
(3.8).
Where,
C = weight of ceramic crucible + dried residue, g
Materials and Methods
S. A. Deowan : Development of Membrane Bioreactor (MBR) Process Applying Novel Low Fouling Membranes
128
Chapter3
D = weight of empty ceramic crucible, g
The Cv value of the analysis was found as ± 3.0% which might have occurred
due to weighing of the samples.
3.9.10 Chloride (Cl-)
The concentrations of chloride (Cl-) were determined by titration method
(Model: 716 DMS Titrino) from Metrohm (USA). The Cv of the instrument
experimentally found as 1.49% with measuring rang up to 100 mg/L of Cl-.
3.9.11 pH and Temperature
All values of pH and temperature were measured with a pH meter (Model: pH
323 meter and Sentix® 41-3 electrode) integrated with temperature sensor from
company WTW GmbH (Germany). The Cv of the method for pH and tempera-
ture according to the product brochure were ± 0.01 pH (for temperature range :
-10°C – 35°C) and ± 0.1 K (for temperature range : 15°C – 35°C) respectively.
Experimentally, the Cv for pH and temperature measurements were ± 0.5 pH
and ±1.08% respectively.
3.9.12 Electrical Conductivity
All conductivity measurements were performed with a conductivity meter
(Model: Cond 315i meter) from WTW GmbH (Germany). The measuring
range of the instrument was 0.00 – 19.99 mS/cm. The Cv of the product bro-
chure was ± 0.5% and experimentally it was found as ± 2.4%.
References
Asatekin, A., Menniti, A., Kang, S., Elimelech, M., Morgenroth, E., Mayes, A.
M. (2006), Antifouling nanofiltration membranes for membrane biore-
actors from self-assembling graft copolymers. Journal of Membrane
Science 285, 81–89.
Bahadır K. Körbahti, Abdurrahman Tanyolac, Continuous electrochemical
treatment of simulated industrial textile wastewater from industrial
components in a tubular reactor, J. Hazard. Mater 170 (2009) 771–778.
Britannica, 2013, http://www.britannica.com/eb/article-9007791/antrhaquinone-dye,
accessed on November 20, 2013
Materials and Methods
S. A. Deowan : Development of Membrane Bioreactor (MBR) Process Applying Novel Low Fouling Membranes
129
Chapter3
Chemical book, (2013),
http://www.chemicalbook.com/ProductChemicalPropertiesCB9368635_EN.ht
m, accessed on 23.09.2013
Carliell, C.M., Barclay, S.J, Naidoo, N., Buckely, C.A., Mulholland, D.A, Sen-
ior, E., 1994. Anaerobic decolourisation of reactive dyes in convention-
al sewage treatment processes. Water S.A. 20, 341 – 345
Carliell, C.M., Barclay, S.J., Buckley, C.A., 1996. Treatment of exhausted re-
active dye bath effluent using anaerobic digestion: laboratory and full
scale trials. Water S.A. 22, 225 - 233
Harris , Daniel C. (2000), Quantitative Chemical Analysis, 5th
ed. ISBN 0-
7167-2881-8, USA
Idil Arslan Alaton, Isil Akmehmet Balcioglu, Detlef W. Bahnemann, Ad-
vanced oxidation of a reactive dyebath effluent:comparison of O3,
H2O2/UV-A processes, water research 36 (2002) 1143-1154.
Korejba, W. (2010), Aufbau und Inbetriebnahme eines Labor-
Membranbioreaktors mit automatischer Datenerfassung und Steuerung,
Master Thesis, Sensor Ssystems Technology, Karlsruhe University of
Applied Sciences, Germany
Microdyn – Nadir, 2013, http://www.microdyn-nadir.com/en/Products/BIO-
CEL%C2%AE/, accessed on November 22, 2013
Mustafa Isik, Delia Teresa Sponza, (2008), Anaerobic/ aerobic treatment of a
simulated textile wastewater, separation and purification technology 60,
64-72.
Nanotech (2013), http://www.creating-nanotech.com/en/product.php?p_sn=24,
acceesed on 26.09.2013
Nystrom, M., Ruohomaki, K., Kaipia, L. (1996), Humic acid as a fouling agent
in filtration, Desalination, 106, 79-87
Palacios, S. (2009), Decolourization of azo and anthraquinone dyes by mean of
microorganisms growing on wood chips, thesis, school of technology
and design, department of bioenergy, Vaxjo, University, Sweden
PMI, porous materials, Inc, USA, http://www.pmiapp.com/contact/index.html,
accessed on 18.06.2013
Seesuriyachan, P., Takenaka, S., Kuntiya, A., Klayraung, S., Murakami, S.,
Aoki, K. (2007), Metabolism of azo dyes by lactobacillus casei TISTR
1500 and effecs of various factors on decolorization, water research, 41
(2007), 985 - 992
Shimadzu, 2013, http://www.shimadzu.com/an/toc/lab/toc-l4.html, accessed on
24.09.13
Materials and Methods
S. A. Deowan : Development of Membrane Bioreactor (MBR) Process Applying Novel Low Fouling Membranes
130
Chapter3
Srisurichan, S., Jiraratananon, R., Fane, A.G. (2005), Humic acid fouling in the
membrane distillation process Desalination, 174 (2005) 63-72
Sutzkover-Gutman, I., Hasson, D., R. Semiat, (2010), Humic substances foul-
ing in ultrafiltration processes Desalination, 261 (2010) 218–231
Walker, R. (1970), The metabolism of azo compounds; a review of the litera-
ture, Food Cosmet Toxicol, 8 (6) 659 -676
Wei, Y. and Zydney, A.L. (1999), Humic Acid Fouling During Microfiltration,
J. Membr. Sci., 157 (1999) 1-12
Chapter 4
Novel Membrane Preparation and Characterisation
S. A. Deowan : Development of Membrane Bioreactor (MBR) Process Applying Novel Low Fouling Membrane
131
4. Chapter 4 : Novel Membrane Preparation and Charac-
terisation
The ultrafiltration (UF) PES membrane is widely applied in the field of food,
beverage, dairy, biotechnology, effluent treatment and medical applications. In
this thesis, the application of UF PES membrane from company Microdyn Na-
dir (Germany) and novel coated UF PES membrane, named as PBM mem-
brane, in textile effluent treatment via MBR process were focused. Typically,
UF PES membranes are prepared by phase-inversion process in which a homo-
geneous polymer solution is converted to porous polymer framework through
the exchange of a solvent with a coagulant which is a strong non-solvent, re-
sulting in the formation of a thin skin layer and a porous asymmetric sub-
structure (Wijmans, 1985). The UF PES membrane used in this case was com-
posed of permanently, hydrophilic polyether sulfone (PES) supported by poly-
ethylene terephthalate (PET) with a pore size of about 0.04 µm (150 kDa) in
active side of the membrane.
As it is reported in different literatures, many researchers have prepared new
type/novel membrane in many ways (Section 1.2, p.2; section 2.2.3.2. p.41) to
have higher performance in different applications compared to its basis. In ad-
dition, Ruckenstein et al (1989, 1992a, 1992b, 1993, 1994, 1995) has devel-
oped new approaches for preparation of hydrophobic-hydrophilic composite
membranes via concentrated emulsion-polymerisation.
The novel membranes in this thesis were prepared by making a novel coating
on top of UF PES membrane applying the process of polymerisable bicontinu-
ous microemulsion (PBM), a protocol developed by ITM-CNR, Italy (Figoli,
2001). The preparation process consists of monomer, co-surfactant, water and
surfactant followed by cross-linker and redox initiator. The target of this new
approach was to prepare a novel coated membrane with increased hydrophilici-
ty and lower fouling propensity. The classical characterisations of the prepared
membranes were performed following the modern techniques (SEM, AFM,
contact angle measurement etc.). In this thesis work, commercial UF PES
membrane and novel coated UF PES membrane have been referred as PES
membrane and PBM membrane respectively.
4.1 Preparation of novel membrane
Novel Membrane Preparation and Characterisation
S. A. Deowan : Development of Membrane Bioreactor (MBR) Process Applying Novel Low Fouling Membrane
132
Chapter4
The membrane preparation was performed through polymerisable bicontinuous
microemulsion and it was polymerised with redox initiator in a N2 saturated
temperature controlled casting chamber.
4.1.1 Microemulsions
A microemulsion is a thermodynamically stable dispersion consisting of two
immiscible liquids (generally oil and water) stabilized by a surfactant. For the
formation of a microemulsion generally a co-surfactant, usually represented by
an alcohol of an intermediate chain length e.g. hexanol, is required (Figoli,
2001). The co-surfactant along with a surfactant reduces the interfacial tension
significantly. The microemulsions form spontaneously, optically transparent,
thermodynamically stable and have smaller droplet size and lower interfacial
energy.
There are three types of microemulsions, namely oil-in water microemulsion
(O/W), water-in oil (W/O) and bicontinuous microemulsion. The former two
types of microemulsions possess droplet-like microstructures, while the latter
consists of bicontinuous structures. The numerous numbers of microstructures
in each type can be used as micro-reactors for polymerization to obtain ul-
trafine latex particles or bicontinuous polymeric materials (Gan et al. 1997).
Over the past decades, much research has been devoted to microemulsions as
reaction media (Kumar and Mittal, 1999; Holmberg, 2003) and their industrial
applications are steadily increasing (The microemulsion book, 1999 and Mi-
alocq, 1987), e.g. polymerization (Gupta, 1992; Candau, 1992), enzymatic
(Holmberg, 1994) and oxidation (Minero, 1988; Aubry, 1997). The microstruc-
tures of W/O and O/W microemulsions have been widely studied and they
have been successfully used for preparing nanoparticles of polymers as well as
inorganic compounds by polymerizing the microemulsions (Candau, 1992;
Kandori, 1988; Chew et al. 1990, Arriagada and Osseo-Asre, 1995). Bicontin-
uous microemulsion generates a network of interconnected channels of water
and oil (MMA in this case) stabilized with surfactant and facilitated with co-
surfactant. After polymerisation the oil phase provides the property of a mem-
brane structure and the water phase defines the pore of the membrane. The
pores might be derived from the interconnected water-filled spaces (modified
from Gan et al. 1997). By changing the core compositions (%) of bicontinuous
microemulsion, the membrane structure can be adjusted.
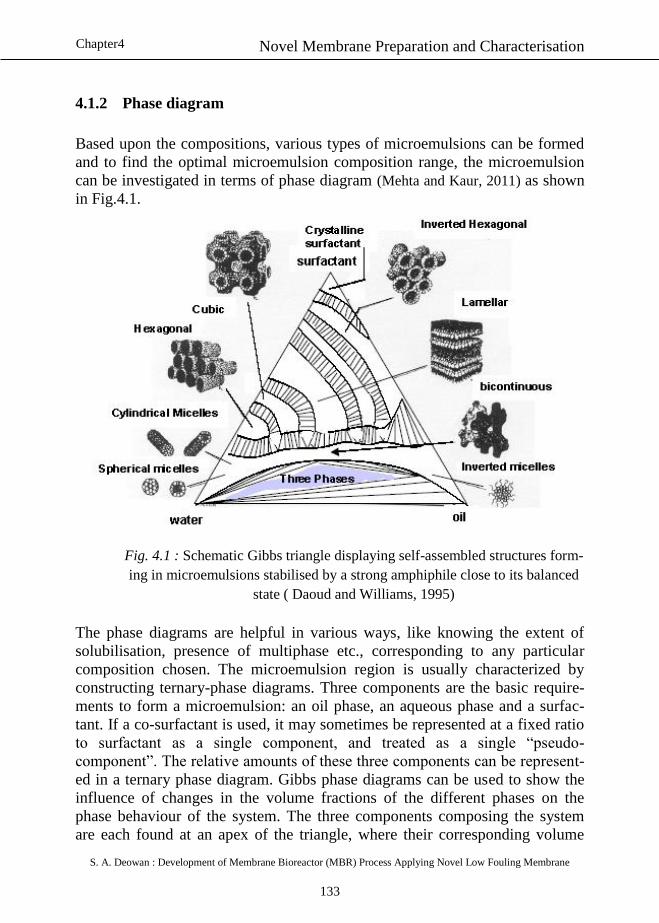
Novel Membrane Preparation and Characterisation
S. A. Deowan : Development of Membrane Bioreactor (MBR) Process Applying Novel Low Fouling Membrane
133
Chapter4
4.1.2 Phase diagram
Based upon the compositions, various types of microemulsions can be formed
and to find the optimal microemulsion composition range, the microemulsion
can be investigated in terms of phase diagram (Mehta and Kaur, 2011) as shown
in Fig.4.1.
Fig. 4.1 : Schematic Gibbs triangle displaying self-assembled structures form-
ing in microemulsions stabilised by a strong amphiphile close to its balanced
state ( Daoud and Williams, 1995)
The phase diagrams are helpful in various ways, like knowing the extent of
solubilisation, presence of multiphase etc., corresponding to any particular
composition chosen. The microemulsion region is usually characterized by
constructing ternary-phase diagrams. Three components are the basic require-
ments to form a microemulsion: an oil phase, an aqueous phase and a surfac-
tant. If a co-surfactant is used, it may sometimes be represented at a fixed ratio
to surfactant as a single component, and treated as a single “pseudo-
component”. The relative amounts of these three components can be represent-
ed in a ternary phase diagram. Gibbs phase diagrams can be used to show the
influence of changes in the volume fractions of the different phases on the
phase behaviour of the system. The three components composing the system
are each found at an apex of the triangle, where their corresponding volume
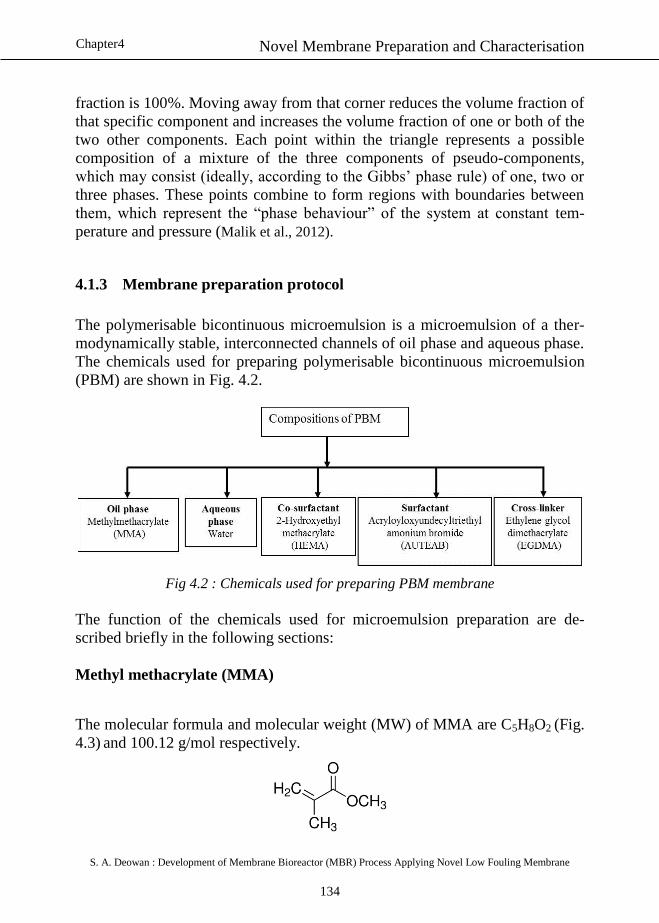
Novel Membrane Preparation and Characterisation
S. A. Deowan : Development of Membrane Bioreactor (MBR) Process Applying Novel Low Fouling Membrane
134
Chapter4
fraction is 100%. Moving away from that corner reduces the volume fraction of
that specific component and increases the volume fraction of one or both of the
two other components. Each point within the triangle represents a possible
composition of a mixture of the three components of pseudo-components,
which may consist (ideally, according to the Gibbs’ phase rule) of one, two or
three phases. These points combine to form regions with boundaries between
them, which represent the “phase behaviour” of the system at constant tem-
perature and pressure (Malik et al., 2012).
4.1.3 Membrane preparation protocol
The polymerisable bicontinuous microemulsion is a microemulsion of a ther-
modynamically stable, interconnected channels of oil phase and aqueous phase.
The chemicals used for preparing polymerisable bicontinuous microemulsion
(PBM) are shown in Fig. 4.2.
Fig 4.2 : Chemicals used for preparing PBM membrane
The function of the chemicals used for microemulsion preparation are de-
scribed briefly in the following sections:
Methyl methacrylate (MMA)
The molecular formula and molecular weight (MW) of MMA are C5H8O2 (Fig.
4.3) and 100.12 g/mol respectively.
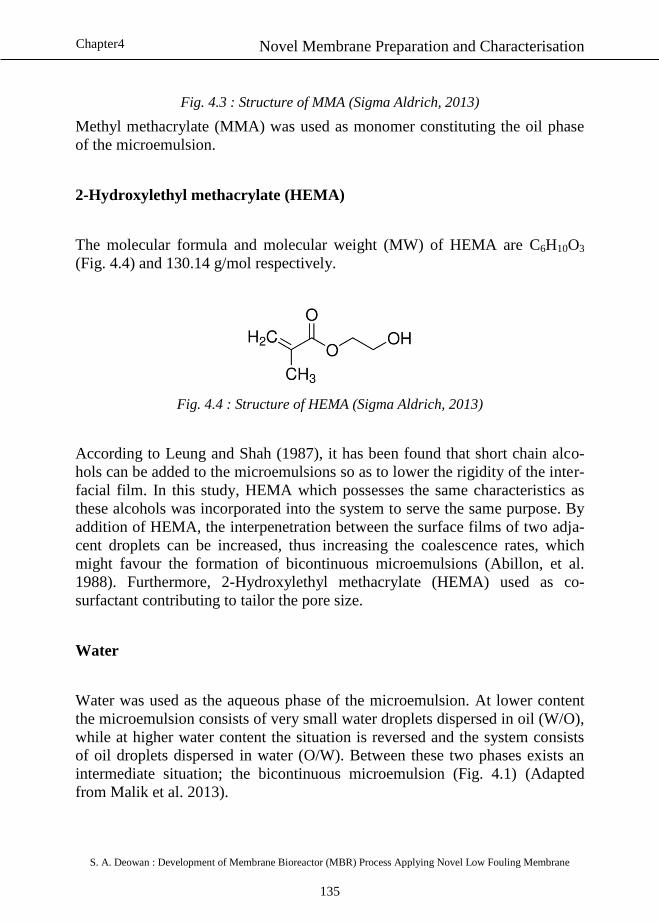
Novel Membrane Preparation and Characterisation
S. A. Deowan : Development of Membrane Bioreactor (MBR) Process Applying Novel Low Fouling Membrane
135
Chapter4
Fig. 4.3 : Structure of MMA (Sigma Aldrich, 2013)
Methyl methacrylate (MMA) was used as monomer constituting the oil phase
of the microemulsion.
2-Hydroxylethyl methacrylate (HEMA)
The molecular formula and molecular weight (MW) of HEMA are C6H10O3
(Fig. 4.4) and 130.14 g/mol respectively.
Fig. 4.4 : Structure of HEMA (Sigma Aldrich, 2013)
According to Leung and Shah (1987), it has been found that short chain alco-
hols can be added to the microemulsions so as to lower the rigidity of the inter-
facial film. In this study, HEMA which possesses the same characteristics as
these alcohols was incorporated into the system to serve the same purpose. By
addition of HEMA, the interpenetration between the surface films of two adja-
cent droplets can be increased, thus increasing the coalescence rates, which
might favour the formation of bicontinuous microemulsions (Abillon, et al.
1988). Furthermore, 2-Hydroxylethyl methacrylate (HEMA) used as co-
surfactant contributing to tailor the pore size.
Water
Water was used as the aqueous phase of the microemulsion. At lower content
the microemulsion consists of very small water droplets dispersed in oil (W/O),
while at higher water content the situation is reversed and the system consists
of oil droplets dispersed in water (O/W). Between these two phases exists an
intermediate situation; the bicontinuous microemulsion (Fig. 4.1) (Adapted
from Malik et al. 2013).
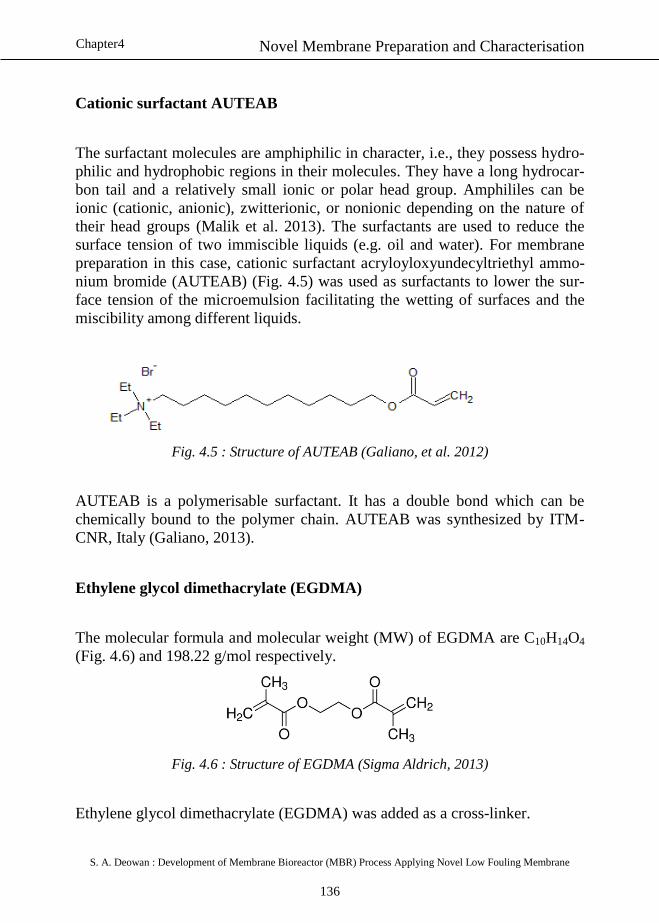
Novel Membrane Preparation and Characterisation
S. A. Deowan : Development of Membrane Bioreactor (MBR) Process Applying Novel Low Fouling Membrane
136
Chapter4
Cationic surfactant AUTEAB
The surfactant molecules are amphiphilic in character, i.e., they possess hydro-
philic and hydrophobic regions in their molecules. They have a long hydrocar-
bon tail and a relatively small ionic or polar head group. Amphililes can be
ionic (cationic, anionic), zwitterionic, or nonionic depending on the nature of
their head groups (Malik et al. 2013). The surfactants are used to reduce the
surface tension of two immiscible liquids (e.g. oil and water). For membrane
preparation in this case, cationic surfactant acryloyloxyundecyltriethyl ammo-
nium bromide (AUTEAB) (Fig. 4.5) was used as surfactants to lower the sur-
face tension of the microemulsion facilitating the wetting of surfaces and the
miscibility among different liquids.
Fig. 4.5 : Structure of AUTEAB (Galiano, et al. 2012)
AUTEAB is a polymerisable surfactant. It has a double bond which can be
chemically bound to the polymer chain. AUTEAB was synthesized by ITM-
CNR, Italy (Galiano, 2013).
Ethylene glycol dimethacrylate (EGDMA)
The molecular formula and molecular weight (MW) of EGDMA are C10H14O4
(Fig. 4.6) and 198.22 g/mol respectively.
Fig. 4.6 : Structure of EGDMA (Sigma Aldrich, 2013)
Ethylene glycol dimethacrylate (EGDMA) was added as a cross-linker.
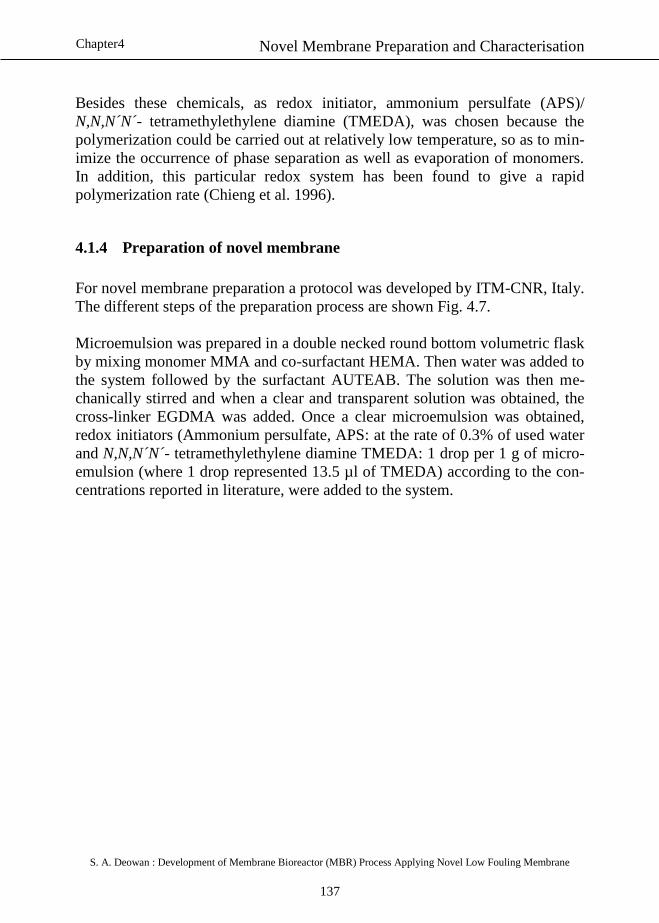
Novel Membrane Preparation and Characterisation
S. A. Deowan : Development of Membrane Bioreactor (MBR) Process Applying Novel Low Fouling Membrane
137
Chapter4
Besides these chemicals, as redox initiator, ammonium persulfate (APS)/
N,N,N´N´- tetramethylethylene diamine (TMEDA), was chosen because the
polymerization could be carried out at relatively low temperature, so as to min-
imize the occurrence of phase separation as well as evaporation of monomers.
In addition, this particular redox system has been found to give a rapid
polymerization rate (Chieng et al. 1996).
4.1.4 Preparation of novel membrane
For novel membrane preparation a protocol was developed by ITM-CNR, Italy.
The different steps of the preparation process are shown Fig. 4.7.
Microemulsion was prepared in a double necked round bottom volumetric flask
by mixing monomer MMA and co-surfactant HEMA. Then water was added to
the system followed by the surfactant AUTEAB. The solution was then me-
chanically stirred and when a clear and transparent solution was obtained, the
cross-linker EGDMA was added. Once a clear microemulsion was obtained,
redox initiators (Ammonium persulfate, APS: at the rate of 0.3% of used water
and N,N,N´N´- tetramethylethylene diamine TMEDA: 1 drop per 1 g of micro-
emulsion (where 1 drop represented 13.5 µl of TMEDA) according to the con-
centrations reported in literature, were added to the system.
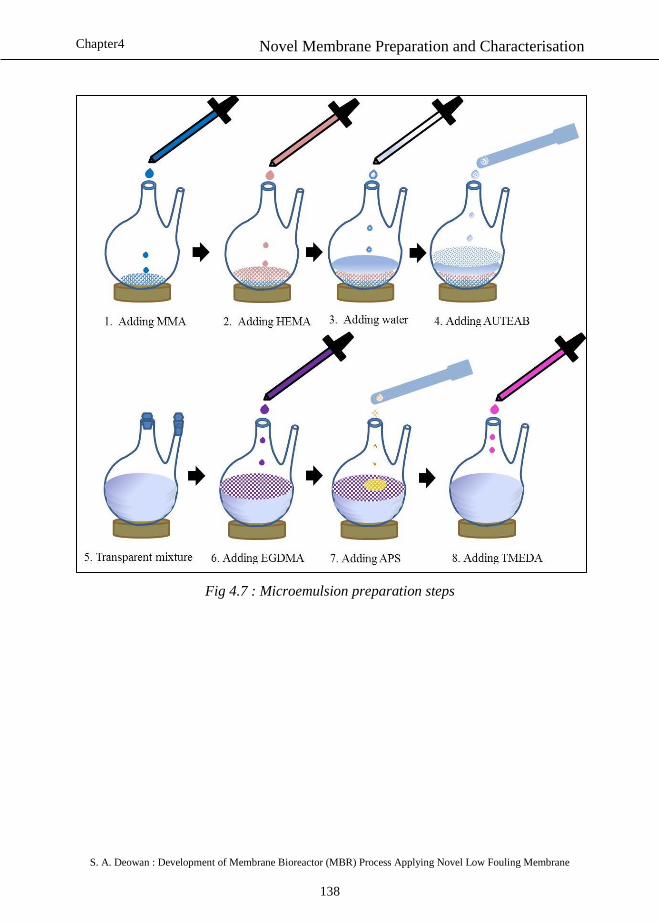
Novel Membrane Preparation and Characterisation
S. A. Deowan : Development of Membrane Bioreactor (MBR) Process Applying Novel Low Fouling Membrane
138
Chapter4
Fig 4.7 : Microemulsion preparation steps
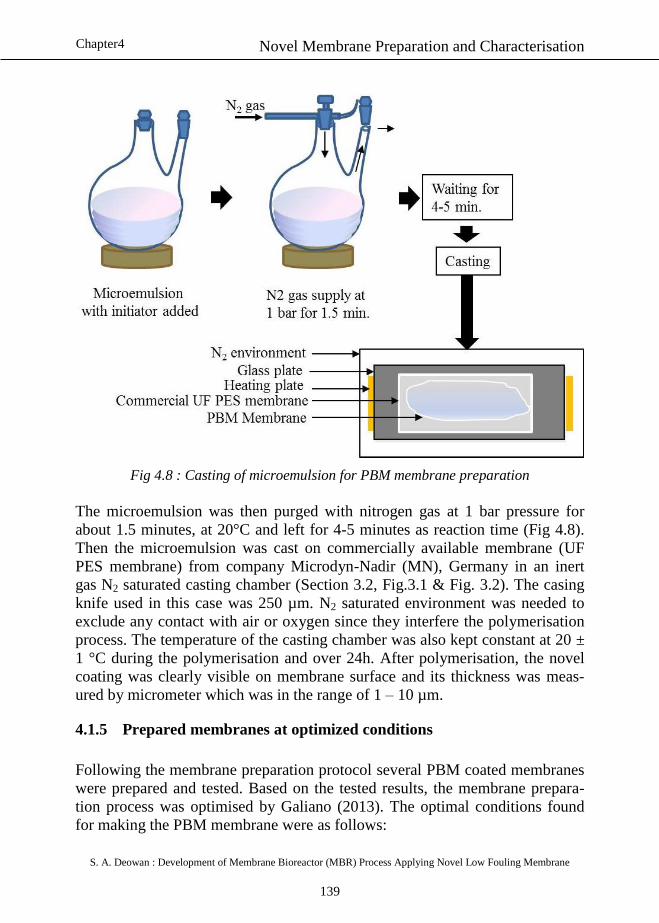
Novel Membrane Preparation and Characterisation
S. A. Deowan : Development of Membrane Bioreactor (MBR) Process Applying Novel Low Fouling Membrane
139
Chapter4
Fig 4.8 : Casting of microemulsion for PBM membrane preparation
The microemulsion was then purged with nitrogen gas at 1 bar pressure for
about 1.5 minutes, at 20°C and left for 4-5 minutes as reaction time (Fig 4.8).
Then the microemulsion was cast on commercially available membrane (UF
PES membrane) from company Microdyn-Nadir (MN), Germany in an inert
gas N2 saturated casting chamber (Section 3.2, Fig.3.1 & Fig. 3.2). The casing
knife used in this case was 250 µm. N2 saturated environment was needed to
exclude any contact with air or oxygen since they interfere the polymerisation
process. The temperature of the casting chamber was also kept constant at 20 ±
1 °C during the polymerisation and over 24h. After polymerisation, the novel
coating was clearly visible on membrane surface and its thickness was meas-
ured by micrometer which was in the range of 1 – 10 µm.
4.1.5 Prepared membranes at optimized conditions
Following the membrane preparation protocol several PBM coated membranes
were prepared and tested. Based on the tested results, the membrane prepara-
tion process was optimised by Galiano (2013). The optimal conditions found
for making the PBM membrane were as follows:
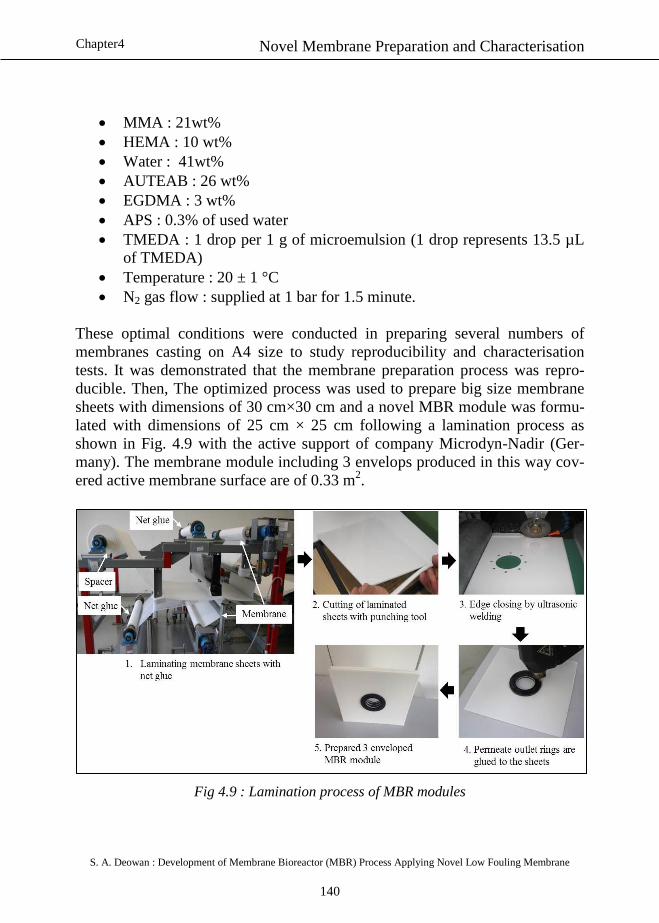
Novel Membrane Preparation and Characterisation
S. A. Deowan : Development of Membrane Bioreactor (MBR) Process Applying Novel Low Fouling Membrane
140
Chapter4
MMA : 21wt%
HEMA : 10 wt%
Water : 41wt%
AUTEAB : 26 wt%
EGDMA : 3 wt%
APS : 0.3% of used water
TMEDA : 1 drop per 1 g of microemulsion (1 drop represents 13.5 µL
of TMEDA)
Temperature : 20 ± 1 °C
N2 gas flow : supplied at 1 bar for 1.5 minute.
These optimal conditions were conducted in preparing several numbers of
membranes casting on A4 size to study reproducibility and characterisation
tests. It was demonstrated that the membrane preparation process was repro-
ducible. Then, The optimized process was used to prepare big size membrane
sheets with dimensions of 30 cm×30 cm and a novel MBR module was formu-
lated with dimensions of 25 cm × 25 cm following a lamination process as
shown in Fig. 4.9 with the active support of company Microdyn-Nadir (Ger-
many). The membrane module including 3 envelops produced in this way cov-
ered active membrane surface are of 0.33 m2.
Fig 4.9 : Lamination process of MBR modules
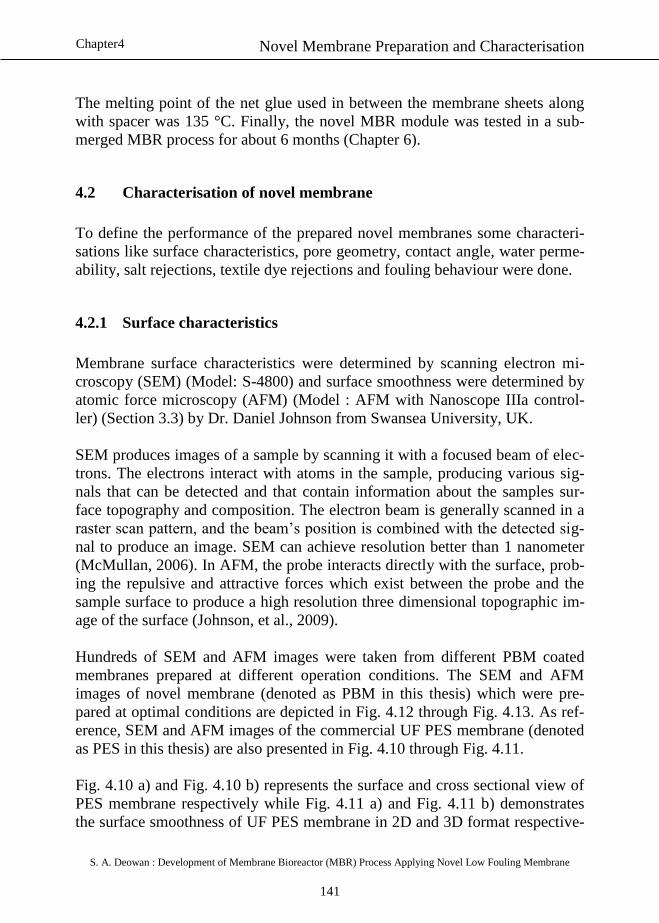
Novel Membrane Preparation and Characterisation
S. A. Deowan : Development of Membrane Bioreactor (MBR) Process Applying Novel Low Fouling Membrane
141
Chapter4
The melting point of the net glue used in between the membrane sheets along
with spacer was 135 °C. Finally, the novel MBR module was tested in a sub-
merged MBR process for about 6 months (Chapter 6).
4.2 Characterisation of novel membrane
To define the performance of the prepared novel membranes some characteri-
sations like surface characteristics, pore geometry, contact angle, water perme-
ability, salt rejections, textile dye rejections and fouling behaviour were done.
4.2.1 Surface characteristics
Membrane surface characteristics were determined by scanning electron mi-
croscopy (SEM) (Model: S-4800) and surface smoothness were determined by
atomic force microscopy (AFM) (Model : AFM with Nanoscope IIIa control-
ler) (Section 3.3) by Dr. Daniel Johnson from Swansea University, UK.
SEM produces images of a sample by scanning it with a focused beam of elec-
trons. The electrons interact with atoms in the sample, producing various sig-
nals that can be detected and that contain information about the samples sur-
face topography and composition. The electron beam is generally scanned in a
raster scan pattern, and the beam’s position is combined with the detected sig-
nal to produce an image. SEM can achieve resolution better than 1 nanometer
(McMullan, 2006). In AFM, the probe interacts directly with the surface, prob-
ing the repulsive and attractive forces which exist between the probe and the
sample surface to produce a high resolution three dimensional topographic im-
age of the surface (Johnson, et al., 2009).
Hundreds of SEM and AFM images were taken from different PBM coated
membranes prepared at different operation conditions. The SEM and AFM
images of novel membrane (denoted as PBM in this thesis) which were pre-
pared at optimal conditions are depicted in Fig. 4.12 through Fig. 4.13. As ref-
erence, SEM and AFM images of the commercial UF PES membrane (denoted
as PES in this thesis) are also presented in Fig. 4.10 through Fig. 4.11.
Fig. 4.10 a) and Fig. 4.10 b) represents the surface and cross sectional view of
PES membrane respectively while Fig. 4.11 a) and Fig. 4.11 b) demonstrates
the surface smoothness of UF PES membrane in 2D and 3D format respective-
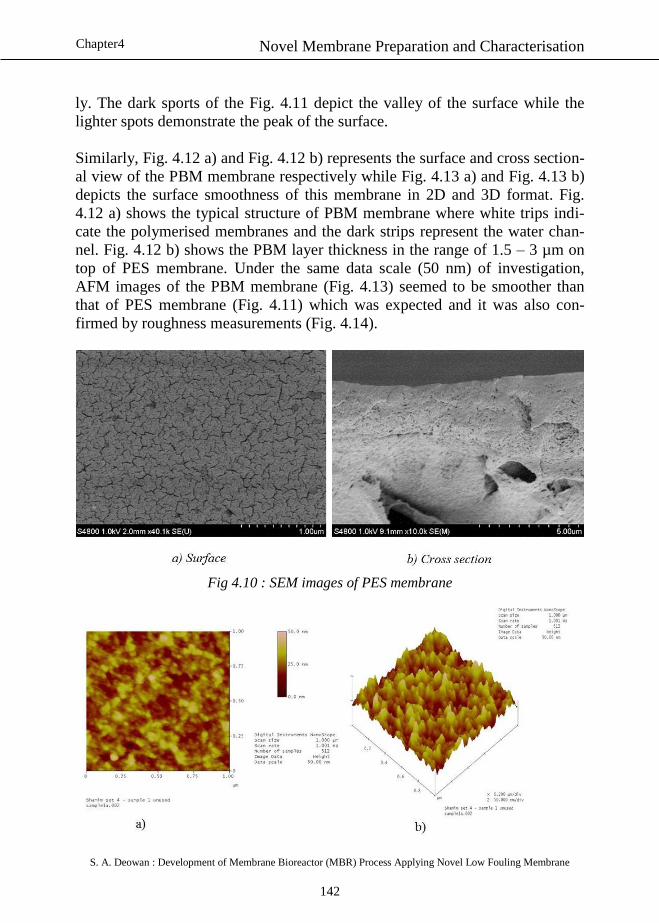
Novel Membrane Preparation and Characterisation
S. A. Deowan : Development of Membrane Bioreactor (MBR) Process Applying Novel Low Fouling Membrane
142
Chapter4
ly. The dark sports of the Fig. 4.11 depict the valley of the surface while the
lighter spots demonstrate the peak of the surface.
Similarly, Fig. 4.12 a) and Fig. 4.12 b) represents the surface and cross section-
al view of the PBM membrane respectively while Fig. 4.13 a) and Fig. 4.13 b)
depicts the surface smoothness of this membrane in 2D and 3D format. Fig.
4.12 a) shows the typical structure of PBM membrane where white trips indi-
cate the polymerised membranes and the dark strips represent the water chan-
nel. Fig. 4.12 b) shows the PBM layer thickness in the range of 1.5 – 3 µm on
top of PES membrane. Under the same data scale (50 nm) of investigation,
AFM images of the PBM membrane (Fig. 4.13) seemed to be smoother than
that of PES membrane (Fig. 4.11) which was expected and it was also con-
firmed by roughness measurements (Fig. 4.14).
Fig 4.10 : SEM images of PES membrane
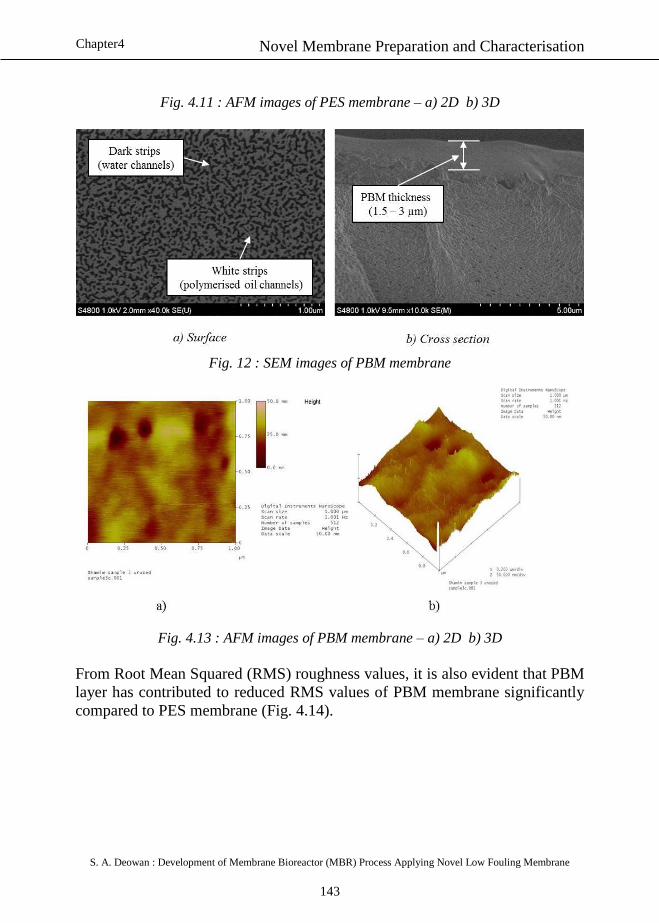
Novel Membrane Preparation and Characterisation
S. A. Deowan : Development of Membrane Bioreactor (MBR) Process Applying Novel Low Fouling Membrane
143
Chapter4
Fig. 4.11 : AFM images of PES membrane – a) 2D b) 3D
Fig. 12 : SEM images of PBM membrane
Fig. 4.13 : AFM images of PBM membrane – a) 2D b) 3D
From Root Mean Squared (RMS) roughness values, it is also evident that PBM
layer has contributed to reduced RMS values of PBM membrane significantly
compared to PES membrane (Fig. 4.14).
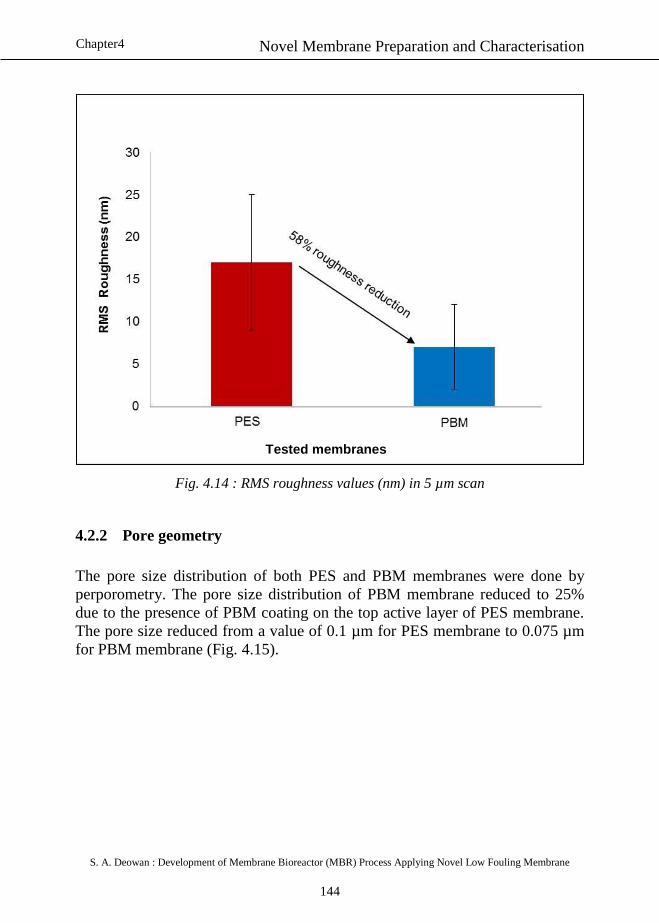
Novel Membrane Preparation and Characterisation
S. A. Deowan : Development of Membrane Bioreactor (MBR) Process Applying Novel Low Fouling Membrane
144
Chapter4
Fig. 4.14 : RMS roughness values (nm) in 5 µm scan
4.2.2 Pore geometry
The pore size distribution of both PES and PBM membranes were done by
perporometry. The pore size distribution of PBM membrane reduced to 25%
due to the presence of PBM coating on the top active layer of PES membrane.
The pore size reduced from a value of 0.1 µm for PES membrane to 0.075 µm
for PBM membrane (Fig. 4.15).
Tested membranes
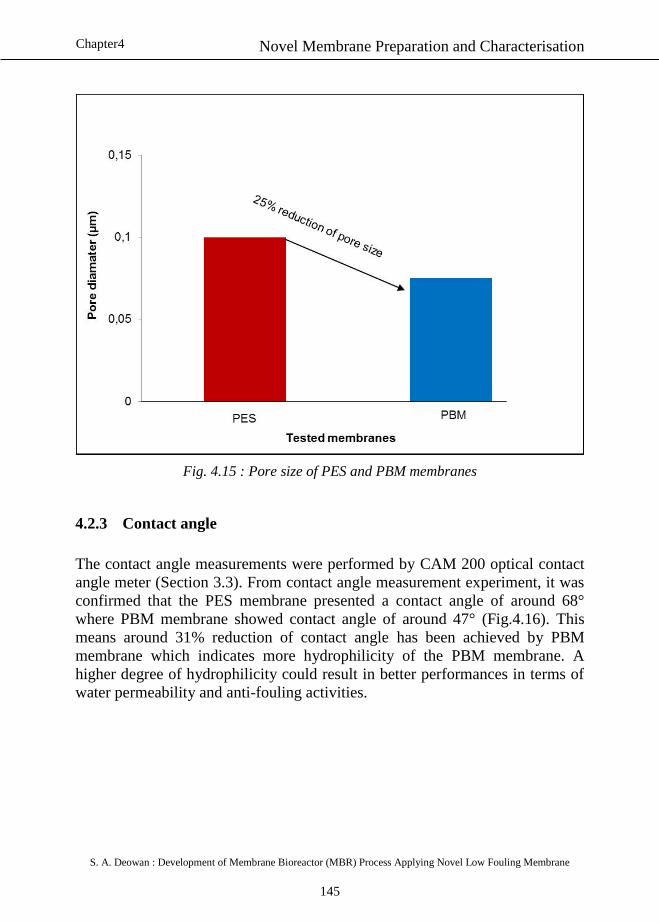
Novel Membrane Preparation and Characterisation
S. A. Deowan : Development of Membrane Bioreactor (MBR) Process Applying Novel Low Fouling Membrane
145
Chapter4
Fig. 4.15 : Pore size of PES and PBM membranes
4.2.3 Contact angle
The contact angle measurements were performed by CAM 200 optical contact
angle meter (Section 3.3). From contact angle measurement experiment, it was
confirmed that the PES membrane presented a contact angle of around 68°
where PBM membrane showed contact angle of around 47° (Fig.4.16). This
means around 31% reduction of contact angle has been achieved by PBM
membrane which indicates more hydrophilicity of the PBM membrane. A
higher degree of hydrophilicity could result in better performances in terms of
water permeability and anti-fouling activities.
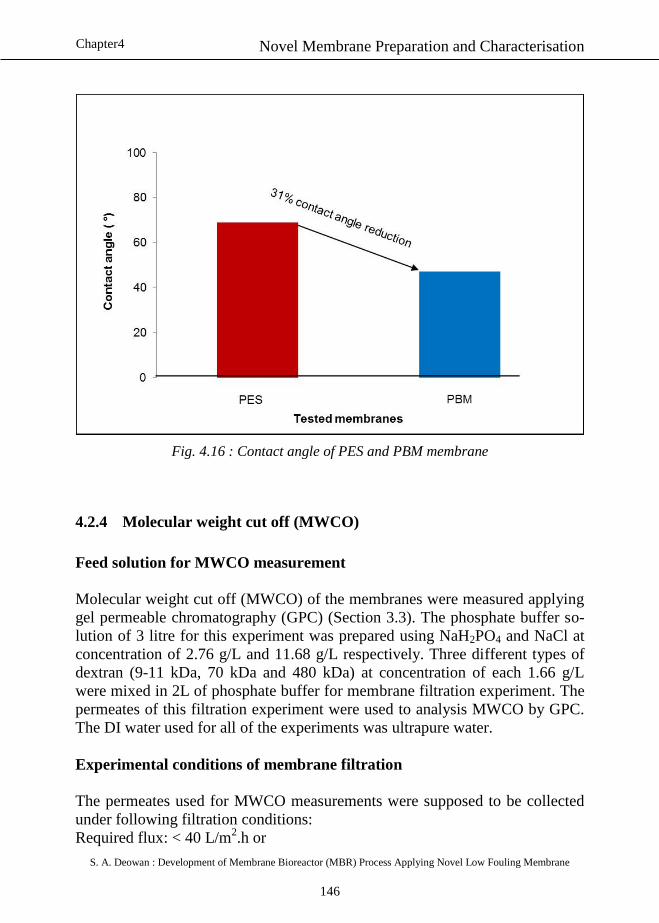
Novel Membrane Preparation and Characterisation
S. A. Deowan : Development of Membrane Bioreactor (MBR) Process Applying Novel Low Fouling Membrane
146
Chapter4
Fig. 4.16 : Contact angle of PES and PBM membrane
4.2.4 Molecular weight cut off (MWCO)
Feed solution for MWCO measurement
Molecular weight cut off (MWCO) of the membranes were measured applying
gel permeable chromatography (GPC) (Section 3.3). The phosphate buffer so-
lution of 3 litre for this experiment was prepared using NaH2PO4 and NaCl at
concentration of 2.76 g/L and 11.68 g/L respectively. Three different types of
dextran (9-11 kDa, 70 kDa and 480 kDa) at concentration of each 1.66 g/L
were mixed in 2L of phosphate buffer for membrane filtration experiment. The
permeates of this filtration experiment were used to analysis MWCO by GPC.
The DI water used for all of the experiments was ultrapure water.
Experimental conditions of membrane filtration
The permeates used for MWCO measurements were supposed to be collected
under following filtration conditions:
Required flux: < 40 L/m2.h or
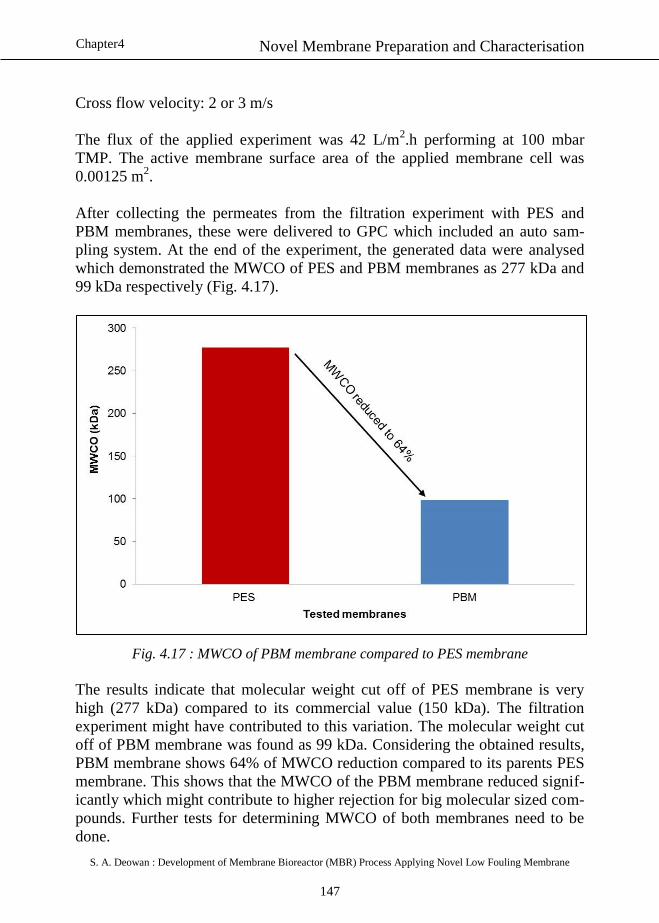
Novel Membrane Preparation and Characterisation
S. A. Deowan : Development of Membrane Bioreactor (MBR) Process Applying Novel Low Fouling Membrane
147
Chapter4
Cross flow velocity: 2 or 3 m/s
The flux of the applied experiment was 42 L/m2.h performing at 100 mbar
TMP. The active membrane surface area of the applied membrane cell was
0.00125 m2.
After collecting the permeates from the filtration experiment with PES and
PBM membranes, these were delivered to GPC which included an auto sam-
pling system. At the end of the experiment, the generated data were analysed
which demonstrated the MWCO of PES and PBM membranes as 277 kDa and
99 kDa respectively (Fig. 4.17).
Fig. 4.17 : MWCO of PBM membrane compared to PES membrane
The results indicate that molecular weight cut off of PES membrane is very
high (277 kDa) compared to its commercial value (150 kDa). The filtration
experiment might have contributed to this variation. The molecular weight cut
off of PBM membrane was found as 99 kDa. Considering the obtained results,
PBM membrane shows 64% of MWCO reduction compared to its parents PES
membrane. This shows that the MWCO of the PBM membrane reduced signif-
icantly which might contribute to higher rejection for big molecular sized com-
pounds. Further tests for determining MWCO of both membranes need to be
done.
Novel Membrane Preparation and Characterisation
S. A. Deowan : Development of Membrane Bioreactor (MBR) Process Applying Novel Low Fouling Membrane
148
Chapter4
4.2.5 Standard salt rejection test
MgSO4 is widely used as model salts for standard salt rejection test of nanofil-
tration (NF) membranes. Since the target novel membrane (PBM) was sup-
posed to be classified as close to NF membrane to achieve compromised water
permeability and organic compounds rejections, MgSO4 was chosen as model
salt for standard salt rejection test. For standard salt rejection test of the novel
membrane, the following standard test conditions were applied:
Applied salt: MgSO4
Concentration of salt: 2,000 ppm
Temperature: 25 ± 1°C
Applied pressure (TMP): 0.5 ± 0.02 bar
Test run time: 1 h
Generally, applied pressure for standard salt rejection of NF membrane is close
to 5 bar. Since the target application of the novel membrane is MBR, where the
applied pressure is very low (vacuum pressure), significantly low pressure
around 0.5 bar has been selected for this standard test. The model salt (MgSO4)
rejection by the commercial PES membrane was negligible since the entire salt
passed through the membrane easily (Fig. 4.18). Because the molecular weight
cut off (MWCO) of commercial PES membrane is 150 kDa and the molecular
weight of used MgSO4 is 120 Da (120.366 g/mol). The MgSO4 salt rejection
with PBM membrane is also negligible since the molecular weight cut off of
the PBM membrane was found as 99 kDa (Fig. 4.17) which is much higher
than the molecular weight of the used salt. Charge exclusion also may play a
major role in obtaining such results.
The PBM membranes prepared only at optimum conditions were applied in
different MBR experiments to have higher antifouling effect and other benefits.
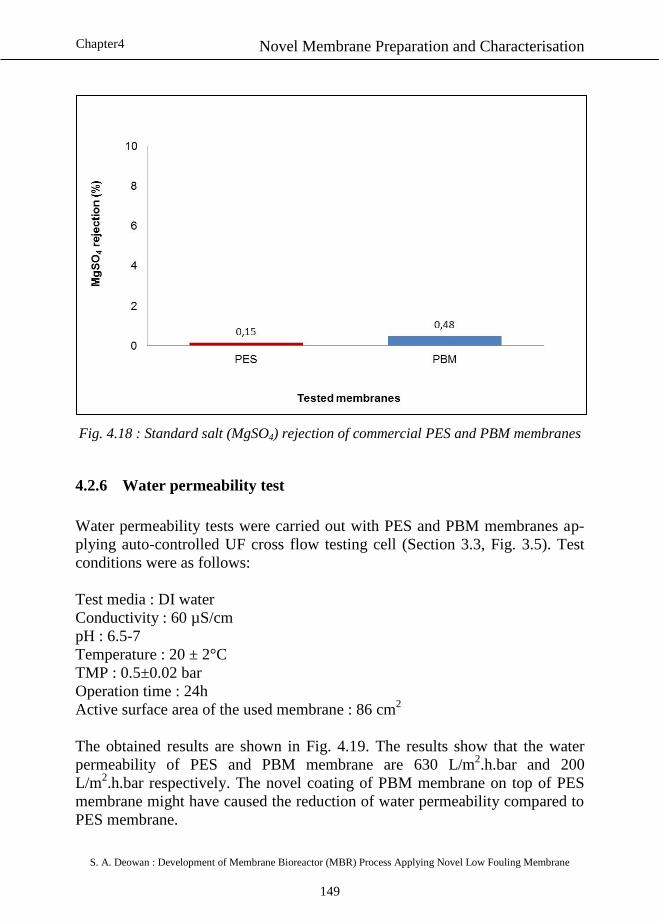
Novel Membrane Preparation and Characterisation
S. A. Deowan : Development of Membrane Bioreactor (MBR) Process Applying Novel Low Fouling Membrane
149
Chapter4
Fig. 4.18 : Standard salt (MgSO4) rejection of commercial PES and PBM membranes
4.2.6 Water permeability test
Water permeability tests were carried out with PES and PBM membranes ap-
plying auto-controlled UF cross flow testing cell (Section 3.3, Fig. 3.5). Test
conditions were as follows:
Test media : DI water
Conductivity : 60 µS/cm
pH : 6.5-7
Temperature : 20 ± 2°C
TMP : 0.5±0.02 bar
Operation time : 24h
Active surface area of the used membrane : 86 cm2
The obtained results are shown in Fig. 4.19. The results show that the water
permeability of PES and PBM membrane are 630 L/m2.h.bar and 200
L/m2.h.bar respectively. The novel coating of PBM membrane on top of PES
membrane might have caused the reduction of water permeability compared to
PES membrane.
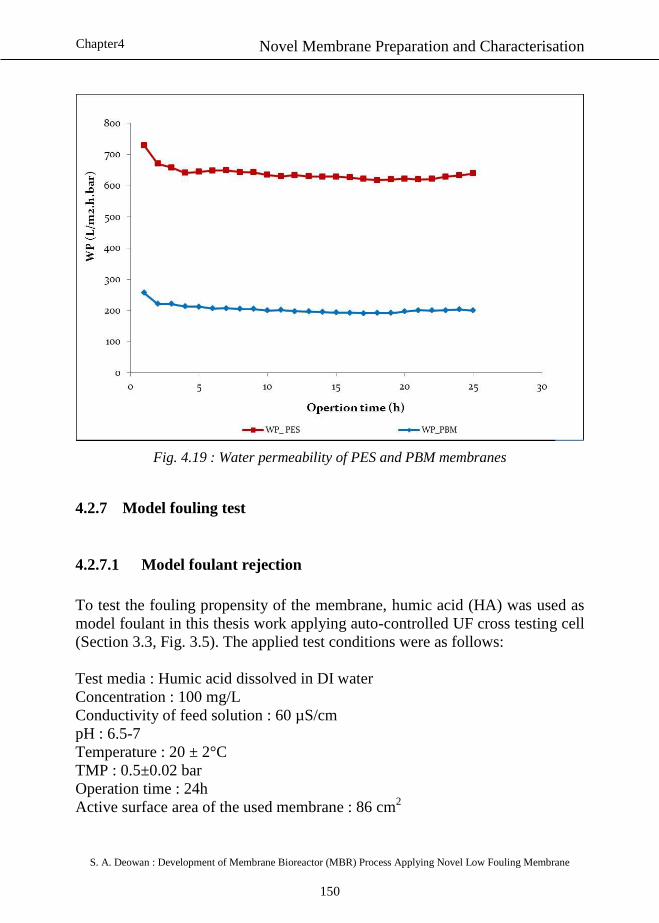
Novel Membrane Preparation and Characterisation
S. A. Deowan : Development of Membrane Bioreactor (MBR) Process Applying Novel Low Fouling Membrane
150
Chapter4
Fig. 4.19 : Water permeability of PES and PBM membranes
4.2.7 Model fouling test
4.2.7.1 Model foulant rejection
To test the fouling propensity of the membrane, humic acid (HA) was used as
model foulant in this thesis work applying auto-controlled UF cross testing cell
(Section 3.3, Fig. 3.5). The applied test conditions were as follows:
Test media : Humic acid dissolved in DI water
Concentration : 100 mg/L
Conductivity of feed solution : 60 µS/cm
pH : 6.5-7
Temperature : 20 ± 2°C
TMP : 0.5±0.02 bar
Operation time : 24h
Active surface area of the used membrane : 86 cm2
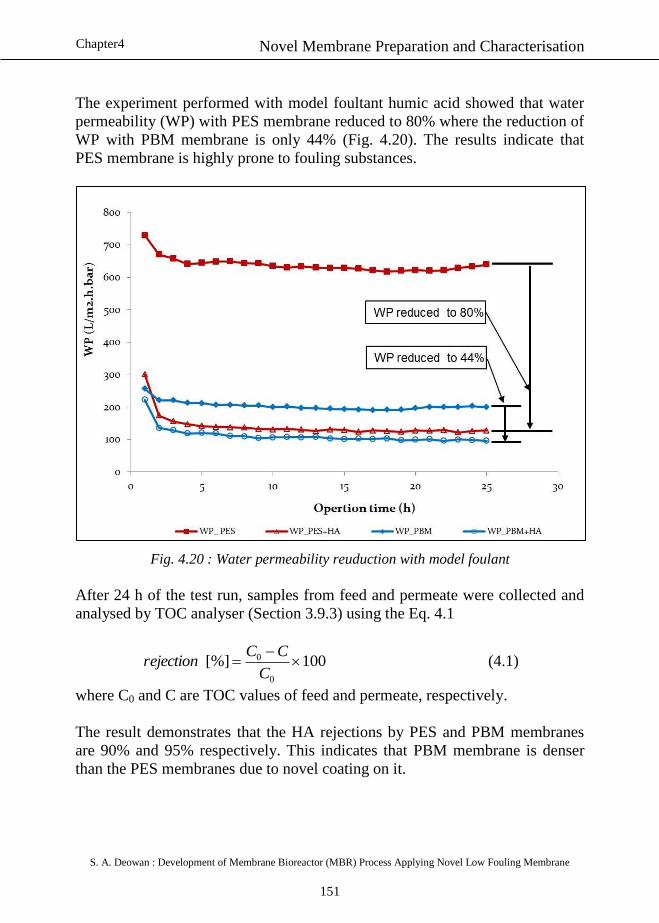
Novel Membrane Preparation and Characterisation
S. A. Deowan : Development of Membrane Bioreactor (MBR) Process Applying Novel Low Fouling Membrane
151
Chapter4
The experiment performed with model foultant humic acid showed that water
permeability (WP) with PES membrane reduced to 80% where the reduction of
WP with PBM membrane is only 44% (Fig. 4.20). The results indicate that
PES membrane is highly prone to fouling substances.
Fig. 4.20 : Water permeability reuduction with model foulant
After 24 h of the test run, samples from feed and permeate were collected and
analysed by TOC analyser (Section 3.9.3) using the Eq. 4.1
100[%]0
0
C
CCrejection (4.1)
where C0 and C are TOC values of feed and permeate, respectively.
The result demonstrates that the HA rejections by PES and PBM membranes
are 90% and 95% respectively. This indicates that PBM membrane is denser
than the PES membranes due to novel coating on it.
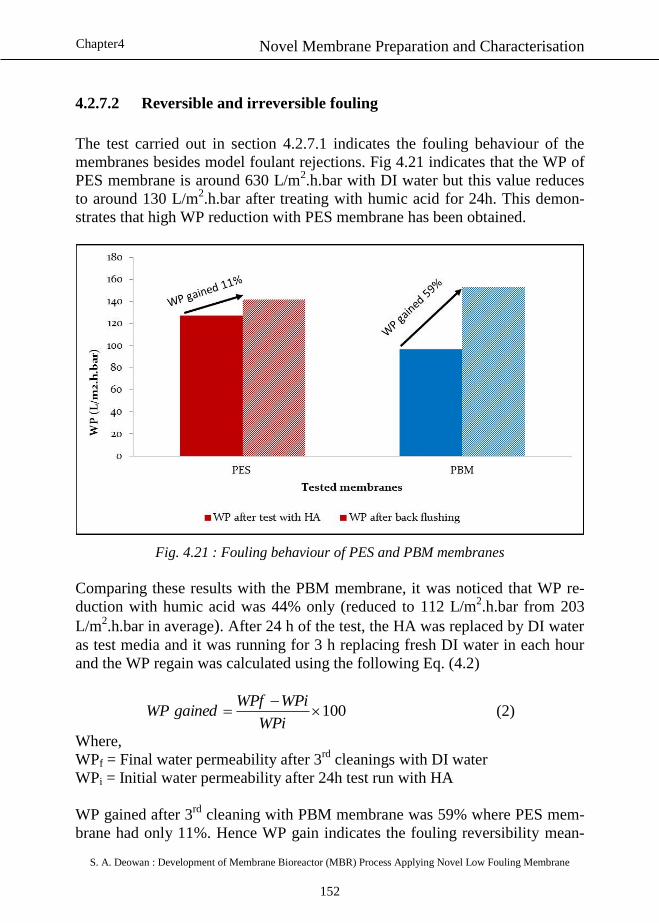
Novel Membrane Preparation and Characterisation
S. A. Deowan : Development of Membrane Bioreactor (MBR) Process Applying Novel Low Fouling Membrane
152
Chapter4
4.2.7.2 Reversible and irreversible fouling
The test carried out in section 4.2.7.1 indicates the fouling behaviour of the
membranes besides model foulant rejections. Fig 4.21 indicates that the WP of
PES membrane is around 630 L/m2.h.bar with DI water but this value reduces
to around 130 L/m2.h.bar after treating with humic acid for 24h. This demon-
strates that high WP reduction with PES membrane has been obtained.
Fig. 4.21 : Fouling behaviour of PES and PBM membranes
Comparing these results with the PBM membrane, it was noticed that WP re-
duction with humic acid was 44% only (reduced to 112 L/m2.h.bar from 203
L/m2.h.bar in average). After 24 h of the test, the HA was replaced by DI water
as test media and it was running for 3 h replacing fresh DI water in each hour
and the WP regain was calculated using the following Eq. (4.2)
100
WPi
WPiWPfgainedWP (2)
Where,
WPf = Final water permeability after 3rd
cleanings with DI water
WPi = Initial water permeability after 24h test run with HA
WP gained after 3rd
cleaning with PBM membrane was 59% where PES mem-
brane had only 11%. Hence WP gain indicates the fouling reversibility mean-
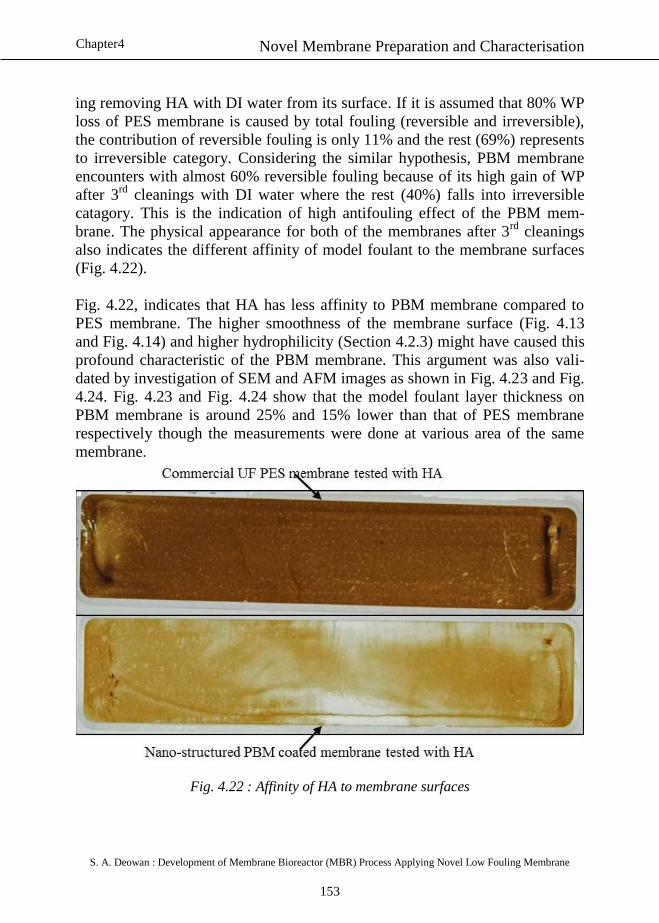
Novel Membrane Preparation and Characterisation
S. A. Deowan : Development of Membrane Bioreactor (MBR) Process Applying Novel Low Fouling Membrane
153
Chapter4
ing removing HA with DI water from its surface. If it is assumed that 80% WP
loss of PES membrane is caused by total fouling (reversible and irreversible),
the contribution of reversible fouling is only 11% and the rest (69%) represents
to irreversible category. Considering the similar hypothesis, PBM membrane
encounters with almost 60% reversible fouling because of its high gain of WP
after 3rd
cleanings with DI water where the rest (40%) falls into irreversible
catagory. This is the indication of high antifouling effect of the PBM mem-
brane. The physical appearance for both of the membranes after 3rd
cleanings
also indicates the different affinity of model foulant to the membrane surfaces
(Fig. 4.22).
Fig. 4.22, indicates that HA has less affinity to PBM membrane compared to
PES membrane. The higher smoothness of the membrane surface (Fig. 4.13
and Fig. 4.14) and higher hydrophilicity (Section 4.2.3) might have caused this
profound characteristic of the PBM membrane. This argument was also vali-
dated by investigation of SEM and AFM images as shown in Fig. 4.23 and Fig.
4.24. Fig. 4.23 and Fig. 4.24 show that the model foulant layer thickness on
PBM membrane is around 25% and 15% lower than that of PES membrane
respectively though the measurements were done at various area of the same
membrane.
Fig. 4.22 : Affinity of HA to membrane surfaces
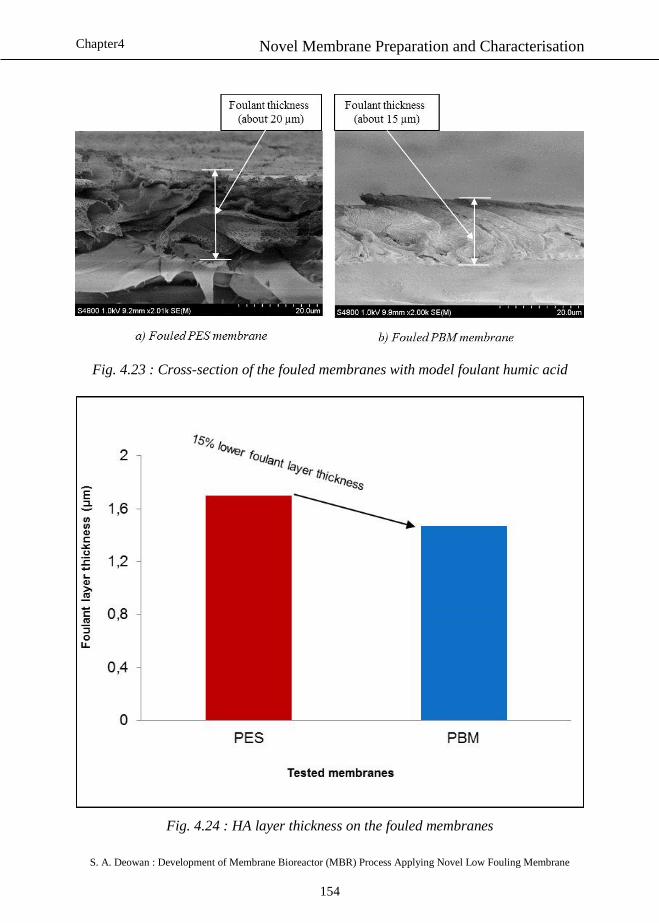
Novel Membrane Preparation and Characterisation
S. A. Deowan : Development of Membrane Bioreactor (MBR) Process Applying Novel Low Fouling Membrane
154
Chapter4
Fig. 4.23 : Cross-section of the fouled membranes with model foulant humic acid
Fig. 4.24 : HA layer thickness on the fouled membranes
Novel Membrane Preparation and Characterisation
S. A. Deowan : Development of Membrane Bioreactor (MBR) Process Applying Novel Low Fouling Membrane
155
Chapter4
4.2.8 Model textile dye rejection test
To perform model textile dye rejection test, model textile dye wastewater
(MTDW) including two reactive dyes, Remazol Brilliant Blue R (referred as
Blue in this case) and Acid Red 4 (referred as Red in this case), was developed
based on literature study (Section 5.3.1). The experiment was carried out with
PES and PBM membranes applying a manually controlled UF cross- flow test-
ing cell (Section 3.3, Fig. 3.3). Test conditions were as follows:
Test media : MTDW
pH : 7.5 ± 0.5
Temperature : 22 ± 2°C
TMP : 3.0±0.50 bar
CFV : 1 L/min.
Operation time : 1 h
Active surface area of the applied membrane: 80 cm2
Compared to the PES membrane, the PBM membrane shows bit higher Blue
rejection but the Red rejection remains the same. The Blue and Red rejections
of PBM membrane are 52% and 25% respectively where PES membrane
shows 45% Blue rejection. This indicates that the Blue rejection by PBM
membrane is 7% points higher than the commercial PES membrane but the
rejection of Red remains the same like commercial one (Fig. 4.25).
This is also the indication that the pore size of the PBM membrane has been
reduced but not enough to reject the materials with low molecular weight cut
off like Red (MWCO of Acid Red4:380 KDa).
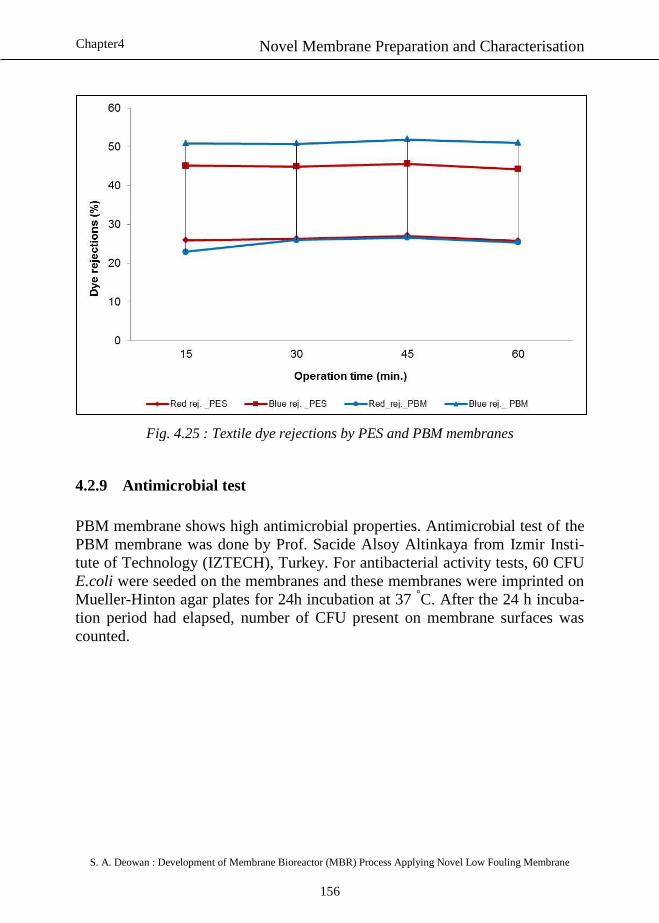
Novel Membrane Preparation and Characterisation
S. A. Deowan : Development of Membrane Bioreactor (MBR) Process Applying Novel Low Fouling Membrane
156
Chapter4
Fig. 4.25 : Textile dye rejections by PES and PBM membranes
4.2.9 Antimicrobial test
PBM membrane shows high antimicrobial properties. Antimicrobial test of the
PBM membrane was done by Prof. Sacide Alsoy Altinkaya from Izmir Insti-
tute of Technology (IZTECH), Turkey. For antibacterial activity tests, 60 CFU
E.coli were seeded on the membranes and these membranes were imprinted on
Mueller-Hinton agar plates for 24h incubation at 37 °C. After the 24 h incuba-
tion period had elapsed, number of CFU present on membrane surfaces was
counted.
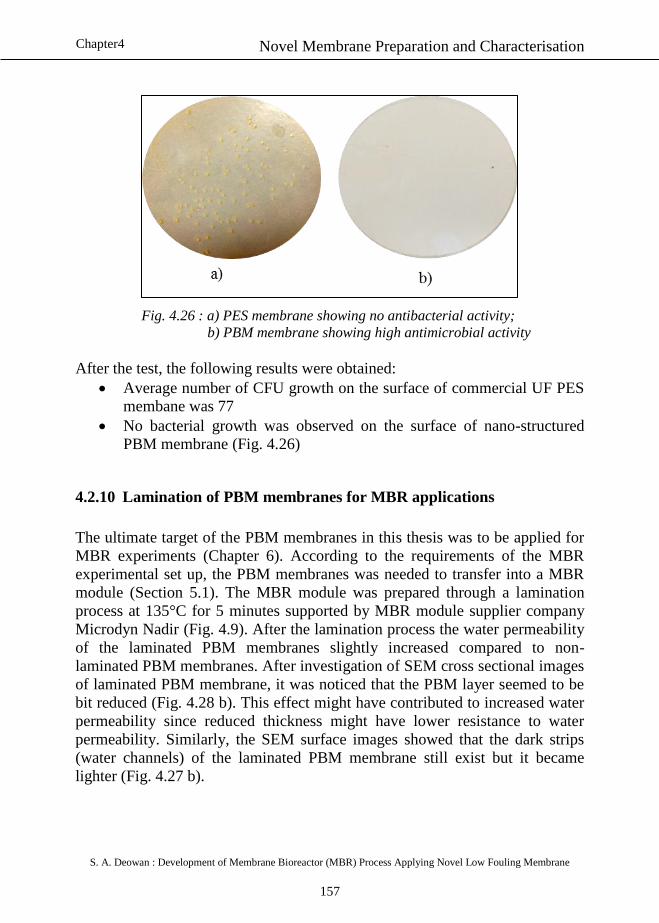
Novel Membrane Preparation and Characterisation
S. A. Deowan : Development of Membrane Bioreactor (MBR) Process Applying Novel Low Fouling Membrane
157
Chapter4
Fig. 4.26 : a) PES membrane showing no antibacterial activity;
b) PBM membrane showing high antimicrobial activity
After the test, the following results were obtained:
Average number of CFU growth on the surface of commercial UF PES
membane was 77
No bacterial growth was observed on the surface of nano-structured
PBM membrane (Fig. 4.26)
4.2.10 Lamination of PBM membranes for MBR applications
The ultimate target of the PBM membranes in this thesis was to be applied for
MBR experiments (Chapter 6). According to the requirements of the MBR
experimental set up, the PBM membranes was needed to transfer into a MBR
module (Section 5.1). The MBR module was prepared through a lamination
process at 135°C for 5 minutes supported by MBR module supplier company
Microdyn Nadir (Fig. 4.9). After the lamination process the water permeability
of the laminated PBM membranes slightly increased compared to non-
laminated PBM membranes. After investigation of SEM cross sectional images
of laminated PBM membrane, it was noticed that the PBM layer seemed to be
bit reduced (Fig. 4.28 b). This effect might have contributed to increased water
permeability since reduced thickness might have lower resistance to water
permeability. Similarly, the SEM surface images showed that the dark strips
(water channels) of the laminated PBM membrane still exist but it became
lighter (Fig. 4.27 b).
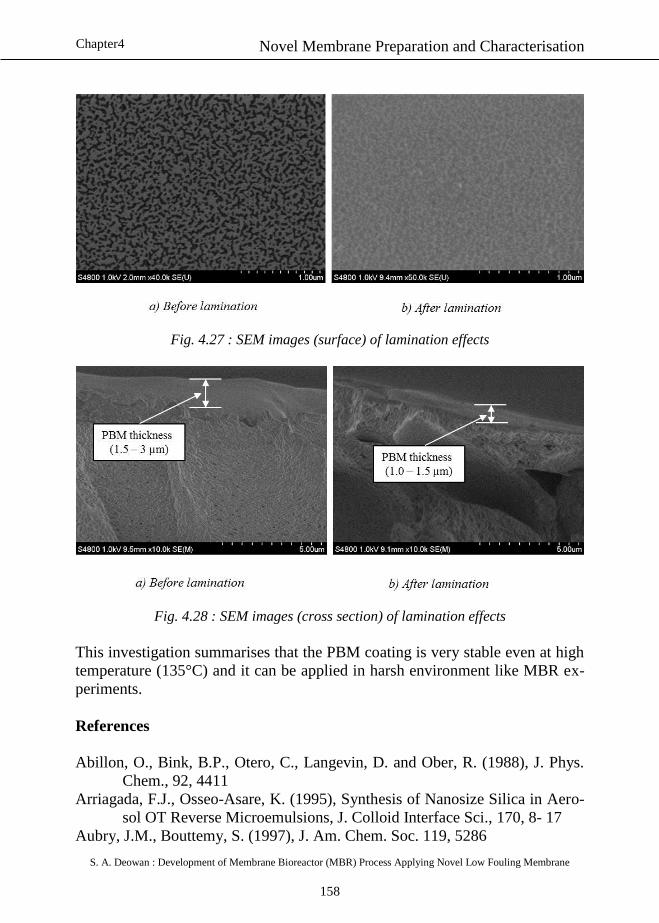
Novel Membrane Preparation and Characterisation
S. A. Deowan : Development of Membrane Bioreactor (MBR) Process Applying Novel Low Fouling Membrane
158
Chapter4
Fig. 4.27 : SEM images (surface) of lamination effects
Fig. 4.28 : SEM images (cross section) of lamination effects
This investigation summarises that the PBM coating is very stable even at high
temperature (135°C) and it can be applied in harsh environment like MBR ex-
periments.
References
Abillon, O., Bink, B.P., Otero, C., Langevin, D. and Ober, R. (1988), J. Phys.
Chem., 92, 4411
Arriagada, F.J., Osseo-Asare, K. (1995), Synthesis of Nanosize Silica in Aero-
sol OT Reverse Microemulsions, J. Colloid Interface Sci., 170, 8- 17
Aubry, J.M., Bouttemy, S. (1997), J. Am. Chem. Soc. 119, 5286
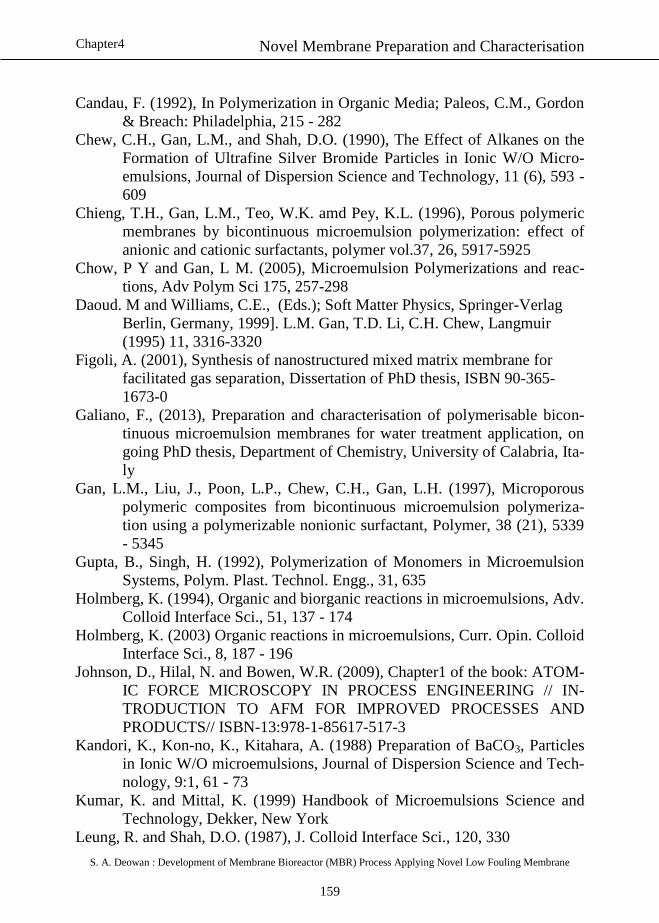
Novel Membrane Preparation and Characterisation
S. A. Deowan : Development of Membrane Bioreactor (MBR) Process Applying Novel Low Fouling Membrane
159
Chapter4
Candau, F. (1992), In Polymerization in Organic Media; Paleos, C.M., Gordon
& Breach: Philadelphia, 215 - 282
Chew, C.H., Gan, L.M., and Shah, D.O. (1990), The Effect of Alkanes on the
Formation of Ultrafine Silver Bromide Particles in Ionic W/O Micro-
emulsions, Journal of Dispersion Science and Technology, 11 (6), 593 -
609
Chieng, T.H., Gan, L.M., Teo, W.K. amd Pey, K.L. (1996), Porous polymeric
membranes by bicontinuous microemulsion polymerization: effect of
anionic and cationic surfactants, polymer vol.37, 26, 5917-5925
Chow, P Y and Gan, L M. (2005), Microemulsion Polymerizations and reac-
tions, Adv Polym Sci 175, 257-298
Daoud. M and Williams, C.E., (Eds.); Soft Matter Physics, Springer-Verlag
Berlin, Germany, 1999]. L.M. Gan, T.D. Li, C.H. Chew, Langmuir
(1995) 11, 3316-3320
Figoli, A. (2001), Synthesis of nanostructured mixed matrix membrane for
facilitated gas separation, Dissertation of PhD thesis, ISBN 90-365-
1673-0
Galiano, F., (2013), Preparation and characterisation of polymerisable bicon-
tinuous microemulsion membranes for water treatment application, on
going PhD thesis, Department of Chemistry, University of Calabria, Ita-
ly
Gan, L.M., Liu, J., Poon, L.P., Chew, C.H., Gan, L.H. (1997), Microporous
polymeric composites from bicontinuous microemulsion polymeriza-
tion using a polymerizable nonionic surfactant, Polymer, 38 (21), 5339
- 5345
Gupta, B., Singh, H. (1992), Polymerization of Monomers in Microemulsion
Systems, Polym. Plast. Technol. Engg., 31, 635
Holmberg, K. (1994), Organic and biorganic reactions in microemulsions, Adv.
Colloid Interface Sci., 51, 137 - 174
Holmberg, K. (2003) Organic reactions in microemulsions, Curr. Opin. Colloid
Interface Sci., 8, 187 - 196
Johnson, D., Hilal, N. and Bowen, W.R. (2009), Chapter1 of the book: ATOM-
IC FORCE MICROSCOPY IN PROCESS ENGINEERING // IN-
TRODUCTION TO AFM FOR IMPROVED PROCESSES AND
PRODUCTS// ISBN-13:978-1-85617-517-3
Kandori, K., Kon-no, K., Kitahara, A. (1988) Preparation of BaCO3, Particles
in Ionic W/O microemulsions, Journal of Dispersion Science and Tech-
nology, 9:1, 61 - 73
Kumar, K. and Mittal, K. (1999) Handbook of Microemulsions Science and
Technology, Dekker, New York
Leung, R. and Shah, D.O. (1987), J. Colloid Interface Sci., 120, 330
Novel Membrane Preparation and Characterisation
S. A. Deowan : Development of Membrane Bioreactor (MBR) Process Applying Novel Low Fouling Membrane
160
Chapter4
Malik, M. A., Wani, M. Y., Hashim M. A. (2012), Microemulsion method: A
novel route to synthesize organic and inorganic nanomaterials, Arabian
Journal of Chemistry (2012), 5, 397 - 417
The Microemulsion book (1999), Industrial Applications of Microemulsions, in
Surfactant Science Series, Vol. 66, Dekker, New York
McMullan, D. (2006), Scanning electron micropoy, 1928 – 1965, Scanning
17(3): 175. Doi:10.1002/sca.4950170309,
http://en.wikipedia.org/wiki/Scanning_electron_microscope, accessed
on September, 2013
Mehta, S.K. and Kaur, G. (2011), Microemulsions: Thermodynamic and Dy-
namic Properties
http://www.intechopen.com/books/thermodynamics/microemulsions-
thermodynamic-and-dynamic-properties
Mialocq, J. – C. 81987)J. Chem. Phys., 84, 1083
Minero, C., Pramauro, E., Pelizetti, E (1988), Langmuir 4, 101.
Ruckenstein, E. (1989), Emulsion pathways to composite polymeric mem-
branes for separation processes, Colloid, Polym. Sci. 267, 792 - 979
Ruckenstein, E., Sun, F. (1992a), A New Concentrated Emulsion Polymeriza-
tion Pathway, J. Appl. Polym. Sci., 1992, Vol. 46, pp. 1271 – 1277
Ruckenstein, E., Chen, H.H. (1992b), Composite Membranes Prepared by
Concentrated Emulsion Polymerization and Their Use for Pervapora-
tion Separation of Water-Acetic Acid Mixtures, J. Membrane Sci., 66,
205
Ruckenstein, E and Sun, F. (1993), Optimization of the Mechanical Properties
of Polymeric Composite Membranes Prepared via Emulsion Pathways,
J. Membrane Sci., 81, 191
Ruckenstein, E., Li H. (1994), Toughened Polystyrene Composites by the Con-
centrated Emulsion Pathway, J. Appl. Polym. Sci., 1994, Vol. 52, pp.
1949 – 1958
Ruckenstein, E. and Sun, F. (1995), Hydrophobic-Hydrophilic Composite
Membranes fort he Pervaporation of Benzene-Ethanol Mixtures, J.
Membrane Sci., 103, 271
Sigma Aldrich (2013),
http://www.sigmaaldrich.com/catalog/product/aldrich/m55909?lang=de
®ion=DE, accessed on 16.10.2013
Sripriya, R., Muthu Raja, K., Santhosh, G., Chandrasekaran, M., Noel, M.
(2007), The effect of structure of oil phase, surfactant and co-surfactant
on the physicochemical and electrochemical properties of bicontinuous
microemulsion, Journal of Colloid and Interface Science 314, 712–717
Novel Membrane Preparation and Characterisation
S. A. Deowan : Development of Membrane Bioreactor (MBR) Process Applying Novel Low Fouling Membrane
161
Chapter4
Sun, F., Ruckenstein, E. (1995), Sorption and pervaporation of benzene-
cyclohexane mixtures through composite membranes prepared via con-
centrated emulsion polymerization, J. Membrane Sci., 99, 273
Wijmans, J.G., Kant, J., Mulder, M.H.V. and Smolders, C.A. (1985), phase
sepration phenomena in solutions of polysulfone in mixtures of a sovent
and a nonsolvent: relationship with membrane formation, Polymer, 26
(10), pp. 1539 – 1545, ISSN 0032 - 3861
William, B. Jr. (2002), Methacrylic Acid and Derivatives, Ullmann’s Encyclo-
pedia of Industrial Chemistry, Wiley-VCH, Weinheim
Chapter 5
Membrane Bioreactor (MBR) Applying Commercial Membranes
S. A. Deowan : Development of Membrane Bioreactor (MBR) Process Applying Novel Low Fouling Membrane
162
5. Chapter 5 : Membrane Bioreactor (MBR) Applying
Commercial Membranes
5.1 Formulation of membrane bioreactor (MBR)
A detailed description of the experimental set up of MBR is given in section
3.4. The commercial membrane used in this MBR module is denoted as “PES”
or “Com1” membrane.The MBR reactor applied in this experiment is defined
as “PES MBR reactor”.
5.2 Start –up of the System and functionality test
The MBR module was incorporated in an experimental set up as shown in sec-
tion 3.4, Fig. 3.9. All the wiring and tubing for acquiring process parameters
were well connected. For data acquisition and process automization LabVIEW
program controlled computer system was connected with the MBR system.
After checking all connections and power supply the system was run with DI
water and the functionalities of each instrument were checked. Firstly, the
MBR plant was started with DI water for 90 minutes. All the equipment and
instruments were checked if they were functioning properly. After the first tri-
al, the plant was tested with tap water of Karlsruhe, Germany for almost 90
minutes and functionality of the plant was checked in the similar way. During
these test run all the sensors incorporated in the system were calibrated. The
results of the DI water test and tap water tests are shown in Fig. 5.1 and Fig.5.2
respectively.
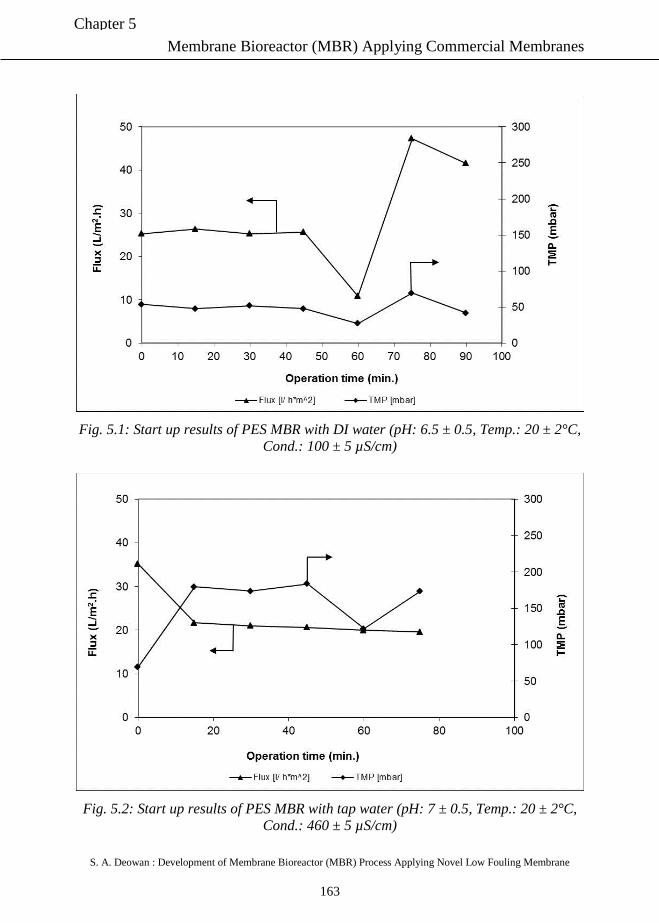
Membrane Bioreactor (MBR) Applying Commercial Membranes
S. A. Deowan : Development of Membrane Bioreactor (MBR) Process Applying Novel Low Fouling Membrane
163
Chapter 5
Fig. 5.1: Start up results of PES MBR with DI water (pH: 6.5 ± 0.5, Temp.: 20 ± 2°C,
Cond.: 100 ± 5 µS/cm)
Fig. 5.2: Start up results of PES MBR with tap water (pH: 7 ± 0.5, Temp.: 20 ± 2°C,
Cond.: 460 ± 5 µS/cm)
Membrane Bioreactor (MBR) Applying Commercial Membranes
S. A. Deowan : Development of Membrane Bioreactor (MBR) Process Applying Novel Low Fouling Membrane
164
Chapter 5
From Fig. 5.1 and Fig. 5.2, it is noticed that the fluxes of the start-up experi-
ments were 25 L/m2 h with DI water and 20 L/m
2 h with tap water with 50 and
100 mbar of TMPs respectively. The flux with DI water was fluctuating with
TMP at the end of the experiment but it can be neglected since it stabilised
after a while (not shown). Design pure water flux of this membrane is supposed
to be 15 - 25 L/m2 h with the operating TMP range of 40-400 mbar provided by
the membrane company (Microdyn-Nadir, 2010). So, the start-up results were
in line with the expected results.
5.3 Selection of test media
Textile wastewater, especially dyes in it, is considered as significant sources of
environmental pollution. There are lots of conventional technologies available
for textile wastewater treatment but none of them are feasible in commercial
scale to remove dyes completely from textile wastewater (Section 2.2). As test
media, this thesis focuses on textile dye wastewater with the aim of pursuing
two purposes. Firstly, testing the membranes with one of the most critical in-
dustrial wastewater and secondly, finding the efficiency of the membrane sys-
tems in dye removing from textile wastewater.
Since the quality of textile wastewater changes due to employed coloring mat-
ters, dyestuffs, accompanying chemicals and processes from season to season
and time to time, the model textile dye wastewater (MTDW) was focused and
developed based on literature studies to have constant wastewater quality (Sec-
tion 3.6). This MTDW was applied as test media for the entire experiments
carried out throughout this thesis works.
5.3.1 Characterisation of model textile dye wastewater (MTDW)
After preparing the feed solution following the protocol described in section
3.6, it was analysed to characterise its compositions analytically. After COD
analysis, it was noticed its value was close to its theoretical values which indi-
cates the accuracy of the analysis as well. Other process parameters like BOD,
pH, chloride conc., Total N (TN) and conductivity were also analysed as re-
ported in Table 5.1.
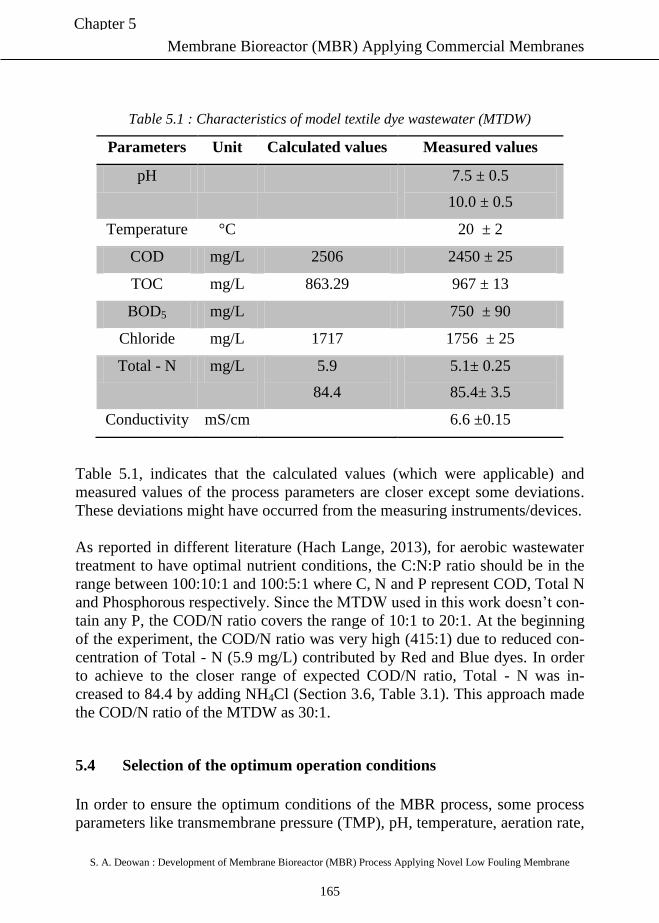
Membrane Bioreactor (MBR) Applying Commercial Membranes
S. A. Deowan : Development of Membrane Bioreactor (MBR) Process Applying Novel Low Fouling Membrane
165
Chapter 5
Table 5.1 : Characteristics of model textile dye wastewater (MTDW)
Parameters Unit Calculated values Measured values
pH 7.5 ± 0.5
10.0 ± 0.5
Temperature °C 20 ± 2
COD mg/L 2506 2450 ± 25
TOC mg/L 863.29 967 ± 13
BOD5 mg/L 750 ± 90
Chloride mg/L 1717 1756 ± 25
Total - N mg/L 5.9
84.4
5.1± 0.25
85.4± 3.5
Conductivity mS/cm 6.6 ±0.15
Table 5.1, indicates that the calculated values (which were applicable) and
measured values of the process parameters are closer except some deviations.
These deviations might have occurred from the measuring instruments/devices.
As reported in different literature (Hach Lange, 2013), for aerobic wastewater
treatment to have optimal nutrient conditions, the C:N:P ratio should be in the
range between 100:10:1 and 100:5:1 where C, N and P represent COD, Total N
and Phosphorous respectively. Since the MTDW used in this work doesn’t con-
tain any P, the COD/N ratio covers the range of 10:1 to 20:1. At the beginning
of the experiment, the COD/N ratio was very high (415:1) due to reduced con-
centration of Total - N (5.9 mg/L) contributed by Red and Blue dyes. In order
to achieve to the closer range of expected COD/N ratio, Total - N was in-
creased to 84.4 by adding NH4Cl (Section 3.6, Table 3.1). This approach made
the COD/N ratio of the MTDW as 30:1.
5.4 Selection of the optimum operation conditions
In order to ensure the optimum conditions of the MBR process, some process
parameters like transmembrane pressure (TMP), pH, temperature, aeration rate,
Membrane Bioreactor (MBR) Applying Commercial Membranes
S. A. Deowan : Development of Membrane Bioreactor (MBR) Process Applying Novel Low Fouling Membrane
166
Chapter 5
hydraulic residence time (HRT), Mixed liquor suspended solids (MLSS), con-
ductivity etc. should be well maintained. These process parameters are dis-
cussed and their suitable ranges have been selected in sections 5.4.1 through
5.4.8.
5.4.1 Transmembrane Pressure (TMP)
Transmembrane pressure (TMP) is the driving force for the filtration of the
MBR process. For good process functionality the transmembrane pressure
should be in the range of 30 mbar to 300 mbar according to the recommenda-
tion of the PES MBR module supplier. This pressure was created by a vacuum
pump. The maximum limit of the transmembrane pressure depends on the
membrane applied along with nature of the membrane module developed by
different companies. Generally transmembrane pressure for submerged aerobic
MBR more than 500 mbar is not recommended by different MBR companies.
The maximum limit of applying TMP for this thesis works were 350 mbar rec-
ommended by the MBR module manufacturer company Microdyn – Nadir
(Germany) and above this limit, it is considered that the membrane is severely
fouled.
5.4.2 pH
Normally the pH of textile dye wastewater is very high (pH 10- pH 11) and it is
therefore critical for the microorganism of the sewage treatment plant. There-
fore, usually prior to biological treatment processes, the pH value of the indus-
trial wastewater has to be reduced to neutral value in order to improve the bio-
degradation of the organic compounds by microorganism. In this experiment,
two pH values (pH 7.5 ± 0.5 and pH 10.5 ± 0.5) were applied by adapting the
chemical compositions of MTDW.
5.4.3 Temperature
Temperature has two effects on MBR process. First effect is on the micro-
organisms. The favourable temperature for micro-organisms is in the range of
15°C to 30°C. In this range specific micro-organisms can grow effectively and
enlarge their community which is expected for better functionality of the pro-
cess. Second effect is related to the membrane. The temperature being applied
to the membrane shouldn’t go typically beyond 50°C. Beyond this range it may
damage the membrane. The temperature range may differ according to the ap-
Membrane Bioreactor (MBR) Applying Commercial Membranes
S. A. Deowan : Development of Membrane Bioreactor (MBR) Process Applying Novel Low Fouling Membrane
167
Chapter 5
plied membrane materials (Lin et. al., 2009). Generally, the typical temperature
of the ambient is around 20°C and many industrial scales MBR plants are op-
erated at this temperature. Therefore, the temperature of the experiments for
this study was kept 20 ± 2 °C.
5.4.4 Aeration rate
In MBR process, the function of the aeration is twofold. Firstly, aeration cre-
ates the cross flow on the surface of the membrane submerged in MBR reactor.
This action assists the filterability of the membrane and also keeps the activat-
ed sludge away from deposition on the surface of the membrane. That means, it
cleans the membrane indirectly. Secondly, aeration supplies oxygen for micro-
organisms in the reactor. From literature studies it is known that the suitable
range of dissolved oxygen for MBR process is in the range of 2 - 4 mg/L (Judd,
2006) which is contributed by suitable aeration rate. For industrial scale appli-
cation, the recommended aeration rate of MBR module manufacturing compa-
ny Microdyn – Nadir for the MLSS range of 5 – 12 g/L was 0.5 m3/m
2M h. The
range of aeration rate for the experiments in this thesis works were from
0.50.±0.05 to 1.0 ± 0.1 m3/h which shows the aeration rate of 1.5 ± 0.15 and 3
± 0.3 m3/m
2M h where “m
2M” indicates the membrane area of 0.33 m
2 used in
the experiments.
5.4.5 Hydraulic residence time (HRT)
Hydraulic residence time (HRT) indicates the average length of time that the
feed solution remains in the MBR reactor before it gets drained as permeate.
The calculation of HRT is shown in Eq. (5.1).
( )
( ) ( )
From Eq. (5.1), it is clear that HRT depends on the hydraulic volume of the
reactor and the permeate flow. In this experiment, the hydraulic volume was 57
L. The HRT of the MBR system depends on the membrane module and type of
wastewater applied for treatment. For MBR process, the higher is the flow rate,
the lower is the HRT. Since the higher permeate flow could not be kept con-
stant with the experimental set up used in this thesis works due to the limitation
Membrane Bioreactor (MBR) Applying Commercial Membranes
S. A. Deowan : Development of Membrane Bioreactor (MBR) Process Applying Novel Low Fouling Membrane
168
Chapter 5
of the membrane module, the HRT was kept in the range of 50-60 h for the
whole experiment.
5.4.6 Mixed liquor suspended solids (MLSS)
MLSS indicates the concentration of suspended solids in the MBR reactor.
This is the combination of microorganisms and non-biodegradable suspended
substances. MLSS plays an important role in degrading organic compounds in
wastewater. According to Krampe (2003) and Gunder (2001) the well-accepted
MLSS value for MBR process is 8-12 g/L. For this work the MLSS value was
kept in the range 8-10 g/L.
5.4.7 Electrical conductivity
Conductivity indicates the amount of total salts in the solutions. Since the
membranes used in MBR process are micro to ultrafiltration, normally salts
can’t be rejected by these membranes. Some part of multivalent ions can be
rejected when tighter ultrafiltration membranes are applied. In this MBR trial,
the conductivity of the permeate and the feed were more or less the same and it
was around 6.6 mS/cm.
5.4.8 Critical flux (CF)
According to Field et al. (1995), the critical flux hypothesis for microfiltration
is that on start-up there exists a flux below which a decline of flux with time
does not occur, above it fouling is observed. This concept was applied in this
thesis with UF PES MBR module following flux step-method. The critical flux
of the applied MBR module was around 6.5 L/m2.h (section 5.6.12). The oper-
ating flux of the system was around 3 L/m2.h which was much lower than the
CF.
5.5 Continuous operation of the experiments
After the functionality tests with DI water and Karlsruhe tap water, the MBR
system was running continuously with prepared MTDW based on selected
suitable operation conditions (Section 5.4) controlled by LabVIEW program
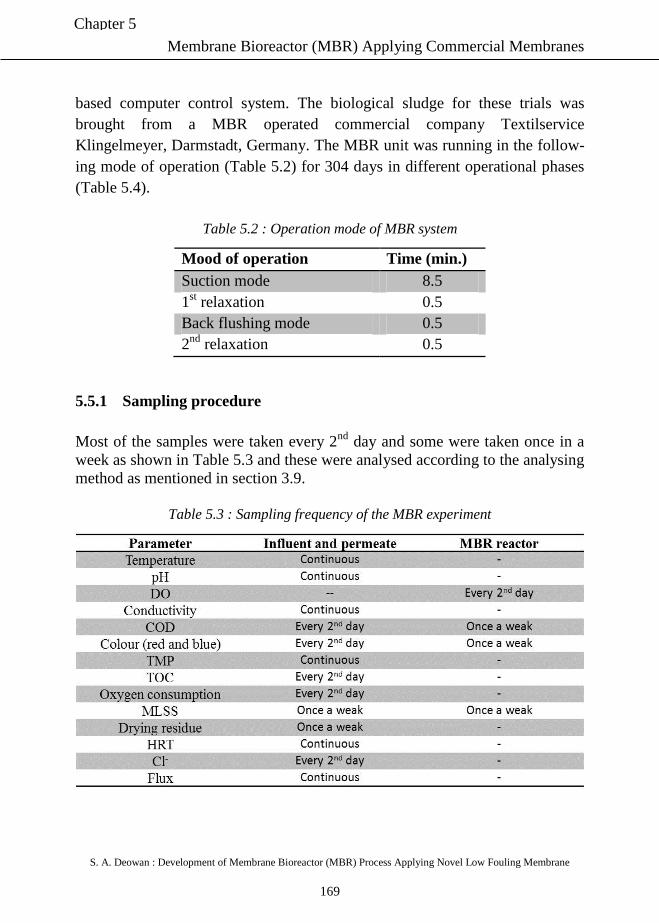
Membrane Bioreactor (MBR) Applying Commercial Membranes
S. A. Deowan : Development of Membrane Bioreactor (MBR) Process Applying Novel Low Fouling Membrane
169
Chapter 5
based computer control system. The biological sludge for these trials was
brought from a MBR operated commercial company Textilservice
Klingelmeyer, Darmstadt, Germany. The MBR unit was running in the follow-
ing mode of operation (Table 5.2) for 304 days in different operational phases
(Table 5.4).
Table 5.2 : Operation mode of MBR system
Mood of operation Time (min.)
Suction mode 8.5
1st relaxation 0.5
Back flushing mode 0.5
2nd
relaxation 0.5
5.5.1 Sampling procedure
Most of the samples were taken every 2nd
day and some were taken once in a
week as shown in Table 5.3 and these were analysed according to the analysing
method as mentioned in section 3.9.
Table 5.3 : Sampling frequency of the MBR experiment
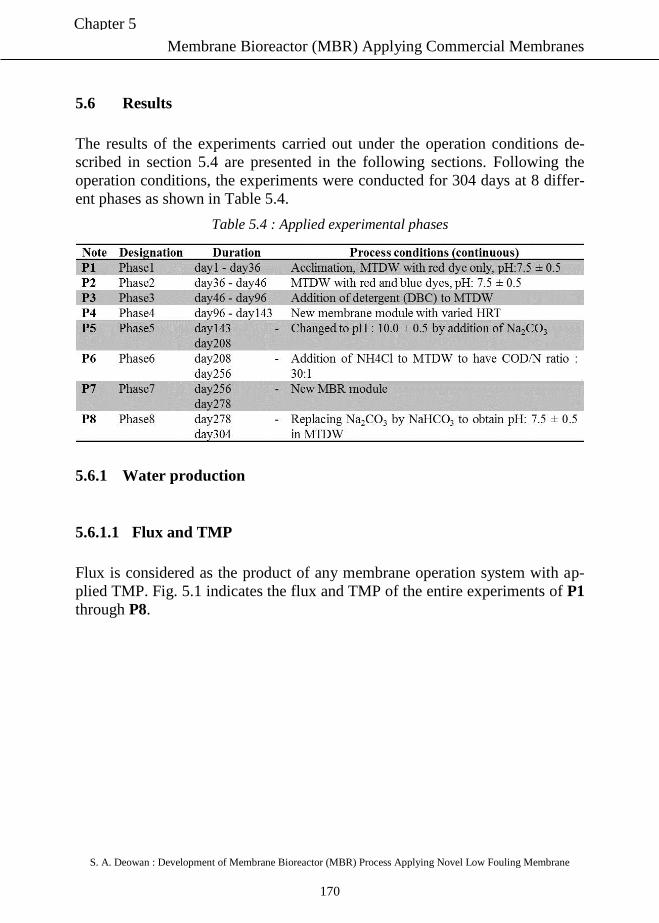
Membrane Bioreactor (MBR) Applying Commercial Membranes
S. A. Deowan : Development of Membrane Bioreactor (MBR) Process Applying Novel Low Fouling Membrane
170
Chapter 5
5.6 Results
The results of the experiments carried out under the operation conditions de-
scribed in section 5.4 are presented in the following sections. Following the
operation conditions, the experiments were conducted for 304 days at 8 differ-
ent phases as shown in Table 5.4.
Table 5.4 : Applied experimental phases
5.6.1 Water production
5.6.1.1 Flux and TMP
Flux is considered as the product of any membrane operation system with ap-
plied TMP. Fig. 5.1 indicates the flux and TMP of the entire experiments of P1
through P8.
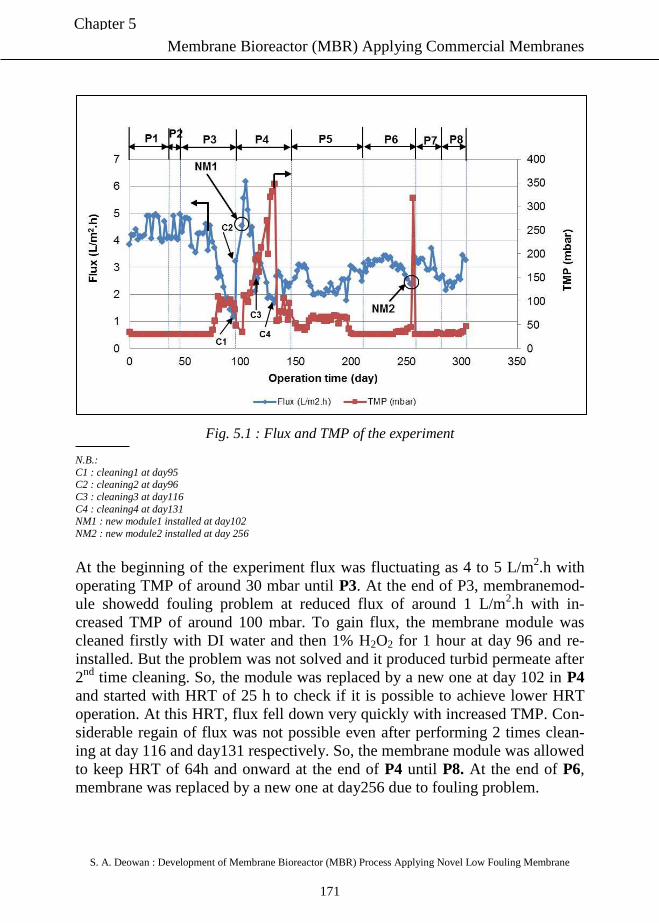
Membrane Bioreactor (MBR) Applying Commercial Membranes
S. A. Deowan : Development of Membrane Bioreactor (MBR) Process Applying Novel Low Fouling Membrane
171
Chapter 5
Fig. 5.1 : Flux and TMP of the experiment
N.B.:
C1 : cleaning1 at day95 C2 : cleaning2 at day96
C3 : cleaning3 at day116
C4 : cleaning4 at day131 NM1 : new module1 installed at day102
NM2 : new module2 installed at day 256
At the beginning of the experiment flux was fluctuating as 4 to 5 L/m2.h with
operating TMP of around 30 mbar until P3. At the end of P3, membranemod-
ule showedd fouling problem at reduced flux of around 1 L/m2.h with in-
creased TMP of around 100 mbar. To gain flux, the membrane module was
cleaned firstly with DI water and then 1% H2O2 for 1 hour at day 96 and re-
installed. But the problem was not solved and it produced turbid permeate after
2nd
time cleaning. So, the module was replaced by a new one at day 102 in P4
and started with HRT of 25 h to check if it is possible to achieve lower HRT
operation. At this HRT, flux fell down very quickly with increased TMP. Con-
siderable regain of flux was not possible even after performing 2 times clean-
ing at day 116 and day131 respectively. So, the membrane module was allowed
to keep HRT of 64h and onward at the end of P4 until P8. At the end of P6,
membrane was replaced by a new one at day256 due to fouling problem.
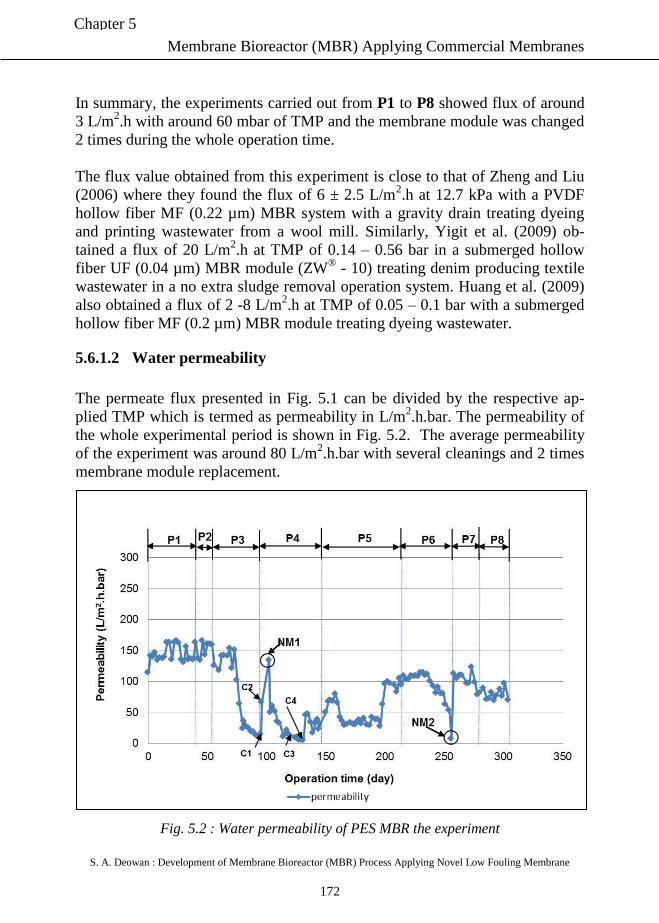
Membrane Bioreactor (MBR) Applying Commercial Membranes
S. A. Deowan : Development of Membrane Bioreactor (MBR) Process Applying Novel Low Fouling Membrane
172
Chapter 5
In summary, the experiments carried out from P1 to P8 showed flux of around
3 L/m2.h with around 60 mbar of TMP and the membrane module was changed
2 times during the whole operation time.
The flux value obtained from this experiment is close to that of Zheng and Liu
(2006) where they found the flux of 6 ± 2.5 L/m2.h at 12.7 kPa with a PVDF
hollow fiber MF (0.22 µm) MBR system with a gravity drain treating dyeing
and printing wastewater from a wool mill. Similarly, Yigit et al. (2009) ob-
tained a flux of 20 L/m2.h at TMP of 0.14 – 0.56 bar in a submerged hollow
fiber UF (0.04 µm) MBR module (ZW® - 10) treating denim producing textile
wastewater in a no extra sludge removal operation system. Huang et al. (2009)
also obtained a flux of 2 -8 L/m2.h at TMP of 0.05 – 0.1 bar with a submerged
hollow fiber MF (0.2 µm) MBR module treating dyeing wastewater.
5.6.1.2 Water permeability
The permeate flux presented in Fig. 5.1 can be divided by the respective ap-
plied TMP which is termed as permeability in L/m2.h.bar. The permeability of
the whole experimental period is shown in Fig. 5.2. The average permeability
of the experiment was around 80 L/m2.h.bar with several cleanings and 2 times
membrane module replacement.
Fig. 5.2 : Water permeability of PES MBR the experiment
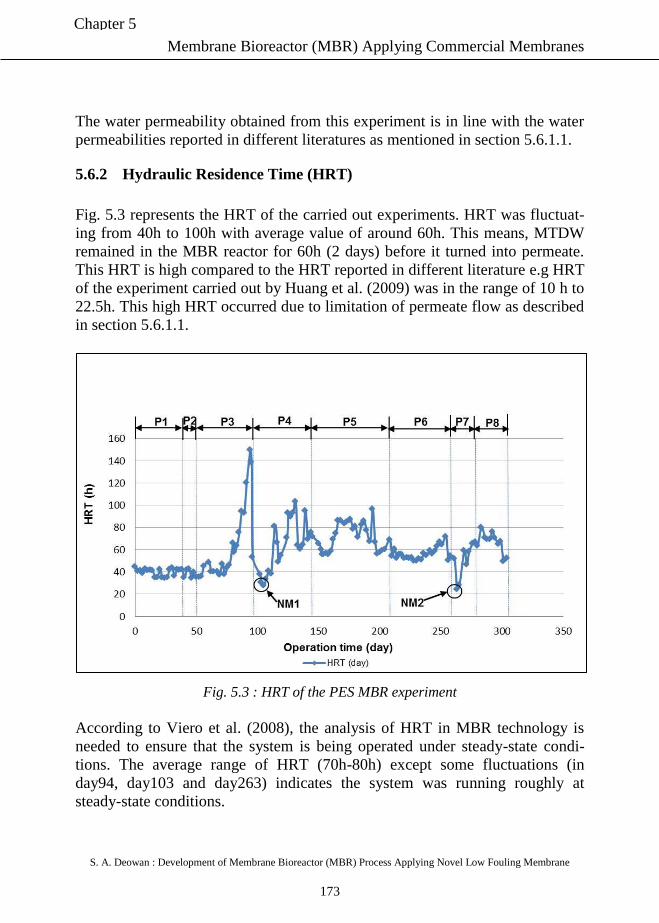
Membrane Bioreactor (MBR) Applying Commercial Membranes
S. A. Deowan : Development of Membrane Bioreactor (MBR) Process Applying Novel Low Fouling Membrane
173
Chapter 5
The water permeability obtained from this experiment is in line with the water
permeabilities reported in different literatures as mentioned in section 5.6.1.1.
5.6.2 Hydraulic Residence Time (HRT)
Fig. 5.3 represents the HRT of the carried out experiments. HRT was fluctuat-
ing from 40h to 100h with average value of around 60h. This means, MTDW
remained in the MBR reactor for 60h (2 days) before it turned into permeate.
This HRT is high compared to the HRT reported in different literature e.g HRT
of the experiment carried out by Huang et al. (2009) was in the range of 10 h to
22.5h. This high HRT occurred due to limitation of permeate flow as described
in section 5.6.1.1.
Fig. 5.3 : HRT of the PES MBR experiment
According to Viero et al. (2008), the analysis of HRT in MBR technology is
needed to ensure that the system is being operated under steady-state condi-
tions. The average range of HRT (70h-80h) except some fluctuations (in
day94, day103 and day263) indicates the system was running roughly at
steady-state conditions.
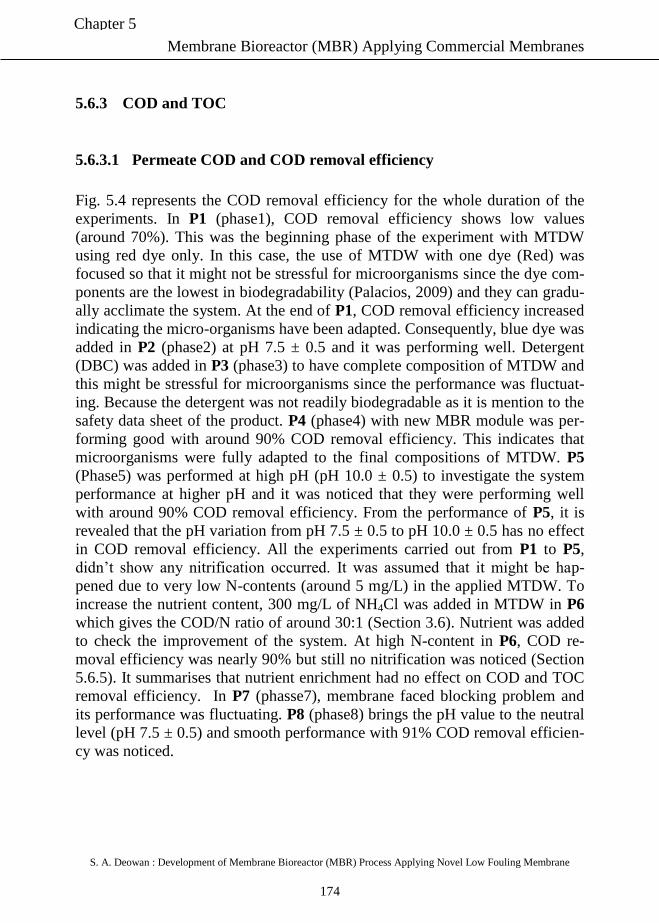
Membrane Bioreactor (MBR) Applying Commercial Membranes
S. A. Deowan : Development of Membrane Bioreactor (MBR) Process Applying Novel Low Fouling Membrane
174
Chapter 5
5.6.3 COD and TOC
5.6.3.1 Permeate COD and COD removal efficiency
Fig. 5.4 represents the COD removal efficiency for the whole duration of the
experiments. In P1 (phase1), COD removal efficiency shows low values
(around 70%). This was the beginning phase of the experiment with MTDW
using red dye only. In this case, the use of MTDW with one dye (Red) was
focused so that it might not be stressful for microorganisms since the dye com-
ponents are the lowest in biodegradability (Palacios, 2009) and they can gradu-
ally acclimate the system. At the end of P1, COD removal efficiency increased
indicating the micro-organisms have been adapted. Consequently, blue dye was
added in P2 (phase2) at pH 7.5 ± 0.5 and it was performing well. Detergent
(DBC) was added in P3 (phase3) to have complete composition of MTDW and
this might be stressful for microorganisms since the performance was fluctuat-
ing. Because the detergent was not readily biodegradable as it is mention to the
safety data sheet of the product. P4 (phase4) with new MBR module was per-
forming good with around 90% COD removal efficiency. This indicates that
microorganisms were fully adapted to the final compositions of MTDW. P5
(Phase5) was performed at high pH (pH 10.0 ± 0.5) to investigate the system
performance at higher pH and it was noticed that they were performing well
with around 90% COD removal efficiency. From the performance of P5, it is
revealed that the pH variation from pH 7.5 ± 0.5 to pH 10.0 ± 0.5 has no effect
in COD removal efficiency. All the experiments carried out from P1 to P5,
didn’t show any nitrification occurred. It was assumed that it might be hap-
pened due to very low N-contents (around 5 mg/L) in the applied MTDW. To
increase the nutrient content, 300 mg/L of NH4Cl was added in MTDW in P6
which gives the COD/N ratio of around 30:1 (Section 3.6). Nutrient was added
to check the improvement of the system. At high N-content in P6, COD re-
moval efficiency was nearly 90% but still no nitrification was noticed (Section
5.6.5). It summarises that nutrient enrichment had no effect on COD and TOC
removal efficiency. In P7 (phasse7), membrane faced blocking problem and
its performance was fluctuating. P8 (phase8) brings the pH value to the neutral
level (pH 7.5 ± 0.5) and smooth performance with 91% COD removal efficien-
cy was noticed.
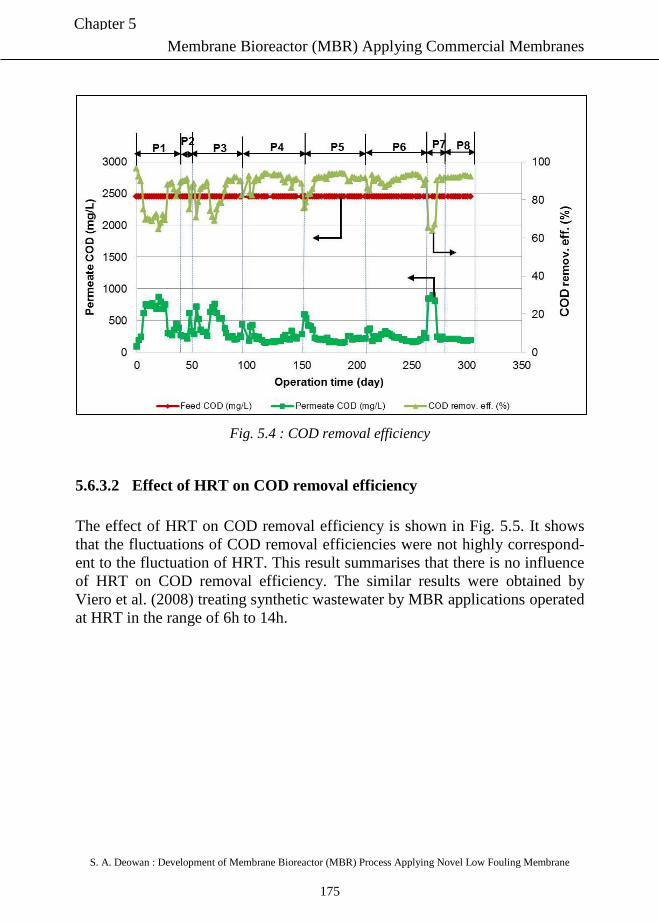
Membrane Bioreactor (MBR) Applying Commercial Membranes
S. A. Deowan : Development of Membrane Bioreactor (MBR) Process Applying Novel Low Fouling Membrane
175
Chapter 5
Fig. 5.4 : COD removal efficiency
5.6.3.2 Effect of HRT on COD removal efficiency
The effect of HRT on COD removal efficiency is shown in Fig. 5.5. It shows
that the fluctuations of COD removal efficiencies were not highly correspond-
ent to the fluctuation of HRT. This result summarises that there is no influence
of HRT on COD removal efficiency. The similar results were obtained by
Viero et al. (2008) treating synthetic wastewater by MBR applications operated
at HRT in the range of 6h to 14h.
Membrane Bioreactor (MBR) Applying Commercial Membranes
S. A. Deowan : Development of Membrane Bioreactor (MBR) Process Applying Novel Low Fouling Membrane
176
Chapter 5
Fig. 5.5 : Effect of HRT on COD removal efficiency
5.6.3.3 COD and TOC relation
COD is a collective value of an oxidizable component (oxygen consumption)
where TOC is a collective value of any organic carbon components. COD and
TOC can be theoretically calculated by stoichiometry as shown in Table 5.1.
The COD value of the wastewater should be correlated with TOC value. There-
fore, both COD and TOC parameters are related to the organic load. The COD
value is widely used for determining the strength of organic pollution of any
wastewater. However, COD can’t reflect the degree of wastewater precisely
due to the impacts of types and concentration of oxidants, reaction temperature
and time, etc. On the other hand, TOC can reflect the strength of organic pollu-
tion correctly. TOC measurement has many advantages such as it takes short
for measurement, gives fast and accurate results, high reliability and stability.
Theoretically, there should be a correlation between COD and TOC. Generally,
TOC is considered as 1/4 to 1/3 of COD values based on theoretical calcula-
tion. Based on theoretical calculation, the TOC and COD values are 863.29
mg/L and 2506 mg/L respectively as shown in Table 5.1. This indicates that
the TOC value is 1/3 of COD value which is in line with expected values.
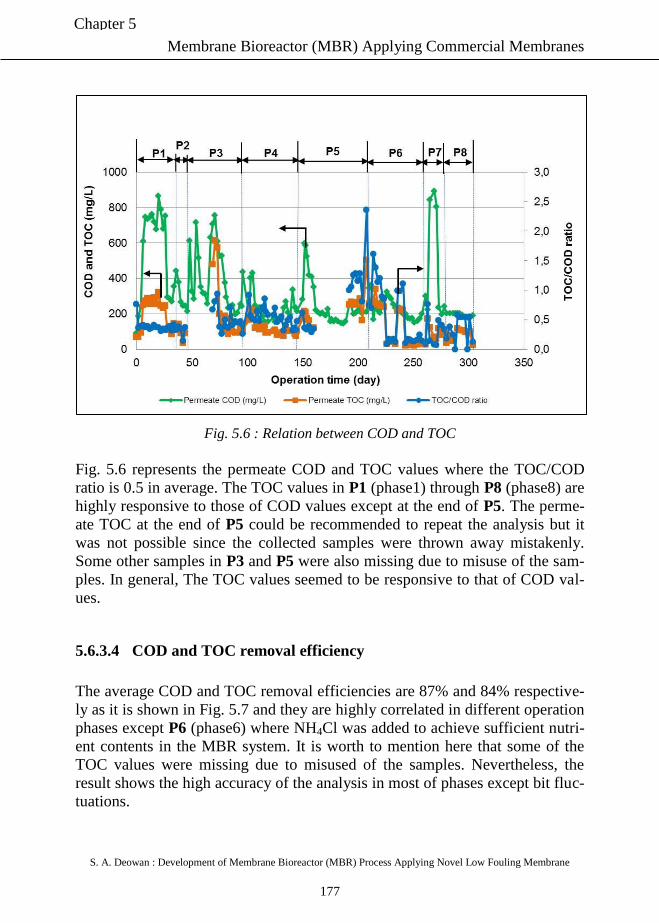
Membrane Bioreactor (MBR) Applying Commercial Membranes
S. A. Deowan : Development of Membrane Bioreactor (MBR) Process Applying Novel Low Fouling Membrane
177
Chapter 5
Fig. 5.6 : Relation between COD and TOC
Fig. 5.6 represents the permeate COD and TOC values where the TOC/COD
ratio is 0.5 in average. The TOC values in P1 (phase1) through P8 (phase8) are
highly responsive to those of COD values except at the end of P5. The perme-
ate TOC at the end of P5 could be recommended to repeat the analysis but it
was not possible since the collected samples were thrown away mistakenly.
Some other samples in P3 and P5 were also missing due to misuse of the sam-
ples. In general, The TOC values seemed to be responsive to that of COD val-
ues.
5.6.3.4 COD and TOC removal efficiency
The average COD and TOC removal efficiencies are 87% and 84% respective-
ly as it is shown in Fig. 5.7 and they are highly correlated in different operation
phases except P6 (phase6) where NH4Cl was added to achieve sufficient nutri-
ent contents in the MBR system. It is worth to mention here that some of the
TOC values were missing due to misused of the samples. Nevertheless, the
result shows the high accuracy of the analysis in most of phases except bit fluc-
tuations.
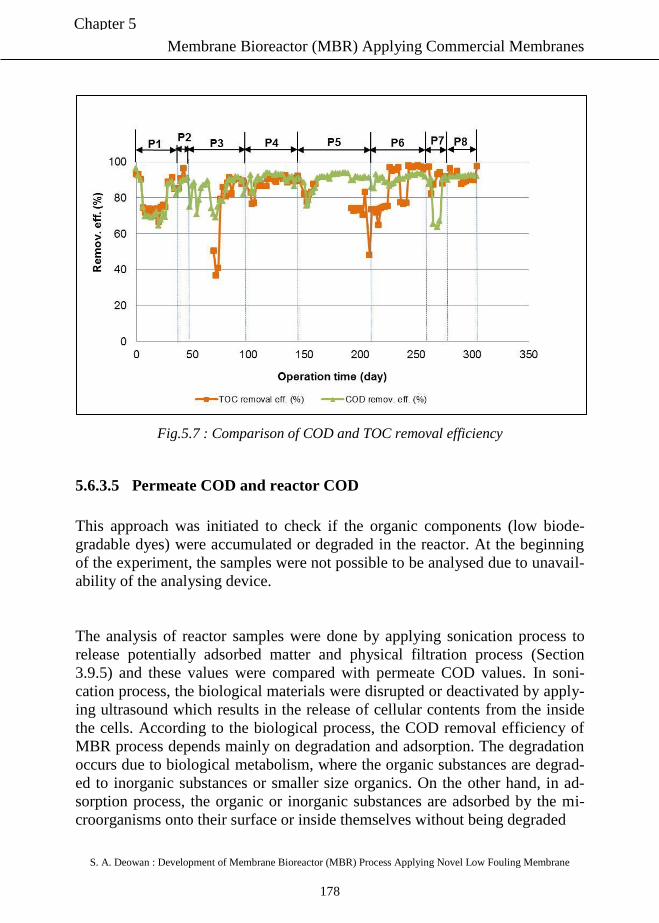
Membrane Bioreactor (MBR) Applying Commercial Membranes
S. A. Deowan : Development of Membrane Bioreactor (MBR) Process Applying Novel Low Fouling Membrane
178
Chapter 5
Fig.5.7 : Comparison of COD and TOC removal efficiency
5.6.3.5 Permeate COD and reactor COD
This approach was initiated to check if the organic components (low biode-
gradable dyes) were accumulated or degraded in the reactor. At the beginning
of the experiment, the samples were not possible to be analysed due to unavail-
ability of the analysing device.
The analysis of reactor samples were done by applying sonication process to
release potentially adsorbed matter and physical filtration process (Section
3.9.5) and these values were compared with permeate COD values. In soni-
cation process, the biological materials were disrupted or deactivated by apply-
ing ultrasound which results in the release of cellular contents from the inside
the cells. According to the biological process, the COD removal efficiency of
MBR process depends mainly on degradation and adsorption. The degradation
occurs due to biological metabolism, where the organic substances are degrad-
ed to inorganic substances or smaller size organics. On the other hand, in ad-
sorption process, the organic or inorganic substances are adsorbed by the mi-
croorganisms onto their surface or inside themselves without being degraded
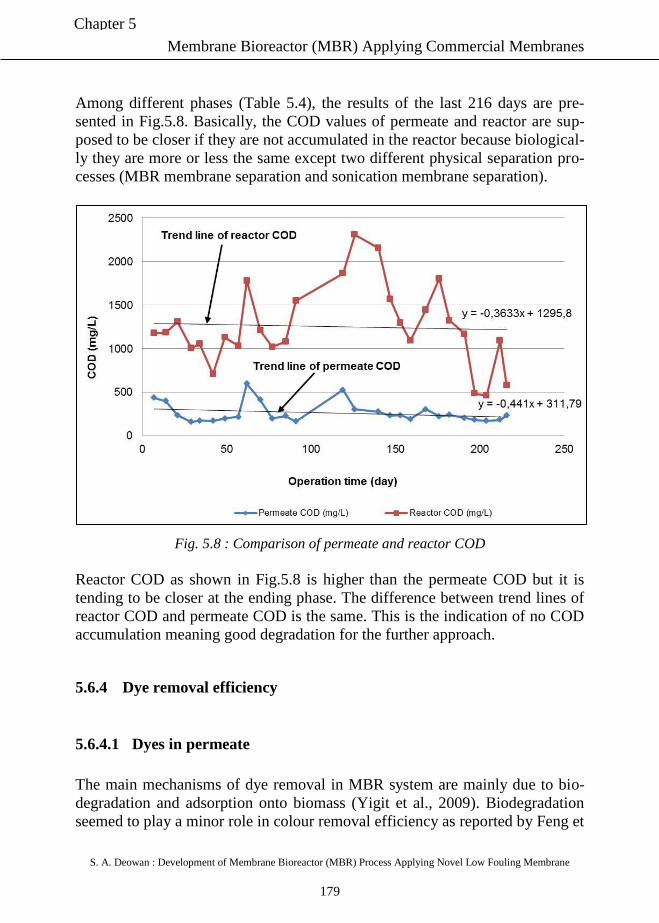
Membrane Bioreactor (MBR) Applying Commercial Membranes
S. A. Deowan : Development of Membrane Bioreactor (MBR) Process Applying Novel Low Fouling Membrane
179
Chapter 5
Among different phases (Table 5.4), the results of the last 216 days are pre-
sented in Fig.5.8. Basically, the COD values of permeate and reactor are sup-
posed to be closer if they are not accumulated in the reactor because biological-
ly they are more or less the same except two different physical separation pro-
cesses (MBR membrane separation and sonication membrane separation).
Fig. 5.8 : Comparison of permeate and reactor COD
Reactor COD as shown in Fig.5.8 is higher than the permeate COD but it is
tending to be closer at the ending phase. The difference between trend lines of
reactor COD and permeate COD is the same. This is the indication of no COD
accumulation meaning good degradation for the further approach.
5.6.4 Dye removal efficiency
5.6.4.1 Dyes in permeate
The main mechanisms of dye removal in MBR system are mainly due to bio-
degradation and adsorption onto biomass (Yigit et al., 2009). Biodegradation
seemed to play a minor role in colour removal efficiency as reported by Feng et
Membrane Bioreactor (MBR) Applying Commercial Membranes
S. A. Deowan : Development of Membrane Bioreactor (MBR) Process Applying Novel Low Fouling Membrane
180
Chapter 5
al. (2010). This suggests that the dye removal efficiency might occur due to
adsorption of dye molecules on biomass. Since the applied dyes (Red and
Blue) in this thesis were low biodegradable, the dye rejections might have oc-
curred due to combination of membrane rejection and biodegradation. Mem-
brane rejection might have contributed 20% – 25% dye rejections whereas 10%
to 15% dye rejections might have done by biodegradation.
Fig. 5.9, represents red and blue dye removal efficiencies in P1 through P8.
Red and blue removal efficiencies are 40% and 30% respectively with lot of
fluctuations in different phases. Molecular weights of red and blue dyes are
380.4 and 626.5 respectively (Section 3.7). Since the membrane used in the
MBR module was ultrafiltration (Section 3.4) with MWCO of 150 kDa, all red
and blue dyes are supposed to pass through the membrane resulting in no rejec-
tion. But Fig. 5.9 shows different scenario. There could be three reasons; first-
ly, the applied dyes are negatively charged and the MBR module is also nega-
tively charged. So, there could be charge exclusion mechanism which might
have resulted in dye rejections. Secondly, the dyes might have been adsorbed
on the surface of the membrane and in the reactor sludge. Thirdly, the dye
rejections might be happened due to partial biodegradation. The higher red dye
rejection might be happened due to higher biological degradation of red dye
than blue. It can be speculated that the red dye which contains azo bond (-
N=N-) is highly prone to digestion with the presence of microorganisms and it
might had been decolorized due to decomposition.
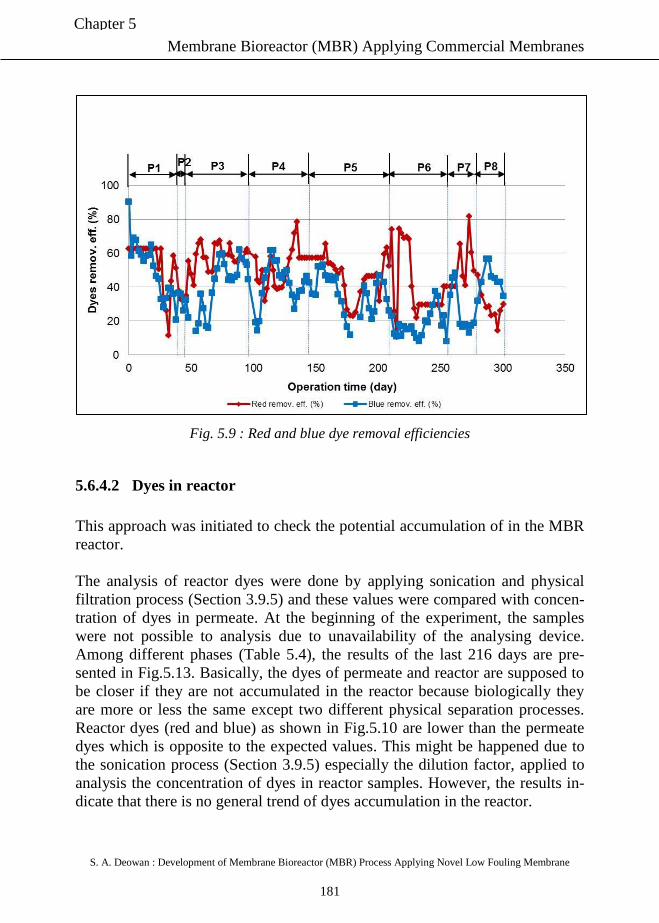
Membrane Bioreactor (MBR) Applying Commercial Membranes
S. A. Deowan : Development of Membrane Bioreactor (MBR) Process Applying Novel Low Fouling Membrane
181
Chapter 5
Fig. 5.9 : Red and blue dye removal efficiencies
5.6.4.2 Dyes in reactor
This approach was initiated to check the potential accumulation of in the MBR
reactor.
The analysis of reactor dyes were done by applying sonication and physical
filtration process (Section 3.9.5) and these values were compared with concen-
tration of dyes in permeate. At the beginning of the experiment, the samples
were not possible to analysis due to unavailability of the analysing device.
Among different phases (Table 5.4), the results of the last 216 days are pre-
sented in Fig.5.13. Basically, the dyes of permeate and reactor are supposed to
be closer if they are not accumulated in the reactor because biologically they
are more or less the same except two different physical separation processes.
Reactor dyes (red and blue) as shown in Fig.5.10 are lower than the permeate
dyes which is opposite to the expected values. This might be happened due to
the sonication process (Section 3.9.5) especially the dilution factor, applied to
analysis the concentration of dyes in reactor samples. However, the results in-
dicate that there is no general trend of dyes accumulation in the reactor.
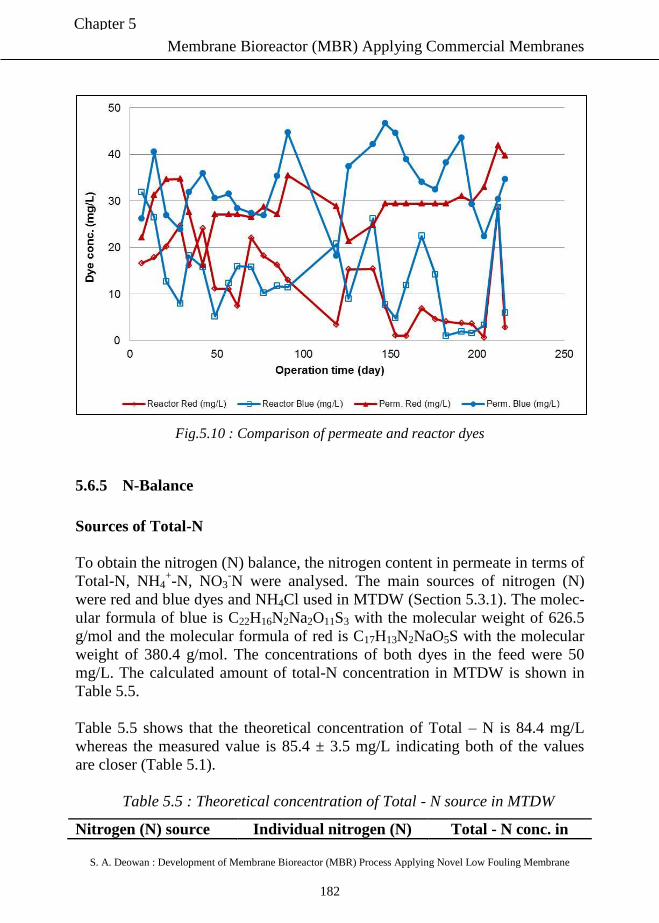
Membrane Bioreactor (MBR) Applying Commercial Membranes
S. A. Deowan : Development of Membrane Bioreactor (MBR) Process Applying Novel Low Fouling Membrane
182
Chapter 5
Fig.5.10 : Comparison of permeate and reactor dyes
5.6.5 N-Balance
Sources of Total-N
To obtain the nitrogen (N) balance, the nitrogen content in permeate in terms of
Total-N, NH4+-N, NO3
-N were analysed. The main sources of nitrogen (N)
were red and blue dyes and NH4Cl used in MTDW (Section 5.3.1). The molec-
ular formula of blue is C22H16N2Na2O11S3 with the molecular weight of 626.5
g/mol and the molecular formula of red is C17H13N2NaO5S with the molecular
weight of 380.4 g/mol. The concentrations of both dyes in the feed were 50
mg/L. The calculated amount of total-N concentration in MTDW is shown in
Table 5.5.
Table 5.5 shows that the theoretical concentration of Total – N is 84.4 mg/L
whereas the measured value is 85.4 ± 3.5 mg/L indicating both of the values
are closer (Table 5.1).
Table 5.5 : Theoretical concentration of Total - N source in MTDW
Nitrogen (N) source Individual nitrogen (N) Total - N conc. in
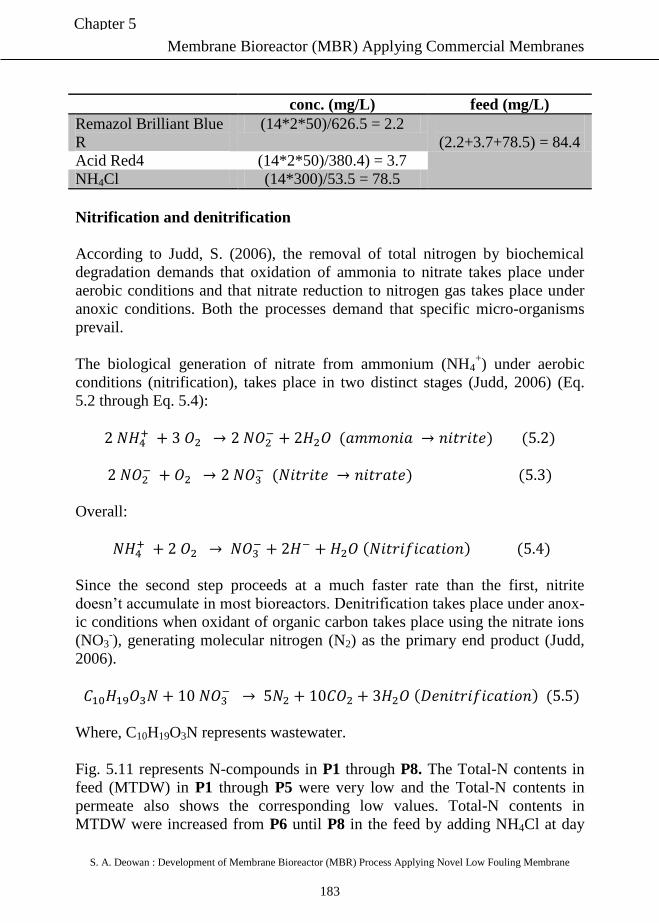
Membrane Bioreactor (MBR) Applying Commercial Membranes
S. A. Deowan : Development of Membrane Bioreactor (MBR) Process Applying Novel Low Fouling Membrane
183
Chapter 5
conc. (mg/L) feed (mg/L)
Remazol Brilliant Blue
R
(14*2*50)/626.5 = 2.2
(2.2+3.7+78.5) = 84.4
Acid Red4 (14*2*50)/380.4) = 3.7
NH4Cl (14*300)/53.5 = 78.5
Nitrification and denitrification
According to Judd, S. (2006), the removal of total nitrogen by biochemical
degradation demands that oxidation of ammonia to nitrate takes place under
aerobic conditions and that nitrate reduction to nitrogen gas takes place under
anoxic conditions. Both the processes demand that specific micro-organisms
prevail.
The biological generation of nitrate from ammonium (NH4+) under aerobic
conditions (nitrification), takes place in two distinct stages (Judd, 2006) (Eq.
5.2 through Eq. 5.4):
( ) ( )
( ) ( )
Overall:
( ) ( )
Since the second step proceeds at a much faster rate than the first, nitrite
doesn’t accumulate in most bioreactors. Denitrification takes place under anox-
ic conditions when oxidant of organic carbon takes place using the nitrate ions
(NO3-), generating molecular nitrogen (N2) as the primary end product (Judd,
2006).
( ) ( )
Where, C10H19O3N represents wastewater.
Fig. 5.11 represents N-compounds in P1 through P8. The Total-N contents in
feed (MTDW) in P1 through P5 were very low and the Total-N contents in
permeate also shows the corresponding low values. Total-N contents in
MTDW were increased from P6 until P8 in the feed by adding NH4Cl at day
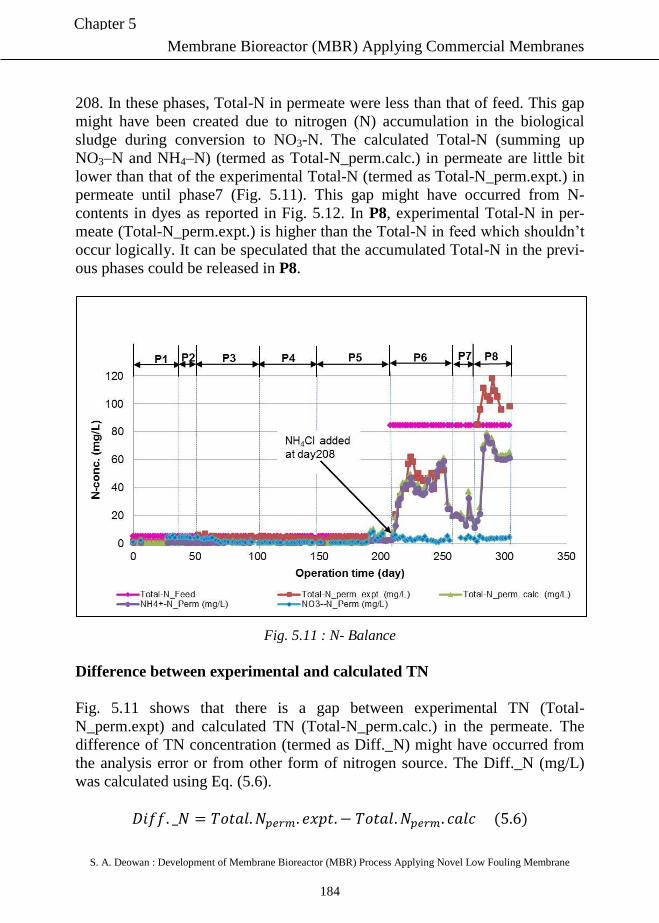
Membrane Bioreactor (MBR) Applying Commercial Membranes
S. A. Deowan : Development of Membrane Bioreactor (MBR) Process Applying Novel Low Fouling Membrane
184
Chapter 5
208. In these phases, Total-N in permeate were less than that of feed. This gap
might have been created due to nitrogen (N) accumulation in the biological
sludge during conversion to NO3-N. The calculated Total-N (summing up
NO3–N and NH4–N) (termed as Total-N_perm.calc.) in permeate are little bit
lower than that of the experimental Total-N (termed as Total-N_perm.expt.) in
permeate until phase7 (Fig. 5.11). This gap might have occurred from N-
contents in dyes as reported in Fig. 5.12. In P8, experimental Total-N in per-
meate (Total-N_perm.expt.) is higher than the Total-N in feed which shouldn’t
occur logically. It can be speculated that the accumulated Total-N in the previ-
ous phases could be released in P8.
Fig. 5.11 : N- Balance
Difference between experimental and calculated TN
Fig. 5.11 shows that there is a gap between experimental TN (Total-
N_perm.expt) and calculated TN (Total-N_perm.calc.) in the permeate. The
difference of TN concentration (termed as Diff._N) might have occurred from
the analysis error or from other form of nitrogen source. The Diff._N (mg/L)
was calculated using Eq. (5.6).
( )
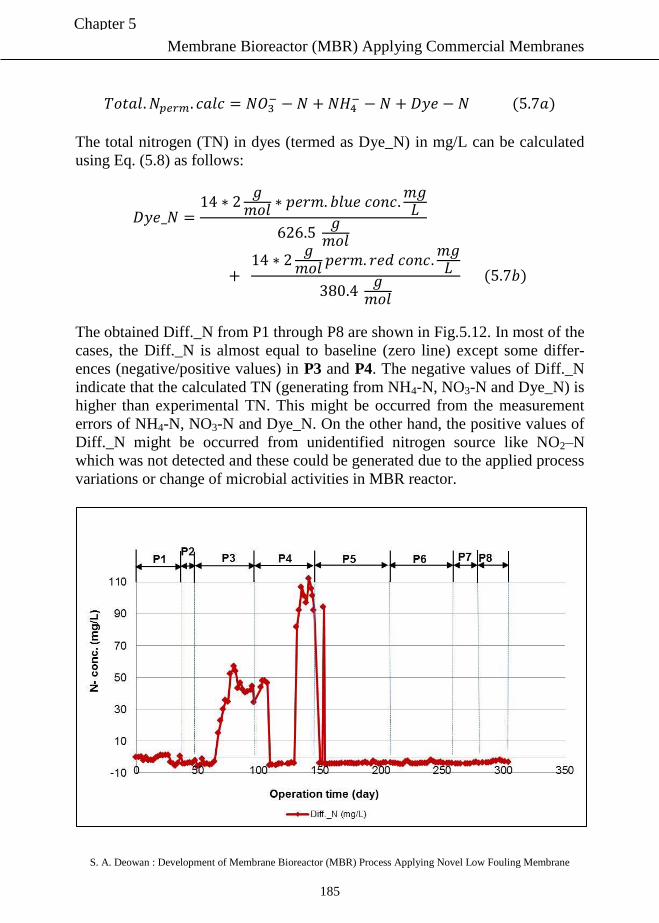
Membrane Bioreactor (MBR) Applying Commercial Membranes
S. A. Deowan : Development of Membrane Bioreactor (MBR) Process Applying Novel Low Fouling Membrane
185
Chapter 5
( )
The total nitrogen (TN) in dyes (termed as Dye_N) in mg/L can be calculated
using Eq. (5.8) as follows:
( )
The obtained Diff._N from P1 through P8 are shown in Fig.5.12. In most of the
cases, the Diff._N is almost equal to baseline (zero line) except some differ-
ences (negative/positive values) in P3 and P4. The negative values of Diff._N
indicate that the calculated TN (generating from NH4-N, NO3-N and Dye_N) is
higher than experimental TN. This might be occurred from the measurement
errors of NH4-N, NO3-N and Dye_N. On the other hand, the positive values of
Diff._N might be occurred from unidentified nitrogen source like NO2–N
which was not detected and these could be generated due to the applied process
variations or change of microbial activities in MBR reactor.
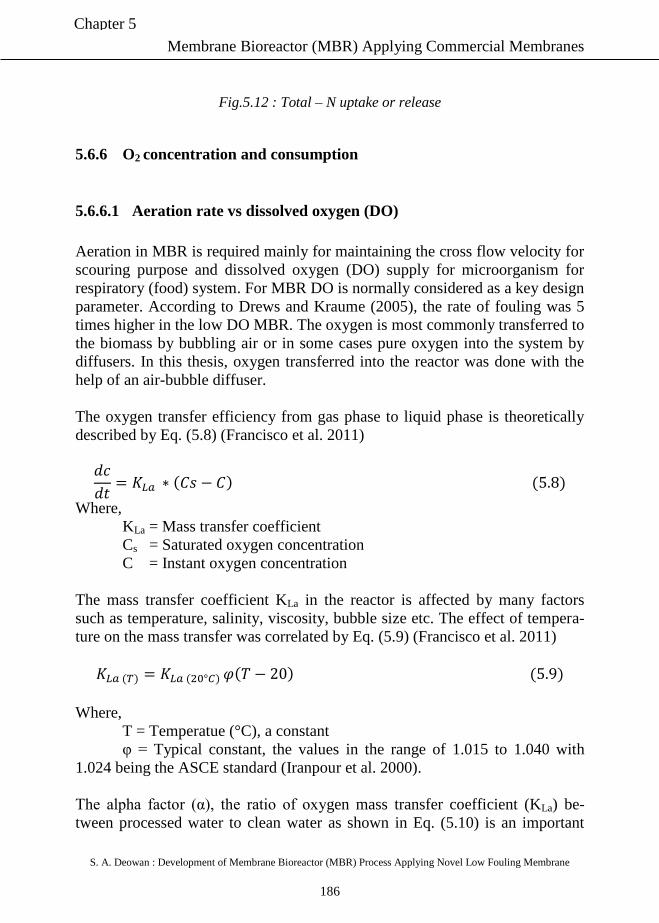
Membrane Bioreactor (MBR) Applying Commercial Membranes
S. A. Deowan : Development of Membrane Bioreactor (MBR) Process Applying Novel Low Fouling Membrane
186
Chapter 5
Fig.5.12 : Total – N uptake or release
5.6.6 O2 concentration and consumption
5.6.6.1 Aeration rate vs dissolved oxygen (DO)
Aeration in MBR is required mainly for maintaining the cross flow velocity for
scouring purpose and dissolved oxygen (DO) supply for microorganism for
respiratory (food) system. For MBR DO is normally considered as a key design
parameter. According to Drews and Kraume (2005), the rate of fouling was 5
times higher in the low DO MBR. The oxygen is most commonly transferred to
the biomass by bubbling air or in some cases pure oxygen into the system by
diffusers. In this thesis, oxygen transferred into the reactor was done with the
help of an air-bubble diffuser.
The oxygen transfer efficiency from gas phase to liquid phase is theoretically
described by Eq. (5.8) (Francisco et al. 2011)
( ) ( )
Where,
KLa = Mass transfer coefficient
Cs = Saturated oxygen concentration
C = Instant oxygen concentration
The mass transfer coefficient KLa in the reactor is affected by many factors
such as temperature, salinity, viscosity, bubble size etc. The effect of tempera-
ture on the mass transfer was correlated by Eq. (5.9) (Francisco et al. 2011)
( ) ( ) ( ) ( )
Where,
T = Temperatue (°C), a constant
φ = Typical constant, the values in the range of 1.015 to 1.040 with
1.024 being the ASCE standard (Iranpour et al. 2000).
The alpha factor (α), the ratio of oxygen mass transfer coefficient (KLa) be-
tween processed water to clean water as shown in Eq. (5.10) is an important
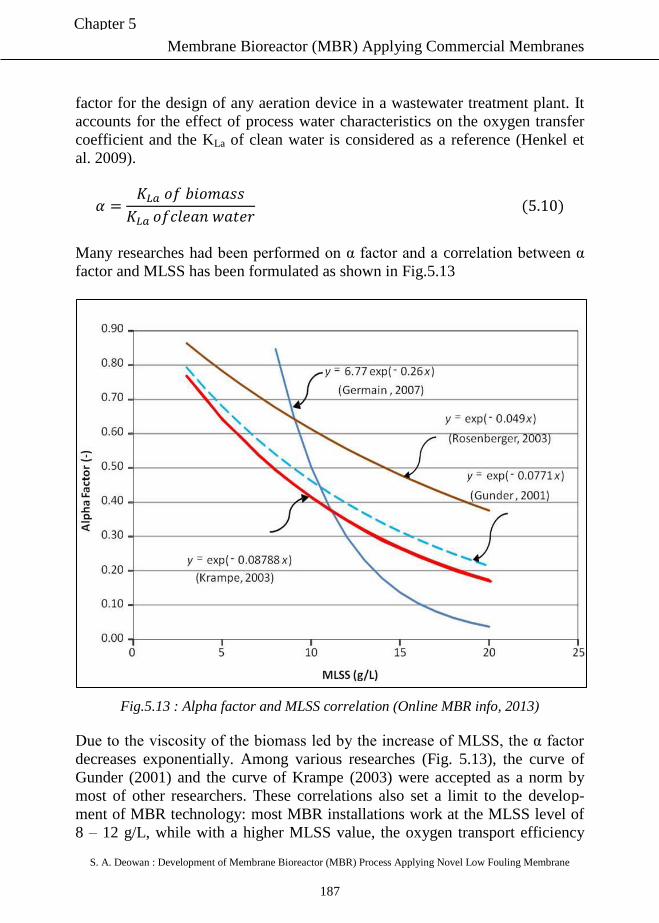
Membrane Bioreactor (MBR) Applying Commercial Membranes
S. A. Deowan : Development of Membrane Bioreactor (MBR) Process Applying Novel Low Fouling Membrane
187
Chapter 5
factor for the design of any aeration device in a wastewater treatment plant. It
accounts for the effect of process water characteristics on the oxygen transfer
coefficient and the KLa of clean water is considered as a reference (Henkel et
al. 2009).
( )
Many researches had been performed on α factor and a correlation between α
factor and MLSS has been formulated as shown in Fig.5.13
Fig.5.13 : Alpha factor and MLSS correlation (Online MBR info, 2013)
Due to the viscosity of the biomass led by the increase of MLSS, the α factor
decreases exponentially. Among various researches (Fig. 5.13), the curve of
Gunder (2001) and the curve of Krampe (2003) were accepted as a norm by
most of other researchers. These correlations also set a limit to the develop-
ment of MBR technology: most MBR installations work at the MLSS level of
8 – 12 g/L, while with a higher MLSS value, the oxygen transport efficiency
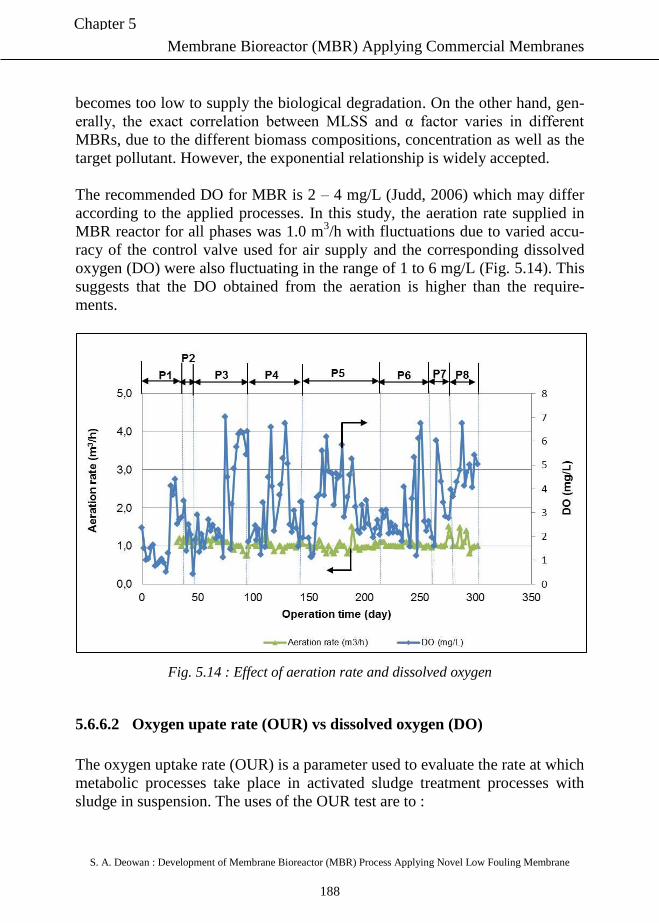
Membrane Bioreactor (MBR) Applying Commercial Membranes
S. A. Deowan : Development of Membrane Bioreactor (MBR) Process Applying Novel Low Fouling Membrane
188
Chapter 5
becomes too low to supply the biological degradation. On the other hand, gen-
erally, the exact correlation between MLSS and α factor varies in different
MBRs, due to the different biomass compositions, concentration as well as the
target pollutant. However, the exponential relationship is widely accepted.
The recommended DO for MBR is 2 – 4 mg/L (Judd, 2006) which may differ
according to the applied processes. In this study, the aeration rate supplied in
MBR reactor for all phases was 1.0 m3/h with fluctuations due to varied accu-
racy of the control valve used for air supply and the corresponding dissolved
oxygen (DO) were also fluctuating in the range of 1 to 6 mg/L (Fig. 5.14). This
suggests that the DO obtained from the aeration is higher than the require-
ments.
Fig. 5.14 : Effect of aeration rate and dissolved oxygen
5.6.6.2 Oxygen upate rate (OUR) vs dissolved oxygen (DO)
The oxygen uptake rate (OUR) is a parameter used to evaluate the rate at which
metabolic processes take place in activated sludge treatment processes with
sludge in suspension. The uses of the OUR test are to :
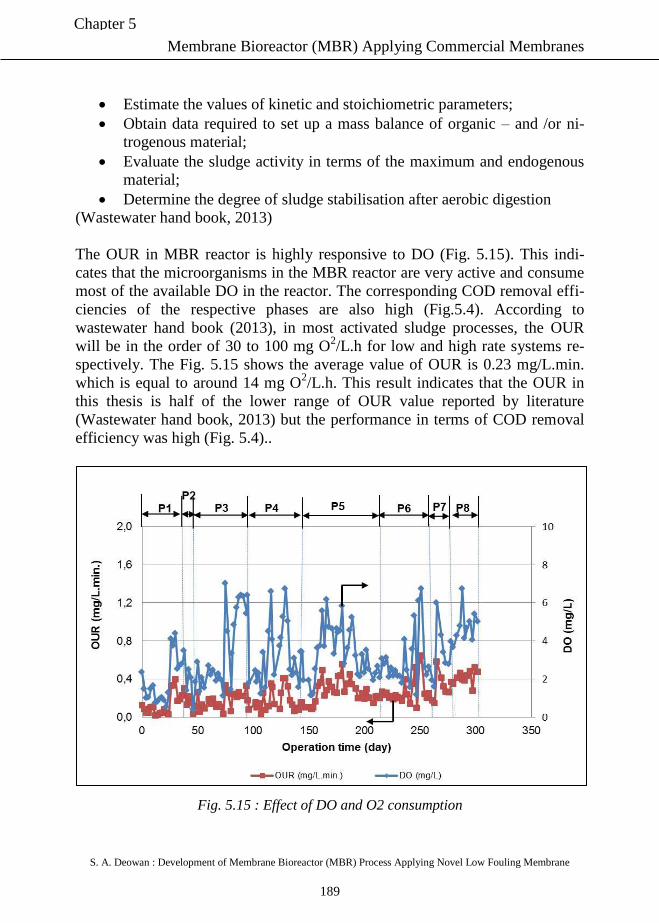
Membrane Bioreactor (MBR) Applying Commercial Membranes
S. A. Deowan : Development of Membrane Bioreactor (MBR) Process Applying Novel Low Fouling Membrane
189
Chapter 5
Estimate the values of kinetic and stoichiometric parameters;
Obtain data required to set up a mass balance of organic – and /or ni-
trogenous material;
Evaluate the sludge activity in terms of the maximum and endogenous
material;
Determine the degree of sludge stabilisation after aerobic digestion
(Wastewater hand book, 2013)
The OUR in MBR reactor is highly responsive to DO (Fig. 5.15). This indi-
cates that the microorganisms in the MBR reactor are very active and consume
most of the available DO in the reactor. The corresponding COD removal effi-
ciencies of the respective phases are also high (Fig.5.4). According to
wastewater hand book (2013), in most activated sludge processes, the OUR
will be in the order of 30 to 100 mg O2/L.h for low and high rate systems re-
spectively. The Fig. 5.15 shows the average value of OUR is 0.23 mg/L.min.
which is equal to around 14 mg O2/L.h. This result indicates that the OUR in
this thesis is half of the lower range of OUR value reported by literature
(Wastewater hand book, 2013) but the performance in terms of COD removal
efficiency was high (Fig. 5.4)..
Fig. 5.15 : Effect of DO and O2 consumption
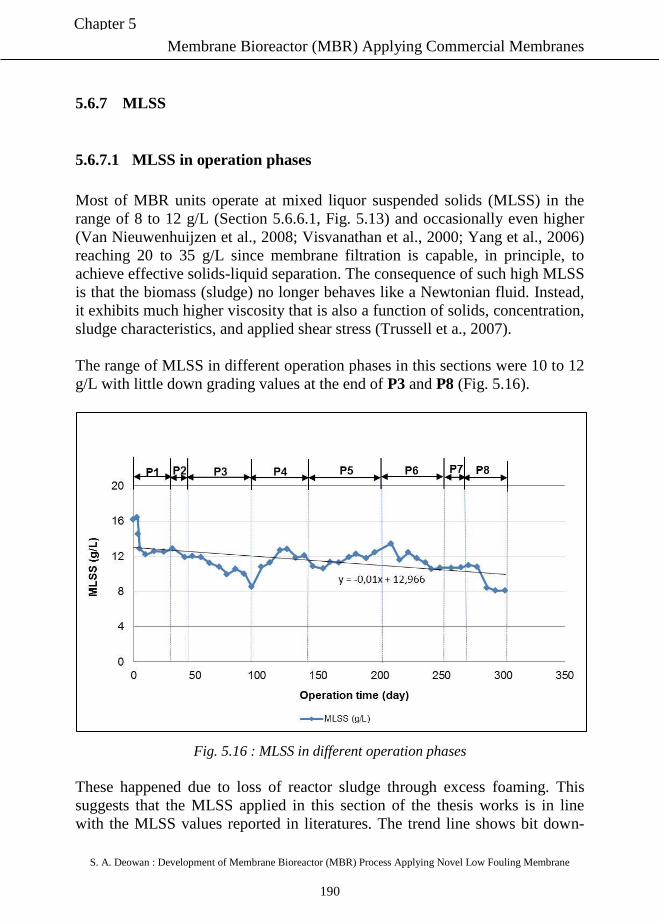
Membrane Bioreactor (MBR) Applying Commercial Membranes
S. A. Deowan : Development of Membrane Bioreactor (MBR) Process Applying Novel Low Fouling Membrane
190
Chapter 5
5.6.7 MLSS
5.6.7.1 MLSS in operation phases
Most of MBR units operate at mixed liquor suspended solids (MLSS) in the
range of 8 to 12 g/L (Section 5.6.6.1, Fig. 5.13) and occasionally even higher
(Van Nieuwenhuijzen et al., 2008; Visvanathan et al., 2000; Yang et al., 2006)
reaching 20 to 35 g/L since membrane filtration is capable, in principle, to
achieve effective solids-liquid separation. The consequence of such high MLSS
is that the biomass (sludge) no longer behaves like a Newtonian fluid. Instead,
it exhibits much higher viscosity that is also a function of solids, concentration,
sludge characteristics, and applied shear stress (Trussell et a., 2007).
The range of MLSS in different operation phases in this sections were 10 to 12
g/L with little down grading values at the end of P3 and P8 (Fig. 5.16).
Fig. 5.16 : MLSS in different operation phases
These happened due to loss of reactor sludge through excess foaming. This
suggests that the MLSS applied in this section of the thesis works is in line
with the MLSS values reported in literatures. The trend line shows bit down-
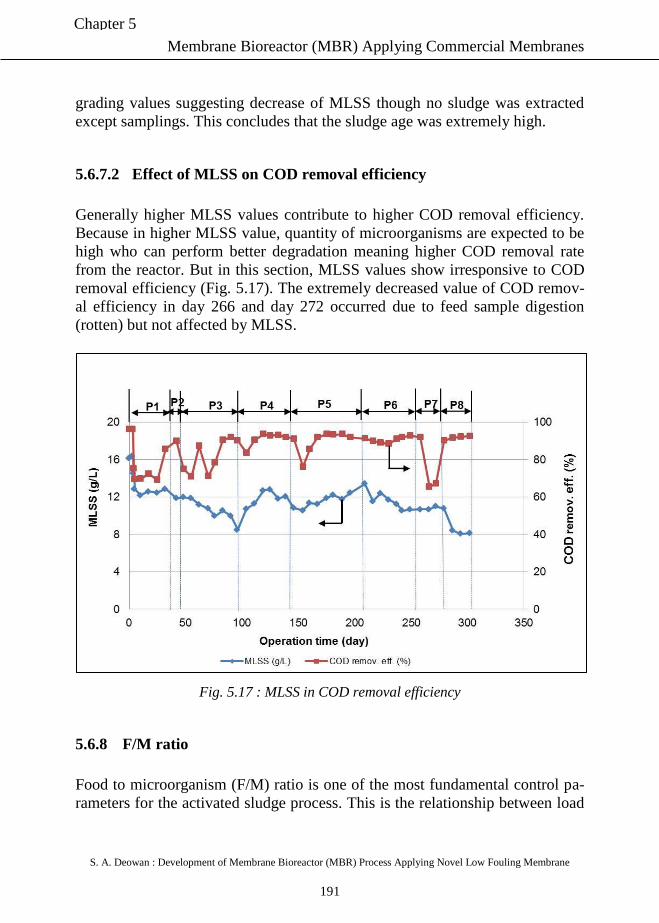
Membrane Bioreactor (MBR) Applying Commercial Membranes
S. A. Deowan : Development of Membrane Bioreactor (MBR) Process Applying Novel Low Fouling Membrane
191
Chapter 5
grading values suggesting decrease of MLSS though no sludge was extracted
except samplings. This concludes that the sludge age was extremely high.
5.6.7.2 Effect of MLSS on COD removal efficiency
Generally higher MLSS values contribute to higher COD removal efficiency.
Because in higher MLSS value, quantity of microorganisms are expected to be
high who can perform better degradation meaning higher COD removal rate
from the reactor. But in this section, MLSS values show irresponsive to COD
removal efficiency (Fig. 5.17). The extremely decreased value of COD remov-
al efficiency in day 266 and day 272 occurred due to feed sample digestion
(rotten) but not affected by MLSS.
Fig. 5.17 : MLSS in COD removal efficiency
5.6.8 F/M ratio
Food to microorganism (F/M) ratio is one of the most fundamental control pa-
rameters for the activated sludge process. This is the relationship between load
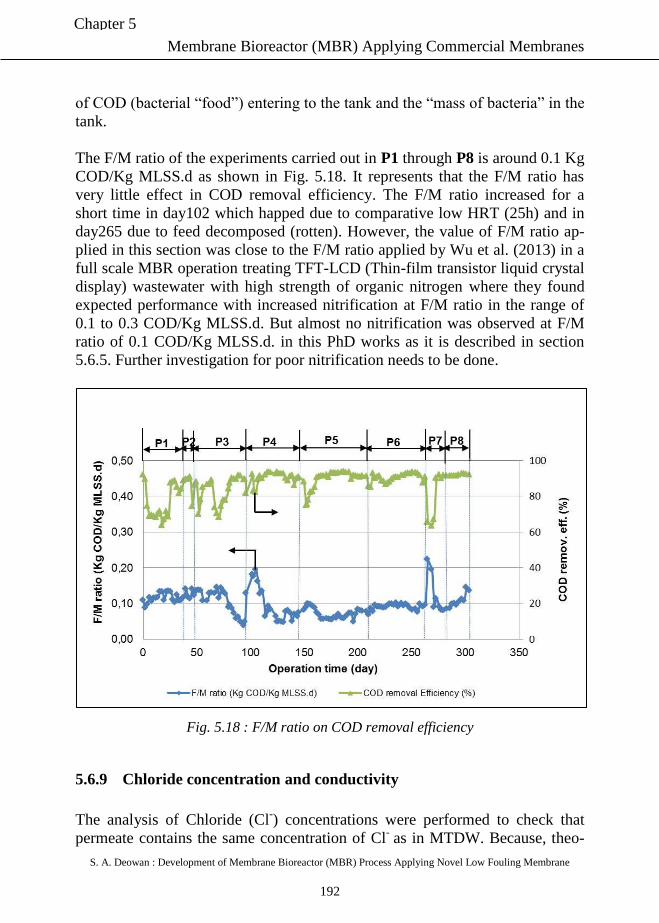
Membrane Bioreactor (MBR) Applying Commercial Membranes
S. A. Deowan : Development of Membrane Bioreactor (MBR) Process Applying Novel Low Fouling Membrane
192
Chapter 5
of COD (bacterial “food”) entering to the tank and the “mass of bacteria” in the
tank.
The F/M ratio of the experiments carried out in P1 through P8 is around 0.1 Kg
COD/Kg MLSS.d as shown in Fig. 5.18. It represents that the F/M ratio has
very little effect in COD removal efficiency. The F/M ratio increased for a
short time in day102 which happed due to comparative low HRT (25h) and in
day265 due to feed decomposed (rotten). However, the value of F/M ratio ap-
plied in this section was close to the F/M ratio applied by Wu et al. (2013) in a
full scale MBR operation treating TFT-LCD (Thin-film transistor liquid crystal
display) wastewater with high strength of organic nitrogen where they found
expected performance with increased nitrification at F/M ratio in the range of
0.1 to 0.3 COD/Kg MLSS.d. But almost no nitrification was observed at F/M
ratio of 0.1 COD/Kg MLSS.d. in this PhD works as it is described in section
5.6.5. Further investigation for poor nitrification needs to be done.
Fig. 5.18 : F/M ratio on COD removal efficiency
5.6.9 Chloride concentration and conductivity
The analysis of Chloride (Cl-) concentrations were performed to check that
permeate contains the same concentration of Cl- as in MTDW. Because, theo-
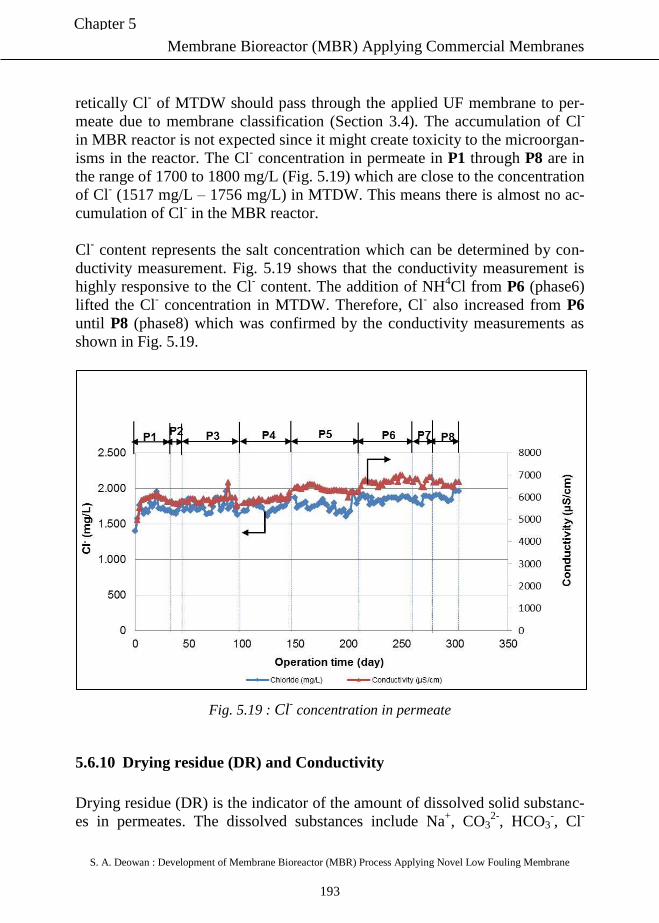
Membrane Bioreactor (MBR) Applying Commercial Membranes
S. A. Deowan : Development of Membrane Bioreactor (MBR) Process Applying Novel Low Fouling Membrane
193
Chapter 5
retically Cl- of MTDW should pass through the applied UF membrane to per-
meate due to membrane classification (Section 3.4). The accumulation of Cl-
in MBR reactor is not expected since it might create toxicity to the microorgan-
isms in the reactor. The Cl- concentration in permeate in P1 through P8 are in
the range of 1700 to 1800 mg/L (Fig. 5.19) which are close to the concentration
of Cl- (1517 mg/L – 1756 mg/L) in MTDW. This means there is almost no ac-
cumulation of Cl- in the MBR reactor.
Cl- content represents the salt concentration which can be determined by con-
ductivity measurement. Fig. 5.19 shows that the conductivity measurement is
highly responsive to the Cl- content. The addition of NH
4Cl from P6 (phase6)
lifted the Cl- concentration in MTDW. Therefore, Cl
- also increased from P6
until P8 (phase8) which was confirmed by the conductivity measurements as
shown in Fig. 5.19.
Fig. 5.19 : Cl- concentration in permeate
5.6.10 Drying residue (DR) and Conductivity
Drying residue (DR) is the indicator of the amount of dissolved solid substanc-
es in permeates. The dissolved substances include Na+, CO3
2-, HCO3
-, Cl
-
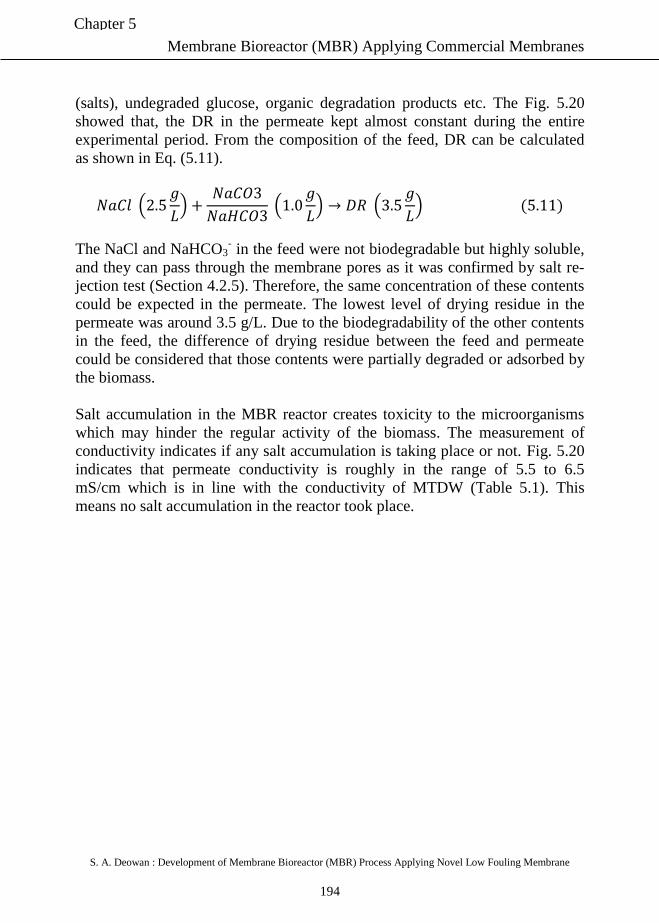
Membrane Bioreactor (MBR) Applying Commercial Membranes
S. A. Deowan : Development of Membrane Bioreactor (MBR) Process Applying Novel Low Fouling Membrane
194
Chapter 5
(salts), undegraded glucose, organic degradation products etc. The Fig. 5.20
showed that, the DR in the permeate kept almost constant during the entire
experimental period. From the composition of the feed, DR can be calculated
as shown in Eq. (5.11).
(
)
(
) (
) ( )
The NaCl and NaHCO3- in the feed were not biodegradable but highly soluble,
and they can pass through the membrane pores as it was confirmed by salt re-
jection test (Section 4.2.5). Therefore, the same concentration of these contents
could be expected in the permeate. The lowest level of drying residue in the
permeate was around 3.5 g/L. Due to the biodegradability of the other contents
in the feed, the difference of drying residue between the feed and permeate
could be considered that those contents were partially degraded or adsorbed by
the biomass.
Salt accumulation in the MBR reactor creates toxicity to the microorganisms
which may hinder the regular activity of the biomass. The measurement of
conductivity indicates if any salt accumulation is taking place or not. Fig. 5.20
indicates that permeate conductivity is roughly in the range of 5.5 to 6.5
mS/cm which is in line with the conductivity of MTDW (Table 5.1). This
means no salt accumulation in the reactor took place.
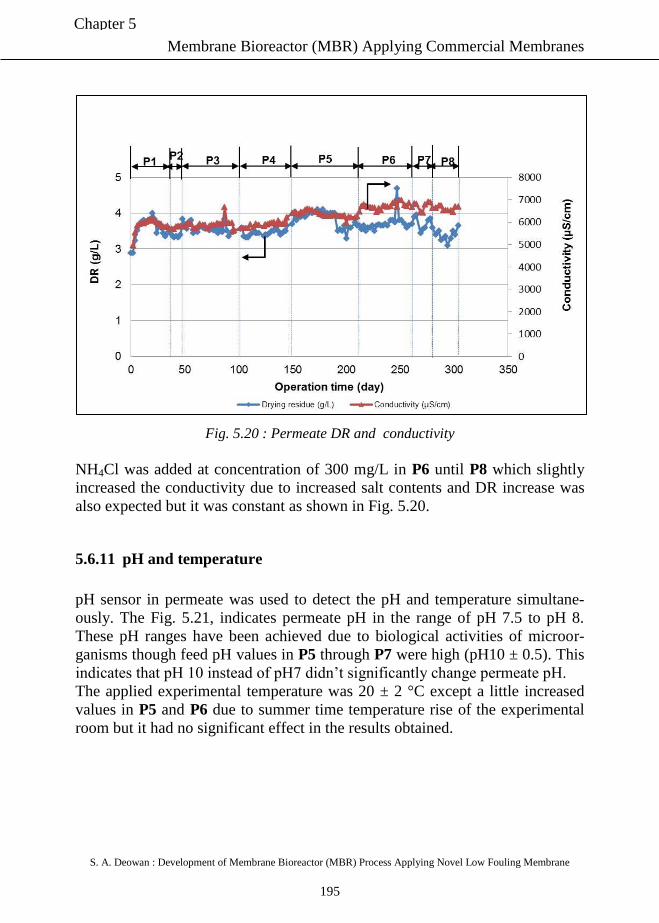
Membrane Bioreactor (MBR) Applying Commercial Membranes
S. A. Deowan : Development of Membrane Bioreactor (MBR) Process Applying Novel Low Fouling Membrane
195
Chapter 5
Fig. 5.20 : Permeate DR and conductivity
NH4Cl was added at concentration of 300 mg/L in P6 until P8 which slightly
increased the conductivity due to increased salt contents and DR increase was
also expected but it was constant as shown in Fig. 5.20.
5.6.11 pH and temperature
pH sensor in permeate was used to detect the pH and temperature simultane-
ously. The Fig. 5.21, indicates permeate pH in the range of pH 7.5 to pH 8.
These pH ranges have been achieved due to biological activities of microor-
ganisms though feed pH values in P5 through P7 were high (pH10 ± 0.5). This
indicates that pH 10 instead of pH7 didn’t significantly change permeate pH.
The applied experimental temperature was 20 ± 2 °C except a little increased
values in P5 and P6 due to summer time temperature rise of the experimental
room but it had no significant effect in the results obtained.
Membrane Bioreactor (MBR) Applying Commercial Membranes
S. A. Deowan : Development of Membrane Bioreactor (MBR) Process Applying Novel Low Fouling Membrane
196
Chapter 5
Fig. 5.21 : pH and temperature of permeate
5.6.12 Critical flux
According to Clech et al. (2003) no single and precise agreed protocol exists
for critical flux measurement. A common practice is to incrementally increase
the flux for fixed duration for each increment, giving a stable TMP at low flux
but an ever-increasing rate of TMP increase at fluxes beyond critical flux (
Bouhabila, 1998, Chen, 1997, Defrance, 1999a, Defrance, 1999b) . This meth-
od is preferred over the TMP-step method since it provides better control of the
flow of material deposition on the membrane surface, as the convective flow of
solute towards the membrane is constant during the run (Defrance, 1999a).
According to Bouhabila (1998), by plotting flux against TMP, it is possible to
observe the transition between constant and non-constant permeability at the
onset of fouling. The flux at this transition has been termed “Secondary critical
flux”. This approach was followed in this PhD works to determine critical flux.
For determining critical flux, the power of the suction pump (in terms of ap-
plied voltage) was increased step wise (Table 5.6) to have step wise flux in-
crease with corresponding TMP. The experiment was carried out for 100
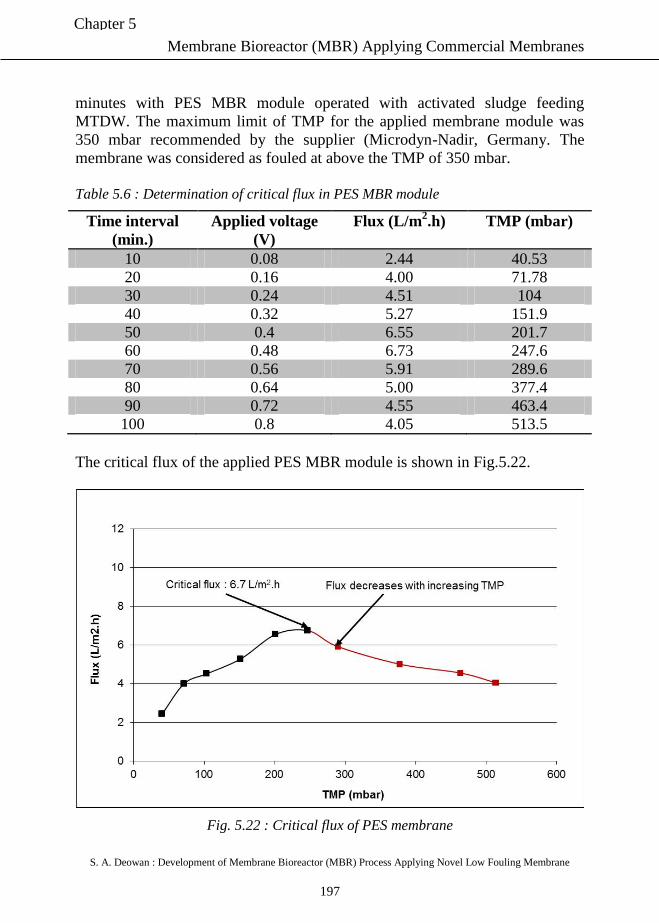
Membrane Bioreactor (MBR) Applying Commercial Membranes
S. A. Deowan : Development of Membrane Bioreactor (MBR) Process Applying Novel Low Fouling Membrane
197
Chapter 5
minutes with PES MBR module operated with activated sludge feeding
MTDW. The maximum limit of TMP for the applied membrane module was
350 mbar recommended by the supplier (Microdyn-Nadir, Germany. The
membrane was considered as fouled at above the TMP of 350 mbar.
Table 5.6 : Determination of critical flux in PES MBR module
Time interval
(min.)
Applied voltage
(V)
Flux (L/m2.h) TMP (mbar)
10 0.08 2.44 40.53
20 0.16 4.00 71.78
30 0.24 4.51 104
40 0.32 5.27 151.9
50 0.4 6.55 201.7
60 0.48 6.73 247.6
70 0.56 5.91 289.6
80 0.64 5.00 377.4
90 0.72 4.55 463.4
100 0.8 4.05 513.5
The critical flux of the applied PES MBR module is shown in Fig.5.22.
Fig. 5.22 : Critical flux of PES membrane
Membrane Bioreactor (MBR) Applying Commercial Membranes
S. A. Deowan : Development of Membrane Bioreactor (MBR) Process Applying Novel Low Fouling Membrane
198
Chapter 5
Fig. 5.22 shows the maximum flux 6.7 L/m2.h at TMP of 247 mbar. After that
the flux declined with increased TMP which is the indication of severe fouling.
So, the critical flux of the membrane is 6.7 L/m2.h.
5.6.13 Membrane resistance model
According to Dracy’s Law a relationship between TMP and flux can be devel-
oped as shown in Eq. (5.12) (Section 2.1.3).
( )
Where,
J = Membrane permeate flux (L/m2.h)
TMP = Transmembrane pressure (mbar)
μ = Dynamic viscosity of permeate (N.s/m2)
Rt = Total filtration resistance (1/m)
Rt can be expressed as the sum of individual resistances which can be varied
based on the number and type of resistances considered (adapted from Jifeng et
al., 2008). For this thesis, the expression of Rt was different based on the test
media and experimental set up. Rt for model foulant humic acid, model textile
dye wastewater and MBR sludge were defined as R_f, R_dye and R_mbr re-
spectively and these are shown in Eq. (5.13) through Eq. (5.15).
( )
( )
( )
Where,
Rm = Constant resistance of the clean membrane (1/m)
Rha = Fouling resistance due to humic acid (1/m)
Rmtdw = Fouling resistance due to MTDW (1/m)
Rsludge = Fouling resistance due to MBR sludge deposited on membrane
surface (1/m)
Membrane Bioreactor (MBR) Applying Commercial Membranes
S. A. Deowan : Development of Membrane Bioreactor (MBR) Process Applying Novel Low Fouling Membrane
199
Chapter 5
Eq. (5.13) can be termed as resistance in membrane series (RIS) model which
is applied to describe membrane fouling mechanisms (Jifeng et al. 2008).
In this section of the thesis works, the RIS model has been adapted according
to applied experimental set ups and test media. The membrane resistances in
different experimental set ups with varied test media have been calculated in
the following sections.
a) Resistances in “UF_auto” set up with model foulant humic acid
(HA)
Prior to MBR applications, the commercial UF PES membrane was tested with
model foulant humic acid (HA) to check the fouling behaviour of the mem-
brane. The experimental set up used in this experiment was an auto-controlled
UF cross-flow testing cell (Section 3.3, Fig. 3.5), termed as “UF-auto” in this
section. Before starting the experiment with humic acid, the pure resistance of
the membrane with DI water was determined. The TMP of the experiment was
500 mbar and the obtained flux was 319.80 L/m2.h with DI water. Considering
dynamic viscosity of the water as 1.002*10-3
at 20°C (Raymond, 1996), Rm
was calculated using Eq. (5.12) to 0.56*1012
1/m. In this calculation, dynamic
viscosity of water was assumed to be equal to that of permeate.
Similarly, the fouling test was carried out with humic acid applying UF auto set
up and membrane resistance was calculated using Eq. (5.13). In this case, flux
of the experiment was 63.67 L/m2.h with TMP of 500 mbar. Using the same
viscosity value, the calculated membrane resistance (denoted as Rha) was
2.26*1012
1/m. In summary, pure membrane resistance contributes to around
20% to its total resistance where the rest of the 80% is contributed by humic
acid.
b) Resistances in “UF_manu” set up with MTDW
The commercial PES membrane was also tested with model textile dyes to
check the affinity of dyes to the membrane surface. The experimental set up
used in this experiment was a manually -controlled UF cross-flow testing cell
(Section 3.3, Fig. 3.3), termed as “UF-manu” in this section. The TMP of the
experiment was 1500 mbar and the obtained flux was 528.17 L/m2.h with DI
water. Considering dynamic viscosity of the water as 1.002*10-3
at 20°C
(Raymond, 1996), Rm was calculated using Eq. (5.12) to 1.02*1012
1/m.
Membrane Bioreactor (MBR) Applying Commercial Membranes
S. A. Deowan : Development of Membrane Bioreactor (MBR) Process Applying Novel Low Fouling Membrane
200
Chapter 5
Similarly, the test was carried out with MTDW and membrane resistance was
calculated using Eq. (5.14). In this case, flux of the experiment was 231.92
L/m2.h with TMP of 1500 mbar. Using the same viscosity value, the calculated
membrane resistance (denoted as Rmtdw) was 2.32*1012
1/m. In summary,
membrane resistance contributes to around 30% to its total resistance where the
rest of the 70% was contributed by MTDW.
c) Resistances in MBR experiment with biological sludge
In MBR experiment, firstly the test was carried out with DI water before the
trial with biological sludge (Section 5.2). The TMP of the experiment was 50
mbar and the obtained flux was around 25 L/m2.h with DI water (Fig.5.1).
Considering the same dynamic viscosity of the water as 1.002*10-3
, Rm was
calculated using Eq. (5.12) to 0.72*1012
1/m.
After that the experiment was carried out in MBR set up for almost 300 days
starting from P1 until P8 (Section 5.6).
In this case, the average flux of the entire experiment was 2.8 L/m2.h with av-
erage TMP of 82.16 mbar. Using the same viscosity value, the calculated
membrane resistance (denoted as Rsludge) using Eq. (5.15) was 10.54*1012
1/m.
In summary, membrane resistance contributes to around 7% to its total re-
sistance where the rest of the 93% was contributed by biological sludge.
The summary of different resistances in different experiments is presented in
Fig. 5.23 and Fig. 5.24. From Fig. 5.23, it is clear that the resistances with hu-
mic acid, MTDW and MBR have been increased significantly compared to
their pure membrane resistances. This means that these kinds of media signifi-
cantly contribute to membrane fouling. Fig. 5.24 indicates that percentage re-
sistances of MBR bio sludge, humic acid and MTDW in their respective exper-
iments are 93%, 80% and 70% respectively and these values compared to their
pure membrane resistances are very high.
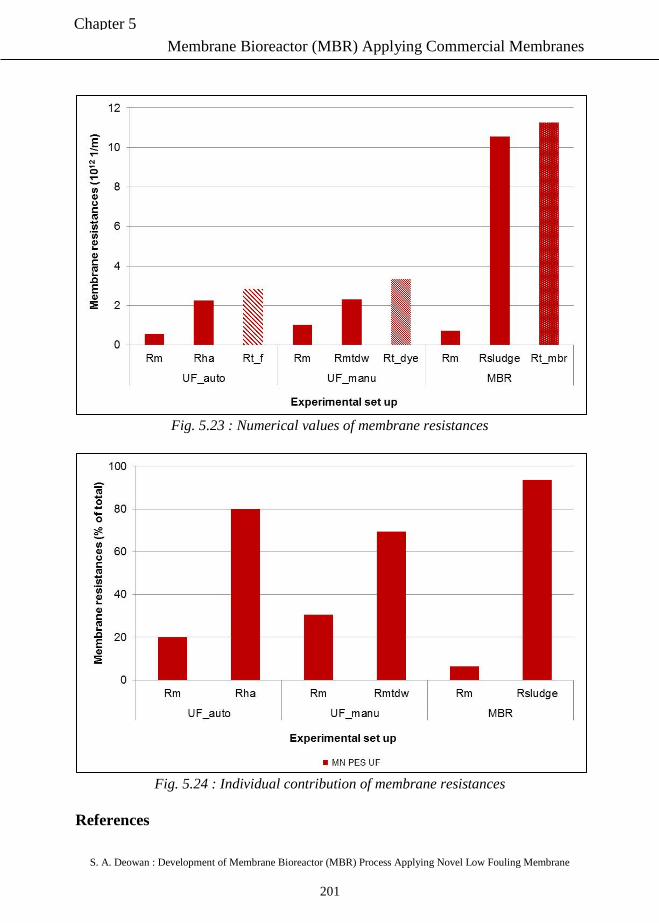
Membrane Bioreactor (MBR) Applying Commercial Membranes
S. A. Deowan : Development of Membrane Bioreactor (MBR) Process Applying Novel Low Fouling Membrane
201
Chapter 5
Fig. 5.23 : Numerical values of membrane resistances
Fig. 5.24 : Individual contribution of membrane resistances
References
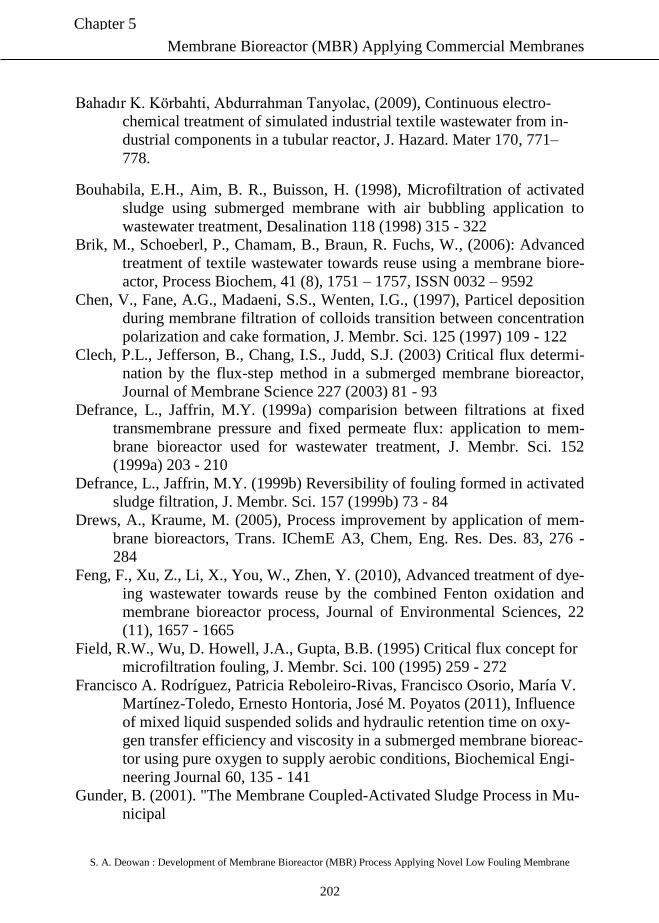
Membrane Bioreactor (MBR) Applying Commercial Membranes
S. A. Deowan : Development of Membrane Bioreactor (MBR) Process Applying Novel Low Fouling Membrane
202
Chapter 5
Bahadır K. Körbahti, Abdurrahman Tanyolac, (2009), Continuous electro-
chemical treatment of simulated industrial textile wastewater from in-
dustrial components in a tubular reactor, J. Hazard. Mater 170, 771–
778.
Bouhabila, E.H., Aim, B. R., Buisson, H. (1998), Microfiltration of activated
sludge using submerged membrane with air bubbling application to
wastewater treatment, Desalination 118 (1998) 315 - 322
Brik, M., Schoeberl, P., Chamam, B., Braun, R. Fuchs, W., (2006): Advanced
treatment of textile wastewater towards reuse using a membrane biore-
actor, Process Biochem, 41 (8), 1751 – 1757, ISSN 0032 – 9592
Chen, V., Fane, A.G., Madaeni, S.S., Wenten, I.G., (1997), Particel deposition
during membrane filtration of colloids transition between concentration
polarization and cake formation, J. Membr. Sci. 125 (1997) 109 - 122
Clech, P.L., Jefferson, B., Chang, I.S., Judd, S.J. (2003) Critical flux determi-
nation by the flux-step method in a submerged membrane bioreactor,
Journal of Membrane Science 227 (2003) 81 - 93
Defrance, L., Jaffrin, M.Y. (1999a) comparision between filtrations at fixed
transmembrane pressure and fixed permeate flux: application to mem-
brane bioreactor used for wastewater treatment, J. Membr. Sci. 152
(1999a) 203 - 210
Defrance, L., Jaffrin, M.Y. (1999b) Reversibility of fouling formed in activated
sludge filtration, J. Membr. Sci. 157 (1999b) 73 - 84
Drews, A., Kraume, M. (2005), Process improvement by application of mem-
brane bioreactors, Trans. IChemE A3, Chem, Eng. Res. Des. 83, 276 -
284
Feng, F., Xu, Z., Li, X., You, W., Zhen, Y. (2010), Advanced treatment of dye-
ing wastewater towards reuse by the combined Fenton oxidation and
membrane bioreactor process, Journal of Environmental Sciences, 22
(11), 1657 - 1665
Field, R.W., Wu, D. Howell, J.A., Gupta, B.B. (1995) Critical flux concept for
microfiltration fouling, J. Membr. Sci. 100 (1995) 259 - 272
Francisco A. Rodríguez, Patricia Reboleiro-Rivas, Francisco Osorio, María V.
Martínez-Toledo, Ernesto Hontoria, José M. Poyatos (2011), Influence
of mixed liquid suspended solids and hydraulic retention time on oxy-
gen transfer efficiency and viscosity in a submerged membrane bioreac-
tor using pure oxygen to supply aerobic conditions, Biochemical Engi-
neering Journal 60, 135 - 141
Gunder, B. (2001). "The Membrane Coupled-Activated Sludge Process in Mu-
nicipal
Membrane Bioreactor (MBR) Applying Commercial Membranes
S. A. Deowan : Development of Membrane Bioreactor (MBR) Process Applying Novel Low Fouling Membrane
203
Chapter 5
Wastewater Treatment." Technomic Publishing Company Inc., Lancas-
ter, USA
Hach Lange, 2013, http://www.hachlange.ma, accessed on November 23, 2013
Henke, J., Lemac, M., Wagner, M., Cornel, P. (2009), Oxygen transfer in
membrane bioreactors treating synthetic greywater, Water Res. 43,
1711 - 1719
Huang, R.R., Hoinkis, J., Hu, Q., Koch, F. (2009), Treatment of dyeing
wastewater by hollow fiber membrane biological reactor, J. Desalina-
tion and Water Treatment, 11, 1 - 6
Idil A., A., Isil, A., B., Bahnemann, D.W., (2002), Advanced oxidation of a
reactive dyebath effluent:comparison of O3, H2O2/UV-A processes, wa-
ter research 36, 1143-1154.
Iranpour, R, Magallanes, A., Zermeno, M., Varsh, V. Brishamchi, A.,
Stenstrom, M. (2000), Assesment of aeration basin performance effi-
ciency: sampling methods and tank coverage, Water Res. 34 (12), 3137
- 3152
Isik, M., Sponza, D. T., (2008), Anaerobic/ aerobic treatment of a simulated
textile wastewater, separation and purification technology 60, 64-72.
Judd, S. (2006), The MBR Book: Principles and Applications of Membrane
Bioreactors in Water and Wastewater Treatment, editor, Elsevier
Jifeng, G., Siqing, X., Rongchang, W. (2008), Study on Membrane Fouling of
Submerged Membrane Bioreactor in Treating Bathing Wastewater,
Journal of Environmental Sciences 20, 1158–1167
Krampe, J., and Krauth, K. (2003), Oxygen transfer into activated sludge with
high
MLSS concentrations. Water Science and Technology 47, 297-303.
Lin, S.H., Peng, C.F. (1996), Continuous treatment of textile wastewater by
combined coagulation, electrochemical oxidation and activated sludge,
Water Res. 30, 587–592.
Microdyn-Nadir GmbH (2010). MBR operating manual, Wiesbaden, Germany,
www.microdyn-nadir.de.
Noor Sabrina Ahmad Mutamim, Zainura Zainon Noor, Mohd Ariffin Abu Has-
san, Gustaf Olsson, (2012), Application of membrane bioreactor tech-
nology in treating high strength industrial wastewater: a performance
review, Desalination 305, 1–11
Online MBR info (2013),
http://onlinembr.info/MBR%20Design/MLSS%20and%20viscosity.htm
, accessed on 27.10.2013
Membrane Bioreactor (MBR) Applying Commercial Membranes
S. A. Deowan : Development of Membrane Bioreactor (MBR) Process Applying Novel Low Fouling Membrane
204
Chapter 5
Palacios, S. (2009), Decolourization of azo and anthraquinone dyes by mean of
microorganisms growing on wood chips, thesis, school of technology
and design, department of bioenergy, Vaxjo, University, Sweden
Raymond A. Serway (1996), Physics for Scientists & Engineers (4th ed.).
Saunders College Publishing. ISBN 0-03-005932-1
Trussell, R.R., Merlo, R.P., Hermanowicz, S.W. (2007), Influence of mixed
liquor properties and aeration intensity on membrane fouling in a sub-
merged membrane bioreactor at high mixed liquor suspended solids
concentration, Water Research, 41 (5), 947 - 958
Van Nieuwenhuijzen, A.F., Evenblij, H., Uijterlinde, C.A. (2008), Review on
the state of science on membrnae bioreactors for municipal wastewater
treatment, Water Science and Technology, 57(7), 979 - 986
Viero, A.F., Sant’ Anna Jr., G. L. (2008), Is hydraulic retentime an essential
parameter for MBR performance?, Journal of Hazardous Materials 150,
185 – 186
Visvanathan, C., Ben Aim, R., Parameshwaran, K. (2000), Membrane separa-
tion bioreactors for wastewater treatment, Critical Review in Environ-
mental Science and Technology, 30 (1), 1 - 48
Yang, W.B., Cickek, N., and Ilg, J. (2006), State-of-the –art of membrane bio-
reactors: Worldwide research and commercial applications in North
America, Journal of Membrane Science, 270 (1-2), 201 - 211
Yigit, N.O., Uzal, N., Koseoglu, H., Harman, I., Yukseler, H., Yetis, U., Civel-
ekoglu, G., Kitis, M. (2009), Treatment of a denim producing textile in-
dustry wastewater using pilot-scale membrane bioreactor, Desalination
240, 143 - 150
Zheng, X. and Liu, J. (2006), Dyeing an printing wastewater treatment using a
membrane bioreactor with a gravity drain, Desalination, 190, 277 – 286
Wastewater handbook (2013)
http://www.wastewaterhandbook.com/webpg/th_organics_34OUR.htm
#3_4_1, accessed on November 24, 2013
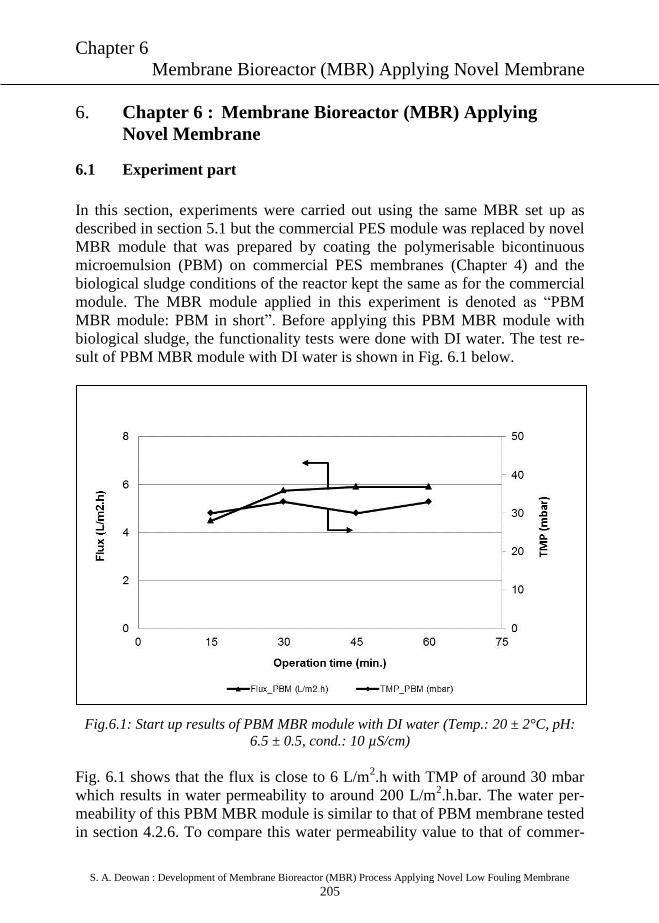
Chapter 6
Membrane Bioreactor (MBR) Applying Novel Membrane
S. A. Deowan : Development of Membrane Bioreactor (MBR) Process Applying Novel Low Fouling Membrane
205
6. Chapter 6 : Membrane Bioreactor (MBR) Applying
Novel Membrane
6.1 Experiment part
In this section, experiments were carried out using the same MBR set up as
described in section 5.1 but the commercial PES module was replaced by novel
MBR module that was prepared by coating the polymerisable bicontinuous
microemulsion (PBM) on commercial PES membranes (Chapter 4) and the
biological sludge conditions of the reactor kept the same as for the commercial
module. The MBR module applied in this experiment is denoted as “PBM
MBR module: PBM in short”. Before applying this PBM MBR module with
biological sludge, the functionality tests were done with DI water. The test re-
sult of PBM MBR module with DI water is shown in Fig. 6.1 below.
Fig.6.1: Start up results of PBM MBR module with DI water (Temp.: 20 ± 2°C, pH:
6.5 ± 0.5, cond.: 10 µS/cm)
Fig. 6.1 shows that the flux is close to 6 L/m2.h with TMP of around 30 mbar
which results in water permeability to around 200 L/m2.h.bar. The water per-
meability of this PBM MBR module is similar to that of PBM membrane tested
in section 4.2.6. To compare this water permeability value to that of commer-
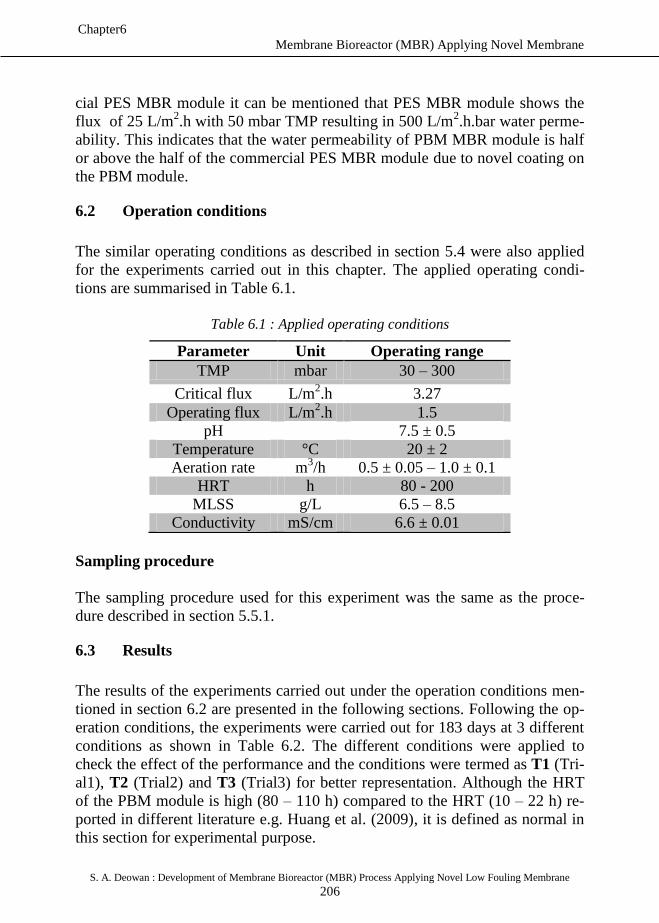
Membrane Bioreactor (MBR) Applying Novel Membrane
S. A. Deowan : Development of Membrane Bioreactor (MBR) Process Applying Novel Low Fouling Membrane
206
Chapter6
cial PES MBR module it can be mentioned that PES MBR module shows the
flux of 25 L/m2.h with 50 mbar TMP resulting in 500 L/m
2.h.bar water perme-
ability. This indicates that the water permeability of PBM MBR module is half
or above the half of the commercial PES MBR module due to novel coating on
the PBM module.
6.2 Operation conditions
The similar operating conditions as described in section 5.4 were also applied
for the experiments carried out in this chapter. The applied operating condi-
tions are summarised in Table 6.1.
Table 6.1 : Applied operating conditions
Parameter Unit Operating range
TMP mbar 30 – 300
Critical flux L/m2.h 3.27
Operating flux L/m2.h 1.5
pH 7.5 ± 0.5
Temperature °C 20 ± 2
Aeration rate m3/h 0.5 ± 0.05 – 1.0 ± 0.1
HRT h 80 - 200
MLSS g/L 6.5 – 8.5
Conductivity mS/cm 6.6 ± 0.01
Sampling procedure
The sampling procedure used for this experiment was the same as the proce-
dure described in section 5.5.1.
6.3 Results
The results of the experiments carried out under the operation conditions men-
tioned in section 6.2 are presented in the following sections. Following the op-
eration conditions, the experiments were carried out for 183 days at 3 different
conditions as shown in Table 6.2. The different conditions were applied to
check the effect of the performance and the conditions were termed as T1 (Tri-
al1), T2 (Trial2) and T3 (Trial3) for better representation. Although the HRT
of the PBM module is high (80 – 110 h) compared to the HRT (10 – 22 h) re-
ported in different literature e.g. Huang et al. (2009), it is defined as normal in
this section for experimental purpose.
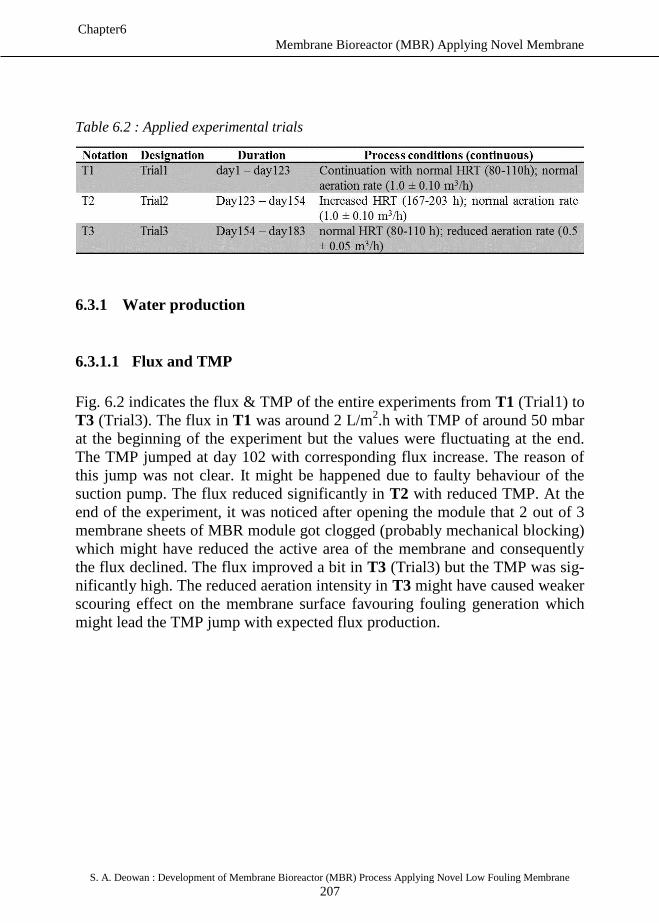
Membrane Bioreactor (MBR) Applying Novel Membrane
S. A. Deowan : Development of Membrane Bioreactor (MBR) Process Applying Novel Low Fouling Membrane
207
Chapter6
Table 6.2 : Applied experimental trials
6.3.1 Water production
6.3.1.1 Flux and TMP
Fig. 6.2 indicates the flux & TMP of the entire experiments from T1 (Trial1) to
T3 (Trial3). The flux in T1 was around 2 L/m2.h with TMP of around 50 mbar
at the beginning of the experiment but the values were fluctuating at the end.
The TMP jumped at day 102 with corresponding flux increase. The reason of
this jump was not clear. It might be happened due to faulty behaviour of the
suction pump. The flux reduced significantly in T2 with reduced TMP. At the
end of the experiment, it was noticed after opening the module that 2 out of 3
membrane sheets of MBR module got clogged (probably mechanical blocking)
which might have reduced the active area of the membrane and consequently
the flux declined. The flux improved a bit in T3 (Trial3) but the TMP was sig-
nificantly high. The reduced aeration intensity in T3 might have caused weaker
scouring effect on the membrane surface favouring fouling generation which
might lead the TMP jump with expected flux production.
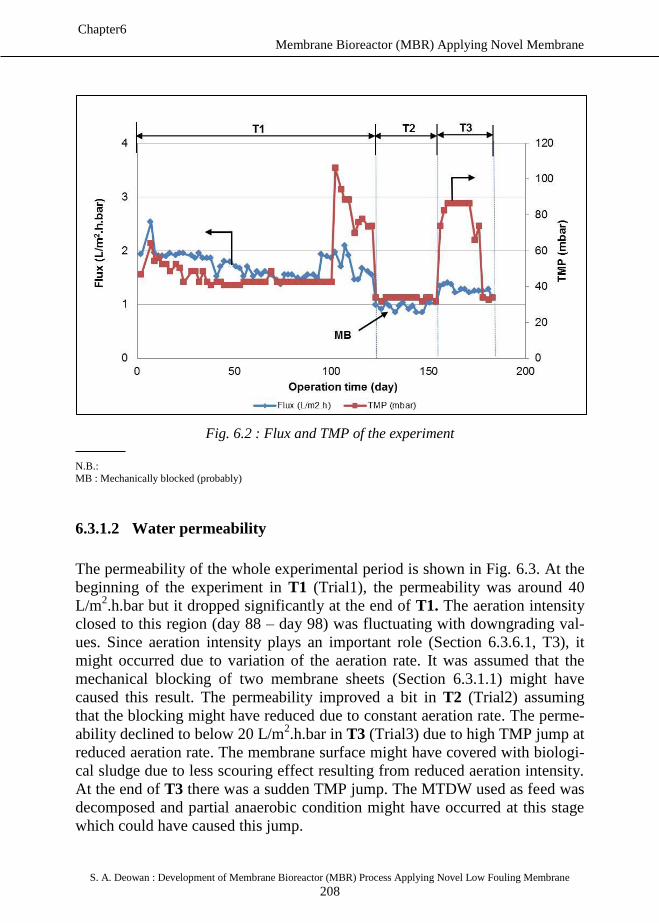
Membrane Bioreactor (MBR) Applying Novel Membrane
S. A. Deowan : Development of Membrane Bioreactor (MBR) Process Applying Novel Low Fouling Membrane
208
Chapter6
Fig. 6.2 : Flux and TMP of the experiment
N.B.:
MB : Mechanically blocked (probably)
6.3.1.2 Water permeability
The permeability of the whole experimental period is shown in Fig. 6.3. At the
beginning of the experiment in T1 (Trial1), the permeability was around 40
L/m2.h.bar but it dropped significantly at the end of T1. The aeration intensity
closed to this region (day 88 – day 98) was fluctuating with downgrading val-
ues. Since aeration intensity plays an important role (Section 6.3.6.1, T3), it
might occurred due to variation of the aeration rate. It was assumed that the
mechanical blocking of two membrane sheets (Section 6.3.1.1) might have
caused this result. The permeability improved a bit in T2 (Trial2) assuming
that the blocking might have reduced due to constant aeration rate. The perme-
ability declined to below 20 L/m2.h.bar in T3 (Trial3) due to high TMP jump at
reduced aeration rate. The membrane surface might have covered with biologi-
cal sludge due to less scouring effect resulting from reduced aeration intensity.
At the end of T3 there was a sudden TMP jump. The MTDW used as feed was
decomposed and partial anaerobic condition might have occurred at this stage
which could have caused this jump.
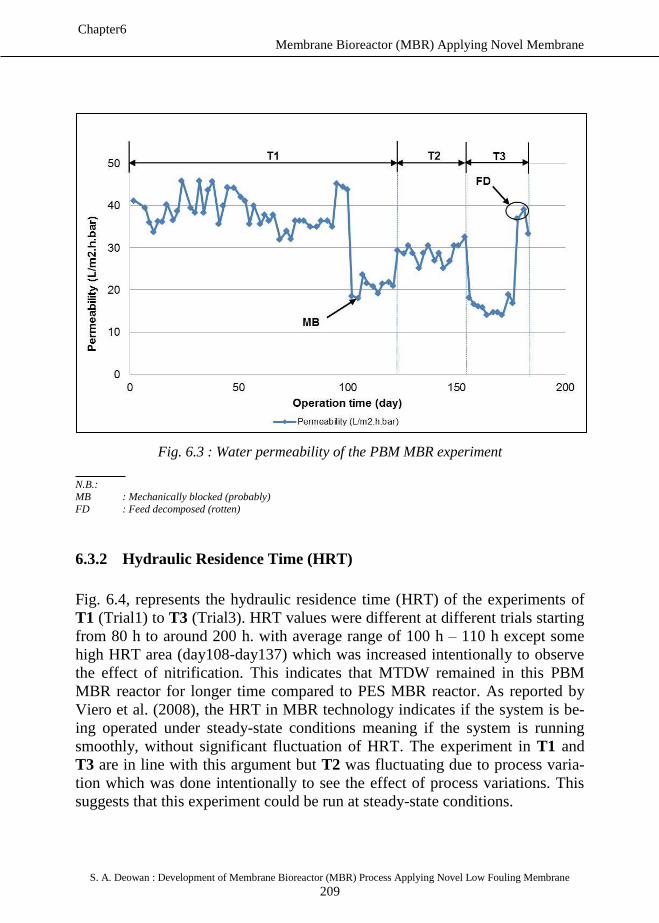
Membrane Bioreactor (MBR) Applying Novel Membrane
S. A. Deowan : Development of Membrane Bioreactor (MBR) Process Applying Novel Low Fouling Membrane
209
Chapter6
Fig. 6.3 : Water permeability of the PBM MBR experiment
N.B.:
MB : Mechanically blocked (probably)
FD : Feed decomposed (rotten)
6.3.2 Hydraulic Residence Time (HRT)
Fig. 6.4, represents the hydraulic residence time (HRT) of the experiments of
T1 (Trial1) to T3 (Trial3). HRT values were different at different trials starting
from 80 h to around 200 h. with average range of 100 h – 110 h except some
high HRT area (day108-day137) which was increased intentionally to observe
the effect of nitrification. This indicates that MTDW remained in this PBM
MBR reactor for longer time compared to PES MBR reactor. As reported by
Viero et al. (2008), the HRT in MBR technology indicates if the system is be-
ing operated under steady-state conditions meaning if the system is running
smoothly, without significant fluctuation of HRT. The experiment in T1 and
T3 are in line with this argument but T2 was fluctuating due to process varia-
tion which was done intentionally to see the effect of process variations. This
suggests that this experiment could be run at steady-state conditions.
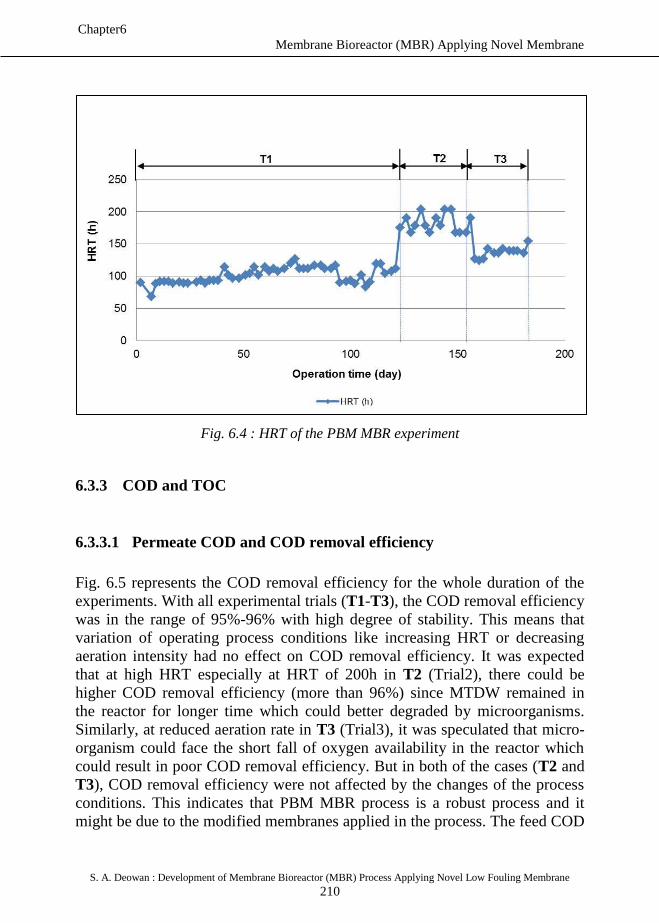
Membrane Bioreactor (MBR) Applying Novel Membrane
S. A. Deowan : Development of Membrane Bioreactor (MBR) Process Applying Novel Low Fouling Membrane
210
Chapter6
Fig. 6.4 : HRT of the PBM MBR experiment
6.3.3 COD and TOC
6.3.3.1 Permeate COD and COD removal efficiency
Fig. 6.5 represents the COD removal efficiency for the whole duration of the
experiments. With all experimental trials (T1-T3), the COD removal efficiency
was in the range of 95%-96% with high degree of stability. This means that
variation of operating process conditions like increasing HRT or decreasing
aeration intensity had no effect on COD removal efficiency. It was expected
that at high HRT especially at HRT of 200h in T2 (Trial2), there could be
higher COD removal efficiency (more than 96%) since MTDW remained in
the reactor for longer time which could better degraded by microorganisms.
Similarly, at reduced aeration rate in T3 (Trial3), it was speculated that micro-
organism could face the short fall of oxygen availability in the reactor which
could result in poor COD removal efficiency. But in both of the cases (T2 and
T3), COD removal efficiency were not affected by the changes of the process
conditions. This indicates that PBM MBR process is a robust process and it
might be due to the modified membranes applied in the process. The feed COD
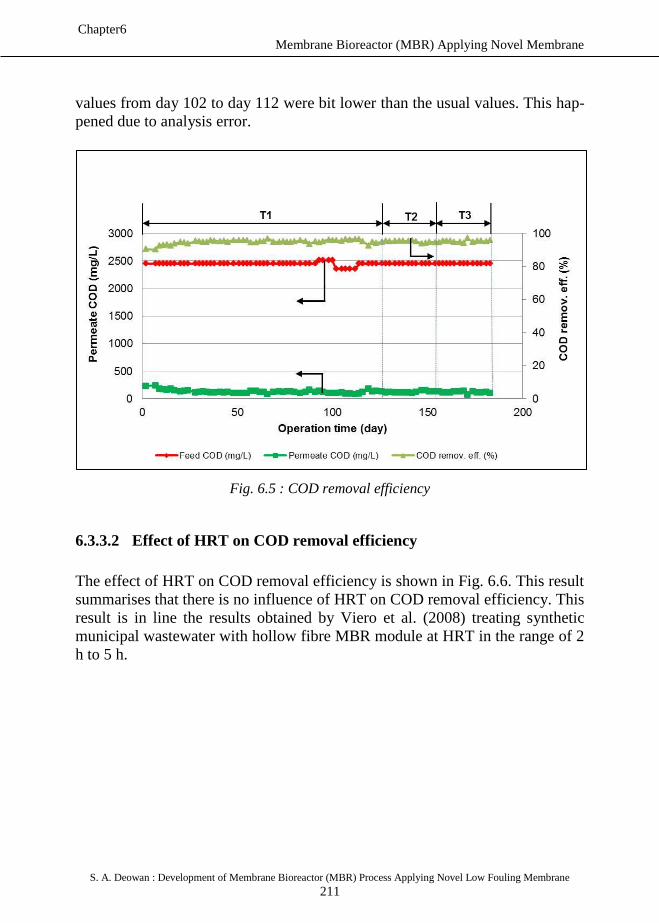
Membrane Bioreactor (MBR) Applying Novel Membrane
S. A. Deowan : Development of Membrane Bioreactor (MBR) Process Applying Novel Low Fouling Membrane
211
Chapter6
values from day 102 to day 112 were bit lower than the usual values. This hap-
pened due to analysis error.
Fig. 6.5 : COD removal efficiency
6.3.3.2 Effect of HRT on COD removal efficiency
The effect of HRT on COD removal efficiency is shown in Fig. 6.6. This result
summarises that there is no influence of HRT on COD removal efficiency. This
result is in line the results obtained by Viero et al. (2008) treating synthetic
municipal wastewater with hollow fibre MBR module at HRT in the range of 2
h to 5 h.
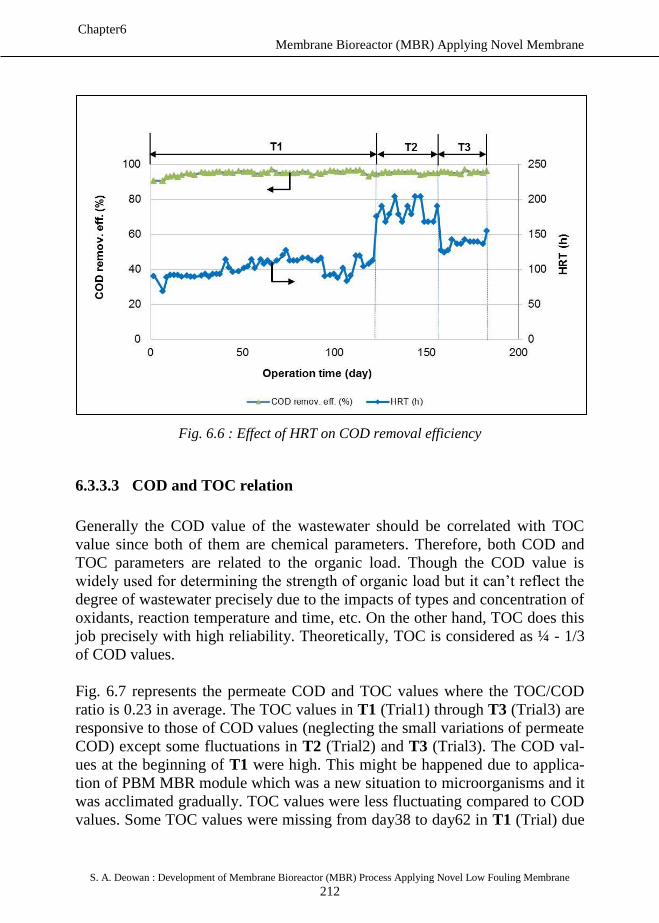
Membrane Bioreactor (MBR) Applying Novel Membrane
S. A. Deowan : Development of Membrane Bioreactor (MBR) Process Applying Novel Low Fouling Membrane
212
Chapter6
Fig. 6.6 : Effect of HRT on COD removal efficiency
6.3.3.3 COD and TOC relation
Generally the COD value of the wastewater should be correlated with TOC
value since both of them are chemical parameters. Therefore, both COD and
TOC parameters are related to the organic load. Though the COD value is
widely used for determining the strength of organic load but it can’t reflect the
degree of wastewater precisely due to the impacts of types and concentration of
oxidants, reaction temperature and time, etc. On the other hand, TOC does this
job precisely with high reliability. Theoretically, TOC is considered as ¼ - 1/3
of COD values.
Fig. 6.7 represents the permeate COD and TOC values where the TOC/COD
ratio is 0.23 in average. The TOC values in T1 (Trial1) through T3 (Trial3) are
responsive to those of COD values (neglecting the small variations of permeate
COD) except some fluctuations in T2 (Trial2) and T3 (Trial3). The COD val-
ues at the beginning of T1 were high. This might be happened due to applica-
tion of PBM MBR module which was a new situation to microorganisms and it
was acclimated gradually. TOC values were less fluctuating compared to COD
values. Some TOC values were missing from day38 to day62 in T1 (Trial) due
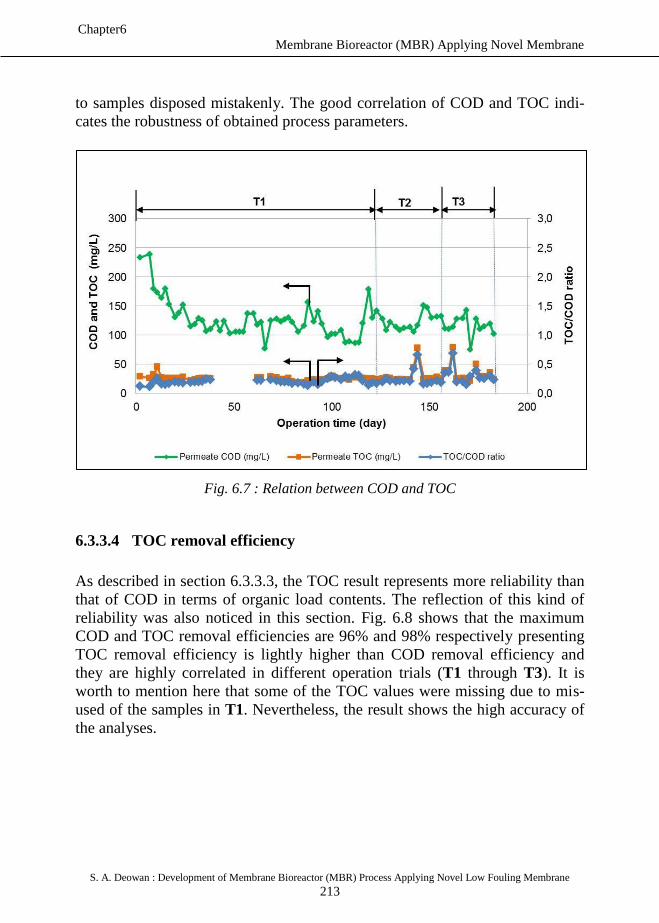
Membrane Bioreactor (MBR) Applying Novel Membrane
S. A. Deowan : Development of Membrane Bioreactor (MBR) Process Applying Novel Low Fouling Membrane
213
Chapter6
to samples disposed mistakenly. The good correlation of COD and TOC indi-
cates the robustness of obtained process parameters.
Fig. 6.7 : Relation between COD and TOC
6.3.3.4 TOC removal efficiency
As described in section 6.3.3.3, the TOC result represents more reliability than
that of COD in terms of organic load contents. The reflection of this kind of
reliability was also noticed in this section. Fig. 6.8 shows that the maximum
COD and TOC removal efficiencies are 96% and 98% respectively presenting
TOC removal efficiency is lightly higher than COD removal efficiency and
they are highly correlated in different operation trials (T1 through T3). It is
worth to mention here that some of the TOC values were missing due to mis-
used of the samples in T1. Nevertheless, the result shows the high accuracy of
the analyses.
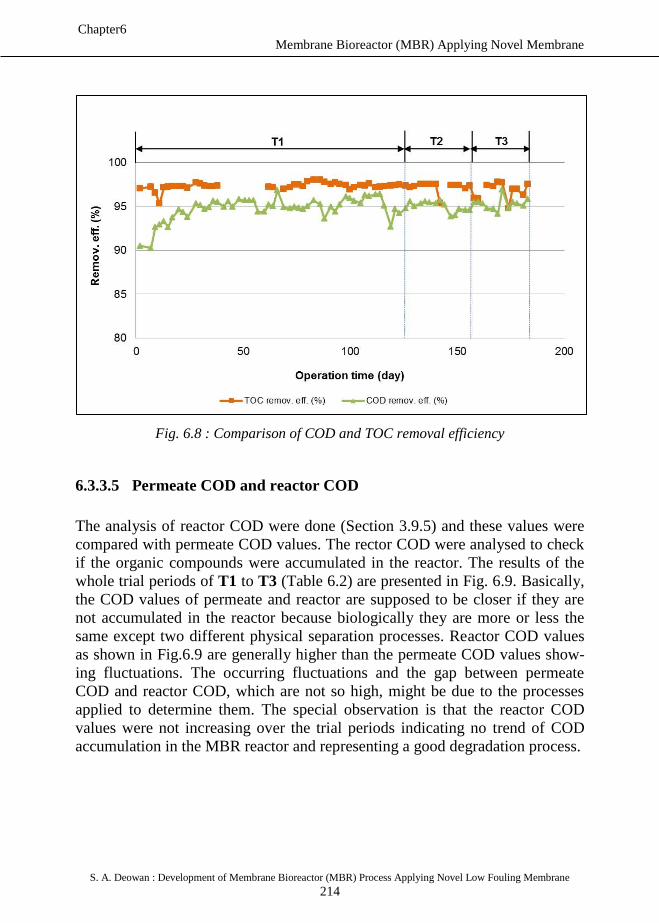
Membrane Bioreactor (MBR) Applying Novel Membrane
S. A. Deowan : Development of Membrane Bioreactor (MBR) Process Applying Novel Low Fouling Membrane
214
Chapter6
Fig. 6.8 : Comparison of COD and TOC removal efficiency
6.3.3.5 Permeate COD and reactor COD
The analysis of reactor COD were done (Section 3.9.5) and these values were
compared with permeate COD values. The rector COD were analysed to check
if the organic compounds were accumulated in the reactor. The results of the
whole trial periods of T1 to T3 (Table 6.2) are presented in Fig. 6.9. Basically,
the COD values of permeate and reactor are supposed to be closer if they are
not accumulated in the reactor because biologically they are more or less the
same except two different physical separation processes. Reactor COD values
as shown in Fig.6.9 are generally higher than the permeate COD values show-
ing fluctuations. The occurring fluctuations and the gap between permeate
COD and reactor COD, which are not so high, might be due to the processes
applied to determine them. The special observation is that the reactor COD
values were not increasing over the trial periods indicating no trend of COD
accumulation in the MBR reactor and representing a good degradation process.
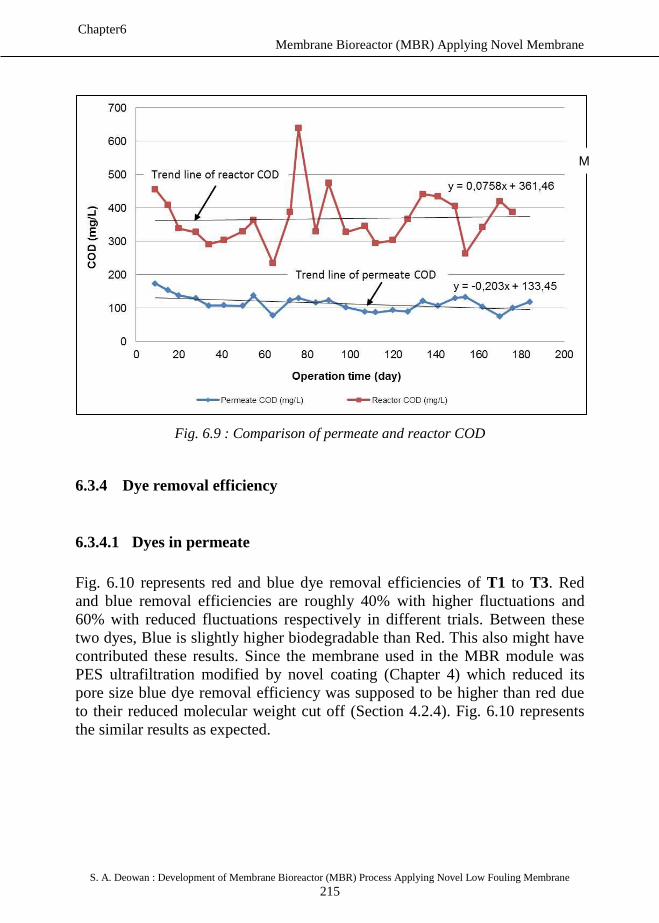
Membrane Bioreactor (MBR) Applying Novel Membrane
S. A. Deowan : Development of Membrane Bioreactor (MBR) Process Applying Novel Low Fouling Membrane
215
Chapter6
Fig. 6.9 : Comparison of permeate and reactor COD
6.3.4 Dye removal efficiency
6.3.4.1 Dyes in permeate
Fig. 6.10 represents red and blue dye removal efficiencies of T1 to T3. Red
and blue removal efficiencies are roughly 40% with higher fluctuations and
60% with reduced fluctuations respectively in different trials. Between these
two dyes, Blue is slightly higher biodegradable than Red. This also might have
contributed these results. Since the membrane used in the MBR module was
PES ultrafiltration modified by novel coating (Chapter 4) which reduced its
pore size blue dye removal efficiency was supposed to be higher than red due
to their reduced molecular weight cut off (Section 4.2.4). Fig. 6.10 represents
the similar results as expected.
M
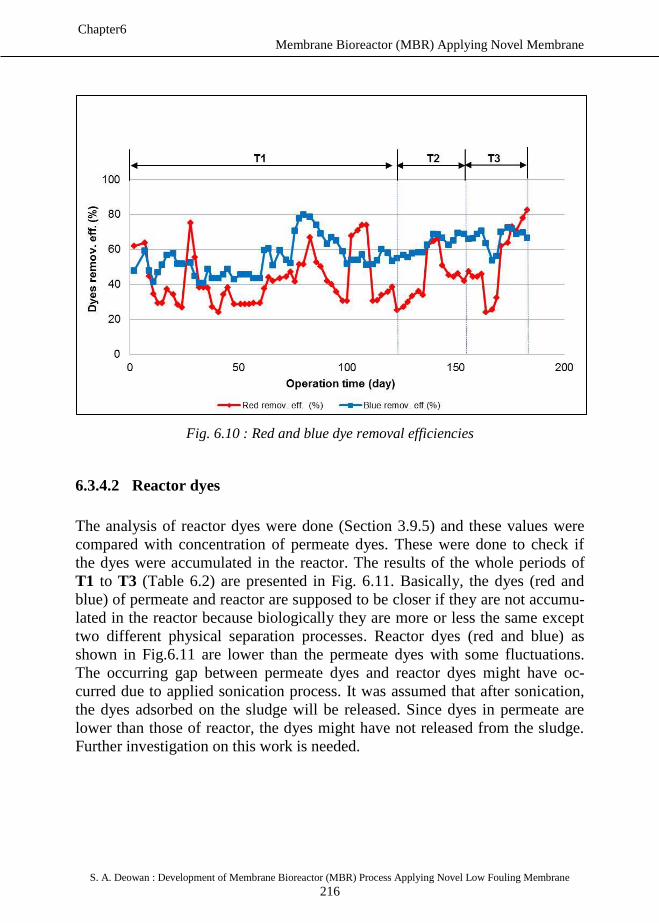
Membrane Bioreactor (MBR) Applying Novel Membrane
S. A. Deowan : Development of Membrane Bioreactor (MBR) Process Applying Novel Low Fouling Membrane
216
Chapter6
Fig. 6.10 : Red and blue dye removal efficiencies
6.3.4.2 Reactor dyes
The analysis of reactor dyes were done (Section 3.9.5) and these values were
compared with concentration of permeate dyes. These were done to check if
the dyes were accumulated in the reactor. The results of the whole periods of
T1 to T3 (Table 6.2) are presented in Fig. 6.11. Basically, the dyes (red and
blue) of permeate and reactor are supposed to be closer if they are not accumu-
lated in the reactor because biologically they are more or less the same except
two different physical separation processes. Reactor dyes (red and blue) as
shown in Fig.6.11 are lower than the permeate dyes with some fluctuations.
The occurring gap between permeate dyes and reactor dyes might have oc-
curred due to applied sonication process. It was assumed that after sonication,
the dyes adsorbed on the sludge will be released. Since dyes in permeate are
lower than those of reactor, the dyes might have not released from the sludge.
Further investigation on this work is needed.
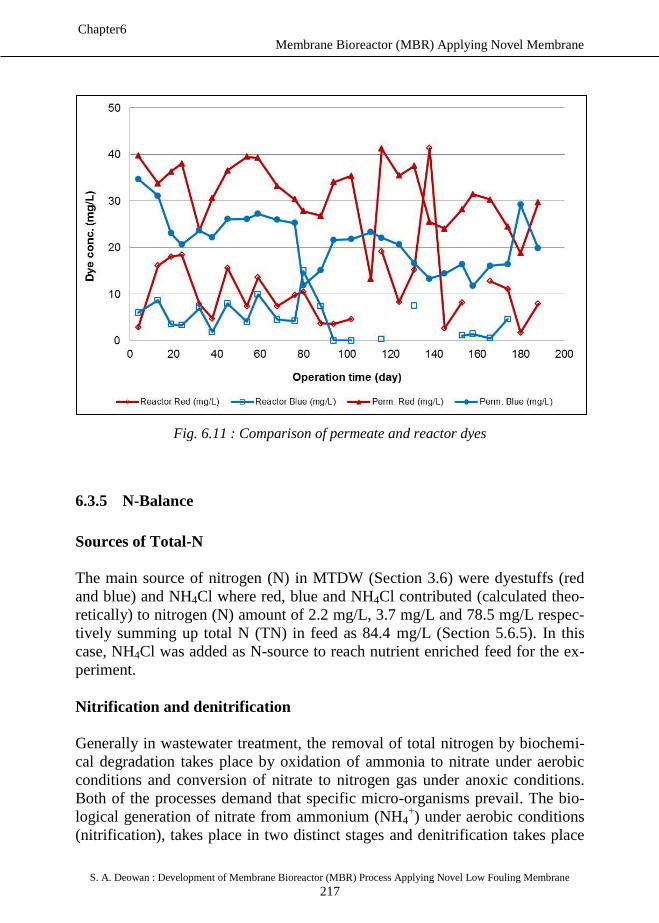
Membrane Bioreactor (MBR) Applying Novel Membrane
S. A. Deowan : Development of Membrane Bioreactor (MBR) Process Applying Novel Low Fouling Membrane
217
Chapter6
Fig. 6.11 : Comparison of permeate and reactor dyes
6.3.5 N-Balance
Sources of Total-N
The main source of nitrogen (N) in MTDW (Section 3.6) were dyestuffs (red
and blue) and NH4Cl where red, blue and NH4Cl contributed (calculated theo-
retically) to nitrogen (N) amount of 2.2 mg/L, 3.7 mg/L and 78.5 mg/L respec-
tively summing up total N (TN) in feed as 84.4 mg/L (Section 5.6.5). In this
case, NH4Cl was added as N-source to reach nutrient enriched feed for the ex-
periment.
Nitrification and denitrification
Generally in wastewater treatment, the removal of total nitrogen by biochemi-
cal degradation takes place by oxidation of ammonia to nitrate under aerobic
conditions and conversion of nitrate to nitrogen gas under anoxic conditions.
Both of the processes demand that specific micro-organisms prevail. The bio-
logical generation of nitrate from ammonium (NH4+) under aerobic conditions
(nitrification), takes place in two distinct stages and denitrification takes place
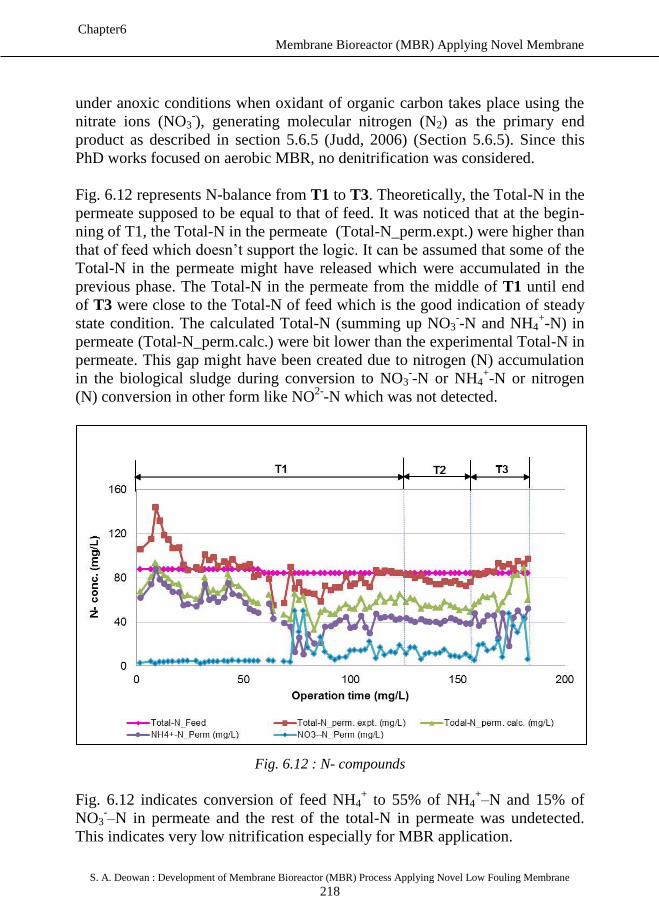
Membrane Bioreactor (MBR) Applying Novel Membrane
S. A. Deowan : Development of Membrane Bioreactor (MBR) Process Applying Novel Low Fouling Membrane
218
Chapter6
under anoxic conditions when oxidant of organic carbon takes place using the
nitrate ions (NO3-), generating molecular nitrogen (N2) as the primary end
product as described in section 5.6.5 (Judd, 2006) (Section 5.6.5). Since this
PhD works focused on aerobic MBR, no denitrification was considered.
Fig. 6.12 represents N-balance from T1 to T3. Theoretically, the Total-N in the
permeate supposed to be equal to that of feed. It was noticed that at the begin-
ning of T1, the Total-N in the permeate (Total-N_perm.expt.) were higher than
that of feed which doesn’t support the logic. It can be assumed that some of the
Total-N in the permeate might have released which were accumulated in the
previous phase. The Total-N in the permeate from the middle of T1 until end
of T3 were close to the Total-N of feed which is the good indication of steady
state condition. The calculated Total-N (summing up NO3--N and NH4
+-N) in
permeate (Total-N_perm.calc.) were bit lower than the experimental Total-N in
permeate. This gap might have been created due to nitrogen (N) accumulation
in the biological sludge during conversion to NO3--N or NH4
+-N or nitrogen
(N) conversion in other form like NO2-
-N which was not detected.
Fig. 6.12 : N- compounds
Fig. 6.12 indicates conversion of feed NH4+ to 55% of NH4
+–N and 15% of
NO3-–N in permeate and the rest of the total-N in permeate was undetected.
This indicates very low nitrification especially for MBR application.
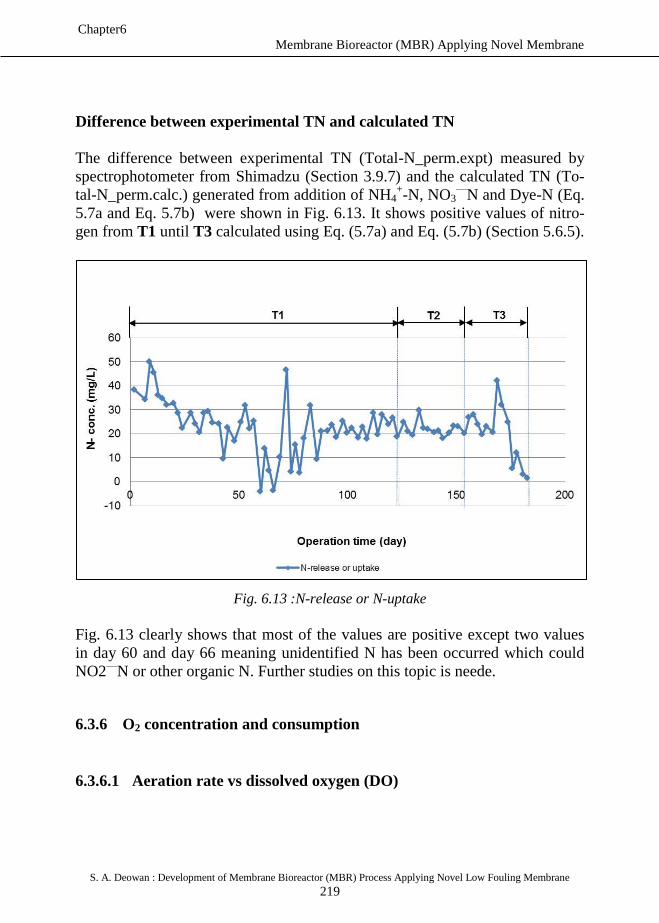
Membrane Bioreactor (MBR) Applying Novel Membrane
S. A. Deowan : Development of Membrane Bioreactor (MBR) Process Applying Novel Low Fouling Membrane
219
Chapter6
Difference between experimental TN and calculated TN
The difference between experimental TN (Total-N_perm.expt) measured by
spectrophotometer from Shimadzu (Section 3.9.7) and the calculated TN (To-
tal-N_perm.calc.) generated from addition of NH4+-N, NO3
—N and Dye-N (Eq.
5.7a and Eq. 5.7b) were shown in Fig. 6.13. It shows positive values of nitro-
gen from T1 until T3 calculated using Eq. (5.7a) and Eq. (5.7b) (Section 5.6.5).
Fig. 6.13 :N-release or N-uptake
Fig. 6.13 clearly shows that most of the values are positive except two values
in day 60 and day 66 meaning unidentified N has been occurred which could
NO2—
N or other organic N. Further studies on this topic is neede.
6.3.6 O2 concentration and consumption
6.3.6.1 Aeration rate vs dissolved oxygen (DO)
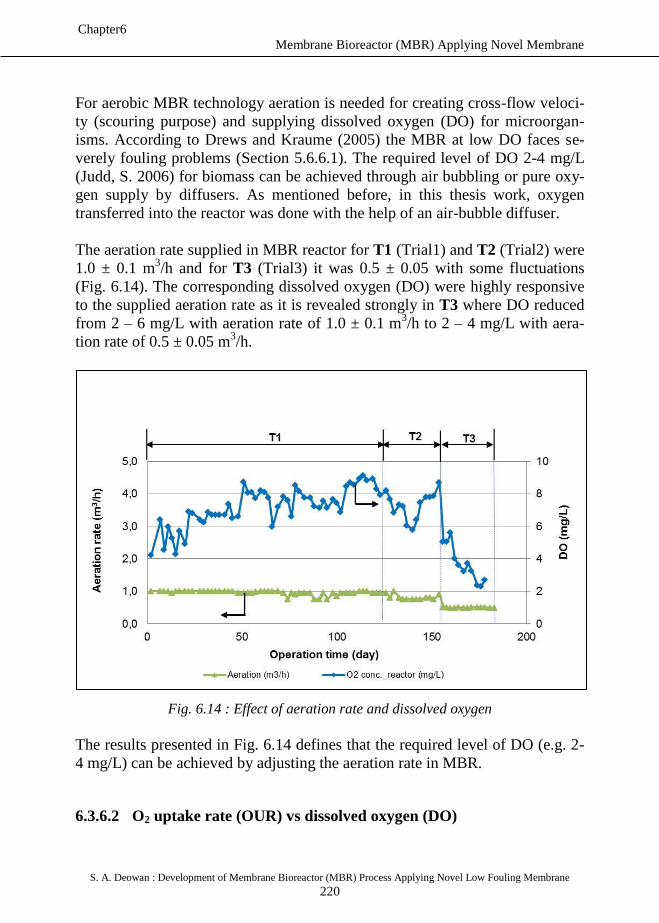
Membrane Bioreactor (MBR) Applying Novel Membrane
S. A. Deowan : Development of Membrane Bioreactor (MBR) Process Applying Novel Low Fouling Membrane
220
Chapter6
For aerobic MBR technology aeration is needed for creating cross-flow veloci-
ty (scouring purpose) and supplying dissolved oxygen (DO) for microorgan-
isms. According to Drews and Kraume (2005) the MBR at low DO faces se-
verely fouling problems (Section 5.6.6.1). The required level of DO 2-4 mg/L
(Judd, S. 2006) for biomass can be achieved through air bubbling or pure oxy-
gen supply by diffusers. As mentioned before, in this thesis work, oxygen
transferred into the reactor was done with the help of an air-bubble diffuser.
The aeration rate supplied in MBR reactor for T1 (Trial1) and T2 (Trial2) were
1.0 ± 0.1 m3/h and for T3 (Trial3) it was 0.5 ± 0.05 with some fluctuations
(Fig. 6.14). The corresponding dissolved oxygen (DO) were highly responsive
to the supplied aeration rate as it is revealed strongly in T3 where DO reduced
from 2 – 6 mg/L with aeration rate of 1.0 ± 0.1 m3/h to 2 – 4 mg/L with aera-
tion rate of 0.5 ± 0.05 m3/h.
Fig. 6.14 : Effect of aeration rate and dissolved oxygen
The results presented in Fig. 6.14 defines that the required level of DO (e.g. 2-
4 mg/L) can be achieved by adjusting the aeration rate in MBR.
6.3.6.2 O2 uptake rate (OUR) vs dissolved oxygen (DO)
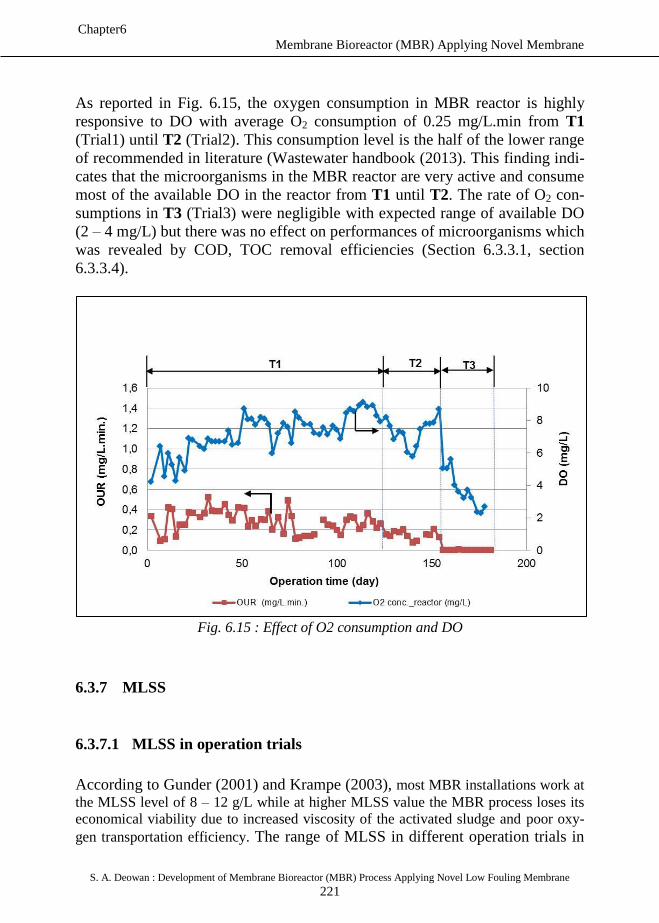
Membrane Bioreactor (MBR) Applying Novel Membrane
S. A. Deowan : Development of Membrane Bioreactor (MBR) Process Applying Novel Low Fouling Membrane
221
Chapter6
As reported in Fig. 6.15, the oxygen consumption in MBR reactor is highly
responsive to DO with average O2 consumption of 0.25 mg/L.min from T1
(Trial1) until T2 (Trial2). This consumption level is the half of the lower range
of recommended in literature (Wastewater handbook (2013). This finding indi-
cates that the microorganisms in the MBR reactor are very active and consume
most of the available DO in the reactor from T1 until T2. The rate of O2 con-
sumptions in T3 (Trial3) were negligible with expected range of available DO
(2 – 4 mg/L) but there was no effect on performances of microorganisms which
was revealed by COD, TOC removal efficiencies (Section 6.3.3.1, section
6.3.3.4).
Fig. 6.15 : Effect of O2 consumption and DO
6.3.7 MLSS
6.3.7.1 MLSS in operation trials
According to Gunder (2001) and Krampe (2003), most MBR installations work at
the MLSS level of 8 – 12 g/L while at higher MLSS value the MBR process loses its
economical viability due to increased viscosity of the activated sludge and poor oxy-
gen transportation efficiency. The range of MLSS in different operation trials in
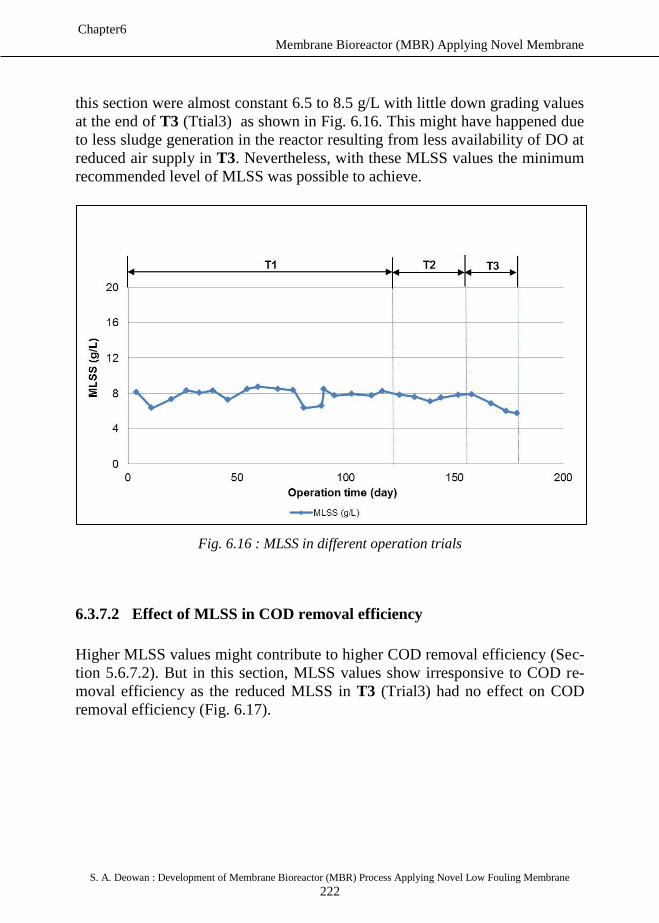
Membrane Bioreactor (MBR) Applying Novel Membrane
S. A. Deowan : Development of Membrane Bioreactor (MBR) Process Applying Novel Low Fouling Membrane
222
Chapter6
this section were almost constant 6.5 to 8.5 g/L with little down grading values
at the end of T3 (Ttial3) as shown in Fig. 6.16. This might have happened due
to less sludge generation in the reactor resulting from less availability of DO at
reduced air supply in T3. Nevertheless, with these MLSS values the minimum
recommended level of MLSS was possible to achieve.
Fig. 6.16 : MLSS in different operation trials
6.3.7.2 Effect of MLSS in COD removal efficiency
Higher MLSS values might contribute to higher COD removal efficiency (Sec-
tion 5.6.7.2). But in this section, MLSS values show irresponsive to COD re-
moval efficiency as the reduced MLSS in T3 (Trial3) had no effect on COD
removal efficiency (Fig. 6.17).
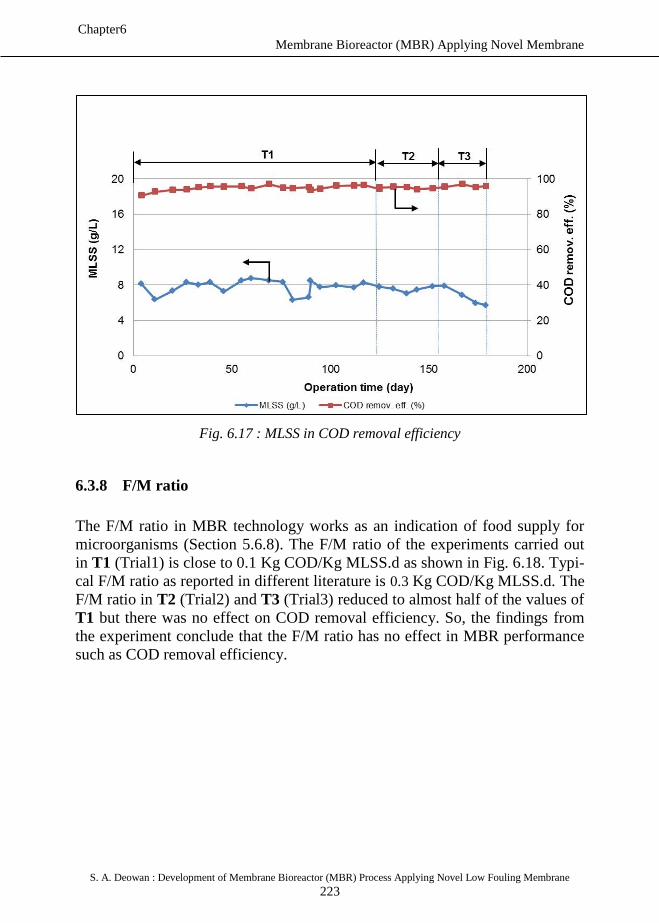
Membrane Bioreactor (MBR) Applying Novel Membrane
S. A. Deowan : Development of Membrane Bioreactor (MBR) Process Applying Novel Low Fouling Membrane
223
Chapter6
Fig. 6.17 : MLSS in COD removal efficiency
6.3.8 F/M ratio
The F/M ratio in MBR technology works as an indication of food supply for
microorganisms (Section 5.6.8). The F/M ratio of the experiments carried out
in T1 (Trial1) is close to 0.1 Kg COD/Kg MLSS.d as shown in Fig. 6.18. Typi-
cal F/M ratio as reported in different literature is 0.3 Kg COD/Kg MLSS.d. The
F/M ratio in T2 (Trial2) and T3 (Trial3) reduced to almost half of the values of
T1 but there was no effect on COD removal efficiency. So, the findings from
the experiment conclude that the F/M ratio has no effect in MBR performance
such as COD removal efficiency.
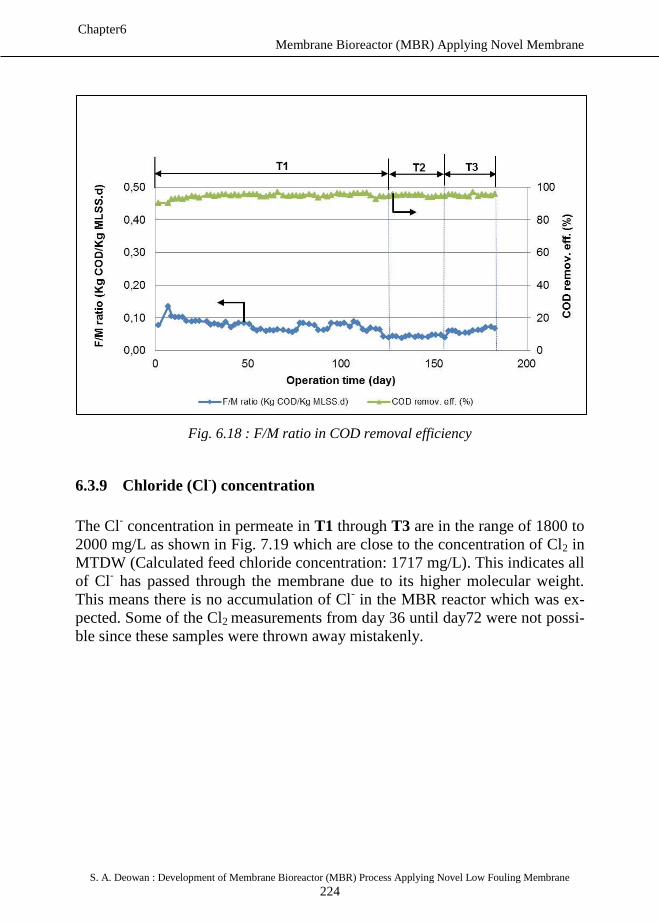
Membrane Bioreactor (MBR) Applying Novel Membrane
S. A. Deowan : Development of Membrane Bioreactor (MBR) Process Applying Novel Low Fouling Membrane
224
Chapter6
Fig. 6.18 : F/M ratio in COD removal efficiency
6.3.9 Chloride (Cl-) concentration
The Cl- concentration in permeate in T1 through T3 are in the range of 1800 to
2000 mg/L as shown in Fig. 7.19 which are close to the concentration of Cl2 in
MTDW (Calculated feed chloride concentration: 1717 mg/L). This indicates all
of Cl- has passed through the membrane due to its higher molecular weight.
This means there is no accumulation of Cl- in the MBR reactor which was ex-
pected. Some of the Cl2 measurements from day 36 until day72 were not possi-
ble since these samples were thrown away mistakenly.
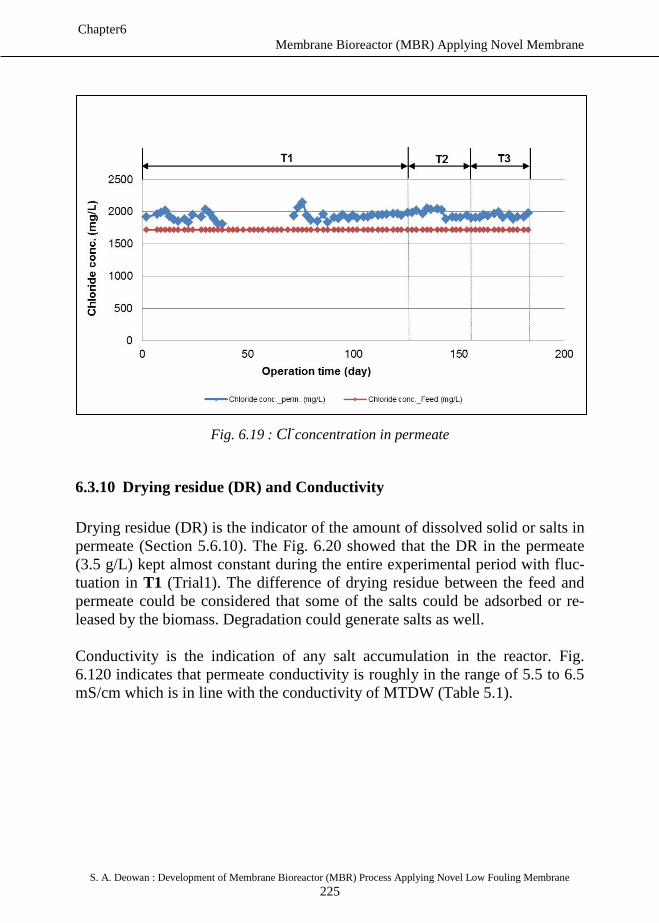
Membrane Bioreactor (MBR) Applying Novel Membrane
S. A. Deowan : Development of Membrane Bioreactor (MBR) Process Applying Novel Low Fouling Membrane
225
Chapter6
Fig. 6.19 : Cl-concentration in permeate
6.3.10 Drying residue (DR) and Conductivity
Drying residue (DR) is the indicator of the amount of dissolved solid or salts in
permeate (Section 5.6.10). The Fig. 6.20 showed that the DR in the permeate
(3.5 g/L) kept almost constant during the entire experimental period with fluc-
tuation in T1 (Trial1). The difference of drying residue between the feed and
permeate could be considered that some of the salts could be adsorbed or re-
leased by the biomass. Degradation could generate salts as well.
Conductivity is the indication of any salt accumulation in the reactor. Fig.
6.120 indicates that permeate conductivity is roughly in the range of 5.5 to 6.5
mS/cm which is in line with the conductivity of MTDW (Table 5.1).
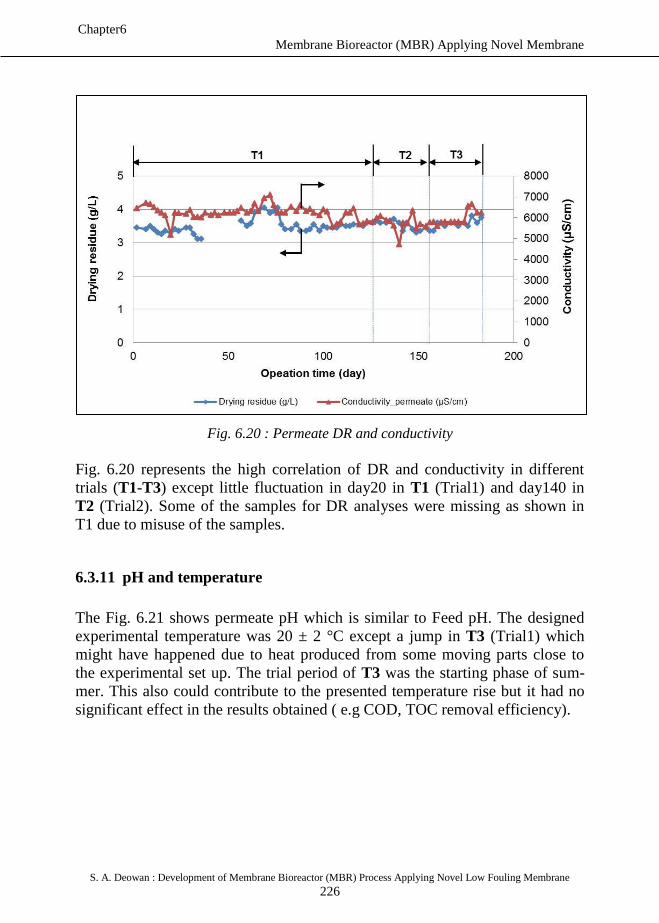
Membrane Bioreactor (MBR) Applying Novel Membrane
S. A. Deowan : Development of Membrane Bioreactor (MBR) Process Applying Novel Low Fouling Membrane
226
Chapter6
Fig. 6.20 : Permeate DR and conductivity
Fig. 6.20 represents the high correlation of DR and conductivity in different
trials (T1-T3) except little fluctuation in day20 in T1 (Trial1) and day140 in
T2 (Trial2). Some of the samples for DR analyses were missing as shown in
T1 due to misuse of the samples.
6.3.11 pH and temperature
The Fig. 6.21 shows permeate pH which is similar to Feed pH. The designed
experimental temperature was 20 ± 2 °C except a jump in T3 (Trial1) which
might have happened due to heat produced from some moving parts close to
the experimental set up. The trial period of T3 was the starting phase of sum-
mer. This also could contribute to the presented temperature rise but it had no
significant effect in the results obtained ( e.g COD, TOC removal efficiency).
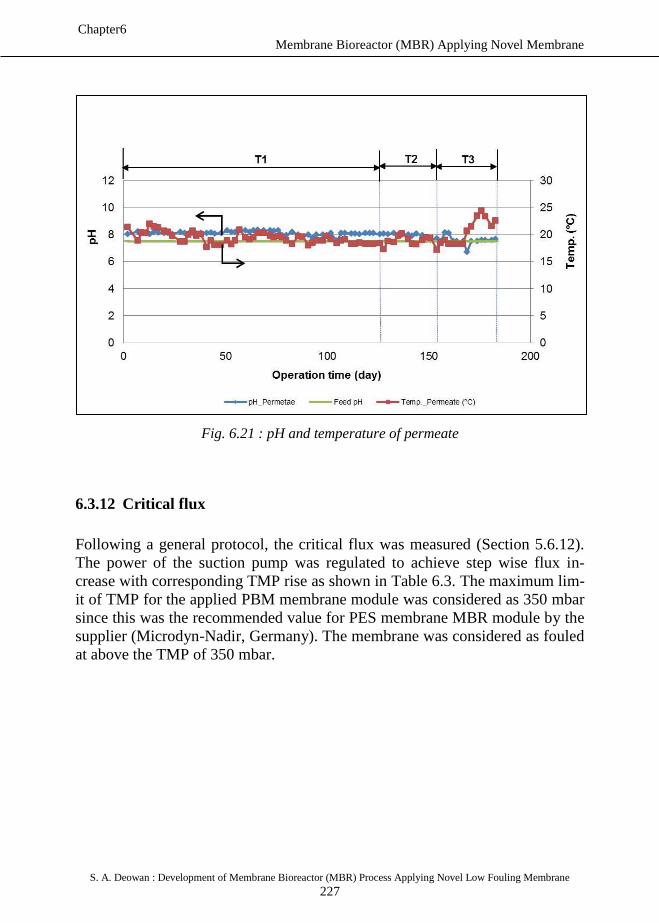
Membrane Bioreactor (MBR) Applying Novel Membrane
S. A. Deowan : Development of Membrane Bioreactor (MBR) Process Applying Novel Low Fouling Membrane
227
Chapter6
Fig. 6.21 : pH and temperature of permeate
6.3.12 Critical flux
Following a general protocol, the critical flux was measured (Section 5.6.12).
The power of the suction pump was regulated to achieve step wise flux in-
crease with corresponding TMP rise as shown in Table 6.3. The maximum lim-
it of TMP for the applied PBM membrane module was considered as 350 mbar
since this was the recommended value for PES membrane MBR module by the
supplier (Microdyn-Nadir, Germany). The membrane was considered as fouled
at above the TMP of 350 mbar.
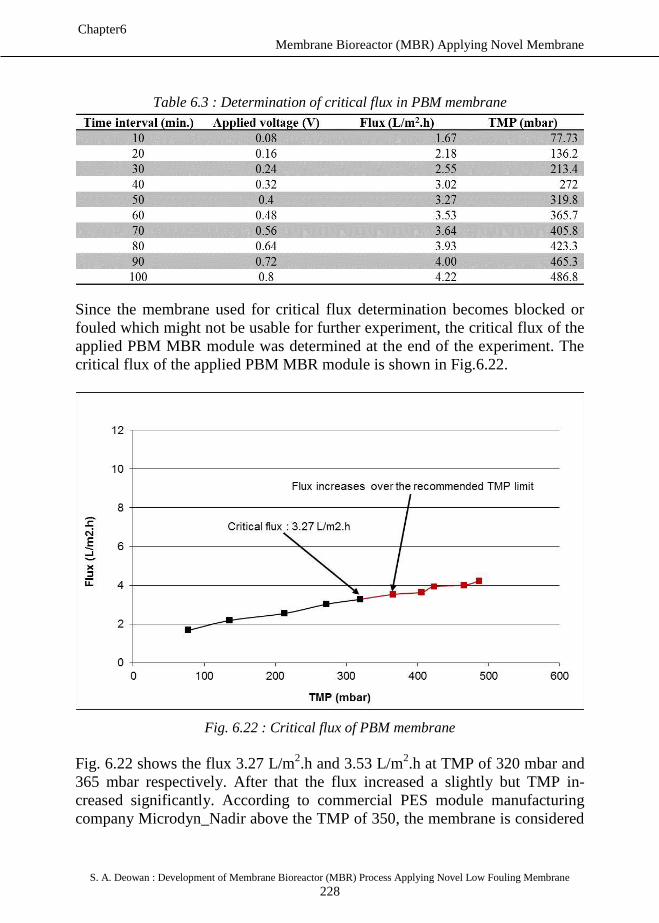
Membrane Bioreactor (MBR) Applying Novel Membrane
S. A. Deowan : Development of Membrane Bioreactor (MBR) Process Applying Novel Low Fouling Membrane
228
Chapter6
Table 6.3 : Determination of critical flux in PBM membrane
Since the membrane used for critical flux determination becomes blocked or
fouled which might not be usable for further experiment, the critical flux of the
applied PBM MBR module was determined at the end of the experiment. The
critical flux of the applied PBM MBR module is shown in Fig.6.22.
Fig. 6.22 : Critical flux of PBM membrane
Fig. 6.22 shows the flux 3.27 L/m2.h and 3.53 L/m
2.h at TMP of 320 mbar and
365 mbar respectively. After that the flux increased a slightly but TMP in-
creased significantly. According to commercial PES module manufacturing
company Microdyn_Nadir above the TMP of 350, the membrane is considered
Membrane Bioreactor (MBR) Applying Novel Membrane
S. A. Deowan : Development of Membrane Bioreactor (MBR) Process Applying Novel Low Fouling Membrane
229
Chapter6
as fouled membrane. So, the critical flux of the membrane was determined as
3.5 L/m2.h (considering slightly above the upper limit of TMP).
6.3.13 Membrane resistance model
As described in section 5.6.13, Darcy’s Law establishes a relationship between
TMP and flux which can be shown in Eq. (6.2)
Where,
J = Membrane permeate flux (L/m2.h)
TMP = Transmembrane pressure (mbar)
μ = Dynamic viscosity of permeate (N.s/m2)
Rt = Total filtration resistance (1/m)
Rt can be expressed as the sum of individual resistances which can be varied
based on the number and type of resistances considered (adapted from Jifeng et
al., 2008). For this thesis, the expression of Rt was different based on the test
media and experimental set up. Rt for model foulant humic acid, model textile
dye wastewater and MBR sludge were defined as R_f, R_dye and R_mbr re-
spectively and these are shown in Eq. (6.3) through Eq. (6.5).
Where,
Rm = Constant resistance of the clean membrane (1/m)
Rha = Fouling resistance due to humic acid (1/m)
Rmtdw = Fouling resistance due to MTDW (1/m)
Rsludge = Fouling resistance due to MBR sludge deposited on membrane
surface (1/m)
Membrane Bioreactor (MBR) Applying Novel Membrane
S. A. Deowan : Development of Membrane Bioreactor (MBR) Process Applying Novel Low Fouling Membrane
230
Chapter6
Eq. (6.3) until Eq. (6.5) can be termed as resistance in membrane series (RIS)
models based on different test media which are applied to describe membrane
fouling mechanisms (Jifeng et al. 2008).
In this section of the thesis, the RIS model has been adapted according to ap-
plied experimental set ups and test media. The membrane resistances in differ-
ent experimental set ups with varied test media have been calculated in the
following sections.
a) Resistances in “UF_auto” set up with model foulant humic acid
(HA)
The PBM membrane was tested with model foulant humic acid (HA) before
applying in the MBR system to check the fouling behaviour of this modified
membrane. The experimental set up used in this experiment was an auto-
controlled UF cross-flow testing cell (Section 3.3, Fig. 3.5), termed as “UF-
auto” in this section. The TMP of the experiment was 500 mbar and the ob-
tained flux was 100.03 L/m2.h with DI water. Considering dynamic viscosity of
the water as 1.002*10-3
at 20°C (Raymond, 1996), Rm was calculated using Eq.
(6.2) to 1.79*1012
1/m. In this calculation, dynamic viscosity of water was as-
sumed to be equal to that of permeate.
Similarly, the fouling test was carried out with humic acid and membrane re-
sistance was calculated using Eq. (6.3). In this case, flux of the experiment was
48.19 L/m2.h with TMP of 500 mbar. Using the same viscosity value, the cal-
culated membrane resistance (denoted as Rha) was 3.73*1012
1/m. In summary,
membrane resistance contributes around 30% to its total resistance where the
rest of the 70% is contributed by humic acid.
b) Resistances in “UF_manu” set up with MTDW
The PBM membrane was also tested with model textile dayes to check the af-
finity of dyes to the membrane surface. The experimental set up used in this
experiment was a manually -controlled UF cross-flow testing cell (Section 3.3,
Fig.3.3), termed as “UF-manu” in this section. The TMP of the experiment was
1500 mbar and the obtained flux was 224.37 L/m2.h with DI water. Consider-
ing dynamic viscosity of the water as 1.002*10-3
at 20°C (Raymond, 1996), Rm
was calculated using Eq. (6.2) to 2.4*10e12 1/m.
Similarly the membrane resistance was calculated using Eq. (6.4) after the test
done with MTDW. In this case, flux of the experiment was 178.77 L/m2.h with
Membrane Bioreactor (MBR) Applying Novel Membrane
S. A. Deowan : Development of Membrane Bioreactor (MBR) Process Applying Novel Low Fouling Membrane
231
Chapter6
TMP of 1500 mbar. Using the same viscosity value, the calculated membrane
resistance (denoted as Rmtdw) was 3.01*1012
1/m. In summary, membrane re-
sistance contributes around 45% to its total resistance where the rest of the
55% was contributed by MTDW.
c) Resistances in MBR experiment with biological sludge
In MBR experiment, firstly the test was carried out with DI water before the
trial with biological sludge (Section 6.1). The TMP of the experiment was 30
mbar and the obtained flux was around 5.51 L/m2.h with DI water (Fig.6.1).
Considering the same dynamic viscosity of the water as 1.002*10-3
, Rm was
calculated using Eq. (6.2) to 2.54*1012
1/m.
After that the experiment was carried out in MBR set up for almost 183 days
starting from T1 until T3 (Section 6.). In this case, the average flux of the en-
tire experiment was 1.5 L/m2.h with average TMP of 51.88 mbar. Using the
same viscosity value and Eq (6.5), the calculated membrane resistance (denot-
ed as Rsludge) was 12.42*1012
1/m. In summary, membrane resistance contrib-
utes around 17% to its total resistance where the rest of the 83% was contribut-
ed by biological sludge.
The summary of different resistances in different experiments is presented in
Fig. 6.23 and Fig. 6.24. From Fig. 6.23, it is clear that the resistances with hu-
mic acid, MTDW and MBR have been increased significantly compared to
their pure membrane resistances. But the increase of membrane resistance with
MTDW is comparatively low. This indicates that HA and MBR sludge signifi-
cantly contribute to membrane fouling. Fig. 6.24 indicates that percentage re-
sistances of MBR bio sludge, humic acid and MTDW in their respective exper-
iments are about 86%, 70% and 55% respectively and these values compared
to their pure membrane resistances are significantly high.
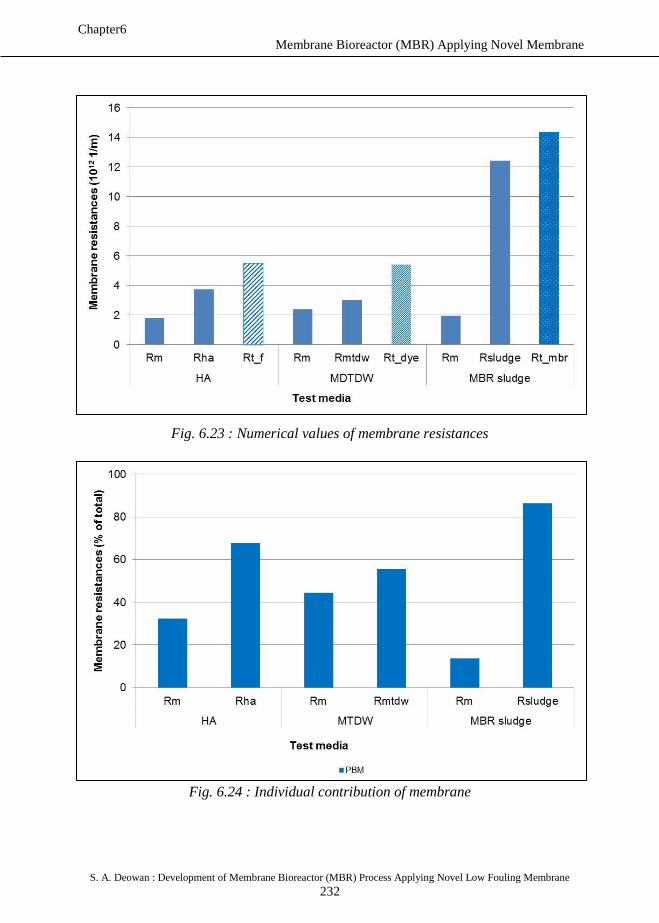
Membrane Bioreactor (MBR) Applying Novel Membrane
S. A. Deowan : Development of Membrane Bioreactor (MBR) Process Applying Novel Low Fouling Membrane
232
Chapter6
Fig. 6.23 : Numerical values of membrane resistances
Fig. 6.24 : Individual contribution of membrane
Membrane Bioreactor (MBR) Applying Novel Membrane
S. A. Deowan : Development of Membrane Bioreactor (MBR) Process Applying Novel Low Fouling Membrane
233
Chapter6
References
Günder, B. (2001). "The Membrane Coupled-Activated Sludge Process in Mu-
nicipal
Wastewater Treatment." Technomic Publishing Company Inc., Lancaster, USA
Huang, R.R., Hoinkis, J., Hu, Q., Koch, F. (2009), Treatment of dyeing
wastewater by hollow fiber membrane biological reactor, J. Desalina-
tion and Water Treatment, 11, 1 - 6
Jifeng, G. X., Siqing, X, Rongchang, W. (2008), Study on Membrane Fouling
of Submerged Membrane Bioreactor in Treating Bathing Wastewater,
Journal of Environmental Sciences 20, 1158–1167
Judd, S. (2006), The MBR Book: Principles and Applications of Membrane
Bioreactors in Water and Wastewater Treatment, editor, Elsevier
Krampe, J., and Krauth, K. (2003), Oxygen transfer into activated sludge with
high MLSS concentrations. Water Science and Technology 47, 297-
303.
Raymond A. Serway (1996). Physics for Scientists & Engineers (4th ed.).
Saunders College Publishing. ISBN 0-03-005932-1
Viero, A.F., Sant’ Anna Jr., G. L. (2008), Is hydraulic retentime an essential
parameter for MBR performance?, Journal of Hazardous Materials 150,
185 – 186
Wastewater handbook (2013)
http://www.wastewaterhandbook.com/webpg/th_organics_34OUR.htm
#3_4_1, accessed on November 24, 2013
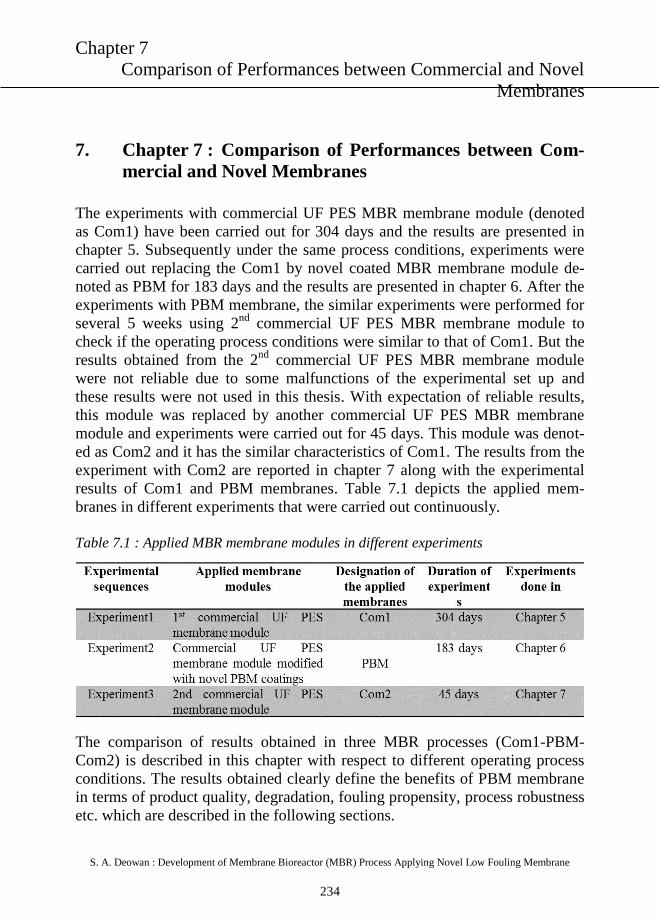
Chapter 7
Comparison of Performances between Commercial and Novel
Membranes
S. A. Deowan : Development of Membrane Bioreactor (MBR) Process Applying Novel Low Fouling Membrane
234
7. Chapter 7 : Comparison of Performances between Com-
mercial and Novel Membranes
The experiments with commercial UF PES MBR membrane module (denoted
as Com1) have been carried out for 304 days and the results are presented in
chapter 5. Subsequently under the same process conditions, experiments were
carried out replacing the Com1 by novel coated MBR membrane module de-
noted as PBM for 183 days and the results are presented in chapter 6. After the
experiments with PBM membrane, the similar experiments were performed for
several 5 weeks using 2nd
commercial UF PES MBR membrane module to
check if the operating process conditions were similar to that of Com1. But the
results obtained from the 2nd
commercial UF PES MBR membrane module
were not reliable due to some malfunctions of the experimental set up and
these results were not used in this thesis. With expectation of reliable results,
this module was replaced by another commercial UF PES MBR membrane
module and experiments were carried out for 45 days. This module was denot-
ed as Com2 and it has the similar characteristics of Com1. The results from the
experiment with Com2 are reported in chapter 7 along with the experimental
results of Com1 and PBM membranes. Table 7.1 depicts the applied mem-
branes in different experiments that were carried out continuously.
Table 7.1 : Applied MBR membrane modules in different experiments
The comparison of results obtained in three MBR processes (Com1-PBM-
Com2) is described in this chapter with respect to different operating process
conditions. The results obtained clearly define the benefits of PBM membrane
in terms of product quality, degradation, fouling propensity, process robustness
etc. which are described in the following sections.
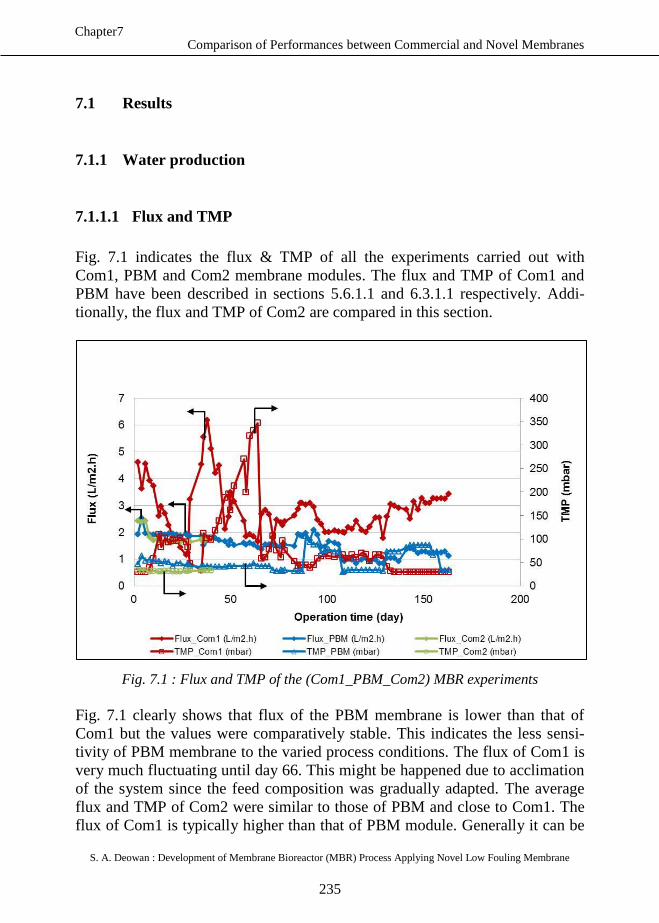
Comparison of Performances between Commercial and Novel Membranes
S. A. Deowan : Development of Membrane Bioreactor (MBR) Process Applying Novel Low Fouling Membrane
235
Chapter7
7.1 Results
7.1.1 Water production
7.1.1.1 Flux and TMP
Fig. 7.1 indicates the flux & TMP of all the experiments carried out with
Com1, PBM and Com2 membrane modules. The flux and TMP of Com1 and
PBM have been described in sections 5.6.1.1 and 6.3.1.1 respectively. Addi-
tionally, the flux and TMP of Com2 are compared in this section.
Fig. 7.1 : Flux and TMP of the (Com1_PBM_Com2) MBR experiments
Fig. 7.1 clearly shows that flux of the PBM membrane is lower than that of
Com1 but the values were comparatively stable. This indicates the less sensi-
tivity of PBM membrane to the varied process conditions. The flux of Com1 is
very much fluctuating until day 66. This might be happened due to acclimation
of the system since the feed composition was gradually adapted. The average
flux and TMP of Com2 were similar to those of PBM and close to Com1. The
flux of Com1 is typically higher than that of PBM module. Generally it can be
Comparison of Performances between Commercial and Novel Membranes
S. A. Deowan : Development of Membrane Bioreactor (MBR) Process Applying Novel Low Fouling Membrane
236
Chapter7
stated that all three experiments (Table 7.1) were carried out more or less under
similar operating conditions.
7.1.1.2 Water permeability (WP)
Water permeabilities of all three experiments are presented in Fig. 7.2. The
average water permeability of PBM membrane is 35 L/m2.h.bar where this
value of Com1 is around 60 L/m2.h. Hence, the water permeability (WP) of
PBM membrane is roughly half of Com1. But within the operation time of 189
days, Com1 membrane faced severely fouling problems on day 27 and day 189
and the modules needed to be replaced by new ones. PBM membrane faced no
fouling problem nearly covering the same period except a slight WP drop on
day 89 (probably due to mechanical blocking of the module which was visible
after opening) and on day137 due to reduced aeration rate. The aeration is the
main energy consumer in MBR technology for scouring of membrane and mi-
croorganisms. The aeration rate was reduced intentionally to observe the scour-
ing effect of the membrane module. The result indicates that PBM has strong
antifouling properties which might be economically viable due to reduced aera-
tion rate reduced cleaning frequency. Generally the cleaning frequency for
MBR module is 3 to 4 times in year. The cleaning frequency with PBM mem-
brane could be reduced significantly. The WP of Com2 membrane module was
around 57 L/m2.h.bar which was close to that of Com1. This might represent
the constant biological conditions of MBR reactors in different experimental
sequences. The WP rise with PBM at the end of the experimental period can be
neglected since the feed supplied to the MBR reactor became decomposed (an-
aerobic).
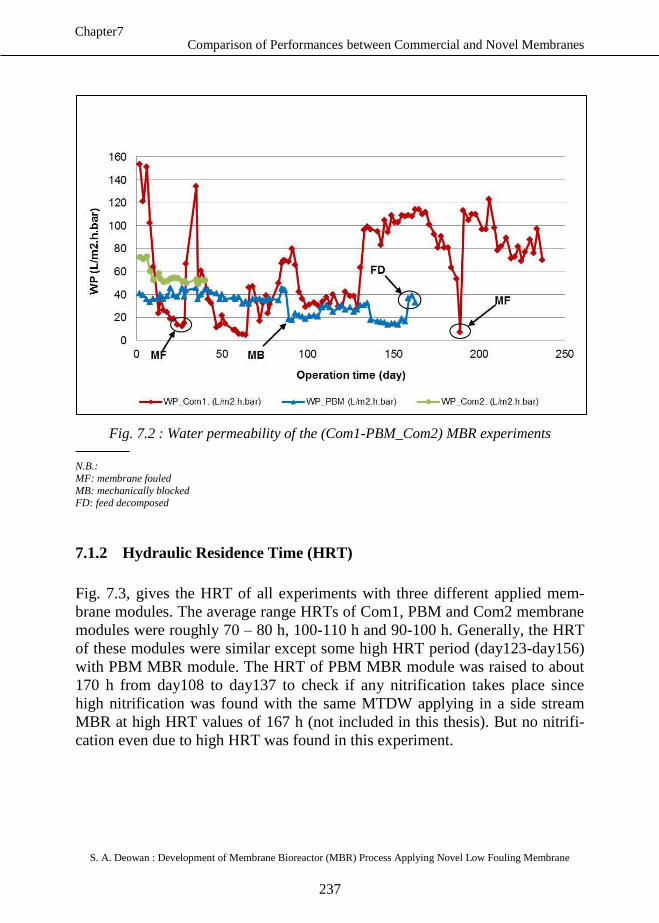
Comparison of Performances between Commercial and Novel Membranes
S. A. Deowan : Development of Membrane Bioreactor (MBR) Process Applying Novel Low Fouling Membrane
237
Chapter7
Fig. 7.2 : Water permeability of the (Com1-PBM_Com2) MBR experiments
N.B.:
MF: membrane fouled
MB: mechanically blocked FD: feed decomposed
7.1.2 Hydraulic Residence Time (HRT)
Fig. 7.3, gives the HRT of all experiments with three different applied mem-
brane modules. The average range HRTs of Com1, PBM and Com2 membrane
modules were roughly 70 – 80 h, 100-110 h and 90-100 h. Generally, the HRT
of these modules were similar except some high HRT period (day123-day156)
with PBM MBR module. The HRT of PBM MBR module was raised to about
170 h from day108 to day137 to check if any nitrification takes place since
high nitrification was found with the same MTDW applying in a side stream
MBR at high HRT values of 167 h (not included in this thesis). But no nitrifi-
cation even due to high HRT was found in this experiment.
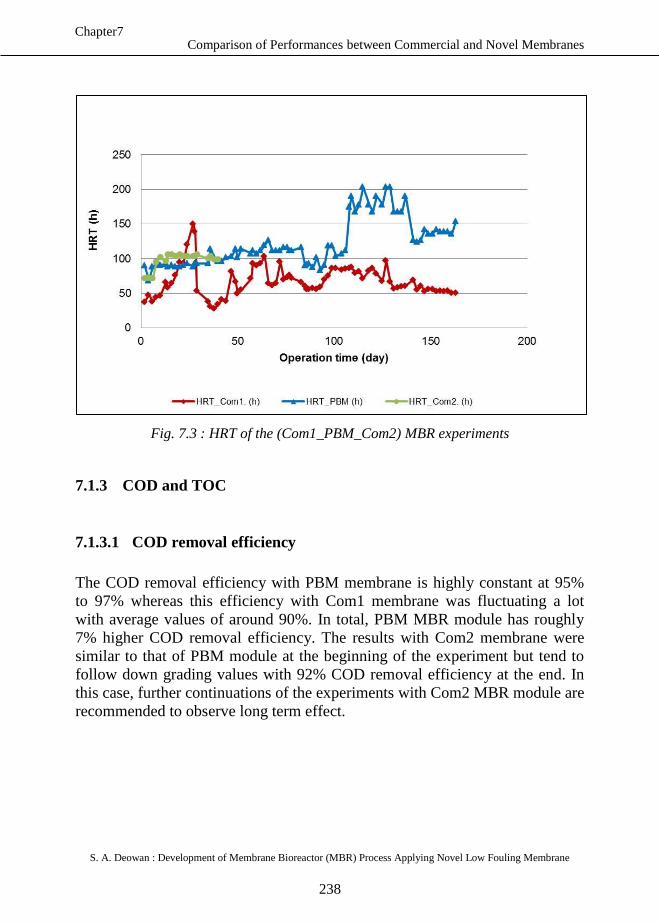
Comparison of Performances between Commercial and Novel Membranes
S. A. Deowan : Development of Membrane Bioreactor (MBR) Process Applying Novel Low Fouling Membrane
238
Chapter7
Fig. 7.3 : HRT of the (Com1_PBM_Com2) MBR experiments
7.1.3 COD and TOC
7.1.3.1 COD removal efficiency
The COD removal efficiency with PBM membrane is highly constant at 95%
to 97% whereas this efficiency with Com1 membrane was fluctuating a lot
with average values of around 90%. In total, PBM MBR module has roughly
7% higher COD removal efficiency. The results with Com2 membrane were
similar to that of PBM module at the beginning of the experiment but tend to
follow down grading values with 92% COD removal efficiency at the end. In
this case, further continuations of the experiments with Com2 MBR module are
recommended to observe long term effect.
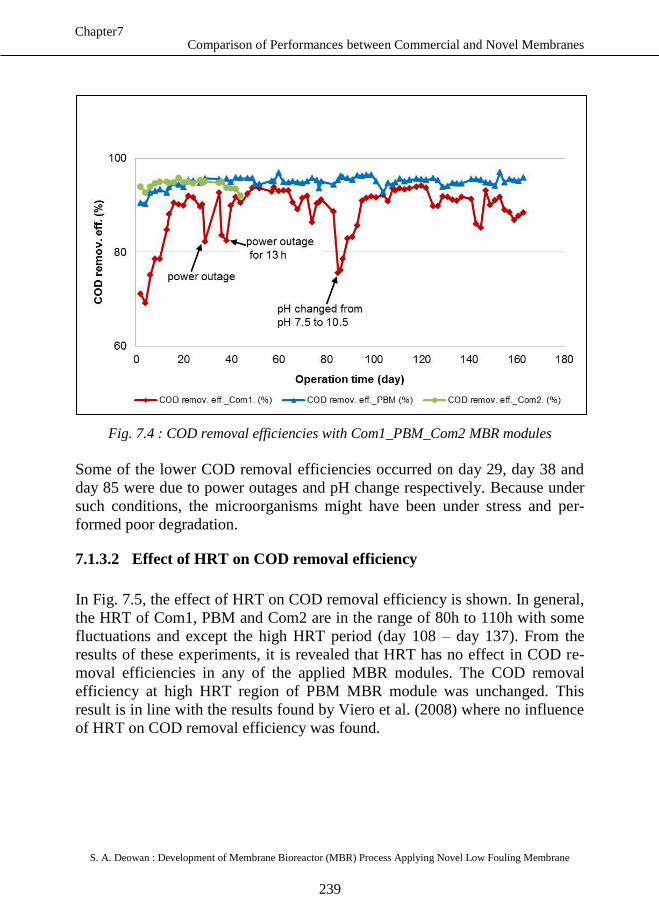
Comparison of Performances between Commercial and Novel Membranes
S. A. Deowan : Development of Membrane Bioreactor (MBR) Process Applying Novel Low Fouling Membrane
239
Chapter7
Fig. 7.4 : COD removal efficiencies with Com1_PBM_Com2 MBR modules
Some of the lower COD removal efficiencies occurred on day 29, day 38 and
day 85 were due to power outages and pH change respectively. Because under
such conditions, the microorganisms might have been under stress and per-
formed poor degradation.
7.1.3.2 Effect of HRT on COD removal efficiency
In Fig. 7.5, the effect of HRT on COD removal efficiency is shown. In general,
the HRT of Com1, PBM and Com2 are in the range of 80h to 110h with some
fluctuations and except the high HRT period (day 108 – day 137). From the
results of these experiments, it is revealed that HRT has no effect in COD re-
moval efficiencies in any of the applied MBR modules. The COD removal
efficiency at high HRT region of PBM MBR module was unchanged. This
result is in line with the results found by Viero et al. (2008) where no influence
of HRT on COD removal efficiency was found.
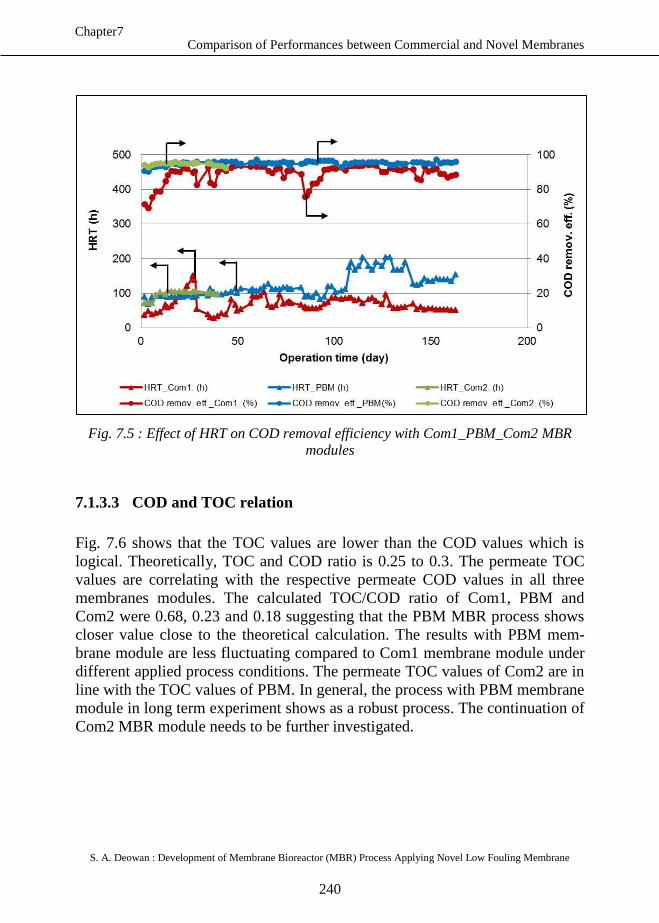
Comparison of Performances between Commercial and Novel Membranes
S. A. Deowan : Development of Membrane Bioreactor (MBR) Process Applying Novel Low Fouling Membrane
240
Chapter7
Fig. 7.5 : Effect of HRT on COD removal efficiency with Com1_PBM_Com2 MBR
modules
7.1.3.3 COD and TOC relation
Fig. 7.6 shows that the TOC values are lower than the COD values which is
logical. Theoretically, TOC and COD ratio is 0.25 to 0.3. The permeate TOC
values are correlating with the respective permeate COD values in all three
membranes modules. The calculated TOC/COD ratio of Com1, PBM and
Com2 were 0.68, 0.23 and 0.18 suggesting that the PBM MBR process shows
closer value close to the theoretical calculation. The results with PBM mem-
brane module are less fluctuating compared to Com1 membrane module under
different applied process conditions. The permeate TOC values of Com2 are in
line with the TOC values of PBM. In general, the process with PBM membrane
module in long term experiment shows as a robust process. The continuation of
Com2 MBR module needs to be further investigated.
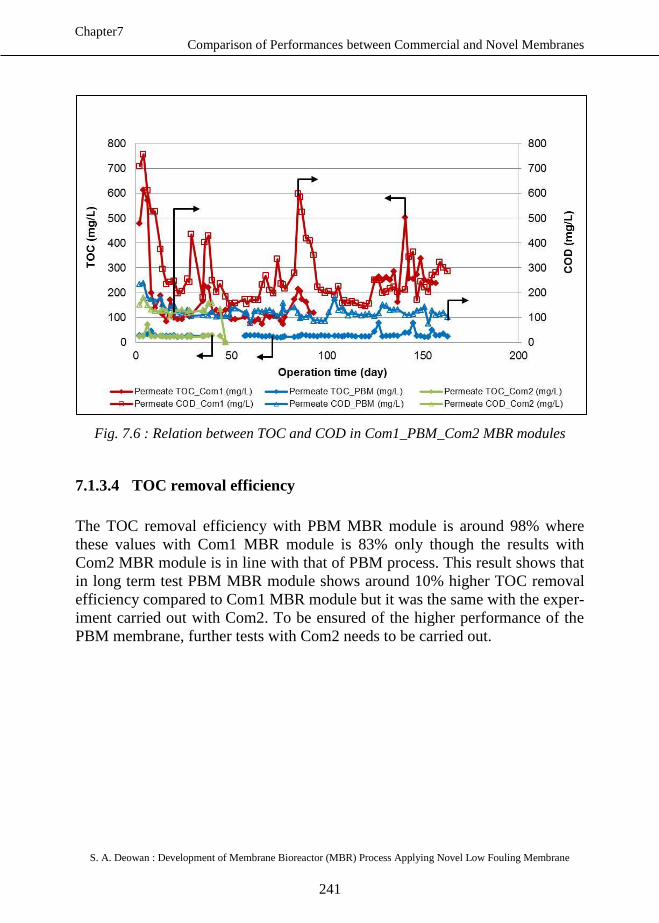
Comparison of Performances between Commercial and Novel Membranes
S. A. Deowan : Development of Membrane Bioreactor (MBR) Process Applying Novel Low Fouling Membrane
241
Chapter7
Fig. 7.6 : Relation between TOC and COD in Com1_PBM_Com2 MBR modules
7.1.3.4 TOC removal efficiency
The TOC removal efficiency with PBM MBR module is around 98% where
these values with Com1 MBR module is 83% only though the results with
Com2 MBR module is in line with that of PBM process. This result shows that
in long term test PBM MBR module shows around 10% higher TOC removal
efficiency compared to Com1 MBR module but it was the same with the exper-
iment carried out with Com2. To be ensured of the higher performance of the
PBM membrane, further tests with Com2 needs to be carried out.
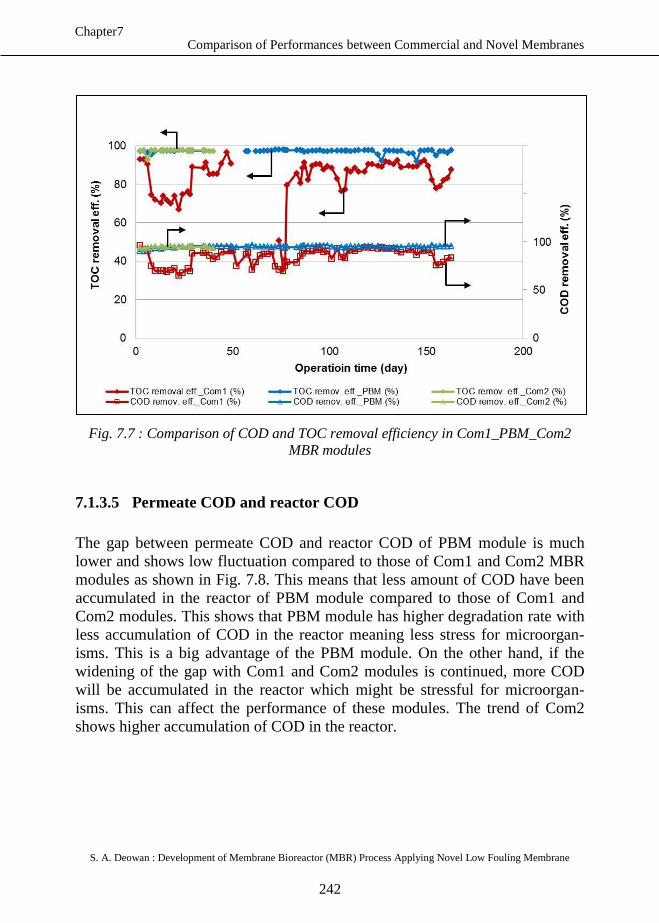
Comparison of Performances between Commercial and Novel Membranes
S. A. Deowan : Development of Membrane Bioreactor (MBR) Process Applying Novel Low Fouling Membrane
242
Chapter7
Fig. 7.7 : Comparison of COD and TOC removal efficiency in Com1_PBM_Com2
MBR modules
7.1.3.5 Permeate COD and reactor COD
The gap between permeate COD and reactor COD of PBM module is much
lower and shows low fluctuation compared to those of Com1 and Com2 MBR
modules as shown in Fig. 7.8. This means that less amount of COD have been
accumulated in the reactor of PBM module compared to those of Com1 and
Com2 modules. This shows that PBM module has higher degradation rate with
less accumulation of COD in the reactor meaning less stress for microorgan-
isms. This is a big advantage of the PBM module. On the other hand, if the
widening of the gap with Com1 and Com2 modules is continued, more COD
will be accumulated in the reactor which might be stressful for microorgan-
isms. This can affect the performance of these modules. The trend of Com2
shows higher accumulation of COD in the reactor.
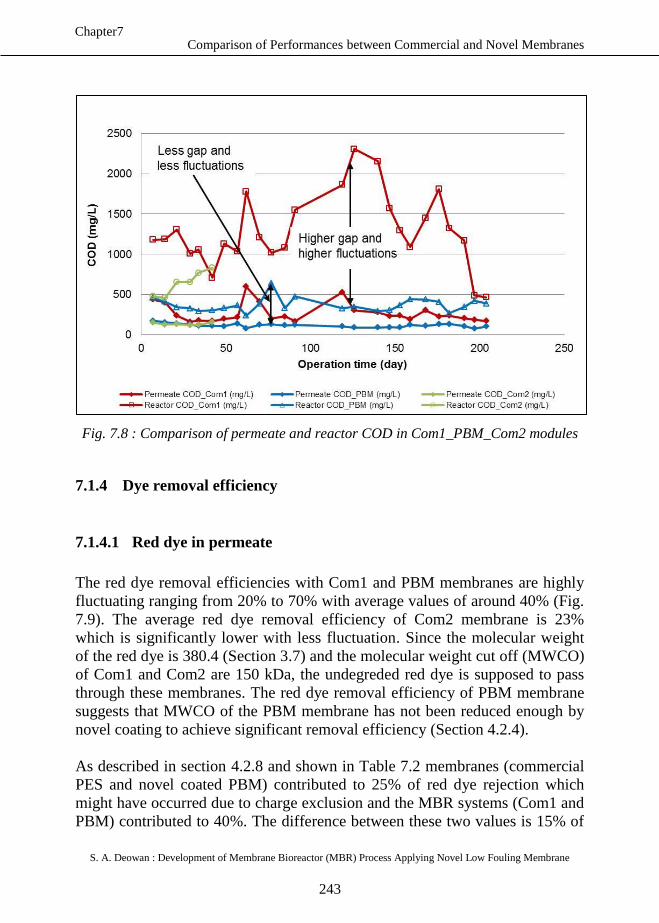
Comparison of Performances between Commercial and Novel Membranes
S. A. Deowan : Development of Membrane Bioreactor (MBR) Process Applying Novel Low Fouling Membrane
243
Chapter7
Fig. 7.8 : Comparison of permeate and reactor COD in Com1_PBM_Com2 modules
7.1.4 Dye removal efficiency
7.1.4.1 Red dye in permeate
The red dye removal efficiencies with Com1 and PBM membranes are highly
fluctuating ranging from 20% to 70% with average values of around 40% (Fig.
7.9). The average red dye removal efficiency of Com2 membrane is 23%
which is significantly lower with less fluctuation. Since the molecular weight
of the red dye is 380.4 (Section 3.7) and the molecular weight cut off (MWCO)
of Com1 and Com2 are 150 kDa, the undegreded red dye is supposed to pass
through these membranes. The red dye removal efficiency of PBM membrane
suggests that MWCO of the PBM membrane has not been reduced enough by
novel coating to achieve significant removal efficiency (Section 4.2.4).
As described in section 4.2.8 and shown in Table 7.2 membranes (commercial
PES and novel coated PBM) contributed to 25% of red dye rejection which
might have occurred due to charge exclusion and the MBR systems (Com1 and
PBM) contributed to 40%. The difference between these two values is 15% of
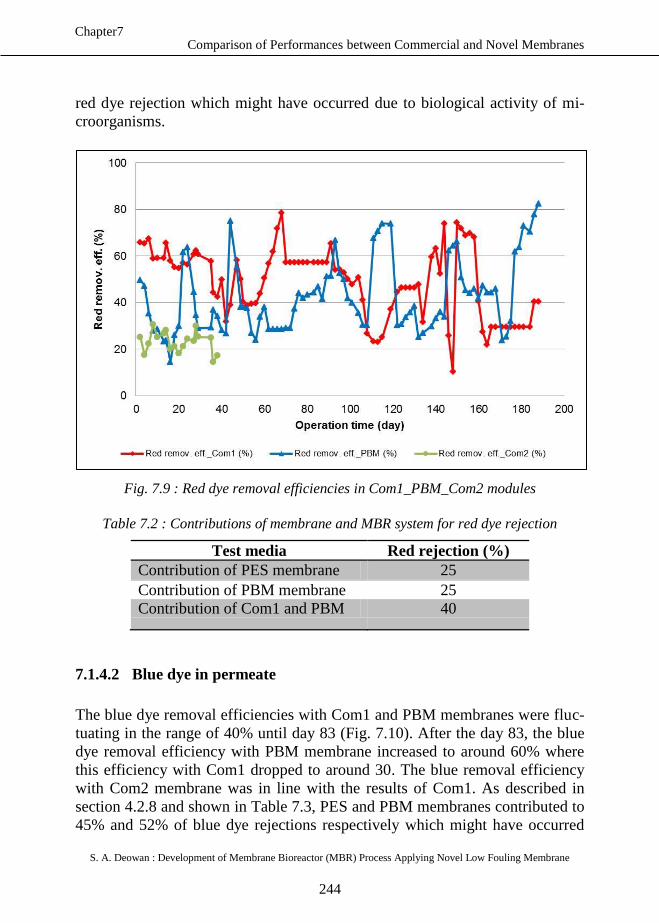
Comparison of Performances between Commercial and Novel Membranes
S. A. Deowan : Development of Membrane Bioreactor (MBR) Process Applying Novel Low Fouling Membrane
244
Chapter7
red dye rejection which might have occurred due to biological activity of mi-
croorganisms.
Fig. 7.9 : Red dye removal efficiencies in Com1_PBM_Com2 modules
Table 7.2 : Contributions of membrane and MBR system for red dye rejection
Test media Red rejection (%)
Contribution of PES membrane 25
Contribution of PBM membrane 25
Contribution of Com1 and PBM 40
7.1.4.2 Blue dye in permeate
The blue dye removal efficiencies with Com1 and PBM membranes were fluc-
tuating in the range of 40% until day 83 (Fig. 7.10). After the day 83, the blue
dye removal efficiency with PBM membrane increased to around 60% where
this efficiency with Com1 dropped to around 30. The blue removal efficiency
with Com2 membrane was in line with the results of Com1. As described in
section 4.2.8 and shown in Table 7.3, PES and PBM membranes contributed to
45% and 52% of blue dye rejections respectively which might have occurred
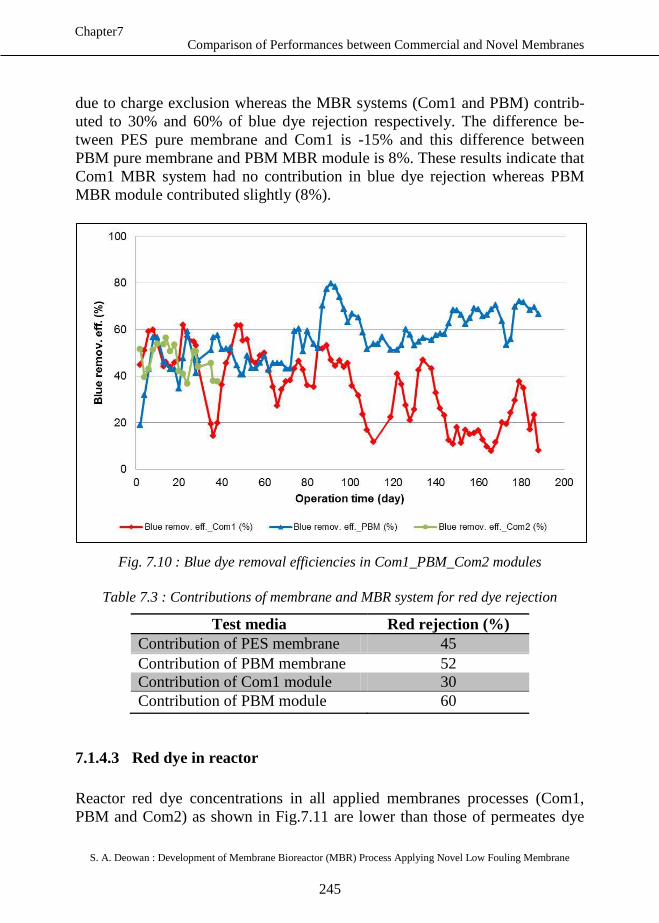
Comparison of Performances between Commercial and Novel Membranes
S. A. Deowan : Development of Membrane Bioreactor (MBR) Process Applying Novel Low Fouling Membrane
245
Chapter7
due to charge exclusion whereas the MBR systems (Com1 and PBM) contrib-
uted to 30% and 60% of blue dye rejection respectively. The difference be-
tween PES pure membrane and Com1 is -15% and this difference between
PBM pure membrane and PBM MBR module is 8%. These results indicate that
Com1 MBR system had no contribution in blue dye rejection whereas PBM
MBR module contributed slightly (8%).
Fig. 7.10 : Blue dye removal efficiencies in Com1_PBM_Com2 modules
Table 7.3 : Contributions of membrane and MBR system for red dye rejection
Test media Red rejection (%)
Contribution of PES membrane 45
Contribution of PBM membrane 52
Contribution of Com1 module 30
Contribution of PBM module 60
7.1.4.3 Red dye in reactor
Reactor red dye concentrations in all applied membranes processes (Com1,
PBM and Com2) as shown in Fig.7.11 are lower than those of permeates dye
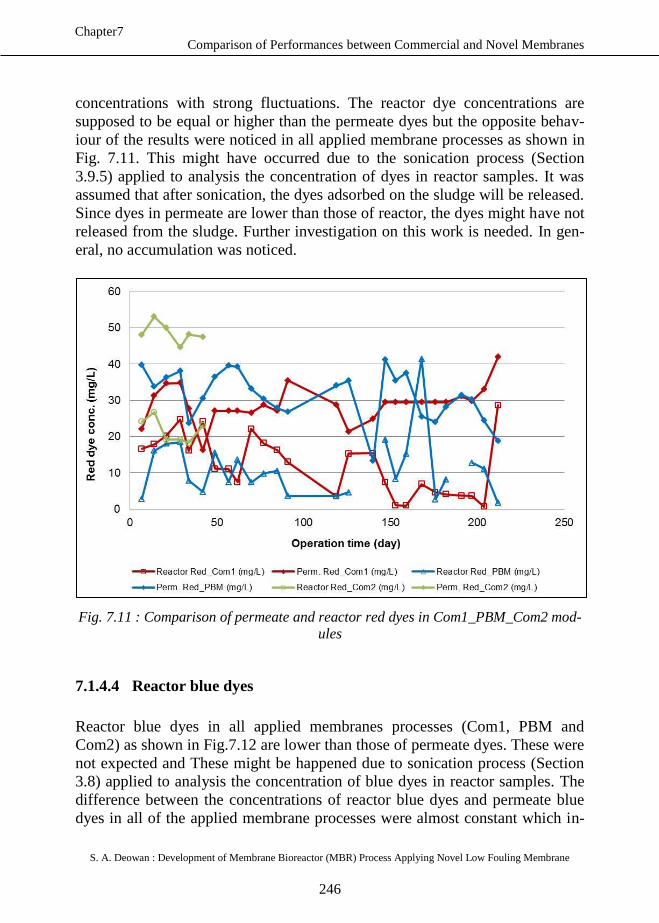
Comparison of Performances between Commercial and Novel Membranes
S. A. Deowan : Development of Membrane Bioreactor (MBR) Process Applying Novel Low Fouling Membrane
246
Chapter7
concentrations with strong fluctuations. The reactor dye concentrations are
supposed to be equal or higher than the permeate dyes but the opposite behav-
iour of the results were noticed in all applied membrane processes as shown in
Fig. 7.11. This might have occurred due to the sonication process (Section
3.9.5) applied to analysis the concentration of dyes in reactor samples. It was
assumed that after sonication, the dyes adsorbed on the sludge will be released.
Since dyes in permeate are lower than those of reactor, the dyes might have not
released from the sludge. Further investigation on this work is needed. In gen-
eral, no accumulation was noticed.
Fig. 7.11 : Comparison of permeate and reactor red dyes in Com1_PBM_Com2 mod-
ules
7.1.4.4 Reactor blue dyes
Reactor blue dyes in all applied membranes processes (Com1, PBM and
Com2) as shown in Fig.7.12 are lower than those of permeate dyes. These were
not expected and These might be happened due to sonication process (Section
3.8) applied to analysis the concentration of blue dyes in reactor samples. The
difference between the concentrations of reactor blue dyes and permeate blue
dyes in all of the applied membrane processes were almost constant which in-
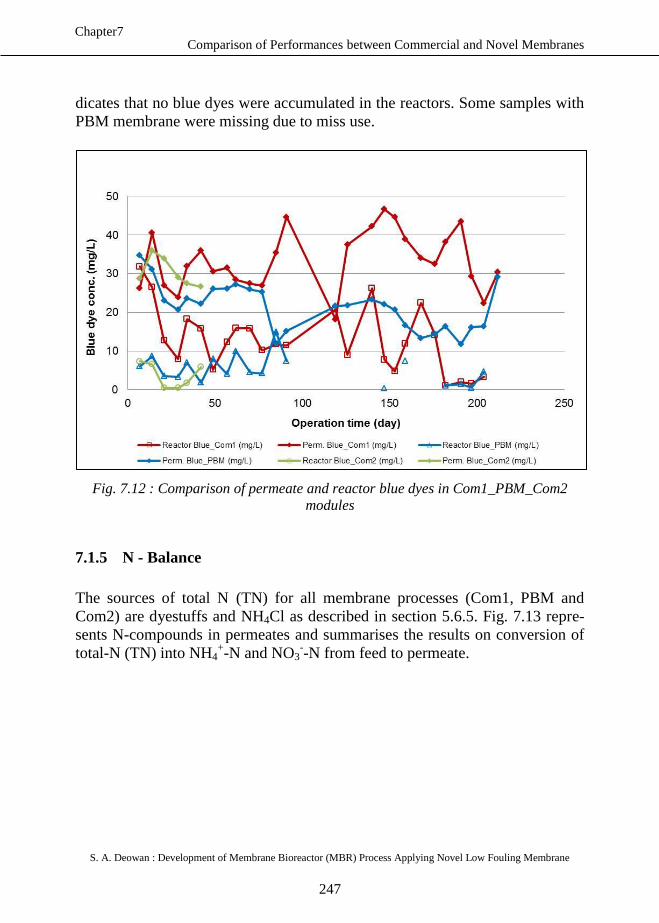
Comparison of Performances between Commercial and Novel Membranes
S. A. Deowan : Development of Membrane Bioreactor (MBR) Process Applying Novel Low Fouling Membrane
247
Chapter7
dicates that no blue dyes were accumulated in the reactors. Some samples with
PBM membrane were missing due to miss use.
Fig. 7.12 : Comparison of permeate and reactor blue dyes in Com1_PBM_Com2
modules
7.1.5 N - Balance
The sources of total N (TN) for all membrane processes (Com1, PBM and
Com2) are dyestuffs and NH4Cl as described in section 5.6.5. Fig. 7.13 repre-
sents N-compounds in permeates and summarises the results on conversion of
total-N (TN) into NH4+-N and NO3
--N from feed to permeate.
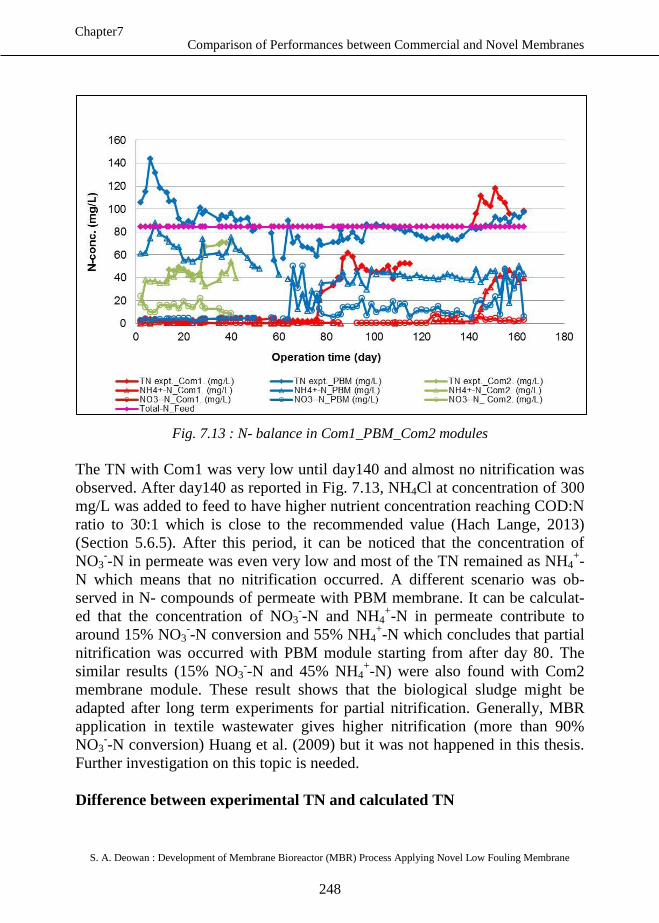
Comparison of Performances between Commercial and Novel Membranes
S. A. Deowan : Development of Membrane Bioreactor (MBR) Process Applying Novel Low Fouling Membrane
248
Chapter7
Fig. 7.13 : N- balance in Com1_PBM_Com2 modules
The TN with Com1 was very low until day140 and almost no nitrification was
observed. After day140 as reported in Fig. 7.13, NH4Cl at concentration of 300
mg/L was added to feed to have higher nutrient concentration reaching COD:N
ratio to 30:1 which is close to the recommended value (Hach Lange, 2013)
(Section 5.6.5). After this period, it can be noticed that the concentration of
NO3--N in permeate was even very low and most of the TN remained as NH4
+-
N which means that no nitrification occurred. A different scenario was ob-
served in N- compounds of permeate with PBM membrane. It can be calculat-
ed that the concentration of NO3--N and NH4
+-N in permeate contribute to
around 15% NO3--N conversion and 55% NH4
+-N which concludes that partial
nitrification was occurred with PBM module starting from after day 80. The
similar results (15% NO3--N and 45% NH4
+-N) were also found with Com2
membrane module. These result shows that the biological sludge might be
adapted after long term experiments for partial nitrification. Generally, MBR
application in textile wastewater gives higher nitrification (more than 90%
NO3--N conversion) Huang et al. (2009) but it was not happened in this thesis.
Further investigation on this topic is needed.
Difference between experimental TN and calculated TN
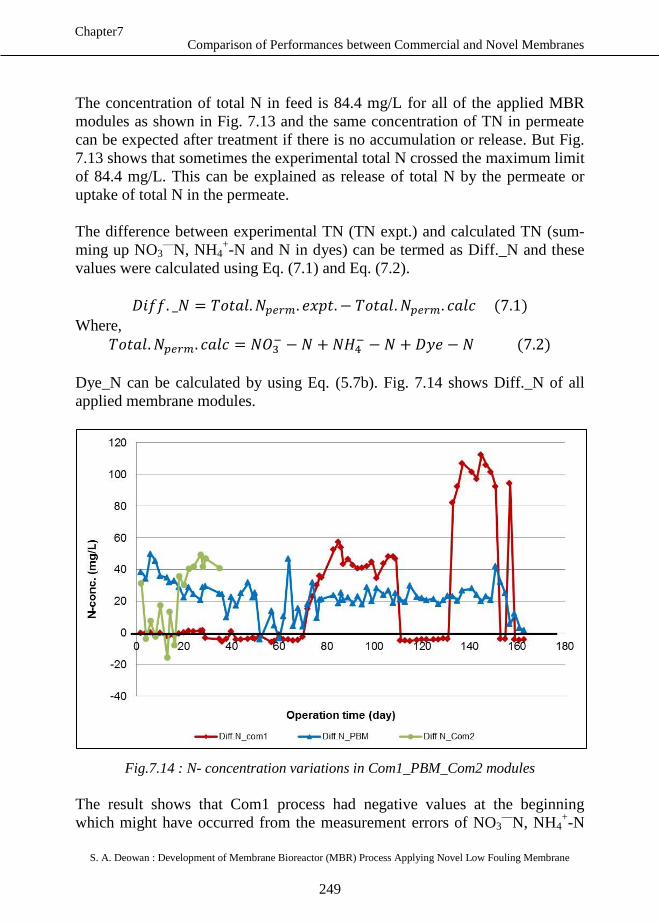
Comparison of Performances between Commercial and Novel Membranes
S. A. Deowan : Development of Membrane Bioreactor (MBR) Process Applying Novel Low Fouling Membrane
249
Chapter7
The concentration of total N in feed is 84.4 mg/L for all of the applied MBR
modules as shown in Fig. 7.13 and the same concentration of TN in permeate
can be expected after treatment if there is no accumulation or release. But Fig.
7.13 shows that sometimes the experimental total N crossed the maximum limit
of 84.4 mg/L. This can be explained as release of total N by the permeate or
uptake of total N in the permeate.
The difference between experimental TN (TN expt.) and calculated TN (sum-
ming up NO3—
N, NH4+-N and N in dyes) can be termed as Diff._N and these
values were calculated using Eq. (7.1) and Eq. (7.2).
Where,
Dye_N can be calculated by using Eq. (5.7b). Fig. 7.14 shows Diff._N of all
applied membrane modules.
Fig.7.14 : N- concentration variations in Com1_PBM_Com2 modules
The result shows that Com1 process had negative values at the beginning
which might have occurred from the measurement errors of NO3—
N, NH4+-N
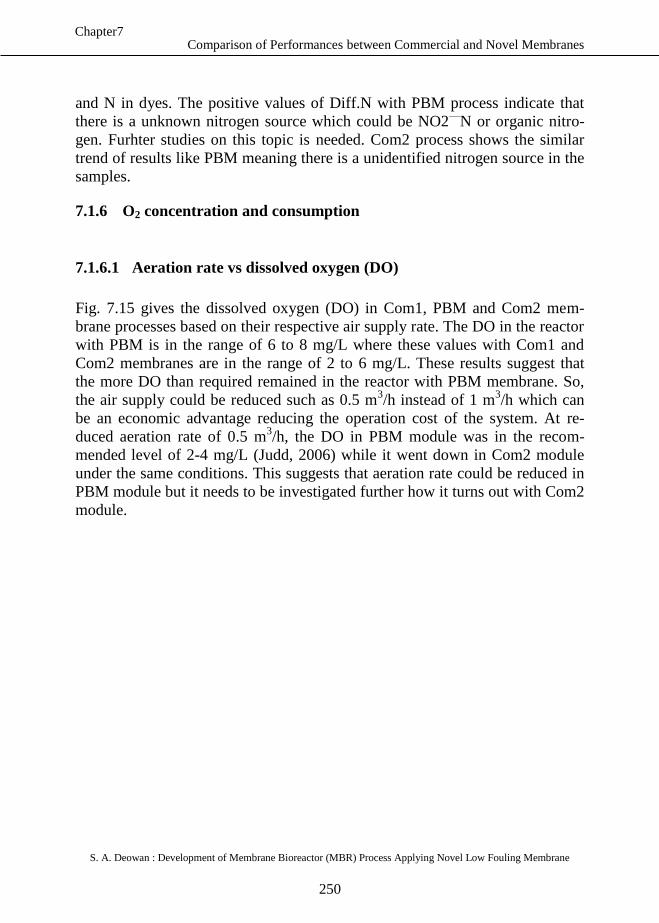
Comparison of Performances between Commercial and Novel Membranes
S. A. Deowan : Development of Membrane Bioreactor (MBR) Process Applying Novel Low Fouling Membrane
250
Chapter7
and N in dyes. The positive values of Diff.N with PBM process indicate that
there is a unknown nitrogen source which could be NO2—
N or organic nitro-
gen. Furhter studies on this topic is needed. Com2 process shows the similar
trend of results like PBM meaning there is a unidentified nitrogen source in the
samples.
7.1.6 O2 concentration and consumption
7.1.6.1 Aeration rate vs dissolved oxygen (DO)
Fig. 7.15 gives the dissolved oxygen (DO) in Com1, PBM and Com2 mem-
brane processes based on their respective air supply rate. The DO in the reactor
with PBM is in the range of 6 to 8 mg/L where these values with Com1 and
Com2 membranes are in the range of 2 to 6 mg/L. These results suggest that
the more DO than required remained in the reactor with PBM membrane. So,
the air supply could be reduced such as 0.5 m3/h instead of 1 m
3/h which can
be an economic advantage reducing the operation cost of the system. At re-
duced aeration rate of 0.5 m3/h, the DO in PBM module was in the recom-
mended level of 2-4 mg/L (Judd, 2006) while it went down in Com2 module
under the same conditions. This suggests that aeration rate could be reduced in
PBM module but it needs to be investigated further how it turns out with Com2
module.
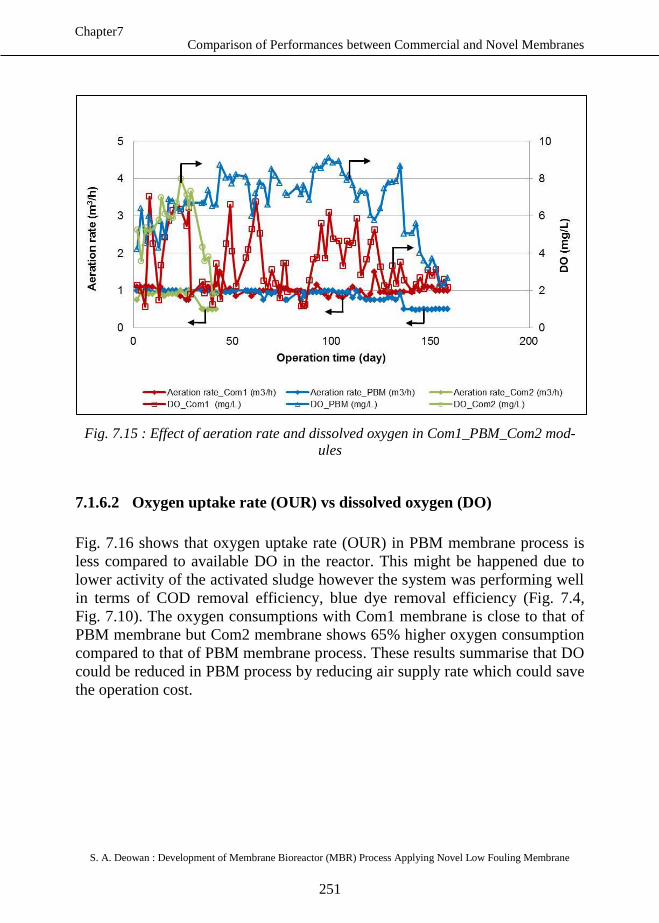
Comparison of Performances between Commercial and Novel Membranes
S. A. Deowan : Development of Membrane Bioreactor (MBR) Process Applying Novel Low Fouling Membrane
251
Chapter7
Fig. 7.15 : Effect of aeration rate and dissolved oxygen in Com1_PBM_Com2 mod-
ules
7.1.6.2 Oxygen uptake rate (OUR) vs dissolved oxygen (DO)
Fig. 7.16 shows that oxygen uptake rate (OUR) in PBM membrane process is
less compared to available DO in the reactor. This might be happened due to
lower activity of the activated sludge however the system was performing well
in terms of COD removal efficiency, blue dye removal efficiency (Fig. 7.4,
Fig. 7.10). The oxygen consumptions with Com1 membrane is close to that of
PBM membrane but Com2 membrane shows 65% higher oxygen consumption
compared to that of PBM membrane process. These results summarise that DO
could be reduced in PBM process by reducing air supply rate which could save
the operation cost.
Comparison of Performances between Commercial and Novel Membranes
S. A. Deowan : Development of Membrane Bioreactor (MBR) Process Applying Novel Low Fouling Membrane
252
Chapter7
Fig. 7.16 : Effect of DO and OUR in Com1_PBM_Com2 modules
7.1.7 MLSS
7.1.7.1 MLSS in operation phases
The range of MLSS in PBM membrane were 6.5 to 8.5 g/L with little down
grading values at the end where these values with Com1 were 10 to 12 g/L
with little down grading values at the end as well (Fig. 7.17). The MLSS in
Com2 process was close to that of Com1. As Gunder (2001) and Krampe
(2003) reported that most MBR installations work at the MLSS level of 8 – 12 g/L
while at higher MLSS value the MBR process loses its economical viability due to
increased viscosity of the activated sludge and poor oxygen transportation efficiency,
the minimum recommended values of the MLSS was reached by PBM membrane
process while Com1 and Com2 were well balanced in the range. Even at minimum
MLSS values, the PBM MBR membrane worked well. The trend of the Com2 shows
higher grading values.
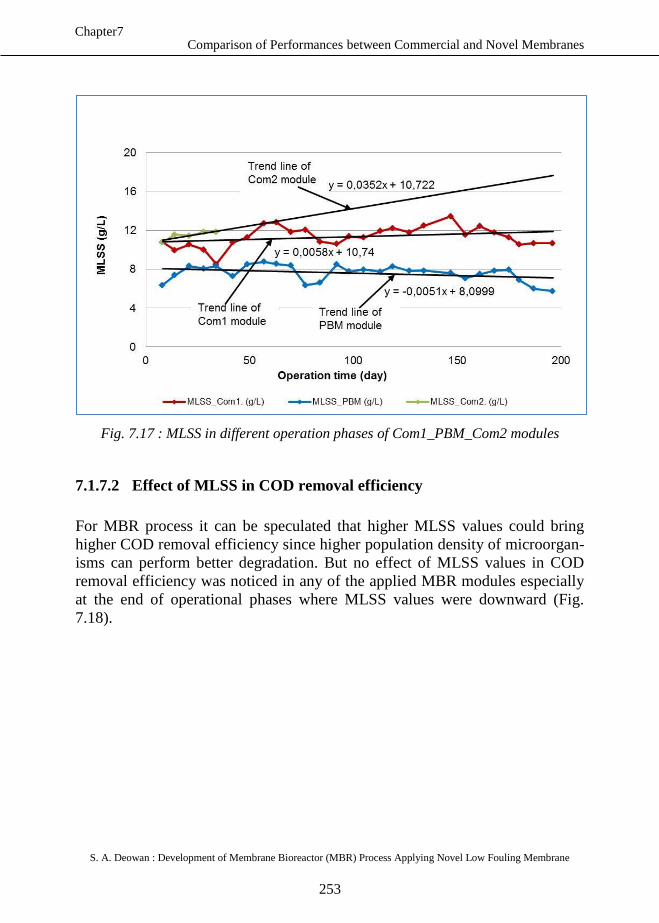
Comparison of Performances between Commercial and Novel Membranes
S. A. Deowan : Development of Membrane Bioreactor (MBR) Process Applying Novel Low Fouling Membrane
253
Chapter7
Fig. 7.17 : MLSS in different operation phases of Com1_PBM_Com2 modules
7.1.7.2 Effect of MLSS in COD removal efficiency
For MBR process it can be speculated that higher MLSS values could bring
higher COD removal efficiency since higher population density of microorgan-
isms can perform better degradation. But no effect of MLSS values in COD
removal efficiency was noticed in any of the applied MBR modules especially
at the end of operational phases where MLSS values were downward (Fig.
7.18).
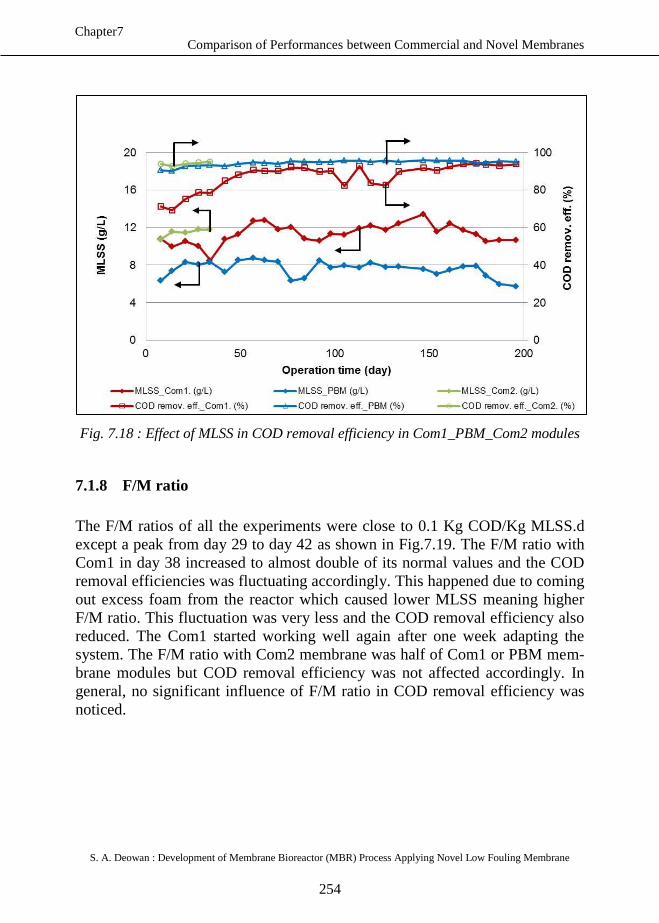
Comparison of Performances between Commercial and Novel Membranes
S. A. Deowan : Development of Membrane Bioreactor (MBR) Process Applying Novel Low Fouling Membrane
254
Chapter7
Fig. 7.18 : Effect of MLSS in COD removal efficiency in Com1_PBM_Com2 modules
7.1.8 F/M ratio
The F/M ratios of all the experiments were close to 0.1 Kg COD/Kg MLSS.d
except a peak from day 29 to day 42 as shown in Fig.7.19. The F/M ratio with
Com1 in day 38 increased to almost double of its normal values and the COD
removal efficiencies was fluctuating accordingly. This happened due to coming
out excess foam from the reactor which caused lower MLSS meaning higher
F/M ratio. This fluctuation was very less and the COD removal efficiency also
reduced. The Com1 started working well again after one week adapting the
system. The F/M ratio with Com2 membrane was half of Com1 or PBM mem-
brane modules but COD removal efficiency was not affected accordingly. In
general, no significant influence of F/M ratio in COD removal efficiency was
noticed.
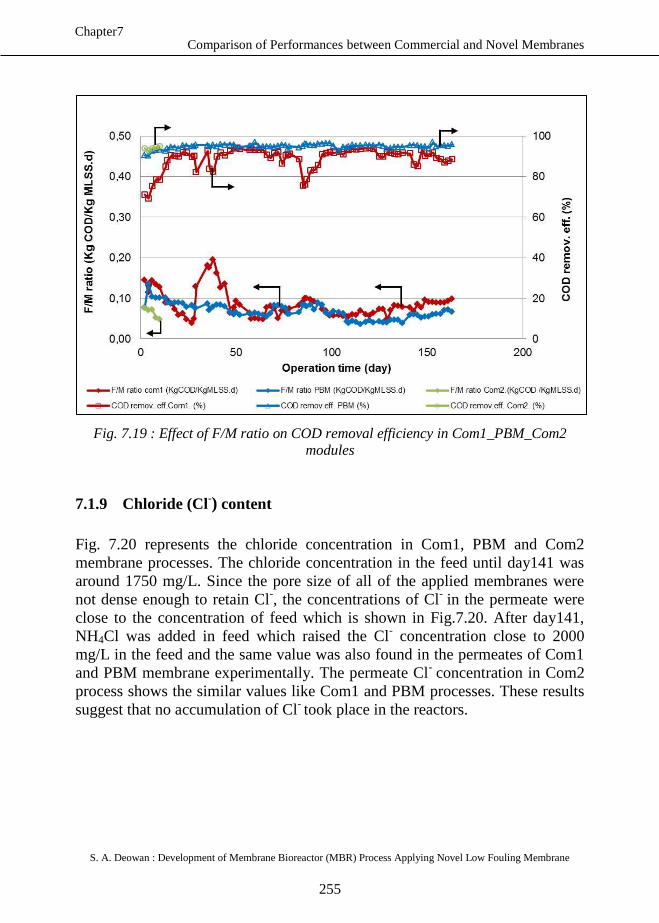
Comparison of Performances between Commercial and Novel Membranes
S. A. Deowan : Development of Membrane Bioreactor (MBR) Process Applying Novel Low Fouling Membrane
255
Chapter7
Fig. 7.19 : Effect of F/M ratio on COD removal efficiency in Com1_PBM_Com2
modules
7.1.9 Chloride (Cl-) content
Fig. 7.20 represents the chloride concentration in Com1, PBM and Com2
membrane processes. The chloride concentration in the feed until day141 was
around 1750 mg/L. Since the pore size of all of the applied membranes were
not dense enough to retain Cl-, the concentrations of Cl
- in the permeate were
close to the concentration of feed which is shown in Fig.7.20. After day141,
NH4Cl was added in feed which raised the Cl- concentration close to 2000
mg/L in the feed and the same value was also found in the permeates of Com1
and PBM membrane experimentally. The permeate Cl- concentration in Com2
process shows the similar values like Com1 and PBM processes. These results
suggest that no accumulation of Cl- took place in the reactors.
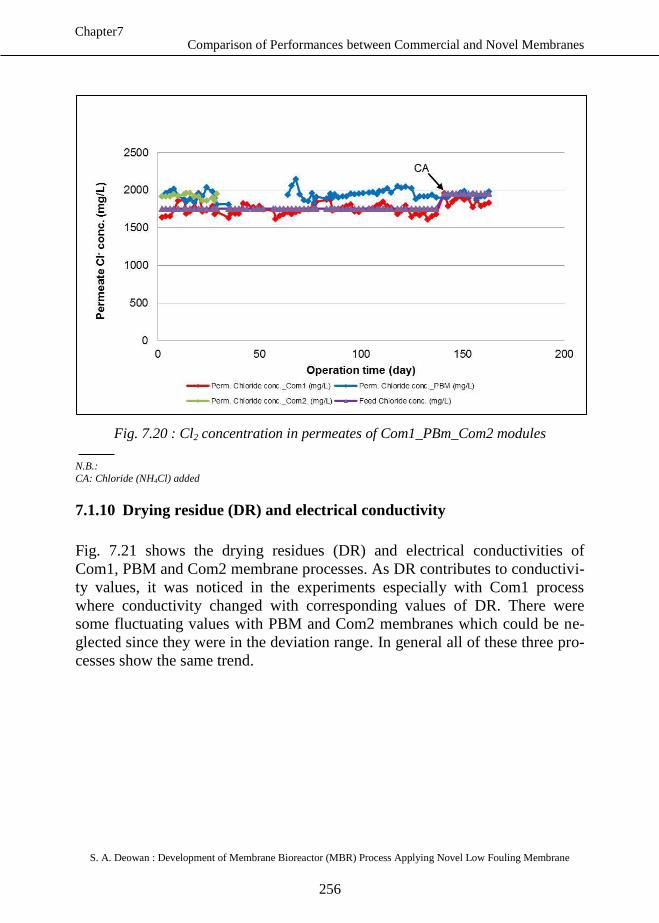
Comparison of Performances between Commercial and Novel Membranes
S. A. Deowan : Development of Membrane Bioreactor (MBR) Process Applying Novel Low Fouling Membrane
256
Chapter7
Fig. 7.20 : Cl2 concentration in permeates of Com1_PBm_Com2 modules
N.B.:
CA: Chloride (NH4Cl) added
7.1.10 Drying residue (DR) and electrical conductivity
Fig. 7.21 shows the drying residues (DR) and electrical conductivities of
Com1, PBM and Com2 membrane processes. As DR contributes to conductivi-
ty values, it was noticed in the experiments especially with Com1 process
where conductivity changed with corresponding values of DR. There were
some fluctuating values with PBM and Com2 membranes which could be ne-
glected since they were in the deviation range. In general all of these three pro-
cesses show the same trend.
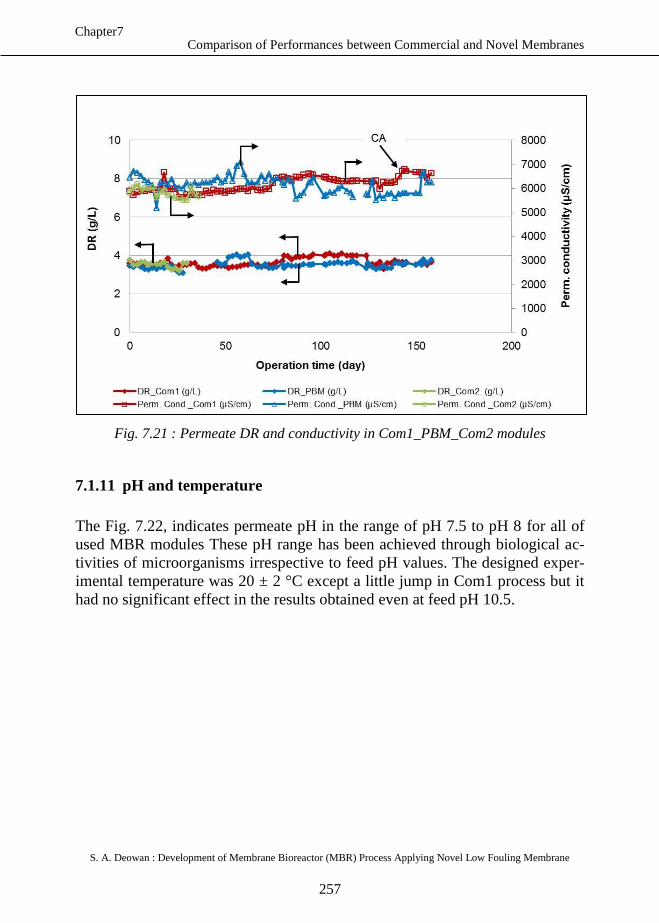
Comparison of Performances between Commercial and Novel Membranes
S. A. Deowan : Development of Membrane Bioreactor (MBR) Process Applying Novel Low Fouling Membrane
257
Chapter7
Fig. 7.21 : Permeate DR and conductivity in Com1_PBM_Com2 modules
7.1.11 pH and temperature
The Fig. 7.22, indicates permeate pH in the range of pH 7.5 to pH 8 for all of
used MBR modules These pH range has been achieved through biological ac-
tivities of microorganisms irrespective to feed pH values. The designed exper-
imental temperature was 20 ± 2 °C except a little jump in Com1 process but it
had no significant effect in the results obtained even at feed pH 10.5.
Perm
eate
co
nd
. (µ
S/c
m)
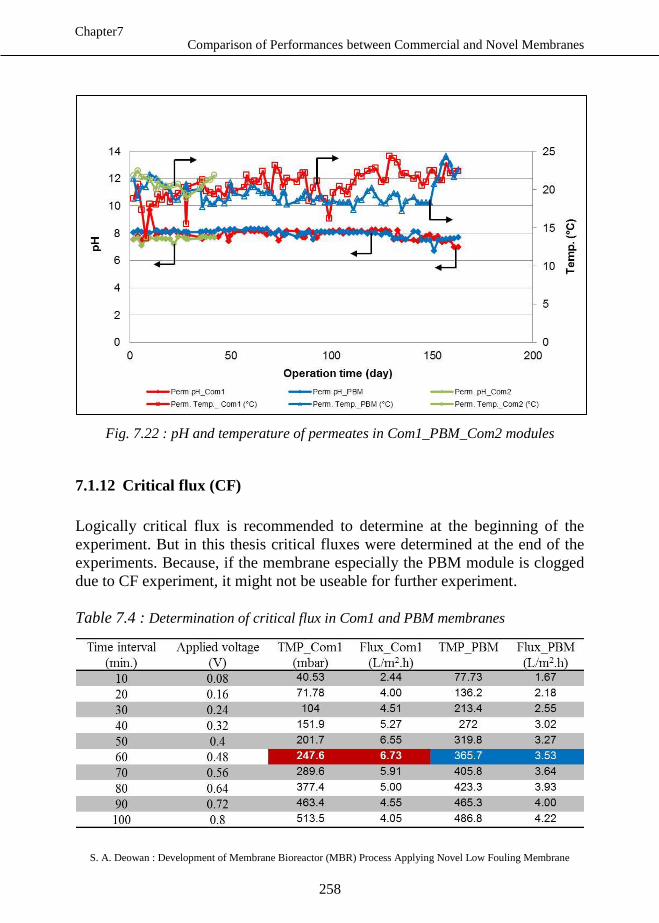
Comparison of Performances between Commercial and Novel Membranes
S. A. Deowan : Development of Membrane Bioreactor (MBR) Process Applying Novel Low Fouling Membrane
258
Chapter7
Fig. 7.22 : pH and temperature of permeates in Com1_PBM_Com2 modules
7.1.12 Critical flux (CF)
Logically critical flux is recommended to determine at the beginning of the
experiment. But in this thesis critical fluxes were determined at the end of the
experiments. Because, if the membrane especially the PBM module is clogged
due to CF experiment, it might not be useable for further experiment.
Table 7.4 : Determination of critical flux in Com1 and PBM membranes
Tem
p. (°
C)
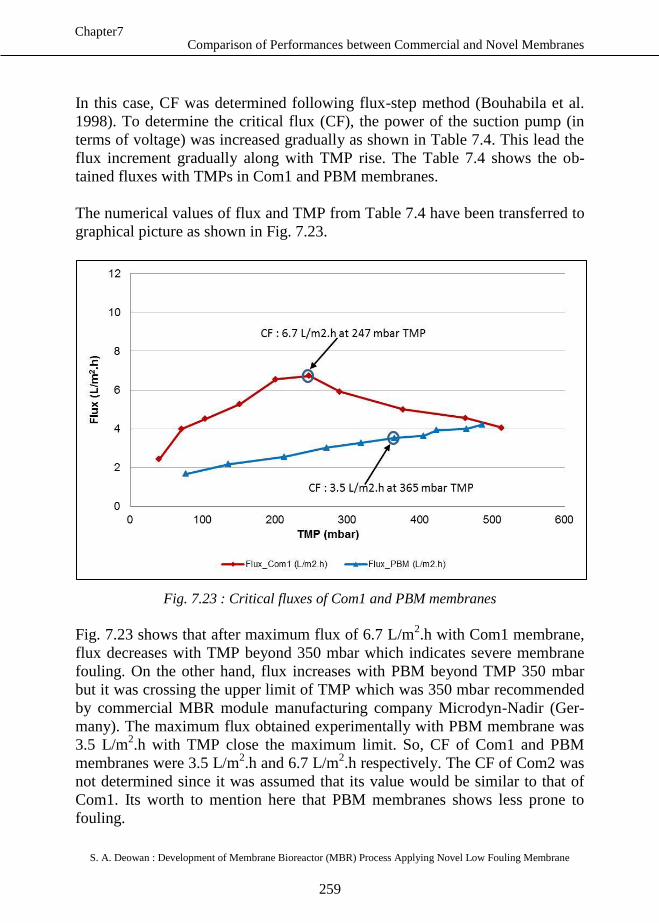
Comparison of Performances between Commercial and Novel Membranes
S. A. Deowan : Development of Membrane Bioreactor (MBR) Process Applying Novel Low Fouling Membrane
259
Chapter7
In this case, CF was determined following flux-step method (Bouhabila et al.
1998). To determine the critical flux (CF), the power of the suction pump (in
terms of voltage) was increased gradually as shown in Table 7.4. This lead the
flux increment gradually along with TMP rise. The Table 7.4 shows the ob-
tained fluxes with TMPs in Com1 and PBM membranes.
The numerical values of flux and TMP from Table 7.4 have been transferred to
graphical picture as shown in Fig. 7.23.
Fig. 7.23 : Critical fluxes of Com1 and PBM membranes
Fig. 7.23 shows that after maximum flux of 6.7 L/m2.h with Com1 membrane,
flux decreases with TMP beyond 350 mbar which indicates severe membrane
fouling. On the other hand, flux increases with PBM beyond TMP 350 mbar
but it was crossing the upper limit of TMP which was 350 mbar recommended
by commercial MBR module manufacturing company Microdyn-Nadir (Ger-
many). The maximum flux obtained experimentally with PBM membrane was
3.5 L/m2.h with TMP close the maximum limit. So, CF of Com1 and PBM
membranes were 3.5 L/m2.h and 6.7 L/m
2.h respectively. The CF of Com2 was
not determined since it was assumed that its value would be similar to that of
Com1. Its worth to mention here that PBM membranes shows less prone to
fouling.
Comparison of Performances between Commercial and Novel Membranes
S. A. Deowan : Development of Membrane Bioreactor (MBR) Process Applying Novel Low Fouling Membrane
260
Chapter7
7.1.13 Membrane resistance model
As described in section 5.6.13, Darcy’s Law establishes a relationship between
TMP and flux. In this section, the membrane in series (RIS) model has been
applied in calculating membrane resistance and other resistances developing
from the test media in different experimental set ups. This approach summaris-
es the results obtained in chapter5 and chapter6 in terms of contribution of re-
sistances to membrane fouling. The detailed description of the experimental set
ups and test media have been discussed in the previous chapters (Chapter 5 and
chapter6) for application of membrane resistance model. The applied total re-
sistances of each individual test media such as humic acid (ha), model textile
dye wastewater (mtdw) and MBR sludge (sludge) are given in Eq. /.1) through
Eq. (7.3).
Where,
Rm = Constant resistance of the clean membrane (1/m)
Rha = Fouling resistance due to humic acid (1/m)
Rmtdw = Fouling resistance due to MTDW (1/m)
Rsludge = Fouling resistance due to MBR sludge deposited on membrane
surface (1/m)
The respective resistances of both Com1 and PBM membranes were calculated
using RIS model as described in section 5.6.13 and section 6.3.13 respectively.
This section compares different resistances with Com1 and PBM with different
test media as shown in Fig. 7.24.
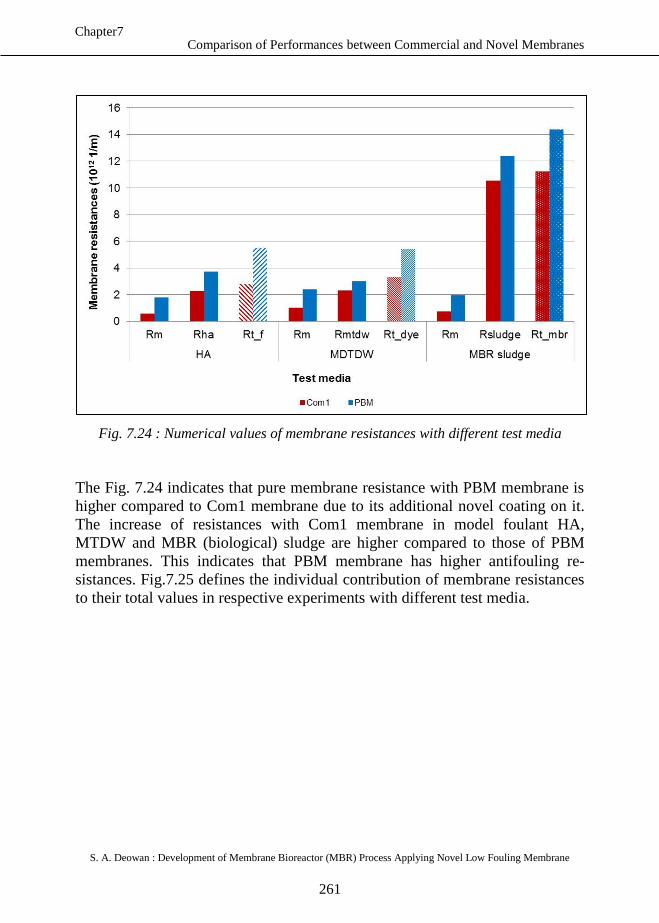
Comparison of Performances between Commercial and Novel Membranes
S. A. Deowan : Development of Membrane Bioreactor (MBR) Process Applying Novel Low Fouling Membrane
261
Chapter7
Fig. 7.24 : Numerical values of membrane resistances with different test media
The Fig. 7.24 indicates that pure membrane resistance with PBM membrane is
higher compared to Com1 membrane due to its additional novel coating on it.
The increase of resistances with Com1 membrane in model foulant HA,
MTDW and MBR (biological) sludge are higher compared to those of PBM
membranes. This indicates that PBM membrane has higher antifouling re-
sistances. Fig.7.25 defines the individual contribution of membrane resistances
to their total values in respective experiments with different test media.
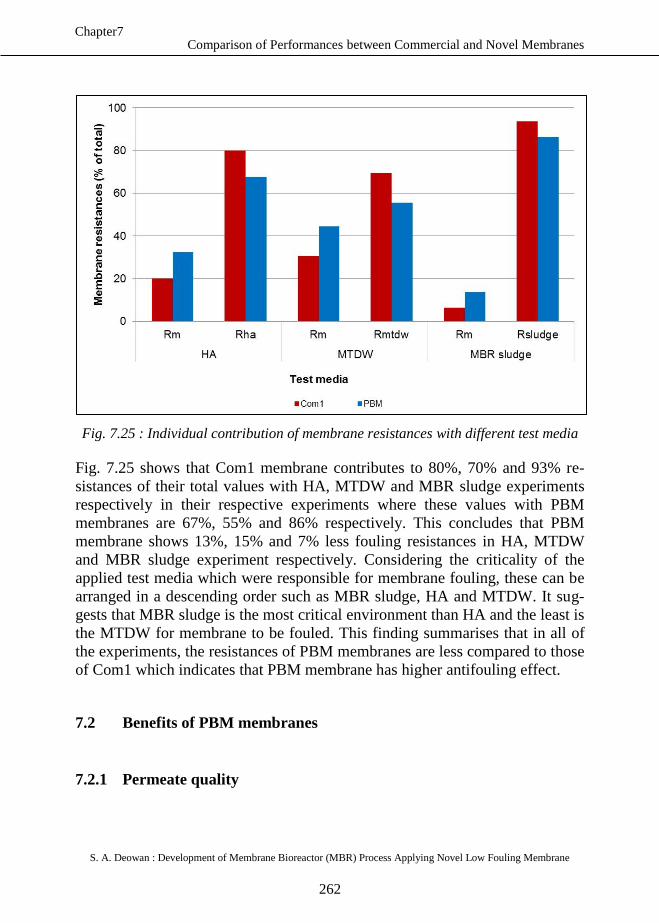
Comparison of Performances between Commercial and Novel Membranes
S. A. Deowan : Development of Membrane Bioreactor (MBR) Process Applying Novel Low Fouling Membrane
262
Chapter7
Fig. 7.25 : Individual contribution of membrane resistances with different test media
Fig. 7.25 shows that Com1 membrane contributes to 80%, 70% and 93% re-
sistances of their total values with HA, MTDW and MBR sludge experiments
respectively in their respective experiments where these values with PBM
membranes are 67%, 55% and 86% respectively. This concludes that PBM
membrane shows 13%, 15% and 7% less fouling resistances in HA, MTDW
and MBR sludge experiment respectively. Considering the criticality of the
applied test media which were responsible for membrane fouling, these can be
arranged in a descending order such as MBR sludge, HA and MTDW. It sug-
gests that MBR sludge is the most critical environment than HA and the least is
the MTDW for membrane to be fouled. This finding summarises that in all of
the experiments, the resistances of PBM membranes are less compared to those
of Com1 which indicates that PBM membrane has higher antifouling effect.
7.2 Benefits of PBM membranes
7.2.1 Permeate quality
Comparison of Performances between Commercial and Novel Membranes
S. A. Deowan : Development of Membrane Bioreactor (MBR) Process Applying Novel Low Fouling Membrane
263
Chapter7
In terms of organic content, the higher COD/TOC reduction in permeate repre-
sents better permeate quality. The COD removal efficiencies in long term ex-
periments with Com1 and PBM membranes were roughly 90% and 97% re-
spectively (Fig. 7.4). On the other hand, dyes reduction in treated water is other
criteria to define permeate quality. The higher is the dye rejection from perme-
ate, the better is the permeate quality. Fig. 7.10 indicates that PBM membrane
has 20% higher blue dye removal efficiency compared to PES membranes
(Com1 and Com2) in the long term experiments. In terms of TOC reduction,
PBM membrane shows 10% higher TOC removal efficiency compared to
Com1 but it is similar with the result of Com2 which needs to be investigated
for long term experiment. These outcomes conclude that PBM membrane,
based on COD and dye removal efficiencies, represents better permeate quality
compared to PES membrane.
7.2.2 Low fouling properties
7.2.2.1 Hydrophilicity
The contact angel of the PBM membrane reduced to 31% which was evident
experimentally (Fig. 4.16). As it is described in section 2.1.3.2.3.1, reduction of
contact angle indicates the higher hydrophilicity of the membrane. So, the in-
crease of the hydrophilicity of the PBM membrane might have contributed to
its low fouling properties.
7.2.2.2 Surface smoothness
The surface of the PBM membrane was very smooth which was revealed
through AFM image analysis (Fig. 4.13) and root mean squared (RMS) rough-
ness analysis (Fig. 4.14). The smoother surface of the PBM might have less
prone to membrane fouling and the foulant cannot build up layer on its surface
which was revealed by test with model foulant humic acid. The test with fou-
lant HA (Section 4.2.7) represents that PBM membrane is less prone to mem-
brane fouling with HA and it shows 59% fouling reversibility where PES
membrane contributes to 11% only.
7.2.2.3 Contribution to fouling resistance
Fig. 7.25 demonstrates that the membrane resistance of PBM membrane, con-
tributed by model foulant HA, MTDW and MBR (biological) sludge system,
Comparison of Performances between Commercial and Novel Membranes
S. A. Deowan : Development of Membrane Bioreactor (MBR) Process Applying Novel Low Fouling Membrane
264
Chapter7
are less compared to those of Com1 membrane. The results from all three ex-
periments suggest that PBM membrane has low fouling propensity meaning
high antifouling effect.
Analysing the results of MBR experiments carried out with commercial PES
UF MBR module (Chapter5) and novel coated PBM MBR module (chapter6),
it was found that commercial module faced severe fouling problems during the
experimental period of 10 months and the modules were needed to replace by
new ones. On the contrary, no replacement of novel coated PBM MBR module
was needed almost for the same duration of experimental period. This finding
suggests that PBM membrane has strong antifouling properties.
Since membrane fouling is regarded as the most important bottleneck for fur-
ther development of MBR technology and is the main limitation for faster de-
velopment, particularly when it leads to flux losses that cleaning can’t restore
(Howell, et al., 2004), the application of PBM membrane in MBR technology
can improve the process with reduced fouling effect.
7.2.3 Antimicrobial properties
The antimicrobial properties of the PBM membrane, performed by prof. Al-
tinkaya from Izmir Institute of Technology (IZTECH), Turkey (Section 4.2.9),
which was not found in applied commercial PES UF membrane (e.g.Com1
membrane), can resist in forming Coliform Unit (CFU) on the membrane sur-
face. This effect can reduce the cleaning cycle of the membrane and ultimately
can increase the life cycle of the membrane resulting in reduced operation cost.
After 6 months of MBR experiments with commercial PES MBR module and
novel coated PBM MBR module, it was noticed that the commercial module
was densely covered with biological sludge (Fig. 7.26) while the PBM module
was comparatively clean (Fig. 7.27). It can be concluded that PBM membrane
prevented microorganisms in creating bacterial colony on the membrane sur-
face which might kept the surface clean.
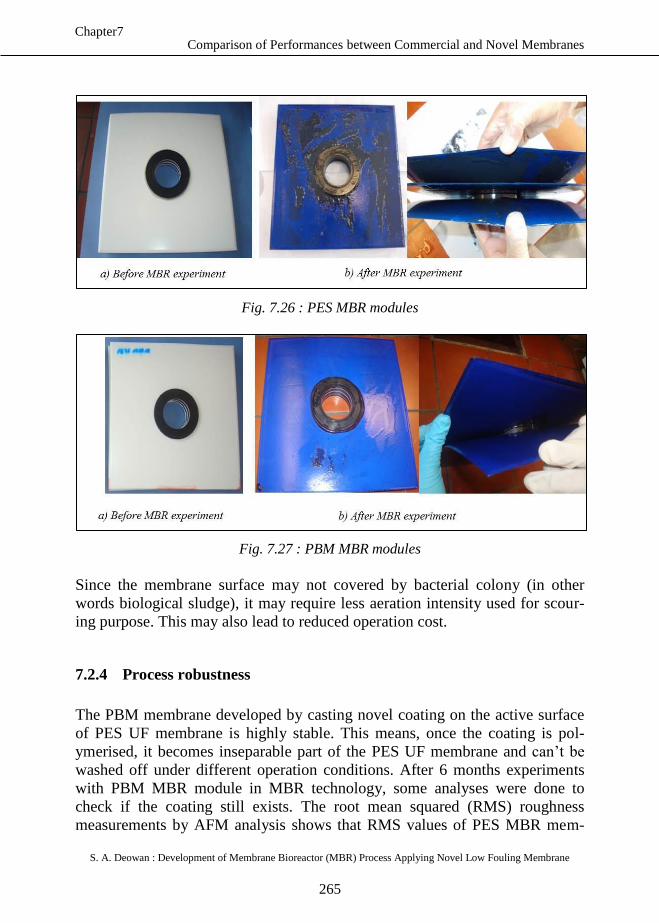
Comparison of Performances between Commercial and Novel Membranes
S. A. Deowan : Development of Membrane Bioreactor (MBR) Process Applying Novel Low Fouling Membrane
265
Chapter7
Fig. 7.26 : PES MBR modules
Fig. 7.27 : PBM MBR modules
Since the membrane surface may not covered by bacterial colony (in other
words biological sludge), it may require less aeration intensity used for scour-
ing purpose. This may also lead to reduced operation cost.
7.2.4 Process robustness
The PBM membrane developed by casting novel coating on the active surface
of PES UF membrane is highly stable. This means, once the coating is pol-
ymerised, it becomes inseparable part of the PES UF membrane and can’t be
washed off under different operation conditions. After 6 months experiments
with PBM MBR module in MBR technology, some analyses were done to
check if the coating still exists. The root mean squared (RMS) roughness
measurements by AFM analysis shows that RMS values of PES MBR mem-
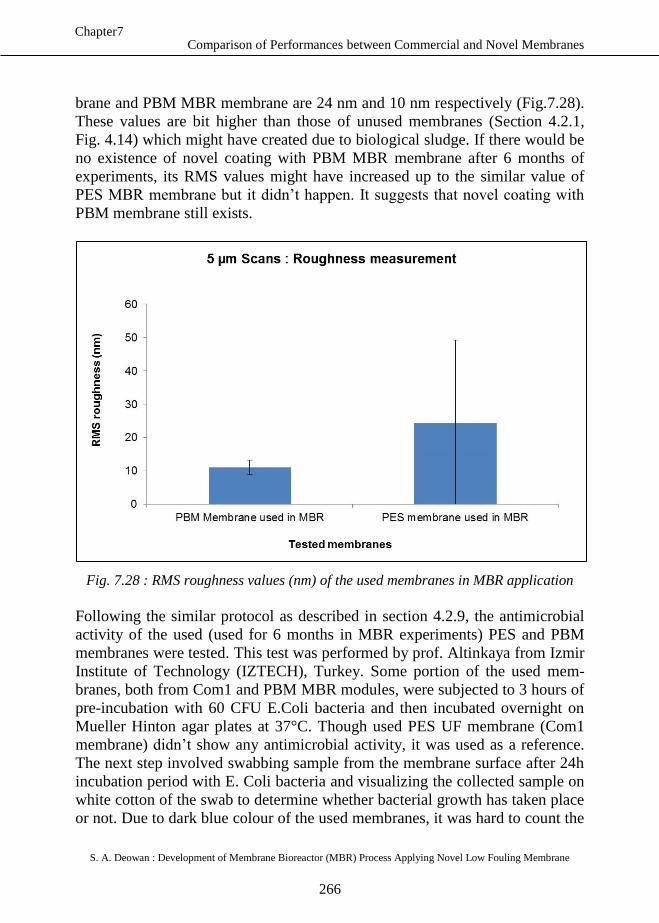
Comparison of Performances between Commercial and Novel Membranes
S. A. Deowan : Development of Membrane Bioreactor (MBR) Process Applying Novel Low Fouling Membrane
266
Chapter7
brane and PBM MBR membrane are 24 nm and 10 nm respectively (Fig.7.28).
These values are bit higher than those of unused membranes (Section 4.2.1,
Fig. 4.14) which might have created due to biological sludge. If there would be
no existence of novel coating with PBM MBR membrane after 6 months of
experiments, its RMS values might have increased up to the similar value of
PES MBR membrane but it didn’t happen. It suggests that novel coating with
PBM membrane still exists.
Fig. 7.28 : RMS roughness values (nm) of the used membranes in MBR application
Following the similar protocol as described in section 4.2.9, the antimicrobial
activity of the used (used for 6 months in MBR experiments) PES and PBM
membranes were tested. This test was performed by prof. Altinkaya from Izmir
Institute of Technology (IZTECH), Turkey. Some portion of the used mem-
branes, both from Com1 and PBM MBR modules, were subjected to 3 hours of
pre-incubation with 60 CFU E.Coli bacteria and then incubated overnight on
Mueller Hinton agar plates at 37°C. Though used PES UF membrane (Com1
membrane) didn’t show any antimicrobial activity, it was used as a reference.
The next step involved swabbing sample from the membrane surface after 24h
incubation period with E. Coli bacteria and visualizing the collected sample on
white cotton of the swab to determine whether bacterial growth has taken place
or not. Due to dark blue colour of the used membranes, it was hard to count the
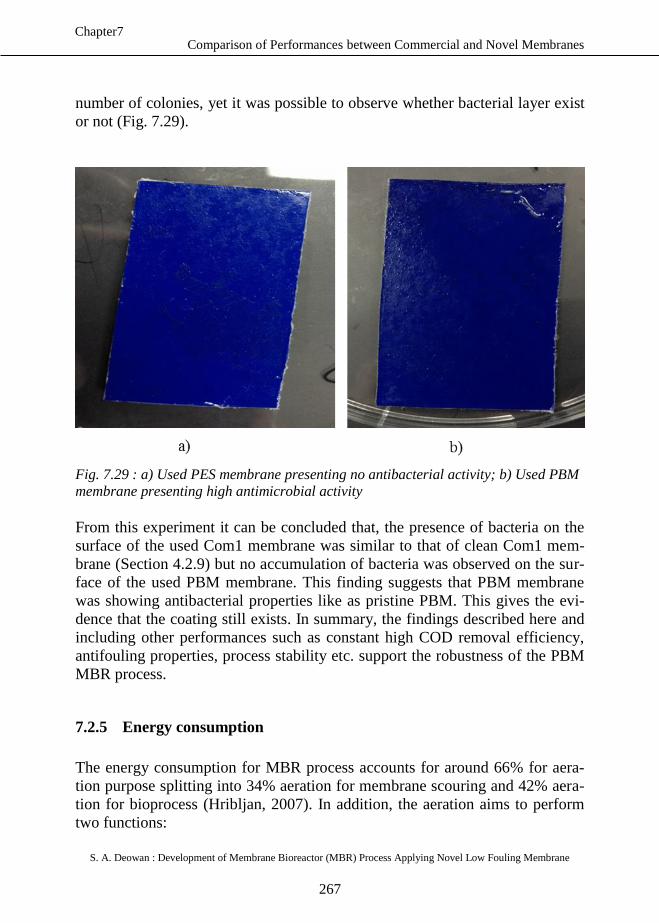
Comparison of Performances between Commercial and Novel Membranes
S. A. Deowan : Development of Membrane Bioreactor (MBR) Process Applying Novel Low Fouling Membrane
267
Chapter7
number of colonies, yet it was possible to observe whether bacterial layer exist
or not (Fig. 7.29).
Fig. 7.29 : a) Used PES membrane presenting no antibacterial activity; b) Used PBM
membrane presenting high antimicrobial activity
From this experiment it can be concluded that, the presence of bacteria on the
surface of the used Com1 membrane was similar to that of clean Com1 mem-
brane (Section 4.2.9) but no accumulation of bacteria was observed on the sur-
face of the used PBM membrane. This finding suggests that PBM membrane
was showing antibacterial properties like as pristine PBM. This gives the evi-
dence that the coating still exists. In summary, the findings described here and
including other performances such as constant high COD removal efficiency,
antifouling properties, process stability etc. support the robustness of the PBM
MBR process.
7.2.5 Energy consumption
The energy consumption for MBR process accounts for around 66% for aera-
tion purpose splitting into 34% aeration for membrane scouring and 42% aera-
tion for bioprocess (Hribljan, 2007). In addition, the aeration aims to perform
two functions:
Comparison of Performances between Commercial and Novel Membranes
S. A. Deowan : Development of Membrane Bioreactor (MBR) Process Applying Novel Low Fouling Membrane
268
Chapter7
Supplying oxygen to microorganisms
Scouring membrane surface against fouling
The aeration rate can be varied based on the oxygen uptake rate (OUR) by mi-
croorganisms and scouring effect. Section 7.1.6 describes that the oxygen up-
take rate by PBM membrane module was less compared to commercial PES
MBR module (Com1 membrane) based on available dissolved oxygen (DO)
which was contributed by the applied aeration rate. Fig. 7.15 shows that at aer-
ation rate of 0.5 ± 0.05 m3/h, the DO was in the range of 2 – 4 mg/L in PBM
process and its performance (e.g. COD removal efficiency) was not affected.
But the performance of Com2 membrane deteriorated (i.e. COD removal effi-
ciency) at the aeration rate of 0.5 ± 0.05 m3/h since its contributed DO might
not be enough to perform the regular activities of bioprocess. This finding sug-
gests that energy consumption in terms of air supply in PBM process might be
reduced to 50%. This topic should be further studied.
On the other hand, since the PBM membrane showed antimicrobial properties;
it was comparatively clean (Section 7.2.3). Therefore, the aeration rate could
be reduced (not shown in this thesis) for scouring purpose which may reduce
the energy in PBM process additionally.
In general, the areas of the membrane modules used for all experiments were
0.33 m2. It was just used for initial experiment. For detailed discussion on en-
ergy saving the experiment with larger module is needed.
7.2.6 Techno-Economical analysis of the applied processes
Section 4.2.2 demonstrates that pore size was reduced with PBM membrane to
25% compared to its pristine PES membrane. The molecular weight cut off
(MWCO) of the PBM membrane reduced to 64% compared to PES membrane
as described in section 4.2.4. The pore size of the PBM membrane can be tuned
by varying the temperature of microemulsion during polymerization and its
chemical compositions. Following these process flexibilities PBM membranes
with different pore size can be prepared based on their applications. Since the
PBM layer is very thin (1 to 10 µm), a small amount of microemulsion was
required to produce PBM coated membrane which is low in preparation but
high in benefits. The cationic surfactant AUTEAB used in preparing PBM
membrane shows antimicrobial properties which represents high resistant
against biofouling especially in MBR applications. Due to very smooth and
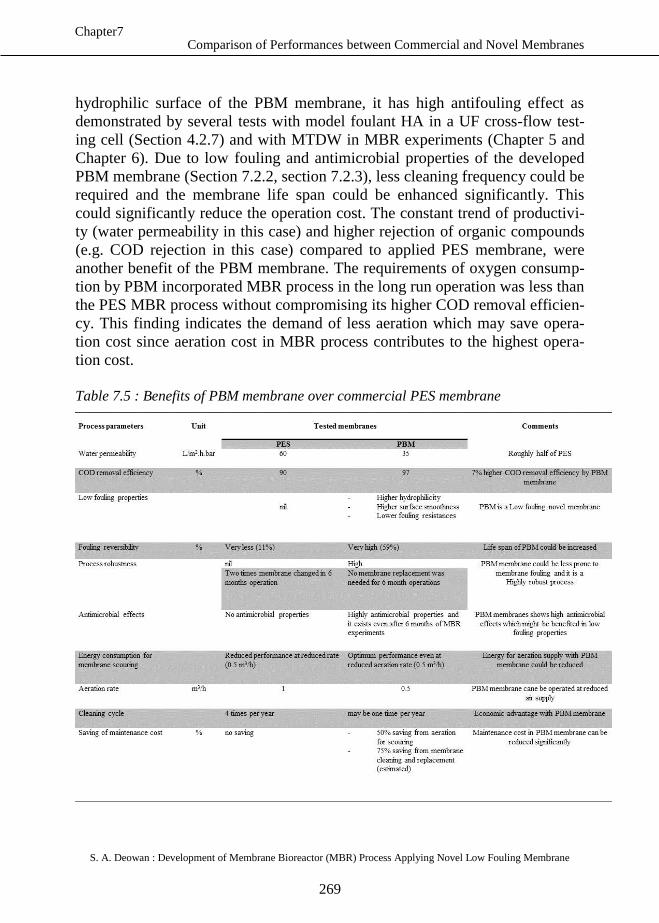
Comparison of Performances between Commercial and Novel Membranes
S. A. Deowan : Development of Membrane Bioreactor (MBR) Process Applying Novel Low Fouling Membrane
269
Chapter7
hydrophilic surface of the PBM membrane, it has high antifouling effect as
demonstrated by several tests with model foulant HA in a UF cross-flow test-
ing cell (Section 4.2.7) and with MTDW in MBR experiments (Chapter 5 and
Chapter 6). Due to low fouling and antimicrobial properties of the developed
PBM membrane (Section 7.2.2, section 7.2.3), less cleaning frequency could be
required and the membrane life span could be enhanced significantly. This
could significantly reduce the operation cost. The constant trend of productivi-
ty (water permeability in this case) and higher rejection of organic compounds
(e.g. COD rejection in this case) compared to applied PES membrane, were
another benefit of the PBM membrane. The requirements of oxygen consump-
tion by PBM incorporated MBR process in the long run operation was less than
the PES MBR process without compromising its higher COD removal efficien-
cy. This finding indicates the demand of less aeration which may save opera-
tion cost since aeration cost in MBR process contributes to the highest opera-
tion cost.
Table 7.5 : Benefits of PBM membrane over commercial PES membrane
Comparison of Performances between Commercial and Novel Membranes
S. A. Deowan : Development of Membrane Bioreactor (MBR) Process Applying Novel Low Fouling Membrane
270
Chapter7
7.3 Outlook for PBM membrane preparation
The process like preparing microemulsion, adding initiators, casting micro-
emulsion etc used for preparing PBM membranes were not automated process
but a hand-made operation. Since the hand-made operation can’t be every time
100% reproducible, this may affect the properties of the prepared membrane
and its performances. After adding initiators and before casting the microemul-
sion, the time frame (4-5 minutes) was critical. The viscosity of the microemul-
sion which increases rapidly based on the concentration of added initiators and
temperature plays an important role in generating the morphology of the mem-
brane. The viscosity increase was noticed only by eye estimation within the
mentioned time frame and in considerable increased viscosity conditions mi-
croemulsion was casted. This part of the PBM membrane preparation was criti-
cal because several times microemulsion got polymerised inside the preparing
flask within this time frame which might have occurred due to temperature
increase in the microemulsion leading the quicker viscosity rise. Another factor
is the application of the casting knife. It’s really very hard to keep the speed of
the casting knife movement constant each time the membrane is prepared. This
option may affect the morphology of the prepared membrane and its perfor-
mance. Because, if the speed of the casting knife movement is high, the coating
thickness can be different than if the speed is reduced. Because, at the latter
case, microemulsion can have more time to contribute in viscosity rise during
polymerisation. After 3rd
time cleaning of the PBM tested with model foulant
humic acid (HA), it shows that some part is darker while others are lighter
(Section 4.2.7.2, Fig. 4.22). This might have occurred due to non-homogeneity
of the membrane surface. The effect of temperature rise in microemulsion vis-
cosity also needs to be investigated in future research.
The membrane modules used in all of the experiments were small and these
were used just for initial tests. If the membrane module is scaled-up to larger
applications, those can’t be prepared by hand made process due to some limita-
tions as mentioned above. In this case, the processes like mixing chemicals for
microemulsion, determining temperature and viscosity of the microemulsion,
controlling the speed of the casting knife, controlling the rate of inert gas,
checking the inertness of the casting chamber needs to be optimized through
process automation.
Comparison of Performances between Commercial and Novel Membranes
S. A. Deowan : Development of Membrane Bioreactor (MBR) Process Applying Novel Low Fouling Membrane
271
Chapter7
References
Bouhabila, E.H., Aim, B. R., Buisson, H. (1998), Microfiltration of activated
sludge using submerged membrane with air bubbling application to
wastewater treatment, Desalination 118 (1998) 315 - 322
Günder, B. (2001). "The Membrane Coupled-Activated Sludge Process in Mu-
nicipal
Wastewater Treatment." Technomic Publishing Company Inc., Lancas-
ter, USA
Hach Lange, 2013, http://www.hachlange.ma, accessed on November 23, 2013
Hribljan, Michel J. (2007), Large MBR Design and Residuals Handling, WEF
Webcast, June 12.
Howell, J.A., Chua, H.C., Arnot, T.C. (2004), In situ manipulation of critical flux in a
submerged membrane bioreactor using variable aeration rates and effects of
membrane history, Journal of Membrane Science, Vol 242 (2004) 13-19 Huang, R.R., Hoinkis, J., Hu, Q., Koch, F. (2009), Treatment of dyeing
wastewater by hollow fiber membrane biological reactor, J. Desalina-
tion and Water Treatment, 11, 1 - 6
Judd, S. (2006), The MBR Book: Principles and Applications of Membrane
Bioreactors in Water and Wastewater Treatment, editor, Elsevier
Krampe, J., and Krauth, K. (2003), Oxygen transfer into activated sludge with
high MLSS concentrations. Water Science and Technology 47, 297-
303.
Chapter 8
Conclusion and Outlook
S. A. Deowan : Development of Membrane Bioreactor (MBR) Process Applying Novel Low Fouling Membrane
272
8. Chapter 8 : Conclusion and Outlook
8.1 Conclusion
This PhD thesis deals with the development of membrane bioreactor (MBR)
process based on novel low fouling membranes towards developing novel
MBR process. As reported in different literature, there are several ways to de-
velop hybrid/novel MBR process like integrating powdered activated carbon
(PAC), biofilm carrier etc. to conventional MBR process and lifting their over-
all performance ((Mulder et al., 2007; Ravindran et al., 2009; Liu et al., 2010
and Yang et al., 2009). To achieve the novelty of the process in this thesis, the
applied commercial membrane used in the MBR module was modified by
nano-structured novel coating through polymerisable bicontinuous microemul-
sion (PBM) process. This results in higher antifouling, antimicrobial properties,
higher COD and higher textile dye (blue) removal efficiency. The progress of
the membrane bioreactor process development was subdivided into several
phases:
In the early stage of the research phase, a suitable option for modifying
the commercial membrane was investigated. ITM-CNR, Italy did ex-
tensive research in this sector. After lot of investigations and scientific
research, the process for preparing novel coating on a commercial PES
UF membrane via polymerisable bicontinuous microemulsion (PBM)
was developed (Chapter 4). Based on this developed process several
novel coated membranes were prepared and characterised to select the
right membranes for MBR module preparation. The ultimate goal was
to compare the results between commercial MBR and novel coated
MBR and to ascertain the novelty of the process.
To reach the target, experiments with commercial MBR module (PES
UF MBR module) were performed continuously in a lab-scale pilot
plant for around 10 months (Chapter 5). This task was conducted in
parallel with novel membrane preparations and characterisations. A
model textile dye wastewater (MTDW) with the view of having con-
stant compositions with respect to time was used as test media for all
experiments. All the experiments were carried out with selected suitable
operation conditions (Section 5.4).
For the MBR experiments with the commercial PES UF MBR module,
6 sheets of novel coated membranes with size of 30 cm × 30 cm were
Conclusion and Outlook
S. A. Deowan : Development of Membrane Bioreactor (MBR) Process Applying Novel Low Fouling Membrane
273
Chapter7
prepared and these were laminated to a 3 enveloped MBR module of 25
cm × 25 cm in size similar to the applied commercial MBR module
with the support of membrane module manufacturing company, Micro-
dyn-Nadir (Germany).
After the MBR experiments with the commercial membrane were com-
pleted, the commercial MBR module was replaced by the novel coated
MBR module and the experiments were carried out under the selected
operating conditions for 6 months (Chapter 6).
The results from two different kind of MBR modules in experimental
sequences such as MBR with commercial membrane (Com1) →MBR
with novel coated membrane (PBM) →again MBR with commercial
membrane (Com2) were compared in terms of water permeability, per-
meate quality, COD/TOC removal efficiency, textile dye removal effi-
ciency, antifouling/antimicrobial properties, N-balance, fouling re-
sistance, process robustness and oxygen consumption (Chapter 7). The
performance analysis showed that PBM incorporated novel coated
MBR module compared to the commercial MBR module has 7% points
higher COD removal efficiency, 20% points higher blue dye removal
efficiency, high antifouling/antimicrobial properties, requires less ener-
gy in terms of aeration and economically viable highly robust process.
In summary, all these benefits directs towards achieving the aim of the
thesis, an upgraded MBR process due to application of novel low foul-
ing membrane.
8.2 Outlook
Despite the demonstrated benefits of PBM coated MBR module, still process
optimization is needed to achieve enhanced performances. The following rec-
ommendations can be made for further improvement of MBR process based on
PBM coated membrane splitting into two sub-sections such as membrane coat-
ing process and MBR process:
MBR process
The water permeability of PBM coated MBR module is roughly half of
the applied commercial MBR module. After the coating the membrane
resistance of PBM coated membrane increased to 3 times higher com-
pared to commercial PES membrane (Section 5.6.13 and section
6.3.13). The extra coating of PBM membrane has created resistance re-
sulting in lower permeability. The PBM coating was prepared by hand-
Conclusion and Outlook
S. A. Deowan : Development of Membrane Bioreactor (MBR) Process Applying Novel Low Fouling Membrane
274
Chapter7
made process and the thickness of the coating was defined by casting
knife. The hand-made casting process should be replaced by an auto-
mated one to achieve uniformity and reproducibility of the process. The
thickness of the PBM coating should be kept as low as possible in order
to keep water permeability high.
The hydraulic retention time (HRT) of the carried out experiment was
very high and it should be reduced in future work. The MBR process
needs to be optimized varying the applied process. The poor nitrifica-
tion was obtained in all applied MBR processes and a further study on
this topic is needed.
Membrane coating process
The quantification of the attached foulants (humic acid) needs to be
done by XRD or other standard process. During the characterization of
PBM coated membrane it was noticed that it has less attachment of
model foulant (HA) compared to applied commercial membranes,
which indicates the high antifouling properties of the coated membrane
(Section 4.2.7.2). It was examined by eye assisted visualization (Fig.
4.22) and cross-sectional SEM image analysis (Fig. 4.23) to understand
the fouling thickness layer but no element analysis was done
The casting chamber needs to be 100% N2-saturated excluding any
trace of air/O2 during polymerization because presence of air/O2 hinders
the polymerization process. Air/O2 was excluded from the flask of mi-
croemulsion applying a stream of N2 for 1 minute at 1 bar applied pres-
sure (Fig. 4.8). For preparing PBM coated novel membrane in this the-
sis work, redox initiator was added to the microemulsion at the last
stage of the preparation process and it was done outside of the casting
chamber, though it lasts for few seconds. This step might have created
the chance for microemulsion to become in contact with air/O2. This
might be a reason of varying polymerization time and performances
that occurred sometimes (Section 7.3). The process for addition of re-
dox initiators to microemulsion should be optimized in such a way that
the trace of air/O2 is excluded from the experimental set up.
N2 gas supplied for creating N2-saturated environment in casting cham-
ber was performed roughly for 1 minute at 1 bar pressure. It was as-
sumed that the chamber was saturated with N2 gas. This process needs
to be optimized installing N2 gas sensor/instrument to be ensured that
the chamber is 100% N2-saturated excluding air/oxygen.
Conclusion and Outlook
S. A. Deowan : Development of Membrane Bioreactor (MBR) Process Applying Novel Low Fouling Membrane
275
Chapter7
After adding redox initiator, the viscosity of the microemulsion increas-
es. For preparing PBM coated membrane within this thesis, it was wait-
ed for 4 – 5 minutes after adding initiator to achieve suitable intermedi-
ate viscosity of the microemulsion. The development of viscosity in-
crease was only monitored by naked eye; no instrument/sensor was
used to quantify the value. Sometimes it happened that the microemul-
sion polymerized inside the flask of microemulsion or the microemul-
sion was too much liquid even in the same time frame. The reason of
these occurrences needs to be investigated. This step of the preparation
process also needs to be optimized using viscosity meter to define the
right viscosity for casting process. The suitability of the application of
UV photo initiator needs to be checked for scaled-up novel preparation
process.
In summary, this thesis represents the development and application steps of
a membrane bioreactor (MBR) with PBM coated novel low fouling mem-
brane. The experiments with PBM coated MBR module were carried out
for 6 months. After the experiment of this duration, the novel coating on
the active surface of the commercial membrane still existed which was re-
vealed by experimental investigations. The presented lab scale novel low
fouling based MBR worked excellent in laboratory scale experiment and it
can readily be deployed in industrial site to be tested with real test media.
However, this technology can still be improved as recommended in this
section to keep pushing the technology until expected achievements are
reached.
References
Liu, Q, Wang, X.C., Liu, Y, Yuan, H., Du, Y. (2010), Performance of a
hybrid membrane bioreactor in municipal wastewater treatment, Desal-
ination 258, 143 - 147
Mulder, J. W., Braunersreuther, M., Schonewille, H., Jager, R. D. and
Veraart, A. (2007), Hybrid MBR for industrial reuse of domestic
wastewater in the Netherlands
Ravindran, V., Tsai, H.H., Williams, M.D., Pirbazari, M. (2009), Hybrid
membrane bioreactor technology for small water treatment utilities:
Process evaluation and primordial considerations, Journal of Membrane
Science 244, 39 - 54
Yang Q., Y., Yang, T., Wang, H., J. and Liu, K. Q. (2009), Filtration char-
acteristics of activated sludge in hybrid membrane bioreactor with po-
rous suspended carriers (HMBR), Desalination 249, 507 - 514
S. A. Deowan : Development of Membrane Bioreactor (MBR) Process Applying Novel Low Fouling Membrane
276
Scientific activities of Shamim Ahmed Deowan
Academic experiences
Supervising:
Supervisor of the following theses/semester research projects in the
field of Chemical Process Engineering at Karlsruhe University of Ap-
plied Sciences:
i) Lubna Jahan, (2013), Investigating the effects of Hydraulic Re-
tention Time (HRT) and oxygen consumption in Membrane Bi-
oreactor (MBR) towards developing novel MBR process, Mas-
ter thesis, July, 2013, Karlsruhe Univesity of Applied Sciences,
Germany
ii) Ting Yu, (2013), Treatment of Model Textile Dye Wastewater
(MTDW) by Submerged Membrane Bioreactor (MBR) Tech-
nology, Master thesis, August, 2013, Karlsruhe Univesity of
Applied Sciences, Germany
iii) Shahid Abbas, (2013), Measurement of Biochemical Oxygen
Demand (BOD), Semester project2, March, 2013, Karlsruhe
University of Applied Sciences, Germany
iv) Bernhard Wagner (2012), Membrane Bioreactor and Model
Textile Dye Wastewater Treatment, Bachelor thesis, April,
2012, Karlsruhe Univesity of Applied Sciences, Germany
v) Lubna Jahan, (2012), Process of determining individual dye
concentration from mixed solution of two different dyes, semes-
ter project2, October, 2012, Karlsruhe University of Applied
Sciences, Germany
vi) Sachin Kalyanrao Mirkale (2012), Rejection of Textile Dye by
Membrane Technology, October, 2012, Karlsruhe University of
Applied Sciences, Germany
vii) Lubna Jahan, (2011), Determining chemical composition of
model dye textile wastewater, semester project1, November,
2011, Karlsruhe University of Applied Sciences, Germany
viii) Abdelhakim El Fadil, (2011), Membrane Bioreactor (MBR) as
an advanced technology for Olive Mill Wastewater (OMW)
treatment, Master thesis, November, 2011, Karlsruhe University
of Applied Sciences, Germany
S. A. Deowan : Development of Membrane Bioreactor (MBR) Process Applying Novel Low Fouling Membrane
277
Attendence to courses and conferences/Publications
Course attendence:
Attending to GRICU PhD National School 2011- Methematical Methods for
Chemical Engineering/Nanotechnologies from 26th
September, 2011 until 1st
October, 2011, at Santa Margherita di Pula, Italy.
Publications:
Patent:
Alberto Figoli, Jan Hoinkis, Bartelo Gabriele, Giorgio De Luca, Fran-
cesco Galiano, Shamim Ahmed Deowan, worldwide patent titled as
“BICONTINUOUS MICROEMULSION POLYMERIZED COATING
FOR WATER TREATMENT”, registration number IT
GE2013A000096, filed on 27.09.2013.
Journal publications:
1. Shamim Ahmed Deowan, Francesco Galiano, Jan Hoinkis, Alberto
Figoli, Enrico Drioli, Submerged Membrane Bioreactor (SMBR) for
Treatment of Textile Dye Wastewater towards Developing Nobel MBR
Process, APCBEE Procedia 5 (2013) 259-264
2. S.A. Deowan, B. Wagner, C. Arsipathi, J. Hoinkis, A. Figoli, E. Drioli
et al, Treatment of model textile dye wastewater (MTDW) towards de-
veloping novel submerged membrane bioreactor process, Procedia En-
gineering 44(2012) 1768-1771
3. Jan Hoinkis, Shamim A. Deowan, Volker Panten, Alberto Figoli, Rong
Rong Huang and Enrico Drioli, Membrane Bioreactor (MBR) Technol-
ogy – A Promising Approach for Industrial Wastewater Reuse, Proce-
dia Engineering 33 (2012) 234-241
Conference publications (Oral):
1. S. A. Deowan, F. Galiano, L. Jahan, C. Aresipathi, S.I. Bouhadjar, A.
Figoli, J. Hoinkis, B. Gabriele, E. Drioli, (2013), Performances of Low
Fouling Novel Submerged Membrane Bioreactor (NSMBR) in Textile
Dye Wastewater Treatment, International Conference “Nanomemwater
2013”, Izmir, Turkey, October 8th – October 10th, 2013
S. A. Deowan : Development of Membrane Bioreactor (MBR) Process Applying Novel Low Fouling Membrane
278
2. S.I.Bouhadjar, S.A.Deowan, F. Galiano, J. Hoinkis, M. Zenad, A. Fi-
goli, (2013), Side-stream MBR for Model Textile Wastewater Treat-
ment Using Commercial and Novel Membranes, International Confe-
rence “Nanomemwater 2013”, Izmir, Turkey, October 8th – October
10th, 2013
3. A. Figoli, F. Galiano, S.A. Deowan, B. Gabriele, J. Hoinkis (2013), A
New Class of Functional Membranes to Lower Fouling and Improve
Rejections of Pollutants, International Conference “Nanomemwater
2013”, Izmir, Turkey, October 8th – October 10th, 2013.
4. S.A. Deowan, F. Galiano, L. Jahan, S.I. Bouhadjar, C. Aresipathi, A.
Figoli, J. Hoinkis, B. Gabriele, E. Drioli, (2013), SCMA 2013 Annual
Conference” Water – In the Best of Times, In the Worst of Times” San
Antonio, Texas, USA, July 31 – August, 2, 2013
5. Shamim Ahmed Deowan, Francesco Galiano, Jan Hoinkis, Alberto
Figoli, Enrico Drioli, Submerged Membrane Bioreactor (SMBR) for
Treatment of Textile Dye Wastewater towards Developing Nobel
MBR Process, ICESD 2013, January 19-20, 2013, Dubai, UAE
6. F. Galiano, S. A. Deowan, Alberto Figoli1, J. Hoinkis, L. Veltri, B.
Gabriele, Performance Test of Novel Membrane Regarding Water
Permeability, Fouling Behavior and Dye Rejection, proceedings of the
First International WATERBIOTECH Conference, October 9-11,
2012, National Research Center (NRC), Cairo, Egypt
7. S.A. Deowan, W. Korejba, C. Aresipathi, J. Hoinkis, A. Figoli, E. Dri-
oli, R. Islam (2011) Design and testing of a pilot scale submerged
membrane bioreactor (MBR) for textile wastewater treatment, ICChE
2011, December 29-30, 2011, BUET, Bangladesh
Conference Publications (Poster):
1. S. A. Deowan, F. Galiano, L. Jahan, S.E. Bouhadjar, C. Aresipathi, B.
Gabriele, J. Hoinkis, A.Figoli, E. Drioli, Novel Nano-structured Mem-
brane Materials for Membrane Bioreactor (MBR) Applications, BioN-
exGen 2nd
training workshop, 15-17 May, 2013, Cetraro, Italy
2. F. Galiano, A. Figoli, S. A. Deowan, J. Hoinkis, L. Veltri, B. Gabriele,
Novel hydrophilic membranes for wastewater treatment, BioNexGen
2nd
training workshop, 15-17 May, 2013, Cetraro, Italy
3. C.Aresipathi, S. A. Deowan, J. Hoinkis, A.S.Beobide, J. Anastasopou-
los, G. Voyiatzis, T. karachalios, K. Kouravelou, Membranes with
Functionalized Carbon Nanotube pores: Synthesis, Characterization and
application to model textile waste water, BioNexGen 2nd
training work-
shop, 15-17 May, 2013, Cetraro, Italy
S. A. Deowan : Development of Membrane Bioreactor (MBR) Process Applying Novel Low Fouling Membrane
279
4. S.A. Deowan, B. Wagner, T. Yu, A. Zhao, L. Jahan, C. Aresipathi, J.
Hoinkis, A. Figoli, E. Drioli Treatment of Model Textile Dye
Wastewater (MTDW) towards Developing Novel Submerged Mem-
brane Bioreactor Process, poster P3047 Euromembrane 2012, 23-27
September, Queen Elizabeth II Conference Centre, London, UK
S. A. Deowan : Development of Membrane Bioreactor (MBR) Process Applying Novel Low Fouling Membrane
280
Acknowledgement
I would like to acknowledge my profound indebtedness to my first supervisor
Prof. Enrico Drioli, Department of Chemical Engineering, University of Ca-
labria, Italy, for his continuous guidance and enormous assistance to implement
this thesis and for providing informative suggestions to make this report a ful-
filled one.
My endless gratefulness is to my second supervisor Dr. Alberto Figoli, a senior
research scientist, Institute on Membrane Technology (ITM-CNR), Italy, to
help me in creating an opportunity to carry out this cooperative PhD thesis un-
der his supervision and to guide me through valuable suggestions and com-
ments.
I am whole-heartedly life span owed to my third supervisor Prof. Jan Hoinkis,
Deparment of Sensor Systems Technology, Faculty of Electrical Engineering
and Electronics, Karlsruhe University of Applied Sciences, Germany who
brought me from an industrial platform to an academic foreground and provid-
ed all kinds of assistances such as technical directions, valuable suggestions,
critical comments, foreign research attachments, supports for conference at-
tendance etc. needed for making this thesis works successful.
I would like to convey my special thanks to my colleague, PhD student Fran-
cesco Galiano, Institute on Membrane Technology (ITM-CNR), Italy for his
endless supports in various fields starting from technical aspects (novel mem-
brane developments, characterisation etc.) to social activities which made my
research attachments in ITM-CNR technically sound and comfortable.
I am grateful to Dr. Daniel Johnson from Swansea University, UK; Prof. Alsoy
Sacide Altinkaya from Izmir Institute of Technology (IZTECH), Turkey and
Prof. Mauro Carraro and his research team from University of Padova, Italy for
their supports in membrane characterisation and testing (partial) carried out for
the thesis works.
I express my thankful attitude to the BioNexGen (grant agreement no. CP-FP-
246039-2) EU-FP7/project for its financial support to carry out the thesis
works.
Acknowledgement
S. A. Deowan : Development of Membrane Bioreactor (MBR) Process Applying Novel Low Fouling Membrane
281
I am grateful to my master thesis students (for whom I was the supervisor)
Bernhard Wagner, Ting Yu and Lubna Jahan for their contributions in experi-
ments and data generation.
I am also intended to thank the members of the research team in Karlsruhe
University of Applied Sciences, Germany named as Dr. Catherine Aresipathi,
PhD student Saadia Ilhem Bouhadjar, researcher Margaritta Aleksandrova,
Aleksandrov Krazimir, Florian Fiedler, Michel Wartha, Torsten Kühle, the
stuffs from the Institute on Applied Research (IAF) and the rest of the mem-
bers from the department of sensor systems technology.
I would also like to express my thankfulness to the members of the research
team in ITM-CNR, Italy namely Dr. Alessandra Criscuoli, Dr. Giorgio De Lu-
ca, PhD student Federica Bisignano, Dr. Lidietta Giorno and the rest of the
members from ITM-CNR, Italy.
I am very much delightful to my wife, Shahin who constantly supported me
with great patience for the progress of my thesis works and sometimes man-
aged the pain of loneliness during my absences for attending conferences out-
side of our residing country. I would also like to express my gratefulness to my
6 year old lovely son Sablil who got limited leisure time from me due to the
load of thesis works and missed me a lot during my absences for attending con-
ferences. I would also like to thank my elder brother Babul Akter who support-
ed me like as my father.
Finally, I would like to thank to all of my friends, relatives and the rest of my
family members and all well-wishers to provide me mental support to be suc-
cessful in this work.
As author I bear the responsibility for all interpretations, opinion and errors in
this report.
S. A. Deowan : Development of Membrane Bioreactor (MBR) Process Applying Novel Low Fouling Membrane
282
Abbreviations
ADUF Aerobic digester ultrafilration
AFM Atomic force microscopy
anMBR Anaerobic membrane bioreactor
AOP Advanced Oxidation Process
APS Ammonium persulfate
ASP Activated sludge process
AUTEAB Acryloyloxyundecyltriethyl ammonium bromide
BAC Biologically activated carbon
BAT Best available technology
BOD Biochemical oxygen demand
CA Cellulosic acetate
CAS Conventional activated sludge
CF Critical flux
CFV Cross-flow velocity
CIA Cleaning in air
CIP Cleaning in place
COD Chemical oxygen demand
Cl2 Chloride
DI Deionised
DR Drying residue
DO Dissolved oxygen
EGDMA Ethylene glycol dimethacrylate
EPS Extra-cellular polymeric substances
F/M Food to microorganism ratio
FS Flat sheet
GAC Granular activated carbon
HA Humic acid
HEMA 2-Hydroxylethyl methacrylate
HF Hollow fibre
HRT Hydraulic residence time
H2O2 Hydrogen peroxide
Abbreviations
S. A. Deowan : Development of Membrane Bioreactor (MBR) Process Applying Novel Low Fouling Membrane
283
IC Inorganic carbon
IDWTP Integrated dyeing wastewater treatment plant
iMBR Immersed MBR
kDa Kilodalton
LiP Lignin peroxidases
MBR Membrane bioreactor
MLD Million liters per day
MLSS Mixed liquor suspended solids
MMA Methyl methacrylate
MnP Manganese dependent peroxidases
MnO4 Permanganate
MPE Membrane performance enhancer
MPR Membrane photocatalytic reactor
MST Membrane sewage treatment
MT Multitubular
MTDW Model textile dye wastewater
MW Molecular weight
MWCO Molecular weight cut off
NaOCl Sodiumhypochloride
NF Nanofiltration
NH4+–N Nitrogen concentration in ammonia
NO3--N Nitrogen concentration in nitrate
NO2-
-N Nitrogen in nitrite
NOM Natural organic matter
O3 Ozone
OH Hydroxide
PAC Powdered activated carbon
PAN Polyacrylonitrile
PBM Polymerisable bicontinuous microemulsion
PE Polyethylene
PES Polythersulfone
PET Polyethylene terephthalate
PVC Polyvinylchloride
PVDF Polyvinylidene difluoride
PP Polypropylene
Abbreviations
S. A. Deowan : Development of Membrane Bioreactor (MBR) Process Applying Novel Low Fouling Membrane
284
PS Polysulfone
PTFE Polytetrafluoroethelene
RIS Resistance in membrane series
RO Reverse osmosis
RO16 Reactive orange 16
SBR Sequencing batch reactor
SEM Scan electronic microscopy
SL Sludge loading
sMBR Side stream MBR
SMP Soluble microbial products
SMPc Soluble microbial products concentration
SRT Sludge retention time
SSF Solid state fermentation
TC Total carbon
TOC Total organic carbon
TMP Transmembrane pressure
TMEDA Tetramethylethylene diamine
TN Total nitrogen
UF Ultrafiltration
UV Ultraviolet
WHO World health organisation
WP Water permeability
WWTPs Wastewater treatment plant
ZW ZeeWeed
S. A. Deowan : Development of Membrane Bioreactor (MBR) Process Applying Novel Low Fouling Membrane
285
Nomenclature
A Absorbance
b Path length or cuvette width (cm)
c Concentration (mg/L)
C Instant oxygen concentration (mg/L)
Cs Saturated oxygen concentration (mg/L)
cv Coefficient of variation
d Diameter of the pore (mm)
g Acceleration due to gravity (m/s2)
J Membrane permeate flux (L/m2.h)
K The Kozeny-Carman constant
KLa Mass transfer coefficient
N The number of pores per square unit of membrane
Δp Pressure difference (bar)
Rm Membrane resistance for pure water filtration across the mem-
brane (1/m)
Re Internal fouling resistance (1/m)
Rc Cake layer resistance (1/m)
Rp Resistance due to concentration polarizsation (1/m)
Ri Resistance due to pore blocking (1/m)
Rt Total filtration resistance (1/m)
S The internal surface area (m2)
s Standard deviations
T Temperatue (°C), a constant
α Alpha factor
Δx Pore length (mm)
Mean value
η Liquid viscosity
εs Surface porosity
τ Tortuosity facor
εv The volume fraction or volume porosity of the pores
ρ Density (kg/m3)
η, μ Dynamic viscosity of permeate (N.s/m2)
ϵ Molar absorptivity constant (L/cm. mg)
Φ Typical constant, the values in the range of 1.015 to 1.040
S. A. Deowan : Development of Membrane Bioreactor (MBR) Process Applying Novel Low Fouling Membrane
286
Appendices
Appendix A LabVIEW Control program
Appendix B Formula for standard deviation and coefficient of varia-
tion (accuracy) calculation
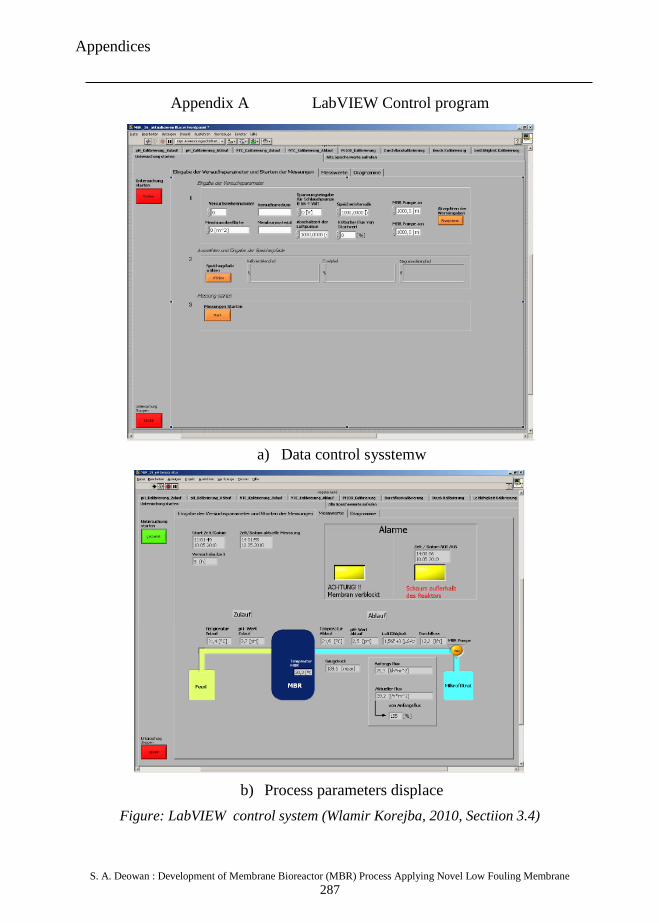
Appendices
S. A. Deowan : Development of Membrane Bioreactor (MBR) Process Applying Novel Low Fouling Membrane
287
Appendix A LabVIEW Control program
a) Data control sysstemw
b) Process parameters displace
Figure: LabVIEW control system (Wlamir Korejba, 2010, Sectiion 3.4)
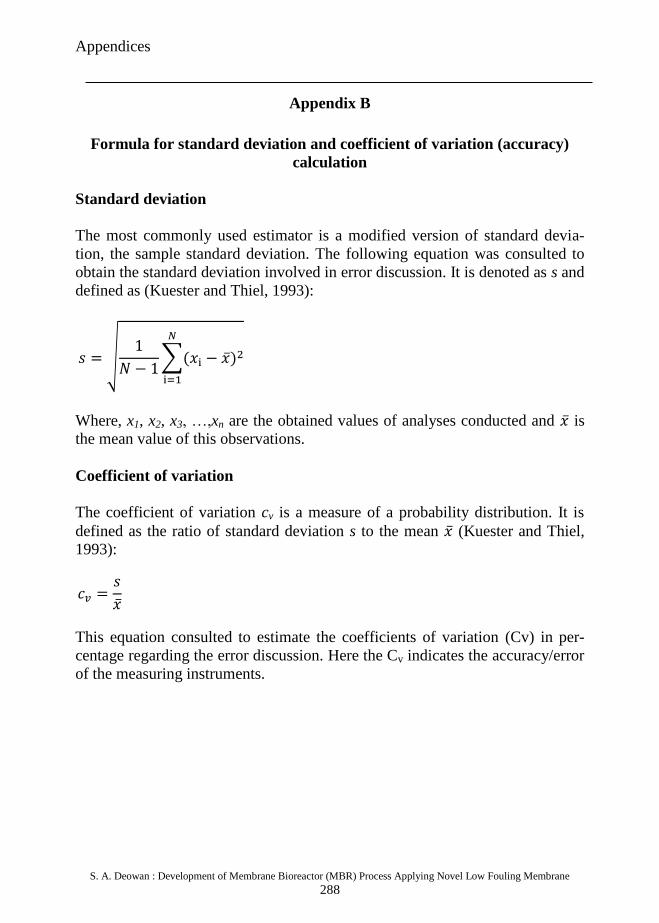
Appendices
S. A. Deowan : Development of Membrane Bioreactor (MBR) Process Applying Novel Low Fouling Membrane
288
Appendix B
Formula for standard deviation and coefficient of variation (accuracy)
calculation
Standard deviation
The most commonly used estimator is a modified version of standard devia-
tion, the sample standard deviation. The following equation was consulted to
obtain the standard deviation involved in error discussion. It is denoted as s and
defined as (Kuester and Thiel, 1993):
√
∑
Where, x1, x2, x3, …,xn are the obtained values of analyses conducted and is
the mean value of this observations.
Coefficient of variation
The coefficient of variation cv is a measure of a probability distribution. It is
defined as the ratio of standard deviation s to the mean (Kuester and Thiel,
1993):
This equation consulted to estimate the coefficients of variation (Cv) in per-
centage regarding the error discussion. Here the Cv indicates the accuracy/error
of the measuring instruments.