does parent satisfaction with a childcare provider matter for loyalty?
TRANSCRIPT
1
Does Parent Satisfaction with a Childcare Provider Matter for Loyalty?
Timothy L. Keiningham, Lerzan Aksoy, Tor W. Andreassen, and Demitry Estrin *
Accepted for publication at the Managing Service Quality, Vol. 1, No. 3 (May), 2006.
Timothy L. Keiningham, Senior Vice President & Head of Consulting IPSOS Loyalty, Morris Corporate Center 2, 1 Upper Pond Rd, Bldg D., Parsippany, NJ 07054 Phone: 973-658-1719 Fax: 973-658-1701 Email: [email protected] Lerzan Aksoy, Assistant Professor of Marketing (corresponding author) Koç University, College of Administrative Sciences and Economics Rumeli Feneri Yolu, Sariyer 34450 Istanbul, Turkey Phone: (90-212) 338 14 56 Fax: (90-212) 338 16 42 Email: [email protected] Tor W. Andreassen, Associate Professor of Marketing Norwegian School of Management, Department of Marketing Nydalsveien 37, P.O. Box 20, N-0442 Oslo, Norway Phone: (47) 46410525 Fax: (47) 67 55 76 76 Email: [email protected] Demitry Estrin, Manager Large financial services company – Company requires anonymity *) All authors have contributed equally to the paper.
2
STRUCTURED ABSTRACT
Does Parent Satisfaction with a Childcare Provider Matter for Loyalty?
Research Paper
Purpose of this paper
This study investigates the relationship between parent satisfaction and child retention at a
childcare provider.
Design/methodology/approach
The survey data used in the analyses involves a sample size of 1,003 respondents, all clients of a
large, national childcare provider in the US. Logistic regression was used to test the propositions.
Findings
The results indicate that parent satisfaction is most important to child retention when the child is
very young (birth to one year of age). As children increase in age, however, parent satisfaction
becomes increasingly less predictive of children’s continued enrollment at a childcare facility.
Research limitations/implications
One of the limitations of this research is that it tests the propositions within a single firm. Future
research should attempt to replicate these findings across several childcare providers.
3
Practical implications
Emphasizing improvements in different attributes for different age groups has implications for
increasing retention for childcare providers, in addition to ultimately increasing the satisfaction
of parents.
What is original/value of paper
While all would agree that childcare services are of extremely high importance (at both a
national and individual level), no research to date has examined the role of parent satisfaction to
the continued enrollment of a child at a childcare facility. Our findings show that the presumed
relationship between satisfaction and retention varies greatly by the age of child.
KEYWORDS: Customer Satisfaction, Customer Retention, Child Care, Customer Service, Service
Environment, Research Paper.
4
INTRODUCTION
How important is parents’ satisfaction with a childcare provider and their repurchase
behavior? Governments often study parents’ satisfaction levels to guide their policy-making
efforts. Similarly, researchers study the drivers of parent satisfaction with the implicit belief that
satisfaction impacts parents’ ultimate behavior.
In general, both practitioners and academics have accepted the premise that customer
satisfaction results in customer behavior patterns that positively impact business results (Kotler,
1994; Rust and Oliver, 1994). A number of studies support the validity of such a linkage.
Research has found that customer satisfaction has a measurable impact on purchase intentions
(Bolton and Drew, 1991), on customer retention (Mittal and Kamakura, 2001), on share of
spending (Baumann, Burton, and Elliott, 2005; Bowman and Narayandas, 2004; Keiningham,
Perkins-Munn, Aksoy, and Estrin, 2005; Keiningham, Perkins-Munn, Evans, 2003) and on
financial performance (Anderson, Fornell and Lehmann, 1994; Leung, Li, and Au, 1998; Zahorik
and Rust, 1993).
Currently, however, the relationship between parent satisfaction and retention of a
childcare provider is accepted as a truism without rigorous empirical research to support the
relationship. Therefore, the need exists for an examination of the relationship between parents’
levels of satisfaction and the retention of their children with a childcare provider. This research
addresses this need by examining this relationship for parents of a large, US childcare provider.
THE USA CHILDCARE MARKET
In the United States, 62.8 percent of mothers of children (ages 0-5) are members of the
labor force, more than double the 30.3 percent level of the 1970s (Blau, 2003a). Someone other
than their parents regularly cares for over seventy percent of children with employed mothers,
5
with figures ranging from twenty-two to thirty-two percent in center-based childcare
arrangements (Capizzano, Adams, and Sonenstein, 2000; Ehrle, Adams and Tout, 2001). As a
result of the dramatic increase in demand, issues surrounding childcare are of great interest to
families, employers, and policy makers in the United States and other countries.
Because few topics are as important to most families as finding the proper balance
between caring for children and work, numerous studies by government entities, think tanks,
non-profit organizations, and academic researchers have focused on childcare issues (Gain 1999;
Mitchell, 1992). These studies, as is the case with this research, almost exclusively focus on
center-based care. This likely occurs because outside of center-based care, childcare primarily
takes place in the homes of parents or relatives, both contexts less likely to be studied. The
Urban Institute reports that childcare arrangements of working mothers for children under the
age of three were handled as follows: 27% Parents, 27% Relatives, 22% Center-based care, 17%
Home-based care, and 7% Nanny care (Ehrle, Adams and Tout, 2001).
With regard to center-based care, research finds that parents consistently express high
levels of satisfaction with their childcare (Bogat and Gensheimer, 1986; Britner and Phillips,
1995; Erdwins, Casper, and Buffardi, 1998). One plausible explanation for this may be found in
satisfaction as relief (Oliver, 1997): that is the satisfaction of finding a suitable place for the
child. Objective assessments of the actual quality of childcare facilities in the USA however are
distressing. Research conducted in the 1990s by four different universities found that only 15%
of childcare facilities could be classified as “excellent,” the bottom 15% were “abysmal” and the
middle 70% were barely adequate (Brownlee et. al., 1997). To resolve this paradox, Brownlee et.
al. (1997) argue that parents want to believe that they have made the right choice for their
6
children, and are therefore in a state of denial in order to cope with the fact that most are sending
their children to “barely adequate” or worse childcare facilities.
The disconnect between parent satisfaction and objective assessments of childcare quality
is lessened in part by findings of the National Child Care Survey (Hoffert et. al, 1991) that
despite the stated levels of high satisfaction, twenty-six percent of parents surveyed indicated
that they wanted to change their childcare arrangements. This would appear to be supported by
the fact that in studies of parents who actually switched childcare providers, service failure is
frequently cited as the impetus behind their switching behavior (Grace and O’Cass, 2001a; Grace
and O’Cass, 2001b; O’Cass and Grace, 2001).
It is clear that the link between satisfaction and retention in the context of childcare
services is not straightforward. While researchers have examined the predictors of parent
satisfaction with childcare (Britner and Phillips, 1995; Britner, 1999), currently no research
exists examining the relationship between parent satisfaction and retention of their children with
a childcare provider. The next section reviews the relevant services literature, culminating in the
hypotheses to be tested.
HYPOTHESES DEVELOPMENT
Given that satisfaction has been shown to be positively related to customer retention
across a variety of industries (for example: Anderson and Sullivan, 1993; Bolton, 1998; Ittner
and Larcker, 1998; Jones and Sasser, 1995; Loveman, 1998; Mittal and Kamakura, 2001), we
would expect the following with regard to a parent’s satisfaction and the retention of a childcare
provider.
H1: Parent satisfaction will be positively related to childcare provider retention.

7
Studies on child development suggest that there are multiple stages of human
development from birth to five years of age (Child Development Institute, 2005). Erik Erikson,
Sigmund Freud, and Margaret Mahler all theorize that children in fact do go through distinct
developmental phases starting from birth (Childstudy.net, 2005) and hence their needs and
behavior during the various stages could differ. For example, studies propose that while not
perfect, after the second birthday, children’s social and emotional development can tend to be
clustered into annual milestones (American Academy of Pediatrics, 2005; Child Development
Institute, 2005). This suggests that parents may have different expectations regarding their
childcare facilities based on the developmental stage of the child and changes in its needs.
Therefore, with regard to the relationship between parent satisfaction and childcare provider
retention, we would expect the following:
H2: The relationship between parent satisfaction and childcare provider retention
will vary by the developmental stage of the child.
To test these hypotheses empirically a study was designed and a survey was conducted.
The following section elaborates upon the research design.
METHODOLOGY
The research for this study was conducted in two parts: 1) an exploratory phase designed
to aid in the creation of a questionnaire, and 2) a quantitative phase consisting of the
administration and analysis of a parent/guardian satisfaction survey.
In an effort to ascertain the components of service important to parents of a childcare
facility, the authors first engaged in several methods of exploratory research. The first step was
to conduct an extensive literature review regarding childcare in the United States. A large body
of research was available, as it is a subject heavily researched by both government and non-profit
8
organizations (for example: The Government Accounting Office, www.gao.gov; The Urban
Institute, www.urban.org; The National Network for Child Care, www.nncc.org). Additionally,
researchers have examined issues of objective quality (Blau and Hagy, 1998; Blau, 2003a) and
parent search behavior (Grace and O’Cass, 2001a & b; O’Cass and Grace, 2001).
The second phase was to conduct in depth, one-on-one interviews with staff at the
childcare facilities regarding their perceptions of the critical service attributes (Carlzon, 1987)
that determine parents’ ultimate satisfaction with the service. In all, ten one-on-one interviews
were conducted either in person or via telephone to randomly selected staff members from
around the United States. Interviews lasted between one and two hours, and were recorded. A
team of researchers then went over each of the interviews to compile a list of attributes
determining satisfaction.
The final step was to conduct two focus groups with parents of children enrolled in the
childcare facility. The two groups consisted of parents of children enrolled at the childcare
facility. Each group was comprised of ten parents and lasted between 1.5 and 2 hours. These
groups were videotaped. As with the one-on-one interviews, a team of researchers then went
over each of the focus group videos to compile a list of attributes.
From the literature review, in-depth interviews, and focus groups, a list of parent needs
was compiled. The list exceeded three hundred needs. These needs were then organized into a
smaller number of managerially relevant groupings using K-J analysis[1] (Bossert, 1991).
In addition to the list of attributes, the exploratory research confirmed what the literature
suggests about how age (particularly school-age versus non-school-age) affects parents’ needs
from a childcare facility. The difference in needs for school-age versus non-school-age children
was largely because school-age children needed less center-based care due to their school
9
schedule. The authors found during in depth interviews with childcare staff and focus groups
conducted with parents that parents held different expectations from their childcare provider
based upon the age/developmental stage of their children even before children reach school age
(e.g., expectations differed for parents of very young children vs. parents of two, three, four-
year-olds, etc.). This likely results from the differing needs and capabilities of children at
various stages of child development (Child Development Institute, 2005).
QUESTIONNAIRE DEVELOPMENT
The list of attributes derived through the K-J analysis was used as the foundation for the
creation of a questionnaire. The questionnaire contained fifty-four closed-end questions
regarding various aspects of the service at their childcare facility and an overall satisfaction
measure. To minimize order bias, the service attribute questions were randomly ordered in
creating the final attribute list. To further mitigate order bias, two versions of the questionnaire
were created, each with opposite ordering of the service attribute questions. All closed-end
questions used a 1 to 10, end-anchored scale to assess the level of satisfaction with the provider.
The questionnaire was then pre-tested with a small number of parents for understandability and
readability.
SURVEY DATA
In order to test these hypotheses empirically data from a large, national US childcare
provider was used. Facilities are located throughout the continental United States (in sixty
percent of US states and the District of Columbia). The firm provides childcare for in excess of
20,000 children annually.
The firm faces competition from several other national and regional care facilities. The
vast majority of competitors, however, are small, single facility operations. It is important to

10
note that even relatively small towns tend to offer a wide array of childcare facilities. For
example, the state of Indiana recognizes 181 different childcare facilities available to parents in
the city of Evansville, population 121,582 according to the US Census (State of Indiana Division
of Family and Children, 2005). In the context of this research, parents would appear to have
discretion in the choice of care facilities chosen.
As a result, while the firm is large relative to the vast majority of its competitors, it does
not exceed a five percent share of the center-based childcare market in any of the markets it
serves. A random sample of 10,000 parents was then drawn from the childcare provider’s
customer database (i.e., all parents had an equal likelihood of being selected). Questionnaires
were mailed to parents’ homes. In all, approximately 10,000 surveys were mailed. Of those
2,020 were returned (a 20% response rate).
Approximately six months after the fielding of the survey, which followed the beginning
of a new school year in the USA (early Fall), the childcare provider provided the authors with
information regarding the continued enrollment of respondents’ children with the childcare
facility. This data was then appended to the survey data.
To eliminate the possible impact of government assistance on the decision to continue to
use the childcare provider, subsidized respondents were removed from the analyses, as subsidies
have been found to directly impact choice options and behavior with regard to childcare (Blau,
2003b; Children’s Defense Fund, 2002).
The focus of this study was on parents of children ages one to five. The reason for this
focus is that information gathered through the all phases of the exploratory research revealed that
parents’ needs differed significantly with regard to childcare after children became of school age.
11
Likewise, needs differed significantly with regard to the care of infants. Therefore, parents of
children less than one or greater than five years of age were removed from this analysis.
Officers of the childcare provider confirmed the validity of this conclusion in their
discussions with the authors. Furthermore, examination of children ages less than five years of
age is typical of research into childcare since after children reach school age, childcare
arrangements tend to become more informal (Blau, 2003a).
Additionally, this study specifically addresses the impact of the developmental stage of a
child on the relationship between parent satisfaction and childcare provider retention. Therefore,
to uniquely address this issue and eliminate bias stemming from experience with the childcare
service for a different child, it was necessary to remove households with children of multiple
ages receiving care from the childcare provider from the analysis. As a result, the total usable
sample for this investigation is 1,003 respondents.
ANALYSES AND RESULTS
To test the existence of a relationship between parent’s overall satisfaction and childcare
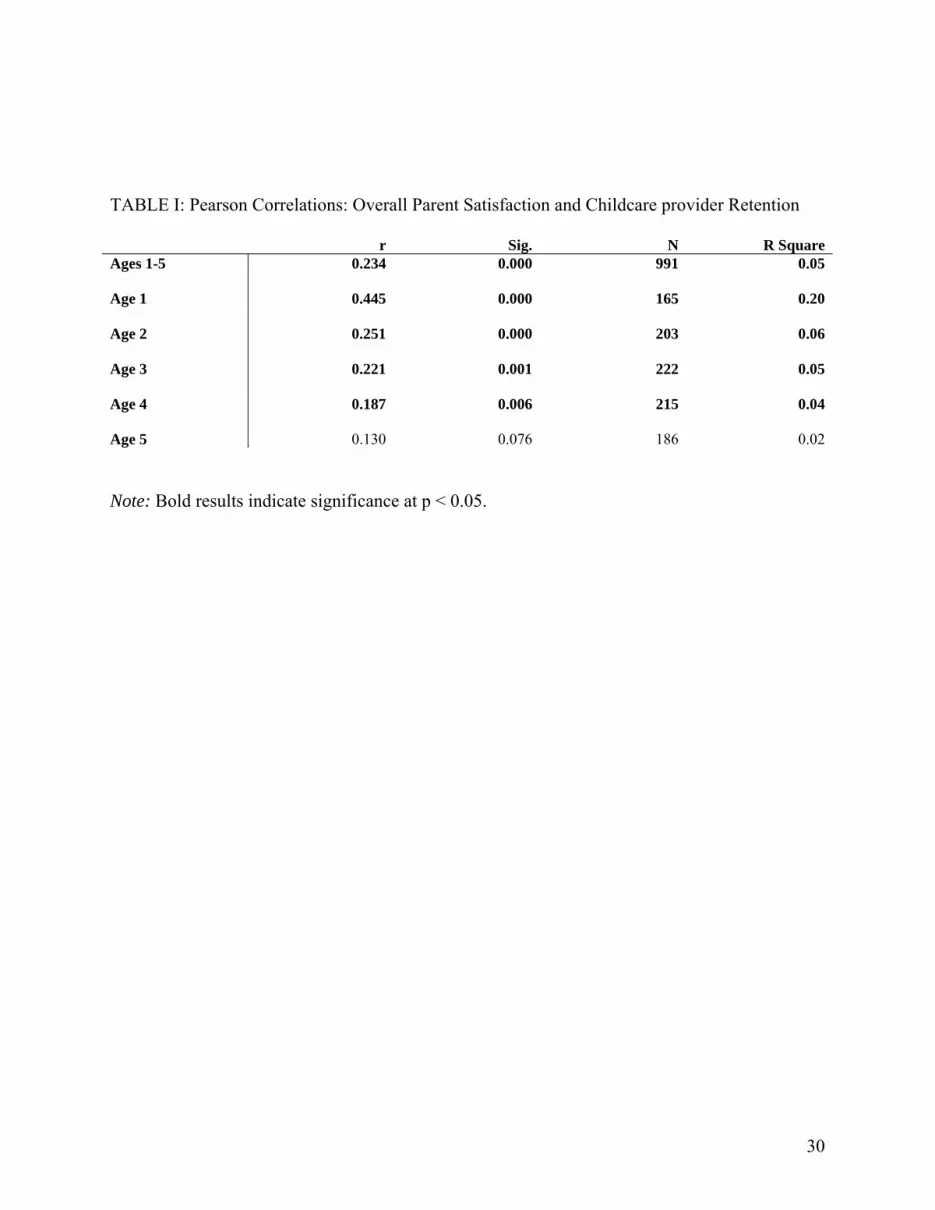
provider’s retention, we tested the correlation between the two variables. Correlations were
examined for parents as a whole, in addition to each child age segment separately. Table 1
shows that satisfaction is positively associated with retention when looking across all child age
groups (1-5) thus confirming Hypothesis 1. When looking at parents as a whole the association
is relatively weak but statistically significant explaining 5% of the variance in the data.
--------------------------
TAKE IN TABLE I
-------------------------
12
Hypothesis 2 stated that the relationship between parent satisfaction and childcare
provider retention should vary by the developmental stage of the child. To conduct a preliminary
test, correlation analysis was performed. When segmenting parents based upon child age, the
relationship differed significantly. Interestingly parent satisfaction had a much stronger link with
childcare provider retention for parents of children 1-year of age than for parents of children ages
2-5. In fact, the variance explained was more than three times greater for parents of 1-year olds
than for any other group (R2 = .20 versus R2 = .06). Additionally, the strength of the relationship
between parent satisfaction and childcare provider retention declined with each increase in age of
the child (child). For parents of 5-year olds, the correlation was not significant at the 95%
confidence level. Obviously for experienced parents, childcare satisfaction is less a driver of
retention. One explanation may be that changing the childcare provider after some years
represent switching costs (pre-contractual search costs and the childcare provider’s unique
understanding of the child) thus satisfaction has less of an impact on whether the parent exits the
relationship.
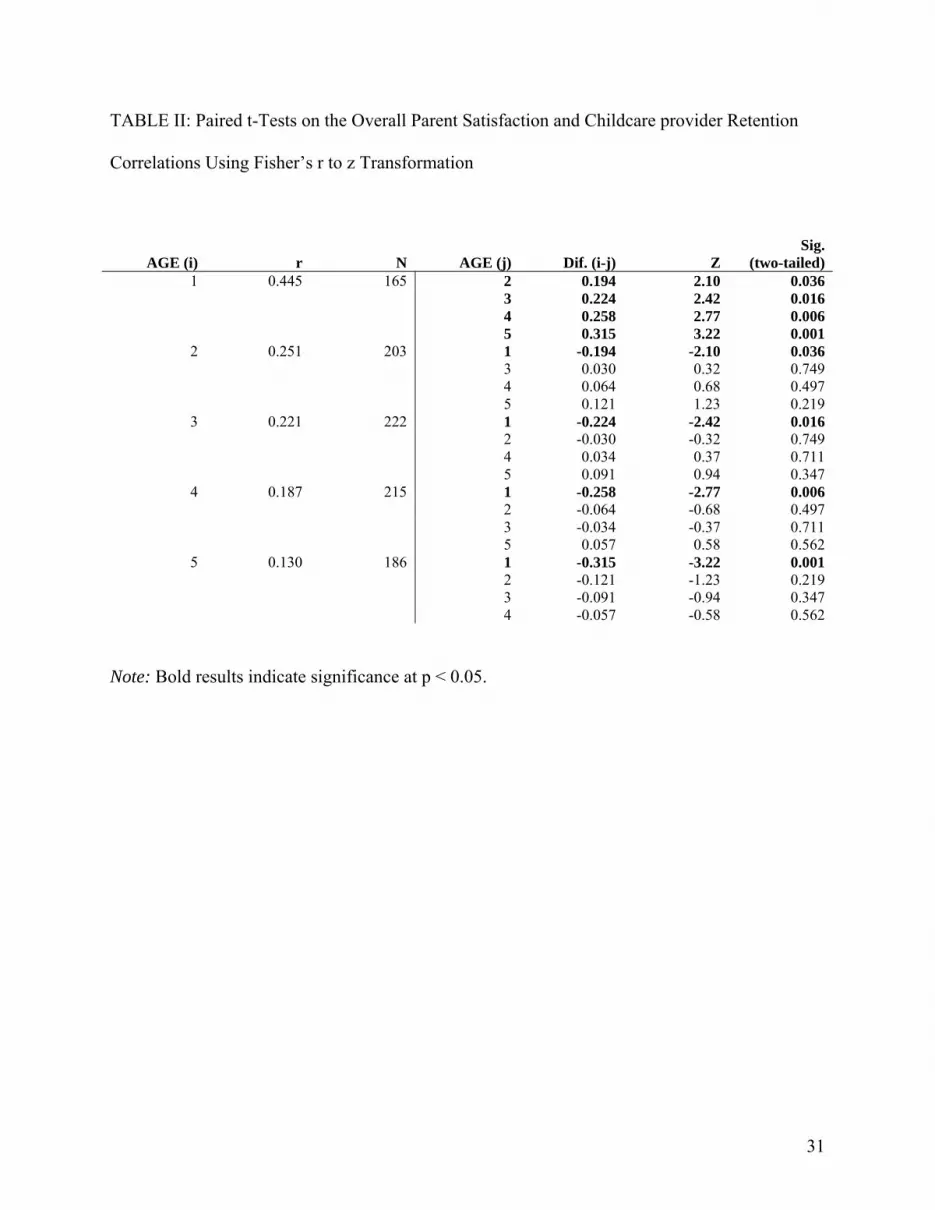
Paired t-tests on the correlations, after using Fisher’s r to z transformation, revealed that
the difference in correlations for the 1-year of age group relative to all other age groups was
significant at the ninety five percent confidence level (see Table 2). Although directionally it
appears that the strength of the relationship between parent satisfaction and childcare provider
retention declines as the child (child) increases in age, the difference in the correlations was not
statistically significant for age groups 2-5.
--------------------------
TAKE IN TABLE II
-------------------------
13
While correlation analysis is useful in establishing a positive relationship[2], more robust
tests should be performed before drawing conclusions regarding hypotheses. While we are
examining links between satisfaction levels to retention, it is a known fact that linear
approximations are not appropriate for two reasons. First, retention is a binary variable (i.e., 0 or
1), typically quasi-likelihood methods based on generalized linear models should be used
(Wedderburn, 1974). Second, the impact of satisfaction on customer behavior has frequently
been demonstrated to be non-linear. Mittal and Kamakura (2001) for example find that the
relationship between satisfaction and repurchase is non-linear. Likewise, Anderson (1998) find
the relationship between customer satisfaction and word-of-mouth and Keiningham, Perkins-
Munn, and Evans (2003) find the relationship between satisfaction and share-of-wallet to be non-
linear.
For these reasons, logistic regression analysis was conducted to develop predictive
models of the relationship between changes in parents’ overall levels of satisfaction and
childcare provider retention. The corresponding specification of the logistic regression model is:
P = exp(b0 +b1x1)/(1 + exp(b0 +b1x1))
where P is the probability of the actual retention with the childcare provider = ‘yes’, exp is the
exponential function and is written as exp(x) or e(x) (where “e” is the base of the natural
logarithm and is approximately equal to 2.7183, b0 is the intercept, b1 is the coefficient for the
predictor variable and x1 is the value of the predictor variable (satisfaction).
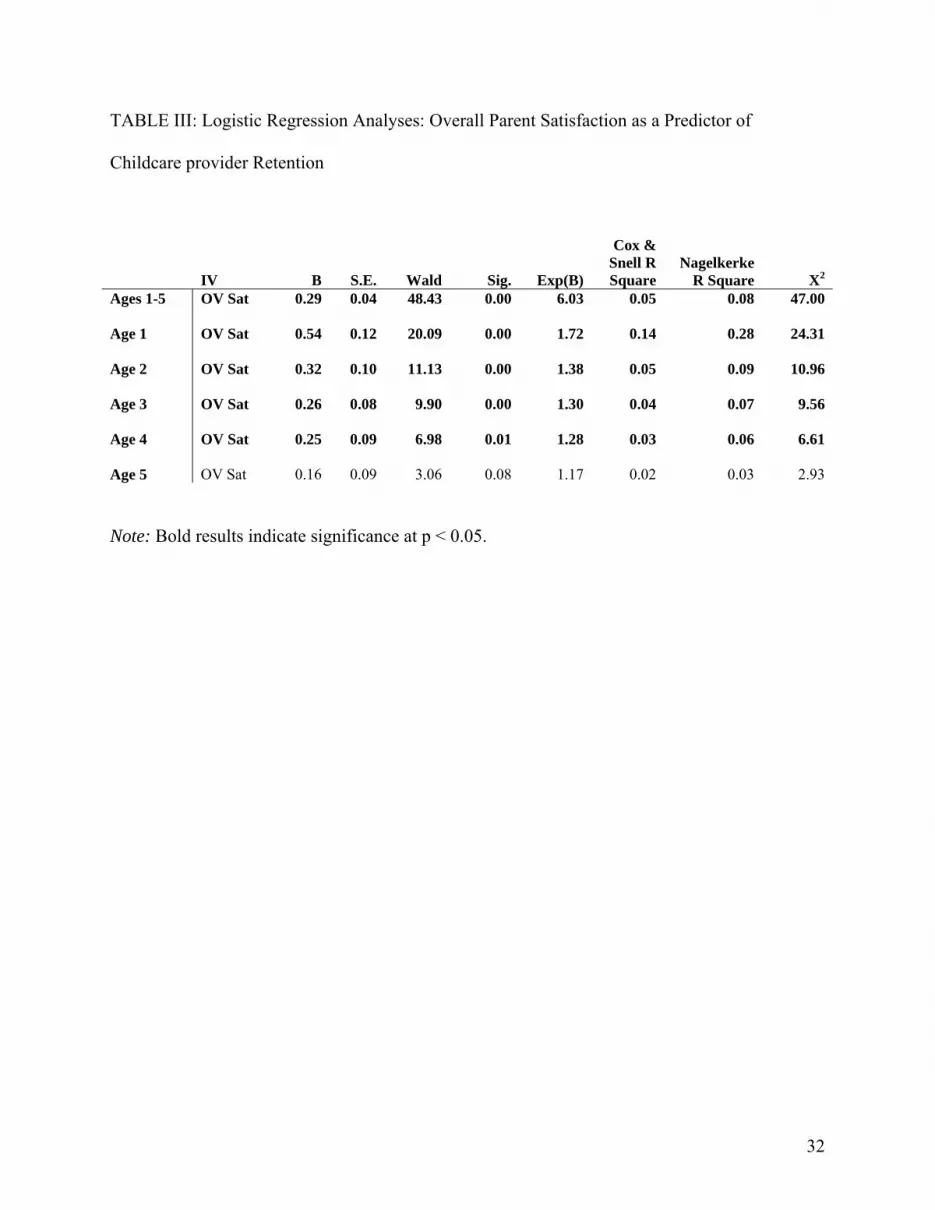
Table 3 shows the results of the logistic regressions. The coefficient estimates, the Wald
statistic and the model chi-square statistic are presented to examine overall model fit. Because
several model specifications are being compared, the odds ratio (i.e., Exponential Beta) and the
Nagelkerke R2 (Nagelkerke 1991) statistics are presented to compare model performance.[3]
14
--------------------------
TAKE IN TABLE III
-------------------------
As with the initial findings based on correlations, when looking at all age groups,
satisfaction is positively associated with retention, in this case explaining 8% of the variance in
the data based upon the Nagelkerke R2. When segmenting parents based upon the age of the
child, the strength of the relationship differed significantly. Again, parent satisfaction was a
much stronger predictor of childcare provider retention for parents of children 1-year of age than
for parents of children ages 2-5, with the variance explained being more than three times greater
for parents of 1-year olds than for any other group (Nagelkerke R2 = .28 versus Nagelkerke R2 =
.09).
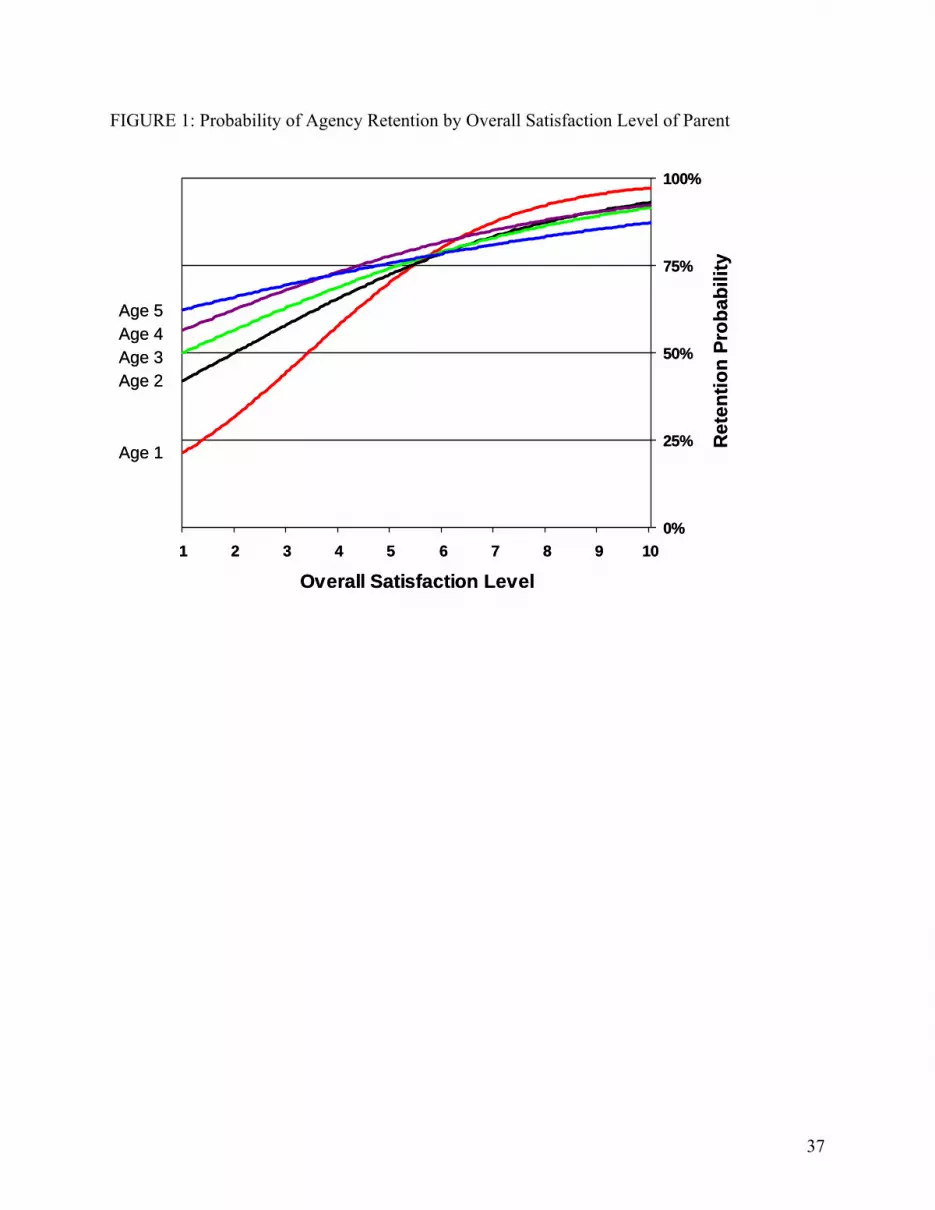
Figure 1 shows the probability of childcare provider retention by the parents’ level of
satisfaction for the various age groups under investigation. In all cases the relationship is
positive although the shape of the curves varies considerably by age group. The pattern that
emerges from the figure is one where incremental increases in satisfaction levels appear to have
a stronger impact on retention for age 1 group. This is especially the case for increases at lower
levels of satisfaction (1-6) and the incremental effect appears to lessen with higher satisfaction
levels (7-10). As older age groups are examined, the steepness of the curve diminishes
indicating decreasing impact of satisfaction on retention with increases in age.
--------------------------
TAKE IN FIGURE 1
-------------------------
15
The results appear to support Hypotheses 1 and 2, that parent satisfaction will be
positively associated with childcare provider retention, and that this relationship would vary by
the developmental stage of the child. It is important to note, however, that a statistically
significant relationship between parent satisfaction and childcare provider retention is not
universal; for parents of children age 5, satisfaction was not a significant predictor of retention.
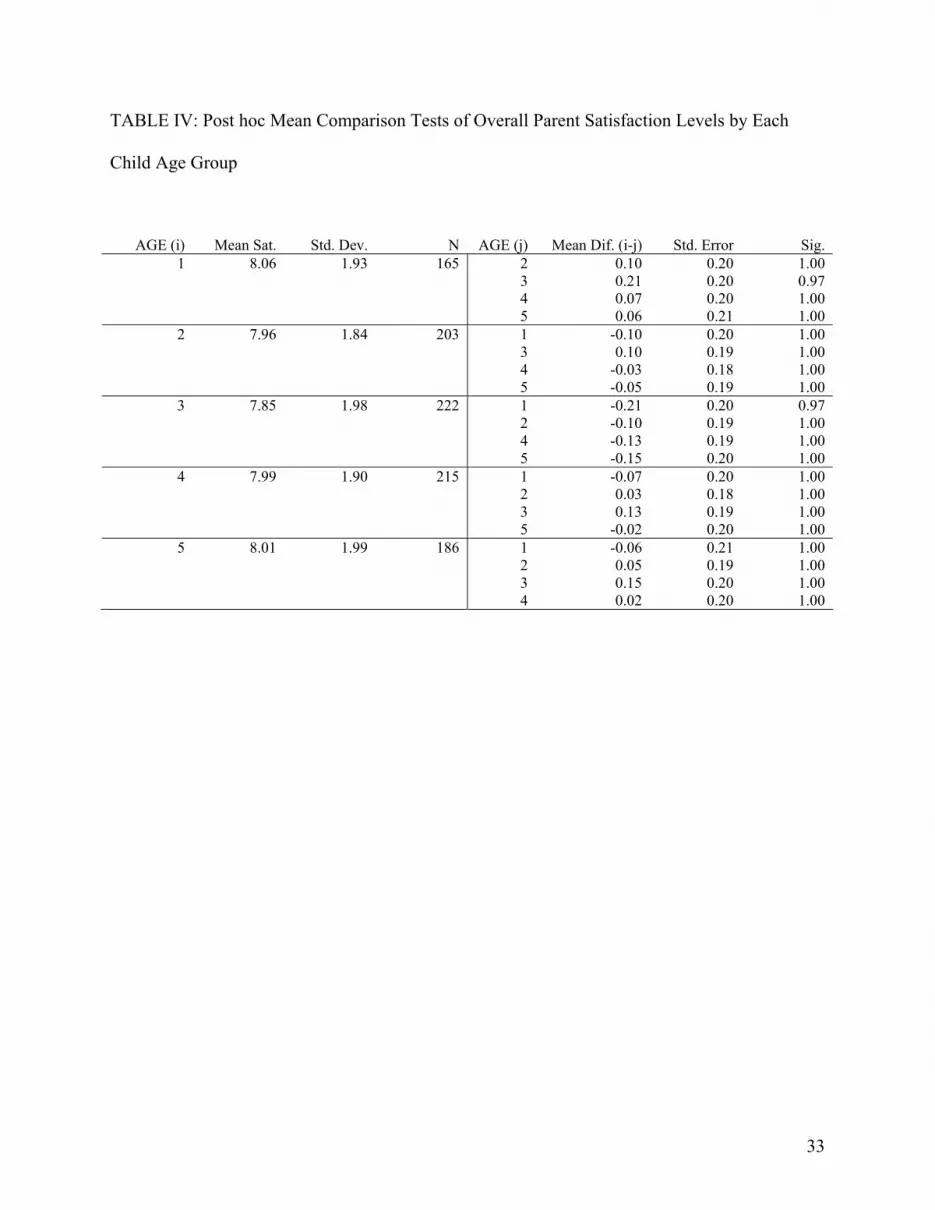
We also tested to determine whether satisfaction levels varied between age groups. To
test this empirically, an ANOVA was conducted to assess differences in overall satisfaction
between age groups. The results indicate no significant differences between groups (F(4,986) =
0.32, p = 0.86). To further prove a lack of difference among groups in satisfaction levels, post
hoc mean comparisons using the Tamhane T2 test (Tamhane, 1977) were conducted. Table 4
summarizes the post hoc comparison test results for each of the groupings.
--------------------------
TAKE IN TABLE IV
-------------------------
There were no statistically meaningful differences in satisfaction levels among the
various groups. In fact, mean satisfaction levels for all groups were relatively high and almost
identical amongst age groups (M = 8.06, 7.96, 7.85, 7.99 and 8.01 for age group 1, 2, 3, 4 and 5
respectively). As parents gain expertise with the childcare provider, their ratings of overall
satisfaction seem to remain positive.
INVESTIGATING SPECIFIC SERVICE ATTRIBUTES DRIVING OVERALL
SATISFACTION
Although the result for overall satisfaction levels shows no variation amongst age groups,
this result does not say much about the drivers of these overall levels of satisfaction within age
16
groups. In fact, it is possible to observe changing importance of specific attribute’s performance
on overall satisfaction with age membership. It has been shown that customers’ evaluation
criteria change as they gain experience (Mittal, Katrichis, and Kumar, 2001). This is
understandable, given that expectations are shaped by experience and therefore change over time
(Rust, Zahorik, and Keiningham, 2004). Experts were found to have more developed and
complex cognitive structures compared with novices (Alba and Hutchinson 1987), and use more
attributes and more attribute levels to differentiate between offerings (Moorthy, Ratchford and
Talukdar, 1997). Hence, it is necessary to understand the drivers of overall satisfaction for
different age groups.
Because novice parents lack experience, when evaluating the quality of the service
offering, it is hypothesized that they will focus more on observables or tangible elements with
the service and the provider (e.g. facilities and equipment, the way the facility-parent interaction
is handled, etc.). For parents with high degree of usage experience with the child, output
elements of the childcare provider’s services rather than the tangibles elements of the childcare
provider’s services are expected to be the key drivers of parent satisfaction. Therefore the
following hypothesis is proposed:
H3: As parents gain expertise with the childcare provider’s service, i.e. the child
stays with the facility for a longer period, we will see significant differences in antecedents
to satisfaction. For those with longer (shorter) experience, output (tangibles) will be a more
important driver of satisfaction.
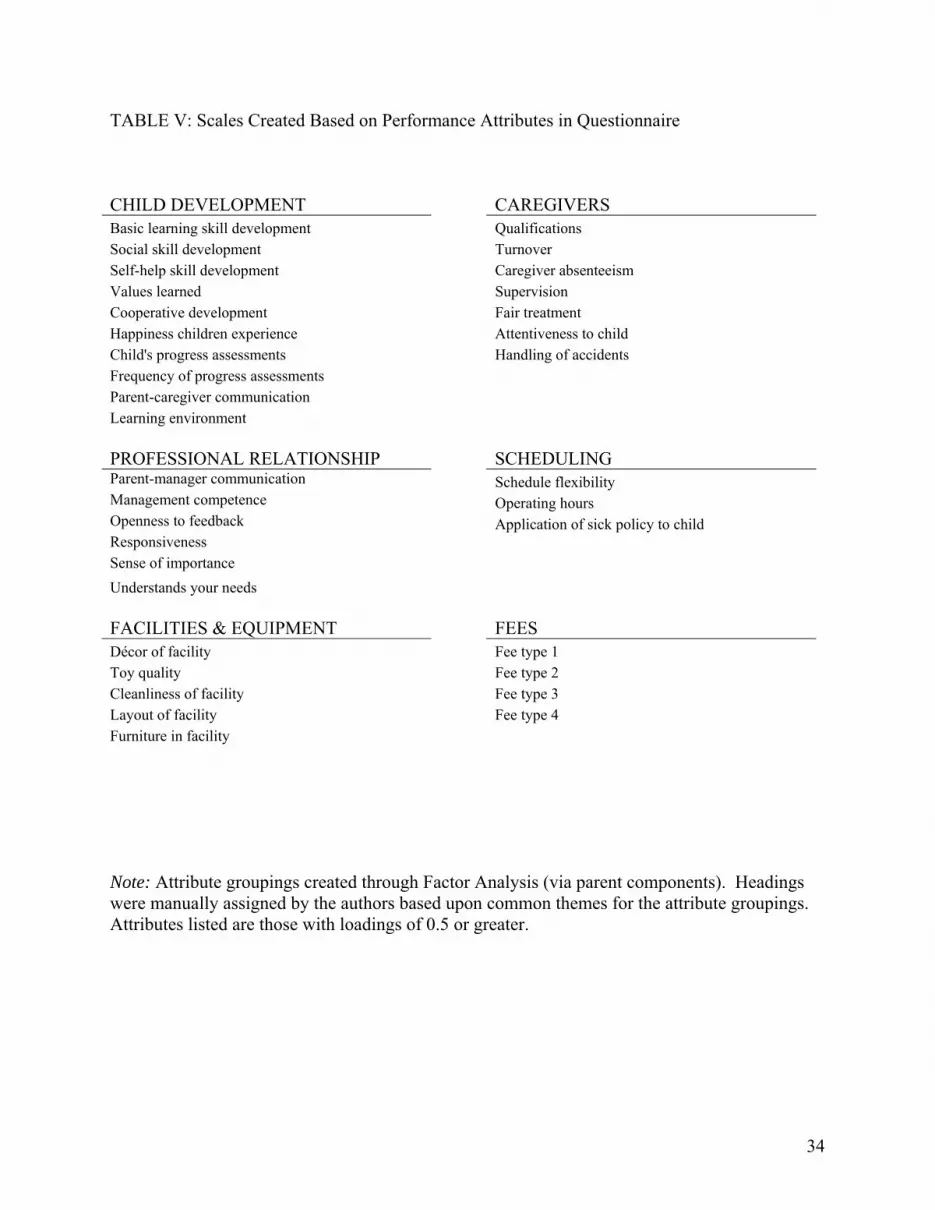
Preliminary analyses included the creation of six scales using Factor Analysis via parent
components (see Table 5). The initial items were purified into the final 35 items making up the 6
scales by eliminating cross loadings. Alpha tests were conducted on each scale to evaluate
17
goodness of fit for those items with factor loadings of .5 or higher. Cronbach’s Alpha was above
the acceptable range (i.e., greater than .70) for all scales (Nunnally, 1967).
The underlying attributes for each scale were all intuitive. Labels for each dimension
were manually assigned based upon common themes for variables associated with each scale.
The common themes of the scales are:
Child Development: a ten item scale (alpha = 0.96)
Caregivers: a seven item scale (alpha = 0.94)
Professional Relationship: a six item scale (alpha = 0.93)
Facilities and Equipment: a five item scale (alpha = 0.89)
Scheduling: a three item scale (alpha = 0.72)
Fees: a four item scale (alpha = 0.84)
--------------------------
TAKE IN TABLE V
-------------------------
The specific attributes measured in this study fall under the 2 broad categories. The
output group consists of child development, whereas professional relationship, facilities &
equipment, scheduling, and fees would fall under tangibles. Parent groups were segmented based
upon the age of child.
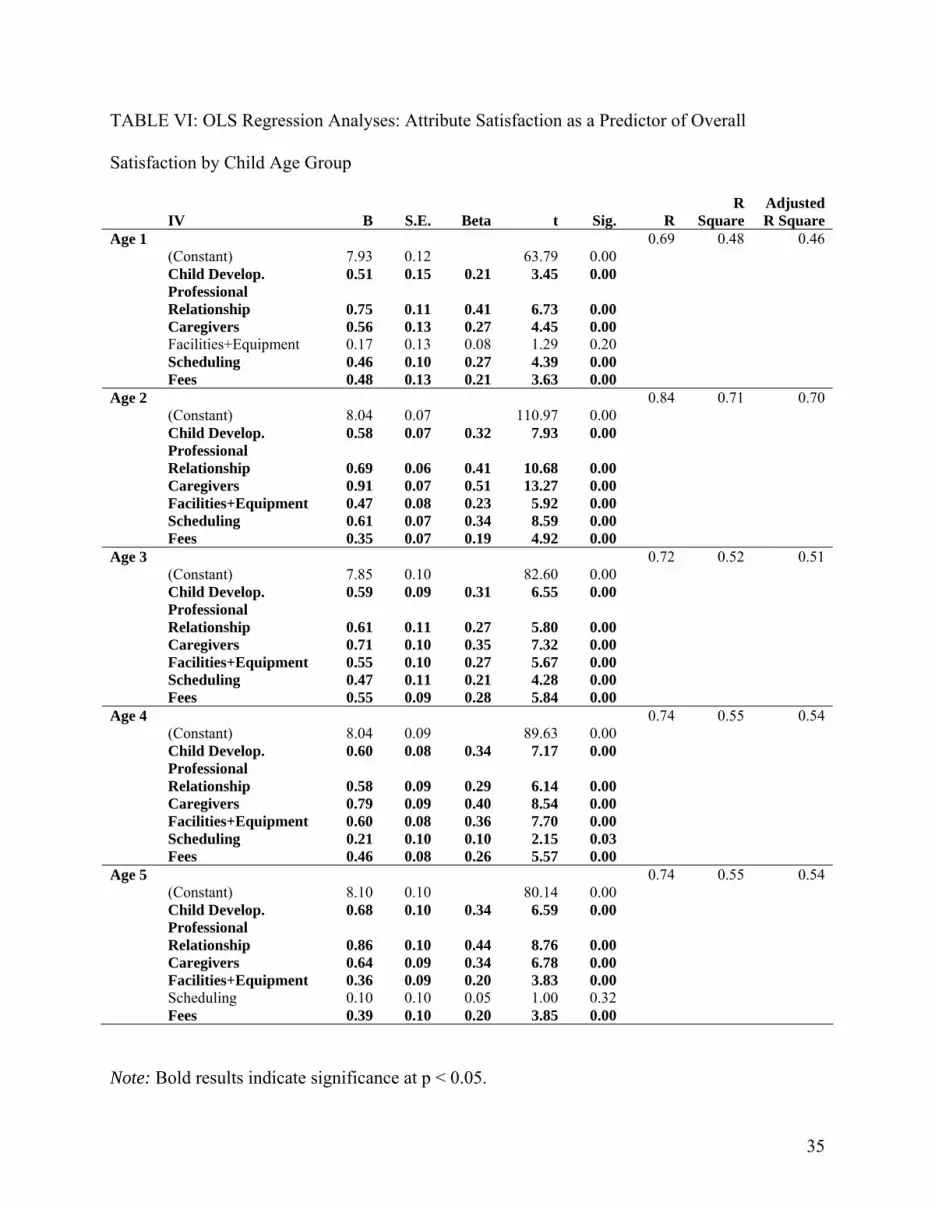
To determine the potential impact of collinearity on the regression coefficients, the
variance inflation factor (Belsley, Kuh, and Welsch, 1980; Hair et. al., 1992) and condition index
(Pedhazur and Schmelkin, 1991) were calculated. Collinearity levels were well under the
thresholds supported by Pedhazur and Schmelkin 1991 (condition index < 30), and Hair et. al.
1992 (VIF < 10), with the maximum condition index = 1.8, and the maximum VIF = 1.2 for any
18
of the regression models. OLS regressions were then run using the six factor scores as
independent variables on overall satisfaction. Table 6 summarizes the relative importance in the
regression of each of the attributes shown in Table 5.
--------------------------
TAKE IN TABLE VI
-------------------------
The contention proposed in hypotheses 3 was that as parents gain expertise with the
childcare provider, they would focus more on output (child development) rather than tangibles as
drivers of overall satisfaction. The results demonstrate that child development is in fact
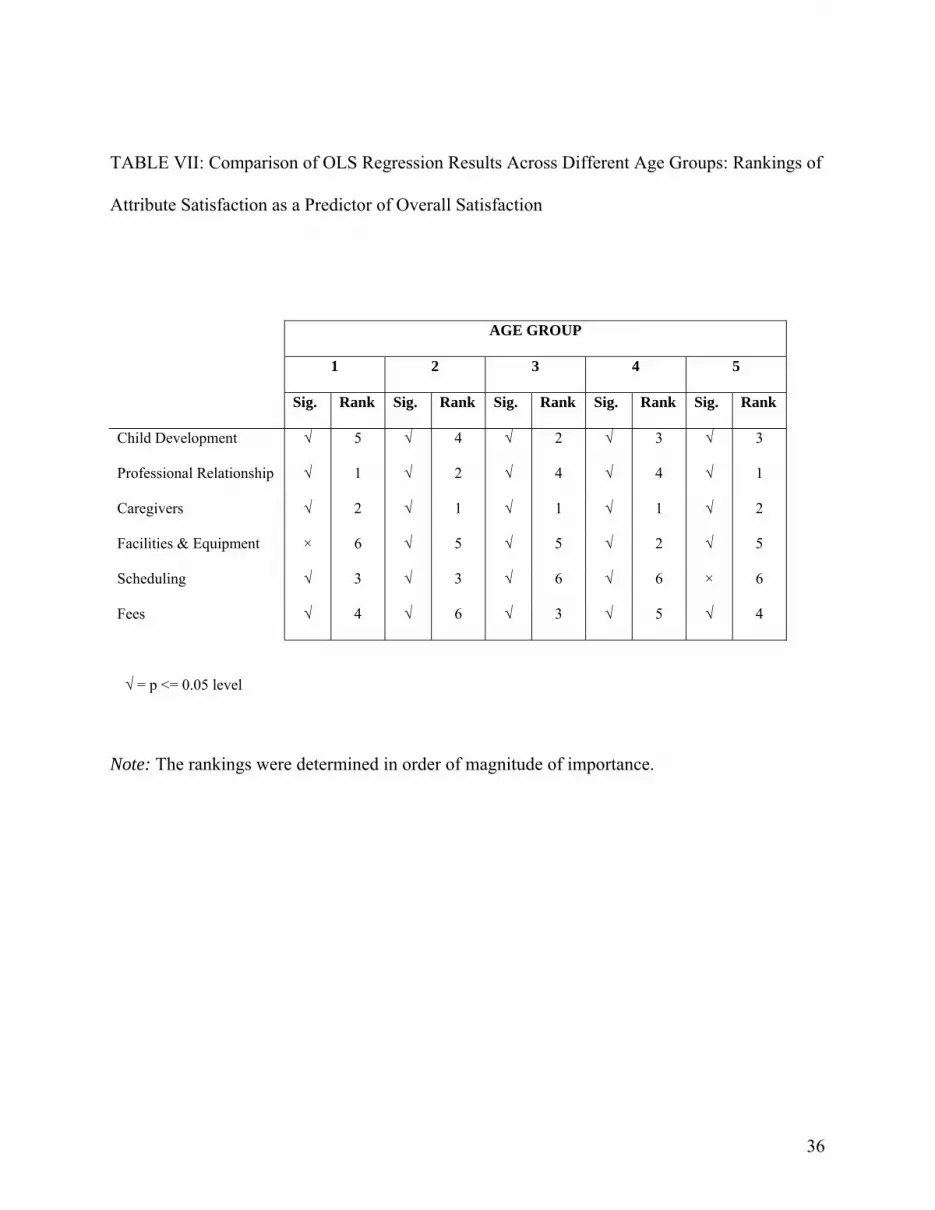
significant and important for all age groups. When the relative rankings of importance are
examined in table 7, we observe that child development while ranked 5 in age group 1 increases
in importance as a driver with greater expertise. For age groups 2, 3, 4 and 5, while not ranked
the top driver, the relative ranking increases from 5 to 4 to 2 and 3. As for the remaining drivers
classified as tangibles, all were significant within the age groups. Contrary to expectations
however, one attribute - facilities and equipment – was not significant for age group 1. These
results therefore lend partial support to hypothesis 3.
Further examination of the rankings indicates that in fact caregivers seem to be the most
important attribute driving overall satisfaction. It is consistently ranked first or second place
within all age groups. Professional relationships also appear important (ranked 1 or 2 for age
groups 1, 2 and 5). Scheduling becomes less important as a driver as expertise with childcare
provider increases. While ranked 3 for younger age groups like 1 and 2, it drops last to 6th place
for older age groups 3, 4 and 5. Finally, facilities and equipment is ranked lower (5 or 6) except
for age group 4 and is non significant for age group 1.
19
--------------------------
TAKE IN TABLE VII
-------------------------
DISCUSSION AND IMPLICATIONS
In line with the findings of the literature, the results indicate that parent satisfaction has a
positive impact on childcare services retention. However, this impact is especially pronounced
earlier in the relationship. Only for parents of children one year of age did satisfaction explain
more than 10% of the variance in retention (explaining 28% of the variance). The economic
implication for childcare providers is that parent satisfaction is a more critical concern with
regard to child retention for parents of very young children (children 1 year of age). Since
parents with very young children are more involved due to the uncertainty in the decision and
most likely it is the first time such a decision is being made and the child is separated from home,
it is possible that satisfaction becomes more important. Furthermore, research regarding
uncertainty and perceived risk may help to explain why parents of older children are less
impacted by satisfaction on the retention of their children with the childcare service. Rust,
Zahorik and Keiningham (1994, 48) note:
“Under some circumstances it is perfectly rational for an individual to choose an
option that actually is expected to be worse (on average) if the downside risk for that
option is less. One thing that tends to reduce uncertainty, and thus worry, is experience.
As experience increases, knowledge about product or service increases, and the expected
distribution of expected outcomes tightens … Downside risk is reduced, and probability
of repurchase therefore increases, even if the perceived quality is only what is expected.
20
This helps explain why customers often appear loyal. They are being rational and
avoiding risk.”
Therefore, parent satisfaction may be overridden by the perceived potential downside risk
and switching costs associated with removing children from a childcare service who has worked
with parents’ children for an extended period, i.e. asset specificity (Williamson, 1975). Although
switching costs may be one potential explanation for the results – based on the competitive
landscape for childcare services described earlier – parents in fact do have alternatives they could
switch should they deem necessary.
It is also interesting to notice from figure 1 that the slope of the curve for age 1 is
significantly different than the other age groups for lower levels of satisfaction. There seems to
be an asymmetric effect where for this group, minor changes in overall satisfaction level given
low degrees of satisfaction have a major impact on the retention probability. However when
overall satisfaction level for this group improves beyond six, the impact on retention probability
approaches that of the other groups. This finding implies that for age group 1 it is absolutely
essential for the childcare provider to avoid low degrees of parent satisfaction in order to retain
the parent’s contract.
The lack of significant differences in overall satisfaction between age groups also
indicates that there are no significant changes in satisfaction with this childcare provider given
time and experience. This result however did not preclude some attribute determinants gaining
relative importance in determining overall satisfaction compared to others with time. It was
expected that output attributes should contribute to overall satisfaction to a greater extent later in
the relationship as opposed to tangibles, which should be more influential earlier on. Since
childcare services have credence properties, the parent could look to more tangible cues at the
21
beginning of the relationship. With time, as child development becomes more observable, this
attribute was expected to become more influential. This proposition was partially supported by
the data. Although child development was less important in the age 1 group and gained
importance with parent experience, it was not the top determinant of overall satisfaction. In this
childcare services context, the quality of the caregiver seems to be the primary determinant of
overall satisfaction. The qualifications of the teachers, supervision, absenteeism of the caregiver
and related issues seem to be paramount to parents within all age groups. Hence, although all
other attributes were mostly significant in predicting overall satisfaction, service providers in this
context should focus particularly on developing and maintaining the quality of issues related to
their caregivers.
Another attribute determined to be important is professional relationships. For several of
the age groups, this attribute ranked 1st or 2nd place. Consequently, childcare service providers
should strive to keep an open relationship with parents and provide regular feedback in a
professional manner. Finally, although statistically significant, scheduling seems to be one of the
least important attributes impacting overall satisfaction, especially with increased experience.
LIMITATIONS
Despite the rewarding results from this study the authors acknowledge that there are
reasons other than satisfaction alone that affect retention. Switching costs in this industry could
be especially high given the waiting lists for childcare at some facilities and the risks associated
with the learning curve of a new provider. Nevertheless, it is important to remember that parents
do have alternatives with regard to childcare (i.e., childcare facilities face a host of competitors).
Therefore, based upon examination of a host of other industries one would reasonably expect
satisfaction to play an important role in retention.
22
The reader is reminded that the purpose of this paper is to provide the first examination of
the relationship between parent satisfaction and actual retention of a childcare provider. This
single focus of satisfaction on customer behavior or financial outcomes is typical of so many
other papers in the marketing literature (for example, Anderson, 1998; Anderson, Fornell, and
Rust, 1997; Keiningham, Perkins-Munn and Evans, 2003; Rust and Zahorik, 1993). This
research seeks to continue in that vein by providing insight into an as yet uninvestigated area of
research.
Nonetheless, this research offers valuable insight into the role that parent satisfaction
plays into the retention of children with caregivers: a topic all would agree to be of significant
importance not only to parents, but also to society as a whole.
23
REFERENCES
Alba, Joseph W., and J. Wesley Hutchinson (1987), "Dimensions of Consumer Expertise,
Journal of Consumer Research, 13 (March), 411-454.
American Academy of Pediatrics (2005), Children’s Health Topics: Developmental
Stages, http://www.aap.org/healthtopics/stages.cfm#inf.
Anderson, Eugene W. (1998), “Customer Satisfaction and Word-of-Mouth,” Journal of
Service Research, Vol. 1, No. 1 (August), 1-14.
________, Claes Fornell and Donald R. Lehmann (1994), “Customer Satisfaction,
Market Share, and Profitability: Findings from Sweden,” Journal of Marketing, 58 (July), 53-66.
________, Claes Fornell, and Roland T. Rust (1997), “Customer Satisfaction,
Productivity, and Profitability: Differences between Goods and Services,” Marketing Science, 16
(2), 129-145.
________ and Mary W. Sullivan (1993), “The Antecedents and Consequences of
Customer Satisfaction for Firms,” Marketing Science, 12 (Spring), 125-143.
Baumann, Chris, Suzan Burton, and Greg Elliott (2005), “Determinants of Customer
Loyalty and Share of Wallet in Retail Banking,” Journal of Financial Services Marketing, 9 (3),
231-248.
Belsley, D.A., E. Kuh, and R.E. Welsch (1980), Regression Diagnostics, New York, NY:
John Wiley and Sons.
Blau, D. M. (2003)a, “An Economic Perspective on Child Care Policy”, Supplement to
Journal of Population and Social Security (Population), Vol. 1, No.1 (June). Available
http://www.ipss.go.jp/English/WebJournal.files/Population/WebPopulation.html
24
________ (2003)b, “Child Care Subsidy Programs” in Means-Tested Transfer Programs
in the United States., Robert Moffitt (ed.), University of Chicago Press for the National Bureau
of Economic Research.
________ and A.P. Hagy (1999), “The Demand for Quality in Child Care,” The Journal
of Political Economy, Vol. 106, no. 1 (February), 104-146.
Bogat, G. A., and L.K. Gensheimer (1986), “Discrepancies between the Attitudes and
Actions of Parents Choosing Day Care,” Child Care Quarterly, Vol. 15, pp. 159-169.
Bolton, R. N. (1998), “A Dynamic Model of the Duration of the Customer’s Relationship
with a Continuous Service Provider: The Role of Satisfaction,” Marketing Science, Vol. 17, No.
1, pp. 45-65.
Bolton, R. N., and James H. Drew (1991), “A Longitudinal Analysis of the Impact of
Service Changes on Customer Attitudes,” Journal of Marketing, 55 (1), 1-10.
Bossert, James L. (1991), Quality Function Deployment: A Practitioner’s Approach,
Milwaukee, WI: ASQC Quality Press.
Bowman, Douglas, and Das Narayandas (2004), “Linking Customer Management Effort
to Customer Profitability in Business Markets,” Journal of Marketing Research, 41 (4), 433-447.
Britner, P. A. (1999) “What Leads to Satisfaction for Child Care Providers and Parents?”
National Network for Child Care, June. Available
http://www.nncc.org/Research/satisfaction.html
________ and D. A. Phillips (1995), “Predictors of Parent and Provider Satisfaction with
Child Day Care Dimensions: A Comparison of Center-Based and Family Child Care,” Child
Welfare, Vol. 74, No. 6, November, pp. 1135-1168.

25
Brownlee, Shannon, Matthew Miller, Susannah Fox, Amy Saltzman and Brendan I.
Koerner (1997), “Lies Parents Tell Themselves About Why They Work,” U.S. News & World
Report. 122 (May 12), 58.
Capizzano, J., Adams, G. and F. Sonenstein, (2000), Child Care Arrangements for
Children Under Five: Variation Across States, The Urban Institute: Series B, No. B-7, March 15.
Available http://www.urban.org/url.cfm?ID=309438
Carlzon, J. (1987), Moments of Truth, Cambridge, MA: Ballinger Books.
Child Development Institute (2005), “Normal Stages of Human Development (Birth to 5
Years),” http://www.childdevelopmentinfo.com/development/normaldevelopment.shtml
Children’s Defense Fund (2002), “Low Income Children Bear the Burden of State Child
Care Cutbacks,” September, http://www.childrensdefense.org
Childstudy.net (2005), Margaret Mahler, Sigmund Freud & Erik Erikson: A Hypertext
Overview, http://childstudy.net/cdw.html
Ehrle, Jennifer, Gina Adams, and Kathryn Tout (2001), Who’s Caring for Our Youngest
Children? Child Care Patterns of Infants and Toddlers (Occasion Paper Number 42),
Washington, DC: The Urban Institute, (January 1), http://www.urban.org/url.cfm?ID=310029
Erdwins, C.J., W.J. Casper, and L.C. Buffardi (1998), Child Care Satisfaction: The
Effects of Parental Gender and Type of Child Care Used. Child & Youth Care Forum, Vol. 27,
No. 2, pp. 111-123.
Gain, L. (1999), Using Consumer Views in Performance Indicators for Children’s
Services: Anntated Bibliography. Melbourne, Australia: Consultancy Report Prepared for the
Steering Committee for the Review of Commonwealth/State Service Provision November 9.
Available http://www.pc.gov.au/gsp/consultancy/childservices/bibliography.pdf
26
Grace, D. and A. O’Cass (2001)a, “Attributions of Service Switching: A Study of
Consumers’ and Providers’ Perceptions of Child-Care Service Delivery,” Journal of Services
Marketing, Vol. 15, Nos. 4/5, pp. 300-321.
________ and ________ (2001)b, “Child Care Services: An Exploratory Study of
Choice, Switching and Search Behavior,” European Journal of Marketing, Vol. 37, Nos. 1/2, pp.
107-132.
Hair, J.F., Jr., R.E. Anderson, R.L. Tatham, and W.C. Black (1992), Multivariate Data
Analysis, New York: MacMillan Publishing Company, 48.
Ittner, Christopher and David F. Larcker (1998), “Are Non-financial Measures Leading
Indicators of Financial Performance? An Analysis of Customer Satisfaction,” Journal of
Accounting Research, 36 (Supplement), 1-35.
Jones, T. O. and E. W. Sasser Jr., (1995), “Why Satisfied Customers Defect,” Harvard
Business Review, Vol. 73, No. 6 (November/December), 88-99.
Keiningham, Timothy L., Tiffany Perkins-Munn, Lerzan Aksoy, and Demitry Estrin
(2005), “Does Customer Satisfaction Lead to Profitability? The Mediating Role of Share of
Wallet,” Managing Service Quality, 15 (2), 172-181.
Keiningham, Timothy L., Tiffany Perkins-Munn, and Heather Evans (2003), “The Impact
of Customer Satisfaction on Share-of-Wallet in a Business-to-Business Environment,” Journal of
Service Research, 6, No. 1 (August), 37-50.
Kotler, Philip (1994), Marketing Management: Analysis, Planning, Implementation and
Control (8th Edition), Englewood Cliffs, NJ: Prentice-Hall, 20.
27
Leung, Kwok, Wai-Kwan Li, and Yuk-Fai Au (1998), “The Impact of Customer Service
and Product Value on Customer Loyalty and Purchase Behavior,” Journal of Applied Social
Psychology, 28 (18), 1731-1741.
Loveman, G. W. (1998), “Employee Satisfaction, Customer Loyalty, and Financial
Performance: An Empirical Examination of the Service Profit Chain in Retail Banking,” Journal
of Service Research, Vol. 1, No. 1, August, 18-31.
Mitchell, A. (1992), Consumers and Child Care: An Annotated Bibliography. New York:
National Center for Children in Poverty, June. Available http://www.nccp.org/media/cac92-
text.pdf
Mittal, V. and W. Kamakura (2001), “Satisfaction, Repurchase Intent and Repurchase
Behavior: Investigating the Moderating Effect of Customer Characteristics,” Journal of
Marketing Research, Vol. 38, February, pp. 131-142.
________, J.M. Katrichis, and P. Kumar (2001), “Attribute Performance and Customer
Satisfaction Over Time: Evidence from Two Field Studies,” Journal of Services Marketing, 15
(4/5), 343-356.
________, P. Kumar, and M. Tsiros (1999), “Attribute-Level Performance, Satisfaction,
and Behavioral Intentions Over Time: A Consumption-System Approach,” Journal of
Marketing, 63, No. 2, April, pp. 88-101.
Moorthy, Sridhar, Brian T. Ratchford, and Debabrata Talukdar (1997), “Consumer
Information Search Revisited: Theory and Empirical Analysis,” Journal of Consumer Research,
23 (March), 263-277
Nagelkerke, N. J. D. (1991), “A Note on a General Definition of the Coefficient of
Determination,” Biometrika, 78 (3), 691-692.

28
Nunnally, J. C. (1967), Psychometric Theory. New York: McGraw Hill Publishing
Company.
O’Cass, A. and D. Grace, D. (2001), “Exploring Childcare Services: Studying the Service
Switching and Choice Issues,” Services Marketing Quarterly, Vol. 23, No. 2, 21-48.
Oliver, Richard L. (1997), Satisfaction: A Behavioral Perspective on the Consumer, New
York: McGraw-Hill Companies, Inc.
Pedhazur, E.J., and L.P. Schmelkin (1991), Measurement, Design, and Analysis: An
Integrated Approach, Hillsdale, NJ: Lawrence Erlbaum.
Rust, Roland T., and Richard L. Oliver (1994), “Service Quality: Insights and Managerial
Implications from the Frontier,” in Service Quality: New Directions in Theory and Practice,
Roland T. Rust and Richard L. Oliver, eds., Thousand Oaks, CA: Sage Publications, Inc.
Rust, R. T. and A. J. Zahorik (1993), “Customer Satisfaction, Customer Retention, and
Market Share,” Journal of Retailing, Vol. 69, No. 2, Summer, 193-215.
________, ________, and T.L. Keiningham (1994), Return on Quality: Measuring the
Financial Impact of Your Company’s Quest for Quality, Chicago, IL: Probus Publishing
Company.
State of Indiana Division of Family and Children, Bureau of Child Development (2005)
http://www.childcarefinder.in.gov
Tamhane, A.C. (1977), “Multiple Comparison in Model I: One-way Anova with Unequal
Variances,” Communications in Statistics, Series A, No. 6, 15-32.
Wedderburn, R. W. M. (1974), “Quasi-likelihood Functions, Generalized Linear Models,
and the Gauss-Newton Method,” Biometrika, 61, 439-447.

29
Williamson, Oliver E. (1975), Market and Hierarchies: Analysis and Antitrust
Impications. A Study in the Economics of Internal Organizations, New York: Free Press.
30
TABLE I: Pearson Correlations: Overall Parent Satisfaction and Childcare provider Retention
r Sig. N R Square Ages 1-5 0.234 0.000 991 0.05 Age 1 0.445 0.000 165 0.20 Age 2 0.251 0.000 203 0.06 Age 3 0.221 0.001 222 0.05 Age 4 0.187 0.006 215 0.04 Age 5 0.130 0.076 186 0.02
Note: Bold results indicate significance at p < 0.05.
31
TABLE II: Paired t-Tests on the Overall Parent Satisfaction and Childcare provider Retention
Correlations Using Fisher’s r to z Transformation
AGE (i) r N AGE (j) Dif. (i-j) Z Sig.
(two-tailed) 1 0.445 165 2 0.194 2.10 0.036
3 0.224 2.42 0.016 4 0.258 2.77 0.006 5 0.315 3.22 0.001
2 0.251 203 1 -0.194 -2.10 0.036 3 0.030 0.32 0.749 4 0.064 0.68 0.497 5 0.121 1.23 0.219
3 0.221 222 1 -0.224 -2.42 0.016 2 -0.030 -0.32 0.749 4 0.034 0.37 0.711 5 0.091 0.94 0.347
4 0.187 215 1 -0.258 -2.77 0.006 2 -0.064 -0.68 0.497 3 -0.034 -0.37 0.711 5 0.057 0.58 0.562
5 0.130 186 1 -0.315 -3.22 0.001 2 -0.121 -1.23 0.219 3 -0.091 -0.94 0.347 4 -0.057 -0.58 0.562
Note: Bold results indicate significance at p < 0.05.
32
TABLE III: Logistic Regression Analyses: Overall Parent Satisfaction as a Predictor of
Childcare provider Retention
IV B S.E. Wald Sig. Exp(B)
Cox & Snell R Square
Nagelkerke R Square X2
Ages 1-5 OV Sat 0.29 0.04 48.43 0.00 6.03 0.05 0.08 47.00 Age 1 OV Sat 0.54 0.12 20.09 0.00 1.72 0.14 0.28 24.31 Age 2 OV Sat 0.32 0.10 11.13 0.00 1.38 0.05 0.09 10.96 Age 3 OV Sat 0.26 0.08 9.90 0.00 1.30 0.04 0.07 9.56 Age 4 OV Sat 0.25 0.09 6.98 0.01 1.28 0.03 0.06 6.61 Age 5 OV Sat 0.16 0.09 3.06 0.08 1.17 0.02 0.03 2.93
Note: Bold results indicate significance at p < 0.05.
33
TABLE IV: Post hoc Mean Comparison Tests of Overall Parent Satisfaction Levels by Each
Child Age Group
AGE (i) Mean Sat. Std. Dev. N AGE (j) Mean Dif. (i-j) Std. Error Sig. 1 8.06 1.93 165 2 0.10 0.20 1.00
3 0.21 0.20 0.97 4 0.07 0.20 1.00 5 0.06 0.21 1.00
2 7.96 1.84 203 1 -0.10 0.20 1.00 3 0.10 0.19 1.00 4 -0.03 0.18 1.00 5 -0.05 0.19 1.00
3 7.85 1.98 222 1 -0.21 0.20 0.97 2 -0.10 0.19 1.00 4 -0.13 0.19 1.00 5 -0.15 0.20 1.00
4 7.99 1.90 215 1 -0.07 0.20 1.00 2 0.03 0.18 1.00 3 0.13 0.19 1.00 5 -0.02 0.20 1.00
5 8.01 1.99 186 1 -0.06 0.21 1.00 2 0.05 0.19 1.00 3 0.15 0.20 1.00 4 0.02 0.20 1.00
34
TABLE V: Scales Created Based on Performance Attributes in Questionnaire
CHILD DEVELOPMENT CAREGIVERS Basic learning skill development Qualifications Social skill development Turnover Self-help skill development Caregiver absenteeism Values learned Supervision Cooperative development Fair treatment Happiness children experience Attentiveness to child Child's progress assessments Handling of accidents Frequency of progress assessments Parent-caregiver communication Learning environment PROFESSIONAL RELATIONSHIP SCHEDULING Parent-manager communication Schedule flexibility Management competence Operating hours Openness to feedback Application of sick policy to child Responsiveness Sense of importance Understands your needs FACILITIES & EQUIPMENT FEES Décor of facility Fee type 1 Toy quality Fee type 2 Cleanliness of facility Fee type 3 Layout of facility Fee type 4 Furniture in facility
Note: Attribute groupings created through Factor Analysis (via parent components). Headings were manually assigned by the authors based upon common themes for the attribute groupings. Attributes listed are those with loadings of 0.5 or greater.
35
TABLE VI: OLS Regression Analyses: Attribute Satisfaction as a Predictor of Overall
Satisfaction by Child Age Group
IV B S.E. Beta t Sig. R R
Square Adjusted R Square
Age 1 0.69 0.48 0.46 (Constant) 7.93 0.12 63.79 0.00 Child Develop. 0.51 0.15 0.21 3.45 0.00
Professional Relationship 0.75 0.11 0.41 6.73 0.00
Caregivers 0.56 0.13 0.27 4.45 0.00 Facilities+Equipment 0.17 0.13 0.08 1.29 0.20 Scheduling 0.46 0.10 0.27 4.39 0.00 Fees 0.48 0.13 0.21 3.63 0.00 Age 2 0.84 0.71 0.70 (Constant) 8.04 0.07 110.97 0.00 Child Develop. 0.58 0.07 0.32 7.93 0.00
Professional Relationship 0.69 0.06 0.41 10.68 0.00
Caregivers 0.91 0.07 0.51 13.27 0.00 Facilities+Equipment 0.47 0.08 0.23 5.92 0.00 Scheduling 0.61 0.07 0.34 8.59 0.00 Fees 0.35 0.07 0.19 4.92 0.00 Age 3 0.72 0.52 0.51 (Constant) 7.85 0.10 82.60 0.00 Child Develop. 0.59 0.09 0.31 6.55 0.00
Professional Relationship 0.61 0.11 0.27 5.80 0.00
Caregivers 0.71 0.10 0.35 7.32 0.00 Facilities+Equipment 0.55 0.10 0.27 5.67 0.00 Scheduling 0.47 0.11 0.21 4.28 0.00 Fees 0.55 0.09 0.28 5.84 0.00 Age 4 0.74 0.55 0.54 (Constant) 8.04 0.09 89.63 0.00 Child Develop. 0.60 0.08 0.34 7.17 0.00
Professional Relationship 0.58 0.09 0.29 6.14 0.00
Caregivers 0.79 0.09 0.40 8.54 0.00 Facilities+Equipment 0.60 0.08 0.36 7.70 0.00 Scheduling 0.21 0.10 0.10 2.15 0.03 Fees 0.46 0.08 0.26 5.57 0.00 Age 5 0.74 0.55 0.54 (Constant) 8.10 0.10 80.14 0.00 Child Develop. 0.68 0.10 0.34 6.59 0.00
Professional Relationship 0.86 0.10 0.44 8.76 0.00
Caregivers 0.64 0.09 0.34 6.78 0.00 Facilities+Equipment 0.36 0.09 0.20 3.83 0.00 Scheduling 0.10 0.10 0.05 1.00 0.32 Fees 0.39 0.10 0.20 3.85 0.00
Note: Bold results indicate significance at p < 0.05.
36
TABLE VII: Comparison of OLS Regression Results Across Different Age Groups: Rankings of
Attribute Satisfaction as a Predictor of Overall Satisfaction
AGE GROUP
1 2 3 4 5
Sig. Rank Sig. Rank Sig. Rank Sig. Rank Sig. Rank
Child Development √ 5 √ 4 √ 2 √ 3 √ 3
Professional Relationship √ 1 √ 2 √ 4 √ 4 √ 1
Caregivers √ 2 √ 1 √ 1 √ 1 √ 2
Facilities & Equipment × 6 √ 5 √ 5 √ 2 √ 5
Scheduling √ 3 √ 3 √ 6 √ 6 × 6
Fees √ 4 √ 6 √ 3 √ 5 √ 4
√ = p <= 0.05 level
Note: The rankings were determined in order of magnitude of importance.
37
FIGURE 1: Probability of Agency Retention by Overall Satisfaction Level of Parent
0%
25%
50%
75%
100%
1 2 3 4 5 6 7 8 9 10
Overall Satisfaction Level
Ret
entio
n Pr
obab
ility
Age 1
Age 2Age 3Age 4Age 5
0%
25%
50%
75%
100%
1 2 3 4 5 6 7 8 9 10
Overall Satisfaction Level
Ret
entio
n Pr
obab
ility
Age 1
Age 2Age 3Age 4Age 5

38
ENDNOTES
1 K-J is a Japanese management technique designed to generate a hierarchical tree diagram of
data. In this exercise, a team organizes a list of needs by group consensus. It uses a bottom-up
approach, organizing the most detailed needs, and then seeing higher levels of organization in
those groupings.
2 Because correlations analysis is a measure of the linear relationship in the data.
3 Nagelkerke's R-Square is the most-reported of the R-squared estimates. It is a modification of
the Cox and Snell coefficient to assure that it can vary from 0 to 1. That is, Nagelkerke's R2
divides Cox and Snell's R2 by its maximum in order to achieve a measure that ranges from 0 to 1.
Therefore Nagelkerke's R-Square will normally be higher than the Cox and Snell measure
(Nagelkerke 1991).