does ontogeny modulate irradiance-elicited plasticity of leaf traits in saplings of rain-forest tree...
TRANSCRIPT
Ann. For. Sci. 66 (2009) 709 Available online at:c© INRA, EDP Sciences, 2009 www.afs-journal.orgDOI: 10.1051/forest/2009062
Original article
Does ontogeny modulate irradiance-elicited plasticity of leaf traitsin saplings of rain-forest tree species? A test with Dicorynia guianensis
and Tachigali melinonii (Fabaceae, Caesalpinioideae)
Sabrina Coste1, Jean-Christophe Roggy1, Laurianne Garraud1, Patrick Heuret2, Eric Nicolini2,Erwin Dreyer3,4*
1 AgroParisTech-ENGREF, INRA, UMR CIRAD-ENGREF-INRA-CNRS “ Écologie des Forêts de Guyane ”,Campus Agronomique de Kourou, 97387 Kourou, Guyane Française
2 INRA, CIRAD, CNRS, IRD, Université de Montpellier 2, UMR “ Botanique et Bioinformatique de l’Architecture des Plantes ”, TA A51/PS2 34398Montpellier Cedex 5, France
3 INRA, UMR 1137 “ Écologie et Écophysiologie Forestières ”, 54280 Champenoux, France4 Nancy-Université, UMR 1137 “ Écologie et Écophysiologie Forestières ”, F54500 Vandoeuvre
(Received 18 September 2008; revised version 30 January 2009; accepted 9 March 2009)
Keywords:plant architecture /phenotypic plasticity /photosynthetic capacity /leaf structure /tropical rain forest
Abstract• Irradiance elicits a large plasticity in leaf traits, but little is known about the modulation of thisplasticity by ontogeny. Interactive effects of relative irradiance and ontogeny were assessed on leaftraits for two tropical rainforest tree species: Dicorynia guianensis Amshoff and Tachigali melinonii(Harms) Barneby (Fabaceae, Caesalpinioideae).• Eleven morphological and physiological leaf traits, relative to photosynthetic performance, weremeasured on saplings at three different architectural development stages (ASD 1, 2 and 3) and used toderive composite traits like photosynthetic N-use efficiency. Measurements were made along a natu-ral irradiance gradient.• The effect of ASD was very visible and differed between the two species. For Dicorynia guianensis,only leaf mass-per-area (LMA) significantly increased with ASDs whereas for Tachigali melinonii,almost all traits were affected by ASD: LMA, leaf N content and photosynthetic capacity increasedfrom ASD 1 to ASD 3. Photosynthetic N-use-efficiency was not affected by ASD in any species.• Leaf traits were severely modulated by irradiance, whereas the degree of plasticity was very similaramong ASDs. Only few interactions were detected between irradiance and ASD, for leaf thickness,carbon content, and the ratio Chl/N for T. melinonii and for photosynthetic capacity in D. guianensis.• We conclude that ontogenic development and irradiance-elicited plasticity modulated leaf traits,with almost no interaction, i.e., the degree of irradiance-elicited plasticity was stable across develop-ment stages and independent of ontogeny in these two species, at least in the early stages of develop-ment assessed here.
Mots-clés :architecture des arbres /plasticité phénotypique /capacité photosynthétique /structure des feuilles /forêt tropicale humide
Résumé – L’ontogenèse module-t-elle la plasticité des traits foliaires induite par la lumière dansdes semis d’arbres de forêt tropicale humide ? Un test avec Dicorynia guianensis et Tachigalimelinonii (Fabaceae, Caesalpinioideae).• Les traits foliaires varient fortement avec l’éclairement mais également avec l’ontogénèse. Cepen-dant, l’impact de l’ontogénèse sur la plasticité induite par l’éclairement reste mal connu. Les interac-tions entre ontogénèse et éclairement relatif ont ainsi été étudiées pour des traits fonctionnels foliairesde deux espèces de forêt tropicale humide de Guyane française : Dicorynia guianensis Amshoff etTachigali melinonii (Harms) Barneby (Fabaceae, Caesalpinioideae).• Onze traits morphologiques et physiologiques foliaires, relatifs aux capacités photosynthétiques,ont été mesurés sur de jeunes arbres ayant atteint trois stades architecturaux de développement suc-cessifs (ASD 1, 2 et 3) et utilisés pour en déduire des traits composites. Les mesures ont été réaliséesle long d’un gradient naturel d’éclairement en forêt.
* Corresponding author: [email protected]
Article published by EDP Sciences
Ann. For. Sci. 66 (2009) 709 S. Coste et al.
• L’impact de stades successifs de développement différait entre espèces. Pour D. guianensis, seule lamasse surfacique (LMA) a augmenté significativement avec les stades de développement tandis quepour T. melinonii, presque tous les traits foliaires étaient modulés. Pour cette espèce, LMA, teneur enN et capacités photosynthétiques ont augmenté de ASD 1 à ASD 3. Par contre, l’efficience d’utilisa-tion de N par la photosynthèse est restée stable entre ASDs.• Les traits foliaires ont été fortement modifiés par l’éclairement mais le degré de plasticité étaitsimilaire entre les ASDs. Des interactions entre ASD et éclairement n’ont été observées que pourl’épaisseur, la teneur en C et le rapport Chl/N de T. melinonii ainsi que pour les capacités photosyn-thétique de D. guianensis.• En dépit de l’effet significatif de l’ontogénèse sur les traits foliaires étudiés, seules de très faiblesinteractions ont pu être détectées avec l’éclairement pour les deux espèces. On peut en conclure queles stades successifs de développement ne modifient pas le degré de plasticité foliaire en réponse àl’éclairement tout au moins dans le cas des stades jeunes pris en compte ici.
List of abbreviations and symbols.
Definition Units
PNUE Photosynthetic N use efficiency
DPF Daily photon flux mol m−2 d−1
DPFrel Relative daily photon flux %
Structural traits
H Length of the main axis cm
D Basal diameter of the main axis cm
LMA Leaf mass per unit leaf area g m−2
Thickness Leaf thickness μm
Density Leaf density (LMA/thickness) g cm−3
Cm Total leaf carbon content mg C g−1
Nm / Na Total leaf nitrogen content * mg N g−1 / mg N m−2
Chlm/Chla Total leaf chlorophyll content * μmol Chl g−1 / μmol Chl m−2
Functional traits
Asatm / Asata Light-saturated net CO2 assimilation rate nmol CO2g−1 s−1 / μmol CO2 m−2 s−1
Vcmaxm / Vcmaxa Maximal Rubisco activity * nmol CO2g−1 s−1 / μmol CO2 m−2 s−1
Jmaxm / Jmaxa Maximal light driven electron transport rate * nmol e− g−1 s−1 / μmol e− m−2 s−1
Rdm / Rda CO2 Production by non photorespiratory respiration * nmol g−1 s−1 / μmol CO2m−2 s−1
Vcmax/N Carboxylation rate per unit nitrogen μmol CO2 mmol−1 N s−1
Jmax/N Electron transport capacity per unit nitrogen μmol CO2 mmol−1 N s−1
Chl/N Investment of leaf nitrogen in chlorophyll μmol Chl mmol−1 N
* “m” and “a” denote mass-based and area-based values, respectively.
709p2
Ontogeny and irradiance elicited plasticity Ann. For. Sci. 66 (2009) 709
1. INTRODUCTION
During ontogeny, trees increase both in size and structuralcomplexity. It is now well established that leaf and wholeplant traits change with tree size (mainly height) and age (e.g.Hoflacher and Bauer, 1982; Mediavilla and Escudero, 2003;Rijkers et al., 2000; Thomas and Winner, 2002). Tree height isknown to influence structural and physiological leaf traits pos-sibly due to hydraulic constraints imposed by increased trans-port distance (Niinemets, 1997a, 2002; Rijkers et al., 2000). Inseveral tropical tree species, leaf mass-per-area ratio (LMA),area-based total leaf N content (Na) and area-based light- satu-rated net CO2 assimilation rate (Asata) increase with tree heightwhereas mass-based total leaf N (Nm), mass-based light satu-rated net assimilation rate (Asatm) and photosynthetic N-useefficiency remain stable (Rijkers et al., 2000).
On the other hand, relative irradiance is well known to dra-matically modify leaf traits, eliciting a large phenotypic plas-ticity (Bradshaw, 1965). In general, shade leaves are thinner,less dense and display lower leaf mass-to-area ratios (LMA)than sun-exposed leaves (Givnish, 1988; Rozendaal et al.,2006; Valladares et al., 2000). They also exhibit lower Asataand dark respiration per leaf area (Rda) (Givnish, 1988; Rijkerset al., 2000). However, little is known about the modula-tion of irradiance-elicited plasticity by ontogeny. Many au-thors emphasized that, because traits vary during the courseof growth and development, it is necessary to compare in-dividuals at a common ontogenetic development stage (i.e.,a common size rather than a common age) to identify envi-ronmentally induced variation in traits (Coleman et al., 1994;Evans, 1972; Poorter, 1999; Poorter et al., 2006; Veneklaasand Poorter, 1988; Wright and McConnaughay, 2002). Fur-thermore, growth and development rates themselves are highlyplastic. Individuals grown under contrasted irradiance usuallydisplay different growth rates, and therefore reach largely dif-ferent sizes at similar ages. Plasticity may therefore be con-founded with ontogenetic responses (Veneklaas and Poorter,1988). This was particularly emphasised in studies of shadetolerance (Lusk and Warton, 2007; Lusk et al., 2008; Mc-Connaughay and Coleman, 1999; Niinemets, 2006).
The majority of studies addressing ontogenetic shifts of leaftraits used plant size (height, diameter or biomass) as a co-variant (Poorter, 1999; Sterck and Bongers, 1998) or focusedon a comparison between very young seedlings or saplingsand mature trees and did not take into account any interme-diate stage (Cavender-Bares and Bazzaz, 2000; Cornelissenet al., 2003; Holscher, 2004; Mediavilla and Escudero, 2003;Thomas and Winner, 2002). A meta-analysis of field measure-ments in saplings vs. mature trees (Thomas and Winner, 2002)showed that Asata was larger in adult trees than in saplings,especially for temperate deciduous trees. An ontogenetic in-crease in LMA led to a decrease of Asatm (Mediavilla and Es-cudero, 2003; Roggy et al., 2005; Thomas and Winner, 2002).
The observed ontogenetic effects may also be induced bydifferences in tree architecture: an increased structural com-plexity, due to branching, crown development or occurrenceof flowering may have important physiological consequenceson functional leaf traits. Successive key stages of architec-
tural development (ASD) have been identified (Barthelemy andCaraglio, 2007), on the basis of the degree of structural com-plexity and of the expression of processes like branching, re-iteration or sexuality. The successive stages may be reachedat different dimensions for individual trees, depending on en-vironmental conditions (Nicolini, 1998; Nicolini et al., 2000;Roggy et al., 2005).
The main objectives of this study were to document thesequestions based on observations with young individuals fromtwo tree species growing along a natural irradiance gradientin the tropical rain forest. Dicorynia guianensis Amshoff andTachigali melinonii (Harms) Barneby (Fabaceae, Caesalpin-ioideae) were selected due to their ability to establish both inthe understorey and in clearings. The two species belong tothe same functional group (heliophilic non pioneer species,Molino and Sabatier, 2001). More specifically, our aim was:(1) to test whether structural and functional leaf traits differedamong ASDs in these species; (2) to quantify the plasticity ofleaf traits along a natural irradiance gradient and (3) to evi-dence potential interactions between irradiance and ASD, i.e.,to test whether irradiance-elicited plasticity differed betweenASDs.
In the present study, we assessed the variability of elevenmorphological and physiological leaf traits related to photo-synthesis over three different ASDs in forests around Kourou,French Guiana. Leaf structure was assessed from leaf mass-per-area ratio (LMA), leaf thickness, leaf density and nitrogen,carbon and chlorophyll contents. The semi-mechanistic photo-synthesis model of Farquhar et al. (1980) was used to quantifyphotosynthetic capacity by assessing in vivo apparent max-imal Rubisco activity (Vcmax), maximal light-driven electronflux (Jmax) and dark respiration (Rd). Photosynthetic N use ef-ficiency was indirectly assessed by the ratios Vcmax/N; Jmax/Nand the relative allocation of N to light interception was as-sessed from the ratio Chlorophylls/N.
2. MATERIAL AND METHODS
2.1. Study site
The study was carried out in coastal French Guiana in SouthAmerica, in the lowland tropical rain-forest of the experimental siteof Paracou and in nearby sites (5◦ 18′ N, 52◦ 55′ W). The climateis characterised by a wet season from December to August, inter-rupted during February by a short dry season, and followed by a longdry season from September to November. Average annual precipita-tion is 2875 ± 540 mm (mean ± SD from 1986 to 2005) with nearlytwo-third received between mid-March and mid-June (Baraloto et al.,2007; Bonal et al., 2000).
2.2. Sampling
Dicorynia guianensis Amshoff and Tachigali melinonii (Harms)Barneby (Fabaceae, Caesalpinioideae) are two rather heliophilic butnon-pioneer species with compound leaves (Molino and Sabatier,2001). D. guianensis is generally considered to be relatively toler-ant to shade (Favrichon, 1994; Roggy et al., 2005). Individuals were
709p3
Ann. For. Sci. 66 (2009) 709 S. Coste et al.
TMASD 1
TMASD 2
TMASD 3
DGASD 1
DGASD 2
DGASD 3
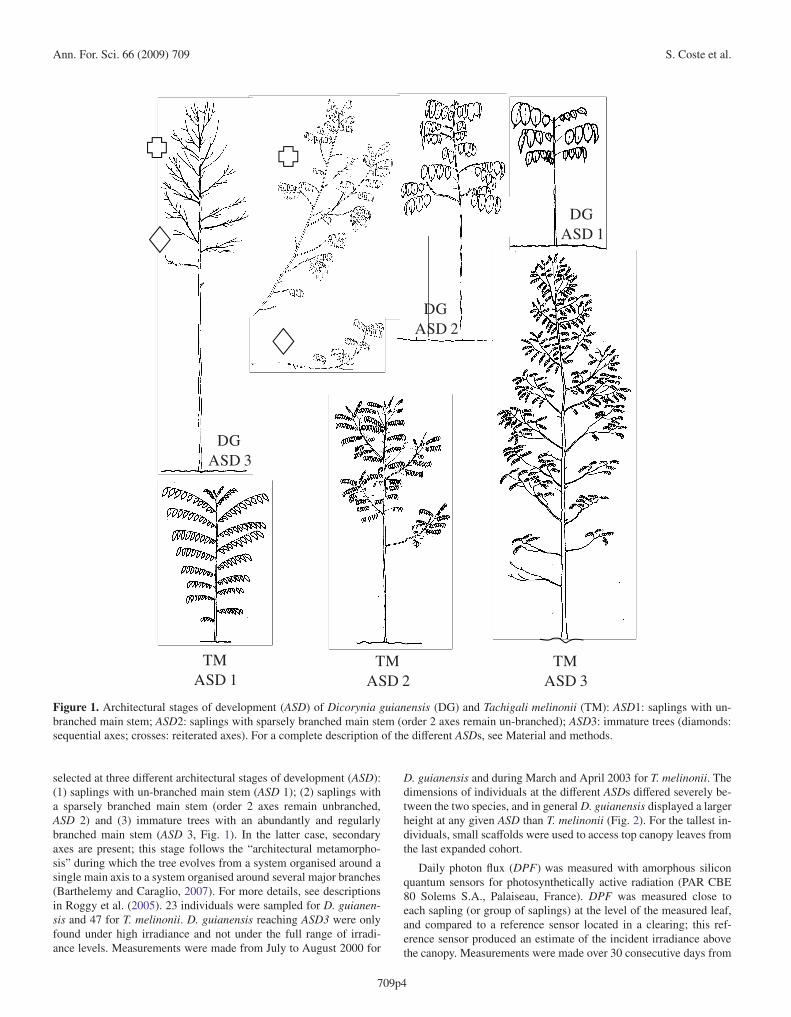
Figure 1. Architectural stages of development (ASD) of Dicorynia guianensis (DG) and Tachigali melinonii (TM): ASD1: saplings with un-branched main stem; ASD2: saplings with sparsely branched main stem (order 2 axes remain un-branched); ASD3: immature trees (diamonds:sequential axes; crosses: reiterated axes). For a complete description of the different ASDs, see Material and methods.
selected at three different architectural stages of development (ASD):(1) saplings with un-branched main stem (ASD 1); (2) saplings witha sparsely branched main stem (order 2 axes remain unbranched,ASD 2) and (3) immature trees with an abundantly and regularlybranched main stem (ASD 3, Fig. 1). In the latter case, secondaryaxes are present; this stage follows the “architectural metamorpho-sis” during which the tree evolves from a system organised around asingle main axis to a system organised around several major branches(Barthelemy and Caraglio, 2007). For more details, see descriptionsin Roggy et al. (2005). 23 individuals were sampled for D. guianen-sis and 47 for T. melinonii. D. guianensis reaching ASD3 were onlyfound under high irradiance and not under the full range of irradi-ance levels. Measurements were made from July to August 2000 for
D. guianensis and during March and April 2003 for T. melinonii. Thedimensions of individuals at the different ASDs differed severely be-tween the two species, and in general D. guianensis displayed a largerheight at any given ASD than T. melinonii (Fig. 2). For the tallest in-dividuals, small scaffolds were used to access top canopy leaves fromthe last expanded cohort.
Daily photon flux (DPF) was measured with amorphous siliconquantum sensors for photosynthetically active radiation (PAR CBE80 Solems S.A., Palaiseau, France). DPF was measured close toeach sapling (or group of saplings) at the level of the measured leaf,and compared to a reference sensor located in a clearing; this ref-erence sensor produced an estimate of the incident irradiance abovethe canopy. Measurements were made over 30 consecutive days from
709p4
Ontogeny and irradiance elicited plasticity Ann. For. Sci. 66 (2009) 709
ASD1 ASD2 ASD3
H(c
m)
0
200
400
600
800Tm Dg
a
b
d
e
c
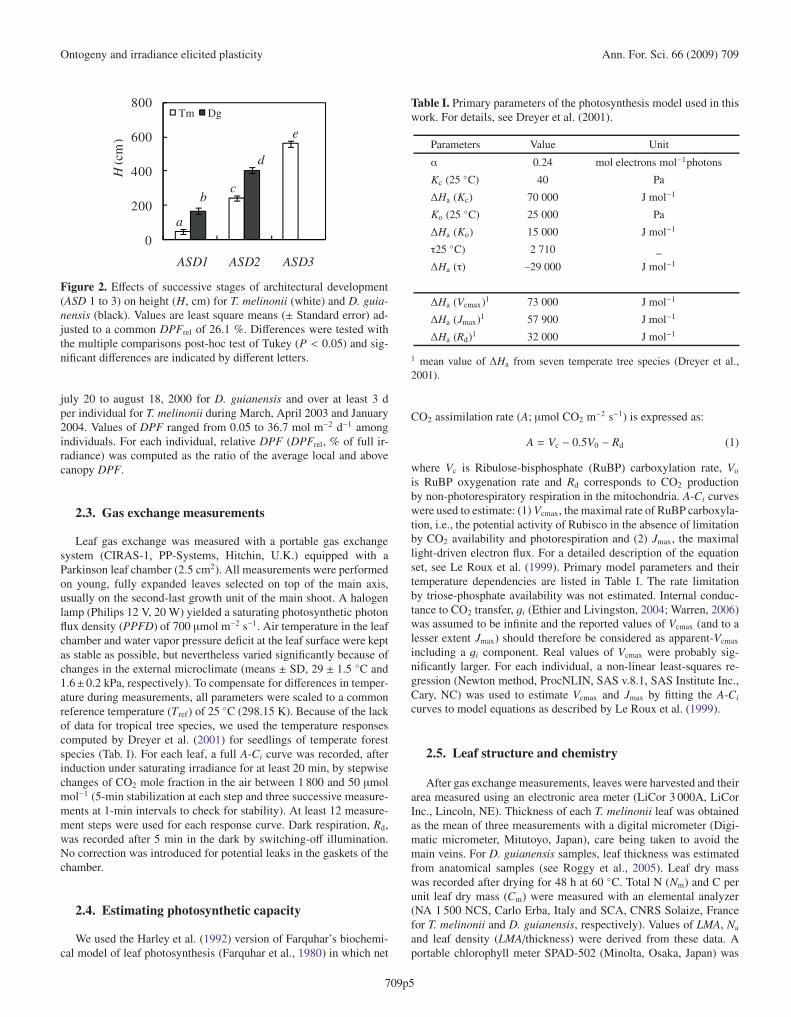
Figure 2. Effects of successive stages of architectural development(ASD 1 to 3) on height (H, cm) for T. melinonii (white) and D. guia-nensis (black). Values are least square means (± Standard error) ad-justed to a common DPFrel of 26.1 %. Differences were tested withthe multiple comparisons post-hoc test of Tukey (P < 0.05) and sig-nificant differences are indicated by different letters.
july 20 to august 18, 2000 for D. guianensis and over at least 3 dper individual for T. melinonii during March, April 2003 and January2004. Values of DPF ranged from 0.05 to 36.7 mol m−2 d−1 amongindividuals. For each individual, relative DPF (DPFrel, % of full ir-radiance) was computed as the ratio of the average local and abovecanopy DPF.
2.3. Gas exchange measurements
Leaf gas exchange was measured with a portable gas exchangesystem (CIRAS-1, PP-Systems, Hitchin, U.K.) equipped with aParkinson leaf chamber (2.5 cm2). All measurements were performedon young, fully expanded leaves selected on top of the main axis,usually on the second-last growth unit of the main shoot. A halogenlamp (Philips 12 V, 20 W) yielded a saturating photosynthetic photonflux density (PPFD) of 700 μmol m−2 s−1. Air temperature in the leafchamber and water vapor pressure deficit at the leaf surface were keptas stable as possible, but nevertheless varied significantly because ofchanges in the external microclimate (means ± SD, 29 ± 1.5 ◦C and1.6±0.2 kPa, respectively). To compensate for differences in temper-ature during measurements, all parameters were scaled to a commonreference temperature (Tref) of 25 ◦C (298.15 K). Because of the lackof data for tropical tree species, we used the temperature responsescomputed by Dreyer et al. (2001) for seedlings of temperate forestspecies (Tab. I). For each leaf, a full A-Ci curve was recorded, afterinduction under saturating irradiance for at least 20 min, by stepwisechanges of CO2 mole fraction in the air between 1 800 and 50 μmolmol−1 (5-min stabilization at each step and three successive measure-ments at 1-min intervals to check for stability). At least 12 measure-ment steps were used for each response curve. Dark respiration, Rd,was recorded after 5 min in the dark by switching-off illumination.No correction was introduced for potential leaks in the gaskets of thechamber.
2.4. Estimating photosynthetic capacity
We used the Harley et al. (1992) version of Farquhar’s biochemi-cal model of leaf photosynthesis (Farquhar et al., 1980) in which net
Table I. Primary parameters of the photosynthesis model used in thiswork. For details, see Dreyer et al. (2001).
Parameters Value Unit
α 0.24 mol electrons mol−1photons
Kc (25 ◦C) 40 Pa
ΔHa (Kc) 70 000 J mol−1
Ko (25 ◦C) 25 000 Pa
ΔHa (Ko) 15 000 J mol−1
τ25 ◦C) 2 710 _
ΔHa (τ) –29 000 J mol−1
ΔHa (Vcmax)1 73 000 J mol−1
ΔHa (Jmax)1 57 900 J mol−1
ΔHa (Rd)1 32 000 J mol−1
1 mean value of ΔHa from seven temperate tree species (Dreyer et al.,2001).
CO2 assimilation rate (A; μmol CO2 m−2 s−1) is expressed as:
A = Vc − 0.5V0 − Rd (1)
where Vc is Ribulose-bisphosphate (RuBP) carboxylation rate, Vo
is RuBP oxygenation rate and Rd corresponds to CO2 productionby non-photorespiratory respiration in the mitochondria. A-Ci curveswere used to estimate: (1) Vcmax, the maximal rate of RuBP carboxyla-tion, i.e., the potential activity of Rubisco in the absence of limitationby CO2 availability and photorespiration and (2) Jmax, the maximallight-driven electron flux. For a detailed description of the equationset, see Le Roux et al. (1999). Primary model parameters and theirtemperature dependencies are listed in Table I. The rate limitationby triose-phosphate availability was not estimated. Internal conduc-tance to CO2 transfer, gi (Ethier and Livingston, 2004; Warren, 2006)was assumed to be infinite and the reported values of Vcmax (and to alesser extent Jmax) should therefore be considered as apparent-Vcmax
including a gi component. Real values of Vcmax were probably sig-nificantly larger. For each individual, a non-linear least-squares re-gression (Newton method, ProcNLIN, SAS v.8.1, SAS Institute Inc.,Cary, NC) was used to estimate Vcmax and Jmax by fitting the A-Ci
curves to model equations as described by Le Roux et al. (1999).
2.5. Leaf structure and chemistry
After gas exchange measurements, leaves were harvested and theirarea measured using an electronic area meter (LiCor 3 000A, LiCorInc., Lincoln, NE). Thickness of each T. melinonii leaf was obtainedas the mean of three measurements with a digital micrometer (Digi-matic micrometer, Mitutoyo, Japan), care being taken to avoid themain veins. For D. guianensis samples, leaf thickness was estimatedfrom anatomical samples (see Roggy et al., 2005). Leaf dry masswas recorded after drying for 48 h at 60 ◦C. Total N (Nm) and C perunit leaf dry mass (Cm) were measured with an elemental analyzer(NA 1 500 NCS, Carlo Erba, Italy and SCA, CNRS Solaize, Francefor T. melinonii and D. guianensis, respectively). Values of LMA, Na
and leaf density (LMA/thickness) were derived from these data. Aportable chlorophyll meter SPAD-502 (Minolta, Osaka, Japan) was
709p5
Ann. For. Sci. 66 (2009) 709 S. Coste et al.
0
500
1000
1500
-1 0 1 2 3
ASD1: y=9.59x+36.4 (r² = 0.37**)
ASD2: y=-159+429 (r² = 0.62***)
ASD3: y=-99.1x+644 (r² = 0.47*)
Log DPFrel (%)
H(c
m)
Tachigali melinonii
-1 0 1 2 3
Dicorynia guianensis
Log DPFrel (%)
ASD1: y=-102x+278 (r² = 0.85***)ASD2: y=-173x+581 (r² = 0.87***)
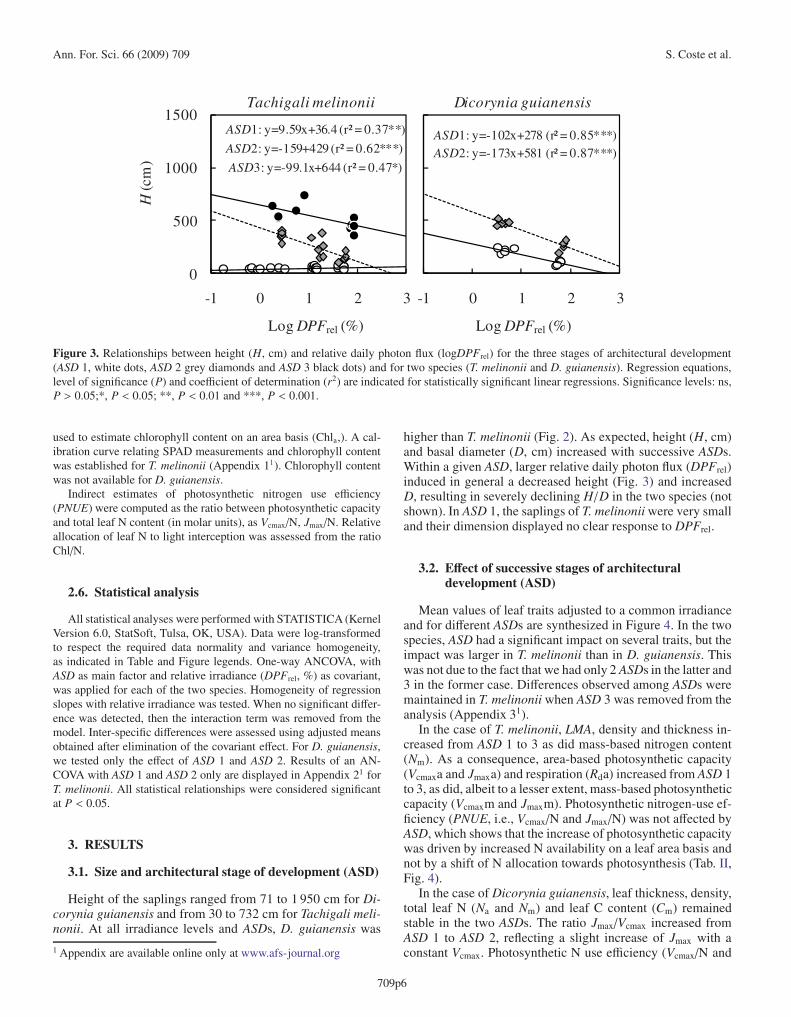
Figure 3. Relationships between height (H, cm) and relative daily photon flux (logDPFrel) for the three stages of architectural development(ASD 1, white dots, ASD 2 grey diamonds and ASD 3 black dots) and for two species (T. melinonii and D. guianensis). Regression equations,level of significance (P) and coefficient of determination (r2) are indicated for statistically significant linear regressions. Significance levels: ns,P > 0.05;*, P < 0.05; **, P < 0.01 and ***, P < 0.001.
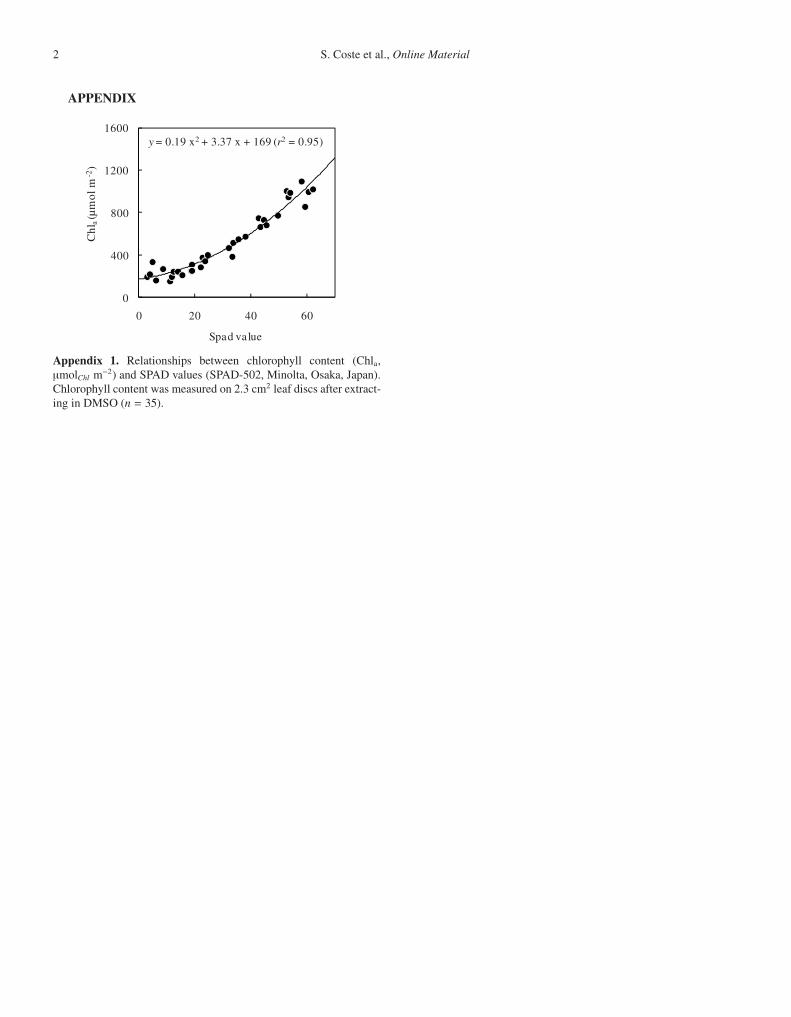
used to estimate chlorophyll content on an area basis (Chla,). A cal-ibration curve relating SPAD measurements and chlorophyll contentwas established for T. melinonii (Appendix 11). Chlorophyll contentwas not available for D. guianensis.
Indirect estimates of photosynthetic nitrogen use efficiency(PNUE) were computed as the ratio between photosynthetic capacityand total leaf N content (in molar units), as Vcmax/N, Jmax/N. Relativeallocation of leaf N to light interception was assessed from the ratioChl/N.
2.6. Statistical analysis
All statistical analyses were performed with STATISTICA (KernelVersion 6.0, StatSoft, Tulsa, OK, USA). Data were log-transformedto respect the required data normality and variance homogeneity,as indicated in Table and Figure legends. One-way ANCOVA, withASD as main factor and relative irradiance (DPFrel, %) as covariant,was applied for each of the two species. Homogeneity of regressionslopes with relative irradiance was tested. When no significant differ-ence was detected, then the interaction term was removed from themodel. Inter-specific differences were assessed using adjusted meansobtained after elimination of the covariant effect. For D. guianensis,we tested only the effect of ASD 1 and ASD 2. Results of an AN-COVA with ASD 1 and ASD 2 only are displayed in Appendix 21 forT. melinonii. All statistical relationships were considered significantat P < 0.05.
3. RESULTS
3.1. Size and architectural stage of development (ASD)
Height of the saplings ranged from 71 to 1 950 cm for Di-corynia guianensis and from 30 to 732 cm for Tachigali meli-nonii. At all irradiance levels and ASDs, D. guianensis was
1 Appendix are available online only at www.afs-journal.org
higher than T. melinonii (Fig. 2). As expected, height (H, cm)and basal diameter (D, cm) increased with successive ASDs.Within a given ASD, larger relative daily photon flux (DPFrel)induced in general a decreased height (Fig. 3) and increasedD, resulting in severely declining H/D in the two species (notshown). In ASD 1, the saplings of T. melinonii were very smalland their dimension displayed no clear response to DPFrel.
3.2. Effect of successive stages of architecturaldevelopment (ASD)
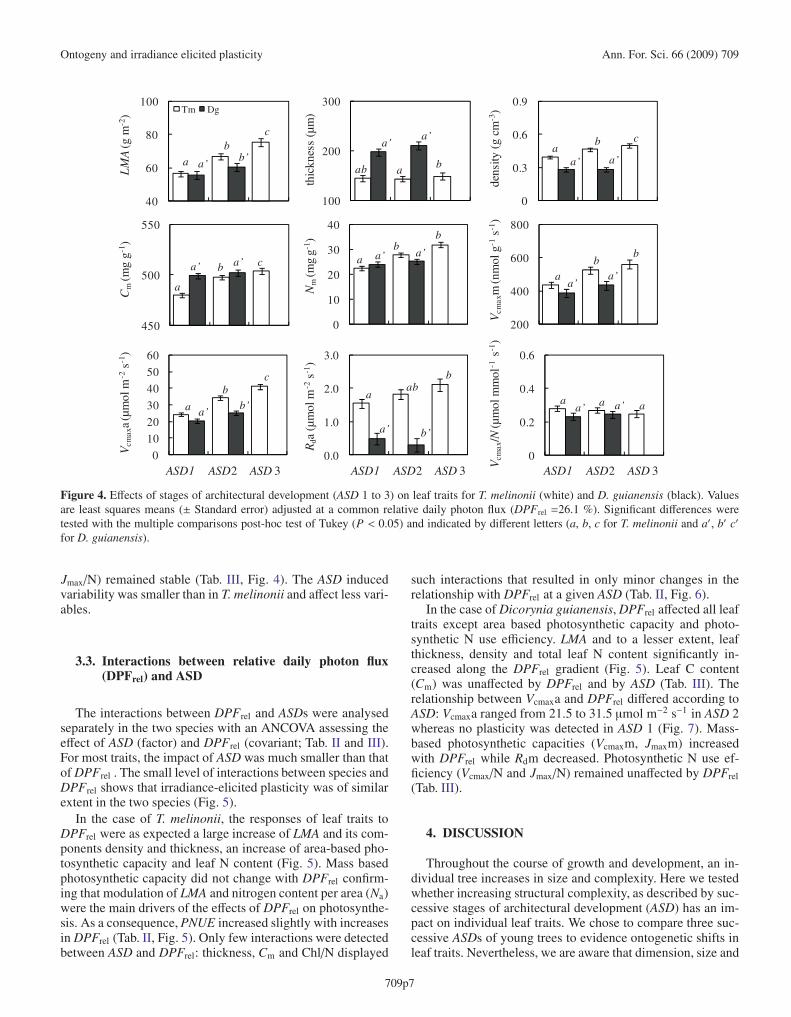
Mean values of leaf traits adjusted to a common irradianceand for different ASDs are synthesized in Figure 4. In the twospecies, ASD had a significant impact on several traits, but theimpact was larger in T. melinonii than in D. guianensis. Thiswas not due to the fact that we had only 2 ASDs in the latter and3 in the former case. Differences observed among ASDs weremaintained in T. melinonii when ASD 3 was removed from theanalysis (Appendix 31).
In the case of T. melinonii, LMA, density and thickness in-creased from ASD 1 to 3 as did mass-based nitrogen content(Nm). As a consequence, area-based photosynthetic capacity(Vcmaxa and Jmaxa) and respiration (Rda) increased from ASD 1to 3, as did, albeit to a lesser extent, mass-based photosyntheticcapacity (Vcmaxm and Jmaxm). Photosynthetic nitrogen-use ef-ficiency (PNUE, i.e., Vcmax/N and Jmax/N) was not affected byASD, which shows that the increase of photosynthetic capacitywas driven by increased N availability on a leaf area basis andnot by a shift of N allocation towards photosynthesis (Tab. II,Fig. 4).
In the case of Dicorynia guianensis, leaf thickness, density,total leaf N (Na and Nm) and leaf C content (Cm) remainedstable in the two ASDs. The ratio Jmax/Vcmax increased fromASD 1 to ASD 2, reflecting a slight increase of Jmax with aconstant Vcmax. Photosynthetic N use efficiency (Vcmax/N and
709p6
Ontogeny and irradiance elicited plasticity Ann. For. Sci. 66 (2009) 709
200
400
600
800
450
500
550
100
200
300
40
60
80
100Tm Dg
0
0.2
0.4
0.6
0
10
20
30
40
0
10
20
30
40
50
60
0.0
1.0
2.0
3.0
Vcm
axa
(µm
ol m
-2s-1
)
Rda
(µm
ol m
-2s-1
)
Vcm
ax/N
(µm
ol m
mol
-1s-1
)
LM
A(g
m-2
)
thic
knes
s (µ
m)
dens
ity (
g cm
-3)
Cm
(mg
g-1)
Nm
(mg
g-1)
Vcm
axm
(nm
ol g
-1s-1
)
ASD1 ASD2 ASD 3 ASD1 ASD2 ASD 3 ASD1 ASD2 ASD 3
a
bc
a’b’
ab a b
a’a’
0
0.3
0.6
0.9
a’a a’a
cbb
a’
c
ab
b
a’a’
abb
b’
a
a’
ab
b
a
a’ a’a’ b a’ c
a’ aa’aa
b’
Figure 4. Effects of stages of architectural development (ASD 1 to 3) on leaf traits for T. melinonii (white) and D. guianensis (black). Valuesare least squares means (± Standard error) adjusted at a common relative daily photon flux (DPFrel =26.1 %). Significant differences weretested with the multiple comparisons post-hoc test of Tukey (P < 0.05) and indicated by different letters (a, b, c for T. melinonii and a′, b′ c′
for D. guianensis).
Jmax/N) remained stable (Tab. III, Fig. 4). The ASD inducedvariability was smaller than in T. melinonii and affect less vari-ables.
3.3. Interactions between relative daily photon flux(DPFrel) and ASD
The interactions between DPFrel and ASDs were analysedseparately in the two species with an ANCOVA assessing theeffect of ASD (factor) and DPFrel (covariant; Tab. II and III).For most traits, the impact of ASD was much smaller than thatof DPFrel . The small level of interactions between species andDPFrel shows that irradiance-elicited plasticity was of similarextent in the two species (Fig. 5).
In the case of T. melinonii, the responses of leaf traits toDPFrel were as expected a large increase of LMA and its com-ponents density and thickness, an increase of area-based pho-tosynthetic capacity and leaf N content (Fig. 5). Mass basedphotosynthetic capacity did not change with DPFrel confirm-ing that modulation of LMA and nitrogen content per area (Na)were the main drivers of the effects of DPFrel on photosynthe-sis. As a consequence, PNUE increased slightly with increasesin DPFrel (Tab. II, Fig. 5). Only few interactions were detectedbetween ASD and DPFrel: thickness, Cm and Chl/N displayed
such interactions that resulted in only minor changes in therelationship with DPFrel at a given ASD (Tab. II, Fig. 6).
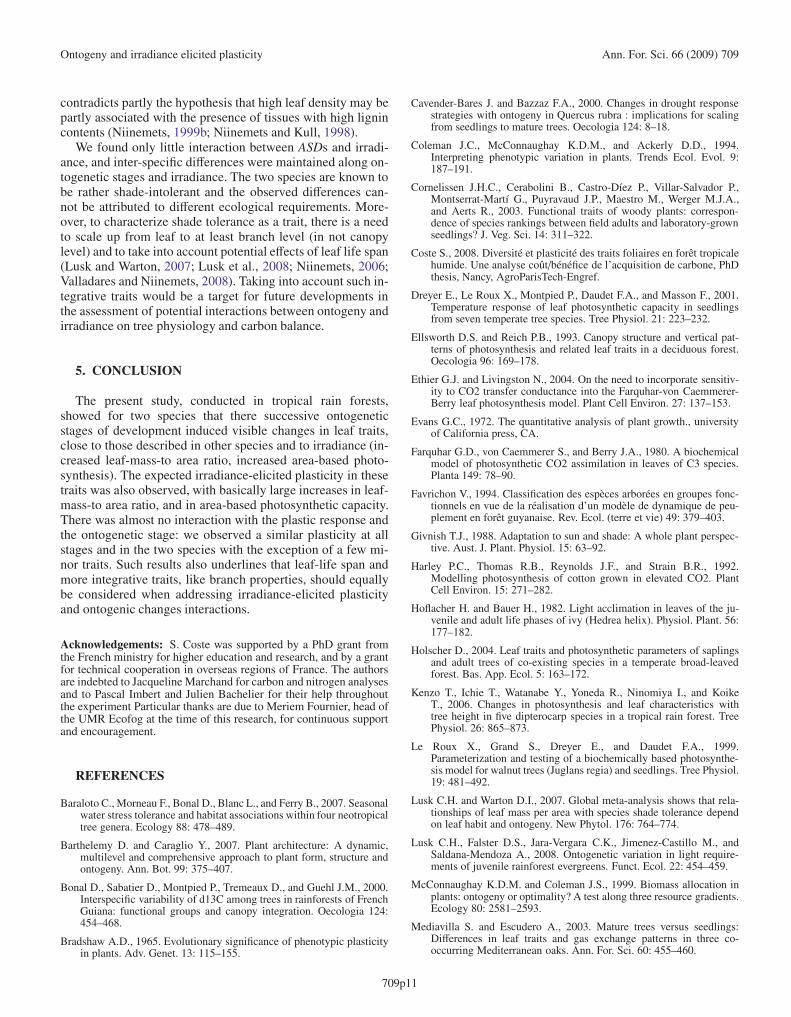
In the case of Dicorynia guianensis, DPFrel affected all leaftraits except area based photosynthetic capacity and photo-synthetic N use efficiency. LMA and to a lesser extent, leafthickness, density and total leaf N content significantly in-creased along the DPFrel gradient (Fig. 5). Leaf C content(Cm) was unaffected by DPFrel and by ASD (Tab. III). Therelationship between Vcmaxa and DPFrel differed according toASD: Vcmaxa ranged from 21.5 to 31.5 μmol m−2 s−1 in ASD 2whereas no plasticity was detected in ASD 1 (Fig. 7). Mass-based photosynthetic capacities (Vcmaxm, Jmaxm) increasedwith DPFrel while Rdm decreased. Photosynthetic N use ef-ficiency (Vcmax/N and Jmax/N) remained unaffected by DPFrel(Tab. III).
4. DISCUSSION
Throughout the course of growth and development, an in-dividual tree increases in size and complexity. Here we testedwhether increasing structural complexity, as described by suc-cessive stages of architectural development (ASD) has an im-pact on individual leaf traits. We chose to compare three suc-cessive ASDs of young trees to evidence ontogenetic shifts inleaf traits. Nevertheless, we are aware that dimension, size and
709p7
Ann. For. Sci. 66 (2009) 709 S. Coste et al.
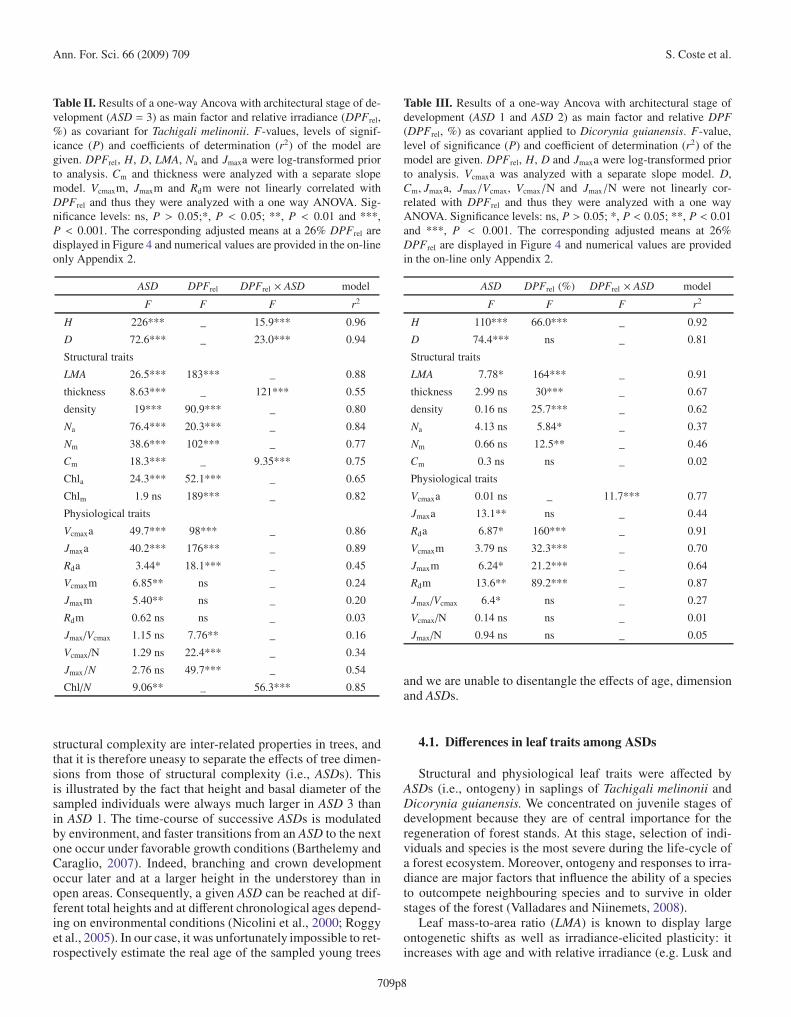
Table II. Results of a one-way Ancova with architectural stage of de-velopment (ASD = 3) as main factor and relative irradiance (DPFrel,%) as covariant for Tachigali melinonii. F-values, levels of signif-icance (P) and coefficients of determination (r2) of the model aregiven. DPFrel, H, D, LMA, Na and Jmaxa were log-transformed priorto analysis. Cm and thickness were analyzed with a separate slopemodel. Vcmaxm, Jmaxm and Rdm were not linearly correlated withDPFrel and thus they were analyzed with a one way ANOVA. Sig-nificance levels: ns, P > 0.05;*, P < 0.05; **, P < 0.01 and ***,P < 0.001. The corresponding adjusted means at a 26% DPFrel aredisplayed in Figure 4 and numerical values are provided in the on-lineonly Appendix 2.
ASD DPFrel DPFrel × ASD model
F F F r2
H 226*** _ 15.9*** 0.96
D 72.6*** _ 23.0*** 0.94
Structural traits
LMA 26.5*** 183*** _ 0.88
thickness 8.63*** _ 121*** 0.55
density 19*** 90.9*** _ 0.80
Na 76.4*** 20.3*** _ 0.84
Nm 38.6*** 102*** _ 0.77
Cm 18.3*** _ 9.35*** 0.75
Chla 24.3*** 52.1*** _ 0.65
Chlm 1.9 ns 189*** _ 0.82
Physiological traits
Vcmaxa 49.7*** 98*** _ 0.86
Jmaxa 40.2*** 176*** _ 0.89
Rda 3.44* 18.1*** _ 0.45
Vcmaxm 6.85** ns _ 0.24
Jmaxm 5.40** ns _ 0.20
Rdm 0.62 ns ns _ 0.03
Jmax/Vcmax 1.15 ns 7.76** _ 0.16
Vcmax/N 1.29 ns 22.4*** _ 0.34
Jmax/N 2.76 ns 49.7*** _ 0.54
Chl/N 9.06** _ 56.3*** 0.85
structural complexity are inter-related properties in trees, andthat it is therefore uneasy to separate the effects of tree dimen-sions from those of structural complexity (i.e., ASDs). Thisis illustrated by the fact that height and basal diameter of thesampled individuals were always much larger in ASD 3 thanin ASD 1. The time-course of successive ASDs is modulatedby environment, and faster transitions from an ASD to the nextone occur under favorable growth conditions (Barthelemy andCaraglio, 2007). Indeed, branching and crown developmentoccur later and at a larger height in the understorey than inopen areas. Consequently, a given ASD can be reached at dif-ferent total heights and at different chronological ages depend-ing on environmental conditions (Nicolini et al., 2000; Roggyet al., 2005). In our case, it was unfortunately impossible to ret-rospectively estimate the real age of the sampled young trees
Table III. Results of a one-way Ancova with architectural stage ofdevelopment (ASD 1 and ASD 2) as main factor and relative DPF(DPFrel, %) as covariant applied to Dicorynia guianensis. F-value,level of significance (P) and coefficient of determination (r2) of themodel are given. DPFrel, H, D and Jmaxa were log-transformed priorto analysis. Vcmaxa was analyzed with a separate slope model. D,Cm, Jmaxa, Jmax/Vcmax, Vcmax/N and Jmax/N were not linearly cor-related with DPFrel and thus they were analyzed with a one wayANOVA. Significance levels: ns, P > 0.05; *, P < 0.05; **, P < 0.01and ***, P < 0.001. The corresponding adjusted means at 26%DPFrel are displayed in Figure 4 and numerical values are providedin the on-line only Appendix 2.
ASD DPFrel (%) DPFrel × ASD model
F F F r2
H 110*** 66.0*** _ 0.92
D 74.4*** ns _ 0.81
Structural traits
LMA 7.78* 164*** _ 0.91
thickness 2.99 ns 30*** _ 0.67
density 0.16 ns 25.7*** _ 0.62
Na 4.13 ns 5.84* _ 0.37
Nm 0.66 ns 12.5** _ 0.46
Cm 0.3 ns ns _ 0.02
Physiological traits
Vcmaxa 0.01 ns _ 11.7*** 0.77
Jmaxa 13.1** ns _ 0.44
Rda 6.87* 160*** _ 0.91
Vcmaxm 3.79 ns 32.3*** _ 0.70
Jmaxm 6.24* 21.2*** _ 0.64
Rdm 13.6** 89.2*** _ 0.87
Jmax/Vcmax 6.4* ns _ 0.27
Vcmax/N 0.14 ns ns _ 0.01
Jmax/N 0.94 ns ns _ 0.05
and we are unable to disentangle the effects of age, dimensionand ASDs.
4.1. Differences in leaf traits among ASDs
Structural and physiological leaf traits were affected byASDs (i.e., ontogeny) in saplings of Tachigali melinonii andDicorynia guianensis. We concentrated on juvenile stages ofdevelopment because they are of central importance for theregeneration of forest stands. At this stage, selection of indi-viduals and species is the most severe during the life-cycle ofa forest ecosystem. Moreover, ontogeny and responses to irra-diance are major factors that influence the ability of a speciesto outcompete neighbouring species and to survive in olderstages of the forest (Valladares and Niinemets, 2008).
Leaf mass-to-area ratio (LMA) is known to display largeontogenetic shifts as well as irradiance-elicited plasticity: itincreases with age and with relative irradiance (e.g. Lusk and
709p8
Ontogeny and irradiance elicited plasticity Ann. For. Sci. 66 (2009) 709
Log DPFrel (%)
0.0
0.2
0.4
0.6
0.8
-1 0 1 2 3
Tm: y = 0.05x+0.21 (r² = 0.30***)
Vcm
ax/N
(µm
ol m
mol
-1s-1
)
Log DPFrel (%)
0
200
400
600
800
1000
-1 0 1 2 3
Dg: y=-85.3x+509 (r² = 0.44***)
Vcm
axm
(nm
ol g
-1s-1
)de
nsity
(g c
m-3
)
0.0
0.2
0.4
0.6
0.8
1.0Tm: y=0.12x+0.31 (r² = 0.63***)Dg: y=0.10x+0.18 (r² = 0.61***)
0
10
20
30
40
50
Nm
(mg
g-1)
Tm: y=-4.71x+31.4 (r² = 0.35***)
Dg: y=-4.2 3x+29.6 (r² = 0. 30**)
Log DPFrel (%)
0
20
40
60
80
100
-1 0 1 2 3
Tm: y=13.8x+17.2 (r² = 0.55***)Dg: y=9.54x+14.3 (r² = 0.38***)
Vcm
axa
(µm
ol m
-2s-1
)
0
40
80
120
160
200Tm: y=28.0x+35.7 (r² = 0.65***)Dg: y=36.7x+21.6 (r² = 0.77***)
LMA
(g m
-2)
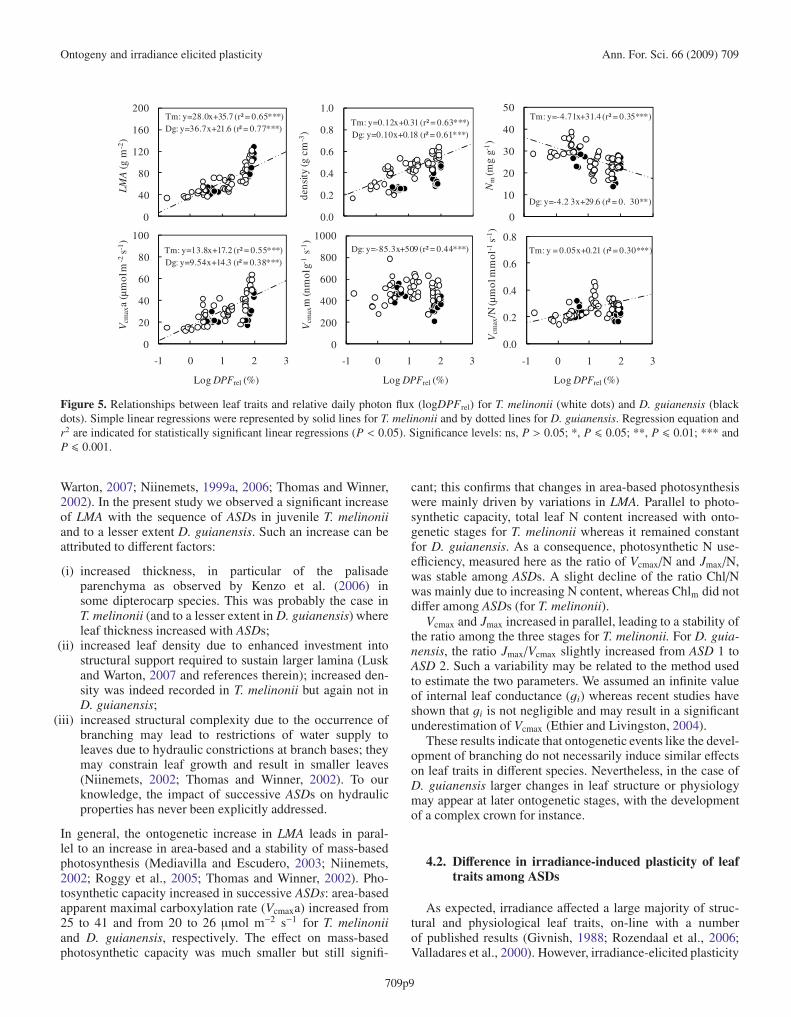
Figure 5. Relationships between leaf traits and relative daily photon flux (logDPFrel) for T. melinonii (white dots) and D. guianensis (blackdots). Simple linear regressions were represented by solid lines for T. melinonii and by dotted lines for D. guianensis. Regression equation andr2 are indicated for statistically significant linear regressions (P < 0.05). Significance levels: ns, P > 0.05; *, P � 0.05; **, P � 0.01; *** andP � 0.001.
Warton, 2007; Niinemets, 1999a, 2006; Thomas and Winner,2002). In the present study we observed a significant increaseof LMA with the sequence of ASDs in juvenile T. melinoniiand to a lesser extent D. guianensis. Such an increase can beattributed to different factors:
(i) increased thickness, in particular of the palisadeparenchyma as observed by Kenzo et al. (2006) insome dipterocarp species. This was probably the case inT. melinonii (and to a lesser extent in D. guianensis) whereleaf thickness increased with ASDs;
(ii) increased leaf density due to enhanced investment intostructural support required to sustain larger lamina (Luskand Warton, 2007 and references therein); increased den-sity was indeed recorded in T. melinonii but again not inD. guianensis;
(iii) increased structural complexity due to the occurrence ofbranching may lead to restrictions of water supply toleaves due to hydraulic constrictions at branch bases; theymay constrain leaf growth and result in smaller leaves(Niinemets, 2002; Thomas and Winner, 2002). To ourknowledge, the impact of successive ASDs on hydraulicproperties has never been explicitly addressed.
In general, the ontogenetic increase in LMA leads in paral-lel to an increase in area-based and a stability of mass-basedphotosynthesis (Mediavilla and Escudero, 2003; Niinemets,2002; Roggy et al., 2005; Thomas and Winner, 2002). Pho-tosynthetic capacity increased in successive ASDs: area-basedapparent maximal carboxylation rate (Vcmaxa) increased from25 to 41 and from 20 to 26 μmol m−2 s−1 for T. melinoniiand D. guianensis, respectively. The effect on mass-basedphotosynthetic capacity was much smaller but still signifi-
cant; this confirms that changes in area-based photosynthesiswere mainly driven by variations in LMA. Parallel to photo-synthetic capacity, total leaf N content increased with onto-genetic stages for T. melinonii whereas it remained constantfor D. guianensis. As a consequence, photosynthetic N use-efficiency, measured here as the ratio of Vcmax/N and Jmax/N,was stable among ASDs. A slight decline of the ratio Chl/Nwas mainly due to increasing N content, whereas Chlm did notdiffer among ASDs (for T. melinonii).
Vcmax and Jmax increased in parallel, leading to a stability ofthe ratio among the three stages for T. melinonii. For D. guia-nensis, the ratio Jmax/Vcmax slightly increased from ASD 1 toASD 2. Such a variability may be related to the method usedto estimate the two parameters. We assumed an infinite valueof internal leaf conductance (gi) whereas recent studies haveshown that gi is not negligible and may result in a significantunderestimation of Vcmax (Ethier and Livingston, 2004).
These results indicate that ontogenetic events like the devel-opment of branching do not necessarily induce similar effectson leaf traits in different species. Nevertheless, in the case ofD. guianensis larger changes in leaf structure or physiologymay appear at later ontogenetic stages, with the developmentof a complex crown for instance.
4.2. Difference in irradiance-induced plasticity of leaftraits among ASDs
As expected, irradiance affected a large majority of struc-tural and physiological leaf traits, on-line with a numberof published results (Givnish, 1988; Rozendaal et al., 2006;Valladares et al., 2000). However, irradiance-elicited plasticity
709p9
Ann. For. Sci. 66 (2009) 709 S. Coste et al.
asd2: y=42.4x+92.6 (r²=0.40**)
asd3: y=46.7x+106 (r²=0.91***)
0
100
200
300
400
-1 0 1 2 3asd1: y=12.5x+467 (r²=0.42**)
asd2: y=3.31x+494 (r² = 0.26*)
400
500
600
-1 0 1 2 3asd1: y=-2.92x+9.52 (r²=0.82***)asd2: y=-2.78x+8.83 (r²=0.77***)
asd3: y=-1.68x+6.75 (r²=0.81***)
0
5
10
15
20
-1 0 1 2 3
thic
knes
s (µm
)C
m(m
g g-1
)C
hl/N
(µm
ol m
mol
-1)
Tachigali melinonii
Log DPFrel (%)
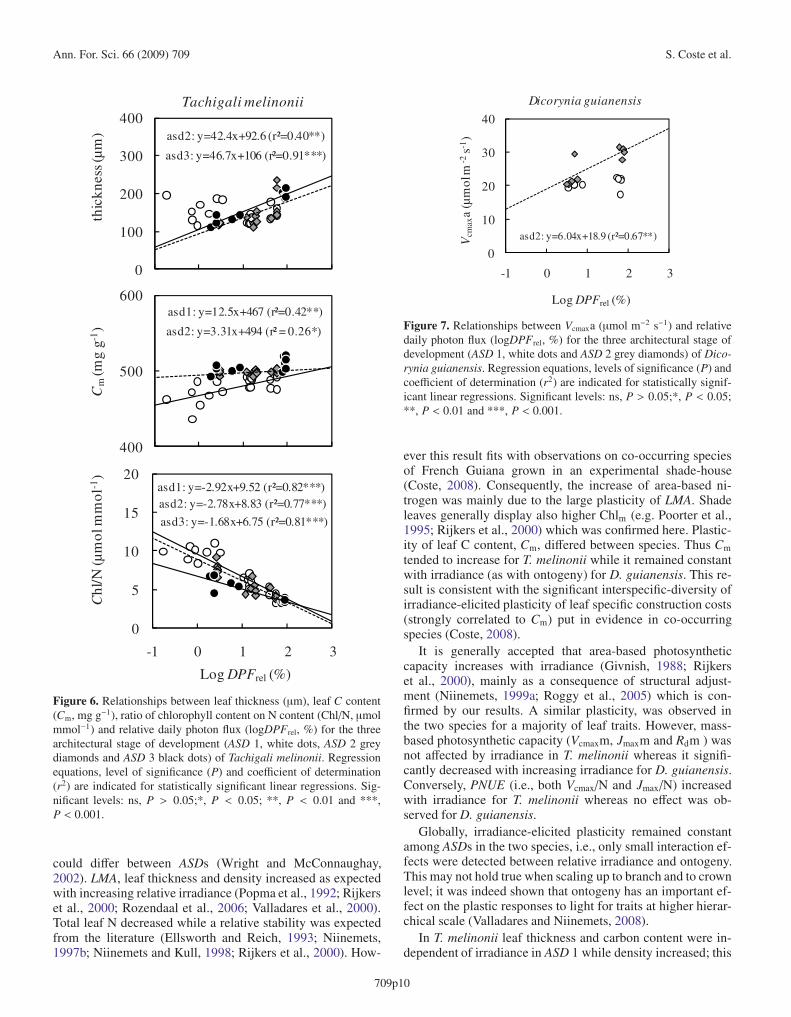
Figure 6. Relationships between leaf thickness (μm), leaf C content(Cm, mg g−1), ratio of chlorophyll content on N content (Chl/N, μmolmmol−1) and relative daily photon flux (logDPFrel, %) for the threearchitectural stage of development (ASD 1, white dots, ASD 2 greydiamonds and ASD 3 black dots) of Tachigali melinonii. Regressionequations, level of significance (P) and coefficient of determination(r2) are indicated for statistically significant linear regressions. Sig-nificant levels: ns, P > 0.05;*, P < 0.05; **, P < 0.01 and ***,P < 0.001.
could differ between ASDs (Wright and McConnaughay,2002). LMA, leaf thickness and density increased as expectedwith increasing relative irradiance (Popma et al., 1992; Rijkerset al., 2000; Rozendaal et al., 2006; Valladares et al., 2000).Total leaf N decreased while a relative stability was expectedfrom the literature (Ellsworth and Reich, 1993; Niinemets,1997b; Niinemets and Kull, 1998; Rijkers et al., 2000). How-
asd2: y=6.04x+18.9 (r²=0.67**)
0
10
20
30
40
-1 0 1 2 3
Vcm
axa
(µm
ol m
-2s-1
)
Log DPFrel (%)
Dicorynia guianensis
Figure 7. Relationships between Vcmaxa (μmol m−2 s−1) and relativedaily photon flux (logDPFrel, %) for the three architectural stage ofdevelopment (ASD 1, white dots and ASD 2 grey diamonds) of Dico-rynia guianensis. Regression equations, levels of significance (P) andcoefficient of determination (r2) are indicated for statistically signif-icant linear regressions. Significant levels: ns, P > 0.05;*, P < 0.05;**, P < 0.01 and ***, P < 0.001.
ever this result fits with observations on co-occurring speciesof French Guiana grown in an experimental shade-house(Coste, 2008). Consequently, the increase of area-based ni-trogen was mainly due to the large plasticity of LMA. Shadeleaves generally display also higher Chlm (e.g. Poorter et al.,1995; Rijkers et al., 2000) which was confirmed here. Plastic-ity of leaf C content, Cm, differed between species. Thus Cm
tended to increase for T. melinonii while it remained constantwith irradiance (as with ontogeny) for D. guianensis. This re-sult is consistent with the significant interspecific-diversity ofirradiance-elicited plasticity of leaf specific construction costs(strongly correlated to Cm) put in evidence in co-occurringspecies (Coste, 2008).
It is generally accepted that area-based photosyntheticcapacity increases with irradiance (Givnish, 1988; Rijkerset al., 2000), mainly as a consequence of structural adjust-ment (Niinemets, 1999a; Roggy et al., 2005) which is con-firmed by our results. A similar plasticity, was observed inthe two species for a majority of leaf traits. However, mass-based photosynthetic capacity (Vcmaxm, Jmaxm and Rdm ) wasnot affected by irradiance in T. melinonii whereas it signifi-cantly decreased with increasing irradiance for D. guianensis.Conversely, PNUE (i.e., both Vcmax/N and Jmax/N) increasedwith irradiance for T. melinonii whereas no effect was ob-served for D. guianensis.
Globally, irradiance-elicited plasticity remained constantamong ASDs in the two species, i.e., only small interaction ef-fects were detected between relative irradiance and ontogeny.This may not hold true when scaling up to branch and to crownlevel; it was indeed shown that ontogeny has an important ef-fect on the plastic responses to light for traits at higher hierar-chical scale (Valladares and Niinemets, 2008).
In T. melinonii leaf thickness and carbon content were in-dependent of irradiance in ASD 1 while density increased; this
709p10
Ontogeny and irradiance elicited plasticity Ann. For. Sci. 66 (2009) 709
contradicts partly the hypothesis that high leaf density may bepartly associated with the presence of tissues with high lignincontents (Niinemets, 1999b; Niinemets and Kull, 1998).
We found only little interaction between ASDs and irradi-ance, and inter-specific differences were maintained along on-togenetic stages and irradiance. The two species are known tobe rather shade-intolerant and the observed differences can-not be attributed to different ecological requirements. More-over, to characterize shade tolerance as a trait, there is a needto scale up from leaf to at least branch level (in not canopylevel) and to take into account potential effects of leaf life span(Lusk and Warton, 2007; Lusk et al., 2008; Niinemets, 2006;Valladares and Niinemets, 2008). Taking into account such in-tegrative traits would be a target for future developments inthe assessment of potential interactions between ontogeny andirradiance on tree physiology and carbon balance.
5. CONCLUSION
The present study, conducted in tropical rain forests,showed for two species that there successive ontogeneticstages of development induced visible changes in leaf traits,close to those described in other species and to irradiance (in-creased leaf-mass-to area ratio, increased area-based photo-synthesis). The expected irradiance-elicited plasticity in thesetraits was also observed, with basically large increases in leaf-mass-to area ratio, and in area-based photosynthetic capacity.There was almost no interaction with the plastic response andthe ontogenetic stage: we observed a similar plasticity at allstages and in the two species with the exception of a few mi-nor traits. Such results also underlines that leaf-life span andmore integrative traits, like branch properties, should equallybe considered when addressing irradiance-elicited plasticityand ontogenic changes interactions.
Acknowledgements: S. Coste was supported by a PhD grant fromthe French ministry for higher education and research, and by a grantfor technical cooperation in overseas regions of France. The authorsare indebted to Jacqueline Marchand for carbon and nitrogen analysesand to Pascal Imbert and Julien Bachelier for their help throughoutthe experiment Particular thanks are due to Meriem Fournier, head ofthe UMR Ecofog at the time of this research, for continuous supportand encouragement.
REFERENCES
Baraloto C., Morneau F., Bonal D., Blanc L., and Ferry B., 2007. Seasonalwater stress tolerance and habitat associations within four neotropicaltree genera. Ecology 88: 478–489.
Barthelemy D. and Caraglio Y., 2007. Plant architecture: A dynamic,multilevel and comprehensive approach to plant form, structure andontogeny. Ann. Bot. 99: 375–407.
Bonal D., Sabatier D., Montpied P., Tremeaux D., and Guehl J.M., 2000.Interspecific variability of d13C among trees in rainforests of FrenchGuiana: functional groups and canopy integration. Oecologia 124:454–468.
Bradshaw A.D., 1965. Evolutionary significance of phenotypic plasticityin plants. Adv. Genet. 13: 115–155.
Cavender-Bares J. and Bazzaz F.A., 2000. Changes in drought responsestrategies with ontogeny in Quercus rubra : implications for scalingfrom seedlings to mature trees. Oecologia 124: 8–18.
Coleman J.C., McConnaughay K.D.M., and Ackerly D.D., 1994.Interpreting phenotypic variation in plants. Trends Ecol. Evol. 9:187–191.
Cornelissen J.H.C., Cerabolini B., Castro-Díez P., Villar-Salvador P.,Montserrat-Martí G., Puyravaud J.P., Maestro M., Werger M.J.A.,and Aerts R., 2003. Functional traits of woody plants: correspon-dence of species rankings between field adults and laboratory-grownseedlings? J. Veg. Sci. 14: 311–322.
Coste S., 2008. Diversité et plasticité des traits foliaires en forêt tropicalehumide. Une analyse coût/bénéfice de l’acquisition de carbone, PhDthesis, Nancy, AgroParisTech-Engref.
Dreyer E., Le Roux X., Montpied P., Daudet F.A., and Masson F., 2001.Temperature response of leaf photosynthetic capacity in seedlingsfrom seven temperate tree species. Tree Physiol. 21: 223–232.
Ellsworth D.S. and Reich P.B., 1993. Canopy structure and vertical pat-terns of photosynthesis and related leaf traits in a deciduous forest.Oecologia 96: 169–178.
Ethier G.J. and Livingston N., 2004. On the need to incorporate sensitiv-ity to CO2 transfer conductance into the Farquhar-von Caemmerer-Berry leaf photosynthesis model. Plant Cell Environ. 27: 137–153.
Evans G.C., 1972. The quantitative analysis of plant growth., universityof California press, CA.
Farquhar G.D., von Caemmerer S., and Berry J.A., 1980. A biochemicalmodel of photosynthetic CO2 assimilation in leaves of C3 species.Planta 149: 78–90.
Favrichon V., 1994. Classification des espèces arborées en groupes fonc-tionnels en vue de la réalisation d’un modèle de dynamique de peu-plement en forêt guyanaise. Rev. Ecol. (terre et vie) 49: 379–403.
Givnish T.J., 1988. Adaptation to sun and shade: A whole plant perspec-tive. Aust. J. Plant. Physiol. 15: 63–92.
Harley P.C., Thomas R.B., Reynolds J.F., and Strain B.R., 1992.Modelling photosynthesis of cotton grown in elevated CO2. PlantCell Environ. 15: 271–282.
Hoflacher H. and Bauer H., 1982. Light acclimation in leaves of the ju-venile and adult life phases of ivy (Hedrea helix). Physiol. Plant. 56:177–182.
Holscher D., 2004. Leaf traits and photosynthetic parameters of saplingsand adult trees of co-existing species in a temperate broad-leavedforest. Bas. App. Ecol. 5: 163–172.
Kenzo T., Ichie T., Watanabe Y., Yoneda R., Ninomiya I., and KoikeT., 2006. Changes in photosynthesis and leaf characteristics withtree height in five dipterocarp species in a tropical rain forest. TreePhysiol. 26: 865–873.
Le Roux X., Grand S., Dreyer E., and Daudet F.A., 1999.Parameterization and testing of a biochemically based photosynthe-sis model for walnut trees (Juglans regia) and seedlings. Tree Physiol.19: 481–492.
Lusk C.H. and Warton D.I., 2007. Global meta-analysis shows that rela-tionships of leaf mass per area with species shade tolerance dependon leaf habit and ontogeny. New Phytol. 176: 764–774.
Lusk C.H., Falster D.S., Jara-Vergara C.K., Jimenez-Castillo M., andSaldana-Mendoza A., 2008. Ontogenetic variation in light require-ments of juvenile rainforest evergreens. Funct. Ecol. 22: 454–459.
McConnaughay K.D.M. and Coleman J.S., 1999. Biomass allocation inplants: ontogeny or optimality? A test along three resource gradients.Ecology 80: 2581–2593.
Mediavilla S. and Escudero A., 2003. Mature trees versus seedlings:Differences in leaf traits and gas exchange patterns in three co-occurring Mediterranean oaks. Ann. For. Sci. 60: 455–460.
709p11
Ann. For. Sci. 66 (2009) 709 S. Coste et al.
Molino J.-F. and Sabatier D., 2001. Tree diversity in tropical rain forests:A validation of the intermediate disturbance hypothesis. Science 294:1702–1704.
Nicolini E., 1998. Architecture et gradients morphogénétiques chez dejeunes hêtres (Fagus sylvatica L. Fagaceae) en milieu forestier. Can.J. Bot. 76: 1232–1244.
Nicolini E., Barthélémy D., and Heuret P., 2000. Influence de la den-sité du couvert forestier sur le développement architectural de je-unes chênes sessiles, Quercus petraea (Matt.) Liebl. (Fagaceae), enrégénération forestière. Can. J. Bot. 78: 1531–1344.
Niinemets Ü., 1997a. Distribution patterns of foliar carbon and nitrogenas affected by tree dimensions and relative light conditions in thecanopy of Picea abies. Trees 11: 144–154.
Niinemets Ü., 1997b. Role of foliar nitrogen in light harvesting and shadetolerance of four temperate deciduous woody species. Funct. Ecol.11: 518–531.
Niinemets Ü., 1999a. Components of leaf dry mass per area - thicknessand density - alter leaf photosynthetic capacity in reverse directionsin woody plants. New Phytol. 144: 35–47.
Niinemets Ü., 1999b. Energy requirement for foliage formation is notconstant along canopy light gradients in temperate deciduous trees.New Phytol. 141: 459–470.
Niinemets Ü., 2002. Stomatal conductance alone does not explain thedecline in foliar photosynthetic rates with increasing tree age andsize in Picea abies and Pinus sylvestris. Tree Physiol. 22: 515–535.
Niinemets Ü., 2006. The controversy over traits conferring shade-tolerance in trees: ontogenetic changes revisited. J. Ecol. 94: 464–470.
Niinemets Ü. and Kull O., 1998. Stoichiometry of foliar carbon con-stituents varies along light gradients in temperate woody canopies:implications for foliage morphological plasticity. Tree Physiol. 18:467–479.
Poorter L., 1999. Growth responses of 15 rain-forest tree species to a lightgradient: the relative importance of morphological and physiologicaltraits. Funct. Ecol. 13: 396–410.
Poorter L., Oberbauer S.F., and Clark D.B., 1995. Leaf optical propertiesalong a vertical gradient in a tropical rain forest canopy in Costa Rica.Am. J. Bot. 82: 1257–1263.
Poorter L., Bongers L., and Bongers F., 2006. Architecture of 54 moist-forest tree species: Traits, trade-offs, and functional groups. Ecology87: 1289–1301.
Popma J., Bongers F., and Werger M.J.A., 1992. Gap-dependence andleaf characteristics of trees in a tropical lowland rain forest inMexico. Oikos 63: 207–214.
Rijkers T., Pons T.L., and Bongers F., 2000. The effect of tree heightand light availability on photosynthetic leaf traits of four neotropicalspecies differing in shade tolerance. Funct. Ecol. 14: 77–86.
Roggy J.-C., Nicolini E., Imbert P., Caraglio Y., Bosc A., and Heuret P.,2005. Links between tree structure and functional leaf traits in thetropical forest tree Dicorynia guianensis Amshoff (Caesalpiniaceae).Ann. For. Sci. 62: 553–564.
Rozendaal D.M.A., Hurtado V.H., and Poorter L., 2006. Plasticity in leaftraits of 38 tropical tree species in response to light; relationshipswith light demand and adult stature. Funct. Ecol. 20: 207–216.
Sterck F.J. and Bongers F., 1998. Ontogenetic changes in size, allometry,and mechanical design of tropical rain forest trees. Am. J. Bot. 85:266–272.
Thomas S.C. and Winner W.E., 2002. Photosynthetic differences be-tween saplings and adult trees: an integration of field results by meta-analysis. Tree Physiol. 22: 117–127.
Valladares F. and Niinemets U., 2008. Shade tolerance, a key plant featureof complex nature and consequences. Annu. Rev. Ecol. Evol. Syst.39: 237–57.
Valladares F., Wright S.J., Lasso E., Kitajima K., and Pearcy R.W., 2000.Plastic phenotypic response to light of 16 congeneric shrubs from aPanamanian rainforest. Ecology 81: 1925–1936.
Veneklaas E.J. and Poorter L., 1988. Growth and carbon partition-ing of tropical tree seedlings in contrasting light environments.In: H. Lambers, H. Poorter and M. Van Vuuren (Eds.), InherentVariation in Plant Growth: Physiological Mechanisms and EcologicalConsequences. , Backhuys publishers, Leiden, The Netherlands,pp. 337–355.
Warren C.R., 2006. Estimating the internal conductance to CO2 move-ment. Funct. Plant Biol. 33: 431–442.
Wright S.D. and McConnaughay K.D.M., 2002. Interpreting phenotypicplasticity: the importance of ontogeny. Plant Spe. Biol. 17: 119–131.
709p12

Ann. For. Sci. 66 (2009) 709
Online Material
2 S. Coste et al., Online Material
APPENDIX
y = 0.19 x2 + 3.37 x + 169 (r2 = 0.95)
0
400
800
1200
1600
0 20 40 60
Chl
a(µ
mol
m-2
)
Spad value
Appendix 1. Relationships between chlorophyll content (Chla,μmolChl m−2) and SPAD values (SPAD-502, Minolta, Osaka, Japan).Chlorophyll content was measured on 2.3 cm2 leaf discs after extract-ing in DMSO (n = 35).
Ann. For. Sci. 66 (2009) 709, Online Material 3
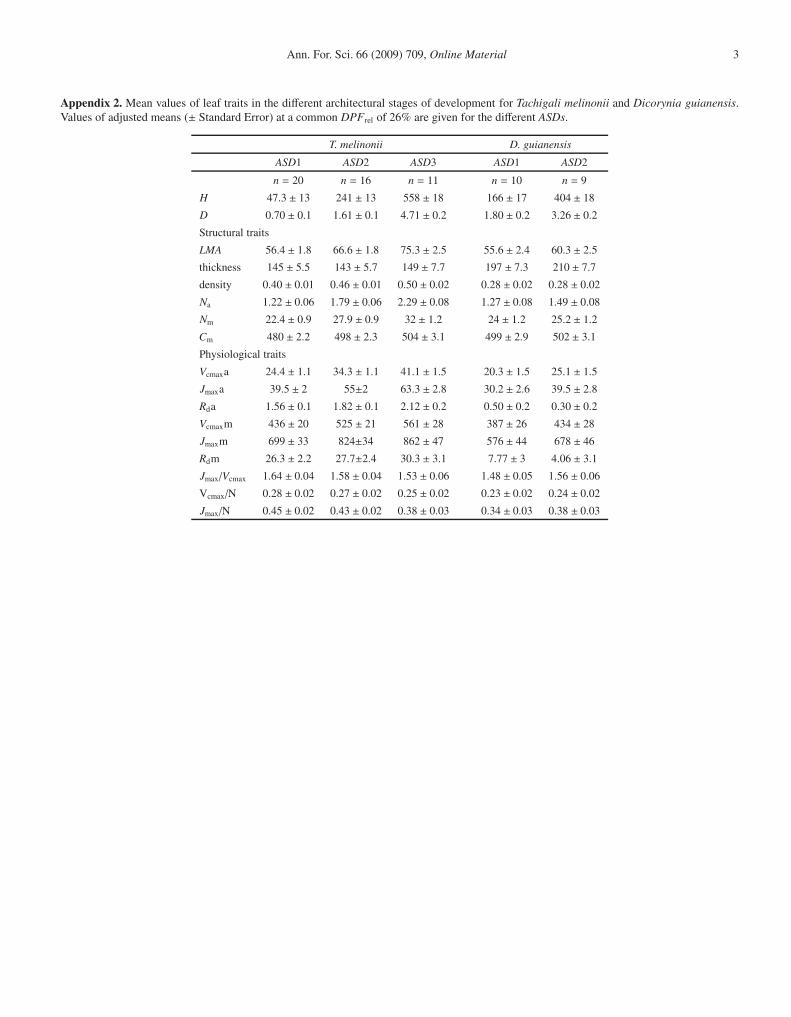
Appendix 2. Mean values of leaf traits in the different architectural stages of development for Tachigali melinonii and Dicorynia guianensis.Values of adjusted means (± Standard Error) at a common DPFrel of 26% are given for the different ASDs.
T. melinonii D. guianensis
ASD1 ASD2 ASD3 ASD1 ASD2
n = 20 n = 16 n = 11 n = 10 n = 9
H 47.3 ± 13 241 ± 13 558 ± 18 166 ± 17 404 ± 18
D 0.70 ± 0.1 1.61 ± 0.1 4.71 ± 0.2 1.80 ± 0.2 3.26 ± 0.2
Structural traits
LMA 56.4 ± 1.8 66.6 ± 1.8 75.3 ± 2.5 55.6 ± 2.4 60.3 ± 2.5
thickness 145 ± 5.5 143 ± 5.7 149 ± 7.7 197 ± 7.3 210 ± 7.7
density 0.40 ± 0.01 0.46 ± 0.01 0.50 ± 0.02 0.28 ± 0.02 0.28 ± 0.02
Na 1.22 ± 0.06 1.79 ± 0.06 2.29 ± 0.08 1.27 ± 0.08 1.49 ± 0.08
Nm 22.4 ± 0.9 27.9 ± 0.9 32 ± 1.2 24 ± 1.2 25.2 ± 1.2
Cm 480 ± 2.2 498 ± 2.3 504 ± 3.1 499 ± 2.9 502 ± 3.1
Physiological traits
Vcmaxa 24.4 ± 1.1 34.3 ± 1.1 41.1 ± 1.5 20.3 ± 1.5 25.1 ± 1.5
Jmaxa 39.5 ± 2 55±2 63.3 ± 2.8 30.2 ± 2.6 39.5 ± 2.8
Rda 1.56 ± 0.1 1.82 ± 0.1 2.12 ± 0.2 0.50 ± 0.2 0.30 ± 0.2
Vcmaxm 436 ± 20 525 ± 21 561 ± 28 387 ± 26 434 ± 28
Jmaxm 699 ± 33 824±34 862 ± 47 576 ± 44 678 ± 46
Rdm 26.3 ± 2.2 27.7±2.4 30.3 ± 3.1 7.77 ± 3 4.06 ± 3.1
Jmax/Vcmax 1.64 ± 0.04 1.58 ± 0.04 1.53 ± 0.06 1.48 ± 0.05 1.56 ± 0.06
Vcmax/N 0.28 ± 0.02 0.27 ± 0.02 0.25 ± 0.02 0.23 ± 0.02 0.24 ± 0.02
Jmax/N 0.45 ± 0.02 0.43 ± 0.02 0.38 ± 0.03 0.34 ± 0.03 0.38 ± 0.03
4 S. Coste et al., Online Material
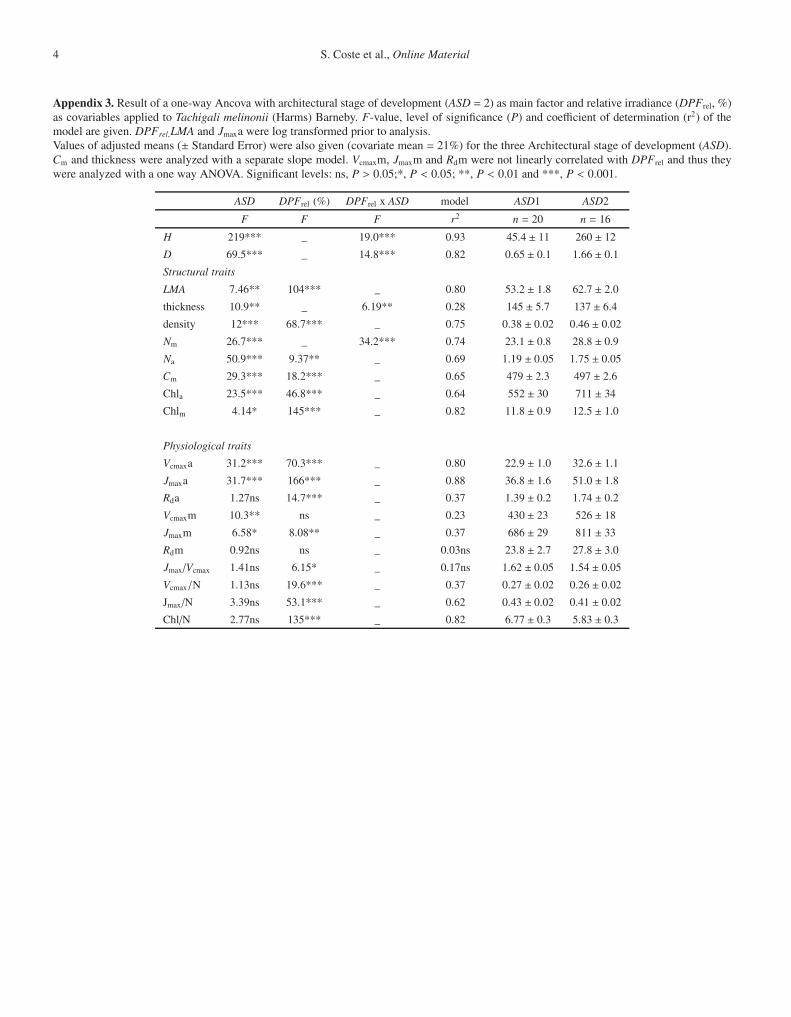
Appendix 3. Result of a one-way Ancova with architectural stage of development (ASD = 2) as main factor and relative irradiance (DPFrel, %)as covariables applied to Tachigali melinonii (Harms) Barneby. F-value, level of significance (P) and coefficient of determination (r2) of themodel are given. DPFrel,LMA and Jmaxa were log transformed prior to analysis.Values of adjusted means (± Standard Error) were also given (covariate mean = 21%) for the three Architectural stage of development (ASD).Cm and thickness were analyzed with a separate slope model. Vcmaxm, Jmaxm and Rdm were not linearly correlated with DPFrel and thus theywere analyzed with a one way ANOVA. Significant levels: ns, P > 0.05;*, P < 0.05; **, P < 0.01 and ***, P < 0.001.
ASD DPFrel (%) DPFrel x ASD model ASD1 ASD2
F F F r2 n = 20 n = 16
H 219*** _ 19.0*** 0.93 45.4 ± 11 260 ± 12
D 69.5*** _ 14.8*** 0.82 0.65 ± 0.1 1.66 ± 0.1
Structural traits
LMA 7.46** 104*** _ 0.80 53.2 ± 1.8 62.7 ± 2.0
thickness 10.9** _ 6.19** 0.28 145 ± 5.7 137 ± 6.4
density 12*** 68.7*** _ 0.75 0.38 ± 0.02 0.46 ± 0.02
Nm 26.7*** _ 34.2*** 0.74 23.1 ± 0.8 28.8 ± 0.9
Na 50.9*** 9.37** _ 0.69 1.19 ± 0.05 1.75 ± 0.05
Cm 29.3*** 18.2*** _ 0.65 479 ± 2.3 497 ± 2.6
Chla 23.5*** 46.8*** _ 0.64 552 ± 30 711 ± 34
Chlm 4.14* 145*** _ 0.82 11.8 ± 0.9 12.5 ± 1.0
Physiological traits
Vcmaxa 31.2*** 70.3*** _ 0.80 22.9 ± 1.0 32.6 ± 1.1
Jmaxa 31.7*** 166*** _ 0.88 36.8 ± 1.6 51.0 ± 1.8
Rda 1.27ns 14.7*** _ 0.37 1.39 ± 0.2 1.74 ± 0.2
Vcmaxm 10.3** ns _ 0.23 430 ± 23 526 ± 18
Jmaxm 6.58* 8.08** _ 0.37 686 ± 29 811 ± 33
Rdm 0.92ns ns _ 0.03ns 23.8 ± 2.7 27.8 ± 3.0
Jmax/Vcmax 1.41ns 6.15* _ 0.17ns 1.62 ± 0.05 1.54 ± 0.05
Vcmax/N 1.13ns 19.6*** _ 0.37 0.27 ± 0.02 0.26 ± 0.02
Jmax/N 3.39ns 53.1*** _ 0.62 0.43 ± 0.02 0.41 ± 0.02
Chl/N 2.77ns 135*** _ 0.82 6.77 ± 0.3 5.83 ± 0.3