does diagnodent provide a reliable caries-removal endpoint?
TRANSCRIPT
Does DIAGNOdent provide a reliable caries-removalendpoint?
Aline A. Neves, E. Coutinho, Jan De Munck, Paul Lambrechts, Bart Van Meerbeek *
Leuven BIOMAT Research Cluster, Department of Conservative Dentistry, School of Dentistry, Oral Pathology and Maxillo-Facial Surgery,
Catholic University of Leuven, Kapucijnenvoer 7, B-3000 Leuven, Belgium
j o u r n a l o f d e n t i s t r y 3 9 ( 2 0 1 1 ) 3 5 1 – 3 6 0
a r t i c l e i n f o
Article history:
Received 1 April 2010
Received in revised form
16 November 2010
Accepted 12 February 2011
Keywords:
Micro-CT
Dentine caries
Caries-excavation
Residual caries
Mineral density
Laser-induced fluorescence
a b s t r a c t
Objectives: To compare mineral density of residual dentine after excavation with different
caries-removal techniques and to evaluate the diagnostic potential of laser-induced fluo-
rescence (LIF), measured by DIAGNOdent, as a tool to determine the caries-removal end-
point.
Methods: Carious teeth were excavated by tungsten-carbide round burs (Komet), ceramic
burs (CeraBurs, Komet), sono-abrasion (Cariex TC tips, Kavo), and by chemo-mechanical
excavation using two enzyme-based solutions (exp. SFC-V and SFC-VIII, 3M-ESPE) or a
sodium hypochlorite-based solution (Carisolv, MediTeam). The caries-excavated teeth were
scanned by micro-CT (1172, Skyscan), after which the mineral density at the bottom dentine
was correlated to LIF measurements at the same region. A micro-CT threshold for dentine
caries was defined by comparison with surface-hardness measurements. The intensity of
dentine staining was evaluated by analysing the component ‘L*’ in CIE-L*a*b-converted
images from the excavated teeth.
Results: No statistically significant difference in mineral density was found at the bottom of
the cavities prepared with the different caries-excavation techniques, except for exp. SFC-V
that left residual dentine with a significantly higher mineral density than when CeraBurs
were used (Tukey–Kramer, p < 0.05). Absence of residual caries was associated with darker
staining of dentine. No significant correlation was found between the distance from the
deepest cavity point to the pulp-chamber roof and LIF measurements. A strong negative
correlation (R = �0.86, p < 0.01) was however found between L* values and LIF measure-
ments, indicating that staining in residual dentine leads to higher LIF measurements.
Conclusions: LIF measured by DIAGNOdent is influenced by staining in residual dentine.
Therefore, its use to determine the caries-removal endpoint is doubtful.
# 2011 Elsevier Ltd. All rights reserved.
avai lab le at www.sc iencedi rec t .com
journal homepage: www.intl.elsevierhealth.com/journals/jden
1. Introduction
The concept of minimal-invasive dentistry aims to maximal-
ly preserve sound tooth tissue.1 In case of caries lesions, the
highly infected and demineralised dentinal tissue should be
eliminated in order to prevent lesion progression. Tooth
* Corresponding author. Tel.: +32 16 337587; fax: +32 16 332752.E-mail address: [email protected] (B. Van Meer
0300-5712/$ – see front matter # 2011 Elsevier Ltd. All rights reserveddoi:10.1016/j.jdent.2011.02.005
preparation should on the other hand remain as conservative
as possible in order to not unnecessarily undermine the
remaining tooth structure and to preserve the tooth’s
mechanical resistance against intra-oral chewing.2 However,
it is not always easy to define at which point dentine
excavation should be stopped. Since ‘soft and wet’ carious
beek).
.

j o u r n a l o f d e n t i s t r y 3 9 ( 2 0 1 1 ) 3 5 1 – 3 6 0352
lesions harbour significantly more bacteria than ‘hard or dry’
lesions,3 clinicians are commonly advised to remove carious
dentine up to the level where it is ‘firm’ and no longer
‘leathery’.4
The traditional and still most widely used method to
remove caries involves steel or tungsten-carbide burs. The
recently marketed CeraBurs (Komet-Brasseler, Lemgo,
Germany) are all-ceramic burs intended for ultra-conservative
caries removal. They are claimed to avoid over-excavation by
providing a self-limiting caries-excavation property.5 Some
more recently introduced sono-abrasive tungsten carbide tips
are also intended for dentine-caries removal (Cariex TC tips,
Kavo, Biberach, Germany), but still need to be tested on their
caries-removal efficiency. Besides mechanical caries removal,
chemical agents to selectively dissolve carious dentine are
currently employed as well. The sodium hypochlorite-based
gel Carisolv (MediTeam, Goteborg, Sweden) appeared effec-
tive,6 but was rather slow.7 Initial results with an experimental
pepsin-based gel (exp. SFC-V and SFC-VIII, 3M-ESPE, Seefeld,
Germany) have revealed a caries-removal effectiveness that is
comparable with that of Carisolv.8
For early caries diagnosis, laser-induced fluorescence (LIF)
has proven its effectiveness. Fluorescence is the emission of
visible light by a substance that has absorbed light of a different
wavelength inducedbyan energy source like a laser.9 In the field
of medical diagnostics, LIF yields information on the metabolic
state of cells or presence of micro-organisms depending on the
nature of the fluorescent molecule (co-enzymes or porphyrin
metabolites, respectively).10 The tissue examined is excited
with a specific laser wavelength that generates a maximum
fluorescent response. After a few nano/micro-seconds, the
tissue will de-excite and emit light at a wavelength larger than
the original excitation wavelength. This fluorescence light is
then measured. The so-called ‘DIAGNOdent’ (Kavo, Biberach,
Germany) is a laser-induced caries-detection device that is
equipped with a semiconductor laser (655 nm) as excitation
source. The laser light is emitted from the tip of the handpiece
that also captures the fluorescence reflected from the tooth
surface, bymeans ofa photodiode (680 nm) incombination with
a long-pass filter that absorbs the backscattered excitation.11
The device quantifies the fluorescence intensity that is
subsequently converted to a calibration standard, ranging from
0 to 99,12 where sound dental tissues will exhibit the lower
readings (0–12).11
Table 1 – Caries-excavation methods and respective caries-re
Caries-excavation method Manufacture
Tungsten carbide round bur (n.10–23, depending
on the dimensions of the lesion)
Komet-Brasseler,
Lemgo, Germany
CeraBurs (n.10–23, depending on the
dimensions of the lesion)
Komet-Brasseler
Airscaler (Soniflex 2003L) coupled to Cariex
TC tips (n.71 and 72)
Kavo, Biberach,
Germany
SFC-V + conventional spoon excavator 3M-ESPE, Seefeld,
Germany
SFC-VIII + conventional spoon excavator 3M-ESPE
SFC-VIII + polymeric instrument (star v1.3) 3M-ESPE
Carisolv + respective hand instruments (n.2–5) MediTeam, Goteb
Sweden
Recently, confocal microscopy demonstrated that detection
of visible fluorescence (orange-red fluorophores), originating
from by-products of bacterial metabolism in carious dentine,
correlated well with the caries-removal endpoint.13 In the same
study, LIF measured at residual dentine by DIAGNOdent
appeared also to correlate with fluorescence measured by
confocal microscopy. Therefore, apart from the intended use of
DIAGNOdent for the detection of occlusal dentine caries
underneath suspicious enamel, other studies explored the
use of DIAGNOdent as a diagnostic tool to check for residual
caries upon caries excavation.12,14,15 An extension of this
application leads to the introduction of a laser-based caries-
excavation methodology that makes use of LIF technology
(feedback system) to selectively remove carious dentine.15–17
At the same time, however, some concerns have been
raised whether LIF can correctly diagnose the end-point of
caries removal. An increased LIF is apparently measured at
residual dentine in the immediate proximity to the dental
pulp,15 whilst surface staining may disturb LIF readings as
well.18 There is especially growing evidence that the latter
surface staining affects the accuracy of LIF to diagnose the
caries-removal endpoint.15 Therefore, the main objective of
this study was to determine the mineral density of residual
dentine after excavation with different caries-removal
methods by means of a non-destructive technique (micro-
CT), this in order to assess the applicability of DIAGNOdent to
check for residual caries in teeth with different degrees of
dentine staining. A secondary aim was to establish a mineral-
density cut-off point for dentine caries in the micro-CT by
comparison with a gold-standard technique for mechanical
characterisation of carious tooth tissue (hardness measure-
ments).
2. Materials and methods
2.1. Selection of teeth and caries removal
From a bulk of extracted, non-restored molars stored in 0.5%
aqueous chloramine, those presenting carious lesions on the
occlusal surface (presumably involving dentine) were pre-
selected. Both teeth with active and inactive caries lesions
were included. After cleaning off plaque, calculus and other
debris with an airscaler (Soniflex 2000 equipped with a scaler
moval endpoint used.
r Caries-removal endpoint N
Hard cavity floor with a blunt explorer 6
Self-limiting cutting ability of the instrument 7
Hard cavity floor with a blunt explorer 6
Self-limiting caries-removal ability of the solution 8
Self-limiting caries-removal ability of the solution 5
Self-limiting caries-removal ability of the solution 7
org, Self-limiting caries-removal ability of the solution 7

[()TD$FIG]
Fig. 1 – Description of each methodological step and corresponding research objective aimed for in this study.
j o u r n a l o f d e n t i s t r y 3 9 ( 2 0 1 1 ) 3 5 1 – 3 6 0 353
tip #5, Kavo, Biberach, Germany), the teeth were embedded for
ease of manipulation by their roots in gypsum with their
occlusal surface left free.
Digital radiographs were obtained (MiniRay, Soredex,
Tuusula, Finland) with the aid of a CCD detector (Vista Ray
CCD System, Durr Dental AG, Bietigheim-Bissingen,
Germany), in order to exclude teeth without distinct dentine
caries. The remaining teeth (n = 56) were then divided in
groups according to the 7 different caries-excavation methods
to be employed (Table 1). Before excavation, the overlying
enamel was removed with a cylinder round diamond bur (ref.
838.314.010, Komet-Brasseler, Lemgo, Germany) coupled to a
high-speed water-cooled air turbine. Five teeth were further
[()TD$FIG]Fig. 2 – (A) RGB colour stereomicroscopic image of a tooth after c
calibration scheme. (B) L* channel image after converting image
region of interest at the deepest part of the cavity correspondin
performed. (For interpretation of the references to colour in this
the article.)
excluded as they exhibited only a small caries into dentine,
whilst another five teeth were excluded after caries-excava-
tion due to pulp exposure, resulting in a total of 46 evaluated
specimens. Fig. 1 shows a detailed description of each study
phase and the corresponding research objective aimed for in
this study.
2.2. DIAGNOdent measurements
After caries excavation following the respective caries-
removal endpoints described in Table 1, the deepest point
of the excavated cavity was identified with a periodontal probe
and the maximum LIF reading was taken with a DIAGNOdent
aries removal and colour-adjustment following the colour-
(A) to L*a*b* colour space. The dotted circle indicates the
g to the region where the DIAGNOdent measurement was
figure legend, the reader is referred to the web version of

j o u r n a l o f d e n t i s t r y 3 9 ( 2 0 1 1 ) 3 5 1 – 3 6 0354
pen 2190 coupled to a sapphire fissure probe after calibration
with a standard stone (C86), as indicated by the manufacturer
(Kavo). Three consecutive measurements were performed,
and when differences were recorded, the average value was
taken as the final reading. Immediately after this DIAGNOdent
measurement, the deepest point of the excavated cavity was
marked on a stereomicroscopic photo taken from the tooth,
for further determination of the staining intensity of the
residual dentine surface.
2.3. Colour image acquisition and calibration
Colour stereomicroscopic images of the occlusal surface of the
excavated teeth were taken in a stereomicroscope (Wild M5A,
Wild-Heerbrugg, Heerburg, Switzerland) illuminated by a
150 W light source (FOT 150, Fiber Optic, Spreitenbach,
Switzerland) coupled to a digital camera (Moticam 2300,
Motic, Xiamen, China).
Before image acquisition, a colour-calibration scheme was
applied. First, the camera was calibrated by applying a white-
balance correction as described by the camera manufacturer.
Secondly, a greyscale patch (n.21, neutral 6.5) from a standard
colour-calibration card (GretagMacbeth Mini Color Checker, X-
Rite, Regensdorf, Switzerland) was imaged and the RGB
histogram was adjusted to the standard value of the grey
patch (R = 160, G = 160, B = 160) in the acquisition mode of the
camera software (Motic Images Plus 2.0, Motic). Next, the
excavated teeth were photographed with a calibrated colour
scale in the RGB-colour space.
Since this first colour calibration was qualitative, the
images were additionally corrected within the open-source
software interface of ImageJ.19 From an ROI selected in the
standard grey-patch image, an RGB histogram was produced
and the mean values of the red, green and blue channels were
taken and multiplied by the respective integer to reach the
standard value of 160. Next, each tooth image was converted
to an RGB stack containing three 8-bit greyscale images
corresponding to the red, green and blue channels, which
were multiplied by the correction integer obtained from the
grey-patch image. The stack was then converted back to RGB
colour (Fig. 2A).
[()TD$FIG]
Fig. 3 – (A) Relative position and thickness of the volume of int
dentine. (B) Volumetric representation of one tooth after caries
yellow the area corresponding to the deepest part of the cavity
minimum distance from the deepest part of the cavity to the pu
interpretation of the references to colour in this figure legend, t
2.4. Quantitative analysis of the staining intensity ofresidual dentine
Quantitative evaluation of the staining intensity of residual
dentine in the excavated cavities was performed after
converting the RGB images to ‘Commission Internationale
de l’Eclairage’ L*a*b* colour space (CIE L*a*b*) and analysing the
component ‘‘L’’ in the converted images. In the CIE L*a*b colour
space, the three coordinates (L, a, b) represent the lightness of
the colour (L = 0 yields black and L = 100 indicates white), its
position between red/magenta and green (a*, negative values
indicate green, whilst positive values indicate magenta) and
its position between yellow and blue (b*, negative values
indicate blue and positive values indicate yellow).20
Conversion of the RGB images to CIE L*a*b* colour space was
performed by means of the ImageJ-based plugin ‘‘Color Space
Converter’’.21 For each tooth, a stack containing three grey-
scale images corresponding to each colour channel (L*, a*, or
b*), was obtained. The image corresponding to the ‘‘L’’ channel
was selected and a 150-pixel diameter ROI (�1 mm diameter)
was placed over the previously marked area that corresponds
to the deepest area in the excavated cavity. The corresponding
‘‘L’’ value from the ROI corresponding to the area evaluated by
DIAGNOdent, was then obtained (Fig. 2B).
2.5. Mineral density in residual dentine
The excavated teeth were also submitted to a micro-CT
scanning procedure and the projection files were further
processed as described elsewhere.22 Briefly, scanning was
performed in a micro-CT device (Skyscan 1172, Skyscan,
Kontich, Belgium) at 100 kV, 100 mA and 14.66 mm pixel size.
Calibration of grey values into mineral density of hydroxyap-
atite (HAp) was undertaken by scanning HAp phantoms with
different mineral densities and obtaining a calibration curve
for the used micro-CT parameters.22 After reconstruction of
the projection images (Nrecon 1.51, Skyscan), the cross-
section slices were processed to reduce the presence of noise
and to alleviate the partial volume effect. Mineral density was
calculated in g/cm3 of HAp over a 70-mm thick region around
the deepest cavity area, as depicted in Fig. 3A.
erest used for mineral-density measurement at residual
removal. In red, the pulp chamber is depicted, whilst in
used for mineral-density measurements, is marked. The
lp-chamber roof was measured. B, buccal; L, lingual. (For
he reader is referred to the web version of the article.)

Fig
.4
–(A
)S
tere
om
icro
sco
pic
ima
ge
of
the
too
thu
sed
for
ha
rdn
ess
mea
sure
men
tsa
nd
com
ple
tem
ap
pin
go
fin
den
tati
on
s.(B
)R
efl
ect
ed
lig
ht
mic
rosc
op
yim
ag
eo
fth
ere
gio
n
of
inte
rest
dep
icte
db
yd
ott
ed
lin
es
in(A
).In
den
tati
on
inca
rio
us
den
tin
eis
ma
rked
by
the
ast
eri
ska
nd
inso
un
dd
en
tin
eb
yth
ea
rro
w.(
C)M
icro
-CT
slic
eco
rresp
on
din
gto
the
mea
sure
dsl
ice
in(A
)a
fter
tra
nsf
er
of
the
sele
cted
RO
Is.
j o u r n a l o f d e n t i s t r y 3 9 ( 2 0 1 1 ) 3 5 1 – 3 6 0 355
2.6. Distance from the bottom of the excavated cavity tothe pulp-chamber roof
The minimal distance between the deepest point in the
excavated cavity and the highest point of the pulp-chamber
roof was measured in mm after 3D-volumetric rendering of
the micro-CT slices (VGStudio Max 2.0, Volume Graphics,
Heidelberg, Germany), as shown in Fig. 3B.
2.7. Determination of the carious dentine threshold usingmicro-CT
For determination of a dentine-caries threshold using micro-
CT, mineral-density values of dentine obtained by micro-CT
were correlated to hardness measurements, which can be
considered a ‘‘gold-standard’’ for dentine-caries determina-
tion.23 One tooth presenting dentine caries was scanned by
micro-CT using the parameters described previously, prior to
being prepared for dentine-hardness measurements.
The tooth was embedded by the crown in epoxy resin
(Epofix Kit, Struers, Ballerup, Denmark) and sectioned in a
mesio-distal direction at the centre of the occlusal caries
lesion with the aid of a diamond cut-off wheel (231CA, Struers,
Ballerup, Sweden) mounted in an Accutom-50 machine
(Struers, Ballerup, Sweden). Metallographic polishing was
accomplished with alumina slurries (10, 6, and 3 mm) and
polishing cloths. Next, the cut tooth surface was mapped with
indentations performed with a Berkovich diamond indenter in
a Nano/Micro-Hardness Tester CSM at approximately every
200 mm (CSM instruments, Peseux, Switzerland) (Fig. 4A and
B). The indenter approach speed was set to 300 mN/min with a
maximum load of 150 mN. As the most central and hence
‘‘soft’’ parts of the carious lesions could not be appropriately
mapped, measurements were done at peripheral regions of
the carious lesion (Fig. 4B, asterisk). The whole mapping of
indentations was transferred to the corresponding micro-CT
slice of the tooth by means of masks consisting of 5-pixel
diameter ROIs (Fig. 4C). The mean mineral density in each ROI
in the micro-CT slice was calculated and correlated to the
hardness measurements.
As the original micro-CT projections were generated into
cross-section slices of the tooth, a slice-to-volume registration
method was manually implemented, where the single
stereomicroscopic ‘‘slice’’ was iteratively compared to best
match the contour of the Y-re-sliced micro-CT data slices.
This transformation from mineral-density micro-CT values
to hardness measurements was necessary to define an
objective endpoint for caries removal. Based on this value,
the excavated teeth were classified according to the mineral
density at the bottom of the excavated cavity. If the mineral
density was lower than the caries-removal endpoint, the tooth
was considered to have residual dentine caries. If the mineral
density was higher, the tooth was considered caries-free.
2.8. Statistical analysis
Pearson’s correlation coefficients (R) were calculated between
the L* values, mineral density and LIF measurements.
Student’s t-test was used to assess differences between L*
values amongst teeth presenting residual caries or not.

Table 2 – Mineral-density values, DIAGNOdent measurements and distance from the deepest point in the cavity to thepulp-chamber roof according to the excavation methods.
Caries-excavationmethod
Mean mineraldensity (g/cm3) � SD
Mean LIFmeasurements � SD
Mean distanceto pulp-chamber roof
(mm) � SD
Conventional bur 1.18 � 0.17 38.33 � 34.93 1.75 � 0.85
Cerabur 0.97 � 0.19* 24.43 � 24.89 1.47 � 0.51
Cariex 1.19 � 0.21 34.67 � 39.78 1.12 � 0.49
SFC-V 1.29 � 0.24* 41.25 � 37.07 1.47 � 0.48
SFC-VIII 1.01 � 0.15 47 � 36.14 1.54 � 0.62
SFC-VIII + instrument 1.07 � 0.12 48.14 � 37.94 1.96 � 0.56
Carisolv 1.13 � 0.10 29.71 � 20.63 1.60 � 0.59
* Statistically significant difference (Tukey–Kramer test, p < 0.05).
j o u r n a l o f d e n t i s t r y 3 9 ( 2 0 1 1 ) 3 5 1 – 3 6 0356
ANOVA with a Tukey–Kramer procedure was used to check for
differences between the excavation groups. Significance was
measured to the level of 5%.
3. Results
Mineral-density values at the bottom of the cavity, mean LIF
values and the mean distance from the bottom of the cavity to
the pulp-chamber roof are shown in Table 2 for the different
excavation methods. No statistical difference was found
between these variables for the different excavation groups,
except for the mineral density measured in the exp. SFC-V
group, which was statistically significantly higher than the
values obtained in the CeraBur group (ANOVA, Tukey–Kramer
procedure, p < 0.05). Although for the mean LIF values some
excavation groups resulted in almost 100% difference, the high
standard deviations probably accounted for the lack of
statistical significance.
The common hardness threshold for ‘‘infected’’ or irre-
versibly denatured dentine found in the literature ranges
around 300 GPa.23 After finding the corresponding point of this
threshold in the correlation obtained in the present study
(Fig. 5), a mineral-density value of 1.11 g/cm3 was found as the
cut-off point for the end-point of caries removal. After using
this cut-off value, evaluation of staining intensity at residual
dentine showed that for teeth where no residual caries was
left (n = 22) statistically significant (two-tailed t-test, p < 0.01)
[()TD$FIG]
Fig. 5 – Correlation between hardness (GPa) obtained by nano-i
lower L* values (41.19 � 17.63) were found than in teeth where
residual caries was left (58.5 � 14.18; n = 24). This indicates
that absence of residual caries was frequently associated with
more intense staining.
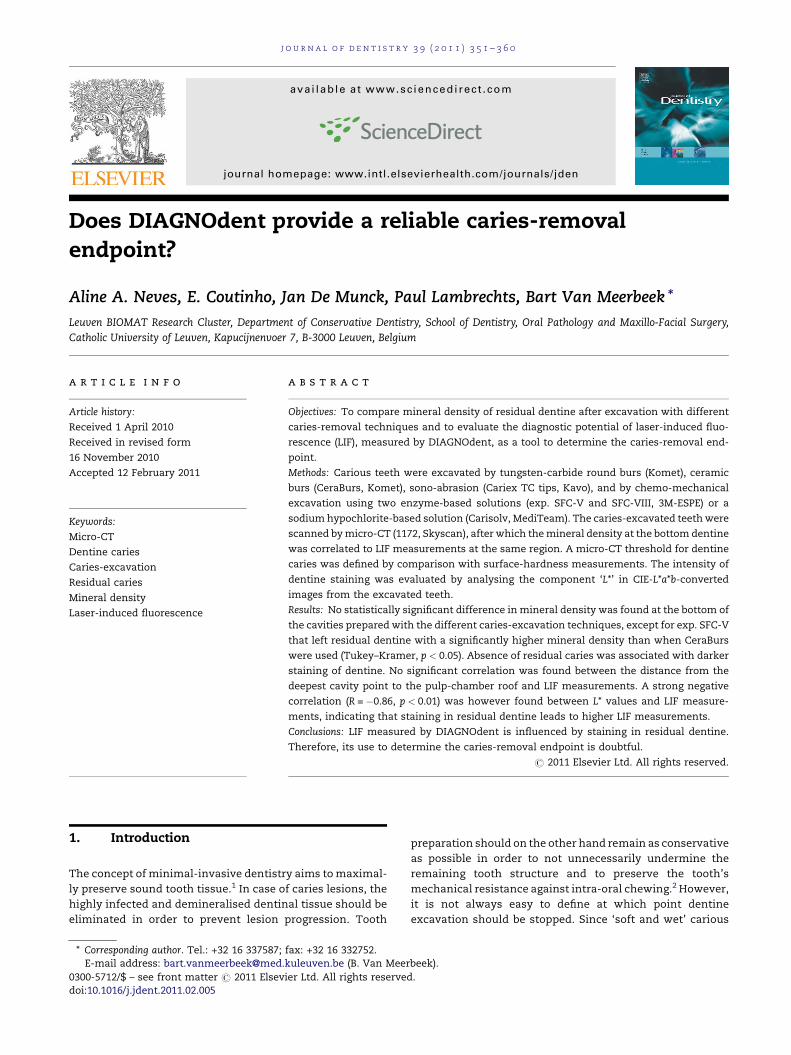
Regardless of the excavation method, no significant
correlation was found between the distance from the deepest
cavity point to the pulp-chamber roof and LIF measurements
(Fig. 6A). On the other hand, a strong negative correlation
(R = �0.86, p < 0.01) was found between the L* values and LIF
measurements (Fig. 6B), indicating that staining in residual
dentine accounts for statistically significantly higher LIF
measurements. In the same way, a significantly negative
correlation (R = �0.622, p < 0.01) was found between the L*
values and mineral-density values (Fig. 6C), pointing out that
stained dentine is generally more mineralised. As a result, a
significantly positive correlation was also found between the
mineral-density values and the LIF measurements (R = 0.57,
p < 0.01), as shown in Fig. 6D.
4. Discussion
The potential of micro-CT in providing quantitative data
regarding mineral density of hard tissues has previously been
demonstrated,24 but in order to achieve this, reliable instru-
ment calibration is required.25 Previous studies using similar
equipment have shown that the medium camera resolution
(17.34 mm voxel size) was sufficient to assess mineral changes
ndentation and mineral density measured by micro-CT.
Fig. 6 – (A) Correlation between LIF measured by DIAGNOdent at the deepest part of the cavity and distance to the pulp chamber. (B) Correlation between LIF measured by
DIAGNOdent and the staining intensity of residual dentine (L* value). (C) Correlation between the staining intensity of residual dentine (L* value) and the mineral density at
the deepest part of residual dentine. (D) Correlation between LIF measured by DIAGNOdent and the mineral density at the deepest part of residual dentine.
jo
ur
na
lo
fd
en
tis
tr
y3
9(2
01
1)
35
1–
36
03
57

j o u r n a l o f d e n t i s t r y 3 9 ( 2 0 1 1 ) 3 5 1 – 3 6 0358
in dentine.26 In this study, a resolution of 14.66 mm was found
appropriate to scan a full volume of the tooth in a suitable time
period (�30 min), whilst providing reliable mineral-density
data.
The dentine-caries threshold used was based on hardness
measurements described in the literature,23 which in our data
corresponded to 1.11 g/cm3 of HAp. This threshold falls within
the range of mineral-density values measured by micro-CT in
previously published papers. Willmot et al.27 for instance
found a mineral concentration of 1.42 g/cm3 HAp for sound
deciduous dentine (1.77 for the upper limit and 1.27 for the
lower limit), whilst Clementino-Luedemann and Kunzel-
mann24 found values between 1.36 and 1.45 g/cm3 for sound
permanent dentine.
Regarding the efficacy of caries removal, the present study
has shown that one of the experimental versions of the
pepsin-based caries-removing gel (exp. SFC-V) presented
more aggressive caries-removing properties, as appeared
from statistically higher mineral-density values measured
after excavation, as compared to those of CeraBurs (Table 2).
On the other hand, exp. SFV-VIII presented similar caries-
removal efficiency as Carisolv. In a previous study,8 micro-CT
demonstrated that exp. SFC-V and Carisolv presented similar
caries-removal properties when caries was removed by a
prototype plastic instrument. The latter may have been
responsible for the less aggressive caries removal. According
to the manufacturer (3M ESPE), differences between SFC-V and
SFC-VIII reside on the thickening agent, which in SFC-V was
not stable enough after a short storage period. It resulted in a
thinner solution, which penetrated more into the deminer-
alised dentine and therefore lead to an increased dentine
dissolution and removal.
Regarding the CeraBurs, the lower mineral-density values
obtained could have resulted from the caries-removal end-
point that relied only on the self-limiting cutting properties of
the bur. These burs are made of ceramic materials, which are
expected to present increased resistance to dulling during
excavation, as compared to the previous self-limiting burs
made of polymeric materials (SmartBurs, SSWhite, Lake-
wood, USA). We believe that the force used by the operator
can also to some extent influence the cutting ability of this
instrument, indicating that thus an operator-learning curve
may be involved. One previous study compared the caries-
removal efficacy by these burs with that of tungsten-carbide
burs.5 They concluded that although Ceraburs left somewhat
more residual carious tissue, the difference was not statisti-
cally significant with that obtained by the tungsten-carbide
burs.
The methodology used to measure the staining intensity of
residual dentine after caries removal was partially based on
methods used in previous literature.28,29 In these studies,
staining of residual dentine was evaluated after application of
a red caries-disclosing solution (Caries Detector, Kuraray
Europe, Frankfurt, Germany). Although a clear association
between the L* values and the staining typically present in
inactive caries was seen, the most direct correlation was found
between the a* values and the staining induced by the caries-
disclosing dye. As in the present study no external staining
was used, the L* values indicated the degree of staining based
on a black to white scale.
It has been shown that the fluorescence of bacterial
metabolites under red light excitation is responsible for the
fluorescence of carious teeth.30 This fact forms the basis for
the use of DIAGNOdent to diagnose occlusal ‘‘hidden’’ caries
lesions. However, bacterial metabolites may not be the only
fluorophores that increase the DIAGNOdent readings, as the
baseline fluorescence of whiter teeth is expected to be lower
compared with that of darker teeth.11 Indeed, the presence of
stain and brown-spot lesions results in an additive fluores-
cence signal and thus definitely affects the DIAGNOdent
performance as a diagnostic tool.18
The rationale behind the use of DIAGNOdent to detect
residual carious dentine is also based on fluorescence induced
by bacterial metabolites present in carious dentine.13 As the
red fluorescent indicator is exhibited by the metabolites, but
not by the cariogenic bacteria themselves,31 its detection
merely means that at some point during caries progression
bacteria had been metabolic active. It does not reflect the
current state of bacterial metabolism in the region, which in
the case of heavily stained, typical inactive caries is normally
very low.32
The typical discolouration found in some carious lesions
can be attributed to the so-called ‘‘Maillard reaction’’, which
occurs between carbohydrates and a protein amino group and
forms brownish polymers causing a typical dentine-caries
discolouration.33 Since products of the Maillard reaction are
able to fluoresce,34 they may thus dramatically increase the
DIAGNOdent readings in stained lesions. Considering that the
colour of carious dentine is not correlated to the levels of
bacterial activity in residual dentine,35 the use of this
technology as a caries-removal endpoint can consequently
be impaired.
The general agreement in previous studies that investigat-
ed the potential to use DIAGNOdent to set the caries-removal
endpoint, was that a cut-off point for ‘‘sound’’ or ‘‘affected’’
dentine tissue could be set between 11 and 20.13,14,16 These
studies, however, did not report on the activity of the lesions
(active or arrested), nor on the status of residual dentine
staining. In one study, where only molars with typical active
caries lesions were used, the lowest DIAGNOdent value, at
which bacteria were detected, was 15.6 � 1.2 (mean � SD),
whilst the largest value without bacterial detection was
40.8 � 2.0 (mean � SD).36 This corroborates to set at the safe
side a probable interval between 11 and 20 as an indication
that all infected tissue is removed from active lesions, where
much staining is not expected.
Mineral-density determination can be considered as
an indirect measurement of the hardness of dentine.
Whereas previously a significant negative correlation
has been found between dentine hardness and level
of bacterial infection, such correlation was not found
for tissue colour/staining and bacterial infection.35 As
hardness in carious dentine is not directly correlated to
staining, it was not surprising that mineral-density values
in this study did not positively correlate with staining in
residual caries (Fig. 6C). On the contrary, the fact that darker
lesions were more mineralised, indicates that a more
conservative removal of primary occlusal caries should
include retaining stained and hard tissue at the bottom of
the cavity.

j o u r n a l o f d e n t i s t r y 3 9 ( 2 0 1 1 ) 3 5 1 – 3 6 0 359
LIF measurements of root caries also disclosed a direct
correlation to tissue staining.37,38 Although the ability to
correctly identify the presence of caries by DIAGNOdent was
very good, in those studies the distinction between ‘‘sound’’
and ‘‘carious’’ dentine was made histologically by means of
polarised light microscopy. The latter identifies any micro-
scopic change in ‘‘sound’’ tissue, but does not register the
actual lesion activity. Interestingly, the higher LIF measure-
ments were associated with heavily stained, but shallow
cavities. LIF measurements were in both studies only weakly
correlated to histological caries assessment.
According to some authors, another possible limitation to
the use of laser-induced fluorescence to diagnose residual
caries is that DIAGNOdent values near the dental pulp are
increased when measured in vivo.15 In accordance with the
present in vitro study, others found no significant increase in
DIAGNOdent readings within the proximity to the pulp.38
These high values measured in vivo should perhaps be
attributed to other factors related to living pulpal tissue.
However, fluorescence-aided caries-removal with an Er:YAG
laser (Key Laser III, Kavo, Biberach, Germany) showed that the
observation of increased fluorescence closer to the dental pulp
was probably not clinically significant.15,39
5. Conclusion
Regarding the caries-excavation methods, the experimental
pepsin-based chemical caries-removal agent ‘exp. SFC-V’
exhibited the most aggressive caries-removing properties,
whilst the CeraBurs left residual dentine with a lower mineral
density than the actually measured threshold for dentine
caries. The significant increase in LIF measured by DIAGNOdent
with increased staining of residual caries may impair the use of
laser-inducedfluorescence toset the endpoint ofcaries removal
during cavity preparation, especially in inactive or stained
lesions. The results of this study indicate that DIAGNOdent
should not be used beyond the manufacturers’ recommenda-
tion to diagnose occlusal caries in suspicious fissures.
r e f e r e n c e s
1. Tyas MJ, Anusavice KJ, Frencken JE, Mount GJ. Minimalintervention dentistry – a review: FDI Commission Project.International Dental Journal 2000;50:1–12.
2. Mount GJ. Minimal intervention dentistry: rationale ofcavity design. Operative Dentistry 2003;28:92–9.
3. Kidd EA, Joystonbechal S, Beighton D. Microbiologicalvalidation of assessments of caries activity during cavitypreparation. Caries Research 1993;27:402–8.
4. Kidd EA. How ‘‘clean’’ must a cavity be before restoration?Caries Research 2004;38:305–13.
5. Dammaschke T, Vesnic A, Schafer E. In vitro comparison ofceramic burs and conventional tungsten carbide bud burs indentin caries excavation. Quintessence International2008;39:495–9.
6. Ericson D, Zimmerman M, Raber H, Gotrick B, Bornstein R,Thorell J. Clinical evaluation of efficacy and safety of a newmethod for chemo-mechanical removal of caries: a multi-centre study. Caries Research 1999;33:171–7.
7. Banerjee A, Kidd EM, Watson TF. In vitro evaluation of fivealternative methods of carious dentine excavation. CariesResearch 2000;34:144–50.
8. Clementino-Luedemann TN, Ilie AD, Hickel R, KunzelmannKH. Micro-computed tomographic evaluation of a newenzyme solution for caries removal in deciduous teeth.Dental Materials Journal 2006;25:675–83.
9. Lacowicz JR. Introduction to Fluorescence. Principles offluorescence spectroscopy. New York: Plenum Publishers; 1999.698 pp.
10. Koenig K, Schneckenburger H. Laser-induced autofluorescence for medical diagnosis. Journal of Fluorescence1994;4:17–40.
11. Lussi A, Hibst R, Paulus R. DIAGNOdent: an opticalmethod for caries detection. Journal of Dental Research2004;83:80–3.
12. Kinoshita J, Shinomiya H, Itoh K, Matsumoto K. Lightintensity evaluation of laser-induced fluorescence aftercaries removal using an experimental caries staining agent.Dental Materials Journal 2007;26:307–11.
13. Lennon AM, Buchalla W, Switalski L, Stookey GK. Residualcaries detection using visible fluorescence. Caries Research2002;36:315–9.
14. Iwami Y, Shimizu A, Hayashi M, Takeshige F, Ebisu S.Relationship between colors of carious dentin and laserfluorescence evaluations in caries diagnosis. Dental MaterialsJournal 2006;25:584–90.
15. Krause F, Braun A, Eberhard J, Jepsen S. Laser fluorescencemeasurements compared to electrical resistance of residualdentine in excavated cavities in vivo. Caries Research2007;41:135–40.
16. Yonemoto K, Eguro T, Maeda T, Tanaka H. Application ofDIAGNOdent as a guide for removing carious dentin withEr:YAG laser. Journal of Dentistry 2006;34:269–76.
17. Matsumoto K, Wang XG, Zhang CF, Kinoshita JI. Effect of anovel Er:YAG laser in caries removal and cavity preparation:a clinical observation. Photomedicine in Laser Surgery2007;25:8–13.
18. Cortes DF, Ellwood RP, Ekstrand KR. An in vitro comparisonof a combined FOTI/visual examination of occlusal carieswith other caries diagnostic methods and the effect of stainon their diagnostic performance. Caries Research 2003;37:8–16.
19. Rasband W. ImageJ. Available from: http://rsb.info.nih.gov/ij/; 1997.
20. Russ J. The image processing handbook. Boca Raton: CRCPress; 2007. 817 pp.
21. Schwartzwald D. Color space converter. Available from:http://rsbweb.nih.gov/ij/plugins/color-space-converter.html; 2007
22. Neves AA, Coutinho E, Vivan-Cardoso M, Jaecques S, VanMeerbeek B. Micro-CT based quantitative evaluation ofcaries excavation. Dental Materials 2010;26:579–88.
23. Pugach MK, Strother J, Darling CL, Fried D, Gansky SA,Marshall SJ, et al. Dentin caries zones: mineral, structure,and properties. Journal of Dental Research 2009;88:71–6.
24. Clementino-Luedemann TN, Kunzelmann KH. Mineralconcentration of natural human teeth by a commercialmicro-CT. Dental Materials Journal 2006;25:113–9.
25. Zou W, Gao J, Jones AS, Hunter N, Swain MV.Characterization of a novel calibration method for mineraldensity determination of dentine by X-ray micro-tomography. Analyst 2009;134:72–9.
26. Schwass DR, Swain MV, Purton DG, Leicher JW. A system ofcalibrating microtomography for use in caries research.Caries Research 2009;43:314–21.
27. Willmott NS, Wong FS, Davis GR. An X-raymicrotomography study on the mineral concentration of

j o u r n a l o f d e n t i s t r y 3 9 ( 2 0 1 1 ) 3 5 1 – 3 6 0360
carious dentine removed during cavity preparation indeciduous molars. Caries Research 2007;41:129–34.
28. Iwami Y, Shimizu A, Narimatsu M, Kinomoto Y, Ebisu S. Therelationship between the color of carious dentin stainedwith a caries detector dye and bacterial infection. OperativeDentistry 2005;30:83–9.
29. Iwami Y, Hayashi N, Takeshige F, Ebisu S. Relationshipbetween the color of carious dentin with varying lesionactivity, and bacterial detection,. Journal of Dentistry2008;36:143–51.
30. Hibst R, Paulus R, Lussi A. Detection of occlusal caries bylaser fluorescence: basic and clinical investigations. MedicalLaser Application 2001;16:205–13.
31. Lennon AM, Buchalla W, Brune L, Zimmermann O, Gross U,Attin T. The ability of selected oral microorganisms to emitred fluorescence. Caries Research 2006;40:2–5.
32. Bjorndal L, Larsen T, Thylstrup A. A clinical andmicrobiological study of deep carious lesions duringstepwise excavation using long treatment intervals. CariesResearch 1997;31:411–7.
33. Kleter GA. Discoloration of dental carious lesions (a review).Archives of Oral Biology 1998;43:629–32.
34. Kleter GA, Damen JJ, Buijs MJ, Ten Cate JM. Modification ofamino acid residues in carious dentin matrix. Journal ofDental Research 1998;77:488–95.
35. Kidd EA, Ricketts DN, Beighton D. Criteria for caries removalat the enamel-dentine junction: a clinical andmicrobiological study. British Dental Journal 1996;180:287–91.
36. Iwami Y, Shimizu A, Narimatsu M, Hayashi M, Takeshige F,Ebisu S. Relationship between bacterial infection andevaluation using a laser fluorescence device, DIAGNOdent.European Journal of Oral Sciences 2004;112:419–23.
37. Wicht MJ, Haak R, Stutzer H, Strohe D, Noack MJ. Intra- andinterexaminer variability and validity of laser fluorescenceand electrical resistance readings on root surface lesions.Caries Research 2002;36:241–8.
38. Karlsson L, Johansson E, Tranaeus S. Validity and reliabilityof laser-induced fluorescence measurements on cariousroot surfaces in vitro. Caries Research 2009;43:397–404.
39. Eberhard J, Eisenbeiss AK, Braun A, Hedderich J, Jepsen S.Evaluation of selective caries removal by a fluorescencefeedback-controlled Er:YAG laser in vitro. Caries Research2005;39:496–504.