doctoral dissertation - core
TRANSCRIPT
Doctoral Dissertation
SUSTAINABILITY OF COMMUNITY-BASED RICE SEED
PRODUCTION: A CASE STUDY IN THE TARAI REGION OF NEPAL
NARAYAN PRASAD KHANAL
Graduate School for International Development and Cooperation, Hiroshima University
September 2013
SUSTAINABILITY OF COMMUNITY-BASED RICE SEED PRODUCETION: A CASE STUDY IN THE TARAI REGION OF
NEPAL
D104340
NARAYAN PRASAD KHANAL
A Dissertation Submitted to the Graduate School for International Development and Cooperation
of Hiroshima University in Partial Fulfillment of the Requirement for the Degree of
Doctor of Philosophy
September 2013

Dedication
Dedicated to my most respectable and beloved
father Mr. Churamani Khanal and mother Mrs. Gun Kumari Khanal
i
Summary of the dissertation
Community-based seed production system is considered to supply diversified rice
varieties in rural areas in a cost effective way. Development agencies have been
promoting this concept to address poverty, food security and climate change adaptation
issues. However, how this system could continue is a contested issue among the
researchers and policy makers due to handling of seed production and marketing
activities by resource poor farmers without business skills. Very limited studies have been
published in this area. This study analyzed the sustainability of this system putting seed
producers and seed consumers in the context, and considering three pillars of sustainable
development i.e. economy, environmental and social in the analytical framework. How
seed producers realize economic benefit and how that benefit continues is the major
research question addressed in this study. Here, efficiency of farmers in production and
marketing captures the economic issue, and the efficiency is analyzed at two levels:
production and marketing. Since seed producers are small farmers, the environmental and
social issues are analyzed linking them with economic issue because environmental and
social benefits are not easily visible for this category of farmers.
Characteristics of seed consumers play important role in seed demand and thereby
economic benefits of seed producers. The seed demand characteristics were analyzed
from the perspective of types of rice varieties grown by consumers and their behavior in
adopting different rice varieties. Result shows that consumers (farmers) grow both
modern and farmers’ varieties; however, majority of these varieties have not been
registered in the government system.
Farmers buy these varieties from neighboring farmers, agrovet, seed producer
organizations and development projects. Farmers’ behavior in buying seed from the
ii
market was analyzed using binary logistic regression. Result shows that farmers with
higher educated household head, access to irrigation facility and having membership in
community-based organizations are more likely to buy seed from the market.
Efficiency of households in producing rice seed was measured for their ability to
maximize rice seed yield in utilizing their most commonly used inputs: operational land,
source seed, chemical fertilizer, livestock and human labor. Both allocative efficiency and
technical efficiency were measured in this study. Allocative efficiency was measured as
the ratio of marginal value product of their inputs to their price. The result shows that
operational land and human labor are over utilized but source seed and chemical
fertilizers are underutilized. The technical efficiency of farmers for utilizing the
above-mentioned inputs was measured through stochastic frontier production model. The
result shows that households are 81% efficient in utilizing the above-mentioned inputs
but there is a quite high variation in the efficiency level among the households. This
variation is mainly explained by education of household head, households’ experience in
rice seed production, and land quality. Land quality is the proxy variable for soil fertility
and irrigation facility.
Soil conservation practices contribute in enhancing the land quality by improving soil
fertility, and it gives the basis for continuity of economic benefits for long time by
minimizing the agricultural impact on air, soil, water and biodiversity. This study shows
that famers use animal manure, zero tillage, green manure and improved practice to
conserve soil. There is positive linkage between these practices and rice yield as well as
technical efficiency of farmers. Factors affecting the adoption of these practices (zero
tillage, green manure and improved practice) were analyzed using multivariate probit
model because these practices are not mutually exclusive with each other.
iii
In this case, the selected conservation practices were simultaneously modeled with
household level demographic, economic and institutional variables. Result shows that
households with larger operational land, less family labor and having higher variety
diversification characteristics are more likely to adopt zero tillage practice. The role of
irrigation facility was found important for the adoption of green manure practices as
farmers were growing green manure crop in spring (dry) season. Similarly, irrigation
facility, training and variety diversification characteristics have significant positive
influence on the adoption of improve practice whereas chemical fertilizer has negative
impact on it.
In addition to realizing economic benefits in seed production phase by gaining
efficiency through proper utilizing their resources, seed producers could also realize
economic benefits by selling seed in the market. However, to gain efficiency in marketing
seed producer organizations need to increase their economy of scale of their outputs. For
this, members of their organizations need to supply maximum proportion of the produced
seed to their organizations. The study shows that 65% of households sell 64% of the rice
seed produced at households in the market. Households’ behavior in selling rice seed in
the market was analyzed by Heckman Selection model because this model captures the
selection bias. The result shows that practice of collecting share by households in seed
producers’ organizations, livestock holding, and training motivate farmers for selling seed
in the market whereas the operational land and irrigation facility motivates them selling
higher amount of seed in the market. Seed price positively influence households’
behavior in selling rice seed as well as its quantity. Additionally, to see the influence of
training on economic efficiency of seed producer organizations in rice seed marketing,
return to investment of four organizations from Chitwan district was compared.
iv
The result shows that those spending on training for their members have better return
to investment figure than their counter part, and also the efficiency of the former
organizations is less sensitive to change in external factors.
In spite of the great potential of seed producers’ organization in reducing marketing
costs, these organizations possess risks from variability of socio-economic characteristics
of their members, and risks from external factors such as market, climate and government
policy. Governance issue of these organizations were analyzed from the perspective of
the capacity of executive body in designing strategies to address the internal and external
factors in line with enhancing efficiency of these organizations in rice seed marketing.
These strategies are members’ participation, implementation of business plan,
development of incentive system, and linkage with service providers. The result shows
that organizations are poorer in incentive and business plans as compared to participation
and linkage, and organizations from Chitwan district are better off in these indicators as
compared to the organizations from other two districts. There is positive impact of
governance indicators on technical efficiency and proportion of seed sold by household in
the market. It provides the evidence that if seed producer organizations improve their
governance indicators, households will realize economic gain. Moreover, leaders’
characteristics were compared with the governance indicators across these organizations,
and it shows that leaders with higher education level and attended business planning
training are better off in governance indicators.
Overall, the study shows that education and irrigation are the most important variables
for the better performance of community-based seed production. It means higher
educated households could enhance their efficiency by proper allocating their resources,
and would be more accountable towards their organizations by participation in the market.
v
It might be difficult to provide formal education to households considering their age;
however, informal trainings and demonstrations about seed production and marketing
would be useful for general members. It would be possible to include higher educated
members in the leadership position considering existing members’ education level. In
such situation, development agencies could facilitate the organization in good governance
with especial focus on incentive system and business plan. The facilitation might
empower the executive committee to select their capable leaders themselves. If the
selection of higher educated leaders from existing members is not possible, the seed
producer organizations could invite the members having potential leader characteristics in
their organizations. Third strategy would be development agencies could support for
organizations’ leaders for higher education.
The study shows that access to irrigation facility motivates the consumers to buy seed
in the market, and contributes in enhancing technical efficiency and motivation of seed
producing households in selling seed in the market. Similarly, irrigation facility also
motivates farmers in adopting green manure crop, and adoption of this practice is
important for improving soil quality. It means extension agencies intended to promote
sustainability of rice seed production system should integrate irrigation issue in their
program.
Similarly, majority of the rice varieties grown in the study area have not been
registered in the government system. So, farmers’ might not get extension facility in the
non-released/non-registered rice varieties, and it might contribute in inefficiency in seed
production and marketing. So, proper mechanism should be developed for the
registration/release of these varieties.
vi
Preface
This dissertation aim to contribute on the current debate on sustainability of
community-based rice seed production in Nepal using the empirical evidence collected
from households and their organizations involved in rice seed production and
consumption in the Tarai region of Nepal. Various demographic, economic and
institutional variables associated with seed production and marketing were collected from
seed producers and consumers from the study area. Governance and seed marketing
information were collected from seed producers’ organizations. The collected information
was analyzed using appropriate econometric tools to address the sustainability question of
how seed producers realize economic benefit and how the benefit continues in the future.
This dissertation consists of nine chapters. Chapter one introduces the research
problem and its objective. Chapter two discusses the concept of sustainability in the
system context, linkage of soil conservation practices and governance indicators with
economic benefits to be realized by seed producers. This chapter also summarizes
government programs and policies supporting community-based seed production in
Nepal. The outcome of this chapter appears as literature review papers in the Journal of
International Development and Cooperation (2012), volume 18, Number 4, pp. 11-20,
and in Nepal Agricultural Research Journal (2010), volume 10, pp. 33-40. Chapter three
is about the research design, and this chapter gives insight about the conceptual
framework used in this study, and methodological approach used in data collection and
data analysis. Chapter four analyzes the situation of rice varieties grown by rice seed
consumers and their behavior in buying seed from the market. The outcome of this
chapter has also been published in the Journal of International Development and
Cooperation (2012), volume 19, Number 4, pp. 17-27.
vii
From chapter five onwards, the analysis is concentrated on seed producer. Chapter
five estimates the technical and allocative efficiency of rice seed producing households,
and analyzes the reasons for variation of efficiency level across the households. The
outcome of this chapter was shared in 62th annual meeting of Association of Regional
Agriculture and Forestry Economics, Osaka, Japan, and has been published in Journal of
Rural Problem (2013), volume 49, Number 1, pp. 27-31. Chapter six discusses about the
soil conservation practices adopted by rice seed growers in the study area and the roles of
households’ socio-economic variables in selecting different soil conservation practices.
The finding from this chapter was shared in 3rd international conference on conservation
agriculture and sustainable upland livelihoods: innovation for, with and by farmers to
adapt to local and global changes in Southeast Asia, Hanoi, Vietnam; and 9th
international conference on environmental, economic, social and cultural sustainability,
Hiroshima, Japan. Also, a paper has been submitted for publication in International
Journal of Sustainability and it is now in press. Chapter 7 analyzes the impacts of
households’ socio-economic characteristics in selling rice seed in the market, and
outcome of this chapter was presented in the 11th international conference on dry land
development: global climate change and its impacts on food and energy security, Beijing,
China. Also, using the finding from this chapter a paper has been submitted for
publication in International Journal of Agriculture and Food Economics, and it is now
under review stage. Similarly, chapter eight analyzes the capacity of seed producers’
organizations in governance, focusing on the relation of organizational governance
indicators on household level economic indicators. Finally, chapter nine concludes the
whole dissertation and gives some recommendations.
viii
Many professionals at various levels contributed in the process of preparing this
dissertation. I take this opportunity to acknowledge all of these people who supported me
during the course of my Ph D.
I am very much thankful to my major academic supervisor Professor Keshav Lall
Maharjan for his guidance during my three years Ph D course giving advice in various
stages of my field research, data analysis and manuscript preparation. His encouragement
and constructive suggestions have triggered me to make this study at this level, grasping
the scientific issues and field reality.
I owe my sincere thanks to the members of examination committee, Professor Shinji
Kaneko, Professor Kensuke Kawamura, Professor Koki Seki and Professor Akinobu
Kawai for their constructive comments during my Jury, candidacy and preliminary
examinations. This research was funded by the Global Environmental Leadership (GEL)
Education Program for Designing a Low Carbon World, Hiroshima University, and
Forum for Rural Welfare and Agricultural Reform for Development, the national
non-governmental organization working in rural livelihood issues in Nepal, for financial
assistance. The financial resource from these institutions were used in carrying out field
research as well as sharing research outputs in the international scientific forums held in
Nepal, Japan, Vietnam and China. I am very much indebted to Mr. Netra Pratap Sen, the
Executive Director of FORWARD and his team members for supporting me in the study
design and data collection process. Similarly, I acknowledge Dr. Krishna Dev Joshi, Prof.
John R. Witcombe and Dr. David Harris, Center for Arid Zone Studies, University of
Wales, UK, for sharing their publications relevant to my research field and giving me
comments in publication materials.
ix
My sincere gratitude also goes to Mr. Dila Ram Bhandari, Mr. Madan Thapa and Mr.
Lal Prasad Acharya from Seed Quality Control Center, the Ministry of Agriculture and
Cooperatives, Kathmandu, Nepal for sharing me policies supporting community-based
seed production in Nepal. They also provided me opportunity to give my comments and
suggestion in the national seed policy document ‘seed vision 2021’. Similarly, I am
thankful to Agricultural Development Bank, District Agricultural Development Offices,
Seed Testing Laboratories and National Agricultural Research Institute for sharing their
strategies for supporting community-based seed production system in Nepal. I got
enormous supports from rice seed producing farmers and their organizations, and seed
consumers in data collection process. Seed producer organizations shared their strategies,
innovations, problems, and other documented information. I duly acknowledge these
people and their organizations. Similarly, I am thankful to field researchers: Mr. Madhu
Gnawali, Mr. Himalaya Subedi, Mr. Achyut Upreti and Mr. Bhuwon Chapagain. It would
not have been possible to bring this manuscript in this form without their dedication and
honesty in the process of information collection.
I would like to express my sincere thanks to all the students from Maharjan’s seminar,
IDEC, Hiroshima University, for their critical comments and constructive suggestion in
my documents. My remembrance also goes to my brothers Mr. Isowori Prasad Khanal,
Mr. Hari Prasad Khanal, Mr. Rishi Aryal, Mr. Krishna Aryal and their family for their
inspiration in this study. At last but not least I am very much thankful to my mom
(Gunkumari), wife (Prativa) and son (Anshul) as well as all of my other relatives for their
inspiration, understanding and supports during my Ph D course.
Narayan Prasad Khanal, Hiroshima University, July 2013
x
Table of contents
Summary of the dissertation ............................................................................................................. i
Preface...................................................................................................................................................... vi
Table of contents ................................................................................................................................... x
List of tables .........................................................................................................................................xiii
List of figures....................................................................................................................................... xiv
List of appendices ............................................................................................................................... xv
Acronyms and abbreviations ........................................................................................................ xvi
Chapter 1. Background of the study ............................................................................................. 1
1.1 Introduction ....................................................................................................................... 1
1.2 Community-based seed production ............................................................................... 5
1.3 Statements of the problem .............................................................................................. 7
1.4 Study rationale .................................................................................................................. 9
1.5 Objective of the study .................................................................................................... 11
Chapter 2. Literature review ................................................................................................... 12
2.1 Introduction ..................................................................................................................... 12
2.2 Concept of sustainability ............................................................................................... 12
2.3 Life cycle of seed industry development .................................................................... 15
2.4 System approach in sustainable development/sustainability ................................... 17
2.5 Factors affecting performance of CBSPs .................................................................... 19
2.5.1 External factors ............................................................................................. 19
2.5.2 Internal factors .............................................................................................. 22
2.6 Soil conservation practices for sustainability of rice-based system in Nepal ........ 25
2.6.1 Soil Organic matter management practices ................................................... 25
2.6.2 Energy saving practices ................................................................................ 30
2.6.3 Other practices .............................................................................................. 33
2.7 Policies and programs for supporting community-based seed producers in Nepal
................................................................................................................................................. 34
2.7.1 Introduction .................................................................................................. 34
2.7.2 Policies ......................................................................................................... 34
2.7.3 Programs ....................................................................................................... 38
Chapter 3. Research design ............................................................................................................ 43
3.1 Introduction ..................................................................................................................... 43
3.2 Conceptual framework .................................................................................................. 43
3.2.1 Components of the framework ...................................................................... 43
xi
3.2.2 Relationship between producers and consumers ........................................... 45
3.3 Study districts ................................................................................................................. 46
3.4 Source of data ................................................................................................................. 49
3.5 Sampling design ............................................................................................................. 49
3.5.1 Seed growers ................................................................................................ 49
3.5.2 Seed consumers ............................................................................................ 49
3.6 Data analysis ................................................................................................................... 50
3.7 Limitation of the study .................................................................................................. 50
Chapter 4. Adoption of improved rice varieties ..................................................................... 52
4.1 Introduction ..................................................................................................................... 52
4.3 Sources of improved rice varieties .............................................................................. 56
4.4 Factors affecting the adoption of improved rice varieties ........................................ 57
4.4.1 Conceptual framework for analyzing the improved rice varieties ................. 57
4.4.2 Empirical model ........................................................................................... 58
4.4.3 Specification of the model and variables ...................................................... 59
4.4.4 Results and discussion .................................................................................. 63
Chapter 5. Efficiency of farmers in rice seed production ................................................... 68
5.1 Introduction ..................................................................................................................... 68
5.2 Analysis of allocative efficiency .................................................................................. 69
5.2.1 Empirical technique ...................................................................................... 69
5.2.2 Summary of input variables .......................................................................... 70
5.2.3 Result and discussion .................................................................................... 71
5.3 Estimation of technical efficiency ............................................................................... 73
5.3.1 Empirical technique ...................................................................................... 73
5.3.2 Summary of explanatory variables ............................................................... 77
5.3.3 Findings from stochastic frontier production model ..................................... 78
5.3.4 Technical efficiency of farmers ..................................................................... 79
5.4 Impact of socio-economic variables on technical efficiency ................................... 79
5.5 Conclusion ...................................................................................................................... 82
Chapter 6. Soil conservation practices in rice seed production ....................................... 83
6.1 Introduction ..................................................................................................................... 83
6.2 Major soil conservation practices used in rice-based system ................................... 83
6.3 Households’ behaviour in adopting soil conservation practices .............................. 85
6.3.1 Conceptual framework .................................................................................. 85
6.3.2 Empirical model ........................................................................................... 87
6.3.3 Results and discussion .................................................................................. 92
xii
6.4 Conclusion ...................................................................................................................... 97
Chapter 7. Marketing of rice seed in the study area ............................................................ 98
7.1 Introduction ..................................................................................................................... 98
7.2 Seed production and sale .............................................................................................. 98
7.3 Household behaviour in selling seed in the market ................................................... 99
7.3.1 Conceptual framework .................................................................................. 99
7.3.2 Empirical method ....................................................................................... 100
7.3.3 Results and discussion ................................................................................ 103
7.4 Relationship between technical efficiency and seed sold by households ............. 109
7.5 Conclusion .................................................................................................................... 110
Chapter 8. Capacity of seed producer organizations in governance............................ 111
8.1 Introduction .................................................................................................................... 111
8.2 Conceptual framework ................................................................................................ 112
8.3 Selection and measurement of indicators ................................................................. 113
8.4 Results and discussion ................................................................................................. 115
8.4.1 Overall performance ................................................................................... 115
8.4.2 Indicator wise performance ........................................................................ 116
8.5 A Case of Institutional innovation in Bijbridhi CBSPO ......................................... 127
8.5.1 Motivation for seed production ................................................................... 127
8.5.2 Functioning of group .................................................................................. 128
8.5.3 Challenges in the group .............................................................................. 130
8.5.4 Conversion of group to company ................................................................ 130
8.5.5 Relation between group and company ........................................................ 132
8.5.6 Reasons for success of the group ................................................................ 133
8.5.7 Challenges for the company ....................................................................... 134
8.6 Conclusion .................................................................................................................... 135
Chapter 9. Conclusions and recommendations .................................................................... 136
References ............................................................................................................................................ 142
Appendices .......................................................................................................................................... 152
xiii
List of tables
Table 2.1 Foundation seed supply situation of major food crops in Nepal ................................................. 39
Table 3.1 Characteristics of the study districts ........................................................................................... 47
Table 4.1 Average area (ha) and yield (kg ha-1) of different rice varieties across the districts ................... 54
Table 4.2 Distribution of households growing rice varieties across the districts ........................................ 55
Table 4.3 Sources of improved rice varieties in the study area................................................................... 57
Table 4.4 Description of explanatory variables used in the model ............................................................. 62
Table 4.5 Summary of socio-economic variables included in binary logistic model ................................. 64
Table 4.6 Summary of the results from binary logistic regression ............................................................. 66
Table 5.1 Summary of the output and input variables ................................................................................ 71
Table 5.2 Elasticity of variable inputs ........................................................................................................ 72
Table 5.3 Estimates of allocative efficiency ............................................................................................... 72
Table 5.4 Socio-economic variables used in the model .............................................................................. 77
Table 5.5 Summary of the explanatory variables ....................................................................................... 78
Table 5.6 Effect of explanatory variables on crop yield ............................................................................. 79
Table 5.7 Influence of socio-economic variables on technical efficiency .................................................. 80
Table 5.8 Observed yield, yield loss and technical efficiency of significant variables ............................... 81
Table 6.1 Summary of soil conservation practices adopted in rice-based system……………...…. ...…...84
Table 6.2 Summary of explanatory variables used in the model…………………………………...….…. 93
Table 6.3 Impact of socio-economic variables on the adoption of soil conservation practices…………... 94
Table 6.4 Rice yield and technical efficiency under different soil conservation practices………………. .95
Table 7.1 Rice seed production and sale across the districts .................................................................... 99
Table 7.2 Description of variables and expected sign .............................................................................. 104
Table 7.3 Impact of explanatory variables on outcome and selection equations ...................................... 106
Table 7.4 Cost benefit analysis of rice seed marketing across the four CBSPOs ..................................... 107
Table 7.5 Return to investment of CBSPOs in different scenarios ........................................................... 109
Table 8.1 Performance of CBSPOs with respect to participation ............................................................. 116
Table 8.2 Performance of CBSPOs with respect to business plan ............................................................ 118
Table 8.3 Performance of CBSPOs with respect to incentive .................................................................. 120
Table 8.4 Performance of CBSPOs with respect to linkage with service providers ................................. 122
Table 8.5 Household level governance and economic indicators across CBSPOs……………… ………126
Table 8.6 Comparison of CBSPOs’ governance indicators with their leaders’ characteristics ................ 127
xiv
List of figures
Figure 1.1 Rice yield trend from 1961 to 2001………………………………………………….……..…..3
Figure 1.2 Types of seed system………………………………………………...……………….…… …..5
Figure 3.1 Conceptual framework of the study……………………………………….. ……………… ..44
Figure 3.2 A map of Nepal showing the study districts……………………………………………… ….47
Figure 3.3 Rainfall trend of study districts………………………………………………………………..48
Figure 3.4 Surveyed VDCs in the selected districts………………………………………………………50
Figure 7.1 Relation between technical efficiency and seed selling behavior of
households………………………………………………………………………………………………..110
Figure 8.1 Comparison of organizations’ performance…………………………………………………..115
Figure 8.2 Impact of governance indicators on technical efficiency and seed selling…………………..124
Figure 8.3 Seed sold by Bijbridhi CBSPO over the years………….………………………………… ..131
xv
List of appendices
Appendix 1 Profile of community-based seed producers selected for the study ...................................... 152
Appendix 2 Profile of seed consumers selected for study in the area....................................................... 153
Appendix 3 Socio-economic characteristics of households in the study area .......................................... 154
Appendix 4 Sources of annual household cash income in the study districts (NRs) ................................ 155
Appendix 5 Sources of income from agriculture sector ........................................................................... 156
Appendix 6 Annual calendar for production and marketing of rice seed in the study area ...................... 156
Appendix 7 Indicators and scores used to assess the capacity of CBSPOs .............................................. 157
Appendix 8 Cash and physical structures of CBSPOs across the study area............................................ 160
Appendix 9 Rice seed sold by CBSPOs to different actors in 2010 ......................................................... 160
Appendix 10 Questionnaire used in the study .......................................................................................... 161
Appendix 11. Academic and professional profile of the author................................................................ 174
xvi
Acronyms and abbreviations
ADB Asian Development Bank
AE Allocative Efficiency
amsl above mean sea level
APP Agriculture Perspective Plan
ARC Agricultural Resource Center
ASC Agriculture Service Centre
BLM Binary Logistic Model
CBOs Community-Based Organizations
CBSPOs Community-based Seed Producers Organizations
CH4 Methane
DADOs District Agriculture Development Offices
DAP Diamonium Phosphate
DFID Department for International Development
DISSPRO District Seed Self-Sufficiency Program
e.g. Example
et al. And others
FAO Food and Agricultural Organizations of the United
Nations
FAOSTAT FAO Statistics
FORWARD Forum for Rural Welfare and Agricultural Reform
for Development
FYM Farm Yard Manure
GELs Global Environmental Leadership Program for
Designing a Low Carbon World
GHI Global Hunger Index
GMOs Genetically Modified Organisms
ha hectare
HHH Household Head
HICEC Hiroshima International Center for Environmental
Cooperation
i.e. That is
IAAS Institute of Agriculture and Animal Science
IFPRI International Food Policy Research Institute
IPCC Intergovernmental Panel on Climate Change
xvii
K Potashium
Kg Kilogram
LFU Labor Force Unit
Ln Log
LSU Livestock Standard Unit
m Meter
MoAC Ministry of Agriculture and Cooperative
MoE Ministry of Environment
MNL Multinomial logit
MVP Multivariate Probit
NARC Nepal Agriculture Research Council
NRRP National Rice Research Program
n number of households
N Nitrogen
N2O Nitrous Oxide
NGO Non-Government Organization
NRs Nepali Rupees
OLS Ordinary Least Square
OM Organic Matter
p Probability
RTI Return To Investment
SCP Soil Conservation Practice
SD Standard Deviation
SML Simulated Maximum Likelihood
SRR Seed Replacement Rate
STATA Data Analysis and Statistical Software
SRI System of Rice Intensification
SQCC Seed Quality Control Center
t Tones
TU Tribhuvan University
UN United Nation
USA United State of America
US$ United States Dollars
VDC Village Development Committee
VDI Variety Diversification Index
VIF Variance Inflation Factor
1
Chapter 1. Background of the study
1.1 Introduction
Food insecurity is the global concern (Asian Development Bank - ADB, 2012).
Previous conventions related to sustainability /sustainable development such as ‘The
Earth Summit’ held at Rio de Janerio, Brazil in 1992, ‘World Summit’ / Rio+10 held at
Johannesburg South Africa in 2002, and ‘Earth Summit’ / Rio+20 at Rio de Janerio at
Brazil in 2012 recognized that food insecurity /hunger is one of the major challenges for
the realization of sustainable development in the world (United Nation – UN, 2012). An
assessment of the Food and Agriculture Organization (FAO) shows that people suffering
from hunger are increasing in the world, especially in the developing countries (FAO,
2010a). For example, in 2010, 925 million people were suffered from hunger (under
nourishment), and this figure is 17% higher than that of 1995. Major reasons for
increasing hunger are population growth, economic crisis, speculation in the market,
and poor performance of food crops. Among these reasons the last one is more
important in the rural areas of the developing countries due to poverty, poor market
penetration, subsistence agriculture and climatic factors. It is projected that food
production in the world needs to be increased by 70% to feed the global population in
2050 (International Food Policy Research Institute- IFPRI, 2012).
It is projected that food security could continue to be a challenging issue in Asia and
Africa in the future. As of 2012, Asia remains the most populous continent, with 4.1
billion people (60% of the world population - 7 billion). The United Nation’s estimate
shows that from 2012 to 2050 out of the two billions people projected to be increased in
the world, Asia will contribute more than half of this increase. Rice contributes 70% of
the calorie and 40% of income of Asian people (as 90% the world rice is produced and
2
consumed in this continent), and it is projected that 50% of the rice production needs to
be increased in this content by 2050 as compared to the figure of 2010 to feed the
growing population. In addition to this, poverty is a serious issue in this continent.
About 22% of the people living in this continent are equal to or below poverty line (per
capita income equal to or below US $1.25 a day), and 18% children are under nourished.
More importantly, South Asia is worse in these indicators as compared to the other parts
of Asia. South Asia contributes 60% of hungry, 65% of extremely poor and 81% of
Asian underweight children. The progress assessment of Millennium Development Goal
2012 also reckoned the very high level poverty in South Asia (ADB, 2012). Nepal lies
in South Asia and it is considered highly vulnerable to food insecurity. Out of the 119
developing countries surveyed in 2012 with respect to their global hunger index (GHI)1,
Nepal falls in 100th position (GHI: 20.3). This index value is 24.5% less than that of
1990, but it is considered high and Nepal falls under alarming category (IFPRI, 2012). A
total of 25% people are below the poverty line, and it is more serious in the rural areas
(27% people are poor) (Central Bureau of Statistics – CBS, 2011a).
Rice is the most important cereal crop of Nepal in terms of both food security and
livelihood perspectives. Rice contributes 51% of the major food crops’ (rice, wheat,
maize, millet and barley) production, and this crop supply 40% of the calorie, and 20%
of protein supplied in Nepalese diet from cereals. Moreover, rice shares 20% of
agriculture gross domestic product and over 70% of the Nepalese people are engaged in
agriculture activities including rice (MoAC, 2011). Rice is grown from tarai (from 70m
amsl) to mountain (up to 3,050m amsl- the highest rice growing altitude in the world) in
Nepal (Paudel, 2011). In 2011, this crop was grown in 1.49 million ha, and the tarai
region (up to 610m amsl) shared 69.6% of the total rice area and 72.1% of the total rice
3
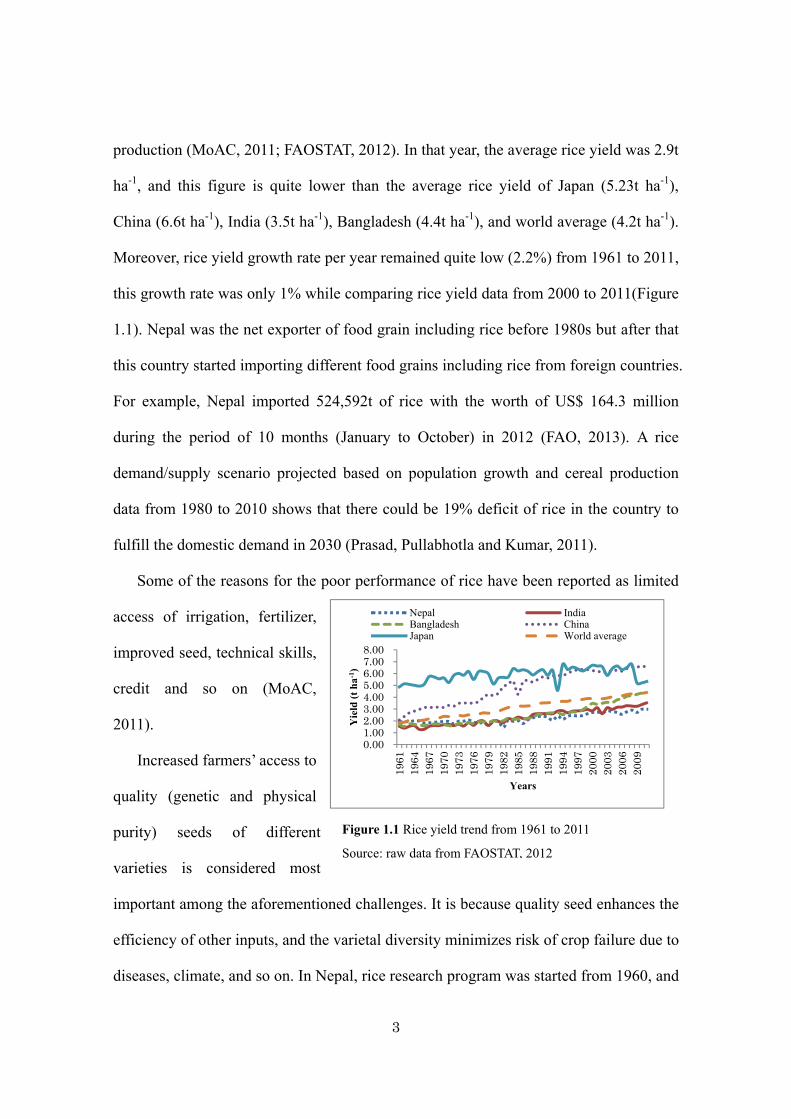
production (MoAC, 2011; FAOSTAT, 2012). In that year, the average rice yield was 2.9t
ha-1, and this figure is quite lower than the average rice yield of Japan (5.23t ha-1),
China (6.6t ha-1), India (3.5t ha-1), Bangladesh (4.4t ha-1), and world average (4.2t ha-1).
Moreover, rice yield growth rate per year remained quite low (2.2%) from 1961 to 2011,
this growth rate was only 1% while comparing rice yield data from 2000 to 2011(Figure
1.1). Nepal was the net exporter of food grain including rice before 1980s but after that
this country started importing different food grains including rice from foreign countries.
For example, Nepal imported 524,592t of rice with the worth of US$ 164.3 million
during the period of 10 months (January to October) in 2012 (FAO, 2013). A rice
demand/supply scenario projected based on population growth and cereal production
data from 1980 to 2010 shows that there could be 19% deficit of rice in the country to
fulfill the domestic demand in 2030 (Prasad, Pullabhotla and Kumar, 2011).
Some of the reasons for the poor performance of rice have been reported as limited
access of irrigation, fertilizer,
improved seed, technical skills,
credit and so on (MoAC,
2011).
Increased farmers’ access to
quality (genetic and physical
purity) seeds of different
varieties is considered most
important among the aforementioned challenges. It is because quality seed enhances the
efficiency of other inputs, and the varietal diversity minimizes risk of crop failure due to
diseases, climate, and so on. In Nepal, rice research program was started from 1960, and
0.001.002.003.004.005.006.007.008.00
1961
1964
1967
1970
1973
1976
1979
1982
1985
1988
1991
1994
1997
2000
2003
2006
2009
Yie
ld (t
ha-1
)
Years
Nepal IndiaBangladesh ChinaJapan World average
Figure 1.1 Rice yield trend from 1961 to 2011
Source: raw data from FAOSTAT, 2012
4
by 2010, this country released over 60 rice varieties for cultivation at farmers’ level. It is
estimated that about 90% of the total rice area is covered by modern rice varieties
(Nepal Agriculture Research Council - NARC, 2011). But there is wide gap (50%)
between the potential and average rice yield in the country. One of the reasons behind
this yield gap is poor access of improved seed (early generation seed of the farmers’
preferred varieties) in the rural areas (Upreti, 2008; MoAC, 2011). It is evident from
poor seed replacement rate (SRR - the ratio of total seed supplied in the country against
the total seed requirement). The government statistics shows that SRR of rice in Nepal
in 2010 was 8.7% which is far below the recommendation made for self pollinated
crops (25%) (Seed Quality Control Center - SQCC, 2012). Low SRR means that
farmers do not frequently change the fresh (early generation) seed, and it is more likely
that older generation seed is susceptible to diseases which reduce crop yield.
Out of the total annual seed supply in the country, the share of government-owned
company, also known as National Seed Company, is only 17%, and rest of the seed is
supplied by farmers’ groups and cooperatives, development projects and agrovets
(traders dealing with agricultural tools, seed, fertilizers, and so on) (SQCC, 2012). To
contribute in the delivery of rice seed in the rural areas research and development
agencies started empowering farmers organized in groups/cooperatives for the
production and marketing of rice seed from early 1990s (Witcombe, Devkota & Joshi,
2010; Pokhrel, 2012). The subsequent sections in this dissertation deal with the
sustainability of the farmers’ managed rice seed production.
5
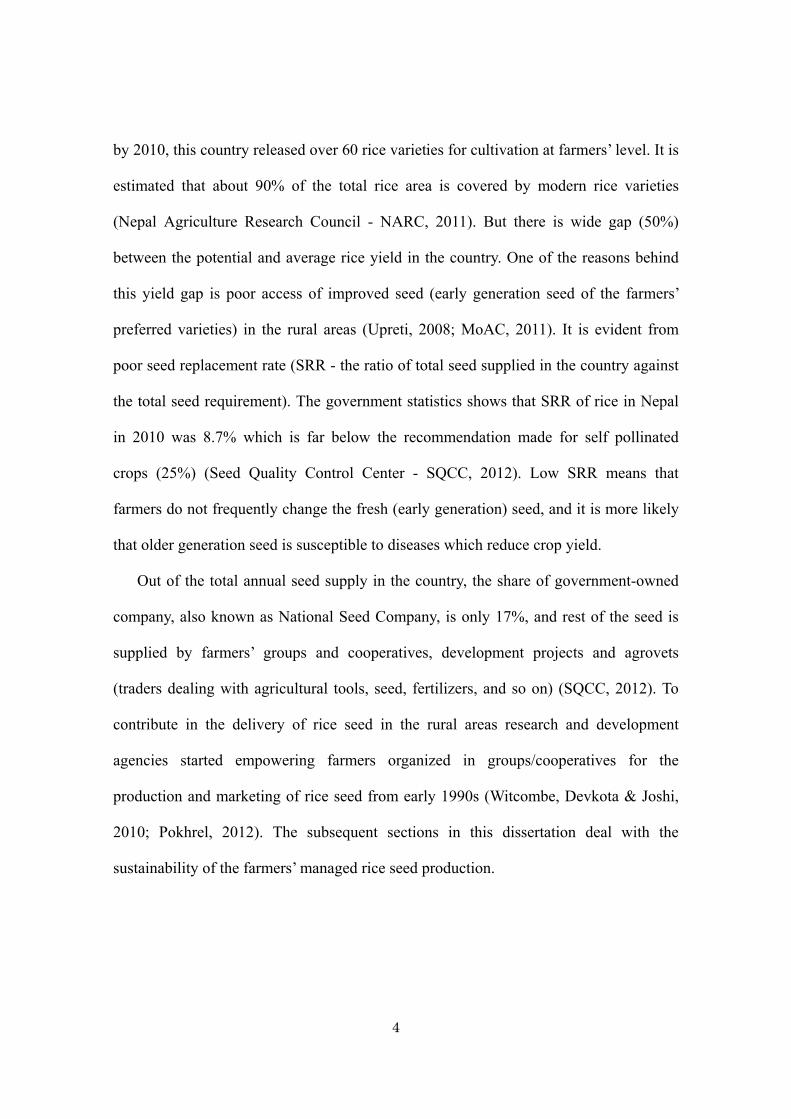
Figure 1.2 Types of seed system Source: Revised from Almekinders and Louwaars, 1999
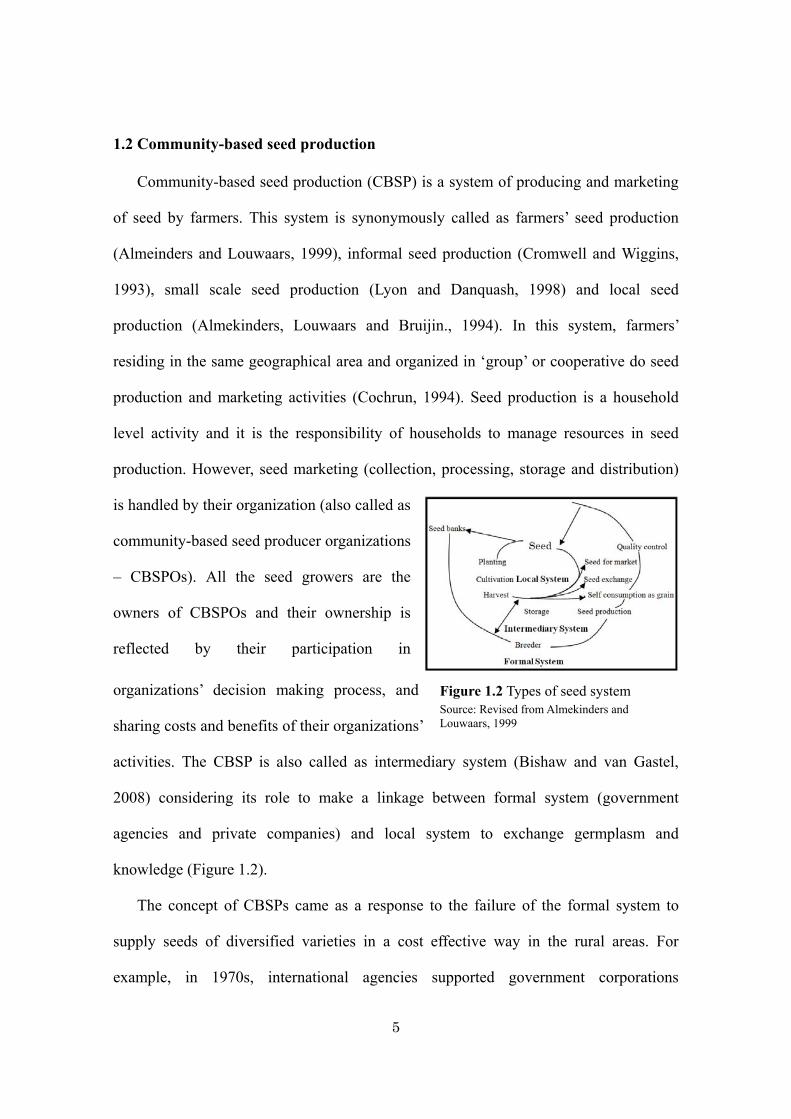
1.2 Community-based seed production
Community-based seed production (CBSP) is a system of producing and marketing
of seed by farmers. This system is synonymously called as farmers’ seed production
(Almeinders and Louwaars, 1999), informal seed production (Cromwell and Wiggins,
1993), small scale seed production (Lyon and Danquash, 1998) and local seed
production (Almekinders, Louwaars and Bruijin., 1994). In this system, farmers’
residing in the same geographical area and organized in ‘group’ or cooperative do seed
production and marketing activities (Cochrun, 1994). Seed production is a household
level activity and it is the responsibility of households to manage resources in seed
production. However, seed marketing (collection, processing, storage and distribution)
is handled by their organization (also called as
community-based seed producer organizations
– CBSPOs). All the seed growers are the
owners of CBSPOs and their ownership is
reflected by their participation in
organizations’ decision making process, and
sharing costs and benefits of their organizations’
activities. The CBSP is also called as intermediary system (Bishaw and van Gastel,
2008) considering its role to make a linkage between formal system (government
agencies and private companies) and local system to exchange germplasm and
knowledge (Figure 1.2).
The concept of CBSPs came as a response to the failure of the formal system to
supply seeds of diversified varieties in a cost effective way in the rural areas. For
example, in 1970s, international agencies supported government corporations
6
(parastatals) in the developing countries to establish organized seed production,
processing and marketing facilities. This program could not supply sufficient quantity of
seeds of the different crop varieties in the rural areas due to ineffective management,
lack of marketing strategies, and high costs involved in the production and marketing.
Similarly, the narrow range of crop varieties developed and tested by parastatals using
package of practices (e.g. fertilizer, pesticides) could not be applicable to the resource
poor farmers. This resulted into the low adoption of these varieties, especially in case of
small farmers. Then, in 1980s the international effort was turned towards promoting
private seed companies to address the seed delivery issue in the rural areas. Again, this
approach could not supply appropriate varieties to resource poor farmers as in the above
case. The private companies opened with the objective of supplying cereals seed in the
rural areas focused their activities only in hybrid seeds (especially vegetables) due to
low profit margin in (non-hybrid) cereal seed (Mywish, Julie and Ducan, 1999; Shrestha
and Ednar, 2007).
It is believed that CBSPOs could address the problems faced by the private
companies and parastatals, and increase farmers’ access to diversified varietal choice.
The reasons behind the argument are as follows. First, these organizations could
minimize costs in production and marketing because both production and marketing
activities are handled at local level with low transportation cost. Similarly, being an
intermediary/less formal sector, CBSPOs do not require go through the complex (long
seed certification procedure adopted by government agencies) seed certification scheme
(David, 2004). Rather, the trained members of CBSPOs monitor the seed production
plots, and apply quality assurance technique such as truthful labeling (the technique
where the producers declare the quality of their produce themselves). These conditions
7
help them for cost reduction in the production phase. Third, CBSPs are allowed to
produce and sell seeds of the local varieties evolved through farmers’ innovations in
addition to the modern varieties developed by research organizations. This helps
CBSPOs to supply diverse crop varieties in accordance with the local needs that vary
across the socio-economic and geo-physical settings (Joshi et al., 1997; Setimela,
Monyo and Banziger, 2004).
There is no formal statistics how many CBSPOs are involved in rice seed
production and marketing and quantity of rice seed supplied in Nepal. The government
statistic shows that 128 CBSPOs (with 2,500 households) registered in the government
agencies, out of which 80% are from tarai regions and involved in cereal seed including
rice (MoAC, 2009).
1.3 Statements of the problem
Poor seed supply is a serious issue in rice in Nepal though this crop serves as an
important source of food and livelihoods of communities. The statistics shows that
formal sector (government agencies and private companies) supply < 2% of total annual
seed requirement Nepal (SQCC, 2012, Almekinders, Louwaars & Bruijin, 1994;
Alemkinders & Louwaars, 1999). Though some CBSPOs are involved in rice seed
production and marketing activities with the support from development projects,
sustainability of these schemes (whether farmers could continue these activities or not)
is a contested issue. The issue has been raised from the perspective of how farmers
could be benefitted from seed production and marketing considering their poor
resources, poor extension service, no/limited business skills, and promoted these
schemes by development projects that are normally more accountable towards donor
agencies with less emphasis on local empowerment (Cromwell & Wiggins 1993;
8
Mywish, Julie & Ducan, 1999; Bishaw & van Gastel, 2008). As a result, policy makers
and donor agencies are also in the confusion about the supporting areas they have to
focus on to strengthen the capacity of community-based seed production.
In spite of this problem, very limited studies have been published in this system.
Also, the available studies are focused mainly on review of government policy
documents focusing on seed regulatory framework and subsidy issues (Cromwell &
Wiggins 1993; Almekinders and Louwaars, 1999; Mywish, Julie & Ducan, 1999;
Bishaw & van Gastel, 2008), and very limited efforts have been made to understand the
sustainability issue using empirical evidence (i.e. using data collected from field). These
studies assumed sustainability of CBSP from the perspective of whether CBSPOs cover
their management costs involved in seed marketing or not (Poudel et al., 2003; Joshi,
2006; Lal, Thapa & Grunat, 2009; Witcombe, Devkota & Joshi, 2010). Also, data used
to analyze the capacity of CBSPOs in covering marketing costs or not were estimated
seed production data, and not the actual volume of seed sold. Studies carried out using
such estimated data could not represent the ground reality because they failed to capture
household level issue. Understanding household level concerns is important to design
appropriate incentive mechanism for farmers, especially in the countries where national
rice seed industry is in the early phase of development (Morris, Smale & Rusuke, 1998;
Almekinders & Louwaars, 1999).There are very limited published studies about the
sustainability of CBSPs using household data (David, 2004; Srinivas et al., 2010), and
also the major focus of these studies is limited on economic issue. It means these studies
have not considered social and environmental concerns in the sustainability. However,
these two issues along with economic issue are important in the sustainability analysis
(World Council on Environment and Development- WCED, 1987).
9
1.4 Study rationale
It is clear from the existing literature that food security is a key issue in Nepal, and
the situation has been worsen in recent days due to various factors such as population
growth, speculation in the market and poor performance of food crops (MoAC, 2011).
More importantly climate change, especially uncertainty in rainfall patterns, has made
the food security situation worsen due to its negative impacts on crop yield. Resource
poor farmers who depend on rice farming for their livelihoods are the most suffers from
this phenomenon. To address the abovementioned challenges in a sustainable way,
increased farmers’ access to diversified rice variety choice including local varieties is
important. Researchers and policy makers are struggling to identify appropriate
mechanism to increase farmers’ access to diversified variety choice as multinational
companies and government corporations have been already failed to address this issue,
and narrow range of rice varieties supplied by these organization could not address
small farmers’ concerns.
In Nepal, rice farming is a traditional practice carried out by farmers. It means
farmers have lots of experience and local knowledge about rice farming and its on-farm
seed management technique (Gamba et al., 1999; Bishaw, 2004; Bania et al., 2000;
Joshi, 1997). This country is also rich in rice biodiversity due to variation geographical
niches (Rana et al., 2007). It is increasingly recognized the importance of local
landraces to enhance livelihoods of people in a sustainable way. Farmers in these areas
could not offer hybrid rice varieties which demand intensive management including the
use of chemical fertilizers and pesticides. Even the farmers from developed countries
who have been using hybrid rice varieties for a long time have started emphasizing local
rice varieties and their seed production to enhance sustainable rice farming system.
10
At the circumstance of biodiversity loss from the formal seed supply system,
community-based seed production system could serve as an alternative seed delivery
technique. This system conserves the local biodiversity and indigenous knowledge
gained by farmers for a long time.
The selection, saving and exchange of seed is an integral part of rice production
system being adopted by farmers traditionally in the world. Empirical evidence shows
that farmers possess a wealth of indigenous knowledge and experience concerning
on-farm seed management (Gamba et al., 1999; Bishaw, 2004; Bania et al., 2000; Joshi,
1997). It means farmers could manage seed production and marketing activity at local
knowledge provided that they get some knowledge about seed quality and marketing
concept. More importantly, being a self-pollinated crop, it is not difficult to adopt seed
quality management measures such as roughing, isolation distance in open-pollinated
rice varieties as compared to cross pollinated crop varieties.
Considering the importance of community-based seed production system, policy
makers associated with the food security, seed security, and climate change adaptation
and have emphasized in local level seed management initiatives. Similarly, the necessity
for strengthening CBSPs/local seed system is highlighted in national and international
levels to enhance resilience of farmers against external shocks such as climate change.
For example, this concept is mentioned in 4th assessment report of inter governmental
panel on climate change (IPCC, 2007), and National Adaptation Program of Action
Nepal (MoE, 2010).
As discussed already CBSP system has been promoting by development projects.
These projects support farmers for inputs and capacity building activities through
trainings, excursion visits, and so on. Realization of benefits by households in rice seed
11
farming would motivate farmers to increase their involvement in rice seed production or
continuously engages in rice seed production. So, increased understanding on roles of
households’ attributes on realizing benefits would be useful in understanding
sustainability of farmers’ managed seed production system. Better understanding in this
area would contribute in strengthening the community-based seed production system by
allowing policy makers in designing appropriate policies for their promotion in national
level.
1.5 Objective of the study
General objective
The general objective of this research is to assess the roles of household
characteristics in economic, environmental and social performance of seed producers.
Here, economic performance indicates efficiency of seed production and marketing,
environmental performance shows the behavior of these households in adopting soil
conservation practices. Similarly, social performance means ability of seed producers’
organization in designing policy to address democracy and risk situations.
Specific objectives
1. To analyze adoption of improved rice varieties in the study area
2. To determine the efficiency of farmers in rice seed production and identify factors
influencing it
3. To assess the soil conservation practices adopted by seed growers
4. To analyze the rice seed marketing in the study area
5. To analyze the capacity of farmers’ organizations in governance
12
Chapter 2. Literature review
2.1 Introduction
This chapter presents the information gathered from existing literature regarding the
concept of sustainability and it meaning while using in system context. It also discusses
the factors associated with the success of community-based seed production concept. It
also summarizes roles of soil conservation practices for the sustainability of rice
production. Summary of programs and policies adopted by government agencies and
NGOs have also been incorporated in this chapter. The findings from this chapter are
utilized in developing conceptual framework in Chapter 3.
2.2 Concept of sustainability
The term ‘sustainability’ is derived from the Latin word Sustinere, meaning to
sustain, endure or support or continue (Onions, 1964). Though the idea of maintaining
or sustaining the benefits of any initiative is not new, the word ‘sustainability’ started
appearing frequently in the literature from 1970s to address the preservation of ecology
for maintaining ecosystem services. Later, ‘ecology’ was merged with ‘development’ in
the form of ‘sustainable development’ when Brundtland commission defined
sustainability in the form of sustainable development considering the role of economy
and society. According to the Brundtland report “Sustainable development is the
development which meets the need of present without compromising the future
generation to meet their needs” (WCED, 1987:43). This definition addresses the
intra-generational and intergenerational equity. The intra-generation issue highlights
necessity to address the issues of poor people in the current generation whereas
inter-generational equity focuses for maintaining the regenerative capacity of ecological
system under different shocks situations, and enhancing the innovation capacity of
13
social system. The term ‘development’ is a dynamic concept, and it implies that the
socio-ecological system needs to address human needs in the changing contexts.
As mentioned in the above definition one of the essential human needs for the
present and the future generation is food and it is the product of agriculture. At the same
time agriculture has wide spread environmental impacts through the emission of green
house gases such as methane (CH4), Nitrous Oxide (N2O) and so on. It is well
recognized that sustainable agriculture deals with the objective of sustainable
development by enhancing the food production and by minimizing the environmental
impacts of agriculture.
The definitions of sustainable agriculture can be broadly divided into two parts:
‘goal describing’ and ‘system describing’, and these concepts give two schools of
thoughts. The goal describing concept deals sustainability in agriculture from the
perspective of promoting practices in agriculture that are alternative to conventional
practices that use more chemical fertilizers and pesticides. This concept came from the
developed countries such as United States of America, Canada and Western Europe
considering how the impact of agriculture on non-renewable resources (e.g. fossil fuel),
soil degradation, water resource, health and environment could be reduced. Studies
dealing with the farmers in these countries considered unsustainable agriculture for the
conventional agriculture, and there was no concern of how to increase food production
as they have already reached at high productivity level. In contrary to this, studies
concerning with agriculture in developing countries argued that the goal describing
concept might not be applicable in the rural areas of these countries. It is because
majority of farmers in these countries are small holders who employ subsistence
farming utilizing negligible amount of external inputs. Crop productivity level is quite
14
lower than that of developed countries though poverty and food insecurity is pervasive.
So, the major concern of these farmers is how to increase the current production level
and how to maintain the new productivity level using the local resources. So, the system
describing concept is better suited to deal with the sustainability of agricultural
initiatives in these countries.
The system describing concept interprets sustainability as the ability of the system
to produce output that is well valued by actors and sufficient input is supplied and
continuity of output for long time (Lewandowski et al, 1999). There are several
definitions of sustainable agriculture under the system describing concept, and the broad
consistency among the definitions is that ‘sustainable agriculture is the use of resources
to produce food and fiber in such a way that the natural resource base (such as
biodiversity, soil quality, forest, water and air quality) is not damaged, and that the
needs of producers and consumers can be met over the long term (Schaller, 1993).
In agricultural sector, producers and consumers are the major actors. Producers
intend to maximize the benefit from agricultural production whereas consumers’ interest
is to access quality product in cheap price. It is difficult to demarcate whose benefits to
be measured in the production and consumption chain of agriculture outputs. From the
shareholders’ perspective, benefits of seed producers might be more important but if we
look at the same issue from stakeholders’ perspective issues of rice grain consumers
(which might not be necessarily the farmers) need to be addressed. However, diversity
of rice varieties in cheap price could address this issue.
Similarly, how long the current level agricultural benefit continues is complex in the
changing context. It is complex to precisely estimate benefit in the changing contexts.
The logical way to address this problem is to how agricultural activities could minimize
15
their impact on natural resources and how to enhance the innovation capacity of people
so that they could averse the risk situation or maintains the regenerative capacity of
socio-ecological system in a short period. Sustainability can also be discussed at the
organizational level. Organizations are role oriented institutions and they are formed
according to government policy, and in this sense they are sustainable (Huntington,
1968). However, structures and activities of organizations might be changing in
accordance with the needs of their stakeholders. However, researchers dealing with
sustainability of agricultural organizations concern on whether these organizations
could cover their full/partial operating costs or whether they could address the equity
issue (i.e. the concerns of poverty) or not, whether they have developed strategies to
address the risk situations or not and so on (Mac et al., 1989). The sustainable
performance of people /organizations is measured considering three indicators:
economic, social and environmental.
2.3 Life cycle of seed industry development
Morris, Smale & Rusuke (1998) summarized the evolutionary growth path of maize
seed industry as their ‘life cycle’ into four stages: pre-industrial, emergence, expansion
and consolidation. Each stage of the life cycle is characterized by a particular
combination of factors relating to the orientation of agriculture, farmers’ seed
acquisition practice, availability of technology, locus of research and development,
predominant seed production method and intellectual property right (Table 2.1). Cereal
seed industries in developing countries are in either pre-industrial or emergence stage,
where development agencies and non-government organizations (NGOs) provide seed
and other extension facilities such as trainings. The extension facilities might be in the
form of subsidy in source seed, credit, processing machines and trainings. On the other
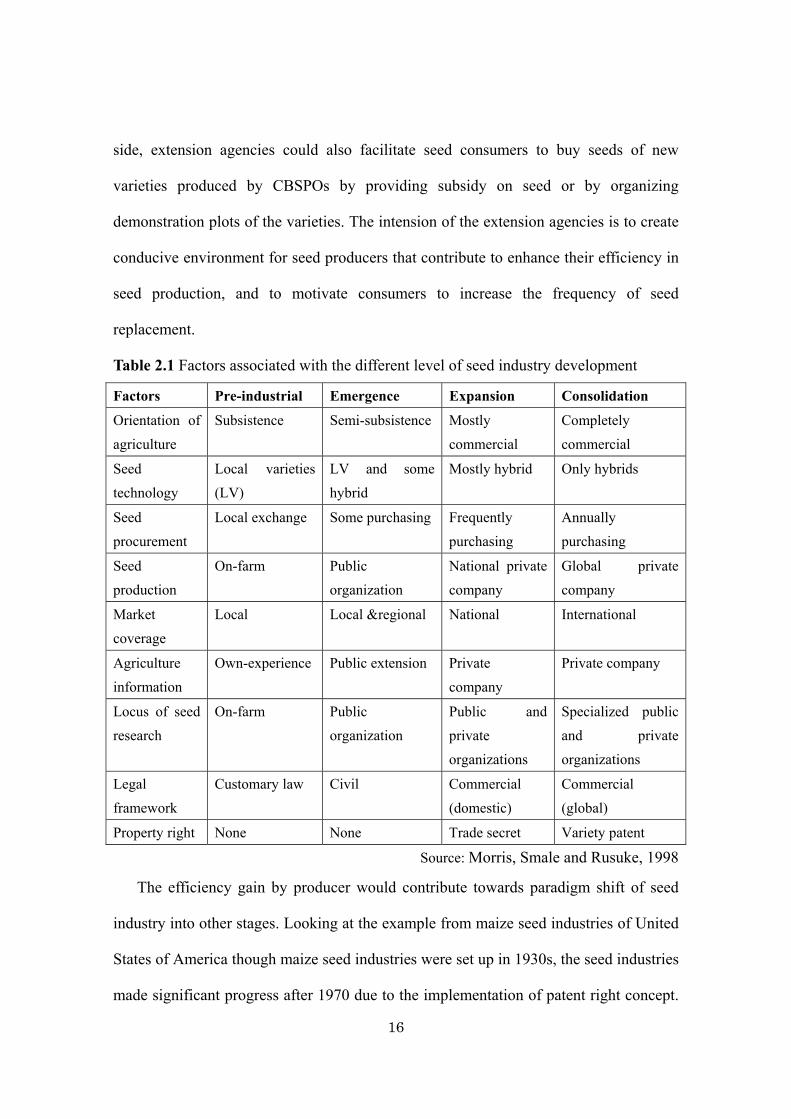
16
side, extension agencies could also facilitate seed consumers to buy seeds of new
varieties produced by CBSPOs by providing subsidy on seed or by organizing
demonstration plots of the varieties. The intension of the extension agencies is to create
conducive environment for seed producers that contribute to enhance their efficiency in
seed production, and to motivate consumers to increase the frequency of seed
replacement.
Table 2.1 Factors associated with the different level of seed industry development
Factors Pre-industrial Emergence Expansion Consolidation
Orientation of
agriculture
Subsistence Semi-subsistence Mostly
commercial
Completely
commercial
Seed
technology
Local varieties
(LV)
LV and some
hybrid
Mostly hybrid Only hybrids
Seed
procurement
Local exchange Some purchasing Frequently
purchasing
Annually
purchasing
Seed
production
On-farm Public
organization
National private
company
Global private
company
Market
coverage
Local Local ®ional National International
Agriculture
information
Own-experience Public extension Private
company
Private company
Locus of seed
research
On-farm Public
organization
Public and
private
organizations
Specialized public
and private
organizations
Legal
framework
Customary law Civil Commercial
(domestic)
Commercial
(global)
Property right None None Trade secret Variety patent
Source: Morris, Smale and Rusuke, 1998
The efficiency gain by producer would contribute towards paradigm shift of seed
industry into other stages. Looking at the example from maize seed industries of United
States of America though maize seed industries were set up in 1930s, the seed industries
made significant progress after 1970 due to the implementation of patent right concept.
17
This encouraged the private agencies to invest on research and development of new
hybrid varieties using biotechnological and field experiments. It not necessary that seed
industry in each country and will follow the same path. It means being a cross
pollinated crop farmers intend to replace to seed stock faster but the case in
self-pollinated crop species might be different. However, researchers argued that the
major driver of the change from one stage to another is efficiency gain by producers and
consumers. It means the seed producers gaining higher efficiency are more likely to
change from one phase to another. Therefore, government agencies and NGOs provide
trainings to enhance their capacity, and arrange for the provision of resources that are
needed for seed production and marketing.
2.4 System approach in sustainable development/sustainability
It is clear from the literature that the quest for sustainability and sustainable
development requires integrating economic, social and environmental factors. This
concept also highlights necessity to integrate spatial and temporal dimensions of
sustainability in the form of intra-generational as well as inter-generational equity.
System approach is considered to grasp these perspectives because the system view is a
way of thinking in terms of connectedness, relationships and contexts. This approach is
contextualized in the particular socio-ecological system, where societal (human) and
ecological sub-systems interact with each other or function themselves. The discourse
here is whether to look at sustainability of human sub-system or ecological sub-system
or socio-ecological system as a whole. Classical economists view earth as an artificial
planet considering complete substitution between human capital and natural capital. The
sustainability of ecological sub-system is viewed as important only as far as required for
the sustainability of the human component, and considering the little knowledge about
18
the future uncertainty precautionary principles were applied in order to incorporate
appropriate level of risk aversion in the face of uncertainty.
The sustainability of ecological system views that natural resources cannot be
substituted with human-made capital. This notion is also in line with very strong
sustainability and considers steady state economy without considering poverty or people.
The notion of socio-ecological concept is more important considering the inter linkage
between society and ecological sub-system. This system provides the basis for the
availability of resources such as assets and entitlements, adaptability, flexibility and
innovation capacity. It means sustainability is not equal to constancy. Sometime
sustainability is perceived as a fixed state of a system but it is not scientifically correct
because even ecological system is in changing over time, involving renewal and
destruction of component adapting to change in their environment and coevolving in it.
So, the concept of sustainability is viewed from sustainable development because the
term development stands for change though it may be quantitative of qualitative. Here
what is sustained or has to be made sustainable is the process of improvement of human
condition (or better off of the living condition where human being resides), a process
that does necessarily require indefinite growth in the consumption of energy and
material. Also we are living through the period of tremendous demographic,
technological and economic transformation and in this process change is unavoidable.
Now the question is what is to be changed such as rigidity and impediments, saving
knowledge, experience and innovation. So, sustainable should address inter and
intergenerational justice, dynamism as technological innovation and change in a social
organization makes the system dynamic.
19
While linking the system concept in seed production, the definition proposed by
Brinkerhoff and Goldsmith (1990) in defining rural institution might be appropriate.
They argued that sustainability of rural agricultural institutions should be analyzed
putting producers and consumers in the context. Producers intend to maximize the
benefit from their production whereas consumers’ interest is to access quality produce in
cheap price. It means producer will continue producing food if the output they produce
will be valuable to them and to the consumers. How long the value of their output will
remain same is difficult to estimate. This inter-generational issue can be addressed only
by assessing how seed producers adopt soil conservation practices which have potential
to maintain soil, water and air quality (Gupta & Sayer, 2007).
2.5 Factors affecting performance of CBSPs
The available literature suggests that cereal seed industry in the developing
countries is in pre-industrial stage or emergence stage (Morris, Smale & Rusuke, 1998).
In these stages, agriculture is mainly subsistence in nature and very few farmers adopt
modern varieties. Development projects implement awareness raising projects to
motivate farmers for the production and consumption of seed. Some of farmers might
start seed production activity in the form of group or cooperative but due to differences
in their socio-economic status, all might not be ready for selling seed in the market. So,
it is important to analyze the performance of seed producers into production phase and
marketing phase. Potential factors affecting the performance of CBSPs are divided into
external factors and internal factors.
2.5.1 External factors
External factors are those which are out of the control from seed producers. These
factors include the policy and programs of the government as well as NGOs because
20
these agencies are the major service providers for seed growers and their organizations.
Seed consumers also called as demand actors could also influence the behavior of seed
producers. So, how policy environment and consumers influence the performance of
seed producers is discussed here.
2.5.1.1 Policy environment
Government agencies and NGOs are the major service providers for CBSP in the
early phase of development. So, rules, regulations and strategies adopted by these
organization while delivering extension services. The issues associated with government
agencies are provision for source seed, seed testing facility and trainings about technical
and managerial aspects of seed production and marketing.
Government owned research farms develop rice varieties and provide source seed to
farmers for seed production. The associated issue is whether the varieties developed by
government research organizations could address the demand of different categories of
farmers. Almekinders, Louwaars & Bruijin, (1994) reported that in many developing
countries still the variety development task is limited on government agencies. The
varieties developed by these organizations are evaluated considering the resource rich
farmers using package of practices (combination of recommended inputs), which could
not be practicable to the small / resource poor farmers. In recent years, participatory
plant breeding approach (the method of developing varieties in partnership with farmers
using inputs used by farmers) is recommended to address this issue (Witcombe & Virk,
1997; Joshi et al., 1997; Joshi et al., 2012). In this approach, farmers learn about plant
breeding techniques including strategies to be adopted for the maintenance of genetic
purity. But, participatory plant breeding is still limited in the activities of NGOs, and it
is yet to be institutionalized in government policy in many countries. For example, seed
21
policy in Vietnam, does not allow for registration of farmers’ bred varieties (Witcombe
& Virk, 1997). Unless the approach is clearly mentioned in the government policy it is
less likely that projects/programs implemented by government agencies adopt the
approach. In Nepal, participatory plant breeding has been institutionalized in the
government policy which is seen from the release of rice varieties developed from this
approach (Joshi et al., 2012).
The second policy concern is provision of skills (technical and business). The
provision of these skills is based on how the provision of these services is integrated
into the government policies. Almekinders, Louwaars & Bruijin (1994) argued that
normally development projects are designed in line with government policies are less
worried about the capacity building of seed producers but are more focused on how they
could achieve their development goals by mobilizing the seed producers. It is because
the major objective of these agencies is to cover the large number of
beneficiaries/farmers by distributing improved seed, and strengthening the capacity of
seed producers would not be their priority. However, development projects mobilize
CBSPOs in distributing seed in local areas and/or in multiplying seed as per the demand
of development projects as CBSPOs could accomplish these activities cheaply. David
(2004) argued that there should be a provision of supporting extension service to
CBSPOs by government agencies even if these organizations are empowered by NGOs.
However, the nature of supports might vary with the stage of seed industry development
in the concerned countries. The possible supporting areas are training on business plan
development and its implementation for the production and marketing of seed, subsidy
for the development of physical structures (such as grading machine, seed storage
building), provision of credit facility on low interest rate, and contribute in creating
22
demand of seed produced by CBSPOs through demonstrations /networking (Witcombe,
Devkota & Joshi, 2010).
2.5.1.2 Seed demand characteristics
In rural areas, there is heterogeneity of farmers in terms of their socio-economic
characteristics such as land size. Normally, larger farmers tend to adopt modern
varieties/hybrid varieties in combination with other agricultural inputs such as chemical
fertilizers/pesticides and so on. On the other hand, small farmers’ priority might be to
grow crop varieties that need less external inputs and are more risk averse in nature.
Similarly, the price of seed, characteristics of the varieties, cropping pattern, land
characteristics, etc, affect the behaviors of farmers buying seed from the market
(Nkonya & Norman, 1997; Paudel & Matsuoka, 2008)
2.5.2 Internal factors
2.5.2.1 Socio-economic characteristics of seed growers
Previous studies have shown that demographic (age and education of household,
family size), economic (operational land, irrigation facility, fertilizer, soil or land
characteristics, etc), and institutional (membership in the organization, access to training,
etc) variables are associated with their efficiency in utilizing resources and participation
of farmers in the market (Rana et al., 2007; Idiong, 2007; Piya, Kiminami & Yagi,
2012).
2.5.2.2 Organizational management
In general, in CBSPs, seed production is carried out at household level but
marketing through their CBSPOs. The marketing activities of CBSPOs include
collecting raw seed from individual growers, process it, store it and distribute to
consumers. They also provide technical services to their members through training or
23
monitoring visit (Kubei, 2007; Witcombe, Devkota & Joshi, 2010). To handle all these
activities CBSPOs form executive committee from the members following democratic
principles, and this committee takes the overall responsibility to make necessary
decisions in the organization respecting their members’ views. CBSPOs in developing
countries are in the form of groups or cooperatives, and many cases these structures are
the continuity or some modification of the traditional social organizations whose
objectives would be primarily of overall socio-economic development of members. The
challenge for these cooperatives would be the issue of free riders, horizon, control and
influence cost (Acharya, 2009) for their sustainability. The issue of common property
(free riders) problem might arise when property rights are not sufficiently defined to
ensure that individual bear the full cost of action or receive benefits from their actions.
The horizon problem arises when cooperative address only short-term benefit at the
expense of long-term viability of the cooperative. For example, one one-member one
vote principle might not motivate the members to invest in the organizations, and as a
result organizations could face shortage of financial resources. To address these
problems, CBSPOs form executive body from members who lead the organization,
initiative activities, create policies and problems, defend the policies and programs with
their members, and coordinate with service providers such as government agencies
(Chand & Karki, 2005).
Another challenge of executive committee is how to develop policies that are
suitable for heterogeneity of their members. It is because many of the cooperative
organizations in the developing countries been promoted from the perspective of
poverty reduction rather than their interest or potential or challenges while starting seed
production and marketing activities (Acharya, 2009). It means poorer members might
24
face difficulty if organizations demand large amount of money to start up their business
activities, and sometimes members might leave the organizations not being able to pay
for the fee set by their organizations. This implies that ‘executive committee’ needs to
address the interest of all categories of their members to enhance their loyalty and
accountability towards their organizations.
Similarly, executive committee might face the conflict on ‘conformance role’ vs
‘performance role’. The conformance role requires that the executive committee need to
work for the welfare of their members, especially for poor people, whereas performance
role requires them to demonstrate the performance of their organizations (for example
organizations’ physical structure development, efficiency in marketing, etc). Generally,
better off members Also, the executive committee might face challenges from
government side what benefit they have created to the local community. It is because
the expectation of consumers towards seed producers is to get quality seed in
cheap/reasonable price. So, the organization could handle these issues by enhancing
economic efficiency in marketing, and designing policies for good governance in the
organization. The good governance in CBSPOs could be understood by analyzing the
capacity of executive’s members in designing and implementing policies for
participation, planning, business plan development and linkage with service providers
(Gray & Kraenzle. 1998; David, 2004; FAO, 2010b). Previous studies have shown that
education, training, previous business experience of leaders, and physical structure of
organizations would have significant positive impacts on organizational performance
(Setimela, Monyo & Banziger, 2004; Bishaw & van Gastel, 2008). Kugbei (2007)
argued that it might be difficult for CBSPOs to implement its activities timely unless
they prepare business plan as it guides them what activities to be implemented when by
25
whom. Similarly, the case of Nigeria shows lack of business plan was the major reason
behind the low performance of CBSPs (FAO, 2010b).
2.6 Soil conservation practices for sustainability of rice-based system in Nepal
Declining water table, poor soil organic matter and emission of Greenhouses Gases
(GHGs) are the major environmental issues associated with the sustainability of
rice-based system in indogangetic plain including Nepal. This system emits nitrous
oxide (N2O), Carbondioxide (CO2) and Methane (CH4). Existing literature suggests that
though Nepal’s share to global GHG emission is negligible (0.025%) the emission rate
is very high (IPCC, 2007). From 1990/91 to 1994/95 Nepal’s GHG emission increased
by 13.1% per annum and agriculture and forestry sectors were the major contributors of
the emission (Maharjan, Joshi & Piya, 2011). The emission of N2O is mainly concerned
with the application of nitrogenous chemical fertilizer whereas CO2 with fossils fuel
consumption and CH4 with water logging condition in rice, manure management, and
burning of crop residues. Soil conservation practices (SCPs) have been proposed to
address these problems in an integrated manner. These practices are built on integrating
local resources and indigenous knowledge farmers have gained from long period of time
(Dumanski et al., 2006; Tripathi et al., 2006; Regmi et al., 2009). This section discus
how SCPs address the aforementioned problems, taking the cases of soil organic matter
enhancing practices, and energy saving practices.
2.6.1 Soil Organic matter management practices
Organic matter enhancement practices in rice-based system of Nepal include farm
yard manure (FYM), compost, green manure, botanical pesticides and so on (Tripathi et
al., 2006; Regmi et al., 2009). It is clear from the previous studies that organic matter
(OM) is the major source of soil carbon and other plant nutrients in the soil and it results
26
to improve the soil quality and crop yield (Stanhill, 1990). For example, incorporating
mungbean biomass, a source of organic matter, after two pickings of pods in rice fields
increases the grain yield of rice by 20% (Khanal et al., 2006). Similarly, incorporating
asuro(Adhatoda sps) leaf increases the rice yield by 45% (Subedi, 1992). Moreover,
in-situ incorporation of dhaincha (Sesbania sps) increases the rice yield by 25%. Green
biomass of these species is rich in plant nutrients, especially in nitrogen (1.8-2.5%)
which results into increased crop yield. Similarly, green biomass incorporated fields
have higher microbial biodiversity which is important for maintaining soil health
(Devkota et al., 2006).
Various physiochemical and biological basis have been postulated to describe the
mechanism behind the roles of organic matter in the sustainability of rice-based system.
The first mechanism is associated with tolerance to drought. Organic matter holds
moisture and makes it available to plant roots, so under drought condition, crop yield in
organically managed systems is higher than that of crops managed integrating chemical
fertilizer and organic manure (Dormaar, Lindwall & Kozub, 1988; Denison, 1996). The
second mechanism is to facilitate plant roots to uptake nutrients from soil. The
population of mycorrhizae (a symbiotic association of fungi with plant roots) has been
shown to be more abundant in the roots of crops grown in soils with higher organic
matter (Eason, Scullion & Scott, 1999). This makes the plants able to extract nutrients
that are bound with soil particles and not easily available to plant roots. Thirdly, organic
matter leads to improve soil stability and resistance to water erosion due to higher
carbon content and improved soil aggregation. Better soil aggregates improve
permeability, lower bulk density and enhance resistance to wind and water erosion
(Stanhill, 1990).
27
In addition to the aforementioned economic benefits organic matter contributes in
minimizing the emission of GHGs. For example, organic soil has higher potential of
carbon sequestration than inorganic soil due to the formation of microspores in the
organic soil. Moreover, organic matter management technique contributes in reducing
the emission of methane. Rice field is the importance source of methane emission in
Nepal. In 1994/95, rice fields emitted 306 giga tons of CH4 which is equivalent to 35%
of the total CH4 emitted in the country. Anaerobic decomposition of organic matter in
the flooded field produces methane and is escape to the atmosphere by diffusion process.
The major pathways of CH4 production in flooded soils are the reduction of CO2 with
H2, with fatty acids or alcohols as hydrogen donor, and the transmethylation of acetic
acid or methanol by methane-producing bacteria (Dormar, Lindwall & Kozub, 1988).
Incorporation of poorly decomposed OM in soil increases the emission of CH4. The
FYM/compost, which is the most dominant source of OM in Nepalese rice-wheat
system, is prepared through anaerobic fermentation and even the fermented product is
not well-decomposed in most of the cases (Subedi, 1997).
In addition to emitting CH4, the poorly decomposed manure also increases severity
of crop pests. This can be solved by the use of effective microorganisms such as
Trichoderma spp., Gliocladium virens as they accelerate the manure decomposition
process. Also, increased aeration in manure pit has been found effective to minimize the
emission of CH4. Another option to minimize emission from manure is the promotion of
bio-gas plants. While doing so, CH4 produced from decomposed organic matter can be
utilized as a source of household energy and the slurry (by product from biogas plant)
can be used as organic manure in crop fields. A study has shown that biogas could
28
reduce emissions by approximately 60% as compared to FYM prepared from
conventional method (Eason, Scullion & Scott, 1999). So, biogas saves fossils fuel by
providing alternative energy source for household energy consumption, and at the same
time it mitigates GHGs from animal manure. There is a growing trend of establishing
biogas plants in the country and clean development mechanism of the Kyoto Protocol
seems to be a good opportunity to promote more biogas plants in the country (Maharjan,
Joshi & Piya, 2011).
The emission of N2O from rice-based system is linked with the nitrogen cycle
associated with the system. Farmers use both chemical fertilizers (e.g. urea) and organic
sources (FYM/compost, green manure) in rice field. Also, nitrogen is added in the soil
by symbiotic (if green legumes grown in the field) and non-symbiotic (e.g. blue green
algae) nitrogen fixation processes. When nitrogenous fertilizers dissolve/decompose in
soil, ammonium (NH4+) ion is released and it further converts into nitrate (NO3
-) ion
through the process called nitrification. This nitrate ion is taken by plant roots. But the
plant roots do not uptake all the nitrate ion at the same time, the remaining part is lost
either through leaching or through denitrification (the process through which the nitrate
form of nitrogen converts into nitrous oxide or nitrogen gas). Studies have shown that
30-70% of nitrogen applied through chemical fertilizer in rice field in Nepal is lost
through denitrification and leaching (Toomsan et al., 2000; Pandey, Shah & Becker,
2008).
In case of rice-based system, during the wheat growing season (November to
February), most of the nitrogen applied in the soil is taken by wheat crop and therefore
the loss of N2O and NO3- is generally low. After harvesting wheat crop, temperature of
bare soil increases due to intense sun light. Then, the process of mineralization and
29
nitrification is accelerated by which the nitrogen bound in the plant roots and organic
matter (in ammonium form) is released (in nitrate form). Pande, Shah & Becker (2008)
found that NH4-N content in the bare soil decreased from 21.2 to 5.9kg ha-1 and from
12.3 to 9.3kg ha-1 after six weeks of wheat harvesting in the year 2001 and 2003,
respectively. But they found N2O peak (11micro mol m-2) to have reduced drastically (2
micro mol N2O m-2) after the rain. This is due to the fact that when N2O reacts with
water it converts into No3- form and leaches out from the soil surface. Similar studies
carried out in China and India have found that N2O is lost from the bare soil in the range
of 0.034–0.06kg N2O–N ha−1 during the spring season (Chen et al., 1997). There is no
exact information available how much amount of N2O is emitted from rice-wheat
system as a whole from per unit land in Nepal.
There is about 0.4 million hectare land fallow in the spring season due to limited
irrigation facility, agronomic options as well as free grazing (Khanal et al., 2006). At
this circumstance, planting spring season crops at the fallow land holds enormous
potential to mitigate N2O emission from soil. Field experiments carried out in Chitwan
and Rupandehi districts of Nepal from 2001 to 2003 show that growing maize,
mungbean or macuna reduces the NO3- nitrogen peak by 50 to 75%. However, macuna
shows the highest response (75% reduction) and is followed by mungbean (65%) and
maize (20%) with reference to loss of nitrate nitrogen from bare soil 20kg ha-1) after 7
weeks of wheat harvesting. The plant analysis showed that total N accumulation by
mucuna, mungbean and maize was 108, 80 and 54kg ha-1, respectively. These results
demonstrate the high potential of spring season crops in trapping the nitrate nitrogen
from atmosphere. However, the legumes are considered much more important than
maize considering their roles in fixing atmospheric nitrogen.
30
2.6.2 Energy saving practices
Zero-tillage (ZT) is a method of tilling the field with minimum soil disturbance. It is
synonymously used with conservation tillage because minimizing the soil disturbance
improves soil quality and production efficiency. Based on crop species in which it is
applied ZT is named with some modification. For example, if small band or trench is
made while applying the ZT practice in legumes to ensure the crop establishment
covering the seed with the layer of soil or organic matter, it is called strip-tillage or
minimum tillage or reduced tillage (Dumanski et al., 2006; Derpsch, 2007). And if seed
is sown directly in the field manually or using seed drill, it is called no-till or surface
seeding, and this practice is common in wheat in India and Pakistan, and is spreading to
Nepal (Tripathi et al., 2006). In this article ZT is synonymously used with surface
seeding or no-till.
ZT is a traditional practice in Nepal being adopted by farmers in lentil, wheat, garlic
and linseed since the long time period, especially in the residual moisture that exists
after rice harvest. However, in all the above cases seed sowing is done manually.
National wheat research organization started on-station research on surface seeding in
wheat in the 1980s, and from the 1990s, the organization started validating the practice
in farmers’ fields. From mid 1990s research activities were started for the validation of
seed drills for surface seeding in wheat both in on-station and on-farm conditions
(Tripathi et al., 2006; Regmi et al., 2009).
Though there is no common practice of ZT in rice, its application even in wheat
offers various socio-economic benefits to rice growers. The first one is associated to
increasing cropping intensity and yield. Studies have shown that it is possible to sow
wheat about 15-20 days earlier than that of the conventional practice through ZT (Ladha
31
et al., 2003; Regmi et al., 2009). As a result, wheat can be harvested earlier and it is
possible to grow spring season crops such as maize, mungbean and so on. Timely
planting of wheat (Oct 15 to Nov 15 as per recommended by NARC) is also important
to escape the problem of terminal drought that causes sterility problem in wheat. Studies
have shown that planting of wheat after first week of December reduces its yield @
1-1.5% per day (Gupta & Sayre, 2007; Ladha et al., 2003). Regmi et al. (2009) found
30-40% higher yield in ZT practice as compared to conventional practice in tarai areas
of Nepal. Similarly, Shah et al. (2011) found 16% higher wheat grain yield in ZT (1.8
tha-1) than that of conventional tillage (1.58t ha-1) in case of Rampur district. The
long-term experiments carried out in India and Pakistan from 1985 to 2003 show
30-50% higher grain yield of wheat in ZT as compared to the conventional one
(Erestein, 2009). It is estimated that about one-third of wheat in Nepal is planted late
due to late-maturing rice varieties such as Basmati and Radha 12. At this circumstance,
ZT would positively contribute to solve this problem by allowing farmers to sow wheat
on time.
Second benefit from ZT is related to increasing energy use efficiency. In Nepal,
about 30-40% of the total production cost in wheat is involved in land preparation
(Yadav et al., 2010). Erenstein & Farooq (2009) showed that ZT saves cost (US$ 52
ha-1) due primarily to the reduction in tractor time and fuel for land preparation, which
leads to into higher benefits of US$ 97 per hectare than conventional practice. Similarly,
Regmi et al. (2009) claimed that ZT saves 64% of the total cost involved in land
preparation.
ZT has been found promising not only in land preparation but it makes the others
intercultural operations easier. For example, it is easier to control obnoxious weeds like
32
Phalaris minor in ZT if wheat is sown using seed drill. Since this machine sows the
seed in rows and it makes the weeding easier (Erenstein & Laxmi, 2008). ZT also
increases the water use efficiency allowing the field to irrigate faster as compared to
conventional tillage. It is due to the fact that more water is needed to irrigate tilled soil
than non-tilled soil. Studies (Ladha et al., 2003; Gupta & Sayre, 2007) have shown that
ZT saves 30-50% water in wheat considering two irrigations (first during crown root
initiation stage after 25-30 days of seed sowing and second during flowering). In
addition to wheat, ZT technique was also tested in rice through direct sowing of rice
seed, but the crop yield was found lower (5.5t ha-1) than that of conventional tillage
(6.3t ha-1). Heavy infestation of weed is one of the factors reducing rice grain yield
(Regmi et al., 2009).
In addition to economic benefits, ZT contributes to social benefits. One of such
benefits is associated with the time saving. There are evidences that households can use
time saved while adopting ZT in social, and leisure purposes (Erenstein & Farooq,
2009). Women generally appreciate ZT due to less anxiety at the time of wheat field
preparation, and this results into more peace at home (Erenstein & Laxmi, 2008; Gupta
& Sayre, 2007). Similarly, Joshi, Mudwari & Bhatta (2006) claim that ZT contributes in
enhancing nutritional security of women by allowing them additional time to grow other
food sources such as vegetables.
The environmental benefits of ZT are associated with its potential to minimize the
consumption of fossil fuels needed for tillage operations and irrigation (Ladha et al.,
2003). A case of South Asia shows that ZT saves 36 liters of diesel for the cultivation of
wheat in a hectare, which is 8% less as compared to the conventional tillage (Erenstein
& Laxmi, 2008). Similarly, ZT saves water where wheat is grown in the irrigated
33
condition. Reducing the consumption of water is also associated with decreasing fossil
fuel consumption. Moreover, ZT minimizes the decomposition of soil organic matter in
the soil which ultimately contributes in reducing the emission of N2O (Tripathi et al.,
2006; Gupta & Sayre, 2007).
2.6.3 Other practices
2.6.3.1 Fertilizer management
To increase fertilizer use efficiency and to reduce emission of GHGs, identification
of appropriate fertilizers and their application method is important. For example, the
application of urea granules coated with dicyandiamide or calcium carbide and its
application matching with crop growth stage not only increases nitrogen use efficiency
but also decreases the nitrogen leaching from soil (Denison, 1996). It is because
nitrogen releases to the soil slowly from the granules and most of the released nitrogen
is absorbed by plants. In addition, botanicals, such as neem (Azadirachta indica) seed
was found promising as nitrogen inhibitor in urea granule in India. The other option in
minimizing the N loss is selection of appropriate fertilizers. The release of nitrogen
from amonium sulphate is slower than that of urea. Also, due to the availability of
sulphur, ammonium sulphate minimizes the emission of CH4 from rice field. Similarly,
the application of gypsum (CaSO4) in the rice field reduces the CH4 emissions by
29–46 % (Domaar, Lindwall & Kozub, 1988).
2.6.3.2 Water and land management
Rice is grown in water retaining soil, and so combining land management
techniques with irrigation would increase the water use efficiency, crop yield and
mitigate the CH4 emission from rice-based system. Some land management techniques
such as laser land leveling, bed planting, have been promising to increase the water use
34
efficiency in rice. One study shows that laser land leveling in wheat field in Pakistan
saves 25% water (Yadav et al., 2010). Similarly, management of proper drainage and
adoption of SRI (System of rice intensification) are other practices contributing on
water management. The SRI combines the concept of drainage along with adoption of
young (10-14 days old) single seedling, space planting and organic manure application.
This technique is being promoted across the rice growing environments; however, its
adoption is limited due to weed infestation and higher cost involved in transplanting rice
seedling (Upreti, 2008).
2.7 Policies and programs for supporting community-based seed producers in
Nepal
2.7.1 Introduction
In Nepal, government agencies and development projects are the major actors
involved in supporting CBSPs. This section discusses the policies and programs of these
actors with respect to the provision of source seed, seed quality testing facility, and
other extension facility (e.g. training) to CBSPs in Nepal.
2.7.2 Policies
Rice research and development activities started in Nepal systematically from 1972
with the establishment of National Rice Research Program at Parwanipur of Bara
district, but policies with reference to seed production and its promotion started only
after the development of National Seed Act in 1988. After this year, various policy
documents have been released from the government even though few of them are
focused on seed sector whereas others on agricultural development as a whole.
2.7.2.1 Agriculture Perspective Plan (APP)
This document was prepared and implemented to guide overall agricultural
35
development in Nepal from 1995 to 2015. The APP is a growth strategy that recognizes
agricultural growth as the main factor of poverty reduction in Nepal. The Government
approved APP in 1995 and then incorporated in its strategy and planning documents
since then. The APP aims at increasing the agricultural growth from 2.5% to 5% and
reducing poverty from 49% to 14% over the 20-year plan period. Though the use of
good quality seeds of improved varieties is widely recognized as fundamental to ensure
increased crop production and productivity in the plan, the strategies to provide good
quality seed of the improved varieties have not been mentioned. It also discussed the
development of infrastructure such as road and irrigation facility for agricultural
development as well as recognized the importance of the participation of private sectors
in agriculture but did not indicate the operational mechanism to implement these
strategies. APP is still the basis for the agricultural development in Nepal.
2.7.2.2 National Agricultural Policy 2004 (NAP)
This policy has been adopted since 2004 and its focus is on improving the
livelihoods of people through transformation of the subsistence agriculture into a
commercialized ones. However, the specific objectives are:
to increase agricultural production and productivity
to make Nepal's agriculture competitive in the regional and the global markets,
through commercialization and competitiveness
to protect, promote and properly utilize the natural and environmental resources,
and biological diversity
In order to raise production and productivity, NAP emphasizes to supply main
production inputs (seeds, fertilizers and breeds) based on market demand. It encourages
the use of hybrid seeds and regular monitoring of genetically modified organisms. It
36
talks about the supply of quality inputs. It has provisioned to provide accreditation to
private laboratories for testing of seed quality. The policy commits to provide special
incentives to Dalit, oppressed and marginalized farmers and agricultural labourers who
own less than a hectare of land with inadequate irrigation facilities.
Moreover, NAP proposes to establish and strengthen Agriculture Resource Centres
(ARC) on the basis of development region as special technology service centres for (a)
collection, processing, storage and transportation of agricultural produce, and (b)
production of quality seeds, seedlings, plants and breeds of animals and plants. These
centres would be gradually strengthened through the provision of trainings so that they
could develop into an integrated centre providing services relating to soil analysis, seed
certification, diagnosis and management of crop and livestock diseases, and training to
entrepreneurs, businessmen, cooperative workers and agricultural workers. In spite of
the optimistic policy, no attempt has been made for its implementation in the ground.
2.7.2.3 National Seed Policy 1999 (NSP)
Until 1998, NARC was the only organization to develop crop varieties and supply
source seed to farmers. However, NSP opened up avenue to involve private sector in
crop variety development and seed trade. The NSP covers seven aspects of seed
industry growth in Nepal: 1) Variety development and maintenance, 2) Seed
multiplication, 3) Quality control, 4) Increased involvement of private sector, 5) Seed
supply, 6) Institutional strengthening, and 7) Biotechnology. The objectives of the NSP
were: (i) making available quality seeds of various crops in required quantity, (ii)
promoting export by producing quality seed, (iii) making seed business effective in
terms of existing world trade, (iv) conserving indigenous genetic resources and
coordinating with concerned organization to protect national right on them. Many
37
provisions in the NSP are progressive towards the development of seed industry in the
country by facilitating the involvement of private sector in this area. As in the previous
policies there was lack of operational strategies. This policy also suggested amending
the Seed Act 1988, incorporating the issues related to the involvement of private sectors
in seed production and supply chain.
2.7.2.4 Seed Act 1988 and its first amendment 2008
A seed act was developed in 1988 to regulate the quality seed production in the
country so that general public people could improve their living standard by increasing
crop yield as a result of adopting improved seed. As per the act, National Seed Board
advises Nepalese Government on formulating and executing national policies for
ensuring availability of quality seeds through regular production, processing and
marketing. The amended document has increased the provision for the participation of
farmers from one to two. Similarly, a representative from agricultural development bank
will be in the national seed committee consisting of 15 members and headed by
Agricultural secretary. Similarly, the revised act has provisioned the licensing to private
sector for setting up seed laboratory. But this act has made it compulsory for the
registration/release of varieties before going for dissemination or mass multiplication. It
does not talk about the farmers’ rights towards the indigenous knowledge and varieties
evolved through their selection process. Similarly, there is nothing mention about how
the plant breeders working with government agencies would realize incentives for the
development of more varieties.
2.7.2.5 Three Year Interim Plan (2010-2013)
This plan highlights the necessity for quality seed production by strengthening
government-owned and private farms which produce certified seed and improved
38
livestock breed. It also highlights necessity for developing international level seed
certification standard in Nepal so that seeds produced in Nepal could be exported to
foreign countries.
2.7.2.6 National Agro Biodiversity Policy (2007)
Nepal is quite rich in biodiversity though the country is small (occupying 0.09% of
the world land). The country possesses biodiversity at generic, species and ecosystem
level. Biological diversity of Nepal is closely linked to livelihoods, human health and
nutrition and indigenous knowledge. This policy provides overall policy framework for
agricultural biodiversity conservation in Nepal. It provisions to carry out research
activities on genetically modified organisms but those interested to do so need to take
permission from government showing its impacts on biodiversity and environment. It
highlights the necessity of recognizing the farmers’ rights in local varieties and
materials but does not discuss about the mechanism to do so.
2.7.2.7 Local Self Governance Act (1999)
The Local Self-Governance Act 2055 (1999) authorises the local bodies such as VDC,
District Development Committees and municipalities to formulate and implement
policies, programs related to agriculture and rural development. Agricultural related
activities highlighted in this act are promotion of agricultural market centres, animal
clinics and irrigation facility. It also stressed that VDC be the focal body to coordinate
field level agricultural activities to be implemented by government and NGOs.
2.7.3 Programs
2.7.3.1 Foundation seed production and its supply
NARC has prime responsibility for the production of breeder seed in Nepal, and this
category of seed is produced at National Rice Research Program and at other NARC
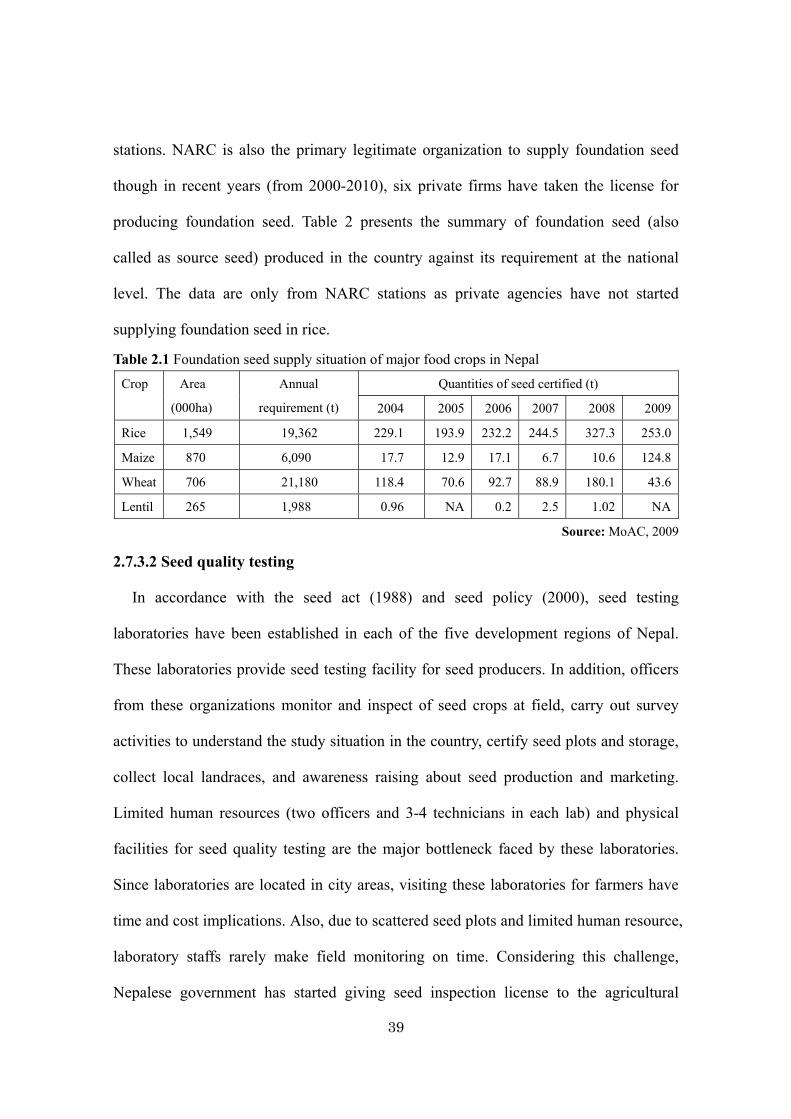
39
stations. NARC is also the primary legitimate organization to supply foundation seed
though in recent years (from 2000-2010), six private firms have taken the license for
producing foundation seed. Table 2 presents the summary of foundation seed (also
called as source seed) produced in the country against its requirement at the national
level. The data are only from NARC stations as private agencies have not started
supplying foundation seed in rice.
Table 2.1 Foundation seed supply situation of major food crops in Nepal
Crop Area
(000ha)
Annual
requirement (t)
Quantities of seed certified (t)
2004 2005 2006 2007 2008 2009
Rice 1,549 19,362 229.1 193.9 232.2 244.5 327.3 253.0
Maize 870 6,090 17.7 12.9 17.1 6.7 10.6 124.8
Wheat 706 21,180 118.4 70.6 92.7 88.9 180.1 43.6
Lentil 265 1,988 0.96 NA 0.2 2.5 1.02 NA
Source: MoAC, 2009
2.7.3.2 Seed quality testing
In accordance with the seed act (1988) and seed policy (2000), seed testing
laboratories have been established in each of the five development regions of Nepal.
These laboratories provide seed testing facility for seed producers. In addition, officers
from these organizations monitor and inspect of seed crops at field, carry out survey
activities to understand the study situation in the country, certify seed plots and storage,
collect local landraces, and awareness raising about seed production and marketing.
Limited human resources (two officers and 3-4 technicians in each lab) and physical
facilities for seed quality testing are the major bottleneck faced by these laboratories.
Since laboratories are located in city areas, visiting these laboratories for farmers have
time and cost implications. Also, due to scattered seed plots and limited human resource,
laboratory staffs rarely make field monitoring on time. Considering this challenge,
Nepalese government has started giving seed inspection license to the agricultural
40
professional in recent years. Until 2010, four private organizations have already taken
the licence for seed quality testing (SQCC, 2012). However, the performance of these
organizations is yet to be assessed.
2.7.3.3 Community-based seed production
The first program implemented by Nepalese government to support
community-based seed production is the District level Seed Self Sufficiency Program
(DISSPRO). This program was implemented by Ministry of Agriculture and
Cooperative since 1998. Initially, this program was implemented in 15 districts, two
tarai and one hill district in each of the five development regions (Poudel et al, 2003).
The selected districts were to produce certified first generation (C1) seed from source
supplied by research stations. As of 2012 this program has been extended across the 63
districts (SQCC, 2012). In this program DADOs and its subsidiary organizations such as
agriculture service centres are the major actors for its implementation. As per the
DISSPRO guideline DADOs provide necessary technical support (through training) in
producing, processing, storing and distribution of seed, for the selected CBSPOs
registered in DADOs. Farmers participating in this programme get 25% subsidy on
source seed together with 100% subsidy on transportation. The recipients are the
households maintaining good relationship with DADOs’ officials. It means those having
good relationship with government officers are more likely to get these facilities.
Moreover, households could also get 25% subsidy on sprayers and pesticides’ cost.
In addition to the above-mentioned household level benefits, DISSPRO provides
grant NRs 25,000 to start their business activities for one group but the total number of
groups (CBSPOs) receiving such grant were 20 by 2009 as a start-up business support
fund, but the total number of organizations receiving this support was 20 by 2009. With
41
the aim of making DISSPRO more commercial oriented, some additional support
schemes have been provisioned under DISSPRO. These schemes are supports for
irrigation facility, and partial grant for developing physical structures such as threshing
floor and seed storage house. CBSPOs receiving these supports are from Chitwan,
Rupandehi and Morang districts.
There is no comprehensive study carried out to evaluate the DISSPRO program in a
country as a whole. But district level case studies (Poudel et al., 2003; Chand & Karki,
2005) shows that DISSPRO was only focused on production aspects rather than
empowering farmers about seed marketing. Also, donor-funded projects implemented
by DADO under DISSPRO framework realized the same problem (Poudel et al., 2003).
For instance, Special Project in Nepal (SPIN) was implemented in six tarai districts of
Nepal from 1995-1999 to enhance farmers’ level seed production in food crops
including rice by DADOs but none of the CBSPOs out of 20 surveyed were continuing
seed production activities while visiting in 2001.
The main reason behind it might be due to lack of marketing knowledge as the
project provided training only in production aspects (Chand & Karki, 2005). Similarly,
the second reason might be due to poor linkage of CBSPOs with service providers. It
was due to the fact that the project provided necessary seed, fertilizer and pesticides to
the farmers on subsidy after buying in the market mobilizing the project staff, but no
attempt was made to link the market actors with CBSPOs. Other associated reasons
might be due to poor access to credit facility in the rural areas. In Nepal, rural finance
includes agricultural finance, microfinance, cooperatives and other informal sources
such as village merchants, friends and relatives. The service of formal financial
institution is concentrated in city areas and these institutions hesitate to lend money to
42
seed enterprises run by farmers. Therefore, CBSPOs have to pay exorbitant interest
rates putting their collaterals such as land certificates, even if financial institutions agree
to provide them loans (Pradhan, 2009).
In addition to the government’s led programs, several donor-supported projects were
also implemented by NGOs in partnership with government agencies to help establish
the local seed supply system in the country. Some of the projects to enumerate are: Seed
Production and Inputs Storage Project, Private Producers Sellers Programme, Mechi
Hill Development Programme, Koshi Hill Seed and Vegetable Development Project,
Rural Save Grain Project, Seed Sector Support Project, Hill Seed Programme, Action
Aid Rural Development Programme for Seed Production, and seed production program
run by Pakhribas Agriculture Center and Lumle Agriculture Center.
All of these projects were implemented in the hills to support local seed supply system
in vegetables and cereal crops. There are no impact evaluation studies of these projects but
it is believed that they created awareness and provided basis for the development of seed
industry in the country. Similarly, these projects were focused on not only seed but also the
other aspects of livelihoods in the rural areas. These projects were also primarily followed
the strategies followed by DISSPRO where previously formed groups, cooperatives with no
or limited business skills were strengthened in seed production and marketing. The recent
projects focused on community-based seed production in cereals and legumes in tarai was
Research into Use Program (2008-2012) which emphasized the empowerment of farmers’
groups and cooperatives through enterprise management training, facilitation for the
development and operation of business plans, and fostering linkage with other service
providers and communities (Forum for Rural Welfare and Agricultural Reform for
Development - FORWARD, 2011).
43
Chapter 3. Research design
3.1 Introduction
This chapter describes the conceptual framework used to analyze the sustainability
of community-based rice seed production. These concepts were developed based on the
existing literature about what makes this seed production system successful. In addition,
this chapter highlights the study districts, methodology for gathering and analyzing data.
3.2 Conceptual framework
There are two approaches used to analyze the sustainability of rural agricultural
systems: a) comparing the performance between successful and unsuccessful systems,
and b) comparing the performance between better performers with lower performers.
This study adopts the second approach for analyzing the sustainability of
community-based seed production system. Another issue in the analysis is what needs to
be sustained. This study considers that benefits to be realized by producers and
consumers need to be sustained as it might not be logical to consider the continuity of
the system elements in the same level in the changing context (Brinkerhoff &
Goldsmith, 1990). The benefit realized by seed producers are analyzed from the
perspective of efficiency both in ‘seed production’ and ‘seed marketing’ phases.
3.2.1 Components of the framework
Producers: Producers represent rice seed producing households having membership
in CBSPOs. Since seed production is carried out household level, it is the household
decision how household converts inputs (land, labor, capital and source seed) into raw
seed using technology (scientific knowledge) and achieve economic and environmental
performance. The economic performance gained by household is efficiency, whereas
environmental performance (here it is adoption of soil conservation practice) shows the
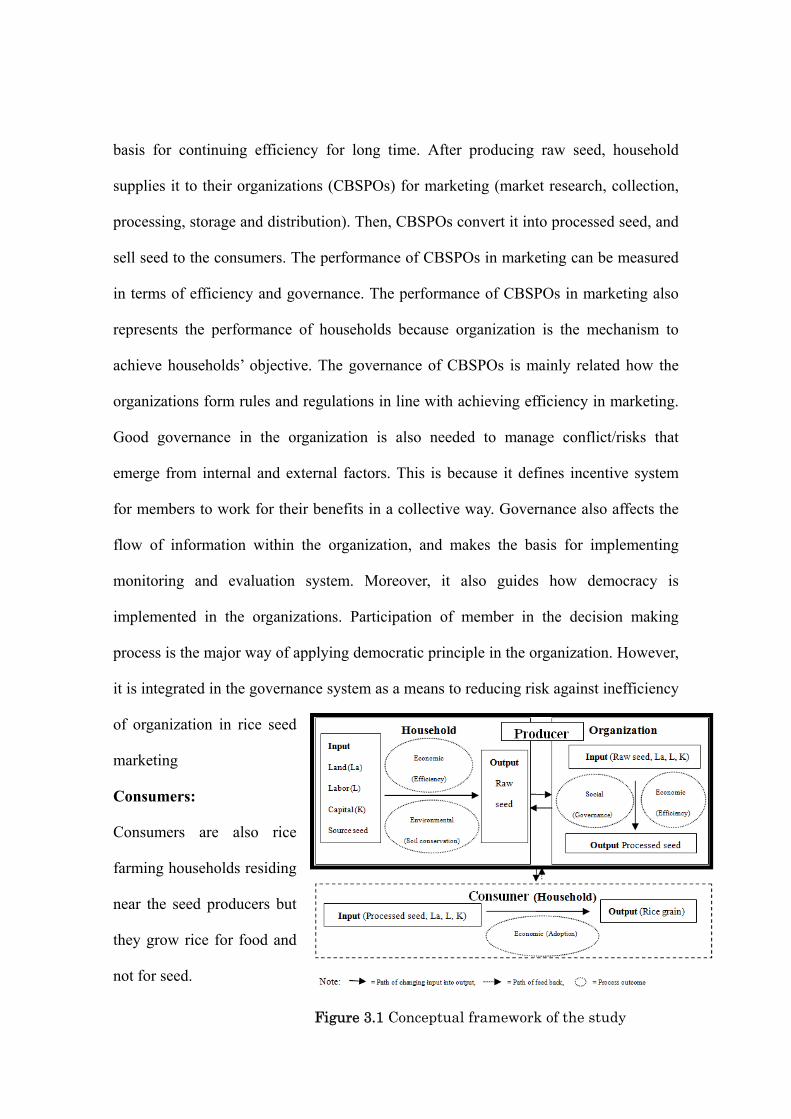
44
basis for continuing efficiency for long time. After producing raw seed, household
supplies it to their organizations (CBSPOs) for marketing (market research, collection,
processing, storage and distribution). Then, CBSPOs convert it into processed seed, and
sell seed to the consumers. The performance of CBSPOs in marketing can be measured
in terms of efficiency and governance. The performance of CBSPOs in marketing also
represents the performance of households because organization is the mechanism to
achieve households’ objective. The governance of CBSPOs is mainly related how the
organizations form rules and regulations in line with achieving efficiency in marketing.
Good governance in the organization is also needed to manage conflict/risks that
emerge from internal and external factors. This is because it defines incentive system
for members to work for their benefits in a collective way. Governance also affects the
flow of information within the organization, and makes the basis for implementing
monitoring and evaluation system. Moreover, it also guides how democracy is
implemented in the organizations. Participation of member in the decision making
process is the major way of applying democratic principle in the organization. However,
it is integrated in the governance system as a means to reducing risk against inefficiency
of organization in rice seed
marketing
Consumers:
Consumers are also rice
farming households residing
near the seed producers but
they grow rice for food and
not for seed.
Figure 3.1 Conceptual framework of the study
45
These households serve as potential buyers of seed produced by the seed producers.
These farmers might get processed seed from CBSPOs and convert it into rice grain
using internal resources. In the process of conversion if they realize benefit it is more
likely that the consumers would continue buying seed from the seed producers
(adoption). The benefit might be in the form of crop yield, straw yield or suitability of
rice varieties in the cropping pattern or market price. However, diversity and cheap
price could address the consumers’ concerns. The adoption of seed/variety is an
economic issue, and environmental and social issues are not focused at this level.
3.2.2 Relationship between producers and consumers
Three theories (system theory, contingency theory and political economy) explain
the relationship between producers and consumers. The system theory discusses how
formal collectivities to informal code of conducts work in the process of converting
source seed into processed seed. Secondly, system theory is concerned simultaneously
with the internal process and the relationship between the system and its environment. It
thus forces us to think about a wide variety of social, economic, political, technical and
other factors that affect sustainability. In other words it enables us to merge
agro-environmental, economic and managerial aspects in sustainability analysis.
System theory, however, provides little guidance about how to portray internal
system processes or changes in response to externality. It is because the optimal
structure or management styles of the production system are contingent on uncertain
and exogenous condition. Contingency theory thus shares with system analysis a
concern for environment. The assumption in the theory is that any human aggregation or
pattern of behavior has to be seen in relation to the complex of outside forces that
threaten or promotes its survival and expansion. The contingency theory fills this gap
46
and demonstrates how producers can best attain congruence with the influences of
external factors.
Producers can also impart direct influence on consumers. For example, marketing
strategies such as seed quality, quantity, location, time of distribution, publicity could
change consumers’ behavior in buying seed. But it is difficult for household to do these
activities individually but they could do while organizing in groups or organizations.
The households’ phenomena to organize in groups/association can be discussed with the
help of political economy. For example, farmers organized in organizations could
improve their economic activity by reducing transaction (marketing) cost and enhancing
bargaining power with service providers. So, the above framework addresses three
pillars (economy, environment and society) of sustainable development.
3.3 Study districts
The study was carried out in three tarai districts: Siraha, Chitwan and Kailali of
Nepal, and these districts represent Eastern, Central and Far-western development
regions of the country, respectively. The commonality across the districts is that
agriculture is the major source of livelihoods of people (Table 3.1). The location of
these districts in Nepal’s administrative map is shown in figure 3.2.
The farmers in these areas are poor (with per capita income less than one dollar a
day), and small farmers (average landholding less than a hectare). Also, majority of
people in these districts are illiterate. Chitwan has better irrigation facility as compared
to that of other two districts. This district has also better road networks with other parts
of the country.
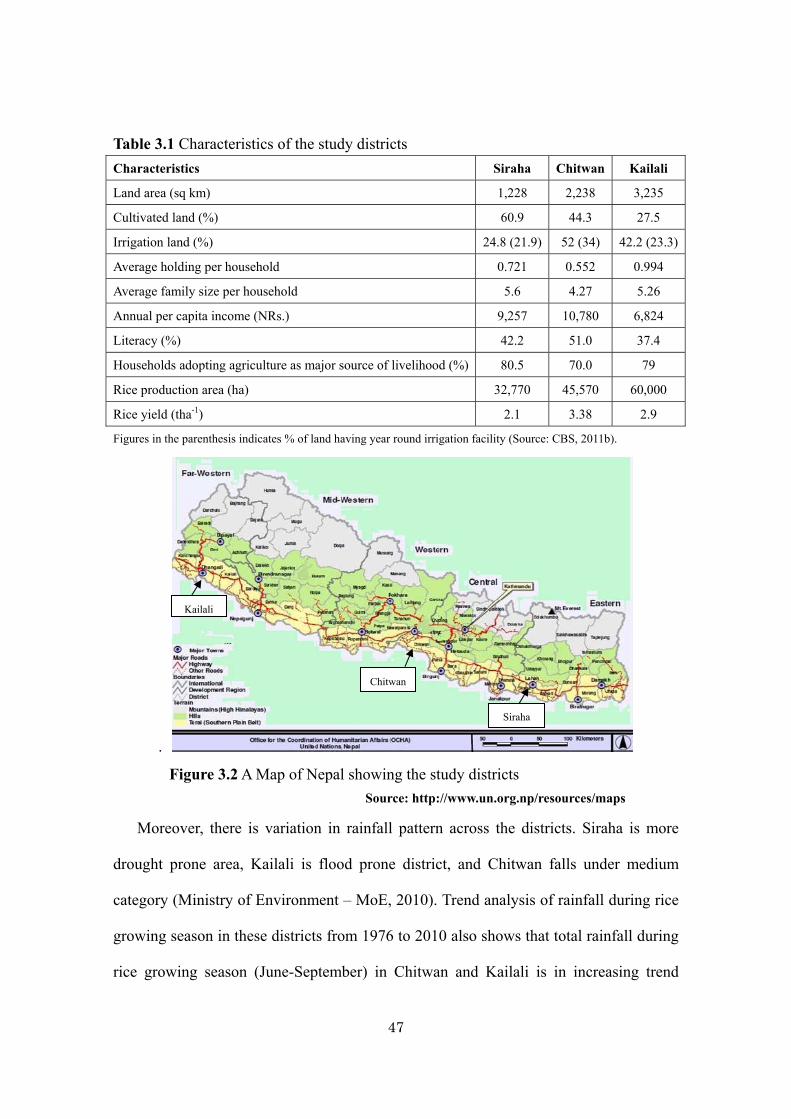
47
Table 3.1 Characteristics of the study districts Characteristics Siraha Chitwan Kailali
Land area (sq km) 1,228 2,238 3,235
Cultivated land (%) 60.9 44.3 27.5
Irrigation land (%) 24.8 (21.9) 52 (34) 42.2 (23.3)
Average holding per household 0.721 0.552 0.994
Average family size per household 5.6 4.27 5.26
Annual per capita income (NRs.) 9,257 10,780 6,824
Literacy (%) 42.2 51.0 37.4
Households adopting agriculture as major source of livelihood (%) 80.5 70.0 79
Rice production area (ha) 32,770 45,570 60,000
Rice yield (tha-1) 2.1 3.38 2.9
Figures in the parenthesis indicates % of land having year round irrigation facility (Source: CBS, 2011b).
.
Figure 3.2 A Map of Nepal showing the study districts
Source: http://www.un.org.np/resources/maps
Moreover, there is variation in rainfall pattern across the districts. Siraha is more
drought prone area, Kailali is flood prone district, and Chitwan falls under medium
category (Ministry of Environment – MoE, 2010). Trend analysis of rainfall during rice
growing season in these districts from 1976 to 2010 also shows that total rainfall during
rice growing season (June-September) in Chitwan and Kailali is in increasing trend
Chitwan
Kailali
Siraha
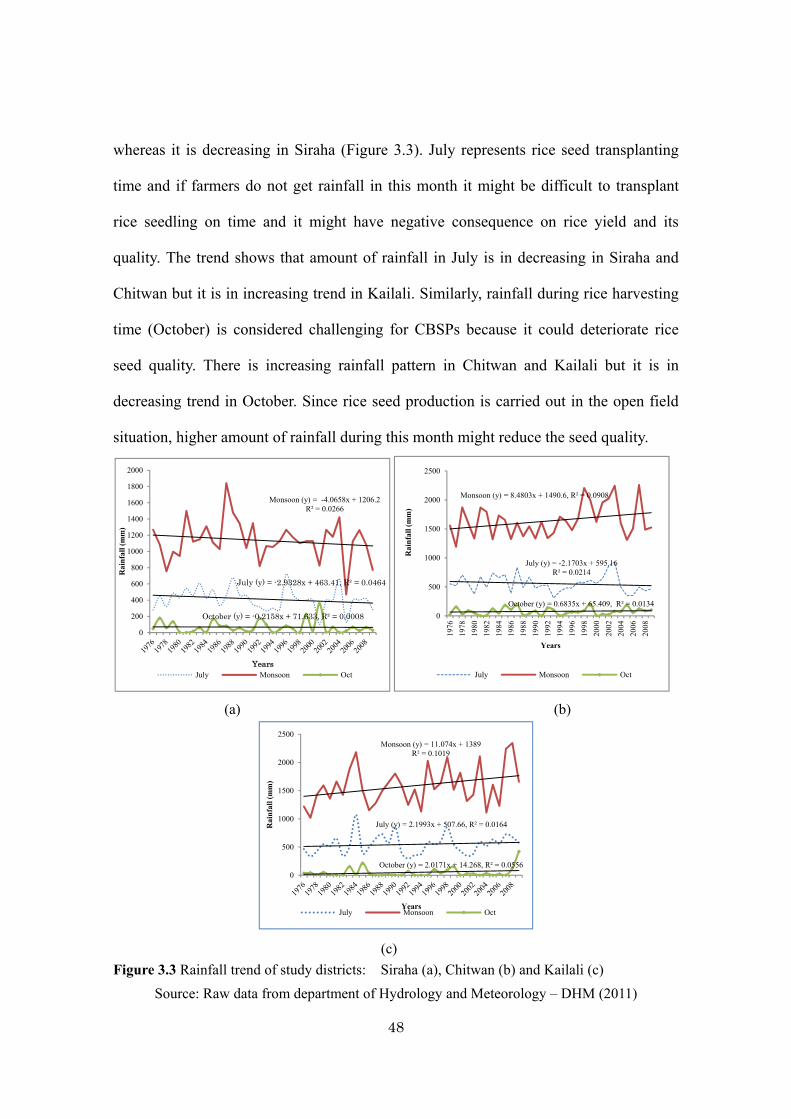
48
whereas it is decreasing in Siraha (Figure 3.3). July represents rice seed transplanting
time and if farmers do not get rainfall in this month it might be difficult to transplant
rice seedling on time and it might have negative consequence on rice yield and its
quality. The trend shows that amount of rainfall in July is in decreasing in Siraha and
Chitwan but it is in increasing trend in Kailali. Similarly, rainfall during rice harvesting
time (October) is considered challenging for CBSPs because it could deteriorate rice
seed quality. There is increasing rainfall pattern in Chitwan and Kailali but it is in
decreasing trend in October. Since rice seed production is carried out in the open field
situation, higher amount of rainfall during this month might reduce the seed quality.
Figure 3.3 Rainfall trend of study districts: Siraha (a), Chitwan (b) and Kailali (c)
Source: Raw data from department of Hydrology and Meteorology – DHM (2011)
July (y) = -2.9328x + 463.41, R² = 0.0464
Monsoon (y) = -4.0658x + 1206.2R² = 0.0266
October (y) = -0.2158x + 71.633, R² = 0.0008
0
200
400
600
800
1000
1200
1400
1600
1800
2000
Rai
nfal
l (m
m)
YearsJuly Monsoon Oct
July (y) = -2.1703x + 595.16R² = 0.0214
Monsoon (y) = 8.4803x + 1490.6, R² = 0.0908
October (y) = 0.6835x + 65.409, R² = 0.0134
0
500
1000
1500
2000
2500
1976
1978
1980
1982
1984
1986
1988
1990
1992
1994
1996
1998
2000
2002
2004
2006
2008
Rai
nfal
l (m
m)
Years
July Monsoon Oct
July (y) = 2.1993x + 507.66, R² = 0.0164
Monsoon (y) = 11.074x + 1389R² = 0.1019
October (y) = 2.0171x + 14.268, R² = 0.05560
500
1000
1500
2000
2500
Rai
nfal
l (m
m)
YearsJuly Monsoon Oct
(a) (b)
(c)
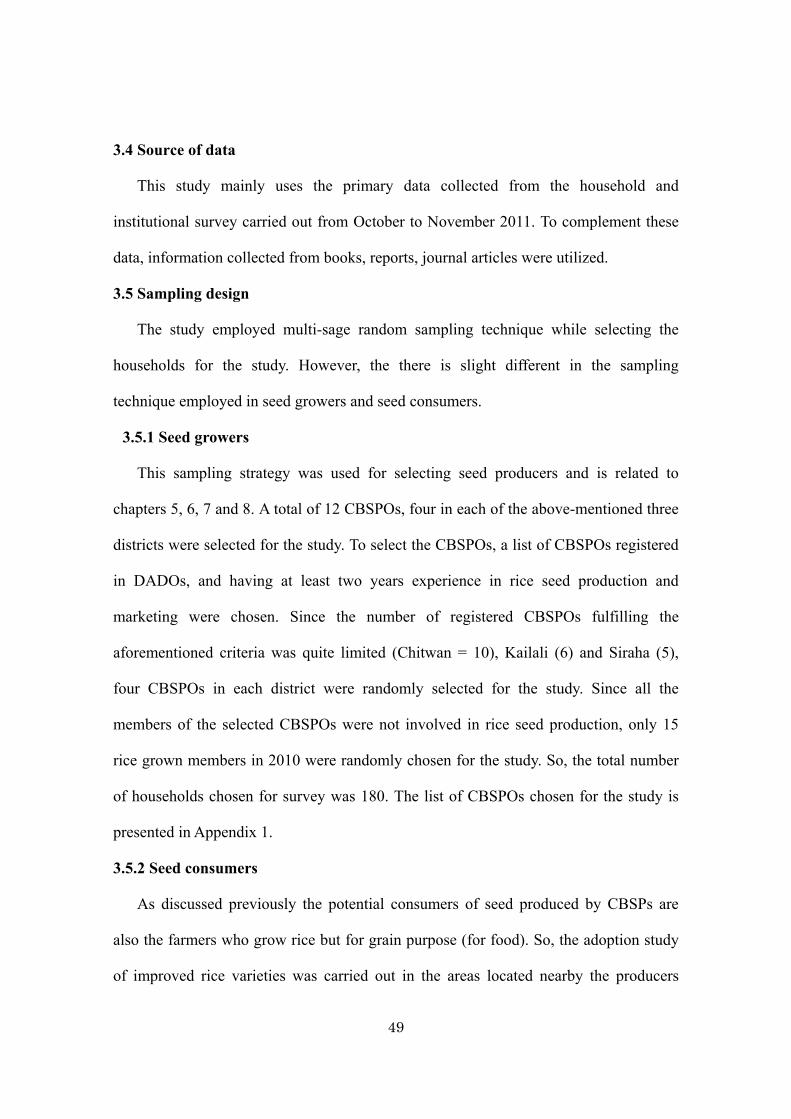
49
3.4 Source of data
This study mainly uses the primary data collected from the household and
institutional survey carried out from October to November 2011. To complement these
data, information collected from books, reports, journal articles were utilized.
3.5 Sampling design
The study employed multi-sage random sampling technique while selecting the
households for the study. However, the there is slight different in the sampling
technique employed in seed growers and seed consumers.
3.5.1 Seed growers
This sampling strategy was used for selecting seed producers and is related to
chapters 5, 6, 7 and 8. A total of 12 CBSPOs, four in each of the above-mentioned three
districts were selected for the study. To select the CBSPOs, a list of CBSPOs registered
in DADOs, and having at least two years experience in rice seed production and
marketing were chosen. Since the number of registered CBSPOs fulfilling the
aforementioned criteria was quite limited (Chitwan = 10), Kailali (6) and Siraha (5),
four CBSPOs in each district were randomly selected for the study. Since all the
members of the selected CBSPOs were not involved in rice seed production, only 15
rice grown members in 2010 were randomly chosen for the study. So, the total number
of households chosen for survey was 180. The list of CBSPOs chosen for the study is
presented in Appendix 1.
3.5.2 Seed consumers
As discussed previously the potential consumers of seed produced by CBSPs are
also the farmers who grow rice but for grain purpose (for food). So, the adoption study
of improved rice varieties was carried out in the areas located nearby the producers
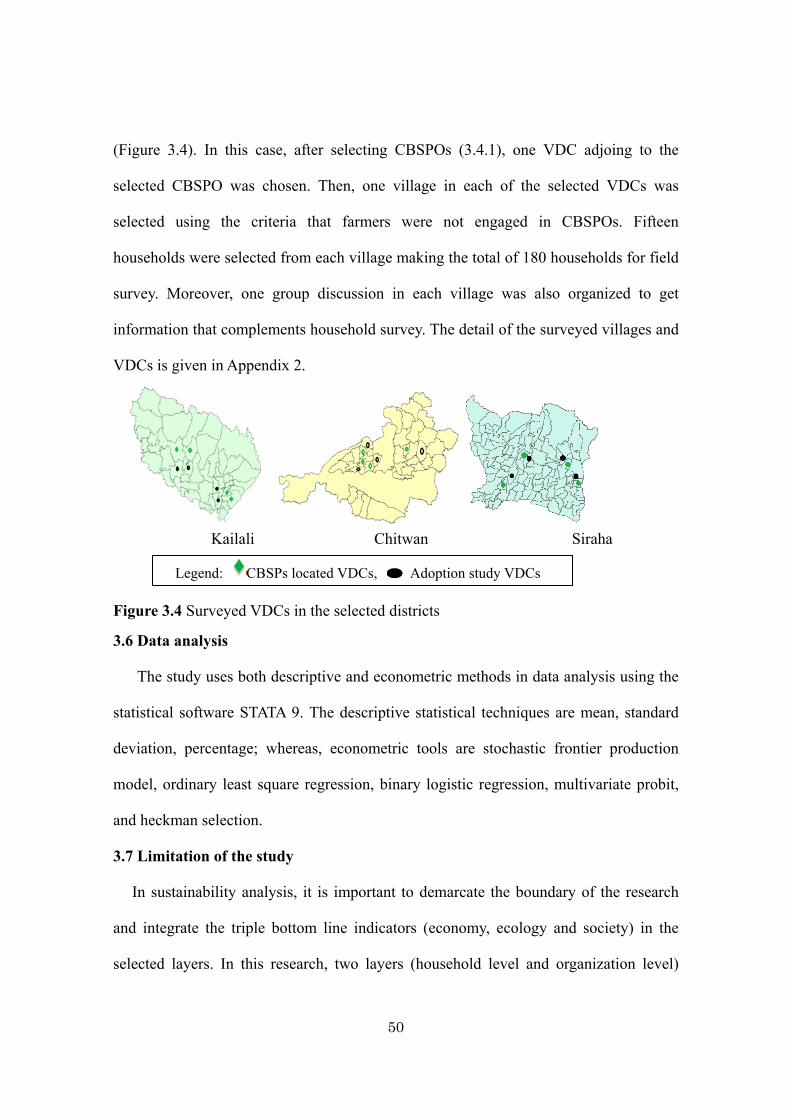
50
(Figure 3.4). In this case, after selecting CBSPOs (3.4.1), one VDC adjoing to the
selected CBSPO was chosen. Then, one village in each of the selected VDCs was
selected using the criteria that farmers were not engaged in CBSPOs. Fifteen
households were selected from each village making the total of 180 households for field
survey. Moreover, one group discussion in each village was also organized to get
information that complements household survey. The detail of the surveyed villages and
VDCs is given in Appendix 2.
Kailali Chitwan Siraha
Figure 3.4 Surveyed VDCs in the selected districts
3.6 Data analysis
The study uses both descriptive and econometric methods in data analysis using the
statistical software STATA 9. The descriptive statistical techniques are mean, standard
deviation, percentage; whereas, econometric tools are stochastic frontier production
model, ordinary least square regression, binary logistic regression, multivariate probit,
and heckman selection.
3.7 Limitation of the study
In sustainability analysis, it is important to demarcate the boundary of the research
and integrate the triple bottom line indicators (economy, ecology and society) in the
selected layers. In this research, two layers (household level and organization level)
Legend: CBSPs located VDCs, Adoption study VDCs
51
were considered in the analysis at producer side whereas one layer (seed consuming
household) considered in consumer side. It does not mean that rice seed value chain
ends at seed consumers but at grain consumers. The grain consumers will be not only
the rice growing farmers but also those who do not grow rice but involve in its
transaction and consumption. The latter two actors’ concerns have not been analyzed in
this study. However, it is hypothesized that seed consumers’ concern of price reduction
and variety diversity could also capture these actors’ concerns as well. Similarly, due to
absence of soil analysis data, ecological indicators such as adoption of soil conservation
practice, was used to represent environment concern in rice seed production.
52
Chapter 4. Adoption of improved rice varieties
4.1 Introduction
Seed consumers in this study are farmers those growing rice for grain and not for
seed. So, they act as buyers of the seed produced by seed producers. So, farmers’
(consumers) behavior in buying seeds play important role in the profitability and
sustainability of community-based seed production. From economic perspective it can
be argued that farmers’ behavior depends on how they value for seed. It is clear from the
literature that people buy seed for improved variety or improved seed (Joshi & Bauer,
2006; Paudel, 2011; Kafle, Paudel & Ghimire, 2012). However, there is no specific
clear cut demarcation between these two terminologies. Professionals working in
agricultural research and extension agencies use this term to refer to the modern
varieties those developed by agricultural research organizations, and improved seed for
the seed of these varieties. People from these backgrounds generally have mindsets that
varieties developed from research stations are always superior to what farmers grow or
innovate (farmers’ varieties).
On the other hand, the meaning of improved varieties might be different for farmers
as they consider multiple aspects such as suitability of seeds in the cropping pattern,
agronomic characteristics of the varieties, market potential and so on. Similarly, another
problem in the rice variety adoption analysis is that whether farmers repeatedly buy
fresh seed of the same variety or go for new variety. To address these complexities,
improved varieties are defined as those which farmers buy from the market. It means
farmers’ behavior in valuing the seed/crop varieties can be captured by this
market-based measure. So, this definition captures both modern varieties and farmers’
varieties. This chapter analyzes the types of varieties farmers buy from the market,
53
sources of these varieties, and impacts of households’ socio-economic determinants for
the adoption of these varieties.
4.2 Rice varieties grown in the study area
The study shows that farmers adopt 17 different rice varieties in the study area in the
growing season of 2010 (Table 4.1). These varieties can be divided into modern
varieties (58.8%) and farmers’ varieties (41.2%). Out of the total modern varieties (10),
only 50% varieties (Savitri, Hardinath 1, Ramdhan, Mithila & Radha 4) are the released
varieties by Nepalese government; whereas, the other four modern varieties (Kanchhi
Masuli, Sarju 52, Sona Masuli and Sawa Masuli) are the ones released by Indian
government in 1970s, and these Indian varieties introduced in Nepal’s tarai districts
through informal channel (farmer to farmer contact) due to open boarder system
between Nepal and India. But according to amended seed act of Nepal (2008), growing
of non-registered / non-released varieties is illegal (SQCC, 2012). So, farmers do not
get extension facility in these varieties.
Recently (since 2005) farmers in Chitwan and Kailali have started growing hybrid
rice variety (Gorakhnath), and agrovet introduced this variety in the study area in
partnership with multinational companies. It means multinational companies have
started pushing hybrid rice varieties providing incentive (subsidy) to agrovets. The
subsidy is in the form of providing seed in credit to agrovet, commission on the seed
sold by agrovets and provision of trainings to hybrid seed consumers. The farmers’
varieties grown in the study area are Bangali Masuli, Bhale Masuli and Mala (in Siraha),
Local Masuli (in Chitwan), and Bans Dhan and Anadi (in Kailali). The study also shows
that the average yield of farmers’ varieties is (3.12t ha-1) 16% less than those of modern
rice varieties released by Nepalese government (3.62t ha-1). But better cooking quality
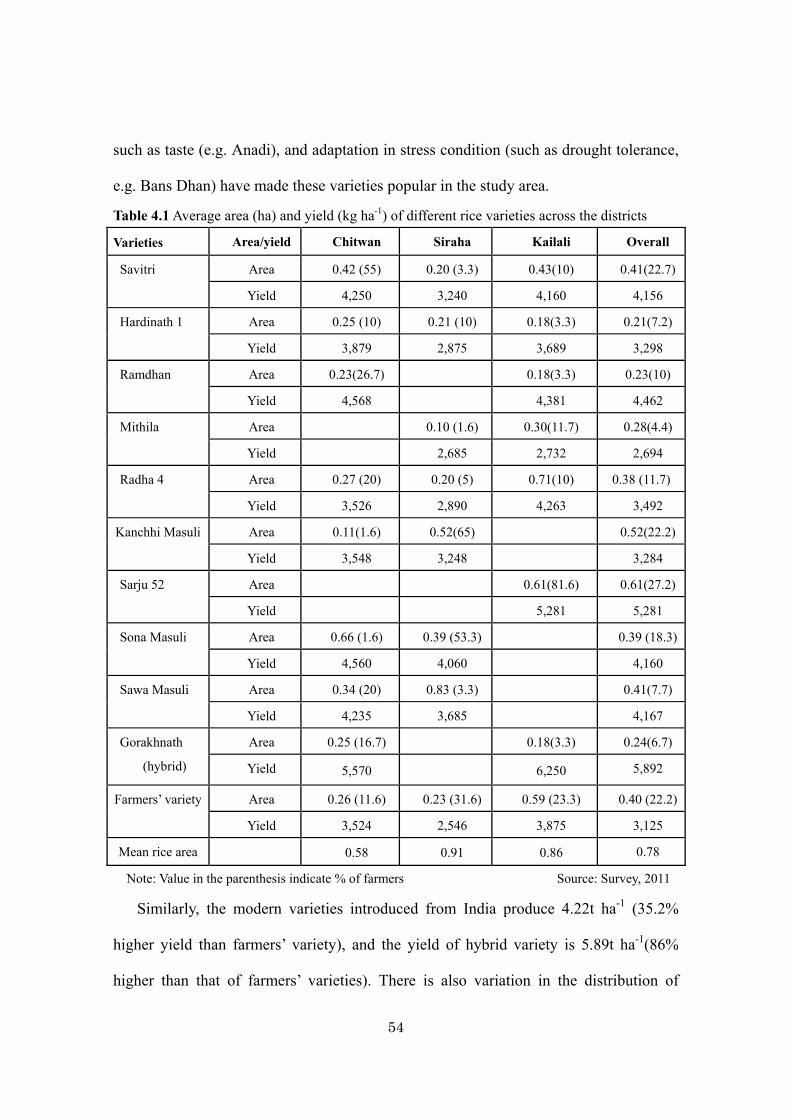
54
such as taste (e.g. Anadi), and adaptation in stress condition (such as drought tolerance,
e.g. Bans Dhan) have made these varieties popular in the study area.
Table 4.1 Average area (ha) and yield (kg ha-1) of different rice varieties across the districts
Varieties Area/yield Chitwan Siraha Kailali Overall
Savitri Area 0.42 (55) 0.20 (3.3) 0.43(10) 0.41(22.7)
Yield 4,250 3,240 4,160 4,156
Hardinath 1 Area 0.25 (10) 0.21 (10) 0.18(3.3) 0.21(7.2)
Yield 3,879 2,875 3,689 3,298
Ramdhan Area 0.23(26.7) 0.18(3.3) 0.23(10)
Yield 4,568 4,381 4,462
Mithila Area 0.10 (1.6) 0.30(11.7) 0.28(4.4)
Yield 2,685 2,732 2,694
Radha 4 Area 0.27 (20) 0.20 (5) 0.71(10) 0.38 (11.7)
Yield 3,526 2,890 4,263 3,492
Kanchhi Masuli Area 0.11(1.6) 0.52(65) 0.52(22.2)
Yield 3,548 3,248 3,284
Sarju 52 Area 0.61(81.6) 0.61(27.2)
Yield 5,281 5,281
Sona Masuli Area 0.66 (1.6) 0.39 (53.3) 0.39 (18.3)
Yield 4,560 4,060 4,160
Sawa Masuli Area 0.34 (20) 0.83 (3.3) 0.41(7.7)
Yield 4,235 3,685 4,167
Gorakhnath
(hybrid)
Area 0.25 (16.7) 0.18(3.3) 0.24(6.7)
Yield 5,570 6,250 5,892
Farmers’ variety Area 0.26 (11.6) 0.23 (31.6) 0.59 (23.3) 0.40 (22.2)
Yield 3,524 2,546 3,875 3,125
Mean rice area 0.58 0.91 0.86 0.78
Note: Value in the parenthesis indicate % of farmers Source: Survey, 2011
Similarly, the modern varieties introduced from India produce 4.22t ha-1 (35.2%
higher yield than farmers’ variety), and the yield of hybrid variety is 5.89t ha-1(86%
higher than that of farmers’ varieties). There is also variation in the distribution of
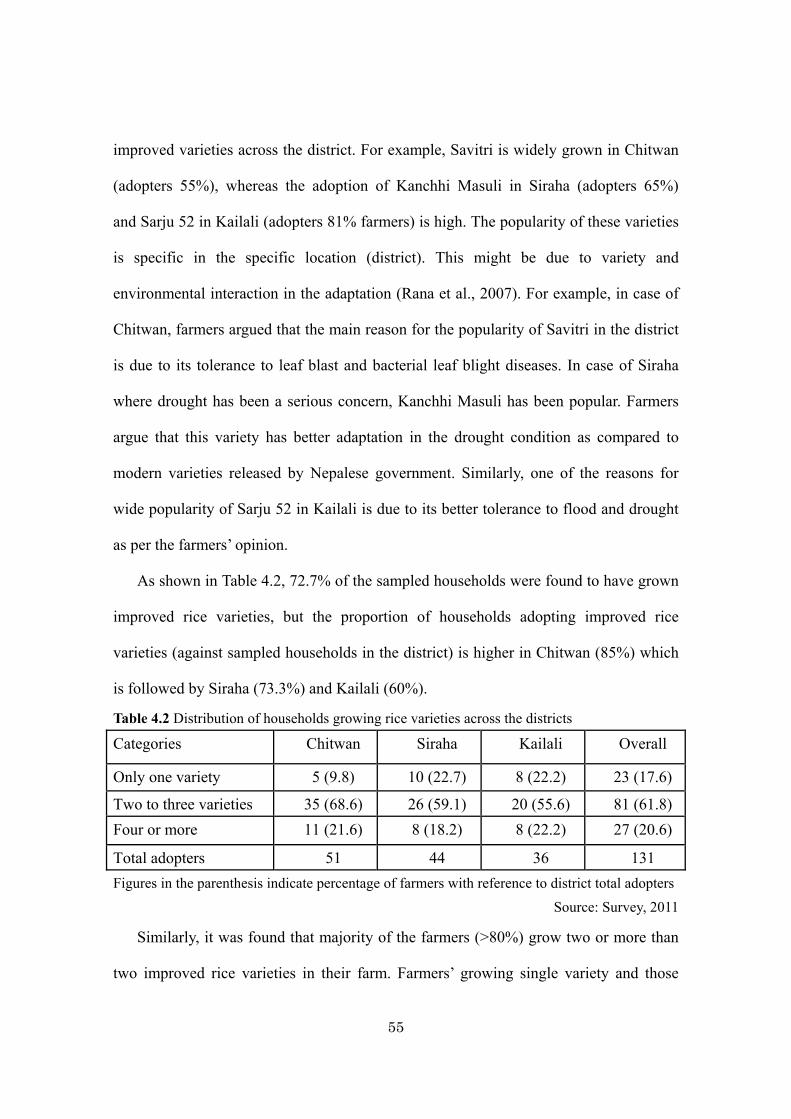
55
improved varieties across the district. For example, Savitri is widely grown in Chitwan
(adopters 55%), whereas the adoption of Kanchhi Masuli in Siraha (adopters 65%)
and Sarju 52 in Kailali (adopters 81% farmers) is high. The popularity of these varieties
is specific in the specific location (district). This might be due to variety and
environmental interaction in the adaptation (Rana et al., 2007). For example, in case of
Chitwan, farmers argued that the main reason for the popularity of Savitri in the district
is due to its tolerance to leaf blast and bacterial leaf blight diseases. In case of Siraha
where drought has been a serious concern, Kanchhi Masuli has been popular. Farmers
argue that this variety has better adaptation in the drought condition as compared to
modern varieties released by Nepalese government. Similarly, one of the reasons for
wide popularity of Sarju 52 in Kailali is due to its better tolerance to flood and drought
as per the farmers’ opinion.
As shown in Table 4.2, 72.7% of the sampled households were found to have grown
improved rice varieties, but the proportion of households adopting improved rice
varieties (against sampled households in the district) is higher in Chitwan (85%) which
is followed by Siraha (73.3%) and Kailali (60%).
Table 4.2 Distribution of households growing rice varieties across the districts
Categories Chitwan Siraha Kailali Overall
Only one variety 5 (9.8) 10 (22.7) 8 (22.2) 23 (17.6)
Two to three varieties 35 (68.6) 26 (59.1) 20 (55.6) 81 (61.8)
Four or more 11 (21.6) 8 (18.2) 8 (22.2) 27 (20.6)
Total adopters 51 44 36 131
Figures in the parenthesis indicate percentage of farmers with reference to district total adopters
Source: Survey, 2011
Similarly, it was found that majority of the farmers (>80%) grow two or more than
two improved rice varieties in their farm. Farmers’ growing single variety and those
56
growing four or more than four varieties are 17.6% and 20.6%, respectively. The above
finding shows that most of the farmers adopt diversified rice varieties. The practice of
diversifying the rice varieties by farmers (specifically on subsistence farming) is also
common in the developing countries as variety diversification strategy minimizes the
risk of crop failure due to natural calamities or diseases / pests severity (Almekinders,
Louwaars and Bruijin. 1994; Gauchan,Smale and Chaudhary, 2005). In group
discussions, some farmers argued that another reason for diversifying varieties at
household level is to enhance the productivity of overall farming system. For example,
early duration varieties such as Radha 4 (maturity 125 days) and Hardinath 1 (maturity
110 days) have been grown by farmers in upland (good drainage) area where they plan
to grow winter vegetables (such as cauliflower, potato, radish, leafy vegetables, etc)
after harvesting rice. Growing vegetables after harvesting these early rice varieties
allows farmers to produce these vegetables about 15-30 days earlier than they do with
medium duration varieties. Vegetables produced early could fetch better price in the
market because they could be during festivals when people have general tendency to
consume higher amount of vegetables. But in the medium or low land areas they choose
longer duration rice varieties (maturing from 130-140 days after seed sowing). In
general, grain yield and straw yield of medium duration rice varieties is higher than
those of early duration varieties (Yadav et al., 2005; NARC, 2011).
4.3 Sources of improved rice varieties
The study shows that farmers buy seed from four sources: neighboring farmers
(81.67%), local agrovet (49.6%), CBSPOs (24.4%) and development projects (19.08%)
implemented by government and NGOs. It means farmers buy seed from multiple
sources though neighboring farmers is the most important source. The agrovet buys
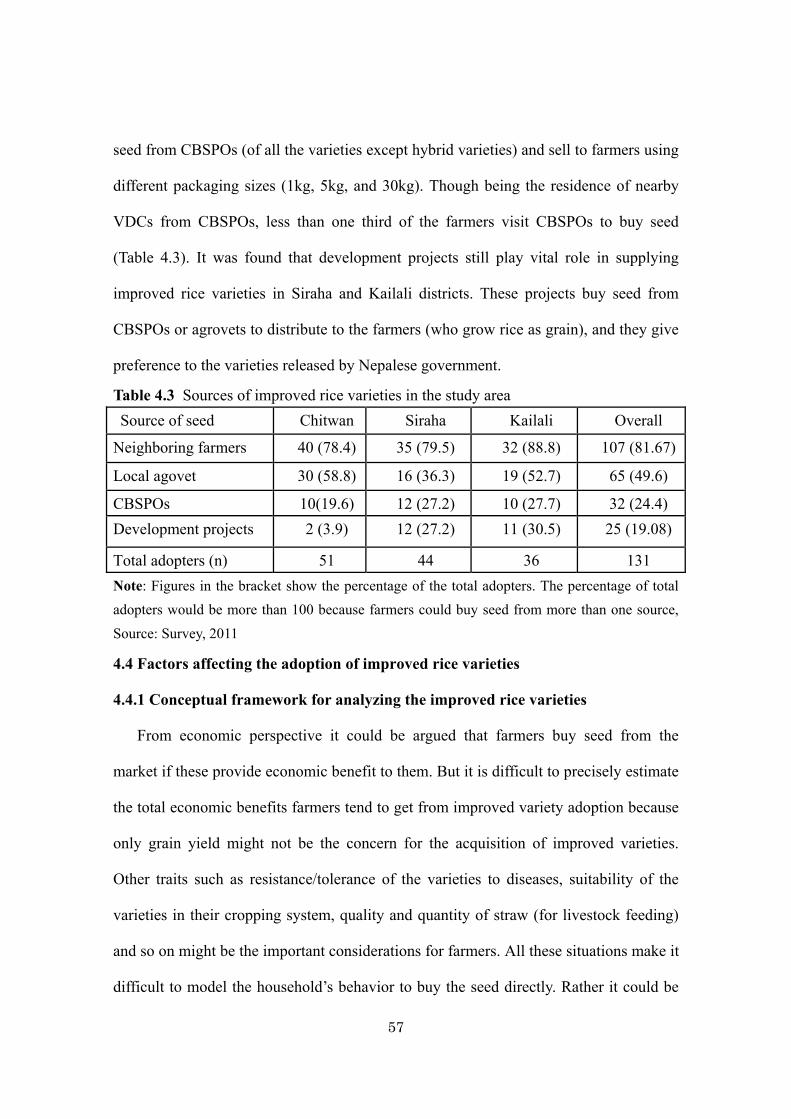
57
seed from CBSPOs (of all the varieties except hybrid varieties) and sell to farmers using
different packaging sizes (1kg, 5kg, and 30kg). Though being the residence of nearby
VDCs from CBSPOs, less than one third of the farmers visit CBSPOs to buy seed
(Table 4.3). It was found that development projects still play vital role in supplying
improved rice varieties in Siraha and Kailali districts. These projects buy seed from
CBSPOs or agrovets to distribute to the farmers (who grow rice as grain), and they give
preference to the varieties released by Nepalese government.
Table 4.3. Sources of improved rice varieties in the study area Source of seed Chitwan Siraha Kailali Overall
Neighboring farmers 40 (78.4) 35 (79.5) 32 (88.8) 107 (81.67)
Local agovet 30 (58.8) 16 (36.3) 19 (52.7) 65 (49.6)
CBSPOs 10(19.6) 12 (27.2) 10 (27.7) 32 (24.4)
Development projects 2 (3.9) 12 (27.2) 11 (30.5) 25 (19.08)
Total adopters (n) 51 44 36 131
Note: Figures in the bracket show the percentage of the total adopters. The percentage of total
adopters would be more than 100 because farmers could buy seed from more than one source,
Source: Survey, 2011
4.4 Factors affecting the adoption of improved rice varieties
4.4.1 Conceptual framework for analyzing the improved rice varieties
From economic perspective it could be argued that farmers buy seed from the
market if these provide economic benefit to them. But it is difficult to precisely estimate
the total economic benefits farmers tend to get from improved variety adoption because
only grain yield might not be the concern for the acquisition of improved varieties.
Other traits such as resistance/tolerance of the varieties to diseases, suitability of the
varieties in their cropping system, quality and quantity of straw (for livestock feeding)
and so on might be the important considerations for farmers. All these situations make it
difficult to model the household’s behavior to buy the seed directly. Rather it could be
58
done from the perspective that farmers develop some perception towards the variety by
analyzing the potential benefits/cost while adopting the varieties in the cropping system
and decide for their adoption. It can be further discussed with the help of Rogors’ (1995)
diffusion theory which explains that adopters go through the five stages (awareness,
persuasion, decision to adopt/test, implementation and feedback) in the
adoption/diffusion process and develop perception towards the varieties. The perception
is influenced by various factors such as demographic, economic, social and institutional
factors (Gauchan, Smale & Chaudhary, 2005; Joshi & Bauer, 2006; Tiwari et al., 2008).
This concept addresses the farmers’ behavior to buy both modern and farmers’ varieties
(Paudel & Matsuoka, 2008).
4.4.2 Empirical model
A binary logistic model (BLM) was used to see the impact of socio-economic
variables on the adoption of improved rice varieties. Since the dependent variable is
binary (i.e. 1 if farmers buy rice seed from the market and 0 for otherwise), the BLM is
suited for the analysis. Although linear probability model such as Ordinary Least Square
(OLS) can be used to analyze binary choice model, certain assumption of classical
regression are violated. They include non-normality and heteroscedastic error, and
questionable R2 as a measure of goodness of fit. Logit and probit models have been
developed to address these issues; however, logit model is preferred if the choice
variables are mutually exclusive with each other (Long & Freese, 2006). Previous
researchers (Joshi & Bauer, 2006; Paudel & Matsuoka, 2008) were also adopted BLM
to analyze the adoption of improved varieties. Theoretically the BLM is given in
equation 4.1 (Agresti, 1996).
Ln (Px/(1-Px) = 0 + 1X1i + 2X2i +…….. kXki + ε …….(4.1).
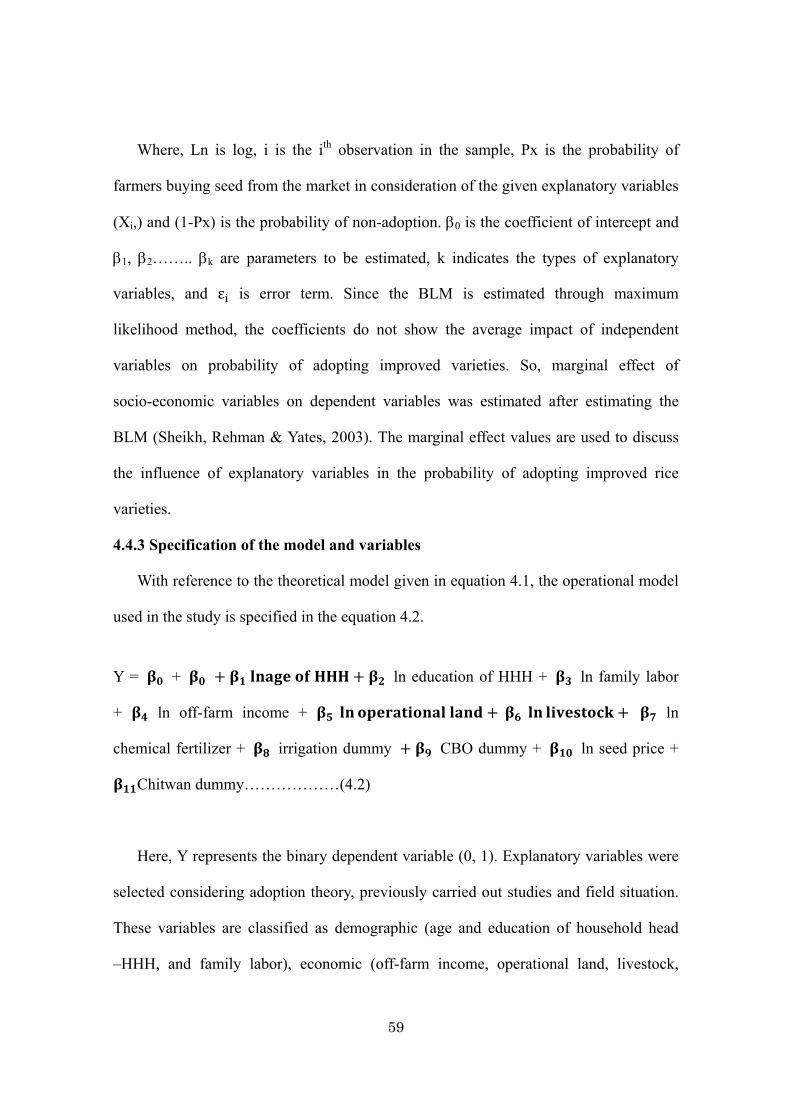
59
Where, Ln is log, i is the ith observation in the sample, Px is the probability of
farmers buying seed from the market in consideration of the given explanatory variables
(Xi,) and (1-Px) is the probability of non-adoption. 0 is the coefficient of intercept and
1, 2…….. k are parameters to be estimated, k indicates the types of explanatory
variables, and ε is error term. Since the BLM is estimated through maximum
likelihood method, the coefficients do not show the average impact of independent
variables on probability of adopting improved varieties. So, marginal effect of
socio-economic variables on dependent variables was estimated after estimating the
BLM (Sheikh, Rehman & Yates, 2003). The marginal effect values are used to discuss
the influence of explanatory variables in the probability of adopting improved rice
varieties.
4.4.3 Specification of the model and variables
With reference to the theoretical model given in equation 4.1, the operational model
used in the study is specified in the equation 4.2.
Y = + ln education of HHH + ln family labor
+ ln off-farm income + ln
chemical fertilizer + irrigation dummy CBO dummy + ln seed price +
Chitwan dummy………………(4.2)
Here, Y represents the binary dependent variable (0, 1). Explanatory variables were
selected considering adoption theory, previously carried out studies and field situation.
These variables are classified as demographic (age and education of household head
–HHH, and family labor), economic (off-farm income, operational land, livestock,
60
chemical fertilizer, irrigation, seed price) and institutional (household’s membership in
community-based organizations- CBOs). The description of the explanatory variables
and their hypothesized influence on the adoption of improved rice varieties is
summarized in Table 4.4.
Since HHH is the major decision maker at household in Nepal, its characteristics
might influence household’s decision for the adoption of improved rice varieties. It was
hypothesized that younger HHH might be better in adopting improved varieties as
compared to their counterparts considering their better linkage with market (Paudel &
Matsuoka, 2008). It was hypothesized that education of HHHs might have positive
impact on the adoption of improved varieties considering that higher educated people
could have better access to extension facility about the improved seed and associated
production technology (Joshi & Bayer, 2006), and they could analyze the potential
benefits and costs while adopting improved rice varieties in a better way than their
counterparts do. Family labor is an important source of input in subsistence farming and
it was hypothesized to have positive influence in the adoption of improved rice varieties.
Households with higher family labor are more likely to implement the field activities on
time (planting, such as weeding, fertilizer application), and it results to increase in yield
(Paudel & Matsuoka, 2008; Paudel, 2011).
Among the economic variables, household’s off-farm cash income was assumed to
have positive impact on improved varieties adoption. It is because access to credit is
still challenging in the study area as most of the bank and micro-finance services are
located in the cities, and it is difficult to access credit for small farmers in these areas
(Pradhan, 2009). It was hypothesized that those having access to off-farm income could
easily get cash and it might be used in buying necessary inputs for rice production, and
61
carrying out crop husbandry activities on time. Similarly, operational land holding was
considered to have positive influence on the adoption of improved varieties as
households with larger operational holding might have higher risk bearing capacity, and
motivation to increase the yield by combining other agricultural inputs. It was assumed
that operational landholding would positively influence households for the adoption of
improved rice varieties (Tiwari et al., 2008). Livestock is the integral component of
Nepalese farming system and farmers use all the manure at their fields whatever
produce at household, so livestock standard unit (LSU3) was calculated and it was used
as a proxy variable to represent the amount of manure applied in rice fields. Livestock
was assumed to have positive influence on improved rice varieties adoption. In addition
to animal manure, farmers use chemical fertilizer, and it was hypothesized that chemical
fertilizer could have positively influence on the adoption of improved varieties due to
positive linkage of chemical fertilizer with crop yield increment (Paudel & Matsuoka,
2008; Regmi et al., 2009). Similarly, it was hypothesized that access to irrigation source
could have positive influence on improved rice varieties adoption. The price of rice seed
was hypothesized to have negative influence on improved variety adoption in
accordance to the micro-economic theory.
Institutional variable included in this study is the household’s membership in
agricultural group or cooperatives and these institutions are termed as CBOs in this
study. These CBOs are farmers’ groups and cooperatives for the socio-economic
empowerment of their members through self-help approach. Being membership in
CBOs, farmers intend to access agricultural training and improved varieties as extension
policy of government and NGOs is group-oriented in Nepal. So, those having
membership in CBOs are more likely to access extension facility from these agencies,
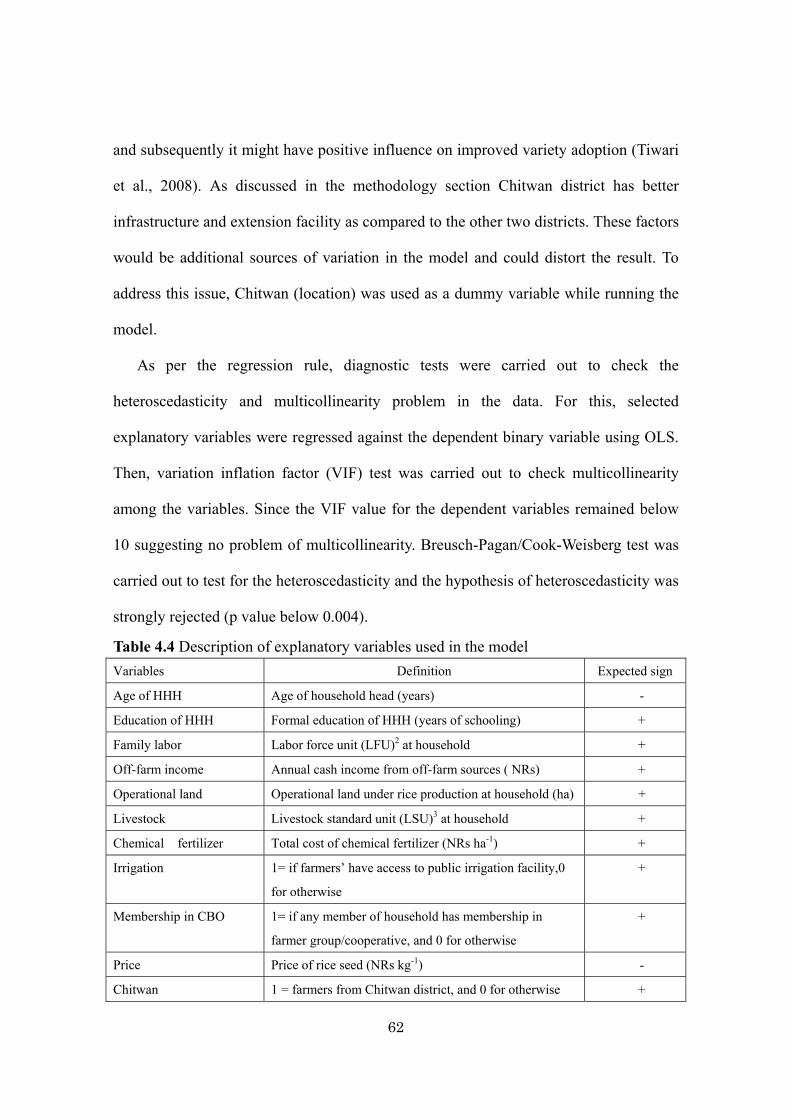
62
and subsequently it might have positive influence on improved variety adoption (Tiwari
et al., 2008). As discussed in the methodology section Chitwan district has better
infrastructure and extension facility as compared to the other two districts. These factors
would be additional sources of variation in the model and could distort the result. To
address this issue, Chitwan (location) was used as a dummy variable while running the
model.
As per the regression rule, diagnostic tests were carried out to check the
heteroscedasticity and multicollinearity problem in the data. For this, selected
explanatory variables were regressed against the dependent binary variable using OLS.
Then, variation inflation factor (VIF) test was carried out to check multicollinearity
among the variables. Since the VIF value for the dependent variables remained below
10 suggesting no problem of multicollinearity. Breusch-Pagan/Cook-Weisberg test was
carried out to test for the heteroscedasticity and the hypothesis of heteroscedasticity was
strongly rejected (p value below 0.004).
Table 4.4 Description of explanatory variables used in the model
Variables Definition Expected sign
Age of HHH Age of household head (years) -
Education of HHH Formal education of HHH (years of schooling) +
Family labor Labor force unit (LFU)2 at household +
Off-farm income Annual cash income from off-farm sources ( NRs) +
Operational land Operational land under rice production at household (ha) +
Livestock Livestock standard unit (LSU)3 at household +
Chemical fertilizer Total cost of chemical fertilizer (NRs ha-1) +
Irrigation 1= if farmers’ have access to public irrigation facility,0
for otherwise
+
Membership in CBO 1= if any member of household has membership in
farmer group/cooperative, and 0 for otherwise
+
Price Price of rice seed (NRs kg-1) -
Chitwan 1 = farmers from Chitwan district, and 0 for otherwise +
63
4.4.4 Results and discussion
4.4.4.1 Summary of study variables
Table 4.5 shows the summary statistics of socio-economic variables of the
households included in binary logistics model with reference to their mean and standard
deviation. Aerage age of HHH is 41.9 years but it varies across the households. The
majority (96%) of the HHHs attended formal schooling and but their average formal
schooling years was 5.2 (primary level of education). The average labor force at
household is 3.2, but varieties from 2 to 15.
In this study households represent small farmers with average operational holding of
0.78ha (range 0.06 - 4.67ha) which is similar to the national average (0.8ha). People in
the study area make their livelihoods both from on-farm (agriculture) and off-farm
(business, salaried job, remittance) activities. Annual average cash income of the
households is NRs 59,922. Only 63.3% of the households get cash income from
agriculture, whereas 66.67% of households receive cash income from off-farm sources.
The average off-farm income of households is NRs 49,531 and it varies from NRs.
4,780 to NRs 122,600 per year. Livestock is the integral part of farming system in the
study area. All the households were found to have raised livestock, and average LSU in
the study area is 3.46 but it varies from 0.5 to 201. Cow, buffalo, goat, poultry and pig
are the major livestock species being raised by farmers.
In addition to animal manure, 90% of farmers apply chemical fertilizers in rice field.
The sources of chemical fertilizers are urea (nitrogenous fertilizer having 60% N),
Diamonium Phosphate (DAP- having 18% N and 48% P) and Muriate of Potash (having
60% K). It was found that the amount of chemical fertilizers applied by farmers in rice
field is N: P: K:: 41.9: 28: 9 kg ha-1 and this doze is smaller than the recommendation
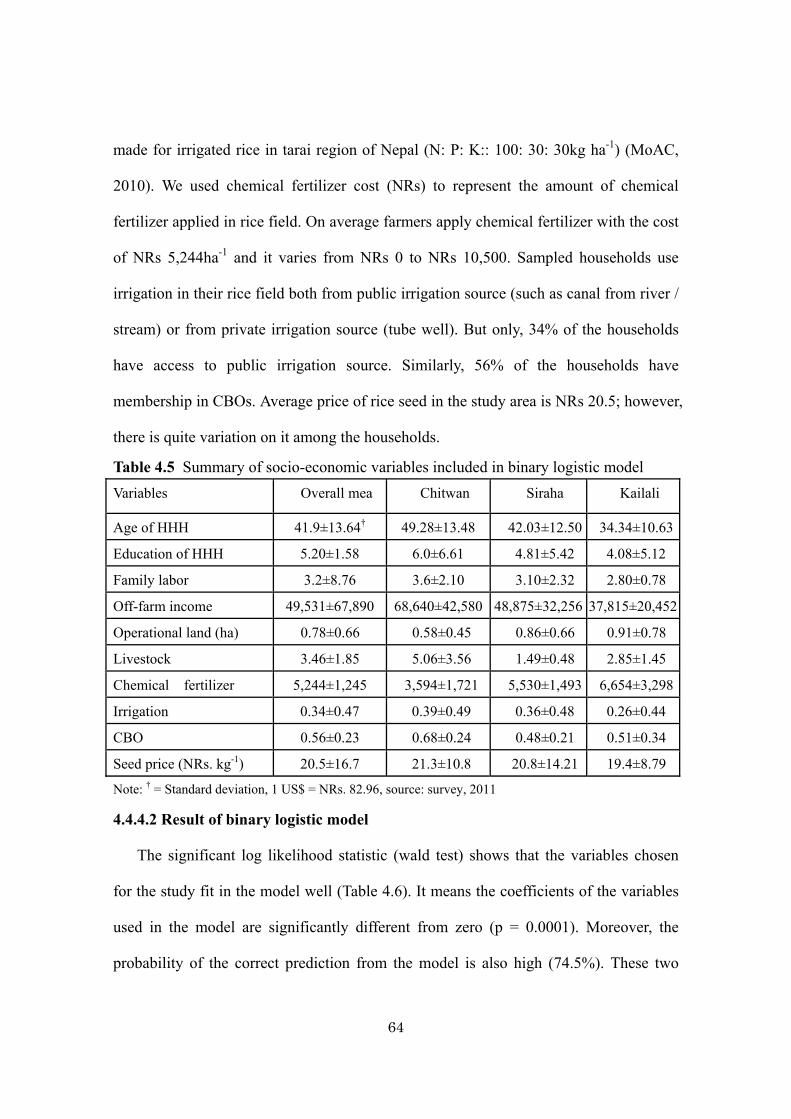
64
made for irrigated rice in tarai region of Nepal (N: P: K:: 100: 30: 30kg ha-1) (MoAC,
2010). We used chemical fertilizer cost (NRs) to represent the amount of chemical
fertilizer applied in rice field. On average farmers apply chemical fertilizer with the cost
of NRs 5,244ha-1 and it varies from NRs 0 to NRs 10,500. Sampled households use
irrigation in their rice field both from public irrigation source (such as canal from river /
stream) or from private irrigation source (tube well). But only, 34% of the households
have access to public irrigation source. Similarly, 56% of the households have
membership in CBOs. Average price of rice seed in the study area is NRs 20.5; however,
there is quite variation on it among the households.
Table 4.5. Summary of socio-economic variables included in binary logistic model
Variables Overall mea Chitwan Siraha Kailali
Age of HHH 41.9±13.64† 49.28±13.48 42.03±12.50 34.34±10.63
Education of HHH 5.20±1.58 6.0±6.61 4.81±5.42 4.08±5.12
Family labor 3.2±8.76 3.6±2.10 3.10±2.32 2.80±0.78
Off-farm income 49,531±67,890 68,640±42,580 48,875±32,256 37,815±20,452
Operational land (ha) 0.78±0.66 0.58±0.45 0.86±0.66 0.91±0.78
Livestock 3.46±1.85 5.06±3.56 1.49±0.48 2.85±1.45
Chemical fertilizer 5,244±1,245 3,594±1,721 5,530±1,493 6,654±3,298
Irrigation 0.34±0.47 0.39±0.49 0.36±0.48 0.26±0.44
CBO 0.56±0.23 0.68±0.24 0.48±0.21 0.51±0.34
Seed price (NRs. kg-1) 20.5±16.7 21.3±10.8 20.8±14.21 19.4±8.79
Note: † = Standard deviation, 1 US$ = NRs. 82.96, source: survey, 2011
4.4.4.2 Result of binary logistic model
The significant log likelihood statistic (wald test) shows that the variables chosen
for the study fit in the model well (Table 4.6). It means the coefficients of the variables
used in the model are significantly different from zero (p = 0.0001). Moreover, the
probability of the correct prediction from the model is also high (74.5%). These two
65
figures show the goodness of fit of the model. The study shows that most of the
variables’ impact on dependent variable is as hypothesized; however, the influence of
age of HHH, family labor and off-farm income is opposite than what was expected.
Among the explanatory variables, irrigation, households’ membership in CBOs, seed
price and location have significant influence on households’ decision for the adoption of
improved varieties.
The higher motivation of irrigation facility accessed households’ for the adoption of
improved varieties might be due to their objective of increasing yield with the adoption
of these varieties (Nkonya & Norman, 1997; Paudel & Matsuoka, 2008) or cropping
intensity (Nkonya & Norman, 1997). However, in addition to canal irrigation (from
river) there is potential to use underground water through tube well but less than 5%
farmers use tube well; however, the reasons behind it yet to be understood.
In this study, households’ membership represents the proxy variable to access
extension facility (e.g. agricultural training) from government and NGOs. The
significant coefficient and higher marginal effect signifies the importance of CBOs’
membership in the adoption of improved rice varieties. As shown in the Table 4.6, the
marginal effect of households’ membership in CBOs is 0.127 which indicates that
households with membership in CBOs have 12.7% higher probability of adopting
improved varieties as compared to their counterpart. This finding is consistent with
other previous studies (Paudel & Matsuoka, 2008; Tiwari et al., 2008). The reason
behind the higher probability of the improved rice varieties adoption by CBOs members
might be due to their better linkage with the extension agencies (Department For
International Development - DFID, 2010). In the group discussions farmers opined that
as a member of CBO they have to participate in the monthly meeting, observation of
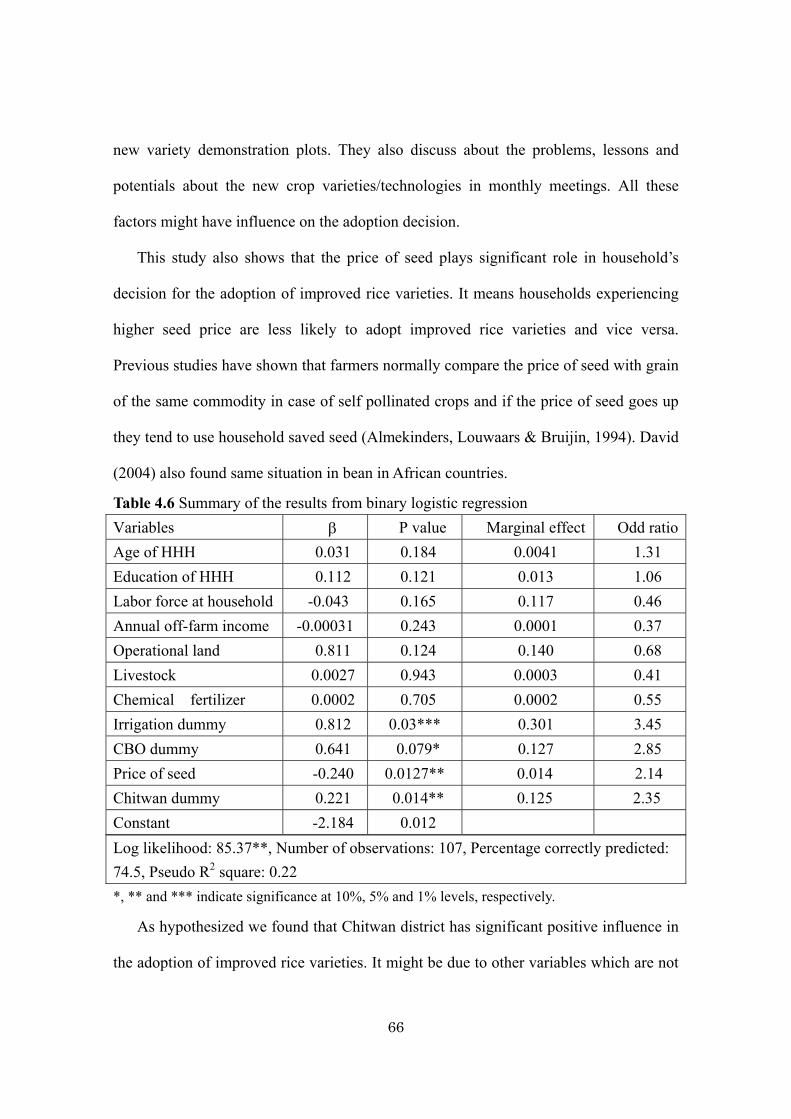
66
new variety demonstration plots. They also discuss about the problems, lessons and
potentials about the new crop varieties/technologies in monthly meetings. All these
factors might have influence on the adoption decision.
This study also shows that the price of seed plays significant role in household’s
decision for the adoption of improved rice varieties. It means households experiencing
higher seed price are less likely to adopt improved rice varieties and vice versa.
Previous studies have shown that farmers normally compare the price of seed with grain
of the same commodity in case of self pollinated crops and if the price of seed goes up
they tend to use household saved seed (Almekinders, Louwaars & Bruijin, 1994). David
(2004) also found same situation in bean in African countries.
Table 4.6 Summary of the results from binary logistic regression
Variables P value Marginal effect Odd ratio
Age of HHH 0.031 0.184 0.0041 1.31
Education of HHH 0.112 0.121 0.013 1.06
Labor force at household -0.043 0.165 0.117 0.46
Annual off-farm income -0.00031 0.243 0.0001 0.37
Operational land 0.811 0.124 0.140 0.68
Livestock 0.0027 0.943 0.0003 0.41
Chemical fertilizer 0.0002 0.705 0.0002 0.55
Irrigation dummy 0.812 0.03*** 0.301 3.45
CBO dummy 0.641 0.079* 0.127 2.85
Price of seed -0.240 0.0127** 0.014 2.14
Chitwan dummy 0.221 0.014** 0.125 2.35
Constant -2.184 0.012
Log likelihood: 85.37**, Number of observations: 107, Percentage correctly predicted:
74.5, Pseudo R2 square: 0.22
*, ** and *** indicate significance at 10%, 5% and 1% levels, respectively.
As hypothesized we found that Chitwan district has significant positive influence in
the adoption of improved rice varieties. It might be due to other variables which are not
67
discussed in this study such as road network, communication, and so on.
4.6 Conclusion
This chapter analyzed the types of improved rice varieties grown by farmers,
sources of these varieties, and influence of households’ socio-economic variables in the
adoption of these varieties. Result shows that farmers intend to diversify their varietal
portfolio adopting both modern and farmers’ varieties, and there is local specificity in
adoption of some varieties. Some of the widely grown rice varieties have not been
registered in the government system and it is important for their registration to ensure
that farmers get extension services from the government agencies. Farmers get seeds of
these varieties from various sources such as neighboring farmers, agrovet, CBSPOs and
development projects. However, the first two sources are more important than others.
Moreover, this study shows that the adoption of improved rice varieties in the study area
is mainly explained by access to irrigation facility, households’ membership in CBOs,
and price of seed. It means combining variety promotional program with irrigation
facility would increase the adoption of improved varieties. Moreover, this study
recognizes that it is still important to facilitate farmers to be organized in CBOs such as
agriculture groups and cooperatives as this activity has positive impact on improved rice
varieties adoption. Similarly, this study shows that households experiencing higher price
of seed are less likely to adopt the improved varieties. It demands for the development
of cost reducing strategies in the production and marketing of seed at local level.
68
Chapter 5. Efficiency of farmers in rice seed production
5.1 Introduction
Efficiency is the ratio of output and input. Farewell (1957) defined economic
efficiency as the ability to produce in given level of output at a lower cost. Economic
efficiency is composed of technical efficiency (TE) and allocative efficiency (AE). A
farmer is said to be technically efficient if it produces maximum level of output in a
given inputs. AE is the extent to which farmers equate marginal value product of factors
of production to their price. So, farmers can be economically efficient if they combine
inputs in least combination to generate maximum output (technical efficiency) as well
as considering least cost to obtain maximum revenue. At this condition farmers are said
to be cost effective and this condition leads to profit maximization.
Efficiency in the production can also be improved by introducing technology from
developed countries to developing ones. But it has been already recognized that small
farmers in the developing countries could not be benefitted from the introduction of
resource demanding technologies. Rather they could realize benefit to some extent if
they could enhance efficiency by proper allocation of the available resources. This
concept yielded a number of past studies in ‘efficiency’ and these studies have rejected
the Schultz’s hypothesis (Schultz, 1964) that ‘poor people in the developing countries
are efficient in utilizing their resources (Kalirajan, 1999; Rahman, 2003; Piya,
Kimanami & Yagi, 2012). These studies have identified the variation of efficiency
among the farmers from 21 to 93%. In practical sense it is very difficult to compare the
efficiency level of farmers from one study to another due to variations in choosing input
variables. This necessitates the measurement of efficiency at local level using most
commonly used input variables so that appropriate policy recommendation could be
69
made. This chapter measures AE and TE of rice seed producing households using the
most commonly used inputs: source seed, family labor, chemical fertilizer, livestock and
operational land, and identifies the socio-economic variables influencing technical
efficiency of farmers.
5.2 Analysis of allocative efficiency
5.2.1 Empirical technique
AE was estimated using Cobb Douglas production function with the assumption that
rice production dependent on operational land, human labor, seed, fertilizer and
livestock. The theoretical model used in the analysis is given in equation 5.1.
Y = AXX
…………X …..(5.1)
Here, Y represents the output, A is the constant, X is input variable, and is the
parameter. The operational model used in the analysis is given in the equation 5.2.
LnY = β + β ln sourceseed + β ln labor β ln chemical fertilizer +
β ln livestock + β ln land + e….(5.2)
Ln represents log and e is the error term. The term source seed is the foundation seed
(early generation seed) which is produced in the agricultural research station. Labor is
the total number of man days required to accomplish the agronomic activities from seed
sowing to harvesting and it was measured in LFU2 as children as well as elderly people
were found to be involved in rice seed production. Livestock was used as a proxy
variable to represent the animal manure applied in the field and it was estimated as
LSU3. Land is the operational land used for rice seed production.
70
The above operational model (5.2) was run using OLS technique and estimated the
marginal value product (MVP) of the aforementioned production factors and compared
it with marginal input cost. Using coefficient from equation 5.2, marginal product
(MP) and average product (AP) was estimated as:
MP = = β , and AP =
Where, Y is rice output, X is the mean of input i , β is the estimated coefficient of
input i. The value of marginal product of input i (VMP ) is calculated by multiplying the
marginal physical product (MP ) with output price (P ). Thus,
VMP= MP*(P )
AE = , where P = Marginal cost of input i
The decision rule is that if AE of X input is >1, the input is underutilized and farmers
could increase the profit by increasing the input. Conversely, if AE of X is <1, this
input is over utilized and farmers have to reduce the input. So, farmers will be at
allocative efficient position when VMP= P
5.2.2 Summary of input variables
The summary of output and input variables with respect to their mean and standard
deviation is summarized in Table 5.1. Average yield of rice in the study area is 3,839kg
ha-1 which is 31% higher than that of national average rice yield of Nepal in 2011
(2,916kg ha-1) (FAOSTAT, 2012). There is quite variation in yield of rice across the
districts and among the overall sampling households. Farmers in Chitwan get higher
yield (4,450kg ha-1), which is 11.7% and 44.2% higher than that of Kailali and Siraha
districts, respectively. There is also variation in the application of source seed across the
districts. Farmers use lower seed rate than that of national recommendation made by
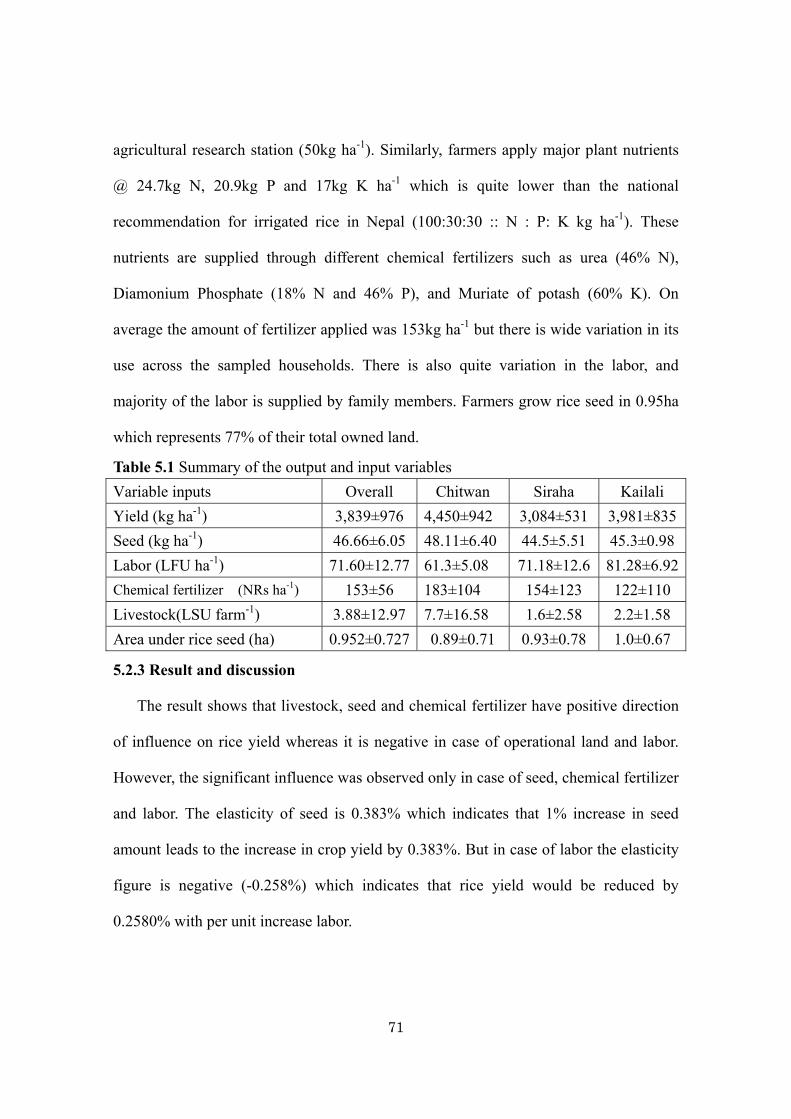
71
agricultural research station (50kg ha-1). Similarly, farmers apply major plant nutrients
@ 24.7kg N, 20.9kg P and 17kg K ha-1 which is quite lower than the national
recommendation for irrigated rice in Nepal (100:30:30 :: N : P: K kg ha-1). These
nutrients are supplied through different chemical fertilizers such as urea (46% N),
Diamonium Phosphate (18% N and 46% P), and Muriate of potash (60% K). On
average the amount of fertilizer applied was 153kg ha-1 but there is wide variation in its
use across the sampled households. There is also quite variation in the labor, and
majority of the labor is supplied by family members. Farmers grow rice seed in 0.95ha
which represents 77% of their total owned land.
Table 5.1 Summary of the output and input variables
Variable inputs Overall Chitwan Siraha Kailali
Yield (kg ha-1) 3,839±976 4,450±942 3,084±531 3,981±835
Seed (kg ha-1) 46.66±6.05 48.11±6.40 44.5±5.51 45.3±0.98
Labor (LFU ha-1) 71.60±12.77 61.3±5.08 71.18±12.6 81.28±6.92
Chemical fertilizer (NRs ha-1) 153±56 183±104 154±123 122±110
Livestock(LSU farm-1) 3.88±12.97 7.7±16.58 1.6±2.58 2.2±1.58
Area under rice seed (ha) 0.952±0.727 0.89±0.71 0.93±0.78 1.0±0.67
5.2.3 Result and discussion
The result shows that livestock, seed and chemical fertilizer have positive direction
of influence on rice yield whereas it is negative in case of operational land and labor.
However, the significant influence was observed only in case of seed, chemical fertilizer
and labor. The elasticity of seed is 0.383% which indicates that 1% increase in seed
amount leads to the increase in crop yield by 0.383%. But in case of labor the elasticity
figure is negative (-0.258%) which indicates that rice yield would be reduced by
0.2580% with per unit increase labor.
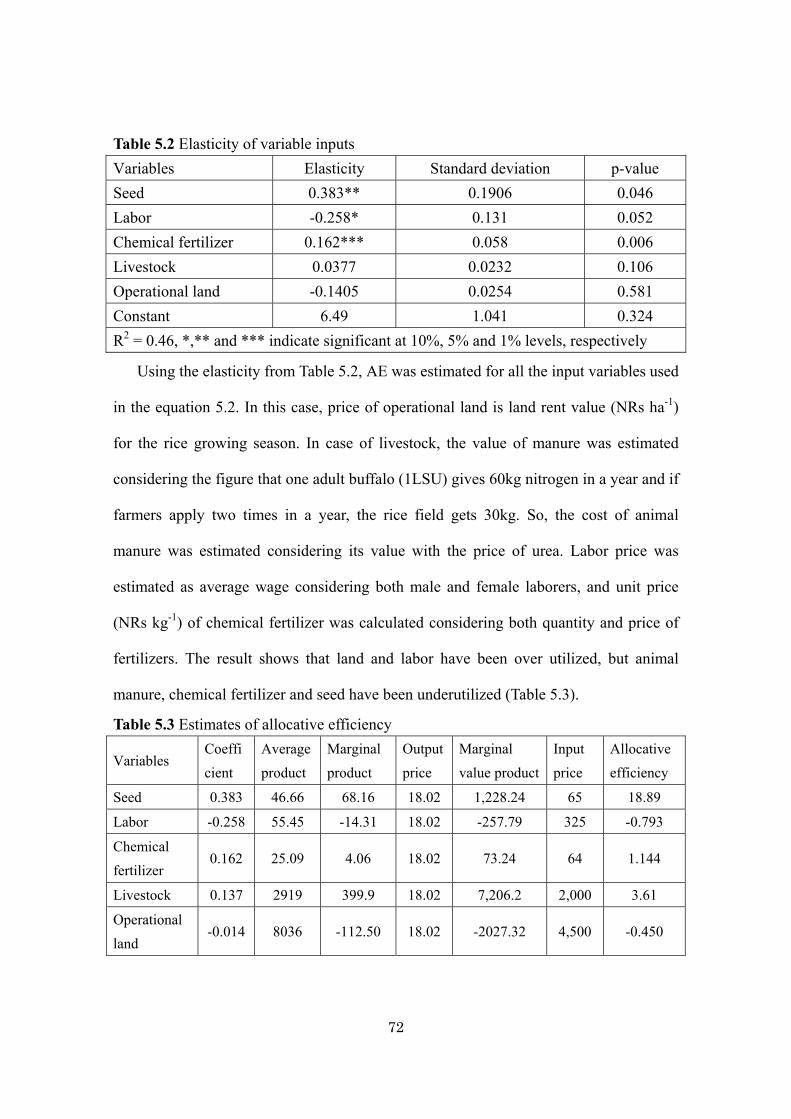
72
Table 5.2 Elasticity of variable inputs
Variables Elasticity Standard deviation p-value
Seed 0.383** 0.1906 0.046
Labor -0.258* 0.131 0.052
Chemical fertilizer 0.162*** 0.058 0.006
Livestock 0.0377 0.0232 0.106
Operational land -0.1405 0.0254 0.581
Constant 6.49 1.041 0.324
R2 = 0.46, *,** and *** indicate significant at 10%, 5% and 1% levels, respectively
Using the elasticity from Table 5.2, AE was estimated for all the input variables used
in the equation 5.2. In this case, price of operational land is land rent value (NRs ha-1)
for the rice growing season. In case of livestock, the value of manure was estimated
considering the figure that one adult buffalo (1LSU) gives 60kg nitrogen in a year and if
farmers apply two times in a year, the rice field gets 30kg. So, the cost of animal
manure was estimated considering its value with the price of urea. Labor price was
estimated as average wage considering both male and female laborers, and unit price
(NRs kg-1) of chemical fertilizer was calculated considering both quantity and price of
fertilizers. The result shows that land and labor have been over utilized, but animal
manure, chemical fertilizer and seed have been underutilized (Table 5.3).
Table 5.3 Estimates of allocative efficiency
Variables Coeffi
cient
Average
product
Marginal
product
Output
price
Marginal
value product
Input
price
Allocative
efficiency
Seed 0.383 46.66 68.16 18.02 1,228.24 65 18.89
Labor -0.258 55.45 -14.31 18.02 -257.79 325 -0.793
Chemical
fertilizer 0.162 25.09 4.06 18.02 73.24 64 1.144
Livestock 0.137 2919 399.9 18.02 7,206.2 2,000 3.61
Operational
land -0.014 8036 -112.50 18.02 -2027.32 4,500 -0.450
73
It means the farmers could maximize the profit from rice seed production by increasing
these three inputs.
5.3 Estimation of technical efficiency
5.3.1 Empirical technique
Stochastic Frontier Production Model was used to analyze TE. In this model, a
farmer is said to be technically efficient if its output falls on the frontier output
(maximum possible output) in the given set of inputs (Battese & Coelli, 1995). There
two types of parametric frontier production functions used in the literature in measuring
the TE of farmers: deterministic and stochastic; however, the latter is considered more
efficient than previous as it has two error terms, one of which separates the random
noise effect from the total residual (also called composed error) and gives consistent
estimate for efficiency/inefficiency (Battese & Coelli, 1995). The theoretical idea of
stochastic frontier production is that no one can produce output beyond the theoretically
possible limit. The measurement of efficiency/inefficiency is thus possible how agents
are far away from the limit. This model was originally proposed by Aigner, Lovell and
Schmidt (1977) and Meeusen and van den Broeck (1977) and its functional form is
expressed as:
Yi = (x ; ) exp (v -u )……………….(5.3)
Here, Yi is the quantity of production of ith farm with i ranging from 1, 2………..n.
x is the explanatory variable input, is the vector of parameters to be estimated, v
represents the two-sided error term accounting for random variation in output due to
factors outside the control of farmers such as measurement errors, diseases and pests
infestation in the field, natural calamities, etc. Another term u represents the error
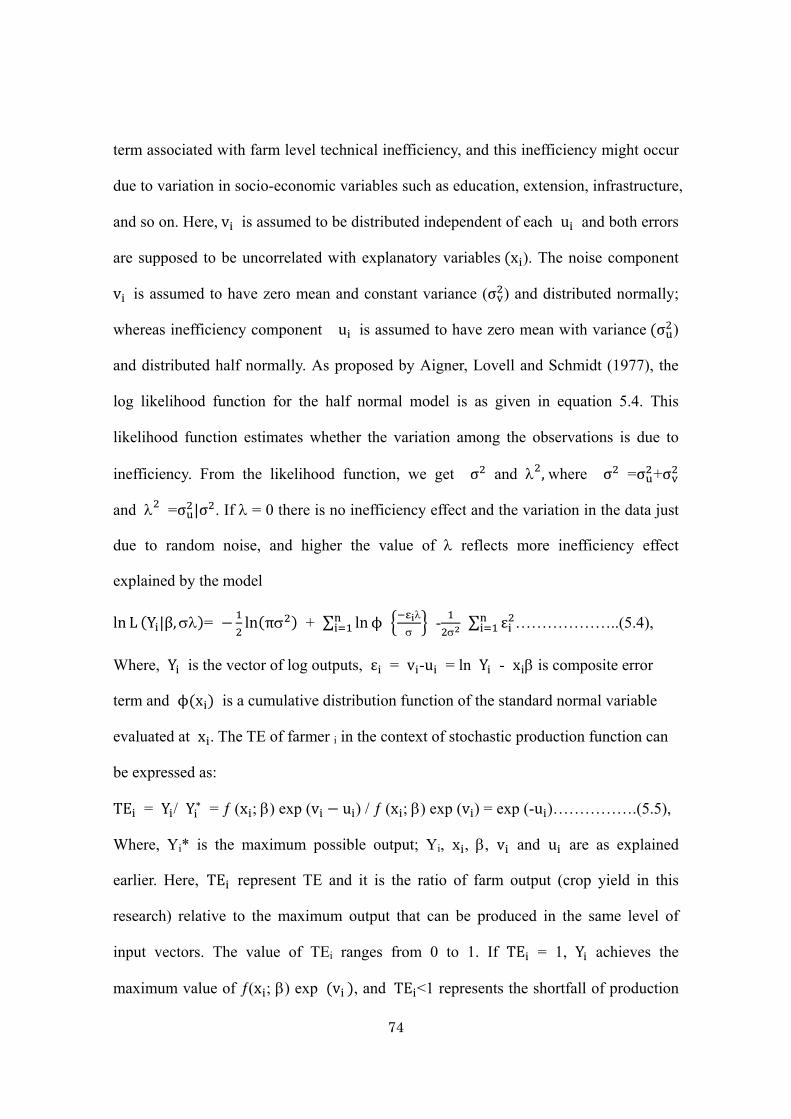
74
term associated with farm level technical inefficiency, and this inefficiency might occur
due to variation in socio-economic variables such as education, extension, infrastructure,
and so on. Here,v is assumed to be distributed independent of each u and both errors
are supposed to be uncorrelated with explanatory variables x ). The noise component
v is assumed to have zero mean and constant variance (σ ) and distributed normally;
whereas inefficiency component u is assumed to have zero mean with variance σ )
and distributed half normally. As proposed by Aigner, Lovell and Schmidt (1977), the
log likelihood function for the half normal model is as given in equation 5.4. This
likelihood function estimates whether the variation among the observations is due to
inefficiency. From the likelihood function, we get σ and ,where σ =σ +σ
and =σ |σ . If = 0 there is no inefficiency effect and the variation in the data just
due to random noise, and higher the value of reflects more inefficiency effect
explained by the model
ln L Y |β, = ln π + ∑ lnϕ
-
∑ ε ………………..(5.4),
Where, Y is the vector of log outputs, ε = v -u = ln Y - x is composite error
term and ϕ x is a cumulative distribution function of the standard normal variable
evaluated at x . The TE of farmer i in the context of stochastic production function can
be expressed as:
TE = Y / Y∗ = (x ; ) exp (v u ) / (x ; ) exp (v ) = exp (-u )…………….(5.5),
Where, Yi* is the maximum possible output; Yi, x , , v and u are as explained
earlier. Here, TE represent TE and it is the ratio of farm output (crop yield in this
research) relative to the maximum output that can be produced in the same level of
input vectors. The value of TEi ranges from 0 to 1. If TE = 1, Y achieves the
maximum value of (x ; ) exp v , and TE <1 represents the shortfall of production
75
from the maximum possible production level in environment characterized by stochastic
elements which vary across the farmers.
In the first stage, TE was computed from stochastic frontier production model (Cobb
Douglas functional form) using the same set of explanatory variables used to estimate
the AE in equation 5.2. In the second step, TE (as dependent variable) was regressed
against socio-economic variables of farmers/farm using OLS as this technique can be
applied if the efficiency values are higher than zero and less than 1. Previous studies
have also adopted two stage procedures to analyze the efficiency of farmers in the
developing countries (Kalirajan, 1999; Sharma, Leung & Zaleski, 1999; Piya, Kiminami
& Yagi, 2012).
After estimating stochastic frontier production function (5.2), the TE was predicted
using the formula given in equation (5.5) and TE score was regressed against
socio-economic variables (5.6) to find out their impact on TE.
TE = δ +1 ln age of HHH +2 ln education of HHH +3 training dummy + 4 ln
active labor force + 5 ln irrigation cost + 6 ln land rent + 7 ln experience + 8 ln
off-farm income + 9 Chitwan + ω ………………(5.6)
Where, represents the parameters associated with socio-economic variables, and ω
is the error term. The sign of socio-economic variables and their description has been
presented in Table 5.4. Out of these variables, the impact of age and education of HHH
were hypothesized to have positive (Ali & Flinn, 1989; Rahman, 2003). Training and
experience in seed production are capacity enhancement variables, and these variables
were supposed to have positive influence on technical efficiency (Rahman, 2003).
Similarly, the influence of irrigation cost was hypothesized to have negative on TE. The
influence of land rent was hypothesized positive (Ghaderzadeh & Rahimi, 2005). Since
76
majority of labor force in rural areas is supplied by family members of farmers, which
makes it easy to access labor when required and easy accessibility of labor might
positively contribute in the production. So, family labor at household was hypothesized
to have positive influence on TE. Similarly, household income from off-farm source
was also assumed positive contribution on TE, as farmers could accomplish agricultural
activities on time if they have access to off-farm resources (Ali & Flin, 1989; Wang,
Cramer & Wailes, 1996; Rahman, 2003). We have used Chitwan as dummy variable in
the analysis considering that this district might have positive influence on TE due to
better infrastructure and extension facility.
Before running stochastic frontier production model and OLS, data were validated
for multicollinearity, heteroskedasticity and endogeneity using VIF test,
Breusch-Pagan/Cook-Weisberg test, and Hausman method, respectively. The VIF test
shows the value <10 indicating no problem of multicollinearity (Pindyck & Rubinfield,
1981). Similarly, Breusch-Pagan/Cook-Weisberg test also indicate that there is no
problem for heteroskedasticity as the hypothesis of constant variances of the residuals
was accepted (p>0.3). While running OLS regression, some variables such as land rent,
irrigation cost and off-farm income were checked for their possibility of endogeneity
with the level of TE. But Hausman test did not show such problem in these variables, so
used simple OLS instead of estimating instrumental variables.
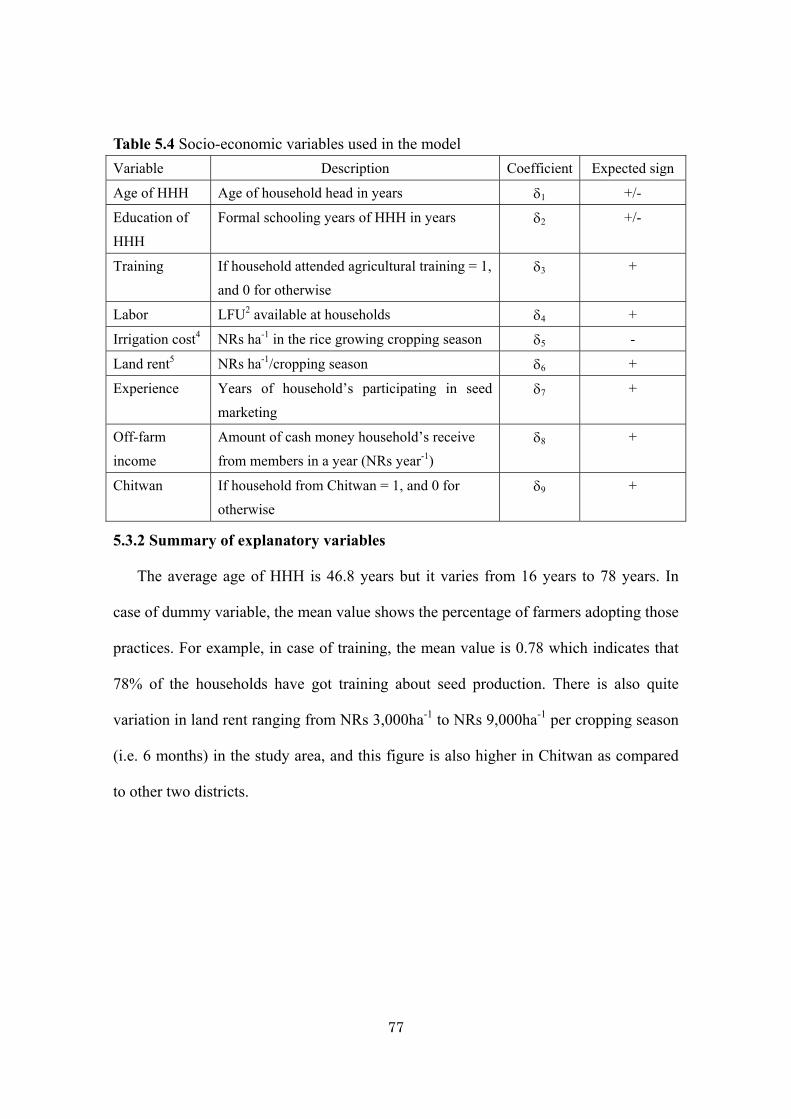
77
Table 5.4 Socio-economic variables used in the model
Variable Description Coefficient Expected sign
Age of HHH Age of household head in years 1 +/-
Education of
HHH
Formal schooling years of HHH in years 2 +/-
Training If household attended agricultural training = 1,
and 0 for otherwise
3 +
Labor LFU2 available at households 4 +
Irrigation cost4 NRs ha-1 in the rice growing cropping season 5 -
Land rent5 NRs ha-1/cropping season 6 +
Experience Years of household’s participating in seed
marketing
7 +
Off-farm
income
Amount of cash money household’s receive
from members in a year (NRs year-1)
8 +
Chitwan If household from Chitwan = 1, and 0 for
otherwise
9 +
5.3.2 Summary of explanatory variables
The average age of HHH is 46.8 years but it varies from 16 years to 78 years. In
case of dummy variable, the mean value shows the percentage of farmers adopting those
practices. For example, in case of training, the mean value is 0.78 which indicates that
78% of the households have got training about seed production. There is also quite
variation in land rent ranging from NRs 3,000ha-1 to NRs 9,000ha-1 per cropping season
(i.e. 6 months) in the study area, and this figure is also higher in Chitwan as compared
to other two districts.
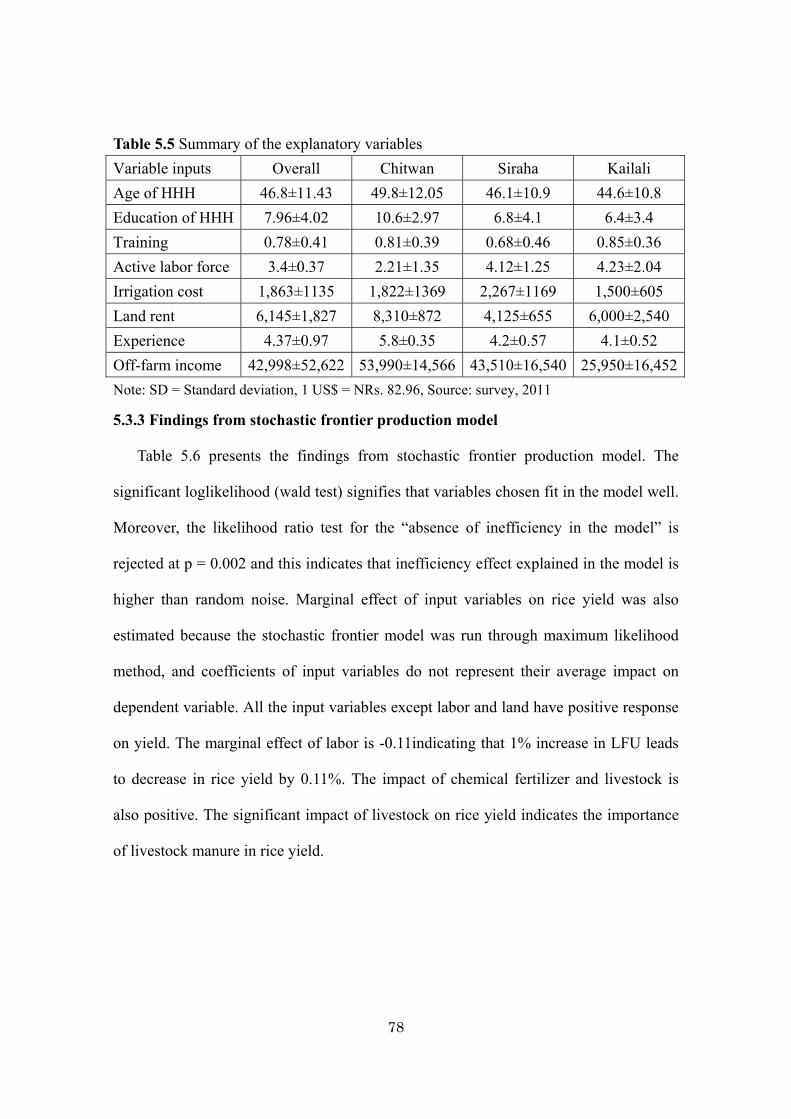
78
Table 5.5 Summary of the explanatory variables
Variable inputs Overall Chitwan Siraha Kailali
Age of HHH 46.8±11.43 49.8±12.05 46.1±10.9 44.6±10.8
Education of HHH 7.96±4.02 10.6±2.97 6.8±4.1 6.4±3.4
Training 0.78±0.41 0.81±0.39 0.68±0.46 0.85±0.36
Active labor force 3.4±0.37 2.21±1.35 4.12±1.25 4.23±2.04
Irrigation cost 1,863±1135 1,822±1369 2,267±1169 1,500±605
Land rent 6,145±1,827 8,310±872 4,125±655 6,000±2,540
Experience 4.37±0.97 5.8±0.35 4.2±0.57 4.1±0.52
Off-farm income 42,998±52,622 53,990±14,566 43,510±16,540 25,950±16,452
Note: SD = Standard deviation, 1 US$ = NRs. 82.96, Source: survey, 2011
5.3.3 Findings from stochastic frontier production model
Table 5.6 presents the findings from stochastic frontier production model. The
significant loglikelihood (wald test) signifies that variables chosen fit in the model well.
Moreover, the likelihood ratio test for the “absence of inefficiency in the model” is
rejected at p = 0.002 and this indicates that inefficiency effect explained in the model is
higher than random noise. Marginal effect of input variables on rice yield was also
estimated because the stochastic frontier model was run through maximum likelihood
method, and coefficients of input variables do not represent their average impact on
dependent variable. All the input variables except labor and land have positive response
on yield. The marginal effect of labor is -0.11indicating that 1% increase in LFU leads
to decrease in rice yield by 0.11%. The impact of chemical fertilizer and livestock is
also positive. The significant impact of livestock on rice yield indicates the importance
of livestock manure in rice yield.
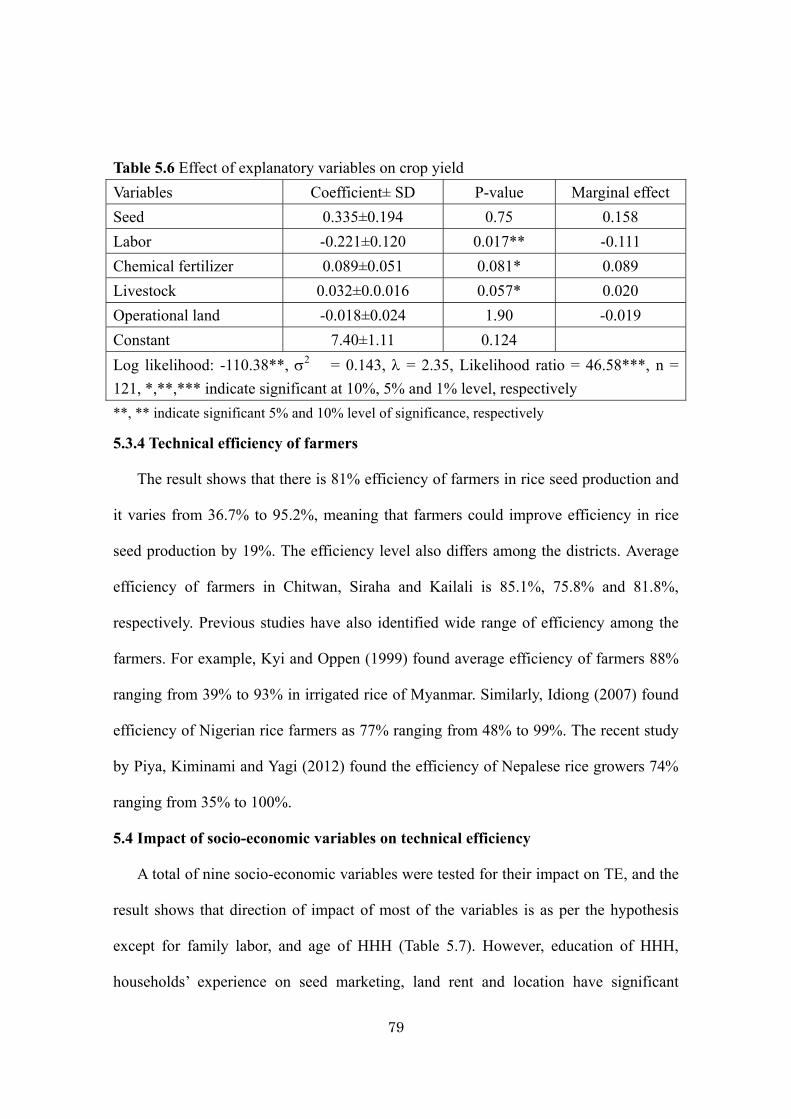
79
Table 5.6 Effect of explanatory variables on crop yield
Variables Coefficient± SD P-value Marginal effect
Seed 0.335±0.194 0.75 0.158
Labor -0.221±0.120 0.017** -0.111
Chemical fertilizer 0.089±0.051 0.081* 0.089
Livestock 0.032±0.0.016 0.057* 0.020
Operational land -0.018±0.024 1.90 -0.019
Constant 7.40±1.11 0.124
Log likelihood: -110.38**, 2 = 0.143, = 2.35, Likelihood ratio = 46.58***, n =
121, *,**,*** indicate significant at 10%, 5% and 1% level, respectively
**, ** indicate significant 5% and 10% level of significance, respectively
5.3.4 Technical efficiency of farmers
The result shows that there is 81% efficiency of farmers in rice seed production and
it varies from 36.7% to 95.2%, meaning that farmers could improve efficiency in rice
seed production by 19%. The efficiency level also differs among the districts. Average
efficiency of farmers in Chitwan, Siraha and Kailali is 85.1%, 75.8% and 81.8%,
respectively. Previous studies have also identified wide range of efficiency among the
farmers. For example, Kyi and Oppen (1999) found average efficiency of farmers 88%
ranging from 39% to 93% in irrigated rice of Myanmar. Similarly, Idiong (2007) found
efficiency of Nigerian rice farmers as 77% ranging from 48% to 99%. The recent study
by Piya, Kiminami and Yagi (2012) found the efficiency of Nepalese rice growers 74%
ranging from 35% to 100%.
5.4 Impact of socio-economic variables on technical efficiency
A total of nine socio-economic variables were tested for their impact on TE, and the
result shows that direction of impact of most of the variables is as per the hypothesis
except for family labor, and age of HHH (Table 5.7). However, education of HHH,
households’ experience on seed marketing, land rent and location have significant
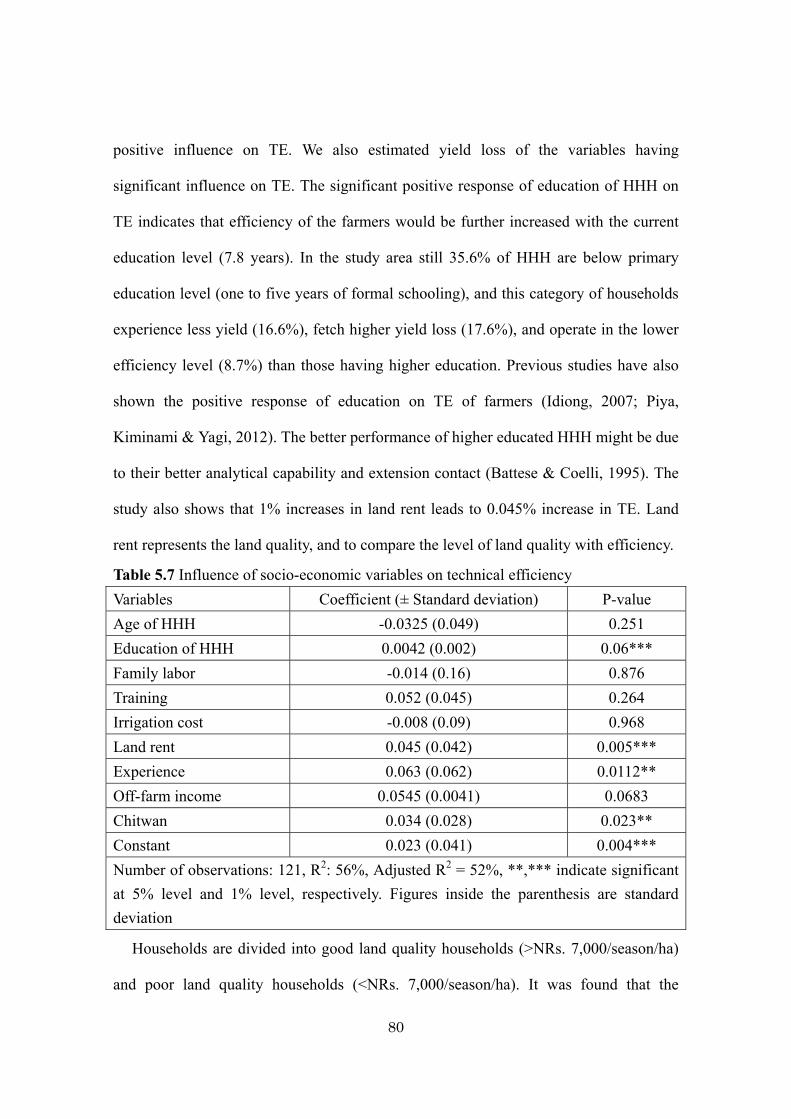
80
positive influence on TE. We also estimated yield loss of the variables having
significant influence on TE. The significant positive response of education of HHH on
TE indicates that efficiency of the farmers would be further increased with the current
education level (7.8 years). In the study area still 35.6% of HHH are below primary
education level (one to five years of formal schooling), and this category of households
experience less yield (16.6%), fetch higher yield loss (17.6%), and operate in the lower
efficiency level (8.7%) than those having higher education. Previous studies have also
shown the positive response of education on TE of farmers (Idiong, 2007; Piya,
Kiminami & Yagi, 2012). The better performance of higher educated HHH might be due
to their better analytical capability and extension contact (Battese & Coelli, 1995). The
study also shows that 1% increases in land rent leads to 0.045% increase in TE. Land
rent represents the land quality, and to compare the level of land quality with efficiency.
Table 5.7 Influence of socio-economic variables on technical efficiency Variables Coefficient (± Standard deviation) P-value
Age of HHH -0.0325 (0.049) 0.251
Education of HHH 0.0042 (0.002) 0.06***
Family labor -0.014 (0.16) 0.876
Training 0.052 (0.045) 0.264
Irrigation cost -0.008 (0.09) 0.968
Land rent 0.045 (0.042) 0.005***
Experience 0.063 (0.062) 0.0112**
Off-farm income 0.0545 (0.0041) 0.0683
Chitwan 0.034 (0.028) 0.023**
Constant 0.023 (0.041) 0.004***
Number of observations: 121, R2: 56%, Adjusted R2 = 52%, **,*** indicate significant
at 5% level and 1% level, respectively. Figures inside the parenthesis are standard
deviation
Households are divided into good land quality households (>NRs. 7,000/season/ha)
and poor land quality households (<NRs. 7,000/season/ha). It was found that the
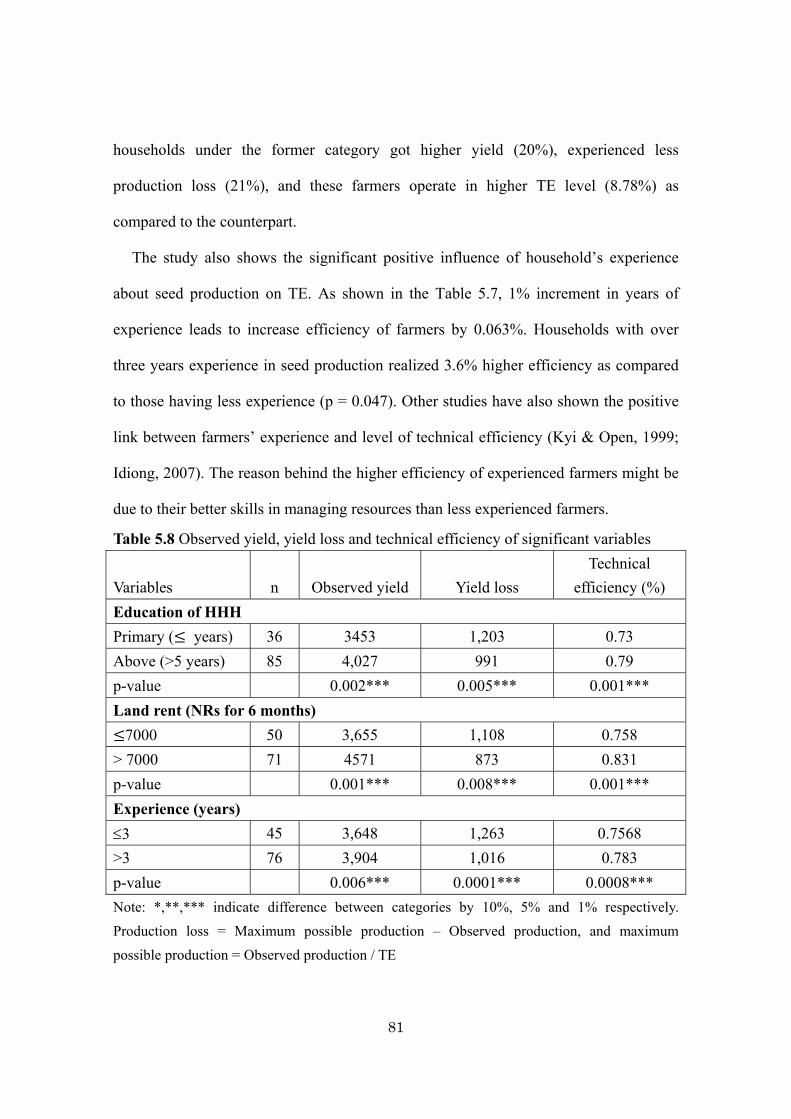
81
households under the former category got higher yield (20%), experienced less
production loss (21%), and these farmers operate in higher TE level (8.78%) as
compared to the counterpart.
The study also shows the significant positive influence of household’s experience
about seed production on TE. As shown in the Table 5.7, 1% increment in years of
experience leads to increase efficiency of farmers by 0.063%. Households with over
three years experience in seed production realized 3.6% higher efficiency as compared
to those having less experience (p = 0.047). Other studies have also shown the positive
link between farmers’ experience and level of technical efficiency (Kyi & Open, 1999;
Idiong, 2007). The reason behind the higher efficiency of experienced farmers might be
due to their better skills in managing resources than less experienced farmers.
Table 5.8 Observed yield, yield loss and technical efficiency of significant variables
Variables
n
Observed yield
Yield loss
Technical
efficiency (%)
Education of HHH Primary ( years) 36 3453 1,203 0.73
Above (>5 years) 85 4,027 991 0.79
p-value 0.002*** 0.005*** 0.001***
Land rent (NRs for 6 months) 7000 50 3,655 1,108 0.758
> 7000 71 4571 873 0.831
p-value 0.001*** 0.008*** 0.001***
Experience (years) 3 45 3,648 1,263 0.7568
>3 76 3,904 1,016 0.783
p-value 0.006*** 0.0001*** 0.0008***
Note: *,**,*** indicate difference between categories by 10%, 5% and 1% respectively.
Production loss = Maximum possible production – Observed production, and maximum
possible production = Observed production / TE
82
5.5 Conclusion
This chapter analyzed the AE and TE of farmers in using their major inputs (seed,
labor, fertilizer, operational land and livestock). The findings from AE shows that
farmers are not allocatively efficient in the study area where labor and land are over
utilized and other three variables (livestock, seed and chemical fertilizers) are
underutilized. It means farmers could increase rice yield by proper allocation of these
variables. Similarly, farmers are 81% technically efficient in the utilization of these
inputs and there is wide variability among the farmers in TE which is mainly explained
by education of HHH, land quality and household’s experience in seed production.
Since the provision of formal education to HHH might not be practicable considering
their age, field demonstrations would be useful to enhance their efficiency level. More
research is needed to identify the appropriate land quality management measures.
Experience in seed production shows the importance of market orientation in TE.
83
Chapter 6. Soil conservation practices in rice seed production
6.1 Introduction
It is clear from the previous chapter that land quality has positive role in enhancing
farmers’ TE in rice seed production. It means there is a potential to enhance economic
benefit at household level by improving land quality. The land quality also provides
basis for the continuation of the current benefit seed producers get from rice seed
production in the future. Soil Conservation practices (SCPs) have been found to address
land quality issue, especially by improving water use efficiency and enhancing soil
organic matter content. In spite of the great roles of SCPs in enhancing rice crop yield
as well as providing basis for sustaining the rice yield, it is important to explore how
farmers select these practices in rice seed production from policy perspective. This
chapter analyzes the impact of socio-economic factors for the adoption of different soil
conservation practices.
6.2 Major soil conservation practices used in rice-based system
Farmers adopt different SCPs considering their cropping system as a whole. For
example, animal manure is applied only once in a year during rice planting time in 30%
of the cases whereas only in wheat in 20% of the cases and half of the respondents
apply animal manure two times in a year. Farmers believe that even if they apply
manure in one crop the remaining nutrient after the harvest of that crop would be useful
for the succeeding crop. It was found that farmers use six types of SCPs in the rice
based system (Table 6.1). These practices are broadly classified into two categories:
water saving (SRI, ZT), and soil organic matter enhancement (animal manure, compost,
botanical pesticide and green manure).
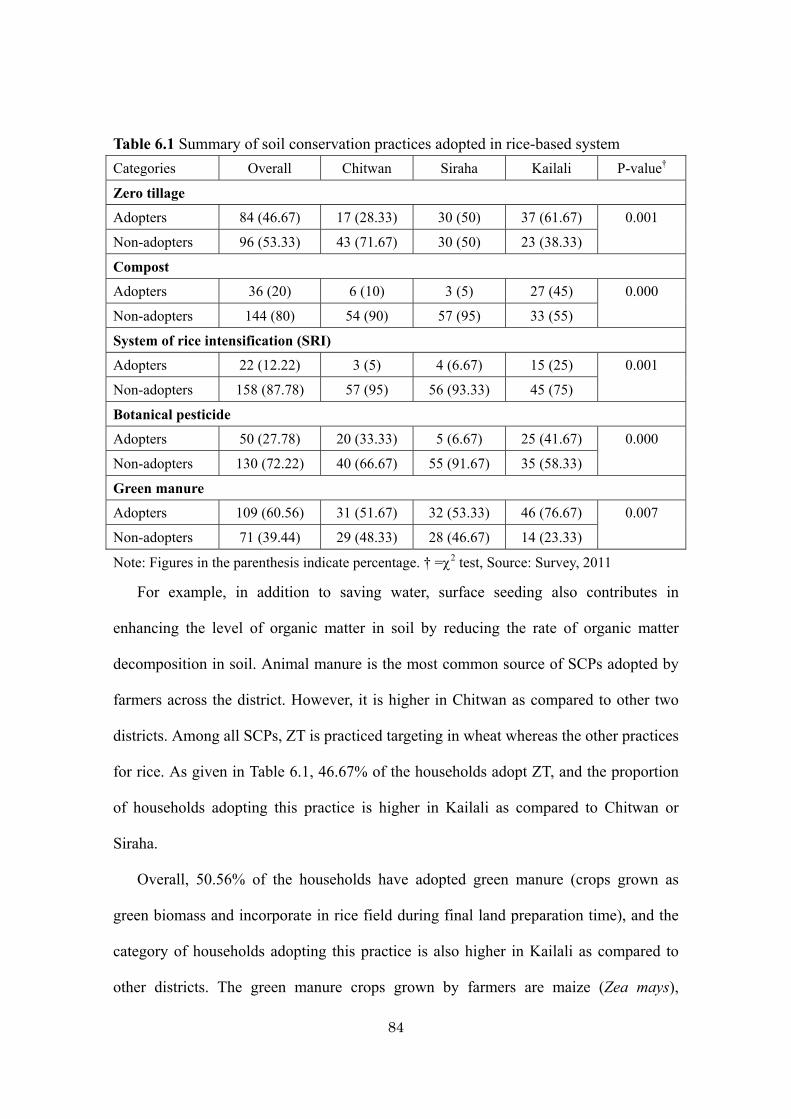
84
Table 6.1 Summary of soil conservation practices adopted in rice-based system
Categories Overall Chitwan Siraha Kailali P-value†
Zero tillage
Adopters 84 (46.67) 17 (28.33) 30 (50) 37 (61.67) 0.001
Non-adopters 96 (53.33) 43 (71.67) 30 (50) 23 (38.33)
Compost
Adopters 36 (20) 6 (10) 3 (5) 27 (45) 0.000
Non-adopters 144 (80) 54 (90) 57 (95) 33 (55)
System of rice intensification (SRI)
Adopters 22 (12.22) 3 (5) 4 (6.67) 15 (25) 0.001
Non-adopters 158 (87.78) 57 (95) 56 (93.33) 45 (75)
Botanical pesticide
Adopters 50 (27.78) 20 (33.33) 5 (6.67) 25 (41.67) 0.000
Non-adopters 130 (72.22) 40 (66.67) 55 (91.67) 35 (58.33)
Green manure
Adopters 109 (60.56) 31 (51.67) 32 (53.33) 46 (76.67) 0.007
Non-adopters 71 (39.44) 29 (48.33) 28 (46.67) 14 (23.33)
Note: Figures in the parenthesis indicate percentage. † =2 test, Source: Survey, 2011
For example, in addition to saving water, surface seeding also contributes in
enhancing the level of organic matter in soil by reducing the rate of organic matter
decomposition in soil. Animal manure is the most common source of SCPs adopted by
farmers across the district. However, it is higher in Chitwan as compared to other two
districts. Among all SCPs, ZT is practiced targeting in wheat whereas the other practices
for rice. As given in Table 6.1, 46.67% of the households adopt ZT, and the proportion
of households adopting this practice is higher in Kailali as compared to Chitwan or
Siraha.
Overall, 50.56% of the households have adopted green manure (crops grown as
green biomass and incorporate in rice field during final land preparation time), and the
category of households adopting this practice is also higher in Kailali as compared to
other districts. The green manure crops grown by farmers are maize (Zea mays),
85
Dhaincha (Sesbania spp) and Til (Sesamum indicum) in Chitwan, whereas it is
Mungbean (Vigna mungo) in Siraha and Kailali. Very limited households (20%) were
found to adopt compost, and Kailai district has the majority of the adopters. Famers
prepare compost using dried leaves collected from forest and or weed/crop residues, and
effective micro-organism/slurry is added to accelerate the process of decomposition.
There is also significant difference between the distribution of adopters and
non-adopters of compost across the districts. Only 12.22% of the households adopt SRI
practice (in rice), and the proportion of SRI adopters was also higher in Kailali as
compared to other two districts. Similarly, only 27% of the households use botanical
pesticides to control pests/diseases in rice. This does not mean that the remaining
households use chemical pesticides, as only 3% households were found to use chemical
pesticide in rice for weed control. The reasons behind the higher proportion of adopters
in Kailali might be due to the impact of development project activities as most of the
respondents (60%) of this district were associated with research into use program
implemented by NGOs.
6.3 Households’ behaviour in adopting soil conservation practices
6.3.1 Conceptual framework
Previous section shows that farmers adopt different SCPs using resources from their
farm and forest. Also, it is clear from the literature that SCPs such as ZT, SS
(Granatstein et al 1987; Ladha et al., 2003), green manure (Dahal et al., 1993; Devkota
et al., 2006; Pandey, Shah & Becker, 2008), system of rice intensification – SRI (Upreti,
2008), botanical pesticides, animal manure and compost (Lal et al., 1998) give
economic, social and environmental benefits to the farmers. It could be argued that
farmers adopt these practices based on the benefits they realized from these practices
86
but it is difficult to capture the trade-off between different benefits received from these
practices. To address this complexity the adoption of SCPs was analyzed from the
perspective that households could realize economic benefits/incentives while adopting
the practices. The consideration of economic benefits might be more appropriate for
small farmers because the environmental and social benefits to be realized by this
category of farmers are time and risk questions and not easily visible (Lee, 1980).
This does not mean that measuring economic benefits from SCPs is simple and
direct. For example, farmers could realize different economic benefits from the same
SCP (e.g. water saving, reduction of cultivation cost and yield increase from surface
seeding) and how farmers allocate their emphasis across these benefits is complex. Also,
farmers as a profit maximizer tend to innovate technologies or process in utilizing the
existing SCPs continuously. This makes it more difficult to put the long term benefits to
be realized by from SCPs into utility functions. Moreover, the criteria set by researchers
and policy makers about economic benefits from SCPs might be different from those of
farmers. In this context, adoption studies from the assumption that farmers adopt the
practices by perceiving potential costs and benefits from available SCPs in the whole
cropping system could be more logical (Kassie et al., 2012; Tripathi et al., 2006).
According to adoption and diffusion theory (Rogors, 1995) perception is a step in the
technology adoption process. The perception is influenced by various demographic (age,
education, labor, attitude), biophysical (disease, pest, climate stress, field
characteristics), economic, social and institutional (land tenure, linkage) factors (Shiekh
et al., 2002; Erenstein & Laxmi, 2008; Kassie et al., 2012).
87
6.3.2 Empirical model
6.3.2.1Theoretical concept
This study used multivariate probit (MVP) model to analyze how explanatory
(socio-economic) variables influence households’ decision to adopt different SCPs. In
this model, dependent variable is multivariate, binary and correlated. This model
assumes that given a set of explanatory variables the multivariate response is an
indicator of the event that some unobserved latent variables (Z), assumed to arise from
the multivariate normal (Gaussian) distribution, and falls within a certain interval (Tabet,
2007). As discussed in the conceptual framework, farmers could integrate different
SCPs to address their economic goal considering the cropping system perspective. This
justifies the modeling of SCPs simultaneously using MVP model rather than Univariate
Probit Model. Though Multinomial Logit is also found using to analyze the similar data
in the literature but MVP is more suited for correlated binary dependent variables which
are not mutually exclusive (Shiekh et al., 2002; Young et al., 2009). Also, the MVP
model relaxes the independence of the irrelevant alternatives property assumed by logit
model (Tabet, 2007). This model was also used by previous researchers (Cappelari and
Jenkins, 2003; Kassie et al., 2012) to analyze the impacts of socio-economic factors in
households’ decision for the adoption of SCPs. Theoretically, the MVP model is
presented in equation 6.1 and 6.2.
Yij = .
………………..(6.1)
Z = x + ε …………………(6.2)
Where, Yij is the binary dependent variable taking value 0 or 1 on the ith households
and jth options in dependent variable. Similarly, Z is the vector of latent variable, is a
matrix of the regression coefficient associated with explanatory variables (X).
88
Moreover, is a vector of residual error term distributed as multivariate normal
distribution with zero mean and unitary variance; ε N (0,), where is the
variance-covariance matrix having value 1 on the leading diagonal. The off diagonal
element in the correlation matrix,ρ = ρ represents the unobserved correlation
between the stochastic elements of the jth and kth items. The relationship between Zij
and kj is given by the likelihood of the observed data that can be obtained by
integrating over the latent variables Z (equation 6.3).
= 1⁄ ,,) = ,……., ∅ ( ⁄ , ,)d ………………..(6.3)
Where is the interval (0,) if = 1, and the interval (-, 0) otherwise.
Similarly, ∅ ( ⁄ , , ) is the probability density function of the standard normal
distribution. The study uses the simulated maximum likelihood (SML) method using
Geweke Hajavassiou-Keane (GHK) simulator in STATA developed by Cappelari and
Jenkins (2003) to estimate the MVP model. According to Cappelari and Jenkins (2003),
the SML simulator tends to be consistent once the number of observations and number
of draws tend to be infinitive. In general, the number of draws is considered square root
of the sample size if the latter is thousand and above. However, for small sample size
the number of draws should be increased from its default number (5) to enhance the
precision of the coefficient. So, the number of draw was set as 100 while estimating the
model.
As per the regression rule, diagnostic tests were carried out to check the
heteroscedasticity and multicollinearity problems n the data. For this, the same set of
socio-economic variables was regressed against the choice dependent variables
individually using OLS technique. VIF test was carried out to check multicollinearity
among the variables. The VIF value for the dependent variables across the three
89
equations was below 10 which indicated that multicollinearity problem did not exist in
the data. Similarly, Breusch-Pagan/Cook-Weisberg test showed that the selected data set
was free from heteroscedasticity as the null hypothesis of constant variances of the
residuals was not rejected (p >0.4) in all the tested equations.
6.3.2.2 Variables and operational model
The study shows that six SCPs: compost, ZT, green manure, system of rice
intensification (SRI) and botanical pesticides were adopted by the farmers. Among these
practices, ZT was adopted in rice whereas all other practices in rice. Since SRI consists
of package of practices such as planting 10-14 days old seedling, maintaining wider
spacing than conventional method while seedling transplanting, provision of major
nutrients from organic matter, and drainage (Upreti, 2008). It was found that none of the
seed producers were using full package of practices of SRI. So, farmers transplanting
single seedling in combination with any one of the above practices were considered
adopters of SRI. The animal manure was dropped from the analysis as all the farmers
were found to adopt this practice. Then, the remaining five variables were used as
dependent variables in the model. Again, the number of farmers adopting botanical
pesticides, SRI, and compost were limited (Table 6.1). So, these three variables were
combined under the name ‘improved practice’, and finally this variable and other two
variables (green manure and ZT) were used as dependent variables in the model. The
operational model used in this paper is given in equation 6.4.
(Zero tillage = β + β age + β education + β family labor + β irrigation
+ β livestock + β training + β operational land + β lnfertilizercost
β on farmincome β diversification index + ) (Green manure = β
β age + β education + β family labor + β irrigation + β livestock +
90
β training + β operational land + β ln fertilizer cost + β on-farm income +
β diversification index + ) (Improved practice = β + β age + β
education + β family labor +β irrigation + β livestock + β training + β
operational land + β lnfertilizer cost + β on-farm income + β diversification
index + )…………………………..(6.4)
Here, Ln = log; β , β and β are the vectors of the coefficients of explanatory
variables related to ZT, green manure and improved practices, respectively. The
explanatory variables used in the study were chosen on the basis of economic theory
and previous studies. Literature shows that demographic, economic and institutional
variables might influence households’ decision for adopting SCPs but the hypothesized
relation of the variables with adoption choices might be specific to local context
(Ereistein, 2009; Kassie et al., 2012). For example, land tenure was used as an
component of explanatory variable to understand its influence in households’ decision
making for adopting SCPs in food production in Tanjania but we found that seed
production was limited only to households’ own land.
The summary of explanatory variables and their hypothesized relation with the
dependent variables is given in Table 6.2. The demographic variables included in the
study are age and education of HHH, and family labor. Age and education were
hypothesized to have positive influence on the adoption of all dependent variables as
they contribute to human capital (Ervin & Ervin, 1982), whereas, the influence of
family labor on ZT was assumed negative as this technique saves labor and allows
farmers for timely wheat sowing. Also, it might contribute on rice yield by improving
the soil organic matter (Tripathi et al., 2006).
91
The economic variables included in the model are operational land, irrigation facility,
livestock holding, fertilizer cost, proportion of on-farm income to total household
income, and variety diversification index (VDI). As shown in Table 6.2, operational
land was hypothesized to have positive influence across the dependent variables as this
category of households has higher motivation to maximize the crop production utilizing
the resources (Shiekh et al., 2002). Households’ access to irrigation facility was
considered negative in case of ZT because farmers normally use ZT in the rain-fed area
utilizing the residual moisture retained in the soil from monsoon season (Tripathi et al.,
2006). But irrigation’s impact was hypothesized positive in ‘green manure’ and
‘improved practice’ as irrigation might influence households’ for adopting these
practices. The influence of livestock was assumed neutral on ZT and improved practice,
but it was hypothesized negative in case of green manure. This is because green manure
releases nutrients in soil quickly and also these manures are rich in nitrogen, and so
farmers with higher livestock holding might be less likely to adopt green manure as they
could apply most of the nutrients from livestock manure. Similarly, the influence of
fertilizer cost was assumed neutral to ZT but negative in green manure and improved
practice. The proportion of household’s annual on-farm income to annual total cash
income was hypothesized to have positive influence across the dependent variables
because farmers having higher proportion of on-farm income might be more conscious
towards adopting SCPs in relation to the economic benefit they intend to get from
farming.
Diversification of crop varieties is the common measure to address risks among
smallholder farmers. It was hypothesized that higher risk averters are more likely to
adopt SCPs because SCPs also contribute in enhancing the diversity of soil microbes
92
(Belknap & Saupe, 1988). The VDI was calculated as a ratio of number of rice varieties
grown by household to the total number of rice varieties grown by respective CBSPOs
because rice is the major crop in seed production (which contributes 80% of the total
seed production). The institutional variable considered in this study is households’
linkage with government and non-government organizations. These organizations
provide training to the seed growers in various dimensions of seed production including
SCPs. So, households’ attending agricultural training was used as a proxy variable to
represent their linkage with these organizations. It was assumed that trained households
are more likely to adopt SCPs due to knowledge and experience they get from training.
6.3.3 Results and discussion
6.3.3.1 Summary statistics
As discussed previously, adopters in SRI, compost and botanical pesticides were
grouped under ‘improved practice’. The summary statistics show that overall, 44% of
households adopted improved practices, and the proportion of adopters is higher in
Kailali (76%) as compared to Chitwan (40%) and Siraha (16%).Table 6.3 presents the
summary of explanatory variables used in the analysis with respect to their mean and
standard deviation. In case of dummy variables, the mean value indicates the percentage
of households adopting the practices.
For example, the mean value for irrigation facility is 0.55 meaning that 55% of the
households have access to pubic irrigation source. Farmers primarily use chemical
fertilizer in rice and its use is quite lower than the national recommendation in rice
(100:30:30kg :: N : P: K kg ha-1) (Tripathi et al., 2006). Overall, farmers apply major
plant nutrients @ 24.7kg N, 20.9kg P and 17kg K ha-1. These nutrients are supplied
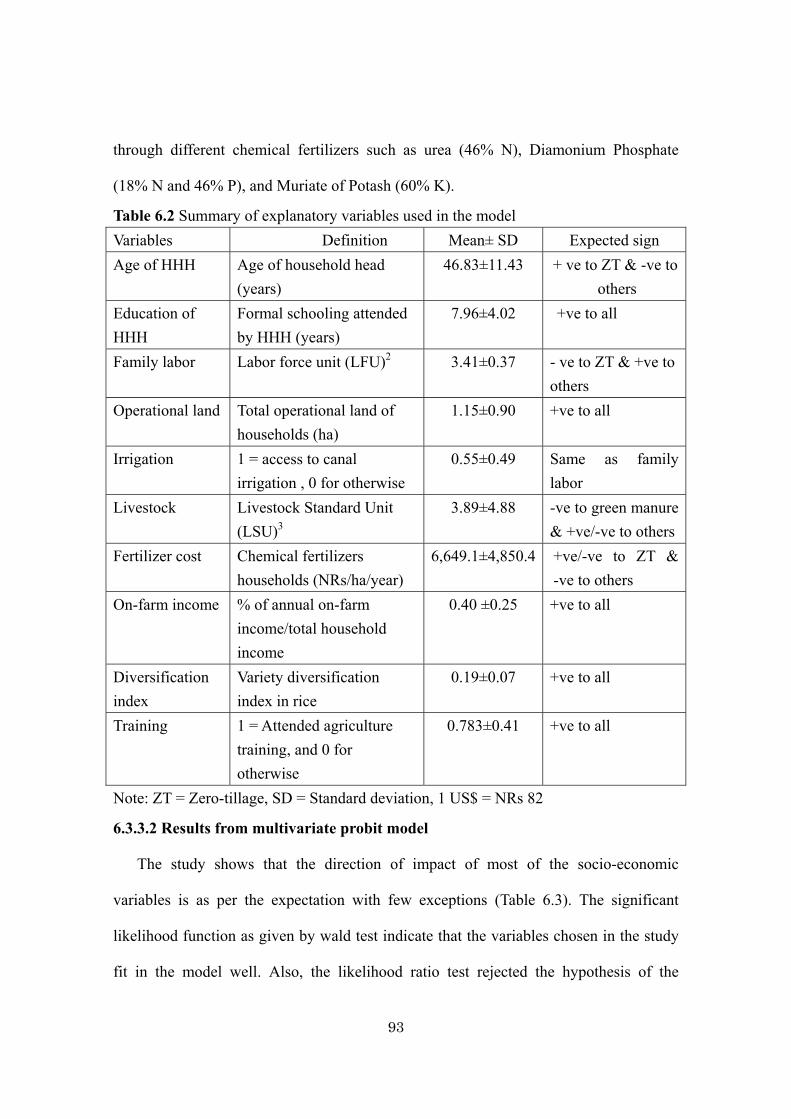
93
through different chemical fertilizers such as urea (46% N), Diamonium Phosphate
(18% N and 46% P), and Muriate of Potash (60% K).
Table 6.2 Summary of explanatory variables used in the model
Variables Definition Mean± SD Expected sign
Age of HHH Age of household head
(years)
46.83±11.43 + ve to ZT & -ve to
others
Education of
HHH
Formal schooling attended
by HHH (years)
7.96±4.02 +ve to all
Family labor Labor force unit (LFU)2 3.41±0.37 - ve to ZT & +ve to
others
Operational land Total operational land of
households (ha)
1.15±0.90 +ve to all
Irrigation 1 = access to canal
irrigation , 0 for otherwise
0.55±0.49 Same as family
labor
Livestock Livestock Standard Unit
(LSU)3
3.89±4.88 -ve to green manure
& +ve/-ve to others
Fertilizer cost Chemical fertilizers
households (NRs/ha/year)
6,649.1±4,850.4 +ve/-ve to ZT &
-ve to others
On-farm income % of annual on-farm
income/total household
income
0.40 ±0.25 +ve to all
Diversification
index
Variety diversification
index in rice
0.19±0.07 +ve to all
Training 1 = Attended agriculture
training, and 0 for
otherwise
0.783±0.41 +ve to all
Note: ZT = Zero-tillage, SD = Standard deviation, 1 US$ = NRs 82
6.3.3.2 Results from multivariate probit model
The study shows that the direction of impact of most of the socio-economic
variables is as per the expectation with few exceptions (Table 6.3). The significant
likelihood function as given by wald test indicate that the variables chosen in the study
fit in the model well. Also, the likelihood ratio test rejected the hypothesis of the
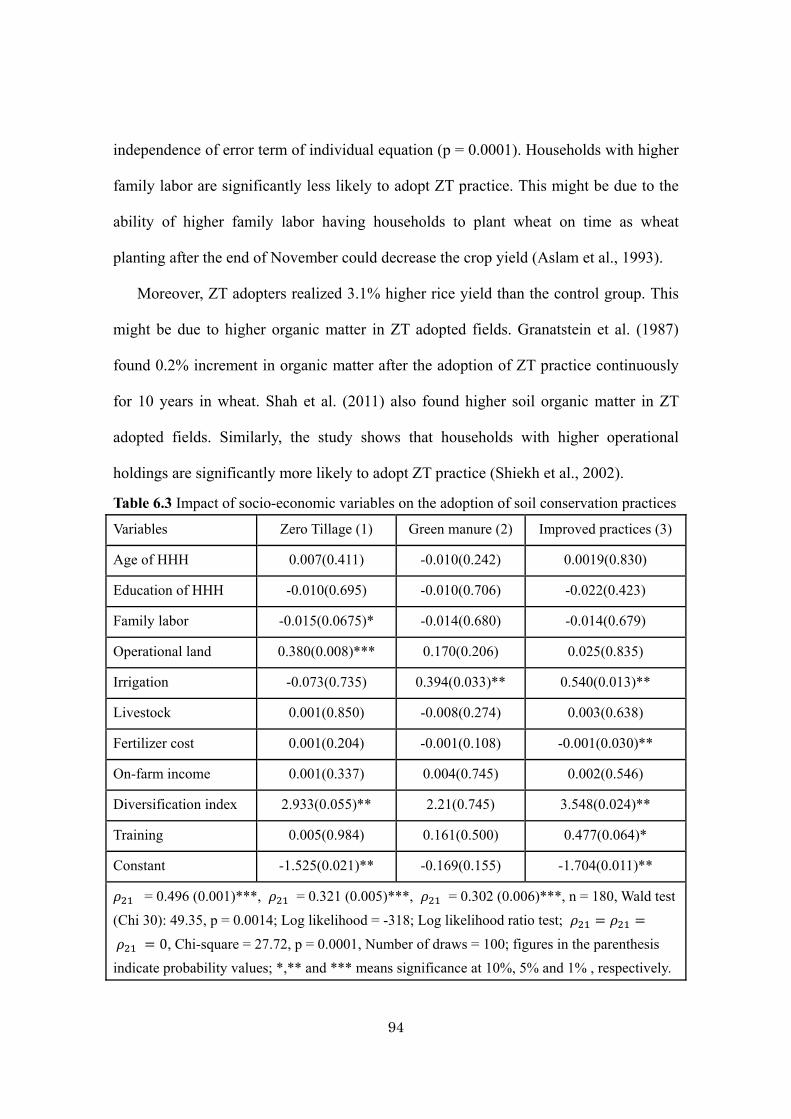
94
independence of error term of individual equation (p = 0.0001). Households with higher
family labor are significantly less likely to adopt ZT practice. This might be due to the
ability of higher family labor having households to plant wheat on time as wheat
planting after the end of November could decrease the crop yield (Aslam et al., 1993).
Moreover, ZT adopters realized 3.1% higher rice yield than the control group. This
might be due to higher organic matter in ZT adopted fields. Granatstein et al. (1987)
found 0.2% increment in organic matter after the adoption of ZT practice continuously
for 10 years in wheat. Shah et al. (2011) also found higher soil organic matter in ZT
adopted fields. Similarly, the study shows that households with higher operational
holdings are significantly more likely to adopt ZT practice (Shiekh et al., 2002).
Table 6.3 Impact of socio-economic variables on the adoption of soil conservation practices
Variables Zero Tillage (1) Green manure (2) Improved practices (3)
Age of HHH 0.007(0.411) -0.010(0.242) 0.0019(0.830)
Education of HHH -0.010(0.695) -0.010(0.706) -0.022(0.423)
Family labor -0.015(0.0675)* -0.014(0.680) -0.014(0.679)
Operational land 0.380(0.008)*** 0.170(0.206) 0.025(0.835)
Irrigation -0.073(0.735) 0.394(0.033)** 0.540(0.013)**
Livestock 0.001(0.850) -0.008(0.274) 0.003(0.638)
Fertilizer cost 0.001(0.204) -0.001(0.108) -0.001(0.030)**
On-farm income 0.001(0.337) 0.004(0.745) 0.002(0.546)
Diversification index 2.933(0.055)** 2.21(0.745) 3.548(0.024)**
Training 0.005(0.984) 0.161(0.500) 0.477(0.064)*
Constant -1.525(0.021)** -0.169(0.155) -1.704(0.011)**
= 0.496 (0.001)***, = 0.321 (0.005)***, = 0.302 (0.006)***, n = 180, Wald test
(Chi 30): 49.35, p = 0.0014; Log likelihood = -318; Log likelihood ratio test;
0, Chi-square = 27.72, p = 0.0001, Number of draws = 100; figures in the parenthesis
indicate probability values; *,** and *** means significance at 10%, 5% and 1% , respectively.
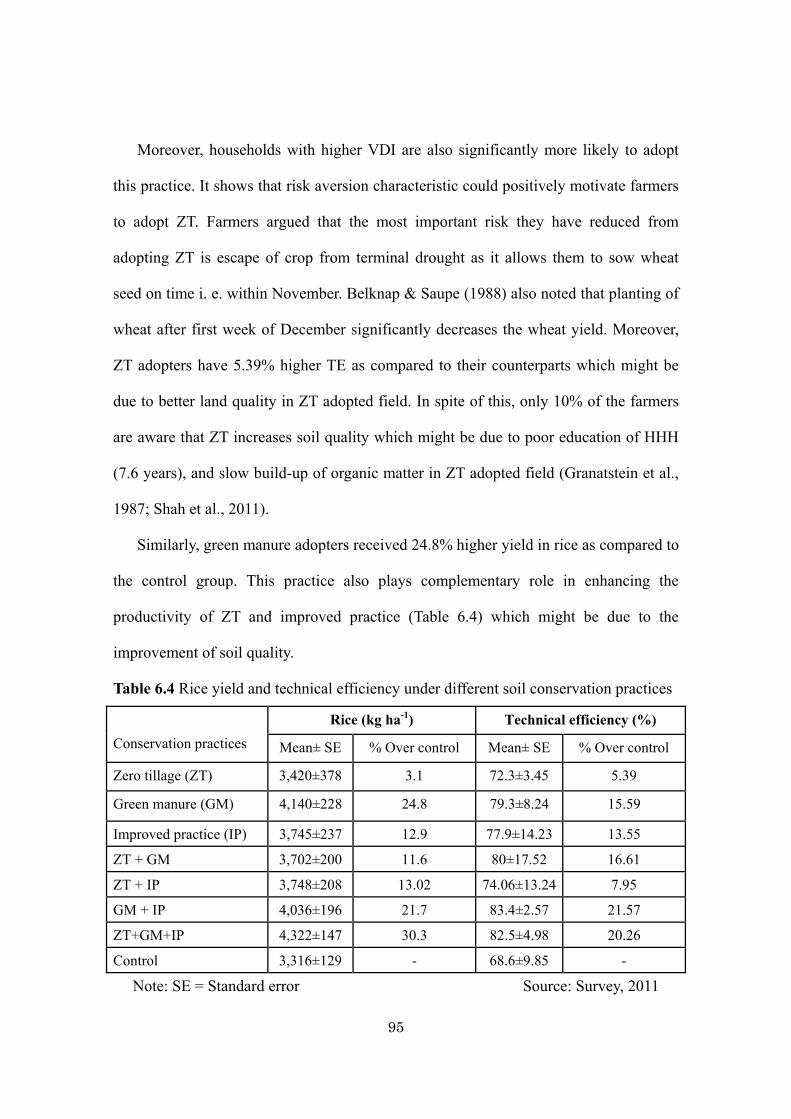
95
Moreover, households with higher VDI are also significantly more likely to adopt
this practice. It shows that risk aversion characteristic could positively motivate farmers
to adopt ZT. Farmers argued that the most important risk they have reduced from
adopting ZT is escape of crop from terminal drought as it allows them to sow wheat
seed on time i. e. within November. Belknap & Saupe (1988) also noted that planting of
wheat after first week of December significantly decreases the wheat yield. Moreover,
ZT adopters have 5.39% higher TE as compared to their counterparts which might be
due to better land quality in ZT adopted field. In spite of this, only 10% of the farmers
are aware that ZT increases soil quality which might be due to poor education of HHH
(7.6 years), and slow build-up of organic matter in ZT adopted field (Granatstein et al.,
1987; Shah et al., 2011).
Similarly, green manure adopters received 24.8% higher yield in rice as compared to
the control group. This practice also plays complementary role in enhancing the
productivity of ZT and improved practice (Table 6.4) which might be due to the
improvement of soil quality.
Table 6.4 Rice yield and technical efficiency under different soil conservation practices
Conservation practices Rice (kg ha-1) Technical efficiency (%)
Mean± SE % Over control Mean± SE % Over control
Zero tillage (ZT) 3,420±378 3.1 72.3±3.45 5.39
Green manure (GM) 4,140±228 24.8 79.3±8.24 15.59
Improved practice (IP) 3,745±237 12.9 77.9±14.23 13.55
ZT + GM 3,702±200 11.6 80±17.52 16.61
ZT + IP 3,748±208 13.02 74.06±13.24 7.95
GM + IP 4,036±196 21.7 83.4±2.57 21.57
ZT+GM+IP 4,322±147 30.3 82.5±4.98 20.26
Control 3,316±129 - 68.6±9.85 -
Note: SE = Standard error Source: Survey, 2011
96
In addition, green manure adopters have 15.59% higher TE as compared to the
control group, and there is complementary role of green manure with other practice in
TE. These figures clearly show the positive role of green manure in enhancing rice yield
as well TE of farmers in using other agricultural inputs. Previously, researchers have
also found positive roles of green manure on rice yield, and the reasons behind it might
be due to improved soil quality as a result of increased organic matter, microbial
diversity and aeration (Dahal et al., 1993; Devkota et al., 2006; Pandey, Sah & Becker,
2008). Farmers grow different green manure crops in their land in the spring season
(April to June) after harvesting of wheat and before transplanting main season rice (July
to October), and incorporate their green biomass into soil during final land preparation
for rice.
Out of the various socio-economic variables tested for green manure adoption only
irrigation shows significant impact on it. It means households having access to irrigation
facility (canal irrigation from river/stream) are more likely to grow green manure crops.
This shows that irrigation is one of the constraints for the adoption of green manure
crops. Though 55% of the households have irrigation facility and farmers in the group
discussion argued that the water level is the irrigation canal reduces by 50% to 75% in
the spring season. As a result, many farmers have to wait rainfall for sowing green
manure crop, and sometimes they fail to sow the seed of these crops. In contrast to ZT,
majority of the farmers (90%) are aware of the role of green manure in the improvement
of soil quality. Though there is no significant influence of chemical fertilizer on green
manure adoption; however, its negative coefficient indicates that higher chemical
fertilizer adopting households are less likely to adopt green manure crop. Green manure
adopters invest 16% less amount money for chemical fertilizer than non-adopters.
97
As in ZT and green manure, improved practice adopters received higher yield and
TE as compared to the control group (Table 6.4). This might be due to higher organic
matter content in the improved practice adopted fields. The adoption of improved
practice is influenced by irrigation, training, fertilizer cost and variety diversification. It
means households having irrigation facility, taken agricultural training, and those with
higher risk aversion characteristics are more likely to adopt improved practice. But
those using higher amount of chemical fertilizer are significantly less likely to adopt
improved practice. This also justifies the farmers’ behavior in adopting improved
practice considering economic perspective though the practice also contributes in saving
water (e.g. SRI), reducing pollution and enhancing soil quality.
6.4 Conclusion
This chapter analyzed the influence of households’ socio-economic variables on the
adoption of ZT, green manure and improved practice in rice using MVP model. Though
SCPs provide economic, social and environmental benefits, we analyzed the influence of
these variables on the adoption of SCPs focusing on economic consideration. There is
positive linkage of SCPs with crop yield and TE which justifies the use of economic
consideration in analyzing the adoption of SCPs. The result of MVP model indicates that
influence of socio-economic variables varies across SCPs. Households with less family
labor, higher operational land, and higher risk aversion characteristics are more likely to
adopt ZT. Similarly, those having irrigation facility are more likely to adopt green manure
crop. Irrigation facility, training and risk aversion characteristics have significant positive
influence on the adoption of improve practice whereas chemical fertilizer has negative
impact on it.
98
Chapter 7. Marketing of rice seed in the study area
7.1 Introduction
It is clear from the previous chapters that in community-based seed production
households’ grow rice seed but they sell seed in the market through their organizations
(CBSPOs). The idea behind rice seed marketing by seed producing households through
their organizations is that organizations could minimize the marketing cost due to their
potential to increase the economy of scale as compared to an individual household. Also,
organizations can hold higher bargaining power in the market chain. The marketing
process involves market research, seed collection from household, process, storage and
distribution of seed. It means to be successful in marketing seed producing households
need to sell maximum proportion of their produced rice to their organization. Similarly,
CBSPOs need to cover their full/partial costs involved in marketing. This chapter
focuses in these two issues.
7.2 Seed production and sale
The study shows that farmers carry out rice seed production activity in majority of
their total operational land (79%). All the sampling households are involved in rice seed
production but only 65% of them sell seed in the market. There is quite variation in the
proportion of seed sold by households in the market across the districts. Households
from Chitwan sell majority of their produce (90%) whereas the proportion of rice seed
sold by farmers in Siraha (50%) and Kailali (55%) is less. Here, seed price means the
price of rice seed CBSPOs fix for their members at the time of rice harvest
(November-December). The rice seed price at this stage is determined by CBSPOs
based on the seed colour (brightness), disease and pest infestation, availability of inert
materials, and rice grain price. Normally, seed rice gets NRs 2 to NRs 3 higher price
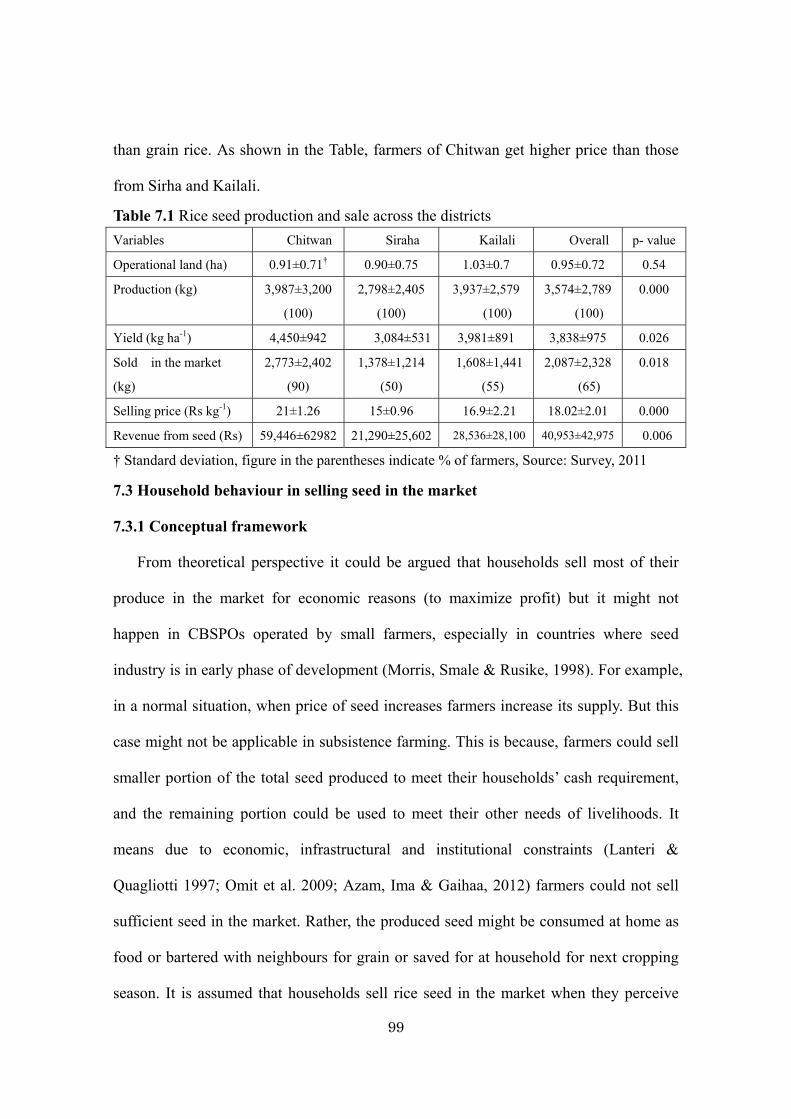
99
than grain rice. As shown in the Table, farmers of Chitwan get higher price than those
from Sirha and Kailali.
Table 7.1 Rice seed production and sale across the districts
Variables Chitwan Siraha Kailali Overall p- value
Operational land (ha) 0.91±0.71† 0.90±0.75 1.03±0.7 0.95±0.72 0.54
Production (kg) 3,987±3,200
(100)
2,798±2,405
(100)
3,937±2,579
(100)
3,574±2,789
(100)
0.000
Yield (kg ha-1) 4,450±942 3,084±531 3,981±891 3,838±975 0.026
Sold in the market
(kg)
2,773±2,402
(90)
1,378±1,214
(50)
1,608±1,441
(55)
2,087±2,328
(65)
0.018
Selling price (Rs kg-1) 21±1.26 15±0.96 16.9±2.21 18.02±2.01 0.000
Revenue from seed (Rs) 59,446±62982 21,290±25,602 28,536±28,100 40,953±42,975 0.006
† Standard deviation, figure in the parentheses indicate % of farmers, Source: Survey, 2011
7.3 Household behaviour in selling seed in the market
7.3.1 Conceptual framework
From theoretical perspective it could be argued that households sell most of their
produce in the market for economic reasons (to maximize profit) but it might not
happen in CBSPOs operated by small farmers, especially in countries where seed
industry is in early phase of development (Morris, Smale & Rusike, 1998). For example,
in a normal situation, when price of seed increases farmers increase its supply. But this
case might not be applicable in subsistence farming. This is because, farmers could sell
smaller portion of the total seed produced to meet their households’ cash requirement,
and the remaining portion could be used to meet their other needs of livelihoods. It
means due to economic, infrastructural and institutional constraints (Lanteri &
Quagliotti 1997; Omit et al. 2009; Azam, Ima & Gaihaa, 2012) farmers could not sell
sufficient seed in the market. Rather, the produced seed might be consumed at home as
food or bartered with neighbours for grain or saved for at household for next cropping
season. It is assumed that households sell rice seed in the market when they perceive
100
economic benefit from it. The perception is influenced by demographic, economic and
institutional resources.
7.3.2 Empirical method
Heckman selection model (Heckman, 1979) was used for data analysis and this
model is considered preferable to OLS if all the households do not participate in the
market as it captures the selection bias. Azam, Ima and Gaiha (2012) also applied this
model to analyze farmers’ market participation in Cambodia. This model consists of two
equations. The first equation is called the selection equation that gives the impacts of
socio-economic variables on probability of CBSPs’ selling seed in the market. The
second equation, also called outcome equation, indicates the impact of these variables
on volume of seed sold in the market. These two equations were simultaneously
modeled using maximum likelihood method as it is more efficient than the two-step
procedure. To separate these two equations, the price of seed was used as an identifier in
the selection equation. The outcome and selection equations are presented in equation
7.1 and 7.2, respectively.
y = x + ………………………(7.1)
Z∗ = w α + ϵ ………………………(7.2)
Where,y is volume of seed sold in the market, Z∗ is a latent variable, x andw
are the vectors of explanatory variables, is the vectors of coefficient, and
andϵ are the error terms. The operational models of the outcome and selection
equations are given in equation 7.3 and 7.4, respectively.
Ln seed sold =β β age of HHH + β education of HHH + β family labor +
β operational land + β ln off-farm income + β irrigation + β livestock + β training
+ β share + β roof type + …………………………..(7.3)
101
Market participation = age of HHH + education of HHH + family
labor + operational land + ln off-farm income + irrigation + livestock +
training + share + roof type + seed price + ϵ ……………….(7.4)
Where, ln is log. Seed sold is the dependent variable used in the outcome equation
which indicates the quantity of rice seed sold by farmers in the market. It is possible that
farmers’ sell seed not only to CBSPOs but also to other actors such as local farmers,
agrovet, development projects and so on. But CBSPOs and DADOs in group
discussions argued that farmers in the study area rarely sell seed directly to other actors.
Rather they sell seed to CBSPOs where they have taken membership, and the CBSPOs
after processing (packaging, quality checking and leveling) sell seeds to the
aforementioned actors. So, CBSPOs are the first hand buyers of rice seed produced by
households. Similarly, market participation is the dependent variable in the selection
equation which shows whether farmers sell seed to CBSPOs or not (i.e. dummy variable
which takes the value 0 or 1).
A total of 11 socio-economic variables were chosen as explanatory variables
considering economic theory, findings from previous literature and experience of
farmers as the combination of these strategies would help to draw the relevant variables
for the study (Table 7.2). These variables include demographic (age and education of
household head – HHH, and family labor), economic (operational land, irrigation
facility, off-farm income, livestock and roof type), and institutional (training, collection
of share in the organization). The justification for the selection of these variables is
given below.
102
The impact of age and education of HHH was hypothesized positive because age
represents experience and education indicates the analytical capability, both of which
might have positive impact on households’ market participation and volume of seed sold.
Similarly, rice seed production is carried out in rural areas where majority of the work is
done by their family members. Also, rice farming is seasonal in nature when most of
laborers are busy in their own households’ activities. Even those wanting to hire
laborers might not get them on time and could not operate field activities properly,
which might influence the quantity and quality of seed. So, it was hypothesized that
family labor (LFU) would have positive impact on both market participation and seed
sale volume.
Operational land, irrigation facility (proportion of the total operational land with
irrigation facility) and organic manure might have positive linkage on crop yield (Azam,
Ima & Gaiha, 2012). So, these variables were assumed to have positive impact on the
seed sale. Livestock (LSU) was used as a proxy variable to represent the amount of
animal manure applied in the field. Similarly, those having higher off-farm income
might be less affected by cash/food shortage, especially from crop harvest until seed
sale, would be more motivated towards seed selling. Moreover, the CBSPOs are poor in
physical structure (e.g. storage house, grading machine), so they have to store seed at
their personal houses for few months after rice harvest until CBSPOs make arrangement
to store it in the common place/store. Those having concrete-roofed houses would be
more likely to be motivated towards seed selling as they could store the seed
maintaining its quality for longer time period than their counterparts. It means in
thatched roofed households there might be higher possibility of seed quality
deterioration due to leakage of moisture from outside. Lower quality seed might be
103
rejected in the market and even if accepted households could get less seed price.
Training and household’s share (cash deposited at CBSPOs by farmers) are the two
institutional variables considered in the study. It was assumed that those receiving
training in any aspect of seed management (production, quality control and marketing)
might be better off both in the market participation and seed selling volume as it tends
to enhance households motivation towards seed selling. Similarly, those deposited cash
at CBSPOs as share were assumed to have better performance in seed selling. It is
because profit generated from marketing of seed could be distributed to farmers based
on proportion of the deposited share. The detail of dependent and explanatory variables
used in the study is presented in Table 7.2.
Before running the Heckman Selection model, data were validated for
multicollinearity and heteroskedasticity. The VIF method was used to detect
multicollinearity because this method is preferred over the correlation coefficient
method (Pindyck & Rubinfield 1981). We did not find the problem of multicollinearity
in the explanatory variables used in the model as the values are less than 10. The test for
homogeneity of variance was conducted using Breusch-Pagan/Cook-Weisberg test for
heteroskedasticity, and the null hypothesis of constant variances of the residuals was not
rejected (p>0.25) across the explanatory variables.
7.3.3 Results and discussion
The study shows that 65.8% of farmers sold rice seed in the market on average
1,356.7kg household-1 and this volume is 64% of the total rice seed produced by
household. The average operational land for rice seed production per household was
0.95ha (Table 7.2). Average age of HHH was 46.83 years but it varies from 17 – 75
years. Average off-farm income of households was NRs 42,998 and this accounts for
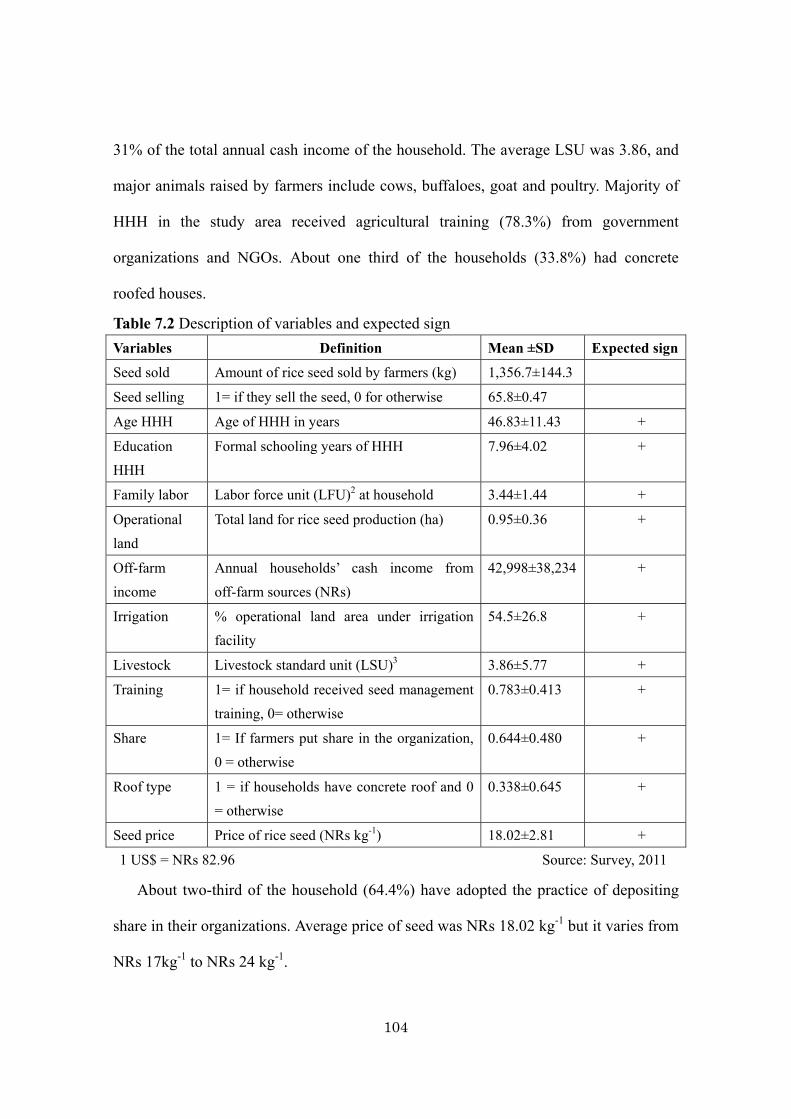
104
31% of the total annual cash income of the household. The average LSU was 3.86, and
major animals raised by farmers include cows, buffaloes, goat and poultry. Majority of
HHH in the study area received agricultural training (78.3%) from government
organizations and NGOs. About one third of the households (33.8%) had concrete
roofed houses.
Table 7.2 Description of variables and expected sign Variables Definition Mean ±SD Expected sign
Seed sold Amount of rice seed sold by farmers (kg) 1,356.7±144.3
Seed selling 1= if they sell the seed, 0 for otherwise 65.8±0.47
Age HHH Age of HHH in years 46.83±11.43 +
Education
HHH
Formal schooling years of HHH 7.96±4.02 +
Family labor Labor force unit (LFU)2 at household 3.44±1.44 +
Operational
land
Total land for rice seed production (ha) 0.95±0.36 +
Off-farm
income
Annual households’ cash income from
off-farm sources (NRs)
42,998±38,234 +
Irrigation % operational land area under irrigation
facility
54.5±26.8 +
Livestock Livestock standard unit (LSU)3 3.86±5.77 +
Training 1= if household received seed management
training, 0= otherwise
0.783±0.413 +
Share 1= If farmers put share in the organization,
0 = otherwise
0.644±0.480 +
Roof type 1 = if households have concrete roof and 0
= otherwise
0.338±0.645 +
Seed price Price of rice seed (NRs kg-1) 18.02±2.81 +
1 US$ = NRs 82.96 Source: Survey, 2011
About two-third of the household (64.4%) have adopted the practice of depositing
share in their organizations. Average price of seed was NRs 18.02 kg-1 but it varies from
NRs 17kg-1 to NRs 24 kg-1.
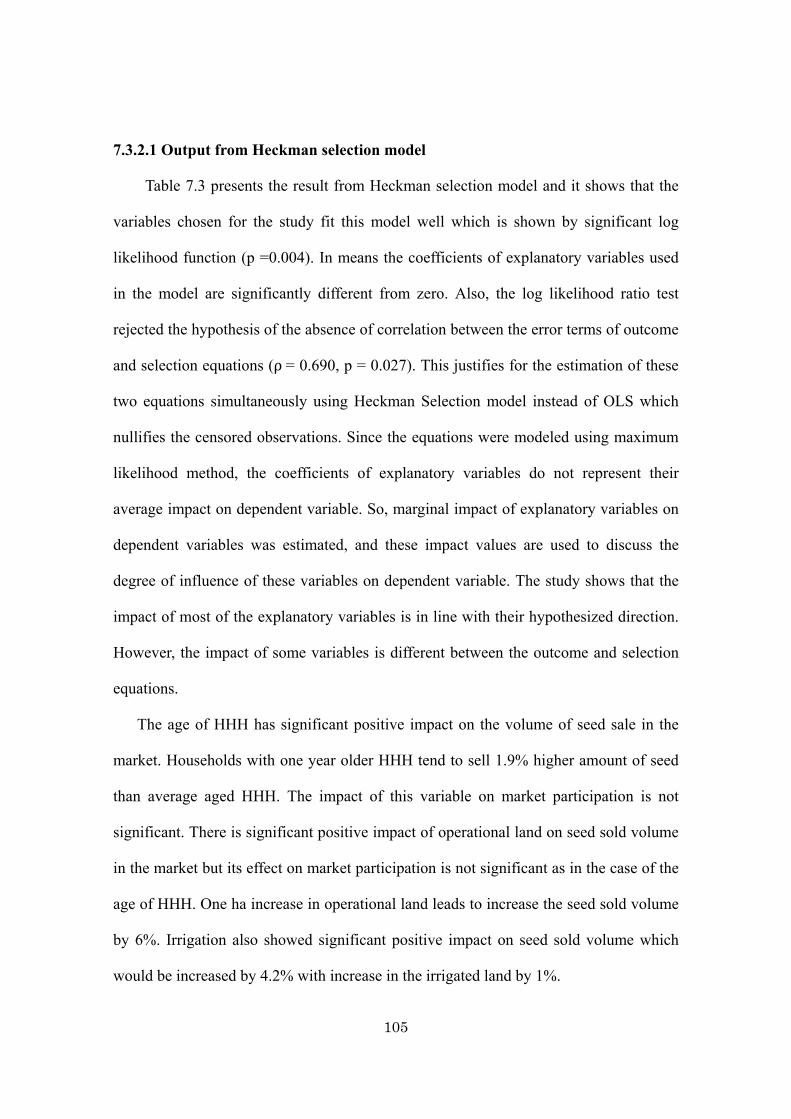
105
7.3.2.1 Output from Heckman selection model
Table 7.3 presents the result from Heckman selection model and it shows that the
variables chosen for the study fit this model well which is shown by significant log
likelihood function (p =0.004). In means the coefficients of explanatory variables used
in the model are significantly different from zero. Also, the log likelihood ratio test
rejected the hypothesis of the absence of correlation between the error terms of outcome
and selection equations (ρ= 0.690, p = 0.027). This justifies for the estimation of these
two equations simultaneously using Heckman Selection model instead of OLS which
nullifies the censored observations. Since the equations were modeled using maximum
likelihood method, the coefficients of explanatory variables do not represent their
average impact on dependent variable. So, marginal impact of explanatory variables on
dependent variables was estimated, and these impact values are used to discuss the
degree of influence of these variables on dependent variable. The study shows that the
impact of most of the explanatory variables is in line with their hypothesized direction.
However, the impact of some variables is different between the outcome and selection
equations.
The age of HHH has significant positive impact on the volume of seed sale in the
market. Households with one year older HHH tend to sell 1.9% higher amount of seed
than average aged HHH. The impact of this variable on market participation is not
significant. There is significant positive impact of operational land on seed sold volume
in the market but its effect on market participation is not significant as in the case of the
age of HHH. One ha increase in operational land leads to increase the seed sold volume
by 6%. Irrigation also showed significant positive impact on seed sold volume which
would be increased by 4.2% with increase in the irrigated land by 1%.
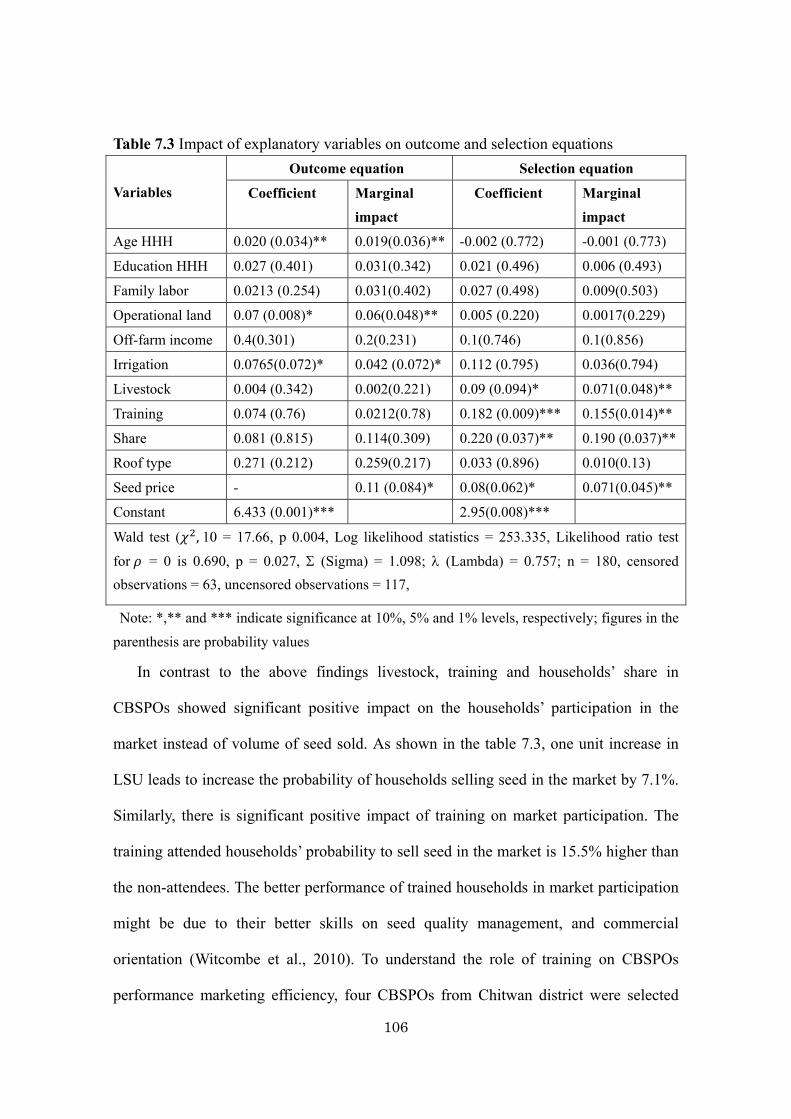
106
Table 7.3 Impact of explanatory variables on outcome and selection equations Variables
Outcome equation Selection equation
Coefficient Marginal impact
Coefficient Marginal impact
Age HHH 0.020 (0.034)** 0.019(0.036)** -0.002 (0.772) -0.001 (0.773)
Education HHH 0.027 (0.401) 0.031(0.342) 0.021 (0.496) 0.006 (0.493)
Family labor 0.0213 (0.254) 0.031(0.402) 0.027 (0.498) 0.009(0.503)
Operational land 0.07 (0.008)* 0.06(0.048)** 0.005 (0.220) 0.0017(0.229)
Off-farm income 0.4(0.301) 0.2(0.231) 0.1(0.746) 0.1(0.856)
Irrigation 0.0765(0.072)* 0.042 (0.072)* 0.112 (0.795) 0.036(0.794)
Livestock 0.004 (0.342) 0.002(0.221) 0.09 (0.094)* 0.071(0.048)**
Training 0.074 (0.76) 0.0212(0.78) 0.182 (0.009)*** 0.155(0.014)**
Share 0.081 (0.815) 0.114(0.309) 0.220 (0.037)** 0.190 (0.037)**
Roof type 0.271 (0.212) 0.259(0.217) 0.033 (0.896) 0.010(0.13)
Seed price - 0.11 (0.084)* 0.08(0.062)* 0.071(0.045)**
Constant 6.433 (0.001)*** 2.95(0.008)***
Wald test ( ,10 = 17.66, p 0.004, Log likelihood statistics = 253.335, Likelihood ratio test
for = 0 is 0.690, p = 0.027, (Sigma) = 1.098; (Lambda) = 0.757; n = 180, censored
observations = 63, uncensored observations = 117,
Note: *,** and *** indicate significance at 10%, 5% and 1% levels, respectively; figures in the
parenthesis are probability values
In contrast to the above findings livestock, training and households’ share in
CBSPOs showed significant positive impact on the households’ participation in the
market instead of volume of seed sold. As shown in the table 7.3, one unit increase in
LSU leads to increase the probability of households selling seed in the market by 7.1%.
Similarly, there is significant positive impact of training on market participation. The
training attended households’ probability to sell seed in the market is 15.5% higher than
the non-attendees. The better performance of trained households in market participation
might be due to their better skills on seed quality management, and commercial
orientation (Witcombe et al., 2010). To understand the role of training on CBSPOs
performance marketing efficiency, four CBSPOs from Chitwan district were selected
107
considering their audit reports for 2010, and estimated their net profit and return to
investment (RTI) using the methodology described by Kubei (2007).
Table 7.4. Cost benefit analysis of rice seed marketing across the four CBSPOs Particular CBSPOs
Revenue and its sources Unnat Pragati Shreeram Bijbridhi
Quantity of seed sold (Kg) 407,245 56,000 347,000 268,000
Value of seed sold (NRs.) 14853,327 1932,000 11624,500 9380,000
Revenue from byproducts (NRs.) 3,000 96,000 15,000 8,000
Revenue from machine (NRs.) 144,232 0 300,000 75,000
Staff mobilization (NRs.) 62,689 0 37,800 28,600
(a)Total revenue (NRs.) 15063,249 2028,000 11977,300 9491,600
Cost items
Quantity bought (kg) 422,669 64,000 350,000 270,000
Cost of seed (NRs) 9132,036 1376,000 7350,000 5400,000
Salary to staff (NRs) 362,898 0 250,000 286,000
Processing cost (NRs) 538,224 204,800 346,000 385,000
Depreciation (NRs) 160,839 2,250 108,000 102,000
Training (NRs) 500,000 0 50,000 35,000
Other management cost (NRs) 187,400 60,253 25,300 10,000
(b) Total cost (NRs) 10881,398 60,253 56,475 29,250
(c) Profit before interest (NRs) = a-b 4181,850 384,697 3848,000 3273,600
(d) Interest (10%) (NRs) = c*0.1 1088,139 164,330 812,930 621,800
(e) Net profit (NRs) = c-d 3093,711 220,366 3035,070 2651,800
Return to investment (%) = e/b 28 13 37 43
Profit per kg of seed sold (NRs) 7.59 3.93 8.74 9.89
Source: Raw data from audit reports of the CBSPOs, 2010
Since CBSPOs were found to sell not only rice seed but also seeds of other crop and
fertilizers, management cost for rice was estimated based on the proportion of annual
CBSPOs gross revenue shared by rice seed. Here, RTI is the ratio of net profit to the
total cost. Moreover, it was found that due to climatic factors, price fluctuation of rice
grain in the market, and rice seed introduced from other areas including India, price of
rice seed varies in the market. As a result CBSPOs might not sell all of their produce as
108
seed but the unsold rice seed is sold in the market in the form of grain with lower price.
To see the sensitivity of these organizations with respect to change in seed price due to
aforementioned external factors, RTI of these organizations was estimated. The result
shows that RTI of CBSPOs spending on training is higher than others. As shown in
Table 7.4, RTI of Bijbridhi (43%), Shreeram (37%), and Unnat (28%) was higher than
that of Pragati (13%). The reasons for higher RTI of those organizations that invested in
training might be due to increased members’ skills on technical matters of seed
production. As a result, the members sold higher proportion of produced seed to
CBSPOs, and the organizations could able to increase their economy of scale.
Further analysis on sensitivity of CBSPOs with change in price shows that Pragati is
more sensitive than other three organizations, and its RTI would be negative as this
organization has to sell 30% of its output as grain in the market instead of seed. Less
sensitiveness of CBSPOs those spending on training might be due to better
accountability of their members towards the organizations in producing quality seed and
selling higher proportion of rice seed produced at their households. Previous studies
also recognized the importance of training for success in community-based seed
production (Almekinders & Louwaars, 1999; Cromwell &Wiggins, 1993). Households’
share in CBSPOs also showed significant positive impact on market participation. There
is 19% higher probability of selling seeds of those who deposited share in CBSPOs than
their counterparts. Seed price shows significant positive impact on households’ decision to
participate in the market. One unit increase in seed price (NRs kg-1) increases the
probability of households’ selling seed in the market by 7.1%. Seed price has also indirect
impact on volume of seed sold in the market as shown from its marginal impact on seed
sold volume.
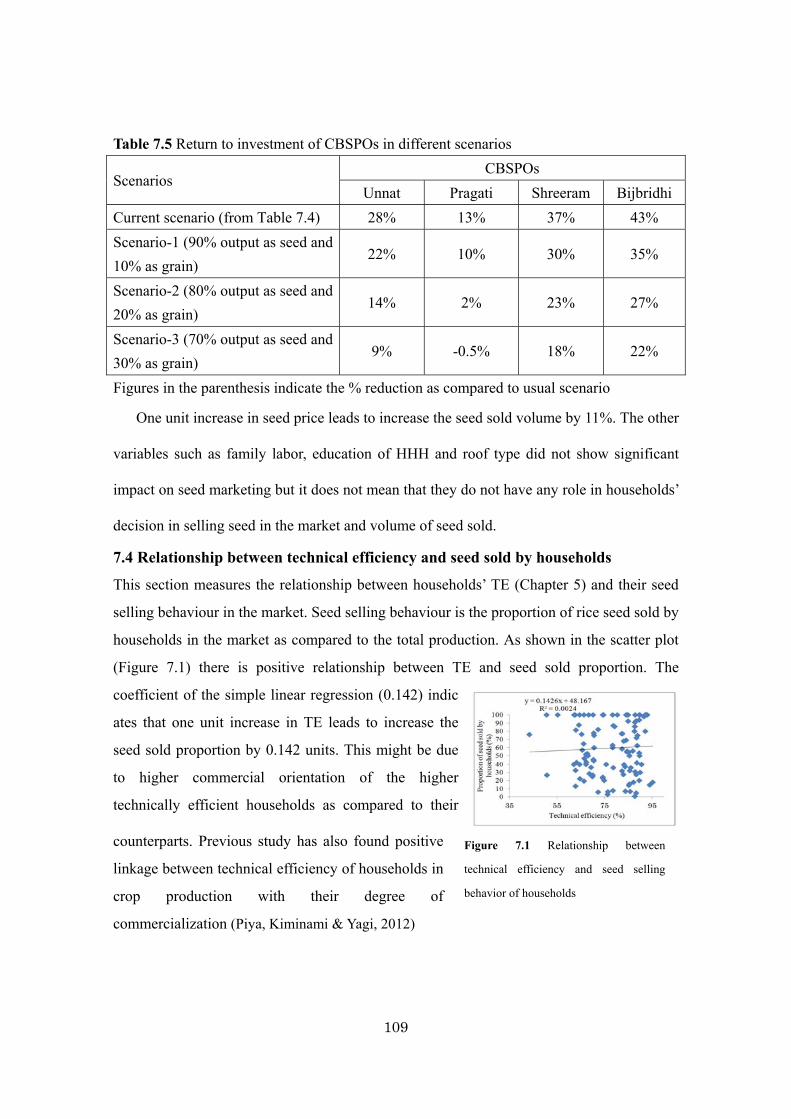
109
Table 7.5 Return to investment of CBSPOs in different scenarios
Scenarios CBSPOs
Unnat Pragati Shreeram Bijbridhi
Current scenario (from Table 7.4) 28% 13% 37% 43%
Scenario-1 (90% output as seed and
10% as grain) 22% 10% 30% 35%
Scenario-2 (80% output as seed and
20% as grain) 14% 2% 23% 27%
Scenario-3 (70% output as seed and
30% as grain) 9% -0.5% 18% 22%
Figures in the parenthesis indicate the % reduction as compared to usual scenario
One unit increase in seed price leads to increase the seed sold volume by 11%. The other
variables such as family labor, education of HHH and roof type did not show significant
impact on seed marketing but it does not mean that they do not have any role in households’
decision in selling seed in the market and volume of seed sold.
7.4 Relationship between technical efficiency and seed sold by households
This section measures the relationship between households’ TE (Chapter 5) and their seed
selling behaviour in the market. Seed selling behaviour is the proportion of rice seed sold by
households in the market as compared to the total production. As shown in the scatter plot
(Figure 7.1) there is positive relationship between TE and seed sold proportion. The
coefficient of the simple linear regression (0.142) indic
ates that one unit increase in TE leads to increase the
seed sold proportion by 0.142 units. This might be due
to higher commercial orientation of the higher
technically efficient households as compared to their
counterparts. Previous study has also found positive
linkage between technical efficiency of households in
crop production with their degree of
commercialization (Piya, Kiminami & Yagi, 2012)
Figure 7.1 Relationship between
technical efficiency and seed selling
behavior of households
110
7.5 Conclusion
In this study we analyzed households’ behavior in selling seed in the market. The
result shows that majority of the households (65.8%) participated in the market and sold
64% of their produce as seed on average. Age of HHH, operational land and irrigation
have major impacts on seed sold volume whereas the major impact of livestock, training
and share is on CBSPs’ participation in the market. Seed price directly impacts on
households’ market participation, and it has also indirect impact on volume of seed sold
in the market. From this study, three variables: training, irrigation and share collection
have been found to be important from policy perspective. Also, CBSPOs investing on
training for their members showed better performance as compared to the one that has
not invested on training with reference to their return to investment and its sensitivity.
Similarly, there is positive relationship between technical efficiency and proportion of
rice seed sold by households in the market.
111
Chapter 8. Capacity of seed producer organizations in governance
8.1 Introduction
Governance is defined as the manner in which power is exercised in the
management of a country’s economic and social resources for development (World
Bank, 1991). This term is used in different organizations whether they are informal or
formal, and work for profit or non-profit. Most of the CBSPOs of Nepal are in the form
of informal groups or cooperatives, and they elect a 7-11 member power exercising
body from their members, which is called as ‘executive committee’. This committee is
headed by a chairperson, and different sub-committees: technical, marketing and
finance are formed from executive committee members to facilitate the seed marketing
process (Witcombe, Devkota and & Joshi, 2010).
The executive committee members are chosen through democratic principles in one
to three years’ interval. Since seed marketing is the primary objective of CBSPOs, the
governance issue in these organizations is analyzed putting seed marketing in the
context. According to McKenzie (2004) organizations are said to capture the essence
of good governance if they address the issue of equity, diversity, connectivity,
democracy and quality of life. Here, equity indicates how organization addresses the
issue of poor members concerns. This chapter measures governance indicators of
CBSPOs, analyzes the impact of these governance indicators on economic indicators
(i.e. household level technical efficiency score in chapter 5 and proportion of rice seed
sold by households to CBSPOs from chapter 7), and discusses the roles of leaders’
characteristics in CBSPOs’ performance in governance. .
112
8.2 Conceptual framework
Most of the CBSPOs in the developing countries are the continuation of the
traditional farmer groups or cooperatives that were initially promoted by development
projects with poverty reduction motive. It means the criteria to participate in such
organizations are being residence of a geographical boundary, and involved in
agricultural activities. So, participants of these organizations are more likely to have
heterogeneity in demographic, economic, and institutional resources. Variation of these
resources might lead to inefficiency of CBSPOs in marketing, and sources of the
variation might be due to linkage of these resources with variability, frequency and
economy of scale of CBSPOs’ output (processed seed). For example, poorer members
of CBSPOs might supply less proportion of their total produced seed to their CBSPOs
as compared to richer members due to food insecurity issue, and so on. Also, being a
small organization owned by small farmers, CBSPOs have to address risks from
external factors such as government policy, climate, market, and so on.
It is believed that the executive committee could address internal and external
factors by developing an appropriate governance system in the organization. For
example, incentive system could address the issue of variability, frequency and
economy of scale. Similarly, members’ participation could also contribute in enhancing
organizations’ efficiency. For example, households with better informed about their
organizations might be more loyal and more accountable towards their organizations’
decisions (White, 1984). To address the external factors, CBSPOs could develop
mechanical, adaptive, reactive or interactive strategies, and make contingent decisions
(Brinkerhoff & Goldsmith, 1990) in line with organizations’ efficiency. Governance
system contributes in addressing these strategies as it defines a mechanism for
113
maintaining authority, formality, hierarchy, and information flow. So, CBSPOs capacity
means the capacity of executive body in addressing the internal and external factors.
Organization’s capacity cannot be simply determined by stock of human (organizational
structure) and physical resources, but by their proficiency in combining these resources
to address the internal and external factors.
One way to look at how much capacity of executive committee members exist is to
look at their performance because it is visible and measurable. Moreover, the
performance of human factor could be dynamic over time due to its capacity to innovate
by integrating lessons or feedbacks from previous events. At this circumstance, the
capacity of executive body could be their performance in designing strategies that
address the aforementioned internal and external factors. These strategies are
participation, incentive system, business plan and linkage. These strategies could
contribute in enhancing institutional innovations for organizations’ efficiency in
different risk scenarios (Cromwell & Wiggins 1993; Mywish, Julie & Ducan, 1999;
David, 2004; Bishaw & van Gastel, 2008).
8.3 Selection and measurement of indicators
As discussed in the conceptual framework, participation, incentive system, business
plan and linkage are the performance indicators used to assess the organizational
governance. However, five sub-indicators under each of the above indicators were
developed and assigned them score in accordance with their level of development. For
example, in case of ‘participation’, sub-indicators were developed considering who are
the vulnerable group to participate, and in what activities members need to be
participated. The study considers women’s participation, strategies to address poorer
members’ concerns in the organizations, members’ participation in annual meeting, and
114
activeness of sub-committee members (technical, financial and marketing
sub-committee). Moreover, CBSPOs of Nepal have followed the traditional cooperative
structures and membership in these organizations is low. It was hypothesized that
addition of new members in addition to those of founder members could enhance
CBSPOs social capital and their economy of scale in seed marketing. Similarly,
business plan is the key operational document which shows how organizations
implement their policies to achieve intended outputs, and to minimize risks from
internal and external factors. CBSPOs’ business plans were analyzed considering the
clarity of sub-committee members’ roles to implement annual activities, methods
adopted by CBSPOs in market research, product diversification, quality control
mechanism and publicity of seed in the market.
CBSPOs argued that members could realize mainly two types of incentives from
these organizations such as economic benefit, and transparency of information (social
benefit). The sub-indicators reflecting the economic benefits include system of
collecting share in the organization as it could enhance members’ motivation to sell seed
in the market through their CBSPOs, payment system for executive members based on
their work load, and incentive system to seed growers so that they could sell majority of
seed produced at households to their organizations. Similarly, indicators reflecting
transparency in the organization include system of sharing executive committee’s
decisions to general members, and system for common property management. The
common property in this case stands for materials (e.g. sprayers to manage diseases and
pests) CBSPOs get from development projects. These materials may be utilized for
household’s benefit in addition to their common benefit while using at organizational
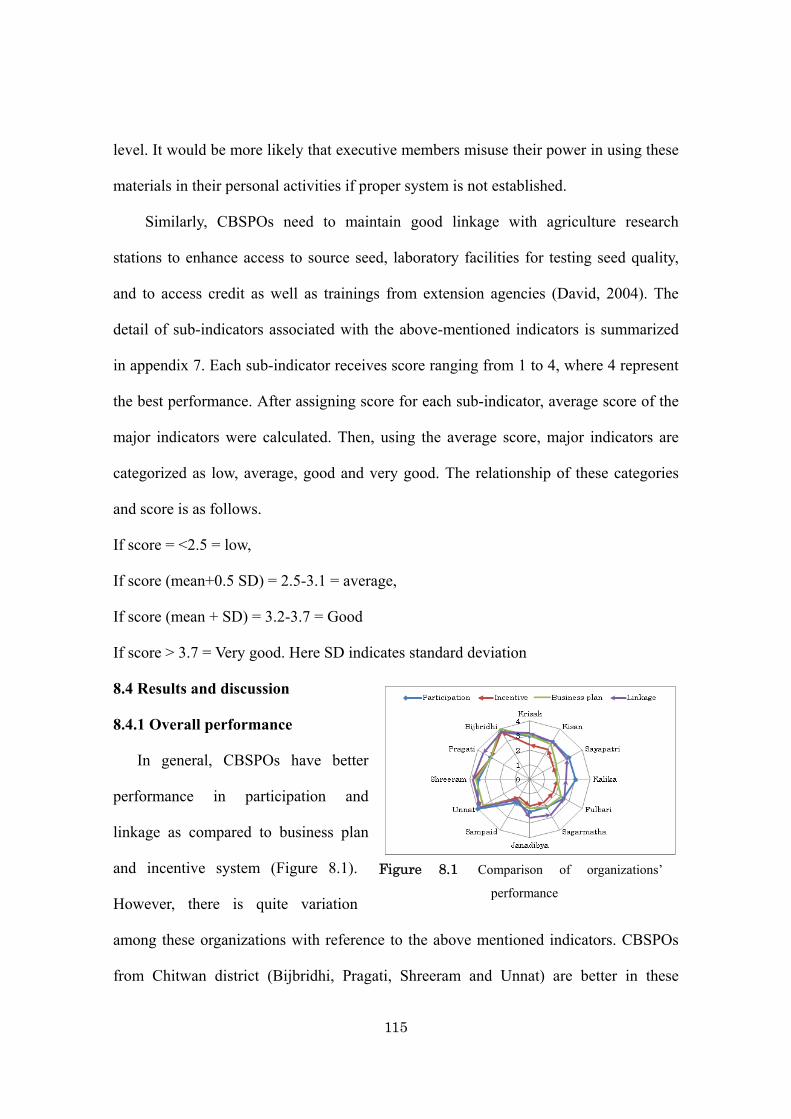
115
level. It would be more likely that executive members misuse their power in using these
materials in their personal activities if proper system is not established.
Similarly, CBSPOs need to maintain good linkage with agriculture research
stations to enhance access to source seed, laboratory facilities for testing seed quality,
and to access credit as well as trainings from extension agencies (David, 2004). The
detail of sub-indicators associated with the above-mentioned indicators is summarized
in appendix 7. Each sub-indicator receives score ranging from 1 to 4, where 4 represent
the best performance. After assigning score for each sub-indicator, average score of the
major indicators were calculated. Then, using the average score, major indicators are
categorized as low, average, good and very good. The relationship of these categories
and score is as follows.
If score = <2.5 = low,
If score (mean+0.5 SD) = 2.5-3.1 = average,
If score (mean + SD) = 3.2-3.7 = Good
If score > 3.7 = Very good. Here SD indicates standard deviation
8.4 Results and discussion
8.4.1 Overall performance
In general, CBSPOs have better
performance in participation and
linkage as compared to business plan
and incentive system (Figure 8.1).
However, there is quite variation
among these organizations with reference to the above mentioned indicators. CBSPOs
from Chitwan district (Bijbridhi, Pragati, Shreeram and Unnat) are better in these
Figure 8.1. Comparison of organizations’
performance
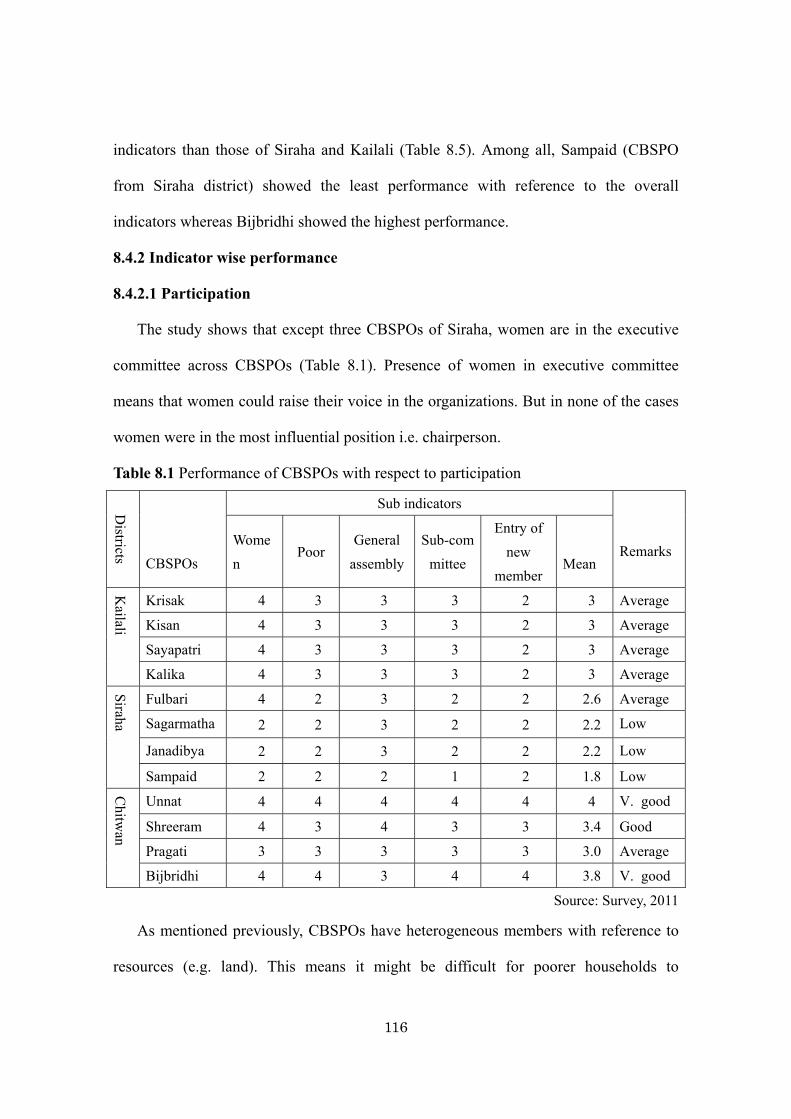
116
indicators than those of Siraha and Kailali (Table 8.5). Among all, Sampaid (CBSPO
from Siraha district) showed the least performance with reference to the overall
indicators whereas Bijbridhi showed the highest performance.
8.4.2 Indicator wise performance
8.4.2.1 Participation
The study shows that except three CBSPOs of Siraha, women are in the executive
committee across CBSPOs (Table 8.1). Presence of women in executive committee
means that women could raise their voice in the organizations. But in none of the cases
women were in the most influential position i.e. chairperson.
Table 8.1 Performance of CBSPOs with respect to participation
Districts
CBSPOs
Sub indicators
Remarks Wome
n Poor
General
assembly
Sub-com
mittee
Entry of
new
member
Mean
Kailali
Krisak 4 3 3 3 2 3 Average
Kisan 4 3 3 3 2 3 Average
Sayapatri 4 3 3 3 2 3 Average
Kalika 4 3 3 3 2 3 Average S
iraha
Fulbari 4 2 3 2 2 2.6 Average
Sagarmatha 2 2 3 2 2 2.2 Low
Janadibya 2 2 3 2 2 2.2 Low
Sampaid 2 2 2 1 2 1.8 Low
Chitw
an
Unnat 4 4 4 4 4 4 V. good
Shreeram 4 3 4 3 3 3.4 Good
Pragati 3 3 3 3 3 3.0 Average
Bijbridhi 4 4 3 4 4 3.8 V. good
Source: Survey, 2011
As mentioned previously, CBSPOs have heterogeneous members with reference to
resources (e.g. land). This means it might be difficult for poorer households to
117
participate in seed marketing if their organizations do not provide them credit facility
and/or early payment for seed that households supply to CBSPOs. It was found that all
CBSPOs have policy of prioritizing poor people in credit or timely payment of seed
they sell to their organizations. But CBSPOs of Chitwan and Kailali have adopted the
practice of early payment for seed. However, two CBSPOs i.e. Unnat and Bijbridhi have
adopted the practice of providing both services (credit facility for implementing seed
production activities, and early payment of seed for their poorer members). There is no
clear cut written mechanism at CBSPOs for selecting poorer members; however,
executive committee members argued that they decide their poorer members based on
land size and annual households’ cash income.
All the organizations have the system of holding general assembly in a yearly basis,
and this event is supposed to choose new leadership from members. However, majority
of CBSPOs except Shreeram and Unnat the same people are in the executive committee
from the beginning of their organizational establishment. It was found that in most of
the cases, sub-committees have been formed but they are functioning only in two
CBSPOs (Unnat and Bijbridhi). In most of the cases there was no entry of new
members since the establishment of the organization, and those who have been added as
members after the establishment of CBSPOs, have not got equal number of share to
those of founder members. For example, in Shreeram founder members have got six
shares with one share equivalent to NRs 5,000 but new comers have received shares @
three shares per member. However, the newly entered members have not been
discriminated in Unnat and Bijbridhi.
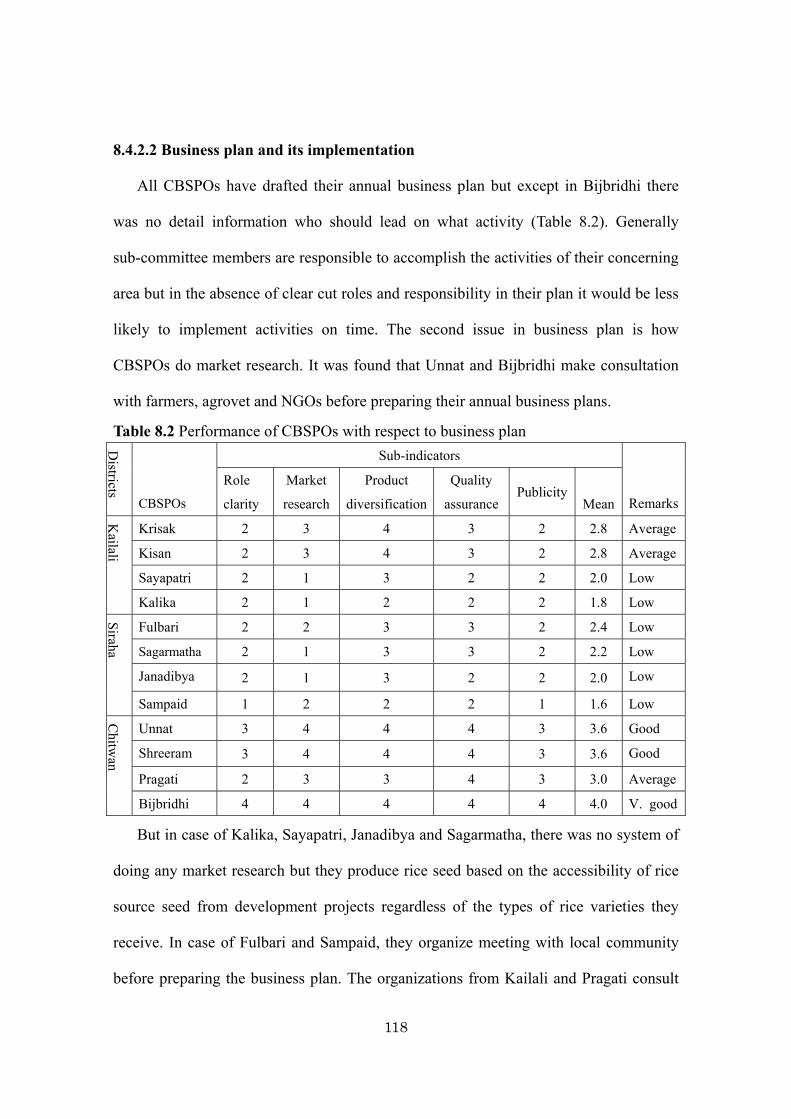
118
8.4.2.2 Business plan and its implementation
All CBSPOs have drafted their annual business plan but except in Bijbridhi there
was no detail information who should lead on what activity (Table 8.2). Generally
sub-committee members are responsible to accomplish the activities of their concerning
area but in the absence of clear cut roles and responsibility in their plan it would be less
likely to implement activities on time. The second issue in business plan is how
CBSPOs do market research. It was found that Unnat and Bijbridhi make consultation
with farmers, agrovet and NGOs before preparing their annual business plans.
Table 8.2 Performance of CBSPOs with respect to business plan
Districts
CBSPOs
Sub-indicators
Remarks
Role
clarity
Market
research
Product
diversification
Quality
assurancePublicity
Mean
Kailali
Krisak 2 3 4 3 2 2.8 Average
Kisan 2 3 4 3 2 2.8 Average
Sayapatri 2 1 3 2 2 2.0 Low
Kalika 2 1 2 2 2 1.8 Low
Siraha
Fulbari 2 2 3 3 2 2.4 Low
Sagarmatha 2 1 3 3 2 2.2 Low
Janadibya 2 1 3 2 2 2.0 Low
Sampaid 1 2 2 2 1 1.6 Low
Chitw
an
Unnat 3 4 4 4 3 3.6 Good
Shreeram 3 4 4 4 3 3.6 Good
Pragati 2 3 3 4 3 3.0 Average
Bijbridhi 4 4 4 4 4 4.0 V. good
But in case of Kalika, Sayapatri, Janadibya and Sagarmatha, there was no system of
doing any market research but they produce rice seed based on the accessibility of rice
source seed from development projects regardless of the types of rice varieties they
receive. In case of Fulbari and Sampaid, they organize meeting with local community
before preparing the business plan. The organizations from Kailali and Pragati consult
119
with local agrovet and local community in this process. The study shows that all the
CBSPOs grow both modern and farmers’ varieties of rice but only Krisak, Kisan, Unnat
and Bijbridhi sell fertilizer to their members in addition to seed.
Similarly, all the CBSPOs sell seeds of other crop varieties; however, maize and
kidney bean were found only in Chitwan but wheat is common across the districts.
CBSPOs argued that diversifying products help CBSPOs minimize the management
costs as well as reduces the necessity of taking loan at organizations. Only CBSPOs of
Chitwan sell their seed in the truthfully labeled bags (including the name of crop and
variety, germination %, weight, seed treated with pesticides or not and name of the
producers’ organization). However, Janadibya, Sampaid and Sayapatri CBSPOs sell rice
seed without tagging. Among CBSPOs of Chitwan, Bijbridhi sells >70% of the total rice
seed production using proper labeling and bagging.
8.4.2.3 Incentive system
All CBSPOs have adopted the practice of collecting cash amounts in their
organizations. They call it ‘share’, and there is a system that profit made by
organizations from seed marketing activities would be distributed to the
members/shareholders based on the proportion of share amount they deposited in the
organization. Less than half of the members have collected share in CBSPOs of Siraha
and in two CBSPOs of Kailali. However, majority of the members (>75%) deposit share
in CBSPOs at Chitwan. Only two CBSPOs (Unnat and Bijbridhi) distributed the profit
generated from seed marketing to their members based on the proportion of their share
ownership (Table 8.3). But in other cases the share amount has contributed to increase
their organizations’ cash reserve (Appendix 8).
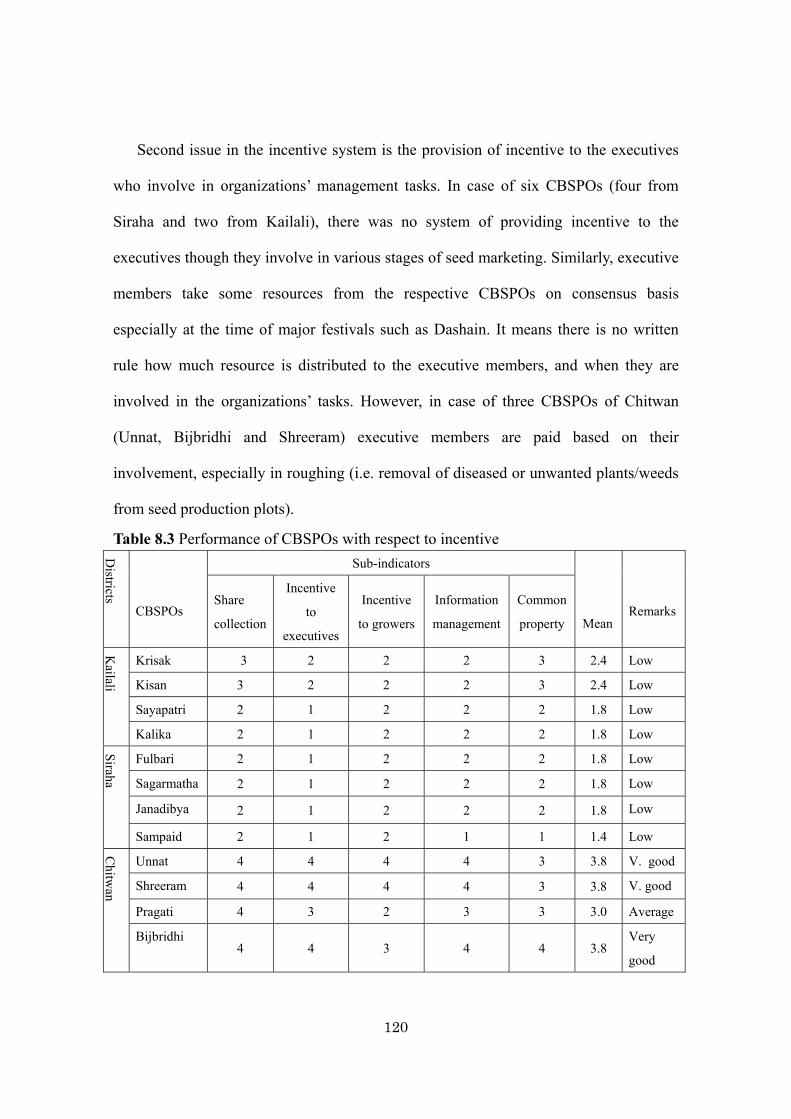
120
Second issue in the incentive system is the provision of incentive to the executives
who involve in organizations’ management tasks. In case of six CBSPOs (four from
Siraha and two from Kailali), there was no system of providing incentive to the
executives though they involve in various stages of seed marketing. Similarly, executive
members take some resources from the respective CBSPOs on consensus basis
especially at the time of major festivals such as Dashain. It means there is no written
rule how much resource is distributed to the executive members, and when they are
involved in the organizations’ tasks. However, in case of three CBSPOs of Chitwan
(Unnat, Bijbridhi and Shreeram) executive members are paid based on their
involvement, especially in roughing (i.e. removal of diseased or unwanted plants/weeds
from seed production plots).
Table 8.3 Performance of CBSPOs with respect to incentive
Districts
CBSPOs
Sub-indicators
Mean
RemarksShare
collection
Incentive
to
executives
Incentive
to growers
Information
management
Common
property
Kailali
Krisak 3 2 2 2 3 2.4 Low
Kisan 3 2 2 2 3 2.4 Low
Sayapatri 2 1 2 2 2 1.8 Low
Kalika 2 1 2 2 2 1.8 Low
Siraha
Fulbari 2 1 2 2 2 1.8 Low
Sagarmatha 2 1 2 2 2 1.8 Low
Janadibya 2 1 2 2 2 1.8 Low
Sampaid 2 1 2 1 1 1.4 Low
Chitw
an
Unnat 4 4 4 4 3 3.8 V. good
Shreeram 4 4 4 4 3 3.8 V. good
Pragati 4 3 2 3 3 3.0 Average
Bijbridhi 4 4 3 4 4 3.8
Very
good
121
It was found that Unnat, Bijbridhi and Shreeram provide seed and fertilizer in
subsidy to their seed growers, but other organizations have not developed such practice.
Transparency of organizations’ decision to their members is considered to play vital role
in improving cohesion among the members in any organizations. Members who are
more informed about their organizations’ decision are more likely to be accountable
towards their organizations (White, 1984). It was found that CBSPOs of Chitwan have
better performance in record keeping as compared to CBSPOs from other two districts.
Moreover, CBSPOs get different materials (such as sprayers, grading machine and so
on) from development projects. However, only Bijbridhi has adopted the practice of
providing these materials to their members for their household activities on payment
basis (for example, members have to pay NRs. 20 while using organization’s one
sprayer for one day).
4.4.2.4 Linkage
Nepal Agricultural Research Council (NARC) provides source seed to seed
producers no matters seed production is carried out individually or by group, but
priority is given for farmers engaged in CBSPOs. It means it is easier for farmers to
access source seed if they approach to NARC through their organizations. It was found
that except CBSPOs of Siraha all other organizations were found to have bought rice
source seed visiting NARC stations. However, the two-way communication has been
established only in Chitwan. It means in Chitwan not only CBSPOs visit NARC stations
to access source seed but NARC’s professionals also make visit to CBSPOs in the
process of monitoring their rice crop at field. CBSPOs argued that NARC professionals’
visit has been useful to enhance seed quality as farmers get technical advice from these
professionals in pests and disease management as well as roughing. CBSPOs were also
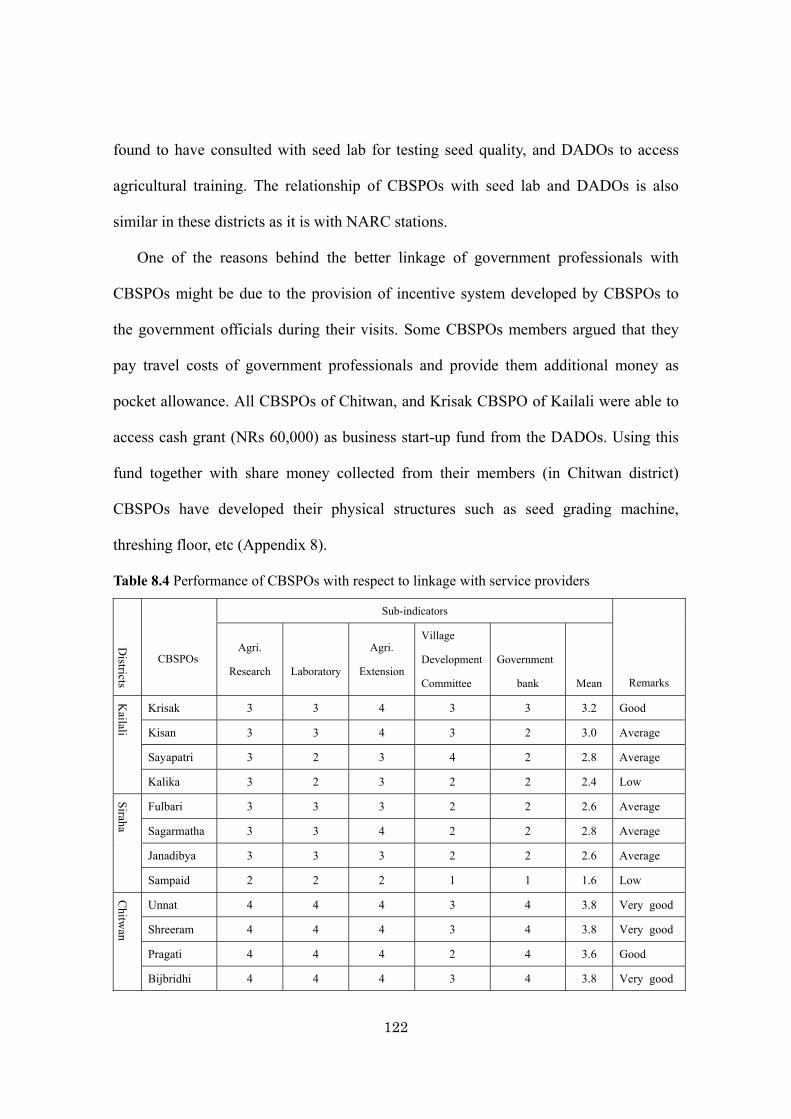
122
found to have consulted with seed lab for testing seed quality, and DADOs to access
agricultural training. The relationship of CBSPOs with seed lab and DADOs is also
similar in these districts as it is with NARC stations.
One of the reasons behind the better linkage of government professionals with
CBSPOs might be due to the provision of incentive system developed by CBSPOs to
the government officials during their visits. Some CBSPOs members argued that they
pay travel costs of government professionals and provide them additional money as
pocket allowance. All CBSPOs of Chitwan, and Krisak CBSPO of Kailali were able to
access cash grant (NRs 60,000) as business start-up fund from the DADOs. Using this
fund together with share money collected from their members (in Chitwan district)
CBSPOs have developed their physical structures such as seed grading machine,
threshing floor, etc (Appendix 8).
Table 8.4 Performance of CBSPOs with respect to linkage with service providers
Districts
CBSPOs
Sub-indicators
Remarks
Agri.
Research
Laboratory
Agri.
Extension
Village
Development
Committee
Government
bank
Mean K
ailali
Krisak 3 3 4 3 3 3.2 Good
Kisan 3 3 4 3 2 3.0 Average
Sayapatri 3 2 3 4 2 2.8 Average
Kalika 3 2 3 2 2 2.4 Low
Siraha
Fulbari 3 3 3 2 2 2.6 Average
Sagarmatha 3 3 4 2 2 2.8 Average
Janadibya 3 3 3 2 2 2.6 Average
Sampaid 2 2 2 1 1 1.6 Low
Chitw
an
Unnat 4 4 4 3 4 3.8 Very good
Shreeram 4 4 4 3 4 3.8 Very good
Pragati 4 4 4 2 4 3.6 Good
Bijbridhi 4 4 4 3 4 3.8 Very good
123
Moreover, even if the National Seed Policy 2000 envisioned VDC as an important
local resource center to support CBSPOs from government side, there is poor
coordination of CBSPOs with VDC. Except in CBSPOs of Sayapatri which built a seed
storage house with partial support from VDC, there is poor communication between
VDCs and CBSPOs. As in the above cases, CBSPOs of Chitwan have taken loan from
Nepalese government bank named as ‘Krisibikash Bank’ which has a mandate to
provide loan to the farmers. In other districts CBSPOs have not taken loan from the
same bank though it has branches in other districts as well. Executive members from
these organizations argued that they could not access loan from the bank not being able
to put collateral. In spite of the requirement for putting collateral in Chitwan, executive
members were found to put their households’ properties, especially land, to get credit
for their organizations.
8.4.4 Relation of governance indicators with economic indicators
There is positive impact of governance indicators on household level TE and
proportion of seed sold by households in the market. However, the degree of impact of
the governance indicators on marketing is higher than they have on TE. The coefficient
for the impact of participation on technical efficiency is 7.68, which means that one unit
increase in participation tends to increase the TE of household by 7.68 units. It is also
clear from this analysis that participation has the highest impact on TE as compared to
the other governance indicators. Similarly, linkage has the highest impact on marketing
and its coefficient is 28.88 (Figure 8.2). It means one unit increase in linkage leads to
increase the households’ seed sold proportion by 28.88 units.
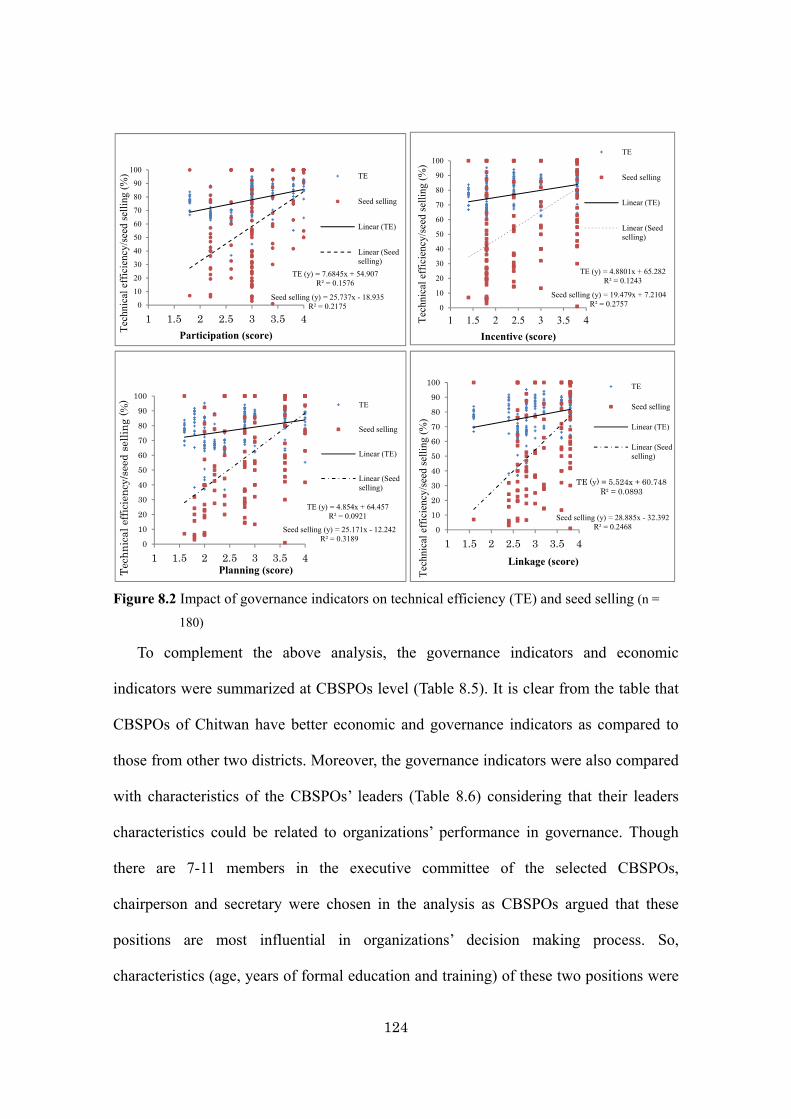
124
Figure 8.2 Impact of governance indicators on technical efficiency (TE) and seed selling (n =
180)
To complement the above analysis, the governance indicators and economic
indicators were summarized at CBSPOs level (Table 8.5). It is clear from the table that
CBSPOs of Chitwan have better economic and governance indicators as compared to
those from other two districts. Moreover, the governance indicators were also compared
with characteristics of the CBSPOs’ leaders (Table 8.6) considering that their leaders
characteristics could be related to organizations’ performance in governance. Though
there are 7-11 members in the executive committee of the selected CBSPOs,
chairperson and secretary were chosen in the analysis as CBSPOs argued that these
positions are most influential in organizations’ decision making process. So,
characteristics (age, years of formal education and training) of these two positions were
TE (y) = 7.6845x + 54.907R² = 0.1576
Seed selling (y) = 25.737x - 18.935R² = 0.21750
10
20
30
40
50
60
70
80
90
100
1 1.5 2 2.5 3 3.5 4
Tec
hnic
al e
ffic
ienc
y/se
ed s
elli
ng (
%)
Participation (score)
TE
Seed selling
Linear (TE)
Linear (Seedselling)
TE (y) = 4.8801x + 65.282R² = 0.1243
Seed selling (y) = 19.479x + 7.2104R² = 0.27570
10
20
30
40
50
60
70
80
90
100
1 1.5 2 2.5 3 3.5 4Tec
hnic
al e
ffic
ienc
y/se
ed s
elli
ng (
%)
Incentive (score)
TE
Seed selling
Linear (TE)
Linear (Seedselling)
TE (y) = 4.854x + 64.457R² = 0.0921
Seed selling (y) = 25.171x - 12.242R² = 0.3189
0
10
20
30
40
50
60
70
80
90
100
1 1.5 2 2.5 3 3.5 4
Tec
hn
ical
eff
icie
ncy
/see
d se
llin
g (%
)
Planning (score)
TE
Seed selling
Linear (TE)
Linear (Seedselling)
TE (y) = 5.524x + 60.748R² = 0.0893
Seed selling (y) = 28.885x - 32.392R² = 0.24680
10
20
30
40
50
60
70
80
90
100
1 1.5 2 2.5 3 3.5 4
Tec
hnic
al e
ffic
ienc
y/se
ed s
elli
ng (
%)
Linkage (score)
TE
Seed selling
Linear (TE)
Linear (Seedselling)
125
compared with CBSPOs’ governance indicators. Here, age represents experience
whereas education and training represent the intellectual ability of the leaders. It means
CBSPOs with higher intellectual leaders can have better performance in governance.
The result shows that there is similarity in age of the leaders across CBSPOs. However,
variation exists in education level and leaders ‘attendance in business plan training. As
shown in Table 8.6, leaders’ education is higher in Chitwan as compared to Siraha and
Kailali. There is also similar trend in average education level of CBSPOs members
across the districts (Chitwan: 10.4 years, Kailali: 6.0 years and Siraha: 6.5 years)
(Appendix 7). It means average education level of general members reflect the leaders’
education in this study. Similarly, CBSPOs’ leaders from Chitwan district have got
business plan training from development agency whereas it was not taken by these
leaders in other districts. The attendance of business plan training by CBSPOs’ of
Chitwan might be due to their higher education level as higher educated leaders might
have better linkage with development projects.
Previous studies have also recognized the importance of education for the better
performance of agricultural cooperatives (Witcombet, Devkota & Joshi, 2010; Acharya,
2009) as the leaders having these skills could show better performance in the
organizational governance. Nkhoma (2011) argued that illiterate leaders are more likely
to be corrupt and opportunistic, which turned the organizations towards financial
mismanagement and nepotism. These types of leaders might not want to develop system
for proper allocation of incentives in a transparent way.
Similarly, accountability is another aspect affected by low education level. Generally,
less educated leaders are less accountable towards what they are supposed to do. These
leaders get better opportunity to misuse power such as diverting activities in accordance
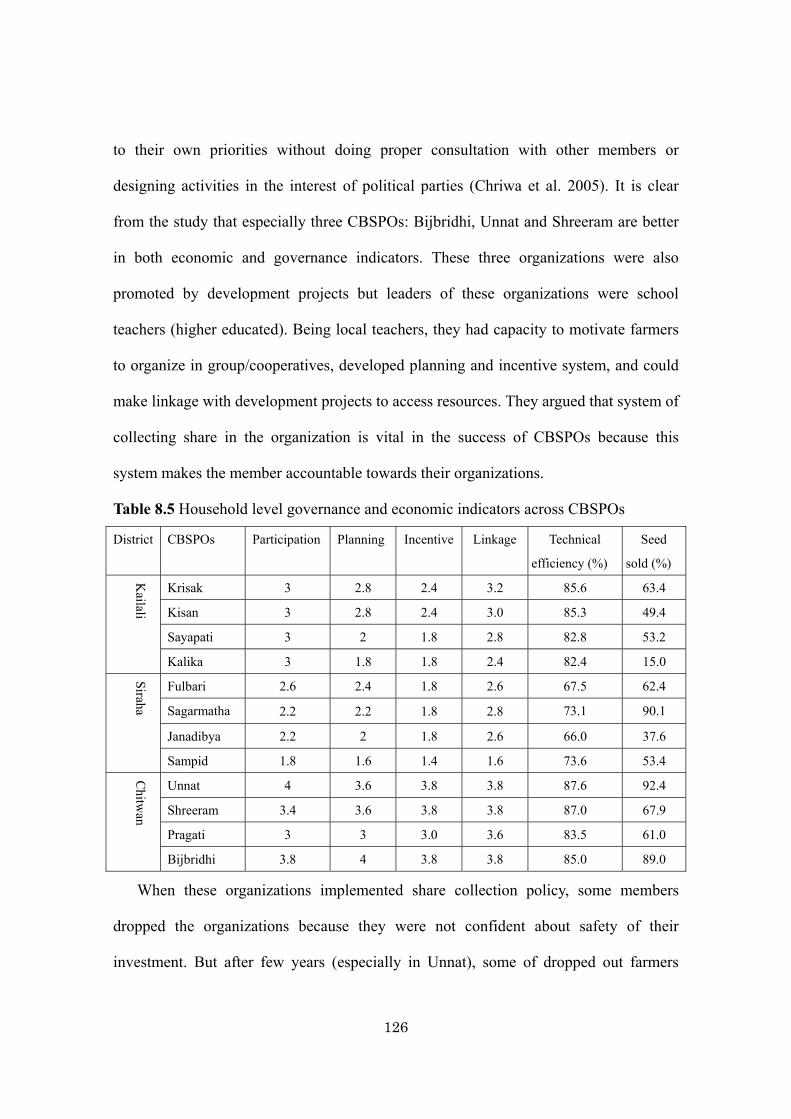
126
to their own priorities without doing proper consultation with other members or
designing activities in the interest of political parties (Chriwa et al. 2005). It is clear
from the study that especially three CBSPOs: Bijbridhi, Unnat and Shreeram are better
in both economic and governance indicators. These three organizations were also
promoted by development projects but leaders of these organizations were school
teachers (higher educated). Being local teachers, they had capacity to motivate farmers
to organize in group/cooperatives, developed planning and incentive system, and could
make linkage with development projects to access resources. They argued that system of
collecting share in the organization is vital in the success of CBSPOs because this
system makes the member accountable towards their organizations.
Table 8.5 Household level governance and economic indicators across CBSPOs
District CBSPOs Participation Planning Incentive Linkage Technical
efficiency (%)
Seed
sold (%)
Kailali
Krisak 3 2.8 2.4 3.2 85.6 63.4
Kisan 3 2.8 2.4 3.0 85.3 49.4
Sayapati 3 2 1.8 2.8 82.8 53.2
Kalika 3 1.8 1.8 2.4 82.4 15.0 S
iraha
Fulbari 2.6 2.4 1.8 2.6 67.5 62.4
Sagarmatha 2.2 2.2 1.8 2.8 73.1 90.1
Janadibya 2.2 2 1.8 2.6 66.0 37.6
Sampid 1.8 1.6 1.4 1.6 73.6 53.4
Chitw
an
Unnat 4 3.6 3.8 3.8 87.6 92.4
Shreeram 3.4 3.6 3.8 3.8 87.0 67.9
Pragati 3 3 3.0 3.6 83.5 61.0
Bijbridhi 3.8 4 3.8 3.8 85.0 89.0
When these organizations implemented share collection policy, some members
dropped the organizations because they were not confident about safety of their
investment. But after few years (especially in Unnat), some of dropped out farmers
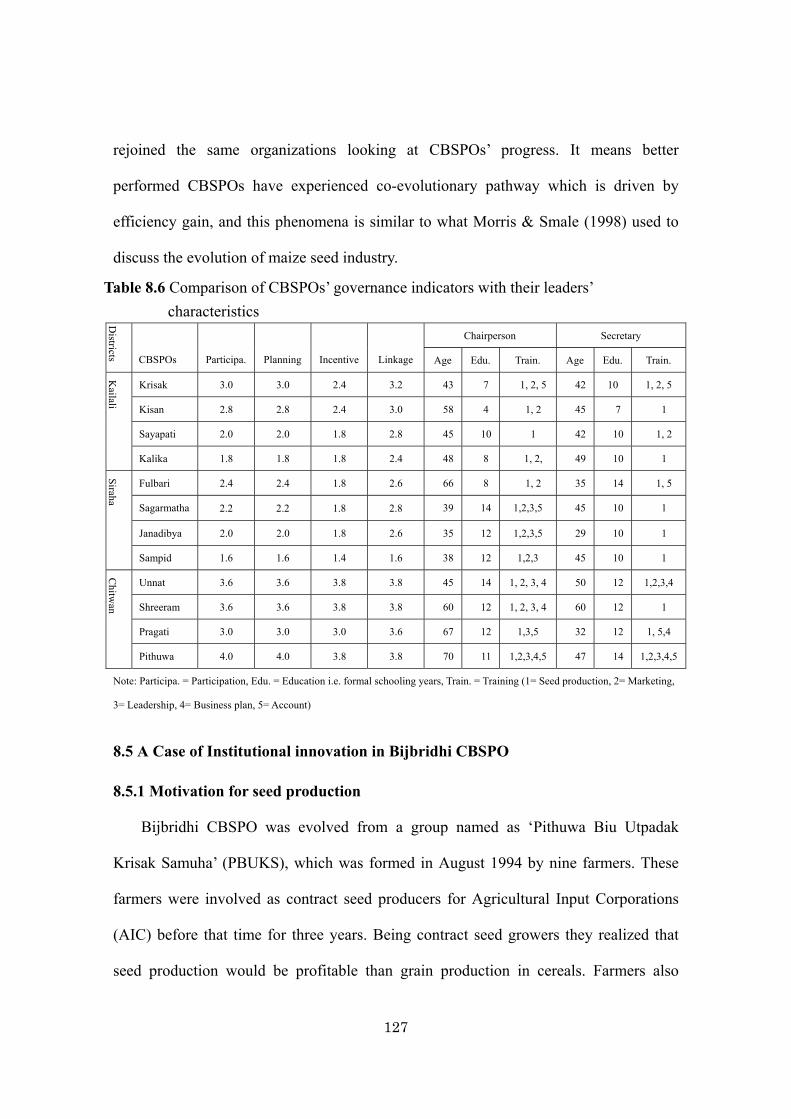
127
rejoined the same organizations looking at CBSPOs’ progress. It means better
performed CBSPOs have experienced co-evolutionary pathway which is driven by
efficiency gain, and this phenomena is similar to what Morris & Smale (1998) used to
discuss the evolution of maize seed industry.
Table 8.6 Comparison of CBSPOs’ governance indicators with their leaders’
characteristics
Districts
CBSPOs
Participa.
Planning
Incentive
Linkage
Chairperson Secretary
Age Edu. Train. Age Edu. Train.
Kailali
Krisak 3.0 3.0 2.4 3.2 43 7 1, 2, 5 42 10 1, 2, 5
Kisan 2.8 2.8 2.4 3.0 58 4 1, 2 45 7 1
Sayapati 2.0 2.0 1.8 2.8 45 10 1 42 10 1, 2
Kalika 1.8 1.8 1.8 2.4 48 8 1, 2, 49 10 1
Siraha
Fulbari 2.4 2.4 1.8 2.6 66 8 1, 2 35 14 1, 5
Sagarmatha 2.2 2.2 1.8 2.8 39 14 1,2,3,5 45 10 1
Janadibya 2.0 2.0 1.8 2.6 35 12 1,2,3,5 29 10 1
Sampid 1.6 1.6 1.4 1.6 38 12 1,2,3 45 10 1
Chitw
an
Unnat 3.6 3.6 3.8 3.8 45 14 1, 2, 3, 4 50 12 1,2,3,4
Shreeram 3.6 3.6 3.8 3.8 60 12 1, 2, 3, 4 60 12 1
Pragati 3.0 3.0 3.0 3.6 67 12 1,3,5 32 12 1, 5,4
Pithuwa 4.0 4.0 3.8 3.8 70 11 1,2,3,4,5 47 14 1,2,3,4,5
Note: Participa. = Participation, Edu. = Education i.e. formal schooling years, Train. = Training (1= Seed production, 2= Marketing,
3= Leadership, 4= Business plan, 5= Account)
8.5 A Case of Institutional innovation in Bijbridhi CBSPO
8.5.1 Motivation for seed production
Bijbridhi CBSPO was evolved from a group named as ‘Pithuwa Biu Utpadak
Krisak Samuha’ (PBUKS), which was formed in August 1994 by nine farmers. These
farmers were involved as contract seed producers for Agricultural Input Corporations
(AIC) before that time for three years. Being contract seed growers they realized that
seed production would be profitable than grain production in cereals. Farmers also
128
thought that AIC was paying them low rate for their seed justifying that seed produced
by these farmers was of poor quality (low physical and genetic purity), and farmers
were producing seed in small quantity. Even if they had a contract with AIC there was
no certainty that AIC would buy seed from them every year as per the contract
agreement. Due to these problems, farmers decided to form their own organization to
produce and sell seed in market. These farmers also got motivation from NGOs and
DADOs to take part in seed production through an organized way.
8.5.2 Functioning of group
The group set up the objective of improving the socio-economic condition of their
members by involving in seed production and marketing. This objective was not set by
farmers themselves but by development projects which were implemented in the area
with the poverty reduction motive. After setting up the objective, the group was legally
registered in DADO of Chitwan in August 1996. Then, all the group members started
producing improved seeds of rice, wheat, maize, lentil and kidney bean, collecting
source seed from NARC stations. These stations are National Maize Research Program,
for rice, wheat and maize; and National Grain Legume Research Program for lentil and
kidney bean. Looking at the benefits taken by these farmers, neighboring farmers, who
were growing the aforementioned crops as grain, approached the group for membership.
The group decided to increase its members to enhance its economy of scale, and by
2001 the members in the group increased to 61. The newly entered members had to pay
membership fee @ NRs 50 per member (later it was increased to NRs. 100). The major
attraction of new members to enter into the group was that they would get extension
facilities from DADO (technical training, exposure visit), agricultural research stations
(source seed, training), seed laboratory (seed testing facility), and NGOs (training,
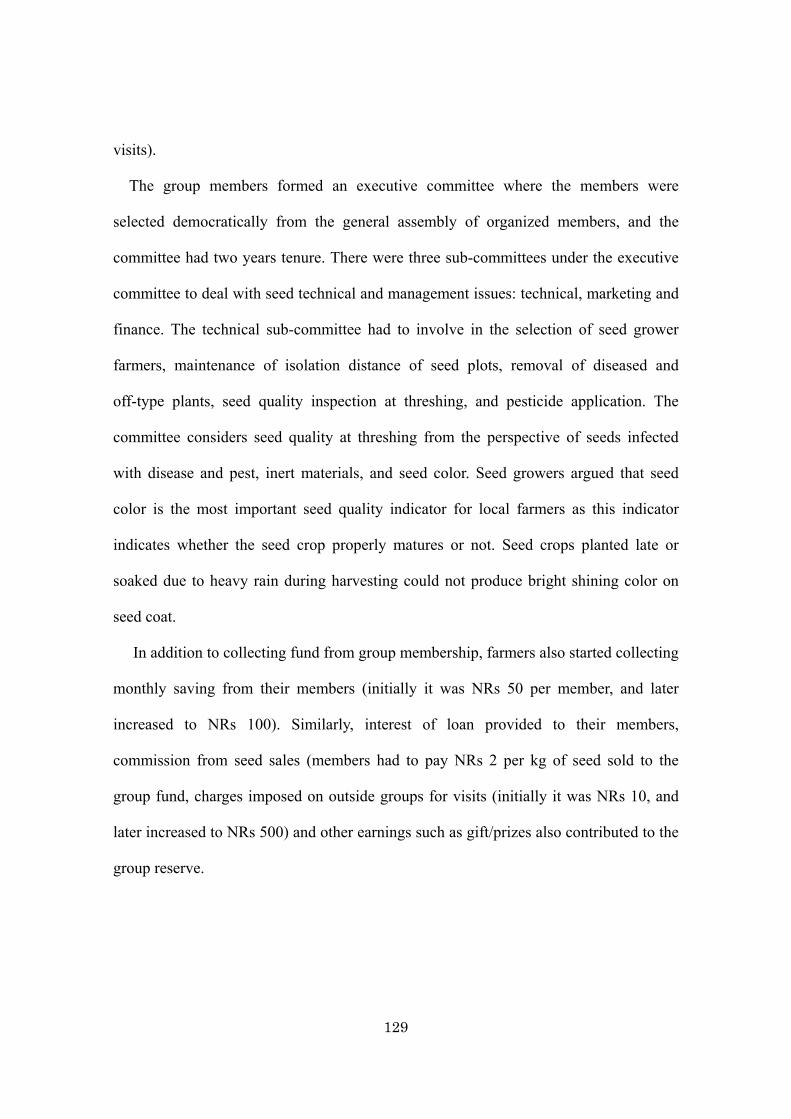
129
visits).
The group members formed an executive committee where the members were
selected democratically from the general assembly of organized members, and the
committee had two years tenure. There were three sub-committees under the executive
committee to deal with seed technical and management issues: technical, marketing and
finance. The technical sub-committee had to involve in the selection of seed grower
farmers, maintenance of isolation distance of seed plots, removal of diseased and
off-type plants, seed quality inspection at threshing, and pesticide application. The
committee considers seed quality at threshing from the perspective of seeds infected
with disease and pest, inert materials, and seed color. Seed growers argued that seed
color is the most important seed quality indicator for local farmers as this indicator
indicates whether the seed crop properly matures or not. Seed crops planted late or
soaked due to heavy rain during harvesting could not produce bright shining color on
seed coat.
In addition to collecting fund from group membership, farmers also started collecting
monthly saving from their members (initially it was NRs 50 per member, and later
increased to NRs 100). Similarly, interest of loan provided to their members,
commission from seed sales (members had to pay NRs 2 per kg of seed sold to the
group fund, charges imposed on outside groups for visits (initially it was NRs 10, and
later increased to NRs 500) and other earnings such as gift/prizes also contributed to the
group reserve.
130
8.5.3 Challenges in the group
In spite of the concerted effort from various organizations for enhancing the group
capacity, the group saving could not substantially increased (NRs 15,000 in 2005 as
compared to NRs. 12,000 in 2000). The executive members argued that major reason
for lower performance of the group was due to the fact that the group became
completely dependent on extension agencies in accessing source seed and selling their
seed. Extension agencies bought most of the seed CBSPO produced for their project
even paying comparatively higher price than it was in the market. As a result, in some
years when projects did not buy seed, farmers could not sell seed as per their plan as the
price set by the group was quite higher than that of other actors. It was due to the fact
that the group set the price with reference to what development projects were paying for
their seed in previous years. Also, cases of conflict started increasing among the
members due to organizations’ inability to develop physical resources for seed
processing and marketing as a result of low group saving, and also poorer members of
the organizations started raising voice for their benefit from the organization.
8.5.4 Conversion of group to company
In 2005, some member of the group, those involved in technical and marketing
sub-committees decided to form a producer seed company. They argued that low group
fund was the main reason for them not being able to develop physical structure, and the
proposal for setting up the company was discussed in the group. However, only 16
members agreed on the proposal and they formally registered the seed company in 2006
in accordance with the Nepalese Company Act 2004. All the members, deposited share
amounting NRs 4,000 to NRs 10,000 and they bought a seed grader machine and build a
seed storage house using fund collected from share amounts from members and grants
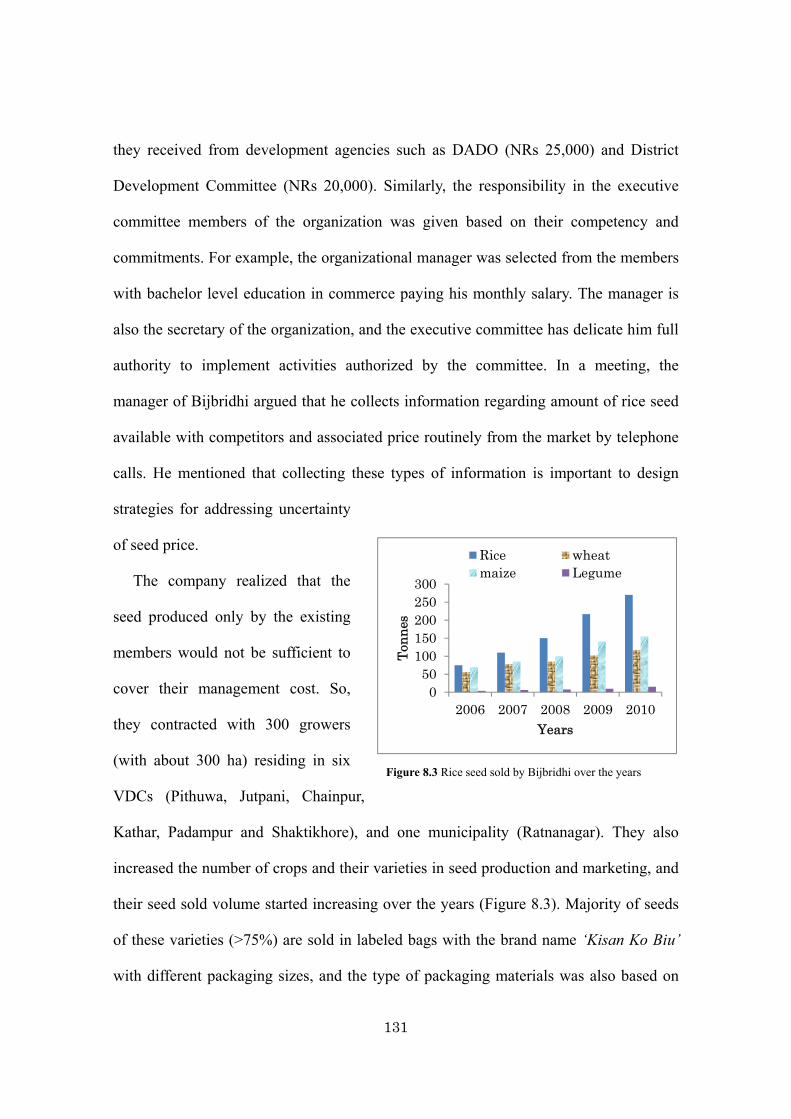
131
they received from development agencies such as DADO (NRs 25,000) and District
Development Committee (NRs 20,000). Similarly, the responsibility in the executive
committee members of the organization was given based on their competency and
commitments. For example, the organizational manager was selected from the members
with bachelor level education in commerce paying his monthly salary. The manager is
also the secretary of the organization, and the executive committee has delicate him full
authority to implement activities authorized by the committee. In a meeting, the
manager of Bijbridhi argued that he collects information regarding amount of rice seed
available with competitors and associated price routinely from the market by telephone
calls. He mentioned that collecting these types of information is important to design
strategies for addressing uncertainty
of seed price.
The company realized that the
seed produced only by the existing
members would not be sufficient to
cover their management cost. So,
they contracted with 300 growers
(with about 300 ha) residing in six
VDCs (Pithuwa, Jutpani, Chainpur,
Kathar, Padampur and Shaktikhore), and one municipality (Ratnanagar). They also
increased the number of crops and their varieties in seed production and marketing, and
their seed sold volume started increasing over the years (Figure 8.3). Majority of seeds
of these varieties (>75%) are sold in labeled bags with the brand name ‘Kisan Ko Biu’
with different packaging sizes, and the type of packaging materials was also based on
Figure 8.3 Rice seed sold by Bijbridhi over the years
050
100150200250300
2006 2007 2008 2009 2010
Ton
nes
Years
Rice wheatmaize Legume
132
consumers’ demand. For example,
Moreover, the company used to sell majority of its seed to NGOs, DADOs, and local
farmers. In 2010, the company sold 557.3t of seed where the share of rice seed was 45%.
There is increasing trend of rice seed sold by the organization (Figure 3), majority of
which was sold to agrovet (>90%), and 40% of their produce is consumed within
Chitwan district mainly through agrovet in the surveyed year. The company record
shows that its seed has been disseminated to 35 districts of Nepal. The company has
developed incentive system to seed producers, executive members, and have good
linkage with government agencies and NGOs. They produce both local varieties and
improved crop varieties to address the consumers’ demand. The members of these
groups also participate in various meetings related to agriculture, seed system in the
country.
8.5.5 Relation between group and company
The company has been able to maintain good relation with PBUK, 25 members of
this group are also the shareholders in the company. The non-shareholders of the
company, especially the poorer members of the group, are also benefitted from the
company as they could access quality seed from the company and increase their
production. Some of group members sell seed to the company. Similarly, the company
provides local farmers seed, chemical fertilizer and bio-fertilizers, even in loan if
needed. Moreover, the company is also benefitted from the group as it takes loan from
PBUK as the members are still continuing monthly saving from the beginning of its
organizational establishment. The committee members argued that PBUK provided
foundation for the establishment of Bijbridhi. This is because the members those
involved in PBUK internalized the benefits from seed production and marketing
133
activities. As a result they developed confidence in seed management activities and
opened a private company using their own investment.
8.5.6 Reasons for success of the group
Among the all CBSPOs surveyed in the study, Bijbridhi CBSPO was found most
successful as it has covered the marketing cost (Table 7.4) and provided additional
benefits to the members. Also, it has captured the issues of both small and large farmers
by including both farmers’ variety and modern varieties in seed production plan.
Moreover, it has developed strategies to address the risks that create organizational
inefficiency in seed marketing by designing governance strategies. There might be
various factors for the success of this organization but one clear cut difference between
Bijbridhi CBSPO and other poor performing CBSPO (such as Pragati) is education of
leadership. The group PBUK was led by high school teacher, some other primary
school’s teachers and retired staff of agricultural extension agencies were included as
members in the group. Due to the educated leaders, the group became able to develop
incentive system in the organization, and developed seed processing structures (grading
machine, seed storage and threshing floor) through public private partnership approach.
Even after changing the organization structure from group to company, the educated and
experience people were selected in the executive committee. Similarly, sub-committee
members were also chosen based on their skills and commitments. These leaders also
were able to make connection with development projects working in the district to
access trainings on various dimensions of seed management. It does not mean that
leadership is the only factor for the good performance of Bijbridhi CBSPO. Education
of seed consumers, accessibility of agricultural inputs such as irrigation facility, source
seed and extension facility is better in Chitwan district. All these factors might have
134
triggered the organization towards better performance.
8.5.7 Challenges for the company
On the question of the sustainability of Bijbridhi, the executive members opined
that source seed, irrigation, and uncertainty management are the key challenges. Out of
the 10t rice source seed demanded in 2010, they received only 50% of it and in many
cases the source seed was poor in terms of germination and genetic purity. The
uncertainty is mainly created by changing rainfall trend. This organization could not
collect 20t of rice variety (Hardinath 1) due to poor seed quality as a result of heavy rain
during rice harvesting.
135
8.6 Conclusion
This chapter measured the governance of CBSPOs with respect to participation,
business plan, incentive system and linkage. The governance indicators provide basis to
enhance organizations’ efficiency in marketing by addressing the internal and external
factors. The result shows that in general CBSPOs have better performance in
participation and linkage as compared to incentive system and business plan. There is
positive impact of governance indicators on households’ economic indicators i.e.
technical efficiency and proportion of rice seed sold in the market. This provides the
basis that even if extension agencies facilitate CBSPOs for designing their governance
indicators benefits will be realized at household level. The better performance of
CBSPOs in governance may be due to their higher educated leaders.
136
Chapter 9. Conclusions and recommendations
This study analyzed the sustainability of community-based rice seed production
from system perspective, putting seed producers and seed consumers in the context.
Here, sustainability is analyzed from the perspective of ‘sustainable development’. This
consideration is important in analyzing the sustainability of community-based seed
production systems, especially those which are in early phase of development. This
study is focused on seed producers, and it attempts to address the question of how seed
producers get economic benefit from seed production and how this benefit would
continue in the future. Since seed production is primarily an economic activity, social
and environmental aspects were analyzed with respect to their linkage with economic
issue. Efficiency gained by seed producers in production and marketing stages is the
economic indicator, whereas organizational governance and the adoption of soil
conservation practices are social and environmental indicators, respectively.
It is clear from the analysis that governance indicators have positive impact on
economic indicators (technical efficiency and proportion of seed sold by household).
Similarly, soil conservation practices have also positive link with crop yield and
technical efficiency. This justifies the rationale for using this approach in the analysis. It
also shows the mechanism for strengthening community-based seed production system.
Seed producers in the study area are small farmers and these categories of farmers
could not enhance their efficiency in utilizing high input technologies but by proper
allocation of their existing resources such as operational land, seed, fertilizer, labor,
livestock and chemical fertilizer. Households with irrigation facility and with higher
educated household head have significantly higher efficiency level. These two variables
have also positive impact on households’ participation in the market. Similarly, access
137
to irrigation has also positive impact in adopting green manure in the field. The green
manure harmonizes farmers’ objectives to increase the crop yield as well as to improve
soil quality. Improved soil quality could also make a basis for continuity of benefits to
seed producers from rice seed production. Similarly, education of household head and
access to irrigation facility has also positive impact on consumers’ behavior in buying
rice seed from the market. Moreover, this study also recognized the importance of
education for enhancing CBSPOs’ performance in governance, which is crucial to
enhance efficiency of seed growers by addressing the issue of participation, business
plan, incentive system and linkage. It means extension agencies intended to strengthen
the sustainability of rice seed production in the study area should focus on education
and irrigation issues.
The government agency should prioritize for enhancing formal education in the
study area for the long term. However, in the short run, extension agencies could
contribute to enhance education level of seed producers on technical and marketing
aspects of seed production through vocational trainings or demonstrations. This is
because average age of HHH head is over 46.8 years, and the provision formal
education for these farmers might not be appropriate. This could also apply for seed
consumers because education has also positive impact on consumers’ behavior in
buying rice seed from the market. It means considering the low education of the
consumers, extension agencies could organize field demonstrations plots of improved
seed produced by CBSPOs to motivate the seed consumers in buying seed from the
market. Also, extension agencies could motivate consumers in buying seed from the
market by providing subsidy on seed produced by CBSPOs for the short run. Though
Nepal has adopted group approach in the agricultural extension system, about half of
138
the seed consumers were not found to be engaged in any agricultural groups or
cooperatives. It means group formation and strengthening in needy areas, and
arrangement for making linkage between CBSPOs and seed consumers’ organizations
would be another strategy for educating seed consumers about seeds supplied by seed
producers.
Since CBSPOs included in the study were not established to develop them into
business organizations but to contribute in poverty reduction strategies through self-help
approach as per the motivation they got from development projects. It means it’s a
challenging job for executive committee how to manage the conflict arising from
variability of their members’ socio-economic characteristics, technology, and external
factors. It is clear from the analysis that executive leaders’ education level could be one
of the factors for better organizations’ governance. However, how higher educated,
dynamic and talented leaders could be introduced in CBSPOs leadership is the key issue.
Since CBSPOs is a democratic organization, it would be the best idea if members would
be able to choose higher educated leadership from among the existing members if
possible. This is because in most of the cases lower educated members are in executive
positions from the beginning of organization establishment even if the higher educated
members available in the organizations. One of the reasons might be lack of incentive
system (financial gain as well as transparency) that would not motivate educated leaders
to take responsibility of these positions. Also, existing leaders, in some cases, are not
interested to leave the position as they might be taking personal advantages from these
organizations as well as from development projects being in the leadership. At this
circumstance, development agencies could facilitate CBSPOs in selecting educated and
talented leaders from the existing members, and support them for designing appropriate
139
organizational governance, especially in business plan and incentive system. If higher
educated leaders are not available, CBSPOs could invite educated shareholders in their
organization from the local community or extension agencies could arrange higher
education for CBSPOs leaders. There is also necessary to incorporate business
development / enterprise development concepts trainings/academic curricula of
academic (agricultural university) and development agencies. It means integrating these
concepts in the course curriculum of extension and education agencies could contribute
in making CBSPOs more dynamic. Moreover, if higher educated trained leaders start
CBSPOs, they could properly address the social, economical and environmental issues
as discussed in this dissertation, and could gain higher efficiency in production and
marketing. This does not mean that education is the only important aspect to be
considered to enhance the performance of community-based seed production.
Similarly, irrigation issue in the study area could be addressed by increasing
investment to build up irrigation canal to access irrigation for existing rivers or from
underground source. Extension agencies could support irrigation facility based on
comparative advantage of available sources. However, these initiatives might demand
huge resources; development of alternative strategies that enhance water use efficiency
such as use of drought tolerant crop varieties would be useful. This might be possible
through local level participatory research and development activities, utilizing the
farmers’ local knowledge and resources.
Moreover, it is clear from the adoption study that farmers buy both modern and
farmers’ varieties but majority of these varieties grown by farmers in these areas have
not been released or registered by the government. Marketing of the seeds of these
non-registered / non-released varieties is considered illegal according to the revised seed
140
act 2008. It means if farmers grow these illegal varieties or CBSPOs grow or sell these
varieties, government agencies will not provide extension facilities in these varieties. At
this circumstance, government agency (National Seed Board) should explore the
reasons for poor registration of these varieties and address the issue accordingly.
141
End Notes 1GHI is the measure of food insecurity in the world. It is estimated considering under
nourishment, child mortality and child under weight. The value of the index is
classified into five categories: <4.9 low, 5-9.9 = moderate, 10-19.9 = serious,
20-29.9 alarming, >30 extremely alarming. Out of 119 countries facing the problem
of hunger, 40, 22, 17, 17 and 3 countries fall under low, moderate, serious, alarming
and extremely alarming categories, respectively. Burundi has the highest GHI (37.1)
(IFPRI, 2012) 2LFU is the measurement of labor force, where people from 15-59 years old regardless
of their sex were categorized as 1 person = 1LFU, but in case of children (10-14
years old) and elderly people (>59 years old) 1 person = 0.5 LFU 3LSU is the aggregates of different types of livestock kept at household in standard unit
calculated using the following equivalents; 1 adult buffalo = 1 LSU, I immature
buffalo = 0.5 LSU, 1 cow = 0.8 LSU, 1 calf = 0.4 LSU, 1 pig = 0.3 LSU, 1sheep or
goat = 0.2 LSU and 1 poultry or pigeon =0.1 LSU (CBS, 2003; Baral, 2005) 4Irrigation cost in the study area was calculated by multiplying the time of farmers with
respective man day rate in case of households using public irrigation source such as
surface water irrigation scheme, and if household used underground water through
tube well rental cost of tube well was calculated
5Land rent was estimated considering the value of rice farmers would get from share
cropping
142
References Acharya, B.M. (2009). Is cooperative really a democratic organization? Lessons learnt from the
selected cooperative acts of the world. Sahakari Sambad Ann. Bull. Cooperative
development Board, Kathmandu, Nepal.
ADB. (2012). Food security and poverty in Asia and Pacific: key challenges and policy issues. Asian Development Bank.
Agresti, A. (1996). An introduction to categorical data analysis. Wiley, USA.
Aigner, D., Lovell, C.A.K. and Schmidtip. (1977). Formulation and estimation of stochastic
frontier production model. Journal of Economics, 6, 21-37.
Ali, M., and Flinn, J. (1989). Profit efficiency among Basimati rice producers in Pakistan
Punjab. American Journal of Agricultural Economics, 71(2), 303-310.
Almekinders, C., and Louwaars, N. (1999). Farmers' seed production: New approaches and practices. Retrieved April 12, 2011, from www.acss.ws/Upload/XML/Research/99.pdf.
Almekinders, C., Louwaars, N.P., and Bruijin, G.H. (1994). Local seed system and their
importance for an improved seed supply in developing countries. Euphytica, 78, 207-216.
Aslam, M., Majid, A., Hashmi, N.I., and Hobbs, P.R. (1993). Improving wheat yield in the
rice–wheat cropping system of Punjab through zero tillage. Pakistan Journal of Agricultural Research 14: 8–11.
Azam, M.S., Ima, K.S., Gaiha, R. (2012). Agricultural supply response and small holder market participation. The case of Combodia. Retrieved January 10, 2013, from
http://www.rieb.kobe-u.ac.jp/academic/ra/dp/English/DP2012-09.pdf.
Baral, N. (2005). Resource use and conservation attitude of local people in the western
tarai landscape, Nepal. Unpublished Master Thesis. Florida: Florida International
University.
Battese, G.E., and Coelli, T.J. (1995). A model for technical inefficiency effects in a stochastic
frontier production function for panel data. Empirical Economics, 20, 325-332.
Belknap, J., and Saupe, W.E. (1988). Farm Family Resources and the Adoption of No-plow
Tillage in Southwestern Wisconsin. North Central Journal of Agricultural Economics, 10,
13–23.
Bishaw, Z., and van Gastel, A.J.G. (2008). ICARDA’s seed delivery approach in less favorable
areas through village-based seed enterprises: Conceptual and organizational issues. Journal of New Seeds, 9 (1), 68-88.
Brinkerhoff, D.W., and Goldsmith, A.A. (1990). Institutional sustainability in agriculture and
143
rural development. Praeger Publisher, New York.
Cappelari, L., and Jenkins, S.P. (2003). Multivariate probit regression using simulated
maximum likelihood. The Stata Journal, 3(3), 278–294.
CBS, (2003). National sample census of agriculture Nepal, 2001/02; Highlights, Kathmandu,
Nepal, National Planning Commission Secretariat, Central Bureau of Statistics.
CBS. (2011a). Poverty in Nepal. Central Bureau of Statistics, Kathmandu, Nepal
CBS. (2011b). Preliminary results of national population census. Central Bureau of Statistics,
Kathmandu, Nepal.
Chand, S.P., and Karki, M. (2005). Community-based seed production in maize: Present status and future opportunities. CIMMYT, Kathmandu, Nepal.
Chen, G.X., Huang, G.H., Huang, B., Yu, K.W., Wu, J. and Xu, H. (1997). Nitrous oxide and
methaneemissions from soil–plant systems: Nutrient Cycling. Agroecosystems, 49, 41–45.
Chriwa, E., Dorward, A., Kachule, R., Kumwenda, L., Kydd, J., and Poole, N. (2005). Farmer organizations for market access: principles for Policy and Practice. Department of
Agricultural Science, Imperial College, London.
Cochrun, S.E. (1994). Understanding and enhancing neighborhood sense of community.
Journal of planning literature, 9, 92-99.
Cromwell, E., andWiggins, S. (1993). Sowing beyond the state: NGO and seed supply in developing countries. Retrieved April 1, 2011, from
linkinghub.elsevier.com/retrieve/pii/0305750X9400133J.
Dahal, K. R., Mishra, N.K., Rajbhandary, B.P., Chaudhary, N.K., and Prasad, M.L. (1993).
Green manuring studies on rice: a research report. Institute of Agriculture and Animal
Science, Rampur, Chitwan.
David, S. (2004). Farmer seed enterprises: a sustainable approach to seed delivery? Journal of Agriculture and Human Values, 21, 387-397.
Denison, R. F. (1996). Organic matters. Retrieved August 5, 2011, from
donlotter.net/lotter_organicag.pdf.
Devkota, K.P., Yadav, D.N., Chaudhary, N.K., Dangol, D.R., and Basnet, K.B. (2006). Influence
of spring season crop residue on productivity of rice-wheat cropping system. Journal of Institute of Agriculture and Animal Science, 27, 53-58.
Derpsch, R. (2007). Historical review of no-tillage cultivation of crops. Retrieved August 5,
2011, from http://www.betuco.be/CA/No-tillage%20cultivation%20crops%20review.pdf.
Dhakal, S. (2011). Success and failure of seed production through agricultural resource centers
in Nepal. An unpublished Master’s Thesis. University of Applied Science, the Netherlands.
DHM. (2011). Climate data of Nepal. Department of Hydrology and Meteorology, Kathmandu,
144
Nepal.
Dormaar, J.F., Lindwall, C. W., and Kozub, G.C. (1988). Effectiveness of manure and chemical
fertilizers in restoring productivity of artificially eroded dark brown chermozemic soil under
dry land conditions. Canadian Journal of Soil Science, 68, 669-679. Retrieved August 2,
2011, from donlotter.net/lotter_ajaa_article.pdf .
Dumanski, J., Peiretti, R., Benetis, J., McGarry, D., and Pieri, C. (2006). The paradigm of
conservation tillage. Soil and Water Conservation, 1, 58-64. Retrieved August 5, 2011, from
http://www.unapcaem.org/publication/ConservationAgri/ParaOfCA.pdf
Eason, W.R., Scullion, J., and Scott, E.P. (1999). Soil parameters and plant responses associated
with arbuscular mycorrhizas from contrasting grassland management regimes. Agriculture Ecosystems and Environment, 73 (3), 245-255.
Erenstein, O., and Laxmi, V. (2008). Zero tillage impacts in india's rice-wheat systems: A review.
Soil and Tillage Research, 100 (2), 1−14.
Erenstein, O. (2009). Zero tillage in rice-wheat system of Indo-gangetic plain: a review of impacts and sustainability implications. Retrieved May 13, 2011, from
http://www.ifpri.cgiar.org/sites/default/files/publications/ifpridp00916.pdf.
Erenstein, O., and Farooq, U. (2009). A survey of factors associated with the adoption of zero
tillage wheat in the irrigated plains of South Asia. Experimental Agriculture, 45 (2),
133−147.
Ervin, C.A. and Ervin, D.E. (1982).Factors affecting the use of soil conservation practices. Land Economics, 58, 79–90.
FAO. (2010a). Global hunger declining but unacceptably it is still high. Retrieved September 11,
2012, from http://www.fao.org/docrep/012/al390e/al390e00.pdf.
FAO. (2010b). Promoting the growth and development of small seed enterprises for food security crops. Retrieved March 10, 2011, from www.fao.org/docrep/013/i1839e/i1839e00.pdf.
FAO. (2013). Crop Situation Update: A Joint Mission of 2012 Summer Crops and Outlook of 2012/13 Winter Crops. Retrieved March 12, 2012, from
https://sites.google.com/site/nefoodsec/home/crop-situation-update
FAOSTAT. (2012). Crop information 2011. Retrieved February 11, 2013, from
http://faostat.fao.org/site/567/DesktopDefault.aspx?PageID=567#ancor.
Farrell, M. J. (1957). The measurement of productivity efficiency. Journal of Royal Statistical Society Series, 120, 253-290.
FORWARD. (2011). Annual Report. Bharatpur, Chitwan, Nepal.
Gauchan, D.M., Smale, M. and Chaudhary, P. (2005). Market-based incentive for conserving
diversity on-farm: the case of rice landraces in central tarai, Nepal. Genetic Research and
145
Crop Evolution, 52, 293-303.
Ghaderzadeh H. and Rahimi, M.H. (2005). Estimation of technical efficiency of wheat farm: A
case study in Kurdistan Province, Iran. American-Eurasian Journal of Agriculture and Environment Science, 4 (1), 104-109.
Granatstein, D.M., Bezdicek, D.F., Cochran, V.L., Elliot, L.F., and Hammel, J. (1987). Long
term tillage and rotation effects on soil microbial biomass, carbon and nitrogen. Bio Fertil Soils, 5, 265-270.
Gray, R., Rosaasen, K., and Taylor, J. (1992). The economic and sociological evaluation of land use options. University of Saskatchewan.
Gray, T.W., and Kraenzle, C.A. (1998). Member participation in agriculture cooperative: a regression and scale analysis. Retrieved April 10, 2011, from
www.rurdev.usda.gov/rbs/pub/rr165.pdf.
Gupta, R., and Sayre, K. (2007). Conservation agriculture in South Asia. Journal of agricultural science, 145 (3), 207−214.
Heckman, J.J. (1979). Sample selection bias as a specification error. Journal of Econometrica 47 (1): 53-161.
Hunington, S.P. (1968). Political order in changing society. New Haven, Yale University Press.
Idiong, I.C. (2007). Estimation of farmer level technical efficiency in small scale swamp rice
production in cross river state, Nigeria: a stochastic frontier approach. World Agricultural Science, 4, 45-60.
IFPRI. (2012). Global hunger index: challenge of hunger ensuring sustainable food security under land, water and energy stress. Retrieved January 10, 2013, from
http://www.ifpri.org/sites/default/files/publications/ghi12.pdf.
IPCC. (2007). Climate change 2007: synthesis report. In: Core writing team, Pachauri, R. K.&
Reisinger A (ed.). Contribution of working group I, II and III to the Fourth Assessment Report of the Intergovernmental Panel on Climate Change IPCC, Geneva, Switzerland.
Retrieved August 8, 2011, from www.ipcc.ch/pdf/assessment-report/ar4/syr/ar4_syr.pdf.
Joshi, K.R. (2006). A survey on marketing potential of maize seed production in the western
hills of Nepal. Nepal Agricultural Research Journal, 7, 82-87.
Joshi, G and Bauer, S. (2006). Farmers’ choice of modern rice varieties in the rain fed
ecosystem of Nepal. Journal of Agriculture and Rural Development in the Tropics and Subtropics, 107 (2), 129–138.
Joshi, B.K, Mudwari, A., and Bhatta, M. R. (2006). Wheat genetic resources in Nepal. Nepal Agriculture Research Journal, 7, 24-29. Retrieved August 10, 2011, from
http://www.narc.org.np/publicaton/pdf/journal/Vol5/genetic_diversity_nepalese_wheat_culti
146
vars_based_agr.pdf .
Joshi, K. D., Subedi, M., Rana, R.B., Kadayat, K.B., and Stahpit, B. R. (1997). Enhancing on-farm varietal diversity through participatory varietal selection: a case study for chaite rice in Nepal. Bangor University, Wales, UK.
Joshi, K.D., Devkota, K.P., Harris, D., Khanal, N.P., Paudyal, B., Sapkota, A., and Witcombe,
J.R. (2012). Participatory approaches rapidly improve household food security in Nepal and
identify policy changes required for institutionalization. Field Crops Research, 131, 40-48.
Kafle, B., Paudel, M.N. and Ghimire, R. C. (2012). Assessing current status of rice varieties in
river basin area of Nepal: concern for diffusion. International Journal of Agriculture: Research and Review, 2 (2), 59-61.
Kalirajan, K.P. (1999). The importance of effective and efficient use in the adoption of
technologies: A micro panel data analysis. Journal of Production Analysis 2: 113-126.
Kassie, M., Eta, M., Shiferaw, B., and Mmbando, F. (2012). Plot and household level determinants of sustainable agricultural practices in rural Tanzania. Retrieved October 12,
2012, from http://www.rff.org/RFF/documents/EfD-DP-12-02.pdf.
Khanal, N.P., Yadav, N.K., Khanal, N.N., Darai, R., Joshi, S., Neupane, R.K., Sherpa, L.P.,
Thapa, S., Gupta, K., Neupane, R., Pokharel, D. N., Sah, R. P., Adhikari, B. N., Joshi, K.D.,
and Harris, D. (2006). A proposal for the release of mungbean varieties NM94 and VC6372 (45-8-1). Retrieved March 11, 2011, from
http://www.cazs.bangor.ac.uk/ccstudio/Library/publications/ReleaseProposals/Mungbean.pdf.
Kugbei, S. (2007). Seed economics: commercial consideration for enterprise management in developing countries. International Center for Agricultural Research in the Dry Areas.
Scientific Publishers, India.
Kyi, T., and Oppen, M.V. (1999). Stochastic frontier production function and technical efficiency estimation: a case study on irrigated rice in Myanmar. Retrieved September 12,
2012, from ftp://ftp3.gwdg.de/pub/tropentag/proceedings/1999/.../STD_C6.pdf.
Ladha, J. K., Hill, J.E., Duxbury、 J. M., Gupta、 R. K., and Buresh, R. J.(2003). Improving the productivity and sustainability of rice-wheat systems: Issues and impacts. Madison,
Wisconsin, U.S.A.: American Society of Agronomy, Crop Science Society of America and
Soil Science Society of America.
Lal, R., J. Kimble, R. Follett, and C. Cole. (1998). The potential of U.S. cropland to sequester carbon and mitigate the greenhouse effect, Ann Arbor Press.
Lal, K.K., Thapa, M., and Guenat, D. (2009). Review of seed projects in Nepal. Swiss Agency
for Development and Cooperation, Kathmandu, Nepal.
147
Lanteri S., and Quagliotti, L. (1997). Problems related to seed production in African region.
Euphytica, 96, 173-183.
Lee, L.K. (1980). The Impact of Landownership Factors on Soil Conservation. American Journal of Agricultural Economics, 62(5), 1070-1076.
Lewandowski, I., Hardtlein, M., and Kaltschmitt, M. (1999). Sustainable crop production:
definition and methodological approach for assessing and implementing sustainability. Crop Science. 39, 184–193.
Long, S.T., and Freese, J. (2006), Regression model for categorical dependent variables using stata. A
Stata Press Publication, Collage Station, Texas.
Lyon, F., and Danquash, A. (1998). Small scale seed provision in Ghana: Social relations, contracts and institutions for micro-enterprise development. Retrieved January 15, 2010,
from www.laolink.org/Literature/agrenpaper_84.pdf.
Mac, R.J., Hill, S.B., Henning, J. and Mehuys, G.R. (1989). Agricultural science and sustainable
agriculture: a review of the existing scientific barriers to sustainable food production and
potential solutions. Biological Agriculture and Horticulture, 6, 173-219.
Maharjan, K.L., Joshi N.P., and Piya L. (2011). Source of climate change, its impacts and mitigation issues in Nepal. Climate Change: Asian Perspective, Rawat Publication, India.
McKenzie, S. (2004). Social sustainability: towards some definitions. Awake Research Institute
Paper Series 27. Retrieved June 25, 2013, from
http://w3.unisa.edu.au/hawkeinstitute/publications/downloads/wp27.pdf
Meeusen, W. and J. van den Broeck. (1977). Efficiency estimates from Cobb-Douglas
production function with composed error. International Economic Review,18, 435-444.
MoAC. (2009). Seed production groups and cooperatives in Nepal. Ministry of Agriculture and
Cooperative, Nepal.
MoAC. (2011). Statistical Information on Nepalese Agriculture. Ministry of Agriculture and
Cooperatives, Kathmandu, Nepal.
MoE. (2010). Climate change vulnerability mapping for Nepal. Ministry of Environment.
National Adaptation program of action to climate change, Kathmandu, Nepal.
Morris, M.L., Smale, M. and Rusike, J. (1998). Maize seed industries: a conceptual framework.
In: Morris, M.L., (ed.). Maize Seed Industries in Developing Countries. Lynne Rienner,
Boulder, Colorado, USA.
Mywish, M., Julie, H., and Ducan, B. (1999). Increasing seed system efficiency in Africa: Concepts, strategies and issues. Retrieved March 15, 2011, from
ideas.repec.org/p/ags/midiwp/54578.html-12k.
NARC. (2011). Released and registered crop varieties in Nepal (1960-2010). Retrieved July 15,
148
2012, from
http://narc.gov.np/publicaton/pdf/varieties_released/Recorded%20released%20varieties.pdf .
Nkonya, E., and Norman, D. (1997). Factors affecting adoption of improved maize in Northern Tanzania. Retrieved August 30, 2012, from
http://onlinelibrary.wiley.com/doi/10.1111/j.1477-9552.1997.tb01126.x/pdf.
Nkhoma, A.T. (2011). Factors affecting sustainability of agricultural cooperatives: lessons from
Malawii. A Master Thesis. Agricultural Commerce of Massey University, New Zealand
Omiti, J.M., Otieno, D.J., Nyanamba, T.O., and Mccullough, E. (2009). Factors influencing the intensity of market participation by smallholder farmers: a case study of rural and peri-urban areas of Kenya. Retrieved December 4, 2012, from
http://ageconsearch.umn.edu/bitstream/56958/2/0301Omiti%20-%20FINAL.pdf.
Onions, C. T. (1964). The shorter oxford English dictionary. Oxford: Clarendon Press.
Pandey, K.R., Shah, S.C., and Becker, M. (2008). Management of native soil nitrogen for
reducing nitrous oxide emission and higher rice production. Journal of Agriculture and Environment, 9, 22-28.
Paudel, M.N. (2011). Rice cultivation in the highest elevation in the world. Agronomy Journal of Nepal, 2, 31-41.
Paudel, P., and Matsuoka, A. (2008). Factors influencing adoption of improved maize varieties
in Nepal: A case study from Chitwan district. Australian Journal of Basic and Applied Science, 2 (4), 823-834.
Pindyck, R.S., and Rubinfield, D. (1981). Econometric models and economic forecasts. New
York: McGraw Hill.
Piya, S., Kiminami, A., and Yagi, H. (2012). Comparing the technical efficiency of rice farmers
in urban and rural areas: a case study from Nepal. Trends in Agriculture Economics, 5,
48-60.
Pokhrel, S. (2012). Role of DISSPRO and CBSPs in current seed supply situation in Nepal. The Journal of Agriculture and Environment, 13, 53-59.
Poudel, D., Choudhary, P., Chowin, K.R., Ghimire, H. (2003). Seed production and marketing through farmers' groups: Case studies. Center for Arid Zone Studies, University of Wales,
UK.
Pradhan, K.K. (2009). Rural finance in Nepal: Prospective from cooperative sector. Cooperative
Development Board, Kathmandu, Nepal. Sahakari Sambad Ann. Bull.
Prasad, S.K., Pullabhotla, H., and Kumar, A.G. (2011). Supply and demand for cereals in Nepal, 2010-2030. IFPRI discussion paper series 01120.
149
Rahman, S. (2003). Profit efficiency among Bangladeshi rice farmers. Food policy 28,487-503.
Retrieved February 25, 2012, from
http://www.sciencedirect.com/science/article/pii/S0306919203000745.
Rana, R.B., Garforth, C., Stapit, B., and Jarvis, D. (2007). Influence of socio-economic and
cultural factors in rice variety diversity management on-farm in Nepal. Agriculture and human values, 24, 461-472.
Regmi, A., Tripathi, G., Giri, S., Bhatta, M., Sherchan, D.P., Karki, K.B., Kumar, V., Ladha,
J.K. (2009). Improving food security through integrated crop and resource management in the rice-wheat system in Nepal. Retrieved September 25, 2011, from
http://irri.org/knowledge/publications/irri-books/integrated-crop-and-resource-management-
in-the-rice-wheat-system-of-south-asia.
Rogers, E.M. (1995). The diffusion of innovations. The Free Press, New York.
Schultz, T.W. (1964). Transforming traditional agriculture. Yale university press, New Haven.
Schaller, N. (1993). The concept of agricultural sustainability. Agriculture, Ecosystem and Environment, 46, 89–97.
Setimela, P. S., Monyo, E., and Banziger, M. (2004). Successful community-based seed production strategies. International Maize and Wheat Improvement Center, Maxico.
Shah, P., Dahal, K. R., Shah, S.K. and Dangol, D.R. (2011). Effect of tillage, mulch and time of
nitrogen application on yield of wheat (Triticum aestivum L.). Agriculture Development Journal, 8, 9-19.
Shrestha, C.B., and Ednar, W. (2007). Seed sector country profile - Nepal. Retrieved April 16,
2011, from http://www.dshc.life.ku.dk/Publications/~/media/Shc/docs/pdf/SSCPNepal.ashx.
Sharma, K.R., Leung, P., Zaleski, H.M. (1999). Technical, allocative and economic efficiency
in swine production in Hawaii: a comparison of parametric and non-parametric approaches.
Agriculture economics, 20, 23-25.
Sheikh, A.D., Rehman, T., Yates, C.M. (2003). Logit models for identifying the factors that
influence the uptake of new technologies by farmers in the rice-wheat and the cotton-wheat
farming systems of Pakistan’s Punjab. Agricultural Systems, 75, 79–95.
SQCC. (2012). Seed balance sheet 2012. Seed Quality Control Center, Ministry of Agriculture
and Cooperative, Kathmandu, Nepal.
Srinivas T, Zewdie, B., Javed, R., Abdoul, A.N., Rahaman, A., and Amegbeto, K. (2010).
ICARDA’s approach in seed delivery: technical performance and sustainability of
village-based seed enterprises in Afghanistan. Journal of New Seeds, 11(2), 138-163.
Stanhill, G. (1990). The comparative productivity of organic agriculture. Agriculture Ecosystems and Environment, 30 (1-2), 1-26.
150
Subedi, K. D. (1992). Search for indigenous green manuring species in order to sustain soil
fertility (in Nepal). Prabidhi Sangalo. Lumle Agricultural Research Centre, Nepal.
Subedi, A. (1997). Farmers' local knowledge agrees with formal experimental results. ILEIA Newsletter.
Tabet, A. (2007). Bayesian Inference in the Multivariate Probit Model: Estimation of the
Correlation Matrix. Master’s Thesis. The University of British Columbia.
Tiwari, K.R., Sitaula, B.K., Nyborg, I.L.P., and Paudel, G.S. (2008). Determinants of farmers’
adoption of improved soil conservation technologies in mid mountain watershed of central
Nepal. Environmental Management, 42, 210-222.
Toomsan, B., Cadisch, G., Srichantawong, M., Thongsodsaeng, C., Giller, K. E., and
Limpinuntana, V. (2000). Biological nitrogen fixation and residual nitrogen benefit of
pre-rice leguminous crops and green manures. Netherlands Journal of Agriculturral Science, 48, 19-29.
Tripp, R. (2001). Provision of seed for agricultural development. Retrieved April 22, 2011, from
mcknight.ccrp.cornell.edu/program_docs/litlists/Rach_Biblio_Seed%20Syst_18may06.pdf.
Tripathi, J., Adhikari, C., Lauren, J. G., Duxbury, J. M., and Hobbs, P. R. (2006). Assessment of farmer adoption of surface seeded wheat in the Nepal tarai. Rice-Wheat Consortium Paper Series 19. Retrieved July 10, 2011, from
gradeducation.lifesciences.cornell.edu/faculty/individual800.
UN. (2012). Future we want outcome document. Retrieved February 1, 2013, from
http://sustainabledevelopment.un.org/index.php?menu=1298.
Upreti, R. (2008). System of rice intensification (SRI) experience of Nepal. A paper presented in
third national symposium on SRI, organized by SRI India at Tamilnadu university,
December 1-3, India.
Wang, J., Cramer, G. L, and Wailes, E. J. (1996). Production efficiency of Chinese agriculture:
evidence from rural household survey data. Agricultural Economics, 15, 17-28.
WCED. (1987). Our common future. Oxford University Press.
White, L. G. (1984). Lessons in Development Project Management. College Park.
Witcombe, J.R., and Virk, D.S. (1997). New directions for public sector variety testing. In: New seed and old laws regulatory reform and the diversification of national seed systems (R Tripp, ed). Overseas Development Institute, United Kingdom.
Witcombe, J.R., Devkota, K.P., and Joshi, K. D. (2010). Linking community-based seed
producers to markets for a sustainable seed supply system. Journal Experimental Agriculture, 46 (4), 425-437.
151
World Bank. (2011). World development indicators & global development finance. Retrieved
January 10, 2012, from worldbank.org/ddp/home.do?Step=12&id=4&CNO=2.
Yadav, R.B., Chaudhary, B., Adhikari, N.P., Akhtar, T. (2005). Hardinath 1, an early maturing
rice genotype released in Nepal. Retrieved July 11, 2012, from
http://dspace.irri.org:8080/dspace/bitstream/123456789/1144/1/Yadaw,%20R.%20B.%20Ha
rdinath%201,%20an%20early.pdf .
Yadav, A., Kamboj, B.D., Gill, B.R., and Malika, R.K. (2010). Towards unpuddled no-till direct seeded rice in Haryana: progress and prospects. Retrieved August 12, 2011, from
http://www.conserveagri.org/PACA%20NL16.pdf.
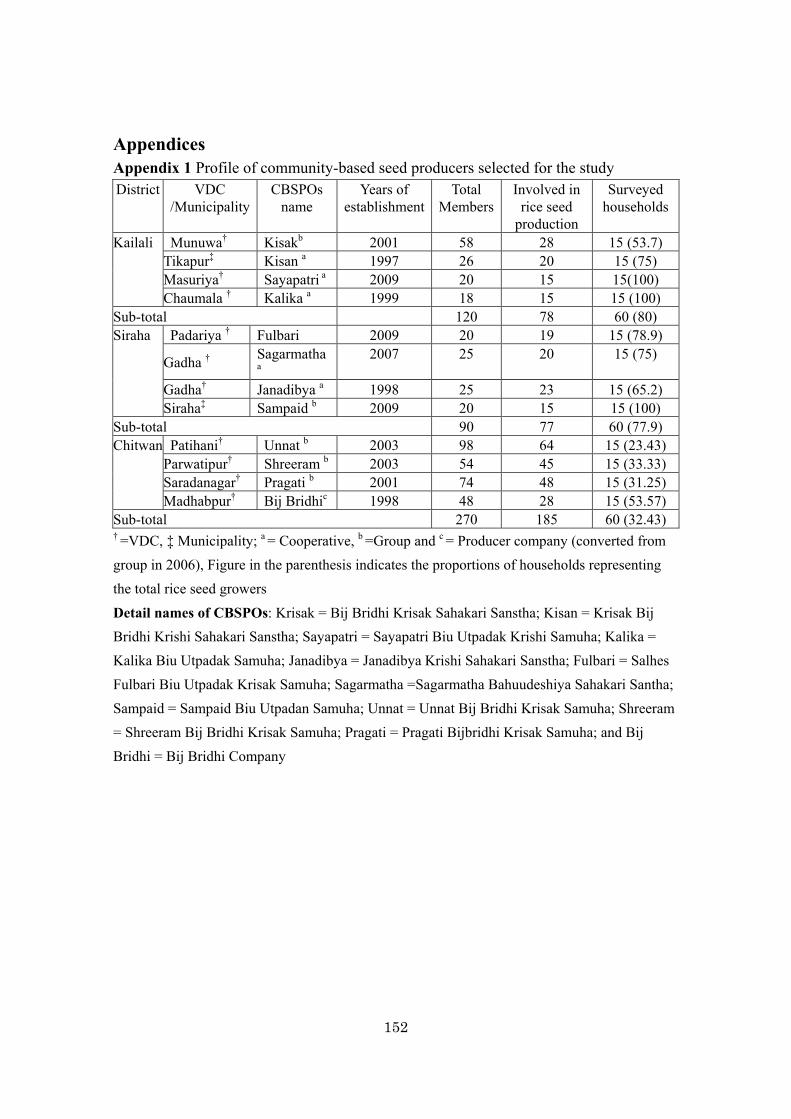
152
Appendices Appendix 1 Profile of community-based seed producers selected for the study District VDC
/Municipality CBSPOs
name Years of
establishmentTotal
MembersInvolved in
rice seed production
Surveyed households
Kailali Munuwa† Kisakb 2001 58 28 15 (53.7) Tikapur‡ Kisan a 1997 26 20 15 (75) Masuriya† Sayapatri a 2009 20 15 15(100) Chaumala † Kalika a 1999 18 15 15 (100)
Sub-total 120 78 60 (80) Siraha Padariya † Fulbari 2009 20 19 15 (78.9)
Gadha † Sagarmatha
a 2007 25 20 15 (75)
Gadha† Janadibya a 1998 25 23 15 (65.2) Siraha‡ Sampaid b 2009 20 15 15 (100)
Sub-total 90 77 60 (77.9) Chitwan Patihani† Unnat b 2003 98 64 15 (23.43)
Parwatipur† Shreeram b 2003 54 45 15 (33.33) Saradanagar† Pragati b 2001 74 48 15 (31.25) Madhabpur† Bij Bridhic 1998 48 28 15 (53.57)
Sub-total 270 185 60 (32.43) † =VDC, ‡ Municipality; a = Cooperative, b =Group and c = Producer company (converted from
group in 2006), Figure in the parenthesis indicates the proportions of households representing
the total rice seed growers
Detail names of CBSPOs: Krisak = Bij Bridhi Krisak Sahakari Sanstha; Kisan = Krisak Bij
Bridhi Krishi Sahakari Sanstha; Sayapatri = Sayapatri Biu Utpadak Krishi Samuha; Kalika =
Kalika Biu Utpadak Samuha; Janadibya = Janadibya Krishi Sahakari Sanstha; Fulbari = Salhes
Fulbari Biu Utpadak Krisak Samuha; Sagarmatha =Sagarmatha Bahuudeshiya Sahakari Santha;
Sampaid = Sampaid Biu Utpadan Samuha; Unnat = Unnat Bij Bridhi Krisak Samuha; Shreeram
= Shreeram Bij Bridhi Krisak Samuha; Pragati = Pragati Bijbridhi Krisak Samuha; and Bij
Bridhi = Bij Bridhi Company
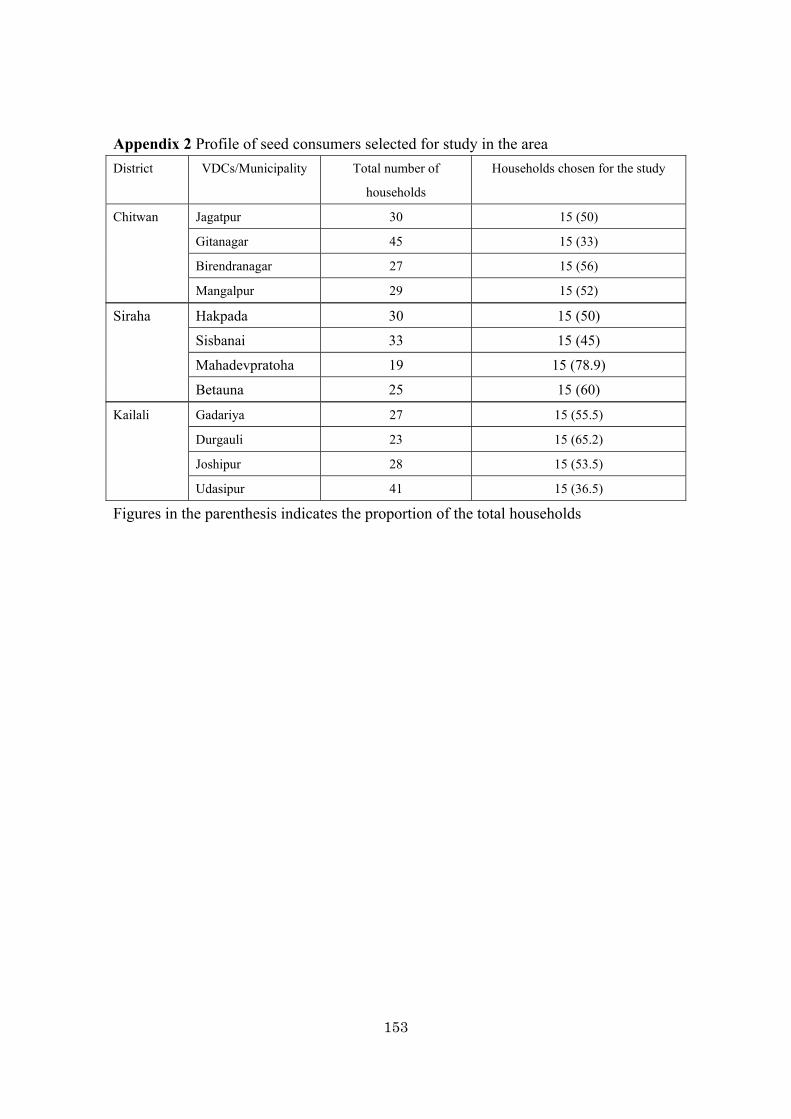
153
Appendix 2 Profile of seed consumers selected for study in the area
Figures in the parenthesis indicates the proportion of the total households
District VDCs/Municipality Total number of
households
Households chosen for the study
Chitwan Jagatpur 30 15 (50)
Gitanagar 45 15 (33)
Birendranagar 27 15 (56)
Mangalpur 29 15 (52)
Siraha Hakpada 30 15 (50)
Sisbanai 33 15 (45)
Mahadevpratoha 19 15 (78.9)
Betauna 25 15 (60)
Kailali Gadariya 27 15 (55.5)
Durgauli 23 15 (65.2)
Joshipur 28 15 (53.5)
Udasipur 41 15 (36.5)
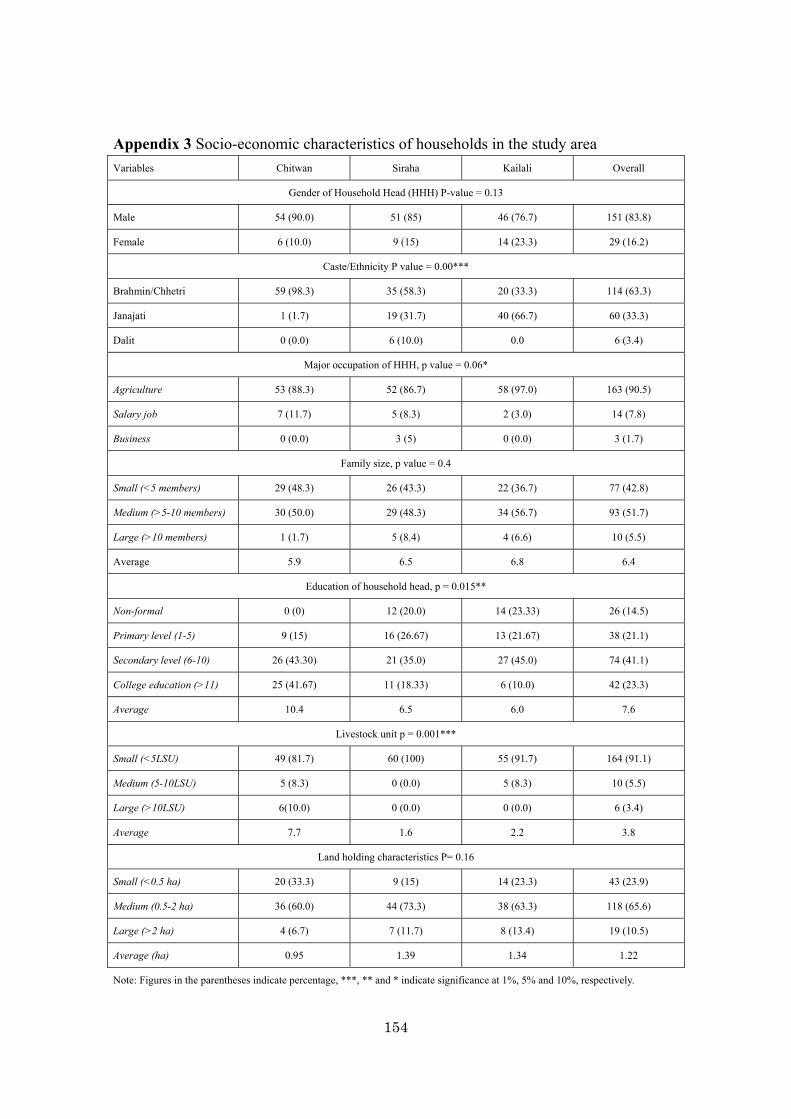
154
Appendix 3 Socio-economic characteristics of households in the study area
Variables Chitwan Siraha Kailali Overall
Gender of Household Head (HHH) P-value = 0.13
Male 54 (90.0) 51 (85) 46 (76.7) 151 (83.8)
Female 6 (10.0) 9 (15) 14 (23.3) 29 (16.2)
Caste/Ethnicity P value = 0.00***
Brahmin/Chhetri 59 (98.3) 35 (58.3) 20 (33.3) 114 (63.3)
Janajati 1 (1.7) 19 (31.7) 40 (66.7) 60 (33.3)
Dalit 0 (0.0) 6 (10.0) 0.0 6 (3.4)
Major occupation of HHH, p value = 0.06*
Agriculture 53 (88.3) 52 (86.7) 58 (97.0) 163 (90.5)
Salary job 7 (11.7) 5 (8.3) 2 (3.0) 14 (7.8)
Business 0 (0.0) 3 (5) 0 (0.0) 3 (1.7)
Family size, p value = 0.4
Small (<5 members) 29 (48.3) 26 (43.3) 22 (36.7) 77 (42.8)
Medium (>5-10 members) 30 (50.0) 29 (48.3) 34 (56.7) 93 (51.7)
Large (>10 members) 1 (1.7) 5 (8.4) 4 (6.6) 10 (5.5)
Average 5.9 6.5 6.8 6.4
Education of household head, p = 0.015**
Non-formal 0 (0) 12 (20.0) 14 (23.33) 26 (14.5)
Primary level (1-5) 9 (15) 16 (26.67) 13 (21.67) 38 (21.1)
Secondary level (6-10) 26 (43.30) 21 (35.0) 27 (45.0) 74 (41.1)
College education (>11) 25 (41.67) 11 (18.33) 6 (10.0) 42 (23.3)
Average 10.4 6.5 6.0 7.6
Livestock unit p = 0.001***
Small (<5LSU) 49 (81.7) 60 (100) 55 (91.7) 164 (91.1)
Medium (5-10LSU) 5 (8.3) 0 (0.0) 5 (8.3) 10 (5.5)
Large (>10LSU) 6(10.0) 0 (0.0) 0 (0.0) 6 (3.4)
Average 7.7 1.6 2.2 3.8
Land holding characteristics P= 0.16
Small (<0.5 ha) 20 (33.3) 9 (15) 14 (23.3) 43 (23.9)
Medium (0.5-2 ha) 36 (60.0) 44 (73.3) 38 (63.3) 118 (65.6)
Large (>2 ha) 4 (6.7) 7 (11.7) 8 (13.4) 19 (10.5)
Average (ha) 0.95 1.39 1.34 1.22
Note: Figures in the parentheses indicate percentage, ***, ** and * indicate significance at 1%, 5% and 10%, respectively.
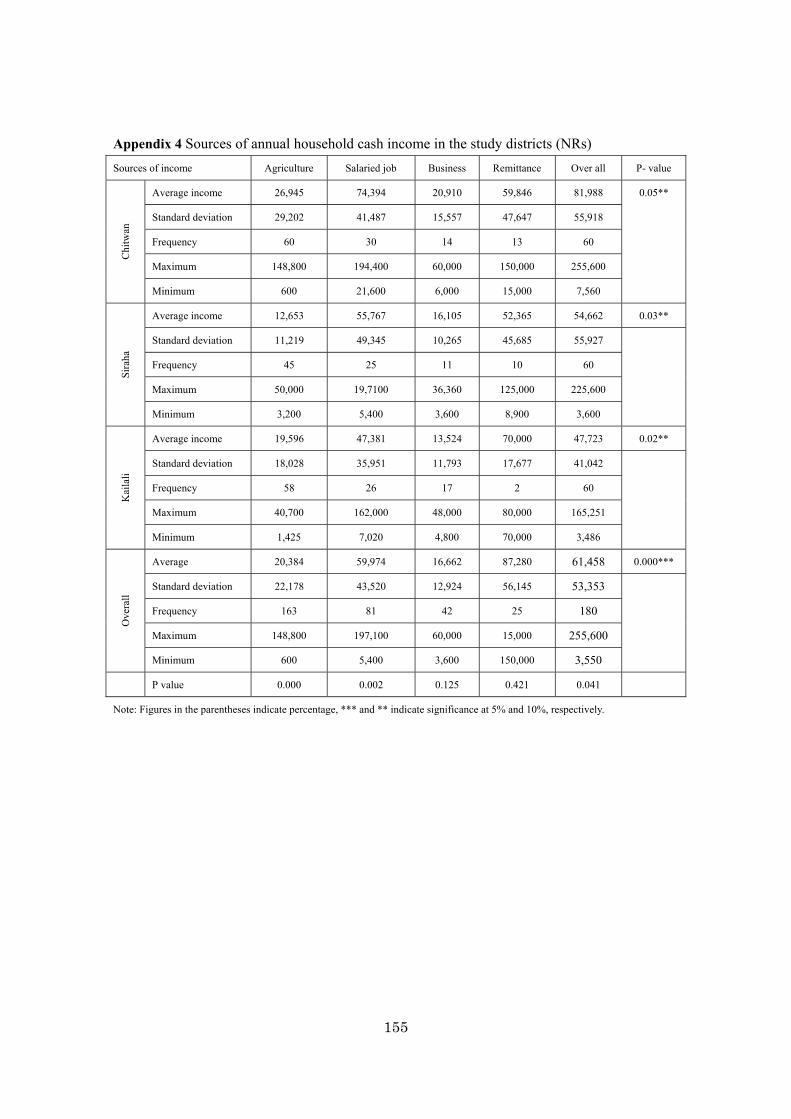
155
Appendix 4 Sources of annual household cash income in the study districts (NRs) Sources of income Agriculture Salaried job Business Remittance Over all P- value
Chi
twan
Average income 26,945 74,394 20,910 59,846 81,988 0.05**
Standard deviation 29,202 41,487 15,557 47,647 55,918
Frequency 60 30 14 13 60
Maximum 148,800 194,400 60,000 150,000 255,600
Minimum 600 21,600 6,000 15,000 7,560
Sir
aha
Average income 12,653 55,767 16,105 52,365 54,662 0.03**
Standard deviation 11,219 49,345 10,265 45,685 55,927
Frequency 45 25 11 10 60
Maximum 50,000 19,7100 36,360 125,000 225,600
Minimum 3,200 5,400 3,600 8,900 3,600
Kai
lali
Average income 19,596 47,381 13,524 70,000 47,723 0.02**
Standard deviation 18,028 35,951 11,793 17,677 41,042
Frequency 58 26 17 2 60
Maximum 40,700 162,000 48,000 80,000 165,251
Minimum 1,425 7,020 4,800 70,000 3,486
Ove
rall
Average 20,384 59,974 16,662 87,280 61,458 0.000***
Standard deviation 22,178 43,520 12,924 56,145 53,353
Frequency 163 81 42 25 180
Maximum 148,800 197,100 60,000 15,000 255,600
Minimum 600 5,400 3,600 150,000 3,550
P value 0.000 0.002 0.125 0.421 0.041
Note: Figures in the parentheses indicate percentage, *** and ** indicate significance at 5% and 10%, respectively.
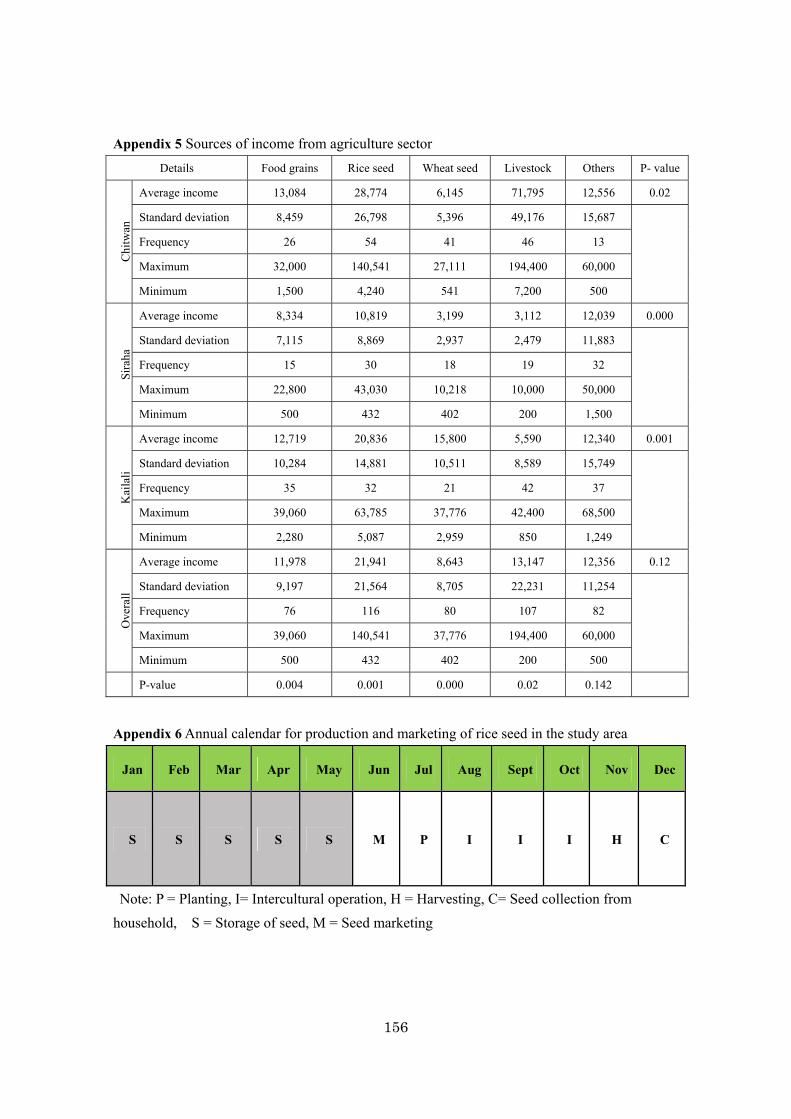
156
Appendix 5 Sources of income from agriculture sector Details Food grains Rice seed Wheat seed Livestock Others P- value
Chi
twan
Average income 13,084 28,774 6,145 71,795 12,556 0.02
Standard deviation 8,459 26,798 5,396 49,176 15,687
Frequency 26 54 41 46 13
Maximum 32,000 140,541 27,111 194,400 60,000
Minimum 1,500 4,240 541 7,200 500
Sir
aha
Average income 8,334 10,819 3,199 3,112 12,039 0.000
Standard deviation 7,115 8,869 2,937 2,479 11,883
Frequency 15 30 18 19 32
Maximum 22,800 43,030 10,218 10,000 50,000
Minimum 500 432 402 200 1,500
Kai
lali
Average income 12,719 20,836 15,800 5,590 12,340 0.001
Standard deviation 10,284 14,881 10,511 8,589 15,749
Frequency 35 32 21 42 37
Maximum 39,060 63,785 37,776 42,400 68,500
Minimum 2,280 5,087 2,959 850 1,249
Ove
rall
Average income 11,978 21,941 8,643 13,147 12,356 0.12
Standard deviation 9,197 21,564 8,705 22,231 11,254
Frequency 76 116 80 107 82
Maximum 39,060 140,541 37,776 194,400 60,000
Minimum 500 432 402 200 500
P-value 0.004 0.001 0.000 0.02 0.142
Appendix 6 Annual calendar for production and marketing of rice seed in the study area
Jan Feb Mar Apr May Jun Jul Aug Sept Oct Nov Dec
S S S S S M P I I I H C
Note: P = Planting, I= Intercultural operation, H = Harvesting, C= Seed collection from
household, S = Storage of seed, M = Seed marketing
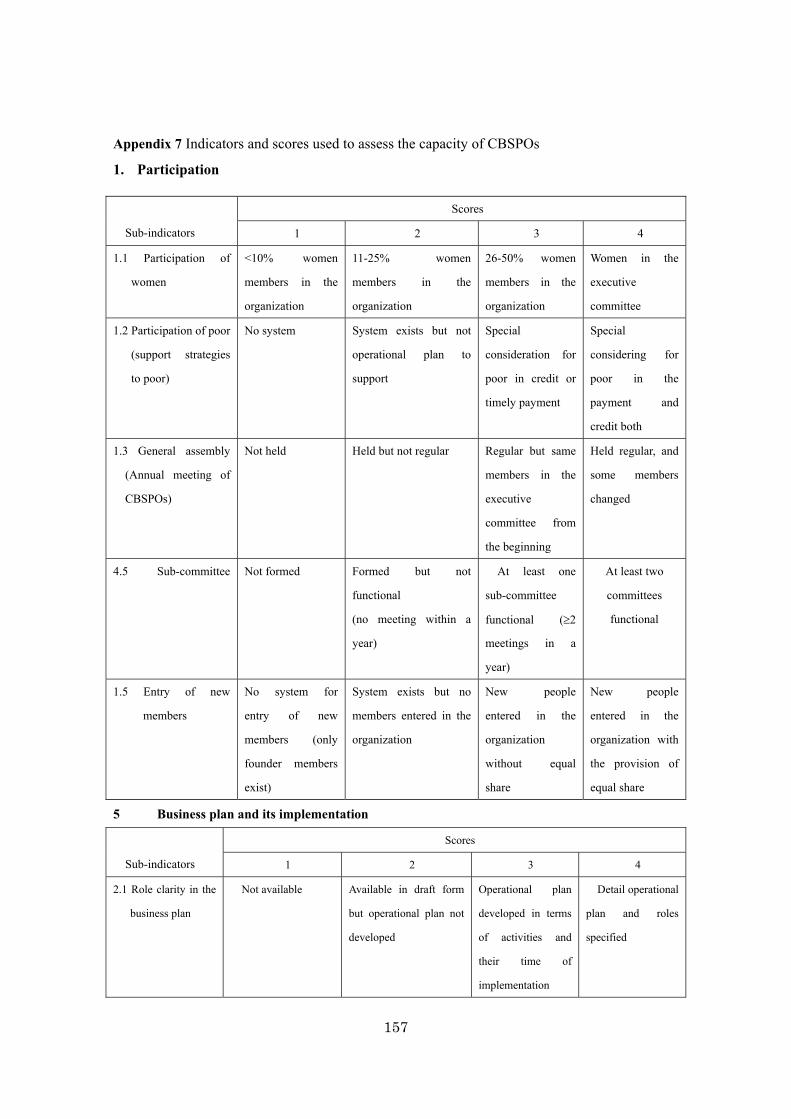
157
Appendix 7 Indicators and scores used to assess the capacity of CBSPOs
1. Participation
Sub-indicators
Scores
1 2 3 4
1.1 Participation of
women
<10% women
members in the
organization
11-25% women
members in the
organization
26-50% women
members in the
organization
Women in the
executive
committee
1.2 Participation of poor
(support strategies
to poor)
No system System exists but not
operational plan to
support
Special
consideration for
poor in credit or
timely payment
Special
considering for
poor in the
payment and
credit both
1.3 General assembly
(Annual meeting of
CBSPOs)
Not held Held but not regular Regular but same
members in the
executive
committee from
the beginning
Held regular, and
some members
changed
4.5 Sub-committee
Not formed Formed but not
functional
(no meeting within a
year)
At least one
sub-committee
functional (2
meetings in a
year)
At least two
committees
functional
1.5 Entry of new
members
No system for
entry of new
members (only
founder members
exist)
System exists but no
members entered in the
organization
New people
entered in the
organization
without equal
share
New people
entered in the
organization with
the provision of
equal share
5 Business plan and its implementation
Sub-indicators
Scores
1 2 3 4
2.1 Role clarity in the
business plan
Not available Available in draft form
but operational plan not
developed
Operational plan
developed in terms
of activities and
their time of
implementation
Detail operational
plan and roles
specified
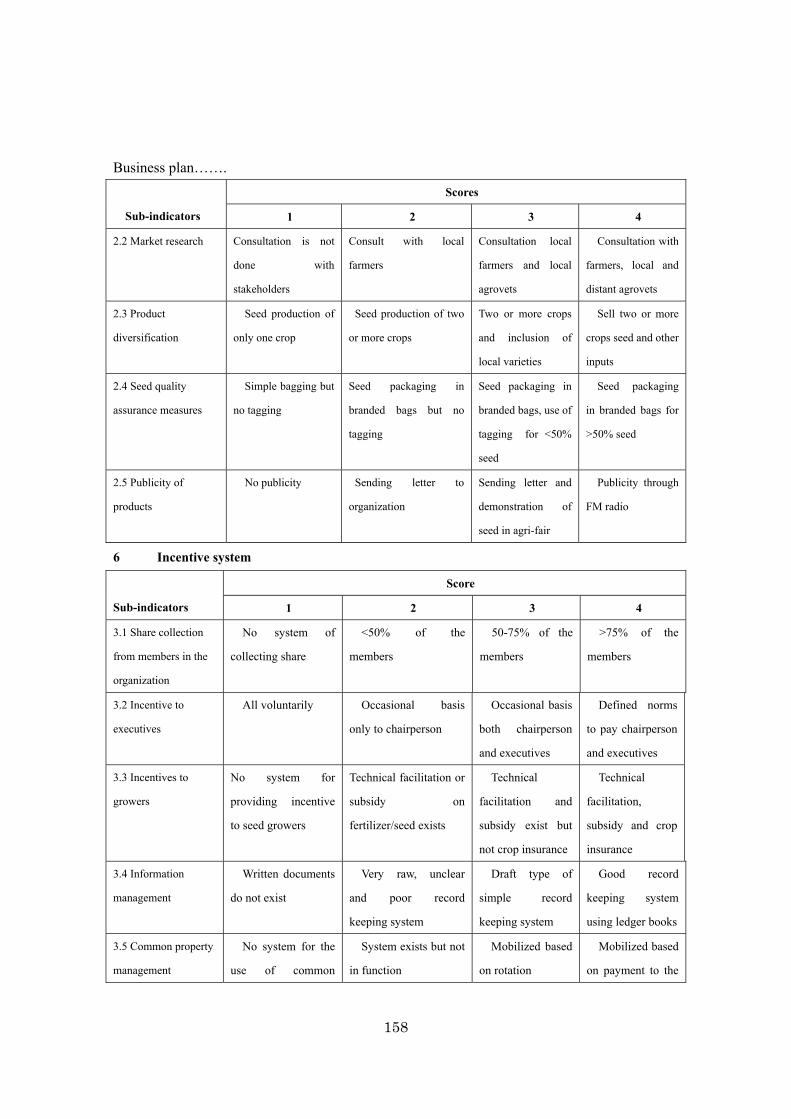
158
Business plan…….
Sub-indicators
Scores
1 2 3 4
2.2 Market research Consultation is not
done with
stakeholders
Consult with local
farmers
Consultation local
farmers and local
agrovets
Consultation with
farmers, local and
distant agrovets
2.3 Product
diversification
Seed production of
only one crop
Seed production of two
or more crops
Two or more crops
and inclusion of
local varieties
Sell two or more
crops seed and other
inputs
2.4 Seed quality
assurance measures
Simple bagging but
no tagging
Seed packaging in
branded bags but no
tagging
Seed packaging in
branded bags, use of
tagging for <50%
seed
Seed packaging
in branded bags for
>50% seed
2.5 Publicity of
products
No publicity Sending letter to
organization
Sending letter and
demonstration of
seed in agri-fair
Publicity through
FM radio
6 Incentive system
Sub-indicators
Score
1 2 3 4
3.1 Share collection
from members in the
organization
No system of
collecting share
<50% of the
members
50-75% of the
members
>75% of the
members
3.2 Incentive to
executives
All voluntarily Occasional basis
only to chairperson
Occasional basis
both chairperson
and executives
Defined norms
to pay chairperson
and executives
3.3 Incentives to
growers
No system for
providing incentive
to seed growers
Technical facilitation or
subsidy on
fertilizer/seed exists
Technical
facilitation and
subsidy exist but
not crop insurance
Technical
facilitation,
subsidy and crop
insurance
3.4 Information
management
Written documents
do not exist
Very raw, unclear
and poor record
keeping system
Draft type of
simple record
keeping system
Good record
keeping system
using ledger books
3.5 Common property
management
No system for the
use of common
System exists but not
in function
Mobilized based
on rotation
Mobilized based
on payment to the
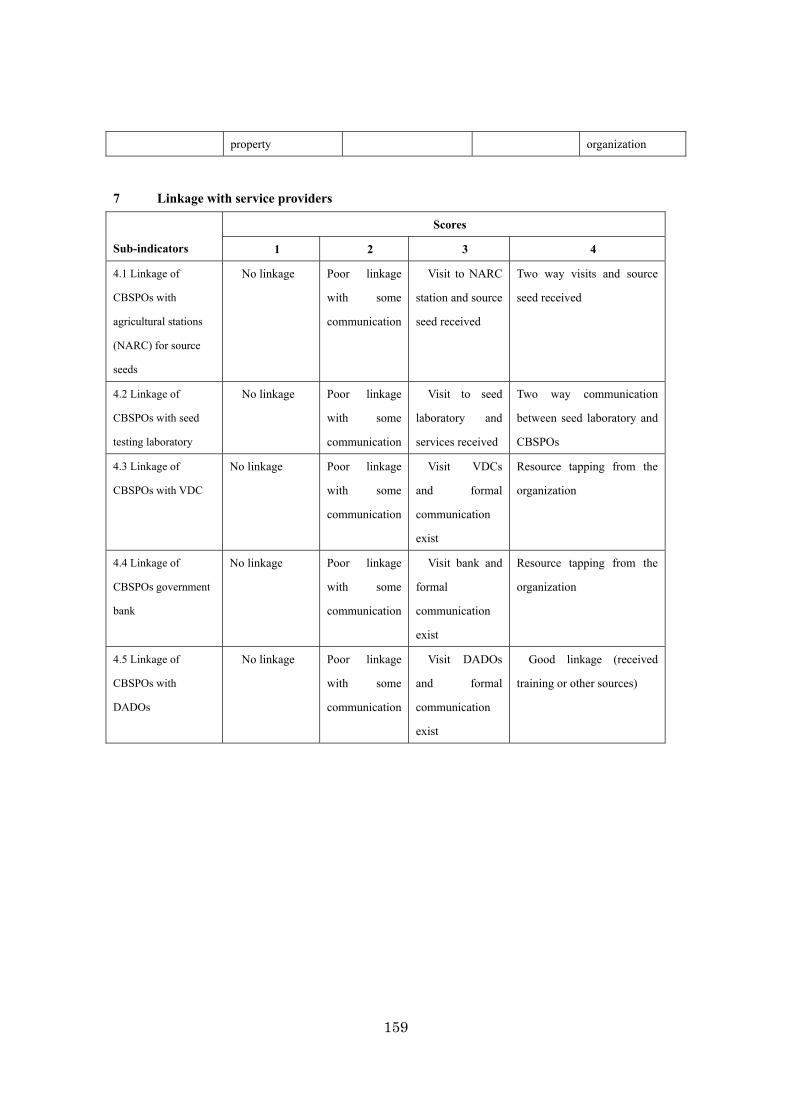
159
property organization
7 Linkage with service providers
Sub-indicators
Scores
1 2 3 4
4.1 Linkage of
CBSPOs with
agricultural stations
(NARC) for source
seeds
No linkage Poor linkage
with some
communication
Visit to NARC
station and source
seed received
Two way visits and source
seed received
4.2 Linkage of
CBSPOs with seed
testing laboratory
No linkage Poor linkage
with some
communication
Visit to seed
laboratory and
services received
Two way communication
between seed laboratory and
CBSPOs
4.3 Linkage of
CBSPOs with VDC
No linkage Poor linkage
with some
communication
Visit VDCs
and formal
communication
exist
Resource tapping from the
organization
4.4 Linkage of
CBSPOs government
bank
No linkage Poor linkage
with some
communication
Visit bank and
formal
communication
exist
Resource tapping from the
organization
4.5 Linkage of
CBSPOs with
DADOs
No linkage Poor linkage
with some
communication
Visit DADOs
and formal
communication
exist
Good linkage (received
training or other sources)
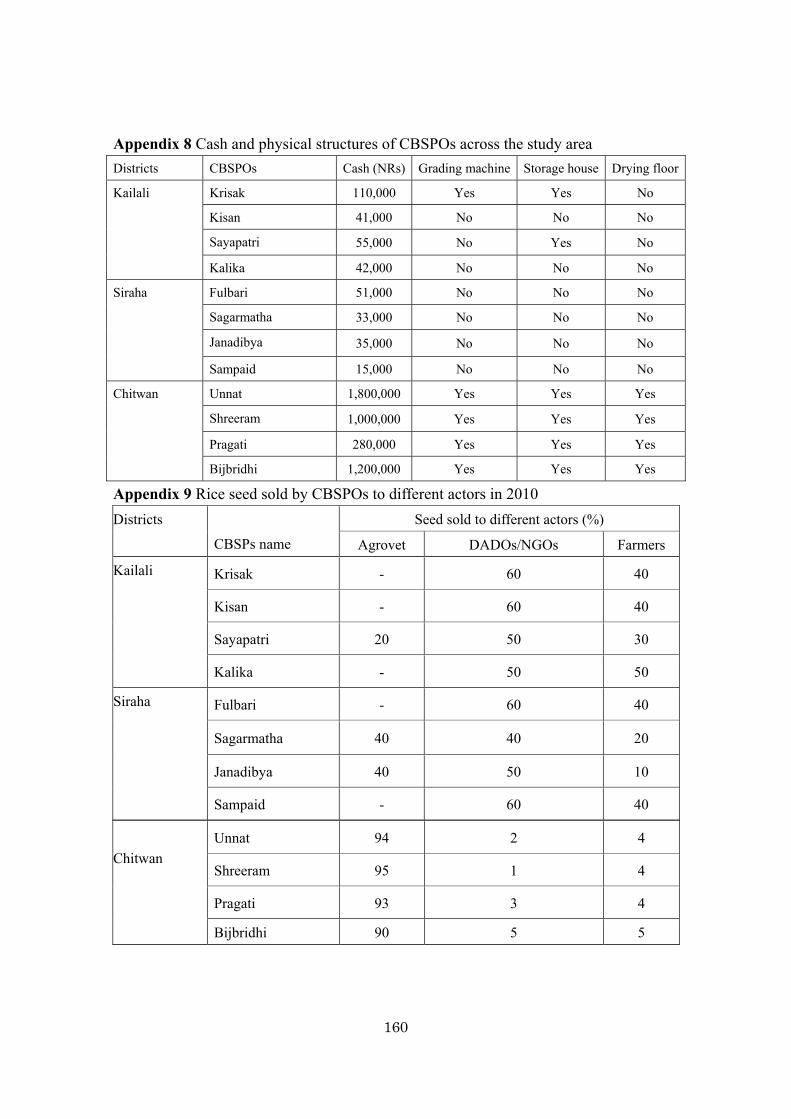
160
Appendix 8 Cash and physical structures of CBSPOs across the study area Districts CBSPOs Cash (NRs) Grading machine Storage house Drying floor
Kailali Krisak 110,000 Yes Yes No
Kisan 41,000 No No No
Sayapatri 55,000 No Yes No
Kalika 42,000 No No No
Siraha Fulbari 51,000 No No No
Sagarmatha 33,000 No No No
Janadibya 35,000 No No No
Sampaid 15,000 No No No
Chitwan Unnat 1,800,000 Yes Yes Yes
Shreeram 1,000,000 Yes Yes Yes
Pragati 280,000 Yes Yes Yes
Bijbridhi 1,200,000 Yes Yes Yes
Appendix 9 Rice seed sold by CBSPOs to different actors in 2010
Chitwan
Unnat 94 2 4
Shreeram 95 1 4
Pragati 93 3 4
Bijbridhi 90 5 5
Districts
CBSPs name
Seed sold to different actors (%)
Agrovet DADOs/NGOs Farmers
Kailali Krisak - 60 40
Kisan - 60 40
Sayapatri 20 50 30
Kalika - 50 50
Siraha Fulbari - 60 40
Sagarmatha 40 40 20
Janadibya 40 50 10
Sampaid - 60 40
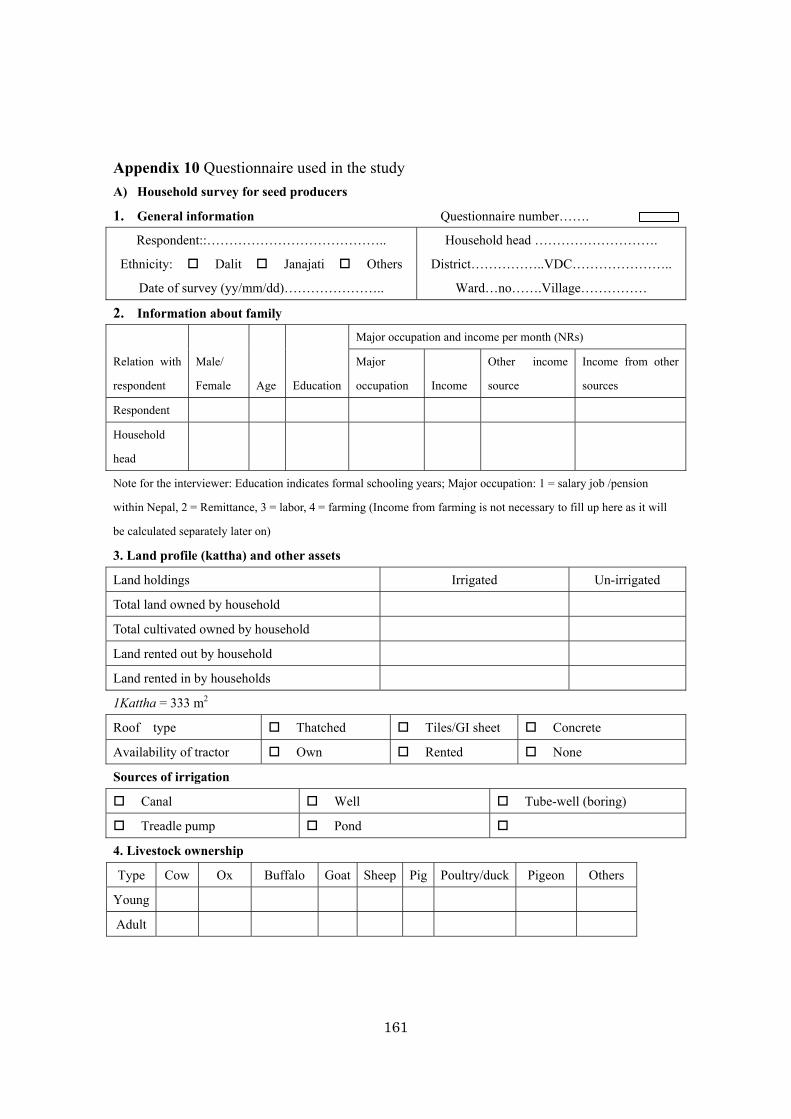
161
Appendix 10 Questionnaire used in the study
A) Household survey for seed producers
1. General information Questionnaire number…….
Respondent::…………………………………..
Ethnicity: Dalit Janajati Others
Date of survey (yy/mm/dd)…………………..
Household head ……………………….
District……………..VDC…………………..
Ward…no…….Village……………
2. Information about family
Relation with
respondent
Male/
Female Age Education
Major occupation and income per month (NRs)
Major
occupation Income
Other income
source
Income from other
sources
Respondent
Household
head
Note for the interviewer: Education indicates formal schooling years; Major occupation: 1 = salary job /pension
within Nepal, 2 = Remittance, 3 = labor, 4 = farming (Income from farming is not necessary to fill up here as it will
be calculated separately later on)
3. Land profile (kattha) and other assets
Land holdings Irrigated Un-irrigated
Total land owned by household
Total cultivated owned by household
Land rented out by household
Land rented in by households
1Kattha = 333 m2
Roof type Thatched Tiles/GI sheet Concrete
Availability of tractor Own Rented None
Sources of irrigation
Canal Well Tube-well (boring)
Treadle pump Pond
4. Livestock ownership
Type Cow Ox Buffalo Goat Sheep Pig Poultry/duck Pigeon Others
Young
Adult
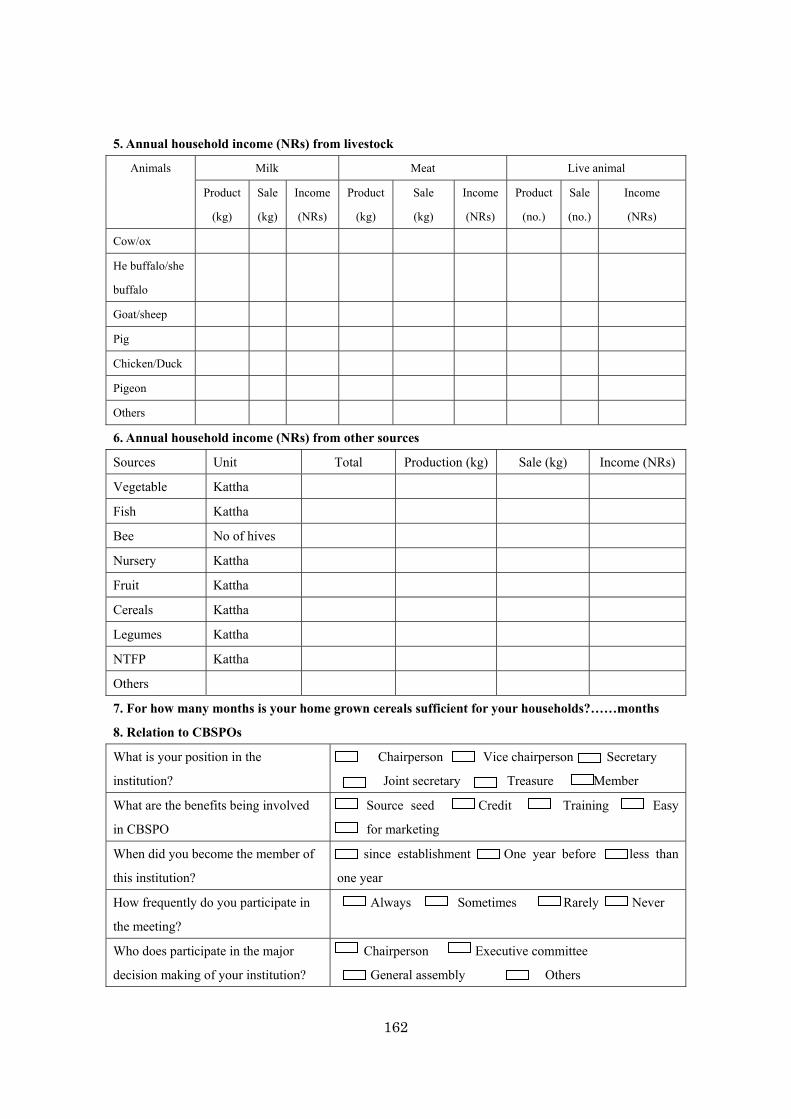
162
5. Annual household income (NRs) from livestock
Animals Milk Meat Live animal
Product
(kg)
Sale
(kg)
Income
(NRs)
Product
(kg)
Sale
(kg)
Income
(NRs)
Product
(no.)
Sale
(no.)
Income
(NRs)
Cow/ox
He buffalo/she
buffalo
Goat/sheep
Pig
Chicken/Duck
Pigeon
Others
6. Annual household income (NRs) from other sources
Sources Unit Total Production (kg) Sale (kg) Income (NRs)
Vegetable Kattha
Fish Kattha
Bee No of hives
Nursery Kattha
Fruit Kattha
Cereals Kattha
Legumes Kattha
NTFP Kattha
Others
7. For how many months is your home grown cereals sufficient for your households?……months
8. Relation to CBSPOs
What is your position in the
institution?
Chairperson Vice chairperson Secretary
Joint secretary Treasure Member
What are the benefits being involved
in CBSPO
Source seed Credit Training Easy
for marketing
When did you become the member of
this institution?
since establishment One year before less than
one year
How frequently do you participate in
the meeting?
Always Sometimes Rarely Never
Who does participate in the major
decision making of your institution?
Chairperson Executive committee
General assembly Others
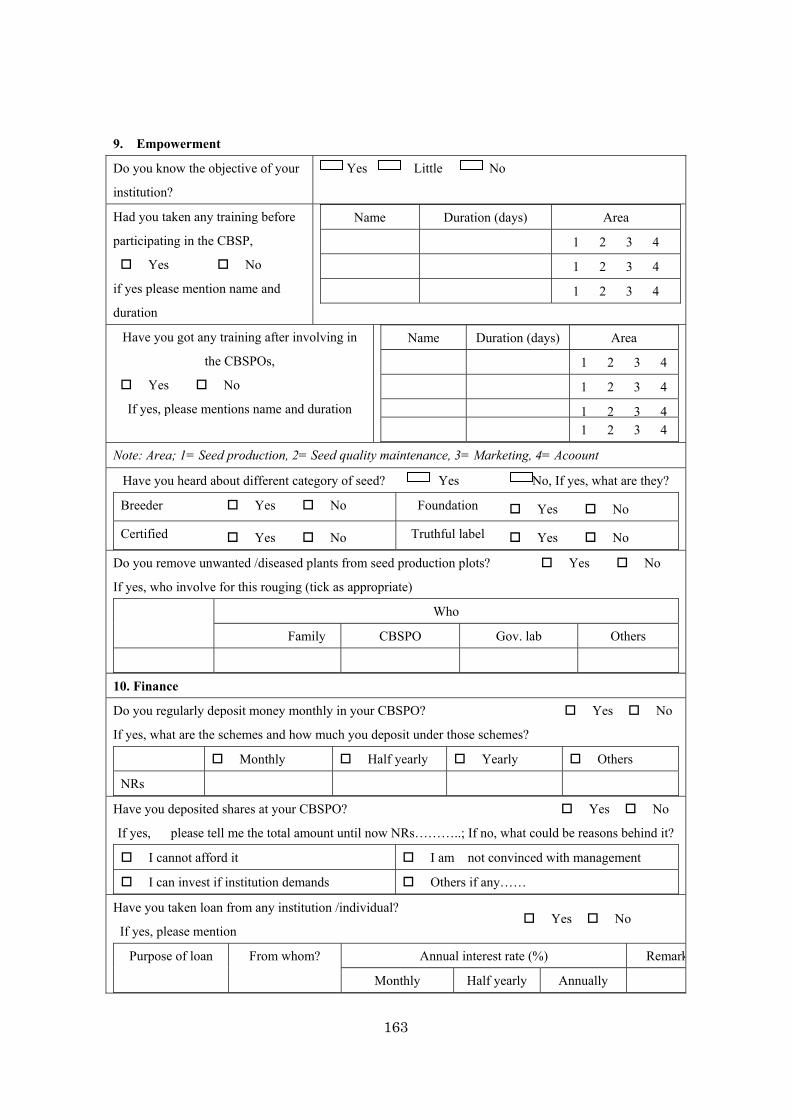
163
9. Empowerment
Do you know the objective of your
institution?
Yes Little No
Had you taken any training before
participating in the CBSP,
Yes No
if yes please mention name and
duration
Name Duration (days) Area
1 2 3 4
1 2 3 4
1 2 3 4
Have you got any training after involving in
the CBSPOs,
Yes No
If yes, please mentions name and duration
Name Duration (days) Area
1 2 3 4
1 2 3 4
1 2 3 4 1 2 3 4
Note: Area; 1= Seed production, 2= Seed quality maintenance, 3= Marketing, 4= Acoount
Have you heard about different category of seed? Yes No, If yes, what are they?
Breeder Yes No Foundation
Yes No
Certified
Yes No Truthful label
Yes No
Do you remove unwanted /diseased plants from seed production plots?
If yes, who involve for this rouging (tick as appropriate)
Who
Family CBSPO Gov. lab Others
Yes No
10. Finance
Do you regularly deposit money monthly in your CBSPO?
If yes, what are the schemes and how much you deposit under those schemes?
Monthly Half yearly Yearly Others
NRs
Yes No
Have you deposited shares at your CBSPO?
If yes, please tell me the total amount until now NRs………..; If no, what could be reasons behind it?
I cannot afford it I am not convinced with management
I can invest if institution demands Others if any……
Yes No
Have you taken loan from any institution /individual?
If yes, please mention
Purpose of loan From whom? Annual interest rate (%) Remark
Monthly Half yearly Annually
Yes No
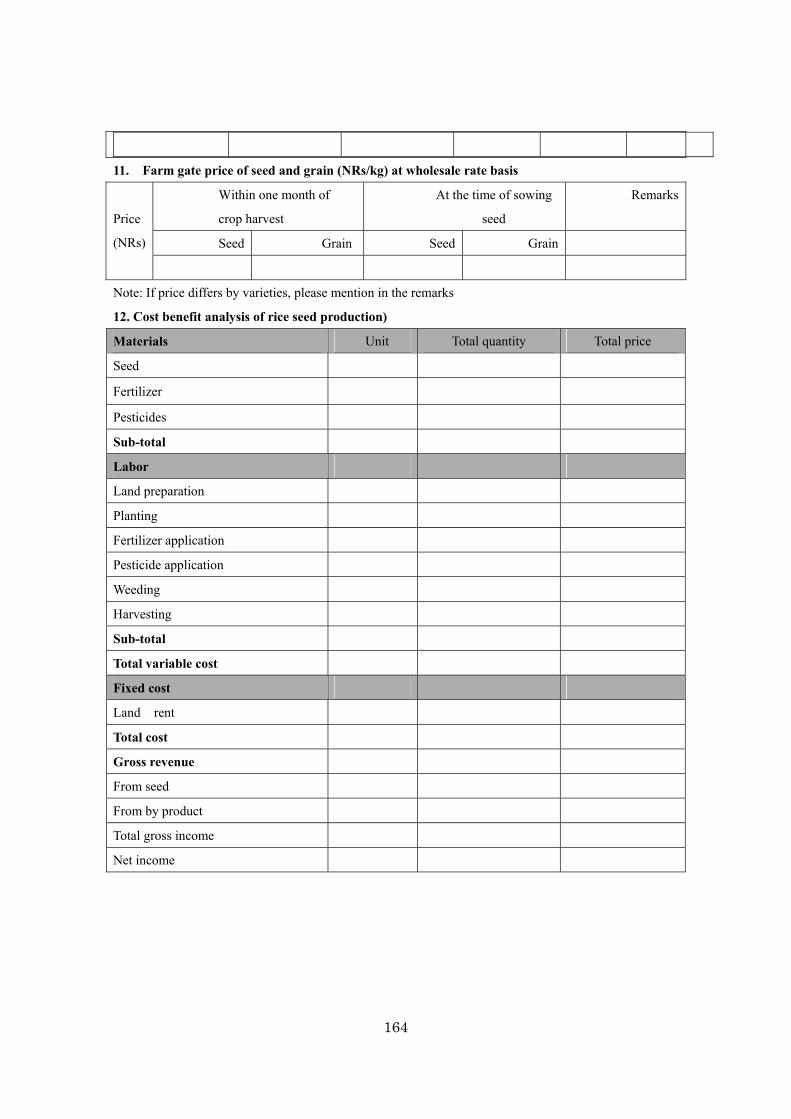
164
11. Farm gate price of seed and grain (NRs/kg) at wholesale rate basis
Price
(NRs)
Within one month of
crop harvest
At the time of sowing
seed
Remarks
Seed Grain Seed Grain
Note: If price differs by varieties, please mention in the remarks
12. Cost benefit analysis of rice seed production)
Materials Unit Total quantity Total price
Seed
Fertilizer
Pesticides
Sub-total
Labor
Land preparation
Planting
Fertilizer application
Pesticide application
Weeding
Harvesting
Sub-total
Total variable cost
Fixed cost
Land rent
Total cost
Gross revenue
From seed
From by product
Total gross income
Net income
165
13. Production and sale situation 2010/11
Crops Variety Area (kattha) Production (kg) Sold to CBSPOs (kg) Sold outside (Kg)
Rice 1
Rice 2
Rice 3
Rice Total
14. If seed sold outside the institutions why do you sell outside?
Higher price To meet immediate needs of the households
CBSP does not guarantee timely Difficult to storage due to inappropriate housing structure
Due to pest problem in storage Others
15. Fertilizer management in rice seed production (kg/kattha)
FYM DAP Urea Potash Others
Amount
Rate (NRs/kg)
How do you apply urea in the rice field? 1) Only at the time of planting; 2) split doze
16. Use of soil conservation practices in rice
Practices Heard Adopted Which crops
Zero tillage
Yes No Yes No
Improved
composting/FYM
Yes No Yes No
Legume biomass
incorporation
Yes No Yes No
Seed priming
Yes No Yes No
System of Rice
Intensification (SRI)
Yes No Yes No
Do you think that adoption of any of the following practices will improve your soil fertility?
Zero tillage Yes No I don’t know
Improved composting/FYM Yes No I don’t know
Legume biomass incorporation Yes No I don’t know
Seed priming
System of Rice Intensification
Yes No I don’t know
Yes No I don’t know
B: Household survey for seed consumers
1. General information Questionnaire number…….
Respondent::…………………………………..
Ethnicity: Dalit Janajati Others
Household head ……………………….
District……………..VDC…………………..
166
Date of survey (yy/mm/dd)………………….. Ward…no…….Village……………
2. Information about family
Relation
with
respondent
Male/
Female
Age Education Major occupation and income per month (NRs)
Major
occupation
Income Other
income
source
Income from
other sources
Respondent
Household
head
Note for the interviewer: Education indicates years of formal schooling; Major occupation: 1 = salary job
/pension within Nepal; 2= Remittance; 3 = labor; 4 = farming (Income from farming is not necessary to
fill up here as it will be calculated separately later on)
Land profile (kattha) and other assets:
Land holdings Irrigated Un-irrigated
Total land owned by household
Total cultivated owned by household
Land rented out by household
Land rented in by households
1Kattha = 333 m2
Roof type Thatched Tiles/GI sheet Concrete
Availability of tractor Own Rented None
Sources of irrigation
Canal Well Tube-well (boring)
Treadle pump Pond
3. Livestock ownership
Type Cow
Ox He Buffalo
She
buffalo Goat Sheep Pig Poultry/duck Pigeon Others
Young
Adult
4. Annual household income (NRs) from livestock
Animals Milk Meat Live animal
Product
(kg)
Sale
(kg)
Income
(Rs)
Product
(kg)
Sale
(kg)
Income
(Rs)
Product
(no.)
Sale
(no.)
Income
(Rs)
Cow/ox
He
167
buffalo/she
buffalo
Goat/sheep
Pig
Chicken/Duck
Pigeon
Others
6. Annual household income (NRs) from other sources
Sources Unit Total Production (kg) Sale (kg) Income (Rs)
Vegetable Kattha
Fish Kattha
Bee No of hives
Nursery Kattha
Fruit Kattha
Cereals Kattha
Legumes Kattha
NTFP Kattha
Others
7. For how many months is your home grown cereals sufficient for your households?……….months
8. Please mention the crop varieties (up to three) you planted in 2067/068 and their characteristics
Crops Varieties (area kattha) Desirable characteristics Undesirable characteristics
Rice1
Rice2
Rice3
9. What are the main sources of seeds you use?
Crops
Sources
Agrovets CBSPOs DADOs/NARC Neighboring farmers Others
Rice
Wheat
Maize
Lentil
Mungbean
Note: Rank in 1 to 5, where 1 is the most important
10. Institutional service
Are you involved in any institutions? Yes No
168
If yes, please mention
Name of the institution/group Your responsibility/position
11. What are the organizations/projects working in your area?
Organizations’ name Main working area Have you benefitted from those
programs? If yes, how?
Working area: Agriculture, Saving credit, Social mobilization, etc
12. What the major sources of getting information about agriculture? (tick as appropriate)
Source Access Source Access
Newspaper 1 2 3 Television 1 2 3
FM Radio 1 2 3 Agriculture service center 1 2 3
Agrovets 1 2 3 Others 1 2 3
1 2 3 1 2 3
Frequency: 1= always; 2= Sometimes; 3=Rarely; 4= Never
C. Questionnaire for institutional level (CBSPOs) survey
1. General Information
CBSP Name:………………………………………………………………………. Q.N………..
District:………………… VDC……………………. Village…………………….
Type of the organization: Group Cooperative
Date of establishment: ………………………………….. ………………………………..
2. Member composition in your organization
General members Gender Ethnicity Origin
Female Male Dalit Janjati Others Tarain Hill migrant
Total
Involved in seed
production
Not involved in
seed production
Has the institution developed its
constitution?
Yes No
3. Composition of Executive Committee
Current (2011)
Positions Name Age Education
Chairperson

169
Vice-chairperson
Secretary
Joint secretary
Treasure
4. Institutional activities
Do you have sub-committees within your
institution?
Yes No
If yes, please tick as appropriate
Sub-committees Very active Active Inactive
Technical
Marketing
Account
What are the sources of income of your institutions?
seed production vegetable production
saving credit Others
What types of meetings do the institution organizes and who participates on these meetings?
Types of meetings Executive committee General members
1) Monthly
5. Capacity building
Do the members in the executive committee have taken any training? Yes No
If yes, please tick as appropriate
Name Status
General seed production Yes No
Marketing Yes No
Business plan Yes No
Account keeping Yes No
Leadership Yes No
6. Marketing
How do you target seed
production/sale?
last year experience Source seed available
Information from DADO Others
Does the institution prepare business plan of seed production and
marketing?
Yes No
Plans Yes No Remarks
170
Production Yes No
Marketing Yes No
Two years records of seed sell
Crop Year Area
planted
(ha)
Seed
collected by
CBSP (t)
Seed collected
just after
harvest (t)
Seed collected at
the time of
selling (t)
seed
sold
(t)
Main
varieties
(3)
Rice 2009/10
2010/11
Others 2009/10
2010/11
Who are the major buyers (tons of seed sold to different agencies in 2010/11)
%
seed
sold
DADOs Agrovets NGO/INGOs Farmers Others Total Districts
coverage
What factors do you consider while deciding seed purchasing price from growers/members?
Grain price of the crop Last years’ experience
What factors do you consider while determining selling price?
Cost of seed purchase Profit to the organization
Price fixed by district seed coordination committee
How do you sale the seed? Retail Wholesale Both
If both, could you please mention about the price
Price (NRs/kg) Retail price General whole sale price Special discount to agrovets
7. Payment mechanism to the growers
Has your organization developed rules for payment to its
growers?
Yes No
If yes, what % of sold amount is paid to different categories of farmers?
Poor household Medium household
During harvesting
After seed sale
8. What types of advertisement/promotional strategies you follow in seed marketing?
FM radio local newsletters
seed display at public form sending letters to DADOs
171
Agrovets, NGOs
9. Value addition technique
Do the institution use packaged and
labeled bag?
Yes No If yes, which crops?
% of seed Packaging size (kg)
1-2 5 10 15 20 25 30
10. How much amount of money goes to institutional saving from per kg of seed sale?
11. Finance
Does the institution have bank account? Yes No
Has your institution taken loan from any institutions/individuals for seed production? Yes; no; if yes
Source Amount Annual interest rates (%)
CBSP members
Bank
Cooperative
Land lord
Others
Do all the members deposit money regularly in your CBSP? Yes No
Saving rate (NRs/month): 1) When you started collecting first time………….; 2) Now…………
12. Communication and networking
What types of information
CBSP maintains?
Meeting minutes Sales record
Loan and payment record None
What is the information
sharing mechanism in your
organization?
Sharing verbally in monthly
meeting
Audit report in yearly basis
Sharing verbally after
attending training/seminar
Others
How frequently are you in contact with the following institutions?
DADO 1 2 3 DDC 1 2 3
VDC 1 2 3 Micro-finance 1 2 3
NARC centers 1 2 3 Agrovets 1 2 3
1 = Frequently; 2 = Sometimes; 3= Never
172
13. Assets of the institution
Materials Total Current value
(NRs)
Source of
fund
If you got in donation please mention
Name of
organization
or individual
Amount (cash or
kind) with unit
Land (kattha) 1 2 3
Storage room (No) 1 2 3
Grader machine
(No)
1 2 3
Seed in storage(t) 1 2 3
Cash in bank (NRs) 1 2 3
Investment in other
business
1 2 3
Source: 1= CBSP’s own fund; 2 = Rent; 3= Donation
Does the institution hire staff? Yes NO
If yes, please mention the names of the staff and some information about them
Name Position Education Training name if taken?
1 2 3 4
1 2 3 4
1 2 3 4
Area: 1= Technical, 2= Marketing; 3= Account; 4= Institutional development; 4= leadership
14. Source of income for the enterprise (2010/11)
Source Annual income(NRs) Source Annual income(NRs)
Seed sale
Membership fee
15. Profitability analysis of CBSPOs in rice seed marketing
CBSPO name Items Cost Items Cost
Volume of seed purchased Labor cost
Value Packaging cost
Moisture loss at processing (%) Communication
Transportation cost Rent of house
Processing cost Revenue
Bagging cost Gross profit
Tax
173
16. Impacts of climate change and responses made by the community
Has flood and drought has affected in your CBSPEs? Yes No
If yes, please mentions the reasons?
Total volume of seed transaction reduced Increased cost involved in
storage
Has your organization developed any policy to safeguard growers
from impacts of climate change?
Yes No
If yes what are those policies?
Hazards Policy
Flood
Drought
Are the current policies sufficient? Yes No
If not what kinds of policy is required
Policy Within CBSPs Government
Please say any 3 important problems faced by your CBSPE
Area Problems Importance
Source seed
Loan
Institutional management
Marketing
Infrastructure
Importance: 1= High; 2 = Medium; 3= Low
174
Appendix 11. Academic and professional profile of the author
1. Personal Information Name:
Permanent address:
Email:
Sex:
Date of birth:
Nationality:
Marital Status:
Narayan Prasad KHANAL
Kerunga-1, Arghakhanchi, Nepal
Male
January 8, 1976
Nepali
Married
2. Academic Background Degree Study area Division (%) Graduation Institution
Ph. D. Rural
Economics
- 2013
September
IDEC, Hiroshima University, Japan
M.Sc. Ag. Plant
Pathology
First (83%) 2002 June Institute of Agriculture and Animal
Science (IAAS), Tribhuvan
University (TU), Rampur, Chitwan,
Nepal
B. Sc. Ag. Horticulture First (75.6%) 1999 May IAAS, TU, Rampur, Chitwan, Nepal
I. Sc. Ag. Agriculture Second
(64.9%)
1994
November
IAAS, TU, Rampur, Chitwan, Nepal
High School Mathematics First (64.8%) 1992 July Shree Mahendra Bidhya Bodh
Secondary School, Arghakhanchi,
Nepal
3. Specialization Participatory research and development
Agriculture, forestry and livestock based rural livelihoods
Impact assessment, capacity building, partnership
Sustainable development
List of projects designed and implemented in my leadership
A) “Participatory crop improvement in South Asia (2008-2010)”, Research into use program,
implemented through FORWARD in 8 Tarai districts of Nepal in partnership with National
Agricultural Research Institutes and Center for Arid Zone Studies, University of Wales, UK
B) “Improving food security through dissemination of improved cereal and legumes varieties and
promotion of community-based seed production system in central Tarai region of Nepal (2008-2010)”
in partnership with National Agriculture Research and Development Fund, Nepal.
C) “Promoting legumes in hills and Tarai of Nepal (2004-2006)”, in partnership with, Nepal
175
Agricultural Research Council, and International Crops Research Institute for the Semi Arid Tropics.
D) “Capacity building of local partners for implementing livelihood improvement activities in Dailekh
district of Nepal (2004-2006)”, in partnership with Helvetas Nepal
E) “Integrated management of rapeseed management in the far and mid-western development region of
Nepal (2003-2006)”, in partnership with National Agricultural Research and Development Fund and
National Oilseed Research Program, Nepal.
F) “Promotion of integrated pest management approaches against fruit borer and viral diseases of
tomato in mid-western development region of Nepal (2003-2007)”, in mid and far-western
development region, in partnership with National Agricultural Research and Development Fund
G) “Food security through strengthening local seed supply system and disseminating improved cereal
crop varieties in mid-hills of Nepal (2000-2003)”, in partnership with National Agricultural Research
and Development Fund and National Grain Legumes Research Program, Nepal
4. Awards Japanese government scholarship to pursue Ph D (2010-2013) at IDEC, Hiroshima University, Japan
Letter of Appreciation for taking lead role in releasing mungbean varieties in partnership between
FORWARD, NARC and Bangor University, UK, in Nepal in 2006
Research Assistantship award from soil health management project (CRSP), Cornell University,
USA during Master degree
Merit scholarship award during I. Sc. Ag. And B.Sc. Ag. Courses from TU, Nepal
5. Employment record Employer Period Position Responsibilities
Graduate School for
International Development
and Cooperation (IDEC),
Hiroshima University, Japan
2012 Oct to Feb 2013 Teaching Assistant Assist resource person in
arranging the classrooms,
delivering lectures, preparing
teaching materials, and other
logistics
Forum for Rural Welfare and
Agricultural Reform for
Development (FORWARD),
Nepal
2006 July to 2010
September
2004 July to 2005
June
2003 January to 2004
June
Program Officer
Sr. Program Officer
Sr. Program Manager
Project design, implementation,
monitoring, evaluation, reporting
IAAS/TU, Rampur, Chitwan 2002 July-2003 Dec Research Associate Data analysis and report writing
National Grain Legume
Research Program, Rampur
2002 Aug -2003 Dec Legume Expert
(part time)
Management of participatory
research
176
6. Language skills Good working knowledge on Nepali and English
Can communicate a little bit on Hindi and Japanese
7. Publications a) Journal Articles (Refereed) Khanal, N.P. and Maharjan, K.L. (2013). Socio-economic determinants for the adoption of improved rice
varieties in the tarai region of Nepal. Journal of International Development and Cooperation.
Special Issue 19(4): 17-27.
Khanal, N.P. and Maharjan K.L. (2013). Technical efficiency of rice seed growers in the Tarai region of
Nepal. Journal of Rural Problem 49 (1): 27-31.
Khanal, N.P. and Maharjan, K.L. (2013). Socio-economic factors influencing the adoption of soil
conservation practices under rice-wheat system in the tarai region of Nepal. This article is in
press in International Journal of Sustainability, CG Publisher.
Khanal, N.P. and Maharjan, K.L. (2013). Factors influencing farmers’ behavior in selling rice seed in the
market. This article is in press in the journal Agriculture and Food Economics, Springer.
Khanal, N.P., Maharjan, K.L. and Sapkota, A. (2012). Technical efficiency in wheat seed production: a
case study from Tarai region of Nepal. Journal of International Development and Cooperation
19 (1): 41-50. http://ir.lib.hiroshima-u.ac.jp/metadb/up/kiyo/AN10482914/JIDC_19-1_41.pdf).
Joshi, K.D., Devkota, K.P., Harris, D., Khanal, N.P., Paudyal, B., Sapkota, A., and Witcombe, J.R.
(2012). Participatory approaches rapidly improve household food security in Nepal and identify
policy changes required for institutionalization. Field Crops Research 131:40-48.
Khanal N.P and Maharjan, K.L. (2010). Sustainability of community-based seed production enterprises
in Nepal: Institutional issues. Nepal Agriculture Research J. 10: 33-40.
ttp://pustakalaya.org/eserv.php?pid=Pustakalaya:3772&dsID=NARC2010_NepalAgricultureRes
earchJournalVol10.pdf
b) Review paper (Refereed) Khanal, N.P., Maharjan, K.L. and Dangol, D. (2012). Soil conservation practices for sustainability of
rice-wheat system in Nepal: A review. Journal of International Development and Cooperation, 18
(4): 11- 20. http://ir.lib.hiroshima-u.ac.jp/metadb/up/kiyo/AN10482914/JIDC_18-4_11.pdf.
c) Proceeding papers Khanal, N.P., Gurung, G.B. and Tiwari, Y.N. (2007). Integrated nutrient management for sustaining
rapeseed in Nepal. Procedinds of 25th National Outreach Research Conference, July 8-10,
Kathmandu, Nepal. Nepal Agriculture Research Council, Khumaltar, Lalitpur, Nepal.
Khanal, N.P., Khanal, N.N., Gurung, G.B., Thapa, S., Gupta, K.P., Sherpa, L.T., Joshi, K.D., Harris, D.,
Kumar Rao, J.V.D.K., and Darai, R. (2006). Mungbean (Vigna radiata (L.) Wilczek) in cereal
fallows: Experience of farmers' participatory research and development activities in foothills and
177
terai of Nepal. In: M.C. Kharkwal (ed), pages 11-21. Proceedings of 4th International Food
Legumes Research Conference. ICAR, India.
Khanal, N.P., Khanal, N.N., Thapa, S., Gupta, K.P., Sherpa, L.T., Joshi, K.D., Harris, D., and Kumar Rao,
J.V.D.K. (2006). Pages 10-17. Potential of Helicoverpa Nucleopolydrovirus for the management
of chickpea pod borer in Nepal. Proceedings of the National Workshop on Permaculture and
Organic Agriculture, 13-15 December, 2005 in Kathmandu, Nepal.
Grazway, D, Pandey, S., Khanal, N.P., and Maharzan, R. (2005). Alternative pest control approaches:
NPV for pod borer control and its uptake in Nepal. In: S. Pande, P.C. Stevension, R.K. Neupane
and D. Grzywacz (eds.), pages 143-152. Policy and strategies for increasing income and food
security through improved crop management of chickpea in rice fallows in Asia. Summary of a
NARC-ICRISAT-NRI workshop, 17-18 November 2004, Kathmandu, Nepal. Patancheru 502
324, Andhra Pradesh, India: International Crops Research Institute for the Semi-Arid Tropics.
Khanal N.P. (2004). Integrated management of foliar diseases of chickpea. In: R.K Neupane, NK Yadav
and R. Darai eds., pages 25-30. Proceedings of the National winter crops workshop (grain
legumes). National Grain Legumes Research Program, Rampur, Chitwan, Nepal.
Khanal, N. P., Shrestha, S.M., and Khattri.Chhetri, G.B. (2004). Integrated use of fungal antagonists,
fungicides and micronutrients against chickpea wilt complex. Proceedings of the 25th National
Winter Crops Workshop organized at Khumaltar, Lalitpur, Nepal from 8-10 March, 2003.
Khanal, N.P. and Khanal, N.N. (2004). Bridging the gap: Role responsibilities and approaches to
scaling-up IPM of chickpea in Nepal. In: S. Pande, P.C. Stevension, R.K. Neupane and D.
Grzywacz (eds.), pages 182-189. Policy and strategies for increasing income and food security
through improved crop management of chickpea in rice fallows in Asia. Summary of a
NARC-ICRISAT-NRI workshop, 17-18 November 2004, Kathmandu, Nepal. Patancheru 502
324, Andhra Pradesh, India: International Crops Research Institute for the Semi-Arid Tropics.
Khanal, N.P. and Shrestha, S.M. (2003). Integrated management citrus root rot in the western hills of
Nepal. In: Citrus decline management in the hills of Nepal. Compilation of research articles,
Dhakal, D. D. and N.P. Khanal (eds.). Institute of Agricultural and Animal Science, Rampur,
Chitwan, Nepal.
d) Policy documents and others Gauchan D, Dahal, K. and Khanal, N.P. (2007). Gains of on-farm resource management project in
enhancing livelihoods of landless communities in Nepal. Plan International, Kathmandu, Nepal.
Khanal, N.P., Khanal, N.N., Yadav, N.K., Darai, R., Joshi, S., Neupane, R.K., Sherpa, L.T., Thapa, S.,
Gupta, K., Neupane, R., Pokharel, D.N., Sah, R.P., Adhikari, B.N., Joshi, K.D., and Harris, D.
(2006). A proposal for the release of Mungbean varieties NM94 and VC6372 (45-8-1): Jointly
Submitted by FORWARD, National Grain Legumes Research Programme (NGLRP), and
178
CAZS-Natural Resources (CAZS-NR), University of Wales, Bangor, UK.
http://www.cazs.bangor.ac.uk/ccstudio/Library/publications/ReleaseProposals/Mungbean.pdf.
8. Participation and presentation in conferences Khanal, N.P. and Maharjan, K.L (2013). Socio-economic determinants for the adoption of soil
conservation practices in the tarai region of Nepal. A paper presented in the 9th International
conference on environmental, cultural, economic and social sustainability be held in
International Conference Center, Hiroshima, Japan, 23-25 January, 2013.
Khanal, N.P. and Maharjan, K.L (2013). Households’ behavior in selling rice seed in the market. A poster
to be presented at the 11th International conference on dry land development: global climate
change and its impacts on food and energy security, organized by dry land development
commission (IDDC), at Beijing, China, 18-23 March, 2013.
Khanal, N.P. and Maharjan, K.L. (2012). Technical efficiency of rice seed growers in the tarai region of
Nepal. A paper presented at 62th annual meeting of Association for Regional Agricultural and
Forestry Economics at Osaka University of Economics, Japan, 19-21 October 2010.
Khanal, N.P. and Maharjan, K.L. (2012). Soil conservation practices in rice-based cropping system: a
case study from tarai region of Nepal. A poster presented at a symposium entitled advanced
education for environmental leader focusing on sustainable development in Asia and Africa at
Nagoya University, Japan, 22 November, 2012.
Khanal, N.P. and Maharjan, K.L (2012). Conservation agricultural practices in rice-wheat system of
Nepal. A poster presented in the 3rd international Conference entitled Conservation Agriculture
and Sustainable Upland Livelihoods: innovation for, with and by farmers to adapt to local and
global changes in the Southeast Asia, Organized by French Center for International Agricultural
Research for Development (CIRAD) Northern Mountainous Agriculture and Forestry Institute
(NOMAFSI), and University of Queensland (Australia) at Hanoi, Vietnam, 10-15 December,
2012.
Piya, L. and N.P. Khanal. 2012. Current situation of hydrological disasters and management policies in
Nepal. A paper presented in the Summer Course entitled development within a low carbon
world: preparing professionals for disaster risk reduction and climate change adaptation, jointly
organized by Global Environmental Leader Program for designing low carbon society, Graduate
School for International Development and Cooperation, Hiroshima University; The school of
Urban and Regional Planning, The University of Philippines, Diliman; and Lyndon B. Johnson
school of public affairs, The University of Texas, Austin, held in the Philippines.
Khanal, N.P. and Maharjan, K.L. (2011). Impact of climate change in seed production in Tarai region of
Nepal. A paper presented in a symposium on climate change, food security and livelihoods,
jointly organized by Hiroshima University and Institute of Agriculture and Animal Science at
Rampur, Chitwan, Nepal, 23 November, 2011.
179
9. Training courses/workshops Summer course 2012 titled Development within a Low Carbon World: Preparing Professionals for
Disaster Risk Management and Climate Change Adaptation, jointly organized by Global
Environmental Leader Program for Designing Low Carbon Society, Graduate School for
International Development and Cooperation; Hiroshima University’s Center for Environmental
Cooperation; The school of Urban and Regional Planning, The University of Philippines, Diliman;
and Lyndon B. Johnson school of public affairs, The University of Texas, Austin, held in the
Philippines from 6 to 16, 2012.
Attended various environmental related lectures and courses (Environmental Cooperation Study-1
and 2; and Practical Seminar-1 and 2 under the program Global Environmental Leader Program for
Designing Low Carbon Society, Graduate School for International Development and Cooperation,
Hiroshima University from 2010 to 2013.
Research method and data analysis training, organized by Institute for Social and Environmental
Research, held in Chitwan, Nepal, in collaboration with the population studies center at the
university of Michigan, USA, from 16-20 May, 2010
Participatory data management and analysis, organized by Center for Arid Zone Studies, University
of Wales, UK, held in Chitwan, Nepal, from 9-10 November, 2008
Value chain study in agricultural crops, organized by FORWARD in Chitwan, Nepal, from 10-15
March, 2007
Nuclear Polyhedrosis Virus production and usages and integrated disease management chickpea
diseases, organized by International Crops Research Institute at Semi Arid Tropics (ICRISAT) in
Hyderabad, India, from 18-27 January, 2005
Helicoverpa Nuclear Polyhydrosis Virus production technology, organized by ICRISAT in Chitwan,
from 16-18 February, 2004
10. Computer and analytical skills Microsoft word, excel and power point
MSTATC, Arc GIS, STATA, MINITAB
11. Membership and Linkage Life member of Society of Agricultural Scientist (SAS), Nepal
Associate Editor/Reviewer in Sustainability Journal
Member of Sustainability Compmunity
Member of Climate Change NGO network Nepal
Member of Association of Regional Agriculture and Forestry Economics, Japan