diversity and inclusivity in video game advertisements
TRANSCRIPT

DIVERSITY AND INCLUSIVITY IN VIDEO GAME ADVERTISEMENTS: AN EXPLORATION OF VIDEO GAME CONSOLE COMMERCIALS
FROM 2003 TO 2017
Alexander Michael Vollbach
A Thesis
Submitted to the Graduate College of Bowling Green State University in partial fulfillment of
the requirements for the degree of
MASTER OF ARTS
May 2018
Committee:
Lisa Hanasono, Committee Co-Chair
Lara Lengel, Committee Co-Chair
Joshua Atkinson

© 2018
Alexander Michael Vollbach
All Rights Reserved
iii
ABSTRACT
Lisa Hanasono, Committee Co-Chair
Lara Lengel, Committee Co-Chair
Drawing from cultivation theory, this project’s main goals were to examine television
advertisements for video game consoles produced by Microsoft, Nintendo, and Sony, and to
identify variations and trends in their racial, gender, and age representations between the years of
2003 and 2017. A quantitative content analysis was conducted on a representative sample of 70
commercials, where characters were coded separately for perceived gender, racial, and age
identity. A series of chi-square tests revealed that while the advertisements tended to
underrepresent women, racial minorities, and non-adults, the inclusion of women increased
substantially between 2006 and 2011. Among many other observed trends, Nintendo tended to
include more non-adults and people of Asian and Pacific Islander descent than Sony and
Microsoft. The results of this exploration inform a discussion on the underrepresentation of
minority groups in advertising and its potential impact on certain groups in our society.
This thesis attempts to position itself as a step in the right direction in the research of
video games as a cultural phenomenon on par with that of television and film. The following
work sets itself apart from other articles and writings of the same kind primarily by scale and
breadth of scope. The observation of the industry over time provides better insights into growth
and trends than the snapshot studies of static years that are currently being published. Much of
the reason for the lack of studies such as this thesis likely has much to do with popular
predispositions staunchly embedded in our societal consciousness regarding the current state of
diversity and inclusivity in the video game industry. The results of this study will better inform
these relatively anecdotal assumptions. Further, it is important to note his thesis seems to find
iv
itself situated as the largest scale overview on representation in video game advertising to date,
poising itself as an important contributor to cultivation theory as it applies to the subject of
racial, age, and gender representation in video game console advertising.
Keywords: Video games; Advertising; Commercials; Diversity; Inclusivity; Cultivation Theory

v
ACKNOWLEDGMENTS
I would like to thank my parents, Pamela Vollbach and Michael Vollbach for believing in
me, for pushing me to succeed, and for all of the support, both emotional and financial, over the
past few years. I would also like to thank my girlfriend, Beth Hill, for her love and her patience
throughout the pursuit of my master's degree and always. Many thanks to all of my amazing and
supportive friends who have put up with my ups and downs over the past two years.
I would like to thank my co-worker and friend, Keith Crossman, for sharing with me his
intricate knowledge of Microsoft Word, and for being a level head off of which I could bounce
ideas. Of course, I would be remiss if I did not extend a very special thanks my second coder,
Gabriel Cruz, without whom none of this would be possible. Lastly, I would like to give thanks
to my wonderful advisors and committee members, Dr. Lara Lengel, Dr. Lisa Hanasono, and Dr.
Joshua Atkinson, for their wisdom, patience, and guidance throughout the writing and revision
processes of this thesis.
vi
TABLE OF CONTENTS
Page
CHAPTER I: INTRODUCTION .......................................................................................... 1
Justification and Background ..................................................................................... 2
CHAPTER II: REVIEW OF LITERATURE ....................................................................... 5
Representation and Gaming ....................................................................................... 5
Cultivation Theory ..................................................................................................... 11
Advertising ............................................................................................................ 16
CHAPTER III: RESEARCH QUESTIONS AND METHODOLOGY ............................... 19
Research Objectives .……………………………………………………………….. 20
Methodology…………………………………………………………………………. 20
Units of Analysis……………………………………………………............ 22
Codes………………………………………………….................................. 22
Video game company………………………………………………… 22
Year .................................................................................................... 22
Racial, gender, and age representation. ............................................. 23
Role .................................................................................................... 24
Collection Procedure .................................................................................................. 24
CHAPTER IV: DATA ANALYSIS AND RESULTS .......................................................... 26
Data Analysis ............................................................................................................ 26
Results ……................................................................................................................ 26
The Big Picture: Describing the Project’s Data ............................................. 27
Gender, Racial, and Age Representations by Company ................................ 28
vii
Gender representation ........................................................................ 28
Racial representation .......................................................................... 30
Age representation ............................................................................. 32
Gender, Racial, and Age Representations by Time Period ............................ 34
Gender representation ........................................................................ 34
Racial representation .......................................................................... 36
Age representation ............................................................................. 38
Gender, Racial, Age Representations by Company
Over Five Time Periods ................................................................................. 40
Gender representation ........................................................................ 40
Racial representation .......................................................................... 45
Age representation ............................................................................. 50
CHAPTER V: DISCUSSION ................................................................................................ 57
Key Findings and Implications .................................................................................. 58
Examining differences in racial, gender, and age representations
by video game company ................................................................................ 58
Examining differences in racial, gender, and age representation
over time ........................................................................................................ 60
Examining differences in racial, gender, and age representations
by company over time. ................................................................................... 62
CHAPTER VI: CONCLUSION ............................................................................................ 65
Limitations ............................................................................................................ 65
Future Research ......................................................................................................... 66

viii
REFERENCES……….. ........................................................................................................ 67
APPENDIX A: CODE BOOK USED TO ANALYZE THE DATA……………………… 73
APPENDIX B: CODING WORKSHEET………………………………………………… 77
ix
LIST OF FIGURES
Figure Page
1 Differences in Gender Representation by Company ................................................. 29
2 Differences in Racial Representation by Company ................................................... 31
3 Differences in Age Representation by Company ....................................................... 33
4 Differences in Gender Representation Over Time ..................................................... 35
5 Differences in Racial Representation Over Time ...................................................... 37
6 Differences in Representations of Age Over Time .................................................... 39
7 Differences in Representations of Gender by Microsoft Over Time ......................... 41
8 Differences in Representations of Gender by Nintendo Over Time .......................... 43
9 Differences in Representations of Gender by Sony Over Time ................................ 44
10 Differences in Racial Representation by Microsoft Over Time ................................ 46
11 Differences in Racial Representation by Nintendo Over Time ................................. 48
12 Differences in Racial Representations by Sony Over Time ...................................... 50
13 Differences in Representations of Age by Microsoft Over Time .............................. 52
14 Differences in Representations of Age by Nintendo Over Time ............................... 54
15 D ifferences in Representations of Age by Sony Over Time..................................... 56
x
LIST OF TABLES
Table Page
1 Chi-Square Analysis of Differences in Gender Representation by Company ........... 29
2 Chi-Square Analysis of Differences in Racial Representation by Company ............ 31
3 Chi-Square Analysis of Differences in Age Representations by Company .............. 33
4 Chi-Square Analysis of Differences in Gender Representation Over Time .............. 35
5 Chi-Square Analysis of Differences in Racial Representations Over Time .............. 37
6 Chi-Square Analysis of Differences in Representations of Age Over Time ............. 39
7 Chi-Square Analysis of Differences in Representations of Gender by
Microsoft Over Time ................................................................................................. 41
8 Chi-Square Analysis of Differences in Representations of Gender by
Nintendo Over Time .................................................................................................. 42
9 Chi- Square Analysis of Differences in Representations of Gender by
Sony Over Time ......................................................................................................... 44
10 Chi-Square Analysis of Differences in Racial Representation by
Microsoft Over Time ................................................................................................. 45
11 Chi-Square Analysis of Differences in Racial Representation by
Nintendo Over Time .................................................................................................. 47
12 Chi- Square Analysis of Differences in Racial Representation by
Sony Over Time ......................................................................................................... 49
13 Chi-Square Analysis of Differences in Representations of Age by
Microsoft Over Time ................................................................................................. 51
14 Chi-Square Analysis of Differences in Representations of Age by

xi
Nintendo Over Time .................................................................................................. 53
15 Chi-Square Analysis of Differences in Representations of Age by
Sony Over Time ......................................................................................................... 55
RUNNING HEAD: DIVERSITY AND INCLUSIVITY IN GAMING 1
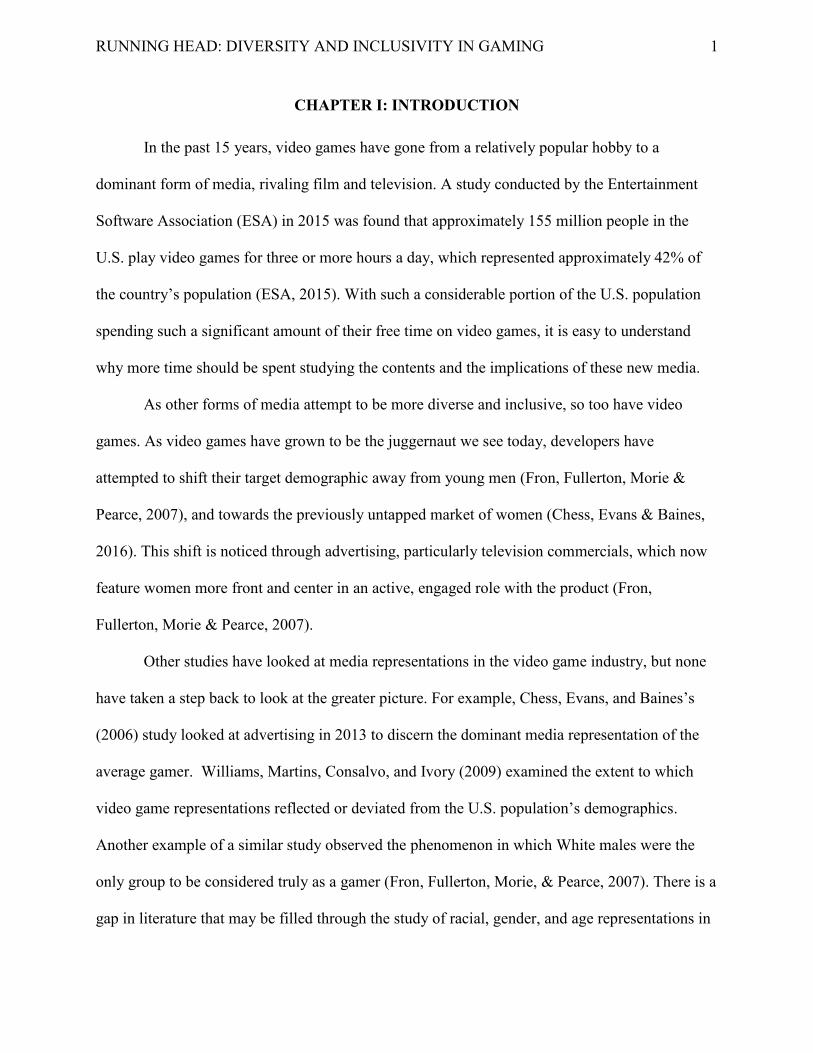
CHAPTER I: INTRODUCTION
In the past 15 years, video games have gone from a relatively popular hobby to a
dominant form of media, rivaling film and television. A study conducted by the Entertainment
Software Association (ESA) in 2015 was found that approximately 155 million people in the
U.S. play video games for three or more hours a day, which represented approximately 42% of
the country’s population (ESA, 2015). With such a considerable portion of the U.S. population
spending such a significant amount of their free time on video games, it is easy to understand
why more time should be spent studying the contents and the implications of these new media.
As other forms of media attempt to be more diverse and inclusive, so too have video
games. As video games have grown to be the juggernaut we see today, developers have
attempted to shift their target demographic away from young men (Fron, Fullerton, Morie &
Pearce, 2007), and towards the previously untapped market of women (Chess, Evans & Baines,
2016). This shift is noticed through advertising, particularly television commercials, which now
feature women more front and center in an active, engaged role with the product (Fron,
Fullerton, Morie & Pearce, 2007).
Other studies have looked at media representations in the video game industry, but none
have taken a step back to look at the greater picture. For example, Chess, Evans, and Baines’s
(2006) study looked at advertising in 2013 to discern the dominant media representation of the
average gamer. Williams, Martins, Consalvo, and Ivory (2009) examined the extent to which
video game representations reflected or deviated from the U.S. population’s demographics.
Another example of a similar study observed the phenomenon in which White males were the
only group to be considered truly as a gamer (Fron, Fullerton, Morie, & Pearce, 2007). There is a
gap in literature that may be filled through the study of racial, gender, and age representations in
DIVERSITY AND INCLUSIVITY IN GAMING 2
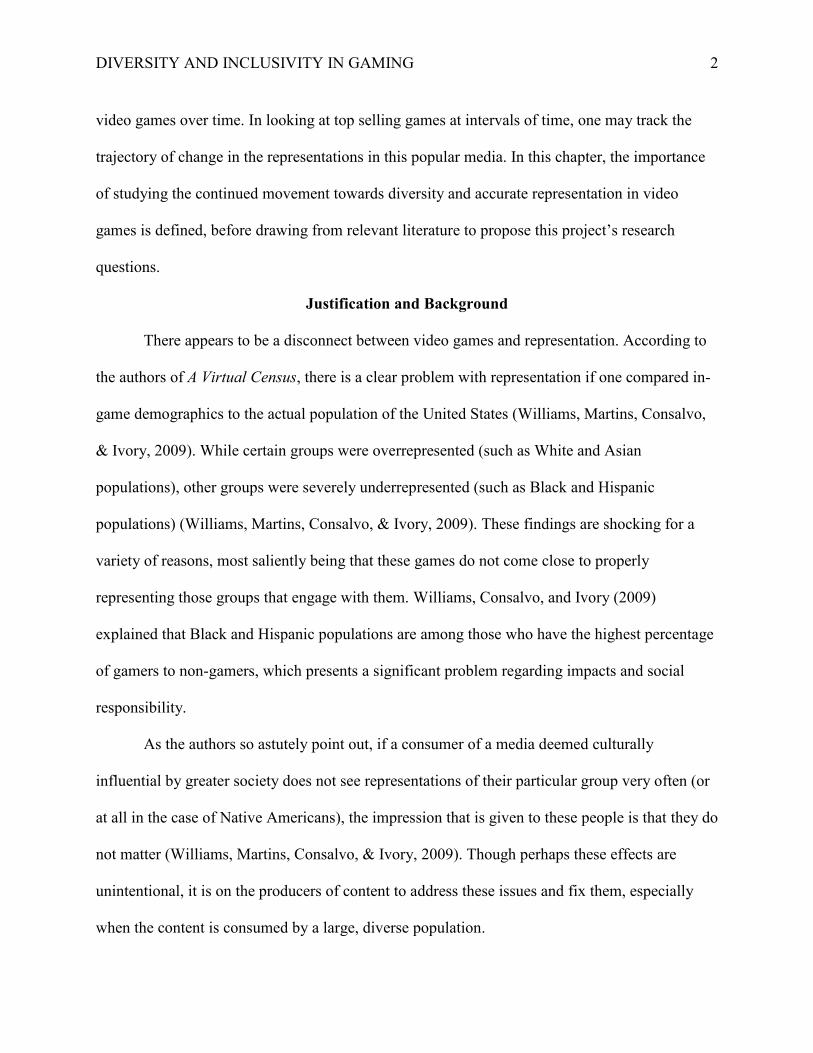
video games over time. In looking at top selling games at intervals of time, one may track the
trajectory of change in the representations in this popular media. In this chapter, the importance
of studying the continued movement towards diversity and accurate representation in video
games is defined, before drawing from relevant literature to propose this project’s research
questions.
Justification and Background
There appears to be a disconnect between video games and representation. According to
the authors of A Virtual Census, there is a clear problem with representation if one compared in-
game demographics to the actual population of the United States (Williams, Martins, Consalvo,
& Ivory, 2009). While certain groups were overrepresented (such as White and Asian
populations), other groups were severely underrepresented (such as Black and Hispanic
populations) (Williams, Martins, Consalvo, & Ivory, 2009). These findings are shocking for a
variety of reasons, most saliently being that these games do not come close to properly
representing those groups that engage with them. Williams, Consalvo, and Ivory (2009)
explained that Black and Hispanic populations are among those who have the highest percentage
of gamers to non-gamers, which presents a significant problem regarding impacts and social
responsibility.
As the authors so astutely point out, if a consumer of a media deemed culturally
influential by greater society does not see representations of their particular group very often (or
at all in the case of Native Americans), the impression that is given to these people is that they do
not matter (Williams, Martins, Consalvo, & Ivory, 2009). Though perhaps these effects are
unintentional, it is on the producers of content to address these issues and fix them, especially
when the content is consumed by a large, diverse population.
DIVERSITY AND INCLUSIVITY IN GAMING 3
To frame this discussion of the criticality of building and maintaining proper
representation in another way, we can look to cultivation theory. As the theory states, a consumer
being barraged with messages can in turn have their perception of the world altered to better
align with these messages (Stacks & Salwen, 2014). This view is adopted primarily due to the
prominence and repetition of the message in question, allowing the consumer to better recall the
details of the message (Stacks & Salwen, 2014). An example of this effect would be a local news
network providing only stories about crime in the area, despite there being no spikes in crime
rates, making residents perceive that their city is plagued by a crime wave that is not actually
taking place.
Shrum (2002) posits that the vividness of a message also plays a distinct role in the recall
of a specific presentation or message:
Like frequency and recency, vividness has particular applicability to media effects. It
seems reasonable to think that television portrayals of particular actions and events may
be more vivid than real world experiences, given the drama-enhancing goal of
entertainment. (p. 73)
Given the immersive nature of these video games and depictions of events and people, it would
be logical to draw the conclusion that these games could be particularly effective in shaping
realities. Combining that vividness with the repetition of gameplay and the length of exposure to
these messages, with many games having a minimum of 10 hours of gameplay, it is easy to see
how consumers could adopt these representations.
When considering the application of cultivation theory to video game advertisements,
rather than the video games themselves, similar arguments towards applicability may be made.
Though the age of dominance may be coming to a close for television advertising, certainly
DIVERSITY AND INCLUSIVITY IN GAMING 4
commercials for video games have yet to slow down. Today, you can find these ads promoted
online on a wide variety of social media sites. Sites such as Facebook and Twitter use ad
tailoring algorithms to deliver ads to the timelines of users who frequent video game related
subjects online. More notable, is the presence of these ads on YouTube. With the presence of
video game advertisements before and within videos related to video games, such as the wildly
popular category of ‘let’s play’ videos, it is easy to see how frequently gamers are exposed to
these ads.
DIVERSITY AND INCLUSIVITY IN GAMING 5
CHAPTER II: REVIEW OF LITERATURE
The literature on games studies and representation, along with other topics unrelated to
violence in games, seems surprisingly sparse, considering the popularity of the media in
American culture (Williams, Martins, Consalvo, & Ivory, 2009; Burgess, Dill, Burgess, &
Brown, 2011; Fox & Tang, 2013; Keogh, 2014). However, it remains a viable and prolific area
of inquiry. This chapter presents the current literature on representation in gaming before
covering the tenants of the theoretical framework guiding this thesis. Finally, the chapter reviews
relevant literature on advertising.
Representation and Gaming
One article with particular relevance concerning representation in media and television
and its impacts is bell hook’s piece “The Oppositional Gaze.” In the article, the problematic
misrepresentation of Black women on television and the relative impact of those
misrepresentations are discussed at length. An example given early in the article considers the
television show “Amos n’ Andy,” noting the popularity of the show in the Black community,
while also noting how these White representations of Black identity are spectated through a
critical lens (hooks, 2003). This is not dissimilar to those experiences of non-White, non-male
consumers of video games as they step into a world built overwhelmingly from White male
perspective, as a study from 2005 found that around 83% of developers are White and around
88% are male (Gourdin, 2005). While it is unclear on how the racial demographics in game
development have shifted since that 2005 study, recent stats from Statista (2018) have shown
that as recently as 2016, women have improved to 23% of game developers versus men.
DIVERSITY AND INCLUSIVITY IN GAMING 6
Moreover, hooks references one of her previous works, which analyzes the depiction of a
character in Amos N’ Andy, Sapphire, as a Black woman on television. As poorly framed as the
Black male characters were in this show, the Black female character (Sapphire) was perhaps
even more problematic. She filled a scapegoating role in which she was a target for everyone to
ridicule, which prompted some of the following responses from Black female viewers of the
syndicated series:
We all laughed at this Black woman who was not us. And we did not even long to be
there on the screen. How could we long to be there when our image, visually constructed,
was so ugly. We did not long to be there. We did not long for her. We did not long to be
this hated Black female thing - foil, backdrop. Her Black female image was not the body
of desire. There was nothing to see. She was not us. (hooks, 2003, p. 97)
This further cements the point made in that Williams and colleagues (2009) discussed regarding
how representation presents certain messages to those groups that consume this media, such as
not being considered important by greater society, which can lead to some very difficult
emotions with which to grapple.
Another consideration to make regarding the media effects of video games is the concept
of immersion. Unlike television and film, video games provide a feeling of active immersion
through integration that is measured through the degree by which that player feels integrated in
the game world (Taylor, 2002). Players can become deeply involved in a game as “an
experiential space,” which is described as intra-diegetic immersion (Taylor, 2002, p. 12). Simply
put, the very nature of these games can effectively make the player feel that they are building the
narrative of the game around them, concealing the true reality of that the game guides the player
DIVERSITY AND INCLUSIVITY IN GAMING 7
along sets of variables predetermined by the developers. This can have some serious implications
on the impact of messages regarding misrepresentation on the player.
Though we now may understand the contents of the games to some degree, and just how
messages are divulged to players, it is important to discuss who these gamers are. According to
Fron, Fullerton, Morie, & Pearce (2007), the answer to this question has much to do with cultural
power structures. In their article, they looked at those persons who hold elite status within the
industry and noted that it is dominated almost entirely by White men. These elites decide what is
developed and published, and most importantly, for which players a game is designed or made.
This process has created the image of the “hardcore gamer” which the authors refer to as a
“rhetoric of play” that is exclusionary in nature, leaving out all those groups not protected by the
White male umbrella (p. 1).
Furthermore, the authors throw the metaphorical gauntlet down for scholars to not
proliferate the problematic rhetoric surrounding the hegemony of play, and for game designers to
challenge these assumptions in their work and develop for those audiences previously considered
others (Fron, Fullerton, Morie, & Pearce, 2007). If we are to change the way groups are or are
not represented in video games, just as any other media, it falls upon those who create and
normalize such products. The pool of individuals who choose to play games is rich and diverse,
and they deserve a pool of games and protagonists that reflects that rich diversity.
To better grasp how the demographics of video game consumers were understood by
those who market for these developers, one may turn to a more recent study on video games,
marketing, and diversity. Though approaches to video game development as late as the 1990’s
saw strong catering towards the male audiences in design and marketing (Fron, Fullerton, Morie,
& Pearce, 2007), newer games have made attempts to be more inclusive, at least in their
DIVERSITY AND INCLUSIVITY IN GAMING 8
advertising. In a study published recently in 2016, a content analysis of video game commercials
airing in 2013 was conducted to ascertain the target demographic of the industry as a whole
(Chess, Evans, & Baines, 2016). This study filed the commercials under each of the major
gaming platforms and weighed the how these platforms represented age, gender, and racial
identity.
The year of 2013 was chosen for their analysis because it was a transitional year for home
console platforms, who were moving on to the next generation of consoles, and the authors
posited that a push for more inclusivity would be made at this juncture (Chess, Evans, & Baines,
2016). They were right in their supposition, apparently, as commercials that centered on the
subject of new consoles proved to have a more diverse cast of actors and actresses than
commercials that focused on content being released for the older consoles (p. 45). This is a
progressive step toward equality, but the authors noted that these commercials were still not
where they should be in terms of inclusivity, as it was discovered that though more women are
present in these commercials, no commercials featured women actually playing games, which
highlights a continued disconnect between the games industry and their consumer-base.
Aside from the findings that the next generation consoles had made a move towards
inclusivity, it was shown that Nintendo led the charge in a manner of speaking. In every category
that the researchers coded for diversity, racial, gender, and age representation, Nintendo proved
to be the most diverse on both their home system and handheld console. This is particularly
interesting when placed in conjunction with Fron, Fullerton, Morie, and Pearce’s (2007) study on
gender representations of video games’ marking materials. The authors had taken note that
Nintendo’s marketing featured more women, along with the rebranding of their system from
“Gameboy” to “DS,” and proposed the idea that through these practices, Nintendo could break
DIVERSITY AND INCLUSIVITY IN GAMING 9
the video game industry away from what they referred in their article to as the “Hegemony of
Play” (p. 9).
This is not to say that developers only make games with protagonists who are White men,
as we see a few examples of minority groups represented throughout the history of video game
development, such as Ryo Hazuki from the critically acclaimed Shenmue series, Louis from the
Left 4 Dead series, Chell from the Portal series, and three of the four playable protagonists from
Borderlands: Mordecai, Roland, and Lillith. However, the question then comes back to the ways
that minority groups are represented. Jansz and Martis (2007) analyzed the heroine of the video
game “Tomb Raider” (Lara Croft) alongside a few other female protagonists. The authors found
that though female characters have found themselves in leading roles as strong protagonists, they
were predominantly White and were typically sexualized in their representation. This
sexualization was evident in their attire and in their body types, as coded by the researchers. It is
also worth noting that in the 12 games and 22 characters observed for this study, only eight
belonged to a racial group other than White, and of the 12 main characters, only three characters
were non-White (p. 145).
Their study shows that women can assume the position of power in these games, but it
does not free them from the male gaze of developers and consumers. This has deeper
implications for other minority groups as well. If racial minority characters are chosen as the
main roles, do they then face misrepresentation and problematic stereotyping as the female
protagonists faced sexualization? Perhaps those who make these games are not particularly the
correct fit for creating characters who accurately portray groups outside of their own racial or
ethnic identity.
DIVERSITY AND INCLUSIVITY IN GAMING 10
A study completed by Taylor (2003) addressed the disconnect that sometimes forms
between the developer and the racial depictions in their video games. This is best highlighted by
a quote she gathered when pressing a developer about a particular artistic choice in the depiction
of non-Whites:
…when I inquired about why most of the heads were what we might think of as
Caucasian, why there were so few heads in this environment that had Asian or Black
features, I was given a fascinating (if not troubling) explanation by several people. As
one designer told me ‘If you color a white head white it looks white, if you color a black
head black it looks black… A few of them are built with deliberate racial characteristics
but I have found that coloring far and above colors, forgive the pun, how people see the
head rather than any given facial characteristics. (Taylor, 2003, p. 32)
The strangeness of this quote stems from a conversation earlier with these very designers on how
committed they were to provide a vision of diversity (2003). The only issue with this “vision” is
the superficial nature of the diversity. This shows how these designers can fall short of
understanding the nuances and importance of racial identity.
Without more diversity in the developer cycle, these types of mistakes must then be
expected to some degree. Developers will continue to make games primarily white and male so
long as those who work in the industry remain primarily white and male. Even with the best
intentions, if one is to rely on a designer to create a proper representation of a minority group
they are unfamiliar with, misrepresentation will happen. Just as bell hooks spoke of the male
gaze as an obstacle to proper representation of Black women in film and television (hooks,
2003), one must turn a critical eye to the developers of these games to address misrepresentation
and indeed lack of representation altogether.
DIVERSITY AND INCLUSIVITY IN GAMING 11
Cultivation Theory
Cultivation theory focuses on the impacts of media messages on consumers. Gerbner,
Gross, Morgan, and Signorielli (1986) inform us that even a small shift in the cultivation of
perspectives, if sufficiently disseminated, can “alter the cultural climate and upset the balance of
social and political decision making without necessarily changing observable behavior” (p. 21).
Cultivation can be defined as “a pattern of operational practices that searches for relationships
between television exposure and a wide range of cultivation indicators” (Potter, 2014, p. 1015).
Keeping this in mind, and referring back to hooks, the underrepresentation of certain groups can
perhaps have a lasting effect on people’s perceptions of the relative inclusivity provided by video
game advertisements. Even worse, the cultivation of these perceptions could have a lasting
impact on how underrepresented groups perceive their own role in the greater landscape of
modern US culture.
One of the key assumptions of cultivation theory is that consumers of television
repeatedly exposed to a message are more likely to adopt or hold beliefs that mirror that message
(Littlejohn & Foss, 2009). In short, the inundation of mass media messages shapes the viewer’s
conception of their immediate reality. For example, a local news station regularly airing stories
about assaults in a specific locality may lead regular viewers of the broadcast to believe that their
region is experiencing a spike in assault related crime in the area. The applicability, however,
extends beyond violence and crime depictions on television. Generally, any question pertaining
to public opinion or perception on a specific concept may be explored through the lens of
cultivation theory (Littlejohn & Foss, 2009).
DIVERSITY AND INCLUSIVITY IN GAMING 12
Ultimately, as Littlejohn and Foss explain, Shrum offers an explanation of the process of
cultivation and how it works, building upon the work Gerbner put into the founding of this
theory:
Simply put, he argues that most people do not give thoughtful answers to questions;
rather, they rely on whatever information seems readily available to them. They do not
systematically scan their memories for relevant information; rather, they take what is
most readily available. (2009, p. 256)
To speak metaphorically, cultivation theory has a lightning-rod effect, where viewers bombarded
with messages take the shortest path to a conclusion based on the most readily available
information. This, then, is the core of my theoretical framework as I argue that
underrepresentation of gender, age, and racial groups in video game advertising leads to an
immediate disassociation between those minority groups and the product in question.
A few studies using cultivation theory have been written prior to this study, including one
already covered earlier in my review of literature The Virtual Census, which helped to spark my
interest in this subject. In this study, Williams Martins, Consalvo, and Ivory (2009) explored
racial, gender, and age representation within video games, drawing implications regarding
impacts of under-representation of minority groups using Cultivation Theory. They found that
Latinx individuals, Native Americans, and older individuals were poorly represented, and
concluded that due to this low level of representation, players will be given the impression that
these groups are less visible than they truly are; in addition, they concluded that members of the
aforementioned groups may feel less important due to the lack of representation.
A more recent study on female representation in video games used cultivation theory to
explore the proliferation of problematic attitudes towards women (Kondrat, 2015). Specifically,
DIVERSITY AND INCLUSIVITY IN GAMING 13
the author determined how video games may contribute to unhealthy or unnatural body ideals.
They ultimately concluded that representations of women were improving over time, thus
changing typical stereotyping of women (p. 189).
A similar study published in 2014 explored the impact of video game play on racial
stereotypes through cultivation research. The argument made by Behm-Morawitz and Ta (2014)
is that because representations of minority groups are so few in number, they are more likely to
be stereotyped, and that those stereotypes will then leave impressions on the gamer. The scholars
concluded that “time spent playing video games is predictive of White video game players’
beliefs about Blacks, such that greater frequency of play is linked to less favorable beliefs”
(Behm-Morawitz & Ta, 2014, pp. 11-12). As the scholars remind us, this agrees with the core
premise behind cultivation theory, where repeated exposure to a message shapes belief.
Outside of the realm of video games, there is much research that has been conducted
recently utilizing cultivation theory as a framework. In a study on media coverage on perceived
threats from Muslims, Khan and Bruschke (2016) employed the use of cultivation theory to
explain attitudes towards Muslims post September 11th. Using questionnaires, Khan and
Bruschke assessed total exposure to radio, television, and the internet in hours. This was then
weighed against the respondent’s perception of connectivity between media and fear. Finally,
this was compared with measures of perceived threat and intercultural contact.
Cultivation theory and its application to advertising was explored in a study which uses
the framework to evaluate gender representation in Philippine television ads. In the article,
Prieler and Centeno (2013) discussed how cultivation theory may lend to the greater discussion
on the reinforcement of gender roles and stereotypes due to the nature of stereotypical depictions
of gender in commercials. Although women were not underrepresented quantitatively in the
DIVERSITY AND INCLUSIVITY IN GAMING 14
advertisements, the ways they were portrayed qualitatively were problematic. They highlighted
how the commercials tended to represent men and women:
settings in which more males were found in the workplace and more females were found
at home; the degree of dress, in which more males were fully dressed and more females
were suggestively dressed; voiceovers, which employed more males than females; and
product categories, in which cosmetics and toiletries were associated primarily with
female characters (Prieler & Centeno, p. 288).
Drawing from the framework, the authors concluded that these commercials continue to
perpetuate and entrench gender stereotypes.
One thing to consider regarding the applicability of cultivation theory in this thesis is the
media content this theory was developed to explore, and just how much the landscape has
changed today. This theory was developed to explore the impacts of television messages on
audiences, a media format that has since lost its dominance. In an article from Morgan,
Shanahan, and Signorielli (2015), the question of cultivation theory’s continued usefulness is
posited, considering the dramatic shift in media away from television and towards internet
content. In the article, an argument is made that cultivation’s continued survival is due in no
small part to the simple nature of its core assumption: “stories we tell (and are told) have
something to do with the way we think about the world” (Morgan, Shanahan, & Signorielli,
2015, p. 678). Simply put, cultivation may examine the relationship between a dependent
variable and exposure to content, which is the case, Morgan and his colleagues note, with many
current studies using this theoretical framework (Morgan, Shanahan, & Signorielli, 2015). The
method by which we receive stories is relatively unimportant when weighed against the content
of that message itself.
DIVERSITY AND INCLUSIVITY IN GAMING 15
Potter (2014) offered a critical analysis of cultivation theory from a modern perspective.
In the article, criticism is thrown towards cultivation research which ignores the notion of time
when deciphering meaning in their findings. A particular emphasis is placed on the avoidance of
tackling “the degree to which those industrial produced meanings are widespread, the extent to
which the population is cultivated by those meanings, and the shape of those meanings’
influence over time” (Potter, 2014, p. 1030). Potter further argues that the current state of
cultivation research is mostly lackluster, that current literature ignores its origins in Gerbner and
instead “evolved into an exploratory forum for any type of media research as long as it looks at
some form of exposure to media content and looks for the relationship of that exposure to some
kind of effects outcome” (Potter, 2014, pp. 1031-1032). The article concludes by remarking that
for future research seeking to observe phenomena other than “macrolevel phenomena of media
influence on large aggregates over time” (Potter, 2014, p. 1032), then authors should look to
other theories regarding media effects which may have a better fit, or to develop newer theories,
rather than attempting to stretch cultivation theory too thinly.
There is indeed a sizable gap in literature regarding representation in video games (Fron,
Fullerton, Morie, & Pearce, 2007; Jansz & Martis, 2007; Williams, Martins, Consalvo & Ivory,
2009). Much of the work on video games has primarily concerned itself with the question of
violence and how the depictions in violent video games may influence players. Though this gap
has begun to be filled by many new enthusiastic scholars, there is still considerable space for
more research to be done.
As discussed in the Williams, Martins, Consalvo, and Ivory (2009) article, many studies
on video games have been limited due to small sample sizes. This thesis draws inspiration from
and expands upon the already uniquely situated article from the Chess, Evans, and Baines (2016)
DIVERSITY AND INCLUSIVITY IN GAMING 16
on representation in video game commercials through the lens of cultivation theory. Due to these
two facts, this thesis seems to then find itself situated as the largest scale overview on
representation in video game advertising to date, poising itself as an important contributor to
cultivation theory as it applies to this subject.
Advertising
To better explore my choice of topic, we must look to scholarship on advertising as well.
According to Thorson and Rodgers (2012), advertising is defined as “paid communication from
an identified sponsor using mass media to persuade an audience” (p. 4). This is an important
distinction to make from other promotional tools, the editors of Advertisement Theory argue,
such as public relations, sales promotion, and personal selling (Rodgers & Thorson, 2012).
Understanding this distinction is fundamental for further reading on advertisement scholarship
and theory.
Something that also must be considered in comparing the advertising strategies of video
game consoles is that only Microsoft may be considered a domestic entity, with its headquarters
situated in Seattle Washington. Sony and Nintendo, in contrast, are Japanese companies, tasked
with marketing internationally. Taylor, Okazaki, and Mueller (2012) remind us that advertisers
must actively adjust marketing strategies to a degree dependent of their perceptions of similarity
and difference between their domestic market and the chosen international markets. This is a
tricky enough needle to thread when considering two western markets such as the United States
and Europe marketing internationally, but when considering an eastern to western marketing
adjustment, one may be safe in assuming that much more dramatic adjustments are required.
Another enlightening study from Aaker, Brumbaugh, and Grier (2000) highlights the
finding that Black individuals reacted more favorably to ads featuring Black actors than White
DIVERSITY AND INCLUSIVITY IN GAMING 17
individuals did to seeing White actors in the same type of ad, which appeared to be directly
related to proportional minority status. One major implication we can draw from this study is that
cultivation theory proves to be an effective framework, seeing that there is measurable impact of
the representation of minority individuals in advertisements on those specific minority groups.
Further, a study on web browsers’ attitudes towards racially-targeted websites found that while
those with a stronger sense of ethnic identity show preference towards group representation, this
factor plays a minimal role in the response White individuals have towards these same ads, being
members of the majority (Appiah, 2004). The implication that may be drawn here is that there is
room for minority representation to become more diverse, as appealing to only the majority
group is less effective, it seems, than focusing even a little bit on the increasing of representation
of under-represented groups.
Finally, in the realm of advertising it is important for us to observe ethical considerations
within the industry and its professionals. In two separate studies, advertising professionals
consistently scored poorly on tests designed to gauge aptitude for ethical reasoning
(Cunningham, 2005; Wilkins & Coleman, 2005). Furthermore, these professionals were found to
have even lower scores in their ethical reasoning when presented issues from within their own
field of advertising (Cunningham, 2005). These shocking findings may help us to draw
conclusions regarding the rate of change over time in the issues of underrepresentation, as we
understand that the industry professionals are hesitant to identify such issues within their field
and work. Author of one of the aforementioned studies, Cunningham (2005), reasoned that this
hesitancy or disconnect was likely due to the professional’s focus on financial viability of the
solution of said problem.
DIVERSITY AND INCLUSIVITY IN GAMING 18
Understanding on some level the motivations and innerworkings of advertising, as stated
earlier in this review of literature, will help to focus the findings of this thesis and indeed provide
a degree of reasoning for trends that may or may not be present. This, combined with the
research conducted on video games and representation presented in the literature review will
help to guide this thesis and inform any implications drawn in the data analysis and discussion.
DIVERSITY AND INCLUSIVITY IN GAMING 19
CHAPTER III: RESEARCH QUESTIONS AND METHODOLOGY
This thesis aims to serve as a step in the right direction in the research of video games as
a cultural phenomenon, helping to place it on the same stage as television, radio, and film. As a
salient media text in modern society, it is important that we understand, or seek to understand,
the contexts surrounding the text, the effects of the text, and the text itself from a communication
perspective.
There are a multitude of reasons why a study like this has yet to be performed. The first
reason relates to the scale of the project. Considering the size of the population sampled
combined with the nature of a study observing a span of fifteen years, most scholars would rather
opt to do a snapshot study of the industry today, rather than viewing the larger context of
progression. Secondly, this study has yet to be done due to lack of interest in this particular
aspect of the video game industry. Games studies is a growing field of scholarship (Chess,
Evans, & Baines, 2016; Williams, Martins, Consalvo, & Ivory, 2009), with important research
being contributed every day, but much of that research is focused on effects of video game
usage, representation within video games themselves, and content of said video games. As such,
the methods by which companies advertise their products have taken a back seat. Lastly this has
not yet been studied likely due to lack of insight, or common perceptions of the current state of
the industry. In much of the literature surrounding video games, many claims or assumptions are
made regarding the state of representation in video game marketing, but not much in the way of
evidence to back these claims. There is not much of a reason to study diversity when the
dominant thought surrounding the industry already criticizes lack of diversity. Hopefully the
results of this study will better inform those assumptions and claims.
DIVERSITY AND INCLUSIVITY IN GAMING 20
Research Objectives
To address whether the concerns regarding diversity and inclusivity in the video game
industry continues to evolve, more targeted research must be conducted on advertisements that
surround these games. This study approaches these advertisements to ascertain how racial,
gender, and age representation in video game console commercials has shifted over to provide
some perspective on where the industry was 15 years ago, where it is now, and where it may be
going forward if they continue their respective trends. This project features three research
questions:
RQ1: To what extent are gender, racial, and age identities represented in advertisements
for consoles produced by Microsoft, Nintendo, and Sony?
RQ2: To what extent are gender, racial, and age identities represented in advertisements
for consoles between 2003 and 2017?
RQ3: How do Microsoft, Nintendo, and Sony differ in their representations of racial,
gender, and age identity over time from 2003 and 2017?
Methodology
This project features a content analysis of video game console advertisements produced
by three major companies (i.e., Microsoft, Nintendo, and Sony) between 2003 and 2017. The
sample was further restricted by parameters which follow. The commercials must be for consoles
produced by Sony, Nintendo, or Microsoft and must also feature human actors or characters with
DIVERSITY AND INCLUSIVITY IN GAMING 21
discernable features, which is to say that games that only feature non-human characters, or
characters with undefined racial, gender, or age identities (e.g., due to obstructions such as
armor) will be cast aside.
These commercials were pulled from the same archive used in the What does a gamer
look like article, Gamepressure.com (Chess, Evans, Baines, 2016). According to the
Gamepressure (2017) archive, there are a total of 431 commercials in the population for the
selected time frame of 2003-2017. However, only 234 commercials featured human characters.
To trim the sample into a more manageable size, the commercials were first separated into the
three categories of Microsoft, Sony, and Nintendo, before being further separated into three-year
blocks (2003-2005, 2006-2008, 2009-2011, 2012-2014, 2015-2017) at which time simple
random samples were taken from each category. For each company, Microsoft, Sony, and
Nintendo, four commercials were sampled from each block, which brought the target total for the
sample to 75 commercials. Unfortunately, Microsoft had some missing data from the first two
time periods, leaving the total sample at 71 commercials. This was the best, most representative
sample attainable due to missing data from Microsoft, as they only have 3 valid commercials in
the 2003-2005 period and 3 valid commercials in the 2006-2008 Time Period. Expanding these
data any further could potentially skew data due to the difference in weighting between the
companies observed.
This was the most effective framework for my study primarily due to the fact that this
time-frame allows me to observe three generations of consoles. Generations used in this manner
refers to the rhythm in which consoles are released, as competitors typically release about every
five years and within one year of each other.
DIVERSITY AND INCLUSIVITY IN GAMING 22
Units of Analysis
As this study was a quantitative content analysis on commercials that vary in content, my
units of analysis had to both be as flexible and clearly defined as possible. For the purpose of
describing the units of analysis, it would be best to first describe the two types of commercials
observed. The first of these commercial categories is live action, or more accurately defined:
commercials which feature live actors, depicted as players of a video game. The other
commercial category is more concerned with the video game itself, and as such is defined by
either live or computer-generated actors, depicting characters of a video game.
The recording units for this thesis, to be clear, are those persons or characters that appear
on screen through the course of the commercial. The methodology for this thesis is informed by
Chess, Evans, and Baines’s (2016) article, What Does a Gamer Look Like? Video Games,
Advertising, and Diversity as a model for my analysis, as it performs a similar type of content
analysis as this thesis seeks to perform, only they limit themselves to only commercials released
in 2013, while also looking at behaviors. Drawing inspiration from this article, this thesis uses
three measurement classifications: game platform, year of release, and physical characteristics of
gamer or character.
Codes
Video game company. As the time frame covered multiple iterations of consoles, the
variables for platform limit themselves to just the names of the companies who develop each of
the three major platforms: Microsoft, Sony, and Nintendo.
Year. Year of release is mostly self-explanatory, as each of these commercials were
coded by year of original air date. This is important to distinguish as certain advertising
DIVERSITY AND INCLUSIVITY IN GAMING 23
campaigns for single product may have commercials that have original air dates in two adjacent
years. Additionally, commercials may run for multiple years after its original air date. The
variables as defined here, 2003-2017, are both mutually exclusive and exhaustive.
Racial, gender, and age representation. The final measure, physical characteristic of
gamer/character, is where we find the most important part of the study. As addressed in the What
Does A Gamer Look Like article, coding racial identity in commercial advertisements is often
difficult do to a lack of biographical information regarding the actors. As Chess, Evans, and
Baines describe:
everything in television commercials is about perception while the real age or ethnicity of
an actor might be disguised by clothing style or makeup, it is only the perception of their
age and ethnicity that carries meaning in the fifteen to thirty seconds that we consume the
commercial. Thus, using a content analysis method wherein we are able to track multiple
visual perceptions about factors such as age, ethnicity, and gender allows us to consider
the tricky space of how the audience is most likely to perceive these characters. In other
words, it does not necessarily matter if an actor is a thirty-five-year-old African American
woman; what matters is how she visually parses to audiences in a short period of time.
(2016, pp. 4-5)
Keeping this in mind, two trained researchers coded age, gender, and racial identity based on
perception. In each of the following categories, labels were included for characters which the
coders were unable to identify for any reason, such as the quality of the video or obscuration of
face or features, which is referred to as “cannot discern.” For the racial category, using the US
census as inspiration, the variables used were White, Black or African American, Native
American or American Indian, Hispanic or Latino, Arab American, Asian or Pacific Islander,
DIVERSITY AND INCLUSIVITY IN GAMING 24
cannot discern or other. For age, the following variables were used: Pre-adolescent, adolescent,
adult, middle age, older adult, and cannot discern. Pre-adolescent included any character clearly
under teenage, adolescent included characters between 13 and 18, or clearly high school aged
individuals. Adults were characters who were 19 to mid-30’s, middle aged around mid-30’s to
60’s, and older adults around mid-60’s and up. Lastly, for gender, individuals will be coded as
either man, woman, trans, or cannot discern. Labels used for each code were drawn from similar
literature dealing with demographics, lifespan development research, and commonly accepted
census categories used by the US census (Heckhausen, Dixon, & Bates, 1989; McCrae et al.,
2000; U.S. Census Bureau, 2017; Williams, Martins, Consalvo, & Ivory, 2009; Williams,
Ponesse, Schachar, Logan, & Tannock, 1999).
Role. Lastly, the characters were coded as either primary or secondary, which is
determined by their perceived role in the commercial. For commercials depicting gamers playing
on a console, primary status is determined by who is depicted as the player, while in
commercials that depict the game characters themselves, Primary character is determined by
perception of role by the coders. Each of the categories being observed, as listed above, along
with their conceptual definitions are contained in the code handbook which was prepared to
coding and is included in this document as Appendix A.
Collection Procedure
Two trained scholars (i.e., a graduate researcher and I) coded the data. Time was taken
prior to the coding process to train the outside coder on the methods of this project, to ensure that
he understood expectations for the data they are to collect. The training process consisted of first
spending time to look through the conceptual definitions and exemplars provided in the prepared
code handbook (Appendix A), before familiarizing that second coder with the coding worksheet
DIVERSITY AND INCLUSIVITY IN GAMING 25
developed for ease of use in data collection, which has been included in this document as
Appendix B. From there, I walked through the process of coding using a commercial, showing
how I would code each character. Afterwards, we walked through a commercial together where
the other coder will code alone and walk me through their process, unpacking reasoning and
motivation where applicable. Finally, we went through a few commercials and coded separately,
comparing notes afterwards. The purpose of this final step was to buff out complications and
disconnections that appeared between the two coders and worked out a common interpretation
on which both agreed. The entire process took around three hours.
Intercoder reliability was calculated using Cohen’s Kappa after coding the first 20% of
the target sample. Cohen’s Kappa determined a reasonable level of consistency and agreement
between the two coders in each category; traditionally, a value greater than .70 is an acceptable
level of intercoder reliability. A sufficient level of intercoder reliability was achieved after one
round of preliminary coding. Role scored as .873 with p<.001, racial identity scored as .87 with
p<.001, Gender scored 1.0 with p<.001, and age scored .78 with p<.001. The rest of the target
sample was divided evenly between the two coders, with 28 commercials going to each coder.
DIVERSITY AND INCLUSIVITY IN GAMING 26
CHAPTER IV: DATA ANALYSIS AND RESULTS
Data Analysis
Ultimately the goal of this thesis is to track the trajectory of the entire video game
industry and to determine whether it is becoming more or less diverse in its marketing. However,
the thesis also aims to analyze how the three major companies in the industry measure up to one
another. To that end, the data collected regarding diversity was sorted by platform and year of
release. This organization allowed visibility of where each of these companies ranked, by year,
in their attempts at diversity and inclusivity. Because the data were nominal in nature, a series of
chi square analyses were performed. This analysis allowed observation and identification of
relationships between the specific companies and diversity in commercials while taking into
consideration the year of release.
Results
The aim of this project was to determine if there were systematic differences in racial,
gender, and age representations in video game console commercials produced by Microsoft,
Nintendo, and Sony from 2003 to 2017. Three research questions were posed: To what extent are
gender, race, and age identities represented in advertisements for video game consoles produced
by Microsoft, Nintendo, and Sony? To what extent are gender, race, and age identities
represented in advertisements for consoles between 2003 and 2017? How do Microsoft,
Nintendo, and Sony differ in their representations of racial, gender, and age identity over time
from 2003 and 2017?
DIVERSITY AND INCLUSIVITY IN GAMING 27
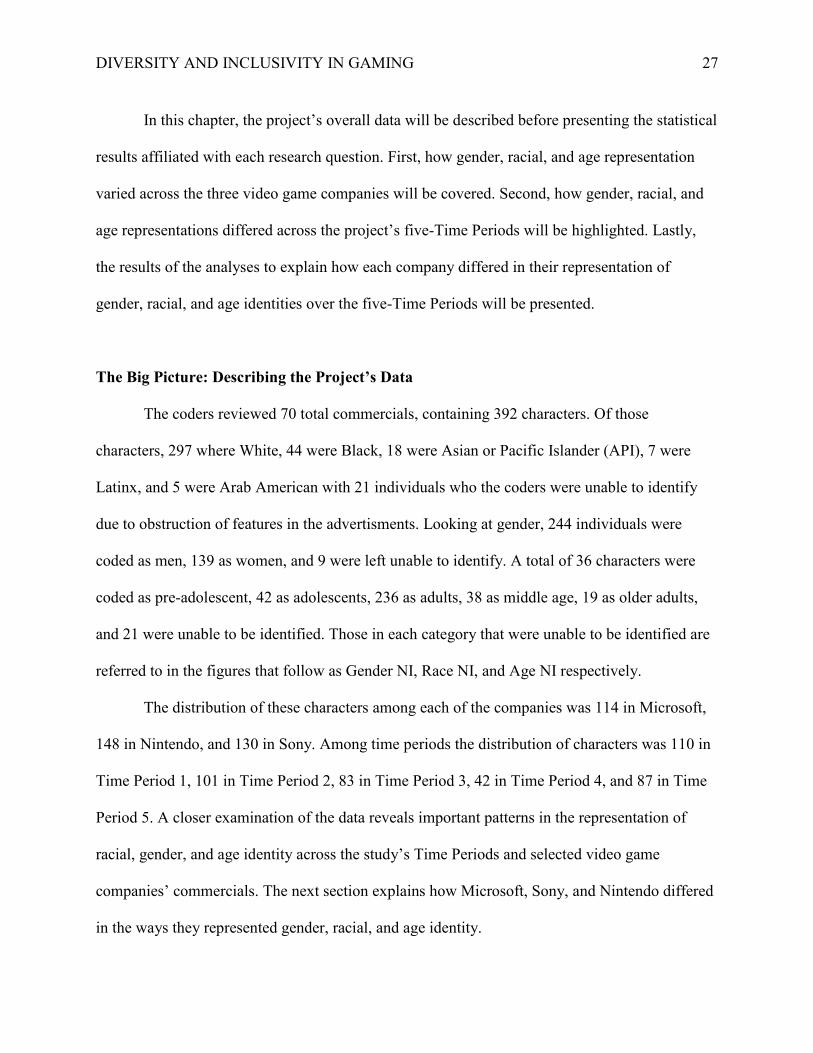
In this chapter, the project’s overall data will be described before presenting the statistical
results affiliated with each research question. First, how gender, racial, and age representation
varied across the three video game companies will be covered. Second, how gender, racial, and
age representations differed across the project’s five-Time Periods will be highlighted. Lastly,
the results of the analyses to explain how each company differed in their representation of
gender, racial, and age identities over the five-Time Periods will be presented.
The Big Picture: Describing the Project’s Data
The coders reviewed 70 total commercials, containing 392 characters. Of those
characters, 297 where White, 44 were Black, 18 were Asian or Pacific Islander (API), 7 were
Latinx, and 5 were Arab American with 21 individuals who the coders were unable to identify
due to obstruction of features in the advertisments. Looking at gender, 244 individuals were
coded as men, 139 as women, and 9 were left unable to identify. A total of 36 characters were
coded as pre-adolescent, 42 as adolescents, 236 as adults, 38 as middle age, 19 as older adults,
and 21 were unable to be identified. Those in each category that were unable to be identified are
referred to in the figures that follow as Gender NI, Race NI, and Age NI respectively.
The distribution of these characters among each of the companies was 114 in Microsoft,
148 in Nintendo, and 130 in Sony. Among time periods the distribution of characters was 110 in
Time Period 1, 101 in Time Period 2, 83 in Time Period 3, 42 in Time Period 4, and 87 in Time
Period 5. A closer examination of the data reveals important patterns in the representation of
racial, gender, and age identity across the study’s Time Periods and selected video game
companies’ commercials. The next section explains how Microsoft, Sony, and Nintendo differed
in the ways they represented gender, racial, and age identity.
DIVERSITY AND INCLUSIVITY IN GAMING 28
Gender, Racial, and Age Representations by Company
To answer the first research question, a series of chi-square analyses was conducted. As
defined by Singleton and Straits (2004), a chi-square test is “based on a comparison of the
observed cell frequencies with the cell frequencies one would expect if there were no
relationship between the variables” (p. 470). This method is used due to the nature of the data
being observed and the nature of the research being done, as this thesis seeks to identify
variances in expected trends. These analyses examined data points at the intersections of gender,
racial, and age representation with each of the three companies. What follows are trends and
insights revealed by that analysis, answering RQ1.
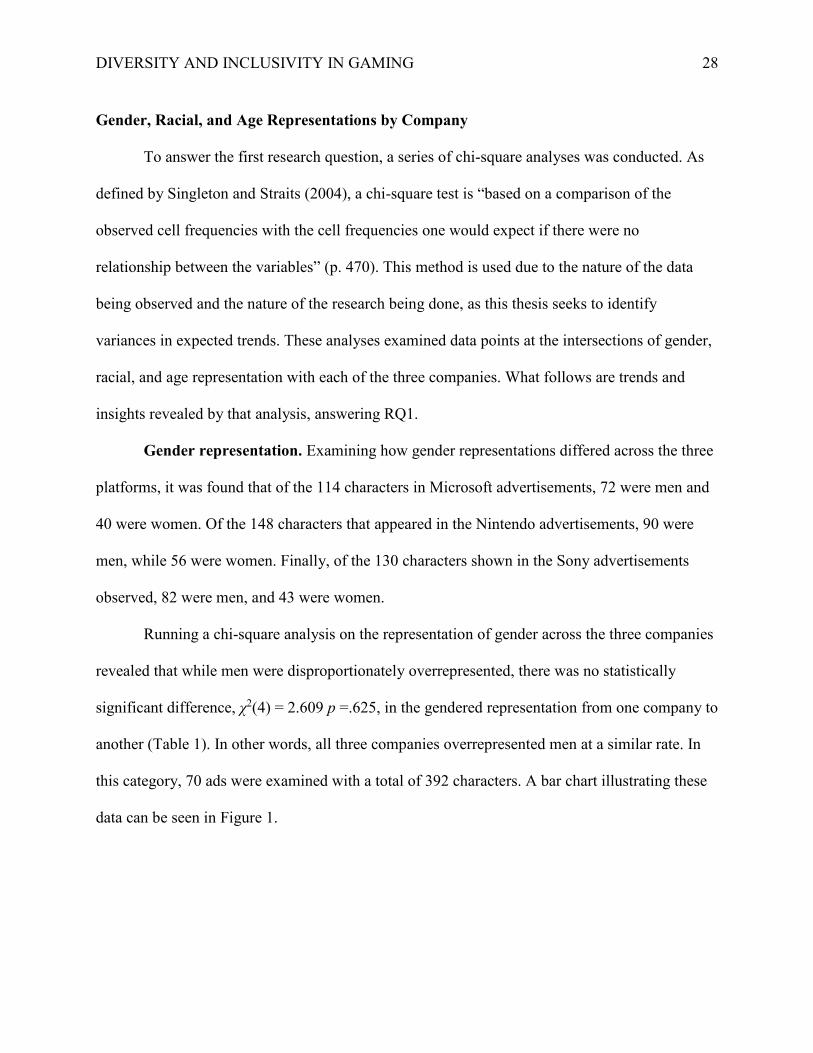
Gender representation. Examining how gender representations differed across the three
platforms, it was found that of the 114 characters in Microsoft advertisements, 72 were men and
40 were women. Of the 148 characters that appeared in the Nintendo advertisements, 90 were
men, while 56 were women. Finally, of the 130 characters shown in the Sony advertisements
observed, 82 were men, and 43 were women.
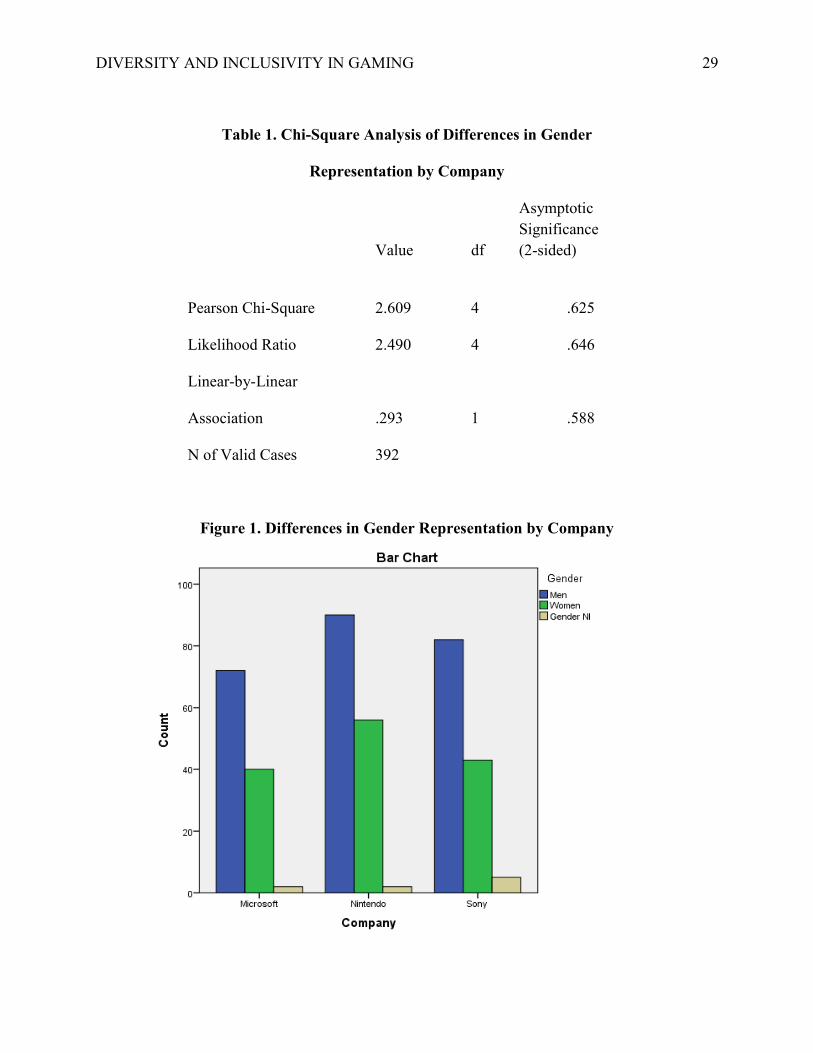
Running a chi-square analysis on the representation of gender across the three companies
revealed that while men were disproportionately overrepresented, there was no statistically
significant difference, χ2(4) = 2.609 p =.625, in the gendered representation from one company to
another (Table 1). In other words, all three companies overrepresented men at a similar rate. In
this category, 70 ads were examined with a total of 392 characters. A bar chart illustrating these
data can be seen in Figure 1.
DIVERSITY AND INCLUSIVITY IN GAMING 29
Table 1. Chi-Square Analysis of Differences in Gender
Representation by Company
Asymptotic Significance Value df (2-sided)
Pearson Chi-Square 2.609 4 .625
Likelihood Ratio 2.490 4 .646
Linear-by-Linear
Association .293 1 .588
N of Valid Cases 392
Figure 1. Differences in Gender Representation by Company
DIVERSITY AND INCLUSIVITY IN GAMING 30
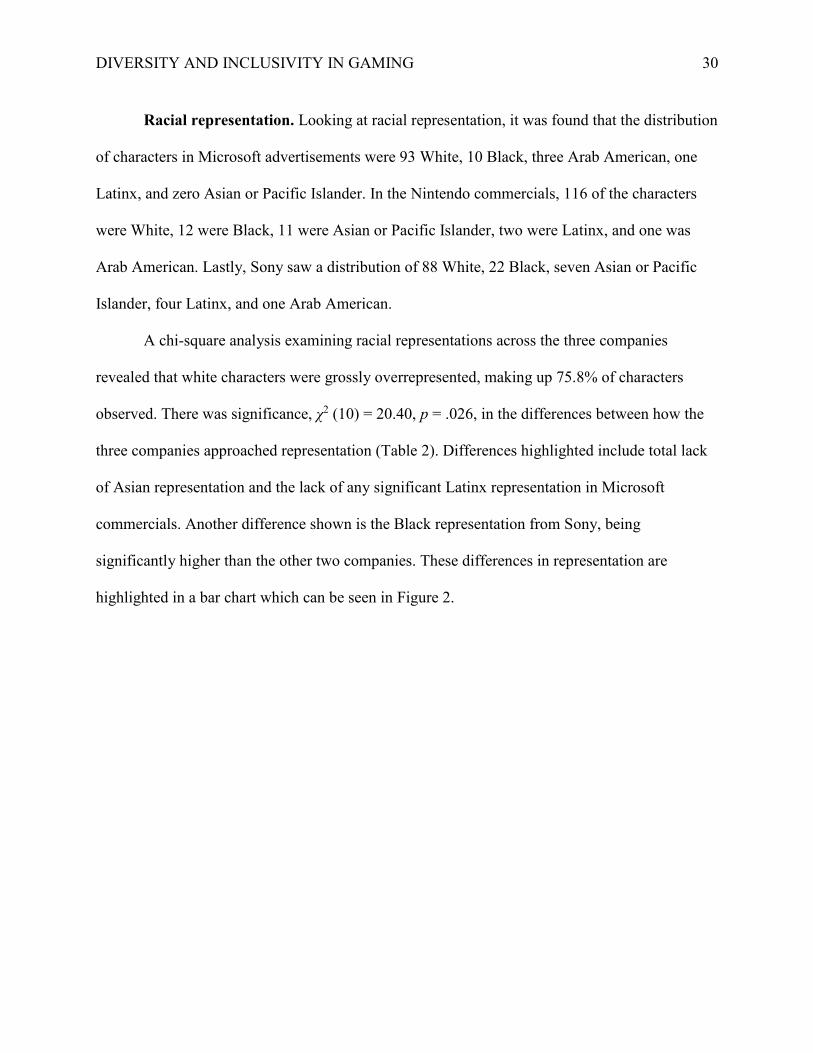
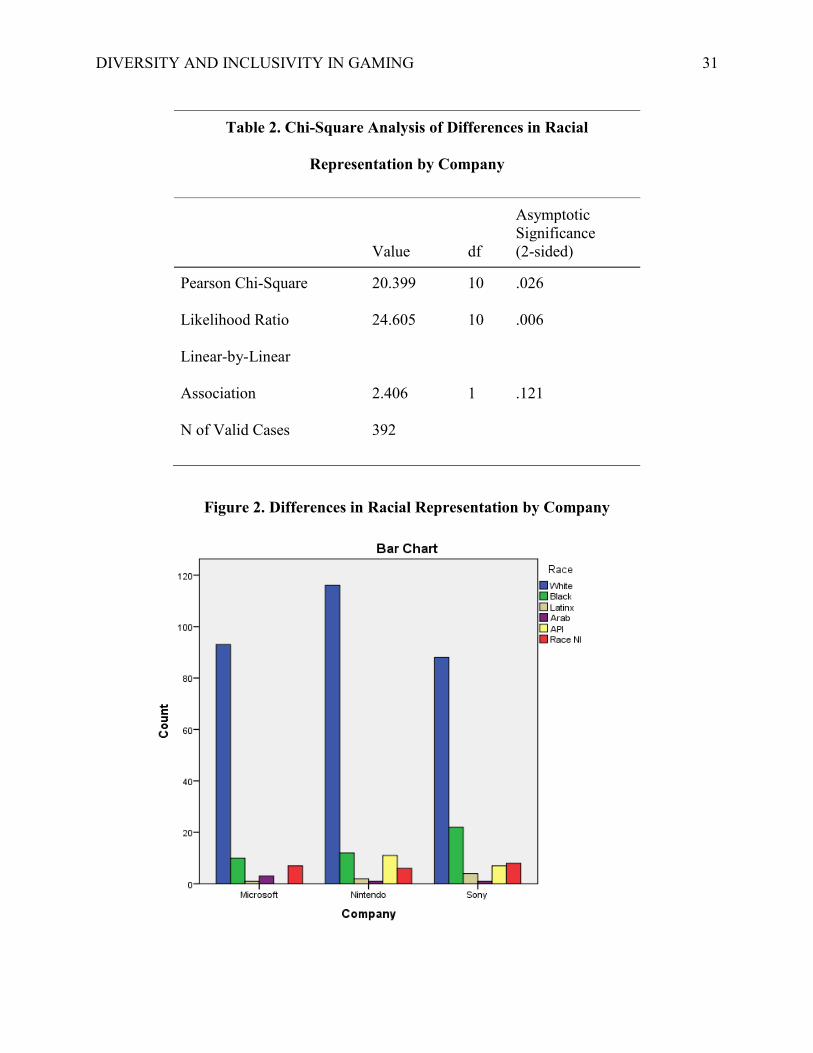
Racial representation. Looking at racial representation, it was found that the distribution
of characters in Microsoft advertisements were 93 White, 10 Black, three Arab American, one
Latinx, and zero Asian or Pacific Islander. In the Nintendo commercials, 116 of the characters
were White, 12 were Black, 11 were Asian or Pacific Islander, two were Latinx, and one was
Arab American. Lastly, Sony saw a distribution of 88 White, 22 Black, seven Asian or Pacific
Islander, four Latinx, and one Arab American.
A chi-square analysis examining racial representations across the three companies
revealed that white characters were grossly overrepresented, making up 75.8% of characters
observed. There was significance, χ2 (10) = 20.40, p = .026, in the differences between how the
three companies approached representation (Table 2). Differences highlighted include total lack
of Asian representation and the lack of any significant Latinx representation in Microsoft
commercials. Another difference shown is the Black representation from Sony, being
significantly higher than the other two companies. These differences in representation are
highlighted in a bar chart which can be seen in Figure 2.
DIVERSITY AND INCLUSIVITY IN GAMING 31
Table 2. Chi-Square Analysis of Differences in Racial
Representation by Company
Asymptotic Significance Value df (2-sided)
Pearson Chi-Square 20.399 10 .026
Likelihood Ratio 24.605 10 .006
Linear-by-Linear
Association 2.406 1 .121
N of Valid Cases 392
Figure 2. Differences in Racial Representation by Company
DIVERSITY AND INCLUSIVITY IN GAMING 32
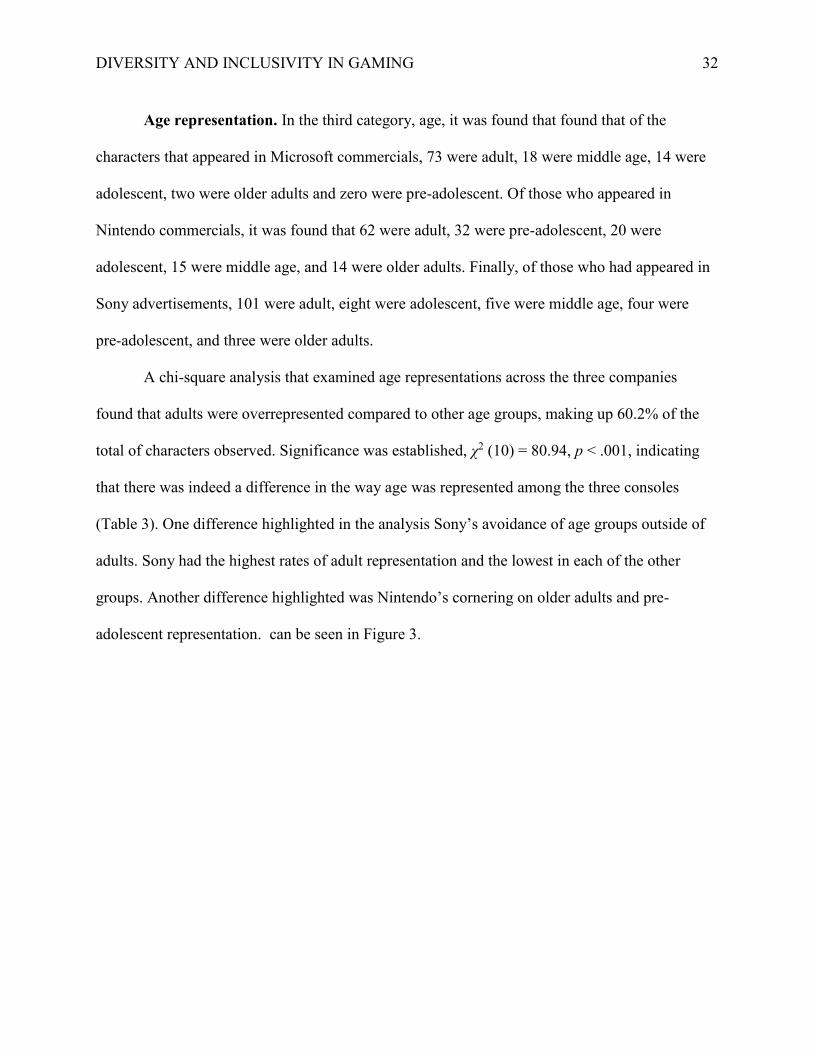
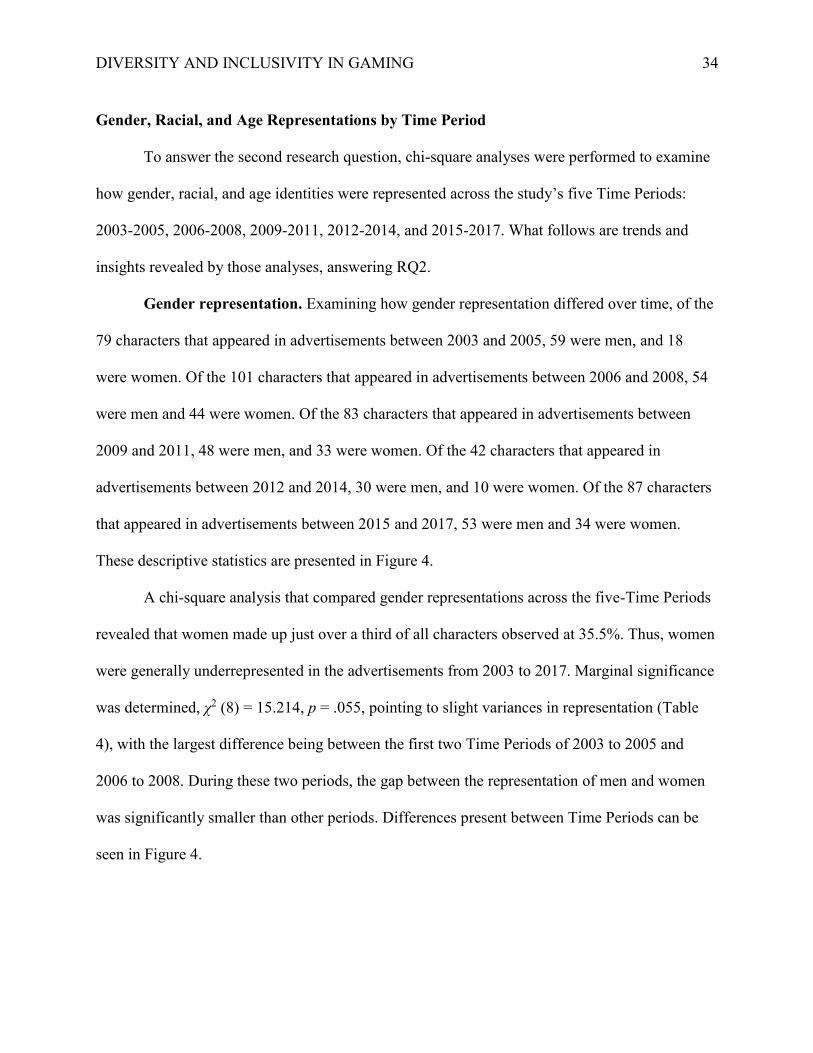
Age representation. In the third category, age, it was found that found that of the
characters that appeared in Microsoft commercials, 73 were adult, 18 were middle age, 14 were
adolescent, two were older adults and zero were pre-adolescent. Of those who appeared in
Nintendo commercials, it was found that 62 were adult, 32 were pre-adolescent, 20 were
adolescent, 15 were middle age, and 14 were older adults. Finally, of those who had appeared in
Sony advertisements, 101 were adult, eight were adolescent, five were middle age, four were
pre-adolescent, and three were older adults.
A chi-square analysis that examined age representations across the three companies
found that adults were overrepresented compared to other age groups, making up 60.2% of the
total of characters observed. Significance was established, χ2 (10) = 80.94, p < .001, indicating
that there was indeed a difference in the way age was represented among the three consoles
(Table 3). One difference highlighted in the analysis Sony’s avoidance of age groups outside of
adults. Sony had the highest rates of adult representation and the lowest in each of the other
groups. Another difference highlighted was Nintendo’s cornering on older adults and pre-
adolescent representation. can be seen in Figure 3.
DIVERSITY AND INCLUSIVITY IN GAMING 33
Table 3. Chi-Square Analysis of Differences in Age
Representations by Company
Asymptotic Significance Value df (2-sided)
Pearson Chi-Square 80.940 10 .000
Likelihood Ratio 87.613 10 .000
Linear-by-Linear
Association .212 1 .645
N of Valid Cases 392
Figure 3. Differences in Age Representation by Company
DIVERSITY AND INCLUSIVITY IN GAMING 34
Gender, Racial, and Age Representations by Time Period
To answer the second research question, chi-square analyses were performed to examine
how gender, racial, and age identities were represented across the study’s five Time Periods:
2003-2005, 2006-2008, 2009-2011, 2012-2014, and 2015-2017. What follows are trends and
insights revealed by those analyses, answering RQ2.
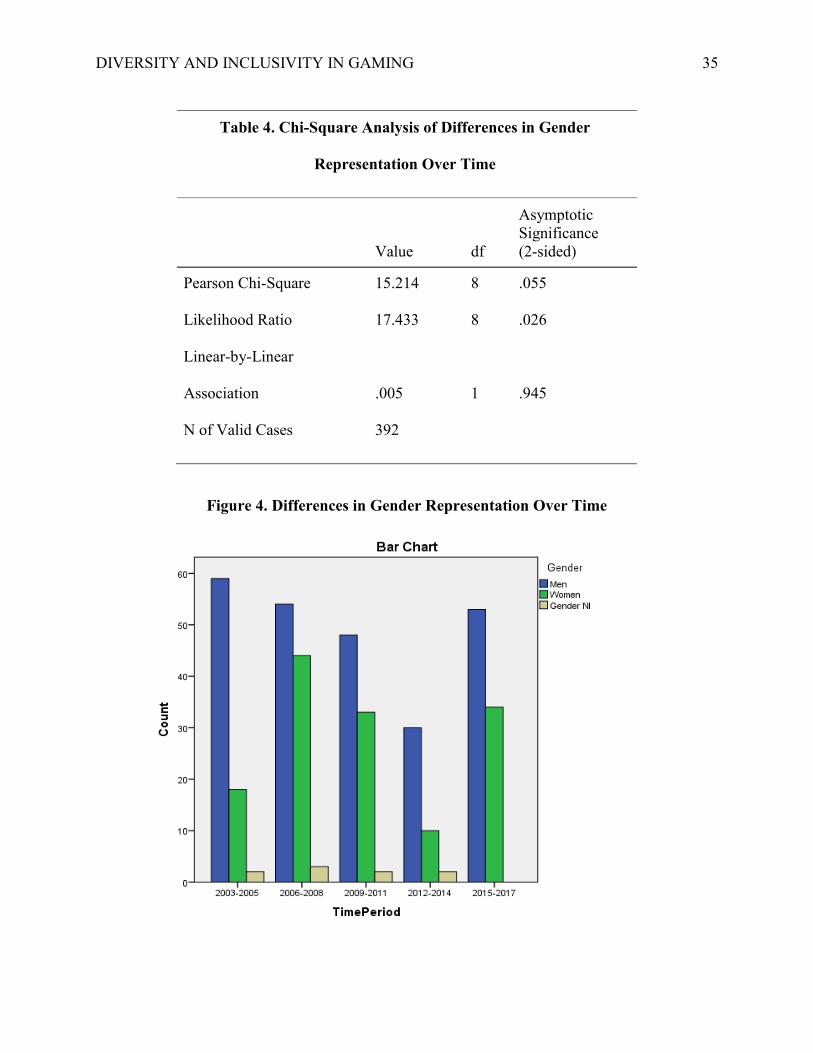
Gender representation. Examining how gender representation differed over time, of the
79 characters that appeared in advertisements between 2003 and 2005, 59 were men, and 18
were women. Of the 101 characters that appeared in advertisements between 2006 and 2008, 54
were men and 44 were women. Of the 83 characters that appeared in advertisements between
2009 and 2011, 48 were men, and 33 were women. Of the 42 characters that appeared in
advertisements between 2012 and 2014, 30 were men, and 10 were women. Of the 87 characters
that appeared in advertisements between 2015 and 2017, 53 were men and 34 were women.
These descriptive statistics are presented in Figure 4.
A chi-square analysis that compared gender representations across the five-Time Periods
revealed that women made up just over a third of all characters observed at 35.5%. Thus, women
were generally underrepresented in the advertisements from 2003 to 2017. Marginal significance
was determined, χ2 (8) = 15.214, p = .055, pointing to slight variances in representation (Table
4), with the largest difference being between the first two Time Periods of 2003 to 2005 and
2006 to 2008. During these two periods, the gap between the representation of men and women
was significantly smaller than other periods. Differences present between Time Periods can be
seen in Figure 4.
DIVERSITY AND INCLUSIVITY IN GAMING 35
Table 4. Chi-Square Analysis of Differences in Gender
Representation Over Time
Asymptotic Significance Value df (2-sided)
Pearson Chi-Square 15.214 8 .055
Likelihood Ratio 17.433 8 .026
Linear-by-Linear
Association .005 1 .945
N of Valid Cases 392
Figure 4. Differences in Gender Representation Over Time
DIVERSITY AND INCLUSIVITY IN GAMING 36
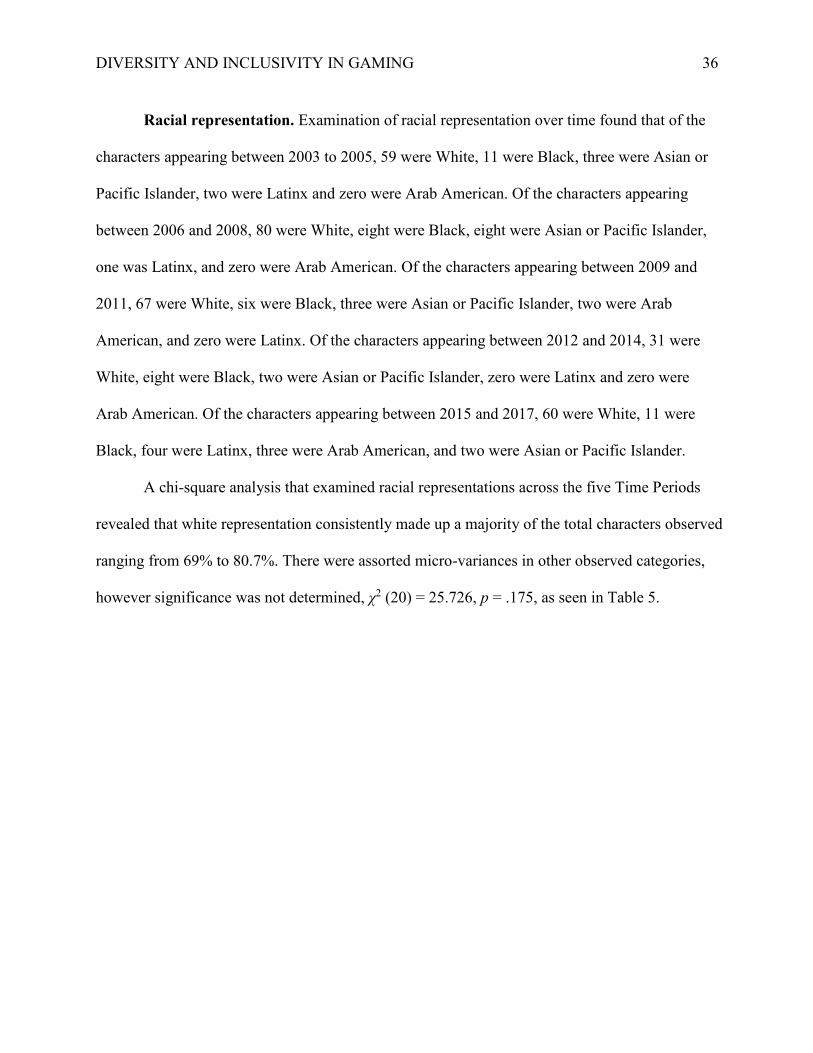
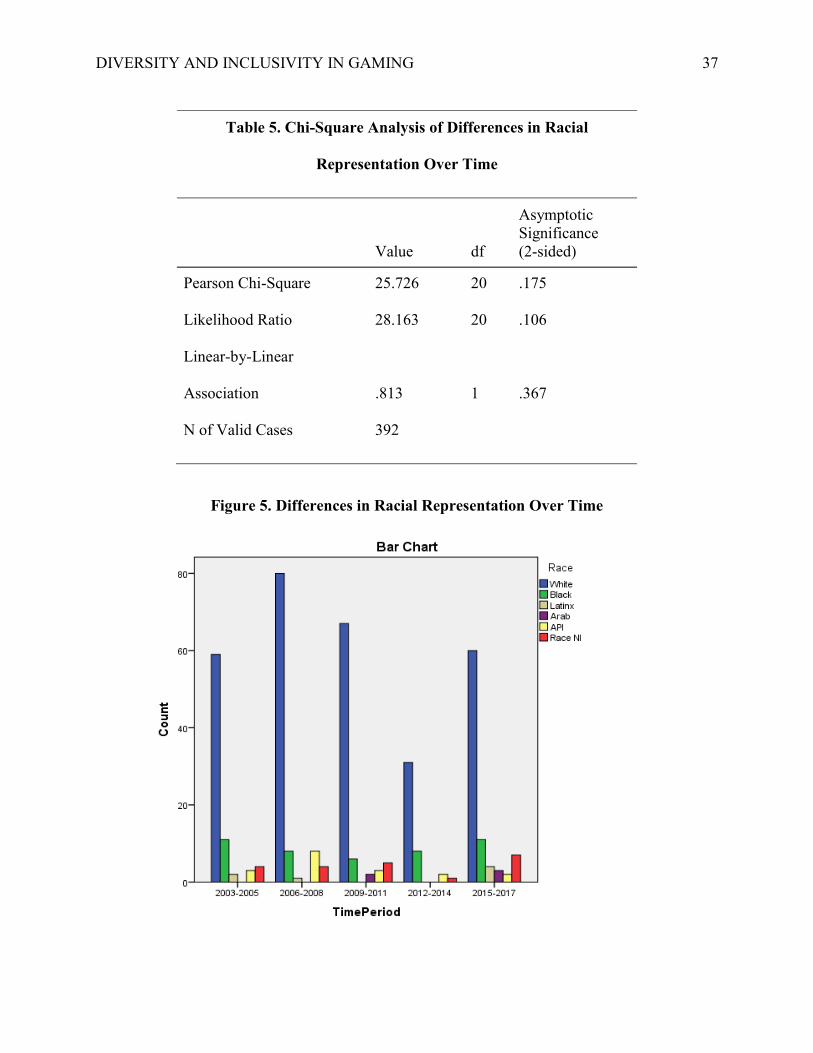
Racial representation. Examination of racial representation over time found that of the
characters appearing between 2003 to 2005, 59 were White, 11 were Black, three were Asian or
Pacific Islander, two were Latinx and zero were Arab American. Of the characters appearing
between 2006 and 2008, 80 were White, eight were Black, eight were Asian or Pacific Islander,
one was Latinx, and zero were Arab American. Of the characters appearing between 2009 and
2011, 67 were White, six were Black, three were Asian or Pacific Islander, two were Arab
American, and zero were Latinx. Of the characters appearing between 2012 and 2014, 31 were
White, eight were Black, two were Asian or Pacific Islander, zero were Latinx and zero were
Arab American. Of the characters appearing between 2015 and 2017, 60 were White, 11 were
Black, four were Latinx, three were Arab American, and two were Asian or Pacific Islander.
A chi-square analysis that examined racial representations across the five Time Periods
revealed that white representation consistently made up a majority of the total characters observed
ranging from 69% to 80.7%. There were assorted micro-variances in other observed categories,
however significance was not determined, χ2 (20) = 25.726, p = .175, as seen in Table 5.
DIVERSITY AND INCLUSIVITY IN GAMING 37
Table 5. Chi-Square Analysis of Differences in Racial
Representation Over Time
Asymptotic Significance Value df (2-sided)
Pearson Chi-Square 25.726 20 .175
Likelihood Ratio 28.163 20 .106
Linear-by-Linear
Association .813 1 .367
N of Valid Cases 392
Figure 5. Differences in Racial Representation Over Time
DIVERSITY AND INCLUSIVITY IN GAMING 38
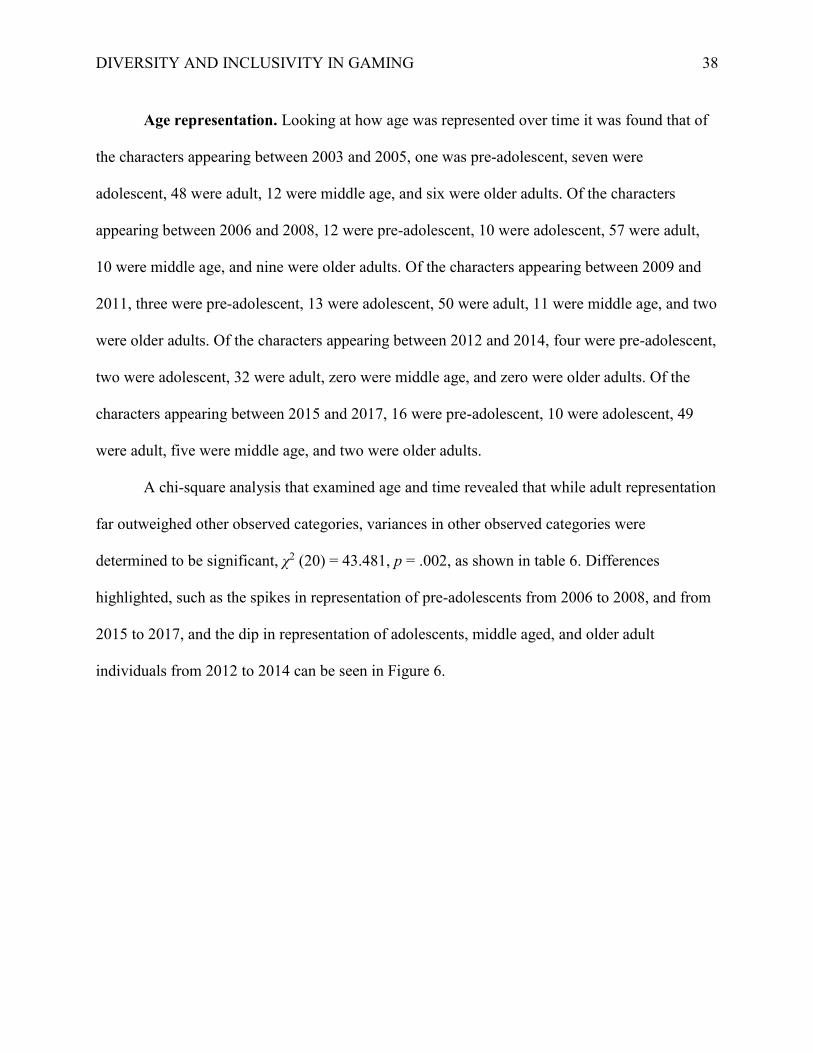
Age representation. Looking at how age was represented over time it was found that of
the characters appearing between 2003 and 2005, one was pre-adolescent, seven were
adolescent, 48 were adult, 12 were middle age, and six were older adults. Of the characters
appearing between 2006 and 2008, 12 were pre-adolescent, 10 were adolescent, 57 were adult,
10 were middle age, and nine were older adults. Of the characters appearing between 2009 and
2011, three were pre-adolescent, 13 were adolescent, 50 were adult, 11 were middle age, and two
were older adults. Of the characters appearing between 2012 and 2014, four were pre-adolescent,
two were adolescent, 32 were adult, zero were middle age, and zero were older adults. Of the
characters appearing between 2015 and 2017, 16 were pre-adolescent, 10 were adolescent, 49
were adult, five were middle age, and two were older adults.
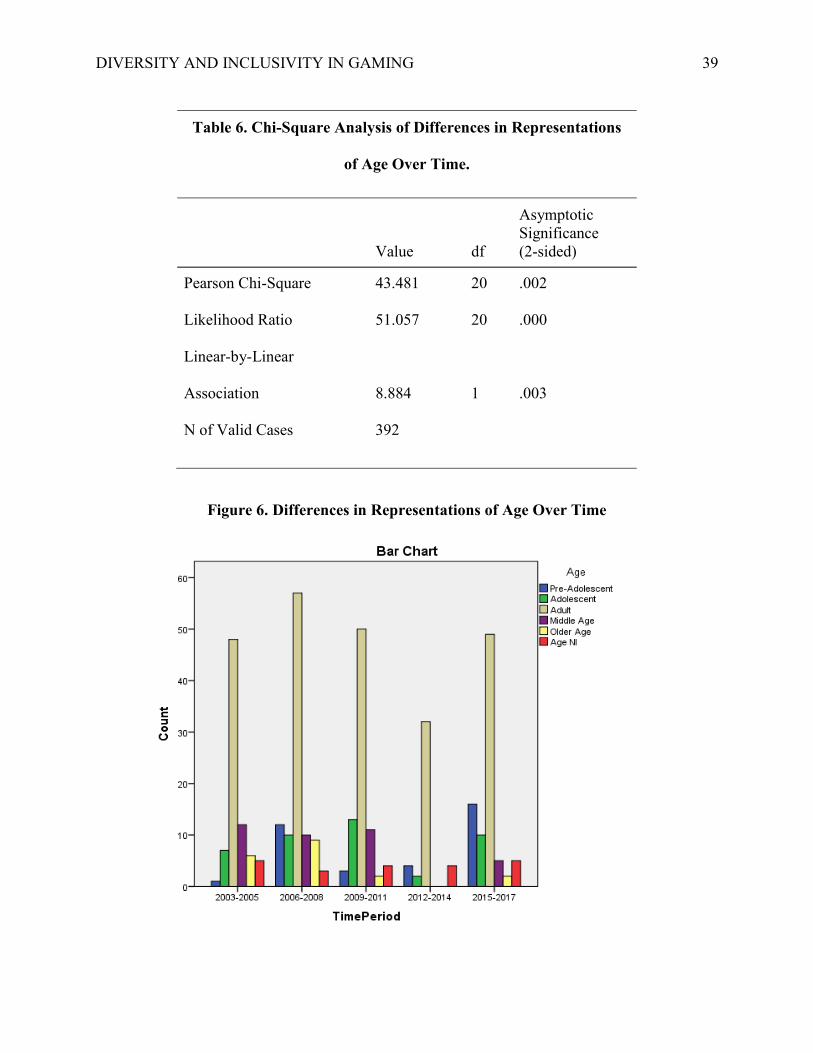
A chi-square analysis that examined age and time revealed that while adult representation
far outweighed other observed categories, variances in other observed categories were
determined to be significant, χ2 (20) = 43.481, p = .002, as shown in table 6. Differences
highlighted, such as the spikes in representation of pre-adolescents from 2006 to 2008, and from
2015 to 2017, and the dip in representation of adolescents, middle aged, and older adult
individuals from 2012 to 2014 can be seen in Figure 6.
DIVERSITY AND INCLUSIVITY IN GAMING 39
Table 6. Chi-Square Analysis of Differences in Representations
of Age Over Time.
Asymptotic Significance Value df (2-sided)
Pearson Chi-Square 43.481 20 .002
Likelihood Ratio 51.057 20 .000
Linear-by-Linear
Association 8.884 1 .003
N of Valid Cases 392
Figure 6. Differences in Representations of Age Over Time
DIVERSITY AND INCLUSIVITY IN GAMING 40
Gender, Racial, Age Representations by Company Over Five Time Periods
To answer the third research question, a series of chi-square analyses were run to
examine data points at the intersections of gender, racial, and age representation with each of the
three companies over the five Time Periods; 2003 to 2005, 2006 to 2008, 2009 to 2011, 2012 to
2014, and 2015 to 2017. What follows are trends and insights revealed by those analyses,
answering RQ3.
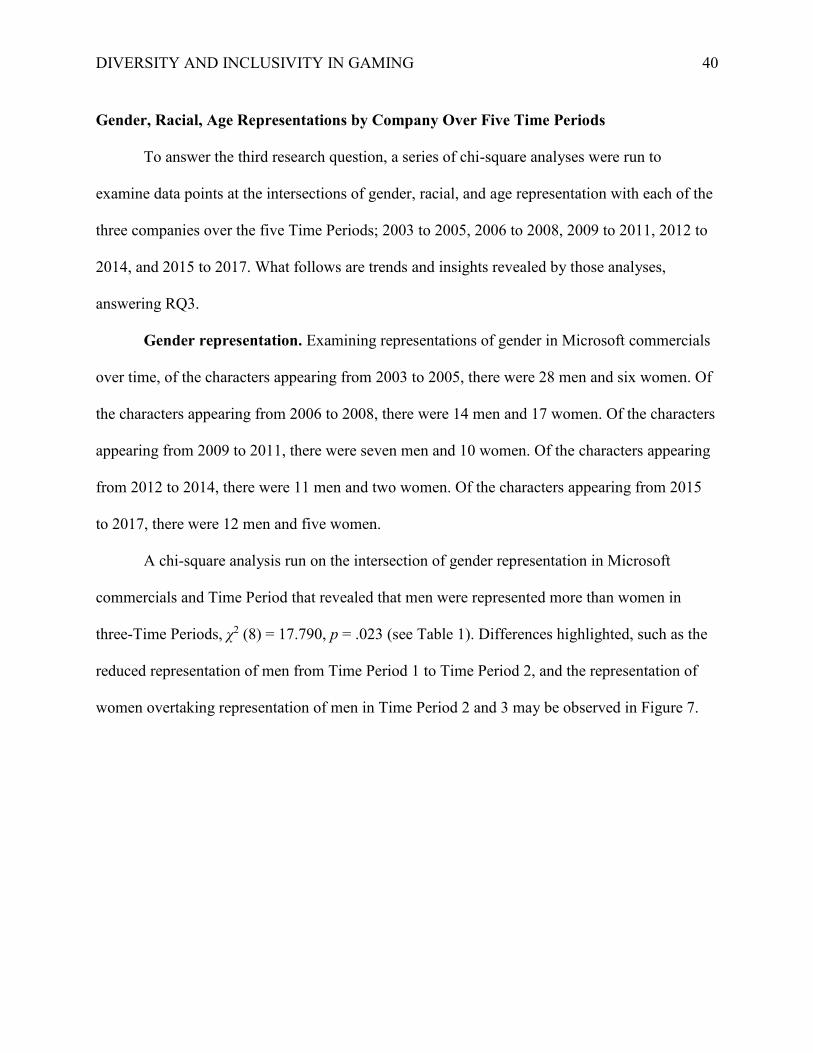
Gender representation. Examining representations of gender in Microsoft commercials
over time, of the characters appearing from 2003 to 2005, there were 28 men and six women. Of
the characters appearing from 2006 to 2008, there were 14 men and 17 women. Of the characters
appearing from 2009 to 2011, there were seven men and 10 women. Of the characters appearing
from 2012 to 2014, there were 11 men and two women. Of the characters appearing from 2015
to 2017, there were 12 men and five women.
A chi-square analysis run on the intersection of gender representation in Microsoft
commercials and Time Period that revealed that men were represented more than women in
three-Time Periods, χ2 (8) = 17.790, p = .023 (see Table 1). Differences highlighted, such as the
reduced representation of men from Time Period 1 to Time Period 2, and the representation of
women overtaking representation of men in Time Period 2 and 3 may be observed in Figure 7.
DIVERSITY AND INCLUSIVITY IN GAMING 41
Table 7. Chi-Square Analysis of Differences in
Representations of Gender by Microsoft Over Time
Asymptotic Significance Value df (2-sided) Pearson Chi-Square 17.790 8 .023
Likelihood Ratio 18.982 8 .015
Linear-by-Linear
Association .183 1 .668
N of Valid Cases 114
Figure 7. Differences in Representations of Gender by Microsoft Over Time
DIVERSITY AND INCLUSIVITY IN GAMING 42
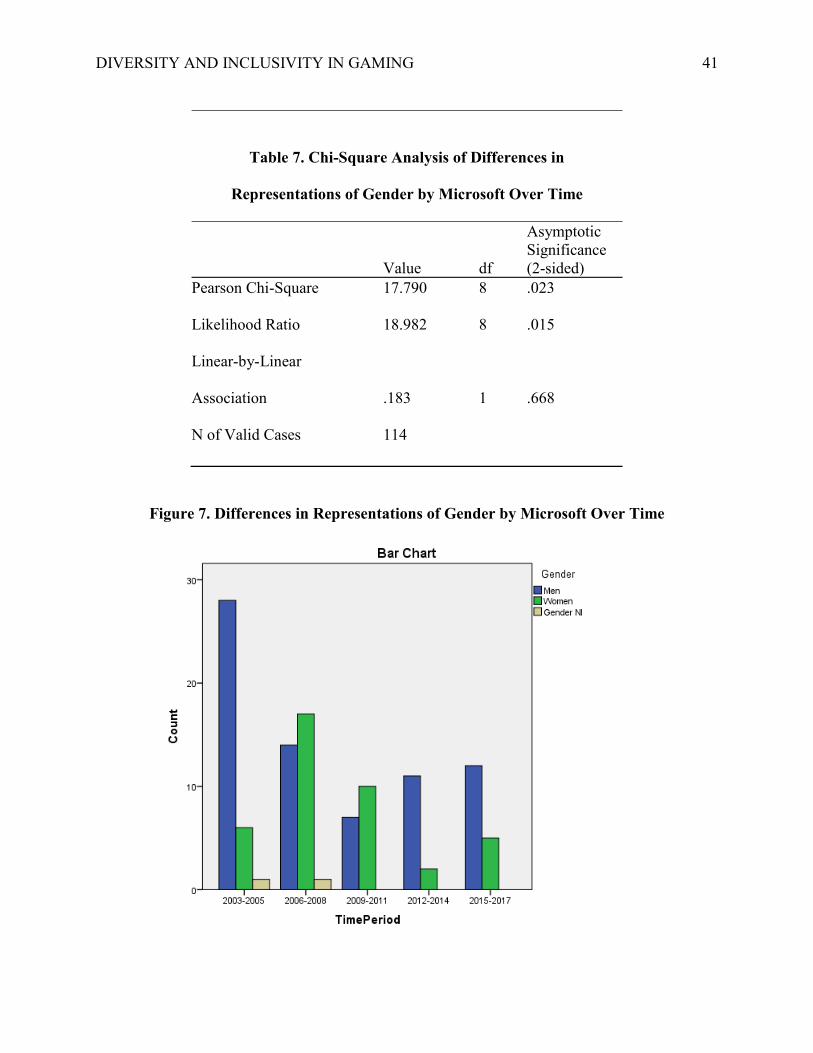
Examining representations of gender in Nintendo commercials over time, of the
characters appearing from 2003 to 2005 the distribution was eight men and two women. Of the
characters appearing between 2006 and 2008, the distribution was 34 men and 21 women. Of the
characters appearing between 2009 and 2011, the distribution was 18 men and nine women. Of
the characters appearing between 2012 and 2014, the distribution was nine men and six women.
Of the characters appearing between 2015 and 2017 the distribution was 21 men and 18 women.
A chi-square analysis that examined the gender representation in Nintendo commercials
and Time Period revealed no significance, χ2 (8) = 12.119, p = .146, as seen in Table 8
immediately below. Following Table 8, the data analysis is detailed in Figure 8.
Table 8. Chi-Square Analysis of Differences in
Representations of Gender by Nintendo Over Time
Asymptotic Significance Value df (2-sided)
Pearson Chi-Square 12.119 8 .146
Likelihood Ratio 9.865 8 .275
Linear-by-Linear
Association .538 1 .463
N of Valid Cases 148
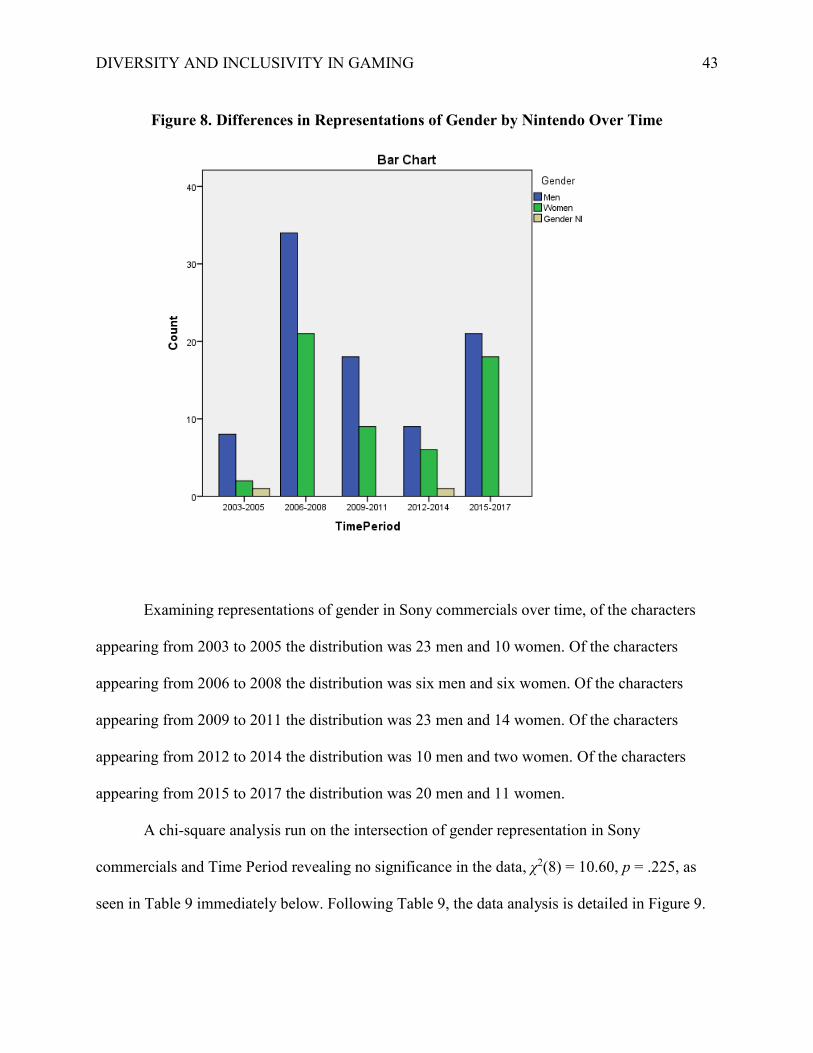
DIVERSITY AND INCLUSIVITY IN GAMING 43
Figure 8. Differences in Representations of Gender by Nintendo Over Time
Examining representations of gender in Sony commercials over time, of the characters
appearing from 2003 to 2005 the distribution was 23 men and 10 women. Of the characters
appearing from 2006 to 2008 the distribution was six men and six women. Of the characters
appearing from 2009 to 2011 the distribution was 23 men and 14 women. Of the characters
appearing from 2012 to 2014 the distribution was 10 men and two women. Of the characters
appearing from 2015 to 2017 the distribution was 20 men and 11 women.
A chi-square analysis run on the intersection of gender representation in Sony
commercials and Time Period revealing no significance in the data, χ2(8) = 10.60, p = .225, as
seen in Table 9 immediately below. Following Table 9, the data analysis is detailed in Figure 9.
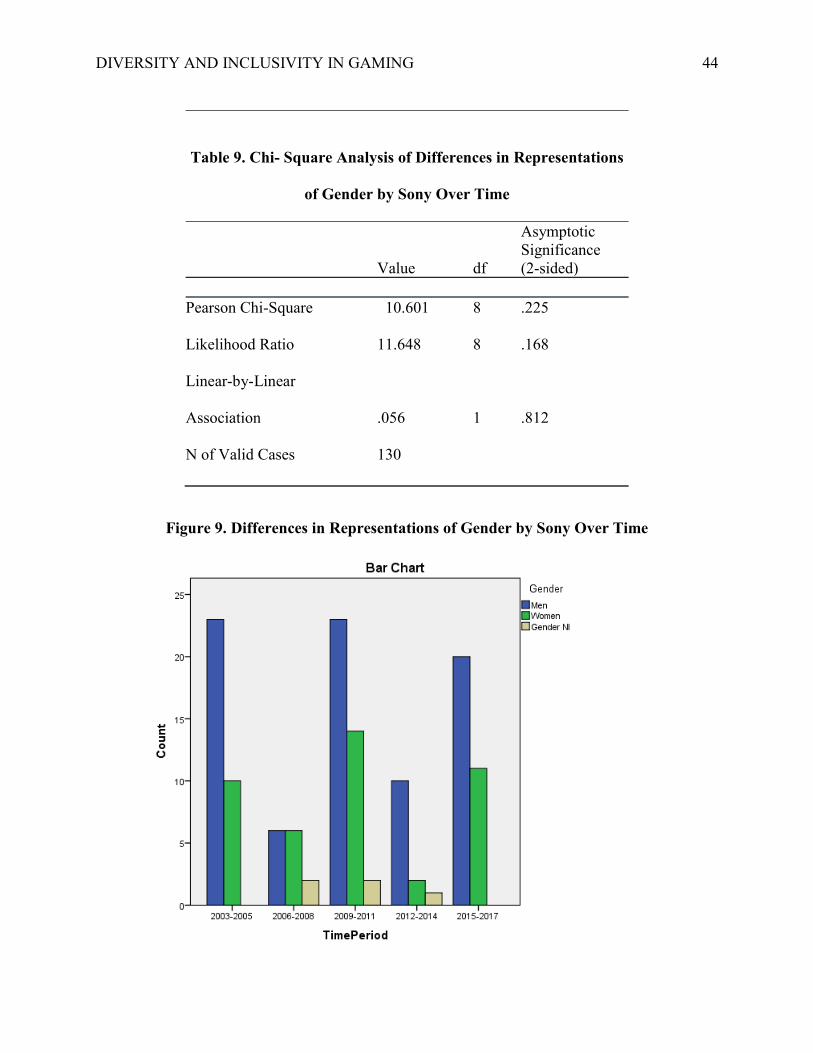
DIVERSITY AND INCLUSIVITY IN GAMING 44
Table 9. Chi- Square Analysis of Differences in Representations
of Gender by Sony Over Time
Asymptotic Significance Value df (2-sided) Pearson Chi-Square 10.601 8 .225
Likelihood Ratio 11.648 8 .168
Linear-by-Linear
Association .056 1 .812
N of Valid Cases 130
Figure 9. Differences in Representations of Gender by Sony Over Time
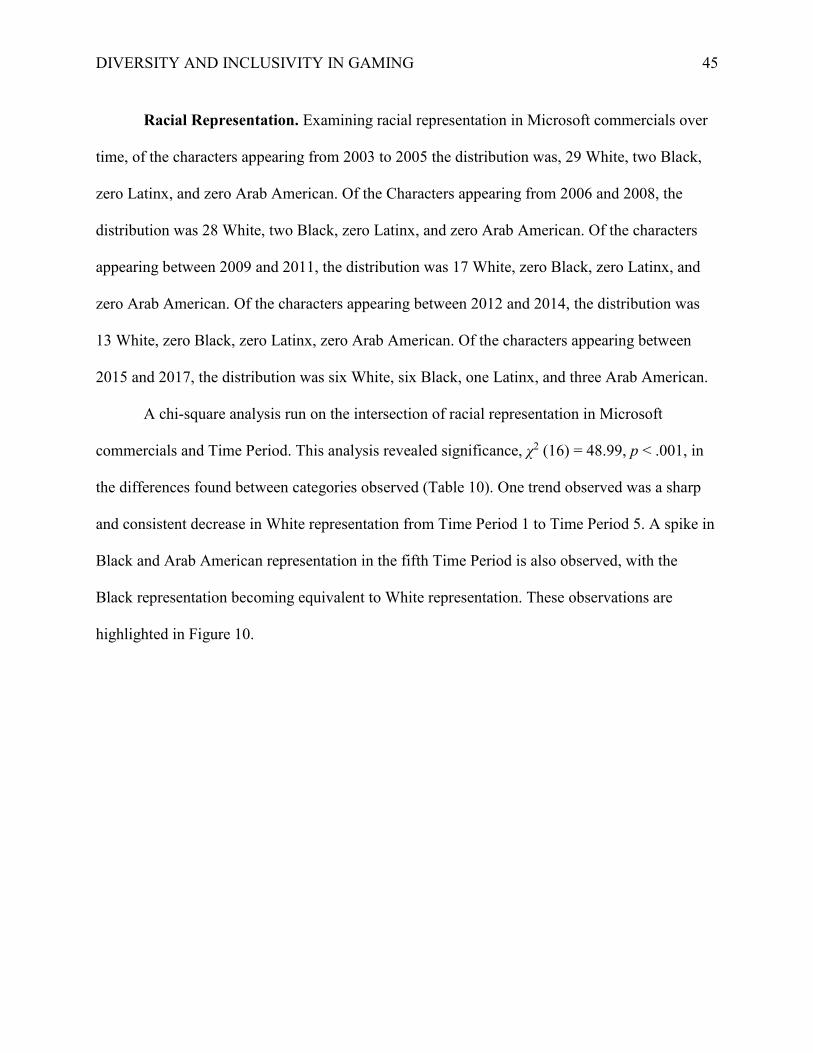
DIVERSITY AND INCLUSIVITY IN GAMING 45
Racial Representation. Examining racial representation in Microsoft commercials over
time, of the characters appearing from 2003 to 2005 the distribution was, 29 White, two Black,
zero Latinx, and zero Arab American. Of the Characters appearing from 2006 and 2008, the
distribution was 28 White, two Black, zero Latinx, and zero Arab American. Of the characters
appearing between 2009 and 2011, the distribution was 17 White, zero Black, zero Latinx, and
zero Arab American. Of the characters appearing between 2012 and 2014, the distribution was
13 White, zero Black, zero Latinx, zero Arab American. Of the characters appearing between
2015 and 2017, the distribution was six White, six Black, one Latinx, and three Arab American.
A chi-square analysis run on the intersection of racial representation in Microsoft
commercials and Time Period. This analysis revealed significance, χ2 (16) = 48.99, p < .001, in
the differences found between categories observed (Table 10). One trend observed was a sharp
and consistent decrease in White representation from Time Period 1 to Time Period 5. A spike in
Black and Arab American representation in the fifth Time Period is also observed, with the
Black representation becoming equivalent to White representation. These observations are
highlighted in Figure 10.
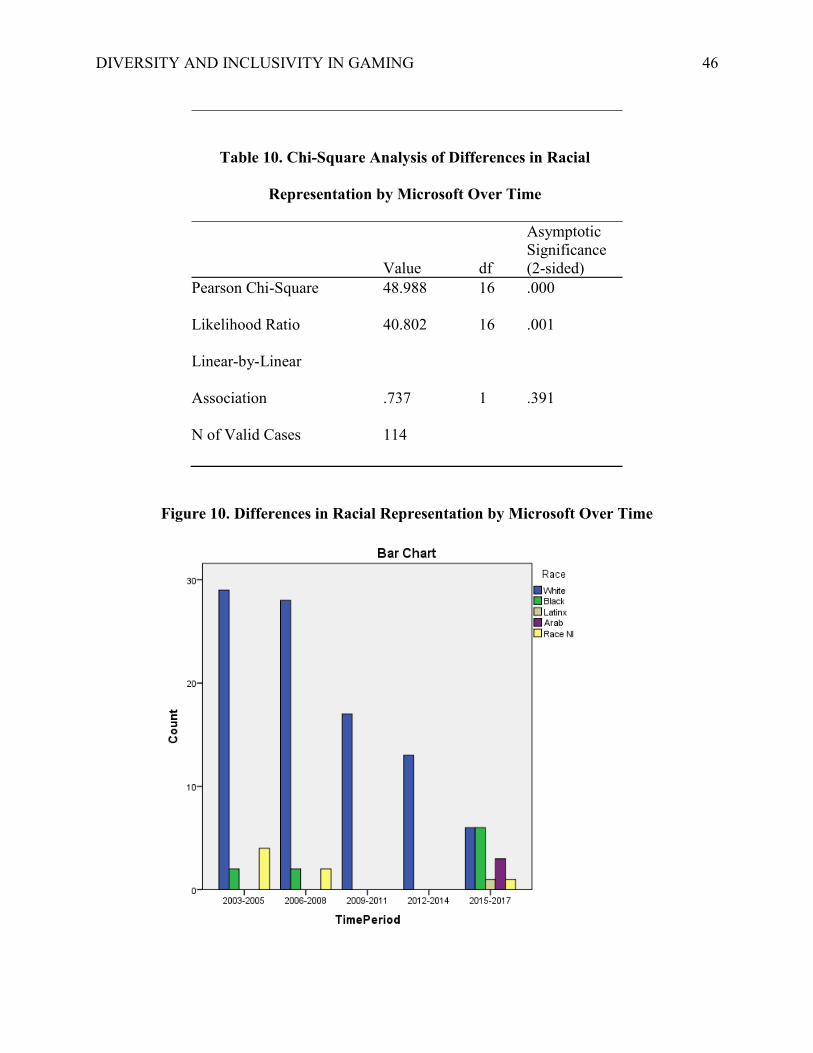
DIVERSITY AND INCLUSIVITY IN GAMING 46
Table 10. Chi-Square Analysis of Differences in Racial
Representation by Microsoft Over Time
Asymptotic Significance Value df (2-sided) Pearson Chi-Square 48.988 16 .000
Likelihood Ratio 40.802 16 .001
Linear-by-Linear
Association .737 1 .391
N of Valid Cases 114
Figure 10. Differences in Racial Representation by Microsoft Over Time
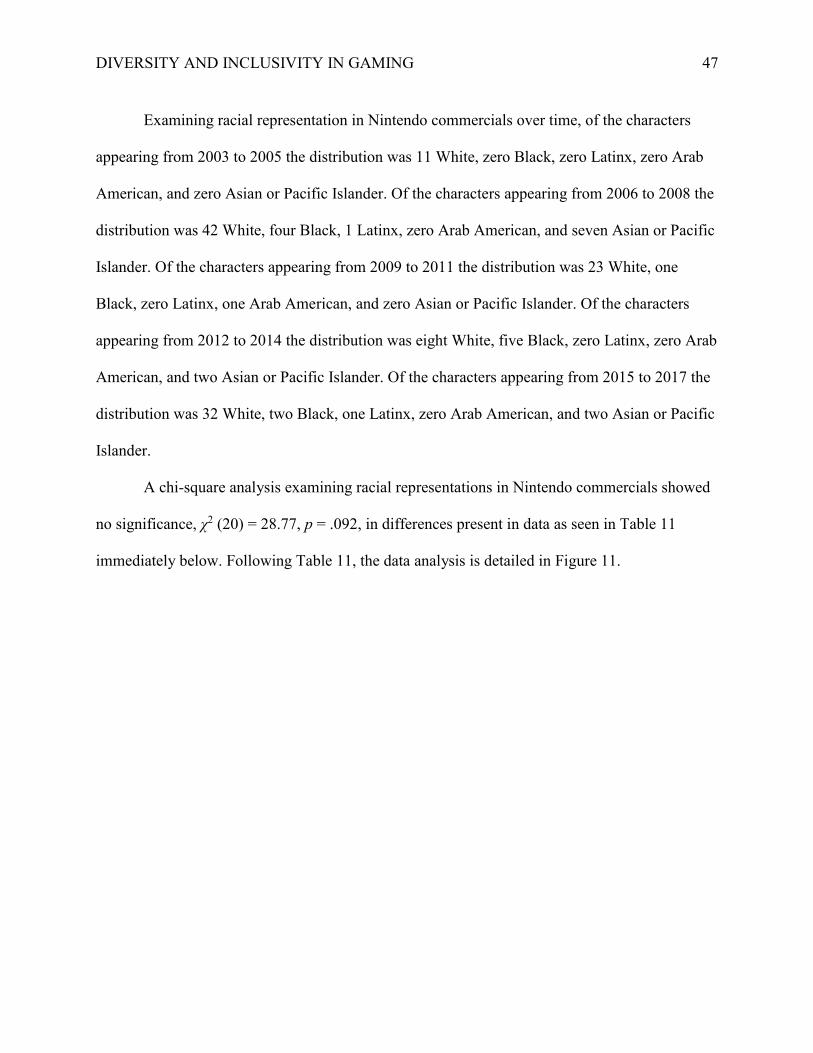
DIVERSITY AND INCLUSIVITY IN GAMING 47
Examining racial representation in Nintendo commercials over time, of the characters
appearing from 2003 to 2005 the distribution was 11 White, zero Black, zero Latinx, zero Arab
American, and zero Asian or Pacific Islander. Of the characters appearing from 2006 to 2008 the
distribution was 42 White, four Black, 1 Latinx, zero Arab American, and seven Asian or Pacific
Islander. Of the characters appearing from 2009 to 2011 the distribution was 23 White, one
Black, zero Latinx, one Arab American, and zero Asian or Pacific Islander. Of the characters
appearing from 2012 to 2014 the distribution was eight White, five Black, zero Latinx, zero Arab
American, and two Asian or Pacific Islander. Of the characters appearing from 2015 to 2017 the
distribution was 32 White, two Black, one Latinx, zero Arab American, and two Asian or Pacific
Islander.
A chi-square analysis examining racial representations in Nintendo commercials showed
no significance, χ2 (20) = 28.77, p = .092, in differences present in data as seen in Table 11
immediately below. Following Table 11, the data analysis is detailed in Figure 11.
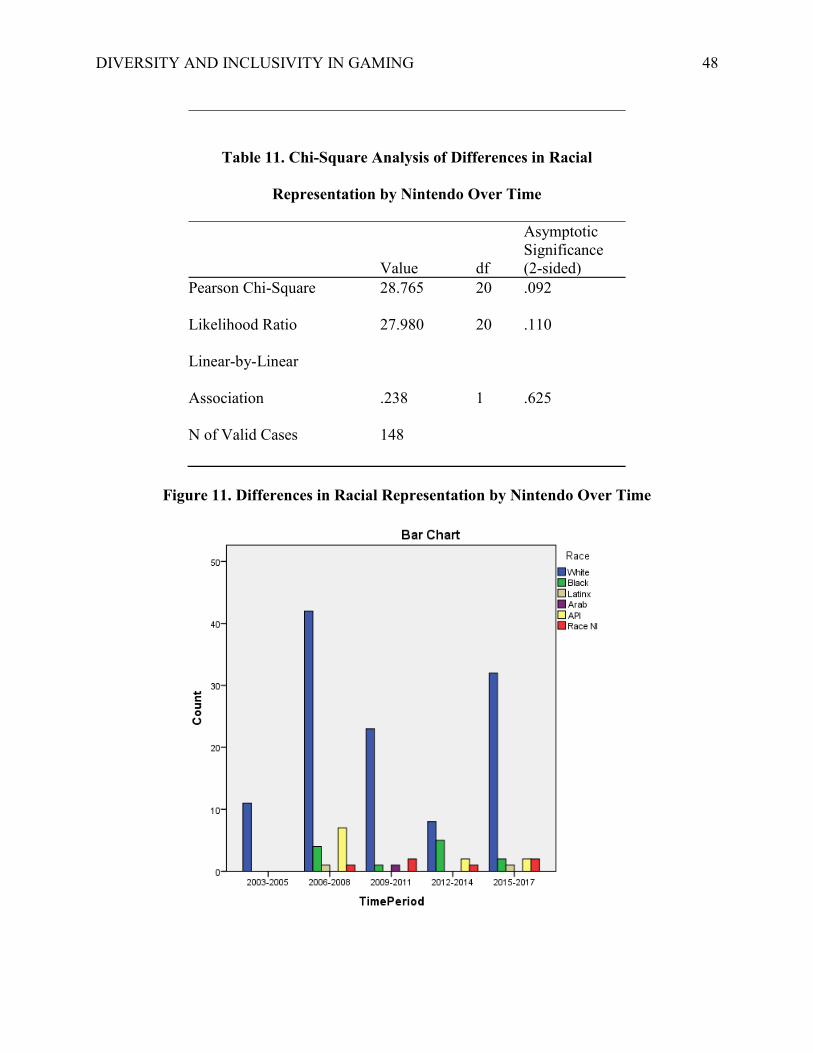
DIVERSITY AND INCLUSIVITY IN GAMING 48
Table 11. Chi-Square Analysis of Differences in Racial
Representation by Nintendo Over Time
Asymptotic Significance Value df (2-sided) Pearson Chi-Square 28.765 20 .092
Likelihood Ratio 27.980 20 .110
Linear-by-Linear
Association .238 1 .625
N of Valid Cases 148
Figure 11. Differences in Racial Representation by Nintendo Over Time
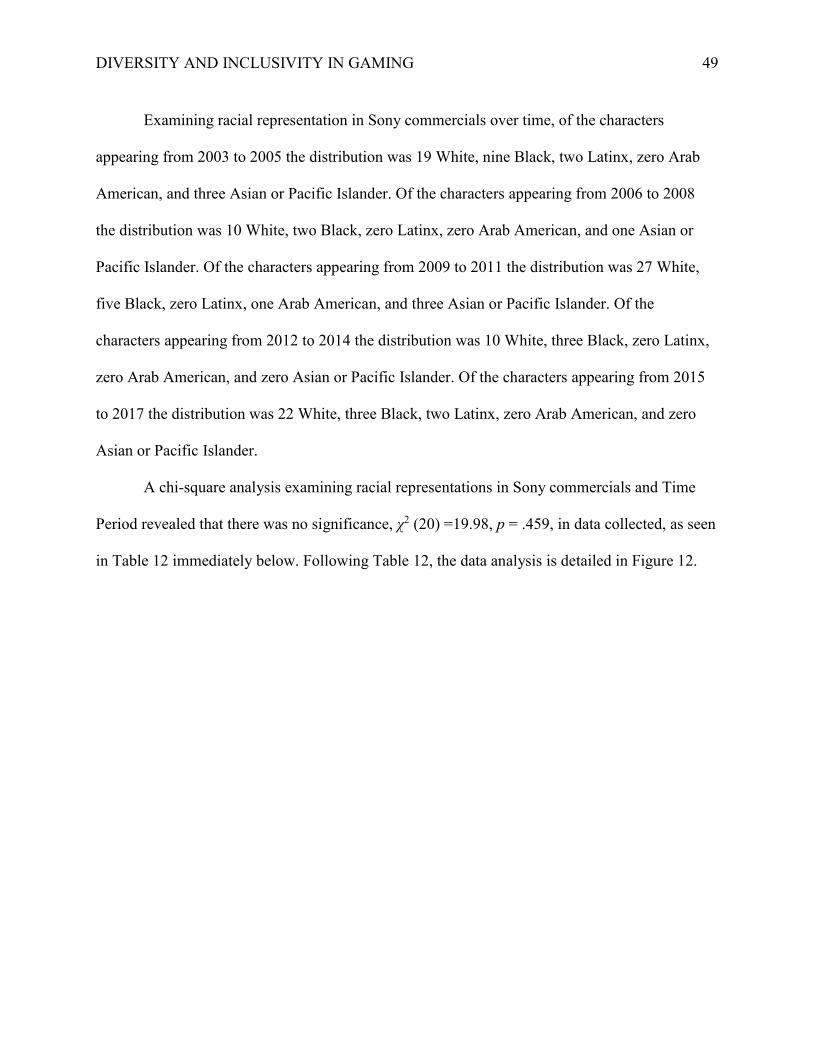
DIVERSITY AND INCLUSIVITY IN GAMING 49
Examining racial representation in Sony commercials over time, of the characters
appearing from 2003 to 2005 the distribution was 19 White, nine Black, two Latinx, zero Arab
American, and three Asian or Pacific Islander. Of the characters appearing from 2006 to 2008
the distribution was 10 White, two Black, zero Latinx, zero Arab American, and one Asian or
Pacific Islander. Of the characters appearing from 2009 to 2011 the distribution was 27 White,
five Black, zero Latinx, one Arab American, and three Asian or Pacific Islander. Of the
characters appearing from 2012 to 2014 the distribution was 10 White, three Black, zero Latinx,
zero Arab American, and zero Asian or Pacific Islander. Of the characters appearing from 2015
to 2017 the distribution was 22 White, three Black, two Latinx, zero Arab American, and zero
Asian or Pacific Islander.
A chi-square analysis examining racial representations in Sony commercials and Time
Period revealed that there was no significance, χ2 (20) =19.98, p = .459, in data collected, as seen
in Table 12 immediately below. Following Table 12, the data analysis is detailed in Figure 12.
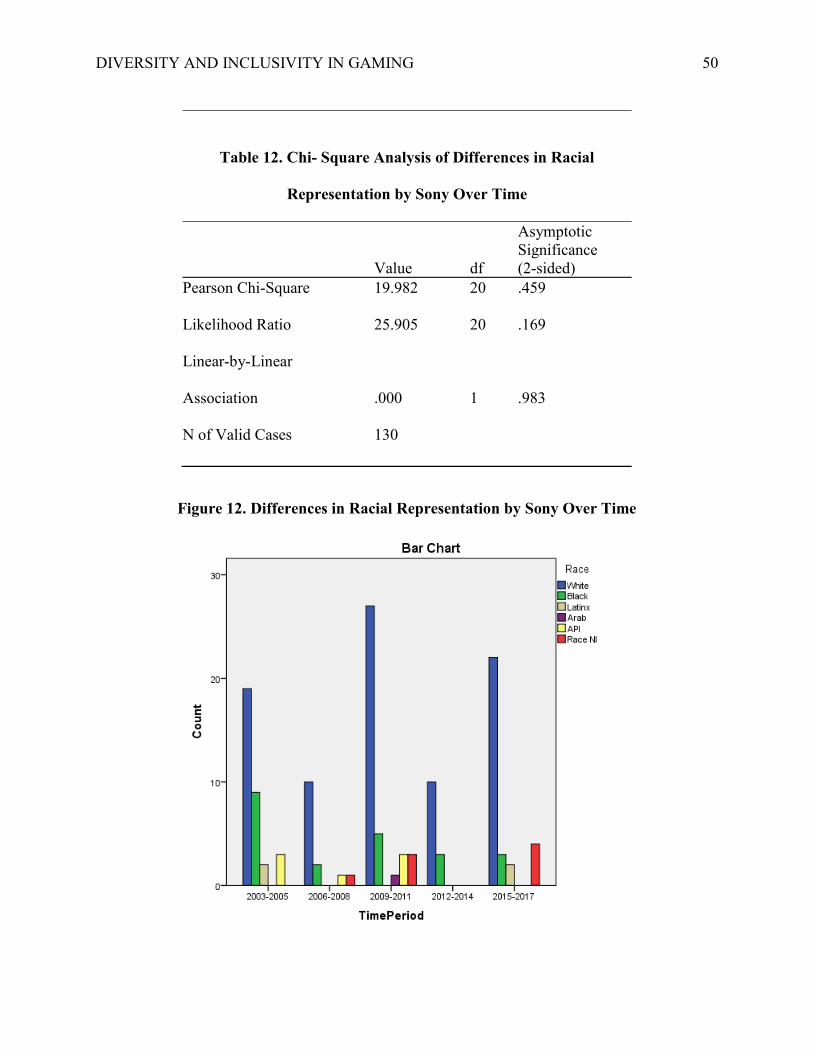
DIVERSITY AND INCLUSIVITY IN GAMING 50
Table 12. Chi- Square Analysis of Differences in Racial
Representation by Sony Over Time
Asymptotic Significance Value df (2-sided) Pearson Chi-Square 19.982 20 .459
Likelihood Ratio 25.905 20 .169
Linear-by-Linear
Association .000 1 .983
N of Valid Cases 130
Figure 12. Differences in Racial Representation by Sony Over Time
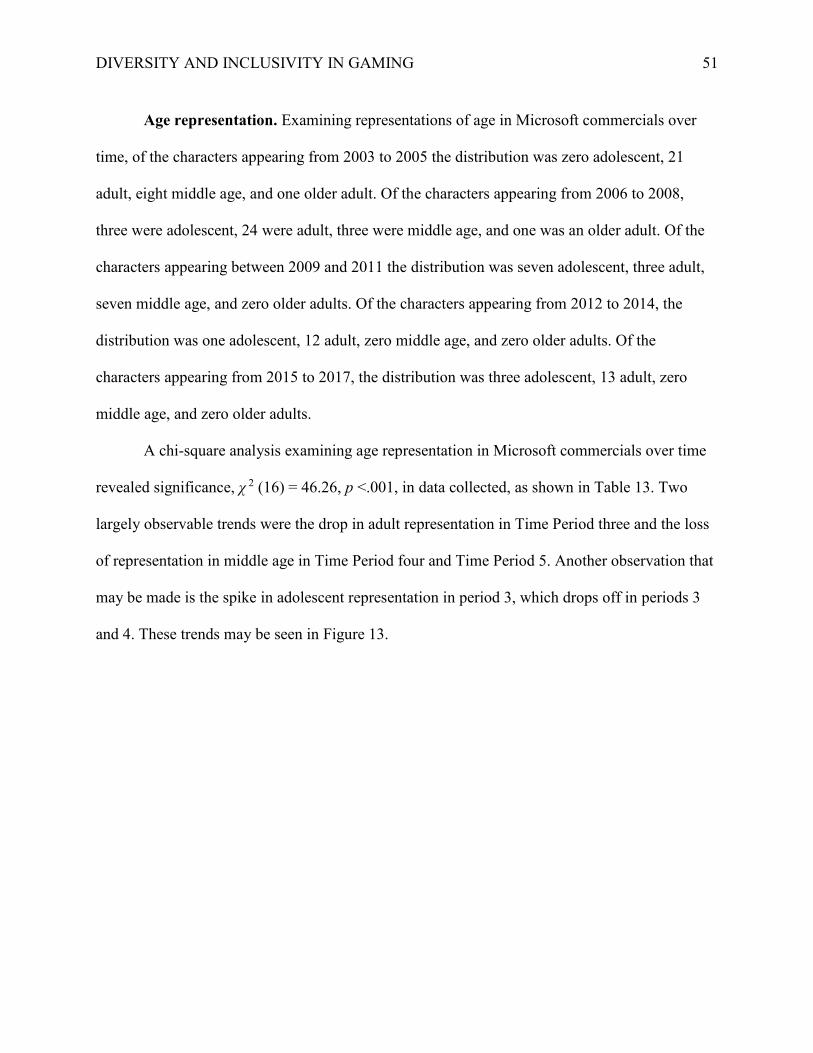
DIVERSITY AND INCLUSIVITY IN GAMING 51
Age representation. Examining representations of age in Microsoft commercials over
time, of the characters appearing from 2003 to 2005 the distribution was zero adolescent, 21
adult, eight middle age, and one older adult. Of the characters appearing from 2006 to 2008,
three were adolescent, 24 were adult, three were middle age, and one was an older adult. Of the
characters appearing between 2009 and 2011 the distribution was seven adolescent, three adult,
seven middle age, and zero older adults. Of the characters appearing from 2012 to 2014, the
distribution was one adolescent, 12 adult, zero middle age, and zero older adults. Of the
characters appearing from 2015 to 2017, the distribution was three adolescent, 13 adult, zero
middle age, and zero older adults.
A chi-square analysis examining age representation in Microsoft commercials over time
revealed significance, χ 2 (16) = 46.26, p <.001, in data collected, as shown in Table 13. Two
largely observable trends were the drop in adult representation in Time Period three and the loss
of representation in middle age in Time Period four and Time Period 5. Another observation that
may be made is the spike in adolescent representation in period 3, which drops off in periods 3
and 4. These trends may be seen in Figure 13.
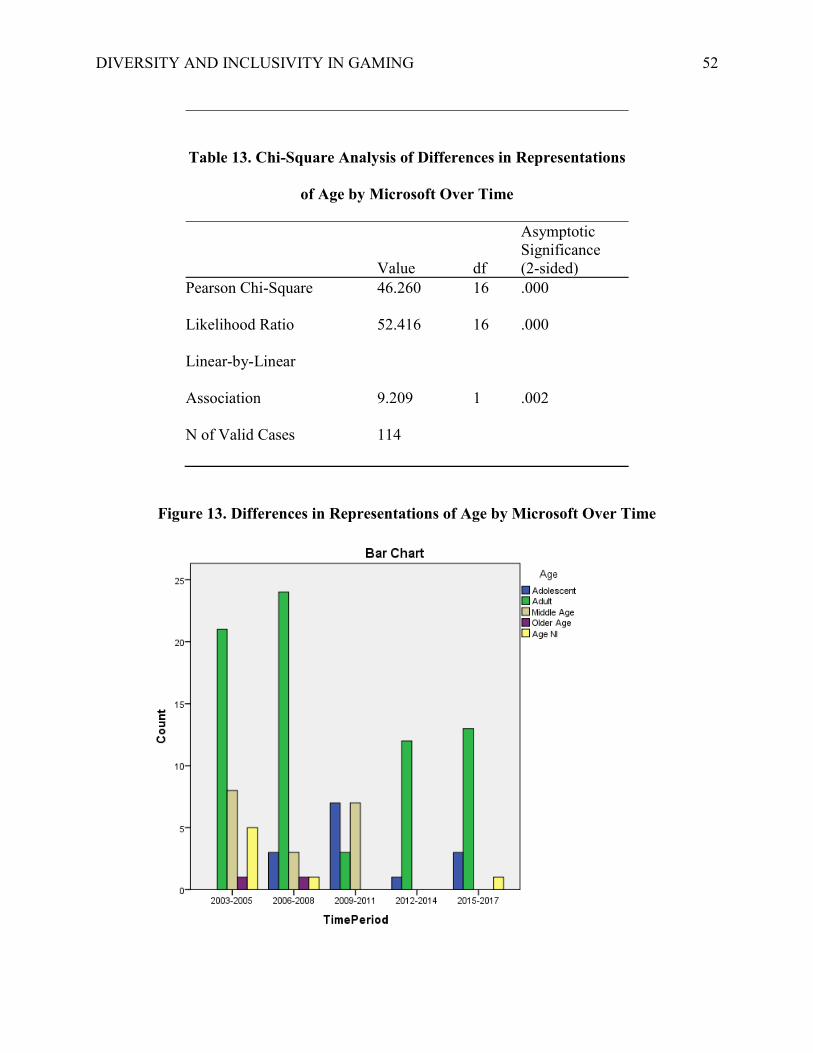
DIVERSITY AND INCLUSIVITY IN GAMING 52
Table 13. Chi-Square Analysis of Differences in Representations
of Age by Microsoft Over Time
Asymptotic Significance Value df (2-sided) Pearson Chi-Square 46.260 16 .000
Likelihood Ratio 52.416 16 .000
Linear-by-Linear
Association 9.209 1 .002
N of Valid Cases 114
Figure 13. Differences in Representations of Age by Microsoft Over Time
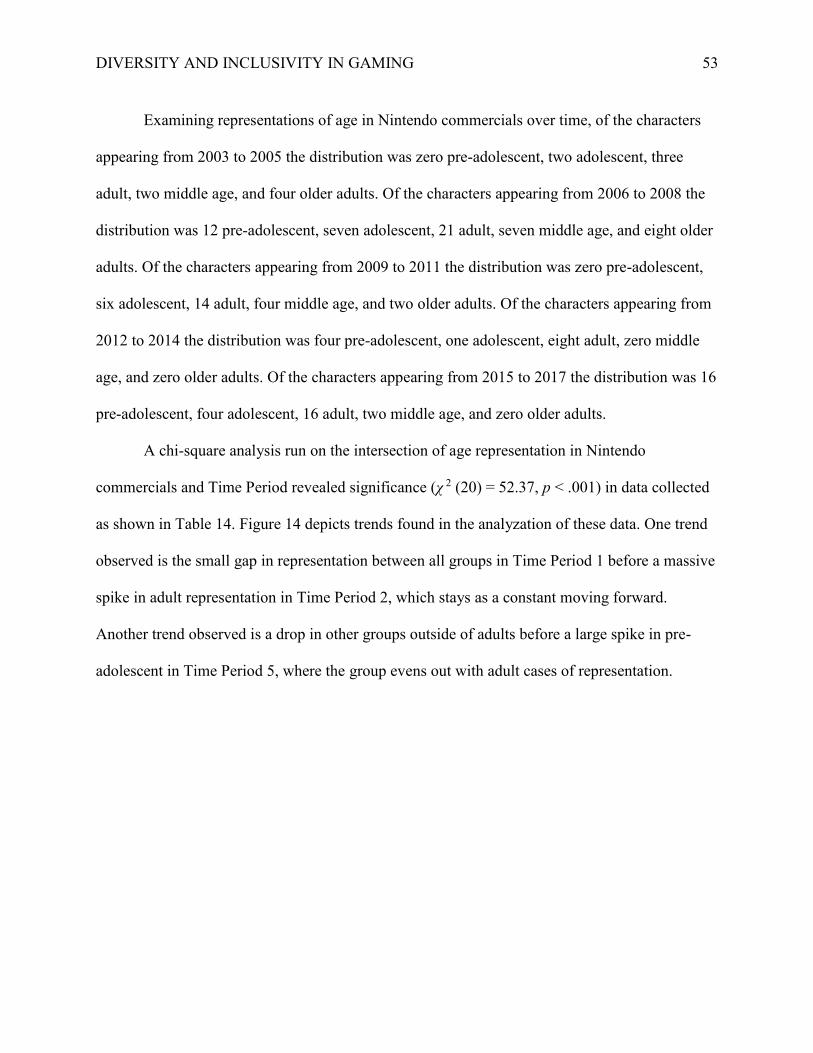
DIVERSITY AND INCLUSIVITY IN GAMING 53
Examining representations of age in Nintendo commercials over time, of the characters
appearing from 2003 to 2005 the distribution was zero pre-adolescent, two adolescent, three
adult, two middle age, and four older adults. Of the characters appearing from 2006 to 2008 the
distribution was 12 pre-adolescent, seven adolescent, 21 adult, seven middle age, and eight older
adults. Of the characters appearing from 2009 to 2011 the distribution was zero pre-adolescent,
six adolescent, 14 adult, four middle age, and two older adults. Of the characters appearing from
2012 to 2014 the distribution was four pre-adolescent, one adolescent, eight adult, zero middle
age, and zero older adults. Of the characters appearing from 2015 to 2017 the distribution was 16
pre-adolescent, four adolescent, 16 adult, two middle age, and zero older adults.
A chi-square analysis run on the intersection of age representation in Nintendo
commercials and Time Period revealed significance (χ 2 (20) = 52.37, p < .001) in data collected
as shown in Table 14. Figure 14 depicts trends found in the analyzation of these data. One trend
observed is the small gap in representation between all groups in Time Period 1 before a massive
spike in adult representation in Time Period 2, which stays as a constant moving forward.
Another trend observed is a drop in other groups outside of adults before a large spike in pre-
adolescent in Time Period 5, where the group evens out with adult cases of representation.
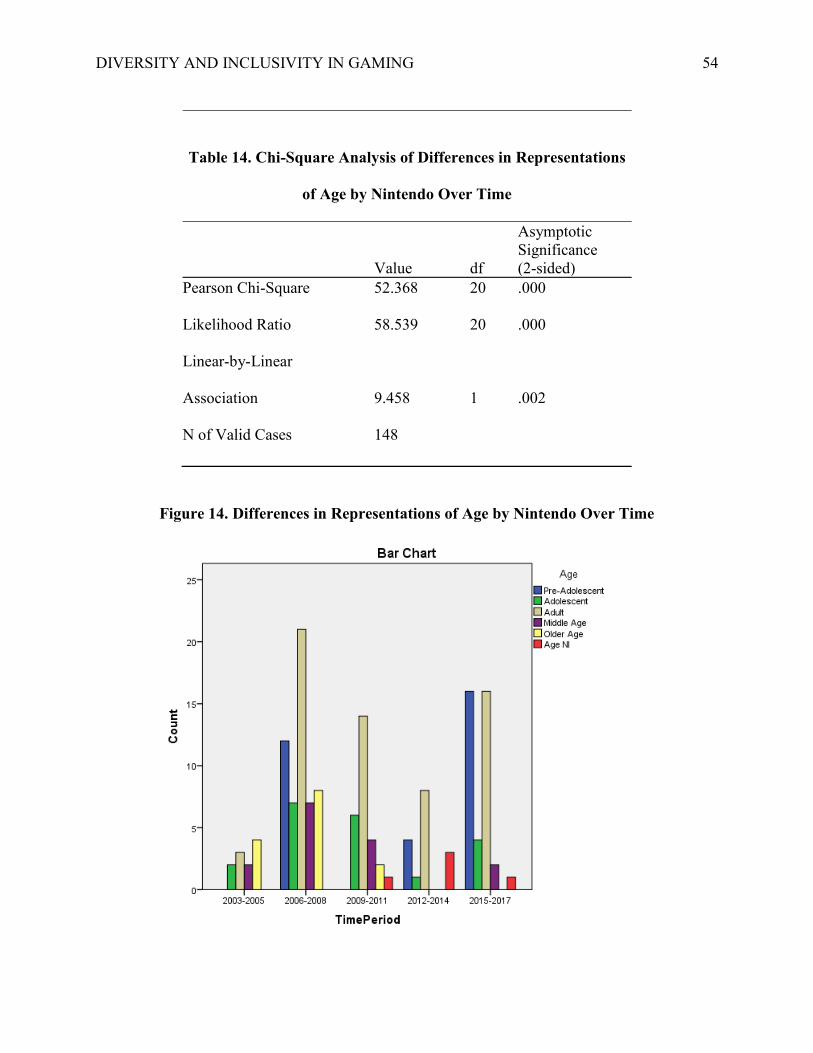
DIVERSITY AND INCLUSIVITY IN GAMING 54
Table 14. Chi-Square Analysis of Differences in Representations
of Age by Nintendo Over Time
Asymptotic Significance Value df (2-sided) Pearson Chi-Square 52.368 20 .000
Likelihood Ratio 58.539 20 .000
Linear-by-Linear
Association 9.458 1 .002
N of Valid Cases 148
Figure 14. Differences in Representations of Age by Nintendo Over Time
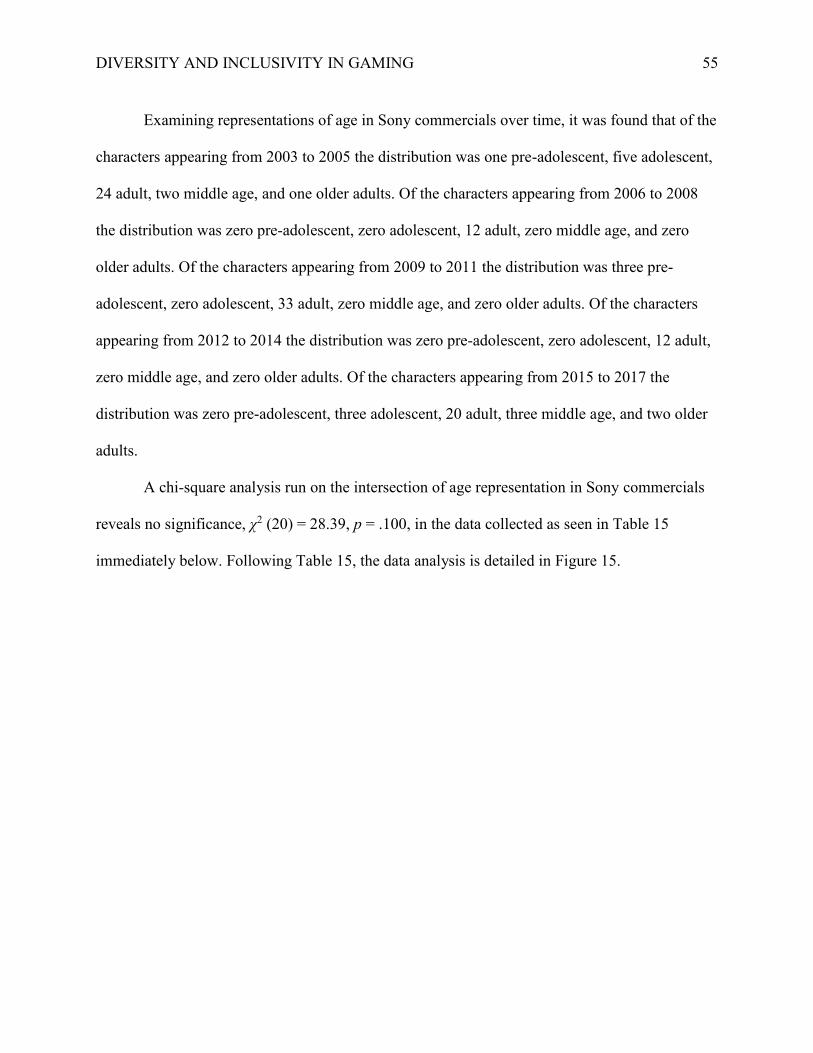
DIVERSITY AND INCLUSIVITY IN GAMING 55
Examining representations of age in Sony commercials over time, it was found that of the
characters appearing from 2003 to 2005 the distribution was one pre-adolescent, five adolescent,
24 adult, two middle age, and one older adults. Of the characters appearing from 2006 to 2008
the distribution was zero pre-adolescent, zero adolescent, 12 adult, zero middle age, and zero
older adults. Of the characters appearing from 2009 to 2011 the distribution was three pre-
adolescent, zero adolescent, 33 adult, zero middle age, and zero older adults. Of the characters
appearing from 2012 to 2014 the distribution was zero pre-adolescent, zero adolescent, 12 adult,
zero middle age, and zero older adults. Of the characters appearing from 2015 to 2017 the
distribution was zero pre-adolescent, three adolescent, 20 adult, three middle age, and two older
adults.
A chi-square analysis run on the intersection of age representation in Sony commercials
reveals no significance, χ2 (20) = 28.39, p = .100, in the data collected as seen in Table 15
immediately below. Following Table 15, the data analysis is detailed in Figure 15.
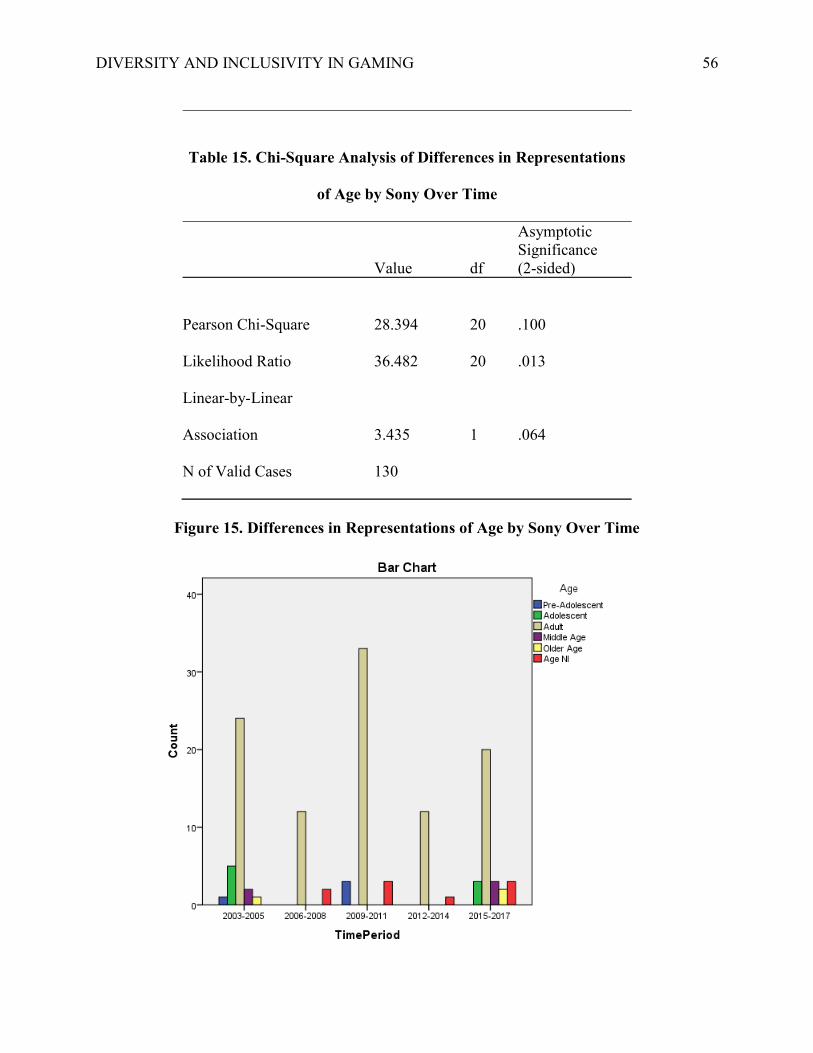
DIVERSITY AND INCLUSIVITY IN GAMING 56
Table 15. Chi-Square Analysis of Differences in Representations
of Age by Sony Over Time
Asymptotic Significance Value df (2-sided)
Pearson Chi-Square 28.394 20 .100
Likelihood Ratio 36.482 20 .013
Linear-by-Linear
Association 3.435 1 .064
N of Valid Cases 130
Figure 15. Differences in Representations of Age by Sony Over Time
DIVERSITY AND INCLUSIVITY IN GAMING 57
CHAPTER V: DISCUSSION
Drawing from the framework of cultivation theory, the goal of this study was to analyze
the racial, gender, and age representations of Microsoft, Nintendo and Sony’s video game
console commercials airing between 2003 and 2017. This thesis addressed three research
questions: To what extent are gender, racial, and age identity represented in advertisements for
consoles produced by Microsoft, Nintendo, and Sony? To what extent are gender, racial, and age
identity represented in advertisements for consoles between 2003 and 2017? How do Microsoft,
Nintendo, and Sony differ in their representations of racial, gender, and age identities over time
from 2003 and 2017? In this chapter, the key findings and implications of my project are first
highlighted.
With the frequency at which gamers are exposed to these ads every day while browsing
the internet, certainly cultivation theory would conclude that the audience may adopt these
depictions and representations of racial, gender, and age identities. YouTube is, in fact the
second most visited site on the internet (Alexa, 2018). In a Google commissioned Nielson study
in 2015, it was found that on mobile browsing alone, YouTube reaches more 18 to 49 year-olds
than any broadcast or cable television network (O’Neil-Hart & Blumenstein, 2016). Further, it
was found in another Nielsen study that in an average month, eight out of ten 18 to 49 year-olds
watch YouTube and another similar study found that in 2015 this demographic has seen a drop
of 4% in watch time on television while time spent on YouTube has increased by 74% (O’Neil-
Hart & Blumenstein, 2016). In total, this comes out to 1.5 billion active monthly users (Matney,
2017), watching one billion hours of YouTube per day (Etherington, 2017). In another article
using Google analytics, Petrova and Gross highlight that 73% of YouTube users who identify as
gamers say that they enjoy watching people play games on the platform, while 48% claim they
DIVERSITY AND INCLUSIVITY IN GAMING 58
watch more gaming videos on the site than they spend actually playing games themselves
(2017). With the combination of pre-roll and mid-roll ads that play on every YouTube gaming
video, it is nearly impossible to avoid constant exposure when watching 30 to 60 minute long
let’s play videos, or three-hour long stream archives.
Key Findings and Implications
Examining differences in racial, gender, and age representations by video game
company. RQ1 asked to what extent are gender, racial, and age identities represented in
advertisements for consoles produced by Microsoft, Nintendo, and Sony. It was found that across
all three companies, men were vastly overrepresented compared to women. However, the
overrepresentation of men in video game console commercials did not differ systematically
among Microsoft, Nintendo, and Sony. That said, there were significant differences present in
the companies’ representations of racial and age identity. The coded data show that none of the
companies had any instances of Native American representation in the sample’s commercials,
along with minimal instances of Asian or Pacific Islander, Latinx, or Arab individuals. Microsoft
had no representations of Asians or Pacific Islanders in this project’s sample, meaning the total
representation of Asian persons were divided between Nintendo and Sony at 61.1% (n=11) and
38.9 % (n=7) respectively. In addition, Sony commercials made up 50% of all Black
representation observed (n=22), and 57.1% of all Latinx representation observed (n=4). White
representation was still dominant in Sony commercials, but only made up 67.7% of characters
observed (n=88) in the company’s advertising versus Microsoft’s White characters at 81.6% of
the total population (n=93) and Nintendo’s White characters at 78.4% of the total population
(n=116).
DIVERSITY AND INCLUSIVITY IN GAMING 59
Non-dominant groups, if represented at all, were severely underrepresented in
comparison to white representation in the scope of all advertisements from each of the three
companies observed. While racial representation differed from company to company, with Sony
showing the most racial diversity, when looking at 15 years of commercials, any frequency under
15 people indicated that there was less than one instance of representation per year on average,
which is the case for all non-White representation other than Sony’s representation of Black
individuals.
The major implication that can be drawn from this using the framework of cultivation
theory would be that these minority groups in the category of racial identity may feel that the
industry has ignored them, or that they are not important to the success of these consoles, as the
ads do not target them. The other implication that we may draw is that the low visibility of these
minority groups implies to avid gamers that these groups are not a part of gaming culture,
creating an unwelcoming atmosphere in the greater culture. Similar implications were drawn in
the article from Williams, Martins, Consalvo, and Ivory (2009), in their comprehensive content
analysis of video games released between March of 2005 and February of 2006. These
implications are drawn directly from the core tenet of cultivation theory, that states that the more
an audience is exposed to a message, the more that audience tends to shape their reality around
said message.
This implication may also be drawn regarding age representations across the three
companies observed. Sony was the worst of three companies in this regard; adults made up
77.7% of all characters present in their advertising. Adults were the dominant group in general
when looking at how the three companies represented age in their advertising, but in contrast to
Sony, the percentage of adults appearing in Microsoft’s commercials made up 64% of all
DIVERSITY AND INCLUSIVITY IN GAMING 60
characters, and adults appearing in Nintendo commercials made up just 41.9% of all characters.
Nintendo, as the previous number would suggest, was the most inclusive and diverse company in
terms of age, with every category present in their advertising, and the lowest category, older
adults, still making up 9.5% of the total population of characters observed.
Examining differences in racial, gender, and age representation over time. RQ2
asked to what extent are gender, racial, and age identities represented in advertisements for
consoles between 2003 and 2017. In the case of gender representation, men were on average
overrepresented versus women, making up anywhere between 60% to 74% of the total
population in Time Periods 1, 4, and 5. Of note, however, are Time Periods 2 (2006-2008) and 3
(2009-2011). From 2006 to 2008, the coded data featured 53.5% of men and 43.6% of women,
and from 2009 to 2011, the coded data included 57.8% men and 39.8% women. Though this
renaissance was short lived, it seems to represent a concentrated effort at gender diversity that
took place in industry marketing for about five years before representation of women again fell
off, never quite recovering. The most likely culprit for this difference in representation is due to
where these years sit in terms of console releases. From 2006 to 2011, The only home consoles
being advertised and sold were the Xbox 360, Nintendo Wii, and the PlayStation 3, Each of
which began sale around 2006 and were phased out in favor of newer consoles around 2012 and
2013.
Applying cultivation theory, we may conclude that women may feel that the industry
recognizes their presence but prefers to focus on men first. In addition, literature on cultivation
covering similar topics would indicate that those who are exposed frequently to these
commercials will likely conclude that women are either losing interest in video games or are
DIVERSITY AND INCLUSIVITY IN GAMING 61
otherwise uninterested in video games in general. Of the relevant findings from this study, this
specific finding should be explored in further research.
When observing what the data show us regarding representations of age, there were a few
interesting findings from which we may draw further implications. For example, representation
of middle age individuals is split nearly evenly among Time Periods 1-3, before completely
falling off for Time Periods 4 and 5. Furthermore, we see a spike in the representation of nearly
all groups other than the dominant adult group being relatively equally represented, with
percentages ranging between 8.9% and 11.9% of the total representation, making Time Period 2
the most diverse Time Period observed. Outside of these observances, spikes and dips are
observed among each of the categories, while the adult group stays a consistent dominant
averaging between 60-76% of total time population of characters in any given Time Period.
Certainly, the message that this representation sends to consumers is that while anyone may have
fun playing these video games, they are actually meant for the young adult crowd, with any other
group being secondary.
The findings on age are consistent with the literature reviewed in preparation for this
study, where adult representation is prioritized over older adults and children (Williams, Martins,
Consalvo, & Ivory, 2009; Chess, Evans, & Baines, 2016). The Williams Martins, Consalvo, and
Ivory (2009) article uses this finding to point out that as gamers get older, and indeed as older
players start playing games seeing that the average age of gamers is steadily rising, these groups
are not seeing themselves represented. Further, Chess et al (2016) found that typical
representations of age present in the commercials they observed from 2013 were used in the
context of family members. This also happened to be the case in many of the commercials
observed in this project, where only a select few ads displayed older adults playing games on
DIVERSITY AND INCLUSIVITY IN GAMING 62
their own without children playing with them, and even in these limited cases, these individuals
were often used as observational comedy implying people aged over 50 playing games is a wild
and humorous concept. These representations, according to cultivation theory can further such
unwelcoming stereotypes surrounding older players. Just as with cases of gender and racial
identity discussed earlier, this creates a common misconception that older individuals should not
be playing video games, and there is no place for them in the community at large.
Examining differences in racial, gender, and age representations by company over
time. RQ3 asked how Microsoft, Nintendo, and Sony differ in their representations of racial,
gender, and age identity over time from 2003 and 2017. Interestingly, though Sony seemed to be
the most diverse and inclusive for racial identity in the exploration of RQ1, data in this section
suggests that this is due to the consistency at which Sony included representations over the five
Time Periods, as no significance was determined in change or trend. Black representation in
relation to other groups steadily making up around 10% of the characters observed in each tie
period, spiking to 27.3% in Time Period 1 and 23.1% in Time Period 4. Sony was so consistent,
in fact, that no significance was found in their representations of age or gender over the five
Time Periods, though it was interesting to see that Sony rarely included non-adults in their
commercials.
Microsoft had some of the more interesting findings in the exploration of this research
question, especially when it came to gender. The significance found in RQ2 regarding the rise in
the representation of women versus men seems to be skewed by the Microsoft commercials
observed during that time. In Time Periods 2 and 3, representations of women outnumbered men,
which is the only case of a typically minority group overcoming representation of a majority
DIVERSITY AND INCLUSIVITY IN GAMING 63
group in all of my observations in this study. This shift in demographics does not stay, however,
as subsequent Time Periods see an extremely sharp drop in representation of women. As
discussed earlier, the Xbox 360 was released in late 2005 and was phased out in favor of the
newer Xbox One in 2013. In short, this means that advertising from Microsoft in Time Periods 2
and 3 was focused on the marketing of the one console. The shifting in marketing from Xbox to
Xbox 360 to Xbox One may be the explanation in disparity in strategy, though it is interesting
that these shifts were not as evident in Sony’s advertising.
Another interesting finding from Microsoft’s data is the trend observed in racial
representation over time. Although relatively no groups outside of White are represented until
Time Period 5, we see instances of white representation dip consistently from period to period
until Period 5, where there were as many White individuals coded as there were Black
individuals, with Arab American and Latinx representation lagging shortly behind. The
implication that may be drawn from these data may be that Microsoft is making a more
concentrated effort to become more inclusive in their advertising since the release of their most
recent console, the Xbox One. this conclusion is drawn due to the fact that the release of the
console happened late in 2013 to low sales versus the PlayStation 4 (Gilbert, 2017), which could
have prompted the dramatic shift in marketing strategy seen between Time Periods 4 and 5.
Finally, Microsoft’s representations of age also saw significance in the difference over
time. Though Time Periods 1, 2, 4, and 5 see the adult group in the majority, with little
representation from other groups; in Time Period 3 adult representation drops to 17.6% of the
total population observed, being replaced with representations of adolescents and middle-aged
individuals. In addition, middle-aged individuals made up 22.9% of the population of characters
observed for Time Period 1. Though variances are observed in certain sections, there is no trend
DIVERSITY AND INCLUSIVITY IN GAMING 64
towards diversity or inclusivity over time, leading to the conclusion that adults are the most
dominantly represented age group in Microsoft marketing.
Nintendo, much like Sony, had no significance determined in the representations of
gender or racial identity. However, significance was determined in the differences in
representations of age in Nintendo advertisements, lending insight to data observed on age over
time in the exploration of RQ 2. Nintendo emerged as the leaders of age diversity in the first
three Time Periods, with a reasonably even distribution of representation in Time Periods 1 and
3, with a huge spike in the representation for all groups observed in Time Period 2. The
aforementioned spike coincides with the release of the Wii console, which Nintendo did their
best to market towards all ages, making it the third bestselling home console of all time (Statista,
2017), and notably popular in senior homes across the United States (Conaway, 2009).
Interestingly, in Time Period 5, pre-adolescent individuals were equally represented to adult
individuals. The major implication that may be drawn from the variances observed in these data
is that though no linear trends are present over time, the variety in representation observed in the
different Time Periods seems to indicate that Nintendo values gamers of all age categories nearly
equally, while still relying on adults from time to time as a primary demographic.
DIVERSITY AND INCLUSIVITY IN GAMING 65
CHAPTER VI: CONCLUSION
In this thesis project, racial, gender, and age representations in video game console
advertisements that aired between 2003 and 2017 were examined. Using cultivation theory as a
framework, this study has effectively answered its three research questions to reveal troubling
patterns in the underrepresentation of people of color, women, and non-adults. Though perhaps
the industry is not overall trending towards better diversity or inclusion, there were findings that
may lend to feelings of hopefulness that the industry may soon make their advertisements more
representative of its consumer base. In the following chapter, the apparent limitations of this
study are first discussed, before concluding with calls for future research on this topic.
Limitations
This study, though enlightening in many regards, is not without some key limitations.
The first limitation is the lack of a certifiably comprehensive archive of all video game
commercials online. Though the website Gamepressure seemed to be very comprehensive in its
cataloging of new commercials as they air on television and online, working backwards
highlighted the issue that care was not taken to archive and save every commercial before the
rise of cheap and easy video hosting online. As a result, commercials became increasingly sparse
when looking for commercials that aired between 2003 and 2008. Efforts were made to branch
out and find commercials hosted on various other sites such as YouTube, but the lack of an
archival or categorical format made it difficult to find commercials if one does not have a
specific title and made it difficult to verify date of initial air. This limitation resulted in missing
data from Microsoft in Time Period 1 and Time Period 2, where only four commercials were
found featuring human characters. One of those four commercials found also had to be removed
as it skewed the data collected in a way that was not representative of all other commercials
DIVERSITY AND INCLUSIVITY IN GAMING 66
observed. Another major limitation would be the natural time constraints that come along with
doing this type of study as a master’s thesis. These time constraints limited me to a
representative sample of all commercials, have thesis had more time, the total population of
commercials could have been ideally coded to give a more comprehensive census of all
representation present in video game console commercials.
Future Research
Further research on the topic of representation in video game commercials building upon
the work started in this thesis. First, the data collected and analyzed in this thesis could be used
to inform critical and qualitative studies on the video game industry and its marketing strategies
to evaluate why such groups are marketed, why others are not present, and what relative success
from each company says about the impact of this marketing. Second, future research could
examine a wider time range of media message. Although this project tracks racial, gender, and
age representations over a 15-year period, additional scholarship could go further into the past by
examining video game console commercials over the past 30 years. Lastly, future scholarship
could benefit from this work being continued every three years. Continual examination on the
gaming industry’s efforts at diversity and inclusivity will continue to be salient as long as video
games remain a dominant form of media. Research such as this thesis will help to trace and
analyze how the industry shifts (or does not shift) to market towards a more diverse array of
consumers.
DIVERSITY AND INCLUSIVITY IN GAMING 67
REFERENCES
Aaker, J. L., Brumbaugh, A. M., & Grier, S. A. (2000). Nontarget markets and viewer
distinctiveness: The impact of target marketing on advertising attitudes. Journal of
Consumer Psychology, 9(3), 127-140. doi:10.1207/S15327663JCP0903_1
Ajzen, I., & Fishbein, M. (1977). Attitude-behavior relations: A theoretical analysis and review
of empirical research. Psychological Bulletin, 84(5), 888-918.
http://psycnet.apa.org/doi/10.1037/0033-2909.84.5.888
Alden, D. L., Steenkamp, J. B. E., & Batra, R. (1999). Brand positioning through advertising in
Asia, North America, and Europe: The role of global consumer culture. The Journal of
Marketing, 63(1), 75-87. doi:10.2307/1252002
Alexa. (2018). Youtube.com traffic statistics [Data Set]. Retrieved from https://www.alexa.com
/siteinfo/youtube.com
Appiah, O. (2004). Effects of ethnic identification on web browsers’ attitudes toward and
navigational patterns on race-targeted sites. Communication Research, 31(3), 312-337.
https://doi.org/10.1177/0093650203261515
Behm-Morawitz, E., & Ta, D. (2014). Cultivating virtual stereotypes?: The impact of video
game play on racial/ethnic stereotypes. Howard Journal of Communications, 25(1), 1-15.
https://doi.org/10.1080/10646175.2013.835600
Burgess, M. C., Dill, K. E., Stermer, S. P., Burgess, S. R., & Brown, B. P. (2011). Playing with
prejudice: The prevalence and consequences of racial stereotypes in video games. Media
Psychology, 14(3), 289-311. doi:10.1080/15213269.2011.596467
DIVERSITY AND INCLUSIVITY IN GAMING 68
Chess, S., Evans, N. J., & Baines, J. J. (2017). What does a gamer look like? Video games,
advertising, and diversity. Television & New Media, 18(1), 37-57.
https://doi.org/10.1177/1527476416643765
Conaway, L. (2009, July 16). Why senior citizens love the Wii. NPR. Retrieved from
https://www.npr.org/sections/thetwo-way/2009/07/why_senior_citizens_love_the_w.html
Cunningham, A. (2005). Advertising practitioners respond: The news is not good. In Wilkins L.
& Coleman R. (Eds.), The moral media: How journalists reason about ethics (114-124).
Mahwah, NJ: Lawrence Erlbaum.
Entertainment Software Association. (2016). Essential facts about the computer and video game
industry. Retrieved from www.theesa.com/wp-content/uploads/2015/04/ESA-Essential
-Facts-2015.pdf
Etherington, D. (2017, February 28). People now watch 1 billion hours of YouTube per day.
TechCrunch. Retrieved from https://techcrunch.com/2017/02/28/people-now-watch-1
-billion-hours-of-youtube-per-day/
Fox, J., & Tang, W. Y. (2014). Sexism in online video games: The role of conformity to
masculine norms and social dominance orientation. Computers in Human Behavior, 33,
314-320. https://doi.org/10.1016/j.chb.2013.07.014
Fron, J., Fullerton, T., Morie, J. F., & Pearce, C. (2007, September). The hegemony of play.
Proceedings of Digital Games Research Association: Situated Play 2007 Conference,
Japan (pp. 1-10).
Gamepressure. (2017). Video game ads [Video library]. Retrieved from http://gameads
.gamepressure.com/
DIVERSITY AND INCLUSIVITY IN GAMING 69
Gerbner, G., Gross, L., Morgan, M., & Signorielli, N. (1986). Living with television: The
dynamics of the cultivation process. In J. Bryant & D. Zillman (Eds.), Perspectives on
media effects (pp. 17-40). Hillsdale, NJ: Erlbaum.
Gilbert, B. (2017, June 5). The PlayStation 4 is selling about twice as fast as the Xbox One.
Business Insider. Retrieved from http://www.businessinsider.com/playstation-4-ps4
-xbox-one-sales-2017-6
Gourdin, A. (2005). Game developer demographics: An exploration of workforce diversity. Mt.
Royal, NJ: International Game Developers Association.
Heckhausen, J., Dixon, R. A., & Baltes, P. B. (1989). Gains and losses in development
throughout adulthood as perceived by different adult age groups. Developmental
psychology, 25(1), 109.
Hooks, B. (2003). The oppositional gaze: Black female spectators. In A. Jones (ed.) The
feminism and visual cultural reader (pp. 94-105). New York, NY: Routledge.
Jansz, J., & Martis, R. G. (2007). The Lara phenomenon: Powerful female characters in video
games. Sex roles, 56(3-4), 141-148. https://doi.org/10.1007/s11199-006-9158-0
Kanter, R. M. (1977). Men and Women of the Corporation. New York, NY: Basic Books
Keogh, B. (2014). Across worlds and bodies: Criticism in the age of video games. Journal of
Games Criticism, 1(1), 1-26.
Khan, Z., & Bruschke, J. (2016). Media coverage of Muslims, perceived threats, ethnocentrism,
and intercultural contact: Applying cultivation theory, integrated threat theory, and the
contact hypothesis. Northwest Journal Of Communication, 44(1), 7-34
DIVERSITY AND INCLUSIVITY IN GAMING 70
Kondrat, X. (2015). Gender and video games: How is female gender generally represented in
various genres of video games? Journal of Comparative Research in Anthropology and
Sociology, 6(1), 171.
Littlejohn, S. W., & Foss, K. A. (Eds.) (2009). Encyclopedia of communication theory (Vol. 1).
Thousand Oaks, CA: Sage.
Matney, L. (2017, June 22). YouTube has 1.5 billion logged-in monthly users watching a ton of
mobile video. TechCrunch. Retrieved from https://techcrunch.com/2017/06/22/youtube
-has-1-5-billion-logged-in-monthly-users-watching-a-ton-of-mobile-video/
McCrae, R. R., Costa Jr, P. T., Ostendorf, F., Angleitner, A., Hřebíčková, M., Avia, M. D., ... &
Saunders, P. R. (2000). Nature over nurture: Temperament, personality, and life span
development. Journal of personality and social psychology, 78(1), 173. http://psycnet
.apa.org/doi/10.1037/0022-3514.78.1.173
Morgan, M., Shanahan, J., & Signorielli, N. (2015). Yesterday's new cultivation,
tomorrow. Mass Communication & Society, 18(5), 674-699. doi:10.1080
/15205436.2015.1072725
O’Neil-Hart, C., Blumenstein, H. (2016). The latest video trends: Where your audience is
watching. Think With Google. Retrieved from https://www.thinkwithgoogle.com
/consumer-insights/video-trends-where-audience-watching/
Petrova, E., Gross, N. (2017). 4 reasons people watch gaming content on YouTube. Think With
Google. Retrieved from https://www.thinkwithgoogle.com/consumer-insights/statistics
-youtube-gaming-content/
Potter, W. J. (2014). A critical analysis of cultivation theory. Journal of Communication, 64(6),
1015-1036. doi:10.1111/jcom.12128
DIVERSITY AND INCLUSIVITY IN GAMING 71
Prieler, M., & Centeno, D. (2013). Gender representation in Philippine television
advertisements. Sex Roles, 69(5-6), 276-288. https://doi.org/10.1007/s11199-013-0301-4
Rodgers, S., & Thorson, E. (Eds.). (2012). Advertising theory. New York, NY: Routledge.
Shrum, L. J. (2002). Media consumption and perceptions of social reality: Effects and underlying
processes. In J. Bryant & D. Zillman (Eds.), Media Effects: Advances in Theory and
Research (pp. 69-95). Mahwah, NJ: Lawrence Erlbaum.
Stacks, D. W., & Salwen, M. B. (Eds.). (2014). An integrated approach to communication theory
and research. New York, NY: Routledge.
Statista. (2017, September). Video game console sales worldwide for products total lifespan as of
September 2017 (in million units) [Data set]. Retrieved from https://www.statista.com
/statistics/268966/total-number-of-game-consoles-sold-worldwide-by-console-type/
Statista. (2018). Distribution of game developers worldwide from 2014 to 2016, by gender [Data
set]. Retrieved from https://www.statista.com/statistics/453634/game-developer-gender
-distribution-worldwide/
Taylor, C. R., Okazaki, S., & Mueller, B. (2012). Theory advancement in international
advertising: Drawing on theories from strategic management and international business.
In S. Rodgers & E. Thorson (Eds.), Advertising Theory (pp. 147-161). New York, NY:
Routledge.
Taylor, L. N. (2002). Video games: Perspective, point-of-view, and immersion. (Master’s Thesis,
University of Florida). Retrieved from https://www.researchgate.net/profile/Laurie
_Taylor2/publication/35486642_Video_games_electronic_resource_perspective_point
-of-view_and_immersion/links/551e9f450cf2a2d9e13c6f53/Video-games-electronic
-resource-perspective-point-of-view-and-immersion.pdf
DIVERSITY AND INCLUSIVITY IN GAMING 72
Taylor, T. D. (2003). Intentional bodies: Virtual environments and the designers who shape
them. International Journal of Engineering Education, 19(1), 25-34.
U. S. Census Bureau (2017). National population totals and components of change: 2010-2017.
Retrieved from https://www.census.gov/data/tables/2017/demo/popest/nation-total
.html#ds
Wilkins, L., & Coleman, R. (2005). The moral media: How journalists reason about ethics. New
York, NY: Routledge.
Williams, D., Martins, N., Consalvo, M., & Ivory, J. D. (2009). The virtual census:
Representations of gender, race and age in video games. New Media & Society, 11(5),
815-834. https://doi.org/10.1177/1461444809105354
Williams, B. R., Ponesse, J. S., Schachar, R. J., Logan, G. D., & Tannock, R. (1999).
Development of inhibitory control across the life span. Developmental psychology, 35(1),
205.
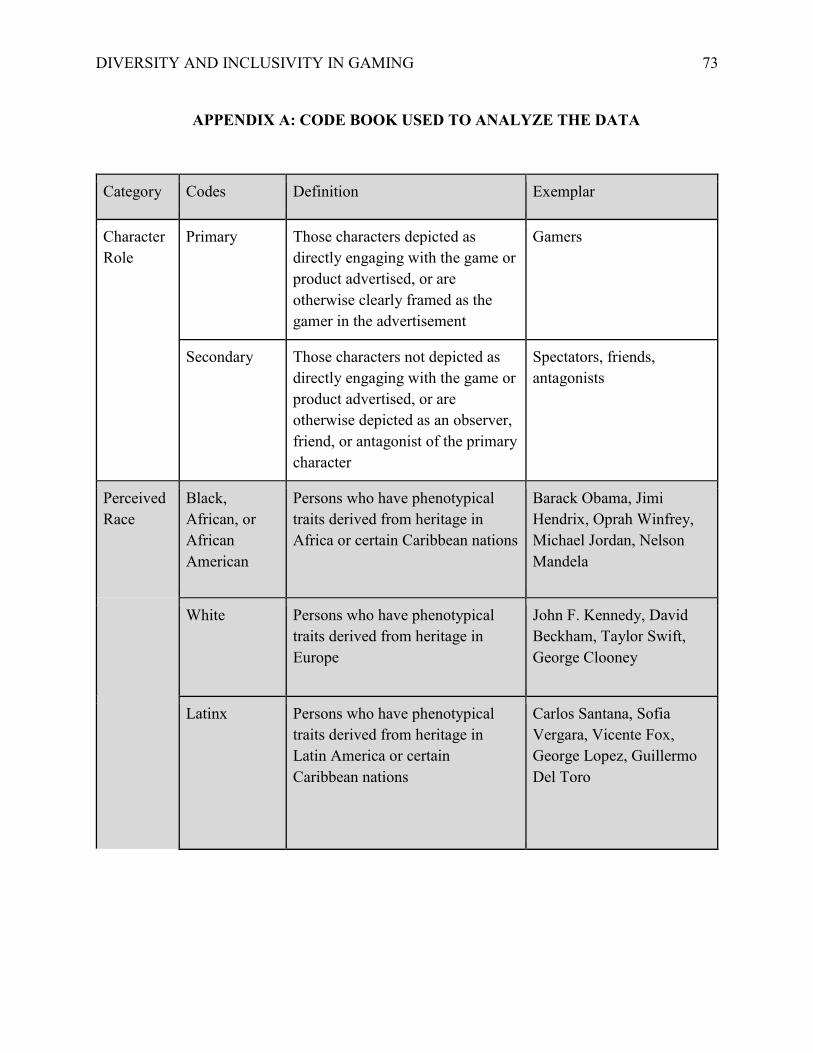
DIVERSITY AND INCLUSIVITY IN GAMING 73
APPENDIX A: CODE BOOK USED TO ANALYZE THE DATA
Category Codes Definition Exemplar
Character Role
Primary Those characters depicted as directly engaging with the game or product advertised, or are otherwise clearly framed as the gamer in the advertisement
Gamers
Secondary Those characters not depicted as directly engaging with the game or product advertised, or are otherwise depicted as an observer, friend, or antagonist of the primary character
Spectators, friends, antagonists
Perceived Race
Black, African, or African American
Persons who have phenotypical traits derived from heritage in Africa or certain Caribbean nations
Barack Obama, Jimi Hendrix, Oprah Winfrey, Michael Jordan, Nelson Mandela
White Persons who have phenotypical traits derived from heritage in Europe
John F. Kennedy, David Beckham, Taylor Swift, George Clooney
Latinx Persons who have phenotypical traits derived from heritage in Latin America or certain Caribbean nations
Carlos Santana, Sofia Vergara, Vicente Fox, George Lopez, Guillermo Del Toro
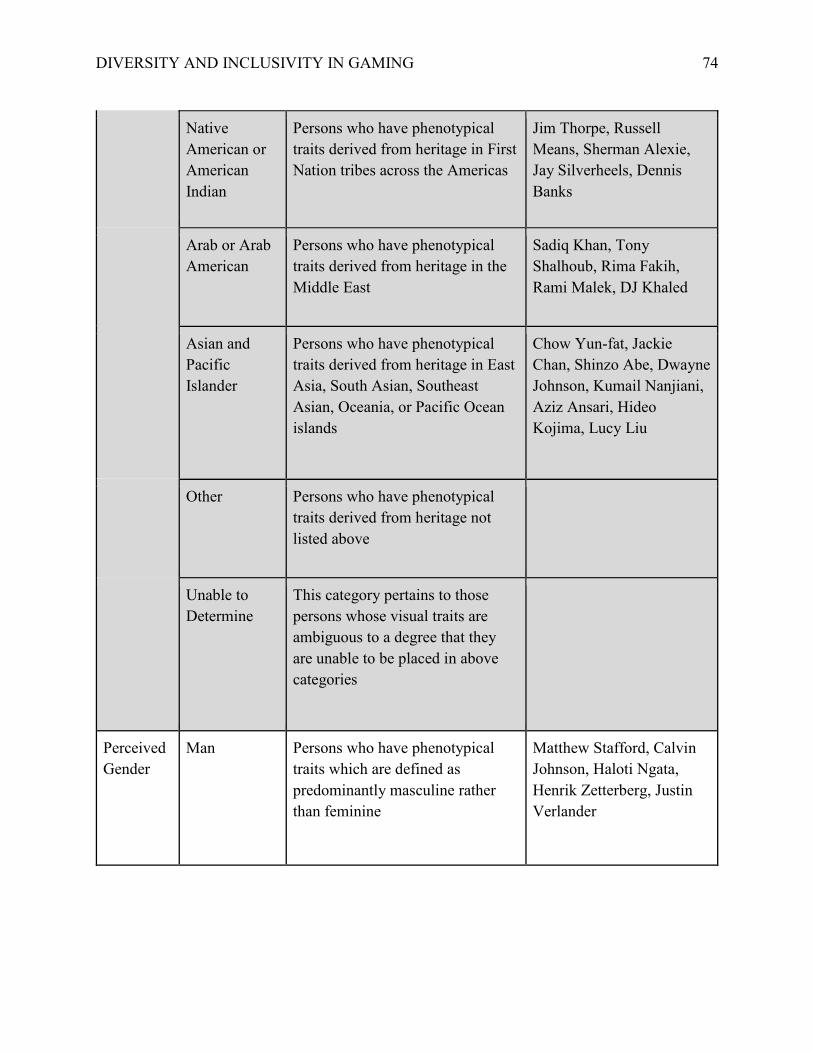
DIVERSITY AND INCLUSIVITY IN GAMING 74
Native American or American Indian
Persons who have phenotypical traits derived from heritage in First Nation tribes across the Americas
Jim Thorpe, Russell Means, Sherman Alexie, Jay Silverheels, Dennis Banks
Arab or Arab American
Persons who have phenotypical traits derived from heritage in the Middle East
Sadiq Khan, Tony Shalhoub, Rima Fakih, Rami Malek, DJ Khaled
Asian and Pacific Islander
Persons who have phenotypical traits derived from heritage in East Asia, South Asian, Southeast Asian, Oceania, or Pacific Ocean islands
Chow Yun-fat, Jackie Chan, Shinzo Abe, Dwayne Johnson, Kumail Nanjiani, Aziz Ansari, Hideo Kojima, Lucy Liu
Other Persons who have phenotypical traits derived from heritage not listed above
Unable to Determine
This category pertains to those persons whose visual traits are ambiguous to a degree that they are unable to be placed in above categories
Perceived Gender
Man Persons who have phenotypical traits which are defined as predominantly masculine rather than feminine
Matthew Stafford, Calvin Johnson, Haloti Ngata, Henrik Zetterberg, Justin Verlander
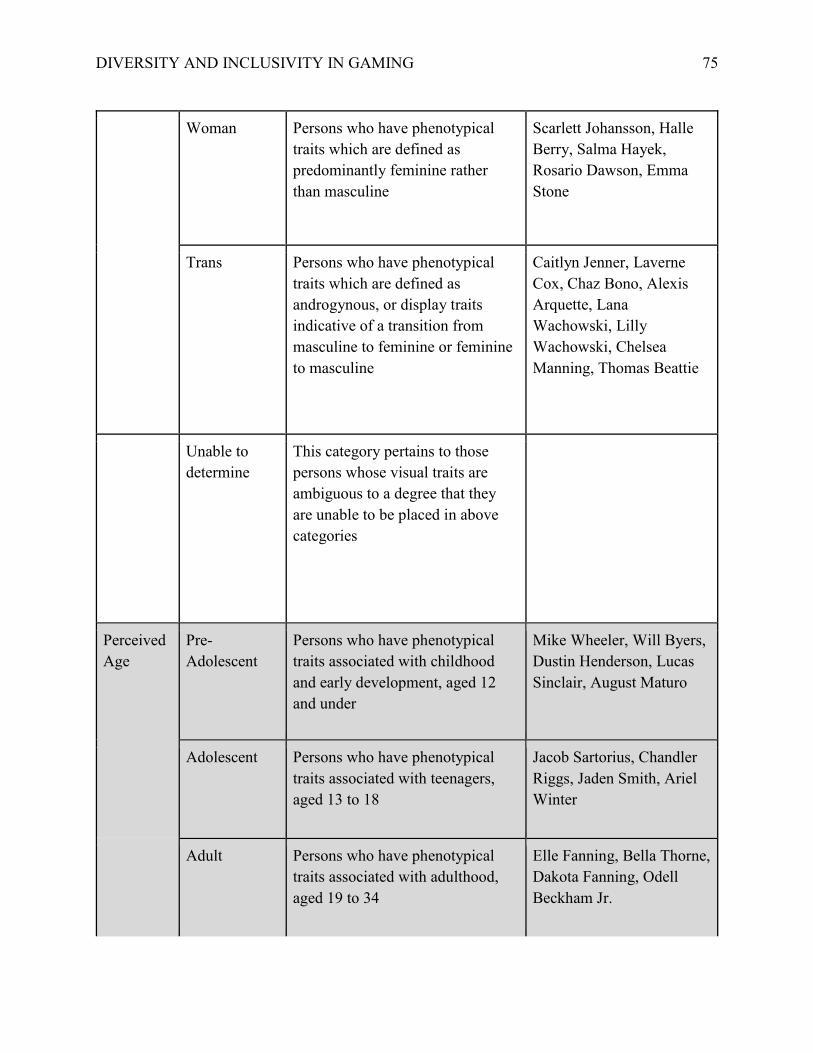
DIVERSITY AND INCLUSIVITY IN GAMING 75
Woman Persons who have phenotypical traits which are defined as predominantly feminine rather than masculine
Scarlett Johansson, Halle Berry, Salma Hayek, Rosario Dawson, Emma Stone
Trans Persons who have phenotypical traits which are defined as androgynous, or display traits indicative of a transition from masculine to feminine or feminine to masculine
Caitlyn Jenner, Laverne Cox, Chaz Bono, Alexis Arquette, Lana Wachowski, Lilly Wachowski, Chelsea Manning, Thomas Beattie
Unable to determine
This category pertains to those persons whose visual traits are ambiguous to a degree that they are unable to be placed in above categories
Perceived Age
Pre-Adolescent
Persons who have phenotypical traits associated with childhood and early development, aged 12 and under
Mike Wheeler, Will Byers, Dustin Henderson, Lucas Sinclair, August Maturo
Adolescent Persons who have phenotypical traits associated with teenagers, aged 13 to 18
Jacob Sartorius, Chandler Riggs, Jaden Smith, Ariel Winter
Adult Persons who have phenotypical traits associated with adulthood, aged 19 to 34
Elle Fanning, Bella Thorne, Dakota Fanning, Odell Beckham Jr.

DIVERSITY AND INCLUSIVITY IN GAMING 76
Jennifer Lawrence, Julio Jones, Antonio Brown, Le’veon Bell, Eddie Lacy, Adrian Peterson
Middle aged Persons who have phenotypical traits associated with middle age, aged 35 to 64
Chris Pratt, Bradley Cooper, Channing Tatum, Ryan Gosling, Ryan Reynolds
Nicole Kidman, Jennifer Aniston, Brad Pitt, Matthew Perry
Tom Cruise, Sharon Stone, Sheryl Crow, John Elway, Steve
Older Age Persons who have phenotypical traits associated with older adults, aged 65 and older
Mark Hamill, Samuel L. Jackson, Meryl Streep, Kurt Russell, Sigourney Weaver
Patrick Stewart, Harrison Ford, William Shatner, Clint Eastwood
Unable to Determine
This category pertains to those persons whose visual traits are ambiguous to a degree that they are unable to be placed in above categories
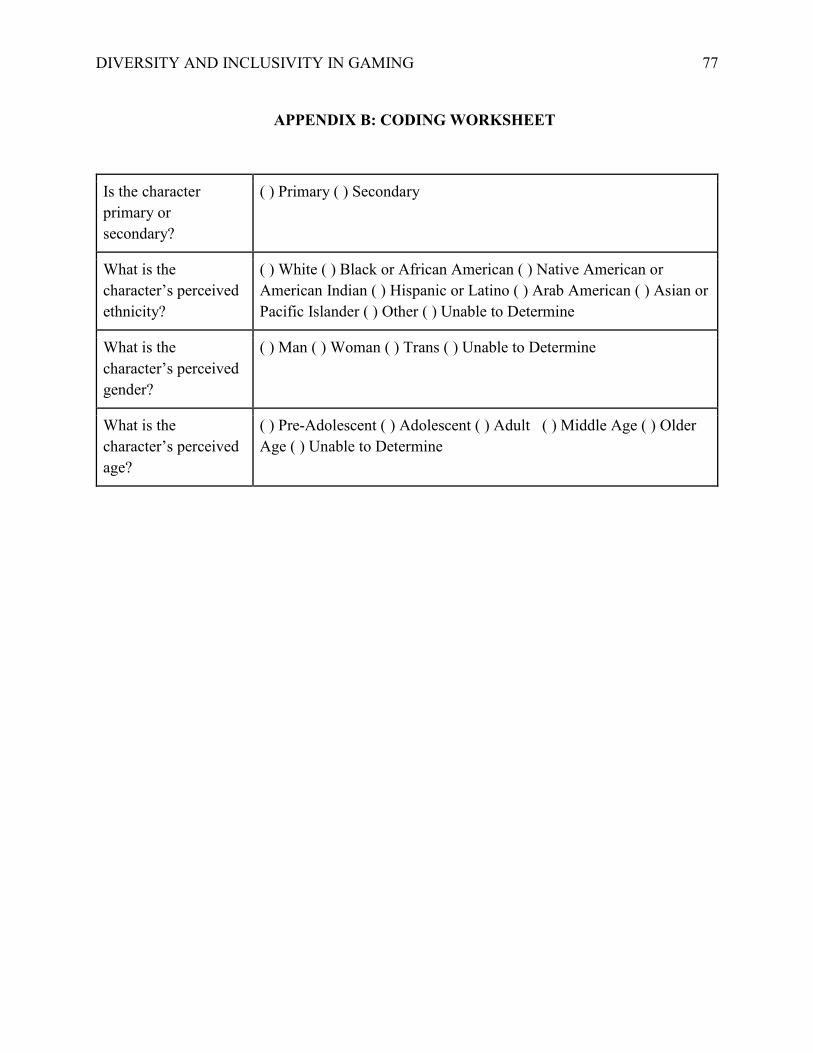
DIVERSITY AND INCLUSIVITY IN GAMING 77
APPENDIX B: CODING WORKSHEET
Is the character primary or secondary?
( ) Primary ( ) Secondary
What is the character’s perceived ethnicity?
( ) White ( ) Black or African American ( ) Native American or American Indian ( ) Hispanic or Latino ( ) Arab American ( ) Asian or Pacific Islander ( ) Other ( ) Unable to Determine
What is the character’s perceived gender?
( ) Man ( ) Woman ( ) Trans ( ) Unable to Determine
What is the character’s perceived age?
( ) Pre-Adolescent ( ) Adolescent ( ) Adult ( ) Middle Age ( ) Older Age ( ) Unable to Determine