diversification strategies in emerging markets - core
TRANSCRIPT
DIVERSIFICATION STRATEGIES IN EMERGING MARKETS WITH SPECIAL REFERENCE TO INDIAN BUSINESS GROUPS
ABSTRACT THESrS SUBMITTED FOR THE AWARD OF THE DEGREE OF
SUBIR SEN
W
1 (t
Under the supervision of
Dr. Parvaiz Talib ( In ternal Advisor) DEPARTMENT OF BUSINESS ADMINISTRATION ALIGARH MUSLIM UNIVERSITY, ALIGARH ( I N D I A )
Dr. Sougata Ray (External Advisor) INDIAN INSTITUTE OF MANAGEMENT
CALCUTTA ( I N D I A )
DEPARTMENT OF BUSINESS ADMINISTRATION FACULTY OF MANAGEMENT STUDIES AND RESEARCH
ALIGARH MUSLIM UNIVERSITY ALIGARH ( INDIA)
2006

- < :
DIVERSIFICATION STRATEGIES IN EMERGING MARKETS
With Special Reference to Indian Business Groups
Abstract
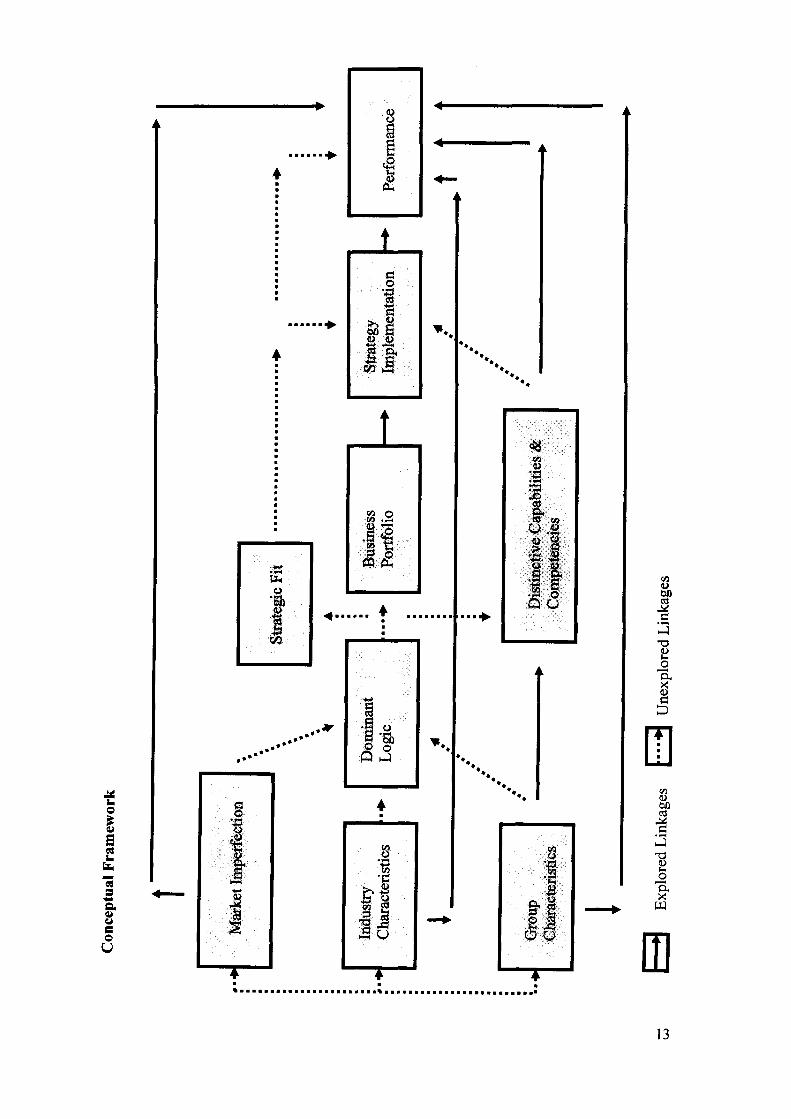
The thesis attempts to put in place- a conceptual framework that provides an
alternative explanation on the nature of relatiorish1p-%efeweeo diversification and
performance. Despite over four decadfes of extensive researghf in this domain, findings
remain inconclusive. There are differences in findings-over time periods, as well as
over contexts. Most importantly, extant research does not substantiate these cross-
findings with sufficient theoretical or logical justification; leaving sufficient scope to
strike new directions. A more plausible explanation for the inconsistencies among
existing research findings may be the failure of most studies to explicitly control for
factors that may have a bearing on the relationship between diversification and
performance. Our case studies across three largest business groups in India reveal that
it not diversity/jer .ye, but the composition of the businesses that ultimately influences
performance. We subsequently build on the concept of dominant logic to bridge the
existing gap. Strategic fit was by and large found to be a superior indicator of
performance compared to diversity. The conclusion is that performance effects of
increased diversity need not be declining provided the top management of business
groups makes a conscious effort to enter businesses which are consistent with its
dominant logic and divest businesses where the fit is deviating.
One of the key aspects of a firm's development from an evolutionary perspective is
the choice of diversification strategies (Chandler, 1962; Kay, 1997). The strategic
management literature therefore suggests diversification as a major strategy (Berry,
1975; Muller, 1987; Fligstein, 1991). In pursuing diversification strategies, the
strategic choices that govern it at various points include its: direction - extent - pace -
timing - route. A review of extant literature reveals that there is a great deal of
variation in the way diversification is conceptualised, defined and measured.
Ansoff s (1957) notion of diversification emphasises the entry of firms into new
markets with new products. Gort (1962) defined diversification in terms of the
concept of heterogeneity of output based on the number of markets served by that
output. To Berry (1975) diversification represents an increase in the number of
industries in which a firm is active. Diversification has also been perceived as
increasing the geographical base of the country.
The literature on diversification not only represents a great variety of perspectives and
disciplinary paradigms, but also covers a wide range of research questions and issues.
Research on diversification was the result of pioneering work of Ansoff (1957). Since
then, research on diversification has been replete with numerous studies. The various
research areas on diversification can be broadly categorised into, (a) firms decision to
diversify - for understanding research on diversification the logically obvious place to
start is the antecedents and influences on a firms' decisions to diversify, (b) choice of
direction of diversification - a firm choosing to diversify can be viewed as basically
seeking ways to modify its business definition, (c) choice of mode of diversification -
it is basically an indication of the extent a firm relies on organic growth vis-^-vis
externally driven growth, (d) diversity status - after a firm has engaged in
diversification over time it attains a certain status or profile, (e) management of
diversification - the problem of managing diversified businesses increase
dramatically as the firm's scope of diversification increases.
While a set of studies has been contained within the individual frameworks as defined
above, there has been another set of studies that has attempted to explore the various
simple and complex linkages within the above individual frameworks. Such studies
have explored simple bivariate as well as contingency type relationships involving
more than a pair of variables, factors, or concepts. Some of the major researched
linkages are (a) the effect of general environment, industry environment, and firm
characteristics on a firms' decision to diversify, choice of direction of diversification,
choice of mode of diversification, diversity status, and (b) the effect of firms decision
to diversify, choice of direction of diversification, choice of mode of diversification,
diversification on performance. However, the most researched linkage in this area
involves diversification and performance (Chatterjee and Wernerfelt, 1991).
Research findings on the nature of relationship between diversification and
performance can be classified under four distinct streams of thought. The earliest
streams of work follow exhaustive study of Gort (1962), which spawned decades of
future research. The basic premise of this stream is that diversification and
performance is linearly and positively related. This position rests upon several
assumptions, including those derived from market power theory and internal market
efficiency among others (Scherer, 1980; Grant, 1998; McCutcheon, 1991). The early
literature on diversification asserts that diversified firms can employ a number of
mechanisms to create and exploit market power advantages, tools that are largely
unavailable to their more focused counterparts (Sobel, 1984; Caves, 1991). Further, a
low diversified firm has no access to investment from cross-subsidisation. So its basic
sources of capital are external - which are more costly than internally generated
funds, when efficiently managed (Froot, Scharfstein and Stein, 1994; Lang, Poulsen
and Stuiz, 1995). In contrast, highly diversified firms' have much greater flexibility in
capital formation since it can access external as well internally generated resources
(StuIz, 1990; Lang and StuIz, 1994). Thus, diversification can generate efficiencies
that are primarily unavailable to a single-business firm (Gertner, Scharfstein and
Stein, 1994).
In the second stream of thought, researchers lend credence to the fact the
diversification and performance is linearly and negatively related. Though many
studies have concluded that highly diversified firms gain significant financial benefits
from using internal markets for capital and other critical resources (Rumelt, 1982;
Williamson, 1986; Ravenscraft and Scherer, 1987; Taylor and Lowe, 1995; Grant,
1998); support for this contention is not universal (McCutcheon, 1991). Jensen (1996)
has argued that top management of diversified firms may be inclined to invest surplus
cash flows (i.e. cash flow exceeding that is required to fund all positive net present
value investments in its present operations) in ways that may support organisational
inefficiencies. In other words, managers may be drawn to over-invest in undeserving
projects (Bolton and Scharfstein, 1990; Stulz, 1990; Berger and Ofek, 1995).
Furthermore, Bhide (1990), and among others (Markides, 1992; Matsusaka, 1993;
Comment and Jarrell, 1995) mounts the case that internal market advantages from
diversification were prevalent in the 60's, but the information asymmetries that
produced this edge slowly diminished since the 70's due to wide spread economic,
technological and regulatory changes. And by the SO's this distinct advantage was
almost nullified.
In the third stream of thought, researchers posit a curvi-linear relationship between
diversification and performance. According to this view, moderately diversified firms
perform better than its low diversified business counterparts. However, they differ in
their predictions of the performance trend as firms move from moderate to high levels
of diversification. Lubatkin and Chatterjee (1994) observe that single-business firms
do not have the opportunity to exploit between-unit synergies or the portfolio effects
that are available only to diversified firms. Hence, single-business firms do not enjoy
scale and scope economies. In contrast moderately diversified firms are involved in
multiple businesses that are able to tap a common pool of resources (Lubatkin and
O'Neill, 1987; Nayyar, 1992), thus yielding advantages over a single-business firm.
Theoretical rationales, which suggest superiority of moderate diversification, have
their focuses on advantages derived from economies of scope (Seth, 1990; Markides
and Williamson, 1994). Specifically, moderately diversified firms generate
operational synergies by designing a portfolio of businesses that are mutually
reinforcing.
Porter (1985) provides numerous examples from case studies how moderate
diversifiers can share activities across businesses in order to boost financial
performance. While benefits accrue to moderately diversified firms, at some point
these efforts are also associated with additional costs. Grant, Jammine and Thomas
(1998) recognise the growing strain on top management as it tries to manage an
increasingly disparate (and therefore, less familiar) portfolio of businesses. Markides
(1992) delineates other costs, such as control and effort losses (due to increased
shirking), coordination costs and other diseconomies related to organisation,
inefficiencies from conflicting dominant logics between businesses, internal capital
market inefficiencies and due to cross-subsidisation. Given these dynamics, one could
argue that the marginal costs of diversification increase rapidly as diversification hits
high levels. Markides and Williamson (1994) refer to this as exaggerated relatedmss
suggesting a mirage effect when assessing apparent similarities between business
units. They argue that moderate diversifiers will outperform their extensive
diversified counterparts only to the degree that they are able to exploit synergies to
create and accumulate strategic assets more quickly and cheaply than its competitors.
Simply amortising existing assets via economies of scope - the popular mouthpiece of
the relatedness theory - will yield only short-term benefits at best. In addition to this
concern Nayyar (1992) points out that activity that is necessary to exploit relatedness
lead to costs that partially blunt the benefits of that strategy. Thus, one can easily
conclude that firms' experience an optimal level of diversification (likely to vary from
case to case), with performance decrements beyond this point of maximisation (i.e.
from moderate to high levels diversification).
A fourth stream of thought, which is basically an extension of the earlier stream,
advocates that effects of moderate and high levels of diversifications are somewhat
equal in their impact on performance. In the earlier stream of work, few researchers
have questioned the superiority of moderate over low or limited diversification.
However, the performance contribution of moderate versus high levels of
diversification is often debated. Considering the arguments that follow, it may be that
the effects of moderate and high levels of diversifications are somewhat equal in their
impact on performance. The primary issue in this controversy arises from concerns
that highly diversified firms may not be able to fully exploit the synergies designed
into the portfolio of businesses. Put another way, synergy initiatives often fall short of
management expectations (Goold and Campbell, 1998). Going further, high
diversifications may present some unique advantages of their own derived primarily
from financial synergies (Kim, Hwang and Burgers, 1989). Highly diversified firms
can also do more to reduce industry specific risks and probabilities of bankruptcy
(also referred to as coinsurance effect) and also lead to enhanced debt carrying
capacity (Barney, 1997; Seth, 1990). Thus, one can easily conclude that firms' do
experience an optimal level of diversification.
Khanna and Palepu (1997) argues that Western companies take for granted a range of
institutions that support their business activities, but many of these institutions are
absent in most emerging markets. These are also referred to as market failures or
institutional voids. It is this difference in institutional context that explains the success
of high levels of diversifications undertaken by business groups and its association
with positive performance effects. Existing literature argues that groups can fill some
subset of the institutional voids in such imperfect markets. Indeed, the descriptive
literature on business groups across several markets emphasises panoply of benefits
that arise out of the intermediation function played by groups in capital maricets (Leff,
1976; Pan, 1991) and labour markets (Leff, 1978). The earliest econometric evidences
came from the studies of Japanese keiretsus (Caves and Uekusa, 1976; Nakatani,
1984). More recently, Lincoln et al., (1996) described a variety of coordinating
mechanisms and their role in reducing the variability of returns of affiliates. Chang
and Hong (1999) suggested that value creation in the case of Korean chaebols might
occur primarily through product and capital market intermediation.
Several studies have demonstrated that on the whole business groups add value
through a combination of product, labour and capital market intermediation (Fisman
and Khanna, 1998; Khanna and Palepu, 1999). However, the benefits of
diversification in emerging markets may not always be sufficient to offset the costs.
Some studies suggest that such investments are characterised by fixed costs (Khanna
and Palepu, 1997; Khanna, Palepu and Wu, 1998). Each business group needs to
invest in creating coordinating mechanisms (Gerlach, 1992; Lincoln et al., 1996),
which facilitate the sharing of information and the enforcement of explicit and
implicit intra-group contracts. Therefore, in the initial stages the fixed costs outweighs
the benefits of diversification, but once a threshold level is breached, the benefits
outweigh the costs. It follows that groups that exceed the threshold diversification
levels will undertake such investments and achieve superior performance.
Such a threshold effect of diversification can also be generated by explanations
grounded in political economy, emphasising a rent-seeking view of groups (Olson,
1982; Granovetter. 1994). Studies by Encarnation (1989), White (1974), Amsden
(1989) and Robison (1986) in different economic contexts lend credence to this view.
Shleifer and Vishny (1993) proposed a formal model having its roots in politico-
economy, which provides an alternative foundation for understanding the mechanism
for generating the threshold effect. Business groups possess various forms of non-
tradable assets, which are scarce and inimitable. Highly diversified groups have
greater opportunities to use these assets than single business firms (Teece, 1980,
1982). Khanna and Palepu (2000) which studied diversification patterns across a
number of emerging markets, including India concluded that net performance effects
of unrelated diversification will initially decline till it reaches a threshold. Beyond this
threshold, marginal increases in group diversification will yield marginal increases in
performance. They further observed that the threshold level will itself rise as market
institutions evolve over time and hence performance effects of such high
diversification will gradually become difficult to achieve.
In contrast, evidences presented by certain researchers (Kakani, 2000; Mohanty 2000)
either negate or contradict the above findings. They observed that moderately
diversified groups outperformed highly diversified ones in India, a giant emerging
market. They further contended that the value of a business group can be enhanced if
they are split into individual and independent business units. One way to explain the
dichotomous findings is that, as markets mature in emerging economies, the ability of
business groups to circumvent market failure will gradually atrophy over time. This
argument also finds support in the works of Chang and Hong (2002) who argue that
the value business groups add may be contingent on the time period under study, as
different stages of economic liberalisation may affect the optimal diversification level
a business group should engage in. However, Khanna and Palepu (2000) have
observed that group effects still persists in most emerging markets, even in markets
which have a longer duration of economic liberalisation compared to India. Therefore,
more robust theoretical justifications are needed to counter the same. In the absence of
the same there is sufficient scope for fresh enquiry and striking out new directions.
These factors suggest that further conceptual development could perhaps enhance our
understanding of the linkage between diversification and performance. Also there is a
dire need to address the indirect influences of diversification on performance
outcomes (Stimpert and Duhaime, 1997). Therefore, unless such factors are controlled
for, the relationship between diversification and performance may be spurious. While
effects external forces on strategic choice are humbly contended; there is a rich
tradition in strategy literature that suggests that managers have sufficient scope to
override the industry context and shape the future of a business group (Child, 1972).
Though the importance of managerial attributes such as distinctive skills, experiences,
perceptions, biases, etc. have been recognized; the literature on diversification have
stayed clear of such issues. However, one such notable exception is the concept of
dominant logic (Prahalad and Bettis, 1986). Despite being a major milestone in
strategic management research, the concept is lying dormant with very little
subsequent improvement. The major reason is its cognitive nature, which has
rendered its measurement and implementation difficult. We build on this concept to
throw additional light on this research domain.
Taking cognizance of the recommendations of Prahalad and Bettis (1995) we agree
that research in strategic management is getting skewed towards offering explanations
grounded purely in I/O Economics, almost ignoring the top management point of
view. While analysing some of the diversification projects pursued by the three
largest business groups in India, we found that top management played a critical role
in the success of the diversification. In contrast, most of existing researches have
ignored this view point, possibly due to conscious choice rather than ignorance.
Considering the magnitude of the problem, we feel that the need of the day is to marry
theories, rather than look at the problem from a single theoretical lens. Taking a cue
from Ramanujam and Varadarajan (1989) we move away from empiricals to clinical
process oriented studies, focusing on conceptual development, rather than end means.
While taking discourse to some of the diversifications pursued by business groups, we
find that while some business groups have added value through diversification, others
have destroyed value. Unrelated diversification even beyond the threshold level has
not always resulted in improved performance. Perhaps, empirical studies failed to
highlight this lacuna, because of the strong initial resource position of most business
groups. It could be also the result of watershed performance in one business, being
suppressed by a staggering loss at the other end. But strategic failure was clear and
apparent in some of the diversifications. Therefore, the implications are that the
relationship between diversification and performance is not so straight-forward as it is
put out to be. Therefore, that the empirical findings regarding diversification and
performance are fraught with contradictions, and has raised more questions than
providing answers.
There is a school of thought that ascribes the success of some highly diversified
business groups to the superior skills of the top management (Prahalad and Bettis,
1986). The particular skill, which the authors identify, is the ability of the top
management to conceptualise the top management task. They held that different
businesses have different dominant logics, i.e. different patterns to conceptualise.
According to their view it talces a highly skilled top management to conceptualise
highly variegated businesses and hence is the reason for the success of some highly
diversified groups. A dominant logic can be defined as the way in which the top
management conceptualises its various business patterns and make critical resource
allocation decisions. To put it more simply, it can be perceived as a set of working
rules (similar to thumb rules) that enables the top management to decide what to do
and more importantly what not to do (i.e. make trade-offs).
This linkage consists of mental maps developed by the top management through its
experiences in the core business and sometimes applied inappropriately in other
businesses. Hence considered more broadly, it can be considered as both a knowledge
structure and a set of elicited management processes. The top management of a
diversified group has a significant influence on the ways its member firms are
managed. It influences to a large extent the style and process of management. This
research follows up on the notion that there is no unique diversification strategy.
Sacrosanct, any diversification can be economically or strategically justified,
depending upon certain ex-ante and ex-post factors. These factors are specific to
business groups and are also contingent upon the stage of nation's economic transition
(Lu, et al., 2002). We argue that dominant logic is one such critical factor that can
generate powerful insights on the relationship between diversification and
performance.
At this stage the central contention of this research is that as long as diversification
strategies of business groups are consistent with its dominant logic, performance will
be enhanced. Further, greater the fit between the dominant logic of the business group
and the business characteristics, greater is the likelihood of superior performance. We
refer to this alignment as strategic fit as it attempts to measure strategic relatedness,
which is by far superior compared to fit measured in terms of products, markets or
technologies. Logic behind this inference can be had from multiple theoretical lenses
having its origin in Organisation Theory, I/O Economics, and Strategic Management.
Hence, we believe this contention has major implications for top management
decision-making and will perhaps lead to a much more consistent and interpretable
findings surrounding diversification and performance.
One of the major implications of this contention is that the top management is less
likely to respond appropriately to diversification strategies, where the dominant logic
is different. As well as respond quickly enough, as they may be unable to interpret the
information surrounding unfamiliar environment (Prahalad and Bettis, 1986). All this
implies hidden costs, which indirectly has a negative bearing on performance. Second,
diversification strategies consistent with group dominant logic facilitates
implementation of strategies as it provides strategic as well as operational control of
the top management over its diversified businesses (Ghemawat, 1991). Third, a
consistent dominant logic ensures unlearning and learning of new skills and practices
required in a fast changing business environment, evident in most emerging markets
(Das, 1981). Fourth, it implies commitment of the top management, which offers a
generalized form of explanation for sustained differences in performance across
business groups (Ghemawat, 1991). Fifth, it facilitates the systematic development
certain idiosyncratic resources, termed capabilities and distinctive competencies,
which are the primary sources of competitive advantage across different markets
(Selznick, 1957; Prahalad and Hamel, 1990). It comprises of delivering unimaginable
value to customers, far ahead of its competitors and at a substantial lower cost. These
complex resources are not easily replicable, imitable or substitutable by even its
closest competitors because of a high degree of causal ambiguity involved in it (King
and Zeithaml, 2001). Sixth, it also results in the reinforcement of fit among its entire
system of activities. This fit leads to a sustainable competitive advantage and is far
more superior to fit based on resources (Porter, 1986).
We undertook in-depth case studies across three largest business groups in India (i.e.
Tata group, Aditya Biria group, and Reliance group); which led us to develop the
following hypotheses:
Hypothesis 1: The choice of portfolio of businesses of a diversified
business group is shaped by the dominant logic of the top management.
10
Hypothesis 2: It is not diversity per se, but the composition of the
groups' business portfolio contributing to diversity that influences
performance.
Hypothesis 3A: The greater the extent of fit of an individual business,
within the portfolio of businesses, with the dominant logic of the top
management, higher is the likelihood of better firm performance.
Hypothesis 3B: The greater the number of individual business, within
the portfolio of businesses, which fit with the dominant logic of the top
management, higher is the likelihood of better group performance.
Hypothesis 4: Dominant logic of the top management is shaped by
characteristics of its core business, industry characteristics, together
with the extent of market imperfection in an economy.
Hypothesis 5: Economic liberalisation leads to a significant decline in
the extent of market imperfection in an economy.
Hypothesis 6A: Economic liberalisation necessitates business groups
to change its dominant logic.
Hypothesis 6B: Inertia constrains business groups from changing its
dominant logic.
Hypothesis 7A: Extent of fit between dominant logic of the top
management and individual businesses within the portfolio of
businesses enables a business group to develop distinctive capabilities.
Hypothesis 7B: Extent of fit between dominant logic of the top
management and individual businesses within the portfolio of
businesses enables a business group to implement strategies better.
This was followed by selective univariate, bi-variate, and multi-variate statistical
analyses across the sample over a fourteen year time-frame (i.e. 1990-2003) which
confirmed our hypotheses with high degrees of significance.
Emerging markets provide business groups with an array of growth opportunities
through diversification, which were earlier, restricted. As new sectors are opened up
11
and existing ones are liberalised, economic liberalisation poses big challenges before
the top management. Whether to pursue diversifications, which presented new
opportunities, or restrict businesses in current ones? Our research provides some
interesting clues to this crucial question. With the onset of the 80's core competence
and focus became the new dictum for the Western conglomerates. Its cascading effect
spread even in the emerging markets. Most business groups operating in emerging
markets were influenced and started curtailing their businesses as a result. This was
followed by large-scale mergers and acquisitions. Subsequently, the market
imperfection theory provided some relief to business groups, and once again the 90's
witnessed business groups following a fresh wave of diversifications, which
continued unabated for more than a decade. However, very recent results indicate that
the threshold level above which such diversification benefits arise may have reached a
crescendo. Thus the benefits of unrelated diversifications may no longer be available
to business groups in markets where the history of economic liberalisation is
sufficiently long (eg. China, Korea, and Chile). This is likely because the institutional
gaps and voids that supported these unrelated business may no longer be present; and
India being at a crucial stage. At this juncture, our research provides some indications
that this may only be partially true. Business groups can still pursue high levels of
diversifications, provided they are consistent with their dominant logic and not to the
contrary. Such diversification are likely to enhance overall group performance. Here it
needs to be mentioned that businesses groups, which operate with a set of large and
broad dominant logic's, are likely to stand advantageous. This would enable them to
cater to a wider range of businesses than its counterparts, which operate on, a limited
set and focused dominant logic's. Here again the crucial question is: how do business
groups manage their portfolio of dominant logic's? The answer is, as the economic
context in emerging markets becomes increasingly market driven, business groups
should learn how to adopt dominant logic(s) which are consistent with emerging
economic environment, and discard old ones which are no longer relevant. Easier said
than done, how do business groups implement this? They must avoid active inertia
through changes in the top management. Learning and unlearning of dominant
logic(s) by the top management in a fast changing economic environment, will hold
the key to success or failure in the future.
12
. . • • ^
u o
s
u
3 a u w a o U
1
1 •I "
^ S
1/5
t c o •a S c s ^ O i
^
' * . .
M CO
H (/) S
o • PH
c2 •c o
ffl o,
c« CO
v • * - •
^ «}
&. <» u ^
•J3
H • ^ H
CO
u
i f 2 1 g o Q O
• . .
CO
T3 0)
X (L>
c
0 to
T3
o
a
111 13
DIVERSIFICATION STRATEGIES IN EMERGING MARKETS WITH SPECIAL REFERENCE TO INDIAN BUSINESS GROUPS
THESIS SUBMITTED FOR THE AWARD OF THE DEGREE OF
y ^ '/^^—^L-.:^ ^I |»p. (justness! (Aittwtntsfraftow)
Dr. Parvaiz Talil L/^2^r. Sougata Ray (Internal Advisor) DEPARTMENT OF BUSINESS ADMINISTRATION ALIGARH MUSLIM UNIVERSITY, ALIGARH (INDIA)
(External Advisor) INDIAN INSHTUTE OF MANAGEMENT CALCUTTA (INDIA)
DEPARTMENT OF BUSINESS ADMINISTRATION FACULTY OF MANAGEMENT STUDIES AND RESEARCH
ALIGARH MUSLIM UNIVERSITY ALIGARH ( INDIA)
2006

j f A«c.r^ V
V^-^... ^ -
"•'ift U n W l S ^
25 SEP ^ 0/4
T8190

Acknowledgement
With the sun setting over my doctoral thesis, promising to rise again over the dawning of a
new sun, I would like to mention my special thanks and gratitude to a select few, who has not
only helped me in this road to enlightening, but has also shaped me, my vision, and for what
I am today. In my early years, my association with my father installed in me some of the
basic tenets of life, without which I j iquld not have really become a complete human being.
The bonding was quite short-lived, and I missed his presence in the formative stages of my
career. Perhaps, his absence compelled me to strive and work even harder, and strike out new
directions. I bow my head in his reverence. In the next phase of my life, my association with
"Goutamda" (Dr. Goutam Sanyal) initiated me into the creative side of research. Without his
grooming, perhaps I would have been left doing something very mundane and boring.
The credit behind the conceptualisation and implementation of this thesis goes entirely to my
mentor, Dr. Sougata Ray. I acknowledge my immense gratitude to him for playing the lead of
friend, philosopher, and guide. During the course of the innumerous discussions that I had
with him I learnt how to think big, think differently, and think truly world-class. Without his
faith in me, and his continuous encouragement and even occasional scolding, perhaps the
thesis would not have seen light at the end of the day. So at the end of the day I would accord
my salute to him for his kind endeavor and for bringing out the researcher in me. Special
regards also goes to Dr. Parvaiz Talib for his encouragement, suggestions and comments,
without which the road would not have been as smooth. I would also record my mention for
him for pain-stakingly going through the draft, suggesting critical changes wherever
necessary. Special thanks also go to both my advisors for honing my writing skills.
At this stage it would be grossly unfair, if I do not place on record the continuous patience
and moral support of my wife, without which perhaps the efforts would have swayed away
from its original goal. I thank her for having reposed her faith in me; the faith that I could do
it. I would also like to mark some special words for my two children - Rishav and Anoushka,
who missed my support in their early days of childhood. Perhaps, one day they would feel
the pulse and the excitement of the long sleepless nights that I had spent sitting in front of a
computer. I also hope that through my mother's eyes I would be able to see the satisfaction of
my father's long cherished dream. The dream to grow up one day, which I think I have
achieved in some way.

Certificate
This is to certify that the thesis titled "DIVERSIFICATION STRATEGIES IN
EMERGING MARKETS - With Special Reference to Indian Business Groups"
registered with Aligarh Muslim University, Aligarh, India, vide Enrollment No. E-5088 dt.
11.06.2002 is an original piece of work and has not been submitted in part or full for the
award of a doctoral degree. My indebtedness to other works and authors has been duly
acknowledged at the relevant places.
Dated: (Subir Sen)
/ArT Dr. Parvaiz Talib - Internal Advisor
(Aligarh Muslim University, Aligarh, India)
Dr. Sougata Ray - External Advisor
(Indian Institute of Management, Calcutta, India)
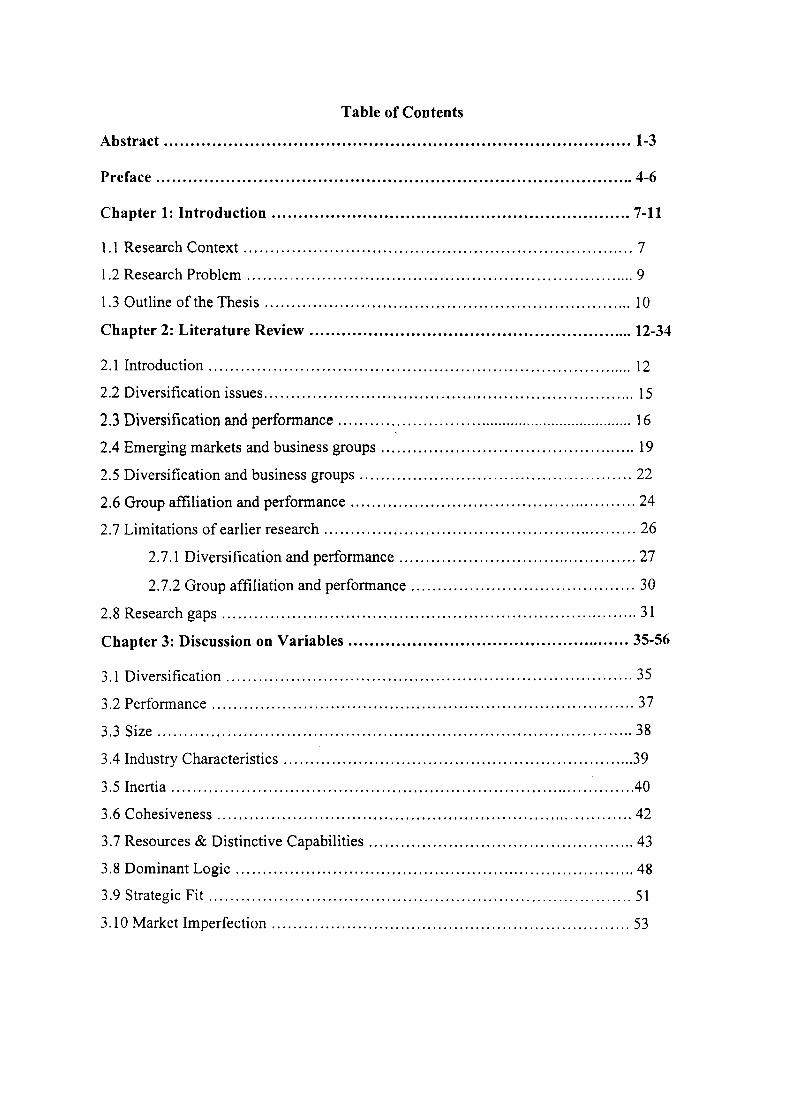
Table of Contents
Abstract 1-3
Preface 4-6
Chapter 1: Introduction 7-11
1.1 Research Context 7
1.2 Research Problem 9
1.3 OutUne of the Thesis 10
Chapter 2: Literature Review 12-34
2.1 Introduction 12
2.2 Diversification issues 15
2.3 Diversification and performance 16
2.4 Emerging markets and business groups 19
2.5 Diversification and business groups 22
2.6 Group affiliation and performance 24
2.7 Limitations of earlier research 26
2.7.1 Diversification and performance 27
2.7.2 Group affiliation and performance 30
2.8 Research gaps 31
Chapter 3: Discussion on Variables 35-56
3.1 Diversification 35
3.2 Performance 37
3.3 Size 38
3.4 Industry Characteristics 39
3.5 Inertia 40
3.6 Cohesiveness 42
3.7 Resources & Distinctive Capabilities 43
3.8 Dominant Logic 48
3.9 Strategic Fit 51
3.10 Market Imperfection 53
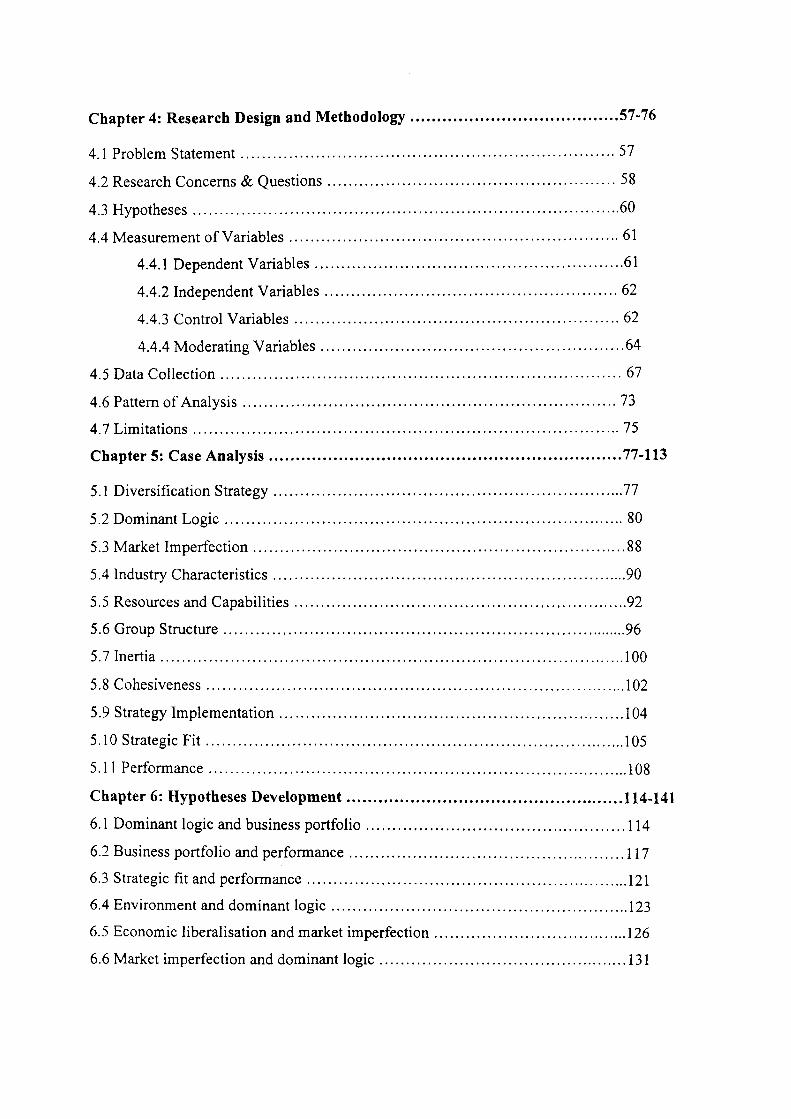
Chapter 4: Research Design and Methodology 57-76
4.1 Problem Statement 57
4.2 Research Concerns & Questions 58
4.3 Hypotheses 60
4.4 Measurement of Variables 61
4.4.1 Dependent Variables 61
4.4.2 Independent Variables 62
4.4.3 Control Variables 62
4.4.4 Moderating Variables 64
4.5 Data Collection 67
4.6 Pattern of Analysis 73
4.7 Limitations 75
Chapter 5: Case Analysis 77-113
5.1 Diversification Strategy 77
5.2 Dominant Logic 80
5.3 Market Imperfection 88
5.4 Industry Characteristics 90
5.5 Resources and Capabilities 92
5.6 Group Structure 96
5.7 Inertia 100
5.8 Cohesiveness 102
5.9 Strategy Implementation 104
5.10 Strategic Fit 105
5.11 Performance 108
Chapter 6: Hypotheses Development 114-141
6.1 Dominant logic and business portfolio 114
6.2 Business portfolio and performance 117
6.3 Strategic fit and performance 121
6.4 Environment and dominant logic 123
6.5 Economic liberalisation and market imperfection 126
6.6 Market imperfection and dominant logic 131
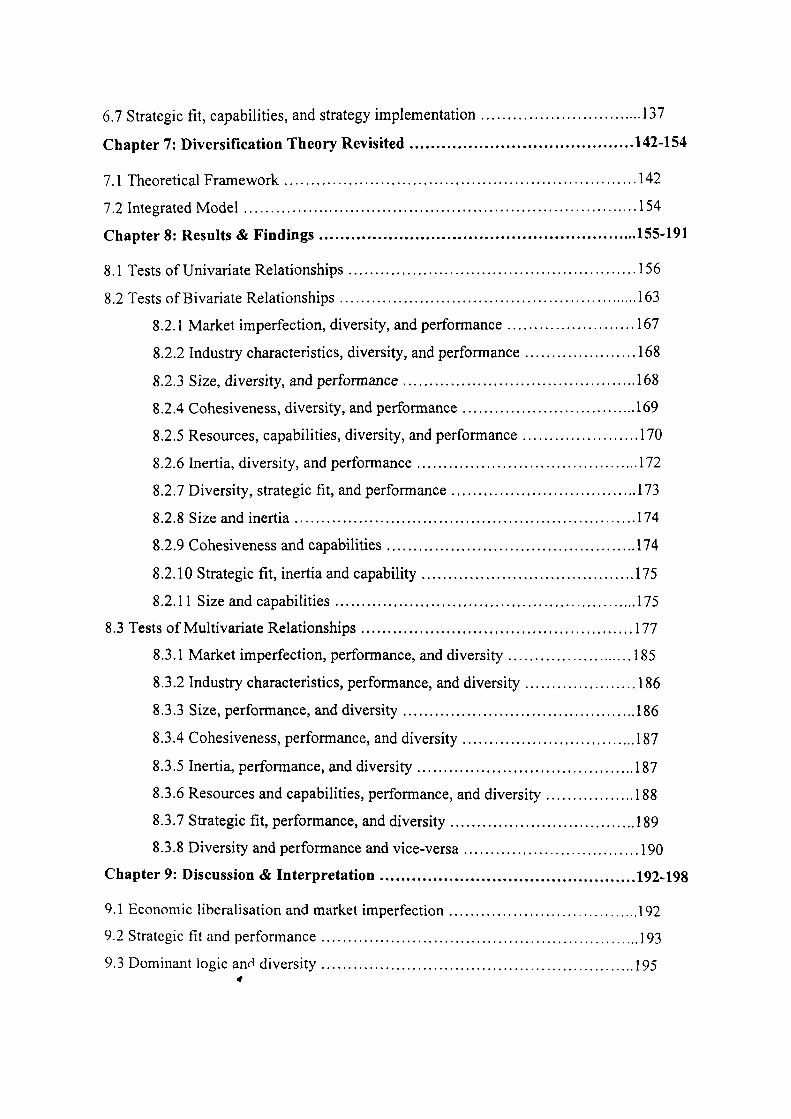
6.7 Strategic fit, capabilities, and strategy implementation 137
Chapter 7: Diversification Theory Revisited 142-154
7.1 Theoretical Framework 142
7.2 Integrated Model 154
Chapter 8: Results & Findings 155-191
8.1 Tests of Univariate Relationships 156
8.2 Tests of Bivariate Relationships 163
8.2.1 Market imperfection, diversity, and performance 167
8.2.2 Industry characteristics, diversity, and performance 168
8.2.3 Size, diversity, and performance 168
8.2.4 Cohesiveness, diversity, and performance 169
8.2.5 Resources, capabilities, diversity, and performance 170
8.2.6 Inertia, diversity, and performance 172
8.2.7 Diversity, strategic fit, and performance 173
8.2.8 Size and inertia 174
8.2.9 Cohesiveness and capabilities 174
8.2.10 Strategic fit, inertia and capability 175
8.2.11 Size and capabilities 175
8.3 Tests of Multivariate Relationships 177
8.3.1 Market imperfection, performance, and diversity 185
8.3.2 Industry characteristics, performance, and diversity 186
8.3.3 Size, performance, and diversity 186
8.3.4 Cohesiveness, performance, and diversity 187
8.3.5 Inertia, performance, and diversity 187
8.3.6 Resources and capabilities, performance, and diversity 188
8.3.7 Strategic fit, performance, and diversity 189
8.3.8 Diversity and performance and vice-versa 190
Chapter 9: Discussion & Interpretation 192-198
9.1 Economic liberalisation and market imperfection 192
9.2 Strategic fit and performance 193
9.3 Dominant logic anH diversity 195
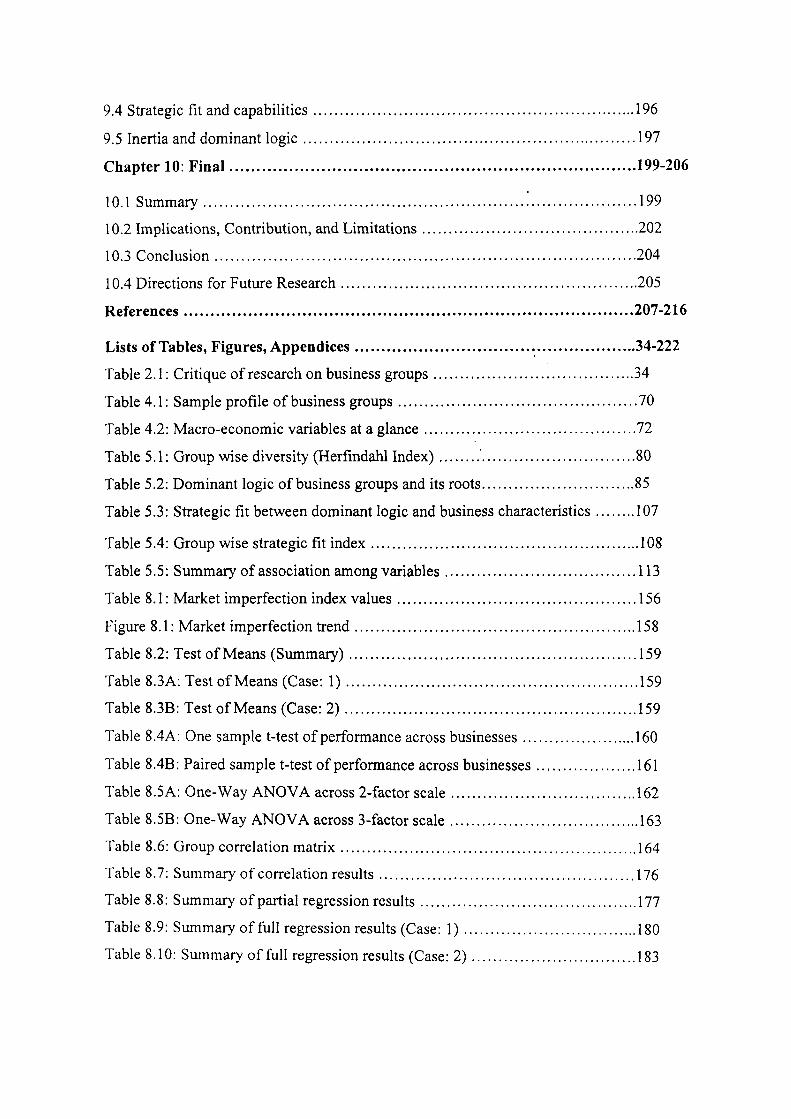
9.4 Strategic fit and capabilities 196
9.5 Inertia and dominant logic 197
Chapter 10: Final 199-206
10.1 Summary '. 199
10.2 Implications, Contribution, and Limitations 202
10.3 Conclusion 204
10.4 Directions for Future Research 205
References 207-216
Lists of Tables, Figures, Appendices 34-222
Table 2.1: Critique of research on business groups 34
Table 4.1: Sample profile of business groups 70
Table 4.2: Macro-economic variables at a glance 72
Table 5. T. Group wise diversity (Herfindahl Index) 80
Table 5.2: Dominant logic of business groups and its roots 85
Table 5.3: Strategic fit between dominant logic and business characteristics 107
Table 5.4: Group wise strategic fit index 108
Table 5.5: Summary of association among variables 113
Table 8.1: Market imperfection index values 156
Figure 8.1: Market imperfection trend 158
Table 8.2: Test of Means (Summary) 159
Table 8.3A: Test of Means (Case: 1) 159
Table 8.3B: Test ofMeans (Case: 2) 159
Table 8.4A: One sample t-test of performance across businesses 160
Table 8.4B: Paired sample t-test of performance across businesses 161
Table 8.5A; One-Way ANOVA across 2-factor scale 162
Table 8.5B: One-Way ANOVA across 3-factor scale 163
Table 8.6: Group correlation matrix 164
Table 8.7: Summary of correlation results 176
Table 8.8: Summary of partial regression results 177
Table 8.9: Summary of full regression results (Case: 1) 180
Table 8.10: Summary of full regression results (Case: 2) 183

Table 8.11: Summary of full regression results 191
Figure 9.1: Comparative performance analysis across businesses 194
Appendix lA & B: Tata group data matrix 218
Appendix 2A & B: Reliance group data matrix 220
Appendix 3A & B: Aditya Birla group data matrix 222
Annexure 223-293
Case Study I: Tata Group 223-250
Case Study II: Reliance Group 251 -277
Case Study III: Aditya Birla Group 278-293
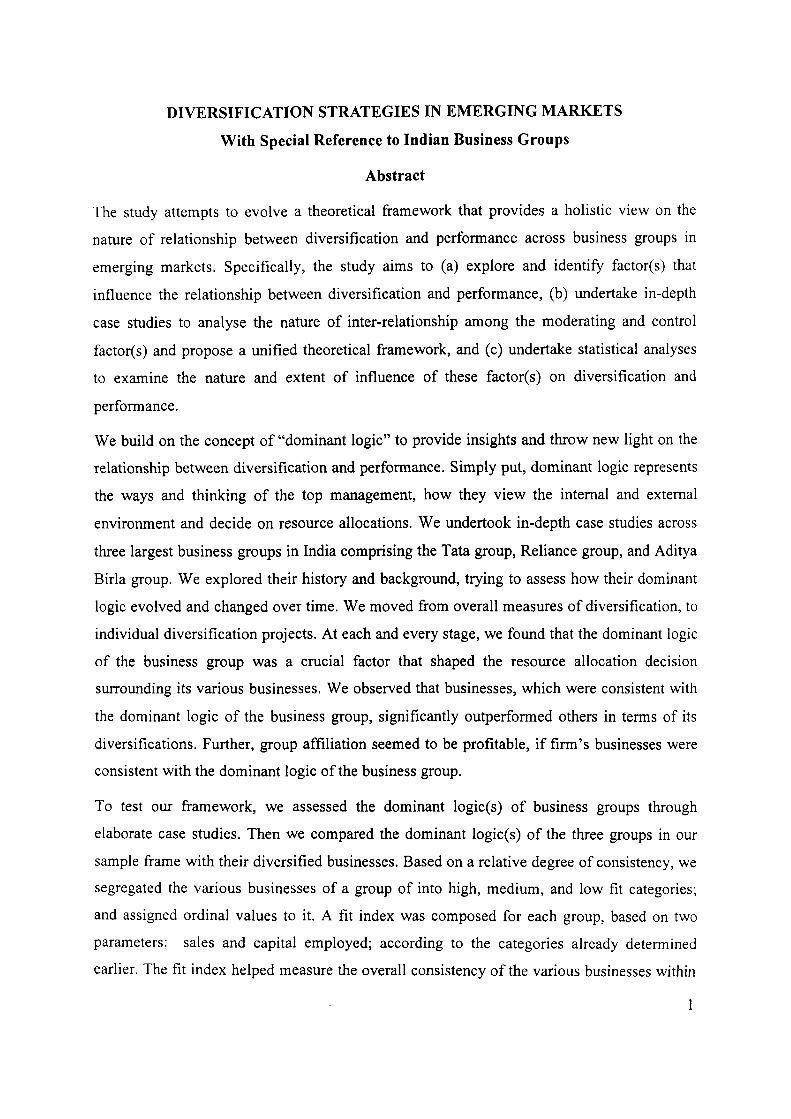
DIVERSIFICATION STRATEGIES IN EMERGING MARKETS
With Special Reference to Indian Business Groups
Abstract
The study attempts to evolve a theoretical framework that provides a holistic view on the
nature of relationship between diversification and performance across business groups in
emerging markets. Specifically, the study aims to (a) explore and identify factor(s) that
influence the relationship between diversification and performance, (b) undertake in-depth
case studies to analyse the nature of inter-relationship among the moderating and control
factor(s) and propose a unified theoretical fi-amework, and (c) undertake statistical analyses
to examine the nature and extent of influence of these factor(s) on diversification and
performance.
We build on the concept of "dominant logic" to provide insights and throw new light on the
relationship between diversification and performance. Simply put, dominant logic represents
the ways and thinking of the top management, how they view the internal and external
environment and decide on resource allocations. We imdertook in-depth case studies across
three largest business groups in India comprising the Tata group, Reliance group, and Aditya
Birla group. We explored their history and background, trying to assess how their dominant
logic evolved and changed over time. We moved fi"om overall measures of diversification, to
individual diversification projects. At each and every stage, we found that the dominant logic
of the business group was a crucial factor that shaped the resource allocation decision
surrounding its various businesses. We observed that businesses, which were consistent with
the dominant logic of the business group, significantly outperformed others in terms of its
diversifications. Further, group affiliation seemed to be profitable, if firm's businesses were
consistent with the dominant logic of the business group.
To test our fi-amework, we assessed the dominant logic(s) of business groups through
elaborate case studies. Then we compared the dominant logic(s) of the three groups in our
sample frame with their diversified businesses. Based on a relative degree of consistency, we
segregated the various businesses of a group of into high, medium, and low fit categories;
and assigned ordinal values to it. A fit index was composed for each group, based on two
parameters: sales and capital employed; according to the categories already determined
earlier. The fit index helped measure the overall consistency of the various businesses within
1
the group as whole. The higher the index value, the higher was the consistency of the various
businesses with the groups' dominant logic and vice-versa. We refer to this consistency as
"strategic fit". The fit is referred to as strategic because it attempts to measure the strategic
relatedness of the various businesses with the dominant logic of the top management. We
measured the control variables according to detailed methodologies available in existing
literature.
Empirical analysis revealed that "strategic fit" had a positive moderating effect on the
relationship between diversification and performance. Even when other factors were
controlled for, the moderating effect remained significant. However, it was also observed that
the direct effect of "strategic fit" on overall group performance was negative. Perhaps the
resource allocation decisions benefited the firms more than the group as whole. The
following observations were also made (a) size had a negative effect (b) industry
characteristics had a positive effect, (c) resources and capabilifies had a positive effect, (d)
internal transactions had a negative effect, (e) inertia had a negative effect on overall group
performance. It was also observed that market imperfection had a positive effect on
performance measured by returns, and a negative effect on performance measured by
margins. Further, businesses, which were consistent with the dominant logic, were found to
significantly outperform others.
The major implication of the study is that it is not diversity per se that ultimately influences
performance. Composition of businesses around a business group's dominant logic (i.e.
strategic fit) has a significant and decisive bearing on performance. The performance effect
of diversification was also a function of the business groups' ability to restructure its
portfolio of dominant logic(s) in the wake of economic liberalisation. This would enable
them to add emerging businesses to its existing portfolio of businesses and divest low
performing businesses, thereby enhancing overall group performance. Therefore, the
conclusion is, market failure alone does not completely explain the evolution, existence and
sustenance of business groups. In fact business groups may actually be the result of a wide
range of cultural, political and socio-economic factors that has little to do with economic
efficiency.
The study contributes to the growing literature on diversification and performance and more
specifically on business groups in more ways than one. It helps us understand the patterns of

diversification strategies pursued by business groups in emerging markets. It attempts to
provide an explanation, which is not purely based on economic forces. This was a major
diverging trend. Lastly, but not least we have made an attempt to integrate multiple
theoretical lenses, which was earlier lacking. We hope that this trend will pave the way to
look at current research problems from a multi-dimensional and multilateral perspective. As
a result we have been, by and large successful in increasing the explanatory power of
diversification on performance by controlling various extraneous factors.
Preface
Socio-economic, cultural, and political forces operating in the economy largely shape the
institution of business groups. Since these forces are likely to be unique in different contexts,
the nature of diversification strategies pursued by them is also likely to be distinct.
Historically, the origins of entrepreneurship started in India in the 1860"s - when the first
cotton mills came up in Mumbai. Till date, Indian business groups, as an institution, have
survived colonialism, partition and liberalisation. They have remained at the forefront of
economic activity, al-through. It represents India's largest institution, symbolizing size, scale,
scope and opportunities.
Indian business groups are perhaps India's most engendered institution as well. And after
surviving many a trials and tribulations, it is now faced with one of the toughest challenges
from global competition. For, however glorious it's past, Indian business groups are
confronted by a disturbingly uncertain future. Will it be able to face the challenges of
economic liberalisation? Will it reign over the economy, or be perpetuated? After all, only
seven of the first fifty business groups in 1947 were even in business by the turn of this
century, and that the thirty two of the country's largest business groups in 1969 are no longer
among the top fifty today (Business Today, January 1997). Globally, less than 10% of the
Fortune 500 companies as first published in 1955, still exist as on 2005 (Govindarajan and
Trimble, 2006). The lesson is clear: top companies and business groups have high mortality
rates as well.
In the wake of economic liberalisation, the one of the critical challenges encountered by
business groups involves pursuing an appropriate diversification strategy. Accustomed to
competing in protected environment, the notion of competing for the customer's attention
and patronage represents a different paradigm altogether. As a result, transition can be truly
traumatic. Business groups unable to transform have to watch their business disintegrate. The
challenge to survival is to adapt and become competitive globally, if not at least locally. The
more demanding decision, which a handful of groups are beginning to take, is to stay and
compete on equal terms with global competition, penetrating into the market place. That, in
turn, is forcing genres of sfrategic choices that Indian business groups have not pursued
extensively in the protected past. It involves forging alliances and joint ventures with global
competitors; developing distinctive competencies; upgrading quality and cost
competitiveness to transcend national boundaries.
The result, but inevitably, is a complete transformation. It demands a process of rigorous and
analytical exploration of the environment, opportunities, and internal capabilities, which
played a relatively negligible role in guiding the choice of diversification strategy in the past.
In an open economy, every emerging field represents an opporttmity for growth to business
groups. But earlier access to the protected environment was a significant criterion for
success. Today an entire portfolio of skills and capabilities are essential for survival. To
conduct a self audit; to take a conscious decision of investing in harvesting those skills; and
to accept that diversification strategies are all about trade-offs, requires a level of strategic
thinking that business groups are just beginning to attain. And the background caused by the
trade-off of these compulsions coupled with the social ethos surrounding the exit of
unprofitable businesses is revolving business groups through an enormous change of mind
set and attitudes.
Despite such intrinsic differences, business groups have been able to cohabit with the
dynamics of the competitive and dynamic environment. The critical issue earlier was to stay
together, which offered the route to controlling various individual firms and creating wealth.
Through this motivation, business groups used bloodlines to build structures and perpetuate
dynastic leadership. Only when family unity was threatened was the business also threatened
as a result. Much the stronger force, however, was the family tradition of building, and
passing on wealth to the heirs, which was almost a compulsion. Coupled with this vector was
the other, materialistic, convention of seeking a safety net for the heir, which provided an
additional impetus for creating a subsidiary business.
The outcome of these forces: the interests of the family became indistinguishable from those
of its businesses. Today, however, the disintegration of these bonds is one of the noticeable
change inducing forces impacting a business group. Part of the impetus came from new
societal structures such as growth of the nuclear family, triumph of individualism, and the
need for instant gratification. The divergent ambitions of succeeding generations, as well as
personality clashes, are throwing strong challenges to stability. Some equally critical
compulsions are being imposed from outside; all of them threatening the age-old benefits and
rationale that drove the group. Under the combined effect of these internal and external
forces, a radically different future is emerging for business groups.
As the families consolidated their business, it created partnerships between its members
involving financial stakes. This enabled the group to retain strategic control over its
diversified businesses. This structure did not disturb the patriarch's line of authority; it also
left enough room for other members to air their personal ambitions. Importantly, the pursuit
of these goals did not lead to the creation of completely new firms. Instead, it only led to
complex networks with cross-holdings meant to ensure financial participation of its different
members. Most family members were directors in almost every variety of business without
hardly any technical background. As a result, the switch to the board managed structure, from
the erstwhile managing agency structure in 1969, saw only superficial changes. The boards of
family businesses thus comprised promoter-directors drawn from the family; a few managers
with long and deep relationships with the family; fi-iends of the family portraying as
professionals, non-executive directors; and institutional directors. However, the maze of
multi-layered firms, with substantial cross-holdings and intermediate investment companies
persisted, so did the centrally controlled structure of the group.
However, since liberalisation, the rationale for these forms has almost disappeared. Equally
important are the new considerations that are dictating the structure of business groups. They
are beginning to consolidate their fractured holdings in order to keep off takeover attempts in
the emerging market for corporate control. Moreover, as the new strategic imperatives,
business groups are being compelled to take on new structures in response: substituting
centralization with a confederate configuration; flattening hierarchical pyramids; and
replacing family management wdth professional management. That the Indian business
groups must follow these paths of transformation is by now an accepted fact. It is the path,
and not the end result that is important in today's emerging context. Unfortimately, merely
embarking on these changes may not alone lead to performance. The extent of progress
already made is a crucial indicator of the chances of a group surviving and creating value in
the new liberalised era.
CHAPTER 1
Introduction
In this chapter we introduce the reader to the background of the research area and its
development in the past few decades. We also attempt to present the different paradigms in
explaining diversification strategies not only in the developed markets, but also in the case of
emerging markets. The centrality of the research problem surrounds our basic observation
that despite offering a plethora of views and approaches, the findings are fraught with
contradictions. We intend to combine muhiple theoretical lenses; cutting across disciplines,
to put in place a unified theoretical framework that attempts explains these dichotomies.
1.1 Research Context
The history of the U.S. economy has witnessed major shifts in the pattern of diversification.
There was an increase in incidence of conglomerate form of diversification during 1960's. It
was observed that two-thirds of the Fortune 500 firms in the U.S. were highly diversified and
similar patterns of diversification were found to exist in Western Europe and Japan (Rumelt,
1974). As a consequence, interest in diversification has grown among practitioners,
academics, and public-policy makers. Studies of diversification have long been a mainstay of
Strategic Management research. They constitute a unique core of growing literature in this
discipline. It began with the pioneering work of Ansoff (1957). The most researched
phenomenon in this extensive body of literature is that involving diversification and
performance (Chatterjee and Wemerfelt, 1991). Beginning with the seminal work of Gort
(1962), Industrial-Organisation (I/O) Economics spawned decades of research based on the
premise that diversification and performance are positively related. This position rests upon
several assumptions, including those derived fi-om market power theory and internal market
efficiency arguments, among others (Scherer, 1980; Grant, 1998).
Another major shift in the patterns of diversification was witnessed with the onset of the
1980's in the U.S. economy. Core competencies and focus became the new guidelines of
conglomerates in most Western economies. Subsequently, there was a spurt in research
activity to explain this new phenomenon. In a tacit rejection of the earlier linear model,
Denis, Denis and Sarin (1997) concluded that recent empirical evidence suggested that the
costs of high levels of diversification outweigh the benefits, that focused firms outperform
their more diversified counterparts. Palich, Cardinal and Miller (2000) in turn proposed a
curvilinear model, based on their findings that moderate levels of diversification yield higher
levels of performance than either limited or extensive diversification.
While U.S. conglomerates started focusing on their diversification strategies, it was also
observed that there was an increasing trend to dismantle the large conglomerates formed in
the 1960's into individual firms. Corporate managers argued that the unwieldy conglomerate
form of structure was no longer responsive to environmental change, which was fast
becoming the order of the day. Also the cost of maintaining a diversified conglomerate
structure was slowly outperforming the benefits. To explain these phenomenon researchers
tried to estimate the relative importance of firm, industry and group differences in the
determination of performance of a business unit. In support Schmalensee (1985) observed
that over a time, effects related to industry structure and group slowly gave way to firm
effects.
But while managers in the West have dismantled many conglomerates assembled in the
1960's, diversified business group remains a dominant form of enterprise throughout most
emerging markets. Some groups operate as holding companies with fiall ownership in many
enterprises, others are collections of public traded companies, but all have some degree of
central control and coordination. In the midst of such controversy Khanna and Palepu (1997)
advocated that Western companies take for granted a range of institutions that support their
business activities, but many of these institutions are absent in most emerging markets.
Therefore, focus may be good advice for firms in the West, but groups operating in emerging
markets can add value by imitating the fijnctions of several institutions that are present only
in advanced economies. In support, it was observed that firm performance would initially
decline with increases in a business group's diversification, until group diversification
reaches a threshold. Beyond this threshold, marginal increases in group's diversification will
yield marginal increases in firm performance. Further, the threshold above which marginal
increases in unrelated group diversification result in marginal increases in firm performance
will rise as market institutions evolve over time (Khanna and Palepu, 2000). Therefore, it
will be become increasingly difficult for business groups to retain the positive effects of
diversification. Hence, in the long run the pattern of performance of business groups in
emerging markets will match with those of its Western counterparts. But the pace at which
8
group effects are likely to atrophy is dependent on the pace of economic liberalization
pursued by the local government.
The authors also observed that after group diversification was controlled for, group affiliation
was associated with positive performance effects. The study by Khanna and Rivkin (2001)
that spanned across fourteen emerging markets concluded that group affiliation appears to
have as profound an effect on profitability as industry membership. Also the performance
effects of group membership will decrease as market institutions evolve over time. In support
Chang and Hong (2002) had also observed that group effects decrease over time. However,
the pace at which group effects will sublime is likely to depend on the particular institutional
setting. While the outcome of this research phenomenon was uniformly observed across
developed markets, they have evoked mixed reactions, particularly in the Indian context.
While economic liberalisation has opened up a plethora of business opportunities, relatively
newer business groups have continued to diversify during the last fifteen years of economic
liberalisation; older business groups have by and large consolidated their business portfolio
with some minor diversifications, while focused business groups still continue to perform
unabated. Empirical findings in the same context remain equally confusing (Kakani, 2000;
Mohanty, 2000). We intend to put in place a theoretical framework that integrates across
these cross-findings.
1.2 Research Problem
Research on diversification and performance has long ignored managerial explanations in
favour of explanations based on purely economic forces. Starting with the pioneering work of
Gort (1962), followed by works of Leff (1976, 1978) and subsequent works of Khanna and
Palepu (1997, 2000) all have based their work, which has its foundations in I/O Economics.
While not opposed to the economic approach, it was felt that the balance between economic
and managerial explanations was becoming dramatically skewed (Prahalad and Bettis, 1995).
This did not square with their personal observations or theoretical biases. An earlier paper
(Bettis, Hall and Prahalad, 1978) began to address this issue. They continued to observe
problems that the top management had in coping with major diversification moves. Our own
case studies revealed how several business groups found it increasingly difficult thinking
about strategically unrelated businesses, or about businesses with different characteristics
firom their core businesses or when industry structures changed radically.
The problem becomes even more complicated on account of economic liberalisation, as the
rules of business changed significantly. Business groups, which were used to perform in a
protected environment, now faced challenges against international competition. While
researchers were focusing exclusively on diversification - performance relationship, they
were at the same time ignoring the extraneous influences of diversification on performance
outcomes. This has been facilitated because most of existing research has looked into the
relationship from the point of view of single theoretical lens. Prahalad and Bettis (1995) felt
that research on diversification and performance was setting into a pattern of regressing a set
of economic and/or accounting variables and a measure of diversification on a performance
measure. This research trend was built on earlier research studies of Wrigley (1970), Rumelt
(1974) and continues till recent times (Khanna and Palepu, 2000; Khanna and Rivkin, 2001).
While new insights were found, it was felt that the marginal value of such studies was
declining. There was also a need to shift focus from macro to micro level of analysis; from
overall profiles of diversification to individual diversification projects and cumulative
diversification experiences (Ramanujam and Varadarajan, 1989; Prahalad and Bettis, 1995).
Following this research tradition we made an attempt to study the diversifications patterns of
Indian business groups and its outcome on performance from the point of view of a multiple
theoretical lens by adopting a micro point of view. We also take a cue from the comments of
Prahalad and Bettis (1995:6) "strategic management often ignored managerial explanations
in favour of explanations based on purely economic forces and untenured faculty should not
hesitate to strike out new directions, if it is firmly believed that the views are justified". This
study combines perspectives from Strategic Management, Organisation Theory, and I/O
Economics to explain the above dichotomies. This would help us achieve three major
objectives. First, it would enable us to idenfify factors that moderate the relationship between
diversification and performance. Second, it would help us in assessing the nature and extent
of moderating effect of these factors on the diversification - performance relationship. Third,
it would enable us to increase the significance and explanatory power of diversification on
performance.
1.3 Outline of the Thesis
The first chapter of the thesis introduces the research context and also provides an overview
of the research problem. A crifical review of major relevant literature on the subject is
10
presented in the second chapter. This chapter serves two purposes - one, giving a critical
exposition of the extant literattire and two, identify major research gaps. An elaborate
discussion on the variables used in the course of the research is made in the third chapter.
The fourth chapter presents a detailed accoimt of research design and methodology adopted
in the study. The fifth chapter analyses the cases relevant to the framework, the details of
which are provided in the armexure. In the sixth chapter we build on the various hypotheses
developed from existing literature and case studies; this forms the backbone of our
conceptual framework. The seventh chapter integrates across the various hypotheses and
proposes a unified theoretical framework on antecedents of diversification and its outcomes
on performance. The eighth chapter reports the results and findings of various statistical
analyses. The discussion and interpretation of results is presented in the ninth chapter. Finally
in chapter ten, the final chapter of the thesis, we have summarised the major findings, discuss
their implication for practicing managers and delineates the contribution of the study to
Strategic Management and Organisational Theory, presents the limitations of the study, and
raises some major issues for fiiture research.
11
CHAPTER 2
Literature Review
In this chapter we attempt to present the major discourses in diversification strategies, from
the point of view of relevant literature. Within this framework we segregate research under
two broad categories. In the first category, studies concerned with describing the relevant
phenomenons and delineating or developing concepts are presented. In the second category,
we have explored literature concerning simple bivariate or contingency type relationships
involving more than a pair of variables, factors, or concepts. We move from simple unitary
motives behind diversification, to complex array of relationships surrounding diversification
and performance. The strength and direction of the relationship has been assessed from the
point of view of conglomerates in the developed markets to business groups in emerging
markets. Finally, we outline the limitations of earlier research followed up by identifying the
prominent research gaps.
2.1 Introduction
The strategy field's core issues - the concept of strategy, causal models relating strategy to
other constructs, and models of strategic management and choice (including diversification
and perfonnance) has been addressed by two key progressions. The mechanistic perspective
is based on disciplinary based theories, the design model and a view of strategy as a planned
posture, has provided a unified view, but a narrow and increasingly pertinent one. The advent
of organic developments that includes strategy process research, evolutionary and process
models, and interactive and integrative views, has provided richness and pertinence, but not a
unified perspective. These two progressions have marked an epistemological shift from
mechanistic to organic assumptions: from discrete to incessant time, from directional to
interactive flow, and from differentiated to integrated constructs and models (Farjoun, 2002).
In the mechanistic perspective, strategy is mainly viewed as a posture - a relatively stable
configuration - a fit or alignment - between mutually supporting organisational elements,
such as activities and organizational structure, and environmental elements, such as a
customer group. Two main types of strategy postures are "position" (i.e. differentiation
strategy) and "scope" (i.e. vertical integrafion) (Chandler, 1962; Rumelt, 1974, 1984; Porter,
1980, 1991; Wernerfelt, 1984). Strategy postures have been the tradifional focus of research
12
on customer groups (Cool and Schendel, 1988), diversification (Montgomery, 1982), and
structure (White, 1986). In addition, early treatments of strategy, rooted in strategic planning
models, have viewed it primarily as a rational plan. According to this view, which still guides
much of the thought in strategy field, action is purposive and prospective, and strategies are
realised and planned (Mintzberg et al., 1998).
Two primary concerns of mechanistic views of strategy research are to explain what
determines firm performance, and to identify what affects firm strategy. Three research
programs have been particularly influential in addressing these questions. The structure -
conduct - performance (SCP) paradigm (Bain 1956) and its derivative, the industry -
structure model (Porter, 1980) and the strategy - structure - performance (SSP) paradigm.
The industry - structure model views the external environment as a key determinant of
strategy and performance. According to their view fit between strategy and its environment
leads to better performance. The strategy - structure - performance (SSP) paradigm
highlights the significance of factors complementary to strategy, such as organisational
structure to firm performance (Chandler, 1962). The model proposes that different growth
strategies are driven by the accumulation and deployment of internal resources, and are
matched by different internal structural arrangements. It particularly implies that the match
between strategy and structure results in better performance. A relatively and more recently
embraced model is the resource-based view (RBV). Early work on RBV delineated a process
theory of the role of resources in firm growth (Penrose, 1959). It sees certain resource
attributes, such as inimitability, uniqueness, and flexibility, as enabling certain strategies (i.e.
cost leadership), and contributing to sustained competitive advantage (Wemerfelt, 1984;
Barney, 1991; Teece et al., 1997).
The mechanistic perspective remains a vital element in the development of strategy research.
It has established the centrality of key constructs, questions, and theoretical relationships, and
its prescriptive orientation reflects the fields commitment to help firms improve their
functioning and performance, and to address key managerial concerns. Yet, despite its many
contributions and achievements, the tenets of the mechanistic perspective have been
increasingly questioned. Its simple assumptions are better suited to a relatively stable and
predictable environment and to the early stages of the field's development. This seems to be
at odds with the more complex and constantly changing observed behaviour of organisations
13
and markets (Farjoun, 2002). This is perhaps what is referred to as complex adaptive systems
(Waldrop, 1992; Gleick, 1987; Cambel, 1993, Gulick, 1992). Furthermore, critics have
described such views as static (Pettigrew, 1992), linear (Henderson and Mitchell, 1997), and
fragmented (Schendel, 1994). Prompted by the limitations of the mechanistic perspective,
and inspired by the advent of new ideas in the social and natural sciences, the strategy fields'
second broad progression saw the emergence and spread of organic developments. Key
developments included research on strategy formulation and implementation (Quinn, 1980;
Minzberg and Waters, 1985), evolutionary ideas and process models (Nelson and Winter,
1982; Van de Ven, Bamett and Burgelman, 1996), the recognition of reciprocal and
interaction relationships between strategy and other constructs (Tirole, 1989; Henderson and
Mitchell, 1997), and interactive research (Baden - Fuller and Stopford, 1994).
These research streams have collectively introduced more dynamic and eclectic views of key
constructs, offered new views of strategy formulation, highlighted the importance of strategy
processes, especially against rational unitary actor models, and portrayed a more complex
view of causality. Moreover, they have shifted the focus from strategic choice to strategic
change, and given much more recognition to 'soft' variables (Farjoun, 2002). Collectively,
the organic perspective represents a paradigm shift in the underlying epistemological
assumptions of the mechanistic perspective concerning time, flow, and coupling within and
across models. First, the organic view adopts an incessant and diachronic concept of time.
Here concepts and relationships are treated as a part of continuous processes and iterated
sequences, and entities are created rather than given; compared with the discrete concept of
the mechanistic view. Second, the mechanistic view contrasts with the organic ideas in its
directional view of flow. It often presents a linear and sequential view of events and causality,
and highlights deterministic causes of behaviour (Bourgeois, 1984). In contrast the organic
view pays relatively more attention to interaction, feedback and to multiple, reciprocal,
exogenous and endogenous influences. Lastly, although early concepts of strategy
emphasised its integrative nature (Andrews, 1971), the mechanistic view is characterised by
internal differentiation: the constructs in both explanatory and prescriptive models are more
developed and better specified than the relationships that hold them together. In contrast
organic views emphasises ideas, which are truly integrated in terms of phenomena and
concepts. In our research context we incorporate some of the 'soft' constructs pertaining to
14
organic views, while also retaining the 'hard' constructs of the mechanistic views, which
remain the backbone of strategy research.
2.2 Diversification issues
One of the key aspects of a firms' development from an evolutionary perspective is the
choice of diversification strategies (Chandler, 1962; Kay, 1997). The strategic management
literature therefore suggests diversification as a major strategy (Berry, 1975; MuUer, 1987;
Fligstein, 1991). In pursuing diversification strategies, the strategic choices that govern it at
various points of time includes its - direction - extent - pace - timing - route. A review of
the literature reveals that there is a great deal of variation in the way diversification is
conceptualised, defined and measured. Ansoff's (1957) notion of diversification emphasises
the entry of firms into new markets with new products. Gort (1962) defined diversification in
terms of the concept of 'heterogeneity of output' based on the number of markets served by
that output. To Berry (1975) diversification represents an increase in the number of industries
in which a firm is active.
The literature on diversification not only represents a great variety of perspectives and
disciplinary paradigms, but also covers a wide range of research questions and issues. We
recognise that level and type of diversification are conceptually distinct, but we do not
differentiate them here. For the time being we assume that single, related, and unrelated
diversifications are equivalent to low, moderate, and high diversification. Research on
diversification was the outcome of the pioneering work of Ansoflf (1957). Since the..,
research on diversification has been replete with numerous studies. The various research
areas on diversification can be broadly categorised into, (a) firms decision to diversify - for
understanding research on diversification the logically obvious place to start is the
antecedents and influences on a firms' decisions to diversify, (b) choice of direction of
diversification - a firm choosing to diversify can be viewed as basically seeking ways to
modify its business definition, (c) choice of mode of diversification - it is basically an
indication of the extent a firm relies on organic growth vis-a-vis externally driven growth, (d)
diversity status - after a firm has engaged in diversification over time it attains a certain
status or profile, (e) management of diversification - the problem of managing diversified
businesses increase dramatically as the firm's scope of diversification increases.
15
While a set of studies has been contained within the individual frameworks as defined above,
there has been another set of studies that has attempted to explore the various simple and
complex linkages among the various individual frameworks. Such studies have explored
simple bivariate relationships as well as contingency type relationships involving more than a
pair of variables, factors, or concepts. Some of the major researched linkages are (a) the
effect of general envirormient, industry environment, and firm characteristics on a firms'
decision to diversify, choice of direction of diversification, choice of mode of diversification,
diversity status, and (b) the effect of firms decision to diversify, choice of direction of
diversification, choice of mode of diversification, diversificafion on performance. However,
the most researched linkage in this area involves diversification and performance (Chatterjee
and Wemerfelt, 1991).
2.3 Diversification and performance
Research findings on the nature of relationship between diversification and performance can
be classified under four distinct streams of thought. The earliest streams of work having its
origin in I/O Economics follow exhaustive work of Gort (1962) that spawned decades of
future research. The basic premise of this stream is that diversification and performance is
linearly and positively related. This position rests upon several assumptions, including those
derived fi-om market power theory and internal market efficiency among others (Scherer,
1980; Grant, 1998; McCutcheon, 1991). The early literature on diversification asserts that
diversified firms can employ a number of mechanisms to create and exploit market power
advantages, tools that are largely unavailable to their more focused counterparts (Sobel.
1984; Caves, 1991). Further, a low diversified firm has no access to investment from cross-
subsidisation. So its basic sources of capital are external - which are more costly than
internally generated fiands, when efficiently managed (Froot, Scharfstein and Stein, 1994;
Lang, Poulsen and Stulz, 1995). In contrast highly diversified firms' have much greater
flexibility in capital formation since it can access external as well internally generated
resources (Stulz, 1990; Lang and Stulz, 1994). Thus, diversification can generate efficiencies
that are primarily unavailable to a single - business firm (Gertner, Scharfstein and Stein,
1994).
In the second stream of thought, researchers lend credence to the fact the diversification and
performance is linearly and negatively related. Though many studies have concluded that
16
highly diversified firms gain significant financial benefits fi-om using internal markets for
capital and other critical resources (Rumelt, 1982; Williamson, 1986; Ravenscraft and
Scherer, 1987; Taylor and Lowe, 1995; Grant, 1998), support for this contention is not
universal (McCutcheon, 1991). Jensen (1996) has argued that top management of diversified
firms may be inclined to invest surplus cash flows (i.e. cash flow exceeding that is required
to fiind all positive net present value investments in its present operations) in ways that
support organisational inefficiencies. In other words, managers may be drawn to over-invest
in undeserving projects (Bolton and Scharfstein, 1990; Stulz, 1990; Berger and Ofek, 1995).
Furthermore, Bhide (1990), and among others (Markides, 1992; Matsusaka, 1993; Comment
and Jarrell, 1995) mounts the case that internal market advantages from diversification were
prevalent in the 1960's, but the information asymmetries that produced this edge slowly
diminished since the 1970's due to wide spread economic, technological and regulatory
changes. And by the 1980's this distinct advantage was almost nullified.
In the third stream of thought, researchers have proposed a curvi-linear relationship between
diversification and performance. According to this view, moderately diversified firms
perform better than its low diversified business counterparts. However, they differ in their
predictions of the performance trend as firms move from moderate to high levels of
diversificafion. Lubatkin and Chatterjee (1994) observe that single-business firms do not
have the opportunity to exploit between-unit synergies or the portfolio effects that are
available only to diversified firms. That is single-business firms do not enjoy scope
economies. In contrast moderately diversified firms are involved in multiple businesses are
able to tap a common pool of resources (Lubatkin and O'Neill, 1987; Nayyar, 1992), thus
yielding advantages over a single-business firm. Theoretical rationales, which suggest
superiority of moderate diversification, have their focuses on advantages derived from
economies of scale and scope (Seth, 1990; Markides and Williamson, 1994). Specifically,
moderately diversified firms generate operational synergies by designing a portfolio of
businesses that are mutually reinforcing.
Porter (1985) provides numerous examples from case studies how moderate diversifiers can
share activities across businesses in order to boost its financial perfoi-mance. While benefits
accrue to moderately diversified firms, at some point these efforts are also associated with
addhional costs. Grant, Jammine and Thomas (1998) recognise the growing strain on top
17
management as it tries to manage an increasingly disparate (and therefore, less familiar)
portfolio of businesses. Markides (1992) delineates other costs, such as control and effort
losses (due to increased shirking), coordination costs and other diseconomies related to
organisation, inefficiencies from conflicting dominant logics between businesses, internal
capital market inefficiencies and due to cross-subsidisation. Given these dynamics,
researchers argue that the marginal costs of diversification increase rapidly as diversification
hits high levels.
Markides and Williamson (1994) refer to this as "exaggerated relatedness" suggesting a
mirage effect when assessing apparent similarities between business units. They argue that
moderate diversifiers will outperform their extensive diversified counterparts only to the
degree that they are able to exploit synergies to create, and accumulate strategic assets more
quickly and cheaply than its competitors. Simply amortising existing assets via economies of
scope - the popular mouthpiece of the relatedness theory - will yield only short-term benefits
at best. In addition to this concern, Nayyar (1992) points out that activity that is necessary to
exploit relatedness lead to costs that partially blunt the benefits of that strategy. Thus, one can
easily conclude that firms' experience an optimal level of diversification (likely to vary from
case to case), with performance decrements beyond this point of maximisation (i.e. from
moderate to high levels diversification).
A fourth stream of thought, which is basically an extension of the earlier stream, advocates
that effects of moderate and high levels of diversifications are somewhat equal in their
impact on performance. In the earlier stream of work, few researchers have questioned the
superiority of moderate over low or limited diversification. However, the performance
contribution of moderate versus high levels of diversification is often debated. Considering
the arguments that follow, it may be that the effects of moderate and high levels of
diversifications are somewhat equal in their impact on performance. The primary issue in this
controversy arises from concerns that moderate diversified firms may not be able to fully
exploit the synergies designed into the portfolio of businesses. Put another way, synergy
initiatives often fall short of management expectations (Goold and Campbell, 1998). Going
further, high diversifications may present some unique advantages of their own derived
primarily from financial synergies (Kim, Hwang and Burgers, 1989). Highly diversified
firms can also do more to reduce industry specific risks and probabilities of bankruptcy (also
18
referred to as coinsurance effect) and also lead to enhanced debt carrying capacity (Barney,
1997; Seth, 1990). Thus, one can easily conclude that firms' do experience an optimal level
of diversification; however, performance effects will become constant beyond the point of
maximisation.
2.4 Emerging markets and business groups
A vast majority of the studies on the nature of relationship between diversification and
performance is based on the developed market context. In this regard, Khanna and Rivkin
(2001: 45) have pointed out that: "conclusions drawn in one context may well not apply to
another". Emerging markets characterised by low-income, rapid growth using economic
liberalisation as their primary engines of growth depict an altogether different context
(Hoskisson et al., 2000). Therefore there is strong justification for a need to focus specifically
on the nature of diversification - performance relationship across emerging markets. A
review of existing literature on emerging markets provides a glimpse of three distinct
perspectives of diversification in emerging markets.
The institutional theory emphasises the influence of the systems surrounding organisations
that shape social and organisational behaviour (Scott, 1995). Institutional forces affect
organisations processes and decision-making. Perspectives derived to examine these
institutional forces have both an economic orientation (Clague, 1997; Coase, 1998; North,
1990) and a social orientation (DiMaggio and Powell, 1993; Scott, 1995). New institutional
economics focuses on the interaction of institutions and firms resulting from market
imperfections (Harriss, Hunter and Lewis, 1995). Peng and Heath (1996) argue that the
internal growth of firms in emerging markets is limited by institutional constraints; as a
result, a network-based growth strategy is expected to be more viable in emerging markets.
Institutions can also facilitate diversification, allowing firms' to react to and play a more
active role in an institutional environment if firms have an adaptive ability that allows them
to move beyond institutional constraints (Oliver, 1991).
A second perspective that can be applied to patterns of diversification in emerging markets is
transaction cost economics. Transaction cost economics studies the firm - environment
interface through a contractual or exchange based approach (Williamson, 1975). Where the
transaction costs of markets are high, hierarchical governance modes will enhance efficiency,
although hierarchical modes can have their own bureaucratic costs. High transaction costs
19
therefore suggest preference for hierarchical governance structures over the private market. It
may also explain the higher incidence of unrelated diversification and counter - trade among
business groups in emerging markets. Peng and Heath (1996) argued that it is difficult for
firms' in emerging markets to grow internally or through mergers and acquisitions owing to
various sorts of institutional failure. They suggest networks as a hybrid strategy. Within this
perspective, we also consider agency theory as an important lens because of its focus on
principal - agent problems under uncertainty. Agency theory suggests that a firm is a 'nexus
of contracts' (Jensen and Meckling, 1976).
The third perspective, the resource-based view (RBV) of the firm is by far the most
significant of the three approaches. The central quesfion addressed by the RBV concern why
firms differ and how they achieve and sustain competitive advantage. Penrose (1959)
provides some of the earliest insights on this view. He advocates that heterogeneous
capabilities give each firm its unique character and the very essence of competitive
advantage. Wemerfelt (1984) suggest that evaluating firms in terms of their resources could
lead to insights different from the traditional I/O perspective (Porter, 1980). Barney (1986)
suggested that strategic resource factors differ in their 'tradability' and that these factors can
be specifically identified and their monetary value determined via a 'strategic factor market'.
Barney (1991) later established four criteria to more fiilly explicate the idea of strategic
tradability. He suggested that firm resources could be differentiated on the basis of value,
rareness, inimitability and substitutability.
A striking feature of most emerging markets is the prominent role played by business groups.
Most business groups' span a diverse set of industries, and are generally associated with a
single extended family. While these confederations of firm's go by different names in
different countries (groupos in Latin America, guenxiqiye in China, keiretsus in Japan,
chaebols in Korea, business houses in India), they share certain broad patterns of similarities.
Though member firms' (i.e. group affiliates) remain legally independent, a maze of economic
and social ties typically unites each group. The sheer ubiquity of business groups suggests
that they may affect, in important ways, the broad patterns of economic performance in
emerging markets (Khanna and Rivkin, 2001). However, the task of defining a 'business
group' is potentially vexing (Strachan, 1976; Leff, 1978; Encarnation, 1989; Granovetter,
1994). Synthesising from earlier studies, Khanna and Rivkin (2001) has proposed the
20
following definition, "^ business group is a set of firms which, though legally independent,
are bound together by a constellation of formal and informal ties and are accustomed to
taking centralised and coordinated action.'" This definition captures two important aspects of
business groups: the ties that bind the firms together and the coordinated actions those ties
enable. The aspects of the ties that bind groups together can be captured from earlier field
research. First, the ties are numerous and overlapping. Second, they span the economic and
the social, formal and the informal. The multiple ties among group affiliates enable them to
take centralised coordinated actions.
To interpret these coordinated actions, we follow a small but growing literature that has its
origin in I/O Economics. It conceives of business groups as responses to market failures and
associated transaction costs (Leff, 1976, 1978; Caves, 1989). A market failure arises when an
economically beneficial transaction - one that would benefit both the buyer and seller - fails
to be consummated because the indirect costs of the transaction outweigh the net benefit
(Williamson, 1975). Transactions may be particularly costly in emerging markets because
institutions of trade, contract enforcement, communication, and information disclosure are
weak (Kharma and Palepu, 1997), exposing them to a trade to opportunistic behaviour. The
work of Aoki (1984, 1990) has framed groups as response mainly to inefficient capital
markets. However, labour, product, technology and other markets are also prone to failure in
most emerging markets. While conglomerates in the West evolved out of their need for
product - market penetration post World War II. The reasons behind the evolution of business
groups in emerging markets are distinctly different. Recent researchers perceive business
groups as responses to all of these failures (Khanna and Palepu, 2000; Khanna and Rivkin,
2001).
Another important stream of work, emerging from sociology (Granovetter, 1994),
emphasises solidarity norms and codes of behaviour among business groups. This rich body
of research consists largely of descriptive as well as statistical works (Gerlach, 1992; Lincoln
et al., 1996; Keister, 1998). In an extension to this line of work, Peng and Luo (2000) offer
the explanation that personal ties possessed by a firm's top managers with top managers at
other firms and governmental officials are positively associated with performance. In both
the transaction costs and sociological streams of work, business groups are viewed as value -
enhancing organisational forms. A third important stream, grounded in political economy,
21
emphasises a view of groups as socially counterproductive rent seekers, in which groups are
primary devices through which rents in an economy accrue disproportionally to a handful of
families that control major groups, to the detriment of the majority of the population
(Ghemawat and Khanna, 1998). Much of the work in this body is descriptive in nature,
detailing the pattern of relationships between groups and political power structures
(Encamation, 1989; Schwartz, 1992; Gill, 1999).
In a recent study Guillen (2000) has proposed a fourth line of thought that justifies the
existence of business groups. It justifies the importance of business groups in emerging
markets from the existence from the asymmetries in foreign trade and investments that exists
in the economy. This encourages entrepreneurs to create business groups as it allows them to
develop and maintain an inimitable capability to combine foreign and domestic resources that
enables them to enter muhiple industries. However, when such asymmetries fall, the scope
and size of business groups becomes a liability rather than strength, because in such
situations groups face intense competitive pressures from other organisational forms.
2.5 Diversification and business groups
Khanna and Palepu (1997) argue that Western companies take for granted a range of
institutions that support their business activities, but many of these institutions are absent or
underdeveloped in most emerging markets. These are also referred to as market failures or
institutional voids. It is this difference in institutional context that explains the success of
high levels of diversifications undertaken by business groups and its association with positive
performance effects. Existing literature argues that groups can fill some subset of the
institutional voids in imperfect markets. Indeed, the descriptive literature on groups across
several markets emphasises an impressive array of benefits that arise out of the
intermediation function played by groups in capital markets (Leff, 1976; Pan, 1991) and
labour markets (Leff, 1978). The earliest econometric evidences came from the studies of
Japanese keiretsus (Caves and Uekusa, 1976; Nakatani, 1984). More recently, Lincoln et al.,
(1996) described a variety of coordinating mechanisms and their role in reducing the
variability of returns of affiliates. Chang and Hong (1999) suggested that value creation in
the case of Korean chaebols might occur primarily through product and capital market
intermediation.
22
Several studies have demonstrated that on the whole business groups add value through a
combination of product, labour and capital market intermediation (Fisman and Khanna,
1998; Khaima and Palepu, 1999). However, the benefits of diversification in emerging
markets may not be sufficient to offset the costs. Some recent studies suggest that such
investments are characterised by fixed costs (Khanna and Palepu, 1997; Khanna, Palepu and
Wu, 1998). Each business group needs to invest in creating a coordinating mechanism
(Gerlach, 1992; Lincoln et al., 1996) that facilitates the sharing of information and the
enforcement of explicit and implicit intra-group contracts. Therefore, in the initial stages the
fixed costs outweighs the benefits of diversification, but once a threshold level is reached, the
benefits outweigh the costs. It follows that groups that exceed the threshold diversification
levels will undertake such investments.
Such a threshold effect of diversification can also be generated by explanations grounded in
political economy, emphasising a rent - seeking view of groups (Olson, 1982; Granovetter,
1994). Studies by Encamation (1989), White (1974), Amsden (1989) and Robison (1986) in
different economic scenarios lend credence to this view. Shleifer and Vishny (1993) proposed
a formal model having its roots in politico - economy, which provides a supplementary basis
for understanding an alternate mechanism for generating the threshold effect. Business
groups possess various forms of non - tradable assets, which are scarce and inimitable.
Highly diversified groups have greater opportunities to use these assets than single business
firms (Teece, 1980, 1982). Khanna and Palepu (2000) conclude that net performance effects
of unrelated diversification will initially decline, till it reaches a threshold. Beyond this
threshold, marginal increases in-group diversification will yield marginal increases in
performance. They further observe that the threshold level will itself rise as market
institutions evolve over time and hence performance effects of such high diversification will
gradually become difficult to achieve.
However, research on business groups in the Indian context has evoked mixed responses.
Kharma and Palepu (1999) observed that though the Government of India initiated reforms in
1991, restrictions on the operation of markets continued to exist. This helped business groups
to capitalise on the inefficiencies to create value. Further, Khaima and Rivkin (2001)
observed that there was little evidence of 'diversification discount' in most emerging
markets, and in a number of cases the authors observed the presence of 'diversification
23
premium'. In contrast, Kakani (2000) studying business groups in the Indian context found
that group diversification was negatively related to performance during the entire 90's, a
period when economic liberalisation had taken effect. The study also highlighted that net
benefits of unrelated diversification (if any) will decline over time. The authors have further
contended that the market imperfection theory has been blown out of proportion, and
business groups are value destroyers in emerging markets too. The observations of Mohanty
(2000) are also on similar lines. They concluded that business groups in India have by far
destroyed value and that the institution of business groups will perform better if they arc
dismantled into individual business units. Their findings suggest that business groups which
flourished during the times of high regulations do not add value any more in a competitive
era. They concluded that focused and related diversifiers outperformed unrelated ones.
2.6 Group afflliation and performance
Another area of interest among strategy researchers concerns the ramification of group
affiliation for enhancing firm performance (Khanna and Rivkin, 2001). Several prominent
economists and sociologists have emphasised that institutions affect economic outcomes
(Granovetter, 1984; Williamson, 1985; Aoki, 1990; North, 1990). In the developed markets,
which is characterised by efficient intermediation, it is less likely that a firm will benefit by
being associated with a conglomerate that is highly diversified across a number of industries
than with the case of a firm with such an association in an economy with severe market
imperfections (Hoskisson and Hitt, 1990). Khaima and Palepu (2000) mentioned that after
group diversification was controlled for, group affiliation would be associated with positive
firm performance. Further, performance effects of group affiliation were found to decrease
over time as market institutions evolve over time. In emerging markets context Chang and
Hong (2002) found that corporate effects, reflected in - group membership do matter along
with industry and firm effects, though group effects declined over time. This is in significant
deviation to the study by Rumelt (1991), which found that firm effects dominate profitability,
followed by industry effects, and that corporate effects on profit variance are nearly zero.
Several subsequent studies in the developed markets either confirmed or disconfirmed the
above findings (Roquebert, Phillips and Westfall, 1996; McGahan and Porter, 1997).
Khanna and Palepu (1997) observed that as fi-ee markets emerge, the ability of business
groups to enhance performance by circumventing market failure would gradually subside.
24
Thus group effects in general would decrease over time (Chang and Hong, 2002). Guillen
(2000) findings were also on similar lines, the higher the market imperfections; greater will
be the importance of business groups in an economy and vice - versa. However, the shocks
to profitability fade at substantially different rates in different markets (Khanna and Rivkin,
2001). The possible conjecture is that, the rate at which group effects atrophy possibly
depends on the pace at which market institutions evolve over time. Therefore, it need not be
necessarily concluded that with market evolvement groups' ability to create market value by
circumventing market efficiencies would gradually subside (Chang and Hong, 2002).
Khanna and Palepu (2000) clearly demonstrated that there were group benefits that were
unrelated to diversification. Though there is mild evidence that benefits of high
diversification pursued by business groups become progressively harder to obtain as market
evolves (Khanna and Palepu, 2000). Chang and Hong (2002) also observed that group effects
are rather small among the largest segment of business groups than the erstwhile smaller
ones. They provide the explanation that, these groups, most of which grew during the early
phases of industrialisation were more or less homogeneous in terms of their strategies.
structure and culture. On the other hand, smaller groups are more heterogeneous. Also most
of the firms affiliated to large groups are more mature, and have their own set of resources.
As a consequence, their own resources may also largely determine the profitability of
affiliates firms. Hence, profit rates of group affiliates were observed to be closer to one
another than they are to non - affiliates. Therefore in such situations firm effects might be
stronger than group effects. Hence most results offer few universal truths valid across all
emerging markets.
Guillen (2000) put forward another view, which has its base in resource-based view (RBV)
of the firm. His main contention was entrepreneurs in emerging markets create business
groups if politico - economic conditions allow them to acquire and maintain the capability of
combining foreign and domestic resources - inputs, processes, and market access - to
repeatedly enter new industries. This contention is based on the logic that, diversification is
to access both domestic and foreign resources rather than to reap scope economies and
minimise transaction costs. Entrepreneurs who learn to combine these resources quickly and
effectively will be best able to create business group by repeatedly entering a variety of
industries. This capability is generic in nature and not precisely industry - specific.
25
Diversifying entrepreneurs will rarely bother to build integrated organisation structures to
capture cross - industry synergies (Hoskisson, 1987; Chandler 1990). They will rather rely
on the looser arrangement of the business group. However, in the Indian context Chacar and
Visa (2005) have not found any significant difference between affiliated and non-affiliated
firms. The distinct possibility may be that groups are really results of a wider range of
cultural and sociological factors that has little to do with economic efficiency (Khanna and
Rivkin, 2001).
2.7 Limitations of earlier research
Although the topic of diversification has stimulated a stream of research studies exploring
various themes and linkages across the developed markets, a substantial body of work (i.e.
research on diversification and performance) across developed markets appears to be just
incremental in nature. The rationale tor many of the studies - within the strategic
management field in particular - appears to be nothing more ambitious than the opportunity
to experiment with a different measure of diversification or performance, or a different
approach to conceptualising and measuring its effectiveness. These observations leads Palich,
Cardinal and Miller (2000) to conclude that this research domain - while large - has not yet
reached maturity. According to the authors a research stream is best characterised as mature
when (a) a substantial number of empirical studies have been conducted, (b) these studies
have generated reasonably consistent and interpretable findings, and (c) the research has led
to general consensus concerning the nature of key relationships.
For instance, we still do not know why synergy in diversification is so elusive to obtain, or
why diversification efforts are sometimes successful and sometimes not. Research examining
diversification and performance has been ongoing for more than four decades, but a unified
theoretical framework is still lacking which attempts to explain the antecedents of
diversification and the relationship between diversification and firm outcomes such as
performance (Hoskisson and Hitt, 1990). This leads Markides and Williamson (1994) to
conclude that there is still considerable disagreement about precisely how and when
diversification can be used to build long-run competitive advantage. Many researchers in this
field share this view (Ramanujam and Varadarajan, 1989; Hoskisson and Hitt, 1990;
Hoskisson et al., 1993; Hill, 1994; Stimpert and Duhaime, 1997). Therefore, much room
26
remains for breakthroughs in this seemingly oversaturated area of inquiry (Ramanujam and
Varadarajan, 1989).
2.7.1 Diversification and performance
Beattie (1980) provides an overview of various theories of conglomerate diversification.
Most empirical studies proceed on the assumption that only one of model is operating, and
accordingly propose unitary motives for diversification (Lubatkin, 1983). Therefore, the
explanatory power has been limited because of their neglect of other equally potent motives.
As a resuh Rumelt (1974) was only able to explain less than 20%, while Montgomery (1979)
could only explain about 38% of the variations in performance. A more plausible explanation
for the inconsistencies among research findings may be the failure of empirical studies to
explicitly address the indirect influences of diversification on performance outcomes
(Stimpert and Duhaime, 1997). In contrast to the inadequate attention given to direct
examination of the motives underlying the diversification decision, the extent of energy
devoted in developing measures of diversification is quite impressive. In many studies
diversification is treated as a continuous variable (Gort, 1962; Berry, 1975; Caves, Porter and
Spence, 1980; Palepu, 1985). While in others, particularly within the strategic management
discipline, categories were developed using somewhat arbitrary cut-off points (Wrigley,
1970; Rumelt, 1974, 1982; Bettis, 1981; Montgomery, 1974, 1982). The use of various
alternative approaches for measuring diversificafion has not led to any greater insights into
the impact of diversification on performance and has been rather incremental in nature.
Markides and Williamson (1994) conclude that disagreement exists because traditional
methods of measuring relatedness in terms of products - markets - technologies are
incomplete because it ignores 'strategic relatedness'. Pitts and Hopkins (1982) stressed, that
the choice of measure should be guided by the research question in hand.
Regarding the measurement of performance, there are clear differences again within three
disciplinary streams. Earlier studies in I/O Economics were concerned with the possible anti
competitive effects of diversification, and focused their attention on market structure
variables. Using a public policy perspective, studies have examined the effects of
diversification on such variables as concentration, industry growth and iimovation. The effect
of diversification on a firm's growth rate and vice-versa has also been of significant interest
(Berry, 1971; Hassid, 1977). The finance literature has been concerned with testing the extent
27
of portfolio risk reduction achieved by diversification from an investor's as opposed to a
managerial point of view. Their dependent variables have been various market measures of
return and risk, although some studies have also used accounting based measures of risk as
well as return.
A review of the literature reveals that accounting based measures have been the primary
focus of much of the strategic management research on diversification. However, there is at
present a lively interest within the strategic management field in adopting market-based
performance measures (Montgomery, Thomas and Kamath, 1984; Hitt and Ireland, 1987;
Amit and Livnat, 1988). Though this trend is welcome, but it is interesting to note that
several years ago, Holzman, Copeland and Hayya (1975) deplored the exclusive focus of on
market based measures of performance in studies of diversification in the finance area. They
argued that decisions regarding diversification are made using profitability data derived from
financial statements and, hence it would be more appropriate to use accounting based
measures to assess the efficacy of diversification efforts. The availability of alternative
measures advocates strongly for the use of an integrative point of view and reliance on
multiple measures of effectiveness so that the cumulation of knowledge across disciplines
can proceed smoothly (Ramanujam and Varadarajan, 1989).
Research having its origin in financial economics and more specifically portfolio theory,
proposes that under conditions of perfect capital markets, diversification provides no
benefits. Still if firms diversify it follows that they are acting in markets that are less than
perfectly competitive. Further, diversification provides no benefits to investors because
alternately they can diversify their equity portfolio at a lesser cost. Thus, the possibility that,
under conditions of efficient capital markets, the rationale for expecting differences in
performance (risk - adjusted) between high and low diversified firms is seldom admitted
explicitly (Montgomery and Singh, 1984; Bettis and Mahajan, 1985; Hoskisson, 1987).
Most explorations of the diversificafion - performance relationships are cross-sectional in
nature. Whether the relationship observed in a particular study is generalisable over time
remain an interesfing, but less researched issue. Some studies that specifically tested for the
temporal stability of the diversification - performance relationship over business cycles have
found that the relationship does vary over cycles. Hill (1983) reported that the performance
of conglomerates improved significantly more than that of non-conglomerates during the
28
upturn, but deteriorated more rapidly during the downturn. A study by Ciscel and Evans
(1984) found that returns to diversification are sensitive to the business cycle but their results
do not strictly correspond to those of Hill (1983). They found that moderate levels of
diversification show improved relative performance in the expansionary periods, while high
levels of diversification generally hurt performance in recessionary periods.
Most strategy studies that spawned the 1970's have made no allowance for business cycle
effects, but for the exception of Michel and Shaked (1984). The authors characterise the time
frame of Rumelt's (1974) study (the 1949 - 69 period) as a stable, low inflation and low
interest rate environment. In contrast, the time frame for the above study (1975 - 81) is stated
to be one of considerable uncertainty largely precipitated by the oil crisis of the early 1970's.
Not surprisingly the two studies reach different conclusions regarding the performance
consequences of unrelated diversification. The implication of the above studies is that the
diversification - performance relationship is time variant. Obviously as this may seem, broad
generalisations regarding the value of diversification are by no means uncommon (Porter,
1987). In addition to the apparent temporal instability of the diversity-performance relation,
the findings of various studies using short time spans (4-5) years to examine cross-sectional
differences across diversification categories seem to be of questionable validity. Another
timing related criticism of the diversification - performance research is the fact that most of
the early results may be outdated and of limited managerial and economic significance today
(Davis, 1985). '
There is an increasing awareness among strategic management researchers that there is an
acute need to devote more attention to process issues in diversification research (Burgleman,
1983; Haspeslagh and Jemison, 1987; Porter, 1985, 1987; Prahalad, 1986, 1995). In this
connection it is frequently asserted that strategy implementation, in general, has received less
attention than strategy formulation in strategic management literature. Certainly, this
criticism takes on added piquancy in the research on diversification. Only a handful of
studies have directly examined the issue of 'how' firms implement their diversification
strategies, and fewer still are studies that explore the performance consequences of different
approaches to implementation. Some notable exceptions are Dundas and Richardson (1982),
Gupta and Govindarajan (1984), Galbraith and Kazanjian (1986), and Leontiades (1986). As
such no study is yet to develop a framework or model that describes the relationships among
29
diversification strategy, intervening variables, and performance (Stimpert and Duhaime,
1997).
2.7.2 Group affiliation and performance
The sheer ubiquity of business groups suggests that they may affect, in important ways, the
broad patterns of economic performance in emerging economies. Yet virtually little
systematic evidence exists concerning the ramifications of group affiliation in enhancing
firm. We lack answers to even certain basic questions. We do not know whether group
affiliation earn higher or lower rates of profit than unaffiliated firms, while theory offers
prediction both ways. Likewise, we do not know how important knowledge of group
affiliation is in improving our understanding of firm profitability, even after other observable
characteristics of the firm, such as the industry in which it competes, are known. While most
of existing research have measured effects of group affiliation on firm performance, its
impact on overall group performance is relatively unknown. There are indications that the
impact of the above on overall group performance may be exactly the opposite.
The performance effects of group affiliation studied by Khanna and Rivkin (2001) across
fourteen emerging markets (which include India among others) suggest that affiliates perform
better than non - affiliates in six countries, and worse than non-affiliates in three, with no
difference in profitability level in the remaining five countries. The effects of group
membership on profitability differ substantially from one country to another. The authors
attempted to account for these differences by taking into account differences in institutional
context. Earlier research has clearly pointed out that there is no priori theoretical reason to
focus on capital market imperfections in searching for a reason for the existence of business
groups; groups might also alleviate failures in product markets, labour markets, and in cross-
border markets for technology (Khanna and Palepu, 2000). In contrast, Khanna and Rivkin
(2001) finds no evidence that group importance is related to proxies for inefficiency in
markets other than capital markets. It has been fiirther contended that the performance effects
of group affiliation are likely to be difficult to obtain as markets evolve (Chang and Hong,
2002). The contention of Kakani (2000) that the Markets in India are as developed as the
West does not seem much convincing. This is considering the short history of economic
liberalisation in India, compared to China, Korea, or even Chile where business groups still
add value through unrelated diversification. Besides, the pace of economic liberalisation in
30
India has also been slower compared to most SE Asian or Latin American countries
(Alluhalia, 2002).
2.8 Research gaps
Economic liberalisation of a number of emerging markets around the world in the recent
decades has drawn attention on the functioning of business groups. An alternative school of
thought has challenged the most dominant belief of the modem era that conglomerates fail to
perform and questioned the wisdom that all firms need to restructure their businesses around
their core competencies (Khanna and Palepu, 1997; 2000; Khanna and Rivkin, 2001;
Prahalad and Hamel, 1990). These authors have argued that for emerging markets, focused
strategies around core competencies may not be an appropriate strategy, and unrelated
diversification may not necessarily retard performance. In fact unrelated diversification may
still be profitable for business groups where the institutional context is characterised by
market failure and high transaction costs. Several studies further reported that group
affiliation had a positive effect on firm performance; and affiliated firms outperformed
unaffiliated firms in emerging markets.
Interestingly, studies dedicated in the Indian context have either negated or contradicted the
above assertions (Kakani, 2000; Mohanty, 2000). They have observed that focused business
groups and related diversifiers have outperformed unrelated ones and group affiliation failed
to add value in India, a giant emerging market. They have even gone ahead to assert that the
value of business groups can be enhanced, provided they are split into individual and
independent business units devoid of group control. Since the theory of market imperfection
is quite comprehensive and tested, existing justifications do not seem to be tenable. More
stronger and robust theory is needed to counter the same.
One way of explaining the above dichotomy is that as emerging markets mature the ability by
business groups to enhance performance by circumventing market failure will gradually
sublime (Khanna and Palepu, 2000). This possibility has also been argued by Chang and
Hong (2000) who argue that the value business groups add may be contingent on the time
period under study. They assert that different stages of economic liberalisation may alter the
optimal mix of business portfolio in which a group should engage. In contrast, Khanna and
Rivkin (2001) have observed that positive group effects are still associated with emerging
markets which have been subjected to a longer tenure of economic liberalisation compared to
31
India. It is interesting to note that most of the above studies have common databases as well
as overlapping time-frames. Hence it is not quite clear why research in the Indian context
reveals a diverging trend.
Insights have revealed that not all diversifications by business groups have yielded similar
resuhs. While certain unrelated diversifications have been successful; some related
diversifications have failed dramatically. Neither affiliation to a business group has always
added value for an individual business. Therefore, the above empirical findings are fraught
with contradictions and have raised more doubts than providing clear answers. These
observations also refuel the long standing inconclusive debate surrounding diversification
and performance. In the absence of reasonably consistent and interpretable findings there is
sufficient scope for fresh enquiry in the area.
Most of earlier studies have taken recourse to the logic of market imperfection having its
roots in I/O Economics to explain the diversification - performance linkage across emerging
markets. The use of alternate or multiple theoretical lenses to explore variables whether there
are other moderating variables affecting this linkage has been lacking. We argue that certain
extraneous variables have not been controlled for; incorporation of such critical variables
may throw new light on the subject. At the theoretical level, researchers often tend to ignore
to incorporate the effect of certain intervening variables either knowingly or unknowingly.
We believe that the inherent bias of researchers in focusing primarily on analytical methods
has often led them to overlook certain critical variables. Though some studies have tried to
introduce a series of intervening variables; a holistic and integrated view has been lacking.
We argue one such crucial concept is - "dominant logic" as originally proposed by Prahalad
and Bettis (1986). Though being considered a milestone in Strategic Management research,
subsequent use of the concept has been lying dormant. Researchers have tended to ignore the
above variable because it cannot be easily measured or amenable to statistical manipulation.
We feel perhaps dominant logic will enable us to integrate across a number of hitherto
unrelated intervening variables. The summary of the limitations of earlier research and
research gaps in three broad areas, viz., context, content and methodology is presented in
Table 2.1.
32
It may be observed that:
• Little research has been reported on diversification and business groups using an
ahemate or multiple theoretical lenses.
• There is a need to control for intervening variables having its origin in multiple
disciplines to explain the linkage between diversification and performance in a more
effective manner.
• The "top management" needs to be incorporated in a way to account for above
differences in findings.
" There is also a need to move away from empirical studies and focus on case studies,
especially on process issues related to diversification.
• While measuring degree of diversification one needs to focus on dynamic measures
of relatedness (i.e. strategic relatedness), instead of approaching the problem through
static measures such as products, markets and technologies.
• Lastly, it is being felt that there is an urge to experiment with new ideas and
approaches if new directions are to be struck.
Thus there was a clear need:
• To study the nature of relationship between diversification and performance across
business groups in the Indian context by controlling various extraneous variables.
• To study the changes in the performance effects of group affiliation in the context of
economic liberalisation using alternate theoretical lenses.
• To incorporate the skills of the "top management" as a major construct in managing
highly diversified businesses and focus on process issues related to diversification.
• Develop on concepts like "dominant logic", which is lying dormant. Adopt a simpler
and working definition of "dominant logic" and move from a purely conceptual stage
to measurement of the construct and it's testing, to generate powerfiil insights.
• To adopt a holistic theoretical framework to explain performance effects of
diversification and group affiliation, which might be generalisable across emerging
markets and also over time?
33
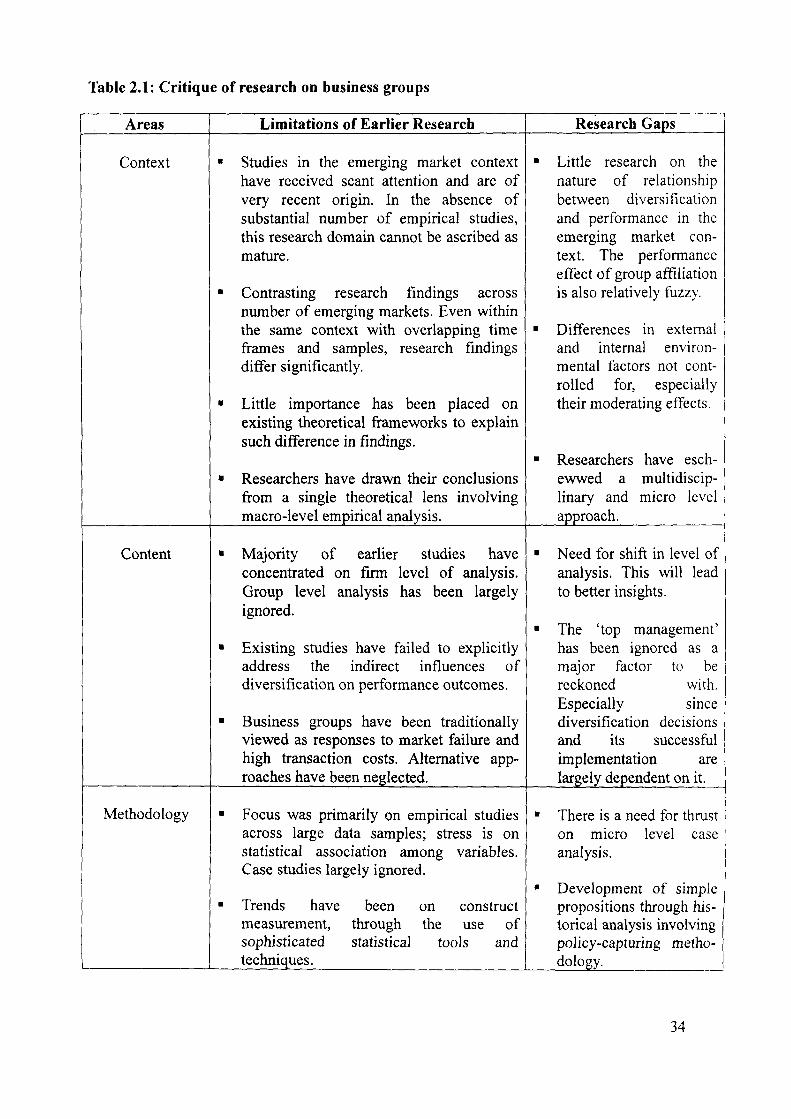
Table 2.1: Critique of research on business groups
Areas
Context
Content
Methodology
Limitations of Earlier Research
• Studies in the emerging market context have received scant attention and are of very recent origin. In the absence of substantial number of empirical studies, this research domain cannot be ascribed as mature.
• Contrasting research findings across number of emerging markets. Even within the same context with overlapping time frames and samples, research findings differ significantly.
" Little importance has been placed on existing theoretical frameworks to explain such difference in findings.
• Researchers have drawn their conclusions from a single theoretical lens involving macro-level empirical analysis.
• Majority of earlier studies have concentrated on firm level of analysis. Group level analysis has been largely ignored.
• Existing studies have failed to explicitly address the indirect influences of diversification on performance outcomes.
• Business groups have been traditionally viewed as responses to market failure and high transaction costs. Alternative approaches have been neglected.
• Focus was primarily on empirical studies across large data samples; stress is on statistical association among variables. Case studies largely ignored.
• Trends have been on construct measurement, through the use of sophisticated statistical tools and techniques.
Research Gaps
• Little research on the nature of relationship between diversification and performance in the emerging market context. The performance effect of group affiliation is also relatively fuzzy.
" Differences in external and internal environmental factors not controlled for, especially their moderating effects.
• Researchers have esch-ewwed a multidiscip-linary and micro level approach.
• Need for shift in level of analysis. This will lead to better insights.
• The 'top management' has been ignored as a major factor to be reckoned with. Especially since diversification decisions and its successful implementation are largely dependent on it.
• There is a need for thrust on micro level case analysis.
• Development of simple propositions through historical analysis involving policy-capturing methodology.
34
CHAPTER 3
Discussion on Variables
In this chapter we discuss the technicalities and issues surrounding the variables which form
the structure of our theoretical framework. Ten such variables identified during the course of
the literature review, have been examined in minute detail. Though in the case of most of the
variables the literature was immensely rich and objective, in some cases it was found to be
quite nascent and cognitive. In such cases, we draw heavily from our case studies, which
would enhance our understanding of the variables. This chapter would lead to better
assessment and appreciation of the methodologies discussed in the subsequent chapter.
3.1 Diversification
After a firm has engaged in diversification over time and has pursued several diversification
projects, by which mode it chooses to grow, it attains a certain status or profile. Researchers
have coined a term "diversity" to capture the nature and extent of diversification of a firm or
a group. The various approaches to measuring diversity can be broadly classified into two
groups - categorical measures, and continuous measures. Categorical measures are based on
qualitative evaluation of the firms' product market scope and diversification rationale. A
pioneering classification appeared on the basis of the firms' specialisation ratio (proportion
of a firm's revenue attributable to its largest discrete product - market activity) and its
direction of diversification in terms of relatedness to the firms' collective skills and strengths
(Wrigley, 1970). Further conceptualisation of a multivariate measure of a firms' diversity
was based on these ratios - specialisation ratio, related ratio and the vertical ratio (Rumelt,
1974). On the basis of these ratios, firms were further assigned into nine diversification sub
categories, within these three broad based categories. In a more recent study a fourth ratio
was proposed - the related core ratio and further classification of firms were made in seven
sub categories (Rumelt, 1982).
A review of the literature reveals wide use of Standard Industrial Classification (SIC) by I/O
Economics for the above categorisation. They assume that if the businesses share the same
SIC code, they must have some common input requirement and similar production or
technology functions. Despite the high degree of objectivity and simplicity afforded by SIC
diversification categorisafion, researchers seem to view these measures as two simplistic to
35
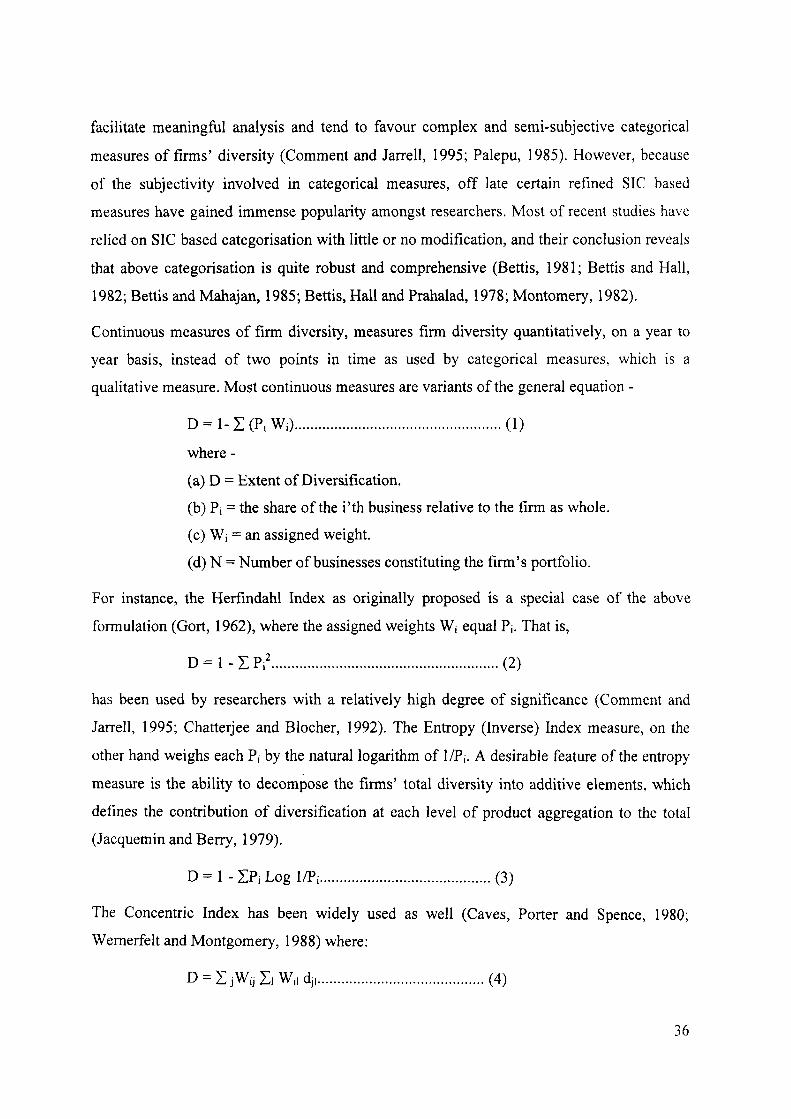
facilitate meaningful analysis and tend to favour complex and semi-subjective categorical
measures of firms' diversity (Comment and Jarrell, 1995; Palepu, 1985). However, because
of the subjectivity involved in categorical measures, off late certain refined SIC based
measures have gained immense popularity amongst researchers. Most of recent studies have
relied on SIC based categorisation with little or no modification, and their conclusion reveals
that above categorisation is quite robust and comprehensive (Bettis, 1981; Bettis and Hall,
1982; Bettis and Mahajan, 1985; Bettis, Hall and Prahalad, 1978; Montomery, 1982).
Continuous measures of firm diversity, measures firm diversity quantitatively, on a year to
year basis, instead of two points in time as used by categorical measures, which is a
qualitative measure. Most continuous measures are variants of the general equation -
D = 1-1 (Pi WO (1)
where -
(a) D = Extent of Diversification.
(b) Pi = the share of the i'th business relative to the firm as whole.
(c) Wi = an assigned weight.
(d) N = Number of businesses constituting the firm's portfolio.
For instance, the Herfindahl Index as originally proposed is a special case of the above
formulation (Gort, 1962), where the assigned weights Wj equal Pi. That is,
D = 1 - 1 Pi' (2)
has been used by researchers with a relatively high degree of significance (Comment and
Jarrell, 1995; Chatterjee and Blocher, 1992). The Entropy (Inverse) Index measure, on the
other hand weighs each Pi by the natural logarithm of 1/Pi. A desirable feature of the entropy
measure is the ability to decompose the firms' total diversity into additive elements, which
defines the contribution of diversification at each level of product aggregation to the total
(Jacquemin and Berry, 1979).
D = 1 - ZPi Log 1/Pi (3)
The Concentric Index has been widely used as well (Caves, Porter and Spence, 1980;
Wemerfelt and Montgomery, 1988) where:
D = Z jWij Z, Wii dj, (4)
where dji is a weight whose value depends on the relations between j and 1 in SIC code.
Researchers have made a thorough comparative analysis of the two different ways of
conceptualising and measuring firm diversity by business count (categorical) and by strategy
(continuous) (Pitts and Hopkins, 1982). They have concluded that a business count measure
is more suitable for comparing diversified and non-diversified firms, but for comparing
differences amongst diversified firms, the strategic measure of diversity (continuous) is
recommended. Existing research has also pointed out that there is a very high degree of
correlation among the various measures of continuous diversity, hence adding more measures
will not necessarily increase the explanatory power on performance (Khanna and Palepu,
1998).
3.2 Performance
Regarding the measure of performance, there are clear differences again within multiple
disciplinary streams. Studies in I/O Economics were concerned with the possible anti
competitive effects and focused their attention on market/industry structure variables. The
financial literature has also witnessed extension of the concepts of systematic and
unsystematic risk used in portfolio diversification studies. The measure of alpha and beta as
surrogates of risk has been used to measure performance in diversification studies, with quite
a high degree of validity (Chatterjee and Blocher 1992; Montgomery and Singh 1984).
While on the accounting side, profitability as a measure of total assets, net worth or total
sales has been most widely used along with accounting determined risk (Bettis and Hall
1982). Other researchers have even used growth measures with relative success
(Varadarajan, 1986). Despite, the general weakness in accounting based measures, certain
researchers have deplored the conclusive focus on market based performance measures on
the ground that, a firms' decision on diversification is derived from accounting data, hence it
would be more appropriate to use accoimting based measures to assess the efficacy of
diversification on performance (Holzmann, Copeland and Hayya, 1975).
It has been pointed out that, 'a firm is worth only what the market is willing to pay', and
hence stock markets provide a very good proxy of firms worth (Brealey and Myers, 1988).
Researchers have also used stock prices to link returns with performance (Mohanty, 2000). In
the I/O Economics field, there is also lively interest in Tobin's Q, as a measure of
performance (Tobin, 1969). Tobin's Q, is defined as the market value of the firm divided by
37
the replacement value of its assets. It has been stressed that market-to-book value of equity
ratio and Tobin's Q are theoretically equivalent measures of value creation (Varaiya et al.,
1987). To measure performance effects specifically related to diversification, researchers
have tried to assess firm value by computing stand-alone values for individual business
segments. It is done by calculating value-multipliers, which compares the firm value as a
whole with the sum of individual business to study value loss or gain fi-om diversification.
This invokes the concept of 'diversificafion discount' and is also referred to as the excess -
value approach (Berger and Ofek, 1995).
Some researchers have even used multivariate studies, linking performance with a string of
dynamic indicators, stressing on strategic relatedness, to predict when related-diversifiers
outperform unrelated ones (Markides et al., 1994). However, measures of strategic
performance (i.e. gains in product market share) cannot be easily practiced in emerging
markets, as data on such factors is not uniformly available. On the overall, it has been
suggested that there are basically four determinants of value-creation - profitability, growth,
risk, and investor's outlook (Branch and Gale, 1983). Several studies have therefore pointed
out that instead of searching for a single measure that most significantly determines
performance; a multi-factor performance assessment is better suited (Bagozzi and Philips,
1982; Keats, 1990).
3.3 Size
Firm size is an important variable that needs to be controlled for to analyse the impact of
diversity on performance (Child, 1972; Morck et al., 1988). As size grows, it becomes more
and more difficuh to sustain impressive performance (Singh and Whittington, 1968).
Presumably this is the rationale behind the organisational size effect (Banz, 1981).
Researchers have also found that firm's size influences aggregate group performance
(Khanna and Palepu, 1999). This is perhaps what certain researchers refer to as
'conglomerate power' (Hill, 1985).
It has been argued that the strategic importance of scope economies arise from a highly
diversified firm's ability to share investments and costs across value chains that competitors,
not possessing such internal and external diversity, cannot (Ghosal, 1987). Such sharing can
take place across various business segments and may involve joint use of different kinds of
resources. Diversified groups often share physical assets across different businesses and
38
markets. Business groups also pursue cross-subsidisation across markets and exploit a
common group identity across different components of a business group's product and
market portfolio. It has been also affirmed that a second important source of scope
economies is shared external relations with customers, suppliers, and other existing
stakeholders (Ghosal, 1987). Finally, shared knowledge is another important component of
scope economies. But, even scope economies may prove costly as different businesses or
products of a diversified business group may face different environmental demands. The
effort to create synergies may fail or it may result in some compromise with the objectives of
external consistency (Porter, 1987).
3.4 Industry Characteristics
Most I/O scholars have been concerned with the effects of industry characteristics on
diversification, rather than performance. Diversified firms are widely believed to be able to
exercise market power through such mechanisms as cross-subsidisation, predatory pricing,
reciprocity in buying and selling, and creating or raising barriers to entry (Palepu, 1985). The
phenomenon of groups, whose activities span to a significant extent the same markets, also
provides support for the above linkage. There is also a converse logic that industry
characteristics determine diversification strategies (Williamson, 1975). The argument goes
that different diversity profiles arise due to different forms of market failure (Dundas and
Richardson, 1980; Lecraw, 1984).
A firms' market position - the particular market segments in which the firm competes -
broadly determines the potential for profitability and growth (Prahalad and Hamel, 1993).
Another distinct perspective is that the industry in which a firm competes constrains its
strategies and affects its performance (Porter's, 1980; 1987). This is primarily due to the
differing nature of competition in different industries in which fjrm's operate. Decomposition
studies in the developed markets (Schmalensee, 1985; Rumelt, 1991; and McGahan and
Porter, 1997) and studies in the emerging market context have indicated that industry effects
exist, and are important determinants of performance (Chang and Hong, 2002).
It has been highlighted that customers and suppliers are two very important factors that shape
the competitive dynamics of an industry Porter (1980). Hence, a firm operating in a particular
industry is more or less forced to adapt to the practices in the industry. The cost structure in a
particular industry segment is by and large dictated by the prevailing economic conditions,
39
industry life cycle and firms' own distinct characteristics. In this regard it has been rightly
pointed out that costs are by and large a function of external forces rather than internal ones
(Porter, 1980). Escape hypothesis articulates that profitability of the industries in which firms
compete have a negative influence on the extent of firm's diversification (Rumelt, 1974).
Therefore, the better the performance of a firm from its largest business segment, the lower
will be its diversity and vice-versa.
3.5 Inertia
The population ecology theorists while focusing on firms have highlighted the role of
organisational inertia. The inertia view postulates that history and internal context of a firm
matters in influencing its diversification strategies (Hannan and Freeman, 1984).
Organisational culture rooted in regulation, top management values, structure and decision
making constrains and retards strategic responses and performance of firms (Ray, 2000).
Inertia therefore, seeks to explain how firms adapt and respond appropriately to a changing
business environment. In a fast changing environment, early recognition of opportunities and
threats, and identification of customer preferences is an important indicator of performance.
Similarly, the evolutionary scholars argue that history matters as much as the present context
of an organisation. It is the reflection of its historical evolution, which constrains future
direction of evolution (Nelson and Winter, 1982; March, 1994; Dosi and Nelson, 1998). The
inertia of an organisation surrounding current strategy develops on earlier commitments, as
certain diversification strategies cannot be altered frequently (Ghemawat, 1991). This limits
the choice of availability of diversification strategies from one point in time to another. As a
result organisations show a general tendency to preserve its earlier strategy, rather than
radically change it (Hannan and Freeman, 1984; Boeker, 1989; Kelly and Amburgey, 1991).
Several earlier researchers have maintained that inertia captured in firm age has a bearing on
its efficacy (Batra, 1999; Lumkin and Dess, 1999; Kroszner, 2000). It has been reasoned that
the inertial forces operating on relatively old firms is one of the key reasons why not so old
groups, lacking capital, reputations are able to create new market niches and compete against
older business groups (Sorenson and Stuart, 1999). The difficulties of keeping pace with
incessant external developments can often frustrate the irmovative practices of many older
business groups', keeping in mind the rapid technological changes.
40
In an overview researchers have identified two distinct approaches to explain such
adaptation: external control model, strategic management model (Romanelli and Tushman,
1986). The external control model subscribes to the enviromnental determinism perspective,
in which a firm's evolution, performance and survival are controlled by the attributes of their
business enviroimient. The main components of environmental determinism are the
population ecology scholars (Hannan and Freeman, 1977; Aldrich, 1979), the institutional
theorists (DiMaggio and Powell, 1983, 1991; Scott, 1987), and to a large extent contingency
theorists (Lawrence and Lorsch, 1967; Hofer, 1975; Khandwalla, 1977; Ginsberg and
Venkataraman, 1985). They consider a firm's performance is largely governed by the
characteristics of its business environment, and that the top management has little control in
moderating such effects.
The main arguments of the population ecology view are that resources are dispersed in the
form of niches and are relatively resistant to manipulation by firms. Firms either fit into
niches and succeed, or are selected out and fail (Harman and Freeman, 1977; Aldrich, 1979;
Miller, 1990). Institutional scholars emphasise that a firm's behaviour is constrained and
determined by the normative and regulatory pressures prevalent in the environment, which
ensures similarity and homogeneity of organisational forms (DiMaggio and Powell, 1983,
1991). On the other hand contingency theory outlines a limited role of managers to respond
to the changing business environment by continuously adapting to the emerging
contingencies. They view the business environment as a system and firms as a part the
system, which is technically constrained by the system (Astley and Fombrum, Bourgeois,
1984). They treat the environment as exogenous with binding effects on firms and put
emphasis on "fit" of organisational variables with the business environment.
The deterministic view finds support from I/O Economics scholars. According to this
perspective an organisation can neither influence conditions nor its performance and it is the
industry structure that largely determines performance (Bain, 1968). As industry structures
inhibit movement of firms between markets through entry barriers and limits the economic
feasibility and appropriateness of strategies within the industr}'; a firms performance is
simple a reflection of its industry structure (Porter and Caves, 1976). Managers therefore
have a passive role on firm's strategies and environmental forces alone determine
performance (Porter, 1981). To conclude, differences in structural characteristics of
41
industries or domains and various niches in the market do exist with varied attractiveness
providing non-uniform opportunities. However, the deterministic viewpoint does not
preclude the existence of strategic choices; they are of the opinion that environmental
pressures severely limit the strategic choices available to managers (Astley and Van de Ven,
1983).
On the contrary, the main arguments of the strategic management model are that managers
have sufficient choice to decide on the firm's course of action, which ultimately decides its
performance, survival and evolution (Lado, Boyd and Wright, 1992). The strategic choice
theorists posit that environment should not be viewed as a set of imposing constraints, as it
does not play a deterministic role (Child, 1972; Weick, 1979). Firms can construct, eliminate
or redefine the objective features of their business environment, can manipulate and
influence it through various environment processes. They can therefore, create their own
measures and reality, and choose their own course of actions to attain a desired goal (Pfeffer
and Salancik, 1978; Bedeian, 1990). Viewing firms as a part of complex systems, proponents
of resource dependent model hold that firms depend on different agencies in the environment
for their resources and in turn influence the resource provider (Pfeffer and Salancik, 1978).
For them, managers manage their external environment as well as the internal environment;
and the former may be as important as the latter (Aldrich and Pfeffer, 1976).
Accordingly, the objective environment is secondary for managerial decision-making, as the
environment perceived by the managers becomes a reality (Child and Keiser, 1981). This
contributes to the variation in responses to the environment among organisations, as
managerial perceptions about the environment are different. Managers therefore possess the
leverage to influence both objective and perceived environments. The normative schools of
strategic management voice similar propositions. The environment offers opportunities to be
exploited by firms as it views strategy as the pre-emptive actions to external opportunities
and threats with a concern to match the organisational capabilities to environmental demands
(Ansoff, 1965, 1979; Andrews, 1971).
3.6 Cohesiveness
Existing research has identified that there are benefits of group membership (Khanna and
Rivkin, 2001). Firms that are affiliated to a group are able to consummate favourable
transactions that non-affiliates cannot. They can access resources and infi-astructure less
42
expensively than their non-group peers, and they can also engage in business through vertical
and horizontal integration without the hazards of arm's-length exchange. They also have a
superior access to the political power structure and hence draw from a richer pool of
opportunities. The bond between group affiliated firms in some formal or informal ways is
referred to as "cohesiveness" (Granovetter, 1994: 454). The block-model analysis of
Japanese networks shows that group membership is particularly related to equity
participation, bank relationships, and director inter-locks (Gerlach, 1992).
There are two aspects of cohesiveness that binds groups together: first, the ties are numerous
and overlapping. Second, they span the economic and the social, the formal and the informal.
This bonding is litvked by relations of inter-personal trust, and on the basis of similar
personal, ethnic or commercial background (Leff, 1978). Researchers particularly resist the
idea that group's constituents can be identified purely on the basis of a single metric, such as
inter-locking directorates; thus: "even a ban on inter-locks would not destroy nor even
seriously impair the important group relations and pattern" (Strachan, 1976:18). In the
context of business groups in India, the emphasis is on multiple forms of ties among group
members: strong social ties of family, caste, religion, language, ethnicity, and region
reinforced cohesiveness among affiliated enterprises (Encamation, 1989).
However there are certain theoretical arguments that suggests to the contrary; cohesiveness
may be costly as well. The major direct costs of being affiliated with a group have to do with
the group undertaking certain coordinated and central decision-making. This may have a
bearing on firm performance. They have, for instance, an obligation to bail out other member
firms that are performing badly; if unaffiliated, such poor performers have no other option,
but to go bankrupt. They may also be obliged, or at least prone, to purchase inputs from
member firms, ignoring transaction costs (Williamson, 1975). Presumably, bases having its
origin in centralised gains rather than decentralised benefits guide most group decisions.
3.7 Resources & Distinctive Capabilities
The resource-based view (RBV) regards resources more broadly than the classical I/O
Economics point of view and conceptualises a firm as a bundle of resources (Wemerfelt,
1984). Along with the traditional form of resources it also includes other forms of resources
like distinctive capabilities and competencies that a firm possesses (Penrose, 1959; Grant,
1991). Basic resources of a firm arise from performing activities over a period of time,
43
acquiring them from outside or some combination of the two (Porter, 1991). When more than
one resource is linked together by a wide range of bonding mechanisms, technology,
management information and control systems, and various formal and informal
organisational processes, they lead to complex resources (Ray, 2000). These complex
resources are termed as distinctive capabilities and competencies. Complex resources or
capabilities arise when more than one basic resource is linked together by a wide range of
bonding mechanisms, technology, management information or control systems and/or
various formal and informal organisational processes (Ray, 2000). In support Porter (1991)
has concluded that complex resources are developed around a group of inter-related activities
along the value-chain.
Firms considerably depend on their existing capabilities for creating and exploiting new
opportunities. The resource position of a firm also determines the means to compete in a
business and the direction to which it should grow (Penrose, 1959). There is a fundamental
connection between resources and value-chain activities (Porter, 1985). Therefore, the
possession of certain complex resources and leveraging these resources leads to the implant
of fresh value creating strategies. These strategies caimot be imitated by even its closest
competitors and helps firms achieve and sustain superior performance (Cormer and Prahalad,
1996; Eisenhardt and Martin, 2000). It was also observed that diversification is not just based
on attractiveness of markets; core competencies also guide diversifications in a major way
(Prahalad and Hamel, 1990). Extant research has identified three distinct types of capabilities
that firms often use to leverage its performance - business specific capability, entrepreneurial
capability, and growth management capability (Ray, 2000). Thus the RBV takes the view
that real source of competitive advantage lies very much inside the firm, depending upon the
ability of the top management to exploit and leverage them (Prahalad, 1993; Barney, 1994;
Collis and Montgomery, 1995).
The concept of resource in the context of business groups is multi-dimensional in nature. It
comprises a set of assets, activities and configurations, which encompasses a set of
knowledge, information, skills, etc (Mc Kilvey, 1982). The logic is that diversification by
business groups in emerging markets is to access both domestic and foreign markets rather
than to reap scope economies and minimise transaction costs (Guillen, 2000). It emphasises
that market imperfections, authority structures or late development do not accurately explain
the importance of business across emerging markets and over time. Business groups will
rarely bother to build integrated structures to capture cross-industry synergies (Hill and
Hoskisson, 1987; Hoskisson, 1987; Chandler, 1990). The main assumption is that business
groups are created if political-economic conditions allow them to acquire and maintain the
capability of combining domestic and foreign resources - inputs, process technologies and
market access - to repeatedly enter new industries. Entrepreneurs who are able to combine
these resources quickly and effectively will be best able to create a business group by
repeatedly entering a variety of industries. This capability for repeated industry entry consists
of a bundle of skills that are precisely generic in nature and not industry specific (Guillen,
2000).
These capabilities are non-tradable because it is embodied in the group's owners, managers
and routines. It is in excess supply immediately after a group consummates entry into a new
industry. Once the diversification in implemented, the capability to enter new industries
becomes idle. Therefore, this generic capability encourages business groups to diversify
across industries, rather than remain focused in a single business line. It was fiirther observed
that, an institutional context characterised by asymmetries in foreign trade and investments,
market imperfections, and state autonomy allow business groups to build and leverage such
generic capabilities (Guillen, 2000). In terms of the following categories, the capability for
repeated industry entry is related to both discrete properties based resources and systematic
knowledge based resources (Miller and Shamsie, 1996). It also contains excess capabilities -
tangible and intangible resources (Hoskisson and Hitts, 1990; Barney, 1991). It has been also
shown that group affiliated firms benefit fi"om group membership through sharing of
intangible and financial resources with other member firms (Chang and Hong, 2000).
Like most resources that create competitive advantage, resources for competitive advantage
in emerging markets are, on the whole, tangible. They are not necessarily product-market
based, as would be suggested by the knowledge-based view of the firm (Conner and
Prahalad, 1996). Although some forms of capabilities are imiform across all markets, some
are unique to emerging markets (Hoskisson et al., 2000). In most emerging markets,
however, such capabilities are difficult to establish without good relationship with local
governments. Business groups, which are able to manage the specific circumstances in
emerging markets, reap the benefits of superior performance (Encamation, 1989). However,
45
as institutions change, business groups that have dominated emerging markets will have less
and less advantage relative to its competitors, both domestic and foreign, that wish to enter
and exit a market.
This generic and non-tradable capability to combine resources for repeated industry entry
however becomes less crucial as free-markets evolve. It therefore, does not allow a business
group to sustain its competitiveness over time. According to the RBV, it becomes imperative
that certain limits to competition do exist. This capability can be accumulated through
learning by doing and maintaining over time a rare, valuable, and inimitable asset (Barney,
1991; Peteraf, 1993). In essence, business groups need to understand the relationship
between its resources and the changing nature of institutional infrastructure as well as the
characteristics of its industry in order to survive (Hoskisson et al., 2000). In doing so,
business groups in emerging markets may be able to become an aggressive contender
domestically and globally by using its resources as a source of competitive advantage (Dewar
and Frost, 1999).
It has been suggested that resources are based in a context and depending on the
characteristics of that context; a focus on resources could create strategic inflexibility and
core rigidities for a firm that would lead to negative returns (Leonard-Barton, 1992). It has
been also analysed that the issue of a firm's sustainable advantage in terms of resource-base
and institutional factors are able to create or develop institutional capital to enhance optimal
use of resources (Oliver, 1997). Firms therefore need to manage the social context of their
resources and capabilities in order to generate rents. However, as institutions change,
business groups, which have dominated emerging markets, will have less and less advantage
relative to its competitors, both domestic and foreign, that wish to enter and exit a market
(Hoskisson et al., 2000). In essence, a firm must understand the relationship between its
assets and the changing nature of institutional infrastructure as well as the characteristics of
its industry.
To win competitive advantage in any market, a firm needs to be able to deliver a given set of
customer benefits at lower costs than competitors, or provide customers with a bundle of
benefits its rivals cannot match (Porter, 1990). It has been also highlighted that the source of
such competitive advantage usually lies in core competencies of a firm (Prahalad and Hamel,
1990). However, to effectively exploit these costs and differentiation drivers, a firm needs to
46
have access and utilise a complex set of tangible and intangible assets. Firms that possess
assets, which underpin competitive advantage, will earn rents (Rumelt, 1987). To the extent
that competing firms can identify these rent producing assets, they can decide between two
alternative ways in replicating competitive advantage: they may seek to imitate these assets
which can earn similar rents, or they may try to substitute them with other assets (Markides
and Williamson, 1994).
Ahhough the RBV has offered a compelling theory of diversification in the developed
countries, its effort in explaining performance of business groups has been quite lacking
(Guillen, 2000). Diversified business groups in emerging markets are also different from the
conglomerates in the developed markets as they did not grow out of a search for financial
diversification, but instead grew out of the ability to set up new ventures across a variety of
industries quickly and at a lower cost (Guillen, 2000). The type of industries the group will
enter will depend on the nature and type of resources. Certain arguments suggest that a firm,
which has developed excess capacity in non-marketable fiangible productive resources,
should diversify in related areas to realise economies of scope, preferably by internal growth.
On the other hand, if the productive resource is top management, and if the top management
has skills in acquiring and managing businesses, then diversification to establish an internal
capital market becomes a possibility. In such a case the acquisition of unrelated businesses
might be entirely consistent with value creation. Therefore, the mere possession of certain
distinctive capabilities does not yield superior performance. They must be exploited and
leveraged in the right direction to realise the potentials of diversification. The resource
position of a firm only determines the means to compete in a business and the direction to
which it should grow (Penrose, 1959).
Financial resources in general are the most flexible of all resources because they can be used
to buy all other types of productive resources. The first, internal funds, consists of liquidity at
hand and unused debt capacity to borrow at normal rates. The second, internal funds include
accumulated reserves. The third, external funds, consists of fresh equity and possible high-
risk debts. Several theories suggests that lower levels of internal (relative to external funds)
will lead to lower levels of unrelated diversificafion and vice-versa (Jensen, 1986;
Montgomery and Singh, 1984; Lubatkin and O'Neill, 1987).
47
3.8 Dominant Logic
There is a school of thought that ascribes the success of some highly diversified business
groups to the superior skills of the (TMT) top management team (Prahalad and Bettis, 1986).
The particular skill, which they identify, is the ability of the TMT to conceptualise the top
management task. They held that different TMT's have different 'dominant logics', different
patterns to conceptualise. According to their view it takes a highly skilled TMT to
conceptualise highly variegated businesses and hence is the reason for the success of some
highly diversified groups.
A dominant logic can be defined as the way in which the top management conceptualise its
various businesses and make critical resource allocation decisions. To put it more simply, it
can be perceived as a set of working rules (similar to thumb rules) that enables the TMT to
decide what to do and more importantly what not to do. This linkage consists of mental maps
developed by the TMT through its experiences in the core business and sometimes applied
inappropriately in other businesses. Hence considered more broadly, it can be considered as
both a knowledge structure and a set of elicited management processes. The TMT of a
diversified group has a significant influence on the ways its member firms are managed. It
influences to a large extent the style and process of management, and as a result the key
resource allocation choices (Donaldson and Lorsch, 1983). Thus diversification strategies of
the top management are processed through pre-existing knowledge systems known as
'schemas' where such dominant logics are stored (Norman, 1976).
Schemas permit managers to categorise an event, assess its consequences, and consider
appropriate actions (including doing nothing). These systems have developed over time
based on the personal experiences of the TMT. It consists of historical representations rather
than of current ones. It represents its beliefs, theories, biases and propositions, which have a
significant bearing on the diversification strategies pursued by business groups. Without
schemas the TMT of any diversified group would become paralysed by the need to analyse
scientifically an enormous number of ambiguous and complex situations. The selection of
environmental elements to be scaimed is influenced by the TMT's schemas. For the present
purpose the schema concept is introduced as a mental structure that can store, process and
retrieve a shared dominant logic. The characteristics of the core business, often the source of
dominant logic of the TMT, tend to cause them to define problems in certain ways and
48
develop familiarity with, and facilitate in the use of, those administrative tools that are
particularly useful in accomplishing the critical tasks of the core business (Prahalad and
Bettis, 1986).
Existing research highlights four distinct streams of thought which highlights the process by
which a dominant logic evolves. In a work having its origin in operant conditioning, it was
argued that behaviour of the TMT is a function of its consequences (Skinner, 1953).
Behaviour can be understood by considering the contingencies that were administered by the
environment in response to certain behaviours. Behaviour that is reinforced is emitted more
frequently in the fiature. In contrast, behaviour that is ignored or punished (negative
reinforcement) is likely to diminish over time. In this perspective dominant logic can be seen
as resulting from the reinforcement that results from doing right things with respect to a set
of business. This in turn determines the approaches the TMT is likely to use in resource
allocation, control over operations, and the approach to intervention in a crisis.
The concept of dominant logic also derives support from the work on scientific and alternate
paradigms (Kuhn, 1970; Alison's (1971). It argues that a particular science at any point in
time can be characterised by a set of shared beliefs or conventional wisdom about the
environment that constitutes what he termed 'dominant paradigm' (Kuhn, 1970). The work
also points out how difficult it is to shift or change dominant paradigms. As a part of
identifying different pattern recognition processes, researchers have identified that human
beings decide on the basis of experience or what worked before, and not on the basis of some
best strategy or optimising procedure (De Groot, 1965; Simon, 1979).
A final area from which the research results are suggestive of the concept of dominant logic
is 'cognitive psychology'. It has been stated that when dealing with imcertain and complex
tasks the TMT often rely on a limited number of heuristic principles which greatly simplifies
the decision making process (Tversky and Kahneman, 1974). The most interesting of these
heuristic principles is what is called 'availability heuristic' (Tversky and Kahneman, 1973).
Basically, the availability heuristic leads people to make decisions by using information that
can be easily brought to mind. This field of research suggests that TMT does not necessarily
use analytical approaches to evaluate the information content of available data or search for
adequate information (Nisbett and Ross, 1980). Therefore, decision-making based on
49
heuristics may work well under conditions of crisis, but may lead to systematic errors under
conditions of certainty.
The characteristics of the economic environment surrounding business groups, competitive
structure of the industry and the underlying features of specific businesses vary over time.
The differences in strategic characteristics surrounding its business portfolio, a measure of
strategic variety, impact the ability of the TMT to manage its diverse portfolio of businesses.
This premise implies that complexity of the top management process is a function of strategic
variety, and not just the number or the size of those businesses. Therefore, the conclusion is
strategically similar businesses can be managed using a shared dominant logic. However,
highly diversified groups with strategic variety, impose the need for multiple dominant
logics. Hence the ability of the TMT to manage a diversified group is limited by the variety
of dominant logics they are used to. Unfortunately, dominant logics are not always infallible
guides to the group and its environment. In fact, they are relatively inaccurate representation
of the environment, particularly when conditions change and strategic variety sets in. Under
such conditions events are not labeled accurately, and sometimes also processed through
inaccurate and/or incomplete knowledge structures.
In the event of strategic variety, the critical tasks for success are substantially different from
its existing dominant logics. Due to operant conditioning, the behaviour of the top
management and approaches they use to manage strategic variety are likely to be linked to its
existing dominant logics, even though they may be inappropriate for the new environment.
Therefore, the strategic variety a group can cope with is dependent on the composition of the
TMT. Undoubtedly, organisation structure can help cope with increased strategic variety,
though in limited ways. It can attenuate the intensity of strategic variety that the top
management must deal with, but it cannot substitute for the need to handle strategic variety.
It imposes the need for a single strategic approach on each business a group handles (Porter
et al., 1983). However, the bottom-line is that the TMT at a given point of time has an in
built limit to the extent of diversification it can manage (Prahalad and Bettis, 1986, 1995).
The concept of organisational learning has been often mathematically embodied in the
'learning curve' (Yelle, 1979), It assumes that learning takes place in a neutral environment.
But as Prahalad and Bettis (1995) points out, in an organisational case a great amount of
'unlearning' has to proceed before any actual 'learning' can take place. The dominant logic
50
theory therefore makes clear that when strategic variety occurs; 'old logics' in a sense must
be unlearned before strategic learning of 'new logics' can take place.
3.9 Strategic Fit
Relatedness is a mechanism by which business groups capture synergies that can enhance the
level of synergy across various businesses. It constitutes a major source of competitive
advantage for firms individually and also business group as a whole (Davis et al., 1992). A
group can achieve sustained superior performance if it is able to exploit resources that are
unavailable to its rivals (Barney, 1991; Markides and Williamson, 1996). A group specific
asset, which may be transferred across affiliated firms, includes technology, marketing
networks, human capital (Teece, 1980, 1982; Levy and Haber, 1986). This transfer of assets
being easier and beneficial for related and linked business groups (Levy, 1989).
So, business groups that effectively capitalises on relatedness may be able to use inter
relationships to outperform business groups with poorly conceived arrays of affiliated firms.
Scale economies and exploitation of by-products can lead to a significant decline in unit costs
and improvement in product/services quality and appeal to customers. In contrast, it has been
rightly pointed out that inter-business coordination and resource sharing may result in
inflexibilities and poor responsiveness by the top management to environmental changes that
may adversely affect its efficacy (Hill and Hoskisson, 1987). In this context, it has been
noted that the traditional ways of measuring relatedness across businesses in terms of
product, market or industry relatedness is incomplete because it ignores the 'strategic
importance' and similarity of the underlying assets residing in these businesses (Markides
and Williamson, 1994).
Fit (also termed co alignment, consistency, and contingency) is emerging as an important
concept in organisational research, including strategic management (Miles and Snow, 1978;
Venkatraman and Camillus, 1984). In simple terms, 'fit' between strategy and its context -
whether it is external environment (Bourgeois, 1980; Anderson and Zeithmal, 1984; Prescot,
1986; Hambrick, 1988) or internal environment (Chandler, 1962; Rumelt, 1974) has
significant positive implications for performance. An alternate hypothesis that follows is that,
profile deviation has significant negative connotations on performance. In an ideal situation,
competitive advantage therefore comes in a way group activities fit and reinforce one
another. It has been emphasised that 'fit' is a far more central component of competitive
51
advantage than most realise (Porter, 1986). Fit is critical because discrete activities often
affect one another. Fit has been further classified into three categories, though they are not
necessarily mutually exclusive. First-order fit implies simple consistency between each
activity (function) and the overall strategy. Second-order fit occurs when the activities are
mutually reinforcing. Third-order fit goes beyond activity reinforcement, to what the author
calls 'optimisation of effort' (Porter, 1986). In all three types of fit, the whole matter more
than any individual part and competitive advantage grows out of the entire system of
activities.
The research on environment (external) - strategy co-alignment can be summarised from two
theoretical perspectives. The reductionistic perspective of co-alignment is based on a central
assumption that the co-alignment between two constructs (envirormient - strategy) can be
understood in terms of pair-wise co-alignment among the individual dimensions that
represent the two constructs (Hofer, 1975; Zeithmal, 1984; Ginsberg and Venkataraman,
1985). The holistic perspective is based on a central premise that it is important to retain the
holistic (i.e. systematic, gestalt) nature of environment - strategy co-alignment. It follows
from the articulation of fit, which characterises environmental niches and organisational
forms (that) must be joined together in a particular configuration to achieve completeness in
a description of a social system (Van de Yen's, 1979). The results of the tests carried out
strongly support the proposition that the attainment of an appropriate match between
environment and strategy has systematic implications for performance (Venkataraman and
Prescott, 1990).
In the environment (internal) - strategy co-alignment research can be summarised from the
perspective of dominant logic. The fit between dominant logic and its diversification strategy
represents an equilibrium level. However, it is not a global optimimi, and when strategic
variety sets in, a new local optimum (new dominant logic) must be developed quickly
(including unlearning the old dominant logic) if the organisation is to survive (Prahalad and
Bettis, 1995). Therefore, the longer a dominant logic has been in place, the more difficult it is
likely to be to unlearn it. Hence time spent by an organisation in equilibrium is an important
organisational variable that characterises inertia. It has been observed that organisational
inertia due to historical evolution of firms constrains strategic responses and performance
(Ray, 2000). Earlier research has shown that in such cases changes in the TMT may help
52
overcome the inertia against strategic change (Boeker, 1997). It has been also pointed out
that when such a system is in equilibrium it acts as though it is blind. However, as it moves
far from equilibriimi, it becomes 'able to perceive', to 'take into account' in its way of
functioning (Prigogine and Stengers, 1984). In other words, firms feel the need to change its
dominant logic only when it moves substantially from equilibrium.
Small displacements in the equilibrium, corresponding to small changes in the business
environment will result in the firm settling back or rolling back into the original equilibrium
level or dominant logic it currently occupies. Under such circumstances the fit between
dominant logic and its diversification may deteriorate, but because of the low degree in
strategic variety the current dominant logic may continue to be in force. However, if the
change in the business envirormient is large enough to displace the current equilibrium level,
a new dominant logic is likely to emerge. Alternatively, the firm may be unable to surmount
the barrier and be dravra back toward the previous equilibriimi level (i.e. old dominant logic).
In such a situation when deviation in fit occurs, it will likely to lead to failure of the firm as a
competitively viable entity (Prahalad and Bettis, 1995).
This approach leads researchers to wonder what course of action a firm should take to ensure
the stability function surroimding the existing dominant logic does not get too rigid. It has
been advocated that firms should clearly differentiate between financial and strategic
performance (Prahalad and Bettis, 1995). Current financial success may limit any significant
challenges to its dominant logic, although strategic performance (on which future financial
success is based) may have significantly deteriorated. One of the major implications of the
dominant logic hypotheses is that top management is less likely to 'respond appropriately' to
situations where the dominant logic is different, as well as not respond quickly enough, as
they may be unable to interpret the meaning of information regarding strategically dissimilar
businesses. And all these imply 'hidden costs' which have a strong negative bearing on
overall performance.
3.10 Market Imperfection
In one line of work, business groups are conceptualised as responses to market imperfections
in an economy. This line of work was pioneered by Leff (1976, 1978), whose writings
emphasise high transaction costs primarily in capital markets and, to a lesser extent in the
market for entrepreneurial talent as sources of market imperfection. Khaima and Palepu
53
(1997, 2000) have argued that there is no priori reason to focus on capital market
imperfections in search for a reason for the existence of business groups; groups might also
alleviate from failures in product markets, labour markets, and in cross-border markets for
technology. Business groups are but the intemalisation of market failure by entrepreneurs
seeking to overcome the difficulties of obtaining capital, labour, raw-materials, components,
and technology in emerging economies (Guillen, 2000). They emphasised the greater the
market imperfections, the greater the importance of business groups in an economy.
It has been also argued that highly diversified groups would thrive at the expense of non-
diversified firms not because they are more efficient, but because they have access to what is
termed as conglomerate power (Hill, 1985). This power comes by way of their having
monopoly and monopsony benefits from the imperfections existing in the economy. This
could be by way of increase in market concentration, by mcrease in the size of an economic
agent and also by increase in the corresponding concentration of human and non-human
resources. In contrast, it has been added that a group with insignificant positions across a
number of markets will not, in sum, have this power (Griffin, 1976).
Western companies for instance take for granted a range of institutions that support their
business activities, but many of these institutions are absent in most emerging markets
(Khanna and Palepu, 1997). Existing research identifies three major sources of market
failure: informational problems, misguided regulations, and inefficient judicial systems. In
the case of product markets, buyers and sellers usually suffer from a severe dearth of
information for three reasons. First, the communication infrastructure in emerging markets is
often underdeveloped. Shortages of power often render modes of communication that do
exist, ineffective. The postal services are typically inefficient, slow, or unreliable. Second,
even when information about products does get around, there are no mechanisms to
corroborate such claims. Third, redress mechanisms are also underdeveloped. As a result of
such imperfections emerging markets face much higher costs in brand building and in doing
business in general, than their counterparts in the developed markets.
Similar bottlenecks exist in caphal markets too. Without access to information, investors
refrain from putting in money in unfamiliar ventures. Venture capital fiinds are also too
nascent. In contrast, monitoring agencies make it difficult for unscrupulous investors to
mislead sophisticated investors in the developed markets. Laws relating to capital markets
54
are also very stringent making managers and directors directly accountable to the investors
and public at large. However, majority of the institutional mechanisms that make developed
capital markets are either weak or too nascent in emerging markets. As a result successfully
diversified groups often take recourse to their existing shareholders for future funding
requirements. As a result, well established groups have superior access to the capital markets
compared to their little known or inefficient counterparts. The advantage is so pronounced
that many governments in emerging markets have often formulated regulations to restrict the
credit exposure of banks and financial institutions to such large groups.
In such cases, resources are allocated via an internal capital market: funds are distributed
across businesses by the central headquarters of the group and it is expected to reduce the
problem of under-investment. The miniature internal capital market could replicate the
allocative and disciplinary roles of the financial markets, shifting resources towards more
profitable areas. The existence of internal capital markets could be beneficial only when the
capital market and existing financial system is not able to allocate capital efficiently (Leff,
1976). It has been affirmed that the grounds are for the need of an internal capital market, as
the stock market is too slow, remote and impersonal (Williamson, 1985). A business group
will benefit immensely, when the projects are either investment intensive, technically
complex or long-gestation oriented. But this could lead to cross-subsidisation of under-
performing businesses as well (Mathur and Kenyon, 1998).
Most emerging markets also suffer from the dearth of well trained people, due to the lack of
high quality technical education and vocational training facilities. In the absence of a
developed labour market, groups create value by training and developing a pool of future
managers. They then spread such fixed costs through appropriate resource transfers over its
affiliated firms. Governments in most emerging markets usually restrain groups to adjust
their workforces to changing economic conditions. Rigid labour laws often create exit
barriers and structured labour coalitions insist on job security in the absence of government
provided unemployment benefits. To countermand such rigidities, groups create extensive
internal labour markets. It has been indicated that highly diversified organisations are best
understood as alternative resource allocation mechanisms (Williamson, 1975). This is
because headquarters typically have access to information unavailable to external parties,
which it extracts through its own internal auditing and reporting procedures.
55

Most groups operating in developed markets know very well the government intervention in
most emerging markets is inordinately high. They also have a difficult time predicting the
outcomes of most regulatory bodies. On top of being heavily involved in an intricate array of
strategic business decisions, the law also establishes a high degree of subjective criteria. This
leaves bureaucrats with a high degree of discretionary powers to interpret the rules, and more
often than not they use their interpretation to source nepotism and pecuniary benefits. In
many cases educating the officials is also more important than exchanging favours.
Diversified business groups add value by creating 'industrial embassies' to the benefit of
their affiliated firms and foreign partners. No wonder, most emerging markets also list high
on the corruption index published by leading international bodies (Transparency
International, 2006).
Despite the extensive involvement of government in most emerging markets, these
economies lack effective mechanisms to enforce contracts. In the developed markets, firms
can work under arm's-length contractual agreements with strong confidence in the law
enforcement authorities. But judicial systems in emerging markets enforce contacts
inefficiently or capriciously; detrimental to the interests of business groups and public at
large. Thus firms are likely to depend more on out-of court settlements for resolving disputes
and less on judicial channels. In such situations fair and honest business practices, corporate
governance, and transparency can go in a long way establishing and leveraging reputation of
business groups in dealing with customers, suppliers, government, and foreign partners. On
the contrary, misdeeds can damage the reputation of the group as well as other affiliated
firms.
56
CHAPTER 4
Research Design and Methodology
In this chapter we attempt to present the arrangement of conditions for collection and
analysis of data in a manner that aims to test the hypotheses and overall validity of our
theoretical framework. Keeping in view, the above the above stated research design has been
split into the following parts: (a) The sampling design which deals with the method of
selecting items to be observed or the given study, (b) The observational design which relates
to the conditions under which the observations are to be made, (c) The statistical design
which concerns with the question of how many fields are to be obtained and how the data
obtained is to be analysed, (d) The operational design deals with the techniques by which the
procedures specified in the sampling, statistical and observational designs can be carried out.
4.1 Problem Statement
Two central questions that has been driving research on business groups in emerging markets
in the last one decade revolves around - whether diversification by business groups creates or
destroys value and whether firms affiliated to a business groups gains or loses from group
affiliation? Though the dominant view is that unrelated diversification by business groups in
emerging markets and group affiliation leads to positive performance effects; few studies in
the Indian context report contrary findings. The major bottleneck is that the findings have
fragile theoretical foundations, and has been unable to overturn earlier strictures. If one
tracks a handful of business groups one can observe that unrelated diversification even
beyond the "threshold level" has not always resulted in improved performance. Sometimes,
the consolidated performance of a business group does not reflect its true picture, due to its
strong initial resource position or windfall performance in some businesses. However,
strategic failure in some diversifications was clear and apparent for a number of business
groups. Therefore, such dichotomies should not be summarily dismissed, citing
methodological reasons. This implies that the relationship between diversification and
performance is not so straightforward and affiliation to a business group does not necessarily
and automatically adds value to a firm. Researches having its origin in I/O Economics have
not been able to provide satisfactory explanation to these contradictions. They have almost
used market imperfection and diversity in the same breadth. The need is break out of the
57
strong-hold of I/O Economics view, instead looking at diversifications from the point of view
of multiple theoretical lenses.
4.2 Research Concerns & Questions
Against this backdrop, to capitalise on the relative strengths of the two progressions (i.e.
mechanistic versus organic), this thesis outlines an organic perspective on existing strategies
core issues. Being organic in nature, this research derives its internal consistency from
epistemological assumptions on time, flow and construct coupling. Paralleling the
mechanistic perspective, it also provides a imified set of conceptual, explanatory, and
prescriptive elements. Particularly it builds upon a concept of diversification strategy as
adaptive coordination of goals and actions. It further extends the Organisation - Environment
- Strategy - Performance (OESP) model, an integrative theoretical structure that links
different middle range theories and synthesises organic and mechanistic ideas (Farjoun,
2002). It attempts to build a diversification - performance model in which the iterative and
integrative qualities of the model are stressed.
These parts of the model are internally compatible, representing the field's continuity and
progress, and are better suited to a more complex, intercormected, uncertain and ever-
changing environment. The development from an organic perspective can contribute to the
strategy field in several aspects. First, without sacrificing key insights and contributions of
the mechanistic perspective and its attention to prescription, an organic perspective can help
renew mechanistic concepts and models by aligning them organic themes. Second, an
organic perspective can integrate various streams of research that share its epistemological
orientation, and foster cross-fertilisation of conceptual, theoretical, and analytic models.
Third, beyond renewal and integration, the organic perspective can stimulate new ideas and
application. Van de Ven and Poole (1995) provides some clue on how the organic
assumptions on time, flow and coupling can be isolated from their original contributions and
can again be applied and recombined in ways other than one originally prescribed. We intend
to do just that.
At this stage our objective is to evaluate theory already in place while not unduly expanding
the existing complex of theoretical array. The purpose is one of theoretical synthesis and
reconciliation, followed by case studies and selective empirical testing, rather than
propoimding something, which is grand and new. Although, we do put forth theoretical
58
positions that are unique, path breaking and cuts across existing concepts and notions. The
objective of this research is to begin the development of a unified theory by presenting a
holistic theoretical framework for understanding previous research on the antecedents and
consequences of diversification and group affiliation on performance outcomes. An
integrative perspective will hopefully impel future efforts to examine more closely the
underlying rationale for diversification before proceeding with the assessments of the
strength of empirical relationships. To begin with we adopt an approach that combines multi
dimensional theories and multi-lateral concepts to propose a holistic and integrative model, a
/a Allison (1971).
In parity with existing research we view business groups as complex systems (Prahalad and
Bettis). Although, there is no generally accepted definition of the term "complex system";
Waldrop (1992:11) notes, ".... usually refers to systems in which a great many independent
agents are interacting with each other in a great many ways". Organisations including
business groups represent such systems. Within any system various properties emerge that
are not a simple property of the constituent agents. In other words, reductionism is not a
viable approach to study complex systems. Knowledge of the parts is not knowledge of the
whole or major parts. As Polyani (1958:4) puts it: "Take a watch to pieces and examine,
however carefiiUy, its separate parts in turn, and you will never come across the principles by
which a watch keeps time." Therefore, while disintegrating a system into its parts is essential
for its better understanding, a holistic view of the system is critical for identifying a solution.
Complex systems generally remit non-linear behaviour (Gleick, 1987; Gulick, 1992; Cambel,
1993). In other words cause and effect are not proportional. A large cause might have a
minimal effect, while conversely a small cause can have a huge impact. This feature is what
is explained as - sensitive dependence on initial systems. Sensitive dependence on initial
conditions simply implies that a small perturbation in the system can have a dramatic effect
on later results. Emergent properties of an organisation include political coalitions, values,
informal structure and sub-optimisation. Prahalad and Bettis (1995) follows that dominant
logic is another important emergent property of complex systems. They further believe that
dominant logic is inherently non-linear, with impact often out of proportion to its inherently
subtle nature. Another emergent property of complex systems is that they seek to adapt to
59
their environment (Holland, 1992; Waldrop, 1992). It views that dominant logic is one
emergent property of complex systems seeking to adapt.
The proposed model shall attempt to explain the dichotomies observed in extant research. We
follow the predicament offered by Prahalad and Hamel (1995); untenured research should be
initiated to strike out new directions, if there are strong theoretical justifications. To begin
with it is evident from existing stream of work that the benefits of diversification are not
automatically realised and administrative mechanisms must be consciously designed to
realise these benefits (Ramanujam and Varadarajan, 1989). In this context, a quote by Jerome
B. Wiesner (President Emeritus, MIT) comes to our mind, "Some problems are just too
complicated for rational, logical solution, they admit insights and not answers." The research
study therefore should not be considered an end, but one that is going to pave the way for the
development of a robust and vinified framework. It specifically addresses the following set of
research questions:
• Why research findings on diversification are not generalisable over time and across
different institutional contexts?
Why different diversification strategies lead to similar effects on performance?
Why same diversification strategies lead to different effects on performance?
Why performance effects of group affiliation are are not uniform across all firms?
Why are performance effects of affiliated firms and non-affiliated firms not similar?
What are the roles of environment, industry and firm context in explaining
diversification strategies of firms?
• What are the roles of environment, industry and firm context in explaining difference
in performance of firms?
4.3 Hypotheses
We propose that if diversification strategies of affiliated firms are consistent with the
dominant logic of the business group, group performance is likely to be better. Further, after
group diversification is controlled for, group affiliation will lead to better firm performance.
One of the major implications of this proposition is that the top management is less likely to
respond appropriately to diversification strategies, where the dominant logic is different. As
well as respond quickly enough, as they may be unable to interpret the information
surrounding unfamiliar environment (Prahalad and Bettis, 1986). All this implies hidden
60
costs which indirectly has a negative bearing on performance. Second, diversification
strategies consistent with group dominant logic facilitates implementation of strategies as it
provides strategic as well as operational control of the top management over its diversified
businesses (Ghemawat, 1991). Third, a consistent dominant logic ensures unlearning and
learning of new skills and practices required in a fast changing business environment, evident
in most emerging markets (Das, 1981). Fourth, it implies commitment of the top
management, which offers a generalised form of explanation for sustained differences in
performance across business groups (Ghemawat, 1991). Fifth, it facilitates the systematic
development and sharing of certain complex resources, termed distinctive capabilities and
competencies, which are the primary sources of competitive advantage across different
markets (Selznick, 1957; Prahalad and Hamel, 1990). It comprises of delivering
unimaginable value to customers, far ahead of its competitors and at a substantial lower cost.
These complex resources are not easily replicable, imitable or substitutable by even its
closest competitors because of a high degree of causal ambiguity involved in it (King and
Zeithaml, 2001). Sixth, it also results in the reinforcement of "fit" among its entire system of
activities. This fit leads to a sustainable competitive advantage and is far more superior to fit
based on resources (Porter, 1986). Finally, groups pursuing an intensive diversification
strategy possess the distinct ability to override the context and change the direction and pace
of the environmental forces in its favour so as to fit its dominant logic.
4.4 Measurement of Variables
4.4.1 Dependent Variables
Performance forms our primary dependent variable. This research will evaluate the impact of
diversification on performance on a string of seven indicators sourced from extant research:
(a) return on capital employed (b) return on net worth (c) return on total assets (d) return on
sales (e) operating profit margin (f) Tobin's q (g) shareholder's value.
(a) ROCE = (PAT + Int Payments + Tax Provisions) / (Net worth + Borrowings) * 100
(b) RONW = PAT / Net worth * 100
(c) ROA = {PAT + Int Payments * 1- (Tax Provisions/ PAT)} / (Total Assets) * 100
(d)ROS = PAT/Sales* 100
(e) Operating Profit Margin = (PAT + Depreciation + Interest Payments + Tax
Provision) / Sales * 100

(f) Tobin's Q = (Market Capitalisation Borrowings) / (Net Fixed Assets)
(g) Shareholder's Value = log (Market Capitalisation)
where Market Capitalisation = no: of shares outstanding (paid-up) * (BSE year
end closing price).
4.4.2 Independent Variables
Diversity forms our basic independent variable. The research has relied on continuous
measures of group diversity because it is a better indicator when comparing across
diversified firms. Continuous measures of firm diversity, measures firm diversity
quantitatively (high - medium - low), on a year-to-year basis, instead of two points in time
as used by categorical measure (single - related - unrelated), which is a qualitative measure.
Most continuous measures are variants of the general equation -
D = 1- S (Pi Wi) (1)
where -
(a) D = Extent of Diversification.
(b) Pi = the share of the i'th business relative to the firm as whole.
(c) Wi = an assigned weight.
(d) N = Number of businesses constituting the firm's portfolio.
For instance, the Herfindahl Index as proposed by Gort (1962) is a special case of the above
formulation, where the assigned weights Wi equal Pi. That is,
D = 1 - 1 Pi' (2)
The Concentric Index has been widely used as well. Caves, Porter and Spence (1980),
Wemerfelt and Montgomery (1988), where:
D = I jWij Z, Wi, dj, (3)
where dji is a weight whose value depends on the relations between j and 1 in SIC system.
4.4.3 Control Variables
We have measured the control variables, which are detailed as follows -
The study used multiple measures to capture the effect of size:
(a) Sales = log (Sales)
(b) Total Assets = log (Total Assets)
62
(c) Capital Employed = log (Capital Employed)
The logarithmic transformation of values of the above variables was carried to make the data
distribution more normal and amenable to subsequent analyses (Kakani, 2000). The
following proxies were used to capture the characteristics of an industry to a large extent:
(a) Interest Coverage = (Earnings before Interest and Taxes) / (Interest Payments)
(b) Debt-Equity Ratio = Total Borrowings / Net Worth
(c) Current Ratio = Current Assets / Current Liabilities
(d) Solvency Ratio = (Current Assets - Current Liabilities) / (Total Sales)
(e) Debtors Cycle = Sundry Debtors / Net Sales * Net Working Days
(f) Creditors Cycle = Sundry Creditors / Net Purchases * Net Working Days
(g) Fixed Costs = Fixed Costs / Total Costs * 100
(h) Dominant Business = (PAT from largest business segment) / (Group PAT) * 100
We have controlled for inertia by capturing the average age of all the firms affiliated to a
business group, which we feel is a more appropriate measure, rather than year of
incorporation of the first affiliate firm (Kakani, 2000).
(a) Inertia = E(Age of individual Firms) / No: of firms in the Group
We have measured cohesiveness from the extent of internal transactions (i.e. financial
transfers) among affiliate firms. Other forms of resource transfer (i.e. man-power, products,
brands, physical assets) though material could not be captured due to lack of data availability.
(a) Internal Transactions = (Borrowing from group co's + Investment in group co's +
Internal Transfers + Loans to group co's) / (Capital Employed)
The following proxies were used to capture the characteristics of fundamental resources to a
large extent:
(a) Reserves and Surplus = log (Reserves and Surplus)
(b) Free Reserves = log (Free Reserves)
(c) Liquidity = log (Cash + Bank)
(d) Cash Profits = log (PAT + Depreciation)
(e) Sustainable Growth Rate = [Retained Profits / PAT] * [ROA + {Borrowings / Net
Worth} * {ROA-(Interest Payments/Borrowings)}]
63
The following proxies were used to capture the characteristics of distinctive capabilities and
competencies:
(a) Intangible Assets = (Intangible Assets + Royalty Expenses + R&D
Expenses on Capital Account + R&D Expenses on Current Account) / (Total
Assets)
(b) Marketing Expenses = (Advertising Expenses + Marketing Expenses +
Distribution Expenses) / (Sales)
(c) Plant and Machinery = log (Plant and Machinery * Average Age)
(d) Capital WIP = log (Capital WIP)
(e) Working Capital Management = Average Creditors Cycle / Average Debtors Cycle
To capture the environmental context on a longitudinal scale we composed a time-series
index attempting to measure the degree of market imperfection in an economy. It comprised
of thirty-seven macro-economic variables sourced from ten macro-economic segments (equal
weight was assigned to all the variables), which are given as follows:
(a) Market Imperfection Index = Z{wi(Population and National Income) +
W2(Industry Variables) + W3(Transportation Variables) + W4(Energy Variables) +
W5(Agriculture Variables) + W6(Employment Variables) + W7(Capital Market
Variables) + wg(Public Finance) + W9(Money Market Variables) + wio(External
Transactions).
4.4.4 Moderating Variables
Strategic fit between dominant logic and firm businesses forms our primary moderating
variable. According to the moderation perspective, the impact that an independent (predictor)
variable has on a dependent (criterion) imeven is determined by the level of a third variable,
termed here as a "moderator". The inter-active effect between the predictor and the
contextual variable (i.e. the moderating variable) is the primary determinant of the criterion
variable. Researchers invoke this perspective when the underlying theory or concept specifies
or indicates that the impact of the predictor varies across the different levels of the moderator.
In more general terms, a moderator can be viewed as a categorical as well as a continuous
variable, which will affect the direction or the strength of the relation between a predictor and
64
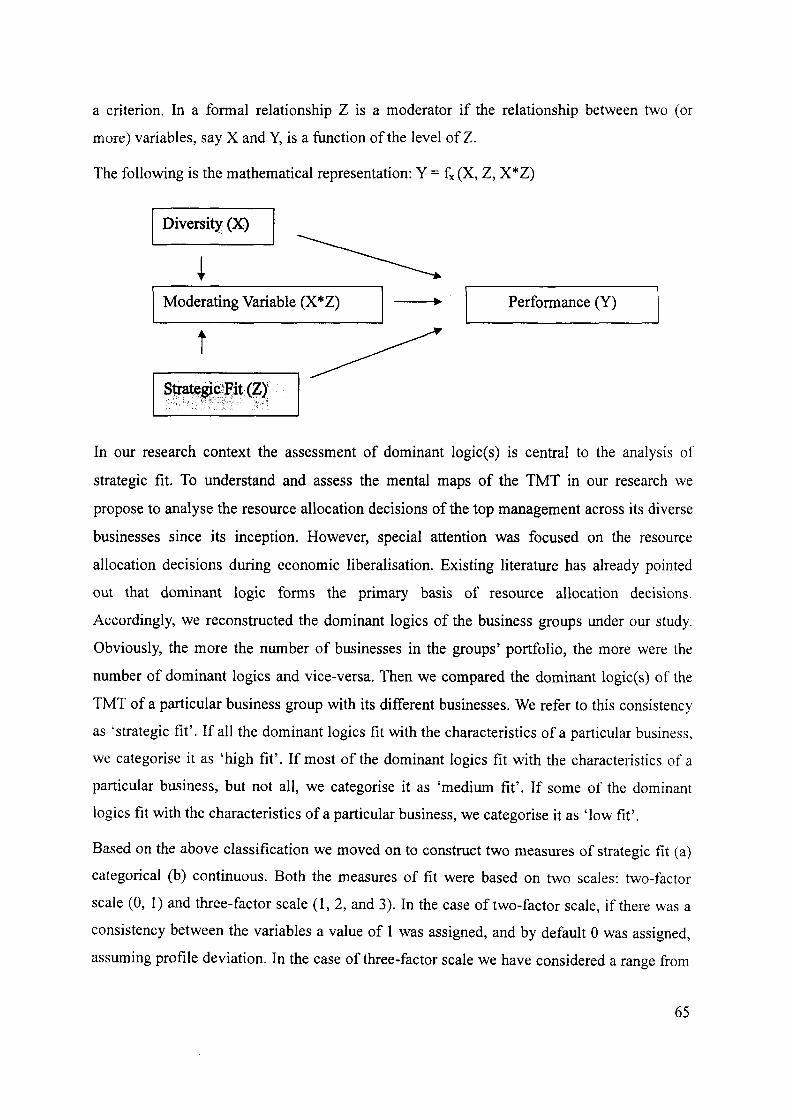
a criterion. In a formal relationship Z is a moderator if the relationship between two (or
more) variables, say X and Y, is a function of the level of Z.
The following is the mathematical representation: Y = fx (X, Z, X*Z)
Diversity (X)
i Moderating Variable (X*Z) Performance (Y)
t Strategic Fit (Z)
In our research context the assessment of dominant logic(s) is central to the analysis of
strategic fit. To understand and assess the mental maps of the TMT in our research we
propose to analyse the resource allocation decisions of the top management across its diverse
businesses since its inception. However, special attention was focused on the resource
allocation decisions during economic liberalisation. Existing literature has already pointed
out that dominant logic forms the primary basis of resource allocation decisions.
Accordingly, we reconstructed the dominant logics of the business groups under our study.
Obviously, the more the number of businesses in the groups' portfolio, the more were the
number of dominant logics and vice-versa. Then we compared the dominant logic(s) of the
TMT of a particular business group with its different businesses. We refer to this consistency
as 'strategic fit'. If all the dominant logics fit with the characteristics of a particular business,
we categorise it as 'high fit'. If most of the dominant logics fit with the characteristics of a
particular business, but not all, we categorise it as 'medium fit'. If some of the dominant
logics fit with the characteristics of a particular business, we categorise it as 'low fit'.
Based on the above classification we moved on to construct two measures of strategic fit (a)
categorical (b) continuous. Both the measures of fit were based on two scales: two-factor
scale (0, 1) and three-factor scale (1, 2, and 3). In the case of two-factor scale, if there was a
consistency between the variables a value of 1 was assigned, and by default 0 was assigned,
assuming profile deviation. In the case of three-factor scale we have considered a range from
65
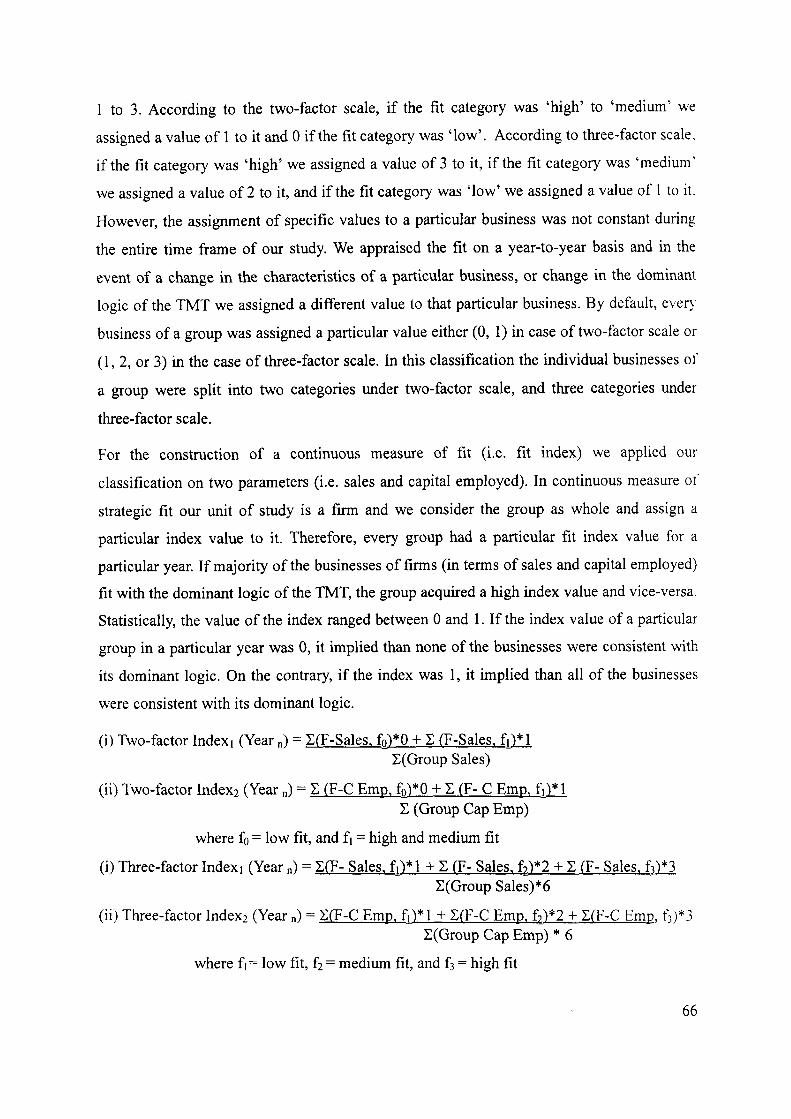
1 to 3. According to the two-factor scale, if the fit category was 'high' to 'medium' we
assigned a value of 1 to it and 0 if the fit category was 'low'. According to three-factor scale,
if the fit category was 'high' we assigned a value of 3 to it, if the fit category was 'medium'
we assigned a value of 2 to it, and if the fit category was 'low' we assigned a value of 1 to it.
However, the assignment of specific values to a particular business was not constant during
the entire time frame of our study. We appraised the fit on a year-to-year basis and in the
event of a change in the characteristics of a particular business, or change in the dominant
logic of the TMT we assigned a different value to that particular business. By default, ever}
business of a group was assigned a particular value either (0, 1) in case of two-factor scale or
(1, 2, or 3) in the case of three-factor scale. In this classification the individual businesses of
a group were split into two categories under two-factor scale, and three categories under
three-factor scale.
For the construction of a continuous measure of fit (i.e. fit index) we applied our
classification on two parameters (i.e. sales and capital employed). In continuous measure of
strategic fit our unit of study is a firm and we consider the group as whole and assign a
particular index value to it. Therefore, every group had a particular fit index value for a
particular year. If majority of the businesses of firms (in terms of sales and capital employed)
fit with the dominant logic of the TMT, the group acquired a high index value and vice-versa.
Statistically, the value of the index ranged between 0 and 1. If the index value of a particular
group in a particular year was 0, it implied than none of the businesses were consistent with
its dominant logic. On the contrary, if the index was 1, it implied than all of the businesses
were consistent with its dominant logic.
(i) Two-factor Index, (Year „) = KF-Sales, fn')*0 + £ (F-Sales. fi)*l 5:(Group Sales)
(ii) Two-factor Index2 (Year „) = £ (F-C Emp. fn *0 + £ (F- C Emp. fi)* 1
E (Group Cap Emp)
where fo = low fit, and fi = high and medium fit
(i) Three-factor Indexi (Year „) = £fF- Sales. f,)*l + £ (V- Sales. f7)*2 + £ (F- Sales. fO*3 £(Group Sales)*6
(ii) Three-factor Indexi (Year „) = ECF-C Emp. fi)*l + £(F-C Emp. f2')*2 + £(F-C Emp. f3)*3 £(Group Cap Emp) * 6
where fi= low fit, fj = medium fit, and f^ = high fit
66
We acknowledge here that firm's and businesses are distinct and different, and flirther
business wise sales would have been a more appropriate measure for the composition of the
"Strategic Fit Index". However, though CMIE reports business wise sales, capital employed
is disclosed only for the firm as a whole. Therefore, to maintain consistency we adopt the
firm values of sales and capital employed, as a close surrogate. An important limitation that
remains as a result of this approximation is that, firms, which have an exposure in multiple
businesses, could not be controlled for as a result. But to avoid ambiguity we went by the
dominant business of the firm xmder consideration.
4.5 Data Collection
Being exploratory in nature, the basic objective of this research was to propose generalised
relationships across variables, which have been naively defined in existing research. We also
empirically verified our hypotheses using panel data analysis. The study is based on
qualitative and quantitative data acquired from secondary sources. Data surrounding
dominant logic from the point of view historical evolution and transition were gathered from
two sources. Regarding the evolution of dominant logic we relied heavily on case studies
published by Harvard Business School and other prominent sources. Regarding the transition
in dominant logic we closely followed first hand interviews of the top management published
in regular business magazines like Business World, Business Today and India Today. We also
monitored prominent press clippings published in newspapers like Economic Times,
Financial Express and Business Standard. The above findings were also substantiated from
Annual Reports of firms. Regarding other contextual (exogenous and endogenous) variables,
we sourced data from a publicly available database (Prowess Release-2.0) from Centre for
Monitoring Economy (CMIE). This database by far, is considered reliable and comparable
and has been widely used in extant research (Kkarma and Palepu, 1999; Khanna and Rivkin,
2001; Kakani, 2000). It is comparable across groups and firms because CMIE adjusts data in
a maimer to restore normality. For the purpose of additional security the aforesaid data was
verified from multiple sources, including official firm/group websites. The above
documentary evidences allowed us to collate informafion on - number of business lines,
dominant business, ownership pattern, age, size. We also sourced data from CMIE Annual
Indicators for constructing a "Market Imperfection Index", which attempted to assess the
relative degree of market imperfection operating in the Indian economy.
67
Business groups forms the primary unit of our study. Our sample comprises of Tata group,
Reliance group and Aditya Birla group. Being exploratory in nature, the research relies more
on depth rather than breadth. Our choice of selection of groups was guided by factors such as
- age, diversity, size, initial resource position, structure and dominant logic of business
groups. Our objective was to capture the vastness of the institution of Indian business groups
in our research. The three groups comprising our study are notably among the three best
performers in the economy in terms of returns, growth and margins. This follows from the
recommendation of Raman jam and Varadarajan, (1989) to focus on firms achieving non-
equilibrium performance.
Khanna and Palepu (1998) has pointed out that identification of group membership in India is
more reliable and easier than in many other emerging markets. First, unlike in other emerging
markets, firms in India are members of only one group (Strachan, 1976; Goto, 1982). Further
there is very little movement of affiliates across groups because of less M&A activity in
India. Unlike in many SE Asian or Latin American economies, firms in India rarely swap
allegiance from one group to another. Therefore, groups in India divest firms, promote or
acquire new firms. CMIE databases classification of firms into groups is quite reliable as it
uses a variety of independent sources to classify firms into business groups. In the Indian
scenario shifts in a firm's business group affiliation is very rare, but if they take place, they
are duly incorporated in the database. There is no ambiguity between CMIE's classification
of firms into groups and those verified from the group's official websites, against which we
have cross-checked. In case of many family controlled groups, which mostly are the case,
succession from one generation to another often also results in the group being split into
multiple parts. However, group splits were not observed across our samples during the time
frame.
Groups comprises of a number of firms mostly listed, while others closely held, hence not
listed. Data regarding listed firms were easily available, reliable and could be verified from
multiple sources. However, data regarding unlisted firms were not available and whatever
was available from independent sources could not be relied upon. Hence for the sake of
genuineness we incorporated data only in the case of listed firms, though its omission may
have caused some bottlenecks. However, despite such deletion we were able to capture on
the overall more than 90% of the data on all the three groups in terms sales, total assets or
68
market capitalisation. Summary results of all listed firms were taken as group data. Initially
we downloaded data from CMIE covering a total of sixty-one variables over a time span
covering (1990-2003). The results of Simmonds (1990) provide support for the suggestion
by Palepu (1985) that the period of study does affect empirical results. But to avoid factors
such as temporal stability influencing our study, we went for a sufficiently long time frame
for our study. We had to cut-off our data point in 2003 to facilitate further data analysis and
interpretation.
The time period is considered to be of enormous significance from the point of view of
economic liberalisation and crisis faced by business groups on account of wide-scale
environment changes. An attempt was made to measure the relative changes in the extent of
market imperfection in the Indian economy during the above-mentioned period. After testing
the significance of the variables, we short-listed fifty-five variables, which we considered
relevant for our study. All data analysis was done on SPSS software package, which is time
tested and robust (Kakani, 2000). Our objective was also to find out the best variables in each
category. Best variables mean variables, which have the best fit with the dependent variable
among all variables in a particular category. We calculated the correlation matrix for all the
three groups individually to rule out possibilities of multi-colinearity. We also conducted
bivariate and multivariate regression analysis on consolidated group data to study the
strength and impact of the various control and independent variables on performance
(dependent variable). The findings caimot be considered conclusive due to lack of sufficient
degrees of freedom on account of small sample size. Sample profiles of the unit (i.e. business
group) of study reveal the following:
69
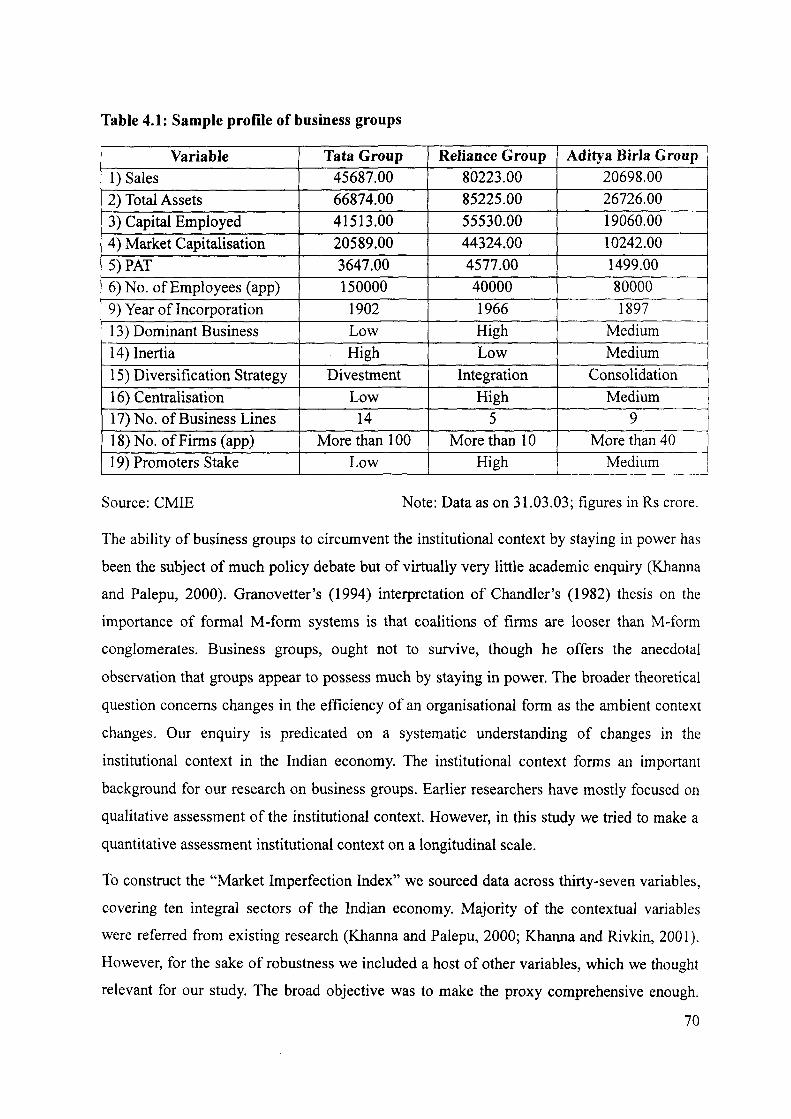
Table 4.1: Sample profile of business groups
Variable 1) Sales 2) Total Assets 3) Capital Employed 4) Market Capitalisation 5) PAT 6) No. of Employees (app) 9) Year of Incorporation 13) Dominant Business 14) Inertia
15) Diversification Strategy 16) Centralisation 17) No. of Business Lines 18) No. of Firms (app) 19) Promoters Stake
Tata Group 45687.00 66874.00 41513.00 20589.00 3647.00 150000
1902 Low
High Divestment
Low 14
More than 100 Low
Reliance Group 80223.00 85225.00 55530.00 44324.00 4577.00 40000 1966 High Low
Integration High
5 More than 10
High
Aditya Birla Group 20698.00 26726.00 19060.00
10242.00 1499.00 80000 1897
Medium Medium
Consolidation Medium
9 More than 40
Medium
Source: CMIE Note: Data as on 31.03.03; figures in Rs crore.
The ability of business groups to circumvent the institutional context by staying in power has
been the subject of much policy debate but of virtually very little academic enquiry (Kharma
and Palepu, 2000). Granovetter's (1994) interpretation of Chandler's (1982) thesis on the
importance of formal M-form systems is that coalitions of firms are looser than M-form
conglomerates. Business groups, ought not to survive, though he offers the anecdotal
observation that groups appear to possess much by staying in power. The broader theoretical
question concerns changes in the efficiency of an organisational form as the ambient context
changes. Our enquiry is predicated on a systematic understanding of changes in the
institutional context in the Indian economy. The institutional context forms an important
background for our research on business groups. Earlier researchers have mostly focused on
qualitative assessment of the institutional context. However, in this study we tried to make a
quantitative assessment institutional context on a longitudinal scale.
To construct the "Market Imperfection Index" we sourced data across thirty-seven variables,
covering ten integral sectors of the Indian economy. Majority of the contextual variables
were referred from existing research (Khanna and Palepu, 2000; Khanna and Rivkin, 2001).
However, for the sake of robustness we included a host of other variables, which we thought
relevant for our study. The broad objective was to make the proxy comprehensive enough.
70

The data was made available from the CMIE - Annual Indicators. A time-trend serves as a
reliable proxy for several changes in an institutional context (Khanna and Palepu, 2000).
Tests for multi-colinearity were also carried out across the time-trend. While constructing the
Market Imperfection Index the base year (100) of all the variables was kept at 1990.
However, except in the case of a few variables where the base year had to be shifted to a
more normal year (technically termed 'masking'). Since for the year 1990 the said variables
reported incomparable values. Table 4.2 reports the raw values of the thirty-seven variables
for 1990 and 2003, used for the purpose of the index.
71
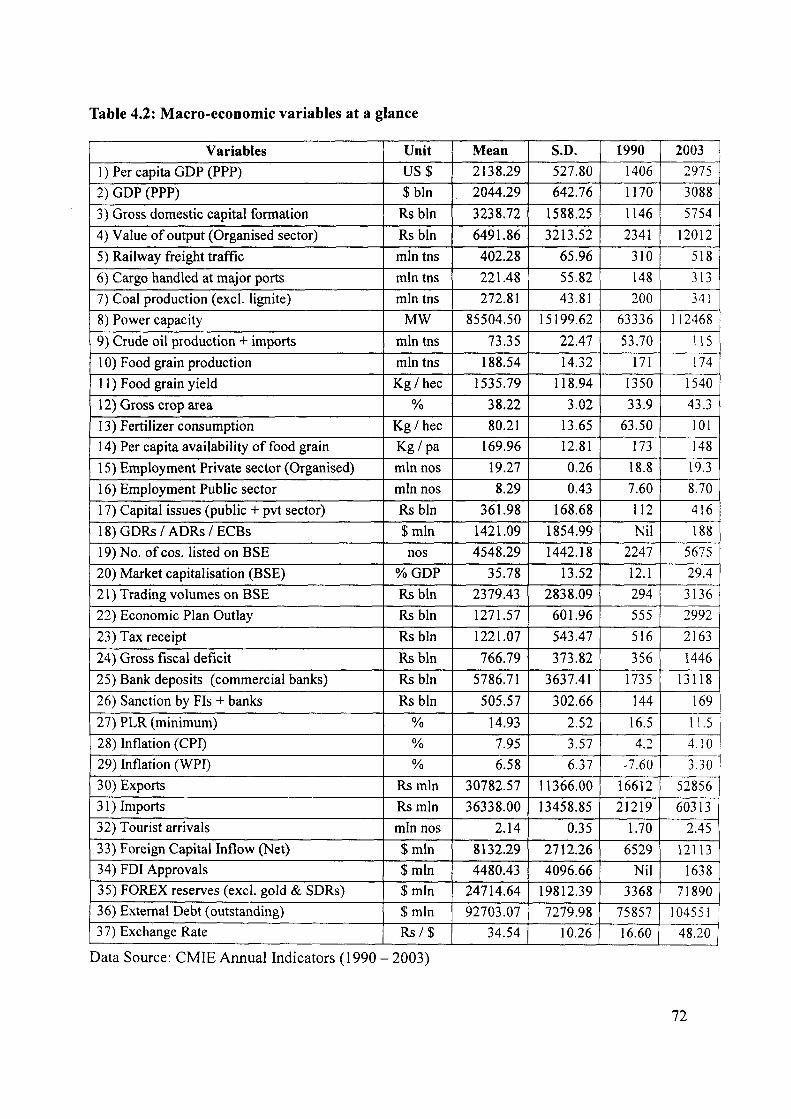
Table 4.2: Macro-economic variables at a glance
Variables 1) Per capita GDP (PPP)
2) GDP (PPP)
3) Gross domestic capital formation
4) Value of output (Organised sector)
5) Railway freight traffic
6) Cargo handled at major ports
7) Coal production (excl. lignite)
8) Power capacity
9) Crude oil production + imports
10) Food grain production
11) Food grain yield
12) Gross crop area
13) Fertilizer consumption
14) Per capita availability of food grain
15) Employment Private sector (Organised)
16) Employment Public sector
17) Capital issues (public + pvt sector)
18)GDRs/ADRs/ECBs
19) No. of cos. listed on BSE
20) Market capitalisation (BSE)
21) Trading volumes on BSE
22) Economic Plan Outlay
23) Tax receipt
24) Gross fiscal deficit
25) Bank deposits (commercial banks)
26) Sanction by FIs + banks
27) PLR (minimum)
28) Inflation (CPI)
29) Inflation (WPI)
30) Exports
31) Imports
32) Tourist arrivals
33) Foreign Capital Inflow (Net)
34) FDI Approvals
35) FOREX reserves (excl. gold & SDRs)
36) External Debt (outstanding)
37) Exchange Rate
Unit US$
$bln
Rsbln
Rsbln
mln tns
mln tns
mln tns
MW
mln tns
mln tns
Kg / hec
%
Kg / hec
Kg/pa
mln nos
mln nos
Rsbln
$ mln
nos
% GDP
Rsbln
Rsbln
Rsbln
Rsbln
Rsbln
Rsbln
%
%
%
Rs mln
Rs mln
mln nos
$mln
$ mln
$ mln
$ mln
Rs /$
Mean
2138.29
2044.29
3238.72
6491.86
402.28
221.48
272.81
85504.50
73.35
188.54
1535.79
38.22
80.21
169.96
19.27
8.29
361.98
1421.09
4548.29
35.78
2379.43
1271.57
1221.07
766.79
5786.71
505.57
14.93
7.95
6.58
30782.57
36338.00
2.14
8132.29
4480.43
24714.64
92703.07
34.54
S.D.
527.80
642.76
1588.25
3213.52
65.96
55.82
43.81
15199.62
22.47
14.32
118.94
3.02
13.65
12.81
0.26
0.43
168.68
1854.99
1442.18
13.52
2838.09
601.96
543.47
373.82
3637.41
302.66
2.52
3.57
6.37
11366.00
13458.85
0.35
2712.26
4096.66
19812.39
7279.98
10.26
1990
1406
1170
1146
2341
310
148
200
63336
53.70
171
1350
33.9
63.50
173
18.8
7.60
112
Nil
2247
12.1
294
555
516
356
1735
144
16.5
4.2
-7.60
16612
21219
1.70
6529
Nil
3368
75857
16.60
2003
2975
3088
5754
12012
518
313
341
112468
115
174
1540
43.3
101
148
19.3
8.70
416
188
5675
29.4
3136
2992
2163
1446
13118
169
11.5
4.10
3.30
52856
60313
2.45
12113
1638
71890
104551
48.20
Data Source: CMIE Annual Indicators (1990 - 2003)
72
4.6 Pattern of Analysis
Similar to most exploratory research, this study relies heavily on case studies to strike out
new directions and propose meaningful relationships across unexplored linkages. The case
study method is a contemporary form of qualitative analysis and involves a careful and
meaningful observation of a social unit. It is a method of study in depth rather than breadth.
It places more emphasis on full analysis of a limited number of events or conditions and their
interrelations. It also deals with the processes that take place within the interrelationships. It
is essentially an extensive investigation of the particular unit under consideration. The
primary objective of the case study is to locate the factors that account for the behaviour of
the given unit as an integrated totality. Eisenhardt (1989) provides a road map to developing
theories from small case studies that may be appropriate in an emerging market context.
Thus a fairly exhaustive study of what a person or group (as to what it does and has done,
what it think it does and has done and what it expects to do and what it ought to do) is called
a life or case history. Certain authors have used the term 'social microscope' for this
methodology. In brief, we can say that case study method is a form of qualitative analysis
where in careful and complete observation of a unit of study or situation is done. Efforts are
also made to study each and every aspect of the concerning unit in minute details; then draw-
generalisations and inferences from case analyses. Research in such situations is primarily a
function of subjective assessment of attitudes, opinions and behaviour. Hence such forms are
also subjected to panel data analyses.
The research was at proposing generalised relationships across variables observed through
case studies. To supplement it, we used panel data analysis to test our hypotheses. Though a
large number of statistical techniques could be used on the same data to address different
research questions by testing out various hypotheses relating to diversification strategy and
performance, we limited our analysis to a few time tested and robust techniques. SPSS
(statistical software) was used to perform the factor, ANOVA, correlation and multiple
regression analyses. Interpretation of the results was based on the following factors:
(a) Adjusted R square - 'R' is the correlation coefficient between two observed set of
variables, the value of which ranges from 0 to 1. It attempts to explain the proportion of
variation in the dependent variable explained by the regression model. The adjusted 'R'
square tends to optimistically estimate how well the model fits the population. The model
73
usually does fit the population as well as it fits the sample from which it is derived. Adjusted
'R' square therefore attempts to correct R square to more closely reflects the goodness of fit
of the model in the population, (b) Standardised Coefficients - Standardised coefficients also
known as "beta coefficients" are the regression coefficients when all the variables are
expressed in standardised (z-score) form. Transforming the independent variables to a
standardised form makes the coefficients more comparable since they are all in the same
units of measure, (c) Significance Level - The f-value is the ratio of two mean squares. A
small significance level indicates that the results are not due to random chance. The p-value
is the conditional probability that a relationship as strong as the one observed in the data
would be present, if the null hypothesis were true. The t-value is used to test the null
hypothesis when there is no linear relationship between a dependent and independent
variable, (d) Standard Error - It is a measure of how much the value of test statistic varies
from sample to sample. It is the standard deviation of the sampling distributions for a
statistic. Standard deviation of the mean is normally taken as the standard deviation of the
sample mean, (e) Eta - It is a measure of association between two variables that ranges from
0 to 1 and is complimentary to R . Eta is asymmetric and does not assume a linear
relationship between the variables. Eta squared can be interpreted as the proportion of
variance in the dependent variable explained by difference among groups, (f) Levene's Test -
It is homogeneity-of-variance test that is less dependent on the assumption of normality than
most tests. It computes for each case, the absolute difference between the value of that case
and its cell mean and performs a one-way ANOVA on those differences.
Some of the earliest research on diversification and performance was centered on the
conglomerates in the West. Off late, studies have focused on business groups in emerging
markets. Yet the vast body of research continues to be fragmentary and controversial. Thus,
the literature has so far failed to provide a definitive explanation on the relationship between
strategic decision-making at the group level and performance outcomes. We feel a more
plausible explanation for the inconsistencies among various research findings may be the
failure of most empirical studies to explicitly address the indirect influences (mainly its
antecedents) of diversification on performance outcomes. Therefore, the need is to propose a
framework that describes the relationships among diversification strategy, intervening
variables and performance. And for this we need to supplement empirical cross-sectional
74
studies with clinical, process-oriented studies of diversification (Ramanujam and
Varadarajan, 1989).
In this context we have pursued small sample studies using a comparative research design in
the belief that such studies will enable us to untangle the complex web of issues and factors
surrounding diversification and make cautious generalisations applicable to clearly defined
contexts. We have also felt the need to shift the focus of analysis from overall profiles of
diversification to individual diversification projects and cumulative diversification
experiences. It is at this stage we felt the need to break out of the realms of Strategic
Management and incorporate multi-lateral theories and multi-dimensional concepts
combining perspectives from Organisation Theory and I/O Economics to increase the
explanatory power of diversification strategy on performance. The broad objective was to
incorporate a multiple-lens approach instead of the traditional single-lens approach that
views business groups as responses to market failure alone.
4.7 Limitations
Research on strategies in emerging markets faces several difficulties. First, theories
promulgated for developed markets may not be appropriate for emerging markets. Second,
emerging markets are not a homogeneous or clearly identifiable and recognisable unit of
study. Therefore, results in one case may not be applicable in case of another. Therefore,
theory development in emerging markets can be problematic. There are major issues to be
addressed with respect to the replication of tests of hypotheses and research instruments
developed and used in developed markets in an emerging market context. An integral part of
this approach is the development of research instruments that can be used in quantitative
studies. In addition, the combination of quantitative and qualitative data in emerging market
research can be particularly usefiil in yielding novel, relevant and reliable insights. In that
case our research is akin to exploratory in nature, where the objective is the development of
hypotheses rather than testing.
Despite offering several advantages over other traditional methods of research, case studies
have certain limitafions as well. They are seldom comparable. Since the subject under case
study tells history in his own words, logical concepts and units of scientific classification
have to be read into it or out by the researcher in the context of the given situation. Certain
researchers do not consider case studies as an appropriated method of scientific enquiry as
75
they are not characterised by impersonal, universal, non-ethical, non-practical and repetitive
aspects of phenomena. The dangers of over-generalisation are also there, in view of the fact
that no set of rules are followed in collection of information and only a handful of units are
studied. Therefore, personal bias of the researcher also carmot be ruled out. Case data and
facts are also often vitiated, because the subject may write what he think the investigator
wants; and greater the rapport, the more subjective the whole process becomes. The rigid
assumptions in the case study method often put the useftilness of case data to doubt. Hence,
its application can be based only in a limited sphere; it is not possible to use it in the case of a
big universe. Sampling is also not amenable in this method. Response of the investigator is
another important limitation of the case study method; therefore incomplete knowledge of the
unit can adversely affect the consequences.
Despite the above stated limitations, case studies are becoming immensely popular in many
streams of sociological and organisational research (Ghemawat and Khanna, 1998). Most of
the limitations can be reduced if the personal biases of the investigator are consciously
controlled for. Provided also the investigator employs modem and reliable methods of
collecting case data and in the scientific techniques of assembling, classifying and processing
the same. Besides, case studies can be also conducted in a manner that the data is amenable
to quantification and statistical analyses. The study also relies on panel data analysis to
confirm and test the hypotheses. However, the acceptability of the robustness of the findings
may be under question, because of the usual limitations of small sample studies.
Despite of data limitations and lack of sufficient conceptualisation, we used suitable proxies
to measure dominant logic and strategic fit with a reasonable degree of perfection. Here
researchers have pointed out the difference between 'espoused theories' and 'theories in use'.
because stated policies and intentions often vary fi-om what is actually used (Argyris and
Schon, 1974). They suggest that a person's theory in use cannot be simply obtained by asking
for it. Creative questionnaires and analytical procedures can elicit the true nature of these
constructs. For example, the policy capturing methodology (Slovic and Lichtenstein, 1971:
Slovie, Fischoff and Lichtenstein, 1977) seems to be a powerftil approach to measuring a
group's dominant logic. We adopted a suitable alternative approach (i.e. historical analysis
through case studies).
76
CHAPTER 5
Case Analysis
During the course of our research we undertook three in-depth case studies surrounding
Indian business groups (viz. Tata group, Reliance group, Aditya Birla group). The cases were
undertaken to enhance our understanding of business groups from the point of view of their
diversification strategies and its impact on performance. We therefore tried to trace the
origins of the three groups, its evolution, with special focus on their restructuring during the
course of economic liberalisation. For each of the three groups a particular business was
analysed in detail, to identify causes that led to diversification success or failure. The details
of the "Case Studies" are presented in Annexure I to III. In this chapter we try to analyse the
case studies, from the perspective of the variables already identified in chapter 3.
5.1 Diversification Strategy
With the onset of economic liberalisation, the Tata group was present in diversified
businesses ranging from steel, cement, chemicals, and automobiles to soaps; a restructuring
of the business portfolio included a series of divestments. As a part of the overhaul, the group
first identified the businesses to be divested. Once the businesses to be divested were
identified, the group evolved specific strategies for the divestments on a case-to-case basis.
The compulsions for divestment were not the same in all cases, since the businesses to be
divested were not necessarily loss-making units (eg. ACC). Though in some cases, certain
businesses had become unprofitable, with prospects for turnaround becoming bleak (eg.
NELCO). While in other cases, some businesses were currently profitable but were not likely
to remain so over the long run (eg. Merind). In other cases, certain businesses were now
targets of entry by players with superior capabilities and a higher stake in the concerned line
of business (eg. TOMCO).
The circumstances surrounding the businesses also varied widely from each other. There was
of course, one common feature among the businesses identified for divestment; they did not
match with the groups' new scheme of things. The commonality stopped there. As a matter
of policy, the group decided to exit those businesses. Due to difficulty in exiting an industry,
the group has, over fime; has become diffiised and lacked focus. While in the case of certain
businesses the groups sold off their entire stake at one go, in case of certain businesses the
77
stake was sold in a stage-by-stage process. Only when the entire divestment process was
complete, the group went in for some major diversifications and acquisitions. While the
groups' business portfolio was heavily tilted towards manufacturing: automobiles, textiles,
steel, energy and chemicals. It also had a strong presence in agri-products, white goods and
hotels and was actively moving into new areas like InfoTech, retailing, insurance and
telecom. The new businesses of the group were much more technology intensive, had a more
service component and were in emerging industries. And in all cases, the presence of the
group in its new businesses was much closer to the end consvraier.
In the case of Reliance group, against a similar backdrop, the group primarily stuck to its
strategy of vertical integration. The product chain included from fabrics to PFY and PSF to
PTA and PX to MEG to PP and PE to naphtha to refining and ultimately to oil and gas
exploration. Though certain diversifications (eg. financial services, media and advertising,
infi:a-structure and ports and power) seemed distinctly unrelated in nature, they were in the
nature of horizontal integration and the lirJcages though not apparent were quite distinct. For
instance when the group diversified into power, financial services and infra-structural
facilities the primary objective was to provide feedstock to its existing businesses. The
telecom project launched after the completion of its vertical chain was the only project,
which seemed for the first time the group had totally bypassed its legacy of integrating down
its product chain. The group, till then, was basically users of technology; the only difference
is that now they are implementing the same it in terms of business. There is also another
striking difference; previously they were totally into manufacturing, however, with telecom
they have added a new dimension to their business portfolio - services.
From trading in cotton, silver, sugar and jute the group the Aditya Birla group forged ahead
in key industries such as textiles, fertilisers, chemicals, sponge iron, cement, refineries,
carbon black, aluminum, financial services and software. In the pre-liberalisation period
geographical diversification was their key engines of growth. Overburdened with businesses
in distant comers of the world, post liberalisation divesting certain businesses and
consolidating position in key businesses, rather than entering new businesses was their new
strategy. The reason: no certain diversification plans showed clear competitive or leadership
edge. New businesses, for the time being, were therefore restricted to the ones already in the
making - telecom, power and refineries and more. During the initial consolidation phase, the
78
group witnessed a shift in focus from the international to domestic arena, with the strategy
again switching to reverse-gear post 2000. After a change in leadership in 1995, the group
restructuring in business portfolio also witnessed a paradigm shift investments; from textiles,
VSF and yam to non-ferrous metals and cement. For instance, of the total future
diversification investment of Rs. 20000 crore, the group was close to allocating around Rs.
16000 crore for its aluminum business alone over the next four years.
Post liberalisation the group had commissioned - MRPL, India's first refinery after the sector
was opened up to the private sector; and as group officials were quick to point out, three
months ahead of actual schedule. It had also started operations in one circle in its telecom
venture through Birla AT&T, and was scheduled to commission two other circles very soon.
Working on the Bina Power project, through its joint venture Birla Powergen, was also at an
advanced stage. The copper smelter project at Indo-Gulf, which had generated some
criticism, had been also successfully completed. The new group chairman had spent the first
five years of his career trying to imtangle the existing portfolio of businesses and drive
operational efficiency. As a result of its strong resource position built up, the group was also
in the process of finalising a massive investment outlay in line within the framework of the
groups' new growth strategy. The plans dravra up included the setting up of two new plants.
So far the board had not yet seen the final blueprints. But after the board ratified it, it would
increase the aluminum capacity three times over, all at one shot, and pitchfork them into the
global top ten manufacturers list. Clearly, the group has now chosen to shift gears. The next
few years would mark an inflexion point within the group. For the first time, the group was
beginning to think big, in terms of international standards. In the past, the group was simply
focused on extracting value rather than betting big on growth. The group now typically chose
to add capacity in small chunks or acquire healthy, but relatively small businesses.
79
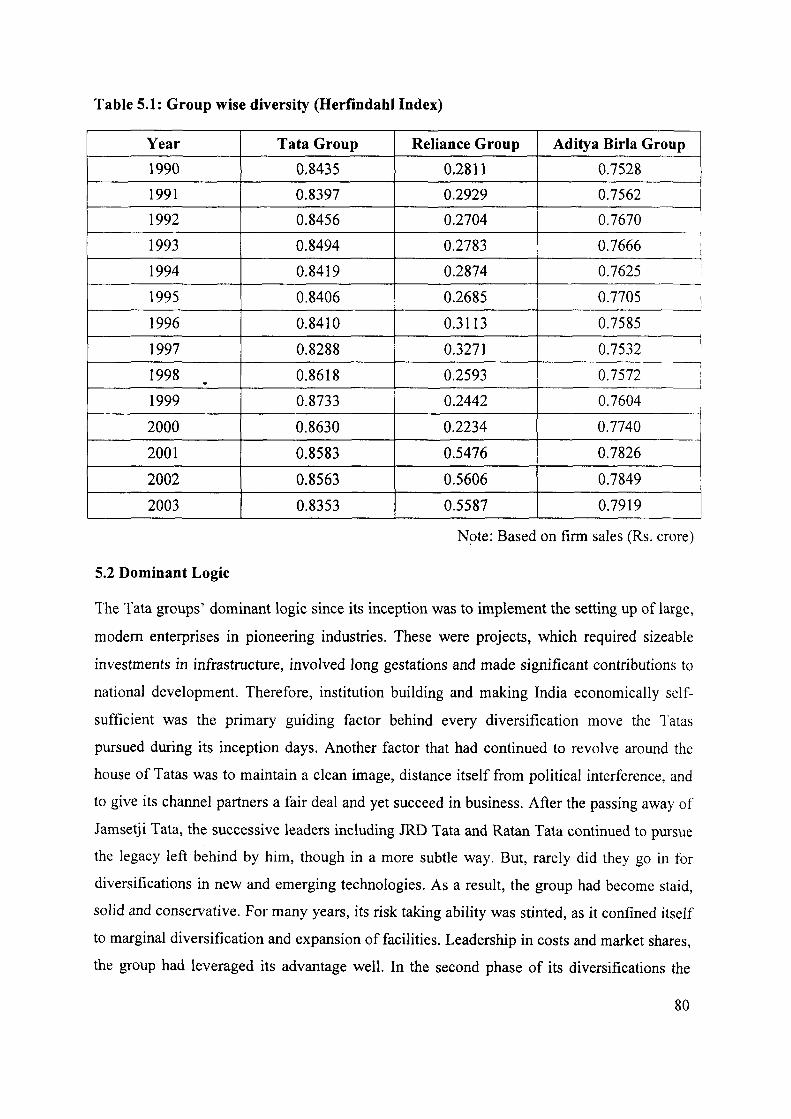
Table 5.1: Group wise diversity (Herfindahl Index)
Year
1990
1991
1992
1993
1994
1995
1996
1997
1998
1999
2000
2001
2002
2003
Tata Group
0.8435
0.8397
0.8456
0.8494
0.8419
0.8406
0.8410
0.8288
0.8618
0.8733
0.8630
0.8583
0.8563
0.8353
Reliance Group
0.2811
0.2929
0.2704
0.2783
0.2874
0.2685
0.3113
0.3271
0.2593
0.2442
0.2234
0.5476
0.5606
0.5587
Aditya Birla Group
0.7528
0.7562
0.7670
0.7666
0.7625
0.7705
0.7585
0.7532
0.7572
0.7604
0.7740
0.7826
0.7849
0.7919
Note: Based on firm sales (Rs. crore)
5.2 Dominant Logic
The Tata groups' dominant logic since its inception was to implement the setting up of large,
modem enterprises in pioneering industries. These were projects, which required sizeable
investments in infrastructure, involved long gestations and made significant contributions to
national development. Therefore, institution building and making India economically self-
sufficient was the primary guiding factor behind every diversification move the Tatas
pursued during its inception days. Another factor that had continued to revolve around the
house of Tatas was to maintain a clean image, distance itself from political interference, and
to give its channel partners a fair deal and yet succeed in business. After the passing away of
Jamsetji Tata, the successive leaders including JRD Tata and Ratan Tata continued to pursue
the legacy left behind by him, though in a more subtle way. But, rarely did they go in for
diversifications in new and emerging technologies. As a result, the group had become staid,
solid and conservative. For many years, its risk taking ability was stinted, as it confined itself
to marginal diversification and expansion of facilities. Leadership in costs and market shares,
the group had leveraged its advantage well. In the second phase of its diversifications the
80
group had rarely been first movers, but it often used its size and muscle to its advantage to
overtake early leaders.
However, through age this dominant logic of the house of Tatas though remained intact, got
substantially diluted over time. This was evident from the diversifications the group pursued
in the late seventies and eighties; the group did not invest in any pioneering and emerging
technology. However, by the turn of the century, the Tata Group under the leadership of
Ratan Tata witnessed for the first time a paradigm shift in its mindset. While keeping the
much revered value system and ethics intact, the group wanted to turn itself into a more
dynamic entity, by investing once again in areas of high-technology. In tune with the
emerging economic environment the group felt the need to enter businesses, which were
technologically inductive and above all concentrate on a few select product-market segments.
The group believed it was in many more businesses than it should have been in and was
perhaps not concerned about its market position in each of those businesses.
The group felt it needed to do businesses much more articulately and remain focused rather
than diffused, become more aggressive than it used to be, much more market driven, and
much more concerned about customer satisfaction. The new priority of the group was to put
in money and managerial resources in businesses where it could achieve a dominant position,
which in turn would provide the benchmark return the group was expecting. The new
business realities had made the historically benevolent group clinical in its diversification
strategies. The paradigm shift in the mindset of the group in the post liberalization period can
be summed up as follows: from core-industries, high infra-structural investment, long
gestation, business ethics and social responsibility to focusing on brands, trimming the
commodity sail, expanding services, get out of businesses that are not among the top three,
and thinking global. In this new regime the group felt the need to put its firms in a framework
where there they would move in one direction. Previously, it was the firm first then the
group. The earlier mind-set was now reversed: first the group then the firm.
The dominant logic of the Reliance group had always been to invest in emerging product-
market segments, which are capable of vertical and horizontal integration. The broad idea
was to dominate markets ahead of competifion, through cost leadership. Another distinct
aspect of their dominant logic was that the product-market segments should be highly price-
elastic. They would then invest in creating world-scale capacities irrespective of domestic
81
market size or potential. The group never gave way to the incrementaUst mind-set. The>
created capacities ahead of actual demand, on the basis of the latent demand. Then they
would go about systematically removing the barriers that were holding back the demand. The
mind-set of the Reliance Group has always been to use the price-elasticity in the product-
market segment to its advantage to blow up the market to international size and scale. Thus
once they had built up the capacities, they systematically went about removing the
impediments that blocked the way for increases in demand, in most cases by radically
breaking the price barrier.
Clearly, the dominant logic of the group rested on the fact the domestic per-capita
consumption of most of its commodities was substantially lower than in the SE Asian or
American markets. In most cases, the user industries were held back due to non-availability
of supplies. They would also continuously build up capacities on every link in the value-
chain to notch up all incremental market shares. The group would then exploit the benefits of
its early entry to create cost barriers for new entrants and existing players. Thus growth
through continuous integration was closely linked with their dominant logic. This would also
in a way substantially reduce the gestation of the projects and ensure the group would break
even much ahead of its industry counterparts. This would enable them to create a market
share of indomitable position. Right from its early days the focus of the group has been to
dominate its industries, miles away from its competitors. Another distinct aspect of their
dominant logic was to control every link in the value-chain. This was observed right from the
days when the group had first set up Vimal chain stores, to its recent network for its
Infocomm project. The group would bypass the existing market structure and set up its own
marketing chain at every level, right up to the customer point. The group would then pursue
this strategy at a grand scale, a practice it has maintained right from its early days. The
bottom-line was quite clear - push hard for capital productivity.
Also as a result of the political proximity the group wielded with most successive
governments, its critics contended that its ability to get licenses granted; obtain preferential
approvals for its resource mobilisation plans from the capital markets and capital goods
imports; and get policies formulated which favoured it (or disadvantaged its competitors or
both), was also a reflection of another facet of its dominant logic. Most business groups
found it expedient to use 'industrial embassies' to generate private deals with politicians and
82
bureaucrats and offered disproportionate benefits in exchange for licenses, political
contributions in return for preferential regulation and the generation of unaccounted money
for sustaining this nexus became, for some, the short-term route for success and rapid
growth. Again, the group took this practice to new heights. Reliance, despite adopting this
same path to a large extent, had also kept a close eye on developing distinctive capabilities,
which it knew would be the ingredients for success in the fixture. Though the group acquired
licenses, clearances and duty benefits; also thought about stringent project deadlines,
economies of scale and international benchmarking. However, post 1995; the group almost
carried the same legacy through, minus the political bouts and exploitations.
The dominant logic of the Aditya Birla group was traditionally built around: to establish
world scale plants; keep the cost of funds low; ensure high rates of capacity utilisation; and
control production costs. Political connectivity, a controlled economy, and surplus-cash
spawned the group whose network was just beginning to extend overseas when the late
chairman died. In the pre-liberalisation era, this worked wonders, but now the new chairman,
re tuned them to maintain its competitiveness. The dominant logic that guided the
consolidation strategy of the group was that the estimated return in the businesses, which
were to be divested, would not commensurate with the investments made. As the utilisation
capacities were in excess of market's size. Therefore, the group felt they would be better off
without those businesses, than carry these sick businesses in the long run. Post liberalisation
their dominant logic towards investments in new industries had become more strategic rather
than opportunistic. But they still continued to be guided by the imperfections existing in the
economy. The copper smelter project was a clear pointer in this regard.
The group under the new leadership decided to retune its dominant logic in order to maintain
its competitiveness. Context was another word the group often relied upon. If the previous
leadership ran the group differently, it was because of a different context in which he built
and managed his businesses. By the time his son took over the reins of the group, he had
realised that the context was changing. India is no longer an insular economy; tariffs are
coming down and institutional investors were coming in. It became clear that they had to
curtail the groups' exposure to a fewer industries. Therefore the group concedes that a
different context needs a radically different approach. The skills that were needed to manage
and succeed in the post-liberalisation era were different from the earlier decades. Right now,
83
the dominant logic of the Aditya Birla group has the two key ingredients that go into the
making of a global cost leader: scales and integration. A focus on world-scale capacities,
constant attention to operational efficiencies and prudent financial management - these are
the common strands that binds the wide range of business of the group.
The focus for the future: to stay in the core sector, and continuously upgrade and improve
costs and quality in existing businesses. There has been a subtle change on the strategy side
too. The group had crafted a clear-cut criterion for new diversifications. The factors: it should
be a differentiated value-added product, with substantial presence in the value-chain. It
should have strategic linkages with the group's existing businesses, indicating clear
sustainable competitive advantage. And critically, project investments needs to be evaluated
over a sustained period - not just the initial investment. The intent is to become globally
competitive. The route is again through cost leadership. The group was also thinking in terms
of value creation when his peers are only thinking big in terms of size and scale. On the other
side, having a global mind-set, including definite strengths in project identification,
implementing projects within estimated costs and schedules and continuously improving
quality and bringing dovm costs will guide future performances. In the past diversifications
were undertaken by various group companies, because at that time it was a question of who
got the license.
84
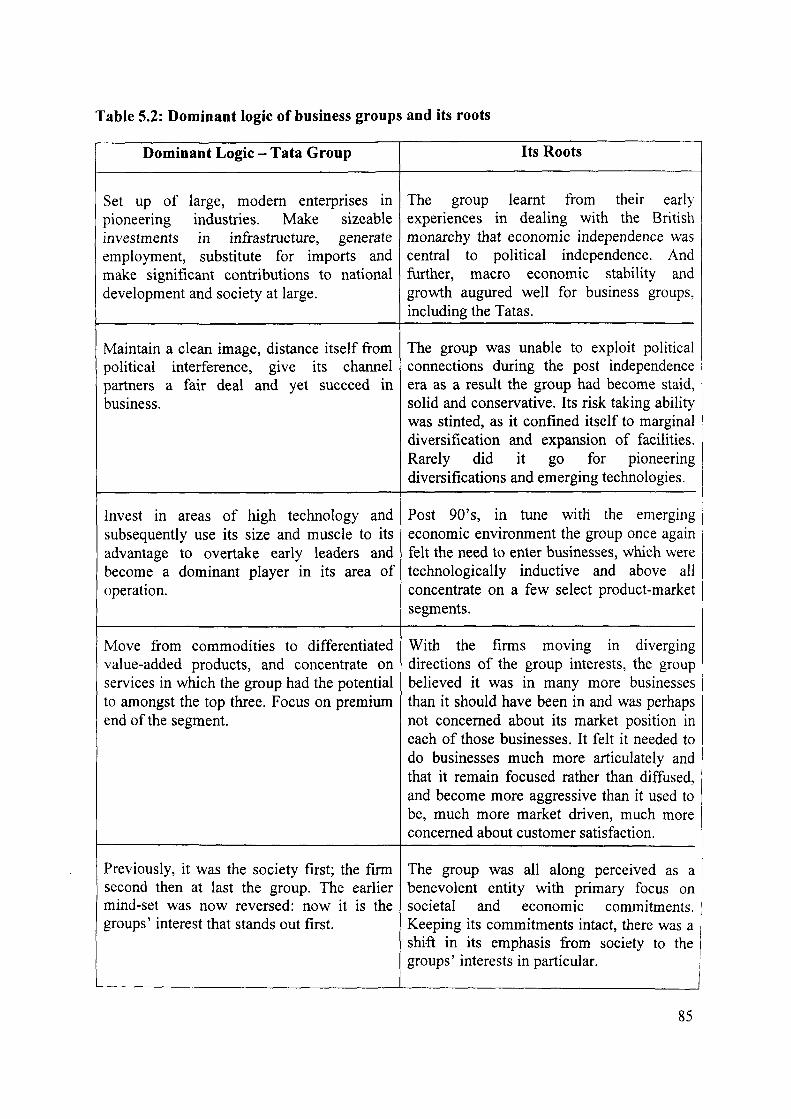
Table 5.2: Dominant logic of business groups and its roots
Dominant Logic - Tata Group
Set up of large, modem enterprises in pioneering industries. Make sizeable investments in infrastructure, generate employment, substitute for imports and make significant contributions to national development and society at large.
Maintain a clean image, distance itself from political interference, give its channel partners a fair deal and yet succeed in business.
Invest in areas of high technology and subsequently use its size and muscle to its advantage to overtake early leaders and become a dominant player in its area of operation.
Move from commodities to differentiated value-added products, and concentrate on services in which the group had the potential to amongst the top three. Focus on premium end of the segment.
Previously, it was the society first; the firm second then at last the group. The earlier mind-set was now reversed: now it is the groups' interest that stands out first.
Its Roots
The group learnt from their early experiences in dealing with the British monarchy that economic independence was central to political independence. And further, macro economic stability and growth augured well for business groups, including the Tatas.
The group was unable to exploit political connections during the post independence era as a result the group had become staid, solid and conservative. Its risk taking ability was stinted, as it confined itself to marginal diversification and expansion of facilities. Rarely did it go for pioneering diversifications and emerging technologies.
Post 90's, in tune with the emerging economic envirormient the group once again felt the need to enter businesses, which were technologically inductive and above all concentrate on a few select product-market segments.
With the firms moving in diverging directions of the group interests, the group believed it was in many more businesses than it should have been in and was perhaps not concerned about its market position in each of those businesses. It felt it needed to do businesses much more articulately and that it remain focused rather than diffused, and become more aggressive than it used to be, much more market driven, much more concerned about customer satisfaction.
The group was all along perceived as a benevolent entity with primary focus on societal and economic commitments. Keeping its commitments intact, there was a shift in its emphasis from society to the groups' interests in particular.
85
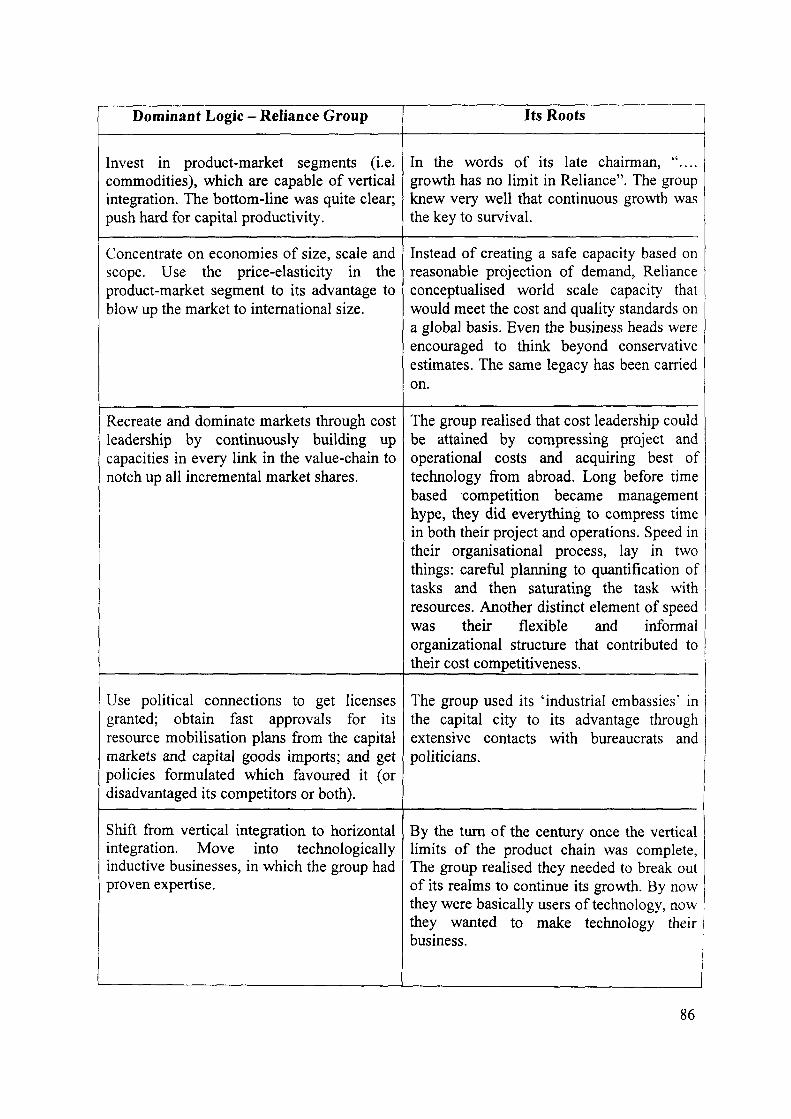
Dominant Logic - Reliance Group
Invest in product-market segments (i.e. commodities), which are capable of vertical integration. The bottom-line was quite clear; push hard for capital productivity.
Concentrate on economies of size, scale and scope. Use the price-elasticity in the product-market segment to its advantage to blow up the market to international size.
Recreate and dominate markets through cost leadership by continuously building up capacities in every link in the value-chain to notch up all incremental market shares.
Use political connections to get licenses granted; obtain fast approvals for its resource mobilisation plans from the capital markets and capital goods imports; and get policies formulated which favoured it (or disadvantaged its competitors or both).
Shift from vertical integration to horizontal integration. Move into technologically inductive businesses, in which the group had proven expertise.
Its Roots
In the words of its late chairman, ".... growth has no limit in Reliance". The group knew very well that continuous growth was the key to survival.
Instead of creating a safe capacity based on reasonable projection of demand. Reliance conceptualised world scale capacity that would meet the cost and quality standards on a global basis. Even the business heads were encouraged to think beyond conservative estimates. The same legacy has been carried on.
The group realised that cost leadership could be attained by compressing project and operational costs and acquiring best of technology from abroad. Long before time based competition became management hype, they did everything to compress time in both their project and operations. Speed in their organisational process, lay in two things: careftil planning to quantification of tasks and then saturating the task with resources. Another distinct element of speed was their flexible and informal organizational structure that contributed to their cost competitiveness.
The group used its 'industrial embassies' in the capital city to its advantage through extensive contacts with bureaucrats and politicians.
By the turn of the century once the vertical limits of the product chain was complete, The group realised they needed to break out of its realms to continue its growth. By now they were basically users of technology, now they wanted to make technology their business.
86
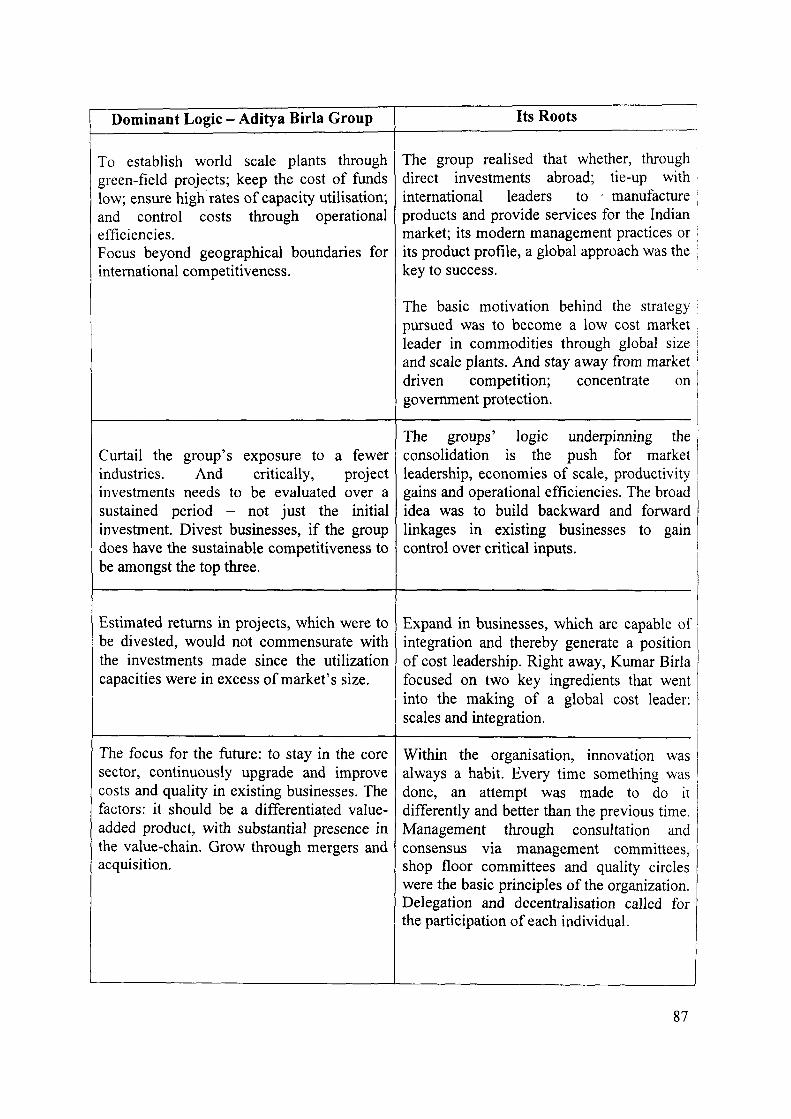
Dominant Logic - Aditya Birla Group
To establish world scale plants through green-field projects; keep the cost of funds low; ensure high rates of capacity utilisation; and control costs through operational efficiencies. Focus beyond geographical boundaries for international competitiveness.
Curtail the group's exposure to a fewer industries. And critically, project investments needs to be evaluated over a sustained period - not just the initial investment. Divest businesses, if the group does have the sustainable competitiveness to be amongst the top three.
Estimated returns in projects, which were to be divested, would not commensurate with the investments made since the utilization capacities were in excess of market's size.
The focus for the fliture: to stay in the core sector, continuously upgrade and improve costs and quality in existing businesses. The factors: it should be a differentiated value-added product, with substantial presence in the value-chain. Grow through mergers and acquisition.
Its Roots
The group realised that whether, through direct investments abroad; tie-up with international leaders to ' manufacture products and provide services for the Indian market; its modem management practices or its product profile, a global approach was the key to success.
The basic motivation behind the strategy pursued was to become a low cost market leader in commodities through global size and scale plants. And stay away from market driven competition; concentrate on government protection.
The groups' logic underpinning the consolidation is the push for market leadership, economies of scale, productivity gains and operational efficiencies. The broad idea was to build backward and forward linkages in existing businesses to gain control over critical inputs.
Expand in businesses, which are capable of integration and thereby generate a position of cost leadership. Right away, Kumar Birla focused on two key ingredients that went into the making of a global cost leader: scales and integration.
Within the organisation, irmovation was always a habit. Every time something was done, an attempt was made to do it differently and better than the previous time. Management through consultation and consensus via management committees, shop floor committees and quality circles were the basic principles of the organization. Delegation and decentralisation called for the participation of each individual.
87
5.3 Market Imperfection
Post-independence, India witnessed policies, which created a socialistic pattern of society.
Governmental regulations and control were excessive, and in many priority sectors there was
an embargo for private players. Therefore, market imperfection and economic development
almost went in opposite directions. In the subsequent periods, border wars with China in
1962 and Pakistan in 1965, backed with harvest failures, increasing trade imbalances,
political uncertainty and escalating social unrest forced the then government into taking a
series of further populist measures. This resulted in an era of increased government
regulation during the period (1965-1980). This was the period when market imperfection in
the Indian economy reached its peak.
The government began to tighten the parameters of business conduct through controls on
foreign collaboration approvals, capacity licensing, differential taxation, import tariffs and
quotas, price controls, exit blocks and approval for fund raising. These controls were largely
intended toward large Indian business groups. To deal with the governments' intensive
regulatory policies, most groups found it expedient to set up "industrial embassies" in the
capital city to deal with regulatory bureaucracy (Encamation, 1989). The intensifying
government involvement had a deleterious impact on the business environment. Over
regulation began to retard growth. Sheltered from foreign competition, domestic industries
became inefficient and the country lagged behind the rest of the world in terms of
technology.
At this stage, some business groups found it expedient to use private deals with politicians
and bureaucrats. Contribution in exchange for licenses, political donations in return for
preferential regulation and the generation of unaccounted money for sustaining this nexus
became, for some, a short-term path for success and rapid growth. In other cases, pre
empting competitors by taking multiple licenses and then not proceeding to build facilities
became a perfectly legal route for using the regulatory regime to profit from the climate of
artificial scarcity. As a result, efficiency was grievously hurt due to government's pursuit of
populist policies. Essentially, excessive government regulations fractured markets and
destroyed economies of size, scale, and scope. Indian business groups therefore became
fractured and diffused. It was during this period most business groups diversified in unrelated
88
areas. The largest and the most successful business groups tended to be run by politico-
friendly entrepreneurs.
Following a balance of payment crisis in 1991, the external debt-service ratio reached an all
time low. The then government initiated drastic reforms to liberalise the Indian economy.
Far-ranging policies began the process of delineating government control in the economy in
favour of increasingly market-based economy. Within just a few years, there was a change
away from the license regime and the mood of the old, protected mindset that had permeated
the Indian economy. Product expansion and diversification became easier, as centralised
planning ceased to operate any more. The number of industries in which only public (state
and central government) undertakings were allowed to operate was brought down from
seventeen to six. This opened up several new fast growing industries like telecom, passenger
cars, electronics, banking and financial services, mining, oil exploration and insurance to the
private sector.
Deregulation of selected industries in India started in the mid-eighties; however, it was only
in 1991 the Government of India initiated a sustained policy and targeting a series of
liberalisation measures, macro-economic reforms and structural adjustments. These reforms
had embraced major aspects of the country's economy. Under the liberalisation measures,
industrial licensing policies and policies on foreign trade had undergone major changes. In
the second category, macro-economic reforms, significant structural adjustments have been
made in the banking sector and capital markets in particular. On the overall, the liberalisation
measures were targeted towards phasing out subsidies, dismantling of erstwhile price control
mechanisms and initiating market driven pricing mechanisms, public sector restructuring and
disinvestments, and introducing an exit policy. And all these measures were broadly targeted
towards integrating the Indian economy with the global economy. It is against this backdrop
'discontinuity' had set in, posing major challenges for policy makers, academicians and
researchers, and business groups at large.
The government also divested minority shares of its state-owned enterprises (in some cases
up to 25%), most notably in steel, oil refining, air transport and mining. The reforms had a
positive effect on the growth of domestic capital market. New banking regulations were
aimed at aiding priority sectors and small firms, in effect restricting lending to the most
prominent business groups. GDR's and private equity investment became a popular route for
89
fundraising among large business groups. The government allowed higher ownership stakes
for foreigners (up to 51%) in 34 high priority sectors and reduction in the red tape, which had
earlier precluded all foreign investment. The government also encouraged foreign investment
as a way of bringing capital, technology and management practices into the country.
However, as foreign investment increased, so did anti-foreign sentiment? Coupled with it, the
Indian markets became more and more efficient as it slowly merged with the global
economy. Business groups could no longer extract benefits to sustain its business. The
"industrial embassies" founded by most Indian business groups, were slowly dismantled and
later wounded up. Groups began to focus more on their inherent resources and capabilities to
diversify, rather than lobby politicians and bureaucrats for licenses. Opportunism slowly
started giving away in favour of diversification strategies guided by principles of reality.
Governmental control slowly started giving way to the law of the "invisible hand". As a
result the Indian economy witnessed a drastic improvement in market efficiency, especially
in the first few years of liberalisation.
5.4 Industry Characteristics
When the telecom sector was opened up for the private sector sometime in 1995, separate
licenses for separate circles were issued to players waiting to operate in basic, cellular, wire
less, Internet and value-added services. At that point of time the Tata Group was prepared to
invest up to Rs. 6000 crore over the next six years. Global research and advisory firm Gartner
Inc forecasted a convergence in call tariffs of Global System for Mobile Communications
(GSM) and Code Division Multiple Access (CDMA) in 2004, even as it predicts pre-paid
services to gamer 68% of the present market-share in India. However, with industry moving
towards a unified license regime, the players can now compete in a given circle in any area
they feel comfortable; which was hitherto restricted in the earlier regime. By the turn of the
century Tatas were then contemplating investing around Rs. 20000 crore in this sector.
Therefore, characteristics of an industry can change the rules of the game; and more
importantly change the posture of the players in the industry.
Due to its high degree of vertical integration in the same product chain, the industry effects
are extremely high on the Reliance Group. Any disruption in the link may have a cascading
effect in the entire value-chain. However, given the group's entry into telecom with a
substantial investment, the downsides of industry risk would be minimised to a large extent
90
in the near fliture. The group had contemplated investments to the tune of Rs. 25000 crore
characterised by the open regime in the industry post 2000.
In the case of Aditya Birla Group commodities are no exception, long-term viabihty hinges
on the group's ability to produce it cheaply through the ups and downs of the commodity
cycle. The 30-mtpa global aluminum market is growing at around 4.5% every year. What is
more important, major activity lied in Asia. Despite China, Middle East and SE Asia already
soaking up capacities, a shortage of around 2 mtpa was in the offmg. In the case of the non-
ferrous (aluminum) industry, which is characterised by long and stable upswings had forced
the Aditya Birla Group to contemplate Rs. 16000 crore as investments in this sector, out of
the total group investments of Rs. 20000 crore. Post liberalisation therefore, changing
industry characteristics became a major force to reckon with. Some of the dramatic changes
can be summarised as follows:
• Entrepreneurial freedom released the growth impulse and altered the rules of the
game significantly. The open regime offered entrepreneurs greater freedom in the
matter of- industries to be entered, investments to be made, and raising of capital. It
became manifested through mergers, acquisitions, takeovers and amalgamations. This
was all in a bid to consolidate their business position. Above all, the industrial
scenario witnessed a diversification spree.
• The massive entry and consolidation on the part of the MNC's was another major
aspect of industrial change. With the removal of FERA restrictions majority of the
MNC's raised their stake in their Indian counterparts to 51% or more. Many other
MNC's started entering India anew, through JV's with Indian partners or through
100% subsidiaries. The strategic intent was of building a strong presence in the Indian
market. Even core sectors were not spared.
• Imports went out of government domain and became a new source of opportunity for
entrepreneurs. Entrepreneurs, who depended substantially on imports, started
handling their imports directly; bypassing the state owned canalising agencies.
International business emerged as a new entrepreneurial opportunity.
• The banking sector comes into a competitive environment. Deregulation in interest
rates led to a competition in garnering deposits. Partial privatisation of nationalised
91
banks was another major development. The industry also witnessed the emergence of
a number a private sector banks. As an offshoot financial services emerged as a major
business.
• The benefits of the industrial changes were apparent in the capital market as well. The
abolition of the CCI and the introduction of free pricing, added buoyancy to the
capital markets. More and more entrepreneurs started relying on the equity route to
finance their diversification plans. Indian firms also started raising capital from global
sources. FII investments became a new source of short-term funds. NBFC's became
another new business opportunity for many entrepreneurs.
• The ascendancy of the private sector was another milestone for the Indian economy.
Barring a few sectors, private players entered almost all core industries. The
government started promofing 100% EOU's, EPZ's, SEZ's to launch Indian
entrepreneurs into the global forefront.
5.5 Resources and Capabilities
The "Tata" brand name was a symbol of immense value. It carried an enduring image of
reliability, honesty and integrity to its customers, investors and business partners. The name
also generated immense trust. Bankers and lenders were ready to stretch their resources to
lend to the house of Tatas. This was the basic cornerstone of leverage for the Tata Group. It
had built a strong presence in almost all the major areas it operated in as well a well-founded
reputation for technological capabilities. As a result the Tata Group had successfully tied up
a number of joint ventures with foreign partners, especially in its new businesses. The
groups' size and scope also gave it an incredible financial muscle. The Tata Group was also
distinguished by its ability to repeatedly recognise, recruh, develop and support highly
talented executives. The group also gave its top management significant support and
commitment to experiment and innovate and provided a high degree of allowance for their
idiosyncrasies in order to draw out the best in them. As a result, the senior Tata management
team had become a constellation of very capable and powerful managers.
However, the Tata's lacked the skill to be flexible and vibrant in businesses where consumer
patterns and trends were changing rapidly. This was an area the group desperately needed to
build upon. As a result, speed was not one of the Tata Groups' core strength; which was
92
essential while operating in an open environment. In all its earlier diversifications the group
had built upon its projects right from the scratch. However, as an auto maker the group now
focused sharply on just one point on the value-chain that stretched between raw materials and
after sales service and assembling the parts into a complete automobile. This was the new
entity of the Tata Group, from a systems generator to systems integrator.
Here the system became the product, and the group did not involve much actual
manufacturing into the product. It bought the components, but it actually designed that
product and assembled it. The groups' transformation involves, from an integrated truck
manufacturer to an automobile integrator; from a product driven company to competence-
centric company; from an engineering-oriented operation to a strategy-fixation enterprise;
from an inward-focused company to a partnership-powered company; from a local company
to a global corporation; from an efficient organisation to a world-class organisation. For now,
the group was organising itself around capabilities and alliances, not only products. A deeper
analysis revealed how the group closed in on the resource gaps: by stretching existing
resources; by using existing resources to acquire or build new complex resources; by
concentrating and complementing existing resources. The ability to integrate and leverage a
project of international size, scale and complexity was something the Tata Group did not
possess a decade ago; but it had become a distinct reality.
The Reliance Group as a practice had continuously invested in state-of-the-art technologies.
Right from its early days it used its import entitlements that were permitted against exports,
in addition to importing raw materials, to import state-of-the-art technology for value-
addition to its existing products like nylon, rayon and polyester. In 1975, a World Bank team
that came to India to inspect the condition of textile mills here, it described Reliance's textile
plant as 'excellent' even by developed country standards. However, the most distinct ability
the Reliance Group possessed amongst its top leadership was to have the ability to foresee
industry-market trends much ahead of its industry counterparts. This stems from another
important facet of the Reliance Group, was their enormous grasp for information. This
enabled the group to recreate new markets, repeatedly, right Jfrom the scratch. This was the
distinct capability the group possessed.
Another distinct feature stemmed from their unique ability; the group was extremely vibrant,
responsive and flexible to market and customer needs. As a result it had always devised
93
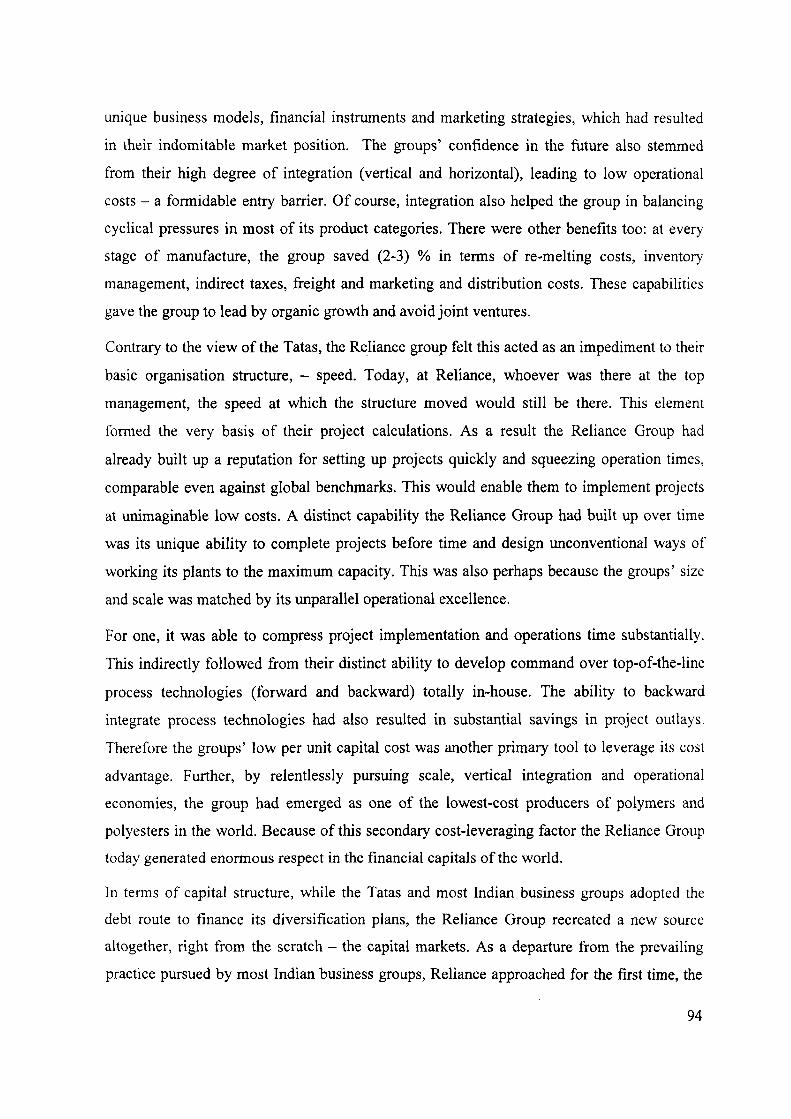
unique business models, financial instruments and marketing strategies, which had resulted
in their indomitable market position. The groups' confidence in the future also stemmed
from their high degree of integration (vertical and horizontal), leading to low operational
costs - a formidable entry barrier. Of course, integration also helped the group in balancing
cyclical pressures in most of its product categories. There were other benefits too: at every
stage of manufacture, the group saved (2-3) % in terms of re-melting costs, inventory
management, indirect taxes, freight and marketing and distribution costs. These capabilities
gave the group to lead by organic growth and avoid joint ventures.
Contrary to the view of the Tatas, the Reliance group felt this acted as an impediment to their
basic organisation structure, - speed. Today, at Reliance, whoever was there at the top
management, the speed at which the structure moved would still be there. This element
formed the very basis of their project calculations. As a result the Reliance Group had
already built up a reputation for setting up projects quickly and squeezing operation times,
comparable even against global benchmarks. This would enable them to implement projects
at unimaginable low costs. A distinct capability the Reliance Group had built up over time
was its unique ability to complete projects before time and design unconventional ways of
working its plants to the maximum capacity. This was also perhaps because the groups' size
and scale was matched by its vmparallel operational excellence.
For one, it was able to compress project implementation and operations time substantially.
This indirectly followed from their distinct ability to develop command over top-of-the-line
process technologies (forward and backward) totally in-house. The ability to backward
integrate process technologies had also resulted in substantial savings in project outlays.
Therefore the groups' low per unit capital cost was another primary tool to leverage its cost
advantage. Further, by relentlessly pursuing scale, vertical integration and operational
economies, the group had emerged as one of the lowest-cost producers of polymers and
polyesters in the world. Because of this secondary cost-leveraging factor the Reliance Group
today generated enormous respect in the financial capitals of the world.
In terms of capital structure, while the Tatas and most Indian business groups adopted the
debt route to finance its diversification plans, the Reliance Group recreated a new source
altogether, right from the scratch - the capital markets. As a departure from the prevailing
practice pursued by most Indian business groups. Reliance approached for the first time, the
94
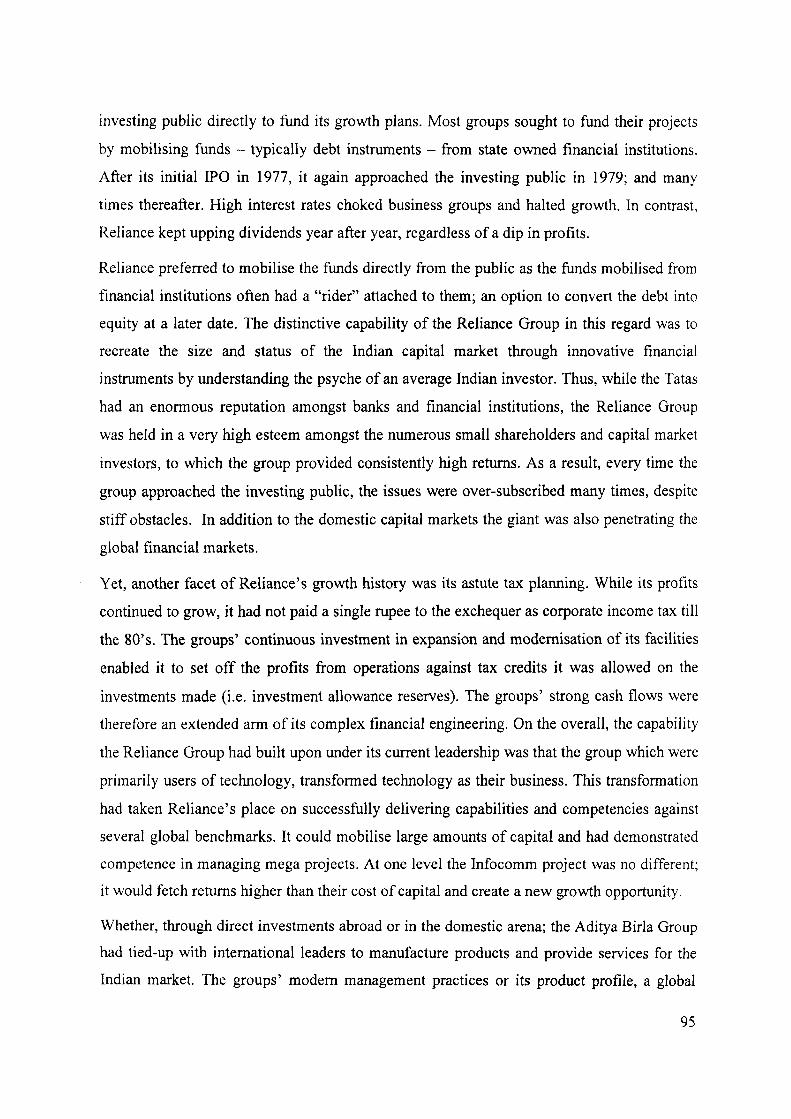
investing public directly to fund its growth plans. Most groups sought to fund their projects
by mobilising funds - typically debt instruments - from state ovsoied financial institutions.
After its initial IPO in 1977, it again approached the investing public in 1979; and many
times thereafter. High interest rates choked business groups and halted growth. In contrast,
Reliance kept upping dividends year after year, regardless of a dip in profits.
Reliance preferred to mobilise the funds directly from the public as the ftands mobilised from
financial institutions often had a "rider" attached to them; an option to convert the debt into
equity at a later date. The distinctive capability of the Reliance Group in this regard was to
recreate the size and status of the Indian capital market through innovative financial
instruments by understanding the psyche of an average Indian investor. Thus, while the Tatas
had an enormous reputation amongst banks and financial institutions, the Reliance Group
was held in a very high esteem amongst the numerous small shareholders and capital market
investors, to which the group provided consistently high returns. As a result, every time the
group approached the investing public, the issues were over-subscribed many times, despite
stiff obstacles. In addition to the domestic capital markets the giant was also penetrating the
global financial markets.
Yet, another facet of Reliance's growth history was its astute tax planning. While its profits
continued to grow, it had not paid a single rupee to the exchequer as corporate income tax till
the 80's. The groups' continuous investment in expansion and modernisation of its facilities
enabled it to set off the profits from operations against tax credits it was allowed on the
investments made (i.e. investment allowance reserves). The groups' strong cash flows were
therefore an extended arm of its complex financial engineering. On the overall, the capability
the Reliance Group had built upon under its current leadership was that the group which were
primarily users of technology, transformed technology as their business. This transformation
had taken Reliance's place on successfully delivering capabilities and competencies against
several global benchmarks. It could mobilise large amounts of capital and had demonstrated
competence in managing mega projects. At one level the Infocomm project was no different;
it would fetch returns higher than their cost of capital and create a new growth opportunity.
Whether, through direct investments abroad or in the domestic arena; the Aditya BirIa Group
had tied-up with international leaders to manufacture products and provide services for the
Indian market. The groups' modem management practices or its product profile, a global
95
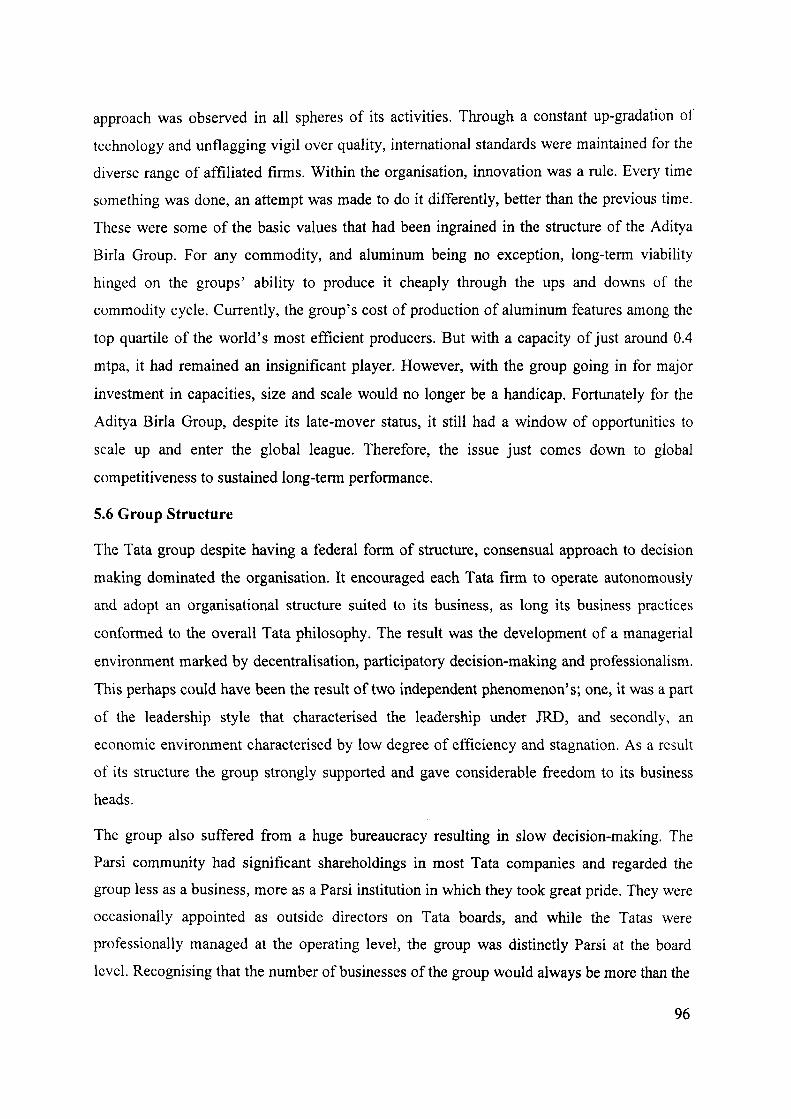
approach was observed in all spheres of its activities. Through a constant up-gradation of
technology and unflagging vigil over quality, international standards were maintained for the
diverse range of affiliated firms. Within the organisation, innovation was a rule. Every time
something was done, an attempt was made to do it differently, better than the previous time.
These were some of the basic values that had been ingrained in the structure of the Aditya
Birla Group. For any commodity, and aluminum being no exception, long-term viability
hinged on the groups' ability to produce it cheaply through the ups and downs of the
commodity cycle. Currently, the group's cost of production of aluminum features among the
top quartile of the world's most efficient producers. But with a capacity of just around 0.4
mtpa, it had remained an insignificant player. However, with the group going in for major
investment in capacities, size and scale would no longer be a handicap. Fortimately for the
Aditya Birla Group, despite its late-mover status, it still had a window of opportunities to
scale up and enter the global league. Therefore, the issue just comes down to global
competitiveness to sustained long-term performance.
5.6 Group Structure
The Tata group despite having a federal form of structure, consensual approach to decision
making dominated the organisation. It encouraged each Tata firm to operate autonomously
and adopt an organisational structure suited to its business, as long its business practices
conformed to the overall Tata philosophy. The result was the development of a managerial
environment marked by decentralisation, participatory decision-making and professionalism.
This perhaps could have been the result of two independent phenomenon's; one, it was a part
of the leadership style that characterised the leadership under JRD, and secondly, an
economic environment characterised by low degree of efficiency and stagnation. As a result
of its structure the group strongly supported and gave considerable freedom to its business
heads.
The group also suffered from a huge bureaucracy resulting in slow decision-making. The
Parsi community had significant shareholdings in most Tata companies and regarded the
group less as a business, more as a Parsi institution in which they took great pride. They were
occasionally appointed as outside directors on Tata boards, and while the Tatas were
professionally managed at the operating level, the group was distinctly Parsi at the board
level. Recognising that the number of businesses of the group would always be more than the
96
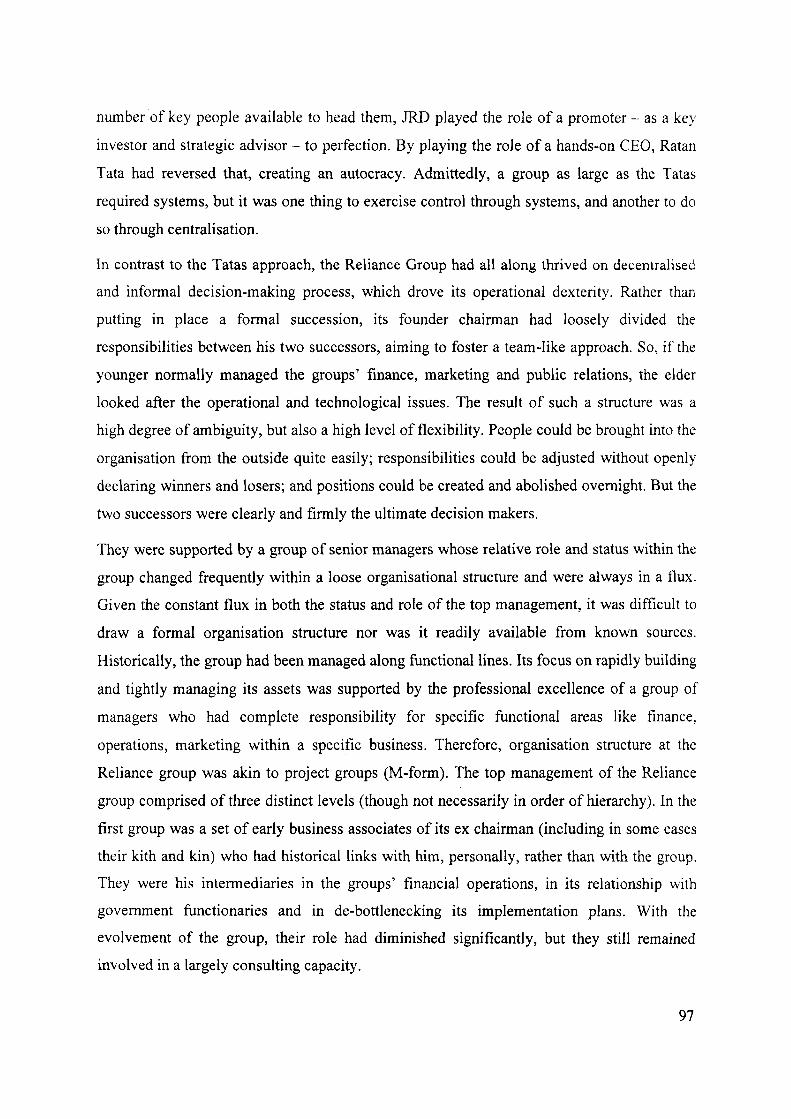
number of key people available to head them, JRD played the role of a promoter - as a key
investor and strategic advisor - to perfection. By playing the role of a hands-on CEO, Ratan
Tata had reversed that, creating an autocracy. Admittedly, a group as large as the Tatas
required systems, but it was one thing to exercise control through systems, and another to do
so through centralisation.
In contrast to the Tatas approach, the Reliance Group had all along thrived on decentralised
and informal decision-making process, which drove its operational dexterity. Rather than
putting in place a formal succession, its founder chairman had loosely divided the
responsibilities between his two successors, aiming to foster a team-like approach. So, if the
younger normally managed the groups' finance, marketing and public relations, the elder
looked after the operational and technological issues. The result of such a structure was a
high degree of ambiguity, but also a high level of flexibility. People could be brought into the
organisation from the outside quite easily; responsibilities could be adjusted without openly
declaring winners and losers; and positions could be created and abolished overnight. But the
two successors were clearly and firmly the ultimate decision makers.
They were supported by a group of senior managers whose relative role and status within the
group changed frequently within a loose organisational structure and were always in a flux.
Given the constant flux in both the status and role of the top management, it was difficult to
draw a formal organisation structure nor was it readily available from known sources.
Historically, the group had been managed along fiinctional lines. Its focus on rapidly building
and tightly managing its assets was supported by the professional excellence of a group of
managers who had complete responsibility for specific functional areas like finance,
operations, marketing within a specific business. Therefore, organisation structure at the
Reliance group was akin to project groups (M-form). The top management of the Reliance
group comprised of three disfinct levels (though not necessarily in order of hierarchy). In the
first group was a set of early business associates of its ex chairman (including in some cases
their kith and kin) who had historical links with him, personally, rather than with the group.
They were his intermediaries in the groups' financial operations, in its relationship with
government fiinctionaries and in de-bottlenecking its implementation plans. With the
evolvement of the group, their role had diminished significantly, but they still remained
involved in a largely consulting capacity.
97
In the second group, were a number of people whom the group had attracted away from very
senior positions, mostly from India's large PSU's. The fact was that the group recognised
that, in India, only PSU managers had the kind of experience in executing projects of size
and complexity that Reliance was contemplating. So the group hired the best people from
this sector and made the optimum use of their skills and experience. The plethora of new
opportunities, in turn, raised questions about Reliance's unique organisation and management
style. Historically, the different managers heading the key functions came together only at
the level of the family members at the apex of the company. While this structure worked
well, it did so at the cost of a severe overloading at the top. Another key constraint of the
existing organisation structure was the lack of teamwork and cooperation within the top
management group heading the different businesses and functions. Given the diversity of
their backgrounds, each of them had a different style and was the product of a different
culture.
The existing organisation structure provided little incentive for them to collaborate
horizontally or to build a shared culture within the businesses they managed. This resulted
out of the lack of coherence and integration at the top, as a result sharing and learning of best
practices within the group suffered. To overcome this barrier the group created a distinct
third level; a new group of professionally qualified managers were inducted to typically
assist the top management on a regular basis on strategy matters. This group had been
typically educated in some of the best technical and management schools in the US with vast
international working experience. The relative role of these three categories of managers was
always in a flux. But the primary objective was to bring in some sort of horizontal integration
in the group's HR structure. One of the options under consideration was to reshape the group
into a classic multi-divisional (M-form), structured around sectors, with each business head
reporting to a Group Executive Committee, which will be reporting to the Chairman himself
With integrated business responsibility, the business heads would be responsible for existing
businesses, freeing the top management for only strategic oversight and corporate
entrepreneurship. Such a restructuring would call for a major readjustment of the roles and
tasks of existing businesses and functional managers, together with substantial delegation of
operational responsibility from the family to them.
98
After ten years of succession, it was clear to the top management that the strength of the
Aditya Birla group lay in being a conglomerate. It did not therefore split its firms into entities
focused on a specific business. Since a young CEO headed the Aditya Birla group, its long-
term stability was almost assured. But what could be critical to the group - which will surely
include other companies in future - was the people factor. Managing a diversified
conglomerate would need managers who were professional and focused - something the
group yet lacked. At the moment, septuagenarian and octogenarian loyalists, who believe in
unconditional loyalty to the CEO, ran the group. While this may well have its advantages in
the short run, in the long nm it could be crucial. The balancing act will not be easy. On one
hand the top management had to ensure that the group's precedent oriented senior
management, collaborators and lenders perceive no crises in the Group Empire and systems.
On the other hand, the top management had to make its own path to establish its identity as
capable of leading the multi-national and multi-dimensional group into the next century. A
series of changes were evident. It began the process of contemporisation by inducting in
fresh talent at midlevels, vertically and horizontally. Management through consultation and
consensus via management committees, shop floor committees and quality circles were basic
principles of the evolving organisation structure. Delegation and decentralisation called for
the participation of each individual. Within the organisation, that is exactly what the top
management was doing: it had begun the process of what they calls institutionalising
procedures and creating a systems orientation. First came the rising sun logo - to impart, as
they put it, a feeling of identity to group companies.
Alongside was a major thrust on human resource development: The HR function was being
treated at the corporate level. They instituted a performance appraisal across the group, and a
programme for tracking and developing high potential managers, which included developing
skills, inter-unit transfers and positioning abroad. The top management had also personally
visited premier management institutes to attract entry-level talent. More critical, perhaps,
were the three new corporate cells, which had already become fimctional for about a year.
The new recruits got more autonomy. While the top management monitored daily production
at every unit, sales and cash flows, it also managed the group by giving the senior executives
greater autonomy and depending on CVA analyses and MIS. Traditionally, the group had
grown through green-field projects, though in future the group will be relying more on
acquisitions and joint ventures. However, the group plans to go by a minimum 50% stake to
99
ensure management control. Although most of group firms were cash rich, the promoter's
stake in many of them was low to moderate. That could be one reason why the group had not
tapped the capital market even once in the last few years, financing every diversification
from internal accruals and huge cash flows from its operations. Perhaps the top management
did not want to dilute the groups' shareholding levels any further.
5.7 Inertia
In the case the Tata group, because of the long history of foundation of and its tolerant
philosophy it was often found carrying businesses which had outlived its utility. While merit
was recognised and rewarded, a poor performer rarely left the organisation, resulting in the
middle management getting over burdened with survivors rather than performers. The slow
turnover of directors caused some frustration among top executives who had been waiting,
for decades in some cases, for that top position. As a result, inertia had slowly crept into its
organisational structure. Inertia is a property of matter (organisations in the instant case) by
which it remains at rest or in uniform motion in the same direction unless acted upon by
some external force.
The downside was that the while the Tatas had done well in technology-intensive areas it had
failed on the market side. There was some concern with the top management about its
inability to perform in competitive market conditions, which stemmed from its inability to
take decisions quickly. The precepts did not gear up the flexibility and dynamism of the Tata
group, required for diversifications that were marketing intensive. The group was sluggish in
some areas in the increasingly open and competitive environment. Although, in 1982, the
government had partially eased price controls in several product-market segments the group
was slow in reacting to the opportunity. In times when the economic scenario was fast
changing, organisations needed to respond appropriately and timely to capture early entry
advantages. The absence of which implied various 'hidden costs'.
However, to bring the much-required speed in the organisational decision-making process,
the group had initiated a series of structural changes and reversed its earlier policy of
decentralisation. Another significant change was to replace the age-old executives with
young generation professionals. However, the drastic changes in the business environment,
compelled the top management to restructure the group altogether, keeping in mind the pace
of economic liberalisation. However, highly diversified groups like the Tatas were slow to
100
react to the changing demand of the environment. Organisational culture rooted in
bureaucracy and regulation, top management mind-set, structure and decision-making
process retarded the process of restructuring. However, once the restructuring was almost
over by the turn of the century, the top management added a thrust to the groups'
diversification strategies once again. Having overcome the barriers of resistance, it knew, it
could implement the groups' vision as conceived earlier.
The very essence of Reliance's organisation structure had been speed. All strategic
considerations are guided by it. The organisation structure at the helm of Reliance group
resulted in a high degree of ambiguity but also accorded a high level of flexibility. People
could be brought into the organisation from the outside quite easily; responsibilities could be
adjusted without openly declaring winners and losers; and positions could be created and
abolished overnight. The top management was supported by a group of business heads whose
relative role and status within the group changed frequently within a loose organisational
structure; that was always in a flux. With the constant flux in both the status and role of the
top management, the formal organisation structure was very flaccid. Therefore, organisation
structure at the Reliance group was more akin to project groups, where a structure could be
formed when a diversification was initiated, and abandoned after delivery. This loosely
bonded organisation structure was the primary source of organisational speed, which had
enabled them to overcome the forces of inertia. Therefore, contrary to average research
opinion besides age, organisation structure was also another distinct soiirce of inertia.
Despite stiff opposition the Aditya Birla group had made sufficient headway into the second
stage of the groups' growth cycle, though much was yet to be done. Given the short time the
present chairman had taken over at the helm of the group, he had already proved himself to
be a successful change agent. This had been possible despite having a rigid organisation
structure; the high degree of centralisation empowered the group chairman to a large extent.
The high degree of autonomy enabled the top management to carry out the necessary
transformation. Within the organisation, that was exactly what the group was doing: it had
begun the process of what it calls 'institutionalising procedures' and creating a 'systems
orientation'. Alongside was a major thrust on human resource development: The group
instituted a performance appraisal system across the group, and a programme for tracking
and developing high potential managers, which included developing skills, inter-unit
101
transfers and positions abroad. More critical, perhaps, were the three new corporate cells,
which had become functional for about a year.
The first was the corporate strategy cell; which examined new investments and projects, and
evaluated national and international developments that will impact group activities. The
second cell was the project-monitoring cell; this tracked ongoing projects on a regular basis
to ensure that the same were proceeding on schedule. The third was the manufacturing
systems cell; which was expected to track and suggest improvements in quality and
productivity. And for the most important part of it, the group had hired people in the young
age group for industry specific functions. Not creating crosscurrents however, the group was
quick to point out that these project teams were meant only for the group chairman, they
were also purely a support function for the top management across the group.
5.8 Cohesiveness
It was infact a matter of pride and status to work in Tata firms, which was regarded among
highly professional and ethical organisations. Tata Steel, for instance, had a history of
constructive and innovative industrial relations. It introduced the eight-hour workday, leave
with pay, accident compensation, maternity benefits, and profit-sharing decades before its
counterparts in the US. A joint-consultative system was also set up in to ensure better
cooperation between employees and the management. To knit the group together, the Tata
Group set up Tata Administrative Services (TAS), composed of management professionals
selected by very senior Tata directors, and placed them in key middle management positions.
They could move horizontally within the group, and were primarily encouraged to develop a
vision of the Tatas as a unified group, rather than as a conglomerate of disjointed companies.
The group had a philosophy of always recruiting the brightest people and then encouraging
them to operate freely and develop independent minds. A strong centralised leadership was
perhaps the single most important driver behind the high degree of cohesiveness (i.e. degree
of bonding) of the Tata group. Cohesiveness implies the tendency among member firms to
exhibit or produce cohesion or coherence (i.e. a cohesive social unit).
However, cohesiveness witnessed a historical low within the group, almost throughout the
eighties, when there was a transition in group leadership. The new group leader was not
perceived as a favourable amongst the chairmen of various firms. Hence the early eighties
saw numerous investment companies being established by different Tata firms, with the aim
102
of carving out their own domains within the group. A number of firms began competing
against one another. Mobility across firms decHned, and each firm began evolving its own
culture and management cadre. Thus the group became just a social club, with the central
group having little legal, financial, or moral control. As a result the Tatas no longer existed as
a group entity, except in their culture and in name. The firms did not see any reason to show
allegiance to the group headquarters. It was only because of the financial institutions, which
were the major shareholders that group management was allowed in those firms.
However, post the 90's; three measures had a significant impact on the groups' cohesiveness.
First, the group conceived, proposed and implemented 'Tata Brand Equity Scheme'. Though
the participating firms later made the plan volvmtary, it brought back the long lost group
identity. Second, it also revived a much-ignored 'Tata Retirement Policy'. This paved the
way for a new generation of members to take over on the board of group headquarters. Third,
the group set up a Group Executive Office (GEO) at the group level and Business Review
Committees (BRC's) at the firm level. All diversification strategies were now to be proposed
by the BRC's and approved before the GEO in order to be implemented. These autonomous
policies brought in some degree of autonomy and in a way increased cohesiveness within the
group to a large extent. However, cohesiveness across firms was primarily restricted to
sharing of human resources.
A fascinating aspect of Reliance was its capital allocation model. Reliance had always been a
low debt group. However, if one takes a look at Reliance Infocomm the other way, it had
zero external debt. It is really like Reliance's ovra debt, Reliance as group. Therefore,
Reliance as a group had financed most of its diversifications through ploughing back of
profits, mostly from member firms. Thus while transfer of human resources within the Tata
group was the cornerstone behind its cohesiveness, financial flexibility and leverage were the
foundations within the members of the Reliance group.
Historically, the Aditya Birla group had operated independently, and exercised control only
from the headquarters, with very nominal investments and resource transfer among the
member firms. However, post liberalisation resource transfer among member firms included
HR and finance, though in a very small way. On the structure side the group was heavily
networked. All member firms freely interacted at the executive as well as board level. The
top management was highly decentralised; every profit centre had total operational freedom
103
within certain broad parameters. The concept of knowledge moving around the group was an
evolving process. The attitude was of wanting to absorb from everything surrounding the
business environment, continuously upgrading and learning.
5.9 Strategy Implementation
Prior to the 90's, major aspects of Tata group's strategy implementation were left to the
individual firms. Perhaps this was an adept strategy during the seventies when the group had
rarely gone in for any major path-breaking diversifications. However, since the eighties, and
more specifically in the nineties, most of the diversifications pursued by the group involved
the total involvement and commitment of the group at all stages of strategy implementation -
right from conceptualisation - implementation to rollout. This in a way enabled the group to
implement strategies much more efficiently and effectively. Some striking references - the
car project was successfully implemented at a cost of Rs. 1700 crore, supposedly much
below the international benchmark of roughly $3 billion (Rs. 12750 crore), within a gestation
of 31 months much against an industry average of 48 months with a steady 20% market
share, which was created from the scratch, speaks volumes.
In case of Reliance's strategy implementation, careful plans to quantification of tasks and
saturating the tasks with resources formed the very basis of its strategy implementation. They
put in all their resources that the task could absorb, without resources tripping over each
other. If time were not a constraining factor, they would have optimised. But given their
tremendous opportunity cost of lost production, it almost did not matter how much it costs
because, if they could get the production going earlier, they would always come out ahead.
Only when the group puts the value of time in the equation did they get sound economics and
then saturation almost always makes sense, as always has been in the case of Reliance.
Reliance today has delivered a project of international size and complexity all alone, without
any joint venture or technological tie-ups. Some striking references - the telecom projected
was successfiilly executed on a total outlay of $ 5 billion, against an intemafional benchmark
of around $ (18-20) billion; within a gestation of around 24 months; capital recovery and
break-even within 12 months. Having already delivered it. Reliance is now concentrating on
delivering its capabilities in strategy implementation in newer areas. However, in the case of
the Aditya Birla Group, we did not observe any unique distinctive capabilities in
implementing its diversification plans.
104
5.10 Strategic Fit
In the case of Tata group, the following traditional businesses: steel, chemicals, automobiles,
and cement had a very 'high' strategic fit with its dominant logic. In all these businesses the
group had made sizeable investments in infrastructure, was labour intensive, substituted for
imports and made significant contributions to economic development. They were also in core
industries, which involved a high gestation. When these businesses were set up in the early
parts of the century, they were indeed large modern enterprises in pioneering industries.
In the second set of businesses we have: energy, tea and hotels, which had a 'medium', fit
with its dominant logic. The energy business had a high strategic fit with all dominant logics"
mentioned above, except for one. Even in the post-independence era, energy was one area,
which was heavily controlled by the state. And that meant for every strategic decision, the
group had to approach the bureaucracy for permission and approval. Critical success factor
for this business therefore meant using political connections to get licenses granted; obtain
fast approvals for its resource mobilization plans and get policies formulated in its favour.
However, this was one area the group was not accustomed to and always avoided. In case of
its tea business, divergence was caused because sizeable investment in infrastructure was
lacking, and therefore did not have a very high gestation. While hotels had a more service
component than manufacturing, which the group was not accustomed to.
In the last set of businesses we have: pharmaceuticals, paints, electricals that had a 'low', fit
with its dominant logic. Primarily, none of these businesses were in the core-manufacturing
sector, while some had a strong service component. Therefore changing customer tastes and
preferences was a major force to be reckoned with. And this is one area; the group was not
quite familiar with, as its structure was consistent with bureaucracy and slow decision
making. These businesses received a set back since they had a major deviation with all its
dominant logics'.
There were some transition businesses as well (i.e. businesses in which the degree of fit
changed during the sample time-frame). They are primarily: hotels, telecom, information
technology, and automobiles. In the first three cases the fit improved, while only in the last
case there was deterioration. In the case of its hotel business, the strategic fit improved
because it was consistent with the evolving dominant logics' in which differentiated products
and services had a higher component. The same logic applies to information technology as
105
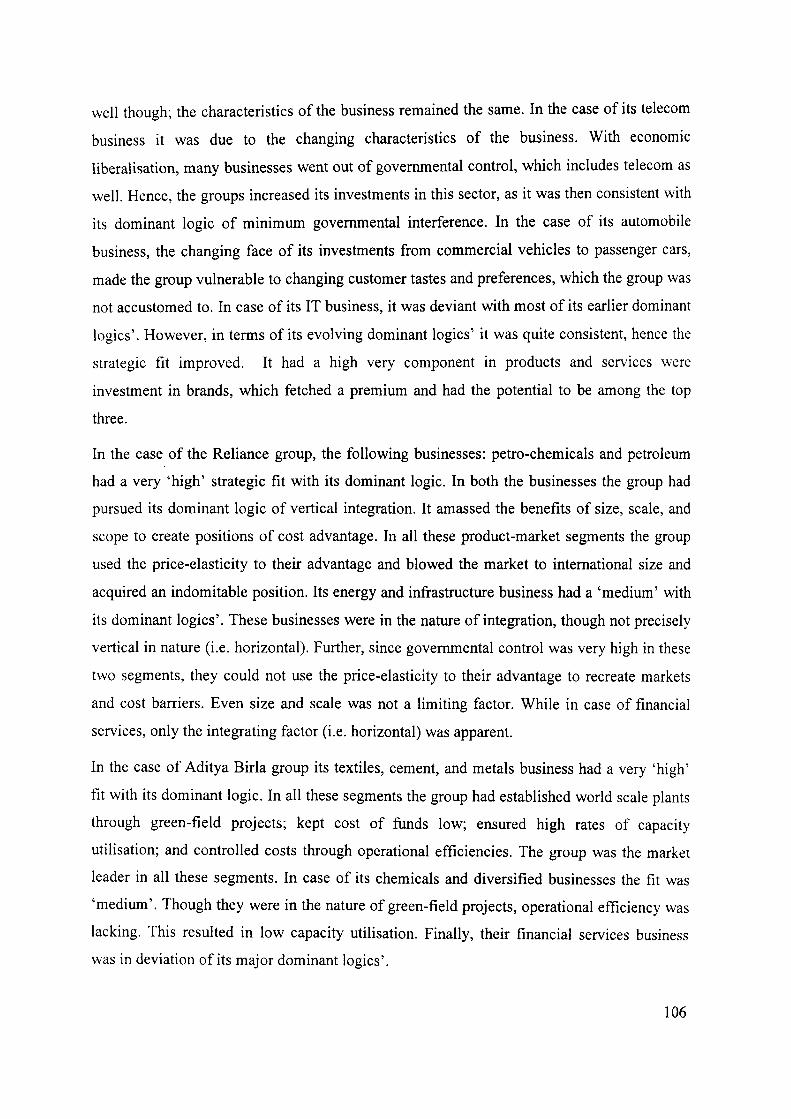
well though; the characteristics of the business remained the same. In the case of its telecom
business it was due to the changing characteristics of the business. With economic
liberalisation, many businesses went out of governmental control, which includes telecom as
well. Hence, the groups increased its investments in this sector, as it was then consistent with
its dominant logic of minimum governmental interference. In the case of its automobile
business, the changing face of its investments from commercial vehicles to passenger cars,
made the group vulnerable to changing customer tastes and preferences, which the group was
not accustomed to. In case of its IT business, it was deviant with most of its earlier dominant
logics'. However, in terms of its evolving dominant logics' it was quite consistent, hence the
strategic fit improved. It had a high very component in products and services were
investment in brands, which fetched a premium and had the potential to be among the top
three.
In the case of the Reliance group, the following businesses: petro-chemicals and petroleum
had a very 'high' strategic fit with its dominant logic. In both the businesses the group had
pursued its dominant logic of vertical integration. It amassed the benefits of size, scale, and
scope to create positions of cost advantage. In all these product-market segments the group
used the price-elasticity to their advantage and blowed the market to international size and
acquired an indomitable position. Its energy and infi-astructure business had a 'medium' with
its dominant logics'. These businesses were in the nature of integration, though not precisely
vertical in nature (i.e. horizontal). Further, since governmental control was very high in these
two segments, they could not use the price-elasticity to their advantage to recreate markets
and cost barriers. Even size and scale was not a limiting factor. While in case of financial
services, only the integrating factor (i.e. horizontal) was apparent.
In the case of Aditya Birla group its texfiles, cement, and metals business had a very 'high'
fit with its dominant logic. In all these segments the group had established world scale plants
through green-field projects; kept cost of fimds low; ensured high rates of capacity
utilisation; and controlled costs through operational efficiencies. The group was the market
leader in all these segments. In case of its chemicals and diversified businesses the fit was
'medium'. Though they were in the nature of green-field projects, operational efficiency was
lacking. This resulted in low capacity utilisation. Finally, their financial services business
was in deviation of its major dominant logics'.
106
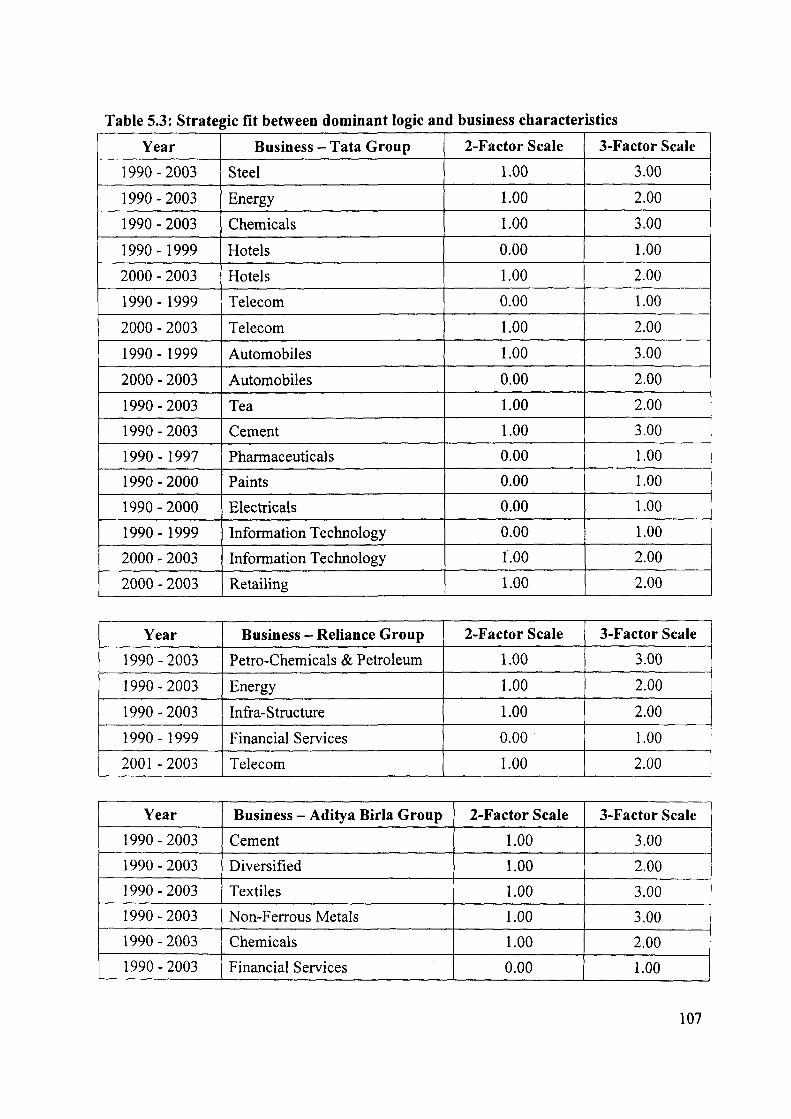
Table 5.3: Strategic fit between dominant logic and business characteristics
Year
1990-2003
1990-2003
1990-2003
1990-1999
2000 - 2003
1990-1999
2000 - 2003
1990-1999
2000 - 2003
1990-2003
1990-2003
1990-1997
1990-2000
1990-2000
1990-1999
2000 - 2003
2000 - 2003
Year
1990-2003
1990-2003
1990 - 2003
1990-1999
2001 - 2003
Year
1990-2003
1990-2003
1990-2003
1990-2003
1990 - 2003
1990-2003
Business - Tata Group
Steel
Energy
Chemicals
Hotels
Hotels
Telecom
Telecom
Automobiles
Automobiles
Tea
Cement
Pharmaceuticals
Paints
Electricals
Information Technology
Information Technology
Retailing
2-Factor Scale
1.00
1.00
1.00
0.00
1.00
0.00
1.00
1.00
0.00
1.00
1.00
0.00
0.00
0.00
0.00
1.00
1.00
Business - Reliance Group
Petro-Chemicals & Petroleum
Energy
Infra-Structure
Financial Services
Telecom
2-Factor Scale
1.00
1.00
1.00
0.00
1.00
Business - Aditya Birla Group
Cement
Diversified
Textiles
Non-Ferrous Metals
Chemicals
Financial Services
2-Factor Scale
1.00
1.00
1.00
1.00
1.00
0.00
3-Factor Scale
3.00
2.00
3.00
1.00
2.00
1.00
2.00
3.00
2.00
2.00
3.00
1.00
1.00
1.00
1.00
2.00
2.00
3-Factor Scale
3.00
2.00
2.00
1.00
2.00
3-Factor Scale
3.00
2.00
3.00
3.00
2.00
1.00
107
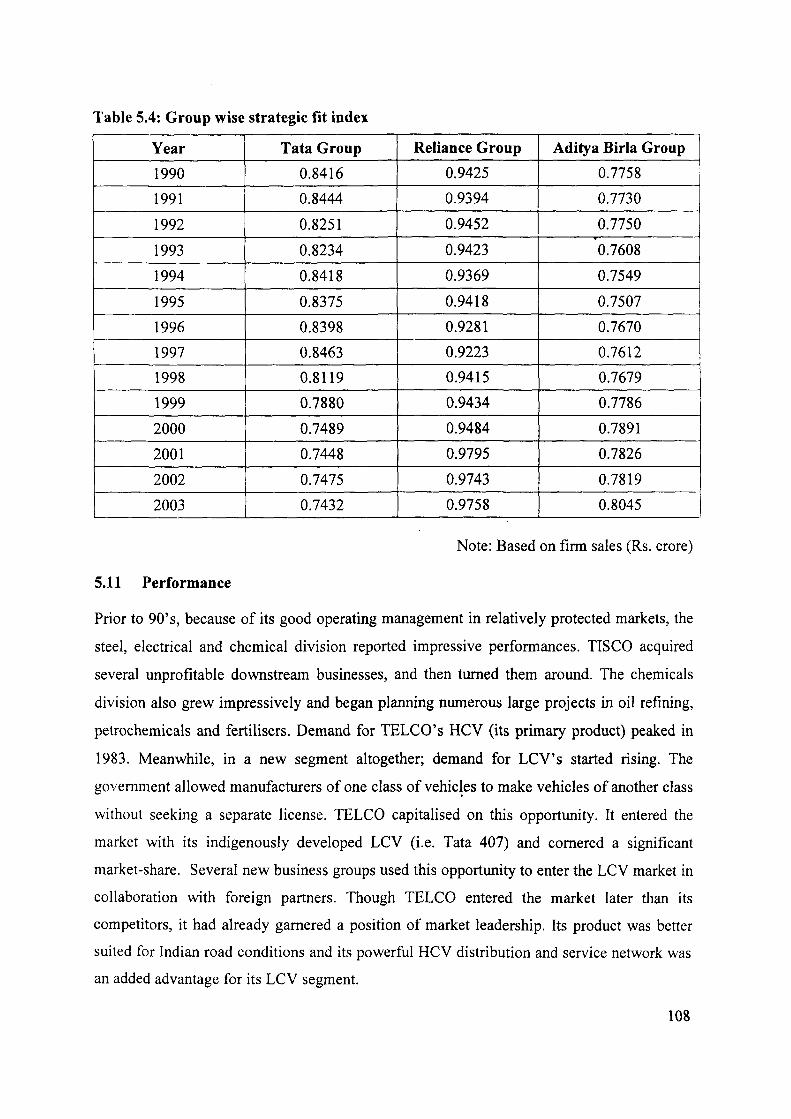
Table 5.4: Group wise
Year
1990
1991
1992
1993
1994
1995
1996
1997
1998
1999
2000
2001
2002
2003
strategic fit index
Tata Group
0.8416
0.8444
0.8251
0.8234
0.8418
0.8375
0.8398
0.8463
0.8119
0.7880
0.7489
0.7448
0.7475
0.7432
Reliance Group
0.9425
0.9394
0.9452
0.9423
0.9369
0.9418
0.9281
0.9223
0.9415
0.9434
0.9484
0.9795
0.9743
0.9758
Aditya Birla Group
0.7758
0.7730
0.7750
0.7608
0.7549
0.7507
0.7670
0.7612
0.7679
0.7786
0.7891
0.7826
0.7819
0.8045
Note: Based on firm sales (Rs. crore)
5.11 Performance
Prior to 90's, because of its good operating management in relatively protected markets, the
steel, electrical and chemical division reported impressive performances. TISCO acquired
several unprofitable downstream businesses, and then turned them around. The chemicals
division also grew impressively and began planning numerous large projects in oil refining,
petrochemicals and fertilisers. Demand for TELCO's HCV (its primary product) peaked in
1983. Meanwhile, in a new segment altogether; demand for LCV's started rising. The
government allowed manufacturers of one class of vehicles to make vehicles of another class
without seeking a separate license. TELCO capitalised on this opportunity. It entered the
market with its indigenously developed LCV (i.e. Tata 407) and cornered a significant
market-share. Several new business groups used this opportunity to enter the LCV market in
collaboration with foreign partners. Though TELCO entered the market later than its
competitors, it had already garnered a position of market leadership. Its product was better
suited for Indian road conditions and its powerful HCV distribution and service network was
an added advantage for its LCV segment.
108
As a result, in the medium to long term, TELCO's LCV sale was more than the sales of all
the new companies combined. The central group also experienced a spectacular growth. Tata
Industries spawned several new businesses. Titan Industries promoted to manufacture
watches, shook an industry dominated by a government PSU. Tata Unisys and TCS
dominated the rapidly growing IT industry. Indian Hotels spawned several new projects in
India and abroad. On the other hand, the continued poor performance and bleak prospects of
the textiles business forced the Tatas to, in effect; implement the recommendations of the
1983 Strategic Plan by trying to exit from that industry'. The Tatas filed for liquidation of one
company and closed down operations of a second. Post 1990, after hibernating for about two
decades the Tatas were once again initiating gigantic diversification projects in accordance
with its 1990 Strategic Plan. Brand business fetched about a fifth of sales and profits in 1990;
today they account for half of the revenues and 58% of net profits. The fact that one-third of
the portfolio had been reviewed and restructured implied that the Tata group had done it.
From an initial investment of Rs. 15000 (less than $2000) in 1958 to start a trading house,
followed by the setting up of a tiny manufacturing facility in 1966, the Reliance group has
managed to set up a synthetic yam, textiles and petrochemicals empire with a market
capitalisation in excess of Rs. 80 billion (about $2.7 billion) in 1994; and was the only
entrant in Business Week's listing of the 50 largest companies headquartered in developing
countries. In India, Reliance was the largest non-government company by almost every
measure including sales, profits, net worth and asset base. Between 1977, when the group
first went public and 1993, the groups' turnover had increased from Rs. 1.2 billion to Rs.
41.06 billion, operating profit from Rs. 150 million to Rs. 8.81 billion, net profit from Rs. 25
million to Rs. 3.22 billion, net worth from Rs. 140 million to Rs. 26.13 billion and asset base
from Rs. 310 million to Rs. 46.41 billion. To fund this staggering growth the group had
mobilised over Rs. 30 billion from the Indian public increasing its shareholder base from
58000 in 1977 to over 3.7 million in 1993.
Its earnings growth is, however, more re-assuring, averaging over 20 % during the same
period. In terms of operating margins the figure increased from 8.84% in 1990 to 15.55% in
1996, only to decline to 8.06% in 2003. Its historical peak of 15.55% in 1996 is perhaps a
sort of record, when compared to its closest competitor Indo Rama Synthetics in the same
year at 0.15%. This had been primarily possible because of its focus on vertical and
109
horizontal integration, which had manifested in this enormous cost leadership. The
shareholders value in terms of market capitalisation increased from Rs. 1044.54 crore in
1990 to a historical peak of Rs. 69037.23 crore in 2001, only to consolidate its position to Rs.
44324.87 crore in 2003. The steady rise in the groups' market capitalisation despite market
volatility makes one thing is very clear - Reliance is averse to market risk. As a result of
Reliance's demand creation activities, it achieved a 100% capacity utilisation for most of its
products, while most of its competitors struggled to achieve 50%. The group also commands
a staggering market share of around 50% in most of the product-market segments in which it
operates. However, with the Reliance Infocomm (a wholly owned subsidiary of Reliance
Industries) holding enormous market power, the fiature is full of opportunities.
By relentlessly pursuing scale, size and efficiency, the Aditya Birla group has emerged today
as the biggest player in most its businesses today. The groups' turnover today spans Rs.
27000 crore with a geographical presence in 18 countries and an employee base of 0.72 lacs.
It is the largest producer of cement in India; it controls 45% of the aluminum and 40% of the
copper markets; it is the market leader in insulators, VSF, yams and carbon black. For the
Aditya Birla group the move in commodities was towards value-added products: previously
at Hindalco, 50% of the total production was in the form of base metals, while the rest was in
value-added products. By the turn of the century 75% of its sales have come from value-
added products. Marketing is being geared up towards brands that can command a premium.
As a result, diverse as its activities are, the group affiliates are dominant players in each of
the business segments they operate in.
Grasim was in the forefront in developing new-generation specialty, high performance fibres.
It had also developed a solvent spinning process for manufacturing cellulose fibre. The
company is also working on manufacturing cellulosic thermoplastic polymer, which can be
converted into fibre/filament by melt spirming techniques. It had developed new processes to
produce rayon grade pulp from bamboo, eucalyptus and mixed hard woods. It was a leading
supplier of technology and machinery related to the production of man-made fibres. It
possessed some strong premium brands and has received prestigious awards in the areas of
productivity and TPM. Hindalco was among the world's most effective producers of
aluminum. It had received several national awards for exports and energy consumption. To
keep ahead of the market, Hindalco was moving ahead towards even higher value-added
110
products. It had implemented a modernisation and expansion programme, with technology
sourced from Reynolds International Inc, US. The company's Renusagar power plant had
consistently achieved a plant load factor of over 95%. Grasim also accounted for about 9% of
the global production of VSF.
Indian Rayon was a branded leader in white cement category. Its hi-tech carbon plant was the
first unit in India to introduce high temperature technology for manufacturing carbon black.
It also pioneered the recovery of waste heat and the use of waste gases to generate power.
The seawater magnesia plant at Visakhapatnam produces refractory grade magnesia from
seawater. Indo-Gulf s Jagdishpur plant was one of the most energy efficient ammonia/urea
plants in the country. It was also the first to introduce gas-based fertiliser plant in the private
sector. Its urea brand Shaktiman had become the market leader. It was also setting up a
copper smelter complex at Dahej in Gujarat. The smelter with a capacity of 1.5 lacs tpa was
perhaps the only plant in India to have the flexibility to use a wide range of copper
concentrates. Indian Rayon was also the second largest textile manufacturer in the countr>
today.
Managalore Refineries and Petrochemicals (MRPL) incorporated the latest hydro-cracker
technology to convert heavy fractions to high value distillates. MRPL had sourced process
technologies from three leading companies: Universal Oil Processes, US; Kinetic
Technology, US; Shell, Netherlands. Its capacity had been recently enhanced from 3 mtpa to
9 mtpa. It was also the first joint sector refinery in India. The newly formed joint venture
Birla AT&T was all set to revolutionise the communication scenario in the country. Birla
Global Finance had already made a foray in a wide range of financial services. It had tied up
with Capital Group, US to launch to distinctive mutual funds in the Indian market. It had also
tied up with Merlin Partners, UK for dealing in investment banking acfivities globally.
Currently, nearly 80% of the group's turnover comes from its textiles business (including
PSF and PFY), cement, carbon black, aluminum and fertiliser. In all these businesses the
group faced little or no threat from local or global competition, even as tariff barriers were
falling. In carbon black, despite the tariff barriers being reduced from 179%) in 1991 to 30%
in 1998, the group had fended off import threats successfully and kept hs bottom-lines
healthy. Beyond the geographical boundaries, the group's affiliates in Thailand - Thai
Carbon Black and Alexandria Carbon Black, together produced 1.2 lakh tpa of carbon black;
111
making them the largest producer in SE Asia. Besides it had built plants in Indonesia,
Malaysia, Philippines and Egypt and its products were exported to US, UK, France, Italy and
Japan.
The share is likely to go up in the future because stringent norms discourage new capacities
in the developed world. These industry specific problems, like environmental pollution,
makes imports a dwindling threat to the group. As such the landed price of VSF and most of
its products are far higher than its domestic prices. A healthy annual growth in demand at
around 8%, fortifies the group's market position. As for cement, domestic capacity pre-empts
imports, however increasing threat is from global players like La Farge, which have strong
resource position. In aluminxrai, the prices are linked to the London Metal Exchange, but
Hindalco's low freight cost makes it more attractive for local users. Businesses like paper
have became sick, with import duties being slashed from 140% in 1991 to 20% in 1998.
112
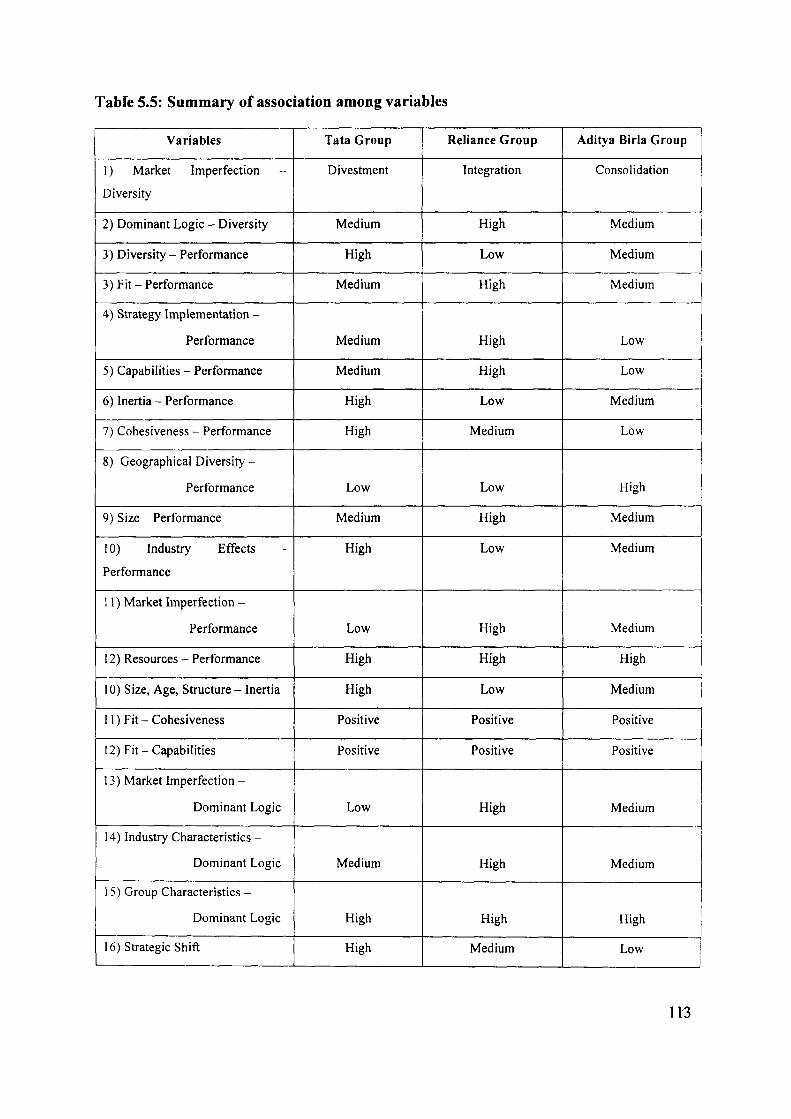
Table 5.5: Summary of association among variables
Variables
1) Market Imperfection -
Diversity
2) Dominant Logic - Diversity
3) Diversity - Performance
3) Fit-Performance
4) Strategy Implementation -
Performance
5) Capabilities - Performance
6) Inertia - Performance
7) Cohesiveness - Performance
8) Geographical Diversity -
Performance
9) Size - Performance
10) Industry Effects
Performance
11) Market Imperfection -
Performance
12) Resources - Performance
10) Size, Age, Structure - Inertia
11) Fit - Cohesiveness
12) Fit- Capabilities
13) Market Imperfection -
Dominant Logic
14) Industry Characteristics -
Dominant Logic
15) Group Characteristics -
Dominant Logic
16) Strategic Shift
Tata Group
Divestment
Medium
High
Medium
Medium
Medium
High
High
Low
Medium
High
Low
High
High
Positive
Positive
Low
Medium
High
High
Reliance Group
Integration
High
Low
High
High
High
Low
Medium
Low
High
Low
High
High
Low
Positive
Positive
High
High
High
Medium
Aditya Biria Group
Consolidation
Medium
Medium
Medium
Low
Low
Medium
Low
High
Medium
Medium
Medium
High
Medium
Positive
Positive
Medium
Medium
High
Low
113
CHAPTER 6
Hypotheses Development
In this chapter we present meaningful bivariate and multivariate relationships surrounding
the variables identified during the course of our research, which have been highlighted in
chapter 3 and 5. Our understanding of the case studies went in a large way in developing the
hypotheses. Through these hypotheses we attempt to seek answers to the research questions
posed in our research problem.
6.1 Dominant logic and business portfolio
Strategic frames are the mental models that shape how the top management view and
interpret its competitive landscape. These frames stores and reflect the groups' way of doing
things. These frames also provide focus, allowing top managers to identify critical pieces of
information and recognise how new data fits into a broader pattern (Sull, 2004). While
frames enable managers to see, they also blind them. By continuously focusing on the same
dimensions of business, frames can also constrict the vision of the top management, blinding
them to novel opportunities and threats beyond their normal periphery of business (Barton,
1992). These frames are what we refer to as a groups' dominant logic. Typically, the
dominant logic of a business group tends to be influenced by its core business; which was
historical basis of its formation.
Within its core business, the critical success factors therefore become ingrained in the minds
of the top management. These heuristic principles became more and more reinforced and
prominent from the result of doing right things with respect to its core business (Prahalad and
Bettis, 1986). These cumulative experiences therefore reflect how the top management views
the internal and external economic environment surrounding it. Hence, whenever the top
management of a business group is faced with the decision of diversifying into a new
business, they rely not on the basis of some ideal strategy or optimising procedure, but on the
basis of experience or what worked before (Prahalad and Bettis, 1995). When dealing with
such uncertain and complex tasks, the top management often rely on a limited set of heuristic
principles, which greatly simplifies the decision making process (Prahalad and Bettis, 1995).
Historically, the Tata groups' business portfolio was heavily tilted towards core
manufacturing: automobiles, textiles, steel, energy, cement, and chemicals. All these
114
diversifications went close in hand with the groups' dominant logic. Their basic frame of
mind was to implement the setting up of large and modem enterprises in pioneering
industries. These were projects, which required sizeable investments in infrastructure,
involved long gestations and made significant contributions to economic development
through import substitution. They were convinced that all round prosperity augured well for
business groups in general. This was the legacy the group carried till the pre-independence
stage. Post independence, the approach was to maintain a clean image; distances itself from
political interference, and to give its business partners a fair deal and yet succeed in business.
In contrast, during the entire 60's and 70's majority of the business groups had set up
"industrial embassies" in the capital city to extract mileage through political coimections. But
this was in contradiction to the philosophy the Tatas pursued. Hence, during this period the
group maintained status quo, followed by only marginal expansions and diversifications. Post
the 90's, the group started believing that it was carrying a large nimiber of sick businesses,
and in majority of these businesses, industry profitability had become stagnant. Therefore to
maintain the groups' leadership, it needed to enter emerging industries once again. As a
result, the group once again started making fresh diversification moves, this time in emerging
technologies: passenger cars, telecom, insurance, IT, and retailing.
Since the inception of the Reliance group, the mindset of the group was always to invest in
emerging product-market segments, which are capable of vertical integration. They went
about establishing huge capacities conforming to global standards, and building up positions
of cost advantage though capital productivity at every link in the value-chain. Finally, use
price-elasticity to its advantage to blow up the market to international size and scale and
dominate markets ahead of competition. The group knew very well that if it could control the
value-chain, the market would be under their control. Thus at each and every stage they
moved one step backward, and also simultaneously expanding existing capacities to attain a
position of indomitable superiority.
However, the vertical product chain of the group was almost complete with the end of the
80's. Therefore, to further their cost advantage they decided to move from vertical to
horizontal integration. Thus the group diversified into: financial services, media and
advertising, infrastructure, ports and power. Though these diversifications seemed distinctly
unrelated in terms nature, they were in the nature of horizontal integrations and the linkages
115
though not apparent were quite distinct. The broad objective behind these diversifications
was to provide parallel feedstock to its existing businesses. Once the horizontal chain was
coming to an end, the group decided to enter businesses where they can capitalise on their
expertise gained through managing complex in-house technologies. It is at this point; the
group launched its telecom business. The telecom business was the only project, which
seemed for the first time that the group had totally bypassed its earlier legacy. But still there
was an insular linkage, though not tacitly expressed. The Reliance groups till then were
basically users of technology; the only deviation was that now they were implementing
technology it in terms of business.
The legacy of Aditya Birla group was traditionally built aroimd: establishing world scale
plants; keeping the cost of funds low; ensuring high rates of capacity utilisation; and
controlling costs. Political connectivity, a closely controlled economy, and surplus funds
networked a conglomerate whose reach extended beyond the geographical boimdaries of the
coimtry. A focus on world-scale capacities, constant attention to operational efficiencies and
prudent financial management - these were the common fi-ames that binded the wide range
of businesses of the group. With this mind-set the group diversified from trading in cotton,
silver, sugar, jute and forged ahead in key industries such as textiles, fertilisers, chemicals,
sponge-iron, cement, refineries, carbon black, aluminium, financial services and software.
With the onset of the 90's, the group realised that not a single diversification plan showed
clear sign competitive or leadership edge. The focus for the future: to stay in the core sector,
and continuously upgrade and improve costs and quality in existing businesses. The group
had crafted a clear-cut criterion for new diversifications. The factors: it should be a
differentiated value-added product, with a substantial presence in the value-chain. It should
also have strategic linkages with the group's existing businesses, indicating clear sustainable
competitive advantage. And critically, project investments needed to be evaluated over a
sustained period - not just the initial investment. The intent was to become globally
competitive. The route is again through cost leadership.
The group was also talking of value creation when its peers were only thinking big in terms
of size and scale. Overburdened with businesses in distant comers of the world, post
liberalisation the group divested certain businesses and started consolidating its position in
existing businesses. The reason: new businesses, for the time being, were therefore restricted
116
to the ones already in the making - telecom, power and refineries. The group restructuring
also witnessed a paradigm shift in investments from textiles, fibre, yam, and cement to non-
ferrous metals. Clearly, the top management has now chosen to make a strategic shift. The
next few years will mark a critical point within the group. In the past, the group was simply
focused on extracting value rather than focus on growth. They typically chose to add capacity
in small chunks or acquire healthy, but relatively small businesses. Again the groups' focus
is, making its presence felt in the international markets.
Though these various businesses seem distinct in terms of industry count (SIC), nevertheless
there existed a common bond in terms of their dominant logic. Thus the top management of a
diversified group should not be viewed as a faceless abstraction, but as a collection of key
individuals (i.e. a dominant coalition) who have significant influence on the way a firm is
managed (Prahalad and Bettis, 1986). These collections of individuals, to a large extent,
influence the style and process of management and as a result the key resource allocation
choices (Donaldson and Lorsch, 1983). Kiesler and Sproul (1982: 557) advocates that
managers operated on mental representations of the world and those representations are
likely to be of historical environments rather than of current ones. Hence it is proposed that -
Hypothesis 1: The choice of portfolio of businesses of a diversified business
group is shaped by the dominant logic of the top management.
6.2 Business portfolio and performance
In the late 60's the Boston Consulting Group (BCG) offered a new way to look at strategic
planning activities (Henderson, 1970, 1973). In essence, the BCG approach views the firm as
a portfolio of businesses, each one offering a unique contribution to growth and profitabilit>'
(Hax and Majluf, 1983). These largely independent units have strategic directions, which are
addressed separately. In order to visualise the relative role played by each business unit, BCG
developed the growth-share matrix. The growth-share matrix was helpfiil in three ways. First,
it offered a powerful display of the strengths of the businesses in the groups' portfolio.
Second, it identified the capacity of each business to generate cash and also reveal its
requirement for cash; thus assists in balancing the groups' cash flow. And third, it reflected
the distinct characteristics of each business unit; it could also suggest strategic directions for
each business, thus influencing overall performance (Hax and Majluf, 1983).
117
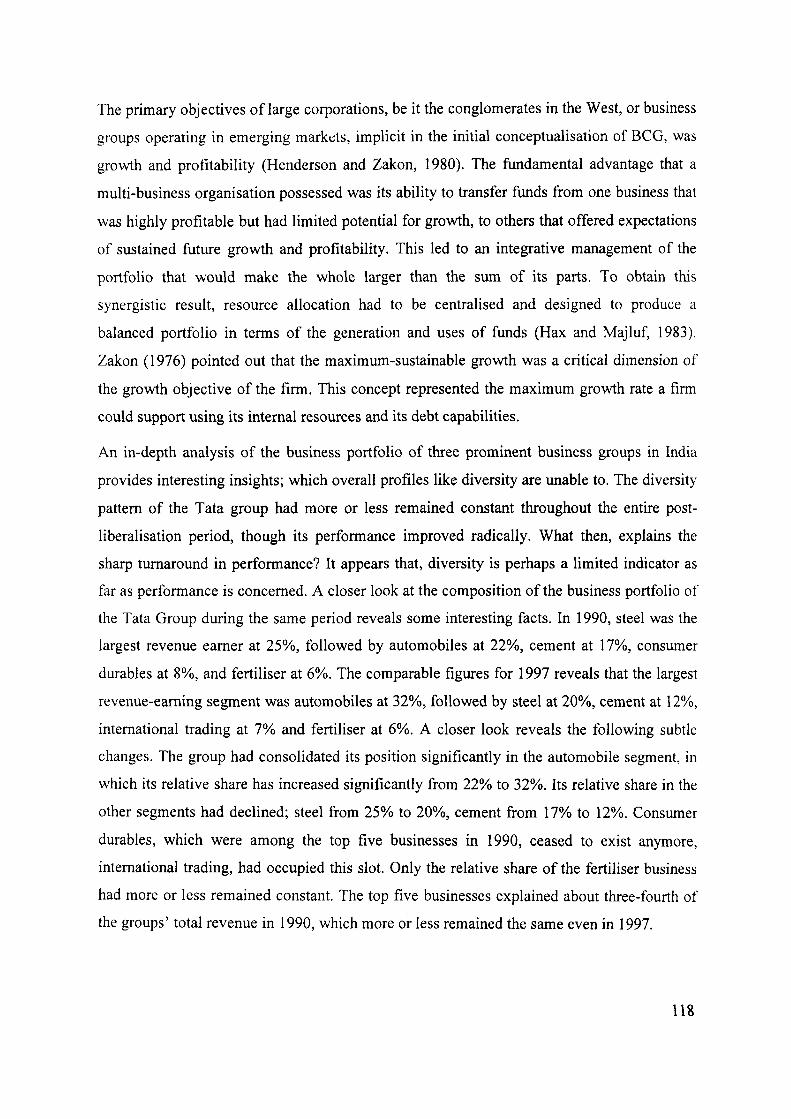
The primary objectives of large corporations, be it the conglomerates in the West, or business
groups operating in emerging markets, implicit in the initial conceptualisation of BCG, was
growth and profitability (Henderson and Zakon, 1980). The fundamental advantage that a
multi-business organisation possessed was its ability to transfer funds from one business that
was highly profitable but had limited potential for growth, to others that offered expectations
of sustained future growth and profitability. This led to an integrative management of the
portfolio that would make the whole larger than the sum of its parts. To obtain this
synergistic result, resource allocation had to be centralised and designed to produce a
balanced portfolio in terms of the generation and uses of ftinds (Hax and Majluf, 1983).
Zakon (1976) pointed out that the maximum-sustainable growth was a critical dimension of
the growth objective of the firm. This concept represented the maximum growth rate a firm
could support using its internal resources and its debt capabilities.
An in-depth analysis of the business portfolio of three prominent business groups in India
provides interesting insights; which overall profiles like diversity are unable to. The diversity
pattern of the Tata group had more or less remained constant throughout the entire post-
liberalisation period, though its performance improved radically. What then, explains the
sharp turnaround in performance? It appears that, diversity is perhaps a limited indicator as
far as performance is concerned. A closer look at the composition of the business portfolio of
the Tata Group during the same period reveals some interesting facts. In 1990, steel was the
largest revenue earner at 25%, followed by automobiles at 22%, cement at 17%, consumer
durables at 8%, and fertiliser at 6%. The comparable figures for 1997 reveals that the largest
revenue-earning segment was automobiles at 32%, followed by steel at 20%, cement at 12%,
international trading at 7% and fertiliser at 6%. A closer look reveals the following subtle
changes. The group had consolidated its position significantly in the automobile segment, in
which its relative share has increased significantly from 22% to 32%. Its relative share in the
other segments had declined; steel from 25% to 20%, cement fi-om 17% to 12%. Consumer
durables, which were among the top five businesses in 1990, ceased to exist anymore,
international trading, had occupied this slot. Only the relative share of the fertiliser business
had more or less remained constant. The top five businesses explained about three-fourth of
the groups' total revenue in 1990, which more or less remained the same even in 1997.
118
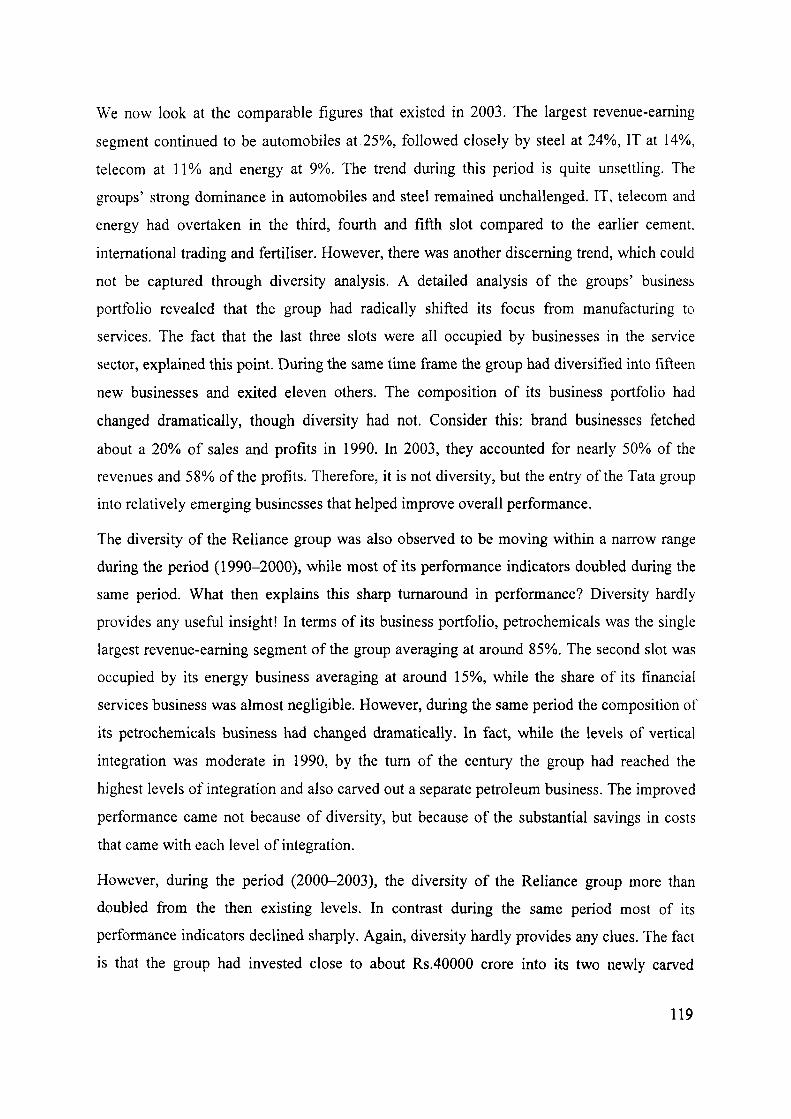
We now look at the comparable figures that existed in 2003. The largest revenue-earning
segment continued to be automobiles at 25%, followed closely by steel at 24%, IT at 14%,
telecom at 11% and energy at 9%. The trend during this period is quite unsettling. The
groups' strong dominance in automobiles and steel remained unchallenged. IT, telecom and
energy had overtaken in the third, fourth and fifth slot compared to the earlier cement,
international trading and fertiliser. However, there was another discerning trend, which could
not be captured through diversity analysis. A detailed analysis of the groups' business
portfolio revealed that the group had radically shifted its focus from manufacturing to
services. The fact that the last three slots were all occupied by businesses in the service
sector, explained this point. During the same time frame the group had diversified into fifteen
new businesses and exited eleven others. The composition of its business portfolio had
changed dramatically, though diversity had not. Consider this: brand businesses fetched
about a 20% of sales and profits in 1990. In 2003, they accounted for nearly 50% of the
revenues and 58%) of the profits. Therefore, it is not diversity, but the entry of the Tata group
into relatively emerging businesses that helped improve overall performance.
The diversity of the Reliance group was also observed to be moving within a narrow range
during the period (1990-2000), while most of its performance indicators doubled during the
same period. What then explains this sharp turnaround in performance? Diversity hardly
provides any useful insight! In terms of its business portfolio, petrochemicals was the single
largest revenue-earning segment of the group averaging at around 85%). The second slot was
occupied by its energy business averaging at around 15%, while the share of its financial
services business was almost negligible. However, during the same period the composition of
its petrochemicals business had changed dramatically. In fact, while the levels of vertical
integration was moderate in 1990, by the turn of the century the group had reached the
highest levels of integration and also carved out a separate petroleum business. The improved
performance came not because of diversity, but because of the substantial savings in costs
that came with each level of integration.
However, during the period (2000-2003), the diversity of the Reliance group more than
doubled from the then existing levels. In contrast during the same period most of its
performance indicators declined sharply. Again, diversity hardly provides any clues. The fact
is that the group had invested close to about Rs.40000 crore into its two newly carved
119
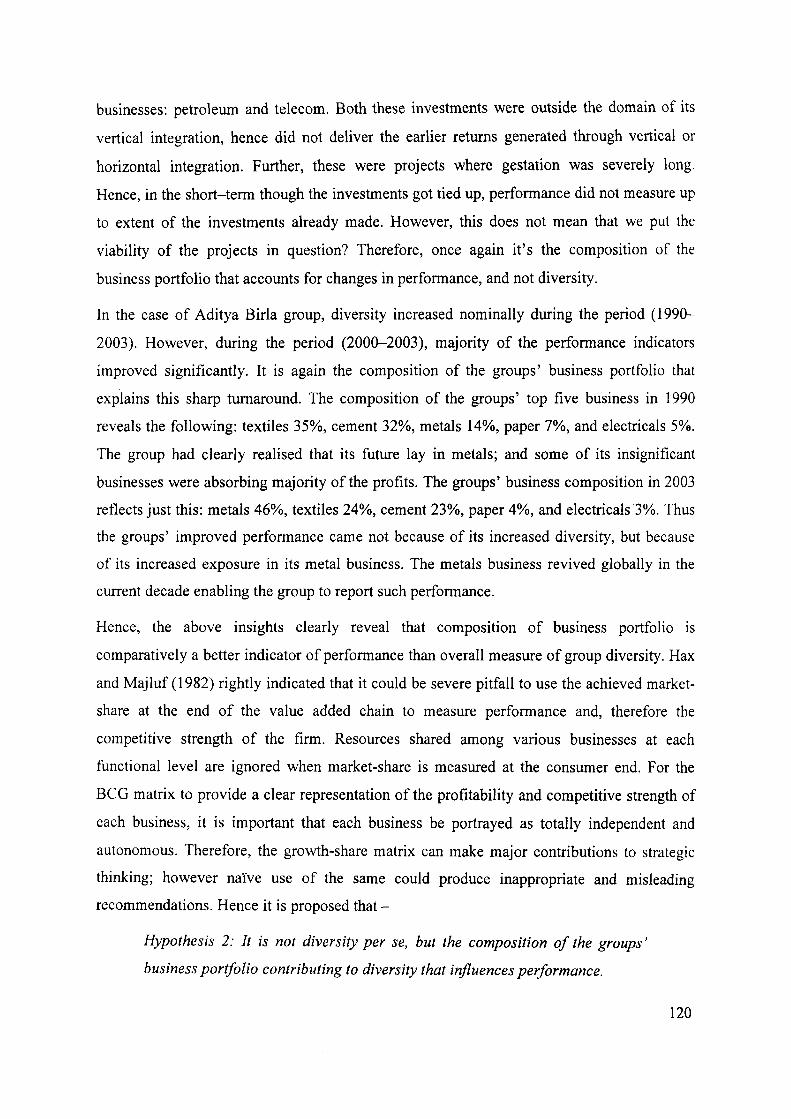
businesses: petrolevun and telecom. Both these investments were outside the domain of its
vertical integration, hence did not deliver the earlier returns generated through vertical or
horizontal integration. Further, these were projects where gestation was severely long.
Hence, in the short-term though the investments got tied up, performance did not measure up
to extent of the investments already made. However, this does not mean that we put the
viability of the projects in question? Therefore, once again it's the composition of the
business portfolio that accounts for changes in performance, and not diversity.
In the case of Aditya Birla group, diversity increased nominally during the period (1990-
2003). However, during the period (2000-2003), majority of the performance indicators
improved significantly. It is again the composition of the groups' business portfolio that
explains this sharp turnaround. The composition of the groups' top five business in 1990
reveals the following: textiles 35%, cement 32%, metals 14%, paper 7%, and electricals 5%.
The group had clearly realised that its future lay in metals; and some of its insignificant
businesses were absorbing majority of the profits. The groups' business composition in 2003
reflects just this: metals 46%, textiles 24%, cement 23%, paper 4%, and electricals 3%. Thus
the groups' improved performance came not because of its increased diversity, but because
of its increased exposure in its metal business. The metals business revived globally in the
current decade enabling the group to report such performance.
Hence, the above insights clearly reveal that composition of business portfolio is
comparatively a better indicator of performance than overall measure of group diversity. Hax
and Majluf (1982) rightly indicated that it could be severe pitfall to use the achieved market-
share at the end of the value added chain to measure performance and, therefore the
competitive strength of the firm. Resources shared among various businesses at each
functional level are ignored when market-share is measured at the consumer end. For the
BCG matrix to provide a clear representation of the profitability and competitive strength of
each business, it is important that each business be portrayed as totally independent and
autonomous. Therefore, the growth-share matrix can make major contributions to strategic
thinking; however naive use of the same could produce inappropriate and misleading
recommendations. Hence it is proposed that -
Hypothesis 2: It is not diversity per se, but the composition of the groups'
business portfolio contributing to diversity that influences performance.
120
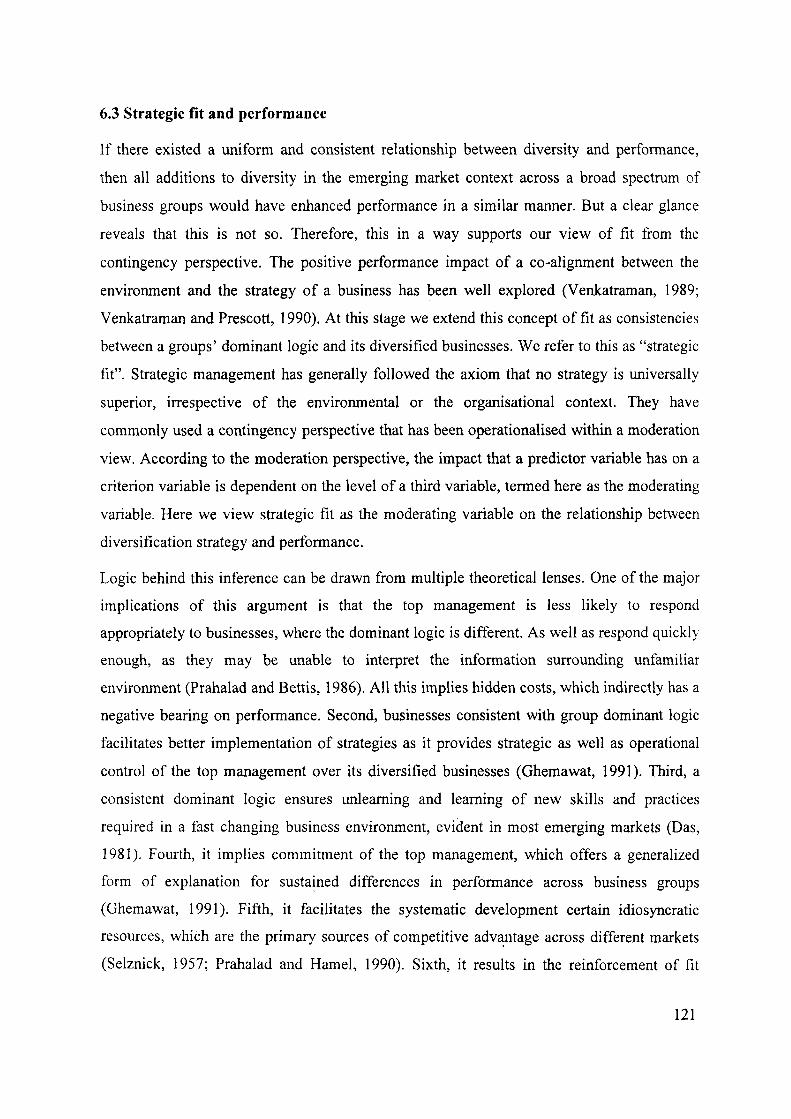
6.3 Strategic fit and performance
If there existed a uniform and consistent relationship between diversity and performance,
then all additions to diversity in the emerging market context across a broad spectrum of
business groups would have enhanced performance in a similar manner. But a clear glance
reveals that this is not so. Therefore, this in a way supports our view of fit from the
contingency perspective. The positive performance impact of a co-alignment between the
environment and the strategy of a business has been well explored (Venkatraman, 1989;
Venkatraman and Prescott, 1990). At this stage we extend this concept of fit as consistencies
between a groups' dominant logic and its diversified businesses. We refer to this as "strategic
fit". Strategic management has generally followed the axiom that no strategy is universally
superior, irrespective of the environmental or the organisational context. They have
commonly used a contingency perspective that has been operationalised within a moderation
view. According to the moderation perspective, the impact that a predictor variable has on a
criterion variable is dependent on the level of a third variable, termed here as the moderating
variable. Here we view strategic fit as the moderating variable on the relationship between
diversification strategy and performance.
Logic behind this inference can be drawn from multiple theoretical lenses. One of the major
implications of this argument is that the top management is less likely to respond
appropriately to businesses, where the dominant logic is different. As well as respond quickly
enough, as they may be unable to interpret the information surrounding unfamiliar
environment (Prahalad and Bettis, 1986). All this implies hidden costs, which indirectly has a
negative bearing on performance. Second, businesses consistent with group dominant logic
facilitates better implementation of strategies as it provides strategic as well as operational
control of the top management over its diversified businesses (Ghemawat, 1991). Third, a
consistent dominant logic ensures unlearning and learning of new skills and practices
required in a fast changing business environment, evident in most emerging markets (Das,
1981). Fourth, it implies commitment of the top management, which offers a generalized
form of explanation for sustained differences in performance across business groups
(Ghemawat, 1991). Fifth, it facilitates the systematic development certain idiosyncratic
resources, which are the primary sources of competitive advantage across different markets
(Selznick, 1957; Prahalad and Hamel, 1990). Sixth, it results in the reinforcement of fit
121
among its entire system of activities. This fit leads to a sustainable competitive advantage
and is far more superior to fit based on resources (Porter, 1986).
In the case of Tata group, the businesses, which had a high fit with, the dominant logic of the
top management includes: steel, cement, and chemicals. There were also some transition
businesses, which included: automobiles and information technology. In the case of Reliance
group, the businesses, which had a high fit with, the dominant logic of the top management
includes: petro-chemicals and petroleum. While, in the case of Aditya Birla group, the
businesses, which had a high, fit with the dominant logic of the top management includes:
cement, textiles and metals. We measured the industry-adjusted performance of these
individual businesses on three counts over a time frame of thirteen years. The industry-
adjusted performance was measured by subtracting the industry average fi-om the firm value
(Shrader, 2001). In all the above cases, the businesses outperformed the industry in most of
the cases. In the case of transition businesses, the businesses outperformed the industry for
the cases in which the fit was consistent with the dominant logic. However, performance of
the business was found to be deviating when the fit was inconsistent with the dominant logic.
In the case of Tata group, the businesses, which has a low fit with, the dominant logic of the
top management includes: pharmaceuticals, paints, and electricals. For the case of Reliance
group, the businesses, which has a low fit with, the dominant logic of the top management
includes: energy and financial services. While, in the case of Aditya Birla group, the
businesses, which has a low, fit with the dominant logic of the top management includes:
chemicals and financial services. In the following cases performance was found to be
lacking, and industry outperformed the businesses in most of the cases. These were
businesses in which resource commitment of the group was lacking; slow in strategic
decision making; comparafively less innovative; and did not possess any distinctive
capabilities, which ultimately resulted in poor performance. Overall group performance in
terms of CAGR is also consistent-with group fit index. The average fit of the Tata group
stood at 0.81, Aditya Birla group at 0.77, and Reliance group at 0.95. While the CAGR of the
Tata and Aditya Birla group were observed to be respectively 13.69%, while in the case of
Reliance Group it was significantly higher 31.81%. Thus, performance of the group was
clearly dominating, where majority of the businesses fit with dominant logic.
122
Diversification strategies within a business group, therefore, makes sense to the extent that
parent creates sufficient value for the firm to compete with other intermediaries. That occurs
when parent's skills and resources fit well with the needs and opportunities of the businesses.
Thus while a high fit can create value; a low one can destroy it (Campbell et al., 1995). In
situations where the fit is deviating, firms are coming to understand that it is often easier to
change the portfolio to fit the group, than to change the group to fit the business (Campbell et
al., 1995). Therefore, at this stage, it is viewed that firm performance is best maximised when
the firm business matches with the majority of the groups' dominant logic's. In contrast,
group performance is best maximised when majority of the firm businesses matches with the
dominant logic of the group. Any profile deviation will have a deteriorating effect on
performance (Venkatraman, 1989). Hence it is proposed that -
Hypothesis 3A: The greater the extent of fit of an individual business, within
the portfolio of businesses, with the dominant logic of the top management,
higher is the likelihood of better firm performance.
Hypothesis 3B: The greater the number of individual business, within the
portfolio of businesses, which fit with the dominant logic of the top
management, higher is the likelihood of better group performance.
6.4 Environment and dominant logic
Typically, the dominant logic in a diversified firm tends to be influenced by its largest
business or its "core business"; which was the historical basis for the groups' formation
(Prahalad and Bettis, 1986). The characteristics of the core business tend to cause managers
to define problems in certain ways and develop familiarity with, and the facility in the use of,
those administrative tools that are particularly useful in accomplishing the critical tasks of the
core business (Prahalad and Bettis, 1986). In the pre-liberalisation period politically friendly
entrepreneurs controlled the largest and most successful modem business groups in most
emerging markets.
A study even emphasised that industrial embassies were maintained by large business
groups, ostensibly for the group companies to interface with the regulatory apparatus
(Encarnation, 1989). Ir some cases, charges were levied that groups secured licenses;
obtained fast approvals for its resource mobilisation plans from the capital markets and
123
capital goods imports; and got policies formulated which favoured it (or disadvantaged its
competitors or both). Most business groups found it expedient to establish contacts with
powerful politicians and bureaucrats and offer donations in exchange for licenses, illegal
political contributions in return for preferential regulation and the generation of unaccounted
money for sustaining this nexus became, for some, the recipe for quick success and rapid
growth (Bardhan, 1997). Some glaring observations -
In June 1986, the GOI banned the conversion of NCD portion of debentures into equity of
Reliance group hours before the board of directors were to meet to recommend conversion of
the NCD portion of its E and F series into equity. The ban followed allegations in the press
that many state owned banks had funded investment firms belonging to the Reliance group
huge sums of money in violation of the prevailing lending norms enabling them to acquire
large quantities of E and F series debentures months before the board meeting. In response,
the group got sanctioned Rs. 5 billion offer of fully convertible debentures (G series), which
was over-subscribed by over seven times. Subsequently, there was also a show cause notice
from the Customs authorities, alleging import and installation of additional machines
unauthorised and also alleging misdeclaration of more than twice the declared capacity. The
authorities' alleged differential duty together with penalty estimated at Rs. 1190 million.
However, the group contested the claim and got a preferential ruling issued in its favour. In
July 1986, the GOI imposed a Customs levy (anti-dumping duty) on the import of PFY
around the same time when Reliance Groups PFY plant was being commissioned. The
government action was triggered by the by the accusation that while being publicly justified
as protection to domestic producers from low imports, the duty actually enabled the domestic
producers - Reliance in particular - to generate windfall profits. A series of favourable
government decisions followed that began to turn the tide of the groups' fortune since early
1987: imports of PSF was canalised through a state agency thus preventing direct import by
end users; a special Customs levy Rs. 3 per kg on PTA (which-Reliance was still importing)
was abolished; the groups' Patalganga complex was granted the status of a refinery, thus
enabling it to lower level of domestic excise duties for raw materials like naphtha; and the
group was permitted to prepone the conversion of G series debentures into equity, which
resulted in an estimated saving of about Rs. 330 million in interest costs. All these facts
points to the fact that the extent of market imperfection in an economy is a predominant
factor shaping the dominant logic of business groups.
124
However, post liberalisation the groups' entry into power, the first major divergence from its
vertical chain, was perhaps initiated from the groups underlying strength in implementing
complex technologies. The group could foresee a terrifying deficit of the order of 50000 MW
power in the economy. Recognising the need for massive investments to improve both the
size, and the quality of the power sector, the GOI had offered a very exciting scheme for
attracting private companies. It will provide exchange rate protection; guarantee a 16% return
on equity, all calculated on a plant load factor significantly below what the group believed to
be achievable. The Reliance group already had the experience of running its own 100 MW
captive power plants at Patalganga and Hazira. They were among the most sophisticated and
best run power plants in the country, which were routinely operated at 95%(+) capacity. The
group also had proven its ability to mobilise large amounts capital and have demonstrated
competence in managing mega projects. Thus the group, which was basically users of
technology, was now diversifying into areas where technology was their business.
Besides power, similar one-time opportunities were also available in various other emerging
areas; telecom being one of them. This time again the major criteria that went behind their
telecom diversification were that the group had the inherent strength and the capability to
implement such complex technologies. At their Jamnagar unit, while setting up their refinery,
they had used a lot of technology - communication, systems and infrastructure. The
movement happened in phases. The group was among the earliest to have implemented giga
bit Ethernet capacity and video conferencing. So again in the midst of the technology boom,
the group, which had exposure in using technology, were basically diversifying into areas
where they could leverage similar technologies as their business.
Similarly, the telecom and automobile diversifications of the Tata group were based on the
relative merits of the project. The institutional voids in the economy had little role to play
behind such diversification strategies. When the telecom sector was opened up for the private
sector in 1995, separate licenses were issued for separate circles to players wanting to operate
in basic, cellular, wire-less, Internet and value-added services. At that point of time the Tata
group was prepared to invest up to Rs. 6000 crore over the next six years. Global research
and advisory firm Gartner Inc forecasted a convergence in call tariffs of GSM and CDMA in
2004, even as it predicts pre-paid services to gamer 68% of the present market-share in India.
However, with industry moving towards a unified license regime, the players can now
125
compete in a given circle in any area they feel comfortable; which was hitherto restricted in
the earlier regime. With the onset of the 90's the Tatas were then contemplating investing
around Rs. 20000 crore in this sector. Therefore, characteristics of an industry can change the
rules of the game; and more importantly change the posture of the players in the industry.
In the case of Aditya Birla group commodities were no exception, long-term viability hinged
on the group's ability to produce it cheaply through the ups and downs of the commodity
cycle. The 30-mtpa global aluminium market was growing at around 4.5% every year. What
was more important, Asia was the hub of major activity. Despite China, Middle East and SE
Asia already soaking up capacities, a shortage of around 2 mtpa was in the offing. In the case
of the non-ferrous (aluminium) industry, which was characterised by long and stable
upswings had forced the Aditya Birla group to contemplate Rs. 16000 crore as investments in
this sector, of the total group investments of Rs. 20000 crore. Post liberalisation therefore,
changing industry characteristics became a major force to reckon with. So at this stage it is
quite clear that industry and group characteristics are also critical factors, responsible for
shaping the dominant logic of business groups. However, our insights suggest that perhaps
market imperfection was pre-dominant in shaping dominant logic of business groups prior to
economic liberalization. However, post-economic liberalization industry and group
characteristics are pre-dominant in shaping dominant logic of business groups. This is,
however, a conjecture that awaits further analysis. Hence it is proposed that -
Hypothesis 4: Dominant logic of the top management is shaped by
characteristics of its core business, industry characteristics, together with the
extent of market imperfection in an economy.
6.5 Economic liberalisation and market imperfection
During the last two or three decades a number of coimtries around the world have undertaken
economic reforms of varying magnitude to liberalise and globalise their economies. The term
"industrialising countries" was first applied to a few fast-growing countries in Asia and Latin
America in the early 1980's. Because of the widespread liberalisation and adoption of
various market-based policies by many developing coimtries, the term 'industrialising
countries' was then replaced by the broader term 'emerging market' (Arnold and Quelch,
1998). An emerging market can be defined as a country that safisfies two criteria: a rapid
pace of economic development and government policies favouring economic liberalisation
126
and the adoption of a free-market system. The International Monetary Finance (IFC)
currently identifies fifty-one such rapid-growth developing countries in Asia, Latin America,
Africa, and the Middle East as emerging markets. To these fast-followers the European Bank
for Reconstruction and Development (EBRD) adds thirteen transition economies in this
classification (Hoskisson et al., 2000).
Most researchers tend to define emerging markets in terms of size, growth, or how recently it
has opened up to the global economy. In contrast, Khanna and Palepu (1997) viewed
diversified groups as responses to market failure. The authors put forth three sources of
market failure, which characterises most emerging markets. They are informational
problems, misguided regulations, and inefficient judicial systems. Political economy
considerations generally suppress the likelihood of information flowing freely and
intermediaries gradually emerging in an economy. This led Khanna and Palepu (2000) to
conclude that economic liberalisation will be characterised by a gradual emergence of
intermediaries and a reduction in ambient transaction costs. Stated equivalently, there will be
a rise in threshold level of group diversification above which groups have an incentive to
invest in creating an internal intermediation system. This is perhaps an indication of the fact
that group effects might have diminished since markets became more efficient and groups'
ability to create value by circumventing market efficiency may have subsided.
In July 1991 Government of India (GOI) initiated a sustained policy and administrative
reforms, popularly known as economic liberalisation. Deregulation of selected industries
started in the mid eighties. However, it was only since July, 1991 GOI started implementing
a large number of policies and administrative reforms such as delicensing of industrial
investment, trade reforms entailing gradual reduction of import duties and promotion of
exports. Public Sector Units (PSU) disinvestment, encouraging Foreign Direct Investment
(FDI), exchange rate reforms, capital market reforms including free pricing of equity and
access to off-shore equity and debt, financial sector reforms to ensure capital adequacy and
establishment of private sector reforms (Ray, 2000). These reforms were collectively known
as economic liberalisation. They had embraced almost all aspects of the country's economy.
We shall now look at some of the sectors in detail and its impact on transaction costs. Our
broad objective is to assess how economic liberalisation fills up the institutional voids in the
economy and increase market efficiency. These policies can be broadly classified under two
127
distinct categories: (i) liberalisation measures (ii) macro-economic reforms and structural
adjustments.
In terms of economic liberalisation, delicensing of several industries had been the most
important measure initiated under the New Industrial Policy (NIP). In the new set up,
business groups were needed only to file an information memorandum with the government
on their new projects, expansions or diversifications. A new broad-banding facility has also
been introduced, giving more flexibility of operations to industries. Moreover, powerful
bureaucratic structures like the Directorate General for Technical Development (DGTD) and
the office of Chief Controller of Imports and Exports (CCI&E) had been abolished as a part
of the process of liberalisation. As a result of the above, exports and imports increased fi-om
Rs.16612 mln and Rs.21219 mln in 1990 to Rs.52856 mln and Rs.60313 mln in 2003.
Deposits of scheduled commercial banks and sanctions by financial institutions and banks
increased from Rs.l735 bin and Rs.l44 bin in 1990 to Rs.l3118 bin and Rs.l69 bin in 2003,
with an intermediary high of Rs. 1013 bin in 2000. The NIP being a policy specifically aimed
at attracting FDI, had introduced many changes in the Foreign Exchange Regulation Act
(FERA), which had incorporated a plethora of controls on firms whose foreign equity
exceeded 40%. With subsequent modifications, many of the inhibiting conditions governing
foreign investment were removed. Automatic clearance for foreign equity up to 51% for new
firms had been allowed in thirty-four high priority industries. This provision was later
extended for existing firms as well. In certain high priority sectors like IT, FDI was allowed
up to 100%. Automatic clearance was given for import of capital goods where foreign
exchange availability was ensured through foreign equity.
Another important move was the creation of specially empowered Foreign Investment
Promotion Board (FIPB) for expeditious clearance of FDI's. Under the NIP, drastic changes
had been made in the Monopolies and Restrictive Trade Practices Act (MRTPC). The Act
had been changed altogether to do away with the threshold asset limits. As a result FDI
inflows increased from a near transient level in 1990 to $1638 mln in 2003, with an
intermediary high of $11338 mln in 1997. The NIP also curtailed PSU's pre-eminent role in
priority sectors and threw open the industrial arena to the private sector in almost full throttle.
The GOI further amended the Sick Industrial Companies Act (SICA) and extended the
purview of the Board for Industrial and Financial Reconstruction (BIFR) to the PSU's.
128
Liberalisation had been the crux of the New Trade Policy (NTP), too. At one stroke, many of
the age old controls governing exports and imports were dismantled. Imports had been
liberalised almost totally, except for a few non-permitted list of items.
There has also been steep reduction in import tariffs from over 200% to the current level of
around (30-40)%. The GOI also introduced partial convertibility of the domestic currency in
1992-93 and full convertibility (cunent account) in 1993-94. As a result of the NIP and NTP
the value-of-output of the organised sector increased from Rs.2341 bin in 1990 to Rs.l2012
bin in 2003. Railway and sea traffic increased from 310 mln.tns and 148 mln.tns in 1990 to
518 mln.tns and 313 mln.tns in 2003. Employment in the combined public and private sector
increased from 26.4 mln.nos in 1990 to 28 mln.nos in 2003. The GOI also brought about a
series of macro-economic reforms and structural adjustments. The reduction of fiscal deficits
and overhauling of the entire tax system was based on fiscal reforms. On the monetary side,
major reforms were also carried out in the banking sector. According to the recommendations
of the Narasimham Committee there was a phased reduction of statutory liquidity ratio (SLR)
and a high degree of flexibility in interest rates was also permitted. It also allowed scheduled
banks to approach the capital market to improve their capital adequacy norms. A series of
reforms were also carried out in the capital markets.
The ceiling on the acquisition of shares by NRI's, overseas corporate bodies and FII's was
raised from 5% to 24%; the office of Controller of Capital Issues (CCI) was abolished and
free pricing of shares was allowed under the purview of Securities Exchange Board of India
(SEBI). As a result total capital issues increased from Rs.l 12.9 bin in 1990 to Rs.416.1 bin in
2003. Indian corporates approaching the global equity markets by way of GDR increased
from a transient level in 1990 to Rs.l88.5 bin in 2003, with an intermediary high of
Rs.6217.7 bin in 2001. Number of firms listed in the Bombay Stock Exchange (BSE)
increased from 2247 in 1990 to 5675 in 2003. Among the various structural adjustments,
phasing out of various subsidies constituted another major element of the reforms program.
The Cash Compensatory System (CCS), which formed the bulk of export subsidy, was
totally abolished. Public sector restructuring was also a major part of the reforms exercise.
The GOI decided against setting up of fresh PSU's. It also decided that further expansion of
existing PSU's through additional government equity would not take place. Disinvestment of
government equity in the PSU's was another major element of public sector restructuring.
129
The government ultimately recognised that if liberalisation was to be taken to its logical
conclusion, an exit policy for industry was essential. It found voluntary retirement scheme
(VRS) as the instrument to balance social and economic risks.
As a result of the various economic liberalisation measures, Indian economic environment
underwent a rapid change. Entrepreneurial freedom provided through economic liberalisation
brought about major shifts in the industrial scenario. There has been an emergence of an
altogether new category of third generation entrepreneurs. There has also been a
diversification spree and a spate of mergers, acquisitions and takeovers. In the wake of
globalisation, most MNC's consolidated their positions in India. They acquired majority
stakes in their Indian enterprises, entered afresh through a 100% subsidiary or created new
joint ventures. Their entry even altered the rules of the game in core sectors like telecom, oil,
mining and power. Imports went out of the domain of the govenmient and became an
entrepreneurial activity. International trade emerged as a separate business opportunity.
Capital markets underwent a radical change. Domestic markets became buoyant followed by
increased activity from Foreign Institutional Investors (FII's) and foreign brokers. Mutual
funds became an emerging area of investments. And slowly Indian capital markets got
integrated with the global capital markets. The restrictions in the banking sector were done
away with. Disinvestment of government equity in nationalised banks followed by
deregulation of interest rates leads to a competitive environment in the banking sector.
Banking services got branded, and banks started functioning as viable commercial
institutions. Financial services emerged as a new business area, leading to a multiplicity of
fund raising options for business groups. All these points to the fact that with economic
liberalisation markets by and large transaction costs have come down and the economy has
become more efficient. The importance of market efficiency lies in the fact that, value
business groups add may be contingent on the time period under study, as different stages of
economic liberalisation may affect the optimal mix of activity in which groups' should
engage (Lu. et al., 2000). Hence it is proposed that -
Hypothesis 5: Economic liberalisation leads to a significant decline in the
extent of market imperfection in an economy.
130
6.6 Market imperfection and dominant logic
Prahalad and Bettis (1986) contend that changing mix of businesses can impose strategic
variety in the case of a diversified business group. But over time even unchanging mix of
businesses can also lead to strategic variety. In the post liberalisation phase, strategic
characteristics of most businesses changed due to changes in structural characteristics of
industries. At this stage we conjecture that strategic variety was also imposed on business
groups as emerging markets were liberalised, due to a significant decline in market
imperfection in the economy. When such transition takes business groups are faced with a
radically changing business environment, which they have not witnessed before. Changes in
a business environment in most cases is taken for granted, however, only radical changes in
the business environment (similar to economic liberalisation) imposes strategic variety on
business groups. Business groups in most developed markets take for granted a range of
institutions that support their business activities. But many of these institutions are very
nascent or may be altogether absent in most emerging markets, including India (Khaima and
Palepu, 1997). In product-markets buyers and sellers usually suffer from a severe dearth of
information due to underdeveloped communications, infrastructure, power shortages,
inefficient postal services, lack of independent rating agencies and capricious and slow law
enforcement systems. Similarly in the capital markets, institutional mechanisms that enable
capital markets function efficiently are absent or ineffective. Also in most developed markets
the Securities and Exchange Commission acts as a deterrent for unscrupulous firms to
mislead investors. Without access to information, investors refrain from investing their funds
in unfamiliar ventures.
However, this intensifying government involvement has a deleterious impact on the overall
Indian business climate. Overregulation began to retard economic growth. Protected from
foreign competition, domestic industries became inefficient, and the country lagged behind
the rest of the world in terms of technology. Unaccustomed to doing business in this way, the
Tatas often found themselves at odds with those in power. In 1978, a strong bid to nationalize
TISCO orchestrated by a coterie of powerftal politicians barely failed, due to protests from
JRD backed by the company management, unions, customers, suppliers and associates.
Faced with difficulfies of operating in such a hostile environment, the Tatas stopped
131
promoting major projects, and went into a defensive mode, trying to protect and maintain
their existing businesses.
In such situations the Aditya Birla group was primarily dependent on raising capital through
internal capital markets. This finds support from the findings of Williamson (1975), which
indicates that the diversified organisation is best understood as an alternative resource
allocation mechanism. Most emerging markets also suffer from a huge scarcity of well-
trained people. Thus the Tatas were prompted to form TAS, to promote, train and elevate its
senior personnel. On the regulation side, most successive governments in India were heavily
involved in an intricate array of economic decisions. The law established subjective criteria
for a majority of such decisions; in such a situation the powerful bureaucrats had a great deal
of discretionary powers on how to apply the rules. Indeed, it was the Reliance Group, which
showed how to use this powerful nexus to its advantage. They added value by acting as
intermediaries when their firms or foreign partners needed to deal with the regulatory
bureaucracy. Prior to economic liberalisation, market imperfection in the Indian economy
was evidently quite high. Therefore, it may be quite that the extent of market imperfection in
the economy was pre-dominant in shaping the dominant logic of most successful business
groups prior to economic liberalisation and in its early stages.
However, post liberalisation the efficiency of the economic environment had increased
dramatically. This put forth a totally different nature of diversification strategies before the
top management of most business groups. These diversification strategies were totally set
apart from those adopted in the pre-liberalisation periods. Thus, most business groups were at
a juncture where they found that their dominant logic had become inconsistent with the
changed economic environment. Their mental representations did not match with the new set
of diversification strategies, as they were of historical ones. Therefore, dominant logic of the
top management is not always an infallible guide to business groups and its environment. In
fact, some are relatively inaccurate representation of the world, particularly as conditions
change (Prahalad and Bettis, 1986). As a result, events are not labeled accurately, and are
sometimes processed through inaccurate and/or incomplete knowledge structures. Therefore
in fresh diversifications, the top management recognised the fact that hasty attempts to
impose its dominant logic may leave the new business dysfunctional. Often the new business
is 'left alone', at least for the time being (Prahalad and Bettis, 1986). This perhaps explains
132
the delay of the Reliance Group in implementing its telecom project, though the license was
acquired as early as 1998. In such situations, the top management also recognises the fact
that the skills and capabilities required for such new businesses might be radically different
from those developed earlier. Therefore, post liberalisation, industry and group
characteristics are perhaps pre-dominant in shaping dominant logic of successful business
groups.
One of the implications of our thesis, so far, is that the top management is less likely to
respond appropriately to situations where the economic environment is quite different, as
well as not respond quickly enough, as they may be unable to interpret the meaning of
information regarding unfamiliar businesses (Prahalad and Bettis, 1986). The series of
bottlenecks in the early stages of the Reliance groups' telecom project, perhaps explains this
logic. Reliance offered low call charges, but kept entry costs high. The price plan aimed at
locking in subscribers could not bring in the desired numbers. Faulty technology led to
heating up of handsets on using internet services. Most cellular companies denied Reliance
complete access to their networks, and also fought back competition heavily which Reliance
had not anticipated earlier. The much touted chaimel strategy threw a spanner in their
marketing plans. And finally. Reliance was surrounded by a series of TRAI regulations,
which seemed difficult to overcome. Perhaps, for the first time Reliance publicly accepted
failure in implementing its diversification strategies. However, once the unlearning process
of its old dominant logic was over and new dominant logics were learnt, diversification
strategies were executed efficiently. Thus unlearning maybe just a special case of learning,
where a crisis triggers the top management to change its dominant logic. Hence, it is
proposed that -
Hypothesis 6A: Economic liberalisation necessitates business groups to
change its dominant logic.
Economic liberalisation also brings in major shifts in regulation, technology, competitive
dynamics of industries, and consumer preferences. The top management usually see them
coming. But many a times, the top management fails to respond because they get trapped by
the success formula that led to their past success. So why do they fail to respond effectively
and appropriately to shifts that they see on the horizon? The top management invariably
anticipates the changes and often commission reports from management consulting firms that
133
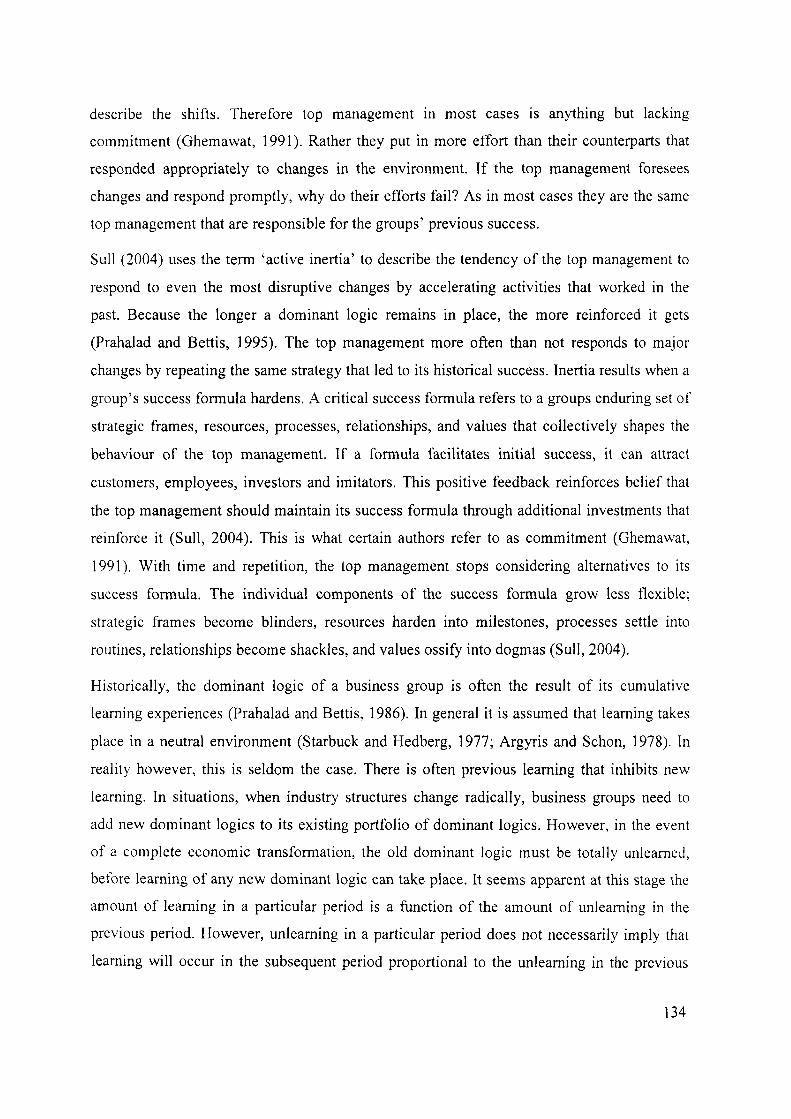
describe the shifts. Therefore top management in most cases is anything but lacking
commitment (Ghemawat, 1991). Rather they put in more effort than their counterparts that
responded appropriately to changes in the envirormient. If the top management foresees
changes and respond promptly, why do their efforts fail? As in most cases they are the same
top management that are responsible for the groups' previous success.
Sull (2004) uses the term 'active inertia' to describe the tendency of the top management to
respond to even the most disruptive changes by accelerating activities that worked in the
past. Because the longer a dominant logic remains in place, the more reinforced it gets
(Prahalad and Bettis, 1995). The top management more often than not responds to major
changes by repeating the same strategy that led to its historical success. Inertia results when a
group's success formula hardens. A critical success formula refers to a groups enduring set of
strategic frames, resources, processes, relationships, and values that collectively shapes the
behaviour of the top management. If a formula facilitates initial success, it can attract
customers, employees, investors and imitators. This positive feedback reinforces belief that
the top management should maintain its success formula through additional investments that
reinforce it (Sull, 2004). This is what certain authors refer to as commitment (Ghemawat,
1991). With time and repetition, the top management stops considering alternatives to its
success formula. The individual components of the success formula grow less flexible;
strategic frames become blinders, resources harden into milestones, processes settle into
routines, relationships become shackles, and values ossify into dogmas (Sull, 2004).
Historically, the dominant logic of a business group is often the result of its cumulative
learning experiences (Prahalad and Bettis, 1986). In general it is assumed that learning takes
place in a neutral environment (Starbuck and Hedberg, 1977; Argyris and Schon, 1978). In
reality however, this is seldom the case. There is often previous learning that inhibits new
learning. In situations, when industry structures change radically, business groups need to
add new dominant logics to its existing portfolio of dominant logics. However, in the event
of a complete economic transformation, the old dominant logic must be totally unlearned,
before learning of any new dominant logic can take place. It seems apparent at this stage the
amount of learning in a particular period is a function of the amount of unlearning in the
previous period. However, unlearning in a particular period does not necessarily imply that
learning will occur in the subsequent period proportional to the unlearning in the previous
134
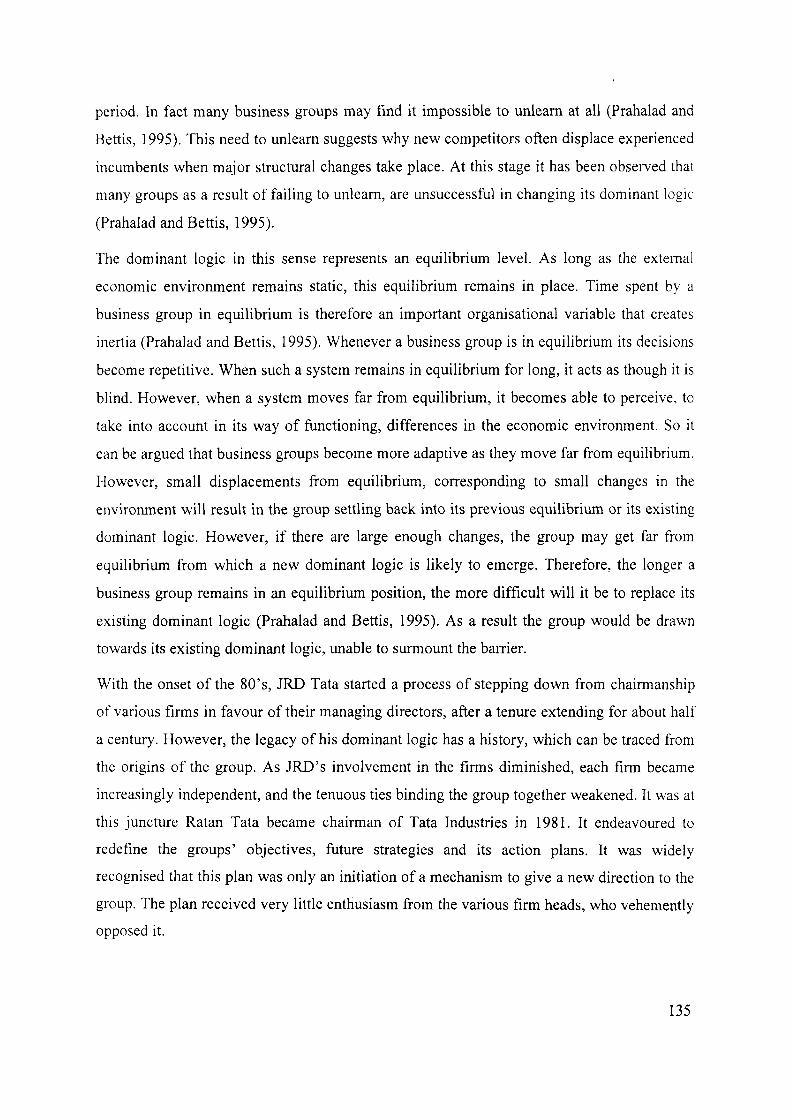
period. In fact many business groups may fmd it impossible to unlearn at all (Prahalad and
Bettis, 1995). This need to unlearn suggests why new competitors often displace experienced
incumbents when major structural changes take place. At this stage it has been observed that
many groups as a result of failing to unlearn, are unsuccessful in changing its dominant logic
(Prahalad and Bettis, 1995).
The dominant logic in this sense represents an equilibrium level. As long as the external
economic environment remains static, this equilibrium remains in place. Time spent by a
business group in equilibrium is therefore an important organisational variable that creates
inertia (Prahalad and Bettis, 1995). Whenever a business group is in equilibrium its decisions
become repetitive. When such a system remains in equilibrium for long, it acts as though it is
blind. However, when a system moves far from equilibrium, it becomes able to perceive, to
take into account in its way of functioning, differences in the economic environment. So it
can be argued that business groups become more adaptive as they move far from equilibrium.
However, small displacements from equilibrium, corresponding to small changes in the
environment will result in the group settling back into its previous equilibrium or its existing
dominant logic. However, if there are large enough changes, the group may get far from
equilibrium from which a new dominant logic is likely to emerge. Therefore, the longer a
business group remains in an equilibrium position, the more difficult will it be to replace its
existing dominant logic (Prahalad and Bettis, 1995). As a result the group would be drawn
towards its existing dominant logic, unable to surmount the barrier.
With the onset of the 80's, JRD Tata started a process of stepping down from chairmanship
of various firms in favour of their managing directors, after a tenure extending for about half
a century. However, the legacy of his dominant logic has a history, which can be traced from
the origins of the group. As JRD's involvement in the firms diminished, each firm became
increasingly independent, and the tenuous ties binding the group together weakened. It was at
this juncture Ratan Tata became chairman of Tata Industries in 1981. It endeavoured to
redefine the groups' objectives, future strategies and its action plans. It was widely
recognised that this plan was only an initiation of a mechanism to give a new direction to the
group. The plan received very little enthusiasm from the various firm heads, who vehemently
opposed it.
135
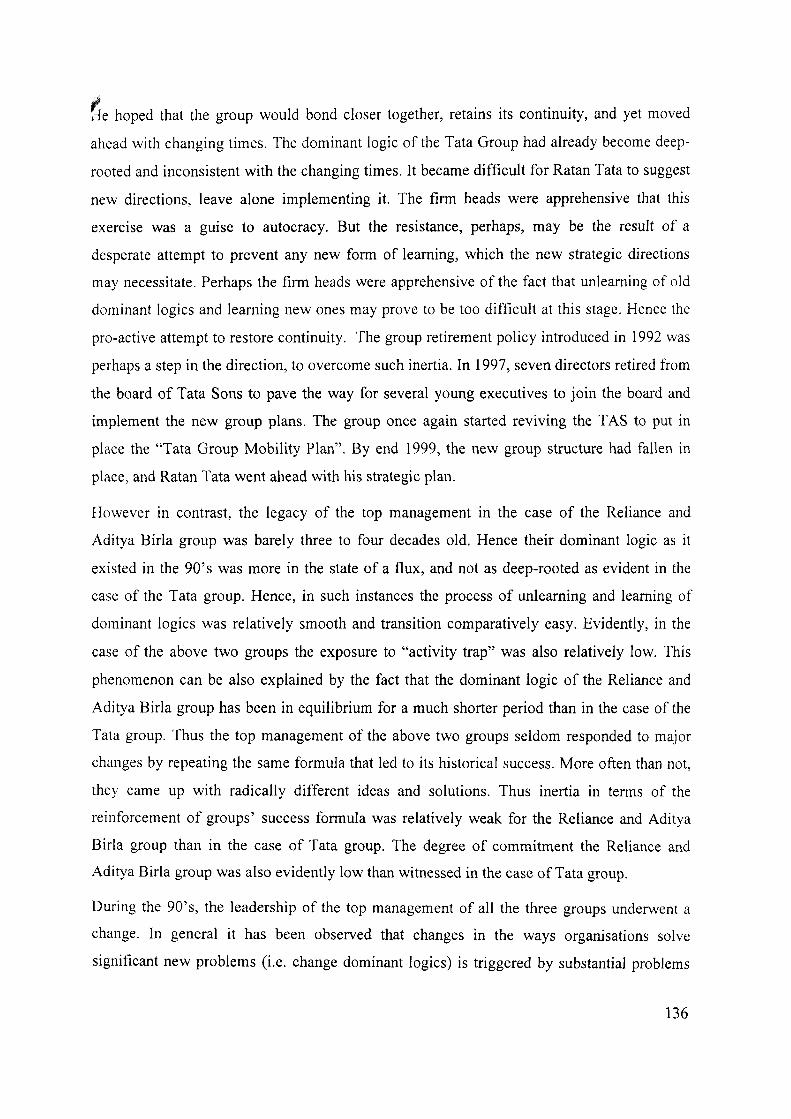
He hoped that the group would bond closer together, retains its continuity, and yet moved
ahead with changing times. The dominant logic of the Tata Group had already become deep-
rooted and inconsistent with the changing times. It became difficult for Ratan Tata to suggest
new directions, leave alone implementing it. The firm heads were apprehensive that this
exercise was a guise to autocracy. But the resistance, perhaps, may be the result of a
desperate attempt to prevent any new form of learning, which the new strategic directions
may necessitate. Perhaps the firm heads were apprehensive of the fact that unlearning of old
dominant logics and learning new ones may prove to be too difficult at this stage. Hence the
pro-active attempt to restore continuity. The group retirement policy introduced in 1992 was
perhaps a step in the direction, to overcome such inertia. In 1997, seven directors retired from
the board of Tata Sons to pave the way for several young executives to join the board and
implement the new group plans. The group once again started reviving the TAS to put in
place the "Tata Group Mobility Plan". By end 1999, the new group structure had fallen in
place, and Ratan Tata went ahead with his strategic plan.
However in contrast, the legacy of the top management in the case of the Reliance and
Aditya Birla group was barely three to four decades old. Hence their dominant logic as it
existed in the 90's was more in the state of a flux, and not as deep-rooted as evident in the
case of the Tata group. Hence, in such instances the process of unlearning and learning of
dominant logics was relatively smooth and transition comparatively easy. Evidently, in the
case of the above two groups the exposure to "activity trap" was also relatively low. This
phenomenon can be also explained by the fact that the dominant logic of the Reliance and
Aditya Birla group has been in equilibrium for a much shorter period than in the case of the
Tata group. Thus the top management of the above two groups seldom responded to major
changes by repeating the same formula that led to its historical success. More often than not,
they came up with radically different ideas and solutions. Thus inertia in terms of the
reinforcement of groups' success formula was relatively weak for the Reliance and Aditya
Birla group than in the case of Tata group. The degree of commitment the Reliance and
Aditya Birla group was also evidently low than witnessed in the case of Tata group.
During the 90's, the leadership of the top management of all the three groups underwent a
change. In general it has been observed that changes in the ways organisations solve
significant new problems (i.e. change dominant logics) is triggered by substantial problems
136
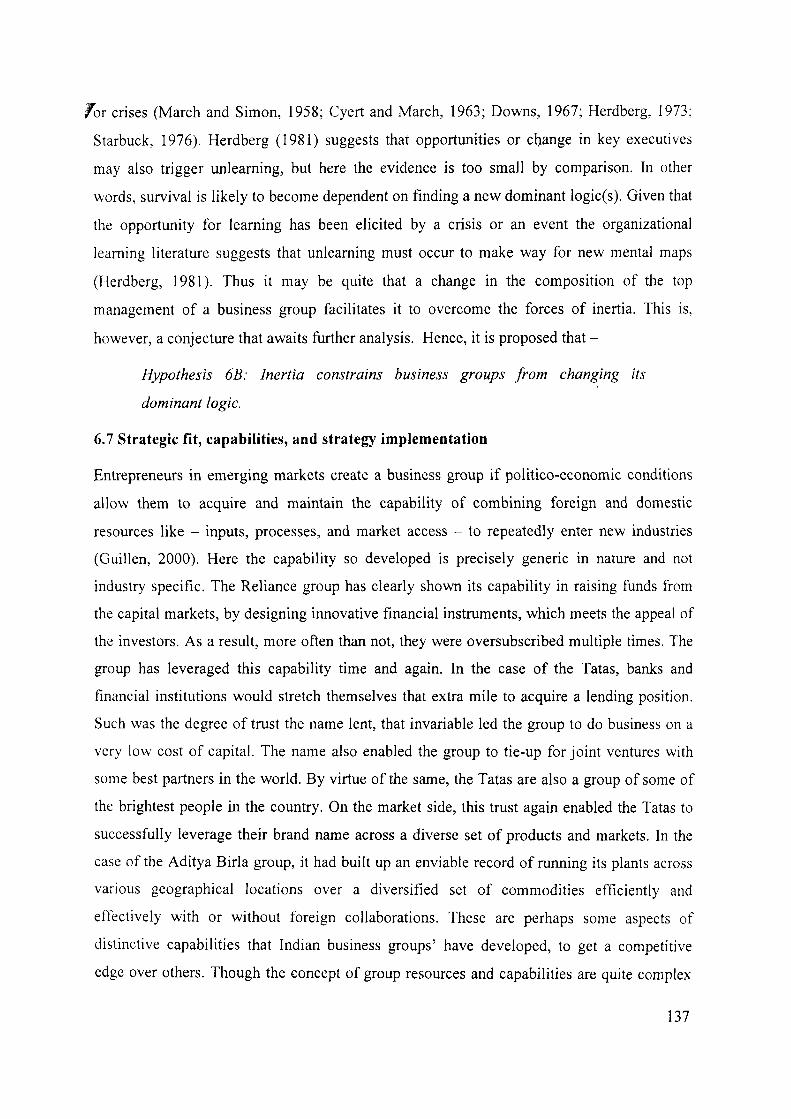
for crises (March and Simon, 1958; Cyert and March, 1963; Downs, 1967; Herdberg, 1973:
Starbuck, 1976). Herdberg (1981) suggests that opportunities or change in key executives
may also trigger unlearning, but here the evidence is too small by comparison. In other
words, survival is likely to become dependent on finding a new dominant logic(s). Given that
the opportunity for learning has been elicited by a crisis or an event the organizational
learning literature suggests that unlearning must occur to make way for new mental maps
(Herdberg, 1981). Thus it may be quite that a change in the composition of the top
management of a business group facilitates it to overcome the forces of inertia. This is,
however, a conjecture that awaits further analysis. Hence, it is proposed that -
Hypothesis 6B: Inertia constrains business groups from changing its
dominant logic.
6.7 Strategic fit, capabilities, and strategy implementation
Entrepreneurs in emerging markets create a business group if politico-economic conditions
allow them to acquire and maintain the capability of combining foreign and domestic
resources like - inputs, processes, and market access - to repeatedly enter new industries
(Guillen, 2000). Here the capability so developed is precisely generic in nature and not
industry specific. The Reliance group has clearly shown its capability in raising funds from
the capital markets, by designing innovative financial instruments, which meets the appeal of
the investors. As a result, more often than not, they were oversubscribed multiple times. The
group has leveraged this capability time and again. In the case of the Tatas, banks and
financial institutions would stretch themselves that extra mile to acquire a lending position.
Such was the degree of trust the name lent, that invariable led the group to do business on a
very low cost of capital. The name also enabled the group to tie-up for joint ventures with
some best partners in the world. By virtue of the same, the Tatas are also a group of some of
the brightest people in the country. On the market side, this trust again enabled the Tatas to
successfully leverage their brand name across a diverse set of products and markets. In the
case of the Aditya Birla group, it had built up an enviable record of running its plants across
various geographical locafions over a diversified set of commodities efficiently and
effectively with or without foreign collaborations. These are perhaps some aspects of
distinctive capabilities that Indian business groups' have developed, to get a competitive
edge over others. Though the concept of group resources and capabilities are quite complex
137
and multi-dimensional in nature, its effectiveness in leveraging performance has been widely
acclaimed (Penrose, 1959). However, how sets of ordinary resources are inter-linked to
create complex resources like distinctive capabilities and competencies still appears very
nascent. The big question is - What enables this?
Porter (1991) points that complex resources are developed around a set of interrelated
activities along the value-chain. There is also a fundamental connection between resources
and value-chain activities (Porter, 1985). By repeating prior activities over time, business
groups acquire complex resources in the form of skills and routines, which gets reinforced at
every stage. The larger the number of basic resources constituting a capability, the greater is
likely to be the number of their inter-linkages leading to the formation of a capability, with
lesser possibility of imitation and higher value to the group. Causal ambiguity refers to this
impediment associated with the uncertainty of pinpointing which specific factors or
processes are required to acquire such a strategic asset, the precise chain of causality is
ambiguous (Markides and Williamson, 1994; King and Zeithmal).
The logic that we surmount here is that, business groups, which are successful in diversifying
in businesses that are high on "strategic relatedness", (i.e. where majority of the firm
businesses are perfectly co-aligned with the dominant logic of its top management), acquire
such distinctive capabilities. Even though relatedness in terms of SIC, markets or
technologies may be very low. Traditional measures of relatedness provide an incomplete
and potentially exaggerated picture of the scope of a diversified business group to exploit the
inter-relationships between its firms. This is because traditional measures look at relatedness
only at the, product, market or industry level, which provides an incomplete and potentially
exaggerated picture of the scope for corporation to exploit interrelationships between its
firms' (Markides and Williamson, 1994; Collis and Montgomery, 1995).
As we explain below, relatedness that really matters is that between strategic assets
(Markides and Williamson, 1994). These assets can be accessed quickly and cheaply by
member firms within a diversified business group. Thus fit occurs when activities are
reinforcing. This fit at every stage in the value-chain leads to the creation of these distinctive
capabilities. And more the number of chains in the fit more is the sustainability of the
competitive advantage that arises out of this resource. If a firm with a distinctive capability
understands the link between the resources it controls and its advantages, then other firms
138
can also learn about the link, acquire necessary resources (assuming they are not perfectly
imitable) and implement the relevant strategies (Barney, 1991: ,109). However, causal
ambiguity blocks the ability of imitation by even its closest competitors. Though we do not
undermine the impact of economies of scale and scope; but such benefits of relatedness are
only short lived. Thus the real leverage comes from exploiting relatedness to create and
accumulate strategic assets more quickly and cheaply than others. These strategic assets give
rise to distinctive capabilities over time. However, they need not be confined to people and
technology alone; they may extend to physical assets as well (Ray, 2000).
The Reliance group has been successful in exploiting its capital raising abilities across its
diversified businesses; even its ability to compress project and operation times is quite
evident. Its ability to backward integrate complex back-end technologies without
technological tie-up speaks a lot about its capabilities. The Tata group has been able to attract
and retain some of the brightest people in the industry across most of its firms and also
proved its ability to extend its brand name across a diverse set of businesses. Across its
emerging businesses it has successfully used its existing resources for multiple uses,
concentrating and complimenting them and stretching them to acquire a broad set of
distinctive capabilities. The Aditya Birla Group has been successfial in efficiently running its
plants across diverse products and locations and yet containing its costs. This has been
possible because all the above business conform very well on the "strategic fit" scale, though
the same fit may not be quite visible in terms of products, market or technologies. This fit
factor brings about the involvement of the top management and its commitment in terms of
resources leading to the development of complex resources. Here in terms of commitment we
mean allocating the maximum amount of resources a task can absorb without over saturating
it. And all this also comes about due to a high degree of strategic and operational control
exercised by the top management over its strategically related businesses (Prahalad and
Betfis, 1986; Ghemawat, 1991). Hence, it is proposed that -
Hypothesis 7A: Extent of fit between dominant logic of the top management
and individual businesses within the portfolio of businesses enables a business
group to develop distinctive capabilities.
In strategy implementation there is great emphasis on speed, speed at which things are done.
Speed here represents time (Bartlett and Ghoshal, 1994). Most economic calculations go
139
wrong because the cost of time is not taken into account. If time was not a constraint,
business groups would have optimised on it. But given the opportunity cost of lost
production, it is perhaps always value enhancing to implement strategies efficiently and
effectively. It is only when the cost of time is taken into account that one gets sound
economics and then saturation almost always makes sense. And perhaps, all these come
when groups' are in position to exploh and leverage its capabilities across diversified
businesses (CoUis and Montgomery, 1995; Hamel and Prahalad, 1991).
The RBV views firms as a collection of tangible and intangible assets and capabilities. These
assets and capabilities determine how efficiently and effectively a company performs its
functional activities (Collis and Montgomery, 1995). The authors further contend that
competitive advantage, whatever its source, can be attributed to the ownership of a valuable
resource that enables the firm to efficiently implement its strategies better than others.
Following this logic, a firm will be positioned to succeed if it has the best and most
appropriate stock of resources for its business and strategy. It will inevitably enable business
groups to effectively implement its strategies.
By the late 80's the Reliance group had already buih up a reputation for setting up projects
quickly; it had, for instance, set up its worsted spinning plant within eight months of the grant
of the license. However for its PFY plant, it outdid even its collaborators by getting it ready
in fourteen months, a feat Du Pont, until then had not managed anywhere else in the world.
And what made this feat possible? Instead of adopting the normal practice of linking the
various pieces of the equipment through a long array of pipes (typical for a continuous
process plant) after receipt of equipment, the group had laid scores of kilometers of pipes in
readiness for the equipment to arrive and to be installed as soon as they landed. By the 90's
this capability was not restricted to their projects alone; they were successfully implementing
it in their operations as well. When one of the groups' complexes was washed by flash
floods, international experts were of the opinion that the minimum recovery time would be
around 90 to 100 hundred days. Some were even less optimistic, predicting that some of the
units would not be functional even in five months time. Reliance got the entire complex fully
functional in 21 days.
The group had by and large replicated the same set of capabilities even while implementing
its telecom project. The group conceived the telecom project in 1998; however, by the end of
140
2002 the group had launched its services across 151 cities and 600 cities by mid 2003. This
was again made possible because the group had already developed the network across 60,000
miles way ahead before the back-end technology was ready. So when the technology was
ready to take off, the network was already in place. And all this has been made possible
because the group had been able to draw upon its earlier experiences. Strategic fit, which
enables it to determine - what amount of resources to allocate for a particular task? This is
perhaps a holistic view, which only groups, which have built such capabilities, can draw
upon.
The Tata group while implementing its car project had faced enormous resource gaps. The
group made it all happen because it had developed a set of capabilities on which it could
back-upon; the ability to align certain existing capabilities with a set of emerging capabilities,
which it had to create and deliver. The skills of various project groups were made to
converge to lower procurement costs and ensure effective value-chain configuration. And
throughout the duration of the project the top management laid down the specific attributes of
the project. This was also observed in the Reliance telecom project, where the involvement of
the top management was significant in implementing its strategies. In areas, where the group
had proven expertise, it used its existing capabilities to develop new capabilities. However, in
areas where they were lacking the necessary skills to build new capabilities, the group was
quick to complement its existing capabilities. This has been possible because of the high
degree of strategic fit, which made the top management committed in terms of involvement
and resources. Hence, at this stage it is proposed that -
Hypothesis 7B: Extent of fit between dominant logic of the top management
and individual businesses within the portfolio of businesses enables a business
group to implement strategies better.
141
CHAPTER 7
Diversification Theory Revisited
In this chapter we try to integrate across the various hypotheses leading to the development
of a unified theoretical framework on diversification. The theoretical framework relies
heavily on the multi-lateral concepts drawn from multiple theoretical lenses. It also tries to
integrate them in a way to identify the antecedents of diversification strategies and explain its
outcomes on performance in a more meaningful manner.
7.1 Theoretical Framework
This research follows up on the notion that there is no unique diversification strategy.
Sacrosanct, a diversification strategy can be economically and strategically justified,
depending upon certain ex-ante and ex-post factors. These factors are specific to business
groups and are also contingent upon the stage of nation's economic transition (Lu, et al.,
2002). Despite substantial research on diversification strategies facing business groups (i.e.
nature and extent of diversification, direction of diversification and mode of diversification),
management of diversity (i.e. strategy implementation) has been comparatively neglected
(Ramanujam and Varadarajan, 1989). It is evident from the various streams of research that
the benefits of diversification are not automatically realised, the active involvement and
commitment of the top management is essential to realise these benefits (Bettis, Hall and
Prahalad, 1978; Bettis and Hall, 1981; Dundas and Richardson, 1982; Porter, 1985; Prahalad
and Bettis, 1986; Ghemawat, 1991; Khanna and Palepu, 1997).
The major implication of the above studies is that top management is as critical in explaining
differences in performance as any other factor. We therefore tried to incorporate the "top
management" as a major intervening variable in explaining different perspectives of
diversification facing business groups. At the lower levels of an organisation the concept of
efficiency is applied where operating responsibilities are clearly defined, discretion is
limited, communication channels are set and position in the command structure is distinct.
This concept of efficiency loses force however, as we approach the top of the management. It
is here diversification strategies facing business groups become a major factor in explaining
differences in performance across firms. The top management of a diversified business group
should not be therefore viewed as a faceless abstraction, but as a collection of key individuals
142
(i.e. dominant coalition) who have significant power to override the context and influence the
way a group is managed (Prahalad and Bettis, 1986).
In this context Das (1981) observed that it is not the quality of business - its competitive
structure - or the patterns of diversification per se that determines early failures and
successes later, but the evolution of the top management and its ability to acquire new skills.
However, incorporating the top management as a control variable is a difficult task. As there
is very little evidence available in existing research in operationalising this construct. In
retrospect, we try to build on the concept of dominant logic to provide additional insights in
this research domain (Prahalad and Bettis, 1986). The broad objective of this framework is to
supplement existing research on business groups and increase its explanatory power on
performance. This research follows up on the notion that views business groups as complex
systems (Prahalad and Bettis, 1995). Business groups in emerging markets obviously
represent complex systems. Standard theories in strategic management, economics and
finance typically concentrate on 'end points', whereas in reality complex adaptive systems
never get there. In such cases improvement is usually much more important than optimisation
(Holland, 1992). In parity with extant research we view dominant logic as an emerging
property of complex adaptive systems (Prahalad and Bettis, 1995).
The top management of a diversified business group operates on certain mental
representation of the business environment around them (Kiesler and Sproul, 1982). These
mental structures represent its beliefs, theories, concepts, propositions and biases surrounding
its diversified businesses. This informal framework enables the top management to
selectively scan the business environment surrounding it and form certain distinct
perceptions and opinions. These perceptions and opinions represent its dominant logic
(Prahalad and Bettis, 1986). Logics are ways of perceiving, acting and responding built into
an organisations top management team. When integrated these individual logics become
dominant logics. Typically, the dominant logic of a diversified business group tends to be
influenced by its core business, which was the historical basis for the group evolution and
growth. Hence considered more broadly dominant logic can be considered as both a
knowledge structure and a set of elicited management processes.
Dominant logic takes shape through the critical experiences of the top management team.
These critical experiences are likely to be historical ones rather than current ones. Critical
143
experiences are closely related to the organisation self-definition and self-reconstruction.
These experiences reflect the open-ended ness of organisational life - the existence of
alternative ways of thinking, responding and changing (Ghemawat, 1991). Dominant logic is
therefore a way the top management conceptualises its various business patterns. It shapes a
groups outlook and orientation to the job, resulting in distinctive patterns of judgment and
emphasis (Ghemawat, 1991). Thus the tendency of the top management of a group to
develop fixed ways of perceiving itself and the environment, often unconsciously, is
therefore of considerable importance (Selznick, 1957).
Building upon the notion of dominant logic which views it as critical factor explaining the
linkage between diversity and performance, we argue dominant logic also plays an
antecedent role on diversification strategies facing business groups in most emerging
markets. Dominant logic not only plays a moderating role on such strategies, but on its
execution as well, thereby influencing its outcome significantly. Extant research supports the
view that the internal and external environment facing business groups has a major bearing
on its diversification strategies and performance (Ramanujam and Varadarajan, 1989;
Hoskisson and Hitt, 1990). Diversification strategies are guided not only by environmental
perception, but also by the belief about "what can be done" and "what cannot be done" based
on implicit assessment of the organisation and its capabilities.
Under conditions of perfect markets the effect of environmental forces on firm performance
is direct. However, since perfect markets remain a distant reality even in the most developed
markets, the top management possesses the distinct ability to moderate the power and
direction of the environmental forces in its own favour, thus influencing performance. As
evident, a series of such "schumpeterian shocks" buffet most economic systems (Hill, 1994).
Hence, the impact of the environmental forces is not uniform across all business groups. It
has been observed across markets that business groups achieve different levels of
performance, by adopting similar diversification strategies. Or on the contrary, business
groups achieve same levels of performance by adopting different diversification strategies.
To explain this dichotomy, we explore how a group's dominant logic acts as a moderating
force between the environmental forces and diversification strategies and strategy
implementation as well. The social structure of an organisation acts as a filter to these
environmental forces (Ghemawat, 1991).
144
The six elements of social structure are - assigned roles, internal interest groups, social
stratification, beliefs, perceptions and dependencies, taken together, forms a complex
network of relations among persons and groups. These networks acts as a filter through
which information is gathered, processed, decisions taken and communicated. It represents a
system of accommodation among potentially conflicting parts. As a result any information in
the filtration process may be outright rejected, conditioned in a different form or accepted in
originality (Ghemawat, 1991). As the environment facing business groups are an agent of
continuous change, the study of dominant logic is therefore a phase of institutional analyses.
When change in general orientation is apparent, perhaps, the most obvious indicator of
organisational character as a palpable reality is the abandonment of old logics and creation of
new logics (Selznick, 1957).
Therefore, the emphasis is on embodiment of values in a group structure through the
elaboration of commitments - ways of thinking, acting and responding that can be changed,
if at all, only at the risk of a severe organisational crisis (Ghemawat, 1991; Prahalad and
Bettis, 1986). As a new crisis occurs, ways of thinking, perceiving and responding that
served the organisation well in the earlier stages may be ill fated for the new tasks. Hence
dominant logic is not always an infallible guide to the organisation and its environment. In
fact, some are relatively inaccurate representation of the environment, particularly as
conditions change (Norman, 1976). As we ascend the echelons of organisation, the analysis
of top management decisions making becomes increasingly complex. Not simply because
they are important, critical and characterised by irreversibility, but because a new logic
emerges (Selznick, 1957). Dominant logic emphasises the adaptive change and evolution of
organisation forms and reacting to internal and external forces. It reflects new logics
emerging and old logics declining, not as a result of conscious design but as a natural and
largely unplanned adaptation to new situations or contexts (Selznick, 1957).
Groups need to dynamically adapt to new logics in such situations. Dynamic adaptation
connotes more than simple activity change or growth. It suggests certain impelling forces that
have a quite different role and origin. The point is not the degree of involvement, but the
reconstruction of needs, the changing posture and strategy and the commitment to new type
offerees (Selznick, 1957). Adaptation fails when it is static. By static adaptation we mean
such an adaptation to patterns as leaves the basic character traits unchanged, and imply the
145
adoption of a new habit. It has Umited effect on new traits (Selznick, 1957). The Umit of
organisational engineering becomes apparent when we need to create a structure uniquely
adapted to new logics. This adaptation goes beyond a tailored combination of uniform
elements; it is an adaptation in depth, affecting the nature of the parts themselves. Thus there
is a need to see the group as a whole and observe how it is transformed as new ways of
dealing in a changed enviroimient endures. This process of becoming infUsed with the values
is a part of what is called institutionalisation (Ghemawat, 1991).
In analysing this institutional change, the factors that shape dominant logic of business
groups is then of considerable importance. Prahalad and Bettis, (1995) is of the opinion that
extant research in strategic management has rather neglected managerial forces in explaining
performance differences in favour of purely economic forces. This research tries to
incorporate the effects of both economic forces and managerial forces on diversification
strategies moderated dominant logic, albeit in a different manner in different stages of
economic transition. Prior to economic liberalisation, most emerging markets were highly
regulatory driven. Hence, envirormiental efficiency in such markets was very low, leading to
very high market imperfections. This led to various sorts of market failure, institutional voids
and high transaction costs (Kharma and Palepu, 1997).
In such contexts, majority of the diversification strategies were subject to government
ratification and approval. Therefore, strategic control at best resided outside the organisation.
Dominant logics of successful groups were guided by their ability to acquire licenses and
quotas, obtain priority approval for its resource mobilisation plans, approval for capital
imports and get policies formulated which favoured it (or disadvantaged its competitors or
both). In general they were broad based, large in number, with very little consistency in
between them. Business groups, which were successful in exploiting these dominant logics,
entered a large number of businesses, and diversified extensively. Encamation (1989)
mentioned large diversified business groups in India, ostensibly for the purpose of lobbying
politicians and bureaucrats to extract benefits, maintained 'industrial embassies' in the capital
city. Therefore, market imperfection was pre-dominant in explaining dominant logic of most
business groups prior to economic liberalisation.
Business group which did not view market imperfection prevailing in the economy as a
distinct reality, found themselves at odds with those in control. As a result they were not able
146
to implement their diversification strategies. As the economic environment remained more or
less static prior to economic liberalisation, business groups did not feel the need to change
their dominant logics. However, the various measure of economic liberalisation pursued by
the Government of India since 1991, resulted in sharp increases in environmental efficiency
in a large number of segments (Ray, 1998). This resulted in overall reduction in market
imperfections in the economy over time. Government controls over diversification strategies
facing business groups were slowly withdrawn. Hence, groups could no longer leverage the
advantages of market imperfection in its favour.
In this scenario, most of its earlier dominant logics had become inconsistent with the
emerging economic environment. Groups then found themselves at odds with the new rules
of domain selection and navigation. Dominant logic inconsistent with the economic
environment led to misguided diversification strategies. The relation of an organisation to its
external environment is however, only one source of institutional experience. There is also an
internal social world to be considered (Selznick, 1957). In this emerging environment, group
characteristics became pre-dominant in shaping dominant logic of successful business
groups, as market imperfections had become primarily negligible. Dominant logics' guided
by group characteristics were focused, consistent and few in number. In support, Penrose
(1959) had observed that group's internal resources largely govern its diversification
strategies.
The responsibility now lied on the top management to scan the economic environment, and
exercise its diversification strategies in domains that were consistent with its resource profile,
organisation structure, size, diversity and scale of operations. In contrast, business groups,
which still attempted to exploit the advantages of market imperfection in its favour, failed,
because the market forces were too strong to be tampered with. Liberalisation also changed
the underlying structural characteristics of most industries. As a result, even groups, which
did not change its business portfolio, had to cope with increasing strategic variety, hence had
to revise its dominant logics (Prahalad and Bettis, 1986). The nature of competitive forces
had changed radically, including bargaining power of customers and suppliers, coupled with
increasing threat of product substitutes and new entrants. Groups now had substantial power
to override the industry context, as strategic control slowly moved into the organisation.
147
In this transition we attempted to explain three concerns, (a) why many institutions fail to see
change in the environment? (b) why many institutions see change in the environment, but are
unable to act? (c) how certain institutions adapt on the face of a changing environment and
successfully transform themselves. We will address the first issue earlier. The direction -
extent - pace - timing of diversification strategies facing business groups are conditioned by
changing self definitions and by alteration in the internal and external commitments of the
group (Ghemawat, 1991). Commitments here mean more than verbal assent or even
ideological attachment. The making of certain value - commitments, marks the evolution of
a business group i.e. diversification strategies which fixes the assumpfion of decision making
as to the nature of enterprise - its distinctive aims, roles in the community and society at
large (Ghemawat, 1991).
It should be mentioned here that earlier commitments mentioned here, constrain
implementing of latter ones. It creates a tendency for precedents to become normative
benchmarks (Hannan and Freeman, 1984). It also results in the tendency of diversification
strategies to persist over time. Business groups, whose earlier commitments were too sticky,
generated inertia (i.e. opportunity costs of earlier commitments exceed its new one). Inertia is
however only one source of commitments. It is also widely caused by lock-in, lock-out and
lags (Ghemawat, 1991). Such business groups remained preoccupied and stressed by its
existing dominant logics. It forced them to reject all information regarding changes in the
environment. As a result information regarding environmental changes remained
unprocessed.
Business groups, which were unable to grow beyond their earlier commitments, failed to
transform their dominant logic from the perspective of economic transition. Therefore the
speed and agility of a group to adapt to emerging contingencies depends on its receptive
barriers. Like human beings, business groups are not equally agile and responsive to change.
This agility depends on socio-cultural factors, formal and informal training and more
importantly on genetic factors that conditions the responsive ability of business groups
(Prahalad and Bettis, 1996). It also pre-disposes a group to certain types of problems and
often interacts with organisational structure and systems in causing strategic bottlenecks.
These factors account for the responsive agility of groups to environmental changes. If the
responsive agility is slow compared to the pace of environmental change, the process of
148
transformation of dominant logic is retarded. As a result groups fail to acquire, build or
develop certain distinctive capabilities and competencies necessary to execute and support
the change. Hence these groups though see the need for change, are unable to act at the
appropriate time or successfully implement its strategies.
However business groups, which successfully transformed its dominant logic appropriate to
the emerging economic environment, enhance their performance. In this transformation new
generation business groups substantially out performed their older counterparts. The logic
behind this inference is that the new generation business groups started with a new dominant
logic altogether and hence did not have to undergo through the process of unlearning its
earlier dominant logics, like its older counterparts (Prahalad and Bettis, 1995). Hence their
response to economic liberalization was faster, as it did not face any earlier commitments.
This was reflected by the fact that most of the early entrants in emerging and deregulated
industries were new generation business groups. When a group is permitted to drift, the
greatest danger lies in the uncontrolled effects on its organisational character (Ghemawat,
1991). If ultimately there is a complete transformation, with a new character emerging, those
who formed and sustained the group in the earlier stages may find themselves misfit to the
newly evolved organisational traits. This has been reflected by the fact that most business
groups who were successful in transforming its dominant logic, had to revamp its group
structure altogether. There is also the likelihood that the organisation character will not be
transformed; it will be attenuated and confused (Ghemawat, 1991).
At this stage the central contention of this research is that as long as diversification strategies
of business groups are consistent with its dominant logic, performance will be enhanced.
This conclusion has major implications for top management decision-making. Logic behind
this inference can be had from multiple theoretical lenses (discussed earlier). Groups
pursuing an intensive diversification strategy possess the distinct ability to override the
context and change the direction and pace of the environmental forces in its favor so as to fit
its dominant logic. This fit between dominant logic and diversification strategies facing
business groups represents an equilibrium level (Prahalad and Betfis, 1986). However, due to
radical changes in internal and/or external contexts strategic variety sets in. With increasing
strategic variety top management needs to revise its dominant logic or add newer dominant
logics to its existing portfolio of dominant logics, or disequilibria will set in. If the top
149
management is unable to acquire dominant logics consistent with changing conditions, the
resulting fit will be disturbed and negative performance effects will follow. As industry
structures change radically, diversification strategies undertaken in the wake of opportunities
offered often resulted in setbacks. This is because strategic and operational control of the top
management over its diversified business were lacking.
When diversification strategies are not consistent with the groups' dominant logic, yet
decisions need to be taken, opportunism sets in. Opportunism is the pursuit of immediate,
short run advantages in a way inadequately controlled by considerations of principle and
ultimate consequences. If opportunism goes too far in accepting the doctrines of reality
principle, utopianism sets in. Utopianism attempts to avoid diversification choices that are no
longer consistent with its dominant logic. Utopian thinking enters when men who purport to
institutional leaders attempt to rely on over generalised purposes to guide their decisions.
When guides are unrealistic, yet decisions are to be taken, more realistic but uncontrolled
criteria will somehow fill the gap. Responsible diversification strategies steers a course
between reality, opportunism and utopianism (Ghemawat, 1991). When diversification
strategies fail, it is perhaps more often by default than by positive error or reason. One type
of default is the failure to set goals. Another, type of default occurs when goals, however
neatly formulated, enjoys only skeptical and superficial acceptance and does not influence
the total structure of the group (Selznick, 1957). In another situation when the fit between
dominant logic and diversification strategies concerning its business portfolio is deviating,
the strategic business unit is often 'left alone', as hasty attempts to superimpose its dominant
logic may render its diversification strategies dysfunctional.
Prior to economic liberalization market failure and high transaction costs forced business
groups to enter a large number of businesses and diversify extensively. It enabled business
groups to acquire a set of broad based resources, with which it could cater to wide variety of
industries. It primarily comprised of access to various critical inputs such as labor, raw
material, process related technologies, markets and distribution channels. These resources
were precisely generic in nature and not industry specific. Firms, that could combine its
resources quickly and effectively, were best able to create a business group by repeatedly
entering a number of industries in a short time (Guillen, 2000). During those periods market
structure was monopoly in nature or at best oligopoly. Groups therefore did not face much
150
difficulty in navigating domains as long as they performed efficiently. Hence the role of the
top management was primarily reduced to operational in nature.
However, post liberalisation industry competitiveness had increased radically. As a result
generalised resources built in the regulated era provided very little competitive advantage to
business groups. A group would be best positioned as much for its quality of resources as
much for its appropriateness in view of its business and strategy (CoUis and Montgomery,
1995). Because these resources were easily replicated, imitated or substituted by its
competitors; hence not appropriate for the emerging competitive environment. As a resource
loses its competitiveness in a chronological context, a resource that is valuable in a particular
industry might fail to deliver the same value in a different industry. Therefore developing
competencies without examining the competitive dynamics of the industry would be
detrimental to performance. Such situations arise, particularly, when dominant logics are
inconsistent with the context. Hence the effects of such generalised resources built in the
regulated era diluted the effects on performance in the liberalized era. In situations when
markets are relatively perfect complex resources forms the primary source of competitive
advantage (Hoskisson and Hitt, 1990).
Complex resources have distinctly different characteristics from basic generalised resources.
It is formed by a wide range of bonding mechanism around a set of basic resources. Complex
resources are also often termed distinctive capabilities and competencies. Groups, which
could transform its dominant logics appropriate to the emerging scenario successfully,
acquired or developed certain complex resources, by using its existing pool of resources to
develop distinctive capabilities. This was facilitated by the intensive involvement and
commitment of the top management. As it enabled the group to set distinct targets, quantity
tasks and expedite the process of development of such capabilities and competencies.
Business groups whose diversification strategies fit ideally with its dominant logic built such
complex resources; which has the potential to contribute to the benefit of multiple businesses.
The expeditious development of such distinctive capabilities and competencies depended on
the speed of the group's transition to economic liberalisation. Groups, which were fast to
respond to such change, outperformed other groups in the process of building such distinctive
capabilities and competencies. As a result groups, which were slow to respond to such
changes, lost out on certain early entry advantages. Selznick (1957) also suggested that
151
groups pursuing an intensive strategy accumulate certain distinctive competencies, and
preferred to choose diversification strategies that benefited from those competencies. It
helped deliver competitive advantage along the value chain (Porter, 1991). These resources
were inimitable, replicable or even substitutable by its closest competitors. It enabled the top
management in effective designing of its resource allocation profile and leveraging its
resources to stretch it (Hamel and Prahalad, 1994). It also enabled the top management to
compliment its existing resources and put it to multiple uses over its diversified businesses.
Therefore, these complex resources went in a long way in enhancing group performance. In a
dynamic competitive environment resources are the primary drivers of performance. It
determined how efficiently and effectively a group implemented its strategies (Collis and
Montgomery, 1995).
Complexity of strategy implementation increases dramatically as the size, scale and scope of
the businesses change. It is frequently asserted that strategy implementation, in general, has
received less attention than strategy formulation (Ramanujam and Varadarajan, 1989). This
criticism takes on added piquancy, especially in strategic management research. Only a
handful of studies have directly examined the issue of how groups implement strategies, and
fewer still are studies that explore the performance consequences of different approaches to
implementation. However, certain notable exceptions are Dundas and Richardson (1982),
Galbraith and Kazanjian (1986), Gupta and Govidarajan (1984), and Leonatiades (1986). By
ignoring strategy implementation many of the benefits of diversification strategies have
therefore been attenuated (Ghemawat, 1991). For instance, we still do not know why synergy
in strategies is so elusive to obtain, or why certain strategies are sometimes successful and
sometimes not (Ramanujam and Varadarajan, 1989). Nonetheless, several pieces of overall
picture are beginning to emerge.
The commonly used tools or levers of implementation are structure (Chandler, 1962; Rumelt,
1974; Hill and Hoskisson, 1987), systems (Berg, 1973; Pitts, 1976), and management style
(Kerr, 1985; Tezel, 1981; Napier and Smith, 1987). However, a lack of a common thread
among these studies makes them difficult to integrate. They remain important fragments of
evidence on the cmcial, but only partially understood, role of implementation aspects in
determining the performance consequences (Ramanujam and Varadarajan, 1989). In
supplementing extant research we argue that distinctive capabilities and competencies are as
!52
critical for successful strategy implementation as any other factor (Hitt and Ireland, 1985;
Miles and Snow, 1978; Snow and Hrebiniak, 1980). Group resources are critical for the
purpose of strategy formulation. However, successful strategy implementation is dependent
on existing resources as much on distinctive capabilities and competencies that are to be
developed expeditiously.
Prahalad and Hamel (1994) argued that groups should exercise diversification strategies in
which they have experiences and developed distinctive capabilities that can be leveraged to
gain competitive advantage. If diversification strategies were not consistent with its dominant
logic, groups would entail difficulty in developing certain complex resources to support its
strategy implementation. The involvement of the top management will be lacking in
providing strategic direction. Further, the fit factor between dominant logic and
diversification strategies also goes in a long way in enforcing critical involvement of the top
management in strategy implementation. It enabled the top management in setting realistic
goals and tasks to expedite its strategies. It also enabled the learning of new skills and
unlearning of old ones, to facilitate strategy implementation. If the fit remained elusive, the
involvement of the top management will be found to be lacking. However still, if decisions
are to be taken, the respective businesses surrounding such choices are 'left alone'. Only
when fit is resumed, either through change in-group dominant logic or environmental
changes, critical involvement of the top management will be restored.
However, business groups, which could not transform its dominant logic, appropriate to the
changing economic environment; failed to develop such complex resources. As a result
groups possessing generalised resources failed to sustain their competitive advantage on the
face of intense competition. As a resuh, its resources eroded, and their entity atrophied over
time. However it need not be necessary concluded that with economic liberalisation group
effects in general will slowly atrophy or sublime over time. Business groups, which are
successftil in adapting to economic liberalisation, transform their dominant logic and build
certain complex resources, would sustain their competitive advantage over time. The
conclusion is market failure alone does not completely explain the evolution, existence and
competitive advantage of business groups in emerging markets. In fact, groups may be the
result of a wide range of organisational and socio-economic factors that has little to do with
economic efficiency (Khanna and Rivkin, 2001).
153
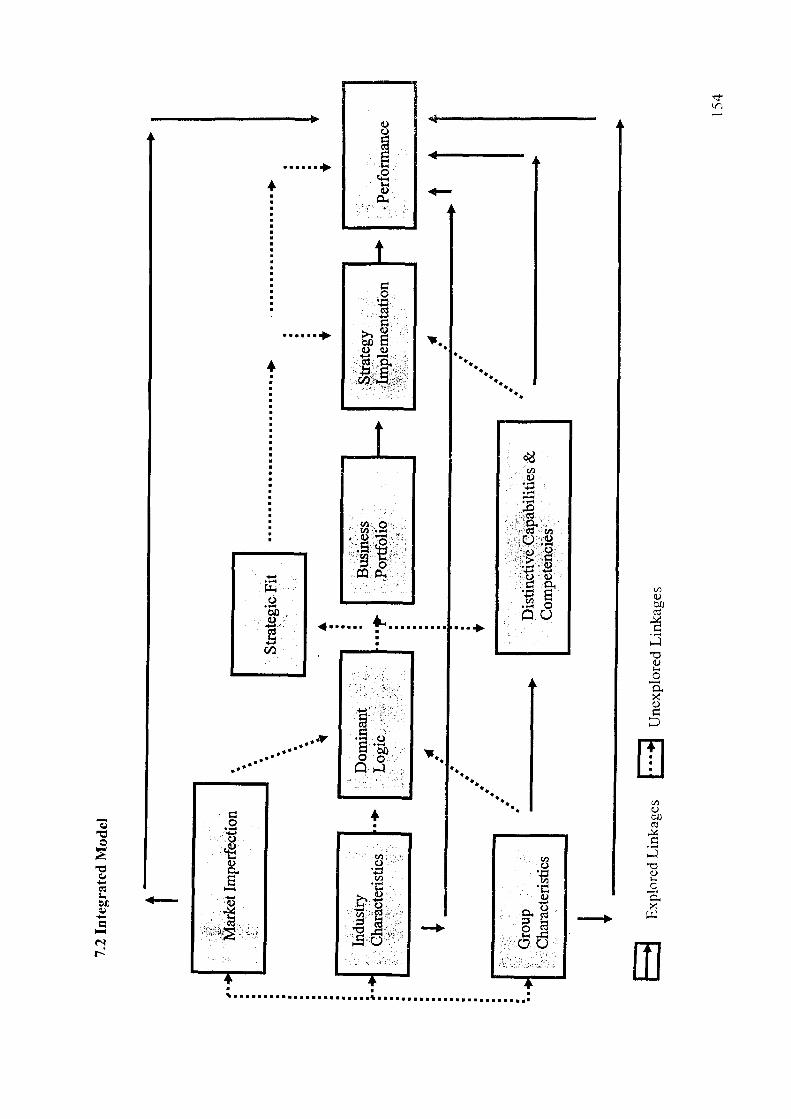
a o
-o u « bxj ^^^""^
w 1—1
r-
c o
a. S 1-3
P. -! ,..::::,.,= ^ . . . ;.'at^..4.i
1
o ?J 43 CO
a o
-2 a
a a, a.
t—I.
I
^.,
M CO
'1 ::)
o -• FH
t i • o
cQ p;
^ OT o +->
• »-( r O CO & I At
. a >
• ( - >
O d
• v^
M <u
0)
u a g o
O U
o. 3 O ;-!
l/l o
*~t VI
•c o • * - »
^ J3
,£3
• o o
c3
0 on
•a
m
CHAPTER 8
Results and Findings
In this chapter we have presented the results of analyses performed by using various
contemporary statistical techniques. At first, we explored whether there were any significant
changes in the external environment after economic liberalisation. For testing the Hypothesis
on changes in market efficiency we constructed a time series index and observed the
significance of the changes in the index values during the period of economic liberalisation.
Next, we observed whether changes in market imperfection lead to a change in industry
characteristics, and group characteristics such as cohesiveness, inertia, resources, capabilities,
diversity, and performance across business groups. For this we sourced values of these
internal and external variables across groups in our sample. We observed the mean and
standard deviation of the above variables. The central tendency and spread of the data points
provides a primary overview of the data set over a sample time frame.
Then we explored whether significant relationship existed between various pairs of
dependent and independent variables through correlation matrices. We also wanted to know
if they were significantly related, and what was the strength of relationships. We adopted
muUiple regression analysis to seek answer to these questions. To find the relative strength
and direction of relationship between diversity and performance with the help of a
moderating factor (i.e. strategic fit) we used simple regression analysis. To find the effect of
the moderating variable (strategic fit * diversity) we converted their values into their
respective z-scores for normalisation purpose. Subsequently, we also used several control
variables to study the effect of the above. For this, we used multiple regression analysis and
observed the significance of the individual variables by conducting t-tests. We also observed
the overall significance of the model through F-tests and adjusted R Square. To find out the
strength and direction of relationships we observed the beta coefficients and their respective
standard errors.
As multivariate analysis demands normal distribution of data, testing of univariate and
multivariate normality was carried out before taking up these analyses. Kolmogorov-Smirnov
one sample test of goodness of fit was carried out to test the univariate normality distribution
of data. We observed the respective values of skewness and kurtosis to test the multivariate
normality of data. As advised in earlier studies, natural logarithmic transformation of these
155
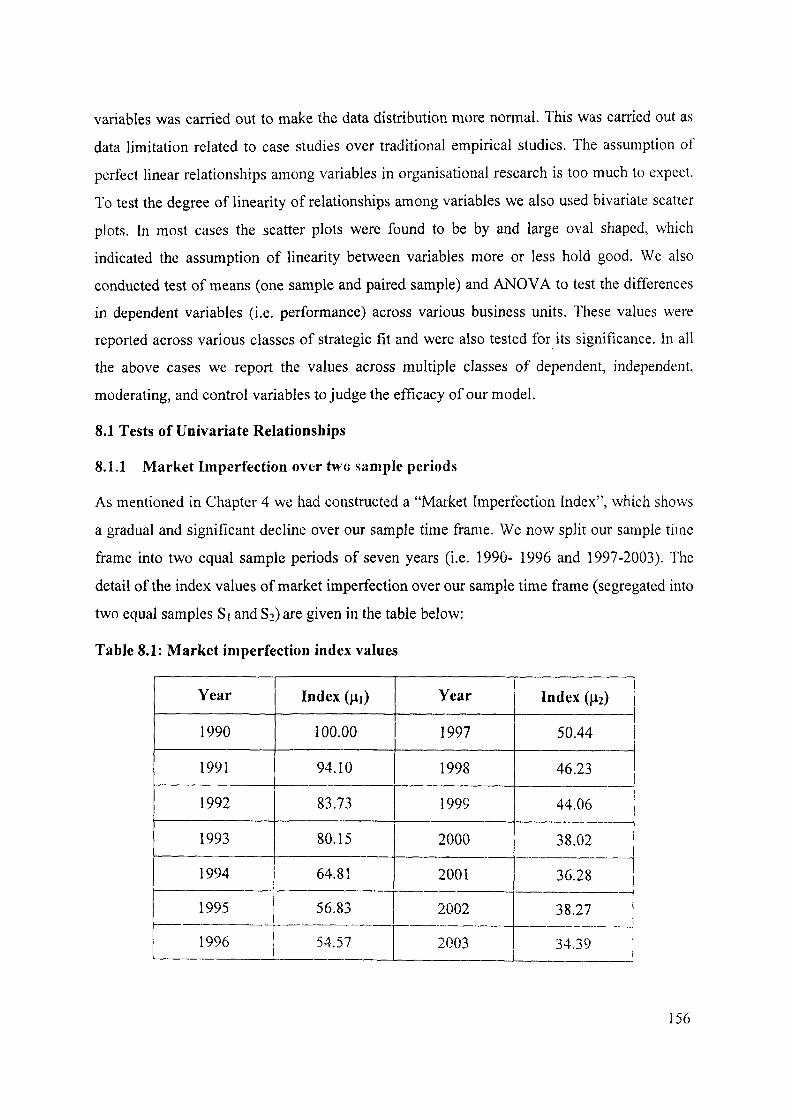
variables was carried out to make the data distribution more normal. This was carried out as
data limitation related to case studies over traditional empirical studies. The assumption of
perfect linear relationships among variables in organisational research is too much to expect.
To test the degree of linearity of relationships among variables we also used bivariate scatter
plots. In most cases the scatter plots were found to be by and large oval shaped, which
indicated the assumption of linearity between variables more or less hold good. We also
conducted test of means (one sample and paired sample) and ANOVA to test the differences
in dependent variables (i.e. performance) across various business units. These values were
reported across various classes of strategic fit and were also tested for its significance. In all
the above cases we report the values across multiple classes of dependent, independent,
moderating, and control variables to judge the efficacy of our model.
8.1 Tests of Univariate Relationships
8,1.1 Market Imperfection over two sample periods
As mentioned in Chapter 4 we had constructed a "Market Imperfection Index", which shows
a gradual and significant decline over our sample time frame. We now split our sample time
fi-ame into two equal sample periods of seven years (i.e. 1990- 1996 and 1997-2003). The
detail of the index values of market imperfection over our sample time frame (segregated into
two equal samples S| and S2) are given in the table below:
Table 8.1: Market imperfection index values
Year
1990
1991
1992
1993
1994
1995
1996
Index ( i)
100.00
94.10
83.73
80.15
64.81
56,83
54.57
Year
1997
1998
1999
2000
2001
2002
2003
Index (fii)
50.44
46.23
44.06
38.02
36.28
38.27
34.39
156
Over this fourteen-year time frame (1990-2003) we are interested in knowing whether there
has been a significant reduction in market imperfection in the economy. We shall now
explain the technique for testing of differences in means. The null hypothesis and alternate
hypotheses are thus stated as follows:
Ho: The market imperfection index is the same for two sample periods (i.e. |ii = 12)
H]-. The market imperfection index is different for two sample periods (i.e. fj.i > [Xi)
where p.] is the sample mean for the period (1990-1996), and 12 is the sample mean for the
period (1997-2003). In the above illustration we took the standard significance level of 5%
and this implies that //Q will be rejected when the sampling result (i.e. observed evidence) has
a less than 0.05 probability of occurring if Ho is true. In other words, the 5% level of
significance means that we can say with 95% confidence of occurring if Ho is true. Thus our
risk level of 5% is deemed appropriate for the context of hypothesis testing. We then applied
a one-tailed test since we do not specify any value for the null hypothesis; or otherwise a
two-tailed test would have been appropriate. Because of the matched pairs we used paired t-
test and worked out the test statistic 't' as under:
t = D - 0
adiff/Vn
where -
D = ZDi and adiff= VlDj ^-(D)^*n
n Vn-1
Degrees of freedom - (n - 1) = 7 - 1 = 6. As //o is one-sided, we shall apply a one-tailed test
(in the right tail, because Hj is of more than type) for determining the rejection region at 5%
level of significance which comes to as under, using the table of t-distribution for 6 degrees
of freedom: R: t = 1.943. The observed value oft is 8.97, which falls in the rejection region,
and thus we reject HQ at 5% level and accept H;. Therefore, the conclusion is that the market
imperfection in the first sample period (Si) is significantly greater than in the second sample
period (S2). This by and large confirms our Hypothesis-5, that economic liberalisation has
resulted in a significant reduction in the extent of market imperfection in the economy. To
further strengthen our analysis we measured the slope of the Market Imperfection curve in
the two periods Si and S2 separately. Because of the inverse nature of the relationship, we
expected the slope to have a negative intercept. For the period Si the slope of the curve was
157
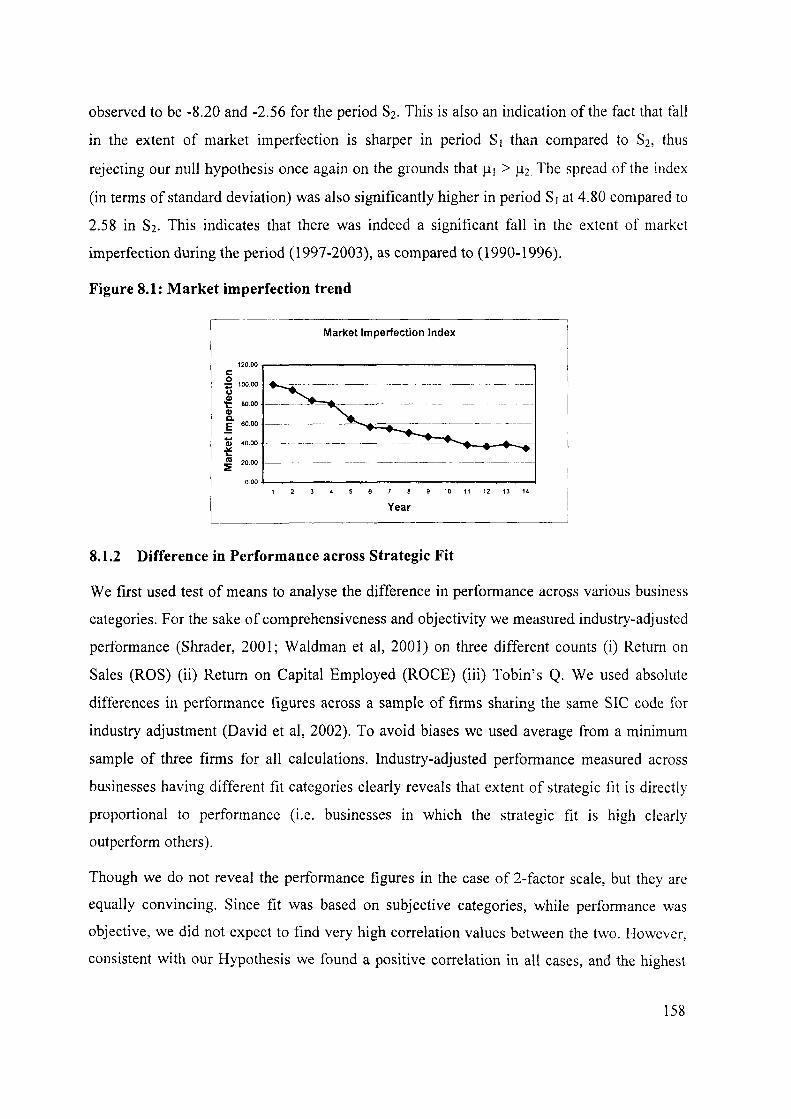
observed to be -8.20 and -2.56 for the period S2. This is also an indication of the fact that fall
in the extent of market imperfection is sharper in period Si than compared to S2, thus
rejecting our null hypothesis once again on the grounds that p-i > [X2, The spread of the index
(in terms of standard deviation) was also significantly higher in period Si at 4.80 compared to
2.58 in S2. This indicates that there was indeed a significant fall in the extent of market
imperfection during the period (1997-2003), as compared to (1990-1996).
Figure 8.1: Market imperfection trend
Market Imperfection Index
10 11 12 13 14
8.1.2 Difference in Performance across Strategic Fit
We first used test of means to analyse the difference in performance across various business
categories. For the sake of comprehensiveness and objectivity we measured industry-adjusted
performance (Shrader, 2001; Waldman et al, 2001) on three different counts (i) Return on
Sales (ROS) (ii) Return on Capital Employed (ROCE) (iii) Tobin's Q. We used absolute
differences in performance figures across a sample of firms sharing the same SIC code for
industry adjustment (David et al, 2002). To avoid biases we used average from a minimum
sample of three firms for all calculations. Industry-adjusted performance measured across
businesses having different fit categories clearly reveals that extent of strategic fit is directly
proportional to performance (i.e. businesses in which the strategic fit is high clearly
outperform others).
Though we do not reveal the performance figures in the case of 2-factor scale, but they are
equally convincing. Since fit was based on subjective categories, while performance was
objective, we did not expect to find very high correlation values between the two. However,
consistent with our Hypothesis we found a positive correlation in all cases, and the highest
158
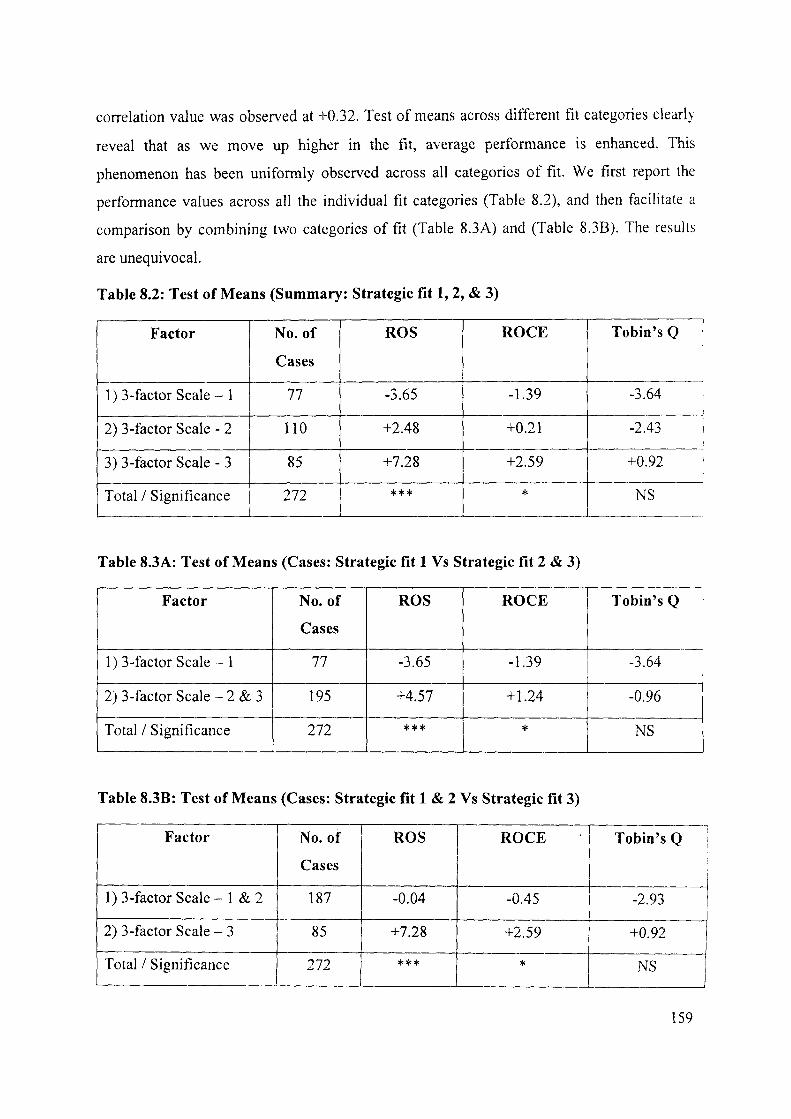
correlation value was observed at +0.32. Test of means across different fit categories clearly
reveal that as we move up higher in the fit, average performance is enhanced. This
phenomenon has been uniformly observed across all categories of fit. We first report the
performance values across all the individual fit categories (Table 8.2), and then facilitate a
comparison by combining two categories of fit (Table 8.3A) and (Table 8.3B). The results
are unequivocal.
Table 8.2: Test of Means (Summary: Strategic fit 1,2, i& 3)
Factor
l)3-factor Scale-1
2) 3-factor Scale - 2
3) 3-factor Scale - 3
Total / Significance
No. of
Cases
77
110
85
272
ROS
-3.65
+2.48
+7.28
***
ROCE
-1.39
+0.21
+2.59
*
Tobin's Q
-3.64
-2,43
+0.92
NS
Table 8.3A: Test of Means (Cases: Strategic fit 1 Vs Strategic fit 2 «& 3)
Factor
1) 3-factor Scale - 1
2) 3-factor Scale - 2 & 3
Total / Significance
No. of
Cases
77
195
272
ROS
-3.65
+4.57
***
ROCE
-1.39
+1.24
*
Tobin's Q
-3.64
-0.96
NS
Table 8.3B: Test of Means (Cases: Strategic fit 1 & 2 Vs Strategic fit 3)
Factor
1) 3-factor Scale - 1 & 2
2) 3-factor Scale - 3
Total / Significance
No. of
Cases
187
85
272
ROS
-0.04
+7.28
***
ROCE
-0.45
+2.59
*
Tobin's Q
-2.93
+0.92
NS
159
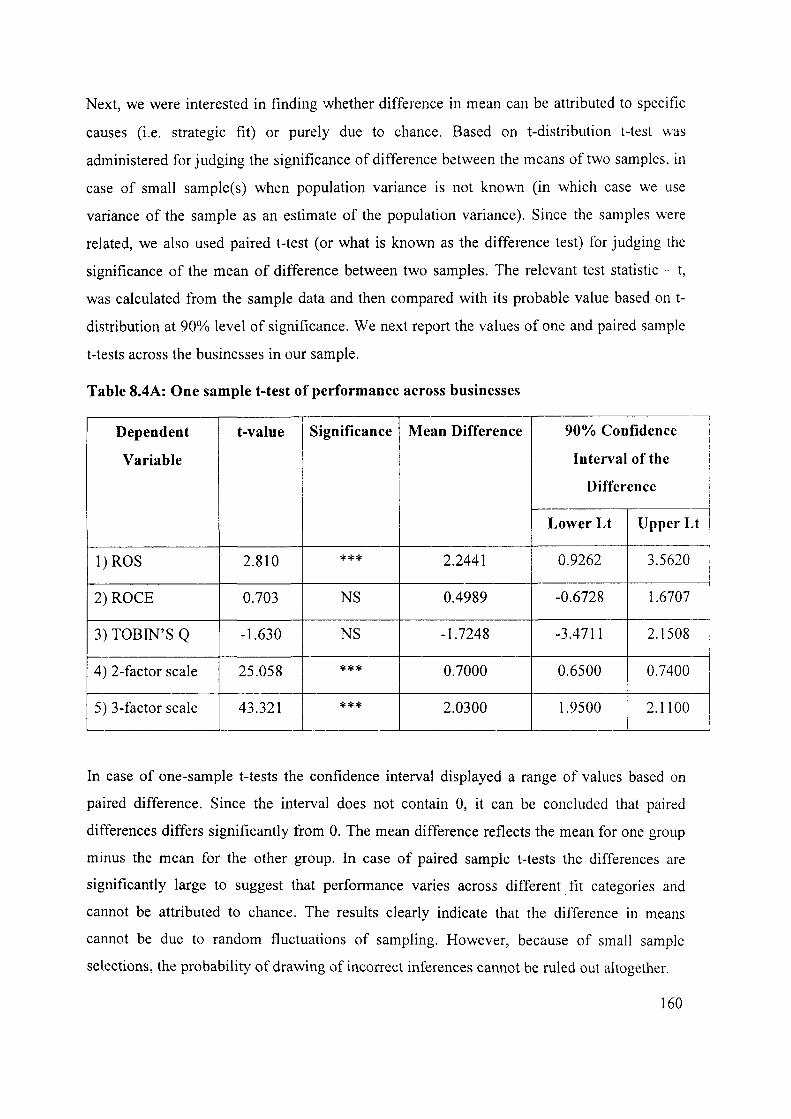
Next, we were interested in finding whether difference in mean can be attributed to specific
causes (i.e. strategic fit) or purely due to chance. Based on t-distribution t-test was
administered forjudging the significance of difference between the means of two samples, in
case of small sample(s) when population variance is not known (in which case we use
variance of the sample as an estimate of the population variance). Since the samples were
related, we also used paired t-test (or what is known as the difference test) for judging the
significance of the mean of difference between two samples. The relevant test statistic - t,
was calculated from the sample data and then compared with its probable value based on t-
distribution at 90% level of significance. We next report the values of one and paired sample
t-tests across the businesses in our sample.
Table 8.4A: One sample t-test of performance across businesses
Dependent
Variable
1)R0S
2) ROCE
3) TOBIN'S Q
4) 2-factor scale
5) 3-factor scale
" •
t-value
2.810
0.703
-1.630
25.058
43.321
Signiflcance
***
NS
NS
***
***
Mean Difference
2.2441
0.4989
-1.7248
0.7000
2.0300
90% Confidence
Inter 'al of the
Difference
Lower Lt
0.9262
-0.6728
-3.4711
0.6500
1.9500
Upper Lt
3.5620
1.6707
2.1508
0.7400
2.1100
In case of one-sample t-tests the confidence interval displayed a range of values based on
paired difference. Since the interval does not contain 0, it can be concluded that paired
differences differs significantly from 0. The mean difference reflects the mean for one group
minus the mean for the other group. In case of paired sample t-tests the differences are
significantly large to suggest that performance varies across different fit categories and
cannot be attributed to chance. The results clearly indicate that the difference in means
cannot be due to random fluctuations of sampling. However, because of small sample
selections, the probability of drawing of incorrect inferences cannot be ruled out altogether.
160
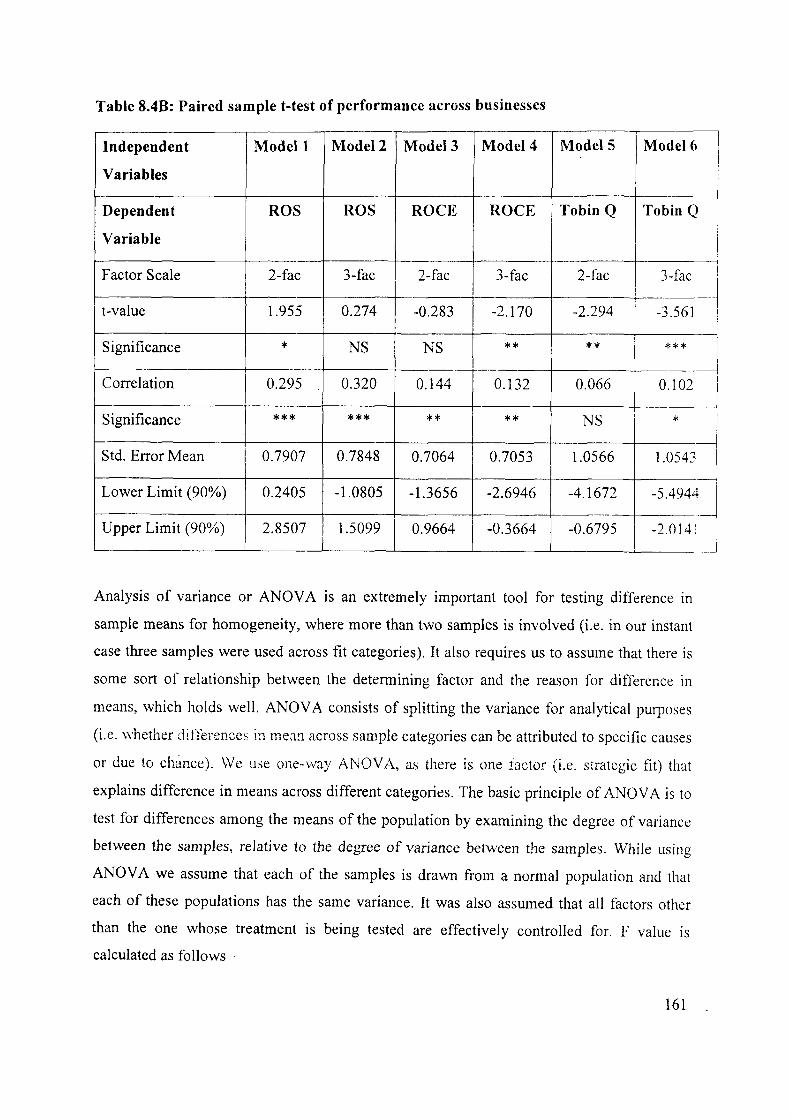
Table 8.4B: Paired sample t-test of performance across businesses
Independent
Variables
Dependent
Variable
Factor Scale
t-value
Significance
Correlation
Significance
Std. Error Mean
Lower Limit (90%)
Upper Limit (90%)
Model 1
ROS
2-fac
1.955
*
0.295
***
0.7907
0.2405
2.8507
Model 2
ROS
3-fac
0.274
NS
0.320
***
0.7848
-1.0805
1.5099
Model 3
ROCE
2-fac
-0.283
NS
0.144
**
0.7064
-1.3656
0.9664
Model 4
ROCE
3-fac
-2.170
**
0.132
**
0.7053
-2.6946
-0.3664
Model 5
Tobin Q
2-fac
-2.294
**
0.066
NS
1.0566
-4.1672
-0.6795
Model 6
Tobin 0
3-fac
-3.561
* + *
0.102
*
1.0543
-5.4944
-2.0141
Analysis of variance or ANOVA is an extremely important tool for testing difference in
sample means for homogeneity, where more than two samples is involved (i.e. in our instant
case three samples were used across fit categories). It also requires us to assume that there is
some sort of relationship between the determining factor and the reason for difference in
means, which holds well. ANOVA consists of splitting the variance for analytical purposes
(i.e. whether differences in mean across sample categories can be attributed to specific causes
or due to chance). We use one-way ANOVA, as there is one tactor (i.e. strategic fit) that
explains difference in means across different categories. The basic principle of ANOVA is to
test for differences among the means of the population by examining the degree of variance
between the samples, relative to the degree of variance between the samples. While using
ANOVA we assume that each of the samples is drawn from a normal population and that
each of these populations has the same variance. It was also assumed that all factors other
than the one whose treatment is being tested are effectively controlled for. F value is
calculated as follows -
161
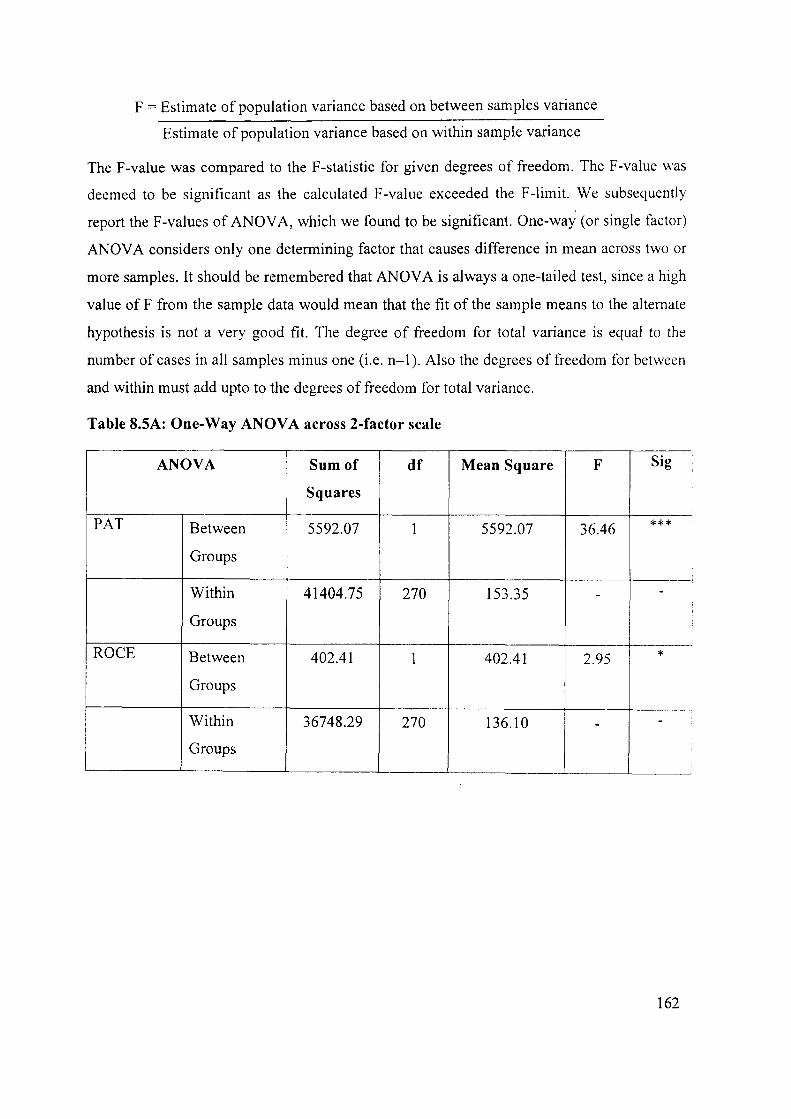
F == Estimate of population variance based on between samples variance
Estimate of population variance based on within sample variance
The F-value was compared to the F-statistic for given degrees of freedom. The F-value was
deemed to be significant as the calculated F-value exceeded the F-limit. We subsequently
report the F-values of ANOVA, which we found to be significant. One-way (or single factor)
ANOVA considers only one determining factor that causes difference in mean across two or
more samples. It should be remembered that ANOVA is always a one-tailed test, since a high
value of F from the sample data would mean that the fit of the sample means to the alternate
hypothesis is not a very good fit. The degree of freedom for total variance is equal to the
number of cases in all samples minus one (i.e. n-1). Also the degrees of freedom for between
and within must add upto to the degrees of freedom for total variance.
Table 8.5A: One-Way ANOVA across 2-factor scale
PAT
ROCE
ANOVA
Between
Groups
Within
Groups
Between
Groups
Within
Groups
Sum of
Squares
5592.07
41404.75
402.41
36748.29
df
1
270
1
270
Mean Square
5592.07
153.35
402.41
136.10
F
36.46
~
2.95
•
Sig
***
*
162
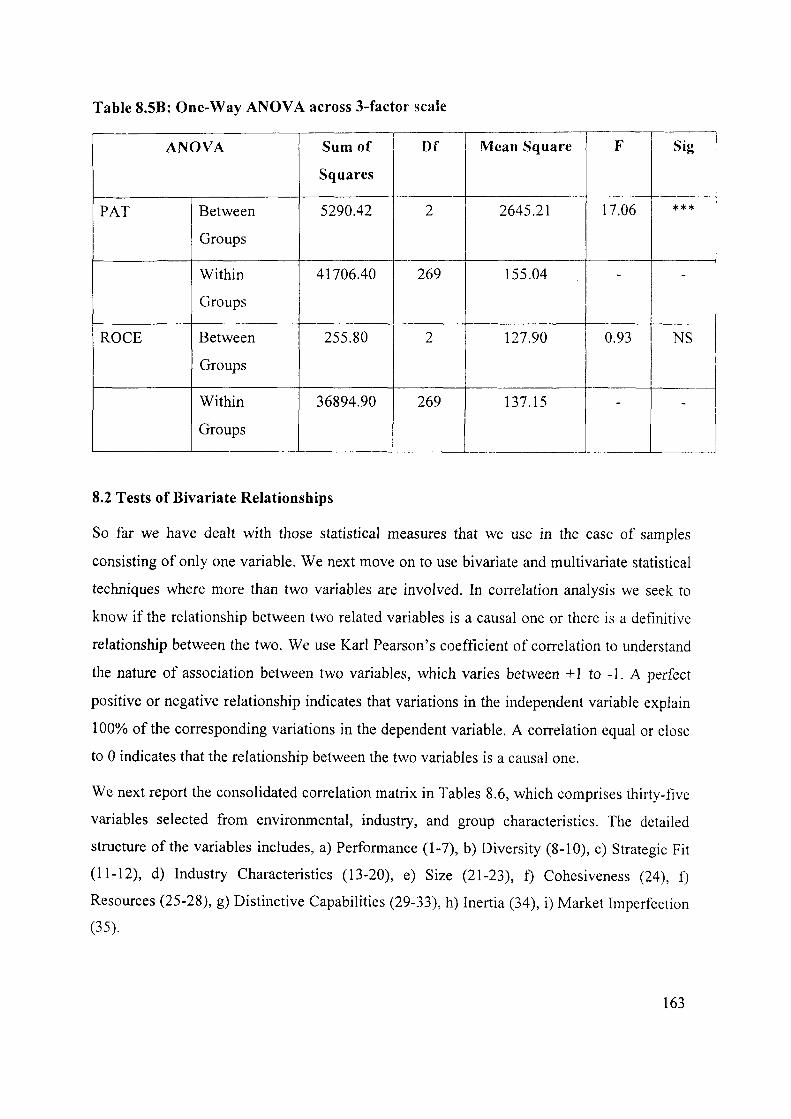
Table 8.5B: One-Way ANOVA across 3-factor scale
ANOVA
PAT
ROCE
Between
Groups
Within
Groups
Between
Groups
Within
Groups
Sum of
Squares
5290.42
41706.40
255.80
36894.90
Df
2
269
2
269
Mean Square
2645.21
155.04
127.90
137.15
F
17.06
0.93
*"
Sig
•
NS
i
8.2 Tests of Bivariate Relationships
So far we have dealt with those statistical measures that we use in the case of samples
consisting of only one variable. We next move on to use bivariate and multivariate statistical
techniques where more than two variables are involved. In correlation analysis we seek to
know if the relationship between two related variables is a causal one or there is a definitive
relationship between the two. We use Karl Pearson's coefficient of correlation to understand
the nature of association between two variables, which varies between +1 to -1. A perfect
positive or negative relationship indicates that variations in the independent variable explain
100% of the corresponding variations in the dependent variable. A correlation equal or close
to 0 indicates that the relationship between the two variables is a causal one.
We next report the consolidated correlation matrix in Tables 8.6, which comprises thirty-five
variables selected from environmental, industry, and group characteristics. The detailed
structure of the variables includes, a) Performance (1-7), b) Diversity (8-10), c) Strategic Fit
(11-12), d) Industry Characteristics (13-20), e) Size (21-23), f) Cohesiveness (24), f)
Resources (25-28), g) Distinctive Capabilities (29-33), h) Inertia (34), i) Market Imperfection
(35).
163
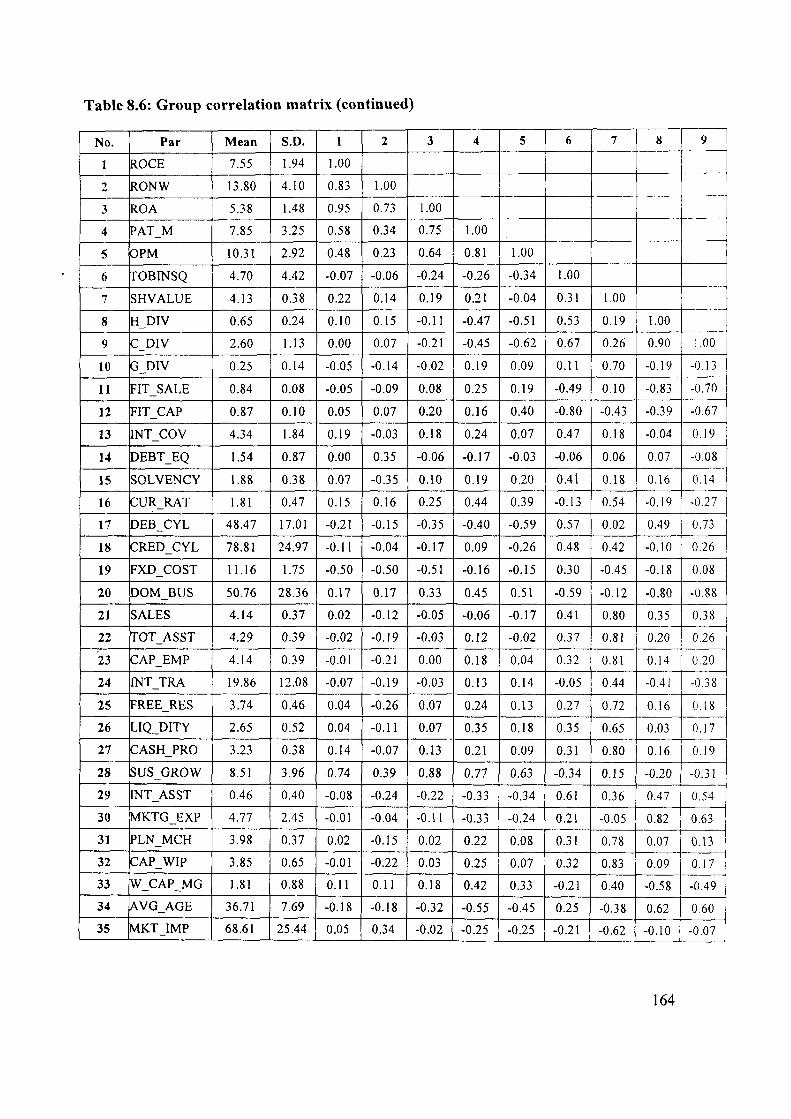
Table 8.6: Group correlation matrix (continued)
No.
1
2
3
4
5
6
7
8
9
10
11
12
13
14
15
16
17
18
19
20
21
22
23
24
25
26
27
28
29
30
31
32
33
34
35
Par
ROCE
RONW
ROA
PAT_M
0PM
TOBINSQ
SHVALUE
H_DIV
CDIV
G_DIV
FITSALE
FIT_CAP
INT_COV
DEBTEQ
SOLVENCY
CUR_RAT
DEB_CYL
CRED_CYL
FXDCOST
DOM_BUS
SALES
TOT_ASST
CAP_EMP
INT_TRA
FREE_RES
LIQ_DITY
CASH_PRO
SUSGROW
INT ASST
MKTG_EXP
PLN_MCH
CAP_WIP
W_CAP_MG
AVG_AGE
MKTIMP
Mean
7.55
13.80
5.38
7.85
10.31
4.70
4.13
0.65
2.60
0.25
0.84
0.87
4.34
1.54
1.88
1.81
48.47
78.81
11.16
50.76
4.14
4.29
4.14
19.86
3.74
2.65
3.23
8.51
0.46
4.77
3.98
3.85
1.81
36.71
68.61
S.D.
1.94
4.10
1.48
3.25
2.92
4.42
0.38
0.24
1.13
0.14
0.08
0.10
1.84
0.87
0.38
0.47
17.01
24.97
1.75
28.36
0.37
0.39
0.39
12.08
0.46
0.52
0.38
3.96
0.40
2.45
0.37
0.65
0.88
7.69
25.44
1
1.00
0.83
0.95
0.58
0.48
-0.07
0.22
0.10
0.00
-0.05
-0.05
0.05
0.19
0.00
0.07
0.15
-0.21
-0.11
-0.50
0.17
0.02
-0.02
-0.01
-0.07
0.04
0.04
0.14
0.74
-0.08
-0.01
0.02
-0.01
0.11
-0.18
0.05
2
1.00
0.73
0.34
0.23
-0.06
0.14
0.15
0.07
-0.14
-0.09
0.07
-0.03
0.35
-0.35
0.16
-0.15
-0.04
-0.50
0.17
-0.12
-0.19
-0.21
-0.19
-0.26
-0.11
-0.07
0.39
-0.24
-0.04
-0.15
-0.22
0.11
-0.18
0.34
3
1.00
0.75
0.64
-0.24
0.19
-0.11
-0.21
-0.02
0.08
0.20
0.18
-0.06
0.10
0.25
-0.35
-0.17
-0.51
0.33
-0.05
-0.03
0.00
-0.03
0.07
0.07
0.13
0.88
-0.22
-0.11
0.02
0.03
0.18
-0.32
-0.02
4
1.00
0.81
-0.26
0.21
-0.47
-0.45
0.19
0.25
0.16
0.24
-0.17
0.19
0.44
-0.40
0.09
-0.16
0.45
-0.06
0.12
0.18
0.13
0.24
0.35
0.21
0.77
-0.33
-0.33
0.22
0.25
0.42
-0.55
-0.25
5
1.00
-0.34
-0.04
-0.51
-0.62
0.09
0.19
0.40
0.07
-0.03
0.20
0.39
-0.59
-0.26
-0.15
0.51
-0.17
-0.02
0.04
0.14
0.13
0.18
0.09
0.63
-0.34
-0.24
0.08
0.07
0.33
-0.45
-0.25
6
1.00
0.31
0.53
0.67
O.ll
-0.49
-0.80
0.47
-0.06
0.41
-0.13
0.57
0.48
0.30
-0.59
0.41
0.37
0.32
-0.05
0.27
0.35
0.31
-0.34
0.61
0.21
0.31
0.32
-0.21
0.25
-0.21
7
1,00
0.19
0.26
0.70
0.10
-0.43
0.18
0.06
0.18
0.54
0.02
0.42
-0.45
-0.12
0.80
0.81
0.81
0.44
0.72
0.65
0.80
0.15
0.36
-0.05
0.78
0.83
0.40
-0.38
-0.62
8
1.00
0.90
-0.19
-0.83
-0.39
-0.04
0.07
0.16
-0.19
0.49
-0.10
-0.18
-0.80
0.35
0.20
0.14
-0.41
0.16
0.03
0.16
-0.20
0.47
0.82
0.07
0.09
-0.58
0.62
-0.10
9
1.00
-0.13
-0.70
-0.67
0.19
-0.08
0.14
-0.27
0.73
0.26
0.08
-0.88
0.38
0.26
0.20
-0.38
0.18
0.17
0.19
-0.31
0.54
0.63
0.13
0.17
-0.49
0,60
-0,07
164

Table 8.6: Group correlation matrix (continued)
No.
1
2
3
4
5
6
7
8
9
10
11
12
13
14
15
16
17
18
19
20
21
22
23
24
25
26
27
28
29
30
31
32
33
34
35
10
1.00
0.40
-0.32
0.03
0.01
0.28
0.61
-0.30
0.28
-0.16
0.19
0.76
0.81
0.82
0.77
0.75
0.65
0.82
0.01
0.32
-0.34
0.86
0.73
0.61
-0.62
-0.66
11
1.00
0.22
0.00
-0.09
-0.24
0.16
-0.38
0.22
-0.03
0.66
-0.04
0.02
0.06
0.57
0.00
0.05
0.06
0.14
-0.23
-0.84
0.11
0.06
0.65
-0.64
0.07
12
1.00
-0.55
0.16
-0.36
0.10
-0.54
-0.68
-0.36
0.53
-0.59
-0.57
-0.52
-0.19
-0.45
-0.59
-0.51
0.32
-0.66
0.02
-0.53
-0.50
-0.06
-0.02
0.29
13
1.00
-0.38
0.51
-0.22
0.40
0.43
0.26
-0.17
0.14
0.19
0.18
0.08
0.18
0.34
0.18
0.16
0.43
-0.23
0.19
0.30
-0.07
-0.01
-0.17
14
1.00
-0.45
0.26
-0.28
-0.13
-0.30
0.22
-0.04
-0.10
-0.11
0.06
-0.22
-0.11
-0.08
-0.25
-0.21
-0.04
-0.06
-0.12
0.18
-0.24
0.21
15
1.00
0.03
-0.03
0.01
0.10
-0.22
0.47
0.51
0.51
0.30
0.63
0.45
0.52
0.30
0.57
0.17
0.49
0.51
-0.03
-0.01
-0.66
16
1.00
-0.47
-O.OI
-0.40
0.33
0.38
0.47
0.50
0.36
0.46
0.43
0.50
0.26
-0.13
-0.14
0.53
0.45
0.50
-0.59
-0.45
17
1.00
0.42
0.43
-0.70
0.01
-0.04
-0.09
-0.49
-0.11
-0.04
-0.14
-0.44
0.40
0.30
-0.14
-0.03
-0.60
0.60
0.16
18
1.00
0.35
-0.20
0.25
0.33
0.30
0.16
0.17
0.47
0.24
-0.22
0.25
-0.38
0.31
0.38
0.39
-0.18
-0.05
19
1.00
-0.18
-0.27
-0.18
-0.20
-0.15
-0.19
0.05
-0.27
-0.45
0.12
-0.16
-0.17
-0.19
-0.17
0.24
0.18
20
1.00
-0.31
-0.23
-0.18
0.42
-0.19
-0.19
-0.13
0.33
-0.54
-0.71
-0.09
-0.18
0.52
-0.69
0.16
21
1.00
0.97
0.95
0.60
0.91
0.74
0.96
-0.05
0.64
0.11
0.92
0.88
0.31
-0.27
-0.80
22
1.00
1.00
0.63
0.96
0.84
0.98
0.00
0,57
0.02
0.98
0.95
0,41
-0.37
-0.88
165

Table 8.6: Group correlation matrix
No.
1
2
3
4
5
6
7
8
9
10
11
12
13
14
15
16
17
18
19
20
21
22
23
24
25
26
27
28
29
30
31
32
33
34
35
23
1.00
0.65
0.97
0.84
0.98
0.05
0.52
0.00
0.98
0.96
0.44
-0.41
-0.90
24
1.00
0.59
0.48
0.67
0.02
0.25
-0.56
0.70
0.59
0.72
-0.72
-0.53
25
1.00
0.81
0.96
0.17
0.53
0.09
0.94
0.93
0.35
-0.34
-0.94
26
1.00
0.82
0.08
0.48
-0.09
0.85
0.86
0.50
-0.40
-0.74
27
1.00
0.12
0.53
-0.02
0.98
0.92
0.45
-0.44
-0.87
28
1.00
-0.25
-0.05
0.04
0.11
0.18
-0.27
-0.16
29
1.00
0.23
0.50
0.48
-0.14
0.24
-0.45
30
1.00
-0.10
-0.02
-0.64
0.74
-0.17
31
1.00
0.92
0.51
-0.49
-0.86
32
1.00
0.42
-0.39
-0.90
33
1.00
-0.79
-0.29
34
1.00
0.28
35
1 00
166
8.2.1 Market Imperfection, Diversity, and Performance
A firm's environment has been defined as the aggregate of those external factors that have
impacts or the potential to have impacts on its functioning (Emery and Tryst, 1965;
Thompson, 1967). Environment is also a source of constraints, contingencies, problems and
opportunities that effect the terms on which an organisation transacts business (Khandwalla,
1977). It provides a firm with opportunities and options about the various aspects of
management of business - growth, profits, business scope, geographical scope, diversity,
economies of scale and other forms of resources (Ray, 2000). This attribute of the
environment indicates its munificence. Munificence is governed by the presence of various
resources in an environment and the competition among firms for those resources.
Environmental influence can thus be broadly classified into: intensity of market forces and
regulatory intensity. In a regulated environment, the government rather than the market
forces regulates the behaviour of firms (Dill, 1958; Desai, 1993). This is what we term
"market imperfection".
Under conditions of high market imperfection, munificence is found to be low, resulting in
low level of competition among firms for those resources. Being a source of resources,
market imperfection has certain governing influence on diversification strategy as well as on
firm performance (Pfeffer and Salancik, 1978). In terms of performance, market imperfection
was found to positively influence returns and negatively influence margins. This is an
indication that munificence presents potential growth opportunities and also increased
competitiveness in the market. Market imperfection was also found to positively influence
diversity. This by and large supports the findings of Khanna and Palepu, (1997). Perhaps,
institutional voids and gaps have an important role to play in explaining unrelated
diversifications by business groups in emerging markets. Further, economic liberalisation
induces business groups to become more focused in the light of reduction in gaps that
prevailed in the economy.
Khanna and Palepu (1997) are of the opinion that highly diversified business groups can be
particularly well suited to such institutional contexts. They conclude that it is the difference
in institutional context that explains success of large diversified corporations in many
developing economies. Business groups can thus add value by imitating the functions of
several institutions that are present in most advanced economies. They effectively mediate
167
between their affiliates and the rest of the economy. This line of work was pioneered by
(Leff; 1976, 1978) and finds use in the subsequent works of Caves and Uekusa (1976), Choi
(1988) and Aoki (1990). This leads to the general conclusion that business groups in
emerging markets add value by diversifying in unrelated areas. However, our results indicate
that this may be only partially true. Therefore, the existence of business groups may be the
resuh of a wide range of sociological and cultural factors, which has little to do with
economic efficiency.
8.2.2 Industry Characteristics, Diversity, and Performance
Industry characteristics have been proposed as an important variable influencing performance
(Hoskisson and Hitt, 1990; Porter, 1980). Industry variables such as solvency, liquidity, and
dominant business have been found to positively influence performance (i.e. a strong
solvency and liquidity positions gives additional bargaining power to firms in dealing with
suppliers, hence lowering input costs and enhancing performance). They have the potential to
create synergy across diversified businesses. This idea of diversification has often been
linked with risk reduction. One potential benefit of increased diversity arises from combining
businesses with imperfectly correlated earning streams. This 'coinsurance effect' gives
diversified groups greater debt carrying capacity than single-line businesses of similar size
(Lewellen, 1971). A business group also has to bear extra costs for having a diversified
operation. They are due to distractions of the top management from its areas of excellence
and also partially due extra burden of managing diversified operations. Porter (1986) argued
that a group diversifying into varied areas create costs, some visible some hidden. In contrast,
factors such as debtors and creditors' cycle, fixed costs have been found to negatively
influence performance (i.e. it induces a firm to block more investments in fixed and working
capital). However, consistent with existing findings we also observed that industry
characteristics negatively influenced diversity.
8.2.3 Size, Diversity, and Performance
Size has been proposed as an important variable influencing performance (Child, 1972;
Morck et al., 1988). Market power view suggests that diversified firms will, "thrive at the
expense of non-diversified firms not because they are more efficient, but because they have
access to what is termed as conglomerate power" (Hill, 1985:9). The author defines that this
power comes by the way of deriving monopoly and monopsony benefits from the market. In
168
support of this context, Griffin (1976) adds, that a firm with insignificant positions in a
number of markets will not, in sum, have this power. In contrast, size was found to
negatively influence performance captured by accounting based measures. Though extant
research has identified conglomerate power with positive perfonnance effects, our research
findings points to the contrary. Perhaps, conglomerate power is more associated with
additional costs and inertia that nullifies the positive performance effects. Ghosal (1987) also
argued that strategic importance of scale and scope economies arises from a diversified
group's ability to share investments and costs across value chains that competitors not
possessing such internal and external diversity cannot. However, when performance was
captured by market based measures, size was found to positively influence performance.
Consistent with existing notions we found that size positively influences diversity.
8.2,4 Cohesiveness, Diversity, and Performance
The very basis of a firm being affiliated with a business group in an emerging market is its
access to a centralised pool of resources (Chang and Hong, 2002). Indeed, most business
groups assume this characteristic to efficiently intermediate between various markets and
have access to substantial upstream and downstream integration (Chang and Choi, 1988).
Central firms develop strong inter-connections with smaller member firms that provide
support in critical areas and various feeder services. This mechanism is important since most
emerging markets are grossly underdeveloped and distorted by inefficient government
intervention (Cole and Park, 1983). Furthermore, business groups also operate an internal
labour market, thereby ensuring better allocation of scarce managerial resources. They also
share technological resources and promote group-wide advertising, which generates
economies of scale and scope (Chang and Hong, 2000). Chang and Hong (2002) suggest that
business groups substantially influence the profitability of individual affiliates through these
actions. Firms tend to display cohesion through various forms of mutual cooperation and
resource transfer among various member firms. Average resource transfer in terms of
cohesiveness was the highest in the case of the Reliance group averaging at around 30%,
17% for Tata group and 12% for Aditya Birla group. Consistent with such notions we found
cohesiveness to positively influence performance margins.
However, such sharing can only take place across business segments only when they are
strategically similar (Porter, 1985). Shared knowledge and external relations is another
169
component of cohesiveness that may affect diversity (Porter, 1987). Different business
segments or products of a diversified business group face different types of environmental
demands. Therefore, an effort to create synergies may fail or it may result in some form of
compromise with the objective of external consistency. Theoretical arguments suggest that
group affiliation may prove to be costly as well. For instance, group affiliation is also
associated with centralised costs, which may or may not be beneficial for the firm. We also
found cohesiveness to influence performance returns negatively.
This has been clearly observed through the implementation of the "Tata Brand Equity Plan";
while it clearly benefited the larger firms, the smaller ones were deprived of such benefits. In
addition to such direct burden, they are other indirect, but less obvious burdens too. They
have, for instance an obligation to bail out member firms that are performing badly; if
unaffiliated, such poor performers would be left to go bankrupt. Moreover, secure in the
cohesiveness of the group, firm managers may have weak incentive to run their business
efficiently. They may also be obliged, or at least prone, to purchase inputs from member
firms, efficient or otherwise. Presumably, groups also include firms whose decisions are
mostly driven by considerations other than local economic gain. Social and cultural ties keep
firms bound to their groups despite economic costs, and poor performance can persist
because selection pressures are modest. Consistent with earlier research findings,
cohesiveness was also found to negatively influence group diversity, and positively influence
geographical diversity.
8.2.5 Resources, Capabilities, Diversity, and Performance
Existing research supports the view that possession of certain basic resources and the
development of distinctive capabilities form the very basis of competitive advantage and
superior performance. Barney (1986) suggested that strategic resource factors differ in their
tradability and that these factors can be specifically identified and their monetary value
determined via a strategic factor market. Barney (1991) later established the criteria to more
fully explicate the idea of strategic tradability. Penrose (1959) argued that heterogeneous
capabilities give each firm its unique character and form the essence of competitive
advantage. This led Wemerfelt (1984) to conclude that that evaluating firms in terms of their
resources could lead to insights different from the tradifional I/O Economics perspective
(Porter, 1980). The measure of resource as an antecedent factor of performance has been
170
identified across various existing research across firms in the developed market context
(Penrose, 1959; Wemerfeh, 1984; Hoskisson and Hitt, 1990). Consistent with such findings
we observed that resources positively influences performance across business groups in
emerging markets as well.
Hoskisson et al. (2000) noted that resources for competitive advantage in emerging markets
are, on the whole, intangible. They are not necessarily product-market driven as would be
suggested by the knowledge-based view of the firm (Conner and Prahalad, 1996). Although
some form of capabilities (i.e. first mover advantages) are standard across markets, many of
which are specific to business groups and emerging markets. In most emerging markets,
capabilities are difficult to establish without a close relationship with home governments.
However, as institutions change business groups are likely to have less and less advantage
relative to domestic and foreign players who wish to enter the market (Khanna and Palepu,
1999) Therefore business groups need to carefully appraise its portfolio of capabilities in the
emerging context. In essence, a group must understand the relationship between its assets
and the changing nature of the institution and the emerging characteristics of its industry
(Hoskisson, et al., 2000).
However, in the emerging market context the nature of capabilities are somewhat different.
Guillen (2000) approach is based on the notion that entrepreneurs in emerging markets create
business groups if political-economic conditions allow them to acquire and maintain the
capability of combining foreign and domestic resources - inputs, processes, and market
access - to repeatedly enter new industries. The study of Encamation (1989) observed that
once such capabilities are acquired they could be successfully exploited and leveraged across
diversified businesses to enhance performance. This also goes with the findings of Bardhan
(1997) on corruption issues. Consistent with such findings we observed that distinctive
capabilities positively influence performance.
Relatedness is a mechanism by which business groups capture synergies among various
firms; it also constitutes as a potential source of competitive advantage (Davis et al., 1992).
An organisation can achieve sustained superior performance by increasing its diversity; if it
is able it is able to exploit its resources or assets that are unavailable to its rivals (Barney,
1991; Markides and Williamson, 1996). As Prahalad and Hamel (1990) put it, competencies
are not only the glue that binds existing businesses, they are also the engines for new
171
business development. Core competencies are the wellspring of new business development.
Patterns of diversification and market entry may be guided by them, and not just by the
attractiveness of markets. These forms of resources being highly tangible and flexible in
nature can be exploited across various sets of businesses, adding to the diversity of the group
(Chatterjee and Wemerfelt, 1991). Penrose (1959) arguments suggest that if the fungible
resource is centered on the top management; and if the top management has skills in
acquiring and managing businesses, then diversification to establish an internal capital
market becomes a possibility. In such a case the acquisition of unrelated businesses might be
entirely consistent with value creation. Guillen (2000) forwards the opinion that capabilities
of business groups in emerging markets basically centres around their ability to combine
critical inputs to repeatedly enter new industries. Our research findings support existing
views that resources and capabilities positively influence diversity as well.
8.2.6 Inertia, Diversity, and Performance
History of a business group has an influence on its strategic adaptation, as it abets inertia.
Inertia is also known to constrain strategic change (Ray, 2000). Miles and Cameron (1982)
observed that past strategic response to environmental changes constrict the nature and range
of diversification strategies that may be feasible. Major shifts in technology, regulation,
competitive dynamics or consumer preferences seldom occur suddenly. Some business
groups spot these changes early and then respond aggressively to these changes. However, at
times they fail to respond because they get trapped by the success formula that led there past
success.
In terms of corporate business portfolio there exists a great diversity in the population of
business groups owing to the historical difference in the strategic evolution of firms in the
regulated era. There are unrelated diversified groups, there are related diversified groups, and
there are single business firms operating side by side. Diversity attempts to capture this
difference in strategic predisposition of groups (Ray, 2002). It captures the dimension of
corporate strategy in the earlier period by taking a stock of the corporate portfolio in terms of
the number of distinct businesses. The inertia of the Tata group was observed to be the
highest, followed by Aditya Birla group, and Reliance group. In line with our expectation, we
found inertia to negatively influence performance. However, if we decompose the effect of
inertia on three-business groups separately, we found that while inertia was negative for the
172
Tata and Aditya Birla group, it was positive for the Reliance group. However, against
contrary expectations inertia was also found to positively influence group diversity, and
negatively influence geographical diversity.
8.2.7 Diversity, Strategic Fit, and Performance
Khanna and Palepu (2000) observed that net performance effects of affiliation with a
diversified business group would be curvilinear. Firm performance will initially decline with
increases in group diversity, until group diversity reaches a threshold. Beyond this threshold.
marginal increases in group diversity will yield marginal increases in firm performance. They
also concluded that, the threshold above which marginal increases in unrelated group
diversity will result in marginal increases in firm performance would rise as market
institutions evolve over time. Thus if we study the diversity-performance relationship in
emerging markets context over a longitudinal time horizon we expect to observe a transition
in the diversity-performance relationship of business groups from a positive to a negative
one. However, negative relationship between diversity and performance can be only expected
when an emerging market witnessed a consistently high level of efficient market
intermediation. Consistent with existing research findings we found that group diversity
negatively influences performance.
Geographical diversification involves producing (or providing) the same products or services
but developing a wider geographical reach (Buhner, 1987; Mudambi et al., 1999). Many
authors (Slocum, 1997; Rees, 1998) stated that geographical diversification offers several
advantages. First, it allows business groups to take advantage of new market positions (Wan,
1998). It also helps to stabilise returns by producing economies of scale and scope
(Hoskisson and Hitt, 1994). Geographical diversification also allows business groups to
exploit its distinctive capabilities across a wider market base (Hoskisson and Hitt, 1990).
Therefore, having a broader geographical scope may allow a group to achieve long-term
strategic competitiveness. Consistent with existing research findings we found that
geographical diversity positively influences performance. We also found that strategic fit
negatively influences performance. Perhaps, fit has a more prominent role in enhancing firm
performance than group ones. It prevents the group from diversifying into emerging
businesses and thereby secures a higher rate of return over traditional businesses. Therefore,
diversity enhances group performance only if the strategic fit is positive.
173
8.2.8 Size and Inertia
Ray (2000) observed that organisational inertia due to historical evolution of firms captured
in size among others constrained strategic responses of firms. Highly diversified, older and
larger firms were slow to react to the changing demand of the environment. In contrast
younger and smaller firms were more aggressive in their strategic responses and performed
better than older and larger firms. Among other factors, organisation culture rooted in
regulation, top management values, present structure and decision-making process perhaps
retarded their strategic response and performance. In a fast changing economic environment,
early recognition of opportunities and threats are a key factor to success. Boeker (1997)
suggests that in such cases changes in the top management may help groups overcome the
forces of inertia that constrains strategic change. However, inconsistent with above findings
we found that size negatively influences inertia.
8.2.9 Cohesiveness and Capabilities
The linkage between group cohesiveness and capabilities is well documented in strategic
management research. In the words of Prahalad and Hamel (1990), in the long run,
competitiveness derives from an ability to build, at lower cost and more speedily than
competitors, the core competencies that spawn unanticipated products. The author's point out
that difference in competitiveness comes not from people or technology related capabilities.
But the adherence of the top management to a concept of the corporation that unnecessarily
limits the ability of individual businesses to fully exploit the deep reservoirs of technological
capability that the entire group possesses. If core competence is about harmonising streams
of technology, it is also about the organisation of work and delivery valueAs Porter (1996)
points out that competitive advantage comes from the way activities fit and reinforce one
another. This way strategic fit creates competitive advantage and superior performance.
Strategic fit among many activities is fundamental not only to competitive advantage but also
to the sustainability of that advantage. Competitive advantage thus grows out of the entire
system of activities. The author concludes that positions built on a system of activities are far
more sustainable than those built on individual activities. And all this comes from increased
sharing of resources (tangible or otherwise) within diversified business groups, which we
term as cohesiveness. Consistent with our observations we observe that cohesiveness
positively influences capabilities.
174
8.2.10 Strategic Fit, Inertia, and Capability
The importance of fit among functional policies is one of the oldest ideas in strategic
management. A firm has been viewed from the point of view of structure, resources, and key
success factors, however, fit is a far more central component than most realise (Porter, 1996).
Fit is important because discrete activities often affect one another. Although some fit among
activities is generic and applies to many firms, the most valuable fit is strategy specific
because it enhances a position's uniqueness and amplifies trade-offs. Any form of capability
grows out of the entire system of activities, rather than any individual activity alone (Porter,
1996). Inertia is one factor that acts as constraint to the development and/or enhancement of
this fit. The bonding mechanisms between ordinary resources that lead to capabilities are
distinctly absent when firms are characterised by inertia. In support, we found that strategic
fit positively influences capabilities; and inertia negatively influences capabilities.
8.2.11 Size and Capabilities
As Prahalad and Hamel (1990) points out that in the short run, a firm's competitiveness
derives from the price-performance attributes of current products. However, in the long run,
competitiveness derives from an ability to build at a lower cost and more speedily than
competitors, the core competencies that spawn unanticipated products. The critical task for
the top management is to create an organisation capable of infusing products with irresistible
functionality or, better yet, creating products those customers need, but have not yet even
imagined. Core competencies are the collective learning in the organisation, especially how
to coordinate diverse production function skills and integrate multiple streams of
technologies. If core competence is about harmonising streams of technology, it is also about
the organisation of work and the delivery of value. It is also about communication,
involvement, and a deep commitment to working across organisational boundaries. The
authors make it clear that core competence does not mean out-spending rivals on research
and development. The benefits of competencies, like the benefits of money supply, depend
not much on the size of the stock the company holds, but on the velocity of their circulation.
When competencies become imprisoned in the cages of size, skills begin to atrophy.
However, inconsistent with the above observation we found that size positively influences
capabilities. Perhaps the effects of conglomerate power are too dominating in emerging
markets.
175
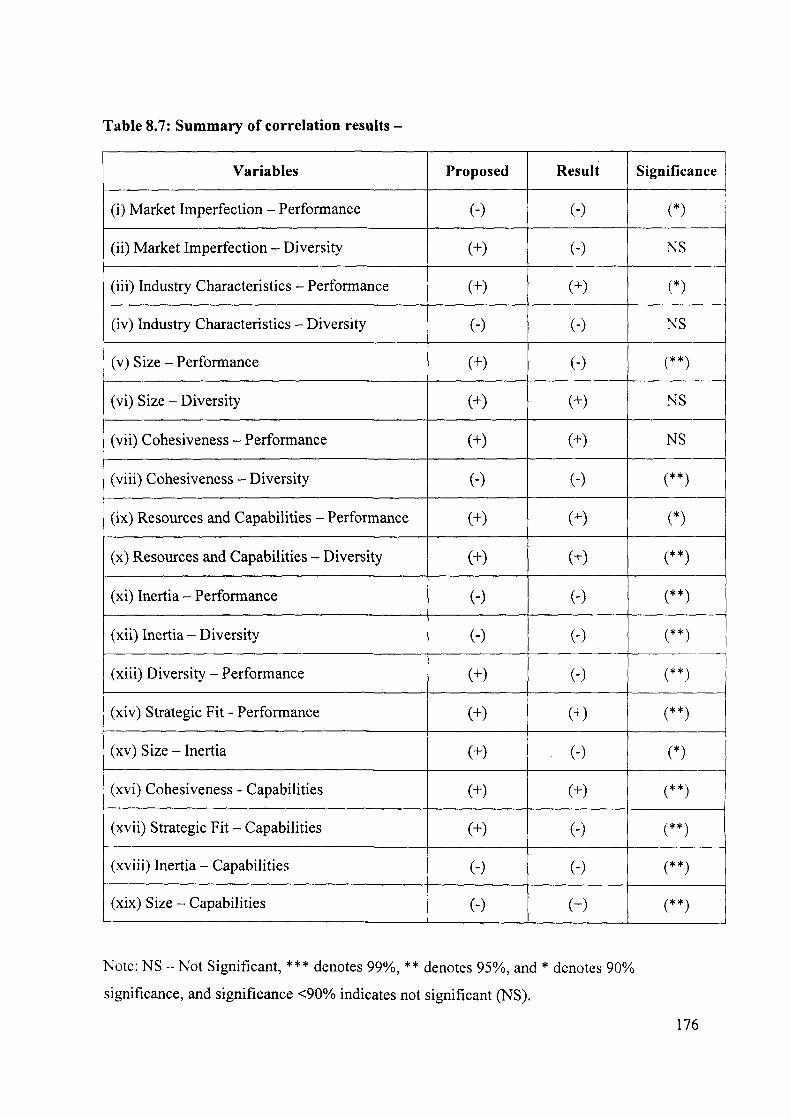
Table 8.7: Summary of correlation results -
Variables
(i) Market Imperfection - Performance
(ii) Market Imperfection - Diversity
(iii) Industry Characteristics - Performance
(iv) Industry Characteristics - Diversity
(v) Size - Performance
(vi) Size - Diversity
(vii) Cohesiveness - Performance
(viii) Cohesiveness - Diversity
(ix) Resources and Capabilities - Performance
(x) Resources and Capabilities - Diversity
(xi) Inertia - Performance
(xii) Inertia - Diversity
(xiii) Diversity - Performance
(xiv) Strategic Fit - Performance
(xv) Size - Inertia
(xvi) Cohesiveness - Capabilities
(xvii) Strategic Fit - Capabilities
(xviii) Inertia - Capabilities
(xix) Size - Capabilities
Proposed
(-)
(+)
(+)
(-)
(+)
(+)
(+)
(-)
(+)
(+)
(-)
(-)
(+)
(+)
(+)
(+)
(+)
(-)
(-)
Result
(-)
(-)
(+)
(-)
(-)
(+)
(+)
(-)
(+)
(+)
(-)
(')
(-)
(+)
(-)
(+)
(-)
(-)
(+)
Significance
(*)
NS
(*)
NS
('**\
NS
NS
(**)
(*)
(**)
(**)
r**\
(**\
f**\
(*)
/**^
r**\
/**^
r**\
Note: NS - Not Significant, *** denotes 99%, ** denotes 95%, and * denotes 90%
significance, and significance <90% indicates not significant (NS).
176
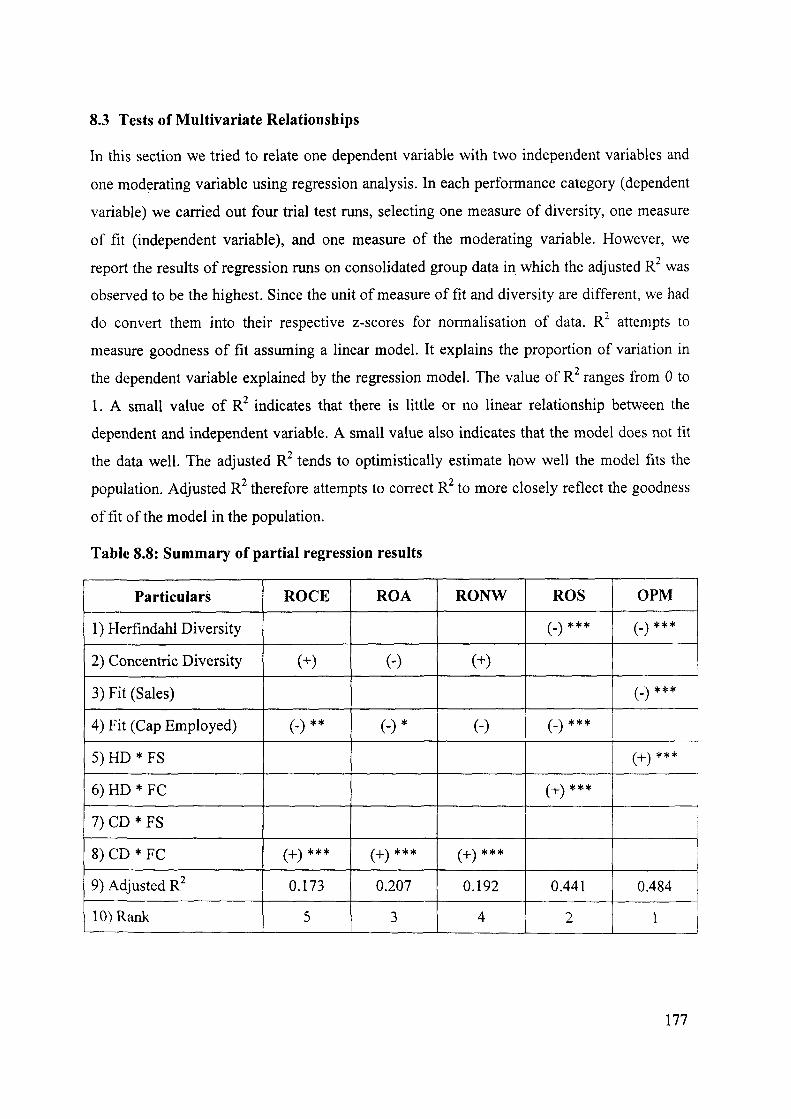
8.3 Tests of Multivariate Relationships
In this section we tried to relate one dependent variable with two independent variables and
one moderating variable using regression analysis. In each performance category (dependent
variable) we carried out four trial test runs, selecting one measure of diversity, one measure
of fit (independent variable), and one measure of the moderating variable. However, we
report the results of regression runs on consolidated group data in which the adjusted R was
observed to be the highest. Since the unit of measure of fit and diversity are different, we had
do convert them into their respective z-scores for normalisation of data. R attempts to
measure goodness of fit assuming a linear model. It explains the proportion of variation in
the dependent variable explained by the regression model. The value of R^ ranges from 0 to
1. A small value of R^ indicates that there is little or no linear relationship between the
dependent and independent variable. A small value also indicates that the model does not fit
the data well. The adjusted R tends to optimistically estimate how well the model fits the
population. Adjusted R^ therefore attempts to correct R^ to more closely reflect the goodness
of fit of the model in the population.
Table 8.8: Summary of partial regression results
Particulars
1) Herfindahl Diversity
2) Concentric Diversity
3) Fit (Sales)
4) Fit (Cap Employed)
5) HD * FS
6) HD * FC
7) CD * FS
8) CD * FC
9) Adjusted R^
10) Rank
ROCE
(+)
(.) **
/ • - ) . " ) * * *
0.173
5
ROA
(-)
( - ) *
/•+\ ***
0.207
3
RONW
(+)
(-)
/ ^ \ Hc icllc
0.192
4
ROS
(\ ***
/ \ :tf**
r_^\ * * *
0.441
2
0PM
/_\ ***
/ \ :|<:(C!|<
(^\ ***
0.484
1
177
We do not report the values of regression tests on Tobin's Q and Shareholders Return, as
they were not found to be significant. Perhaps the measurements of the constructs were not
robust enough, which has also been pointed out by some earlier researchers (Kakani, 2000).
In cases when performance was measured by returns, Concentric Diversity was selected as
the best variable. However, when performance was measured by margins, Herfindahl
Diversity was selected as best variable. Adjusted R^ was highest in the case of 0PM at 0.484,
This indicated that roughly 48.4% of the variation in performance has been explained
through this model. This can be considered highly significant, especially when new
boundaries are being explored. However, when other variables are controlled for, which we
report in the full regression models, we witness a significant increase in the explanator>
power of the model. The main observation was that despite diversity having an inconsistent
effect on performance, the effect of the moderating factor (i.e. strategic fit) has always
remained positive and significant at the 99% level. Subsequently, all the environmental,
industry, group (including strategy) and performance variables in the standardised form were
used for consolidated regression analysis to analyse their cause and effects. We then carried
out regression analysis on two parallel models. In the initial model, performance was derived
as function of-
Performance = fx (Market Imperfection + Industry Characteristics + Size +
Cohesiveness + Inertia + Resources + Capabilities + Diversity + Strategic Fit)
This is in line with the school of thought that considers that strategy variables (i.e. diversity)
together with industry and group variables determine performance (Ramanujam and
Varadarajan, 1989; Hoskisson and Hitt, 1990). In our second model, we have based our study
on the lines of Rumelt's (1974) escape hypotheses. As originally proposed, "...or a great
many firms, diversification is the means employed to escape from declining prospects in their
original business area, poor absolute performance is often the result of participation in a
highly competitive and non-innovative slow growth industry" (1974: 82). It implies
therefore, the profitability of the industries in which firms compete will have a negative
influence on the extent of firm diversification among other factors. In the subsequent model
diversity was derived as a function of-
178
Diversity - fx (Market Imperfection + Industry Characteristics + Size +
Cohesiveness + Inertia + Resources + Capabilities + Performance + Strategic
Fit)
We experimented with different models of regression analysis available in the SPSS software
package to test whether non-linear models gave better results. However, none of these
models yielded substantially better results in terms of adjusted R^ than those given by linear
models. This observation coupled with our earlier observation of scatter plots further boosted
our confidence in assuming that the relationship among the variables under study was by and
large linear. Linear multiple full model regressions were performed using best variables. Best
variables mean variables that best fit among all the variables for a particular category in the
regression model. We use 'best variables' (provides highest adjusted R ) to capture the effect
of a particular category of independent variable on the dependent variable. Standard variables
have also been used in regression models; however, its explanatory power is by no means
superior to the earlier. This is perhaps indicative of the fact that R^ has a very modest role in
regression analysis, being a measure of goodness of fit (Goldberger, 1991: 177-78).
179
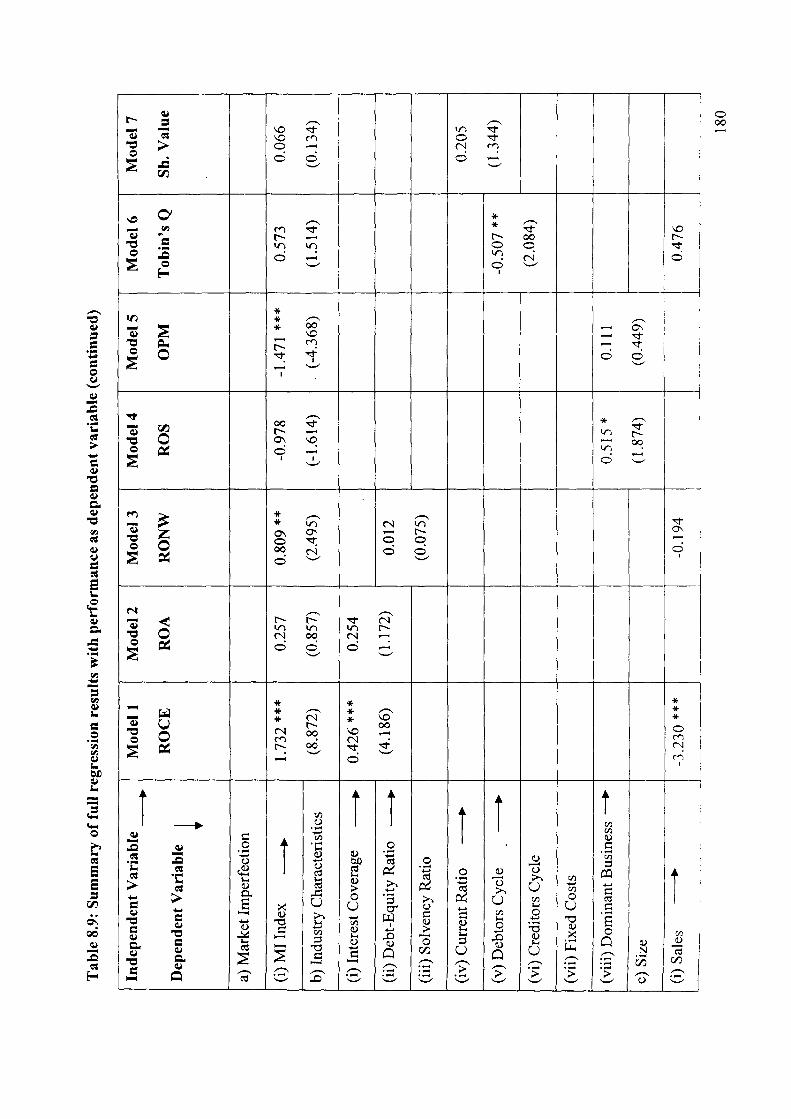
w a c
*-M s o u ^^
> C
a a
w
!
en
bJD
I .
o
«
s
as 00
H
t~ ^ M
4> •a
V© ^ M
V TS e
«/ % T3 o
T3 O
r^ 4>
•a o
f S m ^
V
o
1-H M i *
O
^
i
.2
>
s w
T3 C 4> a. a
T3 S
U _3
« > J3 03
o w "a ic o H
S PU O
o Pi
^
O
< o 0^
M
o OS
I
^
.2
>
c
C 0)
Q.
Q
o
n, E
— VO ^ ^ r<-i
o ^ o o
m r j -t ^ ^ vn u- o ^
* * '-^ * 0 0
[C n • X
0 0 T^
o\ ^ o ^
1 1
as OS o -^ « 0 ( N
t>- f^ ^T) l O f N OO
o o
* * /—-* (N
c^ 0 0
i
X
1
c
1
k
t/5
U
C
<N
o o
• ^ < N i n r~ <N ' - ;
o --
« * ' ^ * "^
O
i k
0) (50
2 > o
u to u t-, u
i k
o
tu 1
Q
i n
p o .
o
1 Pi!
o C
"o C/3
«/-) o ( N
O
i k
-4—>
C!
U
^ - - v ,
^ ^ rn ^
*
t ^ O i n o
1
i k
>-. U
on
O
JO
Q
'^ 0 0
p CM"
^
O
o • • 3
u
en
o U -a
; i ; ^ o
* i n ^ m o
t 1 C/3
(U
c • 1-H
3 m c C
"e o
Q • I-H
• > \—
so r~-'^ d
^ ^ ON
^ d
0 0
^ O N
d 1
* * * ^
1
i
on
<3
o 00
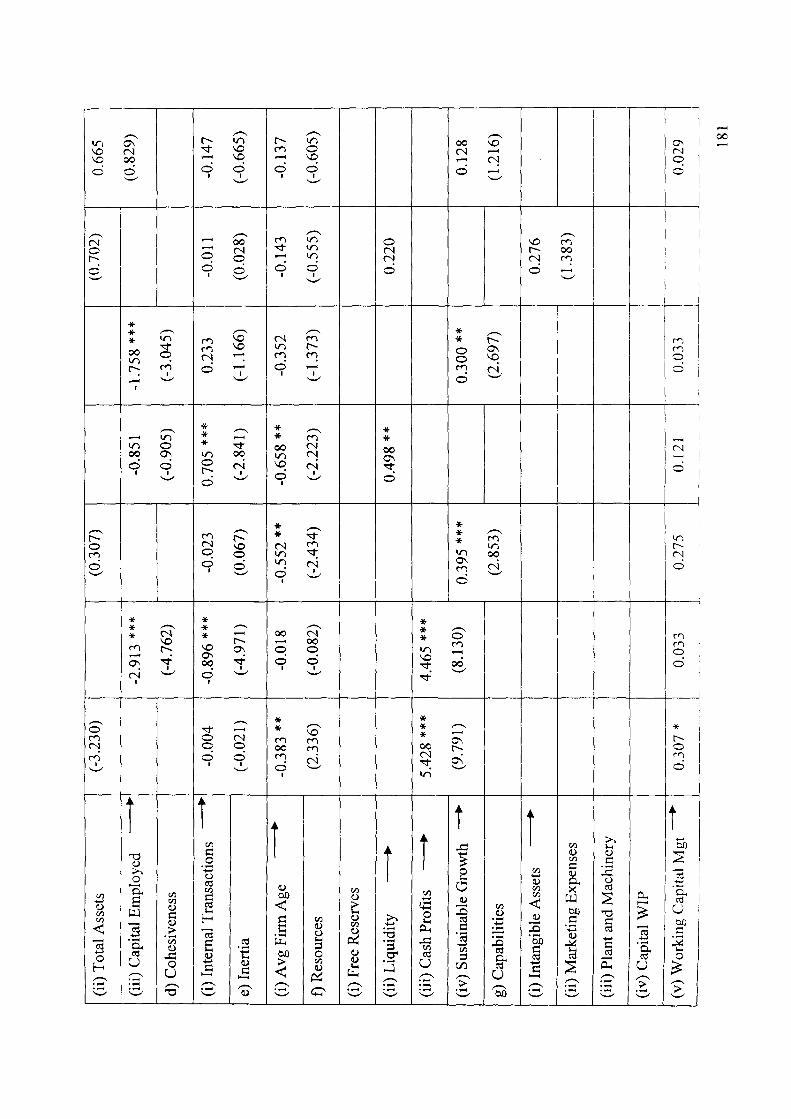
O O
o
o
O
m (N CO
1
«3 • * - » (U
1/3
o
* '—-
0 0 o
Kn •
1
U-) O 0 0 O N
O O 1 1
*
ON ' ^ '
rsi ^^ 1
i
T3
S
1 J
Vi
C <u
_>
o O
,—1 \ 0
o o 1 1
' ^ 0 0
"^ o
*
m 0 0
o "^
P O
* * '—-
0 0 " ^
o - 1
O (N o o o o
1 t
t a
_o ' • * — »
o
H e
CO
c
m O r—1 \ 0
o o 1 1
/ s
r o IT)
o d 1 1
en en d —!
1 1
* m
o O 1
* -^
o ^ 1
OO ( N r— 0 0
o o d d 1 1
*
rn m 0 0 m
o ^^ 1
i k
<u
<
> <
o 3 O
C/3
(U t/3 ID
O
d
* * 0 0
^. d
t •3 3 cr
0 0 VO ( N — - - I ( N
* r-O ON o "^
* * ' ^ * m
i n i n 0 0
d
: o
* * ' s
to ^
i n
t « O ; - i
C«
U
t
o
o
e
C/3 ID
IS
u GO
r - 0 0
d —
i
+-> (U
<
3 5b
c - H
<U 1/3
C <u
X
w GO
_c +-»
>-l
g
o
C -4—*
c
SI • » 4
13
ON
p d
O d
d
i n
d
O d
o en
d
t_ 'So
'S.
U GO C
'•i o
N ^
0 0
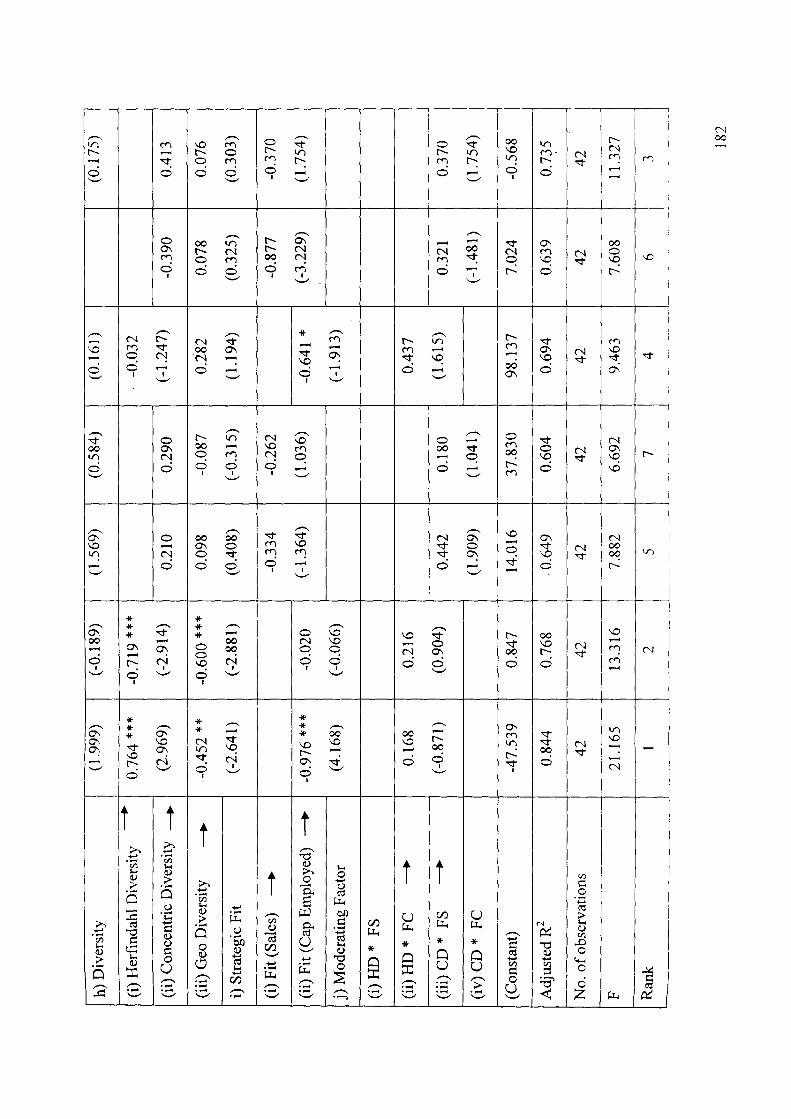
wo
o
d
0 0
d
0\
i n
0 0
d 1
ON ON
l - l
(U
> 5
CO
d
o O N
d 1
O <N
d -^ 1 1
o O N CN
d
o
d
*
ON ON
d ^
*
d ^^
t
> 5 TO
c
t +-»
b1
> 5 o
' C <u o c o U
r- o o m d d
0 0 i n
o m
CM ^ OO ON
t ^ i n 0 0 "^ o m d d
1 1
OO 0 0 O N O O Tj-
d d
O 0 0
d ^^ 1
•»• , — 1
i n ^ ^ ( N
o O
t
k l
> Q o O
o
(50
CO
d ^ 1 ^. .
t ^ ( N 0 0 ( N d r«
1 1
* '—
d V.
(N o d ^
1 ^ y
d —' 1 1
t
O VO ( N VO
o o d d 1 1
* * 0 0 \£> ^ t ^ " ^ ON Tj-
d "^ 1
t o
bO d
• ^ i-i
O
t / }
* Q
O T f r-- i n
04 § d ;7
r-^ i n
O »—'
O ' - I 0 0 T T —' O
d ^
( N ON^ T t O Tl- O N
—1 O <N ON
d d
0 0 r^
t U
Q
t
•
8 •1
u
Q U
OO
i n
d
<N O
m
0 0 ON
o OO
NO
O
0 0
d
O N r o i n
1
u CO
C O U
i n
d
ON
d
O N NO
d
o NO
d
ON
NO
d
0 0 NO
d
0 0
d
T3
<u
<
CN
( N
( N
CN
CN
( N
c/5 C
_o
t u c/l
X ) o
<4-(
o 6
( N
0 0 O VO
ON
ON NO
NO
CN 0 0 0 0
NO 1—t
i n NO
CN
fc
r o
^
Tl-
r-
i n
CN
-
cC
0 .
CN OO
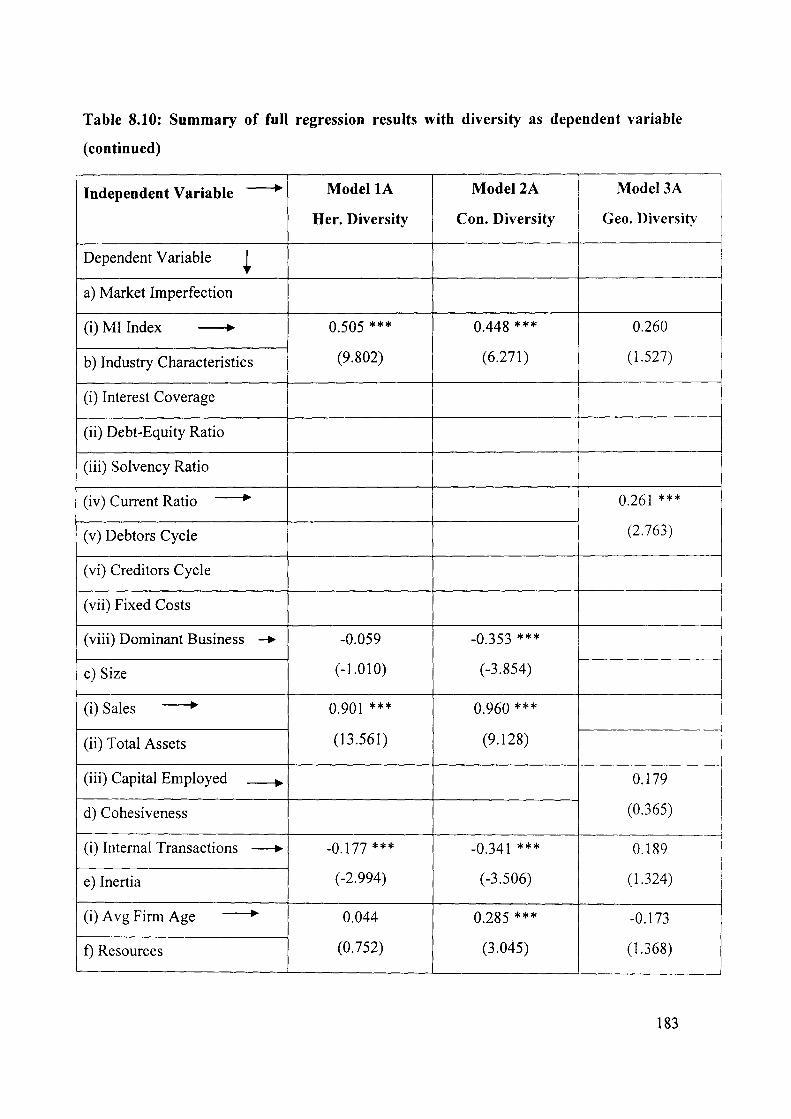
Table 8.10: Summary of full regression results with diversity as dependent variable
(continued)
Independent Variable ^
Dependent Variable 1
a) Market Imperfection
(i) MI Index •
b) Industry Characteristics
(i) Interest Coverage
(ii) Debt-Equity Ratio
(iii) Solvency Ratio
(iv) Current Ratio ^
(v) Debtors Cycle
(vi) Creditors Cycle
(vii) Fixed Costs
(viii) Dominant Business - •
c) Size
(i) Sales •
(ii) Total Assets
(iii) Capital Frnplnyfifi ^
d) Cohesiveness
(i) Internal Transactions •
e) Inertia
(i) Avg Firm Age ^
f) Resources
Model lA
Her. Diversity
0.505 ***
(9.802)
-0.059
(-1.010)
0.901 ***
(13.561)
-0 177 ***
(-2.994)
0.044
(0.752)
Model 2A
Con. Diversity
0.448 ***
(6.271)
-0.353 ***
(-3.854)
0.960 ***
(9.128)
-0 341 ***
(-3.506)
0.285 ***
(3.045)
Model 3A
Geo. Diversity
0.260
(1.527)
0.261 ***
(2.763)
0.179
(0.365)
0.189
(1.324)
-0.173
(1.368)
183
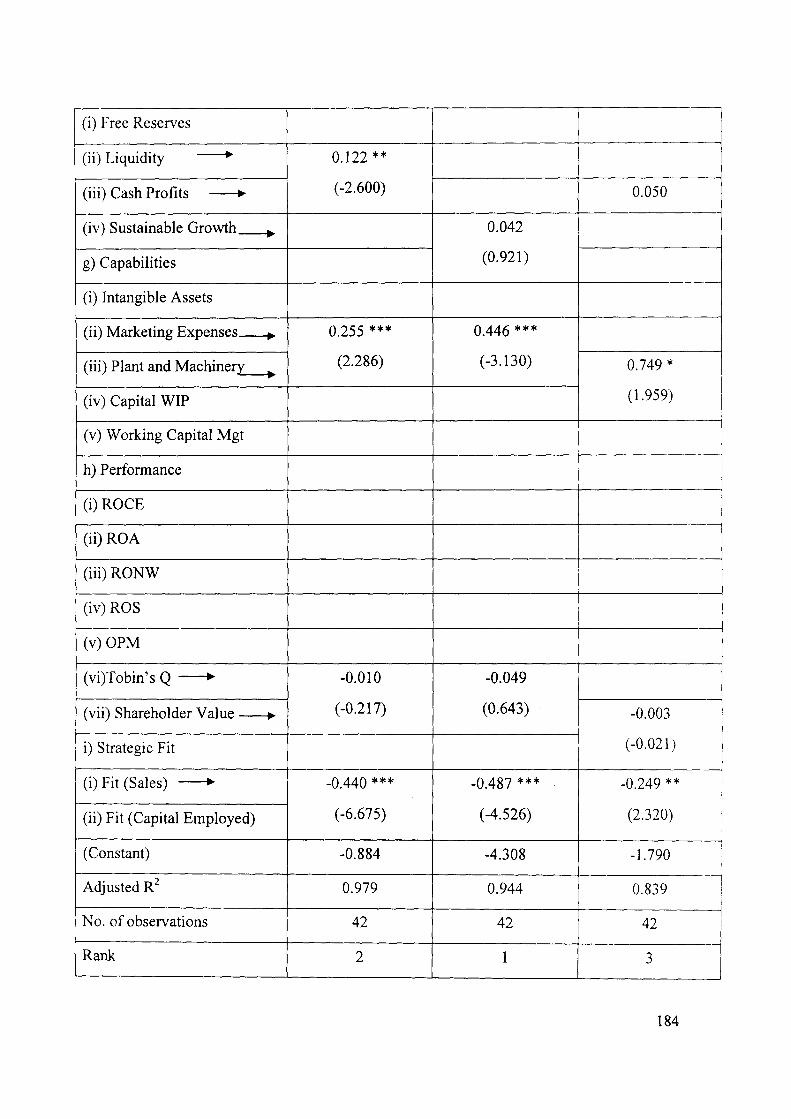
(i) Free Reserves
(ii) Liquidity ^
(iii) Cash Profits •
(iv) Sustainable Growth ^
g) Capabilities
(i) Intangible Assets
(ii) Marketing Expenses ^
(iii) Plant and Machinery
(iv) Capital WIP
(v) Working Capital Mgt
h) Performance
(i) ROCE
(ii) ROA
(iii) RONW
(iv) ROS
(v) 0PM
(vi)Tobin's Q •
(vii) Shareholder Value •
i) Strategic Fit
(i) Fit (Sales) •
(ii) Fit (Capital Employed)
(Constant)
Adjusted R^
No. of observations
Rank
0.122**
(-2.600)
0.255 ***
(2.286)
-0.010
(-0.217)
-0.440 ***
(-6.675)
-0.884
0.979
42
2
0.042
(0.921)
0.446 ***
(-3.130)
-0.049
(0.643)
-0.487***
(-4.526)
-4.308
0.944
42
1
0.050
0.749 *
(1.959)
-0.003
(-0.021)
-0.249 **
(2.320)
-1.790
0.839
42
3
184
Note: In figures reported in Table 8.9 and 8.10 we used regression estimations using ordinary
least squares techniques with non-zero correlations across the error terms for consolidated
group data, following Moulton (1986, 1990). Heteroscedasticy-consistent standard errors
were used to compute t-statistics, which are reported in parentheses together with their
respective beta values. We ranked the models in terms of their overall explanatory power
indicated by its Adjusted R .
Note: *** denotes 99%, ** denotes 95%, * denotes 90% Significance level, and as per
standard practice Significance level <90% has not been reported.
8.3.1 Market Imperfection, Performance, and Diversity
Market imperfection was found to have a positive effect on performance, except when
performance was measured by margins. Existing research has rightly pointed that higher
returns is actually achieved through increase in size and scale of operation, introduction of
increased number of product lines in the existing businesses and diversification in the related
areas (Ray, 2000). However, the negative effect on margins can be explained through
increase in intensity of competition and bargaining power of customers over economic
liberalisation (Ray, 2002). The above effect was foimd to be significant when accounting
captured performance based measures, while it was not significant when performance was
captured by market-based measures. Market imperfection was also found to have a positive
effect on both group as well as geographical diversity. This begins by suggesting groups
acting in perfectly competitive markets cannot benefit through diversification. In such
conditions, stockholders can achieve diversification by reconstructing their financial assets at
a much lesser cost. Thus if groups diversify, it follows that they are acting in markets that are
imperfectly competitive. In the case of Tata group the effect of market imperfection on
diversity and performance was found to be negative as positive compared to Reliance or
Aditya Birla group. This perhaps corroborates our earlier observations.
This can also be explained by the fact that economic liberalisation has resulted in a more
munificent environment, providing business groups with a wider range of opportunities and
strategic choices. Ray (2000) has rightly pointed out that although in the liberalised era firms
showed wider variation in strategic responses, a general pattern has primarily emerged. In
contrast, in the pre-liberalisation era firms in general diversified into new product and
business lines and expanded their geographical base indiscriminately. While the effect of
185
market imperfection on group diversity was significant at the 99% level, the effect was not
significant on geographical diversity. The individual explanatory power (in terms of adjusted
R square) of market imperfection in explaining differences in performance was around 3%
and around 2% in explaining differences in diversity. The standard error of the variable
contained in the regression analysis was low.
8.3.2 Industry Characteristics, Performance, and Diversity
Industry characteristics when measured in terms of in terms of liquidity, solvency, dominant
business, and leverage were found to have a positive effect on performance. However, the
effect of the same on performance was negative when industry characteristics were measured
by debtors' cycle. These effects are consistent with existing findings (Kakani, 2000). There
were other variables (i.e. creditors' cycle and fixed costs) also, but they were not included as
best variables. In the case of individual group regressions, industry characteristics were found
to have the strongest impact on the Reliance group. Perhaps the group had the distinctive
edge to override the context, and change the characteristics of an industry context like no
other. Industry characteristics measured in terms of dominant business was found to have a
negative effect on group diversity. A group having presence in a few dominant businesses
perhaps has little incentive to diversify than compared to groups with presence in a cluster of
businesses with none of the businesses dominating the other. While industry characteristics
measured in terms of liquidity had a positive effect on geographical diversity. The individual
explanatory power (in terms of adjusted R square) of industry characteristics in explaining
differences in performance was around 6%, while at around 2% in explaining differences in
diversity. Therefore, external environmental factors has a bearing in explaining differences in
diversity as well as performance, with the same found to be significant at the 99% level. This
was consistent with the findings of Porter (1980, 1985). The standard error of the variable
contained in the regression analysis was low.
8.3.3 Size, Performance, and Diversity
Size was found to have negative effect on performance, while it was also found to have a
positive effect on group as well as geographical diversity. Scale and scope of operations
inevidently increases as groups diversify across markets and industries. Hence, the positive
effect of size on diversity. As explained earlier, the effect of size is more predominant in
generating inertia rather than market power. Hence, instead of inducing groups to enhance
186
their performance, it reduces it. This leads to negative effect of size on performance. In most
cases the results were consistently significant at the 99% level. In the size category sales was
selected as the best variable. On the overall, the effects were found to be significant at the
99% level. The individual explanatory power (in terms of adjusted R square) of size in
explaining differences in performance was around 3%, while significantly higher in the range
of 10% in explaining differences in diversity. Size was also the single most important
variable capturing the characteristics of the group. The standard error of the variable
contained in the regression analysis was medium.
8.3.4 Cohesiveness, Performance, and Diversity
Cohesiveness was found to have a negative effect on all measures of performance, except for
margins, when the effect was positive. This finding is consistent with existing research,
which had observed that, firms in general tend to increase the sharing of resources across
departments, divisions, and business units within the firm (Ray, 2000). Though there are
various theoretical arguments that suggest in favour of internal transactions in the group
affiliation, there are also indications which points to the contrary; (Khanna and Palepu,
2000). The effect can be considered negative from the point of view that affiliate firms are
placed at a disadvantage by other less obvious factors, i.e. bailing out member firms which
are performing badly. The effect of the same was positive on margins because group
headquarters through strong centralised control usually pre-empt member firms to do
businesses with each other, even at the cost of an external opportunity gain. Cohesiveness
was found to have a negative effect on group diversity while a positive effect was found on
geographical diversity. Thus, while it enabled member firms to enhance their performance, it
also prevented the group from making fresh diversification moves because of paucity in
fimds, which were tied up with failing units. The results were mostly significant at the 99%
level. The individual explanatory power (in terms of adjusted R square) of cohesiveness in
explaining differences in performance was around 3%, while at around Wo in explaining
differences in diversity. The standard error of the variable contained in the regression
analysis was medium.
8.3.5 Inertia, Performance, and Diversity
Inertia was found to have an overall negative effect on all measures performance. Ray (2000)
observed that organisafional inertia constrained strategic responses and performance. The
187
ability of the TMT to acquire new skills is an important determinant of performance,
especially, in fast changing environment. Inertia was also found to have a positive effect on
group diversity and negative effect on geographical diversity. Thus while inertia retarded
group performance; it enabled business groups to diversify further. Thus, it was the older
groups, which were highly diversified, compared to relatively younger groups. Overall,
economic liberalisation had resulted in a more munificent environment characterised by
opportunities for higher growth and return, greater availability of various resources and
easier access to the international market both for imports and exports (Ray, 2000). However,
older firms found it difficult to penetrate foreign markets for lack of global competitiveness
and also because changing rules of the game enabled relatively younger firms to adapt faster.
In terms of intra-group analysis the impact of inertia on performance was the strongest in the
case Tata group, followed by Aditya Birla group. In contrast, the effect of inertia was almost
negligible in the case of Reliance group. This by and large conforms to our use of average
firm age as a surrogate for inertia. The effect of inertia was found to be significant at the
99% level when performance was captured by accounting based measures; however, when
performance was captured by market based measures the effect was not found to be
significant. The effect on diversity was also found to be significant at the 99% level. The
individual explanatory power (in terms of adjusted R square) of inertia in explaining
differences in performance was around 3% while at around 4% in explaining differences in
diversity. The standard error of the variable contained in the regression analysis was very
low.
8.3.6 Resources and Capabilities, Performance, and Diversity
Resources were found to have a positive effect on performance. The results were identical
when we analysed the effect of resources on diversity. The effects on performance were
found to be consistently significant at the 99% level, while the effect of the same on diversity
was not found to be significant. This is perhaps in divergence from the earlier view that
initial resource position played relatively limited role in explaining variations in strategic
choices in the post liberalisation period (Ray, 2000). In case of resources liquidity and cash
profits entered the category as best variables. The individual explanatory power (in terms of
adjusted R square) of resources in explaining differences in performance was around 4%,
while at around 3% in explaining differences in diversity. The standard error of the variable
188
contained in the regression analysis was medium. Capabilities were also found to have a
positive effect on performance as well as diversity. This is in parity with existing research,
which observed that, greater entrepreneurial capability helped firms expand geographically in
the domestic market, while marketing capability helped strengthen international operations
(Ray, 2000). In our regression runs working capital management was unanimously selected
as the best variable when its effect on performance was analysed. In contrast, when its effect
on diversity was analysed marketing expenses together with plant and machinery entered the
model as best variables. The results were consistently significant at the 99% level when its
effect on diversity was analysed, the same was not found to be significant when its effect on
performance was analysed. The individual explanatory power (in terms of adjusted R square)
of capabilities in explaining differences in performance was around 2 %, while significantly
higher in the range of 7 % in explaining differences in diversity. The standard error of the
variable contained in the regression analysis was also medium. Thus both resources and
capabilities are more effective in explaining diversity, rather than performance.
8.3.7 Strategic Fit, Performance, Diversity
Strategic fit was found to have to negative effect on performance as well as diversity.
However, the moderating effect between strategic fit and diversity was consistently found to
be positive on performance. When performance was taken as the dependent variable fit
(sales) as well fit (capital employed) entered the regression model as best variables.
However, when diversity was taken as the dependent variable only fit (sales) entered the
regression model as best variable. The effect of fit on performance was found to be
significant at 99% level only in one model; in all other cases it was found to be non
significant. In contrast the effect of fit on diversity was consistently found to be significant at
95% level or higher in case of all the models. However, the effect of the moderating variable
was not found to be significant. This was presumptive on our part given its nascent
characteristics. The negative effect of strategic fit on performance can be explained by the
fact that it benefits the firm more than the group as a whole, in the form of higher resource
allocation. As a high fit induces the group to concentrate more on its core businesses, and
thereby ignore emerging businesses where the profitability levels are comparatively higher.
A higher fit would also prevent the group from adding newer businesses to its portfolio of
existing businesses, and hence a negative effect on diversity. A lower fit would enable the
189
group to broaden its horizon of businesses and thereby enhance profitabiUty. However, a
positive effect of the moderating factor is perhaps an indication of the fact the benefits of
diversification are only realised when the same are consistent with the dominant logic of the
TMT. This has been observed universally across all the regression models, though not found
to be significant. The individual explanatory power (in terms of adjusted R square) of
strategic fit in explaining differences in performance was around 4 %, while significantly
higher in the range of 7 % in explaining differences in diversity. The standard error of the
variable contained in the regression analysis was low.
8.3.8 Diversity and Performance and vice-versa
The effect of group diversity on performance remains inconclusive in our research, without
any clear picture emerging. The same applies to geographical diversity as well. This confirms
existing research findings that this research domain though large is yet to reach maturity.
Perhaps, diversity in isolation has a very little bearing on performance. In two regression
models diversity was found to be significant at the 99% level, while in other cases it was not
found to be significant. In case of group diversity, both the measures (i.e. Herfindahl Index
and Concentric Index) entered the regression runs as best variables. The individual
explanatory power (in terms of adjusted R square) of group diversity in explaining
differences in performance was around 3 %. The individual explanatory power (in terms of
adjusted R square) of geographical diversity in explaining differences in performance was
around 2%. The explanatory power of these two variables also fluctuated within a wide
range. These wide variations are perhaps indicative of the fact that much depends on the
choice of selection of measure of diversity and performance to explain its effect. The
standard error of the variable contained in the regression analysis was high.
In contrast to the above, performance was found to consistently have a negative effect on
diversity, though the same was not found to be significant. In case of performance, market
based measures were selected as best variables, rather than accounting based measures. This
strongly supports the "escape hypothesis" proposed by Rumeh (1974) as also later suggested
by Christensen and Montgomery (1981). Stimpert and Duhaime (1997) also concluded that
profitability of the industries in which firms compete would have a negative influence on the
extent of firm diversification or more specifically high performance eliminates the need for
greater diversification. Conversely, low performance may provide an impetus to
190
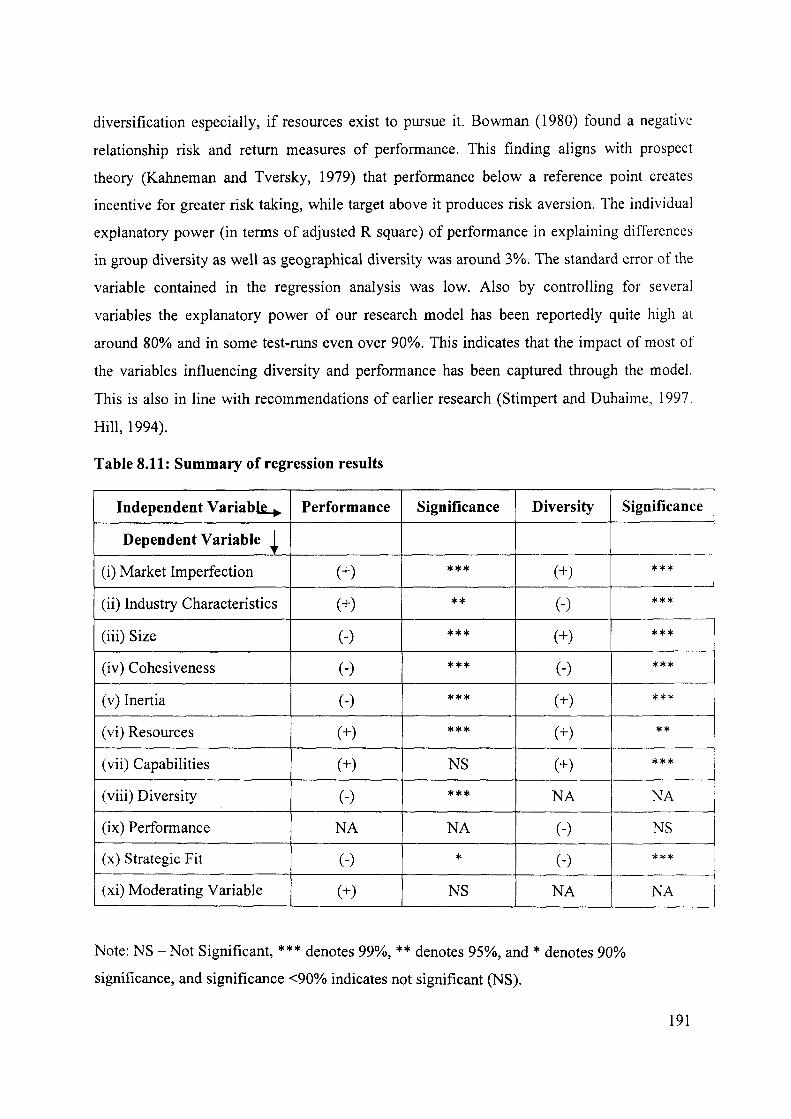
diversification especially, if resources exist to pursue it. Bowman (1980) found a negative
relationship risk and return measures of performance. This finding aligns with prospect
theory (Kahneman and Tversky, 1979) that performance below a reference point creates
incentive for greater risk taking, while target above it produces risk aversion. The individual
explanatory power (in terms of adjusted R square) of performance in explaining differences
in group diversity as well as geographical diversity was around 3%. The standard error of the
variable contained in the regression analysis was low. Also by controlling for several
variables the explanatory power of our research model has been reportedly quite high ai
around 80% and in some test-runs even over 90%. This indicates that the impact of most of
the variables influencing diversity and performance has been captured through the model.
This is also in line with recommendations of earlier research (Stimpert and Duhaime, 1997;
Hill, 1994).
Table 8.11: Summary of regression results
Independent Variable ^
Dependent Variable '
(i) Market Imperfection
(ii) Industry Characteristics
(iii) Size
(iv) Cohesiveness
(v) Inertia
(vi) Resources
(vii) Capabilities
(viii) Diversity
(ix) Performance
(x) Strategic Fit
(xi) Moderating Variable
Performance
(+)
(+)
(-)
(-)
(-)
(+)
(+)
(-)
NA
(-)
(+)
Significance
***
**
***
***
***
***
NS
***
NA
*
NS
Diversity
(+)
(-)
(+)
(-)
(+)
(+)
(+)
NA
(-)
(-)
NA
Significance
* * +
***
***
***
*+*
**
* * +
NA
NS
* * +
NA
Note: NS -Not Significant, *** denotes 99%, ** denotes 95%, and * denotes 90%
significance, and significance <90% indicates not significant (NS).
191
CHAPTER 9
Discussion and Interpretation
In this chapter we report the discussion on results and findings presented in earlier chapter.
The discussion also contains plausible explanation of the results. These explanations have
been arrived at by a combination of factors such as our understanding of business groups,
quantitative information sourced from databases and contextual familiarity of the researcher.
The chapter also tries to explore the acceptability of the hypotheses proposed earlier, and
causes for rejection, if any.
9.1 Economic liberalisation and Market Imperfection
During the last two decades or so a number of countries around the world have undertaken
economic reforms of varying magnitude and scale to liberalise and globalise their economies.
In July 1991 the GOI also initiated a sustained policy of administrative reforms, popularly
known as economic liberalisation. Deregulation of selected industries in India started in the
mid eighties. However, since 1991 the Government of India initiated a large number of
policy and administrative reforms such as liberalisation of industrial licensing, curtailment of
public sector, abolition of import licenses and lowering of import tariffs, followed by
convertibility of the Indian rupee and encouragement of FDI's. This was followed by various
fiscal and monetary reforms, including reforms in the banking sector, capital markets, and
macro-economic adjustments included phasing out of subsidies, dismantling of price
controls, and introduction of an exit policy. These reforms are collectively known as
economic liberalisation.
By and large the new economic policy has reduced governmental control in favour of
market-based control. This resulted in a more efficient economic environment. In support of
our Hypothesis 5, we observed a significant reduction in market imperfection in the Indian
economy as a result of economic liberalisation. Our test of hypotheses rejected the null
hypothesis (^\) at the 95% level, that the extent of average market imperfection in the Indian
economy during the period (1990-1996) was the same as during the period (1997-2003). The
alternate hypothesis (^2) lends credence to Hypothesis 5 that the extent of market
imperfection during the period (1990-1996) was significantly higher than the period (1997-
2003), or conversely, market imperfection during the period (1997-2003) was significantly
192
lesser than in the period (1990-1996). The slope of the regression equation (indicated by its
beta) was also significantly higher at -8.2 during the period (1990-1996) as compared to -2.5
(1997-2003), supporting our contention.
9.2 Strategic Fit and Performance
Researchers have used the concept of fit in strategic management research in a variety of
perspectives from the point of view of content and context. From the point of view of
content, fit has been viewed as moderation, mediation, matching, gestalts, profile deviation,
and co-variation (Venkatraman, 1989). And from the point of view of context, fit has been
studied across inputs, markets, technologies etc. However, none of these perspectives has
been able to provide a satisfactory explanation of the relationship between diversity and
performance. This has been indicated in our full regression analysis (Table 8.9) the effect of
diversity on performance as indicated by its beta coefficient. In some models the beta
coefficient is positive, while in some models it is negative. The findings are clearly
inconsistent with existing research findings.
The possible inference could be that the surrogates of diversity (i.e. Herfindahl and
Concentric Index) and performance (i.e. Accounting and Market based) are not robust
enough or that the relationship between diversity and performance is spurious, negated by
extraneous factors. Our research study points to the latter. Analysis of composition of
businesses in our sample clearly indicates that performance clearly varies across different
classes of strategic fit (Table 8.3) and not across different diversity levels. For instance,
chemicals have an edge over steel; tea has an edge over hotels; aluminium has an edge over
textiles; and petro-chemicals have an edge over financial services. In all these businesses, the
group outsmarted the industry average in more number of counts than its closest competitors,
where the strategic fit was high and vice-versa (see Table 9.1). This clearly supports our
Hypothesis 2, that composition of businesses is a far more effective indicator of firm
performance than diversity.
193
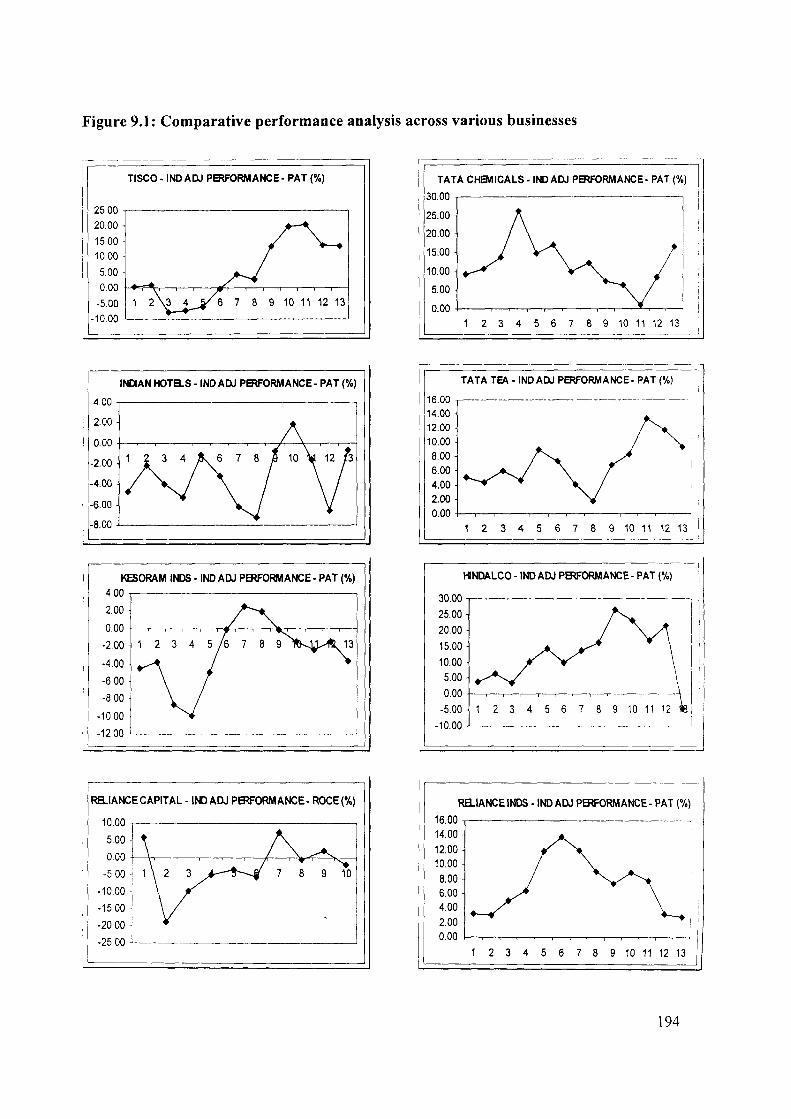
Figure 9,1: Comparative performance analysis across various businesses
TISCO - IND ADJ PBVORMANCE- PAT (%)
6 7 8 9 10 11 12 13
TATA CHBrtlCALS- INDADJ PERFORMANCE- PAT {%)
25.00
20.00
15,00 -
10.00
5.00
f^
/ \
/ VA / • - ^ V'\^ /
^ ~ \ / v
1
1
1 2 3 4 5 6 7 8 9 10 11 12 13
INDIAN HOTH.S - IND ADJ PB^ORMANCE- PAT (%)
2.00-
0.00
-2.00 •
-4.00
-6.00 •
-8 00 •
.
/ \ 1 2 3 4 * , 6 7 8 ^ 1 0 1 ^ 1 2 ^
/ V/ \ / \ / v j V
»
TATA TEA - IND ADJ PERFORMANCE - PAT (%)
1 2 3 4 5 6 7 8 9 10 11 12 13
HINDALCO - IND ADJ PBa=ORMANCE - PAT (%)
RB.IANCE CAPITAL - IND ADJ PSiFORMANCE- ROCE(%]
10.00
RB.IANCE INDS - IND ADJ PBVORM ANCE - PAT (%)
16 00
14.00 -
12.00 1
10.00 •
8.00-1
6.00
4.00
2.00-
0 00 -
r ^ ^ 1 ^\, J ^N^^*^
* t ^ \
•—v^'*^ \ ^
[
1 2 3 4 5 6 7 8 9 10 11 12 13
194
Next, there is another area of contention among researchers whether group affihation is
profitable for a firm or not. While there are benefits associated with group affiliation, there
are costs too. Our test of means clearly reveal that firm performance is enhanced; if the firm
business is consistent with the dominant logic of the TMT (see Table 8.2 and 8.3), though at
the cost of group performance. The electronics business of the Tata Group is a clear example
in this regard. The group continued to pump in funds, though long term survival looked
bleak. Thus, while this benefited the firm, the performance of the group deteriorated. The
table indicates that fit is directly proportional to performance with a correlation of +0.32.
ANOVA (see Table 8.5) across these businesses with two measures of fit indicates that
performance difference across these categories is too significant to be refuted as a mere
aberration. This supports our Hypothesis 3A that firm performance is enhanced when the
individual business fit with the dominant logic of the TMT and vice-versa. In this context we
moved from simple measures of fit, to a much more complex measure of strategic fit; which
we feel is far more superior.
A further look at fiill regression analysis (Table 8.9) clearly indicates though the beta
coefficient of diversity on performance is inconsistent, we have observed a consistent pattern
of the effect of strategic fit and its moderating effect on performance (see Table 8.8). While
the beta coefficient of strategic fit is consistently negative, indicating firm performance is
enhanced at the cost of the group exchequer. While, a positive moderating effect supports our
Hypothesis 3B that group performance is enhanced when greater the number of individual
business, within the portfolio of businesses, fit with the dominant logic of the TMT. This
perhaps enables the group to manage its various firm businesses better, if they are
strategically similar.
9.3 Dominant Logic and Diversity
We had observed that dominant logic provided the greatest impetus to the composition of
business portfolio of a group, hence its diversity. In fact, the composition of the group
portfolio was the cause, while diversity was its effect. Though we do not deny the impact of
the internal and external environment on the composition of the group portfolio; but it is
primarily influenced by the dominant logic of the TMT. The negative beta coefficient of
strategic fit on diversity is an indication of just that (Table 8.10). While a high strategic fit
enhances firm performance through better allocation of resources, higher commitment of the
195
top management leading to more efficient strategy implementation. This strength can have
dysfunctional effects too. Because new diversification projects represent a group's response
to market changes, they are also the focal point for the tension between growth and inertia.
Therefore strategic relatedness exposes the downside of new diversifications: strategic
rigidities. The factor that constitutes strength also comprises vulnerability. Therefore,
diversifications often become dysfunctional because they do not overcome strategic
rigidities. This is indicated by the negative beta coefficient of strategic fit on diversity. The
initial bottleneck faced by the Reliance group in implementing its telecom project is a prima-
facie example in this regard. This by and large lends credence to our Hypothesis 1 that the
composition of portfolio of business of a diversified business group is shaped by the
dominant logic of the TMT.
9,4 Strategic Fit and Capabilities
Increasingly, leveraging the distinctive capabilities of a firm is being suggested as the way to
gain competitive advantage in the market place. Moreover, distinctive capabilities are
fundamental to the success of new diversification projects that groups depend on to advance
a market. Distinctive capabilities of firms also grow stronger with each diversification
project. Furthermore, because a group becomes known for some particular strength (i.e.
distinctive capabilities), it attracts the best of people in those disciplines, financing
institutions tend to lend money at attractive rates, joint-venture partners provide best of
technologies, supplier of inputs provide long standing credit. The project management skills
reflecting the Reliance groups' distinctive capability to compress project as well as
operational times is a distinct example. While a firm, which does not possess these
capabilities, becomes trapped in inertia unable to undertake fresh diversification moves. The
paradoxical nature of distinctive capabilities can pose severe challenges to the TMT, because
failure to recognise and continuously manage distinctive capabilities can hamper firm
performance and compromise the groups' future. How distinctive capabilities affect new
diversifications and how they can be managed to ensure success of the diversification
depends on how well the requirements of the diversification align with distinctive capabilities
currently held by the firm. The success of the Reliance groups' telecom diversification can be
explained just from this point of view; though unrelated in terms of SIC. The diversification
demanded certain distinctive capabilities (i.e. command over complex technologies.
196
backward integrate projects, compress project times), which the group already possessed.
The initial bottlenecks (i.e. lack of the ability to integrate complex sub-processes) faced by
the Tata group in implementing its car project another distinct example in the opposite
direction. The positive beta coefficient of resources and distinctive capabilities on
performance and diversity (see Table 8.9 and 9.10) is just an indication of this corroboration.
This also supports our Hypothesis 7A that strategic fit facilitates the development of
distinctive capabilities, which has a strong bearing on overall group performance.
9.5 iDertia and Dominant Logic
We observed that inertia due to historical evolution of firms constrained strategic responses
and thereby overall performance. Comparatively yoimger groups like the Reliance were more
aggressive in their diversification strategies as compared to the Tatas and also performed
better than older groups. Relatively younger groups like the Aditya Birla group with a few
dominant businesses also performed better. Comparatively younger groups stressed more on
intra-group resource sharing (i.e. cohesiveness). While older groups were also slow to react
to the changing demand of the environment. Organisational culture rooted in bureaucracy,
top management values, structure, and decision-making process retarded diversification
moves and performance. Sensing economic opportunities in the wake of deregulation of
industries, the Tata group initiated a strategic shifi; in 1983; however the same was delayed
and could not be implemented before 1991. The inability of the group to exploit the growth
and profit opportunities in the initial years reflected upon their poor performance. In a fast
changing economic environment, early recognition of opportunities was a strong determining
factor of performance.
In the 80's and early 90's these groups led by septuagenarian and octogenarian managers
were slow to respond to changes. They found it difficult to change old values and cultures
deeply embedded in their people. But most importantly, to unlearn many dominant logics,
which enabled them to successfully manage businesses in the pre-liberalised era, but posed
difficulties in the post-liberalisation regime. Old logics developed in the core businesses in
the protected era and regulated enviroimient had been institutionalised over a long period,
thus making strategic shift difficult. However, the rules of the game in most industries had
been changing fast. Many old practices such as cornering licenses, maintaining power
relations with bureaucrats and politicians, and creating artificial supply gaps were fast
197

becoming obsolete and grossly ineffective. However, changes in the top management with
relatively younger generation professionals led to unlearning of these old practices and
learning of new rules of the game enabling them to change their dominant logics and
discharge these tasks effectively. The negative beta coefficient of inertia on performance
(Table 8.9) and positive beta coefficient on diversity (Table 8.10) confirms just this. This by
and large confirms our Hypothesis 6A and 6B that economic liberalisation compels business
groups to change its dominant logic, while inertia constrains it.
198
CHAPTER 10
Final
10.1 Summary
In the past several years, researchers have sought to assess the relative importance of
industry, business, and corporate factors in determining profitability differences across firms.
To answer this question, researchers focused on empirical studies that use variance
decomposition techniques. These studies incorporate the relative role of entire classes of
effects in explaining differences in profitability. The ctirrent debate about the importance of
industry, business, and corporate effects began with a study by Schmalensee (1985),
followed by studies by Wemerfeh and Montgomery (1988), Rumelt (1991), McGahan and
Porter (1997, 1998), Chang and Singh (1997) and Fox, Srinivasan and Vaaler (1997). These
studies decompose the variance of business group or firm performance into components
associated with corporate (strategy), industry and business effects, and some studies include
year effects and interaction effects as well. Their findings having its origin in I/O Economics
concluded that industry effects dominated profitability, followed by business effects, and
corporate effects are insignificant. However, off late, a revisionist view is going around that
corporate effects does matter; has gained considerable influence in recent years (Bowman
and Helfat, 2001).
Our thesis reaffirms faith in strategy literature that factors at the corporate level of business
groups significantly contribute to differences in profitability, but evidences also suggest that
factors specifically associated with diversification strategy significantly contribute to
corporate effects. Corporate strategy in fact does matter. In order to evaluate such inferences,
we first ask: what in theory are the corporate level factors that influence firm or business
profitability, and to what extent these factors reflect corporate strategy. Corporate influence
on profitability results from factors associated with membership of multiple firms or
businesses within individual groups. Of the many corporate level factors that influence
performance, much research has focused on the scope of the firm, including selection of
industries in which they operate. Building on the work of Rumelt (1974), research has
analysed the link between relatedness in diversification and firm performance. A large
amount of research also has investigated the consequences of vertical integration of firms,
which pointed out to the advantages of vertical integration when transaction costs are high
199
(Williamson, 1975, 1985). Prahalad and Hamel (1990) point to the importance for corporate
success of core competencies that span businesses within a corporation, as another well-
known example of corporate level factors thought to affect profitability.
With regard to conglomerates in the developed markets, Chandler (1962, 1977) emphasised
the advantage of multi-divisional form of organization structure over the functional
organisation of multiple-business form (M-form). Research related to firm organisation has
shown that organisational structure also affects corporate profitability (Hansen and
Wemerfelt, 1989). Other research has dealt with the systems of planning and control,
including the use of strategic versus financial control (Goold and Campbell, 1987).
Additionally, profitability may be influenced by top management skills, which includes
managerial ability, and manifests itself concretely in managerial plans, decisions, directives,
advice, and goal setting for the group as a whole and for individual businesses within the
group (Andrews, 1987; Hambrick and Mason, 1984). Further, researchers have also used
similar techniques to estimate top management effects (in terms of leadership) on
profitability. It captures one type of transient corporate effect for both single-business and
multi-business firms (Lieberson and O'Connor, 1972; Weiner and Mahoney, 1981).
A fundamental part of any group's strategy is its choice of business portfolio to compete in.
According to strategy literature, this decision by and large reflects the superiority of related
over unrelated and single business firms (Ansoff, 1965; Rumelt, 1974; Bettis, 1981; Lecraw,
1984; Palepu, 1985); though some authors point towards unrelated diversification by
business groups in emerging markets as a more effective strategy (Khanna and Palepu, 1997;
Khanna and Palepu, 2000; Khanna and Rivkin, 2001). However, despite over four decades of
extensive research, there is still considerable disagreement about precisely how and when
diversification can be used to build long term competitive advantage (Markides and
Williamson, 1994). The proposition of related diversifications seems robust and
comprehensive, because, it presumably allows the corporate epicenter to exploit the inter
relationship that exists among its various businesses to achieve competitive advantage
through cost and/or product differentiation. We argue traditional measures of relatedness
provide an incomplete and potentially exaggerated picture of the scope for a corporation to
exploit the interrelationships between its different businesses. This is because traditional
measures look at relatedness only at the product, market or industry level. In this controversy
200
we try to build upon a more dynamic concept of strategic relatedness, which is superior to
other traditional measures of relatedness (Markides and Williamson, 1994).
We further argue that traditional ways of measuring relatedness are incomplete because they
ignore the strategic importance and similarity of the underlying assets residing in these
businesses, and primarily because it tends to equate the benefits of relatedness with static
exploitation of economies of scope. In order to predict how much a strategy of related
diversification will contribute to superior long-term returns, it is necessary to adopt a more
holistic view of strategy and need to incorporate the entire gamut of corporate level factors to
understand the influence of strategy on performance, and not merely concentrate on diversity.
Theoretically, this thesis attempts to overcome this major weakness in explaining how
relatedness can yield synergy across a diversified set of businesses.
We built on the concept of dominant logic to develop a platform, which enabled us to take an
birds eye view of factors that influences strategy and performance. In other words, dominant
logic can be seen associated deeply with the genetic factors embedded in the roots of an
organisation. Its influence is pervasive. It permeates the organisation, yet it is invisible. It
predisposes the firm to certain kinds of strategic problems and often interacts with
organisational systems and structures in a complex way in causing these problems. The major
theoretical advance of this study is the contention that, as long as a diversification strategy
(i.e. choice of business) is strategically related with the dominant logic of the group,
performance will be enhanced and vice-versa. Unlike previous studies, this centrality will not
only enable us to identify factors that relate to strategic successes, but strategic failures as
well. This concept not only enables us throw more light on the nature of relationship between
diversity and group performance, but also on the nature of impact of group affiliation on firm
performance.
However, dominant logic is not a static tool, especially when emerging markets use
economic liberalisation as tool to further economic growth. The factors that shape dominant
logic is then of considerable importance, in analysing these institutional changes. Prior, to
economic liberalisation most emerging markets were characterised by institutional voids and
gaps. During such periods market imperfection was pre-dominant in explaining strategic
choice of business portfolios. However, as markets become more and more efficient and
emerging markets integrated with the global markets, group resources and more particularly,
201
distinctive capabilities became more and more pre-dominant in explaining such strategic
choices. In such situations, business groups need to dynamically respond and adapt to such
changes in the business environment, by changing its dominant logic. And more importantly
restore strategic fit, when the equilibrium between dominant logic(s) and business portfolio
becomes deviating. Perhaps, one of the safest ways to take exposure in industries where the
fit is deviating is to radically change the composition of the top management or hand over
control of the business to a strategic partner. Or else wait for the industry to take its own
course of acfion till it fits the dominant logic of the business group. Not only business groups
should be able to see change in the environment but also transform themselves in the light of
the changing economic enviroimient. Business groups, which responded appropriately to
such changes, succeeded; in contrast business groups which fail to respond to the changing
faces of the economic envirormient, inevitably perished. This phenomenon has not only been
observed in emerging markets, but in the case of developed markets as well. Strategic
restructuring of business portfolio is the key to superior performance, especially when the
institutional context changes. This is perhaps an indication that the growth trajectory
followed by a business group is not primarily the outcome of its socio-economic, political
and cultural forces surrounding it. Diversification strategies facing business a group is also an
outcome of its own volition.
10.2 Implications, Contribution, and Limitations
Why is synergy elusive to diversification? The answer to this question has tremendous
implications for top management decision-making. Whenever, diversifications strategies fail
or businesses experience low profits, the top management usually resort to stopgap
approaches. We have observed that the top management usually seeks short-term remedies.
However, when the origin of a problem lie deeply embedded in genetic factors of an
organisation, a more pragmatic approach is essential. The top management should consider
an approach that involves an altogether different paradigm. Any attempt to tamper with
surface level factors will only add complexity to the problem and make the entire
restructuring process futile. In such situations, a change in the organisational systems and
structure will not suffice nor by simply diversifying to break out of the independence of this
industry. Introspection into the dominant logic(s) of an organisation is likely to provide long-
term solutions. Therefore, when strategic bottlenecks are evident, ensuring strategic fit is the
202
key to diversification successes. There are evidently two strategic measures to ensure
adequacy of this fit. One v ay is to totally recast the composition of the top management or
hand over control to an outside strategic partner. Second, wait for the industry to adjust its
forces till it fits the dominant logic.
From the point of view of contribution to theory, the study is an attempt to dig out a concept
(i.e. dominant logic) that is lying dormant for more than two decades, despite being
considered a milestone in strategic management research. It enabled us to study the
applicability of this concept in the emerging market context. The concept has been ignored in
most of subsequent research, because of the mystifying way in which the concept of
dominant logic has been proposed. Criticality, of the concept is undoubtedly acknowledged.
However, its implementation remained a major bottleneck, as the authors did not provide any
clues on measurement of the construct. As assessed by the original authors, it is not only
sufficient to develop methods of directly assessing dominant logic. It is more important to
establish techniques to assess the degree of strategic fit between the dominant logic and
businesses characteristics.
The study also tries to integrate some useful concepts from multiple theoretical lenses to
propose a unified theoretical framework on diversification. Most of earlier studies have
looked at the diversity-performance relationship from the point of view of a single
theoretical lens. This is perhaps an attempt to marry theories combining multiple theoretical
lenses. Managerial explanations have been merged with explanations grounded in economic
theory to enable a holistic view of the research problem. Though the need of the same has
been felt much earlier, but most authors failed to move beyond the conceptualisation phase.
And in some cases even the conceptualisation was incomplete, leaving little or no scope for
further improvement. An important offshoot of the study is the capturing of the dimension of
envirormiental efficiency on a longitudinal scale, which has seldom been attempted before.
We have also made an attempt to develop reliable proxies for certain critical industry and
organisational variables. These proxies can be replicated in other economic contexts to test
their cross-context robustness and to further improve upon them.
To do full justice to addressing this kind of exploratory research, the research design would
have been ideal to use a combination of complementary research designs, viz., a few in-depth
studies followed by large sample survey. Case studies are an ideal platform for an in-depth
203
understanding of strategy crises. However, a full scale empirical research to confirm the
robustness of the proposed framework could not be carried out because one doctoral thesis
alone is not enough for carrying out a research of such magnitude as time, as resources poses
a major constraint. Currently, as our research stands, much room remains for further
development. A distinct step towards ensuring higher significance for our study is to bypass
longitudinal clinical investigation to assess dominant logics. A more direct approach through
top management interaction would be much more meaningful and incisive. Perhaps, the first
step towards assessment of the robustness of the framework is to confine the model to a large
scale empirical testing comprising not less than fifty business groups, coupled with
sophisticated modeling techniques, including neural networks. At successive steps of
analysis, as we move from univariate to bivariate to simple multivariate analyses some of the
relationships between variables become insignificant. This is a pointer that simple linear
regression models may not adequately represent the complex reality surrounding
diversification strategies facing business groups. Finally, efforts should be made to explore
the application of this model over a wide range of strategic choices, and not focusing on
choice of diversification alone.
10.3 Conclusion
The study is a small beginning towards a step in developing a unified theoretical framework
on the nature and extent of diversification, its antecedents and impact on performance. It has
adopted a holistic view combining multiple theoretical lenses to identify external and internal
variables that has a bearing on the nature of relationship between diversity and performance.
Select case studies were drawn across three largest business groups in India to analyse the
nature of inter and cross-relationships among these variables. Special attention was focused
on nature, and impact of the variables and its change from the point of view of economic
liberalisation in India. More specifically, we tried to determine how business groups
restructured their business portfolio in response to the same and its resulting effect on
diversity and performance. Our observations led us to conclude that diversity in isolation has
very insignificant bearing on performance. The composition of the business portfolio of a
group is a far more superior indicator than diversity. We subsequently propose an integrated
model of diversification strategies pursued by business groups in emerging markets. Our
contention is that performance effects of high levels of diversifications may not be declining
204
provided business groups makes a conscious effort to restructure their portfolio of dominant
logics, and diversify in businesses which are consistent to the same.
In this study we have taken a birds-eye view by including a large number of critical
variables. Though breadth is definitely missing from our study, one would appreciate that
especially when new horizons are being explored, depth is more important than breadth. As a
result we have been able to significantly increase the explanatory power of the diversity -
performance relationship, which was not achieved earlier. Economic liberalisation has
formed the primary background for our study. The model has been framed by and large by
incorporating the impacts of first and second phase of economic liberalisation in India on
choice of diversification strategies facing business groups. But as we enter the third and the
most important phase of economic liberalisation, which many other emerging markets have
gone through, the validity of the model may pose questions. During this phase we expect to
witness some critical ratification's (i.e. capital account convertibility, free foreign entry and
exit, etc), which may pose a different set of diversification strategies not experienced earlier.
This may enhance performance of business groups, or may put the entire institution of
business groups at stake. These factors may be required to be controlled for. Though we have
tried to generalise the model as far as practicable, fiirther research studies on this platform
may be launched in other emerging markets to study the efficacy of this model, as different
countries have used different models of economic liberalisation. Hence the crises faced by
business groups in such markets and their subsequent strategies of business portfolio
restructuring may be unique and different from the Indian context. We sincerely hope that
this study will generate sufficient interest, which is likely to spark off new direction for
future research on this framework.
10.4 Directions for Future Research
The validity of our integrated diversification model has been found to hold well across our
sample survey. However, the robustness of the model may be put to question, given the
limitations of sample size. Therefore, at this stage it would be wise to broaden the size of the
sample by including business groups of varying profiles and cross-sections. This would
better our understanding of business groups regarding the centrality of diversification
choices. In order to position our model as a true unified theory, it also needs to be tested
across a wide section of emerging markets. As the origin of business groups in different
205

markets can be traced to different sources of market failure. Our intuitive feelings also
suggests that perhaps our proposed model would also hold good over an array of strategic
choices, viz. choice of mode of strategy implementation, selection of strategy partner, etc. An
extension along those lines would truly make the theory more generalisable in nature.
Finally, assuming that behavioral patterns of business groups represent complex systems, use
of statistical tools like neural networks for testing the model and its validation would be more
incisive.
206
References
Alison, G. J. (1971), "Essence of Decision: Explaining the Cuban Missile Crisis", Little Brown, Boston.
Amsden, A. (1989), "Asia's next giant: South Korea and late industrialisation", NY: Oxford University Press.
Ansoff, H. I. (1957), "Strategies for diversification". Harvard Business Review, 35(5): 113-124.
Ansoff, H.I. (1958), "A Model for Diversification," Management Science, 4: 392-414.
Arnold, D.J. and Quelch, J.A. 1998. "New Strategies in Emerging Markets: A Resource based View," Sloan Management Review, 40(1): 7-20.
Bane, W.T. and Neubauer, F.F. (1981), "Diversification and the failure of new foreign activities," Strategic Management Journal, Vol. 2: 219-233.
Bardhan, P. (1997), "Corruption and Development: A review of Issues," Journal of Economic Literature, Vol.35, 1320-1346.
Barney, J. B. (1986), "Strategic factor markets: Expectations, luck, and business strategy". Management Science, 10: 1231-1241.
Barney, J. B. (1991), "Firm resources and sustained competitive advantage", Journal of Management, 17: 99-120.
Barney, J. B. (1997), "Gaining and sustaining competitive advantage", Addison-Wesley, Reading MA.
Barney, J.B. (1981), "Firm resources and sustained competitive advantage," Journal of Management, 17: 99- 123.
Barton, D.L. (1992), "Core Capabilities and Core Rigidities: A Paradox in Managing New Product Development," Strategic Management Journal, Vol. 13: 363-380.
Berger, P. G. and Ofek, E. (1995), "Diversification effect on firm value", Journal of Financial Economics, 37: 39-65.
Berry, C. H. (1975), "Corporate growth and diversification", Princeton, NJ, Princeton University Press.
Bettis, I. A. and Hall, W. K. (1982), "Diversification strategy, accounting determined risk, and accounting determined return". Academy of Management Journal, 25: 254-264.
Bettis, R. A. (1981), "Performance differences in related and unrelated diversified firms". Strategic Management Journal, 2: 379-393.
Bettis, R. A. Hall, W. K. and Prahalad, C. K. (1978), "Diversity and performance in the multi-business firm", AIDS Proceedings: 210-212.
Bettis, R.A. (1981), "Performance differences in related and unrelated diversified Firms," Strategic Management Journal, 2: 379-393.
Bettis, R.A. and Mahajan, V. (1985), "Risk / Return performance of diversified firms," Management Science, 31: 385-379.
207
Bhide, A. (1990), "Reversing corporate diversification", Journal of Applied Corporate Finance, 3: 70-81.
Bolton, P. and Scharfstein, D. S. (1990), "A theory of predation based on agency problems in financial contracting", American Economic Review, 80: 93-106.
Booz, Allen and Hamilton. (1985), "Diversification: A survey of European Chief Executives," Booz, Allen and Hamilton, Inc. New York.
Boston Consulting Group. (1973), "The Experience Curve Reviewed - IV, The Growth Share Matrix or the Product Portfolio," Boston Consulting Group, Inc New York.
Bowman, E.H. and Helfat, C.E. (2001), "Does corporate strategy matter?," Strategic Management Journal, 22 : 1-23.
Cambel, A. B. (1993), "Applied Chaos Theory: A Paradigm of Complexity", Academic Press, Boston, MA.
Campbell, A. et. al., (1995), "Corporate Strategy: The Quest for Parenting Advantage," Harvard Business Review, 73(1): 120-132.
Caves, R. (1989), "Entrepreneurs and politics in 20th Century Mexico", OUP, NY.
Caves, R. and Uekusa, M. (1976), "Industrial organisation in Japan", Washington, DC: Brookings Institution.
Caves, R. E. (1991), "Diversification and seller concentration: Evidence from change". Review of economics and Statistics, 63: 289-293.
Caves, R. E. and Uekusa, M. (1976), "Industrial organisation in Japan", Washington DC, Brookings Institution.
Caves, R.E. Porter, M.E. and Spence, A.M. (1980), "Competition in the Open Economy: A Model applied to Canada," Harvard University Press, Cambridge, M.A.
Chandler, A. D. (1962), "Strategy and Structure: Chapters in the history of Industrial Enterprise", MIT Press, Cambridge, MA.
Chandler, A. D. (1982), "The M-Form: Industrial Groups, American Style", European Economic Review, 19: 3-23.
Chang, S. J. and Choi, U. (1988), "Strategy, Structure, and Performance of Korean Business Groups: A transaction Cost Approach", Journal of Industrial Economics, 12-. 42-67.
Chang, S. J. and Hong, A. J. (2002), "How much does the business group matter in Korea?", Strategic Management Journal, 23: 265-274.
Chang, S. J. and Hong, J. (1999), "Economic performance of the Korean business groups: Intra group resource sharing and internal business tranaction", Mimeograph, Korea University, Seoul.
Chang, S.J. and Hong, J. (2000), "Economic performance of group affiliated firms: Intra group resource sharing and internal business transacfion;" Academy of Management Journal, Vol. 43, No. 3: 429-448.
Chang, S.J. and Hong, J. (2002), "How much does Business Groups really matter in Korea," Strategic Management Journal, 23:265-274.
208
Channon, D. (1973), "The Strategy and Structure of British Enterprise", Graduate School of Business Administration, Harvard University, Boston.
Chatterjee, S and Blocher, J.D. (1992), "Measurement of firm diversification: Is it Robust?" Academy of Management Journal, Vol. 35. No. 4: 874-888.
Chatterjee, S. and Wemerfelt, B. (1991), "The link between resources and type of Diversification: Theory and Evidence," Strategic Management Journal, Vol.12, 33-48.
Child, J. and Lu, Y. (1996), "Institutional constraints on economic reform: The case of investment decisions in China", Organisation Science, 7: 60-67.
Clague, C. (1997), "Institutions and economic development: Growth and governance in less-developed and post-socialist countries", Baltimore: Johns Hopkins University Press.
Coase, R. (1998), "The new institutional economics", American Economic Review, 88: 72-74.
Comment, R. and Jarrell, G.A. (1995), "Corporate focus and Stock Returns," Journal of Financial Economics, 37: 67-87.
Coimer, K.R. and Prahalad, C.K. (1996), "A resource based theory of the firm: Knowledge versus Opportunism," Organization Science, 7: 477 - 501.
Das, R. (1981), "Managing Diversification: The General Management Perspective", Macmillan India, New Delhi.
Dawar, N. and Frost, T. (1999), "Competing with Giants: Survival Strategies for local companies in Emerging Markets," Harvard Business Review, 77(2): 119-129.
De, Groot. (1965), "Thought and Choice in Chess", Mouton, The Hague.
DiMaggio, P. J. & Powell, W. W. (1983), "The iron cage revisited: Institutional isomorphism and collective rationality in organizational fields", American Sociological Review, 48: 147-160.
Donaldson, G. and Lorsch, J. (1983), "Decision Making at the Top", Basic Books, NY.
Encamation, D. (1989), "Dislodging Multinationals: India's Comparative Perspective", Cornell University Press: Ithaca, NY.
Fama, E.F. and Jensen, M. (1983), "Separation of ownership and control," Journal of Law and Economics, 26: 74-98.
Fisman, R. and Khaima, T. (1998), "Facilitating development: The role of business groups". Harvard Business School Working Paper, Boston, US.
Fligstein, N. (1991), "The structural transformation of American industry. In Walter J. W. Powell and Paul J. DiMaggio (Eds). The new institutionalism in organisational analysis, Chicago. University of Chicago Press.
Froot, K. A. Scharfstein, D. S. and Stein, J. C. (1994), "A framework for risk management". Harvard Business Review, 72(6): 91-102.
Gerlach, M. (1992), "The Japanese corporate network: A block model analysis". Administrative Science Quarterly, 37: 105-139.
209
Ghemawat, P and Khanna, T. 1998. "The nature of Diversified Groups; A researcii design and two case studies," Journal of Industrial Economics, XLVI (1): 35-62.
Ghemawat, P. (1991), "Commitment - The dynamics of strategy", NY: Free Press.
Ghemawat, P. and Khanna, T. (1998), "The nature of diversified business groups; A research design and two case studies". Journal of Industrial Economics, XLVI (1); 35-62.
Gill, S. (1999), "The Pathology of Corruption", Harper Collins, New Delhi.
Goold, M. and Campbell, A. (1998), "Desperately seeking synergy", Harvard Business Review", 76(5): 130-143.
Gort, M. 1962. "Diversification and Integration in American Industry," Princeton University Press, N.J.
Govindarajan, V. and Trimble, C. (2006), "Ten rules for strategic innovators; From ideas to execution", Harvard Business School Press.
Granovetter, M. (1994), "Business Groups: In Handbook of Economic Sociology," Smelser NJ, Swedberg (Ed), Princeton University Press, Princeton, NJ and Russell Sage Foundation, New York.
Grant, R. M. (1998), "Contemporary Strategy Analysis", Blackwell, Oxford.
Grant, R. M. Jammine, A. P., and Thomas, H. (1998), "Diversity, diversification, and profitability among British Manufacturing Go's", Academy of Management Journal, 31:771-801.
Guillen, M. F. (2000), "Business Groups in Emerging Economies: A RBV", Academy of Management Journal, 43(3), 362-380.
Gullick, D. (1992), "Encounters with Chaos", Mc Graw Hill, NY.
Harriss, J., Hunter, J., & Lewis, C. M. (1995), "The new institutional economics and third world development", London: Routledge.
Hill, C.W.L. (1985), "Diversified Growth and Competition," Applied Economics, 17; 827-847.
Hill, C.W.L. (1994), "Diversification and Economic Performance: Bringing structure and Corporate Management back into the picture, (eds.) Rumelt et.al. "FundamentaJ Issues in Strategy," Boston, M.A., Harvard Business School Press.
Hitt, M.A. et al. (2000), "Partner selection in emerging and developed markets contexts: Resource based and organisation and learning perspective, "Academy of Management Journal, Vol. 43, No.3: 449-469.
Holland, J. H. (1992), "Adaptation in Natural and Artificial Systems", MIT Press, Cambridge, MA.
Holzmann, O.J. Copeland, R.M. and Hayya, J. (1975), "Income measure of Conglomerate Performance," Quarterly Review of Economics and Business, 15(3): 66-78.
Hoskisson, R. E. et al. (2000), "Strategy in emerging economies". Academy of Management Journal, Vol. 43, No. 3, 249-267.
Jacquemin, A.P. and Berry, C.H. (1979), "Entropy Measure of Diversification and Corporate Growth," Journal of Industrial Economics, 27: 359-369.
210
Jensen, M. C. (1996), "Agency costs of free cash flow, corporate finance, and takeovers", American Economic Review, 76: 323-329.
Jensen, M., Meckling, W. (1976), "The theory of the firm: managerial behavior, agency costs and ownership structure", Journal of Financial Economics, 3: 305-360.
Kakani, R.K. (2000), "Financial Performance and Diversification Strategy of Indian Business Groups," Working Paper #411, IIM - Calcutta.
Kay, N. M. (1997), "Pattern in corporate evolution", Oxford: Oxford University Press.
Keister, L. (1998), "Engineering growth: Business group structure and firm performance in China's transition economy", American Journal of Sociology, 10: 404-440.
Kharma, T. and Palepu, K. (1997), "Why Focused Strategies may be wrong for Emerging Markets," Harvard Business Review, 75(4): 45-50.
Khanna, T. and Palepu, K. (2000), "The future of business groups: long run evidence from Chile", Academy of Management Journal, 43: 268-285.
Khanna, T. and Palepu, K. (2000b), "Is group affiliation profitable in emerging markets: An analysis of Indian diversified business groups," Journal of Finance, 55(2): 867-891.
Khanna, T. and Palepu, K. (1999), "The Right way to restructure Conglomerates in Emerging Markets," Harvard Business Review, 77(3): 125-134.
Khanna, T. and Rivkin, J.W. (2001), "Estimating the Performance effects of Business Groups in Emerging Markets," Strategic Management Journal, Vol 22: 45-74.
Khanna, T. Palepu, K. and Wu, D. (1998), "House of Tata: The new generation", Case No. 798-037, Harvard Business School, Boston, US.
Khanna, T., and Rivkin, J. W. (2001), "Estimating the performance effects of business groups in emerging markets". Strategic Management Journal, 22: 45-74.
Kiesler, S. and Sproul, L. (1982), "Managerial response to changing environments; Perspectives and problems sensing from social recognition", Administrative Science Quarterly, 37: 548-570.
Kim, W. C. Hwang, P. and Burgers, W. P. (1989), "Global diversification strategy and corporate profit performance". Strategic Management Journal, 10(1): 45-57.
King, A.W. and Zeithaml, C.P. (2001), "Competencies and Firm Performance: Examining the Causal Ambiguity Paradox" Strategic Management Journal, 22: 77-99.
Kuhn, T. S. (1970), "The Structure of Scientific Revolutions", 2nd edn. University of Chicago Press, Chicago, IL.
Lang, L. and Stuz, R. (1994), "Tobin's q, corporate diversification, and firm performance", Journal of Political Economy, 102: 1248-1280.
Lang, L. Poulsen, A. and Stulz, R. (1995), "Asset, sales, firm performance, and the agency costs of managerial discretion". Journal of Financial Economics, 37: 3-37.
Leff, N. (1976), "Capital Markets in the less Developed Countries: The Group Principal," In R. McKinon (Ed), Money and Finance in Economic growth and Development, 97-122, New York - Dekker.
211
Leff, N. (1978), "Industrial organization and entrepreneurship in the developed countries: The Economic Groups," Economic Development and Cultural Change, 26: 661-675.
Lincoln, J. R. Gerlach, M. L. Ahmadjian, C. L. (1996), 'Keiretsu networks and corporate performance in Japan", American Sociological Review, 61: 67-88.
Lubatkin, M. H. and Chatterjee, S. (1994), "Extending modem portfolio theory into the domain of corporate diversification: Does it apply?" Academy of Management Journal, 37: 109-136.
Lubatkin, M. H.. and O'Neill, H. (1987), "Merger strategies and market risk", Academy of Management Journal, 30: 665-684.
Markides J, Constantinos, C. and Williiamson, P.J. (1994), "Related Diversification, Core Competencies and Corporate Performance," Strategic Management Journal, Vol. 15: 144-165.
Markides, C. C. (1992), "Consequences of corporate refocusing: Ex ante evidence", Academy of Management Journal, 35: 398-412.
Markides, J. and Williiamson, P. J. (1994). "Related Diversification, Core Competencies and Corporate Performance," Strategic Management Journal, Vol. 15: 149-165.
Markowitz, H.M. (1959), "Portfolio Selection: Efficient Diversification of Investments," Wiley, N.Y.
Matsusaka, J. G. (1993), "Takeover motives during the conglomerate merger wave", RAND Journal of Economics, 24: 357-379.
Mc. Gahan, A. M. and Porter, M. E. (1997), "How much does industry really matter?". Strategic Management Journal, Summer Special Issue, 18: 15-30.
McCutcheon, B. J. (1991), "What caused conglomerate formation? An examination of managerial behaviour and internal capital markets in the 1960s conglomerates", Doctoral dissertation, University of Chicago.
Michel, A. and Shaked, J. (1984), "Does Business Diversification affect Performance?," Financial Management, 13(4): 18-25.
Mohanty, P. (2000), "Unrelated Corporate Diversification and Shareholders Value," (Eds) Indian Capital Markets, UTI - ICM Publication, Tata McGrawHill: 268-294.
Montgomery, C. A. (1982), "The measurement of firm diversification: Some new empirical evidence". Academy of Management Journal, 25: 299-307.
Montgomery, C. A. and Singh, H. (1984), "Diversification strategy and systematic risk", Strategic Management Journal, 5(2), 181-191.
Montgomery, C.A. (1985), "Product Market Diversification and Market Power," Academy of Management Journal, Vol. 25: 299-337.
Montgomery, C.A. and Singh, H. (1984), "Diversification Strategy and Systematic Risk," Strategic Management Journal: 181-191.
Mueller, D. C. (1987), "The corporation: growth, diversification and mergers", London: Harwood.
212
MuUer, D. (1987), "The structural and environmental correlates of business strategy", Strategic Management Journal, 8: 55-76.
Nakatani, I. (1984), "The economic role of financial corporate grouping", In M. Aoki (Eds), The economic analysis of the Japanese firm, Amsterdam, North Holland.
Nayyar, P. (1992), "On the mesurement of corporate diversification strategy: Evidence from large US service firms". Strategic Management Journal, 13(3): 219-235.
Nisbett, R. and Ross, L. (1980), "Human Inference: Strategies and Shortcomings of social Judgment", Prentice-Hall, Englewood Cliffs, NJ.
Norman, D. (1976), "Memory and Attention" 2 nd edn, Wiley, NY.
North, D. (1990), "Institutions, institutional change and economic performance". New York: Cambridge University Press.
Oliver, C. (1991), "Strategic responses to institutional processes", Academy of Management Review, 16: 145-179.
Olson, M. (1982), "The rise and decline of nations: Economic growth, stagflation, and social rigidities", New Haven, CT: Yale University Press.
Palepu, K. (1985), "Diversification strategy, profit performance and the entropy measure". Strategic Management Journal, 6(3): 239-255.
Palich, L.E. et.al. (2000), "Curvilinearity in the diversification - performance linkage: An examination of over three decades of research," Strategic Management Journal, 21:155-174.
Pan, L. (1991), "Sons of the yellow empire: The story of the overseas Chinese", London: Mandarin Paperbacks / Reed International Books.
Pavan, R. J. (1972), "Strategy and structure of Italian enterprise", Unpublished doctoral dissertation. Harvard Business School, Boston.
Peng, M. W., and Health, P. (1996), "The growth of the firm in planned economies in transition: institutions, organizations, and strategic choice", Academy of Management Review, 21:492-528.
Peng, M. W., Luo, Y. (2000), "Managerial ties and firm performance in a transition economy: The nature of micro-macro link". Academy of Management Journal, 43: 486-501.
Penrose, E. (1959), "The theory of the growth of the firm". White Plains, NY: Sharpe.
Pitts, R. A. and Hopkins, H. D. (1982), "Firm diversity: Conceptualisation and measurement". Academy of Management Review, 7: 620-629.
Pitts, R.A. (1977), "Strategy and Structure for Diversification," Academy of Management Journal, 20: 197-208.
Porter, M. E. (1980), "Competitive strategy: Techniques for analyzing industries and competitors", NY: Free Press.
Porter, M. E. (1985), "Competitive Advantage", Free Press, NY.
Porter, M. E. (1986), "Competition in global industries: A conceptual framework", Boston: Harvard Business School Press.
213
Porter, M.E. (1985), "Competitive Advantage: Creating and Sustaining Superior Performance," Free Press, New York.
Porter, M.E. (1986), "Competition in Global Industries: A Conceptual Framework," Harvard Business School Press, Boston: 15-60.
Porter, M.E. (1987), "From Competitive Advantage to Corporate Strategy," Harvard Business Review, 65(3): 43-59.
Powell, T.C. (2001), "Competitive Advantage: Logical & Philosophical Considerations," Strategic Management Journal, 22: 875-888.
Prahalad, C. K. and Bettis, R. A. (1986), "The dominant logic: A new linkage between diversity and performance", Strategic Management Journal, 7: 485-501.
Prahalad, C. K. and Bettis, R. A. (1995), "The Dominant Logic: Retrospective and Extension", Strategic Management Journal, 16: 5-14.
Prahalad, C. K. and Hamel, G. (1990), "The core competence of the corporation". Harvard Business Review: 79-91.
Prahalad, C.K. and Hamel, G. (1998), "The End of Corporate Imperialism," Harvard Business Review, 76(3): 69-79.
Prahalad, C.K. and Lieberthal, J.A. (1998), "New Strategies in Emerging Markets,"Sloan Management Review, 40(1): 7-20.
Ramanujam, V. and Varadarajan, P. (1989), "Research on corporate diversification: A synthesis", Strategic Management Journal, 10: 523-551.
Ravenscraft, D. J. and Scherer, F. M. (1987), "Mergers, sell-off, and economic efficiency". The Brookings Institution, Washington, DC.
Ray, S. (2000), "Strategic adaptation during Economic Liberalisation,"Decision, Vol. 27, No. 1:117-134.
Ray, S. (2002), "Explaining strategic behaviour of firms during economic liberalisation: Conceptualisation and Identification of a multi-variate model," Working Paper # 447, IIM - Calcutta.
Robinson, R. (1986), "Indonesia: The rise of capital", Sydney: Allen & Urwin.
Roquebert, J. A., Phillips, R. L. and Westfall, P. A. (1996), "Markets Vs Management: What drives profitability," Strategic Management Journal, 17(8): 653-664.
Rumelt, R. P. (1974), "Strategy, structure, and economic performance", Harvard University Press, Cambridge, MA.
Rumelt, R. P. (1982). "Diversification Strategy and Profitability," Strategic Management Journal, 3: 359-369.
Rumeh, R. P. (1991), "How much does industry matter?" Strategic Management Journal, 12(3): 167-185.
Scherer, F. M. (1980), "Industrial market structure and economic performance", Rand McNally College Publishing Co., Chicago, IL.
Schmalensee, M. (1985), "Do markets differ much?"American Economic Review, 75:341-351.
214
• Schwartz, A. (1992), "A nation in waiting: Indonesia in the 1990's", Sydney: Allen and Unwin. Scott, W. R. (1995), "Institutions and Organizations", Thousand Oaks, CA: Sage. Selznick, P. (1957), "Leadership in Administration: A sociological interpretation", NY: Harper & Row.
Seth, A. (1990), "Value creation in acquisitions: A re-examination of performance issues". Strategic Management Journal, 11(2): 99-115.
Shleifer, A. and Vishny, R. (1993), "Corruption", Quarterly Journal of Economics, 108:599-618.
Simmonds, P. G. (1990), "The combined diversification breadth and mode dimensions and the performance of large diversified firms", Strategic Management Journal, 11:399-410.
Simon, H. A. (1979), "Information processing models of cognition". Annual review of Psychology, 30: 363-396.
Skinner, B. F. (1953), "Science and Human Behavior", Macmillan, NY.
Sobel, R. (1994), "The rise and fall of the conglomerate kings", Stein and Day, NY.
Spanos, Y.E. and Lioukas, S. (2001), "An Examination into the casual logic of rent generation: Contrasting Porter's competitive strategy framework and the resource based perspective," Strategic Management Journal, 22: 907 - 934.
Stimpert, J. M. and Duhaime, I. M. (1997), "Seeing the big picture: The influence of industry, diversification, and business strategy on performance", Academy of Management Journal, 40: 560-583.
Strachan, H. (1976), "Family and other business groups in economic development: The case of Nicaragua", Praeger: NY.
Stulz, R. (1990), "Managerial discretion and optimal financing policies", Journal of Financial Economics, 26: 3-27.
Suzuki, Y. (1980), "The strategy and structure of top 100 Japanese industrial enterprises 1950-1970", Strategic Management J
Taylor, P. and Lowe, J. (1995), "A note on corporate strategy and capital structure", Strategic Management Journal, 16(5): 411-414.
Teece, D. (1980), "Economies of scope and the scope of the enterprise", Journal of Economic Behaviour and Organisation, 1: 223-247.
Teece, D. (1982), "Toward an economic theory of the multi-product firm". Journal of Economic Behaviour and Organisation, 3: 39-63.
Tversky, A. and Kahneman, D. (1974), "Judgment under uncertainty: Heuristics and biases". Science, 185: 1124-1131.
Varadarajan, P. (1986), "Product Diversity and firm Performance: An Empirical Investigation,"Joumal of Marketing, 50(3): 43-57.
Waldrop, M. M. (1992), "Complexity", Simon and Schuster, NY.
Wemerfelt, B. (1984), "A resource-based view of the firm". Strategic Management Journal, 5: 171-180.
215
Wemerfelt, B. and Montgomery, C.A. (1988), "Tobin's Q and the importance of focus in firm Performance," American Economic Review, Vol 78, No. 1: 246-250.
Weston, J.F. and Mansighka, S.K. (1971), "Tests of the Efficiency Performance of Conglomerate firms," Journal of Finance, 24: 919-936.
White, L. J. (1974), "Industrial Concentration and Economic Power in Pakistan", Princeton, NJ: Princeton University Press.
Williamson, O. E. (1975), "Markets and hierarchies: Analysis and anti-trust implications". New York: Free Press.
Williamson, O. E. (1986), "Economic Organisation: Firms, Markets and Policy and Control", New York University Press, NY.
Wrigley, L. (1970), "Divisional Autonomy and Diversification," Doctoral Dissertation, Harvard Business School.
216
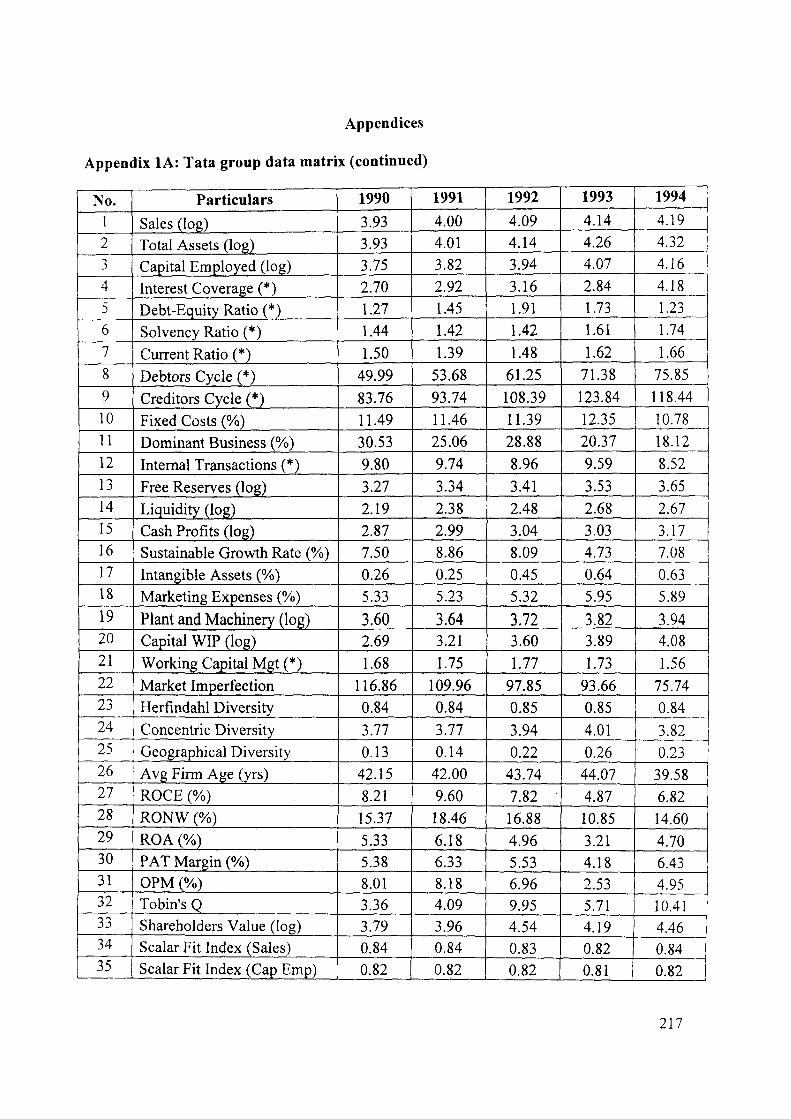
Appendices
Appendix lA: Tata group data matrix (continued)
No. 1 2 3 4 5 6 7 8 9 10 11
12
13 14 15 16 17 18
19 20
21 22 23 24
25 26 27 28 29 30 31 32 33 34 35
Particulars
Sales (log) Total Assets (log) Capital Employed (log) Interest Coverage (*) Debt-Equity Ratio (*) Solvency Ratio (*)
Current Ratio (*) Debtors Cycle (*)
Creditors Cycle (*) Fixed Costs (%) Dominant Business (%) Internal Transactions (*)
Free Reserves (log)
Liquidity (log) Cash Profits (log) Sustainable Growth Rate (%)
Intangible Assets (%) Marketing Expenses (%)
Plant and Machinery (log) Capital WIP (log)
Working Capital Mgt (*)
Market Imperfection Herfmdahl Diversity
Concentric Diversity Geographical Diversity Avg Firm Age (yrs) ROCE (%) RONW (%) ROA (%) PAT Margin (%) 0PM (%) Tobin's Q Shareholders Value (log) Scalar Fit Index (Sales) Scalar Fit Index (Cap Emp)
1990
3.93 3.93 3.75
2.70 1.27 1.44
1.50 49.99
83.76 11.49 30.53
9.80
3.27 2.19 2.87 7.50 0.26 5.33
3.60 2.69
1.68 116.86 0.84
3.77 0.13
42.15 8.21
15.37
5.33 5.38 8.01 3.36 3.79 0.84 0.82
1991
4.00 4.01 3.82 2.92 1.45 1.42
1.39 53.68
93.74
11.46 25.06 9.74
3.34
2.38 2.99 8.86 0.25 5.23
3.64 3.21
1.75
109.96 0.84
3.77 0.14
42.00
9.60 18.46
6.18 6.33 8.18 4.09 3.96 0.84 0.82
1992
4.09 4.14 3.94
3.16 1.91 1.42
1.48 61.25
108.39
11.39 28.88
8.96
3.41
2.48 3.04 8.09
0.45 5.32
3.72 3.60
1.77
97.85 0.85
3.94 0.22
43.74 7.82 16.88
4.96 5.53 6.96 9.95 4.54 0.83 0.82
1993
4.14 4.26 4.07 2.84 1.73 1.61
1.62
71.38 123.84
12.35 20.37
9.59
3.53
2.68 3.03 4.73 0.64 5.95
3.82 3.89
1.73
93.66 0.85
4.01
0.26 44.07 4.87
10.85 3.21 4.18 2.53 5.71 4.19 0.82 0.81
1994
4.19 4.32 4.16
4.18 1.23 1.74
1.66
75.85 118.44
10.78 18.12
8.52
3.65 2.67 3.17 7.08
0.63 5.89
3.94 4.08
1.56
75.74 0.84
3.82 0.23
39.58 6.82
14.60 4.70 6.43 4.95 10.41 4.46 0.84 0.82
217
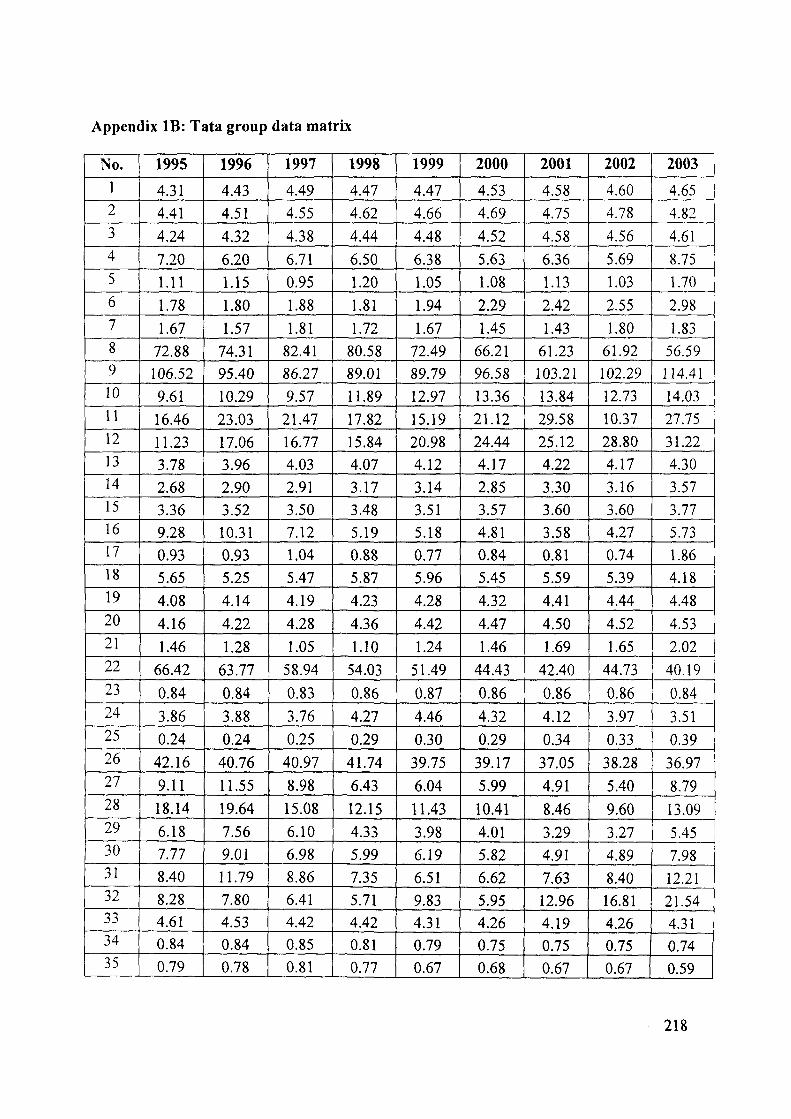
Appendix IB: Tata group data matrix
No. 1 2
3
4 5
6
7
8 9 10
11
12 13 14 15 16 17
18 19
20 21
22
23 24
25
26
27
28
29
30 31
32 33
34 35
1995
4.31
4.41
4.24
7.20
1.11
1.78
1.67
72.88
106.52
9.61
16.46
11.23
3.78
2.68
3.36
9.28
0.93
5.65
4.08
4.16
1.46
66.42
0.84
3.86
0.24
42.16
9.11
18.14
6.18
7.77
8.40
8.28
4.61
0.84
0.79
1996
4.43
4.51
4.32
6.20
1.15
1.80
1.57
74.31
95.40
10.29
23.03
17.06
3.96
2.90
3.52
10.31
0.93
5.25
4.14
4.22
1.28
63.77
0.84
3.88
0.24
40.76
11.55
19.64
7.56
9.01
11.79
7.80
4.53
0.84
0.78
1997
4.49
4.55
4.38
6.71
0.95
1.88
1.81
82.41
86.27
9.57
21.47
16.77
4.03
2.91
3.50
7.12
1.04
5.47
4.19
4.28
1.05
58.94
0.83
3.76
0.25
40.97
8.98
15.08
6.10
6.98
8.86
6.41
4.42
0.85
0.81
1998
4.47
4.62
4.44
6.50
1.20
1.81
1.72
80.58
89.01
11.89
17.82
15.84
4.07
3.17
3.48
5.19
0.88
5.87
4.23
4.36
1.10
54.03
0.86
4.27
0.29
41.74
6.43
12.15
4.33
5.99
7.35
5.71
4.42
0.81
0.77
1999
4.47
4.66
4.48
6.38
1.05
1.94
1.67
72.49
89.79
12.97
15.19
20.98
4.12
3.14
3.51
5.18
0.77
5.96
4.28
4.42
1.24
51.49
0.87
4.46
0.30
39.75
6.04
11.43
3.98
6.19
6.51
9.83
4.31
0.79
0.67
2000
4.53
4.69
4.52
5.63
1.08
2.29
1.45
66.21
96.58
13.36
21.12
24.44
4.17
2.85
3.57
4.81
0.84
5.45
4.32
4.47
1.46
44.43
0.86
4.32
0.29
39.17
5.99
10.41
4.01
5.82
6.62
5.95
4.26
0.75
0.68
2001
4.58
4.75
4.58
6.36
1.13
2.42
1.43
61.23
103.21
13.84
29.58
25.12
4.22
3.30
3.60
3.58
0.81
5.59
4.41
4.50
1.69
42.40
0.86
4.12
0.34
37.05
4.91
8.46
3.29
4.91
7.63
12.96
4.19
0.75
0.67
2002
4.60
4.78
4.56
5.69
1.03
2.55
1.80
61.92
102.29
12.73
10.37
28.80
4.17
3.16
3.60
4.27
0.74
5.39
4.44
4.52
1.65
44.73
0.86
3.97
0.33
38.28
5.40
9.60
3.27
4.89
8.40
16.81
4.26
0.75
0.67
2003
4.65
4.82
4.61
8.75
1.70
2.98
1.83
56.59
114.41
14.03
27.75
31.22
4.30
3.57
3.77
5.73
1.86
4.18
4.48
4.53
2.02
40.19
0.84
3.51
0.39
36.97
8.79
13.09
5.45
7.98
12.21
21.54
4.31
0.74
0.59
218
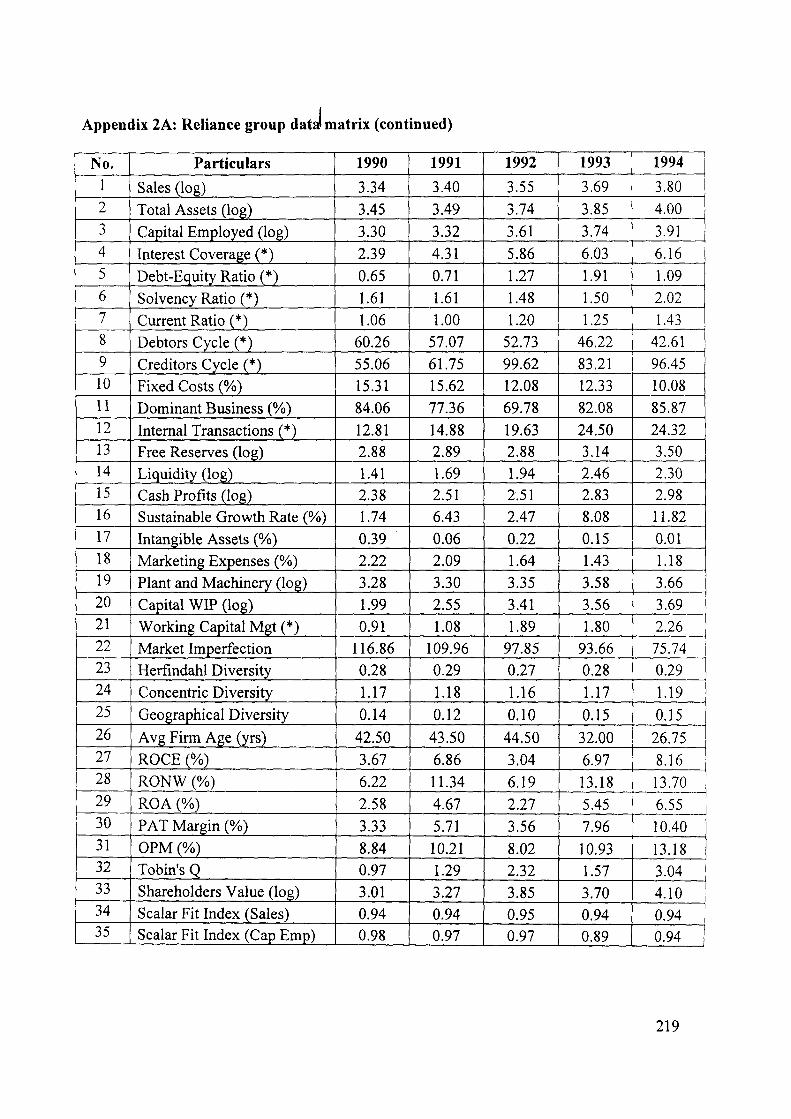
Appendix 2A: Reliance group data! matrix (continued)
No, 1 2 3 4 5 6 7 8 9 10 11
12 13 14 15 16
17 18 19 20
21 22 23 24
25
26
27 28
29 30 31 32 33 34 35
Particulars
Sales (log)
Total Assets (log) Capital Employed (log)
Interest Coverage (*) Debt-Equity Ratio (*)
Solvency Ratio (*) Current Ratio (*) Debtors Cycle (*) Creditors Cycle (*) Fixed Costs (%) Dominant Business (%) Internal Transactions (*) Free Reserves (log) Liquidity (log) Cash Profits (log) Sustainable Growth Rate (%)
Intangible Assets (%) Marketing Expenses (%) Plant and Machinery (log) Capital WIP (log) Working Capital Mgt (*) Market Imperfection Herfmdahl Diversity
Concentric Diversity
Geographical Diversity
Avg Firm Age (yrs) ROCE(%) RONW (%)
ROA (%)
PAT Margin (%) 0PM (%) Tobin's Q Shareholders Value (log) Scalar Fit Index (Sales) Scalar Fit Index (Cap Emp)
1990
3.34
3.45
3.30
2.39
0.65 1.61 1.06
60.26 55.06 15.31 84.06
12.81 2.88 1.41 2.38 1.74
0.39 2.22 3.28 1.99 0.91
116.86 0.28
1.17
0.14
42.50 3.67 6.22
2.58 3.33 8.84 0.97 3.01 0.94 0.98
1991
3.40
3.49 3.32
4.31 0.71 1.61 1.00
57.07 61.75 15.62
77.36 14.88 2.89 1.69 2.51 6.43 0.06 2.09 3.30 2.55 1.08
109.96 0.29 1.18
0.12
43.50 6.86 11.34
4.67
5.71
10.21 1.29 3.27 0.94 0.97
1992
3.55 3.74
3.61
5.86
1.27 1.48
1.20 52.73 99.62 12.08 69.78
19.63 2.88 1.94 2.51 2.47
0.22 1.64
3.35 3.41
1.89 97.85 0.27
1.16
0.10
44.50 3.04
6.19
2.27 3.56
8.02 2.32 3.85 0.95 0.97
1993
3.69
3.85 3.74
6.03
1.91 1.50 1.25
46.22 83.21 12.33 82.08
24.50 3.14 2.46 2.83 8.08 0.15 1.43 3.58 3.56 1.80
93.66 0.28 1.17
0.15
32.00
6.97 13.18
5.45
7.96
10.93 1.57 3.70 0.94 0.89
1994
3.80
4.00 3.91
6.16
1.09 2.02
1.43 42.61
96.45 10.08 85.87 24.32 3.50 2.30 2.98 11.82 0.01 1.18
3.66 3.69 2.26 75.74 0.29
1.19
0.15
26.75 8.16 13.70
6.55
10.40
13.18 3.04
4.10 0.94 , 0.94 j
219
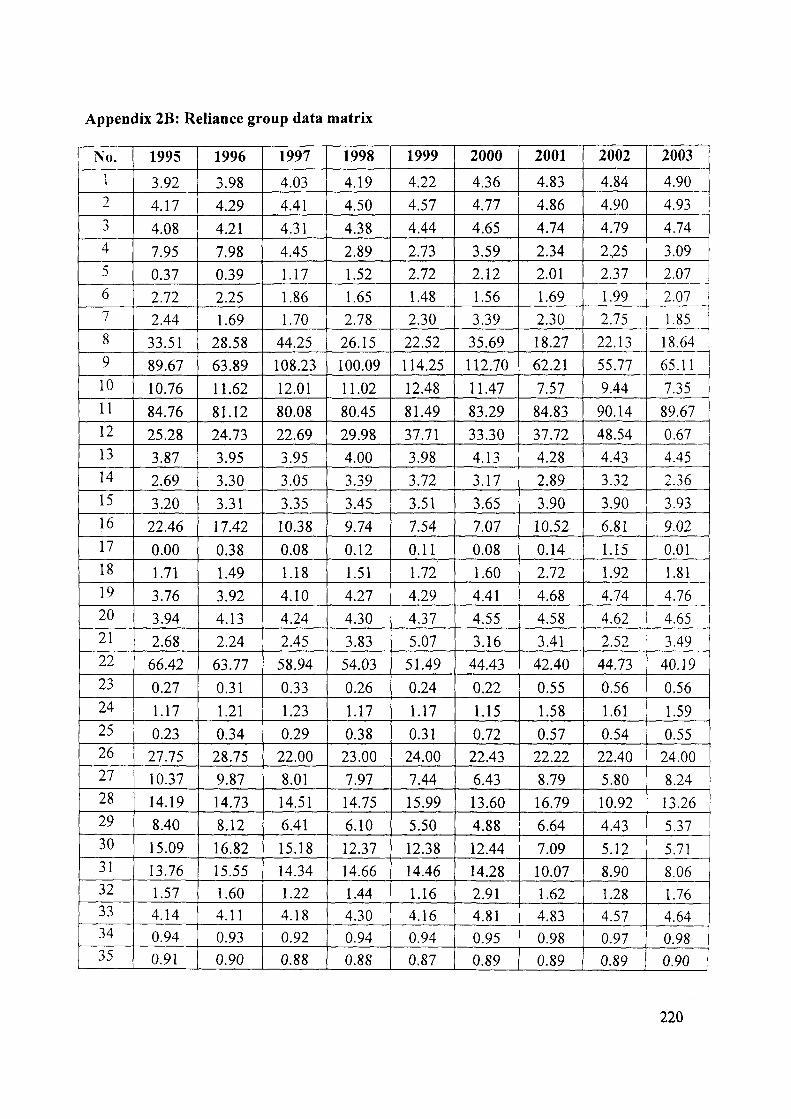
Appendix 2B: Reliance group data matrix
No.
1
2
3
4
5
6
7
8
9
10
11
12
13
14
15
16 17
18
19
20
21
22
23
24
25
26
27
28
29
30
31
32
33 34
''
1995
3.92
4.17
4.08
7.95
0.37
2.72
2.44
33.51
89.67
10.76
84.76
25.28
3.87
2.69
3.20
22.46
0.00
1.71
3.76
3.94
2.68
66.42
0.27
1.17
0.23
27.75
10.37
14.19
8.40
15.09
13.76 1.57 4.14 0.94
0.91
1996
3.98
4.29
4.21
7.98
0.39
2.25
1.69
28.58
63.89
11.62
81.12
24.73
3.95
3.30
3.31
17.42
0.38
1.49
3.92
4.13
2.24
63.77
0.31
1.21
0.34
28.75
9.87
14.73
8.12
16.82
15.55
1.60 4.11
0.93 0.90
1997
4.03
4.41
4.31
4.45
1.17
1.86
1.70
44.25
108.23
12.01
80.08
22.69
3.95
3.05
3.35
10.38
0.08
1.18
4.10
4.24
2.45
58.94
0.33
1.23
0.29
22.00
8.01
14.51
6.41
15.18
14.34
1.22 4.18 0.92
0.88
1998
4.19
4.50
4.38
2.89
1.52
1.65
2.78
26.15
100.09
11.02
80.45
29.98
4.00
3.39
3.45
9.74
0.12
1.51
4.27
4.30
3.83
54.03
0.26
1.17
0.38
23.00
7.97
14.75
6.10
12.37
14.66 1.44
4.30 0.94
0.88
1999
4.22
4.57
4.44
2.73
2.72
1.48
2.30
22.52
114.25
12.48
81.49
37.71
3.98
3.72
3.51
7.54
0.11
1.72
4.29
4.37
5.07
51.49
0.24
1.17
0.31
24.00
7.44
15.99
5.50
12.38
14.46
1.16 4.16 0.94
0.87
2000
4.36
4.77
4.65
3.59
2.12
1.56
3.39
35.69
112.70
11.47
83.29
33.30
4.13
3.17
3.65
7.07
0.08
1,60
4.41
4.55
3.16
44.43
0.22
1.15
0.72
22.43
6.43
13.60
4.88
12.44
14.28
2.91 4.81 0.95
0.89
2001
4.83
4.86
4.74
2.34
2.01
1.69
2.30
18.27
62.21
7.57
84.83
37.72
4.28
2.89
3.90
10.52
0.14
2.72
4.68
4.58
3.41
42.40
0.55
1.58
0.57
22.22
8.79
16.79
6.64
7.09
10.07
1.62 4.83
0.98 0.89
2002
4.84
4.90
4.79
2.25
2.37
1.99
2.75
22.13
55.77
9.44
90.14
48.54
4.43
3.32
3.90
6.81
1.15
1.92
4.74
4.62
2.52
44.73
0.56
1.61
0.54
22.40
5.80
10.92
4.43
5.12
8.90
1.28 4.57 0.97
0.89
2003
4.90
4.93
4.74
3.09
2.07
2.07
1.85
18.64
65.11
7.35
89.67
0.67
4.45
2.36
3.93
9.02
0.01
1.81
4.76
4.65
3.49
40.19
0.56
1.59
0.55 24.00
8.24
13.26
5.37
5.71
8.06
1.76 4.64
0.98
0.90 I
220
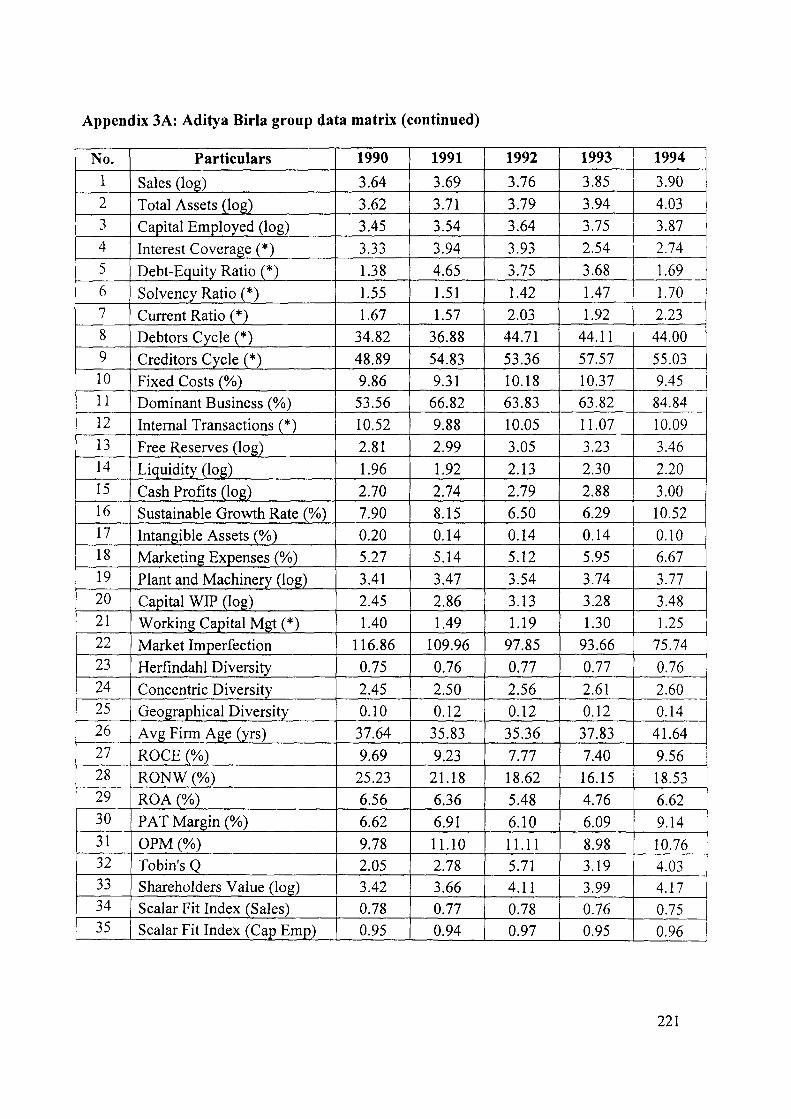
Appendix 3A: Aditya Biria group data matrix (continued)
No. 1 2 3 4 5 6 7 8 9 10 11
12
13 14
15 16 17 18 19
20 21 22 23 24
25 26
27 28 29
30
31 32 33 34 35
Particulars
Sales (log) Total Assets (log) Capital Employed (log) Interest Coverage (*)
Debt-Equity Ratio (*)
Solvency Ratio (*)
Current Ratio (*) Debtors Cycle (*)
Creditors Cycle (*) Fixed Costs (%) Dominant Business (%) Internal Transactions (*) Free Reserves (log)
Liquidity (log) Cash Profits (log) Sustainable Growth Rate (%) Intangible Assets (%) Marketing Expenses (%) Plant and Machinery (log) Capital WIP (log) Working Capital Mgt (*) Market Imperfection Herfmdahl Diversity
Concentric Diversity Geographical Diversity Avg Firm Age (yrs) ROCE(%) RONW (%) ROA (%) PAT Margin (%)
0PM (%) Tobin's Q Shareholders Value (log) Scalar Fit Index (Sales) Scalar Fit Index (Cap Emp)
1990
3.64
3.62 3.45
3.33 1.38
1.55 1.67
34.82
48.89 9.86 53.56 10.52
2.81 1.96 2.70 7.90 0.20 5.27
3.41 2.45 1.40
116.86 0.75
2.45 0.10
37.64
9.69 25.23 6.56
6.62
9.78 2.05 3.42 0.78 0.95
1991
3.69 3.71 3.54 3.94
4.65
1.51 1.57
36.88
54.83 9.31
66.82
9.88 2.99 1.92 2.74
8.15 0.14 5.14 3.47 2.86 1.49
109.96 0.76
2.50 0.12
35.83
9.23 21.18 6.36
6.91 11.10 2.78 3.66 0.77 0.94
1992
3.76
3.79 3.64
3.93 3.75
1.42
2.03 44.71 53.36 10.18 63.83
10.05 3.05
2.13
2.79 6.50 0.14 5.12 3.54
3.13 1.19
97.85
0.77
2.56 0.12 35.36
7.77 18.62
5.48
6.10 11.11 5.71 4.11 0.78 0.97
1993
3.85 3.94 3.75
2.54
3.68
1.47 1.92
44.11
57.57 10.37 63.82
11.07 3.23
2.30 2.88 6.29 0.14 5.95 3.74 3.28 1.30
93.66 0.77
2.61 0.12
37.83
7.40 16.15 4.76
6.09
8.98 3.19 3.99 0.76 0.95
1994
3.90
4.03 3.87 2.74
1.69 1.70
2.23 44.00
55.03 9.45 84.84
10.09
3.46
2.20
3.00 10.52 0.10 6.67
3.77 3.48 1.25
75.74
0.76
2.60 0.14
41.64
9.56 18.53 6.62 9.14
10.76 4.03 4.17 0.75 0.96
221
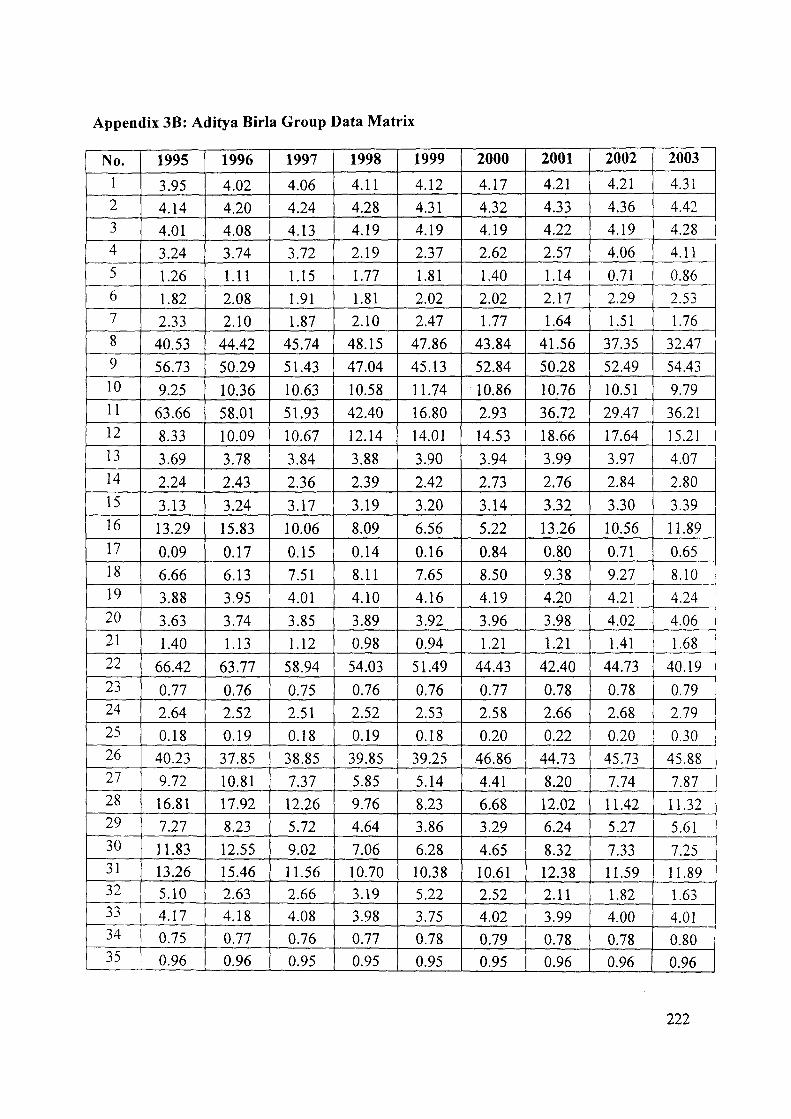
Appendix 3B: Aditya Birla Group Data Matrix
No. 1 2 3 4 5 6 7 8 9 10
11
12
13
14
15
16
17
18
19
20
21
22
23
24
25
26
27
28
29
30
31
32 33
34 35
1995
3.95
4.14
4.01 .
3.24
1.26
1.82
2.33
40.53
56.73
9.25
63.66
8.33
3.69
2.24
3.13
13.29
0.09
6.66
3.88
3.63
1.40
66.42
0.77
2.64
0.18
40.23
9.72
16.81
7.27
11.83
13.26 5.10 4.17
0.75
0.96
1996
4.02
4.20
4.08
3.74
1.11
2.08
2.10
44.42
50.29
10.36
58.01
10.09
3.78
2.43
3.24
15.83
0.17
6.13
3.95
3.74
1.13
63.77
0.76
2.52
0.19
37.85
10.81
17.92
8.23
12.55
15.46 2.63 4.18
0.77
0.96
1997
4.06 4.24
4.13
3.72
1.15
1.91
1.87
45.74
51.43
10.63
51.93
10.67
3.84
2.36
3.17
10.06
0.15
7.51
4.01
3.85
1.12
58.94
0.75
2.51
0.18
38.85
7.37
12.26
5.72
9.02
11.56 2.66 4.08
0.76
0.95
1998
4.11
4.28
4.19
2.19
1.77
1.81
2.10
48.15
47.04
10.58
42.40
12.14
3.88
2.39
3.19
8.09
0.14
8.11
4.10
3.89
0.98
54.03
0.76
2.52
0.19
39.85
5.85
9.76
4.64
7.06
10.70 3.19
3.98
0.77
0.95
1999
4.12
4.31
4.19
2.37
1.81
2.02
2.47
47.86
45.13
11.74
16.80
14.01
3.90
2.42
3.20
6.56
0.16
7.65
4.16
3.92
0.94
51.49
0.76
2.53
0.18
39.25
5.14
8.23
3.86
6.28
10.38 5.22
3.75
0.78
0.95
2000
4.17
4.32
4.19
2.62
1.40
2.02
1.77
43.84
52.84
10.86
2.93
14.53
3.94
2.73
3.14
5.22
0.84
8.50
4.19
3.96
1.21
44.43
0.77
2.58
0.20
46.86
4.41
6.68
3.29
4.65
10.61 2.52
4.02
0.79
0.95
2001
4.21
4.33 4.22
2.57
1.14
2.17
1.64
41.56
50.28
10.76
36.72
18.66
3.99
2.76
3.32
13.26
0.80
9.38
4.20
3.98
1.21
42.40
0.78 ^
2.66
0.22
44.73
8.20
12.02
6.24
8.32
12.38 2.11
3.99
0.78
0.96
2002
4.21
4.36
4.19
4.06
0.71
2.29
1.51
37.35
52.49
10.51
29.47
17.64
3.97
2.84
3.30
10.56
0.71
9.27
4.21
4.02
1.41
44.73
0.78
2.68
0.20
45.73
7.74
11.42
5.27
7.33
11.59 1.82
4.00
0.78
0.96
2003
4.31
4.42
4.28
4.11
0.86
2.53
1.76
32.47
54.43
9.79
36.21
15.21
4.07
2.80
3.39
11.89
0.65
8.10
4.24
4.06
1.68
40.19
0.79
2.79
0.30
45.88
7.87
11.32
5.61
7.25
11.89 1.63
4.01
0.80
0.96
222
Annexure I: Case Study - Tata Group
Jamsetji Tata founded the Tata group. Bom in 1839, he had joined his father as a trader in the 1860's, venturing into Far^ast and Europe. By 1874, he had built enough capital to promote a textile mill. Emboldened by its early success, in 1886, he risked his fortune and reputation by acquiring a failing mill with the help of some outside investors from the Parsi community. Over the next eight years, he turned it into a profitable operation. Next Jamsetji Tata set out to introduce in India the modern manufacturing methods he had observed in his travels abroad. At the turn of the century, he went to England and the United States, exploring the possibility of setting up India's first steel mill. Despite much skepticism, Tata Steel was inaugurated in 1907. Under his able leadership the Tata Group ventured into the hotel business by forming Taj Mahal Hotel, one of India's, and world's premier hotels. After his death in 1904, his son Dorab Tata continued to implement his vision. Tata Hydro-Electric was set up in 1910 to supply electricity to Greater Mumbai. At that time it was the first and only private-sector project of such size and scale. It also collaborated in opening the first cement plant in the country in 1912. In 1917 it entered into soap and detergent manufacturing. In the 1919 it entered the insurance business with the creation of New India Assurance Company. By 1922, the Tata Group diversifications had snowballed into the promotion of 11 companies with an aggregate capital of Rs. 270 million. The group was organized with Tata Sons as the managing agency, which administered existing operations against payment of agency commissions and promoted new projects.
When Jamsetji Tata set up the tentacles of the group he had observed that, "The acquisition of wealth was always subordinate to the constant desire in my heart to improve the industrial and intellectual condition of the people of this country (Harvard Business School Working Paper, August, 1992). This was aptly reflected in some of his early diversifications. At the turn of the century, he had gone to England to explore the possibility of setting up India's first steel mill. When the then chairman of the railway board heard that the Tatas were proposing to make steel rails to British specifications, he scoffed, "I will eat every pound of steel rail they succeed in making (Harvard Business School Working Paper, August, 1992). However, despite much skepticism, Tata Steel was inaugurated in 1907. When Jamsetji Tata had expressed his desire to visit a Bombay hotel, he was shown the board "(f) or Europeans only", this sparked of his desire to build the Taj Mahal Hotel, which was opened in 1903. Therefore to do India proud was a prime motivafing factor behind all major diversifications moves by Jamsetji Tata.
Several of the new Tata companies were overcapitalised in anticipation of rapid expansion. During the period 1922-1938 as the post First World War boom subsided and the economy slowed, they faced severe financial crises. Initially, Tata Sons and other healthy units supported and sustained the weaker companies. But as several Tata establishments faced near bankruptcy, the Tata family sold a part its property and pledged a significant part of its fortune and family heirlooms to raise fimds to prevent insolvency. The Parsi community, to which the Tatas belonged, was very generous supporters of the group, especially during such troubled times. Parsis are a small community of about one lakh, who migrated to India from Persia in the lO"' century, and are now concentrated on the west coast of India in south Gujarat and around Mumbai. They practice, one of the oldest and smallest religions in the world. An ancient, monotheistic religion, the precepts of Zoroastrian ethics focus on maintenance of life and struggle against evil. Socially, they integrated into the multi-cultural
223
fabric of the country without causing antipathy in other rehgious groups. However, they tried to preserve their own distinct identity through social customs, religious practices and endogamy. Parsis were extremely successful in commerce and Industry in India. They had significant shareholdings in most Tata companies and regarded the Tata Group less as a business than as a Parsi institution in which they took great pride. Parsis were occasionally appointed as outside directors on Tata boards, and while the Tatas were professionally managed at the operating level, the group was distinctly Parsi at the board level.
After Jamsetji Tata's death in 1904, his sons continued to implement his vision of building large, modem enterprises in core industries. Later when JRD Tata took charge of the group in 1938, he resolved, "to dedicate himself and the firm to the task of carrying on Jamsetji Tata's vision of a politically free and economically strong India (Harvard Business School Working Paper, August, 1992)." The founder's vision implicitly guided the group during JRD's helmsmanship, as he himself acknowledged, " for me, everything starts with Jamsetji Tata. He had the clearness of vision to predict what India needed in order to achieve economic freedom. When I have to take major decision, I wonder what he would have thought. Following his precepts, we have considered it our duty to develop projects of national importance (Harvard Business School Working Paper, August, 1992). "The philosophy of the Tata Group in the pre-liberalization era can be best illustrated from the comment of a Tata Sons, Director, N.A. Soonawala, "If every one is told not to go into unrelated businesses, how will the airlines, oil and telecom industries develop? The government has said they can't do it. So there's a social benefit to all these diversifications (Harvard Business School, Working Paper, April, 1998)."
Having struggled through the past several years for their very survival, the Tata were looking for fresh leadership and insight when Tata Sons elected JRD Tata 1938, son of Jamsetji Tatas cousin, as its youngest chairman. Taking over businesses with an asset base of around Rs. 105 million, JRD was all set to give new directions to the group. The Tata Group was always based on a federal structure that reveres a king; the chairman of the Tata Sons' board. That worked fine when people like JRD was at the helm. When JRD took over as the chairman of the group, he was barely 34 years old. At that point of time there were many senior executives in the group whose understanding of the complexities of industrial life was much deeper. JRD felt it would have been a virtual disaster if he had chosen to throw his weight around beyond a point. Thus consensual approach to decision making became a part of his career till the end. It is quite possible that his consensual style was a result of the corporate environment in which he had to operate, but it became an integral part of his management style. The result was the development of a managerial environment marked by decentralisation, participatory decision-making and professionalism. Ajit Kerkar, chairman Indian Hotels reminisced, "He (JRD) was the kind of chairman any professional manager would like to have. He laid down the policies but never interfered with the day-to-day working. Even those areas where he and the board did not agree with me, he never imposed his own will on anything. That was his greatness (Harvard Business School, Working Paper, April, 1998)."
In 1944, as the Indian independence struggle gained momentum under the leadership of Mahatma Gandhi and Jawaharlal Nehru, JRD and some other business leaders presented the "Bombay Plan", a blueprint for economic development in free India. The plan proposed that, after independence, imports should be reduced and domestic production geared to meet
224
internal demand. India gained independence in 1947, and Prime Minister Nehru imveiled an economic plan, which contained parts of the 'Bombay Plan', since it aimed at import-substitution driven industrialization. However, the government was also strongly influenced by the Soviet command-economy model of industrial development. The budget therefore allocated investment - intensive strategic and infra-structural industries to government-owned enterprises. The Tata Group, which had focused on several infra-structural industries, was not permitted to expand in many of them. Tata Airlines established in 1932, was converted into a national airline - Air India in 1947; which was also subsequently nationalised in 1953. The Tata Insurance Company was nationalised in two phases, in 1956 and 1971. Tata Steel was not allowed to expand any further. However, protected from foreign competition, the Tatas and several other business groups flourished in the industries open to them.
A fresh wave of diversifications started, as these groups strove to establish their position of eminence. Tata Chemicals started manufacturing caustic soda in 1939, among six other companies in the world. In 1954, TELCO collaborated with Daimler-Benz to introduce modem commercial vehicles on the Indian roads. In 1957, the Tatas bought the shareholding of the Forbes Group from Lead Industries, UK, which wanted to exit operations from India. By 1964, the assets of the Tata Group burgeoned to Rs. 4.2 billion ($884 million). The Tatas continued to contribute generously to philanthropic activities - about 85% of the Tata's family holdings in-group companies were held in charitable trusts. Many of the scholars who had benefited from JN Tata Endowment Trust (formed by Jamsetji Tata in 1892) returned to India and rose to positions of eminence. Further to the setting up of Indian Institute of Science in 1911 by Jamsetji Tata, JRD established the Tata Institute of Social Sciences in 1936, the Tata Memorial Centre for Cancer Research in 1941, the Tata Institute of Fundamental Research in 1945, and the National Centre for Performing Arts in 1966.
By then the "Tata" brand name had become a symbol of immense trust and value. It was worth its weight in gold, carrying an enduring image of reliability, honesty and integrity to its customers, investors and business partners. "The name generates immense trust, bankers and lenders would be ready to stretch themselves that extra mile for the Tatas" (Business Today, January, 1998), says Udayan Bose, CEO, Lazard Credit Capital. Despite its strong presence in all the major areas it operates in as well a well-founded reputation for technological capabilities, the Tata Group has tied up a number of joint ventures, especially in new businesses. "The Tatas are a favourite of foreign technology providers that are comfortable entering India only with a reputable partner (Khanna, T. and Palepu, K., 1997, "Why Focussed Strategies May Be Wrong for Emerging Markets", Harvard Business Review, 75(4); 41-51. The groups' size gives it incredible financial muscle. However, "Speed is not one of the Tata Groups' strengths (Business Today, January, 1998)" says Raj Nair, M.D. Business Consulting Group.
Border wars with China in 1962 and Pakistan in 1965, backed with harvest failures, increasing trade imbalances, political uncertainty and escalating social unrest forced the then socialist Congress government into taking a series of populist measures. This resulted in an era of increased government regulation during the period (1965 - 1980). The government began to tighten the parameters of business conduct through controls such as foreign collaboration approvals, capacity licensing, differential taxation, import tariffs and quotas, price controls, exit blocks and approval for fund raising. These controls were largely
225
intended toward large Indian business groups. To deal with the governments' intensive regulatory policies, most Business Groups found it expedient to set up "industrial embassies" in the capital city to deal with regulatory bureaucracy. The intensifying government involvement had a deleterious impact on business the business environment. Over-regulation began to retard growth. Sheltered from foreign competition, domestic industries became inefficient and the country lagged behind the rest of the world in terms of technology.
At this stage, some business groups found it expedient to cut private deals with powerful politicians and bureaucrats. Bribes in exchange for licenses, illegal political contributions in return for preferential regulation and the generation of unaccounted money for sustaining this corrupt nexus became, for some, the recipe for quick success and rapid growth. In other cases, pre-empting competitors by taking multiple licenses, and then not proceeding to build facilities, became a perfectly legal strategy for using the regulatory regime to profit climate of artificial scarcity. As a result efficiency was grievously hurt due to government's pursuit of populist policies. Essentially, excessive government regulations fractured markets and destroyed economies of scale, size and scope. Indian business groups therefore became much more diffused. The largest and the most successful business groups tended to be run by political savvy entrepreneurs. One study even emphasises the 'industrial embassies' maintained by large business groups in New Delhi, ostensibly for the group companies to interface with the regulatory apparatus.
Besides, with so many legal constraints many business groups resorted with success to the pursuit of the loopholes and the illegal. Also most business groups became accustomed to the strict government regulations, which were responsible for limiting competition and thereby guaranteeing success in any line of business. Unaccustomed to wheeling and dealing in this fashion, the Tatas often found themselves at odds with those in power. In 1978, a strong bid to nationalise Tata Steel orchestrated by a coterie of powerful politicians barely failed after nationwide strong protests. Faced with difficulties of operating in such a hostile environment, the Tatas stopped promoting major projects, and went into a defensive mode, trying to protect and maintain its existing businesses. The new ventures that were initiated between 1965 and 1980 were primarily in service sector. The group's assets in 1977 stood at Rs. 11 billion (US $ 1.4 billion). A Tata Director commented bitterly:
"Efficiency has been grievously hurt due to the government's pursuit of populist policies. Essentially, government regulations fractured markets and destroyed economies of scale. Due to difficulty in exiting an industry, our companies have, over time, become much more diffused than we would like them to be. Besides, with so many legal constraints, several of our competitors have resorted with success to the pursuit of the loopholes and the illegal (Harvard Business School, Working Paper, August, 1992)."
In 1969, the government abolished the managing agency system, which it considered a vestige of colonial times that allowed large business houses to accumulate and exercise excessive market power. With the dissolution of the system, Tata companies became legally independent, but they continued to have JRD as common chairman. They attempted to formalize synergy across the companies through a network of common directors. Also, there was a web of inter-corporate holdings. JRD encouraged each Tata Company to operate autonomously and adopt an organisational form suited to its business; so long its business
226
practices conformed to the Tata philosophy. Thus while Tata Steel had a departmental organisation - Voltas was structured as a matrix organisation - and TCS was organised around project groups.
JRD's helmsmanship was distinguished by his ability to repeatedly recognise, recruit, develop and support highly talented executives. As a result, the senior Tata management became a constellation of very capable and powerful managers whom JRD supported and gave considerable latitude. As a result it became a matter of pride and status to work for the Tata Group, which was regarded as highly professional and ethical organisation. On the other hand, there was also a feeling within the group that it was carrying dead wood because of the tolerant Tata philosophy. While merit was recognised and rewarded, a poor performer rarely left the organisation, resulting in the middle management getting clogged with survivors rather than performers. A senior Tata Executive observed:
"Many of our companies are grossly over-maimed. We have very high wages, and yet we have very high absenteeism. It is very difficuh to squeeze work out of our workers. The employees have no fear of punishment. They can always appeal against a harsh decision to JRD and given his tolerant and charitable nature, he would say - "We can't have this in the Tatas" (Harvard Business School, Working Paper, August, 1992)."
On the defensive mode in the since the 1970's, internally the Tatas curbed initiative and encouraged continuity. By 1980's, most of the senior managers were in their late sixties, or even older. Thus gerontocracy came to rule the House of Tatas. One of the senior directors defended the practice of senior directors remaining involved in the Tata boards:
"Most healthy people live beyond 85 years of age these days. By insisting on retirement at 60, do we condemn them to the shelf for the next 25 years? Will you tell them to stop at the pinnacle of their achievements, at the peak of their performance? Besides, all the parameters of our philosophy have been tried, tested, and lay down, and I can't see any new input possible to it. We have to hold on the pattern set by Jamsetji Tata, and it is these senior people who provide the strongest support (Harvard Business School Working Paper, August, 1992)."
The slow turnover of directors caused some frustration between second tier executives who have been waiting in the wings, for decades in some cases, for that top slot. Fumed a younger Tata executive:
"Unfortunately, the senior directorships have become a priesthood which is unable to induct new, young people and impart values to them. Just as nothing grows under a banyan tree, most of the charismatic directors do not have a strong second or third line to take over behind them. We have an ageing leadership with very little concern for or understanding of modern management. People held back in their more energetic, formative years are able to manifest their creativity only in the evening of their lives, when they are physically slower and intellectually stagnant (Harvard Business School Working Paper, August, 1992)."
227
To knit the group together, they set up Tata Administrative Services (TAS), composed of management professionals selected by very senior Tata directors and placed in key middle management positions. They could move horizontally within the group and were primarily encouraged to develop a vision of the Tatas as a unified group rather than as a conglomerate of disjointed companies. JRD remarked on his philosophy of always recruiting the brightest people and then encouraging them to operate freely and develop independent minds. He summarised his philosophy as follows:
"Once I get good people, I am able to get the best from them, probably because I am somewhat of a democrat. An outstanding manager is somewhat strong willed and of independent character with a distinctive style of management and personal behaviour. I give such a person an allowance for his idiosyncrasies in order to draw out the best in him. Of course, this has made it difficult sometimes to ensure that a reasonably uniform style of management prevailed in the Tata Group. The Tatas have nevertheless been surprisingly cohesive and successfiil because their directors and managers have been professional persons and have been allowed full freedom to deploy their talents and ideas keeping within the Tatas ethos (Harvard Business School Working Paper, August, 1992)."
The policy of the Tatas has always been to give the nation, shareholders, customers and employees a fair deal. The management gave also gave its top management considerable latitude and an allowance for its idiosyncrasies in order to draw out the best in them. It therefore became a matter of pride and status to work in Tata companies, which were regarded as highly professional and ethical organisations. Tata Steel, for instance, had a history of constructive and irmovative industrial relations. It introduced the eight-hour workday, leave with pay, accident compensation, maternity benefits, and profit-sharing decades before its counterparts in the US. A joint-consultative system was also set up in 1957 to ensure better cooperation between employees and the management. A senior Tata Executive observed:
"Bright young people join the Tatas, not because the salary is extraordinarily high, but because the prestige of working for a clean, decent organisation. On the labour front, the Tatas have made a name for themselves by being at the forefront of supporting employee rights. Thus, we have excellent industrial relations with our work force (Harvard Business School, Working Paper, August, 1992)."
As the 1980's dawned, JRD started to step down from the chairmanships of various Tata companies in favour of their Managing Directors. The leadership battle that followed when JRD decided to step down was perhaps a logical corollary of his style of management. As his involvement in the companies diminished, each company became increasingly independent, and the tenuous ties that bonded the group together further weakened. In 1981, JRD stepped down in favour of Ratan Tata, grand nephew of JRD, as Chairman of Tata Industries, a ceremonial position as head of the junior of the two central companies, the other being Tata Sons. He reminisced:
228
"Even as I am forcing myself to slowly disappear from the Tata companies, I am content that, throughout my tenure at the top, we have maintained a clean reputation and yet managed to succeed in business. And I am confident that, though things will change after me, our basic values will remain unchanged. The next generation is also equally committed to the ideals which our group stands for (Harvard Business School, Working Paper, August, 1992)."
Ratan Tata elected to use his position to convert Tata Industries into the strategic planning cell of the entire group. The Tata Group, one of biggest institutions and respected business house was poised at a momentous point in the century old history. A new generation of leaders was emerging, and the environment was also undergoing unprecedented changes. A senior Tata Director commented:
"With the departure of JRD's generation and new, relatively unproven generation taking charge, the future is rife with both opportimities and risks. The group can become much more powerful if we are able to seize the openings ahead. On the other hand there is gnawing doubt whether we will be able to retain the vision and values which have really been at the core of our success, and which have kept the Tatas at the forefront of the Indian business for so long (Harvard Business School, Working Paper, August, 1992)."
Ratan Tata recalled:
"Tata Industries was a shell company with no ongoing operations. But it had on its board the chief executives of all major operating companies. I requested that the board become the strategic arm of the Tatas, but I didn't get great enthusiasm from any of my colleagues. Some of them were apprehensive that I might use the strategic planning exercise as a guise to build an empire. There was also resistance to openly sharing information with their colleagues from other companies, owing to strains of inter-company rivalry (Harvard Business School Working Paper, August, 1992)."
There were several skeptics among the directors, even JRD himself A senior director summed up the mainly negative reactions:
"Our approach was strategic planning is a gimmick. We have done very well without these new-fangled ideas. All decisions are incumbent on government policy anyway. So, why is this young man thrusting new jargon down our throats? In any case, every one of our companies does continuous strategic planning, and there is an advantage in having different, independent, autonomous units loosely tied together by broader policies. Our companies are so diverse, their technologies so different, that centralized planning may lead to disastrous strategic mistakes (Harvard Business School, Working Paper, August, 1992)."
However, Ratan Tata and his team at Tata Industries pressed ahead with the strategic plan. They matrixed the Tata Group into seven business areas and tried, somewhat unsuccessftilly,
229
to get the company heads to thing in terms of business areas. He offered to take a leadership position in the area of high technology. He reasoned:
"I felt that the Tatas were absent from the high-technology areas of the 1980's. This was rather strange, for at the turn of the century, Jamsetji Tata had invested in pioneering long-gestation projects in emerging technologies. In order to carry the same philosophy through, I suggest an eighth business for the Tatas, which would be my own focus - high technology (Harvard Business School, Working Paper, August, 1992)."
The re-constituted proposed business areas were - High Technology Industries, Metals and Associated Industries, Consumer Products, Utilities, Engineering Industries, Chemicals and Agro Industries, Service Industries and International Business. Since the abolition of the Managing Agency System, cohesion amongst the various Tata companies had greatly diminished and is in danger of disappearing altogether. A long term business overview or strategy would contribute substantially towards synergetic growth for the Tatas in the coming years. The 1983 Strategic Plan endeavored to define possible group objectives, future strategies and action plans. It was recognised that the plan only constitutes the initiation of a group mechanism and a first statement of possible group direction, which would have to be followed up in a more formal and on-going basis. The fixture synergy would have to come from a new organisational structure. The major recommendations of the group formed to examine environmental trends for the coming decade are:
• Joint venture partnerships should be explored with the government. • In addition to promoting new projects, Tatas should adopt the route of
acquisitions, mergers and divestitures. • Tatas should increase their shareholding in their group companies. • Tata organisations should form mutually beneficial complementary
relationships with the small-scale sector. • Tatas need to adopt a technology-oriented policy for growth and survival, and
they must exit low technology businesses.
The overall strategies for the Tatas, which underlie the business areas, were aimed at achieving a position of leadership through thrust on:
Technology driven leadership. Concentration on selected product-market segments. Joint-sector projects. Acquisition, merger and divestiture. Synergy.
The Indian economy was grievously hurt by a double blow at the turn of the 1980's: the 1979 oil shock and the subsequent worldwide recession skewed India's trade balance and led to a recession, while cost push inflation continued unabated. Coupled with this was the sharp decline in agricultural production. The economic scenario seemed very bleak under the existing regime of licenses and controls. To spur growth, the government relaxed restrictions on business, and shifted its emphasis toward achieving greater productivity, efficiency, competitiveness, and exports with more reliance on the private sector. Policy changes included an easing of licensing requirements, greater trade and foreign investment liberalisation, and export promotion through more flexible exchange rates. As a result, new
230
opportunities opened up for private enterprise. The economy rebounded: real GDP grew 5.8% on average during 1985 - 1990; inflation was lowered to 6.4%; exports grew by over 10%. Ratan Tata remarked on how the Tata Group was faring in this more open environment:
"Our 1983 recommendations proved prophetic to some extent. The government's new policy could have been drawn from our strategic plan forecasts. The various business groups started moving in the directions our plan had indicated. However, very few companies wholeheartedly implemented our recommendations, and when they actually did, they gave no credit to the plan. In the high-technology areas though, most of Tata Industries applications for new businesses came through (Harvard Business School Working Paper, August, 1992)."
Because of good operating management in relatively protected markets, the steel division, the electrical division and the chemical division turned in stellar performances during the second half of the 1980's. Tata Steel acquired several unprofitable downstream businesses, and then turned them around. The chemicals division also grew impressively and began planning numerous large projects in oil refining, petrochemicals and fertilisers. Demand for TELCO's HCV (its primary product) peaked in 1983. Meanwhile, in a new segment altogether demand for LCV's started rising. The government allowed the manufacturer of one class of vehicles to make vehicles of another class without seeking a separate license. TELCO was quick to capitalise on this opportunity. It entered the market with its indigenously developed LCV (i.e. Tata 407) and cornered a significant market-share. Several new business houses used this opportunity to enter the LCV market in collaboration with foreign partners. Though TELCO entered the market later than the new collaborations, it had already garnered a position of market leadership. Its product was better suited to Indian conditions and its powerful HCV distribution network and service network was an added advantage for its LCV segment. As a result, within six months of introduction, TELCO's LCV sales were more than the sales of all the new companies combined. The central group also experienced a spectacular growth. Tata Industries spawned several new companies. Titan Industries promoted to manufacture watches shook an industry dominated by a government PSU. Tata Unisys and TCS dominated the rapidly growing IT industry. Indian Hotels spawned several new projects in India and abroad. After hibernating for about two decades the Tatas were once again initiating gigantic projects.
On the other hand, the continued poor performance and bleak prospects of the textiles business forced the Tatas to, in effect; implement the recommendations of the 1983 Strategic Plan by trying to exit from that industry. The Tatas filed for liquidation of one company and closed down operations of a second. The public was astounded. A government bi^reaucrat commented acerbically, "It is difficult to believe that the Tatas do not have the resources to bale out their companies. It calls into question the social commitment of the group (Harvard Business School, Working Paper, August, 1992)." In response, the then chairman of the textile group remarked, "Tata companies are independent companies (Harvard Business School Working Paper, August, 1992)."
The Tatas were somewhat sluggish in some areas in the increasingly open and competitive environment. Though, in 1982, the government had partially eased price controls on cement. ACC, a Tata company was slow in reacting to the opportunity. TOMCO and NELCO
231
continued to falter in the market. VOLTAS faced setbacks in the traditional retail distribution business as its suppliers integrated forward and its distributors integrated backward to take away business. In a significant departure from its normal practice, in 1981, VOLTAS appointed R. Sarin, a senior executive from an MNC as President. Sarin brought in a fresh team to re-synthesize the amorphous giant. His team transplanted performance evaluation and responsibility systems from their multi-national experiences. However, these steps met with considerable resistance and smoldering resentment. Tensions developed at the senior levels, factions and cliques formed and as a result neither revenue nor profits improved. Eventually, in 1986, Sarin left VOLTAS, citing incompatibility and difference in cultural styles as the reason for his exit. Despite some setbacks, by the end of the 1980's the Tatas had reasserted themselves as the largest Indian business group. Ratan Tata was appointed deputy chairman of Tata Steel in 1985 he became chairman of TELCO in 1988, and also deputy chairman of Tata Electric in 1989. In 1991, he emerged as the chairman of the Tata Group by virtue of being appointed as chairman of Tata Sons. Taking this opportunity Ratan Tata forged ahead with his unfinished task by proposing the 1991 Strategic Plan, which is basically, an extension of the 1983 Strategic Plan. The basic outline of the plan was laid down as follows:
Mission -
• To selectively enter and manage technology based businesses. • To be the organisational catalyst for inducting new technology based activities
into group companies. • To supplement, support, and protect Tata shareholding in group companies.
Objectives -
• Achieve better growth and returns over a long term than the average performance in its industries.
• Achieve a position of leadership over three to five years in new businesses. • Provide staff inputs to associate companies. • Facilitate induction of new technology-based activities into group companies. • Provide help in consolidation of group companies operating in similar
business areas. Strategies -
• Selectively enter and manage technology-based businesses. • Facilitate diversification of group companies. • Create synergy amongst group companies.
Opportunities -
• Biotechnology. • Electronics & Telecommunications. • Services.
After proposing the 1991 Strategic Plan, Ratan Tata observed: "I think we are in many more businesses than we should have been in and were perhaps not concerned about our market position in each of those businesses. I think the needs today are that we define our businesses much more articulately and that we remain focused rather than difftised, and that we become more aggressive than we used to be, much more market driven, much more concerned about
232
our customer satisfaction (Harvard Business School, Working Paper, 1998)." Ratan Tata on being questioned in an interview regarding - what criteria will he choose in deciding what to keep and what not to, in his groups' exercise in portfolio restructuring? To this he replied, "One is certainly going to be: can we be in the first three in that industry in the country? Secondly, are we willing to continue to put money and managerial resources into that industry to have it continue to be that way? The third is the most serious one, as to whether that particular firm will provide us with the returns that we are expecting (Business World, September, 1999)."
Strong resentment followed with other business heads. As a result marked differences began to emerge within the Tata group with distinct centrifugal tendencies. A senior director expressed the commonly held concern that the group was beginning to break apart:
"The early eighties saw numerous investment companies being established by different Tata companies, with the aim of carving out their own domains with the Tatas. A number of Tata companies began competing against one another. Mobility across group companies declined, and each company began evolving its own culture and management cadre. Thus the Tatas became just a social club, with the central group having no legal, financial, or moral clout. And, however much senior directors may like to believe otherwise, several Tata executives even violated the Tata ethos (Harvard Business School Working Paper, August, 1992)."
JRD commented on his selection of Ratan Tata, "There is no doubt in my mind, objectively and subjectively, that Ratan will do very well as my heir and carry on our family traditions (Harvard Business School, Working Paper, August, 1992)." Russi Modi of the steel division, Darbari Seth of the chemicals division, Nani Palkhivala of the cement division, H.N. Sethna of the electric division and Ajit Kerkar of the hotels division had emerged as extremely powerful chairmen of these dynamic clusters. These directors viewed the Tatas as an agglomeration of very loosely held clusters. Regarding Tata Group's shared identity, Darbari Seth commented, "In law and theory, all Tata companies constitute a commonwealth of nations (Harvard Business School Working Paper, August, 1992)."While Russi Modi remarked, "Today, the Tatas no longer exist as a group, except in their culture and in name. Legally, none of the companies has any reason to show allegiance to Tata Sons. It is only because of the financial institutions, which are the major shareholders that Tata management is allowed in these companies. Tomorrow, if the companies decide to go their separate ways, it will be perfectly legitimate - not popular perhaps, but legitimate (Harvard Business School Working Paper, August, 1992)."
However Ratan Tata commented, "The clusters within the Tata group do have enough shareholdings in their associate companies to be called groups in their own rights (Harvard Business School Working Paper, August, 1992)." All throughout its history the Tata Group had basically followed the precepts set by Jamsetji Tata. This was ingrained in the top leadership at the helm of the Tata Group considering an almost static business environment during the major part of the entire 20" century. However, the drastic changes in the business environment due to economic liberalisation, since Ratan Tata becoming the chairman of Tata Sons, forced him to restructure the group structure and strategy altogether keeping in mind the pace of economic liberalisation. However, highly diversified groups like the Tatas were
233
slow to react to the changing demand of the environment. Organisational culture rooted in bureaucracy and regulation, top management mind-set, structure and decision making process however, retarded the process of restructuring.
By then the group assets had burgeoned to Rs. 75.8 billion. Ratan Tata feh that, while managing the external environment effectively was a major challenge, as critical as a challenge would be managing the internal group dynamics and moulding the available human resources. By the late 1990's inertia within the Tata Group had been reduced drastically, the restructuring was nearly complete enabling Ratan Tata with a platform to carry out his proposed diversifications to give the Tata Group a new identity. In order to face the immediate hazards and grasp the opportunities, the Tatas needed to become more vibrant. He noted, "The Tatas have been a club for a generation. As a result, we have become staid, solid and conservative. For many years, our risk taking ability was stinted, as we confined ourselves to marginal diversification and expansion of facilities. Rarely did we go for new and emerging technologies. Now we have to take bolder steps. We do have capable, young people to carry out our ambitious plans. We have to keep them excited, mobile, lean and hungry. Besides, the lieutenants of yesterday have carved out their domains by ringing the bell, but dare you penetrate the boundaries unasked! Hopefully, the group will again fold back together as the next generation takes charge (Harvard Business School Working Paper, August, 1992)." However, the task before Ratan Tata was not easy. He had commented: "....we had a visionary chairman before me but organisationally it was still very traditional, in many cases we were resistant to change (Business World, September, 1999).
With cash rich foreign firms encroaching on the Indian economy, corporate uneasiness was heightened by India's new takeover code which no longer protected companies from hostile takeovers; only groups with at least 26% ownership could block resolutions. In short most business groups in emerging markets have to unlearn and imdo what their predecessors had done. With the onset of economic liberalization Ratan Tata remarked; "In order to face the immediate hazards and grasp the opportunities on the horizon, the Tatas need to become more vibrant. Now we have to take bolder steps. We do have capable, young people to carry out ambitious plans. We have to keep them excited, mobile, lean and hungry. Besides, the lieutenants of yesterday have carved out their own domains. You are welcomed if you enter these domains by ringing the bell, but dare you penetrate the boundaries unasked (Harvard Business School, Working Paper, 1992)."
With this the Tata Group for the first time in its history posit a major shift in its mindset. The group had always followed Jamsetji's precepts of entering heavy, long-gestation projects that would contribute to nation building. The flip side was that the Tatas have done well in technology-intensive areas, but failed on the market side. The precepts did not gear up the flexibility and dynamism of the Tata Group required for diversificafions that were marketing intensive. During the 1990's, the Tatas had stumbled in industries where investment was not intensive but competition was intense, such as textiles and consumer products. There was some concern with the top management that this inability to perform in competitive market conditions stemmed from its inability to make hard-nosed decisions quickly. In this context Ratan Tata remarked, "Now what we are doing in not just looking at companies, but looking at businesses within a company, and besides it must fit with the group's way of doing business (Business Today, March, 2002)."
234
The current group chairman Ratan Tata, 65, hopes to govern a homogenised and highly focused group. It was for the first time that the Tata Group witnessed a significant shift in the mind-set of the top management; in a way they foresaw their group businesses. In the context of the emerging economic environment Ratan Tata once remarked, ".... the threshold of acceptability or the line between acceptability and non-acceptability in terms of values, business ethics etc. is blurring (Business World, September, 1999)." In the post liberalization period the main focus of the group was to reorganise its firms on the basis of synergies. Another area of serious concern that faced the group in the early stages of economic liberalization is how its firms would prepare for an era of intensified competition. Leadership in costs and market shares, the Tata group has leveraged their advantage well. They have rarely been first movers, but often using their size and muscle, have come from behind to overtake early leaders. Says B.R. Dey, Director, Tata Management & Training Centre: "Ratan Tata would like us to redesign our training methods to meet the objectives of the Tata Group (Business Today, January, 1998)." And what might these be? While keeping the much revered value system and ethics intact, the group wants to turn itself into a more dynamic entity. The paradigm shift in the mindset of the Tata Group in the post liberalization period can be summed up as follows. From core-industries, high infra-structural investment, long gestation, business ethics and social responsibility to focusing on brands, trimming the commodity sail, expanding services and get out of businesses that are not among the top three, and thinking global.
During the same period several small and medium sized groups embarked on ambitious expansion and diversification plans. Outstanding among these was the Reliance Group. Led by the astute Gujarati entrepreneur, Dhirubhai Ambani, the group leveraged government export promotion policies, a rapidly expanding class of middle-income group investors, and access to key politicians and bureaucrats, to diversify at a breathtaking pace fi-om a virtual non-entity in 1970 to become by 1990 the third largest business group in India, after the Tatas and Birlas. However, the Tatas has always stayed away from political interferences. This has been clearly brought out in a recent interview where Ratan Tata clearly remarked: ".... I can't handle political manipulation (India Today, February, 2003)." With the stage being set, the task before Ratan Tata remained two fold. Firstly he needed to raise ftinds to consolidate group's shareholding in its different affiliates that would provide him with a greater degree of financial control and secondly recast the top management of the Tata Group to carry out his strategic plans and exercise better operational control.
However, Ratan Tata did not command the kind of authority that any of his predecessors did. The. result: the group now lacks the spirit of central cohesiveness. There was also strong resistance to change, built as resuh of more than 100 years of legacy. Therefore he had to ensure that strong systems were in place to restructure the group. Without which Ratan Tata felt that he would not be able to carry out his vision. Therefore he needed to re-position the entire top management, to let the Tatas new vision percolate down to the parts of the empire that flourished during times when left to manage on their own freedom. In contrast to the earlier view offered on JRD's style, Ratan Tata when asked on his view on consensus, he remarked: "By and large, I believe in it. But if it is going to lead to everybody going off in his own direction, I think a time comes when the leadership has to indicate where it should go (India Today, February, 2003)." Says J.J. Irani, MD, Tata Steel: "It is true that in the present competitive environment, business strategies have to be clearly defined, the structure of the business groups has to be streamlined, and, in many cases the family size has to be
235
reduced (Business Today, January, 1998)." This is a cause for consternation, considering the Tata Groups' loose financial control over its key firms. The group needed to rectify this by increasing its stake in its member firms. But continuously generating funds to increase stakes, given the high market capitalisation of most firms would be an onerous task for the group.
The group suffered from a huge bureaucracy resulting in languorous decision-making. It is a multi-layered group and Ratan Tata had tried to de-layer the decision making process by proposing the formation of Business Review Committees (BRC) at the firm level and Group Executive Office (GEO) at the group level. But agility is not yet a part of the Tatas. When Ratan Tata was asked to comment on the group new structure, he commented, ".... the reason for that was age. There were CEO's in there 70's that never left their office. They did not have a connection with the market place and I thought we were losing our aggressiveness as a result of that (India Today, February, 2003)." On the issue of size and structure Ratan Tata remarked, "The globalisation issue featured in our 1983 Strategic Plan, but was not done. But we could not revive it in the 90's because we were too pre-occupied (Business Today, February, 2004)." Ratan Tata obviously refers to the structural problems that existed then. In this perspective Ratan Tata then commented: "We have somehow to consider ourselves as one group. That's what we're trying to do in terms of corporate communications. We need to get the companies to operate synergistically with each other. After that, we will have to evolve a structure that has to be accepted, not mandated (Harvard Business School, Working Paper, April, 1998)."
However, Ratan Tata pressed ahead with this strategic plan and structured the group profile into businesses and not individual firms. A first step in that direction was the creafion of the Group Executive Office (GEO) under the aegis of Tata Sons. The GEO would look into the groups' diversificafions, restructuring and acquisitions. The GEO comprised senior Tata Sons directors like R. Gopalakrishnan, Ishaat Hussain and N.A. Soonawala. In turn each Tata affiliate would have a Business Review Committee (BRC), which will interact with the GEO for all strategic decisions. The broad idea is to facilitate greater interaction between Tata Sons and its affiliates - and greater control. In this context Rata Tata remarked: "There was a need to put the companies in a framework where there they would move in one direction. Previously, it was the company first then the group. The earlier strategy was reversed: first the group then the company (India Today, February, 2003)."
Ratan Tata was considering several steps that he hoped would give the group a stronger collective identity and a greater degree of financial control. The principal move he was considering was for Tata Sons to undertake the responsibility of centrally promoting a unified 'Tata Brand', which could be used by all member firms, which subscribed to the 'Tata Brand Equity Scheme'. Every firm that subscribed to the scheme would derive the benefits of the centrally promoted Tata brand and of the Tata affiliation. Tata Sons would require an annual contribution related to each firm net income in order to meet the costs of the development, promotion and protection of the unified Tata brand. He further proposed that subscribing Tata firms each pay a contribution (he adamantly avoided using the term "royalty"), the amount of which would depend upon each firms' degree of association with the brand.
236
Contributing rates would range between 0.10% to 0.25% of a firms net income after excluding taxes and non-operating income, and would be capped at a maximum of 5% profit before taxes. Participating firms would be required to subscribe to a code of conduct, which would ensure uniformly high standards of quality and ethical business practices. Participating firms would also be eligible for recognition of outstanding representation of Tata values with 'JRD Quality Value Award', modelled after the 'Malcolm Baldridge National Quality Award' in the US. Ratan Tata had not anticipated the resistance that it would face within the group, indicating more than opposition to just this plan. This proposition was healthily questioned and debated by some Tata company heads, while a long-time Tata senior member and former chairman ACC led the revolt. A disgruntled Indian Hotels shareholder complained:
"Any payment made by the company for questionable returns substantially affects my income from the company. It will only tighten the grip of Tata Sons over the company at our expense. By advertising that our hotels belong to the Tata Group, we will confiise prospective clients and undermine the significance of the Taj Group of Hotels brand name which has been buih up over 92 years (Harvard Business School, Working Paper, April, 1998)."
Ratan Tata commented: "The intention has been that it (brand) would create a single strong entity that will benefit all the member firms. If you are to fight a Mitsubishi or an X or Y in the free India of tomorrow, you better have one rather than forty brands. You better have the ability to promote that brand in a meaningful manner. Do we have a common thread that runs through the Tata Group? In the past, the thread was embodied in a personality, maybe JRD Tata. But I think times are different now. You have to institutionalize certain things. You cannot be forever on personalities. There may a Mr. Tata as chairman, or there may not be a Mr. Tata as chairman of the group (Harvard Business School, Working Paper, April, 1998)." Tata Sons plarmed to use the fee money to build a national and later international group brand image, by emphasizing a set of core values and ethics, largely through advertising. Tata Sons estimated that a meaningful domestic brand promotion alone would cost at least Rs. 300 million per annvmi.
Many Tata firms urged Tata Sons to adopt a strong, global Tata corporate campaign, and were pleased with Ratan Tata's plan. The managing director of Titan Industries, a Tata group affiliate, wrote, "Tata firms have in recent years been pressing Tata Sons to put their act together with some speed so that they can both take advantages of the opportunities and ward off the competitive threats which have suddenly and so dramatically emerged with the opening up of the Indian economy. The "Tata" name is a powerfiil force and hugely valuable commercial property (Harvard Business School, Working Paper, April, 1998)." While some member firms felt otherwise. However, despite much discontent the scheme was again put before the Tata Sons board for consideration and approval.
After much discussion, finally, the mandatory scheme was made a voluntary one. To meet the overall shortfall, Ratan Tata contemplated selling a 20% private equity stake in a holding wholly owned by Tata Sons, Tata Industries, to Jardine Matheson, a Hong Kong based diversified conglomerate. The deal was expected to push Tata Industries share-capital from Rs. 476 million to Rs. 595 million. Ratan Tata planned to use this capital influx to consolidate Tata's share holding in group companies and partially for venture start-ups
237
promoted by Tata Industries. He also anticipated that the Hong Kong based conglomerate would bring in expertise in a wide rage of business activities such as retailing and distribution, real estate, hotels, construction and financial services. The broad idea was to complement Tata's skill in businesses where consumer patterns and trends change rapidly.
Indeed while the group has been quick to enter certain newly liberalised areas, it lacks exceptional people systems. "Our growth is a little too fast, I'm not sure that we have the right people necessary to sustain it, says, N.A. Palkhivalla (Business Today, January, 1998)." In the meantime, Ratan Tata revived a much-ignored Tata policy, which set the mandatory retirement age for executive directors at 65 and non-executive directors at 75. After much discussion, the policy was made enforceable and in 1997, seven senior directors retired in deterrence to the new order, paving the way for new members to take on the board of Tata Sons. Some of the younger generation members that took on the Tata board subsequently were: R.K. Krishnakumar, steering the tea and hotel business; S. Ramadorai, the technical consultant the group often consults; P. Gopalakrishnan, spearheading the GEO and supervising agro and chemical businesses; Ishaat Hussain, manages the groups finances and provides inputs on new investments; Kishore Chaukar, in charge of integrating the groups telecom foray; Noel Tata, leading the groups retail revolution.
Says Faroukh Mehta, Advisor (HRD) Tata Industries: "The Tata Group believes that executives should become CEO's by the age of 45 years so that they get time to implement their plans (Business Today, January, 1998)." For one, the group is again reviving its premium management cadre, TAS; and the "Tata Group Mobility Plan" is also in place. The group has an enormous responsibility to shoulder. It faces an uncertain future, not because of what it already is, but because of what it is trying to become. Recognising that the number of businesses of the group will always be more than the number of key people available to head them, JRD played the role of a promoter - as a key investor and strategic advisor - to perfection. By playing the role of a hands-on CEO, Ratan Tata has reversed that, creating an autocracy. Admittedly, a group as large as the Tatas requires systems, but it is one thing to exercise control through systems, and another to do so through centralisation.
However despite much opposition, by the end of the 1990's when the group re-structuring was nearly complete, a clear new mind-set had evolved under the leadership of Ratan Tata. The group which was historically skewed towards manufacturing, tried to shift gears and move into branded products and services, which realise more value. The shift is from selling commodities to marketing branded products and services that not just differentiate but fetches a premium. With manufacturing ceasing to on the groups advantage, the thrust is on knowledge-based industries. The next objective as in the words of Ratan Tata, " is to become globally competitive, leverage global opportunities and have the required global capabilities (Hindustan Times, September, 5, 2004)." Consider this on the performance side. Remarks R. Gopal Krishnan, Director, Tata Sons, "Brand business fetched about a fifth of sales and profits in 1990; today they account for half of the revenues and 58% of net profits. The fact that one-third of the portfolio has been reviewed would imply that in some mysterious way (we) have been at it (Business Today, March, 2002)."
Once the restructuring was almost over Ratan Tata added a thrust to his diversification strategies once again. Having overcome the barriers of resistance, he knew, now he could implement his vision. According to independent estimates around Rs. 50000 crore projects
238
were in the pipeline or under implementation. Approximately half of them are for expanding and modernising while the rest are in areas where the group does not operate at present. During 1991 when Ratan Tata took over as group chairman, cohesiveness was at its historical low. All the firms in the Tata Group were pursuing independent strategies and often their business interests clashed with each other resulting in fierce competition amongst different Tata firms.
A close look at the major diversifications of the group in the post liberalization period reveals - IT: from being a software giant, TCS was set to become one of the largest end-to-end solution providers. Though it missed the initial phase of the IT boom, it promised to be the biggest on the stock market with an expected valuation of around Rs. 60000 crore; Steel: cut the staff size by a third, divested non core businesses like cement and trimmed costs to emerge as the cheapest steel maker in the world; Tea: realized growing tea was bad business, bid for "Tetley" and turned Tata Tea into the worlds second largest tea maker; Telecom: from being a non-entity in Andhra Pradesh, the acquisition and joint venture of VSNL and 'Idea' gave the group the imprint that now spans the entire bandwidth from basic, cellular, national and international long distance, internet, wireless and other value added services; Automobiles: engineered the potential of TELCO from a manufacturer of HCV's and LCV's to an integrated car manufacturer. Despite following its usual route of organic growth in case of TACO, Trent, Tata Finance, it also went in for joint ventures like - Idea Cellular with Aditya Birla Group and Tata AIG with AIG of US and also for PSU acquisitions like VSNL and CMC. This not only made the Tata Group leaner and tighter, it also helped them to consolidate its business in major areas (TACO - in car manufacturing, Tata Power - in steel business, Tetley - in retailing tea. Idea Cellular - in telecom operations, CMC - in its IT operations). A close look at the major changes in the groups' business portfolio:
239
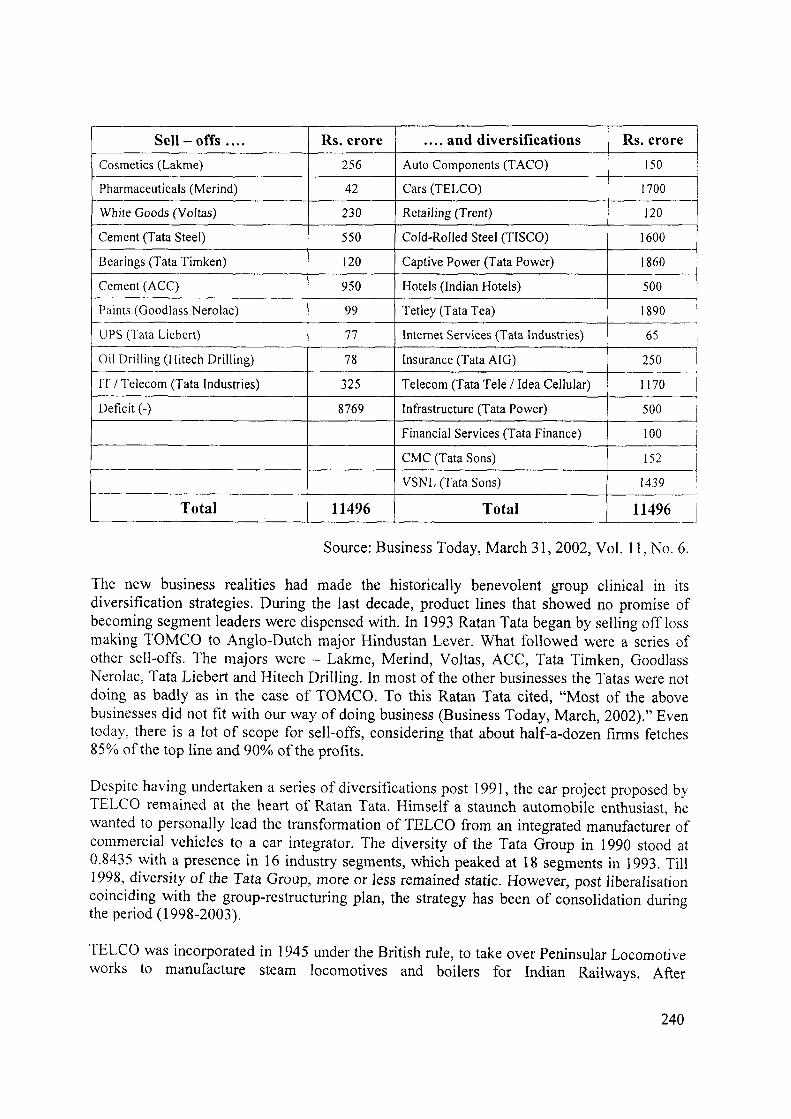
Sell-offs.... Cosmetics (Lakme)
Pharmaceuticals (Merind)
White Goods (Voltas)
Cement (Tata Steel)
Bearings (Tata Timken)
Cement (ACC)
Paints (Goodiass Nerolac)
UPS (Tata Liebert)
Oil Drilling (Hitech Drilling)
IT / Telecom (Tata Industries)
Deficit (-)
Total
Rs. crore
256
42
230
550
120
950
99
77
78
325
8769
11496
. . . . and diversifications
Auto Components (TACO)
Cars (TELCO)
Retailing (Trent)
Cold-Rolled Steel (TISCO)
Captive Power (Tata Power)
Hotels (Indian Hotels)
Tetley (Tata Tea)
Internet Services (Tata Industries)
Insurance (Tata AIG)
Telecom (Tata Tele / Idea Cellular)
Infrastructure (Tata Power)
Financial Services (Tata Finance)
CMC (Tata Sons)
VSNL (Tata Sons)
Total
Rs. crore
150
1700
120
1600
1860
500
1890
65
250
1170
500
100
152
1439
11496
Source: Business Today, March 31, 2002, Vol. 11, No. 6.
The new business realities had made the historically benevolent group clinical in its diversification strategies. During the last decade, product lines that showed no promise of becoming segment leaders were dispensed with. In 1993 Ratan Tata began by selling off loss making TOMCO to Anglo-Dutch major Hindustan Lever. What followed were a series of other sell-offs. The majors were - Lakme, Merind, Voltas, ACC, Tata Timken, Goodiass Nerolac, Tata Liebert and Hitech Drilling. In most of the other businesses the Tatas were not doing as badly as in the case of TOMCO. To this Ratan Tata cited, "Most of the above businesses did not fit with our way of doing business (Business Today, March, 2002)." Even today, there is a lot of scope for sell-offs, considering that about half-a-dozen firms fetches 85% of the top line and 90% of the profits.
Despite having undertaken a series of diversifications post 1991, the car project proposed by TELCO remained at the heart of Ratan Tata. Himself a staunch automobile enthusiast, he wanted to personally lead the transformation of TELCO from an integrated manufacturer of commercial vehicles to a car integrator. The diversity of the Tata Group in 1990 stood at 0.8435 with a presence in 16 industry segments, which peaked at 18 segments in 1993. Till 1998, diversity of the Tata Group, more or less remained static. However, post liberalisation coinciding with the group-restructuring plan, the strategy has been of consolidation during the period (1998-2003).
TELCO was incorporated in 1945 under the British rule, to take over Peninsular Locomotive works to manufacture steam locomotives and boilers for Indian Railways. After
240
independence, under the then industrial pohcy announced by the GOI the production of locomotives was reserved exclusively for state-owned enterprises. As a result TELCO decided to diversify into the manufacture of HCV's in 1954, under technical collaboration with Daimler-Benz. In 1961 it started manufacturing excavators and earth moving equipment. In 1981, the GOI allowed four Japanese firms - Toyota, Mitsubishi, Mazda and Nissan to enter the Indian market through joint ventures for manufacturing LCV's. In 1985, the GOI under its deregulation policies announced its decision to allow "broad-bonding" of licenses.
By then TELCO collaboration with Daimler-Benz had come to an end and it was capable of manufacturing all classes of commercial vehicles with negligible import content. TELCO availed this opportunity and developed a totally indigenous LCV (i.e. the Tata 407) in a record time of 18 months. Close on the heels, two more models were launched: Tata 608 and Tata 709. Although the Japanese collaborated vehicles were more fuel efficient, the Tata LCV's outsmarted its Japanese counter parts in terms market-share (i.e. 59%, TELCO Annual Report, 1995). This was made possible because TELCO's vehicles were cheaper and sturdier; were tolerant to abuse and better suited for Indian road conditions; and moreover enjoyed the countrywide sales and service network of TELCO.
Ratan Tata decided to integrate TELCO's operations even further, and manufacture cars in collaboration with Honda of Japan. However, the GOI refused permission citing tight foreign exchange situation. When the proposed joint venture failed TELCO designed and launched "Tatamobile" in 1988, which was a cross between a car and a LCV. In 1992 TELCO introduced the "Tata Sierra", a two-door personal transport vehicle and the 'Tata Estate, a four-door extension; both built on the 'Tata 207' platform. In 1994, TELCO launched "Tata Sumo" a MUV; a first significant deviafion from the "Tata 207" platform. When bookings opened for the Tata Sumo; the company received bookings for an awesome 90000 vehicles, and still date enjoys a steady market-share of around 20%.
Around that time Ratan Tata proposed at the AGM of Automobile Component Manufacturers Association (ACMA) of delivering a "peoples car". After a gestation of about 5 years, booking for TELCO's first passenger car (i.e. Indica) in the true sense opened at more than 50 dealership points across the country. TELCO had initially planned to accept 10000 bookings in the first phase and another 50000 bookings in the second phase of its operations. However, surpassing all expectations within seven days of the opening of the offer TELCO closed its bookings with 115000 applications - that's 1 booking every 5 seconds. This volume was significant enough to assure that the project would break-even within (18-24) months of its operation.
As an auto maker it will now focus sharply on just one point on the value-chain that stretches between raw materials and after sales-service: assembling the parts into the complete automobile. In this context Ratan Tata remarked on the different scales and complexities of manufacturing, "You can be manufacturer in the context of what many Indian companies are. That is you have a license agreement, you manufacture. You don't embrace any of the technologies. You don't set up capabilities to develop a product. But you continue to manufacture the given product. When you can't do it any more, you find a collaborator who gives you the license to manufacture, or to import whatever the collaborator says. You install a plant and produce that product. That's one interpretation.
241
Then, there is a second level of manufacturing. Here you really adopt the technology and develop a product. You see the product through its crude stage and its gestation period. With experience, you refme the product. It is at least a me-too product, and at least good enough to sell in the market. That's truly manufacturing in a sense, because you really own that product. Finally, there is a third category that is coming into its own today. This is when you are a systems integrator. You develop a system and might consider that system to be your product. And you don't do very much actual manufacturing in that product. You buy the components but you design that product and you assemble that product (Business World January, 2005)." From an integrated truck manufacturer to an automobile integrator; from a product driven company to competence-centric company; from an engineering-oriented operation to a strategy-fixation enterprise; from an inward-focused company to a partnership-powered company; from a local company to a global corporation; from an efficient organisation to a world-class organisation, a close look at TELCO from this point of view, which in way also reveal the group's new outlook.
As a systems integrator TELCO is out-sourcing 80% of the value of the "Indica", translating into 1200 to 1500 plus parts, from 200 odd vendors. It is said that it takes an average of 48 months and roughly $3 billion (Rs. 12750 crore) to develop a new car; but Indica was built in 31 months on a shoe-string budget of Rs. 1700 crore. Hitherto, TELCO had all along focused on the domestic market, relying on demand and relative lack of competition to sell its products. Now it is setting its sights on the international car market. The power train under TELCO's hood for this shift: a rise to world-class standards, which is essential since, even in the domestic car market, it competes against companies with those standards. It is in the strategic choice of the route that it has taken to reach world-class levels lies the key to TELCO's metamorphosis.
For now, it is organising itself around capabilities and alliances; not products. The focus of those capabilities: managing the supply chain. Thus by learning to build and manage a supply chain, it is setting the ground for leveraging the capabilities. So its skills as an integrator; bringing together products and services from both upstream and downstream operations, and packaging them for the customer under a brand name is what TELCO plans to use in its globalization drive. A look at how Ratan Tata made this paradigm shift possible. As it prepares for that stage, the company is also cutting teeth on managing alliances, which is only, way in which it can extend its reach without expending its own precious resources. While there is no doubt about the value-capture potential of the auto-components business, integrating the components with manufacturing operations is the most critical game for automakers.
Automakers worldwide are moving away from the assembly function; and focusing instead on car-design and styling. That TELCO's eyes are trained on the world is clear from the briefs to its vendors. AH vendors have been asked to benchmark only against truly international standards. It was against this backdrop TELCO had to take its primary make-or-buy decisions for the key inputs: design, engine and transmission. Applying the price-control strategy, TELCO went to the Italian company IDEA, for the product design. It bought the engine from Institute Francais du Petrol of France, and applied its skills to suit its requirements. For the transmission, TELCO relied on its in-house option at its Engineering Research Centre (ERC), Pune. We will take a close look at the resource gaps and how the group integrated its entire system to deliver a world-class car.
242
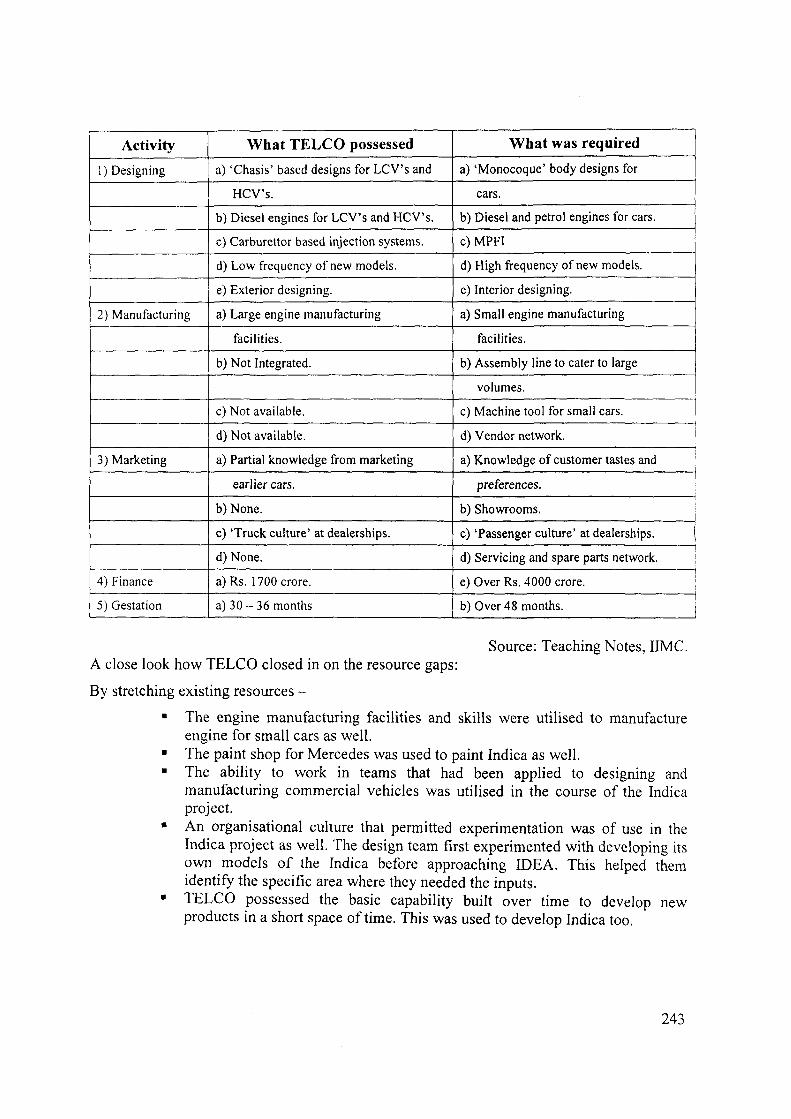
Activity
1) Designing
2) Manufacturing
3) Marketing
4) Finance
5) Gestation
What TELCO possessed
a) 'Cliasis' based designs for LCV's and
HCV's.
b) Diesel engines for LCV's and HCV's.
c) Carburettor based injection systems.
d) Low frequency of new models.
e) Exterior designing.
a) Large engine manufacturing
facilities.
b) Not Integrated.
c) Not available.
d) Not available.
a) Partial knowledge from marketing
earlier cars.
b) None.
c) 'Truck culture' at dealerships.
d) None.
a)Rs. nOOcrore.
a) 30 - 36 months
What was required
a) 'Monocoque' body designs for
cars.
b) Diesel and petrol engines for cars.
c) MPFI
d) High frequency of new models.
e) Interior designing.
a) Small engine manufacturing
facilities.
b) Assembly line to cater to large
volumes.
c) Machine tool for small cars.
d) Vendor network.
a) Knowledge of customer tastes and
preferences.
b) Showrooms.
c) 'Passenger culture' at dealerships.
d) Servicing and spare parts network.
e) Over Rs. 4000 crore.
b) Over 48 months.
A close look how TELCO closed in on the resource gaps:
By stretching existing resources -
Source: Teaching Notes, IIMC.
• The engine manufacturing facilities and skills were utilised to manufacture engine for small cars as well.
• The paint shop for Mercedes was used to paint Indica as well. • The ability to work in teams that had been applied to designing and
manufacturing commercial vehicles was utilised in the course of the Indica project.
" An organisational culture that permitted experimentation was of use in the Indica project as well. The design team first experimented with developing its own models of the Indica before approaching IDEA. This helped them identify the specific area where they needed the inputs.
• TELCO possessed the basic capability built over time to develop new products in a short space of time. This was used to develop Indica too.
243
By using existing resources to acquire or build new resources -
• Machine tool division resources applied to modify second hand plants. • Robots shipped in basic form and then programmed and fitted in-house. • Mercedes relationship utilised to acquire second hand presses from them. • Later machine toll facilities were used to modify these machines. • One new press two second-hand presses modified to suit requirements. • Dies and fixtures were manufactured reducing costs.
By concentrating existing resources -
• The skills of designers, costing experts and manufacturing personnel were made to converge, resulting in low procurement costs and effective value-chain configuration.
• Throughout the duration of the project, the resource leverage effort was focused on meeting the specific attributes laid down by Ratan Tata himself
By complementing resources -
• The design skills of TELCO personnel were complemented with the specific inputs from IDEA.
• Knowledge in diesel engines upgraded with specific inputs from La Modeme Moteur.
TELCO went to all its collaborators with a clear idea of what it wanted. This would not have been perhaps possible without the involvement and commitment of Ratan Tata himself, who spearheaded the "Indica Project" right from the scratch to rollout. The basic focus was not on adding value through assembly, but on coordinating activities on the value-chain. He firstly, set an ambitious task rather than focusing attention on the 'details of improvement', the task of becoming a world-class car manufacturer. He set a clear and precise task, the task was concretised with a focus on the next capability to be developed, the capability to build a small car. The value to be brought to the customer was defined in precise terms with clear benchmarks.
Ratan Tata remained committed all throughout; he did not allow TELCO's resource gaps to act as a detenent. He was personally involved at every stage of the project and helped in achieving convergence and focus. He allowed his team of engineers and designers the freedom to experiment, helping them build expertise through self- learning. This is in consonance with the Tata culture, which allows its top executives an allowance for his idiosyncrasies in order to draw out the best in a person. After the technological collaboration with Daimler-Benz expired in 1969, TELCO had not renewed it further, preferring instead to develop technologies in-house. After a gestation of twelve years TELCO had set up in its Pune complex, the pride of place in the complex had gone to the "Engineering Research Centre" (ERC). By 1994 ERC had grown to be one of the biggest and by far the most advanced establishments in India. The ERC employed over 800 professionals who undertake design and development of vehicles, but also tools, dies, fixtures, and other capital equipments as well.
The prime mover behind these efforts was Mr. Sumant Moolgaokar, who had been the chairman of TELCO from 1970 to 1988. However, it was Ratan Tata who conceived, initiated and implemented the "car projecf since he took over as the chairman of TELCO.
244
Insofar as its manufacturing activities were concerned TELCO had all along preferred to perform most of its activities in-house. This long drawn culture has gone in way contributing towards the success of the car project. By 1990 it had installed facilities to manufacture engines, gearboxes and transmission mechanisms, body panels and important sub-assemblies. It had even been manufacturing its requirement of capital equipment such as machine tools, dies and fixtures, and the castings and forgings required in its vehicles in-house in its machine tools division. The machine tools division also built for the first time in the country, four basic robots for spot and arc welding. It had also developed a Computerised Numerically Controlled (CNC) machines for its manufacturing operations.
However, designing a car was qualitatively different from the designing of commercial vehicles that had been manufactured by TELCO so far. Small cars were of the steel paneled monocoque design, in which the body of the car also acted as the chassis. The commercial and utility vehicles built so far had a separate frame, or chassis on which the body was built. Another aspect in which a small car differed lay in the fact that, the design of the car had to done in such a way that the car would be amenable to manufacture in large volumes. Therefore, the average time taken for a car to roll out of the assembly has to be kept low to achieve the desired volume. Work on the design of the car project started at the ERC since mid 1994. The team studied the designs of many internationally acclaimed small cars, and ran simulations of these cars under test conditions on Indian roads using its CAD facilities. By mid 1995 the team had come up with two rudimentary three-dimensional models, which were shown to Ratan Tata for his approval.
Ratan Tata decided to enlist the help of renowned car designer IDEA to seek specific inputs to fine-txme the in-house efforts. A team of engineers and designers from TELCO interacted with an IDEA team for the entire duration of the project. The designing of the car could not be carried out in isolation and the manufacturing implications had to be foreseen in advance and modifications carried out in the design if required. Thus while the design and development of the prototype was proceeding at IDEA, the Indian counterparts at ERC were busy setting up the assembly line. Because of substantial "hands on work" experience of TELCO engineers, they came up with many suggestions. For instance, the IDEA team came up with a proposal to fix the coefficient of drag (a parameter which determines the air friction around the car) at 0.33. TELCO's engineers reasoned that such a low coefficient of drag, while suitable for high-speed long distance cruising, was not required for Indian conditions. The collaborators agreed with TELCO and increased the coefficient of drag, leading to a sizeable reduction in development costs. After extensive joint inter-action the exterior design of the car was frozen in April, 1996.
At the conceptual stage of the project, the design team at TELCO had decided that it would develop two versions of the small car, one a diesel version and the other a petrol one. After a thorough study of several international small car models, the team decided to have a 54HP engine for its diesel version and a 60HP engine with carburetor for its petrol version. At the time the company could foresee that by the turn of the century, when the car would be launched it needed to incorporate multi-point fuel injection technology for its petrol version to keep up with the then expected emission norms. TELCO decided to take inputs from La Moteur Modeme of France to fine-tune its petrol engines. The design of the transmission was done entirely in-house at TELCO's ERC. The small car required a 5-speed transmission system, which was not designed by TELCO before.
245
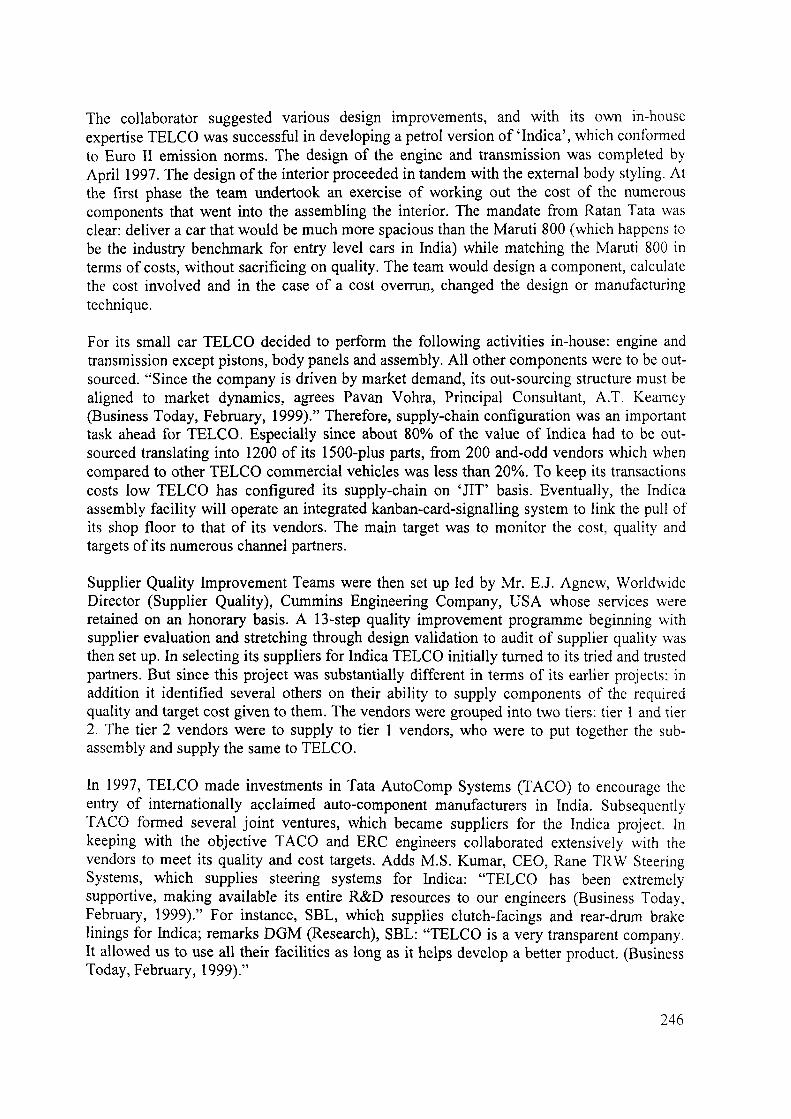
The collaborator suggested various design improvements, and with its own in-house expertise TELCO was successfiil in developing a petrol version o f Indica', which conformed to Euro II emission norms. The design of the engine and transmission was completed by April 1997. The design of the interior proceeded in tandem with the external body styling. At the first phase the team undertook an exercise of working out the cost of the numerous components that went into the assembling the interior. The mandate from Ratan Tata was clear; deliver a car that would be much more spacious than the Maruti 800 (which happens to be the industry benchmark for entry level cars in India) while matching the Maruti 800 in terms of costs, without sacrificing on quality. The team would design a component, calculate the cost involved and in the case of a cost overrun, changed the design or manufacturing technique.
For its small car TELCO decided to perform the following activities in-house: engine and transmission except pistons, body panels and assembly. All other components were to be outsourced. "Since the company is driven by market demand, its out-sourcing structure must be aligned to market dynamics, agrees Pavan Vohra, Principal Consultant, A.T. Kearney (Business Today, February, 1999)." Therefore, supply-chain configuration was an important task ahead for TELCO. Especially since about 80% of the value of Indica had to be outsourced translating into 1200 of its 1500-plus parts, from 200 and-odd vendors which when compared to other TELCO commercial vehicles was less than 20%. To keep its transactions costs low TELCO has configured its supply-chain on 'JIT' basis. Eventually, the Indica assembly facility will operate an integrated kanban-card-signalling system to link the pull of its shop floor to that of its vendors. The main target was to monitor the cost, quality and targets of its numerous chaimel partners.
Supplier Quality Improvement Teams were then set up led by Mr. E.J. Agnew, Worldwide Director (Supplier Quality), Cummins Engineering Company, USA whose services were retained on an honorary basis. A 13-step quality improvement programme beginning with supplier evaluation and stretching through design validation to audit of supplier quality was then set up. In selecting its suppliers for Indica TELCO initially turned to its tried and trusted partners. But since this project was substantially different in terms of its earlier projects; in addition it identified several others on their ability to supply components of the required quality and target cost given to them. The vendors were grouped into two tiers: tier 1 and tier 2. The tier 2 vendors were to supply to tier 1 vendors, who were to put together the subassembly and supply the same to TELCO.
In 1997, TELCO made investments in Tata AutoComp Systems (TACO) to encourage the entry of internationally acclaimed auto-component manufacturers in India. Subsequently TACO formed several joint ventures, which became suppliers for the Indica project. In keeping with the objective TACO and ERC engineers collaborated extensively with the vendors to meet its quality and cost targets. Adds M.S. Kumar, CEO, Rane TRW Steering Systems, which supplies steering systems for Indica: "TELCO has been extremely supportive, making available its entire R&D resources to our engineers (Business Today, February, 1999)." For instance, SBL, which supplies clutch-facings and rear-drum brake linings for Indica; remarks DGM (Research), SBL: "TELCO is a very transparent company. It allowed us to use all their facilities as long as it helps develop a better product. (Business Today, February, 1999)."
246
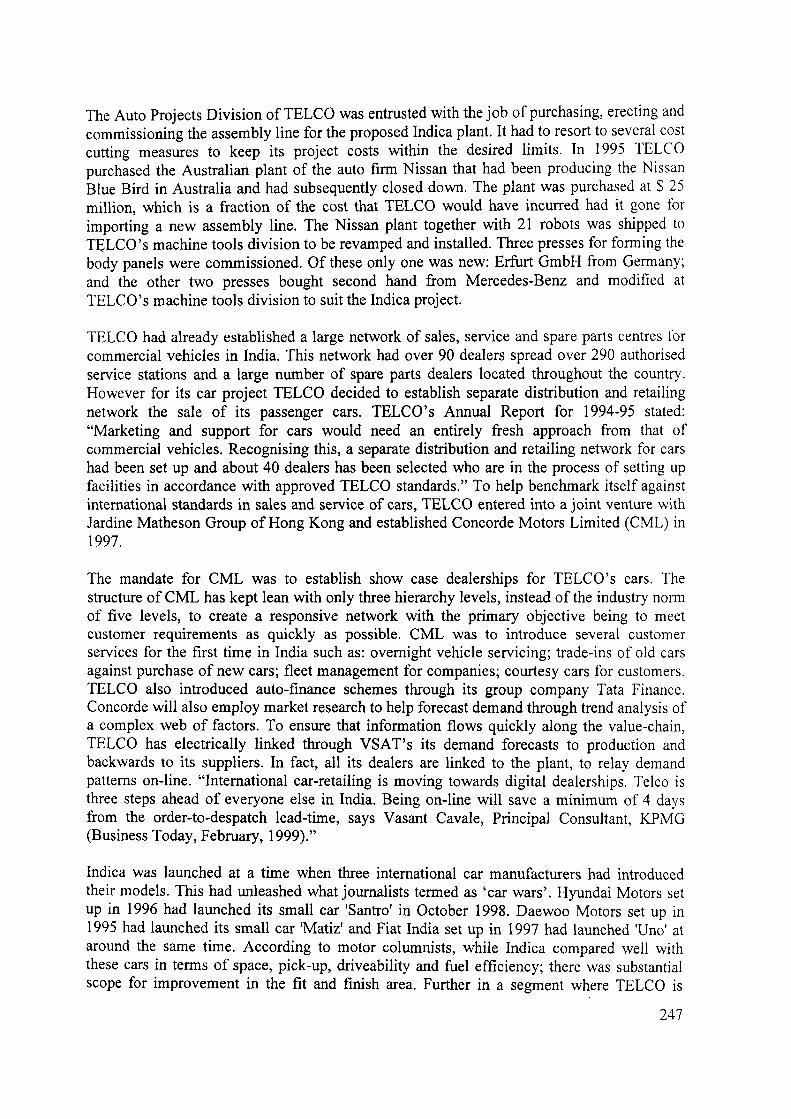
The Auto Projects Division of TELCO was entrusted with the job of purchasing, erecting and commissioning the assembly Hne for the proposed Indica plant. It had to resort to several cost cutting measures to keep its project costs within the desired limits. In 1995 TELCO purchased the Australian plant of the auto firm Nissan that had been producing the Nissan Blue Bird in Australia and had subsequently closed down. The plant was purchased at $ 25 million, which is a fraction of the cost that TELCO would have incurred had it gone for importing a new assembly line. The Nissan plant together with 21 robots was shipped to T^LCO's machine tools division to be revamped and installed. Three presses for forming the body panels were commissioned. Of these only one was new: Erfurt GmbH from Germany; and the other two presses bought second hand from Mercedes-Benz and modified at TELCO's machine tools division to suit the Indica project.
TELCO had already established a large network of sales, service and spare parts centres for commercial vehicles in India. This network had over 90 dealers spread over 290 authorised service stations and a large number of spare parts dealers located throughout the country. However for its car project TELCO decided to establish separate distribution and retailing network the sale of its passenger cars. TELCO's Annual Report for 1994-95 stated: "Marketing and support for cars would need an entirely fresh approach from that of commercial vehicles. Recognising this, a separate distribution and retailing network for cars had been set up and about 40 dealers has been selected who are in the process of setting up facilities in accordance with approved TELCO standards." To help benchmark itself against international standards in sales and service of cars, TELCO entered into a joint venture with Jardine Matheson Group of Hong Kong and established Concorde Motors Limited (CML) in 1997.
The mandate for CML was to establish show case dealerships for TELCO's cars. The structure of CML has kept lean with only three hierarchy levels, instead of the industry norm of five levels, to create a responsive network with the primary objective being to meet customer requirements as quickly as possible. CML was to introduce several customer services for the first time in India such as: overnight vehicle servicing; trade-ins of old cars against purchase of new cars; fleet management for companies; courtesy cars for customers. TELCO also introduced auto-finance schemes through its group company Tata Finance. Concorde will also employ market research to help forecast demand through trend analysis of a complex web of factors. To ensure that information flows quickly along the value-chain, TELCO has electrically linked through VSAT's its demand forecasts to production and backwards to its suppliers. In fact, all its dealers are linked to the plant, to relay demand patterns on-line. "International car-retailing is moving towards digital dealerships. Telco is three steps ahead of everyone else in India. Being on-line will save a minimum of 4 days from the order-to-despatch lead-time, says Vasant Cavale, Principal Consultant, KPMG (Business Today, February, 1999)."
Indica was launched at a time when three international car manufacturers had introduced their models. This had unleashed what journalists termed as 'car wars'. Hyundai Motors set up in 1996 had launched its small car 'Santro' in October 1998. Daewoo Motors set up in 1995 had launched its small car 'Matiz' and Fiat India set up in 1997 had launched 'Uno' at around the same time. According to motor columnists, while Indica compared well with these cars in terms of space, pick-up, driveability and fuel efficiency; there was substantial scope for improvement in the fit and finish area. Further in a segment where TELCO is
247
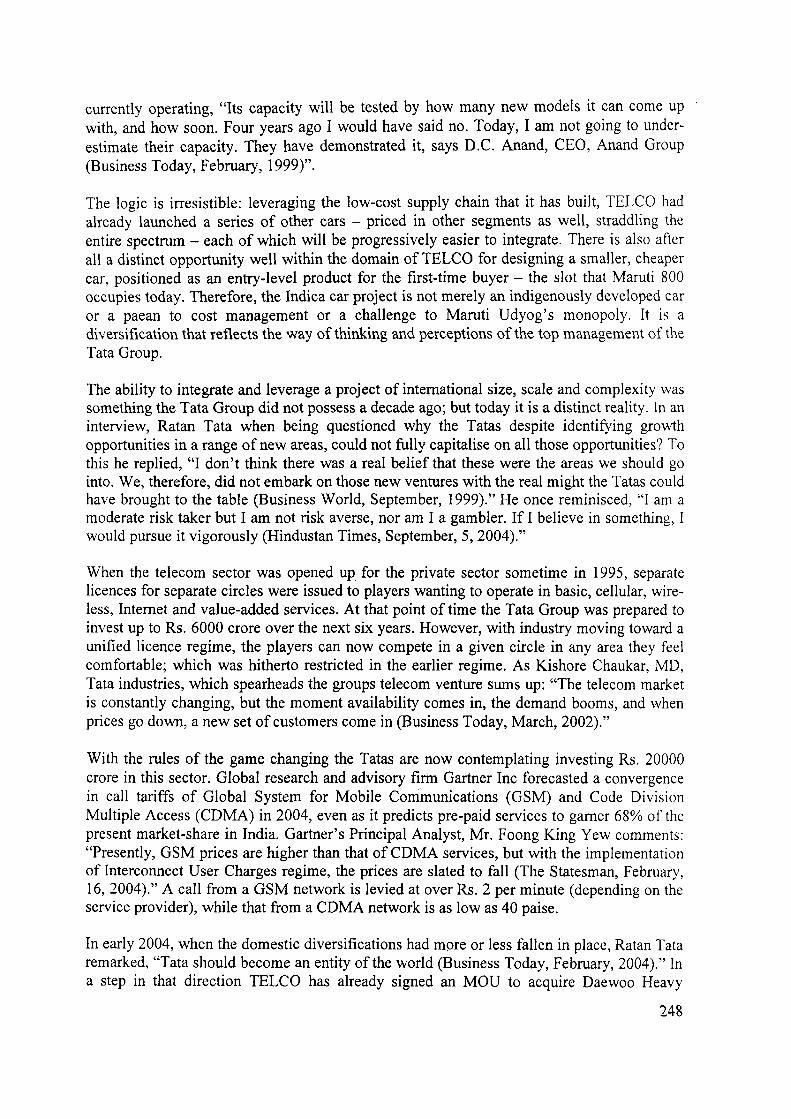
currently operating, "Its capacity will be tested by how many new models it can come up with, and how soon. Four years ago I would have said no. Today, I am not going to underestimate their capacity. They have demonstrated it, says D.C. Anand, CEO, Anand Group (Business Today, February, 1999)".
The logic is irresistible: leveraging the low-cost supply chain that it has built, TELCO had already launched a series of other cars - priced in other segments as well, straddling the entire spectrum - each of which will be progressively easier to integrate. There is also after all a distinct opportunity well within the domain of TELCO for designing a smaller, cheaper car, positioned as an entry-level product for the first-time buyer - the slot that Maruti 800 occupies today. Therefore, the Indica car project is not merely an indigenously developed car or a paean to cost management or a challenge to Maruti Udyog's monopoly. It is a diversification that reflects the way of thinking and perceptions of the top management of the Tata Group.
The ability to integrate and leverage a project of international size, scale and complexity was something the Tata Group did not possess a decade ago; but today it is a distinct reality. In an interview, Ratan Tata when being questioned why the Tatas despite identifying growth opportunities in a range of new areas, could not fully capitalise on all those opportunities? To this he replied, "I don't think there was a real belief that these were the areas we should go into. We, therefore, did not embark on those new ventures with the real might the Tatas could have brought to the table (Business World, September, 1999)." He once reminisced, "I am a moderate risk taker but I am not risk averse, nor am I a gambler. If I believe in something, I would pursue it vigorously (Hindustan Times, September, 5, 2004)."
When the telecom sector was opened up for the private sector sometime in 1995, separate licences for separate circles were issued to players wanting to operate in basic, cellular, wireless, Internet and value-added services. At that point of time the Tata Group was prepared to invest up to Rs. 6000 crore over the next six years. However, with industry moving toward a unified licence regime, the players can now compete in a given circle in any area they feel comfortable; which was hitherto restricted in the earlier regime. As Kishore Chaukar, MD, Tata industries, which spearheads the groups telecom venture sums up: "The telecom market is constantly changing, but the moment availability comes in, the demand booms, and when prices go down, a new set of customers come in (Business Today, March, 2002)."
With the rules of the game changing the Tatas are now contemplating investing Rs. 20000 crore in this sector. Global research and advisory firm Gartner Inc forecasted a convergence in call tariffs of Global System for Mobile Communications (GSM) and Code Division Multiple Access (CDMA) in 2004, even as it predicts pre-paid services to gamer 68% of the present market-share in India. Gartner's Principal Analyst, Mr. Foong King Yew comments: "Presently, GSM prices are higher than that of CDMA services, but with the implementation of Interconnect User Charges regime, the prices are slated to fall (The Statesman, February, 16, 2004)." A call from a GSM network is levied at over Rs. 2 per minute (depending on the service provider), while that from a CDMA network is as low as 40 paise.
In early 2004, when the domestic diversifications had more or less fallen in place, Ratan Tata remarked, "Tata should become an entity of the world (Business Today, February, 2004)." In a step in that direction TELCO has already signed an MOU to acquire Daewoo Heavy
248
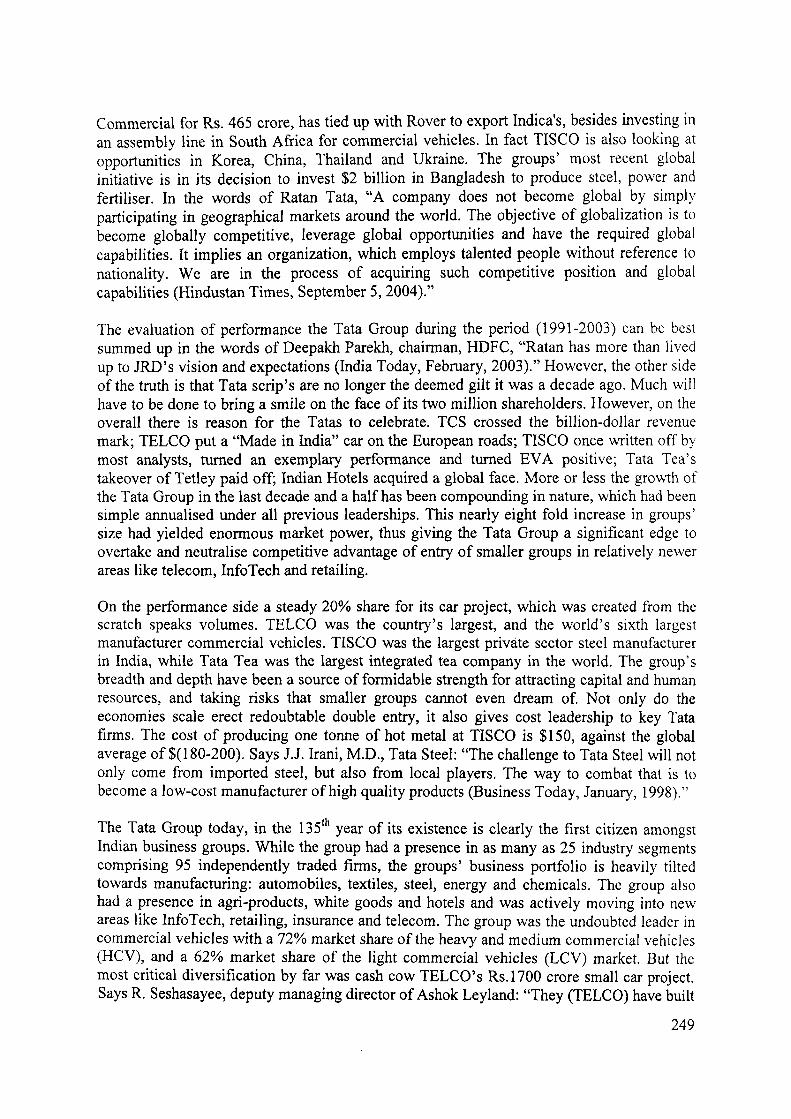
Commercial for Rs. 465 crore, has tied up with Rover to export Indica's, besides investing in an assembly line in South Africa for commercial vehicles. In fact TISCO is also looking at opportunities in Korea, China, Thailand and Ukraine, The groups' most recent global initiative is in its decision to invest $2 billion in Bangladesh to produce steel, power and fertiliser. In the words of Ratan Tata, "A company does not become global by simply participating in geographical markets around the world. The objective of globalization is to become globally competitive, leverage global opportunities and have the required global capabilities. It implies an organization, which employs talented people without reference to nationality. We are in the process of acquiring such competitive position and global capabilities (Hindustan Times, September 5, 2004)."
The evaluation of performance the Tata Group during the period (1991-2003) can be best summed up in the words of Deepakh Parekh, chairman, HDFC, "Ratan has more than lived up to JRD's vision and expectations (India Today, February, 2003)." However, the other side of the truth is that Tata scrip's are no longer the deemed gilt it was a decade ago. Much will have to be done to bring a smile on the face of its two million shareholders. However, on the overall there is reason for the Tatas to celebrate. TCS crossed the billion-dollar revenue mark; TELCO put a "Made in India" car on the European roads; TISCO once written off by most analysts, turned an exemplary performance and turned EVA positive; Tata Tea's takeover of Tetley paid off; Indian Hotels acquired a global face. More or less the growth of the Tata Group in the last decade and a half has been compounding in nature, which had been simple annualised imder all previous leaderships. This nearly eight fold increase in groups' size had yielded enormous market power, thus giving the Tata Group a significant edge to overtake and neutralise competitive advantage of entry of smaller groups in relatively newer areas like telecom, InfoTech and retailing.
On the performance side a steady 20% share for its car project, which was created from the scratch speaks volumes. TELCO was the country's largest, and the world's sixth largest manufacturer commercial vehicles. TISCO was the largest private sector steel manufacturer in India, while Tata Tea was the largest integrated tea company in the world. The group's breadth and depth have been a source of formidable strength for attracting capital and human resources, and taking risks that smaller groups carmot even dream of Not only do the economies scale erect redoubtable double entry, it also gives cost leadership to key Tata firms. The cost of producing one tonne of hot metal at TISCO is $150, against the global average of $(180-200). Says J.J. Irani, M.D., Tata Steel: "The challenge to Tata Steel will not only come from imported steel, but also from local players. The way to combat that is to become a low-cost manufacturer of high quality products (Business Today, January, 1998)."
The Tata Group today, in the 135'*' year of its existence is clearly the first citizen amongst Indian business groups. While the group had a presence in as many as 25 industry segments comprising 95 independently traded firms, the groups' business portfolio is heavily tilted towards manufacturing: automobiles, textiles, steel, energy and chemicals. The group also had a presence in agri-products, white goods and hotels and was actively moving into new areas like InfoTech, retailing, insurance and telecom. The group was the undoubted leader in commercial vehicles with a 72% market share of the heavy and medium commercial vehicles (HCV), and a 62% market share of the light commercial vehicles (LCV) market. But the most critical diversification by far was cash cow TELCO's Rs.l700 crore small car project. Says R. Seshasayee, deputy managing director of Ashok Leyland: "They (TELCO) have built
249
a great secondary support structure over the years in terms of after-sales service and spare parts availability (Business Today, January, 1998)." But passenger cars is a different strategy altogether. It's about reliable technology, aesthetics and competitive prices.
Led by TISCO, which held a 15% market share in the steel industry, the groups' steel and associated metals business would also qualify as cash cow. So would the groups' interest in chemicals through Tata Chemicals. While its soda ash business was steady and secure, its urea project is clearly a question mark. And if Tata Tea was another cash cow, its coffee business was a clear star. The days of Titan Industries as a star seem to be slowly getting over; emerging as another cash cow instead. In the service segments, Indian Hotels would also qualify for that position. Perhaps the brightest star in the Tata Group was its interest in IT, particularly software. TCS (till recently a division of Tata Sons) contributed a health) proportion to the groups' bottom-line. Its engineering business would also qualify as a potential star. Another prospective star is its retailing wing (Trent). The other star, which is slowly loosing its shine, was its power business. It holds an exclusive license of supplying power in Mumbai; one of the fastest growing regions in the country, imtil 2014. Finally, the group has plenty of dogs as well; white goods giant (Voltas), consumer durables (Eureka Forbes) and office automation (Bradma). While its foray into telecom, was still a large question mark.
250
Annexure II: Case Study - Reliance Group
A son of a village school teacher, Dhirajlal Hirachand Ambani (popularly known as Dhirubhai) had journeyed, at the tender age of seventeen, to the West Asian port of Aden, in South Yemen, then a British colony, to earn his livelihood. After working as a clerk for eight years with A. Beese & Co, a French firm that acted as agents for Shell Oil, he returned to India in 1959 after a change in the government there. He then set up Reliance Commercial Corporation with a total capital of Rs. 15000. He exported ginger, cardamom, turmeric and other spices to the West Asian markets where he had established links during his earlier stint. He branched out to trading in fabrics and yam, following a heavy demand for rayon fabrics in India. The group used its "Export Replenishment License" to import rayon into India and sell them at a premium in the local market. Later, when nylon started getting popular in India, the group began exporting rayon fabrics from India and imported nylon in exchange.
The healthy margins, ranging between (100-300)% from that of import of nylon provided more than compensated for the loss made on the export of rayon fabrics. Finding good quality fabrics for export, however, was proving to be increasingly difficult. As a measure of backward integration, the he started manufacturing rayon fabrics at Naroda, Ahmedabad, 500 km north of Mumbai at a total outlay of Rs. 2.7 million in 1966. During the late 1960's nylon, like rayon earlier, was losing ground to another man made fibre - polyester. In 1971, to bring in polyester into the country the GOI aimounced a revised scheme under which import of polyester was permitted against export of nylon. Already in a similar trade, the group took advantage of the scheme and at one stage accounted for 60% of the nylon fabrics exported from India.
The sustained growth in export turnover resulted in Reliance group expanding its manufacturing facilities. While it continued to import polyester yam for captive consumption and local sales, it also used the import entitlements that were permitted against exports, to import state-of-the-art technology for value-addition to its existing products. Even in 1975, a technical team from the World Bank had inspected had inspected a number of textile mills in India, and its report had certified that only Reliance's textile plant could be described as excellent by developing country standards. The focus on exports continued till the late 1970's, when the GOI stopped promoting the scheme any more. The burgeoning demand for polyester in the domestic markets in the early 1980's, made the group shift its attention to the domestic markets. Reliance used the experience gained from manufacturing high quality fabrics for the exports market to attain leadership for its 'Vimal' brand in the local markets. Bulk of the domestic textile mills who manufactured cotton fabrics, had not upgraded their technology by then, which enabled Reliance Group to leverage its market-share.
Historically, the textile market in India had a three-tier stmcture - Manufacturer -Wholesaler - Retailer. The market structure was such, that the wholesale trade heavily controlled it. Dissatisfied with the distribution structure. Reliance opted to bypass the wholesale trade by opening retail showrooms - both its own and franchised - across the country. While Reliance's competitor Bombay Dyeing had innovated this practice, Reliance pursued this strategy on a grand scale. By 1980, Reliance fabrics were available all over India through 20 company owned outlets, over a 1000-franchised outlets and around 20000 regular retail outlets. Not only did Reliance outspend its competition, its advertising budget
251
was among the highest for all products promoted in India. A practice it has maintained since then.
During the same time its turnover jumped to Rs. 2.1 billion and the company was facing capacity constraints. The textile industry, like most other industries was subject to licensing. Therefore, because of the restrictions the group could not install additional looms, as the GOI policy favoured the expansion of SSI. To by-pass this constraint, the group started sourcing grey fabrics from the power looms from nearby SSI's, processed them at its textile facility at Naroda, and sold them under its brand name. It also acquired a sick textile mill, by exchange of shares, to enhance its capacity. Reliance quickly emerged as the largest producer of fabrics in India, a position it has maintained since then.
In 1981, Reliance Group sought to further backward integrate its operations. Following rapid growth in the demand for polyester fabrics, domestic demand for PFY had outstripped domestic supply, the shortfall being met by imports. It immediately secured a license for manufacturing 10000 mtpa of PFY and technology from DuPont for setting up the facility. Beyond the straightforward opportunity for import substitution, the group for the first time saw the move as a way to improve its competitive position. Dhirubhai later explained:
"I was a buyer of this product all over the world and I was observing what was going on - not only with the producers in India, but also abroad. I went to major company in the West and saw how inefficient they were. The bosses were not committed, people were not working, were having long lunch hours and the cost of all these inefficiencies were loaded on to the product and was passed on to me. I knew we could manage the business lot better, make more money than them, and yet supply better and cheaper products to our mills (EFMD Case Study, 1994)."
At the time Reliance set up its PFY plant, this sector was reserved by the GOI for the use by the small-scale weavers in the "art-silk" industry; large textile manufacturers could only use cotton. This was the key barrier to consumption.
"Power looms were often one-two man operations. They typically sourced the yam from outside and carried out only the weaving operation. They sold the woven grey (unfinished) fabric to process houses, which then completed the rest of the operations (processing and printing) and sold the finished product -often unbranded - to the wholesale trade (which invariably financed the whole operation). In contrast Reliance's composite textile mills had fully integrated operations, which carried the entire set of activities in-house - from spiiming the yam to producing the finished fabric (EFMD Case Study, 1994)."
When the Reliance group set up its first backward integration plant for its 10000 mtpa PFY project at Patalganga, Maharashtra over a 300 acre plot, the total area was over 20 times larger than what was required for a project of similar size. This approach represented a major departure from the 'normal' business practice of the time. Instead of creating a "safe" capacity based on reasonable projection of demand; the group applied "world scale" capacity that would meet the cost and quality standards on a global basis. According to H.T. Parekh, the then head of ICICI, who had sanctioned the groups first institutional loan commented:
252
"Dhirubhai always spoke of international standards and sizes. Initially, I admit that I had some doubts whether he would really be able to carry it through. But he has disproved me b\' his resourcefulness (EFMD Case Study, 1994)." This commitment of creating world scale capacity, in turn, was based on Dhirubhai's ambition to do extraordinary things, but also on a specific logic. As further illustrated by S.P. Sapra, President, PSF Business:
"The fundamental difference between Reliance's approach and that of other companies was that Dhirubhai saw things that were hidden to other companies. The user industry was held back by non-availability of supplies. Other companies would typically do a market survey that would show the current usage at, say, 2000 mtpa. They would project the usage into the future and arrive at a demand of say, 5000 mtpa. They would then set up a 3000 mtpa facility, depending on their projections of market share. Dhirubhai threw that incrementalist mind-set away. He created capacity ahead of actual of actual demand and on the basis of the latent demand. Then he would go about systematically removing the barriers that were holding the demand (EFMD Case Study, 1994)."
The Reliance Group would not only enter a business with a large, world scale plant far higher capacity than its domestic rivals, it would also continuously modernise and increase capacity to mop up all the incremental market growth to build a position of absolute industry leadership. For managers used to the most staid approach of large MNC's, Mr. K. Ramamurthy who joined Reliance Group as Vice President from COO in Chemplast explains: "Initially I would go to him (Dhirubhai) with proposals that reflected my conservative market-share objectives. And he would say think what a true world-class operation must look like. And my investment objectives would quadruple (EFMD Case Study, 1994)." Clearly, the Reliance Group hopes rest on the fact the domestic per-capita consumption of polyester in India is 2kg compared to 6kg in China and 7kg world-wide. Similarly, in polymers, consumption per-capita is 3kg in the country, compared to 10kg in China and 15kg worldwide.
Since the growth rate in the domestic polyester and polymer industry is only around (10-15) % increasing capacities at such an alarming rate does not seem feasible. Clearly, the facts rest on the uncarmy abilities of the Reliance Group to recreate new markets. Thus once they have built up the capacities, they systematically remove the impediments that block the way for increases in demand; mostly by radically breaking the price barrier. The groups' confidence in the future stems from its high degree of integration (vertical as well as horizontal), leading to low costs - a formidable entry barrier. Of course, integration also helps the group in balancing cyclical pressures in its product groups. There are other benefits too: at every stage of manufacture, the group saves (2-3) % in terms of re-melting costs, inventory management, indirect taxes, freight and marketing and distribution costs.
To stimulate demand for its product PFY, Reliance launched a "buy-back" scheme whereby it sold its "Recron" brand yam to the small power looms who then sold back the grey cloth back to the company for finishing and eventual sale under the "Vimal" brand-name. Once the positive loop of supply-led demand creation process became fully operational, the group would revert to its tight asset management strategy. The group gave the weavers a fantastic amount of financial support to the small-scale weavers and credit to create demand. In terms
253
of their sales, majority 90% is on cash basis today. Whatever the group ship's today, payment is received by 2:00 pm the next day. In 1984, Reliance Group sought to further expand its polyester portfolio. It obtained the license for manufacturing 45000 mtpa of PSF. At that time domestic capacity of 37000 mtpa was not adequate, so to meet the additional demand an additional 10000 mtpa of PSF was being imported. Both PFY and PSF were used for manufacturing fabrics and are largely substitutable.
"PFY imparted a better sheen (shine) and an apparent silky feel to the fabric and did not wrinkle as much as the PSF fabric did. PSF fabrics on the other hand, provided greater comfort in wear to the consvmier (breathability), especially in a tropical climate. They, however, were relatively more expensive to care for (EFMD Case Study, 1994)."
In addition to expanding its polyester portfolio, it also sought to further backward integrate its operations. It obtained licenses for manufacturing fibre-intermediates such as - PTA and MEG. Reliance also sought to diversify its product portfolio. It obtained the license to manufacture 50000 mtpa of LAB, an intermediate for production of detergents. In keeping with its strategy of continuous investment in additional capacity. Reliance expanded its capacities in each of its existing businesses. In fact, in a nxunber of cases it expanded the capacities even as it was installing the originally sanctioned smaller capacities. Further, in each of its existing businesses, Reliance achieved a level of capacity utilisation that was far higher than that of most competitors. Adds Sapra, "With low utilisation, high capacity can be milestone round your neck (EFMD Case Study, 1994)." For example, the demand for PSF remained sluggish throughout the second half of the 1980's. The domestic industry was plagued with surplus capacity when, in a period of eighteen months, the overall industry capacity went up from 40000 mtpa to 250000 mtpa, due to expansion of facilities by existing players, but primarily due to entry of new players like Reliance.
Realising that the domestic market could not absorb this volimie, Reliance once again turned to exports. It not only used its scale to advantage, but it also upgraded its quality to export a major part of its output. It marketed the product under its own brand name "Recron" and through Du Pont who marketed the product worldwide under its own "Dacron" label. For LAB too, the company faced a similar situation of over capacity and responded by exporting nearly 25000 mtpa of the product. To support such exports, the group set up Reliance Europe, its wholly owned subsidiary in London. The improvement in quality necessary for export, together with the experience with international customers, in turn, reinforced the company's competitive advantage at home. Beyond exports, the company also pursued an aggressive strategy of demand creation at home. It set up "Business Development Groups" to create new investment opportunities that would use its own products as feedstock. It provided such services to potential investors free of cost and it also use its own network to promote those entrepreneurs to secure both funding and distribution. As a result of such demand creation activhies Reliance achieved a 100% capacity utilisation in PSF, while most of its competitors struggled to achieve 50%.
A distinctive element of their strategy is to purchase technology firom the best foreign source rather than create joint ventures. Adds Mr. S.P. Sapra: "Take Century Enka - everything needs Enka's approval. Enka is used to the low growth European enviroimient. So they are incrementalist and cautious. They slow down the Birlas. If Dhirubhai created an alliance with
254

Du Pont everyone in India would have said, great he has got Du Pont in India. But it would have slowed down everything (EFMD Case Study, 1994)." An essential factor connected with this capability is "speed". Says Anil Ambani, M.D. Reliance Industries: "Most traditional economic calculations go wrong because they do not take the cost of time into account. Long before time based competition became management hype, we did everything to compress time in both our projects and our operations. The Reliance Group had already buih up a reputation for setting up projects quickly; it had for instance, set up its worsted spinning plant within eight months of grant of the license.
However for the PFY plant it outdid even its collaborators by getting it ready in fourteen months - a feat Du Pont, until then, had not managed to achieve anywhere else in the world. Instead of adopting the normal practice of linking the various pieces through long arrays of pipes (typical for a continuous process plant) after receipt of the equipment. Reliance laid scores of kilometers of pipes in readiness for the equipment to arrive and to be installed as soon as they landed. At Reliance there was great emphasis on speed. "We do not accept a barrier as a barrier. We deal with issues directly. We do not build defenses for nonperformance, adds S.P. Sapra, (EFMD Case Study, 1994)." Perhaps the most dramatic illustration of Reliance's speed came when its huge Patalganga complex was flooded on the night of July 24, 1989 by flash floods from a nearby river. Technical experts were flown in from Du Pont estimated a minimimi period of (90-100) days before the complex could be operational again. Local newspaper reports, based on the opinion of India's best experts, were even less optimistic, predicting that some of the units would not be operational for at least five months. Reliance had the entire complex fully functional in 21 days. K.K. Malhotra, Chief of Operations, Reliance Industries provides a vivid illustration:
"Understanding the scale of havoc, after the water receded, we had to remove 50000 tormes of garbage - silt, animal carcass, floating junk - before we could get to the actual recovery work. All our sophisticated electronic and electrical equipment were damaged being under water for hours. We set up a control room to connect the site with the outside world. Then we took time to carefully survey the damage and quantify the work. Based on that quantification, we set up objectives, for each plant, when it will be on track. Each day at 11 a.m., I would have a meeting for an hour to review. On the third day I asked the Du Pont people, "What do you think? We had plarmed to get our two huge compressors ready in 14 days. They said, "Out of two, if you can get one ready in a month, you will be lucky." I phoned Mukesh that evening and said, "I want these guys out of here. If they say this it will percolate, and it will break the will. We had the compressors ready one day ahead of schedule, and the whole plant going a week ahead of plan (EFMD Case Study, 1994)."
The real secret, according to Malhotra, lay in two things: "Careful plaiming to quantification of tasks and then saturating the tasks with resources. We put in all our resources that the task can absorb, without people tripping over each other. If I had all the time in world, I would optimise. But given my opportunity cost of lost production, it almost does not matter how much it costs because, if I can get the production going earlier, I always come out ahead. Only when you put the value of time in the equation do you get sound economics and then saturation almost always makes sense (EFMD Case Study, 1994)."
255
As a departure from the prevailing practice pursued by most Indian business groups, Reliance approached the investing public directly to fund its growth plans. Most groups sought to fund their projects by mobilising fimds - typically debt instruments - from state owned financial institutions. High interest rates choked business groups and halted growth. The group kept upping dividends year after year, regardless of a dip in profits. After an IPO in 1977, it again approached the investing public in 1979; this time with an offer of partially convertible debenture. The issue was over-subscribed six times. In 1979 in addition to a 25% dividend, it issued bonus shares in the ratio of 3:5. Its share prices appreciated 450%.
To thousands of well wishers, Dhirubhai uttered, "Hold the papers, one day you will realise there worth (India Today, July, 2002)." Dhrubhai's fear of debt once made him repay a 50-year loan of $150 million in just three years. Reliance preferred to mobilise the funds directly from the public as the funds mobilised from financial institutions often had a rider attached to them; an option to convert the debt into equity at a later date. The distinctive capability of the Reliance Group in this regard was to recreate the capital market through innovative financial instruments by understanding the psyche of the average Indian investor. The appeal of this instrument to the small investor at that time lay in the fact that:
"The instrument yielded interest on the entire amovmt in the initial period (often linked to the gestation period of the project for which the fiinds were being mobilised) and thereafter on the non-convertible portion. Despite a boom in the stock markets, following a forced dilution of equity of MNC's by the GOI under FERA, equity offerings had not still gained widespread public participation. The typical 'small investor' continued to prefer investing in safe return instruments. In such a scenario, an instrument, which offered both interest and an opportunity to gain capital appreciation, attracted support. The conversion imder the capital issue norms operational then was carried out at a price which was far below the price of the equity quoted in the stock exchange, resulting in substantial capital appreciation on the investment (EFMD Case Study, 1994)."
The 1979 issue was quickly followed with issues of partially convertible debentures in 1980 (for modernising its textile facilities), in 1981 (to finance its foray into the manufacture of PFY) and a record (then) Rs. 500 million in 1982 to further modernise its textile facilities.
"Two months prior to the offering. Reliance's stock was subject to a severe bear hammering (short selling) and its stock price had nose-dived. On a single trading day the company's stock price fell by as much as 10% of its value. Following this a few NRI investment companies registered in the Isle of Man moved into the stock market, reportedly on behalf of Dhirubhai - and started buying up all the shares that were being sold and demanded delivery. Since there was a scarcity in circulation of shares, the resultant panic buying by the bears lead to an over 40% rise in the price of Reliance's equity. Dhirubhai became the small investor's stock market deity (EFMD Case Study, 1994)."
The image of the Reliance Group got further reinforced when in 1983, the group in an unprecedented move, offered to convert the non-convertible portion of the debentures issued between 1979 and 1982 into equity. It offered to exchange every Rs. 100 of debt for 1.2
256
equity shares of Rs. 10 face value. The offer met with an overwhelming response as the Reliance share was being quoted at Rs. 115 in the stock market, while the market value of every Rs. 100 debt was hovering around Rs. 84. In a single stroke the group had not only eliminated the debt burden, it had also increased its future fund raising capacity significantly. Within a year of the extinguishment of the debt. Reliance once again mobilised Rs. 3.5 billion of fresh funds from the markets. The latter established yet another record. Not only was it, at that time, the largest ever issue in the Indian capital market history, it met with an over-subscription despite being a non-convertible offer. The group once again demonstrated its capital raising legerdemain.
Yet another facet of Reliance's growth history has been its tax planning. While its profits continued to grow, it had not paid a single rupee to the exchequer as corporate income tax. The groups' continuous investment in expansion and modernisation of its facilities enabled it to set off the profits from operations against tax credits it was allowed on the investments made (investment allowance reserves). In a bid to make companies like Reliance, which had come to be known as zero tax companies, the GOI amended the existing laws which required the companies to pay corporate income tax on at least 30% of their profits after depreciation, but before seeking investment allowance credit and other tax benefits. Reliance, however, still continued to be a zero-tax company. It changed its accounting practice. As against the earlier practice of capitalising interest on long term debt obtained for procuring fixed assets till the date of commissioning of the asset, it capitalised interest for the entire contracted period of such debt on the assumption that interest accrues at the time of availment of the loan till the date of repayment of the said loan, and all loans shall be repaid on due dates (Company Annual Report, 1981-82, p 23).' The groups' strong cash flows are perhaps an extended arm of its astute financial engineering.
In 1983, the Bhopal gas disaster had crippled the operations of Union Carbide in India. At this stage the group had successfully bid and acquired a license for producing PE and PVC. During 1987, the group transferred the license to a newly formed subsidiary - Reliance Petrochemicals. The plant was to be set up at a new location in Hazira, in Gujarat, 230 km north of Mumbai. In 1988 Reliance Petrochemicals issued fully convertible debentures for these projects and mobilised a record breaking Rs. 5.9 billion from the capital market. Its shareholder base reached a peak of 2.3 million investors, yet another milestone in the history of Indian capital markets. Soon thereafter, the GOI announced a new policy, which allowed lower licensed capacities granted earlier, to be scaled to new "minimum economic capacities".
Reliance Petrochemicals opted to upgrade the capacities of the plants. This led to modification in the implementation schedules. Importantly, it also led to an upward revision in the projected investment outlays. The increased fund requirement was met by mobilising debt funds from state owned financial institutions. This required Reliance Petrochemicals to pre-pone the conversion of part B of the convertible debenture issued in 1991. Reliance Petrochemicals opted to convert even part C of the debenture at the same time. Both the conversions were done at par, though at the time of issue, it had planned to do so at a premium. As a result of this exercise, the equity base of Reliance Petrochemicals ballooned to over Rs. 7 billion. Further, the delay in the commissioning of the plants with enhanced capacities had resulted in the project costs shooting up to over Rs. 15 billion, from the Rs. 7
257
billion estimated earlier. It had to not only service this huge equity base, but was also saddled with a debt of over Rs. 8 billion.
In February 1986, Dhirubhai suffered a paralytic stroke. As result his two sons Mukesh Ambani and Anil Ambani then in their late twenties, were catapulted into managing the affairs, while their father recuperated. It was trial by fire for them. Dhirubhai himself did not put in as many hours in the office any more, having moved away from the day-to-day operations to being the visionary and strategist for the group. Nevertheless he continued to be passionately involved, with a single-minded commitment to the institution he built. He commented: "I do not give and have never given attention to anything else except Reliance. I have never been a director in any other company. I am not actively involved in any association or in anything else. My whole thinking - hundred percent of my time from morning till evening - is about how to do better and better at Reliance. Business is my hobby. It is not a burden to me. I enjoy it enormously (EFMD Case Study, 1994)."
Despite Dhirubhai not being around, his sons (Mukesh and Anil) more or less carried the same legacy through. Since it carried on with the same organisation structure, it had not faced much resistance internally. They stuck to their mindset of integration and growth automatically followed. The Reliance Group had all along had a much-focused mind-set. This in a way stopped them from diversifying in unrelated areas. Yet the group often swerved to opportunity - media, power, infi'astructure, ports and terminals and financial services. However, since these diversifications did not match with their way of thinking, it witnessed lack of commitment and financial clout the group could have brought into these projects.
However, telecom was one area where the group could leverage its skills in exploding the market, a capability that it had demonstrated earlier. However, when the group formed Reliance Telecom in 1996, the telecom market was overregulated. TRAI regulations pre-exempted players fi"om competing in circles other than those allotted. Further as Reliance had a basic operator's license, it could only offer fixed line services and not limited mobility. However, a restricted business environment was not in tune with the Reliance mindset. This bottleneck restricted Reliance fi"om demonstrating its skills to swing industry forces in its favour. In earlier situations it had brazenly used its skills to by-pass the regulatory regime by swinging licenses in its favour. However, this time liberalisation had come a long way and efficiency of the market forces prevented Reliance fi-om leveraging the environment.
The Supreme Court had asked the TDSAT to review its order that would clear the entry of WLL services (an approach Reliance had taken to forward calls via contiguous circles). The cellular operators sought for a stay order. However, ultimately, the decision by TDSAT ruled in favour of Reliance. Reliance could now legally and technically forward calls nationally, since it had a basic operator's license in practically every circle. With the ball set, Reliance formed a wholly owned subsidiary. Reliance Infocomm and transferred the license in its favour. What followed next is only history.
All through its history the Reliance group has rarely been far away from controversy. Most business groups found it expedient to cut private deals with powerful politicians and bureaucrats. Bribes in exchange for licenses, illegal political contributions in return for preferential regulation and the generation of unaccounted money for sustaining this corrupt nexus became, for some, the recipe for quick success and rapid growth. In other cases, pre-
258
empting competitors by taking multiple licenses, and then not proceeding to build facilities, became a perfectly legal strategy for using the regulatory regime to profit climate of artificial scarcity. As a result efficiency was grievously hurt due to government's pursuit of populist poHcies.
Essentially, excessive government regulations fractured markets and destroyed economies of scale, size and scope. Indian business groups therefore became much more diffused. Besides, with so many legal constraints many business groups resorted with success to the pursuit of the loopholes and the illegal. Also most business groups became accustomed to the strict government regulations, which were responsible for limiting competition and thereby guaranteeing success in any line of business. The Reliance Group is a glaring example in this context. All through its history, the Reliance Group has had close proximity with the successive Congress governments, led by the then Prime Minister Indira Gandhi.
Its critics contended that the ability to get licenses granted; obtain fast approvals for its resource mobilisation plans from the capital markets and capital goods imports; and get policies formulated which favoured it (or disadvantaged its competitors or both), were a consequence of the enormous political clout it wielded. Some major illustrations:
"In 1982 - Reliance's yam plant goes on stream, using PTA & DMT. GOI raises customs duty on polyester chips, used by Orkay; puts anti-dumping duty on PFY. In 1987 - Reliance sponsors World Cup; Polyester fibre taken off OGL List, GOI reduces import duty on PTA. In 2001 - Reliance bids for IPCL; controversy over government's decision to modify telecom policy. Reliance Infocom vmveils Rs. 25000 crore-investment plan. However, Dhirubhai was quick to cover up his uncanny capabilities, "Entitlements and licenses were available for everyone to take advantage of If they were not quick enough off the mark, is it my fauh?" Perhaps the Reliance Group was the first to bring in the concept of "managing the environment" and also practised it to its best advantage. The group brazenly showed how a repressive system used to controlling and sheltering monopolies could also be co-opted by a rank outsider. He swung licenses, clearances and duty benefits, but it did so in a focused way, always thinking about stringent project deadlines, economies of scale and international benchmarking (EFMD Case Study, 1994)."
Following the assassination of the then Prime Minister Indira Gandhi in 1986, and the subsequent changes in the GOI, the Reliance Group found itself in a storm of controversies. The group could no longer exploit and leverage the benefits of market imperfections in its favour. In the same, the GOI harmed the conversion of its non-convertible portion of debentures into equity, hours before the board of directors of Reliance were to meet and recommend conversion. The ban followed allegations in the press that banks and financial institutions had funded investment companies belonging to the Reliance Group in violation of the prevailing lending norms enabling them to acquire large quantities of the non-convertible portion of the debentures months before the board meeting. The press also alleged that the Reliance Group had set up plants whose capacities were far in excess of its licensed capacity by smuggling them into the country. This eventually led to a show cause notice from the Customs authorities "alleging import and installation of additional machines
259
unauthorised and also misdeclaration of more than twice the declared capacity, (and) claiming alleged differential duty and penalty of Rs 1190 million".
The group however, denied any wrong doing and contested the claim (source: company annual report, 1987-88, p 21 and 1989-90, p 30). During the same year the GOI abolished a customs levy (anti-dumping duty) imposed on the import of PFY around the same time when Reliance's PFY plant was being commissioned. The government action was triggered by the accusation that while publicly justified as protection to domestic producers from low cost imports, the duty actually enabled the domestic producers - Reliance Group foremost among them - to generate windfall profits. As a result of this action PFY prices dropped in the domestic market by 20%. The year ended with Reliance's profit nose-diving from Rs 713 million the year before to only Rs 141 million.
The group fought back the only way it knew - by a direct appeal to the investing public. Following a ban on the conversion of non-convertible debentures into equity, it approached the capital market with a record Rs 5 billion offer of fully convertible debentures. The offer was over-subscribed by over 7 times, with an imprecedented number of 1.75 million applications. Despite all the allegations and setbacks the group had retained the confidence of its millions of shareholders. Another round of changes in the government in 1987 followed a series of favourable decisions for the Reliance Group. Imports of PSF was canalised through a state agency thus preventing direct import by end-users; a special customs levy of Rs 3 per kilogram on PTA (which Reliance was still importing) was abolished; the groups' Patalganga complex was granted the status of refinery - thus it became entitled to lower level of excise duty for raw materials like naphtha; and it was also permitted to prepone the conversion of debentures into equity, which resulted in an estimated savings of about Rs. 330 million in interest costs. It reported a hefty profit of Rs. 800 million in the next accounting year.
In 1988, Reliance acquired a significant stake in L&T through an investment subsidiary. Apart from being India's No. 1 construction and process engineering company, L&T had significant presence in cement, shipping and electronics. At that time Reliance was L&T's largest customer and the two had a long-standing relationship. Reliance acquired the stake with a view to exploit this synergy. L&T was a professionally managed company, with the state owned financial institutions having a 35% stake. Following the acquisition Reliance became the single largest shareholder outside the state owned financial institutions. Within six months of the acquisition Dhirubhai was nominated chairman of the board of directors. In the interregnum three other Reliance directors were inducted into the L&T board. As a result Reliance gained effective control over L&T.
Soon thereafter, the apparently smooth takeover of L&T ran into rough weather. Its subsidiary was accused of having employed surreptitious methods for acquiring this stake. The leading financial institutions had sold a part of their stakes in L&T (around 7%) to a newly set up subsidiary of a leading nationalised bank, apparently to provide it with a jump-start. This firm instead sold the stakes to the Reliance subsidiary. It was finally unraveled that the entire operation was orchestrated to facilitate Reliance to gain control over L&T. Following this revelation, the Reliance subsidiary returned the stakes to the state owned financial institutions. The controversy however did not end there. Reliance was accused of using L&T to shore up its finances. In 1989, L&T made a record public offering of Rs. 8.2 billion of convertible debentures. Reliance was accused of having mobilised the money to
260
fund the cost overrun of its petroleum project. The funds, Rs. 6 billion were actuall> earmarked as suppliers' credit from L«feT to Reliance. Following these accusations and a change of the government in 1990, the state owned financial institutions sought the ouster of Dhirubhai from the L&T board. L&T thus reverted back to its original position as an independent professionally managed company.
The Reliance Group had all along thrived on decentralised and informal decision-making process, which drove its operational dexterity. After 1986 Dhirubhai Ambani passed on the baton of operational management to his two sons, Mukesh and Anil. Rather than putting in place a formal succession, he has loosely divided responsibilities between his two sons, aiming to foster a team-like approach. So, if Anil normally manages the groups finance, marketing and public relations; Mukesh looks after the operational issues. The result of such a structure was a high degree of ambiguity but also high level of flexibility. People could be brought into the organisation from the outside quite easily; responsibilities could be adjusted without openly declaring wiimers and losers; and positions could be created and abolished overnight.
The two sons are clearly and firmly the ultimate decision makers. They are supported by a group of senior managers whose relative role and status within the group changed frequently within a loose organisational structure that was always in a flux. With the constant flux in both the status and role of the top management, it was difficult to draw a formal organisation structure nor was it readily available fi'om inside sources. Historically, the group had been managed along functional lines. The groups focus on rapidly building and tightly managing its assets was supported by the professional excellence of a group of managers who had complete responsibility for specific functional areas like finance, operations, marketing within a specific business. Therefore, organization structure at the Reliance Group is more akin to project groups.
The Delhi based Institute of Quality Limited (IQL), which had a brush with the groups' non-conventional, but effective, systems when the group to look at its quality management systems called it in. "We found that the organisation had no formal system of customer surveys or feedback, and thought we could do some work there. But that idea died when we learnt that the top three people in groups marketing department knew the company's 1000 biggest customers - by name, says Ashish Basu, COO, IQL". With increasing size and complexity, this relatively ad hoc but highly effective way of organising and managing the group has possibly reached its limits. It had so far managed the break-neck speed of growth by continuously bringing talent from outside. There was no time for consolidating the management team, for creating a team spirit or for systematic development of people from within.
The informal organisation structure at the helm of Reliance Group is again clearly brought out from the comments of Prafulla Gupta, a Harvard MBA, who had joined the Reliance Group after working for almost twenty years with Booz, Allen and Hamilton, the international strategy consultants: "They (Mukesh and Anil) have, both individually and collectively, shown a clear willingness to delegate - once there is satisfaction that an executive's judgement and ability to act are consistent with their own perspective and value system. We do not have a formal delegation of authority in our group. It varies with role and the confidence the person can evoke (EFMD Case Study, 1994)." The management of the
261
Reliance Group comprised of three distinct groups (though not necessarily in order of hierarchy). In the first group was a set of eariy business associates of Dhirubhai (including in some cases their kith and kin) who had historical links with him, personally, rather than with the company. They were his intermediaries in his financial operations, in his relationship with government functionaries and in de-bottlenecking his implementation plans. With the evolvement of the group, their role had diminished significantly, but they still remained involved in a largely consuhing capacity. In the second group were a number of people whom the group had attracted away from very senior positions, mostly from India's large PSU's. The fact is that the group recognised that, in India, only PSU managers had the kind the kind of experience in executing projects of size and complexity that Reliance was contemplating. So the group hired the best people from this sector and made the best use of their skills and experience. These people today form the senior most rung of the Reliance Group - who had been the chief implementers of Dhirubhai's vision in the 1970's and 1980's.
In the 1990's however, a new group of professionally qualified managers were being inducted to form a distinct third group, who would assist the top management on a regular basis. This group had been typically educated in some of the best technical and management schools in the US with vast international working experience. The relative role of these three categories of managers was always in a flux. As described by V.V. Bhat, a senior HRD executive with Reliance, "In Reliance, authority and responsibility have to be taken, they are not given. No one has the time to give! We are too busy growing (EFMD Case Study, 1994)." In this context another Reliance executive, K. Narayan adds: "Trust is not a function of being a blood relation of the Ambanis. I am not and most of us in the senior management today are not. Trust is a fimction of my capacity to deliver (EFMD Case Study, 1994).'" Historically, the group had always avoided joint ventures with foreign companies. PrafuUa Gupta, Senior Executive, Reliance Industries provides a fiarther elaboration on this issue:
"If you were a company with a significant non-Indian shareholding, you walked with a chain and ball around your neck. Our business needed speed, so we avoided foreign equity. Now the playing field is level, it does not matter whether you have domestic or foreign equity. In businesses we got into in the past, we had the necessary management capability and there were enough technical and operational skills within India that we could recruit. Now we are getting into oil field development and production. For these businesses, there is lots of technical capability in India, but not enough management capability. At the same time these are $ 100 million to $ 1 billion plays, and we must run these businesses with absolutely world-class competence. So we have three choices. We can identify suitable people abroad and hire them and help them get used to working in India as quickly as possible. Alternatively, we can license or purchase the technology, as we did it for polyester, and grow our competence as we go along. Or, we need to review our strategy with regard to alliances and be willing to get into more and more partnerships to quickly enter new businesses (EFMD Case Study, 1994)."
To further backward integrate its operations; between 1989 and 1992 it had set up facilities to manufacture LAB directly from Kerosene with Paraffin as intermediate raw material. It also commissioned the facilities for the manufacture of PX (input raw material for PTA) at its
262
Patalganga complex. At its Hazira complex it commenced manufacturing MEG, PE and PVC. It also acquired a license for setting up an Ethylene Cracker complex at Hazira to be commissioned in 1995. It would provide the ethylene required for the manufacture of PE, PVC, and MEG. To fund this complex it mobilised over RS 9 billion from the investing public and rolled over and rolled over earlier debentures, which were due for redemption. It was also in the process of setting up of facilities for manufacturing ethylene di-chloride, a feedstock for manufacturing PVC. It also planned to build a world scale caustic soda -chlorine facility. While chlorine was expected to be fully used for meeting its own captive needs for the manufacture of ethylene di-chloride, caustic soda was plaimed to be sold in the open markets. In 1992, it formed Reliance Polypropylene and Reliance Polyethylene as joint ventures with C. Itochu, Japan. These companies would manufacture 250000 mtpa of polypropylene and 160000 mtpa of polyethylene at its Hazira complex. They together mobilised over Rs. 6 billion from the capital market to part finance the projects which were expected to go on-stream by end 1994.
In its bid to emerge as the largest vertically integrated manufacturer. Reliance secured a license to set up a 900000-mtpa refinery in 1992. It subsequently promoted a new company, Reliance Petroleum, in which it had a 21% stake, for setting up the refinery, which would meet hs feed stock requirement of naphtha for the manufacture of PX, Kerosene and LAB. The new company successfiilly approached the capital market in 1993, with an offering of Rs. 21 billion convertible debentures, to part finance the Rs. 51 billion-refinery project. The refinery was expected to on stream by mid 1996. The new company had entered into marketing and distribution arrangement with the state owned PSU, Bharat Petroleum (BPCL). BPCL was the third largest integrated refinery and marketing oil company in India, which would have exclusive rights to market the entire range of products except that - a) Reliance could sell petroleum products to large companies through pipeline transfers and b) Reliance group companies would have the first option to obtain their requirements of feed stocks in bulk through pipelines.
In addition to vertically integrating its operation. Reliance was also expanding its existing businesses, in each of which it had already achieved positions of absolute leadership in the domestic markets. It was in the process of setting up of a new polyester complex at Hazira, where it intended to manufacture 120000 mtpa of PFY, 100000 mtpa of PSF, 80000 mtpa of PET and 350000 mtpa of PTA. "This complex would be bigger than our polyester complex at Patalganga. On completion, our total polyester capacity would be over 500000 mtpa and that would make us No. 1 integrated manufacturer in the world. Don't you think that would be a truly unique achievement for an Indian company? said a jubilant Dhirubhai (EFMD Case Study, 1994)." And to complete the vertical integration chain, the Reliance Group successfiilly bid for the development of oil fields when this sector was opened up by the GOI in 1994. Under the then existing policy. Reliance however could not directly market the oil so produced. It was required to sell the entire output to the central agencies (for detailed product flow chart see armexure).
A distinct capability the Reliance Group has built up over time is its unique ability to complete projects before time and design imconventional ways of working its plants to the maximum capacity. The groups' size and scale is matched by its operational excellence. For one, it is able to compress project implementation time substantially. The group by pushing ahead the pace at the grass-roots oil refinery at Jamnagar: scheduled to be completed in May,
263
1999, it is likely to shave costs by being ready in December, 1998. The groups' history is replete with numerous similar examples. In addition, the group has the distinct ability to develop command over top-of-the-line process technologies totally in-house. This is helped by the fact that its 20 plants are centred over four locations - Patalganga and Naroda in Maharashtra and Hazira and Jamnagar in Gujarat, which enjoys close proximity. In this context Anil Ambani puts it, applying "sweat technology" to squeeze out the maximum. And historically, its plants have operated at utilisation levels exceeding 100% year after year. "We have been taught to think beyond, it comes naturally, says Kamal Nath, Senior Vice-President, Reliance Group (Polymer Business) (Business Today, January, 1998)."
By relentlessly pursuing scale, vertical integration and operational economies, the Reliance Group today generates enormous respect in the financial capitals of the world. The group became the first Asian company to float a $ 100 million bond with a 100-year maturity period in the US market. Adds Anil Ambani, MD, Reliance Group, "This kind of global trust was not something Reliance had bargained nor worked towards. These are the benefits of being a truly global corporation (Business Today, January, 1998)." In addition the giant is also milking the global financial markets too; it has already borrowed $1.3 billion during the period 1995-97. Also because of its investment in scale integration, project management capabilities, and command over manufacturing processes, the group is one of the lowest-cost producers of polymers and polyesters in the world today. The continuous capacity growth allowed the Reliance Group to emerge as the lowest cost polyester producer in the world. In 1994, its conversion cost was 18 cents per pound, as against the costs of 34, 29, and 23 cents per pound for West European, North American, and Far Eastern manufacturers (data source: EFMD Case Study, 1994). Hence the groups cost of polymer production is 9% lower than that of North American companies, and 23% lower than those in South Korea.
Moreover, the groups' capital cost per tonne for the same is around (25-30) % lower than producers in the US, Eiu-ope, and South-East Asia (data source: Business Today, January, 1998). What's more, subsequent lowering of import duties to 40% on PSF and PFY at a time when the global industry is going through a glut - prices were $1200 in October, 1997, down from $1850 in October, 1995 - have put increased pressure on margins. But Reliance continues to march ahead in terms of sheer volumes and marketing skills. Little wonder, then, at a time when PSF and PFY prices were at their cut-throat worst, the groups' cost leadership manifested itself in net margins of 15% in 1996-97. By contrast, its closest competitor, the then Rs. 1185 crore Indo Rama Synthetics, registered a net margin of 0.15% for the same period. Its President, Strategic & Corporate Services, Mr. V.K. Singhal, analyses: "The captive production of PTA and MEG for producing PSF leads to considerable margin enhancement and value-addition in the fibre business (Business Today, January, 1998)." However as Mr. S.P. Sapra, President, PSF Business comments: "... their real success lies in transferring the ownership, and implementation, of this vision to the lowest rungs of the company (Business Today, January, 1998)."
From scale to integration, from operational efficiencies to financial engineering. Reliance Group represents the pinnacle of success. As it witnesses dramatic increases in size, the groups' sine quo «on-status will only be accentuated. But where does it go fi-om here? The group claims that its future lies only at home, it has already reached stage where its preeminence is xmquestionable. On that basis the Reliance Group will have to look outwards to compete with international giants like - DuPont, Dow Chemicals, Mitsui and Monsanto. It
264
will also have to constantly re-invent itself to larger scales. Actually, the oversupply in the domestic polymer industry from time to time is Reliance's own creation. Moreover, the group is adding capacities at an alarming rate. Why is Reliance, then building capacities so far ahead of demand? Since its exports in 1996-97 were a meager Rs. 200 crore - 2% of its total sales, it is not really looking outwards.
The plethora of new opportunities, in turn, raised questions about Reliance's unique organisation and management style. Historically, the different managers heading the key functions came together only at the level of the family members at the apex of the company. While this structure worked well, it did so at the cost of a severe overloading at the top. Another key constraint of the existing organisation structiu-e was the lack of teamwork and cooperation within the senior management group heading the different businesses and functions, given the diversity of their backgrounds, each of them had a different style and was the product of a different culture. The existing organisation structure provided little incentive for them to collaborate horizontally or to build a shared culture within the business units they managed. Because of the lack of coherence and integration at the top, sharing of learning and best practices within the group suffered. According to S.P. Sapra, President, PSF Business, "There are pockets of excellence, but we are not fully able to get the best out of every component. It is happening at least to some extent in the production and technical side, but less so in the business management side (EFMD Case Study, 1994)."
One of the options under consideration was to reshape the group into classic multi-divisional form, structured around sectors such as fibres polyester staple fibre (PSF) and polyester filament yam (PFY), chemicals such as linear alkyl benzene (LAB) and Caustic Soda, polymers such as poly-ethylene (PE), poly propylene (PP), and poly-vinyl chloride (PVC), fibre intermediates such as para-xylene (PX), purified tetra-pthalic acid (PTA), and mono ethylene glycol (MEG) and textiles, with each business head reporting to a Group Executive Committee, which will be reporting to the chairman himself With integrated business responsibility, the business heads would be responsible for existing businesses, freeing the top management for only strategic and administrative oversight and corporate entrepreneurship. Such a restructuring would call for a major readjustment of the roles and tasks of existing businesses and functional managers, together with substantial delegation of operational responsibility from the family to them. Finally, the group was aware of a need to build norms and a better-structured process for management development. However, the group still thrives on continuity, and there has little or no transition in the true sense. Today, at Reliance, whoever is there at the top management, the speed at which the group moves will still be there.
Significantly, the group has also changed its financing pattern. During the period (1995-97), it had eschewed the equity route at home to borrow $1.30 billion through international debt at coupon rates ranging between (6.20-10.32) percent. Given how expensive debt has been in the post-liberalisation India, it was hardly surprising that Reliance's average interest rate has dropped from 14.10% to 9.50% from 1993 to 1997. By replacing costly domestic loans with cheap foreign borrowings, the group had also increased its average maturity period of its loans from 4.5 years in 1993-94 to 13 years in 1996-97. This benchmarks the group favourably with its global peers, none of which has a maturity of less than five years for its loans. Of course, any depreciation in the rupee against the US $ will adversely impact the group in a complex manner. While its product prices will improve, the cost of raw materials
265
- three-fourths of which are imported - will go up simultaneously. What will actually help is that the group has parked $806 million - or approximately 60% of its outstanding foreign exchange loans abroad, providing a hedge against rupee depreciation. And since the group dependent on import of naphtha till circa 2000, making payments in dollars and not in a depreciating rupee will actually boost the groups' performance.
In 1994, the Indian economy was in the midst of a radical change. Following the governments economic reforms programme, petrochemicals was no longer a select preserve of a privileged few. Entry was made easy for both domestic and global companies. There was a reduction in protective import tariffs and was expected to be reduced even further over the next few years. While these tangible changes in policy were having their direct effects on the industry, perhaps their more significant influence was on the mind-sets of managers in Reliance's Indian and foreign competitors. As S.P. Sapra, President, PSF Business adds: "By operating as if the environment was deregulated, we have a head start. But others are catching up. In the Indian side, the visibility and success of Reliance has made others develop the courage to think big. The Reliance formula will no longer be a secret. Also, they will not have the impediments we had. They will be on tested grounds. More importantly, they will be able to benchmark themselves against us (EFMD Case Study, 1994)." Overall, the easing of entry barriers did not worry Reliance too much. As argued by Anil Ambani, MD, Reliance Industries, "It would cost Shell $8 billion to replicate our position in India. Given their world-wide resource needs, they cannot commit that amount of money to one market (EFMD Case Study, 1994)."
The reduction in tariffs, however, had already led to increasing competitive pressures. The world is in a recession and the fear is that India may be exposing itself to recessionary competition and large scale dumping. At our stage of development, we cannot afford to do that, said Dhirubhai Ambani, Chairman, Reliance Industries (EFMD Case Study, 1994)." Itself subject to an anti-dumping suit launched in 1993 by a European chemical company in Brussels, the group laimched its own anti-dumping suit in India against Brazilian, Mexican and South American companies exporting petrochemicals to the Indian market. While unleashing fiercer competition, the economic reform's programme had also opened up new opportunities not only in the refining and oil exploration - which the Reliance Group had already taken actions to exploit - but also in a host of other areas. Prafulla Gupta, Senior Executive, Reliance Industries describes the power sector as an example:
"We have a terrifying deficit of the order of 50000 MW. Recognising the need for massive investments to improve both the size and the quality of the power sector, the GOI has offered a very exciting scheme for attracting private companies. It will provide exchange rate protection; guarantee a 16% return on equity, all calculated at a plant load factor significantly below what we believe to be achievable. We have the experience of running our own 100 MW captive power plants at Patalganga and Hazira. They are among the most sophisticated and best run power plants in the country. We routinely operate them at 95%+ capacity. We can mobilise large amounts of capital and have demonstrated competence in managing mega projects. At one level this is no brainier; we will get returns higher than our cost of capital and create a huge new growth opportunity. In fact, we have already bid for one facility each in Delhi and Maharashtra, for a total of 750 MW. But we also have to think of
266
the opportunity cost, of the risk of oil price rise and so on (EFMD Case Study, 1994)."
With this philosophy in mind the group promoted Reliance Energy in the early 90's, by taking over BSES. Despite the business being unrelated in terms of industry, for the Reliance Group it was basically a horizontal integration. The breath taking growth rate of the Reliance Group in the past, however, would appear positively lethargic if the company achieved its plans in the future. In the words of Dhirubhai Ambani: "Growth has no limit in Reliance (EFMD, Case Study, 1994)." According to him, "I keep revising my vision. A vision has to be within reach, not in the air. It has to be achievable". The same vision continues even after the passing away of Dhirubhai Ambani. "The first thing that drives our choice of business is growth, and the second thing that drives it is competitiveness, adds Mukesh Ambani (Business World, August, 2003)." Competitiveness here means outperforming others in virtually all parameters of success. Dhirubhai once noted, "I believe we can be a $10 billion company by the end of the century (EFMD, Case Study, 1994)." To achieve this ambition of another eight-fold growth in six years the Reliance had plans to invest over Rs. 100 billion between 1994 and 1998. 40% of this investment was earmarked for expanding the polyester fibre and fibre intermediates business that would help the group emerge as the world's largest integrated producer of polyester.
A bulk of the remaining 60% was earmarked for setting up one of India's largest oil refineries - a logical step in the group's drive for vertical integration. Not included in the Rs. 100 billion-investment plan was the bid it had made for production of oil and gas in the offshore fields in India. By 1994 the bid had been successful, raising the group's growth prospects enormously, but also its investment requirements by another Rs. 13 billion. This is more or less in consistent with the groups' mind-set to build on a step by step process of backward integration from textiles to fibres to fibre-intermediates and feed stocks and finally to oil refining and exploration (for details see annexure). The radical changes in the Indian business environment in the 1990's, posed a strategic gap before the top management of the Reliance Group. With fast paced deregulation, a number of one-time opportunity windows were opening up in potentially giant sectors. Should the group use its proven skills and competencies in mobilising large amounts of capital, in creating new markets and in managing mega-projects to diversify in these relatively unrelated businesses?
Besides power, similar one-time opportunities were also available in telecommunications, insurance, electronics and many other areas. In most cases, entry would become far more difficult at a later stage. Therefore, a key decision within the top management focused on whether the group should go beyond the fabric to crude oil vertical chain that it had historically focused on and which still offered almost unlimited opportunities for further growth. The benefit of focus was obvious, yet to a group in hurry and a management team accustomed achieving the impossible, the new opportunities were almost too attractive to resist. Should the group then use it's proven capabilities in mobilising large amounts of capital, in creating large new markets, and in managing mega-projects to jump into these relatively unrelated businesses?
Reliance follows a very simple capital allocation model. Every business has the first opportunity to re-invest in the existing business provided they deliver 20%. If one cannot find opportunities in existing business, one has to search elsewhere. During the entire 80's
267
and 90's there was enough backlog to re-invest in existing business. However, with the petroleum refinery at Jamnagar going on-stream in the late 90's the entire link in value-chain was completed. So it was necessary for the first time in Reliance history to think beyond its existing businesses of vertical integration. Having already sunk in about Rs. 10000 crore in under two years and with plans to pump in another Rs. 15000 crore in the next three years, Reliance Infocomm is by far the most complex project Reliance has ever pursued.
In this regard international telecom equipment vendor Nortel, which had supplied critical equipment to the project, says that this is perhaps the biggest integrated telecom project in the world yet. Nortel India, Chairman, Joseph Samuel notes, "Now, Indian telecom will draw international attention (Business World, December, 2002)." It has not been easy for the Reliance Group. It had to rework its convergence plans a number of times since the project was initiated in early - 1999. The final Infocomm strategy was based on the new generation CDMA technology that would offer not only cellular services, but also would be coupled with high-speed optical fibre networks underground. The basic idea: offer cellular services at the cost of a basic service. It was not until early - 2002 that all the elements of the final business plan were put in place. An illustration on how the project was initiated:
"Rewinding to the last quarter of 1999, when Reliance Group had just commissioned its Jamnagar refinery. On that occasion Dhirubhai was to address a conference of 100 young CEO's from India and abroad. At that time the then Andhra Pradesh chief minister Chandrababu Naidu enquired what Reliance was going to do in the new knowledge economy. On that night after the conference, Mukesh met Dhirubhai after dinner and had a three - minute conversation on the potentials of the emerging telecom industry. Then Dhirubhai asked Mukesh: "Do you imderstand all this?" Mukesh replied: "By and large, I did." The next two questions from Dhirubhai were: "Is this the ftiture?" and "Do we have the strength in us to do all this?" Dhirubhai ended by saying: "Yes, if we can do it we should be in it full fledged." There was also this old Reliance maxim drilled into us - If you do more of the same, then you are likely to land in trouble. At Reliance, the top management stays involved in a project till it becomes sustainable. Once that happens, it gets out of the way, and hands over the business to the operations team. In another month or two, we should be done with Jamnagar. So it was clear that we had to start the next thing (Business World, December, 2002)."
While setting up the refinery at Jamnagar, Reliance had used a lot of technology - in communication, systems and putting up the infrastructure. The movement happened in bits and pieces. Reliance was perhaps among the earliest to install giga-bit Ethernet capacity and video conferencing in India, though for its own in-house use. They had also connected the entire Jamnagar petrochemical complex with a series of closed-circuit cameras, which was wired to centralised control room. Till then they were basically users of technology, they had not thought about it as a business. So they started looking at the big picture holistically over a 10-20 year timeframe. After gruelling brainstorming of ideas among a handftil of key executives it was clear that communication technology alone is not going to deliver value, but eventually it will be information. Dhirubhai once remarked: "If common people should be able to call across the country and say 'Hello, how are you?' for the cost of a. paan, only then the services market will be for the masses and the market will explode. The industry
268
needs to break its elitist framework by breaking this price barrier (Business World, December, 2002)." He further observed, there is illiteracy in India, but people can surely speak. At the end of the day the bottom-line was clear - push hard for capital productivity.
When the group was working on the numbers, people were talking about billions, something around $(18-20) billions of dollars of investment for its proposed scale of operation. Mukesh observed: "Someone quoted $ 2 billion to set up our back-office systems for our network. That simply won't work. We had to bring down costs drastically - with the kind of pricing we wanted to do for our calls - we targeted costs that were one-sixth or even one-eighth of the quoted market costs (Business World, December, 2002)." At this point of time they drew on their earlier experiences to build up it's on own capabilities of - integration. Mukesh recollects, "Some ten years ago, when I was putting up a polyester plant, I showed my father a reactor we wanted for the plant and how we were going to get it. One look and he (Dhirubhai) poured cold water over the plan. He took the weight of the reactor and said that I was paying Rs. 300 per kilo of steel in the reactor when the market price was only Rs. 30 in India and Rs. 15 globally. He made me build the reactor on my own (Business World, December, 2002)."
Based on such critical experiences, Reliance Infocomm built its back-office software in-house at an estimated cost of only $ 350 million. This was the backbone for the killer pricing. When Reliance started their planning per subscriber (sub) cost in GSM was $(400-600). The group had however budgeted for $ 90 a sub. Applying its skills in negotiating it asked its vendors to choose between making $ 50 on 5 million hubs or $ 5 on 100 million hubs. The environment also favoured them. The tech market started collapsing by the end of 2000 and international vendors were more than willing to talk, allowing Reliance to enter the market at a trough. The primary assumption was that the market would grow exponentially from current 10 million to aroimd 100 million in the first five years of operation. So, it was a combination of events and capabilities that got the project off the ground.
The tariff plan forms the crux of Reliance's strategy. The group had already submitted all relevant documents to TRAI - on investments, operating expenses, pricing structure, which also includes its profits. TRAI has broadly outlined how companies should price their services. It says, pricing should not be predatory (should not be below operating costs), (or) discriminatory or there should be no cross-subsidy from other businesses. At a projected 20 paise per minute call, its tariff will be roughly 15% of the lowest plan of its leading competitors. Also, most call costs are calculated on per half-minute basis. That is, if you speak for 15 seconds, you will still be charged for 30. Reliance will charge calls for every 15 seconds talk. Of course, Mukesh and his team sweated over eight months to get the pricing right.
Firstly, a specialised European telecom research company did a market survey to develop insights into market segmentation. Then, an internal team took three months to develop a sophisticated pricing model to independently plot the average mobile time used per month with peak and off-peak time network usage. Finally, the market survey results were superimposed on the pricing model to arrive at an appropriate price. The bottom-line: even though an average Indian spends only 150 minutes of mobile time now, the usage is highly price-elastic. Simply put, lower the prices, the higher is the usage. Diamond Cluster, a Barcelona based telecom Consultancy Company, played a key role in this exercise. "The
269
pricing model was one of the most complex exercises we have ever come across, says partner Nevid Nikravan (Business World, December, 2002)."
In early 2000 when the top management of the Reliance Group was working on the preliminary project costs, the total bill worked out between $(18-20) billion. However, if the pricing structure was to be kept consistent with the philosophy of its founder, the project cost had to be contained within $5 billion. Says Mukesh Ambani: "At that time nobody took us seriously. The cost was unheard of (Business World, December, 2002)." The project network involved Geographical Information Systems (GIS) - mapping of 104 cities metre by metre, with an estimate to cover 600 cities within two years of operationalisation. At this stage Reliance made some crucial make-or-buy decisions. Instead of buying the back-office software for $ 2 billion for its network operations, it decided to develop it in-house, which cost no more $ 350 million. That was the foundation for the killer pricing.
When Reliance set up its 27-mtpa grassroots refinery in Jamnagar, the fundamental assumption was that it would gamer 30% market share. This time too, the Ambanis wanted 30% of the entire mobile subscribers or a whopping 2.5 million to 3 million subscribers. That way the group expects to break-even in its first year of operation. Though the industry has been in operation for nearly twelve years in a row, only a couple of cellular operators have actually broken even so far. The dice is heavily loaded against them, given the fact that it took seven years for the Indian mobile market to grow to 8 million users. In the long run the group expects voice services will eventually contribute only 20% of the revenue.
The bigger play is in wiring up enterprise customers. "Our driving principle is that Infocomm is now no longer a support fiinctions for business. It is now the core of any business model, says Prakash Bajpai, President (Enterprise), Reliance Infocomm (Business World, December, 2002)." As he adds, many Indian companies are already moving ahead to implement the concept of an extended enterprise. They are, in effect, building an elaborate electronic web. which interconnects its dealers, customers, distributors and employees. But by all reckoning, the enterprise is yet to take off in India. The groups' assumption is that lack of sufficient bandwidth is drastically cramping growth. Today for cormectivity solutions, the best that any business enterprise can get is to settle for leased lines, which has a carrying capacity of just a mere 100 kbps.
Reliance plans to skip the megabit generation, and directly offer gigabit speeds at current prices. To do that, it plans to take the fibre right inside a company. Then, to spur usage, it hosts a series of business applications, including ERP on its servers. Reliance knows applications will make all the difference. Which is why, in the Knowledge City in Pune, where the Reliance Infocomm headquarters are located, about 500 odd programmers are busy creating new applications that will be crammed into the phone "Our pricing for enterprises will be below the inflexion point of affordability, says Bajpai, (Business World, December, 2002)." The advantage of the Reliance Group at this stage is that none of its private competitors can hope to match just yet.
In October 2002, Reliance Infocomm moved its headquarters from Ballard Estate to Dhirubhai Ambani Knowledge Centre (DAKC) in Pune. The top management descended on the National Network Operation Centre (NNOC) and tried switching on the network. Snags hit the system; the links between the cities had to be cajoled to blink. Mukesh Ambani was
270
perturbed, but grew cautious. Even as the deadline drew close, there were indications that all the technical hitches had not been sorted out. Reliance had decided to set up 250-300 proprietary stores all over India, however, till August only one such store was set up in Mumbai. In May 2002, Reliance placed Amit Bose, an ex HLL, to head its marketing. But its competitive strategies, based on FMCG perceptions, failed to incite the top management.
The entire marketing strategy had to be reworked all over again right from the scratch. Even by mid November, a month before the launch, a lot of things were not falling into place. There were indications that all the technical hitches had been sorted out. Much of the fibre optic pipelines had been laid, but some bits still needed work. The pricing of the services were yet to be finalised. In this scramble, Mukesh Ambani began to depend more and more on his old associates for critical advice. Professionals who had been hired for this project to head various departments were increasingly left out in the cold. Even so, the Reliance core team decided to press ahead with the laimch. While Mukesh concentrated on the technical snags, he left the entire marketing to his old loyalists. This in a way implied the trust and commitment of the top management.
Reliance had initially targeted a Rs. 150 crore promotional budget to cover the two months after the launch, when the subscription plan would be open. Amit Bose and his team were ready with the launch but they wanted a higher budget. However, existing Reliance marketing professionals thought even the existing budget to be excessive. The team led by Anand Jain and Manoj Modi by-passed the media companies and went directly to the publishers and broadcasters. By bargaining hard, they managed to buy media space and time worth Rs. 325 crore for Rs. 80 crore. Some media houses even offered discount up to 80%, unheard of in media advertising. Bose and his team lost face, and slowly they were left out of major marketing decisions.
Reliance had to finally rely on its old channel partners to form the Reliance Infocomm dealer network. The last ditch for the initial marketing team was the pricing strategy, which was finalised by the core advisers of Mukesh Ambani. The initial marketing team led by Bose was to follow the usual selling tactics that was followed by other operators. But the targets Reliance had set needed a radically different approach. The pricing strategy that was finalised by Jain and his team was built around the strategy of capital recovery. The calculation: for every subscription the group would get a minimum of Rs. 22000 (including local call deposit). For the three million-target sets. Reliance Infocomm would have Rs. 6600 crore in its kitty. Till March 2003, Reliance had invested Rs. 9000 crore in this project (equity - Rs. 5250 crore and internal debt - Rs. 3750 crore) and the "Pioneer" scheme would make the project cash surplus and achieve the targeted break-even in the first year itself
Since its high profile launch on December 28, 2002, the Infocomm project has been plagued by unprecedented problems. On the pricing side. Reliance offered low call charges, but kept entry costs high. This pricing strategy was built around the concept of capital recovery. The price plan aimed at locking in subscribers could not bring in the expected numbers. On the technology front, the ad said Kabhi Mobile Kabhi Computer. But the latest LG handsets left much to be desired. They also heated up on using Internet services. Regarding competition, almost all private cellular companies and BSNL denied Reliance complete access to their networks. As a result it failed to tie-up interconnect agreements with other operators as quickly as it hoped so. The court cases have held up the plans for roaming services. On
271
channel strategy, the much-touted Dhirubhai Ambani Entrepreneur Scheme flopped. Incompetent dealers have thrown a spanner in their marketing plans. On the regulatory side, the cellular operators fought back with a ferocity Reliance had not expected. This forced TRAI to look into Reliance's pricing structure.
The GSM operators lobbied to remove the interconnect charge differences between cellular and basic players. Once TRAI re-examined its pricing structure, the advantage Reliance had started out with was considerably weakened. SMS was no longer free. The new regime also allowed the GSM operators to drop their own prices close to what was being offered by Reliance. At one stroke, they almost neutralised the price advantage of the Ambanis. And finally, although Reliance had the license to offer only limited mobility, it was offering customers full roaming anywhere in India. (It planned to do so by forwarding calls via contiguous circles, since it had taken licenses for practically every telecom circle in the country. Therefore, in practical terms it offered full mobility). This handicap however was removed with the Reliance Group being successful in lobbying for a unified license regime, which was later adopted by TRAI.
Four months after the roll out. Reliance officials admit that they have not been able to meet subscriber targets. Meanwhile the GSM operators (including BSNL) started going slow in inking intercormect agreements with Reliance Infocomm in different circles. As a result, the group had to postpone its rollout twice. And even after final commercialisation in April 2003, it could only cover 60 cities against a target of 120 cities. Only a third of the expected market share has been cornered (i.e. approximately 1 million customers within three months of its laimch). However, contrary to public opinion the Infocomm project cannot be said to be facing a crisis. The current problems cannot even be considered a major setback for the project or the group. They are far more in the nature of teething troubles. It was not any one big mistake; rather the rollout chaos was the culmination of a series of small missteps. However yet, the kind of troubles that Reliance had got into with its Infocomm project is significant for one reason. Over past two decades. Reliance had built up an image of a group that could manage any project of any complexity or size without a single misstep. The Ambanis had built up an aura of invincibility. And that is an aura that got shattered. As a senior Airtel executive put is: "Reliance has never faced failure publicly (Business World, December, 2002)."
In fact the Infocomm projects troubles are expected to have maximum impact on the groups' image, not its financials or long term strategy. The primary problem was that even when the strategy was finalised, the top management did not spend much time on the marketing end. Reliance loved controlling every step on the marketing chain - therefore, it had not built up much expertise on the retailing side, especially consumer sector. This is the area the top management had ignored and failed; the most critical factor for the culmination of the major bottlenecks. By very rough estimates the group today commands a rough 50% market share of the 9 million subscribers for mobile telecom. The business also earned a Rs. 88 crore profit in 2002-03.
However, the story is not over yet. This was just phase one. Already, the stage is set for Reliance Infocomm's next offensive - in the market for wiring up business enterprises. It has already identified 200000 units where it will take the optic fibre right inside the business premises. Companies can use a host of business applications at much higher speeds.
272
Infocomm's third phase, when it comes, will be the real path-breaker, though. The idea is to provide broadband services directly to homes using a popular technology called Ethernet that allows data to flow in gigabits or a 100 times the copper cable speeds. "Infocomm is an annuity business; we expect it to be an important cash-cow in the coming years, says Prakash Bajpai, President (Enterprise), Reliance Infocomm (Business World, August, 2003)."
Another important facet of the Reliance Group is their enormous appetite for information. "They (Mukesh and Anil) are enormously bold and their actions are influenced by their unmatched access to information. They would know what is happening in every single corridor of the government ministries. They know about their customers. They know more about their competitors - even about their day-to-day operations - than the top managers of those companies. They would know where money would flow, and it is not just about their immediate business. They suck up knowledge about everything, constantly. Their magic is not just ambition, but ambition with information, adds Ramamurthy, (EFMD Case Study, 1994). This by and large is a legacy handed over to them by their father Dhirubhai. In 1985 he quizzed a visitor: "The two largest businesses are oil and tourism. Guess what would be the largest business 15 years from now? And then with the characteristic twinkle in his eyes, he said, "Information" (India Today, July, 2002)". Dhirubhai had an uncanny ability to visualize futxare trends. It was the forecast from a man who had barely passed his matriculation. Little did he know that by the turn of the century 'Information' would be a major business for the group? The group has already sunk in Rs. 25000 crore on this project, by frivolously building a telecom network in 115 cities covering a distance of over 60000 kms.
In the near future the group expects to see its presence in the following emerging areas: oil retailing, gas pipelines, telecom broadband and power networks. It also plans use its interface with customers in oil, power and telecom to create a mega retail business on the lines of Wal-Mart. While the details are not in place, the group is already forging ahead with major alliances. The group will be into networking like never before. On the power side as well there is an expected supply gap to the extent of 100000 MW in the next five years. But instead of jumping into generation, it is eyeing distribution first, since that gives better control over cash flows. When the group was almost through with the refining in the late 90's, it was clear that services would be the new emerging economy.
As Dhirubhai Ambani reported at the AGM in 2000, "We see services growing, they are going to form a large part of the global GDP and whatever the opportunity we get, we will create competencies and invest in service businesses with our goal as 2005 (Business World, August, 2003)." Given the groups healthy cash flows, the group had to visualise areas for leveraging its philosophy in contemplating projects of international size and complexity, domestic and international financing, and ability to develop cutting-edge technologies in-house to deliver unimaginable value to an average Indian consumer at affordable costs, by breaking the price barrier and thereby restructuring the market altogether in terms of size, scale and scope.
The group also needs to work upon is its ability to manage people through a formal organisation structure. The group was earlier managing (50000-60000) people at a few locations in the country. It now needs to manage (180000-200000) people around the country. If the group is successful on this front, it will give them a platform to move at
273
geographical locations beyond the boundaries of this country. The group has already placed more than 150 people in its polyester and refining business in 20 countries across the world. As Mukesh Ambani adds, " give us two to three years, and we will be a good, strong consumer-facing organisation (Business World, August, 2003)."
The capability that Reliance has now to build upon is - understanding consumer preferences and delivering consumer value. For this the group plans to bypass the usual market network -agent - wholesaler - retailer; like in the earlier Vimal instance; to ensure the customer can directly see, feel and touch Reliance services directly. Another fascinating aspect of Reliance is its capital allocation. Reliance has always been a low debt group. However, if you look at Reliance Infocomm the other way, it has zero external debt. It is really like Reliance's own debt, Reliance as group. That is the strength of Reliance now.
As result of his abilities built over years in backward integration of technologies, Reliance Infocomm successfully demonstrated in building the back-office software systems totally in-house for an estimated $ 350 million; as against the backdrop of an international estimate of around $ 2 billion. Despite not having a long drawn history in retailing Reliance had almost built a network of 10000 web stores in a record time. Despite a fraction of the projected services being available at launch; it was successful in cramming all its freebies as proposed. Says Reliance Entertainment, Chairman, Amit Khanna: "All this has happened almost overnight without any break in services. That should explain our capabilities (Business World, May, 2003)." And while all the other telecom operators (GSM and WLL) were busy moving into different circles with joint ventures which combines best of technologies from the developed countries; Reliance was basking in glory having delivered a project of international size and complexity all alone, without any joint-venture or technological tie-up. Having already delivered it. Reliance is now concentrating on delivering capabilities in newer areas.
Delivering gas to homes through pipelines at half the cost of an LPG; generating and selling power at Rs. 2.50 a unit; converting gas to diesel at half the present international cost; providing music and video on demand at affordable prices at millions of homes through information highways. This symbolises the attempt of India's largest business group to move into the next orbit. It also symbolises the attempt to transform an industrial behemoth into a consumer-facing organisation. It would be foolhardy to expect the journey to be smooth; but anybody who has watched Reliance grow over the years would know, it would be even foolhardy not to take it seriously. This is based on the Reliance dictum, "Once you have a goal, you should be focused on it and not on the obstacles. The day you start focusing on the obstacles, you'll miss the goal (Business World, August, 2003)."
The group has already built up a plan on capital savings by combining the networks for power, gas and communications. This will lead to a lot of synergy. However, the group is yet to build a similar synergy in operating costs. At present the group is targeting a market of 200 million households, with an annual disposable income of $ 600. Similar services in the US by AT&T costs around $ 180, but with that kind of costs the market size in India would shrink to below 5 million customers. However, this is not the market size Reliance is contemplating. So all Reliance has to do is to radically break the price barrier to achieve this. And at the end of the road the potentials are enormous. Consider this: There are 6 billion people living on this planet. Take out 1.5 billion people who are in the developed world that leaves 4.5 billion
274

people who have got such low purchasing power that the Western world does not even think they are worth chasing. For this the group has to build upon a series of capabilities, not just one or two. Only the cumulative synergy of all such capabilities can bring in the desired effect.
Reliance has already located gas at major parts of this country. All it needs to do is source it at a low cost, convert it and put it for multiple uses like power, petrochemicals, domestic consumption etc. It also plans to use it for innovative purposes like refrigeration, converting it to diesel, ventilation etc. And with this the possibilities are enormous. The group is already working on issues like capital costs, catalytic costs and conversion efficiency. But the real challenge is to get the right kind of catalyst and to get the economics right. Despite having a half chance, few global players possess the ability to replicate such an envious position. Taking into consideration the low per-capita consumption of energy in India, there is the potential for enormous growth in the next 20 years. This was quite similar to the capital-productivity-execution problem faced by Reliance for its Infocomm project. "It is a full business model, a unique business model that we are trying to develop ourselves, adds Mukesh Ambani, (Business World, August 2003)." The groups' key emphasis will be on fast turnaround of capital. Perhaps Reliance Infocomm was the fastest in the world in terms of capital recovery.
Having already emerged as the largest business group in India, there was a need to create a more organised process for nurturing and developing the groups' human resources. And this might require a far more radical change in the groups' style of functioning than any change in its formal structure. However, as it becomes a truly world-class, professionally managed powerhouse, the Reliance Group will have to affect another crucial change: its image. Constantly under attack from its business rivals and politicians throughout the 1980's and a major part of the 1990's, the group has had more than its share of controversy. Since the after-taste still lingers, the group needs to present a more transparent face. However, the biggest challenge before the group yet is a battle of inheritance between the two brothers (Mukesh and Anil) over issues of corporate governance and sharing of power in the groups' ambitious telecom foray and power ventures.
Just when the battle between Reliance siblings Mukesh and Anil seemed to be spiralling out of control, the family matriarch Kokilaben stepped in. She asked an old family friend, ICICI Bank CEO, K.V. Kamath to work out an amicable solution in his personal capacity. Her brief to him was simple: come up with a valuation, which offers an equitable solution to a problem, which was threatening to engulf the group apart. In order to unravel the complicated web of assets and family holdings, Kamath in turn engaged leading investment banker Nimesh Kampani (of J.M. Morgan Stanley) to work out the unravel the fortune estimated at around Rs. 80000 crore (Hindustan Times, March 13, 2005). This could lead to the opening of a pandora's box with major tax implications and unfolding of a complex web of cross-holdings in which the management control and ownership of various group companies is currently enmeshed. According to the industry grapevine, a settlement is around the comer. The three likely possible options:
In the first scenario, Mukesh gets Reliance Industries (minus refinery and marketing), IPCL and Reliance Infocomm. Anil gets Reliance Industries (Refinery and Marketing), Reliance Energy, and Reliance Capital including insurance and brokerage and hard cash. Roadblock:
275
The division of Reliance Industries would have been possible through the de-merger of Reliance Petroleum, which was merged into Reliance Industries a couple of years ago. This has been ruled out as this would rob the company of its cash flows and create dissonance in the structure of the behemoth. In the second scenario, Mukesh gets Reliance Industries (minus oil and gas), IPCL and Reliance Infocomm. Anil gets Reliance Industries (oil and gas). Reliance Energy, and Reliance Capital including insurance and brokerage and hard cash. Tagging oil and gas with Reliance Energy would help it in its aspiration to become a global energy conglomerate. Roadblock: Breaking up Reliance Industries is just too much trouble. In the third scenario, Mukesh gets Reliance Industries and IPCL without disturbing Reliance Industries structure, Reliance Power and Utilities and Reliance Power and Terminals. Anil gets Reliance Infocomm, Reliance Telecom, Reliance Energy and Reliance Capital including insurance and brokerage. Roadblock: Mukesh Ambani will have to give up Reliance Infocomm, something that is very dear to him.
From an initial investment of Rs. 15000 (less than $2000) in 1958 to start a trading house, followed by the setting up of his first tiny manufacturing facility in 1966, Dhirubhai Ambani has managed to set up a synthetic yam, textiles and petrochemicals empire that with a market capitalisation in excess of Rs. 80 billion (about $2.7 billion) in 1994, was the only entrant in Business Week's listing of the 50 largest companies headquartered in developing countries. In India, Reliance was the foremost non-government company by almost every measure including revenues, profits, net worth and asset base. Its earnings growth is, however, more re-assuring, averaging around (21-22) % during the same period. Even as its margins have got squeezed in line with the global glut in polyester, Jardine Fleming estimates that the tripling of its volumes will ensure a three year CAGR of EPS of 26 % (Business Today, January, 1998).
Its historical peak of 15.55% in 1996 is perhaps a sort of record, when compared to its closest competitor Indo Rama Synthetics in the same year at 0.15%. This has been primarily possible because of its focus on vertical integration, which had manifested in this enormous cost leadership. However, with the Reliance Infocomm (a wholly owned subsidiary of Reliance Industries) holding enormous market power, the future is only ripe with opportunities. The steady rise in the groups' market capitalisation despite market volatility makes one thing is very clear - Reliance is averse to market risk. A look at the RIL and RPL merger will reveal a different picture. Because what one is doing is merging capital employed in a Rs. 25000 crore asset, which is one year old with another Rs. 25000 crore asset, which is perhaps 10 years old. However, if we adjust the capital employed in terms of their age factor, then we can get a different picture altogether. Comparisons have to be facilitated between its peers (domestic and international) on a continuous basis. Only then one can get a more meaningful picture. In the 90's when the group built the refinery, the groups' cash flow was around Rs. 5000 crore. And on that platform the group decided to invest Rs. 25000 crore on its Infocomm project. Once the Infocomm project goes on-stream the groups' cash flow will be in the range of Rs. 20000 crore. The real challenge will come when the group will be faced with a situation when it needs to invest Rs. lOOOOO crore. Adds Mukesh Ambani: "... those kinds of opportunities rarely exist; there is a physical limitation (Business World, August, 2003)." But if Reliance gets its networking right, it may not seem to be distant reality.
Today the Reliance Group promoted by Dhirubhai Ambani is elephantine in size, but it also floats like a butterfly. Ever since the textile major integrated backward into the manufacture
276
of PFY, in 1982, it has built-up huge capacities in every product-line in the value-chain. Circa 1998, the group is the sixth largest producer of PFY (capacity 2.1 million tpa), fifth largest producer of PSF (capacity 2.7 million tpa), tenth largest producer of PE (capacity 3.5 million tpa). And with the completion Hazira Phase II expansion project, the group had the largest grass-roots cracker in the world (capacity 7.5 million tpa). By vertically integrating the value-chain from polymers, chemicals, fibres, fibre-intermediates, textiles, and ultimately, branded ready-made's, the group is perhaps possess the only global operation that is vertically integrated from textiles at one end to oil and gas exploration at the other. Reliance's businesses primarily comprises of seven independent divisions: polyester fibres (contribution to business: market-share - 14% and 40%), fibre intermediates (22% and 55%), polymers (25% and 45%), polymer intermediates (25% and 55%), chemicals (13% and 38%), textiles (5% and 60%), and oil and gas (1%) source (Business Today, January, 1998).
Barring oil and gas, which are still a question mark the group leads the market by miles in other constituents. They are therefore, all shining stars. It the mid 90's it had invested Rs. 9700 crore in a 15 million tpa grassroots oil refinery at Jamnagar. And in a final act of integration, it had invested Rs. 1800 crore to develop the Panna, Mukta and Tapti oil fields in the Western parts of the country. The group had by far built up scale through vertical integration and focus. As for the groups foray into power it has already implemented three power projects with a combined capacity of 1300 MW at Patalganga (Maharashtra), Bawana (Delhi), and Jamnagar (Gujarat). It has also moved into financial services to manage the groups overall financial linkages. Though the power and finance diversifications seem unrelated in-terms of industry coimt, they are horizontal integration moves, because the linkages between them are crucial for overall performance of the group. On the overall the mindset of the Reliance Group had been to build up scale with focus, coupled with diversification exposures primarily along vertical and horizontal lines.
277
Annexure III: Case Study - Aditya Birla Group
The history of the B.K.Birla - Kumar Mangalam Birla group (recently christened as Aditya Birla Group dates back to 1912; currently led by 36 year old Kumar Mangalam Birla since 1995, son of late Aditya Birla and grand son of B.K. Birla. From trading in cotton, silver, sugar and jute the group the group forged ahead in key industries such as textiles, fertilisers, chemicals, sponge iron, cement, refineries, carbon black, aluminiiim, financial services and software. For Kumar Mangalam Birla, the ascension coincided with an economic downturn, and hence steering a behemoth that has presence in diverse industries and a conservative organisational structure that is nearly 100 years old is no doubt a difficult task. However, the groups current vision is to put a predominantly commodity manufacturing group into an orbit of global infrastructure industries, which its late chairman Aditya Birla had left unfinished.
The roots of the Aditya Birla group dates back to the 19th century in the picturesque town of Pilani set amidst the Rajasthan desert. It was here that Seth Shiv Narayan Birla started trading in cotton, laying the foundation for the House of Birlas. Through India's arduous times of the 1850s, the Birla business (consolidated) expanded rapidly. In the early part of the 20th century, our Group's founding father, Ghanshyamdas Birla, set up industries in critical sectors such as textiles and fibre, aluminium, cement and chemicals. As a close confidante of Mahatma Gandhi, he played an active role in the Indian freedom struggle. He represented India at the first and second round-table conference in London, along with Gandhiji. It was at "Birla House" in Delhi that the luminaries of the Indian freedom struggle often met to plot the downfall of the British Raj. Ghanshyamdas Birla foxmd no contradiction in pursuing business goals with the dedication of a saint, emerging as one of the foremost industrialists of pre-independence India. The groups' legendary leaders' grandson, Aditya Vikram Birla, soaked up the principles by which he lived.
A formidable force in Indian industry, Mr. Aditya Birla dared to dream of setting up a global business empire at the age of twenty-four. He was the first to put Indian business on the world map, as far back as 1969, long before globalisation became a buzzword in India. In the then vibrant and fi'ee market South East Asian coimtries, he ventured to set up world-class production bases. He had foreseen the winds of change and staked the future of his business on a competitive, free market driven economy order. He put Indian business on the globe, twenty-two years before the former Prime Minister, Mr. Narasimha Rao and the former Union Finance Minister, Dr. Maimiohan Singh, formally introduced economic liberalisation. He set up 19 companies outside India, in Thailand, Malaysia, Indonesia, the Philippines and Egypt. Interestingly, for Mr. Aditya Birla, globalisation meant more than just geographic reach. He believed that a business could be global even whilst being based in India. Therefore, back in his home-territory, he drove single-mindedly to put together the building blocks to make their Indian business a force to be reckoned with in the boimdaries of the international marketplace.
Under his stewardship, his companies rose to be the world's largest producer of VSF, the largest refiner of palm oil, the third largest producer of insulators and the sixth largest producer of carbon black. In India, they attained the status of the largest single producer of viscose filament yam, apart from being a producer of cement, grey cement and rayon grade pulp. The Group is also the largest producer of aluminium in the private sector, the lowest first cost producers in the world and the only producer of linen in the textile industry in India.
278
At the time of his untimely demise, the Group's revenues crossed Rs. 15000 crore globally, with assets of over Rs. 16000 crore, comprising of 55 benchmark quality plants, employee strength of 75,000 and a shareholder community of 600,000. Most importantly, his companies earned respect and admiration of the people, as one of India's finest business houses, and the first Indian International Group globally. Through this outstanding record of enterprise, he helped create enormous wealth for the nation, and respect for Indian entrepreneurship in South East Asia. In his time, his success was unmatched by any other industrialist in India.
That India attains respectable rank among the developed nations' was a dream he forever cherished. He was proud of India and took equal pride in being an Indian. Under the leadership of its present Chairman, Mr. Kumar Mangalam Birla, the group has sustained and established a leadership position in its key businesses through continuous value-creation. Spearheaded by Grasim, Hindalco, Indian Rayon, Indo Gulf Fertilisers and companies in Thailand, Malaysia, Indonesia, the Philippines and Egypt, the Aditya Birla group is a leader in a swathe of products — viscose staple fibre, aluminium, cement, copper, carbon black, palm oil, insulators, and garments. And with successful forays into financial services, telecom, software and BPO, the Group is today one of Asia's most diversified business groups.
Way back in 1974, Aditya Birla set up the group's first overseas venture in Thailand. A year later, he set up the group's first textile mill in the Philippines, which exports to US, South Korea, Australia and China. Given a legacy of such thinking, Kumar Mangalam Birla may have to prove himself, but his job lies in slashing, rather than entering new businesses. Indeed, his strategic decision to shelve the group's non-core projects has not only clarified the tack the group will take in the future, but also his ability to take decisions quickly. In tune with such policy he has already divested Indo Gulf Fertiliser's Rs. 1350 paper and pulp project in Uttar Pradesh, and Indian Rayon's Rs. 105 crore fibreglass projects in Rajasthan. The rationale: the estimated returns would not have been commensurate with the investments made since the utilisation capacities were in excess of market's size. "Our approach towards investments in new industries has become strategic rather than opportunistic, says B.N. Puranmalka, Managing Director, Indo Gulf Fertiliser, (Business Today, January, 1998)."
In building a conglomerate, the late Aditya Birla also created India's first quasi-transnational. For the visionary scion, change was not just a consequence; it was the bedrock on which the group was built. The cornerstones of the philosophy of the Aditya Birla Group had been traditionally woven around: establish world scale plants; keep the cost of ftmds low; ensure high rates of capacity utilisation; and control costs. Under the industrial licence raj, this worked wonders, but now Kumar Managalam needs to retune them to maintain its competitiveness. Since a young CEO heads it, the group's long-term stability is almost assured. But what could be critical to the group - which will surely include B.K. Birla companies in future - is the people factor. Managing a diversified conglomerate will need managers who are professional and focussed - something the group yet lacks.
At the moment, sexagenarian and septuagenarian loyalists, who believe in unconditional loyalty to the CEO, run the group. While this may well have its advantages in the short run, in the long run it could be suicidal. A global empire has come to Kumar Mangalam on a
279
platter. An empire those three generations of Birlas built with foresight and intricate planning. Political connectivity, a controlled economy, and surplus cash spawned a conglomerate whose tentacles were just beginning to extend overseas when Aditya Birla died. "The group have some inherent strength. They must now be married to an amended direction to make progress, adds Walter Viera, a consultant to the group, (Business Today, January, 1998)." The current group chairman is pushing hard with the globalisation of the empire, by expanding manufacturing bases in Asia, where the business downturn in the 1990's makes the timing for this push perfect.
Integration is the primary factor that had propelled the Aditya Birla Group. For instance the Rs. 1150 crore Hindalco is the largest integrated producer of aluminium in the country, with its own bauxite reserves and downstream production facilities. By controlling the biggest cost factors in the manufacturing of aluminium - power and alumina - through its own 500 MW power plant and captive mines, Hindalco had emerged as the lowest cost producer of aluminium in the world. Even though India accounts for only 3% of the global output of aluminium; Hindalco's conversion cost is only $1033 per toime as against Alcan's $1250. Century Textiles is one of largest composite cotton mills in the country, producing over 110 million metres of cotton cloth per annum. It is also one of the leading cement producers in the country. And while Indian Rayon is the third largest player in rayon yam, the group is the third largest and sixth largest producers of carbon black (insulators), respectively, in the world. It is also the largest private sector producer of rayon grade pulp. Right away, the Aditya Birla Group has the two key ingredients that go into the making of a global cost leader: scales and integration.
After the untimely death of Aditya Birla in 1995, the group initiated a series of meetings and presentations with institutional investors, banks and analysts to project the only heir to the Aditya Birla empire, Kumar Mangalam Birla as the leader to an empire comprising a turnover of Rs. 7200 crore, a fixed asset base of Rs. 13000 crore and a human resource base of 0.4 lac employees. The reason: to stem and dispel doubts about the group's future prospects and upcoming projects. In the past one year, the entire group closed in around the new and untried chairman. No communication, official or otherwise came out of the group headquarters. Industry House, Mumbai - as Kiomar Mangalam settled into his job - except for the occasional rumours about disgruntled senior managers. The fact is that Kumar Mangalam is at least three decades younger than most of his managers make things even more difficult.
The young Birla clarifies, "I had no time to talk to the media - there was so much work to do. My priority was to ensure that everything goes on smoothly (The Economic Times, March 13, 1997)". But as major group companies - Grasim, Hindalco and Indo Gulf Fertiliser -came up with comparatively lower profitability in their half-yearly results and the status of projects in telecom, copper, paper and power stayed fuzzy, investor confidence looked doubtfiil. Could Kumar Mangalam keep the flag flying? More importantly, consider the size of the task ahead: diversifications into telecom, power, a refinery, wood pulp and copper smelting. New projects worth Rs. 8300 crore, ongoing capacity expansions worth Rs. 5369 crore are at the helm of group's majors. And one 29 year old at the helm without much formal grooming in the group's activities, the doubts began to seem natural.
280
Kumar Mangalam's balancing act was not easy. On one hand he had to ensure that the group's precedent oriented senior management, drawn selectively by his father from the Marwari community and collaborators and lenders perceive no upveals in the Group Empire and systems created by Aditya Birla. On the other hand, he has to make his own tracks to establish his identity as capable of leading the multi-national and multi-dimensional group into the next century. Says Harsh Goenka, Vice-Chairman, RPG Group, "He is very sincere and hard working, and academically well qualified. It is just that expectations from him are quite high - I am confident of him, but it will take at least two years for him to leave his imprint on the group (The Economic Times, March 13, 1997)."
Kumar Mangalam, who was always content to follow in his father's footsteps, is now carefully working out his ovra blueprint for the future. Characteristically cautious, there is no dramatic departure from the past. As he himself commented, "I don't believe in making changes for the sake of making changes (The Economic Times, March 13, 1997)." The man who had spent the past one year concentrating on ensuring that the loss of the leader did not hamper the group's working or progress in ongoing projects, was ready to prove that he was up to it. For the year 1996-97, though the year-end results will not be dramatic given the market conditions in its different businesses. "Profitability in Indian Rayon will be better than last years; at Grasim it will be about the same; and at Hindalco only slightly lower. Only at Indo-Gulf, we will be imable to make up for the performance of the first six months, says M.C. Bagrodia, Senior Group President, (The Economic Times, March 13, 1997)."
Kumar Mangalam Birla on the direction the Group has taken in the last four years:
"I would like to take this opportunity to retrace the direction of our group over the past four years. If one were to encapsulate it in a single word - the dominant strategic theme over the past four years has been consolidation. This is in line with our vision of being a premium conglomerate, with a clear business focus at each business level, relentlessly pursuing value creation. The logic underpirming consolidation is the push for market leadership, economies of scale, productivity gains and operational efficiencies".
First, I believe our overseas units have exemplified the process of consolidation. The financial shock that hit the South East Asian countries in 1997 took until last year to fully wear off. Whilst several erstwhile corporate titans in the region have crumbled, our units, without exception, have not only emerged unscathed but stronger, and have continued to grow and excel. Let me remind you that our units overseas operate in a far more liberalised environment than we have in India, and duties on finished products are from nil to a maximum of five per cent. I believe that we can be truly proud of their achievements. In many ways, they hold a mirror to what the future economic scenario will be like in India, when duty differentials reduce to global levels. The acquisition of a 74.6 per cent equity stake in Indal from Alcan, at an investment of a little over Rs.lOOO crore, has been a milestone. Bringing Indal into the Group's fold has helped us position ourselves along every link in the value-addition chain of the business, from metal to downstream products, where the Hindalco - Indal combine accounts for an over 70 per cent market share.
281
Moving on to the other metal in the Group's stable, it is commendable that Birla Copper has attained a leadership status ~ commanding a market share of over 45 per cent -- within a short span of three years from its first commissioning. The de-bottlenecking of the copper smelter at Dahej last year has resulted in cost efficiently enhancing the smelter capacity by 50 per cent to 150,000 tpa last year, and the ramp-up achieved has truly set a new global benchmark. The acquisition of the Nifty mines in Australia from Straits (Nifty) Pty Ltd has elevated Birla Copper to an integrated copper producer. Yet another landmark restructuring move has been the decision to consolidate Indo-Gulf s copper business with Hindalco. All these moves take us ahead on the road towards unifying the Group's non-ferrous metals businesses, and transforming Hindalco into a globally competitive non-ferrous metals powerhouse. Post-restructuring, Indo-Gulf will emerge ftilly focused on fertilizers, with a brand that commands a huge equity, strong cash flows and a leadership position in the fertilizer industry. It is well positioned to take advantage of the opportunities that arise from the disinvestment program of the government.
The decision to de-merge the Insulator Division - one of the Group's best performing businesses - and transfer it to a separate 50:50 joint venture with NGK of Japan, the leading global player in the business, is a crucial step to take the insulator business to new heights. The partnership with NGK will help to build upon and strengthen the leadership position we already enjoy in the domestic market; because of the access we will have to the latest in product and manufacturing technology. In addition, there will be opportunities for getting plugged into a global marketing network. Through this route we will take the insulator business to new heights. A slew of initiatives have also been taken to consolidate the operations of Grasim -among them, the closure of the pulp and fibre plants at Mavoor and the sale of the loss-making fabric operations at Gwalior. Over the past three years, Grasim has become much leaner and stronger — with the debt/equity ratio improving from 0.93 to 0.58, interest charges falling from Rs. 292 crore to Rs. 168 crore, operating profit rising from Rs. 678 crore to Rs.ll42 crore, and workforce rationalization taking the manpower strength from 24,400 to 16,600. In the Telecom business, we joined hands with the Tata Group. Beginning in two states, we have expanded to seven states - after having bid successfully for Delhi and Madhya Pradesh and acquiring the Chattisgarh circle. Our subscriber base has reached 1.1 million. Our footprint covers 40 per cent of the cellular market in India, with a 47 per cent market share in the circles where we operate and an 11 per cent market share nationally.
They have also divested the Group's stake in MRPL to ONGC. Although the sale of the group companies' equity stakes in MRPL will have a one-time impact on their profits, the exit from MRPL indicates our firm resolves to rationalize the Group's portfolio of businesses with a view on the fiiture, and also bears testimony of our commitment to a key group of stakeholders: our lenders. The Birla Sun Life joint venture, which started off three years ago, has developed a major presence in the insurance and mutual funds' sectors. Birla Sun Life is perceived as a leading quality market player recognized for its superior service levels, and we consider this as a core business with immense growth potential in the years ahead. From all of this, a clear trend emerges. The group's strategy dictates that it get out of businesses where they are bit players and strengthen the businesses where they have clear competencies, so that it get to the top of the league or consolidate its position there, as the case may be. This leads to a sharper and tighter business portfolio with its firepower being better targeted.
282
Though Kumar Mangalam has made sufficient headway in the second stage of the groups' growth cycle, much is yet to be done. Given the short time he has taken over at the helm of the group, Kumar Mangalam has already proved himself to be a successful change agent. Luckily for him, a doting grand father - Basant Kumar Birla has thrown all his weight behind his grandson. He commented, "Kumar is clear in his thoughts, and imless he is convinced, he will not agree to anything (Business Today, January, 1998)." The focus for the future: to stay in the core sector, and continuously upgrade and improve costs and quality in existing businesses. New businesses, for the time being, are restricted to the ones already in the making - telecom, power and refineries. Adds Kumar Mangalam: "We are now in the phase of consolidation. The idea is to build backward and forward linkages in existing businesses to gain control over critical inputs (The Economic Times, March 13,1997)."
Available resources within the group therefore, would be ploughed back as investments in the group's core businesses. Hence, the Rs. 600 crore rayon grade wood pulp at project at Grasim is a priority - as rayon production, where imported wood pulp is a major cost factor. So are a variety of captive power generation projects to augment power supplies for its cement plants will ease chronic power shortages. Again, for its cement business, the group has invested in the "own-your-ovm wagon scheme" to ease logistic problems. On the other hand, the bagasse based paper project and a fibreglass project have been dropped. The reason: neither diversification plans showed clear competitive nor leadership edge. "We will only operate in businesses where we can be clearly be dominant players, says Kumar Mangalam himself, (The Economic Times, March 13, 1997)." Businesses, which carmot provide this, are low priority.
A focus on world-scale capacities, constant attention to operational efficiencies and prudent financial management - the common strands binding the wide range of business areas of the group are responsible for the impressive achievements of the group. The Aditya Birla Group is the first Indian multi-national, which made direct foreign investments overseas. Today the group has a manufacturing presence in the vibrant economies of South-East Asia - in Thailand, Indonesia, Malaysia, Philippines and Egypt. Further it has marketing offices in Singapore, Dubai, UK, US, Russia, South Africa, Tanzania, Vietnam, China and Myanmar. The group had pushed ahead aggressively in the power sector through a joint venture with Power Gen, UK's largest utility company.
It also had a pre-dominant presence in frontier technologies through Birla AT&T Communications, a joint-venture with America's AT&T, undoubtedly the world's best known name in communications. It has a leading position in the financial services sector, with an established reputation as one of India's leading managers of mutual funds, a business for which there is a tie-up with Capital International of the US, one of the largest and most respected names in this field, worldwide. Nearly 90% of its group companies have ISO certification. The group also had the distinction of being: the worlds largest producer of VSF, the worlds largest refiner of palm oil at a single location, worlds third largest single location producer of electrical insulators, worlds sixth producer of carbon black and India's largest private sector producer of caustic soda, Portland cement, rayon grade pulp and rayon.
The rapid strides made by the group have been possible due to the strong underlying principles, which have been the cornerstone of the groups' corporate philosophy. For the Aditya Birla Group, the world is indeed its oyster. Whether, through direct investments
283
abroad; tie-up with international leaders to manufacture products and provide services for the Indian market; its modem management practices or its product profile, a global approach has been observed in all spheres of its activities. Through a constant up-gradation of technology and unflagging vigil over quality, international standards are maintained for the diverse range of group companies. Within the organisation, innovation is a habit. Every time something is done, an attempt is made to do it differently and better than the previous time. Management through consultation and consensus via management committees, shop floor committees and quality circles are basic principles of the organisation. Delegation and decentralisation call for the participation of each individual. The group's commitment to enviromnent and social welfare is evident from its range of activities in these fields. Its projects bring progress to remote and backward areas and its plants are the nucleus of thriving community development.
The move in commodities is towards value added products: previously at Hindalco, 50% of the total production was in the form of base metals, while the rest is in value-added products. By the end of the century 75% of its sales will come from value-added products. Marketing was being geared up towards brands than can command a premium. "Indo-Gulf's Shaktiman brand commands a premium in the urea market - we provide a total customer package, adds Kumar Mangalam, (The Economic Times, March 13, 1997)." However, it is not that the Aditya Birla Group will no longer grow or diversify. In fact a dozen of different proposals were being examined. But there has been a subtle change on the strategy side. Kumar Mangalam has crafted a clear-cut criterion for new investment decisions. The factors: it should be a differentiated value-added product, with substantial presence in the value-chain. It should have strategic linkages with the group's existing businesses, indicating clear sustainable competitive advantage. And critically, project investments needs to be evaluated over a sustained period - not just the initial investment.
In the past one year the group had commissioned phase I, a capacity of 3 mtpa at MRPL, India's first refinery after the sector was opened up to the private sector - and as group officials are quick to point out, three months ahead of actual schedule, in March 1996, and now functioning at 120%) capacity utilisation. It had also received all clearances and tied up funds for its Rs. 3690 crore phase II expansion to 9 mtpa, which is expected to be complete by August 1999. It had also started operations in one circle in its telecom venture through Birla AT&T, and is scheduled to commission two other circles very soon. Working on the Rs. 2710 crore Bina power project, through its joint venture Birla Powergen, was at an advanced stage. The Rs. 1850 crore copper smelter projects at Indo-Gulf, which had generated some criticism, are due to be completed by 1997.
Says Pradip Shah, Chairman, Ind-Ocean Venture Advisors, "I am optimistic about his capability. He is trained under his father for five years, and he has a very level head over his shoulders (The Economic Times, March 13, 1997)." "One can appreciate that there is apprehension in the market. But Kumar Mangalam has worked with his father so long that within the group we see no appreciable difference, admits M.C. Bagrodia, Senior Group President, (The Economic Times, March 13, 1997)." That is the crux of his strategy: to make a difference, without seeming to make it obvious. Traditionally, the group has grown through green-field projects, though in future the group will be also relying on acquisitions and joint ventures. However, the group plans to go by a minimum 50% stake to ensure management control. Historically, the firms of the Aditya Birla Group had operated independently,
284
controlled only from the headquarters, with very nominal investments and resource transfer among the member firms. However, with post liberalisation resource transfer among member firms of other groups of similar size had increased drastically, the Aditya Birla Group was slow to respond to the same.
Diverse as its activities are, the group companies are dominant players in each of the business segments they operate in. Grasim is in the forefront in developing new-generation speciality, high performance fibres. It has developed a solvent spiiming process for producing cellulose fibre. The company is also working on producing cellulosic thermoplastic polymer, which can be converted into fibre/filament by melt spinning techniques. It has developed new processes to produce rayon grade pulp from beimboo, eucalyptus and mixed hard woods. It is a leading supplier of technology and machinery related to the production of man-made fibres. It possesses some strong premium brands and has received prestigious awards in the areas of productivity and TPM. Hindaico is among the world's most efficient producers of aluminium. It has received several national awards for exports and energy consumption. To keep ahead of the market, Hindaico is moving ahead towards higher value-added products. It has implemented a modernisation and expansion programme, with technology sourced from Reynolds International Inc, US. The company's Renusagar power plant has consistently achieved a plant load factor of over 95%.
Indian Rayon is a branded leader in white cement category. Its hi-tech carbon plant was the first unit in India to introduce high temperature technology for manufacturing carbon black. It also pioneered the recovery of waste heat and the use of waste gases to generate power. The sea-water magnesia plant at Visakhapatnam produces refractory grade magnesia from sea water. Indo-Gulf's Jagdishpur plant is one of the most energy efficient ammonia/urea plants in the coimtry. It was also the first to introduce gas-based fertiliser plant in the private sector. Its urea brand "Shaktiman" had become the market leader. It is also getting up a copper smelter complex at Dahej in Gujarat. The smelter with a capacity of 1.5 lacs tpa is perhaps the only plant in India to have the flexibility to use a wide range of copper concentrates.
Managalore Refineries and Petrochemicals (MRPL) plant incorporated the latest hydro-cracker technology to convert heavy fractions to high value distillates. MRPL has sourced process technologies from three leading companies: Universal Oil Processes, US; Kinetic Technology, US; Shell, Netherlands. Its capacity had been recently enhanced from 3 mtpa to 9 mtpa. It is also the first joint sector refinery in India. The newly formed joint venture Birla AT&T is all set revolutionise the communication scenario in the country. Birla Global Finance has already made a foray in a wide range of financial services. It had tied up with Capital Group, US to launch to distinctive mutual fimds in the Indian market. It had also tied up with Marlin Partners, UK for dealing in investment banking activities globally.
One factor, which is a mixed blessing, is the support of the top management. "I have worked with G.D. Birla, Aditya Birla and now with Kumar Mangalam. We are professional managers; our loyalty is with the job, says B.N. Puranmal, MD, Indo-Gulf Fertilisers, (The Economic Times, March 13, 1997)." The Birla Group is very dependent on the personal touch. It will take Kumar Mangalam some time to build his own equations with his senior managers. As a supportive function his mother Rajashree Birla had also started taking a more active role, and her unequivocal presence helps to ease the transition. On the other side
285
having a global mind-set, including definite strengths in project identification, in implementing projects with estimated costs and schedules and in continuously improving quality and bringing down costs will guide future performances. In the past diversifications were undertaken various group companies, because at that time it was a question of who got the license. However, in its future investments the group needs to be convinced - what is the right thing to do - that will enhance shareholder value. Since this would be an irreversible decision, it needs to be thought out very clearly.
By relentlessly pursuing scale, size and efficiency, it has emerged today as the biggest player in most its businesses today. The groups' turnover spans Rs. 27000 crore with a geographical presence in 18 countries and an employee base of 0.72 lacs. It is the largest producer of cement in India; it controls 45% of the aluminium and 40% of the copper markets; it is the market leader in insulators, VSF, yams and carbon black. After ten years of succession, it was clear to Kumar Mangalam that the strength of the Aditya Birla Group lay in being a conglomerate. He did not therefore split his companies into entities focused on one or two businesses. He did jettison some projects.
The group publicly announced a paper and chemicals project, closed down some plants (a sea water magnesium unit in Vishakapatnam) and sell his stake in others (MRPL, a petrochemicals joint-venture with government owned HPCL) and all this to build on his core businesses. In cement, Kumar snapped up companies and factories, increasing his production capacity from 5 mtpa 1998 to 31 mtpa in 2003. Likewise in non-ferrous metals, it acquired Indal from Alcan to add to his group's already substantial interest in aluminium through flagship Hindalco. In copper, three years after commissioning the first smelter, it also took over two copper mines in Australia. "Despite the pressures he faced at the time of his taking over, he had the vision to take his key businesses to a higher level", says Amit Chandra of DSP Merrill Lynch (Business Today, December, 2003).
Although most of Birla's companies are sitting on piles of cash, the promoter's stake in many of them is low to moderate. In Grasim it is less than 21%; in Indian Rayon 27% and in Hindalco under 25%. That could be one reason why the group has not tapped the capital market even once, financing every diversification from internal accruals and huge cash flows from its operations. Perhaps Kumar did not want to dilute the groups' shareholding levels any fiirther. In the last eight years cash from operations at just the three big companies - Grasim, Hindalco and Indian Rayon aggregated to more than Rs. 35000 crore ($ 7.65 billion). Though the late Aditya Birla relied more on organic growth to grow his businesses through green-field expansion, the young Kumar took advantage of the group's consolidation in cement and metals to grow by mergers and acquisitions. "Our goal is to make all our businesses globally competitive, says Debu Bhattacharya, CEO, Hindalco (Business Today, December, 2003)". Therefore the group made its foray into relatively freer markets like Egypt, Thailand, Indonesia, Malaysia and Philippines.
Kumar Mangalam had spent the first five years of his career trying to untangle his existing jumble of businesses and drive operational efficiency. As a result of its strong resource position built up, the group is in the process of finalising a massive investment plan in line with young Birla's new growth strategy. It plans to invest a fiirther Rs. 20000 crore across his businesses - primarily in aluminium, copper, cement and fertiliser. For a comparison, in aluminium alone, the group will investment more than it has done in the last two decades.
286
Clearly, the Birla has now chosen to shift gears. The next few years will mark an inflexion point within the group. For the first time, the group is beginning to think big, really big. In the past, Birla was simply focussed on extracting value rather than betting big on growth. He typically chose to add capacity in small chunks or acquire healthy, but rQlatively small businesses. Consider a couple of his big bets - in 2000, he bought the Rs. 1750 crore Indal, which added a third to his existing aluminium capacity. After that, it took him an agonising 36 months to clinch a deal in early 2004 to buy L&T's cement business worth Rs. 2500 crore.
Of the total investment of Rs. 20000 crore, insiders say, Birla is close to allocating around Rs. 16000 crore over the next four years for his aluminium business. The plans were drawn up by Hindalco's, MD, Debu Bhatiacharya, includes the setting up of two new plants. So far the board had not yet seen the final blueprints. But after it is ratified by the board, it will increase the aluminium capacity of the Aditya Birla Group three times over, all at one shot, and pitchfork him into the global top ten manufacturers list. Will Hindalco's plan suck out much of the outlay, it will also force the group to take on some debt, and something the group has shied away for a long time. If things go according to plan, the rewards will be big too. When the two new plants become operational in a little over four years, the Rs. 6800 crore Hindalco will be almost as big as the group is today. And in nearly half the time the young Birla took to increase the group's empire from Rs. 7200 crore to around Rs. 28000 crore after he took over the helm. "Our plan for aluminium is unlike anything we have done before, it will take us into a different league, says Debu Bhattacharya, (Business World, September, 2004)". The stock markets too seem to have noticed. "Conglomerates are all about size and scale. Birla was talking of value creation when his peers were thinking big. The market was not convinced", adds a leading mutual fund manager (Business World, September, 2004).
A little before a decade the Aditya Birla Group was the second largest conglomerate, ahead of the Reliance Group, and only behind the Tata Group. Since then the Reliance Group has zoomed past both the Tatas and the Birlas. Its turnover had shot upto Rs. 99000 crore on the back of its aggressive backward integration plans and foray into telecom. The Tata Groups turnover had grown to Rs. 65000 crore, led by the expansion and diversification plans by its two flagship companies, TELCO and TISCO. The Aditya Birla Groups turnover now is just Rs. 27000 crore. The new growth plan should, however, address some of that concern. In the last eight years the young Birla has consciously shifted focus from predominantly fibre based business to one that is driven by non-ferrous metals and cement. The share of the textile business had since dropped from around 25% of the groups' turnover, to below 5% now. In contrast the share of the metals and cement business has increased to over 60%. So the group had literally put all its eggs in one basket - aluminium. The intent is to become globally competitive. The route is again through cost leadership.
So why is the group so aggressive on aluminium? And will it give him a tenable place in the global metal business? This is much in line with its global strategy devised with help of strategy consultants - Boston Consulting Group. The confluence of four issues had prompted Birla to pin his hopes on aluminium. In the last few years, the leading aluminium players in the world, Alcan (capacity - 3.5 mtpa) and Alcoa (capacity - 4.1 mtpa), have begun a ftirious consolidation spree. They have acquired nimierous small players across Europe and the US. This enabled the top ten players in the industry to control more than 50% of the market. In the process, greater scale has helped bring down the unit cost of production. Now, the price movements in the aluminium business are indicated by the LME, leaving very little scope for
287
manipulation by individual players. So far, Hindalco has been able to keep its costs down, releasing nearly Rs. 1500 crore of free cash flows.
For any commodity, and aluminium is no exception, long-term viability hinges on its ability to produce it cheaply through the ups and downs of the commodity cycle. Currently, Hindalco's cost of production fares among the top quartile of the world's most efficient producers. But with a capacity of just around 0.4 mtpa, it had remained to be an insignificant player. Even the tenth largest player produces 50% more than that of Hindalco. As other companies start expanding, Hindalco's lack of scale was soon become a major handicap. It would also have a bearing on its ability to keep costs low "Staying in the business with the same capacity is like running on the treadmill, you just stay Where you are, says Debu Bhattacharya (Business World, September, 2004)". Fortunately for Hindalco, despite its late-mover status, it still had a window of opportunity to scale up and enter the global league. The 30-mtpa global aluminium market is growing at 4.5% every year. What is more important, Asia is where the hub of action is. Despite China, Middle East and South-East Asia already soaking up capacities, a shortage of aroimd 2 mtpa is in the oflfing.
But once demand tapers off - and that won't happen in a hurry, since the upturn in the aluminium cycle is just starting. Therefore, the issue just boils down to global competitiveness to sustain long-term performance. That is one where Hindalco enjoyed a clear advantage. India had good quality of bauxite ore, the fifth largest in the world. Having smelters near the mine pithead will save substantial costs, which will have a direct impact on margins, especially in a downturn. Currently, majors in China namely - Guandong Fenglu Aluminium Company and Aluminium Corporation of China are just of Hindalco's size. Its Chinese counterparts, on the other hand, had to import the ore and thus bear an additional transportation cost, denting their competitiveness.
However, the technology used by the Chinese producers is around 30% cheaper than the commonly used Pechiney's technology by Hindalco. Also reserves of bauxite is getting exhausted at many of its locations forcing the group to source elsewhere, thereby incurring higher transportation costs. It may be able to ward off competition from the Chinese, but on the domestic front it had to contend with formidable competition fi-om Sterlite Group, promoted by Anil Agarwal. The group's investment started more or less at the same time of that of the Birla that neutralising any footage for late entry. Thus while Sterlite lost over its bid for Alcan, it outsmarted the Birlas in their bid for getting control over state owned Rs. 900 crore Balcan. Therefore Hindalco's resource bundle would have to be sharpened to ensure its competitiveness in the long run.
The Rs. 16000 crore investment plan for aluminium will flow into two projects - the Utah Alumina Project and the Aditya Aluminium Project, both based in Orissa. The eastern state of India had by far the biggest quality of bauxhe reserves comparable to the best in the world. (This also explains why the global mining giants like the $ 15 billion BOP had chosen Orissa as a safe destination). The two projects are somewhat different from each other. A two-stage process makes aluminium from bauxite. First, an intermediate alumina is extracted from the bauxite ore. Bauxite is generally found mixed with red mud, around (3-4) metres below the land surface. On an average around three tonnes of bauxite is required to extract one tonne of alumina. Thereafter, alumina is reduced to aluminium metal by an electrolytic process in a smelter. At this stage the location of the smeher from the reserves site help maintains cost to
288
a large extent. "We can reduce costs only to an extent, beyond that, there is a crying need to increase scale, adds Debu Bhattacharya, (Business World, September, 2004)". The second stage requires a lot of power - which can account for around 40% of the total costs. So companies, choose to further process alumina into aluminium depending on the cost of power. As things stand, there exists a robust market for both alumina and aluminium.
In the Utkal project, where the Birlas have a 55% stake along with Alcan, the plan is to have a 1.5 mtpa alumina plant. This project has been on the anvil for the past six years, but never took of because the government could not rehabilitate the people living near the mines. Now the problem seems to have been sorted out, and the Birlas should be awarded the mining lease shortly. The Aditya project is a wholly owned subsidiary of Hindalco with a capacity of 1 mtpa of alumina, and 3.5 mtpa of aluminium. This will catapult Hindalco into the top 10 aluminium makers in the world. Today, the effective import duty on aluminium is pegged at 10%. But to ensure that the new projects remain competitive even if duties fall further, the plans had to clear stiff internal hurdles for a host of financial parameters like return on capital employed, return on equity, interest cover, and that too, assuming a zero import duty on the primary metal.
Even as Birla cranks up his aluminium business, considerable focus is also on copper. But unlike aluminium, where size and scale is the key factor, the story is different in the case of copper. Here expansion has more to do with being cost competitive, rather than growing the business in terms of size. When the Birlas first ventured into copper in the mid 1990's, they started the business more as a domestic play. The differential between import duty on the metal and its raw material was high (nearly 30%). This allowed the domestic players earn a very good margin as just mere converters. There was also growing demand for copper for use in jelly-filled telecom cables. So in 1997, the group, through their fertiliser company Indo-Gulf, put up a copper smelter along the port area in Dahej in Gujarat. This was to ensure that they could import the metal easily. Of course they had to contend with the same infra-structural headaches that are common with most projects. There was no infrastructure then available in Dahej to import large quantities of solid cargo. Birla then spent a considerable time and money in setting up a new port. No power was available on the site, so the group had lay railway lines to transport coal for a new power plant. There were no housing facilities. So the group had to develop a township for its employees. None of this quite mattered then, since profitability was assured due to the import duty cushion and the reasonably strong intemafional copper prices.
But by around 2000, import duties started coming down (the present differential duty is 10%). That exposed the vulnerability in the group's strategy. There are typically two categories of copper smelters: ones attached to the captive mines, and the standalone smelters, which buy ore from the market. However, when copper prices move upwards; the standalone smelters end up paying a substantial premium for the ore. This disturbs the cost equation and leaves the players scrapping for bottoms. There are two obvious routes out of this situation. First, the group had to find out a way shore up its supply of ore. Secondly, it has to mitigate the additional investments made on infrastructure. Luckily, the port in Dahej is the only bulk solid handling port in the region. So the group had allowed commercial access for handling vessel to third parties. Next to bring some cash to the business, the company began to convert sulphuric acid, a by-product of copper, into phosphate fertiliser
289
and sell it. It also started recovering gold and silver from the smelter - all to extract a bit more value. Yet all this is not enough.
A few months ago, copper conversion charges fell to almost pence per pound. That really shook the group. If the groups business were to remain profitable, its efficiency in terms of cost would have to be in the top quartile amongst the worlds leading producers. Just like in aluminium. That means the group has to increase capacity and use the additional volumes to spread its fixed costs. That's exactly what the group is doing at an investment of Rs. 1800 crore. When the copper expansion goes on-stream end 2005, the group will have the advantage of having the largest single location smelter in the world. The group is also in the process of acquiring more mines so that it can procure at least 40% of the raw in-house. That is when the conversion costs will be just (5-6) pence per pound, and the group will be positioned in the top quartile.
While the Aditya Birla Group laid the foundations for its metal business; it was also building up an impregnable position in cement. In July, 2004, the group took over the cement business of L&T, giving its capacity a clear market leader, at nearly 31 mtpa much ahead of its closest competitor Gujarat Ambuja - ACC combine at (28 mtpa). The group had paid Rs. 2200 crore to buy a 51% stake in the business. Soon thereafter it renamed the much-famed 'L&T Cement' with 'Ultra Tech Cement'. Given the sizeable investment, the business would have to earn a much higher return. Considering the industry outlook, that may not be very difficult. The cement market is growing at around 8%, and it also pre-empts new investments in green-field capacities because they are not viable at current cost levels. Industry experts are of the opinion that in the short-medium term demand will far exceed supplies, considering the large-scale investments on infrastructure and housing projects.
When that happens, the price realisations for cement at around $(40-45) per tonne, they are far lower than the international benchmark of $(60-80) will go up. That will have a huge impact on the margins of its cement business. Already with a gross margin of 28%, Grasim is reckoned to be among the most profitable cement companies in the world. The group had already started adding small chunks of capacity to grow market share, however, focus will be clearly on consolidation. Despite having made significant investment overseas, the group had currently put its brakes on its geographical diversity, by committing major investments in the domestic circle. And this is at a time when most Indian business groups are furiously expanding overseas. This may seem ironical, especially since, frustrated by the regulatory environment, Kumar's father, late Aditya Birla, was among the first Indian industrialists to establish global outposts, way back in 1974.
''Context is another word the young Birla uses often in his conversation about his businesses. If his father ran the conglomerate differently from him, it was because of a different context in which he built and managed his businesses. By the time he took over the reins of the group, he had realised that the context was changing. India was no longer an insular economy; tariffs were coming down and you had institutional investors coming in. It became clear that we had to place our bets in fewer industries (Business Today, December, 2003)". Therefore he concedes a different context needed a radically different approach. The skills that were needed to manage and succeed in the post-liberalisation era were very different from the earlier decades. Fixing that was his biggest challenge. Birla began the process of "contemporisation" by inducting in fresh talent at midlevels, vertically and horizontally.
290
Within the organisation, that is exactly what he is doing: he has begun the process of what he calls institutionalising procedures and creating a systems orientation. First came the rising sun logo - to impart, as he puts it, a feeling of identity to group companies. Alongside is a major thrust on human resource development: The HR function is being treated at the corporate level. He instituted a performance appraisal across the group, and a programme for tracking and developing high potential managers, which includes developing skills, inter-unit transfers and secondments abroad. Kumar Mangalam has also personally visited top management institutes to attract entry-level talent. More critical, perhaps, are the three new corporate cells, which have already functional for about a year. The first is the corporate strategy cell; which examines new investments and projects, and evaluates national and international developments that will impact group activities. The second cell is the project-monitoring cell; this tracks ongoing projects on a regular basis to ensure that projects are proceeding on schedule.
The third is the manufacturing systems cell; which is expected to track and suggest improvements in quality and productivity. And for the most important part of it, the group has hired people in the age group of 28-30 for industry specific functions. No creating cross currents however, in typical Birla style, he is quick to point out that these crack teams are meant only for the chairman's office, they are also purely a support fimction for senior management across the group. On the structure side the group is heavily networked. All member firms freely interact. The top management is highly decentralised; every profit centre has total operational fi-eedom within certain broad parameters. The concept of knowledge moving around the group is a continuous process. The attitude is of wanting to absorb from everything surrounding the business environment, continuously upgrading and learning.
In the past five years, around 325 senior people retired, and at least 400 young talents were inducted in. It wasn't a coincidence that one of the first senior-level recruit was a HR specialist, Santrupt Misra, who came aboard from HLL. He commented, "The group's HR policy has gone in for a complete overhaul, with emphasis now on adoption of globally accepted best practices" (Business Today, December, 2003). The new hires - as well as exiting people, got more autonomy. While the senior Birla kept tabs personally on daily production at every unit, sales and cash flows, his inheritor manages the group by giving the senior executives greater autonomy and depending on CVA analyses and MIS. In fact when the group took over a second Australian copper mine, it was Hindalco's Debu Bhattacharya who led the team and clinched the deal; earlier it would have been a Birla himself However, that does not mean the young Birla is a hands-off manager. When Chermai based chartered accountant, S. Gurumurthy mediated to settle the L&T deal, it was Kumar himself who saw it through from the frontline, not any of his deputies.
Currently, Kumar Mangalam's A -Team comprises of: Santrupt Misra - an ex HLL joined in 1996, he heads the HR and corporate InfoTech functions of the group and has put in place the groups HR systems and processes; Saurabh Misra - an ex ITC joined in 1999, heads the groups cement businesses. He played a key role in the take over of the L&T's cement division. He was also responsible for the Birla - AT&T merger with Tata Cellular, to form IDEA Cellular; Debu Bhattacharya - another ex HLL joined in 1998, spearheaded the groups foray into copper. He now heads the group's non-ferrous metals business, simultaneously
291
being the MD of Hindalco; Shailendra Jain - an old - timer, he began his career in the group in 1965, heads the groups VSF and yam businesses, both domestic as well as overseas; Sanjeev Aga - ex MD Blow Plast joined in 1997, handles the groups fledgling software business as well as TransWorks, the newly BPO outfit; S.K. Mitra -joined the group in 1994 and is the head of the group's overall financial planning, as well as heading the mutual funds and insurance joint-ventures; M.C. Bagrodia - at 66, he is one of the oldest in his core team who has worked with four generations of Birla's since 1956, He currently heads the Birla Management Centre, the group's apex strategic decision making entity; Bharat K. Singh - As director corporate strategy and business development, he heads a team that tracks and evaluates new business opportimities and recommends new strategies and plans.
Back in 1995, it wasn't the stock markets that were sceptical about the young Birla. Ten years on, Kumar's recast of the group and consolidation of its businesses through acquisition, integration and restructuring seems to have paid back "Grasim has been the fastest growing cement company in the last five years, while the VSF business has provided most of the cash, says D.D. Rathi, Group Executive President (Business Today, December, 2003)". In commodity businesses like cement and aluminium, Birla has managed to guard against cyclical vagaries of the marketplace by going up the value-chain. In case of Hindalco, 60% of the production is of value-added products. In the highly profitable insulation business, it has tied up with NGK of Japan. Says Rakesh Jain, a former GE Plastics Executive, who had been appointed CEO of Indo-Gulf Fertilisers; "We are well positioned to weather any uncertainty, including decontrol of the sector" (Business Today, December, 2003).
One of the final outcomes has been the re-rating of stocks of the group's pivotal companies. Grasim on the strength of its cement business, trades at a PE of 17.75 (November, 2003), compared to 9.7 in 1995; Hindalco at 20.5, compared to 11.2 in 1995. Says Manish Chokhani, Director, Enam Securities, "The market has factored in the organisational changes and re-rated the group's stocks" (Business Today, December, 2003). True, there are others with big ambition in commodity-oriented businesses - like Sterlite Industries (Hindalco's primary competitor), but Birla's sheer dominance across a swathe of commodities is difficult to match. Thus while commodity businesses are highly cyclical in nature, the groups strong exposure in a number of commodities, had reduced its risk on the vagaries of cyclical fluctuations.
But the same carmot be said of his other businesses. Like many other big industrial groups, Aditya Birla group has also forayed into new and emerging industries. In sharp contrast to his commodities businesses, they are still small and in some instances not very successful. His InfoTech venture is too tiny in comparison to the industry heavy weights; his presence in telecom in IDEA Cellular is more of a financial stake, rather than strategic; and a slew of joint-ventures in financial services like mutual fiinds and insurance are still in their formative stages. Although the takeover of Madura Garments in 2000, gave him a head start in the apparel market, competition in that segment is ever increasing, with incoming threat from local players. He also made tentative entries into entertainment and media (including an aborted move for a joint-venture with Star TV). The young Birla defends some of these not-so-successful ventures as 'testing the waters'; and others like his BPO and IT businesses as the ones that could well prove too big in the long haul. He is not quite sure whether his group will look different in the next (5-10) years in terms of business portfolio; but he is very sure it will be quite different in terms of size. Kumar Mangalam replies, "I am convinced that we
292
(the group) have all that it takes to be in the Fortune 500 by the turn of the decade" (Business Today, December, 2003).
Currently, nearly 80% of the group's turnover comes from its cash cows of textiles (including VSF and VFY), cement, carbon black, aluminium and fertiliser. In all these industries the group faces little or no threat from local or global competition even as tariff barriers are falling. In carbon black, despite the tariff barriers being reduced from 179% in 1991 to 30% in 1998, the group had fended off import threats successfully and kept its bottom-lines healthy. Beyond the geographical botmdaries, the group's companies in Thailand - Thai Carbon Black and Alexandria Carbon Black, together produces 1.2 lakh tpa of carbon black; making them the largest producers in South-East Asia. Besides it has plants in Indonesia, Malaysia, Philippines and Egypt and its products are exported to US, UK, France, Italy and Japan. Indian Rayon is the second largest textile manufacturer in the country today. Grasim today accounts for about 9% of the global production of VSF. The share is likely to go up in the future because stringent norms discourage new capacities in the developed world. These industry specific problems, like envirormiental pollution, makes imports a dwindling threat to the group. As such the landed price of VSF and most of its products are far higher than its domestic prices. A healthy annual growth in demand at around 8%, fortifies the group's market position.
As for cement, domestic capacity pre-empts imports, however increasing threat is from global players like La Farge, which have deep pockets. In aliuniniimi, the prices are linked to the LME, but Hindalco's low freight costs make it more attractive to local users. Businesses like paper have become dogs with import duties being slashed from 140% in 1991 to 20% in 1998. And the new businesses the group has jumped into - such as telecom services, qualify only as post liberalisation question marks. Therefore restructuring the translational conglomerate to face international competition will not be an easy task, nor that the Birlas are blind to the need to reconfigure. Far from it, admits B.K. Birla the septuagenarian groups' founder whose Rs. 4500 crore group comprising primarily Rs. 1990 crore Century Textiles, Rs. 600 crore Century Textiles and Rs. 650 crore Kesoram Industries will eventually come to Kumar Managalam: "Restructuring will not be easy task given the groups 93 year old legacy and the country's tax structure (Business Today, January, 1998)." As a sort to medium term strategy, the group had launched an internal refocusing programme, code-named "Vision -2002", whose objective is to chart out the groups competitiveness in the next five years. Post 1992 boom and the accession of Kumar Mangalam as the group's chairman, the stock market had heavily discoimted the group's stocks negatively. However, post 2000 when all the diversifications had fallen into place, investor's confidence revived, and valuation of group companies improved.
293