diurnal variation, vertical distribution and source apportionment of carcinogenic polycyclic...
TRANSCRIPT
$VLDQ�3DFLÀF�-RXUQDO�RI�&DQFHU�3UHYHQWLRQ��9RO��������� 1851
DOI:http://dx.doi.org/10.7314/APJCP.2013.14.3.1851Diurnal Variation in Carcinogenic PAHs in Chiang-Mai, Thailand
$VLDQ�3DFLÀF�-�&DQFHU�3UHY� 14 (3), 1851-1863
Introduction
Several attempts have been made to obtain information related to the fate of particulate polycyclic aromatic hydrocarbons (PAHs) in atmospheric environment from different countries (Tsapakis et al., 2005; Hong et al., 2007; Tasdemir and Esen, 2007; Tham et al., 2008; Zhang and Tao, 2008; Lee et al., 2011; Hanedar et al., 2011; Tan et al., 2011; Choi et al., 2012; Hu et al., 2012). PAHs DUH�FODVVLÀHG�DV�D�JURXS�RI�SHUVLVWHQW�RUJDQLF�SROOXWDQWV�(POPs), typically contain two to eight aromatic rings, generated by imperfect combustions or high-pressure processes when organic materials are exposed to high temperatures or pressures. PAHs can be released by both DQWKURSRJHQLF��H�J��WUDIÀF�HPLVVLRQV��GRPHVWLF�KHDWLQJ��industrial activities) and natural emission sources (e.g. DJULFXOWXUDO�ZDVWH�DQG�ELRPDVV�EXUQLQJV��IRUHVW�ÀUHV���/L�et al., 1999; Okuda et al., 2002; Yang et al., 2002; Rajput et al., 2011; Riva et al., 2011; Slezakova et al., 2011; Lu et al., 2012). Numerous interests have been focusing over its negative impacts on human health associated with cancer, endocrine disruption, reproductive and developmental effects in the past decades (Hoyer, 2001; Matsui, 2008; Liao et al., 2011; Wickramasinghe et al., 2012). It is also 1,'$�&HQWHU� IRU�5HVHDUFK� DQG�'HYHORSPHQW� RI�'LVDVWHU�3UHYHQWLRQ� DQG�0DQDJHPHQW�� 6FKRRO� RI� 6RFLDO� DQG�(QYLURQPHQWDO�'HYHORSPHQW��1DWLRQDO�,QVWLWXWH�RI�'HYHORSPHQW�$GPLQLVWUDWLRQ��1,'$���6HUHHWKDL�5RDG��.ORQJ�&KDQ��%DQJNDSL��%DQJNRN���������7KDLODQG�� )RU�FRUUHVSRQGHQFH��SRQJSLDMXQ#JPDLO�FRP
Abstract
Diurnal variation of particulate polycyclic aromatic hydrocarbons (PAHs) was investigated by collecting PM10
at three different sampling altitudes using high buildings in the city center of Chiang-Mai, Thailand, during the
relatively cold period in late February 2008. At site-1 (12 m above ground level), B[a]P concentrations ranged
from 30.3 -1,673 pg m-3 with an average of 506±477 pg m-3��FRQWULEXWLQJ�RQ�DYHUDJH�������������WR�ƙ3$+V��,QG�and B[b]F concentrations varied from 54.6 to 4,579 pg m-3 and from 80.7 to 2,292 pg m-3 with the highest average
of 1,187±1,058 pg m-3 and 963±656 pg m-3��FRQWULEXWLQJ�RQ�DYHUDJH�������������DQG������������WR�ƙ3$+V��respectively. Morning maxima were predominantly detected in all observatory sites, which can be described by
W\SLFDO�GLXUQDO�YDULDWLRQV�RI�WUDIÀF�ÁRZ�LQ�&KLDQJ�0DL�&LW\��VKRZLQJ�D�PRUQLQJ�SHDN�EHWZHHQ���$0��DQG���$0��'HVSLWH�WKH�IDFW�WKDW�PRVW�PRQLWRULQJ�VLWHV�PLJKW�EH�VXEMHFWHG�WR�VSHFLÀF�VLWH�LPSDFWV��LW�FRXOG�EH�VHHQ�WKDW�3$+�SURÀOHV�LQ�6LWH���DQG�6LWH���ZHUH�DVWRQLVKLQJO\�KRPRJHQHRXV��7KH�ODFN�RI�GLIIHUHQFHV�VXJJHVWV�WKDW�WKH�VRXUFH�VLJQDWXUHV�RI�VHYHUDO�3$+V�EHFRPH�OHVV�GLVWLQFW�SRVVLEO\�GXH�WR�WKH�LPSDFWV�RI�WUDIÀF�DQG�FRRNLQJ�HPLVVLRQV�IURP�ground level.
Keywords: Diurnal variation - vertical distribution - PAHs - agricultural-waste burning - Chiang-Mai
RESEARCH ARTICLE
'LXUQDO� 9DULDWLRQ�� 9HUWLFDO� 'LVWULEXWLRQ� DQG� 6RXUFH�Apportionment of Carcinogenic Polycyclic Aromatic
Hydrocarbons (PAHs) in Chiang-Mai, Thailand
6LZDWW�3RQJSLDFKDQ
well known that PAHs play a major role in causing lung cancers (Okona-Mensah et al., 2005; Liao et al., 2011; Xia et al., 2013). Currently, there are some trends in that more studies are highlighting the behaviour of particulate PAHs in tropical countries (Mayol-Bracero et al., 2001; Bourotte et al., 2005; Boonyatumanond et al., 2007; He and Balasubramanian, 2009; Vasconcellos et al., 2010). In spite of copious studies related to the determination of 3$+�FRPSRVLWLRQV� LQ� FRDUVH� DQG�ÀQH� SDUWLFOHV� DURXQG�the world, there is inadequate information considering the characterization of particulate PAHs in tropical atmosphere. Most examinations have been focused on empirical estimations of source apportionment of PAHs using factor analysis’ technique with data from ground-based measurement (Wan et al., 2006; Gupta et al., 2011; Dvorská et al., 2012; Hu et al., 2012). Unfortunately, there are only limited studies observing the fate of particulate PAHs in Thailand (Chetwittayachan et al., 2002; Ruchirawat et al., 2002; 2005; 2007; Boonyatumanond et al., 2007; Pongpiachan et al., 2009). Above all, there are no international publications associated with both diurnal and vertical distribution of PAHs in the atmospheric environment of Thailand.
Siwatt Pongpiachan
$VLDQ�3DFLÀF�-RXUQDO�RI�&DQFHU�3UHYHQWLRQ��9RO���������1852
Many studies have mentioned the deterioration of air quality level triggered by agricultural-waste and biomass burnings in the northern part of Thailand over the past few years (Oanh et al., 2011; Wiwatanadate and Liwsrisakun, 2011; Li et al., 2012). For example, the significant enhancement in the number of patients continually feeling distressed with respiratory disease was detected to increase 20% in 2007 as compared to the identical period in 2006 (Pengchai et al., 2009). Unintentional biomass burnings, DJULFXOWXUDO�ZDVWH� EXUQLQJV� DQG� IRUHVW� ÀUHV�� LQFOXGLQJ�trans boundary haze pollution from neighboring countries appears to responsible for the heightening of PM10 level and thus the increasing number of patients admitted to hospital during the haze episode. Apart from smoking, the environmental and occupational factors might have SOD\HG�D�VLJQLÀFDQW�UROH�RQ�OXQJ�FDQFHU�LQ�&KLDQJ�0DL�province (Wiwatanadate, 2011). For instance, in the year 2007, the age-standardized incidence rate in males was 31.3 and that in female was 22.9 per 100,000 population �:LZDWDQDGDWH���������7KHVH�ÀQGLQJV�DUH�FRQVLVWHQW�ZLWK�the results of relatively high monohydroxy polycyclic aromatic hydrocarbons (OHPAHs) found in urine samples IURP�QRQ�VPRNLQJ�WD[L�GULYHUV��WUDIÀF�SROLFHPHQ�DQG�UXUDO�villagers of Chiang Mai, Thailand (Chetiyanukornkul et al., 2006). Although meteorological factors can dramatically LQÁXHQFH� WKH� IDWH� RI� SDUWLFXODWH�3$+V�� WKHUH� KDV� EHHQ�no study examining both diurnal variations and vertical distributions of particulate PAH contents in different altitudes of urban atmosphere in a northern city of Thailand. Overall, the major objectives of this study are to i) examine the diurnal variation of PAH contents in PM10 at three different heights and ii) conduct the source apportionment of PAHs at different atmospheric layers by using principal component analysis (PCA). PM10 samples were collected every three hours for three days at three different levels (i.e. site-1: 12 m; site-2: 52 m; site-3: 152 m above the ground level) at the Imperial Mae Ping Hotel (site-2) and Centara Duangtawan Hotel (site-1 and site-3) from February 25th-28th, 2008. Materials and Methods
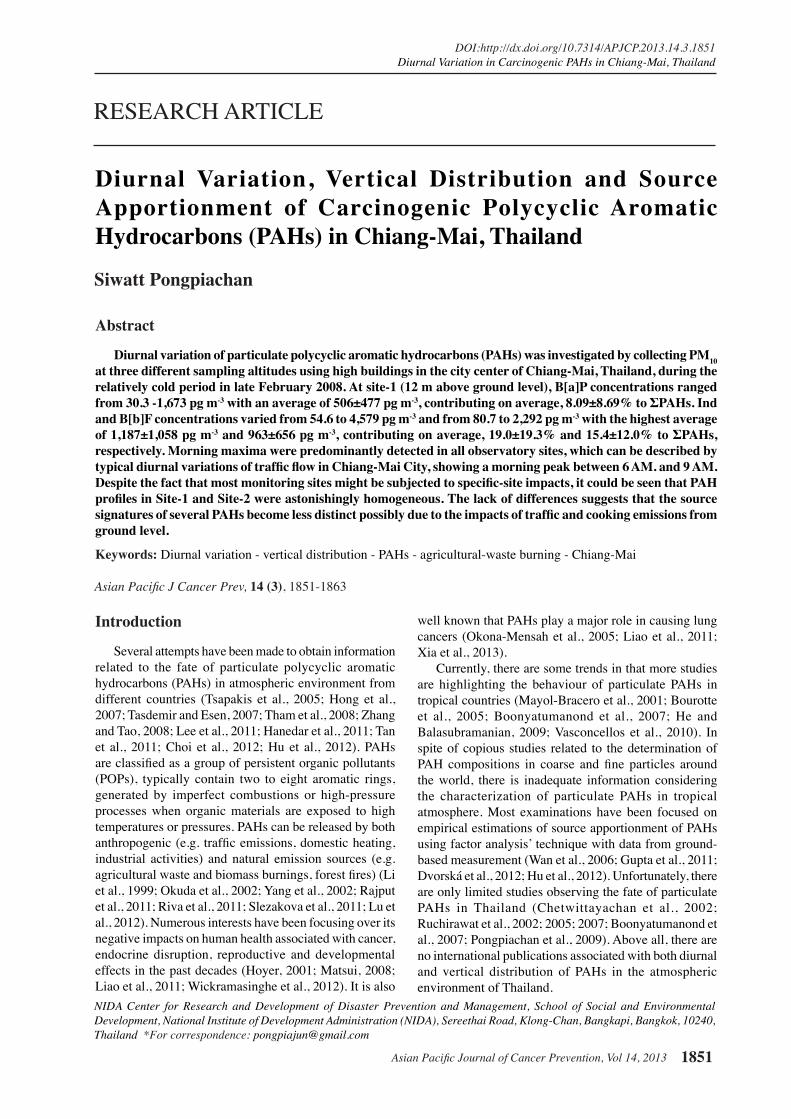
'HVFULSWLRQ�RI�REVHUYDWRU\�VWDWLRQV Two observatory stations, namely Centara Duangtawan Hotel (18°47’03.46’’N 98°59’56.72’’E) and Imperial Mae Ping Hotel (18°46’59.03’’N 98°59’53.29’’E), are situated in the most densely populated area in Chiang-Mai City, which is highly reputed among foreign visitors as tourism hotspots called “Night Bazaar”. Three different sampling stations were cautiously chosen due to their heights. Site-1 and site-3 were located at Centara Duangtawan Hotel at 12 m and 152 m above ground level respectively, whilst site-2 was situated at Imperial Mae Ping Hotel at 52 m above the building basement. Figure 1 shows the map of sampling sites area. The street map of Night Bazaar is shown in the left panel of Figure 1 with the Ping river and Khlong Mae Sa canal shown as blue. The monitoring stations are situated ~640 m away from the Ping River in the west and ~3.65 km from the Chiang-Mai International Airport in the east.
Chiang-Mai is the largest and most culturally VLJQLÀFDQW�FLW\�LQ�QRUWKHUQ�7KDLODQG��7KH�FLW\�RI�&KLDQJ�Mai consists of a total population of approximately 160,000. The observatory site is roughly 2.85 km away IURP�D�KHDY\�WUDIÀF�KLJKZD\�1R����LQ�WKH�ZHVW�DQG�a��km away from the city center in the southeast. Apart from WKH�WUDIÀF��WKHUH�DUH�QR�PDMRU�LQGXVWULDO�DQG�DJULFXOWXUDO�waste burning activities for several kilometers around the observatory site and thus the PAH contents are more representative of the urban background. An intensive sampling campaign was conducted at all observatory sites instantaneously from February 25th (Monday) to 28th (Thursday) 2008 in the relatively cold period. PM10 samples were collected every three hours consecutively from 2100 h February 25th to 2100 h February 28th by using Andersen High Volume Air Sampler PM10 TE6001 ZLWK� WKH�ÁRZ� UDWH� RI� ������P3 min-1. Further detailed information of the PM10 sampling method was given in “Compendium Method IO-2.2. Sampling of Ambient Air for PM10 Using an Andersen Dichotomous Sampler”.
Figure 1. Diurnal Variation of Three-to-Four Ring
PAHs in Chiang-Mai from 25/02/08-28/02/08
$VLDQ�3DFLÀF�-RXUQDO�RI�&DQFHU�3UHYHQWLRQ��9RO��������� 1853
DOI:http://dx.doi.org/10.7314/APJCP.2013.14.3.1851Diurnal Variation in Carcinogenic PAHs in Chiang-Mai, Thailand
)LOWHU�VDPSOH�FROOHFWLRQ�DQG�PHWHRURORJLFDO�GDWD Local meteorological parameters such as barometric pressure, temperature, humidity, rainfall, wind speed and direction, UV/solar radiation were measured at 1 min intervals using instruments and cabled weather station with a versatile sensor suite, Davis Vantage Pro2. The wind and other meteorological parameter sensors were installed at ~1.5 m from the ground level from each observatory site. PM10 samples were collected on 47 mm :KDWPDQ�TXDUW]�PLFURÀEUH�ÀOWHUV��40�$��IRU�WKH�DQDO\VLV�RI� 3$+V� DQG�ZDWHU�VROXEOH� LRQLF� VSHFLHV��7KH�40�$�were pre-heated to 800°C for 3 h prior to use to avoid any potential contamination. The weight of PM10 samples ZDV�REWDLQHG�E\�VXEWUDFWLQJ�WKH�LQLWLDO�ZHLJKW�RI�40�$�E\�using electronic microbalance Mettler Toledo AB204-S (Columbus (Ohio), USA). The vertical atmospheric temperature, pressure, relative humidity and wind speed SURÀOHV�ZHUH�PRQLWRUHG�HYHU\�VL[�KRXUV�E\�XVLQJ�ZHDWKHU�balloon coupled with radiosonde and carefully analyzed by research staff from the Meteorological Department of Thailand.
3RO\F\FOLF�DURPDWLF�K\GURFDUERQV��3$+V� All organic solvents (i.e. DCM and Hexane) are HPLC JUDGH��SXUFKDVHG�IURP�)LVKHU�6FLHQWLÀF��$�FRFNWDLO�RI����PAHs Norwegian Standard (NS 9815: S-4008-100-T) (phenanthrene (Phe), anthracene (An), fluoranthene �)OXR���S\UHQH��3\U�����K�EHQ]R>D@ÁXRUHQH����+�%>D@)�����K�EHQ]R>E@ÁXRUHQH� ���+�%>E@)��� EHQ]>D@DQWKUDFHQH��%>D@$��� FKU\VHQH� �&KU\��� EHQ]R>E@ÁXRUDQWKHQH� �%>E@)���EHQ]R>N@ÁXRUDQWKHQH��%>N@)���EHQ]R>D@S\UHQH��%>D@P), benzo[e]pyrene (B[e]P), indeno[1,2,3-cd]pyrene (Ind), dibenz[a,h]anthracene (D[a,h]A), benzo[g,h,i]SHU\OHQH��%>J�K�L@3���HDFK�����ƫJ�P/-1 in toluene: unit: 1×1 mL) and a mix of recovery Internal Standard PAHs (d12-perylene (d12-Per), d10�ÁXRUHQH��G10�)O���HDFK�����ƫJ�mL-1 in xylene: unit: 1×1 mL) were supplied by Chiron AS (Stiklestadveine 1, N-7041 Trondheim, Norway). Standard VWRFN�VROXWLRQV�RI���ƫJ�P/-1 of deuterated PAHs (used as LQWHUQDO�VWDQGDUG��DQG����ƫJ�P/-1 of native PAHs were prepared in nonane. Working solutions were obtained by appropriate dilution in n-cyclohexane. All solutions were stored in amber colored vials at -20oC. Silica gel (0.040-0.063 mm), purchased from Merck. All materials used (silica gel, glass and cotton wool etc.) were Soxhlet extracted with DCM for 24 h, and kept dry (in desiccator) until use. All glassware was cleaned by washing with decanted water before drying at 55°C, and rinsed with DCM just before use. The fractionation/cleanup and blow-down process followed the method reported by Gogou et al. (1996). After the extraction, the DCM solvent was concentrated to dryness by a combination of rotary evaporation and blowing under a gentle nitrogen stream. The concentrated extract was then diluted in 10 ml of n-hexane before application to the top of a disposable silica gel column. The extract was then fractionated into LQGLYLGXDO�FRPSRXQG�FODVVHV�E\�ÁDVK�FKURPDWRJUDSK\�RQ�silica gel as follows: The concentrate was applied to the top of a 30×0.7 cm diameter column, containing 1.5 g of silica gel (activated at 150ºC for 3 h). Nitrogen pressure ZDV�XVHG�WR�LQ�RUGHU�WR�REWDLQ�D�ÁRZ�RI�����PO�PLQ-1 at
the bottom of the column. The following solvents were used to elute the different compound classes: (1) 15 ml n-hexane (fraction 1, light molecular weight PAHs); (2) 15 ml toluene-n-hexane (5.6:9.4) (fraction 2, middle and heavy molecular weight PAHs). The sample was further reduced to incipient prior to being made up to volume ZLWK�F\FORKH[DQH��H[DFWO\�����ƫO�LQ�D�*&�06�YLDO�LQVHUW�IRU�ERWK�*))�40)�DQG�38)�VDPSOHV��SULRU�WR�*&�06�analysis (i.e. Varian Saturn Ion Trap 2000 GC/MS System with CP-3800 GC). More detailed GC/MS method was provided in a previous reference and will not be discussed here (Pongpiachan et al., 2009). Accuracy was evaluated using the standard SRM 1941b. Mean recovery (based on H[WUDFWLRQ�RI�PDWUL[�PDWFKHG�FHUWLÀHG�UHIHUHQFH�PDWHULDOV��of Phe, Fluo, Pyr, B[a]A, Chry, B[b]F, B[k]F, B[e]P, Ind, B[g,h,i]P were 119±16%, 112±12%, 95±11%, 82±13%, 77±28%, 87±29%, 87±38%, 125±53%, 128±26%, 124±27% respectively. The precision of the procedure, calculated as relative standard deviation on the duplicate samples, was less than 15%. All sample concentrations were calculated using standardized relative response factors run with each batch (Pongpiachan et al., 2009).
7UDFH�JDVHRXV�DQG�ZDWHU�VROXEOH�LRQLF�VSHFLHV The determination of atmospheric trace gas concentrations constitutes (i.e. NOx, CO and O3) was performed by using a chemiluminescence technique. NO/NO2/NOx Analyzer (Model 200E, Teledyne Technologies Incorporated, USA), which gives an average of sampling data in the range of 50 ppb to 20 ppm with the instrumental detection limit of 0.4 ppb, was carefully selected for the NOx measurement. CO was detected by a gas ÀOWHU� FRUUHODWLRQ�&2�$QDO\]HU��0RGHO� ���(��7HOHG\QH�Technologies Incorporated, USA with the function of continuous self- checking with alarms and bi-directional RS-232 for remote operation. The instrumental sensitivity for CO determination ranges from 0-1 ppm to 0-1,000 ppm with the instrumental detection limit of 0.04 ppm. In this study, O3 was monitored by UV Adsorption O3 Analyzer Model 400 E, Teledyne Technologies Incorporated, USA with the analytical range of 0-100 ppb to 0-10 ppm with the instrumental detection limit of 0.6 ppb. NOx, CO and O3 were continuously monitored and then automatically averaged over 15 minutes. Seven water-soluble ionic species (WSIS), namely Cl-, NO3
-, SO42-, Na+, NH4
+, K+ and Ca2+, in PM10 were also measured during the monitoring campaign. The Metrohm IC system which comprise 819 Advance IC Pump, 819 Advance IC Detector, 820 Advance IC Separation Center, 833 Advance IC Liquid Handling Suppressor Unit and 830 Advance IC Interface, was employed for the analysis of seven WSIS. The setup, quality control and quality assurance of instrument and analytical method have been previously explained (Lai et al., 2007; Tao et al., 2007). For more details the reader is referred to the aforementioned publications.
2&�(&�DQDO\VLV Procedures for OC/EC analysis including calibrations DQG�4$�4&�ZHUH� FRQGXFWHG� DW� WKH� ODERUDWRU\� RI� WKH�Department of Civil and Structural Engineering, Research Centre for Urban Environmental Technology and
DOI:http://dx.doi.org/10.7314/APJCP.2013.14.3.1851Diurnal Variation in Carcinogenic PAHs in Chiang-Mai, ThailandSiwatt Pongpiachan
$VLDQ�3DFLÀF�-RXUQDO�RI�&DQFHU�3UHYHQWLRQ��9RO���������1854
Management, The Hong Kong Polytechnic University, China. These procedures are essentially the same as described earlier by Cao et al. (2003). Generally, OC DQG�(&�ZHUH� GHÀQHG� DV� VXP�RI�2&� IUDFWLRQV� DQG�(&�fractions (OC1+OC2+OC3+OC4) and EC fractions (EC1+EC2+EC3+OP) individually, based on the IMPROVE TOC (Interagency Monitoring to Protect Visual Environments Total Organic Carbon) protocol (Chow et al., 1993; 2001; Fung et al., 2002). For more GHWDLOV��WKH�TXDOLW\�FRQWURO�DQG�TXDOLW\�DVVXUDQFH��4$�4&��have been discussed in Cao et al. (2003).
'DWD�DQDO\VLV In DJJORPHUDWLYH�KLHUDUFKLFDO�FOXVWHULQJ every case is initially considered as a cluster then the two cases with the lowest distance (i.e. highest similarity) are combined into a cluster. The case with the lowest distance to either RI� WKH�ÀUVW� WZR� LV� FRQVLGHUHG�QH[W�� ,I� WKDW� WKLUG�FDVH� LV�FORVHU�WR�D�IRXUWK�FDVH�WKDQ�LW�LV�WR�HLWKHU�RI�WKH�ÀUVW�WZR��the third and fourth cases become the second two-case FOXVWHU��LI�QRW��WKH�WKLUG�FDVH�LV�DGGHG�WR�WKH�ÀUVW�FOXVWHU��The process is repeated, adding cases to existing clusters, creating new clusters, or combining clusters to get to the GHVLUHG�ÀQDO�QXPEHU�RI�FOXVWHUV��,Q�FRQWUDVW��WKH�GLYLVLYH�FOXVWHULQJ�works in the opposite direction, starting with all cases in one large cluster. As one might have an interest in investigating the diurnal variation patter of PAHs, the DJJORPHUDWLYH�KLHUDUFKLFDO�FOXVWHU�DQDO\VLV is probably the most suitable for this objective, with relatively small sample numbers. The fundamental principles of various chemical methods for receptor modeling, including chemical mass balance (CMB) and multivariate method, have been review in details (Blifford, 1967; Gordon, 1988; Watson, 1994). Factor analysis offers the advantages of not requiring prior knowledge of the chemical composition and size GLVWULEXWLRQ�RI� HPLVVLRQV� IURP�VSHFLÀF� VRXUFHV� �VRXUFH�SURÀOHV��EXW�KDV�WKH�GUDZEDFN�RI�EHLQJ�PDWKHPDWLFDOO\�indeterminate, allowing a wide range of possible solutions even when it is applied to relatively simple simulated data sets. In urban atmosphere, which is composed by many potential and diverse sources, principal component analysis (PCA) has been chosen by many researchers for source apportionment. This technique has been widely applied to source apportionment of particulate pollutants, especially trace metals, and more recently, PAHs. In order to identify sources, multivariate receptor modeling can be applied to the observed target compound data. Multivariate approaches are based on the idea that the time dependence of a chemical species at the receptor site will be the same for species from the same source. Chemical species are measured in a large number of samples gathered at a single receptor site over time. Species of similar variability are grouped together in a minimum number of factors that explain the variability of data set. It is assumed that each factor is associated with a source or source type. However, the method has some limitations in that it can recognize at most only about eight individual source categories in any study, and poor discrimination of closely related source categories is commonly found. A further disadvantage of multivariate factor analysis is that large numbers of ambient air samples
must be collected and analyzed (usually at least 50) and the statistically independent source tracers are required for each major source type. In contrast to CMB model, multivariate techniques such as PCA are preferable since they require no qualitative insight of the sources of certain chemical species, and thus overcome the limitations of CMB, (Rachdawong et al., 1998; Park et al., 2005). The aim of PCA is to identify the major sources of air pollutant emissions and to select statistically independent source tracers, (Bruno et al., 2000; Miller et al., 2002; Guo et al., 2003). All variables are expressed in standardized form with a mean of 0 and a standard deviation of 1. The total variance therefore equals the total number of variables, and the variance of each factor expressed as a fraction of the total variance (referred to as the eigenvalue). If a factor has a low eigenvalue, then it is contributing little to the explanation of variances in the variables and may be ignored. PCA is generally used when the research purpose is data reduction (i.e. to reduce the information in many measured variables into a smaller set of components). PCA seeks a linear combination of variables such that the maximum variance is extracted from the variables. It then removes this variance and seeks a second linear combination that explains the maximum proportion of the remaining variance, and so on. This is called the principal axis method and results in orthogonal (uncorrelated) factors. Thus, the largest combination, accounting for most of the variance, becomes principal component 1 (PC1), the second largest accounts for the next largest amount of variances and becomes principal component 2 (PC2), and VR�RQ��,Q�JHQHUDO��WKH�ÀUVW�FRPSRQHQW��P�) for observed variables X�, X�, ………, XS can be expressed as:
P1=a
(1)1X
1+a
(1)2X
2+.... ....+a
(1)pX
p Equation 1
Where the a�����D���������������D���S are the weights chosen to maximize the ratio of the variance of P� to the total variation, subject to the constraint that
ƙp
i=1
a2
(1)i
=at
(1)
a(1)
=1 Equation 2
The second principal component (P�) is the combination of the observed variables, which is uncorrelated with WKH�ÀUVW� OLQHDU�FRPELQDWLRQ�DQG�ZKLFK�DFFRXQWV�IRU� WKH�maximum amount of the remaining total variance not already accounted for by P�. Assume that the data set has n samples for S variables. The basic (nxS) data matrix can be written as:
X11
X12
... ... X1p
X21
X22
... ... X2p
X
(nxp)=
... ... ... ... ... Equation 3
... ... ... ... ...
Xn1
Xn2
... ... Xnp
Where XLM is the value of variable M obtained for sample i. When the matrix X is used, P can be rewritten as:
P=(X-M)A Equation 4
Where 0 is the mean matrix given by:
-X
1
-X
2 ... ...
-X
p
-X
1
-X
2 ... ...
-X
p
$VLDQ�3DFLÀF�-RXUQDO�RI�&DQFHU�3UHYHQWLRQ��9RO���������1855
DO
I:http://dx.doi.org/10.7314/APJCP.2013.14.3.1851D
iurnal Variation in Carcinogenic PAHs in Chiang-M
ai, Thailand
M(nxp) =
... ... ... ... ...
Eq
uatio
n 5
... ... ... ... ...
-X1 -X
2 ... ... -Xp
Where Equation (5) is the m
ean for variable M.
-X
j ���Q�ƙn
i=1 X
ij E
qu
atio
n 6
The m
atrix of VWDQGDUGLVHG�ORDGLQJV, A, is a (SxS) matrix such that A
TA=I. The VFRUHV�P
DWUL[, P, is a (nxS) matrix such that P
TP is a diagonal matrix. Equation
(3) becomes
X
=M
+P
AT
Eq
uatio
n 7
Factor analysis of PCA has been accom
plished in this study on the three-hour average PM
10 data sets including 15 PAH
s, seven water-soluble ionic species,
three trace gaseous species, six meteorological param
eters, organic carbon and elem
ental carbon. The minim
um num
ber of samples (n) for conducting factor
analysis can be calculated by using the following equation;
n
>30+
(V+
3)/2
Eq
uatio
n 8
w
here V represents the number of variables (H
enry et al., 1984). Since RXWOLHUV��L�H��DV�GHÀQHG�E\�WKUHH�WLP
HV�RI�VWDQGDUG�GHYLDWLRQ�IURP�WKH�P
HDQ��of raw
data can dramatically cause unusual errors or events in the analytical
results, it is important to rem
ove these outliers prior to data analysis to avoid propagation of errors (K
umar et al., 2001). In the present investigation, 33
variables and 70 samples (after rem
oving outliers) were taken into accounts for
conducting PCA. Varim
ax rotated factor analysis was selected for perform
ing PCA on m
eteorological parameters of the am
bient air, chemical com
positions of PM
10 and trace gaseous species of the observatory sites. It is worth m
entioning that only those factors having eigenvalue of m
ore than one were selected to
have normalized variables that carry out unit of variance (K
umar et al., 2001).
It is therefore not necessary to perform factor analysis of those initial variables,
which possess an eigenvalue less than one (M
aenhaut and Cafmeyer, 1987). The
number of principal com
ponents (PC) will be carefully chosen based on the sum
of cum
ulative percentage variance higher than 80%. In addition, PCA has been
widely used in perform
ing source apportionment of PA
Hs in aerosol particle
samples from
the atmospheric environm
ent of New
Dehli, India (G
upta et al., 2011), H
arbin, China (Ma et al., 2010), Porto A
legre, RS, Brazil (Teixeira et al., 2012) and Flanders, Belgium
(Ravindra et al., 2006). In addition, SPSS 13.0 was
also used for the Analysis of Variance (AV
OVA
) technique of Multiple Linear
5HJUHVVLRQ�$QDO\VLV��0
/5$��IRU�WKH�VSHFXODWLRQ�RI�LQÁXHQFH�RI�P
HWHRURORJLFDO�param
eters and carbonaceous fractions on variation of particulate PAH
s as previously described by D
achs et al. (2002). In addition, all statistical analysis w
as carried out using the software “SPSS version 13”.
Resu
lts
Statistical descriptions of PA
Hs collected during the observatory period at
Centara Duangtaw
an Hotel and Im
perial Mae Ping H
otel are illustrated in Table 1. A
t all monitoring elevations, the m
ean contents for PM10 ranged from
49.4 to ������ƫJ�P
-3�DQG�IRU�ƙ3$+V��L�H��VXP
�RI����3$+V�1
RUZHJLDQ�6WDQGDUG��1
6�������S-4008-100-T)) and B[a]P from
304 to 18,672 pg m-3 and from
13.7 to 4,673 pg m
-3, respectively. At site-1 (12 m
above ground level), B[a]P concentrations ranged from
30.3 to 1,673 pg m-3 w
ith an average of 506±477 pg m-3, contributing
RQ�DYHUDJH�������������WR�ƙ3$
+V��,QG�DQG�%
>E@)�FRQFHQWUDWLRQV�YDULHG�IURP�
54.6 to 4,579 pg m-3 and from
80.7 to 2,292 pg m-3 w
ith the highest average of 1,187±1,058 pg m
-3 and 963±656 pg m-3, contributing on average, 19.0±19.3%
DQG�����������
�WR�ƙ3$+V��UHVSHFWLYHO\��7KLV�LP
SOLHV�WKDW�ÀYH�WR�VL[�ULQJ�3$+V�
�3$+V��������DUH�FUXFLDO�FRQWULEXWRUV�WR�ƙ3$
+V�P
DVV�FRQFHQWUDWLRQV��,W�LV�DOVR�interesting to note that the m
ajority of PAH
s (5,6) shows the m
aximum
values at Site-3. Since vehicular exhausts and cooking em
issions are two m
ain sources of PA
Hs at ground level, it appears reasonable to assum
e the highest contents of B[a]A
, Chry, B[k]F, B[e]P, B[a]P and B[g,h,i]P at Site-3 are as a consequence of long range transportation of biom
ass burnings from forests and agricultural
0
25.0
50.0
75.0
100.0
New
ly d
iagn
osed
with
out
trea
tmen
t
New
ly d
iagn
osed
with
tre
atm
ent
Pers
iste
nce
or r
ecur
renc
e
Rem
issi
on
Non
e
Chem
othe
rapy
Radi
othe
rapy
Conc
urre
nt c
hem
orad
iatio
n
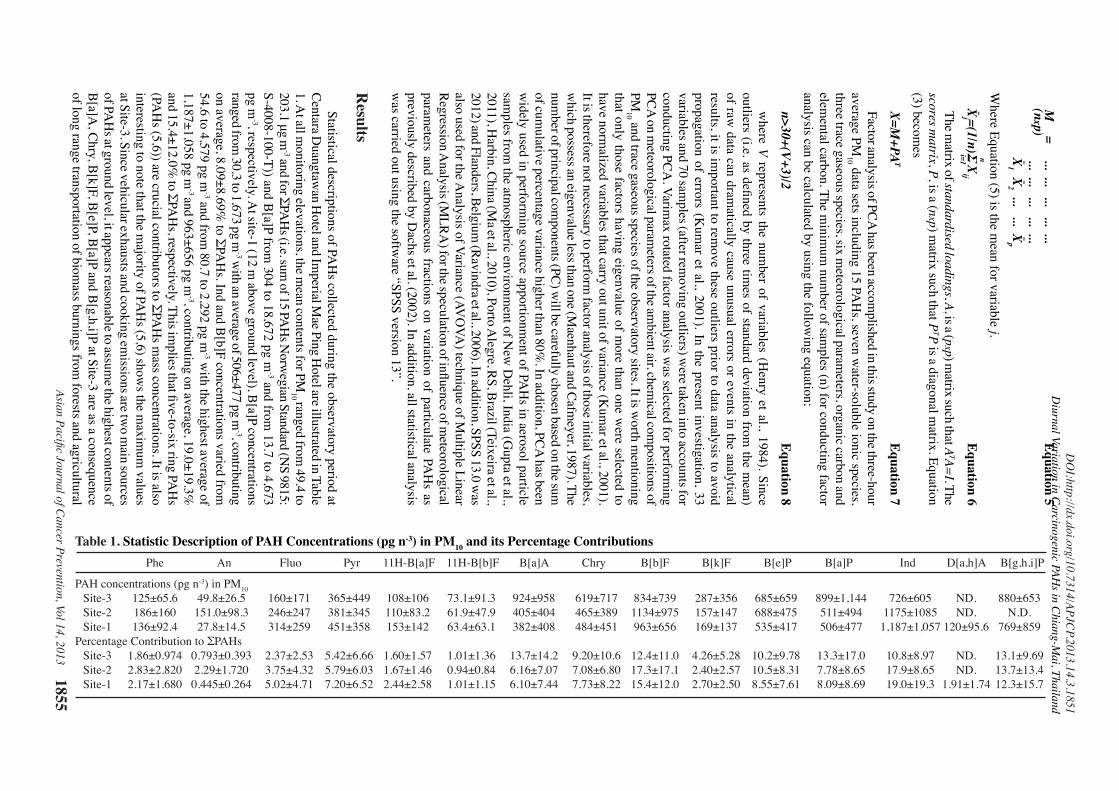
Table 1. 6WDWLVWLF�'HVFULSWLRQ�RI�3$+�&RQFHQWUDWLRQV��SJ�Q-3) in PM10
and its Percentage Contributions
Phe An Fluo Pyr 11H-B[a]F 11H-B[b]F B[a]A Chry B[b]F B[k]F B[e]P B[a]P Ind D[a,h]A B[g,h,i]P
PAH concentrations (pg n-3) in PM10 Site-3 125±65.6 49.8±26.5 160±171 365±449 108±106 73.1±91.3 924±958 619±717 834±739 287±356 685±659 899±1,144 726±605 ND. 880±653 Site-2 186±160 151.0±98.3 246±247 381±345 110±83.2 61.9±47.9 405±404 465±389 1134±975 157±147 688±475 511±494 1175±1085 ND. N.D. Site-1 136±92.4 27.8±14.5 314±259 451±358 153±142 63.4±63.1 382±408 484±451 963±656 169±137 535±417 506±477 1,187±1,057 120±95.6 769±8593HUFHQWDJH�&RQWULEXWLRQ�WR�ƙ3$+V� � � � � � � � Site-3 1.86±0.974 0.793±0.393 2.37±2.53 5.42±6.66 1.60±1.57 1.01±1.36 13.7±14.2 9.20±10.6 12.4±11.0 4.26±5.28 10.2±9.78 13.3±17.0 10.8±8.97 ND. 13.1±9.69 Site-2 2.83±2.820 2.29±1.720 3.75±4.32 5.79±6.03 1.67±1.46 0.94±0.84 6.16±7.07 7.08±6.80 17.3±17.1 2.40±2.57 10.5±8.31 7.78±8.65 17.9±8.65 ND. 13.7±13.4 Site-1 2.17±1.680 0.445±0.264 5.02±4.71 7.20±6.52 2.44±2.58 1.01±1.15 6.10±7.44 7.73±8.22 15.4±12.0 2.70±2.50 8.55±7.61 8.09±8.69 19.0±19.3 1.91±1.74 12.3±15.7
DOI:http://dx.doi.org/10.7314/APJCP.2013.14.3.1851Diurnal Variation in Carcinogenic PAHs in Chiang-Mai, ThailandSiwatt Pongpiachan
$VLDQ�3DFLÀF�-RXUQDO�RI�&DQFHU�3UHYHQWLRQ��9RO���������1856
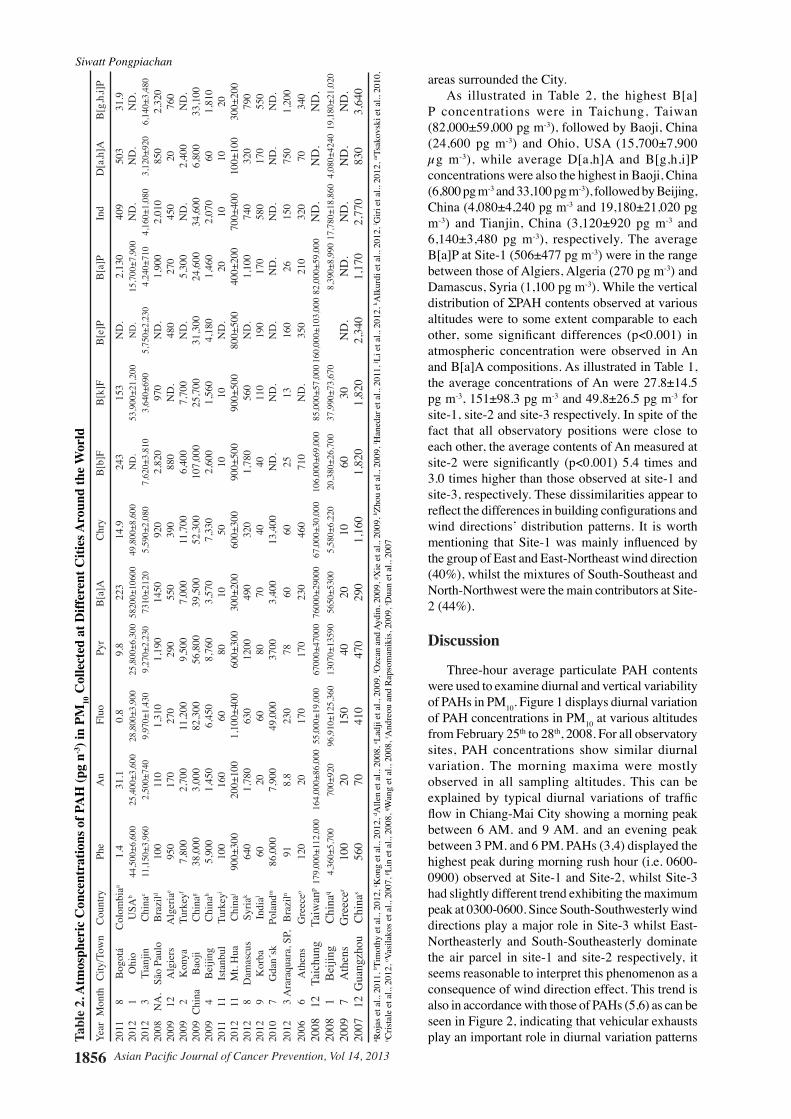
areas surrounded the City. As illustrated in Table 2, the highest B[a]P concentrations were in Taichung, Taiwan (82,000±59,000 pg m-3), followed by Baoji, China (24,600 pg m-3) and Ohio, USA (15,700±7,900 µg m-3), while average D[a,h]A and B[g,h,i]P concentrations were also the highest in Baoji, China (6,800 pg m-3 and 33,100 pg m-3), followed by Beijing, China (4,080±4,240 pg m-3 and 19,180±21,020 pg m-3) and Tianjin, China (3,120±920 pg m-3 and 6,140±3,480 pg m-3), respectively. The average B[a]P at Site-1 (506±477 pg m-3) were in the range between those of Algiers, Algeria (270 pg m-3) and Damascus, Syria (1,100 pg m-3). While the vertical GLVWULEXWLRQ�RI�ƙ3$+�FRQWHQWV�REVHUYHG�DW�YDULRXV�altitudes were to some extent comparable to each RWKHU�� VRPH� VLJQLÀFDQW� GLIIHUHQFHV� �S�������� LQ�atmospheric concentration were observed in An and B[a]A compositions. As illustrated in Table 1, the average concentrations of An were 27.8±14.5 pg m-3, 151±98.3 pg m-3 and 49.8±26.5 pg m-3 for site-1, site-2 and site-3 respectively. In spite of the fact that all observatory positions were close to each other, the average contents of An measured at VLWH���ZHUH� VLJQLÀFDQWO\� �S�������� ���� WLPHV� DQG�3.0 times higher than those observed at site-1 and site-3, respectively. These dissimilarities appear to UHÁHFW�WKH�GLIIHUHQFHV�LQ�EXLOGLQJ�FRQÀJXUDWLRQV�DQG�wind directions’ distribution patterns. It is worth PHQWLRQLQJ� WKDW�6LWH���ZDV�PDLQO\� LQÁXHQFHG�E\�the group of East and East-Northeast wind direction (40%), whilst the mixtures of South-Southeast and North-Northwest were the main contributors at Site-2 (44%). Discussion
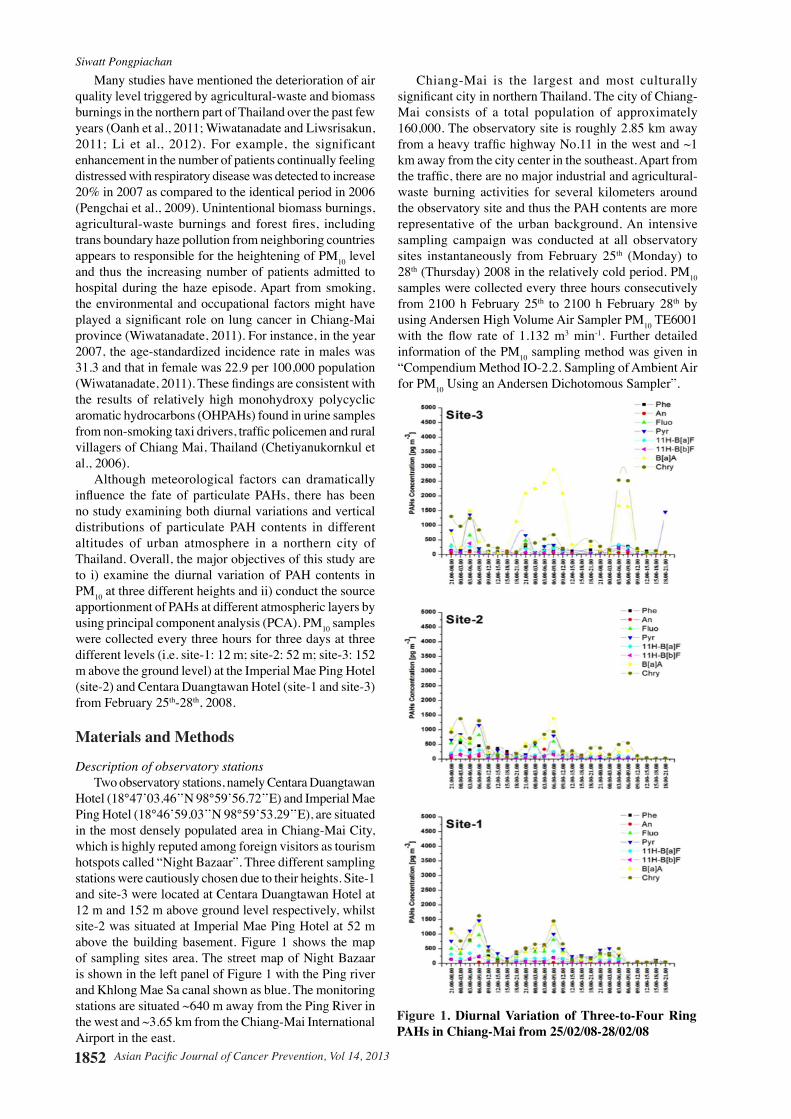
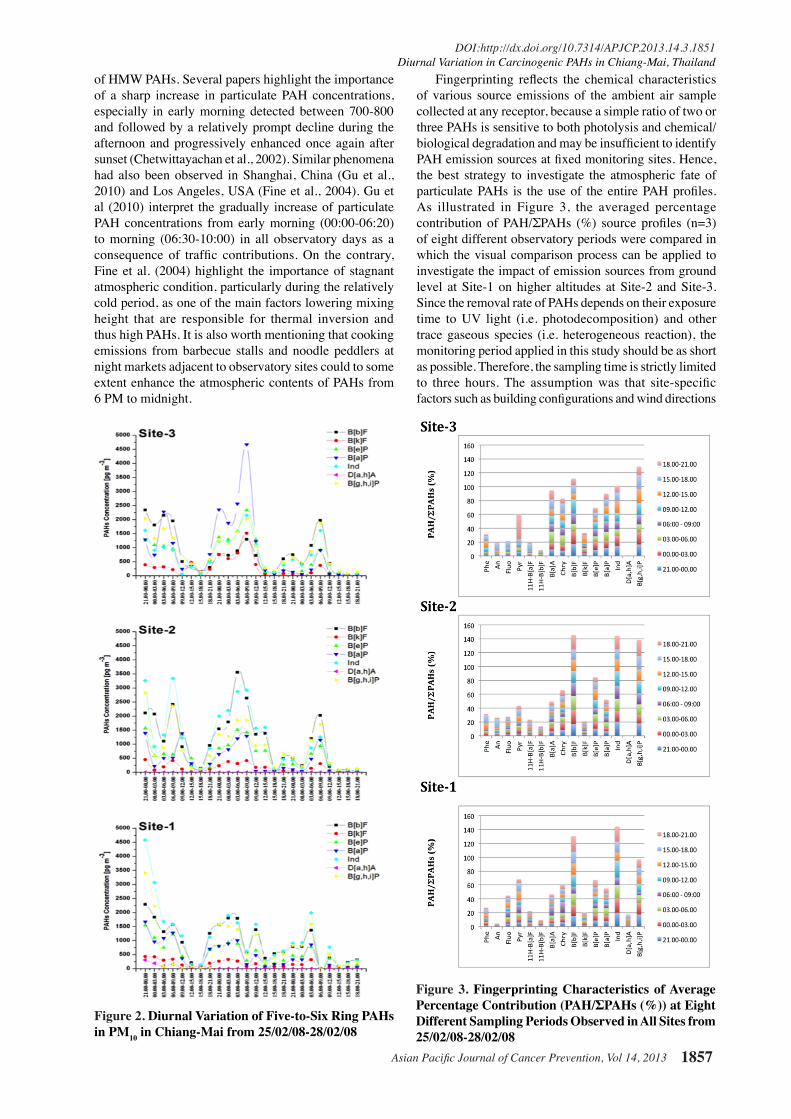
Three-hour average particulate PAH contents were used to examine diurnal and vertical variability of PAHs in PM10. Figure 1 displays diurnal variation of PAH concentrations in PM10 at various altitudes from February 25th to 28th, 2008. For all observatory sites, PAH concentrations show similar diurnal variation. The morning maxima were mostly observed in all sampling altitudes. This can be H[SODLQHG� E\� W\SLFDO� GLXUQDO� YDULDWLRQV� RI� WUDIÀF�ÁRZ�LQ�&KLDQJ�0DL�&LW\�VKRZLQJ�D�PRUQLQJ�SHDN�between 6 AM. and 9 AM. and an evening peak between 3 PM. and 6 PM. PAHs (3,4) displayed the highest peak during morning rush hour (i.e. 0600-0900) observed at Site-1 and Site-2, whilst Site-3 had slightly different trend exhibiting the maximum peak at 0300-0600. Since South-Southwesterly wind directions play a major role in Site-3 whilst East-Northeasterly and South-Southeasterly dominate the air parcel in site-1 and site-2 respectively, it seems reasonable to interpret this phenomenon as a consequence of wind direction effect. This trend is also in accordance with those of PAHs (5,6) as can be seen in Figure 2, indicating that vehicular exhausts play an important role in diurnal variation patterns T
ab
le 2
. A
tmosp
heric
Con
cen
trati
on
s o
f P
AH
(p
g n
-3)
in P
M1
0 C
oll
ecte
d a
t D
iffe
ren
t C
itie
s A
rou
nd
th
e W
orld
Year
Mon
th C
ity/T
own
Coun
try
Phe
An
Fluo
Py
r B[
a]A
Chry
B[
b]F
B[k]
F B[
e]P
B[a]
P In
d D
[a,h
]A
B[g,
h,i]P
2011
8
Bogo
tá
Colo
mbi
aa 1.
4 31
.1
0.8
9.8
223
14.9
24
3 15
3 N
D.
2,13
0 40
9 50
3 31
.920
12
1 O
hio
USA
b 44
,500
±6,6
00
25,4
00±3
,600
28
,800
±3,9
00
25,8
00±6
,300
582
00±1
0600
49
,800
±8,6
00
ND
. 53
,900
±21,
200
ND
. 15
,700
±7,9
00
ND
. N
D.
ND
.20
12
3 Ti
anjin
Ch
inac
11,1
50±3
,960
2,
500±
740
9,97
0±1,
430
9,27
0±2,
230
7310
±212
0 5,
590±
2,08
0 7,
620±
3,81
0 3,
640±
690
5,75
0±2,
230
4,24
0±71
0 4,
160±
1,08
0 3,
120±
920
6,14
0±3,
480
2008
N
A.
São
Paul
o Br
azild
100
110
1,31
0 1,
190
1450
92
0 2,
820
970
ND
. 1,
900
2,01
0 85
0 2,
320
2009
12
A
lgie
rs
Alg
eria
e 95
0 17
0 27
0 29
0 55
0 39
0 88
0 N
D.
480
270
450
20
760
2009
2
Kon
ya
Turk
eyf
7,80
0 2,
700
11,2
00
9,50
0 7,
000
11,7
00
6,40
0 7,
700
ND
. 5,
300
ND
. 2,
400
ND
.20
09 C
hina
Ba
oji
Chin
ag 38
,000
3,
000
82,3
00
56,8
00
39,5
00
52,3
00
107,
000
25,7
00
31,3
00
24,6
00
34,6
00
6,80
0 33
,100
2009
4
Beiji
ng
Chin
ah 5,
900
1,45
0 6,
450
8,76
0 3,
570
7,33
0 2,
600
1,56
0 4,
180
1,46
0 2,
070
60
1,81
020
11
11
Ista
nbul
Tu
rkey
i 10
0 16
0 60
80
10
50
10
10
N
D.
20
10
10
2020
12
11
Mt.
Hua
Ch
inaj
900±
300
200±
100
1,10
0±40
0 60
0±30
0 30
0±20
0 60
0±30
0 90
0±50
0 90
0±50
0 80
0±50
0 40
0±20
0 70
0±40
0 10
0±10
0 30
0±20
020
12
8 D
amas
cus
Syria
k 64
0 1,
780
630
1200
49
0 32
0 1,
780
560
ND
. 1,
100
740
320
790
2012
9
Kor
ba
Indi
al 60
20
60
80
70
40
40
11
0 19
0 17
0 58
0 17
0 55
020
10
7 G
dan´
sk
Pola
ndm
86,0
00
7,90
0 49
,000
37
00
3,40
0 13
,400
N
D.
ND
. N
D.
ND
. N
D.
ND
. N
D.
2012
3
Ara
raqu
ara,
SP,
Br
aziln
91
8.8
230
78
60
60
25
13
160
26
150
750
1,20
020
06
6 A
then
s G
reec
eo 12
0 20
17
0 17
0 23
0 46
0 71
0 N
D.
350
210
320
70
340
2008
12
Ta
ichu
ng
Taiw
anp 1
79,0
00±1
12,0
00
164,
000±
86,0
00 5
5,00
0±19
,000
67
000±
4700
0 76
000±
2900
0 67
,000
±30,
000
106,
000±
69,0
00
85,0
00±5
7,00
0 160
,000
±103
,000
82,
000±
59,0
00
ND
. N
D.
ND
.20
08
1 Be
ijing
Ch
inaq
4,36
0±5,
700
700±
920
96,9
10±1
25,3
60
1307
0±13
590
5650
±530
0 5,
580±
6,22
0 20
,380
±26,
700
37,9
90±7
3,67
0
8,39
0±8,
990
17,7
80±1
8,86
0 4,
080±
4240
19,
180±
21,0
2020
09
7 A
then
s G
reec
er 10
0 20
15
0 40
20
10
60
30
N
D.
ND
. N
D.
ND
. N
D.
2007
12
Gua
ngzh
ou
Chin
as 56
0 70
41
0 47
0 29
0 1,
160
1,82
0 1,
820
2,34
0 1,
170
2,77
0 83
0 3,
640
a Roj
as e
t al.,
201
1, b T
imot
hy e
t al.,
201
2, c K
ong
et a
l., 2
012,
d Alle
n et
al.,
200
8, e L
adji
et a
l., 2
009,
f Ozc
an a
nd A
ydin
, 200
9, g X
ie e
t al.,
200
9, h Z
hou
et a
l., 2
009,
i Han
edar
et a
l., 2
011,
j Li e
t al.,
201
2, k A
lkur
di e
t al.,
201
2, l G
iri e
t al.,
201
2, m
Tsak
ovsk
i et a
l., 2
010,
n C
rista
le e
t al.,
201
2, o V
asila
kos e
t al.,
200
7, p L
in e
t al.,
200
8, q W
ang
et a
l., 2
008,
r And
reou
and
Rap
som
anik
is, 2
009,
s Dua
n et
al.,
200
7
$VLDQ�3DFLÀF�-RXUQDO�RI�&DQFHU�3UHYHQWLRQ��9RO��������� 1857
DOI:http://dx.doi.org/10.7314/APJCP.2013.14.3.1851Diurnal Variation in Carcinogenic PAHs in Chiang-Mai, Thailand
of HMW PAHs. Several papers highlight the importance of a sharp increase in particulate PAH concentrations, especially in early morning detected between 700-800 and followed by a relatively prompt decline during the afternoon and progressively enhanced once again after sunset (Chetwittayachan et al., 2002). Similar phenomena had also been observed in Shanghai, China (Gu et al., 2010) and Los Angeles, USA (Fine et al., 2004). Gu et al (2010) interpret the gradually increase of particulate PAH concentrations from early morning (00:00-06:20) to morning (06:30-10:00) in all observatory days as a FRQVHTXHQFH� RI� WUDIÀF� FRQWULEXWLRQV��2Q� WKH� FRQWUDU\��Fine et al. (2004) highlight the importance of stagnant atmospheric condition, particularly during the relatively cold period, as one of the main factors lowering mixing height that are responsible for thermal inversion and thus high PAHs. It is also worth mentioning that cooking emissions from barbecue stalls and noodle peddlers at night markets adjacent to observatory sites could to some extent enhance the atmospheric contents of PAHs from 6 PM to midnight.
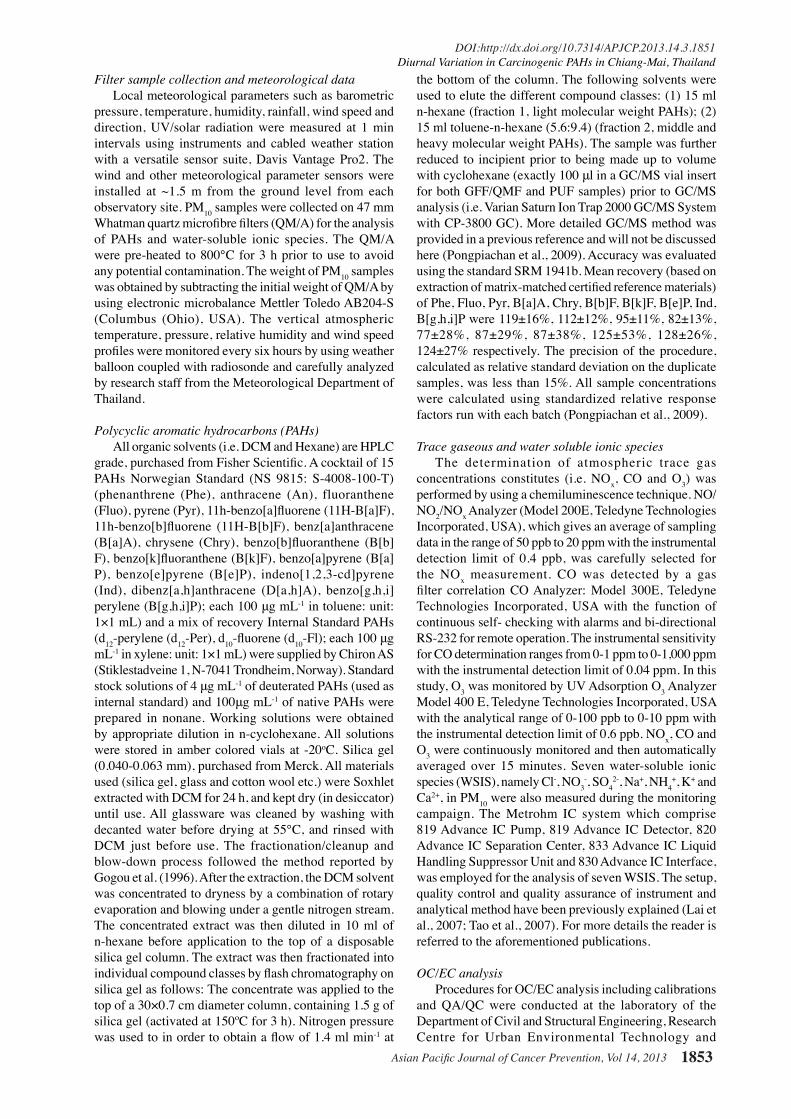
)LQJHUSULQWLQJ� UHÁHFWV� WKH� FKHPLFDO� FKDUDFWHULVWLFV�of various source emissions of the ambient air sample collected at any receptor, because a simple ratio of two or three PAHs is sensitive to both photolysis and chemical/ELRORJLFDO�GHJUDGDWLRQ�DQG�PD\�EH�LQVXIÀFLHQW�WR�LGHQWLI\�3$+�HPLVVLRQ�VRXUFHV�DW�À[HG�PRQLWRULQJ�VLWHV��+HQFH��the best strategy to investigate the atmospheric fate of SDUWLFXODWH�3$+V� LV� WKH�XVH�RI� WKH� HQWLUH�3$+�SURÀOHV��As illustrated in Figure 3, the averaged percentage FRQWULEXWLRQ� RI�3$+�ƙ3$+V� ���� VRXUFH� SURÀOHV� �Q ���of eight different observatory periods were compared in which the visual comparison process can be applied to investigate the impact of emission sources from ground level at Site-1 on higher altitudes at Site-2 and Site-3. Since the removal rate of PAHs depends on their exposure time to UV light (i.e. photodecomposition) and other trace gaseous species (i.e. heterogeneous reaction), the monitoring period applied in this study should be as short as possible. Therefore, the sampling time is strictly limited WR� WKUHH� KRXUV��7KH� DVVXPSWLRQ�ZDV� WKDW� VLWH�VSHFLÀF�IDFWRUV�VXFK�DV�EXLOGLQJ�FRQÀJXUDWLRQV�DQG�ZLQG�GLUHFWLRQV�
Figure 2. 'LXUQDO�9DULDWLRQ�RI�)LYH�WR�6L[�5LQJ�3$+V�in PM
10 in Chiang-Mai from 25/02/08-28/02/08
Figure 3. Fingerprinting Characteristics of Average
3HUFHQWDJH�&RQWULEXWLRQ��3$+�ƙ3$+V������DW�(LJKW�'LIIHUHQW�6DPSOLQJ�3HULRGV�2EVHUYHG�LQ�$OO�6LWHV�IURP�25/02/08-28/02/08
DOI:http://dx.doi.org/10.7314/APJCP.2013.14.3.1851Diurnal Variation in Carcinogenic PAHs in Chiang-Mai, ThailandSiwatt Pongpiachan
$VLDQ�3DFLÀF�-RXUQDO�RI�&DQFHU�3UHYHQWLRQ��9RO���������1858
WKDW�LQÁXHQFHG�WKH�YDULDELOLW\�RI�WKH�LQGLYLGXDO�FRPSRXQG�FRQFHQWUDWLRQV�DQG�WKH�ÀQJHUSULQW�SDWWHUQV�DUH�RI�PLQRU�LPSRUWDQFH��7KH� SUHVHQWDWLRQ� RI� 3$+�ƙ3$+V� ���� LQ�Figure 3 permits a rapid visual categorization of group-1: Site-1 and Site-2, and group-2: Site-3. Figure 3 shows the distributional characteristics of group-1, corresponding to the three major features. Firstly, the most abundant quantified PAHs in decreasing order are: Ind>B[b]F>B[g,h,i]P in HMW PAHs, secondly: B[e]P>Chry>B[a]P in MMW PAHs, and thirdly: B[a]A>Fluo>Phe in LMW 3$+V��5HJDUGOHVV�RI�WKH�VLWH�VSHFLÀF��PRQLWRULQJ�SHULRG�and the difference of PAHs concentration level determined LQ�6LWH���DQG�6LWH����WKH�ÀQJHUSULQWV�RI�DOO�3$+V�DUH�DOPRVW�HTXLYDOHQW�WR�HDFK�RWKHU��7KLV�VXJJHVWV�SRWHQWLDO�LQÁXHQFHV�RI�WUDIÀF�DQG�FRRNLQJ�HPLVVLRQV�IURP�JURXQG�OHYHO�RQ�6LWH�2. There are some remarkable differences between group-1 and group-2. Firstly, the decreasing order of PAHs(5,6) in group-2 was B[g,h,i]P>B[b]F>Ind>B[a]P>B[e]P>B[k[F in that order. Secondly, there are the reverse descending order of PAHs(3,4) from Chry>B[a]A observed in group-1 to B[a]A>Chry detected in group-2. Thirdly, group-2 has the highest percentage contribution of observatory period of 1800-2100 detected in Pyr, indicating that Site-3 might KDYH�EHHQ�LQÁXHQFHG�E\�RWKHU�3$+�HPLVVLRQ�VRXUFHV�DSDUW�from vehicular exhausts and cooking emissions.
Dachs et al. (2002) had investigated the processes driving short-term variability of PAHs at Baltimore and northern Chesapeake Bay atmosphere using the Analysis of Variance (AVOVA) technique of Multiple Linear Regression Analysis (MLRA). Air samples collected from Chesapeake Bay represent clean air from coastal and rural area while those of Baltimore represent contaminated air from urban/industrial area. PAH concentrations in Chesapeake Bay increased when air masses passed the Baltimore area. By contrast, the volatilization of PAHs out of the Bay could be an alternative emission source of PAHs to adjacent bay and rural atmosphere, at least when DLU�PDVVHV�DUH�QRW�LQÁXHQFHG�E\�WKH�%DOWLPRUH�XUEDQ�DQG�industrial area. The variation of gaseous PAH depends mainly on meteorological variables such as ambient temperature, wind speed and wind direction (Dachs et al., 2002). For particulate PAH, the chemical compositions, namely, the content of OC and EC could be responsible IRU� WKH�YDULDWLRQV�� ,Q� RUGHU� WR� LQYHVWLJDWH� WKH� LQÁXHQFH�of carbonaceous fractions and meteorological variables, 3$+�DHURVRO�FRQFHQWUDWLRQV�KDYH�EHHQ�ÀWWHG�E\�PXOWLSOH�linear regressions to
CAerosol
=a+bT+cU10
+dSin(WD)+eCos
(WD)+fCOC
+gCEC
Equation 9
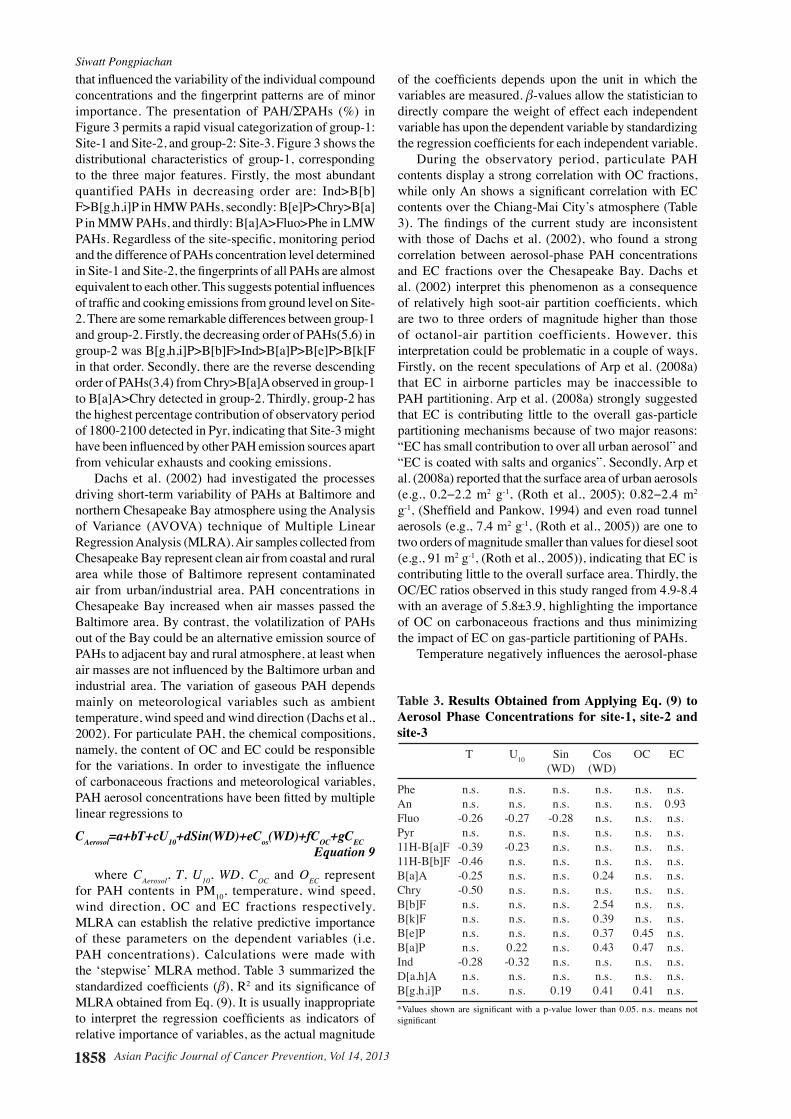
where &$HURVRO, T, U��, WD, &2& and O(& represent for PAH contents in PM10, temperature, wind speed, wind direction, OC and EC fractions respectively. MLRA can establish the relative predictive importance of these parameters on the dependent variables (i.e. PAH concentrations). Calculations were made with the ‘stepwise’ MLRA method. Table 3 summarized the VWDQGDUGL]HG�FRHIÀFLHQWV� �ơ), R2�DQG� LWV�VLJQLÀFDQFH�RI�MLRA obtained from Eq. (9). It is usually inappropriate WR� LQWHUSUHW� WKH� UHJUHVVLRQ� FRHIÀFLHQWV� DV� LQGLFDWRUV� RI�relative importance of variables, as the actual magnitude
RI� WKH� FRHIÀFLHQWV� GHSHQGV�XSRQ� WKH�XQLW� LQ�ZKLFK� WKH�variables are measured. ơ-values allow the statistician to directly compare the weight of effect each independent variable has upon the dependent variable by standardizing WKH�UHJUHVVLRQ�FRHIÀFLHQWV�IRU�HDFK�LQGHSHQGHQW�YDULDEOH��
During the observatory period, particulate PAH contents display a strong correlation with OC fractions, ZKLOH�RQO\�$Q�VKRZV�D� VLJQLÀFDQW�FRUUHODWLRQ�ZLWK�(&�contents over the Chiang-Mai City’s atmosphere (Table ����7KH� ÀQGLQJV� RI� WKH� FXUUHQW� VWXG\� DUH� LQFRQVLVWHQW�with those of Dachs et al. (2002), who found a strong correlation between aerosol-phase PAH concentrations and EC fractions over the Chesapeake Bay. Dachs et al. (2002) interpret this phenomenon as a consequence RI� UHODWLYHO\� KLJK� VRRW�DLU� SDUWLWLRQ� FRHIÀFLHQWV��ZKLFK�are two to three orders of magnitude higher than those of octanol-air partition coefficients. However, this interpretation could be problematic in a couple of ways. Firstly, on the recent speculations of Arp et al. (2008a) that EC in airborne particles may be inaccessible to PAH partitioning. Arp et al. (2008a) strongly suggested that EC is contributing little to the overall gas-particle partitioning mechanisms because of two major reasons: “EC has small contribution to over all urban aerosol” and “EC is coated with salts and organics”. Secondly, Arp et al. (2008a) reported that the surface area of urban aerosols �H�J��� ���ï����P2 g-1�� �5RWK� HW� DO��� ������� ����ï����P2 g-1���6KHIÀHOG�DQG�3DQNRZ��������DQG�HYHQ�URDG�WXQQHO�aerosols (e.g., 7.4 m2 g-1, (Roth et al., 2005)) are one to two orders of magnitude smaller than values for diesel soot (e.g., 91 m2 g-1, (Roth et al., 2005)), indicating that EC is contributing little to the overall surface area. Thirdly, the OC/EC ratios observed in this study ranged from 4.9-8.4 with an average of 5.8±3.9, highlighting the importance of OC on carbonaceous fractions and thus minimizing the impact of EC on gas-particle partitioning of PAHs.
7HPSHUDWXUH�QHJDWLYHO\�LQÁXHQFHV�WKH�DHURVRO�SKDVH�
Table 3. 5HVXOWV�2EWDLQHG� IURP�$SSO\LQJ�(T�� ���� WR�Aerosol Phase Concentrations for site-1, site-2 and
site-3
T U10 Sin Cos OC EC (WD) (WD)
Phe n.s. n.s. n.s. n.s. n.s. n.s.An n.s. n.s. n.s. n.s. n.s. 0.93Fluo -0.26 -0.27 -0.28 n.s. n.s. n.s.Pyr n.s. n.s. n.s. n.s. n.s. n.s.11H-B[a]F -0.39 -0.23 n.s. n.s. n.s. n.s.11H-B[b]F -0.46 n.s. n.s. n.s. n.s. n.s.B[a]A -0.25 n.s. n.s. 0.24 n.s. n.s.Chry -0.50 n.s. n.s. n.s. n.s. n.s.B[b]F n.s. n.s. n.s. 2.54 n.s. n.s.B[k]F n.s. n.s. n.s. 0.39 n.s. n.s.B[e]P n.s. n.s. n.s. 0.37 0.45 n.s.B[a]P n.s. 0.22 n.s. 0.43 0.47 n.s.Ind -0.28 -0.32 n.s. n.s. n.s. n.s.D[a,h]A n.s. n.s. n.s. n.s. n.s. n.s.B[g,h,i]P n.s. n.s. 0.19 0.41 0.41 n.s.*9DOXHV� VKRZQ� DUH� VLJQLÀFDQW�ZLWK� D� S�YDOXH� ORZHU� WKDQ������� Q�V��PHDQV� QRW�VLJQLÀFDQW
$VLDQ�3DFLÀF�-RXUQDO�RI�&DQFHU�3UHYHQWLRQ��9RO��������� 1859
DOI:http://dx.doi.org/10.7314/APJCP.2013.14.3.1851Diurnal Variation in Carcinogenic PAHs in Chiang-Mai, Thailand
concentrations of PAHs, suggesting that the atmospheric LQYHUVLRQ�OD\HU�VLJQLÀFDQWO\�HOHYDWHG�WKH�FRQFHQWUDWLRQV�RI�Fluo, 11H-B[a]F, 11H-B[b]F, B[a]A, Chry and Ind during nighttime. On the other hand, wind speed displays negative correlations with only three particulate contents, namely Fluo, 11H-B[a]F and Ind, implying that wind speed does not induce a dilution of the atmospheric signal due to a greater mixing height. In other words, an incidental and concealed impact of elevated aerosol-phase concentrations PD\�EH�FRYHUHG�E\�WKH�LQÁXHQFH�RI�ZLQG�GLUHFWLRQ�DV�FDQ�be seen in relatively high positive values of parameter H� �L�H�� WKH� VWDQGDUGL]HG� FRHIÀFLHQWV� �ơ) of Cos(WD)) displayed in Table 3. The PAHs (5,6) show higher concentrations for air masses from the northwesterly sector, thus from the Doi Suthep area, a mountain located 15 km away from the northwest of observatory sites (positive values of the parameter e in Equation (9), see Table 3). This is in agreement with the fact that the vast majority of hotspots occurred in Doi Suthep area, and WKXV� HPSKDVL]LQJ� WKH� VLJQLÀFDQFH�RI�ELRPDVV�EXUQLQJV�on air quality level of Chiang-Mai City. In addition, the DJULFXOWXUDO�ZDVWH� EXUQLQJ� IURP� ULFH� ÀHOGV� ORFDWHG� LQ�Northern and Northeastern region can also be considered as potential sources of PAHs during the sampling period.
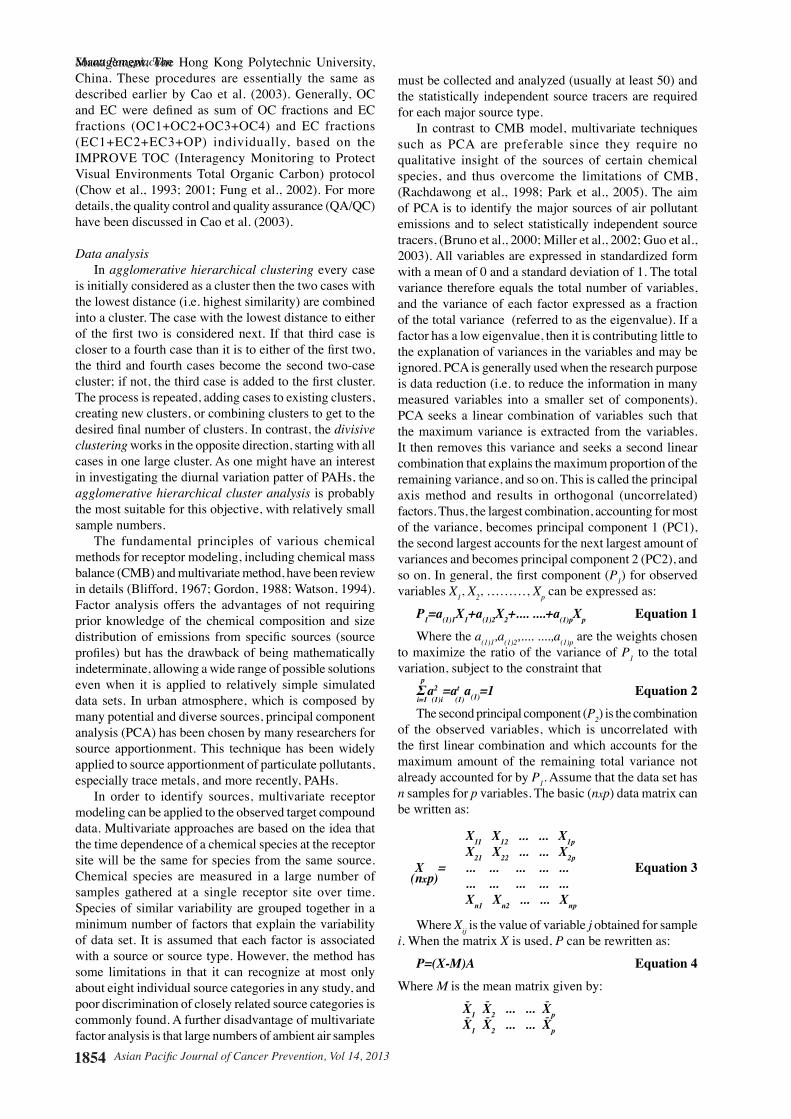
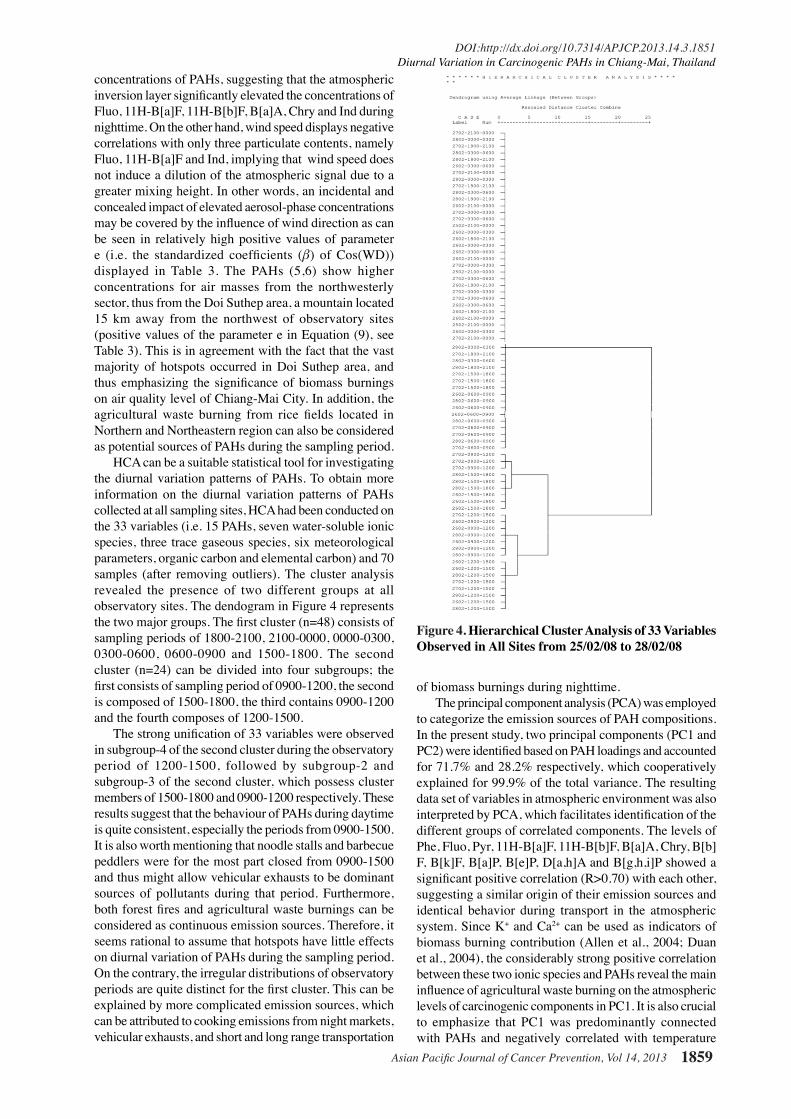
HCA can be a suitable statistical tool for investigating the diurnal variation patterns of PAHs. To obtain more information on the diurnal variation patterns of PAHs collected at all sampling sites, HCA had been conducted on the 33 variables (i.e. 15 PAHs, seven water-soluble ionic species, three trace gaseous species, six meteorological parameters, organic carbon and elemental carbon) and 70 samples (after removing outliers). The cluster analysis revealed the presence of two different groups at all observatory sites. The dendogram in Figure 4 represents WKH�WZR�PDMRU�JURXSV��7KH�ÀUVW�FOXVWHU��Q ����FRQVLVWV�RI�sampling periods of 1800-2100, 2100-0000, 0000-0300, 0300-0600, 0600-0900 and 1500-1800. The second FOXVWHU� �Q ���� FDQ�EH�GLYLGHG� LQWR� IRXU� VXEJURXSV�� WKH�ÀUVW�FRQVLVWV�RI�VDPSOLQJ�SHULRG�RI������������WKH�VHFRQG�is composed of 1500-1800, the third contains 0900-1200 and the fourth composes of 1200-1500.
7KH�VWURQJ�XQLÀFDWLRQ�RI����YDULDEOHV�ZHUH�REVHUYHG�in subgroup-4 of the second cluster during the observatory period of 1200-1500, followed by subgroup-2 and subgroup-3 of the second cluster, which possess cluster members of 1500-1800 and 0900-1200 respectively. These results suggest that the behaviour of PAHs during daytime is quite consistent, especially the periods from 0900-1500. It is also worth mentioning that noodle stalls and barbecue peddlers were for the most part closed from 0900-1500 and thus might allow vehicular exhausts to be dominant sources of pollutants during that period. Furthermore, ERWK�IRUHVW�ÀUHV�DQG�DJULFXOWXUDO�ZDVWH�EXUQLQJV�FDQ�EH�considered as continuous emission sources. Therefore, it seems rational to assume that hotspots have little effects on diurnal variation of PAHs during the sampling period. On the contrary, the irregular distributions of observatory SHULRGV�DUH�TXLWH�GLVWLQFW�IRU�WKH�ÀUVW�FOXVWHU��7KLV�FDQ�EH�explained by more complicated emission sources, which can be attributed to cooking emissions from night markets, vehicular exhausts, and short and long range transportation
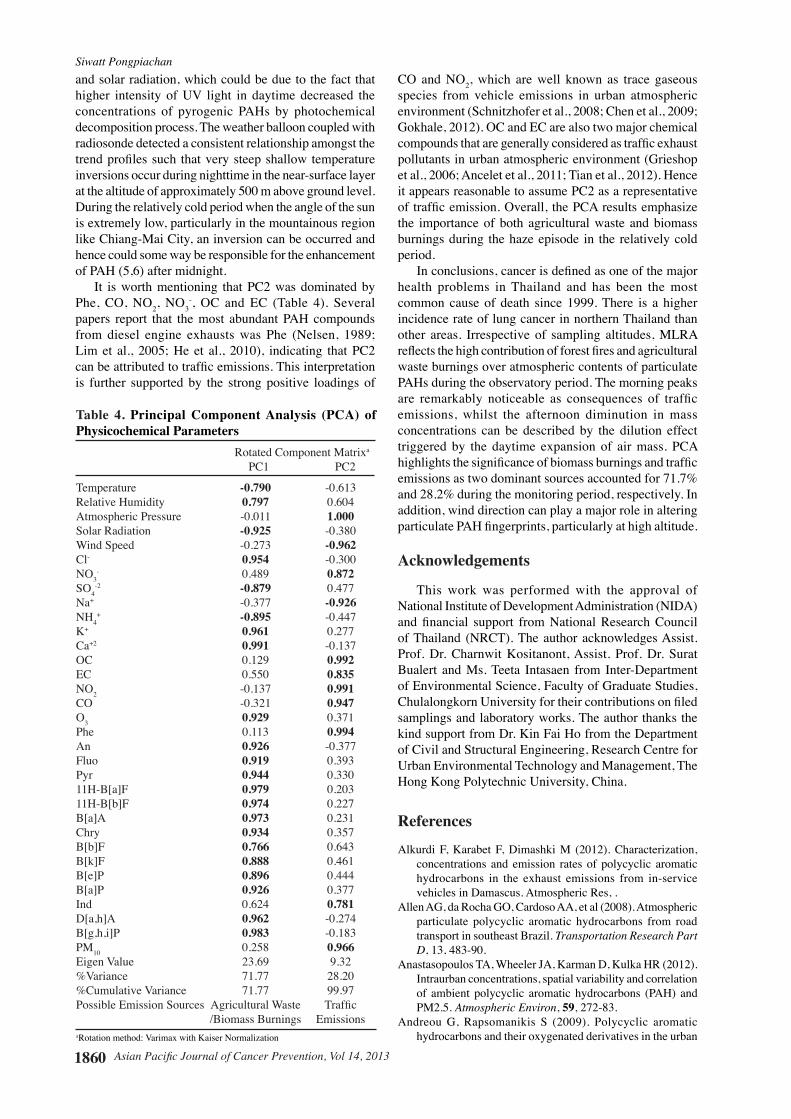
of biomass burnings during nighttime.The principal component analysis (PCA) was employed
to categorize the emission sources of PAH compositions. In the present study, two principal components (PC1 and 3&���ZHUH�LGHQWLÀHG�EDVHG�RQ�3$+�ORDGLQJV�DQG�DFFRXQWHG�for 71.7% and 28.2% respectively, which cooperatively explained for 99.9% of the total variance. The resulting data set of variables in atmospheric environment was also LQWHUSUHWHG�E\�3&$��ZKLFK�IDFLOLWDWHV�LGHQWLÀFDWLRQ�RI�WKH�different groups of correlated components. The levels of Phe, Fluo, Pyr, 11H-B[a]F, 11H-B[b]F, B[a]A, Chry, B[b]F, B[k]F, B[a]P, B[e]P, D[a,h]A and B[g,h,i]P showed a VLJQLÀFDQW�SRVLWLYH�FRUUHODWLRQ��5!������ZLWK�HDFK�RWKHU��suggesting a similar origin of their emission sources and identical behavior during transport in the atmospheric system. Since K+ and Ca2+ can be used as indicators of biomass burning contribution (Allen et al., 2004; Duan et al., 2004), the considerably strong positive correlation between these two ionic species and PAHs reveal the main LQÁXHQFH�RI�DJULFXOWXUDO�ZDVWH�EXUQLQJ�RQ�WKH�DWPRVSKHULF�levels of carcinogenic components in PC1. It is also crucial to emphasize that PC1 was predominantly connected with PAHs and negatively correlated with temperature
Figure 4. Hierarchical Cluster Analysis of 33 Variables
2EVHUYHG�LQ�$OO�6LWHV�IURP����������WR���������
DOI:http://dx.doi.org/10.7314/APJCP.2013.14.3.1851Diurnal Variation in Carcinogenic PAHs in Chiang-Mai, ThailandSiwatt Pongpiachan
$VLDQ�3DFLÀF�-RXUQDO�RI�&DQFHU�3UHYHQWLRQ��9RO���������1860
and solar radiation, which could be due to the fact that higher intensity of UV light in daytime decreased the concentrations of pyrogenic PAHs by photochemical decomposition process. The weather balloon coupled with radiosonde detected a consistent relationship amongst the WUHQG�SURÀOHV�VXFK� WKDW�YHU\�VWHHS�VKDOORZ�WHPSHUDWXUH�inversions occur during nighttime in the near-surface layer at the altitude of approximately 500 m above ground level. During the relatively cold period when the angle of the sun is extremely low, particularly in the mountainous region like Chiang-Mai City, an inversion can be occurred and hence could some way be responsible for the enhancement of PAH (5,6) after midnight.
It is worth mentioning that PC2 was dominated by Phe, CO, NO2, NO3
-, OC and EC (Table 4). Several papers report that the most abundant PAH compounds from diesel engine exhausts was Phe (Nelsen, 1989; Lim et al., 2005; He et al., 2010), indicating that PC2 FDQ�EH�DWWULEXWHG�WR�WUDIÀF�HPLVVLRQV��7KLV�LQWHUSUHWDWLRQ�is further supported by the strong positive loadings of
CO and NO2, which are well known as trace gaseous species from vehicle emissions in urban atmospheric environment (Schnitzhofer et al., 2008; Chen et al., 2009; Gokhale, 2012). OC and EC are also two major chemical FRPSRXQGV�WKDW�DUH�JHQHUDOO\�FRQVLGHUHG�DV�WUDIÀF�H[KDXVW�pollutants in urban atmospheric environment (Grieshop et al., 2006; Ancelet et al., 2011; Tian et al., 2012). Hence it appears reasonable to assume PC2 as a representative RI�WUDIÀF�HPLVVLRQ��2YHUDOO��WKH�3&$�UHVXOWV�HPSKDVL]H�the importance of both agricultural waste and biomass burnings during the haze episode in the relatively cold period.
,Q�FRQFOXVLRQV��FDQFHU�LV�GHÀQHG�DV�RQH�RI�WKH�PDMRU�health problems in Thailand and has been the most common cause of death since 1999. There is a higher incidence rate of lung cancer in northern Thailand than other areas. Irrespective of sampling altitudes, MLRA UHÁHFWV�WKH�KLJK�FRQWULEXWLRQ�RI�IRUHVW�ÀUHV�DQG�DJULFXOWXUDO�waste burnings over atmospheric contents of particulate PAHs during the observatory period. The morning peaks DUH� UHPDUNDEO\� QRWLFHDEOH� DV� FRQVHTXHQFHV� RI� WUDIÀF�emissions, whilst the afternoon diminution in mass concentrations can be described by the dilution effect triggered by the daytime expansion of air mass. PCA KLJKOLJKWV�WKH�VLJQLÀFDQFH�RI�ELRPDVV�EXUQLQJV�DQG�WUDIÀF�emissions as two dominant sources accounted for 71.7% and 28.2% during the monitoring period, respectively. In addition, wind direction can play a major role in altering SDUWLFXODWH�3$+�ÀQJHUSULQWV��SDUWLFXODUO\�DW�KLJK�DOWLWXGH���
$FNQRZOHGJHPHQWV�
This work was performed with the approval of National Institute of Development Administration (NIDA) DQG�ÀQDQFLDO� VXSSRUW� IURP�1DWLRQDO�5HVHDUFK�&RXQFLO�of Thailand (NRCT). The author acknowledges Assist. Prof. Dr. Charnwit Kositanont, Assist. Prof. Dr. Surat Bualert and Ms. Teeta Intasaen from Inter-Department of Environmental Science, Faculty of Graduate Studies, &KXODORQJNRUQ�8QLYHUVLW\�IRU�WKHLU�FRQWULEXWLRQV�RQ�ÀOHG�samplings and laboratory works. The author thanks the kind support from Dr. Kin Fai Ho from the Department of Civil and Structural Engineering, Research Centre for Urban Environmental Technology and Management, The Hong Kong Polytechnic University, China.
References
Alkurdi F, Karabet F, Dimashki M (2012). Characterization, concentrations and emission rates of polycyclic aromatic hydrocarbons in the exhaust emissions from in-service vehicles in Damascus. Atmospheric Res, .
Allen AG, da Rocha GO, Cardoso AA, et al (2008). Atmospheric particulate polycyclic aromatic hydrocarbons from road transport in southeast Brazil. 7UDQVSRUWDWLRQ�5HVHDUFK�3DUW�D, 13, 483-90.
Anastasopoulos TA, Wheeler JA, Karman D, Kulka HR (2012). Intraurban concentrations, spatial variability and correlation of ambient polycyclic aromatic hydrocarbons (PAH) and PM2.5. $WPRVSKHULF�(QYLURQ, 59, 272-83.
Andreou G, Rapsomanikis S (2009). Polycyclic aromatic hydrocarbons and their oxygenated derivatives in the urban
Table 4. Principal Component Analysis (PCA) of
Physicochemical Parameters
Rotated Component Matrixa
PC1 PC2
Temperature -0.790 -0.613Relative Humidity 0.797 0.604Atmospheric Pressure -0.011 1.000
Solar Radiation -0.925 -0.380Wind Speed -0.273 -0.962
Cl- 0.954 -0.300NO3
- 0.489 0.872
SO4-2 -0.879 0.477
Na+ -0.377 -0.926
NH4+ -0.895 -0.447
K+ 0.961 0.277Ca+2 0.991 -0.137OC 0.129 0.992
EC 0.550 0.835
NO2 -0.137 0.991
CO -0.321 0.947
O3 0.929 0.371Phe 0.113 0.994
An 0.926 -0.377Fluo 0.919 0.393Pyr 0.944 0.33011H-B[a]F 0.979 0.20311H-B[b]F 0.974 0.227B[a]A 0.973 0.231Chry 0.934 0.357B[b]F 0.766 0.643B[k]F 0.888 0.461B[e]P 0.896 0.444B[a]P 0.926 0.377Ind 0.624 0.781
D[a,h]A 0.962 -0.274B[g,h,i]P 0.983 -0.183PM10 0.258 0.966
Eigen Value 23.69 9.32%Variance 71.77 28.20%Cumulative Variance 71.77 99.973RVVLEOH�(PLVVLRQ�6RXUFHV� $JULFXOWXUDO�:DVWH� 7UDIÀF /Biomass Burnings EmissionsaRotation method: Varimax with Kaiser Normalization
$VLDQ�3DFLÀF�-RXUQDO�RI�&DQFHU�3UHYHQWLRQ��9RO��������� 1861
DOI:http://dx.doi.org/10.7314/APJCP.2013.14.3.1851Diurnal Variation in Carcinogenic PAHs in Chiang-Mai, Thailand
atmosphere of Athens.�-�+D]DUGRXV�0DWHULDOV, 172, 363-73.Arp HPH, Schwarzenbach RP, Goss KU (2008a). Ambient gas/
particle partitioning. 1. Sorption mechanisms of apolar, polar, and ionizable organic compounds. (QYLURQ�6FL�DQG�7HFKQRORJ\, 42, 5541-7.
Blifford IH, Meeker GO (1967). A factor analysis model of large scale pollution. $WPRVSKHULF�(QYLURQPHQW, 12, 147-57.
Boonyatumanond R, Murakami M, Wattayakorn G, Togo A, Takada H (2007). Sources of polycyclic aromatic hydrocarbons (PAHs) in street dust in a tropical Asian mega-city, Bangkok, Thailand.�6FL�7RWDO�(QYLURQ, 384, 420-32.
Bourotte C, Forti CM, Taniguchi S, Bícego CM, Lotufo AP ��������$�ZLQWHUWLPH� VWXG\� RI� 3$+V� LQ� ÀQH� DQG� FRDUVH�aerosols in São Paulo city, Brazil. $WPRVSKHULF�(QYLURQPHQW, 39, 3799-811.
Bruno P, Caselli M, Curri LM, et al (2000). Chemical characterisation of ancient pottery from south of Italy by inductively coupled plasma atomic emission spectroscopy (ICP-AES): statistical multivariate analysis of data. $QDO\WLFD�&KLPLFD�$FWD, 410, 193-202.
Cao JJ, Lee SC, Ho KF, et al (2003). Characteristics of carbonaceous aerosol in pearl river delta region, China during 2001 winter period. $WPRVSKHULF�(QYLURQPHQW, 37, 1451-60.
Chetiyanukornkul T, Toriba A, Kameda T, Tang N, Hayakawa K, (2006). Simultaneous determination of urinary hydroxylated metabolites of naphthalene, fluorene, phenanthrene, ÁXRUDQWKHQH�DQG�S\UHQH�DV�PXOWLSOH�ELRPDUNHUV�RI�H[SRVXUH�to polycyclic aromatic hydrocarbons. $QDO\WLFDO� DQG�%LRDQDO\WLFDO�&KHPLVWU\, 386, 712-8.
Chetwittayachan T, Shimazaki D, Yamamoto K, (2002). A comparison of temporal variation of particle-bound polycyclic aromatic hydrocarbons (pPAHs) concentration in different urban environments: Tokyo, Japan, and Bangkok, Thailand. $WPRVSKHULF�(QYLURQ, 36, 2027-37.
Choi DS, Ghim SY, Lee YJ, Kim YJ, Kim PY (2012). Factors affecting the level and pattern of polycyclic aromatic hydrocarbons (PAHs) at Gosan, Korea during a dust period. -�+D]DUGRXV�0DWHULDOV, 227, 79-87.
&KRZ�-&��:DWVRQ�-*��&URZ�'��/RZHQWKDO�'+��0HUULÀHOG�7�(2001). Comparison of IMPROVE and NIOSH carbon measurements. $HURVRO�6FLHQFH�DQG�7HFKQRORJ\, 34, 23-34.
Chow JC, Watson JG, Pritchett LC, et al (1993). The DRI thermal/optical reflectance carbon analysis system: Description, evaluation and applica- tions in US air quality studies. $WPRVSKHULF�(QYLURQ, 27, 1185-201.
&ULVWDOH�-��6LOYD�)6��=RFROR�*-��0DUFKL�055���������,QÁXHQFH�of sugarcane burning on indoor/outdoor PAH air pollution in Brazil. (QYLURQPHQWDO�3ROOXWLRQ, 169, 210-6.
Dachs J, Glen RT, Gigliotti LC, et al (2002). Process driving the short-term variability of polycyclic aromatic hydrocarbons in the Baltimore and northern Chesapeake Bay atmosphere, USA. $WPRVSKHULF�(QYLURQ, 36, 2281-95.
Duan J, Bi X, Tan J, Sheng G, Fu J (2007). Seasonal variation on size distribution and concentration of PAHs in Guangzhou city, China. &KHPRVSKHUH, 67, 614-22.
Dvorská A, Komprdová K, Lammel G, Klánová J, Plachá H (2012). Polycyclic aromatic hydrocarbons in background air in central Europe – Seasonal levels and limitations for source apportionment. $WPRVSKHULF�(QYLURQ, 46, 147-54.
Fine PM, Chakrabarti B, Krudysz M, Schauer JJ, Sioutas C (2004). Diurnal variations of individual organic compound FRQVWLWXHQWV�RI�XOWUDÀQH�DQG�DFFXPXODWLRQ�PRGH�SDUWLFXODWH�matter in the Los Angeles basin. (QYLURQ�6FL�7HFKQRO, 38, 1296-304.
Fung KK, Chow JC, Watson JG (2002). Evaluation of OC/EC speciation by thermal manganese dioxide oxidation and the
IMPROVE method. -�$LU�DQG�:DVWH�0DQDJHPHQW�$VVRF, 52, 1333-41.
Giri B, Patel KS, Jaiswal NK, et al (2012). Composition and sources of organic tracers in aerosol particles of industrial central India. $WPRVSKHULF�5HV, 27, 64.
Gogou A, Stratigakis N, Kanakidou M, Stephanou E (1996). Organic aerosol in eastern maditerranean: component source reconciliation by using molecular markers and atmospheric back trajectories. 2UJDQLF�*HRFKHPLVWU\, 25, 79-96.
Gordon GE (1988). Receptor models. (QYLURQ� 6FL� DQG�7HFKQRORJ\, 22, 1132-42.
Gu Z, Feng J, Han W, et al (2010). Diurnal variations of polycyclic aromatic hydrocarbons associated with PM2.5 in Shanghai, China. -�(QYLURQ�6FL, 22, 389-96.
Guo H, Lee CS, Ho FK, et al (2003). Particle-associated polycyclic aromatic hydrocarbons in urban air of Hong Kong. $WPRVSKHULF�(QYLURQ, 37, 5307-17.
Gupta S, Kumar SA, Srivastava A, Jain KV (2011). Size distribution and source apportionment of polycyclic aromatic hydrocarbons (PAHs) in aerosol particle samples from the atmospheric environment of Delhi, India. 6FL�7RWDO�(QYLURQ� 409, 4674-80.
Hanedar A, Alp K, Kaynak B, et al (2011). Concentrations and sources of PAHs at three stations in Istanbul, Turkey. $WPRVSKHULF�5HV, 99, 391-9.
He J, Balasubramanian R (2009). A study of gas/particle partitioning of SVOCs in the tropical atmosphere of Southeast Asia. $WPRVSKHULF�(QYLURQ, 43, 4375-83.
Henry RC, Lewis CW, Hopke PK, Williamson HJ (1984). Review of receptor model fundamentals. $WPRVSKHULF�(QYLURQ, 18, 1507-15.
Hong SH, Yin LH, Wang HX, Ye XC (2007). Seasonal variation of PM10-bound PAHs in the atmosphere of Xiamen, China. $WPRVSKHULF�5HV, 85, 429-41.
Hoyer BP (2001). Reproductive toxicology: current and future directions. %LRFKHPLFDO�3KDUPDFRORJ\, 62, 1557-64.
+X�-��/LX�4&��=KDQJ�3*��=KDQJ�/<���������6HDVRQDO�YDULDWLRQ�and source apportionment of PAHs in TSP in the atmosphere of Guiyang, Southwest China. $WPRVSKHULF�5HV, 118, 271-9.
Kong S, Lu B, Ji Y, et al (2012). Distribution and sources of polycyclic aromatic hydrocarbons in size-differentiated UH�VXVSHQGHG�GXVW�RQ�EXLOGLQJ�VXUIDFHV�LQ�DQ�RLOÀHOG�FLW\��China. $WPRVSKHULF�(QYLURQ, 55, 7-16.
Kumar AV, Patil RS, Nambi KSV (2001). Source apportionment RI�VXVSHQGHG�SDUWLFXODWH�PDWWHU�DW�WZR�WUDIÀF�MXQFWLRQV�LQ�Mumbai, India. $WPRVSKHULF�(QYLURQPHQW, 35, 4245-51.
Ladji R, Yassaa N, Balducci C, Cecinato A, Meklati BY (2009). Annual variation of particulate organic compounds in PM10 in the urban atmosphere of Algiers. $WPRVSKHULF�5HV, 92, 258-69.
Lai CS, Zou CS, Cao J, Lee CS, Ho FK (2007). Characterizing ionic species in PM2.5 and PM10 in four Pearl River Delta cities, South China. -�(QYLURQ�6FL, 19, 939-47.
Lee YJ, Kim PY, Kang HC (2011). Characteristics of the ambient particulate PAHs at Seoul, a mega city of Northeast Asia in comparison with the characteristics of a background site. $WPRVSKHULF�5HV, 99, 50-6.
Li C, Tsay CS, Hsu CN, et al (2012). Characteristics and composition of atmospheric aerosols in Phimai, central Thailand during BASE-ASIA. $WPRVSKHULF�(QYLURQ, In Press, Corrected Proof, Available online 13 April 2012.
Li J, Wang G, Zhou B, et al (2012). Airborne particulate organics at the summit (2060 m, a.s.l.) of Mt. Hua in central China during winter: Implications for biofuel and coal combustion. $WPRVSKHULF�5HV, 106, 108-19.
Li TC, Mi HH, Lee JW, et al (1999). PAH emission from the industrial boilers. -�+D]DUGRXV�0DWHULDOV, 69, 1-11.
DOI:http://dx.doi.org/10.7314/APJCP.2013.14.3.1851Diurnal Variation in Carcinogenic PAHs in Chiang-Mai, ThailandSiwatt Pongpiachan
$VLDQ�3DFLÀF�-RXUQDO�RI�&DQFHU�3UHYHQWLRQ��9RO���������1862
0
25.0
50.0
75.0
100.0
New
ly d
iagn
osed
with
out
trea
tmen
t
New
ly d
iagn
osed
with
tre
atm
ent
Pers
iste
nce
or r
ecur
renc
e
Rem
issi
on
Non
e
Chem
othe
rapy
Radi
othe
rapy
Conc
urre
nt c
hem
orad
iatio
n
Liao MC, Chio PC, Chen YW, et al (2011). Lung cancer risk LQ� UHODWLRQ� WR� WUDIÀF�UHODWHG� QDQR�XOWUDÀQH�SDUWLFOH�ERXQG�PAHs exposure: A preliminary probabilistic assessment. -�+D]DUGRXV�0DWHULDOV, 190, 150-8.
Lin MD, Rau JY, Tseng HH, et al (2008). Characterizing PAH emission concentrations in ambient air during a large-scale joss paper open-burning event. -�+D]DUGRXV�0DWHULDOV, 156, 223-9.
Lu T, Huang Z, Cheung SC, Ma J (2012). Size distribution of EC, OC and particle-phase PAHs emissions from a diesel engine fueled with three fuels. 6FL�7RWDO�(QYLURQ, 438, 33-41.
0D�/:��/L� )<��4L�+�� HW� DO� �������� 6HDVRQDO� YDULDWLRQV� RI�sources of polycyclic aromatic hydrocarbons (PAHs) to a northeastern urban city, China. &KHPRVSKHUH, 79, 441-7.
Maenhaut W, Cafmeyer J (1987). Particle induced X-ray emission analysis and multivariate techniques: an application to the study of the sources of respirable atmospheric particles in Gent, Belgium. -�7UDFH�DQG�0LFURSUREH�7HFKQLTXHV, 5, 135-58.
Matsui S (2008). Endocrine Disruptors. Encyclopedia of Ecology, 1259-1260.
Mayol-Bracero LO, Rosario O, Corrigan EC, et al (2001). Chemical characterization of submicron organic aerosols in the tropical trade winds of the Caribbean using gas chromatography/mass spectrometry. $WPRVSKHULF�(QYLURQ, 35, 1735-45.
Miller LS, Anderson JM, Daly PE, Milford BJ (2002). Source apportionment of exposures to volatile organic compounds. Evaluation of receptor models using simulated exposure data. $WPRVSKHULF�(QYLURQ, 36, 3629-41.
Oanh KNT, Leelasakultum K (2011). Analysis of meteorology and emission in haze episode prevalence over mountain-bounded region for early warning. 6FL�7RWDO�(QYLURQ, 409, 2261-71.
Oanh KNT, Ly TB, Tipayarom D, et al (2011). Characterization of particulate matter emission from open burning of rice straw. $WPRVSKHULF�(QYLURQ, 45, 493-502.
Okona-Mensah KB, Battershill J, Boobis A, Fielder R (2005). An approach to investigating the importance of high potency polycyclic aromatic hydrocarbons (PAHs) in the induction of lung cancer by air pollution. )RRG�&KHPLFDO�7R[LFRO, 43, 1103-16.
Okuda T, Kumata H, Zakaria PM, et al (2002). Source LGHQWLÀFDWLRQ�RI�0DOD\VLDQ�DWPRVSKHULF�SRO\F\FOLF�DURPDWLF�hydrocarbons nearby forest fires using molecular and isotopic compositions. $WPRVSKHULF�(QYLURQPHQW, 36, 611-8.
Ozcan S, Aydin ME (2009). Polycyclic aromatic hydrocarbons, polychlorinated biphenyls and organochlorine pesticides in urban air of Konya, Turkey. $WPRVSKHULF�5HV, 93, 715-22.
3DUN�66��.LP�-<���������6RXUFH�FRQWULEXWLRQV�WR�ÀQH�SDUWLFXODWH�matter in an urban atmosphere. &KHPRVSKHUH, 59, 217-26.
Pengchai P, Chantara S, Sopajaree K, et al (2009). Seasonal variation, risk assessment and source estimation of PM10 and PM10-Bound PAHs in the ambient air of Chiang Mai and Lamphun, Thailand. (QYLURQ�0RQLWRULQJ�$VVHVVPHQW, 154, 197-218.
Pongpiachan S (2006). Source apportionment of semi-volatile organic compounds in urban and rural air. PhD thesis, University of Birmingham, Birmingham.
Pongpiachan S, Bualert S, Sompongchaiyakul P, Kositanont C (2009). Factors affecting sensitivity and stability of polycyclic aromatic hydrocarbons. -�$QDO\WLFDO� /HWWHUV, 42, 2106-30.
Pongpiachan S, Thamanu K, Ho KF, Lee SC, Sompongchaiyakul 3���������3UHGLFWLRQV�RI�JDV�SDUWLFOH�SDUWLWLRQLQJ�FRHIÀFLHQWV�(Kp) of polycyclic aromatic hydrocarbons at various occupational environments of Songkhla province, Thailand.
6RXWKHDVW�$VLDQ�-�7URSLFDO�0HG�3XEOLF�+OWK, 40, 1377-94. Rachdawong P, Christensen RE, Chi S (1998). Source
LGHQWLÀFDWLRQ�RI�3&%V� LQ� VHGLPHQWV� IURP� WKH�0LOZDXNHH�Harbor Estuary, USA. :DWHU�6FLHQFH�7HFKQRO, 37, 199-206.
Rajput P, Sarin MM, Rengarajan R, Singh D (2011). Atmospheric polycyclic aromatic hydrocarbons (PAHs) from post-harvest biomass burning emissions in the Indo-Gangetic Plain: Isomer ratios and temporal trends. $WPRVSKHULF�(QYLURQ, 45, 6732-40.
Ravindra K, Bencs L, Wauters E, et al (2006). Seasonal and site-VSHFLÀF�YDULDWLRQ�LQ�YDSRXU�DQG�DHURVRO�SKDVH�3$+V�RYHU�Flanders (Belgium) and their relation with anthropogenic activities. $WPRVSKHULF�(QYLURQ� 40, 771-85.
Riva G, Pedretti FE, Toscano G, Duca D, Pizzi A (2011). Determination of polycyclic aromatic hydrocarbons in domestic pellet stove emissions. %LRPDVV�%LRHQHUJ\, 35, 4261-7.
Rojas NY, Milquez HA, Sarmiento H (2011). Characterizing priority polycyclic aromatic hydrocarbons (PAH) in particulate matter from diesel and palm oil-based biodiesel B15 combustion. $WPRVSKHULF�(QYLURQ� 45, 6158-62.
Roth CM, Goss KU, Schwarzenbach RP (2005). Sorption of a diverse set of organic vapors to urban aerosols. (QYLURQ�6FLHQFH�7HFKQRO, 39, 6638-43.
Roth CM, Goss KU, Schwarzenbach RP (2005). Sorption of a diverse set of organic vapors to diesel soot and road tunnel aerosols. (QYLURQ�6FLHQFH�7HFKQRO, 39, 6632-7.
Ruchirawat M, Mahidol C, Tangjarukij C, et al (2002). Exposure to genotoxins present in ambient air in Bangkok, Thailand — particle associated polycyclic aromatic hydrocarbons and biomarkers. 6FL�7RWDO�(QYLURQ, 287, 121-32.
Ruchirawat M, Navasumrit P, Settachan D, et al (2005). Measurement of genotoxic air pollutant exposures in street vendors and school children in and near Bangkok. 7R[LFRO�$SSO�3KDUPDFRO, 206, 207-14.
Ruchirawat M, Settachan D, Navasumrit P, Tuntawiroon J, Autrup H (2007). Assessment of potential cancer risk in children exposed to urban air pollution in Bangkok, Thailand. 7R[LFRORJ\�/HWWHUV, 168, 200-9.
6KHIÀHOG�$(��3DQNRZ�-)���������6SHFLÀF�VXUIDFH�DUHD�RI�XUEDQ�atmospheric particulate matter in Portland, Oregon. (QYLURQ�6FL�7HFKQRO, 28, 1759-66.
Slezakova K, Castro D, Begonha A, et al (2011). Air pollution IURP� WUDIÀF� HPLVVLRQV� LQ�2SRUWR�� 3RUWXJDO��+HDOWK� DQG�environmental implications. 0LFURFKHPLFDO�-, 99, 51-9.
Tan J, Guo S, Ma Y, et al (2011). Characteristics of particulate PAHs during a typical haze episode in Guangzhou, China. $WPRVSKHULF�5HV, 102, 91-8.
Tao J, Ho FK, Chen L, et al (2007). Effect of chemical composition of PM2.5 on visibility in Guangzhou, China, 2007 spring. 3DUWLFXRORJ\, 7, 68-75.
Tasdemir Y, Esen F (2007). Urban air PAHs: Concentrations, WHPSRUDO�FKDQJHV�DQG�JDV�SDUWLFOH�SDUWLWLRQLQJ�DW�D� WUDIÀF�site in Turkey. $WPRVSKHULF�5HV, 84, 1-12.
Teixeira CE, Agudelo-Castañeda MD, Fachel GMJ, et al (2012). 6RXUFH�LGHQWLÀFDWLRQ�DQG�VHDVRQDO�YDULDWLRQ�RI�SRO\F\FOLF�DURPDWLF�K\GURFDUERQV�DVVRFLDWHG�ZLWK�DWPRVSKHULF�ÀQH�DQG�coarse particles in the Metropolitan Area of Porto Alegre, RS, Brazil. $WPRVSKHULF�5HV, 118, 390-403.
Tham FWY, Takeda K, Sakugawa H (2008). Polycyclic aromatic hydrocarbons (PAHs) associated with atmospheric particles LQ�+LJDVKL�+LURVKLPD��-DSDQ��,QÁXHQFH�RI�PHWHRURORJLFDO�conditions and seasonal variations. $WPRVSKHULF�5HV, 88, 224-33.
Timothy TA, Truong TM, Mantha M, McGowin EA (2012). $WPRVSKHULF�SRO\F\FOLF�DURPDWLF�K\GURFDUERQ�SURÀOHV�DQG�sources in pine needles and particulate matter in Dayton,
$VLDQ�3DFLÀF�-RXUQDO�RI�&DQFHU�3UHYHQWLRQ��9RO��������� 1863
DOI:http://dx.doi.org/10.7314/APJCP.2013.14.3.1851Diurnal Variation in Carcinogenic PAHs in Chiang-Mai, Thailand
Ohio, USA. $WPRVSKHULF�(QYLURQ� 51, 196-202.Tsakovski S, Tobiszewski M, Simeonov V, Polkowska Z,
Namiesnik J (2010). Chemical composition of water from roofs in Gdansk, Poland. (QYLURQ�3ROOXWLRQ, 158, 84-91.
Tsapakis M, Stephanou GE (2005). Occurrence of gaseous and particulate polycyclic aromatic hydrocarbons in the urban atmosphere: study of sources and ambient temperature effect on the gas/particle concentration and distribution. (QYLURQPHQWDO�3ROOXWLRQ, 133, 147-56.
Vasconcellos CP, Souza ZD, Sanchez-Ccoyllo O, et al (2010). Determination of anthropogenic and biogenic compounds on atmospheric aerosol collected in urban, biomass burning and forest areas in São Paulo, Brazil.� 6FL�7RWDO�(QYLURQ, 408, 5836-44.
Vasilakos C, Levi N, Maggos T, et al (2007). Gas–particle concentration and characterization of sources of PAHs in the atmosphere of a suburban area in Athens, Greece.� -�+D]DUGRXV�0DWHULDOV, 140, 45-51.
Yang HH, Lai OS, Hsieh TL, Hsueh JH, Chi WT (2002). 3URÀOHV� RI�3$+�HPLVVLRQ� IURP� VWHHO� DQG� LURQ� LQGXVWULHV��&KHPRVSKHUH, 48, 1061-74.
Wan X, Chen J, Tian F, et al (2006). Source apportionment of PAHs in atmospheric particulates of Dalian: Factor analysis with nonnegative constraints and emission inventory analysis. $WPRVSKHULF�(QYLURQ� 40, 6666-75.
Wang X, Cheng H, Xu X, Zhuang G, Zhao C (2008). A wintertime study of polycyclic aromatic hydrocarbons in PM2.5 and PM2.5–10 in Beijing: Assessment of energy structure conversion. -�+D]DUGRXV�0DWHULDOV, 157, 47-56.
Watson JG, Chow JC, Lu Z, et al (1994). Chemical mass balance source apportionment of PM10 during the Southern California air quality study. $HURVRO�6FLHQFH�7HFKQRO, 21, 1-36.
Wickramasinghe PA, Karunaratne PGGD, Sivakanesan R (2012). PM10-bound polycyclic aromatic hydrocarbons: Biological indicators, lung cancer risk of realistic receptors and ‘source-exposure-effect relationship’ under different source scenarios. &KHPRVSKHUH, 87, 1381-7.
Wiwatanadate P, Liwsrisakun C (2011). Acute effects of air SROOXWLRQ�RQ�SHDN�H[SLUDWRU\�ÁRZ�UDWHV�DQG�V\PSWRPV�DPRQJ�asthmatic patients in Chiang Mai, Thailand. ,QW�-�+\JLHQH�(QYLURQPHQWDO�+HDOWK, 214, 251-7.
Wiwatanadate P (2011). Lung cancer related to environmental and occupational hazards and epidemiology in Chiang Mai, Thailand. *HQHV�DQG�(QYLURQPHQW, 33, 120-7.
Xia Z, Duan X, Tao S, et al (2013). Pollution level, inhalation exposure and lung cancer risk of ambient atmospheric polycyclic aromatic hydrocarbons (PAHs) in Taiyuan, China. (QYLURQPHQWDO�3ROOXWLRQ, 173, 150-6.
Xie M, Wang G, Hu S, et al (2009). Aliphatic alkanes and polycyclic aromatic hydrocarbons in atmospheric PM10 aerosols from Baoji, China: Implications for coal burning. $WPRVSKHULF�5HV, 93, 840-8.
Zhang Y, Tao S (2008). Seasonal variation of polycyclic aromatic hydrocarbons (PAHs) emissions in China. (QYLURQ�3ROOXWLRQ, 156, 657-63.
Zhou J, Wang T, Zhang Y, et al (2009). Composition and sources of organic matter in atmospheric PM10 over a two year period in Beijing, China.�$WPRVSKHULF�5HV, 93, 849-61.