distribution of soil microbial biomass and free-living nematode population in terrace...
TRANSCRIPT
Distribution of Soil Microbial Biomass andFree-living Nematode Population in TerraceChronosequences of Makhtesh-Ramon Crater
Nosir Shukurov
Faculty of Life Sciences, Bar-Ilan University, Ramat-Gan, Israel andInstitute of Geology and Geophysics, Academy of Sciences of Uzbekistan,Tashkent, Uzbekistan
Stanislav Pen-MouratovNatalia Genzer
Faculty of Life Sciences, Bar-Ilan University, Ramat-Gan, Israel
Josef Plakht
Ramon Science Center, Jacob Blaustein Institute for Desert Research,Ben-Gurion University of the Negev, Mizpeh Ramon, Israel
Yosef Steinberger
Faculty of Life Sciences, Bar-Ilan University, Ramat-Gan, Israel
In this study, we examined the effects of the age of erosional fluvial terraces ofMakhtesh Ramon (Ramon crater) in the central Negev Desert on soil chemicaland biological properties. There were significant effects of erosion age of these ter-races on soil moisture, organic carbon, soil salinity, and electrical conductivity. It isknown that soil biological activity in arid ecosystems is determined by well-knownlimiting factors such as soil moisture and organic matter. Significant ðP < 0:002Þdifferences in total nematode population and microbial biomass [(22.0–3.4Cmic
(mg C g�1 soil)] were observed between terraces. Biological activity of soils in lowerand younger terraces was greater than in older and higher terraces. The ecophysio-logical status (qCO2) of the soil microbial community was found to decrease from amaximal value of 1.3 to 0.32mg CO2�C (gCmich)
�1 along the terraces (fromyounger to older ones). This study illustrates the integrated effect of age, altitude,and the morphostratigraphic position of terraces on the biological activity of soils.
Keywords Makhtesh Ramon, microbial biomass, nematodes, soil, terraces
Received 14 December 2004; accepted 22 February 2005.We would like to thank Mrs. Ginetta Barness for her useful help and technical assistance.
We also thank the Israel Nature and National Parks Protection Authority for their permissionto undertake this study.
Address correspondence to Prof. Y. Steinberger, Faculty of Life Sciences, Bar-IlanUniversity, Ramat-Gan 52900, Israel. E-mail: [email protected]
Arid Land Research and Management, 19:197–213, 2005Copyright # Taylor & Francis Inc.ISSN: 1532-4982 print/1532-4990 onlineDOI: 10.1080/15324980590951342
197
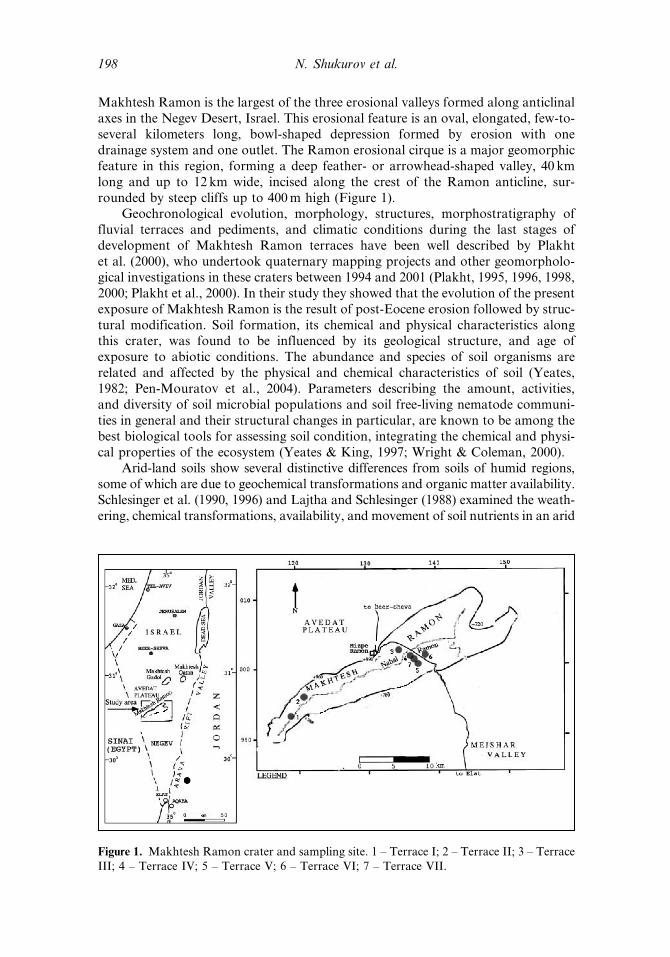
Makhtesh Ramon is the largest of the three erosional valleys formed along anticlinalaxes in the Negev Desert, Israel. This erosional feature is an oval, elongated, few-to-several kilometers long, bowl-shaped depression formed by erosion with onedrainage system and one outlet. The Ramon erosional cirque is a major geomorphicfeature in this region, forming a deep feather- or arrowhead-shaped valley, 40 kmlong and up to 12 km wide, incised along the crest of the Ramon anticline, sur-rounded by steep cliffs up to 400m high (Figure 1).
Geochronological evolution, morphology, structures, morphostratigraphy offluvial terraces and pediments, and climatic conditions during the last stages ofdevelopment of Makhtesh Ramon terraces have been well described by Plakhtet al. (2000), who undertook quaternary mapping projects and other geomorpholo-gical investigations in these craters between 1994 and 2001 (Plakht, 1995, 1996, 1998,2000; Plakht et al., 2000). In their study they showed that the evolution of the presentexposure of Makhtesh Ramon is the result of post-Eocene erosion followed by struc-tural modification. Soil formation, its chemical and physical characteristics alongthis crater, was found to be influenced by its geological structure, and age ofexposure to abiotic conditions. The abundance and species of soil organisms arerelated and affected by the physical and chemical characteristics of soil (Yeates,1982; Pen-Mouratov et al., 2004). Parameters describing the amount, activities,and diversity of soil microbial populations and soil free-living nematode communi-ties in general and their structural changes in particular, are known to be among thebest biological tools for assessing soil condition, integrating the chemical and physi-cal properties of the ecosystem (Yeates & King, 1997; Wright & Coleman, 2000).
Arid-land soils show several distinctive differences from soils of humid regions,some of which are due to geochemical transformations and organic matter availability.Schlesinger et al. (1990, 1996) and Lajtha and Schlesinger (1988) examined the weath-ering, chemical transformations, availability, and movement of soil nutrients in an arid
Figure 1. Makhtesh Ramon crater and sampling site. 1 – Terrace I; 2 – Terrace II; 3 – TerraceIII; 4 – Terrace IV; 5 – Terrace V; 6 – Terrace VI; 7 – Terrace VII.
198 N. Shukurov et al.
ecosystem in southwesternUSA. They reported that soil nutrients, namely phosphorus,in soil decreased with increasing soil age. Similar studies have been reported by Wardet al. (2001) for the central Negev Desert ecosystem.
Danin et al. (1998), studying desert crust morphology and its relation to micro-biotic succession along a time sequence of terrace formation in the Judean Desert,found an increase in biological activity on a time scale, whereas Evenari et al.(1982) elucidated the importance of organic matter accumulation in terraces in orderto increase the activity of decomposers to enhance immobilization and mineraliza-tion processes and increase the availability of nutrients to primary producers.
The uniqueness of the terrace chronosequence formation in the MakhteshRamon crater is in the similarity of exposure to environmental pressure along witha bio-eco-evolutionary process. Therefore, we hypothesize that soil biological activitywill be correlated with the chronosequence—aging of terraces with increasing soilorganic matter. The aim of this study was to determine the relation between the soilbiological activities in terrace sediments formed along a chronosequence scale.
Description of the Study Area and Terraces
Makhtesh Ramon is a deep erosional ‘‘cirque’’ 40 km long and 12 km wideentrenched along an anticline axis and surrounded by steep walls. It is centered at30�350N, 34�500E, the long axis running ENE to WSW (Figure 1). It has an areaof 241 km2. Altitudes range from 1.020m on the western rim to 420m a.s.l. nearthe outlet of the main wadi, Nahal Ramon. This ephemeral stream is 39 km longwithin the makhtesh, and drains most of it. Nahal Neqarot, which flows east ofthe Ramon anticline towards the Dead Sea, serves as the local erosional base levelof the Ramon Valley (Plakht et al., 2000).
The climate of the area is arid to extremely arid. The mean multiannual rainfall is85mm at the northern rim and 56mm at the ‘‘cirque’’ bed in the central part. A meanmaximal daily temperature of 34�C is measured in July, whereas a mean minimal tem-perature of 12.5�C is measured in January. The Quaternary development ofMakhteshRamon can be generalized as an alternation of periods of erosion and stability, causedby periodic lowering of base level. The first stage of base-level lowering began witherosional activity, associated with the deformation along the Dead Sea-Arava RiftValley (Zilberman, 1991). Erosion destroyed the regional Oligocene erosion surfaceand exposed the Ramon anticline structure. The lower landforms are younger becauseof the higher topographic position of Makhtesh Ramon in relation to its base level inthe Dead Sea basin. An interrupted incision of the Makhtesh Ramon drainage systemoccurred since the Pliocene (Zilberman, 1991; Ben-David, 1993; Ben-David et al.,2002). During the Pleistocene, Makhtesh Ramon was situated high relative to itsdrainage base level (Ben-David et al., 1992). This resulted in the preservation ofstepped fluvial terraces, the lowest of which is the youngest (Plakht, 1996).
Seven terraces, dated by the RTL (radio-thermo-luminescent) method, agesfrom 10Ka to 500Ka, were found in the Makhtesh Ramon crater and describedby Plakht (2000). These terraces are as follows. The alluvium of terrace I (aged as10Ka), is relatively homogeneous and consists mainly of pebbles interbedded withthin bands of sand. The alluvium of terrace II (27–36Ka of age) in Makhtesh Ramoncontains a large amount of fine material with alternating calcic horizons, mostly ofaeolian origin. The alluvium of terrace III (48–60Ka of age) is composed mainly ofpebbles in the sandy matrix of Makhtesh Ramon. It sometimes contains buried
Microbial Biomass and Nematodes in Makhtesh-Ramon 199
gypsic paleosol. The alluvium of terrace IV (101–150Ka of age) in Makhtesh Ramonis composed mainly of interbedded pebbles and sandy-loamy layers, alternating withhorizons of buried calcic paleosol containing carbonate nodules. Coarse graveldominates the composition of the alluvium of terrace V (205–240Ka of age) inMakhtesh Ramon. Terrace VI (220–278Ka of age) is capped by interbedded layersof pebbles and sands, and contains 2–3 horizons of brownish buried soil 0.5m thick.Terrace VII (375–443Ka of age) is the highest in Makhtesh Ramon, consistingmainly of a well-rounded conglomerate interbedded with layers of well-cementedcarbonate sand (Table 1).
Materials and Methods
Five random soil samples were collected from the upper 0–10 soil layer of each of theseven erosion terraces (Table 1) in the early hours at the end of the rainy season of2003–2004. The soil samples were collected and placed in individual plastic bags, andstored in an isolated container during transportation to the laboratory. After arrivalat the laboratory, the soil samples were sieved through a 2-mm mesh sieve in order toremove organic debris before biological and chemical analyses. During analysis, thesoil samples were kept at 4�C.
The following analyses were undertaken on each one of the samples collected atthe study site:
1. Soil water content (SWC) was determined gravimetrically as percentage of drymass by drying the samples to a constant weight at 105�C.
2. Total organic carbon (Corg) was determined using a modified method of Rowell(1994).
3. Total soluble nitrogen (TSN) in soil was determined by using the method ofHouba et al. (1987). The amounts of TSN in the soil extracts were determinedusing a Skalar Autoanalyzer unit (S.F.A.S., 1995).
4. pH was determined in H2O (soil:solution ratio 1:2.5) with a potentiometric glasselectrode.
5. Soil salinity was determined in soil extracts and expressed as electrolytic conduc-tivity (EC) S m�1.
6. Soluble cations (Ca2þ, Kþ, Naþ ) were determined by flame photometer(Rhoades, 1982).
7. Soil microbial biomass (Cmic) was determined using a chloroform fumigation incu-bation (CFI) assay, according to Jenkinson & Powlson (1976). Five-gram soilsamples were adjusted to 40% water-holding capacity and fumigated in aCHCl3-saturated atmosphere in a desiccator for 24 h. The fumigated and corre-sponding nonfumigated (control) samples were then transferred to 0.5-L glass jarsand incubated for 10 days at 25�C in the dark. CO2 concentration was measured inthe head space of the glass jars using a Gas Chromatograph (GC), and Cmic wascalculated as: Cmic ¼ [(CO2�C from fumigated soil)�(CO2�C from control sam-ple)]=kc. A kc of 0.41 was used, as proposed by Anderson & Domsch (1990).
8. Soil basal respiration (BR)—as the CO2 evolution was determined by GC(Sparling & West, 1990).
9. Metabolic coefficient (qCO2) was calculated as the ratio between CO2 pro-duction and microbial biomass (Anderson & Domsch, 1990). The qCO2 is a spe-cific parameter for evaluating the effects of environmental conditions on the soilmicrobial biomass.
200 N. Shukurov et al.
Table
1.Main
ecophysiologicalcharacteristics
ofsoilsamplesfrom
differentTerracesofMakhtesh
RamonCrater(m
eanþstandard
deviation,n¼
35)
Age
SWC
Corg
TSN
EC
Caþ2
Naþ
Kþ
Terraces
Ka
g�kg�1
g�kg�
1g�kg�
1dS�m
�1
mg�kg�
1mg�kg�
1mg�kg�
1
Iupto
10
69.2�5.1
a,b
2.2�0.4
a0.57�0.43c,d
0.04�0.011c
265�213c
541�93c,d
17.0�5.1
a
II27–36
73.3�9.3
a1.4�0.5
b,c
0.26�0.18d
0.034�0.009c
219�101c
450�97d
6.8�7.8
b
III
48–60
73.4�10.1
a1.2�0.4
b,c
1.09�0.5
b0.05�0.010b,c
706�104c
588�69b,c
12.6�6.3
a,b
IV101–150
65.0�6.3
a,b,c
1.0�0.0
c1.19�0.14a,b
0.074�0.015a
1209�385b
635�76a,b,c
12.6�6.3
a,b
V205–240
62.1�12.1
a,b,c
1.0�0.0
c1.53�0.01a
0.086�0.011a
1794�829a
692�88a,b
10.2�4.9
a,b
VI
220–278
56.4�18.2
b,c
1.6�0.5
b0.91�0.24b,c
0.094�0.031a
410�103c
743�125a
4.4�3.3
b
VII
375–443
53.3�9.0
c1.0�0.0
c0.51�0.23d
0.036�0.013c
650�243c
266�104e
7.4�4.9
b
SWC,soilwatercontent;Corg,totalorganic
carbon;TSN,totalsoluble
nitrogen;EC,soilsalinity.
Significantdifferences(P
<0.05)betweensamplingterracesare
indicatedbydifferentletters(a,b,c).
201
10. Microbial coefficient, known as substrate availability, was determined as theCmic=Corg ratio.
11. Nematode population was determined by extraction from 100 g soil samples usingthe Baermann funnel procedure (Cairns, 1960). The recovered organisms werecounted using a compound microscope and preserved in formalin (Steinberger& Sarig, 1993). The nematodes from each sample were collected and identifiedaccording to order, family, and genus, using a compound microscope. Nema-todes were classified into the following trophic groups: (1) bacterivores; (2) fun-givores; (3) plant parasites; and (4) omnivores-predators, according to knownfeeding habitats or stoma and esophageal morphology (Steinberger & Sarig,1993; Yeates et al., 1993). The nematode community was analyzed using the fol-lowing approaches: (1) absolute abundance of individuals 100 g�1 dry soil; (2)absolute number of trophic structure; and (3) ecological indices: (a) trophicdiversity (TD), where TD ¼ 1=RPi2 (Heip et al., 1988) (b) Shannon Index(H0), where H0 ¼ �RPiðlnPiÞ (Shannon & Weaver, 1949); (c) modified maturityindex ðRMIÞ, nematode maturity index (MI) of Bongers (1990) is modified toinclude plant feeding nematodes and thus better reflects ecosystem development(Yeates, 1994). RMI incorporates ecological characteristics of families based ona colonizer-to-persister scale 1–5, lower RMI values indicating more disturbedenvironments; (d) richness index (SR), SR ¼ (S�1)=In(N), where S is the num-ber of taxa and N is the number of individuals identified (Yeates & King, 1997);(e) evenness index (J0), where J0 ¼ H0=lh (S), H0 is the Shannon Index, ln is thelog base (e) and S is equal to number of taxa (Pielou, 1975).
The data presented in our study are reported as oven-dried weights. All data weresubjected to statistical analysis of variance (ANOVA). When significance at a level ofp < 0.05 was observed, Tukey’s values were calculated for separation of the means.
Results
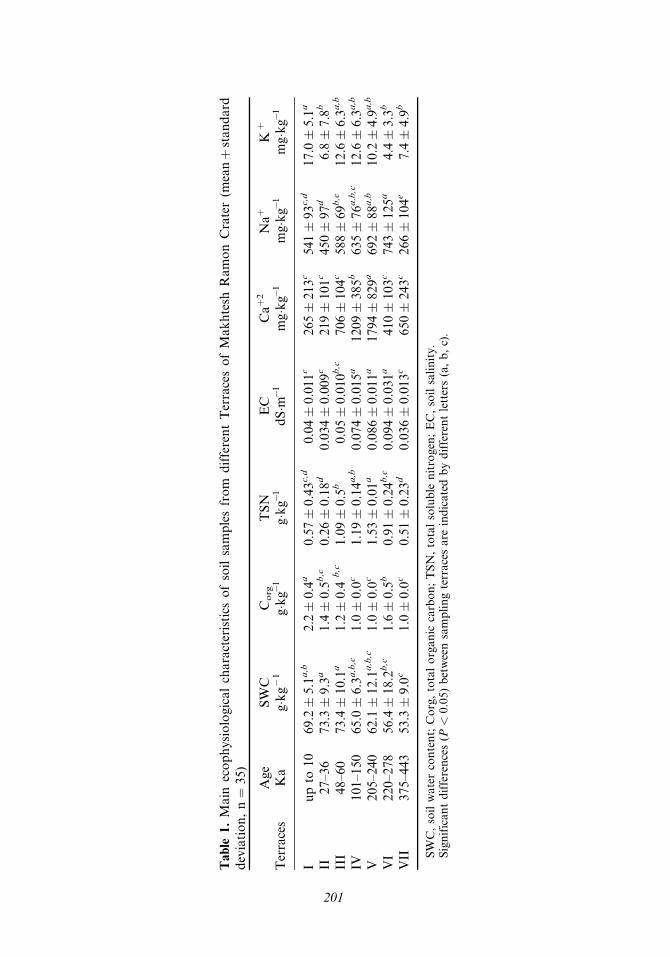
Soil water content ranged between 53.3 and 73.4 g kg�1 in soil samples collectedalong the seven terraces (Figure 2). In the youngest terraces (I, II, III), the meanvalues of soil water content was relatively higher (69.2–73.4 g kg�1) than in the otherfour older terraces (IV, V, VI, and VII), where the mean values ranged between 53.3–65.0 g kg�1 (Table 1). The differences in soil water content between the terracesyielded significant ð p < 0:05Þ differences between the different terraces (Table 1).
Soil total organic carbon (Corg) was found to decrease gradually from a meanlevel of 2.2 g kg�1 in the youngest terrace (aged 10Ka) to a minimal value of 1.0 gkg�1 for terraces IV, V, and VII (Table 1), while in terrace VI the soil organic carbonreached a relatively higher mean value of 1.6 g kg�1. Although little differences werefound in soil organic carbon levels between the terraces, the increasing age of theterraces (except terrace VI) yielded a significant decrease in Corg (Figure 2; Table 1).
Total soluble nitrogen in soil samples taken from the difference terraces(Figure 1) exhibited a relatively low mean value of 0.57 and 0.26 g kg�1 for terracesI and II. In terraces III, IV, V, and VI, the values increased two to three times, tomaximum mean levels of 1.53 g kg�1 (terrace V). The pattern obtained exhibited sig-nificant accumulation of TSN in terrace aged between 48 to 240Ka, after that agradual decrease in TSN was obtained (Figure 2; Table 1).
The soil sample taken from the seven terraces was weakly alkaline, with the pHranging from 7.3 to 7.9, without any significant differences between the samples.
202 N. Shukurov et al.

Electrolytic conductivity values were found to follow a pattern similar to thatreported for TSN, with relatively low values for terraces I and II (0.04 and0.034 dS m�1, respectively) followed by a gradual increase to a mean maximal levelof 0.094 dS m�1 in terrace VI, followed by a significant ð p < 0:05Þ decrease
Figure 2. Soil moisture and organic matter contents in soil samples taken from the differentterraces of the Makhtesh Ramon erosion cirque. 1 – Terrace I; 2 – Terrace II; 3 – TerraceIII; 4 – Terrace IV; 5 – Terrace V; 6 – Terrace VI; 7 – Terrace VII.
Microbial Biomass and Nematodes in Makhtesh-Ramon 203
compared to terrace IV, V, and VI with mean values of 0.074, 0.086, and 0.094 dSm�1, respectively (Figure 3, Table 1).
A spatial comparison of the cation content of soil samples from differenterosional terraces revealed that the concentration of Ca2þ and Naþ in the soils(Figure 3) followed a pattern similar to EC and TSN, with lower values in the youngterraces and an increase in the older ones, leading to partially significant differencesbetween them (p < 0:05; Table 1). The Kþ content in the soil samples followed pat-terns similar to the Ca2þ and Naþ ions (Table 1).
Soil microbial biomass (Figure 4) was found to reach significantly higher values,such as 18.97 and 22.02 Cmic (mgC g�1 soil), in soil samples taken from terraces I andII, respectively. A 2–7-fold decrease in microbial biomass was obtained with increasein terrace age from 60–443Ka. These significant differences led to significant differ-ences between sampling locations (p < 0:0001; Table 2).
Soil Basal Respiration (BR) showed a relatively similar pattern to thoseobtained by microbial biomass, with the values obtained in the youngest terraces Iand II, the BR being 46.6–53.2 mg CO2�C(g soil h)�1, respectively. In the older ter-races IV, V, VI, and VII, CO2 evolution decreased 1.5- to 2-fold lower than in ter-races I and II, to values ranging between 27.4 and 40.7 mgCO2�C(g soil h)�1
(Figure 4), yielding a significant difference ðP < 0:005Þ between them (Table 2).As a result of the significant changes in microbial biomass and CO2 evolution,
the Ecophysiological Status (qCO2) of the soil microbial community was foundto decrease from a maximal value of 1.3 to 0.32mgCO2�C(gCmich)
�1 along theterraces (from younger to older) (Figure 4, Table 1). These ‘‘mirror images’’ ofqCO2 behavior, which decreased significantly with the increase in terrace age,showed the difference in utilization of substrates for the microbial biomass.
The pattern obtained for the microbial coefficients (Cmic=Corg) which can beinterpreted as substrate availability, was found to follow the ecophysiological index,with values ranging from 2.38–3.74% in terraces aging up to 150Ka (Figure 4),whereas the values obtained for terraces V, VI, and VII decreased significantly (over1,5 times to 0.46–188%) (Table 2).
Nematode Population, the total number of soil free-living nematodes among theterraces, ranged from a mean of 1 to 25 individuals 100 g�1 dry soil (Figure 4). Themaximal population was found in terrace I, with 25 individuals 100 g�1 dry soil whichdecreased gradually to a mean value of 1 individual 100 g�1 dry soil at terrace 5, witha similar value for the remaining locations, leading to significant differencesðP < 0:002Þ (Table 2) between them.
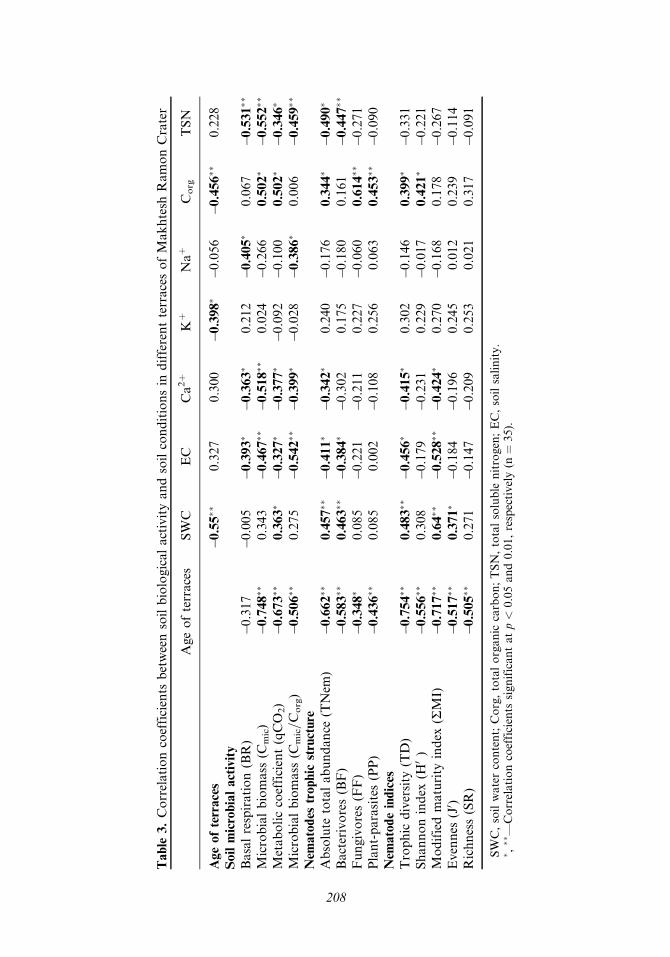
A significant positive correlation was found between the total density of the soilfree-living nematode population and soil moisture (P < 0:005, n ¼ 35), soil organicmatter (P < 0:04, n ¼ 35), soil microbial biomass (P < 0:001, n ¼ 35), and themicrobial coefficient Cmic=Corg (P < 0:01, n ¼ 35). Total nematode density wasfound to be negatively affected at a level of P < 0:05 by Ca2þ , TSN concentration,and soil electrical conductivity.
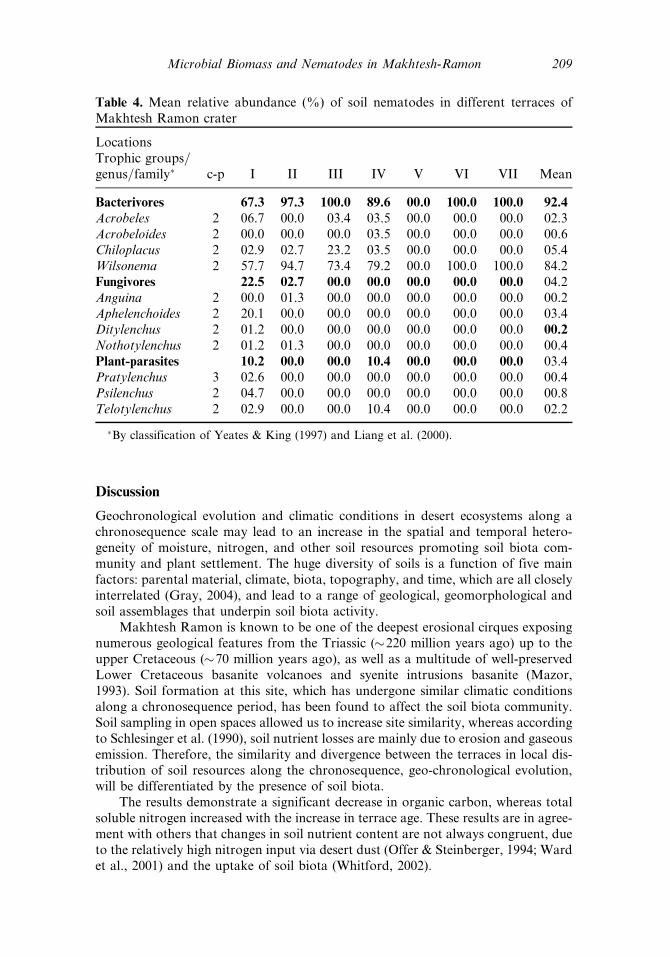
For Nematode taxa and trophic group, A total of 11 genera were found, includingfour bacterivores, four fungivores, and three plant-parasites (omnivore-predatorswere not found) (Table 3). The bacterivore trophic group was the dominant group,represented by over 50% of the total taxa, followed by the fungivores and the plant-parasites. Of all the taxa, the Wilsonema, belonging to the bacterivore trophic group,was the most dominant taxon in the young as well as old terraces (Table 4). Most ofthe taxa were found in the youngest terraces (I, II, III, IV), whereas in terraces V, VI,
204 N. Shukurov et al.
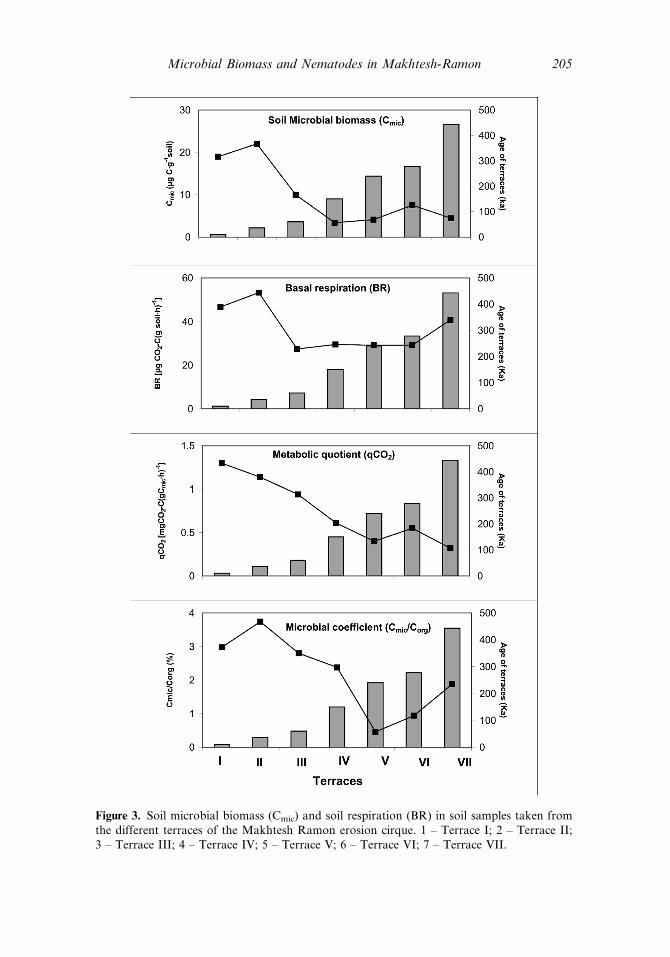
Figure 3. Soil microbial biomass (Cmic) and soil respiration (BR) in soil samples taken fromthe different terraces of the Makhtesh Ramon erosion cirque. 1 – Terrace I; 2 – Terrace II;3 – Terrace III; 4 – Terrace IV; 5 – Terrace V; 6 – Terrace VI; 7 – Terrace VII.
Microbial Biomass and Nematodes in Makhtesh-Ramon 205
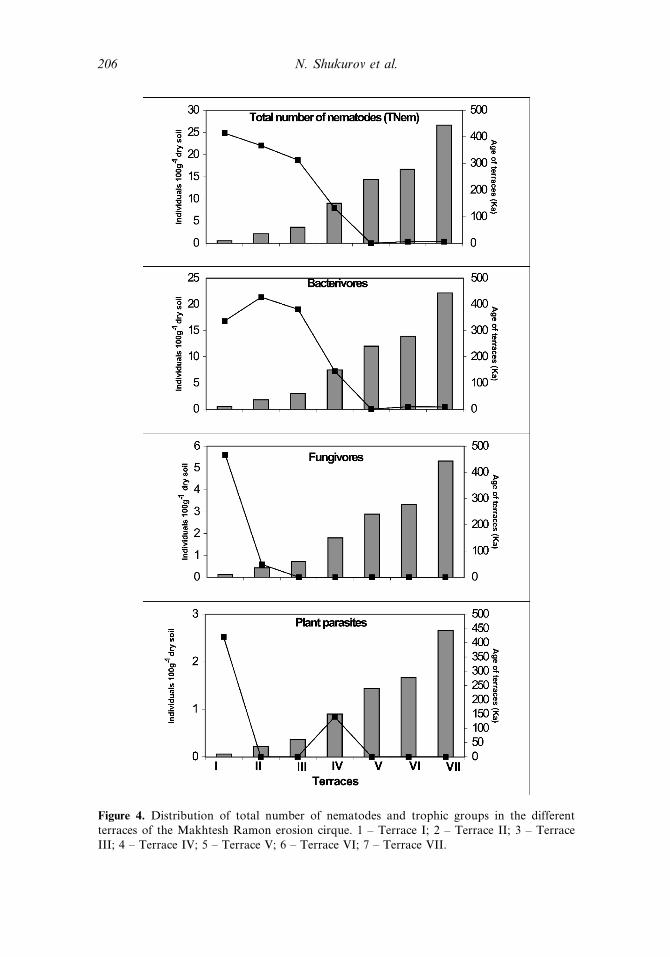
Figure 4. Distribution of total number of nematodes and trophic groups in the differentterraces of the Makhtesh Ramon erosion cirque. 1 – Terrace I; 2 – Terrace II; 3 – TerraceIII; 4 – Terrace IV; 5 – Terrace V; 6 – Terrace VI; 7 – Terrace VII.
206 N. Shukurov et al.
and VII, onlyWilsonema was present while the other two trophic groups disappearedwith the increase in terrace age (Table 3; Figure 5).
According to Bongers (1990), c-p indices, with values ranging between 1 and 5,describe nematode life strategies from a population that is tolerant to a populationknown as colonizers, that is sensitive to environmental distribution. He divided thisrange into three distinct parts, where values 1 and 2 are known to be tolerant, andconsist mainly of bacterivores and fungivores. The second groups consist of c-pvalues of 4 and 5, are sensitive to abiotic fluctuations, and are known as persisters.The third c-p group, with a value of 3, is known as an intermediate group thatincludes some colonizers and some persisters. In our study, 91% of the populationwas found to be represented by c-p values of 2, and only 9% (one representa-tive—Pratylechus) with a c-p value of 3 was found in the soil samples taken fromthe youngest terrace (terrace I) (Table 3).
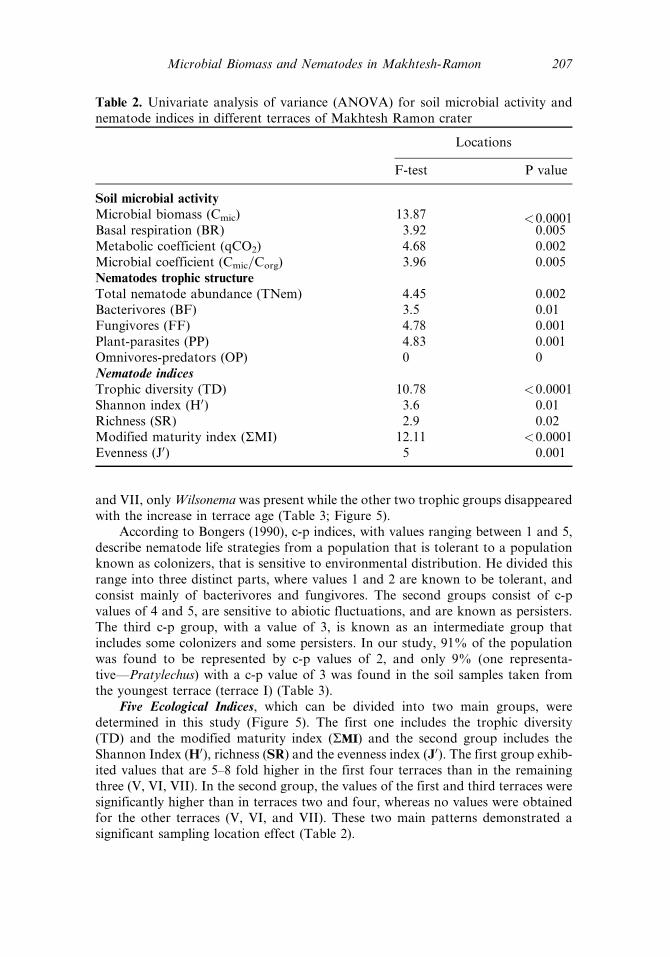
Five Ecological Indices, which can be divided into two main groups, weredetermined in this study (Figure 5). The first one includes the trophic diversity(TD) and the modified maturity index (RMI) and the second group includes theShannon Index (H0), richness (SR) and the evenness index (J0). The first group exhib-ited values that are 5–8 fold higher in the first four terraces than in the remainingthree (V, VI, VII). In the second group, the values of the first and third terraces weresignificantly higher than in terraces two and four, whereas no values were obtainedfor the other terraces (V, VI, and VII). These two main patterns demonstrated asignificant sampling location effect (Table 2).
Table 2. Univariate analysis of variance (ANOVA) for soil microbial activity andnematode indices in different terraces of Makhtesh Ramon crater
Locations
F-test P value
Soil microbial activity
Microbial biomass (Cmic) 13.87 <0.0001Basal respiration (BR) 3.92 0.005Metabolic coefficient (qCO2) 4.68 0.002Microbial coefficient (Cmic=Corg) 3.96 0.005Nematodes trophic structure
Total nematode abundance (TNem) 4.45 0.002Bacterivores (BF) 3.5 0.01Fungivores (FF) 4.78 0.001Plant-parasites (PP) 4.83 0.001Omnivores-predators (OP) 0 0Nematode indicesTrophic diversity (TD) 10.78 <0.0001Shannon index (H0) 3.6 0.01Richness (SR) 2.9 0.02Modified maturity index (RMI) 12.11 <0.0001Evenness (J0) 5 0.001
Microbial Biomass and Nematodes in Makhtesh-Ramon 207
Table
3.Correlationcoefficients
betweensoilbiologicalactivityandsoilconditionsin
differentterracesofMakhtesh
RamonCrater
Ageofterraces
SWC
EC
Ca2þ
Kþ
Naþ
Corg
TSN
Ageofterraces
�0.55��
0.327
0.300
�0.398�
�0.056
�0.456��
0.228
Soilmicrobialactivity
Basalrespiration(BR)
�0.317
�0.005
�0.393�
�0.363�
0.212
�0.405�
0.067
�0.531��
Microbialbiomass
(Cmic)
�0.748��
0.343
�0.467��
�0.518��
0.024
�0.266
0.502�
�0.552��
Metaboliccoefficient(qCO
2)
�0.673��
0.363�
�0.327�
�0.377�
�0.092
�0.100
0.502�
�0.346�
Microbialbiomass
(Cmic=Corg)
�0.506��
0.275
�0.542��
�0.399�
�0.028
�0.386�
0.006
�0.459��
Nem
atodes
trophic
structure
Absolute
totalabundance
(TNem
)�0
.662��
0.457��
�0.411�
�0.342�
0.240
�0.176
0.344�
�0.490�
Bacterivores(BF)
�0.583��
0.463��
�0.384�
�0.302
0.175
�0.180
0.161
�0.447��
Fungivores(FF)
�0.348�
0.085
�0.221
�0.211
0.227
�0.060
0.614��
�0.271
Plant-parasites(PP)
�0.436��
0.085
0.002
�0.108
0.256
0.063
0.453��
�0.090
Nem
atodeindices
Trophic
diversity
(TD)
�0.754��
0.483��
�0.456�
�0.415�
0.302
�0.146
0.399�
�0.331
Shannonindex
(H0)
�0.556��
0.308
�0.179
�0.231
0.229
�0.017
0.421�
�0.221
Modifiedmaturity
index
(RMI)
�0.717��
0.64��
�0.528��
�0.424�
0.270
�0.168
0.178
�0.267
Evennes
(J0 )
�0.517��
0.371�
�0.184
�0.196
0.245
0.012
0.239
�0.114
Richness(SR)
�0.505��
0.271
�0.147
�0.209
0.253
0.021
0.317
�0.091
SWC,soilwatercontent;Corg,totalorganic
carbon;TSN,totalsoluble
nitrogen;EC,soilsalinity.
� ,��—
Correlationcoefficients
significantatp<
0.05and0.01,respectively(n
¼35).
208
Discussion
Geochronological evolution and climatic conditions in desert ecosystems along achronosequence scale may lead to an increase in the spatial and temporal hetero-geneity of moisture, nitrogen, and other soil resources promoting soil biota com-munity and plant settlement. The huge diversity of soils is a function of five mainfactors: parental material, climate, biota, topography, and time, which are all closelyinterrelated (Gray, 2004), and lead to a range of geological, geomorphological andsoil assemblages that underpin soil biota activity.
Makhtesh Ramon is known to be one of the deepest erosional cirques exposingnumerous geological features from the Triassic (�220 million years ago) up to theupper Cretaceous (�70 million years ago), as well as a multitude of well-preservedLower Cretaceous basanite volcanoes and syenite intrusions basanite (Mazor,1993). Soil formation at this site, which has undergone similar climatic conditionsalong a chronosequence period, has been found to affect the soil biota community.Soil sampling in open spaces allowed us to increase site similarity, whereas accordingto Schlesinger et al. (1990), soil nutrient losses are mainly due to erosion and gaseousemission. Therefore, the similarity and divergence between the terraces in local dis-tribution of soil resources along the chronosequence, geo-chronological evolution,will be differentiated by the presence of soil biota.
The results demonstrate a significant decrease in organic carbon, whereas totalsoluble nitrogen increased with the increase in terrace age. These results are in agree-ment with others that changes in soil nutrient content are not always congruent, dueto the relatively high nitrogen input via desert dust (Offer & Steinberger, 1994; Wardet al., 2001) and the uptake of soil biota (Whitford, 2002).
Table 4. Mean relative abundance (%) of soil nematodes in different terraces ofMakhtesh Ramon crater
LocationsTrophic groups=genus=family� c-p I II III IV V VI VII Mean
Bacterivores 67.3 97.3 100.0 89.6 00.0 100.0 100.0 92.4
Acrobeles 2 06.7 00.0 03.4 03.5 00.0 00.0 00.0 02.3Acrobeloides 2 00.0 00.0 00.0 03.5 00.0 00.0 00.0 00.6Chiloplacus 2 02.9 02.7 23.2 03.5 00.0 00.0 00.0 05.4Wilsonema 2 57.7 94.7 73.4 79.2 00.0 100.0 100.0 84.2Fungivores 22.5 02.7 00.0 00.0 00.0 00.0 00.0 04.2Anguina 2 00.0 01.3 00.0 00.0 00.0 00.0 00.0 00.2Aphelenchoides 2 20.1 00.0 00.0 00.0 00.0 00.0 00.0 03.4Ditylenchus 2 01.2 00.0 00.0 00.0 00.0 00.0 00.0 00.2
Nothotylenchus 2 01.2 01.3 00.0 00.0 00.0 00.0 00.0 00.4Plant-parasites 10.2 00.0 00.0 10.4 00.0 00.0 00.0 03.4Pratylenchus 3 02.6 00.0 00.0 00.0 00.0 00.0 00.0 00.4Psilenchus 2 04.7 00.0 00.0 00.0 00.0 00.0 00.0 00.8Telotylenchus 2 02.9 00.0 00.0 10.4 00.0 00.0 00.0 02.2
�By classification of Yeates & King (1997) and Liang et al. (2000).
Microbial Biomass and Nematodes in Makhtesh-Ramon 209
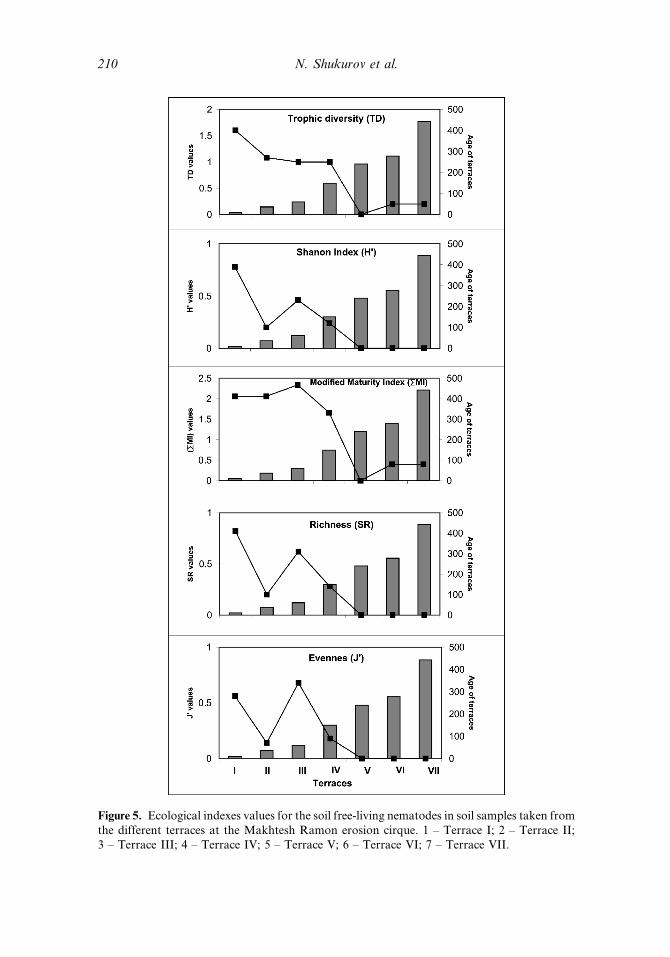
Figure 5. Ecological indexes values for the soil free-living nematodes in soil samples taken fromthe different terraces at the Makhtesh Ramon erosion cirque. 1 – Terrace I; 2 – Terrace II;3 – Terrace III; 4 – Terrace IV; 5 – Terrace V; 6 – Terrace VI; 7 – Terrace VII.
210 N. Shukurov et al.
In their studies, Plakht et al. (2000) were able to define the age structure andnegative impact of erosion without emphasizing the changes in soil quality. Theconsistent results of abiotic parameters for different terrace ages elucidate the impor-tance of soil quality modification, evolution, and the changes undergone on a chron-osequence basis. The soil biota community is an essential component of soil viability,which diminished during the studies on soil quality. They are known to be the pri-mary recyclers of carbon and nitrogen in the soil environment and are importantin the production and consumption of soil gas, mobilization of nutrients and metals,and the dissolution of soil minerals.
The consistent results in microbial and nematode population activity were foundto be complementary with the increase in terrace age, followed by changes in carbonand total soluble nitrogen in the soil samples. Such changes could be caused at thefirst step by immobilization activity of soil biota that in the young terraces have arelatively high carbon and nitrogen content. We assume that the increase in nitrogenlevels with the increase in terrace age originates in inputs of airborne particles (Offeret al., 1996).
The coherent decrease in the number of soil free-living nematode trophic groups,species richness, and ecological indices with the increase in terrace age, may beconsistent with Grime’s (1979) ‘‘Intermediate Disturbance Hypothesis.’’ Accordingto this hypothesis, stable environments tend to have few species that are able todominate the others, whereas in highly disturbed sites, only a few species can with-stand the extreme conditions and are able to fulfill their biological functions. Thegeochronological evolution, morphology, and sedimentary structure of alluvialterraces developed under changing climatic conditions create many unique nicheswhere divergence can be compared in many species from prokaryotic bacteria toeukaryotic populations. The study along these terrace’s chronosequence pedimentterraces, which permit multiple taxon comparison and generalization of organism-environment relationships, can lead to the understanding of evolutionary forces inbiodiversity patterns, adaptation, and specialization, as suggested by Nevo (1997)for the ‘‘Evolution canyon.’’
References
Anderson, T. H. and K. H. Domsch. 1990. Application of eco-physiological quotients (qCO2
and qD) on microbial biomass from soils of different cropping histories. Soil Biology andBiochemistry 22:251–255.
Ben-David, R. 1993. Stages in the evolution of landscape in the Makhtesh Ramon and NahalNeqarot. Israel Journal of Earth Sciences 42:189–195.
Ben-David, R., Eyal, Y., Zilberman, E., and Bowman, D. 1992. Drainage system evolution inthe Ramon and Neqarot area in Neogene and the Quaternary. Israel Geological SocietyAnnual Meeting, Ashkelon, Israel, p. 21 (Abstract).
Ben-David, R., Y. Eyal, E. Zilberman, and D. Bowman. 2002. Fluvial systems response to riftmargin tectonics: Makhtesh Ramon area, southern Israel. Geomorphology 45:147–163.
Bongers, T. 1990. The maturity index: An ecological measure of environmental disturbancebased on nematode species composition. Oecologia 83:14–19.
Cairns, E. J. 1960. Methods in nematology, pp. 33–84, in J. N. Sasser and W. R. Jenkins, eds.,Nematology, Fundamentals and recent advances with emphasis on plant parasitic and soilforms. University of North Carolina Press, Chapel Hill, North Carolina, USA.
Danin, A., I. Dor, A. Sandler, and R. Amit. 1998. Desert crust morphology and its relations tomicrobiotic succession at Mt. Sedom, Israel. Journal of Arid Environments 38:161–174.
Microbial Biomass and Nematodes in Makhtesh-Ramon 211
Evenari, M. E., L. Shanan, and W. Tadmore. 1982. The Negev: The challenge of a desert.Harvard University Press, Cambridge, Massachussets, USA.
Gray, M. 2004. Geodiversity: Valuing and conserving abiotic nature. John Wiley, Chichester,UK.
Grime, J. P. 1979. Plant strategies and vegetation processes. John Wiley, New York, USA.Heip, C., P. M. J. Herman, and K. Soetaert. 1988. Data processing, evaluation and analysis,
pp. 197–231, in R. P. Higgins and H. Thiel, eds., Introduction to the study of meiofauna.Smithsonian Institution Press, Washington, D.C., USA.
Houba, V. J. G., I. Novozamsky, J. Vittenbogaard, and J. J. Van Der Lee. 1987. Automaticdetermination of total soluble nitrogen in soil extracts. Landwirtschaftliche Forschung40:295–302.
Jenkinson, D. S. and D. S. Powlson. 1976. The effects of biocidal treatments on metabolism insoil. V. A method for measuring soil biomass. Soil Biology and Biochemistry 8:209–213.
Lajtha, K. and W. H. Schlesinger. 1988. The biogeochemistry of phosphorus cycling andphosphorus availability along a desert soil chronosequence. Ecology 69:24–39.
Liang, W., Y. Pinhas-Adiv, H. Shtultz, and Y. Steinberger. 2000. Nenatode populationdynamics under the canopy of desert holophytes. Arid Soil Research and Rehabilitation.14: 183–192.
Mazor, E. 1993. Introduction to the Ramon National Geological Park. Israel Journal of EarthSciences 42:103–114.
Nevo, E. 1997. Evolution in action across phylogeny caused by microclimatic stresses at‘‘evolution canyon.’’ Theoretical Population Biology 52:231–243.
Offer, Z. Y., S. Sarig, and Y. Steinberger. 1996. Dynamics of nitrogen and carbon content ofaeolian dry deposition in an arid region. Arid Soil Research and Rehabilitation 10:193–199.
Offer, Z. Y. and Y. Steinberger. 1994. Some data on elemental composition of airborne particu-late matter in the northern Negev Desert, Israel. Environmental Conservation 21:342–346.
Pen-Mouratov, S., M. Rakhimbaev, G. Barness, and Y. Steinberger. 2004. Spatial and tem-poral dynamics of the nematode populations under Zygophyllum dumosum in an aridenvironment. European Journal of Soil Biology 40:31–46.
Pielou, E. C. 1975. Ecological diversity. John Wiley, New York, USA.Plakht, J. 1995. Climatic conditions during the stages of development of Makhtesh Ramon.
Israel Journal of Earth Sciences 44:149–157.Plakht, J. 1996. Mapping of quaternary units in Makhtesh Ramon, central Negev. Israel
Journal of Earth Sciences 45:217–222.Plakht, J. 1998. Shape of pebbles as an indicator of climatic changes during the Quaternary in
Makhtesh Ramon, Negev, Israel. Zeitschrift fur Geomorphologie 42:221–231.Plakht, J. 2000. Quaternary units in Makhteshim, Negev Desert: Similarities and peculiarities.
Israel Journal of Earth Sciences 49:179–187.Plakht, J., N. Patyk-Kara, and N. Gorelikova. 2000. Terrace-pediments in Makhtesh Ramon,
Central Negev, Israel. Earth Surface Processes and Landforms 25:29–39.Rhoades, J. D. 1982. Soluble salts, pp. 167–179, in A. L. Page, R. H. Miller, and D. R. Keeney,
eds., Methods of soil analysis, part 2, Chemical and microbiological properties. AmericanSociety of Agronomy, Soil Science Society of America, Madison, Wisconsin, USA.
Rowell, D. L. 1994. Soil Science: Methods and applications. Longman Group UK Ltd.,London, UK.
S.F.A.S. 1995. Manual-San plus analyzer. SKALAR Analytical, The Netherlands.Schlesinger, W. H., J. A. Raikes, A. E. Hartley, and A. F. Cross. 1996. On the spatial pattern
of soil nutrients in desert ecosystems. Ecology 77:364–374.Schlesinger, W. H., J. F. Reynolds, G. L. Cunningham, L. F. Huenneke, W. M. Jarrel,
R. A. Virginia, and W. G. Whitford. 1990. Biological feedbacks in global desertification.Science 247:1043–1048.
Shannon, C. E. and W. Weaver. 1949. The mathematical theory of communication. Universityof Illinois Press, Urbana, Illinois, USA.
212 N. Shukurov et al.
Sparling, G. P. and A. W. West. 1990. A comparison of gas chromatography and differentialrespirometer methods to measure soil respiration and to estimate the soil microbialbiomass. Pedobiologia 34:103–112.
Steinberger, Y. and S. Sarig. 1993. Responses by soil nematode populations in the soilmicrobial biomass to a rain episode in the hot, dry Negev Desert. Biology and Fertilityof Soils 16:188–192.
Ward, D., K. Feldman, and Y. Avni. 2001. The effects of loess erosion on soil nutrients,plant diversity and plant quality in Negev desert wadis. Journal of Arid Environments48:461–473.
Whitford, W. G. 2002. Ecology of desert systems. Academic Press, New York, USA.Wright, C. J. and D. C. Coleman. 2000. Cross-site comparison of soil microbial biomass, soil
nutrient status, and nematode trophic groups. Pedobiologia 44:2–23.Yeates, G. W. 1982. Variation in pasture nematode populations over thirty-six months in a
summer dry silt loam. Pedobiologia 24:329–346.Yeates, G. W. 1994. Modification and qualification of the nematode maturity index. Pedobio-
logia 38:97–101.Yeates, G. W., T. Bongers, R. G. M. De Goede, D. Freckman, and S. S. Georgieva. 1993.
Feeding habits in soil nematode families and genera—An outline for soil ecologists.Journal of Nematology 25:315–331.
Yeates, G. W. and K. L. King. 1997. Soil nematodes as indicators of the effect of managementon grasslands in the New England Tablelands (NSW): Comparison of native andimproved grasslands. Pedobiologia 41:526–536.
Zilberman, E. 1991. Landscape evolution in the central, northern and northwestern Negev duringthe Neogene and the Quaternary. Geological Survey of Israel, Report GSI=45=90.
Microbial Biomass and Nematodes in Makhtesh-Ramon 213