distribution and diet of 0-group cod (gadus morhua) and haddock (melanogrammus aeglefinus) in the...
TRANSCRIPT

ORIGINAL PAPER
Distribution and diet of 0-group cod (Gadus morhua) and haddock(Melanogrammus aeglefinus) in the Barents Sea in relation to foodavailability and temperature
Padmini Dalpadado Æ Bjarte Bogstad ÆElena Eriksen Æ Laura Rey
Received: 12 November 2008 / Revised: 28 May 2009 / Accepted: 1 June 2009 / Published online: 28 June 2009
� Springer-Verlag 2009
Abstract Distribution of 0-group cod (Gadus morhua)
and haddock (Melanogrammus aeglefinus) in August–
September 2005 and 2006 was mainly restricted to the
Atlantic waters of the western and central areas of the
Barents Sea. The main distribution of 0-group fish over-
lapped largely with areas of high biomass ([7 gm-2 dry
weight) of zooplankton. The copepod Calanus finmarchi-
cus and krill Thysanoessa inermis, which are dominant
zooplankton species in both Atlantic and boreal waters of
the Barents Sea, were the main prey of 0-group cod and
haddock. The main distribution, feeding areas and prey of
0-group cod and haddock overlapped, implying that com-
petition for food may occur between the two species.
However, though their diet coincided to a certain degree,
haddock seems to prefer smaller and less mobile prey, such
as Limacina and appendicularians. As 0-group fish
increased in size, there seems to be a shift in diet, from
small copepods and towards larger prey such as krill and
fish. Overall, a largely pelagic feeding behaviour of
0-group cod and haddock was evident from this study.
Keywords 0-group � Cod � Haddock � Diet �Zooplankton � Trophic interactions � Barents Sea
Introduction
Many studies in the recent years (Falk-Petersen et al. 2007
and references therein, Wassmann 2008) indicate that the
warming climate may have large impact on the arctic
ecosystem. Warming conditions may favour organisms that
thrive in warm waters but may have adverse effects on
cold-water species. Such impacts are most likely to have
consequences on the food web as a whole. An example of
such changes is indicated by Falk-Petersen et al. (2007),
where it is suggested that a warmer climate with reduced
ice cover and new phytoplankton regimes will lead to a
shift in zooplankton size spectrum, towards a smaller
zooplankton size spectrum dominated by, e.g. C. finmar-
chicus, with lower energy content. These authors indicate
that sea birds such as little auk (Alle alle) specialised,
feeding on larger, energy-rich species, e.g. Calanus gla-
cialis and C. hyperboreus for their breeding success, may
change their ecology when they have to switch to less
energy-rich prey such as C. finmarchicus. The warmer
conditions in the Barents Sea have also led to changes in
distribution of many fish species (Stiansen and Filin 2008).
For cod, it has been shown that not only their distribution
but also their spawning sites and recruitment success is
affected by climate (Sundby and Nakken 2008). Changes in
distribution of fish species could also cause changes in
species overlap and hence predator–prey interactions.
The spawning grounds of North East Arctic cod (Gadus
morhua) and North East Arctic haddock (Melanogrammus
aeglefinus) are located along the west coast of Norway.
During spring, both the Norwegian Atlantic and the Nor-
wegian Costal Currents transport the pelagic eggs into the
Barents Sea (Sonina 1969; Dingsør et al. 2007; Sundby and
Nakken 2008). The cod spawns mainly along the Norwe-
gian coast (Lofoten and Møre Coast) from February to
April (Fig. 1). Although some overlap between cod and
haddock spawning areas exists, the main spawning of
haddock occurs in deeper waters and close to the shelf’s
edge from May to June. The major spawning areas of
haddock are located off Møre, Lofoten and Tromsø (Fig. 1)
P. Dalpadado (&) � B. Bogstad � E. Eriksen � L. Rey
Institute of Marine Research, P.O. Box 1870, Nordnes,
5817 Bergen, Norway
e-mail: [email protected]
123
Polar Biol (2009) 32:1583–1596
DOI 10.1007/s00300-009-0657-7

(Sonina 1969). The Barents Sea is used as a nursery ground
by both species, and thus their distribution and feeding
areas may overlap to a great extent as 0-groups and as
adults. However, the distribution of cod extends farther to
the north and east than that of haddock, as cod has a lower
temperature limit than haddock (Bergstad et al. 1987).
‘‘The international 0-group survey in the Barents Sea
and adjacent waters’’ has been carried out since 1965, and
annual indices of 0-group fish have been calculated
(Nakken and Raknes 1996; Dingsør 2005; ICES 2008;
Eriksen et al. 2009). This survey is now a part of a joint
Norwegian–Russian ecosystem survey (Anonymous 2006).
The diet of 0-group cod in the Barents Sea has been
investigated both during spring and summer (Sysoeva and
Degtereva 1965; Pedersen and Fossheim 2008) and in
October–December (Ponomarenko 1983). For diet of
0-group haddock, scattered information is available from
spring/summer and from October–December (Sysoeva
1972; Baranova 1972). Little information is available for
the whole Barents Sea on the diet of 0-group cod and
haddock in August–September. Thus, a project was initi-
ated at the Institute of Marine Research, Bergen, Norway,
to study trophic interactions among 0-group cod and had-
dock in August–September 2005 and 2006. In addition to
investigating feeding interactions, we have also extended
this study to examine the distribution patterns of 0-group
cod and haddock in relation to oceanographic conditions
and zooplankton abundance.
Materials and methods
0-group cod and haddock were sampled during Joint
Norwegian–Russian ecosystem survey in the Barents Sea
Fig. 1 Schematic presentation
of the main spawning areas of
North East Arctic cod and North
East Arctic haddock. Redrawn
from Sundby and Nakken
(2008), Dingsør et al. (2007)
and Gjøsæter et al. (2008)
1584 Polar Biol (2009) 32:1583–1596
123

in August–September 2005 and 2006 (Anonymous 2005,
2006). This survey is conducted just prior to the bottom
settling of the 0-group. The samples included in our anal-
ysis are solely from the Norwegian vessels, and cod and
haddock caught by pelagic and bottom trawl was used for
stomach analysis. The reason for limiting our study to data
from Norwegian vessels is that Russian vessels only sam-
pled stomachs of cod from bottom trawl hauls, and no
stomachs from pelagic trawl hauls at all. 0-group cod and
haddock were sampled using a small mesh (8 mm mesh
size) mid-water trawl (‘‘Harstadtral’’). The trawl was towed
at three depths with the headline of the trawl positioned at
0, 20 and 40 m and a towing speed of three knots. The
duration of towing carried out at each depth strata was
10 min. Additional tows were carried out in deeper layers,
when 0-group was recorded by the echosounder at depths
[40 m. The density of 0-group cod and haddock was
calculated using standard methods described by Dingsør
(2005), Anonymous (2006) and Eriksen et al. (2009). The
number of fish per nm2 at each station is estimated using
the number caught, trawl opening of 20 or 30 m (variable
from year to year), and total distance towed, corrected for
number of depth steps. In order to calculate the total
0-group abundance in the Barents Sea, the total area is
divided into 22 subareas (strata), average densities in each
stratum are calculated and corrections for the coverage area
in each stratum are made.
Ten individuals of both cod and haddock were selected
randomly from the catch at each station for diet investi-
gations. The stomachs were then removed and individually
frozen; these were later analysed in detail in the laboratory
to identify the prey to species and size/stage when possible.
The individual prey taxa or groups were put into pre-
weighed aluminium foils and then dried at 60�C in the
laboratory for about 1 day or in the case of larger organ-
isms, e.g. large krill or fish larvae, until a constant weight
was obtained.
In addition, cod stomachs were sampled from bottom
trawl investigations by the use of a Campelen 1800 shrimp
trawl. This trawl has an 80 mm stretched mesh size in the
front, and a 22 mm mesh size in the cod end. The towing
time was 30 min. A single cod was sampled from each
5 cm length group (5–9 cm, 10–14 cm and so on) at each
station, and the 0-group cod was selected based on age
readings. The stomach content investigations of cod is a
long-term study (1984 to present), providing input to the
main joint Russian/Norwegian cod stomach data base and
includes diet information of all ages/sizes of cod (Dolgov
et al. 2007). Similar to the pelagic stomach analysis, the
stomachs of fish caught by the bottom trawls were also
frozen individually, and prey was subsequently identified
to the lowest possible taxonomic level when possible. For
practical reasons, in the bottom trawl investigations where
all size groups of cod are incorporated and thus the stom-
achs may contain large fish prey, the wet weight of prey
organisms were taken. A conversion factor of 0.2 (wet
weight/dry weight ratio of 5.0—see Skjoldal et al. 2004)
was used to convert the wet weight to dry weight.
As stomach analysis is time consuming, we had to limit
the number of samples analysed. The main focus was on
the analysis of 0-group cod stomachs. When the analysis of
haddock stomachs was carried out, only the stations that
overlapped or were within the immediate vicinity of sta-
tions with cod diet data were chosen.
For each station, the mean partial fullness index (PFI)
was calculated to compare quantities of prey groups in the
stomachs of predators of various sizes (Lilly and Fleming
1981). The PFI is based on the assumption that stomach
capacity is a power function of fish length. The index was
estimated with prey grouped by either species or species
group. The PFI of prey group i in predator k is given in
Eq. 1
PFIi;k ¼Si;k
Lkð Þ3� 104 ð1Þ
where Si,k is the weight (g) of prey species i found in the
stomach of predator k, and Lk is the length (cm) of predator
k. The total fullness index (TFI) (PFI summed for all prey)
was also calculated.
On the above-mentioned cruises of 2005 and 2006,
zooplankton was regularly sampled using WP2 and
MOCNESS plankton nets with 180 lm mesh size. The
WP2 is a simple ring net with a 56 cm diameter, and
vertical hauls were taken from bottom to surface using this
net. The MOCNESS is a 1 m2 net, which is equipped with
multiple nets (up to 8) with opening and closing devises.
The WP2 was operated more often than the MOCNESS
(ratio approximately 3–1). Only the integrated biomass
from bottom to surface was used in this study. The biomass
estimates was expressed as g dry weight (dw) per m2. For
each MOCNESS and WP2 profile, the biomass was cal-
culated using the dry weight of zooplankton organisms in
each depth stratum (applies only to MOCNESS), the
sampled depth, and the volume of water filtered. Gjøsæter
et al. (2000) have shown that although the two gears
sampled different size fractions, the total biomass sampled
by the two gears, WP2 and MOCNESS were comparable
and not significantly different. Therefore, the results of the
two gears were combined in this study in order to obtain a
more comprehensive data set of zooplankton abundance. A
CTD Sonde was regularly used throughout these cruises to
obtain salinity and temperature data. The temperature and
salinity at depths of 10, 50 and 100 m were used to classify
the zooplankton stations into different water masses using
the descriptions given by Loeng (1989, 1991) and Gjøsæter
et al. (2002).
Polar Biol (2009) 32:1583–1596 1585
123
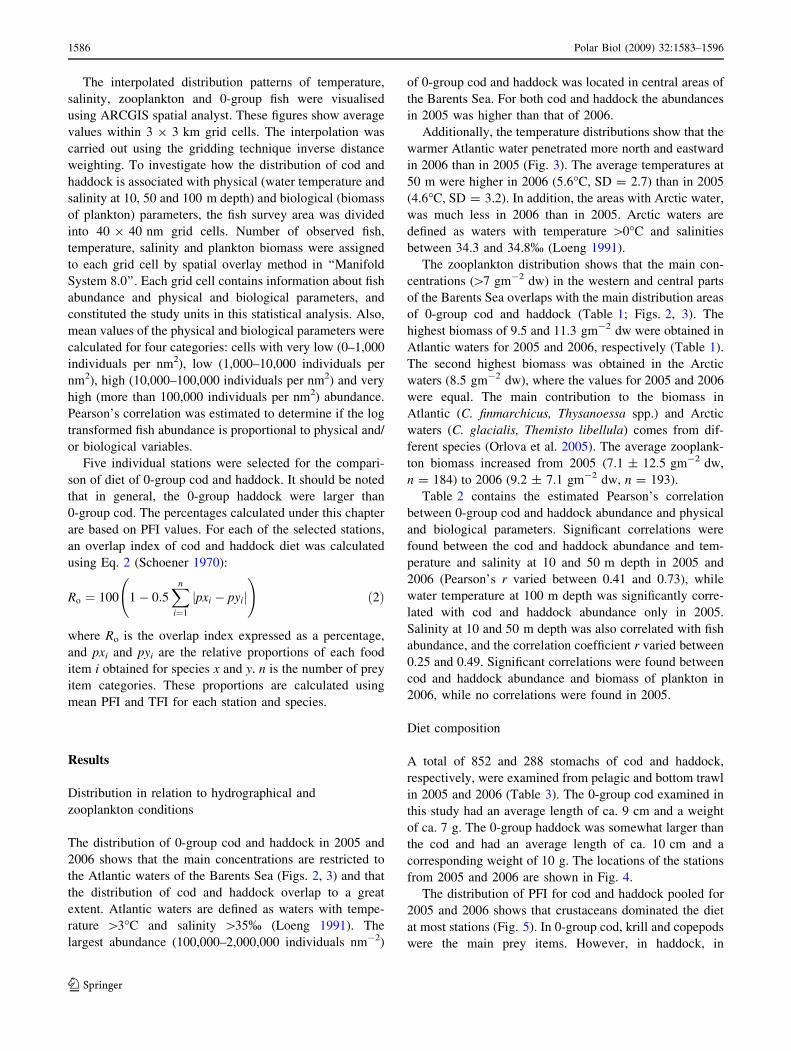
The interpolated distribution patterns of temperature,
salinity, zooplankton and 0-group fish were visualised
using ARCGIS spatial analyst. These figures show average
values within 3 9 3 km grid cells. The interpolation was
carried out using the gridding technique inverse distance
weighting. To investigate how the distribution of cod and
haddock is associated with physical (water temperature and
salinity at 10, 50 and 100 m depth) and biological (biomass
of plankton) parameters, the fish survey area was divided
into 40 9 40 nm grid cells. Number of observed fish,
temperature, salinity and plankton biomass were assigned
to each grid cell by spatial overlay method in ‘‘Manifold
System 8.0’’. Each grid cell contains information about fish
abundance and physical and biological parameters, and
constituted the study units in this statistical analysis. Also,
mean values of the physical and biological parameters were
calculated for four categories: cells with very low (0–1,000
individuals per nm2), low (1,000–10,000 individuals per
nm2), high (10,000–100,000 individuals per nm2) and very
high (more than 100,000 individuals per nm2) abundance.
Pearson’s correlation was estimated to determine if the log
transformed fish abundance is proportional to physical and/
or biological variables.
Five individual stations were selected for the compari-
son of diet of 0-group cod and haddock. It should be noted
that in general, the 0-group haddock were larger than
0-group cod. The percentages calculated under this chapter
are based on PFI values. For each of the selected stations,
an overlap index of cod and haddock diet was calculated
using Eq. 2 (Schoener 1970):
Ro ¼ 100 1� 0:5Xn
i¼1
jpxi � pyij !
ð2Þ
where Ro is the overlap index expressed as a percentage,
and pxi and pyi are the relative proportions of each food
item i obtained for species x and y. n is the number of prey
item categories. These proportions are calculated using
mean PFI and TFI for each station and species.
Results
Distribution in relation to hydrographical and
zooplankton conditions
The distribution of 0-group cod and haddock in 2005 and
2006 shows that the main concentrations are restricted to
the Atlantic waters of the Barents Sea (Figs. 2, 3) and that
the distribution of cod and haddock overlap to a great
extent. Atlantic waters are defined as waters with tempe-
rature [3�C and salinity [35% (Loeng 1991). The
largest abundance (100,000–2,000,000 individuals nm-2)
of 0-group cod and haddock was located in central areas of
the Barents Sea. For both cod and haddock the abundances
in 2005 was higher than that of 2006.
Additionally, the temperature distributions show that the
warmer Atlantic water penetrated more north and eastward
in 2006 than in 2005 (Fig. 3). The average temperatures at
50 m were higher in 2006 (5.6�C, SD = 2.7) than in 2005
(4.6�C, SD = 3.2). In addition, the areas with Arctic water,
was much less in 2006 than in 2005. Arctic waters are
defined as waters with temperature [0�C and salinities
between 34.3 and 34.8% (Loeng 1991).
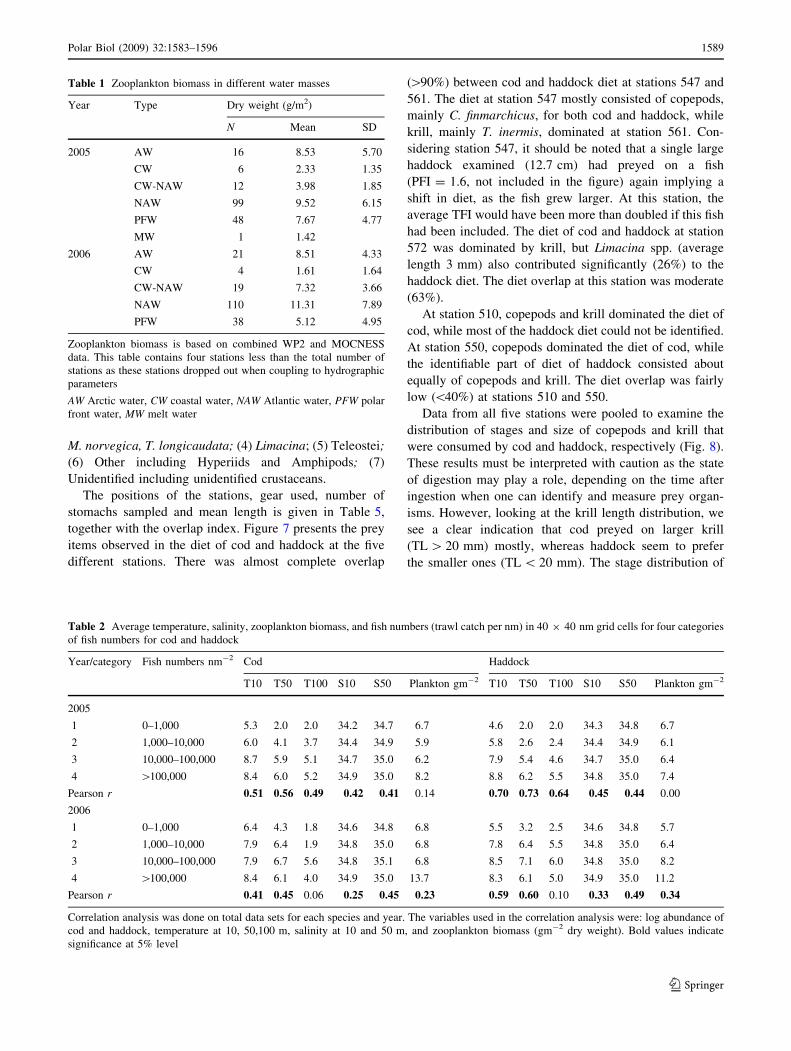
The zooplankton distribution shows that the main con-
centrations ([7 gm-2 dw) in the western and central parts
of the Barents Sea overlaps with the main distribution areas
of 0-group cod and haddock (Table 1; Figs. 2, 3). The
highest biomass of 9.5 and 11.3 gm-2 dw were obtained in
Atlantic waters for 2005 and 2006, respectively (Table 1).
The second highest biomass was obtained in the Arctic
waters (8.5 gm-2 dw), where the values for 2005 and 2006
were equal. The main contribution to the biomass in
Atlantic (C. finmarchicus, Thysanoessa spp.) and Arctic
waters (C. glacialis, Themisto libellula) comes from dif-
ferent species (Orlova et al. 2005). The average zooplank-
ton biomass increased from 2005 (7.1 ± 12.5 gm-2 dw,
n = 184) to 2006 (9.2 ± 7.1 gm-2 dw, n = 193).
Table 2 contains the estimated Pearson’s correlation
between 0-group cod and haddock abundance and physical
and biological parameters. Significant correlations were
found between the cod and haddock abundance and tem-
perature and salinity at 10 and 50 m depth in 2005 and
2006 (Pearson’s r varied between 0.41 and 0.73), while
water temperature at 100 m depth was significantly corre-
lated with cod and haddock abundance only in 2005.
Salinity at 10 and 50 m depth was also correlated with fish
abundance, and the correlation coefficient r varied between
0.25 and 0.49. Significant correlations were found between
cod and haddock abundance and biomass of plankton in
2006, while no correlations were found in 2005.
Diet composition
A total of 852 and 288 stomachs of cod and haddock,
respectively, were examined from pelagic and bottom trawl
in 2005 and 2006 (Table 3). The 0-group cod examined in
this study had an average length of ca. 9 cm and a weight
of ca. 7 g. The 0-group haddock was somewhat larger than
the cod and had an average length of ca. 10 cm and a
corresponding weight of 10 g. The locations of the stations
from 2005 and 2006 are shown in Fig. 4.
The distribution of PFI for cod and haddock pooled for
2005 and 2006 shows that crustaceans dominated the diet
at most stations (Fig. 5). In 0-group cod, krill and copepods
were the main prey items. However, in haddock, in
1586 Polar Biol (2009) 32:1583–1596
123

addition to krill and copepods that were found in their
stomachs, other organisms such as appendicularians and
Limacina species were also present, thus showing that
these are important prey items in some areas. The main
copepod species preyed on by both species were C. finm-
archicus, which appeared to dominate in both abundance
and biomass in Atlantic waters. Occasionally a deeper
dwelling (100–200 m), cold-water species, Metridia longa
was also preyed upon. Of the krill species, Thysanoessa
inermis dominated in all stomachs examined. In addition,
T. longicaudata and Meganyctiphanes norvegica were
important prey in some stations.
0-group cod and haddock preyed occasionally on fish. In
most cases, the fish found in stomachs of cod and haddock
were much digested and therefore registered only as Te-
leostei. However, in some 0-group stomachs, fish such as
young capelin (Mallotus villosus) and long rough dab
(Hippoglossoides platessoides) were found and in a few
haddock stomachs sculpins were identifiable.
TFI of 0-group cod and haddock presented in Fig. 6
indicates the degree of stomach fullness. The TFI values
obtained from this study were combined with subjectively
assigned filling degree to get an indication of which values
of TFI correspond to various degrees of stomach fullness.
Empty stomachs had a TFI of 0 whereas values around 0.4–
0.6 correspond to almost full stomachs. Fish with extended
stomachs, and with transparent stomach wall due to large
amount of stomach contents, had TFI values up to 1.0–1.3.
The stations with high TFI values for haddock generally
also have high TFI values for cod.
A one-way ANOVA was carried out to determine the
significance of differences among the mean TFI of fish
caught by the two trawls (pelagic and bottom trawl). The
test was carried out on pooled data from 2005 and 2006 due
to the low number of observations in some years. Both cod
and haddock specimens caught by the pelagic trawl had
higher TFI values than those caught by the bottom
trawl (cod F = 32.4, P \ 0.0001; haddock F = 13.6,
P \ 0.0001) indicating a largely pelagic feeding behaviour
by the 0-group fish. Day and night samples were separated
using inclination of the sun as criteria. The inclination was
calculated with commonly known algorithms (Olseth and
Fig. 2 Temperature distribution at 50 m overlaid with distribution of
0-group cod, haddock (log number nm-2), and zooplankton biomass
(g dry weight m-2) in 2005. The cod and haddock data were redrawn
from Anonymous (2005, 2006) because the area between 75 and 80�N
and 15 and 40�E was covered mainly by Russian vessels. Zooplank-
ton biomass dry weight data are not available for 2005 from this area
from the Russian vessels
Polar Biol (2009) 32:1583–1596 1587
123

Skartveit 1985), using position, time and date at each sta-
tion. In cod caught by the pelagic trawl, TFI values were
significantly higher at nighttime than at daytime in both
2005 and 2006 (Table 4). However, TFI values of cod
caught with the bottom trawl at daytime from both years
were not significantly different from those specimens
caught at nighttime. For haddock, the number of observa-
tions was too low to draw firm conclusions, although the
results indicate that fish have a continuous feeding pattern,
feeding at both daytime and nighttime.
Ontogenetic differences in diet
To examine ontogenetic differences in diet, fish were
divided into two distinctive size categories, larger or
smaller than 10 cm, and data from 2005 and 2006 were
pooled. The main prey items of small cod were copepods
(54%) and krill (31%). In large cod, these prey items also
dominated, with krill being the most dominant prey (45%).
Copepods accounted for a much lesser amount (25%) in the
diet of smaller cod. These results imply a shift towards
larger prey items with increasing size of 0-group cod. Such
a change was also seen in haddock, but the diet of this
species was more diverse. The dominant prey groups of
smaller haddock were Appendicularia (29%), Limacina
(18%), copepods (18%) and krill (15%). In larger haddock,
krill were most abundant (25%), followed by smaller prey
items such as Limacina (17%), Appendicularia (15%) and
copepods (14%). It should also be noted that 5% of the diet
of larger haddock consisted of Teleostei, while this taxon
was absent in the diet of smaller haddock.
Diet overlap between cod and haddock
For diet overlap studies, the following seven prey catego-
ries were selected from five stations: (1) C. finmarchicus
inclusive Calanus; (2) Calanoids including M. longa,
and Copepoda; (3) Euphausiidae including T. inermis,
Fig. 3 Temperature distribution at 50 m overlaid with distribution of
0-group cod, haddock (log number nm-2), and zooplankton biomass
(g dry weight m-2) in 2006. Cod, haddock and zooplankton data were
redrawn from Anonymous (2006) because the area 75–80�N and
15–40�E was covered mainly by Russian vessels
1588 Polar Biol (2009) 32:1583–1596
123
M. norvegica, T. longicaudata; (4) Limacina; (5) Teleostei;
(6) Other including Hyperiids and Amphipods; (7)
Unidentified including unidentified crustaceans.
The positions of the stations, gear used, number of
stomachs sampled and mean length is given in Table 5,
together with the overlap index. Figure 7 presents the prey
items observed in the diet of cod and haddock at the five
different stations. There was almost complete overlap
([90%) between cod and haddock diet at stations 547 and
561. The diet at station 547 mostly consisted of copepods,
mainly C. finmarchicus, for both cod and haddock, while
krill, mainly T. inermis, dominated at station 561. Con-
sidering station 547, it should be noted that a single large
haddock examined (12.7 cm) had preyed on a fish
(PFI = 1.6, not included in the figure) again implying a
shift in diet, as the fish grew larger. At this station, the
average TFI would have been more than doubled if this fish
had been included. The diet of cod and haddock at station
572 was dominated by krill, but Limacina spp. (average
length 3 mm) also contributed significantly (26%) to the
haddock diet. The diet overlap at this station was moderate
(63%).
At station 510, copepods and krill dominated the diet of
cod, while most of the haddock diet could not be identified.
At station 550, copepods dominated the diet of cod, while
the identifiable part of diet of haddock consisted about
equally of copepods and krill. The diet overlap was fairly
low (\40%) at stations 510 and 550.
Data from all five stations were pooled to examine the
distribution of stages and size of copepods and krill that
were consumed by cod and haddock, respectively (Fig. 8).
These results must be interpreted with caution as the state
of digestion may play a role, depending on the time after
ingestion when one can identify and measure prey organ-
isms. However, looking at the krill length distribution, we
see a clear indication that cod preyed on larger krill
(TL [ 20 mm) mostly, whereas haddock seem to prefer
the smaller ones (TL \ 20 mm). The stage distribution of
Table 1 Zooplankton biomass in different water masses
Year Type Dry weight (g/m2)
N Mean SD
2005 AW 16 8.53 5.70
CW 6 2.33 1.35
CW-NAW 12 3.98 1.85
NAW 99 9.52 6.15
PFW 48 7.67 4.77
MW 1 1.42
2006 AW 21 8.51 4.33
CW 4 1.61 1.64
CW-NAW 19 7.32 3.66
NAW 110 11.31 7.89
PFW 38 5.12 4.95
Zooplankton biomass is based on combined WP2 and MOCNESS
data. This table contains four stations less than the total number of
stations as these stations dropped out when coupling to hydrographic
parameters
AW Arctic water, CW coastal water, NAW Atlantic water, PFW polar
front water, MW melt water
Table 2 Average temperature, salinity, zooplankton biomass, and fish numbers (trawl catch per nm) in 40 9 40 nm grid cells for four categories
of fish numbers for cod and haddock
Year/category Fish numbers nm-2 Cod Haddock
T10 T50 T100 S10 S50 Plankton gm-2 T10 T50 T100 S10 S50 Plankton gm-2
2005
1 0–1,000 5.3 2.0 2.0 34.2 34.7 6.7 4.6 2.0 2.0 34.3 34.8 6.7
2 1,000–10,000 6.0 4.1 3.7 34.4 34.9 5.9 5.8 2.6 2.4 34.4 34.9 6.1
3 10,000–100,000 8.7 5.9 5.1 34.7 35.0 6.2 7.9 5.4 4.6 34.7 35.0 6.4
4 [100,000 8.4 6.0 5.2 34.9 35.0 8.2 8.8 6.2 5.5 34.8 35.0 7.4
Pearson r 0.51 0.56 0.49 0.42 0.41 0.14 0.70 0.73 0.64 0.45 0.44 0.00
2006
1 0–1,000 6.4 4.3 1.8 34.6 34.8 6.8 5.5 3.2 2.5 34.6 34.8 5.7
2 1,000–10,000 7.9 6.4 1.9 34.8 35.0 6.8 7.8 6.4 5.5 34.8 35.0 6.4
3 10,000–100,000 7.9 6.7 5.6 34.8 35.1 6.8 8.5 7.1 6.0 34.8 35.0 8.2
4 [100,000 8.4 6.1 4.0 34.9 35.0 13.7 8.3 6.1 5.0 34.9 35.0 11.2
Pearson r 0.41 0.45 0.06 0.25 0.45 0.23 0.59 0.60 0.10 0.33 0.49 0.34
Correlation analysis was done on total data sets for each species and year. The variables used in the correlation analysis were: log abundance of
cod and haddock, temperature at 10, 50,100 m, salinity at 10 and 50 m, and zooplankton biomass (gm-2 dry weight). Bold values indicate
significance at 5% level
Polar Biol (2009) 32:1583–1596 1589
123

copepods preyed on, indicates that in general, CIV–CVI
stages were dominant, however, in some stations CI–CIII
were also abundant and with no clear difference between
cod and haddock on the selection of copepodite stages.
Discussion
Feeding behaviour
Though the main prey consumed did not differ much, some
variations in the diet was observed between cod and
Table 3 Summary of number of stomachs examined, mean length, mean weight, and total fullness index (TFI, dry weight) of cod and haddock
Trawl type No. of stations No. of fish Length (cm) Weight (g) TFI
Average SD
Cod
2005 Bottom 115 159 9.2 6.65 0.137 0.298
Pelagic 42 418 8.9 5.59 0.243 0.257
2006 Bottom 42 96 9.9 8.11 0.185 0.433
Pelagic 16 179 9.4 7.16 0.377 0.294
Haddock
2005 Bottom 1 4 8.4 5.30 0.144 0.098
Pelagic 12 89 10.5 10.31 0.159 0.201
2006 Bottom 3 33 11.4 13.06 0.106 0.072
Pelagic 9 162 10.1 10.78 0.359 0.308
Fig. 4 Location of stations in 2005 and 2006 where cod and haddock
stomach samples were investigated. Stations where diet overlap
between cod and haddock (referred in Table 5) was examined, are
marked in red
Fig. 5 Distribution of partial fullness index (PFI) in cod and haddock
from 2005 and 2006 cruises. For cod and haddock only stations with
more than five and three fish, respectively, were included in this figure
1590 Polar Biol (2009) 32:1583–1596
123

haddock. In general, it is known that haddock fed on
smaller prey items than cod. The mouth gape of 0-group
haddock is smaller than in 0-group cod, and this may be the
reason for feeding on smaller prey (Robb and Hislop 1980).
In the northern North Sea, Robb (1981) observed that
0-group haddock fed mostly on appendicularians. In this
study, we observed that haddock taken at the same station
fed on other prey such as Limacina spp. and appendicula-
rians in addition to copepods and krill. Limacina spp. and
appendicularians are smaller and less mobile organisms
than krill, for example.
The diet of 0-group cod found in our study has many
similarities with the results found by Ponomarenko (1983)
based on a long time series of diet data from 0-group cod
sampled by bottom trawl in October–December in the
Barents Sea. She found, however, that the main prey
groups were euphausiids, fish and gammarids, while
copepods were of little importance. Early in the summer,
copepods are the most important prey items (Sysoeva and
Degtereva 1965; Pedersen and Fossheim 2008), so August–
September seems to be a transition stage from feeding
mainly on copepods to feeding mainly on other, larger,
prey items.
Sysoeva (1972) found that the diet of haddock larvae in
June–July was dominated by krill, copepodites and ap-
pendicularians, which correspond well to our results. The
diet of 0-group haddock found in our studies was different
from the diet of 0-group haddock sampled by bottom trawl
in October–December in the Barents Sea, which was
dominated by Polychaeta and amphipods (Baranova 1972).
Diurnal variations in diet indicate that the 0-group
haddock seem to have a continuous feeding pattern
including both daytime and night. In contrast, the cod seem
to mainly limit their feeding to night time. Our observa-
tions on diurnal feeding pattern of 0-group cod and had-
dock seem to fit well with observations from the North Sea
Fig. 6 Distribution of total fullness index (TFI) in cod and haddock
from 2005 and 2006 cruises. For cod and haddock only stations with
more than five and three fish, respectively, were included in this figure
Table 4 TFI distribution at day and night, in 2005 and 2006, for pelagic and bottom trawl investigations
Cod Haddock
Trawl type No. of fish Mean SD F value Pr [ F No. of fish Mean SD F value Pr [ F
2005
Day Bottom 106 0.105 0.18 4 0.144 0.10
Night Bottom 53 0.198 0.44 3.48 0.063 ND ND ND NA
Day Pelagic 289 0.209 0.24 74 0.165 0.21
Night Pelagic 129 0.321 0.28 17.70 <0.0001 15 0.128 0.12 0.41 0.5254
2006
Day Bottom 46 0.192 0.58 1 0.139
Night Bottom 50 0.179 0.22 0.020 0.887 32 0.105 0.07 NA
Day Pelagic 84 0.313 0.26 126 0.335 0.27
Night Pelagic 95 0.434 0.31 7.800 0.005 36 0.442 0.41 3.49 0.064
Day and Night are differentiated based on calculations of inclination of the sun. Calculations are based on commonly known algorithms using
position, time, date at each station. Day is regarded as sun inclination[-0.8, and night as sun inclination\-0.8. Summary of ANOVA carried
out to test differences in day and night by trawl type is also given. Bold values indicate that the values are significantly different at 1% level
ND no data, NA not applied due to few data
Polar Biol (2009) 32:1583–1596 1591
123

(Robb and Hislop 1980; Robb 1981) and Icelandic waters
(Palsson 1973).
Even though krill is a major part of the diet of 0-group
cod and haddock, there seem to be size segregation, with
haddock preferring smaller size krill than cod. The prey
selectivity of these fish is based on a limited number of
stations and should be investigated more. Results from this
study also indicate that there is a shift in diet towards krill
and fish as 0-group cod and haddock grow larger. Onto-
genetic differences in diet are common for many fish
species and were also observed for 0-group haddock and
cod from the North Sea (Robb and Hislop 1980; Robb
1981, and from Icelandic waters (Palsson 1973).
Observations indicated above from the Barents Sea and
other areas indicate that although the main prey types of
cod and haddock to a large degree overlap, there are dif-
ferences in feeding behaviour in relation to: (1) type of
food preyed on, e.g. cod feeding on active pelagic prey
whereas haddock feed on slow moving prey, (2) size of
prey, e.g. cod feeding on larger prey than haddock and (3)
when the main feeding occur, e.g. cod feed mainly at night
whereas haddock seem to feed both during day and night.
These differences likely reflect a strategy adopted by the
two species to reduce intra-specific competition, which
would be beneficial especially at times when food is
limiting.
Distribution and abundance in relation to temperature
and food conditions
Distribution maps based on combined Norwegian and
Russian investigations from 2005 and 2006 and additional
years show that the abundances of both 0-group cod and
haddock were extremely low in the eastern parts of the
Barents Sea (Anonymous 2006). High abundances of
0-group cod and haddock are largely restricted to Atlantic
waters in the central and western Barents Sea, and overlaps
with high biomass of zooplankton in the Barents Sea.
In the Atlantic waters, copepods, e.g. C. finmarchicus,
contribute largely to the zooplankton biomass (Orlova et al.
2005; Tande 1991). At euphausiid-rich locations, such as
areas around the Svalbard bank (Einarsson 1945;
Dalpadado and Skjoldal 1996; Zhukova et al. 2009),
0-group fish seem to feed largely on krill. Zhukova et al.
(2009) report that large concentrations of krill (exceeding
1,000 individuals/m3) dominated by T. inermis, are located
south and south east of Svalbard. The large amount of krill
found in 0-group stomachs investigated at stations 424
(75�540N, 30�280E), 510 (73�520N, 30�280E) and 561
(73�330N, 21�410E), which are located adjacent to the
Svalbard bank, may reflect the presence of high concen-
trations of krill in these areas. Astthorsson and Palsson
(1987), studying euphausiid predation by cod, reported that
T. inermis was the most abundant krill species found in
stomachs of 0-group cod ([7 cm) in sub-Arctic waters off
Iceland.
As the distribution, feeding areas and prey of 0-group
cod and haddock overlap, some degree of competition for
food likely exists between the two species. Dingsør et al.
(2007) reports that high densities of 0-group cod may lead
to a reduction in the survival of 0-group haddock, due to
competition for food among the two species. Results from
this study show that the main prey of 0-group cod and
haddock to some extent overlap and competition for food
may occur. Relative to the plankton availability, the fish
seem to select the most abundant prey organisms such as
copepod C. finmarchicus and krill T. inermis. Floeter and
Temming (2003) examined whether North Sea cod feeding
on other fish is based on preference or availability and
concluded that prey abundance is the main determinant of
the diet composition.
Denser concentrations of cod and haddock over larger
areas and, correspondingly, higher abundance indices of
both species were observed in 2005 when compared with
2006. The abundance of 0-group haddock was higher than
that of 0-group cod in both years. This is unusual; normally
the abundance of 0-group cod is much higher than that of
0-group haddock. It should also be noted that the 2005 and
2006 year classes of haddock were very abundant at ages
1–2 (ICES 2008). The low biomass of zooplankton
observed in the southern Barents Sea in 2005 may be a
result of high predation by abundant 0-group fish such as
cod and haddock. In years with high abundance of one
species, e.g. 0-group cod may lead to inter-specific
Table 5 Diet similarity at five selected stations
Station Latitude Longitude Trawl No. of fish sampled Mean length (cm) Similarity index
Cod Haddock Cod Haddock
510 73�520 30�280 Bottom 12 16 10.6 11.5 32.98
547 73�170 20�190 Pelagic 15 14 8.9 9.9 93.54
550 72�430 20�360 Pelagic 14 18 9.2 10.9 35.93
561 74�330 21�400 Pelagic 13 8 9.7 11.3 92.99
572 74�090 34�380 Pelagic 23 22 9.7 10.1 63.24
1592 Polar Biol (2009) 32:1583–1596
123

0 GROUP COD 0 GROUP HADDOCK
37%
15%
33%
1% 14%
0%
Calanoid copepods
C.finmarchicus
Euphausiids
M.longa
Unidentified
Other
2006ST:510 Bottom trawl
88%
9%
Calanoid copepods
M.longa
C.finmarchicus
Other
2005ST:547 Pelagic trawl Cod
L=8.9cm, W=6.1g,N=15
CodL=10.6cm, W=9.3g,N=12
24%
3%
Calanoids copepods
C.finmarchicus
Euphausiids
Unidentified
2005ST:550 Pelagic trawl
CodL=9.2cm, W=6.6g, N=14
18%
12%
69%
Calanoid copepods
Euphausiids
Hyperiids
Unidentified
2006ST:510 Bottom trawl
HaddockL=11.5cm, W=12.6g, N=16
79%
9%
6% 3%
Calanoid copepods
C.finmarchicus
Euphausiids
Crustaceans
Hyperiids
Unidentified
Other
2005ST:547 Pelagic trawl
HaddockL=9.9cm, W=8.9g, N=14
28%
43%Calanoid copepods
C. finmarchicus
Euphausiids
Limacina spp.
2005ST:550 Pelagic trawl Haddock
L=10.9cm, W=11.8g, N=18
72% Other
7%
8%
85%
Calanoid copepods
Euphausiids
T.inermis
Other
2005ST:561 Pelagic trawl
46%
21%
15%
14%
4%Calanoid copepods
Euphausiids
T. inermis
M. norvegica
Teleosts
Hyperiids
Unidentified
Other
2006ST:572 Pelagic trawl
CodL=9.7cm,W=8.0g, N=23
100%
Euphausiids
Other
2005ST:561 Pelagic trawl
HaddockL=11.3cm, W=11.5g, N=8
3%
36%
17%
26%
5%
7%5%
Calanoid copepods
Euphausiids
T.inermis
T.longicaudata
M.norvegica
Limacina spp.
Teleosts
Unidentified
Other
2006ST:572 Pelagic trawl
HaddockL=10.0cm, W=9.6g,N=22
22%
Unidentified
Other
CodL=9.7cm, W=7.9g, N=13
Fig. 7 Comparison between cod and haddock of distribution of PFI at selected stations from 2005 and 2006 cruises
Polar Biol (2009) 32:1583–1596 1593
123

competition for food resources, resulting in unfavourable
conditions for the recruitment success of other fish species.
Role of 0-group in the Barents Sea ecosystem
0-group cod and haddock may have an important role in the
Barents Sea ecosystem both as a predator and as a prey.
Based on the 0-group survey indices corrected for length-
dependent catch efficiency (Anonymous 2007; Eriksen
et al. 2009), the biomass of 0-group cod was estimated to
360,000 tonnes in 2005 and 125,000 tonnes in 2006, while
the corresponding figures for haddock were 779,000 and
257,000 tonnes, respectively. The value for haddock in
2005 is the highest in the time series, which goes back to
1980, while the highest value for cod was 1,286,000 tonnes
in 1995. These biomasses are lower than the biomass of
pelagic fishes in the Barents Sea (Stiansen and Filin 2008).
The consumption/biomass ratio is, however, higher for
small fish such as 0-group than for pelagic fishes. The
0-group fish, especially cod, are distributed widely through
the Barents Sea. Thus, 0-group cod and haddock (and
0-group fish of other species as well) are a key energy
transporter in the Barents Sea ecosystem in some years.
Impact of climate warming on prey distribution
and abundance
The Barents Sea is experiencing warming climate and the
sea temperatures in the entire Barents Sea in 2007 were
amongst the warmest ever observed (Stiansen and Filin
2008). The continued significant reduction in the extent of
the summer sea ice cover is a dramatic illustration of the
pronounced impact increased global temperatures has on
the Arctic regions. The warming conditions may influence
the ecosystem in both a positive and negative ways. If the
climatic warming continues, one could expect a more north
and eastward distribution than today for 0-group cod and
haddock as well as their main prey C. finmarchicus and
T. inermis. However, the extension of the northward dis-
tribution may be limited for the 0-group due to settlement
to the bottom in August–September. Krill studies carried
out by Zhukova et al. (2009) indicate that the abundance of
Atlantic species, e.g. T. inermis increased due to increased
seawater temperatures in the Barents Sea. The C. finmar-
chicus population is also known to increase in abundance
and extend their distribution in warm years (Orlova et al.
2005; Kwasniewski et al. 2003). Similar observations are
0
5
10
15
20
25
34323028262422201816141210
34323028262422201816141210
Nu
mb
er
870
0
50
100
150
200
250
300
C I -III
C VI -IV
0
1
2
3
4
5
6
7
Nu
mb
er
0
10
20
30
40
50
60
Total length (mm)
Total length (mm)
Copepods in cod stomachs
Copepods in haddock stomachs
CopepoditeKrill in cod stomachs
Krill in haddock stomachs
ST 510 ST 547 ST 550 ST 561 ST 572
ST 510 ST 547 ST 550 ST 561 ST 572
(a)
(b)
(c)
(d)
Fig. 8 Length distribution of krill and stage distribution of copepods
from cod and haddock stomachs at selected stations. In krill, total
length (TL)—from tip of the rostrum to end of telson was measured.
Pooled data from 2005 and 2006 cruises are presented. Copepod (CI–
CIII vs. CIV–CVI) were determined based on prosome length and
other characteristics
1594 Polar Biol (2009) 32:1583–1596
123

made from other regions as well. A regime shift in zoo-
plankton community in the North Sea (Beaugrand et al.
2003) is believed to have a negative impact on higher
trophic levels, thus possibly leading to recruitment changes
in some key fish species.
Haddock that seems to have a more preference to war-
mer waters than cod (Sonina 1969; Bergstad et al. 1987;
results from this study) may extend their distribution even
further. Another possible consequence of warming climate
is the reduced ice cover, which in turn influence the bio-
logical production in the northern Barents Sea. Reduced ice
cover may lead to reduction of the very large primary
production close to the ice edge, which takes place in a
short period each year. This is again quite important to
zooplankton and fish production in the northern regions,
having impact on the entire ecosystem.
Acknowledgments This project was part of the research pro-
gramme ‘‘Ecosystem Barents Sea’’ at the Institute of Marine
Research, Bergen, Norway. We thank Harry Williams, Haakon Hop,
Fran Mowbray and one anonymous referee for constructive comments
on a previous version of the manuscript.
References
Anonymous (2005) Survey report from the Joint Norwegian/Russian
ecosystem survey in the Barents Sea August–October 2005, vol
1. IMR/PINRO Joint Report Series, No. 2/2005, pp 1–99
Anonymous (2006) Survey report from the Joint Norwegian/Russian
ecosystem survey in the Barents Sea August–October 2006, vol
1. IMR/PINRO Joint Report Series, No. 2/2006, pp 1–97
Anonymous (2007) Survey report from the Joint Norwegian/Russian
ecosystem survey in the Barents Sea August–October 2007, vol
1. IMR/PINRO Joint Report Series, No. 4/2007, pp 1–97
Astthorsson OS, Palsson OK (1987) Predation on euphausiids by cod,
Gadus morhua, in winter in Icelandic subarctic waters. Mar Biol
96:327–334
Baranova ZP (1972) The feeding of haddock fingerlings in the
Southern Barents Sea. ICES CM 1972/F:15, pp 1–6
Beaugrand G, Brander KM, Lindley JA, Souissi S, Reid PC (2003)
Plankton effect on cod recruitment in the North Sea. Nature
426:661–664
Bergstad OA, Jørgensen T, Dragesund O (1987) Life history and
ecology of the gadoid resources of the Barents Sea. Fish Res
5:119–161
Dalpadado P, Skjoldal HR (1996) Abundance, maturity and growth of
the krill species, Thysanoessa inermis and T. longicaudata in the
Barents Sea. Mar Ecol Prog Ser 144:175–183
Dingsør GE (2005) Estimating abundance indices from the interna-
tional 0-group fish survey in the Barents Sea. Fish Res 72:205–
218
Dingsør GE, Ciannelli L, Chan KS, Ottersen G, Stenseth NC (2007)
Density dependence and density independence during the early
life stages of four marine fish stocks. Ecology 88:625–634
Dolgov AV, Yaragina NA, Orlova EL, Bogstad B, Johannessen E,
Mehl S (2007) 20th anniversary of the PINRO-IMR cooperation
in the investigations of feeding in the Barents Sea—results and
perspectives. Proceedings of the 12th Norwegian—Russian
Symposium 21–22 August 2007, Tromsø, Norway. IMR/PINRO
report series 5/2007, pp 44–78
Einarsson H (1945) Euphausiacea 1. Northern Atlantic species. Dana-
Report. Carlsberg Found 27, pp 1–195
Eriksen E, Prozorkevich D, Dingsør GE (2009) An evaluation of 0-
group abundance indices of Barents Sea fish stocks. Open Fish
Sci J 2:6–14
Falk-Petersen S, Pavlov V, Timofeev S, Sargent JR (2007) Climate
variability and possible effects on arctic food chains: the role of
Calanus. In: Ørbæk JB, Tombre T, Kallenborn R, Hegseth E,
Falk-Petersen S, Hoel AH (eds) Arctic alpine ecosystems and
people in a changing environment. Springer, Berlin, pp 147–166
Floeter J, Temming A (2003) Explaining diet composition of North
Sea cod (Gadus morhua): prey size preference vs. prey
availability. Can J Fish Aquat Sci 60:140–150
Gjøsæter H, Dalpadado P, Hassel A, Skjoldal HR (2000) A
comparison of performance of WP2 and MOCNESS. J Plankton
Res 22:1901–1908
Gjøsæter H, Dalpadado P, Hassel A (2002) Growth of Barents Sea
capelin (Mallotus villosus) in relation to zooplankton abundance.
ICES J Mar Sci 59:959–967
Gjøsæter H, Huse G, Robberstad Y, Skogen M (eds) (2008) Havets
ressurser og miljø. Fisken og havet, særnummer 1-2008, pp 34–
36 (In Norwegian, English summary)
ICES (2008) Report of the arctic fisheries working group, 21–29 April
2008, Copenhagen, Denmark. ICES CM 2008/ACOM:01,
pp 1–531
Kwasniewski S, Hop H, Falk-Petersen S, Pedersen G (2003)
Distribution of Calanus species in Kongsfjorden, a glacial fjord
in Svalbard. J Plankton Res 25:1–20
Lilly GR, Fleming AM (1981) Size relationships in predation by
Atlantic cod, Gadus morhua, on capelin, Mallotus villosus, and
sand lance, Ammodytes dubius, in the Newfoundland area.
NAFO Sci Council Stud 1:41–45
Loeng H (1989) The influence of temperature on some fish population
parameters in the Barents Sea. J Northwest Atl Fish Sci 9:103–113
Loeng H (1991) Features of the physical oceanographic conditions of
the Barents Sea. Polar Res 10:5–18
Nakken O, Raknes A (1996) Corrections of indices of abundance of
0-group fish in the Barents Sea for varying capture efficiency.
ICES C.M. 1996/G:12, pp 1–10
Olseth JA, Skartveit A (1985) Stralingshandbok. Det norske metere-
ologiske institutt, Oslo, Klima nr. 7, pp 1–57
Orlova EL, Boitsov VD, Dolgov AV, Rudneva GB, Nesterova VN
(2005) The relationship between plankton, capelin and cod under
different conditions. ICES J Mar Sci 62:1281–1292
Palsson OK (1973) Nahrunguntersuchungen an den Jugendstadien (0-
gruppen) einiger Fischarten in islandischen Gewassern. Berichte
Deutschen Wissenschaft Kommission Meeresforschung 23, pp
1–32 (in German)
Pedersen T, Fossheim M (2008) Diet of 0-group stages of capelin
(Mallotus villosus), herring (Clupea harengus) and cod (Gadusmorhua) during spring and summer in the Barents Sea. Mar Biol
153:1037–1046
Ponomarenko IY (1983) Long-term dynamics of bottom-dwelling
young cod survival connected with feeding and temperature
conditions. ICES CM 1983/L:9, pp 1–17
Robb AP (1981) Observations on the food and diel feeding behaviour
of pelagic 0-group gadoids in the northern North Sea. J Fish Biol
18:183–194
Robb AP, Hislop JRG (1980) The food of five gadoids species during
the pelagic 0-group phase in the northern North Sea. J Fish Biol
16:199–217
Schoener TW (1970) Nonsynchronous spatial overlap of lizards in
patchy habitats. Ecology 51:408–418
Skjoldal HR, Dalpadado P, Dommasnes A (2004) Food webs and
trophic interactions. In: Skjoldal HR (ed) The Norwegian Sea
ecosystem. Tapir Academic Press, Trondheim, pp 447–506
Polar Biol (2009) 32:1583–1596 1595
123

Sonina MA (1969) Biology of the Arcto—Norwegian haddock during
1937–1965. Fish Res Bd Can Transl Ser 1924:1–151
Stiansen JE, Filin AA (eds) (2008) Joint PINRO/IMR Report on the
State of the Barents Sea Ecosystem in 2007, with expected
situation and Considerations for management. IMR-PINRO Joint
Report Series 2008(1), Institute of Marine Research, Bergen,
Norway, p 185
Sundby S, Nakken O (2008) Spatial shifts in spawning habitats of
Arcto-Norwegian cod related to multidecadal climate oscilla-
tions and climate change. ICES J Mar Sci 65:953–962
Sysoeva TK (1972) Feeding and survival of the Barents Sea haddock
and fry. ICES CM 1972/F:16, pp 1–7
Sysoeva TK, Degtereva AA (1965) The relation between the feeding
of cod larvae and pelagic fry and the distribution and
abundance of their principle food organisms. ICNAF Spec
Pub 6:411–416
Tande KS (1991) Calanus in North Norwegian fjords and in the
Barents Sea. Polar Res 10:389–407
Wassmann P (2008) Impact of global warming on arctic pelagic
ecosystems and processes. In: Duarte CM (ed) Impacts of global
warming on polar ecosystems. Fundacion BBVA Bilbao, pp
111–139
Zhukova NG, Nesterova VN, Prokopchuk IP, Rudneva GB (2009)
Winter distribution of euphausiids (Euphausiacea) in the Barents
Sea (2000–2005). Deep-Sea Res II 56. doi:10.1016/j.dsr2.2008.
11.007
1596 Polar Biol (2009) 32:1583–1596
123