dispersion, mechanical and thermal properties of nano graphite platelets reinforced flouroelastomer...
TRANSCRIPT
e-Polymers 2008, no. 023 http://www.e-polymers.org
ISSN 1618-7229 Dispersion, mechanical and thermal properties of nano graphite platelets reinforced flouroelastomer composites
Deng Xu,1 2 V. Sridhar,1 Thanh Tu Pham,1 Jin Kuk Kim1*
1*Elastomer Laboratory, Department of Polymer Science & Engineering, Gyeong sang National University, Jinju, Korea; e-mail: [email protected] 2College of Material science and Chemical Engineering, Tian Jin Polytechnic University, Tianjin, China. (Received: 10 August, 2007; published: 9 February, 2008)
Abstract: The potential of exfoliated graphite nano platelets (xGnP™) as reinforcing fillers in flouroelastomer has been investigated. The dispersion of the nano graphite platelets in the polymer matrix has been investigated by WAXD, SEM, TEM, EPMA and AFM. WAXD studies indicated that the processing of composites did not change the inter-gallery distance (d-spacing) of the graphite platelets. The effect of increasing nano graphite loadings on mechanical properties like tensile strength, modulus and tear resistance has been studied. Formation of weld lines on the fracture surface of the composite has been observed by SEM. The thermal stability was determined using thermogravimetric analysis. The composites showed higher thermal stability in comparison with nonreinforced polymer.
Introduction For all practical applications (except adhesives), elastomers are reinforced with fillers to improve their performance by incorporating inorganic fillers. Traditionally this has been achieved by using materials such as carbon blacks, clays, talc and silica. But new generation fillers like carbon nano tubes, carbon silica dual phase filler, nano clays and nano graphite are continuously challenging the hegemony of these traditional fillers. The advantage of using nano scale fillers is their very high surface to volume ratio which leads to greater polymer-filler interactions thereby giving rise to significantly improved mechanical & thermo-mechanical properties. In recent years, there has been considerable research on nano particle based composites. Especially nano clay reinforced plastics[1-3]and elastomers[4,5] have been extensively studied. Studies have shown that very low amount of fillers(less than 10%) can achieve excellent performance characteristics like tensile strength & modulus when compared to 40-60% in micro sized fillers like carbon blacks and silica. Nano graphite show layered structure similar to nano-clays and have a high aspect ratio in the range of 1000-1500. Many studies have reported better modulus, tensile strength and dynamic mechanical properties by the addition of nano-clays in elastomeric matrices[6-8]. Graphite can provide additional advantages like excellent electrical and thermal conductivity. Exfoliated graphite is prepared by rapid heating of a graphite intercalation compound (GIC). An exfoliated graphite nanoparticle is composed of stacks of nanosheets that may vary from 4- 40 nm. They also show good affinity for both organic compounds and polymers, therefore some monomers and polymers can be absorbed into the pores and galleries of exfoliated graphite.
1Unauthenticated
Download Date | 7/19/16 12:23 PM
Though there have been many studies on the effect of addition of nano graphite in polymer matrix, it hasn’t been reported in elastomer matrices. The present work is a part of our systematic study on performance characteristics like mechanical, thermal, dielectric and dynamic mechanical properties of flouroelastomers reinforced with novel carbon based fillers like nano graphite and carbon nano tubes[9]. The objective of the present paper is to report the effect of addition of graphite platelets on properties of flouroelastomer composites. The dispersion of the filler in the polymer matrix has been studied by X-ray diffraction, scanning and transmission electron microscopy. The effect of increasing graphite loadings on the performance characteristics like tensile strength, modulus and tear strength is also reported. The thermal degradation property of the composites has been studied carried out using thermo-gravimetric analysis in oxygen atmosphere. Results and Discussion Dispersion and morphology
10 20 30 40 50 60 70 80 90
Inte
nsity
, au
Diffraction angle, 2θ
0.5 phr 1.5 phr 2.5 phr 3.5 phr
(a)
23 24 25 26 27 28 29 30 31
Inte
nsity
, au
Diffraction angle, 2θ
0 phr 0.5 phr 1.5 phr 2.5 phr 3.5 phr
(b)
0.0 0.5 1.0 1.5 2.0 2.5 3.0 3.50
2
4
6
8
10
12
14
16
18
Are
a of
the
grap
hite
pea
k
Nano graphite loading, phr
(c)
(d)
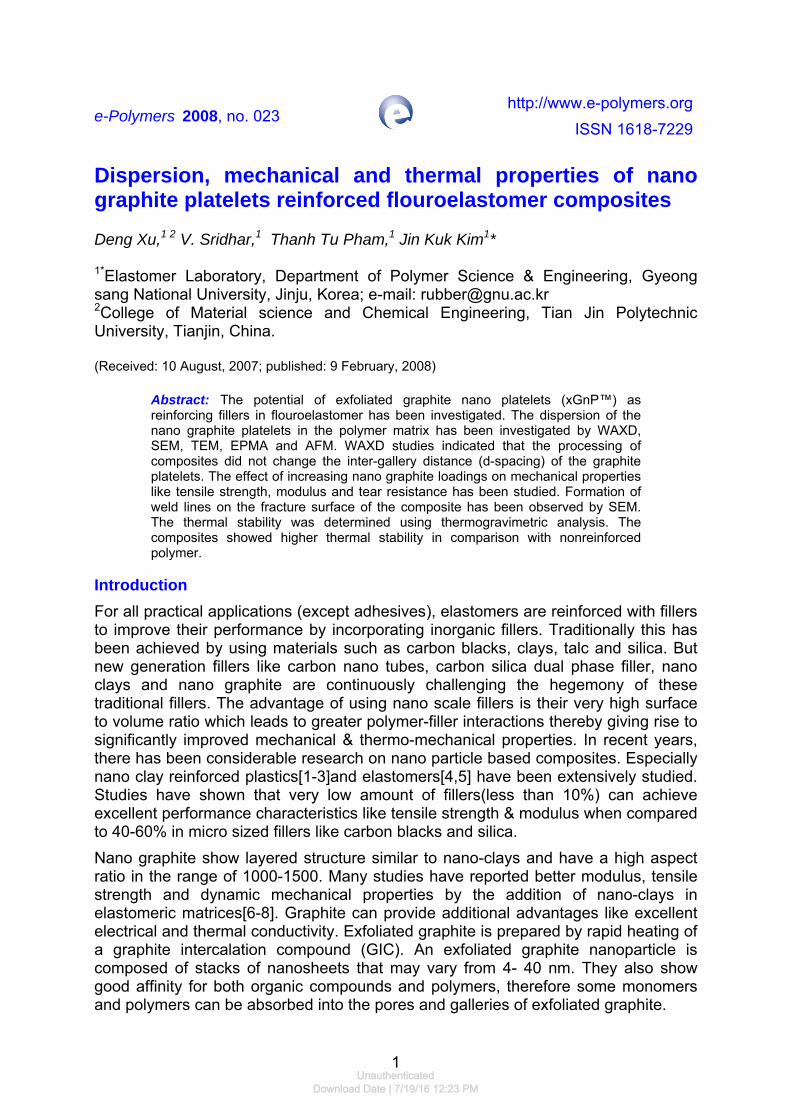
(Unfilled) (0.5 phr) (1.5 phr) (2.5 phr) (3.5 phr) Fig. 1. WAXD diffractographs of the matrix and the nano graphite/flouroelastomer composites.
2Unauthenticated
Download Date | 7/19/16 12:23 PM
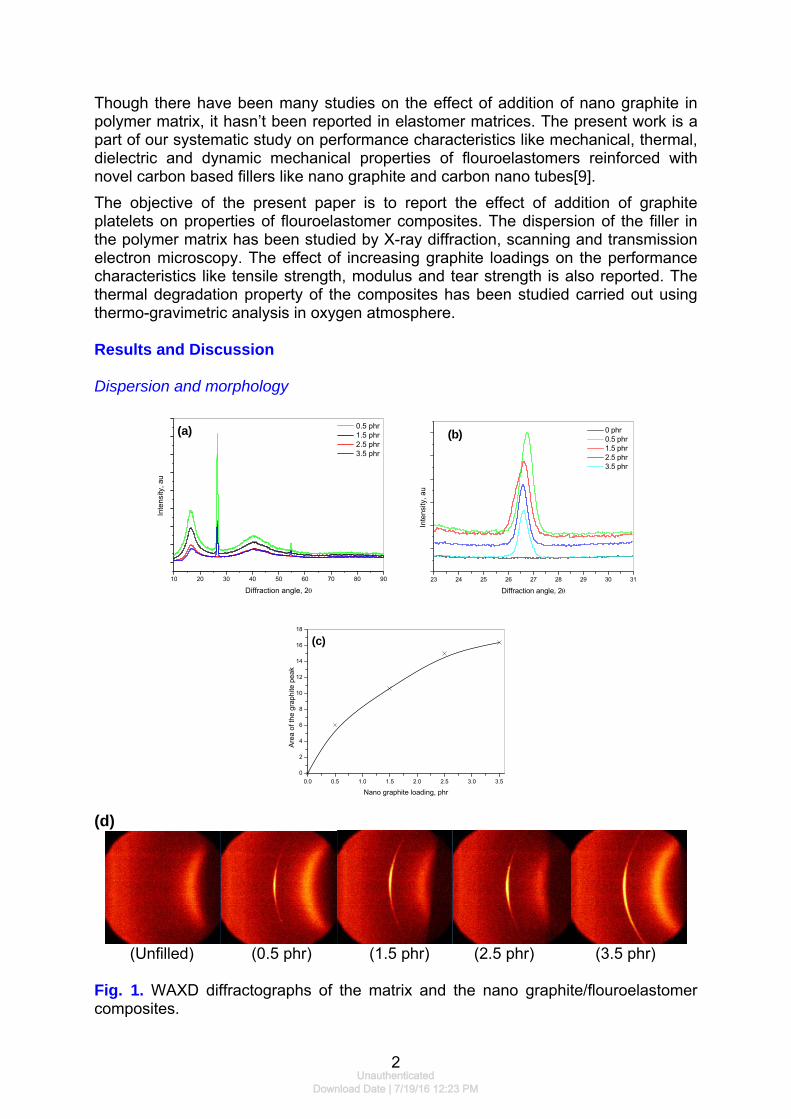
The dispersion of the nano graphite platelets has been studied by WAXD, SEM and TEM. Figure 1 shows the X-Ray diffractograph of unfilled and reinforced flouroelastomer compounds. From the plots it can be observed that both pure graphite platelets and graphite/FKM exhibit an intense peak at diffraction angle of 26.4, corresponding to a basal spacing of 3.37A°. A similar observation was reported by Yasmin and Daniel [11] who concluded that graphite platelets are still multilayered and maintain their original d-spacing. The occurrence of peak at diffraction angle of 26.38 irrespective of the sample preparation techniques (shear mixing, sonication and conventional melt mixing) has been reported by Yasmin et al. [12]. Other reports of occurrence of this peak at 26.4 corresponding to d-spacing of 3.37 A° in expanded graphite and at 26.350 (d-spacing of 3.380A) in in-situ polymerized styrene-MMA-graphite composites has been reported by Chen et. al. [13] and by Uhl et al. [14] in nano graphite reinforced HIPS (high impact polystyrene) and ABS (Acrylonitrile-butadiene-styrene). But it can be observed that with increase in nano-graphite loading there is increase in intensity of the peaks (as shown in Figure 1(b)) which can be attributed to presence of higher number of graphite layers [12]. This increase in height is quantified as area under the graphite peak and plotted against the nano graphite loading and shown in Figure 1(c). From the plot a continuous increase in the area with filler loading can be observed. A similar observation has been reported by Causin et al [15] in PP/nano graphite composites. These observations are also reflected in the 2D general area diffractographs shown in Figure 1(d) wherein an increase in intensity of the graphite peak with increasing concentrations of nano graphite platelets can be observed. Dispersion of the graphite platelets at shorter length scale has been studied using TEM and representative microphotograph at 2.5 phr and 3.5 phr nano graphite loadings is shown in Figure 2(a) and 2(b) respectively.
(a) (b)
Fig. 2. TEM of nano graphite dispersed flouroelastomer composites at 2.5phr (a) and 3.5phr (b). From figure it can be observed that the graphite nanosheets consist of thin graphite nano-lamellae with thickness of 1–5 nm or thinner and with inter-gallery spacings of 3.37 A°. These inter-gallery distances reflect the XRD measurements. Atomic force microscopy was further used to observe the morphology of the nano graphite dispersion in neat elastomer and flouroelastomer-graphite nanocomposites. Though there have been a number of studies on nanographite reinforced polymers,
3Unauthenticated
Download Date | 7/19/16 12:23 PM
AFM testing have been less investigated. This manuscript reports the morphological studies of nano graphite reinforced elastomers for the first time.
(a) (b)
(c) (d)
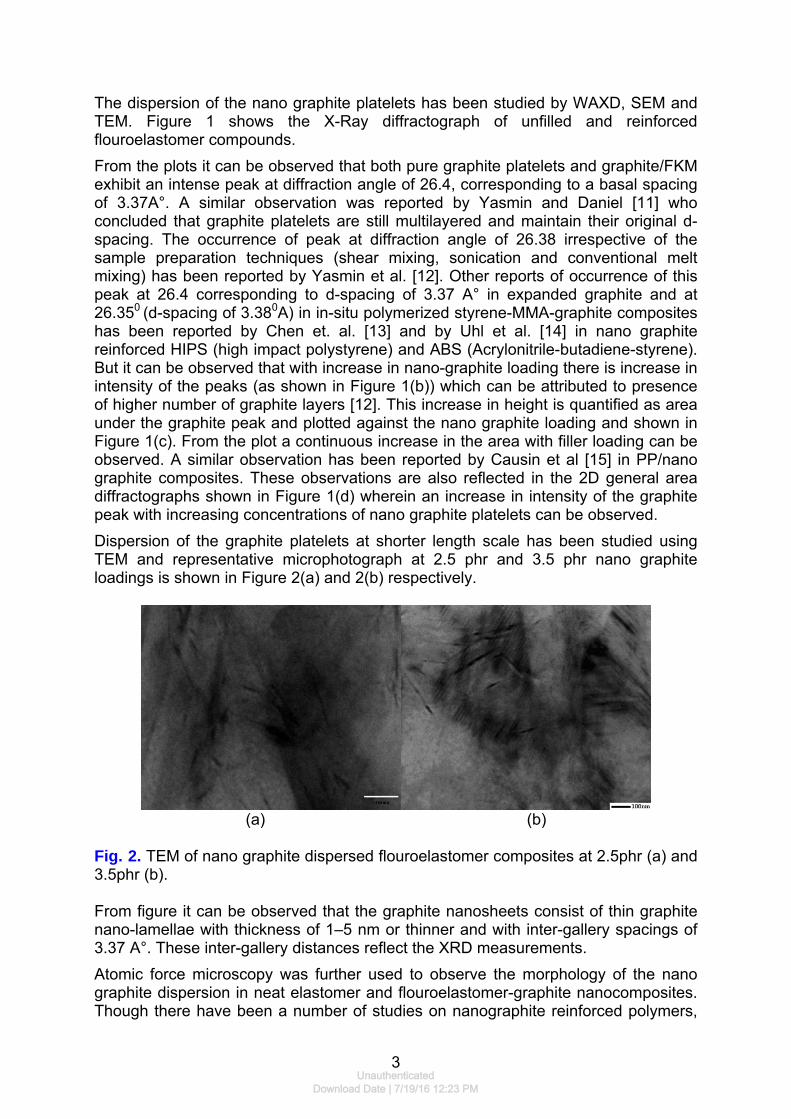
(e) Fig. 3. AFM topological pictures of (a) unfilled (b) & (c) Topology and 3-D AFM image of 0.5 phr nano-graphite reinforced fluoroelastomer composites respectively, (d) cropped topographical image of the nano graphite platelets and (e) line diagram respectively.
Figure 3(a) seems to suggest that in neat elastomers, the elastomer tends to coalesce to form clusters while in the nanocomposite the ability to form clusters is significantly reduced (Fig. 3b & 3d). This result is consistent with the recent results which show that addition of layered fillers (nano clays) prevents coalesence of elastomer as clusters [16] enabling a non-agglomerated dispersion in the matrix. This
4Unauthenticated
Download Date | 7/19/16 12:23 PM
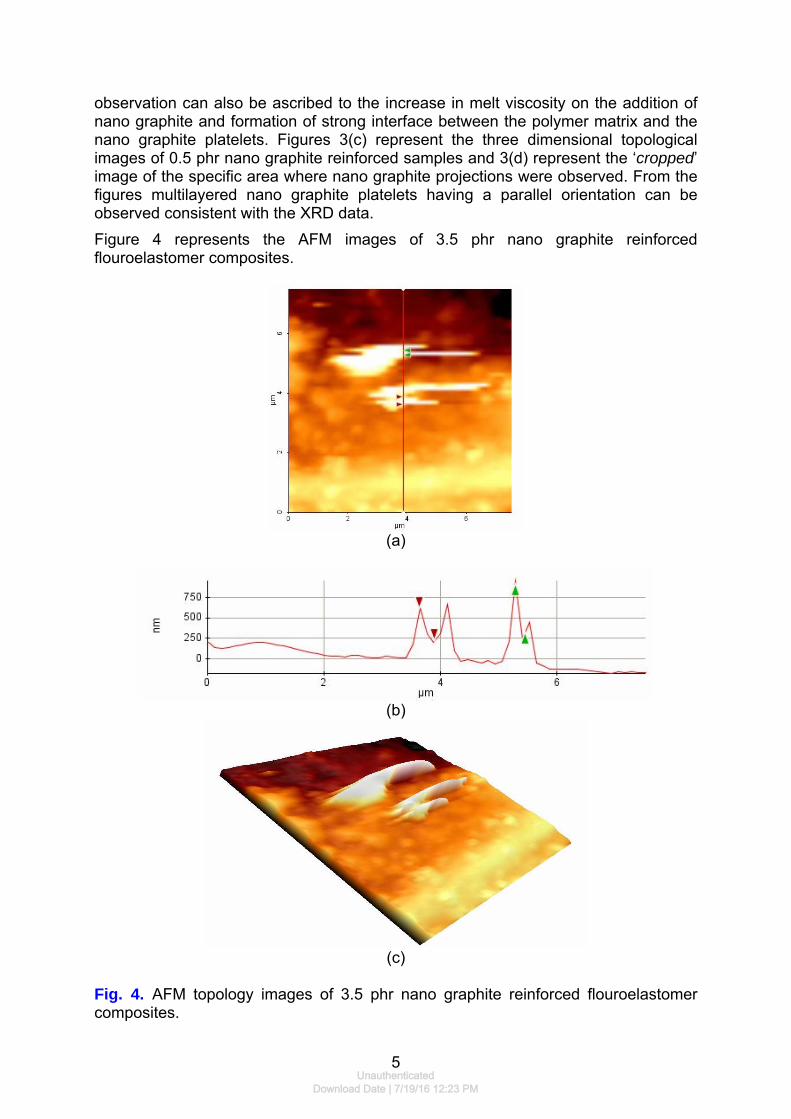
observation can also be ascribed to the increase in melt viscosity on the addition of nano graphite and formation of strong interface between the polymer matrix and the nano graphite platelets. Figures 3(c) represent the three dimensional topological images of 0.5 phr nano graphite reinforced samples and 3(d) represent the ‘cropped’ image of the specific area where nano graphite projections were observed. From the figures multilayered nano graphite platelets having a parallel orientation can be observed consistent with the XRD data. Figure 4 represents the AFM images of 3.5 phr nano graphite reinforced flouroelastomer composites.
(a)
(b)
(c)
Fig. 4. AFM topology images of 3.5 phr nano graphite reinforced flouroelastomer composites.
5Unauthenticated
Download Date | 7/19/16 12:23 PM

The line diagram and 3D image (4(a) and 4(c) respectively) shows agglomeration of the graphite platelets. Figures 4(e) and 4(b) also suggest that the surface smoothness of nanocomposites seemed to decrease with increasing nanographite content. This observation is consistent with the findings of Mehta et. al who reported a similar phenomenon in nano clay reinforced polymers[17]. EPMA (Electron probe micro analysis) The dispersion of nano graphite platelets in the fluoroelastomer matrix was further studied by Electron probe micro analysis (EPMA). Though researchers have used a variety of methods like SEM, TEM, AFM and MFM to characterize dispersion of nanoparticles in a polymer matrix, EPMA have never been utilized. This manuscript reports for the first time the utility of EPMA to characterize the dispersion of nanopraticles in elastomer composites. The main advantage of EPMA is selective elemental scans. In the present study carbon scan has been carried out and a representative carbon scan of nano graphite loaded fluoroelastomer compound is shown in Figure 5. From the figure it can be observed that nano graphite platelets are well dispersed. A more detailed study on the utility of EPMA as a tool to study nano filler dispersion in polymer matrix is under preparation.
Fig. 5. Two dimensional distribution of nano graphite platelets in fluoroelastomer matrix: Carbon scan. Mechanical properties -Tensile strength and Modulus The variation in tensile strength, modulus and tear resistance with increasing nano graphite loadings is shown in Figures 6-8 respectively. From the figures 6 and 7 it
6Unauthenticated
Download Date | 7/19/16 12:23 PM
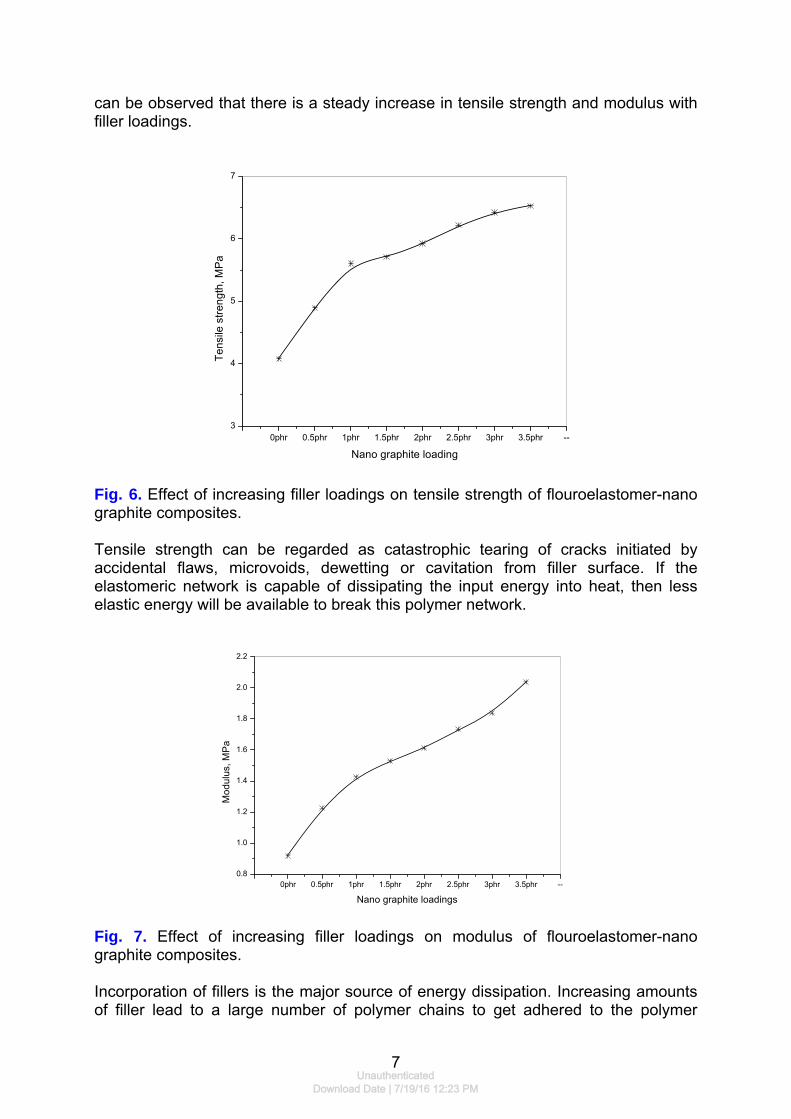
can be observed that there is a steady increase in tensile strength and modulus with filler loadings.
0phr 0.5phr 1phr 1.5phr 2phr 2.5phr 3phr 3.5phr --3
4
5
6
7
Tens
ile s
treng
th, M
Pa
Nano graphite loading
Fig. 6. Effect of increasing filler loadings on tensile strength of flouroelastomer-nano graphite composites. Tensile strength can be regarded as catastrophic tearing of cracks initiated by accidental flaws, microvoids, dewetting or cavitation from filler surface. If the elastomeric network is capable of dissipating the input energy into heat, then less elastic energy will be available to break this polymer network.
0phr 0.5phr 1phr 1.5phr 2phr 2.5phr 3phr 3.5phr --0.8
1.0
1.2
1.4
1.6
1.8
2.0
2.2
Mod
ulus
, MP
a
Nano graphite loadings
Fig. 7. Effect of increasing filler loadings on modulus of flouroelastomer-nano graphite composites. Incorporation of fillers is the major source of energy dissipation. Increasing amounts of filler lead to a large number of polymer chains to get adhered to the polymer
7Unauthenticated
Download Date | 7/19/16 12:23 PM
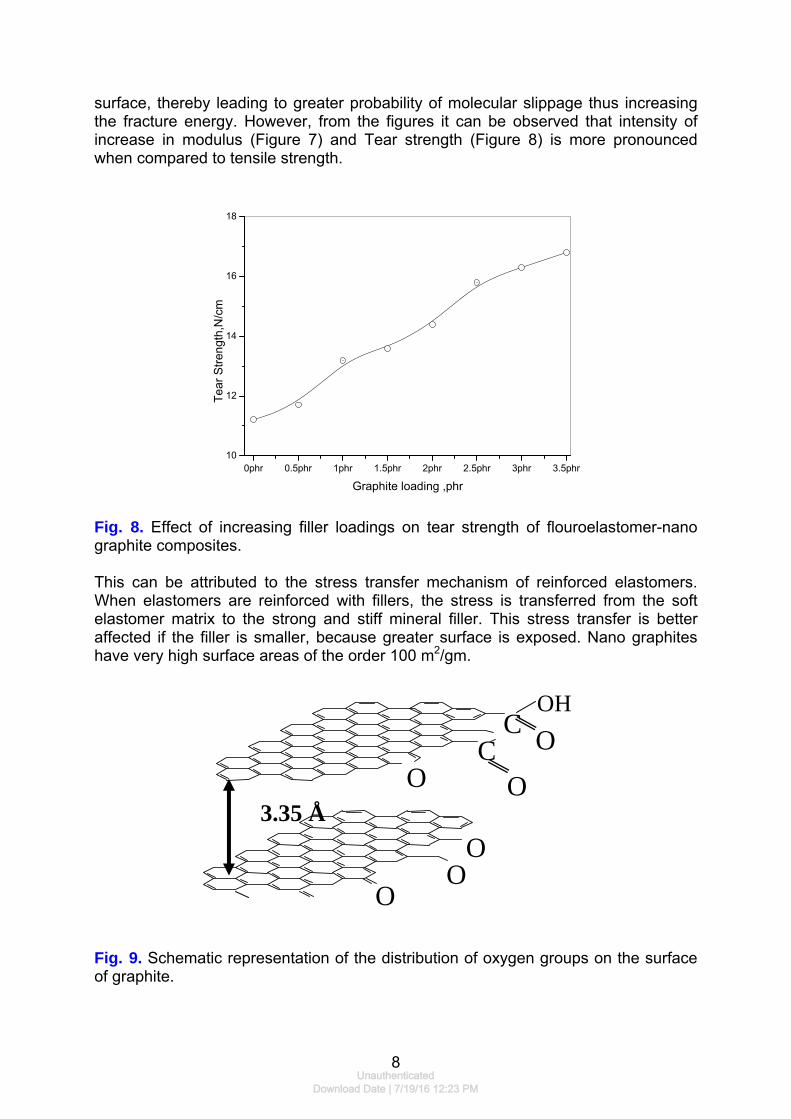
surface, thereby leading to greater probability of molecular slippage thus increasing the fracture energy. However, from the figures it can be observed that intensity of increase in modulus (Figure 7) and Tear strength (Figure 8) is more pronounced when compared to tensile strength.
0phr 0.5phr 1phr 1.5phr 2phr 2.5phr 3phr 3.5phr10
12
14
16
18Te
ar S
treng
th,N
/cm
Graphite loading ,phr
Fig. 8. Effect of increasing filler loadings on tear strength of flouroelastomer-nano graphite composites. This can be attributed to the stress transfer mechanism of reinforced elastomers. When elastomers are reinforced with fillers, the stress is transferred from the soft elastomer matrix to the strong and stiff mineral filler. This stress transfer is better affected if the filler is smaller, because greater surface is exposed. Nano graphites have very high surface areas of the order 100 m2/gm.
3.35 Å
C
OC
O
OHO
O
OO
Fig. 9. Schematic representation of the distribution of oxygen groups on the surface of graphite.
8Unauthenticated
Download Date | 7/19/16 12:23 PM
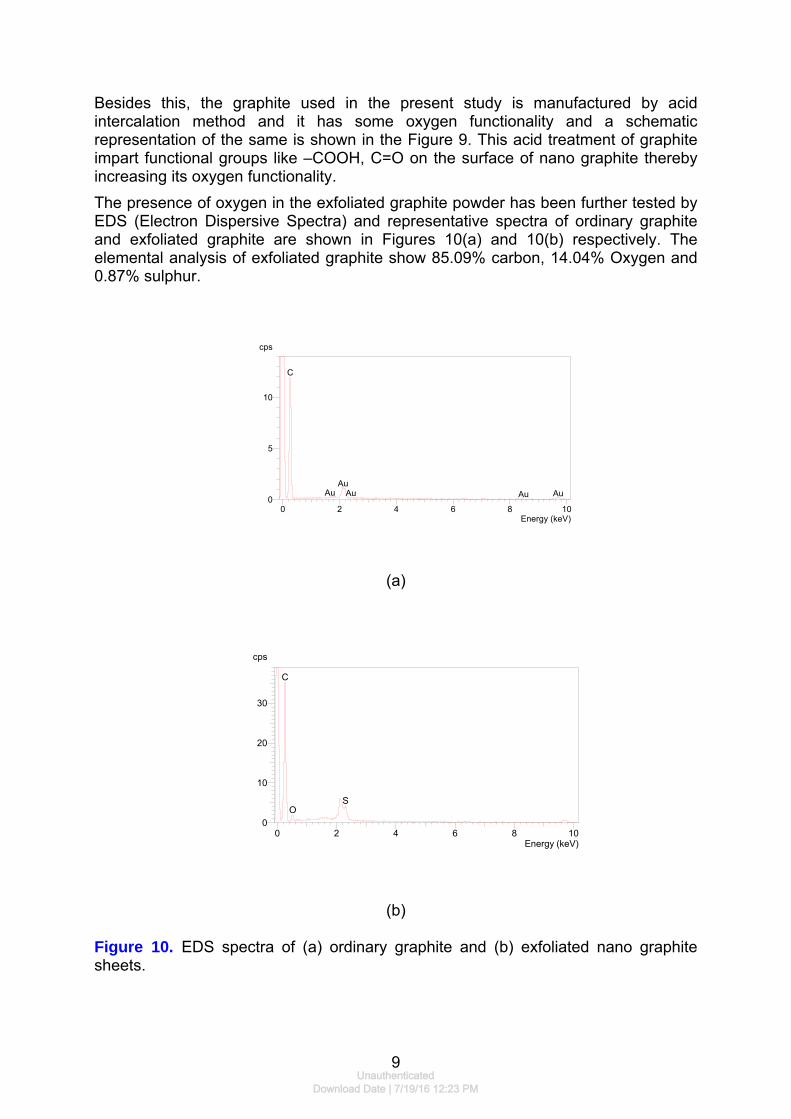
Besides this, the graphite used in the present study is manufactured by acid intercalation method and it has some oxygen functionality and a schematic representation of the same is shown in the Figure 9. This acid treatment of graphite impart functional groups like –COOH, C=O on the surface of nano graphite thereby increasing its oxygen functionality. The presence of oxygen in the exfoliated graphite powder has been further tested by EDS (Electron Dispersive Spectra) and representative spectra of ordinary graphite and exfoliated graphite are shown in Figures 10(a) and 10(b) respectively. The elemental analysis of exfoliated graphite show 85.09% carbon, 14.04% Oxygen and 0.87% sulphur.
0 2 4 6 8 10Energy (keV)
0
5
10
cps
C
AuAu
Au Au Au
(a)
0 2 4 6 8 10Energy (keV)
0
10
20
30
cps
C
OS
(b)
Figure 10. EDS spectra of (a) ordinary graphite and (b) exfoliated nano graphite sheets.
9Unauthenticated
Download Date | 7/19/16 12:23 PM
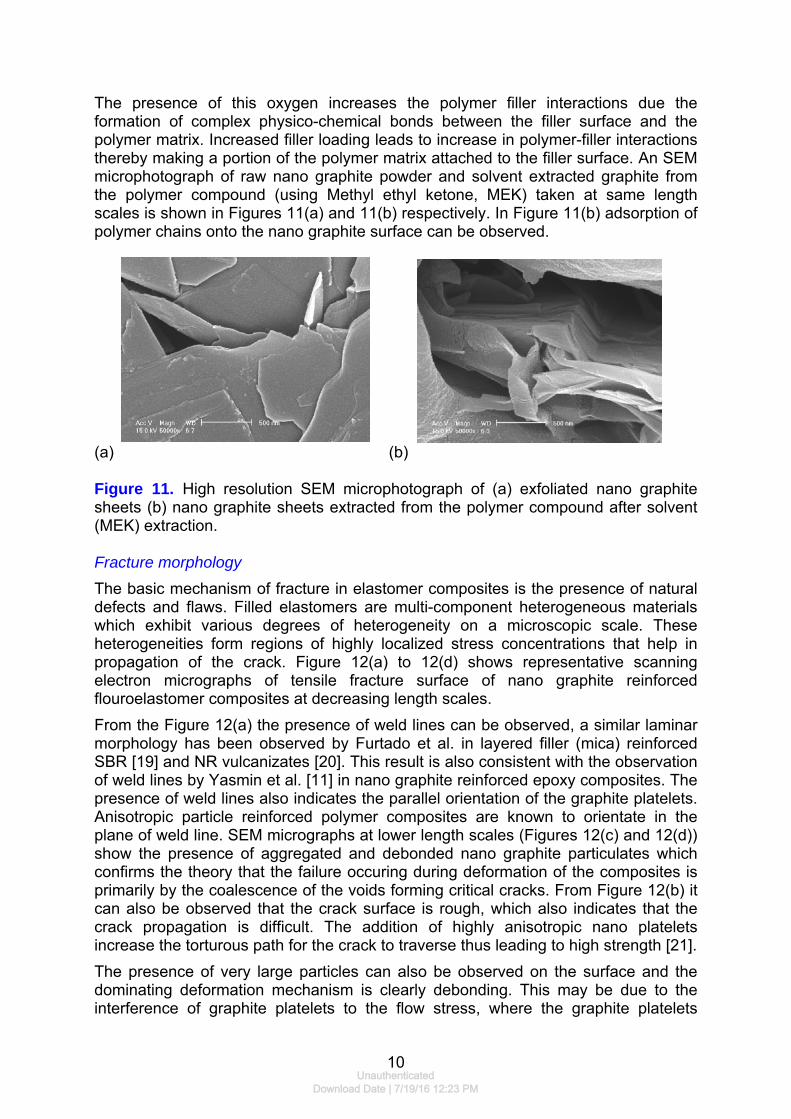
The presence of this oxygen increases the polymer filler interactions due the formation of complex physico-chemical bonds between the filler surface and the polymer matrix. Increased filler loading leads to increase in polymer-filler interactions thereby making a portion of the polymer matrix attached to the filler surface. An SEM microphotograph of raw nano graphite powder and solvent extracted graphite from the polymer compound (using Methyl ethyl ketone, MEK) taken at same length scales is shown in Figures 11(a) and 11(b) respectively. In Figure 11(b) adsorption of polymer chains onto the nano graphite surface can be observed.
(a) (b) Figure 11. High resolution SEM microphotograph of (a) exfoliated nano graphite sheets (b) nano graphite sheets extracted from the polymer compound after solvent (MEK) extraction. Fracture morphology The basic mechanism of fracture in elastomer composites is the presence of natural defects and flaws. Filled elastomers are multi-component heterogeneous materials which exhibit various degrees of heterogeneity on a microscopic scale. These heterogeneities form regions of highly localized stress concentrations that help in propagation of the crack. Figure 12(a) to 12(d) shows representative scanning electron micrographs of tensile fracture surface of nano graphite reinforced flouroelastomer composites at decreasing length scales. From the Figure 12(a) the presence of weld lines can be observed, a similar laminar morphology has been observed by Furtado et al. in layered filler (mica) reinforced SBR [19] and NR vulcanizates [20]. This result is also consistent with the observation of weld lines by Yasmin et al. [11] in nano graphite reinforced epoxy composites. The presence of weld lines also indicates the parallel orientation of the graphite platelets. Anisotropic particle reinforced polymer composites are known to orientate in the plane of weld line. SEM micrographs at lower length scales (Figures 12(c) and 12(d)) show the presence of aggregated and debonded nano graphite particulates which confirms the theory that the failure occuring during deformation of the composites is primarily by the coalescence of the voids forming critical cracks. From Figure 12(b) it can also be observed that the crack surface is rough, which also indicates that the crack propagation is difficult. The addition of highly anisotropic nano platelets increase the torturous path for the crack to traverse thus leading to high strength [21]. The presence of very large particles can also be observed on the surface and the dominating deformation mechanism is clearly debonding. This may be due to the interference of graphite platelets to the flow stress, where the graphite platelets
10Unauthenticated
Download Date | 7/19/16 12:23 PM
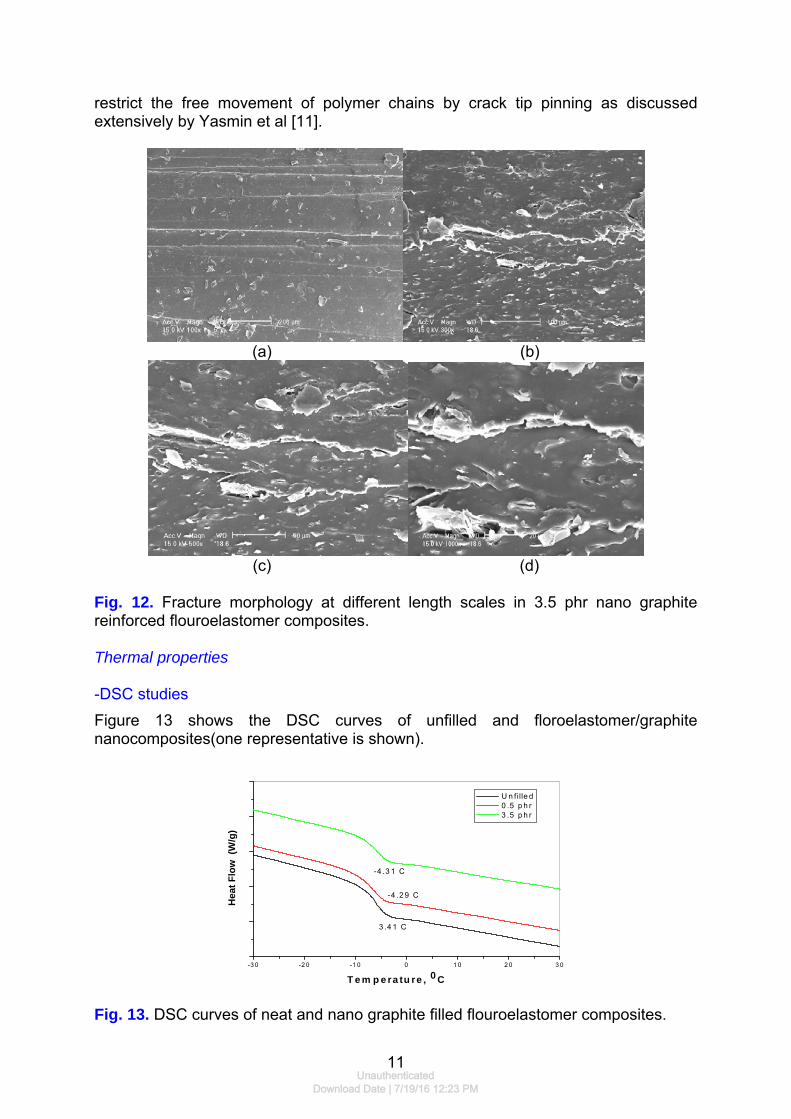
restrict the free movement of polymer chains by crack tip pinning as discussed extensively by Yasmin et al [11].
(a) (b)
(c) (d)
Fig. 12. Fracture morphology at different length scales in 3.5 phr nano graphite reinforced flouroelastomer composites. Thermal properties -DSC studies Figure 13 shows the DSC curves of unfilled and floroelastomer/graphite nanocomposites(one representative is shown).
-3 0 -2 0 -1 0 0 1 0 2 0 3 0
Hea
t Flo
w (
W/g
)
T e m p e ra tu re , 0 C
U n fille d 0 .5 p h r 3 .5 p h r
3 .4 1 C
-4 .2 9 C
-4 .3 1 C
Fig. 13. DSC curves of neat and nano graphite filled flouroelastomer composites.
11Unauthenticated
Download Date | 7/19/16 12:23 PM
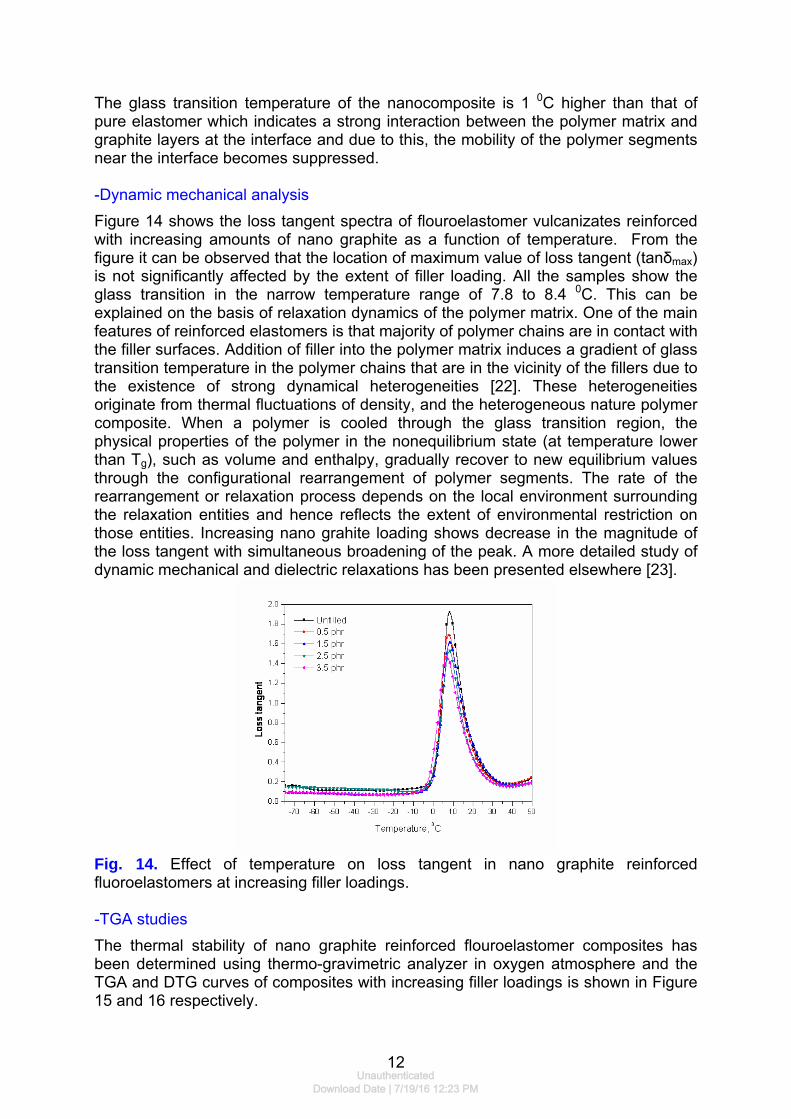
The glass transition temperature of the nanocomposite is 1 0C higher than that of pure elastomer which indicates a strong interaction between the polymer matrix and graphite layers at the interface and due to this, the mobility of the polymer segments near the interface becomes suppressed. -Dynamic mechanical analysis Figure 14 shows the loss tangent spectra of flouroelastomer vulcanizates reinforced with increasing amounts of nano graphite as a function of temperature. From the figure it can be observed that the location of maximum value of loss tangent (tanδmax) is not significantly affected by the extent of filler loading. All the samples show the glass transition in the narrow temperature range of 7.8 to 8.4 0C. This can be explained on the basis of relaxation dynamics of the polymer matrix. One of the main features of reinforced elastomers is that majority of polymer chains are in contact with the filler surfaces. Addition of filler into the polymer matrix induces a gradient of glass transition temperature in the polymer chains that are in the vicinity of the fillers due to the existence of strong dynamical heterogeneities [22]. These heterogeneities originate from thermal fluctuations of density, and the heterogeneous nature polymer composite. When a polymer is cooled through the glass transition region, the physical properties of the polymer in the nonequilibrium state (at temperature lower than Tg), such as volume and enthalpy, gradually recover to new equilibrium values through the configurational rearrangement of polymer segments. The rate of the rearrangement or relaxation process depends on the local environment surrounding the relaxation entities and hence reflects the extent of environmental restriction on those entities. Increasing nano grahite loading shows decrease in the magnitude of the loss tangent with simultaneous broadening of the peak. A more detailed study of dynamic mechanical and dielectric relaxations has been presented elsewhere [23].
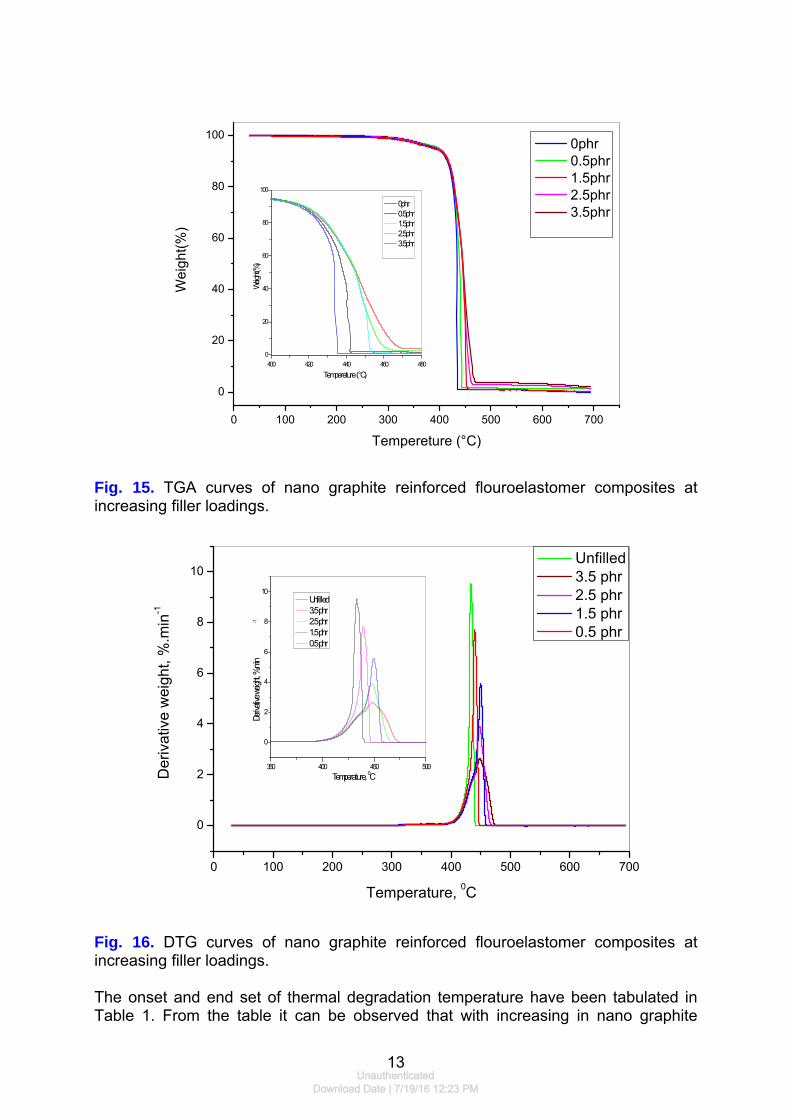
Fig. 14. Effect of temperature on loss tangent in nano graphite reinforced fluoroelastomers at increasing filler loadings. -TGA studies The thermal stability of nano graphite reinforced flouroelastomer composites has been determined using thermo-gravimetric analyzer in oxygen atmosphere and the TGA and DTG curves of composites with increasing filler loadings is shown in Figure 15 and 16 respectively.
12Unauthenticated
Download Date | 7/19/16 12:23 PM
0 100 200 300 400 500 600 700
0
20
40
60
80
100
400 420 440 460 4800
20
40
60
80
100
Tempereture (°C)
Weigh
t(%)
0phr 0.5phr 1.5phr 2.5phr 3.5phr
Wei
ght(%
)
Tempereture (°C)
0phr 0.5phr 1.5phr 2.5phr 3.5phr
Fig. 15. TGA curves of nano graphite reinforced flouroelastomer composites at increasing filler loadings.
0 100 200 300 400 500 600 700
0
2
4
6
8
10
350 400 450 500
0
2
4
6
8
10
Temperature, 0C
Deriva
tive we
ight, %
.min
-1
Unfilled 3.5 phr 2.5 phr 1.5 phr 0.5 phr
Unfilled 3.5 phr 2.5 phr 1.5 phr 0.5 phr
Der
ivat
ive
wei
ght,
%.m
in-1
Temperature, 0C
Fig. 16. DTG curves of nano graphite reinforced flouroelastomer composites at increasing filler loadings. The onset and end set of thermal degradation temperature have been tabulated in Table 1. From the table it can be observed that with increasing in nano graphite
13Unauthenticated
Download Date | 7/19/16 12:23 PM
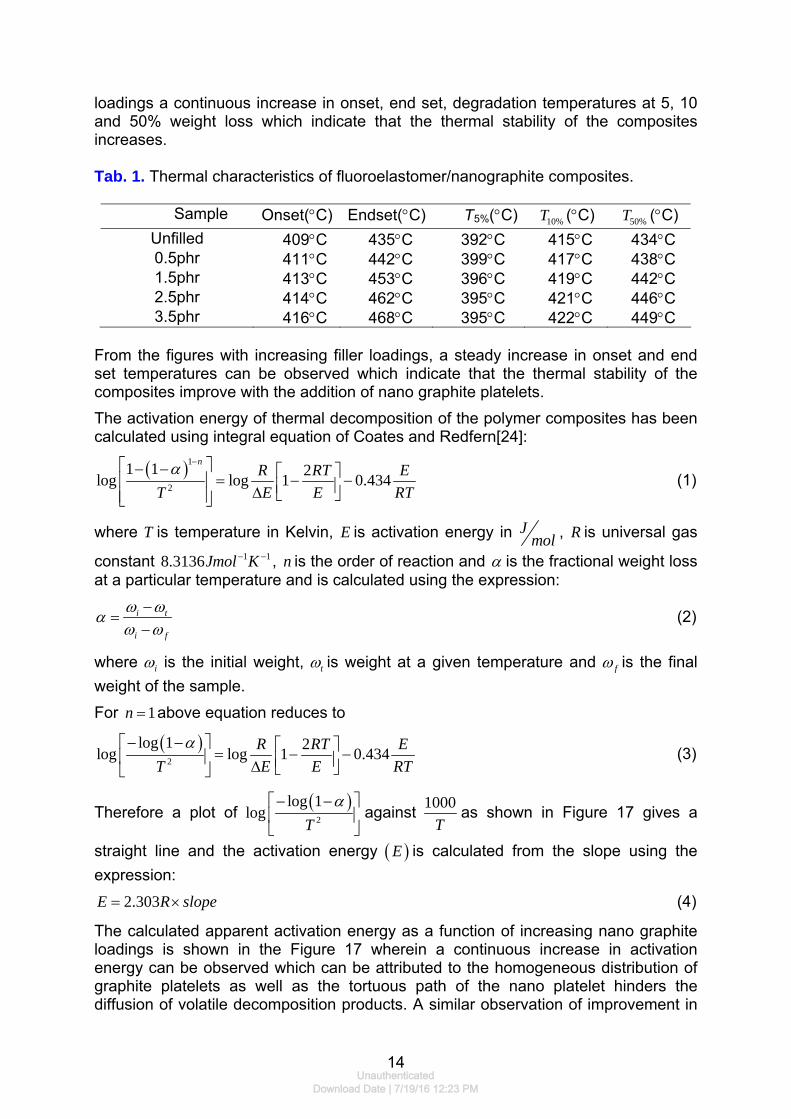
loadings a continuous increase in onset, end set, degradation temperatures at 5, 10 and 50% weight loss which indicate that the thermal stability of the composites increases. Tab. 1. Thermal characteristics of fluoroelastomer/nanographite composites.
Sample Onset(°C) Endset(°C) T5%(°C) 10%T (°C) 50%T (°C) Unfilled 409°C 435°C 392°C 415°C 434°C 0.5phr 411°C 442°C 399°C 417°C 438°C 1.5phr 413°C 453°C 396°C 419°C 442°C 2.5phr 414°C 462°C 395°C 421°C 446°C 3.5phr 416°C 468°C 395°C 422°C 449°C
From the figures with increasing filler loadings, a steady increase in onset and end set temperatures can be observed which indicate that the thermal stability of the composites improve with the addition of nano graphite platelets. The activation energy of thermal decomposition of the polymer composites has been calculated using integral equation of Coates and Redfern[24]:
( )12
1 1 2log log 1 0.434n
R RT ET E Eα −⎡ ⎤− − ⎡ ⎤= − −⎢ ⎥ ⎢ ⎥Δ ⎣ ⎦⎢ ⎥⎣ ⎦ RT
(1)
where is temperature in Kelvin, E is activation energy in T Jmol , R is universal gas
constant 1 18.3136Jmol K− − , is the order of reaction and n α is the fractional weight loss at a particular temperature and is calculated using the expression:
i t
i f
ω ωαω ω
−=
− (2)
where iω is the initial weight, tω is weight at a given temperature and fω is the final weight of the sample. For above equation reduces to 1n =
( )2
log 1 2log log 1 0.434R RT ET E E
α− −⎡ ⎤ ⎡ ⎤= − −⎢ ⎥ ⎢ ⎥Δ ⎣ ⎦⎣ ⎦ RT (3)
Therefore a plot of ( )2
log 1log
Tα− −⎡ ⎤
⎢ ⎥⎣ ⎦
against 1000T
as shown in Figure 17 gives a
straight line and the activation energy ( )E is calculated from the slope using the expression:
2.303E R slope= × (4)
The calculated apparent activation energy as a function of increasing nano graphite loadings is shown in the Figure 17 wherein a continuous increase in activation energy can be observed which can be attributed to the homogeneous distribution of graphite platelets as well as the tortuous path of the nano platelet hinders the diffusion of volatile decomposition products. A similar observation of improvement in
14Unauthenticated
Download Date | 7/19/16 12:23 PM
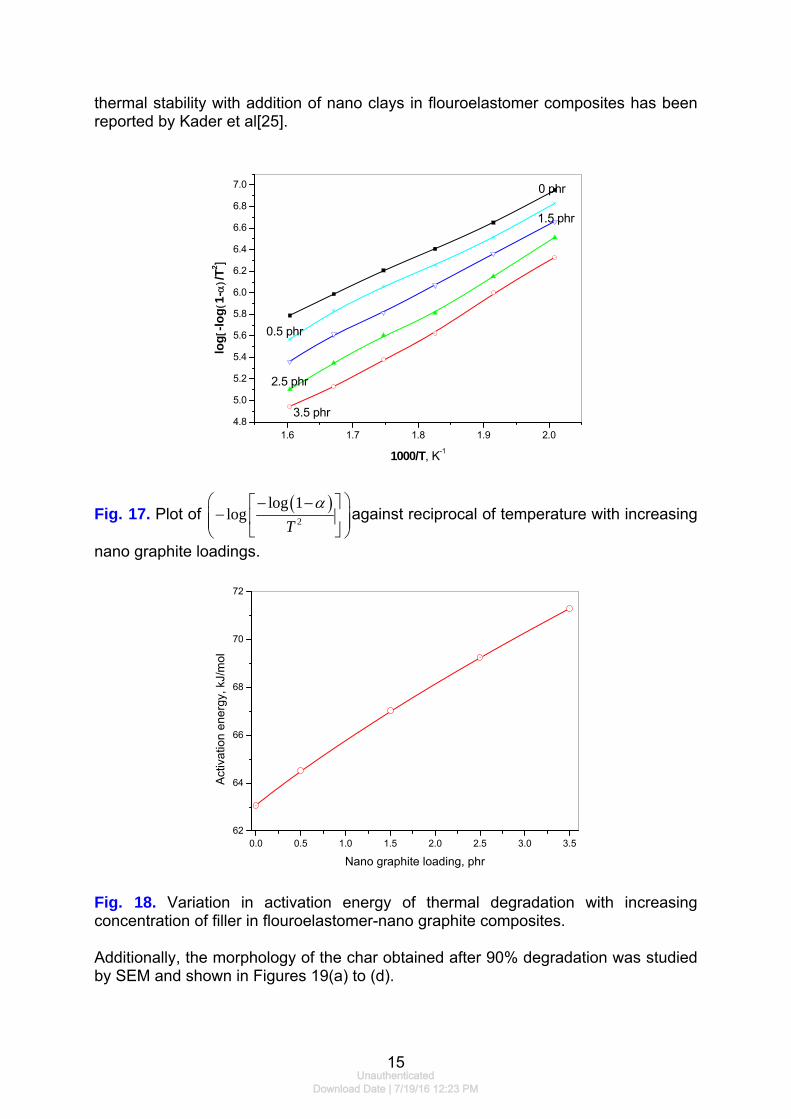
thermal stability with addition of nano clays in flouroelastomer composites has been reported by Kader et al[25].
1.6 1.7 1.8 1.9 2.04.8
5.0
5.2
5.4
5.6
5.8
6.0
6.2
6.4
6.6
6.8
7.0
log[
-log(
1-α)/T
2 ]
1000/T, K-1
0 phr
0.5 phr
1.5 phr
2.5 phr
3.5 phr
Fig. 17. Plot of ( )2
log 1log
Tα⎛ ⎞− −⎡ ⎤
−⎜ ⎢⎜ ⎣ ⎦⎝ ⎠⎟⎥ ⎟ against reciprocal of temperature with increasing
nano graphite loadings.
0.0 0.5 1.0 1.5 2.0 2.5 3.0 3.562
64
66
68
70
72
Activ
atio
n en
ergy
, kJ/
mol
Nano graphite loading, phr
Fig. 18. Variation in activation energy of thermal degradation with increasing concentration of filler in flouroelastomer-nano graphite composites. Additionally, the morphology of the char obtained after 90% degradation was studied by SEM and shown in Figures 19(a) to (d).
15Unauthenticated
Download Date | 7/19/16 12:23 PM
(a) (b)
(c) (d)
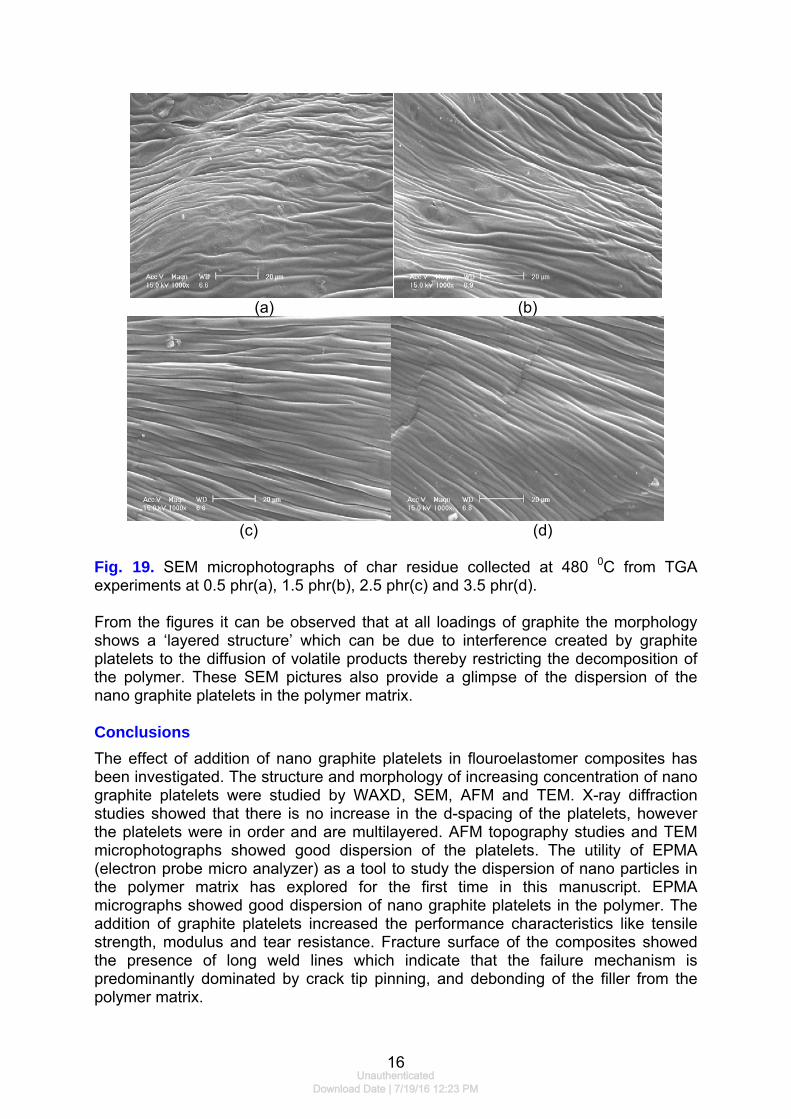
Fig. 19. SEM microphotographs of char residue collected at 480 0C from TGA experiments at 0.5 phr(a), 1.5 phr(b), 2.5 phr(c) and 3.5 phr(d). From the figures it can be observed that at all loadings of graphite the morphology shows a ‘layered structure’ which can be due to interference created by graphite platelets to the diffusion of volatile products thereby restricting the decomposition of the polymer. These SEM pictures also provide a glimpse of the dispersion of the nano graphite platelets in the polymer matrix. Conclusions The effect of addition of nano graphite platelets in flouroelastomer composites has been investigated. The structure and morphology of increasing concentration of nano graphite platelets were studied by WAXD, SEM, AFM and TEM. X-ray diffraction studies showed that there is no increase in the d-spacing of the platelets, however the platelets were in order and are multilayered. AFM topography studies and TEM microphotographs showed good dispersion of the platelets. The utility of EPMA (electron probe micro analyzer) as a tool to study the dispersion of nano particles in the polymer matrix has explored for the first time in this manuscript. EPMA micrographs showed good dispersion of nano graphite platelets in the polymer. The addition of graphite platelets increased the performance characteristics like tensile strength, modulus and tear resistance. Fracture surface of the composites showed the presence of long weld lines which indicate that the failure mechanism is predominantly dominated by crack tip pinning, and debonding of the filler from the polymer matrix.
16Unauthenticated
Download Date | 7/19/16 12:23 PM
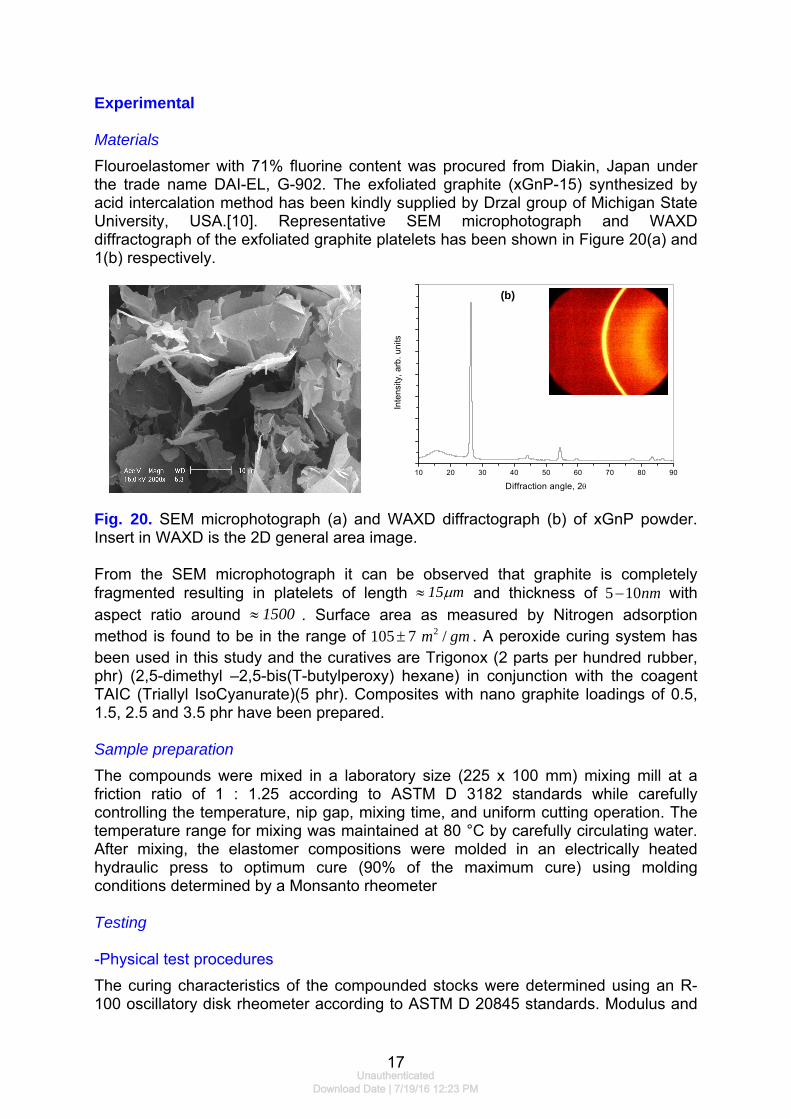
Experimental Materials Flouroelastomer with 71% fluorine content was procured from Diakin, Japan under the trade name DAI-EL, G-902. The exfoliated graphite (xGnP-15) synthesized by acid intercalation method has been kindly supplied by Drzal group of Michigan State University, USA.[10]. Representative SEM microphotograph and WAXD diffractograph of the exfoliated graphite platelets has been shown in Figure 20(a) and 1(b) respectively.
10 20 30 40 50 60 70 80 90
Inte
nsity
, arb
. uni
ts
Diffraction angle, 2θ
(b)
Fig. 20. SEM microphotograph (a) and WAXD diffractograph (b) of xGnP powder. Insert in WAXD is the 2D general area image. From the SEM microphotograph it can be observed that graphite is completely fragmented resulting in platelets of length m15μ≈ and thickness of 5 1 with aspect ratio around . Surface area as measured by Nitrogen adsorption method is found to be in the range of 105
0nm−1500≈
7± 2 /m gm . A peroxide curing system has been used in this study and the curatives are Trigonox (2 parts per hundred rubber, phr) (2,5-dimethyl –2,5-bis(T-butylperoxy) hexane) in conjunction with the coagent TAIC (Triallyl IsoCyanurate)(5 phr). Composites with nano graphite loadings of 0.5, 1.5, 2.5 and 3.5 phr have been prepared. Sample preparation The compounds were mixed in a laboratory size (225 x 100 mm) mixing mill at a friction ratio of 1 : 1.25 according to ASTM D 3182 standards while carefully controlling the temperature, nip gap, mixing time, and uniform cutting operation. The temperature range for mixing was maintained at 80 °C by carefully circulating water. After mixing, the elastomer compositions were molded in an electrically heated hydraulic press to optimum cure (90% of the maximum cure) using molding conditions determined by a Monsanto rheometer Testing -Physical test procedures The curing characteristics of the compounded stocks were determined using an R-100 oscillatory disk rheometer according to ASTM D 20845 standards. Modulus and
17Unauthenticated
Download Date | 7/19/16 12:23 PM
tensile strength have been determined from stress-strain curves using dumbbell shaped specimens punched out from molded rubber sheet using a type D die at a cross head speed of 500 mm/min. Tear strength was determined according to ASTM D 624 (type C) using trouser samples. Both tensile and tear tests were carried out using a Tensilon, 2000, Universal testing machine. -Scanning electron microscopy Morphology of the compounds has been studied using a scanning electron microscope (SEM) (Philips XL30 S FEG(Netherlands)), after auto sputter coating of the sample surface with gold. -Wide angle X-ray diffraction (WAXD) WAXD was used to verify the structure of the composite. WAXD was performed on a general area X-Ray diffraction system manufactured by Bruker AXS, with Cu Kα radiation (λ =1.541 A°) operating at 40 kV and 20 mA. -Atomic force microscopy (AFM) The atomic force microscopy was carried out using a Multimode SPM operated in MFM mode and manufactured by XE-100(PSIA, Korea). The tip was cobalt coated sharpened silicon nitride cantilever with an approximate radius of curvature of 40 nm. The specimens were prepared by cryomicrotoming of composites with glass knives at −140 0C. The average thickness of the specimens was 10 μm. The measurements of the samples were performed under ambient conditions. Height and phase images were recorded simultaneously at the resonance frequency of the cantilever with a scan rate of 1 Hz and a resolution of 256 samples per line. The images were analyzed using XEI-PSIA(v1.6.1) image processing software. -Thermogravimetric Analysis The thermal stability of the composites was investigated using a Perkin-Elmer Series 7 thermal analysis system. The TGA scans were recorded at a heating rate of 20 0C/min under constant oxygen flow of 50 ml/min from room temperature to 700 0C. At least three tests were carried out for each sample. References [1] Park, H.H.; Jana, S.C. Polymer, 44, 2003, 2091. [2] Usuki, A.; Kojima, Y.; Kawasumi, M.; Okada, A.; Fukushima, Y.; Kurauchi, T.; Kamigaito, O. J. Mater. Res., 8, 1993,1179. [3] Alexandre, M.; Dubois, P. Mater.Sci. Engng., R28 ,2000,1. [4] Mousa, A.; Karger-Kocsis, J. Macro.Mater.Engg., 286, 2001, 260. [5] Burnside, S.D.; Giannelis, E.P. J. Poly. Sci. B. Polym. Phys., 38, 2000, 1595. [6] Varghese, S.; Karger-Kocsis, J.; Gatos, K.G. Polymer, 44, 2003, 3977. [7] Delozier, D.M.; Orwoll, R.A.; Cahoon, J.F.; Johnston, N.J.; Smith, J.G.; Connell, J.W. Polymer, 43, 2002, 813. [8] Sridhar, V.; Chaudhary, R.N.P.; Tripathy, D.K. 100, 2006, 3161. [9] Pham, T.T.; Sridhar, V.; Kim, J.K. Polym Composites, 2007, in press PC-07-0100.R1) [10] Fukushima, H.; Drzal, L.T.; Rook, B.P.; Rich, M.J. J. Therm. Anal. Calor., 85, 2006, 235.
18Unauthenticated
Download Date | 7/19/16 12:23 PM
[11] Yasmin, A.; Daniel, I.M. Polymer, 45, 2004, 8211. [12] Yasmin, A.; Luo, J.Y.; Daniel, I.M. Comp. Sci. Technol., 2006, 66, 1182. [13] Chen, G.H.; Wu, D.J.; Weng, W.G.; Yan, W.L. J. Appl.Polym.Sci., 2001, 82, 2506. [14] Uhl, F.M.; Yao, Q.; Wilkie, C.W. Polym.Adv.Tech., 2005, 16,533. [15] Causin, V.; Marega, C.; Marigo, A.; Ferrara, G.; Ferraro, A. Eur. Polym. J., 2006, 42, 3153. [16] Duquesne, S.; Le Bras, M.; Bourbigot, S.; Delobel, R.; Vezin, H.; Camino, G.; Eling, B.; Lindsay, C.; Roels, T. Fire Mater., 2003, 27, 103. [17] Mehta, S.; Mirabella, F.M.; Rufener, K.; Bafna, A. J. Appl. Polym. Sci. 2004, 92, 928. [18] Chen, X. C.; You, B.; Zhou, S. X.; Wu, L. M. Surf Interface Anal, 2003, 35, 369. [19] Furtado, C.R.G.; Leblanc, J.L.; Nunes, R.C.R. Eur Polym. J., 1999, 35, 1319. [20] Castro, D.F.; Suarez, J.C.M.; Nunes, R.C.R.; Visconte, L.L.Y. J. Appl. Polym. Sci., 2003, 90, 2156. [21] Isuk, I.; Yilmazer, U.; Bayram, G. Polymer, 2003, 44, 6371. [22] Long, D.; Lequeux, F. EPJ E, 2001, 4, 371. [23] Sridhar, V.; Deng, X.; Thanh, T.P.; Mahapatra, S.P.; Kim, J.K. Polymer Composites, 2008 (in press, PC-07-0351.R1). [24] Coates, A.W.; Redfern, J.P. Nature, 1964, 21,201. [25] Kader, M.A.; Lyu, M.J.; Nah, C. Comp. Sci and Technol., 2006, 66, 1431.
19Unauthenticated
Download Date | 7/19/16 12:23 PM