disability among native-born and foreign-born blacks in the united states
TRANSCRIPT
Disability Among Native-born and Foreign-born Blacks in theUnited States
Irma T. Elo,Population Studies Center, University of Pennsylvania, 3718 Locust Walk, Philadelphia, PA19104, USA [email protected]
Neil K. Mehta, andCenter for Social Epidemiology and Population Health, University of Michigan, Ann Arbor, MI,USA
Cheng HuangHubert Department of Global Health, Rollins School of Public Health, Emory University, Atlanta,GA, USA
AbstractUsing the 5% Public Use Micro Data Sample (PUMS) from the 2000 U.S. census, we examinedifferences in disability among eight black subgroups distinguished by place of birth and Hispanicethnicity. We found that all foreign-born subgroups reported lower levels of physical activitylimitations and personal care limitations than native-born blacks. Immigrants from Africa reportedlowest levels of disability, followed by non-Hispanic immigrants from the Caribbean.Sociodemographic characteristics and timing of immigration explained the differences betweenthese two groups. The foreign-born health advantage was most evident among the least-educatedexcept among immigrants from Europe/Canada, who also reported the highest levels of disabilityamong the foreign-born. Hispanic identification was associated with poorer health among bothnative-born and foreign-born blacks.
KeywordsImmigration; Disability; Black/African American; Caribbean; Africa
IntroductionRacial/ethnic differences in health are central to understanding the persistence of healthdisparities in the United States. Traditionally, most research on racial/ethnic healthdifferences has focused on blacks and whites, with a more recent interest in Hispanic healthand the Hispanic health paradox: the better-than-expected health outcomes among Hispanicsgiven their low average socioeconomic status (SES) (Franzini et al. 2001; Hummer et al.2000; Markides and Eschbach 2005; Palloni and Arias 2004). At the same time, theincreasing racial/ethnic diversity of U.S. immigrants since the mid-1960s has produced morevaried and complex identities within racial/ethnic groups that have been largely ignored instudies of immigrant health and health disparities with some exceptions (Alba and Nee2003; Hummer et al. 2000; Jasso et al. 2004; Malone et al. 2003; Massey 1995; Mutchler etal. 2007; Read and Emerson 2005).
© Population Association of America 2011
Correspondence to: Irma T. Elo.
NIH Public AccessAuthor ManuscriptDemography. Author manuscript; available in PMC 2012 May 23.
Published in final edited form as:Demography. 2011 ; 48(1): 241–265. doi:10.1007/s13524-010-0008-x.
NIH
-PA Author Manuscript
NIH
-PA Author Manuscript
NIH
-PA Author Manuscript
One important change resulting from the new immigration patterns is the increasingproportion of self-identified blacks who are foreign-born and who represent a growing shareof recent immigrant flows. Following the passage of the immigration reform legislation inthe mid-1960s, the number of black immigrants to the United States increased substantially;by 2005, foreign-born blacks made up 8% of the U.S. black population, up from less than1% in 1960 (Kent 2007; Malone et al. 2003). Most black immigrants come from theCaribbean and Africa, although relatively few Africans came before 1980 and most havearrived since 1990 (Kent 2007). In contrast, the flow of immigrants from the Caribbean hasbeen relatively steady over the past three decades and continues to make up the largest shareof black immigration to the United States (60% in the 1990s), followed by immigration fromAfrica (36%) (Kent 2007). Black immigration from Europe and elsewhere has been andcontinues to be small.
The social and economic outcomes of black immigrants compared with those of native-bornblacks have been used to test competing theories of black disadvantage. Some early work onthis topic pointed to better labor market outcomes of black immigrants as evidence thatcultural factors took primacy in explaining native-born black disadvantage (e.g., Sowell1978). More recent work, however, questions the universality of the black immigrant“success” story and presents a more nuanced portrait of the black immigrant experience thathighlights the role of selectivity, differences among black immigrant subgroups, andstructural factors that limit the opportunities of both black immigrants and their native-borncounterparts (e.g., Corra and Kimuna 2009; Dodoo 1997; Kalmijn 1996; Shaw-Taylor andTuch 2007).
Although there is a growing body of research on socioeconomic experiences of blackimmigrants, there are limited studies of their health outcomes. Prior research on the health ofblack immigrants has been hampered by small sample sizes. In this study, we take advantageof the expanded questions on disability included in the 2000 U.S. census to investigatedisability among native-born and foreign-born black U.S. residents. The size of the 5%Public Use Microdata Sample (PUMS) of the 2000 census makes it possible to disaggregatethe black population by region of birth and Hispanic identity.
Our primary objectives are to compare levels of self-reported physical disability and self-care disability between foreign-born and native-born blacks and to investigate whetherregion of birth predicts health status among the foreign-born. In addition, we examinewhether the Hispanic health paradox is also evident among Hispanic blacks: that is, whetherHispanic blacks report better health outcomes than non-Hispanic blacks. Although previousstudies show that Hispanic identity is associated with a health advantage (e.g., Hummer etal. 1999a, b), it is unclear whether this advantage extends to Hispanic blacks.
BackgroundThe immigrant subgroup and its native-born counterpart that have received the mostattention in the literature to date are U.S. Hispanics. This focus stems at least in part fromthe facts that Hispanics are the largest immigrant ethnic group, data on Hispanics are readilyavailable, and there is much scientific interest in the Hispanic health paradox (Jasso et al.2004; Markides and Eschbach 2005; Turra and Elo 2008). A few studies have also examinedhealth among other immigrant groups, and most have documented better health and loweradult and infant mortality among foreign-born whites, blacks, and Asian and PacificIslanders than among their native-born counterparts or among native-born whites (e.g.,David and Collins 1997; Elo and Preston 1997; Frisbie et al. 2001; Hummer et al. 1999a, b;Jasso et al. 2004; Singh and Siahpush 2002). Among U.S. black residents, infants of foreign-born black women are less likely to be born preterm, have low birth weight, or die in their
Elo et al. Page 2
Demography. Author manuscript; available in PMC 2012 May 23.
NIH
-PA Author Manuscript
NIH
-PA Author Manuscript
NIH
-PA Author Manuscript
first year of life (David and Collins 1997; Hummer et al. 1999a; Singh and Yu 1996). Inaddition, all-cause mortality appears to be lower among black immigrants than among theirnative-born counterparts (Hummer et al. 1999b), including mortality from several leadingcauses of death, such as cardiovascular diseases, cancer, and respiratory diseases(pneumonia, influenza, and chronic obstructive pulmonary disease) (Singh and Siahpush2002). Based on information drawn from various waves of the National Health InterviewSurvey (NHIS), Read and Emerson (2005) documented generally lower levels of activitylimitations, better self-rated health, and lower hypertension among foreign-born blacks thannative-born blacks.
Unlike studies of Hispanics, which have examined variation in health outcomes amongvarious Hispanic subgroups (Mexicans, Cubans, Puerto Ricans, other foreign-born, andnative-born Hispanics) (e.g., Cho et al. 2004; Hummer et al. 2000), most studies of non-Hispanic immigrant health have ignored subgroup heterogeneity. One recent exception is astudy by Mutchler et al. (2007), in which the authors examined disability among elderlyAsian immigrants by country of origin, also using data from the 2000 census. Their resultsshowed considerable subgroup heterogeneity in disability among the elderly, measured bydifficulty going outside alone as well as limitations in physical activity and in performingself-care tasks (see also Cho and Hummer 2001). One study has also investigated subgroupvariability in health outcomes among foreign-born blacks in the United States (Read andEmerson 2005). The results of this investigation, based on the 2000–2002 waves of theNHIS, suggested that black immigrants from Africa and the West Indies have superiorhealth compared with native-born blacks and with black immigrants from Europe, whosehealth appears to be similar to that of native-born blacks.
The aforementioned studies of native-born and foreign-born blacks focus primarily on non-Hispanics, and studies of Hispanics do not generally distinguish Hispanics by race. Thisconvention is at least partly related to the fact that Hispanics largely disregard the traditionalU.S. concept of race and frequently choose “other race” when asked about their racialidentity (Campbell and Rogalin 2006; Hitlin et al. 2007; Landale and Oropesa 2002;Rodríguez 2000). For example, in the 2000 U.S. census, more than 40% of Hispanics self-identified as “other race,” and only about 2% self-identified as “black/African American,”with nearly the remainder self-identifying as “white” (Grieco and Cassidy 2001).
Thus, little is known about the health status of foreign-born or native-born Hispanic blacks.Among foreign-born Hispanic blacks, the largest group (about 30%) is from the DominicanRepublic (authors’ tabulation from the 2000 U.S. census). The number of immigrants fromthe Dominican Republic approximately doubled between 1990 and 2000, and in 2000 thisgroup constituted the fourth-largest immigrant group from Latin America (Grieco 2004).Other major sending countries for foreign-born Hispanic blacks were Panama and Mexico,each contributing about 15% (authors’ tabulations from the 2000 census). Whether thehealth status of foreign-born Hispanic blacks resembles that of foreign-born non-Hispanicblacks from the Western Hemisphere has not been previously addressed. Also little is knownabout health differences among native-born Hispanic and non-Hispanic blacks.
Socioeconomic Status and Racial Context of OriginNumerous studies have documented significant associations between various measures ofSES and health in the United States and elsewhere (Elo 2009; Elo and Preston 1996;Feinstein 1993; Preston and Taubman 1994; Smith 2005; Williams 1990). SES is also asignificant predictor of health among U.S. blacks, and black-white differences in SES havebeen implicated in black-white differences in health and mortality, (Crimmins et al. 2001;Hayward et al. 2000; Williams and Collins 1995). Because some foreign-born blacksubgroups have more-favorable socioeconomic profiles (at least when measured by
Elo et al. Page 3
Demography. Author manuscript; available in PMC 2012 May 23.
NIH
-PA Author Manuscript
NIH
-PA Author Manuscript
NIH
-PA Author Manuscript
educational attainment) than do native-born blacks (authors’ tabulations from the 2000census), we expect SES differentials to explain some part of the more-favorable healthoutcomes among the foreign-born. One exception to this pattern is the low educationalattainment of foreign-born Hispanic blacks (authors’ tabulations from the 2000 census).Socio-demographic differences among the native-born black subgroups are also expected tobe related to differences in their health outcomes. Although SES differences may partiallyexplain health differences across black subgroups, we hypothesize that the associationbetween SES and health within subgroups may differ. Recent studies have documentedflatter educational health gradients among foreign-born than native-born Hispanics, a patternthat was explained mainly by the relatively good outcomes among immigrants with lowlevels of education (Goldman et al. 2006; Turra and Goldman 2007). A similar finding alsoappears to extend to foreign-born blacks relative to native-born blacks (Kimbro et al. 2008).We build on this prior research by examining educational health gradients among the U.S.black population by region of birth.
In addition, it has been theorized that the racial context in the country of origin influenceshealth outcomes of black immigrants (Read and Emerson 2005). According to thishypothesis, black immigrants from countries with majority white populations, where blackshave experienced a racial climate similar to that in the United States, have similar healthstatus as U.S.-born blacks and worse health than black immigrants from countries whereblacks constitute the majority and where they have not been subjected to racial prejudice(Read and Emerson 2005). Accordingly, we would expect to find better health outcomesamong immigrants from Africa and the West Indies than from Europe. At the same time, wespeculate that foreign-born Hispanics who identify as black, including migrants from PuertoRico, may have been subject to prejudice similar to that they may encounter upon arrival inthe United States and thus may have worse health outcomes than African or Caribbeanimmigrants, a result contrary to the Hispanic health paradox.
The Role of Selective MigrationOne of the principal theories offered for better health status and lower mortality of foreign-born compared with native-born U.S. residents is selective migration. Immigrants do notrepresent a random sample of the population in their country of origin; instead, theycorrespond to a group of individuals positively selected on health and other observed andunobserved characteristics, such as ambition and motivation (Jasso et al. 2004; Model 2008).Health selection also appears to pattern the health of internal migrants (i.e., those whomigrate within the United States). For example, migrant selectivity from Puerto Rico is oneexplanation for lower infant mortality among children of Puerto Rican–born women whomigrated to the U.S. mainland compared with that of children of mainland-born PuertoRican mothers (Landale et al. 2000). Health selection is thought to be especially strong atworking ages, when individuals are most likely to migrate for economic reasons (Marmot etal. 1984; Palloni and Ewbank 2004; Sharma et al. 1990). Thus, we hypothesize that thosewho immigrated during working ages have lower disability than those who arrived aschildren or adolescents or at ages 55 and older.
Among foreign-born black immigrants, we speculate that health selectivity is particularlyhigh among immigrants from Africa, who are, on average, more highly educated and morelikely to enter the United States on diversity visas and employment-based preferences thanother black immigrants. Jasso et al. (2005:147) found that recent immigrants who came tothe United States on diversity visas appeared to be “most positively selected on health.” Incontrast, Caribbean immigrants, who make up the largest black immigrant subgroup, aremore likely than African immigrants to arrive on family-sponsored preferences or asimmediate relatives of U.S. citizens (Akresh and Frank 2008; Kent 2007; Read and Emerson2005). For example, based on recent data for 2001–2006, 87% of Caribbean immigrants
Elo et al. Page 4
Demography. Author manuscript; available in PMC 2012 May 23.
NIH
-PA Author Manuscript
NIH
-PA Author Manuscript
NIH
-PA Author Manuscript
entered on family-sponsored preferences or as immediate relatives of U.S. citizens,compared with only 40% of African immigrants (Kent 2007). Nevertheless, migrantselectivity has also been implicated in some of the economic and labor market successes ofWest Indian immigrants relative to U.S.-born blacks (Model 2008). Nevertheless, the higherlevel of selection among African immigrants leads us to hypothesize that they will havelower levels of disability compared with Caribbean immigrants.
At the same time, there has been an increase in the percentage of African immigrants whoenter the United States as refugees, up from approximately 20% in the 1990s to 29% in2001–2006 (Kent 2007). The percentage of Caribbean immigrants who entered with arefugee visa remains relatively low (~3% during 2001–2006) (Kent 2007). Refugees arelikely to be less selective on SES and/or health than those who enter on diversity visas oremployment-based preferences. This speculation is supported by evidence from a study ofrecent U.S. immigrants who were asked to rate their health relative to the average level ofhealth in their home country. Those who arrived as refugees had twice the odds of reportingworse-than-average health compared with those on employment-based visas (Akresh andFrank 2008). Thus, health selectivity among immigrants from Africa will vary over time.
In addition, health-selective emigration of the foreign-born to their countries of origin afterresiding in the United States can affect comparisons of health outcomes between the native-born and the foreign-born. This so-called “salmon bias” hypothesis, which has been offeredas a partial explanation for the Hispanic health paradox, proposes that some immigrantsreturn to their homelands when they find themselves in poor health. Such health-selectiveemigration would thus result in a better average health status among the foreign-born whoremain in the United States than would otherwise be the case (Franzini et al. 2001; Jasso etal. 2004; Markides et al. 1997). Return migration is thought to be prevalent amongHispanics because of the cultural importance of family ties and the close proximity ofsending countries to the United States (Abraido-Lanza et al. 1999; Turra and Elo 2008). Itmay also be present among other black immigrant subgroups, especially from countrieslocated nearby, and among Puerto Ricans migrating to the U.S. mainland. Thus, migrationselectivity may also be relevant for understanding health differences among native-bornblack population subgroups.
Acculturation, Health Behaviors, and StressBesides selective migration, a commonly cited explanation for better health outcomes ofimmigrants compared with native-born U.S. residents are differences in lifestyles, socialsupport, and health-related behaviors. This “cultural buffering” hypothesis postulates that“other cultures compared to the United States are more likely to be characterized by normsand values that restrain risky behaviors (smoking, abuse of alcohol and drugs) and promotestronger familial and social support networks” (Cho et al. 2004:189). These culturalcustoms, especially among recent migrants, protect immigrants from the negativeconsequences of socioeconomic disadvantage and stress associated with the migrationexperience itself. After arriving in the United States, however, acculturation to the U.S.environment is hypothesized to lead to negative changes in health behaviors and diet anderode social and familial ties (Amaro et al. 1990; Angel et al. 2001; Hummer et al. 1999b;Mutchler et al. 2007). This explanation gains some support from evidence showing thatforeign-born individuals are less likely to smoke than the native-born, but that thesedifferences diminish with longer duration of stay in the United States (Singh and Siahpush2002). Similarly, Antecol and Bedard (2006) found that recent immigrants had more-favorable levels of body mass index (BMI) than their native-born counterparts, but that theBMI levels of those who immigrated 10 years (females) and 15 years (males) ago weresimilar to those of the native-born. These patterns have also been documented among
Elo et al. Page 5
Demography. Author manuscript; available in PMC 2012 May 23.
NIH
-PA Author Manuscript
NIH
-PA Author Manuscript
NIH
-PA Author Manuscript
foreign-born black U.S. residents, who are less likely to smoke and be obese than native-born blacks (Antecol and Bedard 2006; King et al. 1999; Singh and Siahpush 2002).
At the same time, less attention has been paid to the possible negative health consequencesof migration itself. It disrupts social ties and can at least temporarily lead to diminishedsocial networks and access to emotional and instrumental social support, which in turn canincrease levels of stress (Angel et al. 2001; Jasso et al. 2004; Kasl and Berkman 1983). Jassoet al. (2005:128) identified various sources of stress with potentially negative healthconsequences, including “visa stress, defined as the set of stresses related to obtaining alegal permanent residence and migration stress, which refer to process of moving from onecountry to another, net of the visa application process.” The authors provide some evidencefor the possibility that the negative consequences of the migration experience and U.S.exposure are conditioned by visa status and may be alleviated or reversed after theacquisition of legal, permanent residency in the United States (Jasso et al. 2005).
We speculate that U.S. exposure may generate particularly high levels of stress among blackimmigrants as they face prejudice, discrimination, and residential segregation in the raciallystratified U.S. society, factors that also contribute to lower health status of native-bornblacks relative to other native-born U.S. residents (Acevedo-Garcia and Lochner 2003; Huieet al. 2002; Williams and Collins 2001). Thus, we hypothesize that the potential negativehealth consequences of longer duration of U.S. residence for black immigrants stems notonly from possible costs of acculturation but also from exposure to racial discrimination andits associated disadvantages (Smedley et al. 2001; Smelser et al. 2000).
In addition, among the native-born, we speculate that self-identification as black amongHispanics signals a “double” minority status. For these individuals, such identification maymean that exposure to a racist U.S. environment is compounded by a marginalized statuswithin a larger Hispanic community. This marginalization itself in turn can have adversehealth consequences through adoption of negative health behaviors and exposure to stressfullife circumstances.
DataWe use the 5% PUMS of the 2000 U.S. census, which because of its large sample size,facilitates analyses of small racial/ethnic groups by place of birth (Ruggles et al. 2004). Weinclude individuals aged 25 and older who self-identified as black/African American orblack/African American and some other race, a strategy similar to that used in other studiesto classify multirace individuals (Mutchler et al. 2007; Tucker et al. 2002). The 2000 censuswas the first census that permitted multiple race reporting. Approximately 36.4 millionindividuals (12.9% of the U.S. population) self-identified as black/African American (95%of the total) or black/African American in combination with at least one other race (5%)(Grieco and Cassidy 2001). In addition to the race question, the census included a separatequestion on Hispanic identity. In 2000, 35.3 million individuals (13% of the U.S.population) classified themselves as Hispanic, of whom approximately 2% self-identified asblack/African American (Grieco and Cassidy 2001). Our unweighted sample size is 857,207black U.S. residents aged 25 and older in 2000.1
Census Measures of DisabilityThe 2000 census included an expanded set of questions on disability, which were consideredan improvement over questions in prior censuses. One cluster of questions asked about long-lasting functional limitations involving vision, hearing, and physical disability; and the
1We excluded individuals for whom race or Hispanic identity was imputed by the Census Bureau.
Elo et al. Page 6
Demography. Author manuscript; available in PMC 2012 May 23.
NIH
-PA Author Manuscript
NIH
-PA Author Manuscript
NIH
-PA Author Manuscript
second cluster focused on difficulty in performing certain activities because of a physical, amental, or an emotional condition. Taken together, these questions capture loosely definedsensory, physical, mental, self-care, and employment disability as well as difficulty goingoutside the home for shopping or to a doctor (Waldrop and Stern 2003).
In this article, we focus on physical activity limitations and personal care limitations, whichare measured by the following two questions: (1) physical disability: “Does this person haveany of the following long-lasting conditions—a condition that substantially limits one ormore basic physical activities, such as walking, climbing stairs, reaching, lifting, orcarrying?”; and (2) self-care disability: “Because of a physical, mental, or emotionalcondition lasting 6 months or more, does this person have any difficulty in doing any of thefollowing activities: dressing, bathing, or getting around inside the home?” Although thesemeasures are far less detailed than those commonly collected in health surveys such as theNational Health Interview Survey (NHIS) or the Health and Retirement Study (HRS), theyare related to commonly used measures of functional limitations and activities of daily living(ADLs). Specifically, physical disability consists of Nagi-like scale items of functionallimitations (Nagi 1991), and the self-care disability assesses difficulty in performing a subsetof basic tasks included in the Katz measure of ADL (Katz et al. 1963). Similar disabilityindicators from the 2000 census were used in the study of disability among elderly Asiansubgroups (Mutchler et al. 2007). Both dependent variables are coded 1 for persons withdisability and 0 otherwise. We chose not to include the other disability items because theyare more easily subject to language or cultural barriers (such as visiting a doctor's office). Inaddition, a recent study (Stern 2003) identified inconsistencies in the prevalence estimates of“employment disability” and “go-outside-home” disability in the 2000 census and theCensus 2000 Supplementary Survey (C2SS), a national sample based on the AmericanCommunity Survey (ACS). For the two disability items used in this article, the two sets ofprevalence estimates were very similar (Stern 2003).
Explanatory VariablesWe examine physical care and personal care disability among eight black subgroupsdistinguished by region of birth and Hispanic ethnicity: native-born non-Hispanic blacks,native-born Hispanic blacks, black Puerto Ricans born in the U.S. mainland, black island-born Puerto Ricans, foreign-born Hispanic blacks, non-Hispanic blacks born in theCaribbean, non-Hispanic blacks born in Africa, and non-Hispanic blacks born in Canada/Europe.2 We also examine disability by period of entry and age at entry to the United Statesamong the foreign-born, factors that have been linked to variation in health status in priorstudies (Angel et al. 2001; Cho et al. 2004; Landale et al. 2000; Read and Emerson 2005;Singh and Miller 2004). Based on recent immigration patterns of blacks to the United States,we identify three time periods of entry: before 1980, 1980–1989, and 1990–2000. Wecategorize age at entry as less than 20 years (childhood and adolescence), ages 20–54(young adulthood and working ages), and ages 55 and older (middle and older ages).
In addition, we control for current age and sex. Because there is considerable variation ineducational attainment and marital status between native-born and foreign-born blacks andamong the foreign-born by place of birth (Kent 2007; Read and Emerson 2005), we includemarital status and educational attainment as explanatory variables. In prior studies,educational attainment and marital status have been closely associated with health behaviorsand health status, including disability (Freedman and Martin 1999; Hayward et al. 2000;
2The Caribbean group includes Guyana because it shares a similar colonial and cultural history with other British West Indian nations.We combine Canada and Europe because of small sample sizes and because both represent a majority white context. We exclude asmall group of foreign-born non-Hispanic blacks who represent a heterogeneous set of sending countries. Preliminary analysis showedthat their exclusion did not alter the findings.
Elo et al. Page 7
Demography. Author manuscript; available in PMC 2012 May 23.
NIH
-PA Author Manuscript
NIH
-PA Author Manuscript
NIH
-PA Author Manuscript
Lillard and Waite 1995; Preston and Taubman 1994). Furthermore, as a measure of SES,education is acquired relatively early in life and is less subject to reverse causality thanincome, which is more likely to be affected by current health states in adults (Smith 2005).Educational attainment is coded as less than high school, high school diploma or GED, somecollege, a college degree, or at least some graduate education. Marital status is coded asnever married, currently married, separated/divorced, or widowed. There are also largedifferences in the settlement patterns of black immigrants in the United States by place ofbirth. For example, Caribbean-born blacks live mainly on the East Coast, while African-origin immigrants are more widely dispersed (Kent 2007; Logan 2007). Thus, we alsocontrol for region of residence coded as Northeast, Midwest, South, and West.
Statistical Methods and Analytic StrategyWe estimate a series of logistic regression models predicting the presence of a physicalactivity limitation and a personal care limitation. All models are estimated in Stata 10 (StataCorporation 2007), and all results are presented as odds ratios. All estimates are weighted byusing weights provided in the 5% PUMS data file.
We begin by comparing disability prevalence among the eight subgroups, controlling onlyfor age and sex (Model 1), and then test whether sociodemographic characteristics explainsubgroup differences (Model 2). Following previous studies of immigrant health, we alsoinvestigate whether length of time in the United States predicts disability among the foreign-born and whether disability of those who have resided in the United States for longestperiods resembles that of native-born non-Hispanic blacks.
We then estimate a series of models to analyze differences in disability among the foreign-born by region of birth. Model 1 estimates disability among the foreign-born subgroups,adjusting only for age and sex. In Model 2, we introduce sociodemographic characteristics;in Model 3, we add age at immigration and timing of immigration. Given the differences insociodemographic profiles and patterns of immigration, we expect that adjusting for thesecharacteristics will help explain variation in disability among the foreign-born. Finally,following Goldman et al. (2006), Turra and Goldman (2007), and Kimbro et al. (2008), weexplore whether the education-disability gradient varies between native-born non-Hispanicblacks and the immigrant subgroups.
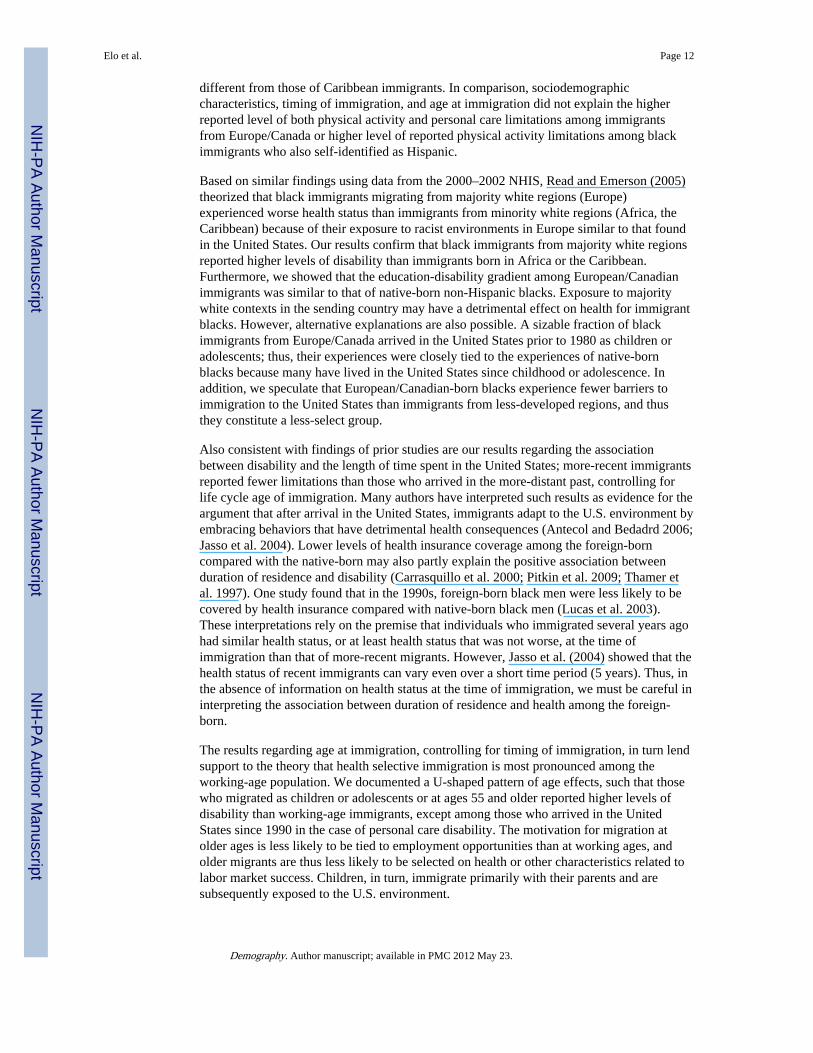
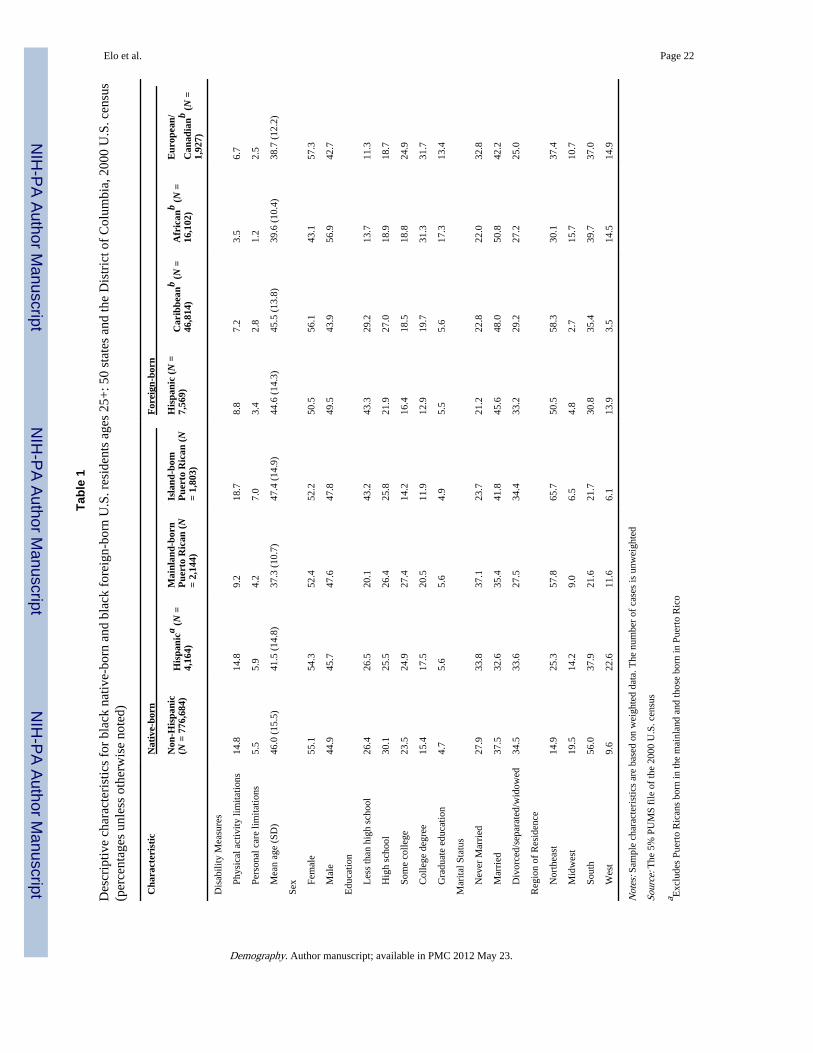
ResultsTable 1 presents sample characteristics. Native-born non-Hispanic blacks made upapproximately 91% of the sample; native-born Hispanic blacks, including Puerto Ricans,composed about 1%; and the foreign-born composed about 8% of the sample. Among theforeign-born, immigrants from the Caribbean were the largest group (65%), followed byAfricans (22%), foreign-born Hispanics (10%), and Europeans/Canadians (3%).
The prevalence of both physical activity limitations and personal care limitations was higheramong the native-born than the foreign-born. Among native-born blacks, island-born PuertoRicans reported the highest level of physical activity limitations (19%) and personal carelimitations (7%), followed by Hispanic blacks (15% and 6%), non-Hispanic blacks (15%and 6%), and mainland-born Puerto Ricans (9% and 4%). Among the foreign-born, Africanimmigrants reported the lowest level of both types of disability (4% and 1%), with thehighest levels recorded among Hispanic immigrants (9% and 3%).
Of all black subgroups, African immigrants had the highest level of education, with about49% having at least a college degree. Black immigrants from Europe/ Canada were alsohighly educated, with 45% having a college degree or graduate level schooling. The most
Elo et al. Page 8
Demography. Author manuscript; available in PMC 2012 May 23.
NIH
-PA Author Manuscript
NIH
-PA Author Manuscript
NIH
-PA Author Manuscript
poorly educated were island-born Puerto Ricans and Hispanic immigrants, of whom abouttwo-thirds had only a high school degree or less. The education distributions amongimmigrants from the Caribbean, native-born Hispanics, and native-born non-Hispanic blackswere similar (Table 1).
In addition, the foreign-born were more likely to be currently married than the native-bornsubgroups, and African immigrants stood out as being much more likely to be male. Theregional distribution of the black subgroups reflects the settlement patterns of the native-born and foreign-born black U.S. residents (Table 1).
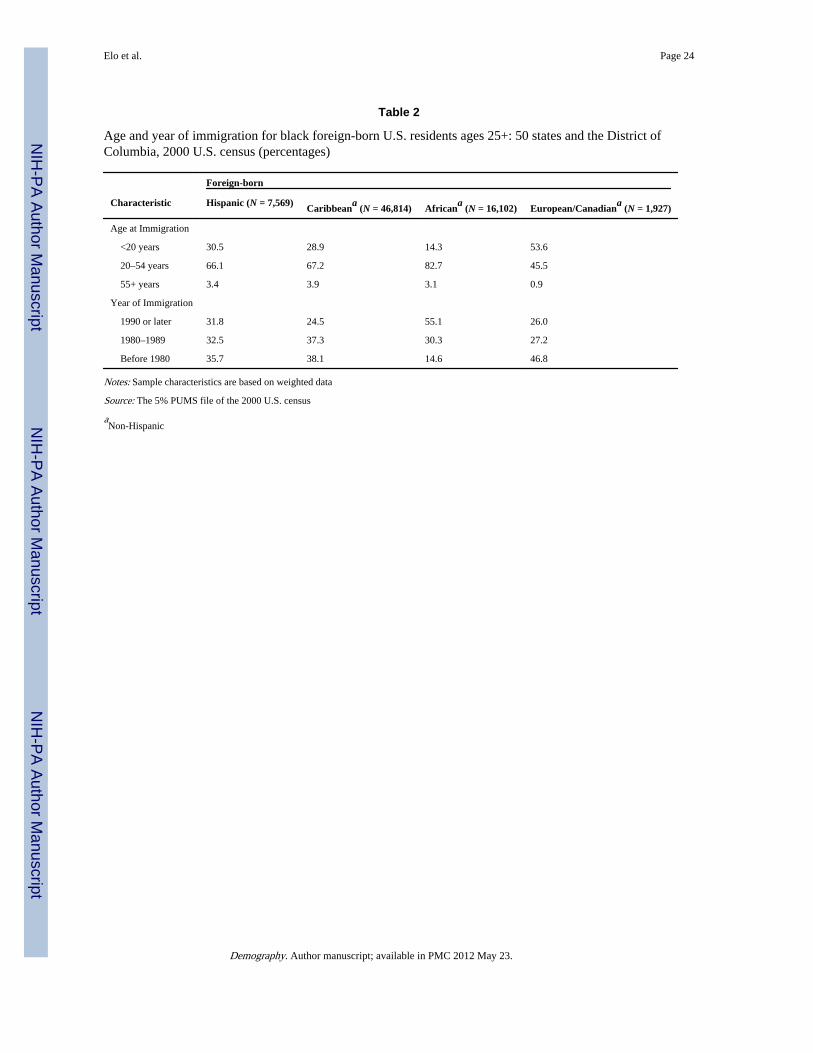
Among the foreign-born, there were substantial differences in age at immigration and yearof immigration (Table 2). For example, about 54% of the European/Canadian immigrantscame as children or adolescents (aged<20 years) compared with only about 14% of African,29% of Caribbean, and 31% of Hispanic black immigrants. Furthermore, about 55% ofblack immigrants from Africa arrived in the United States after 1990, with less than one-third of the others immigrating during this decade. In contrast, close to 47% of blackimmigrants from Europe/Canada migrated prior to 1980. The pattern of immigration by ageand year among Caribbean and Hispanic immigrants was most similar.
Variation in Disability Among Black Population SubgroupsTable 3 presents results from logistic regression models predicting physical activitylimitations and personal care limitations. Model 1, which adjusts for age and sex only,indicates that all foreign-born subgroups reported a significantly lower level of physicalactivity limitations than each native-born group (i.e., native-born Non-Hispanic, native-bornHispanic, mainland-born Puerto Rican, island-born Puerto Rican).3 Among the foreign-born,African immigrants reported a significantly lower level of physical activity limitations thanall other immigrant subgroups, followed by Caribbean immigrants, whose disability level inturn was significantly lower than that of the other groups. In Model 2, we includeadjustments for sociodemographic characteristics to test whether the differences between thenative-born and the foreign-born can be explained by subgroup variation insociodemographic characteristics. Despite the fact that educational attainment, maritalstatus, and region of residence were all significant predictors of physical activity limitations(results not shown), their inclusion did not explain the foreign-born advantage (Table 3).The immigrant advantages in personal care limitations were broadly comparable with theexception of a nonsignificant difference between native-born non-Hispanic blacks andimmigrants from Europe/Canada. Thus, despite substantial subgroup differences insociodemo-graphic characteristics, they did little to explain the foreign-born healthadvantage.
We also found significant differences in physical activity and personal care limitationsamong native-born blacks by Hispanic ethnicity and migration status from Puerto Rico.Native-born black Hispanics reported a significantly higher level of physical activity andpersonal care limitations than native-born non-Hispanic blacks. Furthermore, both island-born and U.S.-born Puerto Ricans reported higher level of physical activity limitations andpersonal care limitations than native-born non-Hispanic blacks, although not all comparisonsreached statistical significance (Models 1 and 2, Table 3). This pattern is consistent with ourspeculation that self-identification as black among native-born Hispanics may result inmarginalization within the larger Hispanic community, leading to adverse healthconsequences.
3To test for significant differences among subgroups, we use the Wald test as implemented in Stata 10, which is similar to thelikelihood ratio test (results not shown).
Elo et al. Page 9
Demography. Author manuscript; available in PMC 2012 May 23.
NIH
-PA Author Manuscript
NIH
-PA Author Manuscript
NIH
-PA Author Manuscript
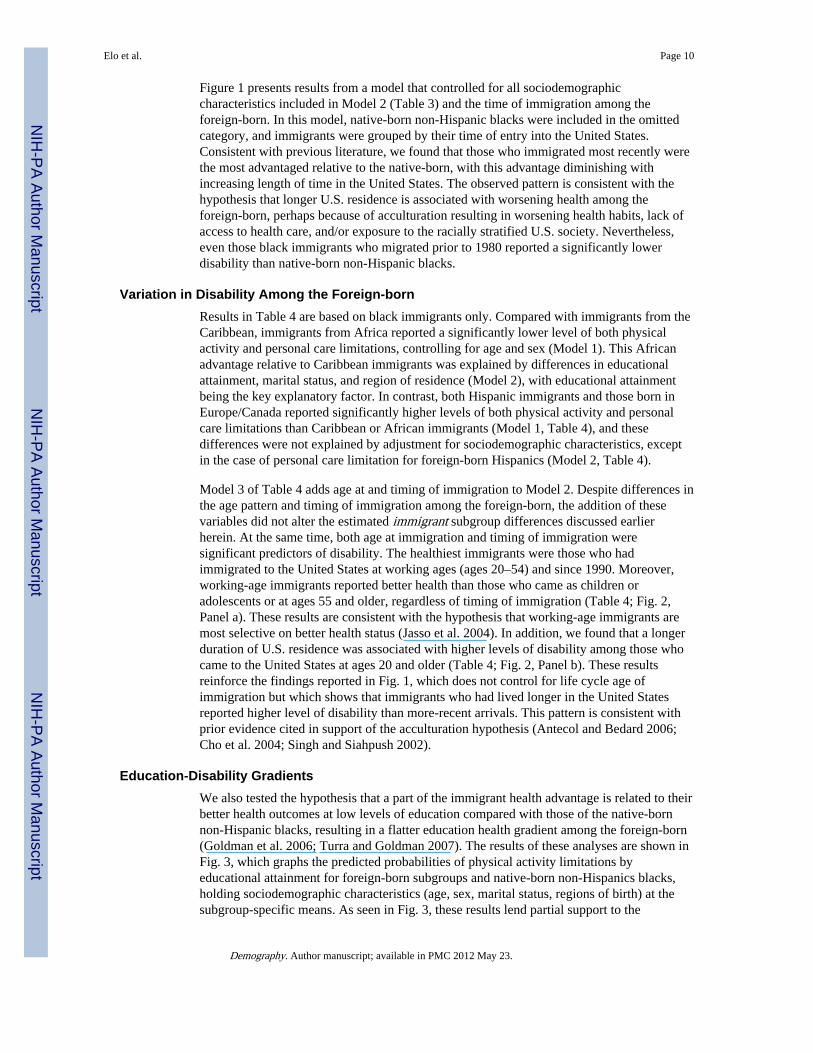
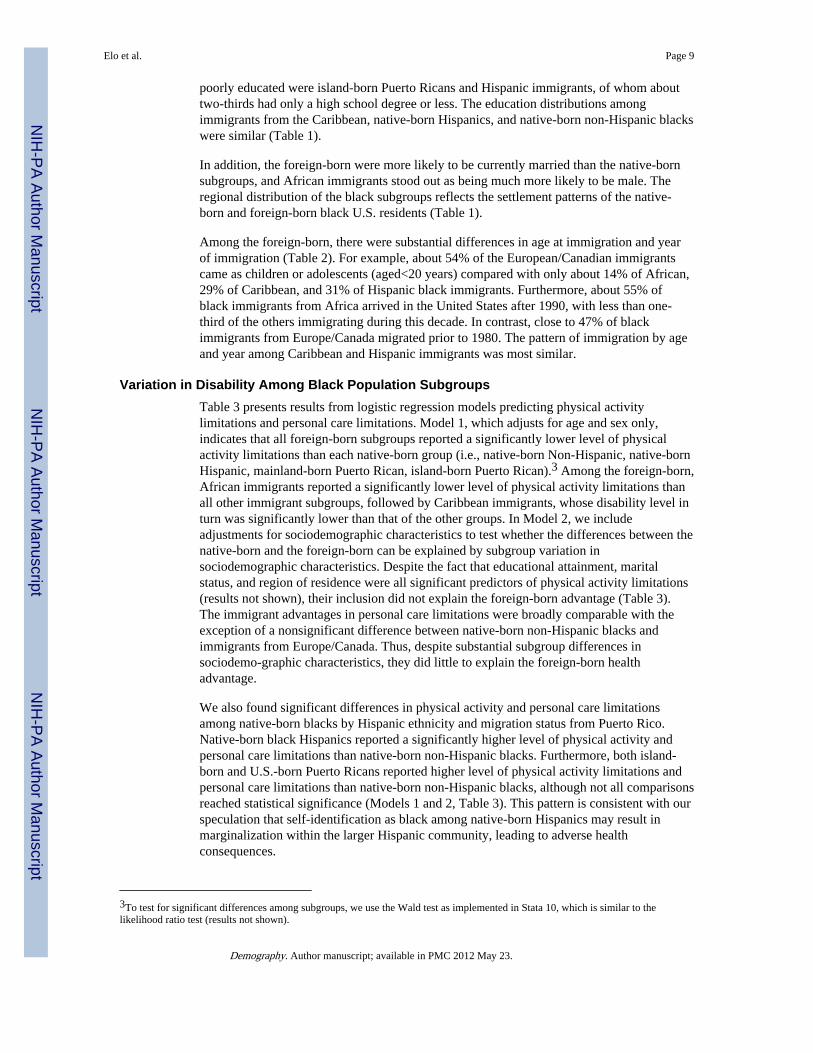
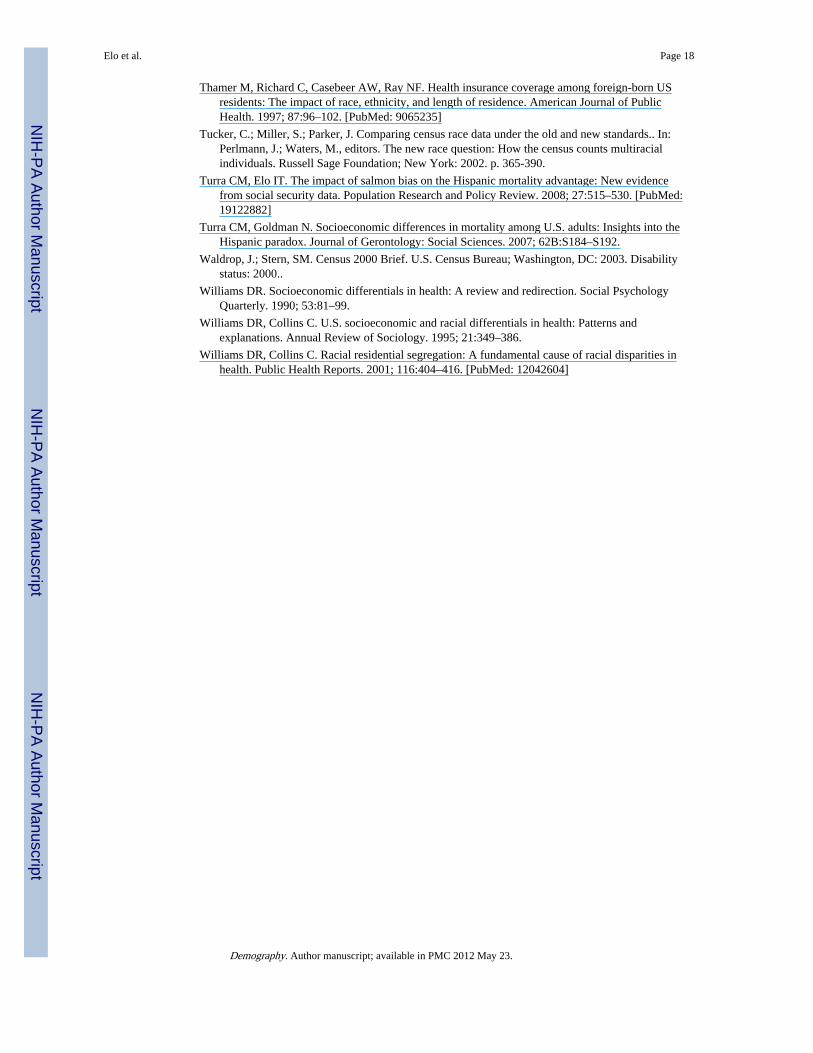
Figure 1 presents results from a model that controlled for all sociodemographiccharacteristics included in Model 2 (Table 3) and the time of immigration among theforeign-born. In this model, native-born non-Hispanic blacks were included in the omittedcategory, and immigrants were grouped by their time of entry into the United States.Consistent with previous literature, we found that those who immigrated most recently werethe most advantaged relative to the native-born, with this advantage diminishing withincreasing length of time in the United States. The observed pattern is consistent with thehypothesis that longer U.S. residence is associated with worsening health among theforeign-born, perhaps because of acculturation resulting in worsening health habits, lack ofaccess to health care, and/or exposure to the racially stratified U.S. society. Nevertheless,even those black immigrants who migrated prior to 1980 reported a significantly lowerdisability than native-born non-Hispanic blacks.
Variation in Disability Among the Foreign-bornResults in Table 4 are based on black immigrants only. Compared with immigrants from theCaribbean, immigrants from Africa reported a significantly lower level of both physicalactivity and personal care limitations, controlling for age and sex (Model 1). This Africanadvantage relative to Caribbean immigrants was explained by differences in educationalattainment, marital status, and region of residence (Model 2), with educational attainmentbeing the key explanatory factor. In contrast, both Hispanic immigrants and those born inEurope/Canada reported significantly higher levels of both physical activity and personalcare limitations than Caribbean or African immigrants (Model 1, Table 4), and thesedifferences were not explained by adjustment for sociodemographic characteristics, exceptin the case of personal care limitation for foreign-born Hispanics (Model 2, Table 4).
Model 3 of Table 4 adds age at and timing of immigration to Model 2. Despite differences inthe age pattern and timing of immigration among the foreign-born, the addition of thesevariables did not alter the estimated immigrant subgroup differences discussed earlierherein. At the same time, both age at immigration and timing of immigration weresignificant predictors of disability. The healthiest immigrants were those who hadimmigrated to the United States at working ages (ages 20–54) and since 1990. Moreover,working-age immigrants reported better health than those who came as children oradolescents or at ages 55 and older, regardless of timing of immigration (Table 4; Fig. 2,Panel a). These results are consistent with the hypothesis that working-age immigrants aremost selective on better health status (Jasso et al. 2004). In addition, we found that a longerduration of U.S. residence was associated with higher levels of disability among those whocame to the United States at ages 20 and older (Table 4; Fig. 2, Panel b). These resultsreinforce the findings reported in Fig. 1, which does not control for life cycle age ofimmigration but which shows that immigrants who had lived longer in the United Statesreported higher level of disability than more-recent arrivals. This pattern is consistent withprior evidence cited in support of the acculturation hypothesis (Antecol and Bedard 2006;Cho et al. 2004; Singh and Siahpush 2002).
Education-Disability GradientsWe also tested the hypothesis that a part of the immigrant health advantage is related to theirbetter health outcomes at low levels of education compared with those of the native-bornnon-Hispanic blacks, resulting in a flatter education health gradient among the foreign-born(Goldman et al. 2006; Turra and Goldman 2007). The results of these analyses are shown inFig. 3, which graphs the predicted probabilities of physical activity limitations byeducational attainment for foreign-born subgroups and native-born non-Hispanics blacks,holding sociodemographic characteristics (age, sex, marital status, regions of birth) at thesubgroup-specific means. As seen in Fig. 3, these results lend partial support to the
Elo et al. Page 10
Demography. Author manuscript; available in PMC 2012 May 23.
NIH
-PA Author Manuscript
NIH
-PA Author Manuscript
NIH
-PA Author Manuscript
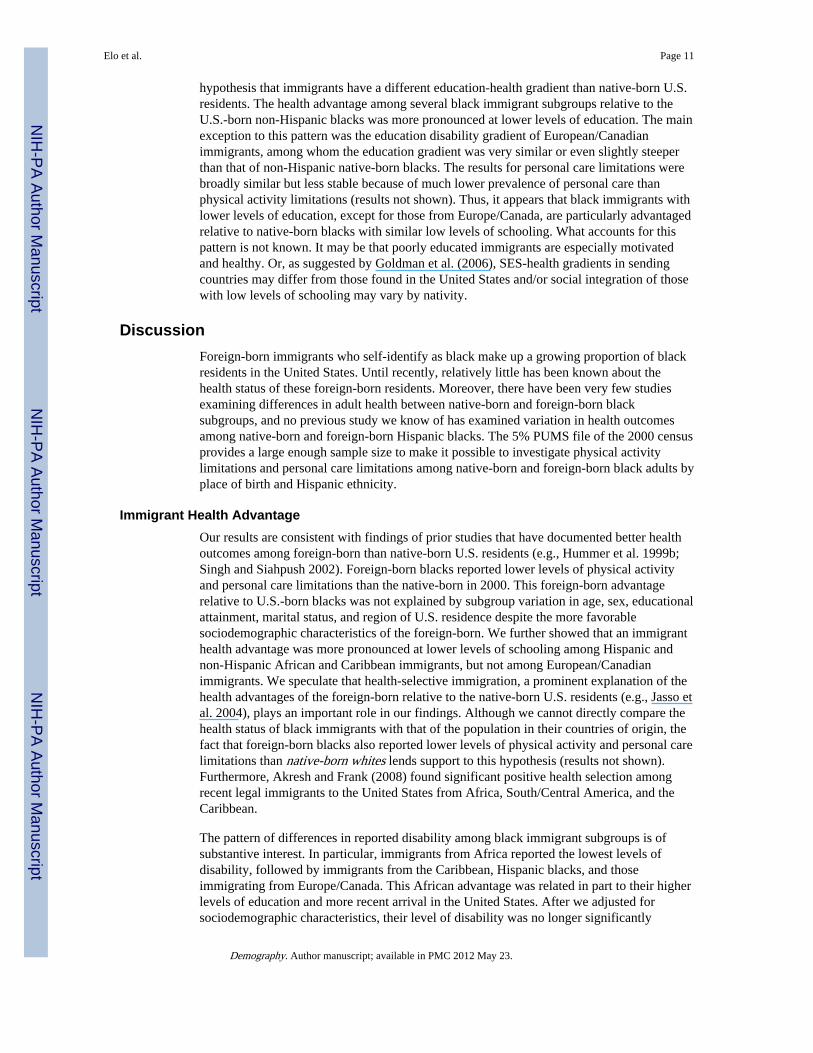
hypothesis that immigrants have a different education-health gradient than native-born U.S.residents. The health advantage among several black immigrant subgroups relative to theU.S.-born non-Hispanic blacks was more pronounced at lower levels of education. The mainexception to this pattern was the education disability gradient of European/Canadianimmigrants, among whom the education gradient was very similar or even slightly steeperthan that of non-Hispanic native-born blacks. The results for personal care limitations werebroadly similar but less stable because of much lower prevalence of personal care thanphysical activity limitations (results not shown). Thus, it appears that black immigrants withlower levels of education, except for those from Europe/Canada, are particularly advantagedrelative to native-born blacks with similar low levels of schooling. What accounts for thispattern is not known. It may be that poorly educated immigrants are especially motivatedand healthy. Or, as suggested by Goldman et al. (2006), SES-health gradients in sendingcountries may differ from those found in the United States and/or social integration of thosewith low levels of schooling may vary by nativity.
DiscussionForeign-born immigrants who self-identify as black make up a growing proportion of blackresidents in the United States. Until recently, relatively little has been known about thehealth status of these foreign-born residents. Moreover, there have been very few studiesexamining differences in adult health between native-born and foreign-born blacksubgroups, and no previous study we know of has examined variation in health outcomesamong native-born and foreign-born Hispanic blacks. The 5% PUMS file of the 2000 censusprovides a large enough sample size to make it possible to investigate physical activitylimitations and personal care limitations among native-born and foreign-born black adults byplace of birth and Hispanic ethnicity.
Immigrant Health AdvantageOur results are consistent with findings of prior studies that have documented better healthoutcomes among foreign-born than native-born U.S. residents (e.g., Hummer et al. 1999b;Singh and Siahpush 2002). Foreign-born blacks reported lower levels of physical activityand personal care limitations than the native-born in 2000. This foreign-born advantagerelative to U.S.-born blacks was not explained by subgroup variation in age, sex, educationalattainment, marital status, and region of U.S. residence despite the more favorablesociodemographic characteristics of the foreign-born. We further showed that an immigranthealth advantage was more pronounced at lower levels of schooling among Hispanic andnon-Hispanic African and Caribbean immigrants, but not among European/Canadianimmigrants. We speculate that health-selective immigration, a prominent explanation of thehealth advantages of the foreign-born relative to the native-born U.S. residents (e.g., Jasso etal. 2004), plays an important role in our findings. Although we cannot directly compare thehealth status of black immigrants with that of the population in their countries of origin, thefact that foreign-born blacks also reported lower levels of physical activity and personal carelimitations than native-born whites lends support to this hypothesis (results not shown).Furthermore, Akresh and Frank (2008) found significant positive health selection amongrecent legal immigrants to the United States from Africa, South/Central America, and theCaribbean.
The pattern of differences in reported disability among black immigrant subgroups is ofsubstantive interest. In particular, immigrants from Africa reported the lowest levels ofdisability, followed by immigrants from the Caribbean, Hispanic blacks, and thoseimmigrating from Europe/Canada. This African advantage was related in part to their higherlevels of education and more recent arrival in the United States. After we adjusted forsociodemographic characteristics, their level of disability was no longer significantly
Elo et al. Page 11
Demography. Author manuscript; available in PMC 2012 May 23.
NIH
-PA Author Manuscript
NIH
-PA Author Manuscript
NIH
-PA Author Manuscript
different from those of Caribbean immigrants. In comparison, sociodemographiccharacteristics, timing of immigration, and age at immigration did not explain the higherreported level of both physical activity and personal care limitations among immigrantsfrom Europe/Canada or higher level of reported physical activity limitations among blackimmigrants who also self-identified as Hispanic.
Based on similar findings using data from the 2000–2002 NHIS, Read and Emerson (2005)theorized that black immigrants migrating from majority white regions (Europe)experienced worse health status than immigrants from minority white regions (Africa, theCaribbean) because of their exposure to racist environments in Europe similar to that foundin the United States. Our results confirm that black immigrants from majority white regionsreported higher levels of disability than immigrants born in Africa or the Caribbean.Furthermore, we showed that the education-disability gradient among European/Canadianimmigrants was similar to that of native-born non-Hispanic blacks. Exposure to majoritywhite contexts in the sending country may have a detrimental effect on health for immigrantblacks. However, alternative explanations are also possible. A sizable fraction of blackimmigrants from Europe/Canada arrived in the United States prior to 1980 as children oradolescents; thus, their experiences were closely tied to the experiences of native-bornblacks because many have lived in the United States since childhood or adolescence. Inaddition, we speculate that European/Canadian-born blacks experience fewer barriers toimmigration to the United States than immigrants from less-developed regions, and thusthey constitute a less-select group.
Also consistent with findings of prior studies are our results regarding the associationbetween disability and the length of time spent in the United States; more-recent immigrantsreported fewer limitations than those who arrived in the more-distant past, controlling forlife cycle age of immigration. Many authors have interpreted such results as evidence for theargument that after arrival in the United States, immigrants adapt to the U.S. environment byembracing behaviors that have detrimental health consequences (Antecol and Bedadrd 2006;Jasso et al. 2004). Lower levels of health insurance coverage among the foreign-borncompared with the native-born may also partly explain the positive association betweenduration of residence and disability (Carrasquillo et al. 2000; Pitkin et al. 2009; Thamer etal. 1997). One study found that in the 1990s, foreign-born black men were less likely to becovered by health insurance compared with native-born black men (Lucas et al. 2003).These interpretations rely on the premise that individuals who immigrated several years agohad similar health status, or at least health status that was not worse, at the time ofimmigration than that of more-recent migrants. However, Jasso et al. (2004) showed that thehealth status of recent immigrants can vary even over a short time period (5 years). Thus, inthe absence of information on health status at the time of immigration, we must be careful ininterpreting the association between duration of residence and health among the foreign-born.
The results regarding age at immigration, controlling for timing of immigration, in turn lendsupport to the theory that health selective immigration is most pronounced among theworking-age population. We documented a U-shaped pattern of age effects, such that thosewho migrated as children or adolescents or at ages 55 and older reported higher levels ofdisability than working-age immigrants, except among those who arrived in the UnitedStates since 1990 in the case of personal care disability. The motivation for migration atolder ages is less likely to be tied to employment opportunities than at working ages, andolder migrants are thus less likely to be selected on health or other characteristics related tolabor market success. Children, in turn, immigrate primarily with their parents and aresubsequently exposed to the U.S. environment.
Elo et al. Page 12
Demography. Author manuscript; available in PMC 2012 May 23.
NIH
-PA Author Manuscript
NIH
-PA Author Manuscript
NIH
-PA Author Manuscript
Disability Among Hispanic BlacksAlthough there is ongoing interest in the Hispanic health paradox, few studies haveexamined the health status of Hispanic blacks (e.g., Borrell 2006; Borrell and Dallo 2008).Thus, an important contribution of this study is the separate identification of Hispanic andnon-Hispanic blacks. Unlike previous studies that indicate a Hispanic health advantagerelative to non-Hispanic white and/or black U.S. residents, we find that both native-born andforeign-born Hispanic blacks generally displayed higher levels of disability compared withtheir respective non-Hispanic groups. For example, foreign-born Hispanic blacks reported ahigher level of disability than African or Caribbean immigrants. Likewise, native-bornHispanic blacks reported a higher level of disability than native-born non-Hispanic blacks.In addition, island-born Puerto Ricans reported higher levels of disability than native-bornnon-Hispanic blacks as did mainland-born Puerto Ricans in the case of personal carelimitations. Hence, Hispanic identification in this study was associated with a disadvantagedhealth status—a result that in general was robust for adjustment for sociodemographiccharacteristics.
Hispanics who self-identify as black/African American may do so for a variety of reasons.These include having a non-Hispanic black parent (Logan 2004), phenotype/skin color(Rodríguez 2000), or that one's “black” identity reflects life experiences (Hitlin et al. 2007).These Hispanic blacks constitute a distinct subgroup within the Hispanic population.Compared with Hispanics who identify as “other” or “white,” they are more raciallysegregated from whites and more likely to live in neighborhoods with non-Hispanic blacks(Denton and Massey 1989). Hispanic blacks also have a lower median household income,higher unemployment, and a higher poverty rate than other Hispanics (Logan 2004). Asnoted in the introduction of this article, we speculate that being a black and a Hispanicsignals a “double” minority status, which in the case of native-born Hispanic blacks maylead to an inferior status within the Hispanic community. Among foreign-born Hispanicblacks, poorer health outcomes may be rooted in racial marginalization within raciallystratified Hispanic-sending nations (Howard 2001), a hypothesis consistent with the racialcontext of origin theory proposed by Read and Emerson (2005). Thus, the Hispanic healthparadox does not extend to black Hispanics.
Limitations and Avenues for Future ResearchThis study has several limitations. First, the measures of health are self-reported or proxy-reported; and normative perceptions of health and illness, which may vary by country oforigin, may influence responses to census questions. Therefore, differences in reportedlevels of disability by place of birth may not accurately represent true differences inunderlying health status. We limited our disability measures to those that were likely to bebetter reported. Nevertheless, some caution should be exercised in interpreting differentialsin self-reported physical health measures across different cultural and national origin groups(Carr et al. 2001; Mathers 2003; Murray and Chen 1992; Sen 2002). Furthermore, some whoentered the United States on diversity visas or on employment-based preferences maymistakenly fear that reporting a disability on the census would lead to loss of employment orvisa status and therefore do not report an existing disability.
Second, our results with respect to age at and year of immigration were based on cross-sectional data and must be interpreted with caution. For example, we could not control forhealth status at the time of immigration. In addition, Redstone and Massey (2004) haveshown that census questions on timing of immigration provide imprecise estimates ofduration of stay in the United States. Many migrants enter and leave the United Statesnumerous times before they make a permanent move. As a result, estimates of exposure timeto the U.S. environment based on census data are likely to be imprecise, and their accuracy
Elo et al. Page 13
Demography. Author manuscript; available in PMC 2012 May 23.
NIH
-PA Author Manuscript
NIH
-PA Author Manuscript
NIH
-PA Author Manuscript
may vary by immigrant subgroup. Future research on acculturation and health trajectoriesamong immigrants over time would greatly benefit from analyses of longitudinal data thatmake it possible to follow immigrant cohorts after their arrival in the United States. Inaddition, multi-generational studies of black immigrants and comparisons with populationsin their countries of origin would help shed light on the impact of the U.S. environment onthe health of black and other immigrant subgroups.
Third, we did not examine whether differences in residential segregation patterns amongnative-born blacks by Hispanic ethnicity or among foreign-born black subgroups wereassociated with variation in health outcomes. This area also merits further investigation.Finally, it was not possible to assess the potential role of selective return migration (salmonbias) on differences in disability. Health-selective return migration among the foreign-bornsubgroups (and among island-born Puerto Ricans) would result in an underestimation ofdisability levels for these populations.
AcknowledgmentsAn earlier version of this paper was presented at the 2008 annual meeting of the Population Association ofAmerica, New Orleans, LA, April 2008. We thank the discussant and reviewers for their helpful comments. Theresearch was supported by the National Institute of Aging Grants #P30 AG12836 and #T32 PredoctoralInstitutional Training Grant AG000177; and Eunice Kennedy Shriver National Institute of Child Health and HumanDevelopment (NICHD) Population Research Infrastructure Program R24-044964, University of Pennsylvania. NeilK. Mehta is currently a Robert Wood Johnson Foundation Health & Society Scholar at the University of Michigan.
ReferencesAbraido-Lanza AF, Dohrenwend BP, Ng-Mak DS, Turner JB. The Latino mortality paradox: A test of
the ‘salmon bias’ and healthy migrant hypotheses. American Journal of Public Health. 1999;89:1543–1548. [PubMed: 10511837]
Acevedo-Garcia, D.; Lochner, KA. Residential segregation and health.. In: Kawachi, I.; Berkman, LF.,editors. Neighborhoods and health. Oxford University Press; New York: 2003. p. 265-287.
Akresh IR, Frank R. Health selection among new immigrants. American Journal of Public Health.2008; 98:1–7.
Alba, R.; Nee, V. Remaking the American mainstream. Harvard University Press; Cambridge, MA:2003.
Amaro H, Whitake R, Coffman G, Hereen T. Acculturation and marijuana and cocaine use: Findingsfrom HHANES 1982–84. American Journal of Public Health. 1990; 80(Suppl.):54–60. [PubMed:9187583]
Angel JL, Buckley CJ, Sakamoto A. Duration or disadvantage? Exploring nativity, ethnicity, andhealth in midlife. Journal of Gerontology: Social Sciences. 2001; 56B:S275–S284.
Antecol H, Bedard K. Unhealthy assimilation: Why do immigrants converge to American health statuslevels? Demography. 2006; 43:337–360. [PubMed: 16889132]
Borrell LN. Self-reported hypertension and race among Hispanics in the National Health InterviewSurvey. Ethnicity & Disease. 2006; 16:71–77. [PubMed: 16599351]
Borrell LN, Dallo FD. Self-rated health and race among Hispanic and non-Hispanic adults. Journal ofImmigrant and Minority Health. 2008; 10:229–238. [PubMed: 17653864]
Campbell ME, Rogalin CL. Categorical imperatives: The interaction of Latino and racialidentification. Social Science Quarterly. 2006; 87:1030–1052.
Carr AJ, Gibson B, Robinson PG. Measuring quality of life: Is quality of life determined byexpectations or experience? British Medical Journal. 2001; 322:1240–1243. [PubMed: 11358783]
Carrasquillo O, Carrasquillo A, Shea S. Health insurance coverage of immigrants living in the UnitedStates: Differences by citizenship status and country of origin. American Journal of Public Health.2000; 90:917–923. [PubMed: 10846509]
Elo et al. Page 14
Demography. Author manuscript; available in PMC 2012 May 23.
NIH
-PA Author Manuscript
NIH
-PA Author Manuscript
NIH
-PA Author Manuscript
Cho Y, Hummer R. Disability status differentials across fifteen Asian and Pacific Islander groups andeffect of nativity and duration of residence in the U.S. Social Biology. 2001; 48:171–195.[PubMed: 12516223]
Cho Y, Frisbie WP, Rogers RG. Nativity, duration of residence, and the health of Hispanic adults inthe United States. International Migration Review. 2004; 38:184–211.
Corra MK, Kimuna SR. Double jeopardy? Female African and Caribbean immigrants in the UnitedStates. Journal of Ethnic and Migration Studies. 2009; 35:1015–1035.
Crimmins, EM.; Hayward, MD.; Seeman, TE. Race/ethnicity, socioeconomic status and health.. In:Anderson, NB.; Bulatao, RA.; Cohen, B., editors. Critical perspectives on racial and ethnicdifferences in health in late life. National Academies Press; Washington, DC: 2001. p. 310-352.
David RJ, Collins JW. Differing birth weight among infants of U.S.-born blacks, African-born blacks,and U.S.-born whites. The New England Journal of Medicine. 1997; 337:1209–1214. [PubMed:9337381]
Denton NA, Massey DS. Racial identity among Caribbean Hispanics: The effect of double minoritystatus on residential segregation. American Sociological Review. 1989; 54:790–808.
Dodoo FN-A. Assimilation differences among Africans in America. Social Forces. 1997; 76:527–546.
Elo IT. Social class differentials in health and mortality: Patterns and explanations in comparativeperspective. Annual Review of Sociology. 2009; 35:553–572.
Elo IT, Preston SH. Educational differentials in mortality in the United States 1979–1985. SocialScience & Medicine. 1996; 42:47–57. [PubMed: 8745107]
Elo, IT.; Preston, SH. Racial and ethnic differences in mortality at older ages.. In: Martin, LG.; Soldo,BJ., editors. Racial and ethnic differences in the health of older Americans. National AcademiesPress; Washington, DC: 1997. p. 10-42.
Feinstein J. The relationship between socioeconomic status and health: A review of the literature. TheMilbank Quarterly. 1993; 71:279–322. [PubMed: 8510603]
Franzini L, Ribble JC, Keddie AM. Understanding the Hispanic paradox. Ethnicity & Disease. 2001;11:496–518. [PubMed: 11572416]
Freedman VA, Martin LG. The role of education in explaining and forecasting trends in functionallimitations among older Americans. Demography. 1999; 36:461–473. [PubMed: 10604075]
Frisbie WP, Cho Y, Hummer RA. Immigration and the health of Asian and Pacific Islander adults inthe United States. American Journal of Epidemiology. 2001; 153:372–380. [PubMed: 11207155]
Goldman N, Kimbro RT, Turra CM, Pebley AR. Socioeconomic gradients in health for white andMexican-origin populations. American Journal of Public Health. 2006; 96:2186–2193. [PubMed:17077396]
Grieco, E. The foreign born from the Dominican Republic in the United States. Report. MigrationPolicy Institute; 2004. Available online athttp://www.migrationinformation.org/USfocus/display.cfm?ID=259
Grieco, EM.; Cassidy, RC. Census 2000 Brief. U.S. Census Bureau; Washington, DC: 2001. Overviewof race and Hispanic origin 2000..
Hayward MD, Crimmins EM, Miles TP, Yu Y. The significance of socioeconomic status in explainingthe racial gap in chronic health conditions. American Sociological Review. 2000; 65:910–930.
Hitlin S, Brown JS, Elder GH. Measuring Latinos: Racial vs. ethnic classification and self-understandings. Social Forces. 2007; 86:587–611.
Howard, D. Coloring the nation: Race and ethnicity in the Dominican Republic. Signal Books; Oxford,United Kingdom: 2001.
Huie SAB, Hummer RA, Rogers RG. Individual and contextual risks of death among race and ethnicgroups in the United States. Journal of Health and Social Behavior. 2002; 43:359–381. [PubMed:12467258]
Hummer RA, Biegler M, DeTurk PB, Forbes D, Frisbie WP, Hong Y, et al. Race/ethnicity, nativity,and infant mortality in the United States. Social Forces. 1999a; 77:1083–1018.
Hummer RA, Rogers RG, Nam CB, LeClere FB. Race/ethnicity, nativity, and U.S. adult mortality.Social Science Quarterly. 1999b; 80:136–153.
Elo et al. Page 15
Demography. Author manuscript; available in PMC 2012 May 23.
NIH
-PA Author Manuscript
NIH
-PA Author Manuscript
NIH
-PA Author Manuscript
Hummer RA, Rogers RG, Amir SH, Forbes D, Frisbie WP. Adult mortality differentials amongHispanic subgroups and non-Hispanic Whites. Social Science Quarterly. 2000; 81:459–476.[PubMed: 17879490]
Jasso, G.; Massey, DS.; Rosenzweig, RS.; Smith, JP. Immigrant health, selectivity and acculturation..In: Anderson, NB.; Bulatao, RA.; Cohen, B., editors. Critical perspectives on racial and ethnicdifferences in health in late life. National Academies Press; Washington, DC: 2004. p. 227-266.
Jasso G, Massey DS, Rosenzweig RS, Smith JP. Immigration, health, and New York City: Earlyresults based on the U.S. new immigrant cohort of 2003. Economic Policy Review. 2005; 11:127–151.
Kalmijn M. The socioeconomic assimilation of Caribbean American blacks. Social Forces. 1996;74:911–930.
Kasl SV, Berkman L. Health consequences of the experiences of migration. Annual Review of PublicHealth. 1983; 4:69–90.
Katz SA, Ford B, Moskowitz RW, Jackson BA, Jaffe MW. Studies of illness in the aged: The index ofADL, a standardized measure of biological and psychosocial function. Journal of the AmericanMedical Association. 1963; 185:914–919. [PubMed: 14044222]
Kent, M. Population Bulletin. Vol. 62. Population Reference Bureau; Washington, DC: 2007.Immigration and America's black population..
Kimbro RT, Bzostek S, Goldman N, Rodriquez G. Race, ethnicity, and the education gradient inhealth. Health Affairs. 2008; 27:361–372. [PubMed: 18332490]
King G, Polednak AP, Bendel R, Hovey D. Cigarette smoking among native and foreign-born AfricanAmericans. Annals of Epidemiology. 1999; 9:236–244. [PubMed: 10332929]
Landale NS, Oropesa RS. White, black, or Puerto Rican? Racial self-identification among mainlandand island Puerto Ricans. Social Forces. 2002; 81:231–254.
Landale NS, Oropesa RS, Gorman BK. Migration and infant death: Assimilation or selective migrationamong Puerto Ricans? American Sociological Review. 2000; 65:888–909.
Lillard LA, Waite LJ. ’Til death do us part: Marital disruption and mortality. The American Journal ofSociology. 1995; 100:1131–1156.
Logan JR. How race counts for Hispanic Americans. Race Relations Abstracts. 2004; 29(7):7–19.
Logan, JR. Who are other African Americans? Contemporary African and Caribbean immigrants inthe United States.. In: Shaw-Taylor, Y.; Tuch, SA., editors. The other Americans: ContemporaryAfrican and Caribbean immigrants in the United States. Rowman & Littlefield Publishers; NewYork: 2007. p. 49-67.
Lucas JW, Barr-Anderson DJ, Kington RS. Health status, health insurance, and health care utilizationpatterns of immigrant black men. American Journal of Public Health. 2003; 93:1740–1747.[PubMed: 14534231]
Malone, N.; Baluja, KF.; Costanzo, JM.; Davis, CJ. Census 2000 Brief. U.S. Census Bureau;Washington, DC: 2003. The foreign-born population: 2000..
Markides KS, Eschbach K. Aging, migration, and mortality: Current status of research on the Hispanicparadox. Journal of Gerontology. 2005; 60B:68–75.
Markides, KS.; Rudkin, L.; Angel, J.; Espino, DV. Health status of the Hispanic elderly.. In: Martin,LG.; Soldo, BJ., editors. Racial and ethnic differences in the health of older Americans. NationalAcademies Press; Washington, DC: 1997. p. 105-162.
Marmot MG, Adelstein AM, Bulusu L. Lessons from the study of immigrant mortality. Lancet. 1984;1:1455–1457. [PubMed: 6145889]
Massey DS. The new immigration and ethnicity in the United States. Population and DevelopmentReview. 1995; 21:631–652.
Mathers CD. Towards valid and comparable measurement of population health. Bulletin of the WorldHealth Organization. 2003; 81:787–788. [PubMed: 14758404]
Model, S. West Indian immigrants: A black success story?. Russell Sage Foundation; New York:2008.
Murray CJL, Chen LC. Understanding morbidity change. Population and Development Review. 1992;18:481–503.
Elo et al. Page 16
Demography. Author manuscript; available in PMC 2012 May 23.
NIH
-PA Author Manuscript
NIH
-PA Author Manuscript
NIH
-PA Author Manuscript
Mutchler JE, Prakash A, Burr JA. The demography of disability and effects of immigrant history:Older Asians in the United States. Demography. 2007; 44:251–263. [PubMed: 17583304]
Nagi, SZ. Disability concepts revised: Implications for prevention.. In: Pope, AM.; Tarlov, AR.,editors. Disability in America: Toward a national agenda for prevention. National AcademiesPress; Washington, DC: 1991. p. 309-339.
Palloni A, Arias E. Paradox lost: Explaining the Hispanic adult mortality advantage. Demography.2004; 41:385–415. [PubMed: 15461007]
Palloni, A.; Ewbank, DC. Selection processes in the study of racial and ethnic differentials in adulthealth and mortality.. In: Anderson, NB.; Bulatao, RA.; Cohen, B., editors. Critical perspectiveson racial and ethnic differences in health in late life. National Academies Press; Washington, DC:2004. p. 171-226.
Pitkin DK, Bahney BW, Lurie N, Escarce JJ. Review: Immigrants and health care access, quality, andcost. Medical Care Research and Review. 2009; 66:355–408. [PubMed: 19179539]
Preston, SH.; Taubman, P. Socioeconomic differences in adult mortality and health status.. In: Martin,LG.; Preston, SH., editors. Demography of aging. National Academies Press; Washington, DC:1994. p. 279-318.
Read JG, Emerson MO. Racial context, black immigration and the U.S. black/white health disparity.Social Forces. 2005; 84:181–199.
Redstone I, Massey DS. Coming to stay: An analysis of the U.S. census question on immigrants’ yearof arrival. Demography. 2004; 41:721–738. [PubMed: 15622951]
Rodríguez, CE. Changing race: Latinos, the census, and the history of ethnicity in the United States.New York University Press; New York: 2000.
Ruggles, S.; Sobek, M.; Alexander, T.; Fitch, CA.; Goeken, R.; Hall, PK.; King, M.; Ronnander, C.Integrated Public Use Microdata Series: Version 3.0 [Machine-readable database]. MinnesotaPopulation Center [producer and distributor]; Minneapolis, MN: 2004. Available online athttp://usa.ipums.org/usa
Sen A. Health: Perception versus observation. British Medical Journal. 2002; 324:860–861. [PubMed:11950717]
Sharma RD, Michalowski M, Verma RBP. Mortality differentials among immigrant populations inCanada. International Migration. 1990; 28:443–450. [PubMed: 12159559]
Shaw-Taylor, Y.; Tuch, SA. “Earnings, wealth, and social capital: A review of debates and issues.. In:Shaw-Taylor, Y.; Tuch, SA., editors. The other Americans: Contemporary African and Caribbeanimmigrants in the United States. Rowman & Littlefield Publishers; New York: 2007. p. 117-152.
Singh GK, Miller BA. Health, life expectancy, and mortality patterns among immigrant population inthe United States. Revue Canadienne de Sante Publique. 2004; 95:I-14–I-21. [PubMed: 15191127]
Singh GK, Siahpush M. Ethnic-immigrant differentials in health behaviors, morbidity, and cause-specific mortality in the United States: An analysis of two national data bases. Human Biology.2002; 74:83–109. [PubMed: 11931581]
Singh GK, Yu SM. Adverse pregnancy outcomes: Differences between US- and foreign-born womenin major US racial and ethnic groups. American Journal of Public Health. 1996; 86:837–843.[PubMed: 8659659]
Smedley, BD.; Stith, AY.; Nelson, AR., editors. Unequal treatment: Confronting racial and ethnicdisparities in health care. National Academy Press; Washington, DC: 2001.
Smelser, NJ.; Wilson, WJ.; Mitchell, F., editors. America becoming: Racial trends and theirconsequences. National Academies Press; Washington, DC: 2000.
Smith JP. Unraveling the SES-health connection in aging, health, and public policy. supplement toPopulation and Development Review. 2005; 30:108–132.
Sowell, T. Three black histories.. In: Sowell, T.; Collins, LD., editors. Essays and data on Americanethnic groups. Urban Institute; Washington, DC: 1978. p. 7-64.
Stata Corporation. Stata 10. Stata Corporation; College Station: 2007.
Stern, SM. Counting people with disabilities: How survey methodology influences estimates in Census2000 and the Census 2000 Supplementary Survey.. A paper prepared for the Annual Conference ofthe American Statistical Association; San Francisco. August 7; 2003.
Elo et al. Page 17
Demography. Author manuscript; available in PMC 2012 May 23.
NIH
-PA Author Manuscript
NIH
-PA Author Manuscript
NIH
-PA Author Manuscript
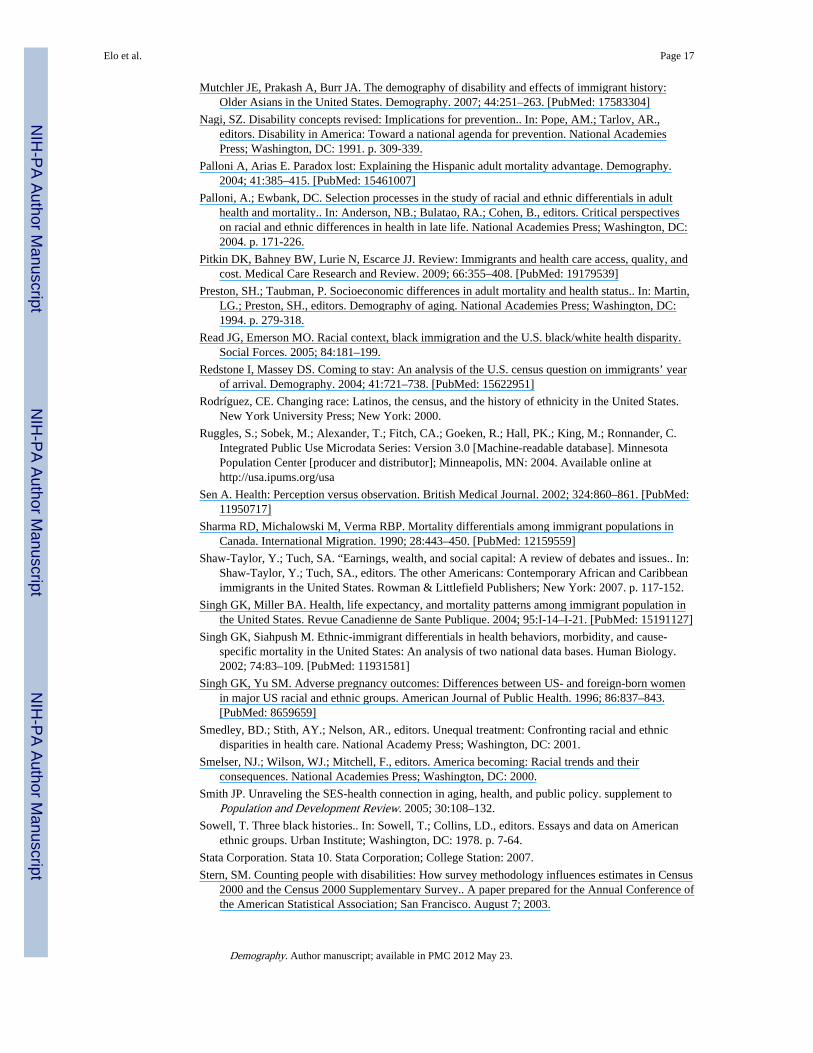
Thamer M, Richard C, Casebeer AW, Ray NF. Health insurance coverage among foreign-born USresidents: The impact of race, ethnicity, and length of residence. American Journal of PublicHealth. 1997; 87:96–102. [PubMed: 9065235]
Tucker, C.; Miller, S.; Parker, J. Comparing census race data under the old and new standards.. In:Perlmann, J.; Waters, M., editors. The new race question: How the census counts multiracialindividuals. Russell Sage Foundation; New York: 2002. p. 365-390.
Turra CM, Elo IT. The impact of salmon bias on the Hispanic mortality advantage: New evidencefrom social security data. Population Research and Policy Review. 2008; 27:515–530. [PubMed:19122882]
Turra CM, Goldman N. Socioeconomic differences in mortality among U.S. adults: Insights into theHispanic paradox. Journal of Gerontology: Social Sciences. 2007; 62B:S184–S192.
Waldrop, J.; Stern, SM. Census 2000 Brief. U.S. Census Bureau; Washington, DC: 2003. Disabilitystatus: 2000..
Williams DR. Socioeconomic differentials in health: A review and redirection. Social PsychologyQuarterly. 1990; 53:81–99.
Williams DR, Collins C. U.S. socioeconomic and racial differentials in health: Patterns andexplanations. Annual Review of Sociology. 1995; 21:349–386.
Williams DR, Collins C. Racial residential segregation: A fundamental cause of racial disparities inhealth. Public Health Reports. 2001; 116:404–416. [PubMed: 12042604]
Elo et al. Page 18
Demography. Author manuscript; available in PMC 2012 May 23.
NIH
-PA Author Manuscript
NIH
-PA Author Manuscript
NIH
-PA Author Manuscript
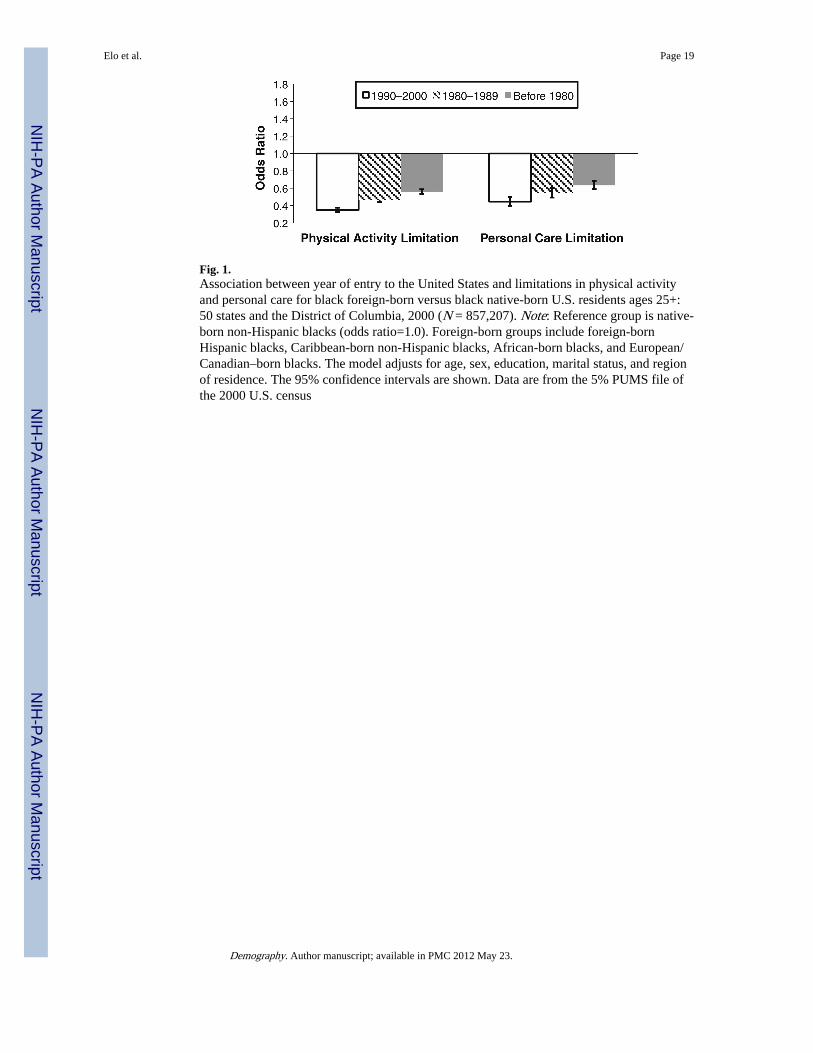
Fig. 1.Association between year of entry to the United States and limitations in physical activityand personal care for black foreign-born versus black native-born U.S. residents ages 25+:50 states and the District of Columbia, 2000 (N = 857,207). Note: Reference group is native-born non-Hispanic blacks (odds ratio=1.0). Foreign-born groups include foreign-bornHispanic blacks, Caribbean-born non-Hispanic blacks, African-born blacks, and European/Canadian–born blacks. The model adjusts for age, sex, education, marital status, and regionof residence. The 95% confidence intervals are shown. Data are from the 5% PUMS file ofthe 2000 U.S. census
Elo et al. Page 19
Demography. Author manuscript; available in PMC 2012 May 23.
NIH
-PA Author Manuscript
NIH
-PA Author Manuscript
NIH
-PA Author Manuscript
Fig. 2.Association between age and year of entry to the United States and limitations in physicalactivity and personal care for black foreign-born U.S. residents ages 25+: 50 states and theDistrict of Columbia, 2000 (N = 72,412). Note: Reference group is 1990–2000 arrival atworking ages (ages 20–54). The model adjusts for age, sex, education, marital status, andregion of residence. The 95% confidence intervals are shown. Data are from the 5% PUMSfile of the 2000 U.S. census
Elo et al. Page 20
Demography. Author manuscript; available in PMC 2012 May 23.
NIH
-PA Author Manuscript
NIH
-PA Author Manuscript
NIH
-PA Author Manuscript
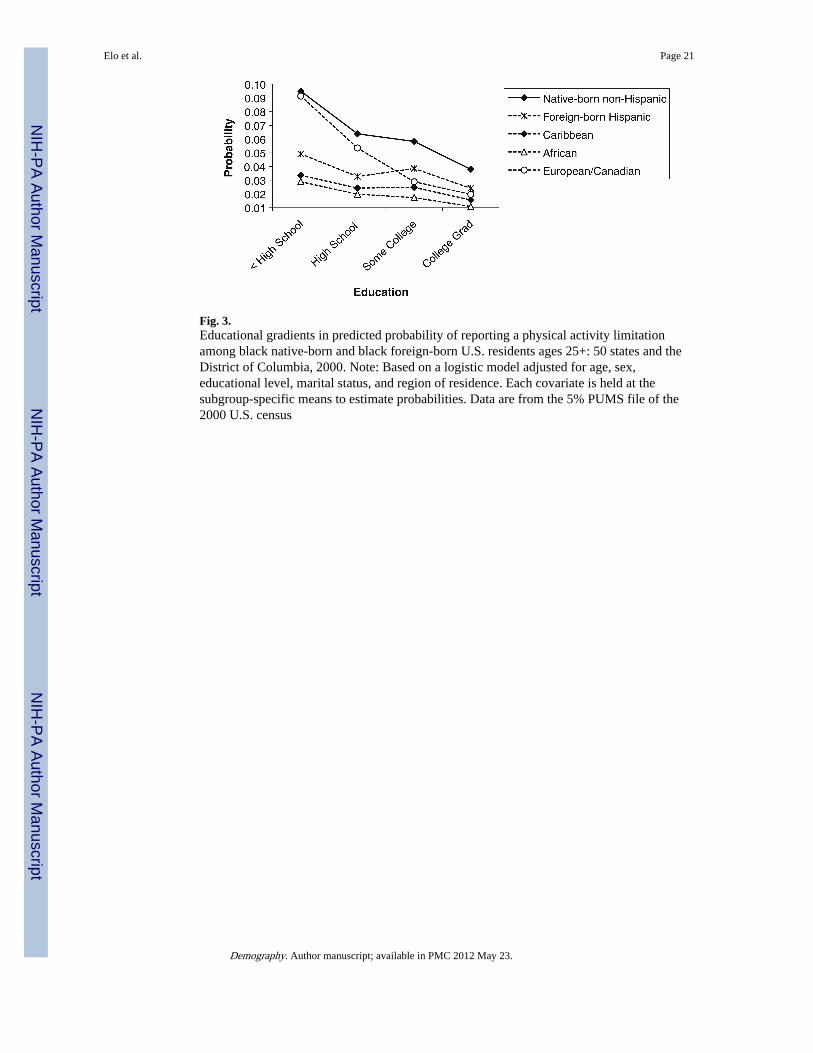
Fig. 3.Educational gradients in predicted probability of reporting a physical activity limitationamong black native-born and black foreign-born U.S. residents ages 25+: 50 states and theDistrict of Columbia, 2000. Note: Based on a logistic model adjusted for age, sex,educational level, marital status, and region of residence. Each covariate is held at thesubgroup-specific means to estimate probabilities. Data are from the 5% PUMS file of the2000 U.S. census
Elo et al. Page 21
Demography. Author manuscript; available in PMC 2012 May 23.
NIH
-PA Author Manuscript
NIH
-PA Author Manuscript
NIH
-PA Author Manuscript
NIH
-PA Author Manuscript
NIH
-PA Author Manuscript
NIH
-PA Author Manuscript
Elo et al. Page 22
Tabl
e 1
Des
crip
tive
char
acte
rist
ics
for
blac
k na
tive-
born
and
bla
ck f
orei
gn-b
orn
U.S
. res
iden
ts a
ges
25+
: 50
stat
es a
nd th
e D
istr
ict o
f C
olum
bia,
200
0 U
.S. c
ensu
s(p
erce
ntag
es u
nles
s ot
herw
ise
note
d)
Cha
ract
eris
tic
Nat
ive-
born
For
eign
-bor
n
Non
-His
pani
c(N
= 7
76,6
84)
His
pani
ca (N
=4,
164)
Mai
nlan
d-bo
rnP
uert
o R
ican
(N
= 2,
144)
Isla
nd-b
omP
uert
o R
ican
(N
= 1,
803)
His
pani
c (N
=7,
569)
Car
ibbe
anb (
N =
46,8
14)
Afr
ican
b (N
=16
,102
)
Eur
opea
n/
Can
adia
nb (N
=1,
927)
Dis
abili
ty M
easu
res
P
hysi
cal a
ctiv
ity li
mita
tions
14.8
14.8
9.2
18.7
8.8
7.2
3.5
6.7
P
erso
nal c
are
limita
tions
5.5
5.9
4.2
7.0
3.4
2.8
1.2
2.5
M
ean
age
(SD
)46
.0 (
15.5
)41
.5 (
14.8
)37
.3 (
10.7
)47
.4 (
14.9
)44
.6 (
14.3
)45
.5 (
13.8
)39
.6 (
10.4
)38
.7 (
12.2
)
Sex
F
emal
e55
.154
.352
.452
.250
.556
.143
.157
.3
M
ale
44.9
45.7
47.6
47.8
49.5
43.9
56.9
42.7
Edu
catio
n
L
ess
than
hig
h sc
hool
26.4
26.5
20.1
43.2
43.3
29.2
13.7
11.3
H
igh
scho
ol30
.125
.526
.425
.821
.927
.018
.918
.7
S
ome
colle
ge23
.524
.927
.414
.216
.418
.518
.824
.9
C
olle
ge d
egre
e15
.417
.520
.511
.912
.919
.731
.331
.7
G
radu
ate
educ
atio
n4.
75.
65.
64.
95.
55.
617
.313
.4
Mar
ital S
tatu
s
N
ever
Mar
ried
27.9
33.8
37.1
23.7
21.2
22.8
22.0
32.8
M
arri
ed37
.532
.635
.441
.845
.648
.050
.842
.2
D
ivor
ced/
sepa
rate
d/w
idow
ed34
.533
.627
.534
.433
.229
.227
.225
.0
Reg
ion
of R
esid
ence
N
orth
east
14.9
25.3
57.8
65.7
50.5
58.3
30.1
37.4
M
idw
est
19.5
14.2
9.0
6.5
4.8
2.7
15.7
10.7
S
outh
56.0
37.9
21.6
21.7
30.8
35.4
39.7
37.0
W
est
9.6
22.6
11.6
6.1
13.9
3.5
14.5
14.9
Not
es: S
ampl
e ch
arac
teri
stic
s ar
e ba
sed
on w
eigh
ted
data
. The
num
ber
of c
ases
is u
nwei
ghte
d
Sour
ce: T
he 5
% P
UM
S fi
le o
f th
e 20
00 U
.S. c
ensu
s
a Exc
lude
s Pu
erto
Ric
ans
born
in th
e m
ainl
and
and
thos
e bo
rn in
Pue
rto
Ric
o
Demography. Author manuscript; available in PMC 2012 May 23.

NIH
-PA Author Manuscript
NIH
-PA Author Manuscript
NIH
-PA Author Manuscript
Elo et al. Page 23b N
on-H
ispa
nic
Demography. Author manuscript; available in PMC 2012 May 23.
NIH
-PA Author Manuscript
NIH
-PA Author Manuscript
NIH
-PA Author Manuscript
Elo et al. Page 24
Table 2
Age and year of immigration for black foreign-born U.S. residents ages 25+: 50 states and the District ofColumbia, 2000 U.S. census (percentages)
Foreign-born
Characteristic Hispanic (N = 7,569) Caribbeana (N = 46,814) African
a (N = 16,102) European/Canadian
a (N = 1,927)
Age at Immigration
<20 years 30.5 28.9 14.3 53.6
20–54 years 66.1 67.2 82.7 45.5
55+ years 3.4 3.9 3.1 0.9
Year of Immigration
1990 or later 31.8 24.5 55.1 26.0
1980–1989 32.5 37.3 30.3 27.2
Before 1980 35.7 38.1 14.6 46.8
Notes: Sample characteristics are based on weighted data
Source: The 5% PUMS file of the 2000 U.S. census
aNon-Hispanic
Demography. Author manuscript; available in PMC 2012 May 23.
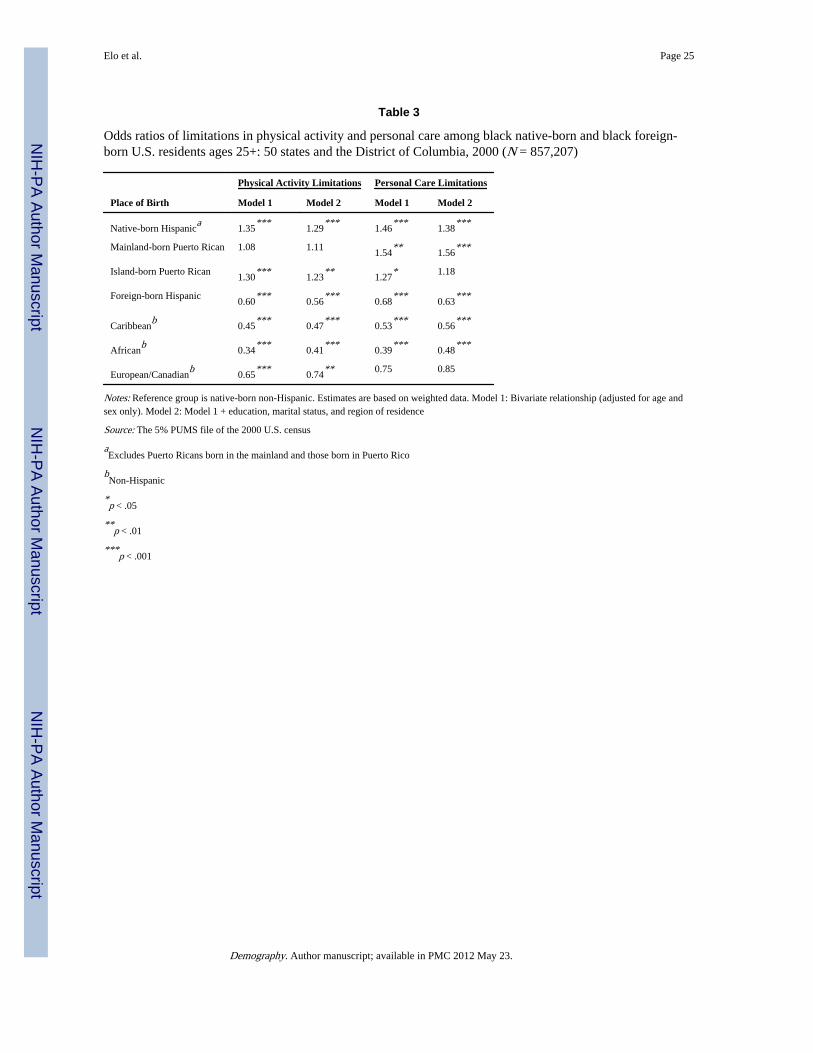
NIH
-PA Author Manuscript
NIH
-PA Author Manuscript
NIH
-PA Author Manuscript
Elo et al. Page 25
Table 3
Odds ratios of limitations in physical activity and personal care among black native-born and black foreign-born U.S. residents ages 25+: 50 states and the District of Columbia, 2000 (N = 857,207)
Physical Activity Limitations Personal Care Limitations
Place of Birth Model 1 Model 2 Model 1 Model 2
Native-born Hispanica
1.35***
1.29***
1.46***
1.38***
Mainland-born Puerto Rican 1.08 1.111.54
**1.56
***
Island-born Puerto Rican1.30
***1.23
**1.27
* 1.18
Foreign-born Hispanic0.60
***0.56
***0.68
***0.63
***
Caribbeanb
0.45***
0.47***
0.53***
0.56***
Africanb
0.34***
0.41***
0.39***
0.48***
European/Canadianb
0.65***
0.74** 0.75 0.85
Notes: Reference group is native-born non-Hispanic. Estimates are based on weighted data. Model 1: Bivariate relationship (adjusted for age andsex only). Model 2: Model 1 + education, marital status, and region of residence
Source: The 5% PUMS file of the 2000 U.S. census
aExcludes Puerto Ricans born in the mainland and those born in Puerto Rico
bNon-Hispanic
*p < .05
**p < .01
***p < .001
Demography. Author manuscript; available in PMC 2012 May 23.
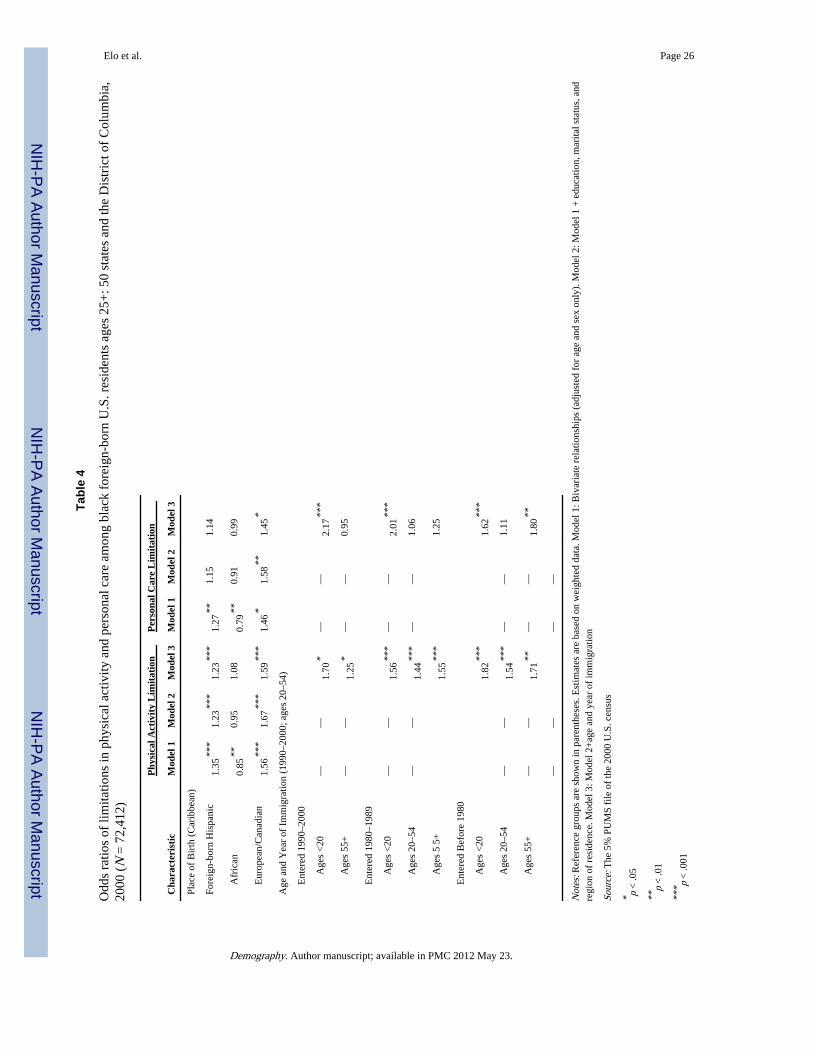
NIH
-PA Author Manuscript
NIH
-PA Author Manuscript
NIH
-PA Author Manuscript
Elo et al. Page 26
Tabl
e 4
Odd
s ra
tios
of li
mita
tions
in p
hysi
cal a
ctiv
ity a
nd p
erso
nal c
are
amon
g bl
ack
fore
ign-
born
U.S
. res
iden
ts a
ges
25+
: 50
stat
es a
nd th
e D
istr
ict o
f C
olum
bia,
2000
(N
= 7
2,41
2)
Phy
sica
l Act
ivit
y L
imit
atio
nP
erso
nal C
are
Lim
itat
ion
Cha
ract
eris
tic
Mod
el 1
Mod
el 2
Mod
el 3
Mod
el 1
Mod
el 2
Mod
el 3
Plac
e of
Bir
th (
Car
ibbe
an)
Fore
ign-
born
His
pani
c1.
35**
*1.
23**
*1.
23**
*1.
27**
1.15
1.14
A
fric
an0.
85**
0.95
1.08
0.79
**0.
910.
99
E
urop
ean/
Can
adia
n1.
56**
*1.
67**
*1.
59**
*1.
46*
1.58
**1.
45*
Age
and
Yea
r of
Im
mig
ratio
n (1
990–
2000
; age
s 20
–54)
E
nter
ed 1
990–
2000
Age
s <
20—
—1.
70*
——
2.17
***
Age
s 55
+—
—1.
25*
——
0.95
E
nter
ed 1
980–
1989
Age
s <
20—
—1.
56**
*—
—2.
01**
*
Age
s 20
–54
——
1.44
***
——
1.06
Age
s 5
5+1.
55**
*1.
25
E
nter
ed B
efor
e 19
80
Age
s <
201.
82**
*1.
62**
*
Age
s 20
–54
——
1.54
***
——
1.11
Age
s 55
+—
—1.
71**
——
1.80
**
——
——
Not
es: R
efer
ence
gro
ups
are
show
n in
par
enth
eses
. Est
imat
es a
re b
ased
on
wei
ghte
d da
ta. M
odel
1: B
ivar
iate
rel
atio
nshi
ps (
adju
sted
for
age
and
sex
onl
y). M
odel
2: M
odel
1 +
edu
catio
n, m
arita
l sta
tus,
and
regi
on o
f re
side
nce.
Mod
el 3
: Mod
el 2
+ag
e an
d ye
ar o
f im
mig
ratio
n
Sour
ce: T
he 5
% P
UM
S fi
le o
f th
e 20
00 U
.S. c
ensu
s
* p <
.05
**p
< .0
1
*** p
< .0
01
Demography. Author manuscript; available in PMC 2012 May 23.