directional persistence of cell migration coincides with stability of asymmetric intracellular...
TRANSCRIPT
Biophysical Journal Volume 98 January 2010 67–75 67
Directional Persistence of Cell Migration Coincides with Stabilityof Asymmetric Intracellular Signaling
Michael C. Weiger, Shoeb Ahmed, Erik S. Welf, and Jason M. Haugh*Department of Chemical and Biomolecular Engineering, North Carolina State University, Raleigh, North Carolina
ABSTRACT It has long been appreciated that spatiotemporal dynamics of cell migration are under the control of intracellularsignaling pathways, which are mediated by adhesion receptors and other transducers of extracellular cues. Further, there isample evidence that aspects of cell migration are stochastic: how else could it exhibit directional persistence over timescalesmuch longer than typical signal transduction processes, punctuated by abrupt changes in direction? Yet the mechanisms bywhich signaling processes affect those behaviors remain unclear. We have developed analytical methods for relating parallellive-cell microscopy measurements of cell migration dynamics to the intracellular signaling processes that govern them. Inthis analysis of phosphoinositide 3-kinase signaling in randomly migrating fibroblasts, we observe that hot spots of intensesignaling coincide with localized cell protrusion and endure with characteristic lifetimes that correspond to those of cell migrationpersistence. We further show that distant hot spots are dynamically and stochastically coupled. These results are indicative ofa mechanism by which changes in a cell’s direction of migration are determined by a fragile balance of relatively rapid intracellularsignaling processes.
INTRODUCTION
The movement of eukaryotic cells on a uniformly adhesive
surface is traditionally characterized as a persistent random
walk. In this conceptual model, cells migrate along a fairly
straight path during short time intervals, whereas over longer
time intervals, the cells execute random changes in direction.
The transition between these regimes occurs on a timescale
of ~3–30 min, depending on the experimental context
(1–4). Although it is clear that migration on a rigid surface
coated with extracellular matrix (ECM) is rather different
from cell motility in vivo, as seen in wound healing, tissue
morphogenesis, and cancer metastasis (5–7), cell migration
in two dimensions remains a viable system for studying
fundamental aspects of cell migration. In particular, there
is a gap in our understanding of how the various intracellular
signal transduction pathways that regulate cell protrusion,
adhesion, and contractility associated with cell migration
are dynamically coordinated (8–10).
A diverse array of signaling enzymes and adaptor proteins
have been implicated in random and spatially biased cell
migration (11), and the importance of any one molecular
pathway is likely to be context-dependent, even for the
same cell. With that said, activation of phosphoinositide
3-kinase (PI3K)-dependent pathways apparently plays the
most ubiquitous role, serving as a point of convergence for
soluble and ECM-associated cues and a hub for signaling
through Rho-family GTPases, serine-threonine kinases, and
other modulators of adhesion and cytoskeletal dynamics
(12). PI3Ks are lipid kinases that activate signaling by gener-
ating 30-phosphorylated phosphoinositide (30 PI) lipids, and
Submitted June 27, 2009, and accepted for publication September 25, 2009.
*Correspondence: [email protected]
Editor: Denis Wirtz.
� 2010 by the Biophysical Society
0006-3495/10/01/0067/9 $2.00
accumulation of 30 PIs at the plasma membrane can be moni-
tored in living cells using certain fluorescent fusion protein
biosensors (13). PI3K signaling has been implicated in
numerous aspects of cell migration, including spatial gradient
sensing, cell polarization, and modulation of cell protrusion,
and perhaps this is why its precise mechanisms and roles in
different cellular and environmental contexts have been
difficult to parse (14–17). What is apparent, however, is that
PI3K activation is among the furthest-upstream processes to
exhibit symmetry breaking; in response to spatially uniform
stimulation with chemoattractants, human leukocytes (differ-
entiated HL-60 cells), vegetative Dictyostelium discoideumcells, and mouse fibroblasts all exhibit localized regions of
30 PI enrichment, seen as patches or ‘‘hot spots’’ of higher
biosensor fluorescence (16,18–20).
Recently, we used total internal reflection fluorescence
(TIRF) microscopy to show that hot spots of PI3K signaling
are also present in fibroblasts randomly migrating on immo-
bilized fibronectin, and further, that the hot spots are
dynamic and preferentially localized in membrane protru-
sions oriented in the direction of overall cell movement
(17). Those observations have led us to ask how the spatial
pattern of intracellular signaling, through PI3K and other
pathways, might be related to the direction and efficiency
of cell movement observed using live-cell fluorescence
microscopy, and how the dynamics of hot spots and other
important features of the signaling pattern might be related
to local changes in cell motility. To address these questions,
we have developed a collection of image analysis protocols
that we call signaling vector analysis (SVA). After outlining
the development of the approach, and its variations, we
report its application to an expanded set of 28 randomly
migrating fibroblasts; in these cells, nearly 1400 hot spots
of PI3K signaling were identified, tracked, and related to
doi: 10.1016/j.bpj.2009.09.051
68 Weiger et al.
the morphodynamics of the cells as they moved. From these
observations and analyses, we offer what to our knowledge is
a new conceptual model of random migration persistence
based on the protrusion of stochastically activated, yet
coordinated, lamellipodia, reminiscent of a tug of war. By
identifying the characteristic timescales associated with hot-
spot dynamics, this conceptual model gives way to a quantita-
tive one, in which signaling hot spots are maintained for an
uncertain duration through a dynamic yet fragile equilibrium
of relatively fast activation and deactivation processes.
MATERIALS AND METHODS
Cell culture and reagents
Stable expression of the 30 phosphoinositide-specific biosensor construct
EGFP-AktPH in NIH 3T3 mouse fibroblasts (American Type Culture
Collection, Rockville, MD) was achieved by retroviral infection and puro-
mycin selection, as previously described (17). The cells were subcultured
using Dulbecco’s modified Eagle’s medium supplemented with 10% v/v
fetal bovine serum and 1% v/v penicillin/streptomycin/glutamate as the
growth medium. All tissue culture reagents were purchased from Invitrogen
(Carlsbad, CA). Human plasma fibronectin was obtained from BD Biosci-
ences (San Jose, CA) and Invitrogen.
Cell migration experiments
Glass coverslips were cleaned, sterilized, coated with fibronectin (10 mg/ml)
for 1 h at 37�C, washed with deionized, sterile water, and dried within
30 min of the experiment. EGFP-AktPH-expressing cells were serum-
starved for 2.5 h and then detached with a brief trypsin-EDTA treatment
and suspended in the imaging buffer (20 mM HEPES, pH 7.4, 125 mM
NaCl, 5 mM KCl, 1.5 mM MgCl2, 1.5 mM CaCl2, 10 mM glucose, 1% v/v
fetal bovine serum, 2 mg/ml fatty-acid-free bovine serum albumin). After
centrifugation at 100 � g for 3 min, the cells were resuspended in imaging
buffer and plated on the fibronectin-coated coverslips at a density of
10,000 cells/ml and allowed to spread for 1 h before imaging. Mineral
oil was layered on top of the buffer to prevent evaporation during the
experiment.
TIRF microscopy
TIRF microscopy is used to selectively excite fluorophores within ~100 nm
of the substratum-buffer interface, illuminating the plasma membrane contact
area and, in fibroblasts, ~5–10% of the cytoplasm directly above it (21). Our
prism-based TIRF microscope has been described in detail previously (22).
EGFP was excited using a 60-mW 488-nm line from a tunable-wavelength
argon ion laser head (Melles Griot, Irvine, CA). A 20� water immersion
objective (Achroplan, 0.5 NA; Zeiss, Oberkochen, Germany) and 0.63�camera mount were used. Digital images, with 2 � 2 binning, were acquired
at 2-min intervals using a Hamamatsu ORCA ER cooled CCD (Hamamatsu,
Bridgewater, NJ), with a fixed exposure time � gain of 1000–1200 ms, and
Metamorph software (Universal Imaging, West Chester, PA).
Image segmentation and implementationof macroscopic SVA
Image segmentation was performed as follows. A custom code was written
in MATLAB (The MathWorks, Natick, MA) to read the image files as data
matrices and process them using the k-means clustering method, which bins
pixels by relative intensity, assuming a specified number (k) of peaks in the
intensity distribution. For our images, k ¼ 4 was found to be optimum. The
pixels in the acellular background (lowest intensity) are grouped in bin 1,
Biophysical Journal 98(1) 67–75
whereas regions of intense fluorescence (hot spots) are found in bin 4. For
each cell, masks were generated that define regions of interest corresponding
to the entire cell contact area (bins 2–4) and hot-spot regions (bin 4 only).
MATLAB Image Processing Toolbox was used to determine the area (A),
average intensity (F), and centroid coordinates of each labeled region, and
a minimum area cutoff of 20 pixels was imposed on the hot spots to ensure
that they are contiguous regions, not transient speckles.
For each cell image, the macroscopic signaling vector is calculated as
follows (17) (Fig. 1 a). The coordinates of the cell’s centroid are subtracted
from those of each of its hot spots, i, defining the position of the hot spot
relative to the cell centroid, xi ¼ (xi,yi), and its vector, si, is defined with
magnitude equal to the fluorescence volume (AiFi); the overall, resultant
signaling vector SR is the sum of si:
si ¼ AiFi
xiffiffiffiffiffiffiffiffiffiffiffiffiffiffiffiffix2
i þ y2i
p ; SR ¼XN
i¼ 1
si: (1)
The temporal resolution of image acquisition, Dt (2 min), was found to be
too fine for tracking the cell (centroid) movement vector, defined as C;
a time step of 6Dt (12 min) was found to be optimal. For the purpose of
vector correlation, the signaling vector assigned to a particular cell move-
ment step, from ti to ti þ 6Dt, was taken as the average of the six SR calcu-
lated for ti, ti þ Dt, ., ti þ 5Dt (SAve).
A method for correlating any two sets of vectors was implemented in
MATLAB, using a correlation coefficient metric, r, defined in detail by
Hanson et al. (23). The metric incorporates both the magnitudes and direc-
tions of the two vector sets and ranges from �1 (perfectly anticorrelated) to
1 (perfectly correlated); r ¼ 0 indicates completely uncorrelated data. The
method was applied to SAve and C, with varied time lag (positive time lag
indicating that the signaling vector preceded the cell movement), and the
same procedure was used to autocorrelate each of the vectors.
Hot-spot tracking for microscopic SVA
Hot-spot regions, identified as described in the previous section, were
tracked using custom MATLAB codes as follows. For each hot-spot region
in a particular image, the algorithm looks for one or more region(s) with
overlapping pixels in the next two frames (thus guarding against the possi-
bility that the hot spot was missed for a frame). If there are none, it is marked
as a death event for the hot spot in the previous image. Conversely, if the
same procedure is performed in reverse, and it is found that a hot spot in
the next image does not overlap with any in the previous frame, it is marked
as a birth event. If a hot spot is found to overlap with only one hot spot in the
next frame (or with one hot spot two frames later, if the hot spot was missed
for a frame, as outlined above), the movement is assigned to the same hot-
spot path. If, on the other hand, a hot spot in the previous image is found to
overlap with two or more hot spots in the next image, it is counted as
a branching event; the same outcome when the procedure is performed in
reverse is counted as a merging event. A branching event is disregarded if
the hot spot apparently splits and then merges within the next two frames
(in which case the merging event is also disregarded). This added step
guards against the possibility that the algorithm temporarily misses the conti-
nuity of a weaker, but nonetheless intact, hot spot. Another potential artifact
is the possibility that a hot spot moves so quickly during a 2-min interval that
it causes a break in the path of continuous overlap, resulting in an apparent
death of a hot spot and birth of another in the same interval. In the 28 cells
analyzed, there were 247 instances of coincident death-birth, and these were
checked manually for interruption of tracking; none were obvious failures of
the tracking algorithm, but in nine cases (3.6%), the death and birth events
were such that the determination was ambiguous.
The path of each hot-spot region determines its lifetime and net distance
moved (the distance between its centroid positions at birth and death). All
combinations of branched and merged hot-spot paths were considered.
For example, consider a hot spot that is born and later merges with another
hot spot that had not previously branched or merged; these two hot-spot
paths would be considered distinct paths that now share a common subpath.
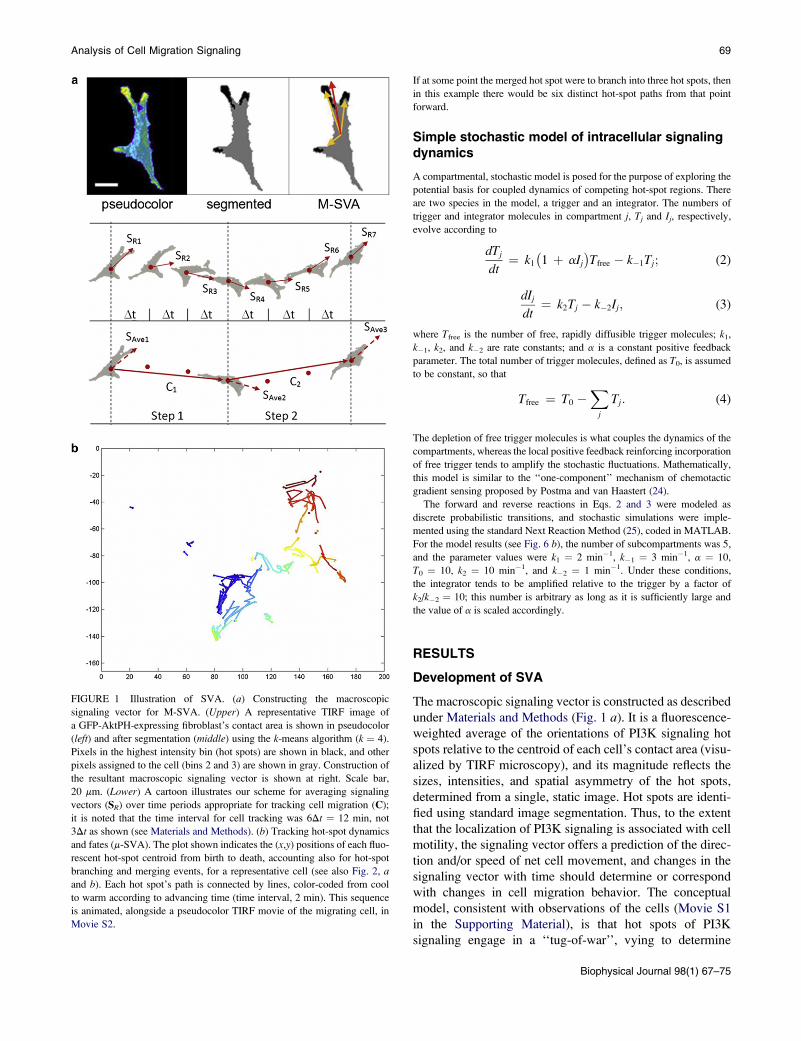
FIGURE 1 Illustration of SVA. (a) Constructing the macroscopic
signaling vector for M-SVA. (Upper) A representative TIRF image of
a GFP-AktPH-expressing fibroblast’s contact area is shown in pseudocolor
(left) and after segmentation (middle) using the k-means algorithm (k ¼ 4).
Pixels in the highest intensity bin (hot spots) are shown in black, and other
pixels assigned to the cell (bins 2 and 3) are shown in gray. Construction of
the resultant macroscopic signaling vector is shown at right. Scale bar,
20 mm. (Lower) A cartoon illustrates our scheme for averaging signaling
vectors (SR) over time periods appropriate for tracking cell migration (C);
it is noted that the time interval for cell tracking was 6Dt ¼ 12 min, not
3Dt as shown (see Materials and Methods). (b) Tracking hot-spot dynamics
and fates (m-SVA). The plot shown indicates the (x,y) positions of each fluo-
rescent hot-spot centroid from birth to death, accounting also for hot-spot
branching and merging events, for a representative cell (see also Fig. 2, aand b). Each hot spot’s path is connected by lines, color-coded from cool
to warm according to advancing time (time interval, 2 min). This sequence
is animated, alongside a pseudocolor TIRF movie of the migrating cell, in
Movie S2.
Analysis of Cell Migration Signaling 69
If at some point the merged hot spot were to branch into three hot spots, then
in this example there would be six distinct hot-spot paths from that point
forward.
Simple stochastic model of intracellular signalingdynamics
A compartmental, stochastic model is posed for the purpose of exploring the
potential basis for coupled dynamics of competing hot-spot regions. There
are two species in the model, a trigger and an integrator. The numbers of
trigger and integrator molecules in compartment j, Tj and Ij, respectively,
evolve according to
dTj
dt¼ k1
�1 þ aIj
�Tfree � k�1Tj; (2)
dIj
dt¼ k2Tj � k�2Ij; (3)
where Tfree is the number of free, rapidly diffusible trigger molecules; k1,
k�1, k2, and k�2 are rate constants; and a is a constant positive feedback
parameter. The total number of trigger molecules, defined as T0, is assumed
to be constant, so that
Tfree ¼ T0 �X
j
Tj: (4)
The depletion of free trigger molecules is what couples the dynamics of the
compartments, whereas the local positive feedback reinforcing incorporation
of free trigger tends to amplify the stochastic fluctuations. Mathematically,
this model is similar to the ‘‘one-component’’ mechanism of chemotactic
gradient sensing proposed by Postma and van Haastert (24).
The forward and reverse reactions in Eqs. 2 and 3 were modeled as
discrete probabilistic transitions, and stochastic simulations were imple-
mented using the standard Next Reaction Method (25), coded in MATLAB.
For the model results (see Fig. 6 b), the number of subcompartments was 5,
and the parameter values were k1 ¼ 2 min�1, k�1 ¼ 3 min�1, a ¼ 10,
T0 ¼ 10, k2 ¼ 10 min�1, and k�2 ¼ 1 min�1. Under these conditions,
the integrator tends to be amplified relative to the trigger by a factor of
k2/k�2 ¼ 10; this number is arbitrary as long as it is sufficiently large and
the value of a is scaled accordingly.
RESULTS
Development of SVA
The macroscopic signaling vector is constructed as described
under Materials and Methods (Fig. 1 a). It is a fluorescence-
weighted average of the orientations of PI3K signaling hot
spots relative to the centroid of each cell’s contact area (visu-
alized by TIRF microscopy), and its magnitude reflects the
sizes, intensities, and spatial asymmetry of the hot spots,
determined from a single, static image. Hot spots are identi-
fied using standard image segmentation. Thus, to the extent
that the localization of PI3K signaling is associated with cell
motility, the signaling vector offers a prediction of the direc-
tion and/or speed of net cell movement, and changes in the
signaling vector with time should determine or correspond
with changes in cell migration behavior. The conceptual
model, consistent with observations of the cells (Movie S1
in the Supporting Material), is that hot spots of PI3K
signaling engage in a ‘‘tug-of-war’’, vying to determine
Biophysical Journal 98(1) 67–75
70 Weiger et al.
the direction of cell movement; it is further posited that the
relative amount of fluorescence in each hot spot determines
its influence on translocation of the cell centroid. We refer
to this proposed relationship between signaling pattern and
overall cell movement as macroscopic SVA (M-SVA).
We are also interested in the dynamics and fates of the
individual hot spots (Fig. 1 b and Movie S2). If one were
to track the motions of hot spots, would their lifetimes or
velocities depend on their relative fluorescence levels? We
also seek to characterize the rates of stochastic birth and
death of individual hot spots and to determine whether or
not such events are coupled. For instance, if the amount of
PI3K or another key molecular component were stoichiomet-
rically limiting, one might expect that the death of one hot
spot would be followed by the birth of another (or vice versa)
with a greater than average probability. We refer to the
tracking of individual hot-spot movements and fates as
microscopic SVA (m-SVA).
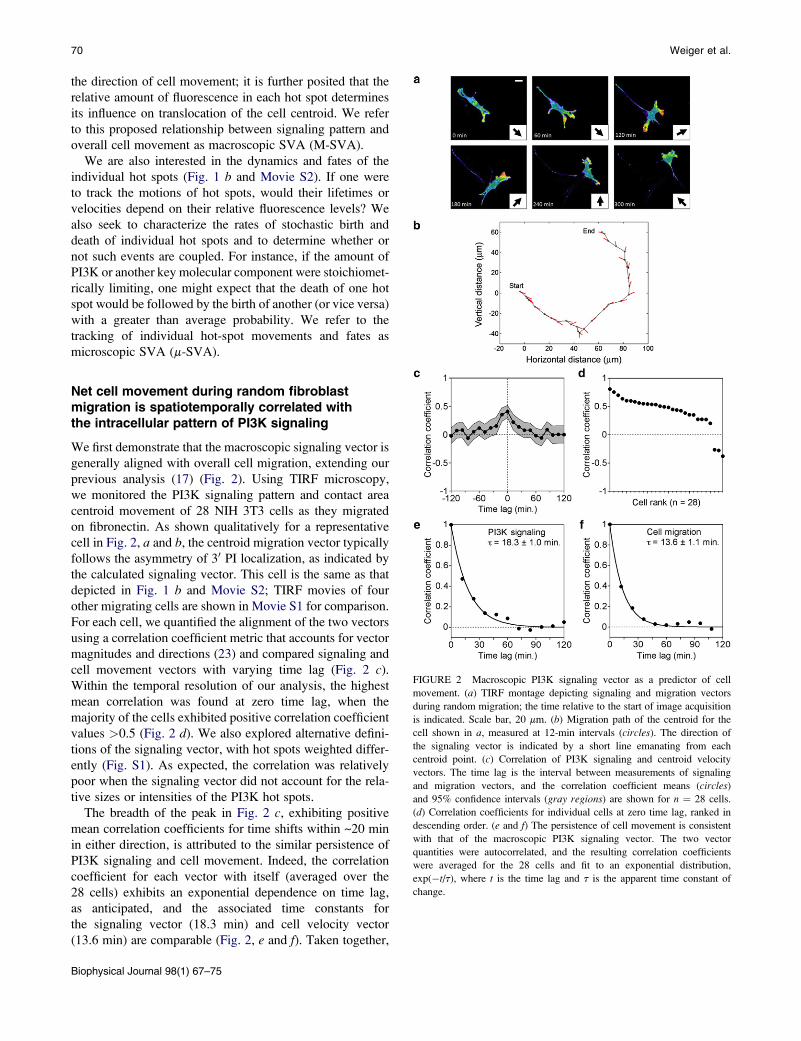
FIGURE 2 Macroscopic PI3K signaling vector as a predictor of cell
movement. (a) TIRF montage depicting signaling and migration vectors
during random migration; the time relative to the start of image acquisition
is indicated. Scale bar, 20 mm. (b) Migration path of the centroid for the
cell shown in a, measured at 12-min intervals (circles). The direction of
the signaling vector is indicated by a short line emanating from each
centroid point. (c) Correlation of PI3K signaling and centroid velocity
vectors. The time lag is the interval between measurements of signaling
and migration vectors, and the correlation coefficient means (circles)
and 95% confidence intervals (gray regions) are shown for n ¼ 28 cells.
(d) Correlation coefficients for individual cells at zero time lag, ranked in
descending order. (e and f) The persistence of cell movement is consistent
with that of the macroscopic PI3K signaling vector. The two vector
quantities were autocorrelated, and the resulting correlation coefficients
were averaged for the 28 cells and fit to an exponential distribution,
exp(�t/t), where t is the time lag and t is the apparent time constant of
change.
Net cell movement during random fibroblastmigration is spatiotemporally correlated withthe intracellular pattern of PI3K signaling
We first demonstrate that the macroscopic signaling vector is
generally aligned with overall cell migration, extending our
previous analysis (17) (Fig. 2). Using TIRF microscopy,
we monitored the PI3K signaling pattern and contact area
centroid movement of 28 NIH 3T3 cells as they migrated
on fibronectin. As shown qualitatively for a representative
cell in Fig. 2, a and b, the centroid migration vector typically
follows the asymmetry of 30 PI localization, as indicated by
the calculated signaling vector. This cell is the same as that
depicted in Fig. 1 b and Movie S2; TIRF movies of four
other migrating cells are shown in Movie S1 for comparison.
For each cell, we quantified the alignment of the two vectors
using a correlation coefficient metric that accounts for vector
magnitudes and directions (23) and compared signaling and
cell movement vectors with varying time lag (Fig. 2 c).
Within the temporal resolution of our analysis, the highest
mean correlation was found at zero time lag, when the
majority of the cells exhibited positive correlation coefficient
values >0.5 (Fig. 2 d). We also explored alternative defini-
tions of the signaling vector, with hot spots weighted differ-
ently (Fig. S1). As expected, the correlation was relatively
poor when the signaling vector did not account for the rela-
tive sizes or intensities of the PI3K hot spots.
The breadth of the peak in Fig. 2 c, exhibiting positive
mean correlation coefficients for time shifts within ~20 min
in either direction, is attributed to the similar persistence of
PI3K signaling and cell movement. Indeed, the correlation
coefficient for each vector with itself (averaged over the
28 cells) exhibits an exponential dependence on time lag,
as anticipated, and the associated time constants for
the signaling vector (18.3 min) and cell velocity vector
(13.6 min) are comparable (Fig. 2, e and f). Taken together,
Biophysical Journal 98(1) 67–75
Analysis of Cell Migration Signaling 71
these results indicate that changes in cell migration behavior
occur in tandem with changes in the pattern of PI3K signaling.
Hot spots of PI3K signaling are enrichedin regions of membrane protrusion
According to our conceptual model, local PI3K signaling
dynamics are related to asymmetric membrane protrusion.
If so, another quantitative way to test the model is to demon-
strate that PI3K hot spots are enriched in the protruded area
(PA), determined for each cell and for a certain time interval
(12 min, consistent with the analysis in Fig. 2), and much
less so in the corresponding retracted area (RA) (Fig. 3 a).
To show this, we define the level of enrichment, E, as the
fraction of the PA or RA populated with hot-spot pixels
divided by the fraction of the total contact area (in the earlier
image) populated with hot-spot pixels; E > 1 means that
hot spots are enriched in the region of interest. The time-
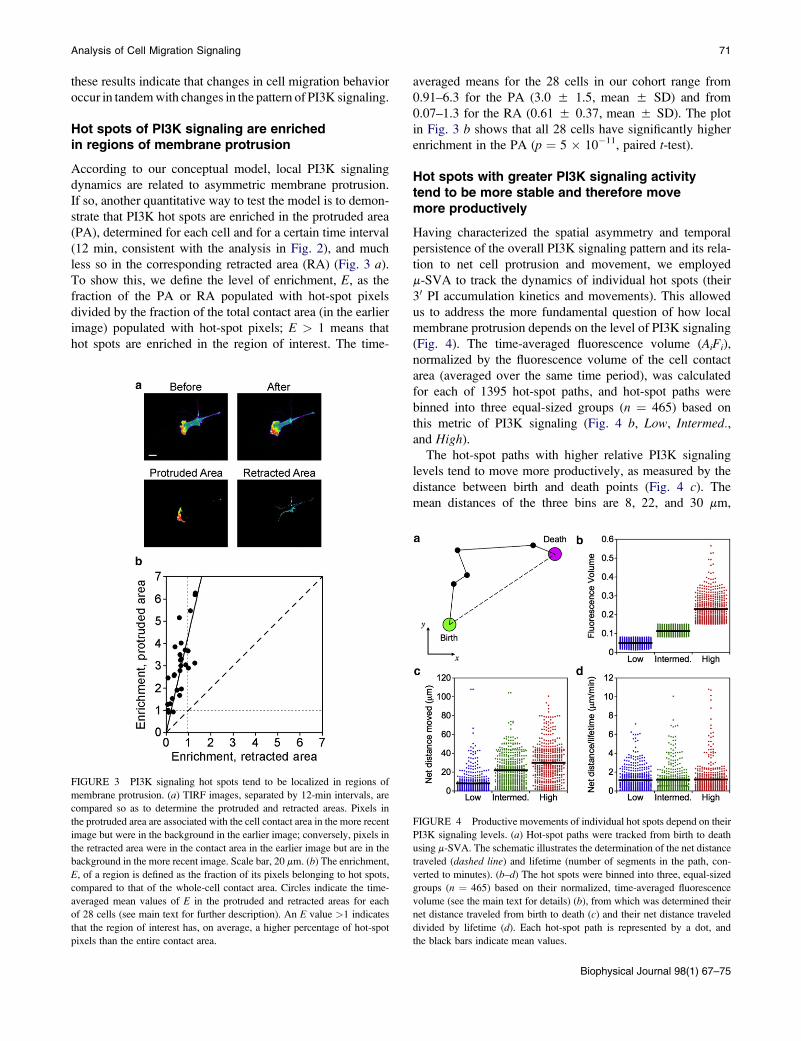
FIGURE 3 PI3K signaling hot spots tend to be localized in regions of
membrane protrusion. (a) TIRF images, separated by 12-min intervals, are
compared so as to determine the protruded and retracted areas. Pixels in
the protruded area are associated with the cell contact area in the more recent
image but were in the background in the earlier image; conversely, pixels in
the retracted area were in the contact area in the earlier image but are in the
background in the more recent image. Scale bar, 20 mm. (b) The enrichment,
E, of a region is defined as the fraction of its pixels belonging to hot spots,
compared to that of the whole-cell contact area. Circles indicate the time-
averaged mean values of E in the protruded and retracted areas for each
of 28 cells (see main text for further description). An E value >1 indicates
that the region of interest has, on average, a higher percentage of hot-spot
pixels than the entire contact area.
averaged means for the 28 cells in our cohort range from
0.91–6.3 for the PA (3.0 5 1.5, mean 5 SD) and from
0.07–1.3 for the RA (0.61 5 0.37, mean 5 SD). The plot
in Fig. 3 b shows that all 28 cells have significantly higher
enrichment in the PA (p ¼ 5 � 10�11, paired t-test).
Hot spots with greater PI3K signaling activitytend to be more stable and therefore movemore productively
Having characterized the spatial asymmetry and temporal
persistence of the overall PI3K signaling pattern and its rela-
tion to net cell protrusion and movement, we employed
m-SVA to track the dynamics of individual hot spots (their
30 PI accumulation kinetics and movements). This allowed
us to address the more fundamental question of how local
membrane protrusion depends on the level of PI3K signaling
(Fig. 4). The time-averaged fluorescence volume (AiFi),
normalized by the fluorescence volume of the cell contact
area (averaged over the same time period), was calculated
for each of 1395 hot-spot paths, and hot-spot paths were
binned into three equal-sized groups (n ¼ 465) based on
this metric of PI3K signaling (Fig. 4 b, Low, Intermed.,and High).
The hot-spot paths with higher relative PI3K signaling
levels tend to move more productively, as measured by the
distance between birth and death points (Fig. 4 c). The
mean distances of the three bins are 8, 22, and 30 mm,
FIGURE 4 Productive movements of individual hot spots depend on their
PI3K signaling levels. (a) Hot-spot paths were tracked from birth to death
using m-SVA. The schematic illustrates the determination of the net distance
traveled (dashed line) and lifetime (number of segments in the path, con-
verted to minutes). (b–d) The hot spots were binned into three, equal-sized
groups (n ¼ 465) based on their normalized, time-averaged fluorescence
volume (see the main text for details) (b), from which was determined their
net distance traveled from birth to death (c) and their net distance traveled
divided by lifetime (d). Each hot-spot path is represented by a dot, and
the black bars indicate mean values.
Biophysical Journal 98(1) 67–75
72 Weiger et al.
respectively, and all pairwise comparisons among these
groups are statistically significant (p < 10�10, Student’s t-test). A similar trend was found when comparing the life-
times of the three groups (results not shown), and when
the net movement of each hot-spot path is normalized by
its lifetime, the three groups binned by fluorescence level
are not statistically different (Fig. 4 d; p > 0.45 for all
comparisons by Student’s t-test). This implies that hot spots
with greater PI3K signaling move more productively
because they live longer, not because they move more
efficiently.
The persistence of cell migration is consistentwith the characteristic lifetime of individual PI3Khot spots
The information gathered using the m-SVA approach can
also be used to quantify hot-spot fates, which we characterize
in terms of birth (appearance of a new hot spot), death (disap-
pearance of a hot spot), branching (splitting of one hot spot
into two or more), and merging (coalescing of multiple hot
spots into one) events. The rate of each of these processes
was taken as the total number of events divided by the total
time of observation. As noted under Materials and Methods,
the disappearance of a hot spot in one frame followed by the
appearance of an overlapping hot spot in the next frame was
not considered a bona fide death (or birth) event, and a hot
spot splitting and then coalescing within two successive
frames (4 min) was not considered a bona fide branching
(or merging) event. We found that these steps were effective
in filtering out spurious fate assignments by the hot-spot
tracking algorithm.
The average number of hot spots, N, and the frequencies
of the four fate events are listed in Table 1. We find good
agreement between the inverse of the specific death rate,
N/Vdeath (18.7 min), and the time constant of macroscopic
signaling vector persistence (18.3 min; Fig. 2 e). Because
the rates of birth and death are closely matched (Vbirth zVdeath, and, because the number of hot spots is approximately
conserved, Vbranch z Vmerge), the value of N/Vbirth (19.8 min)
also captures the timescale of major changes in the signaling
pattern. Further, there is good correspondence between the
timescale of overall hot-spot consumption (or generation),
calculated as N/(Vdeath þ Vmerge) (13.4 min), and the time
constant of cell movement persistence (13.6 min; Fig. 2 f).
TABLE 1 Parameters characterizing the fates of PI3K
signaling hot spots
Parameter Value (mean 5 SD)
Number of hot spots, N 2.3 5 0.7
Average birth rate, Vbirth 0.117 5 0.057 min�1
Average death rate, Vdeath 0.123 5 0.061 min�1
Average branch rate, Vbranch 0.054 5 0.036 min�1
Average merge rate, Vmerge 0.049 5 0.037 min�1
Biophysical Journal 98(1) 67–75
The fates and dynamics of distinct PI3K hot spotsare stochastically coupled
We next asked whether hot spot births and deaths are random
or coupled events. To answer this question, we determined,
for each cell, the waiting times between successive hot-spot
births (birth-birth), successive deaths (death-death), death
and birth events (death-birth, where each birth is matched
with the most recent death), and likewise birth and death
events (birth-death). If the second of the two events were
random, the waiting-time distribution would not depend on
the nature of the first; otherwise, the two events may be
considered coupled.
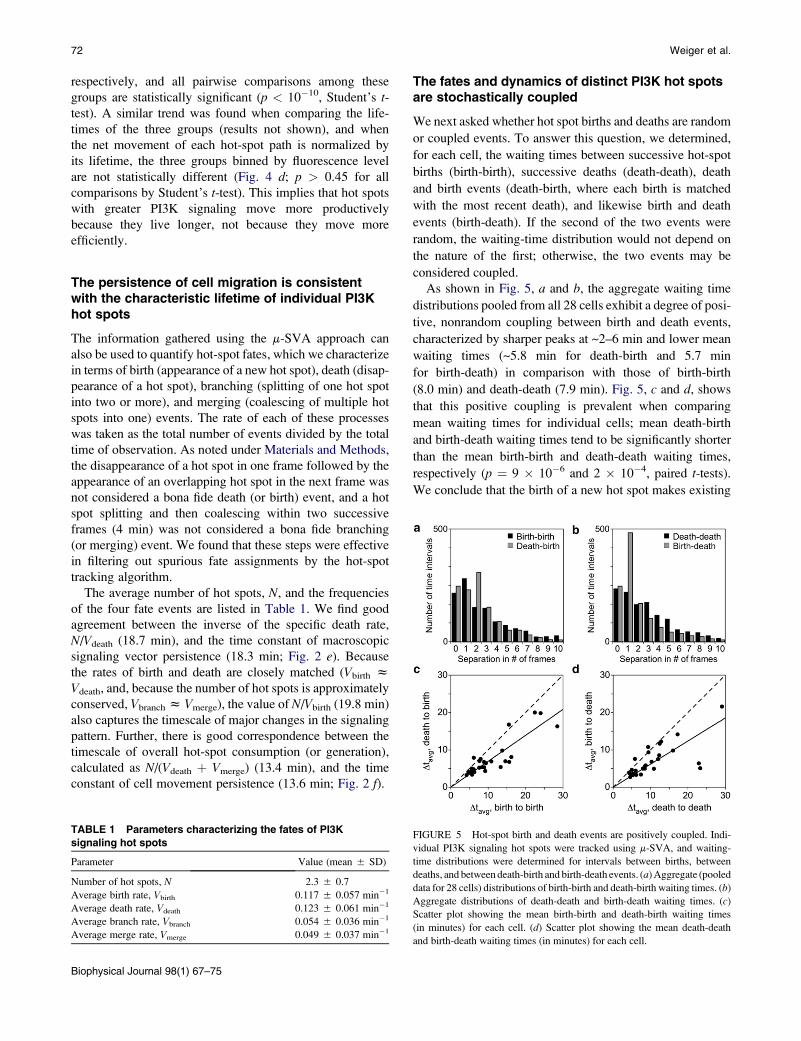
As shown in Fig. 5, a and b, the aggregate waiting time
distributions pooled from all 28 cells exhibit a degree of posi-
tive, nonrandom coupling between birth and death events,
characterized by sharper peaks at ~2–6 min and lower mean
waiting times (~5.8 min for death-birth and 5.7 min
for birth-death) in comparison with those of birth-birth
(8.0 min) and death-death (7.9 min). Fig. 5, c and d, shows
that this positive coupling is prevalent when comparing
mean waiting times for individual cells; mean death-birth
and birth-death waiting times tend to be significantly shorter
than the mean birth-birth and death-death waiting times,
respectively (p ¼ 9 � 10�6 and 2 � 10�4, paired t-tests).
We conclude that the birth of a new hot spot makes existing
FIGURE 5 Hot-spot birth and death events are positively coupled. Indi-
vidual PI3K signaling hot spots were tracked using m-SVA, and waiting-
time distributions were determined for intervals between births, between
deaths, and between death-birth and birth-death events. (a) Aggregate (pooled
data for 28 cells) distributions of birth-birth and death-birth waiting times. (b)
Aggregate distributions of death-death and birth-death waiting times. (c)
Scatter plot showing the mean birth-birth and death-birth waiting times
(in minutes) for each cell. (d) Scatter plot showing the mean death-death
and birth-death waiting times (in minutes) for each cell.
Analysis of Cell Migration Signaling 73
hot spots more vulnerable to dying out and, conversely, the
death of a hot spot tends to hasten the birth of another.
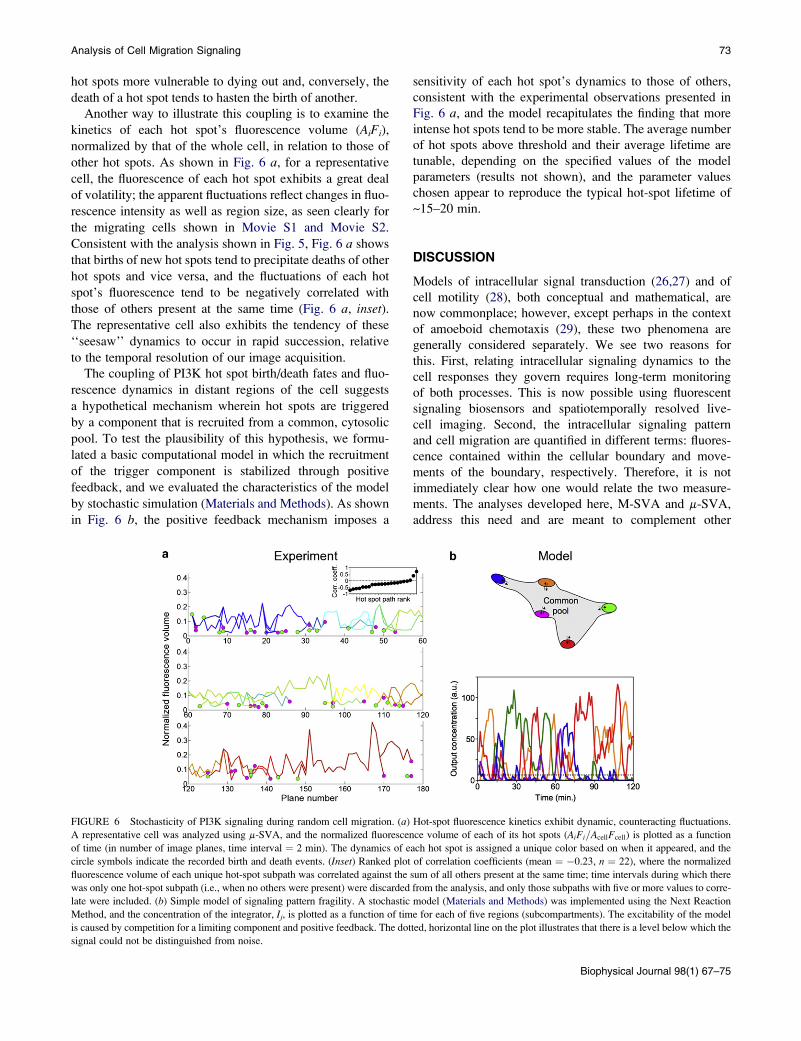
Another way to illustrate this coupling is to examine the
kinetics of each hot spot’s fluorescence volume (AiFi),
normalized by that of the whole cell, in relation to those of
other hot spots. As shown in Fig. 6 a, for a representative
cell, the fluorescence of each hot spot exhibits a great deal
of volatility; the apparent fluctuations reflect changes in fluo-
rescence intensity as well as region size, as seen clearly for
the migrating cells shown in Movie S1 and Movie S2.
Consistent with the analysis shown in Fig. 5, Fig. 6 a shows
that births of new hot spots tend to precipitate deaths of other
hot spots and vice versa, and the fluctuations of each hot
spot’s fluorescence tend to be negatively correlated with
those of others present at the same time (Fig. 6 a, inset).The representative cell also exhibits the tendency of these
‘‘seesaw’’ dynamics to occur in rapid succession, relative
to the temporal resolution of our image acquisition.
The coupling of PI3K hot spot birth/death fates and fluo-
rescence dynamics in distant regions of the cell suggests
a hypothetical mechanism wherein hot spots are triggered
by a component that is recruited from a common, cytosolic
pool. To test the plausibility of this hypothesis, we formu-
lated a basic computational model in which the recruitment
of the trigger component is stabilized through positive
feedback, and we evaluated the characteristics of the model
by stochastic simulation (Materials and Methods). As shown
in Fig. 6 b, the positive feedback mechanism imposes a
FIGURE 6 Stochasticity of PI3K signaling during random cell migration. (a)
A representative cell was analyzed using m-SVA, and the normalized fluorescen
of time (in number of image planes, time interval ¼ 2 min). The dynamics of e
circle symbols indicate the recorded birth and death events. (Inset) Ranked plot
fluorescence volume of each unique hot-spot subpath was correlated against the
was only one hot-spot subpath (i.e., when no others were present) were discarded
late were included. (b) Simple model of signaling pattern fragility. A stochastic
Method, and the concentration of the integrator, Ij, is plotted as a function of tim
is caused by competition for a limiting component and positive feedback. The dot
signal could not be distinguished from noise.
sensitivity of each hot spot’s dynamics to those of others,
consistent with the experimental observations presented in
Fig. 6 a, and the model recapitulates the finding that more
intense hot spots tend to be more stable. The average number
of hot spots above threshold and their average lifetime are
tunable, depending on the specified values of the model
parameters (results not shown), and the parameter values
chosen appear to reproduce the typical hot-spot lifetime of
~15–20 min.
DISCUSSION
Models of intracellular signal transduction (26,27) and of
cell motility (28), both conceptual and mathematical, are
now commonplace; however, except perhaps in the context
of amoeboid chemotaxis (29), these two phenomena are
generally considered separately. We see two reasons for
this. First, relating intracellular signaling dynamics to the
cell responses they govern requires long-term monitoring
of both processes. This is now possible using fluorescent
signaling biosensors and spatiotemporally resolved live-
cell imaging. Second, the intracellular signaling pattern
and cell migration are quantified in different terms: fluores-
cence contained within the cellular boundary and move-
ments of the boundary, respectively. Therefore, it is not
immediately clear how one would relate the two measure-
ments. The analyses developed here, M-SVA and m-SVA,
address this need and are meant to complement other
Hot-spot fluorescence kinetics exhibit dynamic, counteracting fluctuations.
ce volume of each of its hot spots (AiFi=AcellFcell) is plotted as a function
ach hot spot is assigned a unique color based on when it appeared, and the
of correlation coefficients (mean ¼ �0.23, n ¼ 22), where the normalized
sum of all others present at the same time; time intervals during which there
from the analysis, and only those subpaths with five or more values to corre-
model (Materials and Methods) was implemented using the Next Reaction
e for each of five regions (subcompartments). The excitability of the model
ted, horizontal line on the plot illustrates that there is a level below which the
Biophysical Journal 98(1) 67–75
74 Weiger et al.
computational approaches for analyzing fluorescence
microscopy data in cell biology (30–32). The approach is
based on the concept that hot-spot regions of intense
signaling promote local membrane protrusion, effectively
pushing the cell in different directions.
The SVA approach was applied to PI3K signaling in
randomly migrating fibroblasts, and tracking the dynamics
and fates of PI3K hot spots led us to develop a phenomenolog-
ical model of cell migration. In this model, the stability of each
hot spot, stochastically coupled to the dynamics of other hot
spots, determines the persistence of cell movement. The time-
scale of hot-spot turnover was 15–20 min for the experimental
conditions used here, which is much slower than the under-
lying dynamics of intracellular signaling; we know that the
mean lifetime of 30 PI lipids is only ~1 min in these cells
(21), for example. Therefore, hot-spot fates must be governed
by comparatively rare stochastic transitions that, through
a coupling mechanism, have the potential to dramatically per-
turb, and thus remodel, the pattern of intracellular signaling.
We found that a simple model in which different regions
of the cell compete for a limiting component, subject to
positive feedback, reproduces several aspects of the observed
signaling dynamics that are, in turn, correlated with cell
protrusion and movement. The interpretation is that signaling
hot spots arise and are maintained through a dynamic—and
ultimately fragile—equilibrium of relatively fast molecular
recruitment processes. An important aspect of the hypothet-
ical model is positive feedback, which could be chemical
(24) or mechanical (33) in nature and which might be
influenced by changes in cell morphology (34,35) during
migration; indeed, we were not able to definitively resolve
from our data whether changes in PI3K signaling precede
changes in cell motility or vice versa. If conceptualized as
a biochemical feedback, wherein the product of an enzymatic
reaction contributes to enhanced recruitment of the enzyme,
our model is similar to the ‘‘one-component’’ mechanism of
chemotactic gradient sensing proposed by Postma and van
Haastert (24). Also in the realm of chemotaxis, more bio-
chemically explicit models invoking positive feedback
between PI3K and Rho- and Ras-family GTPases have been
formulated more recently (36–38). A key distinction in the
model presented here is its focus on stochastic rather than
deterministic processes. Obviously, in the absence of a spatial
cue, the deterministic version of the model can only generate
a homogeneous pattern.
Whereas our simple model is based on depletion of
a limiting component from the cytosol, another well-known
(and mathematically similar) coupling mechanism is the acti-
vation of a fast-diffusing (i.e., global) inhibitor (29,39). The
influence of an inhibitor could result in larger, even cata-
strophic fluctuations if it were to act infrequently to slow
down or halt the incorporation of signaling components
into hot-spot regions, as conceptualized recently for the
effect of capping protein on actin filament dynamics in filo-
podia (40).
Biophysical Journal 98(1) 67–75
The analyses reported here rely on SVA methods that
should be portable to other systems, provided that the bound-
aries of the cell and its local regions of higher fluorescence
intensity are clearly distinguishable. Excellent resolution
was achieved in our experiments through the use of TIRF
microscopy, so it remains to be seen how well the approach
would work using other microscopy modes, or, with certain
modifications, for migration in three dimensions (where
TIRF is not possible). For measurements in which only a slice
of the cell cortex is resolved, using confocal fluorescence
microscopy, for example, other image analysis methods
might be more useful on the front end (30). Nevertheless,
it is envisioned that SVA could serve as a tool for unraveling
the spatial regulation of cell motility at the molecular level,
regardless of context.
SUPPORTING MATERIAL
Two movies and a figure are available at http://www.biophysj.org/biophysj/
supplemental/S0006-3495(09)01565-3.
This work was supported by the National Science Foundation through the
Science and Technology Center Program (CHE-9876674) and grant
CBET-0828936. Mathematical modeling work was partially supported by
the Cell Migration Consortium under National Institutes of Health grant
U54-GM064346.
REFERENCES
1. Berg, H. C. 1983. Random Walks in Biology. Princeton UniversityPress, Princeton, N.J.
2. Dunn, G. A., and A. F. Brown. 1987. A unified approach to analysingcell motility. J. Cell Sci. 8 (Suppl.):81–102.
3. Lauffenburger, D. A., and J. L. Linderman. 1993. Receptors: Modelsfor Binding, Trafficking, and Signaling. Oxford University Press,New York.
4. Dickinson, R. B., and R. T. Tranquillo. 1993. Optimal estimation ofcell-movement indexes from the statistical analysis of cell trackingdata. AIChE J. 39:1995–2010.
5. Green, J. A., and K. M. Yamada. 2007. Three-dimensional microenvi-ronments modulate fibroblast signaling responses. Adv. Drug Deliv.Rev. 59:1293–1298.
6. Prasad, M., and D. J. Montell. 2007. Cellular and molecular mecha-nisms of border cell migration analyzed using time-lapse live-cellimaging. Dev. Cell. 12:997–1005.
7. Condeelis, J., and J. E. Segall. 2003. Intravital imaging of cell move-ment in tumours. Nat. Rev. Cancer. 3:921–930.
8. Maheshwari, G., and D. A. Lauffenburger. 1998. Deconstructing (andreconstructing) cell migration. Microsc. Res. Tech. 43:358–368.
9. Ridley, A. J., M. A. Schwartz, ., A. R. Horwitz. 2003. Cell migration:integrating signals from front to back. Science. 302:1704–1709.
10. Sabouri-Ghomi, M., Y. Wu, ., G. Danuser. 2008. Visualizing andquantifying adhesive signals. Curr. Opin. Cell Biol. 20:541–550.
11. Wang, Y., S. J. Ding, ., R. L. Klemke. 2007. Profiling signaling polarityin chemotactic cells. Proc. Natl. Acad. Sci. USA. 104:8328–8333.
12. Cain, R. J., and A. J. Ridley. 2009. Phosphoinositide 3-kinases in cellmigration. Biol. Cell. 101:13–29.
13. Varnai, P., and T. Balla. 2006. Live cell imaging of phosphoinositidedynamics with fluorescent protein domains. Biochim. Biophys. Acta.1761:957–967.
Analysis of Cell Migration Signaling 75
14. Loovers, H. M., M. Postma, ., P. J. van Haastert. 2006. Distinct rolesof PI(3,4,5)P3 during chemoattractant signaling in Dictyostelium:a quantitative in vivo analysis by inhibition of PI3-kinase. Mol. Biol.Cell. 17:1503–1513.
15. Hoeller, O., and R. R. Kay. 2007. Chemotaxis in the absence of PIP3gradients. Curr. Biol. 17:813–817.
16. Sasaki, A. T., C. Janetopoulos, ., R. A. Firtel. 2007. G protein-inde-pendent Ras/PI3K/F-actin circuit regulates basic cell motility. J. CellBiol. 178:185–191.
17. Weiger, M. C., C.-C. Wang, ., J. M. Haugh. 2009. Spontaneousphosphoinositide 3-kinase signaling dynamics drive fibroblastspreading and random migration. J. Cell Sci. 122:313–323.
18. Servant, G., O. D. Weiner, ., H. R. Bourne. 2000. Polarization ofchemoattractant receptor signaling during neutrophil chemotaxis.Science. 287:1037–1040.
19. Postma, M., J. Roelofs, ., P. J. Van Haastert. 2003. UniformcAMP stimulation of Dictyostelium cells induces localized patches ofsignal transduction and pseudopodia. Mol. Biol. Cell. 14:5019–5027.
20. Schneider, I. C., E. M. Parrish, and J. M. Haugh. 2005. Spatial analysis of30 phosphoinositide signaling in living fibroblasts: III. influence of cellmorphology and morphological polarity. Biophys. J. 89:1420–1430.
21. Schneider, I. C., and J. M. Haugh. 2004. Spatial analysis of 30 phosphoi-nositide signaling in living fibroblasts: II. Parameter estimates for indi-vidual cells from experiments. Biophys. J. 86:599–608.
22. Schneider, I. C., and J. M. Haugh. 2005. Quantitative elucidation ofa distinct spatial gradient-sensing mechanism in fibroblasts. J. CellBiol. 171:883–892.
23. Hanson, B., K. Klink, ., C. J. Willmott. 1992. Vector correlation:review, exposition and geographic application. Ann. Assoc. Am. Geogr.82:103–116.
24. Postma, M., and P. J. M. Van Haastert. 2001. A diffusion-translocationmodel for gradient sensing by chemotactic cells. Biophys. J. 81:1314–1323.
25. Gibson, M. A., and J. Bruck. 2000. Efficient exact stochastic simulationof chemical systems with many species and many channels. J. Phys.Chem. A. 104:1876–1889.
26. Kholodenko, B. N. 2006. Cell-signalling dynamics in time and space.Nat. Rev. Mol. Cell Biol. 7:165–176.
27. Haugh, J. M. 2008. Mathematical modeling of biological signaling
networks. In Wiley Encyclopedia of Chemical Biology. T. P. Begley,
chief advisor, editor. John Wiley & Sons, New York.
28. Mogilner, A. 2009. Mathematics of cell motility: have we got its
number? J. Math. Biol. 58:105–134.
29. Iglesias, P. A., and P. N. Devreotes. 2008. Navigating through models
of chemotaxis. Curr. Opin. Cell Biol. 20:35–40.
30. Dormann, D., T. Libotte, ., T. Bretschneider. 2002. Simultaneous
quantification of cell motility and protein-membrane-association using
active contours. Cell Motil. Cytoskeleton. 52:221–230.
31. Machacek, M., and G. Danuser. 2006. Morphodynamic profiling of
protrusion phenotypes. Biophys. J. 90:1439–1452.
32. Dorn, J. F., G. Danuser, and G. Yang. 2008. Computational processing
and analysis of dynamic fluorescence image data. Methods Cell Biol.
85:497–538.
33. Novak, I. L., B. M. Slepchenko, ., L. M. Loew. 2004. Cooperativity
between cell contractility and adhesion. Phys. Rev. Lett. 93:268109.
34. Meyers, J., J. Craig, and D. J. Odde. 2006. Potential for control of
signaling pathways via cell size and shape. Curr. Biol. 16:1685–1693.
35. Haugh, J. M. 2007. Membrane-binding/modification model of signaling
protein activation and analysis of its control by cell morphology.
Biophys. J. 92:L93–L95.
36. Dawes, A. T., and L. Edelstein-Keshet. 2007. Phosphoinositides and
Rho proteins spatially regulate actin polymerization to initiate and main-
tain directed movement in a one-dimensional model of a motile cell.
Biophys. J. 92:744–768.
37. Onsum, M., and C. V. Rao. 2007. A mathematical model for neutrophil
gradient sensing and polarization. PLoS Comput. Biol. 3:436–450.
38. Skupsky, R., W. Losert, and R. J. Nossal. 2005. Distinguishing modes
of eukaryotic gradient sensing. Biophys. J. 89:2806–2823.
39. Meinhardt, H., and A. Gierer. 2000. Pattern formation by local self-
activation and lateral inhibition. Bioessays. 22:753–760.
40. Zhuravlev, P. I., and G. A. Papoian. 2009. Molecular noise of capping
protein binding induces macroscopic instability in filopodial dynamics.
Proc. Natl. Acad. Sci. USA. 106:11570–11575.
Biophysical Journal 98(1) 67–75