differences between the glycosylation patterns of haptoglobin isolated from skin scales and plasma...
TRANSCRIPT

Differences between the Glycosylation Patterns ofHaptoglobin Isolated from Skin Scales and Plasma ofPsoriatic PatientsBernardetta Maresca1, Luisa Cigliano1*, Maria Stefania Spagnuolo2, Fabrizio Dal Piaz3, Maria M. Corsaro4,
Nicola Balato5, Massimiliano Nino5, Anna Balato5, Fabio Ayala5, Paolo Abrescia1
1 Dipartimento delle Scienze Biologiche, Universita di Napoli Federico II, Napoli, Italia, 2 Istituto per il Sistema Produzione Animale in Ambiente Mediterraneo, Consiglio
Nazionale delle Ricerche, Napoli, Italia, 3 Dipartimento di Scienze Farmaceutiche e Biomediche, Universita degli Studi di Salerno, Fisciano (Salerno), Italia, 4 Dipartimento di
Chimica Organica e Biochimica, Universita di Napoli Federico II, Complesso Universitario M. S. Angelo, Napoli, Italia, 5 Dipartimento di Patologia Sistematica - Sezione di
Dermatologia, Universita di Napoli Federico II, Napoli, Italia
Abstract
Improved diagnosis of psoriasis, by new biomarkers, is required for evaluating the progression rate of the disease and theresponse to treatment. Haptoglobin (Hpt), a glycoprotein secreted by hepatocytes and other types of cells includingkeratinocytes, was found with glycan changes in psoriasis and other diseases. We previously reported that Hpt isolated fromplasma of psoriatic patients is more fucosylated than Hpt of healthy subjects. The aim of this study was to compare theglycosylation pattern of Hpt isolated from skin scales or plasma of patients with psoriasis with that of Hpt from cornifiedepidermal layer or plasma of healthy subjects. High performance liquid chromatography analysis of the glycans isolatedfrom the protein backbone revealed that glycan patterns from skin and plasma of patients were similar, and mostlydisplayed quantitative rather than qualitative differences from normal pattern. Biotin-labeled lectins were used to evaluatequantitative differences in the glycoforms of Hpt from plasma and psoriatic skin scales. Hpt from skin and plasma of patientsshowed more fucosylated and branched glycans than Hpt from plasma of healthy subjects. Tryptic glycopeptides of Hptwere also analyzed by mass spectrometry, and a decreased amount of sialylated glycan chains was found in glycopeptidesof skin Hpt, as compared with Hpt from plasma. High levels of glycans with fucosylated and tetra-antennary chains weredetected on the peptide NLFLNHSENATAK from Hpt of psoriatic patients. Our data demonstrate that specific changes inglycan structures of Hpt, such as enhanced glycan branching and fucose content, are associated with psoriasis, and thatdifferences between circulating and skin Hpt do exist. A lower extent of glycan fucosylation and branching was found in Hptfrom plasma of patients in disease remission. Altered glycoforms might reflect changes of Hpt function in the skin, andcould be used as markers of the disease.
Citation: Maresca B, Cigliano L, Spagnuolo MS, Dal Piaz F, Corsaro MM, et al. (2012) Differences between the Glycosylation Patterns of Haptoglobin Isolated fromSkin Scales and Plasma of Psoriatic Patients. PLoS ONE 7(12): e52040. doi:10.1371/journal.pone.0052040
Editor: Roger Chammas, Faculdade de Medicina, Universidade de Sao Paulo, Brazil
Received June 21, 2012; Accepted November 8, 2012; Published December 18, 2012
Copyright: � 2012 Maresca et al. This is an open-access article distributed under the terms of the Creative Commons Attribution License, which permitsunrestricted use, distribution, and reproduction in any medium, provided the original author and source are credited.
Funding: This work was supported by a research grant from the University of Naples Federico II (Ric. Dip. 10112/2010). The funders had no role in study design,data collection and analysis, decision to publish, or preparation of the manuscript.
Competing Interests: The authors have declared that no competing interests exist.
* E-mail: [email protected]
Introduction
Haptoglobin (Hpt) is an acute-phase glycoprotein known to
bind free haemoglobin (Hb) for degradation and iron recycling
[1,2]. Hpt is produced mostly in liver by hepatocytes [3,4] and
secreted into blood circulation. Its levels markedly increase during
the acute phase of inflammation and in neoplastic disease in
response to inflammatory cytokines [1]. In addition to binding Hb,
a number of other physiological roles of Hpt were suggested. Hpt
might play a role in angiogenesis and wound healing, as it inhibits
gelatinases thus contributing to remodel the extracellular matrix
[5]. Moreover, Hpt was recently reported to bind the apolipo-
protein (Apo) A–I and ApoE, and impair their key function in
stimulating the enzyme lecithin:cholesterol acyl transferase
(LCAT) and mediating cholesterol delivery to hepatocytes [6,7].
Although the tissue-specific expression of Hpt in some peripheral
organs was demonstrated [8–12], the role of Hpt in the skin or skin
diseases like psoriasis has not yet been studied. Limited studies
provide evidence that Hpt might be synthesized and/or secreted
into the skin [13], and demonstrate its inhibitory effect on the
differentiation of immature epidermal Langerhans cells in antigen
presenting cells [14]. Locally produced Hpt might have a
modulatory role on skin cells and/or on cells of the immune
system, recruited at the site of inflammation. We have previously
demonstrated that, in Psoriasis vulgaris, plasma Hpt displays
glycoforms with reduced affinity for both Hb and ApoA-I as
compared with glycoforms isolated from plasma of healthy
subjects, and inhibits the LCAT activity less than normal protein
[15]. These glycoforms were suggested to be associated with skin
disease and secreted at enhanced levels during inflammation
[15,16]. Actually, abnormal glycosylation of glycoproteins has
been correlated with cancer, inflammatory diseases, and congen-
ital disorders [17]. Four asparagine residues of the Hpt subunit bare known to link glycans (N23, N46, N50, and N80) [18], and tri-
or tetra-antennary glycans were found on this subunit from
PLOS ONE | www.plosone.org 1 December 2012 | Volume 7 | Issue 12 | e52040

patients with rheumatoid arthritis [19], endometriosis [20], or
ovarian cancer [21]. In addition, the levels of N-acetylneuraminic
acid (NeuAc, also called sialic acid and indicated by the acronym
S) and/or fucose (Fuc) were found associated with prostate cancer
[22], pancreatic cancer [23], carbohydrate-deficient glycoprotein
syndrome [24], or liver disease [25]. We recently reported that the
glycan pattern of Hpt isolated from plasma of patients with acute
coronary syndrome displays more branched and fucosylated
structures as compared to that of Hpt from healthy subjects
[26]. We also found higher number of different fucosylated and tri-
antennary or tetra-antennary glycans in Hpt from plasma of
patients with psoriasis than in controls [16].
Our objective was to study whether the Hpt glycan changes
found in the plasma of patients with psoriasis are a consequence of
systemic inflammation or can be also found in Hpt isolated from
skin lesions. Moreover we compared glycan structures associated
with Hpt isolated from skin scales of patients and epidermal layers
of healthy subjects, in order to investigate whether specific
glycoforms in the skin of patients do exist.
Results
HPLC analysis of Hpt glycansHpt was purified from plasma (pHpt-P) and skin scales (sHpt-P)
of patients with psoriasis, or plasma of healthy donors (pHpt-N).
Purified pHpt-P, sHpt-P, and pHpt-N were treated with N-
glycosidase to separate N-linked glycans from the polypeptide
backbone. The released glycans were labelled with the fluorophore
2-AB and analyzed by HPLC, as previously reported [27]. The
elution patterns of the glycans from pHpt-P and sHpt-P were
similar to that of glycans from pHpt-N. Six major (namely peaks ato f) and a number of minor peaks were present on chromato-
grams of glycans from pHpt-N (Figure 1, panel A). The pattern of
pHpt-P glycans was similar to that of pHpt-N glycans, but peak bwas missing (Figure 1, panel B), whereas only peaks c and f could
be clearly detected in the glycan pattern from sHpt-P (Figure 1,
panel C). Differences in maximum and area were found for peaks
with the same migration (expressed in GU value). Quantitative
measurements of the relative amount of the major peaks were
done by integrating their areas on the chromatograms, and
arbitrarily expressing the obtained values as ratios with the peak carea, which was given the value 1 (Table 1). The data suggest that
the relative areas of peaks were different in patients when
compared to controls. Peak f was found markedly increased in
glycan patterns of pHpt-P and sHpt-P (see also Figure 1, panels B
and C versus panel A). A relational database was used to sort out
the structures of Hpt major glycans, on the basis of their GU 60.1.
A number of possible structures could correspond to the values of
GU we found. Thus, for example, ten different tri- and tetra-
antennary glycans (with or without Fuc) are all reported to migrate
as peak c. These data confirm previous information on multiple
structures of glycans of pHpt-P and pHpt-N, and indicate that also
sHpt-P is glycosylated. In particular, the finding of higher amounts
of peak f in the glycan pattern of sHpt-P, as compared with that of
pHpt-P, suggests that sHpt-P diffuses from skin to blood, and
comparative HPLC analysis of pHpt-P and pHpt-N might be a
useful tool to monitor sHpt-P secretion into the skin.
Analysis of Hpt glycans by lectinsELISA with biotin-labeled lectins is a widely used technique for
analysing the amounts of different structures of complex N-linked
glycans. The lectins Concanavalin A (ConA, binding the mannose
core of glycans), Sambucus nigra (SNA, binding S a2,6-linked to
galactose, from here on named G), Maackia amurensis (MAA,
binding S a2,3-linked to G) and Lotus tetragonolobus agglutinin
(LTA, binding Fuc), were used to evaluate quantitative differences
in their reactivity to the glycoforms of Hpt from plasma of patients
and controls, and psoriatic skin scales. On the basis of our
preliminary HPLC analysis, which suggested the presence in
pHpt-P and sHpt-P of highly branched tetra-antennary glycans,
pHpt-P and sHpt-P were expected to display lower reactivity to
ConA whereas higher reactivity to LTA than pHpt-N. In fact,
Figure 1. Normal phase HPLC pattern of 2AB-glycans frompHpt-N, pHpt-P and sHpt-P. Purified pHpt-N, pHpt-P, and sHpt-Pwere deglycosylated by treatment with PNGase F, and their glycanswere labelled by 2 aminobenzamide. After solid phase extraction, theglycans were fractionated by HPLC using a TSK-gel Amide-80 column(4.66250 mm) with a linear gradient of ammonium formate at pH 4.4(87.5 to 162.5 mM) with CH3CN (65 to 35%) in 75 min, at 0.4 ml/minflow rate. Elution was monitored by measuring the label fluorescence at425 nm (lEX = 360 nm). Panel A: glycans from pHpt-N. Panel B: glycansfrom pHpt-P. Panel C: glycans from sHpt-P. The GU ladder representsthe migration of labelled oligosacharides with different units of glucose.The marked peaks were used for comparative analysis.doi:10.1371/journal.pone.0052040.g001
Haptoglobin Glycans in Skin Psoriatic Scales
PLOS ONE | www.plosone.org 2 December 2012 | Volume 7 | Issue 12 | e52040
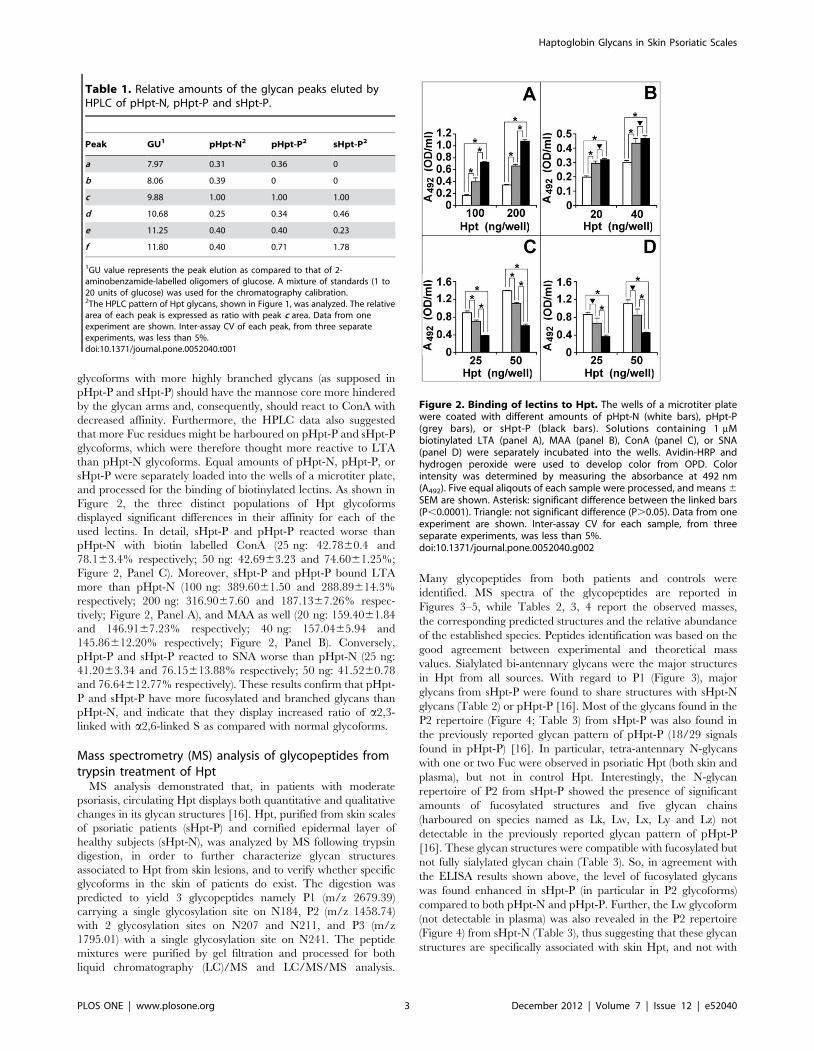
glycoforms with more highly branched glycans (as supposed in
pHpt-P and sHpt-P) should have the mannose core more hindered
by the glycan arms and, consequently, should react to ConA with
decreased affinity. Furthermore, the HPLC data also suggested
that more Fuc residues might be harboured on pHpt-P and sHpt-P
glycoforms, which were therefore thought more reactive to LTA
than pHpt-N glycoforms. Equal amounts of pHpt-N, pHpt-P, or
sHpt-P were separately loaded into the wells of a microtiter plate,
and processed for the binding of biotinylated lectins. As shown in
Figure 2, the three distinct populations of Hpt glycoforms
displayed significant differences in their affinity for each of the
used lectins. In detail, sHpt-P and pHpt-P reacted worse than
pHpt-N with biotin labelled ConA (25 ng: 42.7860.4 and
78.163.4% respectively; 50 ng: 42.6963.23 and 74.6061.25%;
Figure 2, Panel C). Moreover, sHpt-P and pHpt-P bound LTA
more than pHpt-N (100 ng: 389.6061.50 and 288.89614.3%
respectively; 200 ng: 316.9067.60 and 187.1367.26% respec-
tively; Figure 2, Panel A), and MAA as well (20 ng: 159.4061.84
and 146.9167.23% respectively; 40 ng: 157.0465.94 and
145.86612.20% respectively; Figure 2, Panel B). Conversely,
pHpt-P and sHpt-P reacted to SNA worse than pHpt-N (25 ng:
41.2063.34 and 76.15613.88% respectively; 50 ng: 41.5260.78
and 76.64612.77% respectively). These results confirm that pHpt-
P and sHpt-P have more fucosylated and branched glycans than
pHpt-N, and indicate that they display increased ratio of a2,3-
linked with a2,6-linked S as compared with normal glycoforms.
Mass spectrometry (MS) analysis of glycopeptides fromtrypsin treatment of Hpt
MS analysis demonstrated that, in patients with moderate
psoriasis, circulating Hpt displays both quantitative and qualitative
changes in its glycan structures [16]. Hpt, purified from skin scales
of psoriatic patients (sHpt-P) and cornified epidermal layer of
healthy subjects (sHpt-N), was analyzed by MS following trypsin
digestion, in order to further characterize glycan structures
associated to Hpt from skin lesions, and to verify whether specific
glycoforms in the skin of patients do exist. The digestion was
predicted to yield 3 glycopeptides namely P1 (m/z 2679.39)
carrying a single glycosylation site on N184, P2 (m/z 1458.74)
with 2 glycosylation sites on N207 and N211, and P3 (m/z
1795.01) with a single glycosylation site on N241. The peptide
mixtures were purified by gel filtration and processed for both
liquid chromatography (LC)/MS and LC/MS/MS analysis.
Many glycopeptides from both patients and controls were
identified. MS spectra of the glycopeptides are reported in
Figures 3–5, while Tables 2, 3, 4 report the observed masses,
the corresponding predicted structures and the relative abundance
of the established species. Peptides identification was based on the
good agreement between experimental and theoretical mass
values. Sialylated bi-antennary glycans were the major structures
in Hpt from all sources. With regard to P1 (Figure 3), major
glycans from sHpt-P were found to share structures with sHpt-N
glycans (Table 2) or pHpt-P [16]. Most of the glycans found in the
P2 repertoire (Figure 4; Table 3) from sHpt-P was also found in
the previously reported glycan pattern of pHpt-P (18/29 signals
found in pHpt-P) [16]. In particular, tetra-antennary N-glycans
with one or two Fuc were observed in psoriatic Hpt (both skin and
plasma), but not in control Hpt. Interestingly, the N-glycan
repertoire of P2 from sHpt-P showed the presence of significant
amounts of fucosylated structures and five glycan chains
(harboured on species named as Lk, Lw, Lx, Ly and Lz) not
detectable in the previously reported glycan pattern of pHpt-P
[16]. These glycan structures were compatible with fucosylated but
not fully sialylated glycan chain (Table 3). So, in agreement with
the ELISA results shown above, the level of fucosylated glycans
was found enhanced in sHpt-P (in particular in P2 glycoforms)
compared to both pHpt-N and pHpt-P. Further, the Lw glycoform
(not detectable in plasma) was also revealed in the P2 repertoire
(Figure 4) from sHpt-N (Table 3), thus suggesting that these glycan
structures are specifically associated with skin Hpt, and not with
Table 1. Relative amounts of the glycan peaks eluted byHPLC of pHpt-N, pHpt-P and sHpt-P.
Peak GU1 pHpt-N2 pHpt-P2 sHpt-P2
a 7.97 0.31 0.36 0
b 8.06 0.39 0 0
c 9.88 1.00 1.00 1.00
d 10.68 0.25 0.34 0.46
e 11.25 0.40 0.40 0.23
f 11.80 0.40 0.71 1.78
1GU value represents the peak elution as compared to that of 2-aminobenzamide-labelled oligomers of glucose. A mixture of standards (1 to20 units of glucose) was used for the chromatography calibration.2The HPLC pattern of Hpt glycans, shown in Figure 1, was analyzed. The relativearea of each peak is expressed as ratio with peak c area. Data from oneexperiment are shown. Inter-assay CV of each peak, from three separateexperiments, was less than 5%.doi:10.1371/journal.pone.0052040.t001
Figure 2. Binding of lectins to Hpt. The wells of a microtiter platewere coated with different amounts of pHpt-N (white bars), pHpt-P(grey bars), or sHpt-P (black bars). Solutions containing 1 mMbiotinylated LTA (panel A), MAA (panel B), ConA (panel C), or SNA(panel D) were separately incubated into the wells. Avidin-HRP andhydrogen peroxide were used to develop color from OPD. Colorintensity was determined by measuring the absorbance at 492 nm(A492). Five equal aliqouts of each sample were processed, and means 6
SEM are shown. Asterisk: significant difference between the linked bars(P,0.0001). Triangle: not significant difference (P.0.05). Data from oneexperiment are shown. Inter-assay CV for each sample, from threeseparate experiments, was less than 5%.doi:10.1371/journal.pone.0052040.g002
Haptoglobin Glycans in Skin Psoriatic Scales
PLOS ONE | www.plosone.org 3 December 2012 | Volume 7 | Issue 12 | e52040

Figure 3. Mass spectrum of the P1 glycopeptide repertoire from skin of patients. Purified sHpt-P was digested by trypsin, and the resultingfragments were fractionated by UPLC and analyzed by ESI-MS. Positive ions of P1 (MVSHHNLTTGATLINEQWLLTTAK) glycopeptides from Hpt of skin ofpatients is shown. Glycopeptide peaks are indicated with their observed mass value (see Table 2) and chain structure. Peaks with mass attributable tonon-glycosylated species were ignored.doi:10.1371/journal.pone.0052040.g003
Figure 4. Mass spectrum of the P2 glycopeptide repertoire from skin of patients. Purified sHpt-P was digested by trypsin, and the resultingfragments were fractionated by UPLC and analyzed by ESI-MS. Positive ions of P2 (NLFLN HSENATAK) glycopeptides from Hpt of skin of patients isshown. Glycopeptide peaks are indicated with their observed mass value (see Table 3). The glycoforms found only in sHpt-P and not in pHpt-N and inpHpt-P are indicated. Peaks with mass attributable to non-glycosylated species were ignored.doi:10.1371/journal.pone.0052040.g004
Haptoglobin Glycans in Skin Psoriatic Scales
PLOS ONE | www.plosone.org 4 December 2012 | Volume 7 | Issue 12 | e52040
the pathology. Moreover, the overall level of fucosylated residues
in sHpt-N was found lower than that from sHpt-P.
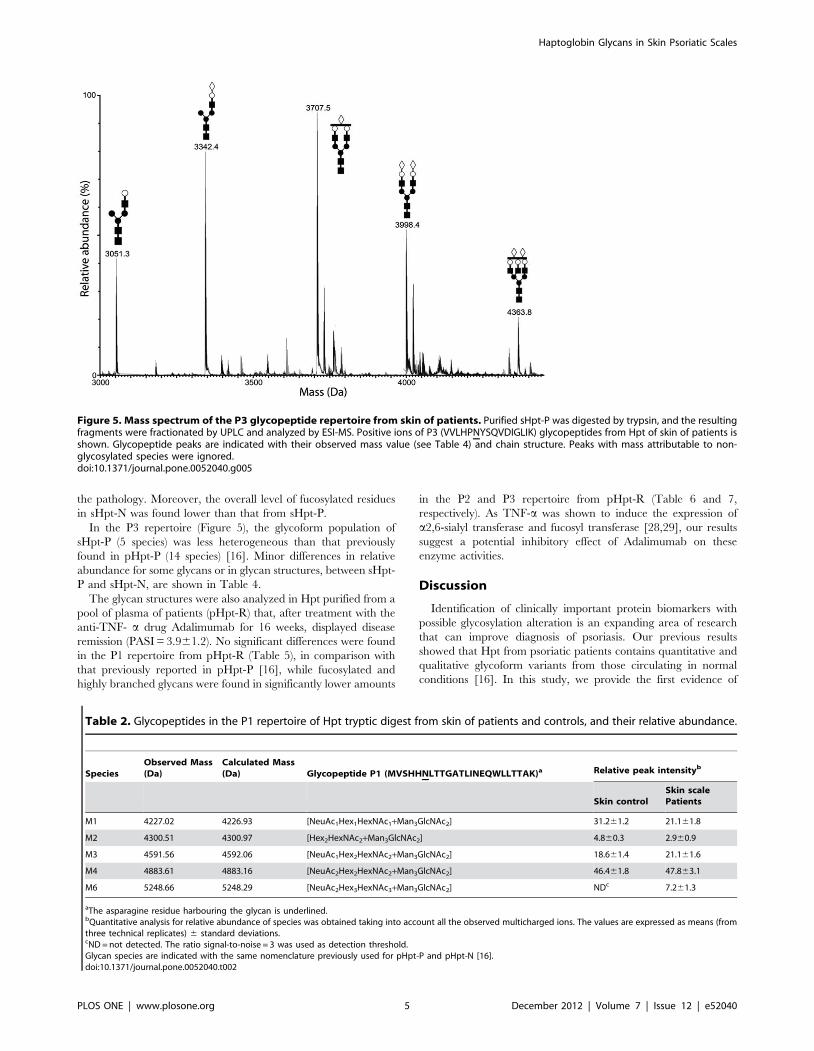
In the P3 repertoire (Figure 5), the glycoform population of
sHpt-P (5 species) was less heterogeneous than that previously
found in pHpt-P (14 species) [16]. Minor differences in relative
abundance for some glycans or in glycan structures, between sHpt-
P and sHpt-N, are shown in Table 4.
The glycan structures were also analyzed in Hpt purified from a
pool of plasma of patients (pHpt-R) that, after treatment with the
anti-TNF- a drug Adalimumab for 16 weeks, displayed disease
remission (PASI = 3.961.2). No significant differences were found
in the P1 repertoire from pHpt-R (Table 5), in comparison with
that previously reported in pHpt-P [16], while fucosylated and
highly branched glycans were found in significantly lower amounts
in the P2 and P3 repertoire from pHpt-R (Table 6 and 7,
respectively). As TNF-a was shown to induce the expression of
a2,6-sialyl transferase and fucosyl transferase [28,29], our results
suggest a potential inhibitory effect of Adalimumab on these
enzyme activities.
Discussion
Identification of clinically important protein biomarkers with
possible glycosylation alteration is an expanding area of research
that can improve diagnosis of psoriasis. Our previous results
showed that Hpt from psoriatic patients contains quantitative and
qualitative glycoform variants from those circulating in normal
conditions [16]. In this study, we provide the first evidence of
Figure 5. Mass spectrum of the P3 glycopeptide repertoire from skin of patients. Purified sHpt-P was digested by trypsin, and the resultingfragments were fractionated by UPLC and analyzed by ESI-MS. Positive ions of P3 (VVLHPNYSQVDIGLIK) glycopeptides from Hpt of skin of patients isshown. Glycopeptide peaks are indicated with their observed mass value (see Table 4) and chain structure. Peaks with mass attributable to non-glycosylated species were ignored.doi:10.1371/journal.pone.0052040.g005
Table 2. Glycopeptides in the P1 repertoire of Hpt tryptic digest from skin of patients and controls, and their relative abundance.
SpeciesObserved Mass(Da)
Calculated Mass(Da) Glycopeptide P1 (MVSHHNLTTGATLINEQWLLTTAK)a Relative peak intensityb
Skin controlSkin scalePatients
M1 4227.02 4226.93 [NeuAc1Hex1HexNAc1+Man3GlcNAc2] 31.261.2 21.161.8
M2 4300.51 4300.97 [Hex2HexNAc2+Man3GlcNAc2] 4.860.3 2.960.9
M3 4591.56 4592.06 [NeuAc1Hex2HexNAc2+Man3GlcNAc2] 18.661.4 21.161.6
M4 4883.61 4883.16 [NeuAc2Hex2HexNAc2+Man3GlcNAc2] 46.461.8 47.863.1
M6 5248.66 5248.29 [NeuAc2Hex3HexNAc3+Man3GlcNAc2] NDc 7.261.3
aThe asparagine residue harbouring the glycan is underlined.bQuantitative analysis for relative abundance of species was obtained taking into account all the observed multicharged ions. The values are expressed as means (fromthree technical replicates) 6 standard deviations.cND = not detected. The ratio signal-to-noise = 3 was used as detection threshold.Glycan species are indicated with the same nomenclature previously used for pHpt-P and pHpt-N [16].doi:10.1371/journal.pone.0052040.t002
Haptoglobin Glycans in Skin Psoriatic Scales
PLOS ONE | www.plosone.org 5 December 2012 | Volume 7 | Issue 12 | e52040
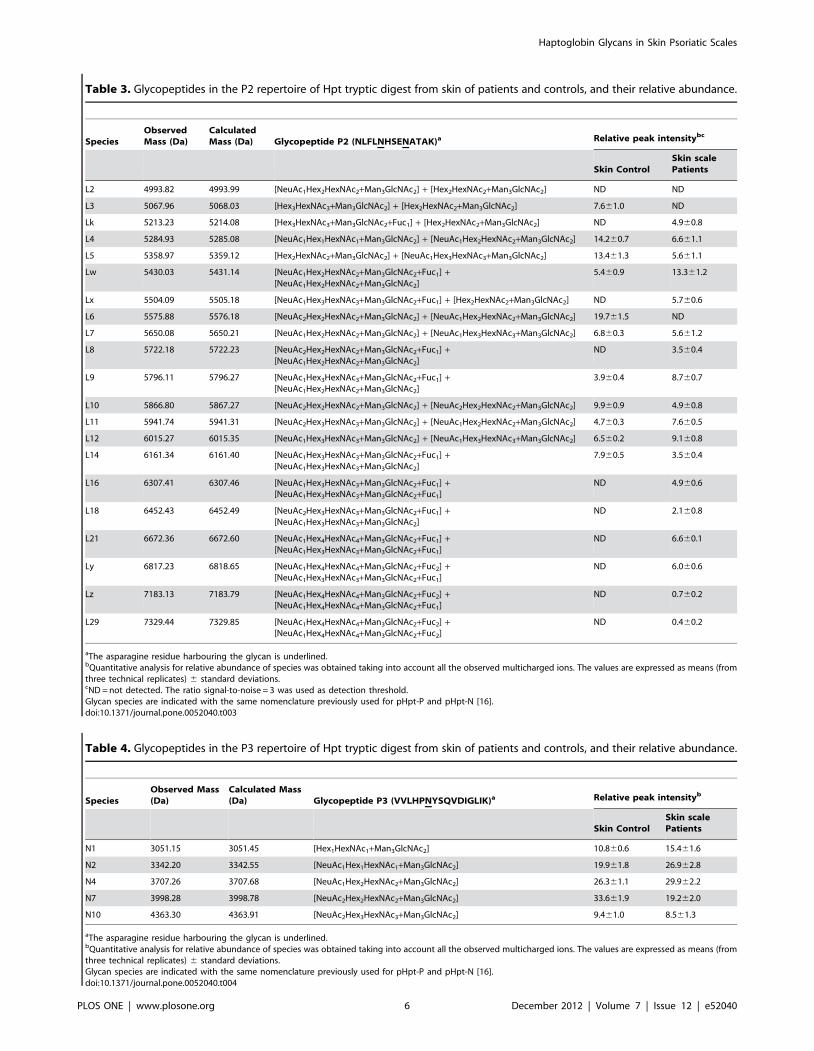
Table 3. Glycopeptides in the P2 repertoire of Hpt tryptic digest from skin of patients and controls, and their relative abundance.
SpeciesObservedMass (Da)
CalculatedMass (Da) Glycopeptide P2 (NLFLNHSENATAK)a Relative peak intensitybc
Skin ControlSkin scalePatients
L2 4993.82 4993.99 [NeuAc1Hex2HexNAc2+Man3GlcNAc2] + [Hex2HexNAc2+Man3GlcNAc2] ND ND
L3 5067.96 5068.03 [Hex3HexNAc3+Man3GlcNAc2] + [Hex2HexNAc2+Man3GlcNAc2] 7.661.0 ND
Lk 5213.23 5214.08 [Hex3HexNAc3+Man3GlcNAc2+Fuc1] + [Hex2HexNAc2+Man3GlcNAc2] ND 4.960.8
L4 5284.93 5285.08 [NeuAc1Hex1HexNAc1+Man3GlcNAc2] + [NeuAc1Hex2HexNAc2+Man3GlcNAc2] 14.260.7 6.661.1
L5 5358.97 5359.12 [Hex2HexNAc2+Man3GlcNAc2] + [NeuAc1Hex3HexNAc3+Man3GlcNAc2] 13.461.3 5.661.1
Lw 5430.03 5431.14 [NeuAc1Hex2HexNAc2+Man3GlcNAc2+Fuc1] +[NeuAc1Hex2HexNAc2+Man3GlcNAc2]
5.460.9 13.361.2
Lx 5504.09 5505.18 [NeuAc1Hex3HexNAc3+Man3GlcNAc2+Fuc1] + [Hex2HexNAc2+Man3GlcNAc2] ND 5.760.6
L6 5575.88 5576.18 [NeuAc2Hex2HexNAc2+Man3GlcNAc2] + [NeuAc1Hex2HexNAc2+Man3GlcNAc2] 19.761.5 ND
L7 5650.08 5650.21 [NeuAc1Hex2HexNAc2+Man3GlcNAc2] + [NeuAc1Hex3HexNAc3+Man3GlcNAc2] 6.860.3 5.661.2
L8 5722.18 5722.23 [NeuAc2Hex2HexNAc2+Man3GlcNAc2+Fuc1] +[NeuAc1Hex2HexNAc2+Man3GlcNAc2]
ND 3.560.4
L9 5796.11 5796.27 [NeuAc1Hex3HexNAc3+Man3GlcNAc2+Fuc1] +[NeuAc1Hex2HexNAc2+Man3GlcNAc2]
3.960.4 8.760.7
L10 5866.80 5867.27 [NeuAc2Hex2HexNAc2+Man3GlcNAc2] + [NeuAc2Hex2HexNAc2+Man3GlcNAc2] 9.960.9 4.960.8
L11 5941.74 5941.31 [NeuAc2Hex3HexNAc3+Man3GlcNAc2] + [NeuAc1Hex2HexNAc2+Man3GlcNAc2] 4.760.3 7.660.5
L12 6015.27 6015.35 [NeuAc1Hex3HexNAc3+Man3GlcNAc2] + [NeuAc1Hex3HexNAc3+Man3GlcNAc2] 6.560.2 9.160.8
L14 6161.34 6161.40 [NeuAc1Hex3HexNAc3+Man3GlcNAc2+Fuc1] +[NeuAc1Hex3HexNAc3+Man3GlcNAc2]
7.960.5 3.560.4
L16 6307.41 6307.46 [NeuAc1Hex3HexNAc3+Man3GlcNAc2+Fuc1] +[NeuAc1Hex3HexNAc3+Man3GlcNAc2+Fuc1]
ND 4.960.6
L18 6452.43 6452.49 [NeuAc2Hex3HexNAc3+Man3GlcNAc2+Fuc1] +[NeuAc1Hex3HexNAc3+Man3GlcNAc2]
ND 2.160.8
L21 6672.36 6672.60 [NeuAc1Hex4HexNAc4+Man3GlcNAc2+Fuc1] +[NeuAc1Hex3HexNAc3+Man3GlcNAc2+Fuc1]
ND 6.660.1
Ly 6817.23 6818.65 [NeuAc1Hex4HexNAc4+Man3GlcNAc2+Fuc2] +[NeuAc1Hex3HexNAc3+Man3GlcNAc2+Fuc1]
ND 6.060.6
Lz 7183.13 7183.79 [NeuAc1Hex4HexNAc4+Man3GlcNAc2+Fuc2] +[NeuAc1Hex4HexNAc4+Man3GlcNAc2+Fuc1]
ND 0.760.2
L29 7329.44 7329.85 [NeuAc1Hex4HexNAc4+Man3GlcNAc2+Fuc2] +[NeuAc1Hex4HexNAc4+Man3GlcNAc2+Fuc2]
ND 0.460.2
aThe asparagine residue harbouring the glycan is underlined.bQuantitative analysis for relative abundance of species was obtained taking into account all the observed multicharged ions. The values are expressed as means (fromthree technical replicates) 6 standard deviations.cND = not detected. The ratio signal-to-noise = 3 was used as detection threshold.Glycan species are indicated with the same nomenclature previously used for pHpt-P and pHpt-N [16].doi:10.1371/journal.pone.0052040.t003
Table 4. Glycopeptides in the P3 repertoire of Hpt tryptic digest from skin of patients and controls, and their relative abundance.
SpeciesObserved Mass(Da)
Calculated Mass(Da) Glycopeptide P3 (VVLHPNYSQVDIGLIK)a Relative peak intensityb
Skin ControlSkin scalePatients
N1 3051.15 3051.45 [Hex1HexNAc1+Man3GlcNAc2] 10.860.6 15.461.6
N2 3342.20 3342.55 [NeuAc1Hex1HexNAc1+Man3GlcNAc2] 19.961.8 26.962.8
N4 3707.26 3707.68 [NeuAc1Hex2HexNAc2+Man3GlcNAc2] 26.361.1 29.962.2
N7 3998.28 3998.78 [NeuAc2Hex2HexNAc2+Man3GlcNAc2] 33.661.9 19.262.0
N10 4363.30 4363.91 [NeuAc2Hex3HexNAc3+Man3GlcNAc2] 9.461.0 8.561.3
aThe asparagine residue harbouring the glycan is underlined.bQuantitative analysis for relative abundance of species was obtained taking into account all the observed multicharged ions. The values are expressed as means (fromthree technical replicates) 6 standard deviations.Glycan species are indicated with the same nomenclature previously used for pHpt-P and pHpt-N [16].doi:10.1371/journal.pone.0052040.t004
Haptoglobin Glycans in Skin Psoriatic Scales
PLOS ONE | www.plosone.org 6 December 2012 | Volume 7 | Issue 12 | e52040

differences between circulating and skin Hpt. Here we report that
the HPLC patterns of glycans from pHpt-P and sHpt-P were
different from that of glycans from pHpt-N. In particular, some
pHpt-P glycans, as compared with pHpt-N glycans displaying the
same GU value, were present at lower level, or missing whereas
other glycans were more abundant. The observed quantitative
differences were enhanced in the pattern from skin Hpt. In this
pattern we detected greater amounts of two major peaks, and
material containing highly branched glycans. These data provide
evidence on changes in glycan structures linked to Hpt of patients
with psoriasis, and suggest that disease condition enhances glycan
branching and Fuc content. In this frame, the finding that
quantitatively rather than qualitatively changes increase in glycans
of skin Hpt, as compared with those of pHpt-P, led us to argue that
glycoforms of the former protein population might diffuse from
epidermis to blood thus modifying the glycoform composition of
circulating Hpt. Hpt with altered glycosylation pattern might be
produced by keratinocytes [13] in the skin at the site of
inflammation and secreted into the plasma. Our hypothesis on
changes and source of psoriasis-associated Hpt glycoforms was
strengthened by results from experiments with lectins. In fact,
besides the HPLC experiments, also the assays of Hpt reactivity to
specific lectins indicate that pHpt-P contains more highly
branched glycans and higher Fuc level than pHpt-N, and such a
difference increases with skin Hpt. The MS analysis of skin Hpt
confirmed that clear differences in the N-glycan repertoire do exist
between psoriatic and healthy subjects. Actually P2 glycoforms
with fucosylated tri- or tetra-antennary N-glycans (Lk, Lw, Lx, Ly,
and Lz), that were not previously detected in pHpt-P and pHpt-N
[16], were detected in sHpt-P. The finding of the glycoform Lw
also in the glycan repertoire of sHpt-N suggests that its glycan
structure is specifically associated with skin Hpt, and not with the
disease. Moreover, the amount of fucosylated residues was higher
in sHpt-P than in sHpt-N. Significant increases in Fuc levels and
glycan branching in Hpt have been found to be associated with
ovarian cancer [21,30], lung cancer [31], pancreatic cancer [23],
Table 5. Glycopeptides in the P1 repertoire of Hpt tryptic digest from plasma of patients in disease remission.
SpeciesObserved Mass(Da)
Calculated Mass(Da) Glycopeptide P1 (MVSHHNLTTGATLINEQWLLTTAK)a
Relative peakintensityb
M1 4227.02 4226.93 [NeuAc1Hex1HexNAc1+Man3GlcNAc2] 25.861.5
M2 4300.51 4300.97 [Hex2HexNAc2+Man3GlcNAc2] 5.460.8
M3 4591.56 4592.06 [NeuAc1Hex2HexNAc2+Man3GlcNAc2] 23.361.3
M4 4883.61 4883.16 [NeuAc2Hex2HexNAc2+Man3GlcNAc2] 41.362.6
M6 5248.66 5248.29 [NeuAc2Hex3HexNAc3+Man3GlcNAc2] 5.260.8
aThe asparagine residue harbouring the glycan is underlined.bQuantitative analysis for relative abundance of species was obtained taking into account all the observed multicharged ions. The values are expressed as means (fromthree technical replicates) 6 standard deviations.Glycan species are indicated with the same nomenclature previously used for pHpt-P and pHpt-N [16].doi:10.1371/journal.pone.0052040.t005
Table 6. Glycopeptides in the P2 repertoire of Hpt tryptic digest from plasma of patients in disease remission.
SpeciesObserved Mass(Da)
Calculated Mass(Da) Glycopeptide P2 (NLFLNHSENATAK)a
Relative peakintensityb
L2 4993.82 4993.99 [NeuAc1Hex2HexNAc2+Man3GlcNAc2] + [Hex2HexNAc2+Man3GlcNAc2] 3.560.7
L3 5067.96 5068.03 [Hex3HexNAc3+Man3GlcNAc2] + [Hex2HexNAc2+Man3GlcNAc2] 3.960.5
L4 5284.93 5285.08 [NeuAc1Hex1HexNAc1+Man3GlcNAc2] + [NeuAc1Hex2HexNAc2+Man3GlcNAc2] 8.461.0
L5 5358.97 5359.12 [Hex2HexNAc2+Man3GlcNAc2] + [NeuAc1Hex3HexNAc3+Man3GlcNAc2] 8.860.7
Lw 5430.03 5431.14 [NeuAc1Hex2HexNAc2+Man3GlcNAc2+Fuc1] + [NeuAc1Hex2HexNAc2+Man3GlcNAc2] 12.260.8
Lx 5504.09 5505.18 [NeuAc1Hex3HexNAc3+Man3GlcNAc2+Fuc1] + [Hex2HexNAc2+Man3GlcNAc2] 6.560.6
L6 5575.88 5576.18 [NeuAc2Hex2HexNAc2+Man3GlcNAc2] + [NeuAc1Hex2HexNAc2+Man3GlcNAc2] 7.660.2
L7 5650.08 5650.21 [NeuAc1Hex2HexNAc2+Man3GlcNAc2] + [NeuAc1Hex3HexNAc3+Man3GlcNAc2] 4.260.3
L9 5796.11 5796.27 [NeuAc1Hex3HexNAc3+Man3GlcNAc2+Fuc1] + [NeuAc1Hex2HexNAc2+Man3GlcNAc2] 6.160.5
L10 5866.80 5867.27 [NeuAc2Hex2HexNAc2+Man3GlcNAc2] + [NeuAc2Hex2HexNAc2+Man3GlcNAc2] 9.460.5
L11 5941.74 5941.31 [NeuAc2Hex3HexNAc3+Man3GlcNAc2] + [NeuAc1Hex2HexNAc2+Man3GlcNAc2] 10.261.0
L14 6161.34 6161.40 [NeuAc1Hex3HexNAc3+Man3GlcNAc2+Fuc1] + [NeuAc1Hex3HexNAc3+Man3GlcNAc2] 9.361.5
L16 6307.41 6307.46 [NeuAc1Hex3HexNAc3+Man3GlcNAc2+Fuc1] +[NeuAc1Hex3HexNAc3+Man3GlcNAc2+Fuc1]
4.860.5
L21 6672.36 6672.60 [NeuAc1Hex4HexNAc4+Man3GlcNAc2+Fuc1] +[NeuAc1Hex3HexNAc3+Man3GlcNAc2+Fuc1]
5.160.8
aThe asparagine residue harbouring the glycan is underlined.bQuantitative analysis for relative abundance of species was obtained taking into account all the observed multicharged ions. The values are expressed as means (fromthree technical replicates) 6 standard deviations. Glycan species are indicated with the same nomenclature previously used for pHpt-P and pHpt-N [16].doi:10.1371/journal.pone.0052040.t006
Haptoglobin Glycans in Skin Psoriatic Scales
PLOS ONE | www.plosone.org 7 December 2012 | Volume 7 | Issue 12 | e52040

colon cancer [32] and hepatocellular carcinoma [33]. A body of
information is available about highly branched glycans and
increased Fuc level in other acute phase glycoproteins in several
diseases. Therefore, it is conceivable that such glycans might play a
role during inflammation. On the other side, changes in normal
glycan structures might be associated with loss of normal function.
These two consequences of glycan modification might not be
alternative, and both might occur in disease. As a matter of fact,
glycans of Hpt are known to be engaged in binding haemoglobin
[34], but pHpt-P was found displaying lower binding activity than
pHpt-N [15].
Our results also show that Hpt from patients contains lower
amount in sialic acid residues a2,6-linked to galactose than normal
Hpt. This type of glycosidic bond is required for immunosuppres-
sion of lymphocytes B [35]. Conversely, in psoriasis, Hpt contains
higher amount in sialic acid residues a2,3-linked to galactose than
normal Hpt. This change in the type of glycosidic bond likely
occurs on tri-antennary chains because a2,3-sialyltrasferase shows
a much higher affinity than a2,6-sialyltransferase for arms growing
on branched glycans [36]. Therefore increase in the amount of
a2,3-linked sialic acid well agrees with increase in branching of
Hpt from patients. These features are both known to promote the
binding of glycoproteins to Galectin-3 [37,38]. Hpt glycoforms
which binds Galectin-3 were actually detected [39,40]. Galectins is
known to play regulatory roles in inflammation, immunity and
cancer [41–44]. In particular, Galectin-3 plays a number of roles
on lymphocytes T such as modulation of cell adhesion and
induction of apoptosis [45], and secretion of IL-6 [46]. Galectin-3
is abundantly expressed also by keratinocytes and other epithelial
cell, and was suggested to inhibit ERK and stimulate Akt [47]. It is
therefore conceivable that Hpt, in the skin of patients with
psoriasis, might participate to mechanisms regulating the immune
response. Also Galectin-1 was found bound to Hpt glycoforms,
that were present at increased levels in sera of patients with breast
cancer [48]. These glycoforms, containing N-linked glycans with
less terminal sialic acids and more arms than normal glycoforms,
had different trafficking, as compared to non-bound glycoforms,
after their endocytosis into macrophages [48]. Further analyses are
needed to evaluate whether skin Hpt interacts with Galectin-1 or
Galectin-3 in the skin, or targets cells involved in the autoimmune
response in psoriasis, and to disclose molecular mechanisms in
which the specific glycoforms we detected might participate (o fail
to participate).
The analysis of glycan structures of pHpt-R showed the
presence of a lower amount of fucosylated and highly branched
structures, when compared with the previously reported N-glycan
repertoire of pHpt-P [16]. Furthermore, the N-glycan repertoire of
pHpt-R revealed the presence of two glycoforms (namely Lw and
Lx). Since these glycan structures were present in sHpt-P and
sHpt-N, but not in pHpt-N and pHpt-P [16], this result suggests
that the anti-TNF-a treatment might support Lw and Lx
production in the anti-inflammatory response.
In conclusion, three glycoforms (Lk, Ly and Lx) were specifically
detected only in psoriatic skin, and might be used as markers of the
pathology, although it remains to clarify whether these glycoforms
are specific for psoriasis or are also associated with skin diseases
different from psoriasis. However, a more detailed analysis of
changes in the glycan structures of Hpt from both plasma and skin
is required to assess whether these changes are associated with
disease progression and/or relapse.
Materials and Methods
MaterialsChemicals of the highest purity, bovine serum albumin (BSA),
human Hpt (mixed phenotypes: Hpt 1-1, Hpt 1–2, Hpt 2–2),
rabbit anti-human Hpt IgG, goat anti-rabbit horseradish perox-
idase-conjugated (GAR-HRP) IgG, o-phenylenediamine (OPD), 2-
aminobenzamide, N-glycosidase from Flavobacterium meningosepticum
(PNGase F, E.C. 3.5.1.52), phenylmethanesulfonyl fluoride
(PMSF), and Avidin conjugated with horseradish peroxidase
(Avidin-HRP), were purchased from Sigma-Aldrich (St. Louis,
MO, USA). Organic solvents were purchased from Romil
(Cambridge, UK), and polystyrene 96-wells microtiter plates from
Nunc (Roskilde, Denmark). 2-aminobenzamide-labelled glycans,
and glucose oligomers for HPLC calibration were obtained from
Ludger (Culham Science Center, Oxfordshire, UK). Discovery
DPA-6S solid-phase extraction columns were purchased from
Supelco (Bellefonte, PA, USA), and the TSK-gel Amide-80
column was from Tosoh Bioscience (Stuttgart, Germany).
Sephacryl S-200, HiTrap Blue HP polypropylene column, and
CNBr-activated Sepharose CL-4B of GE Healthcare (Uppsala,
Sweden) were used. The Biotin-labelled lectins LTA, MAA, SNA,
and ConA were purchased from EY laboratories (San Mateo, CA,
USA).
Ethic statementsThe present investigation conforms to the principles outlined in
the declaration of Helsinki, and it was approved by the Ethics
Committee of the University of Naples Federico II. Patients and
healthy subjects were enrolled in the study after their informed
consent.
Table 7. Glycopeptides in the P3 repertoire of Hpt tryptic digest from patients in disease remission.
Species Observed Mass (Da) Calculated Mass (Da) Glycopeptide P3 (VVLHPNYSQVDIGLIK)aRelative peakintensityb
N1 3051.15 3051.45 [Hex1HexNAc1+Man3GlcNAc2] 14.761.6
N2 3342.20 3342.55 [NeuAc1Hex1HexNAc1+Man3GlcNAc2] 27.062.3
N4 3707.26 3707.68 [NeuAc1Hex2HexNAc2+Man3GlcNAc2] 28.961.6
N7 3998.28 3998.78 [NeuAc2Hex2HexNAc2+Man3GlcNAc2] 22.161.6
N10 4363.30 4363.91 [NeuAc2Hex3HexNAc3+Man3GlcNAc2] 7.360.9
aThe asparagine residue harbouring the glycan is underlined.bQuantitative analysis for relative abundance of species was obtained taking into account all the observed multicharged ions. The values are expressed as means (fromthree technical replicates) 6 standard deviations.Glycan species are indicated with the same nomenclature previously used for pHpt-P and pHpt-N [16].doi:10.1371/journal.pone.0052040.t007
Haptoglobin Glycans in Skin Psoriatic Scales
PLOS ONE | www.plosone.org 8 December 2012 | Volume 7 | Issue 12 | e52040
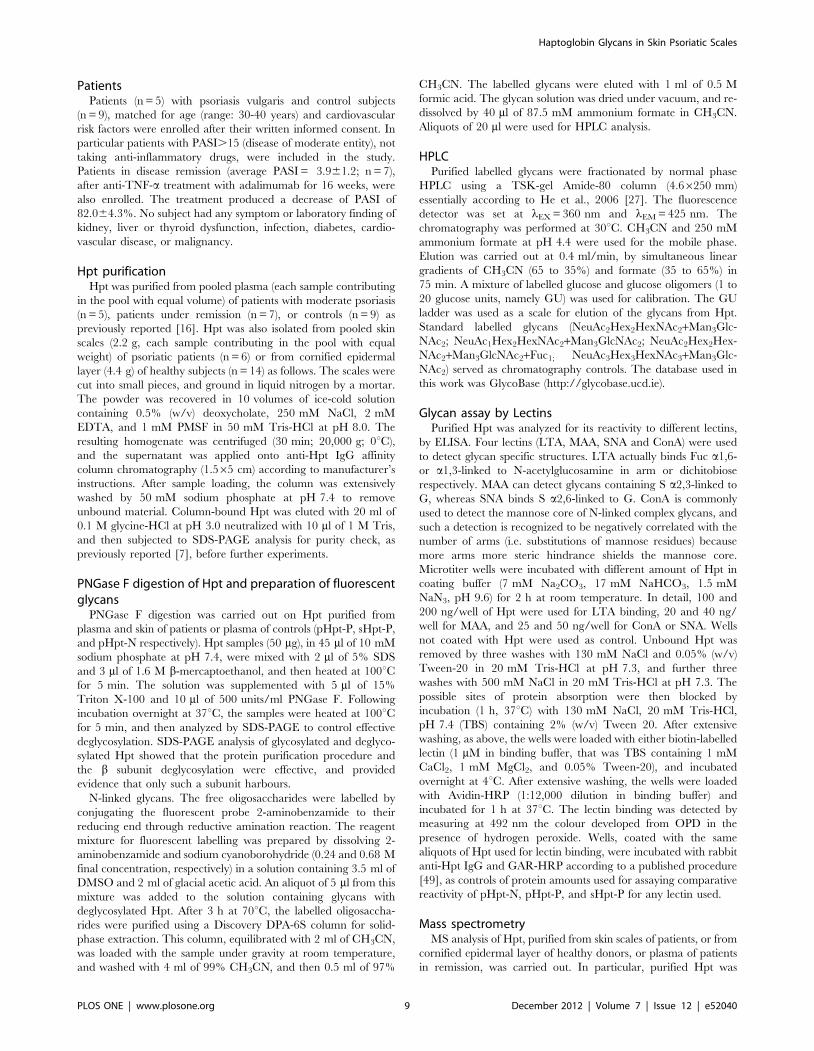
PatientsPatients (n = 5) with psoriasis vulgaris and control subjects
(n = 9), matched for age (range: 30-40 years) and cardiovascular
risk factors were enrolled after their written informed consent. In
particular patients with PASI.15 (disease of moderate entity), not
taking anti-inflammatory drugs, were included in the study.
Patients in disease remission (average PASI = 3.961.2; n = 7),
after anti-TNF-a treatment with adalimumab for 16 weeks, were
also enrolled. The treatment produced a decrease of PASI of
82.064.3%. No subject had any symptom or laboratory finding of
kidney, liver or thyroid dysfunction, infection, diabetes, cardio-
vascular disease, or malignancy.
Hpt purificationHpt was purified from pooled plasma (each sample contributing
in the pool with equal volume) of patients with moderate psoriasis
(n = 5), patients under remission (n = 7), or controls (n = 9) as
previously reported [16]. Hpt was also isolated from pooled skin
scales (2.2 g, each sample contributing in the pool with equal
weight) of psoriatic patients (n = 6) or from cornified epidermal
layer (4.4 g) of healthy subjects (n = 14) as follows. The scales were
cut into small pieces, and ground in liquid nitrogen by a mortar.
The powder was recovered in 10 volumes of ice-cold solution
containing 0.5% (w/v) deoxycholate, 250 mM NaCl, 2 mM
EDTA, and 1 mM PMSF in 50 mM Tris-HCl at pH 8.0. The
resulting homogenate was centrifuged (30 min; 20,000 g; 0uC),
and the supernatant was applied onto anti-Hpt IgG affinity
column chromatography (1.565 cm) according to manufacturer’s
instructions. After sample loading, the column was extensively
washed by 50 mM sodium phosphate at pH 7.4 to remove
unbound material. Column-bound Hpt was eluted with 20 ml of
0.1 M glycine-HCl at pH 3.0 neutralized with 10 ml of 1 M Tris,
and then subjected to SDS-PAGE analysis for purity check, as
previously reported [7], before further experiments.
PNGase F digestion of Hpt and preparation of fluorescentglycans
PNGase F digestion was carried out on Hpt purified from
plasma and skin of patients or plasma of controls (pHpt-P, sHpt-P,
and pHpt-N respectively). Hpt samples (50 mg), in 45 ml of 10 mM
sodium phosphate at pH 7.4, were mixed with 2 ml of 5% SDS
and 3 ml of 1.6 M b-mercaptoethanol, and then heated at 100uCfor 5 min. The solution was supplemented with 5 ml of 15%
Triton X-100 and 10 ml of 500 units/ml PNGase F. Following
incubation overnight at 37uC, the samples were heated at 100uCfor 5 min, and then analyzed by SDS-PAGE to control effective
deglycosylation. SDS-PAGE analysis of glycosylated and deglyco-
sylated Hpt showed that the protein purification procedure and
the b subunit deglycosylation were effective, and provided
evidence that only such a subunit harbours.
N-linked glycans. The free oligosaccharides were labelled by
conjugating the fluorescent probe 2-aminobenzamide to their
reducing end through reductive amination reaction. The reagent
mixture for fluorescent labelling was prepared by dissolving 2-
aminobenzamide and sodium cyanoborohydride (0.24 and 0.68 M
final concentration, respectively) in a solution containing 3.5 ml of
DMSO and 2 ml of glacial acetic acid. An aliquot of 5 ml from this
mixture was added to the solution containing glycans with
deglycosylated Hpt. After 3 h at 70uC, the labelled oligosaccha-
rides were purified using a Discovery DPA-6S column for solid-
phase extraction. This column, equilibrated with 2 ml of CH3CN,
was loaded with the sample under gravity at room temperature,
and washed with 4 ml of 99% CH3CN, and then 0.5 ml of 97%
CH3CN. The labelled glycans were eluted with 1 ml of 0.5 M
formic acid. The glycan solution was dried under vacuum, and re-
dissolved by 40 ml of 87.5 mM ammonium formate in CH3CN.
Aliquots of 20 ml were used for HPLC analysis.
HPLCPurified labelled glycans were fractionated by normal phase
HPLC using a TSK-gel Amide-80 column (4.66250 mm)
essentially according to He et al., 2006 [27]. The fluorescence
detector was set at lEX = 360 nm and lEM = 425 nm. The
chromatography was performed at 30uC. CH3CN and 250 mM
ammonium formate at pH 4.4 were used for the mobile phase.
Elution was carried out at 0.4 ml/min, by simultaneous linear
gradients of CH3CN (65 to 35%) and formate (35 to 65%) in
75 min. A mixture of labelled glucose and glucose oligomers (1 to
20 glucose units, namely GU) was used for calibration. The GU
ladder was used as a scale for elution of the glycans from Hpt.
Standard labelled glycans (NeuAc2Hex2HexNAc2+Man3Glc-
NAc2; NeuAc1Hex2HexNAc2+Man3GlcNAc2; NeuAc2Hex2Hex-
NAc2+Man3GlcNAc2+Fuc1; NeuAc3Hex3HexNAc3+Man3Glc-
NAc2) served as chromatography controls. The database used in
this work was GlycoBase (http://glycobase.ucd.ie).
Glycan assay by LectinsPurified Hpt was analyzed for its reactivity to different lectins,
by ELISA. Four lectins (LTA, MAA, SNA and ConA) were used
to detect glycan specific structures. LTA actually binds Fuc a1,6-
or a1,3-linked to N-acetylglucosamine in arm or dichitobiose
respectively. MAA can detect glycans containing S a2,3-linked to
G, whereas SNA binds S a2,6-linked to G. ConA is commonly
used to detect the mannose core of N-linked complex glycans, and
such a detection is recognized to be negatively correlated with the
number of arms (i.e. substitutions of mannose residues) because
more arms more steric hindrance shields the mannose core.
Microtiter wells were incubated with different amount of Hpt in
coating buffer (7 mM Na2CO3, 17 mM NaHCO3, 1.5 mM
NaN3, pH 9.6) for 2 h at room temperature. In detail, 100 and
200 ng/well of Hpt were used for LTA binding, 20 and 40 ng/
well for MAA, and 25 and 50 ng/well for ConA or SNA. Wells
not coated with Hpt were used as control. Unbound Hpt was
removed by three washes with 130 mM NaCl and 0.05% (w/v)
Tween-20 in 20 mM Tris-HCl at pH 7.3, and further three
washes with 500 mM NaCl in 20 mM Tris-HCl at pH 7.3. The
possible sites of protein absorption were then blocked by
incubation (1 h, 37uC) with 130 mM NaCl, 20 mM Tris-HCl,
pH 7.4 (TBS) containing 2% (w/v) Tween 20. After extensive
washing, as above, the wells were loaded with either biotin-labelled
lectin (1 mM in binding buffer, that was TBS containing 1 mM
CaCl2, 1 mM MgCl2, and 0.05% Tween-20), and incubated
overnight at 4uC. After extensive washing, the wells were loaded
with Avidin-HRP (1:12,000 dilution in binding buffer) and
incubated for 1 h at 37uC. The lectin binding was detected by
measuring at 492 nm the colour developed from OPD in the
presence of hydrogen peroxide. Wells, coated with the same
aliquots of Hpt used for lectin binding, were incubated with rabbit
anti-Hpt IgG and GAR-HRP according to a published procedure
[49], as controls of protein amounts used for assaying comparative
reactivity of pHpt-N, pHpt-P, and sHpt-P for any lectin used.
Mass spectrometryMS analysis of Hpt, purified from skin scales of patients, or from
cornified epidermal layer of healthy donors, or plasma of patients
in remission, was carried out. In particular, purified Hpt was
Haptoglobin Glycans in Skin Psoriatic Scales
PLOS ONE | www.plosone.org 9 December 2012 | Volume 7 | Issue 12 | e52040

analyzed by MS, after trypsin digestion and fragments fraction-
ation by UPLC, as previously reported [16].
Decoding of sugar composition into structure ofcomplex N-linked glycans
Three N-linked glycopeptides were expected to result from Hpt
(accession number: P00738) digestion by trypsin, namely glycosy-
lated fragments P1, P2, and P3 (containing the amino acid
sequences 179–202, 203–215, and 236–251, respectively). The
data on the carbohydrate composition were obtained as follows.
The mass of a given glycopeptide was considered to be the sum of
glycan mass plus peptide mass. Therefore, the masses of P1
(2679.39), P2 (1458.74), and P3 (1795.01) were subtracted from
each glycopeptides mass, and the three resulting values were
analyzed separately for their content in units of hexose (Hex, H for
acronym), N-acetylhexosamine (HexNAc, HN for acronym),
deoxyhexose (dHex), and N-acetylneuraminic acid (NeuAc, or S
for acronym as already mentioned).
Composition decoding was done by a step-to-step building up
procedure starting from the reducing end of the glycan, according
to current information and nomenclature for structures of N-
linked complex glycans. Thus, for example, the composition unit
HexNAc2Hex3 was considered to account for dichitobiose (two
residues of N-acetylglucosamine joined by a b1–4 glycosidic bond),
followed by a mannose core (b1–4 linked mannose, which is 3-O-
and 6-O-substituted with two a mannose), and named Man3-
GlcNAc2. Further steps were substitutions of the mannose core
with HexNAc, which is named antenna, or bisecting if linked to
terminal or dichitobiose-linked mannose, respectively. Each arm
was elongated with Hex (galactose). NeuAc, when present, was
considered to be at the terminal end of the arm. Substitution of
dichitobiose or arm(s) with Fuc accounted for dHex units. Where
Fuc is linked (on dichitobiose or antenna) and whether NeuAc is
a2,3 or a2,6 linked to Hex was not assessed in this study. Thus, a
mass compatible with, for example, Hex5HexNAc4NeuAc1 was
expressed as (NeuAc1Hex2HexAc2+Man3GlcNAc2) in MS anal-
ysis or HN4H5S1 for brevity. Similarly, the carbohydrate
composition from two glycans of P2, e.g. (NeuAc1Hex1Hex-
NAc1+Man3GlcNAc2) together with (NeuAc1Hex2HexNAc2+-Man3GlcNAc2) was also expressed as HN7H9S2.
StatisticsIn the HPLC experiments, at least three separate preparations
of Hpt glycans were used, and inter-assay CV for homologous
peaks of pHpt-N, pHpt-P, or sHpt-P was calculated. In assays of
lectin binding, experiments with three separate preparations of
pHpt-N, pHpt-P, and sHpt-P were carried out, and five equal
aliquots of each preparation were analyzed. In these assays, data
from each experiment were expressed as means 6 SEM. Statistical
differences were determined using t-test or, where appropriate,
one-way ANOVA, followed by Tukey’s test for multiple compar-
isons (GraphPad Software Inc., San Diego, CA). Differences were
considered statistically significant when the two-sided P value was
less than 0.05.
Acknowledgments
The skilful technical assistance of Dr. C.R. Pugliese in ELISA experiments
is acknowledged.
Author Contributions
Conceived and designed the experiments: BM LC PA MMC FA.
Performed the experiments: LC BM MSS FDP AB. Analyzed the data:
LC BM MSS MMC FDP PA. Contributed reagents/materials/analysis
tools: LC MSS FDP FA NB MN PA. Wrote the paper: LC BM MSS PA.
References
1. Langlois MR, Delange JR (1996) Biological and clinical significance of
haptoglobin polymorphism in humans. Clin Chem 4: 1589–1600.
2. Wada T, Oara H, Watanabe K, Kinoshita H, Yachi A (1970) Autoradiographic
study on the site of uptake of the haptoglobin-hemoglobin complex.
J Reticuloendothel Soc 8: 185–193.
3. Bowman BH, Kurosky A (1982) Haptoglobin: the evolutionary product of
duplication, unequal crossing over, and point mutation. Adv Hum Genet 12:
189–261, 453–454.
4. Kalmovarin N, Friedrichs WE, O’Brien HV, Linehan LA, Bowman BH, et al.
(1991) Extrahepatic expression of plasma protein genes during inflammation.
Inflammation 15: 369–379.
5. de Kleijn DP, Smeets MB, Kemmeren PP, Lim SK, Van Middelaar BJ, et al.
(2002) Acute-phase protein Haptoglobin is a cell migration factor involved in
arterial restructuring. FASEB J 16: 1123–1125.
6. Spagnuolo MS, Cigliano L, D’Andrea LD, Pedone C, Abrescia P (2005)
Assignment of the binding site for haptoglobin on apolipoprotein A-I. J Biol
Chem 280: 1193–1198.
7. Cigliano L, Pugliese CR, Spagnuolo MS, Palumbo R, Abrescia P (2009)
Haptoglobin binds the anti-atherogenic protein Apolipoprotein E: impairment
of the apolipoprotein E stimulation on both the enzyme lecithin-cholesterol
acyltransferase activity and cholesterol uptake by hepatocytes. FEBS J 276:
6158–6171.
8. Dobrotina NA, Ezhova GP (1977) Glycoprotein components of the skin under
normal conditions and in several types of pathology (in Russian). Vopr Med
Khim 23: 215–219.
9. Dobryszycka W (1997) Biological functions of haptoglobin-new pieces to an old
puzzle. Eur J Clin Chem Clin Biochem 35: 647–654.
10. Lim SK, Kim H, Lim SK, bin Ali A, Lim YK, et al. (1998) Increased
susceptibility in Hp knockout mice during acute hemolysis. Blood 92: 1870–
1877.
11. Yang F, Haile DJ, Berger FG, Herbert DC, Van Beveren E, et al. (2003)
Haptoglobin reduces lung injury associated with exposure to blood. Am J Physiol
Lung Cell Mol Physiol 284: L402–L409.
12. D’Armiento J, Dalal SS, Chada K (1997) Tissue, temporal and inducible
expression pattern of haptoglobin in mice. Gene 195: 19–27.
13. Wang H, Gao XH, Wang YK, Li P, He CD, et al. (2005) Expression of
haptoglobin in human keratinocytes and Langerhans cells. Br J Dermatol 153:
894–899.
14. Xie Y, Li Y, Zhang Q, Stiller MJ, Wang CL, et al (2000) Haptoglobin is a
natural regulator of Langerhans cell function in the skin. J Dermatol Sci 24: 25–
37.
15. Cigliano L, Maresca B, Salvatore A, Nino M, Monfrecola G, et al. (2008)
Haptoglobin from psoriatic patients exhibits decreased activity in binding
haemoglobin and inhibiting lecithin-cholesterol acyltransferase activity. J Eur
Acad Dermatol 22: 417–425.
16. Maresca B, Cigliano L, Corsaro MM, Pieretti G, Natale M, et al. (2010)
Quantitative determination of haptoglobin glycoform variants in psoriasis. Biol
Chem 391: 1429–1439.
17. Varki A, Freeze HH (2009) Essentials of Glycobiology. Cold Spring Harbor
(NY). p 784.
18. Kurosky A, Barnett DR, Lee TH, Touchstone B, Hay RE, et al. (1980) Covalent
structure of human haptoglobin: a serine protease homolog. Proc Natl Acad Sci
USA 77: 3388–3392.
19. Thompson S, Dargan E, Griffiths ID, Kelly CA, Turner GA (1993) The
glycosylation of haptoglobin in rheumatoid arthritis. Clin Chim Acta 220: 107–
114.
20. Piva M, Moreno JI, Sharpe-Timms KL (2002) Glycosylation and over-
expression of endometriosis-associated peritoneal haptoglobin. Glycoconj J 19:
33–41
21. Thompson S, Dargan E, Turner GA (1992) Increased fucosylation and other
carbohydrate changes in Haptoglobin in ovarian cancer. Cancer Lett 66: 43–48.
22. Fujimura T, Shinohara Y, Tissot B, Pang PC, Kurogochi M, et al. (2008)
Glycosylation status of Haptoglobin in sera of patients with prostate cancer vs
benign prostate disease or normal subject. Int J Cancer 122: 39–49.
23. Nakano M, Nakagawa T, Ito T, Kitada T, Hijioka T, et al. (2008) Site-specific
analysis of N-glycans on haptoglobin in sera of patients with pancreatic cancer: a
novel approach for the development of tumor markers. Int J Cancer 122: 2301–
2309.
24. Ferens-Sieczkowska M, Midro A, Mierzejewska-Iwanowska B, Zwierz K,
Katnik-Prastowska I (1999) Haptoglobin glycoforms in a case of carbohydrate-
deficient glycoprotein syndrome. Glycoconj J 16: 573–577.
Haptoglobin Glycans in Skin Psoriatic Scales
PLOS ONE | www.plosone.org 10 December 2012 | Volume 7 | Issue 12 | e52040

25. Mann AC, Record CO, Self CH, Turner GA (1994) Monosaccharide
composition of haptoglobin in liver diseases and alcohol abuse: large changesin glycosylation associated with alcoholic liver disease. Clin Chim Acta 227: 69–
78.
26. Spagnuolo MS, Cigliano L, Maresca B, Pugliese CR, Abrescia P (2011)Identification of plasma haptoglobin forms which loosely bind hemoglobin. Biol
Chem 392: 371–376.27. He Z, Aristoteli LP, Kritharides L, Garner B (2006) HPLC analysis of discrete
haptoglobin isoform N-linked oligosaccharides following 2D-PAGE isolation.
Biochem Bioph Res Com 343: 496–503.28. Azuma Y, Murata M, Matsumoto K (2000) Alteration of sugar chains on
alpha(1)-acid glycoprotein secreted following cytokine stimulation of HuH-7 cellsin vitro. Clin Chim Acta 294: 93–103.
29. Ishibashi Y, Inouye Y, Okano T, Taniguchi A (2005) Regulation of sialyl-lewis xepitope expression by TNF-alpha and EGF in an airway carcinoma cell line,
Glycoconj J 22: 53–62.
30. Saldova R, Royle L, Radcliffe CM, Abd Hamid UM, Evans R, et al. (2007)Ovarian cancer is associated with changes in glycosylation in both acute-phase
proteins and IgG. Glycobiology 17: 1344–1356.31. Kossowska B, Ferens-Sieczkowska M, Gancarz R, Passowicz-Muszynska E,
Jankowska R (2005) Fucosylation of serum glycoproteins in lung cancer patients.
Clin Chem Lab Med 43: 361–369.32. Park SY, Lee SH, Kawasaki N, Itoh S, Kang K, et al. (2011) a1-3/ fucosylation
at Asn 241 of b-haptoglobin is a novel marker for colon cancer: A combinatorialapproach for development of glycan biomarkers. Int J Cancer 130 (10): 2366–
2376.33. Comunale MA, Lowman M, Long RE, Krakover J, Philip R, et al. (2006)
Proteomic analysis of serum associated fucosylated glycoproteins in the
development of primary hepatocellular carcinoma. J Proteome Res 5: 308–315.34. Kaartinen V, Mononen I (1998) Hemoglobin binding to deglycosylated
haptoglobin. Biochem Biophys Acta 14: 345–352.35. Hanasaki K, Powell LD, Varki A (1995) Binding of human plasma
sialoglycoproteins by the B-cell specific lectin CD-22. Selective recognition of
immunoglobulin M and haptoglobin. J Biol Chem 270: 7543–7550.36. Nemansky M, Schiphorst WE, Van den Eijnden DH (1995) Branching and
elongation with lactosaminoglycan chains of N-linked oligosaccharides result in ashift toward termination with alpha 2–.3-linked rather than with alpha 2–.6-
linked sialic acid residues. FEBS Lett 363: 280–284.
37. Leffler H, Carlsson S, Hedlund M, Qian Y, Poirier F (2004) Introduction to
galectins. Glycoconj J 19: 433–440.38. Stowell SR, Arthur CM, Mehta P, Slanina KA, Blixt O, et al. (2008) Galectin-1,
22, and 23 exhibit differential recognition of sialylated glycans and blood group
antigens. J Biol Chem 283: 10109–10123.39. Cederfur C, Salomonsson E, Nilsson J, Halim A, Oberg CT, et al. (2008)
Different affinity of galectins for human serum glycoproteins: Galectin-3 bindsmany protease inhibitors and acute phase proteins. Glycobiology 18: 384–394.
40. Bresalier RS, Bryd JC, Tessler D, Lebel J, Koomen J, et al. (2004) A circulating
ligand for galectin-3 is a haptoglobin-related glycoprotein elevated in individualswith colon cancer. Gastroenterology 127: 741–748.
41. Almkvist J, Karlsson A (2004) Galectins as inflammatory mediators. Glycoconj J19: 575–581.
42. Dumic J, Dabelic S, Flogel M (2006) Galectin-3: an open-ended story. BiochimBiophys Acta 1760: 616–635.
43. Ideo H, Seko A, Yamashita K (2005) Galectin-4 binds to sulfated glycosphin-
golipids and carcinoembryonic antigen in patches on the cell surface of humancolon adenocarcinoma cells. J Biol Chem 280: 4730–4737.
44. Rabinovich GA, Liu FT, Hirashima M, Anderson A (2007) An emerging role forgalectins in tuning the immune response: lessons from experimental models of
inflammatory disease, autoimmunity and cancer. Scand J Immunol 66: 143–
158.45. Chen IJ, Chen HL, Demetriou M (2007) Lateral compartmentalization of T cell
receptor versus CD45 by Galectin-N-glycan binding and microfilamentscoordinate basal and activation signalling. J Biol Chem 282: 35361–35372.
46. Fukaya Y, Shimada H, Wang LC, Zandi E, DeClerck YA (2008) Identificationof galectin-3-binding protein as a factor secreted by tumor cells that stimulates
interleukin-6 expression in the bone marrow stroma. J Biol Chem 283: 18573–
18581.47. Saegusa J, Hsu DK, Liu W, Kuwabara I, Kuwabara Y (2008) Galectin-3
protects keratinocytes from UVB-induced apoptosis by enhancing AKTactivation and suppressing ERK activation. J Invest Dermatol 128: 2403–2411.
48. Carlsson MC, Cederfur C, Schaar V, Balog CIA, Lepur A (2011) Galectin-1-
Binding Glycoforms of Haptoglobin with Altered Intracellular Trafficking, andIncrease in Metastatic Breast Cancer Patients. PLoS ONE 6: e26560.
49. Cigliano L, Spagnuolo MS, Abrescia P (2003) Quantitative variations of theisoforms in haptoglobin 1–2 and 2–2 individual phenotypes. Arch Biochem
Biophys 416: 227–237.
Haptoglobin Glycans in Skin Psoriatic Scales
PLOS ONE | www.plosone.org 11 December 2012 | Volume 7 | Issue 12 | e52040