development of the mussel aquaculture lease site model musmod ©: a field program to calibrate model...
TRANSCRIPT
LJournal of Experimental Marine Biology and Ecology,219 (1998) 143–169
Development of the mussel aquaculture lease site modelMUSMOD : a field program to calibrate model formulations
a , b c*Carter R. Newell , Daniel E. Campbell , Scott M. GallagheraGreat Eastern Mussel Farm, Inc. P.O. Box 141, Tenants Hbr., ME 04860, USA
bUSEPA, Atlantic Ecology Division, 27 Tarzwell Dr., Narragansett, RI 02882, USAcDepartment of Biology, Woods Hole Oceanographic Instutution, Woods Hole, MA 02543, USA
Accepted 25 June 1997
Abstract
Field observations were used along with mathematical modelling to develop model formulationsto represent mussel (Mytilus edulis) growth at several shallow subtidal study sites along the Maine
coast, USA. In order to match predicted growth from the model MUSMOD (D.E. Campbell,C.R. Newell, 1997. MUSMOD : A mussel production model for use on bottom culture lease sites.
J. Exp. Mar. Biol. Ecol., in press.) with observed growth rates in the field, modifications weremade in the model with respect to: (a) factors affecting the supply of food to the mussel feedingzone (vertical mixing, settling, resuspension and particle depletion); (b) short-term variability inmussel feeding and respiration over a tidal cycle; (c) the effects of seasonal variations in foodquality on assimilation, scope for growth, and observed growth.
Surface and bottom water samples taken from 1989 to 1991 revealed daily fluctuations in SPM,POM, chlorophyll a, particulate carbon and nitrogen, and phytoplankton carbon which weresimilar to annual ranges. Maine waters are typified by a spring diatom bloom, followed by a rise indetritus in early summer. Successful representation of mussel growth was obtained when foodconcentration was expressed as phytoplankton and detrital carbon, and assimilation was modelledas a function of food type (phytoplankton or detritus), and detritus quality (as percent of maximumannual N/C ratio of the detritus). By expressing particle depletion as a percent reduction fromconditions at the edge of the lease site, scope for growth was modelled over an annual period.
Observations with a time-lapse benthic video monitor (TLBVM) and flow-through physiologi-cal chambers demonstrated tidal variations in filtration rate, respiration rate and shell gape insubtidal mussels, with periods of valve closure correlated with low particle concentrations. Theseobservations support the hypothesis that mussel energy gain is maximized during fluctuating foodavailability by the control of pumping rate via the shell gape response. This may explain why fieldobservations of filtration rate are sometimes lower than maximum published values, and allows themussels to maintain a slightly positive scope for growth by reducing respiratory losses when foodparticles are limiting.
The settling flux of phytoplankton and detritus, while poorly characterized in coastal New
*Corresponding author.
0022-0981/98/$19.00 1998 Elsevier Science B.V. All rights reserved.PII S0022-0981( 97 )00179-2
144 C.R. Newell et al. / J. Exp. Mar. Biol. Ecol. 219 (1998) 143 –169
England waters, provides over 30% of the estimated food supply to subtidal mussel cultures andmay explain, in part, the patterns of shell gape observed in this study. 1998 Elsevier ScienceB.V.
1. Introduction
This paper, along with and Newell and Shumway (1993), and Campbell and Newell(1997), describes investigations of inshore oceanography coupled with studies of sestonquality, mussel scope for growth and observed growth at subtidal bottom culture sites inMaine, USA. Through a cooperative effort of mathematical modelling and field research,
we were able to develop the model (MUSMOD ) over a period of 3 years which metthe dual criteria of being as simple as possible to accurately represent mussel growth atthe site, and complex enough to include most of the major mechanisms controlling foodsupply and demand at relatively high energy, low turbidity sites along the Maine coast.
The general purpose of MUSMOD is to predict the growth of juvenile musselsseeded on bottom aquaculture lease sites in relation to the natural conditions whichdetermine the maximum production or ‘carrying capacity’ of the site. For an aquacultur-ist, control of the mussel seed size (10–40 mm), time of year seeded (May toNovember), and seeding density (between 200 and 1000 per square meter) maysignificantly increase mussel growth rates and seed to harvest yields. At a given time ofyear, mussel biomass will reach a maximum (carrying capacity) and growth ofindividual shellfish will largely be a function of seeding density. Previous studies(Hosomi, 1985; Hughes and Griffeths, 1988; Newell, 1990; Svane and Ompi, 1991)have shown that mussels reach asymptotic mass per unit area at any given site. In
22Maine, productive sites may reach 1 kg dry weight m during certain times of the year(Newell, 1990).
The effects of food competition may be influenced at two scales: within a musselpatch due to strong horizontal sub-meter gradients in food concentration (Frechette et al.,1989, 1994, see Figure 26; Newell and Shumway, 1993) and mussel growth rates(Newell, 1990); and within the lease site where the bottom waters are gradually depletedin seston in the downstream direction. By minimizing individual mussel patch size,growth rates in relation to seeding density becomes largely a function of food supply and
demand at the site, which is characterized in the model MUSMOD using the fieldmeasurements of phytoplankton and detrital carbon, detritus quality, current speed andwater depth, and mussel clearance rates. Modelling bivalve growth is accomplished byconsidering the conditions of food availability at the edge of the culture site, wheredepletion is not expected to occur, and by predicting the scope for growth (Bayne andNewell, 1983) over an annual cycle. The effects of depletion on growth at locationswithin the lease site have previously been examined using the finite difference model ofFrechette et al. (1989), which predicted particle concentration contours in the down-stream direction. Use of the finite difference model of Frechette et al. (1989) allowed usto adjust mussel seeding densities to produce a predicted maximum of 50% particledepletion over a kilometer scale under typical culture conditions (Figure 2 in Newell and
C.R. Newell et al. / J. Exp. Mar. Biol. Ecol. 219 (1998) 143 –169 145
Shumway, 1993). The food ration is reduced by a certain percentage, and scope forgrowth is calculated accordingly. The net result is that observed growth is a function ofboth food supply, as well as particle depletion by the filter feeders.
We present here data from a field program at Mud Cove, Maine, where the modelMUSMOD was first developed. Patterns of food supply, estimates of food quality,
short-term patterns of demand by the mussels, scope for growth and observed growthwere used to improve the representation of mussel growth in a model which places newemphasis on the importance of the settling flux to mussels, and the consideration of tidalvariations in pumping rate through the shell gape response in situ.
2. Materials and methods
2.1. Water sampling
Water sampling methods are described in Newell and Shumway, 1993. The fieldexperiments were performed at Mud Cove, Stinson Neck, Stonington, Maine (448 N,688W), at a shallow (1 m depth at low tide) 11 ha bottom lease. Tidal range varies from
213 to 4 m, mean current speed varies from 7.8 to 15 cm s within the site, and tidalexchange was estimated as 78% for spring versus 62% at neap tides. Both surface (1 mbelow water surface) and bottom (0–15 cm off the bottom) 2.2-liter grab samples weretaken using an alpha bottle (Grizzle, 1988). Samples were analyzed for chlorophyll ausing a whole water technique (0.975-ml samples placed in chilled acetone and filteredseawater blank-corrected; Phinney and Yentsch, 1985); particulate carbon and nitrogen,POC and PON (250-ml samples, using pre-ashed GFC filters, a Perkin-Elmer CHNelemental analyzer and acetanilide as a standard); phytoplankton species, biovolume andcarbon equivalents (2-ml settled volumes, conversion to carbon after Strathmann, 1967);particulate organic matter (POM) and suspended particulate matter (SPM: 1-l samplesusing pre-washed pre-tared 47-mm GFC filters). SPM and POM samples were pre-washed with 3% ammonium formate, (unwashed samples overestimated SPM by 2.54and POM by 1.35). Dry weight of seston was based on drying at 808C to constantweight, and POM was calculated from the weight loss upon ignition at 4508C. Samplesdried to constant weight at 80 versus 1208C were not significantly different. This is incontrast to some other studies where higher temperatures were used to remove hydratedwater from the seston (e.g. Urrutia et al., 1996). The POC samples were not exposed toHCl to remove carbonates.
2.2. Physiological experiments
Repeated physiological measurements on the same individual as well as on severalanimals simultaneously conducted under identical environmental conditions duringwhich food or oxygen levels do not drop below physiological thresholds necessitates theuse of efflux, or flow-through methodologies. Such an apparatus was assembled inside ashed along the shore and intake water was pumped from the lease site using a Tealsubmersible pump (0.5 m off the bottom) into a 30-l insulated cooler (head tank)
146 C.R. Newell et al. / J. Exp. Mar. Biol. Ecol. 219 (1998) 143 –169
through which a 243-mm filter covered the outflow to a metering pump. The 10-channelMasterflex pump provided uniform flow to the metabolic chambers, and the pump was
21adjustable to keep the flow rate in each chamber between 50 and 250 ml min . Flowfrom the head tank was provided to surge chambers, which reduced the pulse effect ofthe pump and trapped all air bubbles. In a 120-l cooler, the 10 metabolic chambers (eightto nine experimental, one to two controls) were held in an ambient water bath, belowwhich was placed a submerged magnetic stirring system. Mussels were placed onplatforms in individual jars with stirring rods. The number of mussels (two to nine) andmussel size (0.14–1.39 g) was varied between chambers to obtain similar amounts ofbiomass in each chamber. Water flowed to the bottom of the jar through a glass tube,then out the surface. Tubes coming out of each chamber were sampled using Coultercounter vials, and analyzed in triplicate (3–40 mm diameter) using a Coulter Zm
Counter, and corrected for filtered seawater blanks. Filtration rate was calculated as:
filtration rate 5 flow rate 3 (C 2 C ) /C (1)i o o
where C is the particle concentration in control waters and C is the concentration fromi o
the mussel chambers, i.e. the concentration around the mussels (Hildreth and Crisp,1976) when a stir bar is used.
All filtration rates were converted to rates of a standard animal of 1 g dry tissueweight using an exponent of 0.66 (Mohlenberg and Riisgard, 1979). Differencesbetween experimental and control chambers were usually about 10–20% during theexperiments.
We measured mussel respiration by slowing down the flow from rates used in feeding21experiments (e.g. from 200 to 50 ml min ) and measuring the differences in oxygen
tension between control and experimental chambers with a Strathkelvin oxygen meter.Respiration rates were converted to a standard animal using an exponent of 0.75(Riisgard and Randlov, 1981).
Absorption (or assimilation) efficiency was assessed using the Conover ash tracermethod (Conover, 1966), by pipetting feces from each mussel chamber and comparingthe organic to inorganic ratio of the feces with 1-l water samples taken from the controlchambers during the runs.
Scope for growth, in calories per hour, was estimated using the equation of Frechetteand Grant (1991), based on the carbon and nitrogen content of the seston and musselfiltration, respiration and absorption efficiency (AE) as follows:
C 5V 3 P (2)p CN
21where C is food consumption, V is filtration rate in l h and P is sum of particulatep CN
carbon and nitrogen in the seston. Energy content of the organic matter E, in calories permg dry weight, was calculated after Platt and Irwin (1973) as:
E 5 2 0.555 1 0.113 (%C) 1 0.054 (C:N) (3)
We then calculated energy intake as:
C 5 C 3 E (4)e p
C.R. Newell et al. / J. Exp. Mar. Biol. Ecol. 219 (1998) 143 –169 147
using the average C:N ratio of 7.26 for Mud Cove. Respiration was converted intoenergy units using the conversion 1 ml oxygen520.1 J (Gnaiger, 1983). Scope forgrowth was calculated as:
21SFG (cal h ) 5 (C 3 AE) 2 R (5)e
2.3. Growth samples
From April to June, 1990, 1000 metric tons of mussels of mean size 38 mm (dry22tissue weight 0.2 g) were seeded at an initial bottom density of about 500 m within
the lease area. Mussel growth samples were obtained using a PONAR grab sampler2 2(0.0523 m ) from a boat or a diver-operated coring device (0.0613 m ) randomly placed
along a 100-m transect (see also Newell, 1990). After determining shell length andpacked shell volume from the larger sample, a total of 30–50 mussels were randomlysub-sampled for dry meat weight (at 808C) and shell length. Mussel shell length and drytissue weight were log transformed and the linear regression coefficient was used to10
calculate the corresponding dry tissue weight for the mean shell length of each sample.
2.4. Time-lapse benthic video monitor
Video experiments were performed at the upstream edge of the lease on the flood tidein November, 1990, and near the middle of the lease site in April, 1991 (Fig. 1). Aquadrapod mounted time-lapse benthic video monitor (TLBVM) was developed atWoods Hole Oceanographic Institution using a video camcorder with a close-up lens, apressure housing, a time-lapse control mechanism, two side-mounted lights, and a powersource. The unit was designed such that the lens was 1 m from the bottom andsuspended over a mussel patch so as not to interfere with boundary layer flow. The openarea between the legs was placed perpendicular to current direction during the fielddeployments. Detachable concrete pads (25 kg) were attached to the base of thequadrapod to prevent falling over during the field experiments. The TLBVM was placedover seeded mussel patches for a 10-h period in November, 1990, and a 17-h period inApril, 1991. After recovering the camera, the distances between the valves weremeasured from a video screen at 10-min intervals for 30–35 individual mussels. Datawere then expressed as percent of maximum shell gape over time. Prior to and duringthe November, 1990, video experiments, mussel filtration rates and oxygen consumptionrates were measured in flow-through chambers (efflux apparatus) using water pumped,from 0.5 m off the bottom, 100 m to a shore-side shed as described above.
2.5. Laboratory experiments
In order to investigate the response of shell gape to additions of algae, a group ofmussels from the study site was placed in a recirculating flume in the laboratory andpulsed additions of cultured algae were coupled with video measurements of shell gape.Tracings of an in vivo fluorometer were calibrated to cell densities using a microscopesettling chamber.
148 C.R. Newell et al. / J. Exp. Mar. Biol. Ecol. 219 (1998) 143 –169
2.6. Current speed
During all the field experiments, an Interocean S4 electromagnetic current meter wasdeployed at a height of 0.5 m off the bottom near the TLBM with measurements ofcurrent speed, current direction, water temperature and water depth taken at 10-minintervals for periods of 2 (11/90) and 1 min (4 /91) respectively.
2.7. Statistical tests
All statistical tests were performed on Systat version 5.0. For physiological tests, amultivariate repeated measures ANOVA (see Ward et al., 1992 for more discussion) wasused, since the same mussels were measured over time to determine the effects of tidalstage on filtration rate.
3. Results
3.1. Laboratory experiments
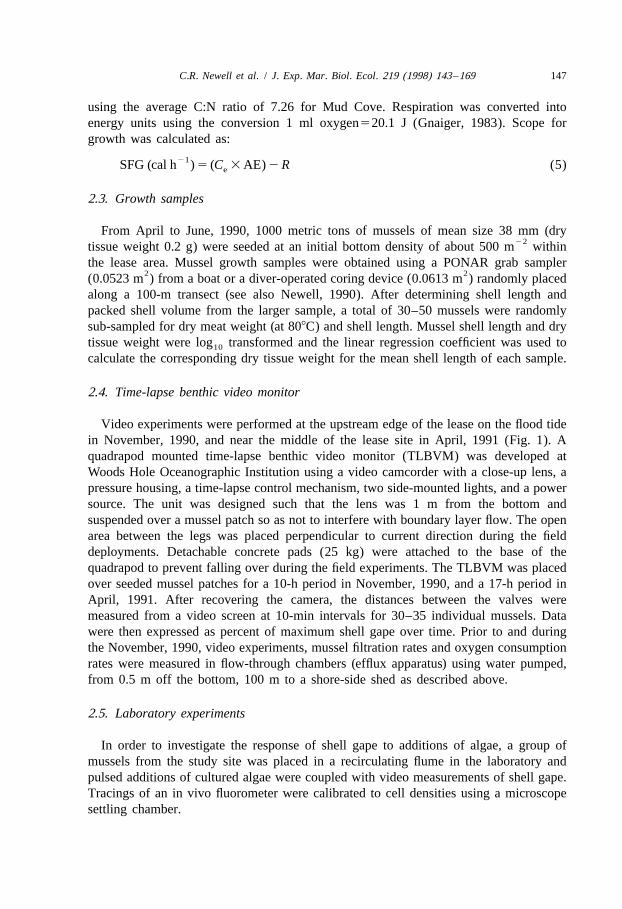
Mussel responses to pulsed addition of algae are presented in Fig. 1. Within 10 min ofincreases in phytoplankton concentration, mussels opened shell valves and increased
Fig. 1. Response of mussel shell gape (as % maximum for each individual) to pulsed additions of culturedalgae.
C.R. Newell et al. / J. Exp. Mar. Biol. Ecol. 219 (1998) 143 –169 149
pumping rates until the phytoplankton were grazed down and cell populations decreased.Mussel shell gape began to reduce to a relative minimum when algal cell densities were
21at about 10 000 cells ml .
3.2. Food supply
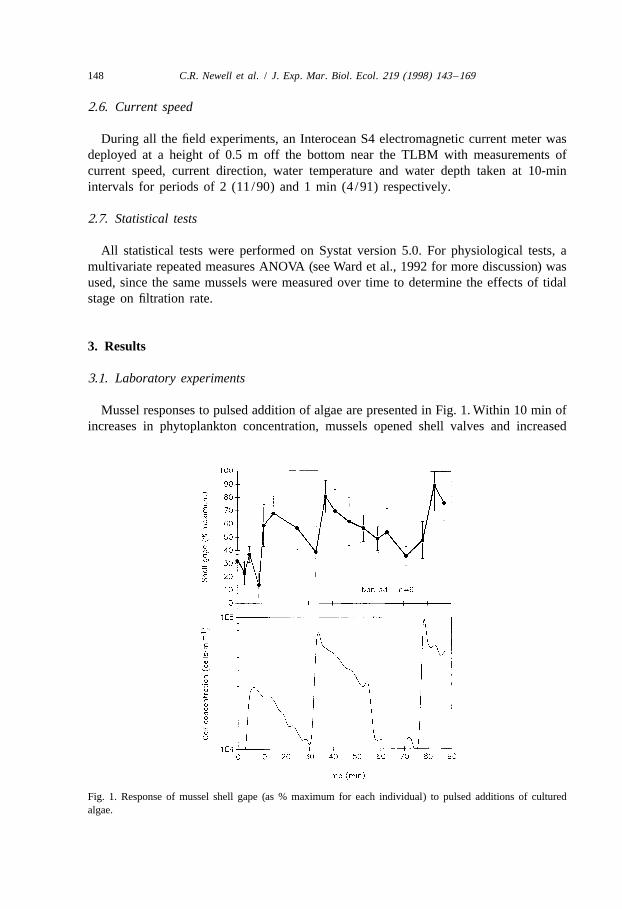
Annual changes in SPM, POM and chlorophyll a in the surface and bottom waters ofMud Cove from January, 1990 to June of 1991 are presented in Fig. 2a, Fig. 2b,respectively, and mean values for seston concentration (using mean of surface andbottom samples for each sampling date) are presented in Table 1. The waters aregenerally well-mixed, with surface and bottom grab samples similar in seston con-centration. As presented in Table 7 in Newell and Shumway (1993), surface and bottommean values for Mud Cove showed nearly identical mean values of POC, PON,chlorophyll a, SPM and POM, but phytoplankton carbon was 32% higher in the surfacewaters, due to in part to water stratification in the summer and also to depletion by themussels from the bottom waters. We only used samples from the edge of the lease site todevelop the food curves for model calibrations and validations.
Because food quality estimates depend on POC and PON samples as well as ofmeasurements of phytoplankton carbon using cell volumes, we investigated thepossibility of using chlorophyll a as estimated from fluorescence as a cheaper indicatorof phytoplankton carbon. Mean, standard error, and regression coefficients for sites inMaine are presented in Table 2.
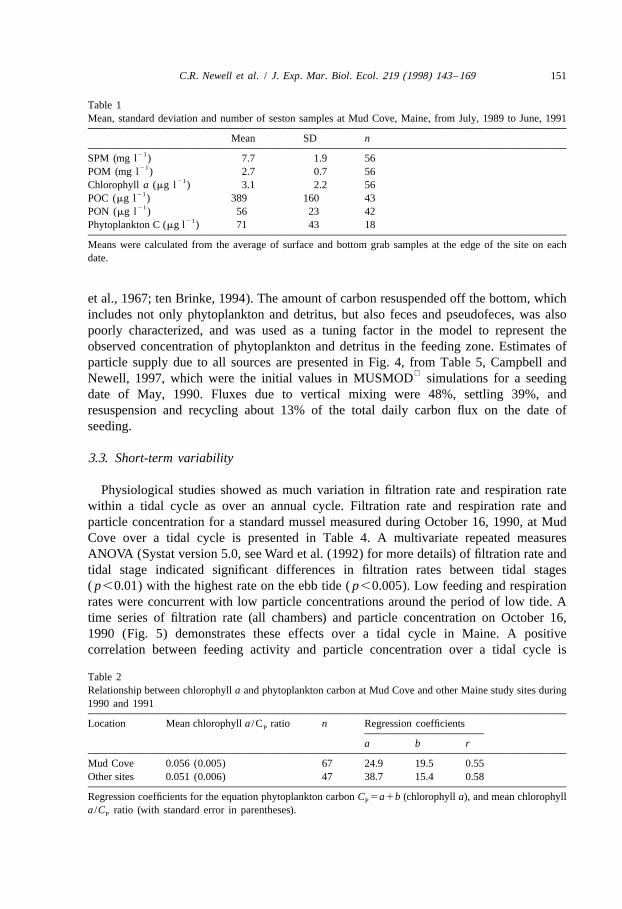
Ranges in seston concentration over a daily period are similar in range to annualvariability. Typically, there is spring bloom of phytoplankton which is represented bythe peak in chlorophyll a, followed by a peak in detrital carbon, calculated as totalcarbon2phytoplankton carbon (based on cell volumes and carbon equivalents). Detritalcarbon increased following a decrease in phytoplankton carbon and declined in latesummer and through the autumn and winter (Fig. 3a), while detrital quality (Fig. 3b)increased in the fall. The timing of the spring bloom varied between years; in 1990 therewere a series of peaks in chlorophyll a from January to May, while in 1991 the bloomwas mainly during April and May. The presence or absence of a fall phytoplanktonbloom at Mud Cove varied between years, resulting in different modelled growth ofmussel tissue (see Campbell and Newell, 1997, Figure 9).
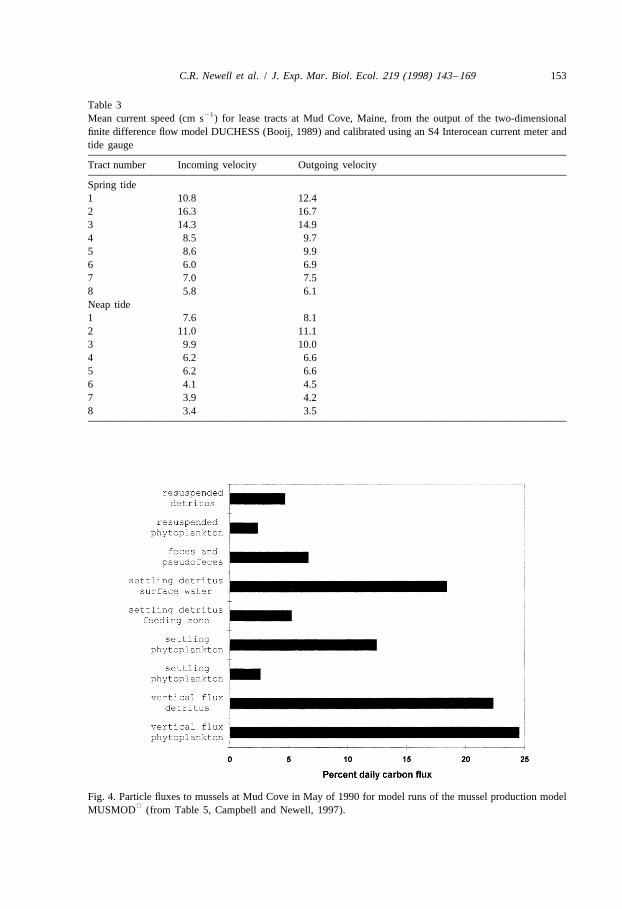
The supply of food to the bottom was modelled as a function of vertical mixing drivenby the mean current speed (Campbell and Newell, 1997), settling and resuspension. Weestimated vertical mixing using an explicit formulation of the shear velocity U * fromcurrent speed, bottom roughness and water depth (see Table 2, Newell and Shumway,1993), and were able to simulate food vertically transported by tidal currents at specificlocations (e.g. 2–3-ha tracts) within this well-mixed site from the output of thetwo-dimensional finite difference hydrodynamic model DUCHESS (Booij, 1989). Meanincoming and outgoing current speeds for each lease tract on spring and neap tides arepresented in Table 3. This table illustrates the importance of a flow model in determiningthe spatial variability in current speed within a site for the estimating of food supply tomussels. For example, lease tracts 2 and 3 have twice the mean current speed of tracts 6and 7.
150 C.R. Newell et al. / J. Exp. Mar. Biol. Ecol. 219 (1998) 143 –169
Fig. 2. Changes in SPM, POM (a) and chlorophyll a (b) in the surface and bottom waters of Mud Cove, Mainefrom January, 1990 to June, 1991. Samples were taken from the edge of the lease site on the incoming tide.
The importance of particle settling at slack water was observed when experiments toinvestigate mussel feeding, respiration and patterns of shell gape in relation to food fluxwere performed over a tidal cycle (see below). We used a particle settling rate of 5 m
21day to estimate the settling flux based on literature values of marine aggregates inestuaries with similar SPM levels, and from natural phytoplankton populations (Eppley
C.R. Newell et al. / J. Exp. Mar. Biol. Ecol. 219 (1998) 143 –169 151
Table 1Mean, standard deviation and number of seston samples at Mud Cove, Maine, from July, 1989 to June, 1991
Mean SD n21SPM (mg l ) 7.7 1.9 5621POM (mg l ) 2.7 0.7 56
21Chlorophyll a (mg l ) 3.1 2.2 5621POC (mg l ) 389 160 4321PON (mg l ) 56 23 42
21Phytoplankton C (mg l ) 71 43 18
Means were calculated from the average of surface and bottom grab samples at the edge of the site on eachdate.
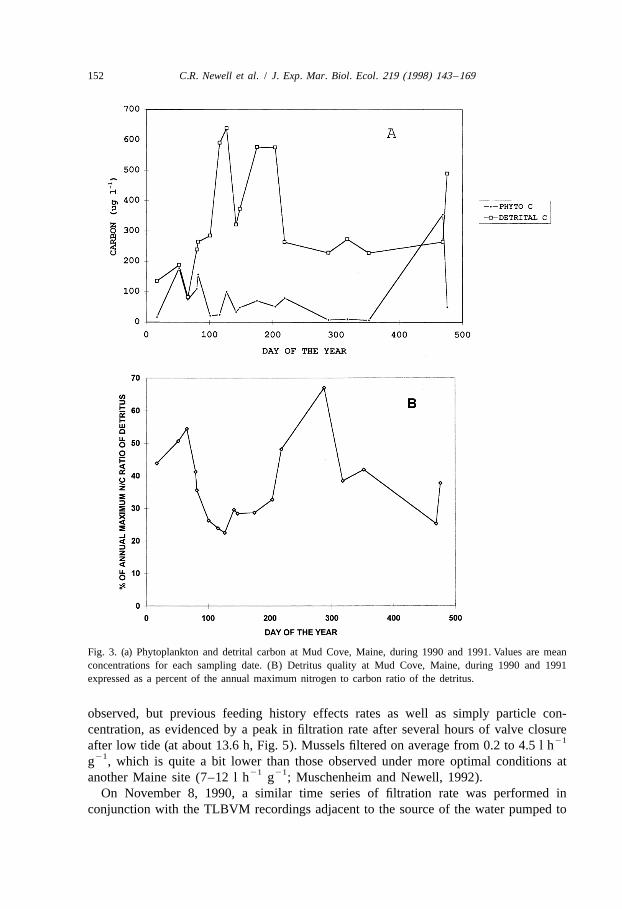
et al., 1967; ten Brinke, 1994). The amount of carbon resuspended off the bottom, whichincludes not only phytoplankton and detritus, but also feces and pseudofeces, was alsopoorly characterized, and was used as a tuning factor in the model to represent theobserved concentration of phytoplankton and detritus in the feeding zone. Estimates ofparticle supply due to all sources are presented in Fig. 4, from Table 5, Campbell and
Newell, 1997, which were the initial values in MUSMOD simulations for a seedingdate of May, 1990. Fluxes due to vertical mixing were 48%, settling 39%, andresuspension and recycling about 13% of the total daily carbon flux on the date ofseeding.
3.3. Short-term variability
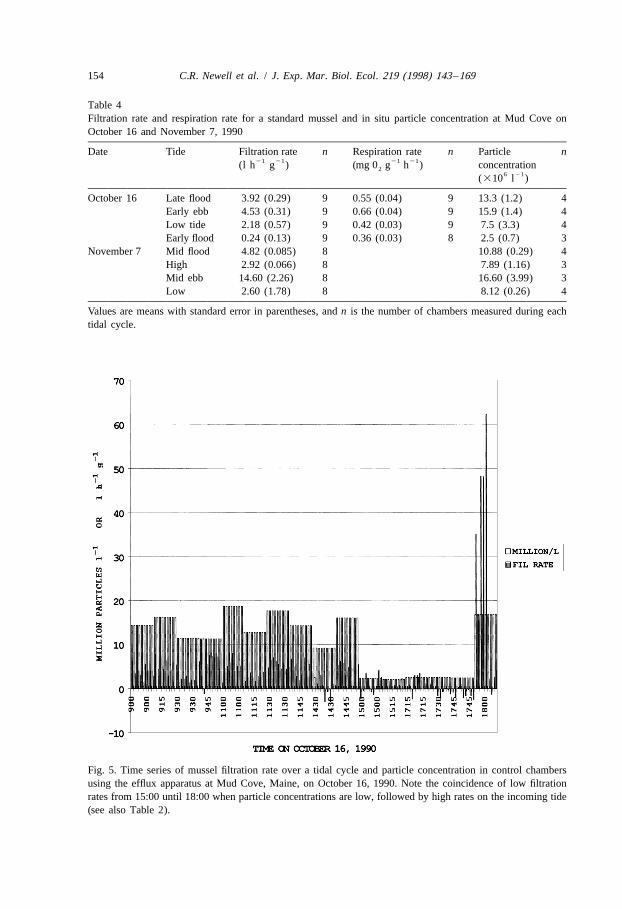
Physiological studies showed as much variation in filtration rate and respiration ratewithin a tidal cycle as over an annual cycle. Filtration rate and respiration rate andparticle concentration for a standard mussel measured during October 16, 1990, at MudCove over a tidal cycle is presented in Table 4. A multivariate repeated measuresANOVA (Systat version 5.0, see Ward et al. (1992) for more details) of filtration rate andtidal stage indicated significant differences in filtration rates between tidal stages( p,0.01) with the highest rate on the ebb tide ( p,0.005). Low feeding and respirationrates were concurrent with low particle concentrations around the period of low tide. Atime series of filtration rate (all chambers) and particle concentration on October 16,1990 (Fig. 5) demonstrates these effects over a tidal cycle in Maine. A positivecorrelation between feeding activity and particle concentration over a tidal cycle is
Table 2Relationship between chlorophyll a and phytoplankton carbon at Mud Cove and other Maine study sites during1990 and 1991
Location Mean chlorophyll a /C ratio n Regression coefficientsP
a b r
Mud Cove 0.056 (0.005) 67 24.9 19.5 0.55Other sites 0.051 (0.006) 47 38.7 15.4 0.58
Regression coefficients for the equation phytoplankton carbon C 5a1b (chlorophyll a), and mean chlorophyllP
a /C ratio (with standard error in parentheses).P
152 C.R. Newell et al. / J. Exp. Mar. Biol. Ecol. 219 (1998) 143 –169
Fig. 3. (a) Phytoplankton and detrital carbon at Mud Cove, Maine, during 1990 and 1991. Values are meanconcentrations for each sampling date. (B) Detritus quality at Mud Cove, Maine, during 1990 and 1991expressed as a percent of the annual maximum nitrogen to carbon ratio of the detritus.
observed, but previous feeding history effects rates as well as simply particle con-centration, as evidenced by a peak in filtration rate after several hours of valve closure
21after low tide (at about 13.6 h, Fig. 5). Mussels filtered on average from 0.2 to 4.5 l h21g , which is quite a bit lower than those observed under more optimal conditions at
21 21another Maine site (7–12 l h g ; Muschenheim and Newell, 1992).On November 8, 1990, a similar time series of filtration rate was performed in
conjunction with the TLBVM recordings adjacent to the source of the water pumped to
C.R. Newell et al. / J. Exp. Mar. Biol. Ecol. 219 (1998) 143 –169 153
Table 321Mean current speed (cm s ) for lease tracts at Mud Cove, Maine, from the output of the two-dimensional
finite difference flow model DUCHESS (Booij, 1989) and calibrated using an S4 Interocean current meter andtide gauge
Tract number Incoming velocity Outgoing velocity
Spring tide1 10.8 12.42 16.3 16.73 14.3 14.94 8.5 9.75 8.6 9.96 6.0 6.97 7.0 7.58 5.8 6.1Neap tide1 7.6 8.12 11.0 11.13 9.9 10.04 6.2 6.65 6.2 6.66 4.1 4.57 3.9 4.28 3.4 3.5
Fig. 4. Particle fluxes to mussels at Mud Cove in May of 1990 for model runs of the mussel production modelMUSMOD (from Table 5, Campbell and Newell, 1997).
154 C.R. Newell et al. / J. Exp. Mar. Biol. Ecol. 219 (1998) 143 –169
Table 4Filtration rate and respiration rate for a standard mussel and in situ particle concentration at Mud Cove onOctober 16 and November 7, 1990
Date Tide Filtration rate n Respiration rate n Particle n21 21 21 21(l h g ) (mg 0 g h ) concentration2
6 21(310 l )
October 16 Late flood 3.92 (0.29) 9 0.55 (0.04) 9 13.3 (1.2) 4Early ebb 4.53 (0.31) 9 0.66 (0.04) 9 15.9 (1.4) 4Low tide 2.18 (0.57) 9 0.42 (0.03) 9 7.5 (3.3) 4Early flood 0.24 (0.13) 9 0.36 (0.03) 8 2.5 (0.7) 3
November 7 Mid flood 4.82 (0.085) 8 10.88 (0.29) 4High 2.92 (0.066) 8 7.89 (1.16) 3Mid ebb 14.60 (2.26) 8 16.60 (3.99) 3Low 2.60 (1.78) 8 8.12 (0.26) 4
Values are means with standard error in parentheses, and n is the number of chambers measured during eachtidal cycle.
Fig. 5. Time series of mussel filtration rate over a tidal cycle and particle concentration in control chambersusing the efflux apparatus at Mud Cove, Maine, on October 16, 1990. Note the coincidence of low filtrationrates from 15:00 until 18:00 when particle concentrations are low, followed by high rates on the incoming tide(see also Table 2).
C.R. Newell et al. / J. Exp. Mar. Biol. Ecol. 219 (1998) 143 –169 155
the efflux apparatus (Table 4). A similar pattern of filtration rate was noted, with lowfiltration rates during the periods of low water and early flood tide, associated with lowparticle concentrations, and maximum filtration rates on the ebb, when there was amaximum particle concentration. Multivariate repeated measures ANOVA again indi-cated significant differences in filtration rates between tidal stages ( p.0.01), with thehighest filtration rate during the ebb tide ( p.0.005).
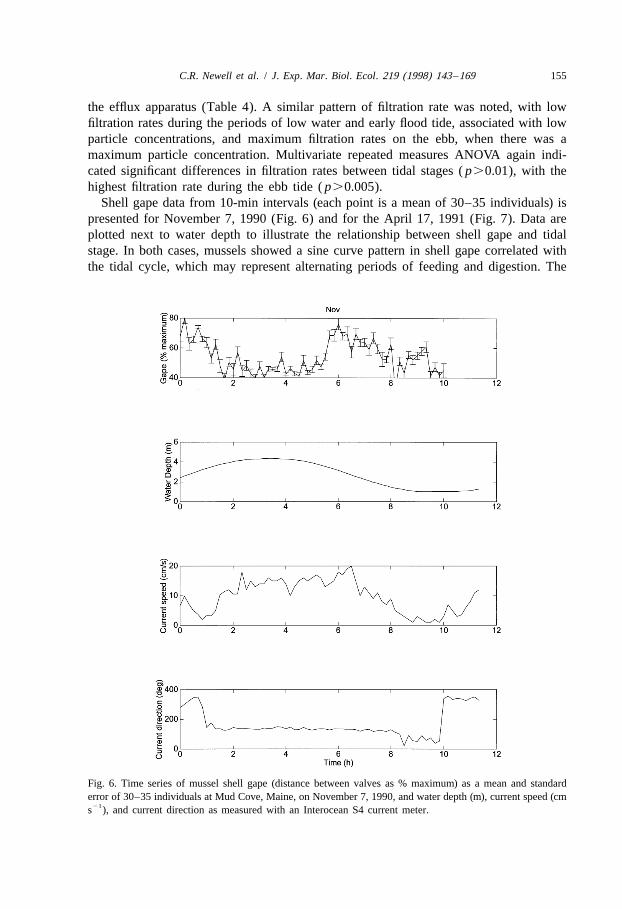
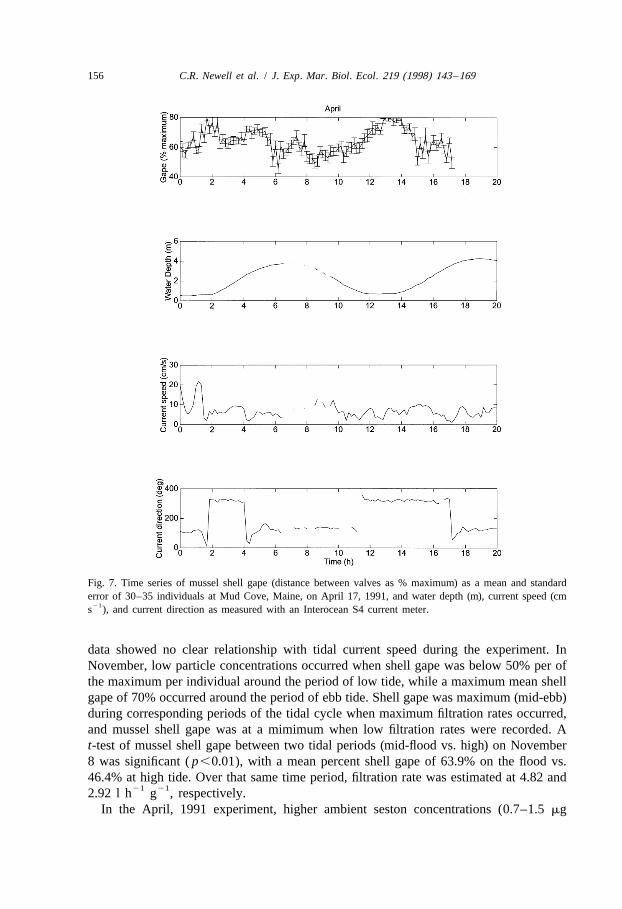
Shell gape data from 10-min intervals (each point is a mean of 30–35 individuals) ispresented for November 7, 1990 (Fig. 6) and for the April 17, 1991 (Fig. 7). Data areplotted next to water depth to illustrate the relationship between shell gape and tidalstage. In both cases, mussels showed a sine curve pattern in shell gape correlated withthe tidal cycle, which may represent alternating periods of feeding and digestion. The
Fig. 6. Time series of mussel shell gape (distance between valves as % maximum) as a mean and standarderror of 30–35 individuals at Mud Cove, Maine, on November 7, 1990, and water depth (m), current speed (cm
21s ), and current direction as measured with an Interocean S4 current meter.
156 C.R. Newell et al. / J. Exp. Mar. Biol. Ecol. 219 (1998) 143 –169
Fig. 7. Time series of mussel shell gape (distance between valves as % maximum) as a mean and standarderror of 30–35 individuals at Mud Cove, Maine, on April 17, 1991, and water depth (m), current speed (cm
21s ), and current direction as measured with an Interocean S4 current meter.
data showed no clear relationship with tidal current speed during the experiment. InNovember, low particle concentrations occurred when shell gape was below 50% per ofthe maximum per individual around the period of low tide, while a maximum mean shellgape of 70% occurred around the period of ebb tide. Shell gape was maximum (mid-ebb)during corresponding periods of the tidal cycle when maximum filtration rates occurred,and mussel shell gape was at a mimimum when low filtration rates were recorded. At-test of mussel shell gape between two tidal periods (mid-flood vs. high) on November8 was significant ( p,0.01), with a mean percent shell gape of 63.9% on the flood vs.46.4% at high tide. Over that same time period, filtration rate was estimated at 4.82 and
21 212.92 l h g , respectively.In the April, 1991 experiment, higher ambient seston concentrations (0.7–1.5 mg
C.R. Newell et al. / J. Exp. Mar. Biol. Ecol. 219 (1998) 143 –169 157
21 21chlorophyll a l , November, 1990 vs. 3.4–9.9 mg chlorophyll a l , April, 1991) wereassociated with greater mean values of shell gape during the spring than the fall (64.0 vs.54.1%, respectively).
Mussel respiration rates observed throughout the year during active feeding were as21 21 21 21high as 0.8 ml O l g , and as low as 0.2 ml O l g during periods of low food2 2
availability and valve closure. Mussel oxygen consumption was highest around high andebb tides, probably due to the importance of tidal transport and settling of food particlesduring these tidal stages.
Variations in absorption efficiency within a week in October of 1990 on three calmdays (October 11, 15 and 16) and one windy day (October 12), are presented in Table 5.Differences in the absorption efficiency of mussels were as high between calm andwindy days during a week as they were over an annual cycle at that site.
3.4. Seasonal patterns
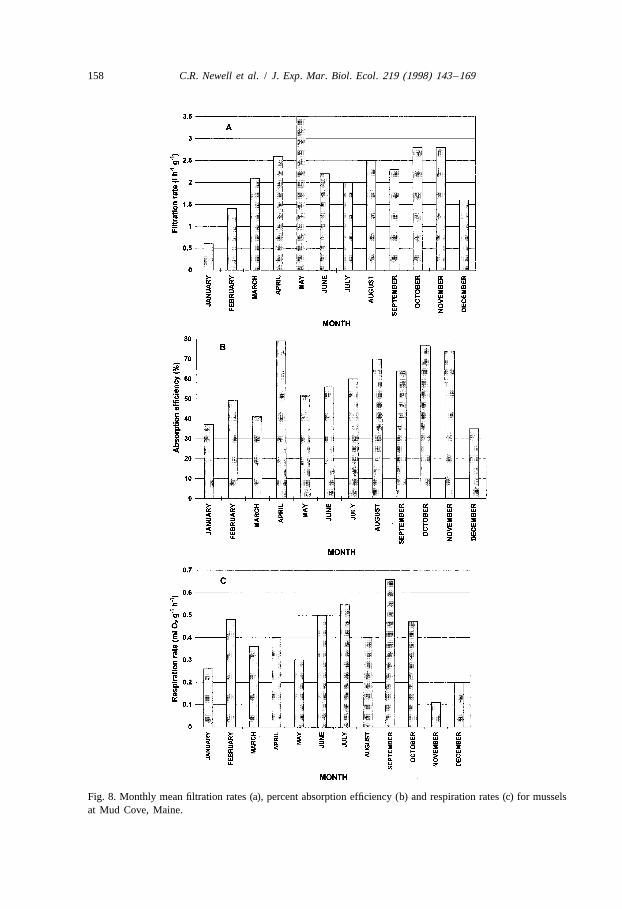
Monthly average filtration rates, assimilation rates and respiration rates for Mud Cove21 21are presented in Fig. 8. Mean mussel filtration rate was equal to or above 2 l h g
from March to November, and lower during the winter months. Percent assimilation washighest during the spring bloom in April (about 80%) and also during the fall, andlowest in winter. Due to the preponderance of diatoms (over 95% of the phytoplanktonbiomass at Mud Cove) in Maine waters, we used a value of 90% for absorptionefficiency of phytoplankton carbon, and a maximum of 65% for absorption of detritus in
the model MUSMOD (Campbell and Newell, 1997) based on a review of the literature.Mussel growth in tissue (see Figure 4, Campbell and Newell, 1997) was the most
rapid in the spring and early summer, during and after the phytoplankton bloom. Thefact that mussel growth continues at a rapid pace after a drop in chlorophyll aconcentrations underscores the importance of freshly settled detritus in the mussel diet.
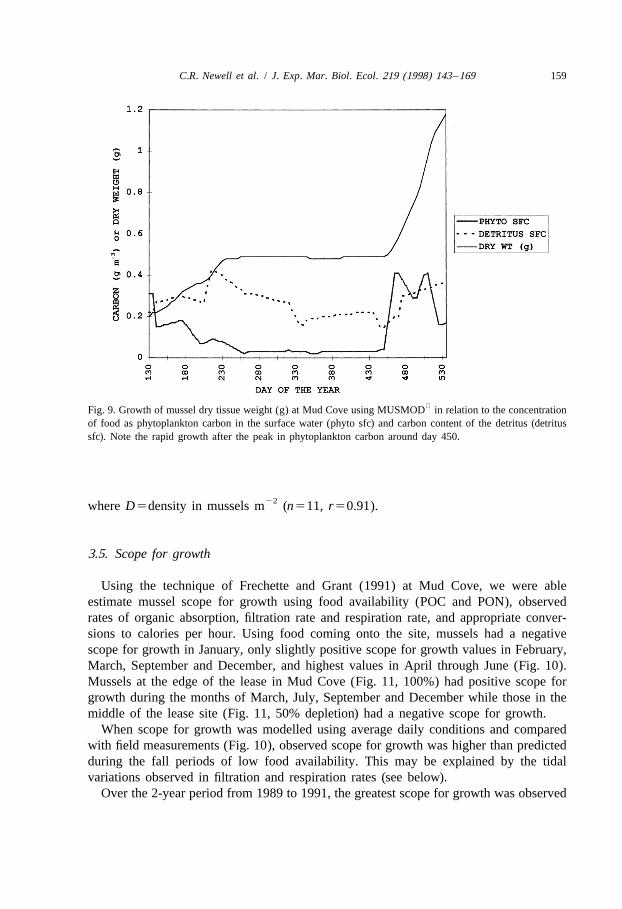
The growth of mussel tissue during the MUSMOD simulations in relation to the foodconcentration is shown in Fig. 9. Rapid growth trajectories in the spring and earlysummer are linked with seasonal maxima of phytoplankton and detritus from April toJune of each year.
The direct effects of density on shell growth were also studied at Mud Cove fromJune, 1990 to March, 1991. Shell growth over the study period was related to bottomdensity by the equation:
21shell growth (mm day ) 5 0.033 2 (0.000011D) (6)
Table 5Absorption efficiency of mussels at Mud Cove during October, 1990. ANOVA indicated a highly significant( p,0.001) effect of date.
Date Mean absorption efficiency (%) SD n
October 11 78.8 5.43 8October 12 52.0 6.99 8October 15 79.9 1.93 8October 16 78.9 3.24 9
158 C.R. Newell et al. / J. Exp. Mar. Biol. Ecol. 219 (1998) 143 –169
Fig. 8. Monthly mean filtration rates (a), percent absorption efficiency (b) and respiration rates (c) for musselsat Mud Cove, Maine.
C.R. Newell et al. / J. Exp. Mar. Biol. Ecol. 219 (1998) 143 –169 159
Fig. 9. Growth of mussel dry tissue weight (g) at Mud Cove using MUSMOD in relation to the concentrationof food as phytoplankton carbon in the surface water (phyto sfc) and carbon content of the detritus (detritussfc). Note the rapid growth after the peak in phytoplankton carbon around day 450.
22where D5density in mussels m (n511, r50.91).
3.5. Scope for growth
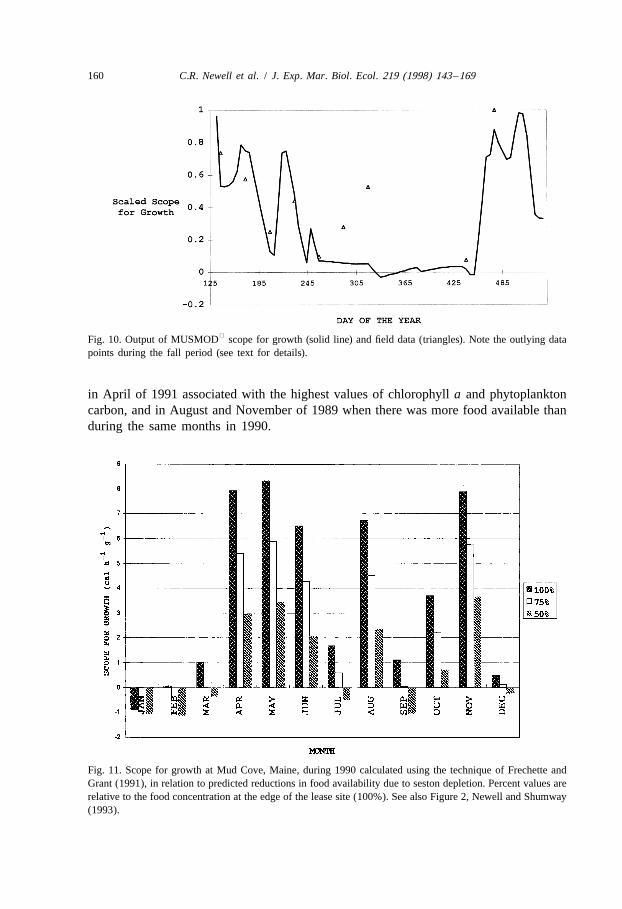
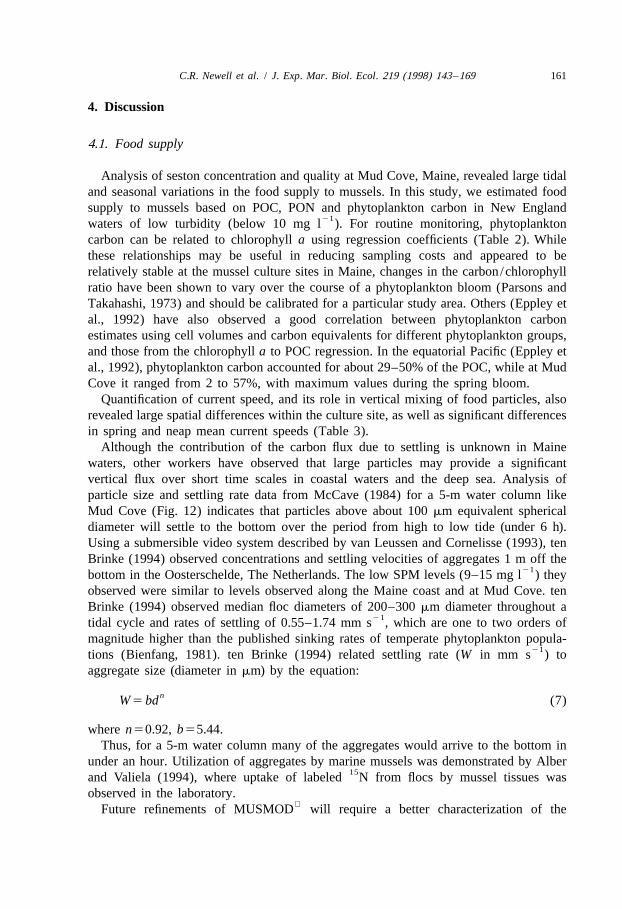
Using the technique of Frechette and Grant (1991) at Mud Cove, we were ableestimate mussel scope for growth using food availability (POC and PON), observedrates of organic absorption, filtration rate and respiration rate, and appropriate conver-sions to calories per hour. Using food coming onto the site, mussels had a negativescope for growth in January, only slightly positive scope for growth values in February,March, September and December, and highest values in April through June (Fig. 10).Mussels at the edge of the lease in Mud Cove (Fig. 11, 100%) had positive scope forgrowth during the months of March, July, September and December while those in themiddle of the lease site (Fig. 11, 50% depletion) had a negative scope for growth.
When scope for growth was modelled using average daily conditions and comparedwith field measurements (Fig. 10), observed scope for growth was higher than predictedduring the fall periods of low food availability. This may be explained by the tidalvariations observed in filtration and respiration rates (see below).
Over the 2-year period from 1989 to 1991, the greatest scope for growth was observed
160 C.R. Newell et al. / J. Exp. Mar. Biol. Ecol. 219 (1998) 143 –169
Fig. 10. Output of MUSMOD scope for growth (solid line) and field data (triangles). Note the outlying datapoints during the fall period (see text for details).
in April of 1991 associated with the highest values of chlorophyll a and phytoplanktoncarbon, and in August and November of 1989 when there was more food available thanduring the same months in 1990.
Fig. 11. Scope for growth at Mud Cove, Maine, during 1990 calculated using the technique of Frechette andGrant (1991), in relation to predicted reductions in food availability due to seston depletion. Percent values arerelative to the food concentration at the edge of the lease site (100%). See also Figure 2, Newell and Shumway(1993).
C.R. Newell et al. / J. Exp. Mar. Biol. Ecol. 219 (1998) 143 –169 161
4. Discussion
4.1. Food supply
Analysis of seston concentration and quality at Mud Cove, Maine, revealed large tidaland seasonal variations in the food supply to mussels. In this study, we estimated foodsupply to mussels based on POC, PON and phytoplankton carbon in New England
21waters of low turbidity (below 10 mg l ). For routine monitoring, phytoplanktoncarbon can be related to chlorophyll a using regression coefficients (Table 2). Whilethese relationships may be useful in reducing sampling costs and appeared to berelatively stable at the mussel culture sites in Maine, changes in the carbon/chlorophyllratio have been shown to vary over the course of a phytoplankton bloom (Parsons andTakahashi, 1973) and should be calibrated for a particular study area. Others (Eppley etal., 1992) have also observed a good correlation between phytoplankton carbonestimates using cell volumes and carbon equivalents for different phytoplankton groups,and those from the chlorophyll a to POC regression. In the equatorial Pacific (Eppley etal., 1992), phytoplankton carbon accounted for about 29–50% of the POC, while at MudCove it ranged from 2 to 57%, with maximum values during the spring bloom.
Quantification of current speed, and its role in vertical mixing of food particles, alsorevealed large spatial differences within the culture site, as well as significant differencesin spring and neap mean current speeds (Table 3).
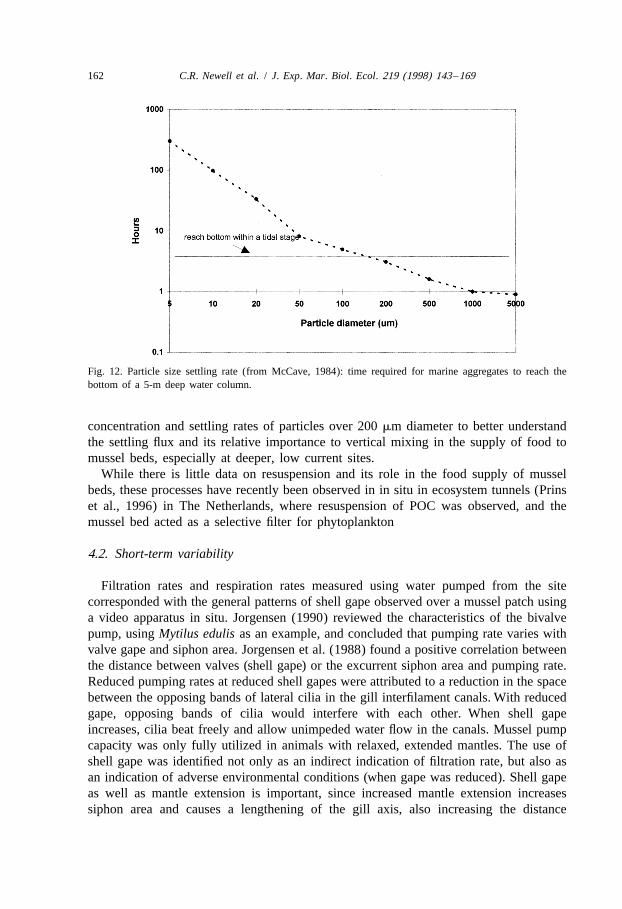
Although the contribution of the carbon flux due to settling is unknown in Mainewaters, other workers have observed that large particles may provide a significantvertical flux over short time scales in coastal waters and the deep sea. Analysis ofparticle size and settling rate data from McCave (1984) for a 5-m water column likeMud Cove (Fig. 12) indicates that particles above about 100 mm equivalent sphericaldiameter will settle to the bottom over the period from high to low tide (under 6 h).Using a submersible video system described by van Leussen and Cornelisse (1993), tenBrinke (1994) observed concentrations and settling velocities of aggregates 1 m off the
21bottom in the Oosterschelde, The Netherlands. The low SPM levels (9–15 mg l ) theyobserved were similar to levels observed along the Maine coast and at Mud Cove. tenBrinke (1994) observed median floc diameters of 200–300 mm diameter throughout a
21tidal cycle and rates of settling of 0.55–1.74 mm s , which are one to two orders ofmagnitude higher than the published sinking rates of temperate phytoplankton popula-
21tions (Bienfang, 1981). ten Brinke (1994) related settling rate (W in mm s ) toaggregate size (diameter in mm) by the equation:
nW 5 bd (7)
where n50.92, b55.44.Thus, for a 5-m water column many of the aggregates would arrive to the bottom in
under an hour. Utilization of aggregates by marine mussels was demonstrated by Alber15and Valiela (1994), where uptake of labeled N from flocs by mussel tissues was
observed in the laboratory.Future refinements of MUSMOD will require a better characterization of the
162 C.R. Newell et al. / J. Exp. Mar. Biol. Ecol. 219 (1998) 143 –169
Fig. 12. Particle size settling rate (from McCave, 1984): time required for marine aggregates to reach thebottom of a 5-m deep water column.
concentration and settling rates of particles over 200 mm diameter to better understandthe settling flux and its relative importance to vertical mixing in the supply of food tomussel beds, especially at deeper, low current sites.
While there is little data on resuspension and its role in the food supply of musselbeds, these processes have recently been observed in in situ in ecosystem tunnels (Prinset al., 1996) in The Netherlands, where resuspension of POC was observed, and themussel bed acted as a selective filter for phytoplankton
4.2. Short-term variability
Filtration rates and respiration rates measured using water pumped from the sitecorresponded with the general patterns of shell gape observed over a mussel patch usinga video apparatus in situ. Jorgensen (1990) reviewed the characteristics of the bivalvepump, using Mytilus edulis as an example, and concluded that pumping rate varies withvalve gape and siphon area. Jorgensen et al. (1988) found a positive correlation betweenthe distance between valves (shell gape) or the excurrent siphon area and pumping rate.Reduced pumping rates at reduced shell gapes were attributed to a reduction in the spacebetween the opposing bands of lateral cilia in the gill interfilament canals. With reducedgape, opposing bands of cilia would interfere with each other. When shell gapeincreases, cilia beat freely and allow unimpeded water flow in the canals. Mussel pumpcapacity was only fully utilized in animals with relaxed, extended mantles. The use ofshell gape was identified not only as an indirect indication of filtration rate, but also asan indication of adverse environmental conditions (when gape was reduced). Shell gapeas well as mantle extension is important, since increased mantle extension increasessiphon area and causes a lengthening of the gill axis, also increasing the distance
C.R. Newell et al. / J. Exp. Mar. Biol. Ecol. 219 (1998) 143 –169 163
between interfilament canals. The muscles controlling siphon and mantle retraction arecontinuous with those attached to the base of the gills. Thus, in a study of pumping ratesusing both direct (water flow) and indirect (particle tracer) methods, Famme et al. (1986)designated valve and mantle edge positions, and correlated pumping rates, as 11 (wideopen valves, extended and diverging mantles), 1 (valves open with mantle edges parallelto each other) and 12 (mantle edges converging). Control of shell gape may be passive,due to the pressure of external forces such as adjacent mussels which physically preventopening to maximal shell gape, or active, due to muscular control such as the responseto low food conditions (Riisgard and Randlov, 1981) or adverse environmentalconditions such as chemical contaminants (Kramer et al., 1989). Ameyaw-Akumfi andNaylor (1987) failed to confirm any endogenous circadian or circtidal rhythm inshell-gaping of Mytilus edulis under constant conditions, suggesting that for this sessilespecies, pumping rate was forced by exogenous factors in the field. The stimulation ofclearance and ingestion rates of Placopecten magellanicus by phytoplankton metabolites(Ward et al., 1992) suggests the possible role of a chemical cue in mediating theseresponses in some bivalves. However, studies with M. edulis (Ward and Targett, 1989)did not demonstrate the stimulation of clearance rates by dissolved phytoplanktonexudates. In a study of active metabolism associated with feeding in mussels, Thompsonand Bayne (1972) demonstrated a threshold particle concentration for filtration rates andoxygen consumption rates to increase from standard to active rates, including a responsefrom non-organic particulates and non-particulate algal exudates. In filtered seawater,mussels remained closed. Winter (1978) presented a model of the relationships betweenfood concentration and filtration rate: from a low threshold concentration filtrationincreases to the point of maximum ingestion of food by mussels, limited by gut volume,and then there is a gradual decline. While regression rates of pumping rates on dry tissueweight in undisturbed mussels with maximum shell gape and mantle extension are high
21 0.66(filtration rate (l h )57.5W , r50.99; Mohlenberg and Riisgard, 1979), rates21observed in the field using natural seston may be lower (e.g. 2 l h , Widdows et al.,
21 31979; 1–2.5 l h , Carver and Mallet, 1990). At algal densities below 1.5310 cells21ml , mussels may reduce shell gape and filtration rate (Riisgard and Randlov, 1981).
Those published values agree quite well with particle concentrations on the early flood23 21tide (2.5310 particles ml ) at Mud Cove when filtration rate was at a minimum 0.24
21 22l h . In mussel beds where bottom densities may exceed 2000 m (Smaal, 1991;Newell, 1990), high filtration rates of neighboring mussels upstream may reduce particledensities, causing seston depletion (Frechette and Bourget, 1985; Frechette et al., 1989),and resultant active reductions in shell gape.
In a review of filter-feeder metabolism, Jorgensen (1990) attributed low rates ofoxygen consumption of mussels with reduced shell gape to reductions in the diffusion ofoxygen across the mantle epithelium during reduced water flows. At many instancesduring the year, the mussels were food limited. If mussels were assumed to filter at aconstant rate, they would have a negative scope for growth during periods of foodlimitation because of high respiration rates. At Mud Cove during the fall of 1990, themussels were able to maintain a constant tissue weight during periods of low foodavailability by the coordination of pumping activity with maximum food availabilityover a tidal cycle and through the conservation of energy losses. The observations that
164 C.R. Newell et al. / J. Exp. Mar. Biol. Ecol. 219 (1998) 143 –169
filtration rate is not always at maximum published rates but varies according to thesite-specific factors which control food availability (vertical mixing, settling, resuspen-sion and particle depletion) points to the importance of small-scale oceanographicprocesses as forcing functions in bivalve production.
Rates of water processing by bivalves form one of the most uncertain terms in modelsof benthic suspension feeder carrying capacity (Powell et al., 1992). Short-term (over atidal cycle) variability in the quantity and quality of seston available to benthicsuspension feeders has been noted (Kranck, 1980; Cadee, 1982; Fegley et al., 1992) andresponses in both clearance rates and retention efficiency have been observed (Stenton-Dozey and Brown, 1992) which may significantly effect individual and populationproduction. Under fluctuating seston regimes, large fluctuations in filtration rates havebeen observed (Frechette and Bourget, 1987). Using flow-through measurements ofparticle consumption by bivalves in chambers (Widdows et al., 1979; Frechette et al.,1989) processing of large amounts of samples are required, and boundary layercharacteristics of food supply, such as fine near-bottom gradients in the seston field(Muschenheim and Newell, 1992) may be disturbed. Sampling may be limited to onlyone tidal cycle and processes such as settling of organic matter during slack tides may beoverlooked. Observations of natural high-frequency variations in pumping rates using anapparatus such as the TLBVM may provide answers to such problems as the coupling ofseston supply to consumption of suspension feeders, the particle thresholds for theinitiation of feeding and day to night variations in feeding behavior.
4.3. Seasonal patterns
Early in our model formulations, we used POM/particle volume (Bayne et al., 1989)as an indication of food quality. However, when we examined POM in the field, thechanges over the spring period were not large enough to explain such a rapid growthtrajectory of mussel tissue in Mud Cove in June of 1991 (see Figure 9b, Campbell andNewell, 1997). Summer POM concentrations were similar to the spring values and butwere also associated with a low nitrogen content of the detritus. A better fit ofpredictions of mussel growth to the food data occurred when we separated sestonconcentration into phytoplankton and detrital components, and adjusted the foodabsorption by the mussels based on food type and detritus quality. After food qualitywas adjusted in the model in this way, an excellent fit of the tissue growth to the fooddata was observed. High growth rates were associated with the peaks in phytoplanktonand detrital carbon in the spring and early summer, and there is also a late summer peakin detritus quality which may be attributed to colonization of detritus by bacteria(Seiderer and Newell, 1985).
The adjustment of absorption efficiency to variations in food quality of bothphytoplankton and detrital components in MUSMOD was not done in the models of
Brylinsky and Sephton (1991), or SMOES (Klepper, 1989; Klepper et al., 1994) whereassimilation efficiency was held as a constant. However, the SMOES model did includelabile detritus as a significant food source to the filter-feeding components of the model.We could not use the relationships between POM and absorption as in Bayne et al.(1993) and Hawkins et al. (1990) because of the seasonal differences in the ratio of
C.R. Newell et al. / J. Exp. Mar. Biol. Ecol. 219 (1998) 143 –169 165
POM to detrital quality at our sites in Maine. A plot of food concentration and quality,and tissue growth at Mud Cove using MUSMOD simulations (Fig. 9) illustrates the
importance of seasonal dynamics of the food availability and quality to the growth ofmussels at a shallow subtidal site in Maine.
4.4. Scope for growth
When scope for growth obtained in the field was compared with early model outputs,the observed scope for growth during low food periods was higher than that predicted bythe model. This was also evidenced by no loss of tissue weight from days 245 to 425
22(Campbell and Newell, 1997, figure 4) when food supplies dropped to 0.4 g C m21day . The energy saving compensations by the mussels, namely reduced pumping rates
and respiration rates during periods of low food availability, followed by active feedingduring periods of high food, allowed the mussels to survive the periods of low food.This short-term variability in the food supply was not initially represented in the dailyaverage values used in MUDMOD, where the scope for growth reflected the averageof high- and low-food periods over a tidal cycle. When the filtration and respiration ratesin the model were adjusted to reflect the percent of time the mussels were feeding, therewas a better fit to the observed data (see Campbell and Newell, 1997).
When seston concentration was reduced due to seston depletion by mussels in MudCove, scope for growth was reduced, resulting in sometimes positive scope for growth atthe edge of the lease site and negative scope for growth further in. These resultsillustrate the importance of seston demand as well as seston supply in modelling thegrowth of populations of bivalves in shallow subtidal areas.
Interannual variability in the intensity of the spring bloom and irregularities in thefrequency of fall blooms may explain year to year differences in mussel growth ratesobserved at the lease sites. Page and Ricard (1990) observed a good correlation betweenchlorophyll a concentration and mussel growth rates on oil platforms in California. As istrue with measurements such as filtration rate and respiration rate, daily variations infood concentration and quality can be as high as the annual variability at these tidallydriven locations along the Maine coast.
5. Conclusions
Field observations combined with mathematical modelling provided a powerfulmethod for the simple representation of mussel growth at bottom lease sites in Maine.By dividing food availability for suspension feeding bivalves such as the blue musselinto two major components, phytoplankton and detrital carbon (with a detritus qualityfactor based on the N/C ration of the detritus) and adjusting absorption efficiencyaccording to food quality, we were able to obtain a good match between predictedgrowth and observed growth of mussels in Maine. Because growth depends on both foodconcentration and quality, in the spring mussel growth is dependent on the phyto-plankton carbon, while later in the year both the concentration and the quality of thedetritus is important. By using chlorophyll a instead of direct measurements of
166 C.R. Newell et al. / J. Exp. Mar. Biol. Ecol. 219 (1998) 143 –169
phytoplankton carbon, savings could be made in estimating food availability for bivalveswhen appropriate site-specific calibrations are made.
Observations of mussel scope for growth using a flow-through, or efflux apparatusallowed us to estimate daily averages for the model, which included significantly lowerrates of filtration and respiration when particle concentrations were below 5000 particles
21ml .In the development of a model to seed mussel bottom leases to their carrying capacity
in Maine, an effort was made to investigate the use of mussel shell gape as an estimateof pumping rate in mussels because high-frequency measurements could be made onundisturbed mussel beds using an underwater video. The shell gape assay was used tofollow tidal cycle variations in the feeding activity of undisturbed mussels in relation toparticle concentration during both low (fall) and high (spring) seston concentrations andwas compared with direct measurements of filtration rates in flow-through, or effluxchambers. The data suggest the coupling of mussel shell gape with the tidal supply ofseston at two locations within a commercial bottom lease, and a threshold particleconcentration for maximum filtration activity, correlated with maximum shell gape.Shell gape seems to provide a somewhat coarse correlate of filtration rate, but isimportant in the context that shell closure may indicate prolonged periods of low foodover a tidal cycle, between sites, or seasonally. It is also difficult to utilize this techniqueas an absolute measure of filtration rate rather than a relative measure of pumpingactivity. Excurrent siphon area is likely to be more closely coupled with filtration rate.
High filtration and respiration rates were associated with the incoming tide after aprolonged period of low filtration rates, and possibly with a large settling flux after hightide. The sedimentation of estuarine flocs may explain why under similar conditions ofcurrent speed during the flood and ebb tide the mussels pump at a higher rate on the ebb.
Future improvements in MUSMOD will require better estimates of particle settlingand resuspension at particular sites of interest, and the inclusion of a model formulationof filtration rate which will handle higher levels of suspended matter.
Acknowledgements
Funding for this project was provided by the National Science Foundation (underaward number ISI8809760 to C.R.N.). We thank J. Davis for technical assistance withthe efflux apparatus, J. Richardson for help with the flow modelling, C. Gregory for thephytoplankton analyses, and B. Bayne and an anonymous referee for critically readingearlier versions of the manuscript.
References
Alber, M., Valiela, I., 1994. Incorporation of organic aggregates by marine mussels. Mar. Biol. 121, 259–265.Ameyaw-Akumfi, C., Naylor, E., 1987. Temporal patterns of shell-gape in Mytilus edulis. Mar. Biol. 95,
237–242.
C.R. Newell et al. / J. Exp. Mar. Biol. Ecol. 219 (1998) 143 –169 167
Bayne, B.L., R.C. Newell, 1983. Physiological energetics of marine molluscs. In: Wilbur, K.M., Saleuddin,A.S. (Eds.), The Mollusca, vol. 4. Academic Press, New York, pp. 407–515.
Bayne, B.L., Hawkins, A.J.S., Navarro, E., Iglesias, J.I.P., 1989. Effects of seston concentration on feeding,digestion and growth in the mussel Mytilus edulis. Mar. Ecol. Prog. Ser. 55, 47–54.
Bayne, B.L., Iglesias, J.I.P., Hawkins, A.J.S., Navarro, E., Heral, M., Deslous-Paoli, J.M., 1993. Feedingbehaviour of the mussel Mytilus edulis L: responses to variations in quantity and organic content of theseston. J. Mar. Biol. Assoc. UK 73, 813–829.
Bienfang, P.K., 1981. Sinking rates of heterogeneous, temperate phytoplankton populations. J. Plankton Res. 3,235–252.
Booij, N., 1989. User Manual for the program DUCHESS, Delft University of Technology, Delft, TheNetherlands.
Brylinsky, M., Sephton, T.W., 1991. Development of a computer simulation model of a cultured blue mussel(Mytilus edulis) population. Can. Tech. Rep. Fish. Aquat. Sci. 1805, 1–85.
Cadee, G.C., 1982. Tidal and seasonal variation in particulate and dissolved organic carbon in the WesternDutch Wadden Sea and Marsdiep tidal inlet. Neth. J. Sea Res. 15, 228–249.
Campbell, D.E., Newell, C.R., 1997. MUSMOD : A mussel production model for use on bottom culture leasesites. J. Exp. Mar. Biol. Ecol., in press.
Conover, R.J., 1966. Assimilation of organic matter by zooplankton. Limnol. Ocenogr. 11, 338–354.Carver, C.E.A., Mallet, A., 1990. Estimating the carrying capacity of a coastal inlet for mussel culture.
Aquaculture 88, 39–53.Eppley, R.W., Holmes, R.W., Strickland, J.D.H., 1967. Sinking rates of marine phytoplankton measured with a
fluorometer. J. Exp. Mar. Biol. Ecol. 1, 191–208.Eppley, R.W., Chavez, F.P., Barber, R.T., 1992. Standing stocks of particulate carbon and nitrogen in the
equatorial Pacific at 1509W. J. Geophys. Res. 97, 655–661.Famme, P., Riisgard, H.U., Jorgensen, C.B., 1986. On direct measurement of pumping rates in the mussel
Mytilus edulis. Mar. Biol. 92, 323–327.Fegley, S.R., MacDonald, B.A., Jacobsen, T.R., 1992. Short-term variation in the quantity and quality of
seston available to benthic suspension feeders. Est. Cstl. Shlf. Sci. 34, 393–412.Frechette, M., Bourget, E., 1985. Energy flow between the pelagic and benthic zones: factors controlling
particulate organic matter available to an intertidal mussel bed. Can. J. Fish. Aquat. Sci. 42, 1158–1165.Frechette, M., Bourget, E., 1987. Significance of small-scale spatio-temporal heterogeneity in phytoplankton
abundance for energy flow in Mytilus edulis. Mar. Biol. 94, 231–240.Frechette, M., Grant, J., 1991. An in situ estimation of the effect of wind-driven resuspension on the growth of
the mussel Mytilus edulis L. J. Exp. Mar. Biol. Ecol. 148, 201–213.Frechette, M., Butman, C.A., Geyer, W.R., 1989. The importance of boundary-layer flows in supplying
phytoplankton to the benthic suspension feeder, Mytilus edulis L. Limnol. Oceanogr. 34, 19–36.Frechette, M., LeFaivre, D., Butman, C.A., 1994. Bivalve feeding and the benthic boundary layer. In: Dame,
R.F. (Ed.), Bivalve Filter Feeders in Estuarine and Coastal Ecosystem Processes, NATO ASI Series, vol. G33. Springer-Verlag, Berlin, pp. 325–369.
Gnaiger, E., 1983. Calculation of energetic and biochemical equivalents of respiratory oxygen consumption.In: Gnaiger, E., Forstner, H. (Eds.), Polarographic Oxygen Sensors. Springer-Verlag, Berlin, pp. 337–345.
Grizzle, R.E., 1988. The relative effects of tidal currents, seston and bottom sediments on individual growth ofMercenaria mercernaria (Linne): Feeding ecology and aquacultural implications. Ph.D. Thesis, RutgersUniversity, 293 pp.
Hawkins, A.J.S., Navarro, E., Iglesias, J.I.P., 1990. Comparative allometries of gut-passage time, gut contentand metabolic faecal loss in Mytilus edulis and Cerastoderma edule. Mar. Biol. 105, 197–204.
Hildreth, D.I., Crisp, D.J., 1976. A corrected formula for calculation of filtration rate of bivalve molluscs in anexperimental flowing system. J. Mar. Biol. Assoc. UK 56, 111–120.
Hosomi, A., 1985. On the persistent trend of constant biomass and the constant total occupation area of themussel Mytilus galloprovincialis (Lamark). Venus Jpn. J. Mal. 44, 33–38.
Hughes, R.N., Griffeths, C.L., 1988. Self-thinning in barnacles and mussels: the geometry of packing. Am.Nat. 132, 484–491.
Jorgensen, C.B., 1990. Bivalve Filter Feeding: Hydrodynamics, Bioenergetics, Physiology and Ecology. Olsenand Olsen, Denmark, 140 pp.
168 C.R. Newell et al. / J. Exp. Mar. Biol. Ecol. 219 (1998) 143 –169
Jorgensen, C.B., Larsen, P.S., Mohlenberg, F., Riisgard, H.U., 1988. The mussel pump: properties andmodelling. Mar. Ecol. Prog. Ser. 45, 205–216.
Klepper, O., 1989. A model of carbon flows in relation to macrobenthic food supply in the Oosterscheldeestuary. Wageningen, The Netherlands, 270 pp.
Klepper, O., van der Tol, M.W.M., Scholten, H., Herman, P.M.J., 1994. SMOES: a simulation model for theoosterschelde ecosystem. Part I: description and uncertainty analysis. Hydrobiology 282/283, 431–436.
Kramer, K.J.M., Jenner, H.A., de Zwart, D., 1989. The valve movement response of mussels: a tool inbiological monitoring. Hydrobiology 188, 433–443.
Kranck, K., 1980. Variability of particulate matter in a small coastal inlet. Can. J. Fish. Aquat. Sci. 37,1209–1215.
McCave, I.N., 1984. Size spectra and aggregation of suspended particles in the ocean. Deep Sea Res. 85,329–352.
Mohlenberg, F., Riisgard, H.U., 1979. Filtration rate, using a new indirect technique, in thirteen species ofsuspension feeding bivalves. Mar. Biol. 54, 143–147.
Muschenheim, D.K., Newell, C.R., 1992. Utilization of seston flux over a mussel bed. Mar. Ecol. Prog. Ser.85, 131–136.
Newell, C.R., 1990. The effects of mussel (Mytilus edulis, Linnaeus, 1758) position in seeded bottom patcheson growth at subtidal lease sites in Maine. J. Shellfish. Res. 9, 113–118.
Newell, C.R., Shumway, S.E., 1993. Grazing of natural particulates by bivalve molluscs: a spatial andtemporal perspective, In: Dame, R.F. (Ed.), Bivalve Filter Feeders in Estuarine and Coastal EcosystemProcesses, NATO ASI Series, vol. G 33. Springer-Verlag, Berlin, Heidelberg, pp. 85–148.
Page, H.M., Ricard, Y.O., 1990. Food availability as a limiting factor to mussel Mytilus edulis growth inCalifornia coastal waters. Fish. Bull. 88, 677–686.
Parsons, T.R., Takahashi, M., 1973. Biological Oceanographic Processes. Pergamon Press, Oxford, 187 pp.Phinney, D.A., Yentsch, C.S., 1985. A novel phytoplankton chlorophyll technique: toward automated analysis.
J. Plankton Res. 7, 633–642.Platt, T., Irwin, B., 1973. Caloric content of phytoplankton. Limnol. Oceanogr. 18, 306–310.Prins, T.C., Smaal, A.C., Pouwer, A.J., Dankers, N., 1996. Filtration and resuspension of particulate matter and
phytoplankton on an intertidal mussel bed in the Oosterschelde estuary (SW Netherlands). Mar. Ecol. Prog.Ser. 142, 121–134.
Powell, E.N., Hofmann, E.E., Klinck, J.M., Ray, S.M., 1992. Modeling oyster populations I. A commentary onfiltration rate. Is faster always better?. J. Shellfish. Res. 11, 387–398.
Riisgard, H.U., Randlov, A., 1981. Energy budgets, growth and filtration rates in Mytilus edulis at differentalgal concentrations. Mar. Biol. 61, 227–234.
Seiderer, L.J., Newell, R.C., 1985. Relative significance of phytoplankton, bacteria and plant detritus as carbonand nitrogen sources for the kelp bed filter-feeder Choromytilus meridionalis. Mar. Ecol. Prog. Ser. 22,127–139.
Smaal, A.C., 1991. The ecology and cultivation of mussels: new advances. Aquaculture 94, 245–261.Strathmann, R.R., 1967. Estimating the organic carbon content of phytoplankton from cell volume or plasma
volume. Limnol. Oceanogr. 12, 411–418.Stenton-Dozey, J.M.E., Brown, A.C., 1992. Clearance and retention efficiency of natural suspended
particulates by the rock-pool bivalve Venerupis corrugatus in relation to tidal availability. Mar. Ecol. Prog.Ser. 82, 175–186.
Svane, I., Ompi, M., 1991. Patch dynamics in beds of the blue mussel Mytilus edulis L.: Effects of site, patchsize, and position within a patch. Ophelia 37, 187–202.
ten Brinke, W.B.M., 1994. Settling velocities of mud aggregates in the Oosterschelde tidal basin (theNetherlands) determined by a submersible video system. Est. Cstl. Shelf Sci. 39, 549–564.
Thompson, R.J., Bayne, B.L., 1972. Active metabolism associated with feeding in the mussel Mytilus edulis L.J. Exp. Mar. Biol. Ecol. 9, 111–124.
Urrutia, M.B., Iglesias, J.I.P., Navarro, E., Prou, J., 1996. Feeding and absorption in Ceratoderma edule underenvironmental conditions in the bay of Marennes-Oleron (western France). J. Mar. Biol. Assoc. UK 76,431–450.
van Leussen, W.M., Cornelisse, J.M., 1993. The determination of the sizes and settling velocities of estuarineflocs by an underwater video system. Neth. J. Sea Res. 31, 231–241.

C.R. Newell et al. / J. Exp. Mar. Biol. Ecol. 219 (1998) 143 –169 169
Ward, J.E., Targett, N.M., 1989. Influence of microalgal metabolites on the feeding behavior of the bluemussel, Mytilus edulis. Mar. Biol. 101, 313–321.
Ward, J.E., Cassell, H.K., MacDonald, B.A., 1992. Chemoreception in the sea scallop Placopectenmagellanicus (Gmelin). I. Stimulatory effects of phytoplankton metabolites on clearance and ingestionrates. J. Exp. Mar. Biol. Ecol. 163, 235–250.
Widdows, J., Fieth, P., Worrall, C.M., 1979. Relationships between seston, available food and feeding activityin the common mussel Mytilus edulis. Mar. Biol. 50, 195–207.
Winter, J.E., 1978. A critical review on some aspects of filter-feeding in lamellibranchiate bivalves. Haliotis 7,71–87.