development of human resource - journal of asian business
TRANSCRIPT
1. Introduction
together with the development of vietnam’seconomy, the need for high qualified human re-source is very pressing. not only do enterprisesrecruit exact individuals for appropriate posts, butthey also have to attempt to retain staff’s loyaltywhich is affected by salary, work conditions, andfringe benefits. By helping employees gain theirjob satisfaction, enterprises can assure a stableworkforce for running business.
taân Hieäp phaùt trading and service co., ltd.(hereunder referred to as “the company” for short)primarily produces and trade in beer, liquor andbeverage. exit interview questionnaires show thatthe company’s employees would like a highersalary, mid-shift breaks, a suitable working sched-ule, safe working environment, and more fringebenefits. some extant researches have pointed outthe satisfaction with tasks assigned as the mostimportant factor affecting staff’s loyalty (luddy,
2005 & chou, 2007). thus, it is necessary to studyjob satisfaction in a hope of adjusting policies onhuman resources management.
2. Theoretical fundamentals
a. Job satisfaction:
there have been many concepts of job satisfac-tion thus far. ellickson and logsdon (2002) sug-gest that job satisfaction is the extent to whichemployees are fond of their job, and the attitude,either positive or negative, towards the job. as perQuinn and staines (1979), job satisfaction is ex-pressed via positive responses to job. luddy (2005)places a stress on factors affecting job satisfaction,viz. status, supervision of boss, relationship withcolleagues, job characteristics, fringe benefits andother rewards (i.e. promotion opportunity, betterworking facilities, organizational structure, etc.).as Kreitner and Kinicki (2007) put it, job satisfac-tion is reflected via the extent to which an em-ployee like their assigned task; or in other words,
*: University of Finance - Marketing
A recent research by Chou (2007) has shown that a variety of discontent at work is the
primary excuse for employees’ resignation. Thus, it raises a need for enterprises to meas-
ure job satisfaction of their staff with a view to avoiding the happening of further unex-
pected resignations and establishing a better policy on human resource management.
The Job Descriptive Index (JDI), which has been adjusted for the case of Vietnam, will
be employed to measure job satisfaction of production workers at Taân Hieäp Phaùt Co.,
Ltd. This adjusted scale includes five facets, viz. salary, relationship with boss, job char-
acteristics, working conditions, and fringe benefits, which will be evaluated by means of
the Cronbach’s Alpha, EFA, and regression analyses. Then, some solutions are to be rec-
ommended.
Keywords: job satisfaction, salary, relationship with boss, job characteristics, working conditions, fringe bene-
fits
Economic Development Review - June 20118
Development of human resource
it is the affection of an employee towards the job.
Herzberg et al. (1959) puts forth a two-factortheory (i.e. motivation-hygiene theory). accordingto that, motivational factors include achievement,recognition, job characteristics, responsibility,promotion, and growth; hygiene or maintenancefactors comprise company policy and administra-tion, supervision, relationship with co-workers,working conditions, pay and benefits, relationshipwith co-workers, personal life, status and job se-curity. essentially, hygiene factors are needed toensure an employee is not dissatisfied. motivationfactors are needed to motivate an employee tohigher performance.
according to the equity theory, which was firstdeveloped by John stacey adams in 1963, thestructure of equity in the workplace is evaluatedon the basis of the ratio of inputs (i.e. what em-ployees bring to a job) to outcomes (i.e. what em-ployees receive from inputs against the perceivedinputs and outcomes of others). Inputs consist ofexperience, effort, and personal competence. out-comes include salary, recognition, reputation,sense of achievement, praise, fringe benefits, etc.If an employee notices that another person is get-ting more recognition and rewards for their con-tributions, even when both have done the sameamount and quality of work, it would persuade theemployee to be dissatisfied.
Hackman and oldham (1974) developed the jobcharacteristics model which states that there arefive core job characteristics, namely skill variety,task identity, task significance, autonomy, andfeedback. they impinge on three critical psycho-logical states, viz. experienced meaningfulness, ex-perienced responsibility for outcomes, andknowledge of actual results, which in turn influ-ence work outcomes.
b. Measuring job satisfaction: Job Descrip-
tive Index (JDI):
minnesota satisfaction Questionnaire by Weisset al. (1967), JDI by smith et al. (1969), and jobsatisfaction survey by spector (1997) are threetypical apparatuses which, (especially the two for-mers), are widely employed to measure job satis-faction (Green, 2000).
as smith et al. (1969) put it, job satisfaction ismeasured on facets namely salary, promotion andtraining opportunity, relationship with boss andpeers, and job characteristics. price (1997) sup-
poses that JDI is a useful tool for measuring jobsatisfaction because of the fact that JDI possessesa good content, and well-established and reliableconcepts (Kerr, 1995). It is just within the last twodecades of the 20th century that JDI has been em-ployed in some 600 published researches (ajmi,2001).
luddy (2005) utilized JDI to investigate jobsatisfaction amongst 203 employees at a publichealth institution in Western cape, africa; andfound out that occupation, ethnic group, gender,educational level, seniority, age and status haveprofound impacts on job satisfaction.
In vietnam, traàn Kim Dung (2005) employedJDI and maslow’s hierarchy of needs to measurejob satisfaction with a result that there emergestwo more factors namely fringe benefits and work-ing conditions.
c. Research model:
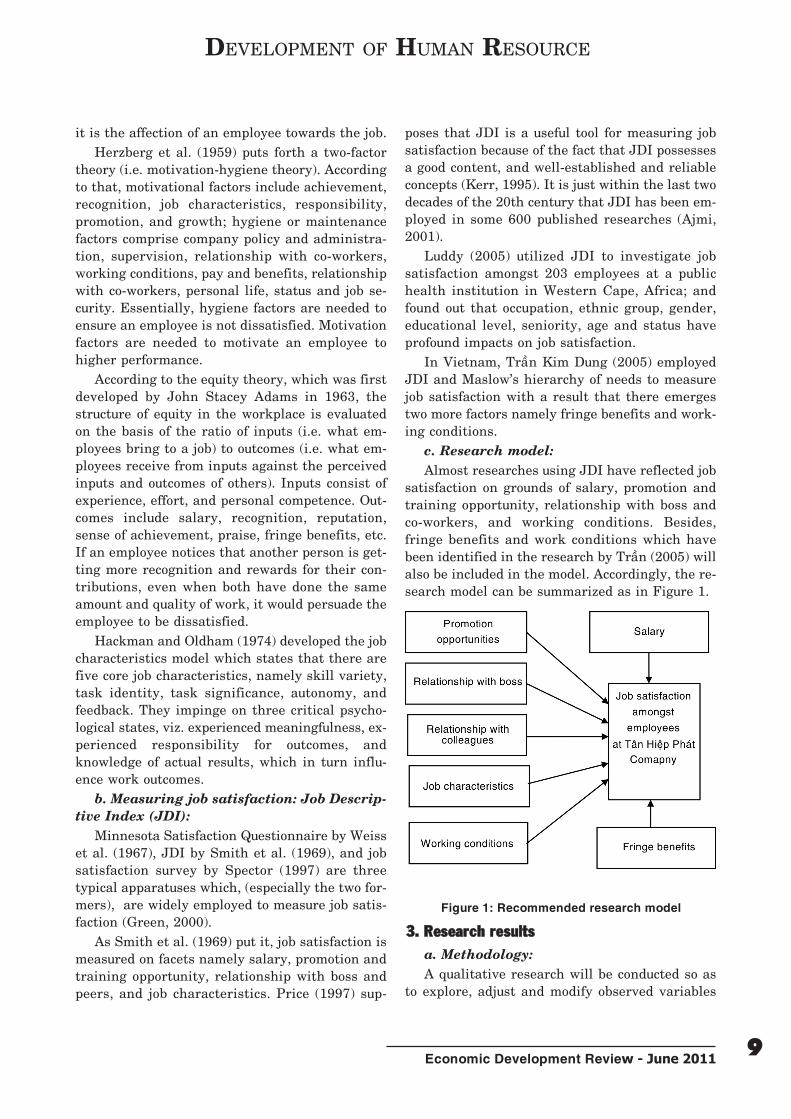
almost researches using JDI have reflected jobsatisfaction on grounds of salary, promotion andtraining opportunity, relationship with boss andco-workers, and working conditions. Besides,fringe benefits and work conditions which havebeen identified in the research by traàn (2005) willalso be included in the model. accordingly, the re-search model can be summarized as in figure 1.
Figure 1: Recommended research model
3. Research results
a. Methodology:
a qualitative research will be conducted so asto explore, adjust and modify observed variables
Economic Development Review - June 20119
Development of human resource
which are to be used to test concepts. accordingly,some groups of eight (four males and four femalesfor each) will be established according to non-probability sampling for group discussion. re-search participants are those who have beenworking for the company for more than one year,ages from 20 to 35, and have the monthly salaryof over vnD2 million. there are four workers, twooperating ones, and two maintaining ones for eachgroup. accordingly, a preliminary questionnairehas been developed.
In order to assure the questionnaire is easilycomprehensible and applicable, a pilot researchmust be conducted (saunders et al., 2007). twentyquestionnaires have been sent to twenty employ-ees who meet the above-mentioned requirements;and face-to-face interviews have been done tomake sure that they can easily comprehend all thewords of the questionnaire. then, the official ques-tionnaire will be worked out.
the full-scale study is conducted quantitatively.face-to-face interviews with 300 employees of thecompany in combination with the official ques-tionnaire will help collate data.
b. Sample features:
of 300 questionnaires collected, there are 13unusable ones due to lack of responses to somequestions. among the remainder, 69.7% are malesand 30.3% females. those aging from 20 to 25 oc-cupy 54.4%, from 25 to 30 representing 42.9%, andthe remainder for those over 30 years old. Interms of salary, some 51.2% of the population gainfrom vnD2 million to vnD3 million per month.
counting to october 2010, those who have beenworking for the company from one to three yearsrepresent 48.8%, from six months to one year oc-cupying 42.5%, from three to five years accountingfor 7%, and over 5 years making up 1.7%. In termsof educational level, those with the post-secondaryeducation account for 48.1%, with the junior highschool certificate making up 20.6%, with the sen-ior high school occupying 30%, and with highereducation just representing below 1%. Besides, interms of status, around 44.6% are workers, 38%are operating staff, 15% are maintaining ones, and2.4% are others.
c. Testing the scale and research model:
the cronbach’s alpha and efa are employedto test the scale. the former will be utilized first
with a view to leaving out unfit variables; andefa is used for testing the remainder. many re-searchers agree that when cronbach’s alpha rangeis from 0.6 onward, the scale is usable; and vari-ables with the correlation coefficient being smallerthan 0.3 will be rejected (nunnally and Bernstein,1994).
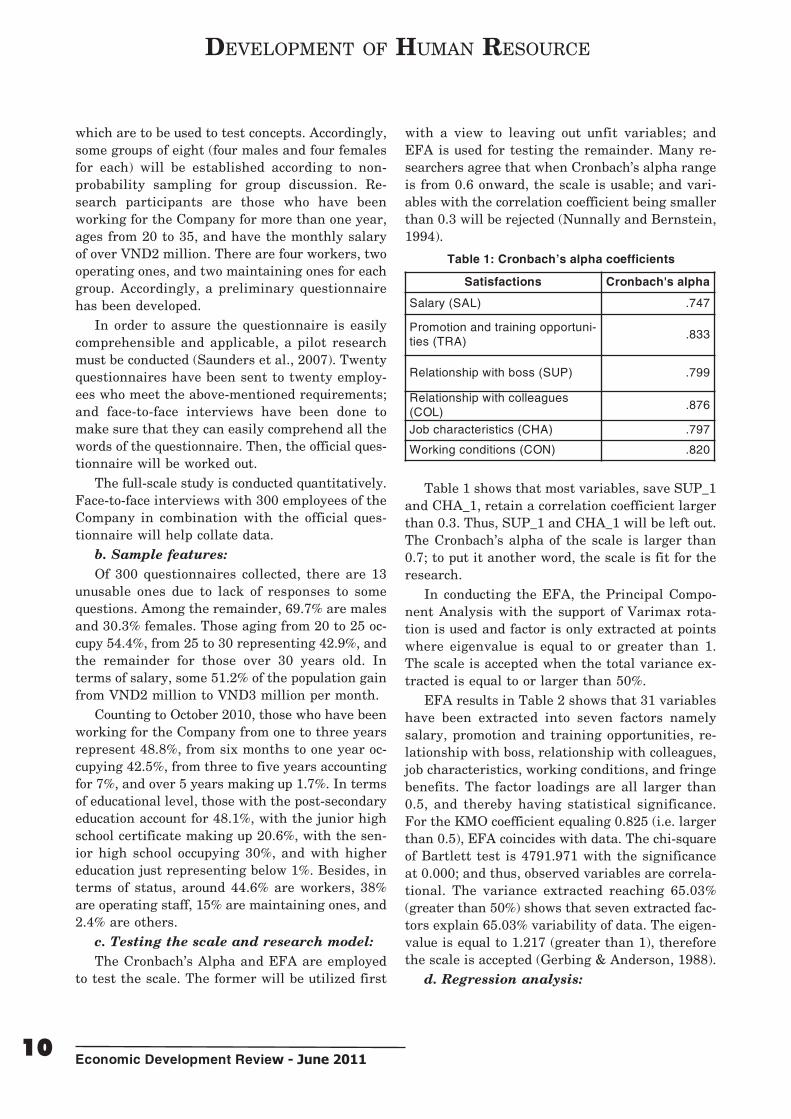
Table 1: Cronbach’s alpha coefficients
table 1 shows that most variables, save sup_1and cHa_1, retain a correlation coefficient largerthan 0.3. thus, sup_1 and cHa_1 will be left out.the cronbach’s alpha of the scale is larger than0.7; to put it another word, the scale is fit for theresearch.
In conducting the efa, the principal compo-nent analysis with the support of varimax rota-tion is used and factor is only extracted at pointswhere eigenvalue is equal to or greater than 1.the scale is accepted when the total variance ex-tracted is equal to or larger than 50%.
efa results in table 2 shows that 31 variableshave been extracted into seven factors namelysalary, promotion and training opportunities, re-lationship with boss, relationship with colleagues,job characteristics, working conditions, and fringebenefits. the factor loadings are all larger than0.5, and thereby having statistical significance.for the Kmo coefficient equaling 0.825 (i.e. largerthan 0.5), efa coincides with data. the chi-squareof Bartlett test is 4791.971 with the significanceat 0.000; and thus, observed variables are correla-tional. the variance extracted reaching 65.03%(greater than 50%) shows that seven extracted fac-tors explain 65.03% variability of data. the eigen-value is equal to 1.217 (greater than 1), thereforethe scale is accepted (Gerbing & anderson, 1988).
d. Regression analysis:
Satisfactions Cronbach's alpha
Salary (SAL) .747
Promotion and training opportuni-ties (TRA)
.833
Relationship with boss (SUP) .799
Relationship with colleagues(COL)
.876
Job characteristics (CHA) .797
Working conditions (CON) .820
Economic Development Review - June 201110
Development of human resource
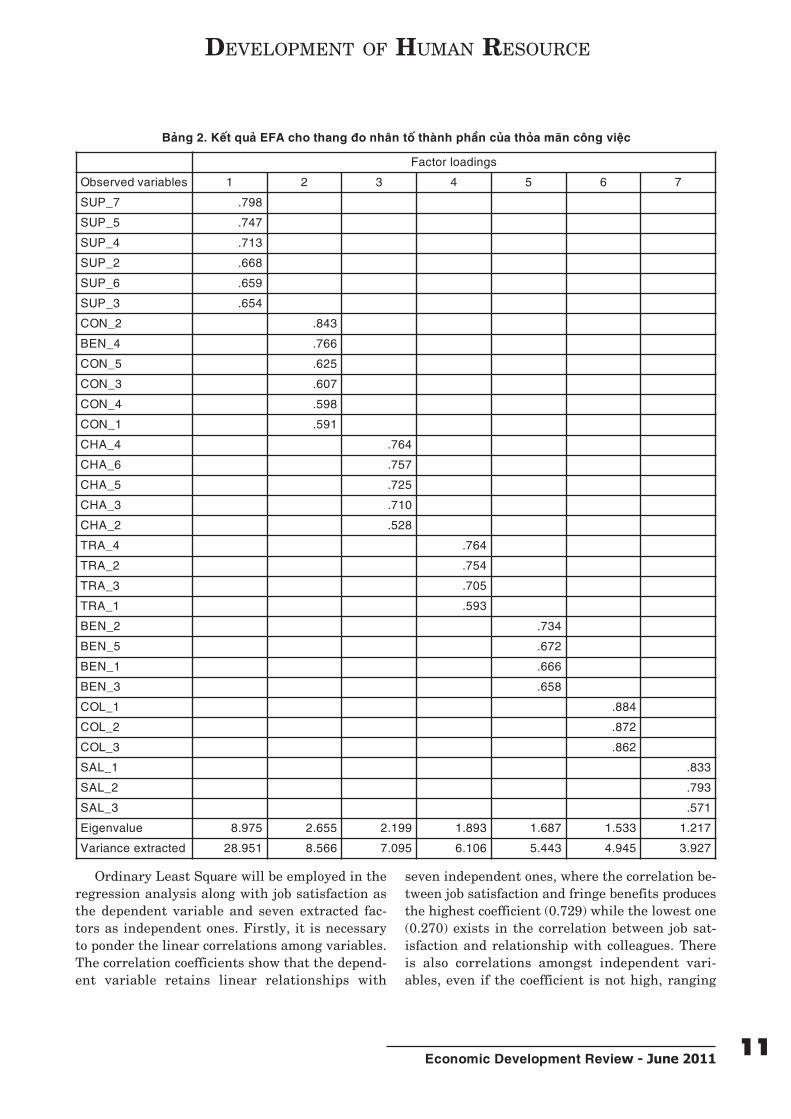
ordinary least square will be employed in theregression analysis along with job satisfaction asthe dependent variable and seven extracted fac-tors as independent ones. firstly, it is necessaryto ponder the linear correlations among variables.the correlation coefficients show that the depend-ent variable retains linear relationships with
seven independent ones, where the correlation be-tween job satisfaction and fringe benefits producesthe highest coefficient (0.729) while the lowest one(0.270) exists in the correlation between job sat-isfaction and relationship with colleagues. thereis also correlations amongst independent vari-ables, even if the coefficient is not high, ranging
Factor loadings
Observed variables 1 2 3 4 5 6 7
SUP_7 .798
SUP_5 .747
SUP_4 .713
SUP_2 .668
SUP_6 .659
SUP_3 .654
CON_2 .843
BEN_4 .766
CON_5 .625
CON_3 .607
CON_4 .598
CON_1 .591
CHA_4 .764
CHA_6 .757
CHA_5 .725
CHA_3 .710
CHA_2 .528
TRA_4 .764
TRA_2 .754
TRA_3 .705
TRA_1 .593
BEN_2 .734
BEN_5 .672
BEN_1 .666
BEN_3 .658
COL_1 .884
COL_2 .872
COL_3 .862
SAL_1 .833
SAL_2 .793
SAL_3 .571
Eigenvalue 8.975 2.655 2.199 1.893 1.687 1.533 1.217
Variance extracted 28.951 8.566 7.095 6.106 5.443 4.945 3.927
Baûng 2. Keát quaû EFA cho thang ño nhaân toá thaønh phaàn cuûa thoûa maõn coâng vieäc
Economic Development Review - June 201111
Development of human resource
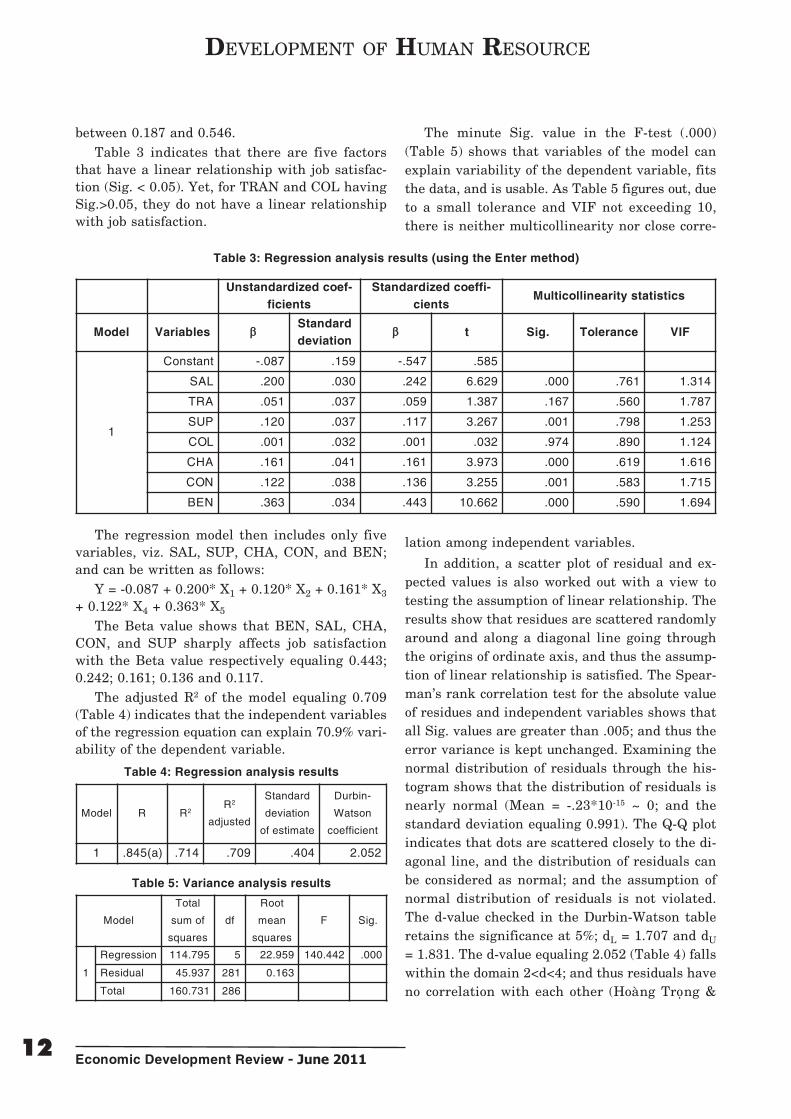
between 0.187 and 0.546.
table 3 indicates that there are five factorsthat have a linear relationship with job satisfac-tion (sig. < 0.05). Yet, for tran and col havingsig.>0.05, they do not have a linear relationshipwith job satisfaction.
the regression model then includes only fivevariables, viz. sal, sup, cHa, con, and Ben;and can be written as follows:
Y = -0.087 + 0.200* X1 + 0.120* X2 + 0.161* X3
+ 0.122* X4 + 0.363* X5
the Beta value shows that Ben, sal, cHa,con, and sup sharply affects job satisfactionwith the Beta value respectively equaling 0.443;0.242; 0.161; 0.136 and 0.117.
the adjusted r2 of the model equaling 0.709(table 4) indicates that the independent variablesof the regression equation can explain 70.9% vari-ability of the dependent variable.
Table 4: Regression analysis results
Table 5: Variance analysis results
the minute sig. value in the f-test (.000)
(table 5) shows that variables of the model can
explain variability of the dependent variable, fits
the data, and is usable. as table 5 figures out, due
to a small tolerance and vIf not exceeding 10,
there is neither multicollinearity nor close corre-
lation among independent variables.
In addition, a scatter plot of residual and ex-
pected values is also worked out with a view to
testing the assumption of linear relationship. the
results show that residues are scattered randomly
around and along a diagonal line going through
the origins of ordinate axis, and thus the assump-
tion of linear relationship is satisfied. the spear-
man’s rank correlation test for the absolute value
of residues and independent variables shows that
all sig. values are greater than .005; and thus the
error variance is kept unchanged. examining the
normal distribution of residuals through the his-
togram shows that the distribution of residuals is
nearly normal (mean = -.23*10-15 ~ 0; and the
standard deviation equaling 0.991). the Q-Q plot
indicates that dots are scattered closely to the di-
agonal line, and the distribution of residuals can
be considered as normal; and the assumption of
normal distribution of residuals is not violated.
the d-value checked in the Durbin-Watson table
retains the significance at 5%; dl = 1.707 and du
= 1.831. the d-value equaling 2.052 (table 4) falls
within the domain 2<d<4; and thus residuals have
no correlation with each other (Hoaøng troïng &
Unstandardized coef-
ficients
Standardized coeffi-
cientsMulticollinearity statistics
Model Variables bStandard
deviationb t Sig. Tolerance VIF
1
Constant -.087 .159 -.547 .585
SAL .200 .030 .242 6.629 .000 .761 1.314
TRA .051 .037 .059 1.387 .167 .560 1.787
SUP .120 .037 .117 3.267 .001 .798 1.253
COL .001 .032 .001 .032 .974 .890 1.124
CHA .161 .041 .161 3.973 .000 .619 1.616
CON .122 .038 .136 3.255 .001 .583 1.715
BEN .363 .034 .443 10.662 .000 .590 1.694
Table 3: Regression analysis results (using the Enter method)
Model R R2R2
adjusted
Standard
deviation
of estimate
Durbin-
Watson
coefficient
1 .845(a) .714 .709 .404 2.052
Model
Total
sum of
squares
df
Root
mean
squares
F Sig.
1
Regression 114.795 5 22.959 140.442 .000
Residual 45.937 281 0.163
Total 160.731 286
Economic Development Review - June 201112
Development of human resource
chu nguyeãn moäng ngoïc, 2008). the above tests
point out that regression assumptions are not vi-
olated.
e. Description of job satisfaction:
Table 6: Descriptive statistics of job satisfaction
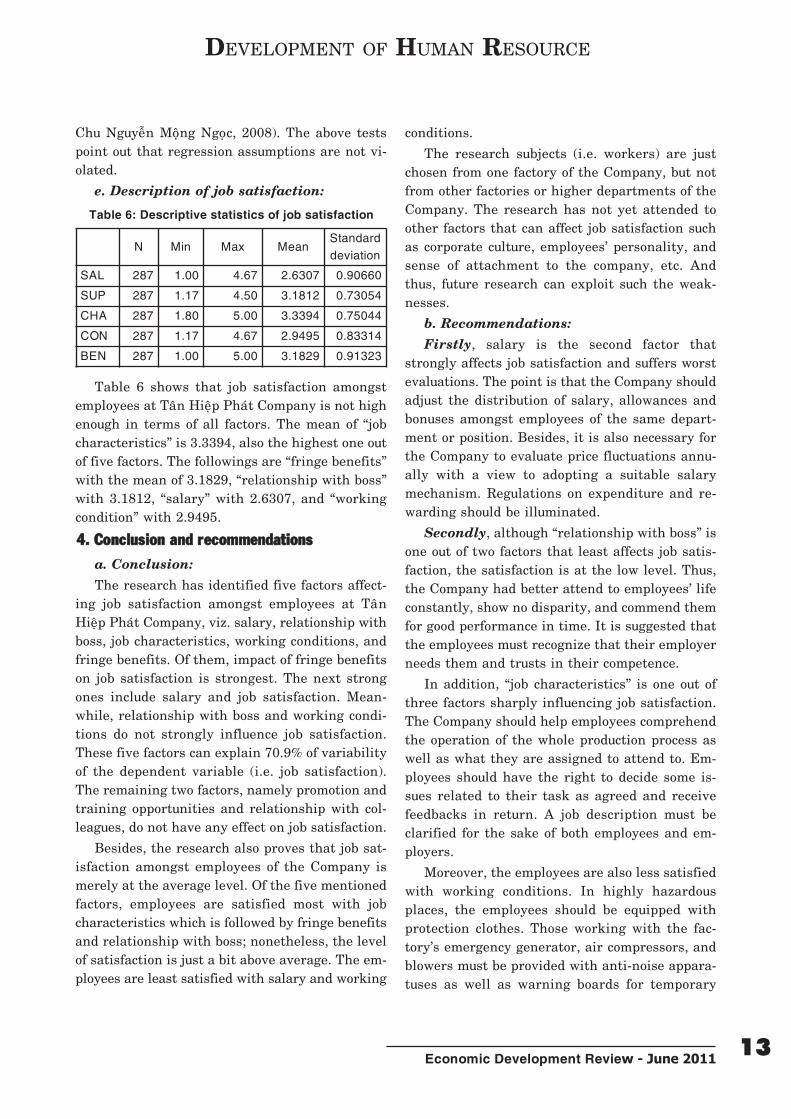
table 6 shows that job satisfaction amongst
employees at taân Hieäp phaùt company is not high
enough in terms of all factors. the mean of “job
characteristics” is 3.3394, also the highest one out
of five factors. the followings are “fringe benefits”
with the mean of 3.1829, “relationship with boss”
with 3.1812, “salary” with 2.6307, and “working
condition” with 2.9495.
4. Conclusion and recommendations
a. Conclusion:
the research has identified five factors affect-
ing job satisfaction amongst employees at taân
Hieäp phaùt company, viz. salary, relationship with
boss, job characteristics, working conditions, and
fringe benefits. of them, impact of fringe benefits
on job satisfaction is strongest. the next strong
ones include salary and job satisfaction. mean-
while, relationship with boss and working condi-
tions do not strongly influence job satisfaction.
these five factors can explain 70.9% of variability
of the dependent variable (i.e. job satisfaction).
the remaining two factors, namely promotion and
training opportunities and relationship with col-
leagues, do not have any effect on job satisfaction.
Besides, the research also proves that job sat-
isfaction amongst employees of the company is
merely at the average level. of the five mentioned
factors, employees are satisfied most with job
characteristics which is followed by fringe benefits
and relationship with boss; nonetheless, the level
of satisfaction is just a bit above average. the em-
ployees are least satisfied with salary and working
conditions.
the research subjects (i.e. workers) are just
chosen from one factory of the company, but not
from other factories or higher departments of the
company. the research has not yet attended to
other factors that can affect job satisfaction such
as corporate culture, employees’ personality, and
sense of attachment to the company, etc. and
thus, future research can exploit such the weak-
nesses.
b. Recommendations:
Firstly, salary is the second factor that
strongly affects job satisfaction and suffers worst
evaluations. the point is that the company should
adjust the distribution of salary, allowances and
bonuses amongst employees of the same depart-
ment or position. Besides, it is also necessary for
the company to evaluate price fluctuations annu-
ally with a view to adopting a suitable salary
mechanism. regulations on expenditure and re-
warding should be illuminated.
Secondly, although “relationship with boss” is
one out of two factors that least affects job satis-
faction, the satisfaction is at the low level. thus,
the company had better attend to employees’ life
constantly, show no disparity, and commend them
for good performance in time. It is suggested that
the employees must recognize that their employer
needs them and trusts in their competence.
In addition, “job characteristics” is one out of
three factors sharply influencing job satisfaction.
the company should help employees comprehend
the operation of the whole production process as
well as what they are assigned to attend to. em-
ployees should have the right to decide some is-
sues related to their task as agreed and receive
feedbacks in return. a job description must be
clarified for the sake of both employees and em-
ployers.
moreover, the employees are also less satisfied
with working conditions. In highly hazardous
places, the employees should be equipped with
protection clothes. those working with the fac-
tory’s emergency generator, air compressors, and
blowers must be provided with anti-noise appara-
tuses as well as warning boards for temporary
N Min Max MeanStandard
deviation
SAL 287 1.00 4.67 2.6307 0.90660
SUP 287 1.17 4.50 3.1812 0.73054
CHA 287 1.80 5.00 3.3394 0.75044
CON 287 1.17 4.67 2.9495 0.83314
BEN 287 1.00 5.00 3.1829 0.91323
Economic Development Review - June 201113
Development of human resource
power cut or repair. the company should have
coaches to transport workers to the factory. Be-
sides, sale and marketing strategies should also
be well established in a hope of generating a feel-
ing of job security among employees.
last but not least, “fringe benefits” has the
strongest effect on job satisfaction. Yet in fact, the
satisfaction of fringe benefits among employees is
just a bit above average. the research shows that
employees show a discontent at the trade union.
thus, the company should improve the role and
competence of the trade union which is supposed
to protect the rights and benefits of workersn
References
1. Adams, J. S. (1963), “Toward an Understanding of
Inequity”, Journal of Abnormal and Social Psychology,
Vol.67, p.422-436.
2. Ajmi, R. A. (2001), “The Effect of Personal Char-
acteristics on Job Satisfaction Among Male Managers in
the Kuwait Oil Industry”, International Journal of Com-
merce & Management, Vol.11(3/4), p.91-110.
3. Chou, Y. M. (2007), “A Renewed Look at the
Turnover Model for Accounting Knowledge Work Force”,
Journal of American Academy of Business, Vol.11, p.103-
109.
4. Ellickson, M.C. & K. Logsdon (2002), “Determi-
nants of Job Satisfaction of Municipal Government Em-
ployees”, State and Government Review, Vol.33, No.3,
p.173-84.
5. Gerbing, W. D. & J.C. Anderson (1988), “An Up-
date Paradigm for Scale Development Incorporating Uni-
dimensionality and Its Assessments”, Journal of
Marketing, Vol.25, No.2, p.186-192.
6. Green, J. (2000), “Job Satisfaction of Community
College Chairpersons”, Doctoral dissertation, Virginia
Polytechnic Institute and State University.
7. Hackman, J. R & G.R. Oldham (1974), “The Job
Diagnosis Survey: An Instrument for the Diagnosis of
Jobs and the Evaluation of Job Redesign Project”, Tech-
nical Report No.4, Department of Administrative Sci-
ences, Yale University, USA.
8. Herzberg, F. et al. (1957), Job Attitudes: Review of
Research and Opinion, Psychological Service of Pitts-
burgh, Pennsylvania.
9. Herzberg. F., B. Mausner & B. Snyderman (1959),
The Motivation to Work, Wiley, New York.
10. Hoaøng Troïng & Chu Nguyeãn Moäng Ngoïc (2008),
Phaân tích döõ lieäu nghieân cöùu vôùi SPSS (SPSS and data
analysis), Hoàng Ñöùc Publisher.
11. Kerr, B. A. (1985), “Review of the Job Descriptive
Index”, The Ninth Mental Measurements Yearbook, Lin-
coln, NE: Buros Institute, p.754-756.
12. Kreitner, R. & A. Kinicki (2007), Organizational Be-
havior, 7th Ed., McGraw Hill, Irwin.
13. Luddy, N. (2005), Job Satisfaction amongst Em-
ployees at a Public Health Institution in the Western Cape,
University of Western Cape, South Africa.
14. Maslow, A. H. (1943), “A Theory of Human Moti-
vation”, Psychological Review, Vol.50, p.370-396.
15. Nunnally, J. & I.H. Bernstein (1994), Pschycho-
metric Theory, 3rd Ed., McGraw-Hill, New York.
16. Price, J. (1997), “Handbook of Organizational
Measurement”, International Journal of Manpower,
Vol.18, p.305-558.
17. Quinn, R. P. & G. L. Staines (1979), The 1977
Quality of Employment Survey, Institute for Social Re-
search, University of Michigan, Ann Arbor, Michigan.
18. Saunders, M., Ph. Lewis, & A. Thornhill (2007),
Research Methods for Business Students, 4th Ed., Pren-
tice Hall.
19. Smith, P. C., L.M. Kendall & C.L. Hulin (1969),
The Measurement of Satisfaction in Work and Retirement,
Rand McNally, Chicago.
20. Spector, P. E. (1997), Job Satisfaction: Applica-
tion, Assessment, Causes, and Consequences, Thousand
Oaks, CA: Sage Publications, Inc.
21. Traàn Kim Dung (2005), Ño löôøng möùc ñoä thoûa
maõn ñoái vôùi coâng vieäc trong ñieàu kieän cuûa Vieät Nam
(Measuring job satisfaction in Vietnam). Phaùt trieån Khoa
hoïc Coâng ngheä, Vol.8.
22. Weiss, D. J. et al. (1967), Manual for the Min-
nesota Satisfaction Questionnaire, The University of Min-
nesota Press.
Economic Development Review - June 201114
Development of human resource