development of high-density snp genotyping arrays for white spruce ( picea glauca ) and...
TRANSCRIPT
Development of high-density SNP genotyping arrays forwhite spruce (Picea glauca) and transferability to subtropicaland nordic congeners
NATHALIE PAVY,1* FRANCE GAGNON,1* PHILIPPE RIGAULT,2* SYLVIE BLAIS,1 ASTRID
DESCH ENES,1 BRIAN BOYLE,1 BETTY PELGAS,1,3 MARIE DESLAURIERS,1,4 S �EBASTIEN
CL �EMENT,1,4 PATRICIA LAVIGNE,1,3 MANUEL LAMOTHE,1,3 JANICE E.K. COOKE,5
JUAN P. JARAMILLO-CORREA,1,6 JEAN BEAULIEU,1,4 NATHALIE ISABEL,1,3 JOHN MACKAY1 and
JEAN BOUSQUET1
1Canada Research Chair in Forest and Environmental Genomics, Centre for Forest Research and Institute for Systems and
Integrative Biology, Universit�e Laval, Qu�ebec, Canada, QC G1V 0A6, 2Gydle Inc., 1363 Avenue Maguire, Qu�ebec, Canada, QC
G1T 1Z2, 3Natural Resources Canada, Canadian Forest Service, Laurentian Forestry Centre, 1055 Rue du P.E.P.S., C.P. 10380,
succ, Sainte-Foy, Qu�ebec, Canada, QC G1V 4C7, 4Natural Resources Canada, Canadian Wood Fibre Centre, 1055 Rue du P.E.P.S.,
C.P. 10380, succ. Sainte-Foy, Qu�ebec, Canada, QC G1V 4C7, 5Department of Biological Sciences, CW405 Biological Sciences
Building, University of Alberta, Edmonton, Canada, AB T6G 2E9, 6Departamento de Ecolog�ıa Evolutiva, Instituto de Ecolog�ıa,
Universidad Nacional Aut�onoma de M�exico, Apartado Postal 70-275, M�exico, D.F. Mexico
Abstract
High-density SNP genotyping arrays can be designed for any species given sufficient sequence information of high
quality. Two high-density SNP arrays relying on the Infinium iSelect technology (Illumina) were designed for use in
the conifer white spruce (Picea glauca). One array contained 7338 segregating SNPs representative of 2814 genes of
various molecular functional classes for main uses in genetic association and population genetics studies. The other
one contained 9559 segregating SNPs representative of 9543 genes for main uses in population genetics, linkage map-
ping of the genome and genomic prediction. The SNPs assayed were discovered from various sources of gene rese-
quencing data. SNPs predicted from high-quality sequences derived from genomic DNA reached a genotyping
success rate of 64.7%. Nonsingleton in silico SNPs (i.e. a sequence polymorphism present in at least two reads) pre-
dicted from expressed sequenced tags obtained with the Roche 454 technology and Illumina GAII analyser resulted
in a similar genotyping success rate of 71.6% when the deepest alignment was used and the most favourable SNP
probe per gene was selected. A variable proportion of these SNPs was shared by other nordic and subtropical spruce
species from North America and Europe. The number of shared SNPs was inversely proportional to phylogenetic
divergence and standing genetic variation in the recipient species, but positively related to allele frequency in P. gla-
uca natural populations. These validated SNP resources should open up new avenues for population genetics and
comparative genetic mapping at a genomic scale in spruce species.
Keywords: gene SNPs, genotyping, Infinium SNP array, interspecific divergence, Picea, SNP sharing
Received 1 October 2012; revision received 1 December 2012; accepted 4 December 2012
Introduction
SNPs have become cornerstone markers for a wide vari-
ety of genetic applications in model and nonmodel spe-
cies (Stapley et al. 2010; Ekblom & Galindo 2011) because
of their abundance in genomes and their amenability to
high-throughput genotyping. EST sequence redundancy
and gene resequencing offer efficient ways to identify
extensive SNP data sets amenable to genotyping
(e.g. Pavy et al. 2006). In conifers, the development of
in silico SNP resources was enhanced by several large-
scale EST sequencing projects (MacKay & Dean 2011).
These SNP resources have enabled the development of
genotyping assays used for linkage mapping (e.g. Pavy
et al. 2008a; Eckert et al. 2010; Chancerel et al. 2011),
quantitative trait loci analyses (e.g. Pelgas et al. 2011) as
well as population genetics and genetic association stud-
ies (e.g. Namroud et al. 2008; Eckert et al. 2009, 2010;
Correspondence: Jean Bousquet, Fax: 418-656-3493;
E-mail: [email protected]
*These authors contributed equally to this work.
© 2013 Blackwell Publishing Ltd
Molecular Ecology Resources (2013) doi: 10.1111/1755-0998.12062
Holliday et al. 2010; Beaulieu et al. 2011; Prunier et al.
2011; Chen et al. 2012). The application of genomic
prediction to trees (Grattapaglia & Resende 2011; Kumar
et al. 2012; Resende et al. 2012) is also expected to
rely heavily on the genotyping of large sets of SNPs
(Grattapaglia et al. 2011).
We have previously developed several spruce SNP
genotyping arrays based on the GoldenGate assay
(Illumina) (Fan et al. 2006), each targeting from many
hundreds to around a 1000 SNPs (e.g. Pavy et al. 2008a,
2012a; Beaulieu et al. 2011; Pelgas et al. 2011; Prunier
et al. 2011). In the present study, we tested previously
genotyped SNPs and many thousand new ones with the
iSelect Infinium genotyping assay (Illumina) (Gunderson
2009), which is more highly multiplexed than the Gold-
enGate assay. Typical of the Infinium assay, the first step
is a whole genome amplification to produce a large num-
ber of DNA copies, which is favourable for obtaining
enough template DNA for species with large genomes,
such as spruces (in excess of 1010 bp, Murray 1998) and
accomodating small tissue samples, such as for nondes-
tructive analysis at the seedling stage. In plants, Infinium
iSelect SNPs arrays have been designed for a number of
species for which the genome is completely or almost
completely sequenced, such as grape (Myles et al. 2010),
maize (Ganal et al. 2011; Mammadov et al. 2011), potato
(Hamilton et al. 2011), apple tree (Chagn�e et al. 2012) and
peach tree (Verde et al. 2012). For plant species with
unsequenced genomes, it has been used for loblolly pine
(Eckert et al. 2010), rye (Haseneyer et al. 2011) and sun-
flower (Bachlava et al. 2012).
Picea is a large circumpolar genus with over 35 species
of northern latitudes or at high altitudes in subtropical
areas. Several spruce species have wide ecological and
economical relevance in northern countries, with tree
improvement and reforestation programmes implicating
millions of seedlings annually (Bousquet et al. 2007; Mul-
lin et al. 2011). The genus is phylogenetically complex
with deep lineages and closely related species forming
hybridizing complexes (Bouill�e et al. 2011). Although
phylogenetically distant spruce lineages have diverged
more than 10 Ma, it has been shown that part of the
nuclear gene SNPs are shared between distant lineages
(Bouill�e & Bousquet 2005; Namroud et al. 2010). As
previously shown for PCR primer sequences (Perry &
Bousquet 1998), SNP genotyping resources developed
for one species may have potential applications for other
species, depending on sequence identity between
genomes. Interspecies transferability would facilitate
population genetics and comparative genome mapping
studies across the genus, especially for species with more
limited genomic resources.
In this study, we have integrated data from high-
throughput sequencing, data mining of gene functions
and functional genomic analyses to identify sets of candi-
date genes for further genetic analyses in spruce. We
designed two large-scale SNP genotyping arrays for
white spruce [Picea glauca (Moench) Voss], which
provided valid genotyping data for 1855 gene SNPs
previously published and for 13 533 new SNPs
distributed among 10 296 genes. We also assessed to
what extent P. glauca SNPs were shared with other
spruce species including endangered subtropical taxa
with limited availability of genomic resources and major
nordic species implicated in various population and
comparative genomics projects.
Methods
SNP discovery and array design
Two iSelect Infinium (Illumina) SNP arrays were
designed from P. glauca SNPs. The PgAS1 array was
mainly designed for population genetics and genetic
association studies, whereas the PgLM3 array was con-
structed for population genetics, genomic prediction and
linkage mapping purposes. SNPs were obtained from
three sources: (i) SNPs recovered from previously
described GoldenGate (Illumina) arrays (Pavy et al.
2008a, 2012a; Beaulieu et al. 2011; Pelgas et al. 2011); (ii)
SNPs identified from the alignment of sequences from
genomic DNA (gDNA) obtained with the Sanger tech-
nology such as previously described (Pavy et al. 2008a);
(iii) in silico SNPs predicted from the alignment of
NextGen transcript sequences (Rigault et al. 2011). The
in silico SNPs assayed on the PgAS1 array were derived
from the alignment of 454 GS-FLX and 454 Titanium
(Roche) cDNA reads sequenced from 40 P. glauca indi-
viduals (reported by Rigault et al. 2011), whereas SNPs
assayed on the PgLM3 array were generated from the
alignment of cDNA reads from the parents of the map-
ping population #C94-1-2516 (♀77111 9 ♂2388) (Pelgas
et al. 2011) sequenced by using the 454 GS-FLX, the 454
Titanium (Roche) and the Genome Analyzer II (Illumina)
platforms. These sequence reads are available in the
NCBI archive under the project number SRP003565. SNP
prediction was achieved with proprietary software
developed by Gydle� (Qu�ebec) by considering several
criteria: depth of alignment, minor allele frequency
(MAF), conformation of the sequence surrounding the
SNP including the absence of repetitive elements and
neighbouring polymorphisms. If a targeted SNP was
close to another polymorphic site, this latter translated
into a degenerated base in the sequence flanking the
SNP. Thus, 20.4% of the sequences submitted to Illumina
for the PgAS1 array included at least one degenerated
base. For the PgLM3 array, there were 6.1% of such
sequences. The design requirement to obtain more SNPs
© 2013 Blackwell Publishing Ltd
2 N. PAVY ET AL .
per gene for genetic association studies led to the selection
of more SNPs per gene than for PgLM3 where only one
SNP per gene was necessary for gene mapping purposes.
Such design requirements resulted in a less optimal selec-
tion of SNPs for the PgAS1 array than for PgLM3, includ-
ing a higher frequency of degenerated sites in the flanking
sequences of the SNPs. Whenever possible, SNPs of type
II (one bead) were prioritized over SNPs of type I (two
beads) (Gunderson 2009). The locus-specific probes were
designed and synthesized by Illumina.
For the PgAS1 array, SNPs were selected in candidate
genes putatively involved in a large number of traits
including wood formation, growth and adaptation to
biotic and abiotic factors (see Results). Thus, a broad list
of 3532 potential candidate genes was compiled based on
transcriptomic studies (Pavy et al. 2008b; El Kayal et al.
2011), functional analyses of transcription factors (Bomal
et al. 2008; Bedon et al. 2010; Cot�e et al. 2010), QTL (Pel-
gas et al. 2011) and outlier detection studies (Namroud
et al. 2008), as well as functional annotations from Arabi-
dopsis genes (e.g. Groover 2005; Demura & Fukuda 2007;
Zhang et al. 2011). As linkage disequilibrium decays
rapidly within P. glauca genes (Namroud et al. 2010;
Pavy et al. 2012b), one SNP was targeted, wherever
possible, every 200 bp of cDNA sequence. This design
constraint implicated that some singleton SNPs (i.e. a
variant observed only once at a given position of the read
sequence alignment) had to be assayed because of low
sequencing depth in some genes, even if it was antici-
pated that the confidence and success rate would be less
for singleton SNPs. On average for in silico PgAS1 SNPs,
the alignment depths were 19.7 and 7.4 reads for nonsin-
gleton and singleton SNPs respectively. In total, 14 734
distinct SNPs were submitted to Illumina. In the end,
13 162 SNPs (89.3%) from 3473 candidate genes could be
assayed whereas for the remaining SNPs, the bead chip
manufacture procedures failed.
With the PgLM3 array, the major aim was to develop
a resource enabling a large coverage of the genome for
genomic prediction in populations in high linkage dis-
equilibrium and for the genetic mapping of as many
genes as possible with a single SNP per gene locus
(except two SNPs for a few high priority genes). More-
over, to ensure map integration with previous spruce
gene linkage maps (Pelgas et al. 2006, 2011; Pavy et al.
2008a, 2012a), SNPs from already positioned genes were
included. SNPs successfully genotyped with the PgAS1
array and polymorphic between parents of the mapping
population were also included on PgLM3. Again, by con-
straint of design, SNPs of lower quality, including single-
tons, had to be used for genes with low sequencing
depth to complete the array. For the PgLM3 array, mean
depths of 43.1 and 28.3 reads were reached for nonsin-
gleton and singleton SNPs respectively. These depths
were higher than the ones obtained for predicting SNPs
for the PgAS1 array, which was consistent with the
higher number of ESTs used in the alignment for the pre-
diction of PgLM3 SNPs. Among the 15 660 SNPs submit-
ted to Illumina, 14 139 (90.3%) distinct SNPs from 14 063
genes were successfully manufactured.
Gene annotation
All genotyped SNPs reported in the present study are
from expressed genes. For diverse types of applications
such as genetic association testing or gene mapping,
gene annotations are an essential part of SNP array
description. A previous report about the white spruce
transcriptome sequenced to date described the gene con-
tent as well as the gene families based on similarities
with sequences from the protein families PFAM database
(Rigault et al. 2011). The sequences were retrieved from
this P. glauca GCAT3.3 assembly (Rigault et al. 2011). To
complement their functional annotations, we performed
a Blastx search with Blast2GO default parameters (but
e-value <e-10) against the nonredundant (nr) protein
sequence database and then run the Gene Ontology map-
ping step by using the plant GO-Slim terms (Conesa et al.
2005). An enrichment analysis of GO terms was con-
ducted by using the Fisher’s two-tailed test implemented
in Blast2GO with a FDR <5%.
Plant material
For the PgAS1 array, 3670 P. glauca trees from more than
40 natural populations representative of the species
range in eastern Canada were genotyped including two
large-scale association genetics populations for growth,
adaptation and wood-related traits, as well as the parents
of the outbred F1 crosses # C94-1-2516 (♀77111 9 ♂2388)
and # C96-1-2856 (♀80112 9 ♂80109) (Pelgas et al. 2011).
Also, pedigree trees or trees from natural populations for
seven other spruce species distributed worldwide were
genotyped: ten individuals from black spruce [P. mariana
(Mill.) B.S.P.], including eight trees from distant natural
populations in Qu�ebec and two pedigree trees; seven
pedigree trees of interior spruce (P. glauca x engelmannii)
provided by K. Ritland (University of British Columbia,
Canada); six pedigree trees from Sitka spruce [P. sitchen-
sis (Bong.) Carri�ere] provided by S. A’Hara and J. Cott-
rell (British Forestry Commission, Midlothian, United
Kingdom); four pedigree trees of Norway spruce [P. abies
(L.) Karst] provided by M. Lascoux (Uppsala University,
Sweden) and M. Fladung (Federal Research Centre for
Forestry and Forest Products, Institute for Forest Genet-
ics and Forest Tree Breeding, Großhansdorf, Germany)
and five individuals from distinct natural populations
for each of three Mexican spruce species, namely
© 2013 Blackwell Publishing Ltd
DESIGN AND APPLICATIONS OF SPRUCE SNP ARRAYS 3
Mexican spruce (P. mexicana Mart�ınez), Chihuahua
spruce (P. chihuahuana Mart�ınez) and Martinez spruce
(P. martinezii TF Patterson). DNA samples for genotyping
were isolated from spruce needles and terminal buds
by using the NucleoSpin 96 Plant II extraction system
of Macherey-Nagel (Bethlehem, Pennsylvania) and the
DNeasy 96 Plant Kit of Qiagen (Mississauga, Ontario).
In total, 2236 P. glauca individuals were genotyped
with the PgLM3 array, the majority of them (1996) form-
ing the linkage mapping population # C94-1-2516 (Pelgas
et al. 2011), whereas the other ones (240) were from natu-
ral populations of eastern Canada. Trees from the seven
other spruce species were also included as described
above. Twenty trees from P. mariana representative of
distant natural populations in Qu�ebec (for a total of 30)
as well as four additional pedigree trees from P. abies
provided by P. Ingvarsson (Umea Plant Science Centre,
Sweden) were also analysed.
Positive controls were used for both the PgAS1 and
PgLM3 SNP arrays. They were the parents of the map-
ping population #C94-1-2516, given that their genotypes
were known for the SNPs recovered from previous Gold-
enGate arrays they aimed at mapping genes (Pelgas et al.
2011; Pavy et al. 2012a). Each parent was replicated on
every other DNA plate prepared for genotyping. Also,
one sample from a natural population was replicated on
each DNA plate. Thus, a total of two positive controls
were used for each DNA plate.
Genotyping assays
The SNP genotyping assays were carried out with the
team of A. Montpetit at the Genome Quebec Innovation
Centre at McGill University (Montr�eal). A minimum of
80 ng of template gDNA per sample was used. Genotype
calling was performed using the GENOME STUDIO V2010.3
software (Illumina). The criteria for calling SNPs were
based on signals detected from all the white spruce sam-
ples as follows: a minimum GenTrain score of 0.15, a
minimum call rate of 50% and a GenCall score above
0.05. The minimum GenTrain score of 0.15 is relatively
permissive and was adopted given that spruce DNA
samples had never been handled on this genotyping
platform before. Therefore, all SNPs with GenTrain score
below 0.4 were visually inspected and, if necessary, man-
ually curated or rejected. This procedure resulted in the
inspection of many hundreds SNPs. A few SNPs also
assayed on previously designed GoldenGate arrays were
removed because of inconsistent clustering, i.e. heterozy-
gous clusters shifted to homozygous ones or inversely,
as described by Mammadov et al. (2011). Also, we con-
sidered only SNPs with a MAF across the P. glauca natu-
ral populations over 0.001 for PgAS1 and 0.01 for
PgLM3, and exhibiting a minimum of two heterozygous
genotypes. A different MAF was used given the different
numbers of trees from natural populations assayed
between the two arrays. Furthermore, SNPs with fixed or
nearly fixed heterozygosity were discarded, as they may
represent paralogous variation. For the PgLM3 array, the
segregation pattern across the genetic mapping popula-
tion was also taken into account.
Genotyping signals obtained for the other species
used to estimate SNP transferability were not included
in the overall analysis of Gentrain scores and success
rates, which was restricted to P. glauca samples. A SNP
was declared valid for a congener when its genotyping
signals were distributed in more than one P. glauca clus-
ter and when the call rate was above 50%. Only SNPs
successfully called for P. glauca were considered in this
comparative analysis.
Results
Efficiency of Infinium arrays
The reproducibility of the Infinium assay estimated with
positive controls was 99.98% for both the PgAS1 and
PgLM3 arrays (respectively, 99.97% and 99.99%), based
on all segregating SNPs. The genotyping of a subset of
240 trees tested with both arrays resulted in a reproduc-
ibility rate of 99.82%, based on a set of 1509 segregating
SNPs replicated on both arrays. A reproducibility rate of
99.49% was also observed between SNPs successfully
genotyped with Infinium and GoldenGate arrays, based
on a set of 1855 segregating SNPs obtained from previ-
ous GoldenGate arrays.
In total, 7338 SNPs distributed over 2814 genes were
successfully genotyped with PgAS1 for 3670 P. glauca
trees, and 9559 SNPs distributed over 9543 genes were
successfully genotyped with PgLM3 for 2236 P. glauca
trees (Table 1). Merging data from both arrays resulted
in 15 388 unique segregating SNPs over 10 296 genes
(Table 2), including 13 533 newly genotyped SNPs and
1855 SNPs previously published. Their annotations are
provided in Table S1.
The success rate was determined as the number of
segregating SNPs in the assay relative the number of
SNPs assayed. The overall success rates were 55.8% and
67.6% for the PgAS1 and the PgLM3 arrays, respectively
(Table 1). SNPs previously genotyped successfully with
a GoldenGate assay resulted in a success rate of 92.3%
with PgAS1 and 95.4% with PgLM3 (Table 1). SNPs
genotyped on the PgAS1 array and included on the
PgLM3 array were recovered at a rate of 90.7% (Table 1).
On PgAS1, SNPs derived from gDNA resequencing were
more successfully genotyped than in silico SNPs pre-
dicted from EST alignments (Table 1). Among in silico
SNPs, the nonsingleton SNPs reached success rates of
© 2013 Blackwell Publishing Ltd
4 N. PAVY ET AL .
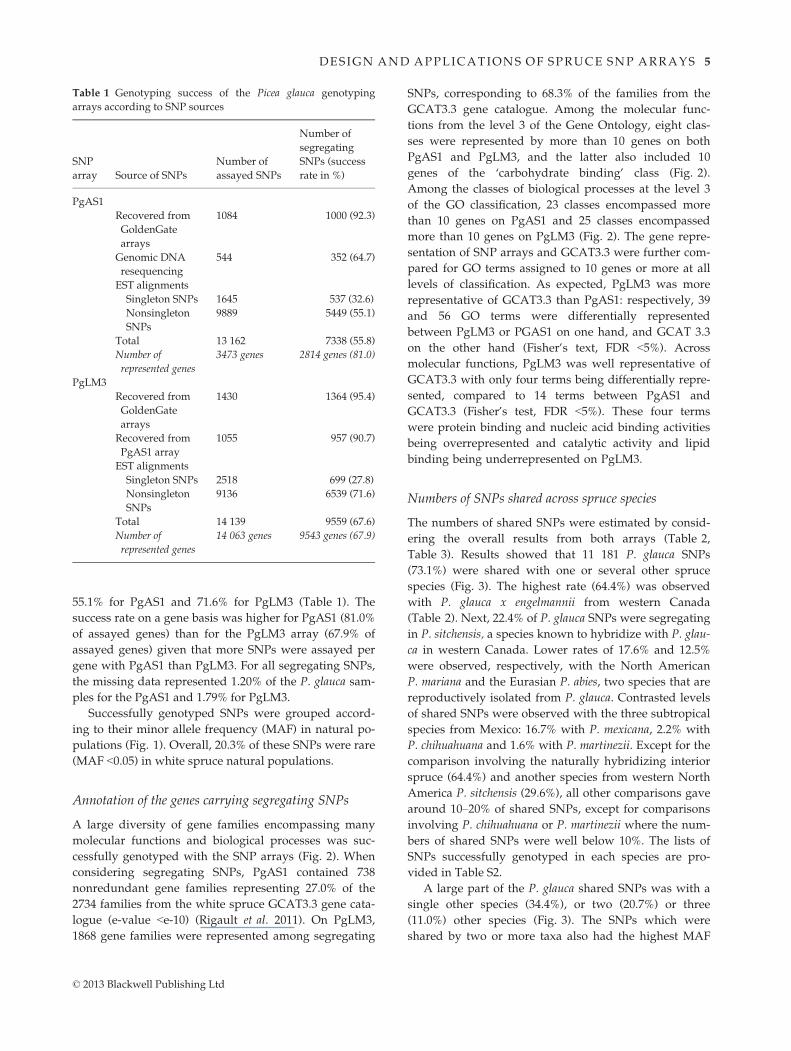
55.1% for PgAS1 and 71.6% for PgLM3 (Table 1). The
success rate on a gene basis was higher for PgAS1 (81.0%
of assayed genes) than for the PgLM3 array (67.9% of
assayed genes) given that more SNPs were assayed per
gene with PgAS1 than PgLM3. For all segregating SNPs,
the missing data represented 1.20% of the P. glauca sam-
ples for the PgAS1 and 1.79% for PgLM3.
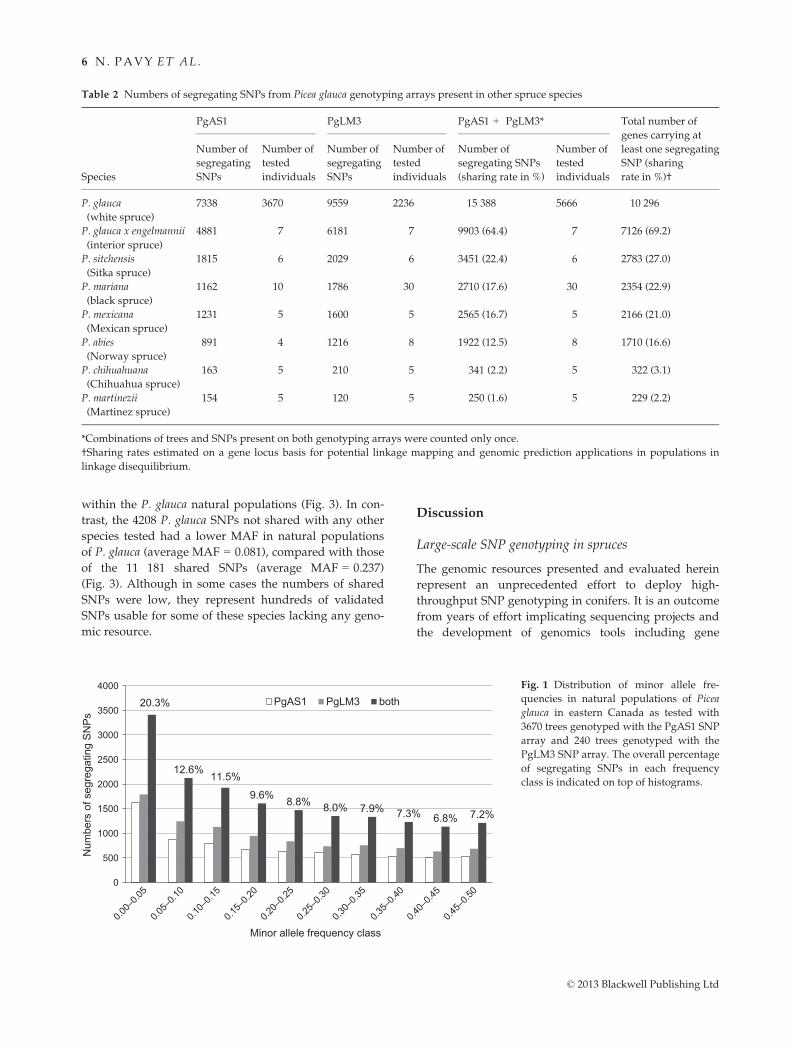
Successfully genotyped SNPs were grouped accord-
ing to their minor allele frequency (MAF) in natural po-
pulations (Fig. 1). Overall, 20.3% of these SNPs were rare
(MAF <0.05) in white spruce natural populations.
Annotation of the genes carrying segregating SNPs
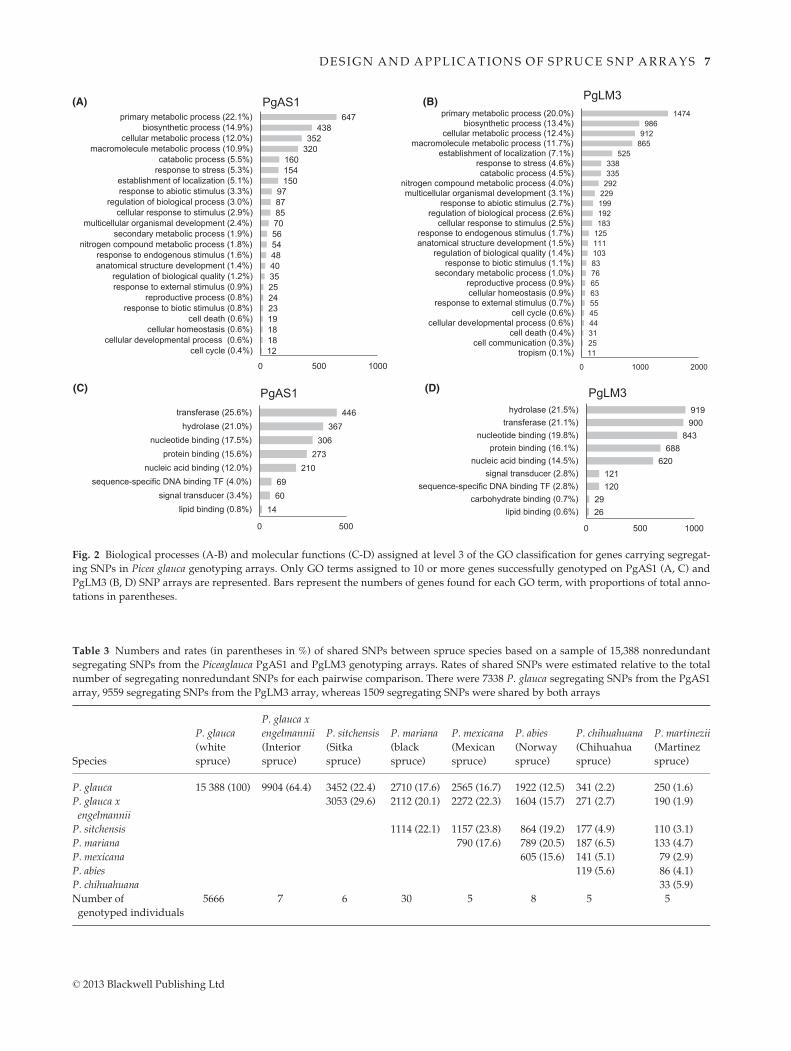
A large diversity of gene families encompassing many
molecular functions and biological processes was suc-
cessfully genotyped with the SNP arrays (Fig. 2). When
considering segregating SNPs, PgAS1 contained 738
nonredundant gene families representing 27.0% of the
2734 families from the white spruce GCAT3.3 gene cata-
logue (e-value <e-10) (Rigault et al. 2011). On PgLM3,
1868 gene families were represented among segregating
SNPs, corresponding to 68.3% of the families from the
GCAT3.3 gene catalogue. Among the molecular func-
tions from the level 3 of the Gene Ontology, eight clas-
ses were represented by more than 10 genes on both
PgAS1 and PgLM3, and the latter also included 10
genes of the ‘carbohydrate binding’ class (Fig. 2).
Among the classes of biological processes at the level 3
of the GO classification, 23 classes encompassed more
than 10 genes on PgAS1 and 25 classes encompassed
more than 10 genes on PgLM3 (Fig. 2). The gene repre-
sentation of SNP arrays and GCAT3.3 were further com-
pared for GO terms assigned to 10 genes or more at all
levels of classification. As expected, PgLM3 was more
representative of GCAT3.3 than PgAS1: respectively, 39
and 56 GO terms were differentially represented
between PgLM3 or PGAS1 on one hand, and GCAT 3.3
on the other hand (Fisher’s text, FDR <5%). Across
molecular functions, PgLM3 was well representative of
GCAT3.3 with only four terms being differentially repre-
sented, compared to 14 terms between PgAS1 and
GCAT3.3 (Fisher’s test, FDR <5%). These four terms
were protein binding and nucleic acid binding activities
being overrepresented and catalytic activity and lipid
binding being underrepresented on PgLM3.
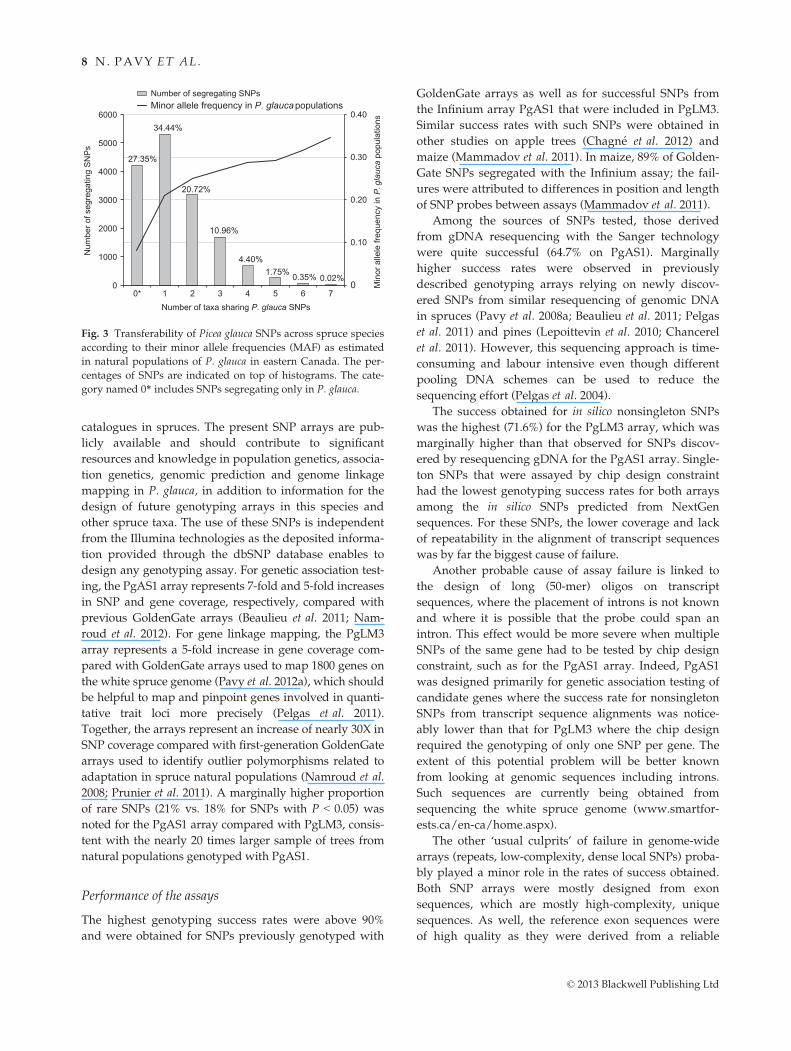
Numbers of SNPs shared across spruce species
The numbers of shared SNPs were estimated by consid-
ering the overall results from both arrays (Table 2,
Table 3). Results showed that 11 181 P. glauca SNPs
(73.1%) were shared with one or several other spruce
species (Fig. 3). The highest rate (64.4%) was observed
with P. glauca x engelmannii from western Canada
(Table 2). Next, 22.4% of P. glauca SNPs were segregating
in P. sitchensis, a species known to hybridize with P. glau-
ca in western Canada. Lower rates of 17.6% and 12.5%
were observed, respectively, with the North American
P. mariana and the Eurasian P. abies, two species that are
reproductively isolated from P. glauca. Contrasted levels
of shared SNPs were observed with the three subtropical
species from Mexico: 16.7% with P. mexicana, 2.2% with
P. chihuahuana and 1.6% with P. martinezii. Except for the
comparison involving the naturally hybridizing interior
spruce (64.4%) and another species from western North
America P. sitchensis (29.6%), all other comparisons gave
around 10–20% of shared SNPs, except for comparisons
involving P. chihuahuana or P. martinezii where the num-
bers of shared SNPs were well below 10%. The lists of
SNPs successfully genotyped in each species are pro-
vided in Table S2.
A large part of the P. glauca shared SNPs was with a
single other species (34.4%), or two (20.7%) or three
(11.0%) other species (Fig. 3). The SNPs which were
shared by two or more taxa also had the highest MAF
Table 1 Genotyping success of the Picea glauca genotyping
arrays according to SNP sources
SNP
array Source of SNPs
Number of
assayed SNPs
Number of
segregating
SNPs (success
rate in %)
PgAS1
Recovered from
GoldenGate
arrays
1084 1000 (92.3)
Genomic DNA
resequencing
544 352 (64.7)
EST alignments
Singleton SNPs 1645 537 (32.6)
Nonsingleton
SNPs
9889 5449 (55.1)
Total 13 162 7338 (55.8)
Number of
represented genes
3473 genes 2814 genes (81.0)
PgLM3
Recovered from
GoldenGate
arrays
1430 1364 (95.4)
Recovered from
PgAS1 array
1055 957 (90.7)
EST alignments
Singleton SNPs 2518 699 (27.8)
Nonsingleton
SNPs
9136 6539 (71.6)
Total 14 139 9559 (67.6)
Number of
represented genes
14 063 genes 9543 genes (67.9)
© 2013 Blackwell Publishing Ltd
DESIGN AND APPLICATIONS OF SPRUCE SNP ARRAYS 5
within the P. glauca natural populations (Fig. 3). In con-
trast, the 4208 P. glauca SNPs not shared with any other
species tested had a lower MAF in natural populations
of P. glauca (average MAF = 0.081), compared with those
of the 11 181 shared SNPs (average MAF = 0.237)
(Fig. 3). Although in some cases the numbers of shared
SNPs were low, they represent hundreds of validated
SNPs usable for some of these species lacking any geno-
mic resource.
Discussion
Large-scale SNP genotyping in spruces
The genomic resources presented and evaluated herein
represent an unprecedented effort to deploy high-
throughput SNP genotyping in conifers. It is an outcome
from years of effort implicating sequencing projects and
the development of genomics tools including gene
Table 2 Numbers of segregating SNPs from Picea glauca genotyping arrays present in other spruce species
Species
PgAS1 PgLM3 PgAS1 + PgLM3* Total number of
genes carrying at
least one segregating
SNP (sharing
rate in %)†
Number of
segregating
SNPs
Number of
tested
individuals
Number of
segregating
SNPs
Number of
tested
individuals
Number of
segregating SNPs
(sharing rate in %)
Number of
tested
individuals
P. glauca
(white spruce)
7338 3670 9559 2236 15 388 5666 10 296
P. glauca x engelmannii
(interior spruce)
4881 7 6181 7 9903 (64.4) 7 7126 (69.2)
P. sitchensis
(Sitka spruce)
1815 6 2029 6 3451 (22.4) 6 2783 (27.0)
P. mariana
(black spruce)
1162 10 1786 30 2710 (17.6) 30 2354 (22.9)
P. mexicana
(Mexican spruce)
1231 5 1600 5 2565 (16.7) 5 2166 (21.0)
P. abies
(Norway spruce)
891 4 1216 8 1922 (12.5) 8 1710 (16.6)
P. chihuahuana
(Chihuahua spruce)
163 5 210 5 341 (2.2) 5 322 (3.1)
P. martinezii
(Martinez spruce)
154 5 120 5 250 (1.6) 5 229 (2.2)
*Combinations of trees and SNPs present on both genotyping arrays were counted only once.
†Sharing rates estimated on a gene locus basis for potential linkage mapping and genomic prediction applications in populations in
linkage disequilibrium.
20.3%
12.6%11.5%
9.6% 8.8% 8.0% 7.9% 7.3% 6.8% 7.2%
0
0.00–
0.05
0.05–
0.10
0.10–
0.15
0.15–
0.20
0.20–
0.25
0.25–
0.30
0.30–
0.35
0.35–
0.40
0.40–
0.45
0.45–
0.50
500
1000
1500
2000
2500
3000
3500
4000
Num
bers
of s
egre
gatin
g S
NP
s
Minor allele frequency class
PgAS1 PgLM3 bothFig. 1 Distribution of minor allele fre-
quencies in natural populations of Picea
glauca in eastern Canada as tested with
3670 trees genotyped with the PgAS1 SNP
array and 240 trees genotyped with the
PgLM3 SNP array. The overall percentage
of segregating SNPs in each frequency
class is indicated on top of histograms.
© 2013 Blackwell Publishing Ltd
6 N. PAVY ET AL .
12181819232425354048545670858797
150154160
320352
438647
0 500 1000
cell cycle (0.4%)cellular developmental process (0.6%)
cellular homeostasis (0.6%)cell death (0.6%)
response to biotic stimulus (0.8%)reproductive process (0.8%)
response to external stimulus (0.9%)regulation of biological quality (1.2%)
anatomical structure development (1.4%)response to endogenous stimulus (1.6%)
nitrogen compound metabolic process (1.8%)secondary metabolic process (1.9%)
multicellular organismal development (2.4%)cellular response to stimulus (2.9%)
regulation of biological process (3.0%)response to abiotic stimulus (3.3%)establishment of localization (5.1%)
response to stress (5.3%)catabolic process (5.5%)
macromolecule metabolic process (10.9%)cellular metabolic process (12.0%)
biosynthetic process (14.9%)primary metabolic process (22.1%)
PgAS1
11253144455563657683103111125183192199229292335338
525865912
9861474
0 1000 2000
tropism (0.1%)cell communication (0.3%)
cell death (0.4%)cellular developmental process (0.6%)
cell cycle (0.6%)response to external stimulus (0.7%)
cellular homeostasis (0.9%)reproductive process (0.9%)
secondary metabolic process (1.0%)response to biotic stimulus (1.1%)
regulation of biological quality (1.4%)anatomical structure development (1.5%)response to endogenous stimulus (1.7%)
cellular response to stimulus (2.5%)regulation of biological process (2.6%)
response to abiotic stimulus (2.7%)multicellular organismal development (3.1%)
nitrogen compound metabolic process (4.0%)catabolic process (4.5%)
response to stress (4.6%)establishment of localization (7.1%)
macromolecule metabolic process (11.7%)cellular metabolic process (12.4%)
biosynthetic process (13.4%)primary metabolic process (20.0%)
PgLM3
146069
210273
306367
446
0 500
lipid binding (0.8%)signal transducer (3.4%)
sequence-specific DNA binding TF (4.0%)nucleic acid binding (12.0%)
protein binding (15.6%)nucleotide binding (17.5%)
hydrolase (21.0%)transferase (25.6%)
PgAS1
2629
120121
620688
843900919
0 500 1000
lipid binding (0.6%)carbohydrate binding (0.7%)
sequence-specific DNA binding TF (2.8%)signal transducer (2.8%)
nucleic acid binding (14.5%)protein binding (16.1%)
nucleotide binding (19.8%)transferase (21.1%)
hydrolase (21.5%)
PgLM3
(A) (B)
(C) (D)
Fig. 2 Biological processes (A-B) and molecular functions (C-D) assigned at level 3 of the GO classification for genes carrying segregat-
ing SNPs in Picea glauca genotyping arrays. Only GO terms assigned to 10 or more genes successfully genotyped on PgAS1 (A, C) and
PgLM3 (B, D) SNP arrays are represented. Bars represent the numbers of genes found for each GO term, with proportions of total anno-
tations in parentheses.
Table 3 Numbers and rates (in parentheses in %) of shared SNPs between spruce species based on a sample of 15,388 nonredundant
segregating SNPs from the Piceaglauca PgAS1 and PgLM3 genotyping arrays. Rates of shared SNPs were estimated relative to the total
number of segregating nonredundant SNPs for each pairwise comparison. There were 7338 P. glauca segregating SNPs from the PgAS1
array, 9559 segregating SNPs from the PgLM3 array, whereas 1509 segregating SNPs were shared by both arrays
Species
P. glauca
(white
spruce)
P. glauca x
engelmannii
(Interior
spruce)
P. sitchensis
(Sitka
spruce)
P. mariana
(black
spruce)
P. mexicana
(Mexican
spruce)
P. abies
(Norway
spruce)
P. chihuahuana
(Chihuahua
spruce)
P. martinezii
(Martinez
spruce)
P. glauca 15 388 (100) 9904 (64.4) 3452 (22.4) 2710 (17.6) 2565 (16.7) 1922 (12.5) 341 (2.2) 250 (1.6)
P. glauca x
engelmannii
3053 (29.6) 2112 (20.1) 2272 (22.3) 1604 (15.7) 271 (2.7) 190 (1.9)
P. sitchensis 1114 (22.1) 1157 (23.8) 864 (19.2) 177 (4.9) 110 (3.1)
P. mariana 790 (17.6) 789 (20.5) 187 (6.5) 133 (4.7)
P. mexicana 605 (15.6) 141 (5.1) 79 (2.9)
P. abies 119 (5.6) 86 (4.1)
P. chihuahuana 33 (5.9)
Number of
genotyped individuals
5666 7 6 30 5 8 5 5
© 2013 Blackwell Publishing Ltd
DESIGN AND APPLICATIONS OF SPRUCE SNP ARRAYS 7
catalogues in spruces. The present SNP arrays are pub-
licly available and should contribute to significant
resources and knowledge in population genetics, associa-
tion genetics, genomic prediction and genome linkage
mapping in P. glauca, in addition to information for the
design of future genotyping arrays in this species and
other spruce taxa. The use of these SNPs is independent
from the Illumina technologies as the deposited informa-
tion provided through the dbSNP database enables to
design any genotyping assay. For genetic association test-
ing, the PgAS1 array represents 7-fold and 5-fold increases
in SNP and gene coverage, respectively, compared with
previous GoldenGate arrays (Beaulieu et al. 2011; Nam-
roud et al. 2012). For gene linkage mapping, the PgLM3
array represents a 5-fold increase in gene coverage com-
pared with GoldenGate arrays used to map 1800 genes on
the white spruce genome (Pavy et al. 2012a), which should
be helpful to map and pinpoint genes involved in quanti-
tative trait loci more precisely (Pelgas et al. 2011).
Together, the arrays represent an increase of nearly 30X in
SNP coverage compared with first-generation GoldenGate
arrays used to identify outlier polymorphisms related to
adaptation in spruce natural populations (Namroud et al.
2008; Prunier et al. 2011). A marginally higher proportion
of rare SNPs (21% vs. 18% for SNPs with P < 0.05) was
noted for the PgAS1 array compared with PgLM3, consis-
tent with the nearly 20 times larger sample of trees from
natural populations genotyped with PgAS1.
Performance of the assays
The highest genotyping success rates were above 90%
and were obtained for SNPs previously genotyped with
GoldenGate arrays as well as for successful SNPs from
the Infinium array PgAS1 that were included in PgLM3.
Similar success rates with such SNPs were obtained in
other studies on apple trees (Chagn�e et al. 2012) and
maize (Mammadov et al. 2011). In maize, 89% of Golden-
Gate SNPs segregated with the Infinium assay; the fail-
ures were attributed to differences in position and length
of SNP probes between assays (Mammadov et al. 2011).
Among the sources of SNPs tested, those derived
from gDNA resequencing with the Sanger technology
were quite successful (64.7% on PgAS1). Marginally
higher success rates were observed in previously
described genotyping arrays relying on newly discov-
ered SNPs from similar resequencing of genomic DNA
in spruces (Pavy et al. 2008a; Beaulieu et al. 2011; Pelgas
et al. 2011) and pines (Lepoittevin et al. 2010; Chancerel
et al. 2011). However, this sequencing approach is time-
consuming and labour intensive even though different
pooling DNA schemes can be used to reduce the
sequencing effort (Pelgas et al. 2004).
The success obtained for in silico nonsingleton SNPs
was the highest (71.6%) for the PgLM3 array, which was
marginally higher than that observed for SNPs discov-
ered by resequencing gDNA for the PgAS1 array. Single-
ton SNPs that were assayed by chip design constraint
had the lowest genotyping success rates for both arrays
among the in silico SNPs predicted from NextGen
sequences. For these SNPs, the lower coverage and lack
of repeatability in the alignment of transcript sequences
was by far the biggest cause of failure.
Another probable cause of assay failure is linked to
the design of long (50-mer) oligos on transcript
sequences, where the placement of introns is not known
and where it is possible that the probe could span an
intron. This effect would be more severe when multiple
SNPs of the same gene had to be tested by chip design
constraint, such as for the PgAS1 array. Indeed, PgAS1
was designed primarily for genetic association testing of
candidate genes where the success rate for nonsingleton
SNPs from transcript sequence alignments was notice-
ably lower than that for PgLM3 where the chip design
required the genotyping of only one SNP per gene. The
extent of this potential problem will be better known
from looking at genomic sequences including introns.
Such sequences are currently being obtained from
sequencing the white spruce genome (www.smartfor-
ests.ca/en-ca/home.aspx).
The other ‘usual culprits’ of failure in genome-wide
arrays (repeats, low-complexity, dense local SNPs) proba-
bly played a minor role in the rates of success obtained.
Both SNP arrays were mostly designed from exon
sequences, which are mostly high-complexity, unique
sequences. As well, the reference exon sequences were
of high quality as they were derived from a reliable
0.10
0.20
0.30
0.40
0
1000
2000
3000
4000
5000
6000
0* 1 2 3 4 5 6 7
Min
or a
llele
freq
uenc
y in
P. g
lauc
apo
pula
tions
Num
ber o
f seg
rega
ting
SN
Ps
Number of taxa sharing P. glauca SNPs
Number of segregating SNPsMinor allele frequency in P. glauca populations
27.35%
34.44%
20.72%
10.96%
4.40%1.75% 0.35% 0.02%
0
Fig. 3 Transferability of Picea glauca SNPs across spruce species
according to their minor allele frequencies (MAF) as estimated
in natural populations of P. glauca in eastern Canada. The per-
centages of SNPs are indicated on top of histograms. The cate-
gory named 0* includes SNPs segregating only in P. glauca.
© 2013 Blackwell Publishing Ltd
8 N. PAVY ET AL .
Sanger-based catalogue of cDNAs (Rigault et al. 2011).
SNPs in flanking sequences were accounted for to the
extent that they were detected, given the low coverage
for some genes and lack of intron sequences in such a
catalogue. Such SNPs in flanking sequences are also
much less of a problem in Infinium assays, which can
tolerate several mismatches in a 50 mer, than for the
GoldenGate assay.
In spite of their lower success rate, singleton SNPs pro-
vided hundreds of segregating markers that will be use-
ful for genetic analyses. A similarly low genotyping
success rate (33.3%) of in silico singleton SNPs was also
found based on a GoldenGate array in catfish (Wang et al.
2008). In other species with no genomic sequence avail-
able, diverse success rates were reported for in silico SNPs
tested on Infinium arrays. In sunflower, 84.1% of the
attempted nonsingleton in silico SNPs were recovered,
with 80.6% of them segregating (Bachlava et al. 2012).
This high success rate resulted from stringent conditions
applied in the SNPs selection, such as sequence depth
and redundancy among genotypes (Bachlava et al. 2012).
By including only nonsingleton in silico SNPs, 58.2% of
the SNPs turned out to be valid in a rye SNP array (Hase-
neyer et al. 2011). This rate is in the same range as that
observed in the present study for the PgAS1 array,
although lower than that observed for PgLM3.
Overall, the PgLM3 array performed better than
PgAS1. PgLM3 was based on SNPs predicted in deeper
alignments, with more repetitions at each position and
greater reliability of SNP calling. The mean depths at the
predicted nonsingleton SNP site were 19.7 and 43.1 reads
for PgAS1 and PgLM3 respectively (see Methods). Fur-
thermore, given the less stringent chip design constraints
where only one SNP per gene was selected for building
PgLM3, the SNP harbouring the best quality could be
retained. Our general findings and those of other studies
indicated that singleton SNPs should be avoided as
much as possible, as there is a high likelihood that they
represent sequencing errors (Pavy et al. 2006; Appleby
et al. 2009; Metzker 2009; van Oeveren & Janssen 2009).
Sequence assembly and SNP probe design also represent
significant challenges because the spruce genome is not
yet sequenced and contains large gene families (e.g. Be-
don et al. 2010). Given that our main goal was not to
study the effect of the in silico prediction parameters
upon the genotyping success rate, but to obtain a large
validated SNP resource enabling future genetic investi-
gations at the spruce transcriptome level, the objective
was well achieved.
SNP annotation
Both arrays described in this report contained a higher
proportion of genes (carrying segregating SNPs) based
on similarity to known protein families or with the GO
classification compared with the overall white spruce
gene catalogue (Table 2). The higher representation of
annotated genes on the genotyping arrays resulted from
the design selection criteria for candidate genes, in par-
ticular when designing PgAS1 compared with PgLM3
gene sequences (Table 2). The arrays were complemen-
tary with regard to the representation of some gene cate-
gories. For example, genes involved in catalytic activity
were overrepresented on PgAS1 and underrepresented
on PgLM3. Genes known to be involved in wood forma-
tion (cell wall, lignification, secondary metabolism), as
well as transcription factors which represent an essential
focus of our research on wood developmental regulation
(e.g. Bomal et al. 2008; Bedon et al. 2010) were also more
represented among the genes of PgAS1.
Numbers of SNPs shared across spruce species
The several thousands P. glauca individuals genotyped
in the present study were from the eastern part of the
species range in Canada where there is little or no signifi-
cant genetic structure among natural populations (Jara-
millo-Correa et al. 2001; Namroud et al. 2008, 2010;
Beaulieu et al. 2011), and where populations belong to
the same geographical lineage (de Lafontaine et al. 2010).
Therefore, for the P. glauca segregating SNPs identified
in the present study, a very high transfer rate should be
obtained at the intraspecific level when using these SNPs
in different regions or with geographically different po-
pulations of the eastern lineage. For populations of the
western lineage (de Lafontaine et al. 2010), a high trans-
fer rate should also be obtained with a value in excess of
that found for the naturally hybridizing interior spruce
species complex, P. glauca x engelmannii (64.4%). The
transfer rate across P. glauca populations will also attain
its maximum value by avoiding SNPs with low natural
frequency (MAF), as shown for the interspecific transfer
rates (Fig. 3).
Although small panels of individuals were used to
assess the numbers of shared SNPs across spruce species,
the results obtained should be highly useful given that
the shared SNPs are directly amenable to genotyping
with expected success rate of 90% or more using similar
platforms, and that for some of the species tested, there
exist little or no genomic resources available. Sets of
shared SNPs will be useful not only for population
genomics applications but also to accelerate comparative
genome mapping studies among spruces. The variation
in numbers of shared SNPs was large and could be
explained following a number of factors. The highest
number was observed with P. glauca x P. engelmannii
(interior spruce), a species complex implicating hybrids of
various composition in British Columbia. P. engelmannii
© 2013 Blackwell Publishing Ltd
DESIGN AND APPLICATIONS OF SPRUCE SNP ARRAYS 9

Parry is also the sister taxon to P. glauca according to
both cpDNA and mtDNA phylogenies (Bouill�e et al.
2011). The second number of shared SNPs was observed
with P. sitchensis, which hybridizes naturally with
P. glauca in their large zone of contact in British Colum-
bia. Even if the genotyped individuals originated from
Britain where the species has been introduced more
than 100 years ago, their natural origin is from western
North America. Whereas the cpDNA phylogeny
places P. sitchensis as a remote lineage to that leading to
P. glauca and P. engelmannii, P. sitchensis forms, with
P. engelmannii, a close sister group to P. glauca on the
mtDNA phylogeny (Bouill�e et al. 2011). Thus, the phylo-
genetic placement of P. sitchensis is uncertain, but overall,
it is phylogenetically more remote from P. glauca than
P. engelmannii is, a pattern in line with the number of
shared SNPs observed.
As for P. mexicana, P. mariana and P. abies, the num-
bers of shared SNPs were noticeably lower than for the
two previous taxa. On the mtDNA phylogeny (Bouill�e
et al. 2011), these species are located well apart from
white spruce, with the European P. abies being the most
divergent one, followed by the North American P. mari-
ana and P. mexicana. On the cpDNA phylogeny (Bouill�e
et al. 2011), P. mexicana is also located closer to P. glauca
than the two other species. Although P. glauca and P.
mexicana are allopatric, they can cross readily (Gordon
1982), whereas for P. glauca, P. mariana and P. abies, inter-
specific crossability is low or null (Mikkola 1969; Gordon
1976), a pattern consistent with the larger phylogenetic
divergence observed among them (Bouill�e et al. 2011).
Thus, if phylogeny and crossability are considered as
predictors of the numbers of SNPs shared between P. gla-
uca and its congeners, this number is expected to be
higher between P. glauca and P. mexicana than that with
either P. mariana or P. abies. The number of SNPs shared
between P. glauca and P. mexicana was higher than that
observed with P. abies, but lower than that with P. mari-
ana. This partly unexpected result could be due to the
marginally reduced genetic diversity in P. mexicana, or
more likely to an inflated number of SNPs shared with
P. mariana, given that a larger number of P. mariana indi-
viduals had to be considered for various purposes.
Indeed, when a more restricted number of trees was con-
sidered for P. mariana, as that tested for the PgAS1 array
(Table 2), a smaller number of shared SNPs was
observed for P. mariana than for P. mexicana. Hence, for
these various species, the variability in numbers of
shared SNPs was well in line with expectations from
crossability studies and patterns of phylogenetic diver-
gence from P. glauca.
Unexpected small numbers of shared SNPs were
observed for the Mexican P. chihuahuana and P. martin-
ezii. To our knowledge, there is no reliable crossability
data between these species and P. glauca, but their phy-
logenetic divergence from P. glauca is about the same as
that observed between P. mexicana and P. glauca on the
mtDNA phylogeny, while this divergence is in the same
range as that observed for P. mariana and P. abies on the
cpDNA phylogeny (Bouill�e et al. 2011). Thus, according
to expectations from phylogenetic divergence, a larger
number of shared SNPs was anticipated with these spe-
cies, somewhere between that observed for P. mexicana
and that for P. mariana or P. abies. The observed low
numbers suggest the existence of another effect than
solely phylogenetic divergence. This trend could be
explained in part by lower levels of genome-wide stand-
ing genetic variation in P. chihuahuana and P. martinezii
than in P. mexicana, consistent with reports of reduced
levels of genetic diversity in these endangered mountain
species of Mexico (Ledig et al. 1997, 2000; Jaramillo-Cor-
rea et al. 2006). Although P. mexicana is also restricted to
a small number of populations, it harbours higher
observed and expected heterozygosities and number of
alleles per allozyme loci compared with the other two
Mexican species, together with a significant excess of
heterozygotes within populations (Ledig et al. 2002).
This pattern implies that the standing genetic variation
in P. mexicana might be in part maintained by selection
against inbreds, as observed for other conifers (Isabel
et al. 1995). This higher genetic diversity presumably
contributed to the larger number of SNPs shared with
P. mexicana compared with the other two Mexican species.
The present results also indicate that whereas some of
the gene SNPs might be shared because of a lack of
reproductive isolation and interspecific gene flow, such
as between P. glauca, P. glauca x P. engelmannii (interior
spruce) and P. sitchensis, others are probably the result of
shared ancestry between species that have diverged
many million years ago, such as between the reproduc-
tively isolated P. glauca and P. mariana, or P. abies (Bouill�e
& Bousquet 2005; Namroud et al. 2010). Also, a positive
relationship was observed between the minor allele fre-
quency of SNPs in natural populations of P. glauca and
the number of SNPs shared with other spruce species
(Fig. 3). This trend indicates that, on average, frequent
alleles were exchanged more often between hybridizing
taxa, and/or are likely to have a more ancient origin, in
some cases dating back million years ago (Bouill�e &
Bousquet 2005).
The net value of the SNP resource reported here
extends well beyond its usefulness for white spruce. It is
a validated resource at the genotyping level, and largely
transferable to other spruce species for population genet-
ics applications and comparative mapping purposes.
These markers are also far from being anonymous, being
representative of a diversity of targeted genes well anno-
tated through a comprehensive gene catalogue and in
© 2013 Blackwell Publishing Ltd
10 N. PAVY ET AL .
the process of being progressively mapped onto the
spruce genome (Pavy et al. 2012a). The complete
genomic resource has been made available through the
dbSNP database.
Acknowledgements
This work was funded by grants from Genome Quebec and
Genome Canada to J. Mackay and J. Bousquet for Arborea II
and a pilote genome sequencing project, by a NSERC dis-
covery grant to J. Bousquet, and grants from the Genomics
R&D Initiative to J. Beaulieu and N. Isabel. We thank Frank
Bedon, Claude Bomal, S�ebastien Caron, Isabelle Gigu�ere, Vicky
Roy (Univ. Laval), Denis Lachance, Caroline Levasseur, Marie-
Jos�ee Morency, Armand S�eguin (Canadian Forest Service,
Qu�ebec, Canada) for contributions to the selection of candidate
genes. We are also grateful to the collaborators who provided
needle specimens or DNA samples from pedigree populations:
Kermit Ritland (Univ. of British Columbia, Canada), Stuart
A’Hara and Joan Cottrell (British Forestry Commission, Midlo-
thian, United Kingdom), Martin Lascoux (Uppsala Univ., Swe-
den), Matthias Fladung (Federal Research Centre for Forestry
and Forest Products, Institute for Forest Genetics and Forest
Tree Breeding, Großhansdorf, Germany) and P€ar Ingvarsson
(Univ. of Umea Plant Science Centre, Sweden). The authors
wish to acknowledge Sauphie Senneville (Univ. Laval) for
logistics and infrastructure support, as well as Daniel Vincent
and Alexandre Montpetit of the genotyping platform of the
McGill University and G�enome Qu�ebec Innovation Centre for
their excellent work and assistance with conducting the geno-
typing assays.
References
Appleby N, Edwards D, Batley J (2009) New technologies for ultra-high
throughput genotyping in plants. Methods in Molecular Biology, 513,
19–39.
Bachlava E, Taylor CA, Tang S et al. (2012) SNP discovery and develop-
ment of a high-density genotyping array for sunflower. PLoS ONE, 7,
e29814.
Beaulieu J, Doerksen T, Boyle B et al. (2011) Association genetics of wood
physical traits in the conifer white spruce and relationships with gene
expression. Genetics, 188, 197–214.
Bedon F, Bomal C, Caron S et al. (2010) Subgroup 4 R2R3-MYBs in conifer
trees: gene family expansion and contribution to the isoprenoid- and
flavonoid-oriented responses. Journal of Experimental Botany, 61,
3847–3864.
Bomal C, Bedon F, Caron S et al. (2008) Involvement of Pinus taeda MYB1
and MYB8 in phenylpropanoid metabolism and secondary cell wall
biogenesis: a comparative in planta analysis. Journal of Experimental Bot-
any, 59, 3925–3939.
Bouill�e M, Bousquet J (2005) Trans-species shared polymorphisms at or-
thologous nuclear gene loci among distant species in the conifer Picea
(Pinaceae): implications for the long-term maintenance of genetic
diversity in trees. American Journal of Botany, 92, 63–73.
Bouill�e M, Senneville S, Bousquet J (2011) Discordant mtDNA and
cpDNA phylogenies indicate geographic speciation and reticulation as
driving factors for the diversification of the genus Picea. Tree Genetics &
Genomes, 7, 469–484.
Bousquet J, Isabel N, Pelgas B et al. (2007) Spruce. In:Forest trees (ed. Kole
C), pp. 93–114. Springer-Verlag, Berlin Heidelberg New York.
Chagn�e D, Crowhurst RN, Troggio M et al. (2012) Genome-wide SNP
detection, validation, and development of an 8K SNP array for apple.
PLoS ONE, 7, e31745.
Chancerel E, Lepoittevin C, Le Provost G et al. (2011) Development and
implementation of a highly-multiplexed SNP array for genetic map-
ping in maritime pine and comparative mapping with loblolly pine.
BMC Genomics, 12, 368.
Chen J, K€allman T, Ma X et al. (2012) Disentangling the roles of history
and local selection in shaping clinal variation in allele frequencies
and gene expression in Norway spruce (Picea abies). Genetics, 191,
865–881.
Conesa A, Gotz S, Garcia-Gomez JM et al. (2005) Blast2GO: a universal
tool for annotation, visualization and analysis in functional genomics
research. Bioinformatics, 21, 3674–3676.
Cot�e CL, Boileau F, Roy V et al. (2010) Gene family structure, expression
and functional analysis of HD-Zip III genes in angiosperm and gymno-
sperm forest trees. BMC Plant Biology, 10, 273.
Demura T, Fukuda H (2007) Transcriptional regulation in wood forma-
tion. Trends in Plant Science, 12, 64–70.
Eckert AJ, Bower AD, Wegrzyn JL et al. (2009) Association genetics of
coastal Douglas fir (Pseudotsuga menziesii var. menziesii, Pinaceae).
I. Cold-hardiness related traits. Genetics, 182, 1289–1302.
Eckert AJ, van Heerwaarden J, Wegrzyn JL et al. (2010) Patterns of popu-
lation structure and environmental associations to aridity across the
range of loblolly pine (Pinus taeda L., Pinaceae). Genetics, 185, 969–982.
Ekblom R, Galindo J (2011) Applications of next generation sequencing
in molecular ecology of non-model organisms. Heredity, 107, 1–15.
El Kayal W, Allen CCG, Ju CJ-T et al. (2011) Molecular events of apical
bud formation in white spruce, Picea glauca. Plant, Cell & Environment,
34, 480–500.
Fan JB, Chee MS, Gunderson KL (2006) Highly parallel genomic assays.
Nature Reviews Genetics, 7, 632–644.
Ganal MW, Durstewitz G, Polley A et al. (2011) A large maize (Zea mays
L.) SNP genotyping array: development and germplasm genotyping,
and genetic mapping to compare with the B73 reference genome. PlosS
ONE, 6, e28334.
Gordon AG (1976) The taxonomy and genetics of Picea rubens and its rela-
tionship to Picea mariana. Canadian Journal of Botany, 54, 781–813.
Gordon A (1982) Genetics of genecology of spruce, Sault Ste. Marie,
Ontario, 1979 and 1980. In: Proceedings of the eighteenth meeting of the
Canadian Tree Improvement Association. Part 1 (ed. Yeatman C), pp.
112–115. Canadian Tree Improvement Association, Duncan, British
Columbia.
Grattapaglia D, Resende MDV (2011) Genomic selection in forest tree
breeding. Tree Genetics & Genomes, 7, 241–255.
Grattapaglia D, Silva-Junior OB, Kirst M et al. (2011) High-throughput
SNP genotyping in the highly heterozygous genome of Eucalyptus:
assay success, polymorphism and transferability across species. BMC
Plant Biology, 11, 65.
Groover AT (2005) What genes make a tree a tree? Trends in Plant Science,
10, 210–214.
Gunderson KL (2009) Whole-genome genotyping on bead arrays. Meth-
ods in Molecular Biology, 529, 197–213.
Hamilton JP, Hansey CN, Whitty BR et al. (2011) Single nucleotide poly-
morphism discovery in elite North American potato germplasm. BMC
Genomics, 12, 302.
Haseneyer G, Schmutzer T, Seidel M et al. (2011) From RNA-seq to large-
scale genotyping - genomics resources for rye (Secale cereale L.). BMC
Plant Biology, 11, 131.
Holliday J, Ritland K, Aitken SN (2010) Widespread, ecologically relevant
genetic markers developed from association mapping of climate-
related traits in Sitka spruce (Picea sitchensis). New Phytologist, 188,
501–514.
Isabel N, Beaulieu J, Bousquet J (1995) Complete congruence between
gene diversity estimates derived from genotypic data at enzyme and
RAPD loci in black spruce. Proceedings of the National Academy of
Sciences of the USA, 92, 6369–6373.
© 2013 Blackwell Publishing Ltd
DES IGN AND APPLICATIONS OF SPRUCE SNP ARRAYS 11
van Oeveren J, Janssen A (2009) Mining SNPs from DNA sequence data;
computational approaches to SNP discovery and analysis. Methods in
Molecular Biology, 578, 73–91.
Jaramillo-Correa JP, Beaulieu J, Bousquet J (2001) Contrasting evolution-
ary forces driving population structure at expressed sequence tag
polymorphisms, allozymes and quantitative traits in white spruce.
Molecular Ecology, 10, 2729–2740.
Jaramillo-Correa JP, Beaulieu J, Ledig FT et al. (2006) Decoupled mito-
chondrial and chloroplast DNA population structure reveals Holocene
collapse and population isolation in a threatened Mexican-endemic
conifer. Molecular Ecology, 15, 2787–2800.
Kumar S, Bink MCAM, Volz RK et al. (2012) Towards genomic selection
in apple (Malus 9 domestica Borkh.) breeding programmes: Prospects,
challenges and strategies. Tree Genetics & Genomes, 8, 1–14.
de Lafontaine G, Turgeon J, Payette S (2010) Phylogeography of white
spruce (Picea glauca) in eastern North America reveals contrasting eco-
logical trajectories. Journal of Biogeography, 37, 741–751.
Ledig FT, Jacob-Cervantes V, Hodgskiss PD et al. (1997) Recent evolution
and divergence among populations of a rare Mexican endemic, Chi-
huahua spruce, following Holocene climatic warming. Evolution, 51,
1815–1827.
Ledig FT, Bermejo-Vel�azquez B, Hodgskiss PD et al. (2000) The mating
system and genic diversity in Mart�ınez spruce, an extremely rare ende-
mic of M�exico’s Sierra Madre Oriental: an example of facultative sel-
fing and survival in interglacial refugia. Canadian Journal of Forest
Research, 30, 1156–1164.
Ledig FT, Hodgskiss PD, Jacob-Cervantes V (2002) Genetic diversity,
mating system, and conservation of a Mexican subalpine relict, Picea
mexicana Mart�ınez. Conservation Genetics, 3, 113–122.
Lepoittevin C, Frigerio JM, Garnier-G�er�e P et al. (2010) In vitro vs in silico
detected SNPs for the development of a genotyping array: what can
we learn from a non-model species? PLoS ONE, 5, e11034.
MacKay J, Dean J (2011) Transcriptomics. In: Genetics, Genomics and Breed-
ing of Conifers (eds Plomion C, Bousquet J & Kole C), pp. 323–357.
Edenbridge Science Publishers & CRC Press, New York.
Mammadov JA, Chen W, Mingus J et al. (2011) Development of versatile
gene-based SNP assays in maize (Zea mays L.). Molecular Breeding, 29,
779–790.
Metzker ML (2009) Sequencing technologies - the next generation. Nature
Reviews Genetics, 11, 31–46.
Mikkola L (1969) Observations on inter-specific sterility in Picea. Annals of
Botany Fenicci, 6, 285–339.
Mullin T, Andersson B, Bastien J-C et al. (2011) Economic importance,
breeding objectives and achievements. In: Genetics, Genomics and Breed-
ing of Conifers (eds Plomion C, Bousquet J & Kole C), pp. 40–127. Eden-
bridge Science Publishers & CRC Press, New York.
Murray BG (1998) Nuclear DNA amounts in gymnosperms. Annals of
Botany, 82, 3–15.
Myles S, Chia J-M, Hurwitz B et al. (2010) Rapid genomic characteriza-
tion of the genus Vitis. PLoS ONE, 5, e8219.
Namroud M-C, Beaulieu J, Juge N et al. (2008) Scanning the genome
for gene single nucleotide polymorphisms involved in adaptive
population differentiation in white spruce. Molecular Ecology, 17,
3599–3613.
Namroud M-C, Guillet-Claude C, Mackay J et al. (2010) Molecular evolu-
tion of regulatory genes in spruces from different species and conti-
nents: heterogeneous patterns of linkage disequilibrium and selection
but correlated recent demographic changes. Journal of Molecular Evolu-
tion, 70, 371–386.
Namroud M-C, Bousquet J, Doerksen T et al. (2012) Scanning SNPs from
a large set of expressed genes to assess the impact of artificial selection
on the undomesticated genetic diversity of white spruce. Evolutionary
Applications, 5, 641–656.
Pavy N, Parsons LS, Paule C et al. (2006) Automated SNP detection from
a large collection of white spruce expressed sequences: contributing
factors and approaches for the categorization of SNPs. BMC Genomics,
7, 174.
Pavy N, Pelgas B, Beauseigle S et al. (2008a) Enhancing genetic mapping
of complex genomes through the design of highly-multiplexed SNP
arrays: application to the large and unsequenced genomes of white
spruce and black spruce. BMC Genomics, 9, 21.
Pavy N, Boyle B, Nelson C et al. (2008b) Identification of conserved core
xylem gene sets: conifer cDNA microarray development, transcript
profiling and computational analyses. New Phytologist, 180, 766–786.
Pavy N, Pelgas B, Laroche J et al. (2012a) A spruce gene map infers
ancient genome reshuffling and subsequent slow evolution in the
gymnosperm lineage leading to extant conifers. BMC Biology, 10, 84.
Pavy N, Namroud M-C, Gagnon F et al. (2012b) The heterogeneous levels
of linkage disequilibrium in white spruce genes and comparative anal-
ysis with other conifers. Heredity, 108, 273–284.
Pelgas B, Isabel N, Bousquet J (2004) Efficient screening for expressed
sequence tag polymorphisms (ESTPs) by DNA pool sequencing and
denaturing gradient gel electrophoresis (DGGE) in spruces. Molecular
Breeding, 13, 263–279.
Pelgas B, Beauseigle S, Acher�e V et al. (2006) Comparative genome map-
ping between Picea glauca, P. abies and P. mariana x rubens, and corre-
spondance with other Pinaceae. Theoretical and Applied Genetics, 113,
1371–1393.
Pelgas B, Bousquet J, Meirmans PG et al. (2011) QTL mapping in white
spruce: gene maps and genomic regions underlying adaptive traits
across pedigrees, years and environments. BMC Genomics, 12, 145.
Perry DJ, Bousquet J (1998) Sequence-tagged-site (STS) markers of arbi-
trary genes: the utility of black spruce-derived STS primers in other
conifers. Theoretical and Applied Genetics, 97, 735–743.
Prunier J, Laroche J, Beaulieu J et al. (2011) Scanning the genome for gene
SNPs related to climate adaptation and estimating selection at the
molecular level in boreal black spruce. Molecular Ecology, 20,
1702–1716.
Resende MFRJ, Munos P, Acosta JJ et al. (2012) Accelerating the domesti-
cation of trees using genomic selection: accuracy of prediction models
across ages and environments. New Phytologist, 193, 617–624.
Rigault P, Boyle B, Lepage P et al. (2011) A white spruce gene catalogue
for conifer genome analyses. Plant Physiology, 157, 14–28.
Stapley J, Reger J, Feulner PGD et al. (2010) Adaptation genomics: the
next generation. Trends in Ecology & Evolution, 25, 705–712.
Verde I, Bassil N, Scalabrin S et al. (2012) Development and evaluation of
a 9K SNP array for peach by internationally coordinated SNP detection
and validation in breeding germplasm. PLoS ONE, 7, e35668.
Wang S, Sha Z, Sonstegard TS et al. (2008) Quality assessment parameters
for EST-derived SNPs from catfish. BMC Genomics, 9, 450.
Zhang J, Elo A, Helariutta Y (2011) Arabidopsis as a model for wood for-
mation. Current Opinion in Biotechnology, 22, 293–299.
J.P.J.-C., J.Be., N.I. provided plant material; B.B., B.P.,
M.D., S.C., M.L., J.E.K.C., J.Be., N.I., J.M. selected the
genes; F.G., S.B. prepared the samples and coordinated
the manufacture of SNP arrays; P.L., S.B. submitted data
to dbSNP; P.R. predicted SNPs; P.R. and J.Bo. designed
the genotyping assays; N.P., F.G., S.B., J.P.J.-C., A.D.,
J.Bo. analysed data and prepared the manuscript; N.I.,
J.Be., J.M., J.Bo. provided funding for the study.
Data Accessibility
Data were deposited in the database of single nucleo-
tide polymorphisms (dbSNP at http://www.ncbi.nlm.
nih.gov/SNP/). Bethesda (MD): National Center for
© 2013 Blackwell Publishing Ltd
12 N. PAVY ET AL .

Biotechnology Information, National Library of
Medicine. dbSNP accessions: ss511222299-ss538955466
(dbSNP Build ID:136). The sequence reads are available
in the NCBI archive under the project number
SRP003565. Lists of SNPs and their gene annotations are
reported in supplementary tables.
Supporting Information
Additional Supporting Information may be found in the online
version of this article:
Table S1 Accessions of SNPs and annotation of genes repre-
sented on the PgAS1 and PgLM3 genotyping arrays.
Table S2 Lists of SNPs (NCBI assay ids) successfully genotyped
in each spruce species.
© 2013 Blackwell Publishing Ltd
DES IGN AND APPLICATIONS OF SPRUCE SNP ARRAYS 13