development of a tool for modeling the fecal contamination
TRANSCRIPT

�����������������
Citation: Van, L.-A.; Nguyen, K.-D.;
Le Marrec, F.; Jairy, A. Development
of a Tool for Modeling the Fecal
Contamination in Rivers with
Turbulent Flows—Application to the
Seine et Marne Rivers (Parisian
Region, France). Water 2022, 14, 1191.
https://doi.org/10.3390/w14081191
Academic Editors: Xiaojun Luo and
Zhiguo Cao
Received: 24 February 2022
Accepted: 5 April 2022
Published: 8 April 2022
Publisher’s Note: MDPI stays neutral
with regard to jurisdictional claims in
published maps and institutional affil-
iations.
Copyright: © 2022 by the authors.
Licensee MDPI, Basel, Switzerland.
This article is an open access article
distributed under the terms and
conditions of the Creative Commons
Attribution (CC BY) license (https://
creativecommons.org/licenses/by/
4.0/).
water
Article
Development of a Tool for Modeling the Fecal Contaminationin Rivers with Turbulent Flows—Application to the Seine etMarne Rivers (Parisian Region, France)Lan-Anh Van 1,*, Kim-Dan Nguyen 2, François Le Marrec 1 and Aïcha Jairy 3
1 Prolog Ingenierie, 3–5 Rue de Metz, 75010 Paris, France; [email protected] Laboratory for Hydraulics Saint-Venant, 6 Quai Watier, 78400 Chatou, France; [email protected] SIAAP, 2 Rue Jules César, CEDEX 12, 75589 Paris, France; [email protected]* Correspondence: [email protected]; Tel.: +33-(0)1-48-01-92-01
Abstract: Bacterial pollution in the water comes in particular from Escherichia coli and fecal col-iforms, responsible for gastroenteritis and diarrhea, intestinal streptococci or enterococci (urinary tractinfections and peritonitis), salmonella which can cause serious gastroenteritis, shigella (dysen-teritis,gastroenteritis), cholera vibrio (cholera). As 23 sites on the Seine and Marne Rivers (Parisian Region)would be identified as the natation competition sites for the Paris-2024 Olympic and ParalympicGames, the water quality at these sites should be seriously monitored. Numerical modeling canbe considered one powerful tool to watch the water quality parameters. However, measurementsshow that the water quality is not homogeneous in a river cross-section, and one-dimensional (1D)models are not enough to accurately calculate the bacteriological concentration dispersion in theaquatic environments. Therefore, a two-dimensional model has been developed by coupling theTELEMAC-2D model and its water quality module WAQTEL for simulating bathing water qualityin the Seine and Marne Rivers. The model was validated against in situ measurements and wascompared against a 1D model. Results show that this model can simulate not only the longitudinalevolution but also the transverse dispersion of bacteriological pollutants. Then, a 3D multi-layermodel has been developed around a bathing site using the TELEMAC-3D model. The result of the3D model is promising and allows us to get a finer representation of the bacteriological concentrationin three dimensions.
Keywords: bathing sites; water quality; Escherichia coli; numerical modeling
1. Introduction
Swimming is a recreational activity during the summer, allowing you to cool off in hotweather. It is also a sport. In urban rivers in cities with millions of inhabitants, the questiontherefore arises is whether swimming would be possible, or in other words, is the waterquality safe for swimming [1].
Indeed, there is a high demand for swimming in urban areas with a particular interestin water quality: In Berlin, a study shows that 46% of the bathers questioned are ready topay to improve the quality of the water in their area’s swimming site [2]. Faced with thisdemand, bathing sites have opened in various European metropolises such as Amsterdam,Rotterdam, Dublin, and Berlin.
In Paris, with the preparation of the Paris-2024 Olympic and Paralympic Games,various bathing sites along the Seine and Marne rivers have been identified and putforward within the framework of an expression of interest [3].
In total, 23 sites have been identified spread over 16 interested cities:
• 6 sites in Seine-Upstream• 5 sites in Paris• 7 sites in Seine-Downstream
Water 2022, 14, 1191. https://doi.org/10.3390/w14081191 https://www.mdpi.com/journal/water

Water 2022, 14, 1191 2 of 26
• 5 sites in Marne
Figure 1 presents the identified bathing sites in the Seine and Marne Rivers.
Water 2022, 14, x FOR PEER REVIEW 2 of 27
• 5 sites in Paris • 7 sites in Seine-Downstream • 5 sites in Marne
Figure 1 presents the identified bathing sites in the Seine and Marne Rivers.
Figure 1. Bathing sites in the Seine and Marne Rivers confirmed by local authorities following the expression of interest (adapted with permission from [3], 2018, APUR according to https://www.apur.org/open_data/resume_licence_ODbl.pdf (accessed on 14 March 2022).
Bacterial pollution in the water comes in particular from Escherichia coli and fecal col-iforms, responsible for gastroenteritis and diarrhea, intestinal streptococci or enterococci (uri-nary tract infections and peritonitis), salmonella which can cause serious gastroenteritis, shigella (dysenteritis, gastroenteritis), cholera vibrio (cholera).
The European Bathing Water Directive 2006/7/EC highlights the measurement of two microbiological parameters, Escherichia coli (EC) and intestinal enterococci (IE), as Fecal In-dicator Bacteria (FIBs) in the context of monitoring the bathing water [4]. Indeed, EC is the most widely used indicator of Fecal Contamination (FC) and is presented as the best indi-cator to monitor the sanitary quality of freshwater [5].
When assessing the sources of fecal contamination of rivers, it is usually to distin-guish point sources from non-point sources, also called diffuse sources. In an urbanized area such as the Seine and the Marne Rivers, the major point source of fecal bacteria con-sists of Wastewater Treatment Plants (WWTPs) effluents, since most inhabitants are con-nected to sewers driving their wastewaters to WWTPs. However, the direct discharge of untreated urban wastewater through Combined Sewer Overflows (CSOs), as well as the discharge of some industrial effluents, can also contribute to contamination. Rainfall is
Figure 1. Bathing sites in the Seine and Marne Rivers confirmed by local authorities following theexpression of interest (adapted with permission from [3], 2018, APUR according to https://www.apur.org/open_data/resume_licence_ODbl.pdf (accessed on 14 March 2022).
Bacterial pollution in the water comes in particular from Escherichia coli and fecalcoliforms, responsible for gastroenteritis and diarrhea, intestinal streptococci or enterococci(urinary tract infections and peritonitis), salmonella which can cause serious gastroenteritis,shigella (dysenteritis, gastroenteritis), cholera vibrio (cholera).
The European Bathing Water Directive 2006/7/EC highlights the measurement oftwo microbiological parameters, Escherichia coli (EC) and intestinal enterococci (IE), as FecalIndicator Bacteria (FIBs) in the context of monitoring the bathing water [4]. Indeed, EC isthe most widely used indicator of Fecal Contamination (FC) and is presented as the bestindicator to monitor the sanitary quality of freshwater [5].
When assessing the sources of fecal contamination of rivers, it is usually to distinguishpoint sources from non-point sources, also called diffuse sources. In an urbanized areasuch as the Seine and the Marne Rivers, the major point source of fecal bacteria consists ofWastewater Treatment Plants (WWTPs) effluents, since most inhabitants are connected tosewers driving their wastewaters to WWTPs. However, the direct discharge of untreatedurban wastewater through Combined Sewer Overflows (CSOs), as well as the dischargeof some industrial effluents, can also contribute to contamination. Rainfall is likely tohave a huge impact on the load of fecal bacteria. Due to CSOs and sometimes incomplete

Water 2022, 14, 1191 3 of 26
treatment in WWTPs in wet weather situations, point sources increase during rain eventsas well as the non-point sources due to increased surface runoff.
Once released in rivers, the disappearance of fecal bacteria in aquatic environmentsresults from the combined actions of various biological (protozoan, grazing, lysis) andphysicochemical parameters (nutrients concentration, sunlight intensity, and temperature).In addition, fecal bacteria can be removed from the water column through sedimentation.The attachment of fecal bacteria to particles in suspension has important implications fortheir fate and their mortality after release in river waters [6].
Being aware that modeling is a useful tool to monitor the water quality in rivers,and helps to better understand the sources, fate, and transport of the fecal contamination,different numerical models have been developed in the Seine and Marne Rivers to simulatethe distribution of FC. First, a module describing the dynamics of fecal bacteria has been de-veloped by Servais in [6]. This module has been coupled on the one hand, to a model of theentire Seine basin up to the estuary mouth (SENEQUE model) [6], and, on the other hand,to a three-dimensional hydrodynamic model of the Seine estuary (SiAM-3D model) [7]. Inthis FC module, two main processes controlling the fate of FC were considered: mortalityand settling. Only one stock of FC was considered in the FC-SENEQUE model, while theFC-SiAM-3D model considers two stocks of FC in the river (free FC and FC attached tosuspended sediments). In this model, only attached FC can settle and different mortalityrates were considered for free and attached FC.
In 2013, the improved FC module has been coupled to the one-dimensional hy-draulic model of PROSE and this model was used to analyze the impact of CSOs inrainy weather [8].
These three models correctly simulate the longitudinal distribution of fecal coliformsin the main rivers of the Seine watershed (SENEQUE and PROSE models) and in the estuary(SiAM-3D). However, none of the studies presented above indicated the high variationof FC concentrations in the transverse direction. Recent measurements carried out in theSeine and Marne rivers in the Parisian Region show that the concentrations of E. coli and IEbacteria vary considerably between the river center and the river banks, even in sections, inwhich there are no external contributions of contaminants [9].
Thus, to establish a precise microbiological state of bathing sites, it is essential to developa modeling tool, which is able to represent this heterogeneity in the transversal direction.
This paper aims to present a coupled 2D/3D hydrodynamic and microbial waterquality model (TELEMAC– WAQTEL model) for studying the fate and transport of E. coliin the Seine and Marne Rivers, taking into account the bacterial decay and the settlingprocesses. Three stocks of E. coli in rivers were considered: free E. coli, E. coli attachedto suspended sediments, and E. coli in the deposited sediments. The three stocks areaffected by different mortality rates (first-order kinetics). Attached E. coli can settle anddeposit in the sediment, while E. coli in the deposited sediments can be re-suspended inthe water column. The model has been first validated against the measurements in theSeine and Marne Rivers from [9] and then compared with the results of the 1D ProSe modeldeveloped within the framework of the PIREN-Seine research program [8]. The simulationswill highlight the spatial variability of microbial pollutants not only in the longitudinalbut also in the transverse directions in these two rivers. This modeling tool will be used tosupport monitoring the water quality around bathing sites.
2. E. coli Model Selection2.1. Hydrodynamic Modelling
As a first step, the hydrodynamics of rivers must be accurately reproduced, includingthe processes of advection and dispersion.
To assess the pollutant plumes transported by a river, the fluxes of solute pollutantsare generally calculated by multiplying the concentration of matter in all or part of the riverby its water discharge passing through the measurement section. This method only allowsvery rough estimations due to the heterogeneity of the flow in rivers.

Water 2022, 14, 1191 4 of 26
However, the heterogeneity of concentrations, downstream of the pollutant plumes,indicates that despite the turbulent nature of their flow, the FIBs do not mix instantly overthe entire section of rivers [9]. Other circulations are involved in the redistribution of FIBswithin the flow, which depends on the transverse flows of particles.
In the laboratory, these transverse phenomena were demonstrated by Taylor [10]with the classical experiment of a viscous flow in a pipe carrying a solute, showing thatlongitudinal transport depends on transverse flows.
In rivers, this phenomenon is amplified by the turbulent nature of the flow, in which thelongitudinal velocity profiles depend on the transverse flows with momentum exchangesbetween the flow and the bed materialized by the stresses that drive the sediments. It isthen not possible to calculate the flow of solutes and suspended particles, and thereforeof FIBs in a river without accounting for the heterogeneity of the velocity fields andtheir large fluctuations, characteristic of turbulent flows, within which the trajectories arenot stationary.
More recent studies and observations show that turbulence generates mean secondaryflows in the plane orthogonal to the main flow not only in meandering rivers but also instraight sections of rivers or channels, in which the flows are not subjected to the action ofcentrifugal force [11].
More recently, in 2012, secondary flows perpendicular to the direction of the mainflow were highlighted by a researcher of the University of Paris Diderot, using ADCPmeasurements in the Seine at the bridge Simone de Beauvoir in Paris. The stationaryvortices extend across the entire channel and rotate at about 0.3% of the streamwise velocity,in accord with prior laboratory observations [12].
In conclusion, multiplying the averaged discharge with the concentration of the FIBswithin a plume, cannot correctly represent the heterogeneity of the velocity field in riversnor the dynamics of fecal contamination in a bathing site. We need a modeling tool togenerate spatially and temporally continuous concentrations and to better understand thetransport of fecal contamination.
2.2. Physical Representation of FIB Dynamics
In addition, we are interested in models that provide a reliable physical representationof the evolution of the concentrations of EC and IE markers in the liquid mass.
These contaminations are transported in the form of microorganisms of varying sizes.The finest particles (free FIB) are held in suspension by the turbulence of the flow andoccupy the entire water column. They are transported by advection. The attached FIB tosuspended sediment is carried and dispersed in the water mass as a tracer, but is also subjectto the laws of sedimentary physics: they settle in calm waters and produce areas of pollutedsediment (attached FIB to bed sediment) and can be re-suspended by a strong flow.
These three families of FIB behave differently with respect to sedimentation and areaffected by different mortality rates. In general, bacteriological pollution of fecal origin at abathing site disappears after 24 to 72 h in the presence of the sun. In contrast, it can last afew days in dark conditions [13].
This disappearance results from the combined action of various physicochemical andbiological parameters, which interact with each other [14]. The predominant factors thatinfluence mortality including temperature, salinity, sunlight, and pH, will be one-by-onediscussed in more detail below.
In inland rivers, the salinity is almost zero and therefore has no effect on coliform mortality.The effect of temperature on the decay of bacterial populations should be evaluated in
the dark to eliminate the effect of solar radiation. If salinity and pH are kept constant, thenthe effect of temperature can be represented by the Arrhenius expression [15]:
kd(t) = kd20ϑMT−20, (1)

Water 2022, 14, 1191 5 of 26
where T (◦C) is the temperature of the water; kd20 is the rate of degradation of microorgan-isms observed at 20 ◦C in freshwater, and ϑM is a parameter that controls the sensitivity ofkd to variations in T.
The graphs in Figure 3 in [15] illustrate the effect of temperature on bacterial mortalitybased on the research conducted at different times by four different research laboratories.Data in these graphs were collected from aquatic environments with salinity below 3‰and pH between 6 and 8 to neutralize the effects of excessive salinity and acidity/alkalinityin the studied aquatic environments. Two environments were tested: an environment richin nutrients and another poor in nutrients. In the graphs, the black curve is an optimum fitcurve. Thus, the parameters of this curve are presented in Table 1.
Table 1. Parameters of the optimum fit curve.
Parameter Symbol E. coli Enterococci
Mortality rate in freshwater kd20(d−1) 0.48 0.45
Mortality temperaturemultiplier in freshwater ϑM(−) 1.11 1.04
The data shows high variation in the mortality rate as a function of temperature.A similarity can be observed between coliforms, with temperature multipliers, ϑM, of1.04–1.11. However, E. coli shows a higher sensitivity to temperature than enterococci.
The effect of pH on the survival of coliforms has been studied in fresh and salinewater. Although there is some doubt about the optimum pH (i.e., the pH at which thedecay rate is least), most authors found mortality rates significantly increase outside of the“neutral” range.
Sunlight exposure is an important inactivation mechanism for all forms of pathogensand microbial indicators in both fresh and saline waters. Evison [16] observed that the effectof light is extremely important, the lethal effect of light increasing with increasing intensity,as would be expected. However, the inactivation mechanism due to solar radiation is onlydominant in waters of high clarity. Consideration must also be given to the attenuation ofradiation with depth and the attenuation of radiation by the suspended load.
In conclusion, the temperature is usually the predominant factor in the degradation ofE. coli in rivers such as the Seine and the Marne.
Thus, to establish a precise microbiological state of bathing sites, and to quantifythe risks caused by microbial pollutants, it is needed, on the one hand, to consider theimportant factors determining the mortality rates of the contamination indicators, andon the other hand, to model the longitudinal and transverse dispersions of contaminantpollutants in the natural environment with precision.
Many studies have shown that concentrations of fecal contaminants in waters can bedescribed using coupled 2D or 3D hydrodynamic and water quality models [17–19].
In this study, the TELEMAC-MASCARET system has been selected [20] as this toolnot only provides high spatio-temporal resolution information about water depths andvelocities, but also its source code can be modified thanks to the open-source code. Themodeling environment can also be launched on parallel processing which significantlyreduces computational time.
The open-source TELEMAC-MASCARET system is a set of modeling tools allowingthe treatment of every aspect of natural free-surface hydraulics: 1D, 2D or 3D currents(MASCARET, TELEMAC-2D, TELEMAC-3D), sedimentology (SISYPHE, GAIA), waterquality (WAQTEL), wave (TOMAWAC), underground flows (ESTEL-2D, ESTEL-3D). Itwas first developed by the National Hydraulics and Environment Laboratory (LNHE), ofthe Research and Development Division of EDF (EDF R&D).
Its 2D hydrodynamics module, TELEMAC-2D, solves the so-called shallow waterequations, also known as the Saint-Venant ones, using the finite-element or finite-volumemethod and an unstructured mesh of triangular elements [21].

Water 2022, 14, 1191 6 of 26
Its 3D hydrodynamics module, TELEMAC-3D, uses the same horizontally unstruc-tured mesh as TELEMAC-2D, but solves the Navier-Stokes equations, whether in hydro-static or non-hydrostatic pressure distribution allowing shorter waves than those in ashallow water context [22].
The WAQTEL (Water Quality TELemac) [23] module is the water quality module thatwas developed by LNHE for the TELEMAC-MASCARET system.
For the present study, a general 2D model has been proposed by the direct coupling ofTELEMAC-2D and WAQTEL. For each step of calculation time, the coupling is done in thefollowing way:
1. TELEMAC-2D calculates the difference in the level of the free-surface level, thevelocity field;
2. WAQTEL calculates the transport of suspended sediments, the bedload, and thetransport of bacteria.
Then, a 3D sub-model has been developed to model a smaller domain around bathingsites. This is suitable in the case where we observe the presence of significant transverseand vertical convective phenomena linked to recirculation currents due to the morphologicand bathymetric changes. It is worth noting that 3D models are more time-consuming than2D models.
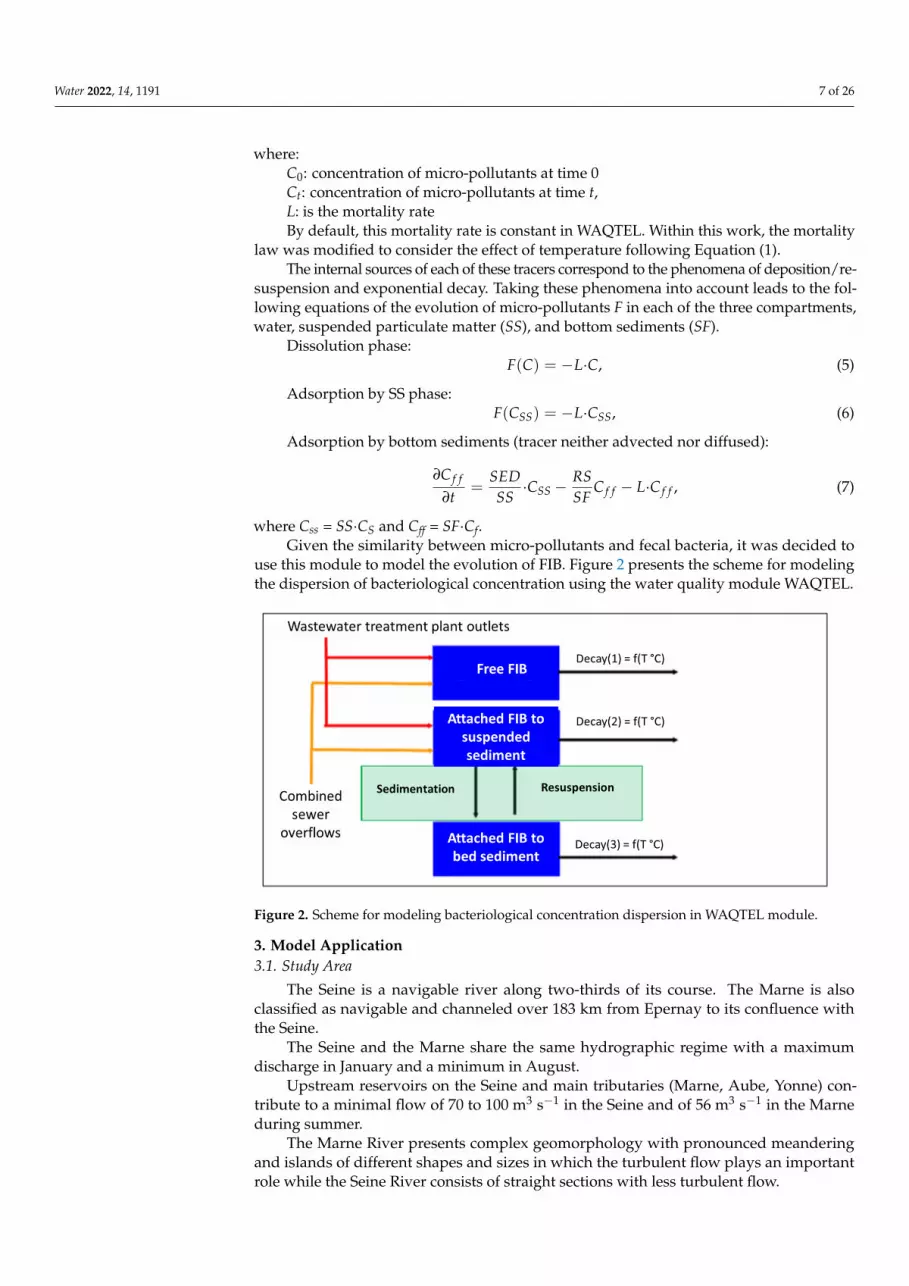
In the water quality module WAQTEL, the sub-module MICROPOL was selected. Thismodule is dedicated to modeling the evolution of micro-pollutants in rivers. It introduces5 tracers:
1. Suspended sediment (SS)2. Bed sediment (SF)3. Free micro-pollutants (C)4. Micro-pollutants absorbed by SS (CS)5. Micro-pollutants absorbed by SF (Cf)
The evolution of suspended solids (SS) and bottom sediments involved in this moduleis represented by the classical deposition and re-suspension laws for cohesive sediment ofKrones and Partheniades.
SED =
{wSS
(1 − τb
τs
)i f τb < τs
0 i f τb ≥ τs
}, (2)
RS =
{e(
τbτr− 1)
i f τb > τr
0 i f τb ≤ τr
}(3)
whereSED is the deposition fluxRS is the erosion fluxτb is the bottom shear stress
τs is the critical shear stress for sedimentationτr is the critical shear stress for re-suspensione is the Partheniades constantwSS is the settling velocityThe model representing the evolution of micro-pollutants assumes that the transfer
of micro-pollutants between the dissolved and particulate phases corresponds to eitheradsorption or ionic exchanges modeled by a reversible reaction of 1st kinetic order. Withoutany data to calibrate these functions, for the sake of simplicity, we considered that thesetwo fractions evolved independently, without any interaction between them. And the ratioof free bacteria to total bacteria was estimated based on measurements.
The model also includes an exponential decay law of micro-pollutant concentrationsin each compartment of the modeled ecosystem, through a constant L.
Ct = C0 e−Lt, (4)
Water 2022, 14, 1191 7 of 26
where:C0: concentration of micro-pollutants at time 0Ct: concentration of micro-pollutants at time t,L: is the mortality rateBy default, this mortality rate is constant in WAQTEL. Within this work, the mortality
law was modified to consider the effect of temperature following Equation (1).The internal sources of each of these tracers correspond to the phenomena of deposition/re-
suspension and exponential decay. Taking these phenomena into account leads to the fol-lowing equations of the evolution of micro-pollutants F in each of the three compartments,water, suspended particulate matter (SS), and bottom sediments (SF).
Dissolution phase:F(C) = −L·C, (5)
Adsorption by SS phase:F(CSS) = −L·CSS, (6)
Adsorption by bottom sediments (tracer neither advected nor diffused):
∂C f f
∂t=
SEDSS
·CSS −RSSF
C f f − L·C f f , (7)
where Css = SS·CS and Cff = SF·Cf.Given the similarity between micro-pollutants and fecal bacteria, it was decided to
use this module to model the evolution of FIB. Figure 2 presents the scheme for modelingthe dispersion of bacteriological concentration using the water quality module WAQTEL.
Water 2022, 14, x FOR PEER REVIEW 7 of 27
these two fractions evolved independently, without any interaction between them. And the ratio of free bacteria to total bacteria was estimated based on measurements.
The model also includes an exponential decay law of micro-pollutant concentrations in each compartment of the modeled ecosystem, through a constant L.
Ct = C0 e−Lt, (4)
where: C0: concentration of micro-pollutants at time 0 Ct: concentration of micro-pollutants at time t, L: is the mortality rate By default, this mortality rate is constant in WAQTEL. Within this work, the mortal-
ity law was modified to consider the effect of temperature following Equation (1). The internal sources of each of these tracers correspond to the phenomena of deposi-
tion/re-suspension and exponential decay. Taking these phenomena into account leads to the following equations of the evolution of micro-pollutants F in each of the three com-partments, water, suspended particulate matter (SS), and bottom sediments (SF).
Dissolution phase: 𝐹(𝐶) = −𝐿 𝐶, (5)
Adsorption by SS phase: 𝐹(𝐶 ) = −𝐿 𝐶 , (6)
Adsorption by bottom sediments (tracer neither advected nor diffused): = 𝐶 − 𝐶 − 𝐿 𝐶 , (7)
where Css = SS·CS and Cff = SF·Cf. Given the similarity between micro-pollutants and fecal bacteria, it was decided to
use this module to model the evolution of FIB. Figure 2 presents the scheme for modeling the dispersion of bacteriological concentration using the water quality module WAQTEL.
Figure 2. Scheme for modeling bacteriological concentration dispersion in WAQTEL module.
3. Model Application 3.1. Study Area
The Seine is a navigable river along two-thirds of its course. The Marne is also classi-fied as navigable and channeled over 183 km from Epernay to its confluence with the Seine.
Figure 2. Scheme for modeling bacteriological concentration dispersion in WAQTEL module.
3. Model Application3.1. Study Area
The Seine is a navigable river along two-thirds of its course. The Marne is alsoclassified as navigable and channeled over 183 km from Epernay to its confluence withthe Seine.
The Seine and the Marne share the same hydrographic regime with a maximumdischarge in January and a minimum in August.
Upstream reservoirs on the Seine and main tributaries (Marne, Aube, Yonne) con-tribute to a minimal flow of 70 to 100 m3 s−1 in the Seine and of 56 m3 s−1 in the Marneduring summer.
The Marne River presents complex geomorphology with pronounced meanderingand islands of different shapes and sizes in which the turbulent flow plays an importantrole while the Seine River consists of straight sections with less turbulent flow.

Water 2022, 14, 1191 8 of 26
The 16 million inhabitants of Île de France represent 28% of the total populationof France. Paris and its suburbs constitute the major anthropogenic pressure within thebasin [24]. An important sewer network brings wastewater to seven treatment plantsalong the course of the two rivers. Urban runoff or combined sewer overflow duringrainfall events are the predominant sources of microbial contamination during low flowperiods [25].
According to the Water Directive, water quality monitoring is required during at leastfour successive bathing seasons, and the data set to estimate water quality must includemore than 16 samples (four samples per season).
Analysis of the bacteriological data from different measurement sites in the Seine andthe Marne Rivers between 2011 and 2014 allows us to highlight the spatial evolution ofbacteria. They are presented in Figure 3 and summarized below:
1. The water quality along the Seine and the Marne for the period of 2011–2014 didnot yet respect the EU Bathing Water Directive, especially during rainy periods(>900 CFU/100 mL).
2. In the Seine River, between Choisy-le-Roi et Ivry-sur-Seine there is a clear increase inthe 90th percentile of E. coli due to the impact of the wastewater treatment plant Seine-Valenton (SEV or SAM in the past) and the Fresnes-Choisy combined sewer discharge.Between Ivry and the Tolbiac Bridge, it is difficult to establish an evolutionary trend:the confluence with the Marne leads to variable concentrations which depend onhydrological conditions. The data tend to show that the 90th percentile values woulddecrease in dry weather but increase in rainy weather.
3. In the Marne River, between Neuilly-sur-Marne and Joinville-le-Pont, there is anincrease in the 90th percentile due to the arrival of a more urbanized area. BetweenJoinville-le-Pont and Saint-Maur-des-Fossés, the 90th percentiles tend to decrease.However, between Saint-Maur-des-Fossés and Champigny-sur-Marne, the concen-trations tend to increase. Between Chennevières and Alfortville, we observe a slightimprovement in bacteriological quality, in connection with the distance to the wastew-ater treatment plant Marne Aval (MAV) outlet.
3.2. Data Collection and Analysis in Dry Weather
A measurement campaign was carried out on the Seine and the Marne Rivers upstreamof Paris in August 2017, with the aim of producing a map of the sanitary water quality indry weather, by Mouchel et al. [9].
The Seine upstream campaign was organized on 3 (from PK 163 to PK 149 where PKis a kilometric unit used by the Navigation Service of the Seine and the Marne Rivers) and4 (from PK 148 to PK 132) August 2017 from Corbeil to the Seine-Marne confluence.
The Marne campaign was carried out on 21st and 22nd August 2017 in which thesampling was organized from Gournay-sur-Marne to the Seine-Marne confluence.
One section was sampled every kilometer substantially. It is important to highlightthat these three points were sampled in each section: on the right bank, on the left bank,and at the center of the section. Samples on each bank were collected 10 m from the bank.All samples were collected 10 cm below the water surface.
From the collected samples, analyzes were performed to determine the ratio of freebacteria to total bacteria. This ratio is 51% for E. coli and 49% for IE with respective standarddeviations of 11% and 28%.
The bacteria mortality constants were estimated and given by Mouchel et al. inTable 4.1 in [9]. It is equal to 0.072 h−1 on the Marne between PK 166 and 178, and 0.063 h−1
on the upstream Seine between PK 141 and 157. It is reminded that the obtained constantsare based on strong assumptions, and examination of the curves confirms that the assump-tion of exponential decay is far from a perfect representation of reality.
Longitudinal evolutions of measured E. coli along the Seine and the Marne are givenin Figures 4.8 and 4.11 in [9].

Water 2022, 14, 1191 9 of 26Water 2022, 14, x FOR PEER REVIEW 9 of 27
(a)
(b)
Figure 3. Percentile 90th of E. coli (EC) and intestinal enterococci (IE) along the Seine and the Marne for 2011–2014: (a) dry weather; (b) rainy weather (adapted from [26] (pp. 42–43)).
Figure 3. Percentile 90th of E. coli (EC) and intestinal enterococci (IE) along the Seine and the Marne for2011–2014: (a) dry weather; (b) rainy weather (adapted from [26] (pp. 42–43)).
Water 2022, 14, 1191 10 of 26
On the Seine, compared to the measurement between 2011 and 2014, the water qualityat the upstream limit was excellent. The sharp increase in concentrations on the left bankand at the center probably corresponds to discharges from the wastewater treatment plantsof Corbeil and Evry.
Subsequently, the concentrations decreased by almost an order of magnitude, whichtestifies to a process of disappearance of FIB.
Another very strong increase appeared at PK 158. It was also positioned on the leftbank and one kilometer upstream of the outlet of the SEV treatment plant (located on theright bank). The discharge point, which would explain the impacts, was therefore locatedon the left bank, between PK 157 and 158. After Mouchel et al. [6], the Fresnes-Choisycombined sewer was a plausible candidate. The Val-de-Marne department confirmedthe occurrence of an exceptional release during the period when the measurement cam-paign was carried out. The average daily discharge rate on August 3rd was estimatedat 0.25 m3 s−1.
On the Marne, in general, the bacteriological quality deteriorated regularly in theupstream part of the sector (from Gournay-sur-Marne to the entrance of the Saint-Maurtunnel). These concentrations continued to increase reaching a maximum of the order of2000 CFU/100 mL for EC at the entrance of the loop of Saint Maur. In this sector, we noteseveral values clearly above the evolution trend, all located on the left bank in the cities ofBry-sur-Marne, Champigny, and Joinville-le-Pont.
From PK 165, the concentrations began to decrease. At PK 170, the EC concentrationwas around 1000 UFC/100 mL. Morbras did not appear to be a major contributor to fecalcontamination in dry weather either. The EC concentration observed at PK 175 (Saint Maurtunnel) was around 200 CFU/100 mL.
After the outlet of the Saint Maur tunnel (PK 175), an increase in EC levels wasobserved at the confluence with the Seine without explanation.
The discharge of the Marne during the study period of 21 and 22 August was 28 to29 m3 s−1.
These data were used to validate the present models in dry weather.
3.3. Computational Domain
Two 2D models have been separately developed, one on the Seine River and anotheron the Marne River.
On the Marne, the model extends from the bridge of Champigny to the confluence withthe Seine. The model includes two liquid boundaries. The upstream limit is located about100 m upstream of the outflow of the MAV wastewater treatment plant. The downstreamlimit of the model is located right before the confluence of the Seine-Marne.
The modeled domain presents complex geomorphology with islands of differentshapes and sizes. The mesh generator Bluekenue [27] makes it possible to define the meshaccording to given criteria (stress lines, size map, etc.) so that the calculations are optimizedin computation time, but also in terms of precision. The mesh has 132,546 nodes and254,701 elements with an average mesh size of 3–5 m.
On the Seine River, the model extends from the Ablon-sur-Seine dam to the confluencewith the Marne River. Different from the Marne, this section of the Seine River is quitestraight without islands. The mesh has 86,839 nodes and 177,702 elements with an averagemesh size of 5 m.
The model domains are presented in Figure 4 below.Most of the bathymetric data were provided by VNF (VNF: Navigable Waterways
of France, responsible for the management of the majority of France‘s inland waterwaysnetwork and the associated facilities), EPTB-SGL (EPTB-SGL: EPTB Seine Grands Lacs:Public Territorial Institute of the Seine basin, responsible for the management of the navi-gation dams and lakes upstream the region of Paris). In the Marne, the bathymetric datefrom Champigny to Saint-Maur-des-Fossé were measured by PROLOG-INGENIERIE in2019. The bathymetry ranges between 21.49 mNGF (NGF: Niveau général de la France is

Water 2022, 14, 1191 11 of 26
the official leveling network in mainland France, with the zero level determined by thetide gauge at Marseille) and 39.35 mNGF in the Marne and in between 21.75 mNGF and36.42 mNGF in the Seine.
Water 2022, 14, x FOR PEER REVIEW 12 of 27
(a) (b)
Figure 4. 2D computational domain on the Seine River (a) and Marne river (b). The red rectangu-lar presents the computational domain of 3D models.
These models were validated against the measured data from [9] in dry weather and compared against the results of the 1D bacteriological ProSe model [8] in rainy weather.
3.4. Physical and Numerical Parameters 3.4.1. Time Step
TELEMAC-2D offers unconditionally stable semi-implicit solution methods. How-ever, it is recommended to adopt a time step such that the Courant number is not larger than 3 in general. Hence, the selected time step was equal to 1 s. The same time step has been also used for the 3D models.
3.4.2. Turbulence Model For 2D models, the k-epsilon turbulence model was selected. For 3D models, it is not
recommended to use the k-epsilon turbulence model in the case of stratification simula-tions because it can give bad results [21]. Experiences show that the k-omega vertical model is more suitable than the two Nakagawa and k-epsilon models in modeling EC concentration releases. This will be presented in detail in Section 3.7.5.
3.4.3. Bed Roughness Friction coefficients were calibrated by comparison with water levels measurement.
A constant Strickler friction coefficient of 40 m1/3s−1 was selected for both the Seine and Marne models after calibration.
3.4.4. Advection & Diffusion Parameters for Tracers For solving the advection step for tracers, the recommended scheme when there are
tidal flats (scheme NERD) was selected. It is reminded that the stability of this scheme is conditioned by a Courant number lower than 1. This condition is satisfied with the se-lected time step of 1 s.
Similarly, the recommended method for solving tracer diffusion (the conjugate gra-dient method) was also selected. In TELEMAC, the tracer’s diffusion coefficient should be specified because it has a very important impact on tracer diffusion in time. In version
Figure 4. 2D computational domain on the Seine River (a) and Marne river (b). The red rectangularpresents the computational domain of 3D models.
In addition, two local 3D models have been developed around a bathing site on theSeine and the Marne Rivers. On the Marne, the Saint-Maur bathing site was selected. Thissite is located in a complex environment that includes several islands, a navigation channel,and a secondary channel. On the Seine, the Vitry-sur-Seine bathing site was selected.
The TELEMAC-3D models use the same horizontally unstructured mesh as that ofTELEMAC-2D but in a smaller domain. Vertically, the TELEMAC-3D mesh was developedaccording to a series of horizontal layers located between the bed and the surface. For thesemodels, we have opted for 10 vertical layers with a homogeneous distribution of layerthicknesses. Usually, bacteriological measurements are taken at a depth of about 10–50 cmfrom the water surface. Considering the average water depth in this area varies between3 and 7 m, 10 layers would be sufficient to compare with the measurements if available.
These models were validated against the measured data from [9] in dry weather andcompared against the results of the 1D bacteriological ProSe model [8] in rainy weather.
3.4. Physical and Numerical Parameters3.4.1. Time Step
TELEMAC-2D offers unconditionally stable semi-implicit solution methods. However,it is recommended to adopt a time step such that the Courant number is not larger than 3in general. Hence, the selected time step was equal to 1 s. The same time step has been alsoused for the 3D models.
3.4.2. Turbulence Model
For 2D models, the k-epsilon turbulence model was selected. For 3D models, it is notrecommended to use the k-epsilon turbulence model in the case of stratification simulationsbecause it can give bad results [21]. Experiences show that the k-omega vertical model ismore suitable than the two Nakagawa and k-epsilon models in modeling EC concentrationreleases. This will be presented in detail in Section 3.7.5.

Water 2022, 14, 1191 12 of 26
3.4.3. Bed Roughness
Friction coefficients were calibrated by comparison with water levels measurement.A constant Strickler friction coefficient of 40 m1/3s−1 was selected for both the Seine andMarne models after calibration.
3.4.4. Advection & Diffusion Parameters for Tracers
For solving the advection step for tracers, the recommended scheme when there aretidal flats (scheme NERD) was selected. It is reminded that the stability of this scheme isconditioned by a Courant number lower than 1. This condition is satisfied with the selectedtime step of 1 s.
Similarly, the recommended method for solving tracer diffusion (the conjugate gra-dient method) was also selected. In TELEMAC, the tracer’s diffusion coefficient shouldbe specified because it has a very important impact on tracer diffusion in time. In versionv8p1r1, this parameter is the same for all tracers. In this study, the diffusion coefficient ofFIB was calibrated using the data of Mouchel et al. [9]. The calibrated value is equal to0.01 m2 s−1.
3.4.5. Sediment Parameters
The erosion and sedimentation parameters depend on the physicochemical character-istics of the sediments. Because these properties are poorly known, these parameters werekept as default values in the models, except for the settling velocity. The settling velocityfound within the framework of the PIREN-Seine project which is equal to 6.6 cm/h wasselected [8].
3.4.6. Bacteria Parameters
As mentioned in Section 2.2, a sensitivity analysis was performed on the Marne modelto select the best ratio between free E. coli to total E. coli. Different simulations wereperformed with different ratios between 25%, 50%, 70%, and 100%. The model gave thebest result with a ratio of 50% of free E. coli. Hence, this value was applied to all themodels in this study. As discussed in the previous section, water temperature is one of thepredominant factors influencing natural mortality. However, during summer, the observedwater temperature in the Seine and the Marne varies little around 20 ◦C, and its effect cantherefore be neglected.
The mortality constant was then calibrated using the measurement from Mouchel’scampaign. Two different values were tested: the one estimated by Mouchel et al. in [6](0.063 and 0.072 h−1 for the Marne and the Seine River, respectively) and the one foundwithin the framework of the PIREN-Seine project (0.045 h−1 for free EC in [8]). The lattervalue was then selected after the calibration step.
3.5. Validation of Hydrodynamic Model
Firstly, the hydrodynamic model was validated against available gauges data on theMarne. The same period of the campaign in [9] (from 21 until 22 August 2017) was selectedas the validation period.
The calculated water level at the Créteil station was compared against the measureddata extracted from https://www.hydro.eaufrance.fr/ (accessed on 14 March 2022). Theposition of this station is given in Figure 5. Figure 5 shows good agreement between themeasured and calculated values. It is necessary to re-mention that the Seine and Marne arenavigable rivers with many dams along the rivers. In summer with low discharges, thewater level between two dams is normally maintained at a retention level.
Furthermore, a comparison was made between the calculated and estimated averagevelocity along with the longitudinal profile of the Seine and Marne during the same periodas the campaign in [9]. The average velocity calculated by the TELEMAC-2D model isillustrated in Figure 6. Figure 6 shows that the velocity is of the order of 0.15 m s−1 on the

Water 2022, 14, 1191 13 of 26
upstream Seine between PK 151 and PK 163, which agrees well with the values estimatedduring the measurement campaign in 2017.
Water 2022, 14, x FOR PEER REVIEW 14 of 27
Figure 5. Comparison between measured and calculated water level at Créteil station (red dot) on the Marne River.
Furthermore, a comparison was made between the calculated and estimated average velocity along with the longitudinal profile of the Seine and Marne during the same pe-riod as the campaign in [9]. The average velocity calculated by the TELEMAC-2D model is illustrated in Figure 6. Figure 6 shows that the velocity is of the order of 0.15 m s−1 on the upstream Seine between PK 151 and PK 163, which agrees well with the values esti-mated during the measurement campaign in 2017.
On the Marne, a similar result was also obtained. The average velocity calculated by the TELEMAC-2D model varies between 0.1 and 0.14 whereas the value estimated by Mouchel et al. in [9] is 0.124 m s−1.
Figure 5. Comparison between measured and calculated water level at Créteil station (red dot) onthe Marne River.
On the Marne, a similar result was also obtained. The average velocity calculatedby the TELEMAC-2D model varies between 0.1 and 0.14 whereas the value estimated byMouchel et al. in [9] is 0.124 m s−1.
3.6. Model Validation in Dry Weather3.6.1. Initial and Boundary Conditions
For dry weather simulation, a constant flow discharge and E. coli concentration wereimposed at the upstream boundary of the Seine model (83 m3 s−1; 200 CFU/100 mL) andthe Marne model (28 m3 s−1; 1500 CFU/100 mL). At the downstream boundary, a constant

Water 2022, 14, 1191 14 of 26
water level (28.1 m NGF) was imposed, while the temperature and bacteriological valueswere left free.
The EC concentration was set to 200 CFU/100 mL at the initial condition.
Water 2022, 14, x FOR PEER REVIEW 15 of 27
Figure 6. Modeled depth-averaged velocity by TELEMAC-2D in the Seine and the Marne.
3.6. Model Validation in Dry Weather 3.6.1. Initial and Boundary Conditions
For dry weather simulation, a constant flow discharge and E. coli concentration were imposed at the upstream boundary of the Seine model (83 m3 s−1; 200 CFU/100 mL) and the Marne model (28 m3 s−1; 1500 CFU/100 mL). At the downstream boundary, a constant water level (28.1 m NGF) was imposed, while the temperature and bacteriological values were left free.
The EC concentration was set to 200 CFU/100 mL at the initial condition.
3.6.2. Wastewater Sources Only one wastewater source of the MAV treatment plant was considered in the water
quality model of the Marne. According to the authors of the measurement campaign, the EC concentration re-
leased from the MAV plant in dry weather ranges from 30,000 to 100,000 CFU/100 mL with a constant flow rate of 0.33 m3 s−1.
According to the data of SIAAP presented in Table 2 [26], the discharge of the MAV plant was equal to 0.29 m3 s−1 on 21st August 2017. The EC concentration at the outlet of the MAV plant was estimated equal to 4.4 × 10⁴ CFU/100 mL, which agrees with the ob-servation of the measurement team [9].
Table 2. Data of wastewater treatment plants from SIAAP.
Date River Treatment Plant Discharge (m3 s−1) NH4 (mg L−1) 3 August 2017 Seine SEV (SAM) 3.80 0.15
21 August 2017 Marne MAV 0.29 0.27
On the Seine river, the discharge released from the SEV plant was equal to 3.8 m3 s−1
on 3 August 2017, and the EC concentration was estimated equal to 1.5 × 10⁴ CFU/100 mL [26].
Besides the SEV plant, two important pollutant sources have been added to the Seine model.
Figure 6. Modeled depth-averaged velocity by TELEMAC-2D in the Seine and the Marne.
3.6.2. Wastewater Sources
Only one wastewater source of the MAV treatment plant was considered in the waterquality model of the Marne.
According to the authors of the measurement campaign, the EC concentration releasedfrom the MAV plant in dry weather ranges from 30,000 to 100,000 CFU/100 mL with aconstant flow rate of 0.33 m3 s−1.
According to the data of SIAAP presented in Table 2 [26], the discharge of the MAVplant was equal to 0.29 m3 s−1 on 21st August 2017. The EC concentration at the outletof the MAV plant was estimated equal to 4.4 × 10⁴ CFU/100 mL, which agrees with theobservation of the measurement team [9].
Table 2. Data of wastewater treatment plants from SIAAP.
Date River Treatment Plant Discharge (m3 s−1) NH4 (mg L−1)
3 August 2017 Seine SEV (SAM) 3.80 0.1521 August 2017 Marne MAV 0.29 0.27
On the Seine river, the discharge released from the SEV plant was equal to 3.8 m3 s−1 on3 August 2017, and the EC concentration was estimated equal to 1.5 × 10⁴ CFU/100 mL [26].
Besides the SEV plant, two important pollutant sources have been added to theSeine model.
The first one is the Fresnes-Choisy collector. The Fresnes-Choisy collector is a stormwa-ter collector receiving many overflows from combined collectors located upstream, it alsoserves periodically as an outlet for the Bièvre. Therefore, when wastewater is present inthis collector, it is diluted, even much diluted, except in very exceptional cases of pollution.The Val-de-Marne department confirmed the occurrence of an exceptional release duringthe period when the measurement campaign was carried out.
The average daily discharge of the Fresnes-Choisy collector on 3 August was equal to0.25 m3 s−1. No measured data on EC concentration was available.

Water 2022, 14, 1191 15 of 26
According to our knowledge, this outlet is a “river” type discharge, with a distinctionbetween the concentrations in dry weather and in rainy weather:
1. The dry weather concentrations are around 6.5 × 10⁴ CFU/100 mL based on the datafrom the summer 2016 measurement campaign.
2. The rainy weather concentrations were calculated from the correlation between FIBand N-NH4 and are equal to 1.25 × 10⁶ CFU/100 mL.
These two concentrations were tested in the model to find the best agreement betweenthe measurement and the model’s results.
The second source of pollution is the Orge River, which is located right upstream of theAblon dam. A discharge of about 1.4 m3 s−1 was measured. However, no EC concentrationmeasurement was available.
In this simulation, an EC concentration of 2.0 × 10⁴ CFU/100 mL was assumed. Notethat the upstream limit of the TELEMAC-2D model is downstream of the Ablon dam, wedecided to inject the flow and EC concentration of the Orge immediately downstream ofthe Ablon dam on the left bank (PK 151).
3.6.3. 2D Model Results
Figure 7 presents the numerical results against the measured longitudinal evolution ofEC concentration on the Seine (left) and Marne River (right).
Water 2022, 14, x FOR PEER REVIEW 16 of 27
The first one is the Fresnes-Choisy collector. The Fresnes-Choisy collector is a storm-water collector receiving many overflows from combined collectors located upstream, it also serves periodically as an outlet for the Bièvre. Therefore, when wastewater is present in this collector, it is diluted, even much diluted, except in very exceptional cases of pol-lution. The Val-de-Marne department confirmed the occurrence of an exceptional release during the period when the measurement campaign was carried out.
The average daily discharge of the Fresnes-Choisy collector on 3 August was equal to 0.25 m3 s−1. No measured data on EC concentration was available.
According to our knowledge, this outlet is a “river” type discharge, with a distinction between the concentrations in dry weather and in rainy weather: 1. The dry weather concentrations are around 6.5 × 10⁴ CFU/100 mL based on the data
from the summer 2016 measurement campaign. 2. The rainy weather concentrations were calculated from the correlation between FIB
and N-NH4 and are equal to 1.25 × 10⁶ CFU/100 mL. These two concentrations were tested in the model to find the best agreement be-
tween the measurement and the model’s results. The second source of pollution is the Orge River, which is located right upstream of
the Ablon dam. A discharge of about 1.4 m3 s−1 was measured. However, no EC concen-tration measurement was available.
In this simulation, an EC concentration of 2.0 × 10⁴ CFU/100 mL was assumed. Note that the upstream limit of the TELEMAC-2D model is downstream of the Ablon dam, we decided to inject the flow and EC concentration of the Orge immediately downstream of the Ablon dam on the left bank (PK 151).
3.6.3. 2D Model Results Figure 7 presents the numerical results against the measured longitudinal evolution
of EC concentration on the Seine (left) and Marne River (right).
(a) (b)
Figure 7. Comparison between measured & modeled longitudinal evolution of free EC concentra-tion in dry weather on the Seine (a) and Marne rivers (b).
On these graphs, the red line presents the calculated free E. coli concentrations on the left bank, the blue line on the right bank, and the green line at the center of the river whereas the points represent the measurement.
Firstly, the result of the Seine model shows that the calculated EC concentrations on the left bank at PK 151 are close to 2000 CFU/100 mL, which agrees well with the meas-urement. The model also shows that the influence of this pollution source seems quite
Figure 7. Comparison between measured & modeled longitudinal evolution of free EC concentrationin dry weather on the Seine (a) and Marne rivers (b).
On these graphs, the red line presents the calculated free E. coli concentrations onthe left bank, the blue line on the right bank, and the green line at the center of the riverwhereas the points represent the measurement.
Firstly, the result of the Seine model shows that the calculated EC concentrations on theleft bank at PK 151 are close to 2000 CFU/100 mL, which agrees well with the measurement.The model also shows that the influence of this pollution source seems quite weak on thetransverse profile. This is also observed in the measurement, from which the concentrationsat the center and on the right bank did not increase downstream of this source.
At PK 158, the model simulated well the increase in EC concentrations on the left bankdue to the Fresnes-Choisy collector. It is noted that a high concentration of EC from theFresnes-Choisy collector was applied to the model. This is consistent with the observationof Mouchel’s team and the confirmation of the department of Val-de-Marne on the intensityof this pollution source during the campaign.

Water 2022, 14, 1191 16 of 26
The increase in concentration due to the SEV plant is also well calculated in the model.Nevertheless, downstream of the SEV outlet, the modeled EC concentrations by TELEMAC-2D are generally lower than those measured. It is noted that between PK 159 and PK 163,several permanent releases can be identified on both sides of the Seine. They were notconsidered in the model due to the lack of information on concentrations and discharges atthese collectors. These sources could contribute to an increase in EC concentrations in theriver as well as the homogeneity of the transverse concentrations.
Secondly, on the Marne River, in general, the EC concentrations decrease regularlyfrom the Champigny bridge to the confluence with the Seine, especially at the center of theriver and on the right bank.
On the left bank, an increase is observed immediately downstream of the MAV plant’soutlet. Although the location of this increase is not identical to the measurement (PK 166in the model instead of PK 165 in the measurement), we believe that the model resultrepresents better the reality because the MAV plant’s outlet is located downstream ofPK 165. There could be an error in the measured longitudinal profile since the longitudinalevolution of measured conductivity in [9] shows an increase in conductivity at PK 166instead of PK 165.
The impact of this source is quite weak in the longitudinal profile, over a limiteddistance of approximately 1 km downstream of the source. These results are consistentwith the measurements.
Nonetheless, the model is not able to represent the variations in EC concentrationfrom PK 173. Here, the measurement shows an abrupt decrease in EC values from about800 CFU/100 mL to 400 CFU/100 mL without any explanation from the measurement team.Similarly, the increase in EC concentrations from PK 175 observed in the measurement isdifficult to explain, according to the authors, and many factors could be mentioned, forexample, the outlet of the Saint-Maur tunnel with the navigation of ships.
In conclusion, although the measured E. coli concentrations are quite scattered overthis section of the Marne River, the TELEMAC-2D model shows its ability to correctlymodel the decrease in longitudinal EC concentrations.
Overall, the obtained results with the TELEMAC-2D model are reasonable comparedto the measurements. It is important to underline that the TELEMAC-2D model canrepresent the transverse variation of the EC concentrations. This is a strong point of theTELEMAC-2D model compared to the one-dimensional model.
3.7. Model Validation in Rainy Weather3.7.1. E. coli Modelling by ProSe Model in Rainy Weather
For the validation of the model in rainy weather, without a complete dataset, itwas decided to model an existing scenario of the ProSe model and then compare it withits results.
The ProSe model is a one-dimensional model with the bacteriological module, whichhas been used for the development of the master plan for sanitation by the SIAAP [8].
The REF-SC4B scenario focuses on the upgrading of the sewage network, resulting inthe elimination of permanent overflows in dry weather. The other improvement includedin this scenario is the disinfection of the MAV and SEV wastewater treatment plants bydecreasing the concentration of FIBs by 3 log units at the station outlets [25].
It is worth noting that Prose is a 1D model that can only give the averaged value of thewater quality of the river at its center. In other words, it cannot represent the concentrationvariation in the vertical and transverse profiles which is essential in monitoring the waterquality of bathing sites.
3.7.2. Simulation Period & Boundary Conditions
In order to compare with the ProSe model, a simulation was carried out with TELEMAC-2D for a period of 6 days from 06/04/2011 to 06/10/2011 and also at a graphical output

Water 2022, 14, 1191 17 of 26
time step of 15 min. This period is sufficient because it covers the pollution peaks onthe rivers.
For the Seine River, the upstream limit of the TELEMAC-2D is identical to that of the ProSemodel. The flow hydrograph as well as the bacteriological concentration of 160 CFU/100 mLat the upstream limit of the ProSe model were retained for the TELEMAC-2D.
Nevertheless, for the Marne, since the computational domain of the TELEMAC-2Dmodel is smaller than the ProSe one, the hydrograph, as well as pollutograph calculatedby the ProSe model at the bacteriological control point of Champigny, were injected at theupstream boundary of the model.
3.7.3. Wastewater Sources
In this simulation, seventeen polluted sources were added to the Marne model, in-cluding the MAV treatment plant outlet. For the Seine model, fifteen polluted sources wereadded in the model including the SEV outlet.
The values of the mortality constants used in the model are those used in the ProSemodel and measured by the PIREN-Seine team on samples collected from the Seine. Avalue in the lower range of those measured by PIREN-Seine is used for E. coli (0.040 and0.012 h−1 for free EC and EC attached to suspended and deposited sediments respectively).
Other physical parameters were kept identical to the model in dry weather.
3.7.4. 2D Model Results
Figure 8 compares the pollutographs calculated by ProSe and TELEMAC-2D at twodifferent control points in the Seine and the Marne models.
Two points on the Marne model are Chennevières and Charentonneau.At Chennevières, the EC concentration calculated by TELEMAC-2D at the center of
the Marne is almost identical to that calculated by the ProSe model. Nevertheless, theTELEMAC-2D results on the left bank are much higher. Indeed, after 2 days, the concentra-tion on the left bank calculated by TELEMAC-2D reached the peak of 1.6 × 10⁵ CFU/100 mL,while the result of ProSe was 6.0 × 10⁴ CFU/100 mL (almost 3 times lower). This is due tothe fact that most of the important sources are located on the left bank, and a 1D model likeProSe is not able to correctly represent the high variability of concentrations over the widthof the river.
At Charentonneau, the result of the pollutograph calculated by TELEMAC-2D at thecenter of the river is not completely identical to that of ProSe. However, the same peak wasobtained after 2.5 days (around 8.0 × 10⁴ CFU/100 mL) on the results of the two models.Similar to Chennevières, the concentration of EC on the left bank is much higher than atthe center and on the right bank (2.7 × 10⁵ CFU/100 mL).
It should be emphasized that almost all-important pollutant sources are located onthe left bank. As a result, the E. coli concentrations downstream of these sources weresignificantly increased over a long distance. However, the diffusion of bacteria remainslimited transversely downstream of wastewater disposals. This phenomenon is particularlyvisible downstream of the Morbras release—the biggest pollution source in the model. Therepresentation of this cross-section variation is very useful in monitoring the water qualityat bathing sites.
On the Seine River, the calculated pollutographs by ProSe and by TELEMAC-2D attwo control points: Choisy-le-Roi and Port-à-l’Anglais were also compared. The results arepresented in Figure 9 below.
At Choisy-le-Roi, the EC concentration calculated by TELEMAC-2D at the centerof the Seine is not identical to that of Prose as observed on the Marne. The shape ofthe pollutograph calculated by TELEMAC-2D is sharper than that calculated by ProSe.However, the peak concentration is similar (around 6.0 × 10⁴ to 7.0 × 10⁴ CFU/100 mLafter 2 days).

Water 2022, 14, 1191 18 of 26Water 2022, 14, x FOR PEER REVIEW 19 of 27
Figure 8. Modeled EC concentration diffusion by TELEMAC-2D on the Marne River (a) and com-parison of the calculated pollutographs by ProSe and by TELEMAC-2D at Charentonneau (b) and at Chennevières (c).
It should be emphasized that almost all-important pollutant sources are located on the left bank. As a result, the E. coli concentrations downstream of these sources were significantly increased over a long distance. However, the diffusion of bacteria remains limited transversely downstream of wastewater disposals. This phenomenon is particu-larly visible downstream of the Morbras release—the biggest pollution source in the model. The representation of this cross-section variation is very useful in monitoring the water quality at bathing sites.
On the Seine River, the calculated pollutographs by ProSe and by TELEMAC-2D at two control points: Choisy-le-Roi and Port-à-l’Anglais were also compared. The results are presented in Figure 9 below.
Figure 8. Modeled EC concentration diffusion by TELEMAC-2D on the Marne River (a) and compar-ison of the calculated pollutographs by ProSe and by TELEMAC-2D at Charentonneau (b) and atChennevières (c).
Nevertheless, the concentration calculated by TELEMAC-2D on the left bank is muchhigher with a peak of 3.5 × 10⁵ CFU/100 mL (about 6 times higher) due to the Fresnes-Choisy collector.
The Port à l’Anglais point is located on the left bank. The result calculated byTELEMAC-2D shows higher concentrations on both banks than at the center of the river,with peaks of 3.0 × 10⁵ and 2.4 × 10⁵ CFU/100 mL on the left and the right bank re-spectively after 2 days. This is due to different disposal points along the two banks ofthis section.
At the center of the river, the concentration peak came 0.5 days later, with a value of4 to 5 times lower (6.0 × 10⁴ CFU/100 mL). The ProSe model gave the averaged result onthe cross-section, in which the peak reached 9.0 × 10⁴ CFU/100 mL after 2 days (i.e., 3 timeslower than the value calculated by TELEMAC-2D on the left bank).
Compared to the 1D ProSe model, the TELEMAC-2D model shows similar results inEC concentrations at the center of the river. However, it is observed from the TELEMAC-2Dresults that, under the impact of disposal points along the river banks, the EC concentrationat the center of the Seine and Marne rivers can be much lower than near the banks. Sincethe river bathing sites are normally located near banks, accounting for this cross-sectionalvariation is very important to establish a precise microbiological state of bathing sites.

Water 2022, 14, 1191 19 of 26Water 2022, 14, x FOR PEER REVIEW 20 of 27
(a) (c)
Figure 9. Modeled EC concentration diffusion by TELEMAC-2D on the Seine River (a) and compar-ison of calculated pollutographs by ProSe and TELEMAC-2D at Port-à-l’Anglais (b) and Choisy-le-Roi (c).
At Choisy-le-Roi, the EC concentration calculated by TELEMAC-2D at the center of the Seine is not identical to that of Prose as observed on the Marne. The shape of the pol-lutograph calculated by TELEMAC-2D is sharper than that calculated by ProSe. However, the peak concentration is similar (around 6.0 × 10⁴ to 7.0 × 10⁴ CFU/100 mL after 2 days).
Nevertheless, the concentration calculated by TELEMAC-2D on the left bank is much higher with a peak of 3.5 × 10⁵ CFU/100 mL (about 6 times higher) due to the Fresnes-Choisy collector.
The Port à l’Anglais point is located on the left bank. The result calculated by TE-LEMAC-2D shows higher concentrations on both banks than at the center of the river, with peaks of 3.0 × 10⁵ and 2.4 × 10⁵ CFU/100 mL on the left and the right bank respectively after 2 days. This is due to different disposal points along the two banks of this section.
At the center of the river, the concentration peak came 0.5 days later, with a value of 4 to 5 times lower (6.0 × 10⁴ CFU/100 mL). The ProSe model gave the averaged result on the cross-section, in which the peak reached 9.0 × 10⁴ CFU/100 mL after 2 days (i.e., 3 times lower than the value calculated by TELEMAC-2D on the left bank).
Compared to the 1D ProSe model, the TELEMAC-2D model shows similar results in EC concentrations at the center of the river. However, it is observed from the TELEMAC-2D results that, under the impact of disposal points along the river banks, the EC concen-tration at the center of the Seine and Marne rivers can be much lower than near the banks. Since the river bathing sites are normally located near banks, accounting for this cross-sectional variation is very important to establish a precise microbiological state of bathing sites.
Figure 9. Modeled EC concentration diffusion by TELEMAC-2D on the Seine River (a) andcomparison of calculated pollutographs by ProSe and TELEMAC-2D at Port-à-l’Anglais (b) andChoisy-le-Roi (c).
The calculated longitudinal EC concentration profile by TELEMAC-2D was also com-pared against the measured one in rainy weather. Figure 10 presents the calculated longi-tudinal EC concentration profile by TELEMAC-2D on the Seine and the Marne Rivers. Itis reminded that for this simulation, the EC concentrations from the SEV and MAV plantoutlets were reduced by 3 log.
On the Seine, between the Ablon dam (PK 151) and PK 154, the E. coli concen-trations are stable. The water quality is quite good with concentration values below900 CFU/100 mL. From PK 154, the EC concentration starts to increase. Between Choisy-le-Roi (PK 156) and Ivry-sur-Seine (PK 162), the impact of the SEV plant is not visible knowingthat this concentration was reduced by 3 log in this scenario. Nevertheless, there is stilla clear increase in concentration, especially on the left bank, due to the Fresnes-Choisydischarge, which is located between PK 157 and PK 158, and other outflows located down-stream of the SEV plant’s outlet. This is consistent with the evolution trend discussed inSection 3.1 as well as the longitudinal profile measured in [9].
On the Marne, according to the bacteriological measurements between 2011 and 2014, thereis a slight improvement in the bacteriological quality between Chennevières and the confluencewith the Seine. This trend is also observed in the results of the TELEMAC-2D model.

Water 2022, 14, 1191 20 of 26
Water 2022, 14, x FOR PEER REVIEW 21 of 27
The calculated longitudinal EC concentration profile by TELEMAC-2D was also com-pared against the measured one in rainy weather. Figure 10 presents the calculated longi-tudinal EC concentration profile by TELEMAC-2D on the Seine and the Marne Rivers. It is reminded that for this simulation, the EC concentrations from the SEV and MAV plant outlets were reduced by 3 log.
(a) (b)
Figure 10. Modeled longitudinal profile of free E. coli concentration by TELEMAC-2D in rainy weather on the Seine River (a) and Marne River (b).
On the Seine, between the Ablon dam (PK 151) and PK 154, the E. coli concentrations are stable. The water quality is quite good with concentration values below 900 CFU/100 mL. From PK 154, the EC concentration starts to increase. Between Choisy-le-Roi (PK 156) and Ivry-sur-Seine (PK 162), the impact of the SEV plant is not visible knowing that this concentration was reduced by 3 log in this scenario. Nevertheless, there is still a clear in-crease in concentration, especially on the left bank, due to the Fresnes-Choisy discharge, which is located between PK 157 and PK 158, and other outflows located downstream of the SEV plant’s outlet. This is consistent with the evolution trend discussed in Section 3.1 as well as the longitudinal profile measured in [9].
On the Marne, according to the bacteriological measurements between 2011 and 2014, there is a slight improvement in the bacteriological quality between Chennevières and the confluence with the Seine. This trend is also observed in the results of the TE-LEMAC-2D model.
In conclusion, the results obtained from the TELEMAC-2D model in rainy weather indicate that the model correctly simulates the longitudinal evolution trends of bacterio-logical pollutants. Moreover, it also allows us to model the transverse variation induced by pollution sources located on both riverbanks.
3.7.5. 3D Model Results Although the results of the TELEMAC-2D models are quite promising, they may not
be sufficient in certain places where knowledge of the dispersion of pollutant plumes in the vertical dimension is required. Moreover, the TELEMAC-2D model does not allow us to specify the exact position of the sewer overflows in the water column because the re-sults of TELEMAC-2D are depth-averaged.
It was therefore decided to develop a TELEMAC-3D micro-model around a bathing site. As mentioned in the previous section, on the Marne, the Saint-Maur bathing site was selected because this site is located in a complex environment that includes several is-lands, a navigation channel, and a secondary channel. In a similar way to the Marne, a 3D micro-model was developed on the Seine around the Vitry-sur-Seine bathing site.
Figure 10. Modeled longitudinal profile of free E. coli concentration by TELEMAC-2D in rainyweather on the Seine River (a) and Marne River (b).
In conclusion, the results obtained from the TELEMAC-2D model in rainy weatherindicate that the model correctly simulates the longitudinal evolution trends of bacteriolog-ical pollutants. Moreover, it also allows us to model the transverse variation induced bypollution sources located on both riverbanks.
3.7.5. 3D Model Results
Although the results of the TELEMAC-2D models are quite promising, they may notbe sufficient in certain places where knowledge of the dispersion of pollutant plumes in thevertical dimension is required. Moreover, the TELEMAC-2D model does not allow us tospecify the exact position of the sewer overflows in the water column because the results ofTELEMAC-2D are depth-averaged.
It was therefore decided to develop a TELEMAC-3D micro-model around a bathingsite. As mentioned in the previous section, on the Marne, the Saint-Maur bathing sitewas selected because this site is located in a complex environment that includes severalislands, a navigation channel, and a secondary channel. In a similar way to the Marne, a3D micro-model was developed on the Seine around the Vitry-sur-Seine bathing site.
It is worth noting that the boundary conditions of the TELEMAC-3D models wereextracted from the results of the TELEMAC-2D models using the nesting technique. Thistechnique allows us to impose the external forcing on the 3D upper boundary (hydro-graphs, bacteriological concentrations) which varies not only in time but also in space. TheTELEMAC-3D code has been modified to account for this variation in EC concentration inthe transverse direction.
Figure 11 presents the diffusion of EC concentration from the upstream boundary ofthe TELEMAC-3D Saint-Maur model. It can be observed that without any disposal point,the EC concentration is higher at the center of the river than near the banks and is higher atthe bottom than near the water surface.
In 3D models, experiences show that the turbulence model plays an important rolein modeling tracer concentrations. It is not recommended to use the k-epsilon turbulencemodel in the case of stratification simulations [23]. A comparison of different turbulencemodels in the vertical (mixing length Nakagawa, k-epsilon, and k-omega) was carried outin the Saint-Maur bathing site model. In these simulations, only one pollution source wasconsidered: the Chennevières outlet. Figure 12 shows the superiority of the k-omega modelcompared to the mixing length and k-epsilon models in modeling E. coli concentrationdiffusion. Those two models gave a field of concentrations of pollutants that are too mixednot only on the vertical but also in the horizontal direction, while the k-omega model gave

Water 2022, 14, 1191 21 of 26
a clear stratification in both directions. The use of the k-omega model allows undoubtedlya better description of the stratification.
Water 2022, 14, x FOR PEER REVIEW 22 of 27
It is worth noting that the boundary conditions of the TELEMAC-3D models were extracted from the results of the TELEMAC-2D models using the nesting technique. This technique allows us to impose the external forcing on the 3D upper boundary (hydro-graphs, bacteriological concentrations) which varies not only in time but also in space. The TELEMAC-3D code has been modified to account for this variation in EC concentra-tion in the transverse direction.
Figure 11 presents the diffusion of EC concentration from the upstream boundary of the TELEMAC-3D Saint-Maur model. It can be observed that without any disposal point, the EC concentration is higher at the center of the river than near the banks and is higher at the bottom than near the water surface.
Figure 11. Variation in EC concentrations at the upstream boundary of the TELEMAC-3D model.
In 3D models, experiences show that the turbulence model plays an important role in modeling tracer concentrations. It is not recommended to use the k-epsilon turbulence model in the case of stratification simulations [23]. A comparison of different turbulence models in the vertical (mixing length Nakagawa, k-epsilon, and k-omega) was carried out in the Saint-Maur bathing site model. In these simulations, only one pollution source was considered: the Chennevières outlet. Figure 12 shows the superiority of the k-omega model compared to the mixing length and k-epsilon models in modeling E. coli concen-tration diffusion. Those two models gave a field of concentrations of pollutants that are too mixed not only on the vertical but also in the horizontal direction, while the k-omega model gave a clear stratification in both directions. The use of the k-omega model allows undoubtedly a better description of the stratification.
Figure 11. Variation in EC concentrations at the upstream boundary of the TELEMAC-3D model.
The Saint-Maur bathing site has been proposed on the right bank of the Marne and isshown in Figure 13. It can be observed that the high concentration of EC induced by theChennevières outflow remains in the main channel on the left bank due to the presence ofthe Casenave island while the bathing site is located on the other bank. Visually, the effectof this source seems negligible on this bathing site. In the case of using a one-dimensionalmodel, the impact of this island could be neglected and the calculated EC concentration atthis bathing site could be over-estimated.
The below graphs present the results of the TELEMAC-3D model upstream of theVitry-sur-Seine bathing site in the Seine river. Firstly, the longitudinal and transverseevolutions of E. coli concentrations modeled by TELEMAC-3D agree well with the 2Dresults as shown in Figure 14.
Secondly, it is observed from the 3D models’ results in Figure 15 that depending onthe discharge of the pollution sources, the bacteriological concentrations rejected can behomogeneous or not in the vertical profile. For example, with an important source likeFresnes-Choisy, the concentrations are well-mixed near the source, but they become higherat the bottom than the water surface once they are diffused far from the source point.
On the transverse profile, the TELEMAC-3D result is similar to the TELEMAC-2D onewith higher concentrations near the left bank while the concentrations at the center and onthe other bank are much lower.
It is worth noting that for the monitoring of water quality at bathing sites, people areinterested in the quality of the surface water. Compared to the TELEMAC-2D model, the3D model gave detailed results on the vertical. This could be necessary in a case where thepresence of considerable transverse and vertical convective phenomena is observed.

Water 2022, 14, 1191 22 of 26Water 2022, 14, x FOR PEER REVIEW 23 of 27
Figure 12. Impact of vertical turbulence models in modeling the concentration diffusion in TE-LEMAC-3D: (a) mixing length model; (b) k-epsilon model; (c) k-omega model.
The Saint-Maur bathing site has been proposed on the right bank of the Marne and is shown in Figure 13. It can be observed that the high concentration of EC induced by the Chennevières outflow remains in the main channel on the left bank due to the presence of the Casenave island while the bathing site is located on the other bank. Visually, the effect of this source seems negligible on this bathing site. In the case of using a one-dimensional model, the impact of this island could be neglected and the calculated EC concentration at this bathing site could be over-estimated.
Figure 12. Impact of vertical turbulence models in modeling the concentration diffusion in TELEMAC-3D: (a) mixing length model; (b) k-epsilon model; (c) k-omega model.

Water 2022, 14, 1191 23 of 26Water 2022, 14, x FOR PEER REVIEW 24 of 27
Figure 13. Modeled diffusion of EC concentration rejected from the Chennevières outlet using TE-LEMAC-3D.
The below graphs present the results of the TELEMAC-3D model upstream of the Vitry-sur-Seine bathing site in the Seine river. Firstly, the longitudinal and transverse evo-lutions of E. coli concentrations modeled by TELEMAC-3D agree well with the 2D results as shown in Figure 14.
Figure 14. Comparison between the result of TELEMAC-2D model (a) and the averaged result over the vertical of TELEMAC-3D model (b) on the Seine.
Figure 13. Modeled diffusion of EC concentration rejected from the Chennevières outlet usingTELEMAC-3D.
Water 2022, 14, x FOR PEER REVIEW 24 of 27
Figure 13. Modeled diffusion of EC concentration rejected from the Chennevières outlet using TE-LEMAC-3D.
The below graphs present the results of the TELEMAC-3D model upstream of the Vitry-sur-Seine bathing site in the Seine river. Firstly, the longitudinal and transverse evo-lutions of E. coli concentrations modeled by TELEMAC-3D agree well with the 2D results as shown in Figure 14.
Figure 14. Comparison between the result of TELEMAC-2D model (a) and the averaged result over the vertical of TELEMAC-3D model (b) on the Seine. Figure 14. Comparison between the result of TELEMAC-2D model (a) and the averaged result overthe vertical of TELEMAC-3D model (b) on the Seine.

Water 2022, 14, 1191 24 of 26
Water 2022, 14, x FOR PEER REVIEW 25 of 27
Secondly, it is observed from the 3D models' results in Figure 15 that depending on the discharge of the pollution sources, the bacteriological concentrations rejected can be homogeneous or not in the vertical profile. For example, with an important source like Fresnes-Choisy, the concentrations are well-mixed near the source, but they become higher at the bottom than the water surface once they are diffused far from the source point.
On the transverse profile, the TELEMAC-3D result is similar to the TELEMAC-2D one with higher concentrations near the left bank while the concentrations at the center and on the other bank are much lower.
It is worth noting that for the monitoring of water quality at bathing sites, people are interested in the quality of the surface water. Compared to the TELEMAC-2D model, the 3D model gave detailed results on the vertical. This could be necessary in a case where the presence of considerable transverse and vertical convective phenomena is observed.
Figure 15. The modeled diffusion of EC concentration along the vertical by TELEMAC-3D model on the Seine river.
4. Discussion As bacterial pollution in the water can cause serious public health problems, the local
government has paid great attention to monitoring water quality at bathing sites in the Seine and Marne Rivers.
According to the regulations for bathing in freshwater (European Directive 2006/7 of 15 February 2006), the monitoring of bathing water quality is based on the concentrations of two bacteria of fecal origin: Escherichia coli and intestinal enterococci.
Although there has been an improvement in the water quality in the Seine and the Marne Rivers since the end of the 1980s, recent microbiological analyses show that epi-sodes of high concentrations in fecal indicators are still present, especially during rainy periods. This contamination makes the Seine and Marne Rivers difficult to bathe in with-out wastewater management.
Being aware that numerical modeling is one powerful tool for short-term forecasting of the dispersion and evolution of pollutants of bacteriological plumes, the main objective of this paper is therefore to develop a numerical model for the prediction of water quality in bathing sites. This model considers three types of FIB: free FIB, FIB attached to sus-pended sediments, and FIB in the deposited sediments. This model also takes into account the mortality of the FIB and the settling—resuspension processes. Most important, this
Figure 15. The modeled diffusion of EC concentration along the vertical by TELEMAC-3D model onthe Seine river.
4. Discussion
As bacterial pollution in the water can cause serious public health problems, the localgovernment has paid great attention to monitoring water quality at bathing sites in theSeine and Marne Rivers.
According to the regulations for bathing in freshwater (European Directive 2006/7 of15 February 2006), the monitoring of bathing water quality is based on the concentrationsof two bacteria of fecal origin: Escherichia coli and intestinal enterococci.
Although there has been an improvement in the water quality in the Seine and theMarne Rivers since the end of the 1980s, recent microbiological analyses show that episodesof high concentrations in fecal indicators are still present, especially during rainy peri-ods. This contamination makes the Seine and Marne Rivers difficult to bathe in withoutwastewater management.
Being aware that numerical modeling is one powerful tool for short-term forecastingof the dispersion and evolution of pollutants of bacteriological plumes, the main objec-tive of this paper is therefore to develop a numerical model for the prediction of waterquality in bathing sites. This model considers three types of FIB: free FIB, FIB attachedto suspended sediments, and FIB in the deposited sediments. This model also takes intoaccount the mortality of the FIB and the settling—resuspension processes. Most important,this modeling tool is able to model the spatial variability of the microbial pollutants notonly in the longitudinal but also in the transverse direction.
A 2D model on the Seine and another one on the Marne River, with a length ofapproximately 15 km, representative of both the hydrodynamic conditions and the impactof pollution sources were developed. The models were validated against the in-situmeasurement in dry weather from Mouchel et al. [9], and then compared with the resultsof the 1D ProSe model in rainy weather [8,24].
The results show that the 2D model can represent the dispersion and the evolution ofbacteriological pollutants longitudinally and transversely.
The model can be then considered a powerful tool for managing the pollution sourcesin rivers. It can help us to identify the sources of pollution that may have a strong impacton the quality of bathing waters, and in the case of a pollution risk being identified, toevaluate the proposed management measures, which would be implemented to ensure
Water 2022, 14, 1191 25 of 26
the health protection of the population, as well as to plan the actions for eliminating thesesources of pollution.
Nevertheless, TELEMAC-2D may not be sufficient in some places where the knowl-edge of the dispersion of pollutant plumes on the vertical is required. In this case, itis recommended to combine it with a 3D micro-model. TELEMAC-3D is able to modelbathing sites and their surroundings in a finer way when significant transverse and/orvertical convective phenomena are observed.
Within this research, no data is available to validate the developed 3D models. Ameasurement campaign in terms of 3D velocity and bacteriology will be necessary. Thiscampaign will aim at highlighting the 3D potential variations in bacteriological flow inbathing sites.
Moreover, although the effect of water temperature was included in the modelingof the decay rate of E. coli concentration, it could not be validated due to the lack ofdata. Besides, since sunlight is also an important factor affecting the survival of bacteria,it would be interesting to include the effect of sunlight in the modeling and validate itagainst measurements.
Author Contributions: Conceptualization, L.-A.V.; Data curation, A.J.; Formal analysis, K.-D.N.and F.L.M.; Methodology, L.-A.V. and K.-D.N.; Resources, A.J.; Supervision, K.-D.N. and F.L.M.;Visualization, L.-A.V.; Writing—original draft, L.-A.V.; Writing—review & editing, K.-D.N., F.L.M.and A.J. All authors have read and agreed to the published version of the manuscript.
Funding: This research received no external funding.
Institutional Review Board Statement: Not applicable.
Informed Consent Statement: Not applicable.
Data Availability Statement: Data presented in the Section 3.2 of this study are available in [9].Data of wastewater treatment plants were provided by the SIAAP and are available on request fromthe SIAAP.
Acknowledgments: Firstly, the authors would like to thank the SIAAP who provided a substantialamount of the data used in this study. Secondly, the authors thank the EPTB Seine Grands Lacsand the VNF who provided the bathymetric data for the construction of the models. The authorsalso thank VEOLIA EAU Île de France for providing data for this study. The authors acknowledgethe work of J-M. Mouchel and his measuring team. Finally, we would like to thank the RegionalIT and digital applications center of Normandy- France (CRIANN) who helped us to benefit thesupercomputing for numerical simulations.
Conflicts of Interest: The authors declare no conflict of interest.
References1. Kistemann, T.; Schmidt, A.; Flemming, H.-C. Post-industrial river water quality—Fit for bathing again? Int. J. Hyg. Environ.
Health 2016, 219, 629–642. [CrossRef] [PubMed]2. Meyerhoff, J.; Dehnhardt, A.; Hartje, V.; Juergen, M. Take your swimsuit along: The value of improving urban bathing sites in the
metropolitan area of Berlin. J. Environ. Plan. Manag. 2010, 53, 107–124. [CrossRef]3. Sites de Baignade en Seine et en Marne—Héritage JO Paris 2024—Présentation des Sites Issus de la Manifestation D’intérêt.
Available online: https://www.apur.org/fr/nos-travaux/sites-baignade-seine-marne-heritage-jo-paris-2024-presentation-sites-issus-manifestation-interet (accessed on 6 February 2022).
4. European Union (EU). Directive 2006/7/EC of the European Parliament and of the Council of 15 February 2006 Concerning the Managementof Bathing Water Quality and Repealing Directive 76/160/EEC; THE EUROPEAN UNION: Brussels, Belgium, 2006.
5. Edberg, S.C.; Rice, E.W.; Karlin, R.J.; Allen, M.J. Escherichia coli: The best biological drinking water indicator for public healthprotection. J. Appl. Microbiol. 2000, 88, 106S–116S. [CrossRef] [PubMed]
6. Servais, P.; Garcia-Armisen, T.; George, I.; Billen, G. Fecal bacteria in the rivers of the Seine drainage network (France): Sources,fate and modelling. Sci. Total Environ. 2007, 375, 152–167. [CrossRef] [PubMed]
7. Garcia-Armisen, T.; Thouvenin, B.; Servais, P. Modelling Faecal Coliforms Dynamics in the Seine Estuary, France. Water Sci.Technol. J. Int. Assoc. Water Pollut. Res. 2006, 54, 177–184. [CrossRef] [PubMed]
Water 2022, 14, 1191 26 of 26
8. Poulin, M.; Pierre, S.; Mouchel, J.-M.; Therial, C.; Lesage, L.; Rocher, V.; Goncalves, A.; Masnada, S.; Lucas, F.; Flipo, N.Modélisation de La Contamination Fécale En Seine: Impact Des Rejets de Temps de Pluie. Programme PIREN-Seine Rapport Modélisation deLa Contamination Fécale Par Temps de Pluie; PIREN-Seine: Paris, France, 2013.
9. Mouchel, J.-M.; Colina-Moreno, I.; Kasmi, N. Evaluation des Teneurs en Bactéries Indicatrices Fécales en Seine dans L’agglomérationParisienne par Temps Sec; PIREN-Seine: Paris, France, 2018.
10. Taylor, G.I. The dispersion of matter in turbulent flow through a pipe. Proc. R. Soc. Lond. 1954, 223, 446–468.11. Gibson, A. On the Depression of the Filament of Maximum Velocity in a Stream Flowing through an Open Channel. Proc. R. Soc.
Lond. 1909, 82, 149–159.12. Chauvet, H.; Devauchelle, O.; Metivier, F.; Lajeunesse, E.; Limare, A. Recirculation cells in a wide channel. Phys. Fluids 2014,
26, 016604. [CrossRef]13. El-Sharkawi, F.; El-Attar, L.; Gawad, A.A.; Molazem, S. Some Environmental Factors Affecting Survival of Fecal Pathogens and
Indicator Organisms in Seawater. Water Sci. Technol. 1989, 21, 115–120. [CrossRef]14. Georges, I.; Servais, P. Sources et Dynamique Des Coliformes Dans Le Bassin de La Seine; PIREN-Seine: Paris, France, 2002.15. Hipsey, M.R.; Antenucci, J.P.; Brookes, J. A generic, process-based model of microbial pollution in aquatic systems. Water Resour.
Res. 2008, 44, 7. [CrossRef]16. Evison, L.M. Comparative Studies on the Survival of Indicator Organisms and Pathogens in Fresh and Sea Water. Water Sci.
Technol. 1988, 20, 309–315. [CrossRef]17. Ouattara, N.K.; de Brauwere, A.; Billen, G.; Servais, P. Modelling faecal contamination in the Scheldt drainage network. J. Mar.
Syst. 2013, 128, 77–88. [CrossRef]18. Sokolova, E.; Pettersson, T.; Bergstedt, O. Hydrodynamic modelling and forecasting of microbial water quality in a drinking
water source. J. Water Supply Res. Technol. 2014, 63, 189–199. [CrossRef]19. Viegas, C.; Neves, R.; Fernandes, R.; Mateus, M. Modelling tools to support an early alert system for bathing water quality.
Environ. Eng. Manag. J. 2012, 11, 907–918. [CrossRef]20. Hervouet, J.-M. Hydrodynamics of Free Surface Flows: Modelling with the Finite Element Method; John Wiley & Sons, Ltd: Hoboken,
NJ, USA, 2007; pp. 1–4. [CrossRef]21. Electricite de France. TELEMAC-2D User Manual—Version V8p2; EDF R&D; Electricite de France: Paris, France, 2020.22. Electricite de France. TELEMAC-3D User Manual—Version V8p2; EDF R&D; Electricite de France: Paris, France, 2020.23. Electricite de France. WAQTEL Technical Manual—Version V8p2; EDF R&D; Electricite de France: Paris, France, 2020.24. Even, S.; Poulin, M.; Garnier, J.; Billen, G.; Servais, P.; Chesterikoff, A.; Coste, M. River ecosystem modelling: Application of the
PROSE model to the Seine river (France). Hydrobiologia 1998, 373/374, 27–45. [CrossRef]25. Mouchel, J.-M.; Lucas, F.S.; Moulin, L.; Wurtzer, S.; Euzen, A.; Haghe, J.-P.; Rocher, V.; Azimi, S.; Servais, P. Bathing activities and
microbiological river water quality in the Paris area: A long-term perspective. In The Seine River Basin; Flipo, N., Labadie, P.,Lestel, L., Eds.; Springer International Publishing: Berlin/Heidelberg, Germany, 2021; pp. 323–353. [CrossRef]
26. Prolog Ingenierie; Hydratec. Mise à Jour du SDA du SIAAP Pour L’atteinte de L’objectif Baignabilité en Seine et en Marne; SIAAP:Versaille, France, 2017.
27. Blue Kenue™: Software Tool for Hydraulic Modellers. Available online: https://nrc.canada.ca/fr/recherche-developpement/produits-services/logiciels-applications/blue-kenuetm-logiciel-modelisateurs-hydrauliques (accessed on 23 February 2022).