development of a spherical micro-indentation test
TRANSCRIPT

Graduate Theses, Dissertations, and Problem Reports
2017
Development of a Spherical Micro-Indentation Test Methodology Development of a Spherical Micro-Indentation Test Methodology
for Creep Analysis and On-set of Tertiary Creep for Solder Alloys for Creep Analysis and On-set of Tertiary Creep for Solder Alloys
Dumbi Azubuike Otunyo
Follow this and additional works at: https://researchrepository.wvu.edu/etd
Recommended Citation Recommended Citation Otunyo, Dumbi Azubuike, "Development of a Spherical Micro-Indentation Test Methodology for Creep Analysis and On-set of Tertiary Creep for Solder Alloys" (2017). Graduate Theses, Dissertations, and Problem Reports. 6362. https://researchrepository.wvu.edu/etd/6362
This Dissertation is protected by copyright and/or related rights. It has been brought to you by the The Research Repository @ WVU with permission from the rights-holder(s). You are free to use this Dissertation in any way that is permitted by the copyright and related rights legislation that applies to your use. For other uses you must obtain permission from the rights-holder(s) directly, unless additional rights are indicated by a Creative Commons license in the record and/ or on the work itself. This Dissertation has been accepted for inclusion in WVU Graduate Theses, Dissertations, and Problem Reports collection by an authorized administrator of The Research Repository @ WVU. For more information, please contact [email protected].

Development of a spherical micro-indentation test
methodology for creep analysis and on-set of tertiary
creep for solder alloys
Dumbi Azubuike Otunyo
Thesis submittedto the Benjamin M. Statler College of
Engineering and Mineral Resourcesat West Virginia University
in partial fulfillment of the requirements for the degree of
Doctor of Philosophyin
Mechanical Engineering
Bruce Kang, Ph.D., ChairEdward Sabolsky, Ph.D.Steven Woodruff, Ph.D.
Xuyean Song, Ph.D.Jacky C. Prucz, Ph.D.
Department of Mechanical and Aerospace Engineering
Morgantown, West Virginia2017
Keywords: load-depth sensing indentation, constant load indentation,

ABSTRACT
Development of a spherical micro-indentation test methodologyfor creep analysis and on-set of tertiary creep for solder alloys
Dumbi Azubuike Otunyo
The continuous miniaturization of electronic devices and systems demands more under-standing of the creep deformation and stress relaxation of solder alloys in order to improvethe structural integrity of electronic devices and systems. Creep is characterized by a slow,time-dependent deformation of the material under constant stress or force. These solderalloys are often subjected to time-dependent deformation during service conditions, hencestrain-time relationships obtained from creep experiments are used to analyze the deforma-tion mechanism of mechanical structures and electronic interconnects under stress controlledconditions. Recently, instrumented indentation methods were proposed to study creep de-formation mechanism as well as determining creep parameters. Instrumented indentation isadvantageous when the material is only available as small test pieces or the area of interestis limited to a small area or feature. Soft materials such as lead alloys present difficultieswhen machining samples for use in traditional material property evaluation tests such astensile tests. Therefore instrumented indentation can provide a simple testing methodologyfor investigating creep mechanical properties of solder alloys.
In this research, material time-dependent behavior of Sn3.5Ag, Sn37Pb and Sn5Sb solderalloys were studied by a unique depth sensing micro-indentation method at room tempera-ture. Stress exponent values were determined through a constant loading process utilizing aspherical micro indentation method, where the strain rate is extracted from the indentationrate. The measured stress exponent values are in good agreement with conventional creepexperiments. Utilizing a multiple loading and partial unloading micro-indentation testingprocedure, time-dependent stiffness changes of these materials could be measured. Thiscontinuous stiffness responses during a creep test can be correlated to test materials microstructural changes during creep, therefore making it capable to predict onset of tertiary creepfailure. Test results show a correlation between measured continuous stiffness response andcreep damage with the capability to predict the onset of tertiary creep of these solder alloys.

ACKNOWLEDGMENTS
I would like to thank my advisor Dr. Bruce Kang for giving me such a wonderful op-
portunity to work with him on such an exciting topic. I would also like to thank my thesis
committee members, Dr Edward Sabolsky, Dr. Steven Woodruff, Dr. Xuyean Song and Dr.
Jacky C. Prucz for their help and technical support
I would also like to thank my friends, family and the Benjamin M. Statler College of
Engineering for their support during my tenure as a graduate student at the West Virginia
University.
iii

TABLE OF CONTENTS
Page
ACKNOWLEDGMENTS. . . . . . . . . . . . . . . . . . . . . . . . iii
LIST OF FIGURES . . . . . . . . . . . . . . . . . . . . . . . . . . viii
Chapter
1. INTRODUCTION . . . . . . . . . . . . . . . . . . . . . . . . . 1
1.1 Background. . . . . . . . . . . . . . . . . . . . . . . . . . . . . . . . . . . . . . . . . . . . . . . . . . . . . . 1
1.2 Research Objective . . . . . . . . . . . . . . . . . . . . . . . . . . . . . . . . . . . . . . . . . . . . . . . 3
1.3 Contribution. . . . . . . . . . . . . . . . . . . . . . . . . . . . . . . . . . . . . . . . . . . . . . . . . . . . . 5
2. CONTACT MECHANICS . . . . . . . . . . . . . . . . . . . . . 6
2.1 Hertzian contact . . . . . . . . . . . . . . . . . . . . . . . . . . . . . . . . . . . . . . . . . . . . . . . . . 6
2.2 Field and Swain method. . . . . . . . . . . . . . . . . . . . . . . . . . . . . . . . . . . . . . . . . . . 7
2.3 Doerner and Nix method . . . . . . . . . . . . . . . . . . . . . . . . . . . . . . . . . . . . . . . . . . 8
2.4 Oliver and Pharr method . . . . . . . . . . . . . . . . . . . . . . . . . . . . . . . . . . . . . . . . . . 9
2.5 Elastic-plastic regime in indentation . . . . . . . . . . . . . . . . . . . . . . . . . . . . . . . . 11
3. INSTRUMENTED INDENTATION . . . . . . . . . . . . . . . . 13
3.1 Spherical Indentation . . . . . . . . . . . . . . . . . . . . . . . . . . . . . . . . . . . . . . . . . . . . . 13
3.2 Instrumented Indentation Data Analysis . . . . . . . . . . . . . . . . . . . . . . . . . . . . 15
3.2.1 Single Point Unloading . . . . . . . . . . . . . . . . . . . . . . . . . . . . . . . . . . . . . . 15
3.2.2 Multiple Partial Unloading . . . . . . . . . . . . . . . . . . . . . . . . . . . . . . . . . . . 16
3.3 Instrumented Indentation Systems . . . . . . . . . . . . . . . . . . . . . . . . . . . . . . . . . . 18
3.3.1 Load Cell . . . . . . . . . . . . . . . . . . . . . . . . . . . . . . . . . . . . . . . . . . . . . . . . . . 19
3.3.2 Actuator. . . . . . . . . . . . . . . . . . . . . . . . . . . . . . . . . . . . . . . . . . . . . . . . . . . 19
3.3.3 Indenter . . . . . . . . . . . . . . . . . . . . . . . . . . . . . . . . . . . . . . . . . . . . . . . . . . . 20
3.3.4 Loading Frame . . . . . . . . . . . . . . . . . . . . . . . . . . . . . . . . . . . . . . . . . . . . . 20
3.4 High Temperature Indentation . . . . . . . . . . . . . . . . . . . . . . . . . . . . . . . . . . . . . 21
3.4.1 System Description. . . . . . . . . . . . . . . . . . . . . . . . . . . . . . . . . . . . . . . . . . 21
iv

4. CREEP . . . . . . . . . . . . . . . . . . . . . . . . . . . . . . 23
4.1 Power-Law Creep. . . . . . . . . . . . . . . . . . . . . . . . . . . . . . . . . . . . . . . . . . . . . . . . . 25
4.2 Creep Steady State Microstructure . . . . . . . . . . . . . . . . . . . . . . . . . . . . . . . . . 26
4.3 Room Temperature Indentation Creep Literature Review . . . . . . . . . . . . . . 27
4.3.1 Indentation Creep from Vickers Hardness . . . . . . . . . . . . . . . . . . . . . . 27
4.4 Indentation Creep . . . . . . . . . . . . . . . . . . . . . . . . . . . . . . . . . . . . . . . . . . . . . . . 33
4.4.1 Indentation Load Relaxation (ILR). . . . . . . . . . . . . . . . . . . . . . . . . . . . 37
4.4.2 Constant Rate of Loading (CRL) . . . . . . . . . . . . . . . . . . . . . . . . . . . . . 38
4.4.3 Step Constant Indentation Strain Rate . . . . . . . . . . . . . . . . . . . . . . . . 39
4.4.4 Constant Load- Hold . . . . . . . . . . . . . . . . . . . . . . . . . . . . . . . . . . . . . . . . 41
4.5 Development of Constant Load-Hold . . . . . . . . . . . . . . . . . . . . . . . . . . . . . . . 42
4.5.1 Development of Constant Load-Hold Lab View Software IV . . . . . . 42
4.5.2 Development of Constant Load-Hold Lab View Software IV Block
Diagram . . . . . . . . . . . . . . . . . . . . . . . . . . . . . . . . . . . . . . . . . . . . . . . . . . . . . . . . 44
4.6 Development of Constant Load-Hold with multiple partial unloading . . . 48
5. RESULTS AND CONCLUSIONS . . . . . . . . . . . . . . . . . 52
5.1 Close-Loop Load Control . . . . . . . . . . . . . . . . . . . . . . . . . . . . . . . . . . . . . . . . . . 52
5.2 Indentation Creep Stress Exponent determination . . . . . . . . . . . . . . . . . . . . 53
5.3 Traditional Tensile Creep test . . . . . . . . . . . . . . . . . . . . . . . . . . . . . . . . . . . . . . 55
5.4 Experimental procedure . . . . . . . . . . . . . . . . . . . . . . . . . . . . . . . . . . . . . . . . . . . 56
5.5 Creep Continuous Stiffness Response CCSR. . . . . . . . . . . . . . . . . . . . . . . . . . 60
5.6 Remaining Life Creep Continuous Stiffness Response CCSR. . . . . . . . . . . . 65
5.7 Conclusions. . . . . . . . . . . . . . . . . . . . . . . . . . . . . . . . . . . . . . . . . . . . . . . . . . . . . . 67
5.8 Future Work . . . . . . . . . . . . . . . . . . . . . . . . . . . . . . . . . . . . . . . . . . . . . . . . . . . . . 68
REFERENCES. . . . . . . . . . . . . . . . . . . . . . . . . . . . . 69
v

LIST OF FIGURES
Figure 2.1 Geometry of impression by indentation . . . . . . . . . . . . . . . . . . . . . . . . . . . . . . 8
Figure 2.2 Load-depth curve by spherical indentation . . . . . . . . . . . . . . . . . . . . . . . . . . . 9
Figure 2.3 Schematic of contact behavior. . . . . . . . . . . . . . . . . . . . . . . . . . . . . . . . . . . . . . 10
Figure 3.1 Contact deformation between two spheres . . . . . . . . . . . . . . . . . . . . . . . . . . . 14
Figure 3.2 Pile-up and sink-in (not simultaneously) occurring during spherical
indentation . . . . . . . . . . . . . . . . . . . . . . . . . . . . . . . . . . . . . . . . . . . . . . . . . . . . . . 14
Figure 3.3 Load displacement curve for single point unloading algorithm.. . . . . . . . . . 16
Figure 3.4 Load displacement curve for multiple partial unloading algorithm. . . . . . . 17
Figure 3.5 Instrumented indentation system loading chain schematic. . . . . . . . . . . . . . 19
Figure 3.6 High temperature indentation system loading frame design; a) i: glass
fiber insulation, ii: furnace heating element, iii: sample, iv: spherical
sapphire 750µm radius indenter, v: alumina indenter rod, vi: 0.8nm
resolution Physik Instrumente P-246.7S 120µm piezoelectric actuator,
vii: 0.1% accuracy Honeywell Model 75 100 lb. load cell and b) optical
image . . . . . . . . . . . . . . . . . . . . . . . . . . . . . . . . . . . . . . . . . . . . . . . . . . . . . . . . . . . 21
Figure 4.1 Creep diagram in uniaxial tension: primary (unsteady) creep (I)
,steady-state creep (II) and tertiary creep (III) . . . . . . . . . . . . . . . . . . . . . . . 24
Figure 4.2 Indentation creep curves at different temperatures . . . . . . . . . . . . . . . . . . . . 31
Figure 4.3 Indentation creep curves at different temperatures . . . . . . . . . . . . . . . . . . . . 31
Figure 4.4 Indentation creep curves at different temperatures . . . . . . . . . . . . . . . . . . . . 32
Figure 4.5 Derivation of stress exponent by the Juhasz et al. method . . . . . . . . . . . . . 32
Figure 4.6 Derivation of stress exponent by the Juhasz et al. method . . . . . . . . . . . . . 33
Figure 4.7 Derivation of stress exponent by the Juhasz et al. method . . . . . . . . . . . . . 34
vi

Figure 4.8 Derivation of stress exponent by the Mulhearn-Tabor method . . . . . . . . . . 35
Figure 4.9 Derivation of stress exponent by the Mulhearn-Tabor method . . . . . . . . . . 36
Figure 4.10 Derivation of stress exponent by the Mulhearn-Tabor method . . . . . . . . . . 36
Figure 4.11 Derivation of stress exponent by the Sargent-Ashby method. . . . . . . . . . . . 37
Figure 4.12 Derivation of stress exponent by the Sargent-Ashby method. . . . . . . . . . . . 38
Figure 4.13 Derivation of stress exponent by the Sargent-Ashby method. . . . . . . . . . . . 39
Figure 4.14 Variation of Indentation Length with Time . . . . . . . . . . . . . . . . . . . . . . . . . . 41
Figure 4.15 Front Panel for Constant Load-Hold . . . . . . . . . . . . . . . . . . . . . . . . . . . . . . . . 43
Figure 4.16 Parameter Control Panel . . . . . . . . . . . . . . . . . . . . . . . . . . . . . . . . . . . . . . . . . . 44
Figure 4.17 Displacement Vs Time graph . . . . . . . . . . . . . . . . . . . . . . . . . . . . . . . . . . . . . . 44
Figure 4.18 Change in Load graph . . . . . . . . . . . . . . . . . . . . . . . . . . . . . . . . . . . . . . . . . . . . 45
Figure 4.19 Load Vs Time Graph . . . . . . . . . . . . . . . . . . . . . . . . . . . . . . . . . . . . . . . . . . . . . 45
Figure 4.20 Block Diagram . . . . . . . . . . . . . . . . . . . . . . . . . . . . . . . . . . . . . . . . . . . . . . . . . . . 46
Figure 4.21 Write to Measurement block diagram . . . . . . . . . . . . . . . . . . . . . . . . . . . . . . . 47
Figure 4.22 Load Control Block diagram False condition . . . . . . . . . . . . . . . . . . . . . . . . . 49
Figure 4.23 Load Control Block diagram True condition . . . . . . . . . . . . . . . . . . . . . . . . . 50
Figure 4.24 Creep and Multiple Partial unloading . . . . . . . . . . . . . . . . . . . . . . . . . . . . . . . 51
Figure 5.1 Indentation Load Versus Time . . . . . . . . . . . . . . . . . . . . . . . . . . . . . . . . . . . . . 52
Figure 5.2 Sn37Pb Displacement time curve . . . . . . . . . . . . . . . . . . . . . . . . . . . . . . . . . . . 54
Figure 5.3 Sn3.5Ag Displacement time curve . . . . . . . . . . . . . . . . . . . . . . . . . . . . . . . . . . 54
Figure 5.4 Sn5Sb Displacement time curve . . . . . . . . . . . . . . . . . . . . . . . . . . . . . . . . . . . . 55
Figure 5.5 Time to Rupture Sn3.5Ag . . . . . . . . . . . . . . . . . . . . . . . . . . . . . . . . . . . . . . . . . 56
Figure 5.6 Creep curve Sn37Pb . . . . . . . . . . . . . . . . . . . . . . . . . . . . . . . . . . . . . . . . . . . . . . 57
Figure 5.7 Creep Curve Sn-5Sb . . . . . . . . . . . . . . . . . . . . . . . . . . . . . . . . . . . . . . . . . . . . . . 57
vii

Figure 5.8 Derivation of Stress Exponent fo Sn37Pb . . . . . . . . . . . . . . . . . . . . . . . . . . . . 59
Figure 5.9 Derivation of Stress Exponent for Sn3.5Ag. . . . . . . . . . . . . . . . . . . . . . . . . . . 59
Figure 5.10 Derivation of Stress Exponent for Sn5Sb . . . . . . . . . . . . . . . . . . . . . . . . . . . . 60
Figure 5.11 BI Function LabView Control Software. . . . . . . . . . . . . . . . . . . . . . . . . . . . . . 61
Figure 5.12 Stiffness Response During Indentation Creep. . . . . . . . . . . . . . . . . . . . . . . . . 62
Figure 5.13 Creep Contact Stiffness Response Low depth Sensing . . . . . . . . . . . . . . . . . 63
Figure 5.14 Creep Contact Stiffness Response High depth Sensing . . . . . . . . . . . . . . . . . 63
Figure 5.15 Sn37Pb with Low Strain Hardening showing low variation in stiffness
response from Low and High depth sensing . . . . . . . . . . . . . . . . . . . . . . . . . . 64
Figure 5.16 Sn3.5Ag with high strain hardening showing large variation in stiffness
response from Low and High depth sensing . . . . . . . . . . . . . . . . . . . . . . . . . . 65
viii

CHAPTER 1
INTRODUCTION
1.1 Background
Solder alloys are widely used in the microelectronics industry. They are intended to
provide electrical, thermal and mechanical continuity to silicon packages and hence a crucial
factor in reliability prediction modelling of silicon packages. These alloys are normally used
at room high homologous temperatures, being at 0.65Tm at room temperature (Where Tm
represents the material melting point). Solder alloys operation time, temperature and stress
dependent response make constitutive modelling a difficult task. Indentation on the other
hand has gained popularity as an experimental tool to determine the material properties of
specimens available in small volumes.
Solder Joint Fatigue is a key cause of product failure in many environments. Sol-
der joint fatigue failures are becoming more prevalent due to continued shrinkage of solder
joint size and pitch that comes with more advanced packages. Thermo-mechanical fatigue
of solder joints is one of the primary wear out mechanisms in electronic products and is
true in products used outside of consumer environments due to longer required lifetimes and
more severe operating conditions. Measurement techniques are constantly being improved
through intensive research in order to accurately obtain mechanical properties of materials.
Indentation is one of the more mature techniques being developed. Indentation tests have for
a long time been a standard method for material characterization, which consists of loading
an indenter made of diamond or any other hard material and pressing it into the surface
of a softer material to be examined. The load-depth relation and unloading characteristics
are then studied extensively experimentally or numerically to determine the relevant me-
chanical behavior or properties. The use of the initial unloading stiffness of the load-depth
1

curve to determine a materials Young’s Modulus[2, 3, 4, 5] is well accepted. Sneddon’s
[2] classical elastic indentation solutions which describe the general relationship among the
load, displacement and contact area for any punch was the backbone for indentation, since
methods of determining Young’s modulus, creep and case depth of materials have been es-
tablished.Utilizing instrumented indentations, Doerner and Nix [5] further investigated the
unloading characteristics. In 1992 Oliver and Pharr [4] showed that Bulychev’s technique
can be applied to any indenter that can be described as a body of revolution of a smooth
function. The results showed that the load-displacement relationships for many simple punch
geometries can conveniently be written as:
P = αhm (1.1)
where P is the indenter load, h is the elastic displacement of the indenter, and α and
m are constants. Values of the exponent m for some common punch geometries are m = 1
for flat cylinders, m = 2 for cones, m = 1.5 for spheres in the limit of small displacements,
and m = 1.5 for paraboloids of revolution.
Creep is a mechanical property seen in numerous applications. Electronic equipment
manufacturers are concerned about the contribution of creep to the failure of solder-joint
interconnects which operate at elevated temperatures for extended periods. Indentation is
used for measuring the constitutive properties of creep, including the stress exponent and
activation energy. These materials have multiple mechanisms of creep which can be detected
using instrumented indentation creep.
One of the driving forces in the gas turbine industry is the increased efficiency resulting
in less fuel consumption and environmental pollution. Thermal Barrier Coating (TBC)
systems however, coated on hot section components (combustion chamber tiles and rotating
blades) of land-based gas turbines increases structural potentials in the resistance against
hot corrosive and oxidative environments. Micro-indentation stiffness response is one of the
techniques used to characterize failure modes for this complex TBC systems [6].
2

In the automotive industry, efficient quality control of parts production is a major
issue. Particularly inspection of case hardened materials involve the destruction of produced
parts to verify quality of carbonization during heat treatment in the manufacturing process.
This reduces the frequency of quality inspections within auto motive manufacturing com-
panies. Most automotive companies will inspect 5 out of 500 parts produced in a day for
quality control assurance. This is attributed to the destructive nature of current evaluation
techniques present and high costs of the non-destructive evaluation technologies.
During indentation the contact area and initial unloading stiffness are the key param-
eters to be identified. Direct measurement of the contact area is not feasible, so unloading
stiffness is typically used to estimate the contact area through some iterative algorithm.
High precision sensors are needed to accurately obtain the load-depth curve and unloading
stiffness data.
Recently a Transparent Indenter Measurement (TIM) technique has been developed
[7, 8], by integrating a Twyman-Green type interferometer into the spherical transparent
indenter head. This system measures the indentation-induced out of plane deformation as
well as the indented surface which evaluates the young’s modulus without unloading stiffness.
A second generation TIM technique developed at West Virginia University is capable
of measuring multiple partial unloading utilizing micro-indentation to evaluate Young’s mod-
ulus without the use of high precision depth sensors. This second generation TIM multiple
partial unloading technique was further developed to evaluate Young’s modulus at elevated
temperatures and controlled environment without the use of depth precision sensors [9, 6].
1.2 Research Objective
In this research, we present a load-based micro-indentation technique for material
property measurement, creep degradation evaluation of solder alloys at homologous temper-
atures. Solder alloys Sn3.5Ag, Sn37Pb and Sn5Sb were tested at homologous temperatures.
The time-dependent evaluation of the stiffness response during the creep reveals the test
3

materials microstructural changes over time as a function of creep. Test results show a cor-
relation to creep damage of the test materials not normally detectable through regular creep
indentation methodologies
It is extremely difficult in reality to characterize creep damage of solders utilizing
methods such as tensile test, scanning electron microscopy and X-ray system due to the
sample size required to perform such tests. The objective of our research is to contribute
a method for utilizing depth-sensing indentation techniques to measure the time dependent
mechanical properties of materials, such as creep and stiffness response of materials during
creep. Understanding the response of a material to an applied force deals with elastic
deformation where the strains are nearly instantaneous, elastic deformation where the strains
are not instantaneous but rather dependent on time and plastic deformation where the
material undergoes non-recoverable strain.
Time dependent phenomena involves creep techniques where load, stress or strain-
rate is held constant for a period of time ranging from seconds to hours while the response of
the material is monitored. The other time dependent phenomena utilizes frequency specific
dynamic techniques where the load or stress is varied at a single frequency during which
the response of the material is measured. It is possible to perform these tests utilizing
bulk testing techniques such as tensile tests, but in many instances due to advanced design
concepts requiring smaller volumes of materials, these bulk testing techniques are rendered
impractical. This is seen in thin film devices found in the microelectronics industry where
solders are used in LED modules used for headlamp illumination, individual cell walls in
stress or even the diseased arterial tissue found within the human body. It is possible for
specimens mentioned in these cases to be prepared in a form that allows for testing with
standard uniaxial techniques. These sample preparation techniques can be tedious and may
alter the properties of the area of interest. Growing technology has made it necessary to
find an alternate means for mechanical characterization. Depth-sensing indentation has been
proven to be a reliable technique for measuring mechanical properties of such small volumes
4

of materials such as Young’s modulus and Hardness values.
In this study, a second generation TIM micro-indentation package will be created
and utilized to measure both time dependent plasticity Creep and Stiffness response during
indentation creep.
1.3 Contribution
In this research, I will be contributing a new indentation methodology that will bridge
the gap in non-destructive evaluation of time dependent mechanical properties of materials,
specifically creep and creep stiffness response.
I will propose new indentation methodology capable of characterizing load depth
response of solder materials during creep. Traditional creep methods are only capable of
determining stress exponents, proposed indentation methodology will be capable of char-
acterizing material stiffness response during creep, which will then be correlated to creep
damage of materials.
5

CHAPTER 2
CONTACT MECHANICS
2.1 Hertzian contact
The stresses and deflections arising from the contact between two elastic solids have
practical applications in hardness testing, wear and impact damage of engineering materials.
In many cases the contact between a rigid indenter and a flat extensive specimen is off
particular interest. The most well-known scenario is the contact between a rigid sphere and
flat surface, where Hertz [10] found that the radius of a circle of contact a is related to the
indenter load P the indenter radius R and the elastic properties of the materials by:
a3 =3PR
4ER(2.1)
Where ER is the combined modulus of the indenter and the specimen defined by the
elastic modulus and Poisson’s ratio of two bodies. Thus the reduced modulus is expressed
by Equation 2.1. R is the relative radius and defined as shown in Equation 2.3.
1
ER=
1− v2
E1
+1− v′2
E2
(2.2)
1
R=
1
R1
+1
R2
(2.3)
The mean contact pressure, pm is given by the indenter load divided by the projected
contact area shown in Equation 2.4. Equation 2.5 is derived by substituting Equation 2.4
into Equation 2.1
pm =P
πa2(2.4)
6

pm =P
πa2= [
4ER3π
]a
R(2.5)
Indentation tests offer load-depth data, Figure 2.2 shows a schematic of indentation of this
relationship. Indentation processes are complex and related not to only elastic, but elastic-
plastic material behavior as well. Hertz governing contact mechanics equations have since
been applied in various indentation research initiatives. For elastic deformation, the total
indentation depth is employed and the rigid body motion is reformulated as Equation 2.6,
where he is elastic indentation depth. This Equation 2.6 presents a clear relationship between
applied load and elastic indentation depth, therefore this is used as a basic equation for elastic
indentation[11].
P =4
3ERR
12h
32e (2.6)
2.2 Field and Swain method
Indentation may be wholly elastic, elastic/plastic, or wholly plastic, and the mix of
these responses is subtly reflected in the loading and unloading process. Many early models
included only elastic behavior under the assumption that unloading is a purely elastic pro-
cess. Field and Swain [12] suggested an indentation method using single partial unloading.
Hertz showed the contact area, Equation 2.1 and substituted into Equation 2.6. The rela-
tionship between contact radius and elastic indentation depth can be defined as Equation 2.7.
Equation 2.7 is translated in terms of contact radius, thus Hertz’s elastic contact solution is
defined as shown in Equation 2.8. The relationship between total depth and contact depth
is shown in Figure 2.1
a2 = Rhe (2.7)
P =4
3ERahe (2.8)
Since the contact depth is arranged by the ”total depth ht and elastic depth he”, it
7

Figure 2.1 Geometry of impression by indentation
is calculated by the total depth and residual depth, Equation 2.9 and Equation 2.10
he = ht − hr (2.9)
hc = ht −e
2(2.10)
2.3 Doerner and Nix method
Doerner and Nix [5] figured out that during the unloading procedure contact radius
remains constant until a plastic regime is reached. Due to this, initial unloading slopes within
the load-depth curve were found to be linear. Utilizing this phenomenon, a relationship
between elastic indentation depth, maximum load, unloading slope and indenter geometry
was established by Sneddon [2].It has already been observed in cylindrical punch indentation
that the unloading slope is linear until full unloading and the contact radius is the same.
Thus Doerner and Nix used cylindrical punch method to determine the contact depth and
contact area. Since an easy way to determine contact depth is developed, the contact depth
has been determined by extrapolation from initial unloading slope to zero load as shown in
Figure 2.2. The contact area is rearranged to give Equation 2.11 and the unloading slope is
8

Figure 2.2 Load-depth curve by spherical indentation
given by Equation 2.12
A = 24.5h2c (2.11)
dP
dh= 2hcER
√24.5
π(2.12)
2.4 Oliver and Pharr method
Contact radius can be related to contact depth and indentation radius utilizing Equa-
tion 2.13. Where hc is contact depth caused by plastic deformation. The Hertzian loading
technique has been adapted to measure the strength and flaw density distribution for trans-
parent brittle materials. Replacing the steel or tungsten carbide spherical indenter, normally
used in Hertzian strength measurements, by a sapphire hemisphere enables direct observa-
9

Figure 2.3 Schematic of contact behavior
tion of the formation of cracks in opaque brittle materials [13]. Figure 2.3 shows sink in
and pile up behavior during contact deformation which is experimentally observed during
spherical indentation.
a =√
2hcR− h2c ≈
√2hcR (2.13)
Previous models were expanded to incorporate elastic-plastic deformation around the
indented region which established a relationship between total indentation depth and inden-
ter contact area [14]. Sneddon suggested elastic depth for an elastic indentation solution,
Equation 2.14.
he = εPmax
(dPdh
)(2.14)
Oliver and Pharr used Sneddon’s elastic solution in order to represent contact depth
with total indentation depth. ε is a coefficient for indenter shape found from experimental
results and is related to material behavior, Equation 2.15
10

hc = ht − εPmax
(dPdh
)(2.15)
Oliver and Pharr showed that the contact stiffness can be evaluated by power law
equation with fitting the unloading data. C, m and hr are determined by least-square
fitting, Equation 2.16
P = C(h− hr)m (2.16)
Doerner and Nix also defined contact area as a function of contact depth. Oliver and
Pharr rearranged the contact area Equation 2.17
A = πa2 = 2πhcR (2.17)
This contact area has high accuracy when determining elastic modulus and other
indentation measurements. Also in the case of adhesive contact, the reduced modulus can
be calculated using unloading slope and contact area Equation 2.18. Where β depends on
indenter geometry and is 1 for a conical indenter.
ER =
√πdP
2β√Adh
(2.18)
Sneddon’s solution was implemented for the Oliver-Pharr method, the effects of the
indenter angle and the Poisson’s ratio were examined [15]. Elastic-plastic behavior has been
considered, but these analytical models are derived under the basic assumption that the
unloading process is purely elastic and tested against homogeneous isotropic material.
2.5 Elastic-plastic regime in indentation
During indentation, the elastic-plastic material behavior in indentation is very com-
plex to describe exactly. Finite element methods have been widely employed in the study
11

of elastic-plastic material behavior during indentation. D.J. Strange et al. conducted finite
element analysis with two separate work hardeneing models and verified their accuracy by
comparing experimental data [16]. I.S. Choi et al. conducted parametric finite element
analysis studies of indentation for non-linear plastic materials by building a methodology for
interpretations of depth sensing techniques [17]. Pile-up/sink-in behavior during indentation
is known to be a function of strain hardening exponent and ratio of yield stress to elastic
modulus [18]. Relationships between material properties and indentation parameters have
been developed for which elastic-plastic properties were found without the use of contact
radius measurements [19].
12

CHAPTER 3
INSTRUMENTED INDENTATION
Indentation is a mechanical testing process that has been used for hardness testing
since the 1800’s. A specific load for a specific time is applied to a given test material by using
hard geometrical materials. Mechanical properties of the materials can then be evaluated
using the material’s response to the applied load. The materials reactions such as depth and
area have been measured using various optical techniques. Indentation testing has quickly
become helpful to all industrial sectors, including lumber, ceramics, and glass production.
Indentation quickly became very popular in the nanotechnology industry due to its non-
destructive evaluation ability to get mechanical properties of small volumes of materials.
Indentation is the primary technique used for the examination of thin films and coat-
ing materials due to their geometry and configuration. The similarity between instrumented
indentation and hardness testing is that they both push a rigid indenter into the surface of
an unknown sample using a specific load. The instrumented indentation then uses high reso-
lution displacement or optical sensors to monitor the indentation size and depth throughout
the evaluation procedure. Also the load-indentation depth plots obtained from these meth-
ods can be used to determine the materials mechanical property information. Brief reviews
of these techniques are discussed below [9]
3.1 Spherical Indentation
Hertz during his time as a post doctorate realized that although much was known
about the optical aspect of two lenses being placed together, no good understanding of
the deflection occurring at the point of contact had been established [10]. Hertz became
particularly concerned by the nature in which localized deformation and pressure between
13

Figure 3.1 Contact deformation between two spheres
Figure 3.2 Pile-up and sink-in (not simultaneously) occurring during spherical indentation
the two spherical surfaces could be quantified Figure 3.1 [20].
Hertz’s established the relationship between contact area and material properties from
which all modern day contact mechanics theories are derived. During spherical indentation
of an elastic material, the specimen’s surface is typically drawn in and downwards toward
the indenter, as a result, a sink in effect around the indenter is observed Figure 3.2.
14

3.2 Instrumented Indentation Data Analysis
Hardness test involves the measurement of the indentation impression size directly,
while instrumented indentation calculates this value with knowledge of the indenter’s geom-
etry and indentation depth. Due to this, instrumented indentation is often referred to as
depth sensing indentation testing. Load and depth curves are recorded as load is applied
to the indenter and specimen, which ultimately leads to the extraction of elastic modulus
and hardness information from the test material. This applied load creates plastic deforma-
tion within the specimen directly beneath the indenter tip, causing a residual impression to
remain following removal of the load. The depth of penetration together with the known
indenter geometry provides an indirect measurement of contact area, from which an esti-
mate of hardness is made. However elastic modulus calculation requires the acquisition of
additional parameters, which are discussed below [6].
3.2.1 Single Point Unloading
Single point unloading uses only one slope within the load displacement curve to cal-
culate the reduced modulus as shown in Figure 3.3. This provides an accurate measurement
of the materials elastic response. Using Equation 3.1, elastic modulus is calculated, where
contact area is calculated using a known indenter geometry and indentation depth A = πa2
[4].
This technique is particularly popular in the material research community for its
shallow penetration depth requirement. The shallow depths required, classify the technique
to be relatively non-destructive, which permits samples composed of multiple layers, such as
thin films, to be evaluated without interference from the substrate’s material properties.
ER =1
2
dP
dh
√π
A(3.1)
15

Figure 3.3 Load displacement curve for single point unloading algorithm.
3.2.2 Multiple Partial Unloading
Developed at West Virginia University, the first generation of instrumented inden-
tation analysis data reduction techniques required the use of transparent sapphire spher-
ical indenter. This transparent indenter measurement (TIM) system, with phase shifting
Twyman-Green and Moir interferometer techniques directly measures the out-of-plane defor-
mation and contact radius throughout the indentation process [21]. This technique requires
the use of sophisticated optical systems to continuously measure the contact radii, which
provides the platform for elastic modulus and true stress strain relationship. A second gen-
eration TIM data reduction technique was developed wherein a partial unloading procedure
was employed to bypass the optical requirement Figure 3.4.
This principle operates under the assumption that the total displacement htotal is the
summation of total indentation depth h and the system deflection hs Equation 3.2. Assuming
the indentation unloading response is solely elastic, the elastic compliance dhedP
is equal to the
indentation compliance dhdP
Equation 3.3 is gotten from the derivative of this function with
respect to indentation load and replacing elastic compliance with indentation compliance.
16

Figure 3.4 Load displacement curve for multiple partial unloading algorithm
htotal = h+ hs (3.2)
dhtotaldP
=1
2ER
√π
A+dhsdP
(3.3)
Assuming the system compliance dhsdP
remains constant throughout a given indenta-
tion test, a function containing only differences in contact area and slope between partial
unloadings is developed Equation 3.4. Contact area and total displacement are the only non-
constant variables, therefore a function that requires only contact area and displacement is
developed for the extraction of reduced modulus.
ER =1
2
√π(
1√A2
− 1√A1
)(dhtotaldP 2
− dhtotaldP 1
)−1 (3.4)
Multiple partial unloading technique does not require any optical contact area mea-
surement. Therefore rewriting the Equation 2.6 in the form P = αhme , solving for he and tak-
17

ing the derivative of both sides with respect to P yields Equation 3.5, where α = (43)ERR
− 12 ,
m = 32
and C = ( 1m
)α1m
As can be seen from Equation 3.5, the total displacement compliance (dhtotaldP
) and p−13
maintain a linear relationship if and only if the system compliance (Cs) remains constant
throughout the multiple partial unloading steps. The slope (C) can then be used in the
determination of the reduced modulus Equation 3.6.
dhtotaldP
= CP (1/m)−1
+dhsdP
(3.5)
ER = (6m3R)−12 (3.6)
It is important to note that the single point unloading are incapable of obtaining
this slope, thus require contact area or indentation depth measurements. Also the multiple
partial unloading method on the other hand eliminates error due to high load application.
Specifically, if a large load is applied, the resulting elastic modulus will be too large, same
goes for if the load is too small, there would be an underestimation of the materials true
elastic modulus.
3.3 Instrumented Indentation Systems
This complex method with a simplistic design and set up requires a vibration free
environment for testing, due to the indentation chain components being extremely sensitive.
This is accomplished by the use of an optical table as a steady platform, and the use of a
rigid loading frame. The rigidity of the loading frame is essential in attaining the boundary
conditions under which the equations for ideal contact mechanics are derived, unfortunately
some level of system deflection exists. The system compliance is unavoidable, yet greater
accuracy is achieved when the value is minimized. Figure 3.5 shows the current indentation
system which comprises of a load cell, indenter, piezoelectric actuator and loading frame.
18

Figure 3.5 Instrumented indentation system loading chain schematic
The indentation chains components must meet the standard practices for instrumented in-
dentation testing developed by ASTM International [22]
3.3.1 Load Cell
The load cell in an indentation system converts a load response to an electrical signal
in the indentation system. Stress analysis is often performed by measuring strains on the
surface of deformed elements. The electrical strain gauge is the most common choice for
measurements of this strain [22]. Known for its accuracy and size the strain gauge load cells
are extremely reliable. The electrical strain gauge can be used to determine the load when
applied to a known material with known geometry. It is by this principle which the strain
gauge load cell operates. It also requires a Wheatstone bridge configuration to amplify the
source of electrical load signals to be acquired throughout the indentation test [23]
3.3.2 Actuator
The piezoelectric actuator consists of multiple piezoelectric discs and is a function
of the applied electric field. Mechanical strain is produced when a voltage is applied to
19

these materials. The piezoelectric actuator is typically used for depth sensing indentation
applications due to its high resolution. Mechanical strain (displacement) similar to that of
thermal expansion is produced when a voltage is applied to these materials. The active
material of the positioning element is composed of piezoelectric disks. Separated by thin
metallic electrodes, these elements provide a great deal of stiffness at high pressures, which
provide stability through the indentation test [23].
3.3.3 Indenter
The choice of indenter used in the indentation system is of utmost importance and
should depend on the choice of material being tested. Sharp indenters such as Vickers,
Bekovich and Knoop induce plasticity earlier in the indentation process; hence they are
used for determination of modulus of top coats of thin films. A Spherical indenter has a
gradual transition from elastic to elastic-plastic response. This is good for determining strain
hardening characteristics of test materials. The indenter material must be quite rigid and
strain resistant. Common materials used for indenters are, sapphire, tungsten carbide and
diamond. Sapphire indenters, although brittle are often the desirable choice for experiments
due to their optical properties and cost [6].
3.3.4 Loading Frame
The loading frame, probably the most important aspect of an indentation system,
usually made of steel, must be of heavy construction. The system compliance depends on the
rigidity of the loading frame, which affect the accuracy of indentation results directly.The
loading frame should be designed with specimen size and geometry in mind. In order to
minimize system compliance, a rigid stabilizing or clamping element must be utilized at
each joint [6].
20

Figure 3.6 High temperature indentation system loading frame design; a) i: glass fiberinsulation, ii: furnace heating element, iii: sample, iv: spherical sapphire 750µm radiusindenter, v: alumina indenter rod, vi: 0.8nm resolution Physik Instrumente P-246.7S 120µmpiezoelectric actuator, vii: 0.1% accuracy Honeywell Model 75 100 lb. load cell and b) opticalimage
3.4 High Temperature Indentation
Instrumented indentation techniques are generally used for room temperature results.
Mechanical property evaluation and characterization at elevated temperatures require an ex-
tension of this instrumented indentation system. Micro-indentation hardness tests performed
on jadeite and diopside at temperatures between 300oC and 750oC have been conducted with
high levels of accuracy [24]. A high temperature system developed at West Virginia Uni-
versity capable of utilizing the previously detailed multiple partial loading and unloading
procedure for mechanical property evaluation will be discussed in detail below.
3.4.1 System Description
A high temperature system using multiple partial unloading micro indentation pro-
cedure was used to evaluate elastic modulus at elevated temperatures [9] Verification tests
21

of this multiple partial unloading procedure at elevated temperatures have been discussed
elsewhere [6]. This high temperature system consists of a low compliant frame structure with
guide rails and boundary constraints as seen in Figure 3.6. The high temperature system is
very rigid and allows for little system compliance. A custom indenter consisting of alumina
rod with a semi-spherical lens linked to the center of the rod is used.This custom indenter is
necessary to protect the highly delicate temperature sensitive components of the indentation
chain from extremely high temperatures.An inverted indentation system is implemented in
this high temperature indentation system, which allows heat lost to radiate in the direction
opposite to that of the indentation chain. A sample constraint composed of both inner and
outer ceramic tube is utilized for creating the boundary conditions required for idealized
indentation throughout testing. The sample is clamped between the base of the inner tube,
and the shelf of the outer tube.
This system is designed to perform instrumented indentation tests on samples at
elevated temperatures and controlled environments. Details of elastic modulus tests per-
formed using multiple partial unloading technique at elevated temperatures and controlled
environment are detailed elsewhere [9].
22

CHAPTER 4
CREEP
Creep effects in metals are of a major concern amongst engineers, firstly because creep
is observed in steam turbine components including pipework, discs and blading operating
at high temperatures. Discs and blades are stressed by centrifugal forces which cannot be
reduced by increasing the thickness; the working stress can only be reduced by designing
the disc to have optimum profile. Therefore there is a direct need to asses the ability of
materials to resist creep, and this is the major reason creep tests are performed [33].
The time-dependent behavior of creep is a process of plastic deformation under applied
stress less than the yield stress. This phenomenon occurs in homologous temperatures (actual
temperature divided by melting temperature)greater than 0.4 (T > 0.4TM)
The aim of creep theory is to describe strains responding to various stress states,
magnitude of stresses and temperatures. The basic results of a creep test are the strain
versus time curve shown in Figure 4.1. Initially, the strain rate dεdt
= ε decreases as a result
of creep resistance of the material deformation with increasing strain (I). This is known
as primary (unsteady) creep. The strain rate, eventually reaches a minimum and becomes
near-constant ( ˙εmin = ˙εss). This is known as secondary or steady-state creep (II). In tertiary
creep (III), the strain-rate increases with strain. The steady-state region of the curve is the
most important section of the creep deformation curve because it indicates how long the
material can be used safely.
Ideally the creep deformation should be linked to an applied stress. Thus, as the
specimen elongates, the cross sectional area decreases and the load needs to be decreased
to maintain constant stress. The effect of a change in stress is only considered for large
deformations, and only comes into play in the tertiary region.
23

Figure 4.1 Creep diagram in uniaxial tension: primary (unsteady) creep (I) ,steady-statecreep (II) and tertiary creep (III)
Creep mechanisms can be visualized by using superposition of various strain-time
curves. Equation 4.1 describes the strain-time relation. Where β is a constant for transient
creep, and k is related to the constant strain rate.
ε = εi(1 + βt13 )exp(kt) (4.1)
A better fit is obtained from Equation 4.2, where r is a constant, εt is the strain at the
transition from primary to secondary creep and εss is the steady-state strain rate.
ε = εi + εt(1− expt(rt)) + t ˙εss (4.2)
There are no generally accepted forms of nonlinear strain-time relations, but Equa-
tion 4.3 is one form, where B, m, D, a and b are empirical constants. Equation 4.4 results if
t > ttransient, which results in the strain rate being the steady-state or minimum strain rate
as shown in Equation 4.5
ε = εi +Bσmt+Dσα(1− exp(βt)) (4.3)
24

ε = εi +Bσmt+Dσα (4.4)
dε
dt= Bσm = ˙εss (4.5)
To consider the temperature effect, the model of Equation 4.5 can be written as an Arthenius-
type model:
dε
dt= Bσm = ˙εss = Aσnexp(
−QRT
) (4.6)
where n is the stress exponent, Q is the activation energy for creep, R is the universal gas
constant and T is the absolute temperature. During an isothermal test, the exponential
function of Equation 4.6 becomes a constant resulting in:
˙εss = ˙εmin = Bσn (4.7)
Equation 4.7 can be linearized by taking logarithms of both sides as shown in Equation 4.8.
Log-log plots of ˙εmin = ˙εss versus σ often results in a bilinear relation in which the slope n
(power law or diffusion creep) can be determined
log ˙εss = log ˙εmin = logB + nlogσ (4.8)
4.1 Power-Law Creep
The central idea of power law creep is that the creep rate, ε, at a given temperature
depends both upon the applied stress, σ, and at least one strength factor, τ
˙εss = f(σ, τ) (4.9)
During creep of a material under constant stress, the creep rate depends on how the
strength parameter changes in the course of creep. Strain hardening and recovery increase
25

and decrease the strength respectively and at steady state the rate of hardening equal to the
rate of recovery [34]. By taking into account the appropriate expressions for hardening and
recovery, it is possible to arrive at the Dorn equation that expresses the correlation of creep
rates among various metals as a function of stress and temperature [35], which is expressed
as:
εs = A[σ
G]nf(T ) (4.10)
Where f(T ) is the temperature dependence which will be considered in the following
section, G is the shear modulus, n being the stress exponent which is defined as dlnε/dlnσ
at a constant temperature and A is a parameter which accounts for any effects of structure
not included in the Dorn equation.
During indentation creep, the elastic modulus is one of the principal factors influencing
the creep rate at a given level of stress. This is important because the speed of dislocation
glide and climb are strongly influenced by the elastic stress fields of dislocations obstructing
the path of moving dislocations.
4.2 Creep Steady State Microstructure
The formation of subgrains dominates the microstructural changes that occur during
the creep flow in most annealed polycrystalline metals at temperatures above 0.5TM , where
TM is the homologous temperature which is actual temperature divided by the melting tem-
perature of the alloy. The subgrain development is due to accumulation of edge dislocations
by climb(polygonization) leading to the development of low-angle boundaries which are now
universally called ”subgrains”. The subgrain structures that are associated with creep do
not form instantaneously, they form gradually throughout the course of primary creep. In
the initial stages of deformation, dislocations move through a well annealed crystal at speeds
approaching the speed of sound in the material [36].During which the dislocation density
26

increases abruptly and dislocations are distributed in a homogeneous fashion [37]. This de-
formation happens until the inter dislocation stresses approach the applied stress, due to
elevated temperatures, thermal activation allows continued dislocation motion past obsta-
cles and deformation can continue. Steady state creep coincides with the development of a
steady state substructure which is characterized by the condition that the average dislocation
density and the subgrain size remain constant with further creep strain[38].
4.3 Room Temperature Indentation Creep Literature Review
4.3.1 Indentation Creep from Vickers Hardness
It is generally accepted that the mechanical behaviour of metallic materials at ho-
mologous temperatures higher than 0.5 can be fairly expressed by the power-law creep in a
wide range of strain rates. Thus, for steady- state creep, the relationship between the strain
rate, state, and the tensile stress, r, at a constant temperature can be expressed by:
ε = Aσn (4.11)
where n is the steady-state stress exponent, defined as n = dlnεdlnσ
, and A is a constant.
Mulhearn and Tabor used the expression shown below to acquire the stress exponent
for pure lead at temperatures above 0.6Tm.
−(n+1
2)logHv = logt+B (4.12)
where Hv is the Vickers number, t is the indentation dwell time and B is a constant.
Hardness against time on a log-log scale, a straight line with slope (n+ 12)−1 is obtained.
Juhasz et al. [100] used vickers tests and obtained the stress exponent n of superplastic
lead-tin alloy in steady-state creep of the following form:
n = [∂lnd
∂lnHv
]d (4.13)
27

where Hv is the Vickers hardness number and d is the variation in indentation depth
and d is the indentation diagonal length. Therefore plotting d against Hv on a double
logarithimic scale, a straight line would be obtained, which the slope is the stress exponent,
n.
Sargent and Ashby [101] performed hot hardness tests on a wide range of materials
and proposed a dimensional analysis for indentation creep. According to their model, the
displacement rate of an indenter has been derived as:
du
dt= [
ε0C2
][(C1
σ0
)(P
A)]n (4.14)
where A is the projected area of indentation, C2 is a constant and ε is the rate at a
reference stress σo, n is the stress exponent and P is the applied load. For a pyramid indenter
the penetration is proportional to√A, i.e.,
u = C3
√A (4.15)
Differentiating Equation 4.15 with respect to time and substituting into Equation
4.14 gives:
dA
dt= C4ε0A(
P
Aσ0)n (4.16)
where C3 and C4 are constants. When P is held constant, Equation 4.16 can be
written as:
1
Hv
dHv
dt= −C4ε0(
Hv
σ0
)n (4.17)
Sargent and Ashby then derived the following relationship between indentation hard-
ness and dwell time:
28

Hv(t) =σ0
(nC4ε0t1n )
(4.18)
where Hv(t) is the time dependent hardness. Using Equation 4.18 the slope of a plot
of ln(Hv) against ln(t) at a constant temperature is − 1n. Also from Equation 4.17 a plot of
ln(Hv) versus ln[− 1HV
dHv
dt] at a constant temperature has slope of n. Using Sargent-Ashby
analysis, we can convert the term 1Hv
dHv
dtin Equation 4.17 to a measurable quantity.
Vickers hardness is given by Hv = 0.1854 Fd2
where F is the applied load in N and d
is the average diagonal length in mm. Therefore the relationship between Vickers hardness
and applied load can be expresses as:
0.1854F = d2Hv (4.19)
During indentation test, the applied load is constant, so differentiating Equation 4.18
gives:
dHv
dt.d2 = −2d
d(d(t))
dt.Hv (4.20)
Further on, this equation can be simplified to the following form:
dHv
dt
1
Hv
=2d
d(4.21)
Substituting Equation 4.17 and 4.18 gives:
nlogHv = log(2d
d) + C (4.22)
Therefore plotting a log of Hv versus log(2dd
) has a slope of 1n
and the stress exponent
can be obtained. It has therefore been proven that indentation creep behavior of cast Pb−Sb
alloys at room temperature (T > 0.5Tm) by measuring the stress exponents of these alloys
29

using above mentioned methods of analysis.
Roumina et al [42] analyzed creep behavior of cast Pb − 20Sb alloys by above men-
tioned indentation methods at room temperature. Multiple samples were tested using Vick-
ers hardness tester where applied load and testing time were the only variables. Indentation
hardness measurements were made on each sample using loads of 50, 100 and 150N for dwell
times up to 120min. Each reading was an average of at least five separate measurements
taken at random places on the surface of the specimens. All of the indentations were taken
a minimum of 5mm away from the edges and 10mm from other indentations. Variation in
indentation diagonal length with time under constant loads of 50, 100 and 10N shows inden-
tation length increases with loading time and the applied load. As can be seen in Figures
4.2, 4.3 and 4.4, the curves have two stages similar to an ordinary creep curve. The initial
stage of the curve shows an increase in the concerned variable with time, with decreasing
rate, followed by a steady-state region where indentation sizes increase linearly with time.
Hardness test being a compression test, fracture of the specimen cannot occur, reason being
the third stage does not exist as an ordinary creep test. As can be seen in Figures 4.2, 4.3
and 4.4, the PbSb alloys exhibit different indentation creep behavior.
According to Mulhearn-Tabor the rate of diagonal variation can be obtained by dif-
ferentiating the curves in Figures 4.2, 4.3 and 4.4. Using Mulhearn-Tabor relationship,
Equation 4.12 and plotting time against hardness on a double logarithimic scale, a straight
line with slope −(n+ 12) is obtained.
Utilizing methods of Juhasz et al, Sargent-Ashby and Mulhearn-Tabor mentioned
before have been applied to the indentation data of the materials to obtain the steady-state
creep exponents. Plotting Vickers hardness number on a double logarithmic scale gives a
slope of n (stress exponent) as can be seen in Figures 4.2, 4.3 and 4.4.
Utilizing the Sargent-Ashby model, the stress exponent acn be obtained from a plot
of logHv versus log 2dd
having a slope of 1n. This can be seen in Figures 4.11, 4.12 and 4.13.
It can be noticed for all three methods that each materials fitted lines are almost parallel,
30

Figure 4.2 Indentation creep curves at different temperatures
Figure 4.3 Indentation creep curves at different temperatures
implying that the stress exponent is independent of the applied load. These dfifferent stress
exponents are shown in Table 4.1.
31

Figure 4.4 Indentation creep curves at different temperatures
Figure 4.5 Derivation of stress exponent by the Juhasz et al. method
The indentation creep test has been demonstrated to be capable of evaluating creep
behavior of materials using small specimens. The stress exponents calculated from these
different methods of analysis are in good agreement with each other. These exponents can
32

Figure 4.6 Derivation of stress exponent by the Juhasz et al. method
be used to determine the mechanisms of creep deformation.
All these methods involve measuring vickers hardness of the sample over a period
of time, which involves taking these measurements at different locations over a period of
time. This requires the use of multiple samples or multiple test conditions which removes
the possibility of analyzing the material response during creep. This research proposes a
method of acquiring the creep from one location over a period of time and can monitor the
material stiffness response during creep.
4.4 Indentation Creep
An indentation test is a convenient method for measuring the mechanical properties
of a material. Its most common application is to measure hardness. The traditional hardness
test involves applying a load L into the surface of a material and the penetration depth hc or
33

Figure 4.7 Derivation of stress exponent by the Juhasz et al. method
Table 4.1 The stress exponents (n-values) derived from different indentation methods
Material Load (N) Juhasz et al.Mulhearn-Tabor
Sargent-Ashby
Grain size(mm)
Pb-1.25%Sb 50 15.2 15.2 15.5 0.33100 13.2 13.2 13.7
150 13.6 13.8 14.1
Pb-2.5%Sb 50 18.1 18 18.4 0.28100 19.5 19.5 20
150 18.2 13.8 14.1
Pb-4.5%Sb 50 15.2 15.2 15.5 0.21100 13.2 13.2 13.7
150 13.6 13.8 14.1
contact of radius ac is measured. Conventional hardness test is one of the oldest and simplest
methods of material evaluation. Tabor [39], showed that elasto-plastic material response in
tensile testing can be correlated to the response in spherical or pyramidal indentation. The
34

Figure 4.8 Derivation of stress exponent by the Mulhearn-Tabor method
indentation creep process can be defined as the time dependent penetration of a hard indenter
into the material under constant load and temperature. The variation in the indentation
size is monitored with dwell time. This can be particularly advantageous when the material
is only available as small test pieces or there are some difficulties with machining of some
samples made of very soft materials. This makes indentation creep a quick, simple and
non-destructive procedure to extract information on the mechanical behavior of materials,
and also reduces the effort for sample preparation. The fundamental process parameters for
spherical indentation are: indentation force P , mean contact pressure pav = Pπa2
, contact
radius a, permanent penetration depth h, and the sphere Diameter D.
It was concluded that the relationship between mean pressure and penetration depth
follows a power law. Tabor used this to map the pressure-contact radius curve pav =
pav(a/D) to the σ − εp curve as shown in Equation 4.23, where εp denotes plastic strain
35

Figure 4.9 Derivation of stress exponent by the Mulhearn-Tabor method
Figure 4.10 Derivation of stress exponent by the Mulhearn-Tabor method
36

Figure 4.11 Derivation of stress exponent by the Sargent-Ashby method
[39].
εp = 0.4a/D (4.23)
Various models have been developed for the analysis of indentation creep data dis-
cussed below.
4.4.1 Indentation Load Relaxation (ILR)
The idea of using ILR techniques was first presented by Hannula et al [40]. This
experiment involves pushing the indenter into the sample, until the desired load is achieved,
then the indenter position is fixed. The elastic strain in the machine is converted to the
plastic strain in the specimen. This technique is used to study time dependent deformation
in small volumes. Using a Vickers indenter with 1µ2 flat area on the apex, an effective stress
was defined as
37

Figure 4.12 Derivation of stress exponent by the Sargent-Ashby method
σeff = P/A (4.24)
where P is the load on the indenter and A is the projected area of contact. An effective
strain rate was defined as
ε = ch
h(4.25)
where c is a constant, h is the instantaneous descent rate of the indenter and h is the indenter
depth (total depth or plastic depth). The stress exponent for creep is then defined as dlnεdlnH
at constant temperature.
4.4.2 Constant Rate of Loading (CRL)
The (CRL) test is a multi-indentation test that was developed for determining stress
exponents using depth sensing indentation systems [41]. This test applies load incrementally
38

Figure 4.13 Derivation of stress exponent by the Sargent-Ashby method
in the indenter at rates specified by the experimenter. In a CRL test, the indenter is loaded
at a constant loading rate until the indenter has reached a prescribed depth in the material.
An effective stress is then calculated based on a series of experiments at different loading
rates for each indentation mode. The stress exponent for creep is then identified from the
applied load and achieved depth as dlnεdlnH
The only problem found with the CRL method is the continuous change of the in-
dentation strain rate through out the loading segment. Although the changes in stress and
strain rate may seem minimal, it is still considered to be a far more dynamic test than others.
4.4.3 Step Constant Indentation Strain Rate
Stemming from the equation of hardness of a material,
39

H =P
A=
P
ch2(4.26)
where H is the hardness, P is the load, A the projected contact area, h is the contact
depth, and c is a constant that depends upon the geometry of the indenter. Hardness
equation can be re-written as
ch2H = P (4.27)
Differentiating equation 4.27 with respect to time leads to
2chhH + ch2H = P (4.28)
Simplified to
h =P
2chH− ch2H
2chH(4.29)
h
h=
P
2chH− ch2H
2ch2H(4.30)
h
h=
1
2(P
P− H
H) = εi (4.31)
where εi is the indentation strain rate. Equation 4.31. Controlling the loading rate
in such a manner as to maintain P /P constant would result in a constant indentation strain
rate. This methodology requires the use of a perfect Berkovich geometry indenter, given by
A = 24.56h2c (4.32)
where hc is the contact depth of the indentation. The Berkovich geometry is typically
chosen over a Vickers indenter as it is much easier to produce near perfect tips due to the
40

natural intersection of three planes at a point.
The variation of the indentation diagonal length with time under constant loads of
50, 100 and 150 N was studied by [42]. It was seen that indentation length increases with
the loading time and the applied load as seen in figure 4.14
Figure 4.14 Variation of Indentation Length with Time
4.4.4 Constant Load- Hold
The idea of measuring creep properties with depth-sensing indentation systems under
constant load was introduced by Pollock et al [44]. Pollock makes the approximation that
the strain rate ε should scale to
ε = k2h
h(4.33)
where h is the instantaneous descent rate of the indenter, h is the instantaneous displacement
and k is a geometric constant. Using this analysis Pollock investigated the time dependent
response of Ni films on Si at room temperature.
41
This experimental procedure involves loading the indenter at a high loading rate
and then holding the load on the indenter constant and monitoring the displacement of
the indenter as a function of time. The contact area changes as the indenter penetrates
the material, while the load is held constant, in other words the effective stress changes
as the test proceeds. One can then obtain several effective stress strain rate pairs from one
indentation experiment. The creep exponent is found from the slope of a plot of log hardness
versus log indentation strain rate.
4.5 Development of Constant Load-Hold
In this research I have created a LABVIEW based software by modifying preexisting
multiple partial unloading software, capable of controlling the preexisting instrumented in-
dentation system described in Section 3.3. To use this software one must first click the find
contact button, which moves the indenter until a predetermined load is identified by the load
cell. The input parameters such as Load, pi velocity and file location must be identified,
before performing the constant load control by clicking the creep test button.
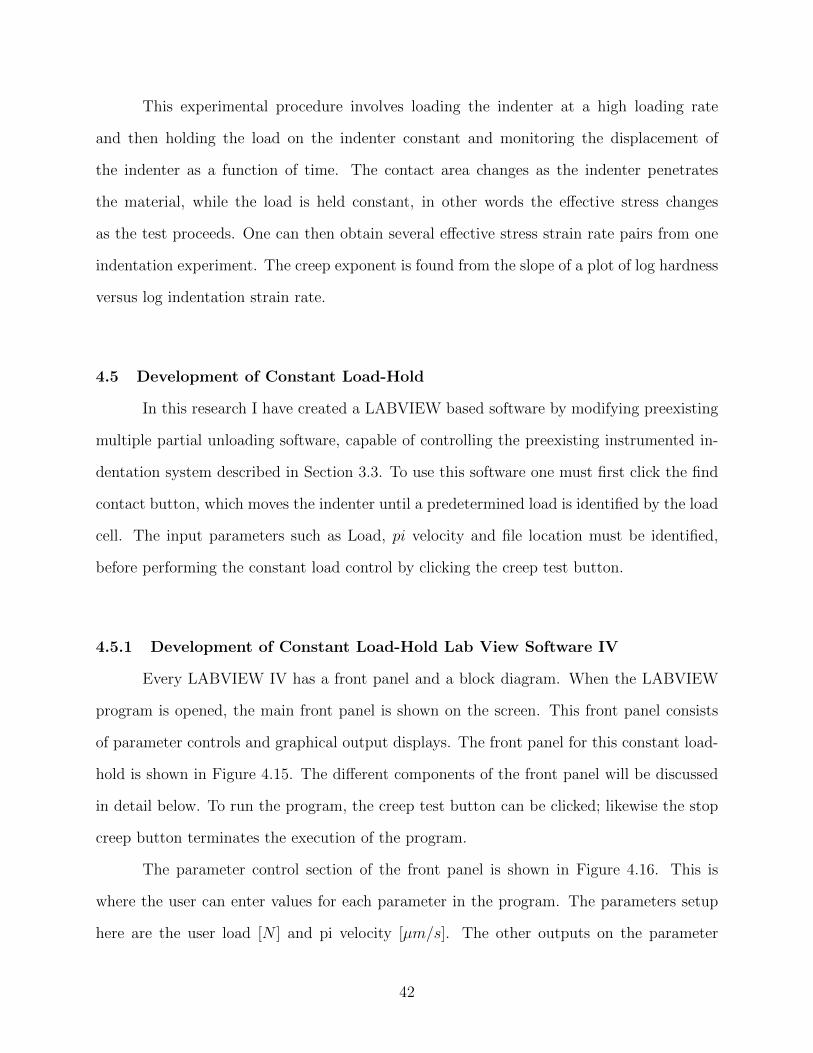
4.5.1 Development of Constant Load-Hold Lab View Software IV
Every LABVIEW IV has a front panel and a block diagram. When the LABVIEW
program is opened, the main front panel is shown on the screen. This front panel consists
of parameter controls and graphical output displays. The front panel for this constant load-
hold is shown in Figure 4.15. The different components of the front panel will be discussed
in detail below. To run the program, the creep test button can be clicked; likewise the stop
creep button terminates the execution of the program.
The parameter control section of the front panel is shown in Figure 4.16. This is
where the user can enter values for each parameter in the program. The parameters setup
here are the user load [N ] and pi velocity [µm/s]. The other outputs on the parameter
42

Figure 4.15 Front Panel for Constant Load-Hold
control panel are the original pi position and the current pi position, which tracks the travel
range of the PZT actuator described in subsection 3.3.2.
Figure 4.17 shows the displacement vs time graph which allows the user observe the
displacement over time during the duration of the experiment. Note that this displacement
is the total indentation displacement htotal as discussed in section 3.2.2.
The user can monitor the change in load using the graph output seen in Figure 4.18.
The change in load for this experiment can then later be exported and calculated as a per-
centage to validate the constant load-hold experiment. The load vs time seen in Figure 4.19
43

Figure 4.16 Parameter Control Panel
Figure 4.17 Displacement Vs Time graph
graph gives the user an idea of the load over the duration of the experiment.
4.5.2 Development of Constant Load-Hold Lab View Software IV Block Dia-
gram
The overall view of the system which controls the inputs entered to give you the system
outputs is shown in Figure 4.20. It consists of various functions blocks which contains controls
to manipulate the instrumented indentation system described in Chapter 3 to generate the
44

Figure 4.18 Change in Load graph
Figure 4.19 Load Vs Time Graph
45

outputs. This allows the different function blocks to be easily viewed and edited if needed.
The various parts of the block diagram will be further explained below.
Figure 4.20 Block Diagram
46

Figure 4.21 Write to Measurement block diagram
Figures 4.22 and 4.23 contains the function blocks necessary for controlling the PZT
actuator based on user load by monitoring if the current load is greater than the user specified
47

load. If this operating condition for this case structure is false, the event described in
Figure 4.22 takes place. Otherwise if the operating condition is true, the event specified in
Figure 4.23 takes place.
Figure 4.21 contains functions for monitoring time, displaying graphs described in
the front panel, and most importantly saving data to a user specified file and location. The
functions in the block diagrams are controlled by a while loop function which is activated
when you push the creep test button. The while loop function will continue to run until the
condition described by the user has been reached or you push the stop creep button. The
data is automatically stored to the user described location during the test.
4.6 Development of Constant Load-Hold with multiple partial unloading
Another goal of this research is to combine the multiple partial unloading technique
described in Section 3.2.2 which utilizes closed loop displacement control, together with the
constant load-hold technique described in Section 4.5 which utilizes closed loop load control,
to create a new bi-function control system which will have a great potential for creep stiffness
response analysis at room and elevated temperature.
This would involve executing both closed loop displacement control and closed loop
load control at separate interfaces to produce plots similar to Figure 4.24
48

Figure 4.22 Load Control Block diagram False condition
49

Figure 4.23 Load Control Block diagram True condition
50

Figure 4.24 Creep and Multiple Partial unloading
51

CHAPTER 5
RESULTS AND CONCLUSIONS
5.1 Close-Loop Load Control
The most important aspect of this creep test is the capability of achieving and keeping
constant load precisely during the creep test. Figure 5.1 shows load being held at 5N over a
period of time.
Solder materials, like lead-antimony solders are extremely soft and extremely de-
formable under ambient conditions, because the room temperature represents a high homol-
ogous temperature to them. Under uniaxial stress, elastic, viscoelastic and inelastic behavior
can be observed. The creep behavior of solder material was observed in this study under
room.
Figure 5.1 Indentation Load Versus Time[UserInputLoad = 5N ] [ActualLoad = 4.9414N ± 5.3724−14N ]
52

5.2 Indentation Creep Stress Exponent determination
The classical approach to compare indentation and uniaxial creep data makes use
of conversion factors. The section stress σN which characterizes the load in an indentation
creep experiment, is defined as the force F applied on the indenter divided by the cylindrical
indenter area A: σN = F/A. The conversion factors co relates the net section stress σN to
an appropriate uniaxial reference stress σ by
σ = coσN (5.1)
where co is a conversion factor which ranges from 0.26-0.36[45]. The uniaxial reference
strain rate ε is
ε = c2d
2r(5.2)
where d is indentation creep depth rate (indentation rate), c2 a conversion factor which is
usually 1, [45], and r the indenter radius. Here we use conversion factors c2 = 0.865. Hyde
et al. [98] determined the conversion factor to relate creep data from indentation and tensile
creep to be c2 = 0.755 determined from finite element calculations.
Following the uniaxial creep behavior of materials, the creep stress exponent is deter-
mined from Norton’s creep law:
ε = cmσnm (5.3)
In the creep experiment, displacement and time are measured first. From this data
Figure 5.4,Figure 5.3 and Figure 5.2 it is possible to extract contact radius utilizing equation
2.1. Where a is contact radius,h is indentation depth, D is indenter Diameter, and C = 0.943
(for Hertzian Elastic Case)
a = C ∗√D ∗ h (5.4)
53

Figure 5.2 Sn37Pb Displacement time curve
Figure 5.3 Sn3.5Ag Displacement time curve
The net section stress σN , which characterizes the load in an indentation creep experi-
ment, is defined as the force F applied on the indenter divided by the cylindrical indenter area
A : σN = FΠa2
. The conversion factors co relates the net section stress σN to an appropriate
uniaxial reference stress σ by
σ = coσN (5.5)
54

Figure 5.4 Sn5Sb Displacement time curve
where co is a conversion factor with range 0.26− 0.36. The uniaxial reference strain rate ε is
ε = C2d
2r(5.6)
where d is indentation creep depth rate (indentation rate), c2 a conversion factor, and r the in-
denter radius. Here we use C2 = 0.865 determined from iteration calculations performed.[46]
n = [Log(ε)
Log(σ)](5.7)
5.3 Traditional Tensile Creep test
Tensile tests were carried out on Sn37Pb, Sn3.5Ag and Sn5Sb solder alloys on a
commercial closed-loop servo-hydraulic test machine and conducted as per ASTM E8M-98
under stroke control with a strain rate of 10−3s−1 at room temperature. Creep tests were con-
ducted at constant loads for these different alloys individually. After the creep rupture tests,
specimen cross-sections were analyzed using an optical microscope and the creep rupture
55

mechanisms were based on the fractography. The creep tests were performed in accordance
with ASTM E139-96 under constant load, and at testing temperatures corresponding to a
range of about 0.5 − 0.74Tm (homologous temperature) for the two given lead solders. A
direct-load creep testing machine was used to perform the constant-load creep test with
application of various load weights as the loading source. Creep curves obtained for these
solder alloys are seen in Figures 5.5, 5.6 and 5.7. The Sn3.5Ag solder has the greatest creep
strength among the given three alloys, as it shows the highest value of stress exponent, lowest
minimum creep rate, and longest rupture time at a given stress and temperature.
Figure 5.5 Time to Rupture Sn3.5Ag
5.4 Experimental procedure
The materials used were three tin alloys, Sn37Pb, Sn3.5Ag and Sn5Sb. These sam-
ples were polished and then tested utilizing the constant load hold multiple partial loading
56

Figure 5.6 Creep curve Sn37Pb
Figure 5.7 Creep Curve Sn-5Sb
and unloading technique, where the applied load and testing time were the only variables.
Indentation load of 5N for a dwell time of 6hrs minimum. The variation of indentation
57

depth vs time can be seen in Figures 5.2, 5.4 and 5.5. It can be seen that the indentation
length increases with the loading time and the applied load. As can be seen in these fig-
ures, the curves consist of two stages similar to an ordinary creep curve. The first stage of
the curve records an increase in the concerned variable with time, with a decreasing rate,
followed by a steady- state region where indentation sizes increase linearly with time. As
the indentation test is actually a compression test, fracture of the specimen does not occur
and hence, it is obviously not possible to record the third stage of the curve as opposed to
what happens in an ordinary creep tests. The testing methodology proposed in this research
will be used to determine the tertiary stage of creep as observed during tensile test utiliz-
ing a unique multiple partial loading and unloading technique during creep constant load
indentation. Figures 5.2, 5.4 and 5.3 also indicates that Sn37Pb, Sn3.5Ag and Sn5Sb alloys
exhibit different indentation creep behavior. Useful in design production of solder alloys, this
methodology would be used to extract creep damage characteristics at a specified stress and
temperature The stress exponent obtained for each alloy via the above mentioned approach,
are represented in Table 5.1.
Table 5.1 Stress Exponents
Materials
Depth SensingStress Expo-nent(n) Methodusing PZT
Strain HardeningExponent np
Error (%)
Sn37Pb 6.5 0.056 4.8 %Sn3.5Ag 10.2 0.703 6.4 %
Sn5Sb 2.6 0.031 13 %
Utilizing equations 5.7, 5.6, 5.5 and 5.4, Logε/Logσ plots of the three alloys in this
study were made in Figures 5.8, 5.10 and 5.9.
The stress exponents calculated using the depth sensing stress exponent method are
58

Figure 5.8 Derivation of Stress Exponent fo Sn37Pb
Figure 5.9 Derivation of Stress Exponent for Sn3.5Ag
in good agreement with the stress exponent calculated using traditional tensile test.It should
be considered that difference of one or two units in stress exponent values has no real physical
significance when dealing with deformation mechanisms. According to the power law creep,
a decrease in stress exponent would result in an increase in creep rate due to a decrease
59

Figure 5.10 Derivation of Stress Exponent for Sn5Sb
in yield strength [42].Therefore the Sn3.5Ag alloy with higher n values is more resistant to
indentation creep compared to Sn37Pb and Sn5Sb alloys. The same result can be extracted
from the indentation curves shown in Figures 5.3, 5.2 and 5.4. The stress exponent values
can be used to identify the mechanisms controlling the deformation process. Diffusional
creep is associated with the n values around 1, grain boundary sliding leads to n values
close to 2 and mechanisms attributed to dislocation movement such as slip creep are linked
to n values in the range of 5 − 7 which moves up to higher values than 8 when particles
reinforcement takes place [42]. The high stress exponents obtained for present materials
indicate that creep deformation is related to the dislocation movement and thus, grain size
is the controlling parameter of deformation.
5.5 Creep Continuous Stiffness Response CCSR
During indentation creep, the stiffness response can be extracted using the unique
multiple partial loading and unloading sequence described in Section 3.2.2. The CCSR is
accomplished by performing multiple partial loading and unloading during creep indentation
utilizing Lab view software created. Compared to a traditional creep test, the CCSR are
60

particularly useful as they measure contact stiffness in small indents carried out over a long
period of time. The depth sensing indenter used in this study can extract the stiffness
response of the material during indentation creep withing seconds utilizing multiple partial
loading and unloading discussed in 3.2.2.
Figure 5.11 BI Function LabView Control Software
To accomplish this, a system capable of controlling the indenter at constant load was
developed in section 5.1. Integrating this system into a bi-functional system, the contact
stiffness response is measured for approximately 30 seconds utilizing the multiple partial
loading and unloading technique every hour during the indentation creep. The solder alloys
studied from 5.1, all have different strain hardening exponent, which was later found to
contribute to the stiffness response during creep.
61

Figure 5.12 Stiffness Response During Indentation Creep
Figure 5.12 shows creep stiffness response of three solder alloys utilizing CCSR method.
It can be observed that the contact stiffness response increases with time during the creep
indentation method, and eventually drops when creep damage sets in. This can be seen when
comparing with creep rupture time experiments performed during traditional tensile tests
as discussed in Section 5.3[47, 34]. Sn3.5Ag exhibits the highest strain hardening exponent,
which transcribes to a larger resistance in deformation during indentation creep. As can
be seen in Figure 5.12, the strain hardening exponent plays a role in the variation seen in
contact stiffness response during indentation creep. Multiple partial loading and unloading
utilized in this study can be separated into two methods, Low depth sensing and High depth
sensing.
Low depth sensing involves using the multiple partial loading unloading technique up
to 5 unloading points, which reduces the response of the material to the top most layer see
Figure 5.13.
While high depth sensing utilizes the same technique up to 10 unloading points which
62

Figure 5.13 Creep Contact Stiffness Response Low depth Sensing
obtains responses from the substrate of the material see Figure 5.14.
Figure 5.14 Creep Contact Stiffness Response High depth Sensing
63

During indentation creep it was observed that solder materials with higher strain hard-
ening exponent exhibited larger differences between 5 unloading and 10 unloading responses
over time. The 5 unloading picks up stiffness response from the surface of the material, so
during the early stages of indentation creep, stiffness response from the substrate on top layer
of the material are similar. During later stages of indentation creep, strain hardening occurs,
which is dependent on the strain hardening exponent. At this point, usually before tertiary
creep comes in play, 5 unloading picks up a larger stiffness response which is indicative of
localized deformation caused by indentation creep. The conclusions from our tests indicate
that materials with higher strain hardening exhibit larger differences between low and high
depth sensing, due to the strain hardening during indentation.
Figure 5.15 Sn37Pb with Low Strain Hardening showing low variation in stiffness responsefrom Low and High depth sensing
The 10 unloading picks up stiffness response far from the surface of the material, so
during the early stages of indentation creep, stiffness response from the substrate on top
layer of the material are similar. During later stages of indentation creep, strain hardening
occurs, which is dependent on the strain hardening exponent. Using 10 unloading shows
stiffness response further away from the Top layer of the material which is further from the
64

region of localized deformation caused by indentation creep.
Figure 5.16 Sn3.5Ag with high strain hardening showing large variation in stiffness responsefrom Low and High depth sensing
5.6 Remaining Life Creep Continuous Stiffness Response CCSR
For design purposes, it would be ideal to have methods available for correlating and
extrapolating creep-rupture data such that the rupture time can be accurately predicted.
Monkam-Grant [48] and Larson-Miller [49] relationships, were used in this current study to
correlate the rupture time data for the given lead free solders under the given test conditions.
Monkman and Grant [48] observed that the rupture time, tf in long term creep test
could be related to the minimum strain rate by a power law function:
εmintmf = CMG (5.8)
where the exponent m and constant CMG are material dependent. The constant CMG
usually depends on temperature. The practical advantage of the Monkman-Grant rule is
65

that the minimum strain rate can be measured early in a creep test so as to predict a long
life case. As long as the value of CMG can be predicted in short-term tests, the remaining
life can then be predicted once the minimum strain rate has been established [47]
Monkman-Grant relationship for each given lead-free solder alloy is approximately in-
dependent of temperature over the range of given test conditions. Therefore we can estimate
the rupture time from the minimum creep rate or vice versa. This model serves as a useful
tool to predict the rupture time for the given two lead-free solders at various combinations
of stress and temperature. Rupture time correlates well with minimum creep rate implies
cavity formation and growth is basic to the inter granular creep fracture process[48].
Another model used in this study is the Larson-Miller relationship, which is similar
in principle but different in its functional form. In 1952, Larson and Miller assumed the
following relationship between creep lifetime, applied stress and temperature [49]:
PLM = T (CLM + logtf ) (5.9)
Where PLM is the Larson-Miller parameter and is a function of applied stress, T is
temperature in Kelvin and tf is creep rupture time in hours. Extracting values of CLM
can be gotten from intercept of logtf versus 1/T discussed in [47]. From equation 5.9, the
Larson-Miller Parameter PLM can be determined for different alloys at different stress levels.
In order to estimate the rupture time utilizing CCSR, it is proposed in this work
to correlate the stiffness response gotten during indentation creep over a period of time
by normalizing the young’s modulus with the applied stress. It is assumed an independent
relationship of temperature in the creep rupture time prediction model. It means the intrinsic
temperature dependence of rupture time is implied in the Young’s modulus term.
Utilizing a simple power law EEdtzf = L, where E is the youngs modulus, Ed is the
stiffness response obtained during indentation creep utilizing CCSR technique, Z and L are
constants modified from Larson-Miller parameters for these specific solder alloys.
66

E
Edtzf = 0.005−−−−−−Sn3.5Ag (5.10)
E
Edtzf = 0.00392−−−−−−Sn37Pb (5.11)
E
Edtzf = 0.00178−−−−−−Sn5Sb (5.12)
Table 5.2 Stress Exponents
MaterialsYoung’sModulus
CCSR Parame-ter L
Average tf
Sn37Pb 29.3 0.00392 3.52±0.37Sn3.5Ag 52.2 0.005 4.10±0.60
Sn5Sb 47.7 0.00178 2.98±0.39
The values from the Equations 5.105.115.11, creep rupture time can be predicted for
these three solders utilizing the CCSR technique.
As discussed the application of these models to analyze the experimental data of
rupture time was quite successful to a certain degree for the given solders alloys. In order to
estimate the rupture time with young’s modulus normalized by the damage modulus.
5.7 Conclusions
.
In this research, material time-dependent behavior of Sn3.5Ag, Sn37Pb and Sn5Sb sol-
der alloys were studied by a unique depth sensing micro-indentation method at room temper-
ature. Stress exponent values were determined through a constant loading process utilizing a
spherical micro indentation method, where the strain rate is extracted from the indentation
67

rate. The measured stress exponent values are in good agreement with conventional creep
experiments. Utilizing a multiple loading and partial unloading micro-indentation testing
procedure, time-dependent stiffness changes of these materials could be measured. This
continuous stiffness responses during a creep test can be correlated to test materials micro
structural changes during creep, therefore making it capable to predict onset of tertiary creep
failure. Test results show a correlation between measured continuous stiffness response and
creep damage with the capability to predict the onset of tertiary creep of these solder alloys.
The indentation experimental setup studied in this research has a number of advan-
tages
• Specimens can be small in size and simple in shape
• Mechanical properties can be studied for a selected localized region
• High-Temperature and inert gas test atmosphere can be prepared easily
• Material Stiffness response during creep can be evaluated
5.8 Future Work
Indentation creep under high temperature condition has received little to no attention
due mainly to the inherent difficulties in measuring the small indentation displacements at
elevated temperatures. Constant Creep Stiffness Response and high temperature indentation
discussed in Chapter 3.4 introduced in this research can bridge the gap in technology required
to study micro-indentation at elevated temperatures.
68

BIBLIOGRAPHY
[1] Baoxing Xu, Zhufeng Yue, and Xi Chen. An indentation fatigue depth propagation
law. Scripta Materialia, 60(10):854 – 857, 2009.
[2] Ian N. Sneddon. The relation between load and penetration in the axisymmetric boussi-
nesq problem for a punch of arbitrary profile. International Journal of Engineering
Science, 3(1):47 – 57, 1965.
[3] X. Baoxing and X. Chen. Determining engineering stress-strain curve directly from
the load-depth curve of spherical indentation test. Journal of Materials Research,
25:2297–2307, 2010.
[4] W. C. Oliver and G.M.Pharr. An improved technique for determining hardness and
elastic modulus using load and displacement sensing indentation experiments. Journal
of Materials Research, 7:1564–1583, 1992.
[5] M. F. Doerner and W.D. Nix. A method for interpreting the data from depth-sensing
indentation measurements. Journal of Material Sciences, 1(4), 1986.
[6] Jared Michael Tannenbaum. Progression in Non-Destructive Spallation Prediction
and Elevated Temperature Mechanical Property Evaluation of Thermal Barrier Coating
Systems by use of a Spherical Micro-Indentation Method. PhD thesis, West Virginia
University, 2011.
[7] C. Feng. and B. Kang. A transparent indenter measurement method for mechanical
property evaluation. Experimental Mechanics, 46(1):91–103, 2006.
[8] C Feng. Development of a Transparent Indenter Measurement System and Indentation
Analysis for Material Mechanical Property Evaluation. PhD thesis, West Virginia
University, 2005.
69

[9] Dumbi Azubuike Otunyo. Mechanical property evaluation of thermal barrier coating
systems at elevated temperatures by use of a spherical micro-indentation method.
Master’s thesis, West Virginia University, 2012.
[10] C Anthony Fischer-Cripps. Introduction to Contact Mechanics. Springer US, 2007.
[11] Kwangsoon Lee. Numerical Simulation of a Load-Based Microindentation Technique
for Nde on Thermal Barrier Coating Systems. PhD thesis, West Virginia University,
2011.
[12] J.S Field and M.V.Swain. A simple predictive model for spherical indentation. Journal
of Materials Research, 8(0):297–306, 1993.
[13] D N Jarrett and P W McMillan and. Hertzian strength measurements of opaque brittle
materials. J Phys E Sci Instrum, 7(913):0, 1974.
[14] G.M. Pharr, W.C. Oliver, and F.R. Brotzen. On the generality of the relationship
among contact stiffness, contact area, and elastic modulus during indentation. Journal
of Materials Research, 7(0):613–617, 1992.
[15] Jack C. Hay and G. M. Pharr. Experimental investigations of the sneddon solution
and an improved solution for the analysis of nanoindentation data. In Symposium
T Fundamentals of Nanoindentation & Nanotribology, volume 522 of MRS Online
Proceedings Library, 1998.
[16] D J Strange and A K Varshneya. Finite element simulation of microindentation on
aluminum. J. Mater. Sci, 36, 1943.
[17] I S Choi, M Dao, and S Suresh. Mechanics of indentation of plastically graded materials
- i analysis. J Mech Phys Solids, 56(157):0, 2008.
[18] X Deng, N Chawla, K K Chawla, and M Koopman. Deformation behavior of (cu,
ag)-sn intermetallics by nanoindentation. Acta Mater, 52(0):4291, 2004.
70

[19] Manhong Zhao, Nagahisa Ogasawara, Norimasa Chiba, and Xi Chen. A new approach
to measure the elastic-plastic properties of bulk materials using spherical indentation.
Acta Materialia, 54(1):23 – 32, 2006.
[20] K L Johnson, K Kendall, and A D Roberts. Surface energy and contact mechanics of
elastic solids. Proceedings of the Royal Society of London, 324:1558, 1971.
[21] C Feng. Development of a Transparent Indenter Measurement System and Indentation
Analysis for Material Mechanical Property Evaluation. PhD thesis, West Viirginia
University, 2005.
[22] ASTM Standard. Standard practice for instrumented indentation testing, designation:
E2546-07, 2007.
[23] Fischer-Cripps. Nanoindentation 2nd ed and. Springer, 2002.
[24] D Dorner amd B Stckhert. Plastic flow strength of jadeite and diopside investigated
by microindentation hardness. Tests, Tectonophysics, 379:1–4, 2004.
[25] ASM. Steel Heat Treating Fundamentals and Processes. Library of Congress, 2013.
[26] G Krauss. Physical Metallurgy and Heat Treatment of Steel, in Metals Handbook Desk
Edition. American Society for Metals, 1985. p 28-2 to 28-10 editor:H.E. Boyer and
T.L Gall, Ed.
[27] P. Panagiotidis, A.S. Antonatos, and G.M. Tsananas. Case depth determination by
using vickers micro-hardness test method at trsc / ppc sa. In 4th ICDNT of HSNT,
2007.
[28] Suvi Santa-aho, Minnamari Vippola, Aki Sorsa, Kauko Leivisk, Mari Lindgren, and
Toivo Lepist. Utilization of barkhausen noise magnetizing sweeps for case-depth de-
tection from hardened steel. {NDT} & E International, 52(0):95 – 102, 2012.
71

[29] J. Gauthier, T.W. Krause, and D.L. Atherton. Measurement of residual stress in steel
using the magnetic barkhausen noise technique. {NDT} & E International, 31(1):23
– 31, 1998.
[30] V. Moorthy, S. Vaidyanathan, T. Jayakumar, and Baldev Raj. Microstructural charac-
terization of quenched and tempered 0.2steel using magnetic barkhausen noise analysis.
Journal of Magnetism and Magnetic Materials, 171(12):179 – 189, 1997.
[31] M S Good, G J Schuster, and J R Skorpik. Ultrasonic material hardness depth mea-
surement. United States Patent, Patent No 5646351, 5646351(5646351), 1997.
[32] R. Baqeri, F. Honarvar, and R. Mehdizad. Case depth profile measurement of hardened
components using ultrasonic backscattering method. In 18th World Conference on
Nondestructive Testing, 2012.
[33] Yu N Rabotnov. Creep Problems in Structural Members. American Elsevier Publishing
Company, 1969.
[34] S K Mitra and D McLean. Work hardening and recovery in creep. proceedings of the
royal society of london. Series A, Mathematical and Physical Sciences, 295(1442):288–
299, 1966. Retrieved from http://www.jstor.org/stable/2415420.
[35] Barry Neal Lucas. An Experimental Investigation of Creep and Viscoelastic Properties
using Depth-Sensing Indentation Techniques. PhD thesis, The University of Tennessee,
1997.
[36] T. Vreeland. Dislocation Dynamics, volume 1. Jaffee (McGraw-Hill Book Company),
1968.
[37] W. D. Nix and B. Ilschner. Strength of Metals and Alloys, volume 1. Pergammon
Press, 1980.
72

[38] W D Nix and J C Gibeling. Flow and Fracture at Elevated Temperatures, volume 1.
American Society for Metals, 1983.
[39] D Tabor. The Hardness of Metals. Clarendon Press, Oxford, 1951.
[40] S Hannula, D S Stone, C Y Science, eds A Geiss, K N Tu, and D R Uhlmann. Electronic
packaging materials science. Mater. Res. Soc. Symp. Proc, 40(1):7, 1985.
[41] M J Mayo, W D Alloys, eds P O Kettunen, T K Lepisto, and M E. Nix in strength of
metals and. Lehtonen (Pergamon Press, 1415, 1988.
[42] R. Roumina, B. Raeisinia, and R. Mahmudi. Room temperature indentation creep of
cast pbsb alloys. Scripta Materialia, 51(6):497 – 502, 2004.
[43] A.R. Geranmayeh and R. Mahmudi. Room-temperature indentation creep of lead-free
sn-5Journal of Electronic Materials, 34(7):1002–1009, 2005.
[44] H M Pollock, D Maugis, and M Barquins. Microindentation Techniques in Materials
Science and Engineering, volume 1. ASTM, 1986.
[45] Y.J. Liu, B. Zhao, B.X. Xu, and Z.F. Yue. Experimental and numerical study of
the method to determine the creep parameters from the indentation creep testing.
Materials Science and Engineering: A, 456(12):103 – 108, 2007.
[46] Y.J. Liu, B. Zhao, B.X. Xu, and Z.F. Yue. Experimental and numerical study of
the method to determine the creep parameters from the indentation creep testing.
Materials Science and Engineering: A, 456(12):103 – 108, 2007.
[47] Chih-Kuang Lin and De-You Chu. Creep rupture of lead-free sn-3.5ag and sn-3.5ag-
0.5cu solders. Journal of Materials Science: Materials in Electronics, 16(6):355–365,
2005.
[48] C MONKMAN and N J GRANT. Proc. ASTM 56, 56:593, 1956.
73

[49] F R LARSON and J MILLER. Trans. ASME 74, 74:765, 1952.
[50] C. Feng and B. S. Kang. Young’s modulus measurement using a simplified transparent
indenter measurement technique. Experimental Mechanics, 48(1):9–15, 2007.
[51] C Anthony Fischer-Cripps. A review of analysis methods for sub-micron indentation
testing. Vacuum, 58(4):0, 2000.
[52] H Hertz. On the contact of elastic solids. page 0, 1896.
[53] S Basu, A Moseson, and M W Barsoum. On the determination of spherical nanoin-
dentation stress-strain curves. J Mater Res, 21(10):0, 2006.
[54] B S-J Kang, Z Yao, and E J Barbero Web. Post-yielding stress-strain determination
using spherical indentation. Mechanics of Advanced Materials & Structures, 13(2):129–
38, 2006.
[55] V Raman and R Berriche. Thin Films: Stresses and Mechanical Properties, volume
188. Mater.Res.Soc.Symp.Proc, 1990.
[56] A I Lure. Three-Dimensional Problems in the Theory of Elasticity. Gostekhizdat, 1964.
[57] C. Feng, J.M. Tannenbaum, B.S. Kang, and M.A. Alvin. A load-based multiple-partial
unloading micro-indentation technique for mechanical property evaluation. Experimen-
tal Mechanics, 50(6):737–743, 2010.
[58] Atsuko Takita, Katsuhiko Sasaki, and Ken-ichi Ohguchi. A method to identify steady
creep strain from indentation creep using a new reference area of indentation. Journal
of Electronic Materials, 43(7):2530–2539, 2014.
[59] Hidenari Takagi, Ming Dao, and Masami Fujiwara. Analysis on pseudo-steady inden-
tation creep. Acta Mechanica Solida Sinica, 21(4), 2008.
74

[60] Aki Sorsa, Kauko Leivisk, Suvi Santa-aho, Minnamari Vippola, and Toivo Lepist. An
efficient procedure for identifying the prediction model between residual stress and
barkhausen noise. Journal of Nondestructive Evaluation, 32(4):341–349, 2013.
[61] S.B. Liu, A. Peyronnel, Q.J. Wang, and L.M. Keer. An extension of the hertz theory
for three-dimensional coated bodies. Tribology Letters, 18(3):303–314, 2005.
[62] Hyungyil Lee, Jin Haeng Lee, and George M. Pharr. A numerical approach to spherical
indentation techniques for material property evaluation. Journal of the Mechanics and
Physics of Solids, 53(9):2037 – 2069, 2005.
[63] Jin Haeng Lee, Taehyung Kim, and Hyungyil Lee. A study on robust indentation
techniques to evaluate elasticplastic properties of metals. International Journal of
Solids and Structures, 47(5):647 – 664, 2010.
[64] S. Djordje, B Srdjan, M Sava, and H Stanley. Barkhausen noise: Elementary sig-
nals, power laws, and scaling relations. Center for Polymer Studies Physical Review,
54(3):2531–2546, 1996.
[65] Santa aho Suvi. Barkhausen Noise Method for Hardened Steel Surface Characterization
- The Effect of Heat Treatments, Thermal Damages and Stresses. PhD thesis, Tampere
University of Technology, 2012.
[66] Catherine A. Tweedie and Krystyn J. Van Vliet. Contact creep compliance of vis-
coelastic materials via nanoindentation. Journal of Materials Research, 21:1576–1589,
2006.
[67] J Betten. Creep Mechanics. Springer-Verlag Berlin Heidelberg, 2008.
[68] Rocio Seltzer and Yiu-Wing Mai. Depth sensing indentation of linear viscoelastic-
plastic solids: A simple method to determine creep compliance. Engineering Fracture
Mechanics, 75(17):4852 – 4862, 2008. Fundamentals of Fracture.
75

[69] Surya R. Kalidindi and Siddhartha Pathak. Determination of the effective zero-point
and the extraction of spherical nanoindentation stress-strain curves. Acta Materialia,
56(14):3523 – 3532, 2008.
[70] F Lei. Development and Applications of Electrical Instrumented Indentation. PhD
thesis, The Pennsylvania State University, 2009.
[71] Ziheng Yao. Development of an Indentation Method for Material Surface Mechanical
Properties Measurement. PhD thesis, West Virginia University, 2005.
[72] B. Taljat and G.M. Pharr. Development of pile-up during spherical indentation of
elasticplastic solids. International Journal of Solids and Structures, 41(14):3891 –
3904, 2004.
[73] V. Moorthy, B.A. Shaw, and J.T. Evans. Evaluation of tempering induced changes in
the hardness profile of case-carburised {EN36} steel using magnetic barkhausen noise
analysis. {NDT} & E International, 36(1):43 – 49, 2003.
[74] M. Beghini, L. Bertini, and V. Fontanari. Evaluation of the stress-strain curve of metal-
lic materials by spherical indentation. International Journal of Solids and Structures,
43(78):2441 – 2459, 2006.
[75] YuebinCharles Lu, SivaN.V.R.K. Kurapati, and Fuqian Yang. Finite element analysis
of deep indentation by a spherical indenter. Journal of Materials Science, 43(18):6331–
6336, 2008.
[76] S. Kucharski and Z. Mrz. Identification of plastic hardening parameters of metals from
spherical indentation tests. Materials Science and Engineering: A, 318(12):65 – 76,
2001.
[77] S. Kucharski and Z. Mrz. Identification of yield stress and plastic hardening parame-
76

ters from a spherical indentation test. International Journal of Mechanical Sciences,
49(11):1238 – 1250, 2007.
[78] K. Zeng and Y. W. Zhang. Indentation creep of polymeric materials: experimental
and analysis. In 11th International Congress on Fracture.
[79] A. F. Bower, N. A. Fleck, A. Needleman, and N. Ogbonna. Indentation of a power law
creeping solid. Proceedings: Mathematical and Physical Sciences, 441(1911):97–124,
1993.
[80] X. Hernot, O. Bartier, Y. Bekouche, R. El Abdi, and G. Mauvoisin. Influence of pene-
tration depth and mechanical properties on contact radius determination for spherical
indentation. International Journal of Solids and Structures, 43(1415):4136 – 4153,
2006.
[81] X. Hernot, O. Bartier, Y. Bekouche, R. El Abdi, and G. Mauvoisin. Influence of pene-
tration depth and mechanical properties on contact radius determination for spherical
indentation. International Journal of Solids and Structures, 43(1415):4136 – 4153,
2006.
[82] A. Bolshakov and G. M. Pharr. Influences of pileup on the measurement of mechanical
properties by load and depth sensing indentation techniques. Journal of Materials
Research, 13:1049–1058, 1998.
[83] J. Hay. Introduction to instrumented indentation testing. Experimental Techniques,
33(6):66–72, 2009.
[84] R. Mahmudi, A. Rezaee-Bazzaz, and H.R. Banaie-Fard. Investigation of stress expo-
nent in the room-temperature creep of sn40pb2.5sb solder alloy. Journal of Alloys and
Compounds, 429(12):192 – 197, 2007.
77

[85] Mats Eskner and Rolf Sandstrm. Measurement of the elastic modulus of a plasma-
sprayed thermal barrier coating using spherical indentation. Surface and Coatings
Technology, 177178(0):165 – 171, 2004. Proceedings of the 30th International Confer-
ence on Metallurgical Coatings and Thin Films.
[86] Mats Eskner and Rolf Sandstrm. Mechanical properties and temperature depen-
dence of an air plasma-sprayed nicocraly bondcoat. Surface and Coatings Technology,
200(8):2695 – 2703, 2006.
[87] B. Taljat, T. Zacharia, and F. Kosel. New analytical procedure to determine stress-
strain curve from spherical indentation data. International Journal of Solids and Struc-
tures, 35(33):4411 – 4426, 1998.
[88] A. Nayebi, R. El Abdi, O. Bartier, and G. Mauvoisin. New procedure to determine
steel mechanical parameters from the spherical indentation technique. Mechanics of
Materials, 34(4):243 – 254, 2002.
[89] E.G Herbert, G.M Pharr, W.C Oliver, B.N Lucas, and J.L Hay. On the measurement
of stressstrain curves by spherical indentation. Thin Solid Films, 398399(0):331 – 335,
2001. Proceedings of the 28th International Conference on Metallurgic Coatings and
Thin Films.
[90] A Rusinko and K Rusinko. Plasticity and Creep of Metals. Springer Berlin Heidelberg,
2011.
[91] Michelle L. Oyen. Spherical indentation creep following ramp loading. Journal of
Materials Research, 20:2094–2100, 2005.
[92] Sinisa Dj. Mesarovic and Norman A. Fleck. Spherical indentation of elastic-plastic
solids. Proceedings: Mathematical, Physical and Engineering Sciences, 455(1987):2707–
2728, 1999.
78

[93] A.E. Giannakopoulos and A. Triantafyllou. Spherical indentation of incompressible
rubber-like materials. Journal of the Mechanics and Physics of Solids, 55(6):1196 –
1211, 2007.
[94] B. Karpuschewski, O. Bleicher, and M. Beutner. Surface integrity inspection on gears
using barkhausen noise analysis. Procedia Engineering, 19(0):162 – 171, 2011. 1st
{CIRP} Conference on Surface Integrity (CSI).
[95] Y.D. Han, H.Y. Jing, S.M.L. Nai, L.Y. Xu, C.M. Tan, and J. Wei. Temperature
dependence of creep and hardness of sn-ag-cu lead-free solder. Journal of Electronic
Materials, 39(2):223–229, 2010.
[96] Olivier Bartier, Xavier Hernot, and Grard Mauvoisin. Theoretical and experimental
analysis of contact radius for spherical indentation. Mechanics of Materials, 42(6):640
– 656, 2010.
[97] N Ogbonna, N.A Fleck, and A.C.F Cocks. Transient creep analysis of ball indentation.
International Journal of Mechanical Sciences, 37(11):1179 – 1202, 1995.
[98] T Hyde, K Yehia, and A Becker. Int J Mech Sci, 35(6):45, 1993.
[99] Hamid Reza Ghorbanzadeh and Abolfaz Rezaee Bazzaz. Enhanced superplasticity in
aa2024 aluminium alloy processed by multiple compressions in a channel die. In 6th
International Conference on Nanomaterials by Severe Plastic Deformation, 2014.
[100] Tasndi P. & Kovcs I Juhsz, A. Superplastic indentation creep of leadtin eutectic.
Journal of Materials Science Letters, 1986.
[101] Sargent P. M. and M. F. Ashby. Indentation creep. Materials Science and Technology,
1992.
79