developing visual expertise - maastricht university
TRANSCRIPT
Developing visual expertise
Citation for published version (APA):
Kok, E. M. (2016). Developing visual expertise: from shades of grey to diagnostic reasoning in radiology.University Press Maastricht. https://doi.org/10.26481/dis.20160401ek
Document status and date:Published: 01/01/2016
DOI:10.26481/dis.20160401ek
Document Version:Publisher's PDF, also known as Version of record
Please check the document version of this publication:
• A submitted manuscript is the version of the article upon submission and before peer-review. There canbe important differences between the submitted version and the official published version of record.People interested in the research are advised to contact the author for the final version of the publication,or visit the DOI to the publisher's website.• The final author version and the galley proof are versions of the publication after peer review.• The final published version features the final layout of the paper including the volume, issue and pagenumbers.Link to publication
General rightsCopyright and moral rights for the publications made accessible in the public portal are retained by the authors and/or other copyrightowners and it is a condition of accessing publications that users recognise and abide by the legal requirements associated with theserights.
• Users may download and print one copy of any publication from the public portal for the purpose of private study or research.• You may not further distribute the material or use it for any profit-making activity or commercial gain• You may freely distribute the URL identifying the publication in the public portal.
If the publication is distributed under the terms of Article 25fa of the Dutch Copyright Act, indicated by the “Taverne” license above,please follow below link for the End User Agreement:
www.umlib.nl/taverne-license
Take down policyIf you believe that this document breaches copyright please contact us at:
providing details and we will investigate your claim.
Download date: 26 May. 2022
Developing visual expertise
From shades of grey to diagnostic
reasoning in radiology
Ellen M. Kok
2
The research reported here was conducted at
In the School of Health Professions Education
In the context of the research school ICO
(Interuniversity Center for Educational Research) Copyright© Ellen Kok, Maastricht 2016 Cover: Alexandra Vent (www.alexandra-vent.de) Datawyse| University Press Maastricht
3
Developing visual expertise
From shades of grey to diagnostic
reasoning in radiology
PROEFSCHRIFT
ter verkrijging van de graad van doctor aan de Universiteit Maastricht
op gezag van Rector Magnificus Prof. Dr. L.L.G. Soete volgens het besluit van het college van Decanen
in het openbaar te verdedigen op vrijdag 1 april 2016 om 12.00 uur
door
Ellen Marijke Kok
4
Promotores Prof. dr. J.J.G. van Merriënboer Prof. dr. S.G.F. Robben Co-promotor Dr. A.B.H. de Bruin Beoordelingscommissie Prof. dr. C.P.M. van der Vleuten (chair) Prof. dr. H.P.A. Boshuizen (Open Universiteit Heerlen) Dr. A. Gegenfurtner Prof. dr. J.E. Wildberger Prof. dr J.M. Wolfe (Harvard Medical School)
5
Table of contents
CHAPTER 1
General introduction
7
CHAPTER 2
Before your very eyes: The value of eye tracking in medical
education
25
CHAPTER 3
Looking in the same manner but seeing it differently: Bottom-up
and expertise effects in radiology
39
CHAPTER 4
Systematic viewing in radiology: seeing more, missing less?
59
CHAPTER 5
Learning radiological appearances of diseases: Does comparison
help?
81
CHAPTER 6
Case comparisons: An efficient way of learning radiology
103
CHAPTER 7
General discussion
125
Summary 141
Nederlandse samenvatting 147
Valorisatie addendum 153
Dankwoord 163
Curriculum Vitae and list of publications 167
SHE dissertation series 169
ICO dissertation series 171

6

7
Chapter 1
General introduction
8
In every-day tasks, visual perception is often an automatic process: we automatically see a chair as being a chair, and our mother as being our mother (Ashcraft, 2003). But in many professional domains, visualizations that are not straightforward need to be interpreted, and perception is not trivial. For example, biologists need to distinguish plants based on their visual characteristics (Kirchoff, Delaney, Horton, & Dellinger-Johnston, 2014), air traffic controllers monitor complex computer screens (van Meeuwen et al., 2014), meteorologists base their predictions on abstract weather maps (Hegarty, Canham, & Fabrikant, 2010; Lowe, 1999), and medical doctors use medical images such as CT-scans, pathology slides, radiographs and ECGs in their diagnostic reasoning (Bertram, Helle, Kaakinen, & Svedstrom, 2013; Jaarsma, Jarodzka, Nap, van Merriënboer, & Boshuizen, 2015; Manning, Ethell, Donovan, & Crawford, 2006; Sibbald, De Bruin, Yu, & van Merriënboer, 2015). Those professional tasks involve complex visualizations whose proper perception requires dedicated training and years of experience to develop (Nodine & Mello-Thoms, 2010). More and more imaging techniques become available in medicine (Iglehart, 2006), making it increasingly urgent to understand how learning to interpret complex visualizations takes place.
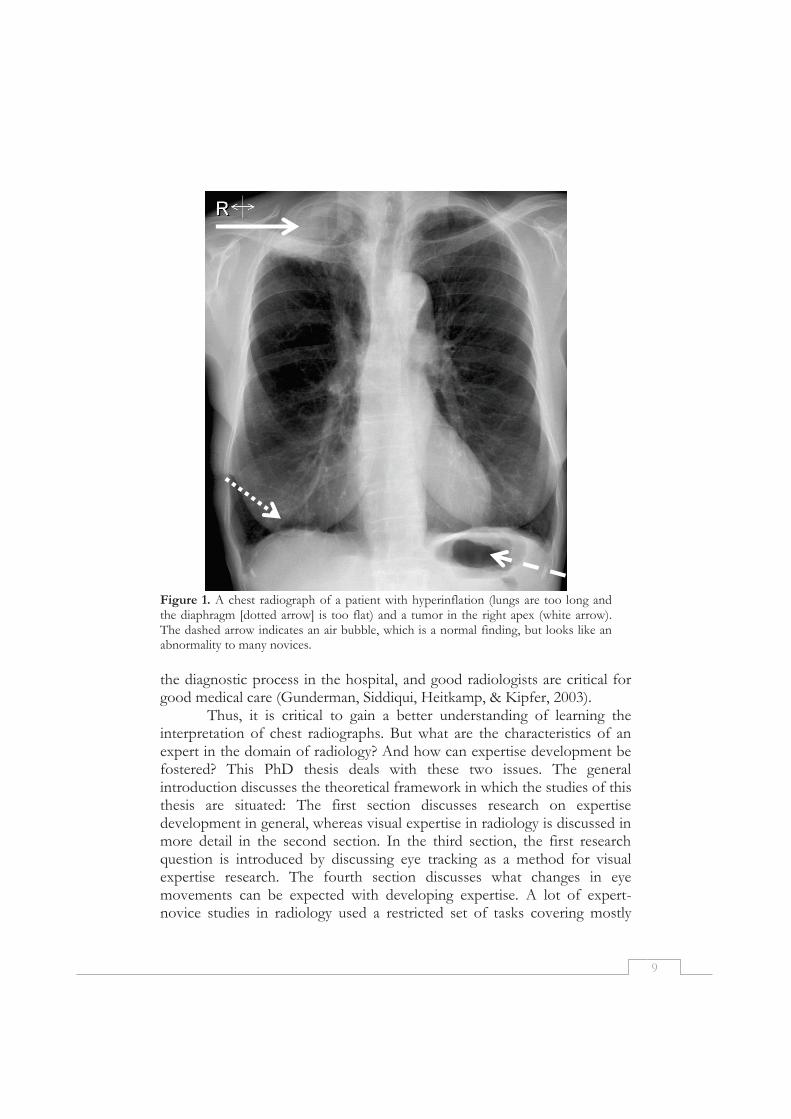
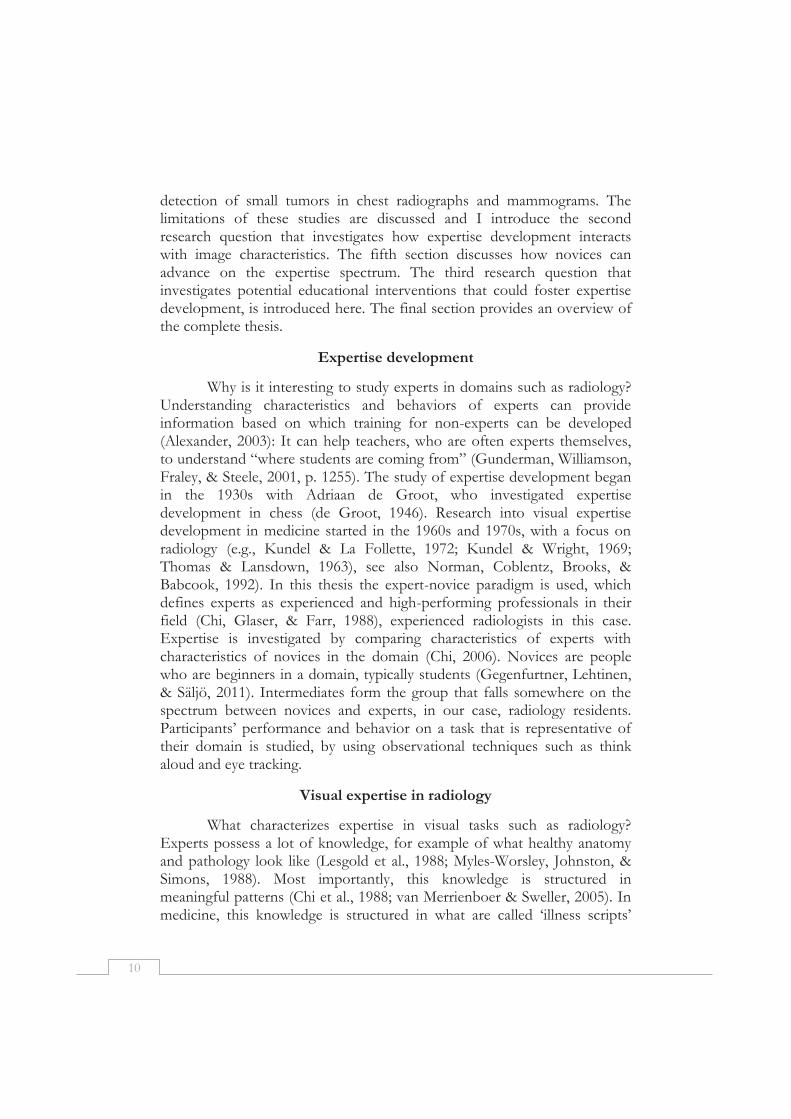
One example of a complex visual task is the interpretation of chest radiographs (see Figure 1 for an example). This task is generally considered a basic skill for radiologists, but is also considered very difficult (Delrue et al., 2011). Chest radiographs (X-ray images of the thorax) contain a wealth of information and are far from self-explanatory (Manning, 2010). They are two-dimensional representations of the three-dimensional body (Mettler, 2005), leading to an over-projection of anatomic areas. Abnormalities can ‘hide’, for example, behind the ribs (Kundel, Nodine, Thickman, Carmody, & Toto, 1985; Samei, Flynn, Peterson, & Eyler, 2003). Furthermore, there are many different variants of normality, making it even harder to interpret the images. Finally, the process of making chest radiographs can produce artefacts that mirror real abnormalities (Krupinski, 2010) or hide abnormalities (Hackler & Gunderman, 2015).
Laypeople have trouble seeing anything meaningful in a radiograph. To them the images look like a constellation of greys, in which many people only recognize the bones (Nodine & Mello-Thoms, 2010). For radiologists, however, chest radiographs provide rich information about the anatomy and possibly pathology of their patients (Wood, 1999). As a side remark: radiologists are also found to develop the ability to distinguish more shades of grey (Sowden, Davies, & Roling, 2000). Radiographs play a key role in
9
Figure 1. A chest radiograph of a patient with hyperinflation (lungs are too long and the diaphragm [dotted arrow] is too flat) and a tumor in the right apex (white arrow). The dashed arrow indicates an air bubble, which is a normal finding, but looks like an abnormality to many novices. the diagnostic process in the hospital, and good radiologists are critical for good medical care (Gunderman, Siddiqui, Heitkamp, & Kipfer, 2003).
Thus, it is critical to gain a better understanding of learning the interpretation of chest radiographs. But what are the characteristics of an expert in the domain of radiology? And how can expertise development be fostered? This PhD thesis deals with these two issues. The general introduction discusses the theoretical framework in which the studies of this thesis are situated: The first section discusses research on expertise development in general, whereas visual expertise in radiology is discussed in more detail in the second section. In the third section, the first research question is introduced by discussing eye tracking as a method for visual expertise research. The fourth section discusses what changes in eye movements can be expected with developing expertise. A lot of expert-novice studies in radiology used a restricted set of tasks covering mostly
10
detection of small tumors in chest radiographs and mammograms. The limitations of these studies are discussed and I introduce the second research question that investigates how expertise development interacts with image characteristics. The fifth section discusses how novices can advance on the expertise spectrum. The third research question that investigates potential educational interventions that could foster expertise development, is introduced here. The final section provides an overview of the complete thesis.
Expertise development
Why is it interesting to study experts in domains such as radiology? Understanding characteristics and behaviors of experts can provide information based on which training for non-experts can be developed (Alexander, 2003): It can help teachers, who are often experts themselves, to understand “where students are coming from” (Gunderman, Williamson, Fraley, & Steele, 2001, p. 1255). The study of expertise development began in the 1930s with Adriaan de Groot, who investigated expertise development in chess (de Groot, 1946). Research into visual expertise development in medicine started in the 1960s and 1970s, with a focus on radiology (e.g., Kundel & La Follette, 1972; Kundel & Wright, 1969; Thomas & Lansdown, 1963), see also Norman, Coblentz, Brooks, & Babcook, 1992). In this thesis the expert-novice paradigm is used, which defines experts as experienced and high-performing professionals in their field (Chi, Glaser, & Farr, 1988), experienced radiologists in this case. Expertise is investigated by comparing characteristics of experts with characteristics of novices in the domain (Chi, 2006). Novices are people who are beginners in a domain, typically students (Gegenfurtner, Lehtinen, & Säljö, 2011). Intermediates form the group that falls somewhere on the spectrum between novices and experts, in our case, radiology residents. Participants’ performance and behavior on a task that is representative of their domain is studied, by using observational techniques such as think aloud and eye tracking.
Visual expertise in radiology
What characterizes expertise in visual tasks such as radiology? Experts possess a lot of knowledge, for example of what healthy anatomy and pathology look like (Lesgold et al., 1988; Myles-Worsley, Johnston, & Simons, 1988). Most importantly, this knowledge is structured in meaningful patterns (Chi et al., 1988; van Merrienboer & Sweller, 2005). In medicine, this knowledge is structured in what are called ‘illness scripts’
11
(Boshuizen & Schmidt, 1992; Schmidt, Norman, & Boshuizen, 1990; Van De Wiel, Boshuizen, & Schmidt, 2000). Illness scripts are elements of organized knowledge, holding information about biological and pathophysiological processes underlying diseases, patient characteristics, signs and symptoms. Since information is effectively organized, information is not randomly taken in from radiographs, but ‘chunked’ in meaningful constellations (Chase & Simon, 1973). Symptoms such as cough, fever, shortness of breath and chest pain in a 60-year old non-smoker together might be chunked into ‘possible pneumonia’.
This structured knowledge also pertains to perceptual information. Experts are superior in perceptual encoding of domain-related patterns (Reingold & Sheridan, 2011). For example, instead of perceiving a hazy white area in the lungs, a radiologist may perceive a possible pneumonia, which might fit with the clinicians’ information that this participant is coughing and has a fever. Raufaste, Eyrolle, and Marine (1998), found that more experienced radiologists were better able to integrate features into clusters of diseases and their complications, while novices ended up with more and smaller clusters of findings that were not related. Similar patterns are found in clinical pathology: Novices mainly use colors and shapes to describe abnormalities (e.g., ‘pink’, ‘round’), which more experienced pathologists integrate and relate to specific pathology (e.g., ‘adenoma’) (Jaarsma et al., 2015).
Three theories describe the perceptual aspects of visual expertise in more detail: the holistic model of image perception, the information reduction theory, and the theory of long-term working memory. The holistic model of image perception states that experts quickly gain a first impression of an image that guides their subsequent viewing behavior (Kundel & Nodine, 1975; Kundel, Nodine, Conant, & Weinstein, 2007). This model bears many similarities to the way everyday scene perception, a task that we are all experts in, is guided by our first impression of a scene. A global attentional pathway allows us to quickly grasp the gist of a scene, which guides subsequent viewing behavior (Drew, Evans, Vo, Jacobson, & Wolfe, 2013). Radiologists have acquired knowledge of where to look for abnormalities, but have also developed an automatic schema of a prototypical ‘normal’ (i.e., healthy) image to check the current image against (Donovan & Litchfield, 2013). Novices, on the other hand, typically employ a slow search-to-find approach (Nodine & Mello-Thoms, 2010). Experts are able to conduct a global analysis of the complete image that leads to the identification of image ‘perturbations’: possible abnormalities that attract attention. Gaze is subsequently directed to those perturbations for further
12
local analysis. Local analysis is required for identification of the abnormality, or for disregarding the perturbation as being a normal variant (Rubin et al., 2014). After this phase, most radiologists employ a short scanning or checking phase to check for inconspicuous abnormalities (Mello-Thoms et al., 2005; Nodine & Mello-Thoms, 2010).
The information reduction theory (Haider & Frensch, 1999) states that experts in a domain are more likely to ignore task-irrelevant and redundant information already on a perceptual level. They focus their attention specifically on task-relevant information, leading to an optimized amount of processed information. The attention of novices, however, is often drawn to salient information (Hmelo-Silver & Pfeffer, 2004; Lowe, 1999). For example, many novices or laypeople pay close attention to air in the stomach of patients (this is visible in Figure 1). This is by no means an abnormality. However, it is a very salient feature, a black, well-delimited area among the white tissue under the diaphragm. Radiologists consistently ignore these salient, but diagnostically irrelevant areas. For example, Rubin et al. (2014) found that experts scanned only 26% of the lung tissue in a chest computed tomography scan, which encompassed 75% of all lung nodules. Healthy tissue was mostly ignored.
Finally, the theory of long-term working memory (Ericsson & Kintsch, 1995) states that the structured knowledge that experts have makes them quicker in retrieving information from long term memory and in storing information in long-term memory. This way, experts can overcome working memory constraints (van Gog, Ericsson, Rikers, & Paas, 2005). This theory is less specific in explaining visual aspects of radiograph interpretation, so the focus is mostly on the first two theories in this thesis.
How is visual expertise development investigated?
Visual expertise development is mostly investigated using observational techniques such as verbal data and eye tracking (Gegenfurtner, Siewiorek, Lehtinen, & Säljö, 2013). Eye tracking is a technique that is particularly useful for investigating visual expertise. It measures the movements of the eyes in order to see what a person is looking at, for how long, and in what order (Holmqvist et al., 2011). The two most important eye movements for this thesis are fixations and saccades. During a fixation, the eye is relatively still and takes in information. Saccades are jumps between fixations, during which information intake is essentially blocked. Eye tracking has been used for investigating expertise development in radiology since the 1970s (Kundel & La Follette, 1972; Kundel & Wright, 1969), but the technique has recently
13
become more popular, since it is now easier to use and less restricting for participants (Holmqvist et al., 2011). Eye tracking provides an objective way for investigating viewing behavior. However, eye movements cannot always be unambiguously interpreted in terms of higher cognitive processes. Thus, the first research question of this thesis is:
1. How can eye tracking contribute to studying the development of visual expertise in radiology?
What differences in eye movements can be expected with developing
expertise?
The three theories explained above predict specific eye movement differences between experts and novices (Gegenfurtner et al., 2011). First of all, the holistic model of image perception states that experts’ gaze is guided by their quick, initial impression of the image (Kundel et al., 2007). Thus, experts are expected to have very short times to first fixation of (even subtle) abnormalities, and longer saccades than novices. Second, the information-reduction theory (Haider & Frensch, 1999) states that non-relevant information is ignored already at a perceptual level. Thus, it predicts that experts fixate relatively more often and longer on relevant information and fixate relatively less often and for a shorter time on irrelevant information, compared to novices. Finally, the theory of long-term working memory (Ericsson & Kintsch, 1995) poses that the way information is structured in the experts’ brain makes it more easily available for retrieval, resulting in shorter fixation durations.
These effects of expertise on viewing behavior can be considered top-down influences on attention. Top-down attention refers to the aspect of our attentional orienting that is under the control of the person who is attending (Johnson & Proctor, 2004). Other top-down influences are, for example, goals, expectations, and instructions. In contrast, bottom-up control of attention refers to the effects of stimulus characteristics on attention (Itti & Koch, 2000).
Although these theories provide important information about characteristics of expertise in radiology, most of the studies that informed those theories have used a restricted set of images and lesions: mostly lung nodules (small tumors) on chest radiographs or tumors on mammograms (74% of all studies reviewed by Reingold & Sheridan, 2011). Lung nodules are challenging to detect on chest radiographs, making lung nodule detection an optimal task for investigating how experts detect small abnormalities. However, detecting lung nodules is only a small part of the task of the radiologist: lung nodules have been noted in only 0.09% to 7%
14
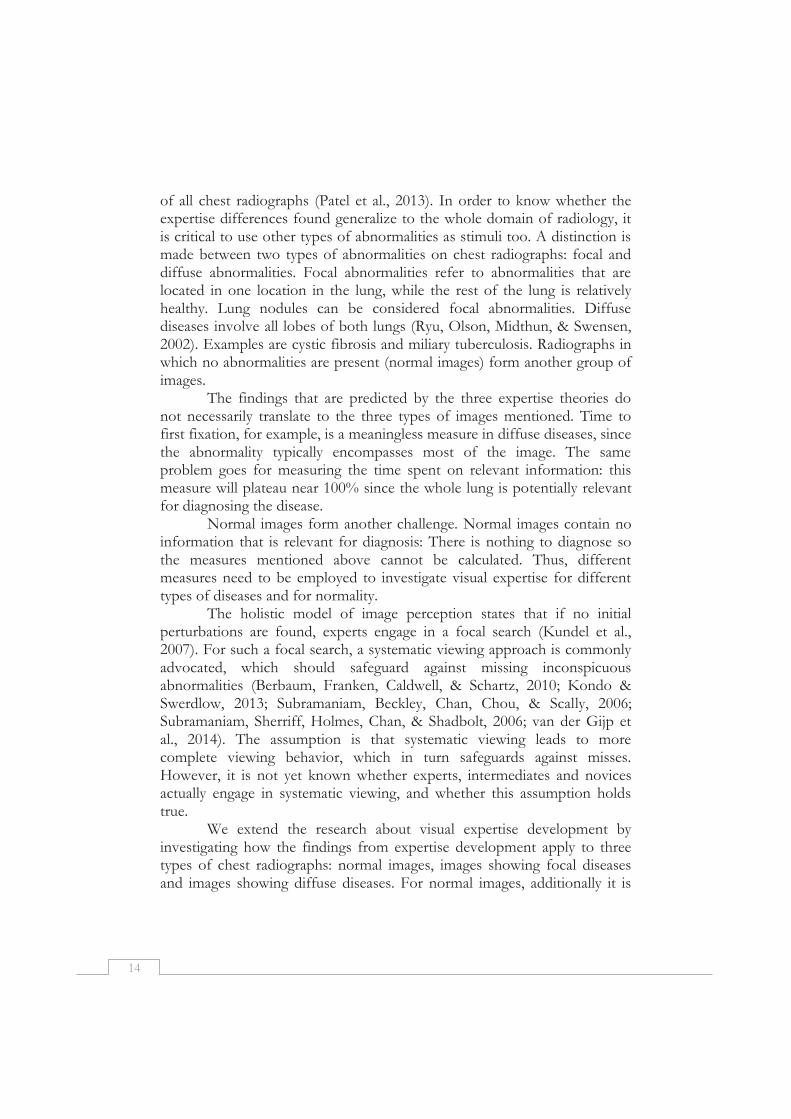
of all chest radiographs (Patel et al., 2013). In order to know whether the expertise differences found generalize to the whole domain of radiology, it is critical to use other types of abnormalities as stimuli too. A distinction is made between two types of abnormalities on chest radiographs: focal and diffuse abnormalities. Focal abnormalities refer to abnormalities that are located in one location in the lung, while the rest of the lung is relatively healthy. Lung nodules can be considered focal abnormalities. Diffuse diseases involve all lobes of both lungs (Ryu, Olson, Midthun, & Swensen, 2002). Examples are cystic fibrosis and miliary tuberculosis. Radiographs in which no abnormalities are present (normal images) form another group of images.
The findings that are predicted by the three expertise theories do not necessarily translate to the three types of images mentioned. Time to first fixation, for example, is a meaningless measure in diffuse diseases, since the abnormality typically encompasses most of the image. The same problem goes for measuring the time spent on relevant information: this measure will plateau near 100% since the whole lung is potentially relevant for diagnosing the disease.
Normal images form another challenge. Normal images contain no information that is relevant for diagnosis: There is nothing to diagnose so the measures mentioned above cannot be calculated. Thus, different measures need to be employed to investigate visual expertise for different types of diseases and for normality.
The holistic model of image perception states that if no initial perturbations are found, experts engage in a focal search (Kundel et al., 2007). For such a focal search, a systematic viewing approach is commonly advocated, which should safeguard against missing inconspicuous abnormalities (Berbaum, Franken, Caldwell, & Schartz, 2010; Kondo & Swerdlow, 2013; Subramaniam, Beckley, Chan, Chou, & Scally, 2006; Subramaniam, Sherriff, Holmes, Chan, & Shadbolt, 2006; van der Gijp et al., 2014). The assumption is that systematic viewing leads to more complete viewing behavior, which in turn safeguards against misses. However, it is not yet known whether experts, intermediates and novices actually engage in systematic viewing, and whether this assumption holds true.
We extend the research about visual expertise development by investigating how the findings from expertise development apply to three types of chest radiographs: normal images, images showing focal diseases and images showing diffuse diseases. For normal images, additionally it is
15
investigated whether experts, intermediates and novices engage in systematic viewing. The second research question is:
2. How do eye movements differ between experts, intermediates and novices in the domain of radiology, and how do expertise differences interact with image characteristics?
Advancing on the expertise spectrum
Having examined expertise-differences in radiology, the focus now turns to the ‘novice’ part of the expertise spectrum, and it is investigated how educational interventions can help students to advance on this spectrum. Educational interventions in radiology have hardly been investigated.
Although expert-novices studies play a critical role in gaining a better understanding of the development of expertise, experts’ problem solving strategies should not be directly copy-pasted to novices: Experts and novices differ in their developed schemata, and providing novices with experts’ problem solving strategies will not necessarily help them to show expert-like behavior (Mathan & Koedinger, 2005; Norman, 2005). Rather, expert-novice studies can signal qualitative differences between medical students, which can inspire educational interventions aimed at those specific differences, or characteristics of novices. Therefore, two different educational interventions were developed that aimed to target novices’ characteristics. First, of all, novices lack the ability to form a global impression of an image, which could guide their subsequent viewing behavior (Kundel et al., 2007). Second, novices have trouble discriminating relevant from irrelevant visual information (Haider & Frensch, 1999). Those characteristics of novices, and a proposed solution is discussed in more detail below.
First of all, students do not have the ability to form a global impression of an image, which can help them guide their viewing behavior, and might benefit from a strategy to guide their viewing behavior. This idea is acknowledged in radiology textbooks (Daffner, 2007; Eastman, Wald, & Crossin, 2006; Mettler, 2005) and websites that teach radiology1.
1 http://www.radiologyassistant.nl/en/p497b2a265d96d/chest-x-ray-basic-interpretation.html and http://radiologymasterclass.co.uk/tutorials/chest/chest_system/chest_system_start.html.
16
Systematic viewing of chest radiographs is thus widely advocated (Berbaum et al., 2010; Kondo & Swerdlow, 2013; Subramaniam, Beckley, et al., 2006; Subramaniam, Sherriff, et al., 2006; van der Gijp et al., 2014).
Systematic viewing was already introduced in the previous section, where it was asked whether novices, intermediates and experts employ a systematic approach to chest radiograph interpretation. This approach is now elaborated on as a potential educational intervention. Systematic viewing means that a set of anatomic structures is consistently checked in accordance with a specific order. Although the order per se is not critical, it is considered critical to be consistent in viewing order over radiographs. The order of checking anatomic regions can be considered a mental checklist, and the assumption is that sticking with this order leads to inspection of the full radiograph: complete coverage. Complete coverage, in turn, prevents the student from missing abnormalities. Thus the effectiveness of a training in systematic viewing was investigated, and compared to the effectiveness of training in non-systematic viewing and a training in full-coverage viewing (i.e., without being systematic).
Another characteristic of novices is that they have trouble discriminating relevant from irrelevant information (Wood, 1999). Novices are found to pay attention to visually salient rather than task-relevant information (Hammer, 2015; Lowe, 1999). This is problematic because if students are not able to attend to relevant information, they will have trouble learning this relevant information (Boucheix & Lowe, 2010). Case comparisons are an excellent way to learn discrimination (Alfieri, Nokes-Malach, & Schunn, 2013; Andrews, Livingston, & Kurtz, 2011; Hammer, Bar-Hillel, Hertz, Weinshall, & Hochstein, 2008). The structural-alignment theory of Markman and Gentner (1997) states that comparison of two stimuli takes place by an alignment of features and relations within one stimulus to another stimulus. This alignment process will subsequently make differences between those stimuli more salient, and this can improve category learning (Hammer, 2015). There is a wide body of literature on the effectiveness of several types of case comparisons, for learning tasks such as learning mathematics (Rittle-Johnson & Star, 2011), learning about geological faults (Jee et al., 2013), learning about psychological concepts (Hannon, 2012), and many other tasks. Evidence for the effectiveness of comparison for real-life, complex visual tasks such as radiograph interpretation is lacking (but see Ark, Brooks, & Eva, 2007; Hatala, Brooks, & Norman, 2003 for an example of comparison learning in ECG interpretation). Hence, the effect of several types of case comparisons on learning radiology was investigated.
17
Thus, the third research question is: 3. What is the effect of systematic viewing training and studying case
comparisons on learning radiology? 4.
Overview of this dissertation
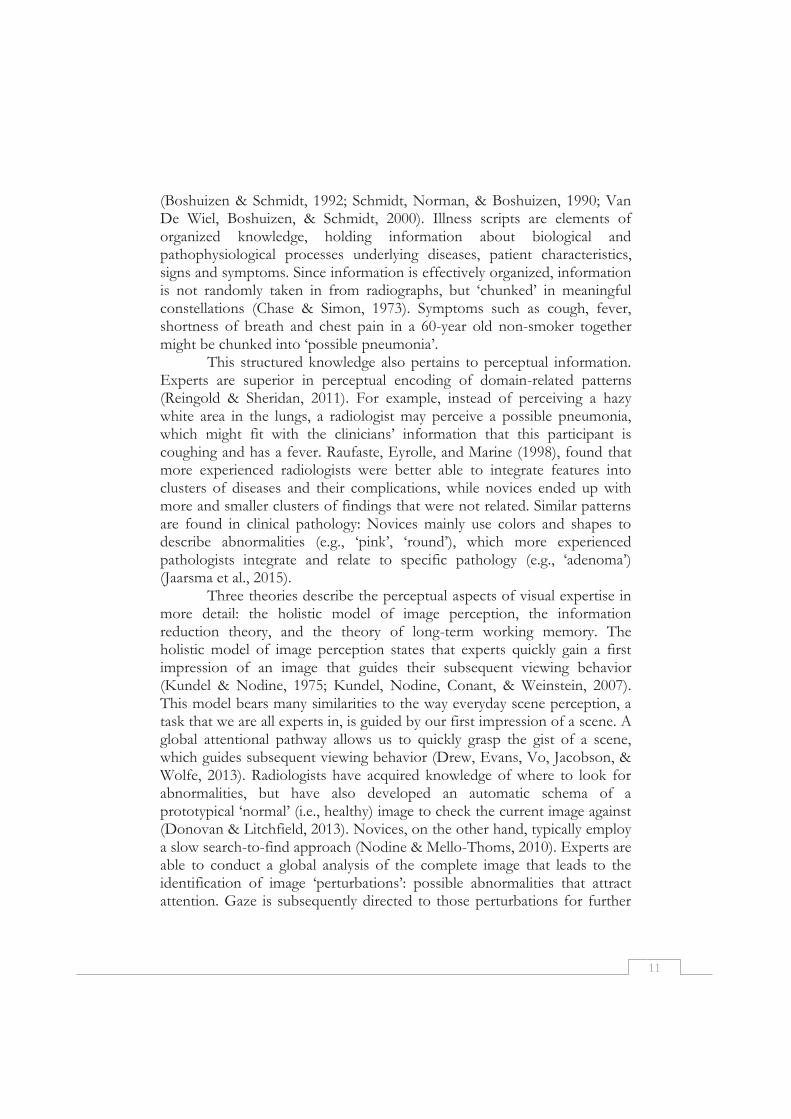
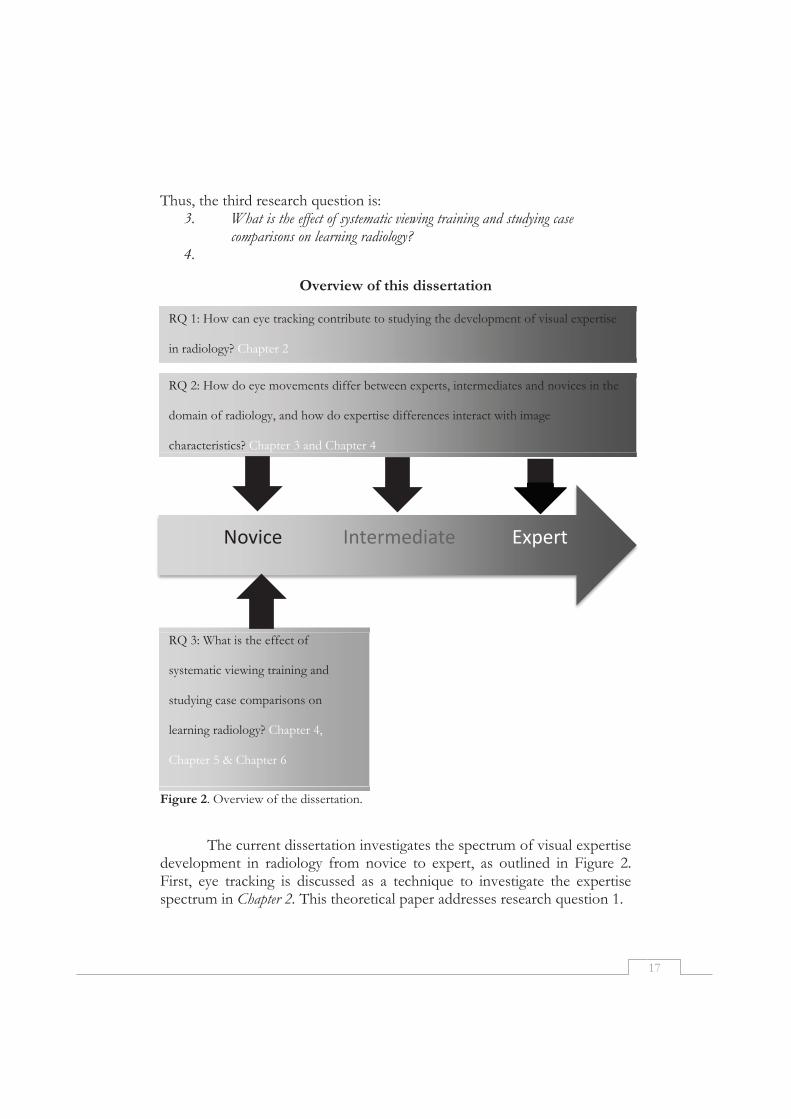
Figure 2. Overview of the dissertation.
The current dissertation investigates the spectrum of visual expertise development in radiology from novice to expert, as outlined in Figure 2. First, eye tracking is discussed as a technique to investigate the expertise spectrum in Chapter 2. This theoretical paper addresses research question 1.
RQ 1: How can eye tracking contribute to studying the development of visual expertise
in radiology? Chapter 2
RQ 2: How do eye movements differ between experts, intermediates and novices in the
domain of radiology, and how do expertise differences interact with image
characteristics? Chapter 3 and Chapter 4
ExpertIntermediateNovice
RQ 3: What is the effect of
systematic viewing training and
studying case comparisons on
learning radiology? Chapter 4,
Chapter 5 & Chapter 6
18
Research question 2 is investigated in Chapter 3 and Chapter 4. Those chapters investigate the development of visual expertise in radiology over the whole spectrum from novice to expert. Chapter 3 investigates the differences between experts, intermediates and novices in the domain of radiology. The focus is on the interaction of expertise, as a top-down driver of attention, with the characteristics of the image, a bottom-up influence. Chapter 4 concentrates on normal images, and investigates expertise differences in systematic viewing.
Research question 3 is addressed in Chapters 4, 5 and 6. These chapters zoom in on the novice-end of the expertise spectrum. Chapter 4 investigates the effectiveness of teaching systematic viewing to medical students. Chapter 5 investigates the effectiveness of comparison learning for radiology. Two types of comparison learning are compared: comparison of radiographs with normal images, and comparison of two radiographs of the same disease, but in different patients. Chapter 6 addresses comparison learning again, but adds comparison of radiographs of different diseases, and a non-comparison control condition. The process of comparison is measured using eye tracking. Chapter 7, finally, provides a general discussion of the results of the empirical studies.
19
References
Alexander, P. A. (2003). The development of expertise: The journey from acclimation to proficiency. Educational Researcher, 32(8), 10-14.
Alfieri, L., Nokes-Malach, T. J., & Schunn, C. D. (2013). Learning through case comparisons: A meta-analytic review. Educational Psychologist, 48(2), 87-113.
Andrews, J. K., Livingston, K. R., & Kurtz, K. J. (2011). Category learning in the context of co-presented items. Cognitive Processing, 12(2), 161-175.
Ark, T. K., Brooks, L. R., & Eva, K. W. (2007). The benefits of flexibility: the pedagogical value of instructions to adopt multifaceted diagnostic reasoning strategies. Medical Education, 41(3), 281-287.
Ashcraft, M. H. (2003). Cognition: New Jersey: Prentice Hall International. Berbaum, K. S., Franken, E., Caldwell, R. T., & Schartz, K. M. (2010). Satisfaction of
search in traditional radiographic imaging. In E. Samei & E. Krupinski (Eds.), The Handbook of Medical Image Perception and Techniques (pp. 107-138). Cambridge: University Press.
Bertram, R., Helle, L., Kaakinen, J. K., & Svedstrom, E. (2013). The Effect of Expertise on Eye Movement Behaviour in Medical Image Perception. Plos One, 8(6).
Boshuizen, H. P., & Schmidt, H. G. (1992). On the role of biomedical knowledge in clinical reasoning by experts, intermediates and novices. Cognitive Science, 16(2), 153-184.
Boucheix, J. M., & Lowe, R. K. (2010). An eye tracking comparison of external pointing cues and internal continuous cues in learning with complex animations. Learning and Instruction, 20(2), 123-135.
Chase, W. G., & Simon, H. A. (1973). Perception in chess. Cognitive Psychology, 4, 55-81. Chi, M. T. H. (2006). Two approaches to the study of experts’ characteristics. The Cambridge
Handbook of Expertise and Expert Performance, 21-30. Chi, M. T. H., Glaser, R., & Farr, M. J. (1988). The Nature of Expertise. Hillsdale, NJ:
Erlbaum. Daffner, R. H. (2007). Clinical Radiology, the Essentials. Lippincott: Williams & Wilkins. de Groot, A. D. (1946). Het denken van den schaker: een experimenteel-psychologische studie:
Amsterdam: Noord-Hollandsche Uitgevers Maatschappij. Delrue, L., Gosselin, R., Ilsen, B., van Landeghem, A., de Mey, J., & Duyck, P. (2011).
Difficulties in the interpretation of chest radiography. In E. E. Coche, B. Ghaye, J. de Mey & P. Duyck (Eds.), Comparative interpretation of CT and standard radiography of the chest (pp. 27-49). Berlin Heidelberg: Springer-Verlag.
Donovan, T., & Litchfield, D. (2013). Looking for Cancer: Expertise Related Differences in Searching and Decision Making. Applied Cognitive Psychology, 27(1), 43-49.
Drew, T., Evans, K., Vo, M. L. H., Jacobson, F. L., & Wolfe, J. M. (2013). Informatics in radiology What can you see in a single glance and how might this guide visual search in medical images? Radiographics, 33(1), 263-274.
Eastman, G. W., Wald, C., & Crossin, J. (2006). Getting started in clinical radiology from image to diagnosis. Stuttgart; New York: Thieme.
Ericsson, K. A., & Kintsch, W. (1995). Long-term working memory. Psychological Review, 102(2), 211-245.
Gegenfurtner, A., Lehtinen, E., & Säljö, R. (2011). Expertise differences in the comprehension of visualizations: a meta-analysis of eye-tracking research in professional domains. Educational Psychology Review, 23(4), 523-552.
20
Gegenfurtner, A., Siewiorek, A., Lehtinen, E., & Säljö, R. (2013). Assessing the Quality of Expertise Differences in the Comprehension of Medical Visualizations. Vocations and Learning, 6(1), 37-54.
Gunderman, R. B., Siddiqui, A. R., Heitkamp, D. E., & Kipfer, H. D. (2003). The Vital Role of Radiology in the Medical School Curriculum. American Journal of Roentgenology, 180(5), 1239-1242.
Gunderman, R. B., Williamson, K., Fraley, R., & Steele, J. (2001). Expertise: implications for radiological education. Academic Radiology, 8(12), 1252.
Hackler, P. C., & Gunderman, R. B. (2015). The Treachery of Images. Academic Radiology. Haider, H., & Frensch, P. A. (1999). Eye movement during skill acquisition: More evidence
for the information-reduction hypothesis. Journal of Experimental Psychology-Learning Memory and Cognition, 25(1), 172-190.
Hammer, R. (2015). Impact of feature saliency on visual category learning. Frontiers in Psychology, 6.
Hammer, R., Bar-Hillel, A., Hertz, T., Weinshall, D., & Hochstein, S. (2008). Comparison processes in category learning: From theory to behavior. Brain Research, 1225, 102-118.
Hannon, B. (2012). Differential-associative processing or example elaboration: Which strategy is best for learning the definitions of related and unrelated concepts? Learning and Instruction, 22(5), 299-310.
Hatala, R. M., Brooks, L. R., & Norman, G. R. (2003). Practice makes perfect: The critical role of mixed practice in the acquisition of ECG interpretation skills. Advances in Health Sciences Education, 8(1), 17-26.
Hegarty, M., Canham, M. S., & Fabrikant, S. I. (2010). Thinking About the Weather: How Display Salience and Knowledge Affect Performance in a Graphic Inference Task. Journal of Experimental Psychology-Learning Memory and Cognition, 36(1), 37-53.
Hmelo-Silver, C. E., & Pfeffer, M. G. (2004). Comparing expert and novice understanding of a complex system from the perspective of structures, behaviors, and functions. Cognitive Science, 28(1), 127-138.
Holmqvist, K., Nyström, M., Andersson, R., Dewhurst, R., Jarodzka, H., & van de Weijer, J. (2011). Eye tracking: A comprehensive guide to methods and measures. Oxford: Oxford University Press.
Iglehart, J. K. (2006). The new era of medical imaging-progress and pitfalls. New England Journal of Medicine, 354(26), 2822.
Itti, L., & Koch, C. (2000). A saliency-based search mechanism for overt and covert shifts of visual attention. Vision Research, 40(10-12), 1489-1506.
Jaarsma, T., Jarodzka, H., Nap, M., van Merriënboer, J. J., & Boshuizen, H. P. (2015). Expertise in clinical pathology: combining the visual and cognitive perspective. Advances in Health Sciences Education, 20(4), 1089-1106.
Jee, B. D., Uttal, D. H., Gentner, D., Manduca, C., Shipley, T. F., & Sageman, B. (2013). Finding faults: analogical comparison supports spatial concept learning in geoscience. Cognitive Processing, 14(2), 175-187.
Johnson, A., & Proctor, R. W. (2004). Attention : theory and practice. Thousand Oaks, CA [etc.]: Sage.
Kirchoff, B. K., Delaney, P. F., Horton, M., & Dellinger-Johnston, R. (2014). Optimizing Learning of Scientific Category Knowledge in the Classroom: The Case of Plant Identification. CBE Life Sciences Education, 13(3), 425-436.
21
Kondo, K. L., & Swerdlow, M. (2013). Medical Student Radiology Curriculum: What Skills Do Residency Program Directors Believe Are Essential for Medical Students to Attain? Academic Radiology, 20(3), 263-271.
Krupinski, E. A. (2010). Perceptual factors in reading medical images. In E. Samei & E. Krupinski (Eds.), The Handbook of Medical Image Perception and Techniques (pp. 81-90). Cambridge: Cambridge University Press.
Kundel, H. L., & La Follette, P. S., Jr. (1972). Visual search patterns and experience with radiological images. Radiology, 103(3), 523-528.
Kundel, H. L., & Nodine, C. F. (1975). Interpreting Chest Radiographs without Visual Search. Radiology, 116(3), 527-532.
Kundel, H. L., Nodine, C. F., Conant, E. F., & Weinstein, S. P. (2007). Holistic component of image perception in mammogram interpretation: Gaze-tracking study. Radiology, 242(2), 396-402.
Kundel, H. L., Nodine, C. F., Thickman, D., Carmody, D., & Toto, L. (1985). Nodule detection with and without a chest image. Investigative Radiology, 20(1).
Kundel, H. L., & Wright, D. J. (1969). The influence of prior knowledge on visual search strategies during the viewing of chest radiographs. Radiology, 93(2), 315-320.
Lesgold, A., Rubinson, H., Feltovich, P., Glaser, R., Klopfer, D., & Wang, Y. (1988). Expertise in a complex skill: Diagnosing x-ray pictures. In M. T. H. Chi, R. Glaser & M. Farr (Eds.), The Nature of Expertise (pp. 311-342). Hillsdale, NJ: Erlbaum.
Lowe, R. K. (1999). Extracting information from an animation during complex visual learning. European Journal of Psychology of Education, 14(2), 225-244.
Manning, D. J. (2010). Cognitive factors in reading medical images. In E. Samei & E. Krupinski (Eds.), The handbook of Medical Image Perception and Techniques (pp. 91-106). Cambridge: Cambridge University Press.
Manning, D. J., Ethell, S. C., Donovan, T., & Crawford, T. (2006). How do Radiologists do it? The Influence of Experience and Training on Searching for Chest Nodules. Radiography, 12(2), 134-142.
Markman, A. B., & Gentner, D. (1997). The effects of alignability on memory. Psychological Science, 8(5), 363-367.
Mathan, S. A., & Koedinger, K. R. (2005). Fostering the intelligent novice: Learning from errors with metacognitive tutoring. Educational Psychologist, 40(4), 257-265.
Mello-Thoms, C., Hardesty, L., Sumkin, J., Ganott, M., Hakim, C., Britton, C., . . . Maitz, G. (2005). Effects of lesion conspicuity on visual search in mammogram reading. Academic Radiology, 12(7), 830-840.
Mettler, F. A. (2005). Essentials of Radiology. Philadelpia: Elsevier Saunders. Myles-Worsley, M., Johnston, W. A., & Simons, M. A. (1988). The Influence Of Expertise
On X-Ray Image-Processing. Journal of Experimental Psychology-Learning Memory and Cognition, 14(3), 553-557.
Nodine, C., & Mello-Thoms, C. (2010). The role of expertise in radiologic image interpretation. In E. Samei & E. Krupinski (Eds.), The Handbook of Medical Image Perception and Techniques (pp. 139-156). Cambridge: Cambridge University Press.
Norman, G. R. (2005). Research in clinical reasoning: past history and current trends. Medical Education, 39(4), 418-427.
Norman, G. R., Coblentz, C. L., Brooks, L. R., & Babcook, C. J. (1992). Expertise In Visual Diagnosis - A Review Of The Literature. Academic Medicine, 67(10), S78-S83.
Patel, V. K., Naik, S. K., Naidich, D. P., Travis, W. D., Weingarten, J. A., Lazzaro, R., . . . Raoof, S. (2013). A practical algorithmic approach to the diagnosis and
22
management of solitary pulmonary nodules: Part 1: radiologic characteristics and imaging modalities. Chest, 143(3), 825-839.
Raufaste, E., Eyrolle, H., & Marine, C. (1998). Pertinence generation in radiological diagnosis: Spreading activation and the nature of expertise. Cognitive Science, 22(4), 517-546.
Reingold, E. M., & Sheridan, H. (2011). Eye movements and visual expertise in chess and medicine. In S. P. Leversedge, I. D. Gilchrist & S. Everling (Eds.), Oxford Handbook of Eye Movements (pp. 528-550). Oxford: Oxford University Press.
Rittle-Johnson, B., & Star, J. R. (2011). The power of comparison in learning and instruction: Learning outcomes supported by different types of comparisons. In J. P. Mestre & B. H. Ross (Eds.), Cognition in Education (Vol. 55, pp. 199-226). Oxford: Academic Press.
Rubin, G. D., Roos, J. E., Tall, M., Harrawood, B., Bag, S., Ly, D. L., . . . Roy Choudhury, K. (2014). Characterizing search, recognition, and decision in the detection of lung nodules on CT scans: elucidation with eye tracking. Radiology, 274(1), 276-286.
Ryu, J. H., Olson, E. J., Midthun, D. E., & Swensen, S. J. (2002). Diagnostic approach to the patient with diffuse lung disease. Mayo Clinic Proceedings, 77(11), 1221-1227.
Samei, E., Flynn, M. J., Peterson, E., & Eyler, W. R. (2003). Subtle lung nodules: Influence of local anatomic variations on detection. Radiology, 228(1), 76-84.
Schmidt, H., Norman, G., & Boshuizen, H. (1990). A cognitive perspective on medical expertise: theory and implications. Academic Medicine, 65(10), 611-621.
Sibbald, M., De Bruin, A. B. H., Yu, E., & van Merriënboer, J. J. G. (2015). Why verifying diagnostic decisions with a checklist can help: insights from eye tracking. Advances in Health Sciences Education.
Sowden, P. T., Davies, I. R. L., & Roling, P. (2000). Perceptual learning of the detection of features in X-ray images: A functional role for improvements in adults' visual sensitivity? Journal of Experimental Psychology Human Perception and Performance, 26(1), 379-390.
Subramaniam, R. M., Beckley, V., Chan, M., Chou, T., & Scally, P. (2006). Radiology curriculum topics for medical students: Students' perspectives. Academic Radiology, 13(7), 880-884.
Subramaniam, R. M., Sherriff, J., Holmes, K., Chan, M. C., & Shadbolt, B. (2006). Radiology curriculum for medical students: clinicians' perspectives. Australasian Radiology, 50(5).
Thomas, E. L., & Lansdown, E. (1963). Visual Search Patterns of Radiologists in Training. Radiology, 81(2), 288-292.
Van De Wiel, M. W., Boshuizen, H. P., & Schmidt, H. G. (2000). Knowledge restructuring in expertise development: Evidence from pathophysiological representations of clinical cases by students and physicians. European Journal of Cognitive Psychology, 12(3), 323-356.
van der Gijp, A., Schaaf, M. F., Schaaf, I. C., Huige, J. C. B. M., Ravesloot, C. J., Schaik, J. P. J., & ten Cate, T. J. (2014). Interpretation of radiological images: towards a framework of knowledge and skills. Advances in Health Sciences Education, 19(4), 565-580.
van Gog, T., Ericsson, K. A., Rikers, R. J. P., & Paas, F. (2005). Instructional design for advanced learners: Establishing connections between the theoretical frameworks of cognitive load and deliberate practice. Educational Technology Research and Development, 53(3), 73-81

23
van Meeuwen, L. W., Jarodzka, H., Brand-Gruwel, S., Kirschner, P. A., de Bock, J. J. P. R., & van Merriënboer, J. J. G. (2014). Identification of effective visual problem solving strategies in a complex visual domain. Learning and Instruction, 32(0), 10-21.
van Merrienboer, J. J. G., & Sweller, J. (2005). Cognitive load theory and complex learning: Recent developments and future directions. Educational Psychology Review, 17(2), 147-177.
Wood, B. P. (1999). Visual expertise. Radiology, 211(1), 1-3.

24
25
Chapter 2
Before your very eyes: The value of eye tracking in medical
education
Kok, E.M., & Jarodzka, H. (2015). Before your very eyes: The value of eye tracking in medical education. Submitted for publication.
26
Abstract
Context Medicine is a highly visual discipline. Physicians from many specialties constantly use visual information in diagnosis and treatment. However, they hardly can make explicit how they use this information. Consequently, it is unclear how to train medical students in this visual processing. Eye tracking is a technique that may offer answers to these open questions as it allows investigating such visual processes directly by measuring the movements of a person’s eyes. In this way, researchers may understand the processes leading to or hindering a particular learning outcome. Aim In the current paper, we clarify the value and limitations of eye tracking to researchers and practitioners in medical education. For example, eye tracking can unravel how experience with medical images impacts diagnostic performance, how students engage with learning materials, and how people use eye movements for social interaction in learning situations. Furthermore, eye tracking can also be used to display eye movements, which in turn can be used directly for instruction as cues in modeling examples. Discussion Eye movements provide valid information on what an observer attends to. When memory or other higher order cognitive skills are of interest, additional data sources may be useful. Most important, though, the design of experiments as well as the analysis and interpretation of eye-tracking data must always be conducted along theoretical models. Only this ensures findings that provide relevant guidelines both for educational practice, and for theoretical development. Conclusion We argue that eye tracking is a promising technique for medical education to gain deeper insights into the processes of learning, but only when used in close relation to educational and vision science theories.
27
Medicine is a highly visual discipline. Radiologists, clinical pathologists, ophthalmologists, dermatologists and cardiologists rely on visual information when diagnosing radiographs, ECG’s, microscope slides, and images of the eye or skin. But visual information is important in all diagnostic reasoning. Surgeons and anesthesiologists cannot work without processing visual input either. And realize how many information relies on vision when having a bad news talk with a patient or a feedback meeting with a student. Medical education research should acknowledge and investigate those visual aspects of performance and learning more.
Special techniques are required to investigate visual aspects of learning and performance. People face difficulties when reporting their viewing behavior, making those reports incomplete and often unreliable (Ericsson & Simon, 1980). Eye tracking is a technique to objectively investigate vision. It measures the movements of the eyes to see what a person is looking at, for how long, and in what order (Holmqvist et al., 2011). In this way we gain deeper insight into vision, attention and cognitive processes accompanying high-level medical performance, but also learning and instruction in medical education. Eye tracking is scarcely used in medical education so far, in contrast to cognitive and educational sciences, where it has grown into a reliable technique to understand and improve learning over the past decades (Rayner, 1998; van Gog & Jarodzka, 2013). Several possible applications in medical education, inspired from educational and cognitive research, are described below and illustrated with exemplary studies from educational psychology.
Eye tracking has largely been used to study the visual aspects of expertise and its development, very often in medicine (Reingold & Sheridan, 2011). Most studies have investigated the domain of radiology. They show, for instance, that experienced radiologists have more efficient ways of looking at radiographs and mammograms (Reingold & Sheridan, 2011). But research on other types of medical images, such as pathology slides, dermatologic lesions, ECG’s, multiplanar images (CT and MRI images), endoscopy or others, is still mostly lacking (apart from few recent exceptions such as Jaarsma, Jarodzka, Nap, van Merriënboer, and Boshuizen (2014)). Insights into how experts diagnose these images can subsequently inform clinical teachers.
Moreover, learning and the processes underlying it have been another important research topic within eye tracking research. While many studies on the effectiveness of education concern only the outcome of a learning process (e.g., the grades), eye tracking also allows insight into processes underlying learning. It can provide information on how the learner reached,
28
or failed to reach, the learning outcome, because it shows how a learner interacts with learning materials. Exemplary studies from educational psychology have investigated research questions on learning material that can be applied to medical education as well (e.g., Jarodzka, Janssen, Kirschner, & Erkens, 2015). For example, do students manage to integrate text and pictures sufficiently? What type of design makes learning environments more effective? What is their cognitive load when engaging in the task? How is viewing behaviour affected by an educational intervention?
Another topic that has recently gained interest in educational psychology is the role of eye movements in social situations (Crosby, Monin, & Richardson, 2008) and classroom management (van den Bogert, van Bruggen, Kostons, & Jochems, 2014). This is not only relevant to primary and secondary education, but also to medical education: Where do experienced lecturers look? How do tutors in problem-based learning use eye movements to manage their tutorial group meetings? But also, how do general practitioners use eye movements in bad-news conversations?
Finally, eye movements of experienced physicians can be shown to students when explaining to them the diagnostic procedure. This can direct the students’ attention to the relevant information. This is called ‘eye movement modelling examples’ (Van Gog, Jarodzka, Scheiter, Gerjets, & Paas, 2009) and could be also used in e-learning scenarios. This method has shown to be effective in, for instance, learning to diagnose patient video cases (Jarodzka, Balslev, et al., 2012). However, further research is required to better understand under which specific circumstances this method is useful and when the eye movements can be easily replaced by, e.g., a hand gesture.
The aim of this paper is to clarify the value and limitations of eye tracking to researchers and practitioners in medical education. We explain what eye tracking does, when eye movements form a valid window into the learner’s mind, and when additional data are necessary to interpret eye-tracking data. Furthermore, we stress that eye tracking should be employed in a theory-driven manner, both for the design and the interpretation of experiments, to yield meaningful findings. We illustrate this with examples of eye-tracking research in medical education as well as applications in fields related to medical education.
29
What does eye tracking do?
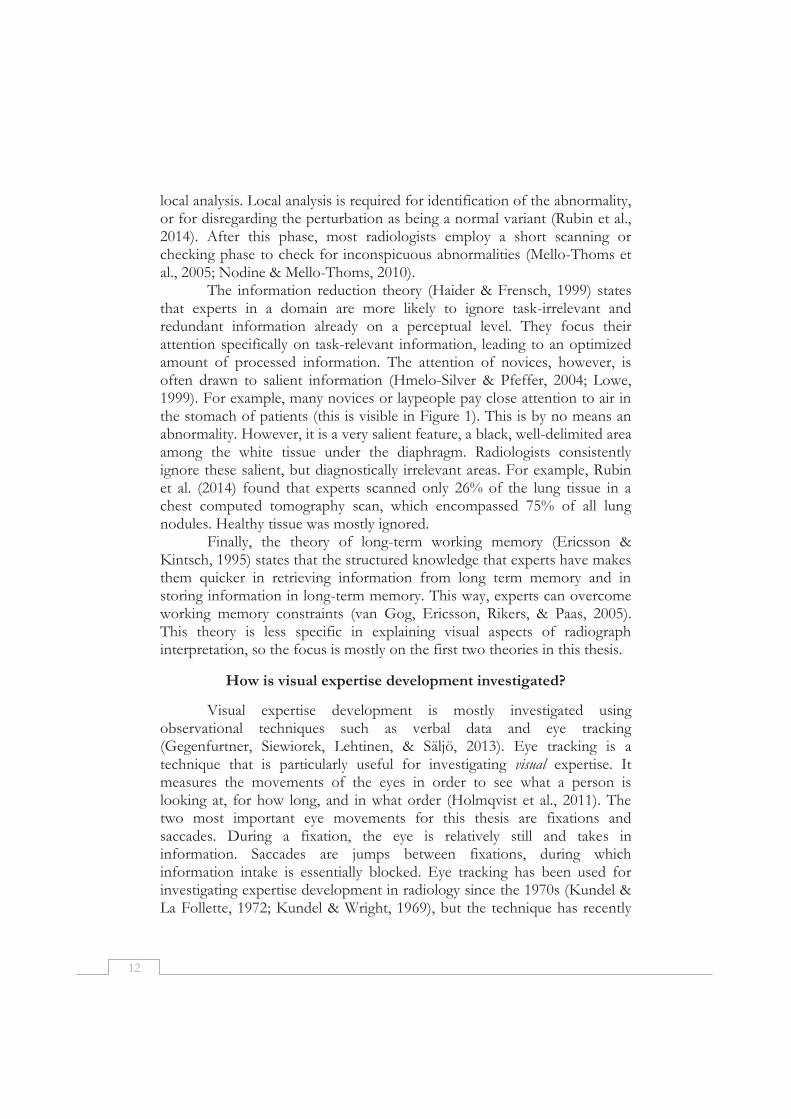
Eye tracking is a technique to measure the movements of the eye(s). This information can be visualized (see e.g. Figure 1) and statistically analyzed. Eye-tracking technology becomes more and more popular as easy to use commercial systems are now available, both in terms of recording and analyzing data. Modern eye trackers capture a video of the eye to determine its movements in relation to a stimulus on a screen (monitor-mounted eye trackers), or in relation to the world around us (mobile eye trackers). An example of mobile eye-tracking can be found in a study by Koh, Park, Wickens, Ong, and Chia (2011), who investigated attentional strategies of novice and experienced scrub nurses during actual caesarean section surgeries.
Several different eye movements exist, but we describe only those that are relevant for eye-tracking research in (medical) education. The best known eye movements are fixations (the circles in Figure 1). During a fixation, the eye is relatively still and takes in information. Fixations usually last about 200-300 milliseconds. The concrete duration of a fixation might provide information about the depth of processing of what a person is looking at (Henderson, Weeks Jr, & Hollingworth, 1999; Rayner, 1998), or the person’s expertise in a task (Kok, De Bruin, Robben, & van Merriënboer, 2012), depending on the task. Saccades (the lines in Figure 1) are the quick movements between fixations which relocate our focus of attention to a new location with the aim of taking in new information. During a saccade, we are essentially blind (Matin, 1974). Furthermore, blinks can be detected by the eye tracker. These are robust indicators of fatigue (Stern, Boyer, & Schroeder, 1994), which could be useful to detect, since it can lead to errors in diagnostic reasoning (Krupinski et al., 2012).
The so far described eye movements occur essentially all the time. When looking at something that is moving, another type of eye movement occurs: smooth pursuit. This may happen when watching video recordings, dynamic or interactive medical images (e.g., ultrasound, scrollable stacks of CT scans or panning of pathological slides), or when looking at the world around us (e.g., when you are moving). Smooth pursuit is essentially a slowly moving fixation and consequently, enables information intake. It is crucial to know, though, that current commercial systems cannot detect smooth pursuit and thus, easily provide wrong data. The only two possibilities to deal with this issue currently are to either program your own smooth pursuit detection algorithms or to analyze raw (i.e., not pre-processed into fixations and saccades) eye tracking data. Thus, care must be taken when using these sorts of stimuli.
30
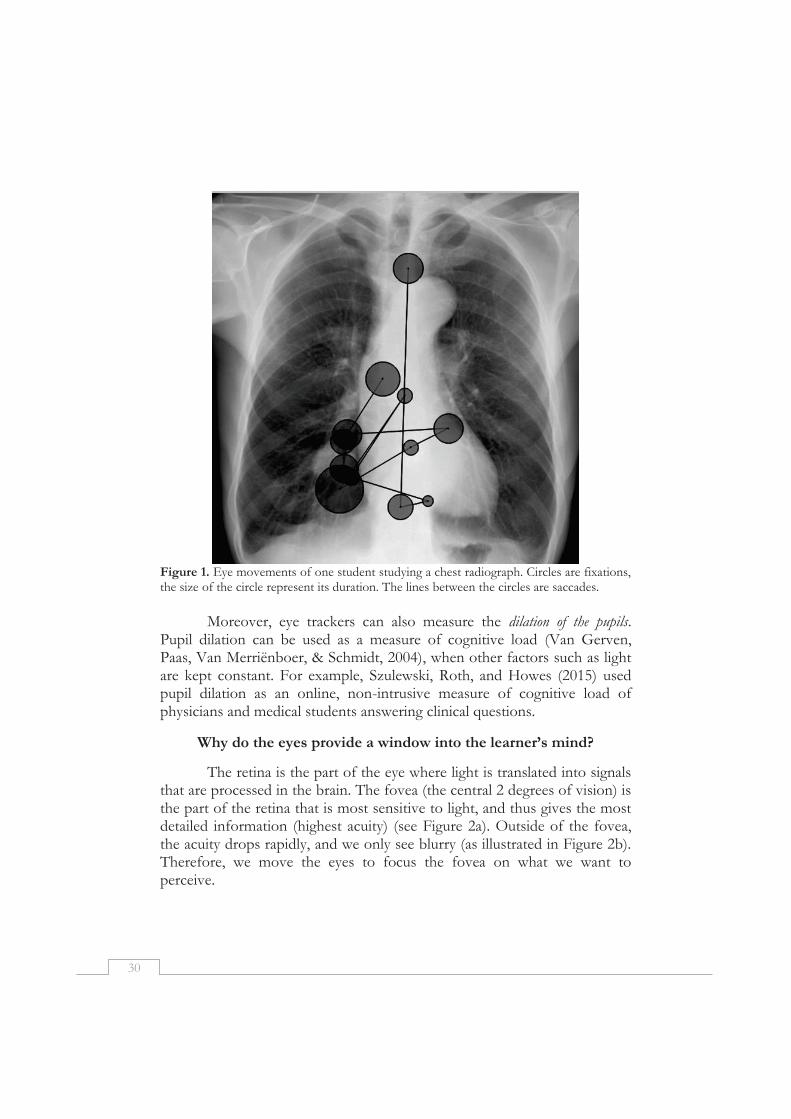
Figure 1. Eye movements of one student studying a chest radiograph. Circles are fixations, the size of the circle represent its duration. The lines between the circles are saccades.
Moreover, eye trackers can also measure the dilation of the pupils.
Pupil dilation can be used as a measure of cognitive load (Van Gerven, Paas, Van Merriënboer, & Schmidt, 2004), when other factors such as light are kept constant. For example, Szulewski, Roth, and Howes (2015) used pupil dilation as an online, non-intrusive measure of cognitive load of physicians and medical students answering clinical questions.
Why do the eyes provide a window into the learner’s mind?
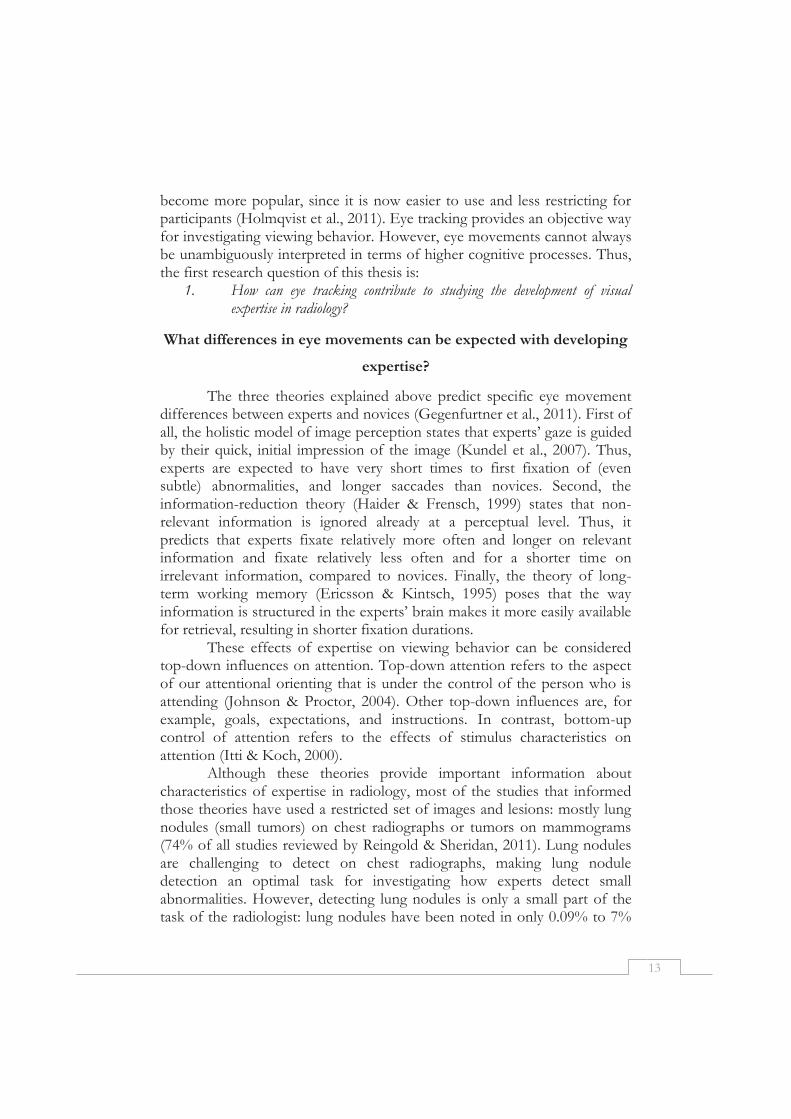
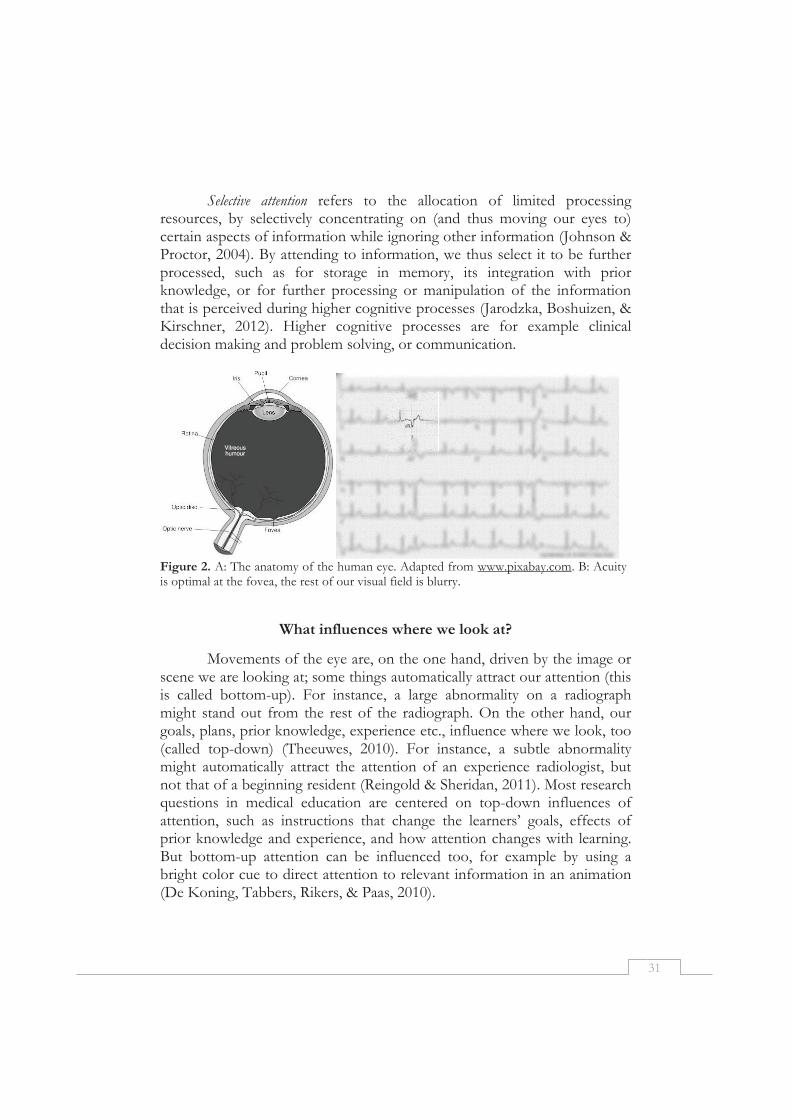
The retina is the part of the eye where light is translated into signals that are processed in the brain. The fovea (the central 2 degrees of vision) is the part of the retina that is most sensitive to light, and thus gives the most detailed information (highest acuity) (see Figure 2a). Outside of the fovea, the acuity drops rapidly, and we only see blurry (as illustrated in Figure 2b). Therefore, we move the eyes to focus the fovea on what we want to perceive.
31
Selective attention refers to the allocation of limited processing resources, by selectively concentrating on (and thus moving our eyes to) certain aspects of information while ignoring other information (Johnson & Proctor, 2004). By attending to information, we thus select it to be further processed, such as for storage in memory, its integration with prior knowledge, or for further processing or manipulation of the information that is perceived during higher cognitive processes (Jarodzka, Boshuizen, & Kirschner, 2012). Higher cognitive processes are for example clinical decision making and problem solving, or communication.
Figure 2. A: The anatomy of the human eye. Adapted from www.pixabay.com. B: Acuity is optimal at the fovea, the rest of our visual field is blurry.
What influences where we look at?
Movements of the eye are, on the one hand, driven by the image or scene we are looking at; some things automatically attract our attention (this is called bottom-up). For instance, a large abnormality on a radiograph might stand out from the rest of the radiograph. On the other hand, our goals, plans, prior knowledge, experience etc., influence where we look, too (called top-down) (Theeuwes, 2010). For instance, a subtle abnormality might automatically attract the attention of an experience radiologist, but not that of a beginning resident (Reingold & Sheridan, 2011). Most research questions in medical education are centered on top-down influences of attention, such as instructions that change the learners’ goals, effects of prior knowledge and experience, and how attention changes with learning. But bottom-up attention can be influenced too, for example by using a bright color cue to direct attention to relevant information in an animation (De Koning, Tabbers, Rikers, & Paas, 2010).
32
How can we see without looking and look without seeing?
We all know that it is possible to look somewhere without actually seeing it, for example when day-dreaming. And, probably even more disturbing, we have the ability to see something without looking at it, for instance, something moving quickly right next to us. Does this make eye tracking an invalid measure of attention?
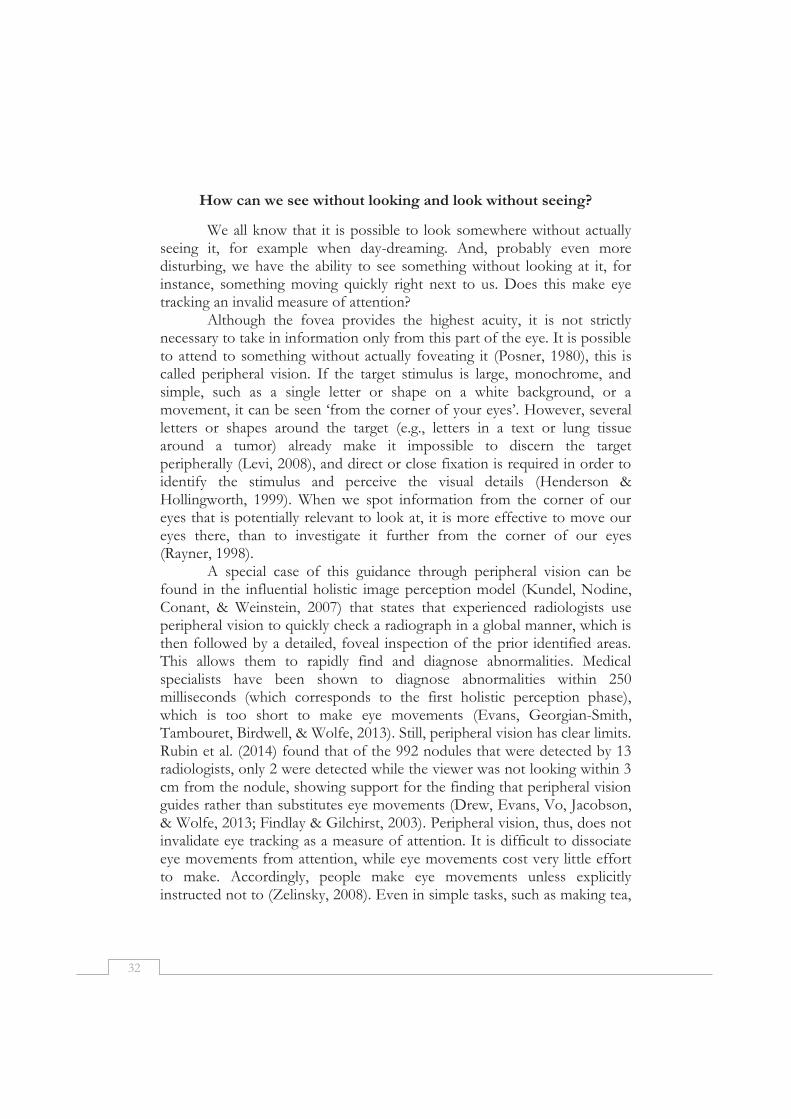
Although the fovea provides the highest acuity, it is not strictly necessary to take in information only from this part of the eye. It is possible to attend to something without actually foveating it (Posner, 1980), this is called peripheral vision. If the target stimulus is large, monochrome, and simple, such as a single letter or shape on a white background, or a movement, it can be seen ‘from the corner of your eyes’. However, several letters or shapes around the target (e.g., letters in a text or lung tissue around a tumor) already make it impossible to discern the target peripherally (Levi, 2008), and direct or close fixation is required in order to identify the stimulus and perceive the visual details (Henderson & Hollingworth, 1999). When we spot information from the corner of our eyes that is potentially relevant to look at, it is more effective to move our eyes there, than to investigate it further from the corner of our eyes (Rayner, 1998).
A special case of this guidance through peripheral vision can be found in the influential holistic image perception model (Kundel, Nodine, Conant, & Weinstein, 2007) that states that experienced radiologists use peripheral vision to quickly check a radiograph in a global manner, which is then followed by a detailed, foveal inspection of the prior identified areas. This allows them to rapidly find and diagnose abnormalities. Medical specialists have been shown to diagnose abnormalities within 250 milliseconds (which corresponds to the first holistic perception phase), which is too short to make eye movements (Evans, Georgian-Smith, Tambouret, Birdwell, & Wolfe, 2013). Still, peripheral vision has clear limits. Rubin et al. (2014) found that of the 992 nodules that were detected by 13 radiologists, only 2 were detected while the viewer was not looking within 3 cm from the nodule, showing support for the finding that peripheral vision guides rather than substitutes eye movements (Drew, Evans, Vo, Jacobson, & Wolfe, 2013; Findlay & Gilchirst, 2003). Peripheral vision, thus, does not invalidate eye tracking as a measure of attention. It is difficult to dissociate eye movements from attention, while eye movements cost very little effort to make. Accordingly, people make eye movements unless explicitly instructed not to (Zelinsky, 2008). Even in simple tasks, such as making tea,
33
where detailed visual information is not very important for correctly executing the task, people make eye movements (Land & Hayhoe, 2001).
What about looking without seeing? Information that is looked at (and thus most likely attended to) is not necessarily understood or processed. For example, in one study, 6th year medical students were found to be similar to radiologists in their viewing of chest radiographs. However, their diagnostic performance was, unsurprisingly, much lower than that of radiologists (Kok et al., 2012).
And do we remember everything we looked at? Attention to an object leads to encoding this information to short-term memory, but not all information that is attended to is maintained in short-term memory, and neither is all information transferred to long-term memory (Peterson & Beck, 2011). Eye movements predict memory: objects that are closer to the location of a fixation are more likely to be remembered, and items that are more often fixated are also more likely to be remembered (Peterson & Beck, 2011). However, information that is fixated is not necessarily remembered (Triesch, Ballard, Hayhoe, & Sullivan, 2003).
Careful experimental design can make it more likely that information that is read (or looked at, in general), is actually processed. For example, an engaging and self-paced task is critical to avoid that participants become bored and make off-task eye movements. Additionally, (retention) tests, observations, log data or verbal data, should be collected to investigate memory or understanding of the information looked at. This methodological triangulation is particularly useful when investigating higher-order cognitive processes. Even though eye movements can provide information on where participants are looking, it is often interesting to know why they looked there. Verbal data, such as think aloud data (Ericsson & Simon, 1980) is most commonly collected together with eye-tracking data to address this issue (e.g., Balslev et al., 2012; Jaarsma, Jarodzka, Nap, van Merriënboer, & Boshuizen, 2015; Jarodzka, Scheiter, Gerjets, & Van Gog, 2010).
How do I spot and conduct high-quality eye-tracking research?
Irrespective of whether you plan to conduct an eye-tracking study yourself, or whether you are about to judge the value of a finding from an eye-tracking study for your research or your educational practice, you must be able to understand what characterizes well-conducted and thus valuable eye-tracking research. First, it is important to consider which process was supposed to be investigated (e.g., attention, memory, higher-order cognitive skills). Based on this, one has to decide what (additional) data should be
34
collected to answer the research question. To interpret the recorded eye-tracking data in a meaningful way, it is critical to choose the measures in line with concrete predictions from education or vision science theories, instead of simply reporting the measures that the eye-tracking software provides.
We illustrate this choice process with one of our studies. Many radiologists believe that a systematic approach to chest radiograph interpretation is critical, because it leads to a complete inspection of the radiograph, thus preventing the radiologists from missing abnormalities. We tested this idea using eye tracking (Kok et al., 2015). Systematic viewing refers to keeping the same order of inspecting anatomic regions, so we choose a measure that can quantify how similar the order of inspecting the images is, called the Levenshtein distance (Holmqvist et al., 2011; Levenshtein, 1966). To test the idea that this leads to a more complete inspection of the radiograph, we calculated the percentage of the image that was inspected. Interestingly, we did not find evidence for the assumed relationship between those two variables and the number of missed abnormalities. This example shows how the translation of theoretical concepts (systematic viewing and completeness) into eye-tracking measures (Levenshtein distance and percentage of the image inspected) and back can contribute to the theoretical understanding and implications for practice.
This is particularly important because many different eye-tracking measures exist. Holmqvist and colleagues report as many as 120 different eye-tracking measures (Holmqvist et al., 2011). This shows the many different possible applications of eye tracking and the richness of the data, but it also poses the researcher with an important question: which measure should I use? Modern eye trackers automatically provide many eye-tracking measures. This makes it very tempting to simply compare those measures between your experimental groups, find the ones that differ significantly and report these. Such a data-dredging approach however, is scientifically unsound (or even fraudulent) because it leads to type-I errors (i.e., false-positives). Moreover, it is unlikely to yield any addition to current knowledge and understanding of the phenomena under study, as these random measures are most likely not relevant for the given research question and theoretical models. Eye-tracking measures should thus match the concept under investigation. Sometimes, this means that concepts do not directly translate into available measures, and measures that are appropriate for the study have to be invented or adapted to answer the research question at hand.
35
Conclusions
Eye tracking is a technique that has a high potential in research in medical education because it provides us with a way to investigate processes of vision, attention and higher-order cognitive skills, which are very important in medicine and medical education. It can help to understand underlying cognitive processes, including learning processes, which often are difficult to access otherwise (Marti, Bayet, & Dehaene, 2015; van Merriënboer, 2015). Furthermore, eye tracking provides a rich source of data at a very fine time-scale. Possible applications are investigating visual characteristics of medical expertise, using eye tracking as a process measure to investigate how students engage with learning materials, investigating classroom management and other social learning situations, and the playback of experienced medical doctors’ eye movements to students.
Eye tracking has the potential to uncover the moment-to-moment processes of learning and effects of instruction, in particular when employed in a theory-driven manner. The requirement for this, however, is that theoretical concepts are explicitly translated into concrete eye-tracking measures, and that findings are related back to theory. The conclusions drawn from the eye-tracking measure should match that measure (e.g., when certain information is fixated, we conclude that the information is taken in, not that it is remembered). Finally, triangulation of different methods is critical when claims are made about higher-order cognitive skills. If these prerequisites are taken into account, eye tracking will help us to understand learning and instruction in medicine, and, more important, improve instruction in educational practice.
36
References
Balslev, T., Jarodzka, H., Holmqvist, K., de Grave, W., Muijtjens, A. M. M., Eika, B., . . . Scherpbier, A. J. J. A. (2012). Visual expertise in paediatric neurology. European Journal of Paediatric Neurology, 16(2), 161-166.
Crosby, J. R., Monin, B., & Richardson, D. (2008). Where do we look during potentially offensive behavior? Psychological Science, 19(3), 226-228.
De Koning, B. B., Tabbers, H. K., Rikers, R., & Paas, F. (2010). Attention guidance in learning from a complex animation: Seeing is understanding? Learning and Instruction, 20(2), 111-122.
Drew, T., Evans, K., Vo, M. L. H., Jacobson, F. L., & Wolfe, J. M. (2013). Informatics in radiology What can you see in a single glance and how might this guide visual search in medical images? Radiographics, 33(1), 263-274.
Ericsson, K. A., & Simon, H. A. (1980). Verbal reports as data. Psychological Review, 87(3), 215-251.
Evans, K. K., Georgian-Smith, D., Tambouret, R., Birdwell, R. L., & Wolfe, J. M. (2013). The gist of the abnormal: above-chance medical decision making in the blink of an eye. Psychonomic Bulletin & Review, 20(6), 1170-1175.
Findlay, J. M., & Gilchirst, I., D. (2003). Active vision: the psychology of looking and seeing. Oxford: Oxford University Press.
Henderson, J. M., & Hollingworth, A. (1999). High-level scene perception. Annual Review of Psychology, 50(1), 243-271.
Henderson, J. M., Weeks Jr, P. A., & Hollingworth, A. (1999). The effects of semantic consistency on eye movements during complex scene viewing. Journal of Experimental Psychology: Human Perception and Performance, 25(1), 210.
Holmqvist, K., Nyström, M., Andersson, R., Dewhurst, R., Jarodzka, H., & van de Weijer, J. (2011). Eye tracking: A comprehensive guide to methods and measures. Oxford: Oxford University Press.
Jaarsma, T., Jarodzka, H., Nap, M., van Merriënboer, J. J., & Boshuizen, H. P. (2015). Expertise in clinical pathology: combining the visual and cognitive perspective. Advances in Health Sciences Education, 20(4), 1089-1106.
Jaarsma, T., Jarodzka, H., Nap, M., van Merriënboer, J. J. G., & Boshuizen, H. P. A. (2014). Expertise under the microscope: processing histopathological slides. Medical Education, 48(3), 292-300.
Jarodzka, H., Balslev, T., Holmqvist, K., Nyström, M., Scheiter, K., Gerjets, P., & Eika, B. (2012). Conveying clinical reasoning based on visual observation via eye-movement modelling examples. Instructional Science, 40(5), 813-827.
Jarodzka, H., Boshuizen, H. P. A., & Kirschner, P. (2012). Cognitive skills in cather-based cardiovascular invervention. In P. Lanzer (Ed.), Cather-based cardiovascular interventions: a knowledge-based approach (pp. 69-86). Heidelberg: Springer.
Jarodzka, H., Janssen, N., Kirschner, P. A., & Erkens, G. (2015). Avoiding split attention in computer-based testing: Is neglecting additional information facilitative? British Journal of Educational Technology, 46(4), 803-817.
Jarodzka, H., Scheiter, K., Gerjets, P., & Van Gog, T. (2010). In the eyes of the beholder: How experts and novices interpret dynamic stimuli. Learning and Instruction, 20(2), 146-154.
Johnson, A., & Proctor, R. W. (2004). Attention : theory and practice. Thousand Oaks, CA [etc.]: Sage.
37
Koh, R. Y., Park, T., Wickens, C. D., Ong, L. T., & Chia, S. N. (2011). Differences in attentional strategies by novice and experienced operating theatre scrub nurses. Journal of Experimental Psychology: Applied, 17(3), 233.
Kok, E. M., De Bruin, A. B. H., Robben, S. G. F., & van Merriënboer, J. J. G. (2012). Looking in the same manner but seeing it differently: Bottom-up and expertise effects in radiology. Applied Cognitive Psychology, 26(6), 854-862.
Kok, E. M., Jarodzka, H., de Bruin, A. B. H., BinAmir, H. A. N., Robben, S. G. F., & van Merriënboer, J. J. G. (2015). Systematic viewing in radiology: seeing more, missing less? Advances in Health Sciences Education, 1-17.
Krupinski, E. A., Berbaum, K. S., Caldwell, R. T., Schartz, K. M., Madsen, M. T., & Kramer, D. J. (2012). Do long radiology workdays affect nodule detection in dynamic CT interpretation? Journal of the American College of Radiology, 9(3), 191-198.
Kundel, H. L., Nodine, C. F., Conant, E. F., & Weinstein, S. P. (2007). Holistic component of image perception in mammogram interpretation: Gaze-tracking study. Radiology, 242(2), 396-402.
Land, M. F., & Hayhoe, M. (2001). In what ways do eye movements contribute to everyday activities? Vision Research, 41(25), 3559-3565.
Levenshtein, V. I. (1966). Binary codes capable of correcting deletions, insertions and reversals. Soviet Physics Doklady, 10(8), 707-710.
Levi, D. M. (2008). Crowding—An essential bottleneck for object recognition: A mini-review. Vision Research, 48(5), 635-654.
Marti, S., Bayet, L., & Dehaene, S. (2015). Subjective report of eye fixations during serial search. Consciousness and Cognition, 33, 1-15.
Matin, E. (1974). Saccadic suppression: a review and an analysis. Psychological Bulletin, 81(12), 899.
Peterson, M. S., & Beck, M. R. (2011). Eye movements and memory. In S. P. Liversedge, I. Gilchirst, D., & S. Everling (Eds.), The Oxford Handbook of Eye Movements (pp. 579-606). Oxford: Oxford University Press.
Posner, M. I. (1980). Orienting of attention. Quarterly Journal of Experimental Psychology, 32(1), 3-25.
Rayner, K. (1998). Eye movements in reading and information processing: 20 years of research. Psychological Bulletin, 124(3), 372-422.
Reingold, E. M., & Sheridan, H. (2011). Eye movements and visual expertise in chess and medicine. In S. P. Leversedge, I. D. Gilchrist, & S. Everling (Eds.), Oxford Handbook of Eye Movements (pp. 528-550). Oxford: Oxford University Press.
Rubin, G. D., Roos, J. E., Tall, M., Harrawood, B., Bag, S., Ly, D. L., . . . Roy Choudhury, K. (2014). Characterizing search, recognition, and decision in the detection of lung nodules on CT scans: elucidation with eye tracking. Radiology, 274(1), 276-286.
Stern, J. A., Boyer, D., & Schroeder, D. (1994). Blink rate: a possible measure of fatigue. Human Factors: The Journal of the Human Factors and Ergonomics Society, 36(2), 285-297.
Szulewski, A., Roth, N., & Howes, D. (2015). The use of task-evoked pupillary response as an objective measure of cognitive load in novices and trained physicians: A new tool for the assessment of expertise. Academic Medicine, 90(7), 981-987.
Theeuwes, J. (2010). Top-down and bottom-up control of visual selection. Acta Psychologica, 135(2), 77-99.
Triesch, J., Ballard, D. H., Hayhoe, M. M., & Sullivan, B. T. (2003). What you see is what you need. Journal of Vision, 3(1), 86-94.
38
van den Bogert, N., van Bruggen, J., Kostons, D., & Jochems, W. (2014). First steps into understanding teachers' visual perception of classroom events. Teaching and Teacher Education, 37, 208-216.
Van Gerven, P. W., Paas, F., Van Merriënboer, J. J., & Schmidt, H. G. (2004). Memory load and the cognitive pupillary response in aging. Psychophysiology, 41(2), 167-174.
van Gog, T., & Jarodzka, H. (2013). Eye tracking as a tool to study and enhance cognitive and metacognitive processes in computer-based learning environments. In R. Azevedo & V. Aleven (Eds.), International Handbook of Metacognition and Learning Technologies (pp. 143-156). New York: Springer Science+ Business media.
Van Gog, T., Jarodzka, H., Scheiter, K., Gerjets, P., & Paas, F. (2009). Attention guidance during example study via the model's eye movements. Computers in Human Behavior, 25(3), 785-791.
van Merriënboer, J. J. G. (2015). What people say # what people do. Perspectives on Medical Education, 4(1), 47-48.
Zelinsky, G. J. (2008). A theory of eye movements during target acquisition. Psychological Review, 115(4), 787.
39
Chapter 3
Looking in the same manner but seeing it differently: Bottom-up
and expertise effects in radiology
Published as: Kok, E. M., De Bruin, A. B. H., Robben, S. G. F., & van Merriënboer, J. J. G. (2012). Looking in the same manner but seeing it differently: Bottom-up and expertise effects in radiology. Applied Cognitive Psychology, 26(6), 854-862.
40
Abstract
Models of expertise differences in radiology often do not take into account visual differences between diseases. This study investigates the bottom-up effects of three types of images on viewing patterns of students, residents and radiologists: Focal diseases (localized abnormality), diffuse diseases (distributed abnormality) and images showing no abnormalities (normal). Participants inspected conventional chest radiographs while their eye movements were recorded. Regardless of expertise, in focal diseases participants fixated relatively long at specific locations, while in diffuse diseases fixations were more dispersed and shorter. Moreover, for students, dispersion of fixations was higher on diffuse compared to normal images, while for residents and radiologists dispersion was highest on normal images. Despite this difference, students showed relatively high performance on normal images but low performance on focal and diffuse images. Viewing patterns were strongly influenced by bottom-up stimulus effects. Although viewing behavior of students was similar to that of radiologists, they lack knowledge that helps them diagnose the disease correctly.
41
As in many other domains of visual expertise, such as meteorology (Canham & Hegarty, 2010), biological classification (Jarodzka, Scheiter, Gerjets, & Van Gog, 2010) and aviation (Remington, Johnston, Ruthruff, Gold, & Romera, 2000), diagnosing medical images requires an intricate interplay between cognitive and perceptual processes (Krupinski, 2010). Experienced radiologists have extensive knowledge of clinically normal exemplars as well as abnormal features that signal pathology (Norman, Coblentz, Brooks, & Babcook, 1992). This enables a radiologist to decide on, for example, the identity of a white area on a chest radiograph: Is this a tumor, pneumonia, or is it just an artifact of the way the image is produced? In order to gather all this information on which a diagnostic decision can be based, visual search has to take place.
Viewing behavior of experts and novices in radiology has been extensively studied (for a recent review, see Nodine & Mello-Thoms, 2010). A lot of research is devoted to the effect of image features on viewing behavior. For example, effects on viewing have been investigated for lesion conspicuity (Krupinski, 2005; Leong, Nicolaou, Emery, Darzi, & Yang, 2007; Manning, Ethell, & Donovan, 2004; Mello-Thoms, et al., 2005), nodule size (Krupinski, Berger, Dallas, & Roehrig, 2003), image quality (Krupinski & Roehrig, 2010), and local anatomical variation (Samei, Flynn, Peterson, & Eyler, 2003). However, most expertise research in radiology does not take into account visual variations within a stimulus-type and is conducted within the context of one specific type of disease, such as chest nodules (e.g., Manning, Ethell, Donovan, & Crawford, 2006) or tumors in mammograms (e.g., Kundel, Nodine, Conant, & Weinstein, 2007). Yet, within one imaging modality, several types of diseases can be present, which could strongly influence viewing behavior in a bottom-up fashion (Kok, De Bruin, Robben, & Van Merriënboer, 2012). The current study adds to the expertise literature in radiology (and possibly other domains of visual expertise) by investigating how those bottom-up effects of type of disease influence eye-movement patterns in novices, intermediates and experts.
Viewing behavior can be investigated using eye tracking. The most important eye movements are fixations and saccades. During a fixation, the eye remains still and takes in information. Saccades are jumps between fixations, during which no information intake occurs (Rayner, 1998). It is known that eye movements, which reflect deployment of attention, can be influenced by bottom-up effects and top-down effects. When stimulus characteristics influence eye movements, this is called bottom-up processing (Itti & Koch, 2001); when cognitive relevance strongly guides visual search, this is called top-down processing (Yarbus, 1967).
42
Top-down effects on viewing can arise from expectations, the specific task at hand, but also from expertise. The characteristics of expertise are extensively studied (see, for example, Ericsson, Charness, Feltovich, & Hoffman, 2006). This line of research started with the early work of De Groot, who investigated expertise in chess (de Groot, 1946). Links were made between expertise in chess (Chase & Simon, 1973) and the medical field, and shortly after, the nature of medical expertise also became a focus of expertise research (e.g., Groen & Patel, 1988; Lesgold et al., 1988; Norman, Brooks, Coblentz, & Babcook, 1992; Schmidt, Norman, & Boshuizen, 1990). Experts possess complex cognitive structures in which information is stored, but also organized (van Merriënboer & Sweller, 2005). In the context of medical expertise, clinical and diagnostic information is often structured in illness scripts (Schmidt & Boshuizen, 1993). Illness scripts hold extensive information related to a disease or a class of diseases, such as signs and symptoms, consequences and context under which the illness develops. Development of illness scripts is believed to occur through the process of chunking. Chunking takes place through repeated exposure to the same symptoms with a specific diagnosis. This eventually leads to direct activation of the diagnosis when a patient exhibits those symptoms (Ericsson & Kintsch, 1995). Although working memory is severely limited in the amount of information elements it can hold and manipulate, scripts can be held in working memory as one element. This allows experts to circumvent working memory constraints that novices experience when trying to hold a lot of information in mind (van Gog, Ericsson, Rikers, & Paas, 2005). Not only does the availability of illness scripts lower the cognitive load imposed by the visual diagnostic task, it also influences visual search in a top-down manner: experts’ knowledge influences their viewing behavior. Gegenfurtner, Lehtinen and Saljö (2011) reviewed three more specific theories of visual expertise in terms of eye-movements: the holistic model of image perception (Kundel, et al., 2007), the theory of long-term working memory (Ericsson & Kintsch, 1995) and the information reduction theory (Haider & Frensch, 1999).
Kundel and Nodine (1983) were among the first to investigate the perceptual aspects of visual expertise in radiology. Their holistic model of image perception describes how the expert’s extensive knowledge base informs their viewing behavior. Upon seeing a medical image, experts gather an initial impression of the image (Kundel et al., 2007) and detect which areas are perturbed (some radiologists report that an abnormal area seems to leap out of an image); those areas are scrutinized for features of pathology. A main advantage that experts have over novices is that their
43
initial impression is more informative. This leads to fixation of perturbations within the first two seconds of viewing and longer saccades (Gegenfurtner et al., 2011).
Ericsson and Kintsch (1995) pose that expertise leads to a change in memory structures, leading to ‘long term-working memory’. Information related to the field of expertise is stored in a structured manner, and is easily available for retrieval. This allows experts to encode and retrieve task-relevant information more quickly compared to novices, resulting in shorter fixation durations. The information-reduction hypothesis (Haider & Frensch, 1999) poses that experts in a task ignore task-irrelevant information at a perceptual level, they show more selective processing. Experts’ memory structures help them select relevant information, which further lowers the amount of information that is to be held in working memory. Students’ working memory, on the other hand, is further taxed by the fact that they also take in irrelevant information, leading to a higher cognitive load. Experts are thus expected to have more fixations of longer duration on task-relevant information and less fixations of shorter duration on task irrelevant or redundant information.
When the time to first fixating relevant information and proportion of time on relevant information are measured, this information needs to be localized: part of the information that is present has to be irrelevant or redundant, otherwise the measures do not make sense. But this is not always the case. Relevant information can also be present on a more global level (see, e.g., Kok et al., 2012; O'Neill et al., 2011; Vogt & Magnussen, 2007). When focusing on chest radiographs (X-ray images), a distinction can be made between focal diseases and diffuse diseases (Kok et al., in 2012), see figure 1 for examples. Focal diseases consist of an abnormality at a specific location such as a tumor. The rest of the lung is relatively unaffected. For example, Figure 1 shows a large, round abnormality in the middle of the right lung (left side of the image). The rest of the lung appears normal. In contrast to focal diseases, diffuse diseases involve the whole lung. Figure 1 shows an example of a diffuse disease, in which both lungs appear spotted and slightly whiter than normal. Images without abnormalities are usually referred to as ‘normal images’. In radiological reports, focal diseases are typically described as objects (e.g., a space-occupying process), so location, size, form, and so forth are noted. In contrast, diffuse diseases are described as a pattern, for instance a reticular pattern (innumerable lines that together resemble a net) or a honeycombing pattern (a pattern of small rings, resembling a honeycomb) (Hansell et al., 2008).
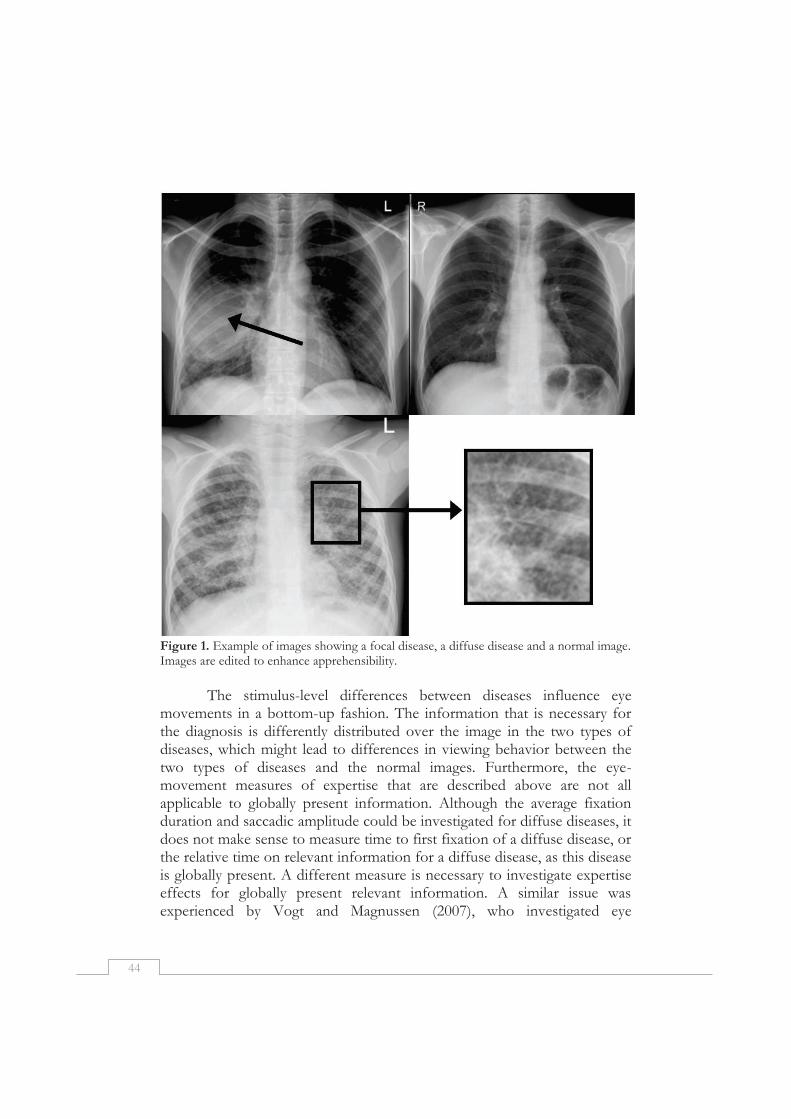
44
Figure 1. Example of images showing a focal disease, a diffuse disease and a normal image. Images are edited to enhance apprehensibility.
The stimulus-level differences between diseases influence eye
movements in a bottom-up fashion. The information that is necessary for the diagnosis is differently distributed over the image in the two types of diseases, which might lead to differences in viewing behavior between the two types of diseases and the normal images. Furthermore, the eye-movement measures of expertise that are described above are not all applicable to globally present information. Although the average fixation duration and saccadic amplitude could be investigated for diffuse diseases, it does not make sense to measure time to first fixation of a diffuse disease, or the relative time on relevant information for a diffuse disease, as this disease is globally present. A different measure is necessary to investigate expertise effects for globally present relevant information. A similar issue was experienced by Vogt and Magnussen (2007), who investigated eye
45
movement patterns of artists and laypeople on different types of images. They calculated a global/local ratio based on the distance between fixations. A higher ratio indicates a global, dispersed viewing pattern while a lower ratio indicates that fixations cluster locally, in specific (informative) regions (Zangemeister, Sherman, & Stark, 1995). This study showed that in the field of art, both bottom-up effects of the type of image (abstract patterns vs. realistic objects) and expertise influence eye movement patterns. Both artists and laypeople showed a more global, dispersed viewing pattern when looking at abstract pictures and a more local viewing pattern when looking at realistic pictures. Strikingly, artists generally looked in a more global way, fixating less on informative objects and more on areas holding no objects (e.g., water surface) compared to laypeople (Vogt & Magnussen, 2007).
This difference between more global and more local viewing patterns was also reported (though not quantified) by O’Neill and colleagues (2011), who investigated viewing patterns of subspecialists and trainees in ophthalmology. Inspection of gaze data showed that glaucoma subspecialists ‘adapted’ their viewing behavior more to the type of glaucomatous damage (focal loss or diffuse loss), while residents did not show adaptation: they showed more focal viewing behavior for both types of diseases. The ‘adaptation’ of viewing behavior to image type can be considered a sign of selective information processing, which is in line with Haider and Frensch’ information reduction theory. Experts appear to activate knowledge structures in working memory, which influence viewing behavior in a top-down manner. Furthermore, the selective information processing lowers cognitive load by lowering the total amount of information that needs to be processed.
We systematically explored the bottom-up effects of type of image on eye-movement patterns of radiologists, residents and students who diagnosed conventional chest radiographs (X-ray images), based on expertise theories of Kundel et al. (2007), Ericsson and Kintsch (1995), and Haider and Frensch (1999). Kundel’s model predicts larger average saccade length for experts compared to students and residents. Ericsson and Kintsch’s theory predicts shorter average fixation durations with increased expertise. Additionally, lower average fixation durations are expected on normal images in comparison with images showing a disease (Manning et al., 2006). Furthermore, we suggest that Haider and Frensch’ theory predicts that experts adapt their viewing behavior better to the type of diseases: We expect a low global/local ratio for focal diseases, a higher ratio for diffuses diseases, and an even higher ratio for normal images. These differences are expected to be strongest for radiologists, and weakest for students.
46
Methods
Participants Novices were 11 sixth year medical students (4 male, 7 female),
mean age 25.2 years (SD = 1.1). Intermediates were 10 residents (4 male, 6 female), mean age 30.4 years (SD = 3.5). Experts were 9 radiologists, (7 male, 2 female), mean age 44.7 years (SD = 9.1).
Residents reported working for 45.4 hours per week on average (SD = 6.2). Radiologists reported working for 48.4 hours per week on average (SD = 15.5). Residents were asked to indicate for how many months they had worked as a resident. The average was 28 months (SD = 22.4). For radiologists, the average length of their career after board licensing was 15.6 years (SD = 8.2 years), the minimum was 6 years and the maximum was 27 years. Students’ experience with thorax radiographs was estimated in hours. The median experience was 6 hours. Design
The design was a 3 x 3 mixed factorial design, with expertise (student, resident, radiologist) as a between-subjects variable and type of image (focal, diffuse, normal) as a within-subjects variable. Dependent variables were percentage correct diagnoses, trial duration, average fixation duration, average saccadic amplitude, and global/local ratio. Apparatus and materials
The study was conducted using a remote high-speed eye-tracker with a 500 Hz sampling rate (Eyelink 1000). Participants’ head movement was restricted only by using a forehead rest, which allowed participants to speak. Images were presented on a 19 inch LCD screen with a resolution of 1024 x 768 pixels. Participants’ utterances were recorded using a digital recorder.
Materials were 24 conventional PA (Posterior-Anterior) chest radiographs (X-rays). Sixteen images showed a disease, eight of which were focal diseases and eight were diffuse diseases. Focal images contained one or more abnormalities at a specific location, while the rest of the lung was not affected. In diffuse images, all lobes of both lungs were affected. Normal images showed no abnormalities (see Figure 1 for examples). All disease images and two of the normal images were chosen to be slightly challenging even for radiologists to ensure sufficient time for inspection of the images.
47
Procedure Before the start of the experiment, participants were asked to sign
an informed consent form and report on their experience in radiology based on a small questionnaire. Participants were assured that participation was anonymous and data was used only for the purpose of this research. It was explained that they were about to inspect chest radiographs, and it was stressed that they should act as they would do in normal practice. Eye dominance was assessed using the Miles test (Miles, 1930). Images were presented in two blocks of 12 images. Calibration of the eye-tracker is required to estimate the gaze direction of participants. A nine-point calibration procedure (see, e.g., Holmqvist et al., 2011) was conducted before each block of 12 images. The participants were instructed to carefully look at 9 circles appearing one by one on the screen. After that, they proceeded to the actual task. They were asked to orally provide only the most likely diagnosis for all images. They could hit a button to continue to the next image. They were asked to work as quickly and as accurately as possible. Before both blocks, one image with an obvious abnormality (large pneumothorax) was shown for practice and participants received feedback before continuing to the first trial. Participants viewed each image in its entirety; zooming was not possible. Analyses
The global/local ratio was computed by dividing the number of long saccades (> 1.6 degrees of visual angle) by the number of short saccades (< 1.6 degrees of visual angle) (Zangemeister et al., 1995). Because this ratio was skewed, a lognormal transformation was performed. The skewness improved from 6.9 to 0.6. Multilevel analysis was conducted for all dependent variables, random intercepts were allowed on the participant level and on the item level. For all analyses, the model with random intercepts had a significantly better fit than models that did not include random intercepts. The correct answer for each image was defined by an expert radiologist based on the given image as well as other information available to this radiologist (diagnosis, CT-scans, lateral chest radiographs and follow-up). Furthermore, it was decided which other valid conclusions might be drawn based on just this image. All data were scored by two independent scorers. Answers for one of the focal images were excluded from analysis because no consensus on correct or incorrect answers could be reached. For all other images, 94.5% were assigned the same score by the two scorers. Other scores were discussed until consensus was reached.
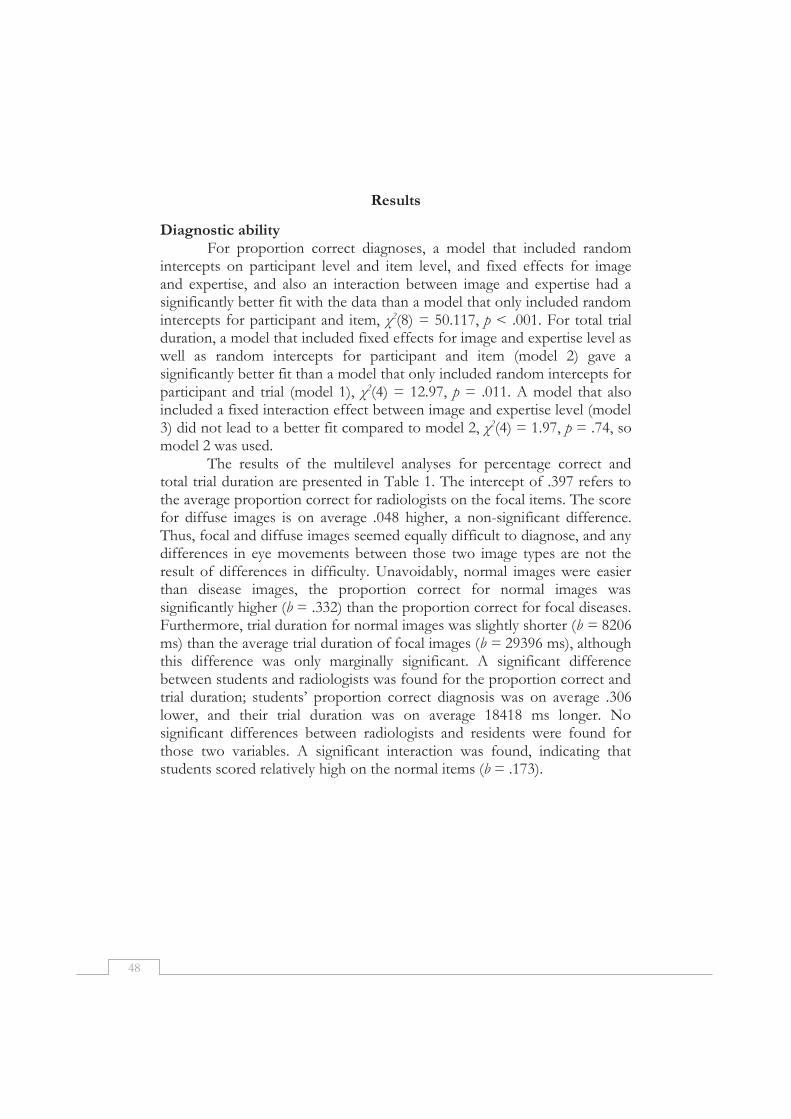
48
Results
Diagnostic ability For proportion correct diagnoses, a model that included random
intercepts on participant level and item level, and fixed effects for image and expertise, and also an interaction between image and expertise had a significantly better fit with the data than a model that only included random intercepts for participant and item, χ2(8) = 50.117, p < .001. For total trial duration, a model that included fixed effects for image and expertise level as well as random intercepts for participant and item (model 2) gave a significantly better fit than a model that only included random intercepts for participant and trial (model 1), χ2(4) = 12.97, p = .011. A model that also included a fixed interaction effect between image and expertise level (model 3) did not lead to a better fit compared to model 2, χ2(4) = 1.97, p = .74, so model 2 was used.
The results of the multilevel analyses for percentage correct and total trial duration are presented in Table 1. The intercept of .397 refers to the average proportion correct for radiologists on the focal items. The score for diffuse images is on average .048 higher, a non-significant difference. Thus, focal and diffuse images seemed equally difficult to diagnose, and any differences in eye movements between those two image types are not the result of differences in difficulty. Unavoidably, normal images were easier than disease images, the proportion correct for normal images was significantly higher (b = .332) than the proportion correct for focal diseases. Furthermore, trial duration for normal images was slightly shorter (b = 8206 ms) than the average trial duration of focal images (b = 29396 ms), although this difference was only marginally significant. A significant difference between students and radiologists was found for the proportion correct and trial duration; students’ proportion correct diagnosis was on average .306 lower, and their trial duration was on average 18418 ms longer. No significant differences between radiologists and residents were found for those two variables. A significant interaction was found, indicating that students scored relatively high on the normal items (b = .173).
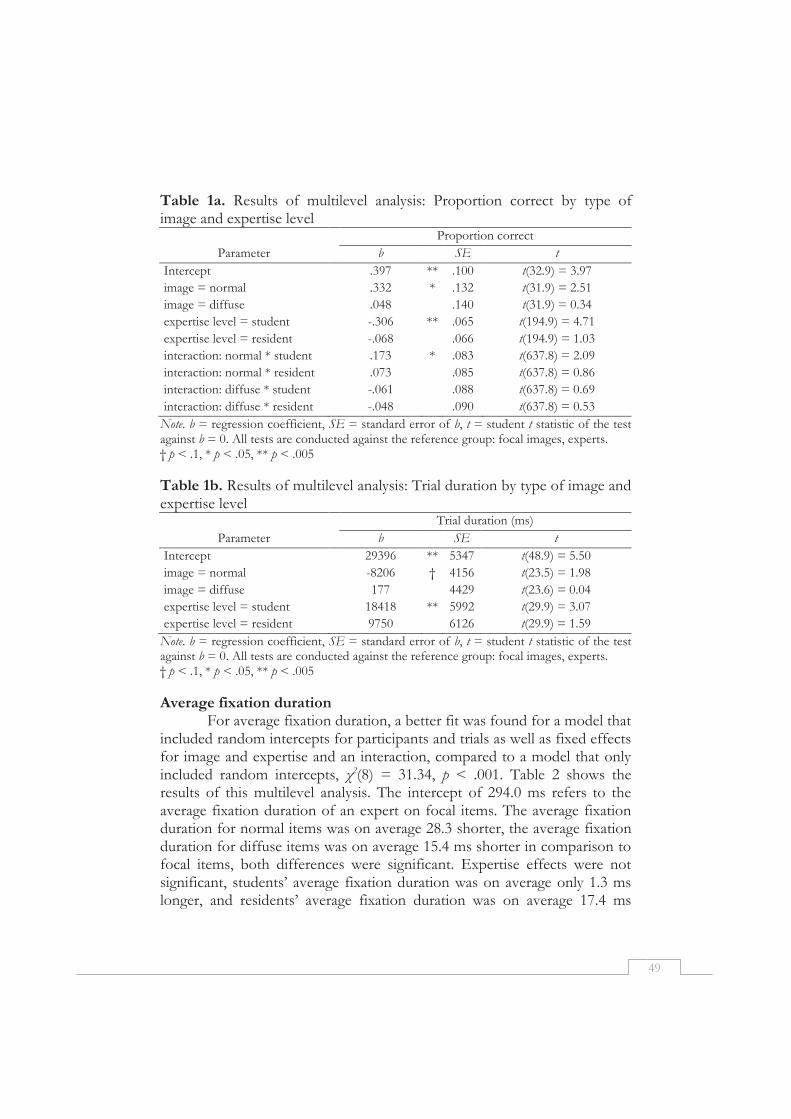
49
Table 1a. Results of multilevel analysis: Proportion correct by type of image and expertise level
Proportion correct
Parameter b SE t
Intercept .397 ** .100 t(32.9) = 3.97
image = normal .332 * .132 t(31.9) = 2.51
image = diffuse .048 .140 t(31.9) = 0.34
expertise level = student -.306 ** .065 t(194.9) = 4.71
expertise level = resident -.068 .066 t(194.9) = 1.03
interaction: normal * student .173 * .083 t(637.8) = 2.09
interaction: normal * resident .073 .085 t(637.8) = 0.86
interaction: diffuse * student -.061 .088 t(637.8) = 0.69
interaction: diffuse * resident -.048 .090 t(637.8) = 0.53
Note. b = regression coefficient, SE = standard error of b, t = student t statistic of the test against b = 0. All tests are conducted against the reference group: focal images, experts. † p < .1, * p < .05, ** p < .005
Table 1b. Results of multilevel analysis: Trial duration by type of image and expertise level
Trial duration (ms)
Parameter b SE t
Intercept 29396 ** 5347 t(48.9) = 5.50
image = normal -8206 † 4156 t(23.5) = 1.98
image = diffuse 177 4429 t(23.6) = 0.04
expertise level = student 18418 ** 5992 t(29.9) = 3.07
expertise level = resident 9750 6126 t(29.9) = 1.59
Note. b = regression coefficient, SE = standard error of b, t = student t statistic of the test against b = 0. All tests are conducted against the reference group: focal images, experts. † p < .1, * p < .05, ** p < .005
Average fixation duration For average fixation duration, a better fit was found for a model that
included random intercepts for participants and trials as well as fixed effects for image and expertise and an interaction, compared to a model that only included random intercepts, χ2(8) = 31.34, p < .001. Table 2 shows the results of this multilevel analysis. The intercept of 294.0 ms refers to the average fixation duration of an expert on focal items. The average fixation duration for normal items was on average 28.3 shorter, the average fixation duration for diffuse items was on average 15.4 ms shorter in comparison to focal items, both differences were significant. Expertise effects were not significant, students’ average fixation duration was on average only 1.3 ms longer, and residents’ average fixation duration was on average 17.4 ms
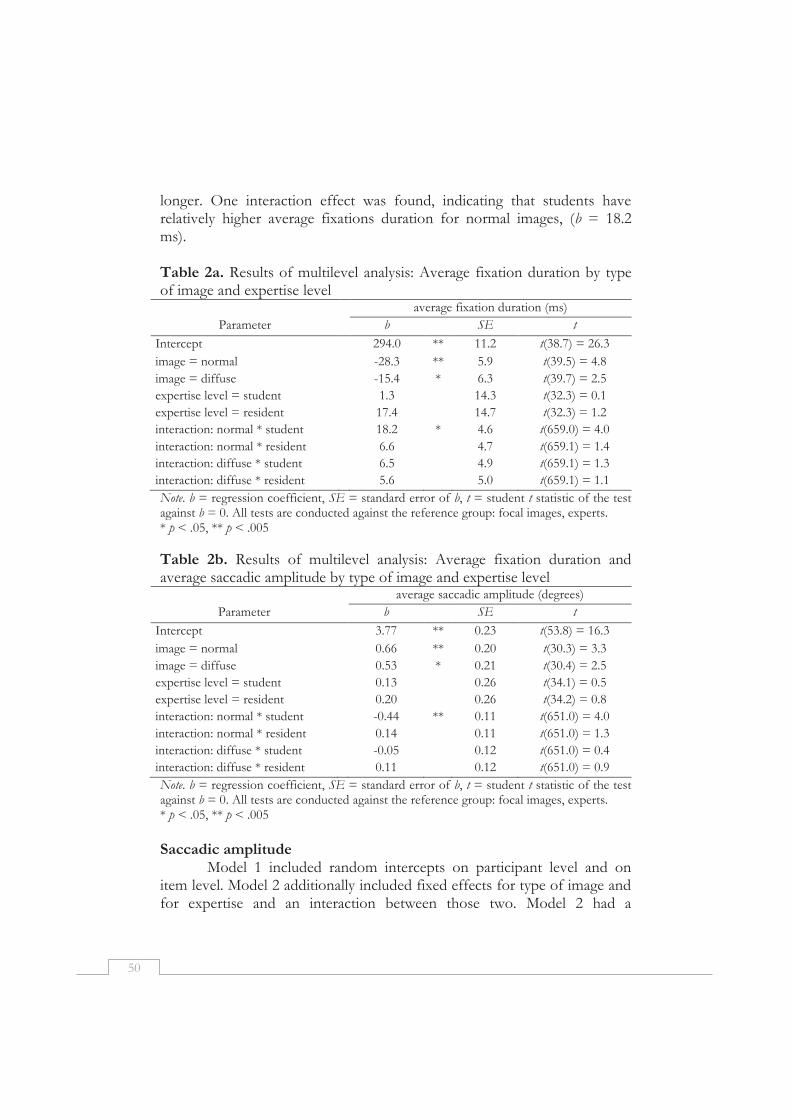
50
longer. One interaction effect was found, indicating that students have relatively higher average fixations duration for normal images, (b = 18.2 ms). Table 2a. Results of multilevel analysis: Average fixation duration by type of image and expertise level
average fixation duration (ms)
Parameter b SE t
Intercept 294.0 ** 11.2 t(38.7) = 26.3
image = normal -28.3 ** 5.9 t(39.5) = 4.8
image = diffuse -15.4 * 6.3 t(39.7) = 2.5
expertise level = student 1.3 14.3 t(32.3) = 0.1
expertise level = resident 17.4 14.7 t(32.3) = 1.2
interaction: normal * student 18.2 * 4.6 t(659.0) = 4.0
interaction: normal * resident 6.6 4.7 t(659.1) = 1.4
interaction: diffuse * student 6.5 4.9 t(659.1) = 1.3
interaction: diffuse * resident 5.6 5.0 t(659.1) = 1.1
Note. b = regression coefficient, SE = standard error of b, t = student t statistic of the test against b = 0. All tests are conducted against the reference group: focal images, experts. * p < .05, ** p < .005
Table 2b. Results of multilevel analysis: Average fixation duration and average saccadic amplitude by type of image and expertise level
average saccadic amplitude (degrees)
Parameter b SE t
Intercept 3.77 ** 0.23 t(53.8) = 16.3
image = normal 0.66 ** 0.20 t(30.3) = 3.3
image = diffuse 0.53 * 0.21 t(30.4) = 2.5
expertise level = student 0.13 0.26 t(34.1) = 0.5
expertise level = resident 0.20 0.26 t(34.2) = 0.8
interaction: normal * student -0.44 ** 0.11 t(651.0) = 4.0
interaction: normal * resident 0.14 0.11 t(651.0) = 1.3
interaction: diffuse * student -0.05 0.12 t(651.0) = 0.4
interaction: diffuse * resident 0.11 0.12 t(651.0) = 0.9
Note. b = regression coefficient, SE = standard error of b, t = student t statistic of the test against b = 0. All tests are conducted against the reference group: focal images, experts. * p < .05, ** p < .005
Saccadic amplitude
Model 1 included random intercepts on participant level and on item level. Model 2 additionally included fixed effects for type of image and for expertise and an interaction between those two. Model 2 had a
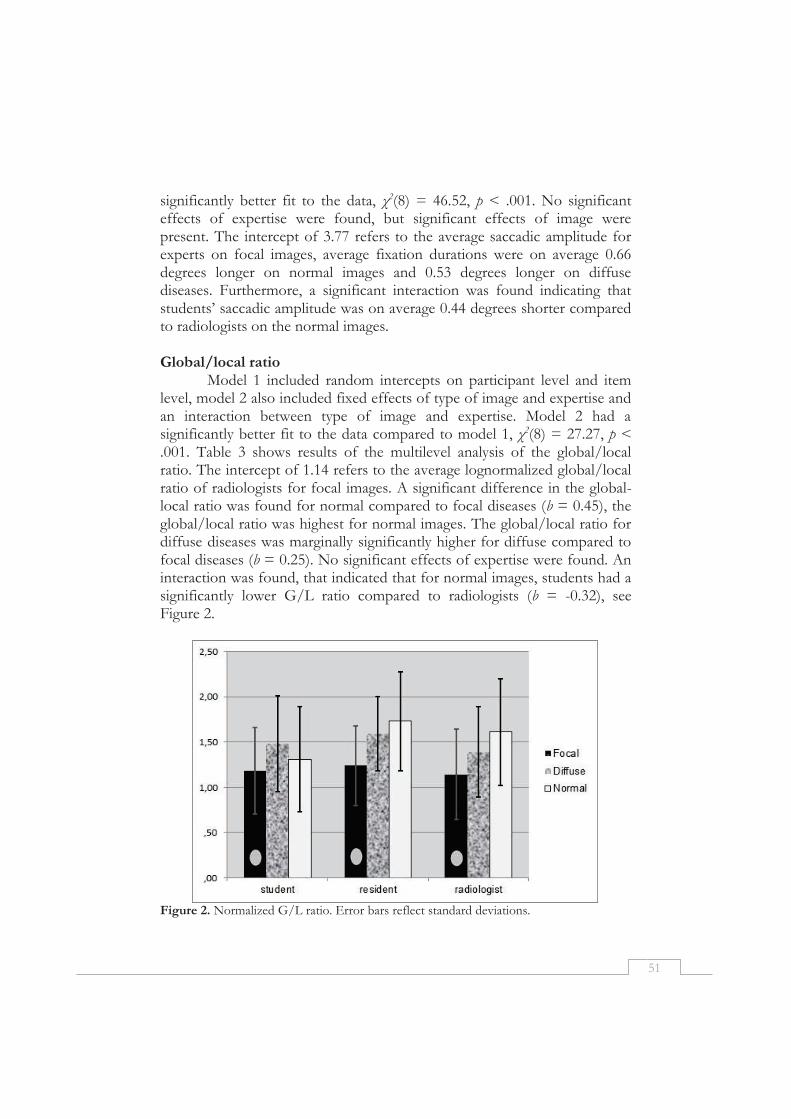
51
significantly better fit to the data, χ2(8) = 46.52, p < .001. No significant effects of expertise were found, but significant effects of image were present. The intercept of 3.77 refers to the average saccadic amplitude for experts on focal images, average fixation durations were on average 0.66 degrees longer on normal images and 0.53 degrees longer on diffuse diseases. Furthermore, a significant interaction was found indicating that students’ saccadic amplitude was on average 0.44 degrees shorter compared to radiologists on the normal images. Global/local ratio
Model 1 included random intercepts on participant level and item level, model 2 also included fixed effects of type of image and expertise and an interaction between type of image and expertise. Model 2 had a significantly better fit to the data compared to model 1, χ2(8) = 27.27, p < .001. Table 3 shows results of the multilevel analysis of the global/local ratio. The intercept of 1.14 refers to the average lognormalized global/local ratio of radiologists for focal images. A significant difference in the global-local ratio was found for normal compared to focal diseases (b = 0.45), the global/local ratio was highest for normal images. The global/local ratio for diffuse diseases was marginally significantly higher for diffuse compared to focal diseases (b = 0.25). No significant effects of expertise were found. An interaction was found, that indicated that for normal images, students had a significantly lower G/L ratio compared to radiologists (b = -0.32), see Figure 2.
Figure 2. Normalized G/L ratio. Error bars reflect standard deviations.
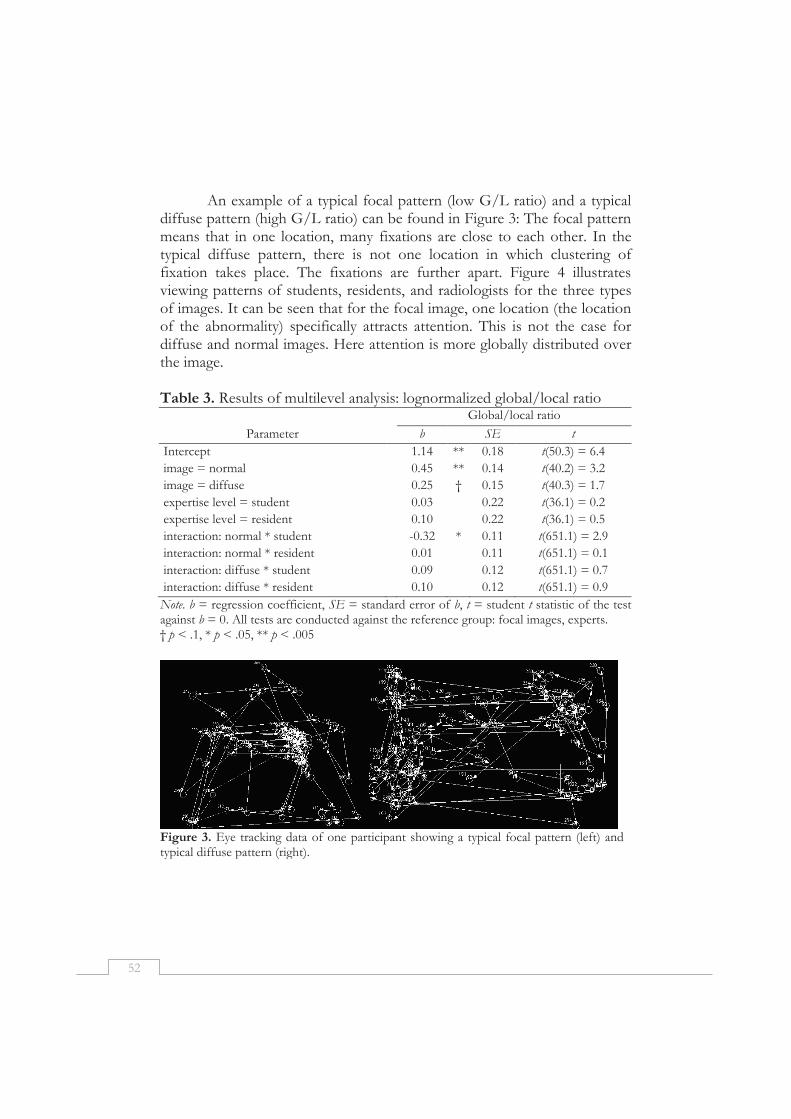
52
An example of a typical focal pattern (low G/L ratio) and a typical diffuse pattern (high G/L ratio) can be found in Figure 3: The focal pattern means that in one location, many fixations are close to each other. In the typical diffuse pattern, there is not one location in which clustering of fixation takes place. The fixations are further apart. Figure 4 illustrates viewing patterns of students, residents, and radiologists for the three types of images. It can be seen that for the focal image, one location (the location of the abnormality) specifically attracts attention. This is not the case for diffuse and normal images. Here attention is more globally distributed over the image. Table 3. Results of multilevel analysis: lognormalized global/local ratio
Global/local ratio
Parameter b SE t
Intercept 1.14 ** 0.18 t(50.3) = 6.4
image = normal 0.45 ** 0.14 t(40.2) = 3.2
image = diffuse 0.25 † 0.15 t(40.3) = 1.7
expertise level = student 0.03 0.22 t(36.1) = 0.2
expertise level = resident 0.10 0.22 t(36.1) = 0.5
interaction: normal * student -0.32 * 0.11 t(651.1) = 2.9
interaction: normal * resident 0.01 0.11 t(651.1) = 0.1
interaction: diffuse * student 0.09 0.12 t(651.1) = 0.7
interaction: diffuse * resident 0.10 0.12 t(651.1) = 0.9
Note. b = regression coefficient, SE = standard error of b, t = student t statistic of the test against b = 0. All tests are conducted against the reference group: focal images, experts. † p < .1, * p < .05, ** p < .005
Figure 3. Eye tracking data of one participant showing a typical focal pattern (left) and typical diffuse pattern (right).
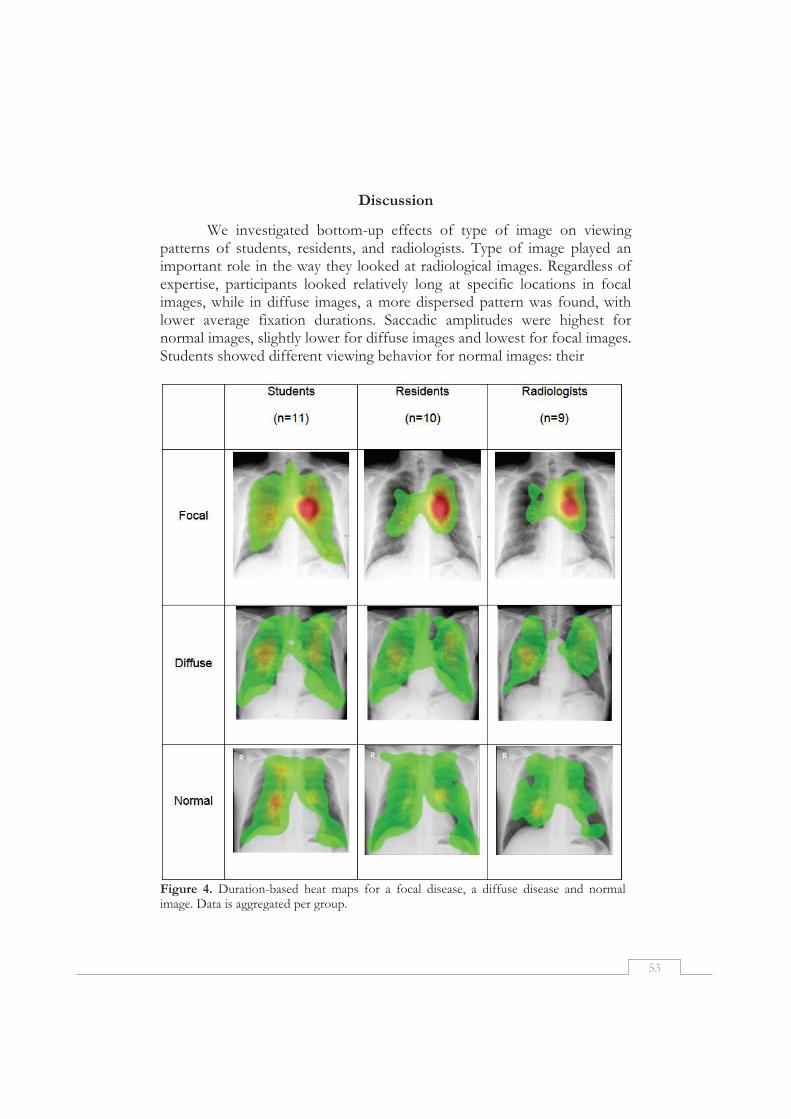
53
Discussion
We investigated bottom-up effects of type of image on viewing patterns of students, residents, and radiologists. Type of image played an important role in the way they looked at radiological images. Regardless of expertise, participants looked relatively long at specific locations in focal images, while in diffuse images, a more dispersed pattern was found, with lower average fixation durations. Saccadic amplitudes were highest for normal images, slightly lower for diffuse images and lowest for focal images. Students showed different viewing behavior for normal images: their
Figure 4. Duration-based heat maps for a focal disease, a diffuse disease and normal image. Data is aggregated per group.
54
average fixation durations were higher than those of residents and radiologists, while their saccadic amplitudes and global/local ratio was lower. In conclusion, differences in viewing patterns between experts and novices are relatively small on disease images but larger on normal images. In contrast, students’ diagnostic accuracy on normal images is relatively high, while for disease images their accuracy is very low.
It was expected that with higher expertise, longer saccade length and short fixation durations would be found. This was not the case for the diffuse and focal diseases. Strong effects of type of image were found, comparable to the ones we expected for the global/local ratio. Not only radiologists adapted their viewing patterns, also for residents and even for students viewing patterns were different for the different types of diseases.
In a focal disease, most information can be gathered when one specific location is inspected in depth (i.e., a low global/local ratio and longer average fixation duration). For diffuse diseases, more information is gained from examining together the elements that make up the pattern. This requires a higher global/local ratio and shorter average fixation durations. For normal images, an even shorter average fixation duration is required: it was shown before in research with chest radiographs that average fixation duration on true positives (correctly diagnosing a lung nodule) is longer than average fixation duration on true negatives (correctly diagnosing normality) (Manning et al., 2006).
Although students’ viewing behavior was similar to that of residents and radiologists, they did not perform nearly as well as the two other groups. Comparable results were found by Crowley and colleagues (Crowley, Naus, Stewart, & Friedman, 2003) and Mello-Thoms and colleagues (Mello-Thoms, et al., 2012). Both report that perceptual aspects of the task (i.e., detecting abnormalities) were developed before participants were able to correctly interpret the abnormalities and to integrate these in a correct diagnosis. Lesgold (1988) posed a similar developmental trajectory, in which perceptual processing develops before cognitive processing. The students in our sample showed differentiation in fixation duration, saccadic amplitude and global/local ratio between the two types of disease, indicating perceptual development. However, they were not yet able to interpret their findings into a diagnosis. Furthermore, students were able to decide for most of the normal images that no abnormality was present. Although knowledge structures that students developed are not nearly as elaborated as the experts’ illness scripts, they seemed already elaborated enough to influence viewing behavior. On the other hand, students’ illness scripts did not yet allow for making correct diagnoses.
55
In contrast to their relatively high performance on normal images, expected eye movement differences between experts and novices were found for the normal images: students had a significantly higher average fixation duration and a significantly lower average saccadic amplitude compared to radiologists. Their global/local ratio was also significantly lower than the ratio of experts.
In this study, we investigated viewing patterns of different expertise groups in terms of fixation durations and distribution of fixations. Our approach of using a global/local ratio is a novel way of investigating top-down expertise differences in visual diagnostic reasoning, when analyzing areas of interest (AOIs) (Holmqvist, et al., 2011) is not possible. Its advantage is that it also considers bottom-up effects of type of image. This novel approach for investigating visual expertise could also be relevant for other domains of visual expertise, such as ophthalmology (O'Neill et al., 2011), art (see Vogt & Magnussen, 2007; Zangemeister et al., 1995) or meteorology (Hegarty, Canham, & Fabrikant, 2010).
Although for disease images the viewing patterns of students are reasonably similar to those of radiologists, their diagnostic ability is much lower. Radiologists possess a large body of knowledge that helps them correctly make diagnostic decisions based on the information that they perceive (Wood, 1999). Although students might look in ways comparable to those of radiologists and residents, they still lack this body of knowledge that helps them to interpret the visual information and give the correct diagnosis. As a title, Claudia Mello-Thoms and colleagues (2008) state that radiology-experts have “different search patterns and similar decision outcomes” (p. 212.). The opposite seems true when experts and novices are compared: Similar search patterns lead to different decision outcomes.
56
References
Canham, M., & Hegarty, M. (2010). Effects of knowledge and display design on comprehension of complex graphics. Learning and Instruction, 20, 155-166.
Chase, W. G., & Simon, H. A. (1973). Perception in chess. Cognitive Psychology, 4, 55-81. Crowley, R. S., Naus, G. J., Stewart, J., & Friedman, C. P. (2003). Development of visual
diagnostic expertise in pathology: An information-processing study. Journal of the American Medical Informatics Association, 10, 39-51.
de Groot, A. D. (1946). Het denken van den schaker: Een experimenteel-psychologische studie: Amsterdam: Noord-Hollandsche Uitgevers Maatschappij.
Ericsson, K. A., Charness, N., Feltovich, P., & Hoffman, R. R. (2006). The cambridge handbook of expertise and expert performance: Cambridge: Cambridge University Press.
Ericsson, K. A., & Kintsch, W. (1995). Long-term working memory. Psychological Review, 102, 211-245.
Gegenfurtner, A., Lehtinen, E., & Säljö, R. (2011). Expertise differences in the comprehension of visualizations: A meta-analysis of eye-tracking research in professional domains. Educational Psychology Review, 1-30.
Groen, G. J., & Patel, V. L. (1988). The relationship between comprehension and reasoning in medical expertise. In M. T. H. Chi, R. Glaser & M. Farr (Eds.), The Nature of Expertise (pp. 287-309): Hillsdale, NJ: Erlbaum.
Haider, H., & Frensch, P. A. (1999). Eye movement during skill acquisition: More evidence for the information-reduction hypothesis. Journal of Experimental Psychology-Learning Memory and Cognition, 25, 172-190.
Hansell, D. M., Bankier, A. A., MacMahon, H., McLoud, T. C., Mueller, N. L., & Remy, J. (2008). Fleischner society: Glossary of terms tor thoracic imaging. Radiology, 246, 697-722.
Hegarty, M., Canham, M. S., & Fabrikant, S. I. (2010). Thinking about the weather: How display salience and knowledge affect performance in a graphic inference task. Journal of Experimental Psychology-Learning Memory and Cognition, 36, 37-53.
Holmqvist, K., Nyström, M., Andersson, R., Dewhurst, R., Jarodzka, H., & Weijer, J. (2011). Eye tracking: A comprehensive guide to methods and measures: Oxford: Oxford University Press.
Itti, L., & Koch, C. (2001). Computational modelling of visual attention. Nature Reviews Neuroscience, 2, 194-203.
Jarodzka, H., Scheiter, K., Gerjets, P., & Van Gog, T. (2010). In the eyes of the beholder: How experts and novices interpret dynamic stimuli. Learning and Instruction, 20, 146-154.
Kok, E. M., De Bruin, A. B. H., Robben, S. G. F., & Van Merriënboer, J. J. G. (2013). Learning radiological appearances of diseases, does comparison help? Learning and Instruction, 23, 90-97.
Krupinski, E. A. (2005). Visual search of mammographic images: Influence of lesion subtlety. Academic Radiology, 12, 965-969.
Krupinski, E. A. (2010). Perceptual factors in reading medical images. In E. Samei & E. Krupinski (Eds.), The Handbook of Medical Image Perception and Techniques (pp. 81-90). Cambridge: Cambridge University Press.
Krupinski, E. A., Berger, W. G., Dallas, W. J., & Roehrig, H. (2003). Searching for nodules: What features attract attention and influence detection? Academic Radiology, 10, 861-868.
57
Krupinski, E. A., & Roehrig, H. (2010). Optimization of display systems. In E. Samei & E. Krupinski (Eds.), The handbook of medical image perception and techniques (pp. 395-405): Cambridge University Press.
Kundel, H. L., & Nodine, C. F. (1983). A visual concept shapes image perception. Radiology, 146, 363-368.
Kundel, H. L., Nodine, C. F., Conant, E. F., & Weinstein, S. P. (2007). Holistic component of image perception in mammogram interpretation: Gaze-tracking study. Radiology, 242, 396-402.
Leong, J. J. H., Nicolaou, M., Emery, R. J., Darzi, A. W., & Yang, G. Z. (2007). Visual search behaviour in skeletal radiographs: A cross-speciality study. Clinical Radiology, 62, 1069-1077.
Lesgold, A., Rubinson, H., Feltovich, P., Glaser, R., Klopfer, D., & Wang, Y. (1988). Expertise in a complex skill: Diagnosing x-ray pictures. In M. T. H. Chi, R. Glaser & M. Farr (Eds.), The nature of expertise (pp. 311-342). Hillsdale, NJ: Erlbaum.
Manning, D. J., Ethell, S. C., & Donovan, T. (2004). Detection or decision errors? Missed lung cancer from the posteroanterior chest radiograph. British Journal of Radiology, 77, 231-235.
Manning, D. J., Ethell, S. C., Donovan, T., & Crawford, T. (2006). How do radiologists do it? The influence of experience and training on searching for chest nodules. Radiography, 12, 134-142.
Mello-Thoms, C., Ganott, M., Sumkin, J., Hakim, C., Britton, C., Wallace, L., & Hardesty, L. (2008). Different search patterns and similar decision outcomes: How can experts agree in the decisions they make when reading digital mammograms? In E. Krupinski (Ed.), Digital mammography (Vol. 5116, pp. 212-219): Berlin/Heidelberg: Springer.
Mello-Thoms, C., Hardesty, L., Sumkin, J., Ganott, M., Hakim, C., Britton, C., Stalder, J., & Maitz, G. (2005). Effects of lesion conspicuity on visual search in mammogram reading. Academic Radiology, 12, 830-840.
Mello-Thoms, C., Mello, C. A. B., Medvedeva, O., Castine, M., Legowski, E., Gardner, G., Tseytlin, E., & Crowley, R. S. (2012). Perceptual analysis of the reading of dermatopathology virtual slides by pathology residents. Archives of Pathology & Laboratory Medicine, 136, 551-562.
Miles, W. R. (1930). Ocular dominance in human adults. The Journal of General Psychology, 3, 412-430.
Nodine, C., & Mello-Thoms, C. (2010). The role of expertise in radiologic image interpretation. In E. Samei & E. Krupinski (Eds.), The Handbook of Medical Image Perception and Techniques (pp. 139-156). Cambridge: Cambridge University Press.
Norman, G. R., Brooks, L. R., Coblentz, C. L., & Babcook, C. J. (1992). The correlation of feature identification and category judgments in diagnostic-radiology. Memory & Cognition, 20, 344-355.
Norman, G. R., Coblentz, C. L., Brooks, L. R., & Babcook, C. J. (1992). Expertise in visual diagnosis - a review of the literature. Academic Medicine, 67, S78-S83.
O'Neill, E. C., Kong, Y. X. G., Connell, P. P., Ong, D. N., Haymes, S. A., Coote, M. A., & Crowston, J. G. (2011). Gaze behavior among experts and trainees during optic disc examination: Does how we look affect what we see? Investigative Ophthalmology & Visual Science, 52, 3976-3983.
Rayner, K. (1998). Eye movements in reading and information processing: 20 years of research. Psychological Bulletin, 124, 372-422.
58
Remington, R. W., Johnston, J. C., Ruthruff, E., Gold, M., & Romera, M. (2000). Visual search in complex displays: Factors affecting conflict detection by air traffic controllers. Human Factors, 42(3), 349-366
Samei, E., Flynn, M. J., Peterson, E., & Eyler, W. R. (2003). Subtle lung nodules: Influence of local anatomic variations on detection. Radiology, 228, 76-84.
Schmidt, H. G., & Boshuizen, H. P. A. (1993). On acquiring expertise in medicine. Educational Psychology Review, 5, 205-221.
Schmidt, H. G., Norman, G. R., & Boshuizen, H. P. A. (1990). A cognitive perspective on medical expertise - theory and implications. Academic Medicine, 65, 611-621.
Van Gog, T., Ericsson, K. A., Rikers, R. M. P. J., & Paas, F. (2005). Instructional design for advanced learners: Establishing connections between the theoretical frameworks of cognitive load and deliberate practice. Educational Technology Research and Development, 53, 73-81.
Van Merriënboer, J. J. G., & Sweller, J. (2005). Cognitive load theory and complex learning: Recent developments and future directions. Educational Psychology Review, 17, 147-177.
Vogt, S., & Magnussen, S. (2007). Expertise in pictorial perception: Eye-movement patterns and visual memory in artists and laymen. Perception, 36, 91-100.
Wood, B. P. (1999). Visual expertise. Radiology, 211, 1-3. Yarbus, A. L. (1967). Eye Movements and Vision. New York: Plenum Press. Zangemeister, W. H., Sherman, K., & Stark, L. (1995). Evidence for a global scanpath
strategy in viewing abstract compared with realistic images. Neuropsychologia, 33, 1009-1025.
59
Chapter 4
Systematic viewing in radiology: seeing more, missing less?
Published as: Kok, E. M., Jarodzka, H., de Bruin, A. B. H., BinAmir, H. A. N., Robben, S. G. F., & van Merriënboer, J. J. G. (2015). Systematic viewing in radiology: seeing more, missing less? Advances in Health Sciences Education, 1-17.

60
Abstract
To prevent radiologists from overlooking lesions, radiology textbooks recommend “systematic viewing”, a technique whereby anatomical areas are inspected in a fixed order. This would ensure complete inspection (full coverage) of the image and, in turn, improve diagnostic performance. To test this assumption, two experiments were performed. Both experiments investigated the relationship between systematic viewing, coverage, and diagnostic performance. Additionally, the first investigated whether systematic viewing increases with expertise; the second investigated whether novices benefit from full-coverage or systematic-viewing training. In Experiment 1, 11 students, ten residents, and nine radiologists inspected five chest radiographs. Experiment 2 had 75 students undergo a training in either systematic, full-coverage (without being systematic) or non-systematic viewing. Eye movements and diagnostic performance were measured throughout both experiments. In Experiment 1, no significant correlations were found between systematic viewing and coverage, r = - .10, p = .62, and coverage and performance, r = -.06, p = .74. Experts were significantly more systematic than students F2,25 = 4.35, p = .02. In Experiment 2, significant correlations were found between systematic viewing and coverage, r = -.35, p < .01, but not between coverage and performance, r = .13, p = .31. Participants in the full-coverage training performed worse compared with both other groups, which did not differ between them, F2,71 = 3.95, p = .02. In conclusion, the data question the assumption that systematic viewing leads to increased coverage, and, consequently, to improved performance. Experts inspected cases more systematically, but students did not benefit from systematic-viewing training.
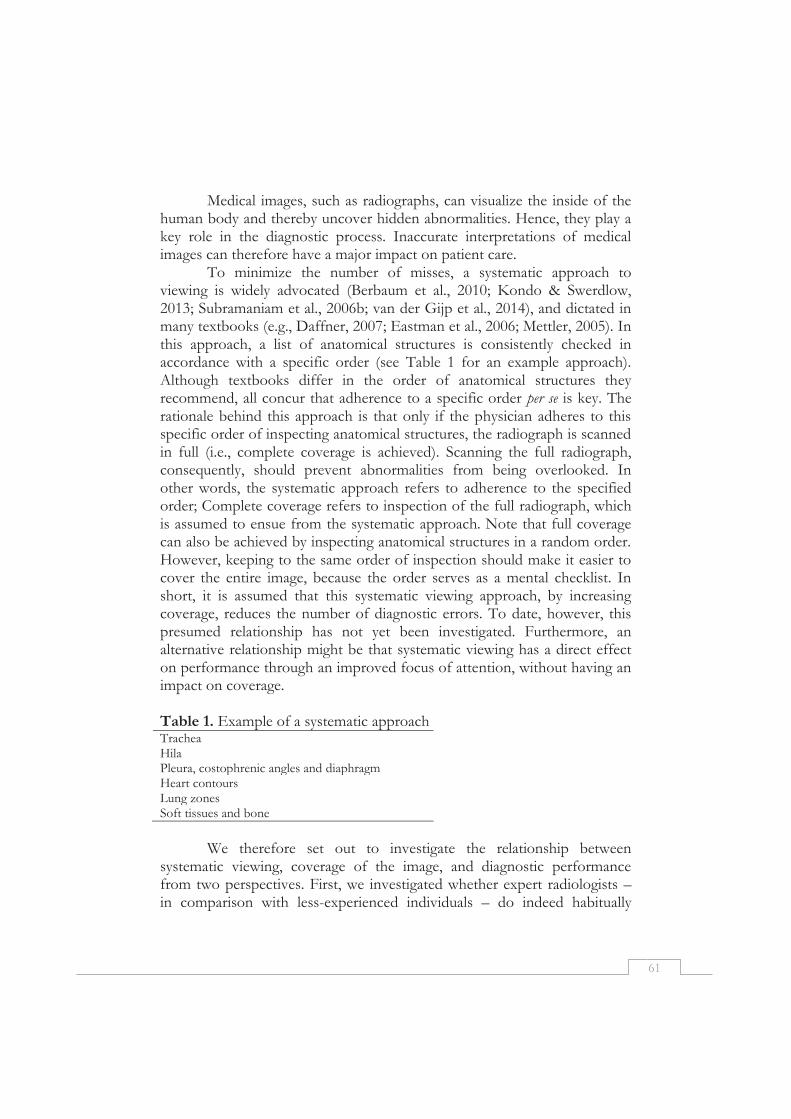
61
Medical images, such as radiographs, can visualize the inside of the human body and thereby uncover hidden abnormalities. Hence, they play a key role in the diagnostic process. Inaccurate interpretations of medical images can therefore have a major impact on patient care.
To minimize the number of misses, a systematic approach to viewing is widely advocated (Berbaum et al., 2010; Kondo & Swerdlow, 2013; Subramaniam et al., 2006b; van der Gijp et al., 2014), and dictated in many textbooks (e.g., Daffner, 2007; Eastman et al., 2006; Mettler, 2005). In this approach, a list of anatomical structures is consistently checked in accordance with a specific order (see Table 1 for an example approach). Although textbooks differ in the order of anatomical structures they recommend, all concur that adherence to a specific order per se is key. The rationale behind this approach is that only if the physician adheres to this specific order of inspecting anatomical structures, the radiograph is scanned in full (i.e., complete coverage is achieved). Scanning the full radiograph, consequently, should prevent abnormalities from being overlooked. In other words, the systematic approach refers to adherence to the specified order; Complete coverage refers to inspection of the full radiograph, which is assumed to ensue from the systematic approach. Note that full coverage can also be achieved by inspecting anatomical structures in a random order. However, keeping to the same order of inspection should make it easier to cover the entire image, because the order serves as a mental checklist. In short, it is assumed that this systematic viewing approach, by increasing coverage, reduces the number of diagnostic errors. To date, however, this presumed relationship has not yet been investigated. Furthermore, an alternative relationship might be that systematic viewing has a direct effect on performance through an improved focus of attention, without having an impact on coverage. Table 1. Example of a systematic approach Trachea Hila Pleura, costophrenic angles and diaphragm Heart contours Lung zones Soft tissues and bone
We therefore set out to investigate the relationship between
systematic viewing, coverage of the image, and diagnostic performance from two perspectives. First, we investigated whether expert radiologists – in comparison with less-experienced individuals – do indeed habitually
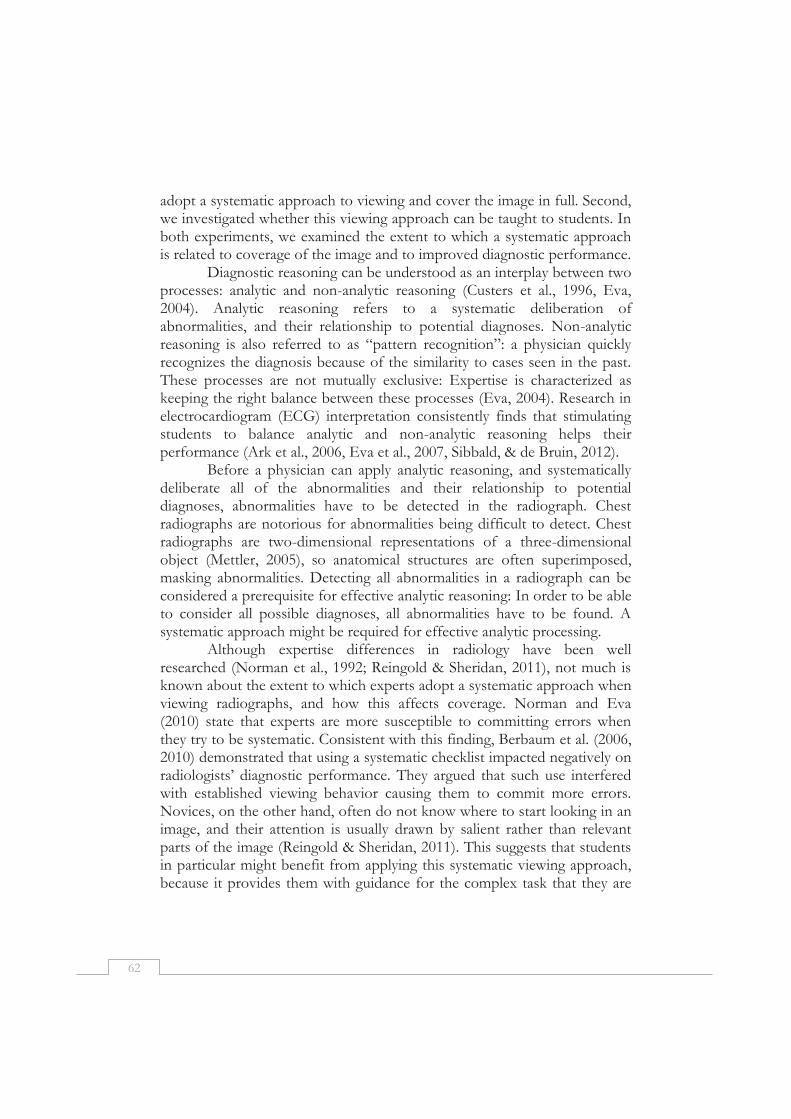
62
adopt a systematic approach to viewing and cover the image in full. Second, we investigated whether this viewing approach can be taught to students. In both experiments, we examined the extent to which a systematic approach is related to coverage of the image and to improved diagnostic performance.
Diagnostic reasoning can be understood as an interplay between two processes: analytic and non-analytic reasoning (Custers et al., 1996, Eva, 2004). Analytic reasoning refers to a systematic deliberation of abnormalities, and their relationship to potential diagnoses. Non-analytic reasoning is also referred to as “pattern recognition”: a physician quickly recognizes the diagnosis because of the similarity to cases seen in the past. These processes are not mutually exclusive: Expertise is characterized as keeping the right balance between these processes (Eva, 2004). Research in electrocardiogram (ECG) interpretation consistently finds that stimulating students to balance analytic and non-analytic reasoning helps their performance (Ark et al., 2006, Eva et al., 2007, Sibbald, & de Bruin, 2012).
Before a physician can apply analytic reasoning, and systematically deliberate all of the abnormalities and their relationship to potential diagnoses, abnormalities have to be detected in the radiograph. Chest radiographs are notorious for abnormalities being difficult to detect. Chest radiographs are two-dimensional representations of a three-dimensional object (Mettler, 2005), so anatomical structures are often superimposed, masking abnormalities. Detecting all abnormalities in a radiograph can be considered a prerequisite for effective analytic reasoning: In order to be able to consider all possible diagnoses, all abnormalities have to be found. A systematic approach might be required for effective analytic processing.
Although expertise differences in radiology have been well researched (Norman et al., 1992; Reingold & Sheridan, 2011), not much is known about the extent to which experts adopt a systematic approach when viewing radiographs, and how this affects coverage. Norman and Eva (2010) state that experts are more susceptible to committing errors when they try to be systematic. Consistent with this finding, Berbaum et al. (2006, 2010) demonstrated that using a systematic checklist impacted negatively on radiologists’ diagnostic performance. They argued that such use interfered with established viewing behavior causing them to commit more errors. Novices, on the other hand, often do not know where to start looking in an image, and their attention is usually drawn by salient rather than relevant parts of the image (Reingold & Sheridan, 2011). This suggests that students in particular might benefit from applying this systematic viewing approach, because it provides them with guidance for the complex task that they are
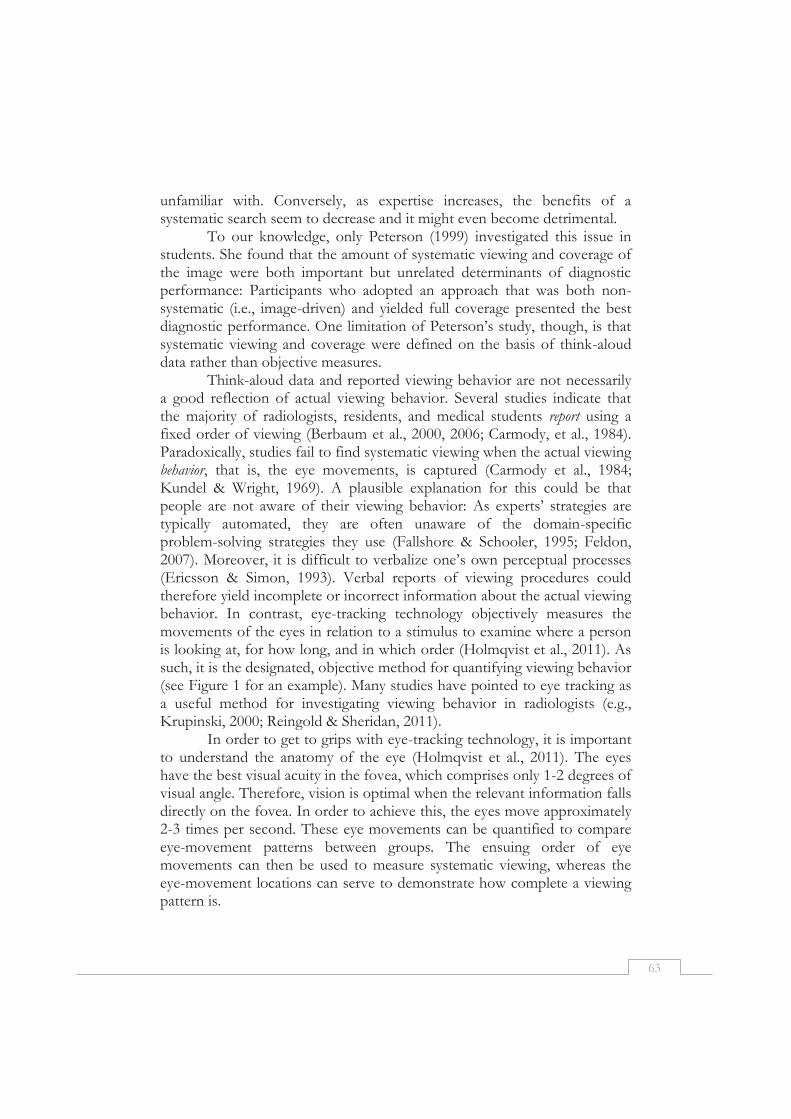
63
unfamiliar with. Conversely, as expertise increases, the benefits of a systematic search seem to decrease and it might even become detrimental.
To our knowledge, only Peterson (1999) investigated this issue in students. She found that the amount of systematic viewing and coverage of the image were both important but unrelated determinants of diagnostic performance: Participants who adopted an approach that was both non-systematic (i.e., image-driven) and yielded full coverage presented the best diagnostic performance. One limitation of Peterson’s study, though, is that systematic viewing and coverage were defined on the basis of think-aloud data rather than objective measures.
Think-aloud data and reported viewing behavior are not necessarily a good reflection of actual viewing behavior. Several studies indicate that the majority of radiologists, residents, and medical students report using a fixed order of viewing (Berbaum et al., 2000, 2006; Carmody, et al., 1984). Paradoxically, studies fail to find systematic viewing when the actual viewing behavior, that is, the eye movements, is captured (Carmody et al., 1984; Kundel & Wright, 1969). A plausible explanation for this could be that people are not aware of their viewing behavior: As experts’ strategies are typically automated, they are often unaware of the domain-specific problem-solving strategies they use (Fallshore & Schooler, 1995; Feldon, 2007). Moreover, it is difficult to verbalize one’s own perceptual processes (Ericsson & Simon, 1993). Verbal reports of viewing procedures could therefore yield incomplete or incorrect information about the actual viewing behavior. In contrast, eye-tracking technology objectively measures the movements of the eyes in relation to a stimulus to examine where a person is looking at, for how long, and in which order (Holmqvist et al., 2011). As such, it is the designated, objective method for quantifying viewing behavior (see Figure 1 for an example). Many studies have pointed to eye tracking as a useful method for investigating viewing behavior in radiologists (e.g., Krupinski, 2000; Reingold & Sheridan, 2011).
In order to get to grips with eye-tracking technology, it is important to understand the anatomy of the eye (Holmqvist et al., 2011). The eyes have the best visual acuity in the fovea, which comprises only 1-2 degrees of visual angle. Therefore, vision is optimal when the relevant information falls directly on the fovea. In order to achieve this, the eyes move approximately 2-3 times per second. These eye movements can be quantified to compare eye-movement patterns between groups. The ensuing order of eye movements can then be used to measure systematic viewing, whereas the eye-movement locations can serve to demonstrate how complete a viewing pattern is.
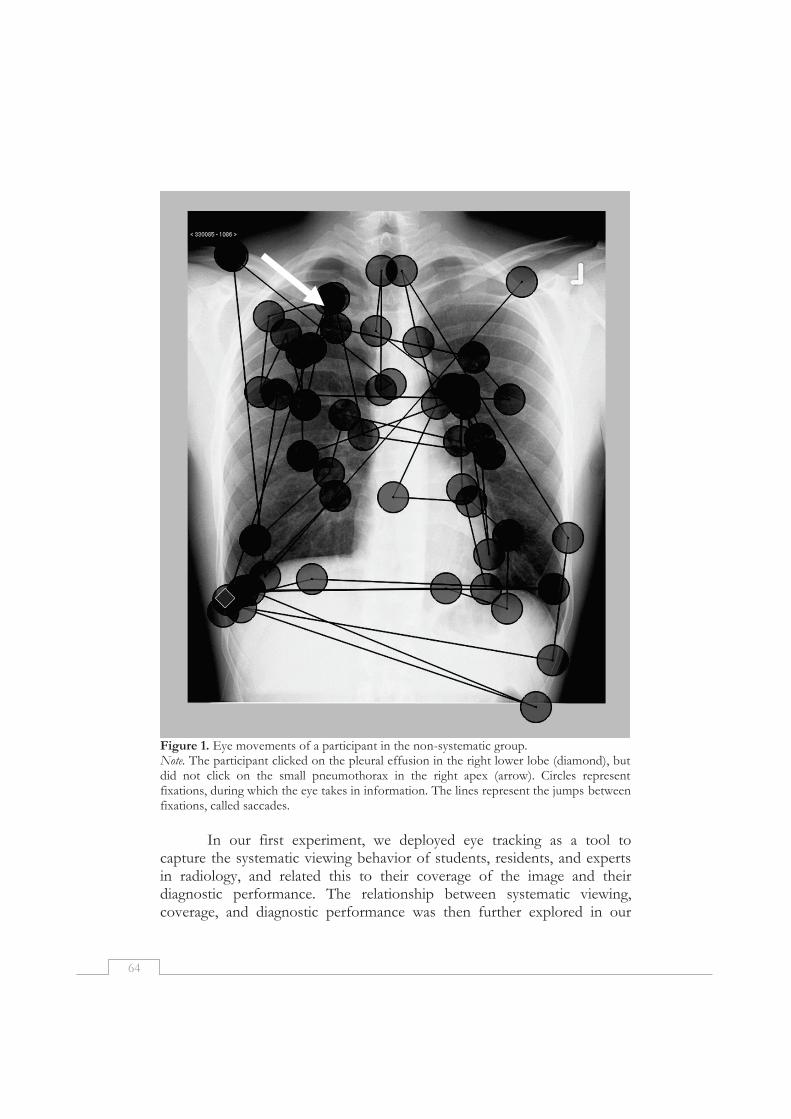
64
Figure 1. Eye movements of a participant in the non-systematic group. Note. The participant clicked on the pleural effusion in the right lower lobe (diamond), but did not click on the small pneumothorax in the right apex (arrow). Circles represent fixations, during which the eye takes in information. The lines represent the jumps between fixations, called saccades.
In our first experiment, we deployed eye tracking as a tool to capture the systematic viewing behavior of students, residents, and experts in radiology, and related this to their coverage of the image and their diagnostic performance. The relationship between systematic viewing, coverage, and diagnostic performance was then further explored in our
65
second experiment, by instructing medical students inexperienced in radiology to inspect chest radiographs in three different manners. Research questions
1. To what extent is systematic viewing related to the amount of coverage of the image and, consequently, to diagnostic performance?
2. Do both systematic viewing and coverage increase with expertise? 3. Do students benefit from training in systematic or full-coverage
viewing when they are learning to evaluate chest radiographs? Our first experiment addresses the first two research questions, whereas our second experiment seeks to answer research questions 1 and 3.
EXPERIMENT 1
Methods
Participants The participants of this experiment were 11 final-year medical
students (seven females, mean age 25.17 years, SD = 1.05) who had had some experience in chest radiograph evaluation during their clinical rotation, but had received no formal training; 10 radiology residents (six females, mean age 30.38 years, SD = 3.48) with an average 28-month (SD = 22.4 months) residency experience; and nine radiologists (two females, mean age 44.7 years, SD = 9.05) with an average post-licensure career of 15.6 years (SD = 8.2 years) in length. Data collection took place in June-July 2011. Participants worked or studied at the Maastricht University Medical Center; they were invited to participate by one of the researchers. All participants gave informed consent. Apparatus
Participants’ eye movements were measured using an Eyelink 1000 remote high-speed eye tracker (SR Research, Ottawa, Canada) with a sampling rate of 500 Hz. Since the Eyelink 1000 eye tracker captured movements of the dominant eye only, participants’ head movements had to be restricted by a forehead rest. This setup still allowed for speaking. The manufacturer reports an average accuracy of 0.25º - 0.5º. Images were presented on a 19-inch LCD display (Samsung SyncMaster 940 BF) with a resolution of 1024 x 768 pixels. Data were analyzed using IBM SPSS Statistics 21 (IBM, Amsterdam, the Netherlands).
66
Materials and procedure Data were collected in the context of a larger study reported
elsewhere (Kok et al., 2012). Although both papers show a slight overlap in raw data, they differ in their research questions and analyses. Prior to the start of the experiment, participants were asked to sign an informed consent form and to fill out a short questionnaire about their experience in radiology. Moreover, eye dominance was assessed using the Miles test (Miles, 1930). Next, the eye-tracking system was calibrated to the dominant eye by repeating a nine-point calibration until accuracy was below 1 degree of visual angle on both the x and y axis. During the experiment, participants were invited to inspect chest radiographs and to act as they would in everyday practice. For each image, they were asked to orally give the diagnosis they deemed most plausible. Participants inspected a total of 24 images with diverse abnormalities. It should be noted that, for the purpose of this article, we included only five conventional chest radiographs of adults, showing no abnormalities, in the analysis. We chose to analyze normal images only so that the most “pure” manifestation of systematic viewing could be rendered visible. Abnormalities are likely to distract from the primary viewing behavior, and, consequently, if systematic viewing were indeed manifested, it could best be rendered visible using normal images. Radiographs were retrieved from an existing teaching file, and the absence of abnormalities was confirmed by two radiologists. Analyses Eye tracking
The minimal fixation duration was set to 100 msec. Eye-tracking data were analyzed utilizing a 7 x 7 grid superimposed on each image. This yielded 49 grid cells of the same size. Coverage was defined as the percentage of grid cells (out of 49) fixated at least once. To investigate whether participants viewed each image in a similar order (i.e., systematic viewing), we calculated the Levenshtein distance (Levenshtein, 1966, see also Holmqvist et al., 2011), which is the most employed measure for comparing viewing orders between two images (Holmqvist et al., 2011). For each trial, we first determined which cells were fixated, and in which order. The fixated grid cells were sequenced based on the time to first fixation. Next, we compared the sequence of grid cells for each combination of two trials for each participant. We calculated how many changes (i.e., deletions, insertions, and substitutions) were needed for one sequence of grid cells to change into the other sequence. The Levenshtein distance between two images is computed by dividing the minimum number of changes by the
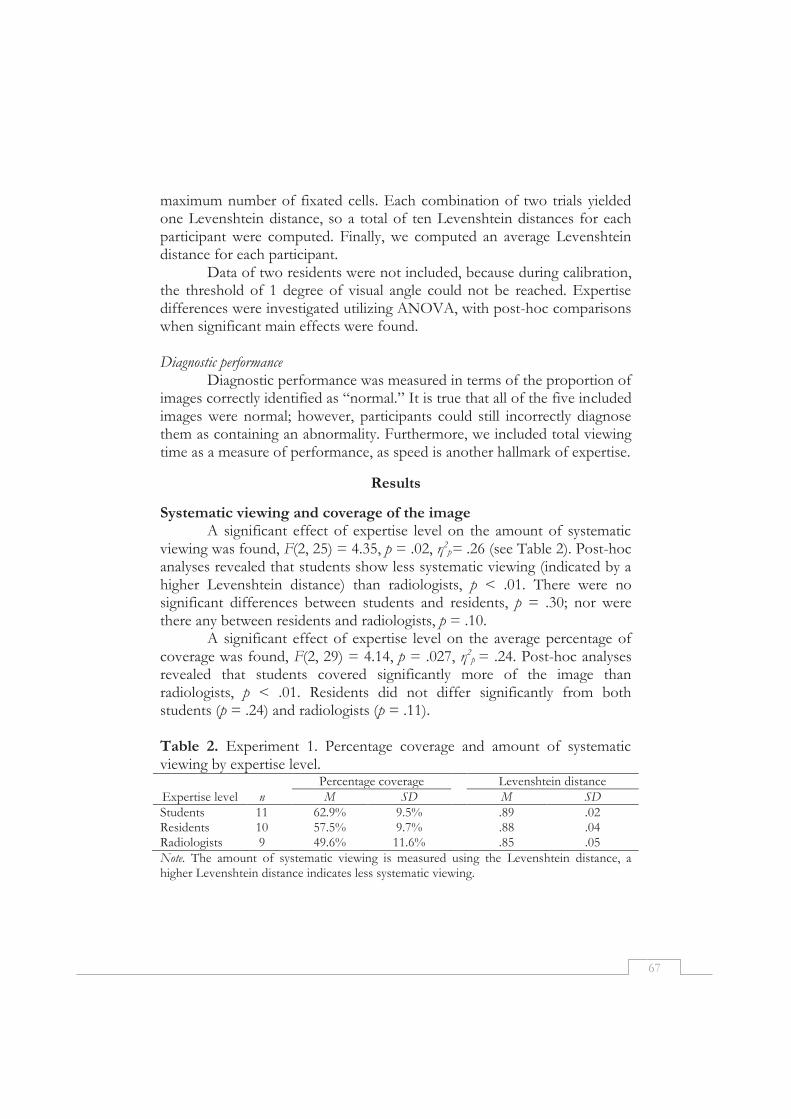
67
maximum number of fixated cells. Each combination of two trials yielded one Levenshtein distance, so a total of ten Levenshtein distances for each participant were computed. Finally, we computed an average Levenshtein distance for each participant.
Data of two residents were not included, because during calibration, the threshold of 1 degree of visual angle could not be reached. Expertise differences were investigated utilizing ANOVA, with post-hoc comparisons when significant main effects were found. Diagnostic performance
Diagnostic performance was measured in terms of the proportion of images correctly identified as “normal.” It is true that all of the five included images were normal; however, participants could still incorrectly diagnose them as containing an abnormality. Furthermore, we included total viewing time as a measure of performance, as speed is another hallmark of expertise.
Results
Systematic viewing and coverage of the image A significant effect of expertise level on the amount of systematic
viewing was found, F(2, 25) = 4.35, p = .02, η2p= .26 (see Table 2). Post-hoc
analyses revealed that students show less systematic viewing (indicated by a higher Levenshtein distance) than radiologists, p < .01. There were no significant differences between students and residents, p = .30; nor were there any between residents and radiologists, p = .10.
A significant effect of expertise level on the average percentage of coverage was found, F(2, 29) = 4.14, p = .027, η2
p = .24. Post-hoc analyses revealed that students covered significantly more of the image than radiologists, p < .01. Residents did not differ significantly from both students (p = .24) and radiologists (p = .11). Table 2. Experiment 1. Percentage coverage and amount of systematic viewing by expertise level.
Percentage coverage Levenshtein distance Expertise level n M SD M SD
Students 11 62.9% 9.5% .89 .02 Residents 10 57.5% 9.7% .88 .04 Radiologists 9 49.6% 11.6% .85 .05 Note. The amount of systematic viewing is measured using the Levenshtein distance, a higher Levenshtein distance indicates less systematic viewing.
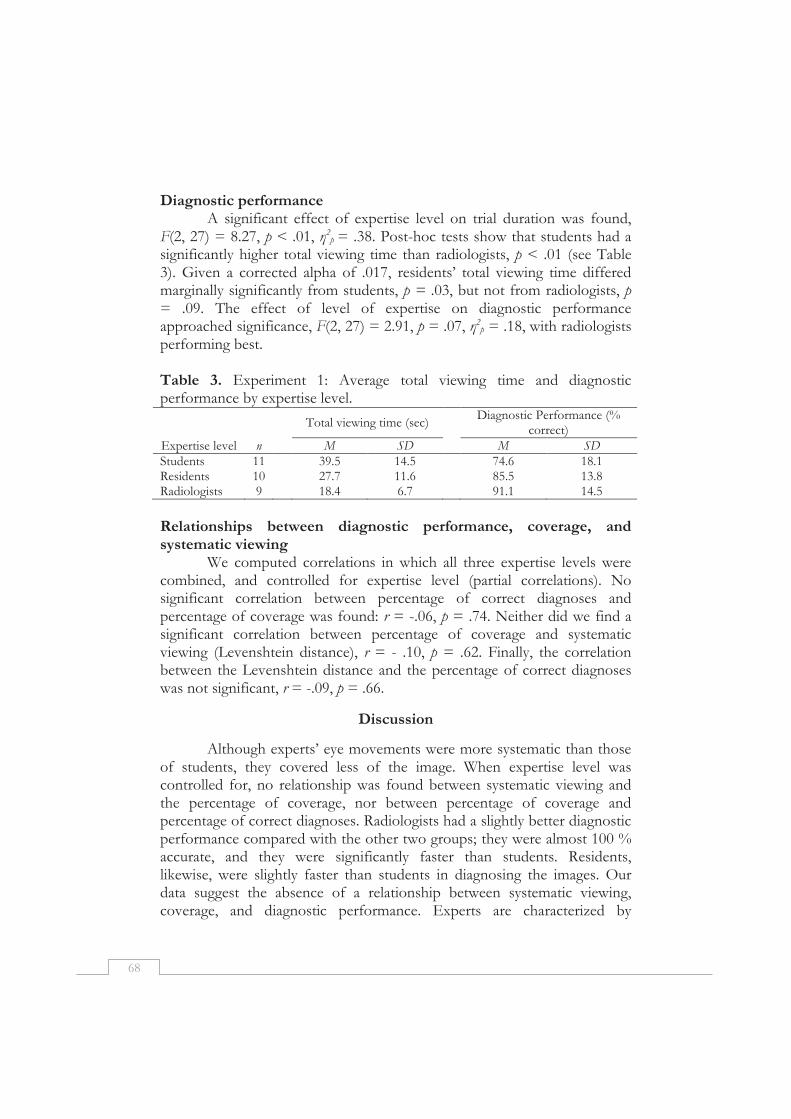
68
Diagnostic performance A significant effect of expertise level on trial duration was found,
F(2, 27) = 8.27, p < .01, η2p = .38. Post-hoc tests show that students had a
significantly higher total viewing time than radiologists, p < .01 (see Table 3). Given a corrected alpha of .017, residents’ total viewing time differed marginally significantly from students, p = .03, but not from radiologists, p = .09. The effect of level of expertise on diagnostic performance approached significance, F(2, 27) = 2.91, p = .07, η2
p = .18, with radiologists performing best. Table 3. Experiment 1: Average total viewing time and diagnostic performance by expertise level.
Total viewing time (sec) Diagnostic Performance (%
correct) Expertise level n M SD M SD
Students 11 39.5 14.5 74.6 18.1 Residents 10 27.7 11.6 85.5 13.8 Radiologists 9 18.4 6.7 91.1 14.5
Relationships between diagnostic performance, coverage, and systematic viewing
We computed correlations in which all three expertise levels were combined, and controlled for expertise level (partial correlations). No significant correlation between percentage of correct diagnoses and percentage of coverage was found: r = -.06, p = .74. Neither did we find a significant correlation between percentage of coverage and systematic viewing (Levenshtein distance), r = - .10, p = .62. Finally, the correlation between the Levenshtein distance and the percentage of correct diagnoses was not significant, r = -.09, p = .66.
Discussion
Although experts’ eye movements were more systematic than those of students, they covered less of the image. When expertise level was controlled for, no relationship was found between systematic viewing and the percentage of coverage, nor between percentage of coverage and percentage of correct diagnoses. Radiologists had a slightly better diagnostic performance compared with the other two groups; they were almost 100 % accurate, and they were significantly faster than students. Residents, likewise, were slightly faster than students in diagnosing the images. Our data suggest the absence of a relationship between systematic viewing, coverage, and diagnostic performance. Experts are characterized by
69
systematic but focused viewing behavior. Although it is tempting to conclude from these findings that we should encourage novices to emulate experts and inspect images in a systematic, focused way, this conclusion is not justified by the current data. Encouraging expert behavior in novices might very well undermine their diagnostic accuracy, because they do not have the structured knowledge required for such an efficient viewing approach. Therefore, an experimental set-up is required to investigate whether students benefit from a systematic viewing approach.
EXPERIMENT 2
In order to investigate whether students benefit from a systematic viewing approach, we trained second-year medical students in one of three different approaches to viewing chest radiographs, specifically: a systematic approach, a full-coverage approach in which being systematic or not played no vital part, and a non-systematic approach in which participants were instructed to look at whatever attracted their attention. The full-coverage training was included to verify the assumed causal effect of systematic viewing on coverage. If the effectiveness of the systematic approach can indeed be ascribed to increased coverage, the groups focusing on the systematic approach and the full-coverage approach should perform equally well. Participants watched an instructional video about the respective viewing approach and subsequently practiced this approach on five images. Finally, they all took the same 22-item test while their eye movements were measured.
Methods
Participants Seventy-five second-year medical students from Maastricht
University, the Netherlands (54 females, mean age 21.57, SD = 2.03), who had no prior clinical experience with viewing chest radiographs participated in this experiment, which spanned the period April - May of 2013 and 2014. Participants were randomly assigned to the systematic-viewing training (n = 25), full-coverage training (n = 26), or non-systematic viewing training (n = 24). Second-year medical students were invited to participate during one of their lectures. A priori written informed consent was obtained from all participants.
70
Apparatus The experiment was conducted using an SMI RED remote eye
tracker with a sampling rate of 250 Hz (SensoMotoric Instruments GmbH, Teltow, Germany). Participants’ head movements were not restricted and movements of both eyes were captured. The manufacturer reports an average accuracy of 0.4°. Images were presented on a 22-inch LCD display with a resolution of 1680 x 1050 pixels. Data were analyzed utilizing IBM SPSS Statistics 21 (IBM, Amsterdam, the Netherlands). Materials and procedure
Data collection took place in individual sessions which consisted of an instructional, practice, and test phase. After having signed the informed consent form, participants watched an instructional video. Three instructional videos were made, each of which emphasized one of the viewing strategies. In these videos of approximately 30 minutes, the basics of chest radiograph interpretation were explained, as well as the radiological manifestation of eight diseases (pneumonia, atelectasis, cardiomegaly, pleural effusion, lung tumor, pneumothorax, chronic obstructive pulmonary disease [COPD], and hilar lymphadenopathy). Aside from the viewing approach that varied in each video, all three videos were alike in content. More specifically, the systematic-viewing training taught participants to inspect the radiographs in a systematic manner, that is, by keeping to the order outlined in Table 1. The full-coverage viewing training, on the other hand, instructed participants to view the image in full by mentally dividing each radiograph into nine imaginary segments (3 × 3) and inspecting each segment separately. During the training, all segments were sequentially spotlighted in a random order. While one segment was spotlighted, the other eight segments were blurred. Finally, the non-systematic viewing training urged participants to start inspecting whatever attracted their attention. In fact, this group was expressly instructed not to be systematic in their viewing. Hence, this training reflects a situation in which students did not learn a specific viewing strategy.
After this instructional phase, the eye tracker was calibrated by repeating a 9-point calibration until accuracy was below 1 degree of visual angle on both the x and y axis and participants were given time to practice their newly acquired viewing skills on five images: one was normal and four presented at least one abnormality. Participants were asked to click on all of the image’s abnormalities, if any. They were asked to report radiological findings and/or to make a diagnosis only after having clicked on all abnormalities. Could they not identify any abnormality, then they could
71
report “no abnormalities”. Once an image had been evaluated this way, an annotated image would pop up indicating the correct location of the lesions. In this image, the respective viewing approach was reiterated. For instance, in the systematic-viewing training, a description of the systematic approach appeared next to the image, indicating the abnormal structures, while in the coverage viewing training, the segment containing the abnormality was accentuated.
The practice phase was succeeded by the actual test phase, which was identical for each group. The instructions were the same as those of the practice phase, save for the annotated images which were not included. Twenty-two radiographs were deployed as test images, 19 of which contained more than one abnormality. One presented one lesion, and two were normal. Abnormalities ranged from 2.2 cm2 to 177.6 cm2 in size, some of which were subtle, others more pronounced. The number of abnormalities totaled 54. The location of each abnormality was confirmed by two senior radiologists. All practice and test cases were images of the eight diseases covered in the instructional video; none of these were previously shown in the video. The images used in both the instructional video and the practice and test phase were retrieved from an existing teaching file. Students were familiar with the diseases covered in the instructional video, although not with their radiological manifestations. Analyses Diagnostic Performance
Three measures of diagnostic performance were used: sensitivity, specificity, and total viewing time. The main outcome measure was sensitivity, which is the amount of correctly clicked abnormalities divided by the total number of abnormalities. Specificity was defined as the proportion of images where the participant did not click on any healthy tissue. Eye tracking
Due to poor data quality, eye-tracking data from 11 participants were excluded from analyses, because during calibration the threshold of 1 degree of visual angle could not be reached. The minimal fixation duration was set to 100 msec. Eye-tracking data were analyzed using a 7 x 7 grid superimposed on each image. Coverage and Levenshtein distance were computed analogous to Experiment 1.
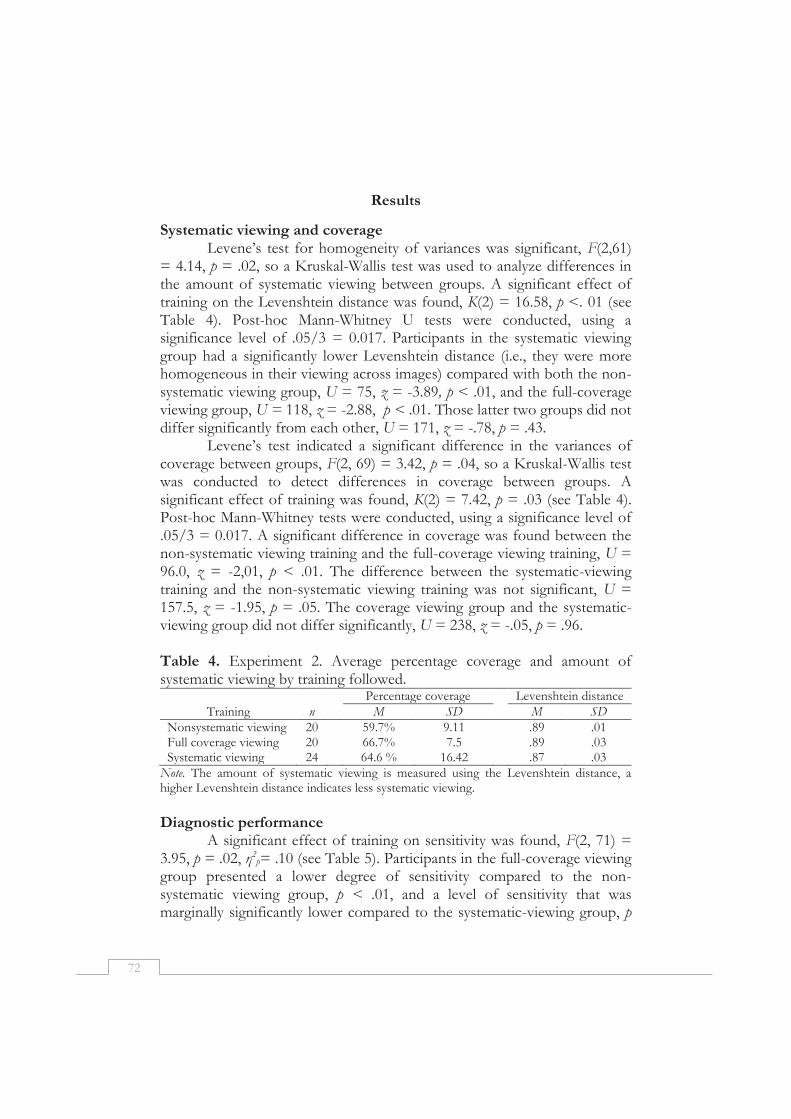
72
Results
Systematic viewing and coverage Levene’s test for homogeneity of variances was significant, F(2,61)
= 4.14, p = .02, so a Kruskal-Wallis test was used to analyze differences in the amount of systematic viewing between groups. A significant effect of training on the Levenshtein distance was found, K(2) = 16.58, p <. 01 (see Table 4). Post-hoc Mann-Whitney U tests were conducted, using a significance level of .05/3 = 0.017. Participants in the systematic viewing group had a significantly lower Levenshtein distance (i.e., they were more homogeneous in their viewing across images) compared with both the non-systematic viewing group, U = 75, z = -3.89, p < .01, and the full-coverage viewing group, U = 118, z = -2.88, p < .01. Those latter two groups did not differ significantly from each other, U = 171, z = -.78, p = .43.
Levene’s test indicated a significant difference in the variances of coverage between groups, F(2, 69) = 3.42, p = .04, so a Kruskal-Wallis test was conducted to detect differences in coverage between groups. A significant effect of training was found, K(2) = 7.42, p = .03 (see Table 4). Post-hoc Mann-Whitney tests were conducted, using a significance level of .05/3 = 0.017. A significant difference in coverage was found between the non-systematic viewing training and the full-coverage viewing training, U = 96.0, z = -2,01, p < .01. The difference between the systematic-viewing training and the non-systematic viewing training was not significant, U = 157.5, z = -1.95, p = .05. The coverage viewing group and the systematic-viewing group did not differ significantly, U = 238, z = -.05, p = .96. Table 4. Experiment 2. Average percentage coverage and amount of systematic viewing by training followed.
Percentage coverage Levenshtein distance Training n M SD M SD
Nonsystematic viewing 20 59.7% 9.11 .89 .01 Full coverage viewing 20 66.7% 7.5 .89 .03 Systematic viewing 24 64.6 % 16.42 .87 .03
Note. The amount of systematic viewing is measured using the Levenshtein distance, a higher Levenshtein distance indicates less systematic viewing.
Diagnostic performance
A significant effect of training on sensitivity was found, F(2, 71) = 3.95, p = .02, η2
p= .10 (see Table 5). Participants in the full-coverage viewing group presented a lower degree of sensitivity compared to the non-systematic viewing group, p < .01, and a level of sensitivity that was marginally significantly lower compared to the systematic-viewing group, p
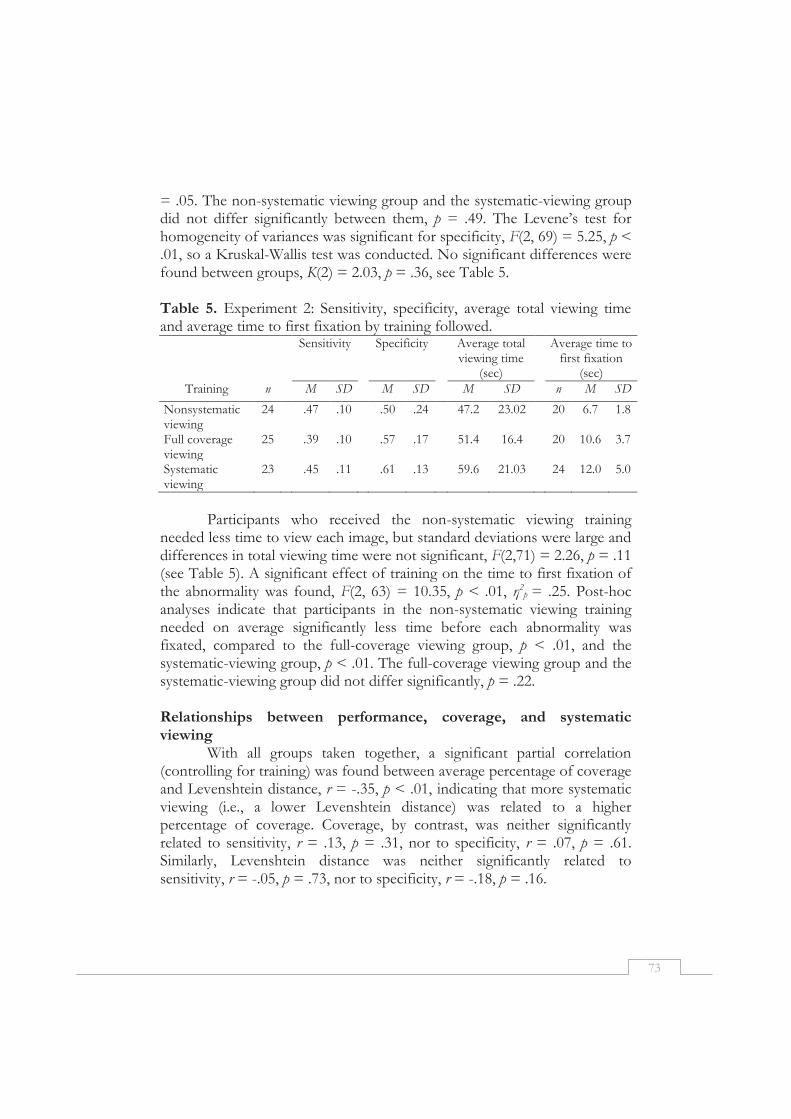
73
= .05. The non-systematic viewing group and the systematic-viewing group did not differ significantly between them, p = .49. The Levene’s test for homogeneity of variances was significant for specificity, F(2, 69) = 5.25, p < .01, so a Kruskal-Wallis test was conducted. No significant differences were found between groups, K(2) = 2.03, p = .36, see Table 5.
Table 5. Experiment 2: Sensitivity, specificity, average total viewing time and average time to first fixation by training followed.
Sensitivity Specificity Average total viewing time
(sec)
Average time to first fixation
(sec) Training n M SD M SD M SD n M SD
Nonsystematic viewing
24 .47 .10 .50 .24 47.2 23.02 20 6.7 1.8
Full coverage viewing
25 .39 .10 .57 .17 51.4 16.4 20 10.6 3.7
Systematic viewing
23 .45 .11 .61 .13 59.6 21.03 24 12.0 5.0
Participants who received the non-systematic viewing training
needed less time to view each image, but standard deviations were large and differences in total viewing time were not significant, F(2,71) = 2.26, p = .11 (see Table 5). A significant effect of training on the time to first fixation of the abnormality was found, F(2, 63) = 10.35, p < .01, η2
p = .25. Post-hoc analyses indicate that participants in the non-systematic viewing training needed on average significantly less time before each abnormality was fixated, compared to the full-coverage viewing group, p < .01, and the systematic-viewing group, p < .01. The full-coverage viewing group and the systematic-viewing group did not differ significantly, p = .22. Relationships between performance, coverage, and systematic viewing
With all groups taken together, a significant partial correlation (controlling for training) was found between average percentage of coverage and Levenshtein distance, r = -.35, p < .01, indicating that more systematic viewing (i.e., a lower Levenshtein distance) was related to a higher percentage of coverage. Coverage, by contrast, was neither significantly related to sensitivity, r = .13, p = .31, nor to specificity, r = .07, p = .61. Similarly, Levenshtein distance was neither significantly related to sensitivity, r = -.05, p = .73, nor to specificity, r = -.18, p = .16.
74
Discussion
Although there was a relationship between the amount of systematic viewing and coverage, coverage did not correlate with either sensitivity or specificity. The eye-tracking data confirm that the three different training videos had the expected effect on viewing behavior: The amount of systematic viewing was highest after the systematic-viewing training, while the full-coverage viewing group and the non-systematic viewing group did not differ significantly in the extent to which they viewed the images systematically. Coverage was highest in the systematic-viewing group and the full-coverage viewing group and significantly lower in the non-systematic viewing group. Sensitivity was highest in the systematic-viewing group and the non-systematic viewing group, whereas participants who had undergone the full-coverage viewing training were significantly less sensitive to abnormalities. No differences were found in specificity. Participants who had participated in the non-systematic viewing training were faster to find abnormalities than were the other two groups. These results question the assumption that systematic viewing leads to improved diagnostic performance through increased coverage. Furthermore, students did not benefit from being trained in systematic viewing.
General discussion
By means of two experiments, we have sought to answer our first research question “To what extent is systematic viewing related to coverage of the image and, consequently, to diagnostic performance?” In neither experiment could we discern a relationship between coverage of the image and diagnostic performance. A direct relationship between systematic viewing and performance could not be discerned either. More specifically, having a more complete view of the image did not result in an increase in the number of abnormalities detected. How can this be explained? Strictly speaking, the assumed relationship between coverage of an image and diagnostic performance presumes that when an abnormality is looked at, it is actually detected. This assumption is probably too strong, even for experienced radiologists. Manning and colleagues (2006a) showed that abnormalities that were not reported (referred to as “misses”) were often looked at by radiologists for up to 5 seconds. Novices even looked at false negatives for up to 8 seconds. This implies that the simple act of fixating your eyes on an abnormality is often not enough to detect it, and therefore, students should learn to recognize an abnormality as such. A strategy to
75
view radiographs is incomplete without content knowledge about what can be seen (Norman, 2005; van der Gijp et al., 2014).
Among the inexperienced students of Experiment 2, we found the amount of systematic viewing and coverage to correlate positively. However, this did not also hold true for the more experienced participants of Experiment 1. The finding that the relationship between systematic viewing and coverage changes with level of expertise was further explored by addressing research question two.
The second research question was: “Do both systematic viewing and coverage increase with expertise?” Radiologists were found to be the most systematic in their inspection of five radiographs. Nevertheless, this did not automatically warrant full coverage of all the radiographs’ regions: Radiologists were far from complete in their viewing behavior. Yet, they outperformed students, so they were very much aware of what to look at. It is common knowledge that expert radiologists cover and need to cover less of an image compared to non-experts (Manning et al., 2006b). With their peripheral vision, they often quickly catch possible abnormalities and they consequently divert their attention to these particular areas, discounting irrelevant areas (Reingold & Sheridan, 2011). Focal search of the whole radiograph is therefore uncommon. Similar results are found when analyzing eye-tracking data of experts reading ECGs (Wood et al., 2013), and even in more remotely related fields, such as air traffic control (van Meeuwen et al., 2014), where experienced air traffic controllers were found to focus their attention as a strategy rather than use complete coverage.
The situation looks quite differently when it involves medical students who are inexperienced in the interpretation of chest radiographs. Although obvious abnormalities can attract their attention, they do not yet have the ability to catch smaller abnormalities from the corner of their eyes; instead, they often need to search actively to find these abnormalities (Kundel et al., 2007). The third research question was concerned with whether systematic viewing or full-coverage training can help students evaluate chest radiographs. It resulted that the group who had undergone the systematic-viewing training did not perform any better. The training that was aimed at full-coverage viewing yielded the poorest diagnostic performance. Participants aimed for full coverage by mentally dividing each image utilizing a 3 x 3 grid, and making sure they inspected each grid cell. Although this procedure did improve coverage as effectively as systematic viewing did, students needed to divide images based on spatial layout rather than content, which might have been counterintuitive. This, in turn, might
76
have distracted students from the main task, leading to a decrease in diagnostic performance.
Participants in Experiment 2 did not always adhere to the viewing approach they were taught, especially not so when an abnormality was clearly visible. We cannot tell whether systematic viewing, when executed perfectly, does indeed lead to improved performance. This raises the question as to why participants failed to execute the viewing approach they were taught. It appears not so easy for students to actively direct their attention, as in systematic viewing, even if they believe they can derive benefits from it. In a visual search experiment, Wolfe and colleagues (2000) found that participants were quicker to detect target letters in a display by means of a random scan than by a systematic search. We recommend that further research be conducted to test the application of this finding in the domain of radiology, and to fully elucidate the observed complexity of employing a systematic viewing approach. Limitations and implications
Some limitations of the experiments are worth noting. First of all, the second experiment was just a single session in which participants learnt a specific viewing strategy. Such a session might not be long enough to thoroughly train students in the viewing strategy. While the numerical differences in coverage and Levenshtein distance were small, they show that we were able to elicit statistically significant differences in viewing behavior after such a short session. We presume the effect will become stronger when learners are exposed to and have practiced the viewing approach for a longer period of time. However, further research is required to verify whether this really is the case.
Second, several issues jeopardize a direct comparison between Experiment 1 and 2, in particular the use of two different eye trackers, and the differences in task and instructions. Eye trackers of different manufacturers slightly differ in the way data are collected, and in the way raw data are transformed into eye-tracking measures. However, we were not intent on making a direct comparison between the exact numbers derived from the two experiments. Instead, we compared the findings from both experiments. Hence, even if small differences between eye trackers have affected the exact percentage of coverage and exact Levenshtein distances, for example, this is unlikely to have altered the relationship between them.
Although we do not expect any differences to have accrued from the use of different eye trackers in the two experiments, differences in task and instructions might have affected the comparability of the experiments.
77
First of all, the first experiment was based on normal images only, whereas in the second experiment, we included normal images as well as cases showing abnormalities. The first experiment aimed to be as ecologically valid as possible, in order to investigate whether radiologists use systematic viewing in practice. In such an ecologically valid situation, many factors influence the data and complicate the detection of systematic viewing behavior. Thus, in a first attempt to detect systematic viewing in eye-tracking data, we analyzed the normal cases only in Experiment 1. In the second experiment, we did include cases presenting abnormalities and showed that our measure for systematic viewing also holds when abnormalities are visible. However, the absolute values of coverage and systematic viewing cannot be compared between the experiments.
The experiments also differed with respect to the instructions. In Experiment 1, we instructed participants to report abnormalities as they would in normal practice. In Experiment 2, participants were second-year students who did not yet have the vocabulary to describe all abnormalities. Clicking on abnormalities therefore was the most valid way to know what these students considered to be an abnormality. This might have prompted them to perform a feature search. The aim of the experiment, however, was not to observe participants in a natural, ecologically valid situation, but to investigate how several viewing strategies impact on performance. The fact that coverage and systematicity were not related to performance in both experiments supports the generalizability of these findings.
An important implication of these experiments is that radiology education should reconsider its current emphasis on systematic viewing, as it might not be justified. This is interesting, given that students have a strong desire to learn a systematic approach (Subramaniam et al., 2006a) and that clinicians and program directors consider this approach essential (Kondo & Swerdlow, 2013; Subramaniam et al., 2006b; van der Gijp et al., 2014). At the same time, however, this finding is not surprising in light of parallel literature on ECG interpretation. In this domain, a diagnostic reasoning approach that combines non-analytic and analytic reasoning was found to be most effective (Sibbald & de Bruin, 2012; Eva et al., 2007; Ark et al., 2006). More specifically, such approaches stimulate participants to check their diagnoses in an analytic manner, rather than search for abnormalities in a systematic manner. Eva et al., (2007), for example, instructed their participants to trust feelings of similarity (i.e., non-analytic reasoning), but to “consider the feature list before providing a final diagnosis” (p. 1155). Sibbald and de Bruin (2012) found that analytic instructions to reanalyze an ECG after initial diagnosis were effective in
78
increasing performance. Hence, in radiology too, strategies should be developed and tested to help students check their diagnoses in a systematic manner, rather than have them search for abnormalities in a systematic manner. Conclusion
The findings of both experiments are at odds with the assumption that systematic viewing leads to improved coverage and, consequently, to better diagnostic performance. Systematic viewing was not directly related to diagnostic performance either. On top of that, students trained in systematic viewing were indeed more systematic than students trained in non-systematic viewing, but their diagnostic performance did not improve. The findings suggest that there is little evidence for the effectiveness of systematic viewing. As this approach is also advocated in many other clinical tasks such as ECG reading (e.g., O'Keefe Jr et al., 2009), it is critical that further research investigate alternative viewing approaches, to minimize detection errors.
79
References
Ark, T. K., Brooks, L. R., & Eva, K. W. (2006). Giving learners the best of both worlds: do clinical teachers need to guard against teaching pattern recognition to novices? Academic Medicine, 81(4), 405-409.
Berbaum, K. S., Franken, E. A., Caldwell, R. T., & Schartz, K. M. (2006). Can a checklist reduce SOS errors in chest radiography? Academic Radiology, 13(3), 296-304.
Berbaum, K. S., Franken, E.A., Caldwell, R. T., & Schartz, K. M. (2010). Satisfaction of search in traditional radiographic imaging. In E. Samei & E. Krupinski (Eds.), The Handbook of Medical Image Perception and Techniques (pp. 107-138). Cambridge: University Press.
Berbaum, K. S., Franken, E. A., Dorfman, D. D., Caldwell, R. T., & Krupinski, E. A. (2000). Role of faulty decision making in the satisfaction of search effect in chest radiography. Academic Radiology, 7(12), 1098-1106.
Carmody, D. P., Kundel, H. L., & Toto, L. C. (1984). Comparison scans while reading chest images. Taught, but not practiced. Investigative Radiology, 19(5), 462-466.
Custers, E., Regehr, G., & Norman, G. R. (1996). Mental representations of medical diagnostic knowledge: a review. Academic Medicine, 71(10), S55-S61.
Daffner, R. H. (2007). Clinical Radiology, the Essentials. Lippincott: Williams & Wilkins. Eastman, G. W., Wald, C., & Crossin, J. (2006). Getting started in clinical radiology, from image to
diagnosis. Stuttgart; New York: Thieme. Ericsson, K. A., & Simon, H. A. (1993). Protocol analysis: Verbal reports as data. Massachusetts:
Mit Press. Eva, K. W. (2004). What every teacher needs to know about clinical reasoning. Medical
Education, 39, 98-106. Eva, K. W., Hatala, R. M., LeBlanc, V. R., & Brooks, L. R. (2007). Teaching from the
clinical reasoning literature: Combined reasoning strategies help novice diagnosticians overcome misleading information. Medical Education, 41(12), 1152-1158.
Fallshore, M., & Schooler, J. W. (1995). Verbal vulnerability of perceptual expertise. Journal of Experimental Psychology-Learning Memory and Cognition, 21(6), 1608-1623.
Feldon, D. F. (2007). The implications of research on expertise for curriculum and pedagogy. Educational Psychology Review, 19(2), 91-110.
Holmqvist, K., Nyström, M., Andersson, R., Dewhurst, R., Jarodzka, H., & Weijer, J. (2011). Eye tracking: A comprehensive guide to methods and measures. Oxford: Oxford University Press.
Kok, E. M., de Bruin, A. B. H., Robben, S. G. F., & van Merriënboer, J. J. G. (2012). Looking in the same manner but seeing it differently: Bottom-up and expertise effects in radiology. Applied Cognitive Psychology, 26(6), 854-862.
Kondo, K. L., & Swerdlow, M. (2013). Medical Student Radiology Curriculum: What skills do residency program directors believe are essential for medical students to attain? Academic Radiology, 20(3), 263-271.
Krupinski, E. (2000). The importance of perception research in medical imaging. Radiation Medicine, 18(6), 329-335.
Kundel, H. L., Nodine, C. F., Conant, E. F., & Weinstein, S. P. (2007). Holistic component of image perception in mammogram interpretation: Gaze-tracking study. Radiology, 242(2), 396-402.
Kundel, H. L., & Wright, D. J. (1969). The influence of prior knowledge on visual search strategies during the viewing of chest radiographs. Radiology, 93(2), 315-320.
80
Levenshtein, V. I. (1966). Binary codes capable of correcting deletions, insertions and reversal. Soviet Physics Doklady, 10, 707-710.
Manning, D. J., Barker-Mill, S. C., Donovan, T., & Crawford, T. (2006). Time-dependent observer errors in pulmonary nodule detection. British Journal of Radiology, 79(940), 342-346.
Manning, D. J., Ethell, S. C., Donovan, T., & Crawford, T. (2006). How do radiologists do it? The influence of experience and training on searching for chest nodules. Radiography, 12(2), 134-142.
Mettler, F. A. (2005). Essentials of Radiology. Philadelpia: Elsevier Saunders. Miles, W. R. (1930). Ocular dominance in human adults. The Journal of General Psychology,
3(3), 412-430. Norman, G. R. (2005). Research in clinical reasoning: past history and current trends.
Medical Education, 39(4), 418-427. Norman, G. R., Coblentz, C. L., Brooks, L. R., & Babcook, C. J. (1992). Expertise in visual
diagnosis - a review of the literature. Academic Medicine, 67(10), S78-S83. Norman, G. R., & Eva, K. W. (2010). Diagnostic error and clinical reasoning. Medical
Education, 44(1), 94-100. O'Keefe Jr, J. H., Hammill, S., Freed, M., & Pogwizd, S. (2009). The ECG criteria book.
Burlington: Jones & Bartlett Learning. Peterson, C. (1999). Factors associated with success or failure in radiological interpretation:
Diagnostic thinking approaches. Medical Education, 33(4), 251-259. Reingold, E. M., & Sheridan, H. (2011). Eye movements and visual expertise in chess and
medicine. In S. P. Leversedge, I. D. Gilchrist & S. Everling (Eds.), Oxford Handbook of Eye Movements (pp. 528-550). Oxford: Oxford University Press.
Sibbald, M., & de Bruin, A. B. (2012). Feasibility of self-reflection as a tool to balance clinical reasoning strategies. Advances in Health Sciences Education, 17(3), 419-429.
Subramaniam, R. M., Beckley, V., Chan, M., Chou, T., & Scally, P. (2006a). Radiology curriculum topics for medical students: Students' perspectives. Academic Radiology, 13(7), 880-884.
Subramaniam, R. M., Sherriff, J., Holmes, K., Chan, M. C., & Shadbolt, B. (2006b). Radiology curriculum for medical students: clinicians' perspectives. Australasian Radiology, 50(5), 442–446.
van der Gijp, A., Schaaf, M. F., Schaaf, I. C., Huige, J. C. B. M., Ravesloot, C. J., Schaik, J. P. J., & ten Cate, T. J. (2014). Interpretation of radiological images: towards a framework of knowledge and skills. Advances in Health Sciences Education, 19(4), 565-580.
van Meeuwen, L. W., Jarodzka, H., Brand-Gruwel, S., Kirschner, P. A., de Bock, J. J. P. R., & van Merriënboer, J. J. G. (2014). Identification of effective visual problem solving strategies in a complex visual domain. Learning and Instruction, 32(0), 10-21.
Wolfe, J. M., Alvarez, G. A., & Horowitz, T. S. (2000). Attention is fast but volition is slow. Nature, 406(6797), 691.
Wood, G., Batt, J., Appelboam, A., Harris, A., & Wilson, M. R. (2013). Exploring the impact of expertise, clinical history, and visual search on electrocardiogram interpretation. Medical Decision Making, 34(1), 75-83.
81
Chapter 5
Learning radiological appearances of diseases: Does
comparison help?
Published as: Kok, E. M., De Bruin, A. B. H., Robben, S. G. F., & Van Merriënboer, J. J. G. (2013). Learning radiological appearances of diseases: Does comparison help? Learning and Instruction, 23, 90-97.
82
Abstract
Comparison learning is a promising approach for learning complex real-life visual tasks. When medical students study radiological appearances of diseases, comparison of images showing diseases with images showing no abnormalities could help them learn to discriminate relevant, disease-related information. Medical students studied 12 diseases on chest x-ray images. They were randomly assigned to a group (n = 31) that compared radiographs of diseases with normal images and a group (n = 30) that only studied radiographs of diseases. On a visual diagnosis test, students who compared with normal images during study were better able to diagnose focal diseases (i.e., lesions at one location) than students who could not compare, but for the diagnosis of diffuse diseases (i.e., involving both lungs) there was no significant difference between groups. Results show that comparison with normal images made it easier to discriminate relevant information for focal diseases.
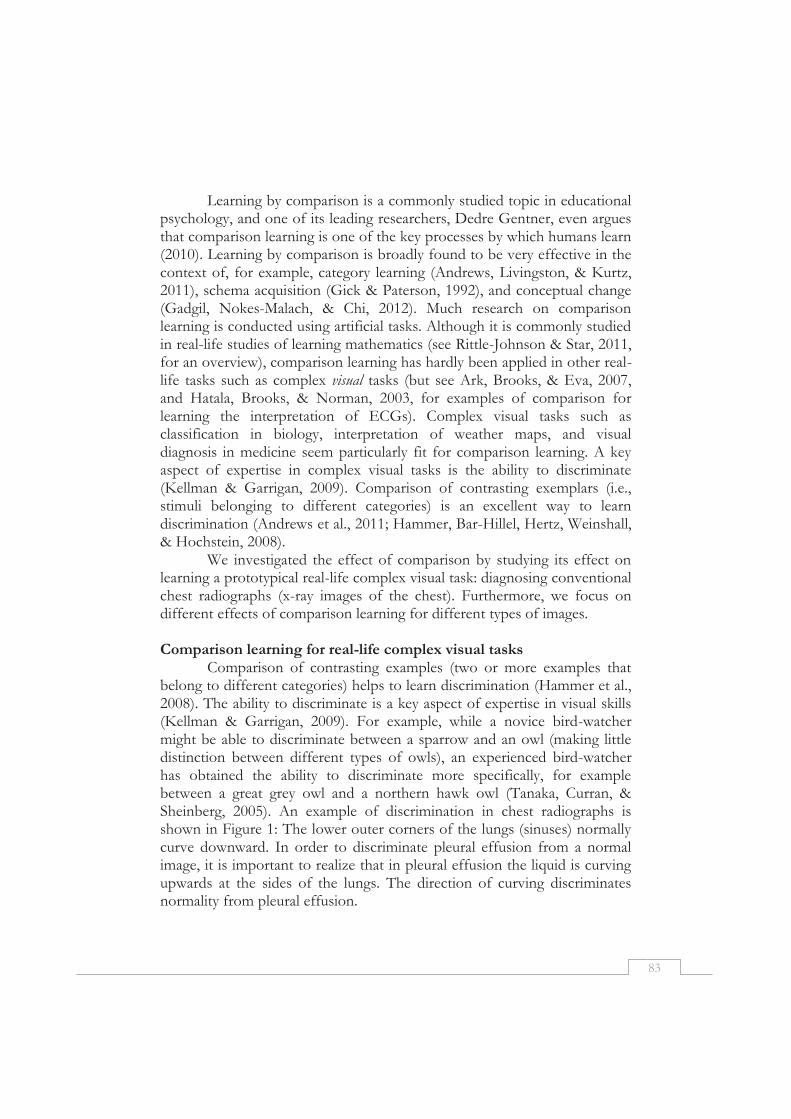
83
Learning by comparison is a commonly studied topic in educational psychology, and one of its leading researchers, Dedre Gentner, even argues that comparison learning is one of the key processes by which humans learn (2010). Learning by comparison is broadly found to be very effective in the context of, for example, category learning (Andrews, Livingston, & Kurtz, 2011), schema acquisition (Gick & Paterson, 1992), and conceptual change (Gadgil, Nokes-Malach, & Chi, 2012). Much research on comparison learning is conducted using artificial tasks. Although it is commonly studied in real-life studies of learning mathematics (see Rittle-Johnson & Star, 2011, for an overview), comparison learning has hardly been applied in other real-life tasks such as complex visual tasks (but see Ark, Brooks, & Eva, 2007, and Hatala, Brooks, & Norman, 2003, for examples of comparison for learning the interpretation of ECGs). Complex visual tasks such as classification in biology, interpretation of weather maps, and visual diagnosis in medicine seem particularly fit for comparison learning. A key aspect of expertise in complex visual tasks is the ability to discriminate (Kellman & Garrigan, 2009). Comparison of contrasting exemplars (i.e., stimuli belonging to different categories) is an excellent way to learn discrimination (Andrews et al., 2011; Hammer, Bar-Hillel, Hertz, Weinshall, & Hochstein, 2008).
We investigated the effect of comparison by studying its effect on learning a prototypical real-life complex visual task: diagnosing conventional chest radiographs (x-ray images of the chest). Furthermore, we focus on different effects of comparison learning for different types of images. Comparison learning for real-life complex visual tasks
Comparison of contrasting examples (two or more examples that belong to different categories) helps to learn discrimination (Hammer et al., 2008). The ability to discriminate is a key aspect of expertise in visual skills (Kellman & Garrigan, 2009). For example, while a novice bird-watcher might be able to discriminate between a sparrow and an owl (making little distinction between different types of owls), an experienced bird-watcher has obtained the ability to discriminate more specifically, for example between a great grey owl and a northern hawk owl (Tanaka, Curran, & Sheinberg, 2005). An example of discrimination in chest radiographs is shown in Figure 1: The lower outer corners of the lungs (sinuses) normally curve downward. In order to discriminate pleural effusion from a normal image, it is important to realize that in pleural effusion the liquid is curving upwards at the sides of the lungs. The direction of curving discriminates normality from pleural effusion.
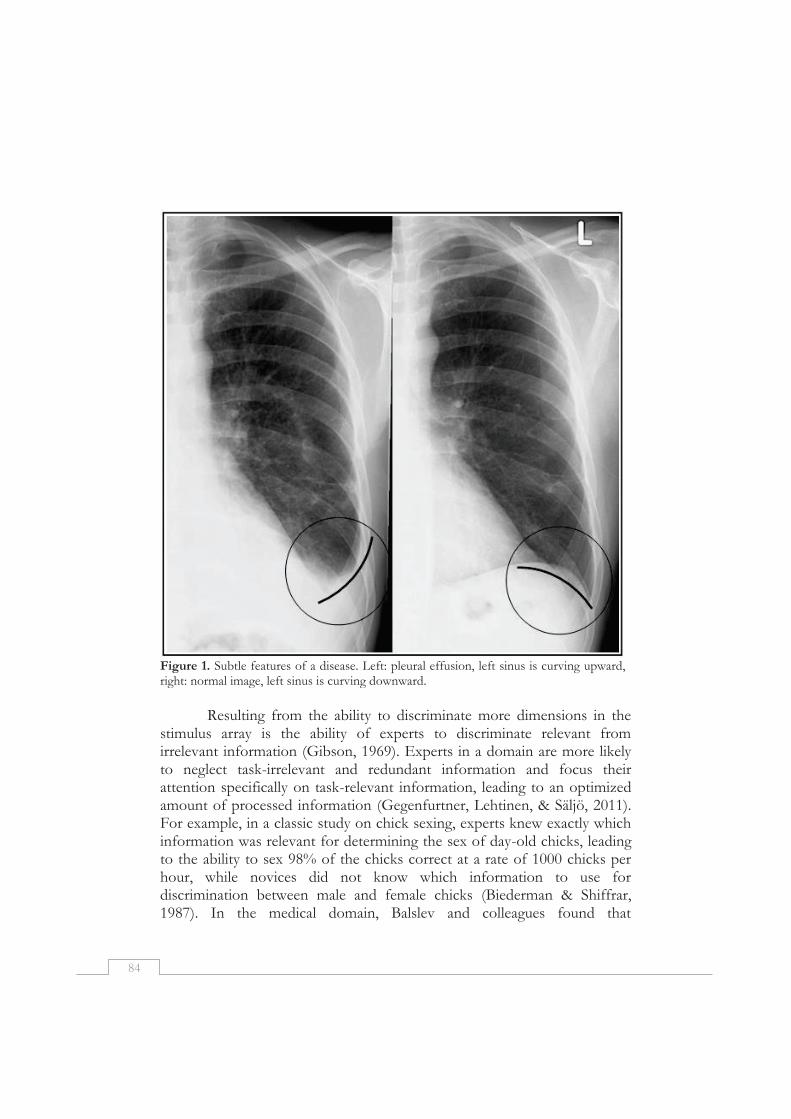
84
Figure 1. Subtle features of a disease. Left: pleural effusion, left sinus is curving upward, right: normal image, left sinus is curving downward.
Resulting from the ability to discriminate more dimensions in the
stimulus array is the ability of experts to discriminate relevant from irrelevant information (Gibson, 1969). Experts in a domain are more likely to neglect task-irrelevant and redundant information and focus their attention specifically on task-relevant information, leading to an optimized amount of processed information (Gegenfurtner, Lehtinen, & Säljö, 2011). For example, in a classic study on chick sexing, experts knew exactly which information was relevant for determining the sex of day-old chicks, leading to the ability to sex 98% of the chicks correct at a rate of 1000 chicks per hour, while novices did not know which information to use for discrimination between male and female chicks (Biederman & Shiffrar, 1987). In the medical domain, Balslev and colleagues found that
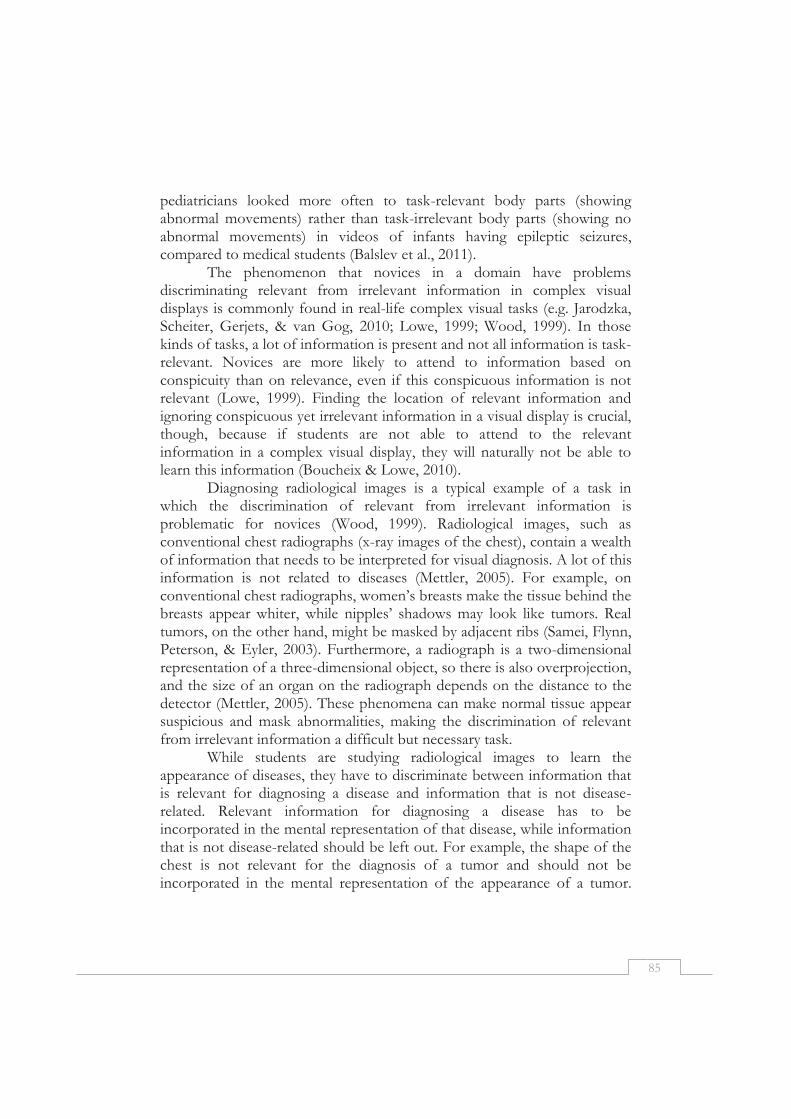
85
pediatricians looked more often to task-relevant body parts (showing abnormal movements) rather than task-irrelevant body parts (showing no abnormal movements) in videos of infants having epileptic seizures, compared to medical students (Balslev et al., 2011).
The phenomenon that novices in a domain have problems discriminating relevant from irrelevant information in complex visual displays is commonly found in real-life complex visual tasks (e.g. Jarodzka, Scheiter, Gerjets, & van Gog, 2010; Lowe, 1999; Wood, 1999). In those kinds of tasks, a lot of information is present and not all information is task-relevant. Novices are more likely to attend to information based on conspicuity than on relevance, even if this conspicuous information is not relevant (Lowe, 1999). Finding the location of relevant information and ignoring conspicuous yet irrelevant information in a visual display is crucial, though, because if students are not able to attend to the relevant information in a complex visual display, they will naturally not be able to learn this information (Boucheix & Lowe, 2010).
Diagnosing radiological images is a typical example of a task in which the discrimination of relevant from irrelevant information is problematic for novices (Wood, 1999). Radiological images, such as conventional chest radiographs (x-ray images of the chest), contain a wealth of information that needs to be interpreted for visual diagnosis. A lot of this information is not related to diseases (Mettler, 2005). For example, on conventional chest radiographs, women’s breasts make the tissue behind the breasts appear whiter, while nipples’ shadows may look like tumors. Real tumors, on the other hand, might be masked by adjacent ribs (Samei, Flynn, Peterson, & Eyler, 2003). Furthermore, a radiograph is a two-dimensional representation of a three-dimensional object, so there is also overprojection, and the size of an organ on the radiograph depends on the distance to the detector (Mettler, 2005). These phenomena can make normal tissue appear suspicious and mask abnormalities, making the discrimination of relevant from irrelevant information a difficult but necessary task.
While students are studying radiological images to learn the appearance of diseases, they have to discriminate between information that is relevant for diagnosing a disease and information that is not disease-related. Relevant information for diagnosing a disease has to be incorporated in the mental representation of that disease, while information that is not disease-related should be left out. For example, the shape of the chest is not relevant for the diagnosis of a tumor and should not be incorporated in the mental representation of the appearance of a tumor.
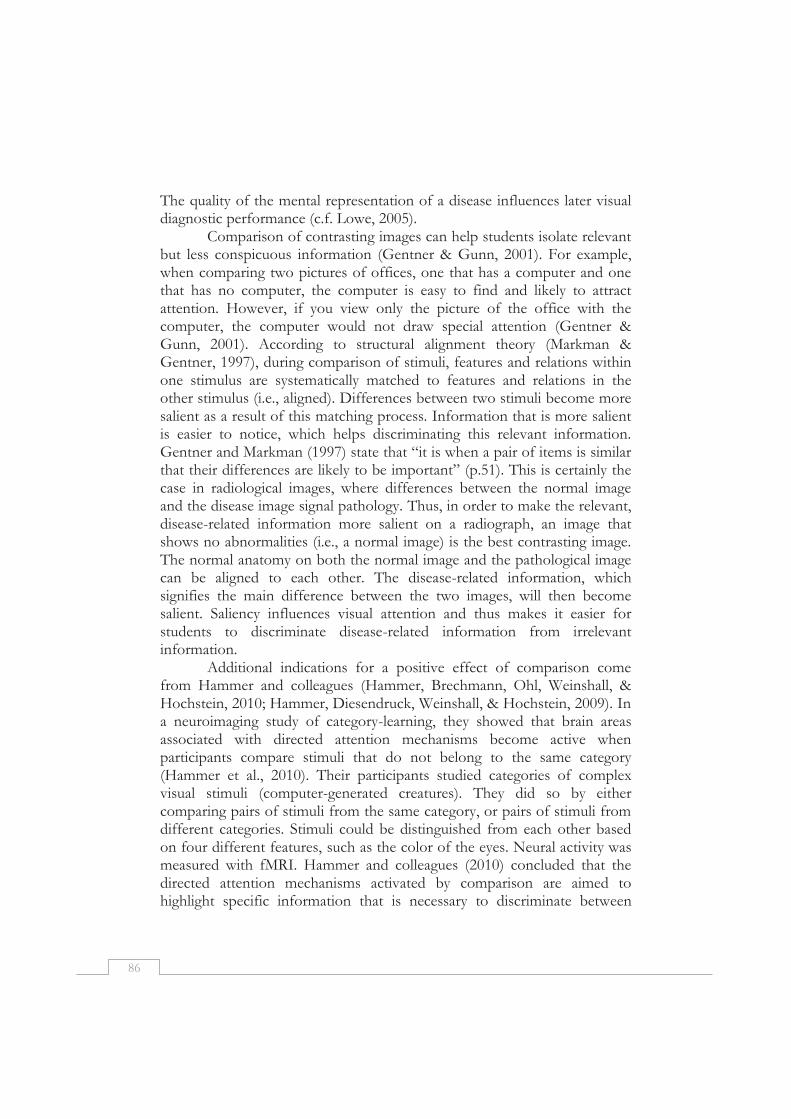
86
The quality of the mental representation of a disease influences later visual diagnostic performance (c.f. Lowe, 2005).
Comparison of contrasting images can help students isolate relevant but less conspicuous information (Gentner & Gunn, 2001). For example, when comparing two pictures of offices, one that has a computer and one that has no computer, the computer is easy to find and likely to attract attention. However, if you view only the picture of the office with the computer, the computer would not draw special attention (Gentner & Gunn, 2001). According to structural alignment theory (Markman & Gentner, 1997), during comparison of stimuli, features and relations within one stimulus are systematically matched to features and relations in the other stimulus (i.e., aligned). Differences between two stimuli become more salient as a result of this matching process. Information that is more salient is easier to notice, which helps discriminating this relevant information. Gentner and Markman (1997) state that “it is when a pair of items is similar that their differences are likely to be important” (p.51). This is certainly the case in radiological images, where differences between the normal image and the disease image signal pathology. Thus, in order to make the relevant, disease-related information more salient on a radiograph, an image that shows no abnormalities (i.e., a normal image) is the best contrasting image. The normal anatomy on both the normal image and the pathological image can be aligned to each other. The disease-related information, which signifies the main difference between the two images, will then become salient. Saliency influences visual attention and thus makes it easier for students to discriminate disease-related information from irrelevant information.
Additional indications for a positive effect of comparison come from Hammer and colleagues (Hammer, Brechmann, Ohl, Weinshall, & Hochstein, 2010; Hammer, Diesendruck, Weinshall, & Hochstein, 2009). In a neuroimaging study of category-learning, they showed that brain areas associated with directed attention mechanisms become active when participants compare stimuli that do not belong to the same category (Hammer et al., 2010). Their participants studied categories of complex visual stimuli (computer-generated creatures). They did so by either comparing pairs of stimuli from the same category, or pairs of stimuli from different categories. Stimuli could be distinguished from each other based on four different features, such as the color of the eyes. Neural activity was measured with fMRI. Hammer and colleagues (2010) concluded that the directed attention mechanisms activated by comparison are aimed to highlight specific information that is necessary to discriminate between
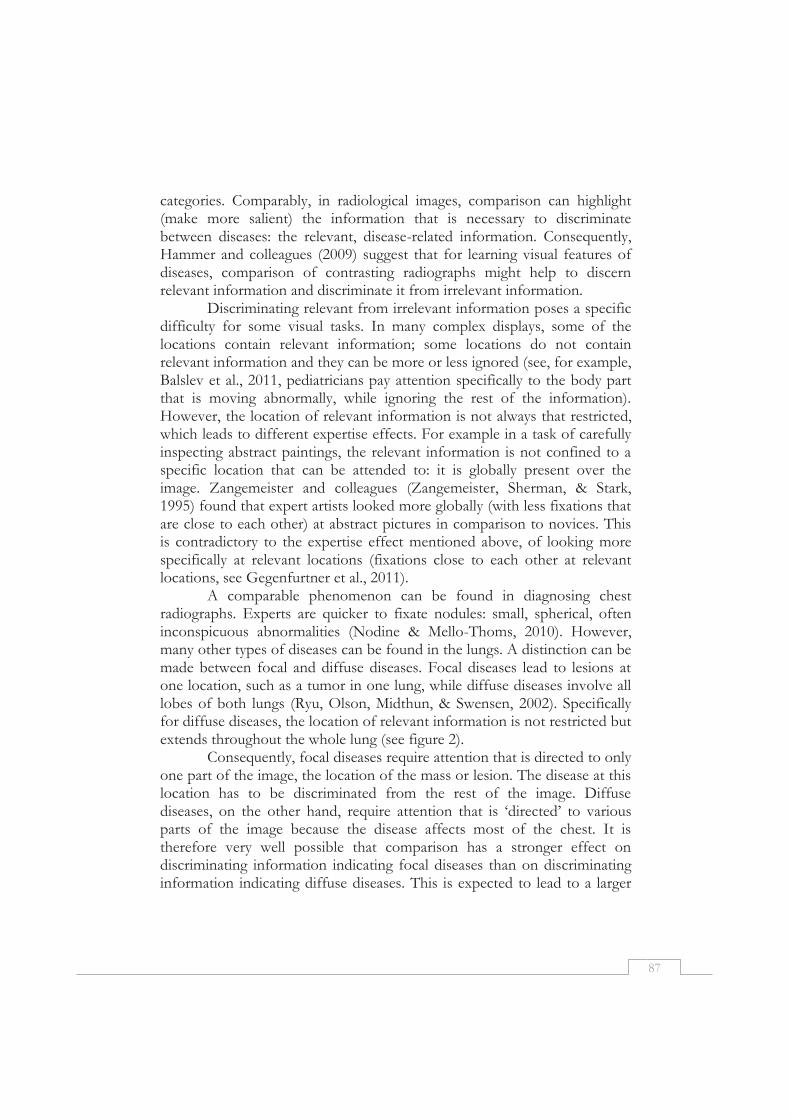
87
categories. Comparably, in radiological images, comparison can highlight (make more salient) the information that is necessary to discriminate between diseases: the relevant, disease-related information. Consequently, Hammer and colleagues (2009) suggest that for learning visual features of diseases, comparison of contrasting radiographs might help to discern relevant information and discriminate it from irrelevant information.
Discriminating relevant from irrelevant information poses a specific difficulty for some visual tasks. In many complex displays, some of the locations contain relevant information; some locations do not contain relevant information and they can be more or less ignored (see, for example, Balslev et al., 2011, pediatricians pay attention specifically to the body part that is moving abnormally, while ignoring the rest of the information). However, the location of relevant information is not always that restricted, which leads to different expertise effects. For example in a task of carefully inspecting abstract paintings, the relevant information is not confined to a specific location that can be attended to: it is globally present over the image. Zangemeister and colleagues (Zangemeister, Sherman, & Stark, 1995) found that expert artists looked more globally (with less fixations that are close to each other) at abstract pictures in comparison to novices. This is contradictory to the expertise effect mentioned above, of looking more specifically at relevant locations (fixations close to each other at relevant locations, see Gegenfurtner et al., 2011).
A comparable phenomenon can be found in diagnosing chest radiographs. Experts are quicker to fixate nodules: small, spherical, often inconspicuous abnormalities (Nodine & Mello-Thoms, 2010). However, many other types of diseases can be found in the lungs. A distinction can be made between focal and diffuse diseases. Focal diseases lead to lesions at one location, such as a tumor in one lung, while diffuse diseases involve all lobes of both lungs (Ryu, Olson, Midthun, & Swensen, 2002). Specifically for diffuse diseases, the location of relevant information is not restricted but extends throughout the whole lung (see figure 2).
Consequently, focal diseases require attention that is directed to only one part of the image, the location of the mass or lesion. The disease at this location has to be discriminated from the rest of the image. Diffuse diseases, on the other hand, require attention that is ‘directed’ to various parts of the image because the disease affects most of the chest. It is therefore very well possible that comparison has a stronger effect on discriminating information indicating focal diseases than on discriminating information indicating diffuse diseases. This is expected to lead to a larger
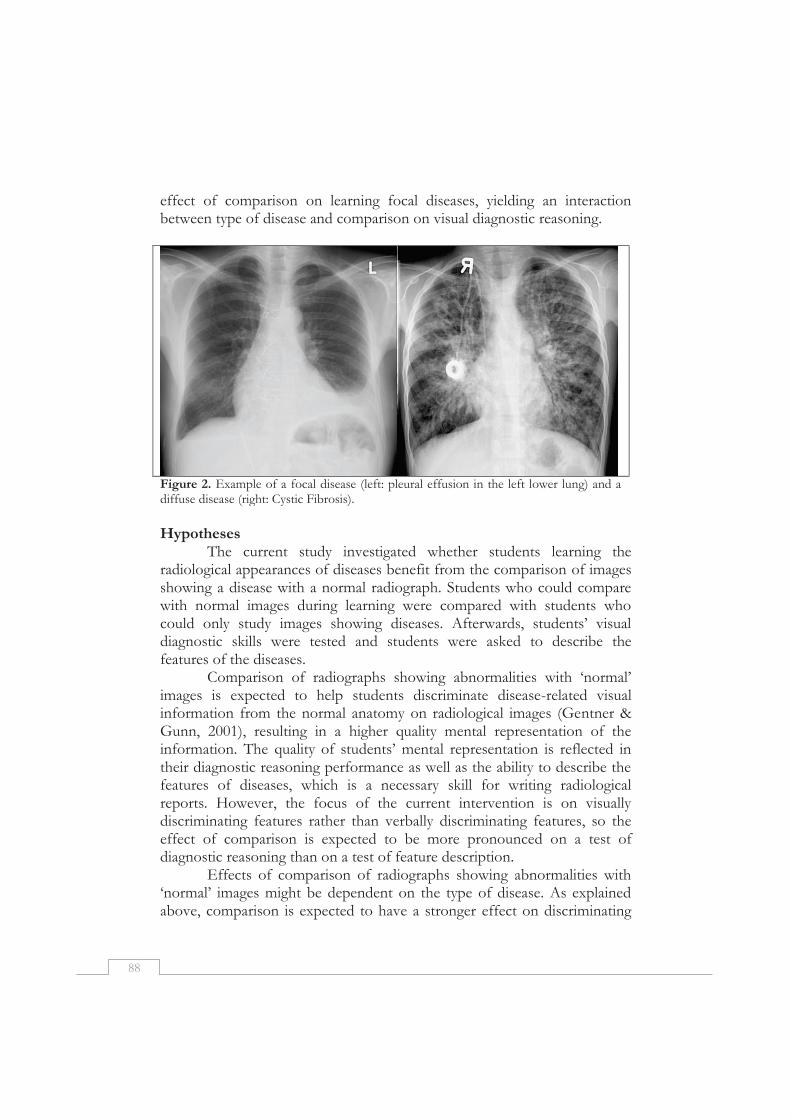
88
effect of comparison on learning focal diseases, yielding an interaction between type of disease and comparison on visual diagnostic reasoning.
Figure 2. Example of a focal disease (left: pleural effusion in the left lower lung) and a diffuse disease (right: Cystic Fibrosis).
Hypotheses
The current study investigated whether students learning the radiological appearances of diseases benefit from the comparison of images showing a disease with a normal radiograph. Students who could compare with normal images during learning were compared with students who could only study images showing diseases. Afterwards, students’ visual diagnostic skills were tested and students were asked to describe the features of the diseases.
Comparison of radiographs showing abnormalities with ‘normal’ images is expected to help students discriminate disease-related visual information from the normal anatomy on radiological images (Gentner & Gunn, 2001), resulting in a higher quality mental representation of the information. The quality of students’ mental representation is reflected in their diagnostic reasoning performance as well as the ability to describe the features of diseases, which is a necessary skill for writing radiological reports. However, the focus of the current intervention is on visually discriminating features rather than verbally discriminating features, so the effect of comparison is expected to be more pronounced on a test of diagnostic reasoning than on a test of feature description.
Effects of comparison of radiographs showing abnormalities with ‘normal’ images might be dependent on the type of disease. As explained above, comparison is expected to have a stronger effect on discriminating
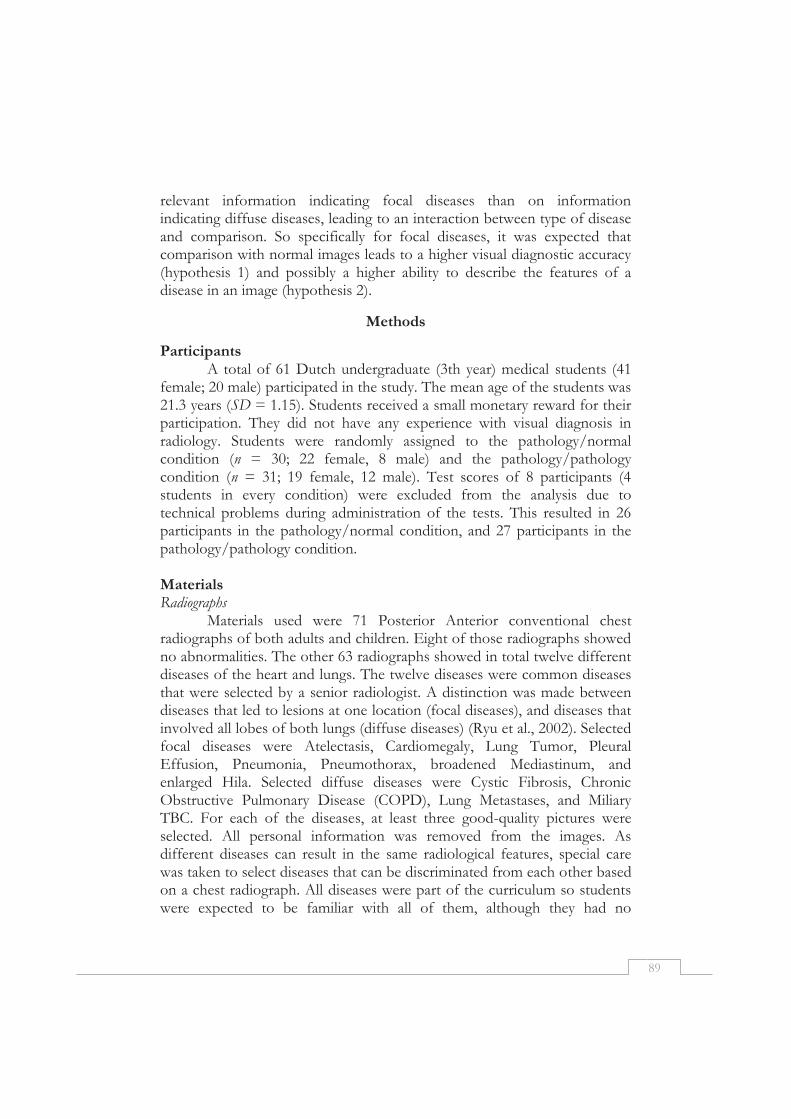
89
relevant information indicating focal diseases than on information indicating diffuse diseases, leading to an interaction between type of disease and comparison. So specifically for focal diseases, it was expected that comparison with normal images leads to a higher visual diagnostic accuracy (hypothesis 1) and possibly a higher ability to describe the features of a disease in an image (hypothesis 2).
Methods
Participants A total of 61 Dutch undergraduate (3th year) medical students (41
female; 20 male) participated in the study. The mean age of the students was 21.3 years (SD = 1.15). Students received a small monetary reward for their participation. They did not have any experience with visual diagnosis in radiology. Students were randomly assigned to the pathology/normal condition (n = 30; 22 female, 8 male) and the pathology/pathology condition (n = 31; 19 female, 12 male). Test scores of 8 participants (4 students in every condition) were excluded from the analysis due to technical problems during administration of the tests. This resulted in 26 participants in the pathology/normal condition, and 27 participants in the pathology/pathology condition. Materials Radiographs
Materials used were 71 Posterior Anterior conventional chest radiographs of both adults and children. Eight of those radiographs showed no abnormalities. The other 63 radiographs showed in total twelve different diseases of the heart and lungs. The twelve diseases were common diseases that were selected by a senior radiologist. A distinction was made between diseases that led to lesions at one location (focal diseases), and diseases that involved all lobes of both lungs (diffuse diseases) (Ryu et al., 2002). Selected focal diseases were Atelectasis, Cardiomegaly, Lung Tumor, Pleural Effusion, Pneumonia, Pneumothorax, broadened Mediastinum, and enlarged Hila. Selected diffuse diseases were Cystic Fibrosis, Chronic Obstructive Pulmonary Disease (COPD), Lung Metastases, and Miliary TBC. For each of the diseases, at least three good-quality pictures were selected. All personal information was removed from the images. As different diseases can result in the same radiological features, special care was taken to select diseases that can be discriminated from each other based on a chest radiograph. All diseases were part of the curriculum so students were expected to be familiar with all of them, although they had no
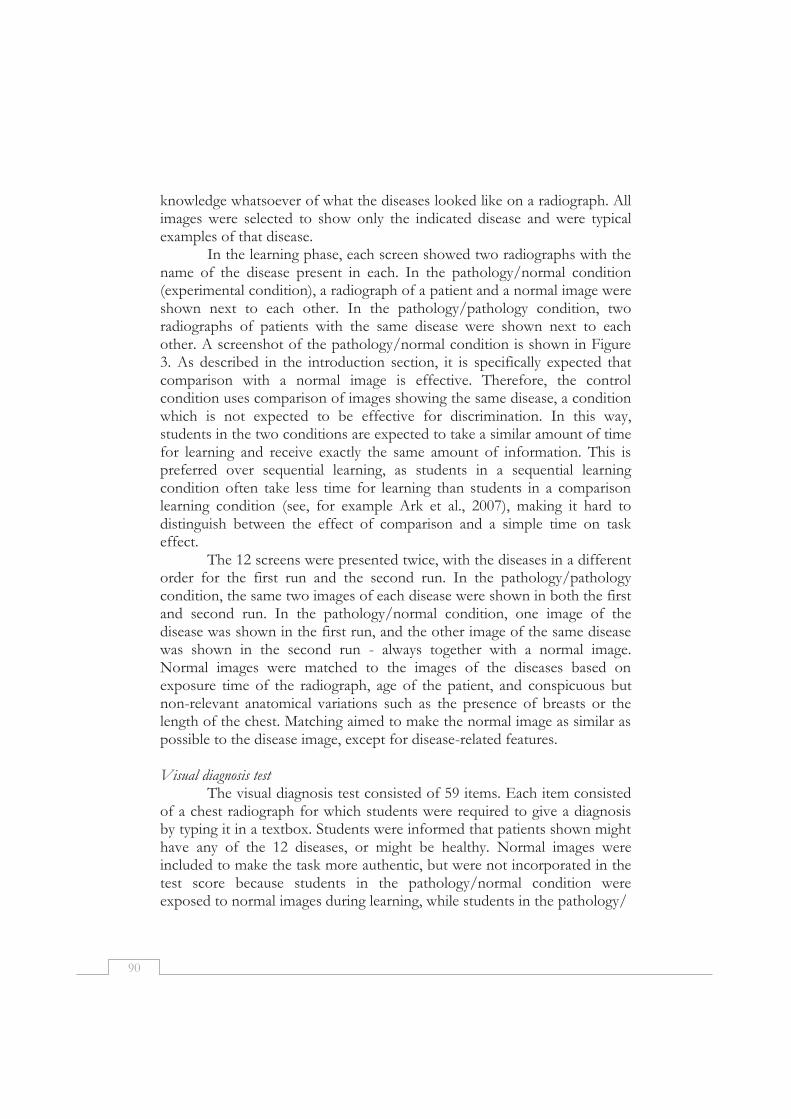
90
knowledge whatsoever of what the diseases looked like on a radiograph. All images were selected to show only the indicated disease and were typical examples of that disease.
In the learning phase, each screen showed two radiographs with the name of the disease present in each. In the pathology/normal condition (experimental condition), a radiograph of a patient and a normal image were shown next to each other. In the pathology/pathology condition, two radiographs of patients with the same disease were shown next to each other. A screenshot of the pathology/normal condition is shown in Figure 3. As described in the introduction section, it is specifically expected that comparison with a normal image is effective. Therefore, the control condition uses comparison of images showing the same disease, a condition which is not expected to be effective for discrimination. In this way, students in the two conditions are expected to take a similar amount of time for learning and receive exactly the same amount of information. This is preferred over sequential learning, as students in a sequential learning condition often take less time for learning than students in a comparison learning condition (see, for example Ark et al., 2007), making it hard to distinguish between the effect of comparison and a simple time on task effect.
The 12 screens were presented twice, with the diseases in a different order for the first run and the second run. In the pathology/pathology condition, the same two images of each disease were shown in both the first and second run. In the pathology/normal condition, one image of the disease was shown in the first run, and the other image of the same disease was shown in the second run - always together with a normal image. Normal images were matched to the images of the diseases based on exposure time of the radiograph, age of the patient, and conspicuous but non-relevant anatomical variations such as the presence of breasts or the length of the chest. Matching aimed to make the normal image as similar as possible to the disease image, except for disease-related features. Visual diagnosis test
The visual diagnosis test consisted of 59 items. Each item consisted of a chest radiograph for which students were required to give a diagnosis by typing it in a textbox. Students were informed that patients shown might have any of the 12 diseases, or might be healthy. Normal images were included to make the task more authentic, but were not incorporated in the test score because students in the pathology/normal condition were exposed to normal images during learning, while students in the pathology/
91
Figure 3. Screenshot of learning phase of the pathology/normal condition, showing a patient with pleural effusion on the left and a radiograph without abnormalities on the right.
pathology condition were not. Fifty-two of the images showed one of the learned diseases, seven images showed no abnormalities. Disease-items consisted of both images of patients seen during the learning-phase and images of new patients. Five items were deleted because they correlated negatively with the total score. Cronbach’s alpha for the visual diagnosis test after deletion of the negatively correlated items was .82. For the first 27 items, students were asked to type the name of the disease that they thought was on the image (one of the 12 learned diseases) or to type “healthy” in case of no abnormalities (thus 13 options in total). For the next 27 items, students were presented with 4 answer options to choose from: the correct answer; “healthy”, and two incorrect options. For the four option items, Cronbach’s alpha was 0.68; for the thirteen options items, Cronbach’s alpha was 0.69. Because all items measured the same construct, they were pooled for all statistical analyses to increase power. The visual diagnosis test score was the proportion of correctly diagnosed images. The order of the items was randomized over participants.
92
Feature description test The feature description test consisted of 12 radiographs, one for
each disease. The same radiographs were presented as in the learning phase. Students were given the correct diagnosis and were required to describe the appearance of each disease on a conventional radiograph. The feature description test score was the proportion correctly described features of the disease. Features that had to be described were established by an expert radiologist before scoring. Only features that could be described based on the given image were scored. For example, three features could be described for the image of COPD: A small and thin heart, a flat diaphragm, and a blackish appearance of the lungs. Answers of students were scored by one researcher who was blind to the condition of the students. Another researcher scored answers of 30 students to determine inter-rater agreement. The inter-rater agreement was calculated for each disease, using Cohen’s Kappa. Kappa per disease ranged from .58 to .92; the mean Kappa is .77, which is considered acceptable. Differences were resolved by discussion between the two scorers, until agreement was reached. Procedure
Participants were tested in six experimenter-supervised groups of up to 18 students, but instructed to work individually on their own computer and not to consult with peers. The experiment consisted of a learning phase and a test phase and took approximately one hour. In the learning phase, participants studied the radiological appearances of the 12 diseases. Diseases were shown one by one on a computer screen, for a maximum of 30 seconds each. Students could choose to continue to the next disease earlier by hitting the F1 button. After the 12 diseases were shown once, they were all shown again in a different order.
After the learning phase, students took the visual diagnosis test. Students were asked to type in the most likely diagnosis for 59 images while viewing the image. This test was self-paced. Subsequently, students took the feature description test: students were presented with an image of each of the diseases. The image of the disease was accompanied by the name of the disease. Students were required to describe how they could recognize that disease on a conventional radiograph. They could type in their answer in a text box while viewing the radiograph. This test was also self-paced. Finally, students were thanked for participation.
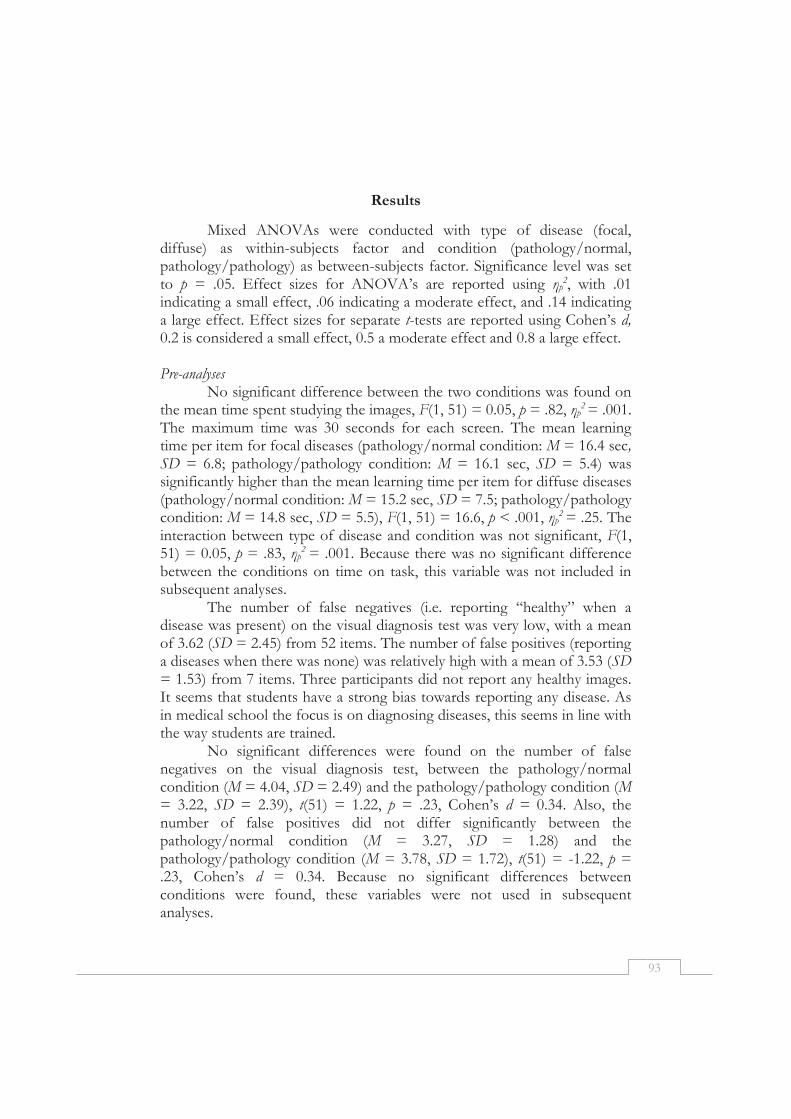
93
Results
Mixed ANOVAs were conducted with type of disease (focal, diffuse) as within-subjects factor and condition (pathology/normal, pathology/pathology) as between-subjects factor. Significance level was set to p = .05. Effect sizes for ANOVA’s are reported using ηp
2, with .01 indicating a small effect, .06 indicating a moderate effect, and .14 indicating a large effect. Effect sizes for separate t-tests are reported using Cohen’s d, 0.2 is considered a small effect, 0.5 a moderate effect and 0.8 a large effect. Pre-analyses
No significant difference between the two conditions was found on the mean time spent studying the images, F(1, 51) = 0.05, p = .82, ηp
2 = .001. The maximum time was 30 seconds for each screen. The mean learning time per item for focal diseases (pathology/normal condition: M = 16.4 sec, SD = 6.8; pathology/pathology condition: M = 16.1 sec, SD = 5.4) was significantly higher than the mean learning time per item for diffuse diseases (pathology/normal condition: M = 15.2 sec, SD = 7.5; pathology/pathology condition: M = 14.8 sec, SD = 5.5), F(1, 51) = 16.6, p < .001, ηp
2 = .25. The interaction between type of disease and condition was not significant, F(1, 51) = 0.05, p = .83, ηp
2 = .001. Because there was no significant difference between the conditions on time on task, this variable was not included in subsequent analyses.
The number of false negatives (i.e. reporting “healthy” when a disease was present) on the visual diagnosis test was very low, with a mean of 3.62 (SD = 2.45) from 52 items. The number of false positives (reporting a diseases when there was none) was relatively high with a mean of 3.53 (SD = 1.53) from 7 items. Three participants did not report any healthy images. It seems that students have a strong bias towards reporting any disease. As in medical school the focus is on diagnosing diseases, this seems in line with the way students are trained.
No significant differences were found on the number of false negatives on the visual diagnosis test, between the pathology/normal condition (M = 4.04, SD = 2.49) and the pathology/pathology condition (M = 3.22, SD = 2.39), t(51) = 1.22, p = .23, Cohen’s d = 0.34. Also, the number of false positives did not differ significantly between the pathology/normal condition (M = 3.27, SD = 1.28) and the pathology/pathology condition (M = 3.78, SD = 1.72), t(51) = -1.22, p = .23, Cohen’s d = 0.34. Because no significant differences between conditions were found, these variables were not used in subsequent analyses.
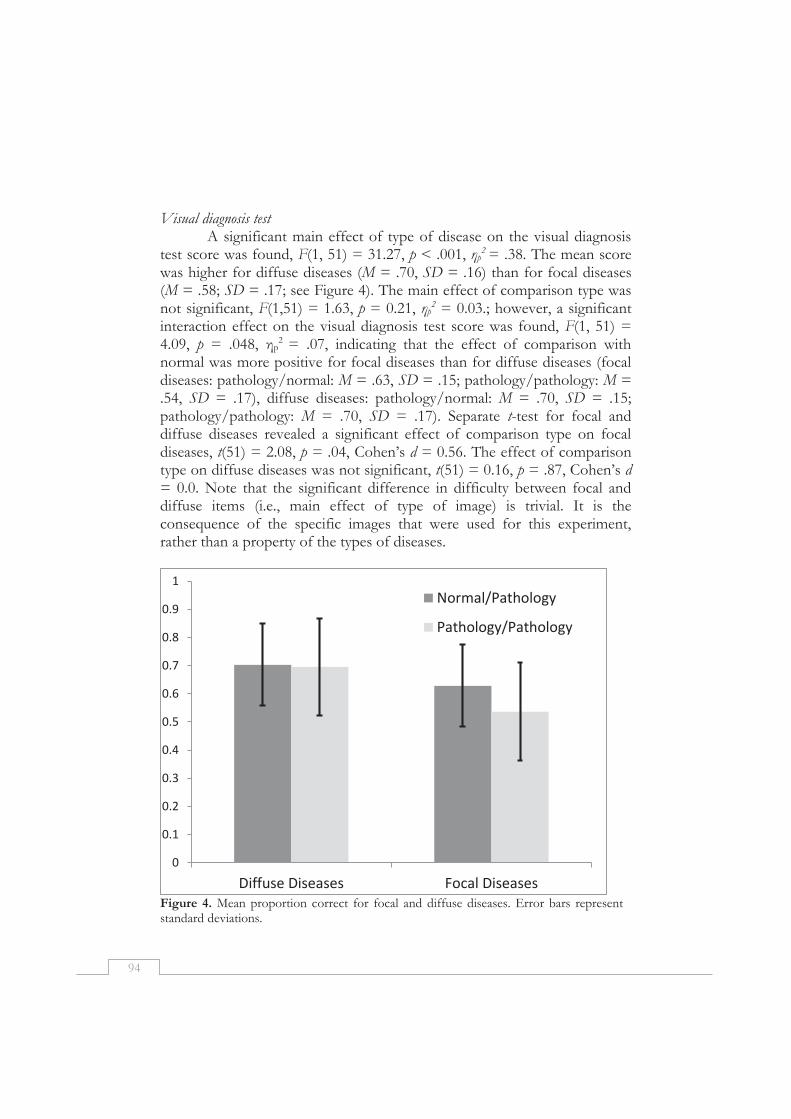
94
Visual diagnosis test
A significant main effect of type of disease on the visual diagnosis test score was found, F(1, 51) = 31.27, p < .001, ηp
2 = .38. The mean score was higher for diffuse diseases (M = .70, SD = .16) than for focal diseases (M = .58; SD = .17; see Figure 4). The main effect of comparison type was not significant, F(1,51) = 1.63, p = 0.21, ηp
2 = 0.03.; however, a significant interaction effect on the visual diagnosis test score was found, F(1, 51) = 4.09, p = .048, ηp
2 = .07, indicating that the effect of comparison with normal was more positive for focal diseases than for diffuse diseases (focal diseases: pathology/normal: M = .63, SD = .15; pathology/pathology: M = .54, SD = .17), diffuse diseases: pathology/normal: M = .70, SD = .15; pathology/pathology: M = .70, SD = .17). Separate t-test for focal and diffuse diseases revealed a significant effect of comparison type on focal diseases, t(51) = 2.08, p = .04, Cohen’s d = 0.56. The effect of comparison type on diffuse diseases was not significant, t(51) = 0.16, p = .87, Cohen’s d = 0.0. Note that the significant difference in difficulty between focal and diffuse items (i.e., main effect of type of image) is trivial. It is the consequence of the specific images that were used for this experiment, rather than a property of the types of diseases.
Figure 4. Mean proportion correct for focal and diffuse diseases. Error bars represent standard deviations.
0
0.1
0.2
0.3
0.4
0.5
0.6
0.7
0.8
0.9
1
Diffuse Diseases Focal Diseases
Normal/Pathology
Pathology/Pathology
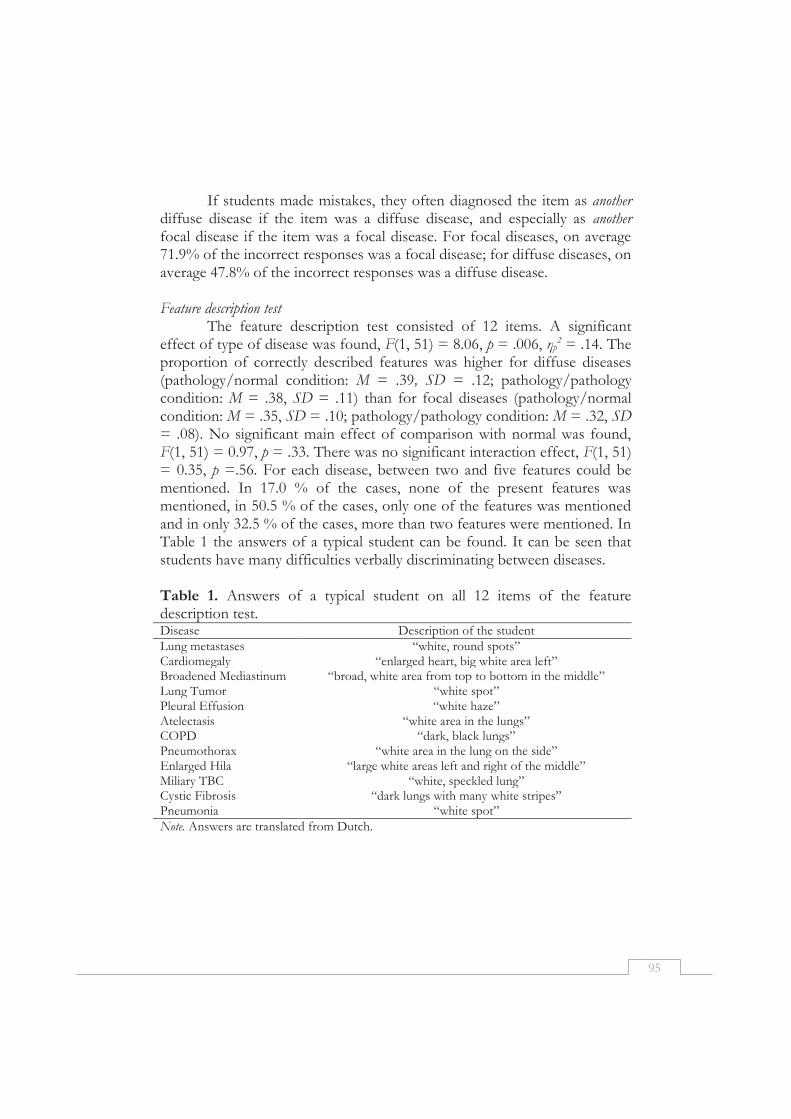
95
If students made mistakes, they often diagnosed the item as another diffuse disease if the item was a diffuse disease, and especially as another focal disease if the item was a focal disease. For focal diseases, on average 71.9% of the incorrect responses was a focal disease; for diffuse diseases, on average 47.8% of the incorrect responses was a diffuse disease. Feature description test
The feature description test consisted of 12 items. A significant effect of type of disease was found, F(1, 51) = 8.06, p = .006, ηp
2 = .14. The proportion of correctly described features was higher for diffuse diseases (pathology/normal condition: M = .39, SD = .12; pathology/pathology condition: M = .38, SD = .11) than for focal diseases (pathology/normal condition: M = .35, SD = .10; pathology/pathology condition: M = .32, SD = .08). No significant main effect of comparison with normal was found, F(1, 51) = 0.97, p = .33. There was no significant interaction effect, F(1, 51) = 0.35, p =.56. For each disease, between two and five features could be mentioned. In 17.0 % of the cases, none of the present features was mentioned, in 50.5 % of the cases, only one of the features was mentioned and in only 32.5 % of the cases, more than two features were mentioned. In Table 1 the answers of a typical student can be found. It can be seen that students have many difficulties verbally discriminating between diseases.
Table 1. Answers of a typical student on all 12 items of the feature description test. Disease Description of the student Lung metastases “white, round spots” Cardiomegaly “enlarged heart, big white area left” Broadened Mediastinum “broad, white area from top to bottom in the middle” Lung Tumor “white spot” Pleural Effusion “white haze” Atelectasis “white area in the lungs” COPD “dark, black lungs” Pneumothorax “white area in the lung on the side” Enlarged Hila “large white areas left and right of the middle” Miliary TBC “white, speckled lung” Cystic Fibrosis “dark lungs with many white stripes” Pneumonia “white spot” Note. Answers are translated from Dutch.
96
Discussion
Medical students studied the radiological appearance of lung and heart diseases on chest radiographs. Half of them could compare the radiographs with images showing no abnormalities (normal images), while the other half could only compare radiographs of patients with the same disease. Students who could compare with normal images outperformed students who could not compare with normal images, for focal diseases but not for diffuse diseases (hypothesis 1). There was no significant difference in the learning time between the conditions, so learning time is unlikely to have caused the significant difference in visual diagnosis test scores between the two conditions on focal items. On the feature description test, no significant effects of comparison were found (hypothesis 2), but this might be caused by difficulties that students have in verbalizing discriminative features of diseases.
Comparison with a normal image was proposed to make it easier for students to discriminate relevant from irrelevant information, by making the features of a disease more salient (Gentner & Gunn, 2001; Hammer et al., 2010). Saliency refers to the conspicuity of a – part of a – stimulus in relation to its environment (Itti & Koch, 2000): It makes particular information stand out from the rest of the image. Making a focal disease stand out from the environment (i.e., the chest) is very effective, because it makes it easier to direct attention to the relevant information. However, for diffuse diseases, the whole chest is involved so the whole image should become more salient. And when everything stands out, it does not stand out any more! Consequently, attention is not directed to a specific location and discrimination of relevant information is not facilitated. This is analogous to highlighting a few words in a text or highlighting all words in a text. If one word is highlighted, it becomes salient. If all words are highlighted, none of them are more salient than others. Accordingly, we found that the positive effect of comparison with the normal image was present for focal diseases but not for diffuse diseases. This indicates that comparison with normal might indeed make the disease-related information more salient, as expected, and therefore easier to discriminate from irrelevant information.
It is not yet clear how attention is directed in diffuse diseases. It seems unlikely that directed attention to a specific relevant location is applicable to diffuse diseases, because there is no location in the image that is more informative than other locations for learning the disease. This is in contrast to focal diseases, where scrutiny of one location yields the information necessary for learning to discriminate the disease. Presumably, another distribution of attention takes place. Using eye-tracking, Nodine,
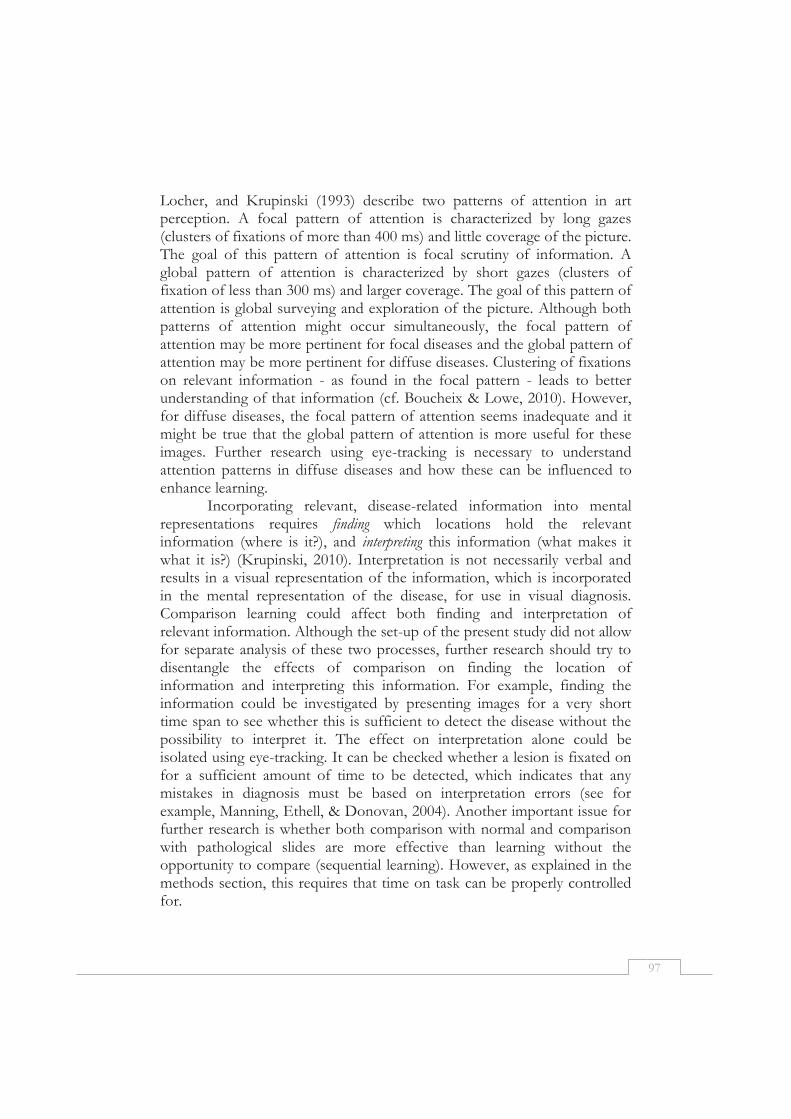
97
Locher, and Krupinski (1993) describe two patterns of attention in art perception. A focal pattern of attention is characterized by long gazes (clusters of fixations of more than 400 ms) and little coverage of the picture. The goal of this pattern of attention is focal scrutiny of information. A global pattern of attention is characterized by short gazes (clusters of fixation of less than 300 ms) and larger coverage. The goal of this pattern of attention is global surveying and exploration of the picture. Although both patterns of attention might occur simultaneously, the focal pattern of attention may be more pertinent for focal diseases and the global pattern of attention may be more pertinent for diffuse diseases. Clustering of fixations on relevant information - as found in the focal pattern - leads to better understanding of that information (cf. Boucheix & Lowe, 2010). However, for diffuse diseases, the focal pattern of attention seems inadequate and it might be true that the global pattern of attention is more useful for these images. Further research using eye-tracking is necessary to understand attention patterns in diffuse diseases and how these can be influenced to enhance learning.
Incorporating relevant, disease-related information into mental representations requires finding which locations hold the relevant information (where is it?), and interpreting this information (what makes it what it is?) (Krupinski, 2010). Interpretation is not necessarily verbal and results in a visual representation of the information, which is incorporated in the mental representation of the disease, for use in visual diagnosis. Comparison learning could affect both finding and interpretation of relevant information. Although the set-up of the present study did not allow for separate analysis of these two processes, further research should try to disentangle the effects of comparison on finding the location of information and interpreting this information. For example, finding the information could be investigated by presenting images for a very short time span to see whether this is sufficient to detect the disease without the possibility to interpret it. The effect on interpretation alone could be isolated using eye-tracking. It can be checked whether a lesion is fixated on for a sufficient amount of time to be detected, which indicates that any mistakes in diagnosis must be based on interpretation errors (see for example, Manning, Ethell, & Donovan, 2004). Another important issue for further research is whether both comparison with normal and comparison with pathological slides are more effective than learning without the opportunity to compare (sequential learning). However, as explained in the methods section, this requires that time on task can be properly controlled for.
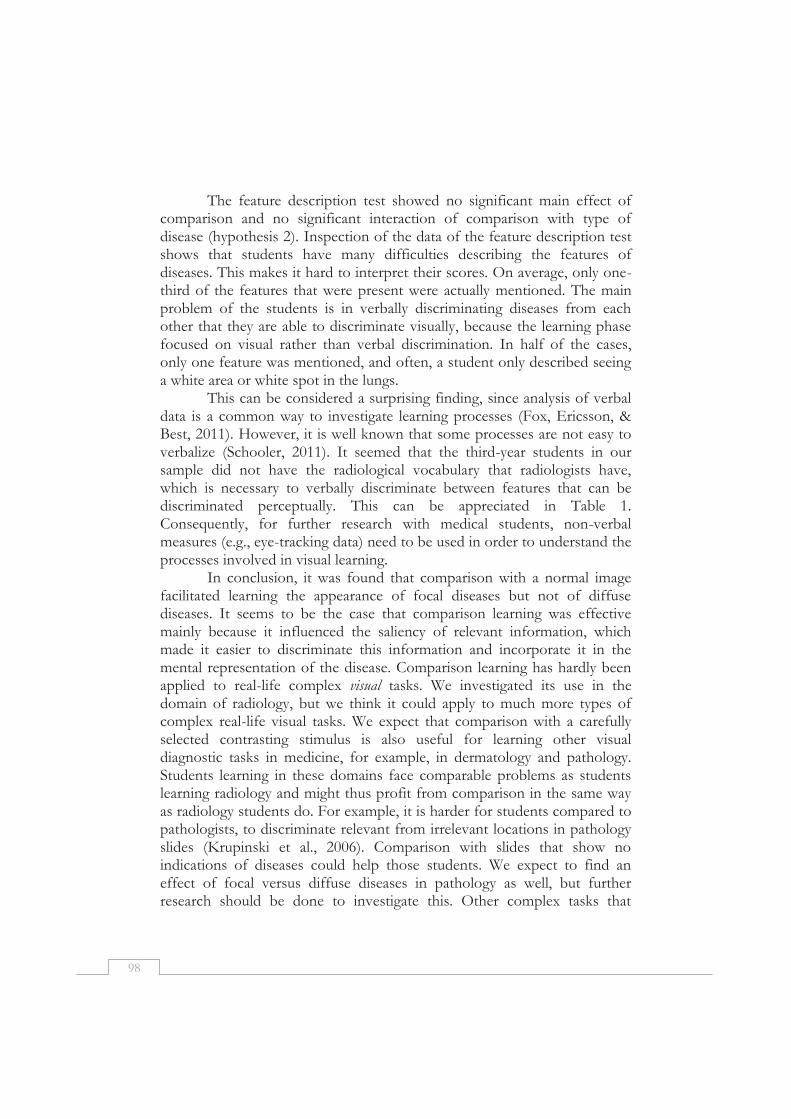
98
The feature description test showed no significant main effect of comparison and no significant interaction of comparison with type of disease (hypothesis 2). Inspection of the data of the feature description test shows that students have many difficulties describing the features of diseases. This makes it hard to interpret their scores. On average, only one-third of the features that were present were actually mentioned. The main problem of the students is in verbally discriminating diseases from each other that they are able to discriminate visually, because the learning phase focused on visual rather than verbal discrimination. In half of the cases, only one feature was mentioned, and often, a student only described seeing a white area or white spot in the lungs.
This can be considered a surprising finding, since analysis of verbal data is a common way to investigate learning processes (Fox, Ericsson, & Best, 2011). However, it is well known that some processes are not easy to verbalize (Schooler, 2011). It seemed that the third-year students in our sample did not have the radiological vocabulary that radiologists have, which is necessary to verbally discriminate between features that can be discriminated perceptually. This can be appreciated in Table 1. Consequently, for further research with medical students, non-verbal measures (e.g., eye-tracking data) need to be used in order to understand the processes involved in visual learning.
In conclusion, it was found that comparison with a normal image facilitated learning the appearance of focal diseases but not of diffuse diseases. It seems to be the case that comparison learning was effective mainly because it influenced the saliency of relevant information, which made it easier to discriminate this information and incorporate it in the mental representation of the disease. Comparison learning has hardly been applied to real-life complex visual tasks. We investigated its use in the domain of radiology, but we think it could apply to much more types of complex real-life visual tasks. We expect that comparison with a carefully selected contrasting stimulus is also useful for learning other visual diagnostic tasks in medicine, for example, in dermatology and pathology. Students learning in these domains face comparable problems as students learning radiology and might thus profit from comparison in the same way as radiology students do. For example, it is harder for students compared to pathologists, to discriminate relevant from irrelevant locations in pathology slides (Krupinski et al., 2006). Comparison with slides that show no indications of diseases could help those students. We expect to find an effect of focal versus diffuse diseases in pathology as well, but further research should be done to investigate this. Other complex tasks that
99
require visual skills might also benefit from comparison, such as interpretation of weather maps (e.g., Lowe, 2005), reading of radar screens, and biological classification of birds. For example, in order to learn patterns on weather maps that lead to thunderstorms, students can compare a weather map showing features that will eventually lead to a thunderstorm with a weather map showing a situation that will not end in a thunderstorm. Comparison could help students to see which information is relevant for predicting thunderstorms. Based on our findings, we would predict that comparison would be especially helpful for learning isolated features rather than the patterns that extend across the map, while Lowe hypothesizes that comparison should be especially effective for learning the patterns across the map (Lowe, 2005). Further research should investigate the specific processes that explain how comparison helps learning in complex visual domains, specifically with regard to differences between focal and diffuse patterns.
Visual diagnosis in radiology is a very difficult skill to learn for medical students (Gunderman, Williamson, Fraley, & Steele, 2001). It is highly complex and it takes thousands of cases (Lesgold et al., 1988) before a novice knows ‘how to see’. But the pressure on students and residents to learn quickly is high, because there is so much other work to do. Finding new ways to make the learning process more effective and efficient is therefore of utmost importance and should receive much more attention because, as Gunderman (2012) states: “Education Matters”!
100
References
Andrews, J. K., Livingston, K. R., & Kurtz, K. J. (2011). Category learning in the context of co-presented items. Cognitive Processing, 12, 161-175.
Ark, T. K., Brooks, L. R., & Eva, K. W. (2007). The benefits of flexibility: the pedagogical value of instructions to adopt multifaceted diagnostic reasoning strategies. Medical Education, 41, 281-287.
Balslev, T., Jarodzka, H., Holmqvist, K., de Grave, W., Muijtjens, A. M. M., Eika, B., van Merriënboer, J., & Scherpbier, A. J. J. A. (2011). Visual expertise in paediatric neurology. European Journal of Paediatric Neurology, 16, 161-166.
Biederman, I., & Shiffrar, M. (1987). Sexing day-old chicks: A case study and expert systems analysis of a difficult perceptual-learning task. Journal of Experimental Psychology: Learning, Memory, and Cognition, 13, 640-645.
Boucheix, J. M., & Lowe, R. K. (2010). An eye tracking comparison of external pointing cues and internal continuous cues in learning with complex animations. Learning and Instruction, 20, 123-135.
Fox, M. C., Ericsson, K. A., & Best, R. (2011). Do procedures for verbal reporting of thinking have to be reactive? A meta-analysis and recommendations for best reporting methods. Psychological Bulletin, 137, 316-344.
Gadgil, S., Nokes-Malach, T. J., & Chi, M. T. H. (2012). Effectiveness of holistic mental model confrontation in driving conceptual change. Learning and Instruction, 22, 47-61.
Gegenfurtner, A., Lehtinen, E., & Säljö, R. (2011). Expertise differences in the comprehension of visualizations: a meta-analysis of eye-tracking research in professional domains. Educational Psychology Review, 23, 1-30.
Gentner, D. (2010). Bootstrapping the mind: Analogical processes and symbol systems. Cognitive Science, 34, 752-775.
Gentner, D., & Gunn, V. (2001). Structural alignment facilitates the noticing of differences. Memory & Cognition, 29, 565-577.
Gentner, D., & Markman, A. B. (1997). Structure mapping in analogy and similarity. American Psychologist, 52, 45-56.
Gibson, E. J. (1969). Principles of Perceptual Learning and Development. New York: Appleton-Century-Crofts.
Gick, M. L., & Paterson, K. (1992). Do contrasting examples facilitate schema acquisition and analogical transfer? Canadian Journal of Psychology-Revue Canadienne De Psychologie, 46, 539-550.
Gunderman, R. B. (2012). Education Matters. Academic Radiology, 19, 117-118. Gunderman, R., Williamson, K., Fraley, R., & Steele, J. (2001). Expertise: implications for
radiological education. Academic radiology, 8, 1252. Hammer, R., Bar-Hillel, A., Hertz, T., Weinshall, D., & Hochstein, S. (2008). Comparison
processes in category learning: From theory to behavior. Brain Research, 1225, 102-118.
Hammer, R., Brechmann, A., Ohl, F., Weinshall, D., & Hochstein, S. (2010). Differential category learning processes: The neural basis of comparison-based learning and induction. Neuroimage, 52, 699-709.
Hammer, R., Diesendruck, G., Weinshall, D., & Hochstein, S. (2009). The development of category learning strategies: What makes the difference? Cognition, 112, 105-119.
101
Hatala, R. M., Brooks, L. R., & Norman, G. R. (2003). Practice makes perfect: The critical role of mixed practice in the acquisition of ECG interpretation skills. Advances in Health Sciences Education, 8, 17-26.
Itti, L., & Koch, C. (2000). A saliency-based search mechanism for overt and covert shifts of visual attention. Vision Research, 40, 1489-1506.
Jarodzka, H., Scheiter, K., Gerjets, P., & van Gog, T. (2010). In the eyes of the beholder: How experts and novices interpret dynamic stimuli. Learning and Instruction, 20, 146-154.
Kellman, P. J., & Garrigan, P. (2009). Perceptual learning and human expertise. Physics of Life Reviews, 6, 53-84.
Krupinski, E.A. (2010). Current perspectives in medical image perception. Attention, Perception, & Psychophysics,72, 1205-1217.
Krupinski, E. A., Tillack, A. A., Richter, L., Henderson, J. T., Bhattacharyya, A. K., Scott, K. M., Graham, A. R., Descour, M. R., Davis, J. R., & Weinstein, R. S. (2006). Eye-movement study and human performance using telepathology virtual slides. Implications for medical education and differences with experience. Human Pathology, 37, 1543-1556.
Lesgold, A., Rubinson, H., Feltovich, P., Glaser, R., Klopfer, D., & Wang, Y. (1988). Expertise in a complex skill: Diagnosing x-ray pictures. In M. T. H. Chi, R. Glaser & M. Farr (Eds.), The nature of expertise (pp. 311-342). Hillsdale, NJ: Erlbaum.
Lowe, R. K. (1999). Extracting information from an animation during complex visual learning. European Journal of Psychology of Education, 14, 225-244.
Lowe, R. K. (2005). Multimedia Learning of Meteorology. In R. E. Mayer (Ed.), The Cambridge Handbook of Multimedia Learning. Cambridge: Cambridge University Press.
Manning, D. J., Ethell, S. C., & Donovan, T. (2004). Detection or decision errors? Missed lung cancer from the posteroanterior chest radiograph. British Journal of Radiology, 77, 231-235.
Markman, A. B., & Gentner, D. (1997). The effects of alignability on memory. Psychological Science, 8, 363-367.
Mettler, F. A. (2005). Essentials of Radiology. Philadelpia: Elsevier Saunders. Nodine, C. F., Locher, P. J., & Krupinski, E. A. (1993). The role of formal art training on
perception and aesthetic judgment of art compositions. Leonardo, 26, 219-227. Nodine, C., & Mello-Thoms, C. (2010). The role of expertise in radiologic image
interpretation. In E. Samei & E. Krupinski (Eds.), The Randbook of Medical Image Perception and Techniques (pp. 139-156). Cambridge: Cambridge University Press.
Rittle-Johnson, B., & Star, J. R. (2011). The power of comparison in learning and instruction: Learning outcomes supported by different types of comparisons. In J. P. Mestre & B. H. Ross (Eds.), Cognition in Education (Vol. 55, pp. 199-226). Oxford: Academic Press.
Ryu, J. H., Olson, E. J., Midthun, D. E., & Swensen, S. J. (2002). Diagnostic approach to the patient with diffuse lung disease. Mayo Clinic Proceedings, 77, 1221-1227.
Samei, E., Flynn, M. J., Peterson, E., & Eyler, W. R. (2003). Subtle lung nodules: Influence of local anatomic variations on detection. Radiology, 228, 76-84.
Schooler, J. W. (2011). Introspecting in the Spirit of William James: Comment on Fox, Ericsson, and Best (2011). Psychological Bulletin, 137, 345-350.
Tanaka, J. W., Curran, T., & Sheinberg, D. L. (2005). The training and transfer of real-world perceptual expertise. Psychological Science, 16, 145-151.
Wood, B. P. (1999). Visual expertise. Radiology, 211, 1-3.

102
Zangemeister, W. H., Sherman, K., & Stark, L. (1995). Evidence for a global scanpath strategy in viewing abstract compared with realistic images. Neuropsychologia, 33, 1009-1025.
103
Chapter 6
Case comparisons: An efficient way of learning radiology
Published as: Kok, E. M., de Bruin, A. B. H., Leppink, J., van Merriënboer, J. J. G., & Robben, S. G. F. (2015). Case comparisons: An efficient way of learning radiology. Academic Radiology, 22(10), 1226-1235.
104
Abstract
Rationale and objectives Radiologists commonly use comparison films in order to improve their differential diagnosis. Educational literature suggests that this technique might also be applied to bolster the process of learning to interpret radiographs. We investigated the effectiveness of 3 comparison techniques in medical students, whom we invited to compare: cases of the same disease (same-disease comparison), cases of different diseases (different-disease comparison), disease images with normal images (disease/normal comparison), and identical images (no comparison/control condition). Furthermore, we used eye-tracking technology to investigate which elements of the two cases were compared by the students. Materials and methods We randomly assigned 84 medical students to one of 4 conditions and had them study different diseases on chest radiographs, while their eye movements were being measured. Thereafter, participants took 2 tests that measured diagnostic performance and their ability to locate diseases respectively. Results Students studied most efficiently in the same-disease and different-disease comparison conditions (test 1: F(3, 68) = 3.31, p = .025, ηp
2 = .128, test 2: F(3, 65) = 2.88, p = .043, ηp
2 = .117). We found that comparisons were effected in 91% of all trials (the control condition excepted). Comparisons between normal anatomy were particularly common (45.8%) in all conditions. Conclusion Comparing cases can be an efficient way of learning to interpret radiographs, especially so when the comparison technique used is specifically tailored to the learning goal. Eye tracking provided insight into the comparison process, by showing that few comparisons were made between abnormalities, for example.
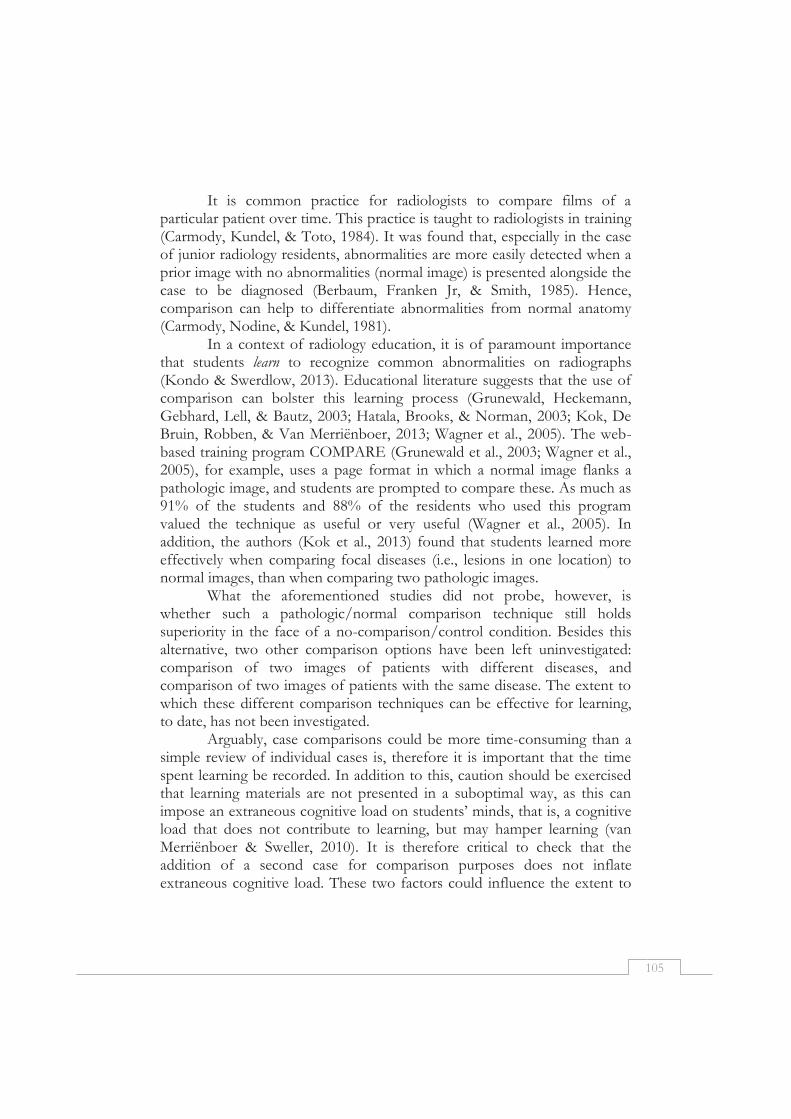
105
It is common practice for radiologists to compare films of a particular patient over time. This practice is taught to radiologists in training (Carmody, Kundel, & Toto, 1984). It was found that, especially in the case of junior radiology residents, abnormalities are more easily detected when a prior image with no abnormalities (normal image) is presented alongside the case to be diagnosed (Berbaum, Franken Jr, & Smith, 1985). Hence, comparison can help to differentiate abnormalities from normal anatomy (Carmody, Nodine, & Kundel, 1981).
In a context of radiology education, it is of paramount importance that students learn to recognize common abnormalities on radiographs (Kondo & Swerdlow, 2013). Educational literature suggests that the use of comparison can bolster this learning process (Grunewald, Heckemann, Gebhard, Lell, & Bautz, 2003; Hatala, Brooks, & Norman, 2003; Kok, De Bruin, Robben, & Van Merriënboer, 2013; Wagner et al., 2005). The web-based training program COMPARE (Grunewald et al., 2003; Wagner et al., 2005), for example, uses a page format in which a normal image flanks a pathologic image, and students are prompted to compare these. As much as 91% of the students and 88% of the residents who used this program valued the technique as useful or very useful (Wagner et al., 2005). In addition, the authors (Kok et al., 2013) found that students learned more effectively when comparing focal diseases (i.e., lesions in one location) to normal images, than when comparing two pathologic images.
What the aforementioned studies did not probe, however, is whether such a pathologic/normal comparison technique still holds superiority in the face of a no-comparison/control condition. Besides this alternative, two other comparison options have been left uninvestigated: comparison of two images of patients with different diseases, and comparison of two images of patients with the same disease. The extent to which these different comparison techniques can be effective for learning, to date, has not been investigated.
Arguably, case comparisons could be more time-consuming than a simple review of individual cases is, therefore it is important that the time spent learning be recorded. In addition to this, caution should be exercised that learning materials are not presented in a suboptimal way, as this can impose an extraneous cognitive load on students’ minds, that is, a cognitive load that does not contribute to learning, but may hamper learning (van Merriënboer & Sweller, 2010). It is therefore critical to check that the addition of a second case for comparison purposes does not inflate extraneous cognitive load. These two factors could influence the extent to
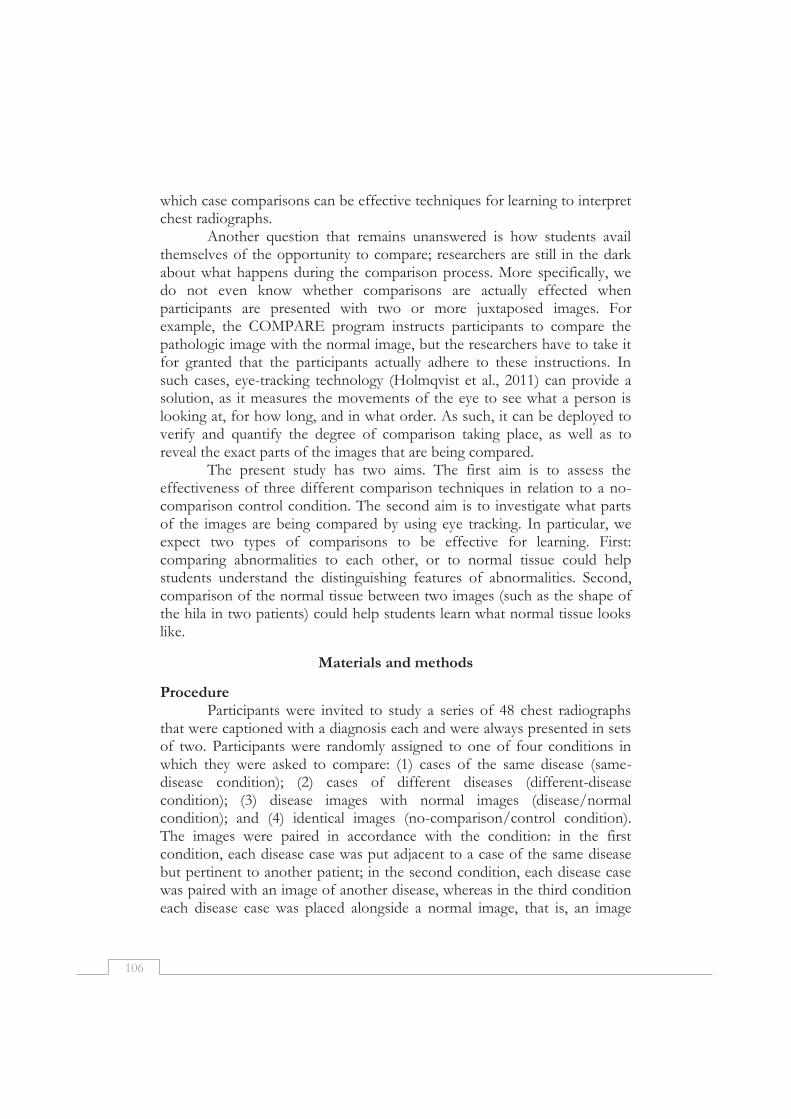
106
which case comparisons can be effective techniques for learning to interpret chest radiographs.
Another question that remains unanswered is how students avail themselves of the opportunity to compare; researchers are still in the dark about what happens during the comparison process. More specifically, we do not even know whether comparisons are actually effected when participants are presented with two or more juxtaposed images. For example, the COMPARE program instructs participants to compare the pathologic image with the normal image, but the researchers have to take it for granted that the participants actually adhere to these instructions. In such cases, eye-tracking technology (Holmqvist et al., 2011) can provide a solution, as it measures the movements of the eye to see what a person is looking at, for how long, and in what order. As such, it can be deployed to verify and quantify the degree of comparison taking place, as well as to reveal the exact parts of the images that are being compared.
The present study has two aims. The first aim is to assess the effectiveness of three different comparison techniques in relation to a no-comparison control condition. The second aim is to investigate what parts of the images are being compared by using eye tracking. In particular, we expect two types of comparisons to be effective for learning. First: comparing abnormalities to each other, or to normal tissue could help students understand the distinguishing features of abnormalities. Second, comparison of the normal tissue between two images (such as the shape of the hila in two patients) could help students learn what normal tissue looks like.
Materials and methods
Procedure Participants were invited to study a series of 48 chest radiographs
that were captioned with a diagnosis each and were always presented in sets of two. Participants were randomly assigned to one of four conditions in which they were asked to compare: (1) cases of the same disease (same-disease condition); (2) cases of different diseases (different-disease condition); (3) disease images with normal images (disease/normal condition); and (4) identical images (no-comparison/control condition). The images were paired in accordance with the condition: in the first condition, each disease case was put adjacent to a case of the same disease but pertinent to another patient; in the second condition, each disease case was paired with an image of another disease, whereas in the third condition each disease case was placed alongside a normal image, that is, an image
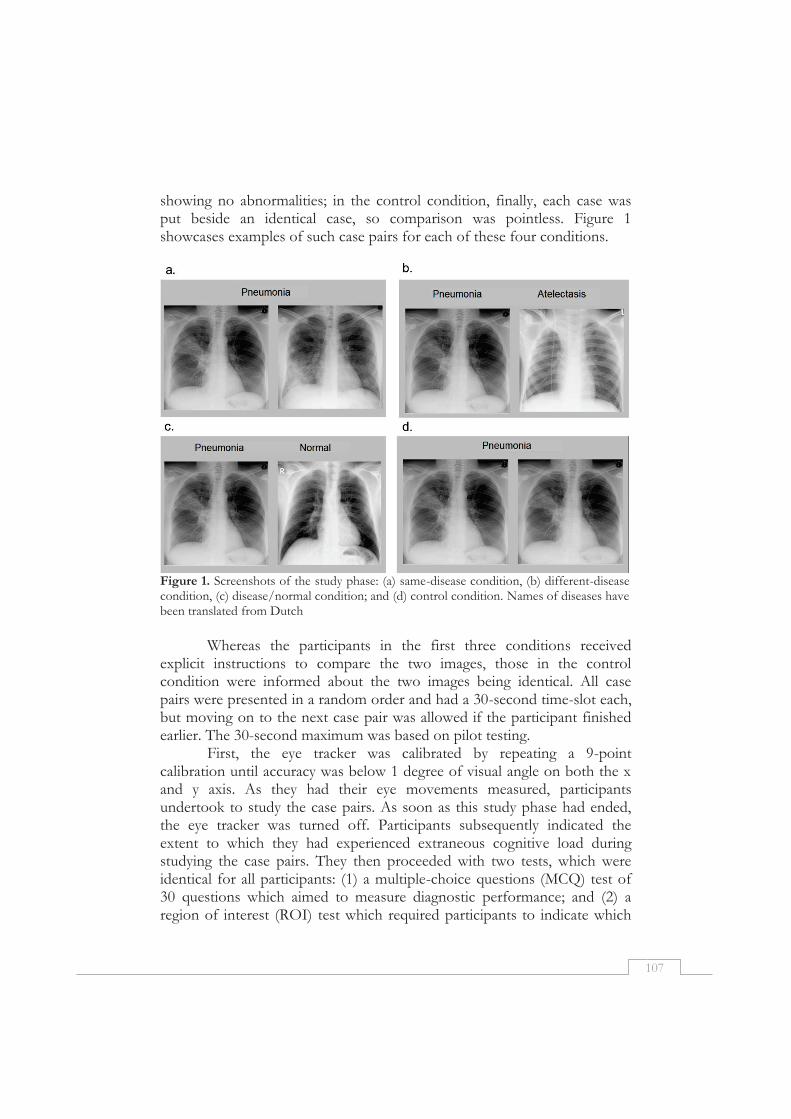
107
showing no abnormalities; in the control condition, finally, each case was put beside an identical case, so comparison was pointless. Figure 1 showcases examples of such case pairs for each of these four conditions.
Figure 1. Screenshots of the study phase: (a) same-disease condition, (b) different-disease condition, (c) disease/normal condition; and (d) control condition. Names of diseases have been translated from Dutch
Whereas the participants in the first three conditions received
explicit instructions to compare the two images, those in the control condition were informed about the two images being identical. All case pairs were presented in a random order and had a 30-second time-slot each, but moving on to the next case pair was allowed if the participant finished earlier. The 30-second maximum was based on pilot testing.
First, the eye tracker was calibrated by repeating a 9-point calibration until accuracy was below 1 degree of visual angle on both the x and y axis. As they had their eye movements measured, participants undertook to study the case pairs. As soon as this study phase had ended, the eye tracker was turned off. Participants subsequently indicated the extent to which they had experienced extraneous cognitive load during studying the case pairs. They then proceeded with two tests, which were identical for all participants: (1) a multiple-choice questions (MCQ) test of 30 questions which aimed to measure diagnostic performance; and (2) a region of interest (ROI) test which required participants to indicate which
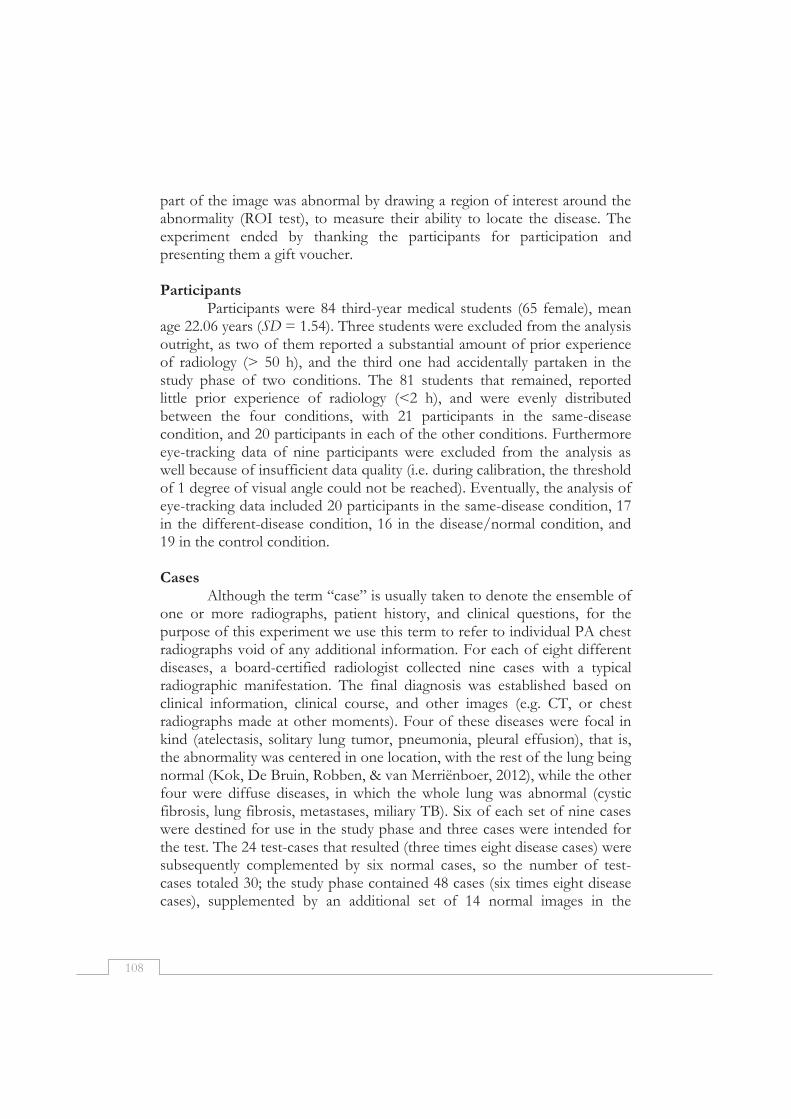
108
part of the image was abnormal by drawing a region of interest around the abnormality (ROI test), to measure their ability to locate the disease. The experiment ended by thanking the participants for participation and presenting them a gift voucher. Participants
Participants were 84 third-year medical students (65 female), mean age 22.06 years (SD = 1.54). Three students were excluded from the analysis outright, as two of them reported a substantial amount of prior experience of radiology (> 50 h), and the third one had accidentally partaken in the study phase of two conditions. The 81 students that remained, reported little prior experience of radiology (<2 h), and were evenly distributed between the four conditions, with 21 participants in the same-disease condition, and 20 participants in each of the other conditions. Furthermore eye-tracking data of nine participants were excluded from the analysis as well because of insufficient data quality (i.e. during calibration, the threshold of 1 degree of visual angle could not be reached). Eventually, the analysis of eye-tracking data included 20 participants in the same-disease condition, 17 in the different-disease condition, 16 in the disease/normal condition, and 19 in the control condition. Cases
Although the term “case” is usually taken to denote the ensemble of one or more radiographs, patient history, and clinical questions, for the purpose of this experiment we use this term to refer to individual PA chest radiographs void of any additional information. For each of eight different diseases, a board-certified radiologist collected nine cases with a typical radiographic manifestation. The final diagnosis was established based on clinical information, clinical course, and other images (e.g. CT, or chest radiographs made at other moments). Four of these diseases were focal in kind (atelectasis, solitary lung tumor, pneumonia, pleural effusion), that is, the abnormality was centered in one location, with the rest of the lung being normal (Kok, De Bruin, Robben, & van Merriënboer, 2012), while the other four were diffuse diseases, in which the whole lung was abnormal (cystic fibrosis, lung fibrosis, metastases, miliary TB). Six of each set of nine cases were destined for use in the study phase and three cases were intended for the test. The 24 test-cases that resulted (three times eight disease cases) were subsequently complemented by six normal cases, so the number of test-cases totaled 30; the study phase contained 48 cases (six times eight disease cases), supplemented by an additional set of 14 normal images in the
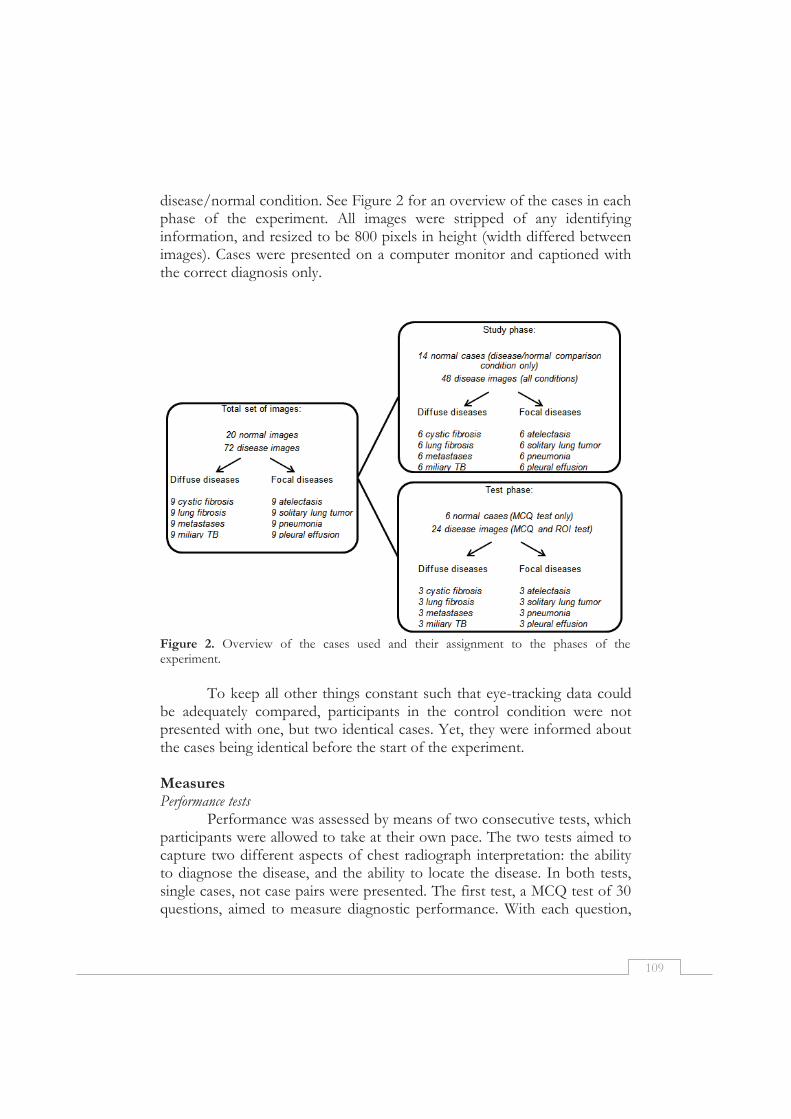
109
disease/normal condition. See Figure 2 for an overview of the cases in each phase of the experiment. All images were stripped of any identifying information, and resized to be 800 pixels in height (width differed between images). Cases were presented on a computer monitor and captioned with the correct diagnosis only.
Figure 2. Overview of the cases used and their assignment to the phases of the experiment.
To keep all other things constant such that eye-tracking data could
be adequately compared, participants in the control condition were not presented with one, but two identical cases. Yet, they were informed about the cases being identical before the start of the experiment. Measures Performance tests
Performance was assessed by means of two consecutive tests, which participants were allowed to take at their own pace. The two tests aimed to capture two different aspects of chest radiograph interpretation: the ability to diagnose the disease, and the ability to locate the disease. In both tests, single cases, not case pairs were presented. The first test, a MCQ test of 30 questions, aimed to measure diagnostic performance. With each question,
110
participants were shown a single case void of any information and asked which disease was visible. In answering, participants could choose one from a list of the aforementioned eight diseases, or “no disease.” A separate MCQ test score was computed for both the disease cases and the normal cases, each score representing the percentage of correct answers.
The second test, which aimed to measure participants’ ability to locate the disease, provided participants with the same cases as those of the MCQ test, but did give a diagnosis. Normal cases were excluded. They were asked to draw a region of interest (ROI) around that part of the image they deemed abnormal by using the mouse. The region drawn by two thorax radiologists was then compared with the participant’s drawing and the percentage of overlap was calculated. The aggregate score was the average percentage of overlap. Cognitive load
Ineffective learning can be the result of extraneous cognitive load that is generated by a suboptimal presentation of the learning task (van Merriënboer & Sweller, 2010). To ascertain that the comparison techniques used would not impose a high extraneous cognitive load on learners because of bad design, we measured extraneous cognitive load by means of an extraneous load scale that forms part of an existing and validated cognitive load inventory (Leppink, Paas, van Gog, van der Vleuten, & van Merriënboer, 2014). This 10-point scale consisted of three questions. With the maximum score being 10, throughout this paper the average of ratings is reported. Apparatus
Eye movements were gauged by means of an SensoMotoric Instruments RED 250 eye tracker1. The study phase of the experiment was prepared and executed using SensoMotoric Instruments Experiment CenterTM software1. The MCQ test was created in E-Prime2, and the ROI test was presented in CAMPUS3. Analyses
One-way analyses of variance (ANOVAs) were performed to test for inter-group differences between the means of the four conditions for all
1 www.smivision.com 2 www.pstnet.com/eprime.cfm 3 www.medizinische-fakultaet-hd.uni-heidelberg.de/CAMPUS-software.109992.0.html.
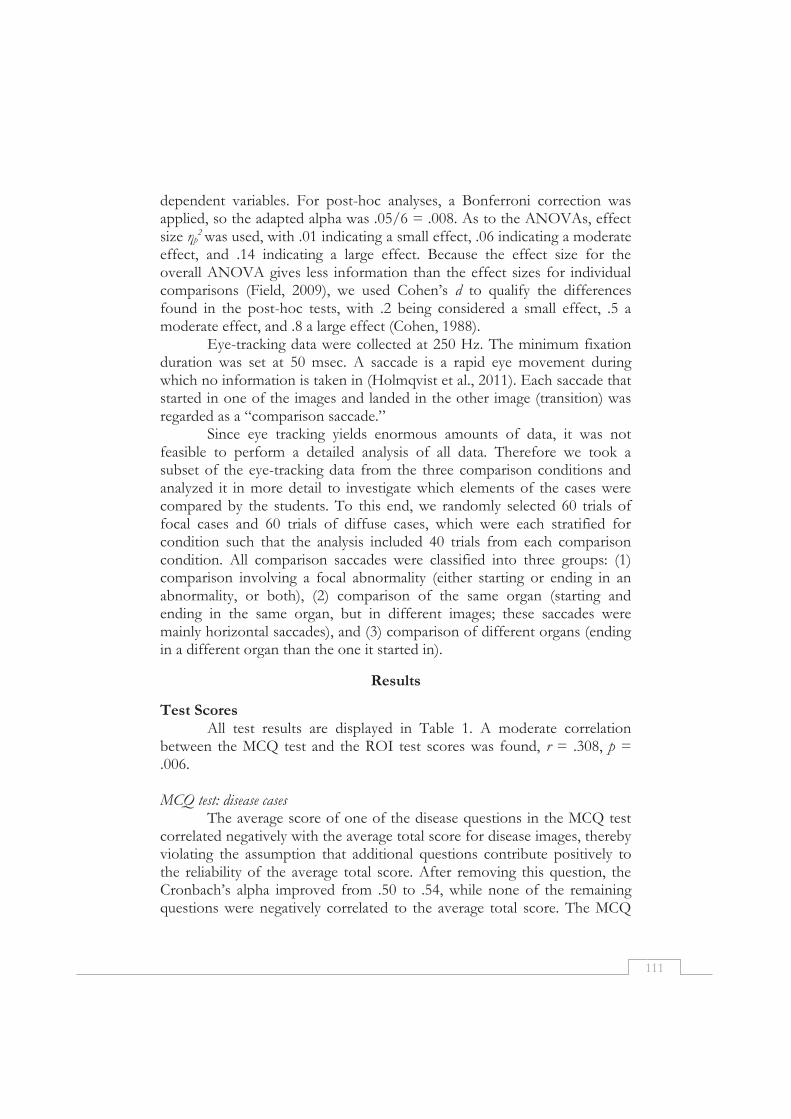
111
dependent variables. For post-hoc analyses, a Bonferroni correction was applied, so the adapted alpha was .05/6 = .008. As to the ANOVAs, effect size ηp
2 was used, with .01 indicating a small effect, .06 indicating a moderate effect, and .14 indicating a large effect. Because the effect size for the overall ANOVA gives less information than the effect sizes for individual comparisons (Field, 2009), we used Cohen’s d to qualify the differences found in the post-hoc tests, with .2 being considered a small effect, .5 a moderate effect, and .8 a large effect (Cohen, 1988).
Eye-tracking data were collected at 250 Hz. The minimum fixation duration was set at 50 msec. A saccade is a rapid eye movement during which no information is taken in (Holmqvist et al., 2011). Each saccade that started in one of the images and landed in the other image (transition) was regarded as a “comparison saccade.”
Since eye tracking yields enormous amounts of data, it was not feasible to perform a detailed analysis of all data. Therefore we took a subset of the eye-tracking data from the three comparison conditions and analyzed it in more detail to investigate which elements of the cases were compared by the students. To this end, we randomly selected 60 trials of focal cases and 60 trials of diffuse cases, which were each stratified for condition such that the analysis included 40 trials from each comparison condition. All comparison saccades were classified into three groups: (1) comparison involving a focal abnormality (either starting or ending in an abnormality, or both), (2) comparison of the same organ (starting and ending in the same organ, but in different images; these saccades were mainly horizontal saccades), and (3) comparison of different organs (ending in a different organ than the one it started in).
Results
Test Scores All test results are displayed in Table 1. A moderate correlation
between the MCQ test and the ROI test scores was found, r = .308, p = .006.
MCQ test: disease cases
The average score of one of the disease questions in the MCQ test correlated negatively with the average total score for disease images, thereby violating the assumption that additional questions contribute positively to the reliability of the average total score. After removing this question, the Cronbach’s alpha improved from .50 to .54, while none of the remaining questions were negatively correlated to the average total score. The MCQ
112
test scores did not reveal any significant effect of condition, F(3, 77) = 1.60, p = .20, ηp
2 = .059. Table 1a. Average scores and standard deviations for the four conditions on the MCQ test (disease and normal questions separately).
MCQ test (disease cases) MCQ test (normal cases)
Condition M SD M SD
Disease/ normal comparison 11.3 3.4 2.8 1.5 (49.1%) (45.8%)
Same-disease comparison 12.5 2.6 1.3 1.2 (54.3%) (22.1%)
Different-disease comparison 13.6 2.7 2.1 1.6 (59.1%) (35.0%)
No comparison 13.5 2.7 2.0 1.8
(58.7%) (33.3%)
Table 1b. Average scores and standard deviations for the four conditions on the ROI test, extraneous cognitive load scale and time spent learning
ROI test Extraneous cognitive load
Time spent learning (min)
Condition M SD M SD M SD
Disease/ normal comparison 30.2% 11.4 0.5 0.7 9.0 3.0 Same-disease comparison 34.8% 6.8 1.0 1.3 7.8 2.7
Different-disease comparison 34.5% 12.3 0.7 0.8 8.5 2.5 No comparison 33.6% 10.5 1.0 1.2 11.5 4.3
Note. M = mean, SD = standard deviation. The MCQ scores are expressed as number of cases correctly identified, with its related percentage in parentheses. The ROI test score is the percentage of overlap. The extraneous cognitive load is the average score (maximum score is 10).
MCQ test: normal cases
The MCQs about “normal” images (showing no abnormalities) were analyzed separately. The six normal questions together had a Cronbach’s alpha of .57. A significant effect of condition on number of images correctly identified as normal was found, F(3, 77) = 3.01, p = .035, ηp
2 = .105, see Table 1. Post-hoc analyses indicate that participants in the disease/normal condition were more successful in distinguishing normal from abnormal cases than participants in the same-disease condition (p = .004, Cohen’s d = 1.08). However, we found no significant difference between the disease/normal condition and both the different-disease condition (p = .18, Cohen’s d = 0.44) and the control condition (p = .12, Cohen’s d = 0.47). The different-disease condition did not differ significantly from the same-disease condition (p = .11, Cohen’s d = 0.57), nor from the control
113
condition (p = .84, Cohen’s d = 0.06). Finally, the latter two groups did not differ significantly between them (p = .16, Cohen’s d = 0.45). ROI test
Cases showing metastases were removed from the analyses of the ROI test, because when drawing ROIs around each metastasis, many of the participants halted as soon as they noticed that many metastases were visible, and communicated this verbally instead. With those images removed, the Cronbach’s alpha of the ROI test was .82. None of the separate average scores correlated negatively with the average total score. No significant effect of condition was found on the ROI test scores, F(3, 73) = 0.26, p = .86, ηp
2 = .010. Extraneous cognitive load
The Cronbach’s alpha for the extraneous cognitive load scale was .54. The fact that this value is somewhat lower than values found in previous studies (Leppink et al., 2014) might be attributable to the restricted range in extraneous cognitive load scores (i.e., the majority of participants rated the extraneous cognitive load as low on all three questions, see Table 1). From these data we can infer that the chosen form of presenting the learning material constituted no further impediment. No significant differences were found between conditions, F(3,77) = 1.12, p = .35, ηp
2 = .042. Time spent studying
We gauged differences between the four groups in the time they needed to study all pair of images, hereinafter referred to as “dwell time”. The differences were significant, F(3, 68) = 4.66, p < .005, ηp
2 = .181, see Table 1. Post-hoc analyses revealed that total dwell time was significantly higher in the control condition compared with both the different-disease condition, p = .008, Cohen’s d = 0.86, and same-disease condition, p = .001, Cohen’s d = 1.05. The total dwell time in the disease/normal condition did not differ significantly from any of the other conditions (different-disease comparison: p = .63, Cohen’s d = 0.21, same-disease comparison: p = .25, Cohen’s d = 0.45, control condition: p = .031, Cohen’s d = 0.66). Neither could we establish any significant differences between the different-disease and same-disease condition, p = .51, Cohen’s d = 0.28.
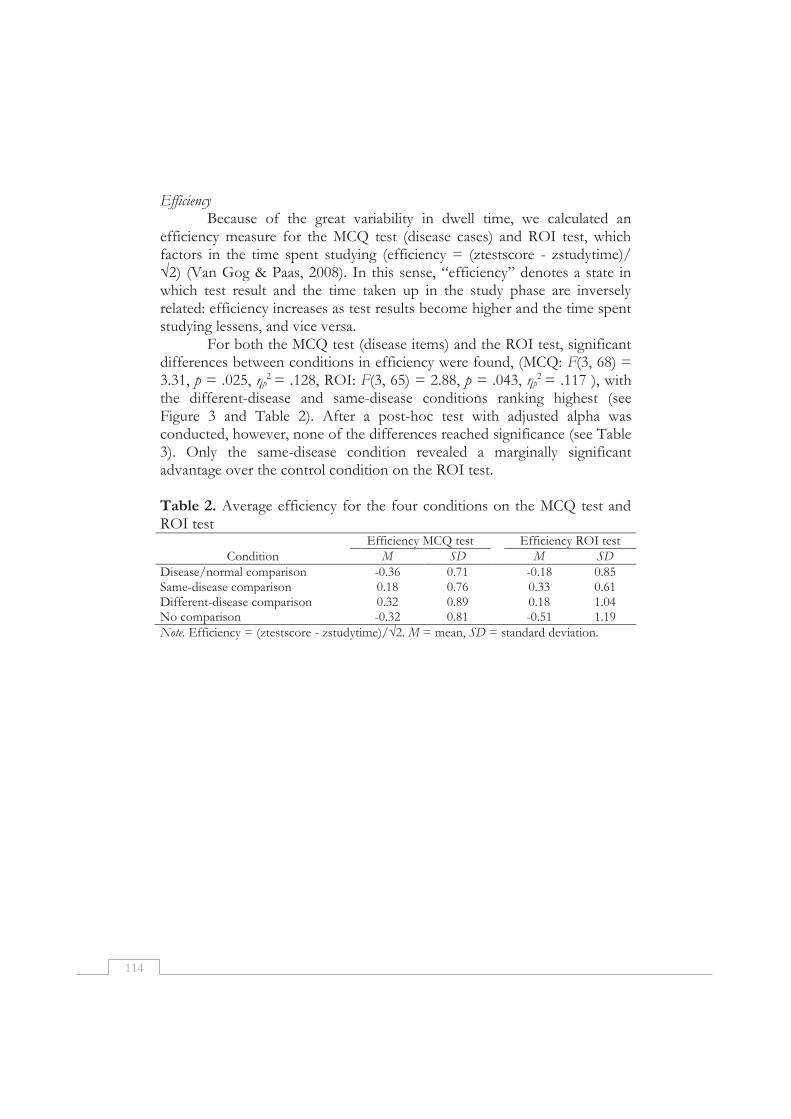
114
Efficiency Because of the great variability in dwell time, we calculated an
efficiency measure for the MCQ test (disease cases) and ROI test, which factors in the time spent studying (efficiency = (ztestscore - zstudytime)/ √2) (Van Gog & Paas, 2008). In this sense, “efficiency” denotes a state in which test result and the time taken up in the study phase are inversely related: efficiency increases as test results become higher and the time spent studying lessens, and vice versa.
For both the MCQ test (disease items) and the ROI test, significant differences between conditions in efficiency were found, (MCQ: F(3, 68) = 3.31, p = .025, ηp
2 = .128, ROI: F(3, 65) = 2.88, p = .043, ηp2 = .117 ), with
the different-disease and same-disease conditions ranking highest (see Figure 3 and Table 2). After a post-hoc test with adjusted alpha was conducted, however, none of the differences reached significance (see Table 3). Only the same-disease condition revealed a marginally significant advantage over the control condition on the ROI test. Table 2. Average efficiency for the four conditions on the MCQ test and ROI test
Efficiency MCQ test Efficiency ROI test Condition M SD M SD
Disease/normal comparison -0.36 0.71 -0.18 0.85 Same-disease comparison 0.18 0.76 0.33 0.61 Different-disease comparison 0.32 0.89 0.18 1.04 No comparison -0.32 0.81 -0.51 1.19 Note. Efficiency = (ztestscore - zstudytime)/√2. M = mean, SD = standard deviation.
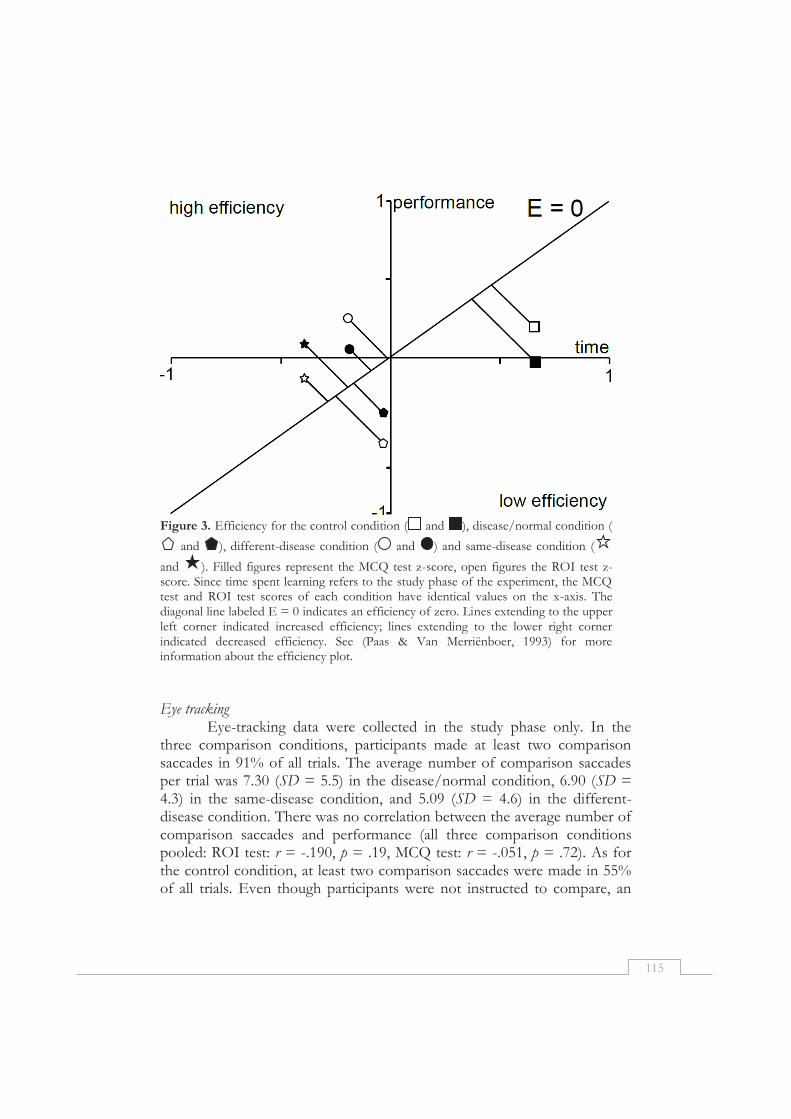
115
Figure 3. Efficiency for the control condition ( and ), disease/normal condition (
and ), different-disease condition ( and ) and same-disease condition (
and ). Filled figures represent the MCQ test z-score, open figures the ROI test z-score. Since time spent learning refers to the study phase of the experiment, the MCQ test and ROI test scores of each condition have identical values on the x-axis. The diagonal line labeled E = 0 indicates an efficiency of zero. Lines extending to the upper left corner indicated increased efficiency; lines extending to the lower right corner indicated decreased efficiency. See (Paas & Van Merriënboer, 1993) for more information about the efficiency plot.
Eye tracking
Eye-tracking data were collected in the study phase only. In the three comparison conditions, participants made at least two comparison saccades in 91% of all trials. The average number of comparison saccades per trial was 7.30 (SD = 5.5) in the disease/normal condition, 6.90 (SD = 4.3) in the same-disease condition, and 5.09 (SD = 4.6) in the different-disease condition. There was no correlation between the average number of comparison saccades and performance (all three comparison conditions pooled: ROI test: r = -.190, p = .19, MCQ test: r = -.051, p = .72). As for the control condition, at least two comparison saccades were made in 55% of all trials. Even though participants were not instructed to compare, an
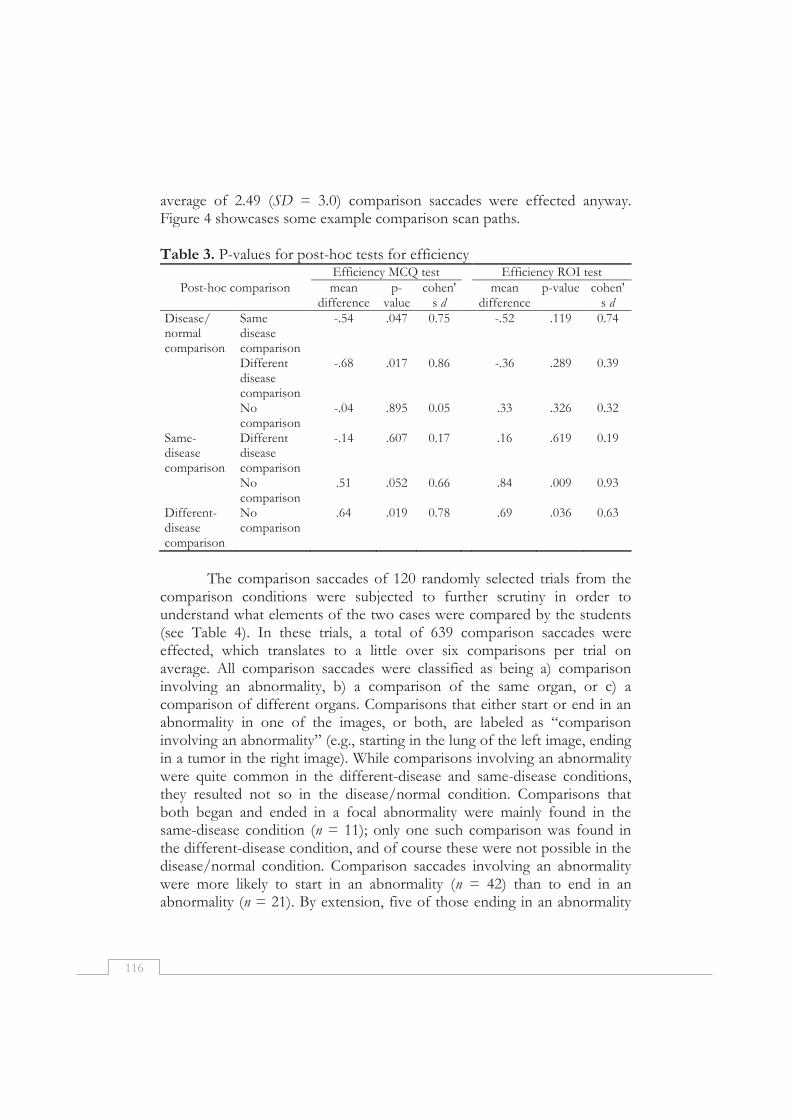
116
average of 2.49 (SD = 3.0) comparison saccades were effected anyway. Figure 4 showcases some example comparison scan paths. Table 3. P-values for post-hoc tests for efficiency Efficiency MCQ test Efficiency ROI test
Post-hoc comparison mean difference
p-value
cohen's d
mean difference
p-value cohen's d
Disease/ normal comparison
Same disease comparison
-.54 .047 0.75 -.52 .119 0.74
Different disease comparison
-.68 .017 0.86 -.36 .289 0.39
No comparison
-.04 .895 0.05 .33 .326 0.32
Same-disease comparison
Different disease comparison
-.14 .607 0.17 .16 .619 0.19
No comparison
.51 .052 0.66 .84 .009 0.93
Different-disease comparison
No comparison
.64 .019 0.78 .69 .036 0.63
The comparison saccades of 120 randomly selected trials from the
comparison conditions were subjected to further scrutiny in order to understand what elements of the two cases were compared by the students (see Table 4). In these trials, a total of 639 comparison saccades were effected, which translates to a little over six comparisons per trial on average. All comparison saccades were classified as being a) comparison involving an abnormality, b) a comparison of the same organ, or c) a comparison of different organs. Comparisons that either start or end in an abnormality in one of the images, or both, are labeled as “comparison involving an abnormality” (e.g., starting in the lung of the left image, ending in a tumor in the right image). While comparisons involving an abnormality were quite common in the different-disease and same-disease conditions, they resulted not so in the disease/normal condition. Comparisons that both began and ended in a focal abnormality were mainly found in the same-disease condition (n = 11); only one such comparison was found in the different-disease condition, and of course these were not possible in the disease/normal condition. Comparison saccades involving an abnormality were more likely to start in an abnormality (n = 42) than to end in an abnormality (n = 21). By extension, five of those ending in an abnormality
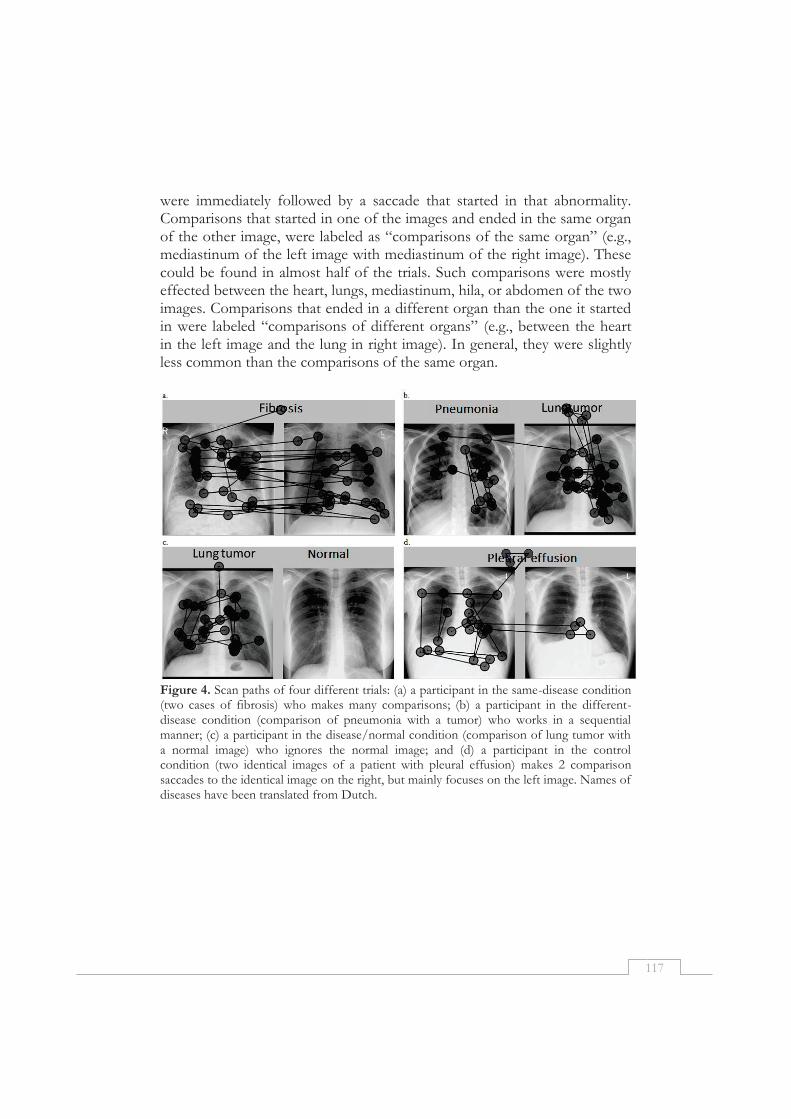
117
were immediately followed by a saccade that started in that abnormality. Comparisons that started in one of the images and ended in the same organ of the other image, were labeled as “comparisons of the same organ” (e.g., mediastinum of the left image with mediastinum of the right image). These could be found in almost half of the trials. Such comparisons were mostly effected between the heart, lungs, mediastinum, hila, or abdomen of the two images. Comparisons that ended in a different organ than the one it started in were labeled “comparisons of different organs” (e.g., between the heart in the left image and the lung in right image). In general, they were slightly less common than the comparisons of the same organ.
Figure 4. Scan paths of four different trials: (a) a participant in the same-disease condition (two cases of fibrosis) who makes many comparisons; (b) a participant in the different-disease condition (comparison of pneumonia with a tumor) who works in a sequential manner; (c) a participant in the disease/normal condition (comparison of lung tumor with a normal image) who ignores the normal image; and (d) a participant in the control condition (two identical images of a patient with pleural effusion) makes 2 comparison saccades to the identical image on the right, but mainly focuses on the left image. Names of diseases have been translated from Dutch.
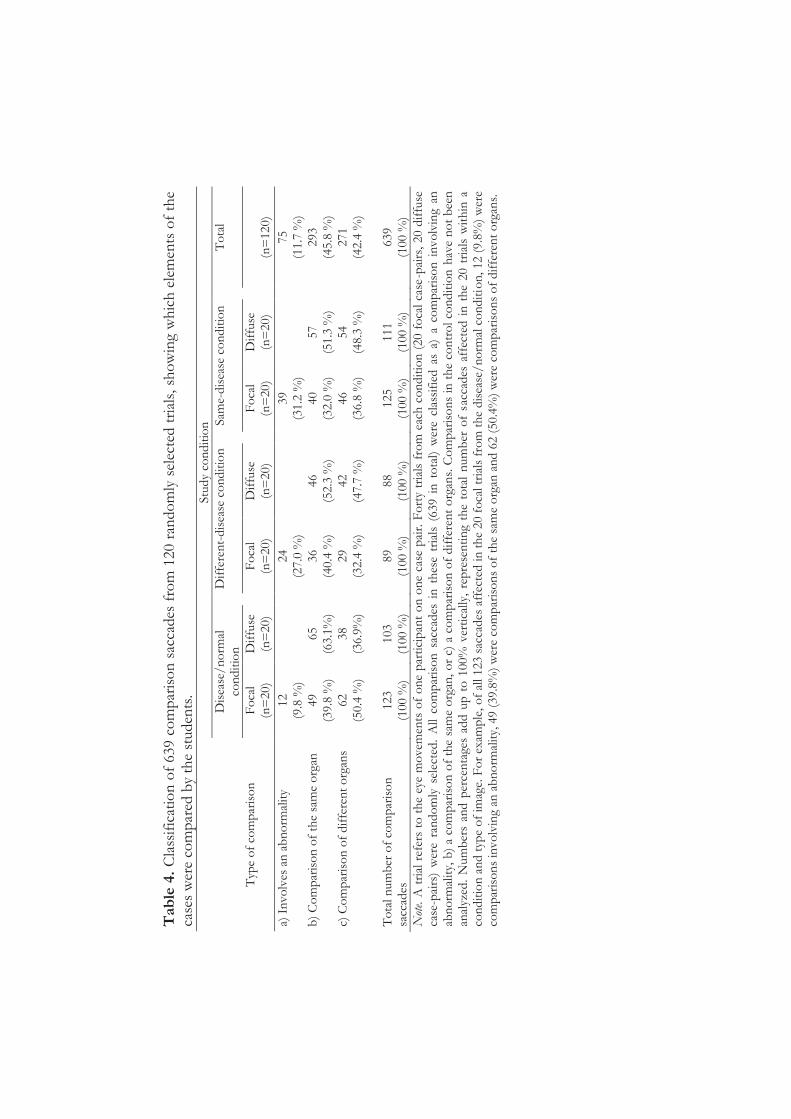
Tab
le 4
. C
lass
ific
atio
n o
f 63
9 co
mp
aris
on
sac
cades
fro
m 1
20 r
ando
mly
sel
ecte
d t
rial
s, s
ho
win
g w
hic
h e
lem
ents
of
the
case
s w
ere
com
par
ed b
y th
e st
uden
ts.
St
ud
y co
nd
itio
n
D
isea
se/
no
rmal
co
nd
itio
n
D
iffe
ren
t-d
isea
se c
on
dit
ion
Sam
e-d
isea
se c
on
dit
ion
To
tal
Typ
e o
f co
mp
aris
on
F
oca
l (n
=20
) D
iffu
se
(n=
20)
F
oca
l (n
=20
) D
iffu
se
(n=
20)
F
oca
l (n
=20
) D
iffu
se
(n=
20)
(n=
120)
a) I
nvo
lves
an
ab
no
rmal
ity
12
(9.8
%)
24
(27.
0 %
)
39
(3
1.2
%)
75
(11.
7 %
) b
) C
om
par
iso
n o
f th
e sa
me
org
an
49
(39.
8 %
) 65
(6
3.1%
)
36
(40.
4 %
) 46
(5
2.3
%)
40
(3
2.0
%)
57
(51.
3 %
)
293
(45.
8 %
) c)
Co
mp
aris
on
of
dif
fere
nt
org
ans
62
(50.
4 %
) 38
(3
6.9%
)
29
(32.
4 %
) 42
(4
7.7
%)
46
(3
6.8
%)
54
(48.
3 %
)
271
(42.
4 %
)
To
tal n
um
ber
of
com
par
iso
n
sacc
ades
12
3 (1
00 %
) 10
3 (1
00 %
)
89
(100
%)
88
(100
%)
12
5 (1
00 %
) 11
1 (1
00 %
)
639
(100
%)
Not
e. A
tri
al r
efer
s to
th
e ey
e m
ove
men
ts o
f o
ne
par
tici
pan
t o
n o
ne
case
pai
r. F
ort
y tr
ials
fro
m e
ach
co
nd
itio
n (
20 f
oca
l ca
se-p
airs
, 20
dif
fuse
ca
se-p
airs
) w
ere
ran
do
mly
sel
ecte
d.
All
com
par
iso
n s
acca
des
in
th
ese
tria
ls (
639
in t
ota
l) w
ere
clas
sifi
ed a
s a)
a c
om
par
iso
n i
nvo
lvin
g an
ab
no
rmal
ity,
b)
a co
mp
aris
on
of
the
sam
e o
rgan
, o
r c)
a c
om
par
iso
n o
f d
iffe
ren
t o
rgan
s. C
om
par
iso
ns
in t
he
con
tro
l co
nd
itio
n h
ave
no
t b
een
an
alyz
ed.
Num
ber
s an
d p
erce
nta
ges
add
up
to
100
% v
erti
cally
, re
pre
sen
tin
g th
e to
tal
num
ber
of
sacc
ades
aff
ecte
d i
n t
he
20 t
rial
s w
ith
in a
co
nd
itio
n a
nd
typ
e o
f im
age.
Fo
r ex
amp
le, o
f al
l 12
3 sa
ccad
es a
ffec
ted
in
th
e 20
fo
cal t
rial
s fr
om
th
e d
isea
se/
no
rmal
co
nd
itio
n, 12
(9.
8%)
wer
e co
mp
aris
on
s in
vo
lvin
g an
ab
no
rmal
ity,
49
(39.
8%)
wer
e co
mp
aris
on
s o
f th
e sa
me
org
an a
nd
62
(50.
4%)
wer
e co
mp
aris
on
s o
f d
iffe
ren
t o
rgan
s.
119
Discussion
The present study has sought to assess the effectiveness of three different comparison techniques in relation to a no-comparison control condition: comparison with a normal image (disease/normal condition), comparison of cases of the same disease (same-disease condition), and comparison of cases of different diseases (different-disease condition). Students’ average scores for both the diagnostic performance test (MCQ test, disease cases) and the ROI test that measured the ability to locate the disease did not appear to differ over conditions. Peculiarly, we did find that participants in the disease/normal condition correctly identified a larger number of normal cases. The presupposition that the use of comparison would impose upon students a higher extraneous cognitive load, luckily, could not be confirmed.
Although we did not find significant differences in test scores between conditions, the conditions did vary markedly with respect to the time participants needed to study the images. Especially the participants in the control condition required almost 30% more time to study the cases compared with the other three conditions.
By including time in the calculation of efficiency, we found that the highest levels of efficiency were attained when same-disease and different-disease comparison techniques were used: while on both tests participants performed similarly or even better with respect to the other two conditions, they required less time. It is important to note that participants in these two conditions had not been exposed to more pathology: all participants reviewed the same number of pathology cases, hence the increased efficiency must have been attributable to the opportunity to compare cases.
In terms of efficiency, the group effecting same-disease comparisons performed best on the ROI test, while the opposite was true for the group comparing different diseases, which performed best on the MCQ test. These findings resound the contention of Hammer and colleagues (Hammer, Diesendruck, Weinshall, & Hochstein, 2009) that, in general, comparison of things that are different (in this case: radiographs of different diseases) can help a student to identify and learn their discriminating features. This is reflected in the MCQ test that measured diagnostic performance, because being able to distinguish between different diseases is central to good performance on this test. Comparison of things that belong to the same category (like different patients with the same disease), on the other hand, can help discover the different manifestations of a disease (Hammer et al., 2009). Use of same-
120
disease comparisons could be the best technique to teach a student about the ranges of pneumonia and their differences. It seems plausible that students in the same-disease comparison condition gained a better insight into the variation within a disease, which in turn helped them to detect the borders and size of an abnormality, and, consequently, to localize the abnormality. Understanding the range within which a disease can manifest itself, is important in deciding what part of the image is normal, and what is not.
Participants in the disease/normal condition performed best with respect to the identification of normal cases in the MCQ test. As they were the only group to have been exposed to normal images during the study phase, the opportunity to compare these images to disease images might have helped them to learn the distinction between the two. At the same time, however, this comparison technique proved less efficient at learning the distinction between different diseases and the variation within the disease, as scores were relatively low for both the MCQ (with regard to disease cases) and ROI test.
In summary, application of different comparison techniques led to equally different emphases on different elements of learning to interpret radiographs. While disease/normal comparisons seemed most effective at learning to discriminate between normal and abnormal images, use of different-disease comparisons seemed the most appropriate technique for learning the distinction between different diseases. By the same token, same-disease comparisons seemed most effective at understanding the different manifestations of a disease and the range of the disease. Thus, it seems important that learners deploy such comparison techniques strategically, as the learning activity’s objective requires. So simply put, the distinction between a pneumonia and cystic fibrosis should not be taught by having the learner sequentially compare both diseases with normal images, but by having them compare the diseases with each other. The sequential comparison of those cases to a normal image, however, could help students to learn to differentiate between normal and abnormal images.
To expand on the foregoing, we postulate that students can gain most from comparison techniques if presented in a specific order: (1) the disease/normal comparison technique, so that they learn to differentiate between normal and abnormal images; (2) the different-disease comparison technique, by which they learn to distinguish one disease from another; and (3) the same-disease comparison technique, to teach them the different manifestations of a particular disease. However, further research is required in which the effectiveness of teaching in this specific order is studied.
121
The second aim was to investigate what parts of the images are being compared, by using eye tracking. The eye-tracking data threw more light upon this. What stood out was that participants really did avail themselves of the opportunity to compare. Moreover, they often compared between normal anatomy, such as the shape of the hila or the size of the mediastinum between the two cases.
Comparison of the abnormality with normal tissue in the juxtaposed case was less common. This was surprising since educational literature suggests that comparison of an abnormality with normal tissue or with another abnormality could help students understand the distinguishing features of the abnormality (Hammer et al., 2009). For example, comparison of the heart border of a patient with pneumonia with the heart border of a healthy patient could help the student understand the silhouette sign in pneumonia. Therefore, if we want students to compare abnormalities with normal tissue, they need explicit instructions to do so (Alfieri, Nokes-Malach, & Schunn, 2013). Students inexperienced in radiology might also need us to direct their attention to the abnormalities, as they could have difficulty detecting these (Reingold & Sheridan, 2011).
One of the limitations of this experiment is that the eye-tracking data were observational. Had participants received explicit instructions as to how to go about comparing, then the effect on performance of the comparison method used could have been investigated outright. Instructing students to compare normal with abnormal tissue, or to focus on similarities or differences between cases, for example, could have rendered comparison techniques more effective for learning. However, the advantage of our observational method is that we could see how and what people compare when given the choice. Prospective studies could focus on whether or not provision of different sets of comparison instructions could influence the effectiveness of specific comparison techniques.
It should not be difficult to implement case comparisons in different teaching settings, as they can be easily introduced into lectures and case reviews, for example. They meet Gunderman and colleagues’ requirement (Gunderman, Williamson, Fraley, & Steele, 2001) that teaching should not be just about delivering concrete facts but also include higher-order concepts. Case comparisons could move a learner beyond a mere understanding of what an abnormality looks like in a single case towards understanding how higher-order concepts are expressed in different patients and different diseases. For example, comparison might help inexperienced medical students understand that pleural effusion is characterized by a
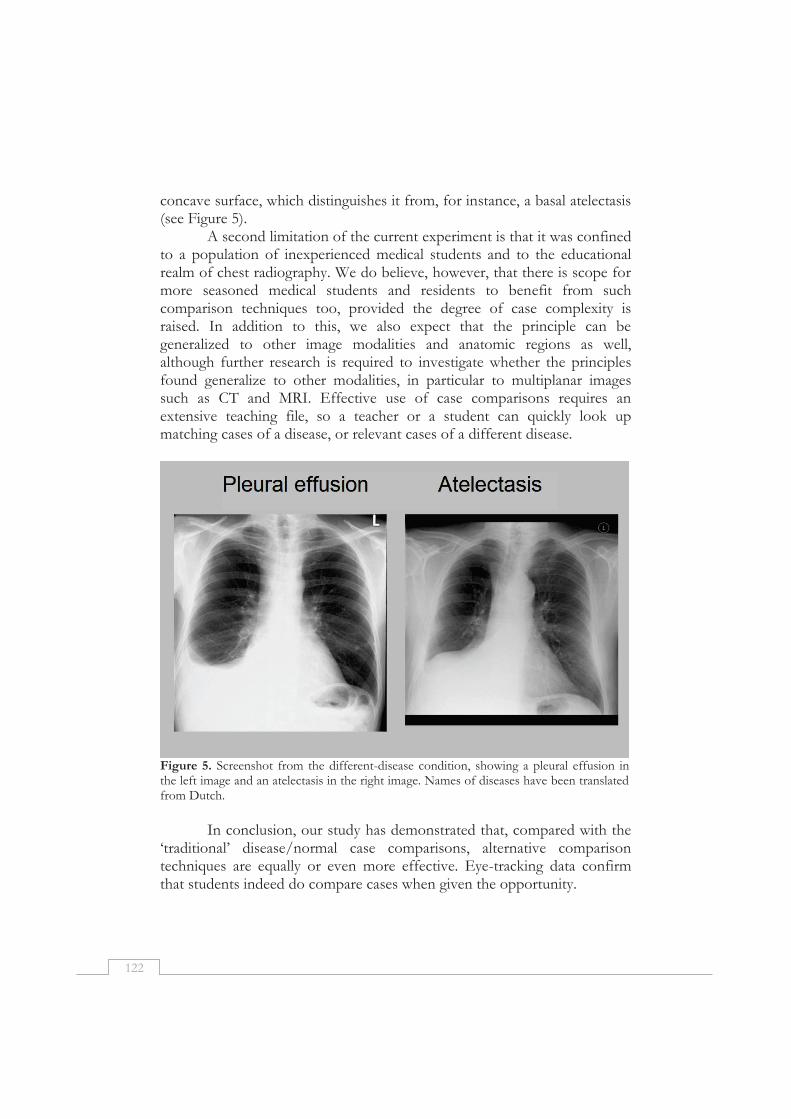
122
concave surface, which distinguishes it from, for instance, a basal atelectasis (see Figure 5).
A second limitation of the current experiment is that it was confined to a population of inexperienced medical students and to the educational realm of chest radiography. We do believe, however, that there is scope for more seasoned medical students and residents to benefit from such comparison techniques too, provided the degree of case complexity is raised. In addition to this, we also expect that the principle can be generalized to other image modalities and anatomic regions as well, although further research is required to investigate whether the principles found generalize to other modalities, in particular to multiplanar images such as CT and MRI. Effective use of case comparisons requires an extensive teaching file, so a teacher or a student can quickly look up matching cases of a disease, or relevant cases of a different disease.
Figure 5. Screenshot from the different-disease condition, showing a pleural effusion in the left image and an atelectasis in the right image. Names of diseases have been translated from Dutch.
In conclusion, our study has demonstrated that, compared with the
‘traditional’ disease/normal case comparisons, alternative comparison techniques are equally or even more effective. Eye-tracking data confirm that students indeed do compare cases when given the opportunity.
123
References
Alfieri, L., Nokes-Malach, T. J., & Schunn, C. D. (2013). Learning through case comparisons: A meta-analytic review. Educational Psychologist, 48(2), 87-113.
Berbaum, K. S., Franken Jr, E. A., & Smith, T. J. (1985). The effect of comparison films upon resident interpretation of pediatric chest radiographs. Investigative Radiology, 20(2), 124-128.
Carmody, D. P., Kundel, H. L., & Toto, L. C. (1984). Comparison scans while reading chest images. Taught, but not practiced. Investigative Radiology, 19(5), 462-466.
Carmody, D. P., Nodine, C. F., & Kundel, H. L. (1981). Finding lung nodules with and without comparative visual scanning. Perception & Psychophysics, 29(6), 594-598.
Cohen, J. (1988). Statistical power analysis for the behavioral sciences. Hillsdale, NJ: Lawrence Earlbaum Associates.
Field, A. P. (2009). Discovering Statistics Using SPSS: Sage Publications: London. Grunewald, M., Heckemann, R. A., Gebhard, H., Lell, M., & Bautz, W. A. (2003).
COMPARE Radiology: Creating an interactive Web-based training program for radiology with multimedia authoring software. Academic Radiology, 10(5), 543-553.
Gunderman, R. B., Williamson, K., Fraley, R., & Steele, J. (2001). Expertise: implications for radiological education. Academic Radiology, 8(12), 1252.
Hammer, R., Diesendruck, G., Weinshall, D., & Hochstein, S. (2009). The development of category learning strategies: What makes the difference? Cognition, 112(1), 105-119.
Hatala, R. M., Brooks, L. R., & Norman, G. R. (2003). Practice makes perfect: The critical role of mixed practice in the acquisition of ECG interpretation skills. Advances in Health Sciences Education, 8(1), 17-26.
Holmqvist, K., Nyström, M., Andersson, R., Dewhurst, R., Jarodzka, H., & van de Weijer, J. (2011). Eye tracking: A comprehensive guide to methods and measures. Oxford: Oxford University Press.
Kok, E. M., De Bruin, A. B. H., Robben, S. G. F., & van Merriënboer, J. J. G. (2012). Looking in the same manner but seeing it differently: Bottom-up and expertise effects in radiology. Applied Cognitive Psychology, 26(6), 854-862.
Kok, E. M., De Bruin, A. B. H., Robben, S. G. F., & Van Merriënboer, J. J. G. (2013). Learning Radiological Appearances of Diseases, does comparison help? Learning and Instruction, 23, 90-97.
Kondo, K. L., & Swerdlow, M. (2013). Medical Student Radiology Curriculum: What Skills Do Residency Program Directors Believe Are Essential for Medical Students to Attain? Academic Radiology, 20(3), 263-271.
Leppink, J., Paas, F., van Gog, T., van der Vleuten, C. P. M., & van Merriënboer, J. J. G. (2014). Effects of pairs of problems and examples on task performance and different types of cognitive load. Learning and Instruction, 30(0), 32-42.
Paas, F. G., & Van Merriënboer, J. J. (1993). The efficiency of instructional conditions: An approach to combine mental effort and performance measures. Human Factors: The Journal of the Human Factors and Ergonomics Society, 35(4), 737-743.
Reingold, E. M., & Sheridan, H. (2011). Eye movements and visual expertise in chess and medicine. In S. P. Leversedge, I. D. Gilchrist, & S. Everling (Eds.), Oxford Handbook of Eye Movements (pp. 528-550). Oxford: Oxford University Press.
Van Gog, T., & Paas, F. (2008). Instructional efficiency: Revisiting the original construct in educational research. Educational Psychologist, 43(1), 16-26.
van Merriënboer, J. J. G., & Sweller, J. (2010). Cognitive load theory in health professional education: design principles and strategies. Medical Education, 44(1), 85-93.

124
Wagner, M., Heckemann, R. A., Nomayr, A., Greess, H., Bautz, W. A., & Grunewald, M. (2005). COMPARE/Radiology, an interactive Web-based radiology teaching program: Evaluation of user response. Academic radiology, 12(6), 752-760.

125
Chapter 7
General Discussion
126
Many perceptual tasks involve complex visualizations. The perception of those visualizations is not trivial, and requires dedicated training and years of experience to fully develop. The main task of interest studied in this thesis was chest radiograph interpretation: diagnosing cardiovascular and pulmonary diseases based on an x-ray image of the chest. For novices in this domain, a chest radiograph is little more than a constellation of greys, while radiologists are able to perceive and interpret those radiographs in such a way that they can reach a correct diagnosis that can inform subsequent patient treatment.
This thesis focused on three research questions to investigate development of visual expertise in radiology. The first research question was: How can eye tracking contribute to studying the development of visual expertise in radiology? This question was addressed in Chapter 2. The second research question was: How do eye movements differ between experts, intermediates and novices in the domain of radiology, and how do expertise differences interact with image characteristics? This question was investigated in Chapter 3 and Chapter 4. The third research question was: What is the effect of systematic viewing training and studying case comparisons on learning radiology? This question was tackled in Chapter 4, Chapter 5 and Chapter 6. In this General discussion, The main findings from the studies are presented first. Subsequently, the theoretical contributions of the studies are discussed, as well as directions for further research. Next, limitations of these studies are discussed. Finally, practical implications are discussed.
Main findings
RQ 1: How can eye tracking contribute to studying the development of visual expertise in radiology?
Eye tracking is a technique to measure the movements of the eyes to investigate what a person is looking at, for how long, and in what order (Holmqvist et al., 2011). Chapter 2 discusses under what circumstances the eyes can provide a window into the learner’s mind. A central concept here is selective attention: the allocation of limited processing resources to certain information while ignoring other information (Johnson & Proctor, 2004). When experiments are carefully designed, eye movements provide information as to what information is attended to. Yet, information that is looked at is not necessarily understood, processed or remembered, and additional data are required to answer research questions related to these processes. Although the eye-tracking studies reported in Chapters 3 and 4 do not directly answer the first research question, they can be used to illustrate this phenomenon.
127
In Chapter 3, eye tracking was employed to investigate differences in viewing behavior between students, radiology residents, and radiologists. Here, students, residents and radiologists were found to be quite similar in viewing behavior on images of diffuse and focal diseases: The way they divided their attention over the images was very much alike. Additional data were collected to investigate their diagnostic performance. Performance was indeed very different between radiologists, radiology residents and students - showing that looking at abnormalities is a necessary but not a sufficient condition for actually diagnosing the abnormality. In Chapter 4, Experiment 2, a similar pattern was found. Training in systematic viewing was enough to influence the way participants direct their visual attention to gather information required for making a diagnosis. However, although the training did influence viewing behavior, diagnostic performance was not impacted, and looking at something proved to be insufficient for the actual diagnosis of the abnormalities.
Those two experiments show that eye movements and other measures such as performance measures do not measure the same processes, and complement each other in drawing a more complete picture of visual expertise development. In conclusion, eye tracking has the potential to uncover processes of learning and visual expertise at a very fine time-scale. Based on eye tracking, inferences can be made about attention. However, to investigate the complete process of visual diagnosis, further data, for example performance data, are required. RQ2: How do eye movements differ between experts, intermediates and novices in the domain of radiology, and how do expertise differences interact with image characteristics?
In Chapter 3, differences in eye movement behavior between radiologists, radiology residents and sixth-year medical students were investigated, while they looked at normal (healthy) images, images of diffuse diseases (involving the whole lung), and images of focal (localized) diseases. Three theories were used to predict eye movements: the holistic model of image perception (Kundel, Nodine, Conant, & Weinstein, 2007), the information reduction theory (Haider & Frensch, 1999), and the theory of long-term working memory (Ericsson & Kintsch, 1995). Participants were found to fixate relatively long at specific locations for focal diseases, while fixations were shorter and more dispersed for diffuse diseases. This pattern was found regardless of expertise. Residents and radiologists showed highest dispersion and lowest fixation durations for normal images, while students showed higher fixation durations and lower dispersion for these
128
images. Furthermore, students performed relatively well on normal images, while residents and radiologists strongly outperformed students on both focal and diffuse images.
In Chapter 4, eye movement differences between expertise groups when inspecting normal images were investigated. Specifically, it was investigated whether experts take a more systematic approach to viewing chest radiographs, and thereby look at a larger surface of the images, and miss fewer abnormalities. Students were found to show significantly less systematic viewing compared to radiologists, whereas residents did not differ from both groups. Coverage, however, was significantly lower in radiologists compared to students. Again residents did not differ from both groups. In terms of performance, students were significantly slower and performed slightly worse compared to radiologists. The expected correlations between systematic viewing and coverage, and coverage and performance were not found. The holistic model of image perception (Kundel et al., 2007) describes that when experts’ attention is not guided by perturbations, they scan the image to check for abnormalities. Our results shed a new light on how they scan the image when no abnormalities are present. Experts were found to inspect images in a more systematic manner than novices, but by searching a smaller part of the image. RQ 3: What is the effect of systematic viewing training and studying case comparisons on learning radiology?
This research question zooms in on the ‘novice’ part of the expertise spectrum. How can novices be taught to diagnose radiological images? In order to answer this question, the specific characteristics of novices need to be targeted. First of all, novices have trouble forming a global impression of an image, which could guide their subsequent viewing behavior (Kundel et al., 2007). Second, novices have trouble discriminating relevant from irrelevant visual information (Haider & Frensch, 1999). Two different educational interventions were developed that aimed to target these characteristics of novices.
The first characteristic was targeted in Chapter 4 by investigating ‘systematic viewing’ as a way to guide viewing behavior. Third-year medical students were trained in either systematic viewing, full-coverage viewing (without being systematic), and non-systematic viewing. The training influenced the eye movements of the participants as expected: Participants in the systematic viewing condition were most systematic, and participants in both the full-coverage viewing and in the systematic viewing condition covered more of the image than participants in the non-systematic viewing
129
condition. Diagnostic performance, however, was significantly lower in the full-coverage viewing condition, the systematic viewing and non-systematic viewing condition performed similarly. The second characteristic of novices, that they have trouble discriminating relevant from irrelevant information, was targeted in Chapter 5 and Chapter 6, in which comparison learning was investigated as a way to foster discrimination. In Chapter 5, students learned more effectively when comparing diseases to normal images than when comparing images of the same disease to each other. This was true for focal but not for diffuse diseases. In this experiment, a no-comparison control condition was not included. In Chapter 6, this no-comparison control condition was added, as well as a condition where participants were required to compare images of different diseases. In this experiment, comparisons of same-disease cases and different-disease cases were found to be most efficient: Participants took less time to study the cases but achieved the same performance level. More specifically, participants in the different-disease condition were best in discriminating diseases, participants in the same-disease condition were best in localizing the diseases. Comparison of cases with normal images was effective for learning to recognize normal images, but less so for discriminating diseases from each other.
Theoretical contributions
Eye movements as a way to gain insight into visual expertise Eye tracking is a tool to gain insight into visual expertise and eye
movement research can help advance theory about visual expertise. Eye movements, however, cannot be considered direct markers of expertise. Reviews such as the meta-analysis by Gegenfurtner, Lehtinen, and Säljö (2011) might be taken to suggest otherwise: It might seem the case that expertise can be directly measured with a restricted set of eye movement measures (e.g., fixation duration, saccade length and time to first fixation of the abnormality) that directly capture expertise. Such a situation can be found in reading research, where a restricted set of eye movement measures is directly linked to clearly defined cognitive processes (Radach & Kennedy, 2012). Our results, and results of several other studies, however, suggest that this is not the case for visual expertise research. The main difference with reading research is that reading researchers deal with stimulus material that is highly similar over studies, and can be tightly controlled (Rayner, 1998). Expertise in complex visual tasks, however, is much broader and includes many different tasks and many different domains (Ericsson, Charness, Feltovich, & Hoffman, 2006). The task of a truck driver or
130
sportsman is very different from the task of a medical doctor, and the task of a surgeon is very different from the task of a radiologist. To go on, the task of a radiologist who looks at a chest computer-tomography (CT) scan is very different from the task of a radiologist looking at a chest radiograph. Finally, also effects of the specific stimulus on the eye movements were found (i.e., diffuse vs. focal diseases; Chapter 3).
The visual expertise theories mentioned earlier are based on a restricted set of visualizations (Gegenfurtner et al., 2011), and research in the domain of radiology in particular makes use of a restricted set of visualizations (see Reingold & Sheridan, 2011). Fortunately, researchers interested in visual expertise in medicine recently started broadening their interest to different types of images, such as computed tomography (CT) scans and clinical pathology. This led to findings that contrast with typical expertise findings. For example, the holistic model of image perception predicts significantly longer saccadic amplitudes with increased expertise (Gegenfurtner et al., 2011). Instead, Bertram, Helle, Kaakinen, and Svedstrom (2013) found that experts in abdominal CT interpretation have significantly lower saccadic amplitudes than novices. Similarly, Jaarsma, Jarodzka, Nap, van Merriënboer, and Boshuizen (2015) did not find significant differences in saccade length between novices, intermediates and experts in clinical pathology. Likewise, in Chapter 3, no significant main effects of expertise on saccade length were found. A general prediction of expertise effects that does not take into account the task at hand thus seems incomplete.
Instead, it is critical that the task at hand is leading when interpreting expertise effects on eye movements. Participants were found to adapt to stimulus characteristics (Chapter 3). Likewise, Bertram and colleagues (2013) found that experts employed eye movements that were sensible given the stimulus type: Shorter saccades for tasks that required the inspection of abnormalities in a small area and longer saccades for tasks that required the inspection of abnormalities in a large area. An important alley for further research would thus be extending visual expertise research to medical images beyond chest radiographs and mammograms, to specialties such as ophthalmology, pathology, and dermatology, but also to dynamic images such as volumetric images (such as CT and MRI) or echography (see e.g., Drew, Vo, & Wolfe, 2013; Jaarsma et al., 2015; O'Neill et al., 2011 for some examples). Visual expertise theories would benefit from a better understanding of how experts are able to adapt to characteristics of the task or the image. A special role might be given to normal (healthy) images, because differences between experts, intermediates and novices were most
131
prominent for those images. The images are also theoretically interesting, because current expertise theories are not able to predict eye movement patterns for images where abnormalities are not present to guide attention. Teaching looking without seeing
We investigated two interventions that aimed at helping students in the ‘novice’ part of the expertise spectrum. Roughly speaking, the systematic viewing training aimed at teaching how to look, and the case comparison method aimed at teaching what to see (cf., Donovan & Litchfield, 2013). In this thesis, training what to see proved more effective than training how to look. These findings fit in a larger theoretical understanding about visual search in complex tasks, in which training how to look is not necessarily effective if the decision component (target present/absent) is non-trivial. In these situations, training what to see might generally be more effective. Further research that supports this proposal is now discussed.
Previous research has found an apparent developmental difference between searching (looking) and diagnostic reasoning (seeing) (Crowley, Naus, Stewart, & Friedman, 2003; Mello-Thoms et al., 2012). Donovan and colleagues’ (2005) also found that looking and seeing do not necessarily develop together. They trained novices in a fracture detection task and found that after the training, participants looked at a wrist x-ray image in a manner that was more similar to experts’ ways of looking. However, this did not result in the novices seeing more fractures.
In other domains, mixed effects are found for the training of specific eye movement strategies (such as systematic viewing). Some studies show that training an eye movement strategy for a specific task is effective (e.g., Wang, Lin, & Drury, 1997), while other studies do not (e.g., Nickles, Melloy, & Gramopadhye, 2003). Furthermore, in some studies it is unclear whether the effectiveness of the training depends on training an eye movement strategy, or on the information that the training provides on what the targets look like (e.g., Nalanagula, Greenstein, & Gramopadhye, 2006).
What could explain the findings that training a way of looking does not necessarily result in an improvement in the number of targets that the participants are seeing? Dewhurst and Crundall (2008) propose that training a specific eye movement strategy might decrease the processing of fixated information because moving the eye and fixating the object are processes that compete for the same resources. Similarly, Wolfe, Alvarez, and Horowitz (2000) show that deliberately investing effort into moving attention in a systematic manner slows search down. Instead, a random
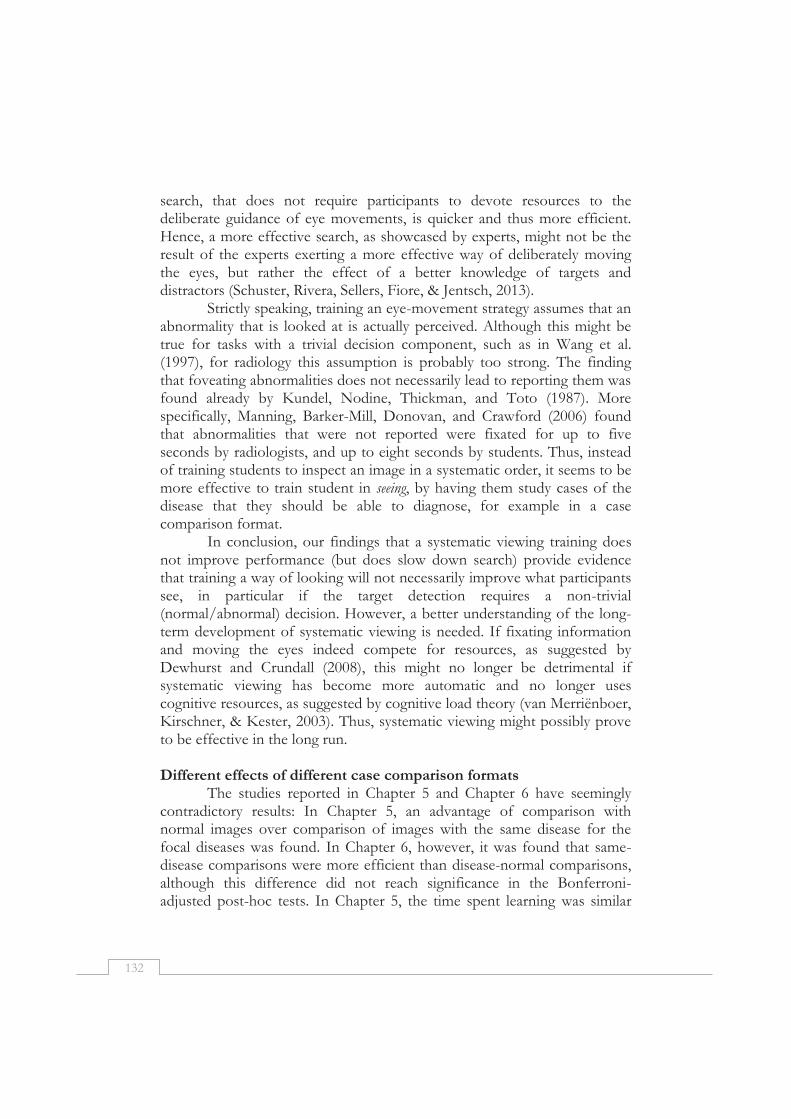
132
search, that does not require participants to devote resources to the deliberate guidance of eye movements, is quicker and thus more efficient. Hence, a more effective search, as showcased by experts, might not be the result of the experts exerting a more effective way of deliberately moving the eyes, but rather the effect of a better knowledge of targets and distractors (Schuster, Rivera, Sellers, Fiore, & Jentsch, 2013).
Strictly speaking, training an eye-movement strategy assumes that an abnormality that is looked at is actually perceived. Although this might be true for tasks with a trivial decision component, such as in Wang et al. (1997), for radiology this assumption is probably too strong. The finding that foveating abnormalities does not necessarily lead to reporting them was found already by Kundel, Nodine, Thickman, and Toto (1987). More specifically, Manning, Barker-Mill, Donovan, and Crawford (2006) found that abnormalities that were not reported were fixated for up to five seconds by radiologists, and up to eight seconds by students. Thus, instead of training students to inspect an image in a systematic order, it seems to be more effective to train student in seeing, by having them study cases of the disease that they should be able to diagnose, for example in a case comparison format.
In conclusion, our findings that a systematic viewing training does not improve performance (but does slow down search) provide evidence that training a way of looking will not necessarily improve what participants see, in particular if the target detection requires a non-trivial (normal/abnormal) decision. However, a better understanding of the long-term development of systematic viewing is needed. If fixating information and moving the eyes indeed compete for resources, as suggested by Dewhurst and Crundall (2008), this might no longer be detrimental if systematic viewing has become more automatic and no longer uses cognitive resources, as suggested by cognitive load theory (van Merriënboer, Kirschner, & Kester, 2003). Thus, systematic viewing might possibly prove to be effective in the long run. Different effects of different case comparison formats
The studies reported in Chapter 5 and Chapter 6 have seemingly contradictory results: In Chapter 5, an advantage of comparison with normal images over comparison of images with the same disease for the focal diseases was found. In Chapter 6, however, it was found that same-disease comparisons were more efficient than disease-normal comparisons, although this difference did not reach significance in the Bonferroni-adjusted post-hoc tests. In Chapter 5, the time spent learning was similar
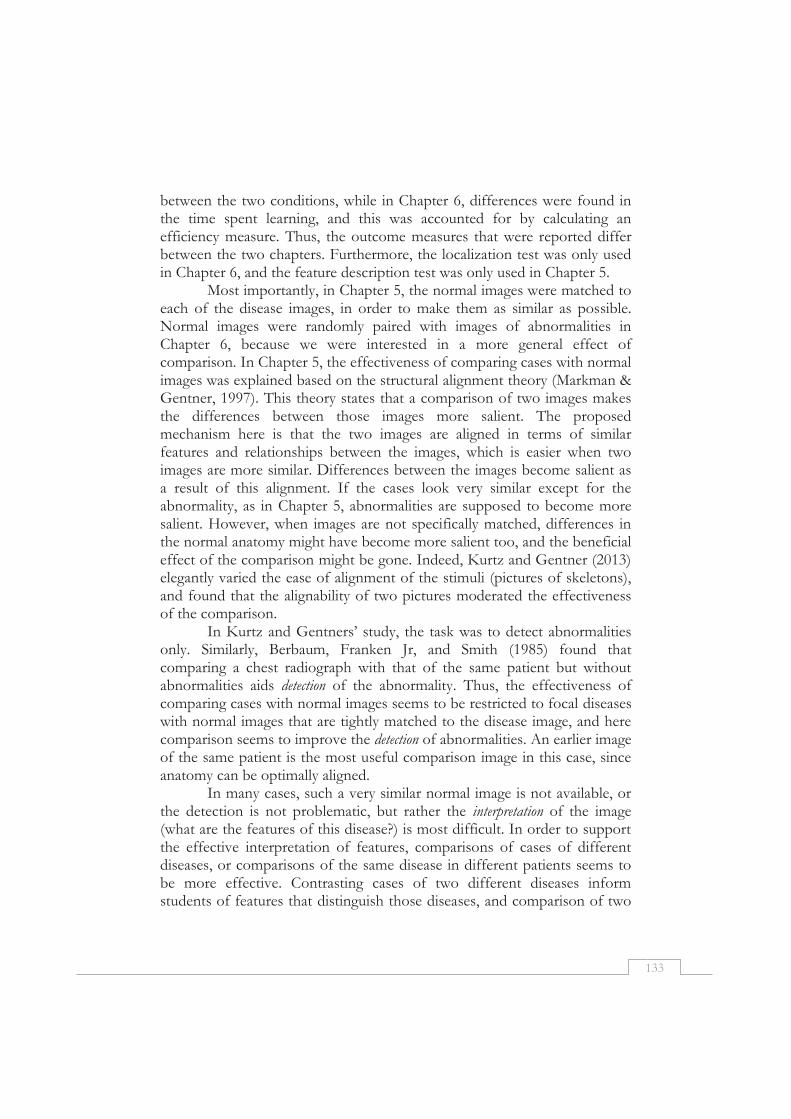
133
between the two conditions, while in Chapter 6, differences were found in the time spent learning, and this was accounted for by calculating an efficiency measure. Thus, the outcome measures that were reported differ between the two chapters. Furthermore, the localization test was only used in Chapter 6, and the feature description test was only used in Chapter 5.
Most importantly, in Chapter 5, the normal images were matched to each of the disease images, in order to make them as similar as possible. Normal images were randomly paired with images of abnormalities in Chapter 6, because we were interested in a more general effect of comparison. In Chapter 5, the effectiveness of comparing cases with normal images was explained based on the structural alignment theory (Markman & Gentner, 1997). This theory states that a comparison of two images makes the differences between those images more salient. The proposed mechanism here is that the two images are aligned in terms of similar features and relationships between the images, which is easier when two images are more similar. Differences between the images become salient as a result of this alignment. If the cases look very similar except for the abnormality, as in Chapter 5, abnormalities are supposed to become more salient. However, when images are not specifically matched, differences in the normal anatomy might have become more salient too, and the beneficial effect of the comparison might be gone. Indeed, Kurtz and Gentner (2013) elegantly varied the ease of alignment of the stimuli (pictures of skeletons), and found that the alignability of two pictures moderated the effectiveness of the comparison.
In Kurtz and Gentners’ study, the task was to detect abnormalities only. Similarly, Berbaum, Franken Jr, and Smith (1985) found that comparing a chest radiograph with that of the same patient but without abnormalities aids detection of the abnormality. Thus, the effectiveness of comparing cases with normal images seems to be restricted to focal diseases with normal images that are tightly matched to the disease image, and here comparison seems to improve the detection of abnormalities. An earlier image of the same patient is the most useful comparison image in this case, since anatomy can be optimally aligned.
In many cases, such a very similar normal image is not available, or the detection is not problematic, but rather the interpretation of the image (what are the features of this disease?) is most difficult. In order to support the effective interpretation of features, comparisons of cases of different diseases, or comparisons of the same disease in different patients seems to be more effective. Contrasting cases of two different diseases inform students of features that distinguish those diseases, and comparison of two
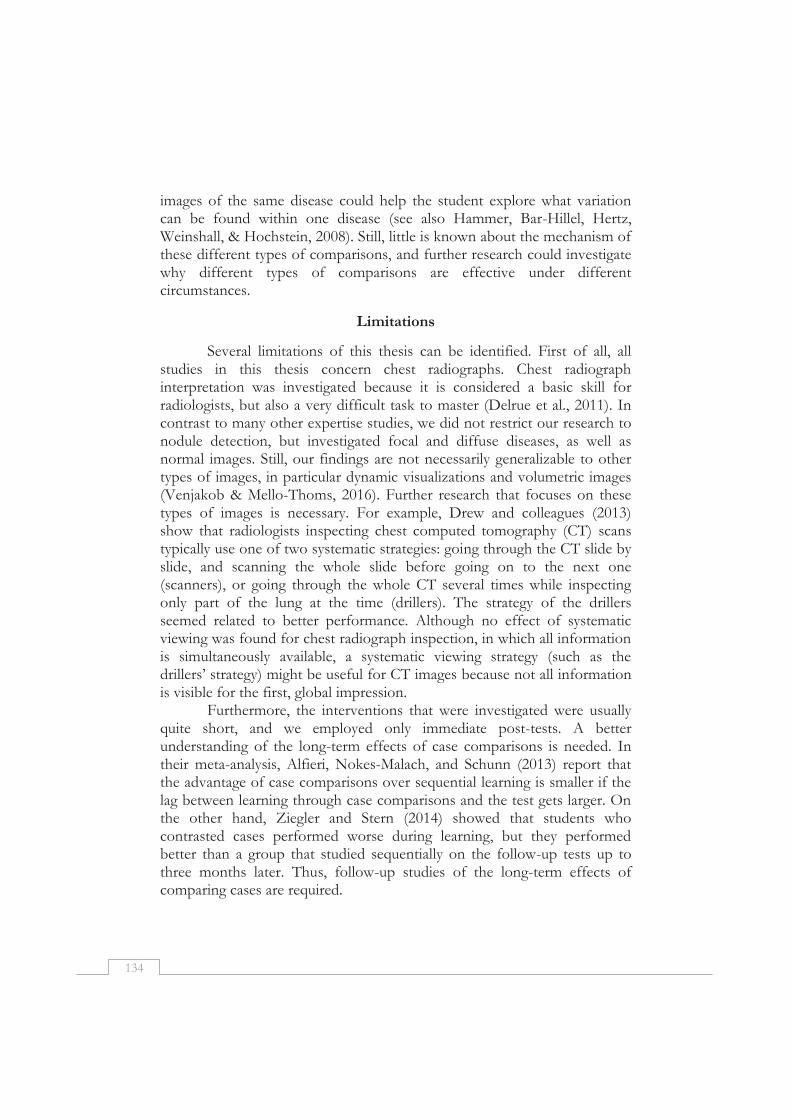
134
images of the same disease could help the student explore what variation can be found within one disease (see also Hammer, Bar-Hillel, Hertz, Weinshall, & Hochstein, 2008). Still, little is known about the mechanism of these different types of comparisons, and further research could investigate why different types of comparisons are effective under different circumstances.
Limitations
Several limitations of this thesis can be identified. First of all, all studies in this thesis concern chest radiographs. Chest radiograph interpretation was investigated because it is considered a basic skill for radiologists, but also a very difficult task to master (Delrue et al., 2011). In contrast to many other expertise studies, we did not restrict our research to nodule detection, but investigated focal and diffuse diseases, as well as normal images. Still, our findings are not necessarily generalizable to other types of images, in particular dynamic visualizations and volumetric images (Venjakob & Mello-Thoms, 2016). Further research that focuses on these types of images is necessary. For example, Drew and colleagues (2013) show that radiologists inspecting chest computed tomography (CT) scans typically use one of two systematic strategies: going through the CT slide by slide, and scanning the whole slide before going on to the next one (scanners), or going through the whole CT several times while inspecting only part of the lung at the time (drillers). The strategy of the drillers seemed related to better performance. Although no effect of systematic viewing was found for chest radiograph inspection, in which all information is simultaneously available, a systematic viewing strategy (such as the drillers’ strategy) might be useful for CT images because not all information is visible for the first, global impression.
Furthermore, the interventions that were investigated were usually quite short, and we employed only immediate post-tests. A better understanding of the long-term effects of case comparisons is needed. In their meta-analysis, Alfieri, Nokes-Malach, and Schunn (2013) report that the advantage of case comparisons over sequential learning is smaller if the lag between learning through case comparisons and the test gets larger. On the other hand, Ziegler and Stern (2014) showed that students who contrasted cases performed worse during learning, but they performed better than a group that studied sequentially on the follow-up tests up to three months later. Thus, follow-up studies of the long-term effects of comparing cases are required.
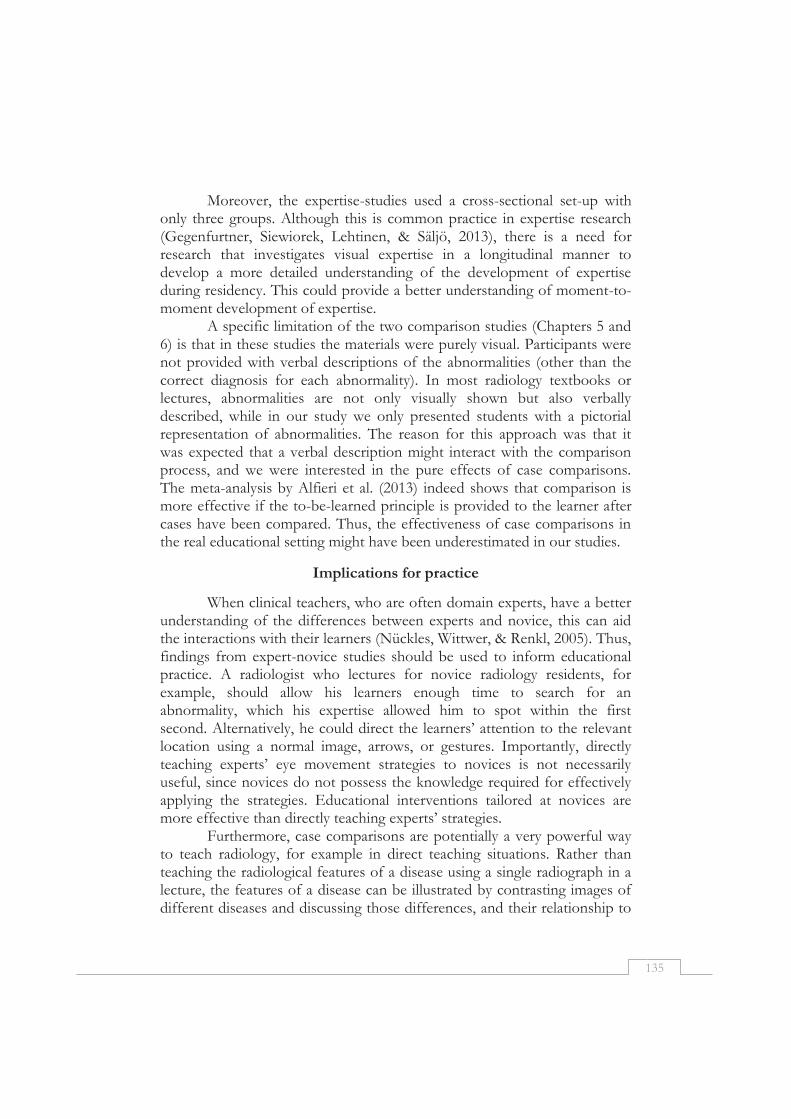
135
Moreover, the expertise-studies used a cross-sectional set-up with only three groups. Although this is common practice in expertise research (Gegenfurtner, Siewiorek, Lehtinen, & Säljö, 2013), there is a need for research that investigates visual expertise in a longitudinal manner to develop a more detailed understanding of the development of expertise during residency. This could provide a better understanding of moment-to-moment development of expertise.
A specific limitation of the two comparison studies (Chapters 5 and 6) is that in these studies the materials were purely visual. Participants were not provided with verbal descriptions of the abnormalities (other than the correct diagnosis for each abnormality). In most radiology textbooks or lectures, abnormalities are not only visually shown but also verbally described, while in our study we only presented students with a pictorial representation of abnormalities. The reason for this approach was that it was expected that a verbal description might interact with the comparison process, and we were interested in the pure effects of case comparisons. The meta-analysis by Alfieri et al. (2013) indeed shows that comparison is more effective if the to-be-learned principle is provided to the learner after cases have been compared. Thus, the effectiveness of case comparisons in the real educational setting might have been underestimated in our studies.
Implications for practice
When clinical teachers, who are often domain experts, have a better understanding of the differences between experts and novice, this can aid the interactions with their learners (Nückles, Wittwer, & Renkl, 2005). Thus, findings from expert-novice studies should be used to inform educational practice. A radiologist who lectures for novice radiology residents, for example, should allow his learners enough time to search for an abnormality, which his expertise allowed him to spot within the first second. Alternatively, he could direct the learners’ attention to the relevant location using a normal image, arrows, or gestures. Importantly, directly teaching experts’ eye movement strategies to novices is not necessarily useful, since novices do not possess the knowledge required for effectively applying the strategies. Educational interventions tailored at novices are more effective than directly teaching experts’ strategies.
Furthermore, case comparisons are potentially a very powerful way to teach radiology, for example in direct teaching situations. Rather than teaching the radiological features of a disease using a single radiograph in a lecture, the features of a disease can be illustrated by contrasting images of different diseases and discussing those differences, and their relationship to
136
anatomy and pathophysiology. Comparing images of the same disease and discussing the commonalities can help to teach students and residents the range of possible appearances of a certain feature. Currently, a great deal of the teaching in the radiology residency consists of workplace learning: Residents individually work through a set of cases and discuss the cases with a supervisor. This means that learning is haphazard, and very much depending on the cases that are currently available. A teaching file could be a way to control exposure and ensure variability. For example, a clinical teacher can collect a set of cases that together visualize the most important features of pneumonia, and stimulate the learner to compare and contrast these cases. The concept of deliberate practice cannot be ignored in this context. Deliberate practice refers to extensive, effortful and repeated practice with the task, ideally followed by immediate feedback. The individual needs to be motivated to invest effort into the study task, and the difficulty-level should be adapted to the participant’s prior knowledge (Ericsson, Krampe, & Teschromer, 1993). Deliberate practice is broadly advocated as the road to expertise in medicine (Ericsson, 2007). Teaching files are an excellent way to allow aspiring radiologists to engage in deliberate practice, in particular when the teaching file format is structured, and provides immediate feedback, and learners engage in activities such as the deliberate comparison of cases to study the features of diseases.
Finally, our data suggest that systematic viewing, often considered the golden standard in radiology, might not be as solid as assumed. Teachers in radiology should thus reconsider their focus on teaching this skill, and instead focus on content rather than viewing strategy. It has to be noted, though, that students consider learning a systematic approach for viewing chest radiographs as the most important radiology-related topic of the medical curriculum (Subramaniam, Beckley, Chan, Chou, & Scally, 2006). Anecdotally, students report feeling lost when not having ‘a system’ for viewing radiological images. Teachers should take this into account and provide students with an alternative strategy. For example, in Chapter 4, participants in the control condition were instructed to attend to whatever attracts their attention.
General conclusion
The studies conducted in this thesis together provide more insight into the visual expertise development of novices, who just perceive a constellation of greys, to experts in radiology, who can provide a detailed diagnosis based on these chest radiographs. Eye tracking can contribute to
137
the study of visual expertise development in radiology by providing a tool to investigate attention. When investigating visual expertise, it is critical to take stimulus characteristics into account. Although systematic viewing is considered the golden standard in teaching radiology, it might not be as solid as assumed. Instead, comparing cases provides a potentially powerful way of teaching radiology, in particular if the type of comparison is closely matched to the learning goal.
138
References
Alfieri, L., Nokes-Malach, T. J., & Schunn, C. D. (2013). Learning through case comparisons: A meta-analytic review. Educational Psychologist, 48(2), 87-113.
Berbaum, K. S., Franken Jr, E. A., & Smith, T. J. (1985). The effect of comparison films upon resident interpretation of pediatric chest radiographs. Investigative Radiology, 20(2), 124-128.
Bertram, R., Helle, L., Kaakinen, J. K., & Svedstrom, E. (2013). The Effect of Expertise on Eye Movement Behaviour in Medical Image Perception. Plos One, 8(6).
Crowley, R. S., Naus, G. J., Stewart, J., & Friedman, C. P. (2003). Development of visual diagnostic expertise in pathology: An information-processing study. Journal of the American Medical Informatics Association, 10(1), 39-51.
Delrue, L., Gosselin, R., Ilsen, B., van Landeghem, A., de Mey, J., & Duyck, P. (2011). Difficulties in the interpretation of chest radiography. In E. E. Coche, B. Ghaye, J. de Mey, & P. Duyck (Eds.), Comparative interpretation of CT and standard radiography of the chest (pp. 27-49). Berlin Heidelberg: Springer-Verlag.
Dewhurst, R., & Crundall, D. (2008). Training eye movements: Can training people where to look hinder the processing of fixated objects? Perception, 37(11), 1729.
Donovan, T., & Litchfield, D. (2013). Looking for Cancer: Expertise Related Differences in Searching and Decision Making. Applied Cognitive Psychology, 27(1), 43-49.
Donovan, T., Manning, D. J., Phillips, P. W., Higham, S., & Crawford, T. (2005). The effect of feedback on performance in a fracture detection task. Proceedings of SPIE - The International Society for Optical Engineering, 5749.
Drew, T., Vo, M. L.-H., Olwal, A., Jacobson, F., Seltzer, S. E., & Wolfe, J. M. (2013). Scanners and drillers: Characterizing expert visual search through volumetric images. Journal of Vision, 13(10).
Drew, T., Vo, M. L. H., & Wolfe, J. M. (2013). The Invisible Gorilla Strikes Again Sustained Inattentional Blindness in Expert Observers. Psychological Science, 24(9), 1848-1853.
Ericsson, K. A. (2007). An expert-performance perspective of research on medical expertise: The study of clinical performance. Medical Education, 41(12), 1124-1130.
Ericsson, K. A., Charness, N., Feltovich, P., & Hoffman, R. R. (2006). The Cambridge Handbook of Expertise And Expert Performance. Cambridge: Cambridge University Press.
Ericsson, K. A., & Kintsch, W. (1995). Long-term working memory. Psychological Review, 102(2), 211-245.
Ericsson, K. A., Krampe, R. T., & Teschromer, C. (1993). The role of deliberate practice in the acquisition of expert performance. Psychological Review, 100(3), 363-406.
Gegenfurtner, A., Lehtinen, E., & Säljö, R. (2011). Expertise differences in the comprehension of visualizations: a meta-analysis of eye-tracking research in professional domains. Educational Psychology Review, 23(4), 523-552.
Gegenfurtner, A., Siewiorek, A., Lehtinen, E., & Säljö, R. (2013). Assessing the Quality of Expertise Differences in the Comprehension of Medical Visualizations. Vocations and Learning, 6(1), 37-54.
Haider, H., & Frensch, P. A. (1999). Eye movement during skill acquisition: More evidence for the information-reduction hypothesis. Journal of Experimental Psychology-Learning Memory and Cognition, 25(1), 172-190.
139
Hammer, R., Bar-Hillel, A., Hertz, T., Weinshall, D., & Hochstein, S. (2008). Comparison processes in category learning: From theory to behavior. Brain Research, 1225, 102-118.
Holmqvist, K., Nyström, M., Andersson, R., Dewhurst, R., Jarodzka, H., & van de Weijer, J. (2011). Eye tracking: A comprehensive guide to methods and measures. Oxford: Oxford University Press.
Jaarsma, T., Jarodzka, H., Nap, M., van Merriënboer, J. J., & Boshuizen, H. P. (2015). Expertise in clinical pathology: combining the visual and cognitive perspective. Advances in Health Sciences Education, 20(4), 1089-1106.
Johnson, A., & Proctor, R. W. (2004). Attention : theory and practice. Thousand Oaks, CA [etc.]: Sage.
Kundel, H. L., Nodine, C., Thickman, D., & Toto, L. C. (1987). Searching for lung nodules a comparison of human performance with random and systematic scanning models. Investigative Radiology, 22, 417-422.
Kundel, H. L., Nodine, C. F., Conant, E. F., & Weinstein, S. P. (2007). Holistic component of image perception in mammogram interpretation: Gaze-tracking study. Radiology, 242(2), 396-402.
Kurtz, K. J., & Gentner, D. (2013). Detecting anomalous features in complex stimuli: The role of structured comparison. Journal of Experimental Psychology-Applied, 19(3), 219-232.
Manning, D. J., Barker-Mill, S. C., Donovan, T., & Crawford, T. (2006). Time-dependent observer errors in pulmonary nodule detection. British Journal of Radiology, 79(940), 342-346.
Markman, A. B., & Gentner, D. (1997). The effects of alignability on memory. Psychological Science, 8(5), 363-367.
Mello-Thoms, C., Mello, C. A. B., Medvedeva, O., Castine, M., Legowski, E., Gardner, G., . . . Crowley, R. S. (2012). Perceptual Analysis of the Reading of Dermatopathology Virtual Slides by Pathology Residents. Archives of Pathology & Laboratory Medicine, 136(5), 551-562.
Nalanagula, D., Greenstein, J. S., & Gramopadhye, A. K. (2006). Evaluation of the effect of feedforward training displays of search strategy on visual search performance. International Journal of Industrial Ergonomics, 36(4), 289-300.
Nickles, G. M., Melloy, B. J., & Gramopadhye, A. K. (2003). A comparison of three levels of training designed to promote systematic search behavior in visual inspection. International Journal of Industrial Ergonomics, 32(5), 331-339.
Nückles, M., Wittwer, J., & Renkl, A. (2005). Information about a layperson's knowledge supports experts in giving effective and efficient online advice to laypersons. Journal of Experimental Psychology: Applied, 11(4), 219.
O'Neill, E. C., Kong, Y. X. G., Connell, P. P., Ong, D. N., Haymes, S. A., Coote, M. A., & Crowston, J. G. (2011). Gaze Behavior among Experts and Trainees during Optic Disc Examination: Does How We Look Affect What We See? Investigative Ophthalmology & Visual Science, 52(7), 3976-3983.
Radach, R., & Kennedy, A. (2012). Eye movements in reading: Some theoretical context. The Quarterly Journal of Experimental Psychology, 66(3), 429-452.
Rayner, K. (1998). Eye movements in reading and information processing: 20 years of research. Psychological Bulletin, 124(3), 372-422.
Reingold, E. M., & Sheridan, H. (2011). Eye movements and visual expertise in chess and medicine. In S. P. Leversedge, I. D. Gilchrist, & S. Everling (Eds.), Oxford Handbook of Eye Movements (pp. 528-550). Oxford: Oxford University Press.
140
Schuster, D., Rivera, J., Sellers, B. C., Fiore, S. M., & Jentsch, F. (2013). Perceptual training for visual search. Ergonomics, 56(7), 1101-1115.
Subramaniam, R. M., Beckley, V., Chan, M., Chou, T., & Scally, P. (2006). Radiology curriculum topics for medical students: Students' perspectives. Academic Radiology, 13(7), 880-884.
van Merriënboer, J. J. G., Kirschner, P. A., & Kester, L. (2003). Taking the Load Off a Learner's Mind: Instructional Design for Complex Learning. Educational Psychologist, 38(1), 5-13.
Venjakob, A. C., & Mello-Thoms, C. R. (2016). Review of prospects and challenges of eye tracking in volumetric imaging. Journal of Medical Imaging, 3(1).
Wang, M.-J. J., Lin, S.-C., & Drury, C. G. (1997). Training for strategy in visual search. International Journal of Industrial Ergonomics, 20(2), 101-108.
Wolfe, J. M., Alvarez, G. A., & Horowitz, T. S. (2000). Attention is fast but volition is slow. Nature, 406(6797), 691-691.
Ziegler, E., & Stern, E. (2014). Delayed benefits of learning elementary algebraic transformations through contrasted comparisons. Learning and Instruction, 33(0), 131-146.

141
Chapter 8
Summary
142
Chapter 1: General introduction
Many professions involve the interpretation of complex visualizations, a task that is non-trivial and requires years of dedicated training to fully develop. Chest radiograph interpretation is such a task: It is considered to be a basic skill for radiologists, but is also considered very hard to learn. Many novices just perceive a constellation of greys, while radiologists can interpret this information into a diagnosis. In this thesis expertise development in radiology was investigated. Prior research on visual expertise development is discussed first. Next, eye movements as a method for investigating visual expertise are discussed, and the first research question is introduced: How can eye tracking contribute to studying the development of visual expertise in radiology? This research question is addressed in Chapter 2. Subsequently, it is discussed what changes in eye movements with increasing expertise can be predicted from theories about visual expertise. Most expertise studies are conducted using a restricted set of tasks, usually the detection of small tumors on chest radiographs and mammograms. The limitations of these studies are discussed and the second research question is introduced: How do eye movements differ between experts, intermediates and novices in the domain of radiology, and how do expertise differences interact with image characteristics? This research question is addressed in Chapters 3 and 4. Finally, the thesis zooms in on the novice-end of the expertise spectrum. Expertise theories provide information on the specific characteristics that novices have in comparison to experts in the domain. Two potential interventions were investigated that target those characteristics. Thus, the third research question is: What is the effect of systematic viewing training and studying case comparisons on learning radiology? This research question is addressed in Chapters 4, 5 and 6.
Chapter 2: Before your very eyes: The value of eye tracking in medical
education
Eye tracking is a technique to investigate visual expertise in medicine. It measures the movements of the eyes to see what a person is looking at, for how long, and in what order. In Chapter 2, the value and limitations of eye tracking for researchers and practitioners in medical education are clarified. Eye tracking can be used to investigate visual expertise development, but also as an online measure of how students engage with learning materials, or to investigate social interaction (e.g., eye contact in feedback meetings) in learning situations. Finally, eye movements can be displayed to students, so they can learn how experts look at the
143
learning material. Eye movements provide valid information about the student’s attention when experiments are carefully designed. However, when memory or higher cognitive skills are investigated, additional data are often required. It is recommended that eye tracking research is conducted and interpreted along theoretical models in order to provide relevant guidelines for practice, and useful additions to theory. All in all, eye tracking is a promising technique for medical education research.
Chapter 3: Looking in the same manner but seeing it differently:
Bottom-up and expertise effects in radiology
Most expertise research in radiology is conducted with a restricted set of tasks. Many different types of images exist in radiology, and the characteristics of the image can guide viewing behavior. This chapter investigates how bottom-up effects of stimulus characteristics interact with top-down effects of expertise in guiding attention. We made a distinction between three types of images: focal (localized) diseases, diffuse diseases which affect the whole lung, and normal (healthy) images. The eye movements of 11 sixth-year medical students, 10 radiology residents and 9 experienced radiologists were measured. They diagnosed 24 conventional chest radiographs, 8 of them showing a focal disease, 8 showing a diffuse disease and 8 normal images. The type of image had a large impact on the eye movements: Viewing patterns of radiologists, residents and students were quite similar for focal and diffuse images. Students viewing behavior differed mostly from the other two groups for the normal images. Their diagnostic accuracy, however, was relatively high for normal images, but very low for the disease images. Although viewing patterns were similar, students lack the knowledge that helps them to correctly diagnose the diseases.
Chapter 4: Systematic viewing in radiology: Seeing more, missing
less?
Radiology textbooks and websites recommend “systematic viewing” of chest radiographs, which refers to consistently inspecting a list of anatomical areas in a fixed order. This is supposed to ensure complete inspection of the image (i.e., full coverage), which should lead to better diagnostic performance because less abnormalities are missed. The assumed mechanism (systematic viewing leads to increased coverage, which leads to less misses) has not been empirically tested so far. We tested this in two experiments. Additionally, Experiment 1 investigated whether systematic
144
viewing increases with higher expertise. Experiment 2 also investigated whether novices benefit from a full-coverage or systematic viewing training. In Experiment 1, 11 sixth-year medical students, 10 radiology residents and 9 experienced radiologists inspected 5 normal chest radiographs. Experiment 2 had 75 2nd year students undergo training in either systematic, full-coverage (without being systematic) or non-systematic viewing. We measured eye movements and diagnostic performance in both experiments. Data in neither of the experiments supports the assumed relationship between systematic viewing, coverage and performance. Experts were significantly more systematic than students, but covered significantly less of the image. Students did not benefit from a systematic-viewing training, although eye-movement data show that the trainings had the expected effects on the viewing behavior.
Chapter 5: Learning radiological appearances of diseases: Does
comparison help?
Learning by comparing cases is found to be effective in many different tasks, such as category learning and mathematics. The structural alignment theory states that during the comparison of two images, features and relationships within an image are systematically matched to the other image. Differences between images become more salient as a result of this matching process. Thus, comparison of contrasting examples (images of diseases with normal images) could help medical students learn the discriminating features of those diseases. A distinction is made between focal (localized) diseases, and diffuse diseases, which affect the whole lung. Sixty-one third-year medical students studied 24 cases of 12 common diseases on chest radiographs. They were randomly assigned to a group that compared those cases with cases that showed no abnormalities (normal images), or that compared two images of the same disease (but in different patients). Subsequently, they took two tests. Students who compared with normal images outperformed the students who compared with images of the same disease, but only for focal and not for diffuse images. It is concluded that comparison with a normal image might have rendered the focal diseases more salient, as predicted by the structural alignment theory. This may have made it easier for students to study the relevant information in the cases.
145
Chapter 6: Case comparisons: An efficient way of learning radiology
We extended our research on case comparisons by adding another way of case comparisons: comparing cases of different diseases. Three ways of comparing cases were investigated: comparing an image with an image showing no abnormalities (disease/normal comparison), comparing two images of the same disease but in different patients (same-disease comparison), and comparing two images of different diseases (different-disease comparison). The effectiveness of these three types of comparison for learning was investigated, and contrasted with a no-comparison control condition. Furthermore, it was investigated what aspects of the cases were compared by using eye tracking. We randomly assigned 84 medical students to one of those 4 conditions, and asked them to study 6 examples of 8 diseases, while their eye movements were measured. Thereafter, participants took two tests, one to measure diagnostic performance, and one to measure their ability to locate the disease. Students were found to study most efficiently (achieving the same learning result, but with less study time) in the same-disease and different-disease comparison conditions. The eye tracking data showed that students actually used the opportunity to compare, they compared mostly between normal anatomies (e.g., the heart in one image with the heart in the other image). It is concluded that the type of comparison should be adapted to the learning goal. More specifically, participants in the same-disease condition were most efficient in learning to locate the disease, and participants in the different-disease condition were most efficient in learning to discriminate between diseases. Comparison with normal was effective mainly for distinguishing normal from abnormal.
Chapter 7: General discussion
The general discussion provides a synopsis of the main findings of this thesis, as well as a discussion of its theoretical contributions. It is argued that eye tracking is a relevant tool to investigate visual expertise and its development, but eye-movement differences cannot be considered direct markers of expertise and should be interpreted in relationship to the stimulus or task. Instead of training students to inspect an image in a certain order, it seems to be more effective to train students in what the stimuli and the targets (abnormalities) look like. The next section discusses three limitations of this thesis. First of all, only chest radiographs were used in this thesis, making it hard to generalize the findings to other types of medical images and complex visualizations. Furthermore, the studies we conducted were all short-term interventions and follow-up studies on long-
146
term effects are required. A specific limitation of the studies reported in Chapters 5 and 6 was that we used only visual information, while verbal descriptions of the abnormalities could potentially make the effect of the case comparisons more powerful. Lastly, implications for practice are discussed: Expertise research has the potential to support the interaction between clinical teachers and their learners. Furthermore, case comparisons are a potentially powerful way to teach radiology, for example in lectures or in teaching files. Although systematic viewing is considered the golden standard in teaching radiology, it might not be as solid as assumed. Together, the studies in this thesis show that eye tracking provides relevant insight into expertise development in radiology, and underlines the need for theory-based educational interventions to help students develop visual expertise.

147
Chapter 9
Nederlandse samenvatting
148
Hoofdstuk 1: Algemene introductie
In veel beroepen moeten professionals complexe visualisaties interpreteren. Het interpreteren van complexe visualisaties is niet triviaal, en er is vaak jaren van toegewijde training nodig om de taak goed te leren uitvoeren. Het interpreteren van thorax röntgenfoto’s is zo’n taak: dit wordt gezien als een basale vaardigheid voor radiologen, maar ook als een taak die lastig is om te leren. Veel beginners nemen slechts een set grijstinten waar, terwijl radiologen deze informatie gebruiken om een diagnose te stellen. In dit proefschrift is de expertiseontwikkeling in de radiologie onderzocht. Bestaand onderzoek naar visuele expertise wordt eerst besproken. Daarna wordt oogbewegingsregistratie beschreven als een methode om visuele expertise te onderzoeken, en hiermee wordt ook de eerste onderzoeksvraag geïntroduceerd: Hoe kan oogbewegingsregistratie bijdragen aan het onderzoek naar de ontwikkeling van visuele expertise in de radiologie? Deze onderzoeksvraag wordt behandeld in Hoofdstuk 2. Vervolgens wordt besproken wat theorieën over visuele expertise voorspellen met betrekking tot veranderingen in oogbewegingen als expertise toeneemt. De meeste expertise-onderzoeken zijn uitgevoerd met een beperkte set van taken, voornamelijk het detecteren van kleine tumoren op thorax röntgenfoto’s en mammogrammen. De beperkingen van deze aanpak worden besproken, en de tweede onderzoeksvraag wordt geïntroduceerd: Hoe verschillen de oogbewegingen tussen experts, gevorderden (‘intermediates’) en beginners in de radiologie, en hoe interacteren expertiseverschillen met kenmerken van het beeld? Deze onderzoeksvraag wordt behandeld in Hoofdstuk 3 en Hoofdstuk 4. Als laatste zoomt dit proefschrift in op het ‘beginners’ deel van het expertise-spectrum. Theorieën over visuele expertise geven informatie over welke kenmerken beginners hebben ten opzichte van experts in het domein. We onderzochten twee interventies die inspelen op deze kenmerken. Daarom is de derde onderzoeksvraag: Wat zijn de effecten van een training in systematisch kijken, en het vergelijken van casussen op het leren diagnosticeren van röntgenfoto’s? Deze onderzoeksvraag wordt onderzocht in de Hoofdstukken 4, 5 en 6.
Hoofdstuk 2: Je ziet het voor je ogen gebeuren: De waarde van
oogbewegingsregistratie voor de medische onderwijskunde
Oogbewegingsregistratie is een techniek om visuele expertise in de geneeskunde te onderzoeken. Het meet de bewegingen van de ogen om te zien waar iemand kijkt, voor hoe lang, en in welke volgorde. In Hoofdstuk 2 wordt uitgelegd wat de waarde is van oogbewegingsregistratie voor onderzoekers en beroepsbeoefenaars in de medische onderwijskunde, en
149
ook wat de mogelijke beperkingen zijn. Oogbewegingsregistratie kan gebruikt worden om visuele expertise te onderzoeken, maar ook als een manier om te registreren hoe studenten zich bezig houden met een leertaak. Daarnaast kan het gebruikt worden om sociale processen in leersituaties te onderzoeken (bijvoorbeeld oogcontact in feedbackbijeenkomsten). Ten slotte kunnen oogbewegingen van een expert aan een student getoond worden, zodat die kan zie hoe een expert naar de leertaak kijkt. Als een experiment goed ontworpen is geven de oogbewegingen valide informatie over het richten van de aandacht door studenten. Echter, wanneer het geheugen of hogere cognitieve vaardigheden het onderwerp van onderzoek zijn, zijn er vaak extra gegevens nodig. Als oogbewegingsregistratie uitgevoerd en geïnterpreteerd wordt vanuit een theoretisch model kunnen deze data relevante richtlijnen opleveren voor de praktijk, en nuttige aanvullingen voor de theorie. Kortom, het meten van oogbewegingen is een veelbelovende techniek voor de medische onderwijskunde.
Hoofdstuk 3: Op dezelfde manier kijken, maar iets anders zien:
Effecten van de stimulus en van expertise in de radiologie
Het grootste deel van het expertise onderzoek in de radiologie is uitgevoerd met een beperkte set van taken: voornamelijk het detecteren van kleine tumoren op röntgenfoto’s en mammogrammen. Echter, er bestaan veel verschillende radiologische stimuli, en de specifieke kenmerken van de stimuli kunnen het kijkgedrag sturen. Dit hoofdstuk onderzoekt hoe de kenmerken van de stimulus interacteren met de effecten van expertise in het sturen van de aandacht. We maken een onderscheid tussen drie typen beelden: focale ziektes (op één locatie), diffuse ziektes die de hele long beïnvloeden, en normale (gezonde) beelden. We maten de oogbewegingen van 11 zesdejaars studenten geneeskunde, 10 artsen in opleiding tot radioloog en 9 ervaren radiologen. Zij diagnosticeerden 24 röntgenfoto’s van de thorax. Op 8 daarvan was een focale ziekte te zien, op 8 was een diffuse ziekte te zien en 8 van de beelden waren normaalbeelden. De kenmerken van het beeld hadden een groot effect op de oogbewegingen: Het kijkgedrag van studenten leek erg op dat van radiologen en assistenten in opleiding tot radioloog voor de focale en diffuse ziektes, maar niet voor de normaalbeelden. De diagnostische accuratesse van de studenten was echter relatief hoog voor normaalbeelden, maar erg laag voor de beide typen ziektes. Hoewel kijkpatronen dus vergelijkbaar waren, missen studenten de kennis om de ziektes correct te diagnosticeren.
150
Hoofdstuk 4: Systematisch kijken in de radiologie: Meer bekijken,
minder missen?
Leerboeken en websites over radiologie raden vaak aan dat röntgenfoto’s van de thorax op een systematische manier bekeken worden. Hiermee wordt bedoeld dat de anatomische gebieden altijd in dezelfde volgorde geïnspecteerd moeten worden. Dit zou ertoe moeten leiden dat het complete beeld bekeken wordt (complete dekking), wat er dan weer voor zou moeten zorgen dat er geen afwijkingen gemist worden. Dit veronderstelde mechanisme (systematisch kijken leidt tot een completer kijkgedrag, wat dan weer leidt tot minder gemiste afwijkingen) is nog niet eerder empirisch getest. We testten dit mechanisme in twee experimenten. Daarnaast onderzocht Experiment 1 of systematisch kijken meer voorkomt bij een hoger expertise-niveau. Experiment 2 keek ook of beginners in de radiologie profijt hebben van een training in het compleet bekijken of systematisch bekijken van röntgenfoto’s. In Experiment 1 keken 11 zesdejaars geneeskundestudenten, 10 assistenten in opleiding tot radioloog, en 9 ervaren radiologen naar 5 normale thoraxfoto’s (i.e., zonder afwijkingen). In Experiment 2 namen 75 tweedejaars geneeskundestudenten deel aan een training. Deze training ging over systematisch bekijken, compleet bekijken (zonder systematisch te zijn) of niet-systematisch bekijken van een röntgenfoto. We maten in beide experimenten de oogbewegingen en de prestaties. De verwachte relatie tussen systematisch kijken, complete dekking en presentatie werd niet ondersteund door de data uit beide experimenten. Experts waren significant systematischer dan studenten, maar bekeken een significant kleiner deel van het beeld. De studenten hadden geen profijt van de training in het systematisch kijken, hoewel de oogbewegingsdata laten zien dat de trainingen wel het verwachte effect op hun oogbewegingen hadden.
Hoofdstuk 5: Het aanleren van de radiologische verschijningen van
ziektes: Helpt vergelijken?
Voor verschillende taken, zoals het leren van categorisatie en het leren van wiskunde, is al gevonden dat het vergelijken van casussen effectief is voor het leren. De ‘structural alignment’ (structurele uitlijning) theorie stelt dat de kenmerken en relaties binnen een stimulus systematisch gerelateerd worden aan een andere stimulus tijdens het vergelijkproces. Als gevolg van dit proces worden verschillen tussen de twee stimuli extra opvallend. Het vergelijken van contrasterende voorbeelden (röntgenfoto’s
151
van ziektes met röntgenfoto’s zonder afwijkingen) zou studenten dus kunnen helpen bij het leren wat de kenmerken van die ziektes zijn. We maken een verschil tussen focale ziektes, die zich op één plek bevinden, en diffuse ziektes, die de hele long beïnvloeden. 61 derdejaars geneeskundestudenten bestudeerden 24 casussen van 12 veelvoorkomende ziektes op thorax röntgenfoto’s. Ze werden random toegewezen aan een groep die deze casussen vergeleek met röntgenfoto’s zonder afwijkingen (normaalbeelden), en een groep die steeds twee casussen van dezelfde ziekte, maar bij een andere persoon, vergeleek. Na afloop kregen ze twee toetsen. De deelnemers die vergeleken met de normaalbeelden hadden een betere toets score, maar alleen voor focale en niet voor diffuse ziektes. Er werden geen verschillen gevonden in het beschrijven van de kenmerken. We concluderen dat het vergelijken van een casus met een normaalbeeld de focale ziektes opvallender heeft gemaakt, zoals verwacht op basis van de ‘structural alignment’ theorie. Dit heeft het gemakkelijker gemaakt voor de studenten om de aandacht te richten op de relevante informatie.
Hoofdstuk 6: Het vergelijken van casussen: Een efficiënte manier van
leren
Het onderzoek naar het vergelijken van casussen werd uitgebreid met een ander type vergelijkingen: het vergelijken van casussen van verschillende ziektes. We vergeleken dus drie types vergelijkingen: het vergelijken van een ziekte met een röntgenfoto waar geen abnormaliteiten op te zien waren (ziek/normaal vergelijking), het vergelijken van twee röntgenfoto’s van dezelfde ziekte maar in andere patiënten (zelfde-ziekte vergelijking), en het vergelijken van twee röntgenfoto’s van verschillende ziektes (verschillende-ziektes vergelijking). We vergeleken deze ziektes met een conditie waarin niet vergeleken kon worden (controle conditie). We maten de oogbewegingen om te zien welke aspecten van de casussen vergeleken werden. We wezen 84 derdejaars geneeskundestudenten random toe aan één van de 4 vergelijk-condities. Ze bestudeerden 6 voorbeelden van 8 verschillende ziektes, en we maten de oogbewegingen. Daarna maakten de deelnemers twee toetsen, een om de diagnostische prestatie te meten, en een om te meten of ze konden aangeven wat de locatie van de ziekte was. We vonden dat studenten het meest efficiënt studeerden in de zelfde-ziekte en verschillende-ziekte vergelijkingscondities. De oogbewegingsdata laten zien dat studenten daadwerkelijk vergeleken. Ze vergeleken vooral de normale anatomie (bijvoorbeeld het hart op de ene röntgenfoto met het hart op de andere röntgenfoto). Er wordt geconcludeerd dat het type vergelijking aangepast moet worden aan het
152
leerdoel: Studenten in de zelfde-ziekte conditie waren het meest efficiënt in het leren lokaliseren van de ziekte, terwijl studenten in de verschillende-ziekte vergelijking conditie het meest efficiënt waren in het leren discrimineren tussen ziektes. De ziek/normaal vergelijking was vooral effectief voor het leren onderscheiden van ziekte en normaliteit.
Hoofdstuk 7: Algemene discussie
Dit hoofdstuk vat de bevindingen van het proefschrift samen en bediscussieert de theoretische bijdragen. We bespreken dat oogbewegingsregistratie nuttig is bij het onderzoeken van visuele expertise, maar dat specifieke oogbewegingsmaten niet gezien moeten worden als directe afspiegeling van expertise, maar geïnterpreteerd dienen te worden in relatie tot de stimulus of de taak. We bespreken verder dat het niet zo effectief is om studenten te trainen in hoe ze naar abnormaliteiten moeten kijken, maar dat we studenten beter kunnen trainen in hoe de stimuli en de afwijkingen er uit zien. Vervolgens worden drie beperkingen van dit proefschrift besproken. Allereerst hebben we alleen thorax röntgenfoto’s onderzocht in dit proefschrift, waardoor de bevindingen niet noodzakelijkerwijs generaliseerbaar zijn naar andere types visualisaties. Verder waren alle onderzoeken korte-termijn interventies, en er is dus onderzoek nodig naar de lange-termijn effecten. Een specifieke beperking van de studies gerapporteerd in Hoofdstuk 5 en Hoofdstuk 6 is dat we alleen visuele informatie hebben gebruikt. Verbale beschrijvingen van de afwijkingen maken het vergelijken van casussen potentieel effectiever. Als laatste worden de implicaties van het onderzoek beschreven. Onderzoek naar expertise heeft de potentie om de interactie tussen klinisch docenten en de lerenden te ondersteunen. Het vergelijken van casussen heeft veel potentie bij het doceren van de radiologie, bijvoorbeeld in colleges of in ‘teaching files’. Het aanleren van een systematische aanpak daarentegen, lijkt niet zo effectief als wel wordt aangenomen. Samen laten deze studies zien dat oogbewegingsregistratie een inzicht geeft in de ontwikkeling van visuele expertise in de radiologie. Daarnaast onderstreept dit proefschrift de behoefte aan onderwijskundige interventies de gebaseerd zijn op theorie, voor de ondersteuning van visuele expertise-ontwikkeling.
153
Valorisation addendum
Onderwijs geven in de radiologie: van tinten grijs naar
diagnostiek
The research described in this PhD thesis is conducted with the aim of supporting radiologists in providing education to students and residents. In order to reach the target audience, this valorisation addendum is also submitted to the journal ‘Memorad’, which is the journal for the Dutch association for radiologists.
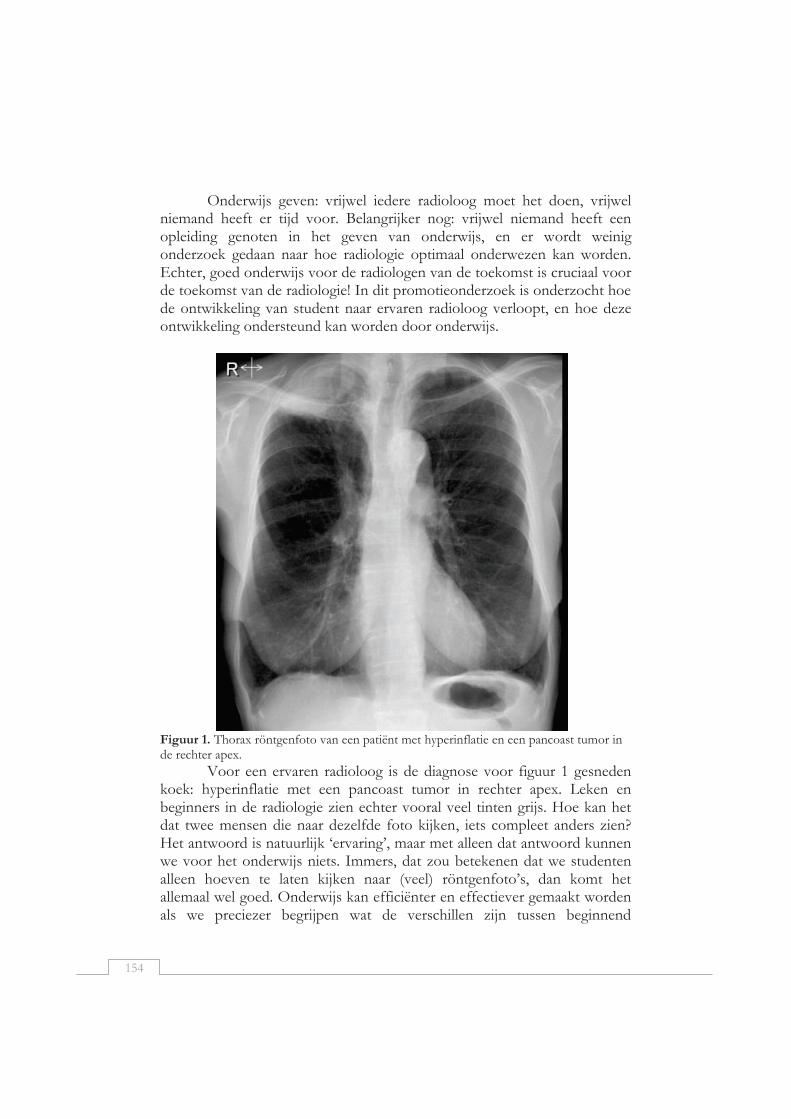
154
Onderwijs geven: vrijwel iedere radioloog moet het doen, vrijwel niemand heeft er tijd voor. Belangrijker nog: vrijwel niemand heeft een opleiding genoten in het geven van onderwijs, en er wordt weinig onderzoek gedaan naar hoe radiologie optimaal onderwezen kan worden. Echter, goed onderwijs voor de radiologen van de toekomst is cruciaal voor de toekomst van de radiologie! In dit promotieonderzoek is onderzocht hoe de ontwikkeling van student naar ervaren radioloog verloopt, en hoe deze ontwikkeling ondersteund kan worden door onderwijs.
Figuur 1. Thorax röntgenfoto van een patiënt met hyperinflatie en een pancoast tumor in de rechter apex.
Voor een ervaren radioloog is de diagnose voor figuur 1 gesneden koek: hyperinflatie met een pancoast tumor in rechter apex. Leken en beginners in de radiologie zien echter vooral veel tinten grijs. Hoe kan het dat twee mensen die naar dezelfde foto kijken, iets compleet anders zien? Het antwoord is natuurlijk ‘ervaring’, maar met alleen dat antwoord kunnen we voor het onderwijs niets. Immers, dat zou betekenen dat we studenten alleen hoeven te laten kijken naar (veel) röntgenfoto’s, dan komt het allemaal wel goed. Onderwijs kan efficiënter en effectiever gemaakt worden als we preciezer begrijpen wat de verschillen zijn tussen beginnend
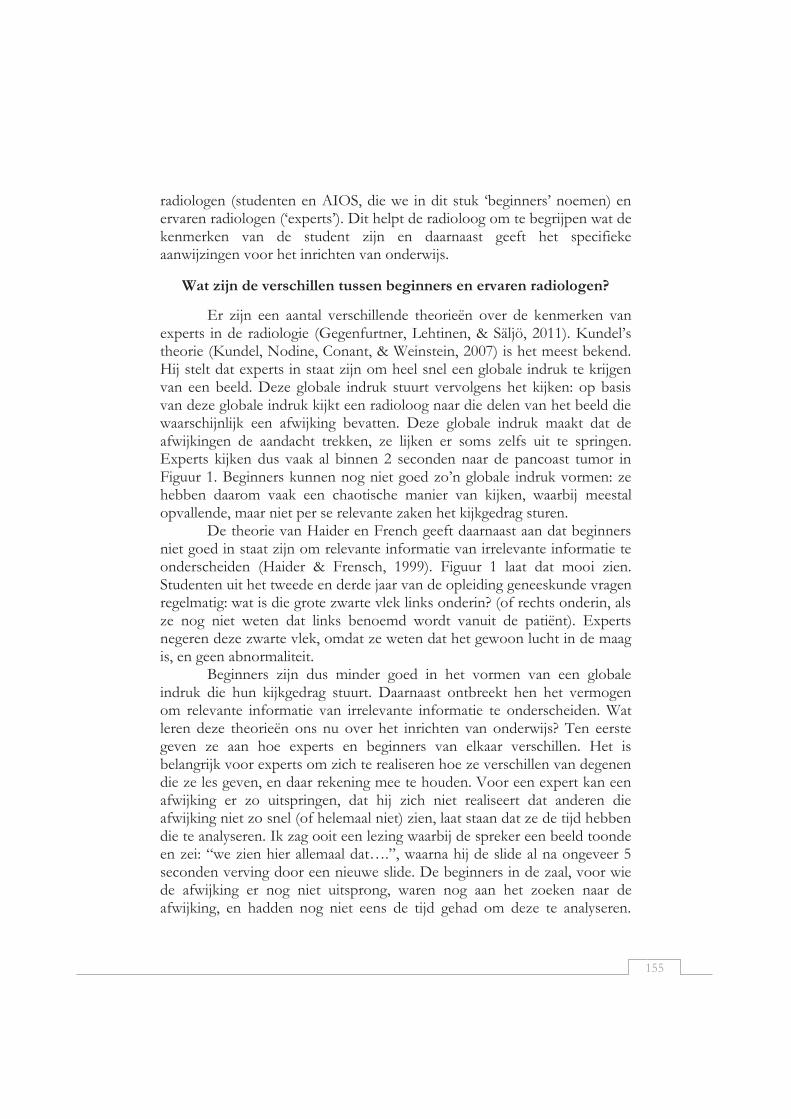
155
radiologen (studenten en AIOS, die we in dit stuk ‘beginners’ noemen) en ervaren radiologen (‘experts’). Dit helpt de radioloog om te begrijpen wat de kenmerken van de student zijn en daarnaast geeft het specifieke aanwijzingen voor het inrichten van onderwijs.
Wat zijn de verschillen tussen beginners en ervaren radiologen?
Er zijn een aantal verschillende theorieën over de kenmerken van experts in de radiologie (Gegenfurtner, Lehtinen, & Säljö, 2011). Kundel’s theorie (Kundel, Nodine, Conant, & Weinstein, 2007) is het meest bekend. Hij stelt dat experts in staat zijn om heel snel een globale indruk te krijgen van een beeld. Deze globale indruk stuurt vervolgens het kijken: op basis van deze globale indruk kijkt een radioloog naar die delen van het beeld die waarschijnlijk een afwijking bevatten. Deze globale indruk maakt dat de afwijkingen de aandacht trekken, ze lijken er soms zelfs uit te springen. Experts kijken dus vaak al binnen 2 seconden naar de pancoast tumor in Figuur 1. Beginners kunnen nog niet goed zo’n globale indruk vormen: ze hebben daarom vaak een chaotische manier van kijken, waarbij meestal opvallende, maar niet per se relevante zaken het kijkgedrag sturen. De theorie van Haider en French geeft daarnaast aan dat beginners niet goed in staat zijn om relevante informatie van irrelevante informatie te onderscheiden (Haider & Frensch, 1999). Figuur 1 laat dat mooi zien. Studenten uit het tweede en derde jaar van de opleiding geneeskunde vragen regelmatig: wat is die grote zwarte vlek links onderin? (of rechts onderin, als ze nog niet weten dat links benoemd wordt vanuit de patiënt). Experts negeren deze zwarte vlek, omdat ze weten dat het gewoon lucht in de maag is, en geen abnormaliteit.
Beginners zijn dus minder goed in het vormen van een globale indruk die hun kijkgedrag stuurt. Daarnaast ontbreekt hen het vermogen om relevante informatie van irrelevante informatie te onderscheiden. Wat leren deze theorieën ons nu over het inrichten van onderwijs? Ten eerste geven ze aan hoe experts en beginners van elkaar verschillen. Het is belangrijk voor experts om zich te realiseren hoe ze verschillen van degenen die ze les geven, en daar rekening mee te houden. Voor een expert kan een afwijking er zo uitspringen, dat hij zich niet realiseert dat anderen die afwijking niet zo snel (of helemaal niet) zien, laat staan dat ze de tijd hebben die te analyseren. Ik zag ooit een lezing waarbij de spreker een beeld toonde en zei: “we zien hier allemaal dat….”, waarna hij de slide al na ongeveer 5 seconden verving door een nieuwe slide. De beginners in de zaal, voor wie de afwijking er nog niet uitsprong, waren nog aan het zoeken naar de afwijking, en hadden nog niet eens de tijd gehad om deze te analyseren.
156
Inzicht in de kenmerken van beginners kan experts helpen hun boodschap aan te passen. In dit geval bijvoorbeeld door de afwijking langer tonen, of aan te wijzen.
Daarnaast geven deze theorieën specifieke informatie over hoe het onderwijs ingericht kan worden. We onderzochten twee manieren om onderwijs te geven (systematisch kijken en casussen vergelijken), die ingrijpen op de kenmerken die beginners hebben ten opzichte van experts in de radiologie. We richten ons in de bespreking vooral op de implicaties van onze bevindingen voor het onderwijs.
Heeft het zin om systematisch te kijken?
Als beginners moeite hebben met het richten van het kijkgedrag, omdat ze nog geen globale indruk kunnen vormen die het kijkgedrag stuurt, ligt het voor de hand om ze een kijkstrategie aan te reiken. Veel opleiders doen dit al: ze stimuleren hun studenten om systematisch naar bijvoorbeeld thorax röntgenfoto’s te kijken.
Met systematisch wordt bedoeld dat een student een vaste volgorde voor het bekijken van anatomische gebieden leert, en zich altijd aan deze volgorde houdt. De volgorde op zich is niet cruciaal, maar de assumptie is dat het aanleren van zo’n volgorde maakt dat de beginner de complete röntgenfoto bekijkt. Door de complete foto te bekijken kunnen er geen afwijkingen gemist worden, en gaat het aantal fouten omlaag.
Dit kan onderzocht worden met eye-tracking, of oogbewegings-registratie. Eye-tracking is een techniek om de oogbewegingen te meten om te zien waar iemand naar kijkt, hoe lang, en in welke volgorde. Hiermee is heel precies te meten hoe systematisch iemand kijkt naar een röntgenfoto, en hoe compleet de foto bekeken wordt. In figuur 2 is te zien hoe een jonge arts kijkt naar een röntgenfoto terwijl de oogbewegingen gemeten worden, en figuur 3 geeft een voorbeeld van oogbewegingsdata. Met behulp van eye-tracking onderzochten we dus hoe systematisch studenten kijken, en of ze systematischer kijken na een training in systematisch kijken. We vonden dat studenten die een training gevolgd hadden in het systematisch kijken ook daadwerkelijk systematischer en completer waren in hun kijkgedrag dan een groep die geleerd had om niet-systematisch naar een röntgenfoto te kijken. Echter, we vonden geen voordeel van systematisch kijken over niet-systematisch kijken. Daarnaast vonden we geen relatie tussen hoe compleet iemand had gekeken, en hoeveel afwijkingen werden gevonden. Op zich is deze bevinding wel te verklaren: hoewel onze deelnemers vaak wel naar de afwijkingen keken, zagen ze de afwijking vaak niet: ze wisten niet hoe afwijkingen te herkennen
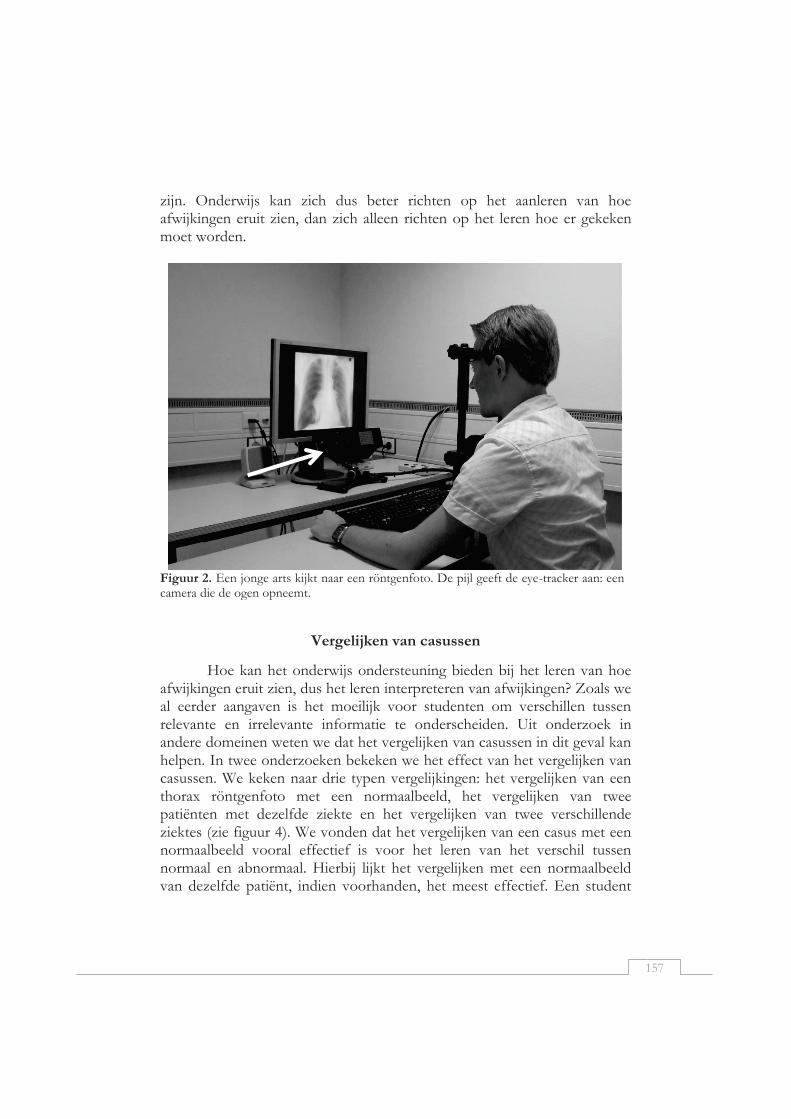
157
zijn. Onderwijs kan zich dus beter richten op het aanleren van hoe afwijkingen eruit zien, dan zich alleen richten op het leren hoe er gekeken moet worden.
Figuur 2. Een jonge arts kijkt naar een röntgenfoto. De pijl geeft de eye-tracker aan: een camera die de ogen opneemt.
Vergelijken van casussen
Hoe kan het onderwijs ondersteuning bieden bij het leren van hoe afwijkingen eruit zien, dus het leren interpreteren van afwijkingen? Zoals we al eerder aangaven is het moeilijk voor studenten om verschillen tussen relevante en irrelevante informatie te onderscheiden. Uit onderzoek in andere domeinen weten we dat het vergelijken van casussen in dit geval kan helpen. In twee onderzoeken bekeken we het effect van het vergelijken van casussen. We keken naar drie typen vergelijkingen: het vergelijken van een thorax röntgenfoto met een normaalbeeld, het vergelijken van twee patiënten met dezelfde ziekte en het vergelijken van twee verschillende ziektes (zie figuur 4). We vonden dat het vergelijken van een casus met een normaalbeeld vooral effectief is voor het leren van het verschil tussen normaal en abnormaal. Hierbij lijkt het vergelijken met een normaalbeeld van dezelfde patiënt, indien voorhanden, het meest effectief. Een student
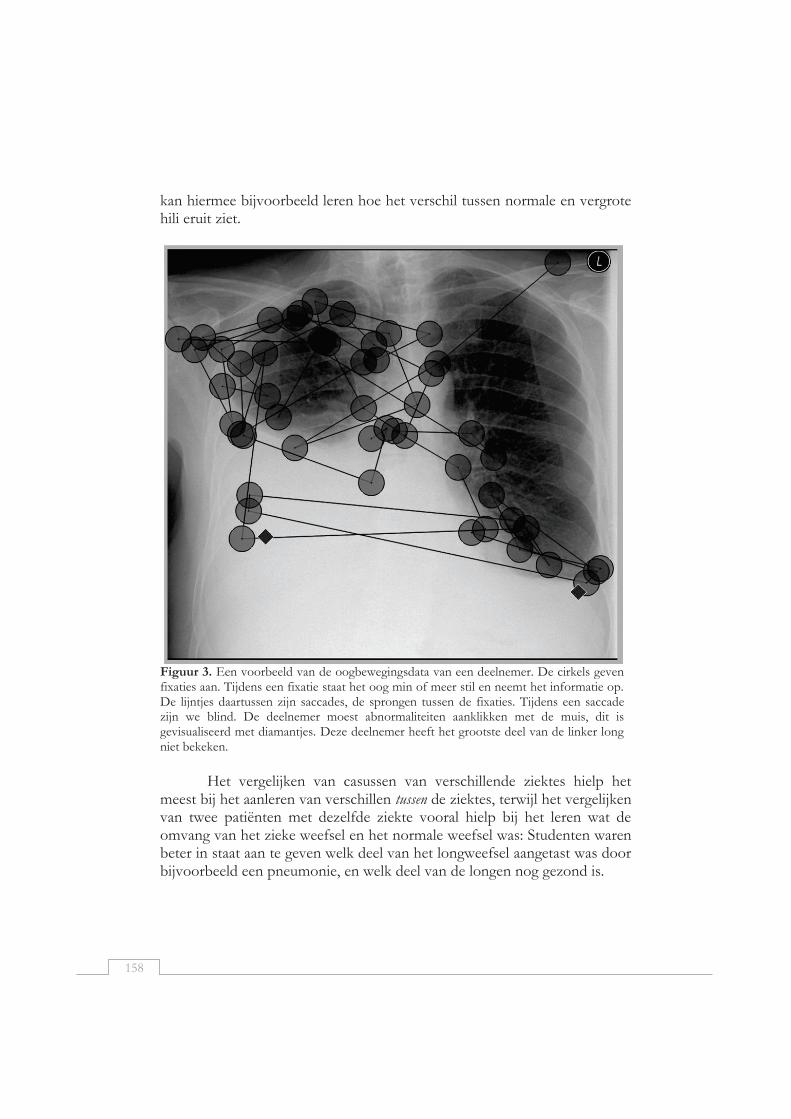
158
kan hiermee bijvoorbeeld leren hoe het verschil tussen normale en vergrote hili eruit ziet.
Figuur 3. Een voorbeeld van de oogbewegingsdata van een deelnemer. De cirkels geven fixaties aan. Tijdens een fixatie staat het oog min of meer stil en neemt het informatie op. De lijntjes daartussen zijn saccades, de sprongen tussen de fixaties. Tijdens een saccade zijn we blind. De deelnemer moest abnormaliteiten aanklikken met de muis, dit is gevisualiseerd met diamantjes. Deze deelnemer heeft het grootste deel van de linker long niet bekeken.
Het vergelijken van casussen van verschillende ziektes hielp het
meest bij het aanleren van verschillen tussen de ziektes, terwijl het vergelijken van twee patiënten met dezelfde ziekte vooral hielp bij het leren wat de omvang van het zieke weefsel en het normale weefsel was: Studenten waren beter in staat aan te geven welk deel van het longweefsel aangetast was door bijvoorbeeld een pneumonie, en welk deel van de longen nog gezond is.
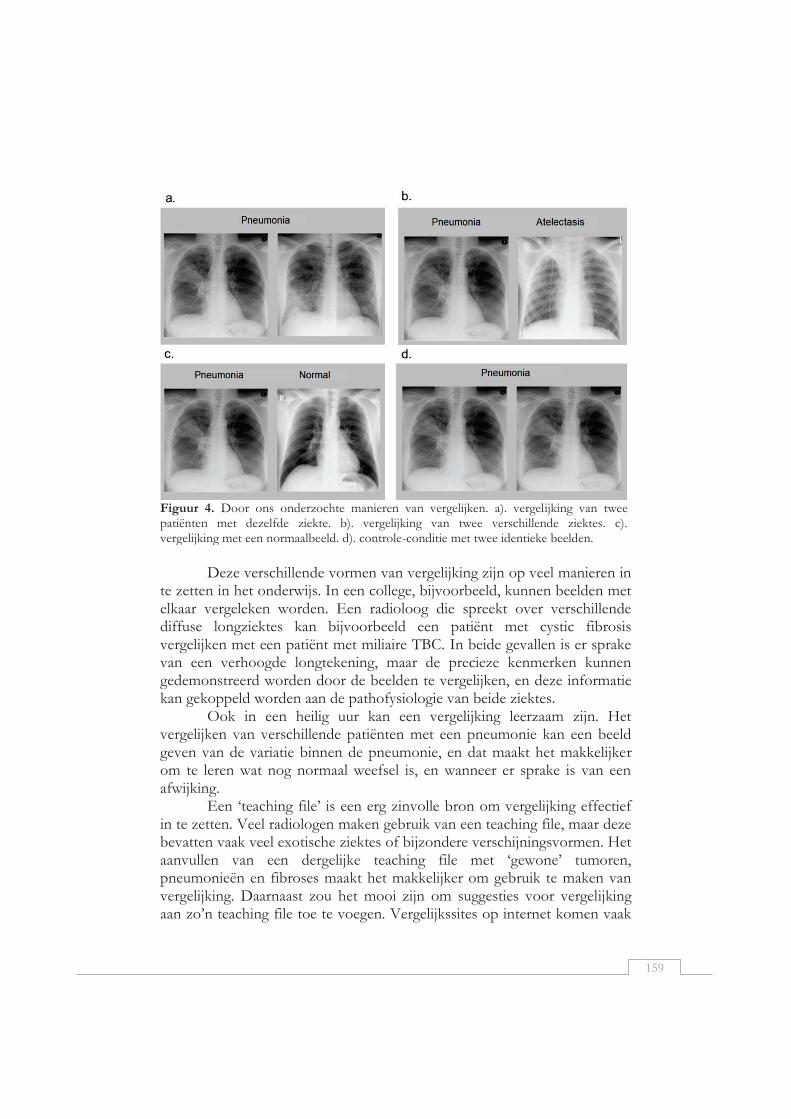
159
Figuur 4. Door ons onderzochte manieren van vergelijken. a). vergelijking van twee patiënten met dezelfde ziekte. b). vergelijking van twee verschillende ziektes. c). vergelijking met een normaalbeeld. d). controle-conditie met twee identieke beelden.
Deze verschillende vormen van vergelijking zijn op veel manieren in te zetten in het onderwijs. In een college, bijvoorbeeld, kunnen beelden met elkaar vergeleken worden. Een radioloog die spreekt over verschillende diffuse longziektes kan bijvoorbeeld een patiënt met cystic fibrosis vergelijken met een patiënt met miliaire TBC. In beide gevallen is er sprake van een verhoogde longtekening, maar de precieze kenmerken kunnen gedemonstreerd worden door de beelden te vergelijken, en deze informatie kan gekoppeld worden aan de pathofysiologie van beide ziektes.
Ook in een heilig uur kan een vergelijking leerzaam zijn. Het vergelijken van verschillende patiënten met een pneumonie kan een beeld geven van de variatie binnen de pneumonie, en dat maakt het makkelijker om te leren wat nog normaal weefsel is, en wanneer er sprake is van een afwijking.
Een ‘teaching file’ is een erg zinvolle bron om vergelijking effectief in te zetten. Veel radiologen maken gebruik van een teaching file, maar deze bevatten vaak veel exotische ziektes of bijzondere verschijningsvormen. Het aanvullen van een dergelijke teaching file met ‘gewone’ tumoren, pneumonieën en fibroses maakt het makkelijker om gebruik te maken van vergelijking. Daarnaast zou het mooi zijn om suggesties voor vergelijking aan zo’n teaching file toe te voegen. Vergelijkssites op internet komen vaak
160
met suggesties voor te vergelijken producten, een soortgelijke manier kan gebruikt worden om zinvolle vergelijkingen te suggereren. Een radioloog kan een assistent bijvoorbeeld stimuleren om verschillende casussen van patiënten met steeds subtielere pneumothoraxen te vergelijken, en zo te leren welke vormen een pneumothorax kan hebben. Het vergelijken van een spanningspneu met een niet-spannings pneu leert de assistent om dit onderscheid te maken. Soortgelijke opdrachten kunnen ook in e-learning modules ingezet worden.
Conclusie
Kennis over de ontwikkeling van expertise in de radiologie kan docenten helpen om hun onderwijs effectiever in te richten. Het is daarbij belangrijk om te weten wat kenmerken zijn van de beginner, en daarop in te spelen. Waar beginners slechts tinten grijs waarnemen, is een expert in staat een röntgenfoto te interpreteren en een diagnose te stellen. We bespraken twee kenmerken van experts in de radiologie: experts hebben de mogelijkheid om een globale indruk te vormen van een beeld, dat hun kijkgedrag stuurt. Daarnaast zijn experts beter in staat om relevante en irrelevante informatie van elkaar te onderscheiden. We vonden geen effect van een training in systematisch kijken. We vonden wél dat het vergelijken een effectieve manier was om het leren te ondersteunen. Dit proefschrift geeft enige wenken voor het inrichten van het onderwijs in de radiologie, maar er is nog weinig bekend over het effectief inrichten van onderwijs, vooral als het gaat om nieuwere technieken zoals MRI en CT. Tien jaar geleden werd al onder de aandacht gebracht dat er weinig onderzoek naar onderwijs in de radiologie uitgevoerd wordt (Robben, 2004). Hoewel er stappen gezet zijn, is er nog altijd weinig informatie over de effectiviteit van onderwijsmethoden in de radiologie. We blijven dus pleiten voor meer onderzoek naar onderwijs, om ons onderwijs aan studenten en assistenten effectiever in te kunnen richten.
161
Referenties
Gegenfurtner, A., Lehtinen, E., & Säljö, R. (2011). Expertise differences in the comprehension of visualizations: a meta-analysis of eye-tracking research in professional domains. Educational Psychology Review, 23(4), 523-552.
Haider, H., & Frensch, P. A. (1999). Eye movement during skill acquisition: More evidence for the information-reduction hypothesis. Journal of Experimental Psychology-Learning Memory and Cognition, 25(1), 172-190.
Kundel, H. L., Nodine, C. F., Conant, E. F., & Weinstein, S. P. (2007). Holistic component of image perception in mammogram interpretation: Gaze-tracking study. Radiology, 242(2), 396-402.
Robben, S. G. F. (2004). Radiologieonderwijs aan medisch studenten. MemoRad, 9(1).

162
163
Dankwoord “Everyone you will ever meet knows something you don't.”
- Bill Nye In al die jaren zijn er ontelbaar veel mensen geweest van wie ik heb mogen leren, en met wie ik van de wetenschap heb mogen genieten. Ik wil hier mijn dankbaarheid uitdrukken. Anique de Bruin, Simon Robben en Jeroen van Merriënboer, jullie zijn het beste begeleiders-team dat ik me kan wensen. Inhoudelijk sterk, met veel gevoel voor humor en steun wanneer nodig. Ik waardeer het ontzettend dat jullie me altijd het gevoel hebben gegeven dat ik geen student ben maar een gewaardeerde collega. Anique, bij jou kon ik altijd terecht. Voor alles. Ook al grapte je dat je me drie keer alleen gelaten hebt, ik wist dat je er altijd voor me was. Je hebt me geïnspireerd en heel veel kansen voor me gecreëerd. Jouw enthousiasme voor onderzoek en oog voor detail maken het ontzettend leuk om met je samen te werken, maar het is ook gewoon altijd erg gezellig! Simon, dank je dat je de gouden standaard wilde zijn. Jij bent een geweldige docent en een geweldige radioloog. Er is geen onderzoek voor nodig om dat zeker te weten. Ik heb er verschrikkelijk veel van geleerd dat je er altijd op hamerde dat ik alles in lekentaal uit moet kunnen leggen. Dank je voor alle deuren die je voor me geopend hebt. Jeroen, ik kan nauwelijks uitdrukken hoe dankbaar ik ben voor het vertrouwen dat je me hebt te geven om verder te gaan dan mijn eigen proefschrift, op zo veel vlakken. Ik heb ontzettend veel geleerd van je analytische blik en je scherpe pen. Halszka, hoewel je niet in mijn team zat heb je een enorm belangrijke bijdrage geleverd aan dit proefschrift. Naast een gezellige congres-buddy en gewaardeerde coauteur ben je ook een mentor en een voorbeeld voor me. Je hebt me op alle mogelijke manieren van advies voorzien over uiteenlopende onderwerpen, van eye tracking tot carrière, van presenteren tot netwerken. Je hebt meer voor mij en voor mijn carrière betekent dan je je kan voorstellen en ik hoop dat we nog vele jaren kunnen samenwerken. Dank je!
164
Leren op de werkplek vindt in het onderzoek plaats in de (AIO)kamer. En ik heb van vele mensen mogen leren. We hebben gediscussieerd over kwalitatief en kwantitatief onderzoek, over presenteren, schrijven, statistiek en plannen. Over geneeskunde en over onderwijs. Over het beantwoorden van vragen die eigenlijk geen vragen zijn, over het Hawthorne effect en over studies die laten zien dat onderwijs werkt en dat studenten het leuk vonden. Over subsidies voor excellente promovendi en extra-medium promovendi. Maar ook over wijn en eten, over reizen, relaties, zwanger zijn, (klein)kinderen, trouwen en verhuizen. Over katten, konijnen en hamsters, over Pinkpop en over persoonlijkheidsvragenlijsten. De AIO kamer was altijd een plek om mijn hart te luchten, hoogtepunten te vieren en mijn gedachten aan te scherpen. Daarom wil ik al mijn kamergenootjes over de jaren heen bedanken: Marjan Govaerts, Hetty Snellen, Greet Fastré, Marjo van Zundert, Jeantine Feijter, Rachelle Kamp, Janneke Frambach, Jorrick Beckers, Katerina Bohle-Carbonell, Emmaline Brouwer, Esther Bergman, Jimmie Leppink, Andrea Oudkerk Pool, Lorette Stammen, Koos van Geel, Sanne Schreurs, bedankt! Daarnaast wil ik alle collega’s bij O&O bedanken. De sfeer op deze afdeling is fantastisch, met een geweldige balans tussen gezelligheid en onderzoek van hoge kwaliteit. Dat blijkt ook wel op de borrels, de lunch-app en de pubquiz avonden, maar ook tijdens symposia, onderwijslunches en congressen. Een aantal mensen wil ik hier bij name noemen, maar iedereen heeft op zijn manier het werken hier leuker en leerzamer gemaakt! Allereerst natuurlijk het secretariaat, Lilian Swaen, Nicky Verleng en Ryan Seyben van O&O, maar ook Monique Tillo van Radiologie. Jullie weten alles en kunnen alles. Bedankt voor al jullie hulp en prettige samenwerking. Kunnen jullie trouwens het geheim onthullen? Hoe krijgen jullie altijd gaatjes in die overvolle agenda’s? Alle collega’s van het EXPED clubje, en in het bijzonder Mariette van Loon, bedankt voor de stimulerende discussies. Angelique van der Heuvel, jij pakt een stuk en maakt daar precies van wat ik eigenlijk wilde zeggen. Je tovert met taal! Dank je voor het editen van mijn papers. Jimmie Leppink, bedankt voor alle hulp bij statistiek-vragen. Alle andere AIOs, op vier en op andere plekken binnen en buiten de universiteit, bedankt voor de inspiratie en gezelligheid!
165
Alle collega’s in den lande van het ICO en het NVMO, bedankt voor de gezelligheid en de stimulerende discussies. In het bijzonder wil ik Thomas Jaarsma, Cecile Ravensloot en Anouk van de Gijp bedanken, de andere visuele-expertise-in-geneeskunde AIOs. Internationally, I’d like to thank Laura Helle for bringing us together many times. Kenneth Holmqvist, I learned so much from you about eye tracking over the years, and I’d like to thank you for your trust in me as a co-author for your eye tracking book. Els Boshuizen, Helen Jossberger, Antje Venjakob, bedankt voor alle gezellige en nuttige inhoudelijke discussies op congressen. Daarnaast wil ik alle student-assistenten bedanken: Marjan Kuklinski, Gielian Meessen, Andrea Oudkerk Pool, Roisin Bavalia, Eddy Bakker. Jullie hebben de grote (saaie) taken van het project gedaan: data scoren, stimuli maken, data verzamelen, programmeren. Jullie hulp is van onschatbare waarde geweest. Bedankt. Over de jaren heen heb ik vier master-studenten mogen begeleiden, en van elk van jullie heb ik verschrikkelijk veel geleerd. Poh-Sun Goh, Hussain BinAmir, Abdel Abed en Koos van Geel. Bedankt! Koos, ik ben ontzettend blij en trots dat jij hier wil gaan promoveren, en mij als begeleider wil. Ik leer veel van je artsen-blik en ik geniet ervan om met een andere inhoudsdeskundige te sparren. De gezamenlijke MRI-sessies op zondag zijn erg ook gezellig! Misschien wel de belangrijkste mensen in het onderzoek: Ik wil al mijn deelnemers bedanken voor hun deelname. Voor alle uren ‘kijken naar het stipje in het midden van het bolletje’, en voor hun deelname aan al die experimenten over ‘het leren van thorax-radiologie’. Mijn paranimfen, Jorrick en Marjan, wil ik graag apart bedanken. Jorrick, jij hebt het promoveren voor mij zeker leuker gemaakt. Jouw humor is cruciaal voor de sfeer in de AIO-kamer, en ik ben blij dat je ook nu weer mijn kamergenootje bent. Daarnaast heb ik vele malen mijn hart bij je uit kunnen storten. Marjan, will you be my number two? Ik ben ontzettend dankbaar dat ik jouw getuige mocht zijn op je bruiloft met jouw number one, en ik ben blij dat jij er bent voor mijn ‘bruiloft met de wetenschap’. Ook jij hebt mijn promotietraject leuker gemaakt.
166
Er zijn een hoop mensen die een bedankje verdienen voor alle steun maar vooral voor de broodnodige afleiding. Lisanne, Nicole, Jeanine, Marjan, Lonneke, Bram, Dorian, Steven, Lian, Janneke, Eddy, Els, Marissa, Lonneke, Jeroen, voor gezellige avondjes en weekendjes, in pretparken, sauna’s, musea, kroegen, musicals en bossen door het hele land. En voor kaartjes, smsjes, telefoontjes en whatsappjes. Alle HEEP-ers bedankt voor de leuke badminton-activiteiten, alle spring-reizigers, bedankt voor de gezellige wandelingen, en alle KVW-ers voor alle fantastische weken! Reinier, vanaf het begin aan mijn zijde, helaas niet tot het einde. Dank je voor je steun en voor onze leuke tijd samen, het ga je goed. Ik wil ook mijn familie bedanken voor alle interesse en afleiding. Opa en Oma, ik ben ontzettend trots dat jullie dit met mij mee mogen maken. Lieve Marike, jouw sinterklaas-gedicht over mijn eerste paper was legendarisch! Ik word toch liever onderzoeker dan huisvrouw! Guus, dank je dat je altijd in bent voor afleiding in de vorm van ‘stoere-mannen’ dingen: schaatsen, langlaufen, wandelen, fietsen en geocachen. Kees en Trudy, pake en moeke, dank jullie voor jullie zorg, steun, vertrouwen en oneindige interesse in mijn onderzoek.
167
Curriculum Vitae Ellen Marijke Kok was born in Hoorn on July 25, 1987. She
received her Bachelor’s degree (cum laude) in Cognitive and Clinical Neuropsychology at the Vrije Universiteit, Amsterdam in 2008, where she followed additional courses in pedagogics and biological psychology. She received her Master’s degree in Neuropsychology from Maastricht University in 2009. She worked as a research assistant for Rosa Martens at Maastricht University, before starting her PhD project in April 2010. This PhD project was conducted at the School of Health Professions Education at Maastricht University.
In addition to the work she conducted for her PhD project, Ellen assisted Anique de Bruin in her VENI-project on metacognition, coauthored the second edition of ‘Eye tracking, a comprehensive guide to methods and measures’, and was a tutor in several courses in the Bachelor Health Sciences, a mentor in the Bachelor Medicine and a teacher in several courses of the School of Health Professions Education. During her work as a PhD student, she received the MIPS scholarship award twice (in 2011 and 2015).
Furthermore, Ellen has been the PhD representative of the ‘Research in Education’ board of the School of Health Professions Education (2011-2023) and she has been a member of the organizing committee of the SHE academy in 2013 and 2015. Finally, she was a member of the educational committee of the ICO (2012-2014), and she chaired this committee from 2014 to 2015.
Currently, she is a postdoctoral researcher at the School of Health Professions Education. In this position, she investigates visual expertise development in several medical domains, and supervises master- and PhD students. She is the junior coordinator of the EARLI SIG 27: online measures of learning processes, and a reviewer for ‘Frontline Learning Research’, ‘IEEE Transactions on Human-Machine Systems’, ‘Journal of Medical Imaging’, ‘Learning and Instruction’, ‘Medical Education’, and ‘Perspectives on Medical Education’.
168
List of Publications de Bruin, A. B. H. , Kok, E. M., Leppink, J., & Camp, G. (2014).
Practice, intelligence, and enjoyment in novice chess players: A prospective study at the earliest stage of a chess career. Intelligence, 45, 18-25.
de Bruin, A. B. H. , Kok, E. M., Leppink, J., & Camp, G. (2014). It
might happen in the very beginning. Intelligence, 45, 107–108. Kok, E. M., de Bruin, A. B. H., Leppink, J., van Merriënboer, J. J.
G., & Robben, S. G. F. (2015). Case Comparisons: An Efficient Way of Learning Radiology. Academic Radiology, 22(10), 1226-1235.
Kok, E. M., de Bruin, A. B. H., Robben, S. G. F., & van
Merriënboer, J. J. G. (2012). Looking in the same manner but seeing it differently: Bottom-up and expertise effects in radiology. Applied Cognitive Psychology, 26(6), 854-862.
Kok, E. M., de Bruin, A. B. H., Robben, S. G. F., & van
Merriënboer, J. J. G. (2013). Learning Radiological Appearances of Diseases, does comparison help? Learning and Instruction, 23, 90-97.
Kok, E. M., Jarodzka, H., de Bruin, A. B. H., BinAmir, H. A. N.,
Robben, S. G. F., & van Merriënboer, J. J. G. (2015). Systematic viewing in radiology: seeing more, missing less? Advances in Health Sciences Education, 1-17.
Leppink, J., Kok, E. M., Bergman, E. M., van Loon, M. H., & de
Bruin, A. B. H. (in press). Four Common Pitfalls of Quantitative Analysis in Experimental Research. Academic Medicine, Published Ahead of Print.
van Loon, M. H., Kok, E. M., Kamp, R. J., Carbonell, K. B.,
Beckers, J., Frambach, J. M., & de Bruin, A. B. (2013). AM last page: avoiding five common pitfalls of experimental research in medical education. Academic Medicine, 88(10), 1588.
169
SHE dissertation series The SHE Dissertation Series publishes dissertations of PhD candidates from the School of Health Professions Education (SHE) who defended their PhD theses at Maastricht University. The most recent ones are listed below. For more information go to: www.maastrichtuniversity.nl/she. Gingerich, A. (03-09-2015) Questioning the rater idiosyncrasy explanation for error
variance, by searching for multiple signals within the noise. Goldszmidt, M. (02.09.2015) Communication and reasoning on clinical teaching teams, the
genres that shape care and education. Slootweg, I. (19.06.2015) Teamwork of Clinical Teachers in Postgraduate Medical Training. Al-Eraky, M. (21.05.15) Faculty development for medical professionalism in an Arabian
context. Wearne, S. (08.04.2015) Is it remotely possible? Remote supervision of general practice
registrars. Embo, M. (13.03.2015) Integrating workplace learning, assessment and supervision in
health care education. Zwanikken, P. (23.01.2015) Public health and international health educational programmes
for low- and middle-income countries: questioning their outcomes and impact. Hill, E. (11-12-2014) A cutting culture: gender and identification in the figured world of
surgery. Diemers, A. (03-10-2014) Learning from pre-clinical patient contacts. Tjiam, I. (17-09.2014) Learning in Urology. Designing simulator based skills Training &
Assessment. Berkenbosch, L. (30-06-2014) Management and leadership education for medical residents. Bergman, E.M. (30-06-2014) Dissecting anatomy education in the medical curriculum. Dijkstra, J. (25-06-2014) Guidelines for designing programmes of assessment. Van Loon, M.H. (08-05-2014) Fostering monitoring and regulation of learning. Frambach, J.M. (26-03-2014) The cultural complexity of problem-based learning across the
world. Hommes, J.E. (26-02-2014) How relations, time & size matter in medical education. Van der Zwet, J. (30-01-2014) Identity, Interaction and Power. Explaining the affordances
of doctor-student interaction during clerkships. Watling, C.J. (22-01-2014) Cognition, Culture, and Credibility. Deconstructing Feedback in
Medical Education. Winston, K. (12-12-2013) Remediation Theory and Practice: Transforming At-Risk
Medical Students. Kamp, R.J.A. (28-11-2013) Peer Feedback to Enhance Learning in Problem-Based Tutorial
Groups. Junod Perron, N. (24-10-2013) Towards a learner-centered approach to postgraduate
communications skills teaching. Pratidina Susilo, A. (24-10-2013) Learning to be the Patient Advocate The Development of
a Communication Skills Course to Enhance Nurses’ Contribution to the Informed Consent Process.
Alves de Lima, A. (23-10-2013) Assessment of clinical competence: Reliability, Validity, Feasibility and Educational Impact of the mini-CEX.
170
Sibbald, M. (09-10-2013) Is that your final answer? How doctors should check decisions. Ladhani, Z. (05-07-2013) Competency based education and professional competencies: a
study of institutional structures, perspectives and practices in Pakistan. Jippes, M. (01-02-2013) Culture matters in medical schools: How values shape a successful
curriculum change. Duvivier, R. J. (12-12-2012) Teaching and Learning Clinical Skills. Mastering the Art of
Medicine. De Feijter, J.M. (09-11-2012) Learning from error to improve patient safety. Prescott, L. (09-11-2012) Ensuring the Competence of Dental Practitioners through the
Development of a Workplace-Based System of Assessment. Cilliers, F.J. (05-09-2012) The Pre-assessment Learning Effects of Consequential
Assessment: Modelling how the Examination Game is Played. Spanjers, I. A.E. (05-07-2012) Segmentation of Animations: Explaining the Effects on the
Learning Process and Learning Outcomes. Al-Kadri, H.M.F. (28-06-2012) Does Assessment Drive Students’ Learning? Leppink, J. (20-06-2012) Propositional manipulation for conceptual understanding of
statistics. Van Zundert, M.J. (04-05-2012) Conditions of Peer Assessment for Complex Learning. Claramita, M. (30-03-2012) Doctor-patient communication in a culturally hierarchical
context of Southeast Asia: A partnership approach. Kleijnen, J.C.B.M. (21-03-2012) Internal quality management and organizational values in
higher education. Persoon, M.C. (19-01-2012) Learning in Urology; The influence of simulators and human
factors. Pawlikowska, T.R.B. (21-12-2011) Patient Enablement; A Living Dialogue. Sok Ying Liaw, (14-12-2011) Rescuing A Patient In Deteriorating Situations (RAPIDS): A
programmatic approach in developing and evaluating a simulation-based educational program.
Singaram, V.S. (7-12-2011) Exploring the Impact of Diversity Factors on Problem-Based Collaborative Learning.
Balslev, T. (24-11-2011) Learning to diagnose using patient video cases in paediatrics: Perceptive and cognitive processes.
Widyandana, D. (19-10-2011) Integrating Pre-clinical skills training in skills laboratory and primary health care centers to prepare medical students for their clerkships.
Durning, S.J. (09-09-2011) Exploring the Influence of Contextual Factors of the Clinical Encounter on Clinical Reasoning Success (Unraveling context specificity).
Govaerts, M.J.B. (08-09-2011) Climbing the Pyramid;Towards Understanding Performance Assessment .
Stalmeijer, R. E. (07-07-2011) Evaluating Clinical Teaching through Cognitive Apprenticeship.
Malling, B.V.G. (01-07-2011) Managing word-based postgraduate medical education in clinical departments.
Veldhuijzen, J.W. (17-06-2011) Challenging the patient-centred paradigm: designing feasible guidelines for doctor patient communication.
Van Blankenstein, F. (18-05-2011) Elaboration during problem-based, small group discussion: A new approach to study collaborative learning.
Van Mook, W. (13-05-2011) Teaching and assessment of professional behavior: Rhetoric and reality.
171
ICO dissertation series In the ICO Dissertation Series the dissertations of graduate students
from faculties and institutes on educational research within the ICO Partner Universities are published: Eindhoven University of Technology, Leiden University, Maastricht University, Open University of the Netherlands, University of Amsterdam, University of Twente, Utrecht University, VU University Amsterdam, and Wageningen University, and formerly University of Groningen (until 2006), Radboud University Nijmegen (until 2004), and Tilburg University (until 2002). The University of Groningen, University of Antwerp, University of Ghent, and the Erasmus University Rotterdam have been ‘ICO ‘Network partner’ in 2010 and 2011. From 2012 onwards, these ICO Network partners are full ICO partners, and from that period their dissertations will be added to this dissertation series.
Strien, J.L.H. van (19-12-2014) Who to Trust and What to Believe? Effects of Prior Attitudes and Epistemic Beliefs on Processing and Justification of Conflicting Information From Multiple Sources. Heerlen: Open University of the Netherlands.
Huizinga, T. (12-12-2014) Developing curriculum design expertise through teacher design teams. Enschede: University of Twente.
Gabelica, C. (4-12-2014) Moving Teams Forward. Effects of feedback and team reflexivity on team performance. Maastricht: Maastricht University.
Wijnia, L. (14-11-2014) Motivation and Achievement in Problem-Based Learning: The Role of Interest, Tutors, and Self-Directed Study. Rotterdam: Erasmus University Rotterdam.
Gaikhorst, L. (29-10-2014) Supporting beginning teachers in urban environments. Amsterdam: University of Amsterdam.
Khaled, A.E. (7-10-2014) Innovations in Hands-on Simulations for Competence Development. Authenticity and ownership of learning and their effects on student learning in secondary and higher vocational education. Wageningen: Wageningen University.
Rijt, J.W.H. van der, (11-9-2014) Instilling a thirst for learning. Understanding the role of proactive feedback and help seeking in stimulating workplace learning. Maastricht: Maastricht University.
Rutten, N.P.G. (5-9-2014) Teaching with simulations. Enschede: University of Twente. Hu, Y. (26-6-2014) The role of research in university teaching: A comparison of Chinese
and Dutch teachers. Leiden: Leiden university. Baars, M.A. (6-6-2014) Instructional Strategies for Improving Self-Monitoring of Learning
to Solve Problems. Rotterdam: Erasmus University Rotterdam. Coninx, N.S. (28-05-2014) Measuring effectiveness of synchronous coaching using bug-in-
ear device of pre-service teachers. Eindhoven: Eindhoven University of Technology.
Loon, Marriette van (8-5-2014) Fostering Monitoring and Regulation of Learning. Maastricht: Maastricht University.
172
Bakker, M. (16-04-2014) Using mini-games for learning multiplication and division: A longitudinal effect study. Utrecht: Utrecht University.
Mascareno, M.N. (11-4-2014) Learning Opportunities in Kindergarten Classrooms. Teacher-child interactions and child developmental outcomes. Groningen: University of Groningen.
Frambach, J.M. (26-3-2014) The Cultural Complexity of problem-based learning across the world. Maastricht: Maastricht University.
Karimi, S (14-3-2014) Analysing and Promoting Entrepreneurship in Iranian Higher Education: Entrepreneurial Attitudes, Intentions and Opportunity Identification. Wageningen: Wageningen University.
Kuijk, M.F. van (13-03-2014). Raising the bar for reading comprehension. The effects of a teacher professional development program targeting goals, data use, and instruction. Groningen: University of Groningen.
Hagemans, M.G. (07-03-2014) On regulation in inquiry learning. Enschede: University of Twente.
Smet, M.J.R. de (31-1-2014). Composing the unwritten text: Effects of electronic outlining on students' argumentative writing performance. Heerlen: Open University of the Netherlands.
Zwet, J. van der (30-1-2014). Identity, interaction, and power. Explaining the affordances of doctor-student interaction during clerkships. Maastricht: Maastricht University.
Cviko, A. (19-12-2013) Teacher Roles and Pupil Outcomes. In technology-rich early literacy learning Enschede: University of Twente.
Kamp, R.J.A. (28-11-2013) Peer feedback to enhance learning in problem-based tutorial groups Maastricht: Maastricht University.
Lucero, M.L. (21-11-2013) Considering teacher cognitions in teacher professional development: Studies involving Ecuadorian primary school teachers Ghent: Ghent University.
Dolfing, R. (23-10-2013) Teachers' Professional Development in Context-based Chemistry Education. Strategies to Support Teachers in Developing Domain-specific Expertise. Utrecht: Utrecht University.
Popov, V. (8-10-2013) Scripting Intercultural Computer-Supported Collaborative Learning in Higher Education Wageningen: Wageningen University.
Bronkhorst, L.H. (4-10-2013) Research-based teacher education: Interactions between research and teaching Utrecht: Utrecht University.
Bezdan, E. ( 04-10-2013) Graphical Overviews in Hypertext Learning Environments: When One Size Does Not Fit All Heerlen: Open University of the Netherlands.
Kleijn, R.A.M. de, (27-09-2013) Master’s thesis supervision. Feedback, interpersonal relationships and adaptivity Utrecht: Utrecht University.
Pillen, M.T. (12-09-2013) Professional identity tensions of beginning teachers Eindhoven: Eindhoven University of Technology.
Meeuwen, L.W. van (06-09-13) Visual Problem Solving and Self-regulation in Training Air Traffic Control Heerlen: Open University of the Netherlands.
Keuvelaar-Van den Bergh, L. (26-06-2013) Teacher Feedback during Active Learning: The Development and Evaluation of a Professional Development Programme. Eindhoven: Eindhoven University of Technology.
Hornstra, T.E. (17-06-2013) Motivational developments in primary school. Group-specific differences in varying learning contexts Amsterdam: University of Amsterdam.
Vandyck, I.J.J. (17-06-2013), Fostering Community Development in School-University Partnerships. Amsterdam: VU Universtiy Amsterdam.
173
Milliano, I.I.C.M. de (24-05-2013) Literacy development of low-achieving adolescents. The role of engagement in academic reading and writing Amsterdam: University of Amsterdam.
Taminiau, E.M.C. (24-05-2013) Advisory Models for On-Demand Learning Heerlen: Open University of the Netherlands.
Azkiyah, S.N. (23-5-2013) The effects of Two Interventions - on Teaching Quality and Student Outcome Groningen: University of Groningen.
Diggelen, M.R. van (21-05-2013) Effects of a self-assessment procedure on VET teachers’ competencies in coaching students’ reflection skills Eindhoven: Eindhoven University of Technology.
M.H. Knol (19-04-2013). Improving university lectures with feedback and consultation. Amsterdam: University of Amsterdam.
Dekker-Groen, A. (19-04-2013) Teacher competences for supporting students’ reflection. Standards, training, and practice Utrecht: Utrecht University.
Verberg, C.P.M. (18-04-2013) The characteristics of a negotiated assessment procedure to promote teacher learning Leiden: Leiden University.
Jong, R.J. de (11-04-2013) Student teachers' practical knowledge, discipline strategies, and the teacher-class relationship Leiden: Leiden University.
Belo, N.A.H. (27-03-2013) Engaging students in the study of physics Leiden: Leiden University.
Bijker, M.M. (22-03-2013) Understanding the gap between business school and the workplace: Overconfidence, maximizing benefits, and the curriculum Heerlen: Open University of the Netherlands.
Noroozi, O. (11-01-2013) Fostering Argumentation-Based Computer-Supported Collaborative Learning in Higher Education Wageningen: Wageningen University.