determinationof glycosylatedhemoglobinby affinitychromatography: comparisonwith colorimetricand...
TRANSCRIPT
CLIN. CHEM. 28/10, 2088-2094 (1982)
2088 CLINICAL CHEMISTRY, Vol. 28, No. 10, 1982
Determination of Glycosylated Hemoglobin by Affinity Chromatography:Comparison with Colorimetric and Ion-Exchange Methods, and Effects ofCommon InterferencesDennis C. Klenk,1 Greg T. Hermanson,1 Randall I. Krohn,1 Edward K. Fujimoto,’ A. Krishna Mallia,1Paul K. Smith,1 Jack D. England,2 Hsiao-Mei Wiedmeyer,2 Randie R. Little,3 and David E. Goldstein2’3
An affinity-chromatographic method for determination ofglycosylated hemoglobin (Anal. Lett. 14: 649-661, 1981)is compared with the thiobarbituric acid colorimetric (I)(Gun. Chem. 27: 669-672, 1981) and the ion-exchangeliquid-chromatographic (II) (Diabetes 29: 623-628, 1980)methods. A correlation of 0.98 was obtained for the affinitymethod vs II and 0.97 for affinity vs I (n = 51). The
within-run CV was 1.9% for specimens from non-diabeticindividuals and 1.0% for those from diabetics. The re-spective between-run CVs were 3.4% and 2.4%. Failureto remove “labile” glucose adducts by 5-h incubation of
erythrocytes in isotonic saline (37 #{176}C)contributed an av-erage error of 13.1 % for II, 5.4% for I, and 1.6% for the
affinity method. Affinity chromatography gave a decreaseof 0.1-0.2% glycosylated hemoglobin for each 1.0 #{176}Ctemperature increase between 18 and 27 #{176}C.Varying thepH of the wash buffer used in the affinity procedure from7.75 to 8.25 (pH 8.0 optimum) produced a net change of0.5% in glycosylated hemogobin with one diabeticspecimen. Using the affinity method, we determined thereference interval for glycosylated hemoglobin in 124
apparently healthy individuals to be 5.3 to 7.5% (mean6.36%, SD 0.55%). Rechromatography by II and iso-electric focusing analysis of the fractions obtained by theaffinity separation revealed a substantial population ofglycosylated hemoglobins not measured by II. The affinitymethod offers a rapid, simple, precise, and accurate al-ternative to methods currently in use and gives substantialfreedom from many common interferences.
AdditIonal Keyphrases: reference interval - specificity ofdetection of glycosylated hemoglobins - chromatography,liquid isoelectric focusing colorimetry diabetes
Precise and accurate measurement of glycosylated hemo-
globin (GlyHb)4 as a tool for diagnosis and management of
diabetes mellitus is a formidable challenge. As re-emphasized
recently (1), a method having high accuracy and precision is
“especially pertinent in chronic disorders where therapeutic
and clinical complications are to be assessed over many years.”With regard to glycosylated hemoglobin, several obstacles
make this a difficult goal:
1. Possible interferences due to the labile fraction (2-5) and
extreme temperature and pH sensitivities of some methods
can introduce large errors (6).
Biochemical Research Division, Pierce Chemical Co.. Rockford,IL 61105.
2 I)epartments of Child Health and pathology, University of
Missouri Health Science Center, Columbia, MO 65212.
Nonstandard abbreviations: HPLC-IE, “high-performance”
liquid chromatography-ion-exchange; TBA, thiobarbituric acid
colorimetric assay; GlyHb, glycosylated hemoglobin; and HbA1�,
(1-terminal-glucose-modified hemoglobin.
Received April 19, 1982; accepted June 30, 1982.
2. The absence of generally available and acceptable
standards makes inter- and intralaboratory comparisons ofresults, or evaluation of new methods, difficult.
3. The many techniques-macro-column, mini-column,
and high-performance liquid chromatograpHy-ion exchange(HPLC-IE), RIA, colorimetry, fluorometry, electrophoresis,
isoelectric focusing, affinity chromatography-described for
this analysis do not necessarily measure the same population
of glycosylated hemoglobmns, nor are they necessarily affected
to the same degree by potential interferences.Besides factors affecting accuracy and precision, practical
considerations such as the need for special equipment and the
number of samples that can be processed per day are impor-
tant considerations.
Several investigators (7-9) have recently proposed an af-
finity-chromatographic method for quantification of glyco-
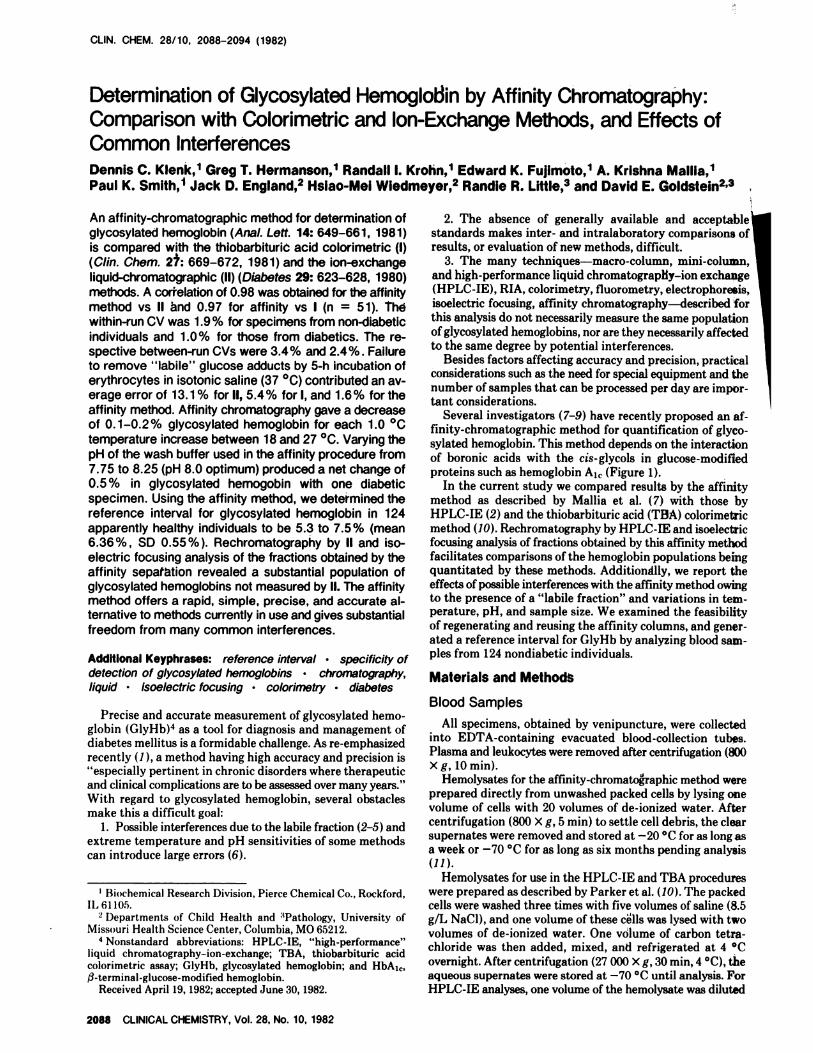
sylated hemoglobin. This method depends on the interaction
of boronic acids with the cis-glycols in glucose-modified
proteins such as hemoglobin A1� (Figure 1).
In the current study we compared results by the affinitymethod as described by Mallia et al. (7) with those by
HPLC-IE (2) and the thiobarbituric acid (TBA) colorimetric
method (10). Rechromatography by HPLC-IE and isoelectric
focusing analysis of fractions obtained by this affinity method
facilitates comparisons of the hemoglobin populations beingquantitated by these methods. Additionally, we report the
effects of possible interferences with the affinity method owingto the presence of a “labile fraction” and variations in tem-perature, pH, and sample size. We examined the feasibilityof regenerating and reusing the affinity columns, and gener-
ated a reference interval for GlyHb by analyzing blood sam-
ples from 124 nondiabetic individuals.
Materials and Methods
Blood Samples
All specimens, obtained by venipuncture, were collected
into EDTA-containing evacuated blood-collection tubes.Plasma and leukocytes were removed after centrifugation (800
X g, 10 mm).
Hemolysates for the affinity-chromatographic method wereprepared directly from unwashed packed cells by lysing onevolume of cells with 20 volumes of de-ionized water. Aftercentrifugation (800 X g, 5 mm)to settle cell debris, the clear
supernates were removed and stored at -20 #{176}Cfor as long asa week or -70 #{176}Cfor as long as six months pending analysis
(11).Hemolysates for use in the HPLC-IE and TBA procedures
were prepared as described by Parker et al. (10). The packed
cells were washed three times with five volumes of saline (8.5g/L NaC1), and one volume of these cells was lysed with two
volumes of de-ionized water. One volume of carbon tetra-
chloride was then added, mixed, and refrigerated at 4 #{176}Covernight. After centrifugation (27 000 X g, 30 mm, 4 #{176}C),theaqueous supernates were stored at -70 #{176}Cuntil analysis. ForHPLC-IE analyses, one volume of the hemolysate was diluted
1=?N.cI wcu l�C
e112 + NC� - IC’IU _______I I AmadoriI I rearrangement IIl-Cl Il-fl NI-Cl
N�l NI1I I Ic12N cl7ll C1211
Ketoamine
Immobilized
Boronic Acid
CLINICAL CHEMISTRY, Vol. 28, No. 10, 1982 2089
G’ucose Schiff base formation
e�-�
NC-lu _-,,� IC-Il+ us4� �.
“1’
Binding of Glycosylated Protein to the
affinity matrix
Fig. 1. Post-translational non-enzymic glycosylation of proteinsand the subsequent interaction of the glycosylated protein withimmobilized boronic acid
with two volumes of de-ionized water. For TBA assays thesamples were appropriately diluted with de-ionized water toadjust the hemoglobin concentration to 10 g/L.
Total Glycosylated Hemoglobin by AffinityChromatography
Prepacked 1-mL columns of immobilized rn-amino-phenylboronic acid on cross-linked, beaded agarose, washbuffer, and elution buffers were supplied as a kit (GLYCO.GEL Test Kit; Pierce Chemical Co., Rockford, IL 61105). Thecolumns incorporate a top porous frit, which automaticallystops the flow when the liquid level in the column reaches it.The wash buffer (per liter, 250 mmol of ammonium acetate,50 mmol of magnesium chloride, and 0.2 g of sodium aside, pH8.0) is used to equilibrate the columns and to wash through
the not-bound, non-glycosylated hemoglobmns. The elutionbuffer (per liter, 200 mmol of sorbitol, 100 mmol of Tris, and0.2 g of sodium azide, pH 8.5) is used to elute the bound, gly-cosylated hemoglobins.
To equilibrate the columns, allow 5 mL of wash buffer topass through the gel, discarding the eluate. Suspend theequilibrated columns over 16 X 150mm test tubes and add 100�sL of hemolysate to the top fit. Allow the sample to pass intothe frit, then add 0.5 mL of wash buffer to carry the samplecompletely into the gel. Then apply an additional 19.5 mL ofwash buffer. The total eluate collected comprises the not-bound, non-glycosylated hemoglobins in a volume of 20.1 mL.Next, place the column over a clean 16 X 100 mm test tube andelute the bound, glycosylated hemoglobins with 5.0 mL of thesorbitol elution buffer. Measure the absorbance (A) of eachfraction at 414 nm and calculate the percentage of glycosylated
hemoglobins according to the formula:
% GlyHb 5 X � x 100%
(20.1 X A,,0� bound) + (5 X Ai�ound)
All assays, unless specified, were performed at ambienttemperature. To regenerate the columns for another assay,add 5 mL of 0.1 mol/L HC1 (reagent grade) to each column.After this has passed through, add 5 mL of storage solution(1 mmol/L HCI). When about 3 mL has passed through thecolumn, replace the caps and store at 4 #{176}C.
HPLC-IE and TBA Assays
We used the automatically controlled HPLC-IE method
of Goldstein et al. (2) to measure the %HbA�� of all samples.This method provides excellent between-run and within-run
precision (2.5% and 2% CVs, respectively) by maintaining
critical control over temperature and automatically inte-grating the resulting chromatograms.
For the colorimetric assays we used the improved TBAmethod of Parker et al. (10). Hemolysate, after heating withoxalic acid, yields hydroxymethylfurfural in proportion to theamount of glycosylated hemoglobin present. Hydroxymeth-ylfurfural is quantitated spectrophotometrically at 443 nmafter reaction with thiobarbituric acid. Values are expressedas nanomoles of hydroxymethylfurfural per 10 mg of hemo-globin.
Correlation Studies
We assayed 51 samples by all three of the above methods.Fourteen of these samples were obtained from apparentlyhealthy volunteers. Ten samples were obtained from adultinsulin-dependent volunteers on the day of the tests.
Twenty-seven frozen (-70 #{176}C)samples were obtained atrandom from the more than 1500 available at the Department
of Child Health, Columbia, MO. These samples were frompatients participating in the long-term longitudinal study onchildren with childhood-onset diabetes reported by Goldsteinetal. (5).
Isoelectric Focusing and RechromatographyExperiments
Isoelectric focusing was performed essentially as previouslydescribed (7). We used an LKB Multiphor system equippedwith the 2209 Multitemp cooling circulator and 2103 powersupply (LKB Instruments, Inc., Rockville, MD 20852). Sep-arations were carried out on polyacrylamide plates (pH range3.5-9.5) according to the manufacturer’s instructions (LKBApplication Note 250).
We obtained fresh blood from a diabetic person, hemolyzedit as described above, and subjected it to affinity chromatog-raphy on 4.5 mL of the boronate support. This larger thannormal column was used to obtain fractions having higherconcentrations of hemoglobin. We applied 450 � of the he-molysate, then washed and eluted with 4.5 times the amounts
of buffers recommended above for the mini-columns. Samplesconsisting of the original hemolysate, the washed-throughfractions (not-bound hemoglobin), and the sorbitol-elutablefractions were pooled separately and dialyzed against water(16 L, three changes, four days). Each of these fractions wasthen electrofocused without delay and viewed either directlyor after staining with Coomassie Brilliant Blue R-250.
We rechromatographed the same fractions analyzed byisoelectric focusing, using HPLC-IE. In this case the fractionsfrom the affinity separation could be used directly withoutdialysis. The analysis was performed as described above.
Results
Correlation Studies
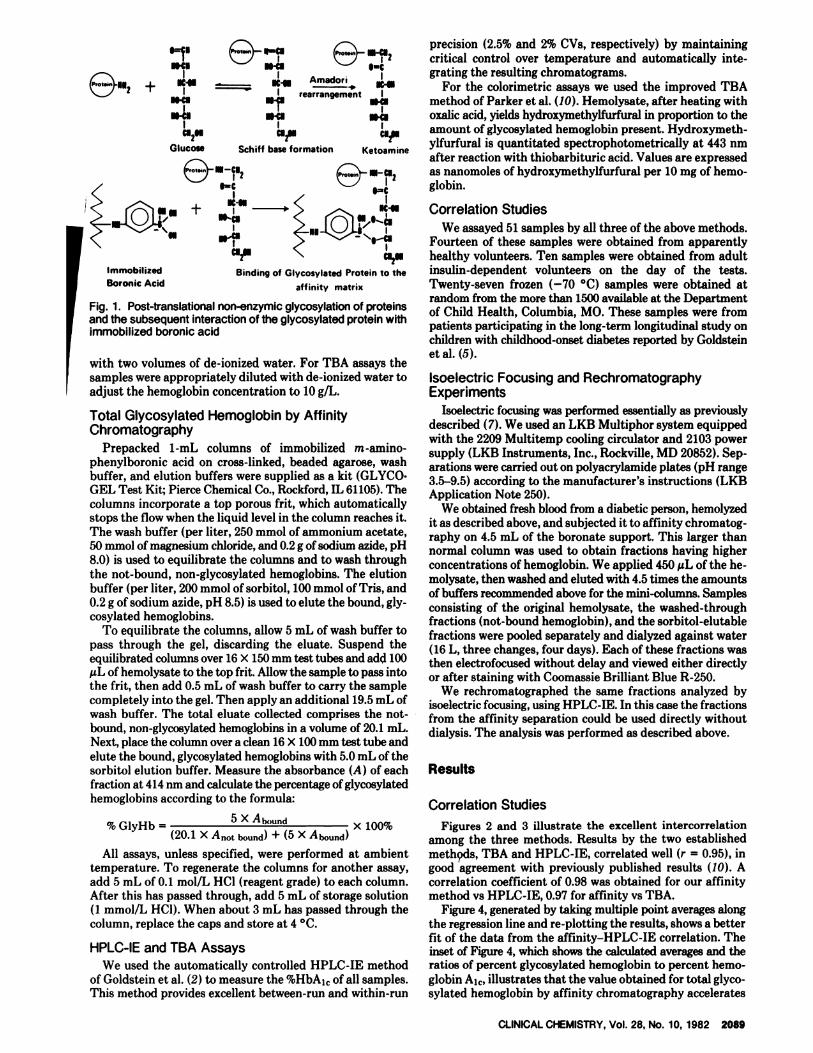
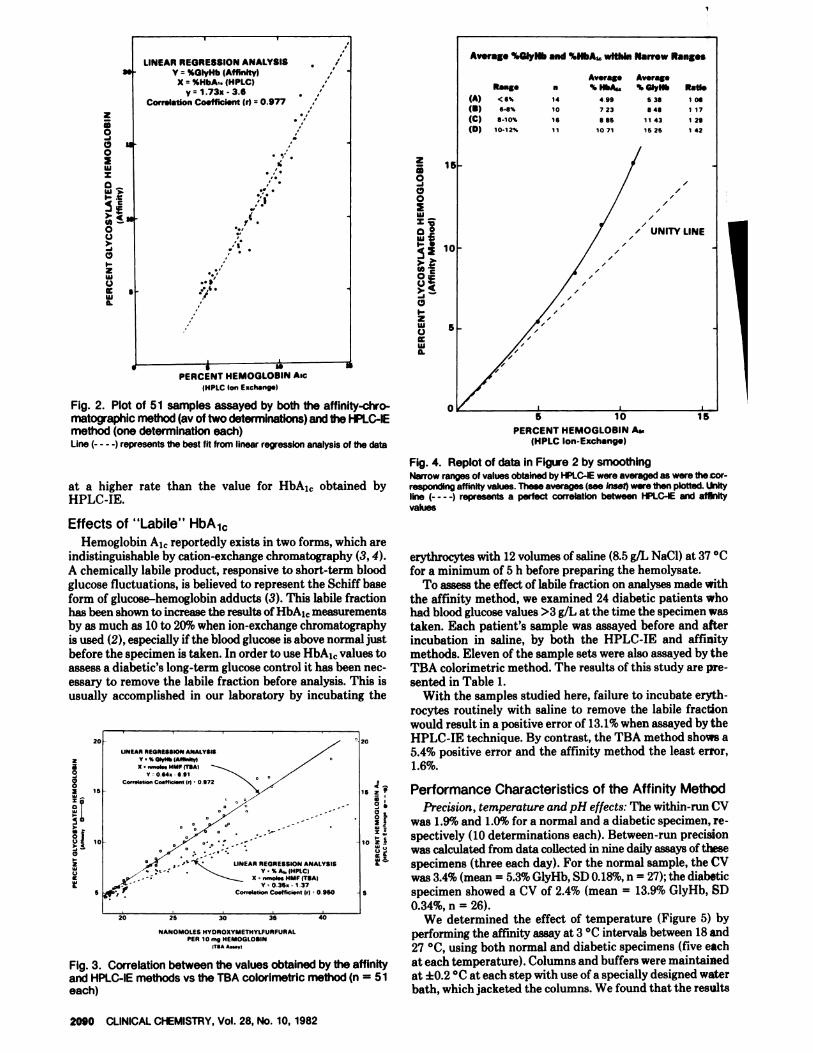
Figures 2 and 3 illustrate the excellent intercorrelationamong the three methods. Results by the two establishedmeth�s, TBA and HPLC-IE, correlated well (r = 0.95), in
good agreement with previously published results (10). Acorrelation coefficient of 0.98 was obtained for our affinitymethod vs HPLC-IE, 0.97 for affinity vs TBA.
Figure 4, generated by taking multiple point averages alongthe regression line and re-plotting the results, shows a betterfit of the data from the affinity-HPLC-IE correlation. Theinset of Figure 4, which shows the calculated averages and theratios of percent glycosylated hemoglobin to percent hemo-
globin A1�, illustrates that the value obtained for total glyco-sylated hemoglobin by affinity chromatography accelerates
a.
(A)
(B)(C)(0)
Rangi
<6%
6-8%
8-10%
10-12%
LINEAR REGRESSION ANALYSISV = %GIyHb (Affinity)
X %HbA’. (HPLCIyr 1 .73x -3.6
Correlation Coefficient (r) 0.977
B
14
10
16
11
Average
‘. HbA.
4 99
7 23
8 86lOll
Av.rag.
% GiyHb
5 38
8 48
11 43
1525
1!
Ratio
I 08
1 17
1 29
I 42
I
//
‘ UNITY LINE/
/
/
/
5
/
PERCENT HEMOGLOBIN Asc(HPLC Ion Ezchang*I
Fig. 2. Plot of 51 samples assayed by both the affinity-chro-matographic method (av of two determinations) and the HPLC-IEmethod (one determination each)Line (- - - -) represents the best fit from linear re�’ession analysis of the data
at a higher rate than the value for HbA1� obtained byHPLC-IE.
I
Fig. 4. Replot of data in Figure 2 by smoothingNarrow ranges of values obtaIned by HPLC-IE were averaged as were the cor-responding affinity values. These averages (see inset) were then plotted. UnItyline (- - - -) represents a perfect correlation between HPLC-lE and affinityvalues
0
PERCENT HEMOGLOBIN A�(HPLC Ion-Exchange)
20
za0
I,0a ‘5
1
5
LINEAR NEQRES$ION ANALYSISY.%QIyH�(Affin9yI
X’,,,,�M,UMPITBAI
Y064,-B91
Co,,.I.,,on CT.ffiT,.T, ‘I 0972
�,,Y ,.-‘� � LINEAR REGRESSION ANALYSISY� %A,.IHPLC)
- .� � S n,,.eI..HMFITBAI
V 035,137
Co,,.I.Ion Ce.fIic,.n, I,) 0960
20 25 30 35 40
Av.rage %GIyNb and %HbA� wtthln Narrow Ranges
2090 CLINICAL CHEMISTRY, Vol. 28, No. 10, 1982
z
0-a050
wz0��
0C.)
C,I-zI55C-)
Ia
Effects of “Labile” HbA1�
z
0
00
w
wEI-.
0�C-)
0I-2uJC-)
Ia0.
Hemoglobin A1� reportedly exists in two forms, which areindistinguishable by cation-exchange chromatography (3,4).
A chemically labile product, responsive to short-term bloodglucose fluctuations, is believed to represent the Schiff base
form of glucose-hemoglobin adducts (3). This labile fractionhas been shown to increase the results of HbAj� measurementsby as much as 10 to 20% when ion-exchange chromatographyis used (2), especially ifthe blood glucose is above normal justbefore the specimen is taken. In order to use HbA1� values toassess a diabetic’s long-term glucose control it has been nec-essary to remove the labile fraction before analysis. This is
usually accomplished in our laboratory by incubating the
NANOMOLES HYDROXYMETHYLFURFURALPER 10 n,g HEMOGLOBIN
TIA *$sflI
Fig. 3. Correlation between the values obtained by the affinityand HPLC-IE methods vs the TBA colorimetric method (n = 51each)
erythrocytes with 12 volumes of saline (8.5 g/L NaCl) at 37 #{176}Cfor a minimum of 5 h before preparing the hemolysate.
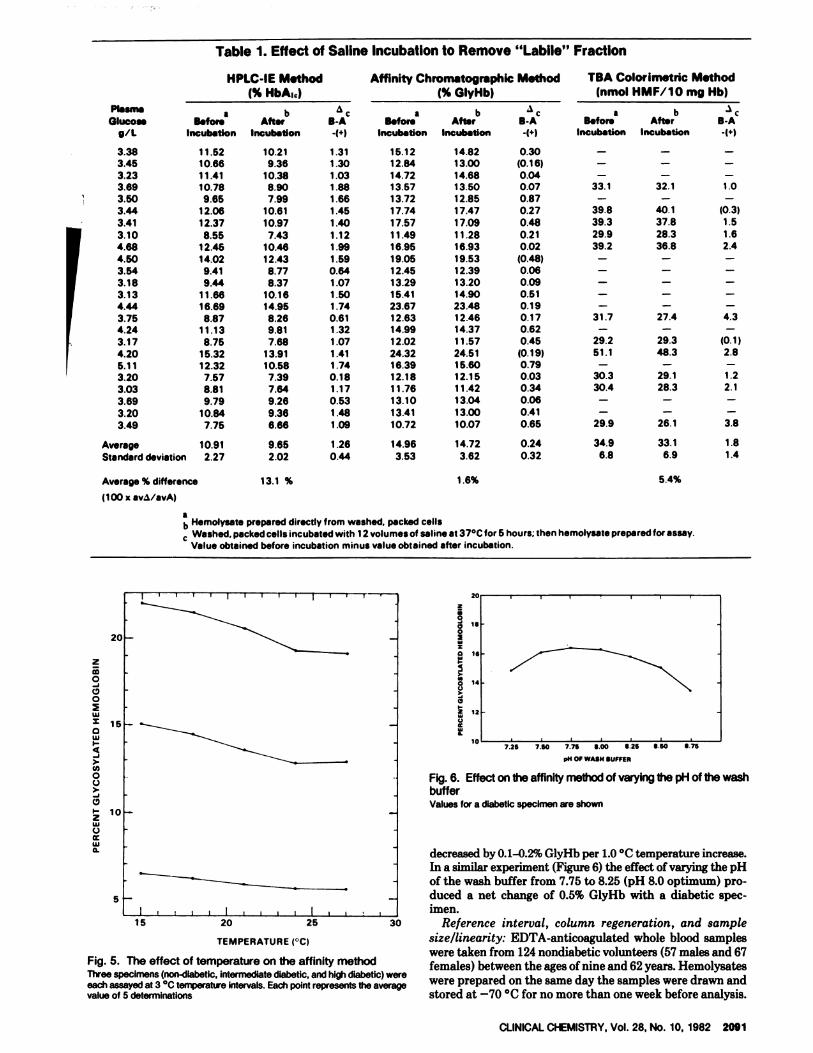
To assess the effect of labile fraction on analyses made with
the affinity method, we examined 24 diabetic patients whohad blood glucose values >3 g/L at the time the specimen was
taken. Each patient’s sample was assayed before and afterincubation in saline, by both the HPLC-IE and affinitymethods. Eleven of the sample sets were also assayed by theTBA colorimetric method. The results of this study are pre-
sented in Table 1.With the samples studied here, failure to incubate eryth-
rocytes routinely with saline to remove the labile fractionwould result in a positive error of 13.1% when assayed by the
20 HPLC-IE technique. By contrast, the TBA method shows a5.4% positive error and the affinity method the least error,1.6%.
Performance Characteristics of the Affinity Method
Precision, temperature and pH effects: The within-run CV
was 1.9% and 1.0% for a normal and a diabetic specimen, re-10 spectively (10 determinations each). Between-run precision
was calculated from data collected in nine daily assays of thesespecimens (three each day). For the normal sample, the CVwas 3.4% (mean = 5.3% GlyHb, SD 0.18%, n = 27); the diabetic
5 specimen showed a CV of 2.4% (mean = 13.9% GlyHb, SD0.34%, n = 26).
We determined the effect of temperature (Figure 5) byperforming the affinity assay at 3 #{176}Cintervals between 18 and27 #{176}C,using both normal and diabetic specimens (five each
at each temperature). Columns and buffers were maintainedat ±0.2 #{176}Cat each step with use of a specially designed waterbath, which jacketed the columns. We found that the results
HPLC-lE Method Affinity Chromatographic Method TBA Colorimetric Method(% HbA10) (% GlyHb) (nmol HMF/1O mg Hb)
a bBfor. After
Incubation Incubation
a bBefore Aftsr B-A
Incubation Incubation -1+)
Plasm,
Olucoag/L
aB.for.
Incubation
bAfter
Incubation
‘�cB-A-(+1
‘
3.383.453.233.693.503.44
3.41
3.104.684.503.543.18
3.134.44
3.754.243.174.205.113.203.033.69
3.203.49
11.5210.6611.4110.78
9.6512.0612.37
8.5512.4514.02
9.419.44
11.6616.69
8.8711.138.75
15.3212.32
7.578.819.79
10.847.75
10.219.36
10.388.90
7.9910.61
10.97
7.4310.4612.43
8.778.37
10.1614.95
8.269.817.68
13.9110.58
7.397.649.269.366.66
1.31
1.301.031.881.661.45
1.40
1.121.991.59
0.641.071.50
1.740.611.321.071.411.740.181.170.531.481.09
15.1212.84
14.7213.5713.7217.74
17.5711.4916.9519.0512.4513.29
15.4123.6712.6314.9912.0224.3216.3912.1811.7613.1013.4110.72
Average
Standard deviation
10.91
2.27
9.65
2.02
1.26
0.44
14.96
3.53
B-A
0.30(0.16)0.040.070.870.270.480.210.02
(0.48)0.060.090.510.190.170.620.45
(0.19)0.790.030.340.060.410.65
0.24
0.32
14.8213.0014.6813.5012.8517.4717.0911.2816.9319.5312.3913.2014.9023.4812.4614.3711.57
24.5115.6012.1511.4213.0413.00
10.07
14.723.62
1.6%
33.1
39.839.329.939.2
31.7
29.251.1
30.330.4
29.9
34.9
6.8
32.1
40.137.828.336.8
27.4
29.348.3
29.128.3
26.1
33.16.9
5.4%
1.0
(0.3)1.51.62.4
4.3
(0.1)2.8
1.22.1
3.8
1.81.4
I I
It
IS
‘4
12
IC7.26 7.80 776 S00 8.25 S 60 8 75
p14 OF WASH SUFFER
Fig. 6. Effect on the affinity method of varying the pH of the washbufferValues for a diabetic specimen are shown
decreased by 0.1-0.2% GlyHb per 1.0 #{176}Ctemperature increase.In a similar experiment (Figure 6) the effect of varying the pH
of the wash buffer from 7.75 to 8.25 (pH 8.0 optimum) pro-duced a net change of 0.5% GlyHb with a diabetic spec-imen.
30 Reference interval, column regeneration, and sample
TEMPERATURE i#{176}C) size/linearity: EDTA-anticoagulated whole blood sampleswere taken from 124 nondiabetic volunteers (57 males and 67
Fig. 5. The effect of temperature on the affinity method females) between the ages of nine and 62 years. HemolysatesThree specimens (non-diabetic, intermediate diabetic, and high diabetic) wereeach assayed at 3#{176}Ctemperattte intervals. Each point represents tt,e average were prepared on the same day the samples were drawn andvalue of 5 determinatIons stored at -70 #{176}Cfor no more than one week before analysis.
15 20 25
CLINICAL CHEMISTRY, Vol. 28, No. 10, 1982 2091
Table 1. Effect of Saline Incubation to Remove “Labile” Fraction
Average % difference 13.1 %
(100 x av�/avA)
z
0
C,0
wS
aIa
>-U)
0C.)
C,I-
2IaC-)
Ui0.
ab Hemolysate prepared directly from washed, packed cells� Washed, packed cells incubated with 12 volumes of saline at 37#{176}Cfor 5 hours; then hemolysate prepared for assay.
Value obtained before incubation minus value obtained after incubation.
z
0
120aI
a
0�N0u
13
zUC
mg HEMOGLOBIN APPLIED
FRACTION NUMBER
TIME (mm.)
2092 CLINICAL CHEMISTRY, Vol. 28, No. 10, 1982
a2
0
.12I
�1
C,
E
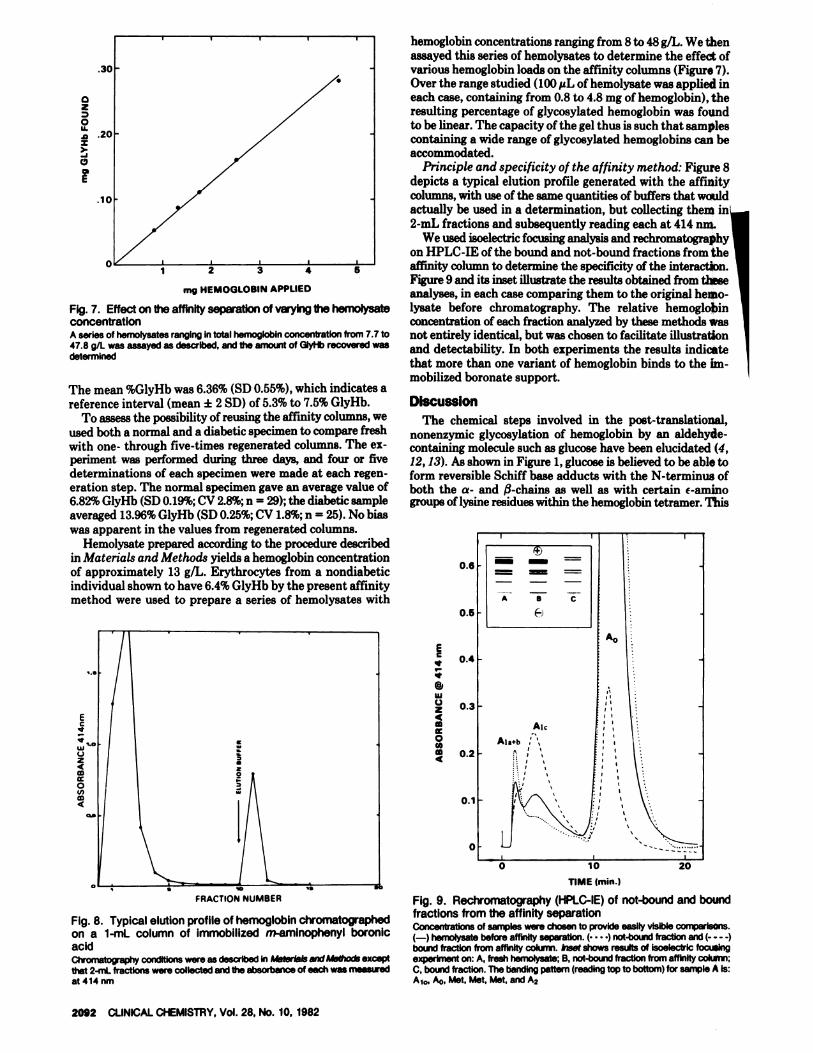
Fig. 7. Effect on the affinity separation of varying the hemolysateconcentrationA series of hemolysates ranging in total hemoglobin concentration from 7.7 to47.8 gIL was assayed as described, and the amount of GiyHb recovered wasdetermined
The mean %GlyHb was 6.36% (SD 0.55%), which indicates areference interval (mean ± 2 SD) of 5.3% to 7.5% GlyHb.
To assess the possibility of reusing the affinity columns, weused both a normal and a diabetic specimen to compare freshwith one- through five-times regenerated columns. The ex-periment was performed during three days, and four or fivedeterminations of each specimen were made at each regen-eration step. The normal specimen gave an average value of6.82% GlyHb (SD 0.19%; CV 2.8%; n = 29); the diabetic sample
averaged 13.96% GlyHb (SD 0.25%; CV 1.8%; n = 25). No biaswas apparent in the values from regenerated columns.
Hemolysate prepared according to the procedure describedin Materials and Methods yields a hemoglobin concentrationof approximately 13 g/L. Erythrocytes from a nondiabeticindividual shown to have 6.4% GlyHb by the present affinitymethod were used to prepare a series of hemolysates with
Fig. 8. Typical elution profile of hemoglobin chromatographedon a 1-mL column of immobilized m-amlnophenyl boronicacidCh’ornato�aphy conditions were as described in Ps�terIals and Methods exceptthat 2-mL fractions were collected and the absorbance of each was meaairedat 414 nm
hemoglobin concentrations ranging from 8 to 48 g/L. We thenassayed this series of hemolysates to determine the effect ofvarious hemoglobin loads on the affinity columns (Figure 7).
Over the range studied (100 �tL of hemolysate was applied ineach case, containing from 0.8 to 4.8 mg of hemoglobin), theresulting percentage of glycosylated hemoglobin was foundto be linear. The capacity of the gel thus is such that samplescontaining a wide range of glycosylated hemoglobins can beaccommodated.
Principle and specificity of the affinity method: Figure 8depicts a typical elution profile generated with the affinity
columns, with use of the same quantities of buffers that wouldactually be used in a determination, but collecting them in2-mL fractions and subsequently reading each at 414 inn.
We used isoelectric focusing analysis and rechromatographyon HPLC-IE of the bound and not-bound fractions from theaffinity column to determine the specificity of the interaction.
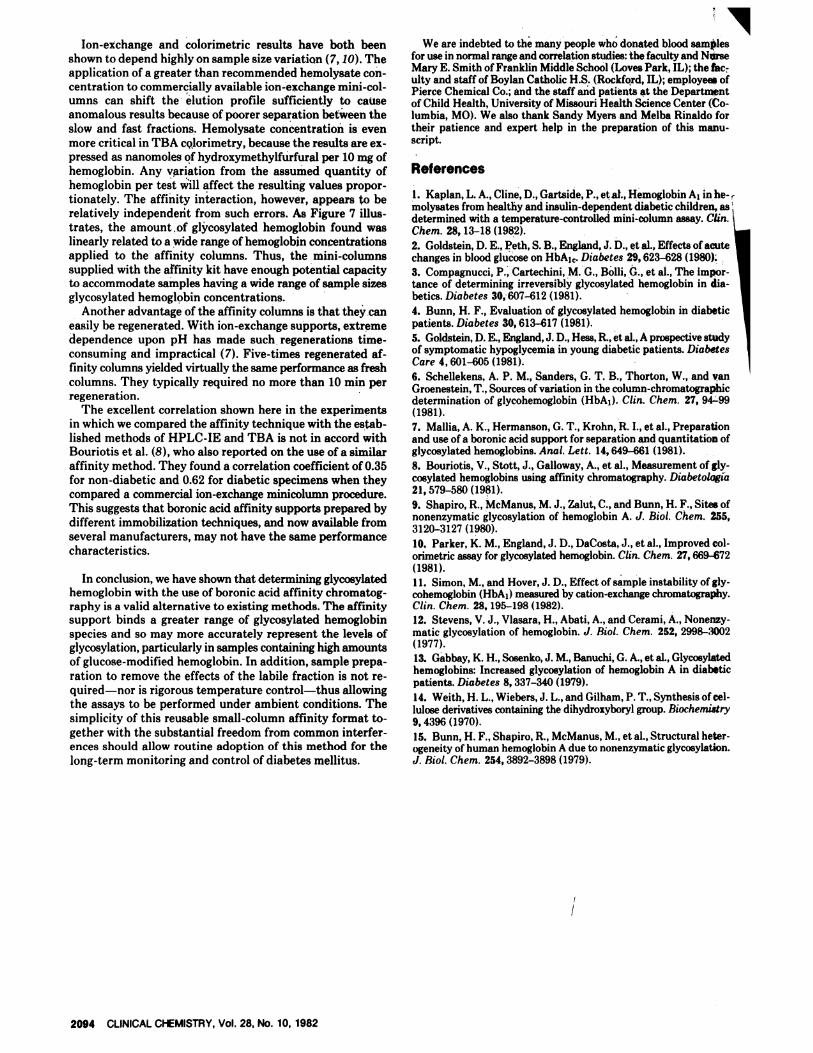
Figure 9 and its inset illustrate the results obtained from theseanalyses, in each case comparing them to the original hemo-
lysate before chromatography. The relative hemoglobinconcentration of each fraction analyzed by these methods wasnot entirely identical, but was chosen to facilitate illustration
and detectability. In both experiments the results indicate
that more than one variant of hemoglobin binds to the im-mobilized boronate support.
DiscussionThe chemical steps involved in the post-translational,
nonenzymic glycosylation of hemoglobin by an aldehyde-containing molecule such as glucose have been elucidated (4,12,13). As shown in Figure 1, glucose is believed to be able toform reversible Schiff base adducts with the N-terminus ofboth the a- and $-chains as well as with certain r-aminogroups of lysine residues within the hemoglobin tetramer. This
EC
@1
Ia
C.)24
0
4
Fig. 9. Rechromatography (HPLC-IE) of not-bound and boundfractions from the affinity separationConcentrations of samples were chosen to provide easily visible comparisons.(-) hemolysate before affinityseparation. (.. .) not-bots”4 fraction and (- - - -)
bound fraction from affinity cokwnn. Inset shows results of isoelectrlc focusingexperiment on: A, fresh hemolysate; B, not-bound fraction from affinity cokxnn;C, bound fraction. The banding pattern (reading top to bottom) for sample A is:A10, A0, Met, Met, Met, and A2

CLINICAL CHEMISTRY, Vol. 28, No. 10, 1982 2093
initial linkage, which is relatively labile, can ultimately un-
dergo an Amadori rearrangement to form the stable ke-toamine complex commoilly referred to as “glycosylated he-
moglobin.” The resultant coplanar cis-diol groups, present
in the hemoglobin molecule as a #{232}onsequence of glucosemodification, can subsequently interact with immobilizedboronic acid to form a strong but reversible five-memberedring complex (14). This complex can be specifically dissociated
during chromatography by use of a counter ligand (sorbitol),
which effectively competes with the bound glycosylated
fraction for the boronic acid sites #{231}nthe gel surface.
The affinity interaction well resbived bound and not-boundspecies during an actual chrbmatography (Figure 8). The
tightness of the binding was graphically illustrated when a test
was run, because a bright-red band afipeared at the top of thecolumn and remained there as the non-glycosylated proteinswere washed through the g�l. Complete resolution is impor-tant, affecting the clinical viability of many commercially
available ion-exchange methods (7). However, the affinitychromatogram is essentially the reVerse of that seen withion-exchange techniques, where the “fast fraction” containsthe glycosylated species.
In ion-exchange separatiOns it is known that the variant of
interest, namely hemoglobin A1�, represents a particular
glucose modification that occurs at the N-terminal of the
13-chain. This species elutes faster than the main A0 fractionon cation-exchange col{imns, thereby providing the means forquantitation.
To determine what variants were actually bound on theaffinity columns, we subjected Ilbrtions representing the
original hemolysates as well as the not-bound and bound
fractions after chromatography to isoelectric focusing and
HPLC-IE analysis. From this an#{224}ly�isthe bound fraction was
found to contaih a heterogeneous fopulation of hemoglobinvariants, which may be indicative, of multi-site glucose mod-ification similar to that previously reported (15). With iso-electric focusing, every band observed in the original hemo-lysate was also seen in the post-chromatography bound frac-
tion. This seems to indicate that every variant resolvable by
isoelectric focusing techniques has the potential of being
glycosylated. If only the A1� moiety is considered, the speci-ficity of the affinity interaction is demonstrated by the re-
moval of this band within the focusing pattern of the not-
bound fraction. On FIPLC-IE analysis, which provides greaterresolution of this variant, rechromatography of this samefraction shows a small peak corresponding to A1� that did not
bind to the affinity gel. This is not the result of insufficient
capacity, becau�,#{235} deliberately overloading the affinity col-
umns with increasingly concentrated hemolysates (Figure 7)
gives virtually the same percentage of glycosylated hemoglo-
bin. It is possible that some sites of glucose modification on
the hemoglobin molecule may not be sterically accessible to
the boronate binding sites on the gel surface. However, this
appears to be of no practical significance, because the totalamount of glucose-modified variants quantitated by the af-finity method is actually much greater than that seen by
ion-exchange inethods. This is graphically shown in Figure
9 by the larke A0 contribution (approximately 40%) that was
found to bind to the boronate support. In addition, the overall
pattern displayed by the bound fraction upon rechromatog-
raphy (HPLC-IE) is strikingly similar to that previously ob-served by using C ‘4-labeled glucose as a tracer of glycosylation
(9), substantiating the hypothesis that this population isglucose modified.
Thus one might expect the affinity technique to show higherpercentages of glycosylated hemoglobins than would be ob-tained by using ion-exchange chromatography. This is exactly
what was observed, and it can be further explained from the
correlation results relating affinity and HPLC-IE to IBAcolorimetric analysis (Figure 3). Since TBA colorimetry shouldgive the best indication of the total extent of glycosylation(every site of glucose-modification being susceptible to reac-tion with ox#{225}licacid), plotting affinity and HPLC-IE resultsagainst it would show which of the two chromatographicmethods actually detects the greater population of glycosyl-
ated hemoglobins. The slope of the linear regression line whichwas generated from the plot of affinity vs TBA is approxi-mately 35% greater than that of the line representing ion-exchange vs colorimetric. This corresponds very well to therelative contribution of about 40% for the A0 peak seen in therechromatography experiment performed on the fraction
bound by the affinity column (Figure 9). The percentages
found by the affinity technique are thus much affected by a
population of glycosylated hemoglobins that has not hereto-fore been routinely measured in tile clinical laboratory. Onewonders whether these other modified hemoglobins changein response to increased serum glucose concentrations in thesame manher as the 13-terminal modified HbA1� does. Theexcelleht linearity of the plot of affihity vs TBA indicates thatthey do. In addition, it has been previously reported (fromresults of TBA colorimetry and ion-exchange chromatogra-phy) that the extent of glycosylation at the 13-terminus cor-relates fairly well (r = 0.72) with the extent of glycosylation
in tHe A0 fraction (13). There is an interesting relationship,howevet,, in Figure 4. The data of the plot of affinity vsHPLC-IE (Figure 2) were smoothed by taking narrow rangesof values and averaging them. This may better represent thecorrelation between 13-terminal glycosylation (as measuredby HPLC-IE) and 13-terminal plus Ao-glycosylation (as mea-sured by affinity). A major consequence of this nonlinear re-lationship is that as the values obl�ained for total glycosylatedhemoglObin by affinity increase, they increase faster than thevalues for HbA1� obtained by ion-exchange chromatography.
This may indicate that as total glycosylation increases,
13-terminal modification represents a progressively lower
proportion of the glucose modification actually present. Thus,the affinity method may more accurately represent the extent
of glycosylation, especially in diabetic individuals.The results of the experiments on the effect of the “labile”
fraction are noteworthy. Unlike ion-exchange chromatokra-phy, the affinity technique doss not express the substantialcontribution due to this interfering species. In fact, the averagerelative error introduced into the affinity determination (L6%)
if incubation in saline is not done before analysis is on the
same order of magnitude as the observed CVs for the method
itself. The data suggest that saline pretreatment of samples
is unnecessary. Possible explanations for this independence
from labile vdriation may be that the Schiff-base adducts are
dissociated during chromatography and/or do not exhibit a
strong affinity interaction.
The affinity method was also found to be able to tolerate
moderate fluctuations in temperature and pH without sig-nificantly altering the results. The dependence oil tempera-ture over the range of 18 to 27 #{176}Cwas at least 10-fold less thanthat previously reported for ion-exchange mini-columns (7).
Dependency on pH was similarly decreased: a variation of±0.25 pH units from the optimum pH of 8.0 produced an
absolute change of 0.5% glycosylated hemoglobin. This can
be compared to the result found by Schellekens et al. (6), whereonly half that much variation from the optimum ph of 6.78produced a absolute net change of at least 12% HbA1� asmeasured by ion-exchange techniques. The fact that with
affinity chromatography the mode of interaction involves a
dependence on dissociation constants rather than on art ion-exchange equilibrium may help explain the method’s relativefreedom from temperature and pH interferences.
2094 CLINICAL CHEMISTRY, Vol. 28, No. 10, 1982
Ion-exchange and colorimetric results have both been
shown to depend highly on sample size variation (7, 10). Theapplication of a greater than recommended hemolysate con-
centration to commercially available ion-exchange mini-col-
umns can shift the elution profile sufficiently to cause
anomalous results because of poorer separation between theslow and fast fractions. Hemolysate concentration is evenmore critical in TEA cQlorimetry, because the results are ex-
pressed as nanomoles of hydroxymethylfurfural per 10 mg of
hemoglobin. Any variation from the assumed quantity of
hemoglobin per test will affect the resulting values propor-
tionately. The affinity interaction, however, appears to be
relatively independent from such errors. As Figure 7 illus-trates, the amount of glycosylated hemoglobin found was
linearly related to a wide range of hemoglobin concentrationsapplied to the affinity columns. Thus, the mini-columnssupplied with the affinity kit have enough potential capacity
to accommodate samples having a wide range of sample sizesglycosylated hemoglobin concentrations.
Another advantage of the affinity columns is that they caneasily be regenerated. With ion-exchange supports, extremedependence upon pH has made such regenerations time-consuming and impractical (7). Five-times regenerated af-
finity columns yielded virtually the same performance as freshcolumns. They typically required no more than 10 mm perregeneration.
The excellent correlation shown here in the experimentsin which we compared the affinity technique with the estab-
lished methods of HPLC-IE and TBA is not in accord withBouriotis et a!. (8), who also reported on the use of a similar
affinity method. They found a correlation coefficient of 0.35for non-diabetic and 0.62 for diabetic specimens when they
compared a commercial ion-exchange minicolumn procedure.This suggests that boronic acid affinity supports prepared by
different immobilization techniques, and now available fromseveral manufacturers, may not have the same performance
characteristics.
In conclusion, we have shown that determining glycosylatedhemoglobin with the use of boronic acid affinity chromatog-raphy is a valid alternative to existing methods. The affinity
support binds a greater range of glycosylated hemoglobin
species and so may more accurately represent the levels of
glycosylation, particularly in samples containing high amounts
of glucose-modified hemoglobin. In addition, sample prepa-
ration to remove the effects of the labile fraction is not re-
quired-nor is rigorous temperature control-thus allowing
the assays to be performed under ambient conditions. The
simplicity of this reusable small-column affinity format to-gether with the substantial freedom from common interfer-ences should allow routine adoption of this method for thelong-term monitoring and control of diabetes mellitus.
We are indebted to the many people who donated blood samplesfor use in normal range and correlation studies: the faculty and NurseMary E. Smith of Franklin Middle School (Loves Park, IL); the fac�ulty and staff of Boylan Catholic H.S. (Rockford, IL); employees ofPierce Chemical Co.; and the staff and patients at the Departmentof Child Health, University of Missouri Health Science Center (Co-lumbia, MO). We also thank Sandy Myers and Melba Rinaldo fortheir patience and expert help in the preparation of this manu-script.
References
1. Kaplan, L. A., Cline, D., Gartside, P., et al., Hemoglobin A1 in he-molysates from healthy and insulin-dependent diabetic children, asdetermined with a temperature-controlled mini-column assay. Clin.Chem. 28, 13-18 (1982).
2. Goldstein, D. E., Peth, S. B., England, J. D., et al., Effects of acutechanges in blood glucose on HbA1�. Diabetes 29,623-628 (1980)�
3. Compagnucci, P., Cartechini, M. G., Bolli, G., et al., The impor-tance of determining irreversibly glycosylated hemoglobin in dia-betics. Diabetes 30,607-612 (1981).
4. Bunn, H. F., Evaluation of glycosylated hemoglobin in diabeticpatients. Diabetes 30, 613-617 (1981).
5. Goldstein, D. E., England, J. D., Hess, R., et al., A prospective studyof symptomatic hypoglycemia in young diabetic patients. DiabetesCare 4,601-605 (1981).
6. Schellekens, A. P. M., Sanders, G. T. B., Thorton, W., and vanGroenestein, T., Sources of variation in the column-chromatographicdetermination of glycohemoglobin (HbA1). C!in. Chem. 27, 94-99
(1981).
7. Mallia, A. K., Hermanson, G. T., Krohn, R. I., et al., Preparation
and use of a boronic acid support for separation and quantitation of
glycosylated hemoglobins. Anal. Lett. 14,649-661(1981).
8. Bouriotis, V., Stott, J., Galloway, A., et al., Measurement of gly-cosylated hemoglobins using affinity chromatography. Diabetologia21,579-580(1981).
9. Shapiro, R., McManus, M. J., Zalut, C., and Bunn, H. F., Sites ofnonenzymatic glycosylation of hemoglobin A. J. Biol. Chem. 255,3120-3127 (1980).
10. Parker, K. M., England, J. D., DaCosta, J., et al., Improved col-
orimetric assay for glycosylated hemoglobin. Clin. Chem. 27,669-672
(1981).
11. Simon, M., and Hover, J. D., Effect of sample instability of gly-cohemoglobin (HbA1) measured by cation-exchange chromatography.Clin. Chem. 28, 195-198 (1982).
12. Stevens, V. J., Vlasara, H., Abati, A., and Cerami, A., Nonenzy-matic glycosylation of hemoglobin. J. Rio!. Chem. 252, 2998-3002
(1977).
13. Gabbay, K. H., Sosenko, J. M., Banuchi, G. A., et al., Glycosylatedhemoglobins: Increased glycosylation of hemoglobin A in diabeticpatients. Diabetes 8, 337-340 (1979).
14. Weith, H. L., Wiebers, J. L., and Gilham, P. T., Synthesis of cel-lulose derivatives containing the dihydroxyboryl group. Biochemistry9,4396 (1970).
15. Bunn, H. F., Shapiro, R., McManus, M., etal., Structural heter-ogeneity of human hemoglobin A due to nonenzymatic glycosylation.J. Rio!. Chem. 254, 3892-3898 (1979).