determinants of growth of employees savings and credit association in ethiopia
TRANSCRIPT

Determinants of Growth of Employees’ Savings and Credit
Associations in Ethiopia: The Case of Addis Ababa
University, Ethio Telecom and Ethiopian Airlines Employees’
Savings and Credit Associations
Tariku Kolcha ID. No. GSR/1357/05
A Thesis Submitted to
The Department of Accounting and Finance
Presented in Partial Fulfillment of the Requirement for
the Degree of Masters of Science in Accounting and
Finance
i

Addis Ababa University
Addis Ababa, Ethiopia
November, 2014
ii

Addis Ababa University
School of Graduate Studies
This is to certify that the thesis prepared by Tariku Kolcha,
entitled: Determinants Growth of Employees’ Savings and Credit
Associations and submitted in partial fulfillment of the
requirements for the Degree of Masters of Science in Accounting
and Finance complies with the regulations of the University and
meets the accepted standards with respect to originality and
quality.
Signed by Examining Committee:
Advisor ____________________________ Signature ____________ Date
___________________
Examiner ____________________________ Signature ____________ Date
___________________
Examiner ____________________________ Signature ____________ Date
___________________
iii
Abstract
Employees’ savings and credit associations (ESCAs) in Ethiopia have been
investing over the years with the objective of maximizing their wealth. As is the
case with all investments, wealth maximization is a key objective whenever ESCAs
have chosen an investment avenue from a universe of possible investment
vehicles. Studies have shown that lack of sufficient growth of ESCAs, have made it
difficult for them to absorb their operational losses, which have threatened their
sustainability. While the purpose of ESCAs is to mobilize members’ funds and
grant credit for the members’ development, this has made it difficult for the
ESCAs to grow their wealth, achieve this objective and contribute favorably to
national domestic savings. This failure to build enough ESCAs’ wealth, through
accumulation of institutional capital, is attributable to weak financial
stewardship, inappropriate capital structure and imprudent funds allocation
strategy. It is against this background that this study assessed the determinant
of growth of ESCAs with a view of improving the situation for socio-economic
development. This study used descriptive design and data was collected from the
respondents of the three ESCAs using a questionnaire and document review tool,
and analyzed using both descriptive and inferential statistics. The study findings
indicated that growth of ESCAs depended on financial stewardship, capital
structure and funds allocation strategy. The study recommends that ESCAs credit
policies should be the one that would enhance the evaluation of loan
applications; ESCAs should make loan provisions to promote safety of funds, and
apply optimum financing mix in their capital structure.
IV

Acknowledgements
I take this opportunity to express my sincere gratitude to
my almighty lord for his miraculous assistance. I am indebted
to a number of individuals and institutions. First, to my
advisor, Dr. P. Laxmikantham for his excellent professional
technical guidance and hospitality, patience and constructive
criticism that made me move on the correct path and gain
confidence in writing this research thesis. My debt of gratitude
goes to the chairman and members of staff, Department of
Accounting and Finance, Addis Ababa University for their
assistance in pursuing my Msc course. I also thank my Msc
colleague, Mr. Tsedal Lemi, Department of Accounting and Finance
with whom we shared a lot of knowledge. I appreciate the
encouragement we have had in the group at Addis Ababa University.
I am grateful to the librarians of College of Business and
Economics and main campus graduate library of Addis Ababa
University. I also acknowledge Federal Cooperatives Agency, AAU
ESCA, ETC ESCA, and Ethiopian Airlines ESCA. Lastly, but not
v

least I am also indebted to my wife, Hmeremichael Tamiru. God
bless you all.
vi

Table of contents
Contents
Page
List of tables............................................I
List of figures..........................................II
Abbreviation and acronyms...............................III
Chapter One...............................................1
1.1. Background of the study............................1
1.2. Statement of the problem...........................2
1.3. Objective of the study.............................4
1.4. Hypothesis.........................................4
1.5. Significance of the study..........................5
1.6. Scope and limitation...............................5
Chapter Two...............................................6
2.1. Theoretical literature.............................6
2.2. Critical review of theories explaining the growth of
saccos................................................14
2.3. Empirical literature..............................19
2.4. Empirical literature overview.....................33
i

2.5. Conceptual model..................................38
Chapter Three............................................47
3.1. Introduction......................................47
3.2. Research design...................................47
3.3. Target population and sampling....................47
3.4. Data collection...................................48
3.5. Reliability and validity testing..................49
3.6. Data analysis.....................................50
Chapter Four.............................................51
4.1. Introduction......................................51
4.2. Response rate.....................................51
4.3. Reliability analysis..............................52
4.4. Analysis of response using mean and standard
deviation.............................................53
4.5. Chi square test on dependence between independent
variables and growth of ESCAs
…………………………………………………………………………….60
4.6. Multiple regressions of independent against the
dependent variable…….….61
ii

Chapter Five.............................................71
5.1. Introduction......................................71
5.2. Summary of findings...............................71
5.3. Conclusion........................................76
5.4. Recommendations...................................77
References
Appendices
List of table
iii

s
Table 3.1 Summary of sample selection of
respondents…………………………………48
Table 4.1 Summary of response rate……………………………………………………..51
Table 4.2 Reliability testing results…………...…………………………………………
52
Table 4.3 Reliability testing analysis for adjusted
instruments………………………….53
Table 4.4 Profitability and distribution of
income……………………………………….53
Table 4.5 Summary of responses concerning financial
stewardship…………………….56
Table 4.6 Summary of responses concerning capital
structure…………………..………58
Table 4.7 Summary of responses concerning funds allocation
strategy…………………59
Table 4.8 Chi-square tests on associations between growth of
esca and financial stewardship, capital structure, and funds
allocation strategy…………………………….61
I

Table 4.9 Results of normality tests on study
variables………………………………….62
Table 4.10 Results of multi-collinearity tests on
independent variables………………...63
Table 4.11 Results of regression of growth of escas against
financial stewardship
indicators…………………………………………………………………………………65
Table 4.12 Results of regression of growth of escas against
capital structure…………..67
Table 4.13 Results of regression of funds allocation
strategy against gesca…………….68
Table 4.14 Summary of results of tests of hypothesis and
related objectives...…………69
List of figures
Figure 2.1 conceptual framework………………………………………………………..39II

Figure 4.1 determination of methods used to measure
distributed surplus………………55
III

Abbreviation and acronyms
AAU ESCA Addis Ababa University Employees’ Savings and
Credit Association
ACCOSCA African Confederation of Cooperatives Saving
and Credit Association
ATC Accounting Technician Certificate
EAL ESCA Ethiopian Air Lines Employees’ Savings and
Credit Association
ESCA Employees’ Savings and Credit Association
ETC ESCA Ethio Telecom Employees’ Savings and Credit
Association
FDRE Federal Democratic Republic of Ethiopia
GESCA Growth of Employees’ Savings and Credit
Associations
PEARLS Protection, Effective Financial Structure,
Asset Quality, Rates of Return and Costs,
Liquidity and Signs of Growth
IV

SACCODO Savings and Credit Co-operatives Development
Office
SACCOs Savings and Credit Co-operatives
SPSS Software Package for Social Science
USA United States of America
WACC Weighted Average Cost of Capital
WOCCU World Council of Credit Unions
V

Chapter OneIntroduction
This chapter presents introductory section of the research
work that consists of background of the study, statement of
the problem, objectives of the study, research hypotheses,
significance of the study, and scope and limitations of the
study.
1.1. Background of the study
Employee saving and credit associations (henceforth ESCAs)
for purpose of savings and credit in Ethiopia started at the
work place where by employees save certain percentages of
their income which gives them the entitlement to borrow
money for reasons they consider important to raise the
living standards of their household (in most cases these
include the buying of fixed assets like house, car,
machinery to start a business, higher education, marriage,
medication of family members, and others).
ESCAs have been in operation in Ethiopia for more than half
a century. They were categorized under Savings and credit
1

co-operatives (SACCOs) and designated as semi-formal
financial institutions. They are outside the control of the
central authorities with respect to ownership of assets and
management. They are established within governmental
organizations and private businesses, and play a significant
role in mobilizing deposit and in allowing employees access
to loans at a cheap rate. Their deposit collection and loan
recoveries are integrated to each organizations payroll
system, hence reducing administrative costs. The fact that
they are protected by operational rules of organizations
reduces their credit risk because an employee cannot default
as long as he earns salary every month. In the event of
default, loans are recovered from earnings of guarantors who
work in the same organization. ESCAs also participate in the
investment market by buying shares of different financial
and non-financial firms in the country.
The ESCAs, as potential sources of savings in the country,
need serious study. The existing literature highly limited
to only few studies on farmers unions and other agricultural
related cooperatives. Similarly the government also highly2

attempted to expand union and farmers cooperatives on the
rural areas of the country while very little attention is
given to ESCAs. Based on this reality it is necessary to
assess over all operation, especially factors affecting
growth, of ESCAs existing in Ethiopia, particularly in Addis
Ababa.
1.2. Statement of the problem
ESCA encourages employees to save a minor percentage of
their monthly income as a compulsory membership contribution
through its saving account services and also grants loans at
a minor cost to all its members. The ESCAs in Ethiopia have
recent origins. The oldest ones were established in the late
1960s, and they grew very slowly until 1978. One reason
behind such slow growth was the political and social
instability which followed the 1974 uprising. ESCAs have
been growing fast since 1978 (ACCOSCA), 1990, p.3). Nowadays
several numbers of ESCAs are operating from smaller scale to
larger investments areas in each organization. Thus, it is
no doubt that ESCAs goes beyond loan provision to the
3

members, but creating a large scaled investment to the
economy.
The fact that cooperatives showed a significant growth in
size and number of members, the rate of growth is not the
same for all cooperatives. Some of them are growing at very
fast rates. Over time, ESCAs have been trying to address
members’ demands by mobilizing funds and granting credit to
members. However, they have not been able to grow their
wealth sufficiently through accumulation of enough
institutional capital to finance non-withdrawable capital
funded assets, provide cushion to absorb losses and
impairment of members’ savings.
From the foregoing background literature, it emerges that
the objective of ESCA is member empowerment through savings
mobilization, disbursement of credit and ensuring ESCA’s
long-term sustainability through prudent financial practice.
However, they contend that there are a number of challenges
in promoting quality financial management such as limited
capital funding sources, loan delinquency, and assessment
4

and management of risks in addition to negative cash
(liquidity), poor governance and poor investment decisions.
That wealth generation is hampered by poor financial
stewardship, under-capitalization of cooperative
enterprises, high cost of funds, and delayed member
payments.
There are few studies conducted to assess the role of these
sectors in saving, investments and their role on entire
economy. Specifically, Studies on ESCAs in Ethiopia are
scant and this led to little knowledge about various aspects
of their operation including administrative costs,
investment income, loan portfolio, loan price and
investments. This study aimed to fill this gap by assessing
all possible aspects related to growth of employees’ saving
and credit association.
1.3. Objective of the study
5

The intent of this study was to assess financial practice as
a determinant of the growth of employees’ savings and credit
association with a view to improving their operations,
growth, investments and role in consumer credit market for
the benefit of the members and the country.
More specifically, the study was guided by the following
objectives
1. To assess whether there is association between
financial stewardship and the growth of employees’
savings and credit associations.
2. To determine whether the growth of employees’ savings
and credit associations is determined by capital
structure.
3. To determine whether the funds allocation strategy
affect the growth of employees’ savings and credit
associations.
1.4. Hypothesis
6
Hypotheses are used to state the relationship between
dependent and independent variables. Thus the study was
based on the following hypotheses:
i. H0: There is no dependence between growth of ESCAs and
financial stewardship.
Ha: There is dependence between growth of ESCAs and
financial stewardship.
ii. H0: There is no dependence between growth of ESCAs
and capital structure.
Ha: There is dependence between growth of ESCAs and
capital structure.
iii. H0: There is no dependence between growth of ESCAs
and funds allocation strategy.
Ha: There is dependence between growth of ESCAs and
funds allocation strategy.
1.5. Significance of the study
It is clear that ESCA plays an important role in credit
provision to employees/ member of thrifts and further
investment in other forms of business. Hence assessing the
7

thrifts costs of operation benefits and investments would
contribute over all informal financial sectors and economy
of the country. ESCAs will be benefited to apply the
recommendations related with investments portfolios and risk
diversification strategies. Any organization employees of
mutual interest to form ESCA with less experience will found
this study as base line to incept and operate in the sector.
1.6. Scope and limitation
Saving and credit cooperatives in Ethiopia are vast in
number in which most of the cooperatives are established
voluntarily in private under different sectors. Ethiopian
government paid special attention to farmers’ cooperatives
under agriculture sectors and other saving and credit unions
in urban areas. Employees saving and loan association is one
among the cooperatives lacking required attention from
federal cooperatives agency. Hence this paper assessed
operation, the growth, and investments of employees saving
and loan associations.
8
The fact that at organizational level there are number of
employees’ savings and credit associations. Among employees’
saving and credit associations operating in Addis Ababa, the
paper is limited to Ethiopian air lines ESCA, Addis Ababa
University ESCA and Ethio Telecom ESCA. The sector is
underdeveloped in terms of administration and control over
responsible body which will made challenging task to collect
appropriate data useful to complete this study.
9
Chapter TwoLiterature Review
Introduction
This chapter presents a review of literature related to
ESCAs. Essentially, it deals with past studies on ESCA,
previously known as Savings and credit cooperatives
(SACCOs), financial practice and growth of ESCA. It will
highlight the global, regional and national trends in
financial practice aspects of SACCOs as they relate to the
growth of SACCOs. Accordingly, past researches will be
explored to shed light on this pertinent area and identify
the gaps in knowledge that this study proposed to fill.
2.1. Theoretical literature
This section of the literature review contains information
on the theoretical background of the study. This includes
the theoretical explanations of the dependent and
independent variables, and their related theories,
2.1.1. The basis of growth in SACCOs
10
The Savings and Credit Co-operative Society (SACCOs) system
encompasses a mutual membership organization involving
pooling voluntary savings together from cooperators in form
of shares. SACCOs are user-owned institutions with savings
accumulated to act as SACCOs’ wealth. The shareholders share
a common bond based on a common area of interest or purpose,
namely; their geographical area, employment, community or
any other affiliation. The principal services of SACCOs
include savings and credit but other services such as money
transfers, payment services, insurance and member
development are also offered (Maina, 2007). The prime
concern of a SACCO Society is to build the financial
strength that would ensure continued service to members.
Apparently, the SACCOs’ wealth needs to be well-managed for
the achievement of the SACCOs’ objectives. In fact, the
concern of this study was that the growth of SACCOs is
grounded on financial stewardship (decision-making aspect),
capital structure and funds allocation strategy.
2.1.2. Financial stewardship and growth of SACCOs
11

Financial stewardship is meant to increase and sustain
SACCOs’ value and satisfy the needs and interests of all the
members. Accordingly, the financial manager is expected to
provide information which will assist in decision-making
concerning the investment of the SACCOs’ capital. The major
financial decisions involved in corporate governance include
laying down basic objectives to be met, evaluation of the
objectives, establishment of the budget, budget approval,
deciding on capital structure, cost of finance, fund
raising, investment and distribution of returns (Horne, 2003
and Mudibo, 2005).
In this context, the financial practice team needs to set up
the objectives of the co-operative. They should come up with
alternative options to invest available funding and evaluate
the core objectives by costing them. The alternatives are
ranked based on cost and benefit analysis and the best fit
is selected. Once the team is satisfied with the selection,
a budget is established for the selected objectives. This
incorporates a plan to show how much would be incurred in
carrying out the chosen alternative. The common budgets12

include working capital, revenue, cost of mobilizing funds,
cash, and disbursement budgets. These budgets are forwarded
to the management committee for approval. The possible
capital structure to invest in the selected objectives is
identified once the budget is approved. In this case, the
management should identify the required start-up capital and
long-term finance in order to achieve its objectives. A
decision is taken on the mix with respect to optimum capital
structure and considerations are made on the returns and
risks of such sources (Singh, 2003). The cost of capital for
each different funding is evaluated because different types
of capital carry different rates of return. For instance,
loans without full security or with a high risk usually
carry higher rates of interest. The Return on Capital
Employed (ROCE) is determined as well and expressed as a
percentage of the capital employed in the co-operative
business. The funds to be used in the investment are raised
from the sources identified during the mobilization of
financial resources (Ross, 1998).
13

After the required funds have been raised, they are then
applied to generate income. This is the utilization of the
finance raised by the society in the selected objectives.
This marks the implementation stage of the investment
identified by the SACCO Society. However, after income has
been obtained, the agent measures the results from the
investment by preparing a statement of comprehensive income
which shows the surplus, statement of financial position
indicating the financial state of affairs as at that time
and cash flow statements. The management committee
determines whether the appropriate returns. The dividends
and rebates are paid according to the SACCOs’ policy where
the focus may be to distribute profits or set up reserves to
pay debt in future or set sinking funds for retirement of
debts (Pandey, 2010).
2.1.3. Impact of capital structure on growth of SACCOs
SACCOs need to establish stable and consistent capital
structure because they require finances to invest in capital
14

and operational expenses for the achievement of their
objectives. In performing this function of sourcing for
funds, the management team determines the most optimal
capital structure to be employed. The capital structure of
the SACCOs comprises members’ shares and debt capital,
savings/deposits and retained surpluses, (Maina, 2007).
SACCOs are generally concerned with invested funds,
institutional and debt funding. Their equity capital can be
obtained by combining direct investment, retained patronage
and surpluses, per unit capital, retained sales of common or
preferred stock and net profits (Evans, 2001).With regard to
share capital, the total finance required is divided into a
number of monetary units called shares and sold to the
prospective investors competitively. The number of shares
held by each investor reflects the degree of his/her claim
on the net assets of the SACCOs. In this case, shares
represent the member’s relative ownership position of the
total investment of the co-operative society. Contrarily,
debt capital is funds borrowed from other institutions or
individuals such as banks, non-bank financial institutions
15

and well-wishers. It normally carries a fixed rate of
interest payable at specified times of the year. Debt
capital requires some prudent management and the purpose of
the loan must be clear. Importantly, debt capital is a
cheaper source of finance though it involves a considerable
risk in case the society is unable to meet the set
obligations of repayment and financial payments.
Further, SACCO societies can draw finances from internal
sources such as institutional capital where, for instance,
the society utilizes the surplus retained in its earlier
years of operation. Institutional capital is a cheaper
source of co-operative financing since they do not involve
floatation costs. They are also more flexible sources of
financing as there are no conditions imposed upon the
society on their utilization. Similarly, SACCOs can also
draw their finances from reserves and provisions. The latter
is the surplus set aside to carter for the SACCOs’ specific
purposes and such funds may be reinvested into the society.
Examples of such sources include sinking funds. In some
cases, accrued expenses can be used by SACCOs as spontaneous16

sources of financing in the course of running the SACCOs’
business. Pragmatically, resources are conserved for
sometime before the expenses are eventually cleared, usually
when the SACCOs cash flow has improved. In such instances,
the SACCO Society may utilize such funds as a source of
financing. In fact, this is a cheaper source of financing
for SACCOs though care should be taken in case of failure to
pay the expenses on time is misinterpreted as the society
having financial liquidity problems (Pandey 2010). At
another level, trade credit can also be used as a source of
financing SACCOs. This kind of scenario happens where the
society finances the acquisition of short-term assets
through credit facility availed by the supplier. In such
transactions, the society is able to conserve cash which is
invested before the creditors are paid. In addition, the co-
operative society can use leasing as a source of financing
the SACCOs’ activities. This involves the use of services
from assets without having any ownership rights. This is a
long-term financial obligation where the SACCO Society
obtains the possession and use of assets without full
17

payment of the value of the assets (Horne, 2003). Thus, the
funds which would have been spent to acquire the assets are
conserved and invested by the co-operative society.
Sometimes the co-operative society may need to dispose
surplus assets. In such situations, the surplus assets such
as bonded vehicles are normally sold after examining their
levels of depreciation and the funds accruing invested.
Similarly, deposits and savings can also act as sources of
financing for SACCO societies. In this regard, SACCO society
members and third parties may put funds into the co-
operative in form of savings or short-term investments.
These funds can be invested by the SACCO Society to generate
returns which can be used in repaying the deposits and
interest with any surplus re-invested in the SACCOs (Evans,
2001). Finally, SACCOs can also use hire purchase as a
financial strategy to implement their projects. Ideally,
this involves the acquisition of assets payable in
installments over a stipulated period of time. The extra
funds which could have been spent in acquiring the asset on
cash basis are invested in an area of high growth by the18

SACCO Society to ensure surpluses for the benefit of the
members. In this strategy, the asset will generate returns
which can be able to finance the repayment of the hire
purchase installments (Ofei, 2001).
The capital structure which optimizes the requirements of
the shareholders and the financial requirement of the
society needs to be maintained and should be compatible with
the interest of other stakeholders such as creditors,
employees, government, customers and the general public.
Capital structure should be in a position to maximize
returns without additional costs. The best optimal capital
structure is the one that yields the minimum weighted
average cost of capital (WACC) (Pandey, 2010). The
computation of WACC requires the sum of the cost of each
individual source capital and its relative weight where the
weight is the relative strength of each source with respect
to the total amount contributed. Capitalization can be
determined using the Net Operating Income (NOI) approach
which states that the value of the firm and the weighted
19

average cost of capital (WACC) are independent of capital
structure.
The cost of debt and the cost of equity are independent of
capital structure (i.e. they remain constant). Therefore,
the cost of capital declines and the share value increases
with debt. The shareholders would receive the same cash
flows regardless of the capital structure (Pandey, 2010).
The traditional approach to valuation and leverage argues
out that a moderate degree of debt can lower the overall
cost of capital. This will, therefore, increase the share
value. This is to say that the SACCO Society can lower its
cost of capital and raise its total value through leverage.
There is an initial increase in the cost of equity which is
offset by lower cost of debt. As the debt increases, there
is an increase in risk and a rise in the cost of equity.
This continues until the lower cost of debt benefit is more
than offset by more expensive equity. Thus, in the
traditional approach, the cost of capital is not independent
of the capital structure of the SACCO Society and there is
no optimal capital structure (Horne, 2003). 20

2.1.4. Association of funds allocation strategy on growth
of SACCOs
Efficient allocation of capital is the most important
financial practice function in any SACCO Society and it
involves decisions of committing the co-operative funds to
SACCOs’ assets. Such decisions determine their value and
size by influencing their growth, surpluses and risk. The
investment decisions are the capital budgets or capital
expenditure decisions. SACCOs should make decisions to
invest their current funds more efficiently in long-term
assets in anticipation of expected flow of benefits over a
series of years. Such investment decisions generally include
expansion, acquisition, modernization and replacement of
long-term assets (Horne, 2003). The SACCOs’ value will
increase if investments are profitable and add value to the
SACCOs’ wealth. These investments should yield benefits in
excess of the minimum benefit as per the opportunity cost of
capital. Thus, before an investment is made, the co-
operative should be able to determine its economic
viability. The methods used to determine the economic21

viability of a project include Net Present Value (NPV);
Internal Rate of Return (IRR); Payback period (Payback) and
Surpluses index (Pandey, 2010).
NPV is the excess of present value of the future cash flows
over the initial outlay of the project. Thus, NPV = Present
Value less Initial Outlay. The project is accepted when the
NPV is equal to or greater than zero. It recognizes the time
value for money. It also correctly shows that cash flow
arising at different time periods differs in value and is
comparable only when their equivalent “present value” is
found. The IRR refers to a point at which the present value
of future cash flow is equivalent to the initial outlay. It
is the rate that equates the present value of cash flow to
the initial outlay. Surpluses index on the other hand, is
the ratio of the projects present value of its cash flow to
its initial outlay. The decision criterion is that a project
will be accepted if it has a surpluses index of one or more.
It gives the same result as NPV. The Payback Period refers
to the period of time that a project takes to recover its
initial outlay. The shorter the payback period, the better22

it is for the co-operative society. However, the method does
not consider all the cash flow as it is interested in the
cash flow in the initial years before the recovery of the
initial outlay. It ignores all other cash flows arising
after recovery of the initial outlay (Horne, 2003). Finally,
distribution shows how profits made during the year are
utilized. Some of the surplus may be transferred to specific
accounts to be utilized in the future for specified
activities such as replacement of assets.
2.2. Critical review of theories explaining the growth of
SACCOs
The existing theories explaining growth of SACCOs can be
categorized into governance (financial stewardship),
dividend, capital structure (capital structure), funds
allocation strategy, and growth theories.
2.2.1. Financial stewardship theories
23

The financial stewardship theories set the SACCOs’
objectives as value maximization which is complemented by
the SACCOs’ vision. Key among these theories is the
stakeholder theory which says that corporate decisions
should consider the interest of shareholders. However, the
theory is not a legitimate contender of value maximization
(Jensen, 2001). Another theory, virtue ethical theory of
corporate governance states that SACCOs’ agents and
shareholders should conduct themselves appropriately. The
theory suggests an ethical approach towards economic
situations such as when there is less wealth or when there
is competition (Zetsche. 2007). The theory involves
effectiveness and intellectual aspects of the steward and
virtues can be instilled with education (Abdullah &
Valentine 2009). This theory is very useful to this study in
that it will help to relate the staff ability to ability to
growth of SACCOs. Agency theory reduces the SACCO Society to
two participants; steward, and the shareholders (Daly et
al., 2003; Clarke, 2004). According to the theory,
shareholders expect the stewards to act and make financial
24
decisions in the interest of the shareholders (Padilla,
2002) with the aim of maximizing shareholders value. This
theory provides a separation of ownership and control
(Bhimani, 2008).
In the Stewardship Theory, stewards protect and make profits
for the shareholders and they are satisfied and motivated
when SACCOs’ objective is attained (Abdullah & Valentine
2009). It stresses that the executive management are
stewards who ensure they operate the SACCO society to
maximize financial performance as well as shareholders’
profits (Daly et al., 2003). Donaldson (1995) contend that
this theory appreciates the importance of structure which
empowers the agents and it allows for the stewards’ autonomy
built on trust. This theory will assist in identifying the
role of the finance staff in growing the SACCOs. Transaction
cost theory recognizes that the organization and structure
of a SACCO Society can determine its profitability. This
theory helps to establish the need for qualified staff in
the SACCO Society for maximization of the SACCOs’ wealth
(Abdullah & Valentine 2009). As with agency theory, the25

finance theory is concerned with ensuring that managers act
to maximize shareholders’ wealth. The theory is an efficient
market model (Blair, 1995; Keasey et al., 2004) which
actually recognizes the agency costs (Jensen & Meckling,
1976). The myopic market model shares a common view with the
agency theory where the firm should serve shareholders’
interests only. According to the model, short-term
performance are encouraged thereby sacrificing long-term
value and competitive capacity of the SACCO society
(Moreland, 1995). According to the model, earnings can
provide a clue as to the firms value (Stein, 1988). This
model argues out that maximization of shareholder welfare
does mean share price maximization. This is owing to the
fact that the market system tends to undervalue long-term
expenditures which may lead to the increase of the
shareholder welfare. Owing to myopic nature in the
governance structure, the agents are forced to take short-
term decisions in increasing share prices (Keasey et al.,
2004).
2.2.2. Theories on capital structure 26
Studies on capital structure have erupted since Modigliani
and Miller theorized in 1958 (Flannery & Hankins, 2007) in
M-M theory. The most popular theories are trade-off theory,
pecking order and market theory (Small Stocks, 2008).
The first theory, trade off theory encourages borrowing for
the firm to enjoy the tax advantage. The trade-off theory
takes a common sense approach by encouraging firms to gain
from the tax advantage in debt financing (Small Stocks,
2008; Ahmed & Hisham, 2009). The second theory, Pecking
order theory, encourages debt financing for the capital
structure (Ahmed & Hisham, 2009). In fact, the internal
financing is preferred to external financing and debt
financing is preferred to other external options. The theory
supports the suggestion that debt is cheapest and most
attractive of the external sources of financing (Flannery
&Hankins, 2007 and Small Stocks, 2008). The third theory,
market theory emphasizes that a firm would prefer equity
financing when the perceived cost of equity is low and
prefer debt financing when cost of debt financing is low.
The financial managers should make security issuance27
decisions based on the cost of equity capital and cost of
debt capital (Huang & Ritter, 2008).
Lastly, Modiglani–Millier (M-M) theorem, often called the
capital structure irrelevance principle indicates that the
value of a firm is not influenced by how the financing is
done (i.e. it is independent of the capital structure)
(Chorafas, 2004). According to the theory, the source of
funds does not affect the value of the firm in the absence
of taxes, bankruptcy costs and asymmetric information and in
an efficient market. This theory is suitably applied where
there is: perfect and efficient market, no transaction
costs, no default risks, no taxation. M-M theory does not
propose a more effective capital structure between the
equity and debt capital but simply states that the source of
fund is inconsequential in the stated conditions (Pandey,
2010). Another theory, the pricing theory shows that a
profit can be obtained by buying the asset on the market at
lower price and simultaneously selling the same asset on the
market with the higher price without necessarily using any
actual investment. In this case, the investors make28

exploitation on them, and as time goes by, the price of the
assets changes up to equilibrium again when there are no
more positive returns between the same assets and the
possibility of profiting from arbitrage is gone (Rorden &
Kristofer, 2010).
2.2.3. Funds allocation strategy theories
The investment flow over a given period can be measured as a
difference between capital at the end of the period and the
share capital at the beginning of the period. The Keynesian
Theory of investment emphasizes on the need of interest
rates in investment decision such that changes in interest
rates affect the level of planned investment. It states that
when interest rates fall, the cost of investment decreases.
One of the investment theories, the E-ratio theory states
that net investment directly depends on the ratio of the
stock market valuation to the replacement cost of that firm.
The E-theory is the optimal investment rate of a function of
future surpluses (Philippon, 2006). According to the
informational theory of investment, information is the
29

primary cause of investment performance. As such, the market
patterns are, therefore, subject to information the
investors have.
The yield theory (simply known as the Y-theory) suggests
that when the stocks are small, the risk free yields, risky
corporate yields and book leverage have a linear combination
leading to aggregate investment (Phillpon, 2006). Lastly,
the Kaleckiam model of growth and distribution (1933)
defines the investment as a function of anticipated growth
of surpluses and interest rates. In the Q-theory, the SACCO
Society would choose investments to equate the marginal
value of capital with the marginal cost of capital
(including adjustment costs) without regarding the
investment costs (DeMarzoy, Fishmanz, Hex & Wang, 2010). The
marginal value of capital, Q equals the average value of
capital, Q1.
2.2.4. Growth theories
Growth can be based on endogenous growth theory or neo-
classical growth model. The neo-classical growth theory
30

argues that the rate of growth is exogenously determined
using the Harrod Damar model or Solow model. Solow-Swan
class growth theory which focuses on capital and labor
indicates that capital is added when SACCOs invest but is
lost due to depreciation. The indication is that there is
capital growth in wealth only when the investment exceeds
depreciation (Gardner, 2006). The investment should insist
on keeping the capital growing to achieve capital growth.
That increase in capital yields leads to an increase in
growth of SACCOs’ Wealth. The theory explains growth as a
factor of accumulation of capital. This model is strongly
supported by Harrod Damar Model of development economics
(1946) which explains the growth rate in terms of saving and
productivity of capital. It explains that increase in
investment leads to accumulation of capital.
2.3. Empirical literature
Studies have been carried out on growth of SACCOs explaining
different determinants of such growth. These studies are
global, regional or local. This study has considered the
31
following studies identifying the gaps and critically
analyzing the findings. The research sought the relevant
information on previous studies from university libraries,
private libraries, and public library and through the
internet search. Such material was in journals, research
papers and working papers.
In 1998, Mrema carried out a study on Tanzanian Women and
Progress in Tuke Consumers' Marketing Co-operative. The
study found that the SACCO Society had increased profits. It
had also continued to pay dividends to members. However, it
faced challenges of illiteracy, lack of training, and
business. It was recommended that through economic power,
members can meet their economic ends that act as motivation
for other members to join the societies. In another study,
Beck et al., (2000) examined the causal impact of financial
development on growth and its sources where they found that
there was a significantly positive causal impact of
financial development on real per capita growth and
productivity per capita growth. The study then recommended
that positive repercussions for long-run economic growth32
improve resource allocation and accelerate productivity
growth. In the year 2001, Davies conducted a study to review
the contemporary debate on governance within the co-
operative sector and make an analysis of the traditional
approach taken by the movement. This study found that
professional management was inevitably gaining ground
against lay directors. The study then recommended that when
people identify with co-operative purpose and values, they
would want to be involved. Good governance in co-operatives
was more a problem of management culture.
Ofei (2001) carried out a study on Retooling Credit Unions
and found that the SACCO Society was diversifying products
and services; had established own central services, such as
the Central Finance Facility; had a risk management schemes;
and had made great strides in the growth of their financial
resources, their operational costs are not able to cover its
costs to make it self-sufficient. The study recommended that
credit unions in Ghana (CUA) Ghana; must charge interest
rates that would ensure viability, sustainability and
growth, for the benefit of all members; geared to self-33

sufficiency and increasing reliance on self-generated funds
and needed to adopt the World Council of Credit Union’s
PEARLS system to enable her monitor the performance of the
Credit Unions in Ghana.
A study by USAID (2001) found that co-operative autonomy was
associated with success; governance structures need to be
strong, transparent and honest; co-operatives needed to
perform well to survive, endure and thrive; and support to
co-operative development that creates dependency undermined
the mutual self-reliance that is central to cooperation.
This led to their recommending that co-operatives needed to
develop professional management in order to adapt, innovate,
and take rational risks to satisfy the expectations of their
owners; and co-operatives succeeded when they consistently
delivered value to their owners.
In another study by Agrawal et al., (2002) on the role of
member-funds in multi-purpose co-operatives, it was found
that; member funds had a central role in enhancing co-
operative performance; funds provided voluntarily were of
34
high quality and externally compelled member funds were of
low quality. The study then recommended that the members’
share capital which provided permanent capital, long-term
capital and short-term capital was very useful to
performance of the SACCO Society for it provides quality and
quantity. Remezani et al., (2002) conducted a study
associating corporate performance and SACCOs value creation
to growth in earnings and found that; EVA, ROE and ROI would
rise earnings and sales growth; firms with moderate growth
in earnings showed highest rates of returns and value
creation for their shareholders. In their recommendations,
they said that; growth should not be the input to strategic
planning but an outcome of sound investment strategy that is
geared towards accepting value creating projects; and
managers needed to shift their strategic goals from creating
growth at the moment and waiting for surpluses later to
enhancing profitable growth now.
Agrawal and Chadha (2005) and Agrawal and Cooper (2007)
conducted another study to examine whether certain corporate
governance mechanisms were related to the probability of a35

firm restating its earnings. In this study, they found that
the key governance characteristics such as independence of
boards and audit committees, and the provision of non-audit
services by outside auditors were unrelated to the
probability of a company restating earnings. They
recommended that independent directors with financial
expertise were valuable in providing oversight of a firm’s
financial reporting practices. Other studies were carried in
the year 2004 on growth of wealth. For example, Brounen
(2001) carried out a study to measure corporate governance
and firm performance. Brounen then found that better-
governed firms were relatively more profitable, more
valuable, and paid out more dividends to their shareholders.
This study noted that good governance was associated with
the firm performance. In another study, Det-Wet (2004) found
that sales growth minus sustainable rate of growth did not
contribute significantly to SACCOs’ value; there was
significant correlation MVA and Estimated Value Added (EVA);
and that there was a weak correlation between the Market
Value Added (MVA) and main drivers of (EVA). His
36

recommendation was that managers needed to use the finding
to optimize their approach to SACCOs’ value management.
Adeyemo and Bamire (2005) in their study found that
unavailability and inadequacy of credit was a major problem;
loan repayment and amount of money borrowed were significant
variables that influenced saving patterns; and fund borrowed
significantly influenced investment patterns. This led to
their making recommendation that saving and investment level
could be enhanced if loans were adequately made available
and proper supervision and monitoring of funds were put in
place. In another study, CGAP (2005) found that donors
participated in SACCOs to provide funds for growth of their
wealth. In this regard, they recommended that the donor
needed to; invest in building capacity instead of injecting
external funds for lending; encourage sound governance
policies; keep financial standards at the core of internal
management and external supervision and support competent,
independent external supervision of SACCOs. Deji (2005)
conducted another study where it was found that there was
positive and significant relationship between membership37

demographic-socio-economic characteristics such as number of
children assisting in farm work to the member’s contribution
to the SACCOs; and membership of co-operative societies was
very significant to favorable adoption behaviour of women
farmers towards innovations. It was recommended that
adoption of agricultural innovation and improved varieties
was crucial to development of members and should hence be
encouraged as a strategy for improving their livelihoods.
In the study conducted by Karki (2005), it was found that in
developing countries, co-operative was one of the income
sources of their rural economy whereas in developed
countries, it took a sustainable business. This is where it
was recommended that strategic plans were necessary to bring
about the internal improvement in co-operative societies,
provide quality services through skill, trained and educated
manpower, and e-commerce.
In the year 2006, other studies on growth of wealth were
also carried out. Archer and Karim (2006) in their study on
capital structure, risk sharing and capital adequacy in
38

Islamic banks found that Islamic banks set up reserves with
the intention of minimizing any need to forgo management
fees. They then recommended that displaced commercial risk
was potentially a means of sharing risks between two classes
of investor with different risk diversification capabilities
and preferences: wealthy shareholders who were potentially
well-diversified and less wealthy members who were not.
A study by Chege (2006) found that loan default was
subjected to changes in interest rates; demographic changes,
credit scores effect, loan default; and values of collateral
to security. The recommendations were that there should be;
lower interest rates; participatory involvement in
regulating monetary policy; introduction of new loan
products; and issue of loans of low value for growth to be
experienced. Fiorillo (2006) conducted another study where
it was found that external funds did not help a weak SACCO
Society become strong; wholesale loans to a SACCO society
could impact the savings culture of the institution
positively or negatively; SACCOs could be very successful
without accessing external funds; efficient capacity39

building was crucial; and monitoring and reporting
requirements imposed could lead to improvements in
management practices to be of great value to the SACCOs. The
study then recommended that external funding should be
discouraged and instead encourage and promote a strong
savings culture. In fact, wholesale lenders should not urge
institutions with excess liquidity to borrow external funds;
and SACCOs should undertake a wide member sensitization
programme about the source and implications of the wholesale
funding.
In a study by Kaupelytė and McCarthy (2006), it was found
that risk management related to credit union development
stages such that as a SACCO Society matures, higher
standards of risk management should be implemented. In some
cases, these changes were accompanied by shifts in the
regulatory framework. The study recommended that the
regulatory regime was not always aligned with the stage of
credit union development and indeed, reflected the economic
policies of the country in which they operate.
40

Nanka-Bruce (2006) conducted another study where it was
found that good corporate governance practices positively
impacted on performance and recommended that firms needed to
impose effective good governance to grow. Ogbimi (2006) in
his study found that; the sources of financial resources
were many and varied; lack of self-discipline in saving
money, impulse buying as well as spending too much on
ceremonies were the major problems of financial management
of rural women; the problem of no savings would always lead
households to financial embarrassment at times of
emergencies; and impulse buying could result to non-purchase
of needs that were of priority. It was then recommended that
trainings in the rural area were important to teach members
of households more about financial management. Emphasis
should be laid on importance of savings, the study by
Sundaram-Stukel (2006) found that innovative approaches to
lending and savings was useful to development; and
partnerships with small-scale and large-scale producers had
the potential to enhance welfare and improve access to
financial services for the poor. This study recommended that
41

there was a potential for many forms of intervention to
increase participation and improve access to financial
services for the poor.
Lastly, Tache (2006) conducted a study which found that
farmers were convinced and decided to have their own
financial institution to empower themselves. They showed
their readiness and commitment to help themselves by good
contribution of registration fees. The study recommended
that support was needed to be given to the SACCOs to start
computer-based accounting and financial management system;
and technical training and monitoring support was needed to
promote the SACCOs.
Substantial studies on growth of SACCOs were carried out in
the year 2007. Ashers (2007) study found quality of
governance and regulation as well as professionalism and
modernization were the main factors to development of firms.
The governance and regulatory structures needed to be
brought in conformity with prospective economic structure;
and relevant laws modernized. This study proposed that
42

better understanding of the reasons for differences between
well-governed and financially sound firms and those that
were not was possible through further research.
Another study was by Nair and Kloeppinger-Todd (2007) which
found that Burkina Faso had a special law for SACCOs,
prudential regulation requirements, and arrangements for
financial supervision, but had inadequate resources and
capacity for effective supervision. In contrast, Brazil
presented a case of well-developed regulation and effective
supervision. This study recommends that SACCOs would provide
financial services in rural areas in developing countries
and be profitable if they operate better in environments
with prudential regulation and financial supervision.
The study by World Bank (2007) found that failure came where
financial co-operative systems were unsustainable, subject
to political influence or used by governments for their own
purposes. This then led to recommendation that for financial
co-operatives to be sustainable, governments needed to
provide an enabling environment, not exercise excessive
43
control that restricts growth and consolidation, and not use
them as channels to provide subsidized credit. Integration
enabled improved governance and the ability to provide a
wide range of services.
Aredo (1993) conducted the survey study on the linkage
between informal and semi formal financial institutions in
Ethiopia. The study used case of selected institutions in
Ethiopia. In this study the researcher selected a case of
four saving and credit associations which were; Ethiopian
Airlines Employees' Savings and Credit Co-operative,
Telecommunication Authority Employees' Savings and Credit
Co-operative, Assella Truck Loaders and Unloaders' Savings
and Credit Co-operative (ATSACC), Addis Ababa University
Employees' Savings and Credit Co-operative (AAUSACC). In his
study the researcher found out that Savings and credit co-
operatives have huge potential for savings mobilization in
Ethiopia. Although the rate of growth of these co-operatives
has been relatively high since 1978, much remains to be done
to realize their existing potential. The case of the model
co-operatives has brought to light certain important points.44

The ingenuity and creativity of those successful co-
operatives are admirable; they are actively investing in
income-generating activities. The weaker co-operatives have
much to learn from the successful ones. The case of the
daily laborers’ co-operative has demonstrated that credit
unions can thrive even among the uneducated and poor workers
operating in the informal sector. It has also found out that
Credit co-operatives have linkage with the informal and
formal sectors.
Overseas Co-operative Development Council, Arlington (OCDC)
(2007) in their study found out that success factors for co-
operatives were; legal framework; an economy that permitted
all types of competitive businesses; membership that is open
to users; equity; high equity/debt ratio; Member-centered
services; board of directors elected by and from members
only; organization around a resource base and service
sufficient to sustain the co-operative as a viable business;
Professional management; access to markets; accountability
of all employees to the co-operative; management training;
membership education; and willingness to use modern45

technology. It recommended that success of co-operatives
would be by; creating an enabling legal and regulatory
environment, accessing markets (Local, Regional and Global),
moving from government to member control, and reaching scale
and emerging from dependency.
The study by World Council of Credit Union (WOCCU) (2007)
found that SACCOs had enough products; the members had the
capacity to save and repay loans if an appropriate promotion
mechanism was devised; and the poor saved if financial
organizations took good care by offering good personalized
services. It was then recommended that SACCOs were
financially sustainable and were in a position to provide a
range of products; and it was noted that there was need for
collaborative efforts of all stakeholders of SACCOs to
ameliorate their existing weaknesses.
Financial Sector Development Secretariat (2007) carried out
a study which showed that SACCOs played a significant role
in savings mobilization, promotion of investment, economic
growth and poverty alleviation. They had huge potential to
46
play a key role in Rwanda’s sustainable economic growth
based on national resources. The recommendation was that to
be effective and successful, this strategy requires a
conducive macro-economic environment.
Huyssteen’s (2005) study showed that existing rating
methodologies could be amended to reflect the unique nature
and character of SACCOs in order to reflect their true risk,
and ultimately address their funding requirements and
liquidity crunches. This could lead to a true indication of
the SACCOs risk, as well as neutralize possible
discrimination between SACCOs. It recommended that, in order
to remain at an acceptable level of liquidity, the bank may
place papers in the market, borrow from other financial
institutions or make use of its reserves.
Another study by Ogsi et al., (2007) showed that lack of
access to finance and high costs of resources were
constraint to operations. It further recommended that
government and private firms should support financial
institutions; business owners should form co-operatives to
47

pool together financial resources for their benefit;
informal finance should be encouraged because it did not
need collateral securities; and training on co-operative
education.
Roselyne (2007) conducted a study which found that factors
that influenced repayment of loans in SACCOs were salary,
nature of loans, and control recovery measures that the
SACCO society has in place to check defaulters. The study
recommends that there was need for SACCOs to implement sound
management, sound control and loan recovery measures. Loan
advance should be based on past repayment history of the
borrower, salary levels and contributions; and there should
be diverse loan products. Kinuthia (2007) carried out a
study which found that SACCOs were incurring losses due to
loan default which affected the wealth of members. The study
recommended that SACCOs should provide guidelines on loan
policy and credit extension to members; need for integration
of SACCOs’ information system to employers; and need for
Ministry of Co-operative Development and Marketing to liaise
with Ministry of Immigration and Registration of Persons to48

be able to instantly access information on departing
employees. The study by Gaita (2007) showed that the lending
institutions were not growing significantly due to poor
lending practices. It recommended that lending institutions
should make products and services more available;
stakeholders should be trained; and favorable regulatory and
legal framework is important for the growth of the
institution.
In another study by Kimani (2007), it was found that the
main causes of inefficiency and ineffectiveness in credit
administration were unqualified staff in SACCOs; inadequate
funds to lend; inadequate training; lack of effective
technology; weak internal control systems; and credit
management committee is very powerful and able to manipulate
the lending. The study recommends that the SACCOs should,
therefore, increase the funds for lending through external
borrowing; employ competent staff; restructure the
organizational structure; funds should be allocated to
investment with high returns; increase the loan products
(diversify) to satisfy members; embrace teamwork; adopt49
modern technology; change interest rates to attract members;
ensure competition with other financial institutions; ensure
networking with other SACCOs; provide education and training
to members and staff; change location of office; participate
in corporate social responsibility.
Another study by WOCCU (2007) found that credit unions in
all had built extremely high levels of members’ goodwill.
Members were quite satisfied with their credit unions. Once
they joined, respondents tended to be highly loyal; and
credit unions had also a significant source of financial
sector expansion. This study recommends that marketing
capacity and outreach was useful in customer service. SACCOs
could reach new markets while cementing the loyalty of
existing members. Grell (2007) carried out another study
which found that outreach had increased and credit unions
were then serving more people; the rate of programme growth
had slowed significantly since the WOCCU project ended.
Credit unions did not track the surpluses of any credit
product and therefore, were not using the cost analysis tool
designed by the WOCCU project to track the surpluses. Credit50

unions had not been as aggressive about expanding the
programme as they were when they had technical assistance
and oversight from WOCCU. The recommendations in this study
were that the program, or some variation of it, could and
should be implemented in other countries. Additionally,
products that credit unions could implement for downscaling
without donor funding, and addressing external challenges
and internal programme management problems in group savings
and lending programmes with or without education that may
impact the sustainability of these programmes over the long
run.
Wieland (2007) also conducted a study which found that
credit unions were tied to prohibitions. For investment
capital to increase it should be invested in trade or a
sharing of risks between the borrower and lender; members
could not be paid returns on deposits though they can
receive a share of institutions net gains annually;
institutions could invest on interest earning accounts
unless sanctioned by Sharia compliant; share investment was
large and onerous; tax implications were fraught; investing51
SACCOs required a deeper thought of SACCOs accounts;
interest returns would make estimating the institutions
position at any point in time more difficult. The study
recommends that SACCOs would gather more local acceptance if
their products and operations were more recognizable.
In a study by Muruana, (2007) it was found that failing loan
portfolio; erosion in value of members’ shares and loss of
value affected SACCOs’ wealth. The study recommended that
SACCOs should make adjustment on lending rate in line with
inflation, adjust interest rates; and Ministry of Co-
operative Development and Marketing (MOCD& M) should develop
a policy on how to counter inflation in SACCOs.
Hein (2008) conducted a study where it was found that
increasing shareholder power would either have positive
(finance-led), negative (normal) or intermediate (profits
without investment) effects on capacity utilization, profits
and capital accumulation. In the medium run, the positive
(finance-led) effects may have to be maintained in a stable
environment under very special conditions, whereas the
52

negative (normal) and the intermediate (profits without
investment) effects turn into cumulative disequilibrium
processes with falling rates of capacity utilization,
profits and capital accumulation and rising debt and
renters’ equity-capital-ratios. The study recommends that
increasing shareholder power was associated with decreasing
managements’ animal spirits, on the one hand, and increasing
dividends distributed to shareholders, on the other hand. In
another study Baker et al., (2008) found that perceptions of
factors that influence dividend policy differ between
managers of financial and non-financial firms. Industry
classification also affected how managers viewed statements
about the dividend pattern, dividend setting process,
dividend policy and firm value, residual dividend theory,
and explanations for paying dividends. They recommended that
researchers investigating dividends should partition the
data by industry type and perhaps other firm characteristics
to better understand the dividend puzzle.
The study by Delcoure (2008) found that corporations that
owned superior corporate brands exhibited higher surpluses53

and create SACCOs’ wealth independent of economic downturns.
It was then recommended that branding efforts added value to
the firm and exhibit risk mitigating characteristics. Chava
and Roberts (2008) carried out a study which found that
capital investment declined sharply following a financial
covenant violation, when creditors use the threat of
accelerating the loan to intervene in management. The study
recommends that reduction in investment was concentrated in
situations in which agency and information problems were
relatively more severe, highlighting how the state-
contingent allocation of control rights could help mitigate
investment distortions arising from financing frictions.
Lari (2008) conducted a study which found that best
financial ratio was able to bring to light fraudulent
financial statements on members’ shares and deposits
dividend return; members’ loan schedule balance/loan ledger
balance; financial investment/total assets; (liquid
investments + liquid assets – short-term creditors)/total
assets; non-earning liquid assets/total assets; net loans to
members/total assets; gross loans to members/total assets,54

members’ deposits/total assets. Best were: net profit/total
assets ratio; total operating expenses/average total assets
ratio; and growth in members’ loans rate.
Lastly, Papias and Ganesa (2009) study found out that age,
gender and size of the household, purpose for credit,
interest rate charges and number of official visits to the
credit societies, had a strong effect on loan repayment
performance (statistically significant at p<0.05) whereas
size of credit disbursed, credit processing and disbursing
time, borrowers' market place and income transfer from
relatives and friends are more or less statistically
significant at p<0.20 level. The remaining factors have
logical and explainable signs but are not statistically
significant. This study recommends that an understanding of
the socio-economic factors affecting repayment behaviour of
rural clients was essential for the outreach and
sustainability of the mushrooming co-operative societies in
the country.
2.4. Empirical literature overview
55

Most research studies on financial management of SACCOs have
been done globally, regionally and locally. These studies
only addressed issues of governance, SACCOs’ financial
health capital structure, loan default, loan management,
capital structure, outreach and SACCOs’ sustainability.
Other studies addressed such issues as financial stewardship
(e.g. effects of governance on wealth, loan default), funds
allocation strategy (for example investment), capital
structure (e.g. effects of external debt) and growth of
wealth independently. Although these studies have been done
on growth of SACCOs’ wealth, none has addressed the
financial stewardship, capital structure and funds
allocation strategy as determinants of growth of ESCAs
especially in Ethiopia.
For instance, the study by Mrema (1998) showed that there
were increased surpluses but it failed to show how the
retained earnings increased as profits increased. There was
also no clear definition of the economic power needed to
grow the economic levels. Beck et al., (2000) study
emphasized on growth of sources but lacked to indicate how56
these sources impact on the growth of wealth. The main
concerns of the study by Davies (2001) were on governance.
However, it failed to even link this governance to growth of
wealth, it only talked of need for good governance which
would make members identify with the SACCOs. Ofei (2001)
related growth to interest rates and self- generated funds.
The study failed to show how these interest rates related to
growth of the wealth and what rates should be charged.
Further, the study failed to show a relationship between
sources of funds and growth of wealth. The study only talked
of sustainability. The study by USAID (2001) very well
showed the need for good stewardship but it did not
emphasize on how growth should be achieved. It only said
that they needed to deliver effectively. This delivery was
not particular and never related to the three determinants;
stewardship; capital structure and funds allocation strategy
to growth.
In a study by Agrawal et al., (2002), emphasis was on the
usefulness of share capital but it failed to show how the
management of the members’ funds, other sources of funds and57

funds allocation strategy would result to growth of wealth.
The study findings by Remezani et al., (2002) were very much
concerned with growth of wealth. It, however, only singled
out the method of achieving this wealth (stewardship) but
failed to include sources of funds and funds allocation in
the findings.
The study by Agrawal and Chadha (2005) and Agrawal and
Cooper (2007) related the growth of surpluses to the
stewardship. It neither touched on the capital structure nor
the allocation of funds. The study by Bowen (2004) related
the growth of surpluses to good stewardship. It, however,
never associated this growth to other factors such as the
capital structure or the allocation of funds. The findings
were similar to that of Det Wet (2004). The same was echoed
by Sundaram-Stukel (2006), Nanka-Bruce (2006), Grell (2007),
Wieland (2007), Muruana (2007). The study by Kaloi (2004)
only shallowly dealt with issues that affected liquidity;
financial stewardship, capital structure and allocation of
capital.
58

The study by Adeyemo and Bamire (2005) identified lack of
funds and poor stewardship and the challenges to growth of
wealth. It did not identify the allocation as a determinant
of growth of wealth. Although the CGAP (2005) study
emphasized on good governance, it did not show how the
wealth would grow. The study by Deji (2005) showed how
members would benefit from the SACCOs, which is the main
objective. However it never showed how the SACCOs’ wealth
would grow. The study by Karki (2005) failed to show how
growth of wealth comes about. It only touched on the
stewardship but not on the capital structure and funds
allocation strategy.
According to the Archer and Karim’s (2006) study, the
reserves were only needed for covering fees not paid for
service instead of using it to grow the firm. The main
concern of the study by Chege (2006) was loan default. The
study never even showed how this default affected the growth
of wealth leave alone showing the determinants of growth of
SACCOs. The main interest on Fiorillo’s (2006) study was the
effect of external lending. Instead of the study encouraging59

alternative ways of sourcing funds, they still emphasized on
wholesale lending. The study did not at all consider the
determinants of growth of wealth. The study by Ogbimi (2006)
was very important to educate SACCO members on how to manage
their wealth but did not show how the firm’s wealth could
grow. Tache’s (2006) study very heavily needed for formation
of SACCOs and the usefulness of common bond but it never
showed how growth can be enhanced by the financial
stewardship, capital structure and funds allocation
strategy.
Asher (2007) shows that sustainability was related to the
stewardship. The study did not at all say how growth of
wealth was related to the three determinants; financial
stewardship, capital structure and funds allocation
strategy. Nair and Kloeppinger-Todd’s (2007) study shows
that sustainability of SACCOs was related to the stewardship
and legal framework. The study did not explain how growth of
wealth would be achieved through the three main
determinants; financial stewardship, capital structure and
funds allocation strategy. According to the World Bank60
(2007), growth and sustainability of SACCOs was related to
the stewardship and legal framework but not also to capital
structure and funds allocation strategy. The study by OCDC
(2007) touched very lightly on the two determinants,
stewardship and capital structure and totally failed to show
how funds allocation strategy would contribute to success.
According to WOCCU (2007) growth and sustainability of
SACCOs was related to the stewardship and legal framework.
The study did not explain how growth of wealth would be
related to capital structure and funds allocation strategy.
According to Financial Sector Development Secretariat
(2007), growth and sustainability of SACCOs was related to
the economic environment but there was no relation to
capital structure and allocation. The study by Huyssteen
(2005) showed that growth and sustainability was related to
the stewardship and legal framework. The study did not
explain how growth of wealth would be achieved.
Ogsi et al., (2007) study showed that sustainability of
SACCOs was related to the capital structure. The study did
61

not explain how growth of wealth would be achieved. The
study by Roselyne’s (2007) study showed that growth of
SACCOs was related to the control of loan default by the
stewards. The study did not explain how growth of wealth
would be achieved.
The study by Kinuthia (2007) reported that growth of SACCOs
was related to the control of loan default by the stewards.
The study did not explain how growth of wealth would be
achieved. Gaita’s (2007) study showed that failures in
SACCOs were related to lending. Growth and sustainability
was related to the stewardship and legal framework. The
study did not explain how growth of wealth would be
achieved. The study by Kimani (2007) identified the causes
of inefficiency and ineffectiveness in credit administration
in SACCOs; and growth and sustainability of SACCOs was
related to the stewardship and legal framework. The study
did not explain how growth of wealth would be achieved. The
study by WOCCU (2007) showed that sustainability of SACCOs
was related to the marketing. It did not explain how growth
of wealth would be achieved. 62

According to Hein (2008), the growth of members’ wealth was
determined by shareholders’ power. The study did not relate
growth to the three factors; capital structure, stewardship
and funds allocation strategy. The study by Baker et al.,
(2008) did not at all talk about growth of wealth depending
on financial stewardship, capital structure and funds
allocation strategy.
The growth according to (2008) was related to product
diversity. The study did not show any other determinants of
growth. The main consideration in the study by Chava and
Roberts (2008) was allocation of funds but the study failed
to consider the other factors of growth. In the study by
Lari (2008), the main considerations were capital structure
which was considerably addressed but the study failed to
consider the other factors of growth. The study by Papias
and Ganesa (2009) examined the factors contributing to
credit repayment behaviour among the members of savings and
credit co-operative societies in rural Rwanda. However, it
failed to address the factors that determined growth in
wealth. 63

These gaps left by previous studies underscore the need for
further research. This study, is therefore, set to fill the
gap that currently exists in this area considering the fact
that wealth maximization (growth) is the main objective of
financial management.
2.5. Conceptual model
The study proposed that the growth of ESCAs is determined by
financial stewardship, capital structure and funds
allocation strategy as captured in figure 2.1 below.
The basic models for this concept are
GESCA= f (LE, LD, LR, LP, DR, SA, INN) for Financial
stewardship.
GESCA= f (SC, SV, IC, DC) for Capital Structure.
GESCA= f (LO, LI, II, NA) for funds allocation strategy.
Where GESCA is Growth of ESCA, LE is Loan Evaluation, LD is
Loan Disbursement, LR is Loan Recovery, LP is Loan
Protection, DR is Default Risk, SA is Staff Competence, INN
is Innovativeness, SC is Share Capital, SV is Savings, IC is
Institutional Capital, DC is Debt Capital, LO is Loans, LI
64

is Liquid Investments, II is Illiquid Investments and NA is
Non-earning Fixed Assets
65

Figure 2.1 Conceptual framework
66
1. Financial Stewardship (FS)
A. Loan Management
I. Loan Evaluation
Eligibility
Ranking
II. Loan Disbursement
Investment Efficiency
Penetration rate
Administrative Cost
III. Loan Recovery
Loan Repayment
Loan Delinquency
IV. Loan Protection
V. Default Risk
B. Institutional Strengths
I. Staff Competence
Academic
Qualifications
Professional
Qualifications
Target Job Training
Experience
II. Innovativeness of
ESCA Products
2. Capital Structure (CS)
A. Share Capital
B. Savings/Deposits
Competition
Political Environment
Technological
Environment
Economic Forces
Legal Framework
Members Demands
Board members Competence
Growth of ESCA (GESCA)
Institutional Capital
Returns to Members

Source: Researcher (2014)
67

Further, there are other factors which cannot be controlled
by the ESCAs but could intervene in the growth of ESCAs
wealth these include Competition, political environment,
technological environment, economic forces, legal framework,
members’ demands and board members’ competence are some
uncontrollable variables.
2.5.1. Independent variables
The rationale behind the selection of these variables is
that first, financial stewardship is viewed, in this study,
as the key ingredient in making financial decisions. Thus,
the direction given by sound investment decisions determines
the future of the growth of ESCAs. In addition, the capital
structure adopted by ESCA may also affect the growth of
ESCAs. In fact, the way funds are used is of great
importance to the growth of the ESCAs. Financial Stewardship
is concerned with the accountability of the management as
regards the financial decision making processes.
Accordingly, the main aspects which are considered to affect
the growth of ESCAs’ wealth include the level of staff
68

knowledge and skills, techniques used in decision-making on
asset management and the ESCAs’ product diversity
(innovativeness). The proposition is that when the staff
making financial decision lack appropriate qualifications,
experience, and training, the decisions made may not lead to
substantial growth in ESCAs’ wealth. In this regard, the
staffs need to have requisite skills and uphold
professionalism among other competencies to arrive at a
sound working investment solution(s). The main components of
financial stewardship are Loan Management (LM) and
Institutional Strengths (IS).
Loan Management is characterized by Loan Evaluation (LE),
Loan Disbursement (LD), Loan Repayment (LR), Loan Protection
(LP), and Default Risk (DR). Loan Evaluation is the
assessment of loan application which provides information on
the eligibility of the application with regard to the
standards set in the ESCAs’ by-laws. The loan assessment
team (supervisory committee) must ensure that the loan
application complies with the by-laws’ requirement for it to
be approved otherwise it is rejected. So, loan evaluation69

being the first step in loan processing, must be done
according to the laid down rules and regulations (i.e. by-
laws of the ESCAs). The considerations of an effective
evaluation include application eligibility and ranking.
Ineligible applications would lead to losses caused by
failure to recover the loan since some of the loanees do not
have capacity to repay the borrowed funds and others lack
sufficient security.
Ranking involves sequencing of approved loan applications.
Failure to rank the loan application means lack of assurance
on when an applicant would expect to get a loan which leads
to members’ dissatisfaction and loss of trust. Eventually,
as a result, the members end up reducing their share
contribution and/or seeking for loan advances from other
sources. This reduces the borrowing as well as the capital
base and thereby affecting the ESCAs’ growth. Effective
decisions on loan disbursement influence the growth
potential of ESCAs’ wealth while ineffective decisions
weaken the earning capacity.
70

The indicators of the loan disbursement decisions include
the efficiency of investment, which is the ratio of loan
portfolio to the total assets. This is where an efficient
loan disbursement grows the loan portfolio which is the core
investment which leads to growth of ESCAs. Another indicator
is the Loan Penetration Rate which is the loan coverage
ratio. The higher the penetration rate, the higher the
availability of loans hence satisfaction of members. A high
penetration rate is an indication of spread of risk and
hence reduction of delinquency rate and reduced losses. This
would also lead to growth of wealth since there is no loss
in principal and interest. The last indicator of loan
disbursement is Administrative Efficiency. This is the total
cost of administration to loan amount disbursed. The lower,
the administrative costs, the lower the amount spent from
the earnings and the higher the growth of ESCAs’ wealth. On
the other hand, the higher the administrative costs, the
higher the expense meaningless earnings and less growth of
ESCAs’ wealth. The administrative costs should be as low as
71

possible, even to being negligible, for the growth of ESCAs
to be recognized.
As regards loan recovery, the ESCAs should ensure high
earning capacity from investments on loans to reflect growth
of ESCAs. This is shown by the Loan Recovery Rate where a
high recovery rate indicates growth of ESCAs and low
recovery rate the opposite. This recovery of the principal
and interest should be done in compliance with a ESCAs’ by-
laws on loan requirements. Delays in servicing the loan
repayment would affect the ESCAs’ liquidity in that, the
funds traded (principal) and the interest are withheld at no
additional profitable gain. Such delay would, therefore,
cause loss in the investment resources. Loan repayment being
the average collection period of the loan is used to measure
the quality of loans in which case a shorter collection
period indicates better quality loans and a longer period is
an indicator of low quality loans. High quality loans are an
indication of growth in ESCAs’ wealth. When ESCA efficiently
manages loans, there is high quality loan management and the
average collection period is short leading to growth of72

ESCA. The other aspect of loan recovery is loan delinquency
in that the loan portfolio occupies the largest proportion
of the total assets of the ESCAs; it holds the largest
source of risk. As such, the risk of the ESCAs largely
depends on the quality of loan portfolio. Where the
collaterals to loan advance are strong, the loan can be
recovered by selling out the collaterals. The loan portfolio
is measured in terms of Loan Delinquency.
Loan Protection which means safety of shareholders’ funds,
involves loan loss provision. Inadequate loan loss provision
results in inflated asset value (overstatement) and
fictitious earnings. Overstatement of loan assets would lead
to losses when these non-performing loans are not paid. Loan
protection provides safety of the ESCAs’ wealth by
provisioning for losses on loans disbursed. This being the
protection of the ESCAs’ assets is made by providing
sufficient allowances for loan losses. Since loan loss
provision is deducted from the gross loan, lack of adequate
provision for loan loss in ESCAs leads to inflated asset
value and reporting of fictitious earnings. However,73

realistic protection leads to reduced overstatement which
enhances shareholders’ confidence retention, attraction of
prospective members, and prevention of potential crises.
Such is an indication of growth of ESCAs. A healthy ESCA
should have adequate provision allowances for non-performing
loans. Any loan not performing for more than 12 months is
considered a bad debt. The last aspect of loan management is
default risk assessment which measures the loan default
probability. It should be noticed that default risk analysis
is the assessment of loans in order to avoid or reduce the
probability of loan default. When the default risk analysis
is effective then risk prone loans would be identified and
then means of avoiding these risks are established thereby
reducing or avoiding the probability of default. This would
increase the growth of ESCA by avoiding loan losses. It
should be noted that loan recovery is a very critical factor
in financial sustainability and growth of the ESCAs where
failure to recover loans (loan default) affects the growth
of the ESCAs’ wealth by causing losses of funds invested and
profits to be earned.
74

The Institutional Strength involves decisions on; Staff
competence (SA), Asset Management (AM) and Innovativeness
(INN). The staff competence, which determines the financial
decision-making abilities, is indicated by the finance staff
Academic Qualifications, Professional Qualifications, Short-
Term Target Oriented Training and experience. Staff
competence has a considerable contribution to the growth of
ESCAs in that finance staff without the relevant
qualifications and adequate experience would not make
quality financial decisions for the ESCAs. The financial
decisions made by such staff do not lead to the optimal
capital structure or even viable investments. Such decisions
would, therefore, lead to losses in the investment hence
failure to have considerable growth of ESCAs’ wealth. Highly
qualified finance staff makes viable strategic decisions on
the ESCAs’ financial practice.
The other aspect of institutional strength is technology
which is innovativeness on loan products. It involves
quality of loan products and diversity of these products. A
wide variety of ESCAs’ products attracts more borrowing from75
the members and non-members thereby drawing more clientele
which leads to increased trading hence growth of ESCAs’
wealth.
On the area of capital structure, the key aspect affecting
the growth of ESCAs is the choice of financing and the
actual capital mix. The stewards need to establish a capital
mix that magnifies the ESCAs’ growth. The stewards need to
establish the most suitable capital structure for the
projects being implemented to arrive at considerable growth
of the ESCAs’ wealth. Capital structure of the ESCAs
comprises the various internal and external sources of
finance, shares (SC), Savings/Deposits (SV), retained
surpluses commonly known as Institutional Capital (IC), and
Debt Capital (DC). ESCAs must employ the most optimal
capital structure for a significant growth to be
experienced. The key aspects affecting the growth of ESCAs’
wealth include the methods and structure of financing mix.
The stewards need to establish the most suitable capital for
the projects being implemented to arrive at a considerable
growth of the ESCA. Where a number of sources are available,76

the appropriate capital structure must be followed to
maximize the surpluses for growth in ESCAs Wealth. Each
component should generate sufficient returns to cover the
related costs and contribute to institutional capital.
Further, prudent funds allocation strategy would yield or
maximize returns with minimum risk and enhance growth of the
ESCAs and ESCAs’ wealth thus leading to the achievement of
its objectives. The growth in ESCAs’ net assets is another
area where this growth can easily be seen or felt. The key
aspect affecting growth of ESCA is the choice of investments
and the actual mix. Importantly, assets are the economic
resource of the ESCAs acquired through investment of,
members’ shares, savings deposits, institutional capital and
loans. Two options exist for the ESCAs on earnings from
investments, namely; re-investment and distribution (payment
to the members as dividends). Thus, it is upon the
management to make appropriate decisions on the utilization
of the income acquired from the ESCAs’ investments. In this
case, if re-investment is a viable option, then it should be
capable of generating considerable growth in wealth.77

Further, the way the income is going to be distributed
affects the growth of the ESCA and its wealth. The decision
in the allocation of funds of ESCAs is critical.
Loans (LO): That loan portfolio is the core investment; the
income from loans must achieve the ESCAs’ objective and
growth of ESCAs. The income generated from investment on
loans must be sufficient to pay all the operating costs,
grow the institutional capital, and finance rebates and
dividend to the shareholders. When this happens, then there
is growth of ESCAs as a result of growth in total loans. If
loans growth keeps pace with growth in total assets, there
is likelihood that surpluses will be maintained. Higher
growth in loan portfolio signals maintenance of surpluses.
Growth in savings deposits affects the growth in loan
portfolio and total assets.
Liquid Investments (LI): it is advisable that a SACCO
Society maintains these short- term assets which can be
converted into cash within a short notice to finance
liquidity gaps. However, these assets should be capable of
78

contributing towards the surplus. Illiquid Investments (II):
Since these are non liquid investments, they should pay for
all their recurrent costs, pay back the initial outlay and
provide the ESCAs’ sinking fund. Growth in ESCAs’ wealth is
not experienced when these investments are depending on
other sources for recurrent costs and they are not able to
pay back their initial outlay thus cannot finance other
projects later. Non-Earning Fixed Assets (NA): Since non-
earning fixed assets do not generate any stream of income,
they should be acquired wisely such that their acquisition
cost must not exceed the outsourcing cost. The outsourcing
cost must outweigh the purchase cost to justify outright
purchase. In that event, the non-earning fixed assets will
be deemed to lead to growth of the wealth.
79

Chapter ThreeResearch Methodology
3.1. Introduction
This chapter presents the design used in the thesis, target
population, sampling procedure, study site, area of study,
research data collection instruments and procedures,
empirical model, measurement of variables, and how data were
analyzed. It has explained why specific techniques and
methods were used in design, analysis and data collection.
3.2. Research design
This study used a descriptive survey (Describing the
characteristics of existing phenomenon) in soliciting
information on the determinants of growth of ESCA.
Descriptive survey design was used since it provides
insights into the research problem by describing the
variables of interest. It was used for defining, estimating,
predicting and examining associative relationships. This
helped in providing useful and accurate information to
answer the questions based on who, what, when, and how.
80

Historical research was used to relate events that have
occurred in the past to current events. It also enabled the
researcher to relate the research problem to the missing
gaps of other research work which have been covered and also
show what the other researchers overlooked possibly due to
time differences or economics and social factors (Kombo
&Tromp, 2006).
3.3. Target population and sampling
The target population was all ESCA in Addis Ababa which had
been in existence for over five years. Three ESCAs were
selected conveniently based on their size, years of
operation and their role in investments. An Ethiopian
airline ESCA is the oldest association with over 49 years of
services and large sized, owning diversified investments
association in Ethiopia. Addis Ababa University ESCA and
Ethio Telecom ESCA are also the second largest of the
sectors in terms of deposits, members, years of operation
and their investments in different sectors.
81
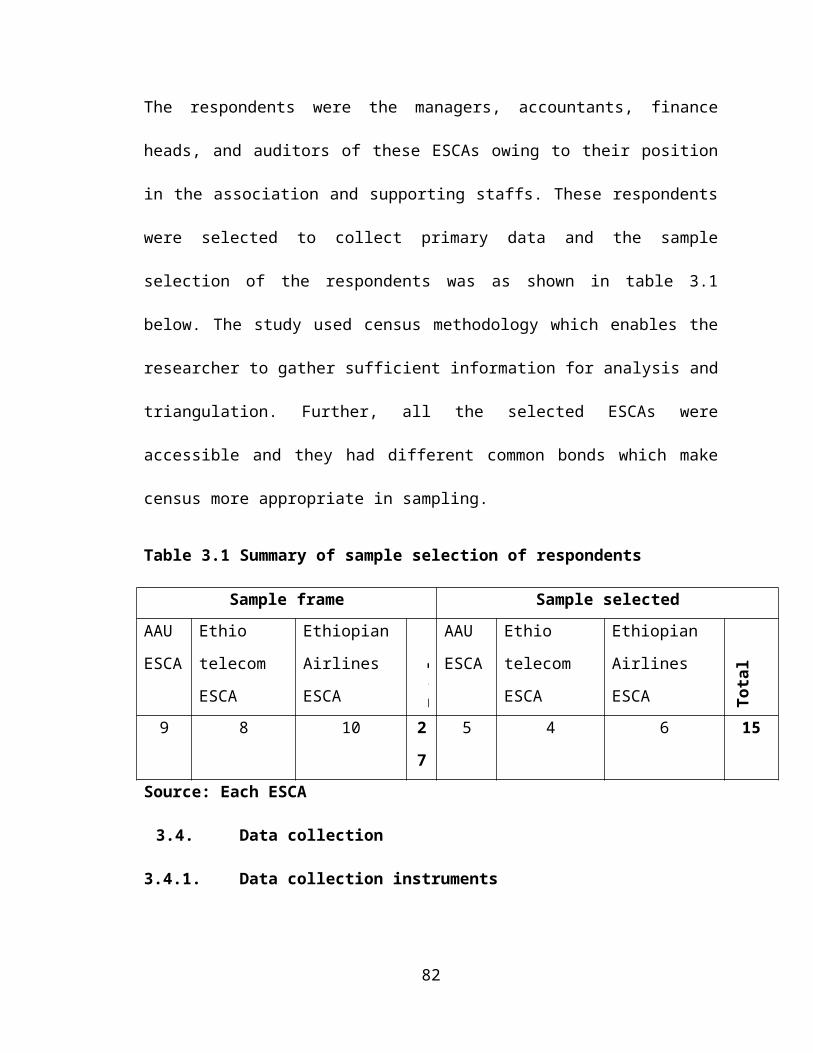
The respondents were the managers, accountants, finance
heads, and auditors of these ESCAs owing to their position
in the association and supporting staffs. These respondents
were selected to collect primary data and the sample
selection of the respondents was as shown in table 3.1
below. The study used census methodology which enables the
researcher to gather sufficient information for analysis and
triangulation. Further, all the selected ESCAs were
accessible and they had different common bonds which make
census more appropriate in sampling.
Table 3.1 Summary of sample selection of respondents
Sample frame Sample selectedAAU
ESCA
Ethio
telecom
ESCA
Ethiopian
Airlines
ESCA Total
AAU
ESCA
Ethio
telecom
ESCA
Ethiopian
Airlines
ESCA Total
9 8 10 2
7
5 4 6 15
Source: Each ESCA
3.4. Data collection
3.4.1. Data collection instruments
82
Data were collected from primary and secondary sources.
Primary data were collected using a semi structured
questionnaire which had both open and closed-ended
questions. Secondary data were collected from the records
and ESCAs’ financial statements using document review guide.
3.4.2. Data collection procedure
During data collection, the researcher first sought an
appointment with the respondents. Arrangements were then
made on when and how to conduct the data collection. When
collecting primary data, the researcher assisted the
respondent’s of ESCA to fill the questionnaire and at the
end confirmed any issues arising out of the data supplied.
3.5. Reliability and validity testing
The study conducted a pilot test of the study tools on
employees’ savings and credit cooperatives (ESCCs) that did
not participate in the study before administering the
research tools. Pilot testing was conducted in an attempt to
test the reliability and validity of the research tools. The
83
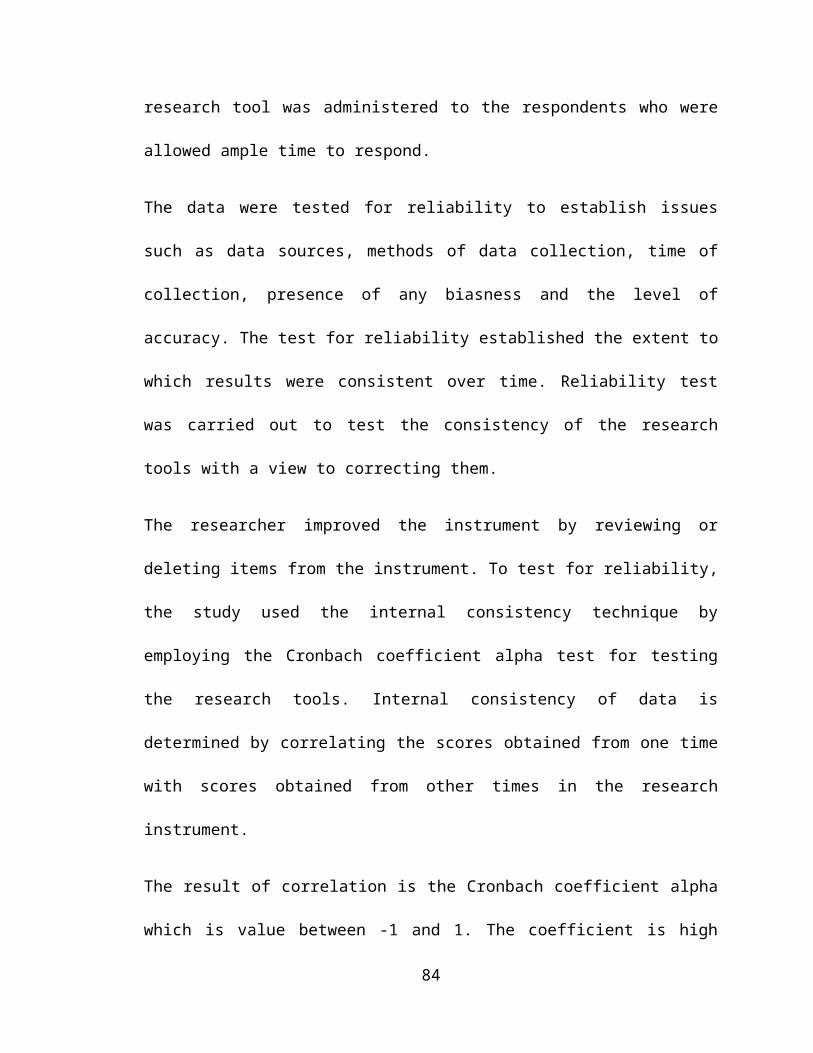
research tool was administered to the respondents who were
allowed ample time to respond.
The data were tested for reliability to establish issues
such as data sources, methods of data collection, time of
collection, presence of any biasness and the level of
accuracy. The test for reliability established the extent to
which results were consistent over time. Reliability test
was carried out to test the consistency of the research
tools with a view to correcting them.
The researcher improved the instrument by reviewing or
deleting items from the instrument. To test for reliability,
the study used the internal consistency technique by
employing the Cronbach coefficient alpha test for testing
the research tools. Internal consistency of data is
determined by correlating the scores obtained from one time
with scores obtained from other times in the research
instrument.
The result of correlation is the Cronbach coefficient alpha
which is value between -1 and 1. The coefficient is high
84

when its absolute value is greater than or equal to 0.7
otherwise it is low. A high coefficient implies high
correlation between these items which means there is high
consistency among the items and such items should be
retained in the tools. This study correlated items in the
instruments to determine how best they relate. Where the
coefficient was very low, then the item was reviewed by
either removing it from the tool or correcting it. Validity
of instrument which is the accuracy and meaningfulness of
inferences was measured using content validity test. Content
validity measures the degree to which data collected using a
particular instrument represent a specific domain of
indicators or content of particular concept.
3.6. Data analysis
Collected data were checked for errors of omission and
commission. The data collected was classified,
operationalised, analyzed and interpreted to establish how
and when these determine the growth of ESCAs. The data
collected were analyzed, with respect to the study
85

objectives, using both descriptive and inferential
statistics. Univariate analysis which is the distributional
properties of a variable was carried out first for each
variable to describe that variable and as a preparation for
multivariate analysis. This is largely a quantitative
analysis where each variable was analyzed independently. The
study used chi-square test to test dependence of growth of
ESCAs on financial stewardship, capital structure and funds
allocation strategy. Thus, the study employed multiple
linear regressions in its multivariate analysis to establish
the nature of the relationship between financial
stewardship, capital structure and funds allocation
strategy. Software Package for Social Sciences (SPSS)
software was used to analyze data.
86

Chapter FourData analysis, Presentation and Interpretation
4.1. Introduction
This chapter presents findings of the study. Data collected
were both qualitative and quantitative. Data were analyzed
using descriptive statistics such as mean and standard
deviation, and inferential statistics such as chi-square
test and regression. Data were presented using tables and
graphs.
4.2. Response rate
As shown in table 4.1 below total of 15 questionnaires were
given out to respondents of the three ESCAs out of which 13
were returned giving a response rate of 86.7%. According to
Mugenda and Mugenda (1999), a 50% response rate is adequate,
60% good and above 70% rated very good. Based on this
assertion the response rate for this study can be said to be
very good at 86.7%.
87

Table 4.1 Summary of response rate
No. of questionnaires
distributed
No. of questionnaires collected
AAU
ESCA
Ethio
telecom
ESCA
Ethiopian
Airlines
ESCA
AAU
ESCA
Ethio
telecom
ESCA
Ethiopian
Airlines
ESCA
Tota
l
5 4 6 1
5
4 4 5 13
Source: Each ESCA
4.3. Reliability analysis
The questionnaires were used as items that were to be
responded to. For reliability analysis Cronbach’s alpha
which is a measure of internal consistency was calculated by
application of SPSS. Cronbach alpha ranges between 0–1. A
higher value shows more reliable generated scale. Table
below illustrates the results of the reliability analysis.
It involved questionnaires from 13 respondents.
88

Table 4.2 Reliability testing results
Variables
Cronbach’s
alpha
No. of
items
Financial Stewardship 0.410 23
Capital Structure 0.838 4
Funds Allocation
Strategy 0.433 12
Source: Computed using SPSS
Grayson (2004) have indicated Cronbach’s alpha 0.7 to be an
acceptable reliability coefficient. As shown in table 4.2,
it was clear that the alpha coefficients of the instruments
of financial stewardship and funds allocation strategies
were less than 0.7. It could, therefore, be concluded that
the instruments did not have an acceptable reliability
coefficient and it was thus important to assess what the
alpha coefficient would be after each item was deleted from
the instruments. Items of alpha of below 0.4 where adjusted
which caused the alpha coefficient to increase to acceptable
level of 0.7 and above (See appendix III). After adjustment
89
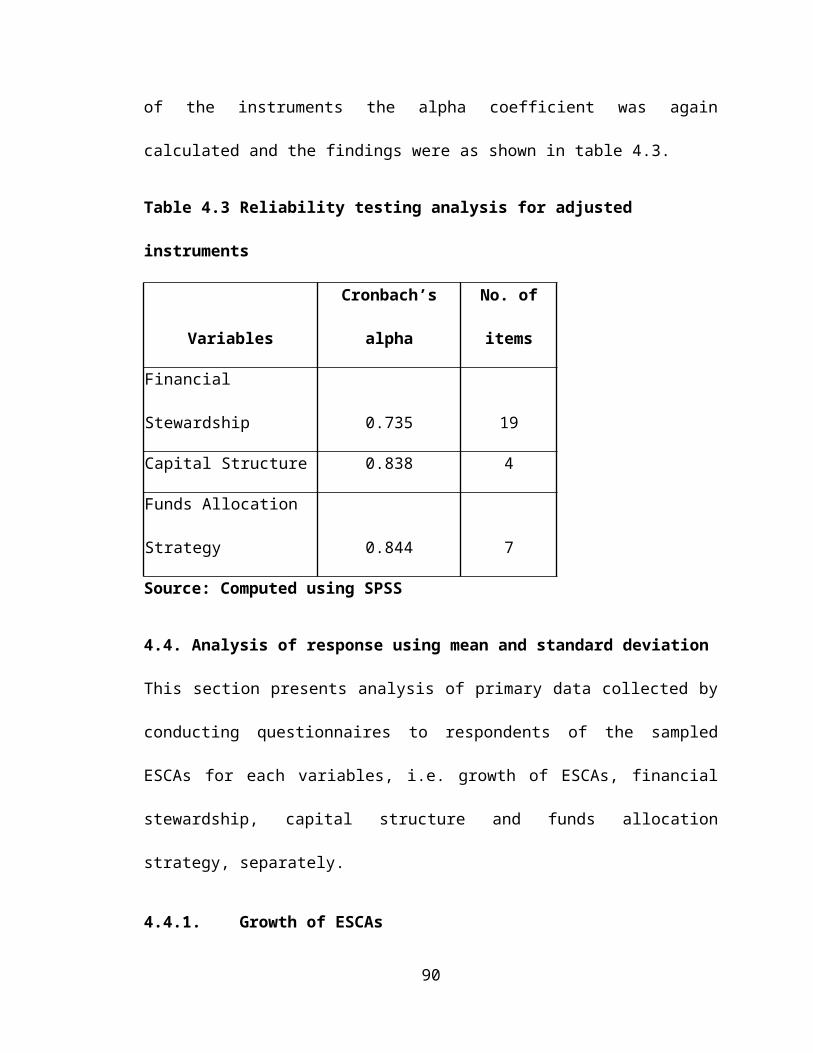
of the instruments the alpha coefficient was again
calculated and the findings were as shown in table 4.3.
Table 4.3 Reliability testing analysis for adjusted
instruments
Variables
Cronbach’s
alpha
No. of
items
Financial
Stewardship 0.735 19
Capital Structure 0.838 4
Funds Allocation
Strategy 0.844 7
Source: Computed using SPSS
4.4. Analysis of response using mean and standard deviation
This section presents analysis of primary data collected by
conducting questionnaires to respondents of the sampled
ESCAs for each variables, i.e. growth of ESCAs, financial
stewardship, capital structure and funds allocation
strategy, separately.
4.4.1. Growth of ESCAs
90

To assess financial practice as determinants of growth of
employees’ savings and credit associations it was considered
important to find out the indicators of growth of ESCA. To
accomplish this, it was considered of primary importance to
establish the profitability and distribution of income in
the ESCA and the findings were as shown in table 4.4.
Table 4.4 Profitability and distribution of income
Component items Mean
Std.
Dev.Our ESCA has been making a surplus every year
from 2009 to 2013 3.38 1.12
Our ESCA has been declaring dividends for the
last five years 3.31 1.18
Dividends per share have been increasing in the
last five years 3.15 1.34
The ESCA has also been contributing to retained
earnings 3.69 1.11
The retained earnings have been growing annually
from 2009 to 2013 3.77 1.01
Source: Computed using response from respondents
Table 4.4 above shows that majority of the respondents
91

agreed that the retained earnings have been growing annually
from 2009 to 2013 and that the ESCA has also been
contributing to retained earnings as indicated by a mean of
≈4 and a standard deviation of ≈1. It was also revealed that
majority of the respondents disagreed that their ESCA had
been making a surplus every year from 2009 to 2013, their
ESCA had been declaring dividends for the last five years
and that dividends per share had been increasing in the last
five years as indicated by a mean of ≈3 and a standard
deviation greater than 1. This is an indicator that ESCAs
consistently grew their wealth. It was further sought to
find out how the surplus distributed as dividends, rebates
and institutional capital (retained earnings) had been
determined and the findings were as illustrated in figure
4.1.
The fact that the respondents were neutral on the
indicators of growth of ESCA’s wealth shows that ESCAs in
Addis Ababa on average have been experiencing moderate
growth of their wealth. The ESCAs which are able to retain
surpluses declare dividends and rebates that grow their92

equity capital and net assets. Growth in retained earnings
prevents ESCAs from heavy reliance on external funding which
has forced many ESCAs into financial distress. One can
justifiably say that ESCAs should endeavor to minimize their
operational costs, grow their surplus and hence be able to
build their institutional capital.
No specific method is
used
Using a Standard
Proportion
Depending on volume of profits
Depending on capital structure
Depending on funds
allocation str...
0
5
10
15
20
25
30
35
40
45 % of Reponse
Figure 4.1 Determination of methods used to measure
distributed surplus
Figure 4.1 illustrates that majority of the respondents
(38.46%) indicated that surplus distributed as dividends,
93

rebates and institutional capital (retained earnings) was
determined depending on volume of profit while only 7.69% of
the responses indicated that it was not determined by any
method.
The other 15.38% of the responses indicated determination by
capital structure and fund allocation each. It was stated
that 23.07% of the responses indicated using standard
proportion to determine surplus. This is an indicator that
the majority of ESCAs distribute surpluses as dividends,
rebates and institutional capital depending on profitability
of ESCAs. The fact that 23.07% of ESCAs uses standard
proportion of distribution of profits indicated very weak
dividend policy. This may be explained by the weak
regulatory framework and human resource capacity.
4.4.2. Financial stewardship
Having determined the growth of ESCAs wealth the study also
tried to determine the factors that influence the growth.
One of the determinants of ESCAs’ growth was financial
stewardship. Financial Stewardship is concerned with the
94

accountability of the management as regards to the routine
financial decision-making process. The findings of the
components of financial stewardship were as shown in table
below.
Table 4.5 Summary of responses concerning financial
stewardship
Component items Mean Std. Dev.
Loan Eligibility 3.85 0.90
Ranking 3.45 1.27
Loan Repayment 3.69 1.11
Innovativeness 3.77 1.09
Loan Protection 2.85 1.07
Loan Disbursement 4.08 0.86
Default Risk 4.00 0.82
Source: Computed using response from respondents
Table 4.5 reveals that majority of the respondents agreed
that loan applications were approved by special committee in
their ESCAs and that ESCAs by-law was the basis of loan
evaluation. This is indicated by a mean (≈4) and standard
deviation (≈1). Majority of the respondents were neutral as
95

to whether ESCAs do loan applications ranking or not, this
is indicated by the mean (≈3) and standard deviation (≈1).
Majority of the respondents agreed that loan pay-out had
been increasing in their ESCA for the last five years and
that their ESCA always disbursed loans as they became due.
This is indicated by the mean (≈4) and standard deviation
(<1). This is a clear indication that higher loan
disbursement builds loan portfolio and interest earnings
hence contributing to growth of wealth. Majority of the
respondents agreed that loan borrowers always honored loan
repayment on due date, loan delinquency had been minimized
in the last five years, loan delinquency was avoided at all
costs and that members of their ESCA were eager to repay
their loans promptly. This is indicated by the mean (≈4) and
standard deviation (≈1). This promotes liquidity hence
enhancing growth of ESCAs.
Majority of respondents were neutral as to whether their
ESCA had provision for irrecoverable loans as indicated by
the mean (≈3) and standard deviation of greater than one.
Majority of the respondents agreed that their ESCA awards96

loan depending on the borrower’s ability to pay, loan with
lower default risk are paid in full to the ESCA and that
where default risk is high, the ESCA awards loan depending
on the borrower’s ability to pay. This reduces impairment of
the loan assets and interest income hence promoting growth
of ESCAs. Majority of the respondents agreed that all loan
products were designed to fit members’ needs, there were
regular diversification of products in their ESCAs as
indicated by a mean ( ≈4) and standard deviation (>1). This
is an indicator that products which are inciting, attractive
and affordable attract more clientele hence growth in loan
portfolio.
4.4.3. Capital structure
ESCAs need to establish stable and consistent capital
structure because they require finances to invest in capital
and operational expenses for the achievement of their
objectives. In performing this function of sourcing for
funds, the management team determines the most optimal
capital structure to be employed. The findings on capital
97

structure were as shown below.
Table 4.6 Summary of responses concerning capital structure
Component items Mean
Std.
Dev.
The ESCA uses cost of capital when determining
the source of funds 4.15 0.69
The ESCA makes careful evaluations when
deciding sources of funds 4.31 0.75
Profitability is a determinant of the source of
funds in this ESCA 4.08 0.76
This ESCA mobilizes funds after consulting the
experts in finance. 3.85 0.99
Source: Computed using response from respondents
Table 4.6 indicates that majority of the respondents agreed
that the ESCA uses cost of capital when determining the
source of funds, the ESCA makes careful evaluations when
deciding sources of funds, profitability is a determinant of
the source of funds in their ESCA and that their ESCA
mobilizes funds after consulting the financial managers.
These are indicated by the mean (≈4) and standard deviation
98

(≈1). This implies that prudent decisions on financing of
ESCAs lead to growth.
4.4.4. Funds allocation strategy
Prudent funds allocation strategy would yield or maximize
returns with minimum risk and enhance growth of the ESCAs
wealth and thus leading to the achievement of their
objectives. Having established the capital structure as a
determinant of ESCAs’ growth, the study sought to find out
the fund allocation strategy of ESCAs. When the income
generated from investment on loans is sufficient to pay all
the operating costs, grow the institutional capital, and
finance rebates and dividend to the shareholders, then
growth in loan asset will lead to growth of wealth. The
study sought to find out whether the income generated from
loans was sufficient and the findings were as indicated in
table 4.7.
Table 4.7 Summary of responses concerning funds allocation
strategy
Component items Mean Std. Dev.99

Loan 3.77 1.09
Liquid Assets 3.46 0.88
Illiquid Assets 2.92 0.86
Source: Computed using response from respondents
The above table indicates that majority of the respondents
agreed that income from loans covered all operating costs
and that income from loans in their ESCA maintained retained
earnings. Majority of the respondents were neutral as to
whether or not non-financial investments paid their
recurrent costs, always paid initial outlay, provided for
sinking fund, supported other projects and that buying of
assets was always justified using cost/benefit analysis .
Majority of the respondent agree that the ESCAs are prudent
in management of their financial investment which promotes
their liquidity and profitability. Non- liquid investments
should pay for all their recurrent costs, pay back the
initial outlay and provide the ESCAs’ sinking fund. They
should also be able to finance other projects later.
100

The study deemed it important to determine the performance
of the non-liquid investments and the results were that
majority of the respondents were neutral as to whether or
not Illiquid investments paid their recurrent cost, always
paid initial outlay, provided for sinking fund or supported
other projects. This is indicated by the mean (≈3) and
standard deviation (≈1). This shows that most investments
are able to pay recurrent costs, initial outlay and provide
for sinking fund.
4.5. Chi square test on dependence between independent
variables and growth of ESCAs
One of the statistical tests that are used to test the
association among variables is chi-square test. However, the
test uses specifically grouped or categorical variables
(ordinal or nominal). To apply this, the study categorized
ESCAs according to their Growth of wealth index and compared
it with the magnitude of financial stewardship (FS), capital
structure (CS) and funds allocation strategy (CA).
The growth of ESCAs indices in the study is within an
101

interval of 1-5, therefore, the study categorized the ESCAs
as level 1 and level 2. Growth level 1 or High Magnitude FS,
CS and CA are represented by index of 3, 4 and 5 while
Growth level 2 or Low Magnitude FS, CS and CA are
represented by index of 1 and 2.
The study based the test on 5% (0.05) level of significance
meaning that the conclusions made in this study were at 95%
confidence level. In chi-square test, there are three
coefficients (statistic) that are vital in the study namely;
Pearson chi-square, Phi and Cramer’s V. Pearson Chi-square
is used to test the associations while Phi and Cramer’s V
are to test the strength of association.
Table 4.8 Chi-Square tests on associations between growth of
ESCA and financial stewardship, capital structure, and funds
allocation strategy
Pearson Chi-
square
p-
value
Strength(Phi/
Cramer’s V)
P-
values
Financial 36.000 0.000 0.960 0.000
102

stewardship
Capital structure 15.840 0.000 0.663 0.000
Funds allocation
strategy 19.800 0.000 0.742 0.000
Size=3, Level
sig.0.05
Source: Computed using SPSS
Since the p-values (.000) are smaller than level of
significant of the study (0.05 or 5%) as shown in the table
4.8, then the test of the study is in favor of the research
hypothesis; therefore we reject the null hypothesis and
conclude that all the determinants of financial practice
i.e. financial stewardship (36.000, p-value, 0.000) capital
structure (15.840, p-value, 0.000) and funds allocation
strategy (19.800,p-value,0.000) were associated to the
growth of ESCA. While financial stewardship (0.960, p-value,
0.000) and funds allocation strategy (0.742, p-value, 0.000)
have strong effect on Growth of ESCA, capital structure has
moderate effect. This therefore shows that financial
stewardship, capital structure and funds allocation strategy
103

are important determinants of growth of ESCA.
4.6. Multiple regressions of independent
against the dependent variable
This section presents analysis of statistical results found
by conducting multiple regressions using SPSS for testing of
variables and regressing of growth of ESCAs against
financial stewardship, capital structure and funds
allocation strategy separately.
4.6.1. Testing study variables for
normality
The study tested for normality using Shapiro Wilk test
(numerical method) since the sample population was small
(less than 50). The results obtained are in Table 4.9.
Table 4.9 Results of normality tests on study variables
Variables Shapiro Wilk test
Growth 0.842
Financial Stewardship 0.732
Capital structure 0.898
104

Funds allocation
strategy 0.915
Source: Computed using SPSS
The p-values for respective variables were greater than
0.05, level of significance, indicating that the data were
normally distributed. Absence or presence of
heteroscedasticity did not render estimators (coefficients)
biased, inconsistent and insufficient, therefore it wasn’t
diagnosed.
The study didn’t focus on the variability of the error term
with respect to time, making autocorrelation check not
necessary. However, the study tested existence of multi-
collinearity and obtained the results in Table 4.10.
Table 4.10 Results of multi-collinearity tests on
independent variables
Predictor Variables Tolerance(1-R2 VIF(Variance Inflation
105

) Factor)
Loan evaluation(LE) 0.824 1.213
Loan disbursement(LD) 0.570 1.754
Loan repayment(LR) 0.923 1.034
Loan protection(LP) 0.959 1.042
Default risk(DR) 0.932 1.072
Innovativeness(INN) 0.724 1.038
Staff competence(SA) 0.916 1.092
Savings(SV) 0.919 1.088
Share capital(SC) 0.537 1.862
Institutional
capital(IC) 0.908 1.101
Debt capital(DC) 0.852 1.173
Loans(LO) 0.527 1.897
Liquid
investments(LI) 0.935 1.675
Illiquid
investments(II) 0.421 2.375
Non-earning fixed
assets(NA) 0.956 1.046
106
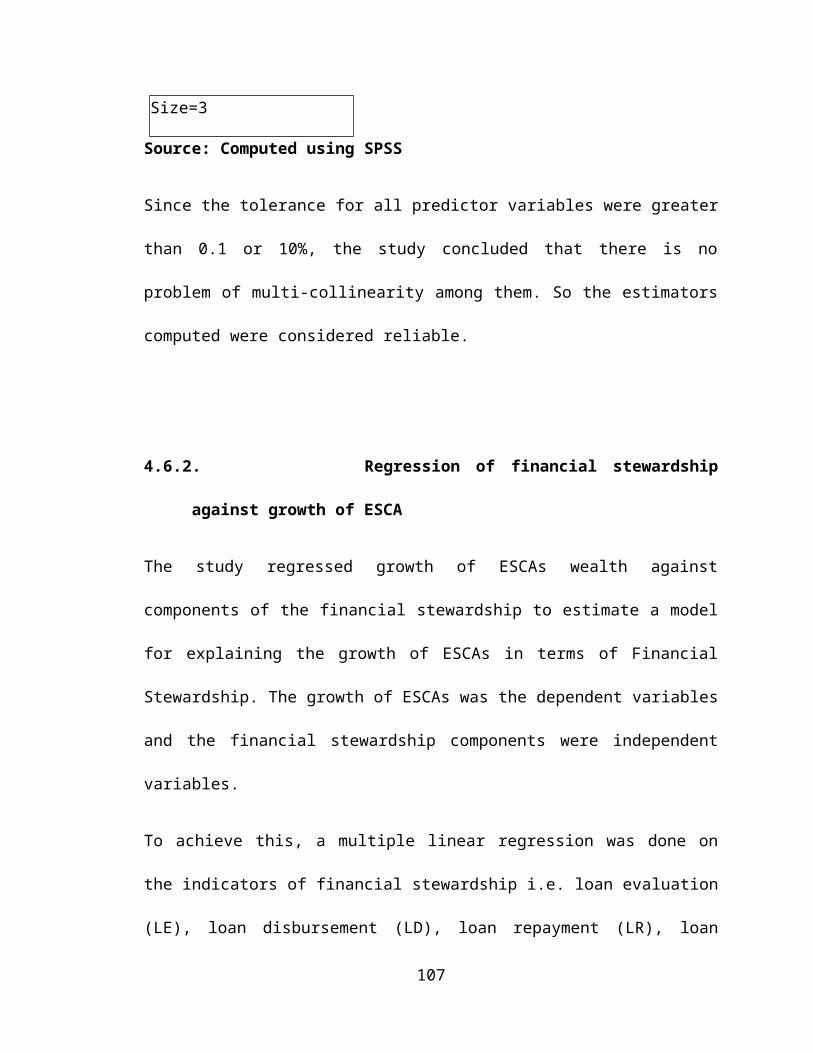
Size=3
Source: Computed using SPSS
Since the tolerance for all predictor variables were greater
than 0.1 or 10%, the study concluded that there is no
problem of multi-collinearity among them. So the estimators
computed were considered reliable.
4.6.2. Regression of financial stewardship
against growth of ESCA
The study regressed growth of ESCAs wealth against
components of the financial stewardship to estimate a model
for explaining the growth of ESCAs in terms of Financial
Stewardship. The growth of ESCAs was the dependent variables
and the financial stewardship components were independent
variables.
To achieve this, a multiple linear regression was done on
the indicators of financial stewardship i.e. loan evaluation
(LE), loan disbursement (LD), loan repayment (LR), loan
107
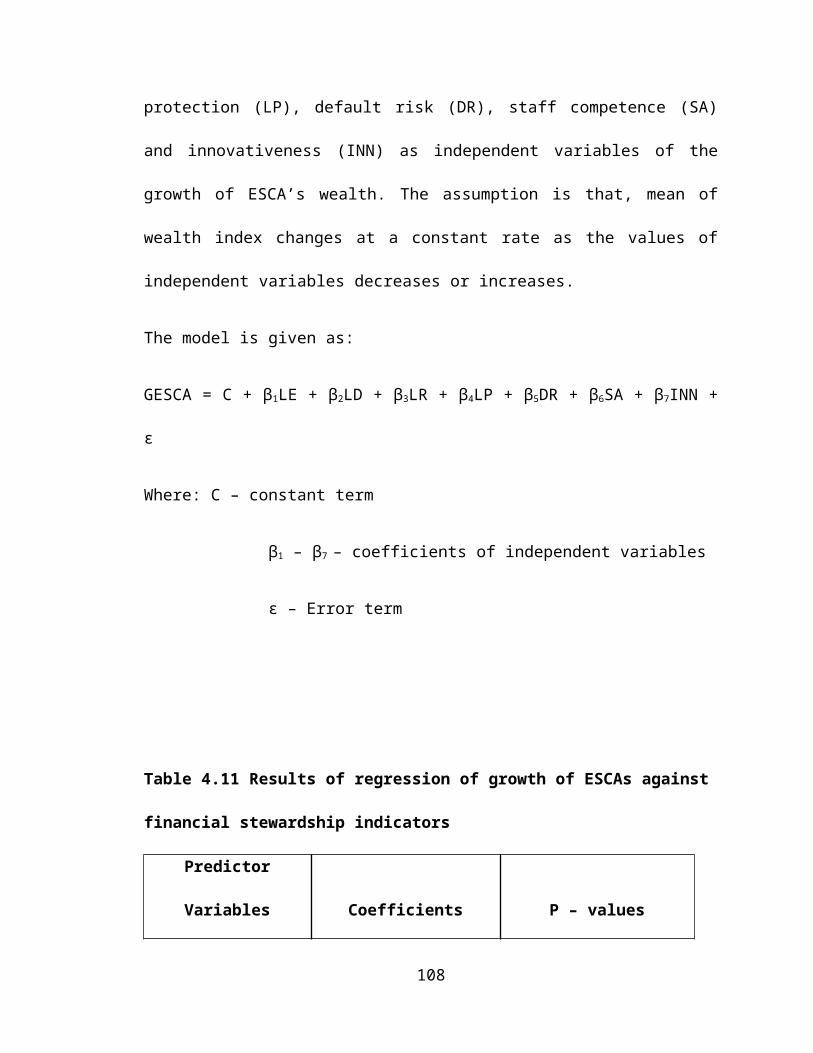
protection (LP), default risk (DR), staff competence (SA)
and innovativeness (INN) as independent variables of the
growth of ESCA’s wealth. The assumption is that, mean of
wealth index changes at a constant rate as the values of
independent variables decreases or increases.
The model is given as:
GESCA = C + β1LE + β2LD + β3LR + β4LP + β5DR + β6SA + β7INN +
ε
Where: C – constant term
β1 – β7 – coefficients of independent variables
ε – Error term
Table 4.11 Results of regression of growth of ESCAs against
financial stewardship indicators
Predictor
Variables Coefficients P – values
108

Constant -4.578 0.0001
Loan evaluation 1.159 0.0003
Innovativeness 0.544 0.0001
Loan disbursement 7.028 0.0001
Loan repayment 3.432 0.0002
Loan protection 2.347 0.0002
Staff competence 0.119 0.0002
Default risk -0.046 0.0004
Size=3 R2=0.966
Adjusted R2= 0.965
Source: Computed using SPSS
The estimated equation is:
GESCA = – 4.578 + 1.159LE + 0.554INN + 7.028LD + 3.432LR +
2.347LP + 0.119SA – 046DR
Table 4.11 shows that loan evaluation; loan disbursement,
loan repayment, loan protection, staff competence and
innovativeness have positive coefficients. This implies that
the variables are directly proportional to the growth of
ESCAs i.e. an increase in one or all except default risk
109

lead to an increase in growth of ESCAs. Default risk has a
negative coefficient which shows that it inversely
proportional to Growth of ESCA. I.e. an increase in default
risk leads to decrease in growth of ESCAs.
When considering of the growth of ESCAs and financial
Stewardship, table 4.11 shows 96.5% of variation in growth
of ESCAs is explained by loan evaluation(LE), loan
disbursement(LD), loan repayment(LR), loan protection(LP),
default risk(DR), staff competence(SA) and innovativeness
(INN). Therefore, financial stewardship indicators are
strong determinant of growth of ESCA.
4.6.3. Regression of capital structure against growth of
ESCA
To estimate a model to explain growth of ESCAs in terms of
the capital structure indicators, the study regressed the
growth against components of the capital structure. Growth
of ESCAs was the dependent variables and the components of
the capital structure were the independent variables. To
achieve this, a multiple linear regression was done on the
110

indicators of capital structure i.e. share capital(SC),
savings(SV), institutional capital(IC) and debt capital(DC)
as independent variables of the growth of ESCAs. The
assumption is that, mean of growth of ESCAs index changes at
a constant rate as the values of independent variables
decreases or increases.
The model is given as:
GESCA = C + β1SC + β2 SV + β3IC + β4DC + ε
Where: C – constant term
β1 – β4 – coefficients of independent variables
ε – Error term
Table 4.12 Results of regression of growth of ESCAs against
capital structure
Predictor Variables Coefficients P – values
Constant 0.685 0.0003
Share capital 5.492 0.0004
Savings 1.833 0.0003
111

Institutional capital 1.052 0.0004
Debt capital 5.434 0.0001
Size=3 R2=0.784
Adjusted R2= 0.778
Source: Computed using SPSS
The estimated equation is:
GESCA = 0.685 + 5.492SC + 1.833SV + 1.052IC + 5.434DC
Table 4.12 shows that share capital, savings, institutional
capital and debt capital have positive coefficients. This
shows that proper combination of the four components of
capital structure would lead to growth of ESCAs. The
coefficient of determination is 0.778, meaning that 77.8% of
change in growth of ESCAs by capital structure.
4.6.4. Regression of funds allocation strategy and growth
of ESCAs
To estimate a model to explain the growth of ESCAs in terms
of funds allocation strategy components and growth, the
112

study regressed the growth against components of funds
allocation strategy. The growth of ESCAs was the dependent
variable and the funds allocation strategy components were
the independent variables. To achieve this, a multiple
linear regression was done on the indicators of funds
allocation strategy i.e. growth of ESCA as dependent
variable against loans (LO), liquid investments (LI),
illiquid investments (II) and non-earning fixed assets (NA)
as independent variables of the growth of ESCAs. The
assumption was that, mean of growth of ESCAs index changes
at a constant rate as the values of independent variables
decrease or increase.
The model is given as:
GESCA = C + β1LO + β2LI + β3II + β4NA + ε
Where: C – constant term
β1 – β4 – coefficients of independent variables
ε – Error term
113
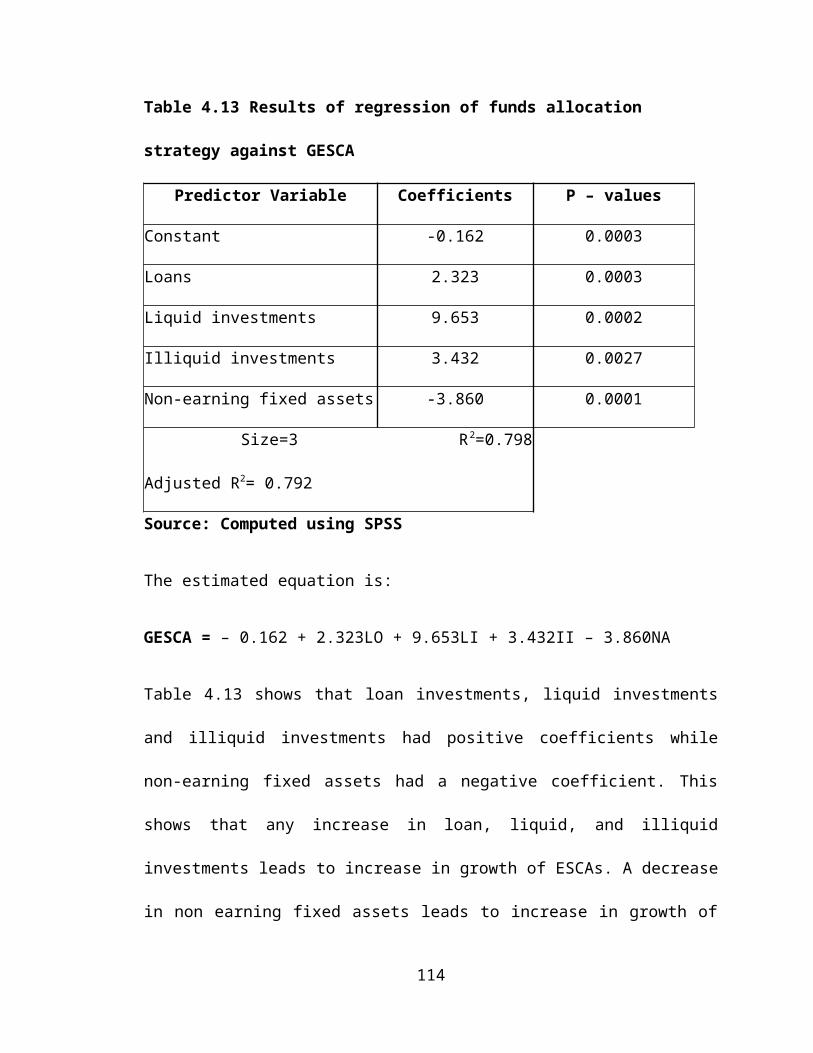
Table 4.13 Results of regression of funds allocation
strategy against GESCA
Predictor Variable Coefficients P – values
Constant -0.162 0.0003
Loans 2.323 0.0003
Liquid investments 9.653 0.0002
Illiquid investments 3.432 0.0027
Non-earning fixed assets -3.860 0.0001
Size=3 R2=0.798
Adjusted R2= 0.792
Source: Computed using SPSS
The estimated equation is:
GESCA = – 0.162 + 2.323LO + 9.653LI + 3.432II – 3.860NA
Table 4.13 shows that loan investments, liquid investments
and illiquid investments had positive coefficients while
non-earning fixed assets had a negative coefficient. This
shows that any increase in loan, liquid, and illiquid
investments leads to increase in growth of ESCAs. A decrease
in non earning fixed assets leads to increase in growth of
114

ESCAs because non earning fixed assets do not generate
returns but only support cash generating units.
Considering the growth of ESCAs and funds allocation
strategy the table 4.13 indicates that 79.2% of variation in
growth of ESCAs is explained by loan investments, liquid
investments, illiquid investments, and non-earning fixed
assets i.e. funds allocation strategy.
Table 4.14 Summary of results of tests of hypothesis and
related objectives
Objective Hypothesis Results Remarks
on
hypothesi
s
To assess whether
there is
association between
financial
stewardship and the
growth of
H0: There is no
dependence
between growth of
ESCAs and
financial
stewardship.
P = 0.000
This is less
than the
significance
level of 0.05.
Rejected
115

employees’ savings
and credit
associations.
To determine
whether the growth
of employees’
savings and credit
associations is
determined by
capital structure.
H0: There is no
dependence
between growth of
ESCAs and capital
structure.
P = 0.000
This is less
than the
significance
level of 0.05.
Rejected
To determine
whether the funds
allocation strategy
affect the growth
of employees’
savings and credit
associations.
H0: There is no
dependence
between growth of
ESCAs and funds
allocation
strategy.
P = 0.000
This is less
than the
significance
level of 0.05.
Rejected
Source: Researcher, 2014
Table 4.14 presents the results of hypotheses where the
study made the following conclusions:
116

On hypothesis number one: there is no dependence between
financial stewardship and growth of ESCAs, the study
accepted the alternative hypothesis and concluded that
financial stewardship is an important determinant of growth
of ESCA.
Hypothesis number two: there is no dependence between
capital structure and growth of ESCAs is rejected. The study
accepted the alternative hypothesis and concluded that
capital structure is an important determinant of growth of
ESCAs.
Hypothesis number three: there is no dependence between
funds allocation strategy and growth of ESCAs, the study
accepted the alternative hypothesis and concluded that funds
allocation strategy is an important determinant of growth of
ESCAs.
117

Chapter FiveDiscussion of Findings, Conclusion and Recommendations
5.1. Introduction
The data were analyzed and presented in form of tables and
charts. The relationship between the determinants
(independent variables) and the growth of ESCAs (dependent
variable) was tested. The policy implications from the
findings and areas for further research are also presented.
The study recommended to ESCAs management, staff and
government various requirements that will ensure growth of
ESCAs.
5.2. Summary of findings
This section presents the findings from the study in
comparison to what other scholars say as noted under
literature review. It looks at the relationship between
financial stewardship, capital structure, and funds
allocation strategy with growth of ESCAs.
118
The first objective was designed to assess whether there is
association between financial stewardship and the growth of
ESCAs. This was established by analyzing the individual
components of financial stewardship. It was found that the
majority of respondents agreed that loan applications were
approved by special committee and that ESCA by-law was the
basis of loan evaluation. Most ESCAs also ranked
applications according to the by-laws. Loan evaluation
contributes positively to the growth of ESCAs as shown by a
positive coefficient of regression. This is to mean that
ESCAs’ wealth increase with the increases in loan
evaluation.
Most of the respondents were in agreement that the loan
payout in ESCAs has been increasing in the last five years
and the ESCA always disbursed loans as they became due. Loan
disbursement depicted positive influence on growth of ESCAs.
This means that proper loan disbursement increases the
growth of ESCAs. Most of the respondents were indifferent
on whether ESCAs had made provisions for irrecoverable loans
as shown by a mean of 2.85. Loan protection showed a119

positive influence on the growth of ESCAs. This means that
as loan protection increases the growth of ESCAs also
increases.
It was observed that the default risk had a negative
influence on the growth of ESCAs. This clearly shows that
any increase in default risk negatively affects growth of
ESCAs. This shows that as default risk decreases the growth
of wealth increases. Gaita (2007) showed that the lending
institutions were not growing significantly due to poor
lending practices and recommended that lending institutions
should make products and services more available. He also
recommended that favorable regulatory and legal framework is
important for the growth of the institution. This agrees
with the current study in that when ESCAs efficiently
manages loans, there is high quality loan management and the
average collection period is short leading to growth of
ESCAs. In addition, realistic protection leads to reduced
overstatement which enhances shareholders’ confidence
120
retention, attraction of prospective members, and prevention
of potential crises.
It was noted that most of the employees in ESCAs had
attained diploma in their academic qualifications. None of
the respondents had attained a Ph.D. Most of the employees
had attained technician and diploma levels in their
professional qualifications. Majority of the respondents
agreed that ESCAs did not provide employees with the
opportunity to attend short-term target oriented courses.
The low levels of academic and professional qualifications
can be attributable to poor remunerations and poor working
conditions in ESCAs. It was observed that staff competence
had a strong positive relationship.
The findings showed that most of loan products were applied
for by borrowers, were designed to fit members’ needs and
there was regular diversification of products in ESCAs. This
ensures satisfaction of members in meeting their needs.
ESCAs should, therefore, design proper mechanisms so as to
121

enhance innovativeness which leads to variety and quality
loan products hence growth of ESCAs.
Innovativeness showed a positive relationship with a growth
of ESCAs. Having looked at components of financial
stewardship, it is therefore important for ESCAs to promote
financial stewardship so as to promote growth of ESCAs. This
is based in the fact that financial stewardship showed
significant positive relationship with the growth of ESCA.
According to Mudibo (2005), the major financial decisions
involved in financial stewardship include product
innovation. Brounen (2001) found that better governed firms
were relatively more profitable, more valuable, and paid out
more dividends to their shareholders. This is in agreement
with this study in that the staffs making financial decision
need to have requisite skills and uphold professionalism
among other competencies to arrive at a sound working
investment solution. However, he laid more emphasis on the
value of governance to the shareholders while this study
lays more emphasis on the value to the ESCAs.
122
The second objective was to determine whether the growth of
ESCAs is determined by capital structure. The findings on
individual components of capital structure showed that most
of the ESCAs use cost of capital when determining sources of
funds and careful evaluations are made when determining
sources of funds. The study analyzed individual components
of capital structure and it was observed that share capital
showed a significant positive relationship with growth of
ESCAs.
Institutional capital also showed a significant positive
relationship with growth of ESCAs. This could be
attributable to the fact that it is an internal fund which
is cost free. Adequate institutional capital should,
therefore, be accumulated so as to cushion the ESCAs against
losses. It was also observed that the relationship between
savings and growth of ESCAs was weak. This could be
attributed to the fact that these are member’s funds which
are withdrawable on demand.
123

Debt capital is external fund hence it tends to be costly to
ESCAs. The ESCAs should, therefore, apply proper capital mix
in their financing. ESCAs should aim at minimizing the use
of debt capital in their financing so as to be able to pay
the related costs.
The significant relationship between capital structure and
growth of ESCAs could be attributable to appropriate mix of
internal and external funds in financing the firm’s assets.
This implies that proper capital structure mix can lead to
growth of ESCAs. WOCCU (2007) indicated that savings and
credit cooperatives should be funded by pre-determined
financing mix. This mode of financing would discourage
flexibility in the choice of financing options. This study
emphasizes on the accumulation of internal financing for
long-term sustainability.
Agrawal et al., (2002) found that members’ funds had a
central role in cooperative performance. This agrees with
this study to some extent as it also emphasizes on the use
of share capital and accumulation of institutional capital.
124

This study does not embrace the use of members’ savings in
financing in view of the fact that these are withdrawable on
demand and carry fixed charges. Fiorillo (2006) found that
external funds did not help a weak savings and credit
cooperatives society become strong. It was recommended that
external funding should be discouraged and instead encourage
and promote a strong saving culture.
The third objective was defined as to determine whether the
funds allocation strategy affect the growth of ESCAs. This
involves the prudent funds allocation strategy which boosts
the volume of returns with minimum risk. The study revealed
that returns on loan investment had a positive significant
relationship with growth of ESCAs. This is attributable to
the fact that loans are the core investment for ESCAs.
Liquid investments showed a strong positive significant
relationship with growth of ESCAs. This could be
attributable to the fact that liquid investments can be
converted into cash easily to meet short-term obligations.
This finances liquidity gaps hence enhancing stability of
125
ESCAs. Non-earning fixed assets showed a negative
relationship with growth of ESCAs. This implies that
acquisition of those assets should be done wisely so that
they are able to repay their current cost. It also depicts
that investment in such assets should be minimized as they
do not generate any returns but only support cash generating
units.
The illiquid investments showed a positive coefficient. This
means that any increased investment in illiquid investments
leads to a decline in growth of ESCAs. On overall, funds
allocation strategy and growth of ESCAs showed strong
positive significant relationship. Prudent investment
strategies therefore enhance growth of ESCA. Kaloi (2004)
found that among other factors, failure to invest in
illiquid investments led to losses hence no growth. This is
not in agreement with this study since the study emphasizes
on investment in liquid investments.
Ogbimi (2006) found that the sources of financial resources
were many and varied; lack of self-discipline in saving
126

money, impulse buying as well as spending too much on
ceremonies were the major problems of financial management
of rural women.
The above mentioned studies resound what has been observed
in the current study in that the way the income is going to
be distributed affects the growth of the ESCAs and its
wealth. The decision in the allocation of funds of ESCAs is
critical.
5.3. Conclusion
To sum up the study the collected data have been analyzed
and discussed with the boundary of the objective of the
study. So the issue addressed in the study in relation to
the determinants of growth of employees’ savings and credit
associations is concluded in the following paragraph.
The study found that the use of institutional capital as a
mode of financing ESCA’s activities would ensure their
sustainability in the competitive cooperative sector. The
study also shows that growth of ESCAs depends on financial
127

stewardship, growth of ESCAs depends on capital structure,
and growth of ESCAs depends on funds allocation strategy.
5.4. Recommendations
The study finds it prudent to make a few recommendations
which are considered important to guide other readers, the
ESCAs and policy-makers.
From the study the following directions for growth of ESCAs
are recommended:
i. ESCAs credit policies should be the one that would
enhance the evaluation of loan applications by ensuring
that loan applications are evaluated and ranked
according to the by-laws. High compliance would lead to
growth because the loan eligibility depicted a positive
relationship with growth of ESCAs. ESCAs should ensure
proper loan disbursement to facilitate loan recovery
128

and minimize administrative costs. Loan disbursement
would, therefore, lead to growth of ESCAs.
ii. ESCAs should make adequate loan provisions to
promote safety of funds. This will ensure that loan
assets are not overstated.
iii. ESCAs should make arrangements for their employees
to attend more short term target oriented trainings.
The academic, professional and short term target
oriented trainings ensure growth of ESCAs.
iv. The ESCAs should apply proper financing mix in
their capital structure. This is due to the fact that
capital structure showed a strong insignificant
relationship with growth of ESCAs. There should,
therefore, be optimum mix between share capital,
institutional capital, savings and debt capital since
any improper mix does not contribute significantly to
the growth of ESCAs.
v. The government should oversee ESCAs to ensure that
institutional capital is used to grow ESCA’s wealth.
129

vi. The study observed that the relationship between
non-earning fixed assets and growth of ESCAs was
inversely proportional. ESCAs should minimize
investment in the non-earning fixed assets since any
increased investment in these assets leads to decrease
in growth.
From this study the following directions for future research
in growth of ESCAs are recommended:
1. Study to be done on effects of board members decisions
on growth of ESCAs.
2. Study on capital structure methods and growth of ESCAs.
3. Study to investigate methods of funds allocation
strategy and growth of ESCAs
130

References
Abdullah, H. & Valentine, B. (2009), fundamental and ethics
theories of corporate governance, journal of middle eastern
finance and economics, 4, 88-96.
ACCOSCA, 1990, savings and credit cooperative development
office in-country training programme Addis Ababa, 1-13
April (Nairobi).
Adeyemo, R. & Bamire, A. S. (2005), saving and investment
patterns of cooperative farmers in southwestern
Nigeria, journal of social science, 11(3): 183-192.
Agrawal, A. & Chadha, S. (2005), corporate governance and
accounting scandals, journal of law and economics, 48, 371-
406.
Agrawal, A. & Cooper, T. (2007), corporate governance and accounting
scandals: evidence from top management, CFO and auditor turnover.
Tuscaloosa: Culverhouse College of Business.
Agrawal, R., Raju, K. V., Reddy, K.P., Srinivasan, R., &
Sriram, M. S. (2002), member-funds and cooperative
performance, research paper, Indian institute of
1

management, state of Andhra Pradesh, India.
Ahmed, H.J.A, & Hisham, N. (2009), revisiting capital
structure theory: a test of pecking order and static
order trade-off model from Malaysian capital market,
international research journal of finance and economics, 30, 58-65.
Aneshensel, C. S. (2004), Univariate analysis: central tendency, spread,
and associations, illustrated edition, Los Angeles:
University of California.
Archer, S. & Karim, R.A.A. (2006), on capital structure, risk
sharing and capital adequacy, in Islamic banks,
International journal of theoretical and applied finance, 09(03), 269-
280.
Asher M. G.. (2007), reforming governance and regulation of
urban co-operative banks in India, journal of financial
regulation and compliance,15(1), 20-29.
Baker, H. K., Dutta, S. & Saadi, S. (2008), impact of
financial and multinational operations on manager
perceptions of dividends, global finance journal, 2008, 19(2),
171.
Banjerjee, B. (2005), financial policy and management accounting, 7th
2

edition, Mumbai: PHI Learning Pvt. Ltd.
Beck, T., Levine, R. & Loayza, N. (2000), finance and the
sources of growth, journal of financial economics 58(1), 261-
300.
Benninga, S. & Czaczkes, B. (2000), financial modeling, 2nd
edition, cambridge: MIT Press.
Bhimani, A. (2008) making corporate governance count: the
fusion of ethics and economic rationality, journal of
management and governance, 2(2), 135-147.
Bierens, H.J. (2007), Multicollinearity, University Park,
Pennsylvania state university.
Blair, M.M. (1995), ownership and control: rethinking corporate
governance for the twenty-first century, Washington DC:
Brookings Institution.
Bowen (2004), growth of surplus and financial stewardship in
savings and credit cooperative societies, research
paper, center for business and corporate finance,
Nigeria.
Brounen, D. & Eichholtz, P. A. (2001), capital structure
theory evidence from European property companies’
3

capital offerings, journal of real estate economics, 21(4,
615-632.
Bujang, I. & Nassir, A.M. (2007), the relevance of Gordon’s
model and earnings multiplier approaches in emerging
stock market: test with appropriate refinements, journal
of international research journal of finance and economics, 7,140-152.
CGAP. (2005), working with savings and credit co-operatives: helping to
improve donor effectiveness in microfinance, donor brief No. 25,
Washington, DC: Pact Publications.
Chava, S. & Roberts, M. R. (2008), How does financing impact
investment? The role of debt covenants, journal of finance,
2008, 63(5), 2085-2121.
Chege, A. (2006), an investigation in determinants of loan defaults within the
banking industry, a case study of HFCK.
Chen, J. (2006), a comparison with behavioral theories, University of
Northern British Columbia, Prince George: BC, Canada.
Chorafas, D. N. (2004), economic capital allocation with Basel II: Cost,
benefit and implementation procedures, illustrated edition,
London: Butterworth-Heinemann.
Clarke, T. (2004), Theories of corporate governance: The philosophical
4

foundations of corporate governance, 1st edition, Routledge:
London and New York.
Daly, C.M., Dalton, D.R. & Canella, A.A. (2003), corporate
governance: Decades of dialogue and data, academy of
management review, 28(3), 371-382
Davies, P. (2005). The governance of cooperatives under
competitive conditions: Issues, processes and culture,
journal of corporate governance, 1, 28-29.
Davis, P. & Worthington, S. (2005), Continuity in capital
accumulation the case of the British cooperative bank,
journal of business ethics, 12(1), 849-859.
Dejene Aredo (1993), the informal and semi-formal financial
sectors in Ethiopia: A study of the Iqqub, Iddir and
savings and credit co-operatives, Ottawa, Canada.
Deji, O. F. (2005). Membership of cooperative societies and
adoption behavior of women farmers: Implication for
rural development, Journal of social science, 10(2), 145-147.
Delcoure, N (2008). Corporate branding and SACCOs’ wealth,
journal of business industry & economics, 12, 313-367.
DeMarzoy, P. M., Fishmanz, M. J., Hex, Z. & Wang, N. (2010),
5

Dynamic agency and the q Theory of investment, Columbia: MIT.
Det Wet J.H.H.(2004). A strategic approach in managing shareholders
wealth of companies listed on the JSE securities exchange South Africa.
Donaldson, T. and Preston, L.E. (1995), the stakeholder
theory of the corporation: Concepts, evidence and
implications, academy of management review, 20, 65-91.
Easterby-Smith, M., Thorpe, R. & Jackson, P. (2008),
Management research, 3rd edition, London: SAGE
Publications Ltd.
Eriksson, P. & Kovalainen, A. (2008), Qualitative methods in business
research, 1st edition. London: SAGE Publications Ltd.
Evans A. C. (2001), Strengthening credit unions in Sri Lanka: Research
monograph, world council of credit unions, Madison:
WI, USA.
Financial Sector Development Secretariat (2007), Umurenge
SACCOs strategy, Kigali, Rwanda: ministry of finance and
economic planning.
Fiorillo, A. (2006), the effects of wholesale lending to SACCOs: A case
study in Kampala, Uganda.
Flannery, M. J. & Hankins K. W., (2007), A theory of capital structure
6

adjustment speed, working paper, University of Florida,
USA.
Gaita, S. (2007), Factors that influence the growth of
enterprises, a case study of enterprises participating
in Msingi loan from Bomas in Thika district, Kenya.
Gardner, B. & Lerman, Z. (2006), Agricultural cooperative
enterprise in the transition from socialist collective
farming, journal of rural cooperation 34(1), 1- 8.
Gijselinckx, C. & Develtere, P. (2007), The cooperative trilemma,
cooperatives between market, state and the civil society, research
paper, Catholis University, Leuven, Belgium.
Grayson, D. (2004), some myths and legends in quantitative
psychology, understanding statistics, Vol. 3 No. 1.
Grell, S. (2007), Deepening outreach through credit unions, A review of the
WOCCU Ecuador rural savings and credit with education project,
Research monograph, world council of credit unions,
Madison: WI, USA.
Hein, E. (2008), Shareholder value orientation, distribution and growth-
short-and medium-run effects in a Kaleckian model, working paper No.
120, Pre Vienna University of economics, Vienna.
7

Ho, R. (2006). Handbook of Univariate and Multivariate data analysis and
interpretation with SPSS, central queensland University,
North Rockhamton, Australia.
Horne, J. C. (2003), Financial Management Policy, 4th edition,
Texas: Prentice hall.
Hung, D. (2008), Price earnings to growth by the numbers
(Part 1 of 2), Review of economics and statistics, 41(2), 99-
105.
Huyssteen, W. (2005), A proposed credit rating methodology for cooperative
banks in South Africa. Conf., 18th annual SAFA conference,
Cape Town, RSA.
Jensen, M. (2001), Value maximization, stakeholder theory,
and the corporate objective function, journal of applied
corporate finance, 22, 32-42.
Jensen, M.C. & Meckling, W.H. (1976). Theory of the Firm:
Managerial behaviour, agency costs, and ownership
structure, journal of financial economics, 3, 305-360.
Kaloi, J.M. (2004), Factors contributing to liquidity problems on saving
credit cooperatives, Moi University, Kenya.
Karki, B.B. (2005), Strategic planning in cooperative sector:
8

A study on dairy cooperative, The Journal of Nepalese business
studies, II (1), 72-80.
Kaupelytė, D. & Mccarthy. O. (2006), Risk Management in
Lithuanian and Irish credit unions: trends and impacts
on credit union development, journal of rural cooperation,
34(2), 179-194.
Keasey, K., Thompson S., & Wright M. (eds) (2004), Corporate
Governance: An international perspective, London: Wiley.
Kim, E.H., Morse, A.& Zingales, L. (2006), What has mattered
to economics since 1970, journal of economic perspectives,
20(4),189–202.
Kimani, A.W. (2007), Inefficiency and ineffectiveness in credit
administration, a case study of Chuna SACCO Society ltd.
Kinuthia, P.M. (2007), Management of loan default problems in SACCOs in
Nairobi province.
Kombo, D.K. & Tromp D.L.A. (2006), Proposal and thesis writing an
introduction, Makuyu: Pualines Publications Africa.
Lari, L. (2008), the power of financial ratios in detecting fraudulent
financial reporting: The case of savings and credit cooperative societies.
Maina, D. T., (2007), corporate finance, Nairobi: regional
9

institute of cooperatives development and management.
Moreland, P. W. (1995), Alternative disciplinary mechanisms
in different corporate systems, Journal of Economic
Behaviour and Organization, 26, 17-34.
Mrema. M. (1988), Tanzanian women and progress in "Tuke"
Consumers' marketing cooperative, PULA: Botswana Journal
of African Studies, 8 (2), 18-36
Mudibo, E. K. (2005), Corporate governance in cooperatives:
the East African experience, Conf. Pan-African
consultative forum on corporate governance 2005,
Dakar, Senegal.
Mugenda O.M & Mugenda A.G (1999), Research methods:
quantitative and qualitative Approaches, African
centre for technology studies press.
Munyiri, C. (2006), Study visit on the role of women in
development of microfinance in Africa, Digest 03, 3, 1-
6.
Muruana, M. N. (2007), Effects of inflation on share capital and loan
portfolio with the cooperative organizations: A case study of Chai saving
and credit co-operative society.
10

Mwakajumilo, S.L.I. (2011), the role of informal microfinance institutions
in saving mobilization, investment and poverty reduction, a case of
savings and credit cooperative Societies in Tanzania from 1961-2008,
Turks and Caicos Islands of British west.
Nair, A. & Kloeppinger-Todd, R. (2007), Reaching rural areas with
financial services: Lessons from financial cooperatives in Brazil, Burkina
Faso, Kenya, And Sri Lanka. Discussion paper No. 35, World
Bank, Washington, DC: USA
Nanka-Bruce, D. (2006), corporate governance, capacity
utilization and growth, case study of Nepal
cooperatives, international review, 20, 2.
Ofei, K.A. (2001), Retooling credit unions: The case of credit union
association of Ghana, IFLIP research paper 01-3, international
labor organization, University of Ghana, Legon.
Ogbimi,G.. E., Soyebo, K.O. & Alabi, D.L. (2006), Minimizing
financial practices problems among rural women for
sustainable economic empowerment. Research journal of social
sciences, 1(1), 51-55.
Ogsi, O.D., Oghotomo, O.R., Taruhr, M.E. & Inoi, O.E. (2007),
cooperative societies and the development of small
11

scale furniture and tailoring enterprise: Evidence
from Delta State Nigeria. Pakistan journal of social sciences
4(1), 69-77.
Overseas cooperative development council [OCDC], (2007),
Cooperatives: Pathways to economic, democratic and social development
in the global economy, Falls church, Virginia: US OCDC.
Padilla, A. (2002), Can agency theory justify the regulation
of insider trading, the quarterly Journal of Austrian economics,
5(1), 3-38. 122
Pandey, I. M. (2010), Financial management, 9th edition, New
Delhi: India Vikas publishing House PVL Ltd.
Papias, M. M. & Ganesan, P. (2009), Repayment behaviour in
credit and savings cooperative societies: Empirical
and theoretical evidence from rural Rwanda, International
journal of social economics, 36(5), 608-625.
Philippon, T. (2006), the y-theory of investment, stern school of business,
working paper No. FIN-056-039: New York University: NBER and
CEPR.
Pischke, J.D. (1996), Capital formation in agricultural cooperatives in
developing countries: research issues, findings and policy implications for
12

cooperatives and donors summary of an analytical paper, research
paper, FAO cooperative, Rome, Italy.
Remezani, C.; Soenen L. & Jung, A. (2002), corporate
surpluses and shareholder wealth creation: financial
analyst journal, 58, 4
Richardson, C. (2001), Surpluses gap theories of investment, Conf., the
University of Western Australia, Perth, Australia.
Ritter, J. R. & Huang, R. (2008), Testing theories of capital
structure and estimating the speed of adjustment,
journal of financial and quantitative analysis, Forthcoming, 1-14.
Rorden, S & Kristofer W. K. (2010), Measuring and handling risk: How
different financial institutions face the same problem, MBA project,
Malardalen University, Sweden.
Roselyne, J, (2007), Loan defaulting among members in SACCOs: A case
study of kevom cooperative society, Kenyatta University of
agriculture and technology, Juja, Kenya.
Ross, S. A. (1998), Fundamentals of corporate finance 4th edition, New
York, U.SA: McGraw Hill.
Singh K.D. (2003), Management economics theory and application. 1st
edition, Dehra Dun , India : Pal Singh.
13
Small Stocks Harris, M. & Raviv, A. (2008). Theories of
capital structure. Journal of Finance, 46(1), 297-355.
Stein, J. C. (1988), Takeover threats and managerial myopia,
the journal of political economy, 96(1), 61-80.
Steve L., Xiuping S. (2002), Corporate governance: paradigms,
dilemmas and beyond, journal of Leeds law school, Leeds
Metropolitan University, 2(1), 200.
Sundaramstukel, R. (2006), Evaluating the role of Peruvian credit unions: A
case study of 8 credit unions, Research monograph, main
street economics, world council of credit unions,
Madison: WI, USA.
Tache, G. M. (2006), SACCO promotion and development-Lira region,
Research paper, chemonics international, USAID, Lira,
Uganda.
USAID. (2001), Report to congress on the implementation of the support for
overseas cooperative development act, Washington: USAID.
Wieland, R. (2007), Supporting credit union development in Afghanistan, An
overview of issues important to the development of Sharia compliant
cooperative finance, Research monograph, main street
economics, world council of credit unions, Madison:
14

WI, USA.
World Bank (2007), providing financial services in rural areas: A fresh look at
financial cooperatives, Washington DC, USA: World Bank.
World Council of Credit Unions [WOCCU] (2007), Credit union growth
program member income survey – 2007, Research monograph,
main street economics, world council of credit unions,
Madison: WI, USA.
World Council of Credit Unions [WOCCU], (2007), Cases study of
four savings and credit cooperative societies (SACCOs) operating in the
Hills of Nepal, Research monograph, world council of
credit unions, Madison: WI, USA.
Zetzsche, D. A. (2007), an ethical theory of corporate governance history,
Research paper, Center for business and corporate law,
Dusseldorf, Germany.
15

Appendic
es
16

Appendix I
Questionnaire
An assessment of determinants of growth of employees’ saving and credit
associations
This questionnaire is prepared by Msc in accounting and
finance student of Addis Ababa University, college of
business and economics. The objective of this questionnaire
is to collect information concerning the determinants of
growth of employees’ saving and credit associations. You are
kindly request to complete this questionnaire sincerely and
honestly. All information you provide will be kept with
strict for academic purpose and will not be used for other
purpose than the intended purpose.
General direction
Please take a few minutes to complete this questionnaire
Please answer the questions correctly and as accurate as
possible
Tick the correct answer in the boxes provided against
1

the questions where provided.
Write brief answers where explanation is required.
You need not write your name on the questionnaire.
Abbreviations
SD Strongly disagree for which response scores 1
D Disagree for which response scores 2
N Neutral for which response scores
3
A Agree for which response scores
4
SA Strongly agree for which response scores 5
ESCA Employees’ Savings and Credit Associations
Section A: Background information
1. When was your ESCA started? __________
2. Please indicate the staff in which you are working in
your ESCA.
Staff your are
working on Year of experience
Finance staff
2

Accounts staff
Other Staff (specify)
Section B: Growth of shareholders’ wealth
3. Please tick the one corresponding to the correct answer
in each statement regarding profitability and
distribution of income in your ESCA.
SD D N A SA
Our ESCA has been making a surplus every year
from 2008 to 2013
Our ESCA has been declaring dividends for the
five years
Dividends per share have been increased in the
last five years
The ESCA has also been contributing to retained
earnings
The retained earnings have been growing
annually from 2008 to 2013
4. How do your ESCA determine the surplus distributed as
dividends, rebates and institutional capital (retained
3

earnings)? Please tick the box corresponding to the
correct answer to the question. Tick only one box
No specific method is used
Using a standard proportion
Depending on volume of profits
Depending on the capital structure
Depending on funds allocation strategy
Other…………………………………………………………...…………………………...
………………………………………………………………………………………………
Section C: Financial stewardship
Part I: Loan evaluation
5. Loan Eligibility.
Please indicate the level of agreement or disagreement
with each of the following statement regarding loan
evaluation in your ESCA.
SD D N A SA
Loan applications are approved by special
committee in our ESCA
4
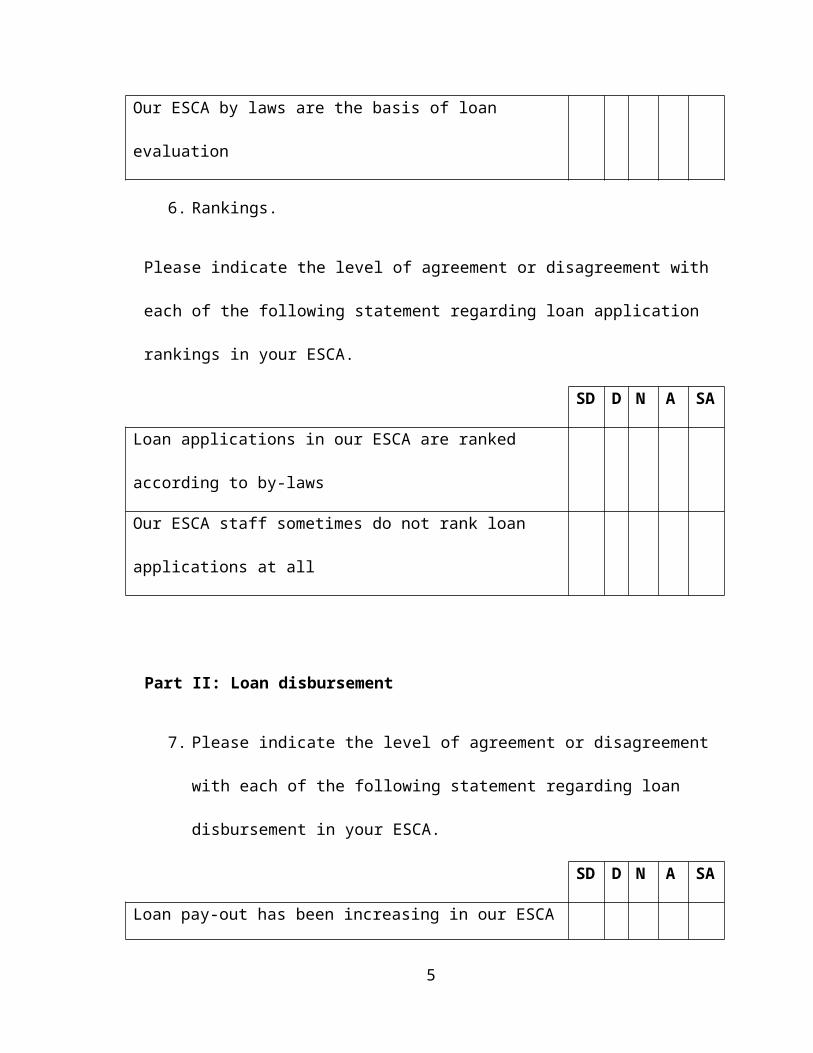
Our ESCA by laws are the basis of loan
evaluation
6. Rankings.
Please indicate the level of agreement or disagreement with
each of the following statement regarding loan application
rankings in your ESCA.
SD D N A SA
Loan applications in our ESCA are ranked
according to by-laws
Our ESCA staff sometimes do not rank loan
applications at all
Part II: Loan disbursement
7. Please indicate the level of agreement or disagreement
with each of the following statement regarding loan
disbursement in your ESCA.
SD D N A SA
Loan pay-out has been increasing in our ESCA
5
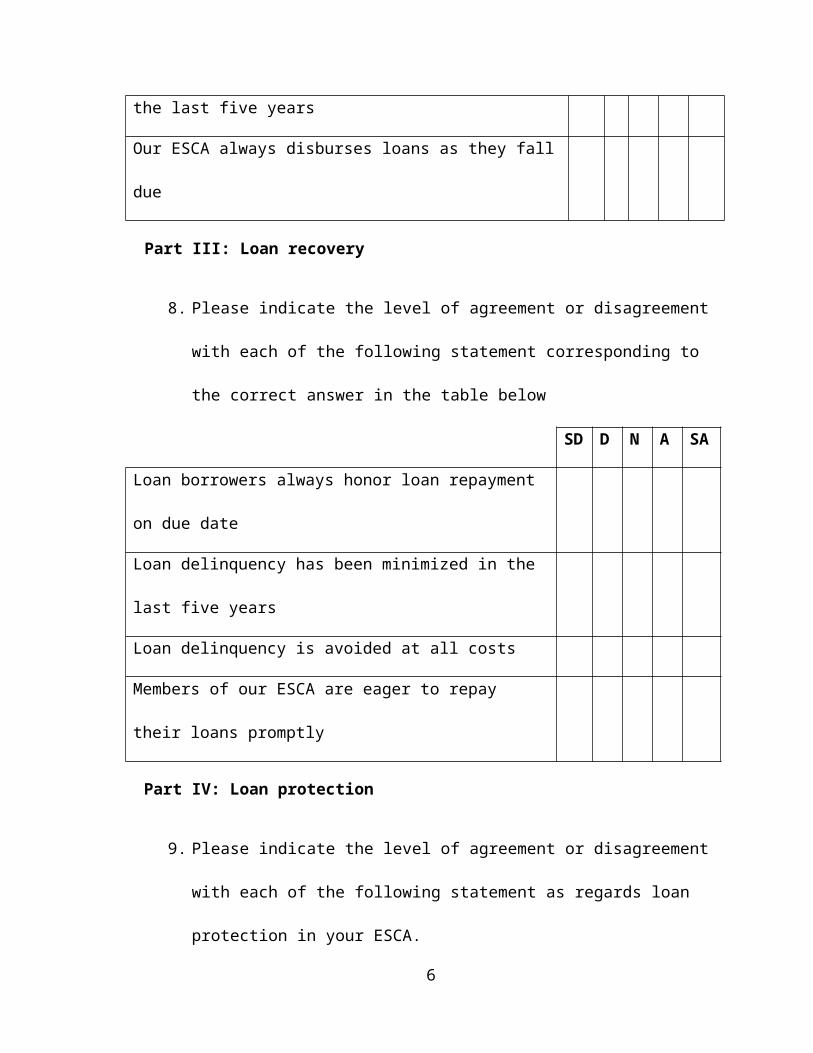
the last five years
Our ESCA always disburses loans as they fall
due
Part III: Loan recovery
8. Please indicate the level of agreement or disagreement
with each of the following statement corresponding to
the correct answer in the table below
SD D N A SA
Loan borrowers always honor loan repayment
on due date
Loan delinquency has been minimized in the
last five years
Loan delinquency is avoided at all costs
Members of our ESCA are eager to repay
their loans promptly
Part IV: Loan protection
9. Please indicate the level of agreement or disagreement
with each of the following statement as regards loan
protection in your ESCA.
6

SD D N A SA
Our ESCA has a provision for
irrecoverable loan
All irrecoverable loan over one year are
written off
Part V: Default risk
10. Default risk assessment
Please indicate the level of agreement or disagreement with
each of the following statement.
SD D N A SA
This ESCA awards loans depending on
borrower’s ability to pay
Loans with lower default risks are paid in
full in the ESCA
Where default risk is high the ESCA awards
loan depending the borrower’s ability to
pay
Part VI: Staff competence
11. Academic qualifications
Please indicate your academic qualification 7

Secondar
y school
Undergraduat
e degree
Masters
degree PhD
Other
(specify)
1 2 3 4 5
12. Professional qualifications
Please indicate your professional qualification
None....................................1
Technician (e.g. ATC)...................2
Diploma (e.g. CPA I)....................3
Professional level I....................4
Professional level II...................5
Professional level III..................6
13. Target
oriented training
Please explain the average period provided for you to attend
short term courses/seminars/ workshops on financial practice
each year? _______________________________
Part VII: Innovativeness
14. Please indicate the level of agreement or
disagreement with each of the following statement
regarding loan products in your ESCA.
8

SD D N A SA
All loan products are applied for by
borrowers to our ESCA
There is regular diversification of products
in our ESCA
There are difficulties in marketing some loan
products in our ESCA
All loan products are designed to fit
members’ needs in our ESCA
Section D: Capital structure
15. Please indicate the level of agreement or
disagreement with each of the following statement
regarding capital structure of your ESCA
SD D N A SA
The ESCA uses cost of capital when
determining the source of fund
The ESCA makes careful evaluations when
deciding source of fund
Profitability is a determinant of the source
of fund in this ESCA
9

This ESCA mobilizes fund after consulting the
financial managers
Section E: Funds allocation strategy
16. Please indicate the level of agreement or
disagreement with each of the following statement
corresponding to the correct answer in the table below
SD D N A SA
Income from loans cover all operating costs
Income from loans in our ESCA maintains
retained earnings
The ESCA always pays dividends after profits
are announced
17. If you have any non financial
investments then please indicate the level
of agreement or disagreement corresponding
the correct answer in each statement below
SD D N A SA
Non-financial investments pay their recurrent
cost in our ESCA
10
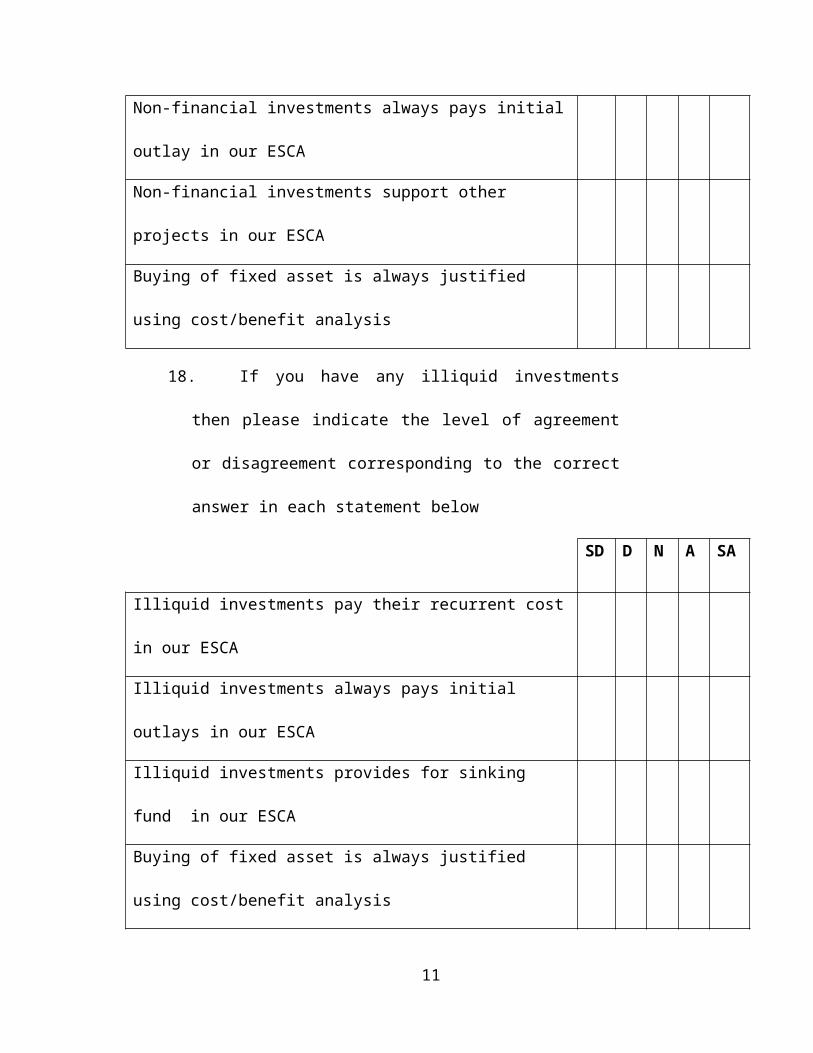
Non-financial investments always pays initial
outlay in our ESCA
Non-financial investments support other
projects in our ESCA
Buying of fixed asset is always justified
using cost/benefit analysis
18. If you have any illiquid investments
then please indicate the level of agreement
or disagreement corresponding to the correct
answer in each statement below
SD D N A SA
Illiquid investments pay their recurrent cost
in our ESCA
Illiquid investments always pays initial
outlays in our ESCA
Illiquid investments provides for sinking
fund in our ESCA
Buying of fixed asset is always justified
using cost/benefit analysis
11

Thank you for your cooperation
12

Appendix II
Document review tool
Section A: Growth of ESCAs
1. Please fill in the table below correctly. Indicate the value
on each of the following items for the years given
Items
Years 2009 2010 2011 2012 2013
Profits (Birr)
Dividends declared
(Birr)
Rebates (Birr)
Number of shares
Share capital (Birr)
Opening institutional
capital (Birr)
Section B: Financial stewardship
1

2. May you please fill the table below on the qualification of
the accounts staff? Specify the total number of staff whose
highest qualification is the one indicated.
Items
Years 2009 2010 2011 2012 2013
Academic
qualifications
Secondary school
Undergraduate degree
Masters degree
PHD
Others
Professional
qualifications
None
Technician (e.g. ATC)
Diploma (in
accounting)
Professional level I
Professional level II
2

Professional level
III
(b) Please fill the table below on short term target
oriented training and staff experience for the period
between 2009 and 2013
Target oriented training2009 2010 2011 2012 2013
Number of staff who attended
Average time taken by each
staff
Work experience 2009 2010 2011 2012 2013
Average experience
Average period with current
employment
3. Innovativeness
Please list the type of loans ever offered by your ESCA from 2009
to 2013 and tick corresponding to that product the year it was
offered.
3

Loan products
Years 2009 2010 2011 2012 2013
4. Loan evaluation
Please fill the table below with correct number of loan
applications for each requirement in the listed years
Items
Years 2009 2010 2011 2012 2013
Number of loan application
approved
Number of eligible
applications approved
Number of application
4

correctly ranked
Number of loan applications
paid
5. Loan disbursement
a) Please fill the table below with correct value for each
asset in the listed years
Years 2009 2010 2011 2012 2013
Asset
(Birr
)
(Bir
r)
(Birr
)
(Birr
)
(Birr
)
Total loan disbursed this year
Total assets
Total number of members who
received loans
Total membership this year
b) Please fill the table below with correct value for each expense
in the listed years
5

Years 2009 2010 2011 2012 2013
Asset
(Bir
r)
(Birr
) (Birr)(Birr)
(Birr
)
Sitting allowance when
processing loans
Bank charges for loan
disbursement
Traveling allowances for loan
processing
Other expenses on loan
processing
6. Loan repayment
May you please provide details of monthly loan repayment amount
for each application?
_________________________________________________________________
_________________________________________________________________
_________________________________________________________________
_________________________________________________________________
6

_________________________________________________________________
_________________________________________________________________
_________________________________________________________________
_________________________________________________________________
________
7. Loan protection
Please fill the table below with correct amount for each item in
the listed years
Years 2009 2010 2011 2012 2013
Asset
(Bir
r) (Birr) (Birr)(Birr)
(Birr
)
Irrecoverable (non performing)
loans
Total loans balance
Provision for loan loss
8. Default risk assessment
May you please provide details of loan disbursements and the
loanees earning details?
7

_________________________________________________________________
_________________________________________________________________
_________________________________________________________________
_________________________________________________________________
____________________________________________________
Section C: Capital structure
9. Source of funds
Please fill the table below with correct amount for each item in
the listed years.
Years 2009 2010 2011 2012 2013
Item (Birr) (Birr) (Birr) (Birr)
(Birr
)
Total savings
Total debt capital
Return on shares
Return on savings
Return on retained
earnings
8

Return on debt capital
Cost related to shares
Cost related to savings
Cost related to retained
earnings
Cost related to debt
capital
Section D: Funds allocation strategy
10. Financial investments
(a) Please fill the table below with correct amount for
each item in the listed years on investments on loans
Amount in the
years 2009 2010 2011 2012 2013
Item
(Birr
) (Birr) (Birr) (Birr) (Birr)
Income from loans
Total operating cost
Liquid investments
Total Investments
9
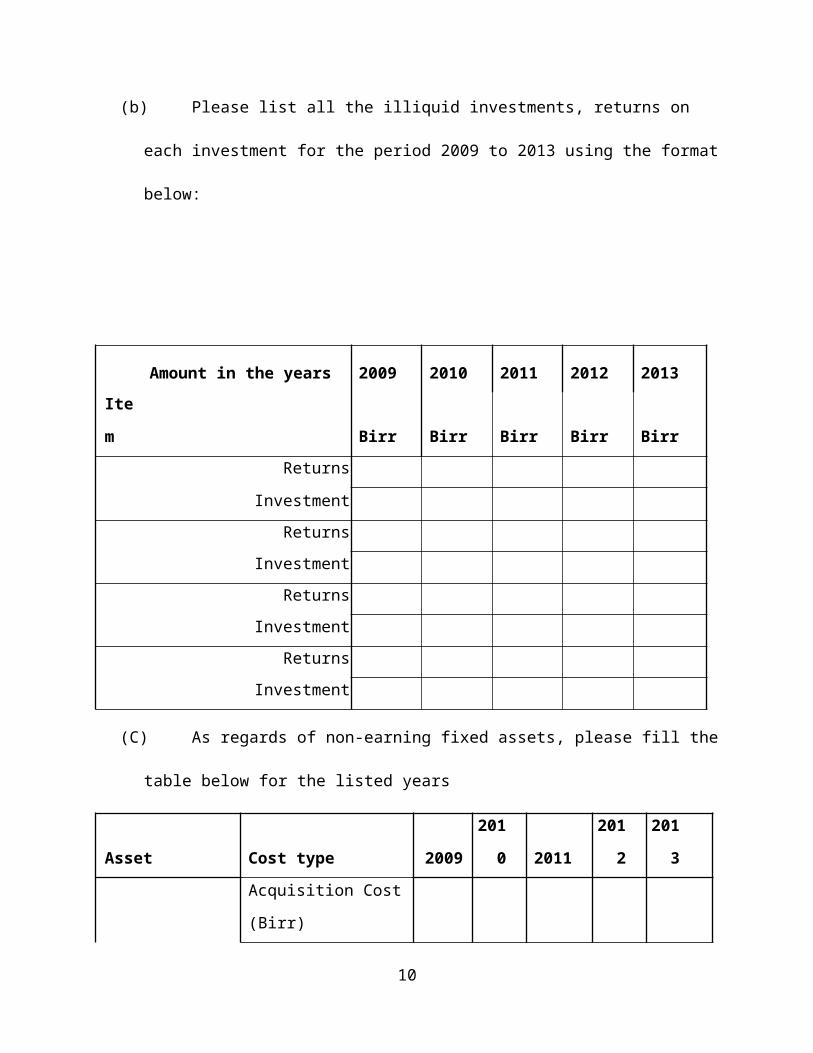
(b) Please list all the illiquid investments, returns on
each investment for the period 2009 to 2013 using the format
below:
Amount in the years 2009 2010 2011 2012 2013Ite
m Birr Birr Birr Birr BirrReturns
Investment Returns
Investment Returns
InvestmentReturns
Investment
(C) As regards of non-earning fixed assets, please fill the
table below for the listed years
Asset Cost type 2009
201
0 2011
201
2
201
3
Acquisition Cost
(Birr)
10

Depreciation (%)Life span (years)Cost of
outsourcing(Birr)Acquisition Cost
(Birr)Depreciation (%)Life span (years)Cost of
outsourcing(Birr)Acquisition Cost
(Birr)Depreciation (%)Life span (years)Cost of
outsourcing(Birr)Acquisition Cost
(Birr)Depreciation (%)Life span (years)Cost of
outsourcing(Birr)
11

Appendix III
Items adjusted to improve reliability of instruments
1. Financial stewardship
The items adjusted in financial stewardship are;
Academic qualification
Professional qualification
Target oriented training
Retention period
2. Funds allocation strategy
The items adjusted in funds allocation strategy are;
Income from loans covers all operating costs.
Non –financial investments provide for sinking fund
Non –financial investment support other projects
Illiquid investments always pay initial outlay
Illiquid investments always support other projects.
3. Capital structure
No item was removed from capital structure
1
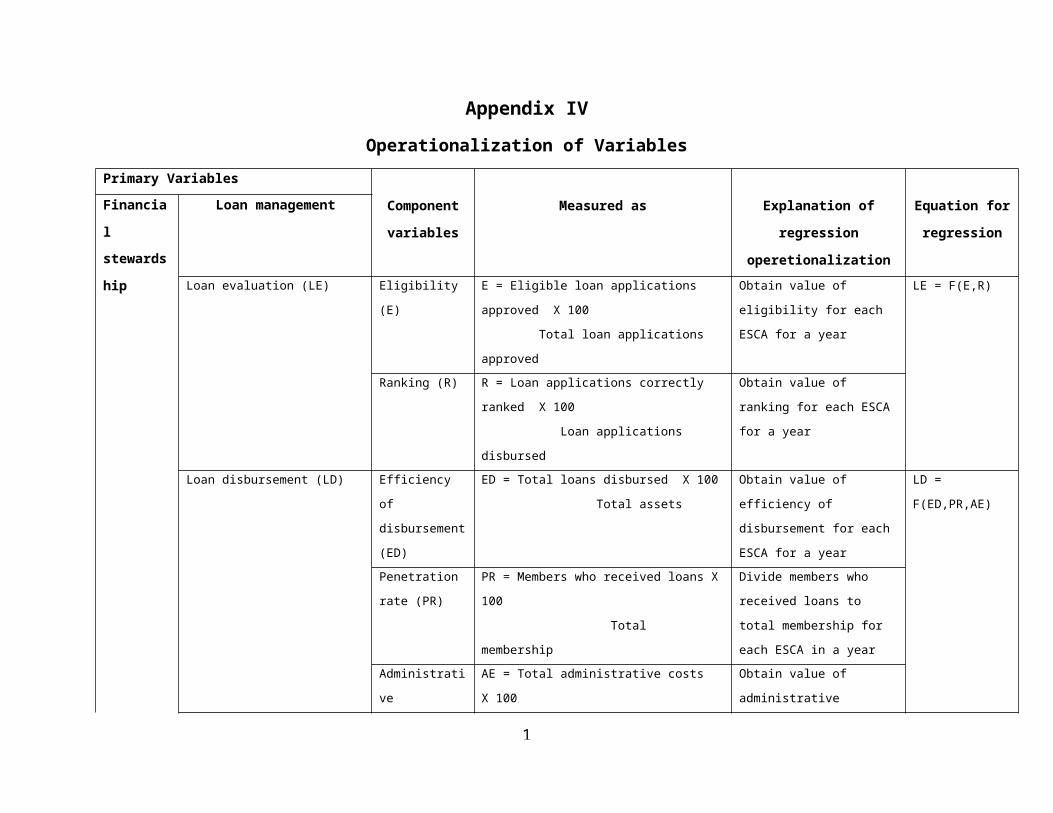
Appendix IVOperationalization of Variables
Primary Variables
Component
variables
Measured as Explanation of
regression
operetionalization
Equation for
regression
Financia
l
Loan management
stewards
hip Loan evaluation (LE) Eligibility
(E)
E = Eligible loan applications
approved X 100
Total loan applications
approved
Obtain value of
eligibility for each
ESCA for a year
LE = F(E,R)
Ranking (R) R = Loan applications correctly
ranked X 100
Loan applications
disbursed
Obtain value of
ranking for each ESCA
for a year
Loan disbursement (LD) Efficiency
of
disbursement
(ED)
ED = Total loans disbursed X 100
Total assets
Obtain value of
efficiency of
disbursement for each
ESCA for a year
LD =
F(ED,PR,AE)
Penetration
rate (PR)
PR = Members who received loans X
100
Total
membership
Divide members who
received loans to
total membership for
each ESCA in a year Administrati
ve
AE = Total administrative costs
X 100
Obtain value of
administrative
1

efficiency
(AE)
Returns on loans efficiency for each
ESCA for a yearLoan recovery (LR) Loan
repayment
(LRP)
LRP = Loan recovery date –
Expected loan recovery date
Obtain value of loan
repayment for each
ESCA for a year
LR =
F(LRP,LDL)
Loan
delinquency
(LDL)
LDL = Delinquent loans X 100
Total Loans
Obtain value of loan
delinquency for each
ESCA for a yearLoan protection (LP) Loan
protection
(LP)
LP = Provision for loan loss X
100
Irrecoverable loss
LP as the ratio of
provision for loan
loss to total
Irrecoverable Loans
for each ESCAs in a
year
LP = F(LP)
Default risk (DR) Default risk
(DR)
DR = Monthly Net Income X
100
Monthly Principal and Interest
Payment on Loan
Obtain default risk
for each ESCA for a
year
DR = F(DR)
Institutional strengthStaff competence (SA) Academic
qualification
(AQ)
The most frequent academic
qualification
Classify the academic
qualification and get
the most frequent
academic qualification
classification for all
respondents
SA =
F(AQ,PQ,TOT,E
xp)
2

Professional
qualification
(PQ)
The most frequent professional
qualification
Classify the
professional
qualification and get
the most frequent
professional
qualificationTarget
oriented
training
(TOT)
TOT
¿∑t=1
n(attendedfortheyear )
T
Average training period
in a year for all ESCAs
Experience
(Exp) Exp = ∑t=1
n(exprience∈years )
T
Obtain the average mean
current experience in
years for the staff of
all ESCAs
Innovativeness Innovativenes
s
INN = Available loan products
Potentioal loan
products
The quality of loan and
diversity in loan
products in each ESCA
in a year
INN = F(INN)
Financial stewardship (FS) = F(LE, LD, LR, LP, DR, SA, INN)
Primary Variables Component
variable
Measured as Explanation of
regression
operetionalization
Equation for
regression
Capital Share capital Share capital SC = Return on shares – Related Obtain the average SC = F(SC)
3

structur
e
(SC) costs X 100
Share
capital
rate of surpluses from
shares
Savings/deposits Savings/deposits
(SV)
SV = Return on savings/deposits –
Related costs X 100
Total
savings/deposits
Obtain the average
rate of surpluses from
savings/deposits
SV = F(SV)
Institutional
capital
Institutional
capital (IC)
IC = Return on institutional capital
X 100
Total institutional
capital
Obtain the average
rate of surpluses from
institutional capital
IC = F(IC)
Debt capital Debt capital
(DC)
DC = Return on debt capital – Related
costs X 100
Total debt capital
Obtain the average
rate of surpluses from
external credit
DC = F(DC)
Capital structure (CS) = F(SC, SV, IC, DC)
Primary Variables Component
variable
Measured as Explanation of
regression
operetionalization
Equation
for
regressio
nFund
allocati
on
Loans Loans (LO) LO = Net income from loan as of current
year X 100
Loans disbursed
Obtain the average
profit from loans
disbursed for each
ESCAs in a year
LO = F(LO)
4

strategy Liquid
investments
Liquid
investment (LI)
LI = Total liquid investments as of current
year X 100
Total
investment
Calculate the
average income from
liquid investment
LI = F(LI)
Illiquid
investments
Illiquid
investment (II)
II = Net income from illiquid investment as
of current year X 100
Total
illiquid investment
Obtain the average
income from illiquid
investments for each
ESCAs in a year
II = F(II)
Non earning
fixed assets
Non earning
fixed asset (NA)
NA = Acquisition cost of non earning fixed
asset X 100
Out sourcing cost of non earning
fixed asset
Obtain the ration of
the acquisition cost
of non earning
assets to the
outsourcing cost of
non earning assets
NA = F(NA)
Fund allocation strategy (CA) = F(LO, LI, II, NA)
5